ANNUAL REPORT 2015 - Canberra Institute of Technology
164
ANNUAL REPORT 2015 CRICOS No. 00001K – RTO Code 0101
-
Upload
khangminh22 -
Category
Documents
-
view
3 -
download
0
Transcript of ANNUAL REPORT 2015 - Canberra Institute of Technology

ANNUAL REPORT 2015
CAN
BERRA IN
STITUTE O
F TECHN
OLO
GY A
NN
UA
L REPORT 2015
CRICOS No. 00001K – RTO Code 0101


ANNUAL REPORT 2014-15
CRICOS No. 00001K – RTO Code 0101
Canberra Institute of Technology Annual Report 20152
Canberra Institute of Technology
Annual Report 2015
© ACT Government, 2016
ISSN 1322-5456
This work is copyright. Apart from any use permitted under the Copyright Act 1968,
no part may be reproduced by any process without written permission from the Manager,
Publications and Communications, Corporate Services Bureau, ACT Government,
GPO Box 158, Canberra ACT 2601.
Designed by CIT Marketing, Canberra Institute of Technology
Provider: 0101
CRICOS: 00001K
Canberra Institute of Technology Annual Report 2015 3
CONTENTS
SECTION A: TRANSMITTAL CERTIFICATE 7
SECTION B: ORGANISATION OVERVIEW AND PERFORMANCE 11 B1: Organisational Overview 12 B2: Performance Analysis 27 B3: Scrutiny 28 B4: Risk Management 31 B5: Internal Audit 32 B6: Fraud Prevention 35 B7: Work, Health and Safety 36 B8: Human Resources Management 39 B9: Ecologically Sustainable Development 43
SECTION C: FINANCIAL MANAGEMENT REPORTING 47 C1: Financial Management Analysis 48 C2: Financial Statements 54 C3: Capital Works 121 C4: Asset Management 125 C5: Government Contracting 126 C6: Statement of Performance 129
SECTION D: NOTICES OF NON COMPLIANCE 137 D1: Dangerous Substances 138 D2: Medicines, Poisons and Therapeutic Goods 139
SECTIONS E-L Not applicable to the Canberra Institute of Technology 141
SECTION M: COMMUNITY ENGAGEMENT AND SUPPORT 142
SECTION N: JUSTICE AND COMMUNITY SAFETY 146 N1: Bushfire Risk Management 146 N2: Freedom of Information 147 N3: Human Rights 148 N4: Legal Services Directions 149
SECTION O: PUBLIC SECTOR STANDARDS AND WORKFORCE PROFILE 150 O1: Culture and Behaviour 150 O2: Public Interest Disclosure 151 O3: Workforce Profile 152
SECTION P: TERRITORY RECORDS 156
ACRONYMS AND ABBREVIATIONS 157
COMPLIANCE INDEX 159
CONTACT OFFICER 160

Canberra Institute of Technology Annual Report 20154

Canberra Institute of Technology Annual Report 2015 5
DALE TIDY Graduate, Photography
I loved how practical the
course was. It covered
so many varieties of
photography. As a young
photographer, you never
know what direction your
career is going to take and
which skills you are going to
need later down the line.”
SECT
ION
A T
rans
mitt
al C
ertifi
cate

Canberra Institute of Technology Annual Report 20156
Canberra Institute of Technology Annual Report 2015 7
SEC
TIO
N A
Tra
nsm
ittal
Cer
tifica
te
Canberra Institute of Technology | GPO Box 826, Canberra, 2601 Australia | T +(61) 02 6207 3107 | F +(61) 02 6207 3109 | E [email protected] | cit.edu.au
CIT Bruce | CIT Fyshwick | CIT Gungahlin | CIT Reid | CIT Tuggeranong | CIT Woden | ABN 432 737 96 990 | CRICOS No. 00001K
Office of the Chief Executive
SECTION A TRANSMITTAL CERTIFICATE
Transmittal Certificate
Ms Meegan Fitzharris MLAMinster for Higher Education, Training and ResearchACT Legislative AssemblyCivic Square, London CircuitCANBERRA ACT 2601
Dear Minister
We present to you the Canberra Institute of Technology Annual Report 2015.
This Report has been prepared under section 6(1) of the Annual Reports (Government Agencies) Act 2004 and in accordance with the requirements under the Annual Report Directions.
It has been prepared in conformity with other legisation applicable to the preparation of the Annual Report by the Canberra Institute of Technology.
I certify that the attached Annual Report is an honest and accurate account and that all material information on the operations of Canberra Institute of Technology during the period 1 January 2015 to 31 December 2015 has been included.
I hereby certify that fraud prevention has been managed in accordance with Public Sector Management Standards, Part 2.
Section 13 of the Annual Reports (Government Agencies) Act 2004 requires that you cause a copy of the Report to be laid before the Legislative Assembly within four months of the end of the reporting period.
Your sincerely
Leanne Cover Craig SloanChief Executive Officer Chair, CIT Board7 April 2016 7 April 2016
Canberra Institute of Technology Annual Report 20158
Craig SloanCIT Board ChairCIT has a proud history of serving the
ACT community. It is a privilege to join an organisation with such a longstanding and esteemed history as we move into a new chapter.
The ACT Government determined new governance arrangements for CIT to position CIT for success in a more competitive and contestable market. The composition of the CIT Board, established on 1 July 2015, is designed to benefit from both private sector and public sector expertise. The Board is working to transform CIT into a future focused innovative organisation that works with industry and business to develop the workforce of the future. This new direction for CIT will be articulated in a strategic plan that will be launched mid-2016.
As a board, and in collaboration with the CIT Executive Team and staff, we have a big job ahead of us as we plan for the future and look to articulate and define our business in the contemporary vocational education and training (VET) environment as we listen to our clients, industry partners and stakeholders.
One of the priorities of the CIT Board is to modernise our learning environment so it is appropriate and responsive to the needs of contemporary learners. This also means making smart business decisions about our facilities, and freeing up capital wherever it makes sense to reinvest in resources for teaching and learning. The funding provided by the ACT Government for a new CIT campus in Tuggeranong will give us the opportunity to put this into practice.
As a board, we are passionate about modernising CIT’s campuses to help drive the organisation
into the future. Again, in order to get this right, we will be listening to students, staff, industry, the community and government.
Another focus of the CIT Board is to define our business development priorities locally, nationally and internationally. At a local level we seek to meet the needs of the ACT learner, employer, government and community. Growing our business nationally and internationally is an exciting task, but certainly also a challenging one that will require a careful analysis of the market and our training products. We will apply the test of what is repeatable, profitable and sustainable.
The CIT Board has established a sub-committee that will lead this work to identify a clearly differentiated market position for CIT and the associated workforce capabilities that will be required. In addition an Audit Risk and Finance Committee has been established to provide assurance that CIT has an appropriate risk management framework in place and that the financial statements are in order.
The CIT Board believes VET will continue to play a critical role in growing the economy of the ACT and region, and it is our challenge and privilege to help position CIT to respond to the challenges of the future for the benefit of the community.
I am pleased to have a key role in the transformation of CIT and I look forward with great enthusiasm to contribute as an active CIT Board Chair.
FROM THE CIT BOARD CHAIR

Canberra Institute of Technology Annual Report 2015 9
FROM THE CHIEF EXECUTIVE OFFICER
Leanne CoverChief Executive OfficerAfter many months of careful planning, it was
exciting to introduce the first ever CIT Board on 1 July 2015, in a major and important change to CIT’s governance arrangements. With a commercially focused decision-making body at the helm, CIT is in a better position than ever to operate effectively in the modern vocational education and training environment.
As we move into a more competitive market, we continue to focus on the student experience and outcomes and building strong partnerships with industry, business and education institutions to inform our business. While we look for opportunity to diversify, our priority remains to offer quality products that respond to local and national training needs, particularly those on the ACT Skills Needs List. This includes engaging with the ACT Government’s Skilled Capital training initiative.
In 2015 the Chief Minister’s focus on government, educational institutions and industry and business working closely together saw the start of a period of major innovation and development in education and training. At CIT, we continue to drive innovation through a focus on meeting the needs and expectations of modern learners.
With this in mind, we have been upgrading our campuses with high speed Wi-Fi to enable increased connectivity for a range of flexible learning models and cross-campus interaction. This principle underpins the development of a new CIT learning environment at Tuggeranong which, in many ways, will be a blueprint for the future with a focus on flexible, multipurpose spaces and increased ICT capability.
One of the great results of an internal innovation program was the development of CIT’s first app, offering current and future students a user-friendly single point of access to a range of CIT services and information. We were also pleased to launch the world’s first biometrics MOOC (massive open online course), which was a fantastic demonstration of our ability to respond to customer demand in an emerging field of interest.
Canberra’s fast growing leadership in renewable energy destines Canberra to become the nation’s hub for renewable energy research, innovation and technology. CIT is a major player in this space with the establishment of the CIT Renewable Energy Skills Centre of Excellence to support the region’s training needs in this emerging industry to help meet the ACT Government’s renewable energy targets.
Becoming a Foundation Partner to the CBR Innovation Network recognises CIT’s role, along with our higher education peers, in the innovation space, and will assist our students to connect with programs, funding and mentoring to turn their ideas into successful enterprises.
2015 also saw the sad loss of former CIT Chief Executive Adrian Marron. I would like to acknowledge Adrian’s contribution to CIT and the vocational education and training sector at a national level. His achievements were recognised with the posthumously awarded Norm Fisher
Canberra Institute of Technology Annual Report 201510
Award for an outstanding and extensive contribution to vocational education and training in the ACT at the ACT Training Excellence Awards in September.
At CIT we continue to think about how we work and connect with our clients, community, industry and competitors. CIT is a proud organisation and a place that all Canberrans can call their own. I am confident that with the support and leadership of the CIT Board we can embrace future challenges, opportunities and fulfil our vision to be the leading provider of contemporary vocational education and training.

Canberra Institute of Technology Annual Report 2015 11
SECT
ION
B O
rgan
isat
ion
Ove
rvie
w
and
Perf
orm
ance
KERRIE THURKET TLE Graduate, Education Support
I met some really lovely and
inspirational people during
this course. The teachers
are so passionate about
their subject area, which
made the subjects really
interesting to learn.”

Canberra Institute of Technology Annual Report 201512
RoleCanberra Institute of Technology (CIT) is a Territory Authority established under the Canberra Institute of Technology Act 1987. It is a publicly owned technical and further education (TAFE) institute, providing vocational education and training (VET) to the Australian Capital Territory (ACT) and region. CIT is the largest registered training organisation (RTO) in the ACT and is committed to excellence in delivering its statutory functions.
The Canberra Institute of Technology Act 1987 was amended in 2014 to replace the CIT Advisory Council with a governing board to better enable CIT to operate as a public provider of VET with a greater commercial and entrepreneurial focus.
The CIT Board commenced operation on 1 July 2015 and provides the strategic focus for CIT to thrive into the future.
The governing board gives CIT the autonomy, flexibility and responsiveness to meet its challenges in more innovative and efficient ways, enabling CIT to better shape the services it utilises and operate more commercially in an increasingly competitive VET marketplace.
FunctionsThe functions of CIT are set out in the Canberra Institute of Technology Act 1987 and include:
a) to conduct an educational institution to provide excellence in study in the fields of vocational education and training and higher education that—
(i) the institute board, with the Minister’s written approval, decides; or
(ii) the Minister directs;–
b) to provide educational products and services, and use the facilities and resources of the institute, to advance and develop knowledge and skills in the community;
c) to support ACT industry and business in pursuing economic growth and sustainability for the community;
d) to perform the role of public provider of vocational education and training in the ACT;
e) to issue awards to people who have satisfactorily completed a course of study at the institute;
f) to issue awards posthumously and to issue honorary awards;
g) to consult and cooperate with other entities and businesses to promote education and training and employment pathways for learners;
h) to make suitable financial arrangements with industry and business for the purpose of the institute’s functions under paragraphs (a) to (e).
In 2015 the ACT Government provided CIT with 65% of its funding for agreed outcomes as described in the CIT annual Statement of Intent which formed part of the ACT Budget. This agreement was co-signed by the ACT Minister for Education and Training, the ACT Treasurer and CIT’s Chief Executive Officer.
CIT also receives revenue from contestable sources including User Choice (Australian apprenticeship funding), Skilled Capital, international students and commercial activities. Further revenue is generated through CIT Solutions, a wholly-owned subsidiary.
B.1 ORGANISATIONAL OVERVIEW
Canberra Institute of Technology Annual Report 2015 13
Strategic planningCIT has a three year strategic plan titled CIT 2014-2016. CIT’s vision, mission, strategic drivers and values are described below.
VISIONTo be the leading provider of vocational education and training in the ACT and Australia.
MISSIONChanging lives through quality education and skills development for individuals, industry and community.
STRATEGIC DRIVERSCIT’s strategic drivers: Learners, People and Partners will enable CIT to strengthen its position as a leader of vocational education and training and to be successful in a more competitive market.
Strategic driver 1: LearnersEnrich CIT learners with skills and knowledge for now and the future.
Strategic driver 2: PeopleCultivate CIT’s workforce to embody a culture of passion, innovation and high performance.
Strategic driver 3: PartnersCollaborate with industry, community and government to diversify and grow CIT partnerships and revenue sources.
VALUESCIT believes quality in education is achieved through the values of: Respect, Integrity, Collaboration and Innovation.
SERVICESCIT provides an extensive range of vocational education programs, including trade and other certificates, diplomas, advanced diplomas and short courses. CIT also provides a small number
of niche higher education degrees and has a range of strategic partnerships with universities and other educational organisations to jointly deliver programs and provide pathways to further training at undergraduate and postgraduate levels.
By cultivating and maintaining strong links with local and regional industries and government, CIT continues to be responsive to local and national workforce development needs.
CIT also offers other accredited courses and fee-for-service programs, often strongly customised to meet the individual requirements of an enterprise or student cohort. Strong industry links have allowed for partnerships leading to customised training delivery in regional and remote areas.
CIT is an approved delegate of the Australian Skills Quality Authority (ASQA) to manage CIT’s scope of registration. Nationally, only a small numbers of RTOs have been awarded this delegated authority.
As at the end of 2015, CIT had 577 current training products on its scope of registration. This comprised 315 training package qualifications and 27 VET-accredited courses, as well as 235 explicitly scoped units of competency. CIT delivers from 33 national training packages across the Australian Qualification Framework (AQF) from certificate I up to the graduate diploma as well as targeted skill sets of one or more competencies.
CIT is accredited by the Tertiary Education Quality and Standards Agency (TEQSA) to continue as a non–self-accrediting, higher education provider (HEP), until 2020. In 2015, CIT had accreditation through TEQSA for two degrees.
CIT is also recognised by the ACT Board of Senior Secondary Studies as a non-school educational institution to deliver the ACT Year 12 Certificate. CIT specialises in delivering the ACT Year 12 Certificate to mature age students.
SEC
TIO
N B
1 O
rgan
isat
iona
l Ove
rvie
w

Canberra Institute of Technology Annual Report 201514
CIT is committed to providing a quality learning experience to students through a wide choice of industry-relevant programs, highly qualified staff, excellent support services and strong opportunities for further advancement in studies. The size and scope of CIT allows for comprehensive student support services that reflect the diversity of CIT students and their needs.
Professional services to assist all students reach their potential are provided in the areas of:
• counselling
• disability support
• foundation skills (including language, literacy and numeracy (LLN) support)
• financial assistance
• international student support
• migrant support
• peer tutoring
• student equity, including Aboriginal and Torres Strait Islander student support through CIT Yurauna Centre
• youth support.
Clients and stakeholdersA well-educated community is the basis of Canberra’s social and economic wellbeing. There is a clear strategic link between VET and economic development in the ACT.
The provision of VET through CIT is an important element in the ACT Government’s commitment to assist people of the ACT to be part of a well trained and highly skilled workforce that will promote a strong and vibrant ACT economy. CIT’s delivery forms an integral component of the ACT Government’s VET commitment.
As the ACT’s largest public provider of industry focused training, CIT has a diverse range
of valued stakeholders including students, employers, industry, government and the community.
CIT maintains close links with the University of Canberra (UC), Australian National University (ANU), Australian Catholic University (ACU) and Charles Sturt University (CSU) through regular meetings with liaison committees. These committees foster collaboration, articulation and strong partnerships.
Throughout 2015 CIT focused on working with industry and business to meet their current and emerging business needs. This has been supported through the CIT Business Development Team, and within particular industries through CIT’s teaching colleges. As a result several new short and long term partnerships have been established and grant opportunities have been accessed.
INDUSTRY RELATIONSHIPSIn 2015, CIT nurtured over 100 existing partnerships and explored new collaborative opportunities with stakeholders in education, industry and the community. In addition, CIT networked with industry associations at local, regional, state and national levels, and has beneficial and strategic partnerships for skills development with organisations including:
• Neoen Hornsdale Windfarm. The CIT Renewable Energy Skills Centre of Excellence is in partnership with Neoen Hornsdale Windfarm which contributes $250,000 per annum towards scholarships and student expenses. The centre aims to keep abreast of renewable energy developments across the region and identify and respond to training requirements. The arrangement is underpinned by the commitment by the ACT Government to support large scale renewable energy generation in meeting its renewable energy targets.
Canberra Institute of Technology Annual Report 2015 15
SEC
TIO
N B
1 O
rgan
isat
iona
l Ove
rvie
w
• Continental Wind Partners (CWP) Renewables: CIT has established another partnership in the development and delivery of programs in the renewable energy sector through CWP Renewables. CIT is working closely with CWP to develop training pathway plans for CWP Renewables to support Australian Government funding grant applications for training in wind energy development (micro-grid technology).
• MIEACT (Mental Illness Education ACT): CIT has partnered with MIEACT to enhance mental health programs in the ACT. As part of the partnership agreement, MIEACT:
– delivers a post-traumatic stress disorder (PTSD) program at CIT on an ongoing basis
– provides training for CIT staff to co-facilitate the PTSD program at CIT
– provides a ‘train the trainer’ option to CIT, providing material for CIT to provide ongoing training to students.
• Community service organisations – CIT supports Multi Cultural Youth Services ACT, Max Employment, North Side Community Services and Canberra College Cares (CCCares) with training delivery for community projects.
• Australian Border Force (ABF) – CIT has developed a niche training program at the request of the ABF in consultation with CIT electrotechnology staff.
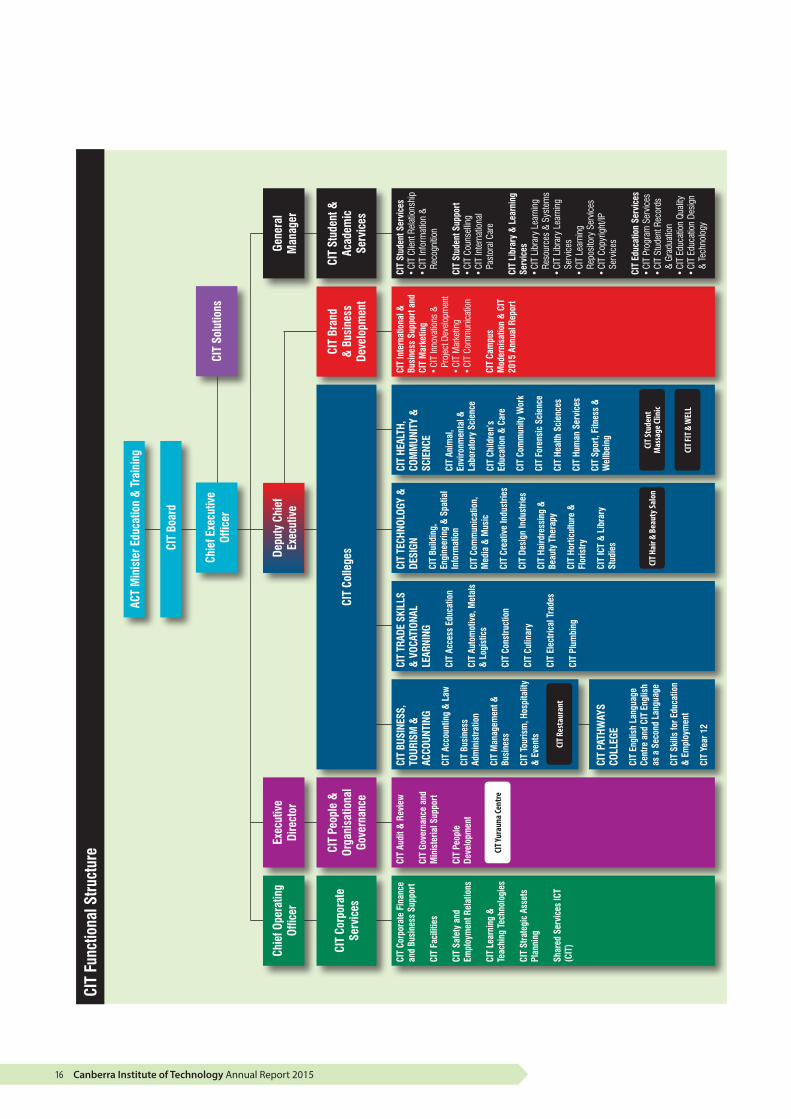
Organisational structureCIT operates under a matrix management organisational design and is made up of three large teaching colleges, two smaller colleges and four support divisions. The colleges bring together disciplines that have links in industry, to create new experiences for students and improve opportunities for collaboration with industry and business. They are:
• CIT Health, Community and Science
• CIT Technology and Design
• CIT Trade Skills and Vocational Learning
• CIT Business, Tourism and Accounting
• CIT Pathways College.
The four divisions provide leadership and support to the teaching colleges. They are:
• CIT Brand and Business Development
• CIT Corporate Services
• CIT People and Organisational Governance
• CIT Student and Academic Services.
INTERNAL ACCOUNTABILITYThe CIT Executive Management Team for 2015 comprised:
Chief Executive Officer, Ms Leanne Cover
The Chief Executive Officer is responsible for the efficient administration of CIT and establishing its corporate and strategic directions. The Chief Executive Officer is supported by the CIT Executive Team:
Deputy Chief Executive, Ms Carolyn Grayson
The Deputy Chief Executive is responsible for ensuring CIT priorities in quality education and training are achieved and also has a strategic responsibility as part of the CIT Executive for the overall success of CIT. The Deputy Chief Executive is responsible for CIT Brand and Business Development, including international business and marketing, and the CIT teaching colleges.
Chief Operating Officer, Mr Shane Kay
The Chief Operating Officer reports to the Chief Executive Officer and provides strategic leadership and financial management and oversight of whole of CIT operational matters. The Chief Operating Officer is also responsible for CIT Corporate Services, which comprises CIT Business Support, CIT Corporate Finance, CIT Facilities and Shared Services ICT (CIT).
Canberra Institute of Technology Annual Report 201516
Chie
f Ope
ratin
gOf
ficer
Exec
utiv
eDi
rect
or
CIT
Corp
orat
eSe
rvic
es
CIT
Corp
orat
e Fi
nanc
e an
d Bu
sine
ss S
uppo
rt
CIT
Faci
litie
s
CIT
Safe
ty a
nd
Empl
oym
ent R
elat
ions
CIT
Lear
ning
&
Teac
hing
Tec
hnol
ogie
s
CIT
Stra
tegi
c As
sets
Pl
anni
ng
Shar
ed S
ervi
ces
ICT
(CIT
)
CIT
Peop
le &
Or
gani
satio
nal
Gove
rnan
ce
CIT
Audi
t & R
evie
w
CIT
Gove
rnan
ce a
nd
Min
iste
rial S
uppo
rt
CIT
Peop
le
Deve
lopm
ent
CIT
BUSI
NESS
, TO
URIS
M &
AC
COUN
TING
CIT
Acco
untin
g &
Law
CIT
Busi
ness
Ad
min
istra
tion
CIT
Man
agem
ent &
Bu
sine
ss
CIT
Tour
ism
, Hos
pita
lity
& E
vent
s
CIT
TRAD
E SK
ILLS
&
VOC
ATIO
NAL
LEAR
NING
CIT
Acce
ss E
duca
tion
CIT
Auto
mot
ive,
Met
als
& L
ogis
tics
CIT
Cons
truct
ion
CIT
Culin
ary
CIT
Elec
trica
l Tra
des
CIT
Plum
bing
CIT
TECH
NOLO
GY &
DE
SIGN
CIT
Build
ing,
En
gine
erin
g &
Spa
tial
Info
rmat
ion
CIT
Com
mun
icat
ion,
M
edia
& M
usic
CIT
Crea
tive
Indu
strie
s
CIT
Desi
gn In
dust
ries
CIT
Haird
ress
ing
&
Beau
ty T
hera
py
CIT
Hort
icul
ture
&
Flor
istr
y
CIT
ICT
& L
ibra
ry
Stud
ies
CIT
HEAL
TH,
COM
MUN
ITY
&
SCIE
NCE
CIT
Anim
al,
Envi
ronm
enta
l &
Labo
rato
ry S
cien
ce
CIT
Child
ren’
s Ed
ucat
ion
& C
are
CIT
Com
mun
ity W
ork
CIT
Fore
nsic
Sci
ence
CIT
Heal
th S
cien
ces
CIT
Hum
an S
ervi
ces
CIT
Spor
t, Fi
tnes
s &
W
ellb
eing
CIT
Stud
ent S
ervi
ces
• CI
T Cl
ient
Rel
atio
nshi
p•
CIT
Info
rmat
ion
&
Reco
gniti
on
CIT
Stud
ent S
uppo
rt•
CIT
Coun
sellin
g•
CIT
Inte
rnat
iona
l Pa
stor
al C
are
CIT
Libr
ary
& L
earn
ing
Serv
ices
• CI
T Li
brar
y Le
arni
ng
Reso
urce
s &
Sys
tem
s•
CIT
Libr
ary
Lear
ning
Se
rvic
es•
CIT
Lear
ning
Re
posi
tory
Ser
vice
s•
CIT
Copy
right
/IP
Serv
ices
CIT
Educ
atio
n Se
rvic
es•
CIT
Prog
ram
Ser
vice
s•
CIT
Stud
ent R
ecor
ds
& G
radu
atio
n•
CIT
Educ
atio
n Qu
ality
• CI
T Ed
ucat
ion
Desi
gn
& T
echn
olog
y
CIT
Bran
d &
Bus
ines
s De
velo
pmen
t
CIT
Stud
ent &
Ac
adem
ic
Serv
ices
Gene
ral
Man
ager
CIT
Colle
ges
CIT
PATH
WAY
S CO
LLEG
E
CIT
Engl
ish
Lang
uage
Ce
ntre
and
CIT
Eng
lish
as a
Sec
ond
Lang
uage
CIT
Skill
s fo
r Edu
catio
n &
Em
ploy
men
t
CIT
Year
12
Depu
ty C
hief
Exec
utiv
e
Chie
f Exe
cutiv
e Of
ficer
CIT
Solu
tions
CIT
Fun
ctio
nal S
truct
ure
CIT
Inte
rnat
iona
l &
Busi
ness
Sup
port
and
CI
T M
arke
ting
• CI
T In
nova
tions
&
Proj
ect D
evel
opm
ent
• CI
T M
arke
ting
• CI
T Co
mm
unic
atio
n
CIT
Cam
pus
Mod
erni
satio
n &
CIT
20
15 A
nnua
l Rep
ort
CIT S
tude
nt
Mas
sage
Clin
ic
CIT F
IT &
WEL
L
CIT H
air &
Bea
uty S
alon
CIT R
esta
uran
t
CIT Y
urau
na Ce
ntre
CIT
Boar
d
ACT
Min
iste
r Edu
catio
n &
Tra
inin
g
Canberra Institute of Technology Annual Report 2015 17
SEC
TIO
N B
1 O
rgan
isat
iona
l Ove
rvie
w
Executive Director, CIT People and Organisational Governance, Dr Nicole Stenlake
The Executive Director, CIT People and Organisational Governance provides leadership in relation to governance and as the CIT Board Secretariat. The Executive Director, CIT People and Organisational Governance is also responsible for CIT Audit and Review, CIT Government Relations, CIT Human Relations, CIT People Development and CIT Yurauna Centre (Indigenous education and support).
General Manager, CIT Student and Academic Services, Ms Sue Maslen
CIT Student and Academic Services provides a broad range of services to lead, monitor and support educational performance for students and staff at CIT. The General Manager, CIT Student and Academic Services is responsible for CIT Education Services, CIT Student Services, CIT Student Support and CIT Library and Learning Services.
General Manager, CIT Solutions, Mr Paul Ryan
The General Manager, CIT Solutions is responsible for the efficient administration of CIT Solutions and establishing its corporate and strategic directions.
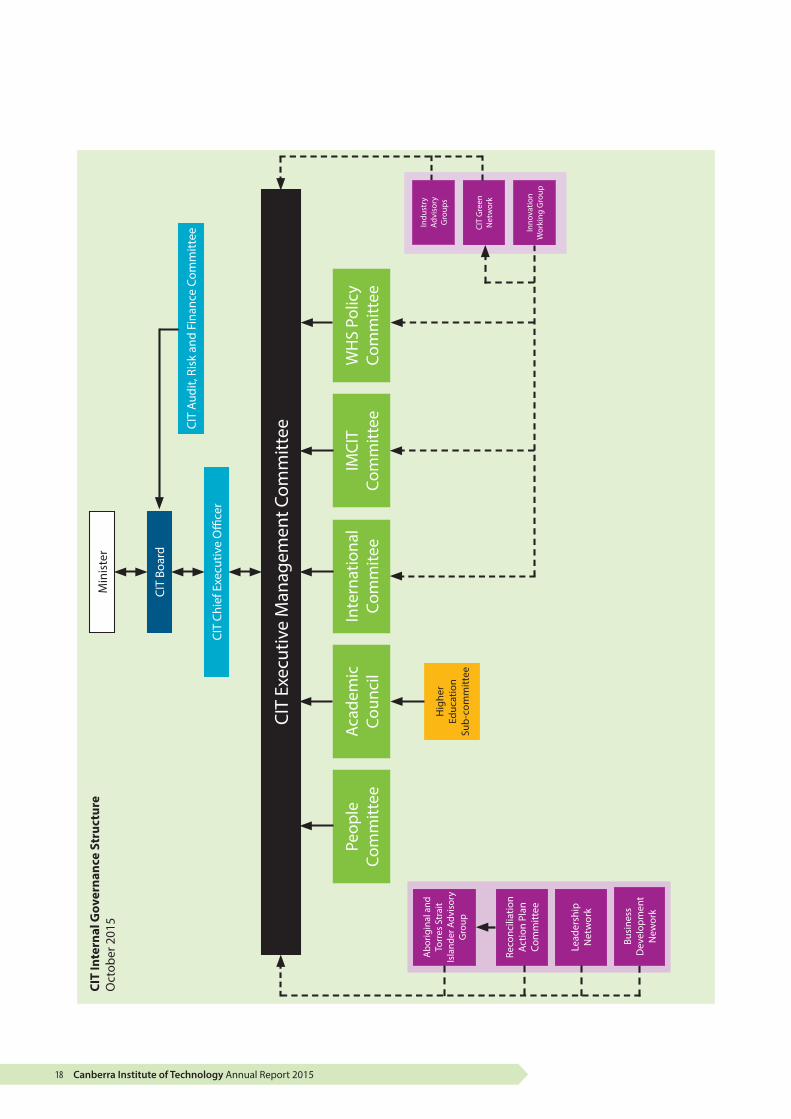
CIT internal governanceThe new governance arrangements which came into effect on 1 July 2015 required a review of the CIT Internal Governance Framework. Under the new arrangements the CIT Chief Executive Officer is accountable to the CIT Board, and the CIT committees/networks within the Internal Governance Framework are accountable to the Chief Executive Officer.
Executive Management Committee (EMC)
The Executive Management Committee replaced the Board of Management on 1 July 2015 with the establishment of the CIT Board. The EMC provides leadership advice in relation to key strategic
direction setting and the efficient and effective operation of CIT. The EMC is accountable to the CEO for the performance outcomes of CIT through the implementation and monitoring of strategic, operational, educational, people and financial business plans and processes, and for ensuring that appropriate frameworks, delegations, policies, procedures and resourcing are in place to support the delivery of CIT strategic and operational objectives.
Finance and Performance Board (until 21 August 2015)
The Finance and Performance Board was the decision-making board within CIT for financial and resource management leadership and advice in accordance with CIT regulatory frameworks, and had responsibility for monitoring overall CIT performance. The Finance and Performance Board also provided advice on other matters referred to it by the Chief Executive or Board of Management. The Finance and Performance Board was chaired by the Chief Operating Officer. Finance and performance matters are now dealt with by the CIT Audit, Risk and Finance Committee and the Executive Management Committee.
CIT Academic Council
The CIT Academic Council, which replaced the Academic Board on 28 August 2015, provides educational leadership and advice relating to strategic direction, regulation, risk, governance, quality and standards, and performance. The CIT Academic Council is accountable to the CEO and is chaired by the Deputy Chief Executive.
CIT Audit Committee (until 24 September 2015)
The CIT Audit Committee, replaced in November 2015, comprised three independent members; two of which were appointed by the Minister for Education and Training (chair and deputy chair) and three CIT staff members. The CIT Audit Committee worked through a charter of activities approved annually by the CEO. The Audit
Canberra Institute of Technology Annual Report 201518
CIT
Exec
utiv
e M
anag
emen
t Com
mitt
ee
CIT
Chie
f Exe
cutiv
e O
ffice
r
CIT
Audi
t, Ri
sk a
nd F
inan
ce C
omm
ittee
CIT
Boar
d
Min
iste
r
Inte
rnat
iona
l Co
mm
itee
IMCI
TCo
mm
ittee
WH
S Po
licy
Com
mitt
eeAc
adem
ic
Coun
cil
Peop
le
Com
mitt
ee
Busi
ness
D
evel
opm
ent
New
ork
Lead
ersh
ip
Net
wor
k
Abo
rigin
al a
nd
Torr
es S
trai
t Is
land
er A
dvis
ory
Gro
up
Hig
her
Educ
atio
n Su
b-co
mm
ittee
CIT
Gre
en
Net
wor
k
Indu
stry
Ad
viso
ry
Gro
ups
Inno
vatio
n
Wor
king
Gro
up
CIT
Inte
rnal
Gov
erna
nce
Stru
ctur
eO
ctob
er 2
015
Reco
ncili
atio
n Ac
tion
Plan
Co
mm
ittee

Canberra Institute of Technology Annual Report 2015 19
SEC
TIO
N B
1 O
rgan
isat
iona
l Ove
rvie
w
Committee was replaced by the Audit Risk and Finance Committee, established by the CIT Board in November 2015. More information about the Audit Risk and Finance Committee is contained in section B5.
Remuneration for executives
All CIT executives were paid in accordance with Determinations of the ACT Remuneration Tribunal and relevant laws and instruments including the Public Sector Management Act 1994 and the Public Sector Management Standards 2006.Under the Remuneration Tribunal Act 1995 the Remuneration Tribunal determines remuneration for the CEO and members of the CIT Board.
Changes to governance
Amendments to the Canberra Institute of Technology Act 1987 in 2014 replaced the CIT Advisory Council with a governing board. The CIT Board commenced on 1 July 2015.
CIT BoardThe CIT Board was established under Section 9 of the Canberra Institute of Technology Act 1987 as a governing board. The CIT Board must have a minimum of nine members, but not more than 11. Members are appointed by the ACT Government minister responsible for education and training. In appointing CIT Board members, the Minister tries to ensure that the following disciplines and areas of expertise are represented: an elected staff and student member, a member from each portfolio responsible for education and training and economic development and up to six non-elected members with experience and expertise in business and industry, social policy, law, finance and digital technology.
The CIT Chief Executive Officer is a member of the governing board pursuant to Section 80 (4) of the Financial Management Act 1996 (FMA).
Under Section 56 of the FMA the CIT Board is liable, under the responsible Minister, for the efficient and effective financial management of the authority. Section 77 of the FMA provides that a governing board has the following functions:
1. setting the authority’s policies and strategies
2. governing the authority consistently with the authority’s establishing Act and other relevant legislation
3. ensuring, as far as practicable, that the authority operates in a proper, effective and efficient way, and
4. ensuring, as far as practicable, that the authority complies with applicable governmental policies (if any).
From 1 July 2015 to 31 December 2015 the CIT Board consisted of nine members (three executive and six non-executive). There were three face-to-face meetings and four teleconferences held during this period. All CIT Board members also attended a comprehensive induction session.
Membership
The CIT Board has nine members.
Details of members for July 1 2015 are as follows:
Mr Craig Sloan (Chair)
Ms Michelle Melbourne (Deputy Chair)
Dr Stephanie Fahey Board Member
Mr Peter McGrath Board Member
Mr Kent Chambers (Elected Student Member)
Ms Anita Wesney (Elected Staff Member)
Mr David Dawes Member (ACTPS) Chief Minister, Treasury and Economic Development Directorate
Ms Diane Joseph Member (ACTPS) Education and Training Directorate

Canberra Institute of Technology Annual Report 201520
Ms Natalie Howson (acting for Diane Joseph from 1/10/2015) Member (ACTPS) Education and Training Directorate)
Ms Leanne Cover CIT CEO and Board Member
CIT Board activities
The CIT Board established the Audit Risk and Finance Committee replacing the CIT Audit Committee. The Audit Risk and Finance Committee held its inaugural meeting on 13 November 2015. More information regarding the Audit Risk and Finance Committee is contained in section B5.
The CIT Board endorsed a CIT Board Charter outlining the roles and responsibilities of board members, code of conduct, conflict of interest and other information relating to meetings, sub-committees and administration.
The CIT Board conducted a planning session which focused on the role of the board, the CIT vision and mission, CIT products and services and the CIT Financial Strategy.
A priority for the board has been to further develop the CIT campus modernisation strategy.
The CIT Board is looking to modernise the learning environment so it is appropriate and responsive to the needs of modern learners. This strategy will guide business decisions about CIT facilities that will free up capital to reinvest in creating a contemporary teaching and learning environment. The funding provided by the ACT Government for a new CIT campus in Tuggeranong has provided the opportunity to implement the first phase of this strategy. The CIT Tuggeranong campus will be launched in July 2016.
Another focus of the CIT Board has been to define CIT business development priorities locally, nationally and internationally. The board seeks to identify a clearly differentiated market position for CIT and the associated workforce capabilities that will be required. At a local level this will focus on meeting the needs of ACT learners, employers, government and community. Growing CIT’s business nationally and internationally will require a careful analysis of the market and CIT training products. The board has begun this work and will be looking for opportunities that are repeatable, profitable and sustainable.
Board Attendance at Meetings
Name Position Face-to-face Meeting Teleconference
Mr Craig Sloan Chair 3 2
Ms Michelle Melbourne Deputy Chair 3 4
Dr Stephanie Fahey Member 3 4
Mr Peter McGrath Member 3 3
Mr Kent Chambers Student Member 3 3
Ms Anita Wesney Staff Member 3 2
Mr David Dawes Member (ACTPS)Economic Development
3 4
Ms Diane Joseph (on leave from 1/10/2015)
Member (ACTPS)Economic Development
1 4
Ms Natalie Howson (replaced Diane Joseph from 1/10/2015)
Member (ACTPS)Economic Development
2 –
Ms Leanne Cover CEO and Member 3 4
Canberra Institute of Technology Annual Report 2015 21
SEC
TIO
N B
1 O
rgan
isat
iona
l Ove
rvie
w
The CIT Board has set about transforming CIT into a future focused innovative organisation that works with industry and business to develop the workforce of the future. This new direction for CIT will be articulated in a strategic plan that will be launched mid-2016.
CIT Advisory CouncilThe Canberra Institute of Technology Advisory Council ceased operating on 30 June 2015 when amended legislation was enacted. Prior to that, the CIT Advisory Council was established under the Canberra Institute of Technology Act 1987 (CIT Act). The role of the CIT Advisory Council was to provide advice to the Chief Executive on educational and financial policies, planning and programming of educational services, the welfare of students, management of CIT and relationship development between CIT and the community.
The CIT Advisory Council could also provide advice directly to the Minister. All members were appointed by the Minister for Education and Training for up to three years.
Membership
The CIT Advisory Council was made up of 12 members.
Details of members for January 1 2015 to 30 June 2015 are as follows:
Ms Christine Magner (Chair) appointed as a member representing the interests of industry and commerce.
Mr Peter McGrath (Deputy Chair) appointed as a member representing the interests of industry and commerce.
Ms Lucy Baranovsky appointed as a member representing the student body.
Mr Phil Butler appointed as a member representing the interests of industry and commerce.
Ms Veronica Croome appointed as a member representing the interests of industry and commerce.
Ms Andrea Ho appointed as a member representing the interests of industry and commerce.
Ms Kathy Kostyrko appointed as a member representing the interests of industry and commerce.
Ms Karen Noble appointed as a member representing an organisation that represents the teaching staff.
Mr Craig Robertson appointed as a member with experience and knowledge relevant to the functions of the council.
Ms Cindy Young appointed as a member representing the interests of industry and commerce.
Advisory Council members were not remunerated.
Advisory Council attendance at meetings
The CIT Advisory Council met three times to 30 June 2015 with members’ attendance at meetings shown in the following table:
CIT Advisory Council activities
The CIT Advisory Council held three meetings to 30 June 2015.
During this time, the CIT Advisory Council continued to work on the new governance arrangements for CIT and worked closely with a consultant to develop a reflections document to record the achievements, learnings and future recommendations.
A CIT Advisory Council Honoured Friend Award was awarded to Mr Kevin Patchell for outstanding services to CIT over 17 years.
Canberra Institute of Technology Annual Report 201522
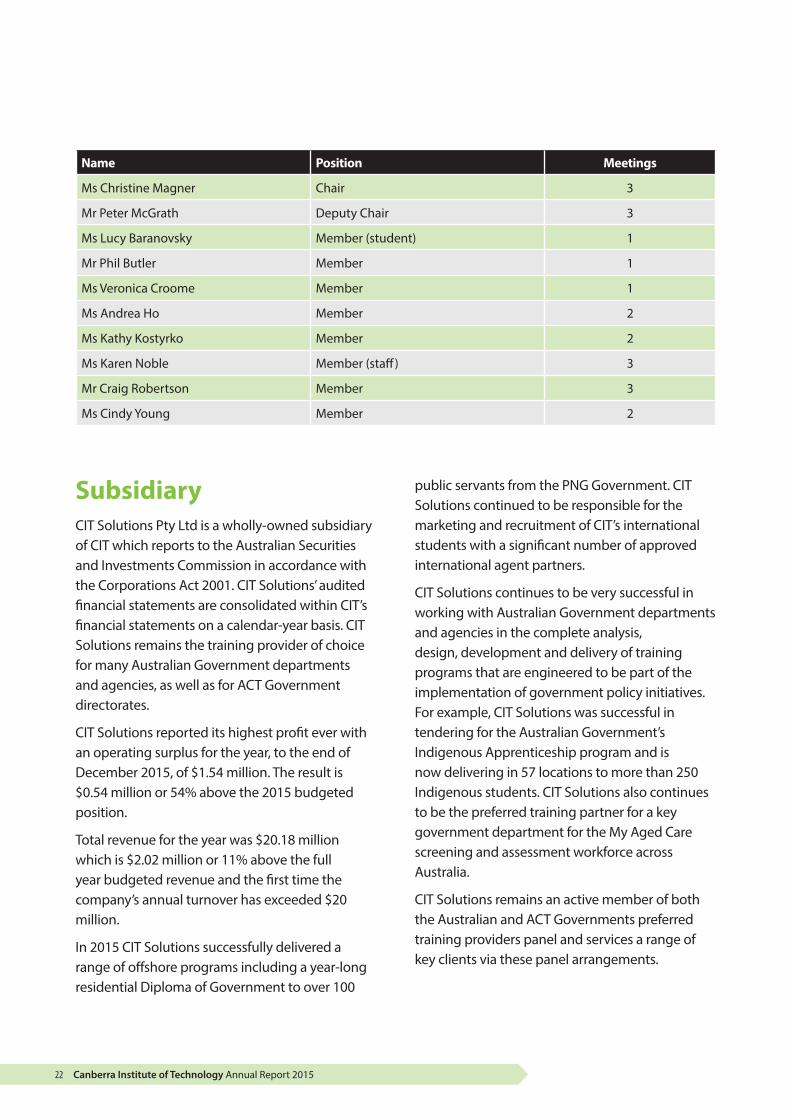
Name Position Meetings
Ms Christine Magner Chair 3
Mr Peter McGrath Deputy Chair 3
Ms Lucy Baranovsky Member (student) 1
Mr Phil Butler Member 1
Ms Veronica Croome Member 1
Ms Andrea Ho Member 2
Ms Kathy Kostyrko Member 2
Ms Karen Noble Member (staff) 3
Mr Craig Robertson Member 3
Ms Cindy Young Member 2
SubsidiaryCIT Solutions Pty Ltd is a wholly-owned subsidiary of CIT which reports to the Australian Securities and Investments Commission in accordance with the Corporations Act 2001. CIT Solutions’ audited financial statements are consolidated within CIT’s financial statements on a calendar-year basis. CIT Solutions remains the training provider of choice for many Australian Government departments and agencies, as well as for ACT Government directorates.
CIT Solutions reported its highest profit ever with an operating surplus for the year, to the end of December 2015, of $1.54 million. The result is $0.54 million or 54% above the 2015 budgeted position.
Total revenue for the year was $20.18 million which is $2.02 million or 11% above the full year budgeted revenue and the first time the company’s annual turnover has exceeded $20 million.
In 2015 CIT Solutions successfully delivered a range of offshore programs including a year-long residential Diploma of Government to over 100
public servants from the PNG Government. CIT Solutions continued to be responsible for the marketing and recruitment of CIT’s international students with a significant number of approved international agent partners.
CIT Solutions continues to be very successful in working with Australian Government departments and agencies in the complete analysis, design, development and delivery of training programs that are engineered to be part of the implementation of government policy initiatives. For example, CIT Solutions was successful in tendering for the Australian Government’s Indigenous Apprenticeship program and is now delivering in 57 locations to more than 250 Indigenous students. CIT Solutions also continues to be the preferred training partner for a key government department for the My Aged Care screening and assessment workforce across Australia.
CIT Solutions remains an active member of both the Australian and ACT Governments preferred training providers panel and services a range of key clients via these panel arrangements.

Canberra Institute of Technology Annual Report 2015 23
SEC
TIO
N B
1 O
rgan
isat
iona
l Ove
rvie
w
EnvironmentThe VET and tertiary education landscape is continually evolving in a period of substantial reform. CIT is responsive to Australian and ACT Government goals, plans and priorities for VET and tertiary education skills development and workforce participation. The work environment is changing and we need to ensure CIT graduates have the skills to meet the current and future needs of employers. The vocational education and training landscape will be increasingly characterised by strong competition with increasing numbers of small RTOs delivering in niche areas. We need to respond appropriately in this changing environment, while ensuring we continue to offer quality training products in an environment where our clients know they are guaranteed to receive the products and delivery that is being offered.
Planning frameworkCIT has a robust and comprehensive planning framework that requires all colleges and divisions to develop individual business plans for the coming year. In 2015 the business plans focused on building a team-based culture and leadership development across the organisation to ensure that all teaching areas aligned with CIT’s strategic direction.
Throughout 2015 the CIT Blueprint was further utilised to guide the work of CIT in the key areas of:
• the implementation of the legislated change in CIT governance
• further development of the campus modernisation strategy through the CIT Board
• redevelopment of the business development strategy through the CIT Board
• research and analysis of systems and practices of Australian Apprenticeships.
In addition CIT-wide plans and strategies such as the CIT Teaching and Learning Framework, CIT People Plan, CIT Capability Framework, CIT Code of Practice, CIT Reconciliation Action Plan (RAP), CIT Foundation Skills Strategy and CIT International Strategy influence the annual business planning process for colleges and divisions. Staff members at all levels contribute to planning through formal and informal processes.
Summary of the agency’s performanceDuring 2015 CIT continued to excel in delivering government-funded and commercial training, despite challenges at local, national and international levels. A key performance highlight was CIT’s maintenance of its very high student and employer satisfaction levels. CIT has continued to actively improve its effectiveness and responsiveness in skilling students using contemporary training methods which have been very positively received by industry and students alike.
The CIT student profile for 2015 was:
• 67.9% came from the ACT, 16.9% from NSW, 9.2.% from other states, and 6% from overseas
• 43% were aged 25 years and under; 57% were 26 years of age and over
• approximately 83% of students studied part-time.
Key performance figures for 2015 include:
• 93% learner satisfaction, which is 8% above target (National Centre for Vocational Education Research (NCVER) 2014 Learner Engagement Survey (LES))
• 87% employer satisfaction, which is 7% above target (CIT 2015 Employer Satisfaction Survey (ESS))

Canberra Institute of Technology Annual Report 201524
• 83.5% of CIT graduates were employed after training, compared to 74.3% nationally (NCVER 2015 Student Outcomes Survey)
• 92.7% of CIT graduates were employed or in further study compared to 86.5% nationally (NCVER 2015 Student Outcomes Survey)
• module pass rate was 81%, which is 6% above target
• 5, 730 program completions
• 5.8 million training hours delivered,
• 29,944 program enrolments
• 14,805 students enrolled in vocational programs
• 8,170 students enrolled in commercial vocational programs, including international students
• 7,037 recreational learners enrolled in adult and community education programs
• 938 international students from 86 countries
• 748 self-identified Aboriginal and Torres Strait Islander students
• 3,286 apprenticeships/traineeships
• 191 Australian School-based Apprenticeship (ASBA) student enrolments
Awards in 2015:
• individual winners, 2015 National Golden Chef’s Hat Award
• individual winner, 2015 Category 2 Wildflowers Australia National Student Competition
• individual winner, 2015 Graduate of the Year Award, Australian Golf Course Superintendents Association (AGCSA)
• individual (staff) winner, 2015 Award for Educational Leadership – awarded posthumously to Mr Geoff Bell (AUSTAFE National Awards)
• individual (executive staff) winner, 2015 Award for Dedication to the VET Sector – awarded posthumously to Mr Adrian Marron (ACT Training Excellence Awards)
• individual (staff) winner, 2015 Award for Outstanding Contribution to VET and Industry (ACT Training Excellence Awards) – awarded to Mr Jerome de Rose
• winner, 2015 ACT Large Registered Training Organisation of the Year (ACT Training Excellence Awards)
• individual winner, 2015 ACT Vocational Student of the Year (ACT Training Excellence Awards)
• individual winner, 2015 ACT Apprentice of the Year (ACT Training Excellence Awards)
• individual winner, gold 2015 Plastering (WorldSkills National Competition)
• individual winner, bronze 2015 Cabinetmaking (WorldSkills National Competition)
OutlookIn 2015 a new Australian Government Department of Education and Training formed and a Minister for Vocational Education and Skills was appointed. There were a number of significant policies and programs that came into effect, the most important for CIT being the introduction of the 2015 Standards for Registered Training Organisations. With these changes came a commitment from the Australian Government to boost the status of vocational education with a focus on a skilled, vocationally educated workforce as one of the most important drivers of our economy.
CIT is fortunate in the ACT to enjoy a firm commitment from the ACT Government to the public provision of VET. However, this does not mean CIT is immune to the effects of the rapidly changing VET environment, and these external
Canberra Institute of Technology Annual Report 2015 25
SEC
TIO
N B
1 O
rgan
isat
iona
l Ove
rvie
w
factors are influencing how CIT operates internally and plans for the future.
Priorities and challengesCurrent and future priorities and challenges for CIT include:
• CIT governance arrangements which have driven significant internal changes. Under the new arrangements CIT is benefiting through the extensive business and industry experience in both the public and private sectors of board members. The governing board has given CIT the autonomy, flexibility and responsiveness to meet its challenges in more innovative and efficient ways. Working with the CIT Board continues to be a top priority for CIT.
• Playing a key role in supporting economic growth in the ACT through the provision of job-ready graduates and the upskilling and reskilling of existing workers. This has been achieved through the delivery of qualifications on the ACT Skills Needs List and by working directly with industry and business to meet their current and emerging training needs.
• Emerging industry needs. CIT is responding to industry requirements for new skills and training needs in emerging sectors. 2015 saw CIT expand its training portfolio into cutting-edge technologies for maintaining and operating renewable wind technologies, biometric technologies through massive open online learning, and developing training to meet the challenges of the National Disability Insurance Scheme (NDIS).
• Skilled Capital. The ACT Government’s Skilled Capital training initiative commenced in January 2015. While the program created almost 2,000 new training places in the ACT in areas of skills need the contestability for these places increased. While CIT was successful in
winning a number of these training places, it remains a high priority for CIT is to increase its market share of these contestable places.
• CBR Innovation. CIT has signed with CBR Innovation as a Foundation Member. The principal objective of CBR Innovation is to provide a network linking businesses and entrepreneurs to services, facilities and stakeholders that will accelerate their innovation and growth and to promote a culture of innovation and entrepreneurship in the ACT. As a Foundation Member, CIT joins with ANU, UC, UNSW, NICTA and the CSIRO to take a central role in growing the innovation ecosystem in the ACT and building individual and corporate capability.
• CIT App. CIT continues to fund internal innovation projects each year to nurture a more flexible, responsive environment for learners and clients. One such project completed in 2015 was the CIT app for current and future students. The app provides CIT customers with a single point of access to multiple online CIT resources for a simpler and smarter CIT experience. The app better aligns CIT with the ACT’s Digital Canberra priorities and responds to clients’ needs by providing easy access to information.
• CIT Tuggeranong. A key CIT priority moving forward is to update and upgrade CIT’s physical footprint to maximise utilisation and reinvest resources wherever possible back into creating contemporary teaching and learning environments. The development and construction phase of the new CIT Tuggeranong, as per the 2012 ACT Government election commitment, is progressing well. The new campus will be launched in July 2016 and will facilitate an increase in dynamic flexible learning opportunities together with full scheduled course delivery.

Canberra Institute of Technology Annual Report 201526
• Pathways from school to CIT and further education. CIT plays a vital role in improving and promoting all student pathways to CIT, from CIT to further training or higher education, and also from higher education to VET training so that working-age Australians have the employability skills needed to fully participate in the workforce. CIT continues to offer ‘taster’ opportunities for students in schools to assist them in making informed choices about areas of training they may be interested in and options for employment. Formal articulation arrangements have been established with a number of universities which provide clear pathways from VET program completion onto higher education studies.
• Australian Apprenticeship Quality Improvement and Sustainability Project. In June 2015 the ACT Education and Training Directorate engaged CIT to undertake two projects with a focus on developing a simplified and streamlined model for Australian Apprenticeships delivery to enable CIT to operate effectively in an environment of greater competition, while ensuring quality of delivery in high risk/licenced trades and resource intensive programs. The review of delivery and assessment approaches has identified opportunities to develop good practice work-based delivery and assessment methodologies. Mechanisms to streamline administrative processes and produce innovative methods for communicating effectively and efficiently with employers and apprentices have also been identified.
• Growing the international market. Increasing international student numbers is a key priority of CIT that has been enhanced through the ACT Government Study Canberra program in which CIT is a partner.
In recent times international student numbers have been impacted by several factors, including Australian Government policy decisions. Now that CIT has been approved for streamlined visa-processing, many international and transnational VET opportunities and partnerships with overseas universities and institutions are being developed and realised. The decrease of the Australian dollar’s value towards the end of 2015 has increased CIT’s international competitiveness. Delivering a high quality educational experience for international students is still the best indicator of long term success in growing the number of international students studying at CIT. CIT and VET in Australia is well placed in the global marketplace as skills training is elevated in importance as a major export and is set to grow as government to government discussions between Australia and Asian neighbours open up.
In 2015 CIT continued to build opportunities in key states in India, primarily Kerala and Gujarat, and signed two MoUs in China to facilitate discussions around student training and exchange opportunities. In Gujarat, CIT delivered its first program to forensics students at the Gujarat Forensic Sciences University (GFSU) and used this opportunity to demonstrate the benefit of delivering skills programs to the university. In Kerala, CIT has worked with two universities that are positioned to develop as skills hubs for the Kerala Education Department. CIT will develop teacher education programs and support the university partners with curriculum and resource development.
CIT’s International Strategy is being informed by the CIT Board and will continue to be a focus for the board in 2016 and beyond.
For more information:Executive Director, CIT People and Organisational Governance | (02) 6207 3133
Canberra Institute of Technology Annual Report 2015 27
B.2 PERFORMANCE ANALYSIS
SEC
TIO
N B
2 SP
erfo
rman
ce A
naly
sis
The CIT mission is to change lives through quality education and skills development for individuals, industry and the community. CIT is committed to meeting the needs of a diverse range of clients through its responsive and innovative education and business practices.
Continued strong graduate employment outcomes, module pass rates and learner and employer satisfaction rates all indicate progress in achieving this mission. Students and employers alike are satisfied with the quality of education and training that CIT provides, and CIT graduate outcomes show that CIT students are readily able to use their new skills to contribute to the local economy and community.
CIT continually seeks to refine and improve its training delivery, and by evaluating and adopting new technologies, CIT continues to provide excellent value-for-money education and training options to the local community.
For more information:Chief Operating Officer | (02) 6207 3114
Canberra Institute of Technology Annual Report 201528
B.3 SCRUTINY
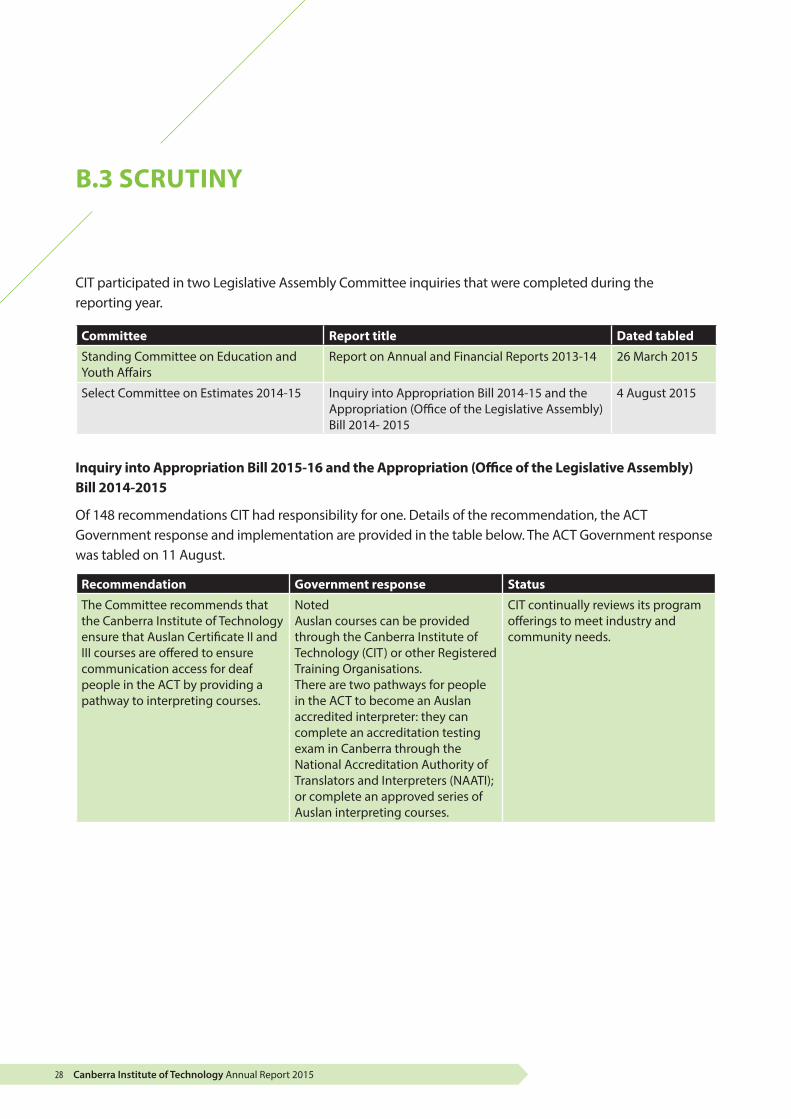
CIT participated in two Legislative Assembly Committee inquiries that were completed during the reporting year.
Committee Report title Dated tabled
Standing Committee on Education and Youth Affairs
Report on Annual and Financial Reports 2013-14 26 March 2015
Select Committee on Estimates 2014-15 Inquiry into Appropriation Bill 2014-15 and the Appropriation (Office of the Legislative Assembly) Bill 2014- 2015
4 August 2015
Inquiry into Appropriation Bill 2015-16 and the Appropriation (Office of the Legislative Assembly) Bill 2014-2015
Of 148 recommendations CIT had responsibility for one. Details of the recommendation, the ACT Government response and implementation are provided in the table below. The ACT Government response was tabled on 11 August.
Recommendation Government response Status
The Committee recommends that the Canberra Institute of Technology ensure that Auslan Certificate II and III courses are offered to ensure communication access for deaf people in the ACT by providing a pathway to interpreting courses.
NotedAuslan courses can be provided through the Canberra Institute of Technology (CIT) or other Registered Training Organisations.There are two pathways for people in the ACT to become an Auslan accredited interpreter: they can complete an accreditation testing exam in Canberra through the National Accreditation Authority of Translators and Interpreters (NAATI); or complete an approved series of Auslan interpreting courses.
CIT continually reviews its program offerings to meet industry and community needs.

Canberra Institute of Technology Annual Report 2015 29
SEC
TIO
N B
3 Sc
rutin
yReport on Annual and Financial Reports 2013-14
The annual and financial reports of all ACT Government agencies are referred to the Standing Committees of the ACT Legislative Assembly for examination and report. The committee’s report on Annual and Financial Reports 2013-14 made 20 recommendations.
CIT had responsibility for three.
Details of the CIT related recommendations, the ACT Government response and implementation are provided in the table below. The ACT Government response was tabled on 4 August 2015.
Recommendation Government response Status
That CIT management continue to place a high priority on improving workplace culture through appropriate staff training and that all senior management commit to regular training that develops additional skills in people management.
NotedCIT has implemented annual compulsory training for all CIT staff on workplace culture. This includes Diversity in the Workplace, Bullying and Harassment Awareness Training, and Workplace Health and Safety Training, with specific modules for managers.
Compulsory training is revised annually with 77% of staff (including casuals) completing the training in 2015.
The Committee recommends that CIT take particular care to ensure that all claims of bullying and harassment by staff and students are dealt with promptly and thoroughly to demonstrate that CIT does recognise the seriousness and importance of addressing all bullying and harassment issues in a timely and professional manner.
NotedCIT takes all allegations of bullying and harassment seriously and deals with all matters raised in a timely manner. The CIT Resolving Workplace Issues Policy and CIT Students Complaints Policy outline the steps in managing these matters and the timeframes for completion.
CompletedCIT continues to promote a culture free from bullying and harassment and deals with any allegations raised in accordance with the CIT Resolving Workplace Issues Policy and CIT Student Complaints Policy. In 2015 no action was required under the misconduct provisions of the Enterprise Agreements in relation to allegations of bullying.
That CIT work more closely with the disability community in determining the future training needs of those seeking professional skills in Auslan interpreting in order to avoid what appears to be the current stop/start approach to the availability and delivery of such courses in the ACT. Additionally the Committee recommends that CIT promote and market the availability of certified courses in Auslan to ensure continuing student enrolment and financial viability of courses.
NotedCIT works with Disability ACT and has commenced discussions with the Manager of the Deaf Education Network from the Deaf Society of NSW, a registered training organisation (RTO), for delivering accredited Auslan courses to students in the ACT. ACT residents can also complete introductory units to Auslan with CIT Solutions, which are offered on a regular basis.CIT does not routinely promote individual courses across its 400 program offerings. However, in December 2014 and January 2015 CIT spent $2,292.93 advertising Auslan certificate courses in print media.
Auslan 1 and 2 are being delivered with CIT Solutions, which are offered on a regular basis.CIT has provided the Deaf Society of NSW access to facilities and content to run accredited Auslan program to ACT residents. This has been formalised in an MoU between both the CIT and the Deaf Society of NSW.CIT is committed to and working with many government and non-government providers to transition to the NDIS, including retraining staff and providing direct programs for clients and carers.
Canberra Institute of Technology Annual Report 201530
Recommendation Government response Status
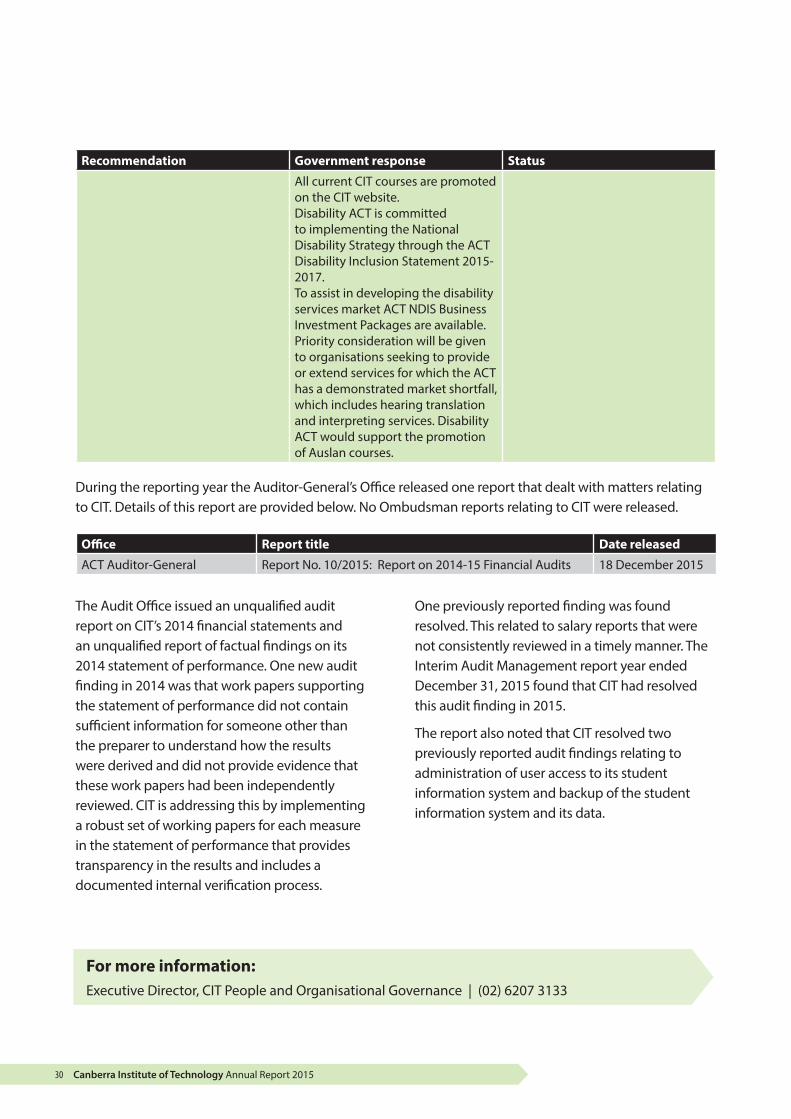
All current CIT courses are promoted on the CIT website.Disability ACT is committed to implementing the National Disability Strategy through the ACT Disability Inclusion Statement 2015-2017.To assist in developing the disability services market ACT NDIS Business Investment Packages are available. Priority consideration will be given to organisations seeking to provide or extend services for which the ACT has a demonstrated market shortfall, which includes hearing translation and interpreting services. Disability ACT would support the promotion of Auslan courses.
During the reporting year the Auditor-General’s Office released one report that dealt with matters relating to CIT. Details of this report are provided below. No Ombudsman reports relating to CIT were released.
Office Report title Date released
ACT Auditor-General Report No. 10/2015: Report on 2014-15 Financial Audits 18 December 2015
The Audit Office issued an unqualified audit report on CIT’s 2014 financial statements and an unqualified report of factual findings on its 2014 statement of performance. One new audit finding in 2014 was that work papers supporting the statement of performance did not contain sufficient information for someone other than the preparer to understand how the results were derived and did not provide evidence that these work papers had been independently reviewed. CIT is addressing this by implementing a robust set of working papers for each measure in the statement of performance that provides transparency in the results and includes a documented internal verification process.
One previously reported finding was found resolved. This related to salary reports that were not consistently reviewed in a timely manner. The Interim Audit Management report year ended December 31, 2015 found that CIT had resolved this audit finding in 2015.
The report also noted that CIT resolved two previously reported audit findings relating to administration of user access to its student information system and backup of the student information system and its data.
For more information:Executive Director, CIT People and Organisational Governance | (02) 6207 3133
Canberra Institute of Technology Annual Report 2015 31
SEC
TIO
N B
4 Ri
sk M
anag
emen
t
B.4 RISK MANAGEMENT
Risk management is an integral component of the governance of CIT business and embedded within business plans. CIT’s risk management framework is based on the Australian/New Zealand Standard on Risk Management (ASNZS 4360:2004), and the ASNZS ISO31000: 2009.
The CIT Strategic Business Risk Profile and Fraud and Corruption Control Plan are based on a CIT Environmental Risk Plan that is reviewed annually. The progress of actions against mitigation strategies for the Business Risk Profile is reported at each Audit Committee meeting (from 13 November 2015 the Audit Risk and Finance Committee) and quarterly to the CIT Executive Management Committee. The profile is live and dynamic, progressively including any emerging risk. The risks are assigned to key executive members and directors for management oversight, monitoring, implementation and review.
CIT’s emerging risks are reviewed continually and reported quarterly to the Executive Management Committee and to the Audit Committee. These are identified through:
• the development and ongoing maintenance of the Risk Management Plans, including the fraud and corruption control and reporting
• regular discussions with the executive team and directors
• reporting as part of the internal Performance Audit and Review Program.
For more information:Executive Director, CIT People and Organisational Governance | (02) 6207 3133
Canberra Institute of Technology Annual Report 201532
The CIT Audit Committee (from 13 November 2015 the Audit Risk and Finance Committee) performs a key corporate governance role in providing independent, objective advice, assurance and assistance to the CIT Board on risk, control and compliance and on its external accountability responsibilities.
The CIT Board established a new Audit, Risk and Finance Committee in November 2015. This was in accordance with the ACT Government Internal Audit Framework and Sections 56 and 77 of the Financial Management Act 1996. The committee performs its role as a sub-committee to the CIT Board through a charter of activities, which is to be reviewed and approved annually. The CIT Board authorises the committee, within the scope of its role and responsibilities, and through the CIT Audit and Review team to:
• obtain any information it needs from any employee and/or external party (subject to their legal obligation to protect information)
• discuss any matters with the internal or external auditor, or other external party (subject to their legal obligation to protect information)
• request the attendance of any employee, including the Chief Executive Officer, at committee meetings
• obtain legal or other professional advice, as considered necessary to meet its obligations, at CIT’s expense.
The Audit, Risk and Finance Committee agendas are based on an annual program of work falling from responsibilities documented in the Audit,
Risk and Finance Committee Charter. After each meeting the Audit, Risk and Finance Committee Chair reports to the CIT Board Chair and Chief Executive Officer on significant matters that may affect the operation of CIT.
From 1 January to 30 September 2015, the CIT Audit Committee comprised three independent members, two of whom were appointed by the Minister (chair and deputy chair) and three internal CIT staff members, making a total of six positions. The CIT Director of Corporate Services and a representative of the ACT Auditor-General’s Office both held observer status. Each Audit Committee member was appointed for a period of two years, apart from the chair who was appointed for three years. Termination of membership was progressive until the new Audit, Risk and Finance Committee was appointed in November 2015.
Four Audit Committee meetings were held until 24 September 2015, one of which included the examination of the CIT annual financial statements.
The CIT Audit, Risk and Finance Committee, appointed November 2015, comprises the Chair, Deputy Chair and a CIT Board representative. All members have been appointed by the CIT Board. The Chair is appointed for three years while the Deputy Chair and CIT Board representative are appointed for two years. Observer status is held by the CIT Chief Operating Officer and a representative from the ACT Auditor-General’s Office. The first meeting of this committee was held on 13 November 2015 and membership is as follows.
B.5 INTERNAL AUDIT
Canberra Institute of Technology Annual Report 2015 33
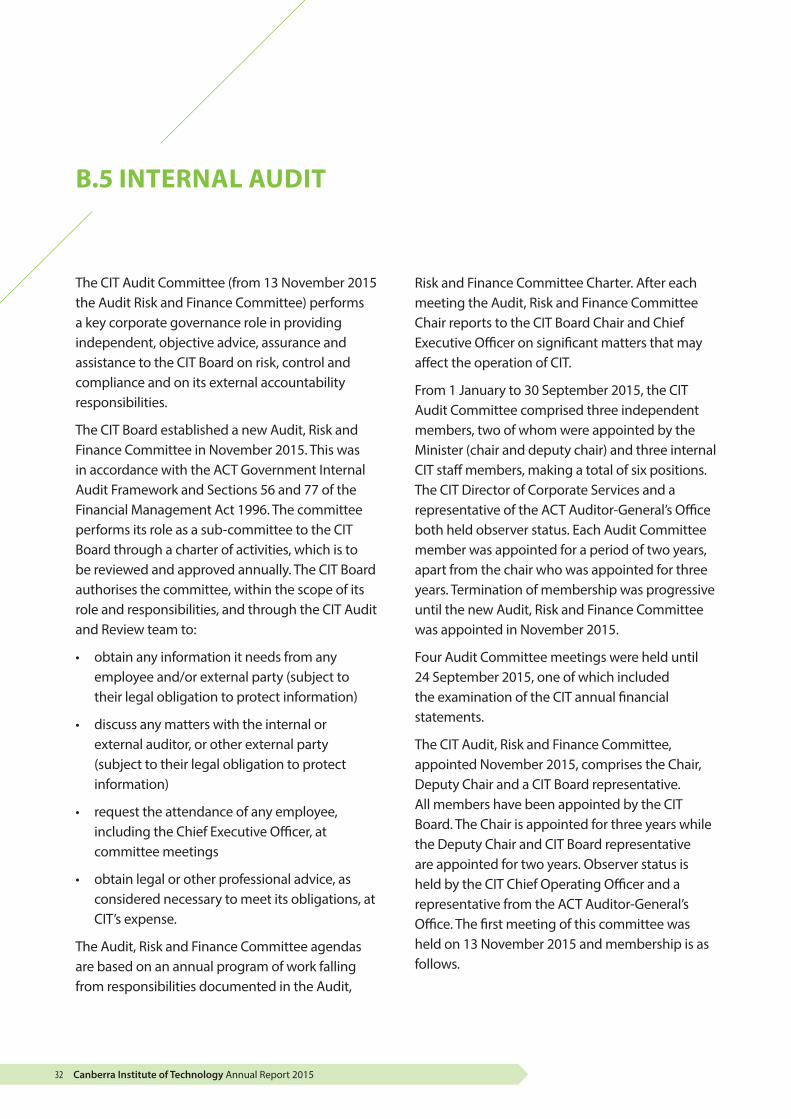
Members attendance at Audit Committee meetings from 1 January – 30 September
Name of Member Position Duration Meetings attended
Mr Kevin Patchell Chair Independent 9 MonthsMembership term completed
4
Dr Margo Wade Deputy Chair Independent 6 Months Membership term completed
3
Ms Robyn McClelland Independent Member 9 MonthsMembership term completed
4
Ms Carolyn Grayson CIT Member 9 monthsMembership term completed
4
Ms Rhonda Fuzzard CIT Member 3 MonthsMembership term completed
1
Dr Nicole Stenlake CIT Member 6 MonthsMembership term completed
2
Mr Shane Kay CIT Chief Operating OfficerObserver Status
9 MonthsMembership term completed
4
Mr Tim Larnach Auditor-General’s OfficeObserver Status
9 MonthsMembership term completed
2
CIT Audit, Risk and Finance Committee
Name of Member Position Duration Meetings attended
Ms Fran Raymond Chair Independent 6 Weeks 1
Mr Bruce Papps Deputy Chair Independent 6 Weeks 1
Mr Peter McGrath CIT Board Representative 6 Weeks 1
Mr Shane Kay CIT Chief Operating OfficerObserver Status
6 Weeks 1
Ms Chloe Wolfe Auditor-General’s OfficeObserver Status
6 Weeks 0
SEC
TIO
N B
5 In
tern
al A
udit

Canberra Institute of Technology Annual Report 201534
Internal audits and reviews conducted by CIT aim to promote improved practice and generate advice as to whether CIT is operating efficiently, effectively and in accordance with the relevant laws and regulations. Audits and reviews are undertaken by the Internal Audit and Review Team and by external contractors. This ensures there is a balance of independent objectivity when providing advice to the Audit Committee, CIT Board and Chief Executive Officer.
All internal audits and reviews are based on CIT’s risks, which are mapped against CIT’s Environmental Risk Profile. Consultations are held with the CIT Executive Team and college directors to ensure our priority risks are considered as part of the final program. Actions against recommendations are monitored through to implementation, including those which are relevant to CIT from external audits, such as the ACT Auditor-General’s Office. A total of five internal audits and reviews were completed in 2015. The progress of the program is reviewed at each Audit Committee meeting and the relevant findings and recommendations are discussed as well as the progress of implementation. All audits and reviews were completed on time and within budget.
Policies, procedures and charters are reviewed annually, along with ANAO Better Practice Guides, to inform relevance and improve quality practice.
For more information:Executive Director, CIT People and Organisational Governance | (02) 6207 3133
Canberra Institute of Technology Annual Report 2015 35
SEC
TIO
N B
6 Fr
aud
Prev
entio
n
B.6 FRAUD PREVENTION
CIT is committed to minimising fraud and corruption through the development, implementation and review of a range of prevention and detection strategies. These strategies aim to build and support a compliance culture that focuses on outcomes and reflects:
• transparency and accountability
• the application of risk-based decision making
• a commitment to best practice.
The CIT Fraud and Corruption Control Framework and Risk Plan work in accordance with the ACT Government Integrity Policy. In 2015 a revised Fraud and Corruption Framework and Fraud Risk Profile were implemented. The framework guides the management of fraud and corruption related activities and includes key elements such as:
• fraud and corruption policy statement and definition
• responsibilities for fraud control in CIT
• strategies to guide managers with prevention, detection, and prosecution
• Public interest disclosure.
Strategies have been developed for detection and prevention, against the identified significant risks, mapping key responsibilities and critical timelines. Progress against these strategies was reported quarterly to the Executive Management Committee and the Audit Committee until September and to its replacement the Audit, Finance and Performance Committee from November.
The CIT Audit and Review manual contains checklists to assist managers with fraud detection and prevention, and six monthly reminders of fraud prevention and detection strategies are distributed to all staff. Fraud and corruption is also included as part of the CIT induction program as well as face-to-face presentations to staff.
There were no instances of fraud and corruption detected or reported at CIT during 2015.
For more information:Executive Director, CIT People and Organisational Governance | (02) 6207 3133
Canberra Institute of Technology Annual Report 201536
CIT has adopted and implemented a continuous improvement approach to its workplace health and safety (WHS) management systems.
During 2015, CIT implemented and improved the following in relation to WHS:
• WHS reporting to the CIT Board was introduced from 1 July 2015
• WHS reporting to the Executive Management Committee was enhanced to include reporting of high risk activities
• a Due Diligence Policy, procedure and checklists for those considered ‘officers’ under the Work Health and Safety Act 2011 was introduced
• due diligence briefings were provided to senior management and the CIT Board
• recommendations from the 2014 WHS Audit have continued to be implemented
• CIT’s program of health and wellbeing initiatives for CIT staff was expanded
• the CIT Risk Register was upgraded
• a survey of CIT’s wellbeing program activities was completed by CIT staff
• CIT’s WHS policies, procedures and online WHS induction program were improved.
Health, safety and wellbeing initiatives/programsCIT staff had access to a range of free health and safety initiatives during 2015. These included:
• an Employee Assistance Program for counselling support
• free voluntary influenza vaccinations
• the inclusion of activities covering stress, grief and how to write a will
• free voluntary health checks
• training for health and safety representatives and first aid officers
• blood donation opportunities
• access to gyms at selected CIT campuses
• ergonomic/workstation assessments
• stretch-break and Dragon software for at-risk staff.
• internal communication to all staff on WHS and health and wellbeing matters
• improved WHS information and resources on the CIT intranet.
Notifiable IncidentsThere were five Notifiable Incidents that required reporting to the regulator in accordance with Part 3, Section 38 of the Work Safety Act 2011.
Worker consultationCIT as at 31 December 2015 had a total of 25 elected health and safety representatives (HSRs). All HSRs have access to training and support to undertake this role.
Quarterly WHS meetings are held on each major campus and are attended by HSRs and senior
B.7 WORKPLACE HEALTH AND SAFETY

Canberra Institute of Technology Annual Report 2015 37
management. These committees manage local WHS issues relevant to the campus.
In addition, CIT’s WHS Policy Committee is chaired by the Chief Operating Officer and attended by selected HSRs and relevant unions. The committee has responsibility for the oversight of workplace health and safety initiatives and policy across CIT. The Chief Operating Officer reports regularly to the CIT Board on WHS matters.
Improvement and Prohibition Notices under Work Safety ActDuring 2015, two improvement notices were issued by the regulator, WorkSafe ACT, relating to the use of unsafe electrical equipment at CIT Bruce and the maintenance, inspection and testing of a Forensic Fuming Cabinet (FFC).
One Prohibition Notice was issued relating to the operation of the FFC until deemed safe to operate in accordance with the manufacturer’s specifications.
An internal review was conducted by the senior safety advisor into these matters and several improvements were implemented as a result.
Early intervention and injury managementWhile CIT’s compensable and non-compensable cases are managed by the Chief Minister, Treasury and Economic Development Directorate’s Injury Management and Safety Team, CIT continues to provide specific resources to support and assist its injured/ill employees to return to the workforce.
Part of that support includes monitoring individual unscheduled absences and following up with employees and managers to tailor support packages that meet individual employee and manager needs.
Support packages implemented for injured or ill employees included:
• the provision of impartial advice on rights and responsibilities
• Graduated Return to Work programs
• workplace assessments and reasonable adjustments
• flexible work arrangements
• managing leave arrangements
• facilitating workload discussions
• liaising with medical professionals and rehabilitation providers
• referral to external support mechanisms.
Performance against the Australian Work Health and Safety Strategy 2012-2022 targets
The following tables represent CIT’s performance against the Australian Work Health and Safety Strategy 2012-2022 targets.
SEC
TIO
N B
7 W
orkp
lace
Hea
lth a
nd S
afet
y

Canberra Institute of Technology Annual Report 201538
Target 1 – reduce the incidence rate of claims resulting in one or more weeks off work by at least 30 per cent
Financial yearCIT # new 5 day
claimsRate per 1,000
employees CIT targetACTPS # new 5 day
claimsACTPS rate per 1,000
employees ACTPS target
2012-13 8 10.70 7.66 369 18.07 16.66
2013-14 6 8.00 7.42 322 15.29 16.15
2014-15 6 8.09 7.19 228 10.75 15.63
2015-16 – – 6.95 – – 15.11
Notes:Dates are based on those claims received by Comcare in each financial year.Past years’ claim numbers may differ from results published in previous annual reports due to maturation of claims data.The report includes accepted claims which result in one or more weeks off work.Data includes claims up to 30 June 2015 as data is only available based on traditional financial years.
The number of new five day claims at CIT remained steady for the 2014-15 financial year. The small increase in the CIT rate per 1,000 employees is due to a reduction in the total CIT workforce and while the rate continues to be higher than the target it remains well below that of the ACTPS rate.
Target 2 – Reduce the incidence rate of claims for musculoskeletal disorders (MSD) resulting in one or more weeks off work by at least 30 per cent
Financial yearCIT # new 5 day
MSD claimsRate per 1,000
employees CIT targetACTPS new 5 day
MSD claimsACTPS rate per 1,000
employees ACTPS target
2012-13 2 2.67 5.64 238 11.66 11.33
2013-14 4 5.33 5.47 210 9.97 10.79
2014-15 2 2.70 5.30 144 6.79 10.45
2015-16 – – 5.12 – – 10.10
Notes:Dates are based on those claims received by Comcare in each financial year.Past years’ claim numbers may differ from results published in previous annual reports due to maturation of claims data.The report includes accepted claims which result in one or more weeks off work.Data includes claims up to 30 June 2015 as data is only available based on traditional financial years.
For more information:Chief Operating Officer | (02) 6207 3114

Canberra Institute of Technology Annual Report 2015 39
SEC
TIO
N B
8 H
uman
Res
ourc
es M
anag
emen
t and
Wor
kpla
ce P
lann
ing
B.8 HUMAN RESOURCES MANAGEMENT AND WORKPLACE PLANNING
Workforce planning at CIT is underpinned by regular workforce statistics reports that are analysed by managers and leaders with the support of HR advisors. A six monthly report is produced in February and August which provides a comprehensive summary of CIT’s workforce including age profile, turnover, nominal hours, workload and positions, EEO statistics, absenteeism and teacher professional development fund allocation. A summary of the key results is provided to the CIT Board.
CIT has a number of plans and frameworks in place to inform HR practice across the organisation.
People Plan
The CIT People Plan identifies the top strategic people priorities for CIT. The plan supports people strategy within colleges and divisions and identifies the learning and development priorities for CIT.
Capability Framework
This framework provides a structured approach to connecting people development to the CIT strategic drivers. It provides a common language about leadership expectations and supports all staff in their learning and development needs. It is also used to help employees understand the core skills, knowledge and behaviours expected in their current role and to enable capability development planning for future roles.
Performance Framework
This framework aims to facilitate meaningful working relationships and productivity through regular focused conversations. The framework includes a Statement of Expectation Agreement and a Learning and Development Plan.
Staff Survey
CIT has implemented the same employee engagement survey in 2010, 2012 and 2015. This survey tool includes detailed online analysis and post-survey action planning software. The survey focuses on three areas: culture/behaviour, strategic intent, and business processes. The 2015 results showed a significant increase in the effectiveness index compared to both 2010 and 2012 results. All but one of the 19 drivers improved from 2012 to 2015 with the biggest improvements in core values and behaviours, external business partners and systems, strategy and business plan and objectives. A score of above 75 is considered to be best practice. The values driver scored more than 75 across all colleges/divisions with an average of 84.
Learning and developmentCIT supports staff capability and skills and knowledge development by providing opportunities and resources for ongoing professional development embedded in a learning organisation framework. Learning and development priorities for 2015, identified in the CIT 2015-16 People Plan, include:
• business development skills
• client service skills
• building high performance
• team development and effectiveness skills
• enhancing leadership and management capability
• change management.

Canberra Institute of Technology Annual Report 201540
LEARNING PROGRAMS FOR ALL EMPLOYEES The ACT Government is increasingly concerned that core information, skills, knowledge and awareness is raised and maintained by all employees in a number of areas to ensure that compliance with government policies is observed. CIT is meeting this requirement through the provision of training to all employees including:
Working Together @ CIT
In 2015 Bullying Awareness and Prevention (Working Together @ CIT) online training was completed by more than 640 CIT staff members and has been an annual requirement since 2012.
Workplace health and safety
In 2015 work health and safety training was also introduced as a mandatory training requirement for all employees. 308 staff have successfully completed WHS Awareness and 127 have completed WHS for Managers training.
Diversity in the Workplace
253 CIT staff have completed Diversity in the Workplace training.
CIT LEARNING AND DEVELOPMENT PROGRAMSCIT understands that effective management is key to the success of any business operation. Examining the marketplace and its environment and creating opportunities to generate growth and profit for the business is critical for CIT. In 2015, CIT People Development ran a series of management programs to assist in the development of our managers. The projects included:
Management Simplified
Management Simplified produced two, six step webinar-based programs designed to develop
practical skills, tools and techniques to make managing employees easier. Each step focuses on different skills required for managers and emerging leaders. 28 participants completed the program Preparing for My Move Into Management in 2015 and a further 31 completed the Achieving Your Personal Success program.
Diploma of Management
CIT People Development, together with CIT Business, offered this tailored development opportunity for CIT employees to gain the nationally recognised qualification, Diploma of Management BSB51107. This qualification covered managing budgets and financial plans, people performance, projects, risk, facilitating continuous improvement, team effectiveness and leadership in the workplace. 14 participants enrolled in the 2015 program.
FASTLEAD
This was the newest addition to the learning and development program. The FASTLEAD program aims to rapidly develop emerging leaders by building skills and knowledge that enable participants to lead their teams to sustained, elevated business results. This program was a coaching-based learning and development opportunity, limited to a small number of participants. The program was piloted for the first time in 2015 with three employees completing the program.
Chief Executive Leadership Forums
The Chief Executive Leadership Forums provide authentic opportunities for CIT managers to address learning opportunities in a group. The forums also ensure the CIT management and leadership team is informed of the direction and priorities of CIT, through updates from the CIT Executive Team. There are four forums per year. The learning components of the forum address strategic issues for CIT and are facilitated by external providers. Approximately 90 participants attend each of the four forums.
Canberra Institute of Technology Annual Report 2015 41
SEC
TIO
N B
8 H
uman
Res
ourc
es M
anag
emen
t and
Wor
kpla
ce P
lann
ing
Mental Health First Aid
Mental Health First Aid is a two day training session that provides participants with skills in how to recognise the signs and symptoms of mental health illness and provide help and support for people with mental health problems, and how to take appropriate action should it be required. 16 CIT employees completed this program in 2015.
Empower – CIT 2015 Skills Summit
On 26 and 27 November 2015, CIT People Development hosted a skills summit open to all CIT employees, both general and teaching staff. Through a series of focus groups, ‘Empower’ focused on topics that were identified by employees as pertinent. These topics aligned with the strategic direction and the 2015-2016 People Plan. Included in the skills summit were business development skills such as customer service, confidence building and change management, and how to be entrepreneurial in the commercial environment.
Topics also included educational themes such as language, literacy and numeracy; innovative assessment tools for foundation skills; and teaching practice. Over the two day period 469 CIT employees participated in 22 workshops and keynote presentations.
Certificate IV in Frontline Management
In 2015, three employees completed the Certificate IV in Frontline Management BSB40812.
Having Difficult Conversations
This program was provided to CIT managers seeking to improve communication skills and to prepare and plan for difficult conversations. 20 CIT employees attended this session.
Training and assessment capability development programs
CIT supports the educational development of its teaching workforce through structured
formal programs and workshops as well as the opportunity for recognition of prior learning. In 2015 over 270 teaching staff completed the following teaching qualifications:
• Certificate IV in Training and Assessment TAE40110 – 231 qualifications were awarded
• Diploma of Vocational Education and Training TAE50111 – 27 qualifications were awarded
• Advanced Diploma of Adult Learning and Development 10051NAT – 15 qualifications were awarded.
Shared Services Learning and Development Calendar
CIT staff accessed a range of learning and development offered through the ACT Government, including:
• Introduction to Government Procurement (Procurement ACT Government) one employee
• Job Application & Interview Skills (Interaction) two employees
• Records Management & Territory Records ACT 2002 (Learning Options) one employee
• ER Delegates Workshop one employee
• Provide First Aid (Parasol EMT) two employees
• Human Dynamics (Interaction) one employee
• Records Management (CIT Solutions) one employee
• Change Awareness (Interaction) one employee
• Writing for Government - Correspondence (CIT Solutions) one employee
• Minute Taking (Interaction) one employee
• MS Excel Advanced Level (Excel Excellence) (AMC) two employees
• Freedom of Information (Learning Options) one employee
• Conflict Resolution Skills (Wisdom) one employee

Canberra Institute of Technology Annual Report 201542
• Privacy Principles in Practice (CIT Solutions) one employee
• Writing for Government - Correspondence (CIT Solutions) one employee
• Managing Time & Workloads (Fresh Coaching & Training) one employee
• Aboriginal and Torres Strait Islander Cultural Awareness Workshop (CIT Solutions) one employee
• MS Excel Intermediate Level (Excel for Finance Staff) (AMC) two employees.
Study Assistance 15 CIT employees participated in the Study Assistance program.
For more information:Executive Director, CIT People and Organisational Governance | (02) 6207 3133
Canberra Institute of Technology Annual Report 2015 43
B.9 ECOLOGICALLY SUSTAINABLE DEVELOPMENT
CIT has continued previous initiatives and partnerships along with the development of further opportunities to reduce the carbon footprint of business activities. This is in keeping with ACT Government targets to develop practices which promote ecologically sustainable development through the Climate Change and Greenhouse Gas Reduction Act 2010 and the Environment Protection Act 1997. CIT supports a range of strategies to address climate change and reduce greenhouse gas emissions. This includes implementing initiatives to improve energy efficiency and water conservation through building upgrades, refurbishment and maintenance programs. Examples include the continued installation of LED lighting, low flush and water conservation urinals and toilets, improvements to building management systems, improvements to space heating and the continuing operation of the recent co-generations power system at CIT Fyshwick.
CIT involves staff and students through education and project initiatives throughout the year to support active participation in reducing our carbon footprint through business delivery and the ongoing awareness of climate change, through:
(a) The CIT website and CIT intranet, which provide information and resources for staff and students on environmental sustainability within CIT. This information increases staff awareness of the environmental impacts associated with daily work practices and provides environmentally friendly alternatives. The communication includes information on environmental initiatives being investigated
and implemented, ways each staff member can help, and resources such as awareness posters that can be downloaded.
(b) CIT Green – a CIT network dedicated to developing, implementing and monitoring sustainable practices. CIT Green held six meetings in 2015 and implemented a range of environmental activities and campaigns. These included:
• ACT Smart (recycling) staff training
• installation of new recycling boxes for all office areas across all campuses
• monthly capture of reliable facts and figures on how much we are recycling at CIT
• the development of new energy saving and sustainable practice posters
• representation at the Carbon Neutral Government Implementation Committee.
(c) Supporting the ACT Government Renewable Energy Industry Development Strategy to meet renewable energy targets by 2020, including by establishing partnerships in research and industry development in renewable technologies. Partner companies include NEOEN and IT Power working in wind turbine and battery power storage respectively.
(d) Renewable Energy Day – an initiative of the South East Region of Renewable Energy Excellence, held at the CIT Sustainable Skills Training Hub at CIT Bruce. The event invited school groups and the public to tour the key sustainability sites around the Canberra region and to explore CIT’s Renewable Energy Skills
Canberra Institute of Technology Annual Report 201544
Centre of Excellence. Renewable industry companies also set up educational stalls at CIT Bruce.
(e) Incorporating reuse and recycling into daily activities in teaching colleges to divert waste products from landfill. The following are three examples.
• Over eight tonnes of scrap metal and batteries from trades training at CIT Fyshwick was sent for recycling in 2015.
• CIT Hairdressing and Beauty Therapy partnered with Sustainable Salons to divert 95% of waste products including aluminium, plastics and hair from the salons for recycling.
• CIT parcelled 357 first aid items for donation to the Nepal earthquake foundation.
In order to reduce greenhouse gas emissions, CIT has a strategy to reduce the overall consumption of electricity and switch to natural gas and solar energy. CIT has operational procedures in place for the monitoring of energy usage. Each campus has building monitoring systems and metering equipment in place to monitor energy usage and make savings where possible.
In 2014/15, CIT installed a further 10kW solar PV Array in the horticulture training facilities at CIT Bruce. Electricity consumption decreased by 2%. The CIT transport fleet reduced by 16% from a fleet of 31 vehicles to 26. Subsequently, petrol consumption reduced by 22% however kilometres travelled reduced by only 3%. An increase in diesel use was apparent. Paper consumption reduced by 21%.
CIT recorded accurate data this year for waste and recycling streams. Reliability of the data was demonstrated to be good to excellent. CIT also identified and recorded data for recycling of other waste streams including e-waste, batteries, scrap metal, printer cartridges and grease
traps. Reliability of data for these streams is also demonstrated to be good to excellent.
The data captured for waste and recycling from previous years (captured from waste/recycling contracts) has proven to be unreliable and therefore recycling trends for waste to landfill, office paper/cardboard and organic recycling could not be compared to previous years. The data appears to indicate a much higher level of recycling of co-mingled waste.

Canberra Institute of Technology Annual Report 2015 45
SEC
TIO
N B
9 Ec
olog
ical
ly S
usta
inab
le D
evel
opm
ent
Indicator as at 30 June 2015 Unit Current FY Previous FY Percentage change
Agency staff and area
Agency staff FTE 716.6 761.7 -6
Workplace floor area Area (m2) 123,539.3 139,535.19 -11
Stationary Energy
Electricity use Kilowatt hours 9,704,950 9,945,681 -2
Renewable electricity use Kilowatt hours 485,248 497,284 -2
Natural gas use Megajoules 37,072,279 34,408,616 8
Transport fuel usage
Total number of vehicles Number 26 31 -16
Total kilometres travelled Kilometres 495,772 512,388 -3
Fuel use – Petrol Kilolitres 18.17 23.44 -22
Fuel use – Diesel Kilolitres 23.00 19.77 17
Fuel use – Liquid Petroleum Gas (LPG) Kilolitres 0 0 0
Fuel use – Compressed Natural Gas (CNG) Kilolitres 0 0 0
Water usage
Water use Kilolitres 40,739 34,885 17
Resource efficiency and waste
Reams of paper purchased Reams 12,912 16,351 -21
Recycled content of paper purchased Percentage 50 50 0
Waste to landfill Litres 366,320 366,320* 0
Co-mingled material recycled Litres 24,000 11,216 114
Paper & cardboard recycled (incl. secure paper) Litres 53,565 53,565* 0
Organic material recycled Litres 33,360 48,720* -31
Greenhouse gas emissions
Emissions from stationary energy use Tonnes CO2-e 10,161 12,405 -18
Emissions from transport Tonnes CO2-e 95.76 113 -15
Total emissions Tonnes CO2-e 10,190.76 12,518 -18
* figures updated February 2016 – estimate based on frequency and volume of the bins collected
For more information:Chief Operating Officer | (02) 6207 3114

Canberra Institute of Technology Annual Report 201546

Canberra Institute of Technology Annual Report 2015 47
SASA SESTIC Graduate, CIT hospitality
I loved the CIT Restaurant
and all the practical
experience we could do.
I remember walking up and
down stairs with bowls of
water to practise service.”
SECT
ION
C F
inan
cial
Man
agem
ent
Repo
rtin
g

Canberra Institute of Technology Annual Report 201548
General overviewThe year 2015 has been successful, with the Canberra Institute of Technology (Institute) continuing to provide government-funded and commercial training, despite continued uncertainty and challenges at local, national and international levels, in particular the introduction of the Commonwealth VET FEE-HELP program, which resulted in intense competition for student numbers through aggressive marketing by for-profit training organisations and consequent intense competition for student numbers. A key performance highlight was the Institute’s maintenance of its high student and employer satisfaction levels. The Institute has continued to improve its effectiveness and responsiveness in skilling students using contemporary training methods which have been positively received by industry and students alike.
OBJECTIVESThe Institute’s mission is ‘changing lives through quality education and skills development for individuals, industry and community’, supporting its vision ‘to be the leading provider of vocational education and training in the ACT and Australia’. The Institute is committed to meeting the needs of a diverse range of clients through its responsive and innovative education and business practices.
Financial performanceIn 2015, the Institute incurred an operating deficit of $11.2 million against a budgeted deficit of $10.6 million, mainly due to a combination of
higher-than-anticipated expenses (particularly non-cash related expenses such as debt write-offs, leave provision adjustments and depreciation). Underlying cash flow was positive, with the cash balance for the year increasing from $4.71 million to $7.32 million during the year.
The individual income and expense variances affecting the operating result are detailed in the income and expense sections of this Financial Management Analysis. The financial information in this Financial Management Analysis is based on audited financial statements for 2015, as well as the Institutes Statement of Intent 2015-16.
Total incomeComponents of income
Total revenue (Figure 1) for 2015 was $101.8 million consisting primarily of $66.4 million (65.2%) received from the ACT Government as Government Payment for Outputs (GPO) and $24.2 million (23.8%) generated from Non-ACT Government User-Charges (local and overseas student fees and training course income).
C.1 FINANCIAL MANAGEMENT ANALYSIS
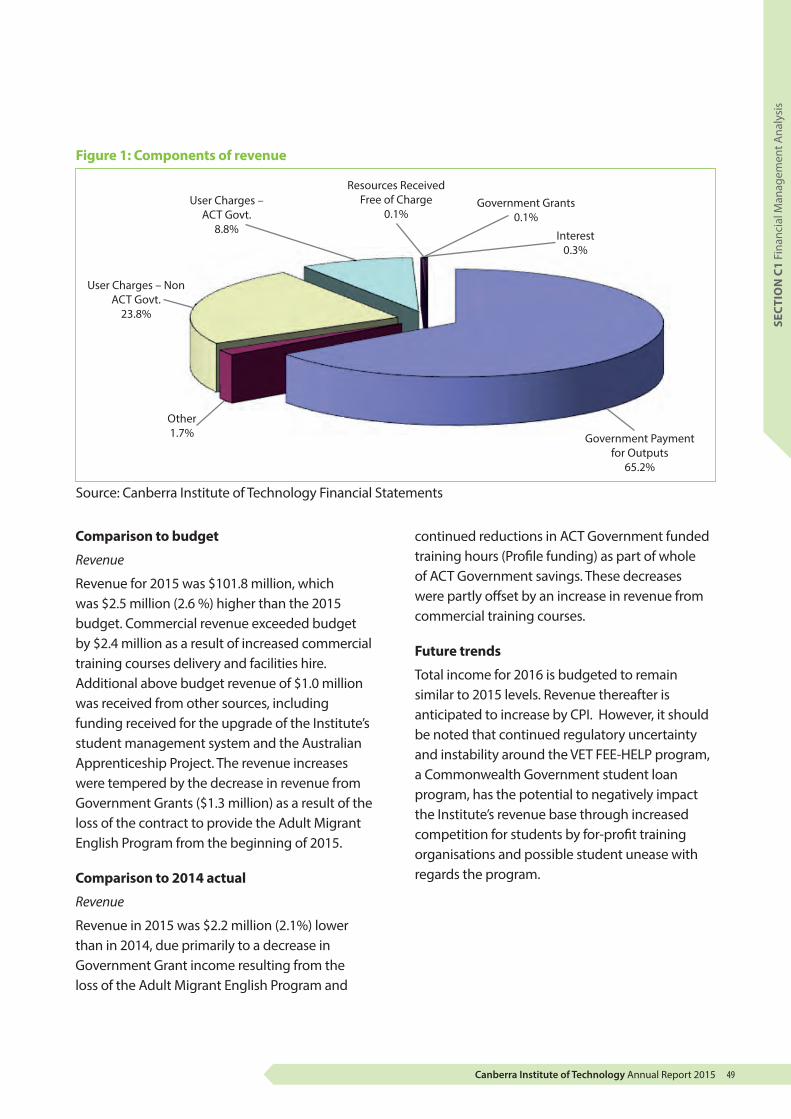
Canberra Institute of Technology Annual Report 2015 49
Figure 1: Components of revenue
Source: Canberra Institute of Technology Financial Statements
Comparison to budget
Revenue
Revenue for 2015 was $101.8 million, which was $2.5 million (2.6 %) higher than the 2015 budget. Commercial revenue exceeded budget by $2.4 million as a result of increased commercial training courses delivery and facilities hire. Additional above budget revenue of $1.0 million was received from other sources, including funding received for the upgrade of the Institute’s student management system and the Australian Apprenticeship Project. The revenue increases were tempered by the decrease in revenue from Government Grants ($1.3 million) as a result of the loss of the contract to provide the Adult Migrant English Program from the beginning of 2015.
Comparison to 2014 actual
Revenue
Revenue in 2015 was $2.2 million (2.1%) lower than in 2014, due primarily to a decrease in Government Grant income resulting from the loss of the Adult Migrant English Program and
continued reductions in ACT Government funded training hours (Profile funding) as part of whole of ACT Government savings. These decreases were partly offset by an increase in revenue from commercial training courses.
Future trends
Total income for 2016 is budgeted to remain similar to 2015 levels. Revenue thereafter is anticipated to increase by CPI. However, it should be noted that continued regulatory uncertainty and instability around the VET FEE-HELP program, a Commonwealth Government student loan program, has the potential to negatively impact the Institute’s revenue base through increased competition for students by for-profit training organisations and possible student unease with regards the program.
SEC
TIO
N C
1 Fi
nanc
ial M
anag
emen
t Ana
lysi
s
Other1.7%
User Charges – Non ACT Govt.
23.8%
User Charges – ACT Govt.
8.8%
Government Grants0.1%
Government Payment for Outputs
65.2%
Resources ReceivedFree of Charge
0.1%
Interest0.3%
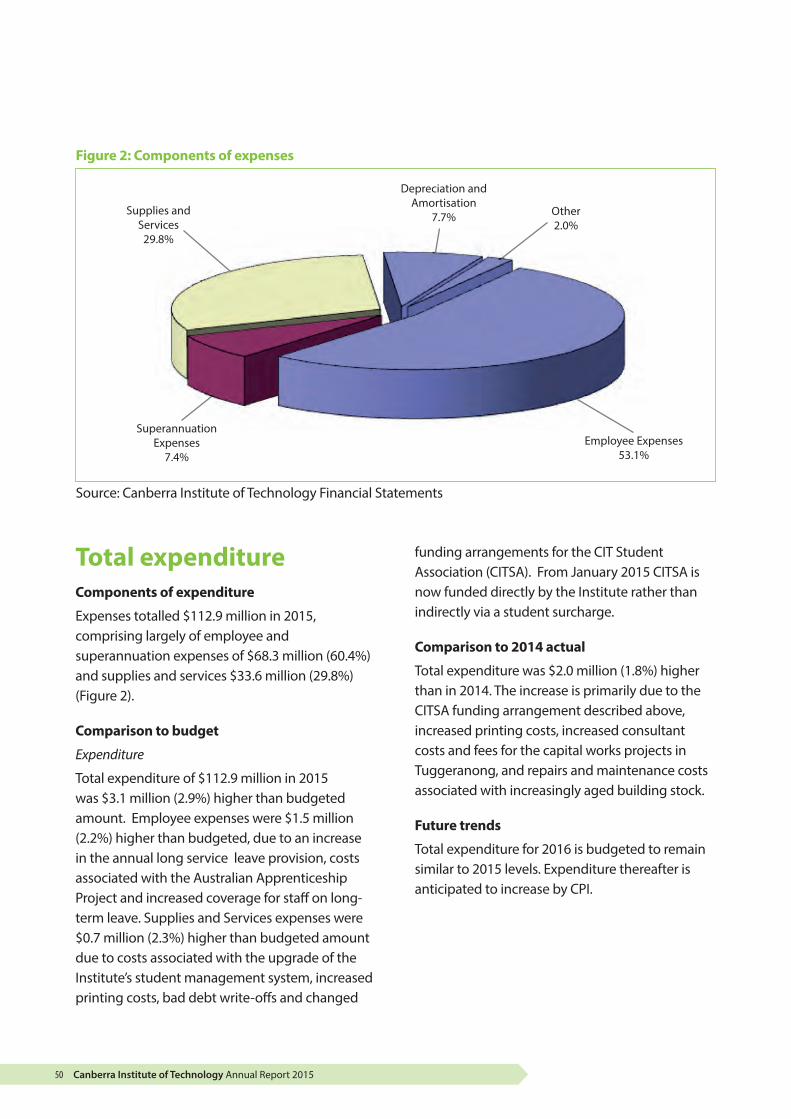
Canberra Institute of Technology Annual Report 201550
Total expenditureComponents of expenditure
Expenses totalled $112.9 million in 2015, comprising largely of employee and superannuation expenses of $68.3 million (60.4%) and supplies and services $33.6 million (29.8%) (Figure 2).
Comparison to budget
Expenditure
Total expenditure of $112.9 million in 2015 was $3.1 million (2.9%) higher than budgeted amount. Employee expenses were $1.5 million (2.2%) higher than budgeted, due to an increase in the annual long service leave provision, costs associated with the Australian Apprenticeship Project and increased coverage for staff on long-term leave. Supplies and Services expenses were $0.7 million (2.3%) higher than budgeted amount due to costs associated with the upgrade of the Institute’s student management system, increased printing costs, bad debt write-offs and changed
funding arrangements for the CIT Student Association (CITSA). From January 2015 CITSA is now funded directly by the Institute rather than indirectly via a student surcharge.
Comparison to 2014 actual
Total expenditure was $2.0 million (1.8%) higher than in 2014. The increase is primarily due to the CITSA funding arrangement described above, increased printing costs, increased consultant costs and fees for the capital works projects in Tuggeranong, and repairs and maintenance costs associated with increasingly aged building stock.
Future trends
Total expenditure for 2016 is budgeted to remain similar to 2015 levels. Expenditure thereafter is anticipated to increase by CPI.
Figure 2: Components of expenses
Source: Canberra Institute of Technology Financial Statements
SuperannuationExpenses
7.4%
Depreciation and Amortisation
7.7%Supplies and Services
29.8%
Other2.0%
Employee Expenses53.1%

Canberra Institute of Technology Annual Report 2015 51
SEC
TIO
N C
1 Fi
nanc
ial M
anag
emen
t Ana
lysi
s
Figure 3: Total assets
Source: Canberra Institute of Technology Financial Statements
Financial position: Total assetsComponents of total assets
Figure 3 indicates that at 31 December 2015 the Institute held 93.9% of its assets in property, plant and equipment and works in progress, and 6.1% in cash and cash equivalents, receivables and other current assets.
Comparison to budget
The total asset position at 31 December 2015 is $198.4 million, $3.2 million (1.7%) higher than the 2015 budget of $195.1 million. This is largely due to an improved cash situation ($2.6 million above budget at year end) due primarily to funds received in advance for the Australian Apprenticeship Project (a review of the Institue’s Australian Apprenticeship model).
Comparison to 2014 actual
The Institute’s total asset position at 31 December 2015 is $0.52 million (0.3%) higher than the 2014 actual result of $197.8 million at 31 December 2014 due largely to the improved cash position discussed above and increased capital works in progress (primarily Tuggeranong location expenditure).
Plant & Equipment
3.4%Land
22.0%
Other 1.0%
Receivables 1.5%
Cash & Cash Equivalents
3.7%
Capital Works in Progress
1.2%
Intangible Assets 0.8%
Building and Improvements
66.4%

Canberra Institute of Technology Annual Report 201552
Financial position: Total liabilitiesFigure 4 indicates that the majority of the Institute’s liabilities relate to employee benefits (72.0%), payables (6.7%) and revenue received in advance (21.3%).
Comparison to budget
The Institute’s liabilities at 31 December 2015 of $26.5 million is $4.3 million higher than the 2015 budget of $22.2 million, due primarily to higher than budgeted revenue received in advance for the Australian Apprenticeship Project and international student fees received in advance.
Comparison to 2014 actual
The Institute’s total liabilities at 31 December 2015 were $4.1 million (18.3%) higher than the 2014 actual result of $22.4 million at 31 December 2014 due to the increase in revenue received in advance as described above, an increase in the long service leave provision and an increase in accrued expenses for 2015 payables arising primarily from the accrual of telecommunications expenses from delayed invoices.
Liquidity
Liquidity is the ability of the Institute to meet its short-term obligations as they fall due. The current working capital ratio (ratio of current assets to current liabilities) is a common indicator for liquidity and measures the ability to fund short-term liabilities from short-term assets.
The current working capital ratio of 0.48 is higher than the budget target of 0.44 for the year and higher than the 2014 outcome of 0.41. The increase from 2014 is mostly a result of increased cash levels primarily from revenue received in advance for the Australian Apprenticeship Project and student fees.
As at 31 December 2015 the Institute’s current assets ($12.16 million) are less than its total current liabilities ($25.52million) by $13.36 million. However, this is not considered a liquidity risk as its cash needs, including the employee entitlement settlement, is anticipated to be met through appropriation from the ACT Government on a cash-needs basis. This is consistent with the whole-of-government cash management regime, which requires excess cash balances to be held centrally rather than within individual agency bank accounts.
Figure 4: Total liabilities
Source: Canberra Institute of Technology Financial Statements
Payables6.7%
Other21.3%
Employee Benefits72.0%

Canberra Institute of Technology Annual Report 2015 53
SEC
TIO
N C
1 Fi
nanc
ial M
anag
emen
t Ana
lysi
s
CIT’s Working Capital Ratio
Actual 2015 $’000
Budget 2015 $’000
Actual 2014 $’000
Current AssetsCash and cash equivalents 7,318 4,710 4,348Receivables 2,904 2,500 2,552Other Assets 1,940 1,850 1,855Total Current Assets 12,162 9,060 8,755
Current LiabilitiesPayables 1,761 1,500 1,402Employee Benefits 18,130 16,700 17,454Other Liabilities 5,626 2,300 2,348Total Current Liabilities 25,517 20,500 21,204Working Capital Ratio 0.48 0.44 0.41
Performance measuresThe main measures relating to government-funded training services indicate steady results. Module pass rates were above target by 8%, although program completion rates were 8% below target.
The 2015 satisfaction surveys of learners and employers showed satisfaction levels of 93% and 87% respectively, indicating that positive views are held by industry and students of the Institute’s training. The Institute has continued to improve its effectiveness and responsiveness in skilling students using contemporary training methods which have been positively received by industry and students alike.
Risk managementManaging the Institute’s risk is a key governance responsibility and comprises the Strategic Business Risk Profile, as well as prevention of fraud and corruption risk. Six categories have been
identified for each, one of which includes financial sustainability.
Progress reports continue to show that many business risk rankings are being reduced as a result of successful mitigation strategies and a focus on continual reporting. The risks identified for both business and fraud and corruption link directly to our Risk Environment Plan, which is regularly reviewed to ensure the Institute is addressing strategic and any emerging risks.
The Institute undertakes monthly reporting and analysis of its financial performance, both at an institute and cost centre level, which assists in identifying and addressing any financial risks. The Institute also undertakes monthly reporting and analysis of its annual performance measures as identified in the Statement of Intent and the ACT Government Budget. This process assists in identifying any performance risks. The financial and performance reporting is communicated to management and the various Institute governance committees on a periodic basis.
For more information:Chief Finance Officer | (02) 6207 3314
Canberra Institute of Technology Annual Report 201554
C.2 FINANCIAL STATEMENTS

Canberra Institute of Technology Annual Report 2015 55
SEC
TIO
N C
2 Fi
nanc
ial S
tate
men
ts
Canberra Institute of Technology Annual Report 201556
Canberra Institute of TechnologyFinancial Statements
For the Year Ended 31 December 2015
Statement of Responsibility
In my opinion, the financial statements are in agreement with the Canberra Institute of Technology’s accounts and records and fairly reflect the financial operations of the Canberra Institute of Technology for the year ended 31 December 2015 and the financial position of the Canberra Institute of Technology on that date.
Craig Sloan Chair Canberra Institute of Technology Board 18 March 2016
Canberra Institute of Technology Annual Report 2015 57
SEC
TIO
N C
2 Fi
nanc
ial S
tate
men
ts
Canberra Institute of TechnologyFinancial Statements
For the Year Ended 31 December 2015
Statement by the Chief Operating Officer
In my opinion, the financial statements have been prepared in accordance with generally accepted accounting principles, are in agreement with the Canberra Institute of Technology’s accounts and records and fairly reflect the financial operations of the Canberra Institute of Technology for the year ended 31 December 2015 and the financial position of the Canberra Institute of Technology on that date.
Shane kay Chief Finance Officer Canberra Institute of Technology 18 March 2016

Canberra Institute of Technology Annual Report 201558
Canberra Institute of TechnologyOperating Statement
For the Year Ended 31 December 2015
Consolidated Institute
Note
Actual 2015
$’000
Actual 2014
$’000
Actual 2015
$’000
Original Budget
2015 $’000
Actual 2014
$’000
IncomeRevenueGovernment Payments for Outputs 4 66,372 67,249 66,372 66,372 67,249
User Charges – ACT Government 5 9,051 10,179 8,942 8,700 9,962
User Charges – Non-ACT Government 5 40,107 34,504 24,239 21,829 21,749
Government Grants 6 66 2,834 66 1,350 2,834
Interest 7 426 392 320 200 326
Resources Received Free of Charge 8 100 68 100 35 68
Other Revenue 9 1,609 1,901 1,740 750 1,802
Total Revenue 117,731 117,127 101,779 99,236 103,990
Gains
Other Gains 10 8 31 8 – 31
Total Gains 8 31 8 – 31
Total Income 117,739 117,158 101,787 99,236 104,021
Expenses
Employee Expenses 11 69,856 68,867 59,983 58,781 59,319
Superannuation Expenses 12 9,233 9,350 8,323 8,046 8,520
Supplies and Services 13 36,686 34,492 33,618 32,876 32,918
Depreciation and Amortisation 14 8,821 8,801 8,746 8,578 8,672
Other Expenses 15 3,039 2,328 2,299 1,546 1,545
Total Expenses 127,635 123,838 112,969 109,827 110,974
Operating Deficit (9,897) (6,680) (11,182) (10,591) (6,953)
Other Comprehensive Income
Items that will not be reclassified subsequently to profit or loss
Decrease in the Asset Revaluation Surplus 28 – (12,576) – – (12,574)
Total Other Comprehensive Income – (12,576) – – (12,574)
Total Comprehensive Income (9,897) (19,256) (11,182) (10,591) (19,527)
The above Operating Statement should be read in conjunction with the accompanying notes.
The Canberra Institute of Technology (the Institute) has only one output class and as such the above Operating Statement is also the Institute’s Operating Statement for Output Class 1.1 Provision of Vocational Education and Training Services.
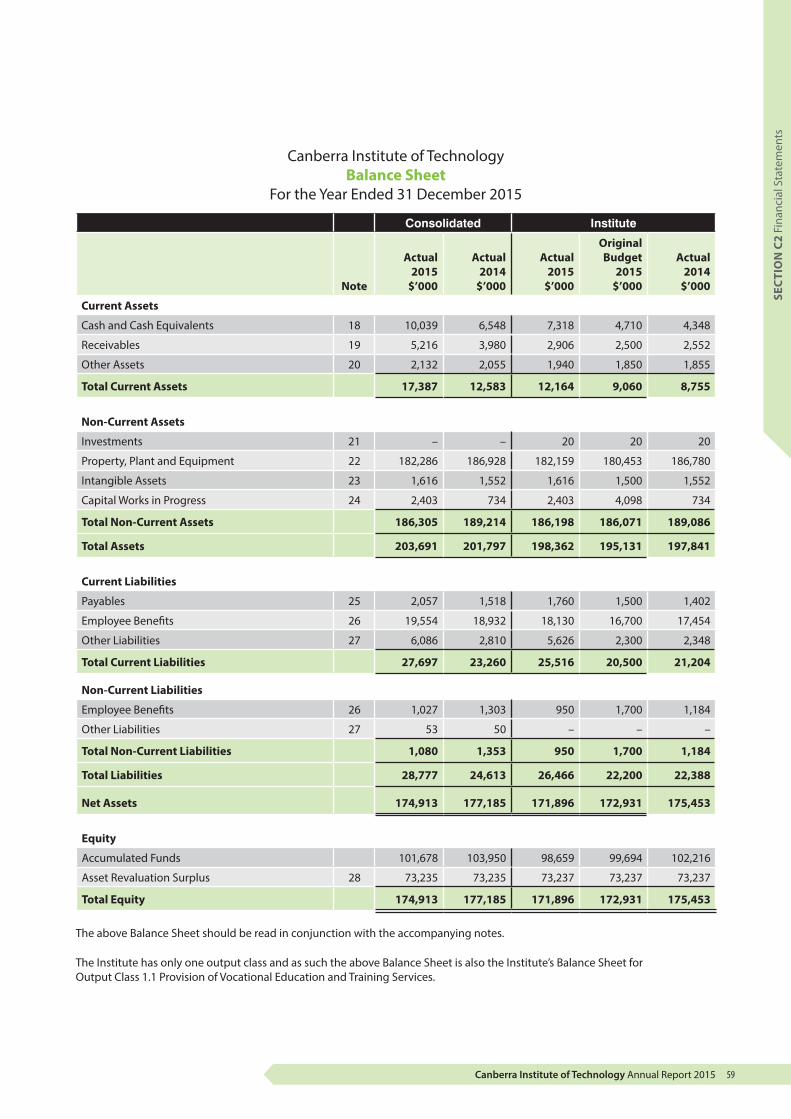
Canberra Institute of Technology Annual Report 2015 59
SEC
TIO
N C
2 Fi
nanc
ial S
tate
men
ts
Canberra Institute of TechnologyBalance Sheet
For the Year Ended 31 December 2015
Consolidated Institute
Note
Actual 2015
$’000
Actual 2014
$’000
Actual 2015
$’000
Original Budget
2015 $’000
Actual 2014
$’000
Current Assets
Cash and Cash Equivalents 18 10,039 6,548 7,318 4,710 4,348
Receivables 19 5,216 3,980 2,906 2,500 2,552
Other Assets 20 2,132 2,055 1,940 1,850 1,855
Total Current Assets 17,387 12,583 12,164 9,060 8,755
Non-Current Assets
Investments 21 – – 20 20 20
Property, Plant and Equipment 22 182,286 186,928 182,159 180,453 186,780
Intangible Assets 23 1,616 1,552 1,616 1,500 1,552
Capital Works in Progress 24 2,403 734 2,403 4,098 734
Total Non-Current Assets 186,305 189,214 186,198 186,071 189,086
Total Assets 203,691 201,797 198,362 195,131 197,841
Current Liabilities
Payables 25 2,057 1,518 1,760 1,500 1,402
Employee Benefits 26 19,554 18,932 18,130 16,700 17,454
Other Liabilities 27 6,086 2,810 5,626 2,300 2,348
Total Current Liabilities 27,697 23,260 25,516 20,500 21,204
Non-Current Liabilities
Employee Benefits 26 1,027 1,303 950 1,700 1,184
Other Liabilities 27 53 50 – – –
Total Non-Current Liabilities 1,080 1,353 950 1,700 1,184
Total Liabilities 28,777 24,613 26,466 22,200 22,388
Net Assets 174,913 177,185 171,896 172,931 175,453
Equity
Accumulated Funds 101,678 103,950 98,659 99,694 102,216
Asset Revaluation Surplus 28 73,235 73,235 73,237 73,237 73,237
Total Equity 174,913 177,185 171,896 172,931 175,453
The above Balance Sheet should be read in conjunction with the accompanying notes.
The Institute has only one output class and as such the above Balance Sheet is also the Institute’s Balance Sheet for Output Class 1.1 Provision of Vocational Education and Training Services.
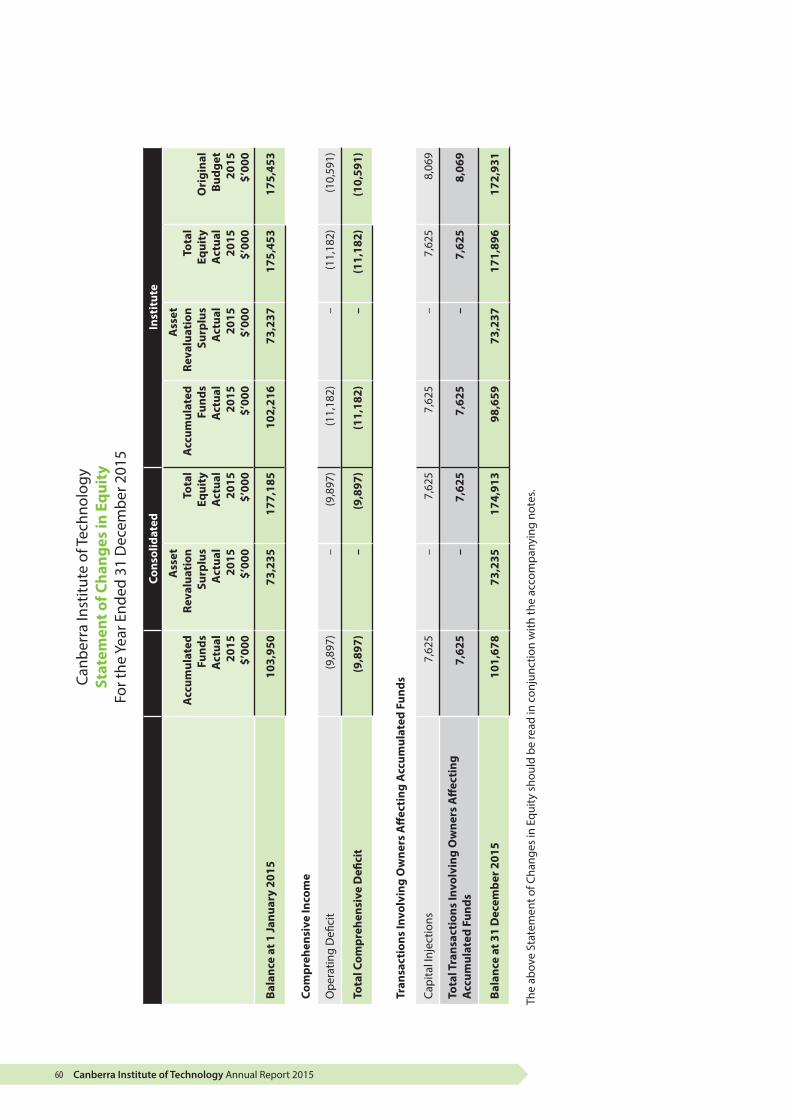
Canberra Institute of Technology Annual Report 201560
Canb
erra
Inst
itute
of T
echn
olog
ySt
atem
ent o
f Cha
nges
in E
quit
yFo
r the
Yea
r End
ed 3
1 D
ecem
ber 2
015
Cons
olid
ated
Inst
itut
e
Acc
umul
ated
Fu
nds
Act
ual
2015
$’
000
Ass
et
Reva
luat
ion
Surp
lus
Act
ual
2015
$’
000
Tota
l Eq
uity
A
ctua
l 20
15
$’00
0
Acc
umul
ated
Fu
nds
Act
ual
2015
$’
000
Ass
et
Reva
luat
ion
Surp
lus
Act
ual
2015
$’
000
Tota
l Eq
uity
A
ctua
l 20
15
$’00
0
Ori
gina
l Bu
dget
20
15
$’00
0
Bala
nce
at 1
Janu
ary
2015
103,
950
73,2
3517
7,18
510
2,21
673
,237
175,
453
175,
453
Com
preh
ensi
ve In
com
e
Ope
ratin
g D
efici
t(9
,897
)–
(9,8
97)
(11,
182)
–(1
1,18
2)(1
0,59
1)
Tota
l Com
preh
ensi
ve D
efici
t(9
,897
)–
(9,8
97)
(11,
182)
–(1
1,18
2)(1
0,59
1)
Tran
sact
ions
Invo
lvin
g O
wne
rs A
ffec
ting
Acc
umul
ated
Fun
ds
Capi
tal I
njec
tions
7,62
5–
7,62
57,
625
–7,
625
8,06
9
Tota
l Tra
nsac
tion
s In
volv
ing
Ow
ners
Aff
ecti
ng
Acc
umul
ated
Fun
ds7,
625
–7,
625
7,62
5–
7,62
58,
069
Bala
nce
at 3
1 D
ecem
ber 2
015
101,
678
73,2
3517
4,91
398
,659
73,2
3717
1,89
617
2,93
1
The
abov
e St
atem
ent o
f Cha
nges
in E
quity
sho
uld
be re
ad in
con
junc
tion
with
the
acco
mpa
nyin
g no
tes.
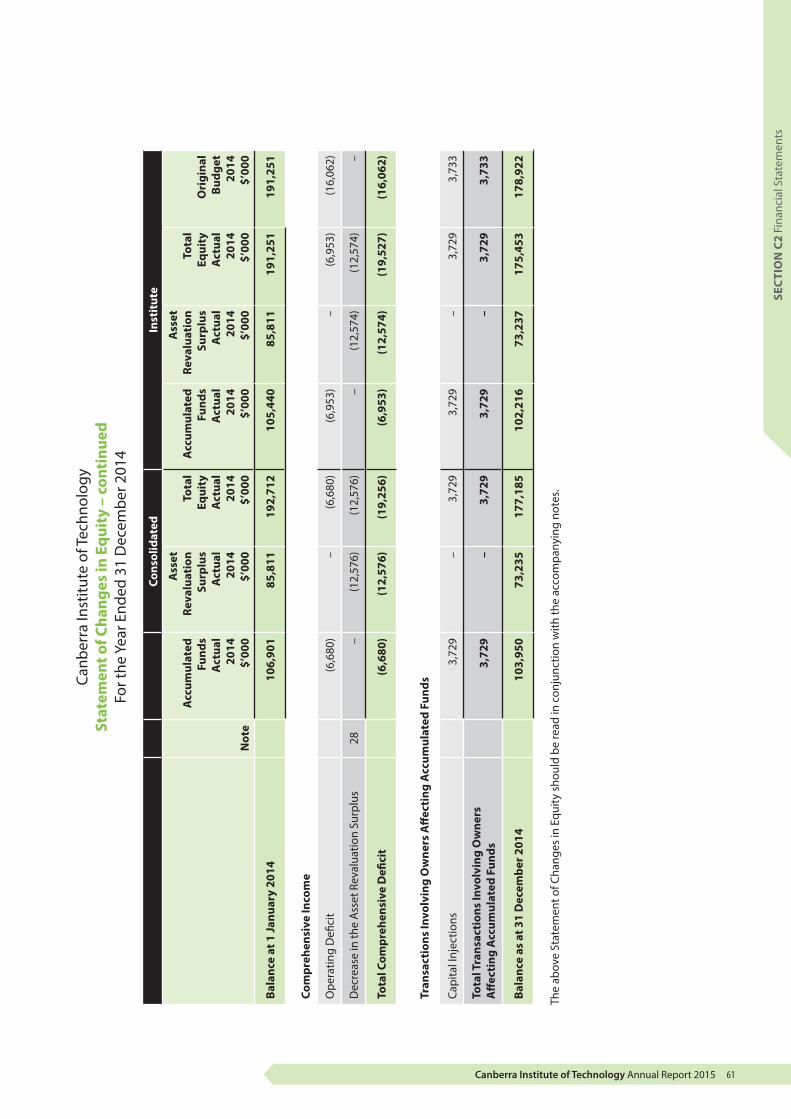
Canberra Institute of Technology Annual Report 2015 61
SEC
TIO
N C
2 Fi
nanc
ial S
tate
men
ts
Canb
erra
Inst
itute
of T
echn
olog
ySt
atem
ent o
f Cha
nges
in E
quit
y –
cont
inue
dFo
r the
Yea
r End
ed 3
1 D
ecem
ber 2
014
Cons
olid
ated
Inst
itut
e
Not
e
Acc
umul
ated
Fu
nds
Act
ual
2014
$’
000
Ass
et
Reva
luat
ion
Surp
lus
Act
ual
2014
$’
000
Tota
l Eq
uity
A
ctua
l 20
14
$’00
0
Acc
umul
ated
Fu
nds
Act
ual
2014
$’
000
Ass
et
Reva
luat
ion
Surp
lus
Act
ual
2014
$’
000
Tota
l Eq
uity
A
ctua
l 20
14
$’00
0
Ori
gina
l Bu
dget
20
14
$’00
0
Bala
nce
at 1
Janu
ary
2014
106,
901
85,8
1119
2,71
210
5,44
085
,811
191,
251
191,
251
Com
preh
ensi
ve In
com
e
Ope
ratin
g D
efici
t(6
,680
)–
(6,6
80)
(6,9
53)
–(6
,953
)(1
6,06
2)
Dec
reas
e in
the
Ass
et R
eval
uatio
n Su
rplu
s28
–(1
2,57
6)(1
2,57
6)–
(12,
574)
(12,
574)
–
Tota
l Com
preh
ensi
ve D
efici
t(6
,680
)(1
2,57
6)(1
9,25
6)(6
,953
)(1
2,57
4)(1
9,52
7)(1
6,06
2)
Tran
sact
ions
Invo
lvin
g O
wne
rs A
ffec
ting
Acc
umul
ated
Fun
ds
Capi
tal I
njec
tions
3,72
9–
3,72
93,
729
–3,
729
3,73
3
Tota
l Tra
nsac
tion
s In
volv
ing
Ow
ners
A
ffec
ting
Acc
umul
ated
Fun
ds3,
729
–3,
729
3,72
9–
3,72
93,
733
Bala
nce
as a
t 31
Dec
embe
r 201
410
3,95
073
,235
177,
185
102,
216
73,2
3717
5,45
317
8,92
2
The
abov
e St
atem
ent o
f Cha
nges
in E
quity
sho
uld
be re
ad in
con
junc
tion
with
the
acco
mpa
nyin
g no
tes.
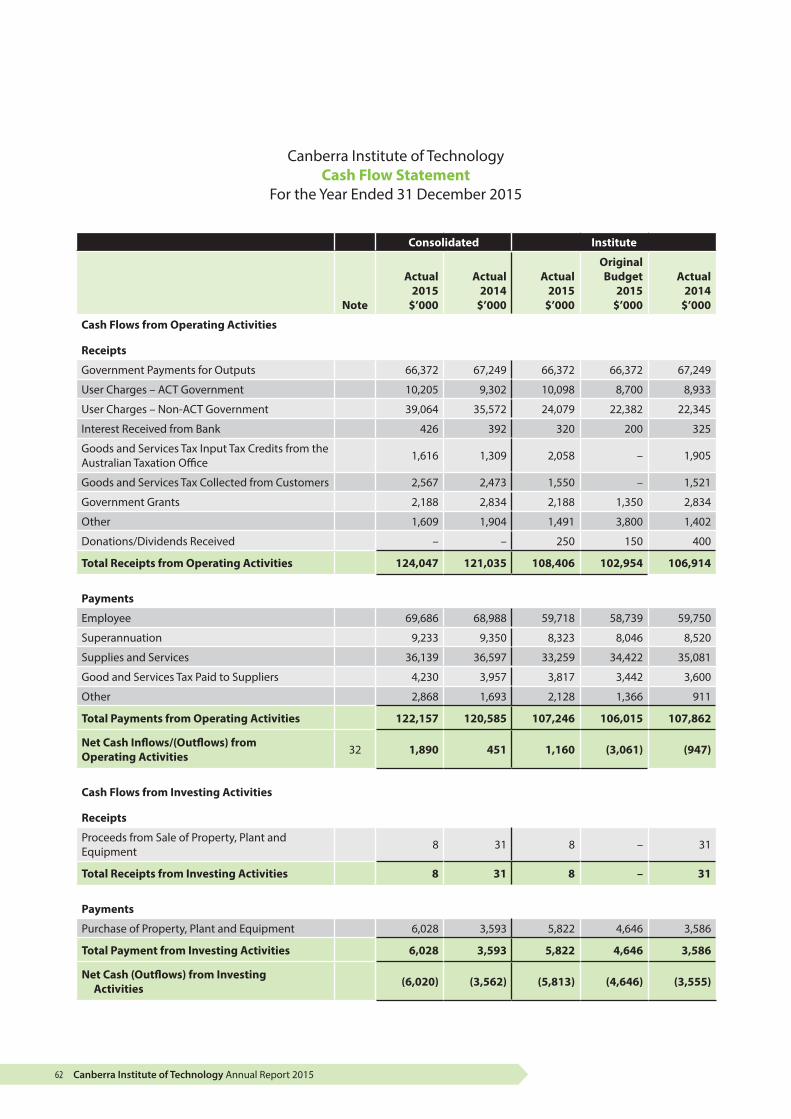
Canberra Institute of Technology Annual Report 201562
Canberra Institute of TechnologyCash Flow Statement
For the Year Ended 31 December 2015
Consolidated Institute
Note
Actual 2015
$’000
Actual 2014
$’000
Actual 2015
$’000
Original Budget
2015 $’000
Actual 2014
$’000
Cash Flows from Operating Activities
Receipts
Government Payments for Outputs 66,372 67,249 66,372 66,372 67,249
User Charges – ACT Government 10,205 9,302 10,098 8,700 8,933
User Charges – Non-ACT Government 39,064 35,572 24,079 22,382 22,345
Interest Received from Bank 426 392 320 200 325
Goods and Services Tax Input Tax Credits from the Australian Taxation Office 1,616 1,309 2,058 – 1,905
Goods and Services Tax Collected from Customers 2,567 2,473 1,550 – 1,521
Government Grants 2,188 2,834 2,188 1,350 2,834
Other 1,609 1,904 1,491 3,800 1,402
Donations/Dividends Received – – 250 150 400
Total Receipts from Operating Activities 124,047 121,035 108,406 102,954 106,914
Payments
Employee 69,686 68,988 59,718 58,739 59,750
Superannuation 9,233 9,350 8,323 8,046 8,520
Supplies and Services 36,139 36,597 33,259 34,422 35,081
Good and Services Tax Paid to Suppliers 4,230 3,957 3,817 3,442 3,600
Other 2,868 1,693 2,128 1,366 911
Total Payments from Operating Activities 122,157 120,585 107,246 106,015 107,862
Net Cash Inflows/(Outflows) from Operating Activities 32 1,890 451 1,160 (3,061) (947)
Cash Flows from Investing Activities
Receipts
Proceeds from Sale of Property, Plant and Equipment 8 31 8 – 31
Total Receipts from Investing Activities 8 31 8 – 31
Payments
Purchase of Property, Plant and Equipment 6,028 3,593 5,822 4,646 3,586
Total Payment from Investing Activities 6,028 3,593 5,822 4,646 3,586
Net Cash (Outflows) from Investing Activities (6,020) (3,562) (5,813) (4,646) (3,555)
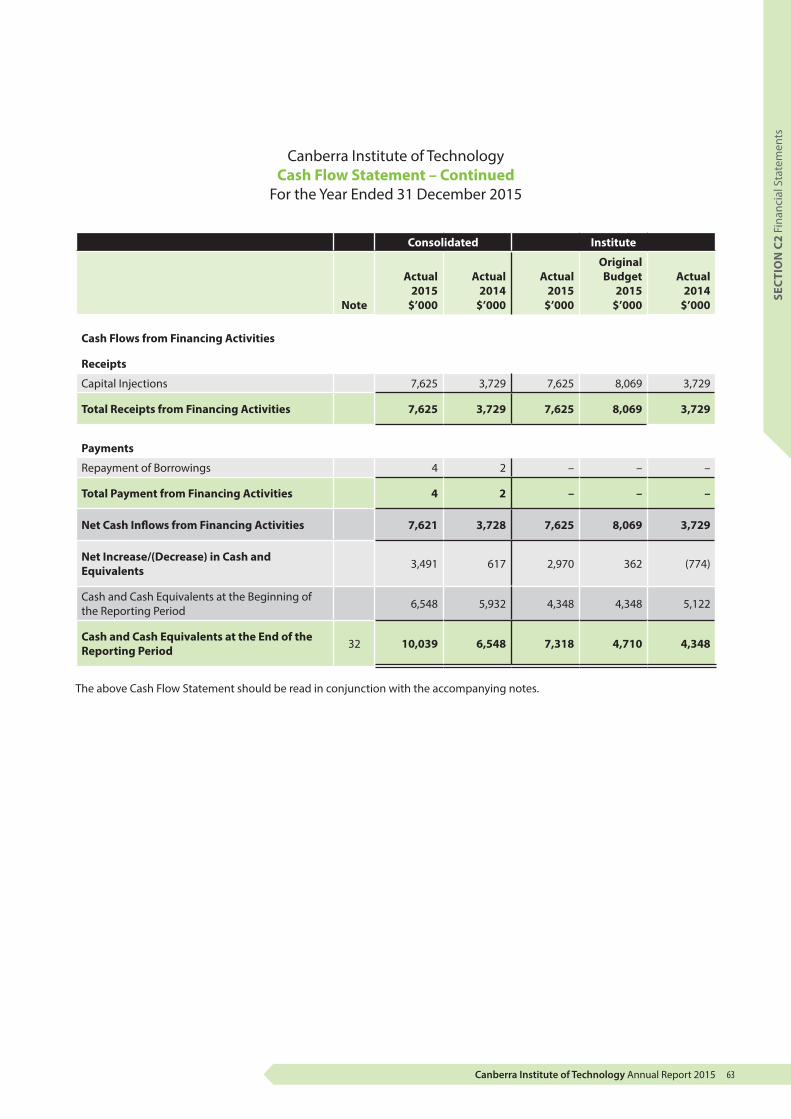
Canberra Institute of Technology Annual Report 2015 63
SEC
TIO
N C
2 Fi
nanc
ial S
tate
men
ts
Canberra Institute of TechnologyCash Flow Statement – Continued
For the Year Ended 31 December 2015
Consolidated Institute
Note
Actual 2015
$’000
Actual 2014
$’000
Actual 2015
$’000
Original Budget
2015 $’000
Actual 2014
$’000
Cash Flows from Financing Activities
Receipts
Capital Injections 7,625 3,729 7,625 8,069 3,729
Total Receipts from Financing Activities 7,625 3,729 7,625 8,069 3,729
Payments
Repayment of Borrowings 4 2 – – –
Total Payment from Financing Activities 4 2 – – –
Net Cash Inflows from Financing Activities 7,621 3,728 7,625 8,069 3,729
Net Increase/(Decrease) in Cash and Equivalents 3,491 617 2,970 362 (774)
Cash and Cash Equivalents at the Beginning of the Reporting Period 6,548 5,932 4,348 4,348 5,122
Cash and Cash Equivalents at the End of the Reporting Period 32 10,039 6,548 7,318 4,710 4,348
The above Cash Flow Statement should be read in conjunction with the accompanying notes.

Canberra Institute of Technology Annual Report 201564
Canberra Institute of TechnologyStatement of Appropriation
For the Year Ended 31 December 2015
Original Budget
2015 $’000
Total Appropriated
2015 $’000
Appropriated Drawn
2015 $’000
Appropriated Drawn
2014 $’000
Controlled
Government Payment for Outputs 66,372 66,372 66,372 67,249
Capital Injections 8,069 7,625 7,625 3,729
Total Appropriation 74,441 73,997 73,997 70,979
The above Statement of Appropriation should be read in conjunction with the accompanying notes.
Column Heading Explanations
The Original Budget column shows the amounts that appear in the Cash Flow Statement in the Institute’s Statement of Intent. This amount also appears in the Cash Flow Statement.
The Total Appropriated column is inclusive of all appropriation variations occurring after the Original Budget.
The Appropriation Drawn is the total amount of appropriation received by the Directorate during the year. This amount appears in the Cash Flow Statement
Variances between ‘Original Budget’ and ‘Total Appropriated’
Capital Injections
Budgets for Capital Injections are set on a July-June financial year basis in alignment with the ACT Government budget process. The variance to 31 December 2015 shown here is the result of some timing adjustments to the 2015-16 capital upgrade program schedule (pushing some works originally scheduled for late 2015 to early 2016) to focus on the prioritised Tuggeranong campus works to be completed by June 2016.

Canberra Institute of Technology Annual Report 2015 65
SEC
TIO
N C
2 Fi
nanc
ial S
tate
men
ts
Canberra Institute of TechnologyNote Index
For the Year Ended 31 December 2015
NOTE INDEX
Note 1 Objectives of the Canberra Institute of Technology
Note 2 Summary of Significant Accounting Policies
Note 3 Change in Accounting Policy and Accounting Estimates, and Correction of a Prior Period Error
Income Notes Note 4 Government Payment for Outputs
Note 5 User Charges
Note 6 Government Grants
Note 7 Interest
Note 8 Resources Received Free of Charge
Note 9 Other Revenue
Note 10 Other Gains
Expense Notes Note 11 Employee Expenses
Note 12 Superannuation Expenses
Note 13 Supplies and Services
Note 14 Depreciation and Amortisation
Note 15 Other Expenses
Note 16 Waivers, Impairment Losses and Write-offs
Note 17 Auditor’s Remuneration
Asset Notes Note 18 Cash and Cash Equivalents
Note 19 Receivables
Note 20 Other Assets
Note 21 Investments
Note 22 Property, Plant and Equipment
Note 23 Intangible Assets
Note 24 Capital Works in Progress
Liability Notes Note 25 Payables
Note 26 Employee Benefits
Note 27 Other Liabilities
Equity Notes Note 28 Asset Revaluation Surplus
Other Notes Note 29 Financial Instruments
Note 30 Commitments
Note 31 Contingent Liabilities and Contingent Assets
Note 32 Cash Flow Reconciliation
Note 33 Events Occurring after Balance Date
Note 34 Related Party Disclosure
Note 35 Third Party Monies
Note 36 Budgetary Reporting

Canberra Institute of Technology Annual Report 201566
Canberra Institute of Technology Notes to and Forming Part of the Financial Statements
For the Year Ended 31 December 2015
NOTE 1 OBJECTIVES OF THE CANBERRA INSTITUTE OF TECHNOLOGY
Operation and Principal Activities
The Canberra Institute of Technology (the Institute) is a multi-campus, multi-disciplinary, tertiary education institution in the ACT, providing vocational education and training to the ACT and surrounding region.
NOTE 2 SUMMARY OF SIGNIFICANT ACCOUNTING POLICIES
(a) Basis of Preparation
The Financial Management Act 1996 (FMA) requires the preparation of annual financial statements for ACT Government territory authorities. The Institute is a prescribed territory authority under the FMA, therefore is required to report on its one output class.
The FMA and the Financial Management Guidelines issued under the Act, require the Institute’s financial statements to include:
(i) an Operating Statement for the year;
(ii) a Balance Sheet at the end of the year;
(iii) a Statement of Changes in Equity for the year;
(iv) a Cash Flow Statement for the year;
(v) a Statement of Appropriation for the year;
(vi) a summary of the significant accounting policies adopted for the year; and
(vii) such other statements as are necessary to fairly reflect the financial operations of the Institute during the year and its financial position at the end of the year.
These general-purpose financial statements have been prepared to comply with ‘Generally Accepted Accounting Principles’ (GAAP) as required by the FMA. The financial statements have been prepared in accordance with:
(i) Australian Accounting Standards;
(ii) ACT Accounting and Disclosure Policies.
The financial statements have been prepared using the accrual basis of accounting, which recognises the effects of transactions and events when they occur. The financial statements have also been prepared according to the historical cost convention, except for assets which were valued in accordance with the (re)valuation policies applicable to the Institute during the reporting period.
As at 31 December 2015, the Institute’s current assets ($12.16 million) are less than its total current liabilities ($25.52 million) by $13.36 million. However, this is not considered a liquidity risk as its cash needs, including the employee entitlement settlement, is anticipated to be met through appropriation from the ACT Government on a cash-needs basis. This is consistent with the whole-of-government cash management regime, which requires excess cash balances to be held centrally rather than within individual agency bank accounts.
Canberra Institute of Technology Annual Report 2015 67
SEC
TIO
N C
2 Fi
nanc
ial S
tate
men
ts
Canberra Institute of Technology Notes to and Forming Part of the Financial Statements
For the Year Ended 31 December 2015
NOTE 2 SUMMARY OF SIGNIFICANT ACCOUNTING POLICIES – CONTINUED
(a) Basis of Preparation - continued
Fair value is the price that would be received to sell an asset or paid to transfer a liability in an orderly transaction between market participants at the measurement date. Fair value is measured using the market approach, the cost approach or the income approach valuation techniques as appropriate. In estimating the fair value of an asset or liability, the Institute takes into account the characteristics of the asset or liability if market participants would take those characteristics into account when pricing the asset or liability at measurement date.
The above approach to fair value measurement does not apply to leasing transactions within the scope of AASB 117 Leases or measurements that have some similarities to fair value but are not fair value, such as value in use in AASB 136 Impairment of Assets.
For disclosure purposes fair value measurements are categorised into Level 1, 2 or 3 based on the extent to which the inputs to the valuation techniques are observable and the significance of the inputs to the fair value measurement in its entirety. The fair value hierarchy is made up of the following three levels:
• Level 1 – quoted prices (unadjusted) in active markets for identical assets or liabilities that the agency can access at the measurement date;
• Level 2 – inputs other than quoted prices included within Level 1 that are observable for the asset or liability, either directly or indirectly; and
• Level 3 – inputs for the asset or liability that are not based on observable market data (unobservable inputs) that are unobservable for particular assets or liabilities.
These financial statements are presented in Australian dollars, which is the Institute’s functional currency. The Institute is a group reporting entity.
(b) Principles of Consolidation
The consolidated financial statements are for the group comprising the Institute and CIT Solutions Pty Limited (the Company). The Company is a wholly-owned subsidiary of the Institute, formed for the purposes of undertaking entrepreneurial and commercial activities on the Institute’s behalf. All inter-entity balances, including unrealised profits and losses, have been eliminated on consolidation. The financial statements of the Company are prepared for the same reporting period as the Institute, using accounting policies that are consistent with those of the Institute.
(c) The Reporting Period
These financial statements state the financial performance, changes in equity and cash flows of the Institute for the year ended 31 December 2015 together with the financial position of the Institute as at 31 December 2015.
Canberra Institute of Technology Annual Report 201568
Canberra Institute of Technology Notes to and Forming Part of the Financial Statements
For the Year Ended 31 December 2015
NOTE 2 SUMMARY OF SIGNIFICANT ACCOUNTING POLICIES – CONTINUED
(d) Comparative Figures
Budget Figures
The Financial Management Act 1996 requires the financial statements to facilitate a comparison with the Institute’s Statement of Intent. The budget numbers disclosed in the financial statements are consistent with those included in the Statement of Intent.
Prior Year Comparatives
Comparative information has been disclosed in respect of the previous period for amounts reported in the financial statements, except where an Australian Accounting Standard does not require comparative information to be disclosed.
Where the presentation or classification of items in the financial statements is amended, the comparative amounts have been reclassified, where practical. Where a reclassification has occurred, the nature, amount and reason for the reclassification is provided.
(e) Rounding
All amounts in the financial statements have been rounded to the nearest thousand dollars ($’000). Use of the “–” represents zero amounts or amounts rounded down to zero.
(f) Revenue Recognition
Revenue is recognised at the fair value of the consideration received or receivable in the Operating Statement. All revenue is recognised to the extent that it is probable that the economic benefits will flow to the Institute and the revenue can be reliably measured. In addition, the following specific recognition criteria must also be met before revenue is recognised:
Government Payment for Outputs
Government Payment for Outputs are recognised as revenue when the Institute gains control over the funding. Control over appropriated funds is normally obtained upon the receipt of cash.
Sale of Goods
Revenue from the sale of goods is recognised as revenue when the significant risks and rewards of ownership of the goods is transferred to the buyer, the Institute retains neither continuing managerial involvement nor effective control over the goods sold, and the costs incurred in respect of the transaction can be measured reliably.
Grants
Revenue is generally recognised when the Institute controls the revenue.
User Charge Revenue
User-charge revenue is recognised upon delivery of the service to customers, or by reference to the stage of completion of contracts or agreements for the services involved. The stage of completion is estimated on the basis of the ratio of costs incurred to date to the estimated total costs of the contract or agreement.

Canberra Institute of Technology Annual Report 2015 69
SEC
TIO
N C
2 Fi
nanc
ial S
tate
men
ts
Canberra Institute of Technology Notes to and Forming Part of the Financial Statements
For the Year Ended 31 December 2015
NOTE 2 SUMMARY OF SIGNIFICANT ACCOUNTING POLICIES – CONTINUED
(f) Revenue Recognition – continued
Rendering of Services
Revenue from the rendering of services is recognised when the stage of completion of the transaction at the reporting date can be measured reliably and the costs of rendering those services can be measured reliably.
Interest
Interest revenue is recognised using the effective interest method.
Dividends
Dividend revenue is recognised when the Institute’s right to receive payment is established.
Revenue Received in Advance
Revenue received in advance is recognised as a liability if there is a present obligation to return the funds received, otherwise all amounts are recorded as revenue.
(g) Resources Received and Provided Free of Charge
Resources received free of charge are recorded as a revenue and expense in the Operating Statement at fair value. The revenue is separately disclosed under resources received free of charge, with the expense being recorded in the line item to which it relates. Goods and services received free of charge from ACT Government agencies are recorded as resources received free of charge, whereas goods and services received free of charge from entities external to the ACT Government are recorded as donations. Services that are received free of charge are only recorded in the Operating Statement if they can be reliably measured and would have been purchased if not provided to the Institute free of charge.
Resources provided free of charge are recorded at their fair value in the expense line items to which they relate.
During the year, the Institute provided services and resources to the following organisations on a free of charge basis:
(i) The CIT Student Association was provided with services and resources free of charge to an amount of $443,873 in 2015 (2014 $453,395) for its use of the Institute’s accommodation and utilities; and
(ii) The Canberra City Band was provided with a benefit of rent to the value of $66,620 in 2015 (2014 $68,049).
(h) Repairs and Maintenance
The Institute undertakes major cyclical maintenance on its buildings. Where the maintenance leads to an upgrade of the building, and increases the service potential of the existing building, the cost is capitalised. Maintenance expenses which do not increase the service potential of the asset are expensed.
Canberra Institute of Technology Annual Report 201570
Canberra Institute of Technology Notes to and Forming Part of the Financial Statements
For the Year Ended 31 December 2015
NOTE 2 SUMMARY OF SIGNIFICANT ACCOUNTING POLICIES – CONTINUED
(i) Waivers of Debt
Debts that are waived during the year are expensed in the year in which the right to payment was waived. Further details of waivers are disclosed at Note 16 – Waivers, Impairment Losses and Write-offs. The Institute did not have any debts waived under Section 131 of the Financial Management Act 1996.
(j) Taxation
The Institute and the Company are exempt organisations under income tax legislation and therefore are not subject to Income Tax. Both the Institute and the Company are liable to pay Goods and Services Tax and Fringe Benefits Tax, and the Company also pays Payroll Tax. Fringe Benefits Tax expense for the year was $82,342 (2014 $87,456).
(k) Current and Non-Current Items
Assets and liabilities are classified as current or non-current in the Balance Sheet and in the relevant notes. Assets are classified as current where they are expected to be realised within twelve months after the reporting date. Liabilities are classified as current when they are due to be settled within twelve months after the reporting date or the Institute does not have an unconditional right to defer settlement of the liability for at least twelve months after the reporting date.
Assets or liabilities which do not fall within the current classification are classified as non-current.
(l) Impairment of Assets
The Institute assesses, at each reporting date, whether there is any indication that an asset may be impaired. Assets are also reviewed for impairment whenever events or changes in circumstances indicate that the carrying amount may not be recoverable. An impairment loss is the amount by which the carrying amount of an asset exceeds its recoverable amount. The recoverable amount is the higher of an asset’s ‘fair value less costs to sell’, and its ‘value in use’. An asset’s ‘value in use’ is its depreciated replacement cost, where the asset would be replaced if the Institute were deprived of it.
Non-financial assets that have previously been impaired are reviewed for possible reversal of impairment at each reporting date.
Any resulting impairment losses, for land, buildings and improvements, and plant and equipment assets, are recognised as a decrease in the Asset Revaluation Surplus relating to these classes of assets. Where the impairment loss is greater than the balance in the Asset Revaluation Surplus for the relevant class of asset, the difference is expensed in the Operating Statement. Impairment losses for intangible assets and leasehold improvements are recognised in the Operating Statement, as intangible assets and leasehold improvements are carried at cost. Also, the carrying amount of the asset is reduced to its recoverable amount.
Canberra Institute of Technology Annual Report 2015 71
SEC
TIO
N C
2 Fi
nanc
ial S
tate
men
ts
Canberra Institute of Technology Notes to and Forming Part of the Financial Statements
For the Year Ended 31 December 2015
NOTE 2 SUMMARY OF SIGNIFICANT ACCOUNTING POLICIES – CONTINUED
(m) Cash and Cash Equivalents
For the purposes of the Cash Flow Statement and the Balance Sheet, cash includes cash at bank, cash on hand and demand deposits.
Cash equivalents are short-term, highly liquid investments that are readily convertible to known amounts of cash and are subject to an insignificant risk of changes in value. Cash equivalents include amounts invested in negotiable certificates of deposit with less than 120 days to maturity.
(n) Receivables
Accounts receivable (including student receivables and other trade receivables) are initially recognised at fair value and are subsequently measured at amortised cost, with any adjustments to the carrying amount being recorded in the Operating Statement.
Trade receivables arise in the normal course of selling goods and services to other agencies and to the public. Trade receivables are payable within 30 days after the issue of an invoice or the goods/services have been provided under a contractual arrangement.
Student receivables arise in the normal course of providing vocational education and training, the majority of which are payable within two weeks of the enrolment date.
Other trade receivables arise outside the normal course of selling goods and services to other agencies and to the public. Other trade receivables are payable within 30 days after the issue of an invoice or the goods/services have been provided under a contractual arrangement.
The allowance for impairment losses represents the amount of trade receivables and student receivables that the Institute estimates will not be repaid. The Institute determines the allowance for impairment losses based on objective evidence and a review of overdue balances. The Institute considers the following is objective evidence of impairment:
(i) becoming aware of financial difficulties of debtors;
(ii) default payments; or
(iii) debts more than 90 days overdue.
The amount of the allowance is the difference between the asset’s carrying amount and the present value of the estimated future cash flows, discounted at the original effective interest rate. Cash flows relating to short-term receivables is not discounted if the effect of discounting is immaterial. The amount of the allowance is recognised in the Operating Statement. The allowance for impairment losses is written off against the allowance account when the Institute ceases action to collect the debt when the cost to recover the debt is more than the debt is worth.
(o) Investments
The Institute holds a long-term investment in CIT Solutions Pty Limited, which is measured at cost. Further details of this investment are provided in Note 21 - Investments.
Canberra Institute of Technology Annual Report 201572
Canberra Institute of Technology Notes to and Forming Part of the Financial Statements
For the Year Ended 31 December 2015
NOTE 2 SUMMARY OF SIGNIFICANT ACCOUNTING POLICIES – CONTINUED
(p) Acquisition and Recognition of Property, Plant and Equipment
Property, plant and equipment is initially recorded at cost. Cost includes the purchase price, directly attributable costs and the estimated cost of dismantling and removing the item (where, upon acquisition, there is a present obligation to remove the item).
Where property, plant and equipment is acquired at no cost, or minimal cost, cost is its fair value as at the date of acquisition. However, property, plant and equipment acquired at no cost or minimal cost as part of a restructuring of administrative arrangements is measured at the transferor’s book value.
Where payment for property, plant and equipment is deferred beyond normal credit terms, the difference between its cash price equivalent and the total payment is measured as interest over the period of credit. The discount rate used to calculate the cash price equivalent is an asset specific rate.
Property, plant and equipment with a minimum value of $2,000 (GST exclusive) is capitalised.
(q) Measurement of Property, Plant and Equipment after Initial Recognition
Property, plant and equipment is valued using the cost or revaluation model of valuation. Land, buildings and improvements, plant and equipment and community and heritage assets are measured at fair value.
Fair value is the price that would be received to sell an asset or paid to transfer a liability in an orderly transaction between market participants at the measurement date.
Fair value for land and non-specialised buildings is measured using the market approach valuation technique. This approach uses prices and other relevant information generated by market transactions involving identical or similar assets.
Fair value for specialised buildings and improvements, plant and equipment, and some heritage assets is measured by reference to the cost of replacing the remaining future economic benefits embodied in the asset i.e. depreciated replacement cost. This is the cost approach valuation technique. Depreciated replacement cost is the current replacement cost of an asset less accumulated depreciation calculated on the basis of such cost to reflect the already consumed economic benefits, expired economic benefits or obsolescence of the asset. Current replacement cost is determined by reference to the cost of a substitute asset of comparable utility, the gross project size specifications or the historical cost, adjusted by relevant indices. For heritage assets, fair value is measured using the market approach valuation technique. This approach uses sales prices and other relevant information generated by market transactions involving similar assets or works by artists with similar standing/style.
Leasehold improvements are carried at cost.
Artworks comprise works produced by students and held for permanent exhibition, for which fair value is determined using a market price where there is a market for the same or a similar item.
Land, buildings and improvements, plant and equipment, and heritage assets are revalued every three years. As these assets were revalued in 2014, the next asset revaluation is scheduled for 2017. However, if at any time management considers that the carrying amount of an asset materially differs from its fair value, then the asset will be revalued regardless of when the last valuation took place. Any accumulated depreciation relating to buildings and improvements, plant and equipment and heritage assets, at the date of revaluation, is written-back against the gross carrying amount of the asset, and the net amount is restated to the revalued amount of the asset.
Canberra Institute of Technology Annual Report 2015 73
SEC
TIO
N C
2 Fi
nanc
ial S
tate
men
ts
Canberra Institute of Technology Notes to and Forming Part of the Financial Statements
For the Year Ended 31 December 2015
NOTE 2 SUMMARY OF SIGNIFICANT ACCOUNTING POLICIES – CONTINUED
(r) Intangible Assets
The Institute’s intangible assets comprise externally acquired software for internal use.
Externally acquired software is recognised and capitalised when:
(i) it is probable that the expected future economic benefits that are attributable to the software will flow to the Institute;
(ii) the cost of the software can be measured reliably; and
(iii) the acquisition cost is equal to or exceeds $50,000.
Capitalised software has a finite useful life. Software is amortised on a straight line basis over its useful life, over a period not exceeding five years. Intangibles are measured at cost.
(s) Depreciation and Amortisation of Non-Current Assets
Non-current assets, with a limited useful life, are subject to systematic depreciation/amortisation over their useful lives in a manner that reflects the consumption of their service potential. The useful life commences when an asset is ready for use. When an asset is revalued, it is subject to depreciation/amortisation over its newly assessed remaining useful life. Amortisation is used in relation to intangible assets, while depreciation is applied to physical assets such as buildings, leasehold improvements, and plant and equipment. Land and heritage assets have an unlimited useful life and are therefore not depreciated.
Leasehold improvements are depreciated over the estimated useful life of each asset, or the unexpired period of the relevant lease, whichever is shorter.
All depreciation is calculated after first deducting any residual values which remain for each asset.
Depreciation/amortisation for non-current assets is determined as follows:
Class of Asset Depreciation/Amortisation Method Useful Life (Years)
Buildings and Improvements Straight Line 5-100
Leasehold Improvements Straight Line 2-10
Plant and Equipment Straight Line 2-20
Externally Acquired Software Straight Line 2-5
The useful lives of all major assets held are reassessed on an annual basis.

Canberra Institute of Technology Annual Report 201574
Canberra Institute of Technology Notes to and Forming Part of the Financial Statements
For the Year Ended 31 December 2015
NOTE 2 SUMMARY OF SIGNIFICANT ACCOUNTING POLICIES – CONTINUED
(t) Payables
Payables are a financial liability and are initially recognised at fair value based on the transaction cost and subsequent to initial recognition at amortised cost, with any adjustments to the carrying amount being recorded in the Operating Statement. All amounts are measured at their nominal amount and are normally settled within 30 days after the invoice date.
Payables include Trade Payables, Accrued Expenses and Other Payables.
Trade Payables represent the amounts owing for goods and services received prior to the end of the reporting period and unpaid at the end of the reporting period and relating to the normal operations of the Institute.
Accrued Expenses represent goods and services provided by other parties during the period that are unpaid at the end of the reporting period and where an invoice has not been received by period end.
Other Payables are those unpaid invoices that do not directly relate to the normal operations of the Institute.
(u) Leases
The Institute has entered into operating leases.
Operating Leases
Operating leases do not effectively transfer to the Institute substantially all the risks and rewards incidental to ownership of the asset under an operating lease. Operating lease payments are recognised as an expense in the Operating Statement on a straight-line basis over the term of the lease.
(v) Employee Benefits
Employee benefits include:
• Short-term employee benefits such as wages and salaries, annual leave loading, annual leave, superannuation and applicable on-costs, if expected to be settled wholly before twelve months after the end of the annual reporting period in which the employees render the related services;
• Other long-term benefits such as long service leave and annual leave; and
• Termination benefits.
On-costs include annual leave, long service leave, superannuation and other costs that are incurred when employees take annual leave and long service leave.
Wages and Salaries
Accrued wages and salaries are measured at the amount that remains unpaid to employees at the end of the reporting period.

Canberra Institute of Technology Annual Report 2015 75
SEC
TIO
N C
2 Fi
nanc
ial S
tate
men
ts
Canberra Institute of Technology Notes to and Forming Part of the Financial Statements
For the Year Ended 31 December 2015
NOTE 2 SUMMARY OF SIGNIFICANT ACCOUNTING POLICIES – CONTINUED
(v) Employee Benefits – continued
Annual and Long Service Leave
Annual and long service leave including applicable on-costs, that are not expected to be wholly settled before twelve months after the end of the reporting period when the employees render the related service, are measured at the present value of estimated future payments to be made in respect of services provided by employees up to the end of the reporting period. Consideration is given to the future wage and salary levels, experience of employee departures and periods of service. At the end of each reporting period, the present value of future annual leave and long service leave payments is estimated using market yields on Commonwealth Government bonds with terms to maturity that match, as closely as possible, the estimated future cash flows.
Annual leave liabilities have been estimated on the assumption they will be wholly settled within three years. In 2015 the rate used to estimate the present value of future payments is 101.0% (100.7% in 2014).
In 2015, the rate used to estimate the present value of future payments for long service leave is 105.4% (106.0% in 2014).
The long service leave liability is estimated with reference to the minimum period of qualifying service. For employees with less than the required minimum period of 7 years qualifying service, the probability that employees will reach the required minimum period has been taken into account in estimating the provision for long service leave and applicable on-costs.
The provision for annual leave and long service leave includes estimated on-costs. As these on-costs only become payable if the employee takes annual and long service leave while in-service, the probability that employees will take annual and long service leave while in service has been taken into account in estimating the liability for on costs.
The significant judgements and assumptions included in the estimation of annual and long service leave liabilities include an assessment by an actuary. The Australian Government Actuary performed this assessment in May 2014. The assessment by an actuary is performed every 5 years. However it may be performed more frequently if there is a significant contextual change in the parameters underlying the 2014 report. The next actuarial review is expected to be undertaken by May 2019. Further information about this estimate is provided in Note 2 (aa) Significant Accounting Judgements and Estimates.
Annual leave and long service leave liabilities are classified as current liabilities in the Balance Sheet where there are no unconditional rights to defer the settlement of the liability for at least 12 months. Conditional long service leave liabilities are classified as non-current because the Institute has an unconditional right to defer the settlement of the liability until the employee has completed the requisite years of service.

Canberra Institute of Technology Annual Report 201576
Canberra Institute of Technology Notes to and Forming Part of the Financial Statements
For the Year Ended 31 December 2015
NOTE 2 SUMMARY OF SIGNIFICANT ACCOUNTING POLICIES – CONTINUED
(w) Superannuation
The Institute receives funding for superannuation payments as part of the Government Payment for Outputs. The Institute then makes payments on a fortnightly basis to the Territory Banking Account to cover the Institute’s superannuation liability for the Commonwealth Superannuation Scheme (CSS) and the Public Sector Superannuation Scheme (PSS). This payment covers the CSS/PSS employer contribution, but does not include the productivity component. The Institute pays the productivity component directly to Comsuper. The CSS and PSS are defined benefit superannuation plans meaning that the defined benefits received by employees are based on the employee’s years of service and average final salary.
Superannuation payments have also been made directly to superannuation funds for those members of the Public Sector who are part of superannuation accumulation schemes. This includes the Public Sector Superannuation Scheme Accumulation Plan (PSSAP) and schemes of employee choice.
Superannuation employer contribution payments, for the CSS and PSS, are calculated by taking the salary level at an employee’s anniversary date and multiplying it by the actuarially assessed nominal CSS or PSS employer contribution rate for each employee. The productivity component payments are calculated by taking the salary level, at an employee’s anniversary date, and multiplying it by the employer contribution rate (approximately 3%) for each employee. Superannuation payments for the PSSAP are calculated by taking the salary level, at an employee’s anniversary date, and multiplying it by the appropriate employer contribution rate. Superannuation payments for fund of choice arrangements are calculated by taking an employee’s salary each pay and multiplying it by the appropriate employer contribution rate.
A superannuation liability is not recognised in the Institute’s Balance Sheet, as the Superannuation Provision Account recognises the total Territory superannuation liability for the CSS and PSS, and Comsuper and the external schemes recognise the superannuation liability for the PSSAP and other schemes respectively.
The ACT Government is liable for the reimbursement of the emerging costs of benefits paid each year to members of the CSS and PSS, in respect of the ACT Government service provided after 1 July 1989. These reimbursement payments are made from the Superannuation Provision Account.
(x) Equity Contributed by the ACT Government
Contributions made by the ACT Government, in its role as owner of the Institute, are treated as contributions to equity.
Increases or decreases in net assets as a result of Administrative Restructures are also recognised in equity.
(y) Insurance
The Institute’s major risks are insured through the ACT Insurance Authority. The excess payable, under this arrangement, varies depending on each class of insurance held.

Canberra Institute of Technology Annual Report 2015 77
SEC
TIO
N C
2 Fi
nanc
ial S
tate
men
ts
Canberra Institute of Technology Notes to and Forming Part of the Financial Statements
For the Year Ended 31 December 2015
NOTE 2 SUMMARY OF SIGNIFICANT ACCOUNTING POLICIES – CONTINUED
(z) Budget Reporting
Explanations of major variances between the 2015 budget and 2015 actual results are presented in Note 36 – Budgetary Reporting.
The definition of ‘major variances’ is provided in Note 36 – Budgetary Reporting.
The budget refers to the original budgeted financial statements presented to the Legislative Assembly in the Institute’s Statement of Intent in a form that is consistent with the Institute’s annual financial statements. The 2015 budget numbers have not been audited.
Budgetary reporting is disclosed for the financial statements with the exception of Statement of Changes in Equity as relevant line items are included in other financial statements.
(aa) Significant Accounting Judgements and Estimates
In the process of applying the accounting policies listed in this note, the Institute has made the following judgements and estimates that have the most significant impact on the amounts recorded in the financial statements:
(i) Fair Value of Assets: The Institute has made a significant estimate regarding the fair value of its assets. Land has been recorded at the market value of similar properties as determined by an independent valuer. Buildings and improvements have been recorded at fair value using depreciated replacement cost and current prices in a market for similar properties in a similar location and condition as determined by an independent valuer. Plant and equipment and heritage assets have been recorded at fair value based on depreciated replacement cost as determined by an independent valuer. This valuation uses significant judgement and estimates to determine fair value, including the appropriate indexation figure and quantum of assets held.
(ii) Employee Benefits: Significant judgements have been applied in estimating the liability for employee benefits. The estimated liability for annual and long service leave requires a consideration of the future wage and salary levels, experience of employee departures, probability that leave will be taken in service and periods of service. The estimate also includes an assessment of the probability that employees will meet the minimum service period required to qualify for long service leave and that on-costs will become payable. Further information on this estimate is provided in Note 2 (v) - Employee Benefits.
(iii) Estimation of the Useful Lives of Property, Plant and Equipment: In making significant estimates to determine the useful lives of its property, plant and equipment, the Institute has considered the historical experience of similar assets. In some cases, an estimation has been based on valuations provided by an independent valuer. The useful lives are assessed on an annual basis and any adjustments are made when considered necessary.
Further disclosure concerning an asset’s useful life can be found at Note 2 (s) – Depreciation and Amortisation of Non-Current Assets.

Canberra Institute of Technology Annual Report 201578
Canberra Institute of Technology Notes to and Forming Part of the Financial Statements
For the Year Ended 31 December 2015
NOTE 2 SUMMARY OF SIGNIFICANT ACCOUNTING POLICIES – CONTINUED
(aa) Significant Accounting Judgements and Estimates – continued
(iv) Allowance for Impairment Losses: The Institute has made a significant estimate in the calculation of the allowance for impairment losses for receivables in the financial statements. This significant estimate is based on a number of categorisations of receivables. The receivables are thus categorised per aging category with the aged category greater than 90 days being impaired. These categorisations are considered by management to be appropriate and accurate, based upon the pattern demonstrated in collecting receivables in the past financial years. The categorisations are associated with accounts in bankruptcy, unpaid objections and past write-offs.
(v) Recoverable Amount of Assets: Note 2 (l) – Impairment of Assets discloses that plant and equipment is annually assessed for impairment. If this assessment indicates an asset is impaired, then an assessment of the asset’s recoverable amount must be estimated to determine whether an impairment loss must be recognised.
(vi) Budgetary Reporting: Significant judgement has been applied in determining what variances are considered as ‘major variances’ requiring explanation in Note 36 – Budgetary Reporting. Variances are considered to be major variances if both of the following criteria are met:
• The line item is a significant line item: the line item actual amount accounts for more than 10% of the relevant associated category (Income, Expenses and Equity totals) or sub-element (e.g. Current Liabilities and Receipts from Operating Activities totals) of the financial statements; and
• The variances (original budget to actual) are greater than plus (+) or minus (-) 10% for the budget for the financial statement line item.
Further information on this is provided in Note 36 – Budgetary Reporting.
(ab) Monies Held on Behalf of Third Parties
The Institute administers these monies on behalf of third parties, independently of Institute funds. They are reported separately in Note 35 – Third Party Monies.
(ac) Impact of Accounting Standards Issued but yet to be applied
The following new and revised accounting standards and interpretations have been issued by the Australian Accounting Standards Board but do not apply to the current period. These standards and interpretations are applicable to future reporting periods. The Institute does not intend to adopt these standards and interpretations early. Where applicable, these Australian Accounting Standards will be adopted from their application date.
(i) AASB 9 Financial Instruments (December 2014) (application date 1 January 2018);
(ii) AASB 15 Revenue from Contracts with Customers (application date 1 January 2017);
(iii) AASB 2010-7 Amendments to Australian Accounting Standard arising from AASB 9 (application date 1 January 2018);
Canberra Institute of Technology Annual Report 2015 79
SEC
TIO
N C
2 Fi
nanc
ial S
tate
men
ts
Canberra Institute of Technology Notes to and Forming Part of the Financial Statements
For the Year Ended 31 December 2015
NOTE 2 SUMMARY OF SIGNIFICANT ACCOUNTING POLICIES – CONTINUED
(ac) Impact of Accounting Standards Issued but yet to be applied – continued
(iv) AASB 2014-5 Amendments to Australian Accounting Standards arising from AASB 15 [AASB 1, 3, 4, 9 (December 2009) (December 2010), 101, 102, 112, 116, 132, 134, 134, 137, 138, 139, 140, 1023, 1038, 1039, 1049, 1053, 1056, Interpretation 12, 127, 132, 1031, 1038 & 1052] (application date 1 January 2017);
(v) AASB 2014-7 Amendments to Australian Accounting Standards arising from AASB 9 (December 2014) [AASB 1, 2, 3, 4, 5, 7, 13, 101, 102, 108, 110, 112, 120, 121, 123, 128, 132, 133, 136, 137, 139, 1023, 1038, 1049, Interpretation 2, 5, 10, 12, 16, 19 &127] (application date 1 January 2018);
(vi) AASB 2014-9 Amendments to Australian Accounting Standards – Equity Method in Separate Financial Statements [AASB 1, 127 &128] (application date 1 January 2016);
(vii) AASB 2014-10 Amendments to Australian Accounting Standards – Sale or Contribution of Assets between an Investor and its Associate or Joint Venture [AASB 10 &128] (application date 1 January 2016);
(viii) 2015-2 Amendments to Australian Accounting Standards – Disclosure Initiative: Amendments to AASB 101 [AASB 7, 101, 134 & 1049] (application date 1 January 2016).
Canberra Institute of Technology Annual Report 201580
Canberra Institute of Technology Notes to and Forming Part of the Financial Statements
For the Year Ended 31 December 2015
NOTE 3 CHANGE IN ACCOUNTING POLICY AND ACCOUNTING ESTIMATES AND CORRECTION OF A PRIOR PERIOD ERROR
Change in Accounting Policy
The Institute had no changes in accounting policy during the reporting period.
Change in Accounting Estimates
Revision of Estimation of the Employee Benefit Liability
As disclosed in Note 2 (v) - Employee Benefits, the estimated future payments for annual and long service leave (including applicable on-costs) that do not fall due in the next twelve months, are measured at the present value of estimated future payments to be made in respect of services provided by employees up to the reporting date. The present value of estimated future payments is calculated using the government bond rate.
Last financial year the rate used to estimate the present value of future payments was 106%, however, due to a change in the government bond rate, the rate is now 105.4%.
This change has resulted in a decrease to the estimate of the long service leave liability and expense in the current reporting period of $73,132.
Correction of Prior Period Errors
The Institute had no correction of prior period errors during the reporting period.

Canberra Institute of Technology Annual Report 2015 81
SEC
TIO
N C
2 Fi
nanc
ial S
tate
men
ts
Canberra Institute of Technology Notes to and Forming Part of the Financial Statements
For the Year Ended 31 December 2015
NOTE 4 GOVERNMENT PAYMENT FOR OUTPUTS
Government Payment for Outputs (GPO) is revenue received from the ACT Government to fund the costs of delivering outputs. The ACT Government pays GPO appropriation to the Institute on a fortnightly basis.
Consolidated Institute
2015 $’000
2014 $’000
2015 $’000
2014 $’000
Revenue from the ACT Government
Government Payment for Outputs 66,372 67,249 66,372 67,249
Total Government Payment for Outputs 66,372 67,249 66,372 67,249
NOTE 5 USER CHARGES
User charge revenue is derived by providing goods and services to other ACT Government agencies and to the public. User charge revenue is not part of ACT Government appropriation and is paid by the user of the goods or services. This revenue is driven by consumer demand and is commercial in nature.
Consolidated Institute
2015 $’000
2014 $’000
2015 $’000
2014 $’000
User Charges – ACT Government
Special Purpose Fund Activities (a) 9,051 10,179 8,942 9,962
Total User Charges – ACT Government 9,051 10,179 8,942 9,962
User Charges – Non-ACT Government
Commercial Revenue (b) 28,636 23,849 12,768 11,094
Student Fees and Charges (c) 11,471 10,647 11,471 10,647
Donations – 8 – 8
Total User Charges – Non-ACT Government 40,107 34,504 24,239 21,749
Total User Charges for Goods and Services 49,158 44,683 33,181 31,711
(a) The decrease in Special Purpose Fund Activities revenue is due primarily to lower revenue from the ACT Government’s ‘Skilled Capital’ funding initiative and the cessation of several funded projects.
(b) The increase in Commercial Revenue was primarily due to increased commercial training course delivery such as the My Aged Care program, spatial and surveying program delivery and income from cultural awareness training and facilities hire revenue through additional lease contracts at Bruce and Reid campuses.
(c) Student fees were increased from January 2015.

Canberra Institute of Technology Annual Report 201582
Canberra Institute of Technology Notes to and Forming Part of the Financial Statements
For the Year Ended 31 December 2015
NOTE 6 GOVERNMENT GRANTS
Consolidated Institute
2015 $’000
2014 $’000
2015 $’000
2014 $’000
Government Grants
Government Grants – Commonwealth (a) 58 2,834 58 2,834
Government Grants – State 8 – 8 –
Total Government Grants 66 2,834 66 2,834
(a) The decrease in Government Grants is primarily due to the loss of the contract to provide the Adult Migrant English Program from the beginning of 2015.
NOTE 7 INTEREST
Consolidated Institute
2015 $’000
2014 $’000
2015 $’000
2014 $’000
Interest Revenue 426 392 320 326
Total Interest Revenue 426 392 320 326
Total interest revenue from financial assets not at fair value through profit and loss. 426 392 320 326
NOTE 8 RESOURCES RECEIVED FREE OF CHARGE
Resources received free of charge relate to goods and/or services being provided free of charge from other agencies within the ACT Government.
The Institute classifies goods and services received free of charge from entities external to the ACT Government as donations. Donations are shown in Note 5 – User Charges.
Consolidated Institute
2015 $’000
2014 $’000
2015 $’000
2014 $’000
Revenue from ACT Government Entities
Legal Services 97 64 97 64
Library Reference Materials 3 4 3 4
Total Resources Received Free of Charge 100 68 100 68
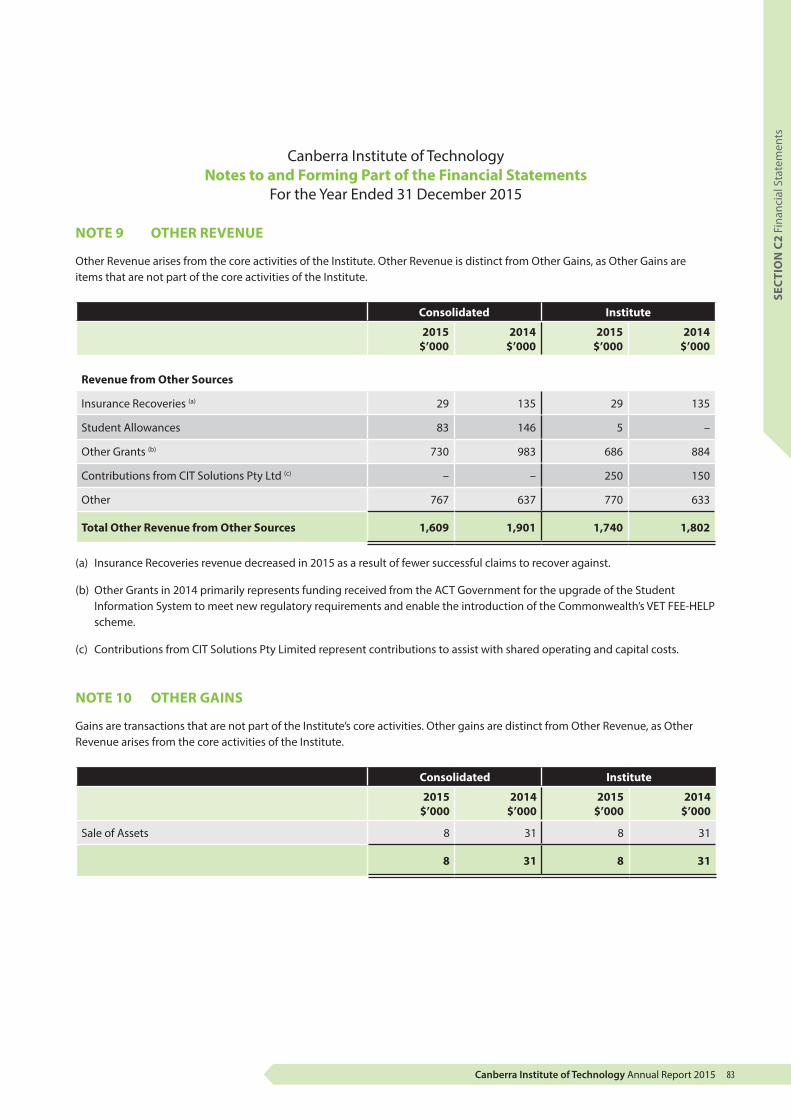
Canberra Institute of Technology Annual Report 2015 83
SEC
TIO
N C
2 Fi
nanc
ial S
tate
men
ts
Canberra Institute of Technology Notes to and Forming Part of the Financial Statements
For the Year Ended 31 December 2015
NOTE 9 OTHER REVENUE
Other Revenue arises from the core activities of the Institute. Other Revenue is distinct from Other Gains, as Other Gains are items that are not part of the core activities of the Institute.
Consolidated Institute
2015 $’000
2014 $’000
2015 $’000
2014 $’000
Revenue from Other Sources
Insurance Recoveries (a) 29 135 29 135
Student Allowances 83 146 5 –
Other Grants (b) 730 983 686 884
Contributions from CIT Solutions Pty Ltd (c) – – 250 150
Other 767 637 770 633
Total Other Revenue from Other Sources 1,609 1,901 1,740 1,802
(a) Insurance Recoveries revenue decreased in 2015 as a result of fewer successful claims to recover against.
(b) Other Grants in 2014 primarily represents funding received from the ACT Government for the upgrade of the Student Information System to meet new regulatory requirements and enable the introduction of the Commonwealth’s VET FEE-HELP scheme.
(c) Contributions from CIT Solutions Pty Limited represent contributions to assist with shared operating and capital costs.
NOTE 10 OTHER GAINS
Gains are transactions that are not part of the Institute’s core activities. Other gains are distinct from Other Revenue, as Other Revenue arises from the core activities of the Institute.
Consolidated Institute
2015 $’000
2014 $’000
2015 $’000
2014 $’000
Sale of Assets 8 31 8 31
8 31 8 31
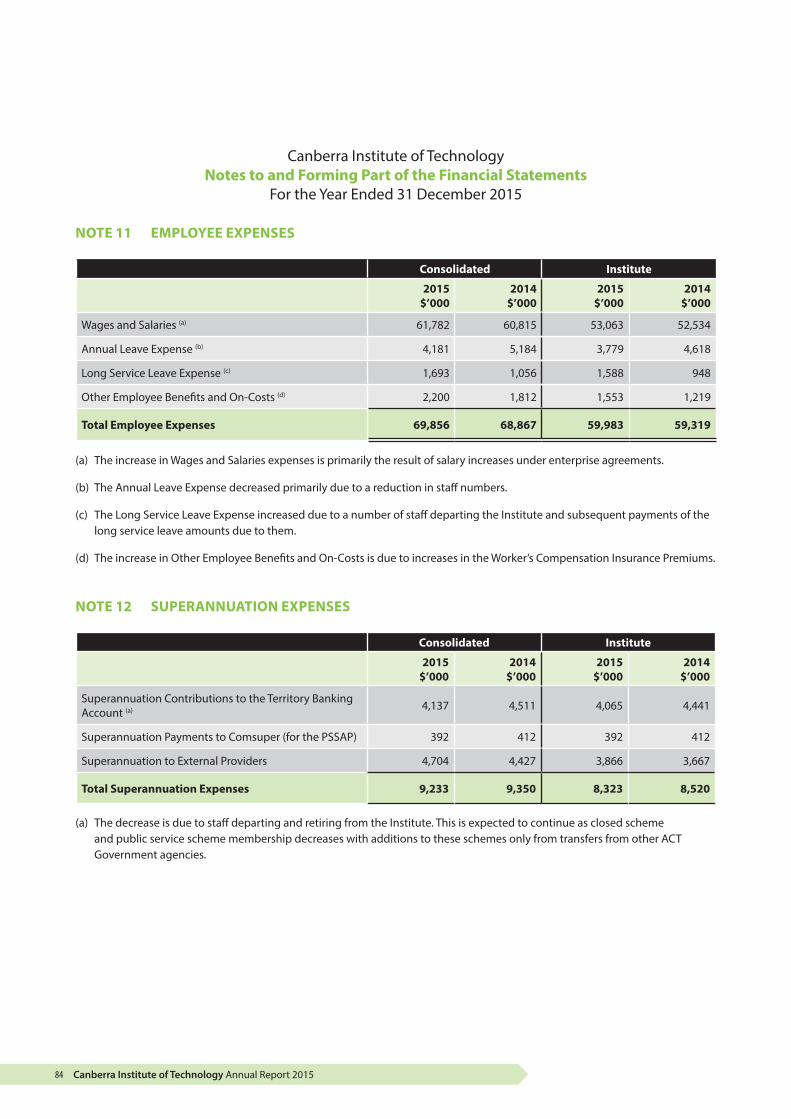
Canberra Institute of Technology Annual Report 201584
Canberra Institute of Technology Notes to and Forming Part of the Financial Statements
For the Year Ended 31 December 2015
NOTE 11 EMPLOYEE EXPENSES
Consolidated Institute
2015 $’000
2014 $’000
2015 $’000
2014 $’000
Wages and Salaries (a) 61,782 60,815 53,063 52,534
Annual Leave Expense (b) 4,181 5,184 3,779 4,618
Long Service Leave Expense (c) 1,693 1,056 1,588 948
Other Employee Benefits and On-Costs (d) 2,200 1,812 1,553 1,219
Total Employee Expenses 69,856 68,867 59,983 59,319
(a) The increase in Wages and Salaries expenses is primarily the result of salary increases under enterprise agreements.
(b) The Annual Leave Expense decreased primarily due to a reduction in staff numbers.
(c) The Long Service Leave Expense increased due to a number of staff departing the Institute and subsequent payments of the long service leave amounts due to them.
(d) The increase in Other Employee Benefits and On-Costs is due to increases in the Worker’s Compensation Insurance Premiums.
NOTE 12 SUPERANNUATION EXPENSES
Consolidated Institute
2015 $’000
2014 $’000
2015 $’000
2014 $’000
Superannuation Contributions to the Territory Banking Account (a) 4,137 4,511 4,065 4,441
Superannuation Payments to Comsuper (for the PSSAP) 392 412 392 412
Superannuation to External Providers 4,704 4,427 3,866 3,667
Total Superannuation Expenses 9,233 9,350 8,323 8,520
(a) The decrease is due to staff departing and retiring from the Institute. This is expected to continue as closed scheme and public service scheme membership decreases with additions to these schemes only from transfers from other ACT Government agencies.
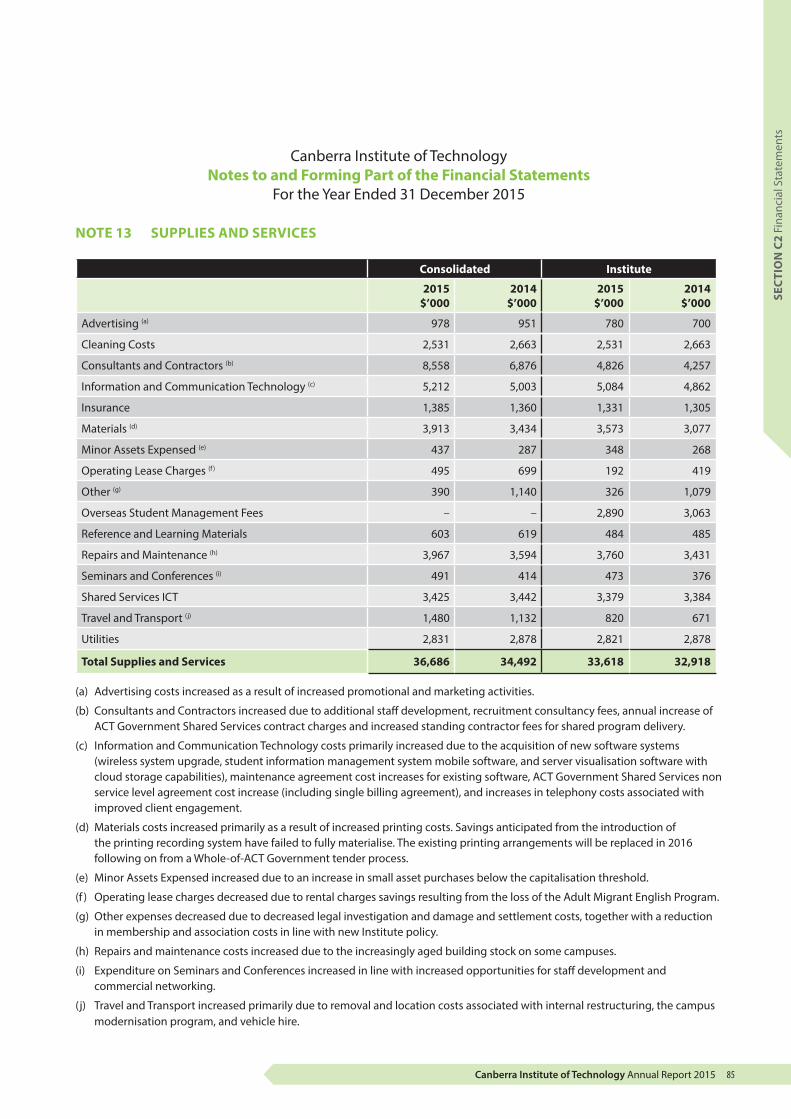
Canberra Institute of Technology Annual Report 2015 85
Canberra Institute of Technology Notes to and Forming Part of the Financial Statements
For the Year Ended 31 December 2015
NOTE 13 SUPPLIES AND SERVICES
Consolidated Institute
2015 $’000
2014 $’000
2015 $’000
2014 $’000
Advertising (a) 978 951 780 700
Cleaning Costs 2,531 2,663 2,531 2,663
Consultants and Contractors (b) 8,558 6,876 4,826 4,257
Information and Communication Technology (c) 5,212 5,003 5,084 4,862
Insurance 1,385 1,360 1,331 1,305
Materials (d) 3,913 3,434 3,573 3,077
Minor Assets Expensed (e) 437 287 348 268
Operating Lease Charges (f ) 495 699 192 419
Other (g) 390 1,140 326 1,079
Overseas Student Management Fees – – 2,890 3,063
Reference and Learning Materials 603 619 484 485
Repairs and Maintenance (h) 3,967 3,594 3,760 3,431
Seminars and Conferences (i) 491 414 473 376
Shared Services ICT 3,425 3,442 3,379 3,384
Travel and Transport (j) 1,480 1,132 820 671
Utilities 2,831 2,878 2,821 2,878
Total Supplies and Services 36,686 34,492 33,618 32,918
(a) Advertising costs increased as a result of increased promotional and marketing activities.
(b) Consultants and Contractors increased due to additional staff development, recruitment consultancy fees, annual increase of ACT Government Shared Services contract charges and increased standing contractor fees for shared program delivery.
(c) Information and Communication Technology costs primarily increased due to the acquisition of new software systems (wireless system upgrade, student information management system mobile software, and server visualisation software with cloud storage capabilities), maintenance agreement cost increases for existing software, ACT Government Shared Services non service level agreement cost increase (including single billing agreement), and increases in telephony costs associated with improved client engagement.
(d) Materials costs increased primarily as a result of increased printing costs. Savings anticipated from the introduction of the printing recording system have failed to fully materialise. The existing printing arrangements will be replaced in 2016 following on from a Whole-of-ACT Government tender process.
(e) Minor Assets Expensed increased due to an increase in small asset purchases below the capitalisation threshold.
(f ) Operating lease charges decreased due to rental charges savings resulting from the loss of the Adult Migrant English Program.
(g) Other expenses decreased due to decreased legal investigation and damage and settlement costs, together with a reduction in membership and association costs in line with new Institute policy.
(h) Repairs and maintenance costs increased due to the increasingly aged building stock on some campuses.
(i) Expenditure on Seminars and Conferences increased in line with increased opportunities for staff development and commercial networking.
(j) Travel and Transport increased primarily due to removal and location costs associated with internal restructuring, the campus modernisation program, and vehicle hire.
SEC
TIO
N C
2 Fi
nanc
ial S
tate
men
ts
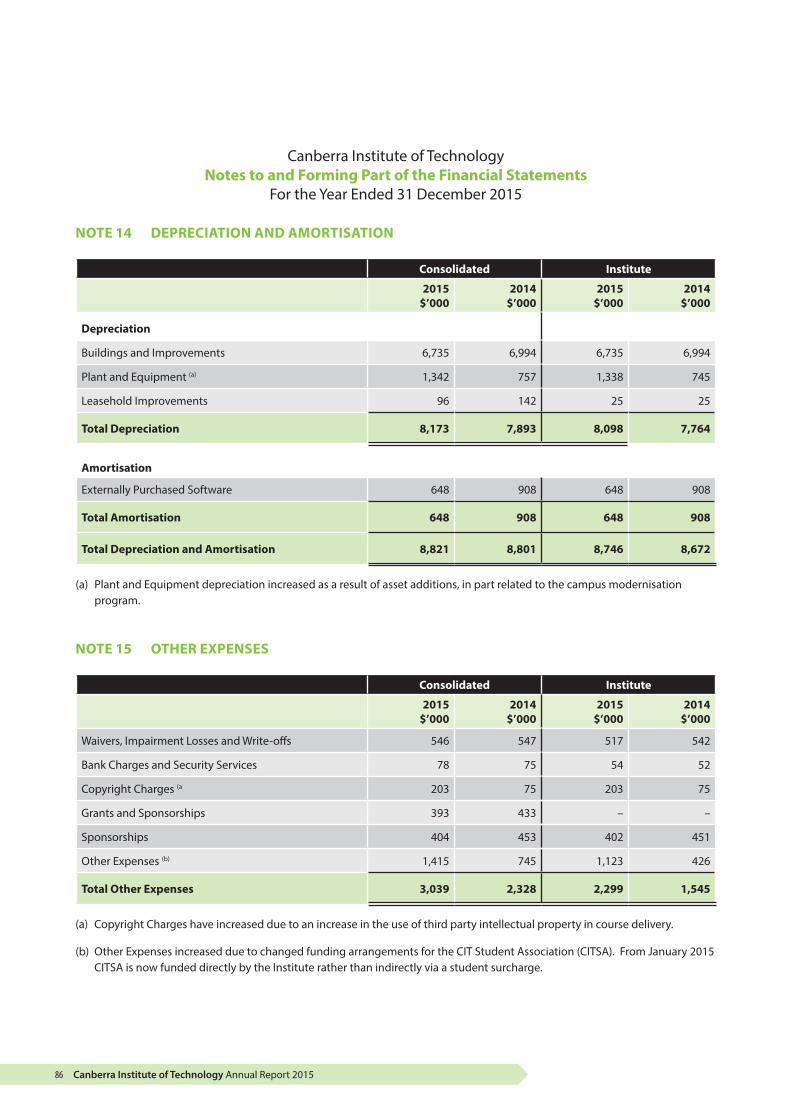
Canberra Institute of Technology Annual Report 201586
Canberra Institute of Technology Notes to and Forming Part of the Financial Statements
For the Year Ended 31 December 2015
NOTE 14 DEPRECIATION AND AMORTISATION
Consolidated Institute
2015 $’000
2014 $’000
2015 $’000
2014 $’000
Depreciation
Buildings and Improvements 6,735 6,994 6,735 6,994
Plant and Equipment (a) 1,342 757 1,338 745
Leasehold Improvements 96 142 25 25
Total Depreciation 8,173 7,893 8,098 7,764
Amortisation
Externally Purchased Software 648 908 648 908
Total Amortisation 648 908 648 908
Total Depreciation and Amortisation 8,821 8,801 8,746 8,672
(a) Plant and Equipment depreciation increased as a result of asset additions, in part related to the campus modernisation program.
NOTE 15 OTHER EXPENSES
Consolidated Institute
2015 $’000
2014 $’000
2015 $’000
2014 $’000
Waivers, Impairment Losses and Write-offs 546 547 517 542
Bank Charges and Security Services 78 75 54 52
Copyright Charges (a 203 75 203 75
Grants and Sponsorships 393 433 – –
Sponsorships 404 453 402 451
Other Expenses (b) 1,415 745 1,123 426
Total Other Expenses 3,039 2,328 2,299 1,545
(a) Copyright Charges have increased due to an increase in the use of third party intellectual property in course delivery.
(b) Other Expenses increased due to changed funding arrangements for the CIT Student Association (CITSA). From January 2015 CITSA is now funded directly by the Institute rather than indirectly via a student surcharge.

Canberra Institute of Technology Annual Report 2015 87
Canberra Institute of Technology Notes to and Forming Part of the Financial Statements
For the Year Ended 31 December 2015
NOTE 16 WAIVERS, IMPAIRMENT LOSSES AND WRITE-OFFS
Under Section 131 of the Financial Management Act 1996 the Treasurer may, in writing, waive the right to payment of an amount payable to the Territory. A waiver is the relinquishment of a legal claim to a debt over which the Institute has control.
The write-off of a debt is the accounting action taken to remove a debt from the books but does not relinquish the legal right of the Institute to recover the amount. The write-off of debts may occur for reasons other than waivers. The waivers, impairment losses and write-offs listed below have occurred during the reporting period for the Institute.
The financial impact of Student Fee Waivers is included under ‘Waivers, Impairment Losses and Write-offs’ in Note 15 – Other Expenses. The number of Student Fee Waivers relates to transactions with 485 students who attracted a waiver during 2015.
The number of Student Fee Irrecoverable Debts relates to transactions with 2,488 students who attracted a write-off during 2015.
Consolidated
2015 2014
Number $’000 Number $’000
Waivers and Write-offs
Student Fee Waivers 485 154 457 130
Student Fee Irrecoverable Debts 2,488 804 1,535 76
Total Waivers and Write-Offs 2,973 958 1,992 206
Impairment Losses
Impairment Loss from Receivables
Increase/(decrease) in Trade Receivables and Other Trade Receivables – (412) – 341
Total Impairment Loss from Receivables – (412) – 341
Total Waivers, Impairment Losses and Write-offs 2,973 546 1,992 547
Institute
2015 2014
Number $’000 Number $’000
Waivers and Write-offs
Student Fee Waivers 485 154 457 130
Student Fee Irrecoverable Debts 2,488 791 1,535 76
Total Waivers and Write-Offs 2,973 945 1,992 206
Impairment Losses
Impairment Loss from Receivables
Increase/(decrease) in Trade Receivables and Other Trade Receivables – (428) – 336
Total Impairment Loss from Receivables – (428) – 336
Total Waivers, Impairment Losses and Write-offs 2,973 517 1,992 542
SEC
TIO
N C
2 Fi
nanc
ial S
tate
men
ts
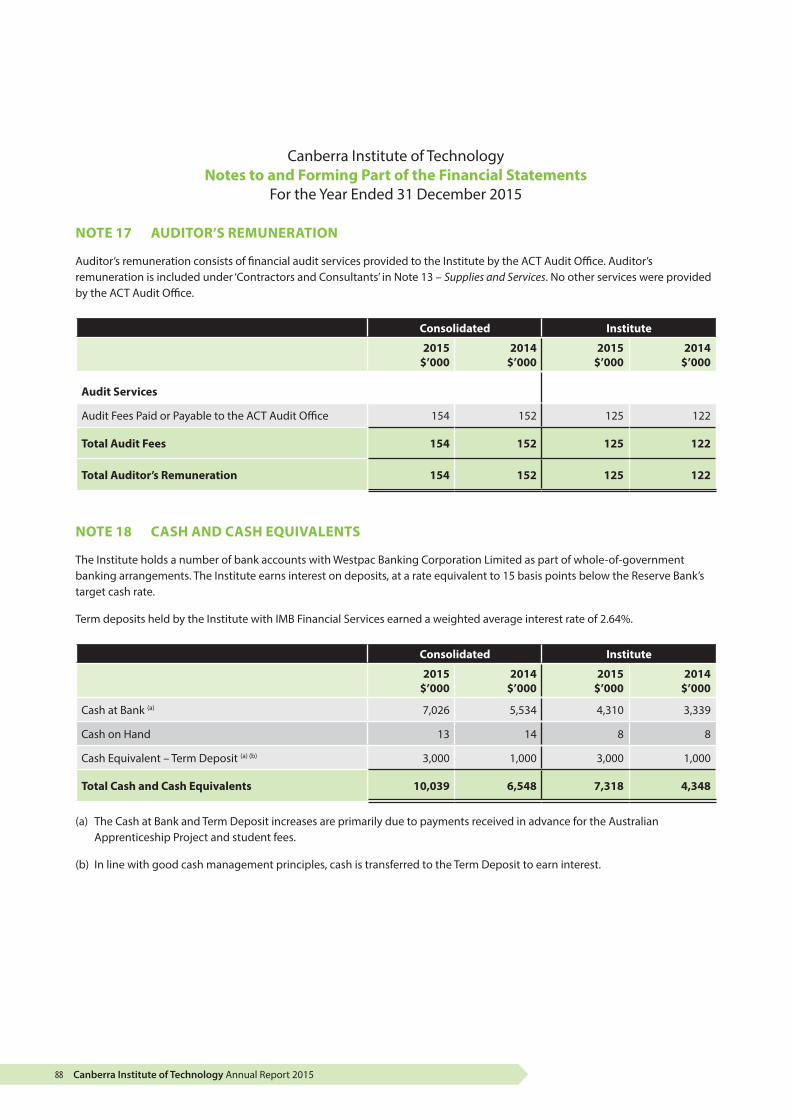
Canberra Institute of Technology Annual Report 201588
Canberra Institute of Technology Notes to and Forming Part of the Financial Statements
For the Year Ended 31 December 2015
NOTE 17 AUDITOR’S REMUNERATION
Auditor’s remuneration consists of financial audit services provided to the Institute by the ACT Audit Office. Auditor’s remuneration is included under ‘Contractors and Consultants’ in Note 13 – Supplies and Services. No other services were provided by the ACT Audit Office.
Consolidated Institute
2015 $’000
2014 $’000
2015 $’000
2014 $’000
Audit Services
Audit Fees Paid or Payable to the ACT Audit Office 154 152 125 122
Total Audit Fees 154 152 125 122
Total Auditor’s Remuneration 154 152 125 122
NOTE 18 CASH AND CASH EQUIVALENTS
The Institute holds a number of bank accounts with Westpac Banking Corporation Limited as part of whole-of-government banking arrangements. The Institute earns interest on deposits, at a rate equivalent to 15 basis points below the Reserve Bank’s target cash rate.
Term deposits held by the Institute with IMB Financial Services earned a weighted average interest rate of 2.64%.
Consolidated Institute
2015 $’000
2014 $’000
2015 $’000
2014 $’000
Cash at Bank (a) 7,026 5,534 4,310 3,339
Cash on Hand 13 14 8 8
Cash Equivalent – Term Deposit (a) (b) 3,000 1,000 3,000 1,000
Total Cash and Cash Equivalents 10,039 6,548 7,318 4,348
(a) The Cash at Bank and Term Deposit increases are primarily due to payments received in advance for the Australian Apprenticeship Project and student fees.
(b) In line with good cash management principles, cash is transferred to the Term Deposit to earn interest.

Canberra Institute of Technology Annual Report 2015 89
Canberra Institute of Technology Notes to and Forming Part of the Financial Statements
For the Year Ended 31 December 2015
NOTE 19 RECEIVABLES
Consolidated Institute
2015 $’000
2014 $’000
2015 $’000
2014 $’000
Current Receivables
Accounts Receivables 3,582 2,999 1,185 1,442
Less: Allowance for Impaired Receivables (56) (56) (56) (56)
Total Accounts Receivable 3,526 2,943 1,129 1,386
Student Receivables
Student Receivables 1,639 1,499 1,639 1,499
Less: Allowance for Impaired Receivables (510) (938) (501) (929)
Total Student Receivables 1,129 561 1,138 570
Inter-Entity Receivable – – 43 76
Accrued Revenue 244 372 244 373
Net GST Receivable 317 104 352 147
Total Accrued Revenue 561 477 639 596
Total Current Receivables 5,216 3,980 2,906 2,552
Total Receivables 5,216 3,980 2,906 2,552
SEC
TIO
N C
2 Fi
nanc
ial S
tate
men
ts

Canberra Institute of Technology Annual Report 201590
Canberra Institute of Technology Notes to and Forming Part of the Financial Statements
For the Year Ended 31 December 2015
NOTE 19 RECEIVABLES – CONTINUED
Consolidated Institute
2015 $’000
2014 $’000
2015 $’000
2014 $’000
Reconciliation of the Allowance for Impaired Receivables
Allowance for Impaired Receivables at the Beginning of the Reporting Period 994 653 984 648
Increase/(decrease) in Allowance Recognised During the Reporting Period (428) 341 (428) 336
Allowance for Impairment Losses at the End of the Reporting Period 566 994 556 984
Classification of ACT Government/Non-ACT Government Receivables
Receivables with ACT Government Entities
Net Accounts Receivable 608 473 310 254
Accrued Revenue 151 – 151 21
Total Receivables with ACT Government Entities 759 473 461 275
Receivables with Non-ACT Government Entites
Net Accounts Receivable 2,896 2,470 850 1,208
Net Student Receivables 1,150 561 1,150 570
Accrued Revenue 93 372 93 352
GST Receivable 318 104 352 147
Total Receivables with Non-ACT Government Entities 4,457 3,507 2,445 2,277
Total Receivables 5,216 3,980 2,906 2,552
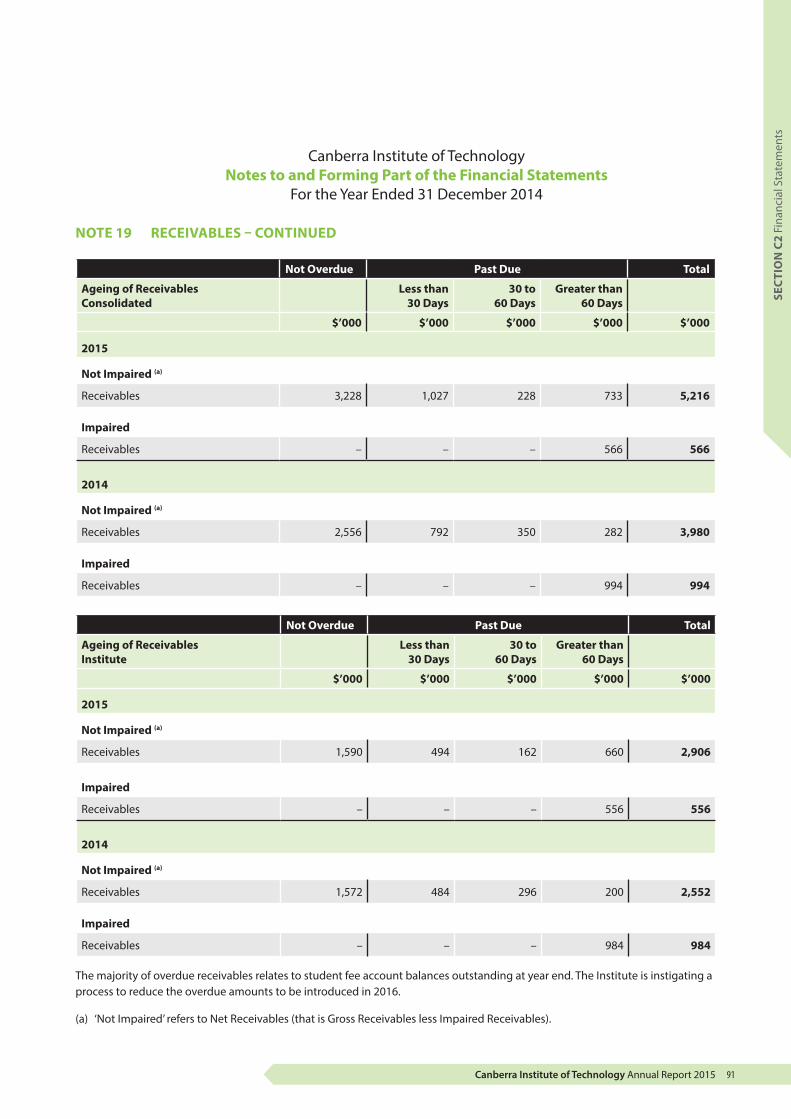
Canberra Institute of Technology Annual Report 2015 91
Canberra Institute of Technology Notes to and Forming Part of the Financial Statements
For the Year Ended 31 December 2014
NOTE 19 RECEIVABLES – CONTINUED
Not Overdue Past Due Total
Ageing of ReceivablesConsolidated
Less than 30 Days
30 to 60 Days
Greater than 60 Days
$’000 $’000 $’000 $’000 $’000
2015
Not Impaired (a)
Receivables 3,228 1,027 228 733 5,216
Impaired
Receivables – – – 566 566
2014
Not Impaired (a)
Receivables 2,556 792 350 282 3,980
Impaired
Receivables – – – 994 994
Not Overdue Past Due Total
Ageing of ReceivablesInstitute
Less than 30 Days
30 to 60 Days
Greater than 60 Days
$’000 $’000 $’000 $’000 $’000
2015
Not Impaired (a)
Receivables 1,590 494 162 660 2,906
Impaired
Receivables – – – 556 556
2014
Not Impaired (a)
Receivables 1,572 484 296 200 2,552
Impaired
Receivables – – – 984 984
The majority of overdue receivables relates to student fee account balances outstanding at year end. The Institute is instigating a process to reduce the overdue amounts to be introduced in 2016.
(a) ‘Not Impaired’ refers to Net Receivables (that is Gross Receivables less Impaired Receivables).
SEC
TIO
N C
2 Fi
nanc
ial S
tate
men
ts

Canberra Institute of Technology Annual Report 201592
Canberra Institute of Technology Notes to and Forming Part of the Financial Statements
For the Year Ended 31 December 2015
NOTE 20 OTHER ASSETS
Consolidated Institute
2015 $’000
2014 $’000
2015 $’000
2014 $’000
Current Other Assets
Prepayments (a) 2,132 2,055 1,940 1,855
Total Current Other Assets 2,132 2,055 1,940 1,855
Total Other Assets 2,132 2,055 1,940 1,855
(a) Prepayments include workers compensation, insurance and software licence prepayments.
NOTE 21 INVESTMENTS
Consolidated Institute
2015 $’000
2014 $’000
2015 $’000
2014 $’000
Non-current Investments
CIT Solutions Pty Limited (a) – – 20 20
Total Current Other Assets – – 20 20
Total Other Assets – – 20 20
(a) The Canberra Institute of Technology holds $20,000 of paid-up capital in CIT Solutions Pty Limited. CIT Solutions Pty Limited offers a range of educational activities and services on a commercial basis.
NOTE 22 PROPERTY, PLANT AND EQUIPMENT
Property, plant and equipment includes the following classes of assets – land, buildings and improvements, leasehold improvements, plant and equipment, and heritage assets. Property, plant and equipment does not include assets held for sale or investment property.
– Land includes leasehold land held by the Institute, but excludes land under infrastructure.
– Buildings and Improvements include office buildings, teaching spaces, workshops, laboratories, infrastructure, fit-out and site works.
– Leasehold improvements represent capital expenditure incurred in relation to leased assets. This includes fit-outs of leased buildings.
– Plant and equipment includes mobile plant, office and computer equipment, furniture and fittings, motor vehicles, and other mechanical and electronic equipment.
– Heritage assets are defined as those non current assets that the ACT Government intends to preserve indefinitely because of their unique historical, cultural or environmental attributes. A common feature of heritage assets is that they cannot be replaced and they are not usually available for sale or redeployment. Heritage assets held by the Institute include artworks, gemstones and sculptures.

Canberra Institute of Technology Annual Report 2015 93
SEC
TIO
N C
2 Fi
nanc
ial S
tate
men
ts
Canberra Institute of Technology Notes to and Forming Part of the Financial Statements
For the Year Ended 31 December 2015
NOTE 22 PROPERTY, PLANT AND EQUIPMENT – CONTINUED
Consolidated Institute
2015 $’000
2014 $’000
2015 $’000
2014 $’000
Land
Land at Fair Value 43,717 43,717 43,717 43,717
Total Land Assets 43,717 43,717 43,717 43,717
Buildings and Improvements
Buildings and Improvements at Fair Value 138,786 136,174 138,786 136,174
Less: Accumulated Depreciation (7,284) (549) (7,284) (549)
Total Written-Down Value of Buildings and Improvements 131,502 135,625 131,502 135,625
Total Written-Down Value of Land and Buildings 175,219 179,342 175,219 179,342
Leasehold Improvements
Leasehold Improvements at Cost 761 1,012 303 280
Less: Accumulated Depreciation (413) (643) (78) (53)
Total Written-Down Value of Leasehold Improvements 348 369 225 227
Plant and Equipment
Plant and Equipment at Fair Value 7,976 7,254 7,962 7,203
Less: Accumulated Depreciation (1,403) (175) (1,391) (130)
Total Written-Down Value of Plant and Equipment 6,574 7,079 6,571 7,073
Heritage Assets
Heritage Assets at Fair Value 144 138 144 138
Total Heritage Assets 144 138 144 138
Total Written-Down Value of Property, Plant and Equipment 182,286 186,928 182,159 186,780
Valuation of Non-Current Assets
Certified Practising Valuers Rodney Hyman Asset Services, a division of Aon Risk Services Limited, performed an independent revaluation of the Institute’s Plant and Equipment and Heritage assets as at 31 December 2014. Certified Practising Valuers Knight Frank Valuations Canberra performed an independent revaluation of the Institute’s Land, Buildings and Improvements, and Infrastructure as at 31 December 2014. The next valuation is scheduled in 2017.
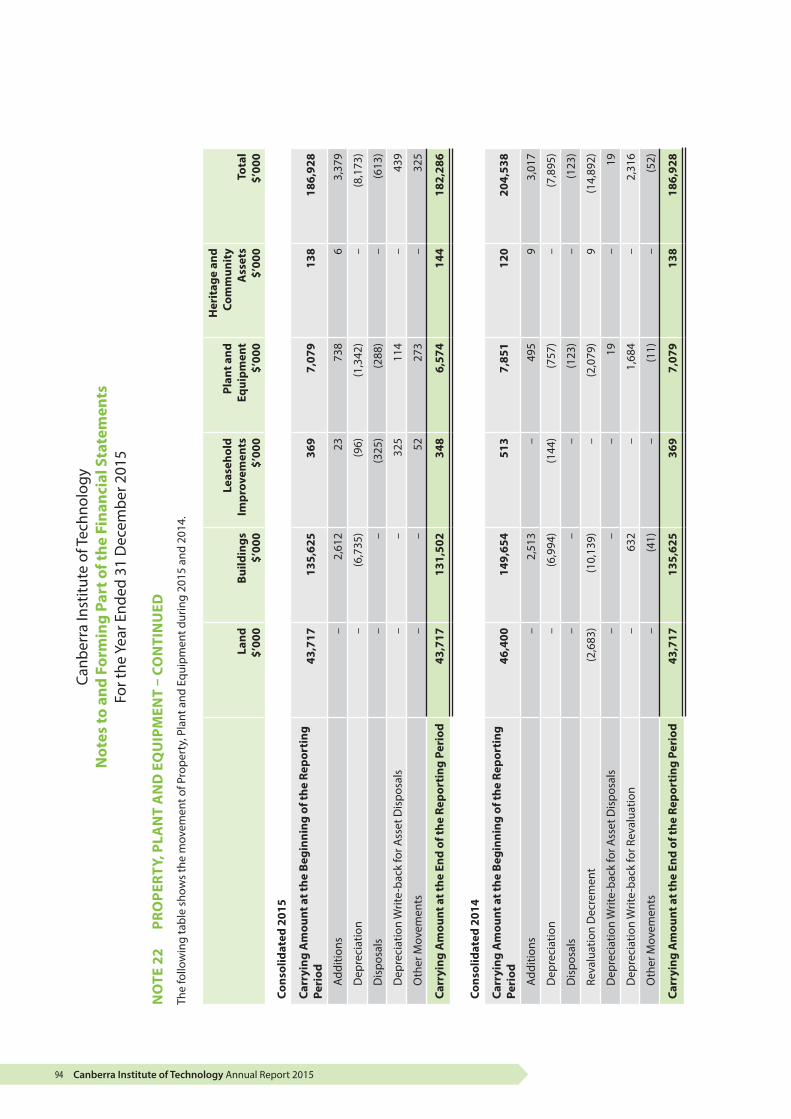
Canberra Institute of Technology Annual Report 201594
Canb
erra
Inst
itute
of T
echn
olog
y N
otes
to a
nd F
orm
ing
Part
of t
he F
inan
cial
Sta
tem
ents
For t
he Y
ear E
nded
31
Dec
embe
r 201
5
NO
TE 2
2 PR
OPE
RTY,
PLA
NT
AN
D E
QU
IPM
ENT
– CO
NTI
NU
ED
The
follo
win
g ta
ble
show
s th
e m
ovem
ent o
f Pro
pert
y, P
lant
and
Equ
ipm
ent d
urin
g 20
15 a
nd 2
014.
Land
$’
000
Build
ings
$’
000
Leas
ehol
d Im
prov
emen
ts
$’00
0
Plan
t and
Eq
uipm
ent
$’00
0
Her
itag
e an
d Co
mm
unit
y A
sset
s $’
000
Tota
l $’
000
Cons
olid
ated
201
5
Carr
ying
Am
ount
at t
he B
egin
ning
of t
he R
epor
ting
Pe
riod
43,7
1713
5,62
536
97,
079
138
186,
928
Addi
tions
–2,
612
2373
86
3,37
9
Dep
reci
atio
n–
(6,7
35)
(96)
(1,3
42)
–(8
,173
)
Dis
posa
ls–
–(3
25)
(288
)–
(613
)
Dep
reci
atio
n W
rite-
back
for A
sset
Dis
posa
ls–
–32
511
4–
439
Oth
er M
ovem
ents
––
5227
3–
325
Carr
ying
Am
ount
at t
he E
nd o
f the
Rep
orti
ng P
erio
d43
,717
131,
502
348
6,57
414
418
2,28
6
Cons
olid
ated
201
4
Carr
ying
Am
ount
at t
he B
egin
ning
of t
he R
epor
ting
Pe
riod
46,4
0014
9,65
451
37,
851
120
204,
538
Addi
tions
–2,
513
–49
59
3,01
7
Dep
reci
atio
n–
(6,9
94)
(144
)(7
57)
–(7
,895
)
Dis
posa
ls–
––
(123
)–
(123
)
Reva
luat
ion
Dec
rem
ent
(2,6
83)
(10,
139)
–(2
,079
)9
(14,
892)
Dep
reci
atio
n W
rite-
back
for A
sset
Dis
posa
ls–
––
19–
19
Dep
reci
atio
n W
rite-
back
for R
eval
uatio
n–
632
–1,
684
–2,
316
Oth
er M
ovem
ents
–(4
1)–
(11)
–(5
2)
Carr
ying
Am
ount
at t
he E
nd o
f the
Rep
orti
ng P
erio
d43
,717
135,
625
369
7,07
913
818
6,92
8
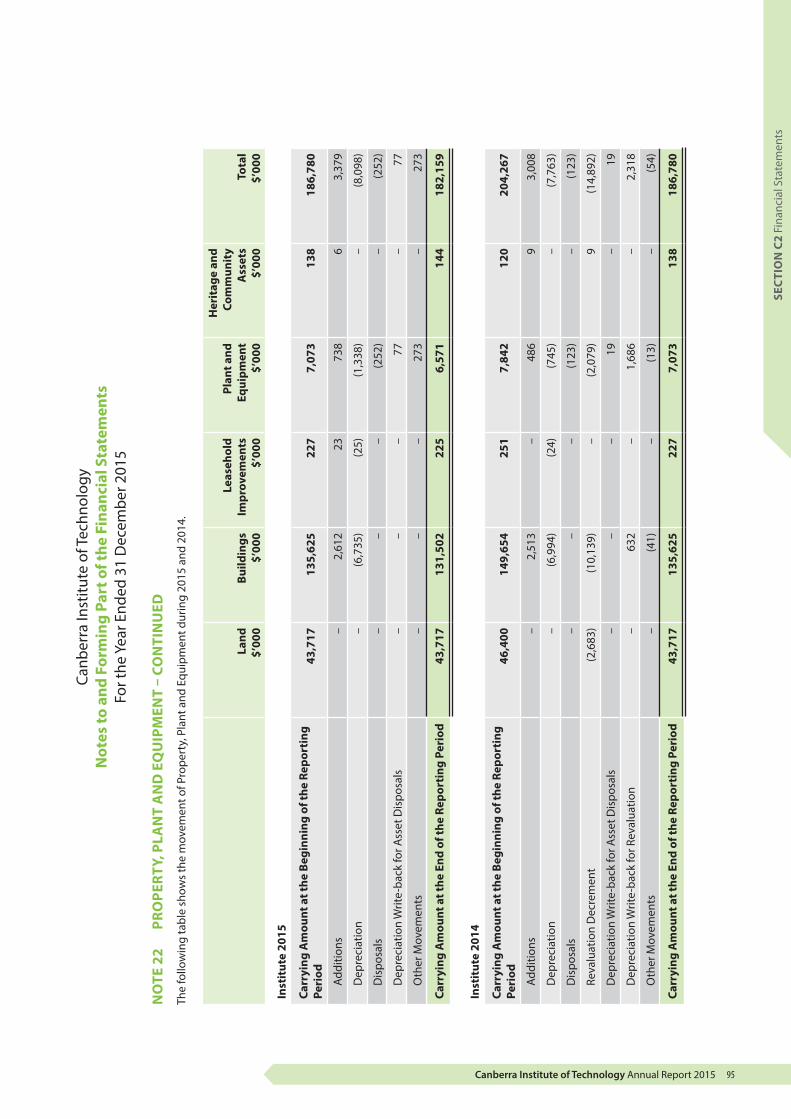
Canberra Institute of Technology Annual Report 2015 95
SEC
TIO
N C
2 Fi
nanc
ial S
tate
men
ts
Canb
erra
Inst
itute
of T
echn
olog
y N
otes
to a
nd F
orm
ing
Part
of t
he F
inan
cial
Sta
tem
ents
For t
he Y
ear E
nded
31
Dec
embe
r 201
5
NO
TE 2
2 PR
OPE
RTY,
PLA
NT
AN
D E
QU
IPM
ENT
– CO
NTI
NU
ED
The
follo
win
g ta
ble
show
s th
e m
ovem
ent o
f Pro
pert
y, P
lant
and
Equ
ipm
ent d
urin
g 20
15 a
nd 2
014.
Land
$’
000
Build
ings
$’
000
Leas
ehol
d Im
prov
emen
ts
$’00
0
Plan
t and
Eq
uipm
ent
$’00
0
Her
itag
e an
d Co
mm
unit
y A
sset
s $’
000
Tota
l $’
000
Inst
itut
e 20
15
Carr
ying
Am
ount
at t
he B
egin
ning
of t
he R
epor
ting
Pe
riod
43,7
1713
5,62
522
77,
073
138
186,
780
Addi
tions
–2,
612
2373
86
3,37
9
Dep
reci
atio
n–
(6,7
35)
(25)
(1,3
38)
–(8
,098
)
Dis
posa
ls–
––
(252
)–
(252
)
Dep
reci
atio
n W
rite-
back
for A
sset
Dis
posa
ls–
––
77–
77
Oth
er M
ovem
ents
––
–27
3–
273
Carr
ying
Am
ount
at t
he E
nd o
f the
Rep
orti
ng P
erio
d43
,717
131,
502
225
6,57
114
418
2,15
9
Inst
itut
e 20
14
Carr
ying
Am
ount
at t
he B
egin
ning
of t
he R
epor
ting
Pe
riod
46,4
0014
9,65
425
17,
842
120
204,
267
Addi
tions
–2,
513
–48
69
3,00
8
Dep
reci
atio
n–
(6,9
94)
(24)
(745
)–
(7,7
63)
Dis
posa
ls–
––
(123
)–
(123
)
Reva
luat
ion
Dec
rem
ent
(2,6
83)
(10,
139)
–(2
,079
)9
(14,
892)
Dep
reci
atio
n W
rite-
back
for A
sset
Dis
posa
ls–
––
19–
19
Dep
reci
atio
n W
rite-
back
for R
eval
uatio
n–
632
–1,
686
–2,
318
Oth
er M
ovem
ents
–(4
1)–
(13)
–(5
4)
Carr
ying
Am
ount
at t
he E
nd o
f the
Rep
orti
ng P
erio
d43
,717
135,
625
227
7,07
313
818
6,78
0

Canberra Institute of Technology Annual Report 201596
Canberra Institute of Technology Notes to and Forming Part of the Financial Statements
For the Year Ended 31 December 2015
NOTE 22 PROPERTY, PLANT AND EQUIPMENT – CONTINUED
Fair Value Hierarchy
The Institute is required to classify property, plant and equipment into a Fair Value Hierarchy that reflects the significance of the inputs used in determining their fair value. The Fair Value Hierarchy is made up of the following three levels:
• Level 1 - quoted prices (unadjusted) in active markets for identical assets or liabilities that the agency can access at the measurement date;
• Level 2 - inputs other than quoted prices included within Level 1 that are observable for the asset or liability, either directly or indirectly; and
• Level 3 - inputs that are unobservable for particular assets or liabilities.
Details of the Institute’s property, plant and equipment at fair value and information about the Fair Value Hierarchy as at 31 December 2015 are as follows:
Consolidated 2015
Property, Plant and Equipment at Fair Value Classification According to Fair Value Hierarchy
Level 1 $’000
Level 2 $’000
Level 3 $’000
Total $’000
Land and Improvements – 43,717 – 43,717
Buildings and Improvements – 2,650 128,852 131,502
Plant and Equipment – 410 6,164 6,574
Heritage Assets (including Artworks) – 136 8 144
– 46,913 135,024 181,937
Consolidated 2014
Property, Plant and Equipment at Fair Value Classification According to Fair Value Hierarchy
Level 1 $’000
Level 2 $’000
Level 3 $’000
Total $’000
Land and Improvements – 43,717 – 43,717
Buildings and Improvements – 2,738 132, 887 135,625
Plant and Equipment – 806 6,273 7,079
Heritage Assets (including Artworks) – 130 8 138
– 47,391 139,168 186,559

Canberra Institute of Technology Annual Report 2015 97
SEC
TIO
N C
2 Fi
nanc
ial S
tate
men
ts
Canberra Institute of Technology Notes to and Forming Part of the Financial Statements
For the Year Ended 31 December 2015
NOTE 22 PROPERTY, PLANT AND EQUIPMENT – CONTINUED
Fair Value Hierarchy – continued
Transfer Between Categories
Transfers at 31 December 2015: There have been no transfers between level 1, 2 and 3 during the current reporting period.
Transfers at 31 December 2014:
Consolidated 2014 Land $’000
Buildings and Improvements
$’000
Plant and Equipment
$’000Heritage Assets
$’000
Transferred to Level 2 – 2,738 – –
Transferred from Level 2 – – (6,273) (8)
Transferred to Level 3 – – 6,273 8
Transferred from Level 3 – (2,738) – –
Buildings and Improvements transfer from Level 3 to Level 2 is due to the existence of an active and liquid market resulting from the application of a direct comparison approach for the Monterey student accommodation and Woden Childcare Centre. Heritage Assets transfer from Level 2 to Level 3 is due to artworks for which there is no active market (artwork is produced by non-recognised artists).
Institute 2015
Property, Plant and Equipment at Fair Value Classification According to Fair Value Hierarchy
Level 1 $’000
Level 2 $’000
Level 3 $’000
Total $’000
Land and Improvements – 43,717 – 43,717
Buildings and Improvements – 2,650 128,852 131,502
Plant and Equipment – 411 6,160 6,571
Heritage Assets (including Artworks) – 136 8 144
– 46,914 135,020 181,934
Institute 2014
Property, Plant and Equipment at Fair Value Classification According to Fair Value Hierarchy
Level 1 $’000
Level 2 $’000
Level 3 $’000
Total $’000
Land and Improvements – 43,717 – 43,717
Buildings and Improvements – 2,738 132,887 135,625
Plant and Equipment – 806 6,267 7,073
Heritage Assets (including Artworks) – 130 8 138
– 47,391 139,162 186,553

Canberra Institute of Technology Annual Report 201598
Canberra Institute of Technology Notes to and Forming Part of the Financial Statements
For the Year Ended 31 December 2015
NOTE 22 PROPERTY, PLANT AND EQUIPMENT – CONTINUED
Fair Value Hierarchy – continued
Transfer Between Categories
Transfers at 31 December 2015: There have been no transfer between level 1, 2 and 3 during the current reporting period.
Transfers at 31 December 2014:
Institute 2014 Land $’000
Buildings and Improvements
$’000
Plant and Equipment
$’000Heritage Assets
$’000
Transferred to Level 2 – 2,738 – –
Transferred from Level 2 – – (6,267) (8)
Transferred to Level 3 – – 6,267 8
Transferred from Level 3 – (2,738) – –
Buildings and Improvements transfer from Level 3 to Level 2 is due to the existence of an active and liquid market resulting from the application of a direct comparison approach for the Monterey student accommodation and Woden Childcare Centre. Plant and Equipment transfer from Level 2 to Level 3 is due to the use of unobservable inputs during the valuation undertaken. Heritage Assets transfer from Level 2 to Level 3 is due to artworks for which there is no active market (artwork is produced by non-recognised artists).
Valuation Techniques, inputs and processes
Level 2 Valuation Techniques and Inputs
Valuation Technique: The valuation technique used to value land and buildings is the market approach that reflects recent transaction prices for similar properties and buildings (comparable in location and size).
Inputs: In determining the value of land, prices and other relevant information generated by market transactions involving comparable land and buildings were considered. Regard was given to the Crown Lease terms and tenure, the Australian Capital Territory Plan and the National Capital Plan, where applicable, as well as current zoning. The Institute considers that the valuation reflects the highest and best use value.
When assessing the value, the prices adopted from the evidence were on a dollar per square meter basis, subsequently applied to the various land areas to derive the total land value. The Monterey student accommodation and Woden Childcare Centre were valued on a direct comparison basis, whereby an active and liquid market exists and comparable market evidence can be analysed to assist in deriving a value.
Valuation technique: The valuation technique applied to Artworks and Heritage assets is the market approach. This approach uses sales prices and other relevant information generated by market transactions involving similar assets or works by artists with similar standing/style.
Inputs: Artworks comprise works produced by students and other artists held for permanent exhibition, for which fair value is determined using a market value (comparable sales) where there is a market for the same or a similar item.
Valuation technique: Plant and Equipment assets are valued using the market approach whereby, the asset with identical or similar assets for which price information is available.
Inputs: In determining the value of plant and equipment, a comparable sales approach was adopted.

Canberra Institute of Technology Annual Report 2015 99
SEC
TIO
N C
2 Fi
nanc
ial S
tate
men
ts
Canberra Institute of Technology Notes to and Forming Part of the Financial Statements
For the Year Ended 31 December 2015
NOTE 22 PROPERTY, PLANT AND EQUIPMENT – CONTINUED
Fair Value Hierarchy – continued
Level 3 Valuation Techniques and Inputs
Valuation Technique: Most of buildings and improvements were considered specialised assets by the valuers and measured using the cost approach that reflects the cost to a market participant to construct assets of comparable utility adjusted for obsolescence. For Buildings, depreciated replacement cost of modern equivalent optimised improvements per square metre of floor area was also used in measuring fair value.
Inputs: In determining the value of buildings and improvements, regard was given to the age of buildings, size of improvements, estimated replacement cost, condition of structures and current use. This required the use of data internal to the Canberra Institute of Technology. When assessing the value, the prices adopted from the evidence were on a dollar per square metre basis, subsequently applied to the various building and improvement areas to derive the total building and improvements value.
Valuation technique: Artworks where there is no active market (produced by non-recognised artists) is valued through the market approach.
Inputs: In determining the value of these artworks, regard was given to aesthetic quality, medium and valuers knowledge of the market, recent sales of works by artists with similar standing/style.
Valuation technique: Plant and Equipment assets, for which comparable sales were not found, were valued using a cost approach that reflects the cost to a market participant to acquire assets of comparable utility, adjusted for obsolescence.
Inputs: In determining the value of plant and equipment, regard was given to estimated replacement cost of new or second hand items, with an allowance for any obsolescence that may exist, were used. Specific observable inputs were replacement and reinstatement values, age and useful life.
There have been no changes to the above valuation techniques during the year.
Transfers in and out of a fair value level are recognised at the end of the reporting period in which the assets are revalued or changed in circumstances that cause a revaluation and transfer.
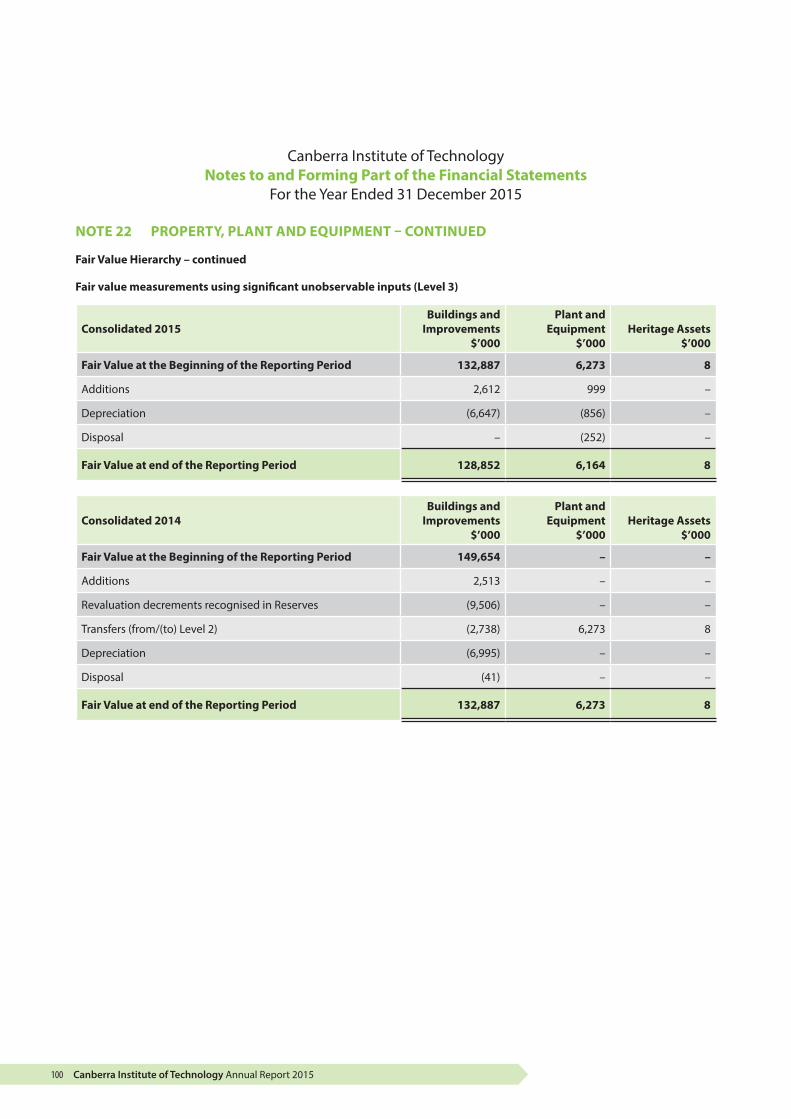
Canberra Institute of Technology Annual Report 2015100
Canberra Institute of Technology Notes to and Forming Part of the Financial Statements
For the Year Ended 31 December 2015
NOTE 22 PROPERTY, PLANT AND EQUIPMENT – CONTINUED
Fair Value Hierarchy – continued
Fair value measurements using significant unobservable inputs (Level 3)
Consolidated 2015Buildings and
Improvements $’000
Plant and Equipment
$’000Heritage Assets
$’000
Fair Value at the Beginning of the Reporting Period 132,887 6,273 8
Additions 2,612 999 –
Depreciation (6,647) (856) –
Disposal – (252) –
Fair Value at end of the Reporting Period 128,852 6,164 8
Consolidated 2014Buildings and
Improvements $’000
Plant and Equipment
$’000Heritage Assets
$’000
Fair Value at the Beginning of the Reporting Period 149,654 – –
Additions 2,513 – –
Revaluation decrements recognised in Reserves (9,506) – –
Transfers (from/(to) Level 2) (2,738) 6,273 8
Depreciation (6,995) – –
Disposal (41) – –
Fair Value at end of the Reporting Period 132,887 6,273 8
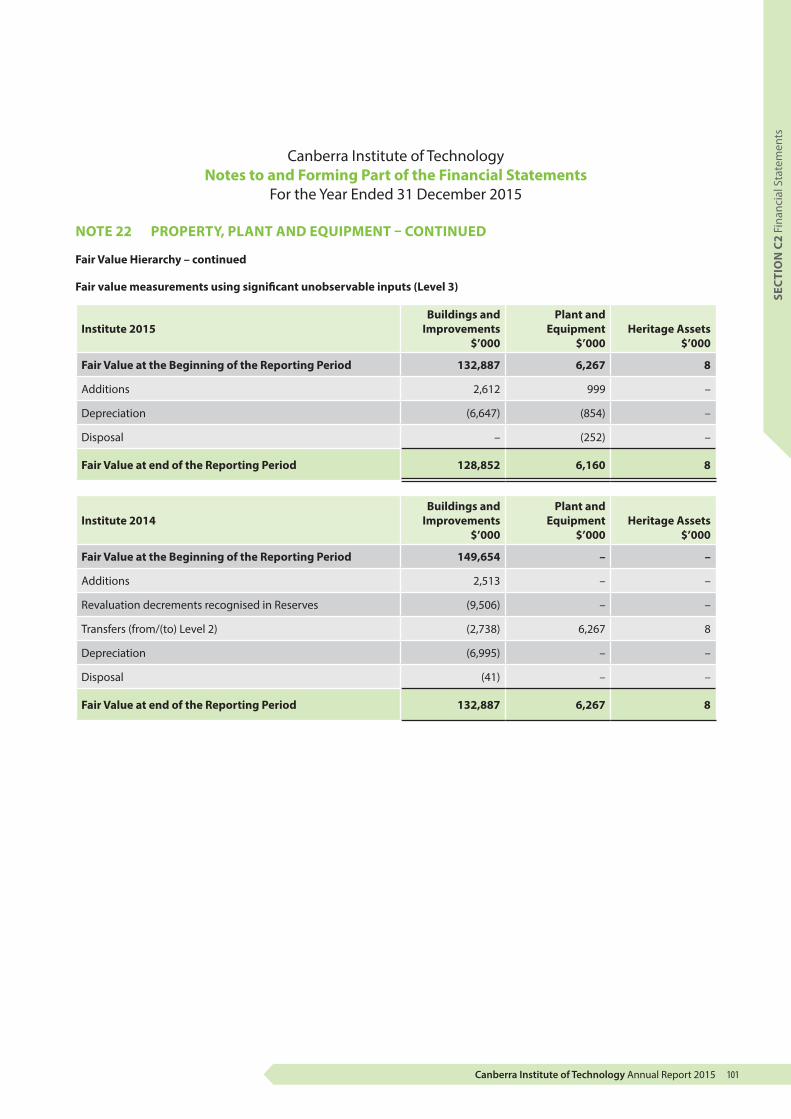
Canberra Institute of Technology Annual Report 2015 101
SEC
TIO
N C
2 Fi
nanc
ial S
tate
men
ts
Canberra Institute of Technology Notes to and Forming Part of the Financial Statements
For the Year Ended 31 December 2015
NOTE 22 PROPERTY, PLANT AND EQUIPMENT – CONTINUED
Fair Value Hierarchy – continued
Fair value measurements using significant unobservable inputs (Level 3)
Institute 2015Buildings and
Improvements $’000
Plant and Equipment
$’000Heritage Assets
$’000
Fair Value at the Beginning of the Reporting Period 132,887 6,267 8
Additions 2,612 999 –
Depreciation (6,647) (854) –
Disposal – (252) –
Fair Value at end of the Reporting Period 128,852 6,160 8
Institute 2014Buildings and
Improvements $’000
Plant and Equipment
$’000Heritage Assets
$’000
Fair Value at the Beginning of the Reporting Period 149,654 – –
Additions 2,513 – –
Revaluation decrements recognised in Reserves (9,506) – –
Transfers (from/(to) Level 2) (2,738) 6,267 8
Depreciation (6,995) – –
Disposal (41) – –
Fair Value at end of the Reporting Period 132,887 6,267 8
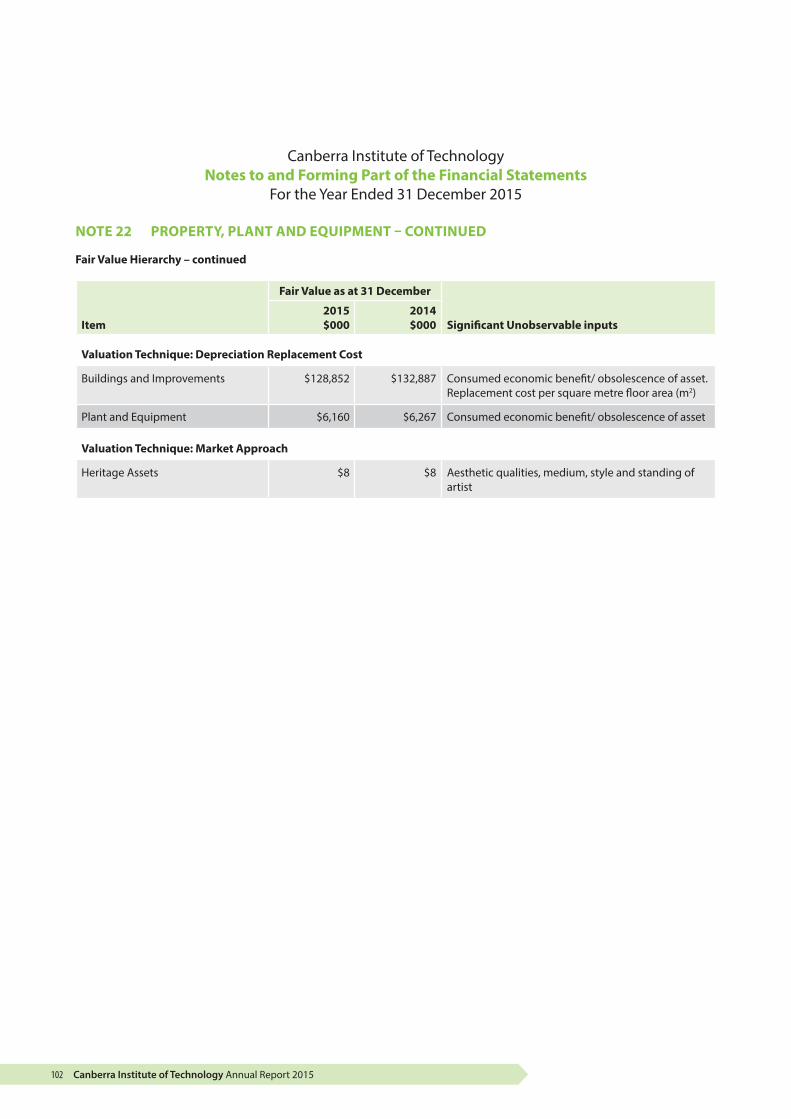
Canberra Institute of Technology Annual Report 2015102
Canberra Institute of Technology Notes to and Forming Part of the Financial Statements
For the Year Ended 31 December 2015
NOTE 22 PROPERTY, PLANT AND EQUIPMENT – CONTINUED
Fair Value Hierarchy – continued
Item
Fair Value as at 31 December
Significant Unobservable inputs2015 $000
2014 $000
Valuation Technique: Depreciation Replacement Cost
Buildings and Improvements $128,852 $132,887 Consumed economic benefit/ obsolescence of asset. Replacement cost per square metre floor area (m2)
Plant and Equipment $6,160 $6,267 Consumed economic benefit/ obsolescence of asset
Valuation Technique: Market Approach
Heritage Assets $8 $8 Aesthetic qualities, medium, style and standing of artist

Canberra Institute of Technology Annual Report 2015 103
SEC
TIO
N C
2 Fi
nanc
ial S
tate
men
ts
Canberra Institute of Technology Notes to and Forming Part of the Financial Statements
For the Year Ended 31 December 2015
NOTE 23 INTANGIBLE ASSETSThe Institute has externally purchased software, comprising five core corporate business systems (off-the-shelf products modified to meet the Institute’s needs) and software titles.
Consolidated Institute
2015 $’000
2014 $’000
2015 $’000
2014 $’000
Computer Software
Externally Purchased Software
Computer Software at Fair Value (a) 6,097 5,385 6,097 5,385
Less: Accumulated Amortisation (b) (4,481) (3,833) (4,481) (3,833)
Total Externally Purchased Software 1,616 1,552 1,616 1,552
Total Computer Software 1,616 1,552 1,616 1,552
Total Intangible Assets 1,616 1,552 1,616 1,552
(a) Computer Software carrying value has increased due to the upgrade of the Student Information System software.
(b) Computer Software amortisation is included in Depreciation and Amortisation in the Operating Statement.
Reconciliation of Intangible Assets
The following table shows the movements in Intangible Assets from the beginning to the end of 2014 and 2015.
Consolidated Institute
2015 $’000
2014 $’000
2015 $’000
2014 $’000
Carrying Amount at the Beginning of the Reporting Period 1,552 1,436 1,552 1,436
Additions 712 1,024 712 1,024
Amortisation (648) (908) (648) (908)
Carrying Amount at the End of the Reporting Period 1,616 1,552 1,616 1,552
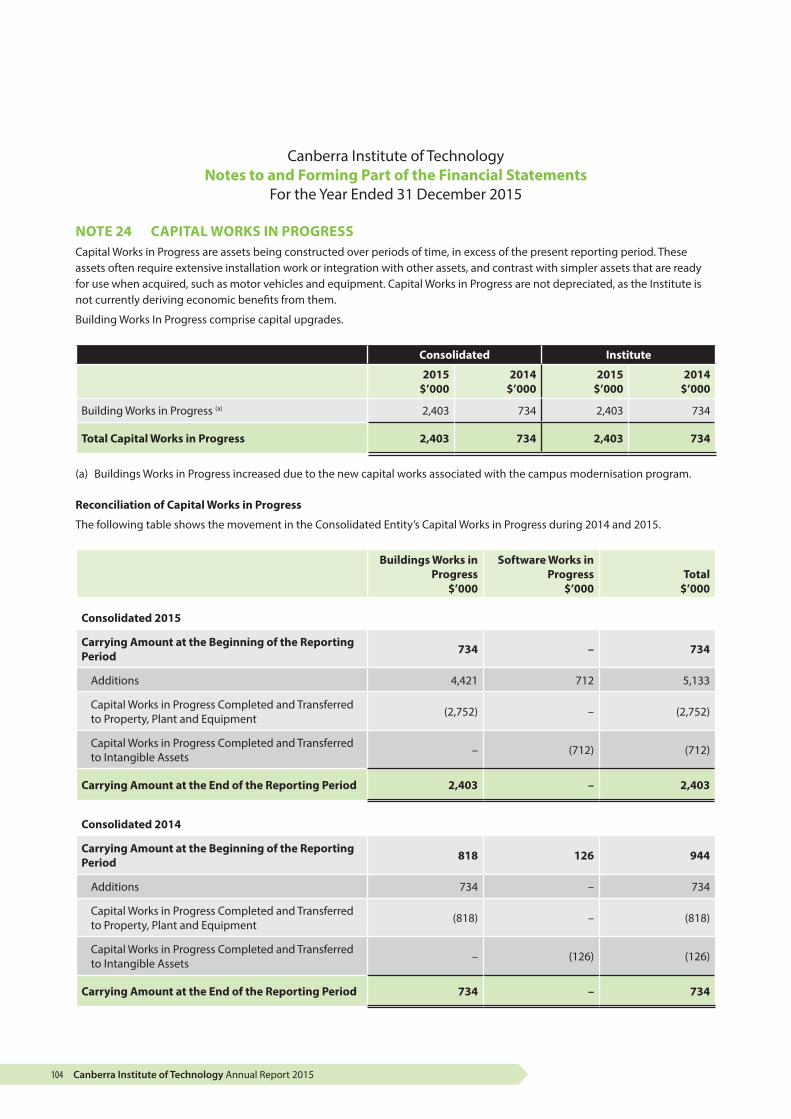
Canberra Institute of Technology Annual Report 2015104
Canberra Institute of Technology Notes to and Forming Part of the Financial Statements
For the Year Ended 31 December 2015
NOTE 24 CAPITAL WORKS IN PROGRESSCapital Works in Progress are assets being constructed over periods of time, in excess of the present reporting period. These assets often require extensive installation work or integration with other assets, and contrast with simpler assets that are ready for use when acquired, such as motor vehicles and equipment. Capital Works in Progress are not depreciated, as the Institute is not currently deriving economic benefits from them.
Building Works In Progress comprise capital upgrades.
Consolidated Institute
2015 $’000
2014 $’000
2015 $’000
2014 $’000
Building Works in Progress (a) 2,403 734 2,403 734
Total Capital Works in Progress 2,403 734 2,403 734
(a) Buildings Works in Progress increased due to the new capital works associated with the campus modernisation program.
Reconciliation of Capital Works in Progress
The following table shows the movement in the Consolidated Entity’s Capital Works in Progress during 2014 and 2015.
Buildings Works in Progress
$’000
Software Works in Progress
$’000Total
$’000
Consolidated 2015
Carrying Amount at the Beginning of the Reporting Period 734 – 734
Additions 4,421 712 5,133
Capital Works in Progress Completed and Transferred to Property, Plant and Equipment (2,752) – (2,752)
Capital Works in Progress Completed and Transferred to Intangible Assets – (712) (712)
Carrying Amount at the End of the Reporting Period 2,403 – 2,403
Consolidated 2014
Carrying Amount at the Beginning of the Reporting Period 818 126 944
Additions 734 – 734
Capital Works in Progress Completed and Transferred to Property, Plant and Equipment (818) – (818)
Capital Works in Progress Completed and Transferred to Intangible Assets – (126) (126)
Carrying Amount at the End of the Reporting Period 734 – 734
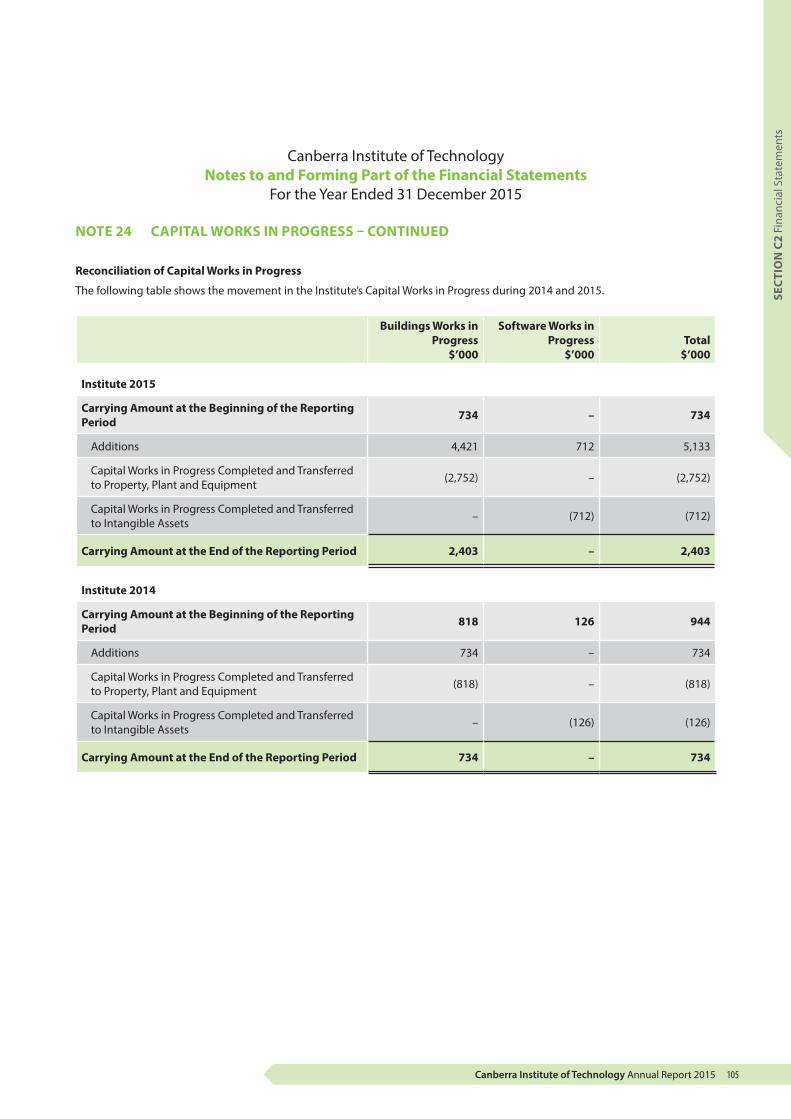
Canberra Institute of Technology Annual Report 2015 105
SEC
TIO
N C
2 Fi
nanc
ial S
tate
men
ts
Canberra Institute of Technology Notes to and Forming Part of the Financial Statements
For the Year Ended 31 December 2015
NOTE 24 CAPITAL WORKS IN PROGRESS – CONTINUED
Reconciliation of Capital Works in Progress
The following table shows the movement in the Institute’s Capital Works in Progress during 2014 and 2015.
Buildings Works in Progress
$’000
Software Works in Progress
$’000Total
$’000
Institute 2015
Carrying Amount at the Beginning of the Reporting Period 734 – 734
Additions 4,421 712 5,133
Capital Works in Progress Completed and Transferred to Property, Plant and Equipment (2,752) – (2,752)
Capital Works in Progress Completed and Transferred to Intangible Assets – (712) (712)
Carrying Amount at the End of the Reporting Period 2,403 – 2,403
Institute 2014
Carrying Amount at the Beginning of the Reporting Period 818 126 944
Additions 734 – 734
Capital Works in Progress Completed and Transferred to Property, Plant and Equipment (818) – (818)
Capital Works in Progress Completed and Transferred to Intangible Assets – (126) (126)
Carrying Amount at the End of the Reporting Period 734 – 734

Canberra Institute of Technology Annual Report 2015106
Canberra Institute of Technology Notes to and Forming Part of the Financial Statements
For the Year Ended 31 December 2015
NOTE 25 PAYABLES
Consolidated Institute
2015 $’000
2014 $’000
2015 $’000
2014 $’000
Current Payables
Accounts Payable (a) 466 312 440 312
Other Payables 10 44 1 44
Sub-Total Payables 476 356 441 356
Accrued Expenses (a) 1,581 1,162 1,319 1,046
Total Current Payables 1,581 1,162 1,319 1,046
Total Payables 2,057 1,518 1,760 1,402
Payables are aged as follows:
Not Overdue 1,775 1,518 1,478 1,402
Overdue for Less than 30 Days (b) 253 – 253 –
Overdue for 30 to 60 Days 23 – 23 –
Overdue for More than 60 Days 6 – 6 –
Total Payables 2,057 1,518 1,760 1,402
Classification of ACT Government/Non-ACT Government Payables
Payables with ACT Government Entities
Other Payables 14 – 14 –
Accrued Expenses 445 91 445 227
Total Payables with ACT Government Entities 459 91 459 227
Payables with Non-ACT Government Entities
Accounts Payable 426 564 426 312
Other Payables 35 44 – 44
Accrued Expenses 1,137 819 875 819
Total Payables with Non-ACT Government Entities 1,598 1,427 1,301 1,175
Total Payables 2,057 1,518 1,760 1,402
(a) The increase in Accrued Expenses is primarily the result of the accrual of telecommunications expenses from delayed invoicing. The increase in accounts payable is due to invoices received at year end for capital works expenditure incurred towards year end such as Bruce and Reid campus refurbishment.
(b) Overdue payables primarily due to hold on payment to supplier by ACT Government Solicitor’s Office as a result of the death of the director of the supply company.
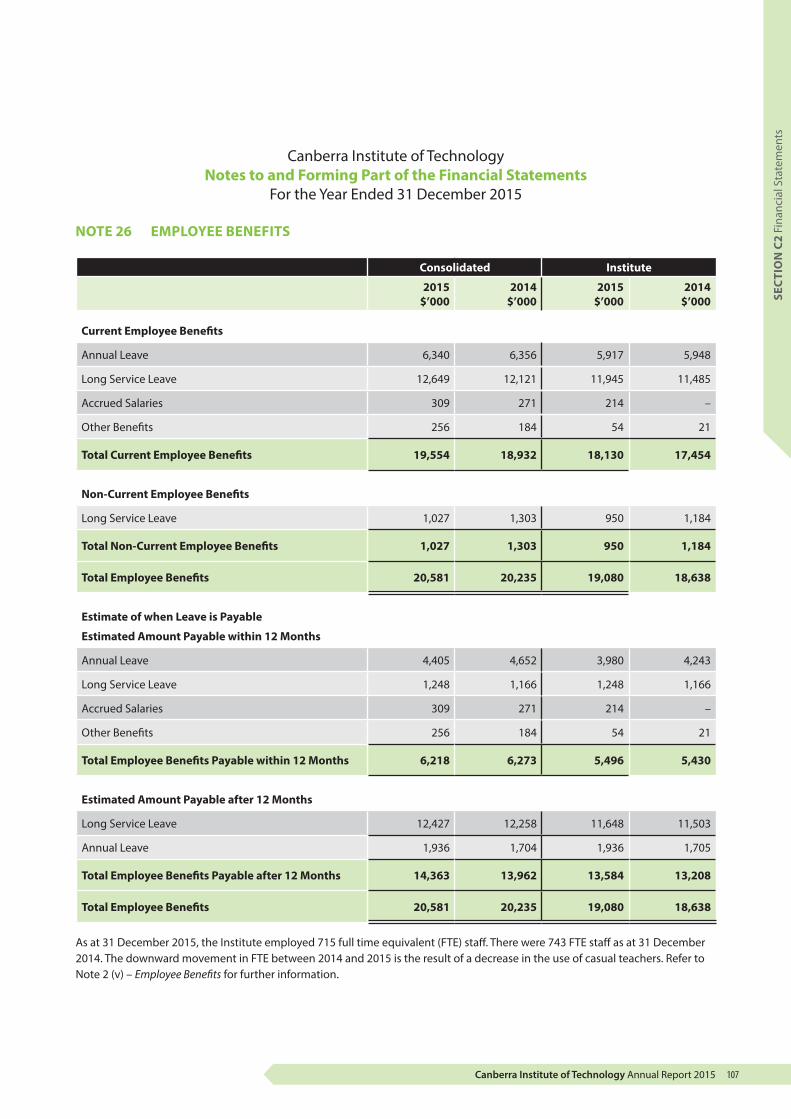
Canberra Institute of Technology Annual Report 2015 107
SEC
TIO
N C
2 Fi
nanc
ial S
tate
men
ts
Canberra Institute of Technology Notes to and Forming Part of the Financial Statements
For the Year Ended 31 December 2015
NOTE 26 EMPLOYEE BENEFITS
Consolidated Institute
2015 $’000
2014 $’000
2015 $’000
2014 $’000
Current Employee Benefits
Annual Leave 6,340 6,356 5,917 5,948
Long Service Leave 12,649 12,121 11,945 11,485
Accrued Salaries 309 271 214 –
Other Benefits 256 184 54 21
Total Current Employee Benefits 19,554 18,932 18,130 17,454
Non-Current Employee Benefits
Long Service Leave 1,027 1,303 950 1,184
Total Non-Current Employee Benefits 1,027 1,303 950 1,184
Total Employee Benefits 20,581 20,235 19,080 18,638
Estimate of when Leave is Payable
Estimated Amount Payable within 12 Months
Annual Leave 4,405 4,652 3,980 4,243
Long Service Leave 1,248 1,166 1,248 1,166
Accrued Salaries 309 271 214 –
Other Benefits 256 184 54 21
Total Employee Benefits Payable within 12 Months 6,218 6,273 5,496 5,430
Estimated Amount Payable after 12 Months
Long Service Leave 12,427 12,258 11,648 11,503
Annual Leave 1,936 1,704 1,936 1,705
Total Employee Benefits Payable after 12 Months 14,363 13,962 13,584 13,208
Total Employee Benefits 20,581 20,235 19,080 18,638
As at 31 December 2015, the Institute employed 715 full time equivalent (FTE) staff. There were 743 FTE staff as at 31 December 2014. The downward movement in FTE between 2014 and 2015 is the result of a decrease in the use of casual teachers. Refer to Note 2 (v) – Employee Benefits for further information.

Canberra Institute of Technology Annual Report 2015108
Canberra Institute of Technology Notes to and Forming Part of the Financial Statements
For the Year Ended 31 December 2015
NOTE 27 OTHER LIABILITIES
Consolidated Institute
2015 $’000
2014 $’000
2015 $’000
2014 $’000
Current Other Liabilities
Revenue in Advance - Student Fees (a) 3,161 2,052 3,161 2,052
Revenue in Advance - Grants (b) 2,374 251 2,374 251
Other Current Liabilities 551 506 91 44
Total Current Other Liabilities 6,086 2,809 5,626 2,347
Non-Current Other Liabilities
Other 53 50 – –
Total Non-Current Other Liabilities 53 50 – –
Total Other Liabilities 6,139 2,859 5,626 2,347
(a) Revenue in Advance – Student Fees have increased due to an increase in overseas student registrations, fees and payments in advance for study in 2016.
(b) Revenue in Advance – Grants increased due to funding for the Australian Apprenticeship Project being received in advance.
NOTE 28 ASSET REVALUATION SURPLUS
Asset Revaluation Surplus
The Asset Revaluation Surplus is used to record the increments and decrements in the value of the Property, Plant and Equipment.
Consolidated Institute
2015 $’000
2014 $’000
2015 $’000
2014 $’000
Balance at the Beginning of the Reporting Period 73,235 85,811 73,237 85,811
Increment in Land due to Revaluation – (2,683) – (2,683)
Decrement in Buildings due to Revaluation – (9,506) – (9,506)
Increment in Heritage Assets due to Revaluation – 9 – 9
Decrement in Plant and Equipment due to Revaluation – (396) – (394)
Total Movement – (12,576) – (12,574)
Balance at the End of the Reporting Period 73,235 73,235 73,237 73,237
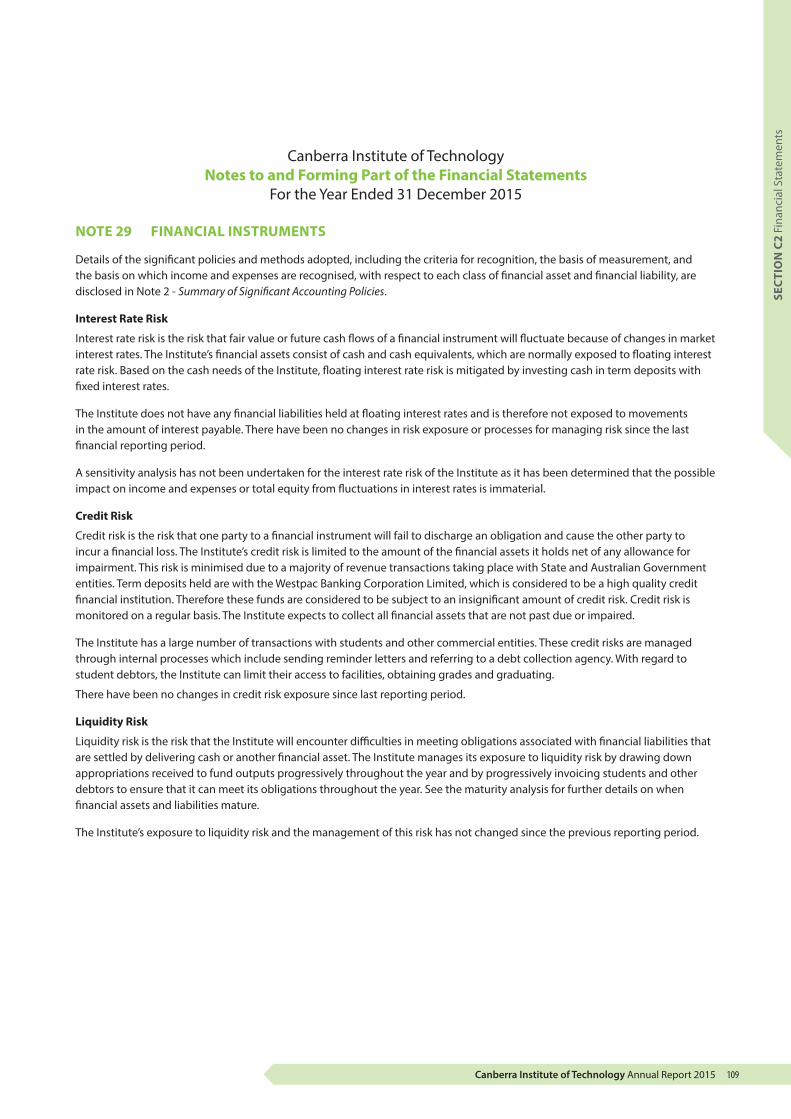
Canberra Institute of Technology Annual Report 2015 109
SEC
TIO
N C
2 Fi
nanc
ial S
tate
men
ts
Canberra Institute of Technology Notes to and Forming Part of the Financial Statements
For the Year Ended 31 December 2015
NOTE 29 FINANCIAL INSTRUMENTS
Details of the significant policies and methods adopted, including the criteria for recognition, the basis of measurement, and the basis on which income and expenses are recognised, with respect to each class of financial asset and financial liability, are disclosed in Note 2 - Summary of Significant Accounting Policies.
Interest Rate Risk
Interest rate risk is the risk that fair value or future cash flows of a financial instrument will fluctuate because of changes in market interest rates. The Institute’s financial assets consist of cash and cash equivalents, which are normally exposed to floating interest rate risk. Based on the cash needs of the Institute, floating interest rate risk is mitigated by investing cash in term deposits with fixed interest rates.
The Institute does not have any financial liabilities held at floating interest rates and is therefore not exposed to movements in the amount of interest payable. There have been no changes in risk exposure or processes for managing risk since the last financial reporting period.
A sensitivity analysis has not been undertaken for the interest rate risk of the Institute as it has been determined that the possible impact on income and expenses or total equity from fluctuations in interest rates is immaterial.
Credit Risk
Credit risk is the risk that one party to a financial instrument will fail to discharge an obligation and cause the other party to incur a financial loss. The Institute’s credit risk is limited to the amount of the financial assets it holds net of any allowance for impairment. This risk is minimised due to a majority of revenue transactions taking place with State and Australian Government entities. Term deposits held are with the Westpac Banking Corporation Limited, which is considered to be a high quality credit financial institution. Therefore these funds are considered to be subject to an insignificant amount of credit risk. Credit risk is monitored on a regular basis. The Institute expects to collect all financial assets that are not past due or impaired.
The Institute has a large number of transactions with students and other commercial entities. These credit risks are managed through internal processes which include sending reminder letters and referring to a debt collection agency. With regard to student debtors, the Institute can limit their access to facilities, obtaining grades and graduating.
There have been no changes in credit risk exposure since last reporting period.
Liquidity Risk
Liquidity risk is the risk that the Institute will encounter difficulties in meeting obligations associated with financial liabilities that are settled by delivering cash or another financial asset. The Institute manages its exposure to liquidity risk by drawing down appropriations received to fund outputs progressively throughout the year and by progressively invoicing students and other debtors to ensure that it can meet its obligations throughout the year. See the maturity analysis for further details on when financial assets and liabilities mature.
The Institute’s exposure to liquidity risk and the management of this risk has not changed since the previous reporting period.
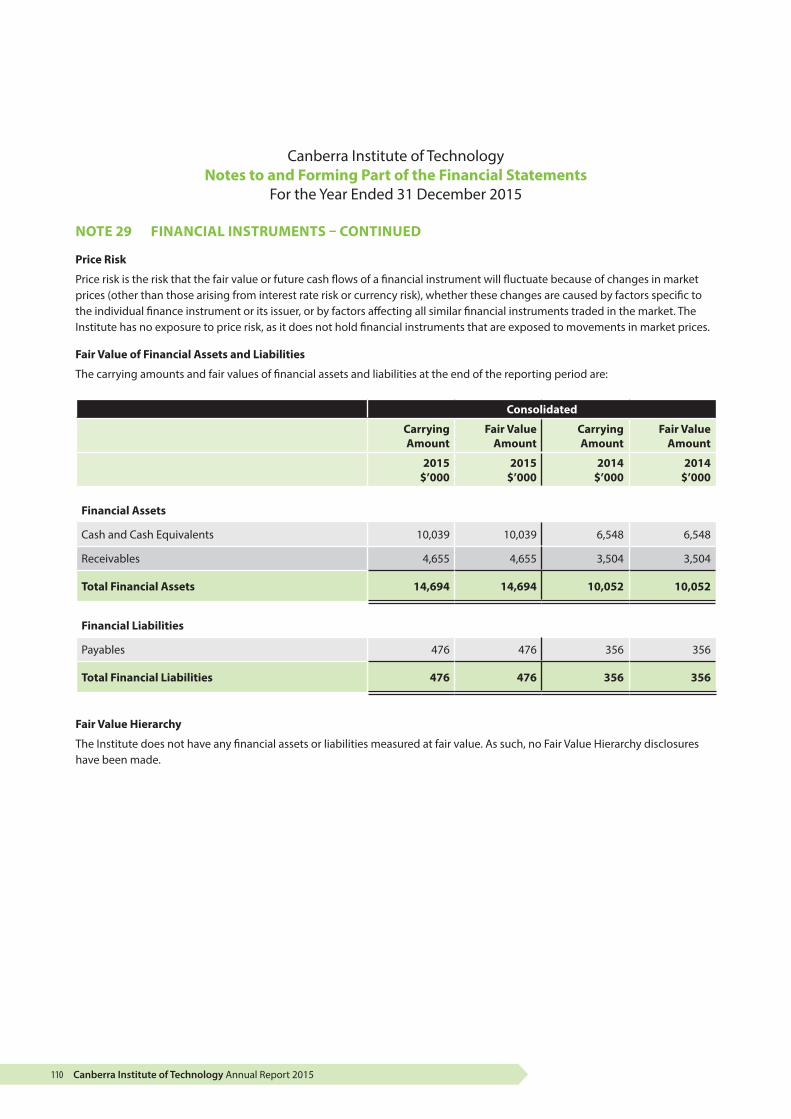
Canberra Institute of Technology Annual Report 2015110
Canberra Institute of Technology Notes to and Forming Part of the Financial Statements
For the Year Ended 31 December 2015
NOTE 29 FINANCIAL INSTRUMENTS – CONTINUED
Price Risk
Price risk is the risk that the fair value or future cash flows of a financial instrument will fluctuate because of changes in market prices (other than those arising from interest rate risk or currency risk), whether these changes are caused by factors specific to the individual finance instrument or its issuer, or by factors affecting all similar financial instruments traded in the market. The Institute has no exposure to price risk, as it does not hold financial instruments that are exposed to movements in market prices.
Fair Value of Financial Assets and Liabilities
The carrying amounts and fair values of financial assets and liabilities at the end of the reporting period are:
Consolidated
Carrying Amount
Fair Value Amount
Carrying Amount
Fair Value Amount
2015 $’000
2015 $’000
2014 $’000
2014 $’000
Financial Assets
Cash and Cash Equivalents 10,039 10,039 6,548 6,548
Receivables 4,655 4,655 3,504 3,504
Total Financial Assets 14,694 14,694 10,052 10,052
Financial Liabilities
Payables 476 476 356 356
Total Financial Liabilities 476 476 356 356
Fair Value Hierarchy
The Institute does not have any financial assets or liabilities measured at fair value. As such, no Fair Value Hierarchy disclosures have been made.
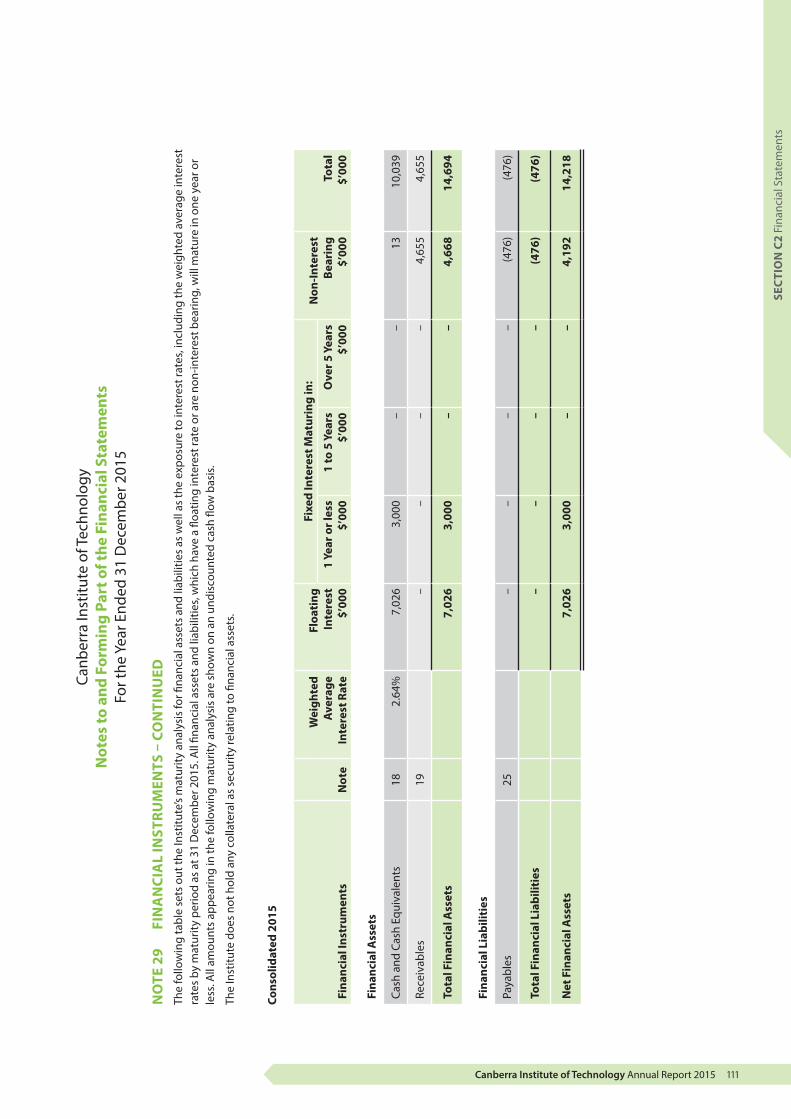
Canberra Institute of Technology Annual Report 2015 111
SEC
TIO
N C
2 Fi
nanc
ial S
tate
men
ts
Canb
erra
Inst
itute
of T
echn
olog
y N
otes
to a
nd F
orm
ing
Part
of t
he F
inan
cial
Sta
tem
ents
For t
he Y
ear E
nded
31
Dec
embe
r 201
5
NO
TE 2
9 FI
NA
NCI
AL
INST
RUM
ENTS
– C
ON
TIN
UED
The
follo
win
g ta
ble
sets
out
the
Inst
itute
’s m
atur
ity a
naly
sis
for fi
nanc
ial a
sset
s an
d lia
bilit
ies
as w
ell a
s th
e ex
posu
re to
inte
rest
rate
s, in
clud
ing
the
wei
ghte
d av
erag
e in
tere
st
rate
s by
mat
urity
per
iod
as a
t 31
Dec
embe
r 201
5. A
ll fin
anci
al a
sset
s an
d lia
bilit
ies,
whi
ch h
ave
a flo
atin
g in
tere
st ra
te o
r are
non
-inte
rest
bea
ring,
will
mat
ure
in o
ne y
ear o
r le
ss. A
ll am
ount
s ap
pear
ing
in th
e fo
llow
ing
mat
urity
ana
lysi
s ar
e sh
own
on a
n un
disc
ount
ed c
ash
flow
bas
is.
The
Inst
itute
doe
s no
t hol
d an
y co
llate
ral a
s se
curit
y re
latin
g to
fina
ncia
l ass
ets.
Cons
olid
ated
201
5
Fina
ncia
l Ins
trum
ents
Not
e
Wei
ghte
d A
vera
ge
Inte
rest
Rat
e
Floa
ting
In
tere
st$’
000
Fixe
d In
tere
st M
atur
ing
in:
Non
-Inte
rest
Be
arin
g $’
000
Tota
l $’
000
1 Ye
ar o
r les
s $’
000
1 to
5 Y
ears
$’
000
Ove
r 5 Y
ears
$’
000
Fina
ncia
l Ass
ets
Cash
and
Cas
h Eq
uiva
lent
s18
2.64
%7,
026
3,00
0–
–13
10,0
39
Rece
ivab
les
19–
––
–4,
655
4,65
5
Tota
l Fin
anci
al A
sset
s7,
026
3,00
0–
–4,
668
14,6
94
Fina
ncia
l Lia
bilit
ies
Paya
bles
25–
––
–(4
76)
(476
)
Tota
l Fin
anci
al L
iabi
litie
s–
––
–(4
76)
(476
)
Net
Fin
anci
al A
sset
s7,
026
3,00
0–
–4,
192
14,2
18
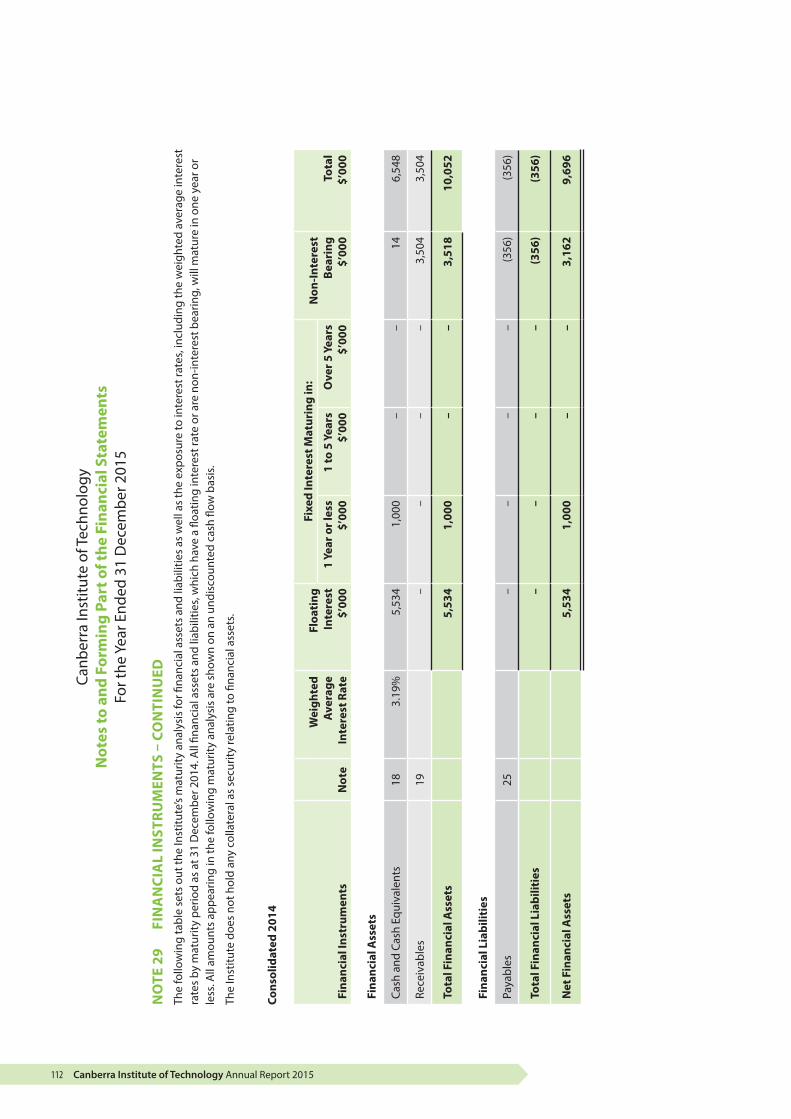
Canberra Institute of Technology Annual Report 2015112
Canb
erra
Inst
itute
of T
echn
olog
y N
otes
to a
nd F
orm
ing
Part
of t
he F
inan
cial
Sta
tem
ents
For t
he Y
ear E
nded
31
Dec
embe
r 201
5
NO
TE 2
9 FI
NA
NCI
AL
INST
RUM
ENTS
– C
ON
TIN
UED
The
follo
win
g ta
ble
sets
out
the
Inst
itute
’s m
atur
ity a
naly
sis
for fi
nanc
ial a
sset
s an
d lia
bilit
ies
as w
ell a
s th
e ex
posu
re to
inte
rest
rate
s, in
clud
ing
the
wei
ghte
d av
erag
e in
tere
st
rate
s by
mat
urity
per
iod
as a
t 31
Dec
embe
r 201
4. A
ll fin
anci
al a
sset
s an
d lia
bilit
ies,
whi
ch h
ave
a flo
atin
g in
tere
st ra
te o
r are
non
-inte
rest
bea
ring,
will
mat
ure
in o
ne y
ear o
r le
ss. A
ll am
ount
s ap
pear
ing
in th
e fo
llow
ing
mat
urity
ana
lysi
s ar
e sh
own
on a
n un
disc
ount
ed c
ash
flow
bas
is.
The
Inst
itute
doe
s no
t hol
d an
y co
llate
ral a
s se
curit
y re
latin
g to
fina
ncia
l ass
ets.
Cons
olid
ated
201
4
Fina
ncia
l Ins
trum
ents
Not
e
Wei
ghte
d A
vera
ge
Inte
rest
Rat
e
Floa
ting
In
tere
st$’
000
Fixe
d In
tere
st M
atur
ing
in:
Non
-Inte
rest
Be
arin
g $’
000
Tota
l $’
000
1 Ye
ar o
r les
s $’
000
1 to
5 Y
ears
$’
000
Ove
r 5 Y
ears
$’
000
Fina
ncia
l Ass
ets
Cash
and
Cas
h Eq
uiva
lent
s18
3.19
%5,
534
1,00
0–
–14
6,54
8
Rece
ivab
les
19–
––
–3,
504
3,50
4
Tota
l Fin
anci
al A
sset
s5,
534
1,00
0–
–3,
518
10,0
52
Fina
ncia
l Lia
bilit
ies
Paya
bles
25–
––
–(3
56)
(356
)
Tota
l Fin
anci
al L
iabi
litie
s–
––
–(3
56)
(356
)
Net
Fin
anci
al A
sset
s5,
534
1,00
0–
–3,
162
9,69
6

Canberra Institute of Technology Annual Report 2015 113
SEC
TIO
N C
2 Fi
nanc
ial S
tate
men
ts
Canberra Institute of Technology Notes to and Forming Part of the Financial Statements
For the Year Ended 31 December 2015
NOTE 29 FINANCIAL INSTRUMENTS – CONTINUED
Consolidated
2015 $’000
2014 $’000
Carrying Amount of Each Category of Financial Asset and Financial Liability
Financial Assets
Loans and Receivables Measured at Amortised Cost 4,655 3,504
Financial Liabilities
Financial Liabilities Measured at Amortised Cost 476 356
Fair Value
The Institute does not have any financial assets or financial liabilities at fair value. As such no Fair Value Hierarchy disclosures have been made.
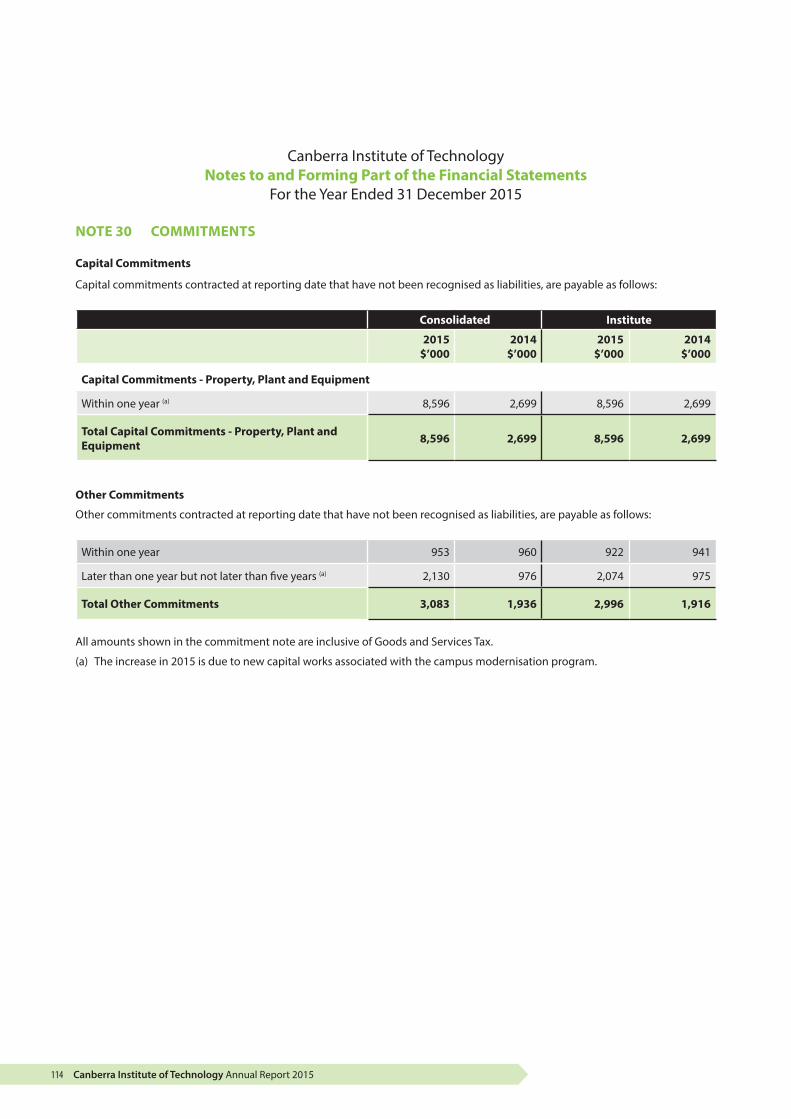
Canberra Institute of Technology Annual Report 2015114
Canberra Institute of Technology Notes to and Forming Part of the Financial Statements
For the Year Ended 31 December 2015
NOTE 30 COMMITMENTS
Capital Commitments
Capital commitments contracted at reporting date that have not been recognised as liabilities, are payable as follows:
Consolidated Institute
2015 $’000
2014 $’000
2015 $’000
2014 $’000
Capital Commitments - Property, Plant and Equipment
Within one year (a) 8,596 2,699 8,596 2,699
Total Capital Commitments - Property, Plant and Equipment 8,596 2,699 8,596 2,699
Other Commitments
Other commitments contracted at reporting date that have not been recognised as liabilities, are payable as follows:
Within one year 953 960 922 941
Later than one year but not later than five years (a) 2,130 976 2,074 975
Total Other Commitments 3,083 1,936 2,996 1,916
All amounts shown in the commitment note are inclusive of Goods and Services Tax.
(a) The increase in 2015 is due to new capital works associated with the campus modernisation program.

Canberra Institute of Technology Annual Report 2015 115
SEC
TIO
N C
2 Fi
nanc
ial S
tate
men
ts
Canberra Institute of Technology Notes to and Forming Part of the Financial Statements
For the Year Ended 31 December 2015
NOTE 31 CONTINGENT LIABILITIES AND CONTINGENT ASSETS
Contingent Liabilities
In December 2015 the Institute reviewed pending legal claims from third parties. A public liability insurance policy, held with the ACT Insurance Authority, provides insurance cover for the legal costs that have occurred through defending claims against the Institute from a third party. At the reporting date the estimated potential liability as a result of court action is $181,000 (2014 $85,000).
Asbestos Containing Materials
Significant amounts of Asbestos Containing Materials have been identified at the Watson Facility, which require remediation. Cost estimate provided to the Institute range from $3,000,000 (to terminate existing leases and demolish the buildings to render the site available for sale/redevelopment) to $6,780,000 (to remediate the buildings one at a time whilst maintaining tenancies in other buildings). ACT Government approval is required prior to undertaking any course of action. No approval had been sought or obtained as at 31 December 2015.
Contingent Assets
At the reporting date an estimate of the potential insurance settlement receivable in relation to pending legal claims from third parties is $170,000 (2014 $75,000).
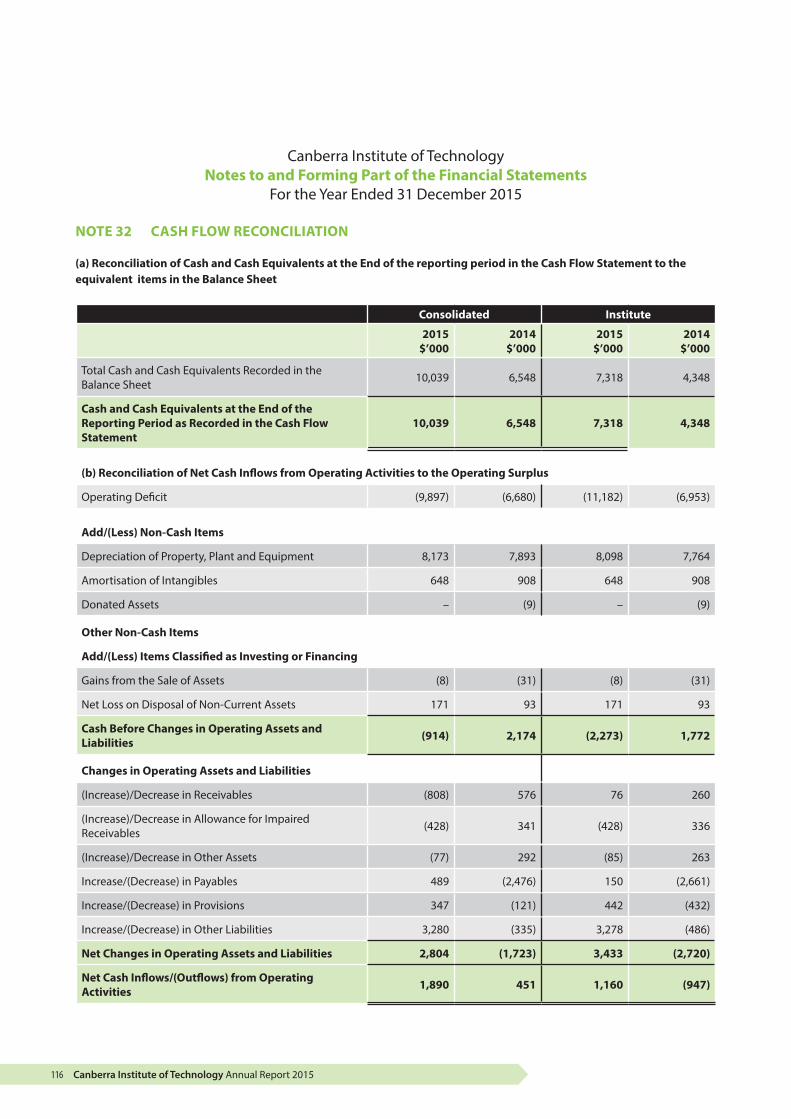
Canberra Institute of Technology Annual Report 2015116
Canberra Institute of Technology Notes to and Forming Part of the Financial Statements
For the Year Ended 31 December 2015
NOTE 32 CASH FLOW RECONCILIATION
(a) Reconciliation of Cash and Cash Equivalents at the End of the reporting period in the Cash Flow Statement to the equivalent items in the Balance Sheet
Consolidated Institute
2015 $’000
2014 $’000
2015 $’000
2014 $’000
Total Cash and Cash Equivalents Recorded in the Balance Sheet 10,039 6,548 7,318 4,348
Cash and Cash Equivalents at the End of the Reporting Period as Recorded in the Cash Flow Statement
10,039 6,548 7,318 4,348
(b) Reconciliation of Net Cash Inflows from Operating Activities to the Operating Surplus
Operating Deficit (9,897) (6,680) (11,182) (6,953)
Add/(Less) Non-Cash Items
Depreciation of Property, Plant and Equipment 8,173 7,893 8,098 7,764
Amortisation of Intangibles 648 908 648 908
Donated Assets – (9) – (9)
Other Non-Cash Items
Add/(Less) Items Classified as Investing or Financing
Gains from the Sale of Assets (8) (31) (8) (31)
Net Loss on Disposal of Non-Current Assets 171 93 171 93
Cash Before Changes in Operating Assets and Liabilities (914) 2,174 (2,273) 1,772
Changes in Operating Assets and Liabilities
(Increase)/Decrease in Receivables (808) 576 76 260
(Increase)/Decrease in Allowance for Impaired Receivables (428) 341 (428) 336
(Increase)/Decrease in Other Assets (77) 292 (85) 263
Increase/(Decrease) in Payables 489 (2,476) 150 (2,661)
Increase/(Decrease) in Provisions 347 (121) 442 (432)
Increase/(Decrease) in Other Liabilities 3,280 (335) 3,278 (486)
Net Changes in Operating Assets and Liabilities 2,804 (1,723) 3,433 (2,720)
Net Cash Inflows/(Outflows) from Operating Activities 1,890 451 1,160 (947)

Canberra Institute of Technology Annual Report 2015 117
SEC
TIO
N C
2 Fi
nanc
ial S
tate
men
ts
Canberra Institute of Technology Notes to and Forming Part of the Financial Statements
For the Year Ended 31 December 2015
NOTE 33 EVENTS OCCURRING AFTER BALANCE DATE
There were no events occurring after the balance date, which would affect the financial statements as at 31 December 2015.
NOTE 34 RELATED PARTY DISCLOSURE
The directors of the Institute during the year were:
Mr Craig Sloan: Chair
Ms Michelle Williamson: Deputy Chair
Ms Leanne Cover: Chief Executive Officer
Dr Stephanie Fahey
Mr Peter McGrath
Ms Diane Joseph
Mr David Dawes
Ms Anita Wesney
Mr Kent Chambers
2015 $’000
Total remuneration paid or due and payable to the directors of the Institute 36
Number
$0 - $1,000 5
$1,001 - $5,000 2
$5,001 - $10,000 1
$10,001 - $20,000 1
9
The Chief Executive Officer did not receive any remuneration as a member of the Board.
The Governing Board came into existence in July 2015 prior to which the Institute did not have any Directors.
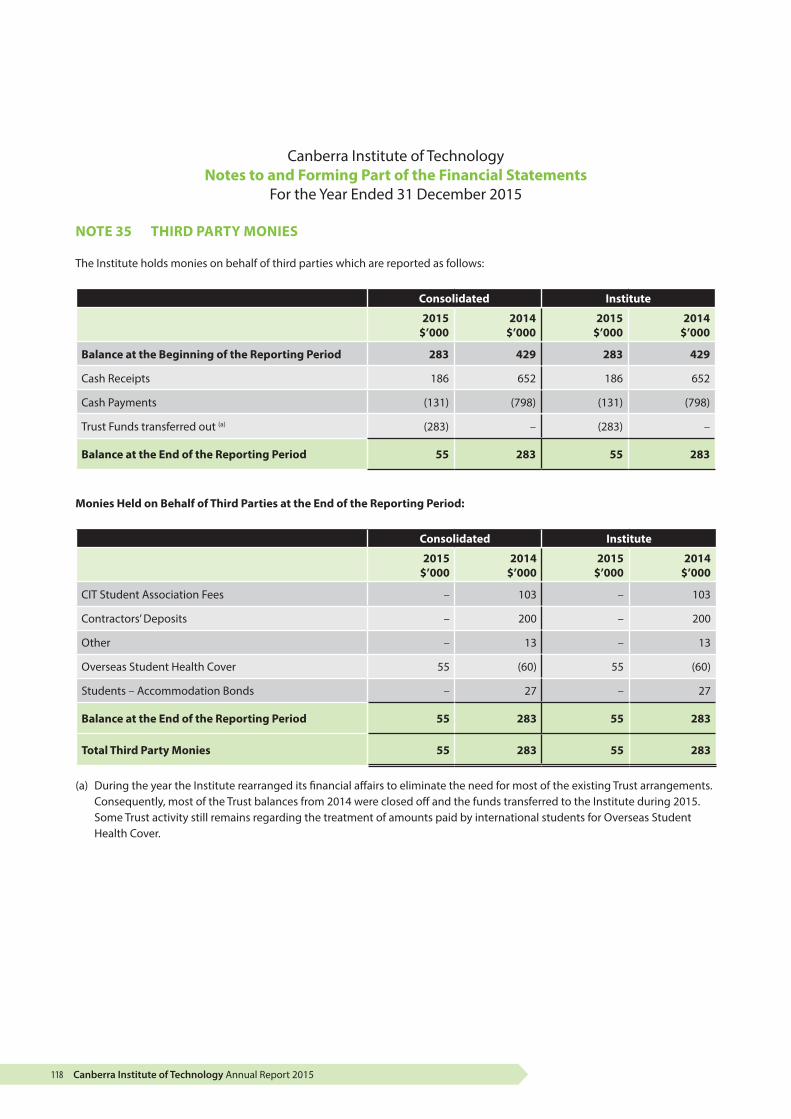
Canberra Institute of Technology Annual Report 2015118
Canberra Institute of Technology Notes to and Forming Part of the Financial Statements
For the Year Ended 31 December 2015
NOTE 35 THIRD PARTY MONIES
The Institute holds monies on behalf of third parties which are reported as follows:
Consolidated Institute
2015 $’000
2014 $’000
2015 $’000
2014 $’000
Balance at the Beginning of the Reporting Period 283 429 283 429
Cash Receipts 186 652 186 652
Cash Payments (131) (798) (131) (798)
Trust Funds transferred out (a) (283) – (283) –
Balance at the End of the Reporting Period 55 283 55 283
Monies Held on Behalf of Third Parties at the End of the Reporting Period:
Consolidated Institute
2015 $’000
2014 $’000
2015 $’000
2014 $’000
CIT Student Association Fees – 103 – 103
Contractors’ Deposits – 200 – 200
Other – 13 – 13
Overseas Student Health Cover 55 (60) 55 (60)
Students – Accommodation Bonds – 27 – 27
Balance at the End of the Reporting Period 55 283 55 283
Total Third Party Monies 55 283 55 283
(a) During the year the Institute rearranged its financial affairs to eliminate the need for most of the existing Trust arrangements. Consequently, most of the Trust balances from 2014 were closed off and the funds transferred to the Institute during 2015. Some Trust activity still remains regarding the treatment of amounts paid by international students for Overseas Student Health Cover.
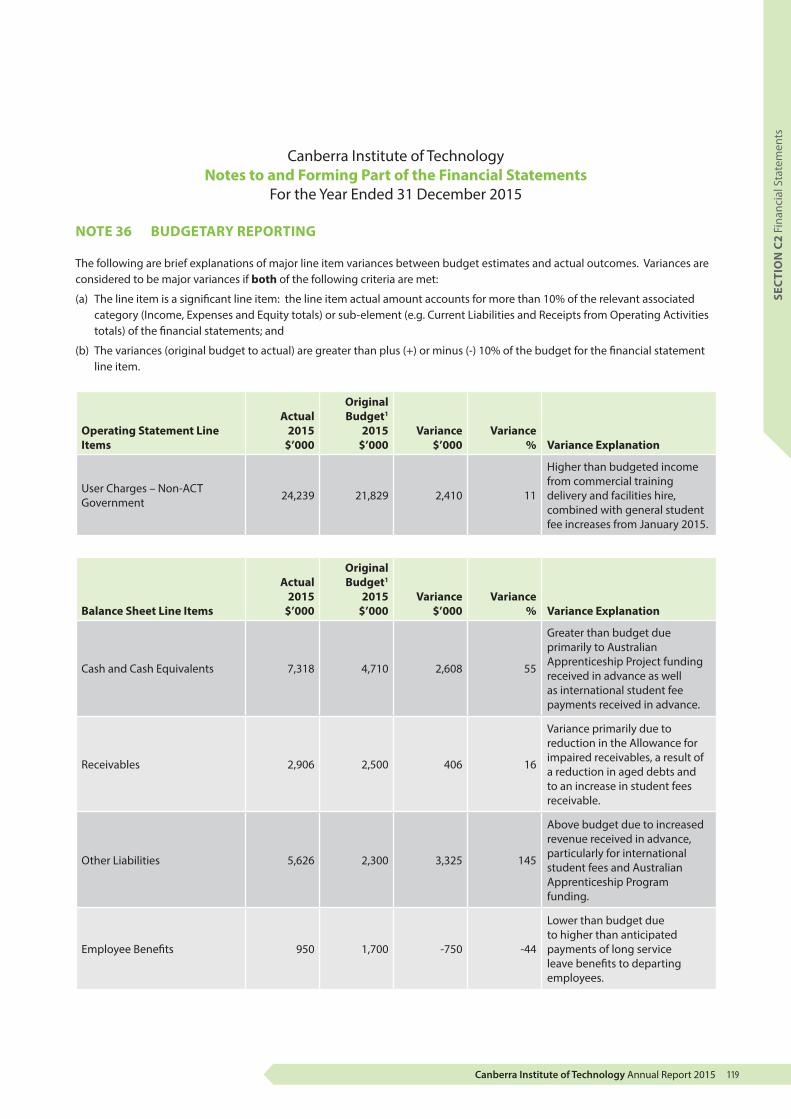
Canberra Institute of Technology Annual Report 2015 119
SEC
TIO
N C
2 Fi
nanc
ial S
tate
men
ts
Canberra Institute of Technology Notes to and Forming Part of the Financial Statements
For the Year Ended 31 December 2015
NOTE 36 BUDGETARY REPORTING
The following are brief explanations of major line item variances between budget estimates and actual outcomes. Variances are considered to be major variances if both of the following criteria are met:
(a) The line item is a significant line item: the line item actual amount accounts for more than 10% of the relevant associated category (Income, Expenses and Equity totals) or sub-element (e.g. Current Liabilities and Receipts from Operating Activities totals) of the financial statements; and
(b) The variances (original budget to actual) are greater than plus (+) or minus (-) 10% of the budget for the financial statement line item.
Operating Statement Line Items
Actual 2015
$’000
Original Budget1
2015$’000
Variance $’000
Variance % Variance Explanation
User Charges – Non-ACT Government 24,239 21,829 2,410 11
Higher than budgeted income from commercial training delivery and facilities hire, combined with general student fee increases from January 2015.
Balance Sheet Line Items
Actual 2015
$’000
Original Budget1
2015$’000
Variance $’000
Variance % Variance Explanation
Cash and Cash Equivalents 7,318 4,710 2,608 55
Greater than budget due primarily to Australian Apprenticeship Project funding received in advance as well as international student fee payments received in advance.
Receivables 2,906 2,500 406 16
Variance primarily due to reduction in the Allowance for impaired receivables, a result of a reduction in aged debts and to an increase in student fees receivable.
Other Liabilities 5,626 2,300 3,325 145
Above budget due to increased revenue received in advance, particularly for international student fees and Australian Apprenticeship Program funding.
Employee Benefits 950 1,700 -750 -44
Lower than budget due to higher than anticipated payments of long service leave benefits to departing employees.
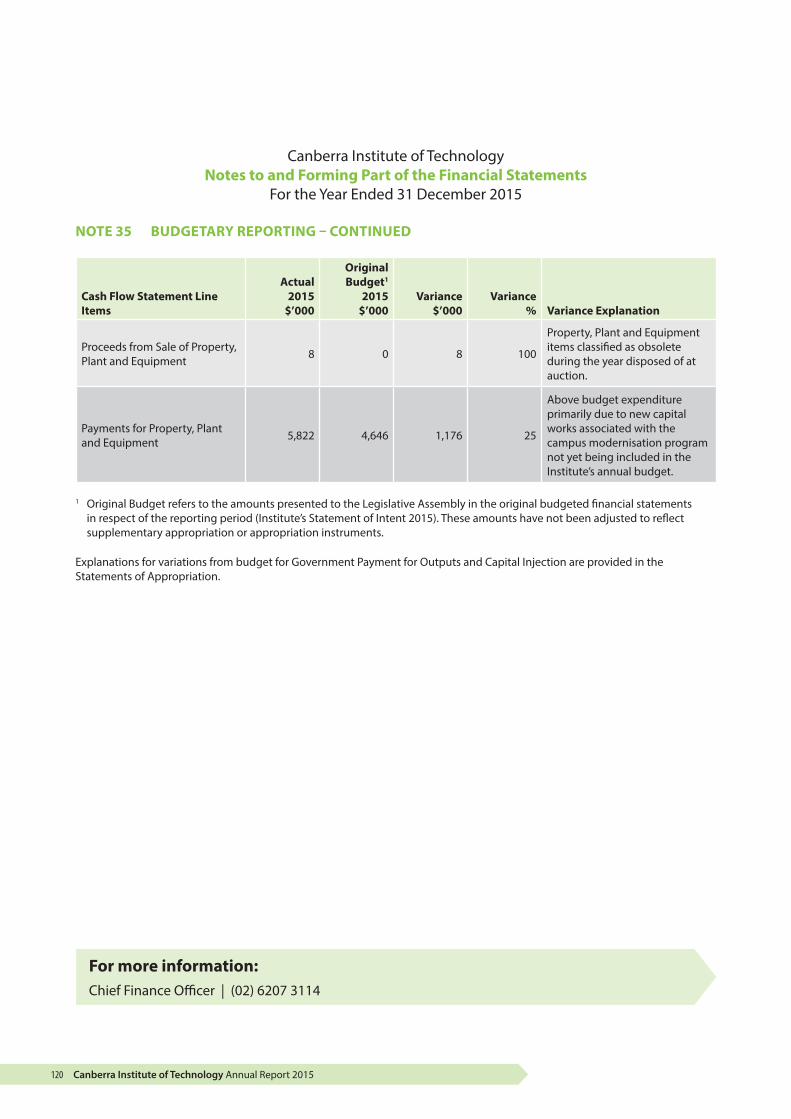
Canberra Institute of Technology Annual Report 2015120
Canberra Institute of Technology Notes to and Forming Part of the Financial Statements
For the Year Ended 31 December 2015
NOTE 35 BUDGETARY REPORTING – CONTINUED
Cash Flow Statement Line Items
Actual 2015
$’000
Original Budget1
2015$’000
Variance $’000
Variance % Variance Explanation
Proceeds from Sale of Property, Plant and Equipment 8 0 8 100
Property, Plant and Equipment items classified as obsolete during the year disposed of at auction.
Payments for Property, Plant and Equipment 5,822 4,646 1,176 25
Above budget expenditure primarily due to new capital works associated with the campus modernisation program not yet being included in the Institute’s annual budget.
1 Original Budget refers to the amounts presented to the Legislative Assembly in the original budgeted financial statements in respect of the reporting period (Institute’s Statement of Intent 2015). These amounts have not been adjusted to reflect supplementary appropriation or appropriation instruments.
Explanations for variations from budget for Government Payment for Outputs and Capital Injection are provided in the Statements of Appropriation.
For more information:Chief Finance Officer | (02) 6207 3114
Canberra Institute of Technology Annual Report 2015 121
SEC
TIO
N C
3 Ca
pita
l Wor
ks
C.3 CAPITAL WORKS
The CIT capital works program consisted of minor capital upgrades undertaken to enhance education delivery, equipment replacement and software upgrades. In 2015, CIT embarked on a major capital works project to develop the new CIT Tuggeranong campus at 205 Anketell Street Greenway. Work on the new campus commenced in December 2015 and is due for completion by end of June 2016.
Minor refurbishments were undertaken at CIT Bruce, CIT Reid and CIT Fyshwick to facilitate the relocation of CIT Woden.
Completed projectsThe following projects were completed:
• Construction of a roof over the sandpit used for construction classes, CIT Bruce
• Upgrade of the signage at all campuses
• Upgrade to curb ramps along Vowels Crescent, CIT Bruce
• Installation of the new lift in B Block, CIT Reid
• Upgrade to mechanical switchboards, CIT Bruce
• Asbestos removal, CIT Bruce
• Construction of first aid room, CIT Fyshwick
• Upgrade of D Block classrooms , CIT Reid
• Refurbishment of G Block classrooms, CIT Reid
• Refurbishment of Bruce Hall, CIT Bruce
• Upgrade of J Block classrooms, CIT Bruce
• Refurbishment of E Block, CIT Reid
Works still in progress• Replacement of the lift in H Block, CIT Bruce
• Replacement of chillers in E and H Blocks, CIT Reid
• Refurbishment of existing toilet block and construction of a new toilet block, CIT Fyshwick
• Administration section in A Block, CIT Bruce. Demolition and fitout alterations
• Refurbishment of B Block, CIT Bruce
• Refurbishment of H Block, CIT Bruce.
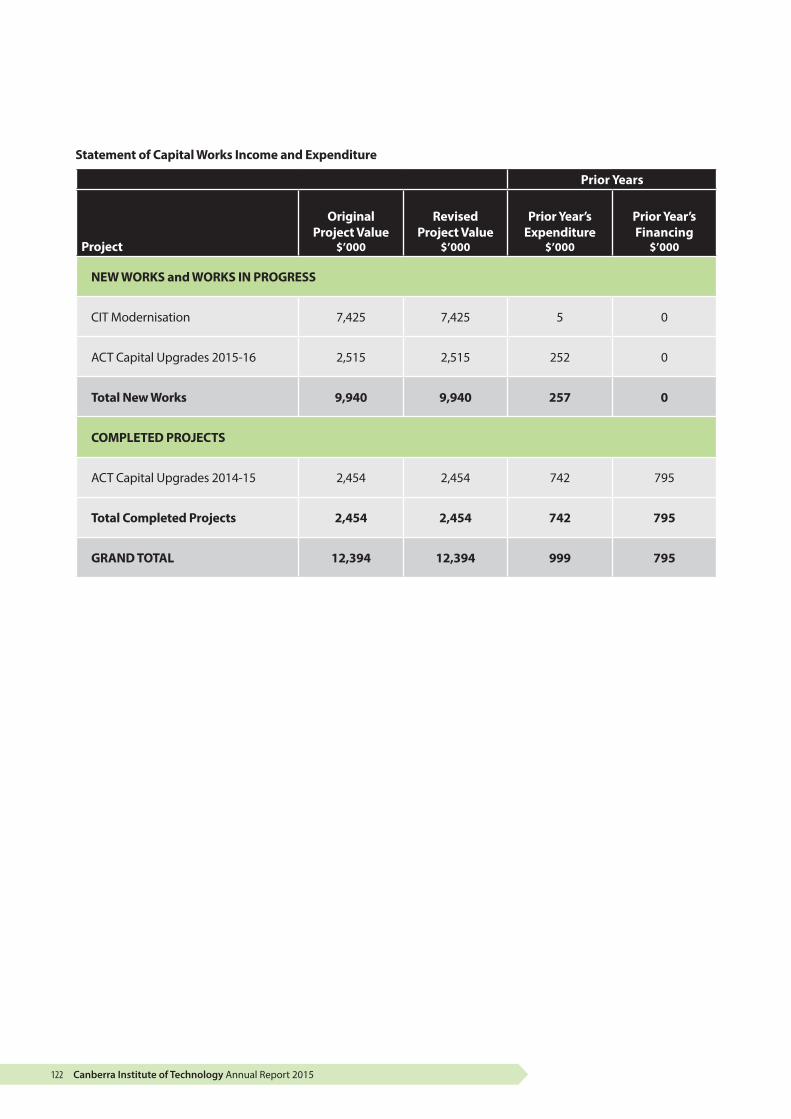
Canberra Institute of Technology Annual Report 2015122
Statement of Capital Works Income and Expenditure
Prior Years
Project
OriginalProject Value
$’000
RevisedProject Value
$’000
Prior Year’sExpenditure
$’000
Prior Year’sFinancing
$’000
NEW WORKS and WORKS IN PROGRESS
CIT Modernisation 7,425 7,425 5 0
ACT Capital Upgrades 2015-16 2,515 2,515 252 0
Total New Works 9,940 9,940 257 0
COMPLETED PROJECTS
ACT Capital Upgrades 2014-15 2,454 2,454 742 795
Total Completed Projects 2,454 2,454 742 795
GRAND TOTAL 12,394 12,394 999 795

Canberra Institute of Technology Annual Report 2015 123
Statement of Capital Works Income and Expenditure – continued
Current Year Completion Date
BudgetedFinancing
$’000
RevisedFinancing
$’000
BudgetedExpenditure
$’000
ActualExpenditure
$’000
Total Financing
to date$’000
Total Expenditure
to Date$’000 Original Revised
1,516 1,418 1,516 1,580 1,418 1,580 Jun 17 Jun 17
535 707 535 547 707 547 Jun 16 Jun 16
2,051 2,125 2,051 2,127 2,125 2,127
1,664 1,664 1,664 1,903 2,459 2,645 Jun 15 Jun 15
1,664 1,664 1,664 1,903 2,459 2,645
3,715 3,789 3,715 4,030 4,584 4,772
SEC
TIO
N C
3 Ca
pita
l Wor
ks

Canberra Institute of Technology Annual Report 2015124
CIT 2014 Capital Works Program Reconciliations
Reconciliation of Total Current Year Financing
Total Current Year Capital Works Financing 3,789
Add: Financing of other Assets (outside capital works) 1,412
Add: Additional ACT Govt Salary Funds 2,423
Capital Injection from Government per Cash Flow Statement 7,625
Reconciliation of Total Current Year Actual Expenditure – against financing
Total Current Year Capital Works Expenditure 4,030
Add: Asset purchases outside of capital works program funded by capital injection 1,412
Less: Currrent Year expenditure committed for Capital Injection next year -272
Add: Previous Year expenditure funded by current year capital injection 32
Add: Additional ACT Govt Salary Funds 2,423
Capital Injection from Government per Cash Flow Statement 7,625
Reconciliation of Total Current Year Actual Expenditure
Total Current Year Capital Works Expenditure 4,030
Add: Capital Works Expenditure expensed on the operating statement -228
Add: Asset purchases outside of capital works program 1,400
Add: Additional ACT Govt Salary Funds 2,423
Purchase of Property Plant and Equipment as per Cash Flow Statement 7,625
For more information:Chief Operating Officer | (02) 6207 3114

Canberra Institute of Technology Annual Report 2015 125
SEC
TIO
N C
4 A
sset
Man
agem
ent
C.4 ASSET MANAGEMENT
CIT manages land and building assets with a land area of 47.25ha, a total floor area of 139,535m2 and a total value of $203.985 million.
CIT’s infrastructure assets are located on four operational campuses:• Reid • Bruce • Woden • Fyshwick.
Additional assets include:• Gungahlin campus • Tuggeranong campus (leased asset)• Sutton Road Training Facility • Watson campus, sub-leased to Academy of
Interactive Entertainment• Monterey Student Residences• Woden Childcare Centre.
The infrastructure assets comprise a diverse range of buildings, grounds and building services of varying age and condition. They range from the first building at CIT Reid constructed in 1960 to the campus at Gungahlin town centre completed in early 2011. CIT buildings incorporate a mix of function types including specialist facilities, workshops, general-purpose classrooms and ancillary office areas. The average age of all CIT buildings is 33 years.
No new buildings were added to the asset register during 2015. As at 31 December 2015, CIT had only its Watson campus nominated as surplus property.
The CIT vehicle fleet consists of 26 passenger vehicles.
Asset maintenance and upgradeCIT conducts ongoing condition audits and the results are incorporated in CIT’s Capital Upgrades and Minor New Works programs.
Minor works undertaken outside the capital works program totalled $190,000. Expenditure on repairs and maintenance including grounds maintenance and cleaning was $5.6 million. No audits were carried out on CIT properties during 2015.
Asset utilisationBecause of the diverse nature of operations throughout CIT, most buildings have multiple usage including classrooms, specialist teaching rooms (workshops, laboratories, etc), support areas (stores, preparation rooms) and offices.
CIT undertakes comparisons of utilisation rates with similar state and territory educational institutions on an annual basis.
The dynamic nature of CIT functions makes it difficult to determine the exact quantum of office space and usage at any one time. Utilisation of office space is always close to 100% as office space is created or removed, subject to demand.
CIT’s space allocation rate for office accommodation is estimated to be approximately 13m2 of floor space per office employee, which is more efficient than the ACT Government’s target rate of 15m2 per employee.
For more information:Chief Operating Officer | (02) 6207 3114
Canberra Institute of Technology Annual Report 2015126
C.5 GOVERNMENT CONTRACTING
Procurement processes within CIT comply with the procurement legislative framework including the Government Procurement Act 2001, Government Procurement Regulation 2007 and subordinate guidelines and circulars. Under whole-of-government procurement arrangements, Shared Services Procurement continues to provide advice and support in relation to procurement and contract management issues, and undertakes higher value procurement activities on behalf of CIT.
CIT engaged external organisations and individuals to undertake a range of services during 2015. The contracting of these external parties occurred for the following reasons: the need for specialist skills and services, the lack of suitable in-house resources, and the need for independent review or facilitation.
Details of individual contracts with expenditure of greater than $25,000 during 2015 are listed below. Expenditure over $25,000 for external sources of labour and services was incurred in 35 contracts, totalling $9,086,231.36.
The largest expenditure item was for CIT’s document and printing solution ($2,115,222.31) with other large expenditure items including cleaning at CIT Reid ($1,058,702.28) and CIT Bruce ($947,241.22) and supply of natural gas across all sites ($664,536.37).
The processes used to select and manage the various consultancies and contractor services were consistent with the ACT Government procurement guidelines and circulars. CIT continues to be responsible for the management of contracts and ensures that these obligations are met and that incidents of non-compliance by contractors are followed up by the nominated agency officer.

Canberra Institute of Technology Annual Report 2015 127
SEC
TIO
N C
5 G
over
nmen
t Con
trac
ting
External sources of labour and services
No Contractor Description of services Amount Date
Complied with Government Procurement Procedures
1 A Plus Plumbing & Building Services Pty Ltd
Provision of Plumbing Maintenance Services for the CIT
$64,113.29 7/7/2014 Yes
2 ActewAGL Retail Supply of Natural Gas to CIT $664,536.37 10/03/2015 Yes
3 Air Plant Sales CIT - Building Maintenance $641,793.03 13/1/2015 Yes
4 AJ & PA Lowry Pty Ltd Trading as ACT Trade Waste
Provision of Waste Removal Services $66,082.02 22/4/2015 Yes
5 Ausgrid Sub Metering NMI $26,110.00 13/05/2015 Yes
6 BRS Commercial Refrigeration Pty Ltd
Provision of Maintenance and Repairs of Refrigeration Equipment for CIT
$133,354.20 17/10/2014 Yes
7 Canberra Institute of Technology Student Association CITSA
VET Outbound Mobility Program $80,000.00 30/04/2015 Yes
8 CBR Brave Ltd CBR Brave 2015 Season Sponsors $25,000.00 6/02/2015 Yes
9 Collard Clarke Jackson, Canberra Pty Ltd
Refurbishment of Tuggeranong CIT Campus
$85,950.00 21/04/2015 Yes
10 Complete Control Pty Ltd Maintenance of DDC Controls to All CIT Campuses
$332,377.00 14/01/2015 Yes
11 Custom Service Leasing Pty Ltd
CIT Fleet Leases 2015-16 $324,787.57 14/01/2015 Yes
12 Dalmaso, Adrian D trading as Dalmaso Plumbing Drainage & Gas
Provision of Plumbing Maintenance Services for the CIT
$241,372.17 7/07/2014 Yes
13 Di Iulio Enterprises Pty Ltd & Larobina Investments Pty Ltd trading as DL Earthworks and Plumbing
Provision of Plumbing Maintenance Services for the CIT
$108,298.60 7/07/2014 Yes
14 Engineered Thermal Systems Pty Ltd
Provision of Maintenance and Repairs of Refrigeration Equipment for the CIT
$34,835.61 17/10/2014 Yes
15 Fuji Xerox Australia Pty Ltd Production of Document Reproduction Equipment and Services
$2,115,222.31 25/01/2008 Yes
16 Hills Ltd Supply of Security and Audio Visual Goods for 2015
$56,033.62 14/01/2015 Yes
17 Hirotec Maintenance Pty Ltd Provision of Fire Protection Equipment Services
$333,427.03 10/01/2013 Yes
18 Vast Security Maintenance, Alteration and Installation Services on Intruder Alarm Systems, CIT Access Card System and CCTV Systems
$233,550.31 25/09/2014 Yes
19 Lec Safe Australia Pty Ltd Provision of Testing and Tagging Services for CIT
$42,559.83 22/10/2012 Yes
20 National Cleaning Services Australia Pty Ltd
Provision of Cleaning Services to CIT Woden Campus
$250,154.50 24/07/2013 Yes
21 National Cleaning Services Australia Pty Ltd
Provision of Cleaning Services to CIT Reid excluding M & K Blocks
$1,058,702.28 17/10/2014 Yes
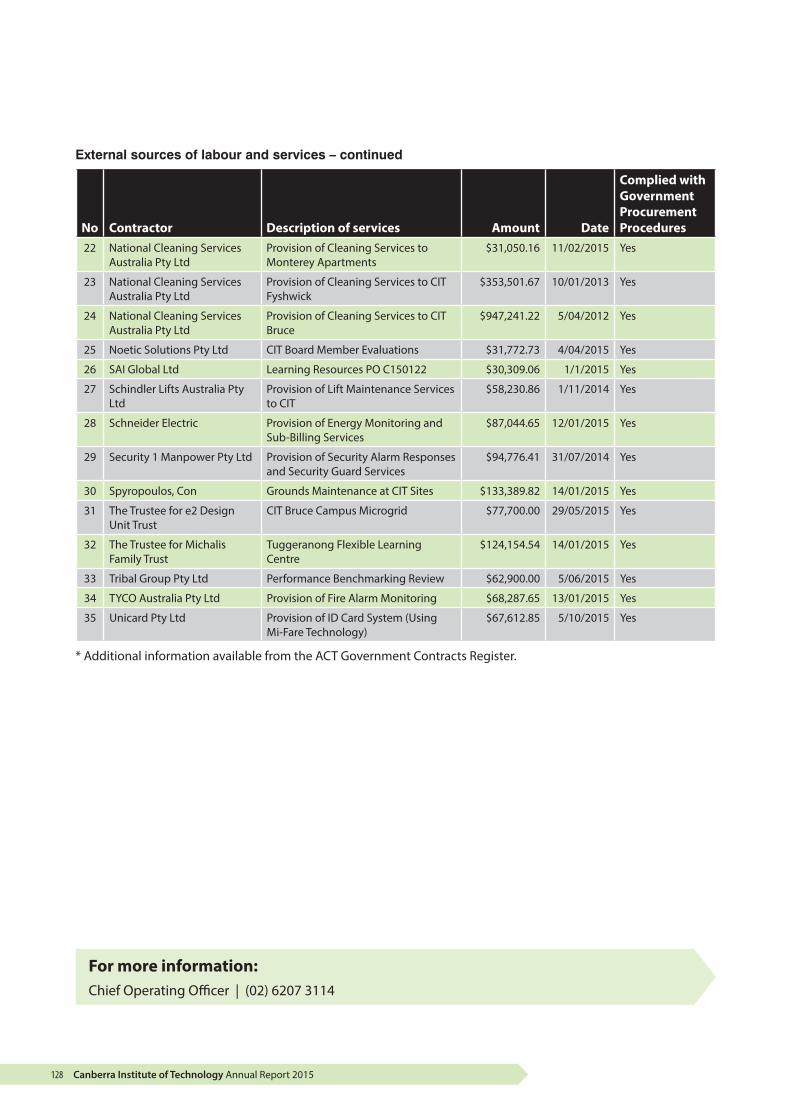
Canberra Institute of Technology Annual Report 2015128
External sources of labour and services – continued
No Contractor Description of services Amount Date
Complied with Government Procurement Procedures
22 National Cleaning Services Australia Pty Ltd
Provision of Cleaning Services to Monterey Apartments
$31,050.16 11/02/2015 Yes
23 National Cleaning Services Australia Pty Ltd
Provision of Cleaning Services to CIT Fyshwick
$353,501.67 10/01/2013 Yes
24 National Cleaning Services Australia Pty Ltd
Provision of Cleaning Services to CIT Bruce
$947,241.22 5/04/2012 Yes
25 Noetic Solutions Pty Ltd CIT Board Member Evaluations $31,772.73 4/04/2015 Yes
26 SAI Global Ltd Learning Resources PO C150122 $30,309.06 1/1/2015 Yes
27 Schindler Lifts Australia Pty Ltd
Provision of Lift Maintenance Services to CIT
$58,230.86 1/11/2014 Yes
28 Schneider Electric Provision of Energy Monitoring and Sub-Billing Services
$87,044.65 12/01/2015 Yes
29 Security 1 Manpower Pty Ltd Provision of Security Alarm Responses and Security Guard Services
$94,776.41 31/07/2014 Yes
30 Spyropoulos, Con Grounds Maintenance at CIT Sites $133,389.82 14/01/2015 Yes
31 The Trustee for e2 Design Unit Trust
CIT Bruce Campus Microgrid $77,700.00 29/05/2015 Yes
32 The Trustee for Michalis Family Trust
Tuggeranong Flexible Learning Centre
$124,154.54 14/01/2015 Yes
33 Tribal Group Pty Ltd Performance Benchmarking Review $62,900.00 5/06/2015 Yes
34 TYCO Australia Pty Ltd Provision of Fire Alarm Monitoring $68,287.65 13/01/2015 Yes
35 Unicard Pty Ltd Provision of ID Card System (Using Mi-Fare Technology)
$67,612.85 5/10/2015 Yes
* Additional information available from the ACT Government Contracts Register.
For more information:Chief Operating Officer | (02) 6207 3114

Canberra Institute of Technology Annual Report 2015 129
SEC
TIO
N C
6 St
atem
ent o
f Per
form
ance
C.6 STATEMENT OF PERFORMANCE

Canberra Institute of Technology Annual Report 2015130
Canberra Institute of Technology Annual Report 2015 131
SEC
TIO
N C
6 St
atem
ent o
f Per
form
ance
Canberra Institute of TechnologyStatement of Performance
For the Year Ended 31 December 2015
Statement of Responsibility
In my opinion, the Statement of Performance is in agreement with the Canberra Institute of Technology’s records and fairly reflects the service performance of the Canberra Institute of Technology for the year ended 31 December 2015 and also fairly reflects the judgements exercised in preparing it.
Craig Sloan Chair Canberra Institute of Technology Board 18 March 2016

Canberra Institute of Technology Annual Report 2015132
Canberra Institute of TechnologyStatement of Performance
For the Year Ended 31 December 2015
Statement by the Chief Operating Officer
In my opinion, the Statement of Performance is in agreement with the Canberra Institute of Technology’s records and fairly reflects the service performance of the Canberra Institute of Technology for the year ended 31 December 2015 and also fairly reflects the judgements exercised in preparing it.
Shane kay Chief Finance Officer Canberra Institute of Technology 18 March 2016
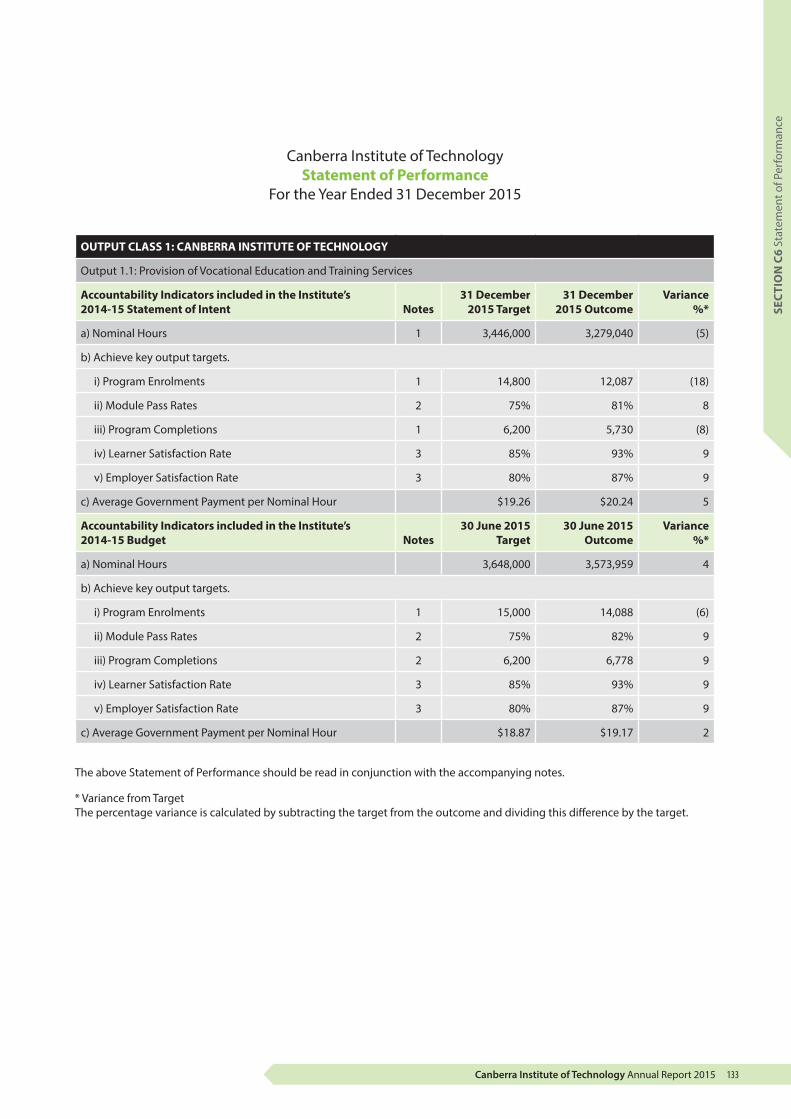
Canberra Institute of Technology Annual Report 2015 133
SEC
TIO
N C
6 St
atem
ent o
f Per
form
ance
Canberra Institute of Technology Statement of Performance
For the Year Ended 31 December 2015
OUTPUT CLASS 1: CANBERRA INSTITUTE OF TECHNOLOGY
Output 1.1: Provision of Vocational Education and Training Services
Accountability Indicators included in the Institute’s 2014-15 Statement of Intent Notes
31 December 2015 Target
31 December 2015 Outcome
Variance %*
a) Nominal Hours 1 3,446,000 3,279,040 (5)
b) Achieve key output targets.
i) Program Enrolments 1 14,800 12,087 (18)
ii) Module Pass Rates 2 75% 81% 8
iii) Program Completions 1 6,200 5,730 (8)
iv) Learner Satisfaction Rate 3 85% 93% 9
v) Employer Satisfaction Rate 3 80% 87% 9
c) Average Government Payment per Nominal Hour $19.26 $20.24 5
Accountability Indicators included in the Institute’s 2014-15 Budget Notes
30 June 2015 Target
30 June 2015 Outcome
Variance %*
a) Nominal Hours 3,648,000 3,573,959 4
b) Achieve key output targets.
i) Program Enrolments 1 15,000 14,088 (6)
ii) Module Pass Rates 2 75% 82% 9
iii) Program Completions 2 6,200 6,778 9
iv) Learner Satisfaction Rate 3 85% 93% 9
v) Employer Satisfaction Rate 3 80% 87% 9
c) Average Government Payment per Nominal Hour $18.87 $19.17 2
The above Statement of Performance should be read in conjunction with the accompanying notes.
* Variance from TargetThe percentage variance is calculated by subtracting the target from the outcome and dividing this difference by the target.
Canberra Institute of Technology Annual Report 2015134
Canberra Institute of TechnologyStatement of Performance
For the Year Ended 31 December 2015
Notes
1 Nominal Hours, Program Enrolments and Program Completions at 31 December 2015 were lower than target due to aggressive competition for students from low-cost education providers taking advantage of the Commonwealth’s VET FEE HELP deferred payment program, combined with the introduction of the ACT Skilled Capital program attracting students who would normally enrol under the ACT Government funded training (Profile) scheme.
2 Program completions and module pass rates are above target due to CIT’s continued focus on high-quality and relevant training and support for CIT’s students, as reflected in CIT’s 2015 Learner Engagement Survey results.
3 The 2015 surveys of learner engagement and employer satisfaction showed overall levels of satisfaction with the training of 93 and 87 per cent respectively, reflecting employers’ and students’ positive view of their experience of CIT training. Learner Satisfaction Rate results were based on the survey of students enrolled in nationally accredited programs. CIT has continued to improve its effectiveness and responsiveness in skilling students with contemporary training methods which have been positively received by industry and students alike.

Canberra Institute of Technology Annual Report 2015 135
SEC
TIO
N C
6 St
atem
ent o
f Per
form
ance
Canberra Institute of TechnologyStatement of Performance
For the Year Ended 31 December 2015
Accountability Indicator Definitions
a) Nominal Hours is the nationally accepted quantitative output measure for the Vocational Education and Training sector. It measures the anticipated hours of supervised learning or training provided by the Institute to adequately present the educational material associated with the delivery and assessment of a program of study. It also includes student contact hours delivered through a recognition of prior learning process.
b) Output targets are as specified below.
i. The number of records of students fulfilling program enrolment requirements in accordance with the national Australian Vocational Education and Training Management Information Statistical Standard (AVETMISS).
ii. The proportion of successful module (subject) outcomes compared to module enrolments weighted by Nominal Hours in accordance with the national AVETMIS Standard.
iii. The number of student records where program completion requirements have been met in accordance with the AVETMIS Standard for students completing study in the previous academic year(s). This measure does not include completions for non-accredited training such as Adult Community Education (ACE) programs.
iv. Learner satisfaction rates measure the proportion of current CIT students participating in the “Learner Engagement Survey” (LES) who indicated that they were satisfied with the training at CIT. The Learner Engagement Survey was designed by the Australian Council for Educational Research (ACER) to collect data relating to one of the Quality Indicators (QI), “Learner Engagement”. All registered training organisations (RTOs) registered with the Australian Skills Quality Authority (ASQA) are required to provide an annual summary report of their performance against the learner engagement indicator to ASQA.
v. Employer satisfaction rates measure the proportion of employers with apprentices or trainees studying at CIT that expressed their satisfaction with the training delivered at CIT. The Employer Satisfaction Survey (ESS) was designed by ACER to collect data relating to one of the QI’s, “Employer Satisfaction”. All RTO’s registered with ASQA are required to provide an annual summary report of their performance against the employer satisfaction indicator to ASQA.
c) The Average Government Payment per Nominal Hour is an output target calculated as the Total Government Payment for Outputs divided by the Nominal Hours outcome for Profile training programs delivered. Noting that ‘Profile’ relates to training activities that are funded directly by the ACT Government appropriation for the provision of public access vocational education and training.
For more information:Chief Finance Officer | (02) 6207 3114

Canberra Institute of Technology Annual Report 2015136

Canberra Institute of Technology Annual Report 2015 137
SECT
ION
D N
otic
es o
f Non
Com
plia
nce
DARC Y JONES Graduate, Sports Turf Management
I have won a number of awards for my
studies at CIT and my workmanship,
which probably goes to show I have
chosen the right career for me, and
it is definitely a good position to be
in to be good at and rewarded for
something you love doing!”

Canberra Institute of Technology Annual Report 2015138
D.1 DANGEROUS SUBSTANCES
Section 200 of the Dangerous Substances Act 2004 requires agencies to provide a statement on the number of notices of non-compliance served and the matter to which each notice related.
CIT did not receive any notices of non-compliance during 2015.
For more information:Chief Operating Officer | (02) 6207 3114
Canberra Institute of Technology Annual Report 2015 139
SEC
TIO
N D
2 M
edic
ines
, Poi
sons
and
The
rape
utic
Goo
ds
D.2 MEDICINES, POISONS AND THERAPEUTIC GOODS
Section 177 of the Medicines, Poisons and Therapeutic Goods Act 2008 requires agencies to provide a statement on the number of notices of non-compliance served and the matter to which each notice related.
CIT did not receive any notices of non-compliance during 2015.
For more information:Chief Operating Officer | (02) 6207 3114

Canberra Institute of Technology Annual Report 2015140
Canberra Institute of Technology Annual Report 2015 141
E INVESTIGATION OF COMPLAINTSF HEALTHG GAMBLING AND RACINGH MINISTERIAL AND DIRECTOR-GENERAL
DIRECTIONSI PUBLIC LAND MANAGEMENT PLANSJ THIRD PARTY INSURANCEK VICTIMS OF CRIMEL WASTE MINIMISATION CONTRAVENTIONS
These sections listed in the Annual Report Directions are not applicable to the Canberra Institute of Technology and so are not in this report.

Canberra Institute of Technology Annual Report 2015142
M COMMUNITY ENGAGEMENT AND SUPPORT
As the only public provider of VET in the ACT, CIT continued to play a vital role in community development in 2015 by providing pathways and access into education for members of the community, as well as a wide range of support services for students. CIT supports the ACT economy to grow by producing skilled job ready graduates.
To meet its functions effectively, CIT maintains close links with industry in its governance structure through program reference groups, industry advisory groups, and through the CIT Council (January to July) and the CIT Board (July – December 2015). The planning process is further informed by the ACT Skills Needs List, published annually by the Education and Training Directorate (ETD), other ACT Government plans and CIT’s Program Review and Improvement cycle.
CIT contributes to the social capital of the ACT through:
• providing vocational pathways through the ACT Senior Secondary Certificate, general education programs and the Skills for Education and Employment (SEE) program
• CIT Yurauna Centre, CIT’s dedicated Aboriginal and Torres Strait Islander teaching and support centre. CIT Yurauna Centre enhances employment opportunities for Aboriginal and Torres Strait Islanders through pastoral assistance and providing courses to improve literacy, numeracy, communication and vocational training
• access and opportunity for disadvantaged members of the community, including provision of training for young parents through a partnership with the ETD Canberra College
Cares (CCCares) initiative, as well as program partnerships aimed at engaging youth at risk
• promoting awareness of the value of VET. Community assistance, sponsorship, scholarships and grants are important in this regard.
Following is a table highlighting financial support CIT provided or managed in 2015.
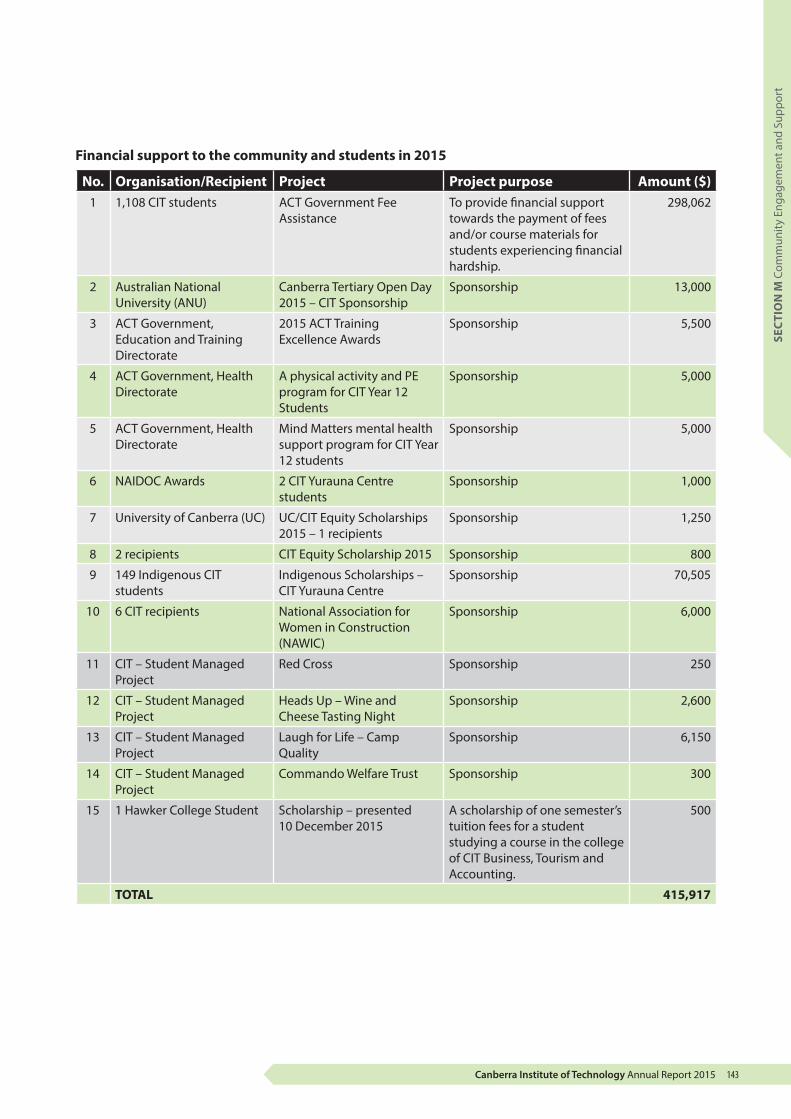
Canberra Institute of Technology Annual Report 2015 143
Financial support to the community and students in 2015
No. Organisation/Recipient Project Project purpose Amount ($)1 1,108 CIT students ACT Government Fee
AssistanceTo provide financial support towards the payment of fees and/or course materials for students experiencing financial hardship.
298,062
2 Australian National University (ANU)
Canberra Tertiary Open Day 2015 – CIT Sponsorship
Sponsorship 13,000
3 ACT Government, Education and Training Directorate
2015 ACT Training Excellence Awards
Sponsorship 5,500
4 ACT Government, Health Directorate
A physical activity and PE program for CIT Year 12 Students
Sponsorship 5,000
5 ACT Government, Health Directorate
Mind Matters mental health support program for CIT Year 12 students
Sponsorship 5,000
6 NAIDOC Awards 2 CIT Yurauna Centre students
Sponsorship 1,000
7 University of Canberra (UC) UC/CIT Equity Scholarships 2015 – 1 recipients
Sponsorship 1,250
8 2 recipients CIT Equity Scholarship 2015 Sponsorship 800
9 149 Indigenous CIT students
Indigenous Scholarships – CIT Yurauna Centre
Sponsorship 70,505
10 6 CIT recipients National Association for Women in Construction (NAWIC)
Sponsorship 6,000
11 CIT – Student Managed Project
Red Cross Sponsorship 250
12 CIT – Student Managed Project
Heads Up – Wine and Cheese Tasting Night
Sponsorship 2,600
13 CIT – Student Managed Project
Laugh for Life – Camp Quality
Sponsorship 6,150
14 CIT – Student Managed Project
Commando Welfare Trust Sponsorship 300
15 1 Hawker College Student Scholarship – presented 10 December 2015
A scholarship of one semester’s tuition fees for a student studying a course in the college of CIT Business, Tourism and Accounting.
500
TOTAL 415,917
SEC
TIO
N M
Com
mun
ity E
ngag
emen
t and
Sup
port

Canberra Institute of Technology Annual Report 2015144
Following is a table highlighting partnerships which support students at CIT.
Partnerships which supported CIT students in 2015 (scholarships and prizes)
No. Recipient(s) Sponsor Support Purpose1 1 recipient ANU Prize Awarded to an outstanding student who has completed
a qualification at diploma level or higher.
2 2 recipients Rotary Club of Canberra – City Prize
Awarded to students who have completed any trade course and have demonstrated a high standard of craftsmanship and personal conduct.
3 1 recipient Rotary Club of Canberra – Weston Creek Prize
Awarded to a student graduating from any CIT course who has made a valuable contribution to the community during their studies in a field relevant to their studies.
4 2 recipients University of Canberra Prizes Awarded to students who have accessed higher education pathways in pursuit of their educational needs.
5 5 recipients Canberra Refugee Support Scholarships
Awarded to asylum seekers or refugees studying or seeking to study in Canberra.
6 Various mental health consumers
ACT Health A scholarship scheme to increase employment opportunities for mental health consumers.
7 10 recipients VET Outbound Mobility study opportunity overseas sponsored through the Australian Government Department of Education and Training
CIT photography, visual arts and Indigenous cultural arts students studied with and learnt from their peers at the Yogyakarta Institute of Arts, Indonesia.
8 10 recipients VET Outbound Mobility Program funded overseas study opportunity sponsored through the Australian Government Department of Education and Training
CIT photography and graphic design students benefited from a learning experience at the Beijing Institute of Fashion and Photography, China.
9 1 recipient UN/CIT Photography Competition prize
The main competition prize for CIT photography work. The winning photography student has the opportunity to work with the United Nations Information Centre on an overseas posting.
10 9 recipients VET Outbound Mobility Program funded overseas study opportunity sponsored through the Australian Government Department of Education and Training
Nine CIT veterinary nursing students volunteered at the Chiang Mai Elephant Nature Park working with rescue elephants in Thailand, and nine worked with orangutans in East Kalimantan, Indonesia, in partnership with the Borneo Orangutan Survival Foundation, as part of their studies.
11 9 recipients VET Outbound Mobility Program funded overseas study opportunity sponsored through theAustralian Government Department of Education and Training
CIT teachers undertaking teacher education training attended a skills conference in India.
Canberra Institute of Technology Annual Report 2015 145
SEC
TIO
N M
Com
mun
ity E
ngag
emen
t and
Sup
port
In-kind support offered by CIT staff and students in 2015 included:
• judging the bread competition at the Royal Canberra Show
• creating boutonnieres for distinguished guests attending Anzac Day services at the Australian War Memorial
• catering for the St John’s Care free community lunch
• donating gifts for the Barnados Christmas Appeal
• providing perishable food to Communities@Work Yellow Van food rescue service
• raising funds for the Indigenous Literacy Foundation through a second-hand book sale
• sponsoring FASHFEST, including coordinating student and staff volunteers from creative disciplines
• provision of facilities at CIT Bruce for the Canberra Raiders to train.
For more information:Executive Director, CIT People and Organisational Governance | (02) 6207 3133
Canberra Institute of Technology Annual Report 2015146
N.1 BUSHFIRE RISK MANAGEMENT
CIT has an evacuation plan for bushfire management as required by the Emergency Services Agency. This plan is only related to and required for CIT Bruce. The Bushfire/Local Disaster Evacuation Plan can be found on CIT’s intranet in the Emergency Procedures (all campuses) document.
For more information:Chief Operating Officer | (02) 6207 3114

Canberra Institute of Technology Annual Report 2015 147
SEC
TIO
N N
2 Fr
eedo
m o
f Inf
orm
atio
n
N.2 FREEDOM OF INFORMATION
The object of the Freedom of Information Act 1989 is to extend as far as possible the right of the Australian community and, in particular, the citizens of the ACT, to access information in the possession of the ACT Government.
CIT mid-year reporting to the Assembly, July 2015
Included in the Justice and Community Services Directorate Annual Report 2014-15.
For more information:Executive Director, CIT People and Organisational Governance | (02) 6207 3133
Canberra Institute of Technology Annual Report 2015148
N.3 HUMAN RIGHTS
The ACT was the first jurisdiction in Australia to enact human rights legislation with the Human Rights Act 2004 taking effect on 1 July 2004. The Act provides an explicit statutory basis for respecting, protecting and promoting civil and political rights. CIT is committed to ensuring the human rights of all its students and staff.
CIT mid-year reporting to the Assembly, July 2015
Included in the Justice and Community Services Directorate Annual Report 2014-15.
For more information:Executive Director, CIT People and Organisational Governance | (02) 6207 3133
Canberra Institute of Technology Annual Report 2015 149
SEC
TIO
N N
4 Le
gal S
ervi
ces
Dire
ctio
ns
N.4 LEGAL SERVICES DIRECTIONS
Under Section 15 of the Law Officer Act 2011 agencies are required to report the measures taken to ensure compliance with legal services directions issued under Section 11 of the Act.
CIT mid-year reporting to the Assembly, July 2015
Included in the Justice and Community Services Directorate Annual Report 2014-15.
For more information:Executive Director, CIT People and Organisational Governance | (02) 6207 3133
Canberra Institute of Technology Annual Report 2015150
O.1 CULTURE AND BEHAVIOUR
For more information:Executive Director, CIT People and Organisational Governance | (02) 6207 3133
Code of PracticeThe CIT Code of Practice complements the ACT Public Service (ACTPS) Code of Conduct for CIT employees by establishing clear guidelines on the standards of behaviour and professional practice expected of CIT employees.
RED FrameworkCIT is committed to the Respect, Equity and Diversity (RED) framework, and having a positive and fair work environment in which employee differences are respected and valued. CIT has 14 RED contact officers across the four major campuses. CIT provided training for these officers in 2015. CIT clearly articulates its expectations of behaviour in relation to respect in the Code of Practice. In 2012 CIT made a commitment to mandatory training for all staff in the prevention of bullying. Since that time we have seen significant improvements in our staff survey results in relation to values and behaviour and a corresponding decrease in the number of serious concerns raised. In 2015 no misconduct proceedings were initiated under the Enterprise Agreements in relation to bullying.
Acknowledgement and Recognition FrameworkThis framework is designed to assist managers and leaders within CIT to support and celebrate the efforts, achievements and successes of their teams and team members. The framework incorporates the factors of inclusion, consultation and flexibility and includes regular opportunities for acknowledgment that culminate in an annual Staff Achievement Awards ceremony.

Canberra Institute of Technology Annual Report 2015 151
SEC
TIO
N O
2 Pu
blic
Inte
rest
Dis
clos
ure
O.2 PUBLIC INTEREST DISCLOSURE
For more information:Chief Operating Officer | (02) 6207 3114
The object of Public Interest Disclosure Act 2012 is to promote public interest by:
• providing a way for people to make public interest disclosures
• ensuring people who make public interest disclosures are protected and treated respectfully
• ensuring public interest disclosures are properly investigated and managed
• ensuring that appropriate consideration is given to the interests of people who make public interest disclosures and the people who are the subject of the disclosures.
CIT’s Public Interest Disclosure Policy outlines the mechanisms for reporting possible wrongdoing at CIT or any ACT Government agency perpetrated by staff or persons engaged by or on behalf of CIT or other ACT Government agencies.
CIT did not receive any public interest disclosures during 2015.

Canberra Institute of Technology Annual Report 2015152
O.3 WORKFORCE PROFILE
Attraction and Retention Initiatives (ARins)Teaching staff at CIT continue to be covered by the ACT Public Sector Canberra Institute of Technology (Teaching Staff) Enterprise Agreement 2013-2017. General staff continue to be covered by the ACT Public Sector Canberra Institute of Technology Enterprise Agreement 2013-2017.
These Enterprise Agreements provide scope for ARIns to be agreed with staff to provide higher levels of remuneration or other benefits above those identified in the Enterprise Agreements.
The following tables outline ARIns (formally SEAs) that were in place during 2015.
Description No. of Individual ARIns
Number of ARIns at 31 December 2015 1
Number of employees who transferred from SEAs during the period 1
Number of ARIns entered into during period 0
Number of ARIns terminated during period 1
Number of ARIns providing for privately plated vehicles as at 30 June 2015 0
Classification Range Remuneration as at 31 December 2015
Individual ARIns SOG A *
*Remuneration excluded from table due to privacy reasons
Staffing profileThe following data reflects CIT staff information as at payday 2 December 2015, and was provided by Shared Services. The statistics exclude CIT Board members, staff not paid by the ACT Public Service, and employees on leave without pay.
The number of staff paid decreased from 985 at payday 3 December 2014 to 908 at 2 December 2015.
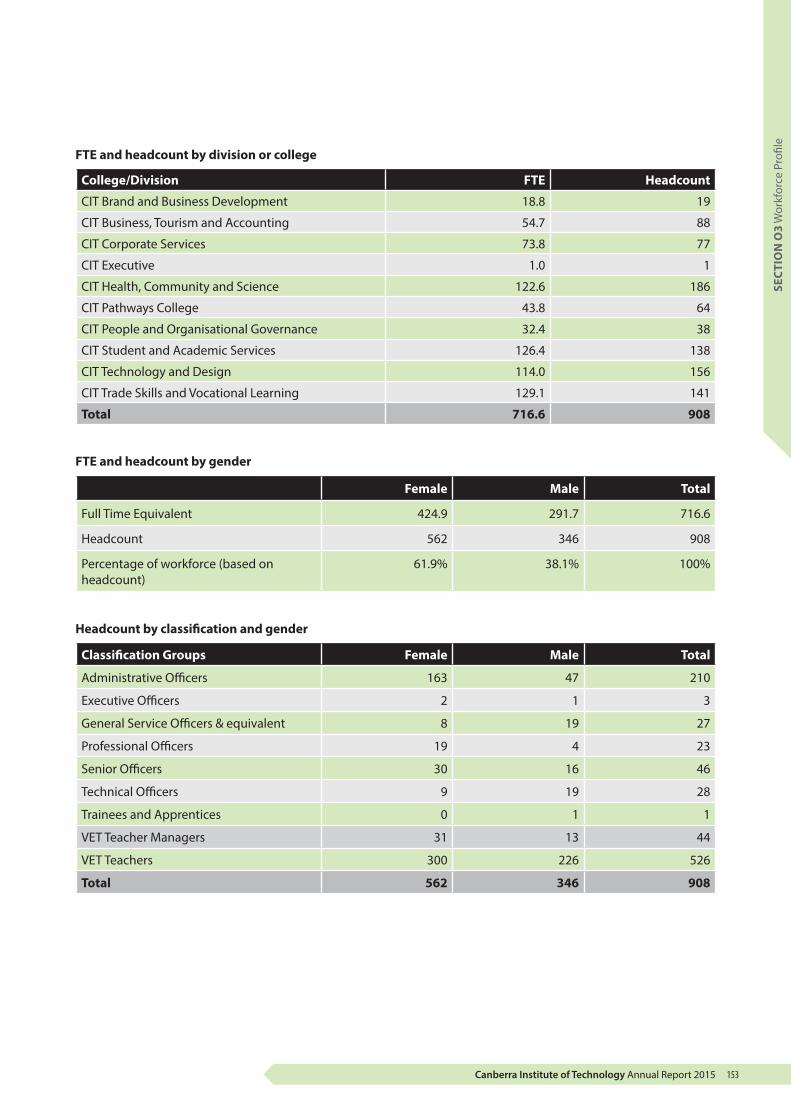
Canberra Institute of Technology Annual Report 2015 153
SEC
TIO
N O
3 W
orkf
orce
Pro
file
FTE and headcount by division or college
College/Division FTE Headcount
CIT Brand and Business Development 18.8 19
CIT Business, Tourism and Accounting 54.7 88
CIT Corporate Services 73.8 77
CIT Executive 1.0 1
CIT Health, Community and Science 122.6 186
CIT Pathways College 43.8 64
CIT People and Organisational Governance 32.4 38
CIT Student and Academic Services 126.4 138
CIT Technology and Design 114.0 156
CIT Trade Skills and Vocational Learning 129.1 141
Total 716.6 908
FTE and headcount by gender
Female Male Total
Full Time Equivalent 424.9 291.7 716.6
Headcount 562 346 908
Percentage of workforce (based on headcount)
61.9% 38.1% 100%
Headcount by classification and gender
Classification Groups Female Male Total
Administrative Officers 163 47 210
Executive Officers 2 1 3
General Service Officers & equivalent 8 19 27
Professional Officers 19 4 23
Senior Officers 30 16 46
Technical Officers 9 19 28
Trainees and Apprentices 0 1 1
VET Teacher Managers 31 13 44
VET Teachers 300 226 526
Total 562 346 908
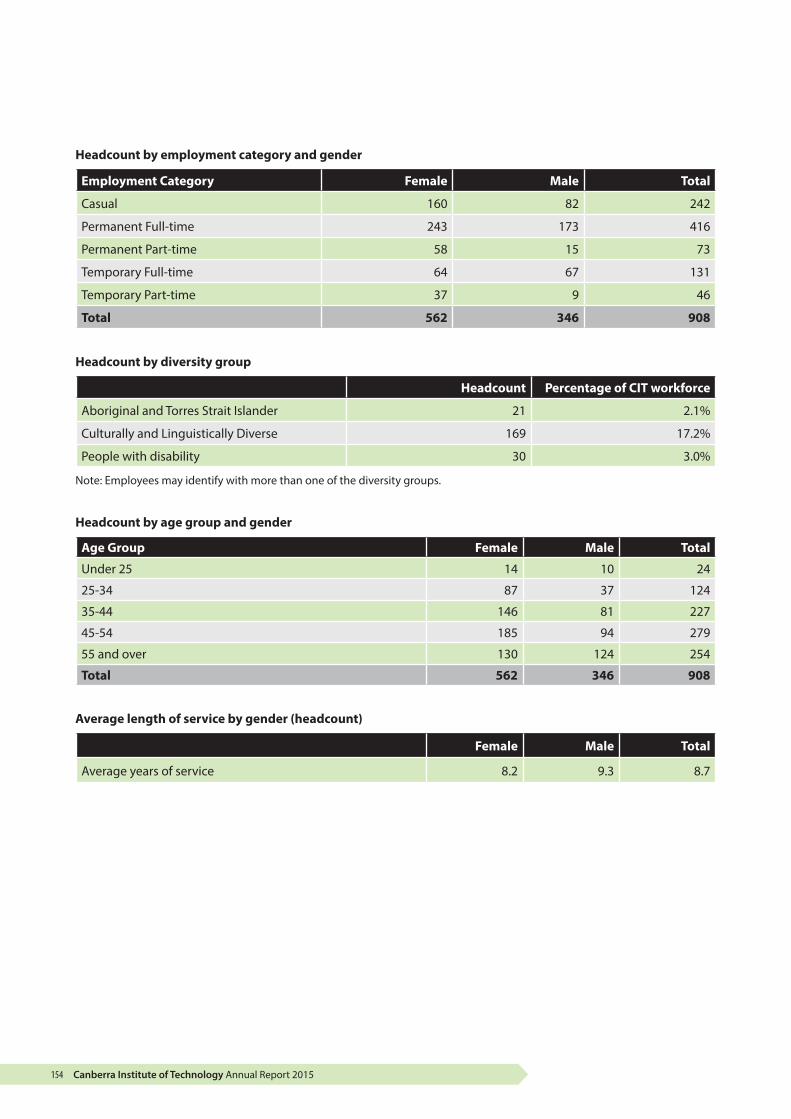
Canberra Institute of Technology Annual Report 2015154
Headcount by employment category and gender
Employment Category Female Male Total
Casual 160 82 242
Permanent Full-time 243 173 416
Permanent Part-time 58 15 73
Temporary Full-time 64 67 131
Temporary Part-time 37 9 46
Total 562 346 908
Headcount by diversity group
Headcount Percentage of CIT workforce
Aboriginal and Torres Strait Islander 21 2.1%
Culturally and Linguistically Diverse 169 17.2%
People with disability 30 3.0%
Note: Employees may identify with more than one of the diversity groups.
Headcount by age group and gender
Age Group Female Male Total
Under 25 14 10 24
25-34 87 37 124
35-44 146 81 227
45-54 185 94 279
55 and over 130 124 254
Total 562 346 908
Average length of service by gender (headcount)
Female Male Total
Average years of service 8.2 9.3 8.7
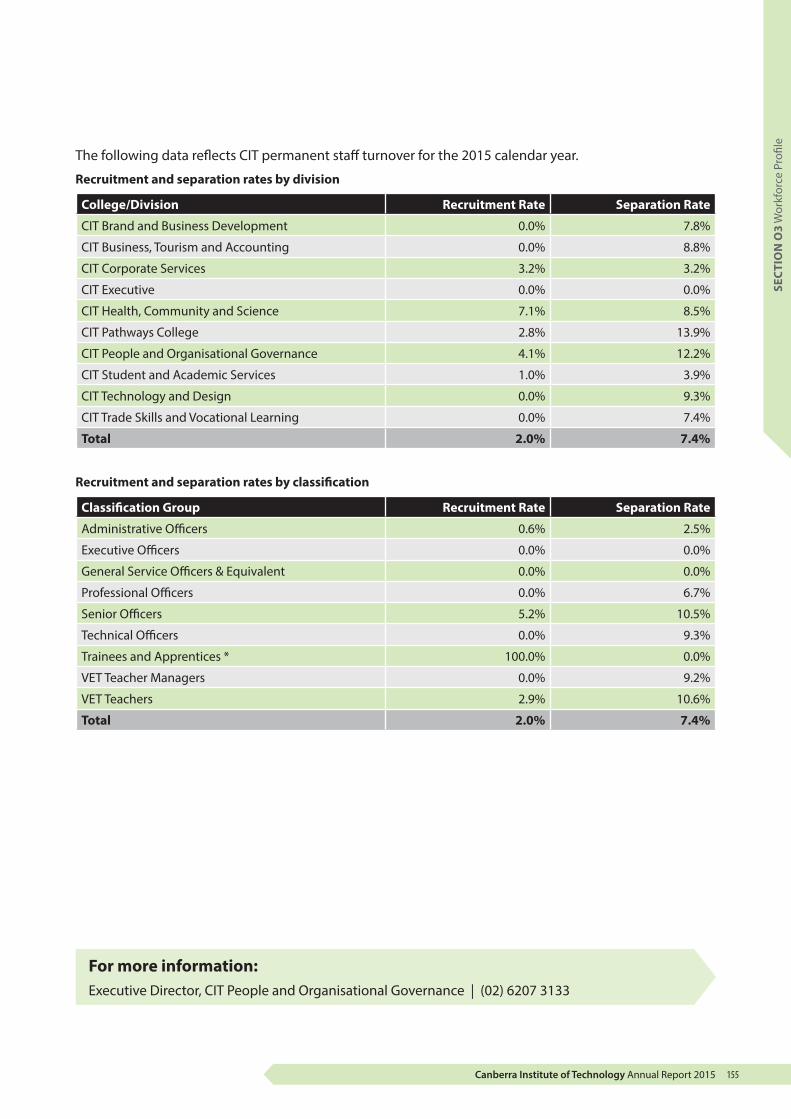
Canberra Institute of Technology Annual Report 2015 155
The following data reflects CIT permanent staff turnover for the 2015 calendar year.
Recruitment and separation rates by division
College/Division Recruitment Rate Separation Rate
CIT Brand and Business Development 0.0% 7.8%
CIT Business, Tourism and Accounting 0.0% 8.8%
CIT Corporate Services 3.2% 3.2%
CIT Executive 0.0% 0.0%
CIT Health, Community and Science 7.1% 8.5%
CIT Pathways College 2.8% 13.9%
CIT People and Organisational Governance 4.1% 12.2%
CIT Student and Academic Services 1.0% 3.9%
CIT Technology and Design 0.0% 9.3%
CIT Trade Skills and Vocational Learning 0.0% 7.4%
Total 2.0% 7.4%
Recruitment and separation rates by classification
Classification Group Recruitment Rate Separation Rate
Administrative Officers 0.6% 2.5%
Executive Officers 0.0% 0.0%
General Service Officers & Equivalent 0.0% 0.0%
Professional Officers 0.0% 6.7%
Senior Officers 5.2% 10.5%
Technical Officers 0.0% 9.3%
Trainees and Apprentices * 100.0% 0.0%
VET Teacher Managers 0.0% 9.2%
VET Teachers 2.9% 10.6%
Total 2.0% 7.4%
SEC
TIO
N O
3 W
orkf
orce
Pro
file
For more information:Executive Director, CIT People and Organisational Governance | (02) 6207 3133
Canberra Institute of Technology Annual Report 2015156
P TERRITORY RECORDS ACT
CIT has a recognised records management program (RMP) that has been approved by the agency principal officer and submitted to the Director of Territory Records.
CIT has specific approved procedures in place which are implemented in conjunction with the RMP. Appropriate training and resources are available to staff throughout the agency.
CIT has included in its RMP arrangements for preserving records that contain information that may allow people to establish links with their Aboriginal or Torres Strait Islander heritage.
CIT has responded to the commencement of Part 3 of the Territory Records Act 2002 – access to records, including details of the assessment of those records to which Section 28 of the Act may apply. CIT continues to develop tools which will help members of the community to interpret CIT’s older records which are open for public access.
CIT is currently implementing HP RM 8 with the long term goal for this solution to be rolled out agency wide as an electronic document and records management system (EDRMS) to be used by all staff to capture corporate records.
For more information:Chief Operating Officer | (02) 6207 3114
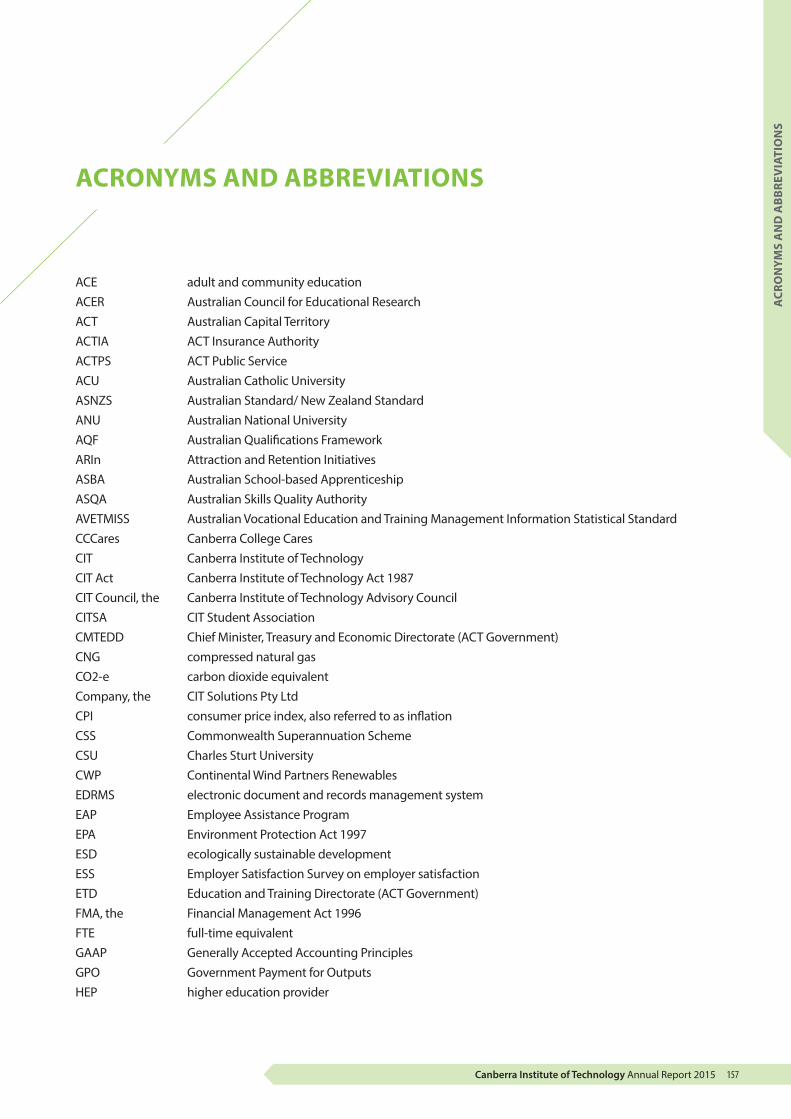
Canberra Institute of Technology Annual Report 2015 157
ACR
ON
YMS
AN
D A
BB
REV
IATI
ON
S
ACRONYMS AND ABBREVIATIONS
ACE adult and community educationACER Australian Council for Educational ResearchACT Australian Capital TerritoryACTIA ACT Insurance AuthorityACTPS ACT Public ServiceACU Australian Catholic UniversityASNZS Australian Standard/ New Zealand StandardANU Australian National UniversityAQF Australian Qualifications FrameworkARIn Attraction and Retention InitiativesASBA Australian School-based ApprenticeshipASQA Australian Skills Quality AuthorityAVETMISS Australian Vocational Education and Training Management Information Statistical StandardCCCares Canberra College CaresCIT Canberra Institute of TechnologyCIT Act Canberra Institute of Technology Act 1987CIT Council, the Canberra Institute of Technology Advisory CouncilCITSA CIT Student AssociationCMTEDD Chief Minister, Treasury and Economic Directorate (ACT Government)CNG compressed natural gasCO2-e carbon dioxide equivalentCompany, the CIT Solutions Pty LtdCPI consumer price index, also referred to as inflationCSS Commonwealth Superannuation SchemeCSU Charles Sturt UniversityCWP Continental Wind Partners RenewablesEDRMS electronic document and records management systemEAP Employee Assistance ProgramEPA Environment Protection Act 1997ESD ecologically sustainable development ESS Employer Satisfaction Survey on employer satisfactionETD Education and Training Directorate (ACT Government)FMA, the Financial Management Act 1996FTE full-time equivalentGAAP Generally Accepted Accounting PrinciplesGPO Government Payment for OutputsHEP higher education provider
Canberra Institute of Technology Annual Report 2015158
HR human resourcesHSR health safety representativeICT information and communication technologyLED lighting light emitting diode lightingLES Learner engagement survey on learner satisfactionLPG liquid petroleum gas MIEACT Mental Illness Education ACTMLA Member of Legislative Assembly MOOC massive open online courseMSD musculoskeletal disordersNH nominal hour NCVER National Centre for Vocational Education Research NDIS National Disability Insurance SchemeQI quality indicator, refer also to LES and ESSPID Public Interest DisclosurePSS Public Sector Superannuation SchemePSSAP Public Sector Superannuation Scheme Accumulation PlanRAP CIT Reconciliation Action PlanRED Respect, equity and diversity RMP records management program RTO registered training organisationSOI CIT Statement of IntentTAFE technical and further educationTDA TAFE Directors AustraliaTEQSA Tertiary Education Quality and Standards AgencyUC University of CanberraUSI unique student identifierVET vocational education and trainingWHS workplace health and safety
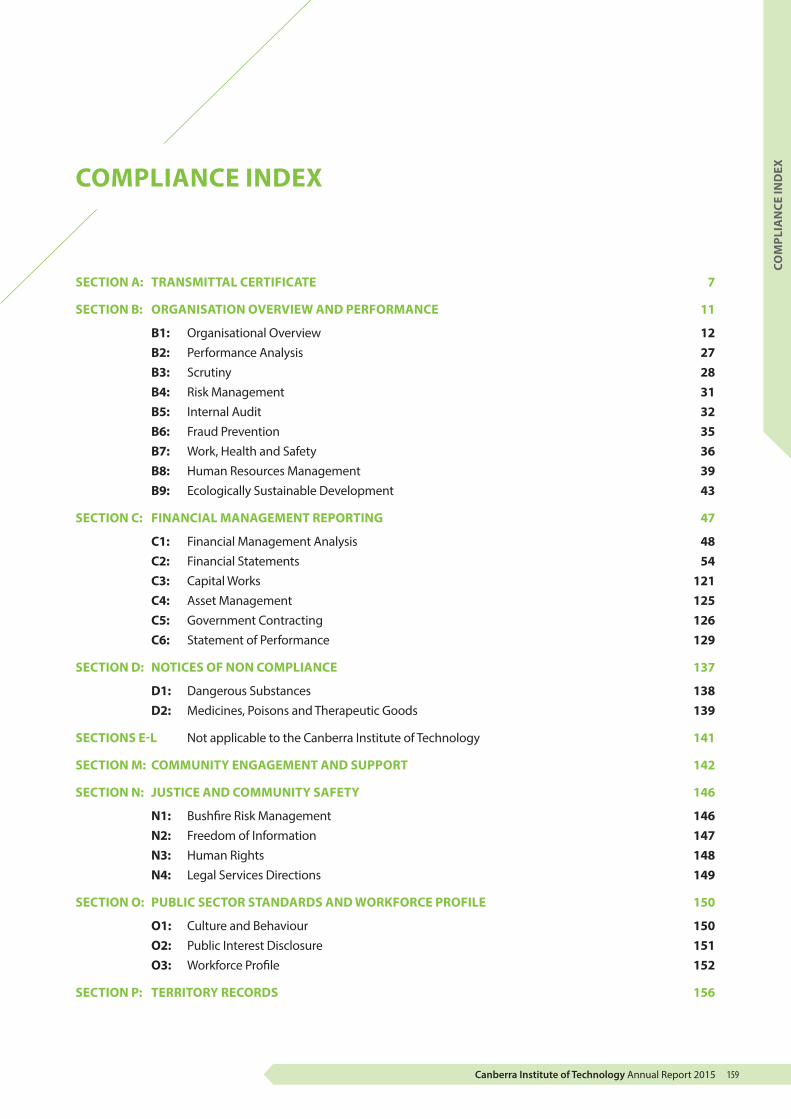
Canberra Institute of Technology Annual Report 2015 159
COM
PLIA
NCE
IND
EXCOMPLIANCE INDEX
SECTION A: TRANSMITTAL CERTIFICATE 7
SECTION B: ORGANISATION OVERVIEW AND PERFORMANCE 11
B1: Organisational Overview 12 B2: Performance Analysis 27 B3: Scrutiny 28 B4: Risk Management 31 B5: Internal Audit 32 B6: Fraud Prevention 35 B7: Work, Health and Safety 36 B8: Human Resources Management 39 B9: Ecologically Sustainable Development 43
SECTION C: FINANCIAL MANAGEMENT REPORTING 47
C1: Financial Management Analysis 48 C2: Financial Statements 54 C3: Capital Works 121 C4: Asset Management 125 C5: Government Contracting 126 C6: Statement of Performance 129
SECTION D: NOTICES OF NON COMPLIANCE 137
D1: Dangerous Substances 138 D2: Medicines, Poisons and Therapeutic Goods 139
SECTIONS E-L Not applicable to the Canberra Institute of Technology 141
SECTION M: COMMUNITY ENGAGEMENT AND SUPPORT 142
SECTION N: JUSTICE AND COMMUNITY SAFETY 146
N1: Bushfire Risk Management 146 N2: Freedom of Information 147 N3: Human Rights 148 N4: Legal Services Directions 149
SECTION O: PUBLIC SECTOR STANDARDS AND WORKFORCE PROFILE 150
O1: Culture and Behaviour 150 O2: Public Interest Disclosure 151 O3: Workforce Profile 152
SECTION P: TERRITORY RECORDS 156

Canberra Institute of Technology Annual Report 2015160
CONTACT OFFICER
Dr Nicole StenlakeExecutive DirectorCIT People and Organisational GovernanceCanberra Institute of TechnologyGPO Box 826CANBERRA ACT 2601
Email: [email protected]
Telephone: (02) 6207 3133
Facsimile: (02) 6207 3109
Website Addresswww.cit.edu.au


ANNUAL REPORT 2015
CAN
BERRA IN
STITUTE O
F TECHN
OLO
GY A
NN
UA
L REPORT 2015
CRICOS No. 00001K – RTO Code 0101