CIT 2019 Annual Report - Canberra Institute of Technology
182
ANNUAL REPORT 2019 Canberra Institute of Technology
-
Upload
khangminh22 -
Category
Documents
-
view
2 -
download
0
Transcript of CIT 2019 Annual Report - Canberra Institute of Technology

CANBERRA IN
STITUTE O
F TECHN
OLO
GY AN
NU
AL REPORT
2019
ANNUAL REPORT2019
Canberra In
stitu
te
of Tech
nology


ANNUAL REPORT2019
Canberra In
stitu
te
of Tech
nology

Acknowledgement of Country
The ACT Government acknowledges the Ngunnawal people as traditional custodians of the Canberra region and that the region is also an important meeting place and significant to other Aboriginal groups. The ACT Government respects the continuing culture and the contribution that Aboriginal and Torres Strait Islander peoples make to the life of this city and surrounding region.
Canberra Institute of Technology Annual Report 2019
© ACT Government 2020
ISSN 1322-5456
This work is copyright. Apart from any use permitted under the Copyright Act 1968, no part may be reproduced by any process without written permission from the Manager, Publications and Communications, Corporate Services Bureau, ACT Government, GPO Box 158, Canberra ACT 2601.
Designed by CIT Marketing, Canberra Institute of Technology
RTO: 0101 CRICOS: 00001K
2 Canberra Institute of Technology: Annual Report 2019

CONTENTS
PART A: TRANSMITTAL CERTIFICATE 5
FROM THE CIT BOARD CHAIR 8
FROM THE CIT CHIEF EXECUTIVE OFFICER 12
PART B: ORGANISATION OVERVIEW AND PERFORMANCE 13
B1: Organisational Overview 14 B2: Performance Analysis 31 B3: Scrutiny 52 B4: Risk Management 53 B5: Internal Audit 54 B6: Fraud Prevention 56 B7: Freedom of Information 57 B8: Community Engagement and Community Support 59 B9: Aboriginal and Torres Strait Islander Reporting 61 B10: Work Health and Safety 65 B11: Human Resources Management 68 B12: Ecologically Sustainable Development 75
PART C: FINANCIAL MANAGEMENT REPORTING 79
C1: Financial Management Analysis 80 C2: Financial Statements 85 C3: Capital Works 152 C4: Asset Management 154 C5: Government Contracting 155 C6: Statement of Performance 166
PART D: WHOLE OF GOVERNMENT ANNUAL REPORTING 173
D1: Bushfire Risk Management 174 D2: Territory Records 175
ACRONYMS AND ABBREVIATIONS 176
COMPLIANCE INDEX 177
CONTACT OFFICER 178
3

4 Canberra Institute of Technology: Annual Report 2019
5
PartA
Transm
ittal
C e r t i fi c a t e

6 Canberra Institute of Technology: Annual Report 2019

RTO Code 0101 CRICOS No. 00001K
|
Transmittal Certifcate
Mr Chris Steel MLA Minister for Tertiary Education ACT Legislative Assembly London Circuit CANBERRA ACT 2601
Dear Minister
This report has been prepared in accordance with section 7(2) of the Annual Reports (Government Agencies) Act 2004 and in accordance with the requirements under the Annual Report Directions.
It has been prepared in conformity with other legislation applicable to the preparation of the Annual Report by CIT.
I certify that information in the attached annual report, and information provided for whole of government reporting, is an honest and accurate account and that all material information on the operations of CIT has been included for the period 1 January 2019 to 31 December 2019.
I hereby certify that fraud prevention has been managed in accordance with Public Sector Management Standards 2006 (repealed), Part 2.3 (see section 113, Public Sector Management Standards 2016).
Section 13 of the Annual Reports (Government Agencies) Act 2004 requires that you present the Report to the Legislative Assembly within 15 weeks after the end of the reporting year.
Yours sincerely
Leanne Cover Craig Sloan Chief Executive Ofcer Chair, CIT Board 24 March 2020 24 March 2020
Canberra Institute of Technology | GPO Box 826, Canberra, 2601 Australia | T +(61) 02 6207 3107 | F +(61) 02 6207 3109 | E [email protected] | cit.edu.au
CIT Bruce | CIT Fyshwick | CIT Gungahlin | CIT Reid | CIT Tuggeranong | ABN 432 737 96 990 | CRICOS No. 00001K | RTO 0101
7
FROM THE CIT BOARD CHAIR
Craig Sloan CIT Board Chair
I am pleased to present the Canberra Institute of Technology (CIT) 2019 Annual Report.
CIT continues to be a key contributor to the prosperity of the ACT economy and community. Through innovative courses and the delivery of quality vocational education and training (VET) we are addressing skill shortages in many vital occupations, supporting advancements in emerging sectors and helping the ACT Government deliver on its key workforce priorities.
CIT has expanded the workforce through its connection with industry and further development of the ACT Governments’ key capability areas. In particular, CIT has been critical in developing capability in the service industries in Canberra. We have continued to be the training provider of choice for many small and medium enterprises and have seen increased demand for our courses in cyber security, ICT, aged care and children education and care services, and have remained pivotal to the nation’s public sector training.
In 2019 campus renewal was once again a major focus for the CIT Board. The November announcement of a new Woden Campus while retaining a presence in the city reflects the ACT Government’s strong commitment to vocational education and skills development for the ACT and region.
This investment of up to $250 million will deliver a state-of-the-art campus within a refreshed Woden
precinct and include a new Transport Canberra interchange and light rail. The CIT Board is committed to working with government, including Major Projects Canberra, to ensure this facility, together with the existing campus network provides CIT with the physical presence to remain at the forefront of delivering the vocational education and training required by the ACT and region’s people, industries and communities now and into the future.
As outlined in the Evolving Together – Strategic Compass 2020, in 2019 we continued to focus on opportunities for innovation and collaboration. Collaborating with the Canberra Innovation Network, our staf have had the opportunity to learn new ways of working and thinking to better equip them to tackle the complex challenges the sector continues to face.
In the latter part of the year, I chaired the inaugural CIT/ACT Industry Roundtable with key industry leaders in the ACT. The roundtable along with the re-invigoration of Industry Advisory Groups across the colleges, ensure we have multiple touch points and connections with employers to confirm that our training products remain responsive and relevant to what is happening in the rapidly changing world of work.
In the last twelve months, CIT has strengthened industry relationships and embedded new partnerships across a range of sectors. CIT continues to work with Microsof to develop and implement
8 Canberra Institute of Technology: Annual Report 2019

“As we move into a new decade, the CIT Board is committed to refining our oferings, transforming our business by improving the customer experience and ensuring future sustainability in an environment of unprecedented volatility and change.”
a program where our students receive dual accreditation when completing the Certificate IV in ICT. CIT has partnered with Australian Government’s Digital Transformation Agency for 13 years and trains between 50 to 80 trainees annually in information, media, technology and cyber security courses.
A further partnership with Accor Hotel Group and the Australian Government has helped address a critical skills gap in the local hospitality industry, delivering a pre-traineeship program to local mature jobseekers with many subsequently securing employment in the sector.
We are working with Vestas (the world leader in wind generated energy) to ensure its workforce has the skills it needs to work across multiple disciplines, including Global Wind Organisation high-risk training, electrotechnology and cyber security. Through these partnerships CIT continues to builds its reputation for helping industry with its entire workforce development needs.
I am very proud that CIT was recognised as the 2019 ACT Large Training Provider of the year and as one of three national finalists at the Australian Training awards held in Brisbane in November. This is the second time in three years that CIT has been named one of the top three large vocational education
providers in the nation. We were also recognised with the 2019 ACT Industry Collaboration Award for our cyber security collaboration and as a finalist for this category at the national training awards. These awards recognise CIT is continuing to meet the needs of industry while working collaboratively with industry, the community and students to achieve excellence in the fast paced tertiary education sector.
As we move into a new decade, the CIT Board is committed to refining our oferings, transforming our business by improving the customer experience and ensuring future sustainability in an environment of unprecedented volatility and change.
It has again been a pleasure working with the CEO, Leanne Cover, and staf across CIT during 2019. On behalf of the Board, I thank everyone for their continued hard work and dedication to CIT and our students.
I also wish to thank my fellow Board members (including those who lef part way through the year) for their commitment to ensuring the longevity and continued success of CIT, with a special mention to Ms Michelle Melbourne, our Deputy Chair who resigned in August. Michelle was our inaugural Deputy Chair from the Board’s commencement in 2015 and I thank her for her enthusiasm, dedication and support.
9

FROM THE CIT CHIEF EXECUTIVE OFFICER
Leanne Cover Chief Executive Oficer
It has been another exciting and challenging year for CIT as we continue to evolve with all of the workforce sectors we serve in Canberra, and across the region, to support economic growth for the community and meet the challenges of preparing for the jobs of today and those that don’t even exist yet.
As career paths are altered by technological innovation and labour market disruptions, we are seeing an increasing demand for vocational education and training. In 2019, CIT continued to adapt and co-evolve with our students and industry. For those already in the workforce, and their employers, CIT has increasingly provided the skills they want and need, for the jobs of today. CIT’s unique relationship with industry has been instrumental in providing small and medium businesses with the ability to reskill and upskill their workforce. CIT also continues to strengthen our position as a provider of choice for Australian government agencies.
Workplaces are fundamentally transforming and along with our students and industry partners, CIT is continuing to adapt as an educational institution. Investing in our people ensures our future viability and underpins our commitment to transform our business.
It is essential that CIT continually develops and advances the knowledge and skills of our own workforce in order to provide excellence in VET and deliver on our Strategic Compass promises.
Our approach to organisational transformation in 2019 reflects our commitment to learn as an organisation
along with the dynamic ecosystem we are a part of. This focus is helping CIT to understand and adapt its courses and services for multiple possible futures and not limit CIT’s future possibilities. This will ensure CIT remains relevant and sustainable in the long term.
Throughout the year, there have been a number of mechanisms to develop our staf’s knowledge of contemporary organisational transformation. A learning series was available for staf to delve into the concepts that underpin the complexity of systems such as CIT. Groups of CIT staf also explored using appropriate tools and approaches that increased our understanding of the context CIT is operating in and built our visibility of the connectivity between the teaching and business functions of the organisation.
CIT continues to develop its leaders at every level. The professional development Mentor and Digital Coach programs provided participants with new skills and the opportunity to reflect on their professional learning journeys. Three hundred staf participated in digital coaching, 52 teachers extended their shared knowledge and networks and 56 CIT leaders upskilled through participation in our mentoring programs.
We have also been experimenting with diferent ways of analysing the data and insights collected through the student and employer satisfaction surveys. A deep dive into the 2018 results was undertaken with participants from all parts of CIT exploring the themes identified and implementing change that directly related to the feedback provided. I am pleased that our 2019 satisfaction rates for both students and
10 Canberra Institute of Technology: Annual Report 2019
“In 2019, we have been increasingly working across the organisation to develop a deeper understanding of our business, increase visibility of the ecosystem we are operating within and ensure our staf are equipped with the knowledge, skills and tools required as we move into the future.”
employers continued to be strong with 90% for students and 90% for employers overall, satisfied with the training provided by CIT.
In 2019, enrolments at CIT continued to steadily increase. Areas of growth were in short course enrolments in emerging areas, apprentices and trainees (bucking the national trend) and students wishing to study under the ACT Government’s Skilled Capital initiative.
CIT has provided students with a number of unique experiences, including 50 students studying a range of disciplines while visiting industry partners in Singapore, Indonesia and Thailand through the Endeavour Leaderships Program. In visiting
these countries CIT students are exposed to global industry trends, diferent cultures, diverse learning opportunities and the chance to broaden their horizons in thinking about their future study and career options.
The coming year will bring more changes within the VET environment with policy and funding decisions being made by the Council of Australian Government (COAG) Skills Council, including through the new National Skills Commission and possible new funding arrangements. CIT will continue our eforts and commitment to learning and adapting so that we can be ready for any of the possible changes ahead and continue to provide high quality VET to our students and community.
11

12 Canberra Institute of Technology: Annual Report 2019

13
PartB
Organisa
tional O
verv
iew
and Perfo
rmance

B.1 ORGANISATIONAL OVERVIEW
Canberra has a global reputation as a world-class education and training city. As the ACT’s premier vocational education and training (VET) provider, the Canberra Institute of Technology (CIT) is delivering training to meet the future needs of the ACT economy. CIT provides training to over 20,000 students each year and increases access to workforce participation and social inclusion for many in the community. CIT is a dynamic, connected and diverse provider of VET ofering quality skills development to individuals, employers and industry in Canberra, Australia and globally.
Roles and Functions CIT is the largest publically funded Registered Training Organisation (RTO) in the ACT and is a Territory Authority established under the Canberra Institute of Technology Act 1987.
CIT is responsible for providing training and education that meets the needs of students, industry, business and the ACT community. In 2019, the ACT Government Minister for Vocational Education and Skills, Ms Meegan Fitzharris MLA, was responsible for CIT until her resignation in June 2019.
From 1 July 2019, CIT became part of the new Tertiary Education portfolio established within the Chief Minister, Treasury and Economic Development Directorate (CMTEDD) encompassing both higher education and vocational education and skills. Mr Andrew Barr MLA, as Minister for Tertiary Education, was responsible for this portfolio for the remainder of 2019.
CIT plays a major role in the development of the ACT’s future workforce and in building the skill base of the economy.
CIT’s core business is the design and facilitation of high quality vocational programs and services to meet the training needs of a diverse customer base – locally, nationally and internationally.
CIT operations are funded by a combination of direct appropriation from the ACT Government and through additional revenue raised by CIT’s commercial and contestable activities.
During 2019, CIT operated across four campuses and two learning centres.
Corporate Objectives The corporate objectives of CIT for 2019, as outlined in its Statement of Intent, are:
> create a more agile CIT that is able to efectively respond to the changing VET environment
> be the provider of choice for students, employers, industry and government
> improve educational outcomes of disadvantaged groups
> operate as a customer centric organisation through increased focus on the student experience
> operate as the public provider of VET in the ACT
> operate with greater commercial and entrepreneurial focus in the increasingly contestable market place
> meet industry needs by providing the highest quality, contemporary training in a variety of flexible modes
> grow the capability and capacity of Canberra’s changing workforce for employers and industry
> contribute to the ACT’s growing economy and the ACT’s reputation of being one of the world’s most liveable cities by attracting high-achieving students and delivering quality training and education that skills the ACT and regional workforce.
Vision and Mission CIT is committed to excellence in the development and delivery of contemporary VET. The CIT Board launched the Strategic Compass 2020 – Evolving Together in 2016 setting the direction of CIT to 2020. The Compass articulates CIT’s vision and mission through four promises to the ACT community:
> Shaping change – Raising our ambitions to meet new expectations
> Growing our region’s economy – Adapting our oferings to provide skills for the future
> Advancing Canberra’s workforce – Contributing to the new economy and positioning for prosperity
> Transforming our business – Investing in our business for viability and value.
14 Canberra Institute of Technology: Annual Report 2019

CIT Gungahlin 459 enrolments
CIT Reid 8,632 enrolments
CIT Fyshwick 2,894 enrolments
CIT Tuggeranong 774 enrolments
CIT Bruce 15,527 enrolments
Total enrolments* 28,806
*A student may be enrolled in one program that is delivered across multiple campuses and therefore be counted more than once in total enrolment figure (this does not include enrolments in Adult and Community Education programs).
CIT massage students
15

CIT Cultural Traits
Values In addition to the ACT Government Public Service values of Respect, Integrity, Collaboration and Innovation, CIT has adopted a set of cultural traits to promote a workforce with the highest integrity to deliver a positive environment for work and study. These cultural traits are at the core of everyday operations at CIT:
Customer Centric – Everyone is a customer and I accept that my actions afect the customer experience.
Professionalism – I work with respect, integrity and expertise for our collective success.
Collaborative – We achieve our common goals and use less individual energy by working together.
Trusted – We are knowledgeable, reliable and honest. We work with integrity, transparency, fairness and respect and are supportive of each other.
Adaptable – I respond positively to change. I seek opportunities to continuously improve and grow my capability.
Accountable – I own my actions and take responsibility for the outcomes.
Inspirational – I motivate others to believe they can do it and inspire them to achieve.
Stakeholders CIT is a Territory Authority tasked with providing vocational education and training to the ACT community. Establishing and maintaining relationships with a wide range of stakeholders is essential to meeting this task. CIT stakeholders include students, employers, industry, governments and the ACT community and regions. CIT also maintains close
partnerships with universities, schools and other education providers.
Environment and Planning Framework The CIT strategic direction is set by the Strategic Compass 2020 – Evolving Together. CIT has fostered productive working relationships within the ACT Government and is a trusted partner on progressing the territory’s priorities—specifically in relation to jobs and growth, economic development and skills for emerging key capability areas.
CIT aligns with ACT Government strategies including: Confident & Business Ready; Canberra: Australia’s Education Capital; Canberra: A Statement of Ambition; Future of Education; Renewables Strategy; and Infrastructure Strategy.
CIT is represented on the TAFE Director’s Australia Board and is also guided by state and commonwealth policy to deliver government commitments on VET. Specifically, CIT is enabling growth in identified demand sectors and supporting the objectives of the National Agreement for Skills and Workforce Development and the National Partnership for the Skilling Australians Fund, signed in 2018 by the ACT Government.
CIT also operates under a number of internal plans and frameworks such as:
> CIT International Strategy
> CIT Teaching and Learning Framework 2017-2020
> CIT Higher Education Strategy
> CIT Digital Strategy 2018-2020.
16 Canberra Institute of Technology: Annual Report 2019

Organisational Structure CIT comprises three divisions, five teaching colleges, and the CIT Yurauna Centre which is a service dedicated to Aboriginal and Torres Strait Islander peoples. Each college, led by an experienced College Director and capable management teams, provides quality vocational education in a range of areas. All teaching areas are supported by quality VET practitioners with current industry qualifications and a breadth of experience.
> The Education and Training Services Division is responsible for the integrity and delivery of teaching and learning across CIT to meet the needs of students in the ACT and regional community. This includes the oversight of CIT Colleges, CIT Yurauna Centre, CIT Education Services, CIT Student Services, and CIT Library and Learning Services. The Division aims to meet the four promises of the Compass by providing high quality vocational education and training, which is engaging, innovative and provides students with an authentic workplace based learning experience. The Division also has a supporting role in ensuring CIT fulfills the compliance requirements set by vocational training and education regulators, including the Australian Skills Quality Agency (ASQA), the Tertiary Education Quality Skills Authority (TEQSA) and the ACT Board of Secondary Schools Studies (BSSS).
> The Corporate Services Division is responsible for a comprehensive range of support services across CIT in the areas of finance, human resources, industrial relations, corporate governance, audit and risk, facilities management, information technology, records management, work health and safety, student administration system and corporate compliance.
Corporate Services also ensures CIT obligations, as a Territory Authority, to the ACT and Australian Governments are met.
> The Industry Engagement and Strategic Relations Division is responsible for supporting and coordinating the growth of CIT’s business through: broad and efective links with industry; aligning CIT programs with industry expectations and outcomes; ensuring stakeholders and the community are aware of the contribution CIT makes to individuals, employers and the ACT economy. In addition, the Division provides ministerial liaison and support to the CIT Chief Executive Oficer (CEO) and CIT Board and liaises with the Economic Development section within CMTEDD regarding the future economic development of the ACT and the region.
CIT Solutions Pty Ltd CIT Solutions Pty Ltd is a wholly-owned subsidiary of CIT that reports to the Australian Securities and Investments Commission in accordance with the Corporations Act 2001. CIT Solutions remains the training provider of choice for many Australian Government departments and agencies and some ACT Government directorates. CIT Solutions also provides training in a large range of foreign languages as well as marketing services to CIT for the recruitment of international students. Short courses in professional development and recreational interest are available to people in Canberra and provide lifelong learning opportunities. The CIT CEO is also the CEO of CIT Solutions. See section B2 for further information about the performance of CIT Solutions in 2019.
2019 ACT Trainee of the Year and CIT staf member, Amelia Gulliford
17

CIT Executive and Functional Structure
CIT Solutions Board
General Manager CIT Solutions
Diane Joseph
Industry Engagement and Strategic Relations
Executive Director – Paul Ryan
College CIT Business and Leadership
Accounting, Bookkeeping and Legal Studies
Business Administration Management and Business
College CIT Pathways College
Access Education English Language Centre
Student Support Counselling
International Pastoral Care Year 12
College CIT Technology & Design
Building, Engineering and Surveying
Creative and Design Graphics, Entertainment, Media
and Music Hairdressing and Beauty Therapy
Horticulture and Floristry Information, Communication
and Technology Centre for Cyber Security
Minister for Tertiary Education
Chief Executive Ofcer Leanne COVER
CIT Board Craig SLOAN, Chair
Education and Training Services
Executive Director – Paula McKenry
Corporate Services Executive Director – Andrew Whale
College CIT Trade Skills
Automotive, Metals and Logistics Construction
Electrical Trades Hospitality, Culinary and Tourism
Plumbing
College CIT Health, Community
& Science Children's Education and Care
Community Work Human Services
Science Wellbeing & CIT Fit & Well
CIT Yurauna Centre
Aboriginal and Torres Strait Islander Programs
Aboriginal and Torres Strait Islander Student Support Community Engagement
CIT Board Secretariat and Government Relations Business Growth and
Development Marketing
Strategic Communications Strategic Growth and
Transformation Training Initiatives Campus Renewal
Student Services Client Relationship
Information and Recognition
Library and Learning Services Library and Learning Services
Library Learning Resources and Systems Learning Management Systems
eLearn Support Copyright / IP Services
Education Services Awards and Programs
Education Design and Technology Education Quality Program Services Quality Assurance
CIT Research
Audit, Risk and Corporate Governance
Facilities
Corporate Finance and Business Support
Employment Relations Work, Health and Safety
Procurement and Contracts and Records Management
Human Resources Safety and Employment Relations People, Performance and Culture
Strategic Workforce Planning
18 Canberra Institute of Technology: Annual Report 2019

CIT Senior Executive Team The Senior Executive Team comprises the CIT CEO; the Executive Director, Education and Training Services; the Executive Director, Industry Engagement and Strategic Relations; the Executive Director, Corporate Services; the Senior Director Finance; and the Senior Director Human Resources. The executive directors work collaboratively and report to the CEO.
CIT CEO, Ms Leanne Cover, reports directly to the CIT Board and provides strategic leadership across CIT. The CEO is responsible for ensuring CIT is continually evolving to a business model able to compete in the rapidly
changing VET environment; driving the long term vision of CIT by ensuring efective delivery of programs; and maintaining productive relationships with the Minister, leaders in the ACT public sector, other training providers and educational institutions. The CEO also provides leadership to the Executive team in: quality VET outcomes strategic planning and governance; staf, community and stakeholder engagement; creating a compelling student experience; planning and reporting; financial and operational analysis; policy development; service delivery excellence; and campus modernisation.
Executive Director, Education and Training Services, Ms Paula McKenry The Executive Director, Education and Training Services provides overall leadership to CIT’s educational leaders to ensure consistent and quality
education and training outcomes are achieved and that CIT meets and exceeds student and employer expectations. The position is also responsible for the leadership of CIT Colleges, CIT Yurauna Centre, CIT Education Services, CIT Student Services and CIT Library and Learning Services. The position provides the primary interface with ASQA, TEQSA and BSSS ensuring CIT’s educational governance is appropriate as a public provider to meet all regulatory requirements, including those in the international student domain.
Executive Director, Corporate Services, Mr Andrew Whale The Executive Director, Corporate Services has primary responsibility for ensuring the eficient operations of CIT through appropriate business
and professional services supporting the strategic and operational needs of CIT. This includes overall management of CIT’s budget and finances, human
resources, property management, information technology, audit and risk, procurement and corporate compliance. This position is also the key liaison point for other ACT Government services supporting CIT.
Executive Director, Industry Engagement and Strategic Relations, Mr Paul Ryan The Executive Director, Industry Engagement and Strategic Relations has primary responsibility to ensure
CIT has broad and efective links with industry to grow CIT’s business; responsibility for the CIT brand and ensuring stakeholders and the community at large are aware of the contribution CIT makes to individuals, employers and the ACT economy; and responsibility for ministerial liaison and providing support to the CIT CEO and CIT Board. In addition, the position liaises with the Economic Development area of CMTEDD regarding the future economic development of the ACT and the region.
Senior Director, Human Services, Ms Cheryl Stef The Senior Director, Human Resources is responsible for planning, developing, coordinating and implementing all aspects of human resource
management, workforce development and industrial relations operations for CIT. The CIT HR team supports organisational outcomes and drives transformational change through the provision of timely and efective support, advice and assistance to the leadership team across all areas of CIT in employment policy and practice, employee and industrial relations, workplace safety and injury. The Senior Director, Human Resources works collaboratively with all areas of CIT to meet commitments articulated in the Strategic Compass 2020 and lead the development of a high performance culture and workforce capability.
Senior Director, Finance, Mr Greg Tong The Senior Director Finance is responsible for CIT’s financial management functions including reporting, budgeting, cash
management, accounts, costing, capital, projects, records management and a range of other administrative support functions. Key links to other ACT Government bodies include ACT Treasury and CMTEDD. The role directly supports internal governance and external compliance activities including reporting student activity and associated statistics to the ACT and Australian Governments.
19

CIT Governance Framework
Minister for Tertiary Education
CIT Board
CEO
Executive Director Education and Training
Services
Executive Director Industry Engagement and
Strategic Relations
Executive Director Corporate Services
Information Management/ Information and Communications
Technology (IMICT) Committee
Aboriginal & Torres Strait Islander Advisory Committee
Academic Council
Teaching and Learning Quality Committee
Program Innovation Committee
Student Experience Committee
Higher Education Committee
Corporate Resources Committee
Campus Work Health and Safety Committee
CIT Audit Committee CIT Solutions Board
General Manager CIT Solutions
Executive Management Committee
Reconciliation Working Group
Strategic Business Growth Committee
CIT Green Network
Workplace Consultative Committee
2019 Canberra Region WorldSkills Restaurant Competition
20 Canberra Institute of Technology: Annual Report 2019

CIT Internal Governance Under the CIT Internal Governance Framework, CIT committees, advisory groups and working groups are accountable to the CEO through the Executive Management Committee.
Committee Name Committee Role
Executive Management Committee (EMC)
To support the CIT Board and the CEO by providing timely, professional and informative advice in relation to key strategic direction setting and the eficient and efective operation of CIT. The EMC is accountable for the performance outcomes of CIT through the implementation and monitoring of strategic, operational, educational, people and financial business plans and processes and for ensuring that appropriate frameworks, delegations, policies, procedures and resourcing are in place to support the delivery of CIT strategic and operational objectives.
Academic Council Academic Council is the principal academic governance body of CIT. Academic governance is the framework of policies, structures, relationships, systems and processes that provide direction and oversight of academic activities (teaching, learning and assessment and research) at CIT. This includes regulation of the quality and standards of performance of CIT VET services. There are four committees (described below) which support and report to the Academic Council: 1. Teaching and Learning Quality Committee 2. Program Innovation Committee 3. Student Experience Committee 4. Higher Education Committee Outcomes of meetings are reported to EMC.
Corporate Resources Committee To provide advice on issues relating to oversight responsibilities relating to financial, human resources and corporate governance matters. This is a subcommittee of EMC.
Aboriginal and Torres Strait Islander Advisory Committee
To provide advice and guidance on training needs from industry and the community for Aboriginal and Torres Strait Islander people as well as input in business planning for the delivery and support of Indigenous education at CIT. The Committee also liaises closely with the Reconciliation Working Group. Outcomes of meetings are reported to EMC.
Reconciliation Working Group The CIT Reconciliation Working Group engages collaboratively with all areas across CIT to advance reconciliation by implementing and monitoring the CIT Reconciliation Action Plan (RAP) and by gathering support and commitment through encouraging all CIT staf to participate in initiatives and events. Outcomes of meetings are reported to EMC.
Strategic Business Growth Committee
To provide advice to ensure CIT is able to efectively and collaboratively establish and achieve revenue targets to ensure CIT’s financial sustainability and competitive market share. The Committee is also responsible for establishing, leading and reviewing the policies, approaches and frameworks around competitive forces such as pricing and funding arrangements.
Campus Work Health and Safety Committee
To facilitate cooperation between staf and management on the development, implementation and review of Work Health and Safety (WHS) policy and procedures. To monitor compliance with WHS legislation, standards, codes of practice, policies and procedures.
21

CIT Yurauna Student
Committee Name Committee Role
Workplace Consultative Committee
To facilitate efective consultation with employees and their representatives, including union representatives, on workplace matters.
Information Management / Information and Communication Technology (IMICT) Committee
To develop and maintain CIT’s vision and strategy for IMICT and to provide governance to the management of the future of IMICT in CIT. The Committee’s primary focus is strategy and tactics.
CIT Green Network To engage with staf and students to promote sustainable practices across all CIT business activities and implement the ACT Government’s Climate Change Action Plan across CIT business activities.
Teaching and Learning Quality Committee
To advise on the development, implementation and review of strategies, policies and initiatives to meet legislative, regulatory and professional requirements and to address quality standards and best practice in teaching and learning.
Program Innovation Committee To advise on and approve strategies, policies and initiatives to review and enhance current teaching and learning programs and identify new and innovative programs and practices. This committee also identifies and uses innovative practices in program delivery that use technology and work-based models.
Student Experience Committee To advise on and approve the development, implementation and review of strategies, policies and initiatives to ensure the learning needs and educational experience of students are addressed. This involves analysing key measures of the student experience and identifying actions to improve and enhance students’ education experience.
Higher Education Committee To advise and make recommendations on the review, development and implementation of strategies, policies and initiatives to ensure HEC leads academic enhancements and CIT meets the Higher Education Framework (Threshold Standards) 2015 and other TEQSA requirements.
22 Canberra Institute of Technology: Annual Report 2019

CIT Board The CIT Board, established in 2015 under the Canberra Institute of Technology Act 1987 (CIT Act), consists of a minimum of seven and no more than 11 members appointed by the ACT Minister for Tertiary Education. The CIT CEO is a Board member in accordance with Section 80 (4) of the Financial Management Act 1996 (FMA).
As required by Section 56 of the FMA, the CIT Board is liable, under the responsible Minister, for the eficient and efective financial management of CIT. The CIT Board Charter outlines the roles and responsibilities of board members, code of conduct, conflict of interest and other information relating to meetings, subcommittees and administration. This information is available on the CIT website.
Prior to April 2019, there were nine members on the CIT Board. On 5 April, the ACT Government introduced changes to the CIT Act to enable CIT to build a more diverse Board to ensure CIT’s long-term success. The changes removed the two ACT Government representatives from the CIT Board.
In August 2019, the inaugural Deputy Chair, Ms Michelle Melbourne, resigned from the Board in light of her changed work circumstances. In November 2019, a recruitment process commenced for a replacement Deputy Chair and a new Board member. In December 2019, the Student Member, Giancarlo Cabrales, resigned due to his anticipated changed study requirements for 2020.
Mr Craig Sloan Ms Michelle Melbourne Ms Leanne Cover (Chair) (Deputy Chair) CIT CEO
(until August 2019)
Mr Raymond Garrand Mr Peter McGrath Mr Nigel Phair Member Member Member
Professor Mr Sam Mills Mr Giancarlo Cabrales Frances Shannon Staf Member Student Member
Member (elected) (elected) (from 1 July 2019) (from 1 July 2019)
23

Board Meeting Attendance in 2019
Name Position Meetings
Craig Sloan Chair 5
Michelle Melbourne Deputy Chair 3
Leanne Cover CIT CEO 5
Raymond Garrand Member 5
Kareena Arthy (until April 2019) ACT Public Service – Economic Development Directorate 1
Natalie Howson (until April 2019) ACT Public Service – Education Directorate 0
Peter McGrath Member 2
Nigel Phair Member 5
Professor Francis Shannon Member 4
Anita Wesney (until 30 June 2019) Staf Member 2
Brendon Moore (until 30 June 2019) Student Member 2
Sam Mills (appointed 1 July 2019) Staf Member 3
Giancarlo Cabrales (appointed 1 July 2019)
Student Member 2
CIT Board Subcommittees
Name Function
Audit Committee Further information on the activities of the Audit Committee is in B.5.
To provide independent, objective assurance and assistance to the CIT Board on CIT’s risk, control and compliance framework, and its external accountability responsibilities. Established by the CIT Board in accordance with the ACT Government Internal Audit Framework and Sections 56 and 77 of the Financial Management Act 1996.
Campus Modernisation Subcommittee As a result of Administrative Arrangements 2019 (No 3) and the establishment of Major Projects Canberra (MPC) responsibility for the delivery of the CIT Campus redevelopment now rests with MPC. The CIT Board Chair and CIT CEO will be members of MPC’s Project Advisory Board for the new Woden campus. The Campus Modernisation Subcommittee did not meet during 2019 and no longer has a remit to operate given changes in Administrative Arrangements.
24 Canberra Institute of Technology: Annual Report 2019

CIT Board Activities CIT Board members bring a range of skills and expertise to CIT. In 2019, the CIT Board met five times and focussed on a range of priorities including:
> building additional capacity and industry partnerships in emerging industries and areas of government demand (such as cyber, renewables, health and education);
> improving the recognition of CIT as a major economic and social contributor to the ACT and region, now and into the future;
> enhancing contemporary organisational transformation and workforce development at CIT through ongoing investment in our people;
> maintaining focus on transforming our business through people, processes and system changes including fully understanding the costs of service delivery;
> working collaboratively across Government including with CMTEDD on campus renewal and possible sites; and following the announcement of a new CIT Woden campus and CIT’s ongoing presence in the city, working with Major Projects Canberra to progress delivery;
> investing in digital infrastructure including as part of CIT’s campus renewal and in line with the Chief Minister’s ambitions for Canberra;
> enhancing teacher capability (including digital fluency) and reshaping education and training products so students have contemporary learning experiences.
During 2019, the CIT Board also reviewed CIT’s approach to higher education and worked collaboratively with CIT Solutions to develop a strategy to attract additional international students from across the globe. Throughout the year the Board maintained a major focus on the budget and explored ways to improve CIT’s future financial sustainability.
Remuneration for Executives and Board Members All CIT executives are paid in accordance with Determinations of the ACT Remuneration Tribunal and relevant laws and instruments, including the Public Sector Management Act 1994 and the Public Sector Management Standards 2006. Under the Remuneration Tribunal Act 1995 the Remuneration Tribunal determines remuneration for the CIT CEO and members of the CIT Board.
Garments and a satchel made by CIT students from Mycelium, sustainable fabric grown from the root structure of mushrooms.
25

Summary of Performance CIT continued to excel in its delivery of government-funded, contestable and commercial training in the increasingly competitive local, national and international markets. CIT and its subsidiary, CIT Solutions, delivered training to 26,793 students across its government-funded, commercial and adult education programs. Of these, 6,013 were non-accredited learners enrolled in recreational courses, professional workshops and foreign language tuition at CIT Solutions.
> Of the remaining 20,780 students at CIT:
– 1,022 (4.9%) self-identified as Aboriginal and/or Torres Strait Islander
– 839 (4.0%) were international students from 75 countries
– 2,132 (10.3%) students self-identified as having a disability
– 4,109 (19.8%) students self-identified as speaking another language other than English at home
– 8,828 (42.3%) students identified as female
– 3,820 were apprenticeships/traineeships (including 179 Australian School-based Apprenticeship (ASBA) student enrolments)
> The majority of CIT students (60.4%) were aged 26 years and over and 87% studied part-time.
60.4%
26 years AGE
25 years
39.6%
approx
87% studied
part-time
839 international students
from 75 countries enrolled at CIT
NSW 20%
Other states 8.3%
ACT 67.4%
Overseas 4.2%
26 Canberra Institute of Technology: Annual Report 2019

Key Performance Figures for 2019 In 2019:
> 90% of CIT graduates were employed or in further study afer training, compared with 85% nationally
> 82% of CIT graduates were employed afer training compared with 72% nationally.
The figures below include all profile funded enrolments (training activities funded directly by the ACT Government) and all contestable funding sources (commercial and apprenticeship enrolments). Further details are in the Statement of Performance at C.6.
> CIT delivered 5.6 million training hours in 2019. This included 2,995,634 nominal hours for profile funded programs, slightly below the 2019 target, with the remaining training hours delivered through contestable programs.
> CIT received 33,305 program enrolments, (including Australian Qualifications Framework (AQF) qualifications, statements of attainment and Adult and Community Education (ACE) programs). This included 11,888 profile enrolments. While this was 2% above the 2019 target of 11,700 overall enrolments at CIT increased by 9.5%.
> The module (single accredited unit of competency) pass rate was 81%, which was 8% above target and remained consistent with 2018.
> There were 4,101 AQF program completions. This was 9% below the 2019 target of 4,500.
> Learner satisfaction with the training at CIT was 90%, 6% above target.
> Employer satisfaction with the training or apprentices was 90%, 13% above target.
students were satisfied with their training
actual target 90%85%
CIT 2019 Learner Engagement Survey
employers surveyed were satisfied with CIT training
actual target 90%80%
CIT 2019 Employer Satisfaction Survey
27

2019 Highlights 2019 was another year of achievements for CIT. Highlights include:
> Australian Training Awards – Top three finalist Large Training Provider of the Year
> Australian Training Awards – Top three finalist ACT Cyber Security Collaboration
> ACT Large Training Provider of the Year
> ACT Trainee of the Year – CIT Student
> ACT Apprentice of the Year – CIT Student
> ACT Aboriginal and Torres Strait Islander Student of the Year – CIT Solutions Student
> ACT VET Teacher/Trainer of the Year
> Nomination for a national Banksia sustainability award
> 50% increase in nursing places approved by Australian Nursing and Midwifery Accreditation Council
> 285% increase in cyber security enrolments
> 7% increase in apprentices and trainees enrolled across 80 qualifications
> 13% increase in mature aged students
> 35 out of 52 students who completed the pre-traineeship program gained employment with industry partners associated with the program
> 62% increase in Skilled Capital program enrolments
> 60% of year 12 students received an ATAR over 80 and over 75% received an ATAR over 75 with the top ATAR being 97.90
> CIT Music and Media Production consolidated to CIT Reid
> new state-of-the-art allied health training facility opened at CIT Bruce
> new state-of-the-art purpose built campus announced for the Woden Town Centre.
CIT Executive Director Corporate Service Andrew Whale at the ACT Training Awards
CIT nursing students
CIT Fit and Well
28 Canberra Institute of Technology: Annual Report 2019

Future Priorities The CIT Board has set the 2020 priorities for implementation of the CIT Strategic Compass – Evolving Together. These are:
1. A sustainable financial model for the future of CIT.
2. Improving CIT’s responsiveness and flexibility to meet the changing VET environment (including changes emanating from the COAG Skills Council).
3. Building additional capacity and industry partnerships in emerging industries and areas of government demand (such as cyber, renewables, health, education and apprenticeships/ traineeships).
4. Improving the recognition of CIT as a major economic and social contributor to the ACT and region, now and into the future.
5. Enhancing contemporary organisational transformation and workforce development at CIT through ongoing investment in our people.
6. Enhancing teacher capability (including digital fluency) and reshaping education and training oferings so students have contemporary learning experiences.
7. Maintaining focus on transforming our business through people, processes and system changes including fully understanding the costs of service delivery.
8. Working collaboratively with Major Projects Canberra on campus renewal at CIT Woden campus and a city presence.
9. Investing in digital infrastructure including as part of CIT’s campus renewal and in line with the Chief Minister’s ambitions for Canberra.
Priorities as defined in the Statement of Intent CIT will continue to contribute to the ACT Government’s agenda of making Canberra more inclusive, progressive and connected through CIT’s future priorities.
Inclusive: > contributing to the ACT’s open and diversified
economy by providing critical skills training for the ACT and regional economy in key capability areas such as the renewable energy, cyber security and health sectors;
> improving access to supportive VET for those experiencing disadvantage and marginalised groups;
> increasing contemporary teaching and learning practices to improve student experiences; and
> attracting and retaining talented people with diverse skill sets.
Progressive: > continuing CIT’s transformation through the CIT
Strategic Compass 2020 – Evolving Together;
> actively contributing to the innovation and entrepreneurial culture in the ACT;
> maintaining a high performing workforce;
> targeting funding toward apprenticeships that address areas of priority industry growth; and
> supporting the Government’s eforts to develop our economy’s competitive strengths.
Connected: > modernising campuses, technology and systems
including investing in digital infrastructure and ensuring CIT systems are ‘fit for purpose’;
> strengthening our position as a leader of VET to ensure success in an increasingly competitive market;
> building on CIT’s reputation as a trusted and high quality provider of VET for those employers in the ACT seeking skilled workers and learners wishing to gain qualifications;
> collaborating across Government, including partnership activities with the CBR Innovation Network; and
> supporting the Government’s international engagement agenda.
29

CIT’s Ivan Radic, 2019 ACT Training Awards Norm Fisher Award recipient
Too ofen, we take for granted the amount of work that happens behind the scenes equipping the CIT buildings and ensuring student education and training spaces are operational and safe. At CIT, the person instrumental in making this happen over many decades has been Ivan Radic, Senior Manager Facilities and recipient of the 2019 Norm Fisher Award at the 2019 ACT Training Awards.
The award is presented in recognition of an outstanding and extensive contribution as an individual to VET in the ACT.
Ivan has ensured students and staf have access to the highly specialised VET training environments at CIT for over 40 years. This includes negotiating complex contracts and managing the design and build of fit-for-purpose teaching spaces such as CITs industry standard dental clinic, forensic crime scene investigation labs, personal training areas, a cyber security lab and a 100% renewable building, the first in the TAFE sector in Australia.
Ivan has also been instrumental in placing CIT at the forefront of environmental sustainability and in meeting the evolving needs of both industry and students. Ivan’s dedication and leadership regarding facilities and services one reason the ACT Commissioner for Sustainability and the Environment relocated to CIT Bruce.
“His team responds to his leadership in a way which is not just a credit to CIT but also a guide to others who might wish to take up some of the aspirations in the ACT Government’s new Climate Strategy (2019-2025),” said ACT Commissioner for Sustainability Kate Auty.
Whether it is giving his colleagues confidence that things are ready for a big event, responding to the odd bad weather event or power outage, or going that extra mile for someone in need, Ivan quietly and humbly does it all. Well done and thank you Ivan – CIT salutes you.
30 Canberra Institute of Technology: Annual Report 2019

B.2 PERFORMANCE ANALYSIS
Output class 1.1 Provision of Vocational Education and Training Services CIT receives direct funding from the ACT Government to provide vocational education and training (VET) to the ACT and region. CIT is the sole public provider of VET in the ACT and provides places in publicly funded training, consistent with needs identified in the CIT Training Profile. CIT delivers 27 national training packages across the Australian Qualification Framework (AQF), from certificate I to graduate certificate levels. As of December 2019, CIT’s scope of registration included 204 current training package qualifications and 13 VET-accredited courses. CIT also specialises in the delivery of the ACT Senior Secondary Certificate from college to mature aged students mature age students.
CIT is committed to continuous improvement supported by ongoing monitoring and auditing to ensure delivery of nationally consistent, high-quality training and assessment services required to meet the VET Quality Framework.
CIT has Australian Skills Quality Authority (ASQA) RTO registration until 2024 including delegated authority to amend its scope of registration for VET training products. In 2019, CIT gained an extension of registration with the Tertiary Education Quality and Standards Agency (TEQSA) as a Non-University Higher Education Provider. CIT was also granted the maximum accreditation of five years for its Diploma of Nursing (HLT54115) program through the Australian Nursing and Midwifery Accreditation Council, until 2023.
CIT has established relationships with universities in the ACT, including partnerships with the University of Canberra, Charles Sturt University, the Australian National University, the University of New South Wales and the Australian Catholic University. These
relationships allows CIT students to gain university credits for their CIT training, and for university graduates to gain practical skills that employers value through training at CIT.
CIT has also continued to develop its position as a trusted provider of training to support the Australian Government and provides training to the Department of Veterans Afairs, Department of Foreign Afairs and Trade, Department of Defence and the Digital Transformation Agency.
National Student Outcomes Survey CIT’s key strategic objective is to provide vocational education and training that meets student needs. The annual National Student Outcomes Survey, conducted by the National Centre for Vocational Education Research (NCVER)1 is used to measure success. By focusing on students’ employment outcomes the Student Outcomes Survey gauges how well CIT serves individuals and the community.
NCVER also collects information on VET students’ reasons for training, satisfaction with training, and further study outcomes and provides a comparison across other state and territory RTOs. Areas of assessment include:
> employed afer training
> not employed before training, employed afer training
> employed or in further study afer training
> enrolled in further study afer training
> achieved main reason for training.
In 2019, 82% of CIT graduates were employed afer training compared with 71% nationally. While this reflects little variation on the 2018 results of 82% of CIT graduates employed afer training compared with 72% nationally, it is a slight decrease from 2017 when 84% of CIT graduates were employed afer training compared with 73% nationally.
1 The National Centre for Vocational Education Research (NCVER) - a not-for-profit company owned by the State, Territory and Federal ministers responsible for vocational education and training. NCVER collects information on VET students’ reasons for training, employment outcomes, satisfaction with training, and further study outcomes. NCVER also provides research on vocational education and training in Australia to governments, the training sector, industry and the community.
31
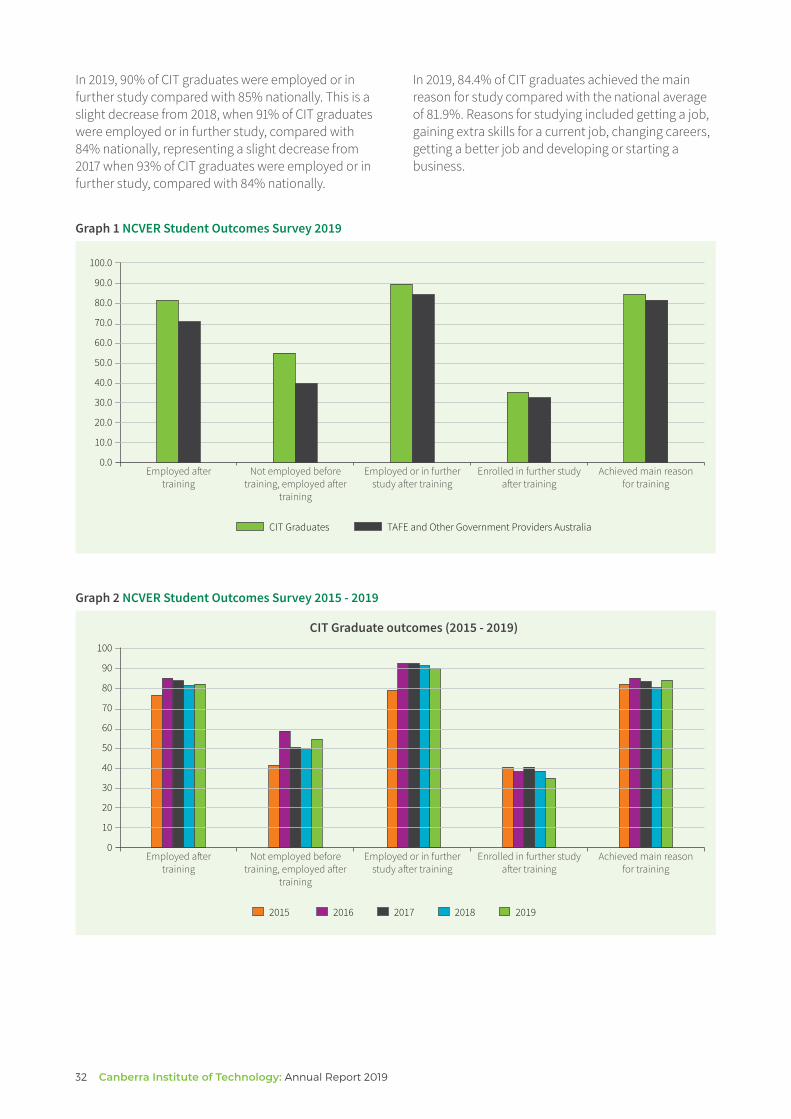
In 2019, 90% of CIT graduates were employed or in further study compared with 85% nationally. This is a slight decrease from 2018, when 91% of CIT graduates were employed or in further study, compared with 84% nationally, representing a slight decrease from 2017 when 93% of CIT graduates were employed or in further study, compared with 84% nationally.
Graph 1 NCVER Student Outcomes Survey 2019
In 2019, 84.4% of CIT graduates achieved the main reason for study compared with the national average of 81.9%. Reasons for studying included getting a job, gaining extra skills for a current job, changing careers, getting a better job and developing or starting a business.
100.0
90.0
80.0
70.0
60.0
50.0
40.0
30.0
20.0
10.0
0.0 Employed afer Not employed before Employed or in further Enrolled in further study Achieved main reason
training training, employed afer study afer training afer training training
CIT Graduates TAFE and Other Government Providers Australia
Graph 2 NCVER Student Outcomes Survey 2015 - 2019
for training
100
90
80
70
60
50
40
30
20
10
0
CIT Graduate outcomes (2015 - 2019)
Employed afer Not employed before Employed or in further Enrolled in further study Achieved main reason training training, employed afer study afer training afer training for training
training
2015 2016 2017 2018 2019
32 Canberra Institute of Technology: Annual Report 2019

2019 Accountability Indicators CIT has continued to perform well in 2019.
The Learner Engagement Survey (LES) and Employer Satisfaction Survey (ESS) are conducted in line with the ASQA Data Provision Requirements 2012 and the National Vocational Education and Training Regulator Act 2011 provisions. All RTOs are required to use mandatory tools to collect learner engagement and employer satisfaction quality indicator data.
> Learner Engagement Survey The result for 2019 was 90 % satisfaction rate with training at CIT, 6% above target. This was a slight increase on the 2018
CIT Learner Engagement Results 2009-2019
result of 89% satisfaction rate and slight decrease from the 2017 satisfaction rate of 91%.
Learner satisfaction rates are based on students enrolled in nationally accredited programs. In 2019, 3,533 students responded to the survey, providing a response rate of 35%. This was an increase from 2,638 (24.6%) students who responded in 2018 and over 1,600 in 2017 and 2016. The survey was conducted from 19 August to 13 September 2019.
> Learner Satisfaction rates with training at CIT over 10 years have remained above 90%, with the exception of 2018, peaking in 2014 at 93.3%.
2009
91.3%
2010
90.0%
2011
92.3%
2012
92.0%
2013
92.3%
2014
93.3%
2015
93.1%
2016
91.6%
2017
91.4%
2018
89.0%
2019
90.3%
Learner Engagement Survey 2009 to 2019
100.0
98.0
96.0
94.0
92.0
90.0
88.0
86.0
84.0
82.0
80.0 2009 2010 2011 2012 2013 2014 2015 2016 2017 2018 2019
CIT Fit & Well
33

> Employer Satisfaction Survey Overall 90% of respondents were satisfied with the training at CIT in 2019 (compared to 94.1% in 2018 which was a 10 year high). The target population is employers of enrolled apprentices or trainees at CIT. Four hundred and forty employers responded this year slightly less than previous years because in 2019
CIT Employer Satisfaction Rates 2009-2019
CIT had more large employers (single respondent) with multiple apprentices. The survey was conducted from 19 August to 13 September 2019.
> Employer satisfaction rates over 10 years have remained between 85% and 94% with the lowest recorded in 2014 and the highest in 2018.
2009 2010 2011 2012 2013 2014 2015 2016 2017 2018 2019
87.9% 90.7% 91.8% 90.3% 89.2% 85.0% 87.5% 85.1% 87.4% 94.1% 89.5%
Employer Satisfaction Survey 2009 to 2019
100.0
98.0
96.0
94.0
92.0
90.0
88.0
86.0
84.0
82.0
80.0 2009 2010 2011 2012 2013 2014 2015 2016 2017 2018 2019
Changing paths led Amelia to ACT Trainee of the Year Award Amelia Gulliford is the winner of the 2019 ACT Trainee of the Year Award. She seized the opportunities provided by CIT to learn, adapt and reinvent herself through her exciting career journey.
A disciplined dancer, Amelia completed a Diploma of Beauty Therapy (SHB50115), which led to a management position at a prestigious beauty salon. Looking for new challenges, and with an understanding of how her VET qualifications contributed to her previous achievements, Amelia decided to pursue a traineeship through a Certificate III in Business Administration (BSB30415) to build her organisational and liaison skills.
The opportunity to undertake a traineeship allowed Amelia to study and gain experience on the job. Afer Amelia’s traineeship concluded within CIT’s Training Initiatives Unit, she had the skills and experience to gain employment as an industry Liaison Oficer for Australian Apprentices within ACT Government where she promotes and supports the growth and retention of ACT apprentices and trainees.
34 Canberra Institute of Technology: Annual Report 2019

> Training Hours In 2019 CIT delivered 5.6 million training hours compared with a total of 5.4 million training hours delivered in 2018. This included 2,995,634 nominal hours for profile-funded programs, slightly below the 2019 target of 3,226,000. The remaining training hours were delivered though contestable programs, which included commercial courses, apprenticeships
and Skilled Capital. Despite being under target for profile hours, CIT was successful in increasing its overall delivery of training hours in 2019.
> Training hours have been rising since 2017.
CIT Veternary Nursing students
> Program enrolments include Australian Qualification Frameworks (AQF) qualifications, statement of attainments and non-accredited training such as Adult and Community Education (ACE). In 2019, CIT received 33,305 program enrolments compared to 30,425 program enrolments in 2018. This includes 11,888 profile enrolments, 2% above the 2019 target of 11,700. While profile enrolments remained steady, overall enrolment increased from 2018.
> Modules include single accredited units of competency. The module pass rate for 2019 was 81% which was 8% above target. This was consistent with results for 2018 and slightly lower than the 2017 module pass rate of 82%.
> Program completions include AQF qualifications and does not include skill sets, statement of attainments and non-accredited training such as ACE. There were 4,101 program completions in 2019. This was 9% below the 2019 target of 4,500 and slightly lower than the program completions in 2018.
All activities conducted at CIT are customer focussed aimed to deliver training to meet student’s needs and deliver optimal outcomes for business, industry and the ACT community.
The following performance analysis aligns with the promises of the CIT Strategic Compass 2020 - Evolving Together and demonstrates CIT’s commitment to achieving success for the ACT community through ensuring the best student outcomes.
35

Promise 1 – Shaping Change – Raising our ambitions to meet new expectations CIT is a major contributor to the Canberra economy and is the regions most trusted and dedicated VET provider. With advances in technology and the rapidly changing world of work and study, CIT recognised the need to adapt it operations to meet the evolving needs of the fast-paced future. Through a culture of innovation and collaboration and access to technology in the learning environment, CIT staf have embraced new and exciting ways of working across the organisation that have resulted in exceptional learning experiences for CIT students. CIT will continue to provide the skills for now and the future as it transforms into a contemporary learning organisation and responds to ongoing challenges.
CIT Transformation CIT is a complex learning organisation. Under the leadership of the CIT Board and CIT CEO, CIT adopted a long-term contemporary approach to organisational transformation and has been increasingly working with staf at all levels and workplaces across CIT. CITs’ growing responsiveness to industry training needs and its ability to respond to changing training markets, underpinned by this approach, has increased understanding of the ways that large complex people systems, operate, respond and adapt to their environment. This approach has also enabled the development of new ways of working with data, more cross-functional team approaches to solving problems (including with students and industry) and innovative approaches to developing new products and services through the Canberra Innovation Network (CBRIN) partner programs. During 2019, under the banner of Evolving Together, CIT delivered:
> a learning series for all staf diving deeper into the concepts that underpin large complex people organisations and introducing new data collection and mapping tools for greater visibility about culture and networks
> intensive knowledge building programs specifically targeted to CIT executive and senior management teams
> a design team to investigate appropriate tools and approaches to use within the CIT context to test new ideas and ways of working in a ‘safe to fail’ environment
> a program for 35 CIT leaders to build understanding of key concepts of network theory and complexity and the interdependencies between the colleges and business units resulting in a dispositional shif to a more collaborative whole of CIT approach to tackling the complex VET environment.
Enhancing Teacher Capabilities CIT prides itself on the professionalism and quality of its teaching staf that deliver training across a broad range of disciplines. Under Evolving Teacher, CIT has invested heavily in enhancing teacher capability to provide CIT students with exceptional learning experiences for optimal outcomes. In 2019, CIT developed a new approach to professional development to upskill trainers and assessors with pedagogical skills and knowledge to prepare for the challenges of the 21st Century training space.
A dedicated team of teaching and learning professionals have been at the forefront of developing capability-building programs available to CIT teaching staf to equip them with the right skills to meet the demands and expectations of contemporary learners as VET practitioners. Programs delivered through 2019 include:
> coaching and mentoring for CIT leaders
> discovery tours to connect staf across CIT
> individual and group based digital coaching program to enhance computer skills
> Adobe Creative Cloud forums for contemporary training delivery.
These programs have been well received by staf and included over 300 staf participating in digital coaching, 56 CIT leaders participating in coaching and mentoring programs, 123 connections through CIT discovery tours, over 100 staf attending Adobe workshops to learn about creating and editing engaging video teaching and learning resources and over 1,000 visits to the Evolving Teacher Intranet site.
The success of the overall program has enabled non-teaching staf to access the professional development opportunities in digital coaching and mentorship.
36 Canberra Institute of Technology: Annual Report 2019

Training and Assessment To meet legislated changes to national trainer and assessor requirements from 1 July 2019, CIT upskilled over 350 teachers and trained over 80 new teaching staf to gain the Certificate IV in Training and Assessment (TAE40116). To meet this requirement, CIT provided in-house training for its highly valued teaching staf. Using a dedicated expert internal team, CIT delivered the TAE competencies using best-practice, engaging and practical learning methods to build depth of knowledge in the key areas of assessment and Language Literacy and Numeracy (LLN). Additionally in 2019, CIT trained over 60 ACT Government VET teachers to upskill to meet the new requirements or gain the full Certificate.
Innovation and Collaboration CIT has been leading the ACT VET sector adapting innovative relationships with industry and driving a culture of innovation and collaboration to encourage staf to adopt new thinking to deliver innovative training solutions to meet the evolving expectations of learners, employers and industry. CIT has an established partnership with the Canberra Innovation Network (CBRIN) that has been instrumental in providing staf with new skills, encouraging cross-college collaboration and design and delivery of innovative projects. During 2019, a variety of innovation workshops were ofered to CIT staf and students including workshops for the Product Innovation Fund and a two-day renewable energy Hackathon.
37

Product Innovation Fund The Product Innovation Fund (PIF), established in 2016, has delivered over 12 innovative projects across CIT. These include implementation of the highly successful 360-degree cameras and the development of a sustainable fabric through a combination of fashion, technology and horticulture (see below). In 2019, in conjunction with CBRIN, the PIF workshops brought together CIT staf, industry professionals, resident innovators and CIT students to address organisation challenges and the impact on stakeholders. The multi-disciplinary teams were provided with practical information, strategies, skills and mentoring to work through the LEAN innovation process.
360 Degree Cameras CIT has incorporated the use of 360-degree cameras in three industry businesses (Solid Plastering, Wall and Ceiling Lining, and Wall and Floor Tiling). The cameras allow for the capture of evidence for workplace assessment and recognition of prior learning. There is growing interest in progressing this mode of training and assessment in Automotive and Metal fabrication trades. The cost of the cameras and the relatively simple set up and use is set to revolutionise the assessment of on the job training for apprentices.
Sustainable Fabric In a collaboration between CIT Fashion and Horticultural, under the guidance of teachers, students have grown sustainable fabric out of Mycelium - the root structure of mushrooms. Students from the fashion department have gone on to produce garments and a satchel from the micro-organism material. The garment samples and handbag were exhibited as part of the Orange Wolves event and received an overwhelming response from the public. CIT Fashion will continue to grow the sustainable fabric for students to work with during 2020. This has also resulted in a partnership between CIT and Fungi Co that will continue to develop and experiment with more sustainable options using the mushrooms. CIT students will be ready for the future fashion industry.
Orange Wolves Event Orange Wolves was a multi-disciplinary three-day immersive experience conceptualised and developed by CIT students, across a range of disciplines launched in 2019, this hands-on learning opportunity exemplifies the significance of vocational education and training. From designing a logo and pitching a concept to displaying their creations and wrapping up when the event concludes, the students were assessed along every stage of the project. Students from fashion, floristry, hairdressing, beauty, visual arts, photography, IT, graphic design, cultural arts, music, media, sound production, interior design, landscape design and building design, were involved. The students brainstormed, sketched and constructed the project through a collaborative process that completely transformed six decommissioned Action buses over a period of four months. The event was open to the public free of charge for three days in the city centre. It would not have been possible without the support of Transport Canberra and the City Renewal Authority which proved a $50,000 grant for the project. Orange Wolves was not only a masterpiece in creativity but developed critical skills in collaboration, communication, teamwork and creative thinking for the students involved.
“We had a lot of great applications in the last round of City Grants funding, but our successful applicants really demonstrated how their project would make the city a more fun, welcoming and exciting place to spend time.”
Malcolm Snow Chief Executive City Renewal Authority
38 Canberra Institute of Technology: Annual Report 2019

CIT CEO Leanne Cover, CIT Director Fiona Dace-Lynn, and Dr Brooke Thomas with Gordon Ramsay MLA at the launch of Orange Wolves
CIT’s 2019 Orange Wolves event in Civic
39

Promise 2 – Growing Our Region’s Economy – Adapting our offerings to provide skills for the future CIT delivers training to meet the future needs of the ACT economy, and supports the ACT Government to deliver on its investments and key capability areas including, cyber security, renewable energy, further education partnerships, and healthy and active living. CIT is also growing the region’s talent and economy by developing and delivering innovative skills training for new and emerging industries.
CIT is at the forefront of innovative training delivery ensuring graduating students not only possess the technical skills required for their occupation but are equipped with sof skills transferrable across industries. Through a combination of on-the-job training and national and international experiences, CIT graduates are well prepared to enter the workforce for the first time, transfer to new industries or gain the upskilling required for a promotion. CIT works closely with industry to ensure the integrity of the training and is continuously improving training delivery.
CIT joins forces with Neoen to support future local jobs in Coleambally CIT partnered with leading renewable energy producer Neoen to help the Indigenous and local community in the remote town of Coleambally NSW. Located in the Riverina Region, Coleambally has recently become home to the largest, fully operational solar photovoltaic facility in Australia. The 189 megawatt peak (MWp) solar farm, owned and operated by Neoen, produces over 390,000 megawatt hour (MWh) of clean, emission-free, renewable energy per annum, enough to power more than 65,000 NSW households.
CIT teachers delivered the week-long training at the Coleambally Central School with Tirkandi Inaburra Cultural and Development Centre Inc. Both organisations jumped at the opportunity to provide their students with entry-level qualifications to work in trades and renewable energy industry awareness.
“The program has been an amazing addition to Tirkandi’s aim of strengthening resilience, re-engaging the boys with an education or vocational pathway, and teaching them life-skills to support their growth,” Tirkandi Centre Manager Matt Watts said.
Renewable Energy Training Demand for training in renewable energies continues to grow. CIT holds Global Wind Organisation (GWO) accreditation (one of only three providers in the southern hemisphere) and delivers a range of qualifications from post-trade skill sets for qualified electricians, solar PV, battery storage and high-risk programs for the wind industry.
In 2019, CIT delivered training in renewable energy in a remote community in NSW (see story below) and was honoured that CIT teacher/trainer, Ken Wilson, was named the 2019 ACT Teacher/Trainer of the Year. Ken provides students with a practical understanding of the risks they will face working in the wind energy industry, ensuring they adhere to global safety standards and technical practices. In 2019, GWO Basic Safety Training and GWO Basic Technical Training increased by 76% across both course and Training in Battery Storage Systems grew by 27%.
Skills required for working in the renewable energy sector cut across a number of disciplines and students are presented with a range of learning experiences to prepare them for working in the industry.
Coleambally Central School said this exciting initiative delivered work competencies based on the renewable energy industry and was a wonderful opportunity for students.
“Community partnerships play an important role in delivering services and programs to our school community, focusing on improving the opportunities available to our students and their families, fostering greater integration between the school and communities and creating better outcomes for students,” Coleambally Central School Principal Timothy Allen said.
Neoen is proud to partner with CIT to provide this training, as it will increasingly be a source of local employment for the future.
40 Canberra Institute of Technology: Annual Report 2019

Renewables Domestic Excursion In 2019, CIT conducted the first domestic excursion for the renewables sector for seven students from the electrical trades, accompanied by two staf. The group attended the All-Energy Conference in Melbourne and then travelled to South Australia where they were exposed to a range of renewable energy businesses. These included: windfarms; a tour to the Tonsley Innovation Park (including the TAFE SA training hub); the only Tesla battery repair centre outside of the USA; an electrical vehicle manufacturing business; a solar thermal tower generating renewable energy; the Sonnen Battery manufacturing plant (formerly the Holden manufacturing plant) and a viewing of the Hornsdale battery.
This was an invaluable experience for students who gained a firsthand understanding of how qualified tradespeople can work across industries and the enormous opportunities for the future of this growing industry. It also provided a picture of what a renewables worker looks like, where the sector is heading and how far it has come in a short time. Students reported feeling inspired to see opportunities beyond just the regular electrician role.
Zero CO2 Hackathon The CIT ZeroCO2 Renewable Energy and Sustainability Hackathon was a collaboration between CIT, CBRIN and Neoen and another example of an innovative learning model. Over 400 people engaged in a variety of activities over the 30 hour-event (including CIT year 12 students), with 49 participants from across Australia registering in the hackathon. The winning team have secured investment from the ACT Government to further develop their ‘proof of concept’ in solar campuses.
“ Neoen was proud to partner with CIT and CBRIN to deliver the Zero CO2 Hackathon, which enabled students to rethink renewable energy and how we can improve the sector through innovation.”
Megan Ward Project Manager, Neoen
CIT CEO Leanne Cover with Petr Adamek CEO CBRIN at the ZeroC02 Hackathon
41

Cyber Security Demand for training in cyber security continues to grow. In 2019, CIT experienced a 285% increase in enrolments with student numbers growing from 206 in 2018 to 793 in 2019. CIT ofers a Certificate IV in Cyber Security (22334Vic), a Graduate Certificate in Networking and Cyber Security (10198NAT) and a Statement of Attainment in Introduction to Organisational Cyber Security (extract from 22334VIC). The statement of attainment was ofered free of charge to all CIT staf and current CIT students during 2019.
Regardless of industry, cyber security training is becoming crucial for any organisation as businesses are increasingly reliant on digital technology. In 2019, CIT welcomed eight technicians from Vestas, a wind turbine solutions and services provider Vestas, for cyber security training. CIT works closely with Vestas providing training across a range of other areas including GWO high-risk training and electrotechnology.
In 2019, CIT Centre of Cyber Security and Games hosted a Cyber Tech Show celebrating one year of cyber security at CIT. The event saw industry and students come together to celebrate and network and two security start-ups were showcased as part of the event at the Training Security Operations Centre at CIT Reid. CIT students were ofered unique opportunities to see and get hands on experience with these technologies, understand how they are used in cyber operations, and meet and talk with cyber experts working in the industry.
The ACT Cyber Security Skills Accelerator is a collaboration, between CIT, Fifh Domain and AustCyber to research and build sustainable cyber
Cyber Tech Show Celebration Cake
training resources, programs and facilities for the Australian workforce. Developing a solution to the cyber security skills shortage, the collaboration now provides the ACT with end-to-end cyber security training, and supports and shares knowledge with TAFE institutions across Australia. The ACT Cyber Security Accelerator was one of three finalists for the Industry Collaboration Award at the Australian Training Awards.
Responding to increasing demand for nurses Due to an increasing demand for Enrolled Nurses both locally and nationally, CIT approached the local industry for support in clinical placements to increase student numbers in the Diploma of Nursing program. Once support was gained, an application for an 80% increase in student numbers was submitted to the Australian Nursing and Midwifery Accreditation Council. This increase was approved and has been implemented over a period of two years with 50% delivered in 2019.
Cyber enrolments
2018 206
2019 793
285% INCREASE
CIT nursing student
42 Canberra Institute of Technology: Annual Report 2019

Seeing Machines (ACT Artificial Intelligence Company) Seeing Machines is a world leader in driver-machine interaction located in Fyshwick, Canberra. The organisation harnesses human factors science to create artificial intelligence technology that observes driver attention and intervenes seamlessly when necessary. This is a new industry partnership for CIT developed through the Business Growth and Development team. In 2019, a cohort of 19 new workers (including 12 students with neurological disabilities and one Aboriginal and Torres Strait Islander student) undertook a pre-apprenticeship in Certificate II in Skills and Vocational Pathways. This involved delivering all core units from the qualification in an intensive delivery style over four weeks with a range of additional support provided to help the students succeed. For these long term unemployed participants, this opportunity helped secure ongoing employment with Seeing Machines through a group training organisation, Australian Training Company. Of the 19 who started training, 18 students have now commenced their Australian Apprenticeship in Certificate III in Customer Engagement.
International students – inbound and outbound CIT maintains an international focus, attracting international students to the ACT and supporting CIT students to train overseas. CIT has a range of exciting study abroad opportunities, giving students an opportunity to undertake study or placement overseas that is related to their studies.
This year CIT attracted 839 international students from 75 countries. On completion of studies many of these students continue on to further educational pathways in the ACT.
In 2018, Canberra Institute of Technology: Economic and Social Contribution to the ACT report estimated that international students studying at CIT and living in the ACT contributed $15 million of added-value to the ACT economy.
CIT also hosted 25 Singaporean sport students with accompanying teachers to provide a taster for sport fitness and massage qualifications.
In 2019, under the Australian Government Endeavour Leadership Program Grants, over 50 CIT students participated in international study tours. These included tours to Singapore to:
> explore advances and new construction techniques, design concepts, urban planning and environmental and climate change strategies
> extend students’ communication skills and provide opportunities to meet and interact with cutting edge cyber security facilities
> expand students’ global vision on the accounting industry and establish new networks while experiencing a full cultural immersion (this tour also visited Bangkok)
> research, design and attend makerspace workshops to create flexible, community spaces within CIT (on return these students presented in a ‘Shark Tank’ styled pitch event that was filmed for a reality TV show produced by CIT media students)
> learn about culture, food, design and service by exploring some of Singapore’s finest restaurant and food events, including a three-day workshop at CIT’s partner institute Temasek Polytehnic.
A further 10 students visited Singapore and Europe as part of a two-week renewable energy study tour to expand their perspective and consider the range of possibilities available in the renewables sector. As part of the tour, students visited the Solar Energy Research Institute of Singapore at the National University of Singapore, Schneider Electric, a leader in digital transformation of energy management and automation in homes and buildings, and the Paris headquarters of Neoen, one of the world’s leading independent producers of renewable energy.
Australian Government Endeavour Leadership Program students in Singapore
43

Promise 3 – Advancing Canberra’s Workforce – Contributing to the new economy and positioning for prosperity CIT is a key economic and social enabler, contributing to the ACT economy by providing VET to support the priorities of the ACT Government in making Canberra more inclusive, progressive and connected. CIT provides the skills for an adaptive, modern workforce. CIT is also a leader in providing education in skill shortage areas and developing targeted programs to increase workforce participation for people experiencing disadvantage. This includes helping people from our diverse community to reach their potential.
Connecting students with jobs CIT has an excellent track-record in students gaining employment on completion of studies with 82% of CIT graduates being employed afer training compared with 71% nationally in 2019. CIT works closely with its industry partners to secure employment opportunities for students. In 2019 CIT experienced close to a 50% increase in employment opportunities being providing to CIT graduates at Accenture-New Applied Now consultancy firm specialising in innovation and technological solutions. While Accenture has previously relied on university graduates to fill vacancies the increasing demand on IT and cyber security roles has resulted in greater numbers of VET graduates being employed by the company. Further examples of CIT connecting students with jobs are discussed throughout this report.
Hospitality Pre-traineeship CIT partnered with local hotel groups (Capital Hotel Group, IHG, Accor), ACT Government, the Department of Jobs and Small Business and JobActive Providers to address a critical skills gap in the local hospitality industry, delivering pre-traineeship programs to local jobseekers. The 10-day tailor-designed program gave participants foundation skills training to successfully prepare them for the hospitality workforce. At the completion of the program successful participants gained employment with their host employers and a pathway to a traineeship. Of the 52 students who completed the program, 35 gained employment with industry partners of the program. This included eight mature age trainees.
Mature Age Workers CIT’s Mature Workers Support project, delivered under the ACT Government’s Mature Workers Grants Program, was established to enable people aged 45 years or older and Australian Apprentices aged 25 years or older to upskill or reskill. To improve employment outcomes, the cohort, of students were provided with high-quality case management services, access to tailored training opportunities and engagement with potential employers. The program also helped address the needs of local businesses seeking to employ additional workers. During 2019, 4,269 students aged 45 and over (including apprentices) engaged with CIT. This increase of 12.84% in mature aged students compared to 2018 is attributed to the project’s marketing, networking and promotional eforts. The project also supported 1,206 mature apprentices (over the age of 25) studying at CIT, an increase of 8% on 2018.
Industry Pathways The Industry Pathways Course is a new vocational training program empowering Year 9 and 10 students in the ACT to make informed choices about their future education and employment. This innovative pilot program commenced in February 2019 exposed ACT secondary school students to a range of work environments. The course focuses on a unique student experience and is based on the ‘jobs without genders’ premise that there should be no personal limits or boundaries to a student’s chosen career path. Throughout the program students are provided with three work placement opportunities selected from a range of occupations in high skills need areas for the Canberra region—including STEM, trades, professional services and community services. A total of 80 students from Namadgi School, Wanniassa School, Melba Copland Secondary School and Mount Stromlo High School were part of the first cohort. Up to an additional 80 places will be provided in 2020, including students from four additional schools.
The Toyota Program CIT has been successfully delivering the Certificate III in Light Vehicle Mechanical Technology (AUR30616) for over 10 years. Under the Toyota Network Training model apprentices attend training for 49 days over the three years, as opposed to the 90 days for mainstream delivery. The completion rate for this program is around 95% and the retention is much the same, far better than the national averages. Toyota Australia provides all resources for the training and assessment of the qualification. CIT, along with QLD TAFE, are leading the way with these statistics and trainee numbers are continuing to grow. The satisfaction
44 Canberra Institute of Technology: Annual Report 2019

responses from employers and students is also very high and has been stable over the past three years. Due to the success of this program, CIT was selected as the preferred provider by Toyota to deliver the program in NSW in 2020.
Apprenticeships and Traineeships CIT has a dedicated Training Initiatives Unit focussed on continuously improving the Australian Apprenticeship experience through processes to support: > enhanced learning engagement for apprentices
and trainees > client engagement and transparency with
employers > ensuring apprentices and trainees have the
support they need to successfully complete their chosen qualification.
Apprentices and Trainees 2016 to 2019
Apprenticeship numbers at CIT continue to grow, bucking the national trend. There was a 7% increase in 2019 with 3,800 apprentices and trainees enrolled across 80 qualifications, compared with 3,570 in 2018. CIT has shown a steady increase in apprentices and trainees since 2016 (see Table 1) which can be attributed to the support provided through the Training Initiatives Unit which also underpins the increase in Australian Apprenticeship enrolments and completions. Areas with increased enrolments in 2019 were fabrication, glass and glazing, landscape construction, plumbing and electrical.
In late 2018, CIT commenced using the employer support function of My Profiling, an electronic tool to support the learning of apprentices and trainees. The tool has increased employer engagement by almost 50%, improving outcomes for both employers and apprentices.
2016 2017 2018 2019
Total Apprentices/Trainees 3,256 3,422 3,570 3,820
Employer Satisfaction Rate 85% 87% 94% 89.5%
CIT carpentry apprentice takes out top ACT award Constructing model planes as a child and studying woodwork in high school were part of the journey through which James White discovered his passion for precise cutting, shaping and building with his hands. James completed a Certificate III in Carpentry at the Canberra Institute of Technology (CIT) and was named 2019 ACT Apprentice of the Year at the ACT Training Awards. Since commencing study at CIT, James completed a full renovation of his home, including the design and construction of a 125 square metre deck. “This would not have been possible without the training and
experience gained through CIT and my apprenticeship,” James said. The skills critical to carpentry and joinery are developed through
mentorship and the teachings of experienced carpenters, but according to James, the training is also about developing the right approach. “Critical to the delivery of quality work is the need for accuracy and
attention to detail,” he said.
“ The skills I have learned both through CIT and on the job have provided the foundation for a long-term, successful and rewarding career.”
James White ACT Apprentice of the Year
45
Skilled Capital The Skilled Capital program is an ACT Government funded training initiative. CIT ofers a comprehensive range of services to provide Skilled Capital students the support they need to complete the training that is right for them. Skilled Capital improves access to high quality training in areas of skills needs and maximises improved employment opportunities for students.
Skilled Capital enrolments have increased by 62% over the past 12 months from 499 in 2018 to 808 in 2019. Industry areas where skilled capital enrolments have increased in 2019 included the skills for work and vocational pathways, early childhood education and care, allied health assistance, cyber security, nursing and project management programs.
Improving Student Outcomes To ensure the best possible student outcomes CIT has a range of programs, activities and services to increase workforce participation and social inclusion for its diverse cohort of students. These included:
> Student Support Services in counselling, careers advice, disability support and financial assistance. Targeted support is also available for international students, mature aged students, women, migrants, refugees and youth.
> working in partnership with the CIT Student Association (CITSA) who provides non-academic support to students including operating bookshops and food and beverage facilities on CIT campuses and an online employment service and accommodation information.
> targeted training and skill development to assist people to enter and re-enter the workforce or further training through the CIT Pathways College.
> CIT delivered Foundation Skills for language, literacy, numeracy and digital to apprentices. CIT Apprentices and trainees are enrolled into a Foundation Skills (FSK20113) qualification and have access to tutorial and mentor support in addition to the student’s vocational qualification. Areas that accessed LLND support for students include, electrotechnology, refrigeration, plumbing, carpentry, cabinet making and aged care individual support (ageing).
> English language classes. In 2019, CIT received $40,000 over four years to waive fees for asylum seekers who hold an ACT Access Card entitling them to two full time semesters or four part-time semesters of English classes.
> providing free English Language conversation groups for international and domestic students to practise their speaking and listening skills were delivered in partnership with CITSA.
> celebrating Harmony Day on 21 March, through a Global Marketplace at CIT Reid. English Language students ran a number of stalls and raised $1,067.60 for Canberra Refugee Support.
> delivering the ACT Work Experience Support Program (WESP) – an ACT Government initiative designed to help people from culturally and linguistically diverse backgrounds gain ofice skills and Australian workplace experience. In 2019, CIT delivered the Certificate II in Business (BSB20115) to 40 WESP participants. This included two groups who spent four weeks at CIT undertaking intensive training in computer based ofice skills, resume writing, interview skills and public sector knowledge relevant to working in a government environment. Following this, students completed an eight week placement in a government agency.
Year 12 Certificate CIT delivers an alternative Year 12 program. In 2019, 60 students graduated with a Senior Secondary Certificate. Of studying to attain an ATAR, over 60% achieved an ATAR over 80 and over 75% achieved an ATAR over 75. The top ATAR was 97.90. VET study units were included in about 40% of graduating students’ Senior Secondary Certificate.
Year 12 continued to deliver the Big Picture program where students participate in project-based and community learning and then have the opportunity to showcase projects in exhibitions. CIT had its first student graduate with a Big Picture Graduation Portfolio, a new parallel pathway to tertiary education for students of Big Picture schools. While the concept of using a portfolio to gain entrance to university is not new, the Big Picture Graduation Portfolio difers in that it is a national, standards-based process that has been negotiated individually with universities around Australia.
46 Canberra Institute of Technology: Annual Report 2019

Collaborative Community Art Project
In 2019, CIT students from Year 12 Big Picture class and the Certificate in General Education for Adults, alongside other students from the Canberra College Big Picture program engaged in a collaborative community art project, supported by staf from the Tedd Nofs Foundation Take Hold Program. Over 10 weeks students learnt and practiced skills in street art, grafiti art and stencilling, collaborating to design and complete a mural at the Weetangera shops. The theme of the mural was both a social and environmental commentary, featuring images of pollution and devastation leading into rebirth and regeneration.
The Weetangera community welcomed the project with shop owners providing the wall space to work on and food and drinks for the participants.
The ongoing partnership between CIT and Take Hold has been very successful in providing guidance and opportunity for a number of at risk students that were provided with a range of support services and referrals.
47

Promise 4 – Transforming our Business – Investing in our business for viability and value CIT operates in a complex and increasingly competitive environment. To remain at the forefront of VET, CIT continues to foster meaningful relationships with industry to ensure training programs provide students with industry relevant, contemporary and job ready skills. CIT oferings provide valuable options for individuals, employers and government.
Business Development and Industry Partnerships Industry partners are critical to CIT’s successful operations. CIT continues to strengthen its industry partners through a dedicated Business Growth and Development team established in 2018. CIT works with ACT industry to deliver training programs that meet the needs of both the ACT economy and community. The model focuses on a centralised point of contact that facilitates greater collaboration across CIT to strengthen strategic partnerships with industry to meet their workforce development needs in areas as diverse as construction, information technology, health and community and business. CIT is also focusing on increasing industry awareness of CIT’s extensive service ofering and the value of VET in attracting and retaining a highly skilled workforce.
In 2019, the team was successful in securing several industry partnerships through various training activities and projects. Stand out projects included the Seeing Machines, Embrace, multiple SPARK programs, Vestas, Microsof Traineeships and the CIT Hospitality Pre-traineeship program. These projects involved collaboration with a variety of stakeholders, new and existing, where CIT was able to design and delivery a range of training services to meet industry needs, including customised and tailored accredited and non-accredited training. Overall, the programs have significantly benefitted CIT and ACT and regional industries, and many participants have since received employment and/or undertaken further study at CIT.
Industry Advisory Groups CIT has a long-standing tradition of engaging with industry and external stakeholders through a number of avenues. One such avenue is Industry Advisory Groups (IAGs) which include a membership base of industry, employer groups, and local and national businesses represented in the ACT. There are approximately seven active IAGs across CIT with up
to 10 members in each supported by the Business Growth and Development team. In 2019, the CIT Board Chair hosted the inaugural CIT/ACT Industry Roundtable with key industry leaders in the ACT. The roundtable, along with the re-invigoration of IAGs across the colleges, gives CIT multiple connections with industry to ensure training products remain responsive and relevant to what is happening in the rapidly changing world of work.
Digitilisation Program With rapid advances in technology, the CIT Digitilisation Program has been building on the understanding of new and contemporary approaches to ensure learners, employers and industry are equipped with the tools and experiences needed for a skilled ACT workforce and ensuring CIT is sustainable and future ready in the digital world. In 2019, CIT secured $5.4 million of funding from the ACT Government for Better ICT for Students and Staf.
To be at the forefront of a contemporary learning environment CIT has focused on enhancing its digital capability. The digitalisation program has already delivered major physical infrastructure and device improvements in 2018 and 2019. In 2020, the direction is moving away from physical infrastructure and focusing on contemporary products and applications that will bring CIT in line with current school solutions and industry standards.
Major objectives delivered in 2019 included the modernisation of desktops, networks and applications. Additional accomplishments in 2019 included:
> rollout of e-Classifier Dissemination Limited Markers (DLM) application
> upgrade of BIEMS, the CIT facilities management system
> update of Adobe Connect
> implementation of Customer Relationship Management system for Business, Growth and Development
> development and implementation of Fun to Fail gamification (ChefCraf).
48 Canberra Institute of Technology: Annual Report 2019

Campus Renewal The ACT Government continues to invest in CIT campus renewal. In 2019, the ACT Government announced up to $250 million to build a new CIT campus at the Woden Town Centre. This exciting purpose built facility is expected to provide a teaching facility for up to 6,500 students and would focus on cyber, technology qualifications and service skills courses. A new state-of-the-art CIT campus is appropriate for the advancement of VET in Canberra and the region. This investment in new facilities supports CIT’s growing student numbers, very high student and employer satisfaction rates and increased employment outcomes for graduates.
A new CIT campus in Woden and a continued presence in the city will strengthen CIT’s existing
campuses in Fyshwick, Bruce, Gungahlin and Tuggeranong and open up a range of new collaboration opportunities for CIT students, with local businesses, industry and the broader community.
CIT continues modernise its facilities to provide the best learning opportunities and environments for optimal student outcomes.
Funding was also secured in 2019 to provide more teaching and learning spaces at the CIT Fyshwick campus. In addition, 2019-20 Better Infrastructure Program funding of $160,000 has been provided for preparatory work for the design and documentation phase to upgrade and construct additional workshop space. Concept design work was completed in 2019.
49
CIT Music and Media Production CIT Music and CIT Media Production were relocated to the Reid campus in 2019. Prior to this, the music program was located at CIT Woden and the media program at CIT Bruce. The centralisation of music and media to the Reid campus, brings closer to CIT’s other creative industries and facilities including the graphic design, web design, photography, fashion and visual arts programs. The new CIT Media and Music facilities include recording studios, rehearsal rooms and labs for sound production, music performance and music electronica courses as well as dedicated filming spaces and editing labs. Regular weeknight performances at CIT Reid provide music students the opportunity to experience live audiences. Students also travel of-campus to work on client events and projects, ensuring they are learning on the job in modern facilities.
Allied health authentic simulated workplace environment A new state-of-the-art allied health simulated workplace environment opened in 2019 within CIT’s healthcare and community services training hub. The new facility makes an important contribution to the delivery of the Certificate IV in Allied Health Assistance, particularly in the preparation of students to work as allied health assistants in fields such as physiotherapy, occupational therapy, dietetics and social work. The new facility is equipped to support training and assessment across a range of other CIT courses including fitness, nursing, aged care, individual support and community work. The facility is also suited to ofering services to the public, including physical activity based rehabilitation for older adults, therapy based sessions for school aged children and adolescents and healthy cooking and eating sessions. Various allied health programs will be run from this facility, complementing existing services delivered through the CIT Fit & Well Gym and Massage Clinic. In 2019, there was a 36% increase in overall enrolments for allied health courses.
CIT Solutions CIT Solutions Pty Ltd is a wholly owned subsidiary of CIT that reports to the Australian Securities and Investments Commission in accordance with the Corporations Act 2001. CIT Solutions’ audited financial statements are consolidated within CIT’s financial statements in this report (see C.2).
During 2019 learning was delivered to 1,737 students enrolled in CIT accredited programs, and non-accredited training was provided to 3,344 learners in
short courses through both face-to-face and on-line delivery modes.
Financially, the Company returned an operating surplus for the year of $0.390m and achieved $18.974m in revenue. This result was achieved with a core workforce of 84 (headcount) supported by a contingent workforce of 224 casual employees.
Revenue in the delivery of the government public sector skills qualifications was significantly higher in 2019 compared to the previous year through the take up of the government’s VET traineeship subsidy for the Diploma of Government program ofered by CIT Solutions. This program was delivered to 12 corporate client groups in 2019 with three publicly advertised oferings. The Company also delivered the Certificate IV in Training & Assessment. An amendment to the national training standards requiring all trainers and assessors to upgrade to the latest qualification in 2019, saw 238 learners complete this program during the year.
The Company successfully delivered two year-long Diploma of Government programs for Indigenous trainees employed through the Department of Human Services and the Department of Small Jobs and Business. A total of 310 trainees enrolled in these two programs with approximately a 90% completion rate.
The year saw the Company implement the Board’s decision to re-structure its operations with a significant refinement of the workforce model. This established a lower cost base to deliver its range of CIT accredited government qualifications with increased profitability using new learning methods and styles to respond to clients’ demands.
The Company was successful in winning a number of contracts with the Department of Health in 2019 to identify training needs, develop and deliver training for the Commonwealth’s My Aged Care workforce. It also continued to manage the online learning platform for the department through which 1,096 learners achieved a Statement of Attainment in My Aged Care training competencies.
The Company supports CIT through the promotion of its courses and the benefits of studying in the ACT to prospective students worldwide. In 2019, CIT Solutions enrolled 839 international students to study at CIT and processed $8.150m in tuition fees. As well as attending international exhibitions and other marketing activities, the Company used 152 student recruitment agencies located within Australia and of-shore to secure enrolments.
The Centre for International Language Training continued to deliver tuition in 32 foreign languages
50 Canberra Institute of Technology: Annual Report 2019
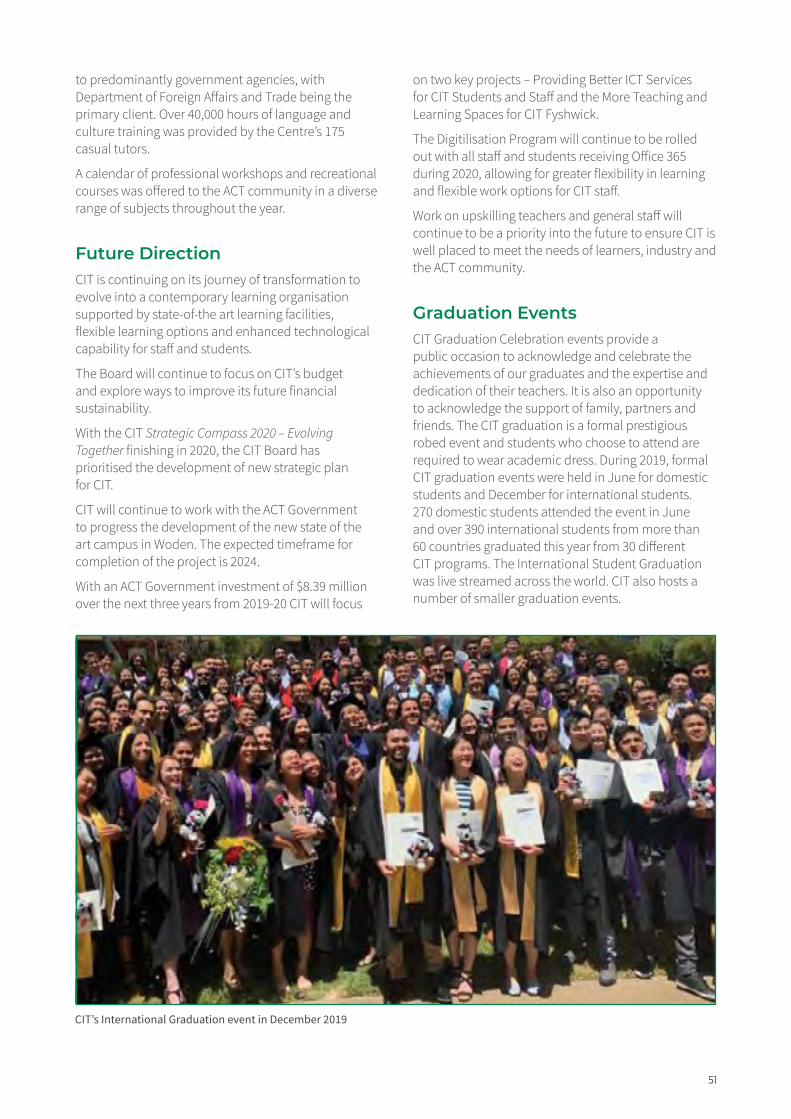
to predominantly government agencies, with Department of Foreign Afairs and Trade being the primary client. Over 40,000 hours of language and culture training was provided by the Centre’s 175 casual tutors.
A calendar of professional workshops and recreational courses was ofered to the ACT community in a diverse range of subjects throughout the year.
Future Direction CIT is continuing on its journey of transformation to evolve into a contemporary learning organisation supported by state-of-the art learning facilities, flexible learning options and enhanced technological capability for staf and students.
The Board will continue to focus on CIT’s budget and explore ways to improve its future financial sustainability.
With the CIT Strategic Compass 2020 – Evolving Together finishing in 2020, the CIT Board has prioritised the development of new strategic plan for CIT.
CIT will continue to work with the ACT Government to progress the development of the new state of the art campus in Woden. The expected timeframe for completion of the project is 2024.
With an ACT Government investment of $8.39 million over the next three years from 2019-20 CIT will focus
on two key projects – Providing Better ICT Services for CIT Students and Staf and the More Teaching and Learning Spaces for CIT Fyshwick.
The Digitilisation Program will continue to be rolled out with all staf and students receiving Ofice 365 during 2020, allowing for greater flexibility in learning and flexible work options for CIT staf.
Work on upskilling teachers and general staf will continue to be a priority into the future to ensure CIT is well placed to meet the needs of learners, industry and the ACT community.
Graduation Events CIT Graduation Celebration events provide a public occasion to acknowledge and celebrate the achievements of our graduates and the expertise and dedication of their teachers. It is also an opportunity to acknowledge the support of family, partners and friends. The CIT graduation is a formal prestigious robed event and students who choose to attend are required to wear academic dress. During 2019, formal CIT graduation events were held in June for domestic students and December for international students. 270 domestic students attended the event in June and over 390 international students from more than 60 countries graduated this year from 30 diferent CIT programs. The International Student Graduation was live streamed across the world. CIT also hosts a number of smaller graduation events.
CIT’s International Graduation event in December 2019
51

B.3 SCRUTINY
ACT Legislative Assembly Inquiries In 2019, CIT participated in three ACT Legislative Assembly Committee inquiries.
> Inquiry into Annual and Financial Reports for 2018-2019 – CIT appeared before the Standing Committee on Education, Employment and Youth Afairs public hearing on 8 November 2019. The Standing Committee is due to report in the ACT Legislative Assembly by the last sitting day in March 2020.
> Inquiry into Appropriation Bill 2018-2019 and the Appropriation (Ofice of the Legislative Assembly) Bill 2019-2020 – CIT appeared before the Select Committee on Estimates 2019-20 on 19 June 2019. The Committee tabled its report in the ACT Legislative Assembly on 30 July 2019. Of the 207 recommendations, none related to CIT.
> Inquiry into Annual and Financial Reports for 2017-18 – CIT appeared before the Standing Committee on Education, Employment and Youth Afairs public hearing on 6 November 2018. The Chair of the Standing Committee, Michael Pettersson MLA, tabled the Committee’s report in the ACT Legislative Assembly on 19 March 2019. The Committee made no recommendations relating to CIT in response to its scrutiny of the 2017 CIT Annual Report.
ACT Auditor-General There were no ACT Auditor-General reports relating to CIT during the reporting year.
ACT Ombudsman Reports There were no ACT Ombudsman reports relating to CIT during the reporting year.
52 Canberra Institute of Technology: Annual Report 2019

B.4 RISK MANAGEMENT
CIT is committed to robust risk management practices, recognising that risk management is an integral part of good management.
CIT risk management is based on the Australian/ New Zealand Standard on Risk Management (ASNZS 4360:2004), and the ASNZ ISO31000 2018 Risk Management Guidelines (the Standard). The Standard is part of CIT’s commitment to governance, improvement and implementation of best risk management practice. CIT has adopted the ACT Insurance Authority Risk Management Framework, its risk management policy and implementation guide, in managing all risks.
CIT actively manages risks through systems, processes and strategies designed to respond to the environment, shape CIT activities and improve capability. Risk identification at CIT also includes strategies to manage fraud and corruption, business continuity, emergency management, incident management, information management and security.
The CIT Executive team lead and oversight business risks and work with senior management to implement transformational and cultural change to improve performance. Progress against risk mitigation strategies is dynamic.
During 2019, the CIT Enterprise Risk Management Profile was reviewed by the CIT Board, the Audit Committee and the Executive team. The profile comprises eight categories against which business risks are assessed:
> value to stakeholders > Strategic Compass 2020 projects > workforce skills and capability > portfolio course oferings > financial sustainability > CIT infrastructure > legislative and regulatory requirements > security and protection.
Emerging risks at CIT are identified through: > internal and external audits or reviews > review of CIT governance, including the
maintenance of policies and procedures > regular discussions with the CIT Board, the
Executive team, directors and managers > monitoring the implementation of internal
performance reviews and audit recommendations > quality assurance assessments and spot checks > regular review of risk across CIT including business
continuity, fraud and corruption > review of key business aspects, such as Work
Health and Safety and records management.
CIT’s financial risks are managed through a clearly defined financial management framework that includes: > quarterly strategic review of financial performance
and corrective action as required by the Executive team
> review of the CIT accountability indicators > review of the output targets to ensure they are
realistic > monthly variance reporting presented by senior
management and dashboard reporting > clearly established ownership of internal budgets > regularly updated financial policy, procedures,
delegations and practice documents > ACT Auditor-General’s ofice reviews and input into
process and procedure > provision of targeted training to staf who have
financial responsibilities > continuous monitoring and review of processes
and systems improvement.
The risks around business continuity, emergency management, and personal incidents are also taken into account as part of overall risk management. CIT regularly reviews its emergency management procedures and practice, as well as personal incidents, both of which are supported with general and specialised training of key staf.
53

B.5 INTERNAL AUDIT
The CIT Audit Committee, a subcommittee of the CIT Board, performs a key corporate governance role. The Audit Committee was established in 2015, through the Audit Committee Charter which is reviewed annually, in line with good practice models documented by the Australian National Audit Ofice (ANAO).
The CIT Audit, Risk and Corporate Governance team supports the Audit Committee in providing independent, objective advice and assurance, as well as assistance to the CIT Board, on risk and control, compliance and external accountability responsibilities.
The Audit Committee is authorised by the CIT Board to carry out its role and responsibilities under the Audit Committee Charter and through the Audit, Risk and Corporate Governance team to:
> obtain any information it needs from any employee and/or external party (subject to their legal obligation under the Information Privacy Act 2014 and Public Sector Management Act 1994 to protect information)
> discuss any matters with internal or external auditors, or other external parties (subject to their legal obligations)
> request the attendance of any employee, including the Chief Executive Oficer, at Committee meetings
> obtain legal or other professional advice, as considered necessary to meet its obligations, at CIT expense.
The Audit Committee meeting agendas are based on an annual program of work, derived from the CIT Enterprise Risk Management Profile and responsibilities documented in the Audit Committee Charter. The Audit Committee Chair formally reports to the CIT Board Chair and the CIT CEO on any significant matters that may impact CIT operations. These issues are also reported to the Executive Management Committee.
The annual audit schedule is determined against the CIT strategic business and anti-fraud and corruption risks. Six audits and reviews were undertaken in 2019 to provide assurance of eficiency and efectiveness, compliance with the laws and regulatory requirement, and to promote continual improvements.
To determine the annual program, consultations are held with the Executive team and directors to ensure CIT priority risks are addressed as part of the final program. Actions against audit recommendations are monitored through to completion including those which are relevant to CIT from external audits, such as the ACT Auditor-General’s Ofice. The progress of the program is reviewed at each Audit Committee meeting and the relevant findings and recommendations discussed to ensure they are on track. All audits and reviews were completed within the scheduled timeframe and budget for 2019 and provided valued recommendations for improvements.
To ensure relevance and quality practice, all internal audit and risk policies, procedures and charters are reviewed annually in accordance with the ANAO Better Practice Guides.
In 2019, the Audit Committee comprised three members - two independent members and one member from the CIT Board who was also the Deputy Chair. The Executive Director, Corporate Services and a representative of the ACT Auditor-General’s Ofice, hold observer status. Audit Committee members are appointed for two years while the Chair is appointed for three years. The CEO is an invited guest to each meeting and presents to a standing agenda item.
Seven committee meetings were held during 2019, three of which focussed on financial matters including reviewing the 2020 Budget process. The remainder addressed the annual program of work, including the review of the Audit Committee Charter and the Internal Audit Charter.
54 Canberra Institute of Technology: Annual Report 2019
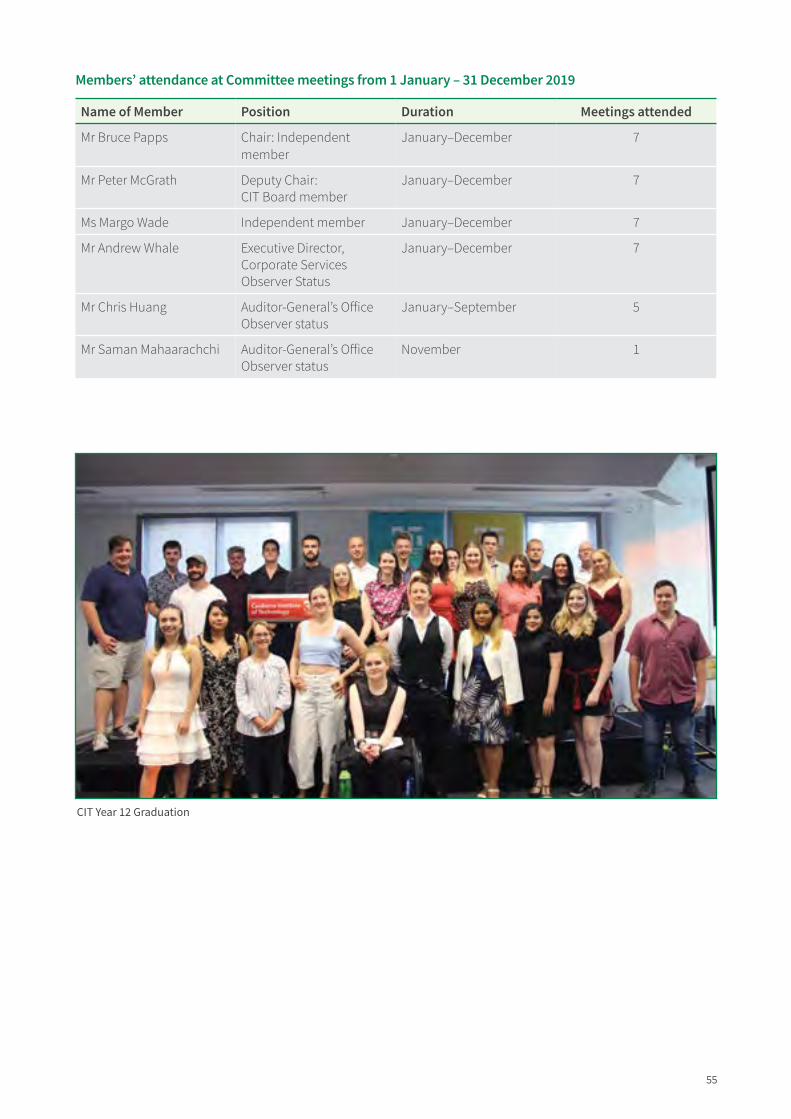
Members’ attendance at Committee meetings from 1 January – 31 December 2019
Name of Member Position Duration Meetings attended
Mr Bruce Papps Chair: Independent member
January–December 7
Mr Peter McGrath Deputy Chair: CIT Board member
January–December 7
Ms Margo Wade Independent member January–December 7
Mr Andrew Whale Executive Director, Corporate Services Observer Status
January–December 7
Mr Chris Huang Auditor-General’s Ofice Observer status
January–September 5
Mr Saman Mahaarachchi Auditor-General’s Ofice Observer status
November 1
CIT Year 12 Graduation
55

B.6 FRAUD PREVENTION
The ACT Government Public Sector Management Standards 2016 detail the formal responsibilities of agencies to promote integrity and to control fraud and corruption. In accordance with this and the ACT Government Integrity Policy, CIT has a Fraud Control Plan that is comprehensively reviewed every two years and an Anti-Fraud and Corruption Risk Profile that is reviewed every six months.
The Senior Executive Responsible for Business Integrity Risk (SERBIR) is responsible for the management of fraud prevention within CIT.
Fraud Control Plan The 2018-20 CIT Fraud Control Plan is a robust and systematic approach which aims to detect, prevent, respond to and report on any allegations of fraud. The Plan operates with key elements such as:
> a policy statement that includes fraud and corruption definitions
> strategies to raise awareness and guide managers on prevention, detection, and prosecution
> responsibilities for fraud control within CIT
> guidance in responding to any Public Interest Disclosures that may be reported.
The Fraud Control Plan will be reviewed in 2020.
Anti-Fraud and Corruption Risk Profile The Anti-Fraud and Corruption Risk Profile is maintained, monitored and reported to the CIT Board, Executive Management Committee and Audit Committee every six months. CIT’s key risks are regularly reviewed and contained in this profile, including both their source and impact with a range of strategies to mitigate the risks. The Anti-Fraud and Corruption Risk Profile is developed as an outcome of the comprehensive biennial review of the Fraud Control Plan.
To raise greater awareness, a set of checklists were developed to assist managers with fraud detection and prevention. Fraud and corruption prevention is part of the CIT Staf on-line Induction Program and face-to-face presentations are provided to staf as required.
In 2019 integrity incidents which required corrective action included: modification of a student’s online account without their knowledge; Campus break-ins and thef of a printing machine and chemicals; and thef of assets from the music department.
56 Canberra Institute of Technology: Annual Report 2019

B.7 FREEDOM OF INFORMATION
CIT ensures compliance with the requirements of the Freedom of Information Act 2016 (the FOI Act) as informed by the ACT Ombudsman’s Guidelines. Summary data for each application is provided below. Details of individual applications and decisions are published by CIT on the FOI Disclosure log.
Open Access Information
Description Total
Number of decisions to publish Open Access information
Number of decisions not to publish Open Access information 0
Number of decisions not to publish a description of Open Access information withheld 0
FOI Application received and decision type
Description Total
Number of access applications received 1
Number of applications where access to all information requested was given 0
Number of applications where access to only some of the information requested was given (partial release)
1
Number of applications where access to the information was refused 0
FOI Processing Timeframe
Description Total
Total applications decided within the time to decide under section 40 1
Applications not decided within the time to decide under section 40 0
Number of days taken to decide over the time to decide in section 40 for each application 0
CIT screen and media students
37
57

0
0
Amendment to Personal Information
Description Total
Number of requests made to amend personal information, and the decisions made
Reviews
Description Total
Number of applications made to ombudsman under section 74 and the results of the application
Number of applications made to ACAT under section 84 and the results of the application 0
Fees
Description Total
Total charges and application fees collected from access applications
Singapore andEurope renewablesstudy tour In the summer of 2019, ten CIT students travelled to Singapore, France and Spain on an innovative renewable technology-learning journey.
The two-week energising learning experience took students to the Institute of Technical Education in Singapore as part of an educational partnership with CIT that fosters collaboration and educational exchanges to prepare students for the global workforce. While in Singapore learning about renewables, students also visited the Solar Energy Research Institute of Singapore at the National University of Singapore, where they saw world’s largest testbed for floating solar photovoltaic systems.
The study abroad experience also included a visit with Schneider Electric (SE) a leader in digital transformation of energy management and automation in homes and buildings. SE exposed students to buildings at the cutting-edge of energy usage and smart technology. Students also had the opportunity to meet with practitioners, suppliers and installers of products and learn about their impact on industry.
In France, the students visited the Paris headquarters of Neoen, one of the world’s leading independent producers of renewable energy. Neoen also facilitated the group’s visit to Cesta’s Solar Park, Europe’s largest solar photovoltaic plant near Bordeaux. Whilst hosted by Abengoa-Algonquin Global Energy Solutions in Seville, Spain, a global leader in the socially responsible development of energy and water assets, the group visited PS10 and PS20, power solar plants that produce electricity with heliostats, or movable mirrors.
This academic and cultural immersive international experience including exposure to industry leaders was made possible through the Australian Government’s Endeavour Mobility Grants.
58 Canberra Institute of Technology: Annual Report 2019
0

B.8 COMMUNITY ENGAGEMENT
AND COMMUNITY SUPPORT
CIT has a broad presence in the ACT community and a wide range of partnerships with industry and community organisations. The diversity of these partnerships, including thousands of local and regional businesses, industry and community organisations, demonstrate the central role that CIT plays in the economic, social and cultural aspects of life within the ACT community.
Open Day CIT held its annual Open Day on Saturday 31 August 2019 at CIT Reid. This is an important event on the CIT annual calendar, promoting career opportunities through VET. The event was promoted through Social Media (Facebook, LinkedIn, Instagram and Twitter), radio advertising on MIX 106.3 and HIT 104.7 (including HIT104.7 broadcasting live at CIT Reid), road signage around Canberra, letterbox mail out (Open Day postcard sent to over 135,000 Canberra households), large signage with Open Day details displayed across CIT campuses and outside of CIT buildings, a full page advertisement in the Canberra Weekly magazine and a dedicated webpage on the CIT website. An estimated 3,000 people attended this event.
School Liaisons CIT teachers, along with CIT marketing, visit schools across the ACT to discuss post-school options in VET plus in addition to hosting school visits at CIT campuses for tours of the facilities. In 2019, CIT either attended or /held 52 school events (compared to 48 in 2018 and 39 in 2017), demonstrating a continued
increased engagement with schools. CIT promotes school visits and campus tours through a monthly newsletter to high school and college careers advisors. Any CIT events open to schools students are promoted through Social Media (Facebook, Instagram) and on the dedicated schools webpage on the CIT website.
Careers Expo - Try a Trade CIT attended the 2019 Canberra Careers Expo hosted by the ACT Government Education Directorate with over 8500 students attending the event over two days. The event aimed at students from Years 9 to 12, provides information about potential careers/ pathways and an opportunity to try or talk to someone about that career or pathway. In 2019, CIT had one of the biggest presences at this event with representatives from every CIT area in attendance. CIT had a large stand in the main exhibition area with CIT Yurauna along with an outdoor display outside the EPIC building.
Bridge Challenge The annual CIT Construction and Engineering Bridge Challenge is a hands-on activity where students compete to create the strongest bridge possible using 12 metres of timber, PVC glue and panel pins. The challenge helps showcase career opportunities in the construction and engineering fields. In 2019, close to 300 students participated from 17 schools across the ACT.
Student from Canberra High School at the CIT 2019 Bridge Challenge
59

CIT Community Support Initiatives With its community and industry partners, CIT ofers a range of scholarships and prizes to assist CIT students with tuition fees and study costs, and to reward them for outstanding performance in their studies.
Grants and Sponsorship 2019
Recipient(s) Sponsor Support Purpose Amount
1,087 recipients CIT Fee Assistance To assist CIT students with fees for courses $325,124
85 recipients CIT Aboriginal and Torres Strait Islander Scholarships
To support Aboriginal and Torres Strait Islander students with their training costs.
$60,068
3 recipients Rotary Club of Canberra City Equity Scholarships
This is available to students living in the local community and in their second continuous semester of study or beyond.
$7,500 ($2,500 each)
3 recipients Soroptimist International Canberra
$3,000 ($1,000 each)
23 recipients ACT Mental Health Consumer Scholarship Scheme
This scholarship supports mental health consumers to gain qualifications in human services. The two-stage scholarship cover statement of attainment and Certificate IV in the community work program.
$10,561
1 recipient Craig O’Neil Prize for a Graduating Accounting Student sponsored by CITSA
This prize is awarded to a CIT Advanced Diploma of Accounting graduate (who is an Australian citizen or a permanent resident of Australia) who has enrolled into university in a related discipline degree.
$2,000
1 recipient The Len Barratt Award This prize is awarded to an Aboriginal and Torres Strait Islander student graduate who has completed a Certificate III or higher program of study at CIT. Recipients need to have demonstrated a positive work ethic and consistent efort toward their studies and gained the respect of their peers.
$2,000
2 recipients Rotary Club of Canberra City Prize
Prizes are awarded to one male and one female student who have completed any trade program. Recipients need to have demonstrated a high standard of crafsmanship and personal conduct.
$300 each
1 recipient Rotary Club of Canberra – Weston Creek Prize
This prize is awarded to a student graduating from any CIT program who has made a valuable contribution to the community during their studies (related to their studies at CIT).
$500
1 recipient University of Canberra Prize (e publication voucher)
This prize recognises a CIT graduate with the most outstanding result in a program that articulates with the University of Canberra.
$250
1 recipient Yass Lodge of Concord No. 27 (Freemasons)
This prize is awarded to the CIT Pathways College graduate that has shown the greatest improvement in English as an additional language study.
$250
1 recipient University of Canberra Prize (ACT Year 12 Certificate)
This prize recognises an ACT Year 12 Certificate graduate with either a mature entry pathway or a tertiary rank
$250
(e.g. ATAR, UAI, TER, TES etc.) that qualifies them to enrol at UC, and that managed personal challenges so that they participated actively and positively in their studies.
60 Canberra Institute of Technology: Annual Report 2019

B.9 ABORIGINAL AND TORRES
STRAIT ISLANDER REPORTING
CIT is committed to promoting a culture that strengthens respect, relationships and opportunities for Aboriginal and Torres Strait Islander peoples through positive and inclusive learning and workforce innovation practices. The CIT Reconciliation Action Plan 2016-2019 is a framework that supports the CIT Strategic Compass 2020 – Evolving Together and business plans. This framework drives CIT’s contribution to reconciliation with the Ngunnawal community and all Aboriginal and Torres Strait Islander peoples’ communities to develop relationships with respect and create meaningful opportunities. With the number of Aboriginal & Torres Strait Islander people accessing CIT continues to grow CIT aims to close the gap in educational outcomes through policy and practices to improve vocational training outcomes for Aboriginal and Torres Strait Islander people. CIT has a number of key strategies that focus on the needs of Australia’s First Nations.
Aboriginal and Torres Strait Islander Advisory Committee CIT has a dedicated Aboriginal and Torres Strait Islander Advisory Committee, made up of Aboriginal and Torres Strait Islander leaders from the ACT community. The committee provides advice and guidance on training needs from industry and the community and plays an important role in the governance of CIT and in the planning for the delivery and support of Indigenous education. The CIT Aboriginal and Torres Strait Islander Advisory Committee met twice in 2019.
CIT Yurauna Centre The CIT Yurauna Centre is a community focused multi-functional Cultural Education Centre that brings individuals together to learn in a culturally safe environment and provides opportunity for people to find real solutions. Yurauna is a centre of educational excellence that provides teaching and support to Aboriginal and Torres Strait Islander peoples across a broad range of programs. Yurauna implements a community engagement model specifically designed to build cultural connections, individual capacity and community networks for education and employment outcomes for Aboriginal and Torres Strait Islander peoples.
The concerns and challenges faced by Aboriginal and Torres Strait Islander peoples are complex, varied, long- term and generational. These challenges require an individual approach that empowers through respectful relationships and meaningful opportunities. Yurauna enhances skill growth for employment opportunities through pastoral assistance and provision of culturally appropriate courses to improve literacy, numeracy, communication and vocational training outcomes.
Yurauna works across the ACT Aboriginal and Torres Strait Islander community to respectfully engage and collaborate for the benefit of the community. Partnership opportunities include meeting with employment service providers and partnering directly with employers for work placement or real jobs to achieve positive outcomes for students.
In 2019 Yurauna hosted meetings for the United Ngunnawal Elders Council, Our Booris, Our Way Steering Committee for the review into ACT Child Protection, Ngunnawal Bush Health Farm Board, Winangaay Ngunnawal Language Group and other meetings with local community organisations and representative bodies. The Yurauna Director is a member of the ACT Aboriginal Torres Strait Islander Elected Body, Chair of the Dhawura Ngunnawal Committee, Member of Aboriginal and Torres Strait Islander Education Advisory Group, Board member of Everyman, Member of Australian Institute of Aboriginal and Torres Strait Islander Studies (AIATSIS) Research Committee.
CIT Yurauna Director Caroline Hughes, CIT Student Kirby Brandy and CIT Teacher Cyndy Newman at Orange Wolves.
61

National 2019 Banksia Awards The Banksia Foundation is a well-established national not-for-profit organisation dedicated to working with industry and community to create an array of platforms to focus attention on the recognition of excellence in sustainability. The 2019 Banksia Sustainability Awards recognised ConnXtions, a CIT Yurauna and Northside Community Service job readiness support program, as a Banksia finalist in the Indigenous Award category. The ConnXtions Program is a holistic approach to the educational needs of Aboriginal and Torres Strait Islander students, recognising both career development needs, as well as the support for culturally aware childcare. CIT Yurauna has become an integral part of CIT and is increasingly successful at supporting Aboriginal and Torres Strait Islander students through their training and into careers.
Reconciliation Action Plan CIT has been a leading advocate for reconciliation in the ACT since the adoption of a reconciliation statement in 2002, with its commitment formalised through the development of a Reconciliation Action Plan (RAP) in 2012, and a stretch RAP for 2016-2019. CIT is actively working with Reconciliation Australia to develop a new stretch RAP. It is envisaged there will be a period of consultation and co-design throughout the first quarter of 2020 with the vision of having a new approved stretch RAP in place by mid-2020.
To strengthen and maintain relationships between Aboriginal and Torres Strait Islander staf and other CIT staf and students CIT partnered with the CIT Student Association to deliver activities for Reconciliation Day and National Sorry Day. In 2019, these included:
> National Sorry Day Bridge Walk
> Reconciliation in the Park event
> College morning teas at Reid and Bruce
> CIT Yurauna Director appearing on ABC Radio regarding Reconciliation
> Screening of “Footprints on Our Land: Aunty Agnes”
> Oficial opening of Reconciliation Week BBQ
> Presenting Elders film screening at the National Museum of Australia
> CIT Marketing developing a Sorry Book and cards for display in Café Yala and open areas
> Bruce and Reid Libraries exhibiting Aboriginal and Torres Strait Islander artwork.
NAIDOC Week Celebrations NAIDOC Week celebrations take place around Australia every year in July, coinciding with CIT’s semester break. CIT celebrates NAIDOC week in October to allow students, teachers and staf to get together to celebrate and learn more about Aboriginal and Torres
Executive Director Education and Training Services, Paula McKenry and CIT Yurauna Director Caroline Hughes with the Yurauna team at the National 2019 Banksia Awards
62 Canberra Institute of Technology: Annual Report 2019

Strait Islander cultures. In partnership with the CIT Student Association, CIT hosted 2019 NAIDOC Week celebrations on Wednesday 17 October at CIT Reid. The national theme of NAIDOC Week celebrations was “Voice. Treaty. Truth. Let’s work together for a shared future.” Significant to the NAIDOC Week theme, the CIT Yurauna Director, a Ngunnawal Elder, has been engaged in eforts to preserve and increase knowledge of Indigenous languages from around Australia.
Living languages In 2019, the Director CIT Yurauna, as a Ngunnawal Elder, participated in a professional development opportunity over five days. The workshop delivered by the AIATSIS and Living Languages focused on linguistics and revitalising Indigenous languages. This program, together with CIT support, has been instrumental in the revitalisation of the Ngunnawal language.
Ms Hughes lent her voice to a recording of a Welcome to Country in Ngunnawal language, which is played at the Canberra Airport’s international terminal. In addition, Ms Hughes’ voice is also heard introducing presenters on ABC Radio Canberra in Ngunnawal language.
Cultural Awareness Training In 2019, the CIT CEO, Executive Team and directors participated in a cultural immersion program that included a guided tour of Tidbinbilla and the sanctuary. This was an opportunity to interact, understand and appreciate traditional cultural practices as well as the importance of fauna and flora for Ngunnawal people and the ACT. CIT also worked to embed Aboriginal and Torres Strait Islander
cultural awareness within Colleges and Divisions and training was ofered to teaching and general staf at diferent times and locations during the year, to maximise attendance. Aboriginal and Torres Strait Islander cultural awareness is also included in all staf induction programs.
CIT Aboriginal and Torres Strait Scholarships Since 2003, to overcome financial barriers to vocational education and training CIT has provided scholarships for Aboriginal and Torres Strait Islander students to improve access and outcomes. The scholarships cover fees for full-time, part-time and flexible delivery study, as well as Recognition of Prior Learning. In 2019, CIT provided 107 Indigenous scholarships for Aboriginal and Torres Strait Islander students at a total cost of $71,698.
In addition to these, CIT Building and Construction Management College introduced three CIT Indigenous Construction Scholarships to build the professional and personal development of Aboriginal or Torres Strait Islander building and construction professionals whether in technical, management or policy roles.
Student Achievements CIT has seen increasing enrolments of Aboriginal and Torres Strait Islander students since 2010, with a slight dip in 2015. In 2019, there were 1,022 Aboriginal and Torres Strait Islander students enrolled in 1,348 programs. CIT has also seen an increase in the number of enrolments with more students completing certificate III and IV and diploma, advanced diploma and degrees (see table below).
Aboriginal and Torres Strait Islander Students 2010 - 2019
2010 2011 2012 2013 2014 2015 2016 2017 2018 2019
Total (headcount) 338 521 534 663 531 748 906 795 856 1,022
Total Enrolments 602 830 922 1,084 916 1,024 1,080 1,024 1,101 1,348
Enrolments in Non-Awards/ Statement of Attainment
263 395 443 420 129 71 135 178 177 312
Enrolments in Certificate I and Certificate II
126 101 129 158 351 210 112 71 128 154
Enrolments in Certificate III and Certificate IV
124 214 273 413 373 492 703 609 627 528
Enrolments in Diploma, Advanced Diploma and Degrees
89 120 77 93 62 82 130 166 169 354
63
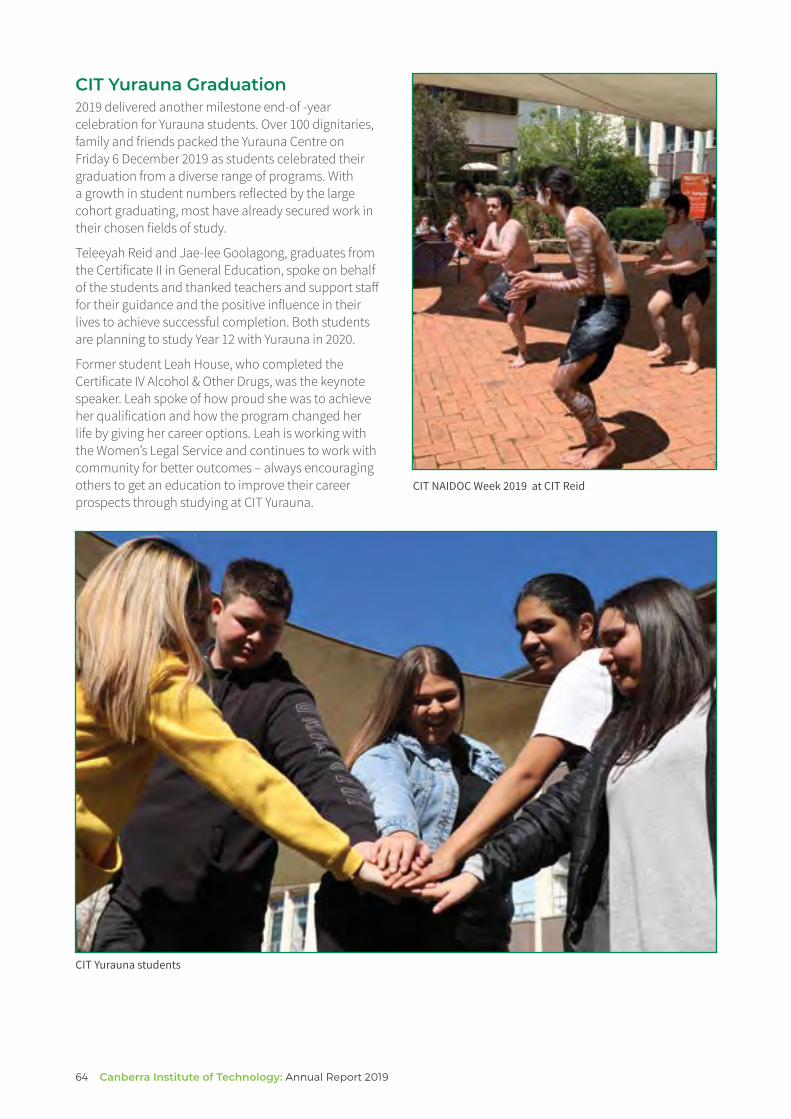
CIT Yurauna Graduation 2019 delivered another milestone end-of -year celebration for Yurauna students. Over 100 dignitaries, family and friends packed the Yurauna Centre on Friday 6 December 2019 as students celebrated their graduation from a diverse range of programs. With a growth in student numbers reflected by the large cohort graduating, most have already secured work in their chosen fields of study.
Teleeyah Reid and Jae-lee Goolagong, graduates from the Certificate II in General Education, spoke on behalf of the students and thanked teachers and support staf for their guidance and the positive influence in their lives to achieve successful completion. Both students are planning to study Year 12 with Yurauna in 2020.
Former student Leah House, who completed the Certificate IV Alcohol & Other Drugs, was the keynote speaker. Leah spoke of how proud she was to achieve her qualification and how the program changed her life by giving her career options. Leah is working with the Women’s Legal Service and continues to work with community for better outcomes – always encouraging others to get an education to improve their career prospects through studying at CIT Yurauna.
CIT NAIDOC Week 2019 at CIT Reid
CIT Yurauna students
64 Canberra Institute of Technology: Annual Report 2019

B.10 WORK HEALTH AND SAFETY
Given the diversity of the business CIT staf and students face a wide range of hazards and risks. In addition CIT’s training role means that it must ensure that students are prepared for industry. This means a robust Work Health and Safety management system and a strong safety culture is required to protect staf students and visitors both now and for the future.
CIT has a comprehensive WHS management system that ensures it complies with the Work Health and Safety Act 2011. The curriculum includes substantial focus on work health and safety. The CIT Board, Executive and staf are committed to addressing WHS matters and continuously improving WHS practices.
In 2019, no improvement, prohibition or non-disturbance notices (under Part 10) or any enforceable undertakings (Part 11) of the WHS Act were issued to CIT. There were no findings of a failure to comply with a safety duty under Part 2, Division 2.2, 2.3 or 2.4 of the Act.
Notifiable Incidents Section 38 of the WHS Act outlines conditions under which a serious workplace incident must be reported to WorkSafe ACT.
During 2019 three incidents occurred that were notified to the regulator. They included:
> A student sufered an anaphylactic reaction at home afer attending a CIT function due to the smell of cinnamon. Prior to the event CIT instructed the caterer not to include cinnamon unfortunately however a mistake was made. In future CIT will provide additional reminders to the caterer. No action was taken by the regulator.
> A student reported an electric shock from a desk. The desk was checked by a certified electrician who declared the desk safe and that the shock must have been static electricity. The regulator confirmed that no further action was necessary.
> A student cut their finger whilst using a Stanley knife and severed a tendon. Competency based training was enhanced to prevent a recurrence. The regulator confirmed that no further action was necessary.
Worker Consultation WHS committee meetings are convened for each campus.
Campus based committees are held quarterly and are chaired by a senior manager with campus based health safety representatives (HSRs) in attendance. These meetings provide the opportunity for consultation on WHS matters directly afecting staf on each campus.
Campus-based committees each nominate two HSRs to attend quarterly CIT Work Health and Safety Committee meetings. The Executive Director of Corporate Services chairs these meetings.
Notes from the WHS campus-based and policy committees are available to all staf on the CIT intranet.
Health, Safety and Wellbeing Initiatives A number of CIT health, safety and wellbeing initiatives occurred in 2019, including:
> improved response and reporting processes were implemented for student behavioural incidents
> WHS spot check program by CIT’s WHS Advisor was conducted for workplaces which have higher inherent risk. E.g. construction
> free influenza vaccinations were ofered to all staf
> implementation of a WHS assessment checklist for home based work
> manual handling training provided in areas with high levels of manual handling activity
> a review was conducted of chemical management including purchasing, use, and disposal
> early intervention support including welfare checks and workplace reasonable adjustments
> a mental health focus group discussion to identify organisational needs
> the promotion of ACT Government Mental Health and Wellbeing initiatives such as Mental Health Guru Online Training
> collaboration with Chief Minister, Treasury and Economic Development Directory (CMTEDD) and Employers Mutual Limited (EML) to better support injured staf.
65

Case Management CIT’s compensation claims are managed by the Chief Minister, Treasury and Economic Development Directorate.
Australian Work Health and Safety Strategy The following tables represent CIT’s performance against Australian WHS Strategy 2012–22 targets.
Target 1 – Reduce the Incidence Rate of Claims Resulting in One or More Weeks Of Work by at Least 30%
ACTPS rate CIT # new Rate per 1,000 ACTPS # new per 1,000
Financial year 5-day claims employees CIT Target 5-day claims employees ACTPS Target
2013–14 5 6.66 5.86 257 12.20 11.70
2014–15 6 8.19 5.67 228 10.49 11.33
2015–16 1 1.42 5.49 205 9.36 10.96
2016–17 3 4.38 5.30 243 10.83 10.58
2017–18 2 2.94 5.11 202 4.07 10.21
2018–19 4 5.66 4.93 201 8.50 9.84
2019–20 2 2.83 4.74 72 3.05 9.46
2020–21 4.55 9.09
2021–22 4.36
16
14
12
10
8
6
4
2
0
New
5 d
ay c
laim
s per
100
0 em
ploy
ees
Baseline 2012–13 2013–14 2014–15 2015–16 2016–17 2017–18 2018–19 2019–20 2020–21 2021–22 (Avg FY 09-12)
CIT rate per 1000 employees ACTPS rate per 1000 employees CIT target 1 ACTPS target 1
Notes: 1. Dates are based on those claims received by Comcare in each financial year. 2. Data is taken at 30 June in each of the years to allow for direct comparisons to be made between years. 3. The report includes accepted claims that result in one or more weeks of work. 4. Data includes claims up to 30 June 2019.
66 Canberra Institute of Technology: Annual Report 2019
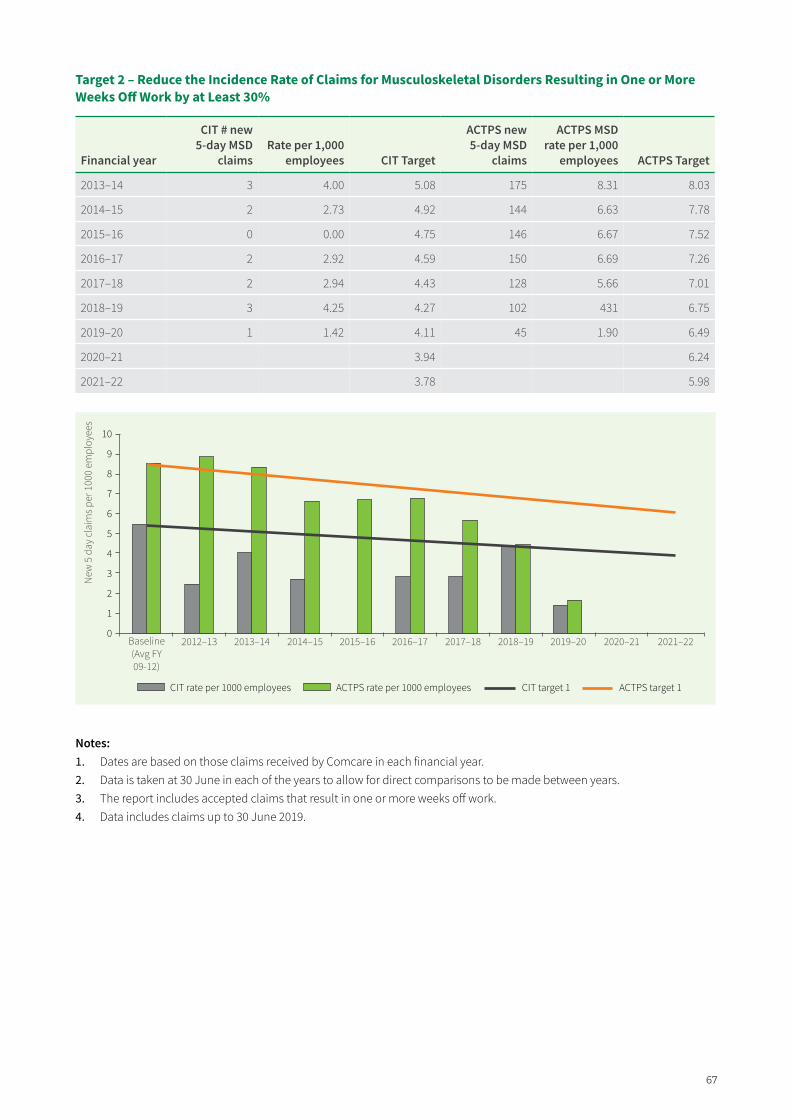
Target 2 – Reduce the Incidence Rate of Claims for Musculoskeletal Disorders Resulting in One or More Weeks Of Work by at Least 30%
CIT # new ACTPS new ACTPS MSD 5-day MSD Rate per 1,000 5-day MSD rate per 1,000
Financial year claims employees CIT Target claims employees ACTPS Target
2013–14 3 4.00 5.08 175 8.31 8.03
2014–15 2 2.73 4.92 144 6.63 7.78
2015–16 0 0.00 4.75 146 6.67 7.52
2016–17 2 2.92 4.59 150 6.69 7.26
2017–18 2 2.94 4.43 128 5.66 7.01
2018–19 3 4.25 4.27 102 431 6.75
2019–20 1 1.42 4.11 45 1.90 6.49
2020–21 3.94 6.24
2021–22 3.78 5.98
10
9
8
7
6
5
4
3
2
1
0
New
5 d
ay c
laim
s per
100
0 em
ploy
ees
Baseline 2012–13 2013–14 2014–15 2015–16 2016–17 2017–18 2018–19 2019–20 2020–21 2021–22 (Avg FY 09-12)
CIT rate per 1000 employees ACTPS rate per 1000 employees CIT target 1 ACTPS target 1
Notes: 1. Dates are based on those claims received by Comcare in each financial year. 2. Data is taken at 30 June in each of the years to allow for direct comparisons to be made between years. 3. The report includes accepted claims that result in one or more weeks of work. 4. Data includes claims up to 30 June 2019.
67
B.11 HUMAN RESOURCES
MANAGEMENT
> investigating a variety of delivery modes to be Workforce Planning ofered in future. Workforce Planning at CIT is underpinned by regular workforce reports analysed by managers with the support of CIT Human Resources. Six monthly reports are produced in February and August providing comprehensive summaries of CIT’s workforce, including: headcount and full-time equivalent (FTE), age profile, nominal teaching hours, Equal Employment Opportunity (EEO) statistics, absenteeism, and teacher professional development fund allocations. The CIT Board is provided with a summary of key results.
Monthly compliance reports are produced for Directors covering teaching load, Cert IV in TAE completions, and mandatory annual training in WHS and workplace culture.
Learning and Development programs and activities CIT Learning and Development Hub In May 2019, CIT introduced an internal Learning and Development Hub – a pilot project established to promote training and development opportunities to staf, designed to build organisational capability 295 staf took advantage of training which covered a variety of categories including Cultural Awareness, Appropriate workplace behaviour, Finances and Budget, Work, Health and Safety, and Electronic filing systems training.
Responses to this initiative were positive with majority of respondents agreeing:
> ‘The training was very informative, interesting and enjoyable to attend’
> ‘Facilitators were memorable and helped link background information with lived experience.’
> ‘Group activities were useful’
> ‘The information provided was important and beneficial’
Identified opportunities for continuous improvement include:
> introducing a more user friendly interface when booking into a program, which will integrate with MS Outlook calendars
As at the end of 2019, CIT had 903 active staf, comprising permanent, temporary and casual workers. 549 staf completed the training, Working Together at CIT and 575 completed Work Health and Safety training.
Preventing and Responding to Sexual Assault and Sexual Harassment
In 2019, CIT reviewed and promoted the sexual assault and sexual harassment policy and procedures. This was accompanied by a comprehensive strategy including class visits by Student Support staf, face-to-face information session for students, and awareness raising through posters, plasma screen displays and information on the CIT website and eLearn. Regular training sessions were also provided to staf on how to respond to reports of sexual assault and sexual harassment.
In 2019:
> 1642 students attended face-to-face sessions
> 315 staf attended training through 18 sessions
> 216 staf attended MATE Bystander training through 12 sessions
> 60 students attended MATE Bystander training through three sessions.
Whole of Government Training and Development Programs
CIT staf also attended fully funded inclusion training and development initiatives, aimed at supporting and retaining Aboriginal and Torre Strait Islander staf and staf with disability and promoting diversity in the ACT Public Service.
Program categories included:
> How to be a Mentor for Aboriginal and Torres Strait Islander Staf
> Leadership Development Program for Aboriginal and Torres Strait Islander staf
68 Canberra Institute of Technology: Annual Report 2019
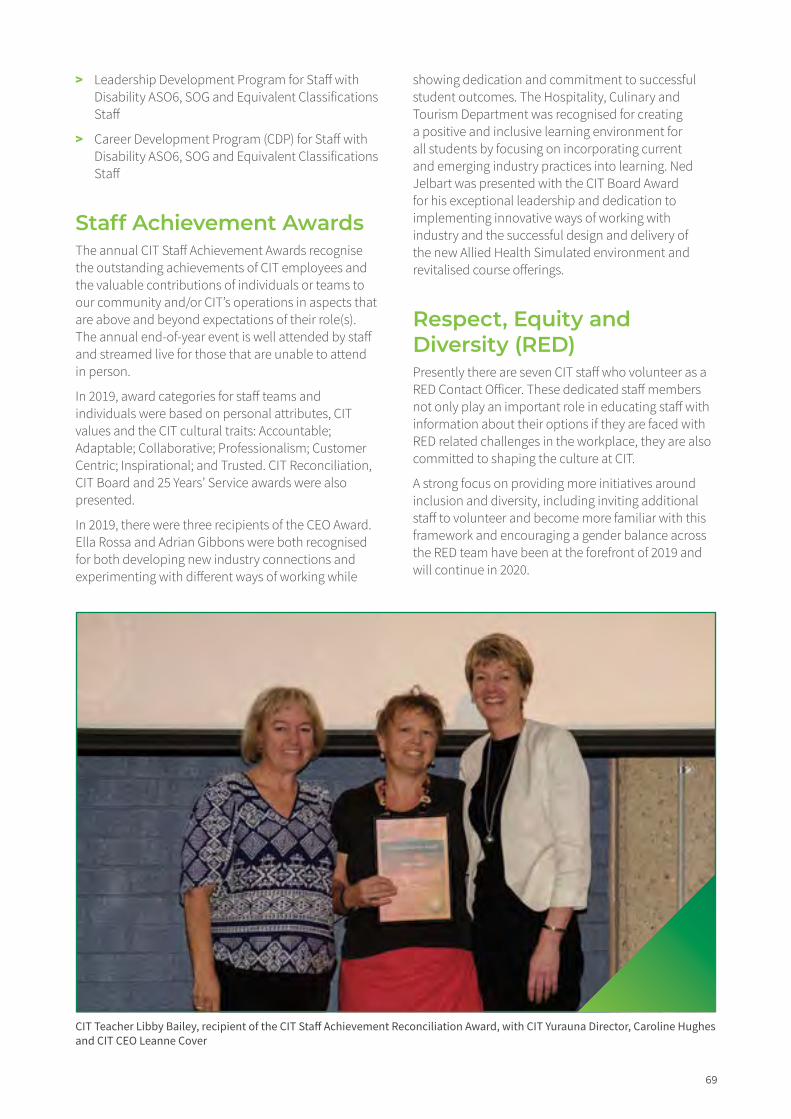
> Leadership Development Program for Staf with Disability ASO6, SOG and Equivalent Classifications Staf
> Career Development Program (CDP) for Staf with Disability ASO6, SOG and Equivalent Classifications Staf
Staff Achievement Awards The annual CIT Staf Achievement Awards recognise the outstanding achievements of CIT employees and the valuable contributions of individuals or teams to our community and/or CIT’s operations in aspects that are above and beyond expectations of their role(s). The annual end-of-year event is well attended by staf and streamed live for those that are unable to attend in person.
In 2019, award categories for staf teams and individuals were based on personal attributes, CIT values and the CIT cultural traits: Accountable; Adaptable; Collaborative; Professionalism; Customer Centric; Inspirational; and Trusted. CIT Reconciliation, CIT Board and 25 Years’ Service awards were also presented.
In 2019, there were three recipients of the CEO Award. Ella Rossa and Adrian Gibbons were both recognised for both developing new industry connections and experimenting with diferent ways of working while
showing dedication and commitment to successful student outcomes. The Hospitality, Culinary and Tourism Department was recognised for creating a positive and inclusive learning environment for all students by focusing on incorporating current and emerging industry practices into learning. Ned Jelbart was presented with the CIT Board Award for his exceptional leadership and dedication to implementing innovative ways of working with industry and the successful design and delivery of the new Allied Health Simulated environment and revitalised course oferings.
Respect, Equity and Diversity (RED) Presently there are seven CIT staf who volunteer as a RED Contact Oficer. These dedicated staf members not only play an important role in educating staf with information about their options if they are faced with RED related challenges in the workplace, they are also committed to shaping the culture at CIT.
A strong focus on providing more initiatives around inclusion and diversity, including inviting additional staf to volunteer and become more familiar with this framework and encouraging a gender balance across the RED team have been at the forefront of 2019 and will continue in 2020.
CIT Teacher Libby Bailey, recipient of the CIT Staf Achievement Reconciliation Award, with CIT Yurauna Director, Caroline Hughes and CIT CEO Leanne Cover
69
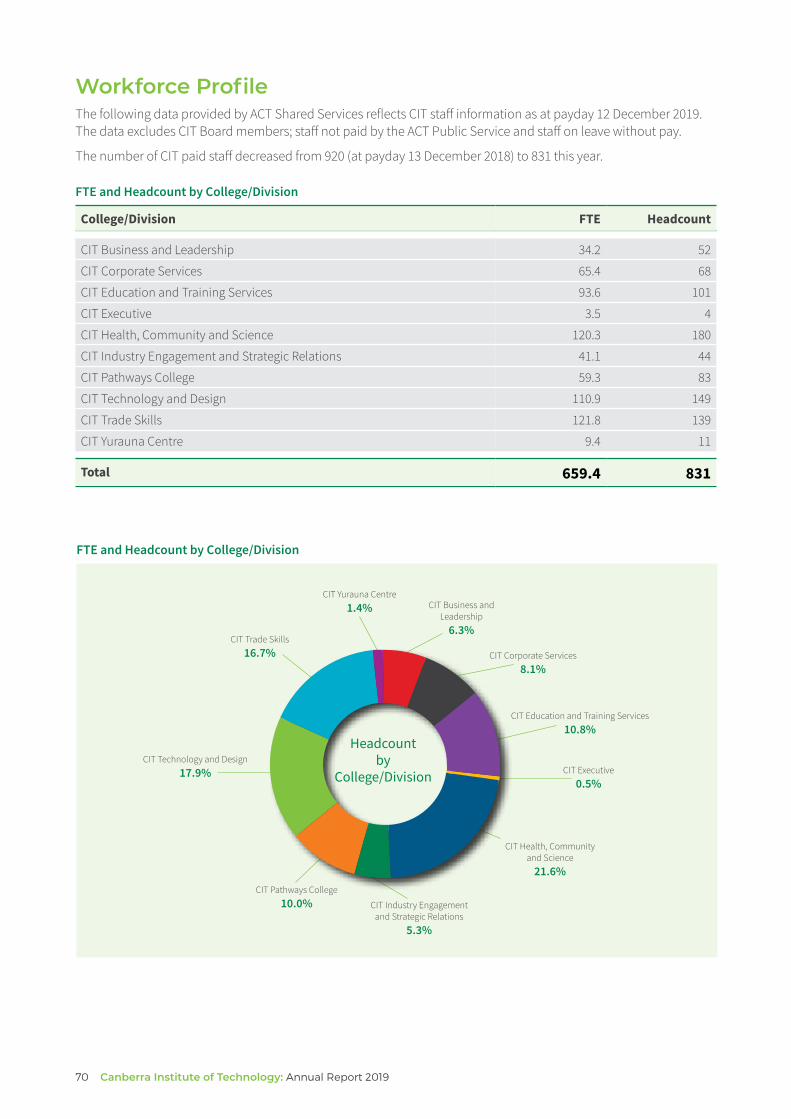
52
Workforce Profile The following data provided by ACT Shared Services reflects CIT staf information as at payday 12 December 2019. The data excludes CIT Board members; staf not paid by the ACT Public Service and staf on leave without pay.
The number of CIT paid staf decreased from 920 (at payday 13 December 2018) to 831 this year.
FTE and Headcount by College/Division
College/Division FTE Headcount
CIT Business and Leadership 34.2
CIT Corporate Services 65.4 68
CIT Education and Training Services 93.6 101
CIT Executive 3.5 4
CIT Health, Community and Science 120.3 180
CIT Industry Engagement and Strategic Relations 41.1 44
CIT Pathways College 59.3 83
CIT Technology and Design 110.9 149
CIT Trade Skills 121.8 139
CIT Yurauna Centre 9.4 11
Total 659.4 831
FTE and Headcount by College/Division
CIT Yurauna Centre CIT Business and
Leadership 6.3%
CIT Corporate Services 8.1%
CIT Executive 0.5%
CIT Pathways College
CIT Technology and Design 17.9%
CIT Trade Skills 16.7%
Headcount by
College/Division
CIT Education and Training Services 10.8%
CIT Health, Community and Science
21.6%
1.4%
10.0% CIT Industry Engagement and Strategic Relations
5.3%
70 Canberra Institute of Technology: Annual Report 2019

FTE and Headcount by Gender
Female Male Total
Full Time Equivalent 376.3 282.3 658.7
Headcount 483 347 830
Percentage of Workforce (Based on Headcount)
58.2% 41.8% 100.0%
Note: There is some inconsistency in the totals by gender in this and following tables. This is due to the exclusion of the Gender flagged as X in the payroll system (Indeterminate, Intersex, Other). These results are specifically excluded, as inclusion may result in people being identifiable when compared against the various categories of employees that are reported.
Headcount By Gender
Male 41.8%
347 Headcount by Gender
483 Female 58.2%
Headcount By Gender 2016-2019
Hea
dcou
nt
1000
900
800
700
600
500
400
300
200
100
0 2016 2017 2018 2019
530
329
859
515
331
846
554
366
920
483
347
830
Female Male Total
71

Headcount by Classification and Gender
Female Male Total
Administrative Oficers 140 58 198
Executive Oficers 2 3 5
General Service Oficers and Equivalent 13 13 26
Professional Oficers 14 8 22
Senior Oficers 35 15 50
Statutory Ofice Holders 1 0 1
Technical Oficers 7 14 21
VET Teacher Managers 26 11 37
VET Teachers 245 225 470
Total 483 347 830
Headcount by Employment Category and Gender
Female Male Total
Casual 94 84 178
Permanent Full-time 225 172 397
Permanent Part-time 53 13 66
Temporary Full-time 61 61 122
Temporary Part-time 50 17 67
Total 483 347
Headcount by Diversity Group
Headcount Percentage of CIT workforce
Aboriginal and/or Torres Strait Islander 23 2.8%
Culturally and Linguistically Diverse 142 17.1%
People with a Disability 29 3.5%
Note: Employees may identify with more than one of the diversity groups.
72 Canberra Institute of Technology: Annual Report 2019
830

Headcount by Age and Gender
Female Male Total
Under 25 17 9 26
25-34 63 54 117
35-44 113 74 187
45-54 167 103 270
55 and over 123 107 230
Total 483 347 830
Headcount By Age
Under 25 3.1%
25–34 14.1%55 and over
27.7%
45–54 32.5%
35–44 22.5%
Headcount by Age
Headcount By Age 2016-2019
350
300
250
200
150
100
50
0
Under 25
2016 2017 2018 2019
31
121
201
276
230
36
108
179
289
234
41
129
199
300
251
Total – 859 Total – 846 Total – 920 Total – 830
26
117
187
270
230
25-34 35-44 45-54 55 and over
Hea
dcou
nt
73

Average Length of Service by Gender
Female Male Total
Average Years 9.2 8.5 8.9
The following data reflects CIT permanent staf turnover for the 2019 calendar year.
Recruitment and Separation Rates
Classification Group Recruitment Rate Separation Rate
Total 9.6% 8.3%
Attraction and Retention Incentives (ARIns) As at December 2019, the ACT Public Sector Canberra Institute of Technology (Teaching Staf) Enterprise Agreement 2018–2021, covered CIT teaching staf. The ACT Public Sector Canberra Institute of Technology Enterprise Agreement 2018–2021 covered general staf.
The Enterprise Agreements (EAs) provide scope for Attraction and Retention Incentives (ARIns) agreed with staf to provide higher levels of remuneration or other benefits above those identified in the EAs.
The following tables outline information pertaining to ARIns in place during 2019.
Attraction and Retention Incentives 2019
Description No. of Individual ARIns
Number of ARIns at 31 December
Number of employees who transferred from SEAs during the period 0
Number of ARIns entered into during period 3
Number of ARIns terminated during period 1
Number of ARIns providing for privately plated vehicles at 31 December 0
Classification Range Remuneration as at 31 December 2019
Individual and Group ARIns SOG A $207,929
SPO C $117,687
PO 2 $99,732
TL 1 $106,582
74 Canberra Institute of Technology: Annual Report 2019
9
B.12 ECOLOGICALLY SUSTAINABLE
DEVELOPMENT
In 2019, as in past years, CIT continued to work towards ACT Government targets set down through the Climate Change and Greenhouse Gas Reduction Act 2010.
CIT supports ACT Government strategies to address climate change and reduce greenhouse gas emissions. This includes implementing initiatives to improve energy eficiency and water conservation through building upgrades, refurbishment and maintenance programs.
CIT manages, monitors and reports all energy systems across a number of sofware platforms including: ENVIZI (which is the main ACT Government Energy reporting platform), SMA Solar Technology AG 2019 ©, Schneider Electrical BMS Dashboard, Airtek International © and BEIMS. This range of sofware applications allows CIT to monitor and in some instance, operate energy systems remotely which provides additional eficiencies on our operations.
In 2019, CIT completed the installation of the Bruce Micro Grid which includes 150kW Solar Array along with 65kWh battery storage capacity, housed onsite in a container at K Block CIT Bruce.
CIT has an ongoing program in place to replace fluorescent tubes. In 2019, 600 LED light fitting were replaced.
CIT supports the ACT Government Renewable Energy Industry Development Strategy to meet renewable energy targets by 2020. This includes continued partnerships in research and industry development in renewable technologies and working to deliver training programs. Companies include NEOEN, IT Power, Evoenergy, Global Wind Organisation, ASPEN, EPC Solar and SIEMENS GAMESA.
CIT Green and Partnerships in Sustainability CIT Green is the CIT network committed to developing, implementing and monitoring sustainable practices, including the engagement of staf and students to work towards a more sustainable campus. CIT Green held five meetings in 2019 and actioned several environmental initiatives. Some examples include:
> working with heads of departments to investigate composting solutions for the culinary school including anaerobic and aerobic systems with the target to implement a system in 2020
> promoting active transport via participation in ride-to-work events, attendance at government events which promote active transport and trialling of electric bikes by CIT Green Committee members to commute to work on a daily basis throughout the year and for transport between campuses
> actively encouraging WebEx meeting format along with staf choosing to hot-desk at an alternative campus to reduce vehicle transport between campuses
> monitoring energy usage across CIT
> representation at the Whole of Government -Carbon Neutral Government Implementation Committee
> providing online information and resources for staf and students on environmental sustainability within CIT to raise staf awareness of the environmental impacts associated with daily work practices and provide environmentally friendly alternatives and opportunities to save energy through business as usual activity.
Recycling CIT incorporates reuse and recycling into daily activities to divert waste products from landfill. In 2019, CIT diverted many waste streams from landfill for recycling by authorised facilities including 20.2 tonnes of scrap metal recycled from collection centres across three major campuses. Scrap metal contributions come from lesson delivery, capital works upgrades and facilities maintenance projects, IT equipment including laptops, PCs, monitors and accessories. Other recyclables include:
> co-mingle waste, paper and cardboard along with secure destruction waste
> printer cartridges and print accessories
> mobile phones and batteries
75
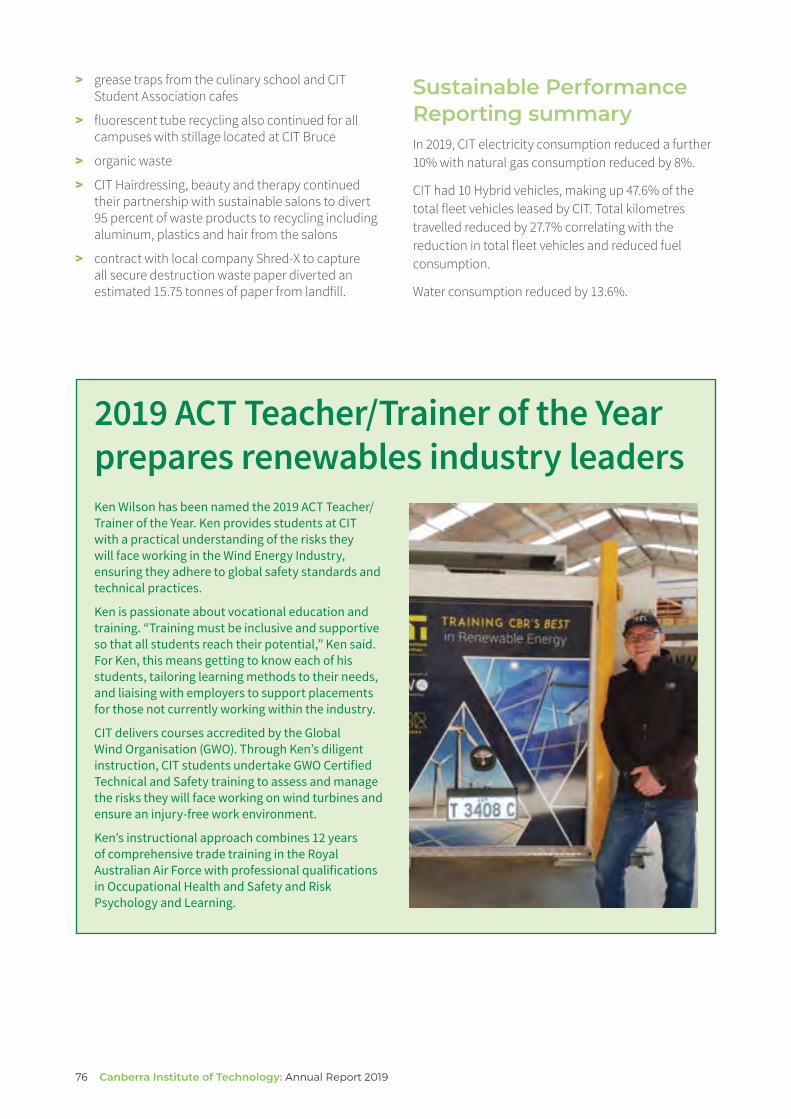
> grease traps from the culinary school and CIT Student Association cafes
> fluorescent tube recycling also continued for all campuses with stillage located at CIT Bruce
> organic waste
> CIT Hairdressing, beauty and therapy continued their partnership with sustainable salons to divert 95 percent of waste products to recycling including aluminum, plastics and hair from the salons
> contract with local company Shred-X to capture all secure destruction waste paper diverted an estimated 15.75 tonnes of paper from landfill.
Sustainable Performance Reporting summary In 2019, CIT electricity consumption reduced a further 10% with natural gas consumption reduced by 8%.
CIT had 10 Hybrid vehicles, making up 47.6% of the total fleet vehicles leased by CIT. Total kilometres travelled reduced by 27.7% correlating with the reduction in total fleet vehicles and reduced fuel consumption.
Water consumption reduced by 13.6%.
2019 ACT Teacher/Trainer of the Year prepares renewables industry leaders Ken Wilson has been named the 2019 ACT Teacher/ Trainer of the Year. Ken provides students at CIT with a practical understanding of the risks they will face working in the Wind Energy Industry, ensuring they adhere to global safety standards and technical practices.
Ken is passionate about vocational education and training. “Training must be inclusive and supportive so that all students reach their potential,” Ken said. For Ken, this means getting to know each of his students, tailoring learning methods to their needs, and liaising with employers to support placements for those not currently working within the industry.
CIT delivers courses accredited by the Global Wind Organisation (GWO). Through Ken’s diligent instruction, CIT students undertake GWO Certified Technical and Safety training to assess and manage the risks they will face working on wind turbines and ensure an injury-free work environment.
Ken’s instructional approach combines 12 years of comprehensive trade training in the Royal Australian Air Force with professional qualifications in Occupational Health and Safety and Risk Psychology and Learning.
76 Canberra Institute of Technology: Annual Report 2019

-9.5
Sustainable development performance – current and previous calendar year
Indicator as at 31 December 2019 Unit Current FY Previous FY Percentage change
Directorate/public sector body staf and area
Directorate/public sector body staf FTE 659.4 728.6
Workplace floor area Area (m2) 104,339.57 104,339.57 0
Stationary energy usage
Electricity use Kilowatt hours 8,079,252 9,011,205 -10.3
Natural gas use Megajoules 22,604,091 24,630,998 -8.2
Diesel Kilolitres 0 0 0
Transport fuel usage
Electric vehicles Number 0 0
Hybrid vehicles Number 10 0 1,000
Other vehicles (that are not electric or hybrid) Number 11 27 -59.2
Total number of vehicles Number 21 27 -22.2
Total kilometres travelled Kilometres 233,333 327,239 -27.7
Fuel use – Petrol Kilolitres 10.38 12.96 -19.9
Fuel use – Diesel Kilolitres 10.62 16.49 -35.6
Fuel use – Liquefied petroleum gas (LPG) Kilolitres 0 0 0
Fuel use – Compressed natural gas (CNG) Cubic Metres (Cm3) 0 0 0
Water usage
Water use Kilolitres 44,054 50,988 -13.6
Resource eficiency and waste
Reams of paper purchased Reams 4,465 4,750 -6
Recycled content of paper purchased Percentage 50 50 0
Waste to landfill Litres 401,500 401,500 0
Co-mingled material recycled Litres 21,520 21,520 0
Paper and cardboard recycled (incl. secure paper) Litres 67,256 67,256 0
Organic material recycled Litres 48,670 48,670 0
Greenhouse gas emissions 1
Emissions from stationary energy use Tonnes CO2-e 2,340 4,722
Emissions from transport Tonnes CO2-e 24 75 -68
Total emissions Tonnes CO2-e 2,365 4,797 -50.7
1 Greenhouse gas emissions Note: 2019 has recorded a significant reduction in CIT Greenhouse gas emissions. This variation is due to the annual revision of ACT custom emission factor for electricity. In comparison to previous years the emission factor halved following the government changes to calculation in March of 2018 https://www.environment.act.gov.au/cc/acts-greenhouse-gas-emissions/measuring-act-electricity-emissions
0
-50.4
77

78 Canberra Institute of Technology: Annual Report 2019

79
PartC
Financial M
anagement
Reporting
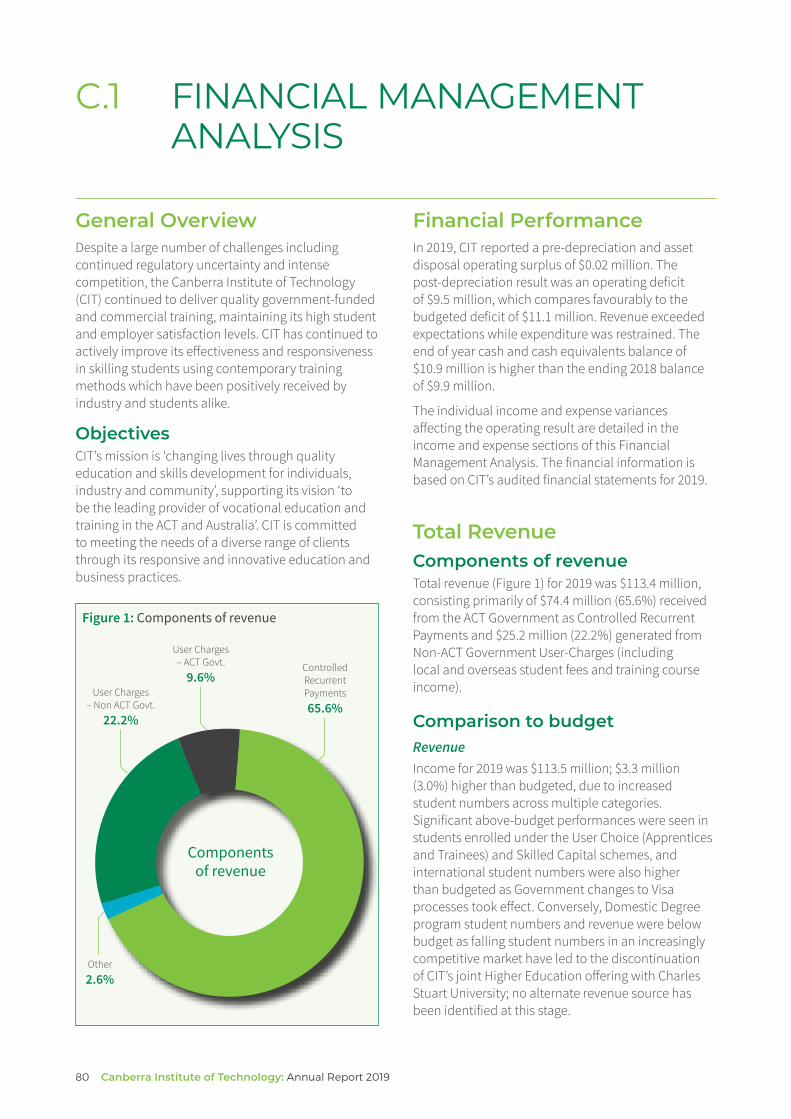
C.1 FINANCIAL MANAGEMENT ANALYSIS
General Overview Despite a large number of challenges including continued regulatory uncertainty and intense competition, the Canberra Institute of Technology (CIT) continued to deliver quality government-funded and commercial training, maintaining its high student and employer satisfaction levels. CIT has continued to actively improve its efectiveness and responsiveness in skilling students using contemporary training methods which have been positively received by industry and students alike.
Objectives CIT’s mission is ‘changing lives through quality education and skills development for individuals, industry and community’, supporting its vision ‘to be the leading provider of vocational education and training in the ACT and Australia’. CIT is committed to meeting the needs of a diverse range of clients through its responsive and innovative education and business practices.
Figure 1: Components of revenue
User Charges – ACT Govt. Controlled
9.6% Recurrent User Charges Payments
– Non ACT Govt. 65.6% 22.2%
Other 2.6%
Components of revenue
Financial Performance In 2019, CIT reported a pre-depreciation and asset disposal operating surplus of $0.02 million. The post-depreciation result was an operating deficit of $9.5 million, which compares favourably to the budgeted deficit of $11.1 million. Revenue exceeded expectations while expenditure was restrained. The end of year cash and cash equivalents balance of $10.9 million is higher than the ending 2018 balance of $9.9 million.
The individual income and expense variances afecting the operating result are detailed in the income and expense sections of this Financial Management Analysis. The financial information is based on CIT’s audited financial statements for 2019.
Total Revenue Components of revenue Total revenue (Figure 1) for 2019 was $113.4 million, consisting primarily of $74.4 million (65.6%) received from the ACT Government as Controlled Recurrent Payments and $25.2 million (22.2%) generated from Non-ACT Government User-Charges (including local and overseas student fees and training course income).
Comparison to budget Revenue Income for 2019 was $113.5 million; $3.3 million (3.0%) higher than budgeted, due to increased student numbers across multiple categories. Significant above-budget performances were seen in students enrolled under the User Choice (Apprentices and Trainees) and Skilled Capital schemes, and international student numbers were also higher than budgeted as Government changes to Visa processes took efect. Conversely, Domestic Degree program student numbers and revenue were below budget as falling student numbers in an increasingly competitive market have led to the discontinuation of CIT’s joint Higher Education ofering with Charles Stuart University; no alternate revenue source has been identified at this stage.
80 Canberra Institute of Technology: Annual Report 2019

Comparison to 2018 Actual Revenue Revenue in 2019 was $5.8 million (5.4%) higher than in 2018, due to an increase in Controlled Recurrent Payments ($2.6 million, 3.6% greater than 2018), and an increase of $2.4 million (7.2%) in User Charges as a result of increase in student numbers. Changes to ACT Government arrangements for funding ACT Shared Services operations resulted in a $0.7 million (671%) increase in Resources Received Free of Charge.
Future trends Other than steady increases in line with increasing student enrolment numbers, CIT is anticipating that total revenue will remain broadly steady over the short to medium term. However, it should be noted that the Vocational Education and Training (VET) sector regulatory environment remains volatile and continued regulatory change may afect future income levels, especially with regards to International student revenue and funding from the User Choice and Skilled Capital funding schemes.
Figure 2: Components of Expenses
Depreciation and Amortisation
Supplies and 7.6% Services Other 28.6% 1.9%
Superannuation Expenses
7.7%
Employee Expenses 54.2%
Components of expenses
Total Expenses Components of expenses Expenses totalled $123.0 million in 2019, with the majority ($76.1 million, 61.9%) comprising employee and superannuation expenses. Supplies and services expenses accounted for an additional 28.6% ($35.2 million) (Figure 2).
Comparison to budget Expenses Total expenses of $123.0 million in 2019 were $1.7 million (1.4%) higher than budgeted, due primarily to higher than budgeted depreciation and the write-of of outstanding student debtor amounts from prior years. Employee expenses (including superannuation) finished the year almost exactly on budget.
Comparison to 2018 actual Total expenses in 2019 were $2.4 million (2.0%) higher than in 2018, primarily due to a 4.0% ($1.4 million) increase in Supplies and Services expenditure, driven by increased expenditure on maintenance (due to CIT’s aging physical infrastructure), ICT (replacing and upgrading legacy systems, and rising electricity costs. Contributing to the increase was a 0.6% ($0.4 million) increase in non-superannuation employee expenses and a 5.8% ($0.5 million) increase in superannuation expenses, due to payrises under a new enterprise agreement and an increase to the superannuation rate. Due to a change in accounting standards, depreciation expenses in 2019 includes $1.0m of depreciation relating to Right of Use assets; this expense was previously classified as rent in prior periods.
Future trends CIT is anticipating an increase in total expenditure over the short to medium term as student numbers steadily increase and additional funds need to be invested in maintaining and upgrading CIT’s aging physical and ICT infrastructure. It should be noted that the Vocational Education and Training (VET) sector regulatory environment remains volatile and that continued regulatory change will impact on future activity levels and ICT system requirements, thereby afecting expenditure.
81

Financial Position: Total Assets Components of total assets At 31 December 2019 92.5% of CIT’s assets were held in property, plant and equipment, intangible assets, assets held for distribution to owners, and works in progress with the remaining 7.5% represented by cash and cash equivalents, receivables and other current assets (Figure 3).
Figure 3: Total Assets
Comparison to budget The total asset position at 31 December 2019 is $216.3 million, which is $8.0 million (3.8%) above budget, primarily due to an above-budget cash position resulting from CIT’s higher than budgeted revenue and lower than budgeted expenditure for the year.
Comparison to 2018 actual CIT’s total asset position at 31 December 2019 was consistent with the equivalent 2018 position of $215.9 million.
Buildings 62.3%
Other 1.1%
Land 17.9%
Total Assets
Plant and Equipment 3.8%
Intangible Assets 0.1%
Capital Works in Progress 0.9%
Cash and Cash Equivalents 5.1%
Receivables 1.3%
Asset Held for Sale 7.5%
Display by CIT Floristry students at the CIT Bruce Library
82 Canberra Institute of Technology: Annual Report 2019

Liabilities
Financial Position: Total Liabilities At 31 December 2019, the majority of CIT’s liabilities related to employee benefits ($22.4 million, 65.9%). Payables made up an additional $2.6 million (7.7%) of the total. Of the remaining $9.3 million (27.4%), revenue received in advance and the non-current portion of the ACT Government Carbon Neutral Government Loan together comprised $4.0 million (11.8%), with an additional $5.3 million (15.6%) of lease liabilities being recognised for the first time in 2019 due to changes to accounting standards.
Figure 4: Total Liabilities Payables 7.7%
Other Liabilities 27.1%
Total
Employee Benefits 65.2%
Comparison to budget CIT’s liabilities at 31 December 2019 of $34.3 million were $9.2 million (36.7%) higher than the 2019 budget of $25.1 million due primarily to the recognition of an additional $5.3 million of lease liabilities (due to a change in accounting standards) and an increase in employee entitlement balances (resulting from a combination of pay rises under a new enterprise bargaining agreement and long-service leave increases due to increments in tenure).
Comparison to 2018 Actual CIT’s total liabilities at 31 December 2019 were $5.6 million (19.3%) higher than the actual result of $28.8 million at 31 December 2018 due to the recognition of lease liabilities as described above.
Liquidity Liquidity is a measure of the ability of CIT to meet its short-term financial obligations as they fall due. The current working capital ratio (ratio of current assets to current liabilities) is a common indicator for liquidity and measures the ability to fund short-term liabilities from short-term assets.
The current working capital ratio of 0.59:1 is higher than the budget target of 0.43:1 due to a higher than expected cash balance as discussed above. The working capital ratio was lower than the 2018 outcome of 0.64:1, primarily due to a reduced receivables balance.
At 31 December 2019, CIT’s current assets ($15.9 million) – excluding Assets Held for Distribution to Owners – were less than the total current liabilities ($26.9 million) by $11.0 million. This is not considered a liquidity risk as the associated cash needs are funded through appropriation from the ACT Government on a cash-needs basis. Although the Long Service Leave employee benefit liability ($13.6m) is technically classified as a current liability according to current accounting standards, data from the past three years has shown that, in practice, less than 10% of this liability has been paid out in any one year.
This is consistent with whole-of-government cash management practices, which requires excess cash balances to be held centrally rather than within individual agency bank accounts. CIT does not anticipate any impact on its liquidity through the operations of its wholly owned subsidiary, CIT Solutions Pty Ltd.
Performance Measures The measures included in the Statement of Performance relate only to the subset of CIT’s education delivery traditionally referred to as the ‘Profile’ student scheme, and do not reflect the totality of CIT’s education delivery. CIT’s Statement of Performance for 2019 shows that the Nominal Hour metric for the Profile scheme was lower than target as students showed a preference for enrolling at CIT under other student schemes that are not included in these measures, most notably the User Choice (Apprentices and Trainees) and Skilled Capital schemes.
CIT’s aggregate student numbers and enrolment counts across all student schemes for the period continued to increase from prior years. CIT has identified updated performance measures that will enable a better assessment of CIT’s aggregate performance in future years.
83
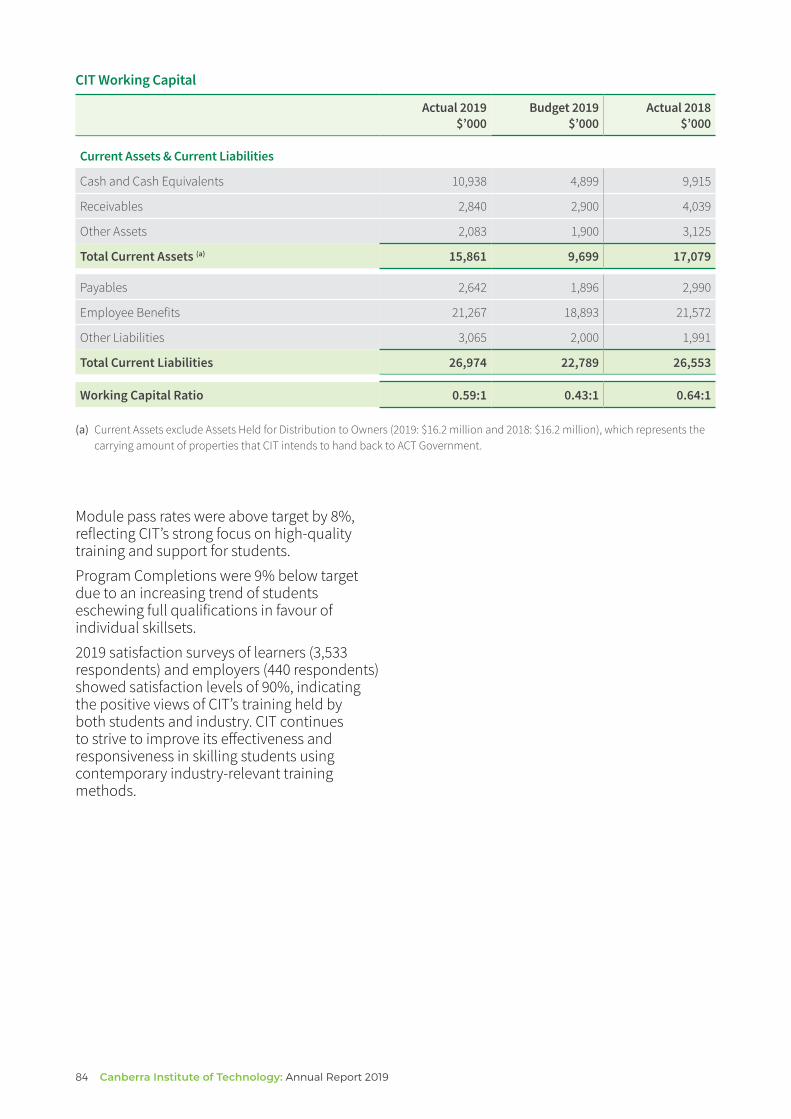
CIT Working Capital
Current Assets & Current Liabilities
Actual 2019 Budget 2019 Actual 2018 $’000 $’000 $’000
Cash and Cash Equivalents 10,938 4,899 9,915
Receivables 2,840 2,900 4,039
Other Assets 2,083 1,900 3,125
Total Current Assets (a) 15,861 9,699 17,079
Payables 2,642 1,896 2,990
Employee Benefits 21,267 18,893 21,572
Other Liabilities 3,065 2,000 1,991
Total Current Liabilities 26,974 22,789 26,553
Working Capital Ratio 0.59:1 0.43:1 0.64:1
(a) Current Assets exclude Assets Held for Distribution to Owners (2019: $16.2 million and 2018: $16.2 million), which represents the carrying amount of properties that CIT intends to hand back to ACT Government.
Module pass rates were above target by 8%, reflecting CIT’s strong focus on high-quality training and support for students.
Program Completions were 9% below target due to an increasing trend of students eschewing full qualifications in favour of individual skillsets.
2019 satisfaction surveys of learners (3,533 respondents) and employers (440 respondents) showed satisfaction levels of 90%, indicating the positive views of CIT’s training held by both students and industry. CIT continues to strive to improve its efectiveness and responsiveness in skilling students using contemporary industry-relevant training methods.
84 Canberra Institute of Technology: Annual Report 2019

C.2 FINANCIAL STATEMENTS
85
86 Canberra Institute of Technology: Annual Report 2019

Canberra Institute of Technology Financial Statements
For the Year Ended 31 December 2019
Statement of Responsibility
In my opinion, the financial statements are in agreement with the Canberra Institute of Technology’s accounts and records and fairly reflect the financial operations of the Canberra Institute of Technology for the year ended 31 December 2019 and the financial position of the Canberra Institute of Technology on that date.
Craig Sloan Chair Canberra Institute of Technology Board 18 March 2020
87
Canberra Institute of Technology Financial Statements
For the Year Ended 31 December 2019
Statement by the Chief Finance Oficer
In my opinion, the financial statements have been prepared in accordance with Australian Accounting Standards, are in agreement with the Canberra Institute of Technology’s accounts and records, and fairly reflect the financial operations of the Canberra Institute of Technology for the year ended 31 December 2019 and the financial position of the Canberra Institute of Technology on that date.
Greg Tong Senior Director/Chief Finance Oficer Canberra Institute of Technology 17 March 2020
88 Canberra Institute of Technology: Annual Report 2019

Canberra Institute of Technology Operating Statement
For the Year Ended 31 December 2019
Consolidated CIT
Note No.
Actual 2019
$’000
Actual 2018
$’000
Actual 2019
$’000
Original Budget
2019 $’000
Actual 2018
$’000
Income Revenue
Controlled Recurrent Payments 3 74,379 71,779 74,379 74,379 71,779
User Charges 4 51,069 48,385 36,173 33,457 33,743
Government Grants 5 1,217 1,197 1,217 840 1,197
Interest 6 296 360 279 300 327
Resources Received Free of Charge 7 810 105 810 35 105
Other Revenue 8 494 554 582 600 463
Total Revenue 128,265 122,380 113,440 109,611 107,614
Gains
Other Gains 9 16 23 16 500 23
Total Gains 16 23 16 500 23
Total Income 128,281 122,403 113,456 110,111 107,637
Expenses Employee Expenses 10 78,559 78,899 66,653 67,063 66,235
Superannuation Expenses 11 10,484 10,117 9,458 9,054 8,942
Supplies and Services 12 35,701 35,647 35,203 35,359 33,830
Depreciation and Amortisation 13 9,445 9,173 9,349 8,240 9,077
Other Expenses 14 3,320 3,461 2,305 1,535 2,463
Total Expenses 137,509 137,297 122,968 121,251 120,547
Operating Deficit (9,228) (14,894) (9,512) (11,140) (12,910)
Total Comprehensive (Deficit) (9,228) (14,894) (9,512) (11,140) (12,910)
The above Operating Statement should be read in conjunction with the accompanying notes.
The Canberra Institute of Technology (CIT) has only one output class and as such the above Operating Statement is also CIT’s Operating Statement for Output Class 1.1: Provision of Vocational Education and Training Services.
89
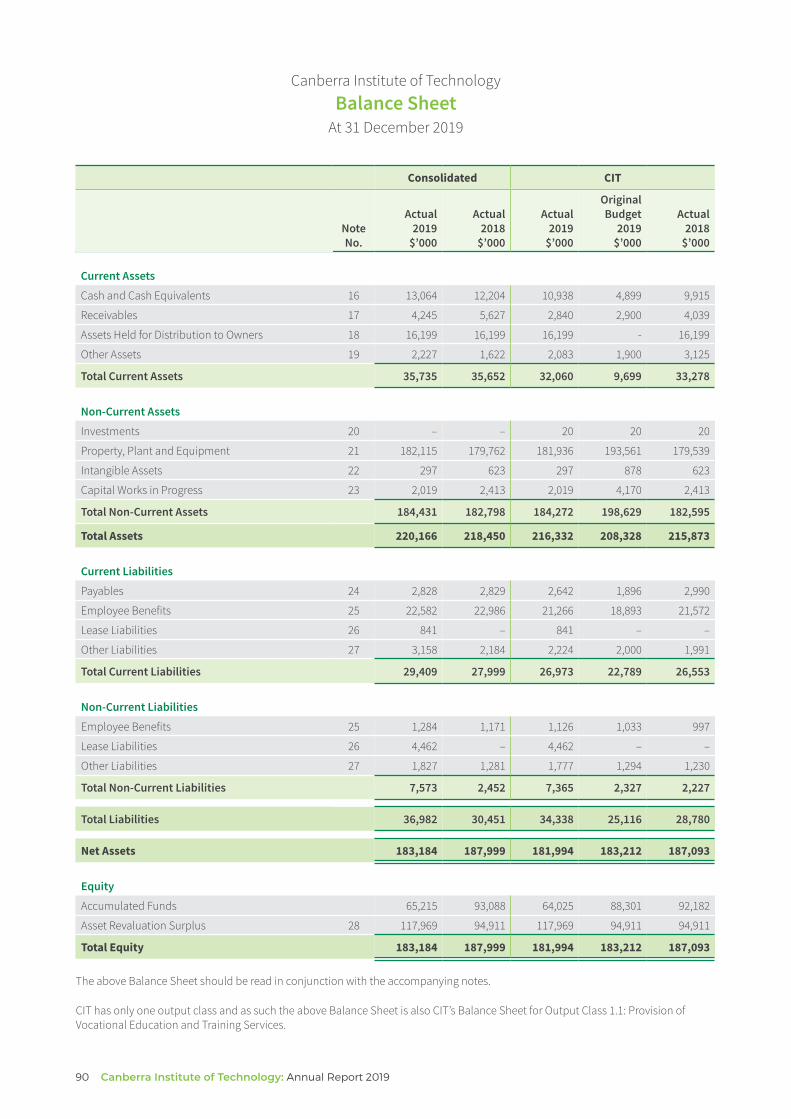
Canberra Institute of Technology Balance Sheet
At 31 December 2019
Consolidated CIT
Note No.
Actual 2019
$’000
Actual 2018
$’000
Actual 2019
$’000
Original Budget
2019 $’000
Actual 2018
$’000
Current Assets
Cash and Cash Equivalents 16 13,064 12,204 10,938 4,899 9,915
Receivables 17 4,245 5,627 2,840 2,900 4,039
Assets Held for Distribution to Owners 18 16,199 16,199 16,199 - 16,199
Other Assets 19 2,227 1,622 2,083 1,900 3,125
Total Current Assets 35,735 35,652 32,060 9,699 33,278
Non-Current Assets
Investments 20 – – 20 20 20
Property, Plant and Equipment 21 182,115 179,762 181,936 193,561 179,539
Intangible Assets 22 297 623 297 878 623
Capital Works in Progress 23 2,019 2,413 2,019 4,170 2,413
Total Non-Current Assets 184,431 182,798 184,272 198,629 182,595
Total Assets 220,166 218,450 216,332 208,328 215,873
Current Liabilities
Payables 24 2,828 2,829 2,642 1,896 2,990
Employee Benefits 25 22,582 22,986 21,266 18,893 21,572
Lease Liabilities 26 841 – 841 – –
Other Liabilities 27 3,158 2,184 2,224 2,000 1,991
Total Current Liabilities 29,409 27,999 26,973 22,789 26,553
Non-Current Liabilities
Employee Benefits 25 1,284 1,171 1,126 1,033 997
Lease Liabilities 26 4,462 – 4,462 – –
Other Liabilities 27 1,827 1,281 1,777 1,294 1,230
Total Non-Current Liabilities 7,573 2,452 7,365 2,327 2,227
Total Liabilities 36,982 30,451 34,338 25,116 28,780
Net Assets 183,184 187,999 181,994 183,212 187,093
Equity
Accumulated Funds 65,215 93,088 64,025 88,301 92,182
Asset Revaluation Surplus 28 117,969 94,911 117,969 94,911 94,911
Total Equity 183,184 187,999 181,994 183,212 187,093
The above Balance Sheet should be read in conjunction with the accompanying notes.
CIT has only one output class and as such the above Balance Sheet is also CIT’s Balance Sheet for Output Class 1.1: Provision of Vocational Education and Training Services.
90 Canberra Institute of Technology: Annual Report 2019

Canb
erra
Inst
itute
of T
echn
olog
y St
atem
ent o
f Cha
nges
in E
quity
Fo
r the
Year
End
ed 3
1 De
cem
ber 2
019
Cons
olid
ated
CI
T
Not
eN
o.
Accu
mul
ated
Fu
nds
Actu
al20
19$’
000
Asse
tRe
valu
atio
n Su
rplu
sAc
tual
2019
$’00
0
Tota
l Eq
uity
Actu
al20
19$’
000
Accu
mul
ated
Fund
sAc
tual
2019
$’00
0
Asse
t Re
valu
atio
n Su
rplu
sAc
tual
2019
$’00
0
Tota
l Eq
uity
Actu
al20
19$’
000
Orig
inal
Budg
et20
19$’
000
Bala
nce
at 1
Jan
uary
201
9 93
,088
94
,911
18
7,99
9 92
,182
94
,911
18
7,09
3 18
7,09
3
Adop
tion
of N
ew A
ccou
ntin
g St
anda
rd A
ASB1
6 (a
) (6
00)
– (6
00)
(600
) –
(600
) –
Com
preh
ensi
ve In
com
e
Ope
ratin
g (D
efic
it)
(9,2
28)
– (9
,228
) (9
,512
) –
(9,5
12)
(11,
140)
Tota
l Com
preh
ensi
ve (D
efic
it)
(9,2
28)
– (9
,228
) (9
,512
) –
(9,5
12)
(11,
140)
Tran
sact
ions
Invo
lvin
g O
wne
rs A
f ect
ing
Accu
mul
ated
Fun
ds
Bala
nce
at 3
1 De
cem
ber 2
019
Tran
sfer
(fro
m)/
to A
sset
Rev
alua
tion
Surp
lus
28
(23,
058)
23
,058
–
(23,
058)
23
,058
–
–
Capi
tal I
njec
tions
5,
013
– 5,
013
5,01
3 –
5,01
3 7,
259
Tota
l Tra
nsac
tions
Invo
lvin
g O
wne
rs A
f ect
ing
Accu
mul
ated
Fun
ds
(18,
045)
23
,058
5,
013
(18,
045)
23
,058
5,
013
7,25
9
65,2
15
117,
969
183,
184
64,0
25
117,
969
181,
994
183,
212
(a)
Re-m
easu
rem
ent o
f the
ope
ning
bal
ance
Acc
umul
ated
Fun
ds re
sulti
ng fr
om th
e in
itial
ado
ptio
n of
AAS
B16
(refe
r to
Appe
ndix
C).
This
adj
ustm
ent t
o Ac
cum
ulat
ed F
unds
is a
tim
ing
dif e
renc
e an
d w
ill u
nwin
d ov
er th
e le
ase
term
.
The
abov
e St
atem
ent o
f Cha
nges
in E
quity
shou
ld b
e re
ad in
con
junc
tion
with
the
acco
mpa
nyin
g no
tes.
91

92 Canberra Institute of Technology: Annual Report 2019
Canb
erra
Inst
itute
of T
echn
olog
y St
atem
ent o
f Cha
nges
in E
quity
– co
ntin
ued
For t
he Ye
ar E
nded
31
Dece
mbe
r 201
8
Cons
olid
ated
CI
T
Not
eN
o.
Accu
mul
ated
Fu
nds
Actu
al20
18$’
000
Asse
tRe
valu
atio
n Su
rplu
sAc
tual
2018
$’00
0
Tota
l Eq
uity
Actu
al20
18$’
000
Accu
mul
ated
Fund
sAc
tual
2018
$’00
0
Asse
t Re
valu
atio
n Su
rplu
sAc
tual
2018
$’00
0
Tota
l Eq
uity
Actu
al20
18$’
000
Bala
nce
at 1
Jan
uary
201
8 10
4,42
6 93
,475
19
7,90
1 10
1,53
6 93
,475
19
5,01
1
Com
preh
ensi
ve In
com
e
Re-m
easu
rem
ent u
nder
AAS
B 9
(a)
83
– 83
83
–
83
104,
509
93,4
75
197,
984
101,
619
93,4
75
195,
094
Ope
ratin
g (D
efic
it)
(14,
894)
–
(14,
894)
(1
2,91
0)
– (1
2,91
0)
Tota
l Com
preh
ensi
ve (D
efic
it)
(14,
894)
–
(14,
894)
(1
2,91
0)
– (1
2,91
0)
Tran
sact
ions
Invo
lvin
g O
wne
rs A
f ect
ing
Accu
mul
ated
Fun
ds
Tran
sfer
(fro
m)/
to A
sset
Rev
alua
tion
Surp
lus
28
(1,4
36)
1,43
6 –
(1,4
36)
1,43
6 –
Capi
tal I
njec
tions
4,
909
– 4,
909
4,90
9 –
4,90
9
Tota
l Tra
nsac
tions
Invo
lvin
g O
wne
rs A
f ect
ing
Accu
mul
ated
Fu
nds
3,47
3 1,
436
4,90
9 3,
473
1,43
6 4,
909
Bala
nce
at 3
1 De
cem
ber 2
018
93,0
88
94,9
11
187,
999
92,1
82
94,9
11
187,
093
(a)
Re-m
easu
rem
ent o
f the
ope
ning
bal
ance
of a
llow
ance
for i
mpa
ired
rece
ivab
les u
nder
AAS
B 9
(refe
r to
Not
e 17
– R
ecei
vabl
es).
The
abov
e St
atem
ent o
f Cha
nges
in E
quity
shou
ld b
e re
ad in
con
junc
tion
with
the
acco
mpa
nyin
g no
tes.
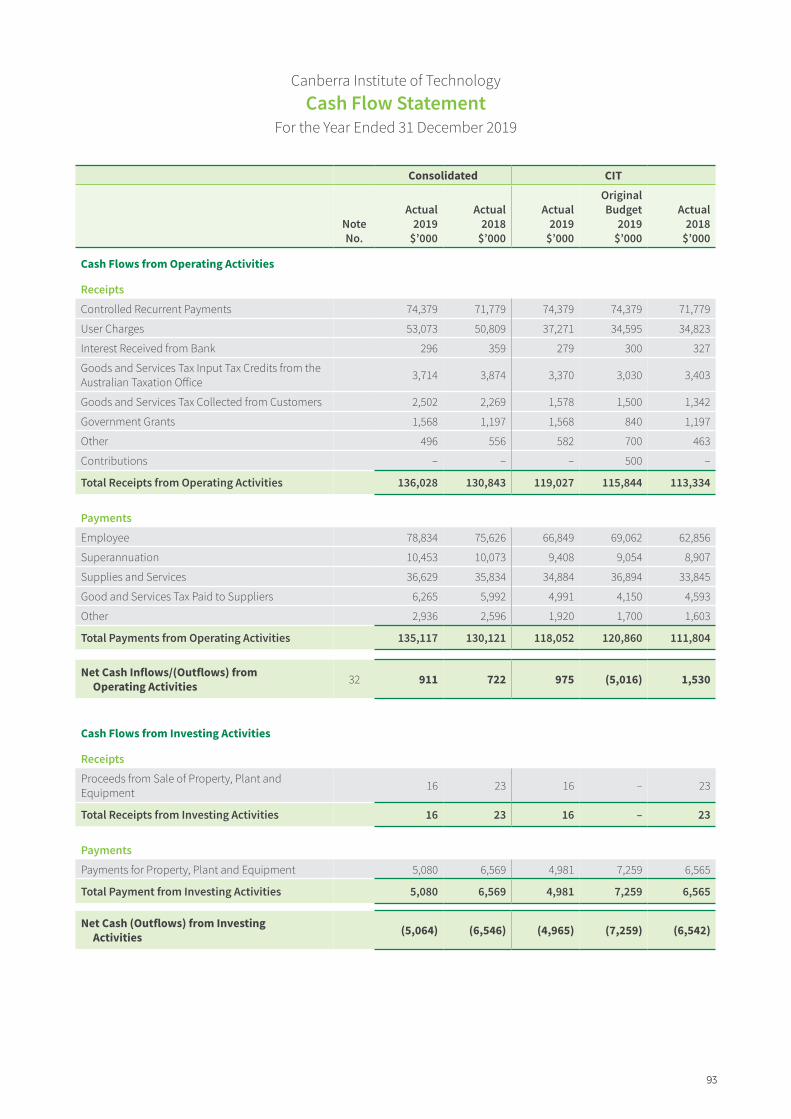
Canberra Institute of Technology Cash Flow Statement
For the Year Ended 31 December 2019
Consolidated CIT
Note No.
Actual 2019
$’000
Actual 2018
$’000
Actual 2019
$’000
Original Budget
2019 $’000
Actual 2018
$’000
Cash Flows from Operating Activities
Receipts
Controlled Recurrent Payments 74,379 71,779 74,379 74,379 71,779
User Charges 53,073 50,809 37,271 34,595 34,823
Interest Received from Bank 296 359 279 300 327
Goods and Services Tax Input Tax Credits from the Australian Taxation Ofice 3,714 3,874 3,370 3,030 3,403
Goods and Services Tax Collected from Customers 2,502 2,269 1,578 1,500 1,342
Government Grants 1,568 1,197 1,568 840 1,197
Other 496 556 582 700 463
Contributions – – – 500 –
Total Receipts from Operating Activities 136,028 130,843 119,027 115,844 113,334
Payments
Employee 78,834 75,626 66,849 69,062 62,856
Superannuation 10,453 10,073 9,408 9,054 8,907
Supplies and Services 36,629 35,834 34,884 36,894 33,845
Good and Services Tax Paid to Suppliers 6,265 5,992 4,991 4,150 4,593
Other 2,936 2,596 1,920 1,700 1,603
Total Payments from Operating Activities 135,117 130,121 118,052 120,860 111,804
911 722 975 (5,016) 1,530Net Cash Inflows/(Outflows) from 32 Operating Activities
Cash Flows from Investing Activities
Receipts
Proceeds from Sale of Property, Plant and Equipment 16 23 16 – 23
Total Receipts from Investing Activities 16 23 16 – 23
Payments
Payments for Property, Plant and Equipment 5,080 6,569 4,981 7,259 6,565
Total Payment from Investing Activities 5,080 6,569 4,981 7,259 6,565
(5,064) (6,546) (4,965) (7,259) (6,542)Net Cash (Outflows) from Investing Activities
93

Canberra Institute of Technology Cash Flow Statement – Continued
For the Year Ended 31 December 2019
Consolidated CIT
Note No.
Actual 2019
$’000
Actual 2018
$’000
Actual 2019
$’000
Original Budget
2019 $’000
Actual 2018
$’000
Cash Flows from Financing Activities
Receipts
Capital Injections 5,013 4,909 5,013 7,259 4,909
Total Receipts from Financing Activities 5,013 4,909 5,013 7,259 4,909
Repayment of Borrowings – – – – –
Total Payments from Financing Activities – – – – –
Payments
Net Cash Inflows from Financing Activities 5,013 4,909 5,013 7,259 4,909
Net Increase/ (Decrease) in Cash and Cash Equivalents 860 (915) 1,023 (5,016) (103)
Cash and Cash Equivalents at the Beginning of the Reporting Period 12,204 13,119 9,915 9,915 10,018
Cash and Cash Equivalents at the End of the Reporting Period 32 13,064 12,204 10,938 4,899 9,915
The above Cash Flow Statement should be read in conjunction with the accompanying notes.
94 Canberra Institute of Technology: Annual Report 2019

Canberra Institute of Technology Statement of Appropriation
For the Year Ended 31 December 2019
Original Total Appropriated Appropriated Budget Appropriated Drawn Drawn
2019 2019 2019 2018 $’000 $’000 $’000 $’000
Controlled Recurrent Payments 74,379 74,379 74,379 71,779
Capital Injections 7,259 9,785 5,013 4,909
Total Appropriation 81,638 84,164 79,392 76,688
The above Statement of Appropriation should be read in conjunction with the accompanying notes.
Column Heading Explanations
The Original Budget column shows the amounts that appear in the Cash Flow Statement in the Australian Capital Territory Budget 2019-2020. This amount also appears in the Cash Flow Statement.
The Total Appropriated column is inclusive of all appropriation variations occurring afer the Original Budget.
The Appropriation Drawn is the total amount of appropriation received by CIT during the year. This amount appears in the Cash Flow Statement.
Variances between ‘Original Budget’, ‘Total Appropriated’ and ‘Appropriation Drawn’:
Controlled Capital Recurrent Payment Injections
$’000 $’000
Reconciliation of Appropriation for 2019
Original Appropriation for 2019 74,379 7,259
Rollover of Undisbursed Appropriation Carried Forward at end of CIT Calendar Year 2018 (FMA s.168) – 2,526
Total Appropriated 74,379 9,785
Rollover of Undisbursed Appropriation Carried Forward – (4,772)at end of CIT Calendar Year 2019 (FMA s.168)
Appropriation Drawn (a) 74,379 5,013
(a) The diference between the Capital Injections Original Budget and the amount drawn during 2019 is due mainly to delays relating to the development application and the process of appointing a project manager for the Better Infrastructure Fund project.
95

Canberra Institute of Technology For the Year Ended 31 December 2019
NOTE INDEX
Note 1 Objectives of the Canberra Institute of Technology Note 2 Significant Accounting Policies
Appendix A – Basis of Preparation of the Financial Statements Appendix B – Significant Accounting Polices Appendix C – Initial Application of Accounting Standards
Income Notes Note 3 Controlled Recurrent Payments Note 4 User Charges Note 5 Government Grants Note 6 Interest Note 7 Resources Received Free of Charge Note 8 Other Revenue Note 10 Other Gains
Expense Notes Note 10 Employee Expenses Note 11 Superannuation Expenses Note 12 Supplies and Services Note 13 Depreciation and Amortisation Note 14 Other Expenses Note 15 Auditor’s Remuneration
Asset Notes Note 16 Cash and Cash Equivalents Note 17 Receivables Note 18 Assets Held for Distribution to Owners Note 19 Other Assets Note 20 Investments Note 21 Property, Plant and Equipment Note 22 Intangible Assets Note 23 Capital Works in Progress
Liability Notes Note 24 Payables Note 25 Employee Benefits Note 26 Lease Liabilities Note 27 Other Liabilities
Equity Notes Note 28 Asset Revaluation Surplus
Other Notes Note 29 Financial Instruments Note 30 Commitments Note 31 Contingent Liabilities and Contingent Assets Note 32 Cash Flow Reconciliation Note 33 Events Occurring afer Balance Date Note 34 Third Party Monies Note 35 Related Party Disclosure Note 36 Budgetary Reporting
96 Canberra Institute of Technology: Annual Report 2019

Canberra Institute of Technology Notes to and Forming Part of the Financial Statements
For the Year Ended 31 December 2019
NOTE 1 OBJECTIVES OF THE CANBERRA INSTITUTE OF TECHNOLOGY
Operations and Principal Activities
The Canberra Institute of Technology (CIT) is a multi-campus, multi-disciplinary, tertiary education institution in the ACT, providing vocational education and training to the ACT and surrounding region.
NOTE 2 SIGNIFICANT ACCOUNTING POLICIES
Refer to the following appendices for the notes comprising significant accounting policies and other explanatory information.
Appendix A – Basis of Preparation of the Financial Statements
Appendix B – Significant Accounting Policies
Appendix C – Initial Application of Accounting Standards AASB 16, AASB 15, and AASB 1058.
NOTE 3 CONTROLLED RECURRENT PAYMENTS
Controlled Recurrent Payments (CRP) are revenue received from the ACT Government to fund the costs of delivering outputs. The ACT Government pays CRP appropriation to CIT on a fortnightly basis.
Consolidated CIT
2019 $’000
2018 $’000
2019 $’000
2018 $’000
Revenue from the ACT Government
Controlled Recurrent Payments 74,379 71,779 74,379 71,779
Total Controlled Recurrent Payments 74,379 71,779 74,379 71,779
97

Canberra Institute of Technology Notes to and Forming Part of the Financial Statements
For the Year Ended 31 December 2019
NOTE 4 USER CHARGES
User charge revenue is derived by providing goods and services to other ACT Government agencies and to the public. User Charge Revenue – ACT Government is Special Purpose Funding revenue received from the ACT Government for students funded under specific funding arrangements and is also legally retained by CIT. User Charge Revenue – Non-ACT Government is paid by the user of the goods or services and legally retained by CIT and driven by consumer demand.
Consolidated CIT
2019 $’000
2018 $’000
2019 $’000
2018 $’000
User Charges – ACT Government
Special Purpose Fund Activities (a) 14,099 11,090 10,931 10,111
Total User Charges – ACT Government 14,099 11,090 10,931 10,111
User Charges – Non-ACT Government
Commercial Revenue (b) 23,626 25,528 11,898 11,865
Student Fees and Charges (c) 13,344 11,767 13,344 11,767
Total User Charges – Non-ACT Government 36,970 37,295 25,242 23,632
Total User Charges 51,069 48,385 36,173 33,743
Revenue has been assessed under the AASB 15 five step model and it has been determined that all revenue should be recognised in the current period as the performance obligations with the customer have been satisfied in the current period.
(a) The increase in Special Purpose Fund Activities revenue is due primarily to a net increase in students funded under specific funding arrangements (e.g. Apprentices and Trainees).
(b) Commercial revenue has decreased as a result of CIT Solutions winning less tenders in the marketplace as a result of increased competition.
(c) The increase in Student Fees and Charges is due to increases in student enrolments.
NOTE 5 GOVERNMENT GRANTS
Consolidated CIT
2019 $’000
2018 $’000
2019 $’000
2018 $’000
Government Grants
Government Grants – ACT Government 1,217 1,197 1,217 1,197
Total Government Grants 1,217 1,197 1,217 1,197
98 Canberra Institute of Technology: Annual Report 2019
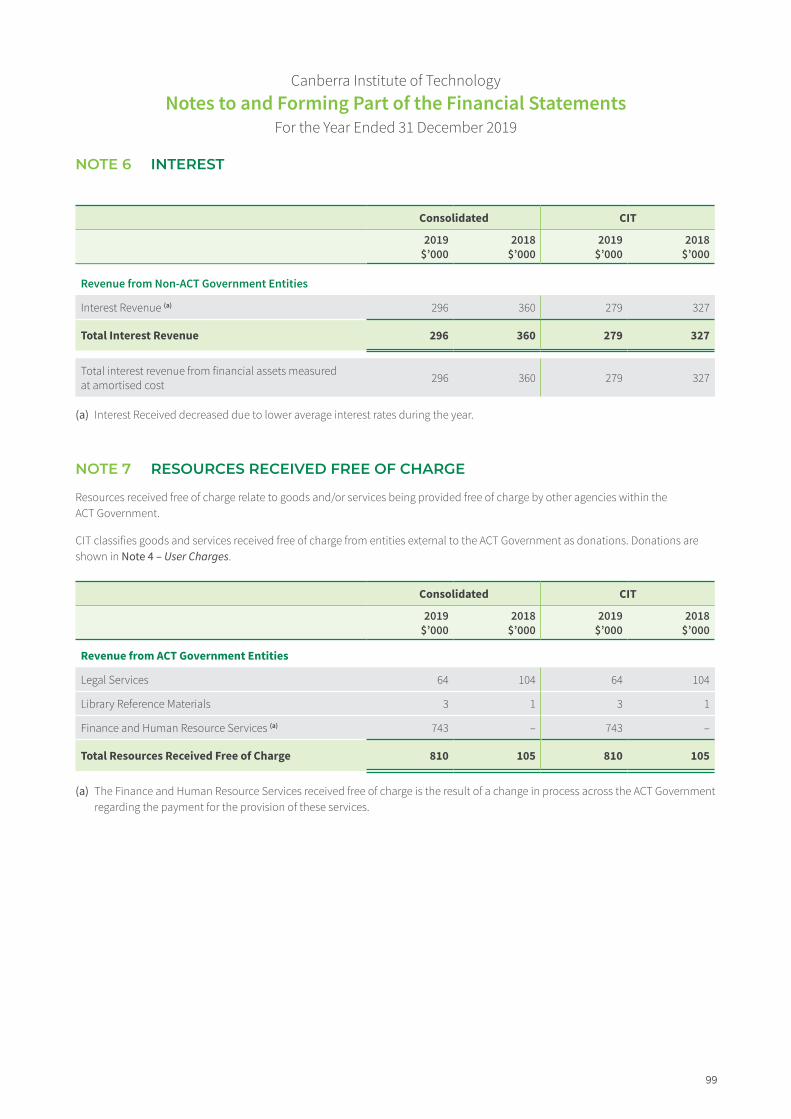
Canberra Institute of Technology Notes to and Forming Part of the Financial Statements
For the Year Ended 31 December 2019
NOTE 6 INTEREST
Consolidated CIT
2019 $’000
2018 $’000
2019 $’000
2018 $’000
Revenue from Non-ACT Government Entities
Interest Revenue (a) 296 360 279 327
Total Interest Revenue 296 360 279 327
Total interest revenue from financial assets measured at amortised cost 296 360 279 327
(a) Interest Received decreased due to lower average interest rates during the year.
NOTE 7 RESOURCES RECEIVED FREE OF CHARGE
Resources received free of charge relate to goods and/or services being provided free of charge by other agencies within the ACT Government.
CIT classifies goods and services received free of charge from entities external to the ACT Government as donations. Donations are shown in Note 4 – User Charges.
Consolidated CIT
2019 $’000
2018 $’000
2019 $’000
2018 $’000
Revenue from ACT Government Entities
Legal Services 64 104 64 104
Library Reference Materials 3 1 3 1
Finance and Human Resource Services (a) 743 – 743 –
Total Resources Received Free of Charge 810 105 810 105
(a) The Finance and Human Resource Services received free of charge is the result of a change in process across the ACT Government regarding the payment for the provision of these services.
99
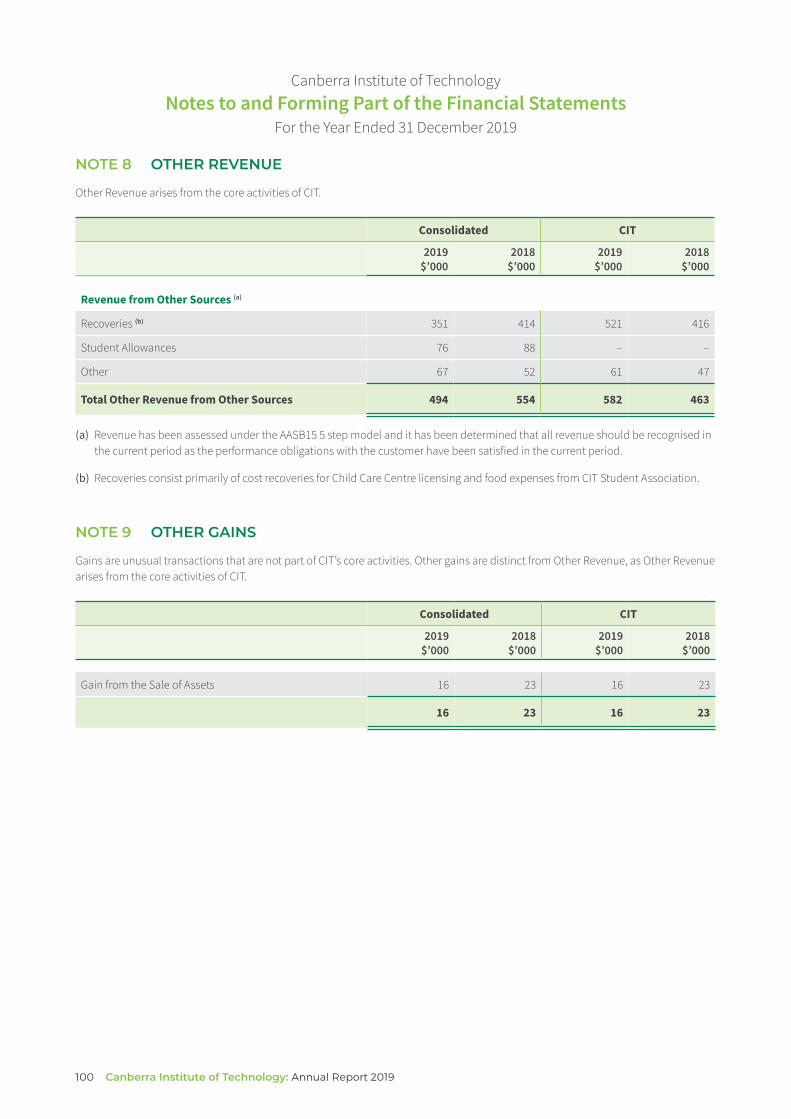
Canberra Institute of Technology Notes to and Forming Part of the Financial Statements
For the Year Ended 31 December 2019
NOTE 8 OTHER REVENUE
Other Revenue arises from the core activities of CIT.
Consolidated CIT
2019 $’000
2018 $’000
2019 $’000
2018 $’000
Revenue from Other Sources (a)
Recoveries (b) 351 414 521 416
Student Allowances 76 88 – –
Other 67 52 61 47
Total Other Revenue from Other Sources 494 554 582 463
(a) Revenue has been assessed under the AASB15 5 step model and it has been determined that all revenue should be recognised in the current period as the performance obligations with the customer have been satisfied in the current period.
(b) Recoveries consist primarily of cost recoveries for Child Care Centre licensing and food expenses from CIT Student Association.
NOTE 9 OTHER GAINS
Gains are unusual transactions that are not part of CIT’s core activities. Other gains are distinct from Other Revenue, as Other Revenue arises from the core activities of CIT.
Consolidated CIT
2019 $’000
2018 $’000
2019 $’000
2018 $’000
Gain from the Sale of Assets 16 23 16 23
16 23 16 23
100 Canberra Institute of Technology: Annual Report 2019
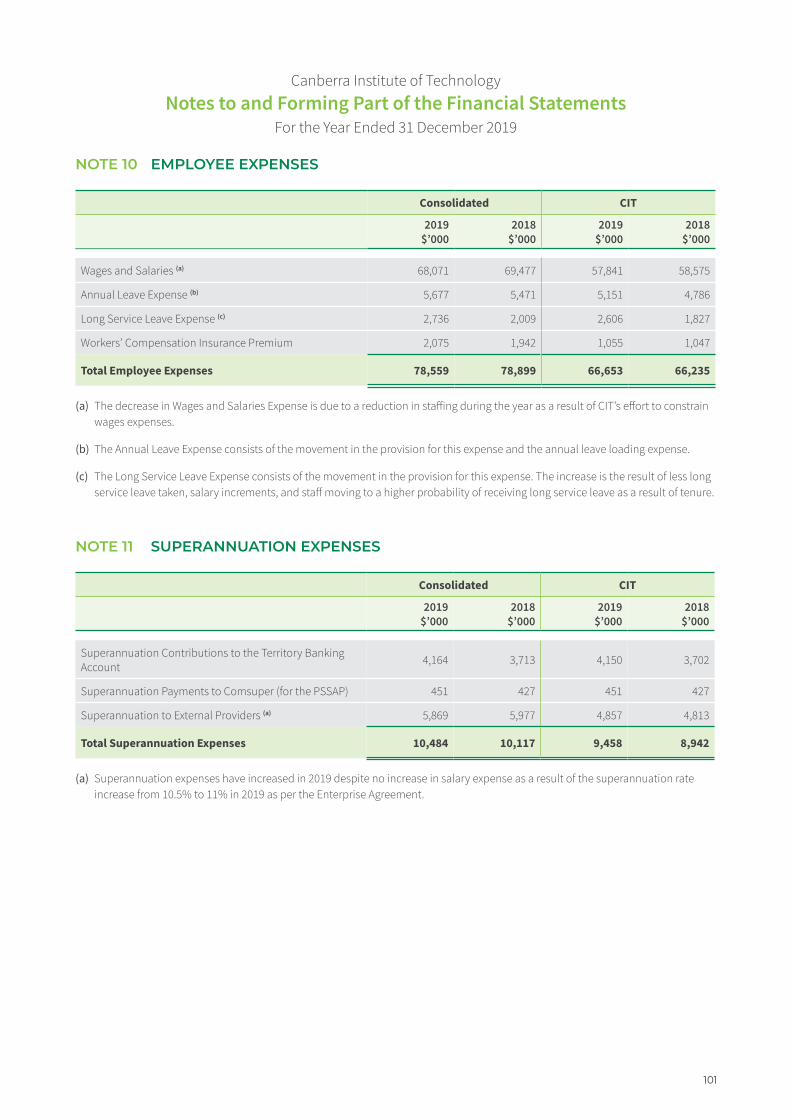
Canberra Institute of Technology Notes to and Forming Part of the Financial Statements
For the Year Ended 31 December 2019
NOTE 10 EMPLOYEE EXPENSES
Consolidated CIT
2019 $’000
2018 $’000
2019 $’000
2018 $’000
Wages and Salaries (a) 68,071 69,477 57,841 58,575
Annual Leave Expense (b) 5,677 5,471 5,151 4,786
Long Service Leave Expense (c) 2,736 2,009 2,606 1,827
Workers’ Compensation Insurance Premium 2,075 1,942 1,055 1,047
Total Employee Expenses 78,559 78,899 66,653 66,235
(a) The decrease in Wages and Salaries Expense is due to a reduction in stafing during the year as a result of CIT’s efort to constrain wages expenses.
(b) The Annual Leave Expense consists of the movement in the provision for this expense and the annual leave loading expense.
(c) The Long Service Leave Expense consists of the movement in the provision for this expense. The increase is the result of less long service leave taken, salary increments, and staf moving to a higher probability of receiving long service leave as a result of tenure.
NOTE 11 SUPERANNUATION EXPENSES
Consolidated CIT
2019 $’000
2018 $’000
2019 $’000
2018 $’000
Superannuation Contributions to the Territory Banking Account 4,164 3,713 4,150 3,702
Superannuation Payments to Comsuper (for the PSSAP) 451 427 451 427
Superannuation to External Providers (a) 5,869 5,977 4,857 4,813
Total Superannuation Expenses 10,484 10,117 9,458 8,942
(a) Superannuation expenses have increased in 2019 despite no increase in salary expense as a result of the superannuation rate increase from 10.5% to 11% in 2019 as per the Enterprise Agreement.
101

Canberra Institute of Technology Notes to and Forming Part of the Financial Statements
For the Year Ended 31 December 2019
NOTE 12 SUPPLIES AND SERVICES
Consolidated CIT
2019 $’000
2018 $’000
2019 $’000
2018 $’000
Advertising 890 1,053 803 901
Cleaning Costs 1,872 2,093 1,872 2,093
Consultants and Contractors (a) 8,641 9,396 6,252 6,130
Information and Communication Technology (b) 10,928 8,945 10,950 8,934
Insurance 876 972 829 927
Materials (c) 2,085 2,276 1,937 2,107
Minor Assets Expensed 448 550 440 545
Operating Lease Charges (d) 201 917 201 917
Overseas Student Management Fees – 135 3,103 3,142
Reference and Learning Materials 761 997 393 568
Repairs and Maintenance (e) 4,282 3,883 4,181 3,809
Seminars and Conferences 229 505 202 483
Travel and Transport 828 952 449 424
Utilities (f) 2,851 2,488 2,851 2,488
Other (g) 809 485 740 362
Total Supplies and Services 35,701 35,647 35,203 33,830
(a) Consultants and Contractors expense has reduced due to training programs being facilitated by core staf compared to the prior year where more external facilitators were used.
(b) Information and Communication Technology consists of the single-billing agreement with ACT Shared Services along with sofware, hardware and computing incidentals paid to external providers. The increase in 2019 is due to higher Shared Services Charges along with increase in 3rd party sofware and web hosting charges.
(c) Materials costs have decreased primarily due to reductions in printing costs due to reduced usage.
(d) Operating Lease Charges have reduced this year due to reclassification under AASB 16. See Appendix C for further details.
(e) Repairs and maintenance costs consists mainly of expenditure undertaken to maintain CIT’s buildings and property. Costs have increased due to the escalating maintenance requirements of CIT’s aging infrastructure and additional expenses relating to the decommissioning of the Woden campus.
(f) Utilities expenditure has increased primarily due to electricity cost increases during the period.
(g) Other costs include Publication expenses which had previously been classified as Reference and Learning Materials.
102 Canberra Institute of Technology: Annual Report 2019

Canberra Institute of Technology Notes to and Forming Part of the Financial Statements
For the Year Ended 31 December 2019
NOTE 13 DEPRECIATION AND AMORTISATION
Consolidated CIT
2019 $’000
2018 $’000
2019 $’000
2018 $’000
Depreciation
Buildings (a) 6,535 7,241 6,535 7,241
Plant and Equipment 1,089 1,001 1,073 997
Right-of-Use Asset (b) 1,005 – 1,005 –
Leasehold Improvements 419 431 339 339
Total Depreciation 9,048 8,673 8,952 8,577
Amortisation
Computer Sofware 397 500 397 500
Total Amortisation 397 500 397 500
Total Depreciation and Amortisation 9,445 9,173 9,349 9,077
(a) Buildings depreciation decreased due to the cessation of depreciation on Woden and Watson properties which were reclassified as Assets Held for Distribution to Owner in 2018.
(b) Right-of-Use Assets have been introduced this year in compliance with AASB 16. See Appendix C for further details.
NOTE 14 OTHER EXPENSES
Consolidated CIT
2019 $’000
2018 $’000
2019 $’000
2018 $’000
Waivers, Impairment Losses and Write-ofs (a) 537 31 502 31
Bank Charges and Security Services 89 88 67 61
Copyright Charges 134 122 134 122
Grants 644 622 – –
Sponsorships 407 355 405 353
Licences and registrations 68 51 72 51
Student Association Funding 659 671 612 625
Interest Charge on Finance Lease (b) 147 – 147 –
Other Expenses (c) 635 1,521 366 1,220
Total Other Expenses 3,320 3,461 2,305 2,463
(a) Waivers, Impairment Losses and Write-ofs increased this year due to the write-of of amounts that are deemed to be irrecoverable from students relating to current and prior years.
(b) Interest Charge on Finance Lease has arisen in 2019 due to the adoption of the AASB 16 accounting standard.
(c) Other Expenses have decreased in 2019 as the 2018 amount includes one-of expenses relating to the transfer of Sutton Road Buildings to ACT Property Group.
103
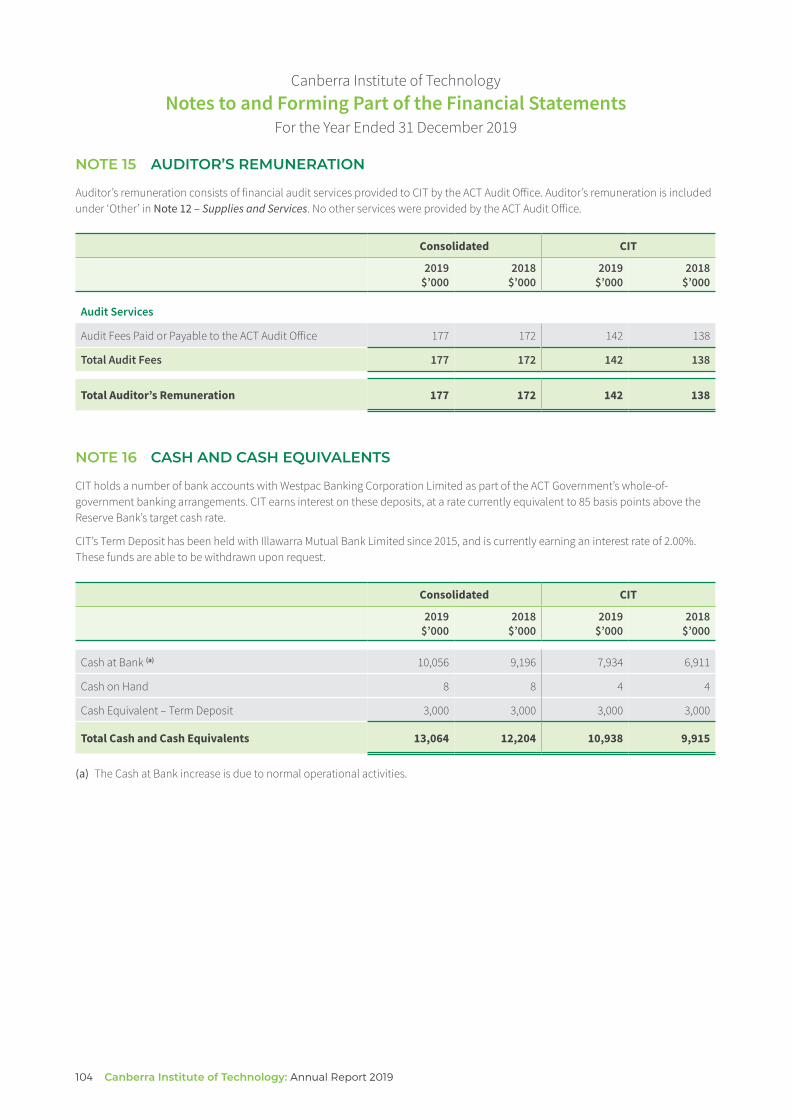
Canberra Institute of Technology Notes to and Forming Part of the Financial Statements
For the Year Ended 31 December 2019
NOTE 15 AUDITOR’S REMUNERATION
Auditor’s remuneration consists of financial audit services provided to CIT by the ACT Audit Ofice. Auditor’s remuneration is included under ‘Other’ in Note 12 – Supplies and Services. No other services were provided by the ACT Audit Ofice.
Consolidated CIT
2019 $’000
2018 $’000
2019 $’000
2018 $’000
Audit Services
Audit Fees Paid or Payable to the ACT Audit Ofice 177 172 142 138
Total Audit Fees 177 172 142 138
Total Auditor’s Remuneration 177 172 142 138
NOTE 16 CASH AND CASH EQUIVALENTS
CIT holds a number of bank accounts with Westpac Banking Corporation Limited as part of the ACT Government’s whole-of-government banking arrangements. CIT earns interest on these deposits, at a rate currently equivalent to 85 basis points above the Reserve Bank’s target cash rate.
CIT’s Term Deposit has been held with Illawarra Mutual Bank Limited since 2015, and is currently earning an interest rate of 2.00%. These funds are able to be withdrawn upon request.
Consolidated CIT
2019 $’000
2018 $’000
2019 $’000
2018 $’000
Cash at Bank (a) 10,056 9,196 7,934 6,911
Cash on Hand 8 8 4 4
Cash Equivalent – Term Deposit 3,000 3,000 3,000 3,000
Total Cash and Cash Equivalents 13,064 12,204 10,938 9,915
(a) The Cash at Bank increase is due to normal operational activities.
104 Canberra Institute of Technology: Annual Report 2019

Canberra Institute of Technology Notes to and Forming Part of the Financial Statements
For the Year Ended 31 December 2019
NOTE 17 RECEIVABLES
Consolidated CIT
2019 $’000
2018 $’000
2019 $’000
2018 $’000
Current Receivables
Trade Receivables (a) 917 3,506 459 1,774
Total Accounts Receivable 917 3,506 459 1,774
Student Receivables
Student Receivables (b) 122 593 122 593
Less: Allowance for Impairment Losses (54) (129) (35) (120)
Total Student Receivables 68 464 87 473
Other Receivables
Inter-Entity Receivable – – – 135
Accrued Revenue (c) 3,260 1,657 2,294 1,657
Total Other Receivables 3,260 1,657 2,294 1,792
Total Current Receivables 4,245 5,627 2,840 4,039
Total Receivables 4,245 5,627 2,840 4,039
(a) Trade receivables have reduced in 2019 as a result of a concerted efort to monitor and control overdue debts.
(b) Student Receivables have reduced in 2019 as a result of the write of of irrecoverable student debts from current and prior periods.
(c) The increase in Accrued Revenue is a result of higher enrolments in ACT Government funded programs in 2019, hence an increased number of student completions at year end, raising the amount of revenue to be paid to CIT by the ACT Government.
105

Canberra Institute of Technology Notes to and Forming Part of the Financial Statements
For the Year Ended 31 December 2019
NOTE 17 RECEIVABLES – CONTINUED
Ageing of Receivables Days Past Due
Consolidated Total
$ Not Overdue
$ 1-30 days
$ 31-60 days
$ 61-90 days
$ >91 days
$
CIT Non-Student Receivables 686 450 136 31 21 48
Student Receivables 122 9 41 31 8 33
Expected credit loss rate – CIT Student Receivables – – 10.4% 28.2% 50.9% 56.05
Expected credit losses CIT 35 – 4 9 4 18
CITSOL Receivables 1,157 1,030 19 59 1 48
Expected credit loss rate – CITSOL – – – – 2.0% 39.9%
Expected credit losses CITSOL 19 – – – – 19
Estimated total gross carrying amount at default 1,911 1,489 192 112 26 92
Expected credit losses 54 – 4 9 4 37
An impairment loss from receivables was recognised prior to 2018 on an incurred loss basis. From 2018, ‘Expected Credit Loss Expense‘ is recognised as the movement in the allowance for expected credit losses. The allowance for expected credit losses of trade receivables is measured at the lifetime expected credit losses at each reporting date. CIT has established a provision matrix based on its historical credit loss experience, adjusted for forward – looking factors specific to the debtors and the economic environment.
Loss rates are calculated separately for groupings of customers with similar loss patterns. CIT has determined there are two material groups for measuring expected credit losses which reflect customer profiles for revenue streams. The calculations reflect observed default rates using credit losses experienced on prior transactions. The calculation was based on 2019 student receivable data which showed consistent patterns to prior years. The default rates are then adjusted by reasonable and forward looking information for expected changes in the macroeconomic indicators that afect the future recovery of those receivables.
106 Canberra Institute of Technology: Annual Report 2019

Canberra Institute of Technology Notes to and Forming Part of the Financial Statements
For the Year Ended 31 December 2019
NOTE 17 RECEIVABLES – CONTINUED
Consolidated CIT
2019 $’000
2018 $’000
2019 $’000
2018 $’000
Reconciliation of the Allowance for Impaired Receivables
Allowance for Impairment Losses at the Beginning of the Reporting Period 120 233 120 233
Remeasurement under AASB 9 – (83) – (83)
Restated Allowance for Impairment Losses at the Beginning of the Reporting Period 120 150 120 150
Net increase in Allowance During the Reporting Period 244 – 244 –
Reduction in Allowance from Amounts Written of During the Reporting Period (329) (21) (329) (30)
Expected Credit Loss Expense – – – –
Allowance for Impairment Losses at the End of the Reporting Period 35 129 35 120
Classification of ACT Government/Non-ACT Government Receivables
Receivables with ACT Government Entities
Net Trade Receivable 66 228 64 109
Accrued Revenue 2,268 1,657 2,003 1,657
Inter-entity Receivable – – – 135
Total Receivables with ACT Government Entities 2,334 1,885 2,067 1,901
Receivables with Non-ACT Government Entites
Net Trade Receivable 832 3,269 395 1,665
Net Student Receivable 87 473 87 473
Accrued Revenue 992 – 291 –
Total Receivables with Non-ACT Government Entities 1,911 3,742 773 2,138
Total Receivables 4,245 5,627 2,840 4,039
The maximum exposure to credit risk at the end of the reporting period for Receivables is the carrying amount of the asset inclusive of any allowance for impairment as shown in the table at Note 29 – Financial Instruments.
CIT does not hold any collateral as security or other credit enhancements for trade receivables.
107

Canberra Institute of Technology Notes to and Forming Part of the Financial Statements
For the Year Ended 31 December 2019
NOTE 18 ASSETS HELD FOR DISTRIBUTION TO OWNERS
CIT has classified the land and buildings at the Woden and Watson Campuses as ‘assets held for distribution to owners’, as these have been deemed as surplus to requirements under the campus modernisation program. The Woden and Watson Campuses’ land and buildings are expected to be disposed of during the next reporting period.
Consolidated CIT
2019 $’000
2018 $’000
2019 $’000
2018 $’000
Land Held for Distribution to Owners (a) 14,411 14,411 14,411 14,411
Buildings Held for Distribution to Owners (a) 1,788 1,788 1,788 1,788
Total Assets Held for Distribution to Owners 16,199 16,199 16,199 16,199
(a) As permitted under AASB 5 - Non-current Assets Held for Sale and Discontinued Operation, the period to dispose of an asset may extend beyond one year from the date of classification due to reasons outside the entity’s control. CIT remains committed to the disposal.
Fair Value Hierarchy
Details of CIT’s assets held for distribution to owners at fair value and information about the Fair Value Hierarchy as at 31 December 2019 are as follows:
Classification According to Fair Value Hierarchy
Level 1 $’000
Level 2 $’000
Level 3 $’000
Total $’000
Assets Held for Distribution to Owners at Fair Value
Land – 14,411 – 14,411
Buildings – 816 972 1,788
Total Assets Held for Distribution to Owners – 15,227 972 16,199
31 December 2018 are as follows:
Classification According to Fair Value Hierarchy
Level 1 Level 2 Level 3 Total $’000 $’000 $’000 $’000
Assets Held for Distribution to Owners at Fair Value
Land – 14,411 – 14,411
Buildings – 816 972 1,788
Total Assets Held for Distribution to Owners – 15,227 972 16,199
108 Canberra Institute of Technology: Annual Report 2019

Canberra Institute of Technology Notes to and Forming Part of the Financial Statements
For the Year Ended 31 December 2019
NOTE 18 ASSETS HELD FOR DISTRIBUTION TO OWNERS – CONTINUED
The Fair Value Hierarchy is discussed in Note 21 – Property, Plant and Equipment.
Transfers Between Categories
There were no transfers between Levels 1, 2 and 3 during the current and previous reporting period.
Valuation techniques, inputs and processes
Level 2 fair values of assets held for distribution to owners are derived using the market approach. The valuation technique used to value land and buildings is the market approach that reflects recent transaction prices for similar properties and buildings (comparable in location and size).
Level 3 fair values of assets held for distribution to owners are derived using the cost approach for specialised buildings and depreciated replacement cost of equivalent modern improvements for buildings.
These assets have been written down to fair value less costs to sell. Assets held for distribution to owners represent a non-recurring fair value measurement.
NOTE 19 OTHER ASSETS
Consolidated CIT
2019 $’000
2018 $’000
2019 $’000
2018 $’000
Current Other Assets
Prepayments (a) 2,227 1,622 2,083 3,125
Total Current Other Assets 2,227 1,622 2,083 3,125
Total Other Assets 2,227 1,622 2,083 3,125
(a) Prepayments include workers compensation, insurance and sofware licence prepayments. The increase in Prepayments occurred as a result of upfront payments related to new cloud based system licencing costs.
109
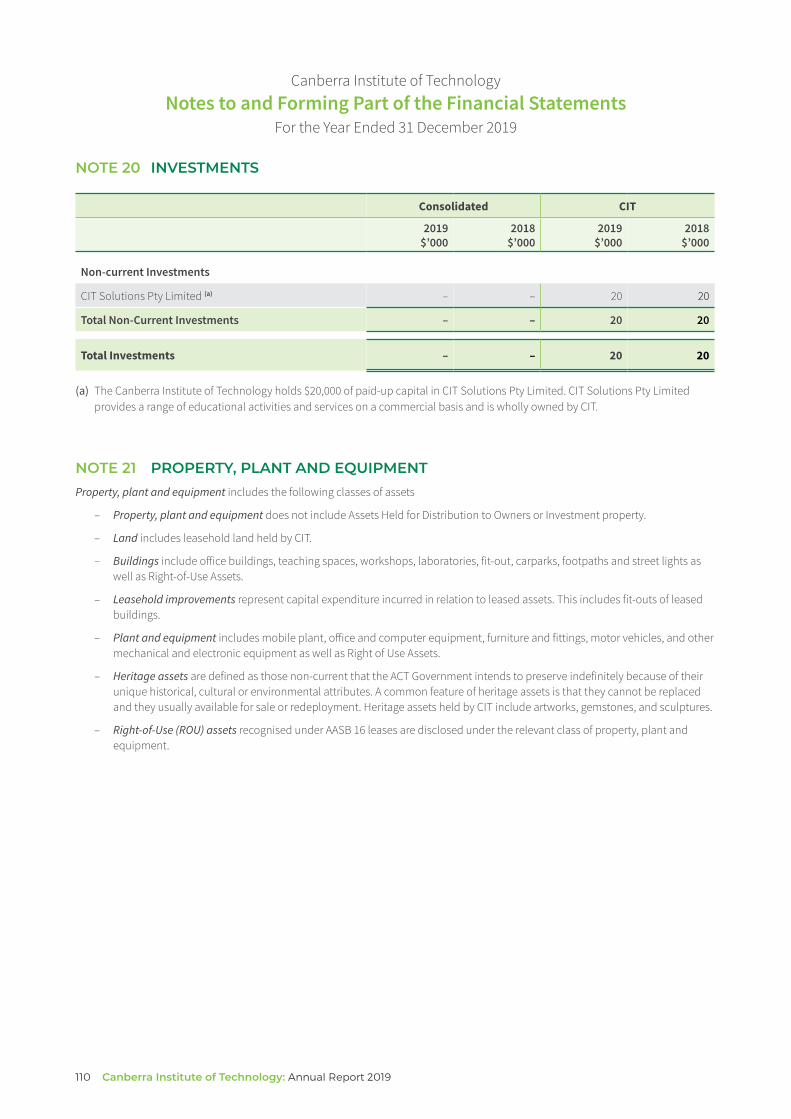
Canberra Institute of Technology Notes to and Forming Part of the Financial Statements
For the Year Ended 31 December 2019
NOTE 20 INVESTMENTS
Consolidated CIT
2019 $’000
2018 $’000
2019 $’000
2018 $’000
Non-current Investments
CIT Solutions Pty Limited (a) – – 20 20
Total Non-Current Investments – – 20 20
Total Investments – – 20 20
(a) The Canberra Institute of Technology holds $20,000 of paid-up capital in CIT Solutions Pty Limited. CIT Solutions Pty Limited provides a range of educational activities and services on a commercial basis and is wholly owned by CIT.
NOTE 21 PROPERTY, PLANT AND EQUIPMENT Property, plant and equipment includes the following classes of assets
– Property, plant and equipment does not include Assets Held for Distribution to Owners or Investment property.
– Land includes leasehold land held by CIT.
– Buildings include ofice buildings, teaching spaces, workshops, laboratories, fit-out, carparks, footpaths and street lights as well as Right-of-Use Assets.
– Leasehold improvements represent capital expenditure incurred in relation to leased assets. This includes fit-outs of leased buildings.
– Plant and equipment includes mobile plant, ofice and computer equipment, furniture and fittings, motor vehicles, and other mechanical and electronic equipment as well as Right of Use Assets.
– Heritage assets are defined as those non-current that the ACT Government intends to preserve indefinitely because of their unique historical, cultural or environmental attributes. A common feature of heritage assets is that they cannot be replaced and they usually available for sale or redeployment. Heritage assets held by CIT include artworks, gemstones, and sculptures.
– Right-of-Use (ROU) assets recognised under AASB 16 leases are disclosed under the relevant class of property, plant and equipment.
110 Canberra Institute of Technology: Annual Report 2019

Canberra Institute of Technology Notes to and Forming Part of the Financial Statements
For the Year Ended 31 December 2019
NOTE 21 PROPERTY, PLANT AND EQUIPMENT – CONTINUED
Consolidated CIT
2019 $’000
2018 $’000
2019 $’000
2018 $’000
Land
Land at Fair Value 38,824 38,824 38,824 38,824
Total Land Assets 38,824 38,824 38,824 38,824
Buildings
Buildings at Fair Value 141,706 137,947 141,706 137,947
Less: Accumulated Depreciation (13,521) (6,986) (13,521) (6,986)
Total Written Down Value of Buildings 128,185 130,961 128,185 130,961
Right-of-Use Asset Buildings 5,153 – 5,153 –
Less: Accumulated Depreciation (711) – (711) –
Total Right-of-Use Asset Buildings 4,442 – 4,442 –
Total Written Down Value of Land and Buildings 171,451 169,785 171,451 169,785
Leasehold Improvements
Leasehold Improvements at Cost 3,819 3,923 3,427 3,427
Less: Accumulated Depreciation (1,506) (1,191) (1,252) (913)
Total Written Down Value of Leasehold Improvements 2,313 2,732 2,175 2,514
Plant and Equipment
Plant and Equipment at Cost 12,488 11,218 12,423 11,205
Less: Accumulated Depreciation (4,714) (4,117) (4,690) (4,109)
Total Written-Down Value of Plant and Equipment 7,774 7,101 7,733 7,096
Right-of-Use Asset Plant and Equipment 727 – 727 –
Less: Accumulated Depreciation (294) – (294) –
Total Written Down Value of ROUA Plant and Equipment 433 – 433 –
Heritage Assets
Heritage Assets at Fair Value 144 144 144 144
Total Heritage Assets 144 144 144 144
182,115 179,762 181,936 179,539Total Written Down Value of Property, Plant and Equipment
Valuation of Non-Current Assets Certified Practising Valuers Knight Frank Valuations Canberra performed an independent revaluation of CIT’s Land and Buildings at 31 December 2017. The Director, CIT Technology and Design, performed a revaluation of CIT’s Heritage assets at 31 December 2017. The next valuation is scheduled for December 2020.
111

112 Canberra Institute of Technology: Annual Report 2019
Canb
erra
Inst
itute
of T
echn
olog
y N
otes
to a
nd F
orm
ing
Part
of t
he F
inan
cial
Sta
tem
ents
Fo
r the
Year
End
ed 3
1 De
cem
ber 2
019
NO
TE 2
1 P
RO
PE
RTY
, PLA
NT
AN
D E
QU
IPM
EN
T –
CO
NTI
NU
ED
Reco
ncili
atio
n of
Pro
pert
y, P
lant
and
Equ
ipm
ent
The
follo
win
g ta
ble
show
s the
mov
emen
t of P
rope
rty,
Pla
nt a
nd E
quip
men
t dur
ing
2019
and
201
8.
Leas
ehol
d Pl
ant a
nd
Her
itage
La
nd
Build
ings
Im
prov
emen
ts
Equi
pmen
t As
sets
To
tal
$’00
0 $’
000
$’00
0 $’
000
$’00
0 $’
000
Cons
olid
ated
201
9
Carr
ying
Am
ount
at t
he B
egin
ning
of t
he R
epor
ting
Perio
d 38
,824
13
0,96
1 2,
732
7,10
1 14
4 17
9,76
2
Addi
tions
–
3,75
9 –
1,90
1 –
5,66
0
Addi
tions
Rig
ht o
f Use
Ass
ets
– 5,
594
– 72
7 –
6,32
1
Depr
ecia
tion
– (6
,535
) (4
19)
(1,0
89)
– (8
,043
)
Depr
ecia
tion
Righ
t of U
se A
sset
s –
(1,1
52)
– (2
94)
– (1
,446
)
Disp
osal
s –
– (1
04)
(694
) –
(798
)
Depr
ecia
tion
Writ
e-ba
ck fo
r Ass
et D
ispo
sals
–
– 10
4 49
1 –
595
Oth
er M
ovem
ents
–
– –
64
– 64
Carr
ying
Am
ount
at t
he E
nd o
f the
Rep
ortin
g Pe
riod
38
,824
13
2,62
7 2,
313
8,20
7 14
4 18
2,11
5
Cons
olid
ated
201
8
Carr
ying
Am
ount
at t
he B
egin
ning
of t
he R
epor
ting
Perio
d 53
,235
13
5,71
8 3,
158
6,90
2 14
4 19
9,15
7
Addi
tions
–
4,27
2 5
1,29
7 –
5,57
4
Depr
ecia
tion
– (7
,241
) (4
31)
(1,0
02)
– (8
,674
)
Disp
osal
s –
– –
(104
) –
(104
)
Asse
t Hel
d fo
r Dist
ribut
ion
to O
wne
rs
(14,
411)
(1
,788
) –
– –
(16,
199)
Depr
ecia
tion
Writ
e-ba
ck fo
r Ass
et D
ispo
sals
–
– –
48
– 48
Oth
er M
ovem
ents
–
– –
(40)
–
(40)
Carr
ying
Am
ount
at t
he E
nd o
f the
Rep
ortin
g Pe
riod
38
,824
13
0,96
1 2,
732
7,10
1 14
4 17
9,76
2

Canb
erra
Inst
itute
of T
echn
olog
y N
otes
to a
nd F
orm
ing
Part
of t
he F
inan
cial
Sta
tem
ents
Fo
r the
Year
End
ed 3
1 De
cem
ber 2
019
NO
TE 2
1 P
RO
PE
RTY
, PLA
NT
AN
D E
QU
IPM
EN
T –
CO
NTI
NU
ED
Reco
ncili
atio
n of
Pro
pert
y, P
lant
and
Equ
ipm
ent
The
follo
win
g ta
ble
show
s the
mov
emen
t of P
rope
rty,
Pla
nt a
nd E
quip
men
t dur
ing
2019
and
201
8.
Leas
ehol
d Pl
ant a
nd
Her
itage
La
nd
Build
ings
Im
prov
emen
ts
Equi
pmen
t As
sets
To
tal
$’00
0 $’
000
$’00
0 $’
000
$’00
0 $’
000
CIT
2019
Carr
ying
Am
ount
at t
he B
egin
ning
of t
he R
epor
ting
Perio
d 38
,824
13
0,96
1 2,
514
7,09
6 14
4 17
9,53
9
Addi
tions
–
3,75
9 –
1,84
9 –
5,60
8
Addi
tion
Righ
t of U
se A
sset
s –
5,15
3 –
727
– 5,
880
Depr
ecia
tion
– (6
,535
) (3
39)
(1,0
73)
– (7
,947
)
Depr
ecia
tion
Righ
t of U
se A
sset
s –
(711
) –
(294
) –
(1,0
05)
Disp
osal
s –
– –
(694
) –
(694
)
Depr
ecia
tion
Writ
e-ba
ck fo
r Ass
et D
ispo
sals
–
– –
491
– 49
1
Oth
er M
ovem
ents
–
– –
64
– 64
Carr
ying
Am
ount
at t
he E
nd o
f the
Rep
ortin
g Pe
riod
38
,824
13
2,62
7 2,
175
8,16
6 14
4 18
1,93
6
CIT
2018
Carr
ying
Am
ount
at t
he B
egin
ning
of t
he R
epor
ting
Perio
d 53
,235
13
5,71
8 2,
853
6,89
2 14
4 19
8,84
2
Addi
tions
–
4,27
2 –
1,29
7 –
5,56
9
Depr
ecia
tion
– (7
,241
) (3
39)
(997
) –
(8,5
77)
Disp
osal
s –
– –
(104
) –
(104
)
Asse
t Hel
d fo
r Dist
ribut
ion
to O
wne
rs
(14,
411)
(1
,788
) –
– –
(16,
199)
Depr
ecia
tion
Writ
e-ba
ck fo
r Ass
et D
ispo
sals
–
– –
48
– 48
Oth
er M
ovem
ents
–
– –
(40)
–
(40)
Carr
ying
Am
ount
at t
he E
nd o
f the
Rep
ortin
g Pe
riod
38
,824
13
0,96
1 2,
514
7,09
6 14
4 17
9,53
9
113

Canberra Institute of Technology Notes to and Forming Part of the Financial Statements
For the Year Ended 31 December 2019
NOTE 21 PROPERTY, PLANT AND EQUIPMENT – CONTINUED
Fair Value Hierarchy The Fair Value Hierarchy below reflects the significance of the inputs used in determining fair value. The Fair Value Hierarchy is made up of the following three levels:
• Level 1 – quoted prices (unadjusted) in active markets for identical assets or liabilities that the agency can access at the measurement date;
• Level 2 – inputs other than quoted prices included within Level 1 that are observable for the asset or liability, either directly or indirectly; and
• Level 3 – inputs that are unobservable for particular assets or liabilities.
Details of CIT’s property, plant and equipment at fair value and information about the Fair Value Hierarchy as at 31 December 2019 are as follows:
Consolidated 2019
Property, Plant and Equipment at Fair Value Classification According to the Fair Value Hierarchy
Level 1 Level 2 Level 3 Total $’000 $’000 $’000 $’000
Land – 38,824 – 38,824
Buildings – 1,365 126,820 128,185
Heritage Assets – 135 8 143
– 40,324 126,828 167,152
Consolidated 2018
Property, Plant and Equipment at Fair Value Classification According to the Fair Value Hierarchy
Level 1 Level 2 Level 3 Total $’000 $’000 $’000 $’000
Land – 38,824 – 38,824
Buildings – 1,415 129,546 130,961
Heritage Assets – 136 8 144
– 40,375 129,554 169,929
114 Canberra Institute of Technology: Annual Report 2019
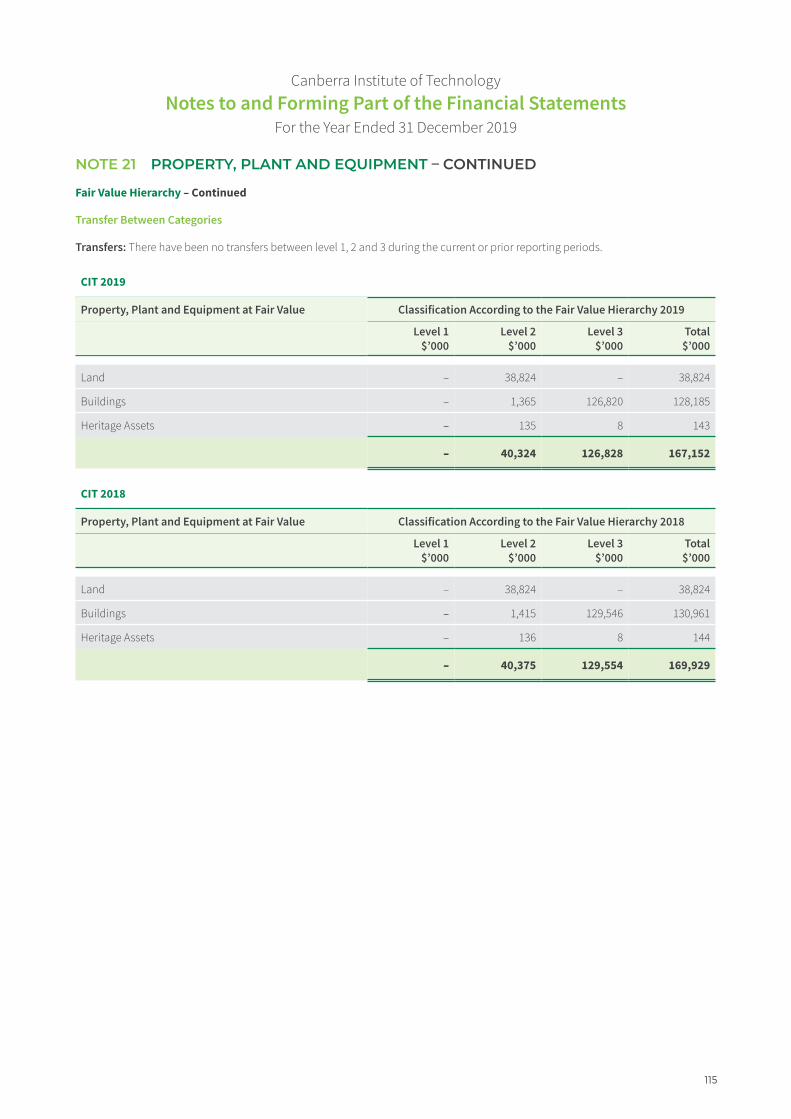
Canberra Institute of Technology Notes to and Forming Part of the Financial Statements
For the Year Ended 31 December 2019
NOTE 21 PROPERTY, PLANT AND EQUIPMENT – CONTINUED
Fair Value Hierarchy – Continued
Transfer Between Categories
Transfers: There have been no transfers between level 1, 2 and 3 during the current or prior reporting periods.
CIT 2019
Property, Plant and Equipment at Fair Value Classification According to the Fair Value Hierarchy 2019
Level 1 Level 2 Level 3 Total $’000 $’000 $’000 $’000
Land – 38,824 – 38,824
Buildings – 1,365 126,820 128,185
Heritage Assets – 135 8 143
– 40,324 126,828 167,152
CIT 2018
Property, Plant and Equipment at Fair Value Classification According to the Fair Value Hierarchy 2018
Level 1 Level 2 Level 3 Total $’000 $’000 $’000 $’000
Land – 38,824 – 38,824
Buildings – 1,415 129,546 130,961
Heritage Assets – 136 8 144
– 40,375 129,554 169,929
115

Canberra Institute of Technology Notes to and Forming Part of the Financial Statements
For the Year Ended 31 December 2019
NOTE 21 PROPERTY, PLANT AND EQUIPMENT – CONTINUED
Fair Value Hierarchy – Continued
Transfer Between Categories
Transfers: There have been no transfers between level 1, 2 and 3 during the current or prior reporting periods.
Valuation Techniques, inputs and processes
Level 2 Valuation Techniques and Inputs
Land and Buildings Valuation Technique: The valuation technique used to value land and buildings is the market approach that reflects recent transaction prices for similar properties and buildings (comparable in location and size).
Inputs: In determining the value of land, prices and other relevant information generated by market transactions involving comparable land and buildings were considered. The following was taken into regard: the Crown Lease terms and tenure, the Australian Capital Territory Plan and the National Capital Plan, where applicable, as well as current zoning. CIT considers that the valuation reflects the highest and best use value.
When assessing the value, the prices adopted from the evidence were on a dollar per square metre basis, subsequently applied to the various land areas to derive the total land value. The Monterey student accommodation was valued on a direct comparison basis, whereby an active and liquid market exists and comparable market evidence can be analysed to assist in deriving a value.
Heritage Assets Valuation technique: The valuation technique applied to Heritage assets is the market approach. This approach uses sales prices and other relevant information generated by market transactions involving similar assets or works by artists with similar standing/ style.
Inputs: Artworks comprise works produced by students and other artists held for permanent exhibition, for which fair value is determined using a market value (comparable sales) where there is a market for the same or a similar item.
Level 3 Valuation Techniques and Inputs
Land and Buildings Valuation Technique: Most buildings were considered specialised assets by the valuer and measured using the cost approach that reflects the cost to a market participant to construct assets of comparable utility adjusted for obsolescence. For buildings, depreciated replacement cost of equivalent modern improvements per square metre of floor area was also used in measuring fair value.
Inputs: In determining the value of buildings, regard was given to the age of buildings, size of improvements, estimated replacement cost, condition of structures and current use. This required the use of data internal to CIT. When assessing the value, the prices adopted from the evidence were on a dollar per square metre basis, subsequently applied to the various building areas to derive the total building value.
Heritage Assets Valuation technique: Heritage assets where there is no active market (produced by non-recognised artists) are valued using unobservable inputs.
Inputs: In determining the value of these artworks, unobservable inputs were developed with regard given to aesthetic quality, medium, valuer knowledge of the market, and recent sales of works by artists with similar standing/style to the non-recognised artists.
There have been no changes to the above valuation techniques during the year.
Transfers in and out of a fair value level are recognised at the end of the reporting period in which the assets are revalued or changed in circumstances that cause a revaluation and transfer.
116 Canberra Institute of Technology: Annual Report 2019

Canberra Institute of Technology Notes to and Forming Part of the Financial Statements
For the Year Ended 31 December 2019
NOTE 21 PROPERTY, PLANT AND EQUIPMENT – CONTINUED
Fair Value Hierarchy – Continued
Fair value measurements using significant unobservable inputs (Level 3)
Buildings Heritage Assets Consolidated 2019 $’000 $’000
Fair Value at the Beginning of the Reporting Period 129,546 8
Additions 3,758 –
Depreciation (6,484) –
Fair Value at end of the Reporting Period 126,820 8
Buildings Heritage Assets Consolidated 2018 $’000 $’000
Fair Value at the Beginning of the Reporting Period 133,373 8
Additions 4,182 –
Depreciation (7,190) –
Disposal (104) –
Transfer to Asset Held for Distribution to Owners (972) –
Other movements 257 –
Fair Value at end of the Reporting Period 129,546 8
117
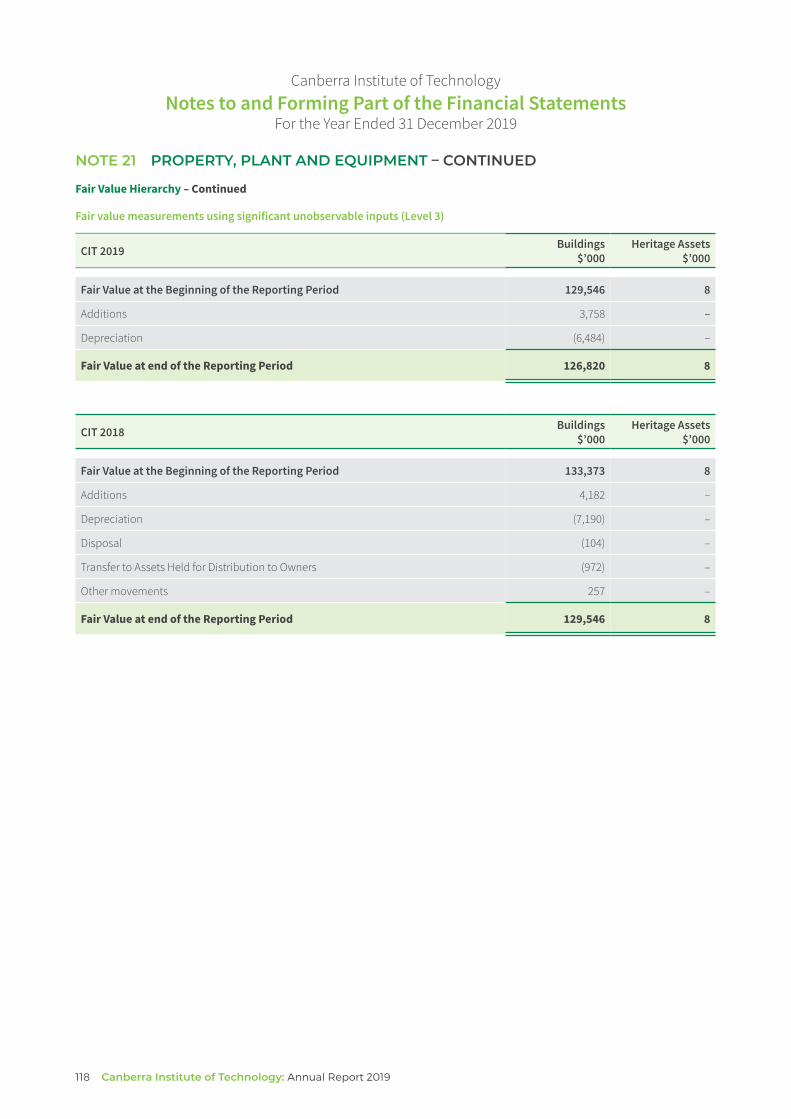
Canberra Institute of Technology Notes to and Forming Part of the Financial Statements
For the Year Ended 31 December 2019
NOTE 21 PROPERTY, PLANT AND EQUIPMENT – CONTINUED
Fair Value Hierarchy – Continued
Fair value measurements using significant unobservable inputs (Level 3)
Buildings Heritage Assets CIT 2019 $’000 $’000
Fair Value at the Beginning of the Reporting Period 129,546 8
Additions 3,758 –
Depreciation (6,484) –
Fair Value at end of the Reporting Period 126,820 8
Buildings Heritage Assets CIT 2018 $’000 $’000
Fair Value at the Beginning of the Reporting Period 133,373 8
Additions 4,182 –
Depreciation (7,190) –
Disposal (104) –
Transfer to Assets Held for Distribution to Owners (972) –
Other movements 257 –
Fair Value at end of the Reporting Period 129,546 8
118 Canberra Institute of Technology: Annual Report 2019

Canberra Institute of Technology Notes to and Forming Part of the Financial Statements
For the Year Ended 31 December 2019
NOTE 22 INTANGIBLE ASSETS CIT has externally purchased sofware, comprising five core corporate business systems (of-the-shelf products modified to meet CIT’s needs) and sofware titles.
Consolidated CIT 2019
$’000 2018
$’000 2019
$’000 2018
$’000
Computer Sofware
Externally Purchased Sofware
Computer Sofware at Cost 6,739 6,668 6,739 6,668
Less: Accumulated Amortisation (a) (6,442) (6,045) (6,442) (6,045)
Total Externally Purchased Sofware 297 623 297 623
Total Computer Sofware 297 623 297 623
Total Intangible Assets 297 623 297 623
(a) Computer Sofware amortisation is included in Depreciation and Amortisation in the Operating Statement.
Reconciliation of Intangible Assets The following table shows the movements in Intangible Assets from the beginning to the end of 2018 and 2019.
Consolidated CIT 2019
$’000 2018
$’000 2019
$’000 2018
$’000
Carrying Amount at the Beginning of the Reporting Period 623 804 623 804
Additions 71 319 71 319
Amortisation (397) (500) (397) (500)
Carrying Amount at the End of the Reporting Period 297 623 297 623
119

Canberra Institute of Technology Notes to and Forming Part of the Financial Statements
For the Year Ended 31 December 2019
NOTE 23 CAPITAL WORKS IN PROGRESS Assets under construction include infrastructure assets, buildings, leasehold improvements and sofware.
Consolidated CIT 2019
$’000 2018
$’000 2019
$’000 2018
$’000
Buildings Works in Progress 1,549 2,342 1,549 2,342
Sofware Works in Progress 470 71 470 71
Total Capital Works in Progress 2,019 2,413 2,019 2,413
Reconciliation of Consolidated Capital Works in Progress The following table shows the movement in the Consolidated Entity’s Capital Works in Progress during 2018 and 2019.
Plant and Equipment Buildings Sofware
Works in Works in Works in Progress Progress Progress Total
$’000 $’000 $’000 $’000
Consolidated 2019
Carrying Amount at the Beginning of the Reporting Period – 2,342 71 2,413
Additions – 5,203 470 5,673
Capital Works in Progress Completed and Transferred to Property, Plant and Equipment – (5,290) – (5,290)
Capital Works in Progress Completed and Transferred to Intangible Asset – – (71) (71)
Capital Works in Progress Expensed – (706) – (706)
Carrying Amount at the End of the Reporting Period – 1,549 470 2,019
Consolidated 2018
Carrying Amount at the Beginning of the Reporting Period 58 2,064 88 2,210
Additions – 4,126 71 4,197
Capital Works in Progress Completed and Transferred to Property, Plant and Equipment (58) (3,848) – (3,906)
Capital Works in Progress Completed and Transferred to Intangible Assets – – (88) (88)
Carrying Amount at the End of the Reporting Period – 2,342 71 2,413
120 Canberra Institute of Technology: Annual Report 2019

Canberra Institute of Technology Notes to and Forming Part of the Financial Statements
For the Year Ended 31 December 2019
NOTE 23 CAPITAL WORKS IN PROGRESS – CONTINUED
Reconciliation of Capital Works in Progress The following table shows the movement in CIT’s Capital Works in Progress during 2018 and 2019.
Plant and Equipment Buildings Sofware
Works in Works in Works in Progress Progress Progress Total
$’000 $’000 $’000 $’000
CIT 2019
Carrying Amount at the Beginning of the Reporting Period – 2,342 71 2,413
Additions (a) – 5,203 470 5,673
Capital Works in Progress Completed and Transferred to Property, Plant and Equipment (b) – (5,290) – (5,290)
Capital Works in Progress Completed and Transferred to Intangible Assets – – (71) (71)
Capital Works in Progress Expensed (c) – (706) – (706)
Carrying Amount at the End of the Reporting Period – 1,549 470 2,019
CIT 2018
Carrying Amount at the Beginning of the Reporting Period 58 2,064 88 2,210
Additions – 4,126 71 4,197
Capital Works in Progress Completed and Transferred to Property, Plant and Equipment (58) (3,848) – (3,906)
Capital Works in Progress Completed and Transferred to Intangible Assets – – (88) (88)
Carrying Amount at the End of the Reporting Period – 2,342 71 2,413
(a) Capital works additions increased as a result of expenditure relating to the Better Infrastructure Funds 2018-19 and the new ACT Government Budget-funded initiative ‘Project Better ICT Services for Students and Staf’.
(b) Capital Works in Progress Completed and Transferred to Property, Plant and Equipment increased primarily due to the capitalisation of Better Infrastructure Funding works for buildings carried over from 2018 and the Training Security Operations Centre for Cyber Security course delivery, the Carbon NeutraI Project LED Lighting Upgrade and Microgrid projects and the Allied Health Clinic projects.
(C) Capital Works in Progress Expensed means that costs previously thought to be capital in nature have been expensed due to a change in plans for the site. This relates to the Campus Modernisation Program for the Reid Campus.
121
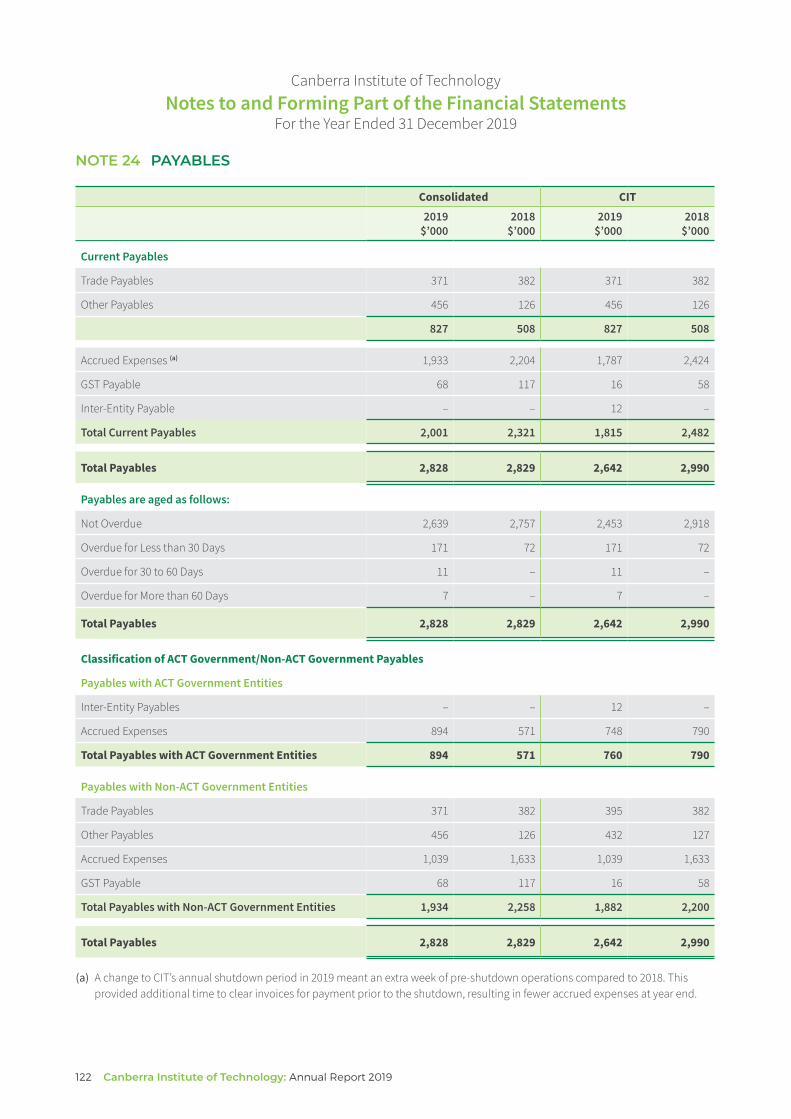
Canberra Institute of Technology Notes to and Forming Part of the Financial Statements
For the Year Ended 31 December 2019
NOTE 24 PAYABLES
Consolidated CIT 2019
$’000 2018
$’000 2019
$’000 2018
$’000
Current Payables
Trade Payables 371 382 371 382
Other Payables 456 126 456 126
827 508 827 508
Accrued Expenses (a) 1,933 2,204 1,787 2,424
GST Payable 68 117 16 58
Inter-Entity Payable – – 12 –
Total Current Payables 2,001 2,321 1,815 2,482
Total Payables 2,828 2,829 2,642 2,990
Payables are aged as follows:
Not Overdue 2,639 2,757 2,453 2,918
Overdue for Less than 30 Days 171 72 171 72
Overdue for 30 to 60 Days 11 – 11 –
Overdue for More than 60 Days 7 – 7 –
Total Payables 2,828 2,829 2,642 2,990
Classification of ACT Government/Non-ACT Government Payables
Payables with ACT Government Entities
Inter-Entity Payables – – 12 –
Accrued Expenses 894 571 748 790
Total Payables with ACT Government Entities 894 571 760 790
Payables with Non-ACT Government Entities
Trade Payables 371 382 395 382
Other Payables 456 126 432 127
Accrued Expenses 1,039 1,633 1,039 1,633
GST Payable 68 117 16 58
Total Payables with Non-ACT Government Entities 1,934 2,258 1,882 2,200
Total Payables 2,828 2,829 2,642 2,990
(a) A change to CIT’s annual shutdown period in 2019 meant an extra week of pre-shutdown operations compared to 2018. This provided additional time to clear invoices for payment prior to the shutdown, resulting in fewer accrued expenses at year end.
122 Canberra Institute of Technology: Annual Report 2019
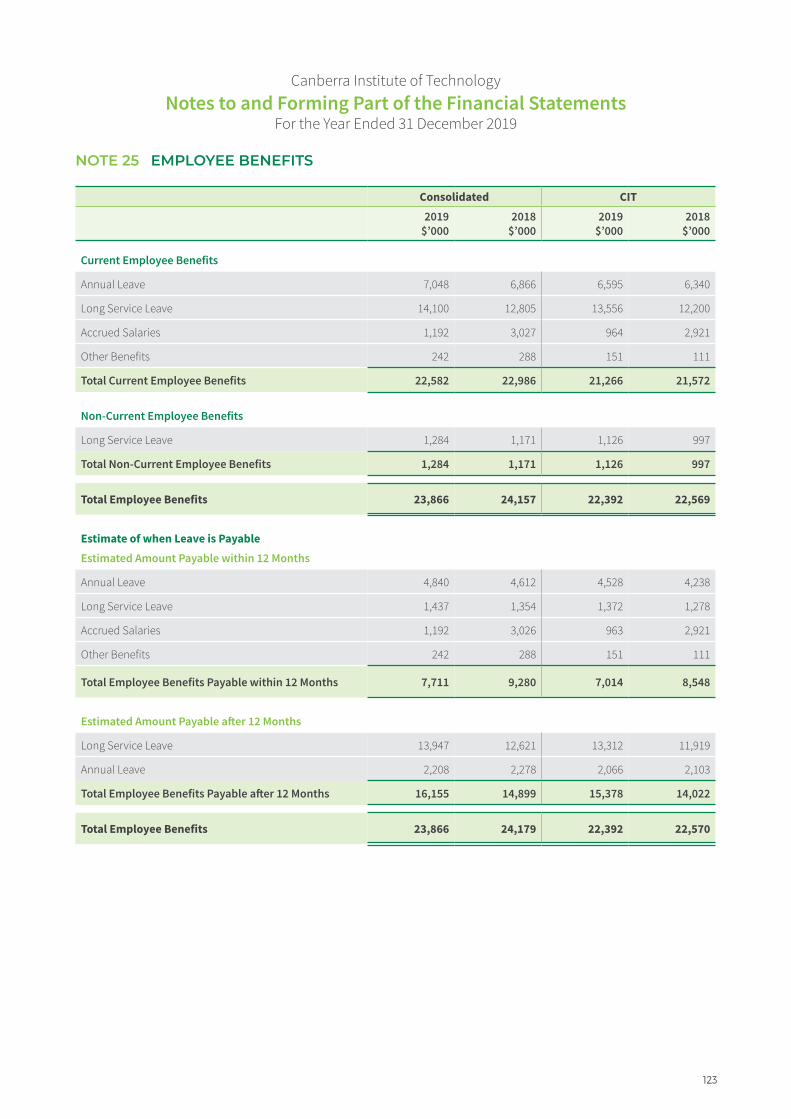
Canberra Institute of Technology Notes to and Forming Part of the Financial Statements
For the Year Ended 31 December 2019
NOTE 25 EMPLOYEE BENEFITS
Consolidated CIT 2019
$’000 2018
$’000 2019
$’000 2018
$’000
Current Employee Benefits
Annual Leave 7,048 6,866 6,595 6,340
Long Service Leave 14,100 12,805 13,556 12,200
Accrued Salaries 1,192 3,027 964 2,921
Other Benefits 242 288 151 111
Total Current Employee Benefits 22,582 22,986 21,266 21,572
Non-Current Employee Benefits
Long Service Leave 1,284 1,171 1,126 997
Total Non-Current Employee Benefits 1,284 1,171 1,126 997
Total Employee Benefits 23,866 24,157 22,392 22,569
Estimate of when Leave is Payable Estimated Amount Payable within 12 Months
Annual Leave 4,840 4,612 4,528 4,238
Long Service Leave 1,437 1,354 1,372 1,278
Accrued Salaries 1,192 3,026 963 2,921
Other Benefits 242 288 151 111
Total Employee Benefits Payable within 12 Months 7,711 9,280 7,014 8,548
Estimated Amount Payable afer 12 Months
Long Service Leave 13,947 12,621 13,312 11,919
Annual Leave 2,208 2,278 2,066 2,103
Total Employee Benefits Payable afer 12 Months 16,155 14,899 15,378 14,022
Total Employee Benefits 23,866 24,179 22,392 22,570
123
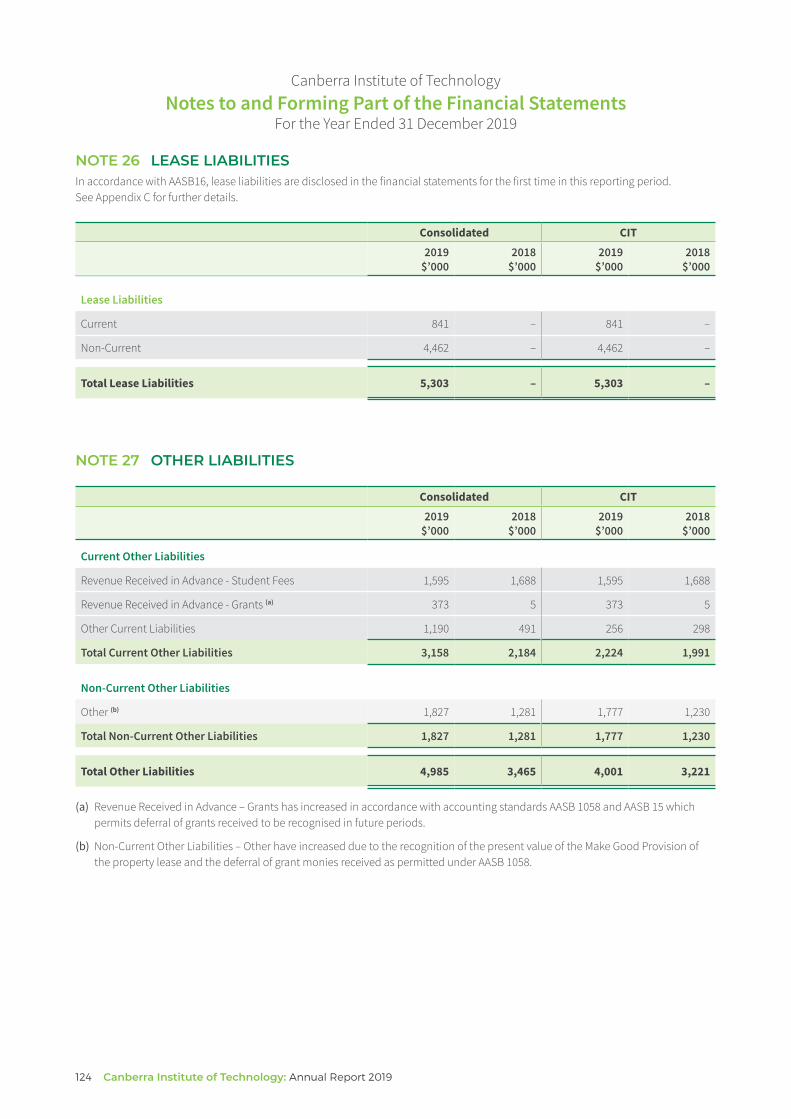
Canberra Institute of Technology Notes to and Forming Part of the Financial Statements
For the Year Ended 31 December 2019
NOTE 26 LEASE LIABILITIES In accordance with AASB16, lease liabilities are disclosed in the financial statements for the first time in this reporting period. See Appendix C for further details.
Consolidated CIT 2019
$’000 2018
$’000 2019
$’000 2018
$’000
Lease Liabilities
Current 841 – 841 –
Non-Current 4,462 – 4,462 –
Total Lease Liabilities 5,303 – 5,303 –
NOTE 27 OTHER LIABILITIES
Consolidated CIT 2019
$’000 2018
$’000 2019
$’000 2018
$’000
Current Other Liabilities
Revenue Received in Advance - Student Fees 1,595 1,688 1,595 1,688
Revenue Received in Advance - Grants (a) 373 5 373 5
Other Current Liabilities 1,190 491 256 298
Total Current Other Liabilities 3,158 2,184 2,224 1,991
Non-Current Other Liabilities
Other (b) 1,827 1,281 1,777 1,230
Total Non-Current Other Liabilities 1,827 1,281 1,777 1,230
Total Other Liabilities 4,985 3,465 4,001 3,221
(a) Revenue Received in Advance – Grants has increased in accordance with accounting standards AASB 1058 and AASB 15 which permits deferral of grants received to be recognised in future periods.
(b) Non-Current Other Liabilities – Other have increased due to the recognition of the present value of the Make Good Provision of the property lease and the deferral of grant monies received as permitted under AASB 1058.
124 Canberra Institute of Technology: Annual Report 2019

Canberra Institute of Technology Notes to and Forming Part of the Financial Statements
For the Year Ended 31 December 2019
NOTE 28 ASSET REVALUATION SURPLUS
Asset Revaluation Surplus
The Asset Revaluation Surplus is used to record the increments and decrements in the value of the Property, Plant and Equipment.
Consolidated CIT 2019
$’000 2018
$’000 2019
$’000 2018
$’000
Balance at the Beginning of the Reporting Period 94,911 93,475 94,911 93,475
Increment in Land due to Revaluation – – – –
Increment in Buildings due to Revaluation – – – –
Increment in Plant and Equipment – – – –
Transfer to/(from) Asset Revaluation Surplus (a) 23,058 1,436 23,058 1,436
Total Increase in the Asset Revaluation Surplus 23,058 1,436 23,058 1,436
Balance at the End of the Reporting Period 117,969 94,911 117,969 94,911
(a) The 2019 amount is the result of the movement of asset reserve amounts from the asset reserve clearing account to accumulated funds due to the retirement of buildings and plant and equipment assets in the prior year, namely the Woden and Watson properties.
125

Canberra Institute of Technology Notes to and Forming Part of the Financial Statements
For the Year Ended 31 December 2019
NOTE 29 FINANCIAL INSTRUMENTS
Details of the significant policies and methods adopted, including the criteria for recognition, the basis of measurement, and the basis on which income and expenses are recognised, with respect to each class of financial asset and financial liability, are disclosed in Note 2 – Significant Accounting Policies.
Interest Rate Risk Interest rate risk is the risk that fair value or future cash flows of a financial instrument will fluctuate because of changes in market interest rates. CIT’s financial assets consist of cash and cash equivalents, which are normally exposed to floating interest rate risk. Based on the cash needs of CIT, floating interest rate risk is mitigated by investing cash in term deposits with fixed interest rates.
CIT does not have any financial liabilities held at floating interest rates and is therefore not exposed to movements in the amount of interest payable. There have been no changes in risk exposure or processes for managing risk since the last financial reporting period.
A sensitivity analysis has not been undertaken for the interest rate risk of CIT as it has been determined that the possible impact on income and expenses or total equity from fluctuations in interest rates is immaterial.
Credit Risk Credit risk is the risk that one party to a financial instrument will fail to discharge an obligation and cause the other party to incur a financial loss.
CIT is exposed to credit risk from:
• the amount of the financial assets it holds net of any allowance for impairment
• financial assets that are not past due or impaired
• transactions with students and other commercial entities
• term deposits
CIT mitigates its credit risk by the following processes and procedures:
• the majority of revenue transactions taking place with ACT Government and Australian Government entities hence any receivable generated does not carry a credit risk
• monitoring and collecting all financial assets not past due or impaired
• transactional risks are managed through internal processes which include contacting debtors by phone and email and referring to a debt collection agency. With regard to student debtors, CIT can limit student access to facilities, obtaining of grades and graduating and by deregistering students with outstanding accounts.
• term deposits are held with the Illawarra Mutual Bank Limited, which has a long term credit rating of Baa1 with Moody’s Investor Services and BBB+ with Fitch Ratings at November 2019.
There have been no changes in credit risk exposure since the last reporting period.
Trade receivables are measured at lifetime expected credit losses (the simplified approach).
Liquidity Risk Liquidity risk is the risk that CIT will encounter dificulties in meeting obligations associated with financial liabilities that are settled by delivering cash or another financial asset. CIT manages its exposure to liquidity risk by drawing down appropriations received progressively throughout the year and by progressively invoicing students and other debtors to ensure that it can meet its obligations throughout the year. See the maturity analysis for further details on when financial assets and liabilities mature.
CIT’s exposure to liquidity risk and the management of this risk has not changed since the previous reporting period.
126 Canberra Institute of Technology: Annual Report 2019

Canberra Institute of Technology Notes to and Forming Part of the Financial Statements
For the Year Ended 31 December 2019
NOTE 29 FINANCIAL INSTRUMENTS – CONTINUED
Price Risk Price risk is the risk that the fair value or future cash flows of a financial instrument will fluctuate because of changes in market prices (other than those arising from interest rate risk or currency risk), whether these changes are caused by factors specific to the individual financial instrument or its issuer, or by factors afecting all similar financial instruments traded in the market. CIT has no exposure to price risk, as it does not hold financial instruments that are exposed to movements in market prices.
Fair Value of Financial Assets and Liabilities The carrying amounts and fair values of financial assets and liabilities at the end of the reporting period are:
Consolidated Carrying Fair Value Amount Amount
2019 2019 $’000 $’000
Carrying Fair Value Amount Amount
2018 2018 $’000 $’000
Financial Assets
Cash and Cash Equivalents 13,064 13,064 12,204 12,204
Financial assets at amortised costs 4,245 4,245 5,627 5,627
Total Financial Assets 17,309 17,309 17,831 17,831
Financial Liabilities
Payables 2,760 2,760 2,712 2,712
Lease Liability (a) 5,303 5,303 – –
Total Financial Liabilities 8,063 8,063 2,712 2,712
Fair Value Hierarchy CIT does not have any financial assets or liabilities measured at fair value. As such, no Fair Value Hierarchy disclosures have been made.
(a) In accordance with AASB 16, Lease Liabilities have been disclosed for the first time this reporting period. See Appendix C for further information.
127

128 Canberra Institute of Technology: Annual Report 2019
Canb
erra
Inst
itute
of T
echn
olog
y N
otes
to a
nd F
orm
ing
Part
of t
he F
inan
cial
Sta
tem
ents
Fo
r the
Year
End
ed 3
1 De
cem
ber 2
019
NO
TE 2
9 FI
NA
NC
IAL
INST
RU
ME
NTS
– C
ON
TIN
UE
D
Cons
olid
ated
and
CIT
cre
dit r
isk
expo
sure
Th
e fo
llow
ing
tabl
e de
tails
the
cred
it ris
k ex
posu
re o
n th
e In
stitu
te’s
Stud
ent t
rade
rece
ivab
les u
sing
a p
rovi
sion
mat
rix.
Days
pas
t due
Tota
l Cu
rren
t <3
0 da
ys
31-6
0 da
ys
61-9
0 da
ys
>91
days
$’
000
$’00
0 $’
000
$’00
0 $’
000
$’00
0
31 D
ecem
ber 2
019
CIT
Stud
ent R
ecei
vabl
es
122
9 41
31
8
33
Expe
cted
cre
dit l
oss r
ate
(a)
0%
10.4
0%
28.2
0%
50.9
0%
56.0
0%
Estim
ated
tota
l gro
ss c
arry
ing
amou
nt a
t def
ault
87
9 37
22
3
16
Expe
cted
cre
dit l
osse
s 35
–
4 9
4 18
CIT
Solu
tions
Tra
de R
ecei
vabl
es
1,45
8 1,
297
53
59
1 48
Expe
cted
cre
dit l
oss r
ate
(a)
– –
– 1.
96%
39
.31%
Estim
ated
tota
l gro
ss c
arry
ing
amou
nt a
t def
ault
1,43
9 1,
297
53
59
1 29
Expe
cted
cre
dit l
osse
s 19
–
– –
– 19
Tota
l Exp
ecte
d Cr
edit
Loss
es
54
– 4
9 4
37
(a)
The
expe
cted
cre
dit l
oss i
s est
imat
ed b
ased
on
hist
oric
al lo
ss ra
tes u
sing
hist
oric
al m
onth
ly d
ebto
r agi
ng ta
bles
.

Canb
erra
Inst
itute
of T
echn
olog
y N
otes
to a
nd F
orm
ing
Part
of t
he F
inan
cial
Sta
tem
ents
Fo
r the
Year
End
ed 3
1 De
cem
ber 2
019
NO
TE 2
9 FI
NA
NC
IAL
INST
RU
ME
NTS
– C
ON
TIN
UE
D
The
follo
win
g ta
ble
sets
out
the
mat
urity
ana
lysi
s for
fina
ncia
l ass
ets a
nd li
abili
ties a
s wel
l as t
he e
xpos
ure
to in
tere
st ra
tes,
incl
udin
g th
e w
eigh
ted
aver
age
inte
rest
rate
s by
mat
urity
pe
riod
at 3
1 De
cem
ber 2
019.
All
finan
cial
ass
ets,
whi
ch h
ave
a flo
atin
g in
tere
st ra
te o
r are
non
-inte
rest
bea
ring,
will
mat
ure
in o
ne y
ear o
r les
s. P
ayab
les w
ill m
atur
e w
ithin
one
yea
r and
th
e no
n-in
tere
st b
earin
g lo
an w
ill m
atur
e in
8 y
ears
. All
amou
nts a
ppea
ring
in th
e fo
llow
ing
mat
urity
ana
lysi
s are
show
n on
an
undi
scou
nted
cas
h flo
w b
asis
.
CIT
does
not
hol
d an
y co
llate
ral a
s sec
urity
rela
ting
to fi
nanc
ial a
sset
s.
Fixe
d In
tere
st M
atur
ing
In:
Wei
ghte
d Av
erag
e Fl
oatin
g 1
Year
O
ver 1
Yea
r O
ver
Non
-Inte
rest
N
ote
Inte
rest
In
tere
st
or L
ess
to 5
Yea
rs
5 Ye
ars
Bear
ing
Tota
l Co
nsol
idat
ed 2
019
No.
Ra
te
$’00
0 $’
000
$’00
0 $’
000
$’00
0 $’
000
Fina
ncia
l Ins
trum
ents
Fina
ncia
l Ass
ets
Cash
and
Cas
h Eq
uiva
lent
s 16
2.
00%
10
,064
3,
000
– –
– 13
,064
Rece
ivab
les
17
– –
– –
4,24
5 4,
245
Tota
l Fin
anci
al A
sset
s 10
,064
3,
000
– –
4,24
5 17
,309
Fina
ncia
l Lia
bilit
ies
Paya
bles
24
–
– –
– –
2,76
0 2,
760
Leas
e lia
bilit
y 26
–
– –
– 5,
303
5,30
3
Tota
l Fin
anci
al L
iabi
litie
s –
– –
– 8,
063
8,06
3
Net
Fin
anci
al A
sset
s/ (L
iabi
litie
s)
10,0
64
3,00
0 –
– (3
,818
) 9,
246
129
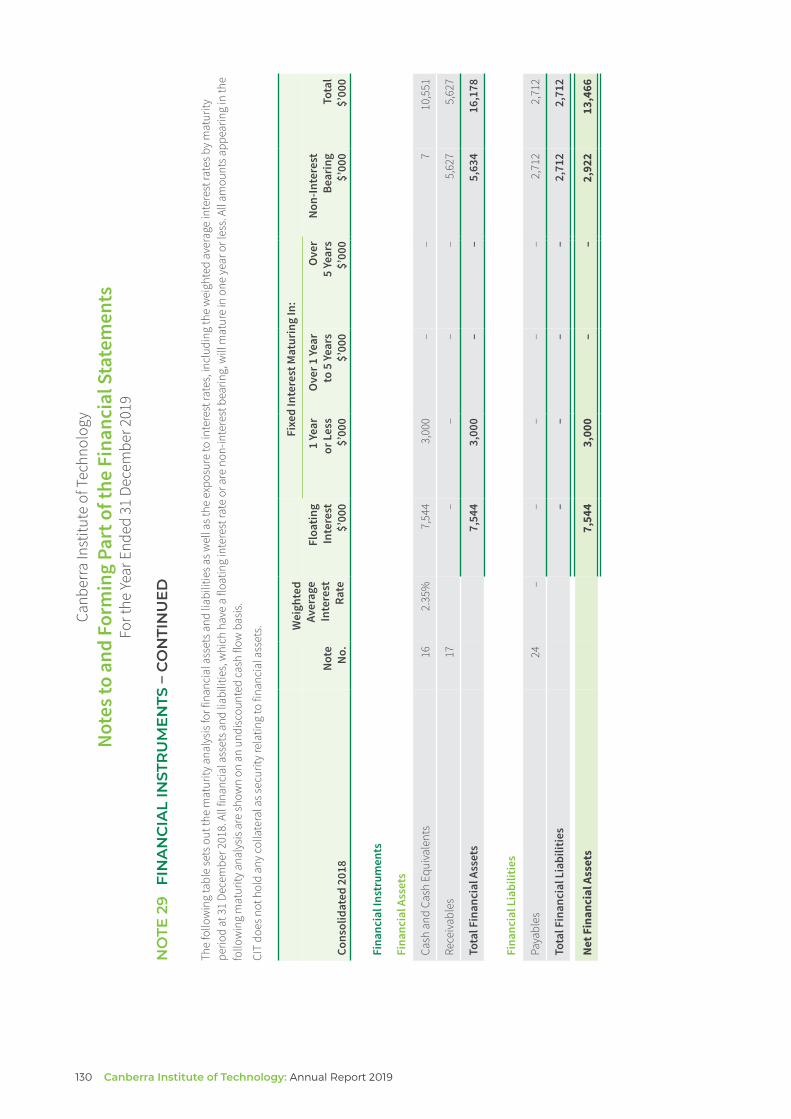
130 Canberra Institute of Technology: Annual Report 2019
Canb
erra
Inst
itute
of T
echn
olog
y N
otes
to a
nd F
orm
ing
Part
of t
he F
inan
cial
Sta
tem
ents
Fo
r the
Year
End
ed 3
1 De
cem
ber 2
019
NO
TE 2
9 FI
NA
NC
IAL
INST
RU
ME
NTS
– C
ON
TIN
UE
D
The
follo
win
g ta
ble
sets
out
the
mat
urity
ana
lysi
s for
fina
ncia
l ass
ets a
nd li
abili
ties a
s wel
l as t
he e
xpos
ure
to in
tere
st ra
tes,
incl
udin
g th
e w
eigh
ted
aver
age
inte
rest
rate
s by
mat
urity
pe
riod
at 3
1 De
cem
ber 2
018.
All
finan
cial
ass
ets a
nd li
abili
ties,
whi
ch h
ave
a flo
atin
g in
tere
st ra
te o
r are
non
-inte
rest
bea
ring,
will
mat
ure
in o
ne y
ear o
r les
s. A
ll am
ount
s app
earin
g in
the
follo
win
g m
atur
ity a
naly
sis a
re sh
own
on a
n un
disc
ount
ed c
ash
flow
bas
is.
CIT
does
not
hol
d an
y co
llate
ral a
s sec
urity
rela
ting
to fi
nanc
ial a
sset
s.
Fixe
d In
tere
st M
atur
ing
In:
Wei
ghte
d Av
erag
e Fl
oatin
g 1
Year
O
ver 1
Yea
r O
ver
Non
-Inte
rest
N
ote
Inte
rest
In
tere
st
or L
ess
to 5
Yea
rs
5 Ye
ars
Bear
ing
Tota
l Co
nsol
idat
ed 2
018
No.
Ra
te
$’00
0 $’
000
$’00
0 $’
000
$’00
0 $’
000
Fina
ncia
l Ins
trum
ents
Fina
ncia
l Ass
ets
Cash
and
Cas
h Eq
uiva
lent
s 16
2.
35%
7,
544
3,00
0 –
– 7
10,5
51
Rece
ivab
les
17
– –
– –
5,62
7 5,
627
Tota
l Fin
anci
al A
sset
s 7,
544
3,00
0 –
– 5,
634
16,1
78
Fina
ncia
l Lia
bilit
ies
Paya
bles
24
–
– –
– –
2,71
2 2,
712
Tota
l Fin
anci
al L
iabi
litie
s –
– –
– 2,
712
2,71
2
Net
Fin
anci
al A
sset
s 7,
544
3,00
0 –
– 2,
922
13,4
66
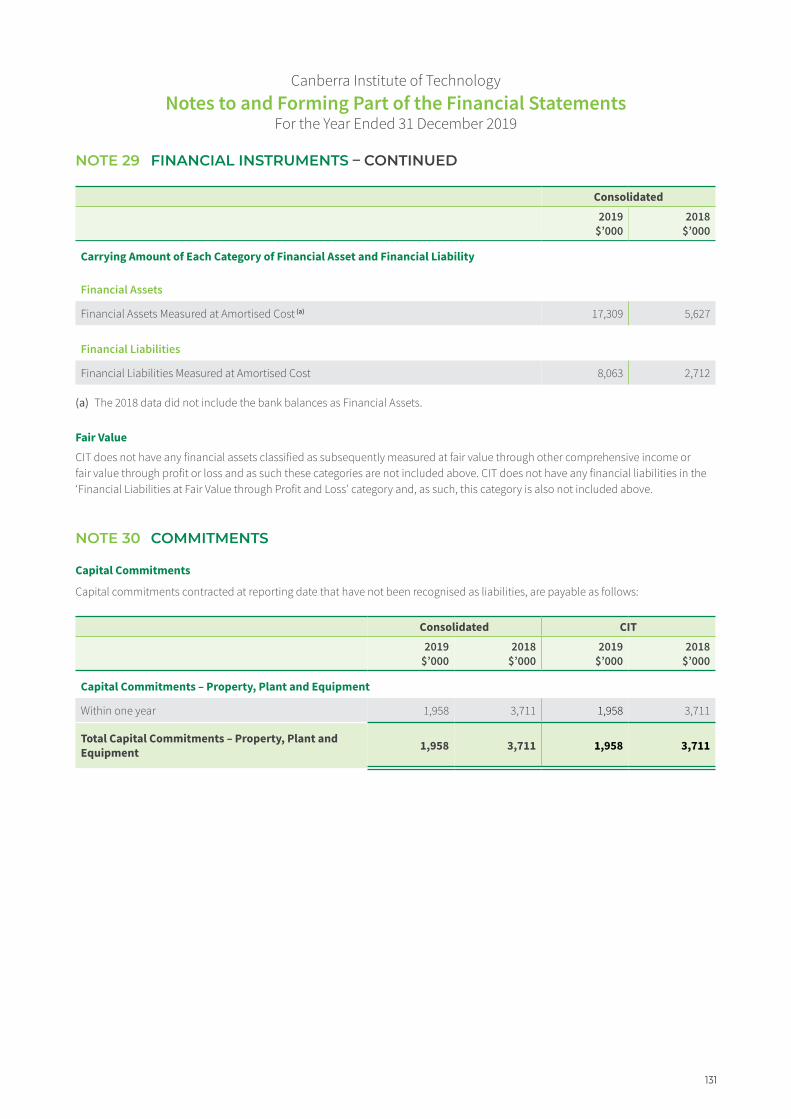
Canberra Institute of Technology Notes to and Forming Part of the Financial Statements
For the Year Ended 31 December 2019
NOTE 29 FINANCIAL INSTRUMENTS – CONTINUED
Consolidated 2019 2018
$’000 $’000
Carrying Amount of Each Category of Financial Asset and Financial Liability
Financial Assets
Financial Assets Measured at Amortised Cost (a) 17,309 5,627
Financial Liabilities
Financial Liabilities Measured at Amortised Cost 8,063 2,712
(a) The 2018 data did not include the bank balances as Financial Assets.
Fair Value CIT does not have any financial assets classified as subsequently measured at fair value through other comprehensive income or fair value through profit or loss and as such these categories are not included above. CIT does not have any financial liabilities in the ‘Financial Liabilities at Fair Value through Profit and Loss’ category and, as such, this category is also not included above.
NOTE 30 COMMITMENTS
Capital Commitments
Capital commitments contracted at reporting date that have not been recognised as liabilities, are payable as follows:
Consolidated CIT 2019
$’000 2018
$’000 2019
$’000 2018
$’000
Capital Commitments – Property, Plant and Equipment
Within one year 1,958 3,711 1,958 3,711
Total Capital Commitments – Property, Plant and Equipment 1,958 3,711 1,958 3,711
131
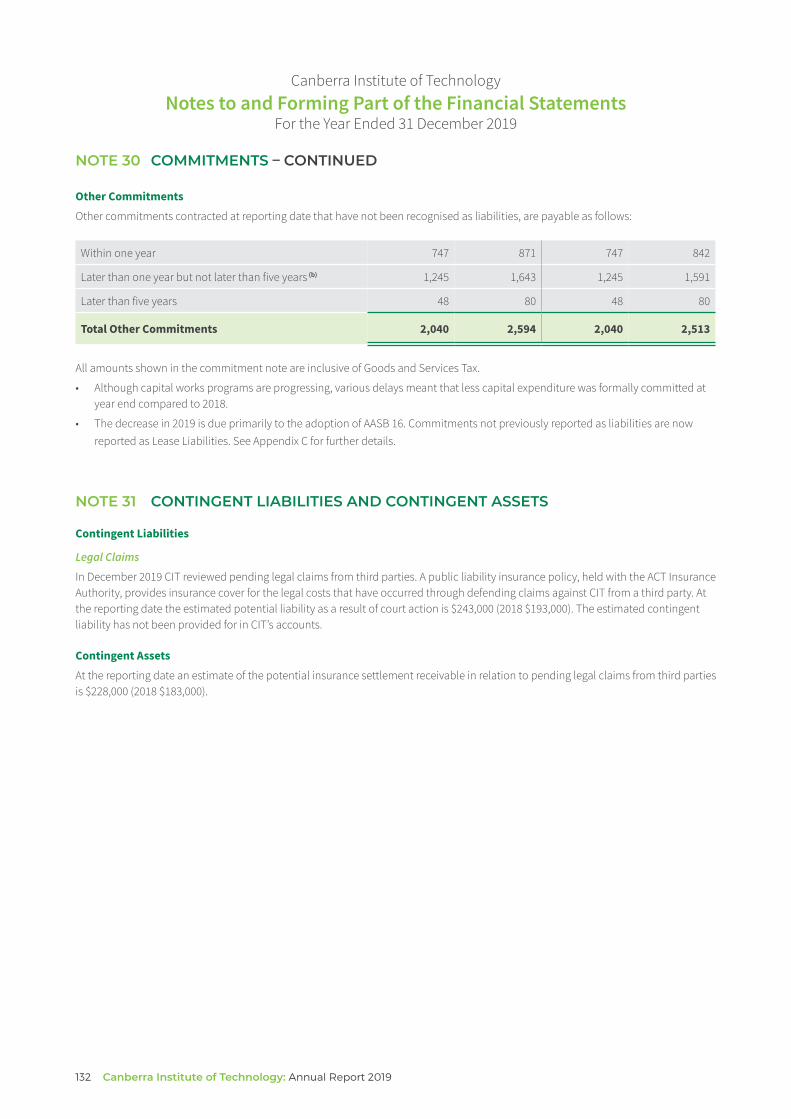
Canberra Institute of Technology Notes to and Forming Part of the Financial Statements
For the Year Ended 31 December 2019
NOTE 30 COMMITMENTS – CONTINUED
Other Commitments Other commitments contracted at reporting date that have not been recognised as liabilities, are payable as follows:
Within one year 747 871 747 842
Later than one year but not later than five years (b) 1,245 1,643 1,245 1,591
Later than five years 48 80 48 80
Total Other Commitments 2,040 2,594 2,040 2,513
All amounts shown in the commitment note are inclusive of Goods and Services Tax.
• Although capital works programs are progressing, various delays meant that less capital expenditure was formally committed at year end compared to 2018.
• The decrease in 2019 is due primarily to the adoption of AASB 16. Commitments not previously reported as liabilities are now reported as Lease Liabilities. See Appendix C for further details.
NOTE 31 CONTINGENT LIABILITIES AND CONTINGENT ASSETS
Contingent Liabilities
Legal Claims
In December 2019 CIT reviewed pending legal claims from third parties. A public liability insurance policy, held with the ACT Insurance Authority, provides insurance cover for the legal costs that have occurred through defending claims against CIT from a third party. At the reporting date the estimated potential liability as a result of court action is $243,000 (2018 $193,000). The estimated contingent liability has not been provided for in CIT’s accounts.
Contingent Assets At the reporting date an estimate of the potential insurance settlement receivable in relation to pending legal claims from third parties is $228,000 (2018 $183,000).
132 Canberra Institute of Technology: Annual Report 2019

Canberra Institute of Technology Notes to and Forming Part of the Financial Statements
For the Year Ended 31 December 2019
NOTE 32 CASH FLOW RECONCILIATION
(a) Reconciliation of Cash and Cash Equivalents at the End of the Reporting Period in the Cash Flow Statement to the Equivalent Items in the Balance Sheet
Consolidated CIT 2019
$’000 2018
$’000 2019
$’000 2018
$’000
Total Cash and Cash Equivalents Recorded in the Balance Sheet 13,064 12,404 10,938 9,915
Cash and Cash Equivalents at the End of the Reporting Period as Recorded in the Cash Flow Statement
13,064 12,404 10,938 9,915
(b) Reconciliation of Net Cash Inflows/(Outflows) from Operating Activities to the Operating Deficit
Operating (Deficit) (9,228) (14,894) (9,512) (12,910)
Add/(Less) Non-Cash Items
Depreciation of Property, Plant and Equipment 9,048 8,674 8,952 8,578
Amortisation of Intangibles 397 500 397 500
Right-of-Use asset expense (1,435) – (888) –
Add/(Less) Items Classified as Investing or Financing
Net (Loss)/ Gain from the Sale of Assets (16) 23 (16) 23
Cash Outflows Before Changes in Operating Assets and Liabilities (1,234) (5,697) (1,067) (3,809)
Changes in Operating Assets and Liabilities
Decrease in Receivables 1,378 2,611 1,200 1,337
(Increase)/ Decrease in Other Assets (609) 240 1,042 220
Increase/ (Decrease) in Payables 444 (197) (496) (126)
Increase/(Decrease) in Provisions (270) 3,136 (175) 3,290
Increase in Other Liabilities 1,202 629 471 618
Net Changes in Operating Assets and Liabilities 2,145 6,419 2,042 5,339
Net Cash Inflows from Operating Activities 911 722 975 1,530
133

Canberra Institute of Technology Notes to and Forming Part of the Financial Statements
For the Year Ended 31 December 2019
NOTE 33 EVENTS OCCURRING AFTER BALANCE DATE
There were no events occurring afer the balance date which would afect the financial statements at 31 December 2019.
NOTE 34 THIRD PARTY MONIES
CIT holds monies on behalf of third parties which are reported as follows:
Consolidated CIT 2019
$’000 2018
$’000 2019
$’000 2018
$’000
Balance at the Beginning of the Reporting Period 37 48 37 48
Receipts for Overseas Student Health Cover (a) 121 189 121 189
Payments for Overseas Student Health Cover (a) (146) (200) (146) (200)
Balance at the End of the Reporting Period 12 37 12 37
Monies Held on Behalf of Third Parties at the End of the Reporting Period:
Overseas Student Health Cover 12 37 12 37
Total Third Party Monies 12 37 12 37
(a) Third party monies are funds received from primarily international students for the payment of Overseas Student Health Cover insurance.
NOTE 35 RELATED PARTY DISCLOSURE
A related party is a person that controls or has significant influence over the reporting entity, or is a member of the Key Management Personnel (KMP) of the reporting entity or its parent entity, and includes their close family members and entities in which the KMP and/or their close family members individually or jointly have controlling interests.
KMP are those persons having authority and responsibility for planning, directing and controlling the activities of CIT, directly or indirectly.
KMP of CIT are the CIT Board Members the Chief Executive and Executive Management of CIT.
The Head of Service and the ACT Executive comprising the Cabinet Ministers are KMP of the ACT Government and therefore related parties of CIT.
There were no related party transactions undertaken directly with CIT by Cabinet Ministers, including the Portfolio Minister, or by the Head of Service during the year ended 31 December 2019.
This note does not include typical citizen transactions between the KMP and CIT that occur on terms and conditions no diferent to those applying to the general public.
134 Canberra Institute of Technology: Annual Report 2019

Canberra Institute of Technology Notes to and Forming Part of the Financial Statements
For the Year Ended 31 December 2019
NOTE 36 RELATED PARTY DISCLOSURE – CONTINUED
(A) CONTROLLING ENTITY
CIT is an ACT Government controlled entity.
(B) KEY MANAGEMENT PERSONNEL
B.1 Compensation of Key Management Personnel
Compensation by CIT to KMP employed by CIT is set out below.
2019 2018 $’000 $’000
Short-term employee benefits 1,857 1,624
Post employment benefits 200 116
Board member fees 105 102
Total Compensation by CIT to KMP (a) 2,162 1,842
(a) The increase from 2018 is due mainly to a new CIT Executive staf who commenced in the second half of 2018.
B.2 Transactions with Key Management Personnel
There were no transactions with KMP that were material to the financial statements of CIT.
B.3 Transactions with parties related to Key Management Personnel
There were no transactions with parties related to KMP, including transactions with KMP’s close family members or other related entities that were material to the financial statements of CIT.
(C) TRANSACTIONS WITH OTHER ACT GOVERNMENT CONTROLLED ENTITIES
All transactions with ACT Government controlled entities are disclosed in the relevant notes to the financial statements.
(D) TRANSACTIONS WITHIN THE CONSOLIDATED GROUP
During the year CIT reported $3,103,099 of expenses ($3,491,000 in 2018) related to CIT Solutions Pty Ltd, mainly for a management fee for the recruitment of international students.
CIT earned $556,000 of revenue ($344,000 in 2018) from CIT Solutions Pty Ltd, largely comprising payments for the lease of CIT’s facilities and administrative services.
All transactions between CIT and CIT Solutions have been disclosed at arm’s length value and normal trading terms and conditions are applied.
135

Canberra Institute of Technology Notes to and Forming Part of the Financial Statements
For the Year Ended 31 December 2019
NOTE 36 BUDGETARY REPORTING
Original Actual Budget1
Operating Statement Line 2019 2019 Variance Variance Items $’000 $’000 $’000 % Variance Explanation
No items fulfil the variance requirements – – – – –
Original Actual Budget1
2019 2019 Variance Variance Balance Sheet Line Items $’000 $’000 $’000 % Variance Explanation
Cash and Cash Equivalents 10,938 4,899 6,039 123%
Student fees and user choice revenues were above target. Also a lower than expected decrease in employee provisions meant less cash paid out to employees. Together these resulted in a higher than expected cash holding.
Assets Held for Distribution to Owners 16,199 – 16,199 100%
The transfer of these properties has been deferred to 2020 for reasons outside the control of CIT. Both parties remain committed to the transfer.
Employee Benefits–Current 21,266 18,893 2,373 13%
Current year provision increased due to increased tenure resulting from the passage of time, salary increments and less than expected leave taken.
Lease Liabilities–Non-Current 4,462 1,294 3,168 245% The first time adoption of AASB 16 has resulted in the recognition of Lease Liabilities.
1 Original Budget refers to the amounts presented to the Legislative Assembly in the original budgeted financial statements in respect of the reporting period (Australian Capital Territory Budget 2018-19). These amounts have not been adjusted to reflect supplementary appropriation or appropriation instruments.
136 Canberra Institute of Technology: Annual Report 2019

Canberra Institute of Technology Notes to and Forming Part of the Financial Statements
For the Year Ended 31 December 2019
NOTE 36 BUDGETARY REPORTING – CONTINUED
Original Actual Budget1
2019 2019 Variance Variance Cash Flow Statement Lines $’000 $’000 $’000 % Variance Explanation
Payments for Property Plant and Equipment 4,981 7,259 (2,278) (31%)
Capital works program timings and rescoping resulted in lower amounts of expenditure being capitalised as Property, Plant and Equipment.
Capital Injections 5,013 7,259 (2,246) (31%)
A lower amount of capital appropriation was drawn down than anticipated due to delays in procurement, appointment of a project manager and obtaining a development application on the Better Infrastructure Program. CIT remains committed to progressing this project.
1 Original Budget refers to the amounts presented to the Legislative Assembly in the original budgeted financial statements in respect of the reporting period (Australian Capital Territory Budget 2018-19). These amounts have not been adjusted to reflect supplementary appropriation or appropriation instruments.
Explanations for variations from budget for Controlled Recurrent Payments and Capital Injections are provided in the Statement of Appropriation.
137

Canberra Institute of Technology Appendix A – Basis of Preparation of the Financial Statements
Forms Part of Note 2 of the Financial Statements For the Year Ended 31 December 2019
APPENDIX A BASIS OF PREPARATION OF THE FINANCIAL STATEMENTS
LEGISLATIVE REQUIREMENT
The Financial Management Act 1996 (FMA) requires the preparation of annual financial statements for ACT Government Agencies.
The FMA and the Financial Management Guidelines issued under the FMA, requires CIT’s financial statements to include:
i. an Operating Statement for the year;
ii. a Balance Sheet for the year;
iii. a Statement of Changes in Equity for the year;
iv. a Cash Flow Statement for the year;
v. a Statement of Appropriation for the year;
vi. an Operating Statement for each class of output for the year;
vii. significant accounting policies adopted for the year; and
viii. other statements as are necessary to fairly reflect the financial operations of the Canberra Institute of Technology during the year and its financial position at the end of the year.
These general-purpose financial statements have been prepared to comply with Australian Accounting Standards as required by the FMA. The financial statements have been prepared in accordance with:
i. Australian Accounting Standards; and
ii. ACT Accounting and Disclosure Policies.
ACCRUAL ACCOUNTING
The financial statements have been prepared using the accrual basis of accounting. The financial statements have also been prepared according to the historical cost convention, except for assets such as those included in property, plant and equipment and financial instruments which were valued at fair value in accordance with the revaluation policies applicable to CIT during the reporting period.
CURRENCY
These financial statements are presented in Australian dollars.
INDIVIDUAL REPORTING ENTITY
CIT is an individual reporting entity.
PRINCIPLES OF CONSOLIDATION
The consolidated financial statements are for the group comprising CIT and CIT Solutions Pty Limited (CIT Solutions). CIT Solutions is a wholly-owned subsidiary of CIT, formed for the purposes of undertaking entrepreneurial and commercial activities on CIT’s behalf. All inter-entity balances, including unrealised profits and losses, have been eliminated on consolidation. The financial statements of CIT Solutions are prepared for the same reporting period as CIT, using accounting policies that are consistent with those of CIT.
138 Canberra Institute of Technology: Annual Report 2019

Canberra Institute of Technology Appendix A – Basis of Preparation of the Financial Statements
Forms Part of Note 2 of the Financial Statements For the Year Ended 31 December 2019
APPENDIX A BASIS OF PREPARATION OF THE FINANCIAL STATEMENTS – CONTINUED
REPORTING PERIOD
These financial statements state the financial performance, changes in equity and cash flows of CIT for the year ended 31 December 2019 together with the financial position of CIT as at 31 December 2019.
COMPARATIVE FIGURES
Budget Figures
To facilitate a comparison with the Budget Papers, as required by the FMA, budget information for 2019 has been presented in the financial statements. Budget numbers in the financial statements are the original budget numbers that appear in the Budget Papers.
Prior Year Comparatives
Comparative information has been disclosed in respect of the previous period for amounts reported in the financial statements, except where an Australian Accounting Standard does not require comparative information to be disclosed.
Where the presentation or classification of items in the financial statements is amended, the comparative amounts have been reclassified where practical. Where a reclassification has occurred, the nature, amount and reason for the reclassification is provided.
Rounding
All amounts in the financial statements have been rounded to the nearest thousand dollars ($’000). Use of “-” represents zero amounts or amounts rounded down to zero.
GOING CONCERN
The 2019 financial statements have been prepared on a going concern basis.
139

Canberra Institute of Technology Appendix B – Significant Accounting Policies
Forms Part of Note 2 of the Financial Statements For the Year Ended 31 December 2019
APPENDIX B SIGNIFICANT ACCOUNTING POLICIES
SIGNIFICANT ACCOUNTING POLICIES – INCOME Where significant accounting policies and other explanatory information is applicable it is provided in this Appendix. Additional information is not provided for all notes in the financial statements.
REVENUE RECOGNITION
Revenue is recognised at the fair value of the consideration received or receivable in the Operating Statement.
NOTE 3 – CONTROLLED RECURRENT PAYMENTS
Controlled Recurrent Payments are recognised as revenues when CIT gains control over the funding. Control over appropriated funds is obtained upon the receipt of cash.
NOTE 4 – USER CHARGES
User charges User-charges revenue is recognised upon delivery of the service to customers.
Sale of Goods Revenue from the sale of goods is recognised as revenue when the performance obligations to the customer have been satisfied as required under AASB15.
Rendering of Services Revenue from the rendering of services is recognised when the stage of completion of the transaction at the reporting date can be measured reliably and the costs of rendering those services can be measured reliably.
NOTE 5 – GOVERNMENT GRANTS
Revenue is recognised when CIT controls the revenue. See Appendix C for further explanations.
NOTE 6 – INTEREST
Interest revenue is recognised in compliance with AASB 15 an AASB 1058. When performance obligations have not been satisfied, revenue is deferred to future periods. Otherwise revenue is recognised in the current period. See Appendix C for further details.
140 Canberra Institute of Technology: Annual Report 2019

Canberra Institute of Technology Appendix B – Significant Accounting Policies
Forms Part of Note 2 of the Financial Statements For the Year Ended 31 December 2019
SIGNIFICANT ACCOUNTING POLICIES – INCOME – CONTINUED
NOTE 7 – RESOURCES RECEIVED AND PROVIDED FREE OF CHARGE
Resources received free of charge are recorded as a revenue and expense in the Operating Statement at fair value. The revenue is separately disclosed under resources received free of charge, with the expense being recorded in the line item to which it relates. Goods and services received free of charge from ACT Government agencies are recorded as resources received free of charge, whereas goods and services received free of charge from entities external to the ACT Government are recorded as donations. Services that are received free of charge are only recorded in the Operating Statement if they can be reliably measured and would have been purchased if not provided to CIT free of charge.
Resources provided free of charge are recorded at their fair value in the expense line items to which they relate.
During the year, CIT provided services and resources to the following organisations on a free of charge basis:
(i) The CIT Student Association was provided with services and resources free of charge to an amount of $475,090 in 2019 (2018 $464,953) for its use of CIT’s accommodation and utilities; and
(ii) The Canberra City Band was provided with a benefit of rent to the value of $71,306 in 2019 (2018 $69,752).
SIGNIFICANT ACCOUNTING POLICIES – EXPENSES
NOTE 10 – EMPLOYEE EXPENSES
Employee benefits include:
• short-term employee benefits such as wages and salaries, annual leave loading, annual leave, superannuation and applicable on cost if expected to be settled wholly before twelve months afer the end of the annual reporting period in which the employees render the related services;
• other long-term benefits such as long service leave and annual leave; and
• termination benefits.
On-costs include annual leave, long service leave, superannuation and other costs that are incurred when employees take annual and long service leave.
(See Appendix B – Note 25 – Employee Benefits for accrued wages and salaries, and annual and long service leave).
141

Canberra Institute of Technology Appendix B – Significant Accounting Policies
Forms Part of Note 2 of the Financial Statements For the Year Ended 31 December 2019
SIGNIFICANT ACCOUNTING POLICIES – EXPENSES – CONTINUED
NOTE 11 – SUPERANNUATION EXPENSES
Employees of CIT will have diferent superannuation arrangements due to the type of superannuation scheme available at the time of commencing employment, including both defined benefit and defined contribution superannuation scheme arrangements.
For employees who are members of the defined benefit Commonwealth Superannuation Scheme (CSS) and Public Sector Superannuation Scheme (PSS) CIT makes employer superannuation contribution payments to the Territory Banking Account at a rate determined by the Chief Minister, Treasury and Economic Development Directorate. CIT also makes productivity superannuation contribution payments on behalf of these employees to the Commonwealth Superannuation Corporation, which is responsible for administration of the schemes.
For employees who are members of defined contribution superannuation schemes (the Public Sector Superannuation Scheme Accumulation Plan (PSSAP) and schemes of employee choice) CIT makes employer superannuation contribution payments directly to the employees’ relevant superannuation fund.
All defined benefit employer superannuation contributions are recognised as expenses on the same basis as the employer superannuation contributions made to defined contribution schemes. The accruing superannuation liability obligations are expensed as they are incurred and extinguished as they are paid.
SUPERANNUATION LIABILITY RECOGNITION
For CIT employees who are members of the defined benefit CSS or PSS the employer superannuation liabilities for superannuation benefits payable upon retirement are recognised in the financial statements of the Superannuation Provision Account.
NOTE 12 – SUPPLIES AND SERVICES
Repairs and Maintenance CIT undertakes major cyclical maintenance on its assets. Where the maintenance leads to an upgrade of the asset, and increases the service potential of the existing asset, the cost is capitalised. Maintenance expenses which do not increase the service potential of the asset are expensed.
Operating Leases Lease payments that are not subject to AASB 16 are recorded as an expense in the Operating Statement on a straight-line basis over the term of the lease. Following the adoption of AASB 16, most of the lease commitments have been reclassified as Right-of-Use Assets and Lease Liabilities. The leases not captured by AASB 16 include short term and low value leases. See Appendix C for further explanations.
142 Canberra Institute of Technology: Annual Report 2019
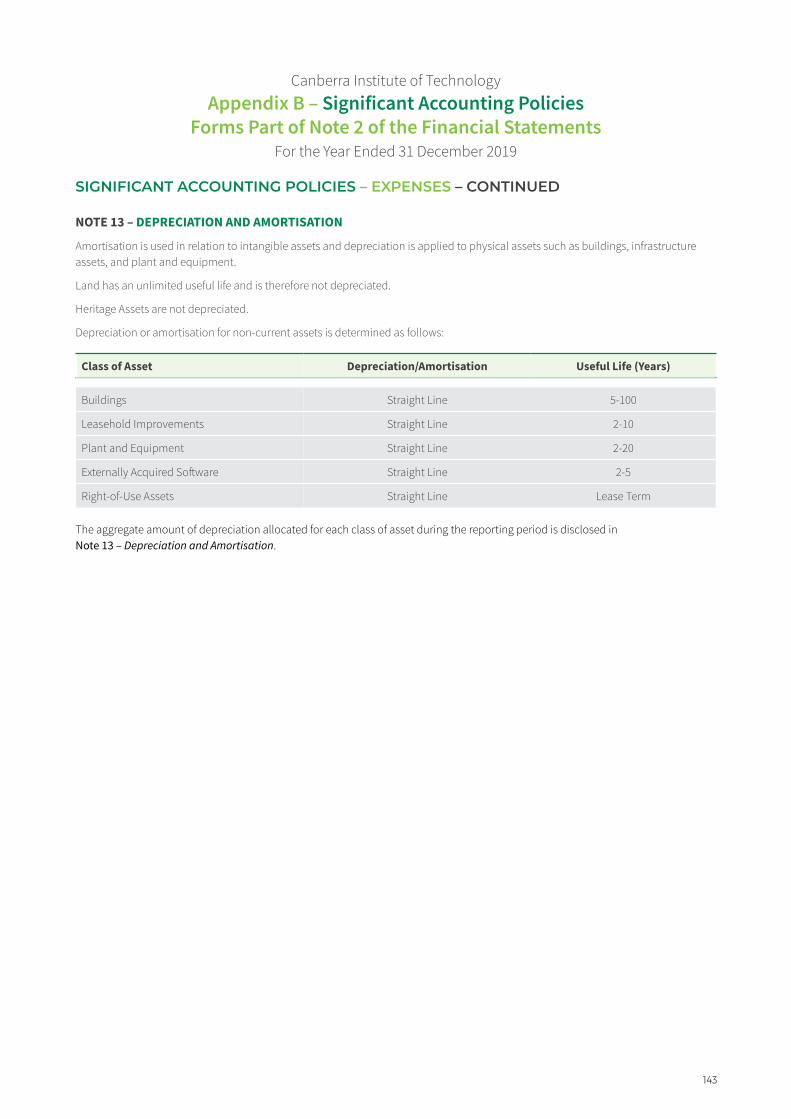
Canberra Institute of Technology Appendix B – Significant Accounting Policies
Forms Part of Note 2 of the Financial Statements For the Year Ended 31 December 2019
SIGNIFICANT ACCOUNTING POLICIES – EXPENSES – CONTINUED
NOTE 13 – DEPRECIATION AND AMORTISATION
Amortisation is used in relation to intangible assets and depreciation is applied to physical assets such as buildings, infrastructure assets, and plant and equipment.
Land has an unlimited useful life and is therefore not depreciated.
Heritage Assets are not depreciated.
Depreciation or amortisation for non-current assets is determined as follows:
Class of Asset Depreciation/Amortisation Useful Life (Years)
Buildings Straight Line 5-100
Leasehold Improvements Straight Line 2-10
Plant and Equipment Straight Line 2-20
Externally Acquired Sofware Straight Line 2-5
Right-of-Use Assets Straight Line Lease Term
The aggregate amount of depreciation allocated for each class of asset during the reporting period is disclosed in Note 13 – Depreciation and Amortisation.
143

Canberra Institute of Technology Appendix B – Significant Accounting Policies
Forms Part of Note 2 of the Financial Statements For the Year Ended 31 December 2019
SIGNIFICANT ACCOUNTING POLICIES – ASSETS
ASSETS – CURRENT AND NON-CURRENT
Assets are classified as current where they are expected to be realised within 12 months afer the reporting date.
Assets which do not fall within the current classification are classified as non-current.
Significant Accounting Judgements and Estimates – Fair Value of Assets CIT has made a significant estimate regarding the fair value of its assets. Land has been recorded at the market value of similar properties as determined by an independent valuer. Buildings have been recorded at fair value using depreciated replacement cost for buildings considered specialised and for non-specialised buildings current prices in a market for similar properties in a similar location and condition as determined by an independent valuer. Heritage assets have been recorded at fair value based on current replacement cost and market value as determined by CIT. The valuation uses significant judgements and estimates to determine fair value, including the appropriate indexation figure and quantum of assets held. The fair value of assets is subject to management assessment between formal valuations.
NOTE 16 – CASH AND CASH EQUIVALENTS
Cash includes cash at bank, cash on hand and demand deposits. Cash equivalents are short-term, highly liquid investments that are readily convertible to known amounts of cash and are subject to an insignificant risk of changes in value. Cash equivalents include amounts invested in negotiable certificates of deposit with less than 120 days to maturity.
NOTE 17 – RECEIVABLES
Accounts Receivables Accounts receivable (including student receivables and other trade receivables) are measured at amortised cost, with any adjustments to the carrying amount being recorded in the Operating Statement.
Impairment Loss – Receivables The allowance for expected credit losses represents the amount of trade receivables and student receivables that CIT estimates will not be repaid. CIT determines the allowance for impairment losses is based on Objective evidence and a review of overdue balances. CIT measures expected credit losses of a financial instrument in a way that reflects:
a. an unbiased and probability-weighted amount that is determined by evaluating a range of possible outcomes;
b. the time value of money; and
c. reasonable and supportable information that is available without undue cost or efort at the reporting date about past events, current conditions and forecasts of future economic conditions (AASB 9.5.5.17).
The amount of the expected credit loss is recognised in the Operating Statement. The allowance for impairment losses are written of against the allowance account when CIT ceases action to collect the debt when the cost to recover the debt is more than the debt is worth.
For trade receivables CIT applied the simplified approach under AASB 9, which uses a lifetime expected loss for all trade receivables.
A provision matrix is used to calculate the expected credit loss.
Where CIT has no reasonable expectation of recovering an amount owed by a debtor and ceases action to collect the debt, as the cost to recover the debt is more than the debt is worth, the debt is written-of by directly reducing the receivable against the loss allowance.
NOTE 18 – ASSETS HELD FOR DISTRIBUTION TO OWNERS
Assets held for distribution to owners are assets that are available for immediate distribution in their present condition, and their distribution is highly probable. Assets held for distribution to owners are measured at the lower of the carrying amount and fair value less costs to sell. Assets held for distribution to owners are not depreciated.
144 Canberra Institute of Technology: Annual Report 2019

Canberra Institute of Technology Appendix B – Significant Accounting Policies
Forms Part of Note 2 of the Financial Statements For the Year Ended 31 December 2019
SIGNIFICANT ACCOUNTING POLICIES – ASSETS – CONTINUED
NOTE 20 – INVESTMENTS
CIT holds a long-term investment in CIT Solutions Pty Limited, which is measured at cost. Further details of this investment are provided in Note 20–Investments.
NOTE 23 – PROPERTY, PLANT AND EQUIPMENT
Acquisition and Recognition of Property, Plant and Equipment All property, plant and equipment is initially recorded at cost.
Where property, plant and equipment are acquired at no cost, or minimal cost, cost is its fair value as at the date of acquisition. However property, plant and equipment acquired at no cost or minimal cost as part of a Restructuring of Administrative Arrangements is measured at the transferor’s book value.
Where payment for property, plant and equipment is deferred beyond normal credit terms, the diference between its cash price equivalent and the total payment is measured as interest over the period of credit. The discount rate used to calculate the cash price equivalent is an asset specific rate.
Property, plant and equipment with a value above $2,000 (GST exclusive) is capitalised.
Measurement of Property, Plant and Equipment afer Initial Recognition Property, plant and equipment is valued using the cost or revaluation model of valuation. Land, buildings, and heritage assets are measured at fair value. Leasehold improvements, Right-of-Use assets and plant and equipment are measured at cost.
Fair value for land and non-specialised buildings is measured using the market approach valuation technique. This approach uses prices and other relevant information generated by market transactions involving identical or similar assets.
Fair value for specialised buildings, and some heritage assets is measured by reference to the cost of replacing the remaining future economic benefits embodied in the asset i.e. depreciated replacement cost. This is the cost approach valuation technique. For other heritage assets, the fair value is measured using the market approach valuation technique. This approach uses sales prices and other relevant information generated by market transactions involving similar assets or works by artists with similar standing/style.
Heritage assets artworks comprise works produced by students and held for permanent exhibition, for which fair value is determined using a market price where there is a market for the same or a similar item. Where there is no active market (produced by non-recognised artists) heritage assets are valued using unobservable inputs such as, aesthetic quality, medium and the knowledge and experience of the valuer.
Land, buildings, and heritage assets are revalued every three years. As these assets were revalued in 2017, the next asset revaluation is scheduled for 2020. However, if at any time management considers that the carrying amount of an asset materially difers from its fair value, then the asset will be revalued regardless of when the last valuation took place. Any accumulated depreciation relating to buildings, plant and equipment and heritage assets, at the date of revaluation, is written-back against the gross carrying amount of the asset, and the net amount is restated to the revalued amount of the asset.
Significant Accounting Judgements and Estimates – Fair Value of Assets CIT has made a significant estimate regarding the fair value of its assets. Land has been recorded at the market value of similar properties as determined by an independent valuer. Buildings have been recorded at fair value using depreciated replacement cost for buildings considered specialised and for non-specialised buildings current prices in a market for similar properties in a similar location and condition as determined by an independent valuer. Heritage assets have been recorded at fair value based on market value as determined by CIT. The valuation uses significant judgements and estimates to determine fair value, including the appropriate indexation figure and quantum of assets held. The fair value of assets is subject to management assessment between formal valuations.
145

Canberra Institute of Technology Appendix B – Significant Accounting Policies
Forms Part of Note 2 of the Financial Statements For the Year Ended 31 December 2019
SIGNIFICANT ACCOUNTING POLICIES – ASSETS – CONTINUED
Significant Accounting Judgements and Estimates – Useful lives of Property Plant and Equipment CIT has made a significant estimate in determining the useful lives of its property, plant and equipment. The estimation of useful lives of property, plant and equipment is based on the historical experience of similar assets and in some cases has been based on valuations provided by Knight Frank Valuations Canberra as at 31 December 2017. The useful lives are assessed on an annual basis and adjustments are made when necessary.
Refer Appendix B – Note 13 – Depreciation and Amortisation for disclosures concerning assets useful life assets.
Impairment of Assets CIT assesses, at each reporting date, whether there is any indication that an asset may be impaired. Assets are also reviewed for impairment whenever events or changes in circumstances indicate that the carrying amount may not be recoverable.
Any resulting impairment losses for land, buildings and improvements are recognised against the relevant class of asset in the Asset Revaluation Surplus with a corresponding reduction to the carrying amount in the Balance Sheet. Where the impairment loss is greater than the balance in the Asset Revaluation Surplus, the diference is expensed in the Operating Statement.
NOTE 22 – INTANGIBLE ASSETS
CIT’s intangible assets comprise externally acquired sofware.
Externally acquired sofware is recognised and capitalised when:
a. it is probable that the expected future economic benefits attributable to the sofware will flow to CIT;
b. the cost of the sofware can be measured reliably; and
c. the acquisition cost is equal to or exceeds $50,000.
Capitalised sofware has a finite useful life. Sofware is amortised on a straight-line basis over its useful life, over a period not exceeding five years. Intangible assets are measured at cost.
SIGNIFICANT ACCOUNTING POLICIES – LIABILITIES
LIABILITIES – CURRENT AND NON-CURRENT
Liabilities are classified as current when they are due to be settled within 12 months afer the reporting date or CIT does not have an unconditional right to defer settlement of the liability for at least 12 months afer the reporting date.
Liabilities which do not fall within the current classification are classified as non-current.
NOTE 24 – PAYABLES
Payables are initially recognised at fair value based on the transaction cost and subsequent to initial recognition at amortised cost, with any adjustments to the carrying amount being recorded in the Operating Statement. All amounts are normally settled within 30 days afer the invoice date.
Payables include Accounts Payables, Accrued Expenses and Other Payables.
146 Canberra Institute of Technology: Annual Report 2019

Canberra Institute of Technology Appendix B – Significant Accounting Policies
Forms Part of Note 2 of the Financial Statements For the Year Ended 31 December 2019
SIGNIFICANT ACCOUNTING POLICIES – LIABILITIES – CONTINUED
NOTE 25 – EMPLOYEE BENEFITS
Wages and Salaries Accrued salaries and wages are measured at the amount that remains unpaid to employees at the end of the reporting period.
Annual and Long Service Leave Annual and long service leave including applicable on-costs that are not expected to be wholly settled within twelve months are measured at the present value of estimated future payments to be made in respect of services provided by employees up to the end of the reporting period. Consideration is given to the future wage and salary levels, experience of employee departures and periods of service. At the end of each reporting period, the present value of annual leave and long service leave payments is estimated using market yields on Commonwealth Government bonds with terms to maturity that match, as closely as possible, the estimated future cash flows.
Annual leave liabilities have been estimated on the assumption that they will be wholly settled within three years. In 2019 the rate used to estimate the present value of future
• annual leave payments is 100.7% (99.7% in 2018); and
• payments for long service leave is 109.7% (103.7% in 2018).
The long service leave liability is estimated with reference to the minimum period of qualifying service. For employees with less than the required minimum period of seven years of qualifying service, the probability that employees will reach the required minimum period has been taken into account in estimating the provision for long service leave and applicable on-costs.
The provision for annual leave and long service leave includes estimated on-costs. As these on-costs only become payable if the employee takes annual and long service leave while in-service, the probability that employees will take annual and long service leave while in service has been taken into account in estimating the liability for on-costs.
Annual leave and long service leave liabilities are classified as current liabilities in the Balance Sheet where there are no unconditional rights to defer the settlement of the liability for at least 12 months. Conditional long service leave liabilities are classified as non-current because CIT has an unconditional right to defer the settlement of the liability until the employee has completed the requisite years of service.
Significant Accounting Judgements and Estimates – Employee Benefits Significant judgements have been applied in estimating the liability for employee benefits. The estimated liability for annual and long service leave requires a consideration of the future wage and salary levels, experience of employee departures, probability that leave will be taken in service and periods of service. The estimate also includes an assessment of the probability that employees will meet the minimum service period required to qualify for long service leave and that on-costs will become payable.
The significant judgements and assumptions included in the estimation of annual and long service leave liabilities include an assessment by an actuary. The Australian Government Actuary performed this assessment in April 2019. The next actuarial review is expected to be undertaken by early 2022.
NOTE 27 – OTHER LIABILITIES
Revenue Received in Advance Revenue received in advance is recognised as a liability if there is a present obligation to return the funds received or if deferral of revenue recognition is permitted or required under AASB 15 and AASB 1058.
147

Canberra Institute of Technology Appendix B – Significant Accounting Policies
Forms Part of Note 2 of the Financial Statements For the Year Ended 31 December 2019
SIGNIFICANT ACCOUNTING POLICIES – OTHER NOTES
NOTE 28 – EQUITY Contributions made by the ACT Government, through its role as owner of CIT, are treated as contributions of equity.
Increases or decreases in net assets as a result of Administrative Restructures are also recognised in equity.
NOTE 29 – FINANCIAL INSTRUMENTS Financial assets are classified as subsequently measured at amortised cost, fair value through other comprehensive income or fair value through profit or loss on the basis of both;
(a) the business model for managing the financial assets; and
(b) the contractual cash flow characteristics of the financial assets.
Financial liabilities are measured at amortised cost.
NOTE 29 – BUDGETARY REPORTING Significant judgements have been applied in determining what variances are considered ‘major variances’. Variances are considered major if both of the following criteria are met:
• The line item is a significant line item: where either the line item actual amount accounts for more than 10% of the relevant associated category (Income, Expenses and Equity totals) or more than 10% of the sub-element (e.g. Current Liabilities and Receipts from Operating Activities totals) of the financial statements; and
• The variances (original budget to actual) are greater than plus (+) or minus (-) 10% of the budget for the financial statement line item.
148 Canberra Institute of Technology: Annual Report 2019

Canberra Institute of Technology Appendix C – Impact of Accounting Standards Issued But Yet to be Applied
Forms Part of Note 2 of the Financial Statements For the Year Ended 31 December 2019
APPENDIX C INITIAL APPLICATION OF ACCOUNTING STANDARDS This note explains the impact of the adoption of new Accounting Standards issued and applied for the first time this year on the Financial Statements. It also discloses the new accounting policies that have been applied from 1 January 2019 to comply with each standard.
AASB 16 Leases The consolidated entity has adopted AASB 16 retrospectively from 1 January 2019, but has not restated comparatives for the 2018 reporting period, as permitted under the specific transitional provisions in the standard. Reclassifications and adjustments arising from the new leasing rules are therefore recognised in the opening Balance Sheet on 1 January 2019.
(a) Adjustments recognised on adoption of AASB 16 On adoption of AASB 16, Lease Liabilities for leases which had previously been classified as ‘operating leases’ under the principles of AASB 117 Leases were recognised. AASB 16 allows either the full or partial retrospective approach to the recognition of lease liabilities. ACT Treasury has allowed two options under the partial retrospective approach; 2a as if the new rules had always been applied meaning payments from the inception of the lease have been discounted and any adjustments are made to the opening balance of Accumulated Funds, and 2b, the present value of the remaining lease payments to be discounted. Comparatives are not restated under the partial retrospective approach. Motor Vehicle and ICT leases have been calculated using approach 2b and the Property Lease has been calculated using approach 2a which is in compliance with Treasury guidance. The lease liability recognised at 1 January 2019 is the liability outstanding at this date.
The lessee’s incremental borrowing rates have been provided by ACT Treasury to be used when the interest rate implicit in the lease cannot be determined.
The associated Right-of-Use assets for the Motor Vehicle and ICT leases have been recognised at the same value as the Lease Liability. The application of Retrospective approach 2a for the property lease has resulted in a downward adjustment of $600,000 to the opening balance of Accumulated Funds. The Right-of-Use asset is depreciating at a faster rate than the reduction of the liability. This is mainly due to the Make Good provision being a component of the Right-of-Use asset, but not a component of the lease liability.
The Right-of-Use asset represents the economic benefit that will be derived from the asset over the remaining lease term. The recognised Right-of-Use assets relate to the following types of assets:
31 Decembefr 2019 1 January 2019 $’000 $’000
Property 4,442 5,153
ICT Equipment 109 234
Motor Vehicles 324 451
Total Right-of-Use Assets 4,876 5,838
149

Canberra Institute of Technology Appendix C – Impact of Accounting Standards Issued But Yet to be Applied
Forms Part of Note 2 of the Financial Statements For the Year Ended 31 December 2019
APPENDIX C INITIAL APPLICATION OF ACCOUNTING STANDARDS – CONTINUED The change in accounting policy afected the following items on the Balance Sheet on 1 January 2019:
• Right-of-Use Assets – increase by $5.8m
• Lease Liabilities – Current – increase by $0.8m
• Lease Liabilities – Non-Current – increase by $5.3m
• Make Good Provision – increase by $0.3m
• Accumulated Funds – decrease by $0.60m
The overall efect on Net Assets is a decrease of $0.6m. The overall efect in 2019 on the Operating Statement is an increase to expenses of $0.2m.
(i) Practical expedients applied
In applying AASB 16 for the first time, the group has used the practical expedient permitted by the standard: accounting for leases with a remaining lease term of less than 12 months at 1 January 2019 as operating leases.
(b) The Group leasing activities and how these are accounted for: The leased assets that are subject to AASB 16 are IT Equipment, Motor Vehicles and Property.
Until the 2018 financial year, leases of Property, Plant and Equipment were classified as operating leases. Payments made under operating leases (net of any incentives received from the lessor) were charged to profit or loss over the period of the lease.
From 1 January 2019, all leases other than the excepted leases as detailed in the practical expedients section above, are to be recognised as a Right-of-Use asset and a corresponding liability at the date at which the leased asset is available for use by the group. Each lease payment is allocated between the liability and finance cost. Transitional provisions as described in (a) above are applied to leases that were in existence at 1 January 2019.
The finance cost is charged to the Operating Statement over the lease period so as to produce a constant periodic rate of interest on the remaining balance of the liability for each period. The Right-of-Use asset is depreciated over the lease term on a straight-line basis.
The outgoings in relation to the property lease are expensed via the Operating Statement.
Assets and liabilities arising from a lease are initially measured on a present value basis.
Lease liabilities include the net present value of the following lease payments:
• fixed payments less any lease incentives receivable; and
• variable lease payments that are based on an index or a rate.
The lease payments are discounted using the interest rate implicit in the lease. If that rate cannot be determined, the lessee’s incremental borrowing rate is used, being the rate that the lessee would have to pay to borrow the funds necessary to obtain an asset of similar value in a similar economic environment with similar terms and conditions.
Right-of-use assets are measured at cost comprising the following:
• the amount of the initial measurement of lease liability;
• any lease payments made at or before the commencement date less any lease incentives received;
• any initial direct costs; and
• restoration costs.
Payments associated with excepted leases are recognised as an expense in the Operating Statement. For the transitional period, existing leases with a residual term of less than 12 months have been expensed in the Operating Statement.
150 Canberra Institute of Technology: Annual Report 2019

Canberra Institute of Technology Appendix C – Impact of Accounting Standards Issued But Yet to be Applied
Forms Part of Note 2 of the Financial Statements For the Year Ended 31 December 2019
APPENDIX C INITIAL APPLICATION OF ACCOUNTING STANDARDS – CONTINUED
AASB 15 - Revenue from Contracts with Customers and AASB 1058- Income of Not for Profit Entities
There has been a significant change in the requirements for recognising certain types of revenue from AASB 1004 to AASB 15 and AASB 1058.These standards should be interpreted in conjunction with each other as revenue not captured by AASB 15 will need to be assessed under AASB 1058. Accounting under AASB15 or AASB 1058 is not an accounting policy choice by the entity. Both AASB 1058 and AASB 15 have been applied for the first time in the current financial year.
The Group has assessed revenue under the 5 step model which is the foundation for AASB 15.
1) Identify the contract with the customer
2) Identify the performance obligations in the contract
3) Determine the transaction price
4) Allocate the transaction price to the performance obligations
5) Recognise revenue when (or as) the performance obligations are satisfied
CIT major revenue categories in the 2019 Financial Year are:
• Controlled Recurrent Payments- accounting treatment remains under AASB1004 Contributions;
• User Charges – captured by AASB 15; and
• Grant and Government Funding – assessed under both AASB 15 and AASB 1058.
CIT has determined that there is no change to revenue recognition for revenue derived from User Charges or from Controlled Recurrent Payments. Due to the nature of CIT operations, the performance obligations under the contract with the customer are satisfied in the current period, hence revenue is recognised in the year of receipt.
A critical issue in accounting for grants and funding arrangements is whether the arrangement is accounted for under AASB 15 or AASB 1058.
(a) Funding to acquire or construct an asset that will be retained by the entity for use to achieve its objectives. AASB 1058 includes specific requirements with respect to grants for construction or acquisition of recognisable non-financial assets
• When a grant is received to construct a building to be controlled by CIT, the funds received are initially recognised as a financial asset (cash) with a corresponding liability (obligation to construct the building). Subsequently, the liability is derecognised as the performance obligation is satisfied (i.e. as the construction of the building is completed).
• Where a grant is received to acquire specific assets, income is recognised when the relevant assets are acquired.
(b) Funding where the grantor directs the benefits to a third party or to the public at large.
• CIT received funding for the tuition of students. The student is deemed to be the customer under the agreement and hence this revenue is subject to AASB 15. The performance obligations are enforceable and suficiently specific in relation to the provision of services, hence revenue is recognised upon settlement of the performance obligations. When these obligations were not fulfilled in the current financial year, the revenue has been deferred.
CIT has assessed the impact of AASB 15 and AASB 1058 to be not material.
The impact of these standards on the financial statements are as follows:
Amount of Grant Revenue Received Total $1.2m
Amount of Grant Revenue recognised in the current financial year $0.9m
Amount of Grant Revenue deferred to subsequent financial years $0.3m
Under AASB 1004, all of the revenue received would have been recognised in the current period with no deferral to future periods.
151

C.3 CAPITAL WORKS
In 2019, the CIT capital works program consisted of campus renewal projects and minor capital upgrades to enhance education delivery including equipment replacement and sofware upgrades.
Completed Projects The following projects were completed:
> Upgrade sawdust extraction and ventilation G block - CIT Bruce
> Upgrade fire detection systems A, B and C block – CIT Fyshwick
> Refurbishment of first floor A block class rooms – CIT Bruce
> Refurbishment of ground floor building A – CIT Bruce
> Allied health training facility – CIT Bruce
> Refurbishment of toilets J block – CIT Bruce
> Refurbishment of lower ground floor D block -CIT Bruce
> Refurbishment of L block for music department – CIT Reid
> Digitisation Project – Reid Campus
> Upgrade lighting A and B blocks – CIT Fyshwick
> Upgrade switchboards – CIT Fyshwick
> Refurbishment of G block classrooms – CIT Fyshwick
> Upgrade external paving and stairways – CIT Fyshwick and Bruce
> Upgrade emergency lighting – All campuses
> Upgrade air-conditioning systems – CIT Reid
Works still in progress > Campus modernisation project early planning
> More teaching and learning spaces for CIT Fyshwick
> New lif D block - CIT Fyshwick
> Replacement of Chiller - CIT Bruce
> Upgrade sewerage main buildings Y and Z – CIT Bruce
> Pavement upgrade E block – CIT Fyshwick
> New Lif A block – CIT Fyshwick
> Upgrade mechanical ventilation C block – CIT Bruce
> Upgrade EWIS system – CIT Bruce
> Upgrade dust extraction in tiling and mortar trades – CIT Bruce
> Resurfacing of Vowels Crescent – CIT Bruce
CIT Fyshwick
152 Canberra Institute of Technology: Annual Report 2019

Stat
emen
t of C
apita
l Wor
ks In
com
e an
d Ex
pend
iture
Prio
r Yea
rs
Curr
ent Y
ear
Com
plet
ion
Date
Orig
inal
Revi
sed
Proj
ect
Proj
ect
Valu
eVa
lue
Proj
ect
$’00
0 $’
000
Prio
r Yea
r’sPr
ior Y
ear’s
Expe
nditu
reFi
nanc
ing
$’00
0 $’
000
Budg
eted
Revi
sed
Budg
eted
Actu
alFi
nanc
ing
Fina
ncin
gEx
pend
iture
Expe
nditu
re$’
000
$’00
0 $’
000
$’00
0
Tota
lTo
tal
Fina
ncin
gEx
pend
iture
to d
ate
to D
ate
$’00
0 $’
000
Orig
inal
Re
vise
d
NEW
WO
RKS
and
WO
RKS
IN P
ROGR
ESS
Bette
r Inf
rast
ruct
ure
Fund
s 201
9-20
2,
616
2,77
6 0
0 83
0 70
3 83
0 83
0 70
3 83
0 Ju
n-20
Ju
n-20
Mor
e jo
bs fo
r our
gro
win
g ci
ty –
CIT
Cam
pus
Mod
erni
satio
n –
early
pl
anni
ng
350
463
0 0
108
88
108
108
88
108
Jun-
20
Jun-
20
Bette
r ICT
Ser
vice
s for
St
uden
ts &
Sta
f 2,
744
2,74
4 0
0 1,
150
897
1,15
0 1,
150
897
1,15
0 Ju
n-20
Ju
n-20
5,71
0 5,
983
Tota
l New
Wor
ks
0 0
2,08
8 1,
688
2,08
8 2,
088
1,68
8 2,
088
COM
PLET
ED P
ROJE
CTS
Bette
r Inf
rast
ruct
ure
Fund
s 201
8-19
2,
708
2,70
8 1,
461
1,32
5 1,
247
1,38
3 1,
247
1,24
7 2,
708
2,70
8 Ju
n-19
Ju
n-19
CIT
Mod
erni
satio
n 1,
000
1,00
0 13
6 39
40
1 49
9 40
1 40
2 53
8 53
8 Ju
n-19
Ju
n-19
Tota
l Com
plet
ed
Proj
ects
3,
708
3,70
8 1,
597
1,36
4 1,
648
1,88
1 1,
648
1,64
9 3,
245
3,24
6
GRAN
D TO
TAL
9,41
8 9,
691
1,59
7 1,
364
3,73
6 3,
570
3,73
6 3,
737
4,93
4 5,
334
153
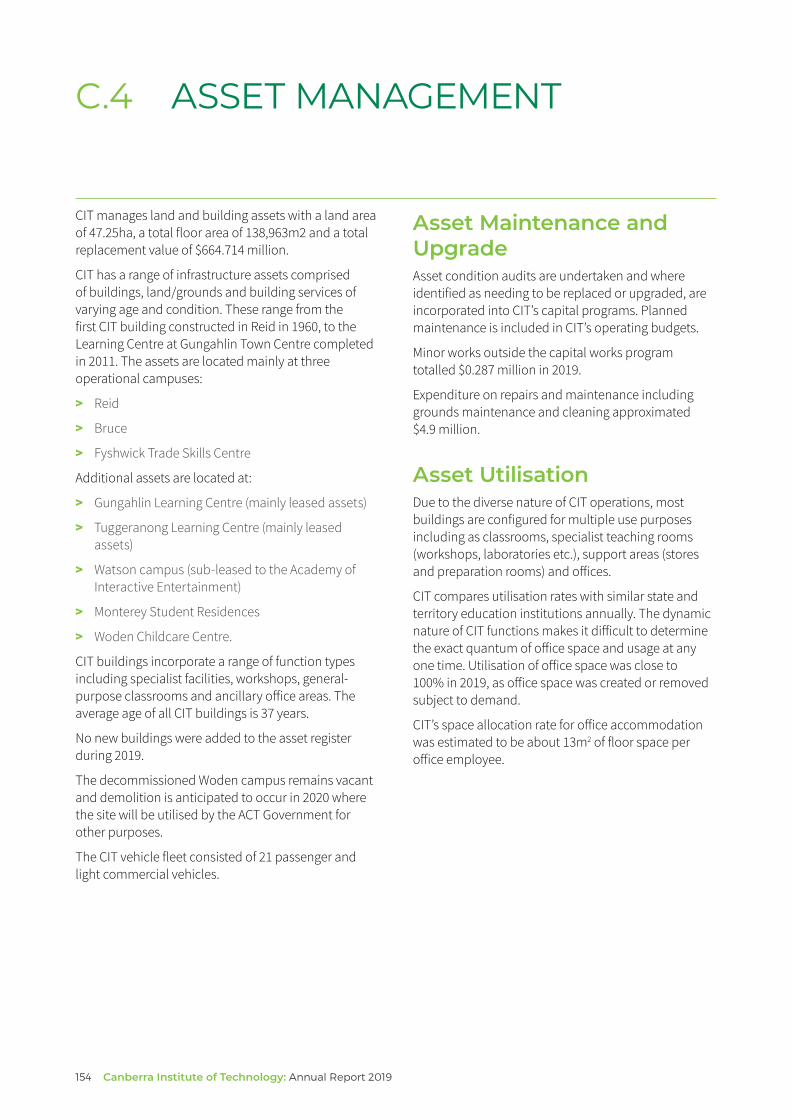
C.4 ASSET MANAGEMENT
CIT manages land and building assets with a land area of 47.25ha, a total floor area of 138,963m2 and a total replacement value of $664.714 million.
CIT has a range of infrastructure assets comprised of buildings, land/grounds and building services of varying age and condition. These range from the first CIT building constructed in Reid in 1960, to the Learning Centre at Gungahlin Town Centre completed in 2011. The assets are located mainly at three operational campuses:
> Reid
> Bruce
> Fyshwick Trade Skills Centre
Additional assets are located at:
> Gungahlin Learning Centre (mainly leased assets)
> Tuggeranong Learning Centre (mainly leased assets)
> Watson campus (sub-leased to the Academy of Interactive Entertainment)
> Monterey Student Residences
> Woden Childcare Centre.
CIT buildings incorporate a range of function types including specialist facilities, workshops, general-purpose classrooms and ancillary ofice areas. The average age of all CIT buildings is 37 years.
No new buildings were added to the asset register during 2019.
The decommissioned Woden campus remains vacant and demolition is anticipated to occur in 2020 where the site will be utilised by the ACT Government for other purposes.
The CIT vehicle fleet consisted of 21 passenger and light commercial vehicles.
Asset Maintenance and Upgrade Asset condition audits are undertaken and where identified as needing to be replaced or upgraded, are incorporated into CIT’s capital programs. Planned maintenance is included in CIT’s operating budgets.
Minor works outside the capital works program totalled $0.287 million in 2019.
Expenditure on repairs and maintenance including grounds maintenance and cleaning approximated $4.9 million.
Asset Utilisation Due to the diverse nature of CIT operations, most buildings are configured for multiple use purposes including as classrooms, specialist teaching rooms (workshops, laboratories etc.), support areas (stores and preparation rooms) and ofices.
CIT compares utilisation rates with similar state and territory education institutions annually. The dynamic nature of CIT functions makes it dificult to determine the exact quantum of ofice space and usage at any one time. Utilisation of ofice space was close to 100% in 2019, as ofice space was created or removed subject to demand.
CIT’s space allocation rate for ofice accommodation was estimated to be about 13m2 of floor space per ofice employee.
154 Canberra Institute of Technology: Annual Report 2019

C.5 GOVERNMENT CONTRACTING
CIT undertakes procurement activities for a range of goods, services and works. Procurement processes within CIT adhere to the Government Procurement Act 2001 and the Government Procurement Regulation 2007. Procurement expenditure, selection and management processes are authorised by the appropriate delegate within CIT.
Procurement ACT continued to provide advice and support on procurement and contract management issues and worked with CIT on high value and/or high risk procurements.
CIT continued to be responsible for the management of contracts and incidents of non-compliance by Contractors were followed up by the nominated CIT Oficer.
Contract Information Details of the contracts on the ACT Government Contracts Register with a value of $25,000 or more, with an execution date between 1 January 2019 and 31 December 2019, listed against CIT are provided below in Table 1.
Details of the contracts on the ACT Government Contracts Register with a value of $25,000 or more, that were not executed during 2019, but remain current and are listed against CIT are provided below in Table 2.
CIT Reid
155
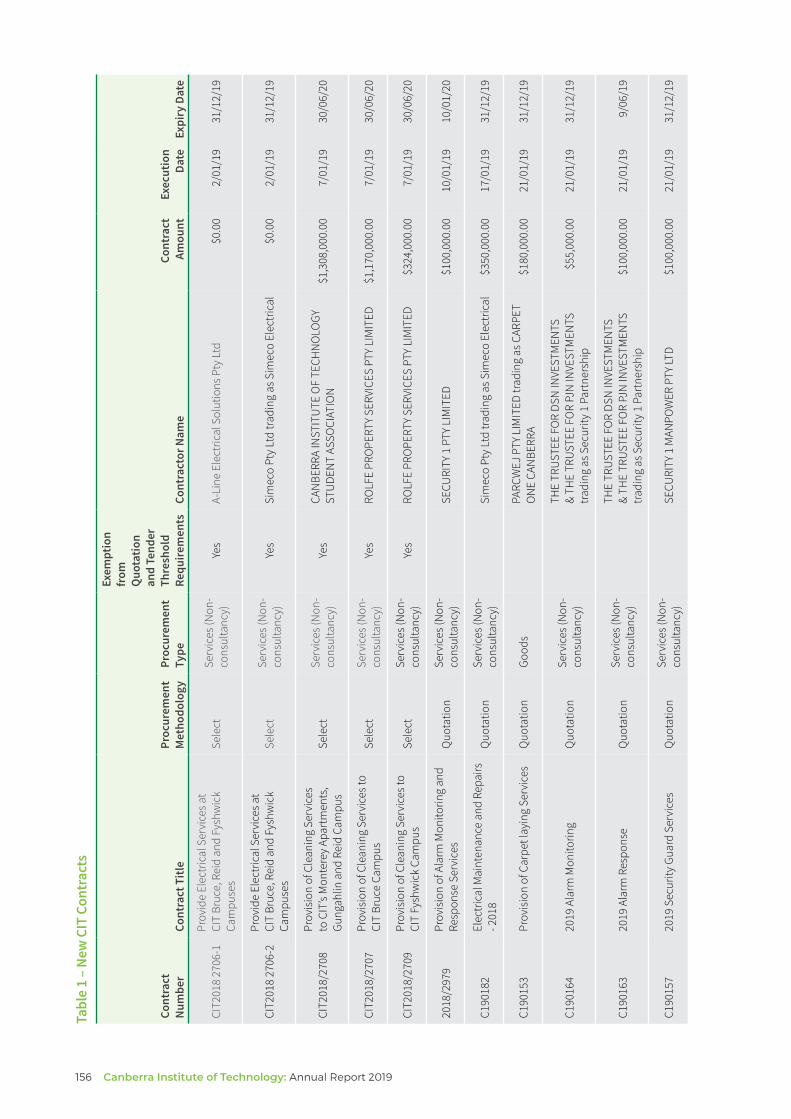
156 Canberra Institute of Technology: Annual Report 2019
Tabl
e 1
– Ne
w C
IT C
ontr
acts
Exem
ptio
n fr
om
Quo
tatio
n an
d Te
nder
Co
ntra
ct
Cont
ract
Ex
ecut
ion
Num
ber
Cont
ract
Titl
e M
etho
dolo
gy
Type
Re
quire
men
ts
Cont
ract
or N
ame
Amou
nt
Date
Ex
piry
Dat
e Pr
ocur
emen
t Pr
ocur
emen
t Th
resh
old
CIT2
018
2706
-1
Prov
ide
Elec
tric
al S
ervi
ces a
t CI
T Br
uce,
Rei
d an
d Fy
shw
ick
Cam
puse
s Se
lect
Se
rvic
es (N
on-
cons
ulta
ncy)
Ye
s A-
Line
Ele
ctric
al S
olut
ions
Pty
Ltd
$0
.00
2/01
/19
31/1
2/19
CIT2
018
2706
-2
Prov
ide
Elec
tric
al S
ervi
ces a
t CI
T Br
uce,
Rei
d an
d Fy
shw
ick
Cam
puse
s Se
lect
Se
rvic
es (N
on-
cons
ulta
ncy)
Ye
s Si
mec
o Pt
y Lt
d tra
ding
as S
imec
o El
ectr
ical
$0
.00
2/01
/19
31/1
2/19
CIT2
018/
2708
Pr
ovis
ion
of C
lean
ing
Serv
ices
to
CIT
’s M
onte
rey
Apar
tmen
ts,
Gung
ahlin
and
Rei
d Ca
mpu
s Se
lect
Se
rvic
es (N
on-
cons
ulta
ncy)
Ye
s CA
NBE
RRA
INST
ITU
TE O
F TE
CHN
OLO
GY
STU
DEN
T AS
SOCI
ATIO
N
$1,3
08,0
00.0
0 7/
01/1
9 30
/06/
20
CIT2
018/
2707
Pr
ovis
ion
of C
lean
ing
Serv
ices
to
CIT
Bruc
e Ca
mpu
s Se
lect
Se
rvic
es (N
on-
cons
ulta
ncy)
Ye
s RO
LFE
PRO
PERT
Y SE
RVIC
ES P
TY L
IMIT
ED
$1,1
70,0
00.0
0 7/
01/1
9 30
/06/
20
CIT2
018/
2709
Pr
ovis
ion
of C
lean
ing
Serv
ices
to
CIT
Fysh
wic
k Ca
mpu
s Se
lect
Se
rvic
es (N
on-
cons
ulta
ncy)
Ye
s RO
LFE
PRO
PERT
Y SE
RVIC
ES P
TY L
IMIT
ED
$324
,000
.00
7/01
/19
30/0
6/20
2018
/297
9 Pr
ovis
ion
of A
larm
Mon
itorin
g an
d Re
spon
se S
ervi
ces
Quo
tatio
n Se
rvic
es (N
on-
cons
ulta
ncy)
SE
CURI
TY 1
PTY
LIM
ITED
$1
00,0
00.0
0 10
/01/
19
10/0
1/20
C190
182
Elec
tric
al M
aint
enan
ce a
nd R
epai
rs
- 201
8 Q
uota
tion
Serv
ices
(Non
-co
nsul
tanc
y)
Sim
eco
Pty
Ltd
tradi
ng a
s Sim
eco
Elec
tric
al
$350
,000
.00
17/0
1/19
31
/12/
19
C190
153
Prov
isio
n of
Car
pet l
ayin
g Se
rvic
es
Quo
tatio
n Go
ods
PARC
WEJ
PTY
LIM
ITED
trad
ing
as C
ARPE
T O
NE
CAN
BERR
A $1
80,0
00.0
0 21
/01/
19
31/1
2/19
C190
164
2019
Ala
rm M
onito
ring
Quo
tatio
n Se
rvic
es (N
on-
cons
ulta
ncy)
THE
TRU
STEE
FO
R DS
N IN
VEST
MEN
TS
& TH
E TR
UST
EE F
OR
PJN
INVE
STM
ENTS
tra
ding
as S
ecur
ity 1
Par
tner
ship
$5
5,00
0.00
21
/01/
19
31/1
2/19
C190
163
2019
Ala
rm R
espo
nse
Quo
tatio
n Se
rvic
es (N
on-
cons
ulta
ncy)
THE
TRU
STEE
FO
R DS
N IN
VEST
MEN
TS
& TH
E TR
UST
EE F
OR
PJN
INVE
STM
ENTS
tra
ding
as S
ecur
ity 1
Par
tner
ship
$1
00,0
00.0
0 21
/01/
19
9/06
/19
C190
157
2019
Sec
urity
Gua
rd S
ervi
ces
Quo
tatio
n Se
rvic
es (N
on-
cons
ulta
ncy)
SE
CURI
TY 1
MAN
POW
ER P
TY LT
D $1
00,0
00.0
0 21
/01/
19
31/1
2/19

Tabl
e 1
– Ne
w C
IT C
ontr
acts
– co
ntin
ued
Exem
ptio
n fr
om
Quo
tatio
n an
d Te
nder
Co
ntra
ct
Proc
urem
ent
Proc
urem
ent
Thre
shol
d Co
ntra
ct
Exec
utio
n N
umbe
r Co
ntra
ct T
itle
Met
hodo
logy
Ty
pe
Requ
irem
ents
Co
ntra
ctor
Nam
e Am
ount
Da
te
Expi
ry D
ate
C190
291
Fire
Ala
rm M
onito
ring
& M
aint
enan
ce
Quo
tatio
n Se
rvic
es (N
on-
cons
ulta
ncy)
TY
CO A
UST
RALI
A GR
OU
P PT
Y LI
MIT
ED
$76,
500.
00
21/0
1/19
31
/12/
19
CIT2
018/
2704
Prov
ide
Mai
nten
ance
Ser
vice
s to
CIT’
s Bui
ldin
g M
anag
emen
t Sys
tem
an
d As
soci
ated
Mec
hani
cal a
nd
Elec
tric
al C
ontr
ols
Sele
ct
Serv
ices
(Non
-co
nsul
tanc
y)
Yes
COM
PLET
E CO
NTR
OL
PTY
LTD
$199
,000
.00
22/0
1/19
31
/12/
19
C190
248
Cybe
r Sec
urity
Res
ourc
e De
velo
pmen
t Q
uota
tion
Cons
ulta
ncy
FIFT
H D
OM
AIN
PTY
LTD
$66,
860.
20
22/0
1/19
30
/06/
19
C190
179
2019
Veh
icle
Hire
Si
ngle
Sel
ect
Serv
ices
(Non
-co
nsul
tanc
y)
Yes
CUST
OM
SER
VICE
LEA
SIN
G PT
Y LT
D $1
94,1
00.0
0 23
/01/
19
31/1
2/19
C190
176
Prov
isio
n of
Bus
ines
s Rel
ocat
ion
Serv
ices
Q
uota
tion
Serv
ices
(Non
-co
nsul
tanc
y)
Sim
eco
Pty
Ltd
tradi
ng a
s Sim
eco
Elec
tric
al
$176
,000
.00
23/0
1/19
31
/12/
19
C190
136
2019
Can
berra
FM
Ser
vice
s - R
adio
Ad
vert
isin
g Si
ngle
Sel
ect
Serv
ices
(Non
-co
nsul
tanc
y)
Yes
AUST
EREO
CAP
ITAL
FM
PTY
LTD
& CA
PITA
L CI
TY B
ROAD
CAST
ERS
PTY
LTD
$200
,000
.00
31/0
1/19
31
/12/
19
C190
134
2019
Prin
t & D
igita
l Adv
ertis
ing
Sing
le S
elec
t Se
rvic
es (N
on-
cons
ulta
ncy)
Ye
s FA
IRFA
X M
EDIA
PU
BLIC
ATIO
NS
PTY
LIM
ITED
$1
00,0
00.0
0 31
/01/
19
31/1
2/19
C190
099
2019
Can
berra
Wee
kly
– Pr
int
Adve
rtis
ing
Sing
le S
elec
t Se
rvic
es (N
on-
cons
ulta
ncy)
Ye
s N
EWST
ATE
MED
IA P
TY LT
D $5
0,00
0.00
31
/01/
19
31/1
2/19
C190
135
2019
PRI
ME
Tele
visi
on –
TV
Adve
rtis
ing
Sing
le S
elec
t Se
rvic
es (N
on-
cons
ulta
ncy)
Ye
s PR
IME
MED
IA G
ROU
P LI
MIT
ED
$100
,000
.00
31/0
1/19
31
/12/
19
C190
133
2019
NIN
E Te
levi
sion
– T
V Ad
vert
isin
g Si
ngle
Sel
ect
Serv
ices
(Non
-co
nsul
tanc
y)
Yes
SOU
THER
N C
ROSS
AU
STER
EO P
TY LT
D $1
00,0
00.0
0 31
/01/
19
31/1
2/19
C190
132
2019
Val
Mor
gan
– Ci
nem
a Ad
vert
isin
g Si
ngle
Sel
ect
Serv
ices
(Non
-co
nsul
tanc
y)
Yes
VAL
MO
RGAN
& C
O. (
AUST
.) PT
Y. LT
D.
$50,
000.
00
31/0
1/19
31
/12/
19
C190
131
2019
WIN
Tel
evis
ion
– TV
Ad
vert
isin
g Si
ngle
Sel
ect
Serv
ices
(Non
-co
nsul
tanc
y)
Yes
WIN
TEL
EVIS
ION
NSW
PTY
LIM
ITED
$1
00,0
00.0
0 31
/01/
19
31/1
2/19
157

158 Canberra Institute of Technology: Annual Report 2019
Tabl
e 1
– Ne
w C
IT C
ontr
acts
Exem
ptio
n fr
om
Quo
tatio
n an
d Te
nder
Co
ntra
ct
Cont
ract
Ex
ecut
ion
Num
ber
Cont
ract
Titl
e M
etho
dolo
gy
Type
Re
quire
men
ts
Cont
ract
or N
ame
Amou
nt
Date
Ex
piry
Dat
e Pr
ocur
emen
t Pr
ocur
emen
t Th
resh
old
CIT2
018/
2705
Pr
ovid
e M
echa
nica
l and
Gen
eral
Bu
ildin
g M
aint
enan
ce S
ervi
ces t
o CI
T Q
uota
tion
Serv
ices
(Non
-co
nsul
tanc
y)
Air P
lant
Sal
es P
ty L
td
$199
,000
.00
1/02
/19
31/1
2/19
2018
.302
76.2
20
Prov
isio
n of
a C
usto
mer
Sa
tisfa
ctio
n Su
rvey
Too
l Pu
blic
Se
rvic
es (N
on-
cons
ulta
ncy)
GU
LAN
GA G
ROU
P PT
Y LT
D $4
00,0
00.0
0 1/
02/1
9 1/
02/2
2
C190
304
Purc
hase
4 S
olar
Pan
els
Sing
le S
elec
t Go
ods
Yes
Sola
r Jui
ce P
ty L
td
$26,
062.
21
1/02
/19
31/1
2/19
C190
356
Mak
e-U
p Ki
ts &
Air-
Brus
h Ki
ts
Quo
tatio
n Se
rvic
es (N
on-
cons
ulta
ncy)
KR
YOLA
N A
UST
RALI
A PT
Y LT
D $6
0,00
0.00
5/
02/1
9 31
/12/
19
C181
069
Nex
tgen
Dist
ribut
ion
- Mic
ro F
ocus
Li
cens
e Q
uota
tion
Good
s N
extg
en D
istrib
utio
n Pt
y Lt
d $9
8,37
9.28
22
/02/
19
31/1
2/19
ME_
1561
9573
9_1
Rem
uner
atio
n Ag
reem
ent b
etw
een
Copy
right
Age
ncy
Lim
ited
and
Canb
erra
Inst
itute
of T
echn
olog
y Si
ngle
Sel
ect
Serv
ices
(Non
-co
nsul
tanc
y)
Yes
COPY
RIGH
T AG
ENCY
LTD
$300
,000
.00
26/0
3/19
31
/12/
21
C190
419
Red
Hat
Ent
erpr
ise
Linu
x Ser
ver
Quo
tatio
n Go
ods
RED
HAT
ASI
A-PA
CIFI
C PT
Y. LT
D.
$25,
274.
70
2/04
/19
24/0
3/20
CIT1
9/24
866
Purc
hase
Ele
ctric
Mot
ors,
ge
nera
tors
and
ass
ocia
ted
equi
pmen
t Q
uota
tion
Good
s EM
E (A
UST
) PTY
LTD
$148
,858
.60
18/0
4/19
31
/12/
19
7303
8-N
CT-0
02
Inte
rnal
Bui
ldin
g La
yout
Con
cept
De
sign
for t
he R
edev
elop
men
t of
CIT
Reid
Pu
blic
Co
nsul
tanc
y H
AYBA
LL P
TY LT
D $1
68,5
91.5
0 23
/04/
19
31/1
2/19
C190
449
Purc
hase
Pow
er T
ools
Q
uota
tion
Good
s SP
ECIA
LTY
FAST
ENER
S PT
Y LT
D $3
6,74
5.50
1/
05/1
9 31
/12/
19
2999
5.21
0 Gr
ound
Mai
nten
ance
Ser
vice
s for
CI
T Ca
mpu
ses
Publ
ic
Serv
ices
(Non
-co
nsul
tanc
y)
The
Trus
tee
for G
ehrig
Fam
ily T
rust
trad
ing
as C
.J G
arde
ns &
Mai
nten
ance
$8
60,0
00.0
0 9/
05/1
9 8/
05/2
2
C190
458
Purc
hase
Mob
ile H
ydra
ulic
Tru
ck
Cran
e Q
uota
tion
Good
s GL
EASO
N C
RAN
ES S
ALES
PTY
LTD
$49,
995.
00
9/05
/19
31/1
2/19
C190
456
2019
Sec
urity
Gua
rd S
ervi
ces
Quo
tatio
n Se
rvic
es (N
on-
cons
ulta
ncy)
SE
CURI
TY 1
MAN
POW
ER P
TY LT
D $1
00,0
00.0
0 9/
05/1
9 31
/12/
19

Tabl
e 1
– Ne
w C
IT C
ontr
acts
– co
ntin
ued
Exem
ptio
n fr
om
Quo
tatio
n an
d Te
nder
Co
ntra
ct
Proc
urem
ent
Proc
urem
ent
Thre
shol
d Co
ntra
ct
Exec
utio
n N
umbe
r Co
ntra
ct T
itle
Met
hodo
logy
Ty
pe
Requ
irem
ents
Co
ntra
ctor
Nam
e Am
ount
Da
te
Expi
ry D
ate
C190
464
Purc
hase
Hita
chi S
ofw
are
Assu
ranc
e Q
uota
tion
Good
s H
ITAC
HI V
ANTA
RA A
UST
RALI
A PT
Y LI
MIT
ED
tradi
ng a
s HIT
ACH
I DAT
A SY
STEM
S PT
Y LT
D $3
9,84
2.75
14
/05/
19
7/07
/20
C190
476
Purc
hase
of C
reat
ive
Clou
d EN
T Q
uota
tion
Good
s DA
TA#3
LIM
ITED
$2
01,5
02.4
0 28
/05/
19
22/0
5/20
C190
472
MIM
S O
nlin
e Li
cenc
es
Sing
le S
elec
t Se
rvic
es (N
on-
cons
ulta
ncy)
Ye
s M
IMS
AUST
RALI
A PT
Y LT
D $3
4,10
0.00
28
/05/
19
16/0
5/20
C190
486
Aust
ralia
n St
anda
rds L
earn
ing
Reso
urce
s Si
ngle
Sel
ect
Serv
ices
(Non
-co
nsul
tanc
y)
Yes
SAI G
LOBA
L PT
Y LI
MIT
ED
$49,
087.
50
4/06
/19
31/1
2/19
C190
492
Reha
bilit
atio
n Gy
m E
quip
men
t fo
r CIT
Alli
ed H
ealth
Sim
ulat
ed
Envi
ronm
ent
Quo
tatio
n Go
ods
The
Trus
tee
for A
xis T
rust
trad
ing
as
ASTI
R AU
STRA
LIA
$51,
638.
84
11/0
6/19
31
/12/
19
CIT2
019-
708-
02
Purc
hase
, Sup
ply
and
Man
age
Prin
t an
d El
ectr
onic
Ser
ial S
ubsc
riptio
ns
Quo
tatio
n Go
ods
ISU
BSCR
IBE
PTY
LIM
ITED
$0
.00
17/0
6/19
17
/06/
22
CIT2
019/
1210
Pr
ovis
ion
of D
igita
l Lea
rnin
g Re
sour
ces f
or C
IT C
onst
ruct
ion
Quo
tatio
n Go
ods
Amm
onite
Pty
Ltd
$2
7,63
7.50
1/
07/1
9 31
/12/
19
CIT2
019/
190
Digi
tal F
luen
cy C
oach
ing
Prog
ram
Q
uota
tion
Serv
ices
(Non
-co
nsul
tanc
y)
THE
JAN
SZ G
ROU
P PT
Y LT
D tra
ding
as
Jans
z Adv
isor
y $1
30,0
00.0
0 3/
07/1
9 3/
12/1
9
CIT2
019-
708-
01
Purc
hase
, Sup
ply
and
Man
age
Prin
t an
d El
ectr
onic
Ser
ial S
ubsc
riptio
ns
Quo
tatio
n Go
ods
EBSC
O IN
TERN
ATIO
NAL
INC.
$0
.00
10/0
7/19
10
/07/
22
CIT2
019/
2022
Pr
ovid
e Ea
rly E
duca
tion
Serv
ices
at
CIT
Yura
una
Cent
re
Sing
le S
elec
t Se
rvic
es (N
on-
cons
ulta
ncy)
Ye
s N
orth
side
Com
mun
ity S
ervi
ce L
imite
d $5
19,7
50.0
0 29
/07/
19
30/0
6/22
CIT2
018/
2626
Fl
exib
le A
llied
Tra
de D
eliv
ery,
Fu
ture
Ski
lls fo
r Fut
ure
Job
Gran
ts
Prog
ram
Si
ngle
Sel
ect
Serv
ices
(Non
-co
nsul
tanc
y)
Yes
ELEA
RNIN
G AU
STRA
LIA
PTY
LTD
tradi
ng a
s m
y pr
ofili
ng
$88,
660.
00
9/09
/19
9/09
/20
C190
594
Prov
ide
Tech
nica
l Ass
istan
ce
Cove
rage
Q
uota
tion
Serv
ices
(Non
-co
nsul
tanc
y)
DATA
#3 L
IMIT
ED.
$56,
052.
37
17/0
9/19
30
/06/
20
C190
615
Ora
cle
Righ
tNow
Lic
ence
Ren
ewal
Q
uota
tion
Good
s O
racl
e Co
rpor
atio
n $1
71,8
96.8
7 26
/09/
19
31/0
7/20
159
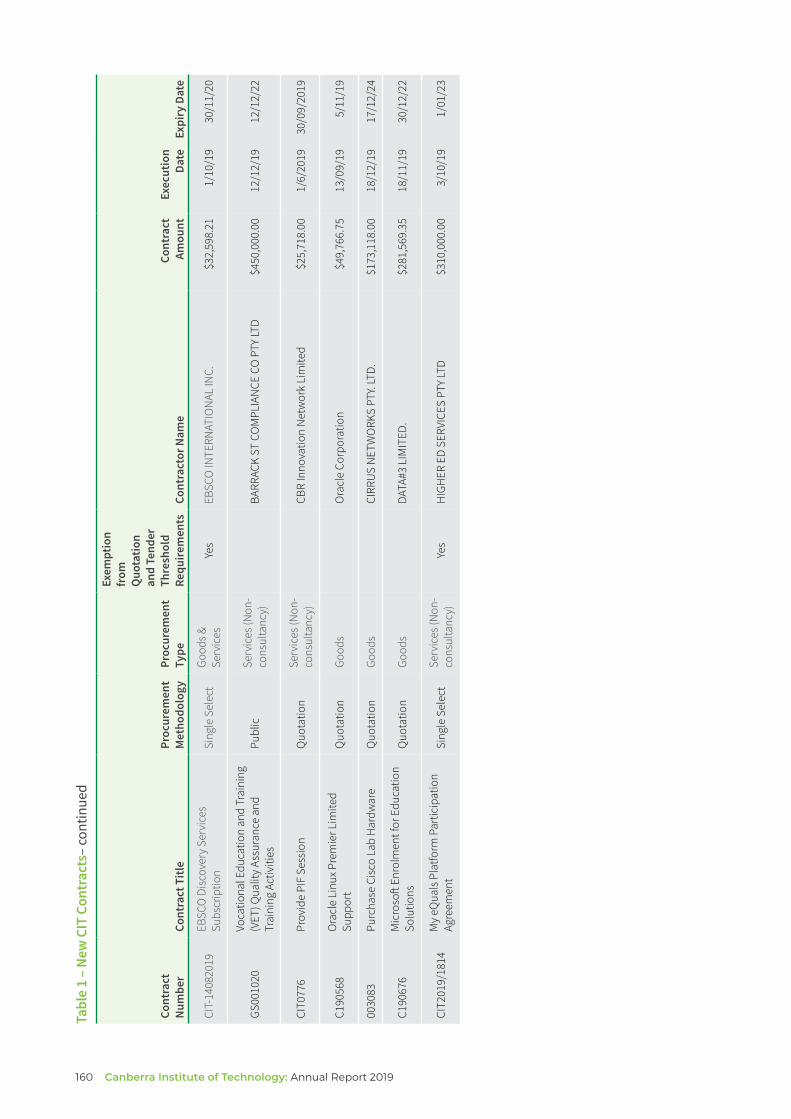
160 Canberra Institute of Technology: Annual Report 2019
Tabl
e 1
– Ne
w C
IT C
ontr
acts
– co
ntin
ued
Exem
ptio
n fr
om
Quo
tatio
n an
d Te
nder
Co
ntra
ct
Cont
ract
Ex
ecut
ion
Num
ber
Cont
ract
Titl
e M
etho
dolo
gy
Type
Re
quire
men
ts
Cont
ract
or N
ame
Amou
nt
Date
Ex
piry
Dat
e Pr
ocur
emen
t Pr
ocur
emen
t Th
resh
old
CIT-
1408
2019
EB
SCO
Dis
cove
ry S
ervi
ces
Subs
crip
tion
Sing
le S
elec
t Go
ods &
Serv
ices
Ye
s EB
SCO
INTE
RNAT
ION
AL IN
C.
$32,
598.
21
1/10
/19
30/1
1/20
GS00
1020
Vo
catio
nal E
duca
tion
and
Trai
ning
(V
ET) Q
ualit
y As
sura
nce
and
Trai
ning
Act
iviti
es
Publ
ic
Serv
ices
(Non
-co
nsul
tanc
y)
BARR
ACK
ST C
OM
PLIA
NCE
CO
PTY
LTD
$450
,000
.00
12/1
2/19
12
/12/
22
CIT0
776
Prov
ide
PIF
Sess
ion
Quo
tatio
n Se
rvic
es (N
on-
cons
ulta
ncy)
CB
R In
nova
tion
Net
wor
k Li
mite
d $2
5,71
8.00
1/
6/20
19
30/0
9/20
19
C190
568
Ora
cle
Linu
x Pre
mie
r Lim
ited
Supp
ort
Quo
tatio
n Go
ods
Ora
cle
Corp
orat
ion
$49,
766.
75
13/0
9/19
5/
11/1
9
0030
83
Purc
hase
Cis
co L
ab H
ardw
are
Quo
tatio
n Go
ods
CIRR
US
NET
WO
RKS
PTY.
LTD.
$1
73,1
18.0
0 18
/12/
19
17/1
2/24
C190
676
Mic
roso
f En
rolm
ent f
or E
duca
tion
Solu
tions
Q
uota
tion
Good
s DA
TA#3
LIM
ITED
. $2
81,5
69.3
5 18
/11/
19
30/1
2/22
CIT2
019/
1814
M
y eQ
uals
Pla
tform
Par
ticip
atio
n Ag
reem
ent
Sing
le S
elec
t Se
rvic
es (N
on-
cons
ulta
ncy)
Ye
s H
IGH
ER E
D SE
RVIC
ES P
TY LT
D $3
10,0
00.0
0 3/
10/1
9 1/
01/2
3

Tabl
e 2
– CI
T Co
ntra
cts C
urre
nt in
201
9
Exem
ptio
n fr
om
Quo
tatio
n an
d Te
nder
Co
ntra
ct
Cont
ract
Ex
ecut
ion
Num
ber
Cont
ract
Titl
e M
etho
dolo
gy
Type
Re
quire
men
ts
Cont
ract
or N
ame
Amou
nt
Date
Ex
piry
Dat
e Pr
ocur
emen
t Pr
ocur
emen
t Th
resh
old
2014
.198
56.2
40
Pane
l for
the
Prov
isio
n of
Plu
mbi
ng
Mai
nten
ance
Ser
vice
s for
the
Canb
erra
Inst
itute
of T
echn
olog
y Pu
blic
Se
rvic
es (N
on-
cons
ulta
ncy)
Da
lmas
o, A
dria
n D
tradi
ng a
s Adr
ian
Dalm
aso
Plum
bing
$0
.00
07/0
7/14
07
/07/
19
2014
.198
56.2
10
Pane
l for
the
Prov
isio
n of
Plu
mbi
ng
Mai
nten
ance
Ser
vice
s for
the
Canb
erra
Inst
itute
of T
echn
olog
y Pu
blic
Se
rvic
es (N
on-
cons
ulta
ncy)
DI IU
LIO
EN
TERP
RISE
S PT
Y LT
D &
Laro
bina
In
vest
men
ts P
ty L
td tr
adin
g as
DL
Eart
hwor
ks a
nd P
lum
bing
$0
.00
07/0
7/14
07
/07/
19
2014
.198
56.2
30
Pane
l for
the
Prov
isio
n of
Plu
mbi
ng
Mai
nten
ance
Ser
vice
s for
the
Canb
erra
Inst
itute
of T
echn
olog
y Pu
blic
Se
rvic
es (N
on-
cons
ulta
ncy)
DO
NT
PAN
IC P
LLU
MBI
NG
PTY
LTD
$0.0
0 07
/07/
14
07/0
7/19
2014
.234
46.2
10
Pane
l for
the
Prov
isio
n of
M
aint
enan
ce a
nd R
epai
rs o
f Re
frige
ratio
n Eq
uipm
ent f
or th
e Ca
nber
ra In
stitu
te o
f Tec
hnol
ogy
Publ
ic
Serv
ices
(Non
-co
nsul
tanc
y)
BRS
COM
MER
CIAL
REF
RIGE
RATI
ON
PTY
LI
MIT
ED
$80,
000.
00
17/1
0/14
17
/10/
19
2016
/176
8 De
liver
y of
the
Bach
elor
of G
ames
an
d Vi
rtua
l Wor
lds
Sing
le S
elec
t Se
rvic
es (N
on-
cons
ulta
ncy)
Ye
s TH
E AC
ADEM
Y O
F IN
TERA
CTIV
E EN
TERT
AIN
MEN
T LI
MIT
ED
$3,9
77,1
32.0
0 01
/01/
15
31/1
2/19
2015
.250
59.2
10
2018
Was
te D
ispo
sal S
ervi
ces
Publ
ic
Serv
ices
(Non
-co
nsul
tanc
y)
J.J.
RIC
HAR
DS &
SO
NS
PTY
LTD
$337
,500
.00
20/0
2/15
22
/04/
20
CIT1
6/19
198
VMw
are
ELA
Lice
nse
& Fi
nanc
ing
Agre
emen
t Q
uota
tion
Good
s FU
JITS
U A
UST
RALI
A LT
D $5
95,5
88.0
4 13
/03/
15
31/0
3/20
07/0
074
Prov
isio
n of
ID C
ard
Syst
em
(Usi
ng M
ifare
Car
d Te
chno
logy
) Si
ngle
Sel
ect
Good
s Ye
s U
NIC
ARD
SYST
EMS
PTY.
LIM
ITED
$1
60,5
05.4
0 05
/10/
15
05/1
0/19
2015
/266
9 Pr
ocur
emen
t of T
estin
g &
Tagg
ing
Canb
erra
Inst
itute
of T
echn
olog
y Q
uota
tion
Serv
ices
(Non
-co
nsul
tanc
y)
ELEC
TRIC
AL T
ESTI
NG
SERV
ICES
PTY
LTD
$104
,535
.00
06/1
1/15
05
/11/
19
RN20
7168
7 Le
ase
of B
lock
19,
Sec
tion
19
Divi
sion
Gre
enw
ay
Sing
le S
elec
t Se
rvic
es (N
on-
cons
ulta
ncy)
Ye
s AU
STRA
LIAG
EN O
FFIC
E PO
RTFO
LIO
SU
B TC
PTY
LTD
$7,5
06,9
00.0
0 24
/11/
15
30/0
4/26
AP 2
7.11
.201
5 El
ectr
onic
Sys
tem
for t
he C
IT B
oard
Si
ngle
Sel
ect
Good
s Ye
s DI
LIGE
NT
BOAR
D SE
RVIC
ES A
UST
RALI
A PT
Y LT
D $1
56,9
92.9
2 02
/12/
15
27/1
1/20
161
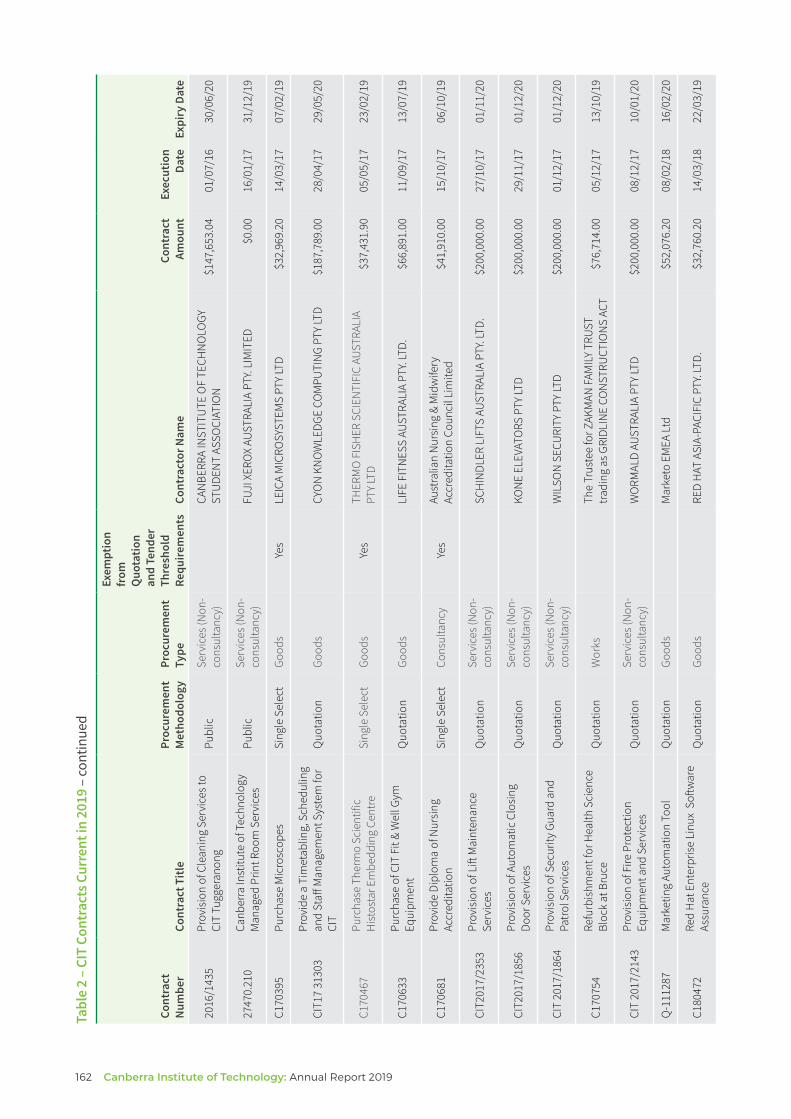
162 Canberra Institute of Technology: Annual Report 2019
Tabl
e 2
– CI
T Co
ntra
cts C
urre
nt in
201
9 –
cont
inue
d
Exem
ptio
n fr
om
Quo
tatio
n an
d Te
nder
Co
ntra
ct
Cont
ract
Ex
ecut
ion
Num
ber
Cont
ract
Titl
e M
etho
dolo
gy
Type
Re
quire
men
ts
Cont
ract
or N
ame
Amou
nt
Date
Ex
piry
Dat
e Pr
ocur
emen
t Pr
ocur
emen
t Th
resh
old
2016
/143
5 Pr
ovis
ion
of C
lean
ing
Serv
ices
to
CIT
Tugg
eran
ong
Publ
ic
Serv
ices
(Non
-co
nsul
tanc
y)
CAN
BERR
A IN
STIT
UTE
OF
TECH
NO
LOGY
ST
UDE
NT
ASSO
CIAT
ION
$1
47,6
53.0
4 01
/07/
16
30/0
6/20
2747
0.21
0 Ca
nber
ra In
stitu
te o
f Tec
hnol
ogy
Man
aged
Prin
t Roo
m S
ervi
ces
Publ
ic
Serv
ices
(Non
-co
nsul
tanc
y)
FUJI
XER
OX
AUST
RALI
A PT
Y. LI
MIT
ED
$0.0
0 16
/01/
17
31/1
2/19
C170
395
Purc
hase
Mic
rosc
opes
Si
ngle
Sel
ect
Good
s Ye
s LE
ICA
MIC
ROSY
STEM
S PT
Y LT
D $3
2,96
9.20
14
/03/
17
07/0
2/19
CIT1
7 31
303
Prov
ide
a Ti
met
ablin
g, S
ched
ulin
g an
d St
af M
anag
emen
t Sys
tem
for
CIT
Quo
tatio
n Go
ods
CYO
N K
NO
WLE
DGE
COM
PUTI
NG
PTY
LTD
$187
,789
.00
28/0
4/17
29
/05/
20
C170
467
Purc
hase
The
rmo
Scie
ntifi
c H
istos
tar E
mbe
ddin
g Ce
ntre
Si
ngle
Sel
ect
Good
s Ye
s TH
ERM
O F
ISH
ER S
CIEN
TIFI
C AU
STRA
LIA
PTY
LTD
$37,
431.
90
05/0
5/17
23
/02/
19
C170
633
Purc
hase
of C
IT F
it &
Wel
l Gym
Eq
uipm
ent
Quo
tatio
n Go
ods
LIFE
FIT
NES
S AU
STRA
LIA
PTY.
LTD.
$6
6,89
1.00
11
/09/
17
13/0
7/19
C170
681
Prov
ide
Dipl
oma
of N
ursi
ng
Accr
edita
tion
Sing
le S
elec
t Co
nsul
tanc
y Ye
s Au
stra
lian
Nur
sing
& M
idw
ifery
Ac
cred
itatio
n Co
unci
l Lim
ited
$41,
910.
00
15/1
0/17
06
/10/
19
CIT2
017/
2353
Pr
ovis
ion
of L
if M
aint
enan
ce
Serv
ices
Q
uota
tion
Serv
ices
(Non
-co
nsul
tanc
y)
SCH
INDL
ER L
IFTS
AU
STRA
LIA
PTY.
LTD.
$2
00,0
00.0
0 27
/10/
17
01/1
1/20
CIT2
017/
1856
Pr
ovis
ion
of A
utom
atic
Clo
sing
Do
or S
ervi
ces
Quo
tatio
n Se
rvic
es (N
on-
cons
ulta
ncy)
KO
NE
ELEV
ATO
RS P
TY LT
D $2
00,0
00.0
0 29
/11/
17
01/1
2/20
CIT
2017
/186
4 Pr
ovis
ion
of S
ecur
ity G
uard
and
Pa
trol
Ser
vice
s Q
uota
tion
Serv
ices
(Non
-co
nsul
tanc
y)
WIL
SON
SEC
URI
TY P
TY LT
D $2
00,0
00.0
0 01
/12/
17
01/1
2/20
C170
754
Refu
rbis
hmen
t for
Hea
lth S
cien
ce
Bloc
k at
Bru
ce
Quo
tatio
n W
orks
Th
e Tr
uste
e fo
r ZAK
MAN
FAM
ILY
TRU
ST
tradi
ng a
s GRI
DLIN
E CO
NST
RUCT
ION
S AC
T $7
6,71
4.00
05
/12/
17
13/1
0/19
CIT
2017
/214
3 Pr
ovis
ion
of F
ire P
rote
ctio
n Eq
uipm
ent a
nd S
ervi
ces
Quo
tatio
n Se
rvic
es (N
on-
cons
ulta
ncy)
W
ORM
ALD
AUST
RALI
A PT
Y LT
D $2
00,0
00.0
0 08
/12/
17
10/0
1/20
Q-1
1128
7 M
arke
ting
Auto
mat
ion
Tool
Q
uota
tion
Good
s M
arke
to E
MEA
Ltd
$5
2,07
6.20
08
/02/
18
16/0
2/20
C180
472
Red
Hat
Ent
erpr
ise
Linu
x So
fwar
e As
sura
nce
Quo
tatio
n Go
ods
RED
HAT
ASI
A-PA
CIFI
C PT
Y. LT
D.
$32,
760.
20
14/0
3/18
22
/03/
19

Tabl
e 2
– CI
T Co
ntra
cts C
urre
nt in
201
9 –
cont
inue
d
Exem
ptio
n fr
om
Quo
tatio
n an
d Te
nder
Co
ntra
ct
Proc
urem
ent
Proc
urem
ent
Thre
shol
d Co
ntra
ct
Exec
utio
n N
umbe
r Co
ntra
ct T
itle
Met
hodo
logy
Ty
pe
Requ
irem
ents
Co
ntra
ctor
Nam
e Am
ount
Da
te
Expi
ry D
ate
C180
510
Data
#3 C
reat
ive
Clou
d M
aste
r Co
llect
ion
Quo
tatio
n Go
ods
DATA
#3 L
IMIT
ED.
$189
,288
.00
29/0
3/18
22
/05/
19
CIT2
018/
783
VET
Qua
lity
& Tr
aini
ng A
ctiv
ities
Si
ngle
Sel
ect
Serv
ices
(Non
-co
nsul
tanc
y)
Yes
BARR
ACK
ST C
OM
PLIA
NCE
CO
PTY
LTD
$240
,000
.00
04/0
4/18
30
/11/
19
C180
545
Hita
chi S
ofw
are
Assu
ranc
e Si
ngle
Sel
ect
Good
s Ye
s H
ITAC
HI V
ANTA
RA A
UST
RALI
A PT
Y LI
MIT
ED
tradi
ng a
s HIT
ACH
I DAT
A SY
STEM
S PT
Y LT
D $3
4,38
9.08
12
/04/
18
31/0
5/19
C180
538
Cam
era
Bodi
es, L
ense
s and
Ac
cess
orie
s Q
uota
tion
Good
s TE
D’S
CAM
ERA
STO
RES
(VIC
.) PT
Y. LI
MIT
ED
$59,
180.
00
19/0
4/18
11
/04/
20
C180
555
Supp
ort S
ervi
ces f
or O
pen
Sour
ce
Sofw
are
Quo
tatio
n Go
ods
EDAL
EX P
TY LT
D $1
54,6
60.0
0 20
/04/
18
01/0
4/20
C180
585
Assi
st w
ith T
rave
l Pay
men
ts a
nd
Fees
Si
ngle
Sel
ect
Serv
ices
(Non
-co
nsul
tanc
y)
Yes
CAN
BERR
A IN
STIT
UTE
OF
TECH
NO
LOGY
ST
UDE
NT
ASSO
CIAT
ION
$1
89,0
00.0
0 09
/05/
18
01/0
3/19
C180
596
Hire
Vix
tro
CISC
O e
quip
men
t and
so
fwar
e Q
uota
tion
Good
s De
Lag
e La
nden
Pty
Lim
ited
$146
,005
.80
21/0
5/18
21
/05/
23
C180
639
Prov
ide
a H
eavy
Veh
icle
Bra
ke
Rolle
r and
Sha
ker
Quo
tatio
n Go
ods
NAT
ION
AL A
UTO
MO
TIVE
EQ
UIP
MEN
T SE
RVIC
ES P
TY LT
D $6
0,14
8.00
13
/06/
18
13/0
6/19
CIT
2017
/214
4 Pr
ovis
ion
of C
oolin
g To
wer
and
Ch
iller
Mai
nten
ance
Ser
vice
s Q
uota
tion
Serv
ices
(Non
-co
nsul
tanc
y)
CARR
IER
AUST
RALI
A PT
Y LT
D $2
00,0
00.0
0 29
/06/
18
01/0
1/21
C180
791
Ora
cle
Serv
ice
Supp
ort &
M
aint
enan
ce
Quo
tatio
n Go
ods
Ora
cle
Corp
orat
ion
$181
,395
.53
19/0
8/18
18
/08/
19
C180
832
Com
mva
ult B
acku
p an
d Re
cove
ry
Quo
tatio
n Go
ods
DATA
COM
SYS
TEM
S (A
U) P
TY LT
D $3
4,38
6.00
05
/09/
18
30/0
9/19
C180
830
Linu
x Pre
mie
r Sup
port
Q
uota
tion
Good
s O
RACL
E CO
RPO
RATI
ON
AU
STRA
LIA
PTY
LIM
ITED
$4
7,85
2.64
05
/09/
18
30/0
9/19
RFQ
2018
/61
Prov
isio
n of
Mai
nten
ance
, Al
tera
tion
and
Inst
alla
tion
Serv
ices
on
Intr
uder
Ala
rm S
yste
ms a
nd C
IT
Card
Acc
ess S
yste
m
Quo
tatio
n Se
rvic
es (N
on-
cons
ulta
ncy)
CO
NTR
OL
BY IN
TEGR
ATIO
N (C
XI) P
TY LT
D $8
0,00
0.00
01
/11/
18
01/1
1/19
163

164 Canberra Institute of Technology: Annual Report 2019
Tabl
e 2
– CI
T Co
ntra
cts C
urre
nt in
201
9 –
cont
inue
d
Exem
ptio
n fr
om
Quo
tatio
n an
d Te
nder
Co
ntra
ct
Cont
ract
Ex
ecut
ion
Num
ber
Cont
ract
Titl
e M
etho
dolo
gy
Type
Re
quire
men
ts
Cont
ract
or N
ame
Amou
nt
Date
Ex
piry
Dat
e Pr
ocur
emen
t Pr
ocur
emen
t Th
resh
old
2018
.310
01.2
20
Prov
isio
n of
Org
anis
atio
nal
Tran
sfor
mat
ion
Stra
tegi
c Gu
idan
ce
and
Men
torin
g Se
rvic
es
Publ
ic
Cons
ulta
ncy
REDR
OU
GE N
OM
INEE
S PT
Y LT
D $1
,220
,000
.00
09/1
1/18
30
/04/
20
C180
990
CIT
– M
icro
sof
Ope
n Va
lue
Agre
emen
t ren
ewal
Ref
No:
2018
-458
227
Quo
tatio
n Go
ods
DATA
#3 L
IMIT
ED.
$106
,818
.02
12/1
1/18
31
/12/
19
2018
.CIT
.021
1 So
fwar
e to
Sup
port
the
Co-o
rdin
atio
n an
d Ad
min
istra
tion
of S
tude
nt P
lace
men
ts
Sing
le S
elec
t Se
rvic
es (N
on-
cons
ulta
ncy)
Q
UAN
TUM
INFO
RMAT
ION
TEC
HN
OLO
GY
PTY.
LTD.
$2
8,05
0.00
14
/11/
18
14/0
3/20
C181
007
Care
er C
entra
l Pilo
t Si
ngle
Sel
ect
Good
s Ye
s JO
BREA
DY T
ECH
PTY
LTD
$29,
700.
00
20/1
1/18
19
/11/
19
2018
.299
22.2
10
Stud
ent I
nfor
mat
ion
Man
agem
ent
Syst
em -
Bann
er
Sing
le S
elec
t Go
ods
Yes
ELLU
CIAN
AU
STRA
LIA
PTY
LIM
ITED
$5
,000
,000
.00
01/1
2/18
01
/12/
23
C190
094
Tuto
ring
Aust
rala
sia-
Stud
iosi
ty
Quo
tatio
n Go
ods
STU
DIO
SITY
PTY
LIM
ITED
trad
ing
as
Tuto
ring
Aust
ralia
sia
Pty
Ltd
$56,
650.
00
18/1
2/18
31
/12/
19

Secure Local Jobs Code No exemptions from the Secure Local Jobs Code Requirements have been provided to CIT.
Aboriginal and Torres Strait Islander Procurement Policy The Aboriginal and Torres Strait Islander Procurement Policy has been in place since 31 May 2019.
Responses In 2019 CIT issued four tender opportunities from the Approved Systems, Tenders ACT and the Goods and Services Simple Procurement Tool.
None of the 11 Tenderers that responded to the four opportunities are identified on the Territories Aboriginal and Torres Strait Islander Enterprise List.
Addressable Spend The number of unique Aboriginal and Torres Strait Islander Enterprises that attributed to CITs addressable spend was nine.
The target addressable spend with Aboriginal and Torres Strait Islander Enterprises for 2019/20 is 1%. Using the estimated metrics provided by Procurement ACT, CIT has already exceeded the annual target in 2019 with an addressable spend of 1.09%.
165

C.6 STATEMENT OF
PERFORMANCE
166 Canberra Institute of Technology: Annual Report 2019

167

Canberra Institute of Technology Statement of Performance
For the Year Ended 31 December 2019
Statement of Responsibility
In my opinion, the Statement of Performance is in agreement with the Canberra Institute of Technology’s records and fairly reflects the service performance of the Canberra Institute of Technology for the year ended 31 December 2019 and also fairly reflects the judgements exercised in preparing it.
Craig Sloan Chair Canberra Institute of Technology Board 18 March 2020
168 Canberra Institute of Technology: Annual Report 2019

Canberra Institute of Technology Statement of Performance
For the Year Ended 31 December 2019
Statement by the Chief Finance Oficer
In my opinion, the Statement of Performance is in agreement with the Canberra Institute of Technology’s records and fairly reflects the service performance of the Canberra Institute of Technology for the year ended 31 December 2019 and also fairly reflects the judgements exercised in preparing it.
Greg Tong Senior Director/Chief Finance Oficer Canberra Institute of Technology 17 March 2020
169

Canberra Institute of Technology Statement of Performance
For the Year Ended 31 December 2019
OUTPUT CLASS 1: CANBERRA INSTITUTE OF TECHNOLOGY
Output 1.1: Provision of Vocational Education and Training Services
1 January 2019 to 31 December 2019
Notes
31 December 2019 Target $’000
31 December 2019 Actual Result
$’000 Variance %*
Total Cost 121,251 122,968 (1)
Controlled Recurrent Payments 74,379 74,379 0
1 July 2018 to 30 June 2019
Notes
30 June 2019 Target $’000
30 June 2019 Actual Result
$’000 Variance %*
Total Cost 1 114,231 124,981 9
Controlled Recurrent Payments 73,134 73,682 1
The above Statement of Performance should be read in conjunction with the accompanying notes.
*Variance from Target: The percentage variance is calculated by subtracting the target from the outcome and dividing this diference by the target.
Notes – Explanation of Material Variances 1 Total Cost to 30 June 2019 exceeded budget due to payrises under a new enterprise agreement, increased maintenance expenditure required for
CIT’s aging infrastructure, and project expenditure under CIT’s Strategic Compass 2020 project plan.
The above Accountability Indicators were examined by the ACT Audit Ofice in accordance with the Financial Management Act 1996. The Total Cost and Controlled Recurrent Payments were not examined by the ACT Audit Ofice in accordance with the Financial Management (Statement of Performance Scrutiny) Guidelines 2019.
170 Canberra Institute of Technology: Annual Report 2019

Canberra Institute of Technology Statement of Performance
For the Year Ended 31 December 2019
1 January 2019 to 31 December 2019
Accountability Indicators included in the Institute’s 31 December 31 December 2019-20 Statement of Intent Notes 2019 Target 2019 Actual Result Variance %*
a) Nominal Hours 1 3,226,000 2,995,634 (7)
b) Achieve key output targets.
i) Program Enrolments 11,700 11,888 2
ii) Module Pass Rates 2 75% 81% 8
iii) Program Completions 3 4,500 4,101 (9)
iv) Learner Satisfaction Rate 4 85% 90% 6
v) Employer Satisfaction Rate 4 80% 90% 13
c) Average Controlled Recurrent Payments per Nominal Hour 1 $23.06 $24.83 8
1 July 2018 to 30 June 2019
Accountability Indicators included in the Institute’s 30 June 30 June 2018-19 Budget Notes 2019 Target 2019 Actual Result Variance %*
a) Nominal Hours 3,228,000 2,907,865 (10)
b) Achieve key output targets.
i) Program Enrolments 11,700 11,798 1
ii) Module Pass Rates 2 75% 81% 8
iii) Program Completions 3 5,500 4,716 (14)
iv) Learner Satisfaction Rate 4 85% 90% 6
v) Employer Satisfaction Rate 4 80% 90% 13
c) Average Controlled Recurrent Payments per Nominal Hour 1 $22.66 $25.13 11
The above Statement of Performance should be read in conjunction with the accompanying notes.
* Variance from Target: The percentage variance is calculated by subtracting the target from the outcome and dividing this diference by the target.
The above Accountability Indicators were examined by the ACT Audit Ofice in accordance with the Financial Management Act 1996. The Total Cost and Controlled Recurrent Payments were not examined by the ACT Audit Ofice in accordance with the Financial Management (Statement of Performance Scrutiny) Guidelines 2019.
171

Canberra Institute of Technology Statement of Performance
For the Year Ended 31 December 2019
NOTES – EXPLANATION OF MATERIAL VARIANCES
1 Nominal Hours under the Profile student scheme were lower than target as students showed a preference for enrolling at CIT under other student schemes that are not included in these measures, most notably the User Choice (Apprentices and Trainees) and Skilled Capital schemes.
2 Module pass rates were above target due to CIT’s continued focus on high-quality and relevant training and support for students, as reflected in its 2019 Learner Engagement Survey results.
3 Program Completions were below target due to an increasing trend of students eschewing full qualifications in favour of individual skillsets.
4 The 2019 surveys of learner engagement and employer satisfaction showed overall levels of satisfaction of 90% (3,533 responses) and 90% (440 responses) respectively, reflecting employers’ and students’ positive view of their experience of CIT. Learner Satisfaction Rate results were based on the survey of students enrolled in nationally accredited programs. CIT has continued to improve its responsiveness to customers and efectiveness in skilling students with contemporary training methods which have been positively received by industry and students.
Accountability Indicator Definitions
a) Student activity data reported here (Nominal Hours, Program Enrolments, Module Pass Rates and Program Completions) only includes the subset of CIT’s education delivery traditionally referred to as ‘Profile’ activity, where ‘Profile’ refers to training ofered with heavily subsidised student fees that is not funded by any source other than ACT Government Controlled Recurrent Payments (CRP). CIT’s other student activity, including student activity subsidised through other ACT Government funding mechanisms such as the User Choice (Australasian Apprenticeships) and Skilled Capital programs is not included in these figures. It should be noted that CIT’s total student activity, which has continued to increase from prior years, is much greater than the Profile figures alone might suggest.
b) Nominal Hours is the nationally accepted quantitative output measure for the Vocational Education and Training sector. It measures the anticipated hours of supervised learning or training provided by Registered Training Organisations (RTOs) to adequately present the educational material associated with the delivery and assessment of a program of study. It also includes student contact hours delivered through a Recognition of Prior Learning (RPL) process.
c) Output targets are as specified below.
i. The number of records of students completing program enrolment requirements in accordance with the national Australian Vocational Education and Training Management Information Statistical Standard (AVETMISS).
ii. The proportion of successful module (subject) outcomes compared to module enrolments weighted by Nominal Hours in accordance with the national AVETMIS Standard.
iii. The number of student records where program completion requirements have been met in accordance with the AVETMIS Standard for students completing study in the previous academic year(s). This measure does not include completions for non-accredited training such as Adult Community Education (ACE) programs.
iv. The learner satisfaction rate measures the proportion of current CIT students participating in the Learner Engagement Survey (LES) who indicated that they were satisfied with the training at CIT.
v. The employer satisfaction rate measures the proportion of employers with apprentices or trainees at CIT that expressed their satisfaction with the training delivered at CIT.
d) The Average Government Payment per Nominal Hour is an output target calculated as the Total Controlled Recurrent Payments divided by the Nominal Hours outcome for Profile training programs delivered. A below-target Nominal Hour outcome will result in a higher figure for this target despite CIT not receiving any additional funding.
172 Canberra Institute of Technology: Annual Report 2019

173
PartD
Whole of G
overn
ment
Annual Reporti
ng

D.1 BUSHFIRE RISK MANAGEMENT
CIT has an evacuation plan for bushfire management as required by the Emergency Services Agency. This plan is only required for the CIT Bruce campus. The Bushfire/Local Disaster Evacuation Plan is included in Emergency Procedures available on the CIT Staf Information Site.
The unprecedented bushfire season in 2019 required CIT to review its bushfire management strategies which now include the following:
> the Security, Emergency Management Senior Oficials Group (SEMSOG) has coordinated preparatory information across ACT directorates and CIT to include support for Business Continuity Plans by the ACT Government in the event of an emergency incident.
> CIT meets regularly with Security Emergency Management Branch (SEMB). In late 2019, CIT received hourly briefs from SEMB relating to fires in our region and the proximity to CIT Campuses.
174 Canberra Institute of Technology: Annual Report 2019

D.2 TERRITORY RECORDS
Records Management Program The CIT Records Management Program outlines how CIT manages its records program in accordance with Section 16 of the Territories Records Act 2002. The current CIT Records Management Program was approved by the Chief Executive Oficer and submitted to the Director of Territory Records in 2017.
The CIT Records Management Program is available on the CIT website.
Aboriginal or Torres Strait Islander Heritage The CIT records management programs, policies and procedures include specific arrangements for preserving records containing information that may allow people to establish links with their Aboriginal or Torres Strait Islander heritage.
All records identified for disposal are actively reviewed prior to destruction to ensure that records that establish links or should otherwise be retained are properly identified.
Records Management Capabilities Records management oficers work with business areas to assess record values and carry out disposal activities for appropriate records.
CIT staf are responsible for undertaking a range of records management activities and are supported and encouraged to undertake recordkeeping in a way that is consistent and accountable. Records management training continues to be actively promoted across CIT with awareness provided to new staf via induction process and internal tailored training is delivered by records management oficers.
CIT uses an electronic document and records management system framework for records management compliance.
Maturity Assessment CIT has not been asked to complete a recordkeeping maturity assessment by the Territory Records Ofice during the reporting period.
175

ACRONYMS AND ABBREVIATIONS
ACE Adult and Community Education
ACT Australian Capital Territory
ACTPS ACT Public Service
ACU Australian Catholic University
AISTSIS Australian Institute of Aboriginal and Torres Strait Islander Studies
ANAO Australian National Audit Ofice
ASNZS Australian/New Zealand Standard
ANU Australian National University
AQF Australian Qualifications Framework
AC Academic Council
ACE Adult and Community Education
ARIn Attraction and Retention Initiatives
ASBA Australian School Based Apprenticeship
ASQA Australian Skills Quality Authority
BSSS Board of Senior Secondary Studies
CBRIN Canberra Innovation Network
CEO Chief Executive Oficer
CIT Canberra Institute of Technology
CITSA CIT Student Association
CMTEDD Chief Minister, Treasury, Economic Development Directory
CRC Corporate Resources Committee
CSU Charles Sturt University
EAP Employee Assistance Program
EMC Executive Management Committee
EML Employer Mutual Limited
ESS Employer Satisfaction Survey
FMA Financial Management Act 1996
FTE full-time equivalent
GWO Global Wind Organisation
HR human resources
HSR health safety representative
IAG Industry Advisory Group ICT information and communication
technology ITE Institute of Technical Education
Singapore LES Learner Engagement Survey LLN Language, Literacy and Numeracy LLND Language, Literacy, Numeracy and Digital MOU Memorandum of Understanding NCVER National Centre for Vocational Education
Research NUHEP Non-University Higher Education Provider RAP Reconciliation Action Plan PIF Product Innovation Fund RED Respect, Equity and Diversity REDCO Respect, Equity Diversity Contact Oficer RMP records management program RTO Registered Training Organisation SERBIR Senior Executive Responsible for Business
Integrity Risk SEMB Security Emergency Management Branch SEMSOG Security, Emergency Management Senior
Oficials Group TAE Training and Education TAFE Technical and Further Education TEQSA Tertiary Education Quality and Standards
Agency UC University of Canberra UNEC United Ngunnawal Elders Council VET Vocational Education and Training WESP Work Experience Support Program WHS Work Health and Safety
176 Canberra Institute of Technology: Annual Report 2019

COMPLIANCE INDEX
The CIT 2019 Annual Report must comply with the Annual Report Directions (the Directions) made under section 8 of the Annual Reports Act. The Directions are found at the ACT Legislation Register: www.legislation. act.gov.au
The Compliance Statement indicates the subsections, under Parts 1 to 5 of the Directions, that are applicable to CIT and the location of information that satisfies these requirements.
Part 1 Directions Overview The requirements under Part 1 of the Directions relate to the purpose, timing and distribution, and records keeping of annual reports. The CIT 2019 Annual Report complies with all subsections of Part 1 under the Directions.
To meet Section 15 Feedback, Part 1 of the Directions, contact details for CIT are provided within the CIT 2019 Annual Report to provide readers with the opportunity to provide feedback.
Part 2 Reporting entity Annual Report Requirements The requirements within Part 2 of the Directions are mandatory for all reporting entities and CIT complies with all subsections. The information that satisfies the requirements of Part 2 is found in the CIT 2019 Annual Report as follows:
A. Transmittal Certificate, see page 7.
B. Organisational Overview and Performance, inclusive of all subsections, see pages 13-77.
C. Financial Management Reporting, inclusive of all subsections, see pages 79-172.
Part 3 Reporting by Exception CIT has nil information to report by exception under Part 3 of the Directions for the 2019 reporting year.
Part 4 Directorate and Public Sector Body Specific Annual Report Requirements CIT is not required to report under Part 4 of the Directions.
Part 5 Whole of Government Annual Reporting All subsections of Part 5 of the Directions apply to CIT. Consistent with the Directions, the information satisfying these requirements is reported in the one place for all ACT Public Service directorates, as follows:
> Bushfire Risk Management, see page 174;
> Human Rights, see the annual report of the Justice and Community Safety Directorate;
> Legal Services Directions, see the annual report of the Justice and Community Safety Directorate
> Public Sector Standards and Workforce Profile, see the annual State of the Service Report; and
> Territory Records, see page 175.
The CIT 2019 Annual Report can be found at https://cit.edu.au
177

CONTACT OFFICER
Andrew Whale Executive Director, Corporate Services Canberra Institute of Technology GPO Box 826 CANBERRA ACT 2601 Email: [email protected] Telephone: (02) 6207 8960
Website Address www.cit.edu.au
178 Canberra Institute of Technology: Annual Report 2019


ANNUAL REPORT2019
Canberra In
stitu
te
of Tech
nology
CANBERRA IN
STITUTE O
F TECHN
OLO
GY ANN
UAL REPO
RT 2019