Annual-Report-2012-2013.pdf - 63 moons
174
www.ftindia.com ANNUAL REPORT 2012-13 BE THE YOU WANT TO SEE
-
Upload
khangminh22 -
Category
Documents
-
view
1 -
download
0
Transcript of Annual-Report-2012-2013.pdf - 63 moons

w w w . f t i n d i a . c o m
A N N U A L R E P O R T 2 0 1 2 - 1 3
B E T H E
Y O U W A N T T O S E E

Board of Directors
Management Team
Ÿ Jignesh ShahChairman & Managing Director
Ÿ Dewang Neralla
Ÿ Manjay Shah
Ÿ Ravi K. Sheth
Ÿ P. G. Kakodkar*
Ÿ Chandrakant Kamdar
Ÿ Ramanathan Devarajan*
Ÿ P. R. Barpande*
Ÿ C. M. Maniar
Ÿ N. Balasubramanian**
Ÿ Jignesh Shah Chairman & Managing Director
Ÿ Dewang NerallaWhole-time Director - Technology
Ÿ Manjay ShahWhole-time Director - Business Development
Ÿ Paras AjmeraDirector - Operations
Ÿ Jigish SonagaraPresident & Head - Exchange Technology
Ÿ Devendra AgrawalChief Financial Officer
Ÿ Rajendra MehtaPresident & Head - Member Technology
Ÿ Prashant DesaiPresident - Investor Relations
Ÿ Miten MehtaPresident - New Projects
Company Secretary
Registered Office
Naishadh P. DesaiSr. Vice President (Legal) & Company Secretary
Hariraj ChouhanVice President & Company Secretary
Financial Technologies (India) Ltd.st Doshi Towers, 1 Floor, 1A & B
No. 156, Periyar, EVR Salai Kilpauk, Chennai – 600 010, India.T: +91 44 4395 0850/51F: +91 44 4395 0899
Financial Technologies (India) Ltd.
FT Tower, CTS No. 256 & 257, Suren Road, Chakala, Andheri (East), Mumbai – 400 093, India.T: +91 22 6686 1010F: +91 22 6686 1050
Corporate Office
Auditors
Share Transfer Agents
Bankers
Deloitte Haskins & Sells
Karvy Computershare Private Ltd.
17 to 24, Vittalrao Nagar, Madhapur, Hyderabad – 500 081, India.www.karvy.com
Ÿ HDFC Bank Ltd.
Ÿ Deutsche Bank AG
Ÿ HSBC Ltd.
Ÿ Standard Chartered Bank
Ÿ Union Bank of India
CORPORATE INFORMATION
TABLE OF CONTENTS
28
38
46
66
67
114
DIRECTORS’ REPORT
MANAGEMENT DISCUSSION & ANALYSIS
CORPORATE GOVERNANCE
FINANCIALS
Standalone
Consolidated
01
07
09
11
21
23
24
25
Letter from Chairman's Desk
Product Overview
Company Profiles
Global Presence
6 Years at a Glance
Financial Highlights
Human Capital Overview
FINANCIAL TECHNOLOGIES OVERVIEW1
5
2
3
4
*Resignednd**Appointed as Director w.e.f. 22 August 2013

India went into economic liberalization in
the early 1990s. Ever since, India and
Indian economy has been making rapid
progress to emerge as one of the fastest
growing globally. The reforms have
transformed many industries. The Indian
financial market place has also
transformed. And we have played a leading
role in it. With innovation, enterprise and
inclusion as the foundation, we have tried
to change the future of financial market
infrastructure in India. Helping us in this
endeavor has been the leading ideal of,
‘be the change you want to see.’
Financial Technologies (India) Ltd. ANNUAL REPORT 2012-13|

1
LETTER FROMCHAIRMAN’S DESK
JIGNESH SHAH | Chairman & Managing Director
Dear Shareholders,
As I set out to write my letter to
you, I know that all of you are
concerned reading about the
challenges that one of your
Company’s subsidiary viz., National
Spot Exchange Ltd. (NSEL) faces.
We have outlined the details of the
same in the leaflet included with
this Report. I know these are tough
times the Company is facing and
Financial Technologies is making all
efforts to come out of such
situation.
It is the quest to ‘change for the better’ that leads to
innovations which beacon excellence. This is what our
aim has been, in all our endeavors. Our outlook as
harbingers of change in many areas in the financial
market space is a natural corollary to our quest for
this very excellence.
reverberating across the
Middle-East and North Africa.
The global economy revival has
been led with printing of currency
and quantitative easing which has
fueled surplus liquidity the world
over and India has also been a
beneficial of the same. However,
the rupee depreciation has taken
some steam off it, as is the case in
all emerging markets. Its interesting
to note that the developing
economies where the global crisis
started in 2008 are showing some
signs of growth and emerging
economies are seeing tougher
times ahead.
The Indian Economy that was
amongst the fastest growing
globally has been facing several
headwinds. The GDP growth has
fallen to a low of 4.8% in the stquarter ended 31 March 2013*.
The interest rate trend which had
reversed has once again done a
U-turn with the rupee creating
havoc and even crossing ` 64 at
the time of writing this letter. The
Indian Economy is facing its
toughest challenge since economic
liberalization in the early 1990s.
*RBI - Macroeconomic and Monetary
Developments First Quarter Review th2013-14, 29 July 2013
The upcoming elections and the
policy paralysis have slowed down
significant corporate investment too.
With this backdrop, India has a
tough couple of years ahead of her.
INDIAN ECONOMY
GLOBAL ECONOMY
We have seen significant political
change last year with presidential
elections taking place in some of
the largest economies of the world
such as China, Egypt, France,
Mexico, Russia and the United
States. Over the course of 2012,
economic uncertainty continued
with impact on overall business
growth prospects. Agreement on a
series of tax rise in the US pulled
the economy back from the brink of
a ‘fiscal cliff’, but tough negotiations
on the debt ceiling and spending
cuts remained.
Political deadlock in Japan and
deliberations continued in euro-
zone with sovereign debt crisis
being far from resolved. Emerging
economies are growing faster, but
challenges persist. In China, new
leadership is expected to focus on
avoiding the middle-income trap for
more sustainable growth. Reforms
to further open up the Indian
economy to FDIs earlier met some
resistance but this is gradually
changing. Signs of reforms in
Russia were tepid and the
government budget remained highly
reliant on the price of oil and gas.
Brazil has seen limited growth over
the last two years although their
interest and unemployment rates
had dropped to record lows. The
new administration in Mexico has
targeted higher growth and greater
security. Maritime disputes are
threatening to upset relations in
South-East Asia, whilst the legacy
of the Arab Spring is still
2
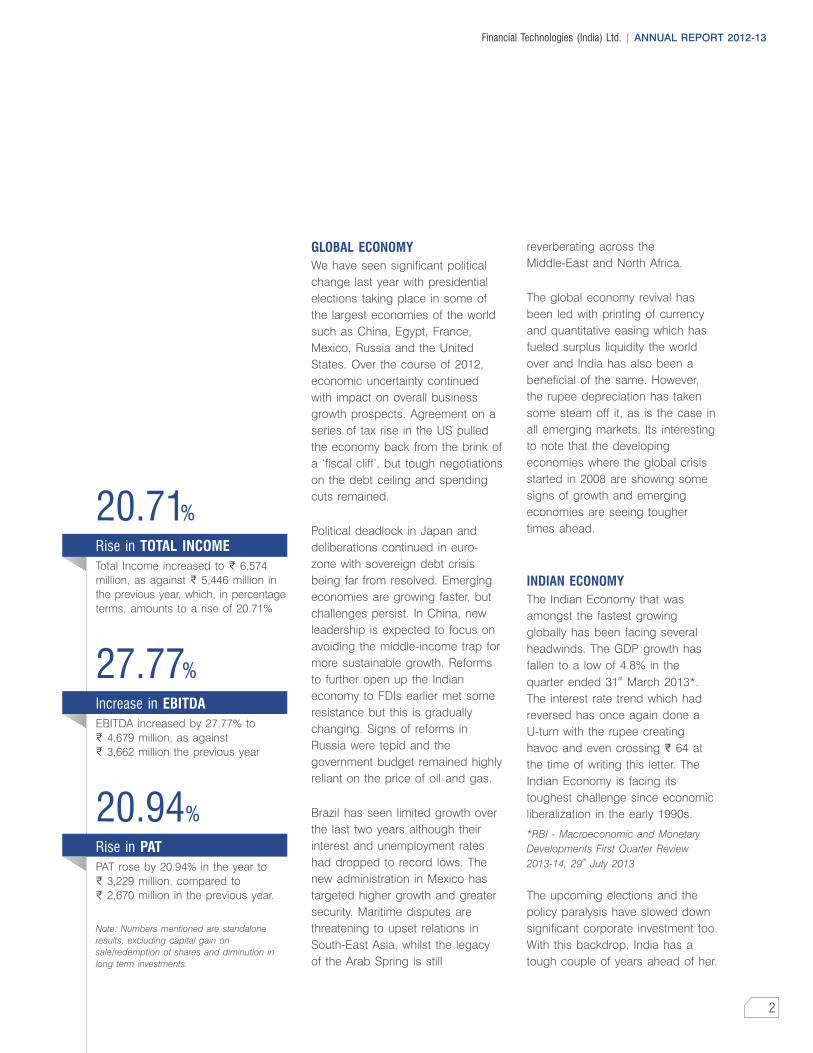
20.71%
27.77%
20.94%
Rise in TOTAL INCOME
Increase in EBITDA
Rise in PAT
Total Income increased to 6,574
million, as against ` 5,446 million in
the previous year, which, in percentage
terms, amounts to a rise of 20.71%
EBITDA increased by 27.77% to
` 4,679 million, as against ` 3,662 million the previous year
PAT rose by 20.94% in the year to
` 3,229 million, compared to
` 2,670 million in the previous year.
Note: Numbers mentioned are standalone
results, excluding capital gain on
sale/redemption of shares and diminution in
long term investments.
`
Financial Technologies (India) Ltd. | ANNUAL REPORT 2012-13

Letter From Chairman’s Desk
As national entities – our
Exchange ventures encompass all
regulatory compliances and are
continuously focused on –
inclusive growth, investor
interests, employment generation
and stakeholder engagement.
3
at Gulf Co-operation Council
Interconnection Authority (GCCIA) in
the UAE.
TMODIN , your Company’s flagship
brokerage solution, continues to be
the first choice of every brokerage TMhouse in India. ODIN integrated
with ACE Derivatives and Commodity
Exchange – India’s newest
commodity Exchange that facilitates
online trading, and clearing and
settlement of commodity futures
transactions, and thereby providing
a platform for its risk management. TMThis year, ODIN ’s capabilities were
enhanced to integrate with new
Exchange segments – MCX-SX
equity and derivative segments,
Universal Commodity Exchange
(UCX) commodity futures segment
and in primary market for OFS
(offer for sale) segment.
TMThis year, ODIN Institutional
extended to provide various
execution-based algorithms and
introduced FIX 24x7 functionality
that enables the sell-side brokers to
accept orders all day from buy-side
clients who route orders from
different time-zones across the
world. Another milestone was the TMaddition of the ODIN QDP product
suite to enable Qualified Foreign
Investors (QFI) to participate in the
Indian equity markets. We have TMalso introduced FX-ELITE which is
an intra-bank online dealing
platform facilitating end-to-end
automated trading for intra-bank
foreign exchange. It is a
fully-customizable solution that
provides an efficient workflow
The Economic Survey 2012-13,
presented by Finance Minister
P. Chidambaram in the Lok Sabha
predicts that the global economy is
likely to recover in 2013 and
various government measures will
help in improving the Indian
economy’s outlook for 2013-14. The
future holds promise for India if
there is a shift in national spending
from consumption to investment,
more job creation and removal of
bottlenecks in investments. Some
reform measures undertaken are
combating inflation with monetary
and supply-side measures.
taken forward India’s footprint into
fast-growing regions of South-East
Asia, Middle-East and Africa. We
are the world’s largest creator of
green-field Exchanges and
complementing them with
ecosystem ventures that
strengthen the scope of these
financial markets.
Financial Exchanges and
ecosystem ventures create powerful
instruments and interventions that
not only energize economic growth
but ensure sustainability. By means
of creating affordable financial
market access through new age
technologies, we are heralding an
era of innovation and excellence for
the ecosystem we operate in. The
following verticals define our
innovative growth models
Technology, Exchanges and
Ecosystem Ventures.
The Technology Vertical
encompasses Exchange Solutions,
Brokerage Solutions, Connectivity
Solutions and Consulting Solutions.
Exchange Solutions are highly
versatile and cover all aspects of
the Exchange operations – from
trading to settlement. It is driven by
strategic and operational needs to
deal with costs and margin
pressures, ever-changing business
environment and regulatory
compliances. The Exchange
Technology Division through its
Energy Market Management System
(EMMS) deployed Energy Solutions
VERTICALS
Technology, Exchange, Ecosystem
YOUR COMPANY
In the current state of affairs when
challenges persist both in India and
globally, your Company has still led
initiatives that explore newer
opportunities and avenues that help
managing market risks better. With
domain expertise, vision to create
new-generation markets and a
potent combination of technology
and finance, we have developed
high quality financial market
infrastructure in India. And we have

Financial Technologies (India) Ltd. | ANNUAL REPORT 2012-13
4
Your Company’s standalone
financials* for the year ended st31 March 2013 are as follows:
Total Income increased to ` 6,574
million, as against ` 5,446 million in
the previous year, which, in
percentage terms, amounts to a
rise of 20.71%
EBITDA increased by 27.77% to
` 4,679 million, as against
` 3,662 million the previous year.
PAT rose by 20.94% in the year to
` 3,229 million, compared to
` 2,670 million in the previous year.
Your Company has since last 29
consecutive quarters declared and
paid dividend to its Shareholders.
During the year, your Company has
declared and paid three interim
dividends of 100% each (` 6/- per
share on par value of ` 2/- per
share) to its shareholders and a
final dividend of 100% (` 2/- per
share) recommended will be paid
subject to the approval of
Shareholders at the ensuing Annual
General Meeting.
*Numbers mentioned are standalone
results, excluding capital gain on
sale/redemption of shares and diminution in
long term investments.
Along with technological
competences and domain
expertise, your Company is today
the world’s largest creator of
green-field Exchanges and
OPERATING REVENUES*
GROUP BUSINESS HIGHLIGHTS
between the Bank Central Treasury
and its Branch Offices, thus
allowing the Treasury to
expeditiously confirm and execute
foreign exchange trading.
This year, your Company introduced TMSTP-Gate Debt Market, a
messaging solution for the debt
market participants to address the
challenges faced in non-
standardized physical format of
contracts. With the launch, your
Company has become the first
company in India to offer
messaging solution to debt market
participants. The solution – an
internet-based service – will
seamlessly interconnect market
participants through standardized
ISO 15022 messaging.
Our Consulting Solution - ESG
added to its services – Datacenter
Hosting which is a low latency
proximity hosting solution that helps
clients to host their servers and
connect with various Exchanges
efficiently using algorithm trading
applications. ESG also added
Information Security Awareness
Programs that enable secure IT
Infrastructure for clients.
Our wide institutional framework of
Exchanges and ecosystem
ventures formulate a
comprehensive market structure not
only in India but also globally. In
our capacity as an Exchange
operator, we believe in fostering
good standards of corporate
governance which plays a pivotal
role in any financial market space.
The diffusion of self-regulation at
every level and adoption of code of
best practices is visible in our
endeavors. As national entities –
our Exchange ventures encompass
all regulatory compliances and are
continuously focused on – inclusive
growth, investor interests,
employment generation and
stakeholder engagement. Our role
is to ensure that this has always
been in our immediate topical
interests and has never been
compromised.
In the commodity Exchange space,
MCX maintained its leadership
position in the Indian commodity
markets space. MCX’s IPO was
adjudged as the ‘Best Mid-cap
Equity Deal’ in Asia-Pacific by
Finance Asia Achievement Awards
2012. It also conferred the ‘Best
Commodity Exchange of the year’
award at the Global Cotton
Conference.
Our Exchange in the energy
segment, IEX continues to be
India’s first and premier Power
Exchange with 95% Market Share
and recorded highest ever REC
traded in a single trading session in
March 2013. The international
Exchanges in multiple geographies
spread across Asia, Middle-East
and Africa namely SMX, GBOT, BFX
and Bourse Africa have been
growing steadily.
With respect to the ecosystem
ventures, NBHC successfully
associated with four new banks
this year.

Letter From Chairman’s Desk
5
associated with six new banks this
year namely, Central Bank of India,
L&T Finance Holdings, Hadoti
Kshetriya Gramin Bank, J&K Bank,
Dombivli Nagari Sahakari Bank and
Ratnakar Bank.
Among other notable developments,
TickerPlant India Ltd. (TPIL)
incorporated new functionalities in its
product offerings with commissioned
enhancements in decision support
tools, pivot point analytics and
technical indicators such as
Ichimoku and smoothened RSI. It
has seamlessly integrated MCX-SX
Cash and F&O segments, and ACE
Exchange.
Financial Technologies
Knowledge Management
Company (FTKMC) successfully
conducted nationwide training
programs as also extensive content
development for the financial
markets. During the year FTKMC
unveiled a special diary providing
comprehensive views on Corporate
Governance, including Strategy,
M&A, Regulations, and Financial
Statement presentation. It has also
represented on ‘Rethinking stGovernance’ the 31 SKOCH
Summit at New Delhi, and
executed a project on drawing a
roadmap for knowledge
management undertaken for
Capital Market Authority, Saudi
Arabia, and a study on Financial
Services Outsourcing for GIZ,
as a part of its project Sino-
German Tianjin Modern
Financial System Development
Project, China.
complementing them with
ecosystem ventures that strengthen
the scope of financial markets. Its
wide institutional framework of
Exchanges and ecosystem ventures
formulate a comprehensive market
structure not only in India but also
globally.
In the commodity Exchange space
in India, Multi Commodity
Exchange (MCX) recorded its
highest daily turnover since inception
of ` 1,199.41 billion. MCX launched
Kapasia Khalli contract and also
Silver 1,000 contracts which
witnessed a record delivery of
1,010 kg in the year. MCX also won
the ‘FOW Award’ for its Gold Petal
Futures Contract under the most
innovative new contract launched
by an Exchange in the metals
category at the FOW Awards for
Asia 2012 organized at Singapore.
Indian Energy Exchange (IEX)
successfully completed five years
and is India’s preferred electricity
trading platform with nationwide
reach covering 101 Members and
over 2,500 active clients registered stas on 31 March 2013 (over 500
private generators and over 1,800
direct consumers). It also witnessed
the highest ever traded volume in
Electricity Market in a year – over
22 Billion Units (kWh). IEX bagged th‘6 Enertia Award’ as ‘Best Power
Exchange in India’ and the
PowerLine Award as ‘Best
Performing Power Exchange’ this
year. It also received India Power
Award of the ‘Best E-enabled
Consumer Platform’.
Singapore Mercantile Exchange
(SMX) inked an MOU with AFET
for global joint development of
Futures Trading and partnered
with Temasek Polytechnic to build
capabilities in commodity and
currency derivatives trading and
processing. SMX won three
Awards at ‘FOW Awards for Asia
2012’.
Bahrain Financial Exchange (BFX)
became a member of the Bahrain
Association of Banks (BAB). It
successfully conducted several
corporate social responsibility
(CSR) educational workshops titled
"Understanding the Financial
Derivatives Markets from Theory to
Practice" for university students in
the Kingdom of Bahrain.
Global Board of Trade (GBOT)
collaborated with the University of
Technology, Mauritius, to promote
education on Financial Markets
which would enable students and
professionals to learn the practical
aspects of financial markets
through workshops, certification
courses and simulation on GBOT
markets. GBOT also conducted
over 50 EDGE Workshops with in-
house and external experts within
the Financial Sector. EDGE is the
knowledge and education initiative
of GBOT titled “Empowerment &
Development through ‘Global
financial markets’ Education”
(EDGE).
With respect to the ecosystem
ventures, National Bulk Handling
Corporation (NBHC) successfully

Financial Technologies (India) Ltd. | ANNUAL REPORT 2012-13
6
atom Technologies acquired 600+
merchants this year and processed
more than 5.5 million transactions
worth 3,396 crore. It tied up with
banks for integrating their Internet
Banking Gateway on atoms’
‘PAYNETZ’ Solution and entered
tie-ups with several leading
government/PSU customers for
payment services. It has, also,
collaborated with leading education
institutions to facilitate sale of
application forms and collection of
fees from their students.
The year 2012 has, indeed, been
vital in shaping our modus
operandi for 2013, given the volatile
macro economy and changing
market landscape. The slightly
weaker global outlook will continue
to be a challenging economic
environment to operate in.
Notwithstanding the transitioning
emerging economies, we remain
steadfast in our mission to
continually innovate to surpass our
own benchmark and achieve long
term sustainable growth. Having
completed an assessment of past
year, we plan to continue product
development and adding more
tech-driven solutions serving our
clients. Our focus will continue to
imbibe market best practices,
develop SMEs and bring
technology in our day-to-day
processes. We aim to continue to
ensure highest returns for
shareholders while blending social
interest with inclusive growth.
THE YEAR AHEAD
Your Company will continue to
pursue its business strategy to
identify and invest in quality assets
with an objective of generating
higher returns on investments over
medium to long term. While doing
so, your Company will ensure the
standards of corporate governance
are comparable to the best in the
world. As our theme goes we are
passionately working towards
building a new breed of leadership
that will inspire, galvanize and edify
our very fabric of the society.
JIGNESH SHAH
Chairman & Managing Director
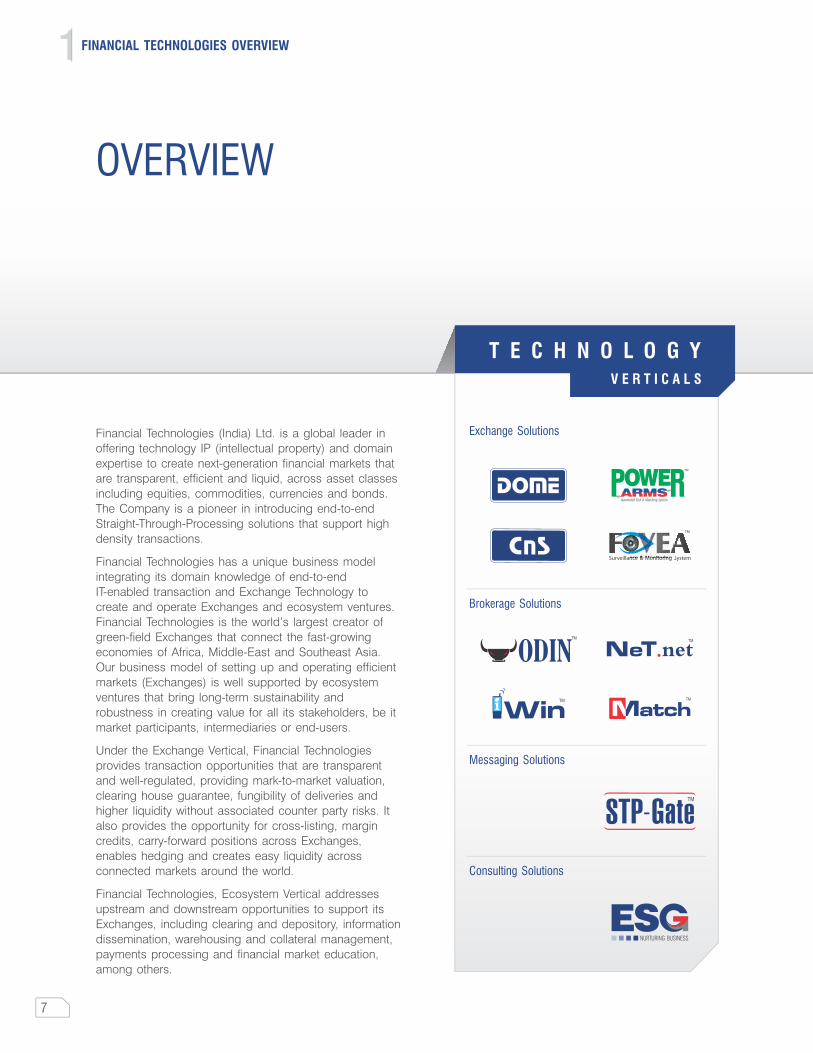
Financial Technologies (India) Ltd. is a global leader in
offering technology IP (intellectual property) and domain
expertise to create next-generation financial markets that
are transparent, efficient and liquid, across asset classes
including equities, commodities, currencies and bonds.
The Company is a pioneer in introducing end-to-end
Straight-Through-Processing solutions that support high
density transactions.
Financial Technologies has a unique business model
integrating its domain knowledge of end-to-end
IT-enabled transaction and Exchange Technology to
create and operate Exchanges and ecosystem ventures.
Financial Technologies is the world’s largest creator of
green-field Exchanges that connect the fast-growing
economies of Africa, Middle-East and Southeast Asia.
Our business model of setting up and operating efficient
markets (Exchanges) is well supported by ecosystem
ventures that bring long-term sustainability and
robustness in creating value for all its stakeholders, be it
market participants, intermediaries or end-users.
Under the Exchange Vertical, Financial Technologies
provides transaction opportunities that are transparent
and well-regulated, providing mark-to-market valuation,
clearing house guarantee, fungibility of deliveries and
higher liquidity without associated counter party risks. It
also provides the opportunity for cross-listing, margin
credits, carry-forward positions across Exchanges,
enables hedging and creates easy liquidity across
connected markets around the world.
Financial Technologies, Ecosystem Vertical addresses
upstream and downstream opportunities to support its
Exchanges, including clearing and depository, information
dissemination, warehousing and collateral management,
payments processing and financial market education,
among others.
OVERVIEW
1FINANCIAL TECHNOLOGIES OVERVIEW
7
T E C H N O L O G Y V E R T I C A L S
Exchange Solutions
Brokerage Solutions
Messaging Solutions
Consulting Solutions

Financial Technologies (India) Ltd. | ANNUAL REPORT 2012-13
Commodity & Collateral Management
Commodity
ots ana ah ain
t es pot
a iti s ingapo e
bai
International Multi-Asset Exchanges
Energy Forex Spot
Payments Processing
Digital Information Broadcasting
Knowledge Training
E X C H A N G E V E R T I C A L S
8
V E R T I C A L S
E C O S Y S T E M

M A R K E T SEXCHANGESOLUTIONS
1 FINANCIAL TECHNOLOGIES OVERVIEWProduct Overview
9
PRODUCTOVERVIEW
Financial Technologies (India) Ltd. (FTIL) is a global leader in creating and operating technology-centric,
next-generation financial markets that are transparent, efficient and liquid, across multi asset classes, including
equities, commodities, currencies and bonds, among others. Its highly robust and scalable Exchange and trading
technology, coupled with deep domain expertise, gives it a decisive edge in driving mass disruptive innovation that
is unmatched in financial markets. This uniquely positions FTIL as the creator of electronic, organized and regulated
financial markets for new asset and investor classes that are either under-served or economically unviable to be
served by traditional markets.
FTIL’s trading technology offerings can be broadly classified into Exchange Solutions, Brokerage Solutions,
Connectivity Solutions, Messaging Solutions and Consulting Solutions.
DOME
CnS
TMFX-Direct
TMFOVEA
Risk Management
TMTRADEDART
TMMarketXstream
TMDMATS
TMPowerARMS
TSO
eRegistry
ECS
PRODUCTS Commodity Equity Currency Fixed Income Energy/Power
Available Not Available

CONNECTIVITYSOLUTIONS
FTNET
TMSTP-Gate
MESSAGINGSOLUTIONS
Financial Technologies (India) Ltd. | ANNUAL REPORT 2012-13
10
TM TMOver and above major domestic markets, ODIN and Match support international Exchanges – ADX (Abu Dhabi), DFM (Dubai), DGCX (Dubai), Tadawul Stock Exchange (Saudi Arabia), SMX (Singapore) and GBOT (Mauritius)
*Availability of the above Products is subject to regulatory approvals, if any.
Available Not Available
ESG
CONSULTINGSOLUTIONS
Commodity Equity CurrencyPRODUCTS*
M A R K E T SBROKERAGESOLUTIONS
FRONT OFFICE
TMODIN
TM ODIN Institutional
TM ODIN Diet
TMNeT.net
TMiWin
TMiWin Touch
TMODIN Program Trading
TMODIN Greek Neutralizer
TMODIN Advanced Charting
TMODIN ATS
TMODIN Atlas
TMProtector
TMe-Hastakshar
TMMATCH
IT Consultancy Process Consultancy Quality Assurance Facility Management
MIDDLE OFFICE
BACK OFFICE

1 FINANCIAL TECHNOLOGIES OVERVIEWCompany Profiles
The Indian financial markets have evolved significantly. India was one of the first globally to lead in electronic trading of equities across its Exchanges. Then came multiple commodity Exchanges, followed by energy and currency. Indian investors embraced these new asset-classes into their portfolios. The brokers who offered only equities, commenced offering multiple asset-classes. Imagine a dealing room with trading terminals of varied asset-classes, various market participants and several Exchanges — BSE, NSE, MCX, NCDEX, MCX-SX, etc. and the complexity that came with it. In trading. In risk management.
Enter Financial Technologies (India) Ltd. (FTIL).
FTIL brought for the first time — the power of multi-asset trading on a TMsingle application through ODIN — a robust and reliable trading
solution — that enabled traders to transact across multiple Exchanges TMand multiple products on a single platform. ODIN created a
nationwide heterogeneous network of trading terminals reaching thousands of towns and cities facilitating market access to multiple Exchanges and empowering brokerage houses.
Subsequently, FTIL developed a host of solutions that cater to equity, treasury, forex, commodity, derivatives, debt and depository segments covering all stages of a trade life cycle to deliver single-point transaction fulfillment. Thus, it delivered mission critical applications with high reliability in one of the fastest evolving financial markets of India. It emerged as the preferred technology partner for deploying straight through processing (STP) solutions for the technology-intensive financial services sector. FTIL was one of the first technology providers in the Indian financial market space to offer real-time connectivity to Exchanges with faster inter-segment trading and an integrated back-office system.
With its Exchange Technology Solutions, FTIL addressed vital prerequisites for Exchanges — providing scalable architecture allowing business expansion and offering comprehensive risk management. FTIL provided integrated solutions which are scalable, easy to maintain and matched the foreseen and unforeseen requirements of Exchanges to efficiently manage their fast-growing transaction volumes. FTIL facilitated change within the financial services industry and revolutionized the financial marketplace by the creation of a single global network.
From
MULTIPLE TRADING TERMINALS
FINANCIAL TECHNOLOGIES (INDIA) LTD. (FTIL)
11

Financial Technologies (India) Ltd. | ANNUAL REPORT 2012-13
CERTIFICATION, AWARDS & RECOGNITION
Ÿ FTIL received its ISO 20000:2011 certificate and is
amongst the first 50 organizations in India and the
first 600 organizations world-wide to attain this
certification
Ÿ FTIL due to its well-defined and quality-proven
processes also received its ISO 14001:2004
certificateTM
Ÿ FTIL’s STP-Gate nominated and won the SKOCH
Digital Inclusion Award 2012 in innovations category
Ÿ FTIL consecutively featured in the American Bankers
FINTECH 100 Rankings for 2011 and 2012
w w w . f t i n d i a . c o m
12
KEY MILESTONES DURING FY 2012-13
Ÿ Keeping in pace with growing needs of the market, FTIL equipped its Exchange Technology Solutions to cater
newer asset classes viz. Equity, Equity Derivatives, Currency Options recently launched at MCX-SX. Additionally,
FTIL successfully implemented 'TSO Workflow Management System' at IEX.
Ÿ FTIL’s Exchange Technology Division implemented its Energy Market Management System (EMMS) for Gulf
Co-operation Council Interconnection Authority (GCCIA).
Ÿ Maintained leadership position with brokerage technology solutions in domestic retail and institutional space. With TMenhanced capabilities ODIN integrated with new Exchange segments — MCX-SX equity and derivative segments,
Universal Commodity Exchange (UCX) commodity futures segment and in primary market for OFS segment.
TMŸ ODIN Institutional extended to provide Execution-based Algorithms, Block Release and IOI (Indication of
Interest) functionality with 24x7 order acceptance catering clients of different time-zones across the world.
TMŸ Introduced ODIN QDP* to enable Qualified Foreign Investors (QFI) to participate in the Indian equity markets
TMand STP-Gate Debt Market*, a messaging solution for the debt market participants to address the challenges TMfaced in non-standardized physical format of contracts. Also introduced ‘FX-ELITE ’* to provide an automated
electronic trading platform for intra-bank dealing of foreign exchange between the Central Treasury and its branches.
*These products are in the process of development, deployment and implementation
PRODUCTS & SERVICES
INSTITUTIONAL ALLIANCES/MEMBERSHIP/ASSOCIATIONS
Ÿ Exchange Solutions
Ÿ Brokerage Solutions
Ÿ Messaging Solutions
Ÿ Connectivity Solutions
Ÿ Consulting Solutions
Ÿ Banking Risk & ADF Solutions
Ÿ Partner – IBM under SVI and SVP programs
Ÿ Memberships – FICCI, CII, NASSCOM, CMAI, DSCI,
IMC
Ÿ Strategic Alliances – Microsoft, HP, Juniper, CISCO,
Dell, APC, Stratus
To
ONE SCREEN FOR ALL

During a decade of its operations, MCX, the leading online
commodity derivatives Exchange in India, has put the nation on
the map of global commodity bourses by being the third largest
commodity futures Exchange* in the world. The Exchange is also
globally ranked first in silver and gold futures*, second in natural
gas and copper futures*, and third in crude oil futures*. Today,
MCX stands as the only Exchange in India to be listed in the
equity market.
By bringing in heterogeneous groups of large and small
participants from across the nation on its online trading platform,
MCX has created a vibrant and transparent commodity
marketplace that has helped the process of risk management and
price discovery, thereby rendering efficiency to commodity value
chains. The prices discovered on MCX also serve as the national
benchmark in many commodities. Moreover, the hedging
effectiveness on MCX is comparable to those of the global
benchmark Exchanges for commodities as diverse as gold, copper
and crude palm oil.
In its endeavor to develop India’s commodity futures market, the
Exchange takes various measures, which include: a) disseminating
commodity price information; b) creating linkages with the
commodity ecosystem entities; c) organizing customized
awareness programs; d) conducting research on various relevant
topics and regularly publishing research findings; e) designing
innovative products to suit the needs of varied participants;
f) engaging with market participants; and g) sensitizing the
concerned stakeholders and authorities through our evidence-
based policy advocacy initiatives.
MCX’s market penetration — 2,100+ members; 400,000+
terminals; presence in 1,900+ cities and towns — stands
testimony to these endeavors. Moreover, through its functioning
and linkages with the broader commodity ecosystem, MCX has
created employment and income opportunities.
1 FINANCIAL TECHNOLOGIES OVERVIEWCompany Profiles
From
BEINGUNKNOWN
13
MULTI COMMODITY EXCHANGE OF INDIA LTD. (MCX)

CERTIFICATION
AWARDS & RECOGNITION
MCX has been certified to three ISO standards
including ISO 9001:2008 quality management standard,
ISO 27001:2005 information security management
standard and ISO 14001:2004 environment
management standard.
Conferred Best Commodity Exchange of the year
award at the Global Cotton Conference
MCX’s IPO was adjudged as the Best Mid-cap
Equity Deal in Asia-Pacific by FinanceAsia
Achievement Awards 2012
MCX won the FOW Award for its Gold Petal Futures
Contract under the most innovative new contract
launch by an Exchange in the metals category at
the FOW Awards for Asia 2012 organized at
Singapore
Ÿ
Ÿ
Ÿ
14
PRODUCTS & SERVICES
INTERNATIONAL ALLIANCES
DOMESTIC ALLIANCES
MCX offers trading in more than 30 commodity futures
contracts across segments including bullion, ferrous and
non-ferrous metals, energy and agricultural commodities.
Ÿ CME Group
Ÿ London Metal Exchange (LME)
Ÿ Shanghai Futures Exchange (SHFE)
Ÿ Taiwan Futures Exchange (TAIFEX)
Ÿ The Baltic Exchange
Ÿ Bombay Metal Exchange
Ÿ Solvent Extractors’ Association of India
Ÿ Weather Risk Management Services
Ÿ Dall & Besan Millers’ Association
Ÿ Ekgaon Technologies
To rd 3 LARGEST
IN TEN YEARS
KEY MILESTONES DURING FY 2012-13rd• 3 largest commodity futures Exchange globally*
• Globally, MCX wasst- 1 in silver and gold futures*nd- 2 in copper and natural gas futures*rd- 3 in crude oil futures*
• MCX maintained its leadership position in the Indian commodity derivatives market with a market share of 87.3%
in FY12-13. The average daily turnover of the Exchange during the fiscal was ` 487.90 billion.th• Recorded its highest daily turnover since inception of ` 1,199.41 billion on 15 April 2013
• Launched Kapasia Khalli, Silver 1000 and Mild Steel ingot/billet contractsrd• Silver 1000 contract witnessed record delivery of 1,010 Kg on 3 November 2012
*Based on FIA Annual volume survey, released in March 2013, in terms of the number of contracts traded during CY 2012
Financial Technologies (India) Ltd. | ANNUAL REPORT 2012-13
w w w . m c x i n d i a . c o m

11 FINANCIAL TECHNOLOGIES OVERVIEWCompany Profiles
15
Year 2003 saw a paradigm shift in the Indian Power Sector. The Electricity Act of 2003 embarked on a transformation drive to increase power generation through enhanced participation by the private sector. With competition as the underlying theme, the Electricity Act, for the first time recognized trading in power as a distinct activity and laid emphasis on building competitive power market in the country with 63 inter-state trading licensees on the OTC market trading surplus power from three months to three years. And yet, India had a unique situation where there was surplus power on a daily basis which was unutilized. Recognizing this gap the Central Electricity Regulatory Commission (CERC) introduced regulation for trading of power below three months on an Exchange platform.
Enter IEX
Since 2008, IEX has been at the forefront in shaping the market for trading in electricity on a day-ahead basis. In 2012-13, an average of 61 million units of electricity were traded in the Day-Ahead Market (DAM) at an average market clearing price of 3.49 per unit, lighting up thousands of homes and industries which would have otherwise remained in dark, either partially of completely. Despite limitation of being able to trade only in less than 11 days, the electricity exchange market today constitutes about 2.6% of the total power generated in the country and the volumes have grown at a CAGR of 59% in the last five years. IEX leads the DAM with 97% market share and has over 2,200 participants.
The advent of IEX enabled creation of a non-discriminatory marketplace with price discovery made in a most competitive way through participation of multiple parties. This led stakeholders to procure power at competitive rates through open access utilizing the exchange platform, thereby managing their power portfolio in a more reliable and cost effective way. IEX is also accelerating renewable energy deployment in the country by trading in Renewable Energy Certificates. IEX is committed to building an efficient, neutral and transparent marketplace for the benefit of all stakeholders in the system including generators, distribution licensees, traders, and consumers.
From
UNUTILIZED POWER
INDIAN ENERGY EXCHANGE LTD. (IEX)

Financial Technologies (India) Ltd. | ANNUAL REPORT 2012-13
16
INSTITUTIONAL ALLIANCES/MEMBERSHIP/ASSOCIATIONS
CERTIFICATION, AWARDS & RECOGNITION
Ÿ
Ÿ
Ÿ
Ÿ
Ÿ
Ÿ
Ÿ
Ÿ
Ÿ
Ÿ
APEx
PJM Technologies Inc
EPEX Spot
CII
FICCI
ASSOCHAM
Council of Power Utilities
th6 Enertia Award as Best Power Exchange in India
Power Line Award as Best Performing Power
Exchange
India Power Award as Best E-enabled Consumer
Platform
PRODUCTS & SERVICES
• SPOT MARKET
• Intraday
- For the same day (last 10 hours)
• Day-Ahead Market
- 15 minute block for the next day
• Day-Ahead Contingency Market
- Hourly for the next day
• FORWARD MARKET
• Dailyth- For rolling seven days (starting after 4 day)
• Weekly
• RENEWABLE ENERGY CERTIFICATES (REC)
• Solar REC
• Non-Solar REC
• ENERGY SAVING CERTIFICATES (ESCerts)
(to be launched)
To
EFFICIENTUTILIZATION
KEY MILESTONES DURING FY 2012-13
ELECTRICITYth
Ÿ Highest ever cleared volume 91,675 MWh for delivery day 24 March 2013 in Day-Ahead Market (DAM)
Ÿ Highest ever traded volume in electricity market in a year — over 22 Billion Units (kWh)
Ÿ Highest ever market share in electricity segment — 97%
Ÿ Participation crossed 2,600 (Electricity and REC)th
Ÿ Highest number of successful portfolios traded on a single day — 1,223 on 9 March 2013
REC
Ÿ Highest ever REC traded in a single trading session — 309,892 (March 2013 session)
Ÿ REC market share — 77%
Ÿ Highest number of successful portfolios traded on a single REC trading session — 1,135 (March 2013 session)
w w w . i e x i n d i a . c o m

1 FINANCIAL TECHNOLOGIES OVERVIEWCompany Profiles
17
Post-harvest credit in India is less than three percent of the agricultural
credit from banks. Traditionally, most agri-credit by banks has been on
the input side, despite the infirmities in the credit and also higher
propensity for impairment. In order to enable remunerative prices to
farmers for their agricultural produce, it is critical that either they get an
effective market linkage or are enabled to time their sale. Credit
support, thus, against their produce is crucial. Despite being a better
avenue and easily enforceable security, post-harvest credit has not
been a viable option for banks due to risks perceived in the underlying
most notably in the quality and quantity as also due to the movement
in prices.
Enter NBHC.
NBHC was started to provide comprehensive warehousing and allied
services (quality certification, pest management services, etc.) for MCX.
Soon, the demand for NBHC’s one-stop-solution expanded such that
today it is the largest private sector collateral management company in
India. Approximately, ` 472 billion worth warehouse receipts have been
issued by NBHC, funded by leading Indian banks.
NBHC is a key player in the agricultural supply chain, enabling farmers
and other stakeholders to store products in a cost-effective manner.
NBHC created favorable impact on commodities ecosystem by
providing comprehensive solutions and helping reduce post-harvest
risks. Its services include supply chain management, warehousing &
bulk handling, collateral management, commodity care and pest
management services, quality assaying & certification, audit
accreditation & valuation services.
From
DISTRESSED SELLING
NATIONAL BULK HANDLING CORPORATION LTD. (NBHC)

Financial Technologies (India) Ltd. | ANNUAL REPORT 2012-13
18
KEY MILESTONES DURING FY 2012-13
Ÿ Number of banks and financial institutions for collateral management services increased to 42 from 37.
Ÿ Achieved a major landmark ` 11,900+ crore of cumulative assets under management (AUM) with funding
facilitated of approx. ` 8,396 crore during the FY13. Total assets under management ` 9,200+ crore as at st31 March 2013.
Ÿ Trade facilitation gained further traction with foray into facilitation of international trade, additional number of
commodities both agri-commodities as well as non agri-commodities.st
Ÿ Storage facilities under management as at as at 31 March 2013 (All types — owned, leased, franchisee and
accredited) 1,574 covering 22.56+ mn sq. ft. with a capacity of 3.76 mn MTs.
Ÿ Commissioned and commenced commercial operations of warehouses across 3 strategic locations aggregating
42,000 MTs. Construction under way at another location additionally augmenting 19,000 MTs.
Ÿ Surpassed cumulatively ` 47,254+ crore of assets under management with indicative funding of ` 33,100+ crore
since inception.
To
FINANCIALSECURITY
w w w . n b h c i n d i a . c o m
PRODUCTS & SERVICES
Ÿ Supply Chain Management services
Ÿ Storage and Bulk Handling Services
Ÿ Collateral Management Services (NBHC Cecure)
Ÿ Commodity Care and Pest Management Services
(NBHC CommGuard)
Ÿ Quality Testing, Grading, Inspection, & Certification
Services (NBHC ProComm)
Ÿ Warehouse Audit and Accreditation and
Commodity Valuation Services (NBHC Mandate)
Ÿ MSP Procurement Services
Ÿ Trade Information Services
INSTITUTIONAL ALLIANCES/MEMBERSHIP/ASSOCIATIONS
CERTIFICATION, AWARDS & RECOGNITION
Ÿ NAWC – National Association of Warehousing
Corporation
Ÿ SOPA – Soyabean Processors Association of India
Ÿ PCAI – Pest Control Association of India, Member
Ÿ NPMA – National Pest Management Association,
USA, Member
Ÿ GAFTA – The Grain and Feed Trade Association,
‘F’ membership
Ÿ Certified ISO 22000:2005
Ÿ Accredited ISO 9001:2008
Ÿ NABL accreditation (ISO 17025:2005) for its
ProComm (QA) Laboratory at Vashi (Navi Mumbai)

1 FINANCIAL TECHNOLOGIES OVERVIEWCompany Profiles
INTERNATIONAL EXCHANGES
Flash back 2005. Consider this. Far East markets did not have a
dedicated commodity exchange. Nor did Middle East and the same for
Africa. The ones in China and India were closed for foreign
participation. And yet were amongst the top ten globally through just
domestic volumes. In the world where East created and West
consumed, the West dominated commodity Exchange market and East
went West for hedging.
Today, 2013.
Financial Technologies has put the East on the global Exchanges map
by setting up dedicated commodity and currency Exchanges in Dubai,
Singapore, Bahrain, Mauritius and Africa. Despite the emergence of
East as an important force influencing commodities supply and
demand, prices of benchmark commodities continue to be determined
by markets in the United States and Europe. For example, markets
take cue for oil prices from the New York Mercantile Exchange
(NYMEX), grains from the Chicago Board of Trade (CBOT), cotton from
New York Board of Trade (NYBOT) and metals from London Metal
Exchange (LME).
Being home to the fastest-growing economies and as the largest
producers and consumers of several key commodities, emerging
economies of Asia, Middle-East and Africa should have access to
domestic markets for hedging. And that’s what we are set to achieve
with a well-spread international presence in the form of – SMX, GBOT,
DGCX, BFX and Bourse Africa in economies of Asia, Middle-East and
Africa.
19
From
PRICE-TAKINGECONOMIES
From
PRICE-TAKINGECONOMIES

To
PRICE-SETTINGEMERGING MARKETS
SINGAPORE MERCANTILE EXCHANGE
(SMX)
CLEARING MEMBERS (Sample List):
TRADING MEMBERS (Sample List):
GLOBAL ASSOCIATIONS/MoUs:
PRODUCT CATEGORIES:
SMX an Approved Exchange
regulated by the Monetary Authority
of Singapore (MAS) is the first pan-
Asian multi-product commodity and
currency derivatives Exchange
offering a comprehensive platform
for trading a diversified basket of
commodities. SMX clears its trades
through it’s wholly owned
subsidiary Singapore Mercantile
Exchange Clearing Corporation
(SMXCC). SMXCC is an Approved
Clearing House regulated by MAS.
Average daily turnover of USD 200
million and average daily volume of
5,614 contracts in FY12-13.
Citigroup, Ong First Tradition, Morgan
Stanley, Newedge, UOB Bullion &
Futures, ICICI Bank, Philip Futures
Total Global Steel, Glencore, Vitol,
Transmarket
FIA, WFE, TOCOM, ORC, RTS,
Metal Bulletin, Temasek Polytechnic,
BCEC, AFET etc.
Precious Metals, Base Metals,
Energy, Currency Pairs, Agricultural
Commodities, Indices
Financial Technologies (India) Ltd. | ANNUAL REPORT 2012-13
BAHRAIN FINANCIAL EXCHANGE
(BFX)
INSTITUTIONAL ALLIANCES:
A pioneering multi-asset
international financial Exchange
based in the Kingdom of Bahrain.
Internationally accessible to trade
cash instruments, derivatives,
structured products, Shariah-
compliant financial instruments.
Launched innovative products such
as the futures contracts on
USD-INR currency index (mini
futures contract), INR-USD currency
pair, Gold, Silver as well as the MCX
$ Gold and MCX $ Silver. Won the
‘Most Innovative Forex Product thAward 2012’ at the 7 Jordan Forex
Expo (JFEX) conducted in May 2012,
for the BFX US dollar vs the Indian
Rupee (USD-INR) Index Futures.
The BFX successfully conducted
several corporate social
responsibility (CSR) educational
workshops titled ‘Understanding the
Financial Derivatives Markets from
Theory to Practice’ for university
students in the Kingdom of Bahrain.
Bahrain Association of Banks
(BAB), International Islamic
Financial Market (IIFM), Chartered
Institute for Securities &
Investments (CISI), Institute of
Credit Management (ICM)
GLOBAL BOARD OF TRADE
(GBOT)
PRODUCTS:
Global multi-asset class Exchange
based in Mauritius; licensed by
Financial Services Commission, stMauritius. 1 Exchange in Africa
ndand 2 in the world to successfully
launch CFD contracts.
GBOT signed an MOU with
University of Technology, Mauritius
to impart financial market
education. First Exchange in the
world offering two African
currencies USD/MUR and
ZAR/USD.
Conducted over 50 GBOT EDGE
Workshops on ‘Art of trading &
Investment’ in Mauritius. GBOT
recorded highest daily turnover of
USD 55.29 million in FY12-13.
Commodity Futures:
Gold, Silver and WTI Crude Oil
Currency Futures:
EUR/USD, GBP/USD, JYP/USD,
ZAR/USD, USD/MUR
CFDs:
Gold, Silver, WTI Crude Oil,
EUR/USD, GBP/USD
w w w . s m x . c o m . s g w w w . b f x . b h w w w . g b o t . m u
20

1 FINANCIAL TECHNOLOGIES OVERVIEWGlobal Presence
GLOBAL PRESENCE
FINANCIAL TECHNOLOGIES (INDIA) LTD.
FT Tower, CTS No. 256 & 257, Suren Road,
Chakala, Andheri (East), Mumbai – 400 093, India.
T: +91 22 6686 1010
F: +91 22 6686 1050
21
Chennai (Registered Office)
Ahmedabad
st 1A & B, 1 floor, Doshi Towers, 156, Periyar EVR Salai, Kilpauk, Chennai – 600 010.
T: +91 44 4395 0850/51F: +91 44 4395 0899
thA-1011, 10 floor, Atma House, Opp. Old RBI, Near Times of India, Ashram Road, Ahmedabad – 380 009.
T: +91 79 3007 4141F: +91 79 3007 4957
Delhi
Hyderabad
th501-505, 5 floor, World Trade Center, Babar Road, Connaught Place, New Delhi – 110 001.
T: +91 11 4300 3000F: +91 11 4300 3030
ndDoor no. 201, 2 floor, Meridian Plaza 6-3-853, Ameerpet, Hyderabad – 500 016.
T: +91 40 3250 6470F: +91 40 4007 5037
Bengaluru
Kolkata
nd2 floor, 206, Money Chambers 6, K. H. Road, Bengaluru – 560 027.
T: +91 80 4167 3706M: +91 99 4565 4307
rdBNCCI House, 3 floor, 23, R. N. Mukherjee Road, Kolkata – 700 001.
T: +91 33 6615 9000F: +91 33 6615 9010
United Arab Emirates
Financial Technologies Middle East1310, Tiffany Towers, Jumeirah LakeTowers, P. O. Box 212010, Dubai, UAE.
T: +97 155 708 0139
CORPORATE OFFICE
INTERNATIONAL OPERATIONS
INDIA OPERATIONS

Financial Technologies (India) Ltd. | ANNUAL REPORT 2012-13
22
EXCHANGE VENTURES
Multi Commodity Exchange of India Ltd.
National Spot Exchange Ltd.
Indian Energy Exchange Ltd.
Exchange Square, CTS No. 255, Suren Road, Andheri (East), Mumbai - 400 093.
T: +91 22 6731 8888F: +91 22 6649 4151
FT Tower, CTS No. 256 & 257, Suren Road, Chakala, Andheri (East),Mumbai - 400 093.
T: +91 22 6761 9900F: +91 22 6761 9931
100A/1 Ground floor, Capital Court, Olof Palme Marg, Munirka, New Delhi - 110 067.
T: +91 11 4300 4000F: +91 11 4300 4015
Singapore Mercantile Exchange Pte Ltd.
Bahrain Financial Exchange
Global Board of Trade Ltd.
Bourse Africa Ltd.
Dubai Gold & Commodities Exchange
3 Phillip Street#12-04 Royal Group BuildingSingapore 048693.T: +65 6590 3700F: +65 6532 2773
th12 Floor, East Tower, Bahrain Financial Harbour, King Faisal Highway, Manama, P. O. Box 1936, Kingdom of Bahrain.T: +973 16 511 511F: +973 16 511 599
stEbène House, 1 Floor,33 Cybercity, Ebène,Republic of Mauritius.T: +230 404 0000F: +230 464 7000
Plot No. 50664, FairgroundsOffice Park, P. O. Box 4966Gaborone, Botswana.
T: +267 316 0605F: +267 316 0622
Emaar Business Park, Bldg No. 2,
Level 1, Sheikh Zayed Road,
P. O. Box 37736, Dubai, UAE.
T: +9714 361 1616F: +9714 361 1617
INDIA INTERNATIONAL
National Bulk Handling Corporation Ltd.
atom Technologies Ltd.
TickerPlant Ltd.
FT Knowledge Management Company Ltd.
th9 floor, Everest Nivara Infotech, Plot No. D-3, TTC Industrial Area, Turbhe, MIDC, Navi Mumbai - 400 705.
T: +91 22 3063 1000F: +91 22 3063 1010
FT Tower, CTS. 256 & 257, Suren Road, Chakala, Andheri (East), Mumbai - 400 093.
T: +91 22 6686 4010F: +91 22 6686 4050
FT Tower, CTS. 256 & 257, Suren Road, Chakala, Andheri (East),Mumbai - 400 093.
T: +91 22 6686 6010F: +91 22 6686 6050
FT Tower, CTS No. 256 & 257, Suren Road, Chakala, Andheri (East),Mumbai - 400 093.
T: +91 22 6686 1010F: +91 22 6686 6050
ECOSYSTEM VENTURES

1 FINANCIAL TECHNOLOGIES OVERVIEW6 Years at a Glance
6 YEARS AT A GLANCE
STANDALONE
Financial Performance (Excluding capital gains, diminution in long term investment and exceptional items)
Total Income
EBITDA
Profit After Tax
2,311
1,384
970
4,994
3,292
2,702
4,114
2,163
1,880
4,378
2,429
2,063
5,446
3,662
2,670
6,574
4,679
3,229
20122011201020092008 2013
CONSOLIDATED
Financial Performance(Excluding capital gains, diminution in long term investment and exceptional items)
Total Income
EBITDA
Profit After Tax
3,692
1,266
712
5,015
1,211
992
4,167
(668)
(162)
4,917
(359)
(541)
6,377
1,273
674
9,560
4,000
2,274
20122011201020092008 2013For the Financial Year Ended
For the Financial Year Ended
23
` million
` million

FINANCIAL HIGHLIGHTS
1 FINANCIAL TECHNOLOGIES OVERVIEWFinancial Highlights
Financial Technologies (India) Ltd. | ANNUAL REPORT 2012-13
TOTAL INCOME EBITDA PAT
FINANCIAL PERFORMANCE | Standalone
` m
illio
n`
mill
ion
131211100908
2,31
1
4,99
4
4,11
4
4,37
8
5,44
6
6,57
4
131211100908
1,38
4
3,29
2
2,16
3
2,42
9
3,66
2
4,67
9
1312111009081,
880
2,06
3 2,67
0
2,70
2
970
3,22
9
TOTAL INCOME EBITDA PAT
FINANCIAL | PERFORMANCE Consolidated
131211100908
3,69
2
5,01
5
4,16
7 4,91
7
6,37
7
9,56
0
131211100908
1,26
6
1,21
1
(668
)
(359
)
1,27
3 4,00
0
131211100908
(162
)
(541
) 67499
2
712
2,27
4
24

HUMAN CAPITAL OVERVIEW
1 FINANCIAL TECHNOLOGIES OVERVIEWHuman Capital Overview
During 2012-13, Financial We have a centralized internal
Technologies maintained its online system for recruitment.
momentum on key people priorities.
HR Department’s (HRD) agenda
continued to provide vigor to its – an Employee Referral human capital with an aim to build
scheme, contributes the most dynamic leadership pipeline that among all human resources can drive its strategic goals in a bid sourcing channels; this year it to inculcate high-performance accounted for 26%. Such a high culture. share of sourcing through internal
Through our activities, we ensure scheme is a true testimony to our
ample opportunities are provided to employee friendly work culture.
succeed and reorient the human We believe in commencing the resources to achieve professional journey of a new joiner to the goals. Keeping our belief of having organization with a detailed a judicial mix of experience and Induction Program. A well-defined youth in our staff strength, we Job Description (JD) and Key continued to undertake competitive Result Areas (KRAs) are shared to campus recruitment drives to enrich facilitate proper understanding of our human capital besides job the role and to enable long term portals and placement consultants.career planning.
We, at Financial Technologies, Strings – Building High
follow the spirit of ‘Affirmative Performance Teams
Action Policy’ for hiring and
sourcing talent. Our aim is to hire After the successful completion of highly talented professionals who workshop - ‘Symphony’ and based are adept in terms of functional as on the feedback received we well as managerial abilities. We also formulated ‘Strings’ a program with conduct benchmark studies in a view to build synergies within order to measure our market teams and the organization as a standing vis-à-vis competitors. whole.
PARICHAY
TALENT MANAGEMENT AND LEARNING AND DEVELOPMENT
ACQUISITIONINITIATIVES
25
Financial Technologies (India) Ltd. | ANNUAL REPORT 2012-13
26
A ‘Symphony orchestra’ symbolizes to implement the key take-aways In Phase-II the certification drive
extraordinary teamwork that results through training in real work life. was expanded to development
in creation of a masterpiece and teams of other Group Companies. The event helped us reinforce the
has four main elements - Strings, In addition, IT and networking feeling of belongingness and
Brass, Woodwind, and Percussion. related certifications, capital market teamwork among the participants.
Thus, our program complementing and equity derivative module The key message for the participants
Symphony was titled 'Strings' which certifications were underway. was that their routine operations
is also the important element in the Overall, the initiative was successful also contribute to achieving bigger
orchestra. Metaphorically, it involves with a valuable support and organizational goals.
various performers (Executives) who involvement of HODs, Team Heads
work in synergy; in accordance to and participants.
the conductor (Team Leader) to Grooming of Contractual Staff
achieve a musical masterpiece
(Business Goals). This program has In recent times, there has been been designed for executives to considerable rise in the number of
Independence Day, 2012provide a fresh and inspiring contractual employees. Hence, the perspective on self-leadership, team HRD specially designed a program We celebrated the completion of 65 synergy and goal setting for to groom contractual employees in years of Independence with great business and oneself. order to make them aware of the patriotic spirit and cheer. Activities
Corporate Culture and strengthen planned included:their Communication Skills. The
Program Objectives: • Clothes, Shoes, Books and program focused on, code of Stationery Donation Drive in conduct, IT and security standards,
• To understand the basics of association with NGOs Mumbai corporate and email etiquettes, time
team formation Mobile creches and GOONJand task management, non-verbal
• To understand the traits of an communication, among other.• Exhibition and Sale of Products effective team player
made by children of • To identify and practice methods NGO - ‘Aseema’FTIL Certified Professional
of dealing with others that Initiative Fun-filled performances on promotes team spirit,
Independence theme by our in-cooperation and open In our constant endeavor to groom house talent followed by special communication and develop skills, and to keep dance workshop on - ‘Spirit of employees abreast of emerging
• To develop techniques for Freedom’. The Celebration started trends in the industry and creating cohesive work-groups with lighting of Diyas by our Chief technology, we launched FTIL by recognizing, acknowledging Guest Mr. Dewang Neralla, Director Certified Professional Initiative. It is and appreciating one’s (Technology), and the event began a development focused initiative capabilities with employees paying a tribute to that helps the employees in
the Nation with the National • To foster trust within teams and undertaking industry acknowledged Anthem. This was followed by floor-among team-members Domains and Technology wise song performances on the Certification.
• To focus on importance of low theme.turnaround time In Phase-I of certification drive, 539
employees from FTIL participated in • To develop skills enabling positive
the process, wherein 382 action on problems faced by
employees undertook technical group without causing conflict
tests and 156 employees from We participated in the ‘STILLS Business and Audit Manual team So far we have concluded six 2012’ – Corporate Photography participated in MCX Certified workshops of ‘Strings’, where we Festival organized by Woot Factor Commodity Professional (MCCP) invited senior leaders to share their and its associates such as Lonely Certification Program. ‘Financial inspiring journey to leadership, and Planet, iStore, Olympus, Apple, etc. Technologies Certified Professional their perspective of operational The program provided an Accreditation’ was awarded to the effectiveness and collaborative opportunity to its participants to employees who successfully teamwork. We also invited the exhibit their artistic and creative cleared the tests and they became managers of ‘Symphony’ to share talent, where employees sent a part of ‘the League of FTIL their perceptions on the changes original photographs of nature, Certified Professionals’.post-Symphony workshop and ways people, animals, street scene, etc.
FUN@WORK INITIATIVES
STILLS 2012

27
clicked by them tagged with a commenced with a dress walk
creative caption. This year ‘STILLS wherein the participants exhibited Juniors’ Day Celebration was
2012’ – Season 3 was promoted different styles of attire that can be organized on Christmas Eve with a
quite innovatively and created a worn at different times and view to enhance pride, sense of
powerful employee connect occasions. The Dress Walk belonging and family bonding
experience. HR, in association with received huge applaud and cheer amongst members across the
IT and Communications, rolled out from all the women present at the organization. Our celebration started
a unique ‘Employee Communication celebration. with Carol singing by a group of
Strategy’ for encouraging our employees. This was followed
participation. Our IT Team created by a very lively puppet show by
a special online interface for The Puppetarians. The little ones
employees to submit their entries were completely enthralled by the
and to create a connect with our puppetarians and were engrossed
employees and get wide-spread all throughout the show. Our Tattoo
participation, we launched a Weekly Corner, Snowman Corner, Lucky
Bulletin called the STILLS Corner, Hair Braiding Corner and
BULLETIN to share with them the Coffee Painting Corner added a
Stills Scorecard on a regular basis. special sparkle to the event.
We won the Top Corporate Award Pratham – An NGO held a Books
(along with Roche Diagnostics) for Exhibition of its latest children’s
maximum employee participation Books, Games and Craft models at
and for executing the ‘Most- the venue. The main highlight of
Innovative Marketing Plan’ to the event was the entry of our
promote the festival within our beloved Santa Claus. At the end of
organization. To our pride, five of the event, return gifts were distributed
our short-listed entries were to all participating children.
displayed for public viewing at the
‘Grand Finale STILLS Showcase’
and they have been awarded with a
Certificate of Appreciation.
On the occasion of International
Women’s day, we had arranged an
event that displayed the thOn 9 November, 2012 we indomitable spirit of a Woman.
celebrated the auspicious festival of As a part of the celebration, a Diwali. Activities planned for the surprise gift was kept at the desk day included,of each woman employee before
they arrived at the workstations. In • CSO-based Event – Exhibition addition, an e-card flashed on their and sale of products by NGOs - screens wishing them a Happy IDOBROWomen’s Day when they switched
• Traditional Day, floor-wise on their computers. These small Decoration, Individual/Group gestures received huge Talent Shows appreciation from all women
employees. Additionally, IDOBRO In the evening, Diwali Celebrations
organized an exhibition-cum-sale of commenced at FT Tower Cafeteria
handicrafts, apparel, stationery, with lighting of Diyas by our Senior
jewellery, home decor and Leaders and was followed by floor
accessories.wise group/individual; performance
by the employees. Each floor All women employees assembled at participated enthusiastically in the the celebration venue in evening performances and the audience with a glint of excitement and was seen cheering and enjoying enthusiasm. The celebration
.
JUNIOR’S DAY, 2012
INTERNATIONAL WOMEN’S DAY,
2013
DIWALI CELEBRATION, 2012
1 FINANCIAL TECHNOLOGIES OVERVIEWHuman Capital Overview

Financial Technologies (India) Ltd. | ANNUAL REPORT 2012-13Financial Technologies (India) Ltd. | ANNUAL REPORT 2012-13
DIRECTORS’ REPORT
• Financial Performance
• Result of Operations
• Business Overview
• Corporate Social Opportunity
• Statutory Information
A N N U A L R E P O R T 2 0 1 2 - 1 3

DIRECTORS’ REPORT
9,559.93
5,560.04
3,999.89
979.98
326.82
2,693.09
1,425.46
1,267.63
1,020.36
(13.60)
2,274.39
9,090.04
11,364.43
92.16
276.47
61.69
325.30
0.82
8.47
10,599.52
49.36
48.42
6,574.21
1,895.71
4,678.50
428.37
225.40
4,024.73
795.92
3,228.81
3,228.81
17,951.35
21,180.16
92.16
276.47
60.51
325.30
20,425.72
70.07
69.48
8,343.00
5,103.90
3,239.10
671.78
316.40
2,250.92
620.89
1,630.03
1,028.31
(17.82)
2,640.52
7,404.65
10,045.17
92.16
276.47
59.80
526.00
0.70
0
9,090.04
57.30
57.30
7,944.07
2,172.10
5,771.97
304.42
173.01
5,294.53
514.24
4,780.29
4,780.29
14,125.49
18,905.78
92.16
276.47
59.80
526.00
17,951.35
103.74
103.74
To,
The Members,
Your Directors present the Twenty Fifth Annual Report of your Company together with the Audited Statement of stAccounts for the year ended 31 March, 2013.
Previous Year2011-12
Previous Year2011-12
FINANCIAL PERFORMANCE (` in million, except per share data)
Total Income
Total Operating Expenditure
EBITDA
Interest
Depreciation/amortization
Profit before tax
Provision for taxation
Profit after Tax/Net Profit for the year
Add: Net share of profit in associates
Add: Net minority interest in profit of subsidiaries
Profit after Tax/Net Profit for the year
Add: Balance brought forward from previous year
Balance available for appropriation
Appropriations
Final dividend (proposed)
Interim dividend
Tax on dividend
Transfer to General Reserve
Transfer to Statutory Reserve
Transfer to Security Guarantee Fund
Balance carried forward to Balance Sheet
Earnings per share
Basic
Diluted
ParticularsCurrent Year
2012-13Current Year
2012-13
2 DIRECTORS’ REPORT
29
ConsolidatedStandalone

RESULT OF OPERATIONS:
BUSINESS OVERVIEW
Vertical of your Company embraces and features that cater to the
Exchange Technology Solutions, growing needs of members to Consolidated Financials
Brokerage Solutions, Connectivity provide robust risk management
Solutions and Consulting Solutions. service to their clients.• During the year under review, the
income from operations grew by Exchange Technology Solutions are During the year under review, your
50% to ` 752 crores from enabling the world’s leading Company launched a new tablet
` 501 crores for the year ended exchanges to seamlessly operate in website solution designed to
st31 March 2012.cross-border markets. Keeping optimize user experience in the
pace with the growing needs of the iPAD and other tablet markets. The • Net profit (excluding capital gain market, Company’s Exchange Company also launched advanced on sale/redemption of shares Technology Division has equipped version of browser-based trading and diminution in long term its solutions to cater to fixed interface and mobile-trading investments) for the year ended
st income markets as well as newer application to provide superior 31 March 2013, increased by asset classes, viz. equity derivatives trading experience to customers 239% to ` 227 crores from and currency options. This division over the internet. This has enabled ` 67 crores for the year ended
st implemented Energy Market customers to access the services 31 March 2012.Management System (EMMS) at anywhere and anytime with
Gulf Co-operation Council contextual interactions.Standalone FinancialsInterconnection Authority (GCCIA) TMThis year ODIN Institutional went • The total revenue from to help seamless exchange of
live on various execution-based operations for the year ended electricity between GCC and the
st algorithms, institutional order slicing 31 March 2013 was at Middle-East countries. GCCIA is a
mechanism (block release), IOI ` 4,509 million as compared to joint stock company subscribed by
(indication of interest) functionality, ` 4,255 million for the year the six gulf countries (Kuwait, Saudi
st smart order routing (SOR) and algo ended 31 March 2012, an Arabia, Bahrain, Qatar, the United orders. Your Company has increase of 6%. Arab Emirates and Oman) formed introduced FIX 24x7 functionality
with the objective to provide • The standalone profit after tax that enables the sell-side brokers to
reliable, competitive and (excluding capital gain on accept orders all day from buy-side
sustainable transmission service.sale/redemption of shares and clients who route orders from different
diminution in long term time-zones across the world.Your Company also leads in India’s
investments) increased by 21% to brokerage technology solutions
Another milestone was the addition ` 323 crores from ` 267 crores TMspace with ODIN continuing to be st of the Qualified Depositories for the year ended 31 March the first choice of every brokerage
Participants (QDP) product suite. 2012.house in India holding a major
These products are specifically market share in the country’s
Qualification in Audit Report developed for QDP as per the electronic trading solutions space.
recent regulations laid down by TMDuring the year, there are no This year, ODIN ’s capabilities were SEBI to enable Qualified Foreign
qualifications in the Auditor’s enhanced to integrate with new Investors (QFI) to participate in the
Report. However the Auditor’s exchange segments – MCX-SX Indian equity markets.
report comprising of emphasis of equity and derivative segments, matter with related to standalone As an endeavor to establish our Universal Commodity Exchange and Consolidated Audit Report presence in the OTC Market, your (UCX) commodity futures segment which has been covered elsewhere Company launched a new forex and in primary market for OFS (offer in this Annual Report including trading product ‘FX-ELITE’. This for sale) segment. Also, ISIN-based Management Response. solution is specifically developed news integration was enabled with
for providing an automated multiple vendors such as Heckyl and electronic trading platform for TickerPlant, among others.intra-bank dealing of foreign
Risk management system/processes exchange (spot and forward (RMS) are being continually Fiscal Year 2012-13 contracts) thus enabling a smoother boosted and adapted to the workflow between the Central Your Company’s approach has changing global risks scenario and Treasury of a Bank and its branches.been multipronged, founded on the the regulatory structure, by your
three pillars viz., Technology, Your Company’s Consulting Company. During the year, RMS Exchanges and Ecosystem Solution - ESG added to its modules have been revamped and Ventures that define its innovative services - Datacenter Hosting, made more dynamic with addition growth model. The Technology which is a low latency proximity of many advanced RMS parameters
Financial Technologies (India) Ltd. | ANNUAL REPORT 2012-13
30
2 DIRECTORS’ REPORT
31
hosting solution that helps clients to highest-ever REC traded in a single Mobile and POS. atom
host their servers and connect with trading session - 309,892 (March Technologies provides financial
various exchanges efficiently using 2013 session). inclusion technology solutions
algorithm trading applications. ESG combining mobile and biometric Among your Company’s also added Information Security technologies, and micro-finance international exchanges spread Awareness Programs that enable products. Amongst other across Asia, Middle-East and secured IT Infrastructure for clients. developments, atom Technologies Africa, SMX has successfully launched IMPS based payment
Along with technological launched the negotiated trade options, and mobile banking. competences and domain facility across all its products and Additionally, it has enhanced its expertise, your Company is today became a correspondent exchange payments portfolio to include multi the world’s largest creator of green- of World Federation of Exchanges bank EMI.field exchanges and complementing (WEF). SMX bagged 3 Awards at them with ecosystem ventures that Among other notable ‘FOW Awards for Asia 2012’, strengthen the scope of financial developments, TickerPlant including the most innovative new markets. Its wide institutional incorporated new functionalities in contract launch by an Exchange for framework of exchanges and its product offerings with ‘SMEURUSD’ and ‘SMPEPPER’.ecosystem ventures formulate a commissioned enhancements in
BFX became a member of the comprehensive market structure not decision support tools, pivot point Bahrain Association of Banks only in India but also globally. analytics and technical indicators (BAB). Additionally, BFX futures like Ichimoku and smoothened RSI.
rdIn the commodity exchange space trading since its launch on 23 It has seamlessly integrated stin India, MCX maintained its November 2011 up to 31 March MCX-SX Cash and F&O segments,
leadership position with a market 2013, increased to USD 68.16 and ACE exchange.share of 87.3% in the year. It has billion. This year BFX conducted
Detailed information on each of these recorded the highest-ever daily several educational workshops titled business lines and their respective turnover of ` 1,199.41 billion. MCX ‘Understanding the Financial ventures has been covered elsewhere in launched two new contracts – Derivatives Markets from Theory to this Annual Report.
‘Kapasia Khalli’ and ‘Silver 1000’ Practice’ for university students in during the year. the Kingdom of Bahrain under its
corporate social responsibility NSEL, in its bid to enrich its
(CSR) initiatives.e-Series bouquet of investment
product, added the ‘e-Platinum’. It, GBOT collaborated with University The Company follows a stable also, undertook MSP pulses and of Technology, Mauritius, to dividend payout policy. Your oilseed procurement for SFAC in promote education on financial Company has paid consecutive Gujarat, Maharashtra and Rajasthan markets through workshops, dividend for last 29 quarters which is and procured the agro-commodities certification courses and simulation in accordance with sustainable worth over ` 2.39 cr. In a drive to on GBOT markets. GBOT dividend payout policy of the bring coffee-growers under the conducted over 50 EDGE Company and linked to its long term umbrella of its services, NSEL (Empowerment & Development growth objectives. During the year signed a pact with Coffee Board of through ‘Global Financial Markets’ under review, your Company paid India to create a Warehouse Education) workshops with in-house three interim dividends totaling Receipt-based electronic Spot and external experts from the 276.47 million ( 6 per share on Market for coffee beans. financial fraternity. par value of 2/- per share). The
Directors recommended a final With respect to the ecosystem Your Company’s another exchange dividend of 2/- per share, subject ventures, NBHC successfully venture in energy segment; IEX to the approval of the shareholders associated with new banks and successfully completed 5 years and at the ensuing Annual General other financial institutions this year continues to be India’s first and Meeting. The total dividend – namely, Central Bank of India, premier power exchange with 95% including interim and final – Hadoti Kshetriya Gramin Bank, J&K market share. IEX recorded highest- aggregated 8/- per share, for the Bank, Dombivli Nagari Sahakari stever cleared volume 91,675 MWh financial year ended 31 March 2013
th Bank, Ratnakar Bank and L&T for delivery day 24 March, 2013 (previous year 8/- per share on par Finance Holdings.and unconstrained volume of value of 2/- each). The total
st115,036 MWh for delivery day 31 atom Technologies is a payment appropriation on account of interim March 2013 in Day-Ahead Market service provider providing payment and final dividend and tax thereon (DAM) segment. IEX recorded processing through Internet, IVR, amounts to 429.15 million.
DIVIDEND
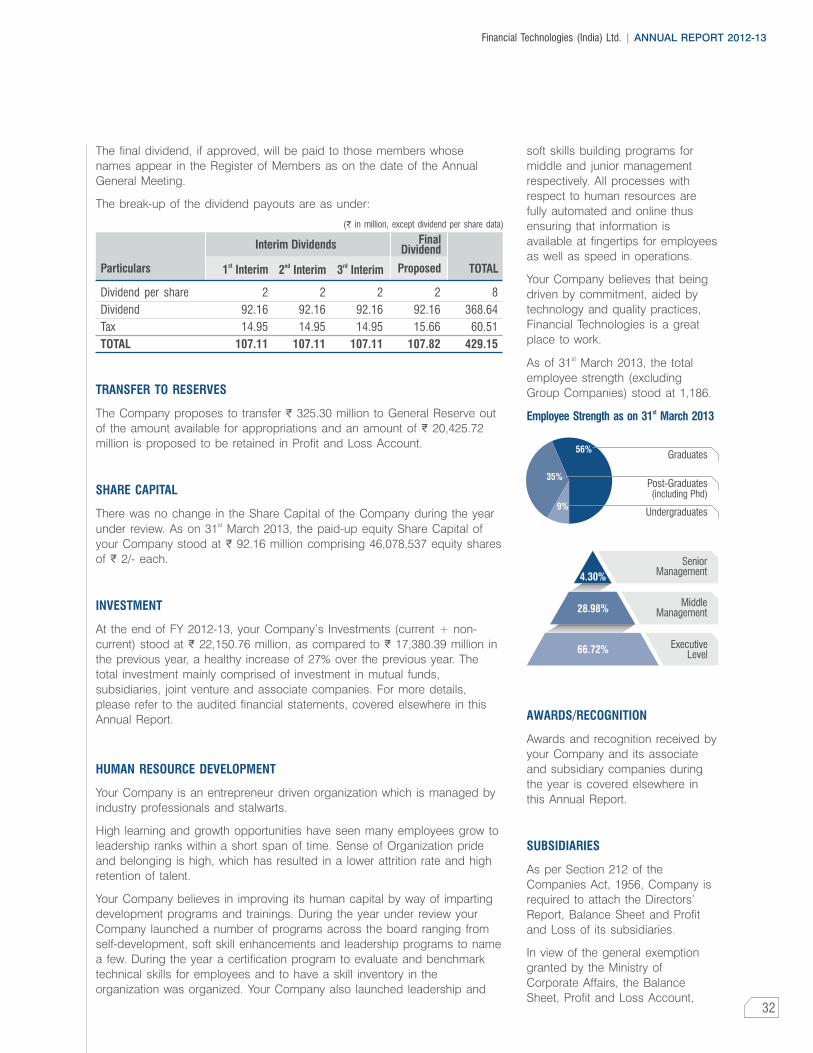
Financial Technologies (India) Ltd. | ANNUAL REPORT 2012-13
32
The final dividend, if approved, will be paid to those members whose soft skills building programs for
names appear in the Register of Members as on the date of the Annual middle and junior management
General Meeting. respectively. All processes with
respect to human resources are The break-up of the dividend payouts are as under:
fully automated and online thus
ensuring that information is
available at fingertips for employees
as well as speed in operations.
Your Company believes that being
driven by commitment, aided by
technology and quality practices,
Financial Technologies is a great
place to work.
stAs of 31 March 2013, the total
employee strength (excluding
Group Companies) stood at 1,186.
The Company proposes to transfer ` 325.30 million to General Reserve out
of the amount available for appropriations and an amount of ` 20,425.72
million is proposed to be retained in Profit and Loss Account.
There was no change in the Share Capital of the Company during the year stunder review. As on 31 March 2013, the paid-up equity Share Capital of
your Company stood at ` 92.16 million comprising 46,078,537 equity shares
of ` 2/- each.
At the end of FY 2012-13, your Company’s Investments (current + non-
current) stood at ` 22,150.76 million, as compared to ` 17,380.39 million in
the previous year, a healthy increase of 27% over the previous year. The
total investment mainly comprised of investment in mutual funds,
subsidiaries, joint venture and associate companies. For more details,
please refer to the audited financial statements, covered elsewhere in this
Annual Report.
Awards and recognition received by
your Company and its associate
and subsidiary companies during
the year is covered elsewhere in Your Company is an entrepreneur driven organization which is managed by
this Annual Report.industry professionals and stalwarts.
High learning and growth opportunities have seen many employees grow to
leadership ranks within a short span of time. Sense of Organization pride
and belonging is high, which has resulted in a lower attrition rate and high As per Section 212 of the
retention of talent.Companies Act, 1956, Company is
Your Company believes in improving its human capital by way of imparting required to attach the Directors’ development programs and trainings. During the year under review your Report, Balance Sheet and Profit Company launched a number of programs across the board ranging from and Loss of its subsidiaries.self-development, soft skill enhancements and leadership programs to name
In view of the general exemption a few. During the year a certification program to evaluate and benchmark
granted by the Ministry of technical skills for employees and to have a skill inventory in the
Corporate Affairs, the Balance organization was organized. Your Company also launched leadership and
Sheet, Profit and Loss Account,
TRANSFER TO RESERVES
stEmployee Strength as on 31 March 2013
SHARE CAPITAL
INVESTMENT
AWARDS/RECOGNITION
HUMAN RESOURCE DEVELOPMENT
SUBSIDIARIES
8
368.64
60.51
429.15
2
92.16
15.66
107.82
2
92.16
14.95
107.11
2
92.16
14.95
107.11
2
92.16
14.95
107.11
(` in million, except dividend per share data)
Dividend per share
Dividend
Tax
TOTAL
Particulars st1 Interim nd2 Interim rd3 Interim Proposed TOTAL
Interim Dividends Final Dividend
4.30%
28.98%
66.72%
Graduates
Post-Graduates(including Phd)
Undergraduates
ExecutiveLevel
Senior Management
Middle Management
35%
56%
9%

2 DIRECTORS’ REPORT
33
stReport of the Board of Directors As on 31 March 2013, 892,500 and showcase its dedication towards
and Auditors of the Subsidiaries are 880,955 stock options under ESOP sustaining the Environment. Your
not attached and do not form a Scheme 2009 and ESOP Scheme Company has achieved the ISO
part of this Annual Report. 2010, respectively, are in force. 14001:2004 certification for
effective Environment Management These documents will be made Requisite disclosure in respect of
Standards, and for being an available upon written request by the Employee Stock Option
Environment-Friendly organization.any shareholder of the Company Scheme in terms of Guidelines of interested in obtaining the same. the Securities and Exchange The above certifications are in line
However, the financial data of the Board of India (Employee Stock with our vision of becoming a
subsidiaries has been furnished Option Scheme and Employee globally recognized Company that
under 'Statement Regarding Share Purchase Scheme) Guidelines provides high quality software and
Subsidiary Companies', which forms 1999, as amended, has been business solutions.
a part of this Annual Report. provided in Annexure "B" in this Further, pursuant to the Accounting Report.Standard AS-21 issued by the
Institute of Chartered Accountants
of India, Consolidated Financial During the FY 2012-13, Financial Statements presented by the Technologies undertook a review to Streamlined processes, customer Company includes financial assess its business implications on orientation, and Information Security information of its subsidiaries.society and the environment. Thus, have always been of paramount
The statement pursuant to Section CSO is conceptually integrated into importance in your Company’s 212 of the Companies Act, 1956, the core businesses with the value business agenda. In continuation containing details of subsidiaries proposition of being steady with its quest for quality driven of the Company, forms a part of contributors to inclusive and services, your Company has this Annual Report. sustainable growth through co-successfully cleared its surveillance
creation of business and social audit for ISO 9001:2008, after value. The Group CSO function is rigorous audits across its business focused on reviewing material operations.social and environmental impacts
Your Company, as a part of its core Besides effective processes, your and creating internal mechanisms business strategy, promotes and Company continues to maintain an for strengthening and reporting on invests in new ventures that utilize effective Information Security driven these.your Company’s technological culture. Its commitment to maintain capabilities and domain expertise The key sustainability and confidentiality, integrity, and by way of subsidiary companies inclusion aspects of the Financial availability of critical information can setting up Exchanges or Ecosystem Technologies are:be witnessed through the retaining Ventures. Your Company carries out of the ISO 27001:2005 certificate Inclusive growth across multiple transactions with related parties on for Information Security. Your value chains: an arms-length basis. Company continues to maintain
Given the nature of the group’s international standards in the area Statement of these transactions core businesses, innovation for of information and data security.given in the Notes to Accounts in inclusion is the overarching theme.
compliance of Accounting Standard Further, your Company continues to Its commodity, financial assets and AS-18, which forms a part of this maintain best-in-class IT services, electricity trading exchanges are Annual Report. and has upgraded its certification creating efficient and transparent
for Information Technology Service markets, the most powerful change
Management. FTIL has successfully agents to democratize access to
cleared the re-certification audit for economic opportunities. Together
ISO 20000:2011 for its Service with the ecosystem companies the
Management which is based on the commodity and financial exchanges During the year under review, the ITIL© framework. IT services within impact stakeholders across various Committee issued 74,350 and FTIL are aligned with best practices value chains, in trading activity, risk 112,280 stock options under ESOP as mandated by this international management, price discovery, Scheme 2009 and ESOP Scheme ISO standard. payment and collateral 2010, respectively, in lieu of management solutions and lapsed/cancelled stock options at an This year, your Company has gone information empowerment. The exercise price of 807.70 per share. a step ahead, and decided to energy exchange has provided a
CORPORATE SOCIAL OPPORTUNITY
(CSO)
QUALITY
RELATED PARTY TRANSACTIONS
EMPLOYEES STOCK OPTION PLAN
(ESOP)

Financial Technologies (India) Ltd. | ANNUAL REPORT 2012-13
34
transparent and efficient platform Sustainable technology: raised was pledged to Mumbai
for trading in electricity and Mobile Creches (MMC).Your Company’s technological
Renewable Energy Certificates thus prowess supports green data • An exhibition of products made
bringing down the demand-supply centres, robust risk-management by children of NGO – Aseema
gap between buyers and sellers of thsystems and environmentally was held on 14 August 2012. power, with a positive impact on
efficient operations catering to Aseema strives to protect and SME operations as well.
various businesses as they expand promote the rights of their footprint. underprivileged children and
women. Products ranging from Inclusive product design: Your Company continues to dupattas, bags, lamp shades,
encourage and support employees coasters and cards were bought MCX has created micro contracts who wish to contribute towards by employees. On Junior’s Day that make price risk management social causes and institutions, by and Christmas, an exhibition of accessible to small participants offering suitable platforms and an books by Pratham - an NGO exposed to global commodity price annual calendar of events. which works towards providing volatility. NBHC has been
quality education to instrumental in making agricultural • Annual blood donation drive was underprivileged children in India commodity funding through thheld on 28 May 2012 in - was held for the sale of low warehouse receipts a real bankable association with BSES Hospital th
proposition for banks with its cost books. On 9 November (Rotary Blood Bank).
integrated collateral management 2012, on the occasion of Diwali,
strategy and it issues receipts for exhibition of products by • As part of our commitment to values as small as ` 5,000. atom members of IDOBRO our planet, World Environment
thTechnologies provides financial (a platform for small scale Day (WED) 2012 - June 5 was inclusion technology solutions women artisan groups and celebrated at the office. There combining mobile and biometric entrepreneurs) was organized.was an awareness campaign technologies, and micro-finance with employees in alignment with
• On International Women’s Day products. TickerPlant offers cost- the UNEP – (United Nations 2013, FTIL facilitated another effective, modular market data Environment Programme)’s IDOBRO sale of handmade services compared with expensive theme for WED 2012: ‘Green artifacts, food products, etc. for bundled services from existing large Economy: Does it include you?’ employees. We continue to players. These services provide as well as a photography talent partner with IDOBRO for ‘impact information empowerment to farmers recognition on the theme of shopping’, at our office at key and small enterprises across smaller ‘Human impact on our events through the year.towns and rural India. environment’.
• Employees support five NGOs • A donation drive was organized
working for different causes th thon 13 and 14 August 2012. Financial market education: through Reach Out - the monthly Children’s clothes and shoes
Payroll Giving programme. These Your Company strongly believes the donated by employees were sent NGOs are Akshay Patra importance of financial market to Mumbai Mobile Creches Foundation, National Association education in enabling financial (MMC). MMC is an NGO working for the Blind, Ashadeep inclusion. Through its group for all over development of the Association, Cancer Patients’ Aid ventures, it has been offering children at construction sites. Association and Save the various financial market courses to Their creches provide food, Children India.increase awareness on: health facilities and education to
children of construction site 1. Advantages of being a part of • During the FY 2012-13 the workers. Adults’ clothes and the formal banking system as Company has given donations to shoes along with books and against being unbanked. Charitable institutions for their stationery were sent to Goonj, various charitable activities like 2. Investing through transparent the NGO, which channelized the for education, health & medical and efficient financial markets to donations for beneficiaries from etc.augment personal growth.underprivileged and vulnerable
3. Enhance return on personal communities. • To support relief work for victims savings by employing it in formal of the natural disaster that recent
• Employees participated in the financial market instruments, struck Uttarakhand, group Standard Chartered Mumbai contributing to economic employees collectively donated a Marathon 2013 and funding so development in the process. sum of ` 3.14 Lakh. Relief

2 DIRECTORS’ REPORT
35
material such as clothes, woolens Auditors independently evaluate the As per the information available
and dry ration was collected. The adequacy of internal controls and with the Company, none of the
monetary and relief material were audit majority of the transactions in Directors of the Company are
sent to Goonj, the NGO, which is value terms. disqualified for being appointed as
appropriately channelizing the a Director as specified in Section
donations for relief work in the 274 of the Companies Act, 1956,
region. as amended.
The Company is committed to
maintain the highest standard of
Corporate Governance and adhere The Risk Management Committee to the Corporate Governance (RMC) was constituted to assist the As required under Section 217 requirements set out by SEBI. The Board in overseeing responsibilities (2AA) of the Companies Act, 1956, report on Corporate Governance, with regard to identification, the Directors hereby confirm:stipulated by Clause 49 of the assessment, control/mitigation and Listing Agreement, is annexed a. that applicable accounting escalation/monitoring of risks. The hereto, and forms part of this standards have been followed RMC is mandated to review, Annual Report. along with the explanation upgrade and penetrate the process
relating to material departures A Certificate from the Auditors of to address and minimize the during the preparation of the the Company confirming operational and other risks annual accounts;compliance with Corporate associated with the Company and
Governance norms, as stipulated in business units on a continuous b. that they have selected such Clause 49 of the Listing Agreement, basis. accounting policies and applied is annexed to the report on them consistently and they have Corporate Governance. made judgments and estimates
that are reasonable and prudent
so as to give a true and fair view Your Company’s land and building, of the Company affairs, and equipment, automobiles, stores profit or loss of the Company, at and spares etc. are adequately the end of the financial year;insured against major risks. Your Management Discussion and
c. that they have taken proper and Company also has appropriate Analysis Statement forms part of sufficient care to maintain insurance cover primarily for error this Annual Report.adequate accounting records in & omission, commercial general accordance with the provisions liability and directors & officers’ of the Companies Act, 1956, for liability, apart from life, mediclaim safeguarding the assets of the and accident insurance for all the Company and for preventing and employees. In accordance with the provisions detecting fraud and other
of the Companies Act, 1956, and irregularities;
the Company's Articles of
Association, Mr. Ravi Sheth and d. that they have prepared the
Mr. C. M. Maniar, Directors of your annual accounts on a going
Company, retire by rotation at the concern basis.Your Company has a robust
ensuing Annual General Meeting Management Information System
(AGM) and being eligible, offer which forms an integral part of
themselves for re-appointment.control mechanism. The Internal
control system is improved and Mr. P. G. Kakodkar, Independent SEBI, vide its Circular modified on an on-going basis to Director, has resigned from the CIR/CFD/DIL/8/2012 dated
th meet the changes in business Board and its Committees and he 13 August 2012, amended the conditions, accounting and ceases to be the Director of the Listing Agreement to include the statutory requirements. Internal Company. Your Directors place on Business Responsibility Reporting in Audit plays a key role to ensure record their appreciation for the Annual Reports of top 100 listed that all assets are safeguarded and valuable advice and guidance entities. As per the said Circular protected and that the transactions provided by Mr. Kakodkar during SEBI mandated that top 100 listed are authorized, recorded and his long association with the entities, based on market reported correctly. The Internal Company. capitalization at BSE and NSE,
CORPORATE GOVERNANCE
RISK MANAGEMENT DIRECTORS’ RESPONSIBILITY
STATEMENT
INSURANCE
MANAGEMENT DISCUSSION AND
ANALYSIS STATEMENT
DIRECTORS
INTERNAL CONTROL SYSTEMS AND
THEIR ADEQUACY
BUSINESS RESPONSIBILITY REPORT

Financial Technologies (India) Ltd. | ANNUAL REPORT 2012-13
36
include Business Responsibility Employees) Rules, 1975, as v. "Group"
Report as part of their Annual amended, the name and other The list of Group Report describing the initiative particulars of the employees are Companies/Associates/Joint taken by the companies from required to be set out in the Ventures where control exists Environmental, Social and Annexure to the Directors’ Report. forms part of this Annual Report.Governance Perspective. However, as per the provisions of
Section 219(1)(b)(iv) of the said The Business Responsibility
Act, the Annual Report, excluding vi. Special BusinessReporting as required by Clause 55
the aforesaid information is being As regards the items mentioned of the Listing Agreement is not sent to all the Members of the in the Notice of the Annual applicable to your Company for the Company and others entitled st General Meeting related to financial year ended 31 March thereto. Members who are Special Business, the resolutions 2013. interested in obtaining such incorporated in the Notice and the particulars may write to the Explanatory Statement relating Company at its Registered Office. thereto, fully indicate the reasons
for seeking the approval of M/s. Deloitte Haskins & Sells - members to those proposals. iii. Conservation of Energy, Chartered Accountants, the Members' attention is drawn to Technology Absorption, Statutory Auditors, will hold office these items and Explanatory Foreign Exchange Earnings until the conclusion of the ensuing Statement annexed to the Notice.and OutgoAnnual General Meeting. The
The particulars as prescribed Company has received necessary under sub-section (1)(e) of certificate from the Auditors, Section 217 of the Companies pursuant to Section 224 (1B) of the
Your Directors place on record their Act, 1956, read with Companies Companies Act, 1956 regarding
gratitude to the Central (Disclosure of particulars in their eligibility for re-appointment.
Government, State Government, report of the Board of Directors) The members are requested to
clients, vendors, financial Rules, 1988, are given in consider appointment of
institutions, bankers and business Annexure "A" of this Report.M/s. Deloitte Haskins & Sells as the
associates for their assistance, co-Statutory Auditors at the ensuing
operation and encouragement Annual General Meeting.
extended to your Company.iv. Transfer of amounts to Investor
Education and Protection FundFor the continued support of
Pursuant to the provisions of Investors, business associates and Section 205A(5) and 205C of the unstinting efforts of colleagues,
i. Fixed Deposits Companies Act, 1956, relevant your directors also wish to place on amounts which remained unpaid record their sincere thanks and During the year, your Company or unclaimed for a period of 7 appreciation.has not accepted or invited any years have been transferred by deposits from public.the Company to the Investor
Education and Protection Fund. ii. Particulars of Employees Details of the amounts
transferred to Investor Education In terms of the provisions of and Protection Fund are covered Section 217(2A) of the elsewhere in this Annual Report.Companies Act, 1956, read with
the Companies (Particulars of
AUDITORS
ACKNOWLEDGEMENT
STATUTORY INFORMATION
For and on behalf of the Board
Dewang Neralla
Whole-time Director
P. R. Barpande
Director
Place: MumbaithDate: 30 July 2013

2 DIRECTORS’ REPORT
37
ANNEXURE "A" TO THE DIRECTORS’ REPORT
The Information required under Section 217(1)(e) of the Companies Act 1956, read with the Companies (Disclosure
of Particulars in the Report of the Board of Directors) Rules, 1988.
Conservation of Energy
Your Company is committed to the adoption of various energy saving methods for conservation of energy and has
taken adequate measures for the same and installed equipments, which would entail cost efficiency. It continues its
endeavor to improve energy conservation and utilization.
Technology Absorption, Research & Development
The Research & Development activity of your Company is mainly focused on the development of new software
products to meet customer requirements. Since your Company operates in a sector which witnesses rapid
technological change and quality up-gradation, product improvement is given special attention.
The future plan of action also lays stress on the introduction of new software products for both Domestic and Export
markets.
Amount spent: Revenue Expenses ` 131.01 million (previous year 128.98 million)
Foreign Earnings & Outgo
The details of foreign exchange earnings and outgo are mentioned in Notes 30(a) & 30(b) of the financial statements.
`

Financial Technologies (India) Ltd. | ANNUAL REPORT 2012-13
38
74,350
807.70 per share
163,630
Nil
81,850
Nil
Nil
892,500
51,000
51,000
Nil
69.48
249.05
112,280
` 807.70 per share
154,261
Nil
131,325
Nil
Nil
880,955
25,000
15,000
10,000
7,500
Nil
Nil
69.48
238.67
a. Options granted out of the lapsed/cancelled stock options during the year
b. Exercise price per option
(The exercise price of the option is the market price of the shares as defined
under the SEBI Guidelines, as on the grant date)
c. Options vested
d. Options exercised
e. Options lapsed/forfeited
f. Variations of terms of options
g. Money realized by exercise
h. Options in force
i. Employee wise details of options granted during the year –
i) Senior Management Personnel
Mr. Paras Ajmera
Mr. Prashant Desai
Mr. Rajendra Mehta
Mr. Dilip Tambe
Mr. Mehmood Vaid
ii) Employees who receive a grant in any one year of option amounting to 5% or
more of options granted during that year – Mr. Paras Ajmera
iii) Employees to whom options equal to or exceeding 1% of the issued capital
have been granted during the year
j. Diluted EPS
k. Fair value of the options
Description
ANNEXURE “B” TO THE DIRECTORS’ REPORT
Pursuant to the applicable requirements of the Securities and Exchange Board of India (Employee Stock Option
Scheme and Employee Stock Purchase Scheme) Guidelines, 1999 (“the SEBI Guidelines”), following disclosures are
made in connection with the "Financial Technologies (India) Limited – Employee Stock Option Scheme 2009 and
2010."
ESOP - 2009 ESOP - 2010
contd.

2 DIRECTORS’ REPORT
39
Description ESOP - 2009 ESOP - 2010
The Company’s Net Profit for the year would
be lower by 200.64 million and earnings per
share as indicated as below:
Adjusted EPS `
- Basic 65.72
- Diluted 65.16
38.57% to 39.27%
1.13 years – 3.13 years
0.74%
7.80% to 7.83%
l. The Company has followed the intrinsic value-based method of accounting for ststock options granted after 1 April, 2005, based on Guidance Note on
Accounting for Employees Share-based payments, issued by the Institute of
Chartered Accountants of India. Had the compensation cost of the Company’s
stock based compensation plan been determined in the manner consistent with
the fair value approach as described in the Guidance Note, the impact on
Company’s net profit and EPS would be:
m. Description of the method and significant assumptions used during the year to
estimate the fair values of the options, including the following weighted average
information:
i) Expected volatility
ii) Option life
iii) Dividend yield
iv) Risk-free interest rate
To allow for the effects of early exercise, it is assumed that the employees
would exercise the options after vesting date. Expected volatility is based on the
historic volatility of the share price over the period that is commensurate with
the expected term of options.
For and on behalf of the Board
Dewang Neralla
Whole-time Director
P. R. Barpande
Director
Place: MumbaithDate: 30 July 2013

Financial Technologies (India) Ltd. | ANNUAL REPORT 2012-13
MANAGEMENT DISCUSSION AND ANALYSIS
• Global Financial Markets Review
• Business Overview
• Competitive Strengths
• Financial Position and Result of Operations
A N N U A L R E P O R T 2 0 1 2 - 1 3
Financial Technologies (India) Ltd. | ANNUAL REPORT 2012-13

GLOBAL FINANCIAL MARKETS
REVIEW
BULLION MARKET REVIEW
will wait till some thresholds, such vis the dollar. Going forward, the
as bringing the unemployment rate trend strengthening of the US dollar
to around 6.5% and maintaining against Euro, British Pound and It has been over five and a half
personal consumption expenditure other emerging economies’ years since the onset of the financial
inflation around 2%, are met along currencies, seems likely.crisis, and global economy appears
the way. However, the move of to be slowly recovering from it.
gradual withdrawal of QE3 did During this period, world-over new
weigh on company shares of stock policy tools have been tested in a
exchanges world over with decline In the era of economic upheaval bid to revive economies. While
in their prices, pushing bond yields post-global financial crisis and the caution is still in order and any
to a 15-month high and led many subsequent uncertainty, gold improvement will be slow, conditions
currencies to touch to their historic became one of the most sought are falling into place for recovery.
lows vis-à-vis the US dollar.after assets. During large part of
The US economy seems to be in Euro-zone economies continued to 2012, gold prices rose, and peaked
much better shape with a firming display a mixed picture on its at USD 1,792 per troy ounce in
economic recovery, but challenges economic performance. The recovery September. However, post-such as rising joblessness persist. November 2012 a declining trend in Euro economies, amidst ongoing In June 2013, the US Fed's policy- was seen in gold prices and in fiscal consolidation measures, is likely setting panel offered a more upbeat April 2013, it declined as investors’ to take longer than expected. Major assessment of the risks facing the perception of gold as the safe economies in the Euro such as the economy than they had observed haven investment started waning.UK and Germany are striving to when they last met in May 2013. restore growth. Meanwhile, the risk of
On the change in the stance of the The panel confirmed that the Euro-zone break-up had subsided by US Fed on QE3, gold prices downside risks to the outlook for mid-2012, when the European Central declined further to touch 15-month the economy and the labor market Bank (ECB) decided to support low of USD 1,290 per troy ounce have diminished and inflation sovereign debt, thereafter the threat of thon 20 June 2013. On this, some appears to have moved back to the currency break-up is also steadily analysts opined that gold prices panel’s long-term goal of 2%. Given receding. However, other issues could further go down, while others the improved scenario, one of the pertaining to lower than potential suggested that it would remain staunch supporters of Quantitative growth continued to persist. Some of range-bound as there are some Easing-3 (QE3) program Federal them are ongoing recession, loss of persisting risks in the Euro area.Reserve Chairman Ben Bernanke competitiveness, and large pile-up of
stated that the US Federal Reserve As regards Indian bullion market, public and private debt.has decided that sometime towards the demand for gold kept rising
As regards currencies, the Euro end-2013 it would initiate the throughout 2012 (as per one of the and British Pound showed volatile process of tapering QE3 gradually estimates, during January 2012-trend throughout 2012 and and by mid-2014 the program March 2013, India imported 215 continued to display a similar trend would come to a halt. The QE3 tonnes of gold). Large import of in 2013. However, in June 2013, a program comprised USD 85 billion- gold led the Indian Government to positive assessment of the US a-month asset purchase by the US impose import duty in September economy by the US Fed led to Federal Reserve. At the same time, 2012. The imposition of customs strengthening of the US dollar and Mr. Bernanke assured investors and duty on gold did relieve some the subsequent relative depreciation traders that the rate of interest demand pressure for gold in the of the Euro and British Pound vis-à-would not be hiked too soon and Indian market.
MANAGEMENT DISCUSSION AND ANALYSIS
3 MANAGEMENT DISCUSSION AND ANALYSIS
41

ASIAN FINANCIAL MARKETS REVIEW
BUSINESS OVERVIEW
INDIAN FINANCIAL MARKETS
REVIEW
Other East Asia-Pacific economies Government of India for some
such as Malaysia and Indonesia sectors including insurance, Asian economies’ overall
posted economic growth of 7.5% telecom and others, capital inflows performance during 2012 remained
and 6.2% in 2012, respectively. may improve and, in turn, is short on expectations owing to a
The World Bank Report on the expected to give the much-needed number of factors such as lower
state of these economies, further, support to depreciating rupee vis-external demand that led to slower
stated that the East Asia and à-vis US dollar.industrial activity, which in turn,
Pacific region contributed around impacted the overall economic
40% of global growth in 2012. recovery.
These signs of economic revival in
the Asia region augur very well for Japan’s, one of the major Asian Your Company, Financial global growth and would improve economies, tryst with natural Technologies (India) Limited (FTIL), the overall business environment disaster ended sooner than later. actively operated in three business in 2013.However, the economy continued to verticals, namely, Technology display overall recessionary and Vertical, Exchange Vertical and deflationary trend. Mr. Shinzo Abe, Ecosystem Vertical, that offer who resumed the office of Prime robust, transparent and cost-Minister of Japan in December efficient exchange platforms for 2012, initiated ‘three-arrowed’
Despite global economic instability diverse asset-classes. With the measures (comprising fiscal and uncertainty Indian economy sheer thought of bringing in stimulus, money printing and grew by 5% in 2012-13. This could Change for the better, your structural reforms) to drag the be attributed to Reserve Bank of Company’s business model draws economy out of the decade-long India’s (RBI) accommodative stance strengths from these three verticals recession, which later came to be in the credit policy through a to create a grand vision for known as ‘Abenomics’. On the number of cuts in key policy rates tomorrow!back of these measures, the to boost economic activities.
economy posted GDP growth of Our business model of setting up However, high and sticky inflation
3.5% during the Q1 of 2013 and operating efficient markets rate compelled RBI to slow its pace
(ending-March) as compared with (exchanges) is well supported by of cuts in interest rates.
0.9% growth recorded during the the ecosystem vertical to bring
same period a year ago. Brisk economic activities reflected about long-term sustainability and
in Indian capital markets throughout robustness in creating value for China – one of the fastest growing
2012. The markets were buoyant on all its stakeholders, be it market economies – appears to be cooling
the back of fund inflows from participants, intermediaries or down on account of weak external
Foreign Institutional Investors (FIIs) end-users. Under the exchange demand. Its growth in 2012 stood at
(with net inflow of USD 24.2 billion vertical, your Company provides 7.8% as compared to 9.3% in 2011.
in 2012 marking a significant rise in transaction opportunities that are Recent readings of the flash HSBC
funds inflow since a record USD transparent and well-regulated, Purchasing Managers’ Index fell to
29.36 billion in 2010), the Sensex providing mark-to-market 48.3 in June 2013 as against the
rose by 25.7% and Nifty grew by valuation, clearing house final reading of the same in May
27.7% during 2012. The outlook for guarantee, fungibility of deliveries 2013 stood at 49.2, drifting away
Indian stock markets looks firm and and higher liquidity without from the 50-point level marking
many analysts say that the markets associated counter party risks. It expansion to contraction. HSBC said
are strong and show potential to also provides the opportunity for that the June 2013-level was the
rise in the near future.cross-listing, margin credits, weakest level since September 2012
Lately due to higher current carry-forward positions across and some of the factors that have account deficit (CAD) (which stood exchanges, enables hedging and led to the contraction are - lower at USD 18.1 billion or 3.6% of external demand, moderating creates easy liquidity across GDP for Q4 of FY13 as against domestic demand and rising de- connected markets around the USD 21.7 billion deficit recorded a stocking pressures. Meanwhile, the world. The ecosystem vertical year earlier), Indian rupee Chinese government has assured addresses upstream and witnessed a volatile phase vis-à-vis that it is aware of the developments downstream opportunities to the US dollar (it touched ` 60.71 and it believes more in using support its exchanges, including
thagainst US dollar on 26 June reforms to come out of this situation clearing, depository, information 2013). With the recent liberalization than using the stimulus to sustain vending, and payment gateway, in FDI norms initiated by the the growth. among others.
Financial Technologies (India) Ltd. | ANNUAL REPORT 2012-13
42

COMPETITIVE STRENGTHS
CHALLENGES
FINANCIAL POSITION AND RESULT
OF OPERATIONS
OUTLOOK
both – spheres it operates in as Your Company, being one of the
well as stakeholders. Also, an earliest entrants in trading The aftermath of global financial
instrumental role played by the technology arena, has garnered an crisis of 2008, witnessed rise in the
strong and independent advisory unparalleled market share with need for safe and secure
body has enabled the Company to dedicated revenue stream. Given investment avenues. In such times,
derive rich mix of knowledge and this disposition, your Company has your Company’s ability to provide
expertise that has added value to a far-reaching task of democratizing transparent and robust Exchange
your Company’s vision and direction. growth opportunities by creating network has given market
financial markets in emerging participants an opportunity to avail
economies. FTIL’s business model benefits flowing from it. In addition,
co-creates business and social your Company’s unique ecosystem
value enabling distribution of ventures have captured both With regard to challenges, benefits of financial markets -upstream and downstream economic upheaval of the past and especially through transparent price opportunities to support its uncertainty of the future has taken discovery and its agile risk exchanges, including clearing and a toll and in the recent global management to all the ecosystem depository, information economic climate there could be a constituents.dissemination, warehousing and ‘wait and watch’ approach by
In the times of nascent economic collateral management, payments foreign investors.recovery in the large economies, processing and financial market
Recently seen precarious your Company will remain education, among others.macroeconomic scenario owing to focused on delivering value to widening current account deficit Your Company’s disposition of stakeholders; empower consumers and weakening of Indian rupee vis-being one of the earliest entrants in through efficient price discovery à-vis US dollar could have its India’s trading technology arena mechanism, and spreading impact on foreign capital inflows. with unparalleled market share and growth opportunities among This may lead to further dedicated revenue stream provides various sections of the society.deterioration in performance of the it competitive strengths vis-à-vis
FTIL, with its forte in technology economy, which, in turn, would lead other players. The Company’s advancement, product innovation to more difficulties of gaining unique business model draws and operational efficiency with overall business momentum. synergies from three different talented human capital, looks at However, recent move of business verticals. Its technical bringing the Change that we want Government of India on easing of expertise in providing trading to see!FDI policy in various sectors technology solutions and also
including multi-brand retail, creating multi-asset exchanges has insurance, among others, could helped FTIL to create a niche place help India attract foreign funds, for itself.thereby giving the much required
Your Company maintains its support to weakening rupee. Shareholder’s Equityleadership position in the brokerage
technology solutions space for both Your Company’s authorized share retail domestic and institutional capital is ` 300 million, divided into markets. Continuous feature 150 million equity shares of ` 2 enhancements and product Lately, we notice that large each. The paid up share capital of launches are giving an opportunity economies are looking up and this your company stood at ` 92.16 to broad-base businesses. would have strong positive impact million. During the year, there was
no change in the paid-up share world-wide including India. In the Your Company has been led by
capital of your Company.given environment, your Company eminent and competent
aspires to strive hard to further management of over 30-member Reserves and Surpluswiden the scope of its global leadership team of
exchange network, enable Your Company’s total reserves and MD/CEO/Directors with over 600 growers/producers to obtain surplus position increased to man years of experience in enhanced value for their produce,
` 26,676.18 million as on financial markets and technology. stempower consumers through cost- 31 March 2013 from ` 24,033.69 Their domain expertise and rich
efficient price discovery, and stmillion as on 31 March 2012, experience of global best practices spreading growth opportunities mainly on account of profit has extensively helped the among various sections of the generated during the year.Company to gain confidence from society.
43
3 MANAGEMENT DISCUSSION AND ANALYSIS

Securities premium account as at Trade Payable Fixed Assetsst31 March 2013 stood at
At the end of the year trade ` 4,174.61 million. During the year,
payables stood at ` 203.46 million there was no change in Securities
as compared to ` 131.28 million at premium account.
the end of previous year.
The Company has transferred Other Liabilities (current + non-` 325.30 million to General current)Reserve out of the amount
available for appropriations and Other liabilities at the end of the
an amount of ` 20,425.72 million year amounted to ` 2,364.80
is proposed to be retained in million as against of ` 1,823.43
Profit and Loss Account. Post million at the end of previous year.
transfer, aggregate general The increase is mainly on account
reserve of the Company stood at of income received in advance for
` 2,641.32 million.subsequent period.
Shareholders’ FundsProvisions (short term + long term)
Total shareholder funds increased Total provisions as at the end of the
to ` 26,768.34 million as on year increased to ` 357.26 million
st31 March 2013 from ` 24,125.85 as against of ` 299.95 million at
stmillion as on 31 March 2012. the end of the previous year. It
consists mainly for provision made Loan Funds
for estimated loss on Interest Rate
Swap Contracts & proposed During the previous year ended st dividend.31 March 2012, the Company had
availed External commercial Investments (current + non-current)borrowings (ECB) aggregating to
USD 110.00 million (equivalent to The total investments as at Your Company has been investing stst` 5,982.82 million as at 31 March 31 March 2013 were at and building necessary
2013 against ` 5,627.22 million as ` 22,150.76 million as compared infrastructure to meet growing stat 31 March 2012) partly for to 17,380.38 million as at requirements of the business.
stinvestments in overseas wholly 31 March 2012. The investments owned subsidiary companies and During the year, the additions to mainly comprised of investment in partly to repay the Zero Coupon fixed assets (including adjustments mutual funds, bonds and Convertible Bonds. The increase in in capital work in progress) were at investments in subsidiaries, joint loan liability is due to exchange rate ` 238.61 million.venture & associate companies. fluctuations during the year. There is The Company, as a part of its
Trade Receivablesno additional loan during the year. core business strategy, promotes
and invests in new ventures that As at the end of year, trade Deferred Tax Liability
utilize its technological capabilities receivables (net of provision) were and domain expertise towards During the year, your Company at ` 831.05 million as compared to creating world class enterprises. has reported accrual of total net ` 362.89 million at the end of the The investment in each such deferred tax liability of ` 238.29 previous year.venture is assessed for its risks million compared to ` 137.33 and is limited to a pre-determined Loans & Advances (current + non-million in the previous year. level and will generate returns after current)Deferred tax assets and liabilities the ventures start ramping-up are recognized for future tax
At the end of the year, Loans and operations in varied time frame consequence attributable to
advances (current + non-current) depending upon the line of timing difference between taxable
(net of provision) amounted to business. The Company, as part of income and accounting income
` 6,913.68 million as against its non-linear business model, will that are capable of reversing in
` 5,404.97 million at the end of endeavor to unlock value by one or more subsequent periods
previous year. Increase is mainly broadening the investor base of its and are measured at
due to loans and advances to ventures.substantively enacted tax rates.
subsidiary companies.
Financial Technologies (India) Ltd. | ANNUAL REPORT 2012-13
44
(` million)
Freehold Land
Leasehold Land
Buildings
Improvement To
Leasehold Premises
Office Equipments
Computer Hardware
Furniture and Fixtures
Vehicles
Intangible assets
including Software.
Technical know-how
etc.
Gross Block
Less: Accumulated
Depreciation/
Amortisation
Net Block
Capital work in
progress (excluding
capital advances)
Total Fixed Assets
466.66
-
2,912.08
10.90
528.63
471.62
484.10
65.79
372.02
5,311.80
541.76
4,770.04
-
4,770.04
466.66
81.70
2,912.08
43.13
463.03
203.17
481.10
45.32
369.08
5,065.28
367.95
4,697.33
7.91
4,705.24
2013 2012stAs on 31 ,March

Cash & Cash Equivalents from investments, interest on Profit
deposits and investments, profit on At the end of the year cash & cash During the year,
sale of investments, rental income, equivalent stood at ` 860.62 million
foreign exchange gains and • Profit before finance cost, as compared to ` 3,990.08 million
miscellaneous income. During the depreciation and tax was at the end of the previous year. At stprevious year ended 31 March ` 4,678.50 million, compared to the end of the year amount kept in
2012, the Company had offered part ` 5,771.97 million in the previous deposits and foreign currency
of its investments under “offer for year.account (EEFC) were at ` 569.51
sale”, in initial public offer of equity million. • Profit before tax and exceptional
by Multi Commodity Exchange of items were ` 4,024.73 million,
India Limited (MCX), part of its Other Assets (current and non-current): compared to ` 5,294.53 million
investments and the resultant profit in the previous year.
of 2,498.21 million was included At the end of the year, other assets under Profit on sale of investments. • Profit after tax was ` 3,228.81 amounted to ` 388.82 million as
million, compared to ` 4,780.29 against ` 301.47 million at the end Expense Review million in the previous year.of the previous year.
During the year, the operating and Revenue Analysis other expenses were at ` 1,895.71
million as compared to ` 1,783.90 During the year, revenue from million (excluding provision for other operations stood at ` 4,509.01 than temporary diminution in value million compared to ` 4,255.48 of long term investment and Loss million in the previous year, an on sale/redemption/reduction in increase of 6.0%. Your Company shares in subsidiary companies) in mainly derived revenues from sale the previous year.of IPR licenses, annual
maintenance charges and project- During the year finance cost was at based services, including software ` 428.37 million as compared for customization. ` 304.42 million, increased mainly
due to interest on foreign currency Other Income loan for entire year as compared
for part of the year in the previous During the year, other income stood year and also partly on account of at 2,065.20 million compared to provision made for estimated loss 3,688.59 million in the previous on Interest Rate Swap Contracts.year. Other Income includes dividend
3 MANAGEMENT DISCUSSION AND ANALYSIS
45
Cautionary Statements: This report may contain forward-looking statements about Financial Technologies (India) Ltd. and its group companies, including their business operations, strategy and expected financial performance and condition. Forward-looking statements include statements that are predictive in nature, depend upon or refer to future events or conditions, or concern future financial performance (including revenues, earnings or growth rates), possible future Company plans and action. Forward-looking statements are based on current expectations and understanding about future events. They are inherently subject to, among other things, risks, uncertainties and assumptions about the Company, economic factors and the industry in general. The Company’s actual performance and events could differ materially from those expressed or implied by forward-looking statements made by the Company due to, but not limited to, important factors such as general economic, political and market factors in India and internationally, competition, technological change and changes in Government regulations.

Financial Technologies (India) Ltd. | ANNUAL REPORT 2012-13
CORPORATE GOVERNANCE
A N N U A L R E P O R T 2 0 1 2 - 1 3
• Report
• Board of Directors
• Audit Committee
• General Body Meeting
• Certification
on Corporate Governance

CORPORATE GOVERNANCE
4 CORPORATE GOVERNANCE
REPORT ON CORPORATE GOVERNANCE
1. COMPANY’S PHILOSOPHY ON THE CODE OF CORPORATE GOVERNANCE
2. BOARD OF DIRECTORS
The detailed report on Corporate Governance for the Financial Year 2012-13 as per the format prescribed by the
Securities and Exchange Board of India (SEBI) and as incorporated in Clause 49 as per the Listing Agreement is set
out hereunder:
Your company’s corporate governance is based on a philosophy of trusteeship, transparency, empowerment,
accountability, consistency and ethical corporate behaviour.
The Corporate Governance philosophy of the Company has been strengthened with the continuous monitoring of
a Code of Conduct for Board of Directors and Senior Management and a Code for Prevention of Insider Trading.
Your Company adheres to the corporate practices as per Clause 49 and also constantly strives to adopt emerging
best practices globally.
Your Company is in compliance with the requirements stipulated under Clause 49 of the Listing Agreement
entered into with Stock Exchanges with regards to Corporate Governance.
In compliance with the disclosure requirements of Clause 49 of the Listing Agreement executed with the Stock
Exchanges, the details are set out below:
2.1 Size and Composition of Board of Directors:
stAs on 31 March, 2013, the Board of Directors of the Company consists of nine (9) professionally competent
members comprising two Promoter designated as Executive Directors, one Whole-time Director and six Non-
Executive Directors, of which five are Independent and one Non-Independent Director. The composition of
the Board of Directors is as per the table given below:
47
Mr. Jignesh P. Shah
Mr. Dewang Neralla
Mr. Manjay P. Shah
Mr. P. G. Kakodkar*
Mr. Chandrakant Kamdar
Mr. R. Devarajan
Mr. C. M. Maniar
Mr. Ravi K. Sheth
Mr. P. R. Barpande
Chairman & MD
Whole-time Director
Whole-time Director
Director
Director
Director
Director
Director
Director
Promoter & Executive Director
Promoter & Executive Director
Executive Director
Independent, Non-Executive
Independent, Non-Executive
Independent, Non-Executive
Independent, Non-Executive
Non-Independent, Non-Executive
Independent, Non-Executive
8,329,585
60,374
76,918
2,150
Nil
Nil
Nil
2,489,762
Nil
00064913
00107134
01283910
00027669
00348385
02604441
00034121
00022121
00016214
Name of Director Designation
Director Identification
Number (DIN) Category
Shareholding in the Company stas of 31 March, 2013 (no. of shares)
*ceased w.e.f. 20.07.2013

Financial Technologies (India) Ltd. | ANNUAL REPORT 2012-13
None of the Non-Executive Directors have any material pecuniary relationship or transactions with the
Company.
During the year, information mentioned in Annexure IA to Clause 49 of the Listing Agreement has been
placed before the Board for its consideration.
2.2 Board Meetings
a) Number of Board Meetings held and the dates thereof:
thThe Board of Directors met five (5) times during the year. The dates of meetings being 30 May, 2012; th st th th06 August, 2012; 31 October, 2012; 06 December 2012 and 28 January 2013. The maximum time
gap between any two meetings was not more than four calendar months.
b) Attendance at the Board Meetings and the last Annual General Meeting:
The table mentioned below gives the attendance record of each Director at the Board Meetings held
during FY 2012-13 as well as the last Annual General Meeting. It also gives details of the number of
other Directorships and Chairmanship/Membership of Committees each Director holds in various stCompanies, as on 31 March, 2013.
c) Code of Conduct:
The Company has formulated and implemented a Code of Conduct for the Board of Directors and
Senior Management of the Company. Annual affirmation of compliance with the Code has been made
by the Directors and Senior Management of the Company. The Code has also been posted on the
Company’s website www.ftindia.com. The necessary declaration by the Chairman & Managing Director
of the Company regarding compliance of the Code of Conduct by Directors and Senior Management of stthe Company for the financial year ended 31 March 2013, forms a part of the Corporate Governance
Report.
d) Insider Trading Policy:
The Company has implemented the Insider Trading System called “Financial Technologies (India) Limited
- Code of Conduct for prevention of Insider Trading (“Share Dealing Code”) to comply with the SEBI
(Prohibition of Insider Trading) Regulations 1992 issued by SEBI, as amended from time to time.48
Directorship of other
Indian Public Companies
--
2
--
--
--
1
--
--
--
--
1
--
2
--
5
8
1
3
5
9
--
4
--
5
12
2
4
Mr. Jignesh P. Shah
Mr. Dewang S. Neralla
Mr. Manjay P. Shah
Mr. P. G. Kakodkar
Mr. Chandrakant Kamdar
Mr. R. Devarajan
Mr. C. M. Maniar
Mr. Ravi K. Sheth
Mr. P. R. Barpande
No
No
No
No
Yes
Yes
No
No
Yes
LastAGM
2
5
5
3
5
5
4
1
4
BoardMeetingName of the Director
5
5
5
5
5
5
5
5
5
No. of Board Meetings held
Committee
ChairmanshipMembership
Notes:
1. None of the Directors of the Company hold memberships of more than ten committees nor are they Chairpersons of more than
five committees (as specified in Clause 49), across all companies of which they are directors.
2. The committees considered for the above purpose are those as specified in the existing Clause 49 of the Standard Listing
Agreement(s) i.e. Audit Committee, and Shareholders’/Investors’ Grievance & Share Transfer Committee.
Attendance Particulars
No. of other Directorships andCommittee Membership/Chairmanship

2.3 The details of directorship of the Company’s Directors in other Indian public Companies are given below:
2.4 Information provided to the Board:
The Board of the Company is presented with all the information whenever applicable and materially
significant. This information is submitted either as a part of agenda papers or tabled before the Board
Meeting or circulated to the members of the Board. This information inter-alia includes:
• Annual Budget including the capital budget and operating plan of the business.
• Un-audited quarterly results and its business segments.
• Minutes of the Audit Committee and other committees.
• Information on recruitment and remuneration of senior employees, including appointment and removal of
Chief Finance Officer & Company Secretary.
• Materially important litigations, show-cause notices, demands, penalties and prosecution.
• Any material default in financial obligations to and by the Company or substantial non-payment for
services rendered by the Company.
• Details of any Joint Venture or collaboration or any major new client wins.
• Fatal or serious accidents, dangerous occurrences etc.
• Transactions which involves substantial payment towards goodwill, brand equity or intellectual property.
• Any issue, which involves possible public liability claims of a substantial nature, including any judgement
or order, which may have passed strictures on the conduct of the Company or taken adverse view
regarding another enterprise that can have negative implications on the Company.
• Any significant development in Human Resources/Industrial Relations front related right from recruitment
to retirement issues.
• Sale of material nature of assets, investments, subsidiaries which is not in the normal course of
business.
• Non-compliance of any regulatory or statutory provisions or listing requirements as well as services
related to shareholders such as non-payment of dividend etc.
• Quarterly details of risk related areas which are material in nature and action initiated by the
management to mitigate the same.
(i) Indian Energy Exchange Ltd., (ii) Multi Commodity Exchange of India Ltd.,
(iii) MCX Stock Exchange Ltd., (iv) National Bulk Handling Corporation Ltd.,
(v) National Spot Exchange Ltd.
(i) atom Technologies Ltd., (ii) Boursa India Ltd., (iii) Financial Technologies
Communications Ltd., (iv) Global Payment Networks Ltd., (v) Indian Bullion Market
Association Ltd., (vi) Riskraft Consulting Ltd., (vii) Tickerplant Ltd.,
(viii)Trans-Global Credit & Finance Ltd., (ix) FT Projects Ltd.
(i) Apian Finance & Investment Ltd., (ii) Fomento Resorts and Hotels Ltd.,
(iii) Uttam Galva Steel Ltd., (iv) Accounts Receivable Management Services (India) Ltd.
Nil
(i) National Bulk Handling Corporation Ltd., (ii) National Spot Exchange Ltd.,
(iii) Riskraft Consulting Ltd., (iv) Tickerplant Ltd., (v) atom Technologies Ltd.
(i) Multi Commodity Exchange of India Ltd., (ii) Foods & Inns Ltd., (iii) Godfrey
Phillips India Ltd., (iv) Gujarat Ambuja Exports Ltd., (v) Hindalco Industries Ltd,
(vi) Indo-Euro Investment Company Ltd., (vii) The Indian Card Clothing Company Ltd.,
(viii) Pioneer Investcorp Ltd., (ix) Sudal Industries Ltd., (x) TCPL Packaging Ltd.,
(xi) Varun Shipping Company Ltd., (xii) Utkal Alumina International Ltd.
(i) Greatship (India) Ltd., (ii) The Great Eastern Shipping Co. Ltd.,
(i) MCX-SX Clearing Corporation Ltd., (ii) Blossom Industries Ltd.,
(iii) Multi Commodity Exchange of India Ltd., (iv) Westlife Development Ltd.
Nil
4 CORPORATE GOVERNANCE
49
Mr. Jignesh P. Shah
Mr. Dewang S. Neralla
Mr. P. G. Kakodkar
Mr. Chandrakant Kamdar
Mr. R. Devarajan
Mr. C. M. Maniar
Mr. Ravi K. Sheth
Mr. P. R. Barpande
Mr. Manjay P. Shah
Name of the Director Other Directorship details
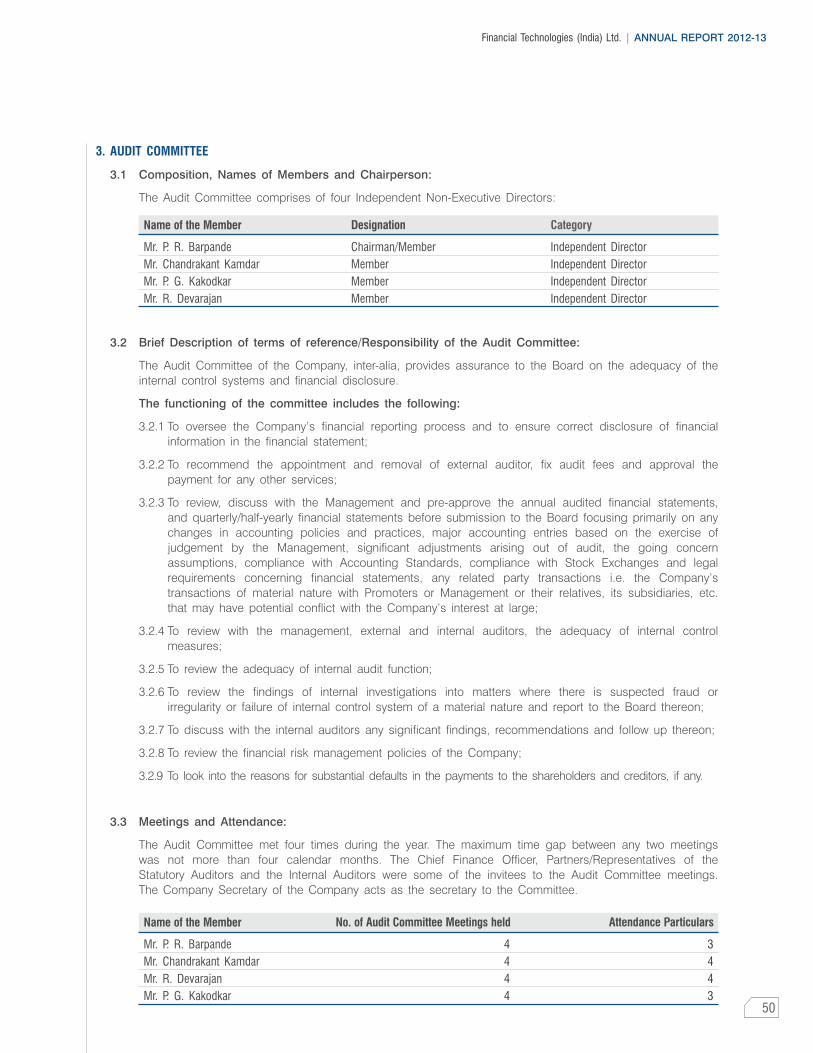
3. AUDIT COMMITTEE
3.1 Composition, Names of Members and Chairperson:
The Audit Committee comprises of four Independent Non-Executive Directors:
3.2 Brief Description of terms of reference/Responsibility of the Audit Committee:
The Audit Committee of the Company, inter-alia, provides assurance to the Board on the adequacy of the
internal control systems and financial disclosure.
The functioning of the committee includes the following:
3.2.1 To oversee the Company’s financial reporting process and to ensure correct disclosure of financial
information in the financial statement;
3.2.2 To recommend the appointment and removal of external auditor, fix audit fees and approval the
payment for any other services;
3.2.3 To review, discuss with the Management and pre-approve the annual audited financial statements,
and quarterly/half-yearly financial statements before submission to the Board focusing primarily on any
changes in accounting policies and practices, major accounting entries based on the exercise of
judgement by the Management, significant adjustments arising out of audit, the going concern
assumptions, compliance with Accounting Standards, compliance with Stock Exchanges and legal
requirements concerning financial statements, any related party transactions i.e. the Company’s
transactions of material nature with Promoters or Management or their relatives, its subsidiaries, etc.
that may have potential conflict with the Company’s interest at large;
3.2.4 To review with the management, external and internal auditors, the adequacy of internal control
measures;
3.2.5 To review the adequacy of internal audit function;
3.2.6 To review the findings of internal investigations into matters where there is suspected fraud or
irregularity or failure of internal control system of a material nature and report to the Board thereon;
3.2.7 To discuss with the internal auditors any significant findings, recommendations and follow up thereon;
3.2.8 To review the financial risk management policies of the Company;
3.2.9 To look into the reasons for substantial defaults in the payments to the shareholders and creditors, if any.
3.3 Meetings and Attendance:
The Audit Committee met four times during the year. The maximum time gap between any two meetings
was not more than four calendar months. The Chief Finance Officer, Partners/Representatives of the
Statutory Auditors and the Internal Auditors were some of the invitees to the Audit Committee meetings.
The Company Secretary of the Company acts as the secretary to the Committee.
Name of the Member Designation Category
Mr. P. R. Barpande
Mr. Chandrakant Kamdar
Mr. P. G. Kakodkar
Mr. R. Devarajan
Chairman/Member
Member
Member
Member
Independent Director
Independent Director
Independent Director
Independent Director
50
Name of the Member No. of Audit Committee Meetings held Attendance Particulars
Mr. P. R. Barpande
Mr. Chandrakant Kamdar
Mr. R. Devarajan
Mr. P. G. Kakodkar
4
4
4
4
3
4
4
3
Financial Technologies (India) Ltd. | ANNUAL REPORT 2012-13

4. RISK MANAGEMENT
5. REMUNERATION AND COMPENSATION COMMITTEE
The Risk Management Committee is inter-alia mandated to review and upgrade the process to address and
minimize the operational, monetary and other risks associated with the Company on a continuous basis.
The Company has laid down procedures about the risk assessment and its mitigation. The procedures are
reviewed periodically to ensure that risk is controlled through properly defined framework.
5.1 Composition, Names of Members and Chairperson
Remuneration and Compensation Committee comprises of four Independent Non-Executive Directors:
5.2 Brief Description of terms of reference:
5.2.1 To review the overall compensation policy and service agreements of the Managing Director and
Whole-time Directors and other employees of appropriate cadres;
5.2.2 To evaluate the remuneration paid by comparable organizations;
5.2.3 To review the performance of the Managing Director and Whole-time Director and recommend to the
Board in this regard;
5.2.4 To monitor and implement the ESOS/ESOP Scheme and also formulate such schemes hereafter for
grant of Stock Options to the employees including the Managing and the Whole-time Director (other
than Promoter Directors) in accordance with the relevant regulations in force at the time; To issue
and allot equity shares and recommend the same to the Board for its consideration and monitor
proper implementation thereof.
During the year, the Committee met three times.
5.3 Remuneration Policy:
The Company’s inter-alia remuneration policy is determined by the success and performance of the
individual employee and the Company. The performance of the individual employee is measured through
an annual appraisal process. The Company, through its compensation program, attracts, develops,
motivates and retains its talented workforce.
5.4 Directors’ Remuneration:
i. Remuneration paid to the Executive Directors:
stThe aggregate value of salary, perquisites paid for the year ended 31 March, 2013 to the Managing
Director and Whole-time Directors are as follows:
Name of the Member Designation Category
Mr. Chandrakant Kamdar
Mr. P. G. Kakodkar
Mr. R. Devarajan
Mr. P. R. Barpande
Chairman/Member
Member
Member
Member
Independent Director
Independent Director
Independent Director
Independent Director
Name of the MemberNo. of Remuneration &
Compensation Meetings held Attendance Particulars
Mr. Chandrakant Kamdar
Mr. P. G. Kakodkar
Mr. R. Devarajan
Mr. P. R. Barpande
3
3
3
3
3
-
3
3
4 CORPORATE GOVERNANCE
51

Besides, the Managing Director and the Whole-time Directors are also entitled to retirement benefits and
encashment of leave, as per the rules of the Company. Notice period of one month is required, as per
the terms of appointment. No fee/compensation is payable to the Directors on severance of directorship
of the Company.
ii. Remuneration paid to the Non-Executive Directors
The Company pays sitting fees of ` 10,000/- per meeting to the Non-executive Directors for attending
the meetings of the Board and of the Audit Committee. The gross sitting fees (including sitting fees stpaid for attending the meetings of the Directors’ Committee) for the year ended 31 March, 2013 is as
follows:
During the year, the Non-Executive Directors were not issued any stock options by the Company. For
the details of shares held by Directors, refer section 2.1 of this Report.
6.1 Composition, Names of Members and Chairperson:
The Committee comprises of:
6.2 Compliance Officer:
Mr. Hariraj S. Chouhan, Vice-President & Company Secretary is the Compliance Officer and can be
contacted at FT Tower, CTS No. 256 & 257, Suren Road, Chakala, Andheri (East), Mumbai – 400 093.
T: +91-22-6686 8010 | F: +91-22-6725 0257 | E: [email protected]
6. SHAREHOLDERS’/INVESTORS’ GRIEVANCE AND SHARE TRANSFER COMMITTEE
Particulars
Name of the Director
Name of the member Designation
Jignesh Shah Managing Director TOTAL
Gross Sitting Fees ( )
Category
Salaries and Allowances*
Monetary value of perquisites
Provision for compensated absences
Commission
TOTAL
Mr. P. G. Kakodkar
Mr. Chandrakant Kamdar
Mr. R. Devarajan
Mr. C. M. Maniar
Mr. Ravi K. Sheth
Mr. P. R. Barpande
Mr. C. M. Maniar
Mr. Dewang S. Neralla
Mr. Manjay P. Shah
64,183,353
438,316
1,069,723
150,000,000
215,691,392
60,000
90,000
90,000
40,000
10,000
70,000
Dewang Neralla Whole-time Director
Manjay Shah Whole-time Director
17,417,041
39,600
290,284
-
17,746,925
17,361,812
10,800
289,364
-
17,661,976
29,404,500
387,916
490,075
150,000,000
180,282,491
*Excludes gratuity and compensated absences which are actuarially valued and where separate amounts are not identifiable
(in `)
Chairman/Member
Member
Member
Independent Director
Whole-time Director
Whole-time Director
Financial Technologies (India) Ltd. | ANNUAL REPORT 2012-13
52

6.3 Brief Description of terms of reference:
The Committee, inter alia, approves transfer and transmission of shares, issuance of duplicate share
certificates and reviews all the matters connected with share transfers. The Committee also looks into the
redressal of shareholders/investors complaints related to transfer of shares, non-receipt of Annual Report,
non-receipt of dividends etc. received directly or through SEBI (SCORES), Stock Exchanges, Ministry of
Corporate Affairs, Registrar of Companies etc. Moreover, the Committee oversees the performance of the
Registrar & Transfer Agent of the Company. The Committee met seven (7) times during the year under
review.
The status of nature of complaints received, resolved and pending during the financial year ended st31 March, 2013.
During the year, no share transfer/ complaints remained pending for more than 30 days. Also, there were stno share transfers pending as on 31 March, 2013.
7.1 The date, time and venue for the last three Annual General Meetings are mentioned hereunder:
Particulars of Special Resolutions passed in the previous three Annual General Meetings:
7. GENERAL BODY MEETINGS
Nature of Complaints Received Resolved Pending
Non-receipt of share certificate after
transfer/merger/split/consolidation
Non-receipt of Annual Report
Non-receipt of Dividend
TOTAL
--
--
--
--
8
5
11
24
8
5
11
24
Financial Year
Financial Year
Date
Date of AGM
Time Venue of the meeting
Particulars
Russian Cultural Centre,74, Kasturi Ranga Road,
Chennai 600 018.
Sri P. Obul Reddy Hall (Vani Mahal) 103,
G. N. Chetty Road, T. Nagar, Chennai – 600017.
Sri P. Obul Reddy Hall (Vani Mahal) 103,
G. N. Chetty Road, T. Nagar, Chennai – 600017.
10.30 a.m.
10.30 a.m.
10.30 a.m.
29-09-2010
29-09-2011
27-09-2012
29-09-2010
29-09-2011
27-09-2012
2009-10
2010-11
2011-12
2009-10
2010-11
2011-12
4 CORPORATE GOVERNANCE
53
i) Consent of the Shareholders for granting ESOPs under ESOS 2010 to the
eligible employees/Directors of the Company.
ii) Consent of the Shareholders for granting ESOPs under ESOS 2010 to the
eligible employees/Directors of the Subsidiary/ies.
iii) Consent of the Shareholders for issuing/offering Depository Receipts/other
equity related instruments through International/Domestic Public Offering
not exceeding ` 1,500 crore.
iv) Revision in the salary of Mr. Manjay P. Shah holding office of profit in
terms of section 314 (1B) of the Companies Act, 1956.
i) Consent of the Shareholders for issuing/offering Depository Receipts/other
equity related instruments through International/Domestic Public Offering
not exceeding ` 1,000 crore.
i) Re-appointment of Mr. Jignesh Shah as the Managing Director
ii) Re-appointment of Mr. Dewang Neralla as the Whole-time Director
iii) Appointment of Mr. Manjay Shah as the Whole-time Director

7.2 Postal Ballot:
During the last financial year, no special resolution was passed through postal ballot. The provisions
relating to postal ballot will be complied with as per the provisions of the Companies Act, 1956, as and
when a situation arises. Similarly, no business is required to be transacted through postal ballot at the
forthcoming Annual General Meeting.
7.3 Disclosures:
7.3.1 The Company has not entered into any transaction of material nature with the Promoter, Directors or
Management, or their relatives which may have potential conflict of interest with the Company at large.
There were no material transactions with related parties that may have any potential conflict with the
interest of the Company at large. Apart from receiving sitting fees, there is no pecuniary transaction with
the Independent/Non-Executive Directors. Transactions with related parties are disclosed in Note No. 41
to the Standalone Accounts in the Annual Report.
7.3.2 There were no instances of non-compliances of any matter related to the capital markets, no penalties and
strictures were imposed by Stock Exchanges or SEBI or any statutory authority during the last three years,
except compounding fees of 30,000/- and ` 60,000/- paid by the Company and its Officers respectively to
Ministry of Corporate Affairs in October 2012, for Section 224(8) of the Companies Act, 1956.
7.3.3 No personnel has been denied access to the Audit Committee.
7.3.4 The Company has fulfilled the non-mandatory requirements as prescribed in Annexure ID of Clause 49,
which are as under:
a) Remuneration & Compensation Committee: For further details please refer clause 5 of this report.
b) Auditor’s qualification: Nil
c) Emphasis of Matter:
Standalone Auditors’ Report
• Please refer Note 37 to the financial statements regarding investments made in certain subsidiaries
and a joint venture which have accumulated losses and the loans and advances/receivables from
these entities, where the provision made for diminution, other than temporary, in the value of
investments is considered to be adequate, for the reasons stated in the said Note.
Consolidated Auditors’ Report
• Note 42 to the Consolidated Financial Statements regarding the associate Company’s stand of not
treating members’ margin and income thereon as part of Settlement Guarantee Fund (SGF)
contemplated under the directions of the Forward Market Commission (FMC) and instead crediting
such margins to ‘Other current liabilities’ and such income to the Statement of Profit and Loss
(amounts unascertained) for the reason stated therein.
• Note 2(C)(iii) to the Consolidated Financial Statements regarding Emphasis of Matter made by the
auditors of a jointly controlled entity, wherein it is stated that the consolidated financial statements stof the said entity for the year ended 31 December, 2012 have been prepared on a going concern
basis, notwithstanding the said entity having incurred a loss ` 279.74 lacs (to the extent of the
Group’s share) and has net liabilities of ` 888.65 lacs (to the extent of the Group’s share) as on
that date, for the reasons stated in the said Note.
d) Training of Board Members: The Board members are updated about the business model of the
Company and also its subsidiaries through presentations at various meetings and by circulating news
articles, research report, monthly bulletins etc.
The Audit Committee periodically reviews significant developments, transactions and arrangements entered into
by the unlisted subsidiary Companies. The Audit Committee also reviews on quarterly basis the investments
made by the Company into the unlisted Subsidiary Companies and reviews on yearly basis the consolidated
financial statements of the Company. The minutes of the Board meetings of the material unlisted subsidiary
companies are periodically placed before the Board of Directors of the Company.
8. SUBSIDIARY COMPANIES:
Financial Technologies (India) Ltd. | ANNUAL REPORT 2012-13
54

9. MEANS OF COMMUNICATION
10. GENERAL SHAREHOLDER INFORMATION
9.1 The quarterly results are published in newspapers, namely Trinity Mirror in English and Makkal Kural in
the regional language.
9.2 The quarterly and half-yearly financials appear on our corporate website www.ftindia.com under the
Investors section.
9.3 The Company’s audited and un-audited financial results, press releases, other press coverage, press
clippings, stock information, Annual Reports, etc, are posted on the Company’s Website www.ftindia.com
9.4 The Company’s financial results, shareholding pattern, corporate announcements, etc, are filed
electronically through CFDS portal viz. www.corpfiling.co.in. Similarly, filings like shareholding pattern,
corporate governance report etc are filed electronically on NEAPS, an electronic filing application
developed by NSE.
9.5 Management’s Discussion and Analysis Report: This information is covered elsewhere in this Annual
Report.
9.6 CEO/CFO Certification: This information is covered elsewhere in this Annual Report.
10.1 Annual General Meeting:
thDate : 25 September 2013, Wednesday
Time : 2.00 p.m.
Venue : Sri P. Obul Reddy Hall (Vani Mahal) 103, G. N. Chetty Road, T. Nagar, Chennai – 600 017.
10.2 Financial Calendar
st stFinancial Year 1 April, 2013 to 31 March, 2014
Financial Reporting for the quarter ending as per Stock Exchange Listing Agreement
(tentative and subject to change):th th30 June, 2013 By or before 14 August, 2013 th th30 September, 2013 By or before 14 November, 2013 st th31 December, 2013 By or before 14 February, 2014 st th31 March, 2014 By or before 30 May, 2014 (audited figures) as per Stock Exchange Listing
Agreement
10.3 Book-Closure Date and Dividend Disclosure:
th tha) The Books shall be closed from 18 September, 2013 to 25 September, 2013 (both days inclusive)
for the purpose of the ensuing Annual General Meeting. The Dividend, if approved by the
shareholders at the Annual General Meeting, shall be paid to all shareholders whose names appearth- as beneficial owners at the end of the business day on 17 day of September 2013, as per the
details available with NSDL & CDSL, andth- on the Register of Members as on 17 day of September 2013 of owners holding shares in physical form.
b) Announcement of Dividend:
The Board of Directors have proposed a final dividend of ` 2/- (i.e. 100%) per share subject to
approval of the shareholders at the ensuing Annual General Meeting. This final dividend, if approved
together with three interim dividends, aggregated to a total dividend of ` 8/- per share (i.e. 400%).
4 CORPORATE GOVERNANCE
55

c) Mode of Payment and Date of Payment:
Final dividend shall be remitted through National Electronic Clearing Service (NECS)/at approved
locations, wherever NECS details are available with the Company, and in all other cases, through
warrants payable at par. These warrants shall be valid for a period of 90 days. Post-expiry of validity thperiod, these may be sent to the Company’s Corporate office at 8 Floor, FT Tower, CTS No. 256 &
257, Suren Road, Chakala, Andheri (East), Mumbai - 400 093, for issuance of Demand draft/Bankers
cheque in lieu of expired warrants.
Date of Payment: Within the statutory time limit.
10.4 Listing
The equity shares of the Company are presently listed on the BSE Limited (formerly Bombay Stock
Exchange Ltd.) (BSE), National Stock Exchange of India Ltd. (NSE), Ahmedabad Stock Exchange Ltd.
(ASE) and Madras Stock Exchange Limited (MSE).
The Global Depository Receipts are listed on the official list of the Luxembourg Stock Exchange and
admitted to trading on the Euro MTF market of the Luxembourg Stock Exchange and quoted on the
International Order Book of the London Stock Exchange.
stAs on 31 March, 2013, there were 48,349 shareholders of the Company.
10.5 Stock Market Codes:
a) Trading Symbol:
b) Depository for Equity Shares : NSDL and CDSL
c) Demat ISIN Number
- Equity share : INE111B01023
d) GDR Security Numbers
- Regulation S GDRs Master Regulation S GDR ISIN: US31769V2060
Master Regulation S GDR Common Code: 032082424
Master Regulations S GDR CUSIP: 31769V206
- Rule 144A GDRs Master Rule 144A GDR ISIN: US31769V1070
Master Rule 144A GDR CUSIP: 31769V107
Master Rule 144A GDR Common Code: 032082823
Name of the Stock Exchanges Scrip Code Reuters Bloomberg
BSE Ltd.
National Stock Exchange of India Ltd.
Madras Stock Exchange Ltd.
Ahmedabad Stock Exchange Ltd.
Luxembourg Stock Exchange - (GDR)
FTECH:IN
-
-
-
-
FITE.BO
FITE.NS
-
-
-
526881
FINANTECH
WTG
67641
FinTechnolIndia GDR ne
Financial Technologies (India) Ltd. | ANNUAL REPORT 2012-13
56

10.6 Stock Market Data:
The market price data is given below, covering the period April 2012 to March 2013
Month & Year High Price High Price Low Price Low PriceVolume Nos. Volume Nos.
Apr-12
May-12
Jun-12
Jul-12
Aug-12
Sep-12
Oct-12
Nov-12
Dec-12
Jan-13
Feb-13
Mar-13
13,07,990
11,65,974
13,20,246
35,83,862
29,29,960
15,81,094
11,60,958
10,26,447
6,91,980
8,89,382
13,11,288
8,87,200
679.00
552.05
583.10
682.00
716.10
823.90
960.20
976.30
1,026.10
1,110.00
825.10
692.90
783.50
694.70
744.80
824.90
862.00
978.85
1,043.85
1,223.80
1,166.00
1,197.90
1,134.90
898.40
52,53,348
48,42,297
52,37,693
1,51,57,227
94,77,134
66,17,520
53,53,431
51,83,248
36,74,166
42,19,140
59,18,218
43,58,463
678.35
551.55
583.00
681.30
714.55
810.00
960.05
977.75
1,027.00
1,108.25
825.00
690.10
790.00
694.85
745.00
824.00
862.85
979.80
1,044.00
1,221.90
1,175.55
1,198.00
1,135.00
869.80
NSE BSE
FTIL Share Price on BSEFTIL Share Price on NSEHigh PriceLow Price
4 CORPORATE GOVERNANCE
57
(Price in `)
Apr
-12
May
-12
Jun-
12
Jul-
12
Aug
-12
Sep
t-12
Oct
-12
Nov
-12
Dec
-12
Jan-
13
Feb-
13
Mar
-13
Apr
-12
May
-12
Jun-
12
Jul-
12
Aug
-12
Sep
t-12
Oct
-12
Nov
-12
Dec
-12
Jan-
13
Feb-
13
Mar
-13
1,300
1,200
1,100
1,000
900
800
700
600
500
400
300
200
100
1,300
1,200
1,100
1,000
900
800
700
600
500
400
300
200
100
Pric
e R
ange
(`
)

10.7 Share Price Performance in broad based indices
Performance of the Company’s shares vis-à-vis Sensex and CNX Nifty at a common base of 100 for the styear-ended 31 March 2013 is given in the chart below:
AT A COMMON BASE OF 100 FROM APRIL 2012 TO MARCH 2013
AT A COMMON BASE OF 100 FROM APRIL 2012 TO MARCH 2013
10.8 Registrar & Transfer Agent:
Karvy Computershare Private Limited, Plot No. 17 to 24, Vittalrao Nagar, Madhapur, Hyderabad – 500 081.
T: +91 040 2342 0818 | F: +91 040 2342 0814 | E: [email protected]
10.9 Share Transfer System:
Shares sent for transfer in physical form are generally registered and returned within a period of 15 days
from the date of lodgment and demat requests are normally confirmed within an average period of 15
days, provided the documents are clear in all respects.
CHART SHOWING FTIL PRICE IN BSE VS SENSEX
CHART SHOWING FTIL PRICE IN NSE VS CNX NIFTY
200
180
160
140
120
100
80
60
40
20
Apr-12 May-12 Jun-12 Jul-12 Aug-12 Sept-12 Oct-12 Nov-12 Dec-12 Jan-13 Feb-13 Mar-13
Apr-12 May-12 Jun-12 Jul-12 Aug-12 Sept-12 Oct-12 Nov-12 Dec-12 Jan-13 Feb-13 Mar-13
Share Price
Nifty
Share Price
Sensex200
180
160
140
120
100
80
60
40
20
Financial Technologies (India) Ltd. | ANNUAL REPORT 2012-13
58

10.10 Dematerialisation of Shares and Liquidity:
The shares of the Company are compulsorily traded in dematerialized (electronic) form and available for sttrading under both the Depositories viz. NSDL and CDSL. As on 31 March, 2013, a total of 45,944,662
equity shares of the Company were dematerialised, forming 99.71% of the Company’s total Share
Capital.
Go Green Initiative:
As a part of Green initiative, the Company has taken necessary steps by sending documents viz.,
Notice of General Meeting, Annual Report etc. by e-mail. Accordingly, the members are requested to
register their e-mail Ids with Registrar & Transfer Agent/Depository to enable the Company to send the
documents by electronic mode. Physical copies shall be sent to all those members whose e-mail
addresses are not registered with the Company and to those who have informed the Company that
they wish to receive the documents in physical mode. Members may send their request to the email id:
st10.11 Distribution of Shareholding and Shareholding Pattern as on 31 March, 2013
10.12 Shareholding Pattern:
Category
Category (Shares)
No. of Shareholders
No. of holders
% of Shareholders
% to Holders
No. of Equity Shares
No. of Shares
% of Shares
% to Equity
Physical
Electronic
Under CDSL
Under NSDL
TOTAL
1 - 500
501 - 1,000
1,001 - 2,000
2,001 - 3,000
3,001 - 4,000
4,001 - 5,000
5,001 - 10,000
10,001 - and above
TOTAL:
0.29
9.14
90.57
100.00
4.88
1.13
0.98
0.61
0.43
0.39
1.26
90.32
100.00
133,875
4,211,756
41,732,906
46,078,537
2,248,845
524,956
451,794
281,157
197,170
179,374
579,358
41,615,883
46,078,537
0.96
38.40
60.64
100.00
97.02
1.47
0.64
0.23
0.12
0.08
0.17
0.27
100.00
464
18,566
29,319
48,349
46,912
709
309
113
56
38
80
132
48,349
4 CORPORATE GOVERNANCE
stAs on 31 March 2013 No. of Shares Held % of Share Held
A. Promoter's Holding
Indian Promoters:
(Promoters, Directors, their relatives and companies under their control)
Foreign Promoters
Sub Total (A)
45.63
-----
45.63
21,027,582
----
21,027,582
59

Notes:
1. The Company issued 11,639,677 GDRs in F.Y. 2007-08, whereby seven GDRs represent one equity share of a nominal value of ` 2/- each.
2. The total foreign holding is 11,466,239 shares, i.e. 24.88% of the total share capital.
Shareholding Pattern
10.13 Statutory Compliance:
During the year, your Company has complied with all applicable provisions, filed all returns/forms and
furnished all relevant particulars as required under the Companies Act, 1956 and allied Acts and Rules,
the Securities and Exchange Board of India (SEBI) Regulations and the Listing Agreements with Stock
Exchanges.
10.14 Outstanding GDR/ADR/Warrants or any convertible instruments, conversion date and impact on
equity:
10.14.1 Employee Stock Option Scheme (ESOP)
During the financial year 2011-12, the Remuneration and Compensation Committee (‘Committee’)
under ESOP Schemes 2009 and 2010, granted 1,800,000 stock options to various employees at
an exercise price of ` 770/- per share. Further, from the available options out of thlapsed/cancelled stock options on 5 March 2013, the Committee granted 74,350 and 112,280
stock options under ESOP Scheme 2009 and ESOP Scheme 2010 respectively, at an exercise stprice of ` 807.70 per share. As on 31 March 2013, 892,500 and 880,955 stock options under
ESOP Scheme 2009 and ESOP Scheme 2010 respectively, are in force.
10.14.2 Global Depository Receipts (GDRs)stThe outstanding GDR as on 31 March, 2013 were 760,158.
stAs on 31 March, 2013 No. of Shares Held % of Share Held
B. Public Shareholding:
Institutional Investors:
a) Mutual Funds
b) Banks
c) Foreign Institutional Investors
d) Financial Institutions
Non-Institutional Investors:
a) Private Corporate Bodies
b) Indian Public
c) NRIs
d) Others
Subtotal (B)
GDRs underlying Equity shares
Subtotal (C)
GRAND TOTAL (A+B+C)
7.50
0.20
24.22
0.08
3.49
9.82
0.42
8.40
54.13
0.24
0.24
100.00
3,455,011
93,119
11,161,836
36,203
1,605,772
4,524,887
195,809
3,869,724
24,942,361
108,594
108,594
46,078,537
Institutional Investors
Private Corporate Bodies
Indian Public
NRIs
Others
GDRs
Indian Promoters 45.63%32.00%
3.49%9.82%0.42%8.40%0.24%
Financial Technologies (India) Ltd. | ANNUAL REPORT 2012-13
60

11. LOCATION OF OFFICES:
12. INVESTOR CORRESPONDENCE:
13. UNPAID/UNCLAIMED DIVIDEND:
1. Chennai: Doshi Towers, First Floor, 1A & B, 156, Periyar, EVR Salai, Kilpauk, Chennai – 600 010.
2. Mumbai: FT Tower CTS No. 256 & 257, Suren Road, Chakala, Andheri (East), Mumbai – 400 093.
All routine correspondence regarding transfer and transmission of shares, split, consolidation and issue of
duplicate/renewed share certificates, etc. should be addressed to the Company’s Registrars and Share
Transfer Agents.
a) Complaints/grievances, if any, should be addressed to
Vice President & Company Secretary
Financial Technologies (India) Ltd.
FT Tower, CTS No. 256 & 257, Suren Road, Chakala, Andheri (East), Mumbai – 400 093.
T: +91 22 6686 8010 | F: +91 22 6725 0257 | E: [email protected]
b) Financial queries, if any, should be addressed to
Investor Relations Department
Financial Technologies (India) Ltd.
FT Tower, CTS No. 256 & 257, Suren Road, Chakala, Andheri (East), Mumbai – 400 093.
T: +91 22 6686 8010 | F: +91 22 6725 0257 | E: [email protected]
Pursuant to the provisions of Section 205A(5) of the Companies Act, 1956, dividend which remains unpaid or
unclaimed for a period of seven years from the date of its transfer to unpaid dividend account, is required to
be transferred by a company to the Investor Education and Protection Fund (IEPF), established by the
Central Government under the provisions of section 205C of the Companies Act, 1956.
During the year, your Company transferred ` 99,659/- (Rupees Ninety Nine Thousand Six Hundred Fifty Nine
only) for Final dividend 2004-2005 and ` 177,452/- (Rupees One lakh Seventy seven thousand four hundred
fifty two only) for interim dividend 2005-06, to Investor Education and Protection Fund (IEPF) on rd nd23 November, 2012 and 22 December 2012, respectively.
Shareholders of the Company who have either not received or have not encashed their dividend warrants, for
Final Dividend 2005-06, Interim and Final Dividend 2006-07, Interim and Final Dividend 2007-08, Interim and
Final Dividend 2008-09, Interim and Final Dividend 2009-10, Interim and Final Dividend 2010-11, Interim and
Final Dividend 2011-12, and Interim dividend 2012-13, are requested to claim the unpaid/unclaimed dividend
from the Company/Share Transfer Agent of the Company before it is transferred to the IEPF.
Particulars Rate of Dividend Due for Transfer on or before
rd03 December, 2013th04 October, 2013th04 January, 2014
th06 April, 2014th20 June, 2014
nd02 December, 2014th04 October, 2014th04 January, 2015
rd23 March, 2015nd02 November, 2015
th29 September, 2006st31 July, 2006
st31 October, 2006st31 January, 2007
th16 April, 2007th28 September, 2007
st31 July, 2007st31 October, 2007th17 January, 2008
th28 August, 2008
260%
40%
40%
40%
180%
100%
50%
350%
400%
200%
Date of Declaration
Contd.
4 CORPORATE GOVERNANCE
61
Final Dividend 2005-06st1 Interim Dividend 2006-07nd2 Interim Dividend 2006-07rd3 Interim Dividend 2006-07th4 Interim Dividend 2006-07
Final Dividend 2006-07st1 Interim Dividend 2007-08nd2 Interim Dividend 2007-08rd3 Interim Dividend 2007-08
Final Dividend 2007-08

14. SECRETARIAL AUDIT FOR RECONCILIATION OF CAPITAL:
As stipulated by SEBI, a qualified Practising Company Secretary carries out Secretarial Audit to reconcile the
total admitted capital with National Securities Depository Limited (NSDL) and Central Depository Services
(India) Limited (CDSL) and the total issued and listed capital. This audit is carried out every quarter and the
report thereon is submitted to the Stock Exchanges, where the Company’s shares are listed. The audit
confirms that the total Listed and Paid-up Capital is in agreement with the aggregate of the total number of
shares in dematerialized form (held with NSDL and CDSL) and total number of shares in physical form.
Information on Directors Re-appointment:
As required under Clause 49 of the Listing Agreement, particulars of the Director seeking re-appointment are
given hereunder:
Directors retiring by rotation, being eligible, offering themselves for re-appointment
Particulars Rate of Dividend Due for Transfer on or before
st1 Interim Dividend 2008-09nd2 Interim Dividend 2008-09rd3 Interim Dividend 2008-09
Final Dividend 2008-09st1 Interim Dividend 2009-10nd2 Interim Dividend 2009-10rd 3 Interim Dividend 2009-10
Final Dividend 2009-10st1 Interim Dividend 2010-11nd2 Interim Dividend 2010-11rd3 Interim Dividend 2010-11
Final Dividend 2010-11st1 Interim Dividend 2011-12nd2 Interim Dividend 2011-12rd3 Interim Dividend 2011-12
Final Dividend 2011-12st1 Interim Dividend 2012-13nd2 Interim Dividend 2012-13rd3 Interim Dividend 2012-13
05 October, 2015th05 January, 2016
th30 March, 2016th29 November, 2016
rd03 October, 2016nd02 January, 2017
th04 April, 2017rd03 December, 2017
th15 October, 2017th13 January, 2018
nd2 April, 2018rd03 December, 2018
th14 October, 2018th15 January, 2019
th06 April, 2019nd02 December, 2019
th11 October, 2019th05 January, 2020
rd3 April, 2020
thst31 July, 2008st31 October, 2008th24 January, 2009
th25 September, 2009th30 July, 2009
th29 October, 2009th29 January, 2010
th29 September, 2010th11 August, 2010
th09 November, 2010th27 January, 2011
th29 September, 2011th10 August, 2011
th11 November, 2011st31 January, 2012
th27 September, 2012th6 August, 2012
st31 October, 2012 th28 January, 2013
200%
100%
100%
100%
100%
100%
100%
100%
100%
100%
100%
100%
100%
100%
100%
100%
100%
100%
100%
Date of Declaration
Name of the Director Mr. Ravi K. Sheth
Date of Birth
Date of appointment on the Board
Qualifications
Expertise
Directorship held in other companies
(excluding foreign and private companies)
Membership/Chairmanship of committees
across public companies
Number of shares held in the Company
02-04-1961
15-09-1994
B.Com. MBA (Babson College, Wellesley, USA)
Business experience of over 27 years
Greatship (India) Ltd.,
The Great Eastern Shipping co. Ltd.
-
2,489,762
Financial Technologies (India) Ltd. | ANNUAL REPORT 2012-13
62

DECLARATION BY THE CHAIRMAN AND MANAGING DIRECTOR UNDER CLAUSE 49 OF THE LISTING AGREEMENT
REGARDING COMPLIANCE TO THE CODE OF CONDUCT
I hereby confirm that all the Directors and the Senior Management personnel of the Company have affirmed stcompliance with the Code of Conduct of the Company for the financial year ended 31 March, 2013.
For Financial Technologies (India) Ltd.
Name of the Director Mr. C. M. Maniar
Date of Birth
Date of appointment on the Board
Qualifications
Expertise
Directorship held in other companies
(excluding foreign and private companies)
Membership/Chairmanship of committees
across public companies
Number of shares held in the Company
04-12-1935
15-10-2010
B.Com., L.L.B., M.A. (Economics & Politics)
Over four decades of experience in Legal Profession, Senior Partner of Crawford
Bayley & Co., Solicitors & Advocates.
Multi Commodity Exchange of India Ltd., Foods & Inns Ltd., Godfrey Phillips India
Ltd., Gujarat Ambuja Exports Ltd., Hindalco Industries Ltd., Indo-Euro Investment
Company Ltd., The Indian Card Clothing Company Ltd., Pioneer Investcorp Ltd.,
Sudal Industries Ltd., TCPL Packaging Ltd., Varun Shipping Company Ltd., Utkal
Alumina International Ltd.
Member of Audit Committee in: Multi Commodity Exchange of India Ltd., Hindalco
Industries Ltd., Pioneer Investcorp Ltd., TCPL Packaging Ltd. and Varun Shipping
Company Ltd.
Member of Shareholders/investors grievance Committee and Share Transfer
Committee in: Hindalco Industries Ltd., Pioneer Investcorp Ltd. and Godfrey
Philips India Ltd.
Nil
Jignesh Shah
Chairman and Managing Director
Place: MumbaithDate: 30 May 2013
4 CORPORATE GOVERNANCE
63

CERTIFICATION OF FINANCIAL STATEMENTS OF THE COMPANY BY THE CHIEF EXECUTIVE OFFICER (CEO) AND THE
CHIEF FINANCIAL OFFICER (CFO)
We, Jignesh Shah, Chairman & Managing Director, and Devendra Agrawal, Chief Financial Officer, certify that:
st1. We have reviewed the financial statements and the cash flow statement for the year ended 31 March, 2013
and to the best of our knowledge and belief;
• these statements do not contain any materially untrue statement or omit any material fact or contain
statements that might be misleading
• these statements together present a true and fair view of the company’s affairs, and are in compliance
with the existing accounting standards, applicable laws and regulations
2. There are, to the best of our knowledge and belief, no transactions entered into by the Company during the
year which are fraudulent, illegal or in violation of the Company’s Code of Conduct
3. We accept the responsibility for establishing and maintaining internal controls for financial reporting. We have
also evaluated the effectiveness of the internal control systems of the Company with respect to financial
reporting and deficiencies in the design or operation of internal controls, if any, have been disclosed to the
Auditors and the Audit Committee. They have been intimated about the steps we have taken or propose to
take to rectify these deficiencies.
4. We have indicated to the Auditors and the Audit Committee of
i. significant changes in internal control during the year;
ii. significant changes in accounting policies during the year; the same have been disclosed in the notes to
the financial statements; and
iii. instances of significant fraud of which we have become aware and the involvement therein, if any, of the
management or an employee who has a significant role in the Company’s internal control system over
financial reporting.
Jignesh Shah
Chairman and Managing Director
Devendra Agrawal
Chief Financial Officer
Place: MumbaithDate: 30 May 2013
Financial Technologies (India) Ltd. | ANNUAL REPORT 2012-13
64

4 CORPORATE GOVERNANCE
65
AUDITORS’ CERTIFICATE ON COMPLIANCE OF CONDITIONS OF CORPORATE GOVERNANCE
To the Members of
Financial Technologies (India) Limited
We have examined the compliance of the conditions of Corporate Governance by FINANCIAL TECHNOLOGIES st(INDIA) LIMITED (“the Company”), for the year ended 31 March, 2013, as stipulated in Clause 49 of the Listing
Agreement of the said Company with relevant Stock Exchanges.
The compliance of the conditions of Corporate Governance is the responsibility of the Management. Our
examination has been limited to a review of the procedures and implementation thereof adopted by the Company
for ensuring compliance with the conditions of Corporate Governance as stipulated in the said Clause. It is neither
an audit nor an expression of opinion on the financial statements of the Company.
In our opinion and to the best of our information and according to the explanations given to us and the
representations made by the Directors and the Management, we certify that the Company has complied, in all
material respects, with the conditions of Corporate Governance as stipulated in Clause 49 of the above mentioned
Listing Agreements.
We further state that such compliance is neither an assurance as to the future viability of the Company nor the
efficiency or effectiveness with which the Management has conducted the state of affairs of the Company.
Place: MumbaithDate: 30 July 2013
For Deloitte Haskins & SellsChartered Accountants
(Registration No.117366W)
Partner
(Membership No.: 36920)
Rajesh K. Hiranandani

Financial Technologies (India) Ltd. | ANNUAL REPORT 2012-13
FINANCIALS
A N N U A L R E P O R T 2 0 1 2 - 1 3
•
• Consolidated
Standalone

STANDALONEFinancials
5 FINANCIALSStandalone

INDEPENDENT AUDITORS’ REPORT to the Members of Financial Technologies (India) Limited
Report on the Financial Statements
We have audited the accompanying financial statements of FINANCIAL TECHNOLOGIES (INDIA) LIMITED (“the Company”) which comprise the st
Balance Sheet as at 31 March, 2013, the Statement of Profit and Loss and the Cash Flow Statement for the year then ended, and a summary of the significant accounting policies and other explanatory information.
Management’s Responsibility for the Financial Statements
The Company’s Management is responsible for the preparation of these financial statements that give a true and fair view of the financial position, financial performance and cash flows of the Company in accordance with the Accounting Standards referred to in Section 211(3C) of the Companies Act, 1956 (“the Act”) and in accordance with the accounting principles generally accepted in India. This responsibility includes the design, implementation and maintenance of internal control relevant to the preparation and presentation of the financial statements that give a true and fair view and are free from material misstatement, whether due to fraud or error.
Auditors’ Responsibility
Our responsibility is to express an opinion on these financial statements based on our audit. We conducted our audit in accordance with the Standards on Auditing issued by the Institute of Chartered Accountants of India. Those Standards require that we comply with ethical requirements and plan and perform the audit to obtain reasonable assurance about whether the financial statements are free from material misstatement.
An audit involves performing procedures to obtain audit evidence about the amounts and the disclosures in the financial statements. The procedures selected depend on the auditors’ judgement, including assessment of the risks of material misstatement of the financial statements, whether due to fraud or error. In making those risk assessments, the auditor considers internal control relevant to the Company’s preparation and fair presentation of the financial statements in order to design audit procedures that are appropriate in the circumstances, but not for the purpose of expressing an opinion on the effectiveness of the Company’s internal control. An audit also includes evaluating the appropriateness of the accounting policies used and the reasonableness of the accounting estimates made by the Management, as well as evaluating the overall presentation of the financial statements.
We believe that the audit evidence we have obtained is sufficient and appropriate to provide a basis for our audit opinion.
Opinion
In our opinion and to the best of our information and according to the explanations given to us, the aforesaid financial statements give the information required by the Act in the manner so required and give a true and fair view in conformity with the accounting principles generally accepted in India:
st(a) in the case of the Balance Sheet, of the state of affairs of the Company as at 31 March, 2013;
(b) in the case of the Statement of Profit and Loss, of the profit of the Company for the year ended on that date and
(c) in the case of the Cash Flow Statement, of the cash flows of the Company for the year ended on that date.
Emphasis of Matter
We draw attention to Note 37 to the financial statements regarding investments made in cer tain subsidiaries and a joint venture which have accumulated losses and the loans and advances/receivables from these entities, where the provision made for diminution, other than temporary, in the value of investments is considered to be adequate, for the reasons stated in the said Note.
Our opinion is not qualified in respect of this matter.
Report on Other Legal and Regulatory Requirements
1. As required by the Companies (Auditor’s Repor t) Order, 2003 (“the Order”) issued by the Central Government in terms of Section 227(4A) of the Act, we give in the Annexure a statement on the matters specified in paragraphs 4 and 5 of the Order.
2. As required under provisions of Section 227(3) of the Act, we report that:
(a) We have obtained all the information and explanations which to the best of our knowledge and belief were necessary for the purposes of our audit.
(b) In our opinion, proper books of account as required by law have been kept by the Company so far as it appears from our examination of those books.
(c) The Balance Sheet, the Statement of Profit and Loss and the Cash Flow Statement dealt with by this Repor t are in agreement with the books of account.
(d) In our opinion, the Balance Sheet, the Statement of Profit and Loss and the Cash Flow Statement comply with the Accounting Standards referred to in Section 211(3C) of the Act.
st(e) On the basis of the written representations received from the directors as on 31 March, 2013 taken on record by the Board of Directors, stnone of the directors is disqualified as on 31 March, 2013 from being appointed as a director in terms of Section 274(1)(g) of the Act.
For DELOITTE HASKINS & SELLSChartered Accountants
(Firm Registration No. 117366W)
Partner(Membership No. 36920)
Rajesh K Hiranandani
thMUMBAI, 30 May, 2013 68
Financial Technologies (India) Ltd. | ANNUAL REPORT 2012-13

ANNEXURE TO THE INDEPENDENT AUDITORS’ REPORT(Referred to in paragraph 1 under ‘Report on Other Legal and Regulatory Requirements’ section of our report of even date)
(i) Having regard to the nature of the Company’s business/activities/results during the year, clauses (vi), (viii), (x), (xii), (xiii), (xiv), (xviii), (xix) and (xx) of Paragraph 4 of the Order are not applicable to the Company.
(ii) In respect of its fixed assets:
(a) The Company has maintained proper records showing full particulars, including quantitative details and situation of fixed assets.
(b) The fixed assets were physically verified during the year by the Management in accordance with a regular programme of verification which, in our opinion, provides for physical verification of all the fixed assets at reasonable intervals. According to the information and explanation given to us, no material discrepancies were noticed on such verification.
(c) The fixed assets disposed off during the year, in our opinion, do not constitute a substantial part of the fixed assets of the Company and such disposal has, in our opinion, not affected the going concern status of the Company.
(iii) According to the information and explanations given to us, the Company does not have any inventories as at the balance sheet date since they are being directly delivered to the customers on procurement and therefore, the question of repor ting on whether: physical verification has been carried out at reasonable intervals; procedures of physical verification of inventories were reasonable and adequate; and discrepancies noticed on physical verification were material, does not arise. On the basis of our examination, in our opinion, the Company has maintained proper records of its inventories.
(iv) The Company has neither granted nor taken any loans, secured or unsecured, to/from companies, firms or other par ties covered in the Register maintained under Section 301 of the Companies Act, 1956.
(v) In our opinion and according to the information and explanations given to us and having regard to the nature of the Company’s business, a comparison of prices could not be made, in respect of income from software products and software services and in respect of some of the items purchased being of special nature and suitable alternative sources are not readily available for obtaining comparable quotations, there is an adequate internal control system commensurate with the size of the Company and the nature of its business with regard to purchases of inventory and fixed assets and income from software products and software services. During the course of our audit, we have not observed any major weakness in such internal control system.
(vi) In our opinion and according to the information and explanations given to us, there are no contracts or arrangements that need to be entered in the Register maintained in pursuance of Section 301 of the Companies Act, 1956.
(vii) In our opinion, the internal audit functions carried out during the year by a firm of Chartered Accountants appointed by the Management have been commensurate with the size of the Company and the nature of its business.
(viii)According to the information and explanations given to us, in respect of statutory dues:
(a) The Company has generally been regular in depositing undisputed statutory dues, including Provident Fund, Investor Education and Protection Fund, Employees’ State Insurance, Income-tax, Sales Tax, Wealth Tax, Service Tax, Customs Duty, Excise Duty and other material statutory dues applicable to it with the appropriate authorities.
(b) There were no undisputed amounts payable in respect of Provident Fund, Investor Education and Protection Fund, Employees’ State Insurance, Income-tax, Sales Tax, Wealth Tax, Service Tax, Customs Duty, Excise Duty and other material statutory dues in arrears as at
st31 March, 2013 for a period of more than six months from the date they became payable.st(c) Details of dues of Income-tax, Sales Tax, Service Tax and Excise Duty which have not been deposited as on 31 March, 2013 on
account of disputes are given below:
Name of Statute Nature of Dues
Forum where Dispute is Pending
Period to whichthe amount relates
Amountinvolved(` lacs)
Finance Act, 1994
Central Excise Act, 1944
Maharashtra Value
Added Tax Act, 2002
Central Sales Tax Act,
1956
Income-tax, Act, 1961
Service Tax
Excise duty (including interest
and penalty)
Value Added Tax (including
interest and penalty)
Central Sales Tax
Income-tax
Commissioner of Service
Tax
Central Excise and Service
Tax Appellate Tribunal
Joint Commissioner of
Sales Tax (Appeal)
Joint Commissioner of
Sales Tax (Appeal)
Deputy Commissioner of
Income Tax (Appeals)
July 9, 2004 to October 6, 2005;
and December, 2004 to March, 2007
March 1, 2006 to December 20, 2006
2005-2006 to 2009-2010
2006-2007
Assessment years: 2009-2010
244.50
203.69
74.35
3.12
1,374.79
There were no unpaid disputed dues in respect of Provident Fund, Investor Education and Protection Fund, stEmployees’ State Insurance, Wealth Tax and Customs Duty as on 31 March, 2013.
69
5 FINANCIALSStandalone

ANNEXURE TO THE INDEPENDENT AUDITORS’ REPORT(Referred to in paragraph 1 under ‘Report on Other Legal and Regulatory Requirements’ section of our report of even date)
(ix) In our opinion and according to the information and explanations given to us, the Company has not defaulted in the repayment of dues to banks. The Company does not have any dues to financial institutions and has not issued any debentures.
(x) In our opinion and according to the information and explanations given to us, the terms and conditions of the guarantees given by the Company for loans taken by its subsidiary companies from banks and financial institutions are not, prima facie, prejudicial to the interests of the Company.
(xi) In our opinion and according to the information and explanations given to us, the term loans have been applied by the Company during the year for the purposes for which they were obtained, other than temporary deployment pending application.
(xii) In our opinion and according to the information and explanations given to us, and on an overall examination of the Balance Sheet of the Company, we report that funds raised on short-term basis have, prima facie, not been used during the year for long-term investment.
(xiii) To the best of our knowledge and according to the information and explanations given to us, no fraud by the Company and no material fraud on the Company has been noticed or reported during the year.
For DELOITTE HASKINS & SELLS
Chartered Accountants(Firm Registration No. 117366W)
Partner(Membership No. 36920)
Rajesh K Hiranandani
thMUMBAI, 30 May, 2013
70
Financial Technologies (India) Ltd. | ANNUAL REPORT 2012-13

71
Balance Sheet stas at 31 March 2013
(` lacs)
Note No.
I. EQUITY AND LIABILITIES
II. ASSETS
1 Shareholders’ funds
(a) Share capital
(b) Reserves and surplus
2 Non-current liabilities
(a) Long-term borrowings
(b) Deferred tax liabilities (net)
(c) Other long-term liabilities
(d) Long-term provisions
3 Current liabilities
(a) Trade payables
(b) Other current liabilities
(c) Short-term provisions
TOTAL
1 Non-current assets
(a) Fixed assets
(i) Tangible assets
(ii) Intangible assets
(iii) Capital work-in-progress
(b) Non-current investments
(c) Long-term loans and advances
(d) Other non-current assets
2 Current assets
(a) Current investments
(b) Trade receivables
(c) Cash and Cash equivalents
(d) Short-term loans and advances
(e) Other current assets
TOTAL
As at 31.03.2012
921.57
240,336.90
241,258.47
56,272.15
1,373.33
15.15
1,457.17
59,117.80
1,312.79
18,219.10
1,542.35
21,074.24
321,450.51
44,303.58
2,669.72
79.12
47,052.42
82,198.15
46,509.24
1,348.84
177,108.65
91,605.70
3,628.93
39,900.83
7,540.49
1,665.91
144,341.86
321,450.51
3
4
5
6
7
8
9
10
11
12A
12B
13
14
15
16
17
18
19
20
1 to 48
921.57
266,761.81
267,683.38
59,828.23
2,382.88
276.72
2,153.50
64,641.33
2,034.63
23,371.23
1,419.05
26,824.91
359,149.62
45,607.32
2,093.11
-
47,700.43
89,464.66
60,696.63
896.86
198,758.58
132,042.90
8,310.47
8,606.20
8,440.16
2,991.31
160,391.04
359,149.62
As at 31.03.2013
See accompanying notes forming part of the financial statements
In terms of our report attached For and on behalf of the BoardFor Deloitte Haskins & SellsChartered Accountants
Chairman & Managing Director Director
Sr. Vice President (Legal) Chief Financial Officer Partner & Company Secretary
Place : Mumbai Place : Mumbaith thDate : 30 May, 2013 Date : 30 May, 2013
Jignesh Shah P. R. Barpande
Naishadh Desai Devendra Agrawal Rajesh K Hiranandani
5 FINANCIALSStandalone

Financial Technologies (India) Ltd. | ANNUAL REPORT 2012-13
72
Statement of Profit and Lossstfor the year ended 31 March, 2013
(` lacs)
Income
Revenue from operations
Other income
Total revenue
Expenses
Purchases of stock-in-trade
Employee benefits expense
Finance costs
Depreciation and amortisation expense
Other expenses
Total expenses
Profit before tax
Tax expense/(credit)
(a) Current tax expense for current year
(b) Less: MAT credit
(c) Current tax expense relating to prior years
(d) Net current tax expense
(e) Deferred Tax
Net tax expense
Profit for the year
Earnings per share:
Basic per share (in `)
Diluted per share (in `)
Face Value Per Share (in `)
42,554.81
36,885.89
79,440.70
281.34
11,248.10
3,044.23
1,730.10
10,191.59
26,495.36
52,945.34
10,133.02
(6,276.00)
1,113.60
4,970.62
171.79
5,142.41
47,802.93
103.74
103.74
2
21
22
23
24
25
26
27
36
1 to 48
45,090.10
20,651.99
65,742.09
31.83
12,410.70
4,283.74
2,253.99
6,514.55
25,494.81
40,247.28
6,949.67
-
-
6,949.67
1,009.55
7,959.22
32,288.06
70.07
69.48
2
In terms of our report attached For and on behalf of the BoardFor Deloitte Haskins & SellsChartered Accountants
Chairman & Managing Director Director
Sr. Vice President (Legal) Chief Financial Officer Partner & Company Secretary
Place : Mumbai Place : Mumbaith thDate : 30 May, 2013 Date : 30 May, 2013
Jignesh Shah P. R. Barpande
Naishadh Desai Devendra Agrawal Rajesh K Hiranandani
See accompanying notes forming part of the financial statements
Year Ended 31.03.2013
Year Ended 31.03.2012Note No.

Cash Flow Statementstfor the year ended 31 March, 2013
73
(` lacs)
Year Ended 31.03.2012
52,945.34
(23,096.59)
29,848.75
10,479.11
40,327.86
(5,783.17)
34,544.69
(3,900.65)
38.12
50,684.07
(17,046.62)
25,193.63
(315,128.47)
293,069.92
10,142.25
(5,508.52)
2,114.98
(31,550.25)
11,571.05
5,062.12
24,741.63
(3,522.59)
21,219.04
(71,662.68)
51,178.88
(4,277.09)
(3,638.02)
(28,398.91)
27,364.82
6,798.80
34,163.62
1,730.10
(26,891.35)
43.88
(12.64)
3,882.35
37.68
(5,025.16)
3,044.23
2,051.56
(1,957.24)
(514.86)
10,993.97
40,247.28
(7,580.54)
32,666.74
82.93
32,749.67
600.34
33,350.01
(4,191.46)
1,415.36
-
(1,425.00)
-
(379,601.02)
340,555.62
-
(3,886.66)
3,341.79
2,870.01
(24,807.81)
3,104.78
8,300.29
(54,324.10)
(1,151.07)
(55,475.17)
-
-
(4,277.26)
(3,100.35)
(7,377.61)
(29,502.77)
34,163.62
4,660.85
2,253.99
(4,697.86)
(460.63)
(35.44)
-
159.54
(8,300.29)
4,283.74
3,409.57
(4,193.16)
(5,604.43)
5,687.36
Year Ended 31.03.2013
A. Cash flow from operating activities
Net profit before tax
Adjustments for:
Depreciation and amortisation expense
Profit on sale of investments (net)
(Profit)/Loss on disposal/write off of fixed assets (net)
Reversal of write down in value of current investments (net)
Loss on sale/redemption/reduction in shares in subsidiary
companies (net)
Provision for doubtful debts/advances and bad debts
written off (net)
Dividend income
Finance costs
Exchange rate fluctuations - loss
Interest income
Operating profit before working capital changes
Adjustments for:
Trade and other receivables
Trade payables and provisions
Cash generated from operations
Net Income Tax refund/(paid)
Net cash from operating activities
B. Cash flow from investing activities
Capital expenditure on fixed assets including capital advances
Proceeds from sale of fixed assets
Proceeds on sale/redemption/reduction in shares in
subsidiary companies (net of expenses)
Purchase of investments in subsidiaries
Proceeds from partial sale of stake in associates
(net of expenses) (Refer Note 38)
Purchase of investments - others
Proceeds from sale of investments - others
Bank balances not considered as Cash and cash equivalents
- Placed
- Matured
Interest income
Loans given to subsidiary companies
Loans repaid by subsidiary companies
Dividend income
Cash flow (used in)/from investing activities
Tax Paid
Net cash flow (used in)/from investing activities
C. Cash flow from financing activities
Repayment of Zero Coupon Convertible Bonds including
premium on redemption and withholding tax thereon
Proceeds from External Commercial Borrowings
Dividend paid during the year including dividend tax
Finance costs
Net cash used in financing activities
Net (decrease)/increase in cash and cash equivalents
Cash and cash equivalents (opening balance)
Cash and cash equivalents (closing balance)
5 FINANCIALSStandalone

Cash Flow Statementstfor the year ended 31 March, 2013 (Contd.)
Financial Technologies (India) Ltd. | ANNUAL REPORT 2012-13
74
Cash and Cash equivalents
Unrealised loss/(gain) on foreign currency cash and cash equivalents
Cash and cash equivalents (Refer Note 18)
Previous Year
34,163.62
2,336.25
36,499.87
Current Year
4,660.85
(0.47)
4,660.38
In terms of our report attached For and on behalf of the Board.For Deloitte Haskins & SellsChartered Accountants
Chairman & Managing Director Director
Sr. Vice President (Legal) Chief Financial Officer Partner & Company Secretary
Place : Mumbai Place : Mumbaith thDate : 30 May, 2013 Date : 30 May, 2013
Jignesh Shah P. R. Barpande
Naishadh Desai Devendra Agrawal Rajesh K Hiranandani
Notes to cash flow statement:
1. Cash and cash equivalents include cash and bank balances in current and deposit accounts, with original maturities not exceeding three
months. Reconciliation of bank balances with cash and cash equivalents is as follows:
2. Fixed deposits with banks with maturity period of more than three months are classified and grouped in investing activities and not included
in cash and cash equivalents.
3. Cash flow statement has been prepared under the "Indirect Method" as set out in Accounting Standard (AS 3)
"Cash Flow Statement".
(` lacs)

75
1. GENERAL INFORMATION
2. SIGNIFICANT ACCOUNTING POLICIES:
The Financial Technologies group is among the global leaders in offering technology IP (Intellectual Property) and domain expertise to create and trade on next-generation financial markets, that are transparent, efficient and liquid, across all asset classes including equities, commodities, currencies and bonds among others. The group is pioneer in end to end Straight Through Processing (STP) solution that support high density transactions. It has developed proprietary technology platform benchmarked against global standard which give it a decisive edge in driving mass disruptive innovation at the speed and cost of execution unmatched in the financial market industry.
The Financial Technologies group operates one of the world’s largest network of 9 exchanges connecting fast-growing economies of Africa, Middle East, India and South East Asia. The group also has five ecosystem ventures to address upstream and downstream opportunities around exchanges, including clearing, depository, information vending, and payment gateway among others.
A. Basis of preparation of financial statements
The financial statements have been prepared under the historical cost convention in accordance with the generally accepted accounting principles in India and the provisions of the Companies Act, 1956.
B. Use of estimates
The preparation of financial statements in conformity with generally accepted accounting principles requires estimates and assumptions to be made that affect the reported amounts of assets and liabilities on the date of the financial statements and the reported amounts of revenues and expenses during the reporting period. Differences between actual results and estimates are recognised in the period in which the results are known/materialise.
C. Fixed assets (tangible assets)
Fixed assets are stated at cost of acquisition or construction and carried at cost less accumulated depreciation and impairment loss, if any.
D. Intangible assets
Intangible assets are recognised only if it is probable that the future economic benefits that are attributable to the assets will flow to the enterprise and the cost of the assets can be measured reliably. Expenditure on an intangible item is expensed when incurred unless it forms part of the cost of intangible asset that meets the recognition criteria. Intangible assets are stated at cost of acquisition and are carried at cost less accumulated amortisation and impairment loss, if any.
E. Operating leases
Assets taken/given on lease under which all the risks and rewards of ownership are effectively retained by the lessor are classified as operating lease. Lease payments/income under operating leases are recognised as expenses/income on a straight line basis over the lease term in accordance with the respective lease agreements.
F. Depreciation and amortisation
Depreciation and amortisation is provided for on straight line basis at the rates prescribed in Schedule XIV to the Companies Act, 1956 except for following assets which are depreciated over the useful lives stated as follows:
G. Investments
Current investments are carried at the lower of cost and fair value. Long-term investments are stated at cost less provision for diminution. Provision for diminution in the value of long-term investments is made only if such a decline is other than temporary in the opinion of the management. The difference between carrying amount of the investment determined on average cost basis and sale proceeds, net of expenses, is recognised as profit or loss on sale of investments.
H. Revenue recognition
Revenue is recognised when no significant uncertainty as to determination and realisation exists. Income from software products (IPR based licenses) and income from software services (project based contracts) for the use of software applications is recognised on delivery/granting of right to use.
Revenue from fixed price service contracts is recognised based on milestones/acts performed as specified in the contracts or on a straight line basis over the contract period where performance of several acts is required over that period.
In the case of time and material contracts, revenue is recognised on the basis of hours completed and material used.
Revenue from annual maintenance contracts, lease of licenses, IT infrastructure sharing income and Shared Business Support Services is recognised proportionately over the period in which the services are rendered/licenses are leased.
Notesstforming part of the financial statements for the Year ended 31 March, 2013
ASSETS
Leasehold improvements to premises
Premium on leasehold land
Patent and Trademarks
Technical know-how and computer software
ESTIMATED USEFUL LIFE
Period of lease
Period of lease
8 years
6 years
5 FINANCIALSStandalone

Revenue from sale of traded goods is recognised when the significant risks and rewards in respect of ownership of products are transferred by the Company.
Sales are stated net of returns, VAT and service tax wherever applicable.
Dividend income is recognised when the Company’s right to receive dividend is established. Interest income is recognised on time proportion basis. Insurance claim is recognised when such claim is admitted by the Insurance Company.
I. Foreign currency transactions and translation
Foreign currency transactions are recorded at the exchange rates prevailing on the date of the transaction.
Monetary items denominated in foreign currency are restated using the exchange rate prevailing at the balance sheet date. Exchange differences relating to long term monetary items are dealt with in the following manner:
(i) Exchange differences arising during the year, in so far as they relate to the acquisition of a depreciable capital asset are added to/deducted from the cost of the asset and depreciated over the balance life of the asset.
(ii) In other cases, such differences are accumulated in a “Foreign Currency Monetary Item Translation Difference Account” and amortised to the statement of profit and loss over the balance life of the long-term monetary item.
All other exchange differences are dealt with in the statement of profit and loss.
Non-monetary items denominated in foreign currency are carried at historical cost.
Foreign branches:
The translation of the financial statements of foreign branches (non integral) is accounted for as under:
(a) All revenues and expenses are translated at average rate.
(b) All monetary and non-monetary assets and liabilities are translated at the rate prevailing on the balance sheet date.
(c) Resulting exchange difference is accumulated in Foreign Currency Translation Reserve Account until the disposal of the net investment in the said non integral foreign operation.
J. Derivative instruments
The Company uses derivative financial instruments such as forward foreign exchange contracts entered into for hedging the risks of foreign currency exposure (in respect of highly probable forecasted transactions/firm commitments) and interest rate swaps to hedge its risks associated with fluctuations in interest rate. As per principles of prudence as enunciated in Accounting Standard 1 (AS-1), “Disclosure of Accounting Policies”, losses, if any, on Mark to Market basis, are recognised in the statement of Profit and Loss and gains are not recognised on prudent basis.
K. Employee Benefits
(a) Post employment benefits and other long term benefits
Payments to defined contribution retirement schemes and other similar funds are expensed as incurred.
For defined benefit schemes and other long term benefit plans viz. gratuity and compensated absences expected to occur after twelve months, the cost of providing benefits is determined using the Projected Unit Credit Method, with actuarial valuations being carried out at the balance sheet date. Actuarial gains and losses are recognised in full in the statement of profit and loss for the period in which they occur. Past service cost is recognised immediately to the extent that the benefits are already vested, and otherwise is amortised on a straight line basis over the average period until the benefits become vested. The retirement benefit obligation recognised in the balance sheet represents the present value of the defined benefit obligation as adjusted for unrecognised past service cost, as reduced by the fair value of scheme assets. Any asset resulting from this calculation is limited to the present value of the available refunds and reduction in contributions to the scheme.
(b) Short term employee benefits
The undiscounted amount of short term employee benefits expected to be paid in exchange for the services rendered by employees is recognised as an expense during the period when the employee renders those services. These benefits include compensated absences such as leave expected to be availed within a year and performance incentives.
L. Borrowing costs
Borrowing costs that are attributable to the acquisition or construction of qualifying assets are capitalised as part of the cost of such assets. A qualifying asset is one that necessarily takes a substantial period of time to get ready for its intended use or sale. Premium relating to redemption of zero coupon convertible bonds is debited to Securities Premium Account as permitted under section 78 of the Companies Act, 1956. Ancillary borrowing costs are amortised over the period of loan. All other borrowing costs are charged to revenue.
M. Income taxes
Income taxes are accounted for in accordance with Accounting Standard (AS-22) “Accounting for Taxes on Income”. Tax expense comprises current tax and deferred tax. Current tax is the amount of tax payable on the taxable income for the year as determined in accordance with the provisions of Income-Tax Act, 1961. The Company recognises deferred tax (subject to consideration of prudence) based on the tax effect of timing differences, being differences between taxable income and accounting income that originate in one period and are capable of reversal in one or more subsequent periods. The effect on deferred tax assets and liabilities of a change in tax rates is recognised in the
Notesstforming part of the financial statements for the Year ended 31 March, 2013
Financial Technologies (India) Ltd. | ANNUAL REPORT 2012-13
76

77
statement of profit and loss using the tax rates and tax laws that have been enacted or substantively enacted by the balance sheet date. Deferred tax assets are not recognised on unabsorbed depreciation and carry forward of losses unless there is virtual certainty that sufficient future taxable income will be available against which such deferred tax assets can be realised.
Minimum Alternative Tax (MAT) credit is recognised as an asset only when and to the extent there is convincing evidence that the entity will pay normal income tax during the specified period. In the year in which the MAT credit becomes eligible to be recognised as an asset in accordance with the recommendations contained in Guidance Note issued by the Institute of Chartered Accountants of India, the said asset is created by way of a credit to the statement of profit and loss and shown as MAT Credit Entitlement. The Company reviews the same at each balance sheet date and writes down the carrying amount of MAT Credit Entitlement to the extent there is no longer convincing evidence to the effect that entity will pay normal income tax during the specified period.
N. Stock based compensation
The compensation cost of stock options granted to employees is measured by the intrinsic value method, i.e. difference between the market price of the Company’s shares on the date of grant of options and the exercise price to be paid by the option holders. The compensation cost, if any, is amortised uniformly over the vesting period of the options.
O. Impairment of assets
The Company assesses at each Balance Sheet date whether there is any indication that an asset may be impaired. If any such indication exists, the Company estimates the recoverable amount of the assets. If such recoverable amount of the asset or the recoverable amount of the cash generating unit to which the asset belongs is less than its carrying amount, the carrying amount is reduced to its recoverable amount. The reduction is treated as an impairment loss and is recognised in the statement of profit and loss. If at the Balance Sheet date there is an indication that if a previously assessed impairment loss no longer exists, the recoverable amount is reassessed and the asset is reflected at lower of the carrying amount that would have been determined had no impairment loss been recognised and recoverable amount.
P. Provisions, contingent liabilities and contingent assets
Provisions involving substantial degree of estimation in measurement are recognised when there is a present obligation as a result of past events and it is probable that there will be an outflow of resources. Contingent liabilities are not recognised but disclosed by way of notes to the accounts. Contingent assets are neither recognised nor disclosed in the financial statements.
3. SHARE CAPITAL
Equity shares of ` 2/- each
Issued, subscribed and fully paid up:
Equity shares of ` 2/- each
TOTAL
Authorised:
` lacs
3,000.00
921.57
921.57
Number of shares
150,000,000
46,078,537
46,078,537
As at 31.03.2012
Number of shares
150,000,000
46,078,537
46,078,537
` lacs
3,000.00
921.57
921.57
La-fin Financial Services Private Limited
Jignesh P. Shah
Ravi K. Sheth
Blackstone GPV Capital Partners Mauritius VI FII Ltd.
Elliot & Page Limited*
Reliance Capital Trustee Company Limited*
*Includes shares held under different sub-accounts/schemes.
% Holding
26.76
18.08
5.40
-
5.69
5.74
Number of Equity
Shares held
12,329,968
8,329,585
2,489,762
3,235,703
-
2,268,275
Number of Equity
Shares held
12,329,968
8,329,585
2,489,762
-
2,619,632
2,643,339
% Holding
26.76
18.08
5.40
7.02
-
4.92
a. During the period of five years immediately preceding the reporting date, the Company has issued:
(i) 194,900 (Previous Year 321,030) Equity shares of 2/- each fully paid-up to the employees under employee stock option ('ESOP') schemes.
(ii) 1,662,811 (Previous Year 1,662,811) Equity shares of ` 2/- each fully paid-up against Global Depositary Receipts ('GDR') issued by the Company.
b. Rights, preferences and restrictions attached to equity shares:
The Company has only one class of shares referred to as equity shares having a par value of ` 2/- per share. Each holder of equity shares is entitled to one vote per share. The Company declares and pays dividend in Indian Rupees. The dividend recommended by the Board of Directors is subject to the approval of the shareholders at the ensuing annual general meeting, except in the case of interim dividend. In the event of liquidation of the Company, the holders of equity shares will be entitled to receive remaining assets of the Company, after distribution of all preferential amounts in the proportion of equity shares held.
c. Details of equity shares held by each shareholder holding more than 5% equity shares in the Company:
`
As at 31.03.2013
As at 31.03.2012
EQUITY SHARES
As at 31.03.2013
Notesstforming part of the financial statements for the Year ended 31 March, 2013
5 FINANCIALSStandalone
d. For particulars of options on unissued capital under employee stock option schemes, Refer Note 43.

Financial Technologies (India) Ltd. | ANNUAL REPORT 2012-13
78
4. RESERVES AND SURPLUS
5. LONG-TERM BORROWINGS
Capital reserve
Balance as per last Balance Sheet
Securities premium account
Balance as per last Balance Sheet
Less: Premium on redemption of Zero Coupon Convertible Bonds (ZCCB)
[net of tax of ` Nil (Previous Year ` 1,959.03 lacs)]
General reserve
Balance as per last Balance Sheet
Add: Transferred from Statement of Profit and Loss
Foreign currency translation reserve
Balance as per last Balance Sheet
(Less)/Add: Effect of foreign exchange rate variation during the year
Foreign currency monetary item translation difference account (FCMITDA)
Balance as per last Balance Sheet
Add: Effect of foreign exchange rate variation during the year
Less: Amortisation during year
Surplus in Statement of Profit and Loss
Balance as per last Balance Sheet
Profit for the year
Less: Appropriations
Interim Dividends [` 6/- per share (Previous Year ` 6/- per share)]
Final Dividend (Proposed) [` 2/- per share (Previous Year ` 2/- per share)]
Tax on Dividend
Transfer to General Reserve
Total Appropriations
Net surplus in Statement of Profit and Loss
TOTAL
Unsecured term loans from banks
External commercial borrowings in foreign currency
TOTAL
During the previous year, the Company had availed three foreign currency term loans viz. external
commercial borrowings aggregating USD 110 million. Loans of USD 35 million and USD 50 million are
repayable in three annual installments (first two installments of 33.33% each and last installment of
33.34%) starting from April 2015 and June 2015 respectively. These loans carry interest at the rate of
applicable quarterly LIBOR plus margin of 3.5% p.a. Balance loan of USD 25 million availed, is
repayable in nine semi-annual installments (first eight installments of 11% each and last installment of
12%) starting from December 2014. This loan carries interest at the rate of applicable quarterly LIBOR
plus margin of 5% p.a.
As at 31.03.2013
147.59
41,746.61
-
41,746.61
23,160.15
3,253.00
26,413.15
(6.28)
7.32
1.04
(4,224.67)
(3,556.08)
1,977.02
(5,803.73)
179,513.50
32,288.06
2,764.71
921.57
605.13
3,253.00
7,544.41
204,257.15
266,761.81
59,828.23
59,828.23
As at 31.03.2012
147.59
45,824.64
(4,078.03)
41,746.61
17,900.15
5,260.00
23,160.15
(2.38)
(3.90)
(6.28)
-
(9,863.35)
5,638.68
(4,224.67)
141,254.86
47,802.93
2,764.71
921.57
598.01
5,260.00
9,544.29
179,513.50
240,336.90
56,272.15
56,272.15
(` lacs)
Notesstforming part of the financial statements for the Year ended 31 March, 2013
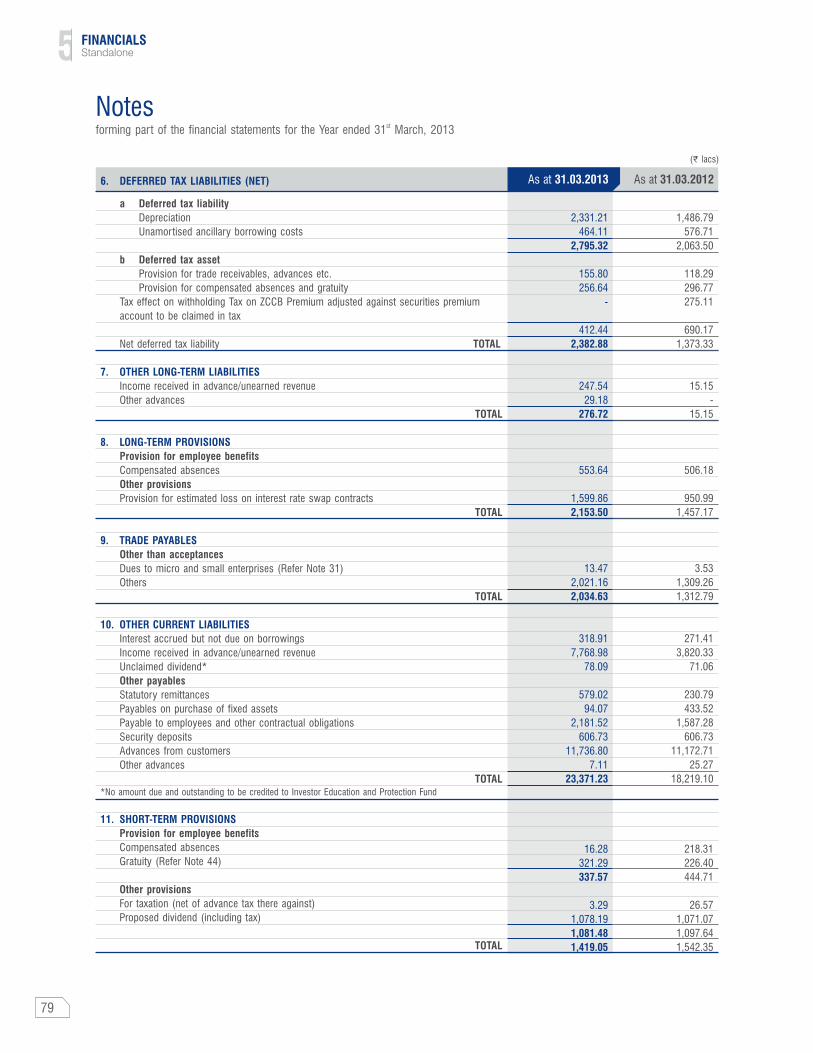
79
(` lacs)
a Deferred tax liability
Depreciation
Unamortised ancillary borrowing costs
b Deferred tax asset
Provision for trade receivables, advances etc.
Provision for compensated absences and gratuity
Tax effect on withholding Tax on ZCCB Premium adjusted against securities premium
account to be claimed in tax
Net deferred tax liability TOTAL
Income received in advance/unearned revenue
Other advances
TOTAL
Provision for employee benefits
Compensated absences
Other provisions
Provision for estimated loss on interest rate swap contracts
TOTAL
Other than acceptances
Dues to micro and small enterprises (Refer Note 31)
Others
TOTAL
Interest accrued but not due on borrowings
Income received in advance/unearned revenue
Unclaimed dividend*
Other payables
Statutory remittances
Payables on purchase of fixed assets
Payable to employees and other contractual obligations
Security deposits
Advances from customers
Other advances
TOTAL*No amount due and outstanding to be credited to Investor Education and Protection Fund
Provision for employee benefits
Compensated absences
Gratuity (Refer Note 44)
Other provisions
For taxation (net of advance tax there against)
Proposed dividend (including tax)
TOTAL
7. OTHER LONG-TERM LIABILITIES
8. LONG-TERM PROVISIONS
9. TRADE PAYABLES
10. OTHER CURRENT LIABILITIES
11. SHORT-TERM PROVISIONS
As at 31.03.2012
1,486.79
576.71
2,063.50
118.29
296.77
275.11
690.17
1,373.33
15.15
-
15.15
506.18
950.99
1,457.17
3.53
1,309.26
1,312.79
271.41
3,820.33
71.06
230.79
433.52
1,587.28
606.73
11,172.71
25.27
18,219.10
218.31
226.40
444.71
26.57
1,071.07
1,097.64
1,542.35
2,331.21
464.11
2,795.32
155.80
256.64
-
412.44
2,382.88
247.54
29.18
276.72
553.64
1,599.86
2,153.50
13.47
2,021.16
2,034.63
318.91
7,768.98
78.09
579.02
94.07
2,181.52
606.73
11,736.80
7.11
23,371.23
16.28
321.29
337.57
3.29
1,078.19
1,081.48
1,419.05
As at 31.03.2013
Notesstforming part of the financial statements for the Year ended 31 March, 2013
6. DEFERRED TAX LIABILITIES (NET)
5 FINANCIALSStandalone
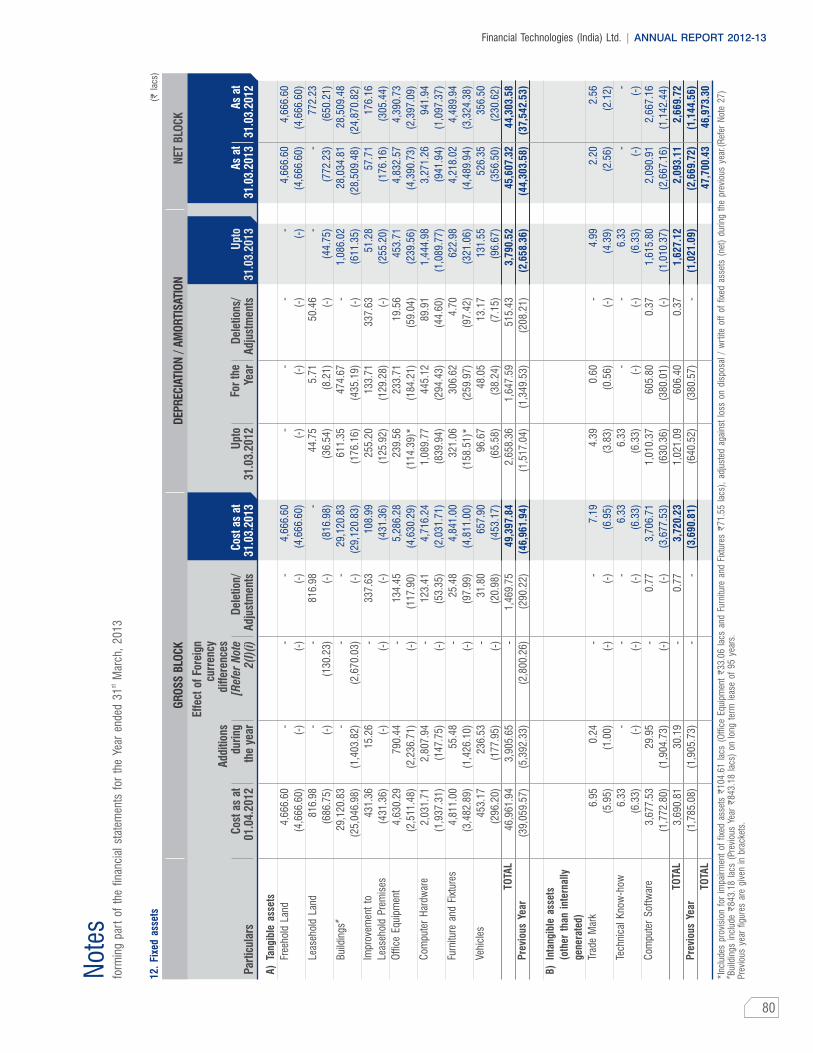
12.
Fixe
d as
sets
Par
ticul
ars
A)
Tang
ible
ass
ets
Free
hold
Lan
d
Leas
ehol
d La
nd
#B
uild
ings
Impr
ovem
ent
to
Leas
ehol
d P
rem
ises
Off
ice
Equi
pmen
t
Com
pute
r H
ardw
are
Furn
iture
and
Fix
ture
s
Vehi
cles
TOTA
L
Pre
viou
s Ye
ar
Trad
e M
ark
Tech
nica
l K
now
-how
Com
pute
r S
oftw
are TO
TAL
Pre
viou
s Ye
ar
TOTA
L
B)
Inta
ngib
le a
sset
s
(oth
er t
han
inte
rnal
ly
gene
rate
d)
Cos
t as
at
01.0
4.20
12
4,66
6.60
(4,6
66.6
0)
816.
98
(686
.75)
29,1
20.8
3
(25,
046.
98)
431.
36
(431
.36)
4,63
0.29
(2,5
11.4
8)
2,03
1.71
(1,9
37.3
1)
4,81
1.00
(3,4
82.8
9)
453
.17
(296
.20)
46,9
61.9
4
(39,
059.
57)
6.95
(5.9
5)
6.3
3
(6.3
3)
3,67
7.53
(1,7
72.8
0)
3,69
0.81
(1,7
85.0
8)
Add
ition
s d
urin
g th
e ye
ar -
(-) -
(-) -
(1,4
03.8
2)
15.2
6 (-)
790.
44
(2,2
36.7
1)
2,80
7.94
(147
.75)
55.4
8
(1,4
26.1
0)
236.
53
(177
.95)
3,90
5.65
(5,3
92.3
3)
0.24
(1.0
0) -
(-)
29.9
5
(1,9
04.7
3)
30.1
9
(1,9
05.7
3)
Eff
ect
of F
orei
gn
curr
ency
di
ffer
ence
s [R
efer
Not
e 2
(I)(
i) -
(-) -
(130
.23) -
(2,6
70.0
3) -
(-) -
(-) -
(-) -
(-) -
(-) -
(2,8
00.2
6) -
(-) -
(-) -
(-) - -
GR
OS
S B
LOC
K
Del
etio
n/A
djus
tmen
ts -
(-)
816.
98 (-) -
(-)
337.
63 (-)
134.
45
(117
.90)
123.
41
(53.
35)
25.4
8
(97.
99)
31.8
0
(20.
98)
1,46
9.75
(290
.22) -
(-) -
(-)
0.77 (-
)
0.77
-
Upt
o31
.03.
2012
-
(-)
44.7
5
(36.
54)
611.
35
(176
.16)
255.
20
(125
.92)
239.
56
(114
.39)
*
1,08
9.77
(839
.94)
321.
06
(158
.51)
*
96.6
7
(65.
58)
2,65
8.36
(1,5
17.0
4)
4.39
(3.8
3)
6.33
(6.3
3)
1,01
0.37
(630
.36)
1,02
1.09
(640
.52)
NET
BLO
CK
DEP
REC
IATI
ON
/ A
MO
RTI
SAT
ION
As
at31
.03.
2013
As
at31
.03.
2012
For
the
Yea
r -
(-)
5.71
(8.
21)
474.
67
(435
.19)
133.
71
(129
.28)
233.
71
(184
.21)
445.
12
(294
.43)
306.
62
(259
.97)
48.0
5
(38.
24)
1,64
7.59
(1,3
49.5
3)
0.60
(0.5
6) -
(-)
605.
80
(380
.01)
606.
40
(380
.57)
Del
etio
ns/
Adj
ustm
ents
- (-)
50.4
6 (-) -
(-)
337.
63 (-)
19.5
6
(59.
04)
89.9
1
(44.
60)
4.70
(97.
42)
13.1
7
(7.1
5)
515.
43
(208
.21) -
(-) -
(-)
0.37 (-
)
0.37
-
4,66
6.60
(4,6
66.6
0) -
(772
.23)
28,0
34.8
1
(28,
509.
48)
57.7
1
(176
.16)
4,83
2.57
(4,3
90.7
3)
3,27
1.26
(941
.94)
4,21
8.02
(4,4
89.9
4)
526.
35
(356
.50)
45,6
07.3
2
(44,
303.
58)
2.20
(2.5
6) -
(-)
2,09
0.91
(2,6
67.1
6)
2,09
3.11
(2,6
69.7
2)
47,7
00.4
3
4,66
6.60
(4,6
66.6
0)
772.
23
(650
.21)
28,5
09.4
8
(24,
870.
82)
176.
16
(305
.44)
4,39
0.73
(2,3
97.0
9)
941.
94
(1,0
97.3
7)
4,48
9.94
(3,3
24.3
8)
356.
50
(230
.62)
44,3
03.5
8
(37,
542.
53)
2.56
(2.1
2) -
(-)
2,66
7.16
(1,1
42.4
4)
2,66
9.72
(1,1
44.5
6)
46,9
73.3
0
(` l
acs)
*Inc
lude
s pr
ovis
ion
for
impa
irm
ent
of f
ixed
ass
ets `
104.
61 l
acs
(Off
ice
Equi
pmen
t `
33.0
6 la
cs a
nd F
urni
ture
and
Fix
ture
s `
71.5
5 la
cs),
adj
uste
d ag
ains
t lo
ss o
n di
spos
al /
wrt
ite o
ff o
f fix
ed a
sset
s (n
et)
durin
g th
e pr
evio
us y
ear.(
Ref
er N
ote
27)
#B
uild
ings
inc
lude
`84
3.18
lac
s (P
revi
ous
Year
`84
3.18
lac
s) o
n lo
ng t
erm
lea
se o
f 95
yea
rs.
Pre
viou
s ye
ar f
igur
es a
re g
iven
in
brac
kets
.
4,66
6.60
(4,6
66.6
0) -
(816
.98)
29,1
20.8
3
(29,
120.
83)
108.
99
(431
.36)
5,28
6.28
(4,6
30.2
9)
4,71
6.24
(2,0
31.7
1)
4,84
1.00
(4,8
11.0
0)
657.
90
(453
.17)
49,3
97.8
4
(46,
961.
94)
7.19
(6.9
5)
6.33
(6.3
3)
3,70
6.71
(3,6
77.5
3)
3,72
0.23
(3,6
90.8
1)
Cos
t as
at
31.0
3.20
13
-
(-) -
(44.
75)
1,08
6.02
(611
.35)
51.2
8
(255
.20)
453.
71
(239
.56)
1,44
4.98
(1,0
89.7
7)
622.
98
(321
.06)
131.
55
(96.
67)
3,79
0.52
(2,6
58.3
6)
4.99
(4.3
9)
6.33
(6.3
3)
1,61
5.80
(1,0
10.3
7)
1,62
7.12
(1,0
21.0
9)
Upt
o31
.03.
2013
Not
esst
form
ing
part
of
the
finan
cial
sta
tem
ents
for
the
Yea
r en
ded
31 M
arch
, 20
13
Financial Technologies (India) Ltd. | ANNUAL REPORT 2012-13
80

(` lacs)
Long Term Investments (fully paid up, valued at cost unless stated otherwise)
A. Trade investments (Unquoted):
(a) In equity shares of subsidiary companies:
1. 6,040,000 (Previous Year 6,040,000) Equity shares of 10/- each in
IBS Forex Limited [at cost less provision for other than temporary
diminution in value ` 136.26 lacs (Previous Year ` 136.26 lacs)]
2. 4,042,500 (Previous Year 4,042,500) Equity shares of ` 10/- each in
TickerPlant Limited (Refer Note 39)
3. 44,999,900 (Previous Year 44,999,900) Equity shares of ` 10/- each in
National Spot Exchange Limited
4. 170,637,063 (Previous Year 28,137,063) Equity shares of ` 1/- each in
atom Technologies Limited (Refer Note 39)
5. 76,000,000 (Previous Year 76,000,000) Equity shares of ` 10/- each in
National Bulk Handling Corporation Limited
6. 1,000,000 (Previous Year 1,000,000) Equity shares of ` 10/- each in
Global Payment Networks Limited
7. 50,000 (Previous Year 50,000) Equity shares of ` 10/- each in
Financial Technologies Communications Limited
8. 60,002 (Previous Year 60,002) Ordinary shares of USD 1/- each in
FT Group Investments Pvt Limited
9. 10,002 (Previous Year 10,002) Ordinary shares of USD 1/- each in
Knowledge Assets Private Limited
10. 3,750,000 (Previous Year 3,750,000) Equity shares of ` 10/- each in
FT Knowledge Management Limited [at cost less provision for other than
temporary diminution in value ` Nil lacs (Previous Year ` 181.00 lacs)]
11. 50,000 (Previous Year 50,000) Equity shares of ` 10/- each in
Takshashila Academia of Economic Research Limited
12. 50,000 (Previous Year 50,000) Equity shares of ` 10/- each in
Boursa India Limited
13. 111,600,001 (Previous Year 111,600,001) Ordinary shares of SGD 1/- each
in Financial Technologies Singapore PTE Limited.
14. 5,000 (Previous Year 5,000) Ordinary shares of MUR 1/- each in
Financial Technologies Projects Pvt. Limited
(b) In equity shares of a joint venture company:
1,900 (Previous Year 1,900) Class B shares of USD 1,000/- each in
Dubai Gold and Commodities Exchange DMCC
(c) In equity shares of associate companies:
1. 68,23,941 (Previous Year 9,140,302) Equity shares of ` 10/- each in
Indian Energy Exchange Limited (Refer Note 47)
2. 5,750,000 (Previous Year 5,750,000) Equity shares of ` 10/- each in
MCX-SX Clearing Corporation Limited
3. 49,000 (Previous Year 49,000) Equity shares of ` 10/- each in
SME Exchange of India Ltd.
(d) In equity shares of other companies:
1. 1,496,500 (Previous Year 1,496,500) Equity shares of ` 1/- each in
Delhi Stock Exchange Limited
2. 10,000 (Previous Year 10,000) Equity shares of ` 10/- each in
National Stock Exchange of India Limited
3. 27,165,000 (Previous Year 27,165,000) Equity shares of ` 1/- each in
MCX Stock Exchange Limited (Refer Note 40)
4. 290,000 (Previous Year 290,000) Equity shares of ` 10/- each in
Vadodara Stock Exchange Limited
`
As at 31.03.2012
467.74
404.25
4,499.99
281.37
8,221.15
100.00
5.00
24.87
3.98
194.00
5.00
5.00
36,874.36
0.08
51,086.79
828.78
914.03
575.00
4.90
1,493.93
1,047.55
278.47
271.65
134.85
1,732.52
467.74
404.25
4,499.99
1,706.37
8,221.15
100.00
5.00
24.87
3.98
375.00
5.00
5.00
36,874.36
0.08
52,692.79
828.78
682.39
575.00
4.90
1,262.29
1,047.55
278.47
-
134.85
1,460.87
As at 31.03.2013
81
Notesstforming part of the financial statements for the Year ended 31 March, 2013
13. NON - CURRENT INVESTMENTS
5 FINANCIALSStandalone

(` lacs)
(e) In Optionally Convertible Preference shares of Subsidiary Companies
15,000,000 (Previous Year 15,000,000) 5% Optionally Convertible Preference
shares of USD 1/- each in FT Group Investments Pvt. Limited.
(f) In warrants of other company
562,460,000 (Previous Year 562,460,000) Warrants of ` 1/- each of
MCX Stock Exchange Limited.
Each warrant in MCX-SX entitles the holder to subscribe to one equity share of
1 each of MCX-SX at any time after six months from the date of issue of
warrants. The warrants are also freely transferable by endorsement and delivery.
The warrants do not carry voting or dividend rights
Total trade investments - Unquoted (A)
B. Trade Investments (Quoted):
In equity shares of an associate company:
13,259,575 (Previous Year 13,259,575) Equity shares of ` 10/- each in
Multi Commodity Exchange of India Limited (Refer Note 38)(Out of which th10,199,674 shares are locked in for the period of three years till 7 March 2015)
Total trade investments - Quoted (B)
C. Other than Trade (Unquoted):
(a) In equity shares of subsidiary companies:
1. 7,000,000 (Previous Year 7,000,000) Equity shares of ` 10/- each in
Riskraft Consulting Limited [at cost less provision for other than temporary
diminution in value ` 634.00 lacs (Previous Year ` 634.00 lacs)]
2. 50,000 (Previous Year 50,000) Equity shares of ` 10/- each in Trans-Global
Credit and Finance Limited
3. 100 (Previous Year 90) Equity Shares of Rand 1/- each in ICX Platform
(Pty) Limited [at cost less provision for other than temporary diminution in
value ` 454.00 lacs (Previous Year ` 273.00 lacs)]
4. 5,249,900 (Previous Year 5,249,900) Equity shares of ` 10/- each in
Credit Market Services Pvt. Limited [at cost less provision for other than
temporary diminution in value ` 513.00 lacs (Previous Year ` 513.00 lacs)]
5. 4,313,845 (Previous Year 4,313,845) Equity shares of ` 10/- each in
Apian Finance & Investment Limited
6. 50,000 (Previous Year 50,000) Ordinary shares of ` 10/- each in
FT Projects Limited
(b) In debentures of subsidiary company:
25 (Previous Year Nil) Unsecured, optionally fully convertible debentures of
` 1,00,00,000/- each in FT Projects Limited
(c) In bonds:
150 (Previous Year 150) Units of ` 1,000,000/- each of 9.5% IndusInd Bank
Limited- Tier II Bonds Issue (Series XIV)
(d) In trust securities:
97 (Previous Year 97) Class A units of ` 100,000/- each towards capital
contribution of India Venture Trust- Fund I
(e) In Government Securities:
National Savings Certificate- VIII Issue (deposited with sales tax authorities)
(f) In units of mutual funds:
1. 5,000,000.00 (Previous Year Nil) units of ` 10/- each of Axis Fixed Term
Plan - Series 34 (392 days) Direct Growth
2. Nil (Previous Year 5,000,000.00) units of ` 10/- each of Birla Sunlife Fixed
Term Plan Series EV Growth (391 Days)
3. Nil (Previous Year 5,000,000.00) units of ` 10/- each of Birla Sunlife Fixed
Term Series ES - Growth 393 days
4. Nil (Previous Year 5,000,000.00) units of ` 10/- each of DSP BlackRock
FMP - Series 38 - 12.5M - Growth
As at 31.03.2012
6,904.50
5,624.60
67,671.12
1,060.77
1,060.77
66.00
5.00
226.13
11.99
549.74
5.00
863.86
-
1,500.00
97.00
0.20
-
500.00
500.00
500.00
6,904.50
5,624.60
68,773.83
1,060.77
1,060.77
66.00
5.00
45.13
11.99
549.74
5.00
682.86
2,500.00
1,500.00
97.00
0.20
500.00
-
-
-
As at 31.03.2013
Financial Technologies (India) Ltd. | ANNUAL REPORT 2012-13
82
Notesstforming part of the financial statements for the Year ended 31 March, 2013
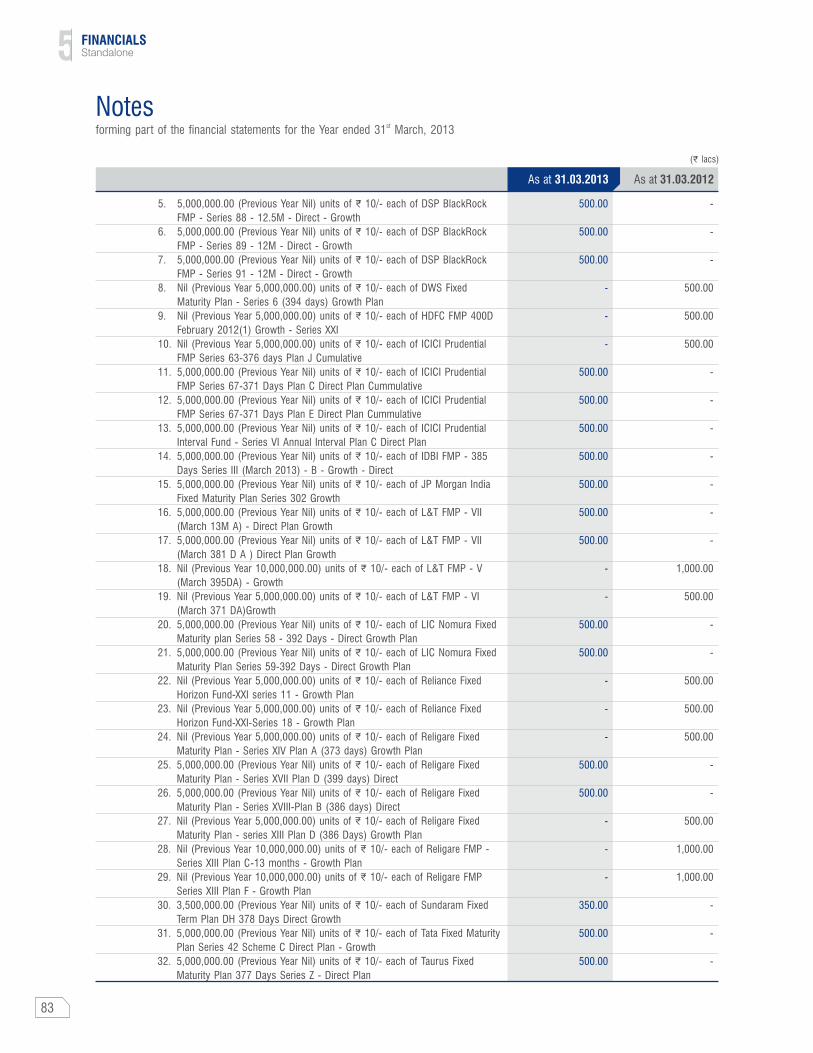
83
(` lacs)
5. 5,000,000.00 (Previous Year Nil) units of ` 10/- each of DSP BlackRock
FMP - Series 88 - 12.5M - Direct - Growth
6. 5,000,000.00 (Previous Year Nil) units of ` 10/- each of DSP BlackRock
FMP - Series 89 - 12M - Direct - Growth
7. 5,000,000.00 (Previous Year Nil) units of ` 10/- each of DSP BlackRock
FMP - Series 91 - 12M - Direct - Growth
8. Nil (Previous Year 5,000,000.00) units of ` 10/- each of DWS Fixed
Maturity Plan - Series 6 (394 days) Growth Plan
9. Nil (Previous Year 5,000,000.00) units of ` 10/- each of HDFC FMP 400D
February 2012(1) Growth - Series XXI
10. Nil (Previous Year 5,000,000.00) units of ` 10/- each of ICICI Prudential
FMP Series 63-376 days Plan J Cumulative
11. 5,000,000.00 (Previous Year Nil) units of ` 10/- each of ICICI Prudential
FMP Series 67-371 Days Plan C Direct Plan Cummulative
12. 5,000,000.00 (Previous Year Nil) units of ` 10/- each of ICICI Prudential
FMP Series 67-371 Days Plan E Direct Plan Cummulative
13. 5,000,000.00 (Previous Year Nil) units of ` 10/- each of ICICI Prudential
Interval Fund - Series VI Annual Interval Plan C Direct Plan
14. 5,000,000.00 (Previous Year Nil) units of ` 10/- each of IDBI FMP - 385
Days Series III (March 2013) - B - Growth - Direct
15. 5,000,000.00 (Previous Year Nil) units of ` 10/- each of JP Morgan India
Fixed Maturity Plan Series 302 Growth
16. 5,000,000.00 (Previous Year Nil) units of ` 10/- each of L&T FMP - VII
(March 13M A) - Direct Plan Growth
17. 5,000,000.00 (Previous Year Nil) units of ` 10/- each of L&T FMP - VII
(March 381 D A ) Direct Plan Growth
18. Nil (Previous Year 10,000,000.00) units of ` 10/- each of L&T FMP - V
(March 395DA) - Growth
19. Nil (Previous Year 5,000,000.00) units of ` 10/- each of L&T FMP - VI
(March 371 DA)Growth
20. 5,000,000.00 (Previous Year Nil) units of ` 10/- each of LIC Nomura Fixed
Maturity plan Series 58 - 392 Days - Direct Growth Plan
21. 5,000,000.00 (Previous Year Nil) units of ` 10/- each of LIC Nomura Fixed
Maturity Plan Series 59-392 Days - Direct Growth Plan
22. Nil (Previous Year 5,000,000.00) units of ` 10/- each of Reliance Fixed
Horizon Fund-XXI series 11 - Growth Plan
23. Nil (Previous Year 5,000,000.00) units of ` 10/- each of Reliance Fixed
Horizon Fund-XXI-Series 18 - Growth Plan
24. Nil (Previous Year 5,000,000.00) units of ` 10/- each of Religare Fixed
Maturity Plan - Series XIV Plan A (373 days) Growth Plan
25. 5,000,000.00 (Previous Year Nil) units of ` 10/- each of Religare Fixed
Maturity Plan - Series XVII Plan D (399 days) Direct
26. 5,000,000.00 (Previous Year Nil) units of ` 10/- each of Religare Fixed
Maturity Plan - Series XVIII-Plan B (386 days) Direct
27. Nil (Previous Year 5,000,000.00) units of ` 10/- each of Religare Fixed
Maturity Plan - series XIII Plan D (386 Days) Growth Plan
28. Nil (Previous Year 10,000,000.00) units of ` 10/- each of Religare FMP -
Series XIII Plan C-13 months - Growth Plan
29. Nil (Previous Year 10,000,000.00) units of ` 10/- each of Religare FMP
Series XIII Plan F - Growth Plan
30. 3,500,000.00 (Previous Year Nil) units of ` 10/- each of Sundaram Fixed
Term Plan DH 378 Days Direct Growth
31. 5,000,000.00 (Previous Year Nil) units of ` 10/- each of Tata Fixed Maturity
Plan Series 42 Scheme C Direct Plan - Growth
32. 5,000,000.00 (Previous Year Nil) units of ` 10/- each of Taurus Fixed
Maturity Plan 377 Days Series Z - Direct Plan
As at 31.03.2012
-
-
-
500.00
500.00
500.00
-
-
-
-
-
-
-
1,000.00
500.00
-
-
500.00
500.00
500.00
-
-
500.00
1,000.00
1,000.00
-
-
-
500.00
500.00
500.00
-
-
-
500.00
500.00
500.00
500.00
500.00
500.00
500.00
-
-
500.00
500.00
-
-
-
500.00
500.00
-
-
-
350.00
500.00
500.00
As at 31.03.2013
Notesstforming part of the financial statements for the Year ended 31 March, 2013
5 FINANCIALSStandalone

Financial Technologies (India) Ltd. | ANNUAL REPORT 2012-13
(` lacs)
33. Nil (Previous Year 5,000,000.00) units of ` 10/- each of Taurus Fixed
Maturity Plan 397 days Series O Growth payout
Total of other than trade - Unquoted (C)
D. Other than Trade (Quoted):
In bonds:
2,000 (Previous year 2,000) Non Convertible 6.85% IIFCL 2014 Tax Free Series II
Bonds of ` 100,000/- each
200,000 (Previous Year Nil) Non Convertible 7.38% REC 2027 Tax Free Series II
Bonds of ` 1,000/- each
200,000 (Previous Year Nil) Non Convertible 7.36% PFC 2028 Tax Free Series II
Bonds of ` 1,000/- each
200,000 (Previous Year Nil) Non Convertible 7.36% IIFCL 2028 Tax Free Series II
Bonds of ` 1,000/- each
Total of other than trade - Quoted (D)
Total Non - current investments (A+B+C+D)
Aggregate amount of Quoted investments
Aggregate market value of listed and Quoted investments
Aggregate amount of Unquoted investments (net of provision for other than
temporary diminution)
Aggregate provision for other than temporary diminution in the value of long - term
investments
Unsecured, considered good
Capital advances
Security deposits
Loans and advances to related parties (Refer Note 41)
Loans and advances to employees
Prepaid Expenses
Balances with government authorities
Advance Income Tax less provision there against including fringe benefit tax
(other than deferred tax)
MAT credit entitlement
TOTAL
Unamortised ancillary borrowing costs
Deposits with banks (under lien with banks against bank guarantees)
TOTAL
A. Current portion of long-term investments (at cost):
(a) In bonds (Quoted):
2,000 (Previous Year 2,000) Non Convertible 6.85% IIFCL 2014 Tax Free Series
II Bonds of ` 100,000/- each
(b) In units of mutual funds (Unquoted):
1. Nil (Previous Year 5,000,000.00) units of ` 10/- each of HSBC Fixed Term
Series 82 (370 days FMP) - Growth
2. 10,000,000.00 (Previous Year Nil) units of ` 10/- each of Baroda Pioneer
367 Day FMP - Seies 4 Growth Plan
3. 5,004,442.00 (Previous Year Nil) units of ` 10/- each of Baroda Pioneer
Fixed Maturity Plan - Series A Plan B - Growth
4. 7,317,913.00 (Previous Year Nil) units of ` 10/- each of Birla Sunlife Fixed
Term Plan - Series GJ Growth - Direct (367 Days)
14. LONG-TERM LOANS AND ADVANCES
15. OTHER NON-CURRENT ASSETS
16. CURRENT INVESTMENTS
As at 31.03.2012
500.00
9,000.00
11,461.06
2,005.20
-
-
-
2,005.20
82,198.15
3,065.97
170,369.45
79,132.18
1,737.26
42.62
257.23
24,376.07
643.08
24.43
31.05
12,387.56
8,747.20
46,509.24
1,347.86
0.98
1,348.84
-
500.00
-
-
-
-
8,850.00
13,630.06
-
2,000.00
2,000.00
2,000.00
6,000.00
89,464.66
7,060.76
116,531.82
82,403.90
1,737.26
37.91
172.43
45,063.63
305.26
391.33
49.37
6,448.39
8,228.31
60,696.63
895.88
0.98
896.86
2,005.20
-
1,000.00
500.44
731.79
As at 31.03.2013
Notesstforming part of the financial statements for the Year ended 31 March, 2013
84

85
(` lacs)
5. 5,000,000.00 (Previous Year Nil) units of ` 10/- each of Birla Sunlife Fixed
Term Plan - Series GM (367 Days) - Growth - Direct
6. Nil (Previous Year 5,000,000.00) units of ` 10/- each of Birla Sunlife Fixed
Term Plan Series EF - Growth (370 days)
7. Nil (Previous Year 2,500,000.00) units of ` 10/- each of Birla Sunlife Fixed
Term Plan Series EK Growth (370 Days)
8. Nil (Previous Year 5,000,000.00) units of ` 10/- each of Birla Sunlife Fixed
Term Plan Series EQ Growth (368 days)
9. 5,000,000.00 (Previous Year Nil) units of ` 10/- each of Birla Sunlife Fixed
Term Plan Series EV Growth (391 Days)
10. 5,000,000.00 (Previous Year Nil) units of ` 10/- each of Birla Sunlife Fixed
Term Series ES - Growth (393 days)
11. 5,000,000.00 (Previous Year Nil) units of ` 10/- each of Birla Sunlife
Interval Income Fund - Annual Plan 3 - Growth - Direct
12. Nil (Previous Year 5,000,000.00) units of ` 10/- each of Birla Sunlife Short
Term Fixed Term Plan Series EI Growth (368 Days)
13. 5,000,000.00 (Previous Year Nil) units of ` 10/- each of BNP Paribas Fixed
Term Fund - Series 25 - Direct - Growth
14. 5,000,000.00 (Previous Year Nil) units of ` 10/- each of BSL Fixed Term
Plan - Series GO (369 Days) - Growth - Direct
15. 5,000,000.00 (Previous Year Nil) units of ` 10/- each of BSL Fixed Term
Plan - Series GQ (367 Days) - Growth - Direct
16. Nil (Previous Year 5,000,000.00) units of ` 10/- each of DSP BlackRock
FMP - Series 32 - 12M Growth
17. 5,000,000.00 (Previous Year Nil) units of ` 10/- each of DSP BlackRock
FMP - Series 38 - 12.5M - Growth
18. 5,000,000.00 (Previous Year Nil) units of ` 10/- each of DSP BlackRock
FMP - Series 43 - 12M Growth
19. 5,000,000.00 (Previous Year Nil) units of ` 10/- each of DSP BlackRock
FMP - Series 59 - 12M - Growth
20. 5,000,000.00 (Previous Year Nil) units of ` 10/- each of DSP BlackRock
FMP - Series 61 - 12M - Growth
21. 2,170,933.33 (Previous Year Nil) units of ` 10/- each of DSP BlackRock
FMP - Series 64 - 12M - Growth
22. 5,000,000.00 (Previous Year Nil) units of ` 10/- each of DSP BlackRock
FMP - Series 66 - 12M - Growth
23. 5,000,000.00 (Previous Year Nil) units of ` 10/- each of DSP BlackRock
FMP - Series 84- 12M - Direct - Growth
24. 5,000,000.00 (Previous Year Nil) units of ` 10/- each of DSP BlackRock
FMP - Series 87- 12M - Direct - Growth
25. 5,000,000.00 (Previous Year Nil) units of ` 10/- each of DSP BlackRock
FMP - Series 90 - 12M - Direct - Growth
26. 5,001,333.51 (Previous Year Nil) units of ` 10/- each of DWS Fixed
Maturity Plan - Series 27-Direct Plan - Growth
27. 5,000,000.00 (Previous Year Nil) units of ` 10/- each of DWS Fixed
Maturity Plan Series 6 (394 days) Growth
28. Nil (Previous Year 5,000,000.00) units of ` 10/- each of DWS Fixed
Maturity Plan Series 1 (370 days) Growth
29. Nil (Previous Year 5,000,000.00) units of ` 10/- each of DWS Fixed
Maturity Plan Series 3 (370 days) Growth
30. Nil (Previous Year 5,000,000.00) units of ` 10/- each of DWS Fixed
Maturity Plan Series 5 (370 days) Growth
31. 5,000,000.00 (Previous Year Nil) units of ` 10/- each of HDFC Annual
Interval Fund Series 1 - Plan B - Direct Growth
32. 3,908,207.00 (Previous Year Nil) units of ` 10/- each of HDFC FMP 371D
August 2012(1) Growth Series 22
As at 31.03.2012
-
500.00
250.00
500.00
-
-
-
500.00
-
-
-
500.00
-
-
-
-
-
-
-
-
-
-
-
500.00
500.00
500.00
-
-
500.00
-
-
-
500.00
500.00
500.00
-
500.00
500.00
500.00
-
500.00
500.00
500.00
500.00
217.09
500.00
500.00
500.00
500.00
500.13
500.00
-
-
-
500.00
390.82
As at 31.03.2013
Notesstforming part of the financial statements for the Year ended 31 March, 2013
5 FINANCIALSStandalone

(` lacs)
33. 5,000,000.00 (Previous Year Nil) units of ` 10/- each of HDFC FMP 371D
February 2013(1) - Direct - Growth
34. 5,000,000.00 (Previous Year Nil) units of ` 10/- each of HDFC FMP 371D
July 2012 (2) - Growth Series 22
35. 3,000,000.00 (Previous Year Nil) units of ` 10/- each of HDFC FMP 372D
Jan 2013 (3) Series 23 - Direct - Growth
36. 5,000,000.00 (Previous Year Nil) units of ` 10/- each of HDFC FMP 372D
July 2012 (1) - Growth Series 22
37. 5,000,000.00 (Previous Year Nil) units of ` 10/- each of HDFC FMP 400D
February 2012(1) Growth
38. Nil (Previous Year 4,071,077.00) units of ` 10/- each of ICICI Prudential
FMP Series 61 - 1 year Plan C cumulative
39. Nil (Previous Year 5,000,000.00) units of ` 10/- each of ICICI Prudential
FMP Series 63 - 1 Year Plan B Cumulative
40. 5,027,676.00 (Previous Year 5,027,676.00) units of ` 10/- each of ICICI
Prudential FMP Series 63 -370 days Plan D Growth
41. 5,000,000.00 (Previous Year Nil) units of ` 10/- each of ICICI Prudential
FMP Series 63 - Plan J Growth (376 days)
42. 4,509,669.53 (Previous Year Nil) units of ` 10/- each of ICICI Prudential
FMP Series 66 - 366 Days Plan F Direct Plan Cummulative
43. 5,000,000.00 (Previous Year Nil) units of ` 10/- each of ICICI Prudential
FMP Series 66 - 366 Days Plan H Direct Plan Cummulative
44. 5,000,000.00 (Previous Year Nil) units of ` 10/- each of ICICI Prudential
FMP Series 66 - 368 Days Plan B Direct Cummulative
45. 5,021,974.00 (Previous Year Nil) units of ` 10/- each of ICICI Prudential
FMP Series 67 - 366 Days Plan B Direct Plan Cummulative
46. 5,043,133.77 (Previous Year Nil) units of ` 10/- each of ICICI Prudential
Regular Savings Fund - Regular Plan - Quarterly Dividend
47. 3,001,472.05 (Previous Year Nil) units of ` 10/- each of IDBI FMP - 367
Days Series III (February 2013) - A -Growth - Direct
48. 5,000,000.00 (Previous Year Nil) units of ` 10/- each of Indiabulls Fixed
maturity Plan 370 Days - Series 1- Growth Plan
49. 5,000,000.00 (Previous Year Nil) units of ` 10/- each of JM Fixed Maturity
Plan Series XXIII - 369 Days Plan A (Direct) Growth
50. 5,000,000.00 (Previous Year Nil) units of ` 10/- each of JP Morgan India
Fixed Maturity Plan Series 17 - Direct - Growth
51. Nil (Previous Year 5,000,000.00) units of ` 10/- each of L&T FMP - V
(February 368D A) Growth
52. 9,000,000.00 (Previous Year Nil) units of ` 10/- each of L&T FMP - VII
(December 369 DA) - Growth
53. 5,000,000.00 (Previous Year Nil) units of ` 10/- each of L&T FMP - VII
(March 367 D A) Direct Plan Growth
54. Nil (Previous Year 5,000,000.00) units of ` 10/- each of L&T FMP Series 6
- Plan E - Growth
55. 10,000,000.00 (Previous Year Nil) units of ` 10/- each of L&T FMP - V
(March 395DA) - Growth
56. 5,000,000.00 (Previous Year Nil) units of ` 10/- each of L&T FMP - VI
(March 371 DA) - Growth
57. 1,679,702.36 (Previous Year Nil) units of ` 10/- each of L&T Triple Ace
Bond Fund - Growth
58. 5,000,000.00 (Previous Year Nil) units of ` 10/- each of Peerless Fixed
Maturity Plan Series 1 Direct Plan Growth Option
59. 5,000,000.00 (Previous Year Nil) units of ` 10/- each of Reliance Fixed
Horizon Fund - XXII - Series 35 - Growth Plan
60. Nil (Previous Year 5,000,000.00) units of ` 10/- each of Reliance Fixed
Horizon Fund XXI-Series 5 Growth Plan
As at 31.03.2012
-
-
-
-
-
407.11
500.00
502.77
-
-
-
-
-
-
-
-
-
-
500.00
-
-
500.00
-
-
-
-
-
500.00
500.00
500.00
300.00
500.00
500.00
-
-
502.77
500.00
450.97
500.00
500.00
502.20
516.74
300.15
500.00
500.00
500.00
-
900.00
500.00
-
1,000.00
500.00
500.00
500.00
500.00
-
As at 31.03.2013
Financial Technologies (India) Ltd. | ANNUAL REPORT 2012-13
86
Notesstforming part of the financial statements for the Year ended 31 March, 2013

87
(` lacs)
61. Nil (Previous Year 5,000,000.00) units of ` 10/- each of Reliance Fixed
Horizon Fund XXI - Series 8 Growth Plan
62. 5,000,000.00 (Previous Year Nil) units of ` 10/- each of Reliance Fixed
Horizon Fund - XXI Series 11 - Growth Plan
63. 5,000,000.00 (Previous Year Nil) units of ` 10/- each of Reliance Fixed
Horizon Fund-XXII Series 15 Growth Plan
64. 10,000,000.00 (Previous Year Nil) units of ` 10/- each of Reliance Fixed
Horizon Fund - XXII - Series 6 - Growth Plan
65. 5,000,000.00 (Previous Year Nil) units of ` 10/- each of Reliance Fixed
Horizon Fund - XXI - Series 18 - Growth Plan
66. 5,000,000.00 (Previous Year Nil) units of ` 10/- each of Reliance Yearly
Interval Fund - Series 2 - Direct Plan Growth Plan
67. 5,000,000.00 (Previous Year Nil) units of ` 10/- each of Reliance Yearly
Interval Fund - Series 3 - Direct Plan - Growth Plan
68. 5,000,000.00 (Previous Year Nil) units of ` 10/- each of Reliance Yearly
Interval Fund - Series 4 - Direct Plan - Growth Plan
69. Nil (Previous Year 5,000,000.00) units of ` 10/- each of Religare Fixed
Maturity Plan - Series XI Plan E (371 days) Growth Plan
70. 5,000,000.00 (Previous Year Nil) units of ` 10/- each of Religare Fixed
Maturity Plan - Series XIV Plan A (373 days) Growth Plan
71. 3,500,000.00 (Previous Year Nil) units of ` 10/- each of Religare Fixed
Maturity Plan - Series XVII - Plan B (369 days) Direct Plan
72. 5,000,000.00 (Previous Year Nil) units of ` 10/- each of Religare Fixed
Maturity Plan - Series XVIII Plan D (368 days) Direct
73. 5,000,000.00 (Previous Year Nil) units of ` 10/- each of Religare Fixed
Maturity Plan - Series XVIII - Plan A (369 days) Direct
74. Nil (Previous Year 5,000,000.00) units of ` 10/- each of Religare Fixed
Maturity Plan - Series XII - Plan C (368 days) Growth Plan
75. 5,000,000.00 (Previous Year Nil) units of ` 10/- each of Religare Fixed
Maturity Plan - Series XIII Plan D (386 Days) Growth Plan
76. Nil (Previous Year 5,000,000.00) units of ` 10/- each of Religare FMP -
Series XII Plan A (370 days) Growth Plan
77. 10,000,000.00 (Previous Year Nil) units of ` 10/- each of Religare FMP -
Series XIII Plan C-13 months - Growth Plan
78. 10,000,000.00 (Previous Year Nil) units of ` 10/- each of Religare FMP
Series XIII Plan F - Growth Plan
79. 5,000,000.00 (Previous Year Nil) units of ` 10/- each of SBI Debt Fund
Series 366 days - 10 Growth
80. 5,000,000.00 (Previous Year Nil) units of ` 10/- each of SBI Debt Fund
Series 366 days - 12 Growth
81. 5,000,000.00 (Previous Year Nil) units of ` 10/- each of SBI Debt Fund
Series 366 days - 20 Growth
82. 5,000,000.00 (Previous Year Nil) units of ` 10/- each of SBI Debt Fund
Series -366 Days 22 Direct Plan - Growth
83. 5,000,000.00 (Previous Year Nil) units of ` 10/- each of SBI Debt Fund
Series 366 days - 8 Growth
84. 5,000,000.00 (Previous Year Nil) units of ` 10/- each of Sundaram Fixed
Term Plan DE 367 Days Direct Growth
85. 5,000,000.00 (Previous Year Nil) units of ` 10/- each of Sundaram Fixed
Term Plan DG 366 Days Direct Growth
86. Nil (Previous Year 4,998,500.00) units of ` 10/- each of Sundaram Interval
Fund Quarterly Plan A Institutional Dividend
87. Nil (Previous Year 3,373,975.00) units of ` 10/- each of Tata Fixed Maturity
Plan 39 Scheme A Growth
88. 5,000,000.00 (Previous Year Nil) units of ` 10/- each of Tata Fixed Maturity
Plan Series 42 Scheme A Direct Plan - Growth
As at 31.03.2012
500.00
-
-
-
-
-
-
-
500.00
-
-
-
-
500.00
-
500.00
-
-
-
-
-
-
-
-
-
500.00
337.40
-
-
500.00
500.00
1,000.00
500.00
500.00
500.00
500.00
-
500.00
350.00
500.00
500.00
-
500.00
-
1,000.00
1,000.00
500.00
500.00
500.00
500.00
500.00
500.00
500.00
-
-
500.00
As at 31.03.2013
Notesstforming part of the financial statements for the Year ended 31 March, 2013
5 FINANCIALSStandalone

Financial Technologies (India) Ltd. | ANNUAL REPORT 2012-13
88
(` lacs)
89. 5,000,000.00 (Previous Year Nil) units of ` 10/- each of Taurus Fixed
Maturity Plan - 369 Days Series X - Growth Plan Direct
90. Nil (Previous Year 5,000,000.00) units of ` 10/- each of Taurus Fixed
Maturity Plan - 370 Days Series M - Growth Plan
91. 5,000,000.00 (Previous Year Nil) units of ` 10/- each of Taurus Fixed
Maturity Plan 366 Days Series Y - Direct Plan
92. 5,000,000.00 (Previous Year Nil) units of ` 10/- each of Taurus Fixed
Maturity Plan 369 Days Series U - Growth Plan
93. 5,000,000.00 (Previous Year Nil) units of ` 10/- each of Taurus Fixed
Maturity Plan 397 days Series O - Growth payout
94. 5,000,000.00 (Previous Year Nil) units of ` 10/- each of Union KBC Fixed
Maturity Plan Series 6 (366 days) - Growth- Direct Plan
95. 5,000,000.00 (Previous Year Nil) units of ` 10/- each of UTI - Fixed Income
Fund Series XIV - I (366 Days) - Direct Plan - Growth
96. 5,000,000.00 (Previous Year Nil) units of ` 10/- each of UTI - Fixed Income
Fund Series XIV - II (366 Days) - Direct Plan - Growth
97. 5,000,000.00 (Previous Year Nil) units of ` 10/- each of UTI - Fixed Income
Fund Series XIV - VI (366 Days) - Direct Plan - Growth
98. 5,000,000.00 (Previous Year Nil) units of ` 10/- each of UTI - Fixed Income
Fund Series XIV - VII (367 Days) - Direct Plan - Growth
Total current portion of long - term investments (A)
B. Other current investments (fully paid up, valued at lower of cost and fair value)
(Unquoted investments):
(a) In equity shares of associate companies:
23,16,361 (Previous Year Nil) Equity shares of ` 10/- each in Indian Energy
Exchange Limited (Refer Note 47)
(b) In equity shares of other companies
1. 27,165,000 (Previous Year Nil) Equity shares of ` 1/- each in MCX Stock
Exchange Limited (Refer Note 40)
2. 1,033,952 (Previous Year 1,033,952) Equity Shares of MUR 1/- each in
Knowledge Economies Limited. (Under Liquidation) [at cost less provision
for diminution (write down) in the value of investment of ` 80.85 lacs
(Previous Year ` 80.85 lacs)]
(c) In units of mutual funds:
1. Nil (Previous Year 2,925,491.65) units of ` 10/- each of Reliance Medium
Term Fund-Daily Dividend Plan
2. Nil (Previous Year 4,999.85) units of ` 1000/- each of PineBridge Liquid
Fund-Super Institutional Daily Dividend
3. 47,057.28 (Previous Year Nil) units of ` 1000/- each of Axis Banking Debt
Fund - Direct Plan - Growth
4. 3,493,266.73 (Previous Year Nil) units of ` 10/- each of Axis Dynamic
Bond Fund - Growth Plan
5. Nil (Previous Year 5,000,000.00) units of ` 10/- each of Axis Fixed Term
Plan Series 20 (3 months) Dividend Payout
6. Nil (Previous Year 5,000,000.00) units of ` 10/- each of Axis Fixed Term
Plan Series 23 (3 months) Dividend Payout
7. Nil (Previous Year 37,776.79) units of ` 1000/- each of Axis Treasury
Advantage Fund - Institutional DDR
8. Nil (Previous Year 650,176.28) units of ` 1000/- each of Baroda Pioneer
Liquid Fund - Institutional Daily Dividend Plan
9. 8,504,630.77 (Previous Year Nil) units of ` 10/- each of Baroda Pioneer
PSU Bond Fund Plan A - Growth Plan
10. 3,642,438.78 (Previous Year Nil) units of ` 10/- each of Birla Sun Life
Short Term Fund - Growth
As at 31.03.2012
-
500.00
-
-
-
-
-
-
-
-
10,497.28
10,497.28
-
-
121.63
121.63
500.14
50.05
-
-
500.00
500.00
377.81
6,505.86
-
-
500.00
-
500.00
500.00
500.00
500.00
500.00
500.00
500.00
500.00
40,663.10
42,668.30
231.64
271.65
59.59
331.24
-
-
500.00
400.00
-
-
-
-
1,000.00
1,500.00
As at 31.03.2013
Notesstforming part of the financial statements for the Year ended 31 March, 2013

89
(` lacs)
11. Nil (Previous Year 5,000,000.00) units of ` 10/- each of Birla Sunlife
Short Term FMP series 30 Dividend Payout (90 days)
12. Nil (Previous Year 5,000,000.00) units of ` 10/- each of Birla Sunlife
Short Term FTP Series 29 Dividend (91 days)
13. 7,668,554.84 (Previous Year Nil) units of ` 10/- each of BNP Paribas
Flexi Debt Fund - Direct Plan - Growth
14. 10,524,966.18 (Previous Year Nil) units of ` 10/- each of BNP Paribas
Flexi Debt Fund - Growth
15. Nil (Previous Year 9,994,103.48) units of ` 10/- each of BNP Paribas
Money Plus - Institutional Plan Daily Dividend
16. 6,478,974.00 (Previous Year Nil) units of ` 10/- each of BNP Paribas
Short Term Fund Income Fund - Growth
17. Nil (Previous Year 5,203,950.18) units of ` 10/- each of BNP Paribas
Short Term Income Fund Institutional DDR
18. 6,195.69 (Previous Year Nil) units of ` 1000/- each of BOI Axa Treasury
Advantage Fund - Direct Plan - Growth
19. 43,509,082.72 (Previous Year Nil) units of ` 10/- each of BSL Dynamic
Bond Fund - Retail - Growth
20. Nil (Previous Year 33,422,040.03) units of ` 10/- each of BSL Dynamic
Bond Fund -Retail Plan Monthly Dividend
21. Nil (Previous Year 15,904,756.76) units of ` 10/- each of BSL Dynamic
Bond Fund -Retail Plan Monthly Dividend - STPI
22. 1,119,748.03 (Previous Year Nil) units of ` 100/- each of BSL Floating Rate
Fund - Long Term - Weekly Dividend - Direct Plan Reinvestment
23. Nil (Previous Year 11,671,258.25) units of ` 10/- each of Canara Robeco
Short Term Institutional Monthly Dividend Fund
24. 15,740,085.68 (Previous Year Nil) units of ` 10/- each of Canara Robeco
Short Term Fund - Regular Growth
25. Nil (Previous Year 54,438.30) units of ` 1000/- each of Canara Robeco
Treasury advanatage Super INSTT Daily dividend Reinvest
26. 253,466.17 (Previous Year Nil) units of ` 1000/- each of Canara Robeco
Treasury Advantage Fund - Direct Growth
27. Nil (Previous Year 354,320.11) units of ` 1000/- each of Daiwa Liquid Fund
Institutional Plan DDR
28. Nil (Previous Year 5,000,000.00) units of ` 10/- each of DSP BlackRock
FMP - Series 30 - 3M Dividend Payout
29. 5,000,000.00 (Previous Year Nil) units of ` 10/- each of DWS Banking &
PSU Debt Fund - Direct Plan - Growth
30. 5,000,000.00 (Previous Year Nil) units of ` 10/- each of DWS Fixed
Maturity Plan Series - 24 - Direct Plan - Growth
31. 9,080,923.76 (Previous Year Nil) units of ` 10/- each of DWS Short
Maturity Fund - Institutional - Growth
32. Nil (Previous Year 11,230,334.02) units of ` 10/- each of DWS Short
Maturity Fund - Institutional Weekly Dividend Plan - Reinvest
33. Nil (Previous Year 3,852,030.45) units of ` 10/- each of DWS Ultrashort
Term Fund Institutional DDR
34. Nil (Previous Year 5,000,000.00) units of ` 10/- each of Edelweiss Fixed
Maturity Plan - Series 5 (91 Days) Dividend Plan
35. 5,027,424.60 (Previous Year Nil) units of ` 10/- each of HDFC Floating Rate
Income Fund -Short Term Plan - Direct Plan - Wholesale Option - Growth
36. Nil (Previous Year 5,000,000.00) units of ` 10/- each of HDFC FMP 92D
February 2012(2) Dividend Series XIX Option: Payout
37. Nil (Previous Year 5,000,000.00) units of ` 10/- each of HDFC FMP 92D
January 2012(1) Dividend Series XIX Option: Payout
38. Nil (Previous Year 5,000,000.00) units of ` 10/- each of HDFC FMP 92D
March 2012(1) Dividend Payout
As at 31.03.2012
500.00
500.00
-
-
1,000.00
-
521.52
-
-
3,512.29
1,657.82
-
1,180.30
-
675.42
-
3,545.04
500.00
-
-
-
1,172.34
385.89
500.00
-
500.00
500.00
500.00
-
-
1,499.79
2,000.00
-
848.09
-
85.00
8,306.26
-
-
1,120.98
-
2,052.94
-
4,500.00
-
-
500.00
500.00
1,191.61
-
-
-
999.50
-
-
-
As at 31.03.2013
Notesstforming part of the financial statements for the Year ended 31 March, 2013
5 FINANCIALSStandalone
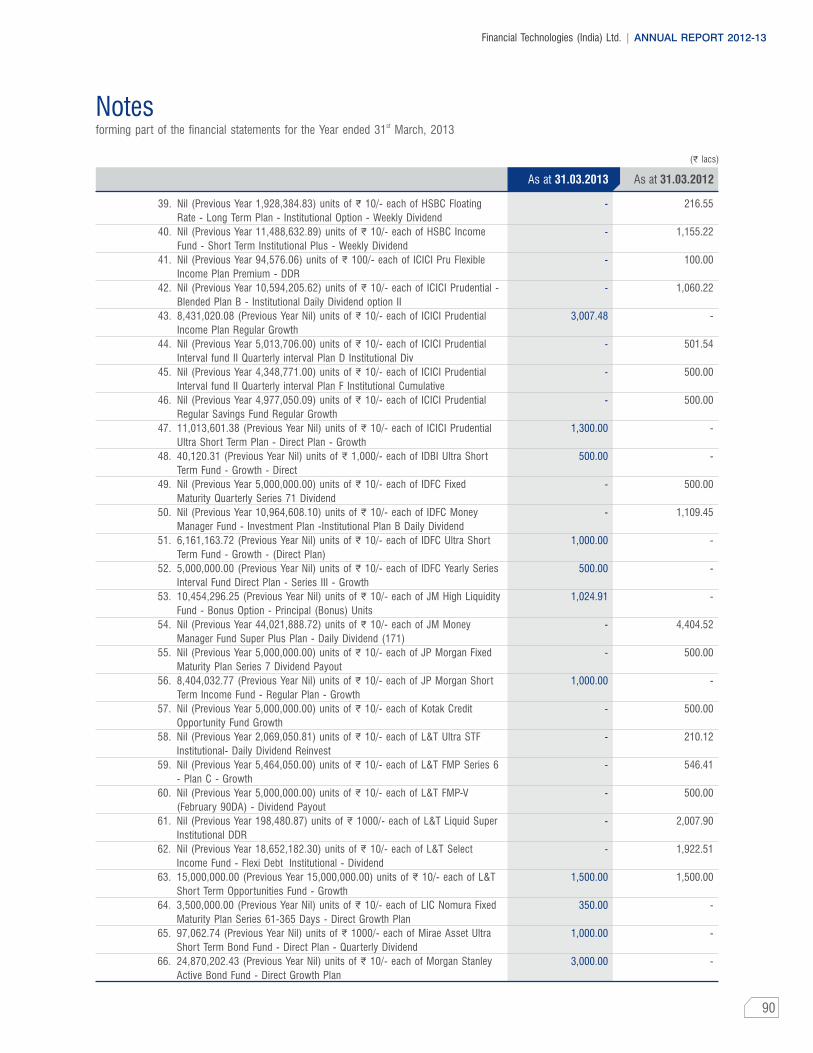
Financial Technologies (India) Ltd. | ANNUAL REPORT 2012-13
90
(` lacs)
39. Nil (Previous Year 1,928,384.83) units of ` 10/- each of HSBC Floating
Rate - Long Term Plan - Institutional Option - Weekly Dividend
40. Nil (Previous Year 11,488,632.89) units of ` 10/- each of HSBC Income
Fund - Short Term Institutional Plus - Weekly Dividend
41. Nil (Previous Year 94,576.06) units of ` 100/- each of ICICI Pru Flexible
Income Plan Premium - DDR
42. Nil (Previous Year 10,594,205.62) units of ` 10/- each of ICICI Prudential -
Blended Plan B - Institutional Daily Dividend option II
43. 8,431,020.08 (Previous Year Nil) units of ` 10/- each of ICICI Prudential
Income Plan Regular Growth
44. Nil (Previous Year 5,013,706.00) units of ` 10/- each of ICICI Prudential
Interval fund II Quarterly interval Plan D Institutional Div
45. Nil (Previous Year 4,348,771.00) units of ` 10/- each of ICICI Prudential
Interval fund II Quarterly interval Plan F Institutional Cumulative
46. Nil (Previous Year 4,977,050.09) units of ` 10/- each of ICICI Prudential
Regular Savings Fund Regular Growth
47. 11,013,601.38 (Previous Year Nil) units of ` 10/- each of ICICI Prudential
Ultra Short Term Plan - Direct Plan - Growth
48. 40,120.31 (Previous Year Nil) units of ` 1,000/- each of IDBI Ultra Short
Term Fund - Growth - Direct
49. Nil (Previous Year 5,000,000.00) units of ` 10/- each of IDFC Fixed
Maturity Quarterly Series 71 Dividend
50. Nil (Previous Year 10,964,608.10) units of ` 10/- each of IDFC Money
Manager Fund - Investment Plan -Institutional Plan B Daily Dividend
51. 6,161,163.72 (Previous Year Nil) units of ` 10/- each of IDFC Ultra Short
Term Fund - Growth - (Direct Plan)
52. 5,000,000.00 (Previous Year Nil) units of ` 10/- each of IDFC Yearly Series
Interval Fund Direct Plan - Series III - Growth
53. 10,454,296.25 (Previous Year Nil) units of ` 10/- each of JM High Liquidity
Fund - Bonus Option - Principal (Bonus) Units
54. Nil (Previous Year 44,021,888.72) units of ` 10/- each of JM Money
Manager Fund Super Plus Plan - Daily Dividend (171)
55. Nil (Previous Year 5,000,000.00) units of ` 10/- each of JP Morgan Fixed
Maturity Plan Series 7 Dividend Payout
56. 8,404,032.77 (Previous Year Nil) units of ` 10/- each of JP Morgan Short
Term Income Fund - Regular Plan - Growth
57. Nil (Previous Year 5,000,000.00) units of ` 10/- each of Kotak Credit
Opportunity Fund Growth
58. Nil (Previous Year 2,069,050.81) units of ` 10/- each of L&T Ultra STF
Institutional- Daily Dividend Reinvest
59. Nil (Previous Year 5,464,050.00) units of ` 10/- each of L&T FMP Series 6
- Plan C - Growth
60. Nil (Previous Year 5,000,000.00) units of ` 10/- each of L&T FMP-V
(February 90DA) - Dividend Payout
61. Nil (Previous Year 198,480.87) units of ` 1000/- each of L&T Liquid Super
Institutional DDR
62. Nil (Previous Year 18,652,182.30) units of ` 10/- each of L&T Select
Income Fund - Flexi Debt Institutional - Dividend
63. 15,000,000.00 (Previous Year 15,000,000.00) units of ` 10/- each of L&T
Short Term Opportunities Fund - Growth
64. 3,500,000.00 (Previous Year Nil) units of ` 10/- each of LIC Nomura Fixed
Maturity Plan Series 61-365 Days - Direct Growth Plan
65. 97,062.74 (Previous Year Nil) units of ` 1000/- each of Mirae Asset Ultra
Short Term Bond Fund - Direct Plan - Quarterly Dividend
66. 24,870,202.43 (Previous Year Nil) units of ` 10/- each of Morgan Stanley
Active Bond Fund - Direct Growth Plan
As at 31.03.2012
216.55
1,155.22
100.00
1,060.22
-
501.54
500.00
500.00
-
-
500.00
1,109.45
-
-
-
4,404.52
500.00
-
500.00
210.12
546.41
500.00
2,007.90
1,922.51
1,500.00
-
-
-
-
-
-
-
3,007.48
-
-
-
1,300.00
500.00
-
-
1,000.00
500.00
1,024.91
-
-
1,000.00
-
-
-
-
-
-
1,500.00
350.00
1,000.00
3,000.00
As at 31.03.2013
Notesstforming part of the financial statements for the Year ended 31 March, 2013

91
(` lacs)
67. 7,892,236.54 (Previous Year Nil) units of ` 10/- each of Morgan Stanley
Short Term Bond Fund - Institutional Plus Growth
68. 5,517,678.59 (Previous Year Nil) units of ` 10/- each of Peerless Flexible
Income Fund Growth
69. 41,835,933.18 (Previous Year Nil) units of ` 10/- each of Peerless Ultra
Short Term Fund - Direct Plan Daily Dividend - Reinvestment
70. Nil (Previous Year 7,009,068.02) units of ` 10/- each of Peerless Ultra
Short Term Fund Super IP DDR
71. 39,420.12 (Previous Year Nil) units of ` 1,000/- each of PineBridge India
Total Return Bond Fund Direct Growth
72. 35,615.18 (Previous Year Nil) units of ` 1,000/- each of PineBridge India
Short Term Fund Direct Growth
73. 127,576.62 (Previous Year Nil) units of ` 1,000/- each of Pramerica
Dynamic Bond Fund Growth Option
74. Nil (Previous Year 20,208.08) units of ` 1,000/- each of Pramerica
Dynamic Bond Fund - Monthly Dividend Reinvestment
75. Nil (Previous Year 30,143.30) units of ` 1,000/- each of Pramerica
Dynamic Bond Fund Monthly Dividend Reinvestment
76. 45,512.55 (Previous Year Nil) units of ` 1,000/- each of Pramerica Short
Term Floating Rate Fund - Direct Plan - Growth Option
77. 18,368.84 (Previous Year Nil) units of ` 1,000/- each of Pramerica Short
Term Floating Rate Fund - Growth Option
78. Nil (Previous Year 56,358.74) units of ` 1,000/- each of Pramerica Short
Term Floating Rate Fund Weekly Dividend Reinvestment
79. Nil (Previous Year 52,608.45) units of ` 1,000/- each of Pramerica Short
Term Income Fund Monthly Dividend - Reinvestment
80. Nil (Previous Year 500,505.32) units of ` 1,000/- each of Principal Cash
Management Fund - Institutional Premium Plan - Dividend Reinvestment Daily
81. 5,126,118.00 (Previous Year Nil) units of ` 10/- each of Principal Income
Fund Short Term Plan - Regular Plan Growth Option-Growth
82. 13,456,595.75 (Previous Year Nil) units of ` 10/- each of Reliance Dynamic
Bond Fund Growth Plan
83. Nil (Previous Year 10,000,000.00) units of ` 10/- each of Reliance Fixed
Horizon Fund XXII Series 1 Dividend Payout
84. 5,000,000.00 (Previous Year Nil) units of ` 10/- each of Reliance Fixed
Horizon Fund-XXII-Series 14- Growth Plan
85. 23,038,781.78 (Previous Year Nil) units of ` 10/- each of Reliance Floating
Rate Fund - Short Term Plan - Growth Plan
86. 2,261,122.92 (Previous Year Nil) units of ` 10/- each of Reliance Medium
Term Fund Direct Growth Plan - Growth Option
87. 62,807.30 (Previous Year Nil) units of ` 1000/- each of Reliance Money
Manager Fund - Direct Growth Plan Growth Option
88. Nil (Previous Year 10,745.05) units of ` 1000/- each of Reliance Money
Manager Fund - Institutional Option-Daily Dividend Plan
89. Nil (Previous Year 14,204,752.17) units of ` 10/- each of Reliance Regular
Savings Fund - Debt Plan - Institutional Growth Plan
90. Nil (Previous Year 21,567,931.95) units of ` 10/- each of Reliance Short
Term Fund- Dividend Plan Reinvestment
91. 11,469,496.30 (Previous Year Nil) units of ` 10/- each of Reliance Short
Term Fund - Growth Plan Growth option
92. 5,000,000.00 (Previous Year Nil) units of ` 10/- each of Reliance Yearly
Interval Fund - Series 5 -Direct Plan - Growth Plan
93. 5,000,000.00 (Previous Year Nil) units of ` 10/- each of Reliance Yearly
Interval Fund - Series 1- Growth Plan
94. 8,907,238.26 (Previous Year Nil) units of ` 10/- each of Religare Active
Income Fund - Growth
As at 31.03.2012
-
-
-
701.29
-
-
-
202.08
302.10
-
-
563.59
527.19
5,005.40
-
-
1,000.00
-
-
-
-
107.60
1,800.05
2,309.86
-
-
-
-
1,000.00
552.45
4,211.41
-
600.00
500.82
1,312.11
-
-
500.00
200.00
-
-
-
1,000.62
2,000.00
-
500.00
4,000.00
550.00
999.35
-
-
-
2,430.71
500.00
500.00
1,181.71
As at 31.03.2013
Notesstforming part of the financial statements for the Year ended 31 March, 2013
5 FINANCIALSStandalone

Financial Technologies (India) Ltd. | ANNUAL REPORT 2012-13
92
(` lacs)
95. Nil (Previous Year 10,762,688.05) units of ` 10/- each of Religare Active
Income Fund - Plan B Monthly Dividend
96. Nil (Previous Year 6,400,297.89) units of ` 10/- each of Religare Credit
Opportunities Fund Institutional - Daily Dividend Reinvestment
97. Nil (Previous Year 5,265,153.09) units of ` 10/- each of Religare Credit
Opportunities Fund Institutional - Monthly Dividend
98. 20,366,816.18 (Previous Year Nil) units of ` 10/- each of Religare Short
Term Fund - Growth
99. Nil (Previous Year 15,396,889.31) units of ` 10/- each of Religare Short
Term Plan Plan A Monthly Dividend
100. 31,018.58 (Previous Year Nil) units of ` 1000/- each of Religare Ultra Short
Term Fund-Direct Plan Growth
101. 5,000,000.00 (Previous Year Nil) units of ` 10/- each of SBI Debt Fund
Series -366 Days 23 Direct Plan - Growth
102. Nil (Previous Year 5,000,000.00) units of ` 10/- each of SBI Debt Fund
Series 90 days -58 Dividend Payout
103. Nil (Previous Year 5,000,000.00) units of ` 10/- each of SBI Debt Fund
Series 90 days -60 Dividend Payout
104. Nil (Previous Year 4,985,332.53) units of ` 10/- each of SBI Magnum
Income Fund – FR Savings Plus Bond Plan -DDR
105. 2,843,833.72 (Previous Year Nil) units of ` 10/- each of SBI Magnum
Income Fund FR Long Term -Direct Plan - Growth
106. 49,871.48 (Previous Year Nil) units of ` 1000/- each of SBI Magnum Insta
Cash Fund - Liquid Floater - Direct Plan - Growth
107. Nil (Previous Year 119,968.52) units of ` 1000/- each of SBI SHF- Ultra
Short Term Fund - Institutional Plan DDR
108. 3,748,716.07 (Previous Year Nil) units of ` 10/- each of SBI Short Term
Debt Fund - Direct Plan - Growth
109. 7,780,875.71 (Previous Year Nil) units of ` 10/- each of SBI Short Term
Debt Fund - Regular Plan - Growth
110. Nil (Previous Year 9,448,113.25) units of ` 10/- each of SBNPP Ultra ST
Fund Super Institutional Dividend Reinvestment Daily
111. Nil (Previous Year 4,997,751.00) units of ` 10/- each of Sundaram Fixed
Income Interval Fund QS Plan B Dividend Payout
112. Nil (Previous Year 5,000,000.00) units of ` 10/- each of Sundaram Fixed
Term Plan Plan CL (366 days)-Growth
113. 2,848,808.06 (Previous Year Nil) units of ` 10/- each of Sundaram Flexible
Fund - Short - Term Plan Regular Growth
114. Nil (Previous Year 4,998,600.00) units of ` 10/- each of Sundaram Interval
Fund Quarterly Plan C - Institutional Dividend Payout
115. 3,026,671.03 (Previous Year Nil) units of ` 10/- each of Sundaram Mthly
Income Plan Mod Bonus (PRINCIPAL Units) Bonus Units
116. 6,295,643.42 (Previous Year Nil) units of ` 10/- each of Sundaram Ultra
Short- Term Fund Direct Plan Growth
117. Nil (Previous Year 10,350,597.74) units of ` 10/- each of Sundaram Ultra
ST Fund Super Institutional Dividend Reinvestment Daily
118. Nil (Previous Year 4,993,458.57) units of ` 10/- each of Tata Fixed Income
Portfolio Fund -B2 IP Dividend Payout
119. Nil (Previous Year 179,034.40) units of ` 1000/- each of Tata Treasury
Manager SHIP DDR
120. Nil (Previous Year 5,000,000.00) units of ` 10/- each of Taurus Fixed
Maturity Plan 91 Days Series N Dividend Payout
121. Nil (Previous Year 5,000,000.00) units of ` 10/- each of Taurus Fixed
Maturity Plan 91 Days Series R Dividend Plan
122. 26,709.93 (Previous Year Nil) units of ` 1000/- each of Taurus Short Term
Income Fund - Existing Plan - Growth
As at 31.03.2012
1,079.73
640.22
534.97
-
1,613.15
-
-
500.00
500.00
501.63
-
-
1,200.40
-
-
948.31
500.00
500.00
-
500.00
-
-
1,038.89
500.00
1,808.82
500.00
500.00
-
-
-
-
3,119.29
-
500.09
500.00
-
-
-
500.00
1,000.00
-
500.00
1,000.00
-
-
-
500.00
-
333.33
1,000.00
-
-
-
-
-
512.06
As at 31.03.2013
Notesstforming part of the financial statements for the Year ended 31 March, 2013

93
(` lacs)
123. Nil (Previous Year 20,655.00) units of ` 1000/- each of Taurus Ultra Short
Term Bond Fund Super Institutional Daily P DDR
124. 31,216.80 (Previous Year Nil) units of ` 1000/- each of Taurus Ultra Short
Term Fund- Existing Plan - Super Institutional Growth
125. 33,266,614.14 (Previous Year Nil) units of ` 10/- each of Templeton India
Income Opportunities Fund - Direct - Growth
126. Nil (Previous Year 33,285,647.59) units of ` 10/- each of Templeton India
Income Opportunities Fund Growth
127. 13,319,573.66 (Previous Year Nil) units of ` 10/- each of Templeton India
Low Duration Fund - Growth
128. Nil (Previous Year 10,266,600.49) units of ` 10/- each of Templeton India
Low Duration Fund - Monthly Dividend Reinvestment
129. 55,317.44 (Previous Year Nil) units of ` 1000/- each of Templeton India
Short Term Income Plan - Institutional Growth
130. 130,428.70 (Previous Year 125,275.05) units of ` 1000/- each of
Templeton India Short Term Income Plan - IP Monthly Dividend Reinvestment
131. 3,581.17 (Previous Year Nil) units of ` 1000/- each of Templeton India
SHORT TERM INCOME Retail Plan - MONTHLY DIVIDEND Reinvestment
132. 1,147,405.55 (Previous Year Nil) units of ` 10/- each of Templeton India
Ultra Short Bond Fund Super Institutional - Direct - Growth
133. Nil (Previous Year 24,983,534.21) units of ` 10/- each of Templeton India
Ultra Short Bond Fund - Super Institutional Plan - Daily Dividend Reinvestment
134. 22,878,032.16 (Previous Year Nil) units of ` 10/- each of Templeton India
Ultra Short Bond Fund - Super Institutional Plan - Growth
135. 46,105.54 (Previous Year Nil) units of ` 1000/- each of Union KBC Ultra
Short Term Fund Debt Fund - Growth - Direct Plan
136. Nil (Previous Year 4,998,550.42) units of 10/- each of UTI - Fixed Income Interval
Fund -Series II- Quarterly Interval Plan Series VII Institutional Dividend Payout
137. Nil (Previous Year 5,000,000.00) units of ` 10/- each of UTI - Fixed
Maturity Plan - Quarterly Series(QFMP 02/12-1) IP Dividend Payout
138. 140,176.32 (Previous Year Nil) units of ` 1000/- each of UTI -Floating Rate
Fund - STP - Regular Plan - Direct Plan - Daily Dividend Reinvestment
139. Nil (Previous Year 100,258.07) units of ` 1000/- each of UTI Money Market
Mutual Fund Institutional Daily Dividend Reinvestment
140. 3,718,329.13 (Previous Year Nil) units of ` 10/- each of UTI Short Term
Income Fund - Institutional Option - Growth
141. 3,615,172.15 (Previous Year Nil) units of ` 10/- each of UTI Short Term
Income Fund - Institutional Option - Direct - Growth
142. Nil (Previous Year 50,224.35) units of ` 1000/- each of UTI Treasury
Advantage Fund Institutional Plan - (Daily Dividend Option) Re-investment
143. Nil (Previous Year 5,000,000.00) units of ` 10/- each of DSP BlackRock
FMP - Series 43 - 12M Growth
Total other current investments (B)
Total current investments (A+B)
Aggregate amount of quoted investments
Aggregate Market value of listed and quoted investments
Aggregate amount of unquoted investments
Aggregate provision for diminution (write down) in the value of other current
investments
As at 31.03.2012
206.91
-
-
3,500.00
-
1,066.13
-
1,500.00
-
-
2,501.25
-
-
500.00
500.00
-
1,005.96
-
-
502.34
500.00
80,986.79
81,108.42
91,605.70
-
-
91,605.70
123.56
-
428.79
4,362.78
-
1,624.19
-
1,000.00
1,561.91
41.81
175.00
-
3,416.88
500.32
-
-
1,509.53
-
500.00
500.00
-
-
88,811.72
89,374.60
132,042.90
2,005.20
2,005.20
130,037.70
88.12
As at 31.03.2013
Notesstforming part of the financial statements for the Year ended 31 March, 2013
5 FINANCIALSStandalone

Financial Technologies (India) Ltd. | ANNUAL REPORT 2012-13
94
(` lacs)
Unsecured, considered good unless stated otherwise
(a) Trade receivables outstanding for a period exceeding six months from the date they
are due for payment
(i) Considered good
(ii) Considered doubtful
(b) Other trade receivables
Considered good
Less: Provision for doubtful receivables
TOTAL
Balances that meet the definition of Cash and Cash equivalents as per AS 3 - Cash
Flow Statements
Cheques on hand
Balances with banks
In current accounts
In EEFC accounts
In deposit accounts with original maturity of less than 3 months
In earmarked accounts
In current accounts
In deposit accounts with original maturity of less than 3 months
Other Bank Balances
In deposit accounts with original maturity of more than 12 months
[Includes ` Nil (Previous Year: ` 4 lacs) under lien with bank against bank guarantees]
In deposit accounts with original maturity of more than 3 months but less than 12 months
[Includes ` 18.33 lacs (Previous Year: ` 210.00 lacs) under lien with bank against bank
guarantees]
In earmarked accounts
Unpaid dividend accounts
TOTAL
Unsecured, considered good unless stated otherwise
Loans and advances to related parties (Refer Note 41)
Security deposits
Considered good
Considered doubtful
Less: Provision for doubtful deposits
Loans and advances to employees
Considered good
Considered doubtful
Less: Provision for doubtful deposits
Prepaid expenses
Balances with government authorities
Advances for supply of goods and services
TOTAL
18. CASH AND CASH EQUIVALENTS
19. SHORT-TERM LOANS AND ADVANCES
As at 31.03.2012
252.41
362.90
3,376.52
3,991.83
(362.90)
3,628.93
111.27
3,552.65
21,762.29
1,268.69
29.04
9,775.93
36,499.87
5.58
3,324.32
71.06
3,400.96
39,900.83
4,843.76
756.51
1.61
758.12
(1.61)
756.51
145.07
4.54
149.61
(4.54)
145.07
399.98
928.56
466.61
7,540.49
248.01
445.22
8,062.46
8,755.69
(445.22)
8,310.47
-
2,799.01
56.51
113.94
33.99
1,656.93
4,660.38
3,846.96
20.77
78.09
3,945.82
8,606.20
5,952.34
875.65
15.25
890.90
(15.25)
875.65
55.13
19.22
74.35
(19.22)
55.13
578.07
659.96
319.01
8,440.16
As at 31.03.2013
Notesstforming part of the financial statements for the Year ended 31 March, 2013
17. TRADE RECEIVABLES

95
(` lacs)
Unbilled revenue
Unamortised ancillary borrowing costs
Interest accrued on bank deposits
Interest accrued on investments
Interest receivable on income- tax refund
Receivable on cancellation of forward foreign exchange contracts
Contractually reimbursable expenses
Rent receivable
Guarantee Fees receivable from related party (Refer Note 41)
Other Receivable
TOTAL
Income from software products (IPR based license)
Income from software services (Project based)
IT infrastructure income
Sale of traded goods
Computer hardware
Computer software
Other operating revenues
Business support services
Others
Interest income on
Bank deposits
Long-term investments
Loans to subsidiaries
Income-tax refund
Loans to employees
Dividend income
From long-term investments
In associates
Others
From current investments
In associates
Others
Profit on sale of investments (net)
Long-term investments
Current investments
In associates (Refer Note 38)
Others
Reversal of write down in value of current investments (net)
Other non-operating income
Rental income from operating leases [Refer Note 29(b)]
Profit on sale of fixed assets
Provision for expenses no longer required written back
22. OTHER INCOME
As at 31.03.2012
-
468.79
135.24
168.78
199.25
610.25
83.60
-
-
-
1,665.91
8,085.43
32,801.12
146.78
296.87
81.77
378.64
987.99
154.85
42,554.81
747.78
284.21
704.29
199.25
21.71
1,957.24
754.38
6.45
132.20
4,132.13
5,025.16
1,653.31
24,982.12
255.92
26,891.35
12.64
1,222.53
-
-
203.33
469.57
231.89
290.68
-
-
103.32
134.36
1,295.13
263.03
2,991.31
7,309.76
35,337.41
1,244.30
19.35
32.37
51.72
1,054.91
92.00
45,090.10
664.58
395.01
2,487.53
580.10
65.94
4,193.16
4,956.25
4.00
-
3,340.04
8,300.29
954.71
-
3,743.15
4,697.86
35.44
1,400.35
460.63
177.65
As at 31.03.2013
Notesstforming part of the financial statements for the Year ended 31 March, 2013
Year Ended 31.03.2013
Year Ended 31.03.2012
20. OTHER CURRENT ASSETS
21. REVENUE FROM OPERATIONS
5 FINANCIALSStandalone

Financial Technologies (India) Ltd. | ANNUAL REPORT 2012-13
96
(` lacs)
Exchange rate fluctuations (net)
Guarantee fees (Includes ` 606.51 lacs relating to previous year)
Miscellaneous income
TOTAL
Computer hardware
Computer software
TOTAL
Salaries and wages
Contribution to provident fund and other funds (Refer Note 44)
Staff welfare expenses
TOTAL
Interest expense on:
Borrowings
Delayed payment of tax
Other borrowing costs:
Provision for estimated loss on interest rate swap contracts
Amortisation of ancillary borrowing costs
TOTAL
Depreciation of tangible assets
Amortisation of intangible assets
TOTAL
Electricity
Rent [Refer Note 29(a)]
Repairs and maintenance- buildings
Repairs and maintenance- others
Insurance
Rates and taxes, excluding taxes on income
Travelling and conveyance
Communication expenses
Legal and professional charges (Refer Note 33)
Software license fees
Loss on sale/redemption/reduction in shares in subsidiary companies (net)
Less: Provision held
Loss on disposal/write off of fixed assets (net)
Less: Provision for impairment held
Bad debts/advances written off
Less: Provision held
Provision for doubtful trade receivables/advances
Donation
Miscellaneous expenses
TOTAL
23. PURCHASES OF STOCK-IN-TRADE
24. EMPLOYEE BENEFITS EXPENSE
25. FINANCE COSTS
26. DEPRECIATION AND AMORTISATION EXPENSE
27. OTHER EXPENSES*
1,763.72
-
13.25
36,885.89
242.65
38.69
281.34
10,563.44
450.95
233.71
11,248.10
1,667.85
0.46
950.99
424.93
3,044.23
1,349.53
380.57
1,730.10
387.22
892.89
18.60
218.17
42.10
246.33
174.02
312.15
991.88
593.53
11,045.35
(7,163.00)
3,882.35
148.49
(104.61)
43.88
96.38
(63.24)
33.14
4.54
966.25
1,384.54
10,191.59
-
-
-
-
49.23
(24.59)
85.50
1,295.13
5.98
20,651.99
14.42
17.41
31.83
11,631.81
544.96
233.93
12,410.70
3,059.36
35.81
648.87
539.70
4,283.74
1,647.59
606.40
2,253.99
460.07
757.22
28.03
479.95
40.79
314.75
235.01
334.20
880.45
543.34
-
-
24.64
134.90
856.00
1,425.20
6,514.55
*Net of recoveries on account of sharing of common expenses with group companies (Refer Note 41)
Notesstforming part of the financial statements for the Year ended 31 March, 2013
Year Ended 31.03.2013
Year Ended 31.03.2012

97
(` lacs)
(` lacs)
(` lacs)
1. Contingent liabilities:
(a) Claims against the company not acknowledged as debt:
(i) Income tax demands against which the Company is in appeal
(including adjustable against Securities Premium account ` 3,869.18 lacs
(Previous Year ` 1,941.03 lacs).
(ii) MVAT, Service tax and Excise dues contested by the Company.
(b) Guarantees
Guarantees given to third parties by the Company on behalf of its subsidiary
companies.
Future cash outflows in respect of the above matters are determinable only on
receipt of judgments/decisions pending at various forums/authorities.
2. Letters of comfort issued to banks in respect of credit facilities availed by subsidiary
companies.
3. Capital and other commitments
(i) Estimated amount of contracts to be executed on capital account and not
provided for.
(ii) for commitments relating to lease (Refer Note 29 below) and for commitment
relating to derivatives (Refer Note 32)
Lease expenditure
Lease rentals [net of recoveries 270.07 lacs
(Previous Year ` 285.81 lacs)] (Refer Note 27 ‘Rent’.)
Obligations on non-cancellable leases
Not later than one year
Later than one year and not later than five years
Later than five years
`
Lease Income
Lease rentals
(included in Note 22 ‘Rental income from operating leases’)
Receivables on non-cancellable leases
Not later than one year
Later than one year and not later than five years
Later than five years
Fixed Assets*
Gross carrying amount of leased assets
Accumulated depreciation
Depreciation recognised
29. OPERATING LEASE
(a) The Company has entered into various cancellable and non cacellable operating lease agreements as a lessee for various premises having lease
term ranging from 5 months to 36 months. The lease rentals recognised as an expense in the statement of profit and loss during the year are
included in note 27 under the head Rent. The future minimum lease payments under non-cancellable operating lease are as follows:
(b) The Company has entered into various cancellable and non cancellable operating lease agreements as a lessor for various premises
having lease ranging from 8 months to 36 months. The lease rentals recognised as income in the statement of profit and loss during the
year are included in note 22 under the head rental income from operating leases.
* The Company is charging rent/amenities to group companies for utilising part of its building. It is not feasible to segregate cost and depreciation amount in respect
of fixed assets so utilised and hence it has not been included in this disclosure.
Previous Year
Previous Year
Previous Year
2,663.06
515.17
66,657.97
5,200.00
227.55
843.01
538.78
320.95
-
1,202.25
1,100.00
1,017.94
-
11,924.57
276.47
194.37
5,352.61
551.56
70,021.16
400.00
1,152.77
757.22
12.72
-
-
1,400.35
129.73
-
-
11,924.57
470.84
194.37
Current Year
Current Year
Current Year
Particulars
Particulars
Notesstforming part of the financial statements for the Year ended 31 March, 2013
28. CONTINGENT LIABILITIES AND COMMITMENTS (to the extent not provided for)
5 FINANCIALSStandalone

31. DISCLOSURES UNDER THE MICRO, SMALL AND MEDIUM ENTERPRISES DEVELOPMENT ACT, 2006:
(a) An amount of ` 13.47 lacs (As at March 31, 2012 ` 3.53 lacs) and ` NIL (Previous Year ` Nil) was due and outstanding to
suppliers as end of the accounting year on account of Principal and Interest respectively. (Refer Note 9)
(b) No interest was paid during the year.
(c) No interest is payable at the end of the year under Micro, Small and Medium Enterprises Development Act, 2006.
(d) No amount of interest was accrued and unpaid at the end of the accounting year.
The above information regarding Micro and Small Enterprises has been determined to the extent replies to the Company's communication
have been received from vendors/suppliers regarding their status under the Micro, Small and Medium Enterprises Development Act, 2006.
This has been relied upon by the auditors.
(` lacs)
Salaries and wages
Travelling expenses
Professional fees
Purchase of goods for trading
Interest expenses on borrowings
Amortisation of ancillary borrowing costs
Premium on redemption of ZCCB
Insurance
Rent
Repairs and maintenance - others
Software license fees
Miscellaneous expenses
TOTAL
USD
Sell USD / Buy INR
Interest rate swap contracts (Floating to Fixed)
Forward exchange contracts
30. (a) Expenditure in foreign currency (including foreign branches):
32. (a) Derivative Instruments Outstanding as at Balance Sheet Date
Previous Year
As at 31.03.2012
132.76
17.85
39.49
65.41
1,667.85
285.28
6,037.06
1.57
4.42
0.35
133.66
110.65
8,496.35
500.00
-
57.42
55.49
29.72
-
3,054.44
383.02
-
1.36
6.23
8.14
172.79
57.79
3,826.40
1,100.00
21.00
Current Year
As at 31.03.2013
Nature of Expenses
Type contract Currency
(` lacs)
Income from software products (IPR based license)
Income from software services (Project based)
Sale of traded goods
Guarantee Fees
Interest on bank deposits
Interest on loans to subsidiaries
TOTAL
(b) Earnings in foreign currency (including foreign branches):
Previous Year
23.33
17,019.82
-
-
319.89
67.51
17,430.55
49.78
8,553.57
8.55
1,295.13
79.24
2,062.13
12,048.40
Current YearNature of Income
Financial Technologies (India) Ltd. | ANNUAL REPORT 2012-13
98
Notesstforming part of the financial statements for the Year ended 31 March, 2013
Amount in foreign currency (USD in lacs)

USD
USD
AED
MUR
USD
SGD
USD
USD
AED
USD
Payables in foreign currency
Borrowings
Advances from customers
Other payables
Receivables in foreign currency
Loans and advances to related parties
Trade receivables
Other receivables
(b) The year end foreign currency exposures that have not been hedged by a derivative instrument or otherwise are given below:
Previous Year
Particulars Currency
Foreign Currency
in lacs
Foreign Currency
in lacs
56,272.15
10,655.92
8.35
365.75
2.31
24,421.94
2,686.25
2.09
17.14
1,100.00
208.30
0.59
-
7.15
0.06
477.40
52.51
0.15
0.34
59,828.23
11,329.32
22.01
0.43
127.99
18.91
46,168.40
246.95
-
1,376.05
1,100.00
208.30
1.48
0.23
2.35
0.43
848.85
4.54
-
25.30
34. SEGMENT REPORTING
35. REVENUE EXPENDITURE INCURRED DURING THE YEAR ON RESEARCH AND DEVELOPMENT
The Company has presented segmental information in its consolidated financial statements, which are presented in the same annual
repor t. Accordingly, in terms of the provisions of Accounting Standard (AS 17) “Segment Reporting”, no disclosures related to segments
are presented in its stand-alone financial statements.
The aggregate amount of revenue expenditure incurred during the year on Research and Development and shown in the respective heads
of the account is ` 1,310.10 lacs (Previous Year ` 1,289.82 lacs).
(` lacs)
(` lacs)
As auditors - statutory audit
For taxation matters
For other services
Reimbursement of expenses
TOTAL
(a) Net profit available for equity shareholders (for basic/diluted EPS)
(b) Weighted average number of equity shares
Basic
Add: Effect of dilutive stock options
Diluted
(c) Basic earnings per share (in `)
(d) Diluted earnings per share (in `)
(e) Face value ` per share
33. LEGAL AND PROFESSIONAL CHARGES INCLUDES PAYMENTS TO AUDITORS (NET OF SERVICE TAX INPUT CREDIT)
36. EARNINGS PER SHARE IS CALCULATED AS FOLLOWS:
Previous Year
Previous Year
28.00
8.00
13.25
0.61
49.86
47,802.93
46,078,537
-
46,078,537
103.74
103.74
2/-
28.00
8.00
15.25
0.65
51.90
32,288.06
46,078,537
391,907
46,470,444
70.07
69.48
2/-
Current Year
Current Year
Particulars
Particulars
99
` Lacs ` Lacs
Notesstforming part of the financial statements for the Year ended 31 March, 2013
Current Year
5 FINANCIALSStandalone

Financial Technologies (India) Ltd. | ANNUAL REPORT 2012-13
100
37.
38.
39.
40.
41. RELATED PARTY DISCLOSURE:
As at March 31, 2013, the Company’s investments in cer tain subsidiaries and a joint venture company aggregating ` 49,090.30 lacs
(Previous Year ` 48,045.31 lacs) and debts and other recoverable aggregating ` 49,003.84 lacs (Previous Year ` 26,403.73 lacs), which
presently have accumulated losses, [share of aggregate losses till March 31, 2013 ` 87,082.53 lacs (Previous year ` 46,207.56 lacs)]
but are expected to be recovered, and have their values unlocked in the near future, since these companies are already at various stages
of executing their business plans and operations, with expected profitability. Accordingly, a provision for other than temporary diminution in
the value of investments of ` 1,737.26 lacs (Previous Year ` 1,737.26 lacs) as at the year end March 31, 2013 is considered to be
adequate. During the previous year an amount of ` 7,163.00 lacs was adjusted against the loss on sale/reduction/redemption in shares in
subsidiary companies (net) (Refer Note 27).
The Company, as a par t of its core business strategy, promotes and invests in new ventures that utilise its technological capabilities and
domain expertise towards creating world class enterprises. The investment in each such venture is assessed for its risks and is limited to
a pre-determined level and will generate returns after the ventures star t ramping-up operations in varied time frame depending upon the
line of business. The Company, as part of its non-linear business model, will endeavor to unlock value by broadening the investor base of
its ventures.
During the previous year, in terms of the compliance of FMC Equity Structure Guidelines dated July 29, 2009, the Company offered under
“offer for sale”, in initial public offer of equity by Multi Commodity Exchange of India Limited (MCX), par t of its investments aggregating
2,643,916 equity shares of ` 10/- each of MCX at a price of ` 1,032 per equity share of ` 10/- each. The resultant profit of ` 24,982.12
lacs (net of directly attributable expenses of ` 2,091.58 lacs) is grouped under ‘Profit on sale of Investments’ in Other Income (Refer Note
22). Subsequent to disinvestments, the Company is holding 26% in the equity share capital of MCX.
During the previous year, two of the Company’s subsidiaries reduced their share capital by ` 13,403.94 lacs against their accumulated
losses, as sanctioned by the Hon’ble High Cour t of Judicature at Bombay. Accordingly, net resultant loss of ` 7,921.54 lacs (net of
provision for other than temporary diminution) was charged to the statement of profit and loss and shown under “Loss on
sale/redemption/reduction in shares in subsidiary companies (net)”.
The Company holds 27,165,000 Equity Shares of ` 1/- each in MCX Stock Exchange Limited (MCX-SX). As per the approval received from
SEBI to MCX-SX, the Company’s equity holding alongwith MCX shall not exceed 5% of the total paid up equity capital of MCX-SX.
Considering the time available to adhere to the direction of SEBI as communicated by MCX-SX, the Company has classified such
investments under Current Investments at this point of time till both the entities together reduce the percentage of holding to 5% in
MCX-SX. The Company intends to hold the remaining shares of MCX-SX after bringing down the shareholding in MCX-SX to 5% put
together with MCX, on a long term basis and accordingly the said Investments will be reclassified under Non-Current Investments.
I. Names of related parties and nature of relationship:
(i) Entities where control exists (Subsidiaries, including step down subsidiaries)
1. TickerPlant Ltd. (TickerPlant)
2. IBS Forex Ltd. (IBS)
3. atom Technologies Ltd. (atom)
4. Riskraft Consulting Ltd. (Riskraft)
5. National Spot Exchange Ltd. (NSEL)
6. Western Ghats Agro Growers Company Limited (subsidiary of NSEL) (w.e.f. September 5, 2012) (WGAGL)
7. Farmer Agricultural Integrated Development Alliance Ltd. (subsidiary of NSEL) (w.e.f. August 1, 2012) (FAIDA)
8. National Bulk Handling Corporation Ltd. (NBHC)
9. FT Group Investments Pvt. Ltd. (FTGIPL)
10. Financial Technologies Middle East- DMCC (FTME) (Subsidiary of FTGIPL w.e.f. March 25, 2012; formerly direct subsidiary of
the Company)
11. Global Board of Trade Ltd. (GBOT) (Subsidiary of FTGIPL w.e.f. March 19, 2012; formerly direct subsidiary of the Company)
12. GBOT Clear Limited (GBOT CL) (subsidiary of GBOT) (w.e.f. February 14, 2013)
13. Knowledge Assets Pvt. Ltd. (KAPL)
14. Financial Technologies Communications Ltd. (FTCL)
15. Global Payment Networks Ltd. (GPNL)
16. FT Knowledge Management Company Ltd. (FTKMCL)
17. Indian Bullion Market Association Ltd. (Subsidiary of NSEL)
18. Trans-Global Credit & Finance Ltd. (TGCFL)
19. Capricorn Fin-Tech (Pvt). Ltd. (Subsidiary of FTME)
20. Bourse Africa Ltd. (BAL) (Subsidiary of FTGIPL)
Notesstforming part of the financial statements for the Year ended 31 March, 2013

101
(` lacs)
1. Loan given:
Opening balance
Given during the year
Repaid/adjusted during the year
Converted into Optionally Convertible Debentures (OCD)
Converted into equity by TickerPlant
Total
29,160.70
(10,311.75)
26,304.20
(31,695.00)
3,104.78
(11,571.05)
2,500.00
(-)
-
(1,275.00)
-
(-)
-
(-)
-
(-)
-
(-)
-
(-)
AssociateCompanies
Joint VentureCompany
Subsidiary Companies
Nature of Transaction
-
(-)
-
(-)
-
(-)
-
(-)
-
(-)
29,160.70
(10,311.75)
26,304.20
(31,695.00)
3,104.78
(11,571.05)
2,500.00
(-)
-
(1,275.00)
21. Boursa India Ltd. (BIL)
22. ICX Platform (Pty) Ltd. (ICX)
23. Credit Market Services Ltd. (CMSL)
24. Takshashila Academia of Economic Research Ltd. (TAER)
25. Apian Finance and Investments Ltd. (Apian)
26. Bahrain Financial Exchange BSC (c) (BFX) (Subsidiary of FTGIPL)
27. Financial Technologies Singapore Pte Ltd. (FTSPL)
28. Singapore Mercantile Exchange PTE Ltd. (SMX) (Subsidiary of FTSPL)
29. Singapore Mercantile Exchange Clearing Corporation PTE Ltd. (SMX-CCL) (Subsidiary of SMX)
30. BFX Clearing & Depository Corporation BSC(c) (Subsidiary of BFX)
31. FT Projects Ltd.
32. Financial Technologies Projects Pvt. Ltd.
33. ICX Africa Ltd. (subsidiary of BAL) (w.e.f. July 26, 2011)
34. Bourse Exchange Nigeria Ltd. (Subsidiary of BAL)
35. Bourse Africa (Kenya) Ltd. (Subsidiary of BAL)
36. Bourse Uganda Ltd. (Subsidiary of BAL)
37. Bourse Zambia Ltd. (Subsidiary of BAL)
38. Bourse Tanzania Ltd. (Subsidiary of BAL)
39. Bourse South Africa Limited (Subsidiary of BAL) (w.e.f. October 19, 2012)
(ii) Associate Companies:
1. Multi Commodity Exchange of India Ltd. (MCX)
2. MCX Stock Exchange Clearing Corporation Ltd. (MCX-SX CCL)
3. Indian Energy Exchange Ltd. (IEX)
4. SME Exchange of India Ltd. (SME) (w.e.f. Sept. 26, 2011)
(iii) Joint Venture Companies:
1. Dubai Gold and Commodities Exchange (DGCX)
(iv) Key Management Personnel
1. Mr. Jignesh Shah : Chairman and Managing director
2. Mr. Dewang Neralla : Whole time director
3. Mr. Manjay Shah* : Whole time director*Appointed as wholetime director w,e.f. April 01, 2012
(v) Relative of the Key Management Personnel where transactions have taken place
Mr. Manjay Shah
(vi) Entity over which Key management personnel is able to exercise significant influence
La-fin Financial Services Pvt. Ltd. (La-fin)
II. Transaction with subsidiaries, associates and joint venture entities:
Notesstforming part of the financial statements for the Year ended 31 March, 2013
5 FINANCIALSStandalone

Financial Technologies (India) Ltd. | ANNUAL REPORT 2012-13
102
(` lacs)
Balance as at end of the year
2. Income from software products (IPR based license)
3. Income from software services (Project based)
4. IT infrastructure sharing income
5. Sale of traded goods
6. Other Operating revenues
Business Support Services
Others
7. Other Income
Interest income
Rental income from operating leases
Dividend Income
Guarantee fees
8. Sale of Tangible Assets
9. Purchase of Tangible Assets
10. Purchase of an Intangible Asset from TickerPlant
11. Recoveries charged by the Company towards expenses
(Refer Note 27)
12. Reimbursement of expenses charged to the Company
-by MCX relating to Offer for Sale by the Company as
part of the public issue of MCX.
- other expenses
13. Advances given
- Balance as at end of the year
14. Current Liabilities as at end of the year
- Trade payables
- Income received in advance/unearned revenue
- Advances from Customers
15. Receivables
- Trade receivables Balance as at end of the year
- Guarantee Fees receivable
Total
49,860.12
(29,160.69)
298.76
(253.73)
24,472.69
(28,268.74)
306.65
(122.69)
16.55
(93.31)
-
849.29
(675.60)
21.28
(22.82)
-
2,487.53
(704.29)
513.21
(362.24)
4,956.25
(886.58)
1,295.13
(-)
2.93
(23.81)
19.50
(17.12)
-
(1,800.00)
726.66
(1,255.52)
1,227.76
(1,375.51)
84.96
(305.82)
1,155.85
(59.14)
-
15.90
(8.35)
1,749.72
(946.80)
11,285.80
(10,614.97)
-
2,693.96
(2,627.55)
1,295.13
(-)
-
(-)
-
(-)
451.92
(398.24)
-
(-)
-
(-)
-
(-)
(-)
-
(-)
-
(-)
-
(-)
-
(-)
-
(-)
-
(-)
-
(-)
-
(-)
-
(-)
-
(-)
-
(-)
-
(-)
-
(33.91)
-
(-)
6.53
(431.70)
-
(-)
AssociateCompanies
Joint VentureCompany
Subsidiary CompaniesNature of Transaction
-
(-)
79.62
(87.64)
13,037.78
(10,776.56)
304.55
(61.38)
8.00
(3.33)
303.55
(240.00)
21.28
(21.28)
-
(-)
-
(-)
4,956.25
(886.58)
-
(-)
0.89
(1.38)
7.24
(2.64)
-
(-)
217.05
(607.53)
1,227.76
(1,375.51)
15.03
(130.72)
4.51
(-)
-
(-)
898.86
(159.67)
-
(-)
51.08
(-)
-
(-)
49,860.12
(29,160.69)
219.14
(166.09)
10,982.99
(17,093.94)
2.10
(61.31)
8.55
(89.98)
545.74
(435.60)
-
(1.54)
2,487.53
(704.29)
513.21
(362.24)
-
(-)
1,295.13
(-)
2.04
(22.43)
12.26
(14.48)
-
(1,800.00)
509.61
(647.99)
-
(-)
69.93
(175.10)
1,151.34
(59.14)
15.90
(8.35)
850.86
(753.22)
11,285.80
(10,614.97)
2,636.35
(2,195.85)
1,295.13
(-)
Notesstforming part of the financial statements for the Year ended 31 March, 2013

(` lacs)
16. Guarantees given by the company on behalf of its
subsidiaries.
Increase in guarantees given
Decrease in guarantees given
Balance as at end of the year
17. Investments made during the year
Subscription to Equity/Ordinary shares
Purchase of Equity/Ordinary shares
Conversion of loan granted into Equity/Ordinary shares by
Ticker plant
Subscription to optionally convertible preference shares
Conversion of loan granted into Optionally Convertible
Debentures (OCD) by FT Projects Ltd.
18. Receipt on sale/reduction of Equity/Ordinary shares
19. Receipt on sale/redemption of optionally convertible
preference shares from FTGIPL
20. Equity investment reduced during the year (Refer Note 39)
21. Investment balance as at end of the year
Cost
Provision for other than temporary diminution in the value
of Investments
Net Carrying value of Investments
Previous year figures are given in brackets.
Total
4,098.19
(8,230.72)
735.00
(16,950.00)
70,021.16
(66,657.97)
1,425.00
(11,540.24)
-
(6.78)
-
(1,275.00)
-
(5,504.50)
2,500.00
(-)
-
(6,851.95)
-
(43,624.42)
-
(13,403.94)
67,900.89
(63,975.89)
1,737.26
(1,737.26)
66,163.63
(62,238.63)
-
(-)
-
(-)
-
(-)
-
(-)
-
(-)
-
(-)
-
(-)
-
(-)
-
(-)
-
(-)
-
(-)
828.78
(828.78)
-
(-)
828.78
(828.78)
AssociateCompanies
Joint VentureCompany
Subsidiary CompaniesNature of Transaction
-
(-)
-
(-)
-
(-)
-
(4.90)
-
(-)
-
(-)
-
(-)
-
(-)
-
(-)
-
(-)
-
(-)
2,554.70
(2,554.70)
-
(-)
2,554.70
(2,554.70)
4,098.19
(8,230.72)
735.00
(16,950.00)
70,021.16
(66,657.97)
1,425.00
(11,535.34)
-
(6.78)
-
(1,275.00)
-
(5,504.50)
2,500.00
(-)
-
(6,851.95)
-
(43,624.42)
-
(13,403.94)
64,517.41
(60,592.41)
1,737.26
(1,737.26)
62,780.15
(58,855.15)
III. Transactions with Key Managerial Personnel, relatives of Key Managerial Personnel and Entity in which the Key Management has control.(` lacs)
1. Salary and Allowances
2. Dividend paid during the year
3. Salary and Allowance payable as at the end of the year
Total
2,156.91
(1,787.71)
1,663.75
(1,660.98)
1,500.00
(1,250.00)
-
(-)
986.40
(983.63)
-
(-)
Relatives of Key
Managerial Personnel
Entity over which the key management personnel is
able to exercise significant
influence-La-Fin
Key Managerial
PersonnelNature of Transaction
-
(60.00)
-
(6.15)
-
(-)
2,156.91
(1,727.71)
677.35
(671.20)
1,500.00
(1,250.00)
Note: Out of the above items, transactions with related parties in excess of 10% of the total related party transactions are:
103
Notesstforming part of the financial statements for the Year ended 31 March, 2013
5 FINANCIALSStandalone

Financial Technologies (India) Ltd. | ANNUAL REPORT 2012-13
104
(a) Key Managerial personnel (` lacs)
Salary and allowances
Jignesh Shah
Dewang Neralla
Salary and Allowance payable as at the end of the year (Jignesh Shah)
Dividend paid
Jignesh Shah
Key Managerial Personnel
1,802.82
(1,551.38)
176.62
(176.33)
1,500.00
(1,250.00)
666.37
(666.37)
Transactions during the year
Notesstforming part of the financial statements for the Year ended 31 March, 2013

(b)
Tran
sact
ions
wit
h su
bsid
iari
es,
asso
ciat
es a
nd a
joi
nt v
entu
re c
ompa
ny i
n ex
cess
of
10%
of
Tota
l R
elat
ed P
arty
Tra
nsac
tion
s:
Loan
giv
en
Loan
rep
aid
Inco
me
from
sof
twar
e pr
oduc
ts
(IPR
bas
ed l
icen
se)
Inco
me
from
sof
twar
e se
rvic
es
(Pro
ject
bas
ed)
IT-i
nfra
stru
ctur
e
shar
ing
inco
me
Sal
e of
tra
ded
good
s
Bus
ines
s S
uppo
rt S
ervi
ces
Oth
ers
Inte
rest
Inc
ome
Rent
al i
ncom
e fro
m o
pera
ting
leas
es
Div
iden
d In
com
e
Sal
e of
Tan
gibl
e A
sset
s
Purc
hase
of
Tang
ible
Ass
ets
Reco
verie
s ch
arge
d by
the
com
pany
tow
ards
exp
ense
s (R
efer
Not
e 27
)
Reim
burs
emen
t of
exp
ense
s
char
ged
to t
he C
ompa
ny -
Oth
ers
expe
nses
Incr
ease
in
guar
ante
es g
iven
Dec
reas
e in
gua
rant
ees
give
n
Inve
stm
ent
mad
e du
ring
the
year
Rece
ipt
on s
ale/
redu
ctio
n of
Equ
ity/
Ord
inar
y sh
ares
Equi
ty i
nves
tmen
t re
duce
d
durin
g th
e ye
ar
atom
Tick
erP
lant
Ris
kraf
tA
pian
FTM
EFT
CL
IBM
AN
SEL
NB
HC
FTK
MC
L
Sub
sidi
arie
s/A
ssoc
iate
s/Jo
int
Vent
ure
Com
pany
Tran
sact
ions
dur
ing
the
year
1,65
6.50
(1,8
90.0
0)
1,45
0.98
(1,2
45.0
0) -
(-) -
(-) -
(-) -
(-) -
(-) -
(-)
288.
32
(187
.68) -
(-) -
(-) -
(-) -
(-) -
(-) -
(-) -
(-) -
(-) -
(-) -
(-) -
(-)
-
(-) -
(-) -
(-) -
(-) -
(-) -
(-) -
(-) -
(-) -
(-) -
(-) -
(-) -
(-) -
(-) -
(-) -
(-) -
(-) -
(-) -
(-) -
(-) -
(-)
718.
00
(1,5
58.5
0)
120.
00
(1,7
75.0
0) -
(-) -
(-) -
(-) -
(-)
60.0
0
(60.
00) -
(-)
44.2
3
(185
.94)
150.
00
(197
.25) -
(-)
1.25
(0.0
5)
2.94
(2.4
9)
98.7
2
(166
.77)
0.44
(0.1
4) -
(-) -
(-) -
(1,2
75.0
0) -
(-) -
(7,8
70.7
5)
-
(-) -
(-) -
(-) -
(-)
1.75
(17.
16) -
(-) -
(-) -
(-) -
(-)
49.1
6 (-) -
(-)
0.18
(20.
17) -
(-)
157.
34
(210
.17)
1.03
(3.6
4) -
(-) -
(-) -
(3.9
7) -
(-) -
(-)
- - -
(2,9
00.0
0)
178.
63
(142
.96)
2,96
9.85
(426
.05)
0.18
(14.
80) -
(85.
65)
146.
14 (-) -
(-) -
(150
.77)
157.
20 (-) -
(-)
0.40 (-
) -
(-)
112.
87 (-) -
(-) -
(-)
735.
00
(16,
950.
00) -
(-) -
(-) -
(-)
-
(-) -
(-) -
(-) -
(-) -
(-) -
(-) -
(-) -
(-) -
(-)
33.7
4
(26.
40) -
(-) -
(-) -
(-) -
(-) -
(-) -
(-) -
(-) -
(-) -
(-) -
(-)
-
(-) -
(-) -
(-) -
(-) -
(-) -
(-) -
(-) -
(-) -
(-) -
(-) -
(-) -
(-) -
(-) -
(-)
55.4
4 (-) -
(-) -
(-) -
(-) -
(-) -
(-)
-
(106
.72) -
(106
.72)
40.5
1
(23.
13) -
(-) -
(-) -
(-) -
(-) -
(-) -
(-) -
(-) -
(-) -
(-) -
(-) -
(-) -
(-) -
(-) -
(-) -
(-) -
(-) -
(-)
735.
75
(1,0
94.2
5)
1,40
4.00
(2,4
28.0
0) -
(-) -
(-) -
(-) -
(-)
240.
00
(240
.00) -
(-)
78.7
5
(73.
18)
63.0
0
(138
.59) -
(-) -
(-)
6.85
(11.
47)
36.5
6
(83.
65) -
(-) -
(-) -
(-)
1,42
5.00
(2,5
02.8
1) -
(-) -
(5,5
33.1
9)
-
(-) -
(-) -
(-) -
(-) -
(-) -
(-) -
(-) -
(-) -
(-)
53.3
4 (-) -
(-) -
(-) -
(-) -
(-)
2.60
(108
.51) -
(-) -
(-) -
(-) -
(-) -
(-)
(` l
acs)
105
Not
esst
form
ing
part
of
the
finan
cial
sta
tem
ents
for
the
Yea
r en
ded
31 M
arch
, 20
13
5 FINANCIALSStandalone

(b)
Tran
sact
ions
wit
h su
bsid
iari
es,
asso
ciat
es a
nd a
joi
nt v
entu
re c
ompa
ny i
n ex
cess
of
10%
of
Tota
l R
elat
ed P
arty
Tra
nsac
tion
s (C
ontd
.):
Loan
giv
en
Loan
rep
aid
Inco
me
from
sof
twar
e pr
oduc
ts
(IPR
bas
ed l
icen
se)
Inco
me
from
sof
twar
e se
rvic
es
(Pro
ject
bas
ed)
IT-i
nfra
stru
ctur
e
shar
ing
inco
me
Sal
e of
tra
ded
good
s
Bus
ines
s S
uppo
rt S
ervi
ces
Oth
ers
Inte
rest
Inc
ome
Rent
al i
ncom
e fro
m o
pera
ting
leas
es
Div
iden
d In
com
e
Sal
e of
Tan
gibl
e A
sset
s
Purc
hase
of
Tang
ible
Ass
ets
Reco
verie
s ch
arge
d by
the
com
pany
tow
ards
exp
ense
s (R
efer
Not
e 27
)
Reim
burs
emen
t of
exp
ense
s
char
ged
to t
he C
ompa
ny -
Oth
ers
expe
nses
Incr
ease
in
guar
ante
es g
iven
Dec
reas
e in
gua
rant
ees
give
n
Inve
stm
ent
mad
e du
ring
the
year
Rece
ipt
on s
ale/
redu
ctio
n of
Equ
ity/
Ord
inar
y sh
ares
Equi
ty i
nves
tmen
t re
duce
d
durin
g th
e ye
ar
GB
OT
FTG
IPL
Bou
rsa
Afr
ica
MC
XFT
Sin
gapo
reFT
Pro
ject
sS
MX
BFX
Taks
hash
ilaIE
X
Sub
sidi
arie
s/A
ssoc
iate
s/Jo
int
Vent
ure
Com
pany
Tran
sact
ions
dur
ing
the
year
-
(-) -
(-)
79.6
2
(87.
64)
12,0
27.5
0
(9,5
19.1
2)
304.
55
(58.
94)
8.00
(3.3
3)
303.
55
(240
.00)
21.2
8
(21.
28) -
(-) -
(-)
4,77
3.45
(795
.18)
0.78
(1.2
9)
7.24
(2.6
4)
193.
39
(582
.65) -
(130
.21) -
(-) -
(-) -
(-) -
(-) -
(-)
-
(-) -
(-) -
(-) -
(5,0
35.8
2) -
(-) -
(-) -
(-) -
(-) -
(-) -
(-) -
(-) -
(-) -
(-) -
(-) -
(-) -
(-) -
(-) -
(-) -
(-) -
(-)
11,7
88.7
3
(23,
020.
43) -
(-) -
(-) -
(-) -
(-) -
(-) -
(-) -
(-)
1,71
1.93 (-
) -
(-) -
(-) -
(-) -
(-) -
(-) -
(-)
4,08
9.49
(8,2
30.7
2) -
(-) -
(-) -
(6,8
38.5
5) -
(-)
-
(-) -
(-) -
(-) -
(-) -
(-) -
(-) -
(-) -
(-) -
(-) -
(-) -
(-) -
(-) -
(-) -
(-) -
(-) -
(-) -
(-) -
(-) -
(-) -
(-)
-
(-) -
(-) -
(-)
2,49
0.14
(3,1
00.5
0) -
(-) -
(-) -
(-) -
(-) -
(-) -
(-) -
(-) -
(-) -
(-) -
(-) -
(-) -
(-) -
(-) -
(-) -
(-) -
(-)
-
(-) -
(-) -
(-)
1,87
6.15
(3,2
93.9
2) -
(-) -
(-) -
(-) -
(-) -
(-) -
(-) -
(-) -
(-) -
(-) -
(-) -
(-) -
(-) -
(-) -
(-) -
(-) -
(-)
2,50
0.00 (-
) -
(-) -
(-) -
(-) -
(-) -
(-) -
(-) -
(-) -
(-) -
(-) -
(-) -
(-) -
(-) -
(-) -
(-) -
(-) -
(-)
2,50
0.00 (-
) -
(-) -
(-)
8,8
88.6
4 (-) -
(-) -
(-) -
(-) -
(-) -
(-) -
(-) -
(-)
346.
28 (-) -
(-) -
(-) -
(-) -
(-) -
(-) -
(-) -
(-) -
(-) -
(9,0
35.3
4) -
(-) -
(-)
-
(-) -
(2,5
69.6
3) -
(-)
2,60
2.10
(4,0
85.1
6) -
(-)
8.55 (-
) -
(-) -
(-) -
(-) -
(-) -
(-) -
(-) -
(-) -
(-) -
(-) -
(-) -
(-) -
(5,5
04.5
0) -
(-) -
(-)
-
(-) -
(-) -
(-) -
(-) -
(-) -
(-) -
(-) -
(-) -
(-) -
(-)
182.
81
(91.
40) -
(-) -
(-) -
(-)
12.0
2 (-) -
(-) -
(-) -
(-) -
(-) -
(-)
(` l
acs)
Financial Technologies (India) Ltd. | ANNUAL REPORT 2012-13
106
Not
esst
form
ing
part
of
the
finan
cial
sta
tem
ents
for
the
Yea
r en
ded
31 M
arch
, 20
13
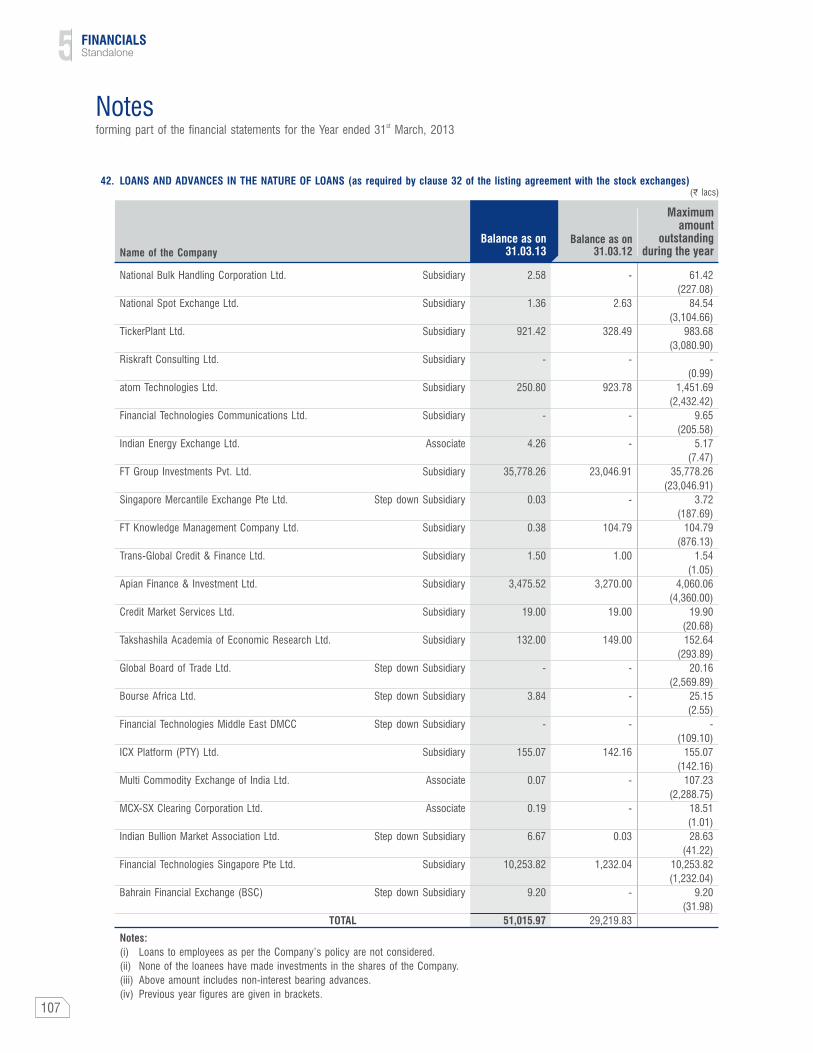
(` lacs)
National Bulk Handling Corporation Ltd.
National Spot Exchange Ltd.
TickerPlant Ltd.
Riskraft Consulting Ltd.
atom Technologies Ltd.
Financial Technologies Communications Ltd.
Indian Energy Exchange Ltd.
FT Group Investments Pvt. Ltd.
Singapore Mercantile Exchange Pte Ltd.
FT Knowledge Management Company Ltd.
Trans-Global Credit & Finance Ltd.
Apian Finance & Investment Ltd.
Credit Market Services Ltd.
Takshashila Academia of Economic Research Ltd.
Global Board of Trade Ltd.
Bourse Africa Ltd.
Financial Technologies Middle East DMCC
ICX Platform (PTY) Ltd.
Multi Commodity Exchange of India Ltd.
MCX-SX Clearing Corporation Ltd.
Indian Bullion Market Association Ltd.
Financial Technologies Singapore Pte Ltd.
Bahrain Financial Exchange (BSC)
TOTAL
Name of the Company
42. LOANS AND ADVANCES IN THE NATURE OF LOANS (as required by clause 32 of the listing agreement with the stock exchanges)
Maximum amount
outstanding during the year
61.42
(227.08)
84.54
(3,104.66)
983.68
(3,080.90)
-
(0.99)
1,451.69
(2,432.42)
9.65
(205.58)
5.17
(7.47)
35,778.26
(23,046.91)
3.72
(187.69)
104.79
(876.13)
1.54
(1.05)
4,060.06
(4,360.00)
19.90
(20.68)
152.64
(293.89)
20.16
(2,569.89)
25.15
(2.55)
-
(109.10)
155.07
(142.16)
107.23
(2,288.75)
18.51
(1.01)
28.63
(41.22)
10,253.82
(1,232.04)
9.20
(31.98)
-
2.63
328.49
-
923.78
-
-
23,046.91
-
104.79
1.00
3,270.00
19.00
149.00
-
-
-
142.16
-
-
0.03
1,232.04
-
29,219.83
Balance as on 31.03.13
Balance as on 31.03.12
2.58
1.36
921.42
-
250.80
-
4.26
35,778.26
0.03
0.38
1.50
3,475.52
19.00
132.00
-
3.84
-
155.07
0.07
0.19
6.67
10,253.82
9.20
51,015.97
Subsidiary
Subsidiary
Subsidiary
Subsidiary
Subsidiary
Subsidiary
Associate
Subsidiary
Step down Subsidiary
Subsidiary
Subsidiary
Subsidiary
Subsidiary
Subsidiary
Step down Subsidiary
Step down Subsidiary
Step down Subsidiary
Subsidiary
Associate
Associate
Step down Subsidiary
Subsidiary
Step down Subsidiary
Notes:
(i) Loans to employees as per the Company’s policy are not considered.
(ii) None of the loanees have made investments in the shares of the Company.
(iii) Above amount includes non-interest bearing advances.
(iv) Previous year figures are given in brackets.
107
Notesstforming part of the financial statements for the Year ended 31 March, 2013
5 FINANCIALSStandalone

Financial Technologies (India) Ltd. | ANNUAL REPORT 2012-13
108
Notesstforming part of the financial statements for the Year ended 31 March, 2013
43. STOCK BASED COMPENSATION
(a) During the financial year 2011-12, Remuneration and Compensation Committee (“Committee”) of the Company had granted 900,000
Stock Options (“Options”) each under the Employee Stock Option Scheme – 2009 & 2010 totalling to 1,800,000 options at a price of
` 770/- to the eligible employees/Directors of the Company (“Employees”) in terms of SEBI (Employee Stock Option Scheme and
Employee Stock Purchase Scheme) Guidelines, 1999 as amended from time to time and as approved by the Shareholders at the th thAnnual General Meetings of the Compnay held on 25 September 2009 & 29 September 2010 respectively.
During the year under review, Remuneration and Compensation Committee (“Committee”) of the Company at their meeting held on
March 05, 2013 has considered and approved the grant from reissue of lapsed/cancelled options of 186,630 Stock Options
(“Options”) under the Employee Stock Option Schemes ("scheme") of which 74,350 options are granted under scheme-2009 and
112,280 options under scheme-2010 at a price of ` 807.70 to the eligible employees/Directors of the Company (“Employees”) in
terms of SEBI (Employee Stock Option Scheme and Employee Stock Purchase Scheme) Guidelines, 1999 as amended from time to
time.
Details of the Option granted under stock option schemes are as under:
Each option entitles the holder to exercise the right to apply for and seek allotment of one equity share of ` 2/- each. The Intrinsic
value of each option is nil, since the options were granted at the market price of the equity shares on the date of grant. The options st nd rdshall vest in three installments of 20%, 30% and 50% at the end of 1 year, 2 year and 3 year respectively from the date of the
grant and can be exercised within three months from vesting of options or as may be determined by the Remuneration &
Compensation Committee. The tenure of the Schemes is for maximum period of five years from the date of grant of options.
Vesting Period
14.03.2012 - 13.03.2013
14.03.2012 - 13.03.2014
14.03.2012 - 13.03.2015
14.03.2012 - 13.03.2013
14.03.2012 - 13.03.2014
14.03.2012 - 13.03.2015
05.03.2013 - 04.03.2014
05.03.2013 - 04.03.2015
05.03.2013 - 04.03.2016
05.03.2013 - 04.03.2014
05.03.2013 - 04.03.2015
05.03.2013 - 04.03.2016
770.00
770.00
770.00
770.00
770.00
770.00
807.70
807.70
807.70
807.70
807.70
807.70
No. of Options Granted
Exercise Price in `Grant DateSchemes
900,000
900,000
74,350
112,280
March 14, 2012
March 14, 2012
March 05, 2013
March 05, 2013
ESOP 2009
ESOP 2010
ESOP 2009
(reissue of lapsed/cancelled options)
ESOP 2010
(reissue of lapsed/cancelled options)
Options outstanding as at the beginning of the year
Options granted during the year
Options exercised during the year
Options lapsed/forfeited/cancelled during the year
Options outstanding as at the year-end
Options exercisable as at the year-end
900,000
(-)
112,280
(900,000)
-
(-)
131,325
(-)
880,955
(900,000)
153,735
(-)
900,000
(-)
74,350
(900,000)
-
(-)
81,850
(-)
892,500
(900,000)
163,630
(-)
The particulars of the options granted, lapsed and cancelled under aforementioned schemes are as follows:
ESOP 2009 (Nos.)
ESOP 2010 (Nos.)Particulars

109
Notesstforming part of the financial statements for the Year ended 31 March, 2013
(b) The Company has followed the intrinsic value-based method of accounting for stock option. Had the compensation cost of the Company's stock
based compensation plans been determined using the fair value approach, the Company’s net profit for the year would have been lower by
` 2,006.40 lacs (Previous Year lower by 114.22 lacs) and earnings per share would have been lower as indicated below:
The weighted average fair value of each option on the date of grant/reissue is ` 249.05 / ` 238.67 under ESOP Scheme - 2009 & 2010
using the Black-Scholes Option Pricing Formula, considering the following parameters:
(` lacs)
Net profit for the year ( lacs)
Less: Total stock-based employee compensation expense determined under fair
value based method
Adjusted net profit for basic & diluted EPS
Weighted average no. of shares : Basic
: Diluted
Basic and diluted earnings per share (face value ` 2/- per share)
- As reported (in `) : Basic
: Diluted
- As adjusted (in `) : Basic
: Diluted
`
Previous Year
47,802.93
114.22
47,688.71
46,078,537
46,078,537
103.74
103.74
103.49
103.49
32,288.06
2,006.40
30,281.66
46,078,537
46,470,444
70.07
69.48
65.72
65.16
Current YearParticulars
Options granted during F.Y. 2012-13
Options granted during F.Y. 2011-12
(i) Expected volatility
(ii) Option life
(iii) Dividend yield
(iv) Risk-free interest rate
38.57% to 39.27%
1.13 years - 3.13 years
0.74%
7.80% to 7.83%
42.18% to 45.94%
1.13 years - 3.13 years
0.68%
8.13% to 8.18%
(v) To allow for the effects of early exercise, it is assumed that the employees would exercise the options after vesting date.
(vi) Expected volatility is based on the historical volatility of the share prices over the period that is commensurate with the expected
term of the option.
44. EMPLOYEE BENEFIT PLANS:
Defined contribution plans: Amounts recognised as expenses towards contributions to provident fund, employee state insurance corporation and
other funds by the Company are ` 294.33 lacs (Previous Year ` 265.30 lacs). Contribution to PF: ` 290.52 Lacs (Previous Year ` 261.62
Lacs) Contribution to ESIC: ` 3.81 Lacs (Previous Year ` 3.68 Lacs)
Post employment defined benefit plans:
Gratuity Plan: The Company makes annual contributions to the Employee’s Group Gratuity Assurance Scheme administered by the Life
Insurance Corporation of India (‘LIC’), a funded defined benefit plan for qualifying employees. The scheme provides for lump sum payment to
vested employees at retirement, death while in employment or on termination of employment of an amount equivalent to fifteen days salary
payable for each completed year of service or part thereof in excess of six months. Vesting occurs on completion of five years of service.
The following table sets out the status of the gratuity plan as required under AS -15 (Revised):
ESOP 2009 & ESOP 2010
Particulars
5 FINANCIALSStandalone

Financial Technologies (India) Ltd. | ANNUAL REPORT 2012-13
110
Notesstforming part of the financial statements for the Year ended 31 March, 2013
Expected rate of return on plan assets is based on expectation of the average long term rate of return expected to prevail over the estimated
term of the obligation on the type of the investments assumed to be held by LIC, since the fund is managed by LIC.
The estimates of future salary increases, considered in actuarial valuation, takes into account inflation, seniority, promotions and other relevant
factors, such as supply and demand in the employment market.
The Company expects to contribute ` 350.19 lacs to the plan assets during financial year 2013-14.
Current YearNature of Transactions Sr No Previous Year
Change in benefit obligation:
Projected benefit obligation at the beginning of the year
Interest Cost
Current Service Cost
Benefits Paid
Actuarial (gain)/loss on obligations
Obligation transferred/settled
Projected benefit obligation at the end of the year
Change in plan assets
Fair Value of the plan asset at beginning of the year
Expected return on plan assets
Contributions
Benefits paid
Obligation transferred
Actuarial gain on plan assets
Fair value of plan assets at the end of the year
Excess of obligation over plan assets
Gratuity expense for the year
Current service cost
Interest cost
Expected return on plan assets
Net actuarial (gain)/loss recognized
TOTAL
Actual return on plan assets
Category of Assets as at end of the year
Insurer Managed Funds
Fund is managed by LIC of India as per IRDA guidelines,
category wise composition of planned asset is not available
TOTAL
Assumptions
Discount rate
Salary escalation rate
Expected rate of return on plan assets
Experience adjustments:
Defined benefit obligation
Fair value of planned assets
Deficit
Experience adjustment on plan liabilities [(Gain)/Loss]
Experience adjustment on plan assets [Gain/(Loss)]
I.
II.
III.
IV.
V.
VI.
VII.
947.81
80.40
116.85
(70.09)
116.35
(28.91)
1,162.41
721.41
62.04
155.74
(70.09)
(28.91)
0.93
841.12
(321.29)
116.85
80.40
(62.04)
115.42
250.63
62.97
841.12
841.12
8.00%
7.50%
8.70%
775.73
64.00
150.50
(96.72)
25.32
28.98
947.81
593.89
49.00
170.07
(96.72)
-
5.17
721.41
(226.40)
150.50
64.00
(49.00)
20.15
185.65
54.17
721.41
721.41
8.75%
7.50%
8.75%
2010
667.03
452.59
214.44
(26.59)
4.28
2009
535.48
349.29
186.19
19.02
1.78
2011
775.73
593.88
181.85
68.23
6.01
2012
947.81
721.41
226.40
71.26
5.17
2013
1,162.41
841.12
321.29
22.61
0.93
(` lacs)

111
45. JOINT VENTURE DISCLOSURE:
(a) Jointly Controlled Entity ('JCE') of the Company:
Name of the Entity : Dubai Gold and Commodities Exchange DMCC (‘DGCX’)
Country of Incorporation : United Arab Emirates
% Holding : 18.58% (Previous Year 18.58%)
(b) Company’s share of interest in the assets, liabilities, income, expenses,contingent liabilities and commitments with respect to JCE as at and
for the year ended March 31, 2013:
The amounts are translated at the year end rate for assets and liabilities and average rate for income and expenses for DGCX.
Transactions during the year ` lacs
I. Assets
1. Fixed Assets
2. Current Assets
(a) Trade receivables
(b) Cash and cash equivalents
(c) Short term loans and advances
(d) Other Current Assets
II. Liabilities
1. Trade payables
2. Other Current Liabilities
3. Provisions
III. Income
1. Admission Fees
2. Transaction Fees
3. Interest Income
4. Other Income
IV. Expenses
1. Employee benefits expense
2. Other expenses
3. Depreciation and amortisation expenses
V. Contingent liabilities
VI. Capital and other commitments
44.03
(83.10)
11.52
(44.01)
8,115.13
(5,189.98)
101.94
(26.03)
82.84
(41.03)
878.07
(767.93)
7,684.65
(4,767.27)
242.22
(198.49)
39.75
(89.53)
758.92
(290.61)
149.68
(107.64)
22.25
(13.64)
447.76
(445.41)
555.08
(328.21)
39.38
(39.84)
-
(-)
-
(-)
Previous year figures are given in brackets.
Notesstforming part of the financial statements for the Year ended 31 March, 2013
5 FINANCIALSStandalone
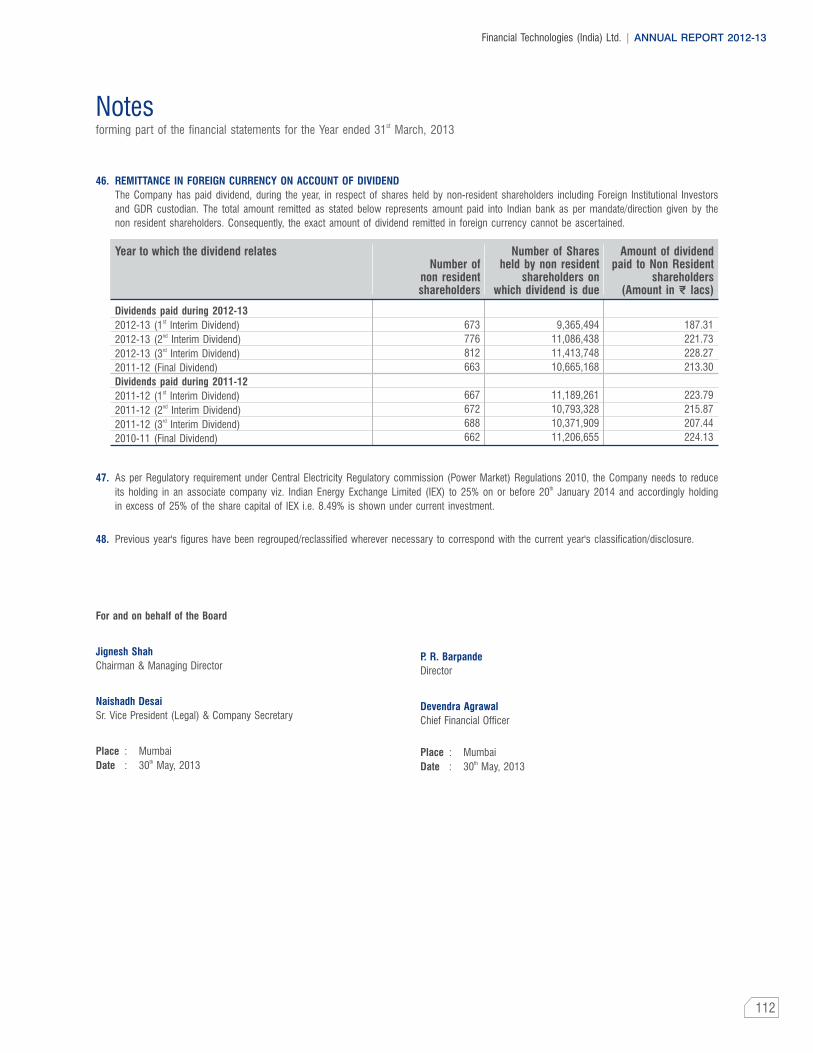
Financial Technologies (India) Ltd. | ANNUAL REPORT 2012-13
112
46. REMITTANCE IN FOREIGN CURRENCY ON ACCOUNT OF DIVIDEND
The Company has paid dividend, during the year, in respect of shares held by non-resident shareholders including Foreign Institutional Investors
and GDR custodian. The total amount remitted as stated below represents amount paid into Indian bank as per mandate/direction given by the
non resident shareholders. Consequently, the exact amount of dividend remitted in foreign currency cannot be ascertained.
47.
48.
As per Regulatory requirement under Central Electricity Regulatory commission (Power Market) Regulations 2010, the Company needs to reduce thits holding in an associate company viz. Indian Energy Exchange Limited (IEX) to 25% on or before 20 January 2014 and accordingly holding
in excess of 25% of the share capital of IEX i.e. 8.49% is shown under current investment.
Previous year's figures have been regrouped/reclassified wherever necessary to correspond with the current year's classification/disclosure.
Dividends paid during 2012-13st2012-13 (1 Interim Dividend)nd2012-13 (2 Interim Dividend)rd2012-13 (3 Interim Dividend)
2011-12 (Final Dividend)
Dividends paid during 2011-12st2011-12 (1 Interim Dividend)nd2011-12 (2 Interim Dividend)rd2011-12 (3 Interim Dividend)
2010-11 (Final Dividend)
187.31
221.73
228.27
213.30
223.79
215.87
207.44
224.13
Year to which the dividend relates Amount of dividend paid to Non Resident
shareholders(Amount in ` lacs)
Number of Shares held by non resident
shareholders on which dividend is due
Number of non resident shareholders
9,365,494
11,086,438
11,413,748
10,665,168
11,189,261
10,793,328
10,371,909
11,206,655
673
776
812
663
667
672
688
662
For and on behalf of the Board
Chairman & Managing Director Director
Sr. Vice President (Legal) & Company Secretary Chief Financial Officer
Place : Mumbai Place : Mumbaith thDate : 30 May, 2013 Date : 30 May, 2013
Jignesh Shah P. R. Barpande
Naishadh Desai Devendra Agrawal
Notesstforming part of the financial statements for the Year ended 31 March, 2013

This page has been left blank intentionally

CONSOLIDATEDFinancials
Financial Technologies (India) Ltd. | ANNUAL REPORT 2012-13

Report on the Consolidated Financial Statements
We have audited the accompanying consolidated financial statements of FINANCIAL TECHNOLOGIES (INDIA) LIMITED (the “Company”), its subsidiaries and jointly controlled entity (the Company, its subsidiaries and jointly controlled entity constitute “the Group”), which comprise the
stConsolidated Balance Sheet as at 31 March, 2013, the Consolidated Statement of Profit and Loss and the Consolidated Cash Flow Statement for the year then ended, and a summary of the significant accounting policies and other explanatory information.
Management’s Responsibility for the Consolidated Financial Statements
The Company’s Management is responsible for the preparation of these consolidated financial statements that give a true and fair view of the consolidated financial position, consolidated financial performance and consolidated cash flows of the Group in accordance with the accounting principles generally accepted in India. This responsibility includes the design, implementation and maintenance of internal control relevant to the preparation and presentation of the consolidated financial statements that give a true and fair view and are free from material misstatement, whether due to fraud or error.
Auditors’ Responsibility
Our responsibility is to express an opinion on these consolidated financial statements based on our audit. We conducted our audit in accordance with the Standards on Auditing issued by the Institute of Char tered Accountants of India. Those Standards require that we comply with ethical requirements and plan and perform the audit to obtain reasonable assurance about whether the consolidated financial statements are free from material misstatement.
An audit involves performing procedures to obtain audit evidence about the amounts and the disclosures in the consolidated financial statements. The procedures selected depend on the auditor’s judgement, including assessment of the risks of material misstatement of the consolidated financial statements, whether due to fraud or error. In making those risk assessments, the auditor considers internal control relevant to the Company’s preparation and presentation of the consolidated financial statements that give a true and fair view in order to design audit procedures that are appropriate in the circumstances, but not for the purpose of expressing an opinion on the effectiveness of the Company’s internal control. An audit also includes evaluating the appropriateness of the accounting policies used and the reasonableness of the accounting estimates made by the Management, as well as evaluating the overall presentation of the consolidated financial statements.
We believe that the audit evidence we have obtained is sufficient and appropriate to provide a basis for our audit opinion.
Opinion
In our opinion and to the best of our information and according to the explanations given to us, and based on the consideration of the reports of the other auditors on the financial statements / consolidated financial statements / financial information of the subsidiaries, jointly controlled entity and associates referred to below in the Other Matter paragraph, the aforesaid consolidated financial statements give a true and fair view in conformity with the accounting principles generally accepted in India:
st(a) in the case of the Consolidated Balance Sheet, of the state of affairs of the Group as at 31 March, 2013;
(b) in the case of the Consolidated Statement of Profit and Loss, of the profit of the Group for the year ended on that date; and
(c) in the case of the Consolidated Cash Flow Statement, of the cash flows of the Group for the year ended on that date.
Emphasis of Matter
We draw attention to:
(a) Note 42 to the Consolidated Financial Statements regarding the associate Company’s stand of not treating members’ margin and income thereon as part of Settlement Guarantee Fund (SGF) contemplated under the directions of the Forward Market Commission (FMC) and instead crediting such margins to ‘Other current liabilities’ and such income to the Statement of Profit and Loss (amounts unascer tained) for the reason stated therein.
(b) Note 2(C)(iii) to the Consolidated Financial Statements regarding Emphasis of Matter made by the auditors of a jointly controlled entity, stwherein it is stated that the consolidated financial statements of the said entity for the year ended 31 December, 2012 have been prepared
on a going concern basis, notwithstanding the said entity having incurred a loss ` 279.74 lacs (to the extent of the Group’s share) and has net liabilities of ` 888.65 lacs (to the extent of the Group’s share) as on that date, for the reasons stated in the said Note.
Our opinion is not qualified in respect of these matters.
INDEPENDENT AUDITORS’ REPORT TO THE BOARD OF DIRECTORS OF FINANCIAL TECHNOLOGIES (INDIA) LIMITED
115
5 FINANCIALSConsolidated
Other Matter
We did not audit the financial statements/consolidated financial statements of 39 subsidiaries and a jointly controlled entity, whose financial statements reflect total assets of ` 194,550.19 lacs as at 31 March, 2013, total revenues of ` 52,126.86 lacs and net cash inflows amounting to ` 12,814.40 lacs for the year ended on that date as considered in the Consolidated Financial Statements, comprising:
st(a) Total assets of ` 177,063.81 lacs as at 31 March, 2013, total revenues of ` 50,089.55 lacs and net cash inflows amounting to ` 12,738.97 lacs for the year ended on that date in respect of 39 subsidiaries whose financial statements / consolidated financial statements have been audited by other auditors and their repor ts have been furnished to us and our opinion in so far as it relates to the amounts included in respect of these subsidiaries is based solely on the repor ts of the other auditors. The consolidated financial statements also
stinclude the Group’s share of net profit of ` 2,285.36 lacs for the year ended 31 March, 2013, as considered in the consolidated financial statements, in respect of 2 associates, whose financial statements have not been audited by us. These financial statements have been audited by other auditors whose repor ts have been furnished to us by the Management and our opinion, in so far as it relates to the amounts and disclosures included in respect of these associates, is based solely on the reports of the other auditors.
st(b) Total assets of ` 17,486.38 lacs as at 31 March, 2013, total revenues of ` 2,037.31 lacs and net cash inflows amounting to st
` 75.43 lacs for the year ended on that date in respect of a jointly controlled entity, whose repor ting date is of 31 December, 2012 and different from the repor ting date of the Company and the consolidated financial statements have been audited by other auditors. In terms of
stAccounting Standard 27, adjustments have been made for transactions of this jointly controlled entity for the periods from 1 January, 2013 st st stto 31 March, 2013 and 1 January, 2012 to 31 March, 2012, on the basis of its management accounts for the said periods. Our opinion in
so far as it relates to the amounts included in respect of this jointly controlled entity is based solely on the repor ts of the other auditors furnished to us and the management accounts as aforesaid.
Our opinion is not qualified in respect of these matters.
For DELOITTE HASKINS & SELLS
Chartered Accountants
(Firm Registration No. 117366W)
Partner
(Membership No. 36920)
st
Rajesh K Hiranandani
INDEPENDENT AUDITORS’ REPORT TO THE BOARD OF DIRECTORS OF FINANCIAL TECHNOLOGIES (INDIA) LIMITED
thMUMBAI, 30 May, 2013
116
Financial Technologies (India) Ltd. | ANNUAL REPORT 2012-13

117
Consolidated Balance Sheet stas at 31 March, 2013
(` lacs)
Note No.
I. EQUITY AND LIABILITIES
1 Shareholders’ funds
(a) Share capital
(b) Reserves and surplus
2 Minority interest
3 Non-current liabilities
(a) Long-term borrowings
(b) Deferred tax liabilities (net)
(c) Other long-term liabilities
(d) Long-term provisions
4 Current liabilities
(a) Short-term borrowings
(b) Trade payables
(c) Other current liabilities
(d) Short-term provisions
TOTAL
II. ASSETS
1 Non-current assets
(a) Fixed assets
(i) Tangible assets
(ii) Intangible assets
(iii) Intangible assets under development
(iv) Capital work-in-progress
(b) Goodwill on consolidation
(c) Non-current investments
(d) Long-term loans and advances
(e) Other non-current assets
2 Current assets
(a) Current investments
(b) Inventories
(c) Trade receivables
(d) Cash and cash equivalents
(e) Short-term loans and advances
(f) Other current assets
TOTAL
As at 31.03.2012
921.57
167,651.35
168,572.92
1,489.39
115,736.52
1,819.10
614.78
1,690.39
119,860.79
8,865.88
6,194.50
59,018.95
2,314.53
76,393.85
366,316.95
49,424.32
838.92
8.27
261.53
50,533.04
1,356.18
52,225.96
26,906.66
3,532.17
134,554.01
111,624.21
18,490.05
7,246.17
66,819.77
10,220.00
17,362.74
231,762.94
366,316.95
3
4
5
6
7
8
9
10
11
12
13 A
13 B
14
15
16
17
18
19
20
21
22
1 to 54
921.57
180,642.84
181,564.41
1,627.88
123,295.04
2,687.15
1,007.07
2,420.85
129,410.11
22,915.32
11,494.04
118,281.37
3,388.65
156,079.38
468,681.78
50,991.92
302.65
-
42.70
51,337.27
1,356.18
59,639.22
22,756.62
2,234.48
137,323.77
137,012.53
38,021.29
42,099.50
64,295.68
11,563.85
38,365.16
331,358.01
468,681.78
As at 31.03.2013
See accompanying notes forming part of the consolidated financial statements
In terms of our report attached For and on behalf of the Board.
For Deloitte Haskins & Sells
Chartered Accountants Chairman & Managing Director Director
Sr. Vice President (Legal) Chief Financial Officer
Partner & Company Secretary
Place : Mumbai Place : Mumbaith thDate : 30 May, 2013 Date : 30 May, 2013
Jignesh Shah P. R. Barpande
Naishadh Desai Devendra Agrawal
Rajesh K Hiranandani
5 FINANCIALSConsolidated

Financial Technologies (India) Ltd. | ANNUAL REPORT 2012-13
118
Consolidated Statement of Profit and Lossstfor the year ended 31 March, 2013
(` lacs)
Note No.
Revenue from operations
Other income
Total revenue
Expenses
Purchases of stock-in-trade
Changes in inventory of stock-in-trade
Employee benefits expense
Finance costs
Depreciation and amortisation expense
Other expenses
Total expenses
Profit before tax
Tax expense / (credit)
(a) Current tax expense for current year
(b) Less: MAT credit
(c) Current tax expense relating to prior years
(d) Less: MAT credit availed relating to prior years
(e) Net current tax expense
(f) Deferred Tax
Net tax expense
Profit after tax before share of profit of associates and minority interest
Net share of profit of associates (equity method)
Net minority interest in profit of subsidiaries
Profit for the year
Earnings per share:
Basic per share (in `)
Diluted per share (in `)
Face Value Per Share (in `)
See accompanying notes forming part of the consolidated financial statements
Year Ended 31.03.2012
50,123.37
33,306.66
83,430.03
290.48
(5.49)
24,687.01
6,717.77
3,164.04
26,067.03
60,920.84
22,509.19
11,099.82
(6,603.50)
1,109.65
-
5,605.97
602.93
6,208.90
16,300.29
10,283.12
(178.17)
26,405.24
57.30
57.30
2
23
24
25
26
27
28
29
30
46
1 to 54
75,193.01
20,406.28
95,599.29
56.65
5.01
25,008.52
9,799.83
3,268.15
30,530.23
68,668.39
26,930.90
13,526.92
(7.86)
98.76
(231.24)
13,386.58
868.05
14,254.63
12,676.27
10,203.65
(136.04)
22,743.89
49.36
48.42
2
Year Ended 31.03.2013
In terms of our report attached For and on behalf of the Board.
For Deloitte Haskins & Sells
Chartered Accountants Chairman & Managing Director Director
Sr. Vice President (Legal) Chief Financial Officer
Partner & Company Secretary
Place : Mumbai Place : Mumbaith thDate : 30 May, 2013 Date : 30 May, 2013
Jignesh Shah P. R. Barpande
Naishadh Desai Devendra Agrawal
Rajesh K Hiranandani
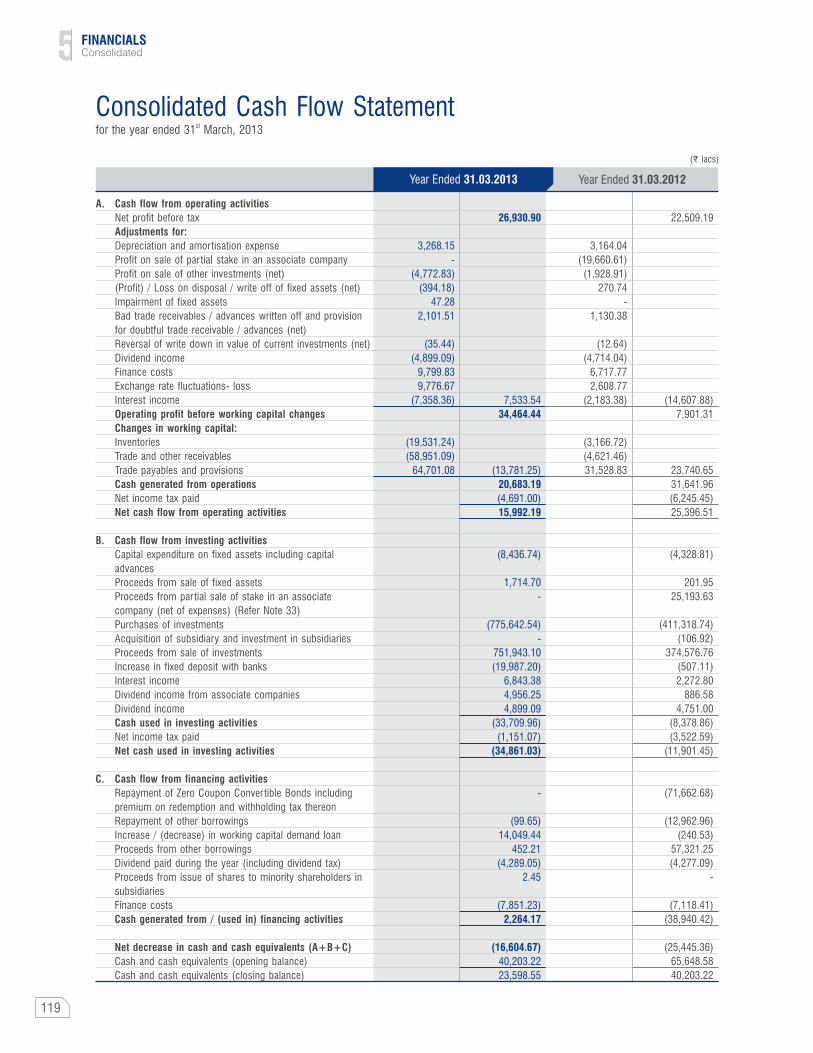
119
Consolidated Cash Flow Statementstfor the year ended 31 March, 2013
(` lacs)
Year Ended 31.03.2012 Year Ended 31.03.2013
A. Cash flow from operating activities
Net profit before tax
Adjustments for:
Depreciation and amortisation expense
Profit on sale of partial stake in an associate company
Profit on sale of other investments (net)
(Profit) / Loss on disposal / write off of fixed assets (net)
Impairment of fixed assets
Bad trade receivables / advances written off and provision
for doubtful trade receivable / advances (net)
Reversal of write down in value of current investments (net)
Dividend income
Finance costs
Exchange rate fluctuations- loss
Interest income
Operating profit before working capital changes
Changes in working capital:
Inventories
Trade and other receivables
Trade payables and provisions
Cash generated from operations
Net income tax paid
Net cash flow from operating activities
B. Cash flow from investing activities
Capital expenditure on fixed assets including capital
advances
Proceeds from sale of fixed assets
Proceeds from partial sale of stake in an associate
company (net of expenses) (Refer Note 33)
Purchases of investments
Acquisition of subsidiary and investment in subsidiaries
Proceeds from sale of investments
Increase in fixed deposit with banks
Interest income
Dividend income from associate companies
Dividend income
Cash used in investing activities
Net income tax paid
Net cash used in investing activities
C. Cash flow from financing activities
Repayment of Zero Coupon Convertible Bonds including
premium on redemption and withholding tax thereon
Repayment of other borrowings
Increase / (decrease) in working capital demand loan
Proceeds from other borrowings
Dividend paid during the year (including dividend tax)
Proceeds from issue of shares to minority shareholders in
subsidiaries
Finance costs
Cash generated from / (used in) financing activities
Net decrease in cash and cash equivalents (A+B+C)
Cash and cash equivalents (opening balance)
Cash and cash equivalents (closing balance)
22,509.19
(14,607.88)
7,901.31
23,740.65
31,641.96
(6,245.45)
25,396.51
(4,328.81)
201.95
25,193.63
(411,318.74)
(106.92)
374,576.76
(507.11)
2,272.80
886.58
4,751.00
(8,378.86)
(3,522.59)
(11,901.45)
(71,662.68)
(12,962.96)
(240.53)
57,321.25
(4,277.09)
-
(7,118.41)
(38,940.42)
(25,445.36)
65,648.58
40,203.22
3,164.04
(19,660.61)
(1,928.91)
270.74
-
1,130.38
(12.64)
(4,714.04)
6,717.77
2,608.77
(2,183.38)
(3,166.72)
(4,621.46)
31,528.83
26,930.90
7,533.54
34,464.44
(13,781.25)
20,683.19
(4,691.00)
15,992.19
(8,436.74)
1,714.70
-
(775,642.54)
-
751,943.10
(19,987.20)
6,843.38
4,956.25
4,899.09
(33,709.96)
(1,151.07)
(34,861.03)
-
(99.65)
14,049.44
452.21
(4,289.05)
2.45
(7,851.23)
2,264.17
(16,604.67)
40,203.22
23,598.55
3,268.15
-
(4,772.83)
(394.18)
47.28
2,101.51
(35.44)
(4,899.09)
9,799.83
9,776.67
(7,358.36)
(19,531.24)
(58,951.09)
64,701.08
5 FINANCIALSConsolidated

Financial Technologies (India) Ltd. | ANNUAL REPORT 2012-13
120
(` lacs)
stfor the year ended 31 March, 2013
Consolidated Cash Flow Statement (contd.)
1. Cash and Cash equivalents
Effect on exchange differences on restatement of foreign currency cash and cash equivalents
Cash and cash equivalents (Refer Note 20)
Previous Year
40,203.22
10,710.32
50,913.54
Notes to cash flow statement: Current Year
23,598.55
4,677.90
28,276.45
In terms of our report attached For and on behalf of the Board.
For Deloitte Haskins & Sells
Chartered Accountants Chairman & Managing Director Director
Sr. Vice President (Legal) Chief Financial Officer
Partner & Company Secretary
Place : Mumbai Place : Mumbaith thDate : 30 May, 2013 Date : 30 May, 2013
Jignesh Shah P. R. Barpande
Naishadh Desai Devendra Agrawal
Rajesh K Hiranandani
2. Fixed deposits with banks with maturity period of more than three months are classified and grouped in investing activities and not included in cash
and cash equivalents.
3. The Cash Flow Statement has been prepared under the "Indirect Method" as set out in Accounting Standard AS-3 "Cash Flow Statement".

Notesstforming part of the consolidated financial statements for the year ended 31 March, 2013
1. GENERAL INFORMATION
2. SIGNIFICANT ACCOUNTING POLICIES:
The Financial Technologies group is among the global leaders in offering technology IP (Intellectual Property) and domain expertise to create and trade on next-generation financial markets that are transparent, efficient and liquid, across all asset classes including equities, commodities, currencies and bonds among others. The group is pioneer in end to end Straight through Processing (STP) solution that support high density transactions. It has developed proprietary technology platform benchmarked against global standard which give it a decisive edge in driving mass disruptive innovation at the speed and cost of execution unmatched in the financial market industry.
The Financial Technologies group operates one of the world’s largest network of 9 connecting fast-growing economies of Africa, Middle East, India and South East Asia. The group also has five ecosystem ventures to address upstream and downstream opportunities around exchanges, including clearing, depository, information vending, and payment gateway among others.
A. Basis of preparation of financial statements
The consolidated financial statements of Financial Technologies (India) Limited (‘the Parent Company’) and its subsidiary companies, associate companies and joint venture company (Refer Note C below for list of entities included in consolidated financial statements) (the Parent Company, its subsidiaries and jointly controlled entity constitute ‘the Group’) have been prepared under the historical cost convention in accordance with the generally accepted accounting principles in India.
The financial statements of subsidiaries and associates used in the consolidation are drawn upto the same reporting date as that of the Parent Company, viz March 31, 2013. In respect of the financial statements of a jointly controlled entity group used in the consolidation,
stwhose reporting date is of 31 December, 2012 and different from the reporting date of the Parent Company, in terms of Accounting stStandard 27, adjustments have been made for transactions of this jointly controlled entity group for the periods from 1 January, 2013 to
st st st31 March, 2013 and 1 January, 2012 to 31 March, 2012, on the basis of its management accounts for the said periods. (see note no 2(C )(iii) below)
B. Use of estimates
The preparation of financial statements in conformity with generally accepted accounting principles requires estimates and assumptions to be made that affect the reported amount of assets and liabilities on the date of the financial statements and the reported amount of revenues and expenses during the reporting period. Differences between actual results and estimates are recognised in the period in which the results are known / materialize.
C. Principles of consolidation
The consolidated financial statements have been prepared in accordance with Accounting Standard (AS-21) “Consolidated Financial Statements”, Accounting Standard (AS-23) “Accounting for Investments in Associates in Consolidated Financial Statements” and Accounting Standard (AS-27) “Financial Reporting of Interests in Joint Ventures” as notified under the Companies (Accounting Standards) Rules, 2006 on the following basis:
(i) Investments in subsidiaries:
(a) The financial statements of the Parent Company and its subsidiaries are combined on line-by-line basis by adding together the book values of like items of the assets, liabilities, income and expenses, after elimination of intra group balances, intra group transactions and unrealised profits or losses on balances remaining within the Group. These financial statements have been prepared using uniform accounting policies for like transactions and other events in similar circumstances.
(b) In case of foreign subsidiaries, being non-integral foreign operations, translation of financial statements for consolidation is done in accordance with the policy stated in Note M below.
(c) The difference between the cost of investment in the subsidiaries, and the share of equity in the subsidiaries, on acquisition date, is recognised in the financial statements as goodwill or capital reserve, as the case may be.
(d) Minority interest in the net assets of consolidated subsidiaries consists of:
i. The amount of equity attributable to minorities at the date the parent-subsidiary relationship came into existence and
ii. The minorities share of movement in equity since the date the parent-subsidiary relationship came into existence.
(e) Minority interest’s share of net profit/loss of consolidated subsidiaries is identified and adjusted against the profit of the group. Minority interest’s share of net assets of consolidated subsidiaries is identified and presented in the consolidated balance sheet separately from liabilities and equity of the Parent Company’s shareholders.
(f) The subsidiary companies considered in the presentation of the consolidated financial statements are:
121
5 FINANCIALSConsolidated

stforming part of the consolidated financial statements for the year ended 31 March, 2013
Notes
Proportion of Ownership Interest
(Previous year)
96.62%
86.29%
99.99%
60.88%
92.68%
-
-
97.59%
100.00%
100.00%
100.00%
99.99%
100.00%
100.00%
100.00%
100.00%
100.00%
100.00%
99.98%
100.00%
100.00%
-
100.00%
100.00%
100.00%
90.00%
99.99%
99.99%
100.00%
100.00%
100.00%
100.00%
100.00%
100.00%
100.00%
100.00%
100.00%
100.00%
-
99.43%
86.29%
99.99%
60.88%
92.68%
100.00%
51.00%
97.59%
100.00%
100.00%
100.00%
99.99%
100.00%
100.00%
100.00%
100.00%
100.00%
100.00%
99.98%
100.00%
100.00%
100.00%
100.00%
100.00%
100.00%
100.00%
99.99%
99.99%
100.00%
100.00%
100.00%
100.00%
100.00%
100.00%
100.00%
100.00%
100.00%
100.00%
100.00%
Country of incorporation
Name of Subsidiaries
Sr. No
India
India
India
India
India
India
India
India
India
U.A.E.
Mauritius
Bangladesh
Kingdom of Bahrain
India
India
India
India
Mauritius
Botswana
Mauritius
Mauritius
Mauritius
Singapore
Singapore
Singapore
South Africa
India
India
India
India
India
Bahrain
Tanzania
Uganda
Kenya
Nigeria
Zambia
Botswana
Botswana
Proportion of Ownership Interest
(Current year)
1.
2.
3.
4.
5.
6.
7.
8.
9.
10.
11.
12.
13.
14.
15.
16.
17.
18.
19.
20.
21.
22.
23.
24.
25.
26.
27.
28.
29.
30.
31.
32.
33.
34.
35.
36.
37.
38.
39.
Financial Technologies (India) Ltd. | ANNUAL REPORT 2012-13
122
atom Technologies Limited (atom)
IBS Forex Limited (IBS)
National Spot Exchange Limited (NSEL)
Indian Bullion Market Association Limited (subsidiary of NSEL)
National Bulk Handling Corporation Limited (NBHC)
Farmer Agricultural Integrated Development Alliance Ltd. st(subsidiary of NSEL w.e.f 1 August, 2012) (FAIDA)
Westernghats Agro Growers Company Limitedth(subsidiary of NSEL w.e.f 5 September, 2012) (WAG)
TickerPlant Limited (TickerPlant)
Riskraft Consulting Limited (Riskraft)
Financial Technologies Middle East DMCC (FTME) (subsidiary of thFTGIPL w.e.f 25 March, 2012) (formerly direct subsidiary of
Financial Technologies (India) Limited)
Financial Technologies Projects Pvt. Ltd. (FTPPL)
Capricorn Fin-Tech (Private) Limited (Subsidiary of FTME)
Bahrain Financial Exchange BSC (c) (BFX)
(subsidiary of FTGIPL)
Financial Technologies Communications Limited (FTCL)
Global Payment Networks Limited (GPNL)
FT Knowledge Management Company Limited (FTKMCL)
Trans-Global Credit & Finance Limited (TGCFL)
FT Group Investments Pvt. Ltd. (FTGIPL)
Bourse Africa Limited (BAL) (subsidiary of FTGIPL)
Knowledge Assets Pvt. Ltd. (KAPL)
Global Board of Trade Limited (GBOT) (subsidiary of FTGIPL thw.e.f 19 March, 2012) (formerly direct subsidiary of
Financial Technologies (India) Limited)
GBOT Clear Limited (GBOT CL) (subsidiary of GBOT)
Financial Technologies Singapore Pte Limited (FTSPL)
Singapore Mercantile Exchange Pte. Ltd. (SMX)
(subsidiary of FTSPL)
Singapore Mercantile Exchange Clearing Corporation Pte. Ltd.
(SMX-CCL) (subsidiary of SMX)
ICX Platform (Pty) Limited (ICX)
Credit Market Services Limited (CMSL)
Apian Finance & Investment Limited (Apian)
Takshashila Academia of Economic Research Limited (TAER)
FT Projects Limited. (FTPL)
Boursa India Ltd. (BIL)
BFX Clearing & Depository Corporation BSCC
(Subsidiary of BFX)
Bourse Tanzania Limited (Subsidiary of BAL)
Bourse Uganda Limited (subsidiary of BAL)
Bourse Africa (Kenya) Limited (subsidiary of BAL)
Bourse Exchange Nigeria Limited (subsidiary of BAL)
Bourse Zambia Limited (subsidiary of BAL) thICX Africa Limited (subsidiary of BAL) (w.e.f 26 July, 2011)
Bourse South Africa Limited (subsidiary of BAL)
(w.e.f October 19, 2012)

123
Notesstforming part of the consolidated financial statements for the year ended 31 March, 2013
(i) In respect of subsidiaries listed in Sr. No. 2, 8, 9, 13, 18, 19, 27 & 29 of para f) above, financial statements have been prepared on a going concern basis, where accumulated losses aggregate ` 38,689.76 lacs which is inter alia dependent on availability of funds to finance future operations, achievement of projected higher growth and continued financial support from the ultimate holding company.
FTGIPL along with its subsidiaries has accumulated consolidated losses of ` 37,946.83 lacs, where their auditors have drawn emphasis of matter paragraph in their report.
(ii) Investments in Associate Companies:
(a) The consolidated financial statements include the share of profit/loss of associate companies, accounted under the ‘Equity method’ under which the Group originally records its investment at cost and the carrying amount is increased/decreased to recognise the Group’s share of profits/losses/changes directly included in associate’s equity after the date of acquisition. An associate is an enterprise in which the investor has significant influence and which is neither a subsidiary nor a joint venture.
(b) The difference between the cost/carrying value of investment in the associates and the share of net assets at the time of acquisition is identified as goodwill or capital reserve, as the case may be and included in the carrying amount of investment and disclosed separately. (Refer Note 40 and 41)
(iii) Investments in Joint Venture Companies:
The Group’s interest in joint venture companies is accounted using proportionate consolidation method and translated (in case of non-integral foreign joint venture company) using the translation principles stated in Note M below.
Held by the Parent Company 18.58% and FTGIPL 20.53%: (Previous Year 18.58% and 20.53% respectively)
Refer Note 44 for the statement of the Group's share of interest in the assets, liabilities, income and expenses with respect to a joint controlled entity group, Dubai Gold and Commodities Exchange DMCC Group (DGCX). DGCX has incurred a loss of ` 279.74 lacs for the
st styear ended 31 December, 2012 (for the year ended 31 March, 2013: ` 156.26 lacs) (the Group’s share) and has net liabilities of st st
` 888.65 lacs as at 31 December, 2012 (for the year ended 31 March, 2013: ` 935.27 lacs) (to the extent of the Group’s share). The continuation of the DGCX’s operations is dependent upon the future profitable operations of DGCX, continued financial support of its shareholders and the ability of DGCX to generate sufficient cash flows to meet its obligations as they fall due. Notwithstanding these facts, the consolidated financial statements of DGCX have been prepared on a going concern basis as the major shareholder (other joint venture partner) of DGCX, has agreed to provide adequate financial support to DGCX to enable it to continue its operations for the foreseeable future and to meet its liabilities as they fall due. The auditors of DGCX have drawn emphasis of matter paragraph in their report on the
stconsolidated Financial Statements of DGCX for the year ended 31 December 2012.
D. Fixed assets (tangible assets)
Fixed assets are stated at cost of acquisition or construction and carried at cost less accumulated depreciation and impairment loss, if any.
E. Intangible assets
Intangible assets are recognised only if it is probable that the future economic benefits that are attributable to the assets will flow to the enterprise and the cost of the assets can be measured reliably. Expenditure on an intangible item is expensed when incurred unless it forms part of the cost of intangible asset that meets the recognition criteria. Intangible assets are stated at cost of acquisition and are carried at cost less accumulated amortisation and impairment loss, if any.
F. Borrowing costs
Borrowing costs that are attributable to the acquisition or construction of qualifying assets are capitalised as part of the cost of such assets. A qualifying asset is one that necessarily takes a substantial period of time to get ready for its intended use or sale. Premium relating to redemption of zero coupon convertible bonds is debited to Securities Premium Account as permitted under section 78 of the Companies Act, 1956. Ancillary borrowing costs are amortised over the period of loan. All other borrowing costs are charged to revenue.
Proportion of Ownership Interest
(Previous year)
26.00%
33.49%
23.00%
49.00%
26.00%
33.49%
23.00%
49.00%
Country of incorporationName of Associates
Sr. No
Multi Commodity Exchange of India Limited (MCX)
Indian Energy Exchange Limited (IEX)
MCX-SX Clearing Corporation Limited (MCX-SX CCL)
SME Exchange of India Limited (SME) th(w.e.f 26 September, 2011)
India
India
India
India
Proportion of Ownership Interest
(Current year)
1.
2.
3.
4.
Proportion of Ownership Interest
(Previous year)
39.11%39.11%
Country of IncorporationName of Entity
Dubai Gold and Commodities Exchange DMCC (DGCX)
(including its subsidiary viz. Dubai Commodities
Clearing Corporation DMCC) Clearing Corporation
DMCC
U.A.E.
Proportion of Ownership Interest
(Current year)
5 FINANCIALSConsolidated

Financial Technologies (India) Ltd. | ANNUAL REPORT 2012-13
124
stforming part of the consolidated financial statements for the year ended 31 March, 2013
Notes
Assets taken/given on lease under which all the risks and rewards of ownership are effectively retained by the lessor are classified as operating lease. Lease payments/income under operating leases are recognised as expenses/income on a straight line basis over the lease term in accordance with the respective lease agreements.
H. Derivative instruments
The Group uses derivative financial instruments such as forward foreign exchange contracts entered into for hedging the risks of foreign currency exposure (in respect of highly probable forecasted transactions/firm commitments) and interest rate swaps to hedge its risks associated with fluctuations in interest rate. As per principles of prudence as enunciated in Accounting Standard 1 (AS-1), “Disclosure of Accounting Policies”, losses, if any, on Mark to Market basis, are recognised in the statement of Profit and Loss and gains are not recognised on prudent basis.
I. Depreciation and amortisation
(a) Depreciation and amortisation is provided for on straight line basis and is based on the following useful lives as per Schedule XIV / as estimated by the management:
(b) Goodwill arising on consolidation is not amortised but is tested for impairment in accordance with the accounting policy stated in para Q below.
J. Investments
Current investments are carried at the lower of cost and fair value. Long-term investments other than in Associates are stated at cost less provision for diminution. Provision for diminution in the value of long-term investments is made only if such a decline is other than temporary in the opinion of the management. Associates are accounted using the equity method as stated in policy C (ii) above. The difference between carrying amount of the investments determined on the basis of average cost and sale proceeds, net of expense, is recognised as profit or loss on sale of investments.
K. Revenue recognition
(a) Revenue is recognised when no significant uncertainty as to determination and realisation exists.
(b) Revenues are stated net of returns, trade discounts, VAT, lease tax and service tax wherever applicable.
(c) Income from software products (IPR based and licenses) and income from software services (project based) for the use of software applications is recognised on delivery/granting of right to use.
Revenue from fixed price service contracts is recognised based on milestones/acts performed as specified in the contracts or on a straight line basis over the contract period where performance of several acts is required over that period. In the case of time and material contracts, revenue is recognised on the basis of hours completed and material used.
Revenue from annual maintenance contracts, lease of licenses, IT infrastructure sharing income and Shared Business Support Services is recognised proportionately over the period in which the services are rendered/licenses are leased.
Revenue from sale of traded goods is recognised when the significant risks and rewards in respect of ownership of products are transferred by the Group.
(d) Income from Procurement service charges are levied on value of procurement and are recognised on accrual basis on completion of procurement and processing activity. Commitment fees are recognised upfront as per the terms of agreement with clients.
(e) In case of exchange related business, Admission fees (nonrefundable) to the exchange collected from new members for joining the exchange are recognised when the membership is approved. Advances against membership application are only recognised as income when the application has been approved. Annual subscription fees (nonrefundable) are collected from members and accrued annually. Transaction fees are charged to members based on the volume of transactions entered into by the members through the exchange. These are accrued when orders placed by members on the network are matched and confirmed. Revenue from terminal charges is accrued on creation of new chargeable user identification.
G. Operating leases
Estimated useful lifeAssets
Building
Leasehold improvements
Premium on leasehold land
Office equipment (excluding computer hardware)
Computer hardware
Furniture and fittings
Vehicles
Trade mark and Copyrights
Technical knowhow
Computer software
58 years
Over the period of lease (over 3 years in case of DGCX and GBOT)
Over the period of lease
3-21 years
3-6 years
3-16 years
10 years
5-10 years
6 years
3-6 years

125
Notesstforming part of the consolidated financial statements for the year ended 31 March, 2013
(f) Delivery fees relating to NSEL are charged to members on the basis of trades executed. In case seller members, delivery fees are recognised on accrual basis and in case of buyer members, delivery fees are recognised at the time of withdrawals of commodities from the exchange/exchange accredited warehouses.
(g) Income from consultancy services is recognised when the services are provided.
(h) Service charges include income from various services viz. IT infrastructure income, collateral management services, delivery fees, POS service charges, gateway service charges, demat, revenue from broking, commission, revenue sharing income, coaching and training fees, internet telecommunication charges, data fee and message services which are recognised as and when services are rendered and in the case of gateway service income, on completion of the transaction.
(i) Storage charges are accrued as income on the completion of storage cycle.
(j) Dividend income is recognised when the Group’s right to receive the dividend is established. Interest income is recognised on time proportion basis. Insurance claim receivable is recognised when such claim is admitted by the Insurance Company.
(k) Income from derivatives comprises of profit/loss on buy/sell of commodity derivative instruments. Profit/Loss on commodity derivative transactions is accounted for on final settlement or on squaring up of contracts. Profit or Loss is calculated as the difference between settlement/squaring up price and the contract price.
L. Stock based compensation
The compensation cost of stock options granted by the Group is measured by the intrinsic value method, i.e. the difference, if any, between the market price/fair value, as the case may be, of the underlying shares on the date of the grant of options and the exercise price to be paid by the option holders, is amortised uniformly over the vesting period of the options. (Refer Note 34).
M. Foreign currency transactions and translation
Foreign currency transactions are recorded at the exchange rates prevailing on the date of the transaction.
Monetary items denominated in foreign currency are restated using the exchange rate prevailing at the balance sheet date. Exchange differences relating to long term monetary items are dealt with in the following manner:
(i) Exchange differences arising during the year, in so far as they relate to the acquisition of a depreciable capital asset are added to / deducted from the cost of the asset and depreciated over the balance life of the asset.
(ii) In other cases, such differences are accumulated in a “Foreign Currency Monetary Item Translation Difference Account” and amortised to the Statement of Profit and Loss over the balance life of the long-term monetary item.
All other exchange differences are dealt with in the Statement of Profit and Loss.
Non-monetary items denominated in foreign currency are carried at historical cost.
Foreign operations
The translation of the financial statements of non integral foreign operations (including branches) is accounted for as under:
(a) All revenues and expenses are translated at average rate.
(b) All monetary and non-monetary assets and liabilities are translated at the rate prevailing on the balance sheet date.
(c) Resulting exchange difference is accumulated in Foreign Currency Translation Reserve Account until the disposal of the net investment in the said non integral foreign operation.
(d) Foreign subsidiaries (non-integral foreign operations) financial statements are prepared in the currency of country in which they are domiciled except when another currency is considered appropriate based on revenue and cost stream.
N. Employee benefits
(a) Post-employment benefits and other long term benefits
Payments to defined contribution retirement schemes viz. provident fund and employee state insurance are expensed as incurred.
For defined benefit schemes and other long term benefit plans viz. gratuity and compensated absences expected to occur after twelve months, the cost of providing benefits is determined using the Projected Unit Credit Method, with actuarial valuations being carried out at the balance sheet date. Actuarial gains and losses are recognised in full in the Statement of Profit and Loss for the period in which they occur. Past service cost is recognised immediately to the extent that the benefits are already vested, and otherwise is amortised on a straight line basis over the average period until the benefits become vested. The retirement benefit obligation recognised in the balance sheet represents the present value of the defined benefit obligation as adjusted for unrecognised past service cost, as reduced by the fair value of scheme assets. Any asset resulting from this calculation is limited to the present value of the available refunds and reduction in contributions to the scheme.
(b) Short term employee benefits
The undiscounted amount of short term employee benefits expected to be paid in exchange for the services rendered by employees is recognised as an expense during the period when the employee renders those services. These benefits include compensated absences such as leave expected to be availed within a year and performance incentives.
5 FINANCIALSConsolidated

Financial Technologies (India) Ltd. | ANNUAL REPORT 2012-13
126
O. Income taxes
Income taxes are accounted for in accordance with Accounting Standard (AS-22) “Accounting for Taxes on Income”. Tax expense comprises current tax and deferred tax. Current tax is the amount of tax payable on the taxable income for the year as determined in accordance with the applicable tax laws. The Group recognises deferred tax (subject to consideration of prudence) based on the tax effect of timing differences, being differences between taxable income and accounting income that originate in one period and are capable of reversal in one or more subsequent periods. The effect on deferred tax assets and liabilities of a change in tax rates is recognised in the statement of profit and loss using the tax rates and tax laws that have been enacted or substantively enacted by the balance sheet date. Deferred tax assets are not recognised on unabsorbed depreciation and carry forward of losses unless there is virtual certainty that sufficient future taxable income will be available against which such deferred tax assets can be realised.
Minimum Alternative Tax (MAT) credit is recognised as an asset only when and to the extent there is convincing evidence that the entity will pay normal income tax during the specified period. In the year in which the MAT credit becomes eligible to be recognised as an asset in accordance with the recommendations contained in Guidance Note issued by the Institute of Chartered Accountants of India, the said asset is created by way of a credit to the Statement of Profit and Loss and shown as MAT Credit Entitlement. The Group reviews the same at each balance sheet date and writes down the carrying amount of MAT Credit Entitlement to the extent there is no longer convincing evidence to the effect that entity will pay normal income tax during the specified period.
P. Inventories
Inventories are valued at lower of cost on First in First out (FIFO) basis or net realizable value. Cost comprises of cost of purchase and other costs incurred in bringing the inventories to their respective present location and condition. In case of defective and obsolete items, due allowance is estimated and provided for wherever necessary.
Packing materials - Fumigation Sheets and Dunnage: Fumigation sheets and dunnage has a useful life of three years and two years respectively. Accordingly cost of fumigation sheets and dunnages are being written off over the period of three years and two years respectively from the date of put to use.
Q. Impairment of assets
The Group assesses at each balance sheet date whether there is any indication that an asset may be impaired. If any such indication exists, the Group estimates the recoverable amount of the assets. If such recoverable amount of the asset or the recoverable amount of the cash generating unit to which the asset belongs is less than its carrying amount, the carrying amount is reduced to its recoverable amount. The reduction is treated as an impairment loss and is recognised in the Statement of Profit and Loss. If at the balance sheet date there is an indication that if a previously assessed impairment loss no longer exists, the recoverable amount is reassessed and the asset is reflected at lower of the carrying amount that would have been determined had no impairment loss been recognised and recoverable amount.
R. Provisions, contingent liabilities and contingent assets
Provisions involving substantial degree of estimation in measurement are recognised when there is a present obligation as a result of past events and it is probable that there will be an outflow of resources. Contingent liabilities are not recognised but disclosed by way of notes to the accounts. Contingent assets are neither recognised nor disclosed in the financial statements.
As at 31.03.2012
3,000.00
921.57
921.57
As at 31.03.2013
150,000,000
46,078,537
46,078,537
3,000.00
921.57
921.57
150,000,000
46,078,537
46,078,537
Number of shares
Number of shares
stforming part of the consolidated financial statements for the year ended 31 March, 2013
Notes
` lacs ` lacs
Authorised:
Equity shares of ` 2/- each
Issued, subscribed and fully paid up:
Equity shares of ` 2/- each
TOTAL
3. SHARE CAPITAL

Capital reserve
Balance as per last Balance Sheet
Capital reserve on consolidation
Balance as per last balance sheet
Securities Premium Account
Balance as per last Balance Sheet
Less: Premium on redemption of Zero Coupon Convertible Bonds (ZCCB)
[net of tax of ` Nil (Previous Year ` 1,959.03 lacs)]
General reserve
Balance as per last Balance Sheet
Add: Transferred from Statement of Profit and Loss
Foreign currency translation reserve
Balance as per last Balance Sheet
(Less)/Add: Effect of foreign exchange rate variation during the year
Statutory reserve
Balance as per last Balance Sheet
Add: Transferred from Statement of Profit and Loss
Security Guarantee Fund
Balance as per last Balance Sheet
Add: amount transferred from surplus balance in the statement of profit and loss
(Refer Note 37(a))
Notesstforming part of the consolidated financial statements for the year ended 31 March, 2013
a. During the period of five years immediately preceding the reporting date, the Company has issued:
(i) 1,94,900 (Previous Year 321,030) Equity shares of 2/- each fully paid-up to the employees under employee stock option ('ESOP') schemes.
(ii) 1,662,811 (Previous Year 1,662,811) Equity shares of ` 2/- each fully paid-up against Global Depositary Receipts ('GDR') issued by the Company.
b. Rights, preferences and restrictions attached to equity shares:
The Company has only one class of shares referred to as equity shares having a par value of ` 2/- per share. Each holder of equity shares is entitled to one vote per share. The Company declares and pays dividend in Indian Rupees. The dividend recommended by the Board of Directors is subject to the approval of the shareholders at the ensuing annual general meeting, except in the case of interim dividend. In the event of liquidation of the Company, the holders of equity shares will be entitled to receive remaining assets of the Company, after distribution of all preferential amounts in the proportion of equity shares held.
c. Details of equity shares held by each shareholder holding more than 5% equity shares in the Company:
`
*Includes shares held under different sub-accounts/schemes.
d. For particulars of options on unissued capital under employee stock option schemes, Refer Note 34.
147.59
1,150.77
45,824.64
(4,078.03)
41,746.61
32,321.85
5,260.00
37,581.85
1,108.42
(778.38)
330.04
11.67
6.98
18.65
-
-
-
As at 31.03.2013
147.59
1,150.77
41,746.61
-
41,746.61
37,581.85
3,253.00
40,834.85
330.04
(3,870.13)
(3,540.09)
18.65
8.24
26.89
-
84.66
84.66
(` lacs)
As at 31.03.2012
127
4. RESERVES AND SURPLUS
La-fin Financial Services Private Limited
Jignesh P. Shah
Ravi K. Sheth
Blackstone GPV Capital Partners Mauritius VI FII Ltd.
Reliance Capital Trustee Company Limited*
Elliot & Page Limited*
As at 31.03.2012
26.76
18.08
5.40
-
5.74
5.69
As at 31.03.2013
12,329,968
8,329,585
2,489,762
-
2,643,339
2,619,632
26.76
18.08
5.40
7.02
4.92
-
12,329,968
8,329,585
2,489,762
3,235,703
2,268,275
-
Number of Equity Shares held
Number of Equity Shares held % Holding % Holding
5 FINANCIALSConsolidated

Financial Technologies (India) Ltd. | ANNUAL REPORT 2012-13
128
stforming part of the consolidated financial statements for the year ended 31 March, 2013
Notes
Foreign currency monetary item translation difference account (FCMITDA)
Balance as per last Balance Sheet
Add: Effect of foreign exchange rate variation during the year
Less: Amortisation during year
Surplus in Statement of Profit and Loss
Balance as per last Balance Sheet
Profit for the year
Less: Appropriations
Interim Dividend [` 6/- per share (Previous Year ` 6/- per share)]
Final Dividend (Proposed) [` 2/- per share (Previous Year ` 2/- per share)]
Tax on Dividend by parent company
Tax on Dividend by subsidiary company
Transfer to General reserve
Transfer to Statutory reserve
Transfer to Security Guarantee Fund (Refer Note 37(a))
Total Appropriations
Net surplus in Statement of Profit and Loss
TOTAL
Secured borrowings
Indian rupee term loan from banks [Refer Note (a) below]
Unsecured term loans from banks
External commercial borrowings in foreign currency [Refer Note (b) below]
Foreign currency term loan [Refer Note (c) below]
Unsecured term loans
From other parties [Refer Note (d) below]
TOTAL
5. LONG-TERM BORROWINGS
As at 31.03.2012
-
(9,863.35)
5,638.68
(4,224.67)
74,046.53
26,405.24
2,764.71
921.57
598.01
-
5,260.00
6.98
-
9,551.27
90,900.50
167,651.35
534.74
56,272.15
58,829.98
99.65
115,736.52
As at 31.03.2013
(4,224.67)
(3,556.08)
1,977.02
(5,803.73)
90,900.50
22,743.89
2,764.71
921.57
605.13
11.79
3,253.00
8.24
84.66
7,649.10
105,995.29
180,642.84
919.11
59,828.23
62,547.70
-
123,295.04
(` lacs)
(a) A group Company viz. NBHC, has taken a secured Indian rupee loan from bank, during the financial year 2011-2012 which carries fixed interest @ 10.25% p.a. The principal amount of loan is payable in 84 equal monthly installments of ` 7.11 lacs each [w.e.f 30 April, 2012]. Interest is to be serviced separately as and when applied. In case of term loan in lieu of subsidy: Bullet payment to be made on the date coinciding with date of final instalment for original term loan. The loan is secured Primarily; exclusive first charge on all the assets including land, building and other assets, created out of the term loan. Collateral: extension of charge on the assets of NBHC
stcreated out of other term loans. Installments falling due in respect of this loan upto 31 March, 2014 have been group under "current maturities of secured long-term borrowings" (Refer Note 11). [During the year, NBHC has taken an additional Indian rupee loan from
stbank on 31 October, 2012 and carries interest @ 10.25% p.a. fixed for the tenor of loan. The principal amount of loan is payable in 78 stequal monthly installments of ` 5.65 lacs w.e.f. 31 January, 2013.]
(b) During the previous year, the Parent Company had availed three foreign currency term loans viz. external commercial borrowings aggregating USD 110 million. Loans of USD 35 million and USD 50 million are repayable in three annual installments (first two installments of 33.33% each and last installment of 33.34%) star ting from April 2015 and June 2015 respectively. These loans carry interest at the rate of applicable quar terly LIBOR plus margin of 3.5% p.a. Balance loan of USD 25 million availed, is repayable in nine semi-annual installments (first eight installments of 11% each and last installment of 12%) star ting from December 2014. This loan carries interest at the rate of applicable quarterly LIBOR plus margin of 5% p.a.
(c) During the previous year, a group Company viz. FTGIPL, had availed foreign currency term loan of USD 115 million. This loan carries interest at the rate of applicable quarterly LIBOR plus margin of 3.2% p.a. The bank interests are payable on a quarterly basis in arrears while the capital repayment will be effected in three installments (first two installments of 33.33% each and last installment of 33.34%) on April 2015, October 2015 and June 2016 respectively.
th

129
6,194.50
6,194.50
11,494.04
11,494.04
Other than acceptances
TOTAL
As at 31.03.2013 As at 31.03.2012
Notesstforming part of the consolidated financial statements for the year ended 31 March, 2013
(a) Deferred tax liability
Depreciation
Unamortised ancillary borrowing costs
(b) Deferred tax asset
Provision for doubtful trade receivables, advances etc.
Provision for compensated absences and gratuity
Tax effect on withholding Tax on ZCCB Premium adjusted against securities premium
account to be claimed in tax
Net deferred tax liability
Income received in advance/unearned revenue
Members liabilities
Deposits from settlement bank
Other Advances
TOTAL
Provision for employee benefits
Compensated absences
Others
Other provisions
Provision for estimated loss on interest rate swap contracts
TOTAL
Secured borrowings
Short term loans from banks
Cash credit from banks
TOTAL
TOTAL
7. OTHER LONG-TERM LIABILITIES
8. LONG-TERM PROVISIONS
9. SHORT-TERM BORROWINGS
2,894.94
464.11
3,359.05
382.25
289.65
-
671.90
2,687.15
245.40
682.49
50.00
29.18
1,007.07
725.01
95.98
820.99
1,599.86
2,420.85
18,447.01
4,468.31
22,915.32
2,093.18
576.71
2,669.89
252.68
323.00
275.11
850.79
1,819.10
41.09
573.69
-
-
614.78
683.73
55.67
739.40
950.99
1,690.39
7,807.92
1,057.96
8,865.88
(` lacs)
(d) A group Company viz. ICX, had availed a loan which was unsecured, interest free and had no fixed terms of repayment. The loan was subordinated in favour of all other creditors and other shareholder's claims and was only repayable once cer tain conditions in the settlement agreement are met.
A group Company viz. NSEL,has taken short term buyers Credit from a bank which carries interest at 1.14% for a tenure of 90 days. Short term loans and cash credit from a bank is secured against Fixed Deposits with banks and stocks. Warehouse receipt loan from a bank has been obtained against pledge of warehouse receipts of agri-stock and produce.
A group Company viz. NBHC, has taken shor t term buyers credit and cash credit facilities also shor t term loan from various banks which carries interest rate between 9.50% - 11.25%, these loans are for the tenor between 60-270 days. Shor t term loans and cash credit facilities are secured by-Pari-passu charge on the current assets of NBHC.
6. DEFERRED TAX LIABILITIES (NET)
10. TRADE PAYABLES
5 FINANCIALSConsolidated

Financial Technologies (India) Ltd. | ANNUAL REPORT 2012-13
130
stforming part of the consolidated financial statements for the year ended 31 March, 2013
Notes
85.43
314.74
3,752.55
71.06
821.96
433.52
1,577.87
46,948.48
64.66
606.73
4,064.95
277.00
59,018.95
722.39
235.58
957.97
285.49
1,071.07
1,356.56
2,314.53
As at 31.03.2013
153.27
368.50
7,567.41
78.09
1,605.78
94.07
3,369.89
87,359.56
-
2,834.73
14,611.47
238.60
118,281.37
596.11
345.06
941.17
1,369.29
1,078.19
2,447.48
3,388.65
As at 31.03.2012
Current maturities of secured long-term borrowings [Refer Note 5(a)]
Interest accrued but not due on borrowings
Income received in advance/unearned revenue
Unclaimed dividend*
Other payables
Statutory remittances
Payables on purchase of fixed assets
Payable to employees and Contractual obligations
Members liabilities
Settlement guarantee fund [Refer Note 37(a)]
Security deposits
Advances from customers
Others
TOTAL*No amount due and outstanding to be credited to Investor Education and Protection Fund
Provision for employee benefits
Compensated absences
Gratuity (Refer Note 49)
Other provisions
For taxation (net of advance tax there against)
Proposed dividend (including tax)
TOTAL
12. SHORT-TERM PROVISIONS
(` lacs)
11. OTHER CURRENT LIABILITIES

131
Upt
o
31.
03.2
012
For
the
Y
ear
Oth
er
Adju
stm
ents
[R
efer
fo
otno
te (i
i)]
Del
etio
ns/
Adj
ustm
ents
U
pto
31.
03.2
013
As
at
31.
03.2
013
As
at
31.
03.2
012
13.
FIX
ED A
SS
ETS
5,20
2.05
(5,2
02.0
5)
772.
23
(650
.21)
29,6
65.4
7
(25,
473.
61)
461.
58
(416
.74)
1,15
5.63
(1,9
18.7
5)
6,65
4.52
(4,6
98.7
4)
4,99
9.09
(3,9
05.2
8)
513.
75
(407
.79)
49,4
24.3
2 -
18.0
2
(20.
02)
4.74
(4.7
4)
816.
16
(1,1
66.1
3)
838.
92
50,2
63.2
4
5,20
2.05
(5,2
02.0
5)
332.
76
(772
.23)
29,5
03.0
2
(29,
665.
47)
271.
70
(461
.58)
3,55
0.44
(1,1
55.6
3)
6,83
5.26
(6,6
54.5
2)
4,65
4.15
(4,9
99.0
9)
642.
54
(513
.75)
50,9
91.9
2
(49,
424.
32)
15.4
7
(18.
02)
4.74
(4.7
4)
282.
44
(816
.16)
302.
65
(838
.92)
51,2
94.5
7
-
(-)
3.30
(44.
75)
1,14
6.01
(649
.72)
868.
34
(983
.47)
2,55
0.98
(1,8
21.2
2)
2,69
2.53
(2,0
61.4
3)
1,28
4.27
(782
.04)
192.
72
(159
.58)
8,73
8.15
(6,5
02.2
1)
17.0
6
(13.
88)
9.59
(9.5
9)
2,71
6.17
(2,2
20.8
0)
2,74
2.82
(2,2
44.2
7)
-
(-)
50.4
6 (-) -
(-)
395.
00
(12.
00)
155.
39
(150
.52)
26.5
1
(104
.00)
12.7
4
(112
.98)
35.5
4
(17.
15)
675.
64
(396
.65) -
(0.0
1) -
(-)
67.4
7
(4.4
8)
67.4
7
(4.4
9)
-
(-) -
(-) -
(-)
51.3
3
(69.
00)
75.0
0
(123
.92)
32.6
4
(68.
42)
25.5
9
(51.
91)
0.74
(0.9
9)
185.
30
(314
.24) -
(-) -
(-)
-154
.54
(107
.73)
-154
.54
(107
.73)
-
(-)
9.01
(8.2
1)
496.
29
(445
.25)
228.
54
(225
.84)
810.
15
(622
.41)
624.
97
(713
.83)
489.
38
(414
.60)
67.9
4
(60.
97)
2,72
6.28
(2,4
91.1
1)
3.18
(3.1
1) -
(-)
408.
30
(549
.77)
411.
48
(552
.88)
-
(-)
44.7
5
(36.
54)
649.
72
(204
.47)
983.
47
(700
.63)
1,82
1.22
(1,2
25.4
1)
2,06
1.43
(1,3
83.1
8)*
782.
04
(428
.51)
*
159.
58
(114
.77)
6,50
2.21
(4,0
93.5
1)
13.8
8
(10.
78)
9.59
(9.5
9)
2,22
0.80
(1,5
67.7
8)
2,24
4.27
(1,5
88.1
5)
DEP
REC
IATI
ON
/ A
MO
RTI
SAT
ION
NET
BLO
CK
*In
Pre
viou
s Ye
ar,
open
ing
prov
isio
n of
` 1
04.6
1 la
cs,
was
adj
uste
d ag
ains
t lo
ss o
n di
spos
al/w
rite
off
of f
ixed
ass
ets
(net
).#B
uild
ing
incl
udes
` 8
43.1
8 la
cs (
Pre
viou
s Ye
ar `
843
.18
lacs
) on
lon
g te
rm l
ease
of
95 y
ears
.
**In
clud
es i
mpa
irm
ent
of f
ixed
ass
ets `
47.
28 l
acs
[Pre
viou
s Ye
ar N
il].
Not
es:
(i)
Equi
pmen
t in
clud
es "
offic
e eq
uipm
ent,
netw
orki
ng e
quip
men
t, fu
mig
atio
n an
d la
bora
tory
equ
ipm
ent"
.
(ii)
Oth
er A
djus
tmen
ts"
are
adju
stm
ents
on
acco
unt
of e
xcha
nge
rate
flu
ctua
tions
on
tran
slat
ion
of F
orei
gn s
ubsi
diar
ies'
and
joi
nt v
entu
re's
fix
ed a
sset
s in
to R
upee
s in
case
of
non-
inte
gral
ope
ratio
ns a
s pe
r A
S 1
1.
(iii)
Pre
viou
s ye
ar f
igur
es a
re g
iven
in
brac
kets
.
Oth
er
Adju
stm
ents
[R
efer
fo
otno
te (i
i)]
Del
etio
n/
Adj
ustm
ents
Cos
t as
at
01.
04.2
012
GR
OS
S B
LOC
K
Add
ition
s d
urin
g th
e ye
ar
Effe
ct o
f Fo
reig
n cu
rren
cy
diffe
renc
es
[Ref
er N
ote
2 M
(i)]
Pa
rtic
ular
s
(A)
Tang
ible
ass
ets
Free
hold
Lan
d
Leas
ehol
d La
nd
#B
uild
ings
Impr
ovem
ent t
o Le
aseh
old
Prem
ises
Com
pute
r H
ardw
are*
*
Equ
ipm
ent
[Ref
er f
ootn
ote
(i)]
Furn
iture
and
Fix
ture
s
Vehi
cles
TOTA
L
Pre
viou
s Ye
ar
(B)
Inta
ngib
le a
sset
s
(oth
er t
han
inte
rnal
ly g
ener
ated
)
Trad
e M
ark
Tech
nica
l K
now
-how
Com
pute
r S
oftw
are
TOTA
L
Pre
viou
s Ye
ar
TOTA
L
5,20
2.05
(5,2
02.0
5)
336.
06
(816
.98)
30,6
49.0
3
(30,
315.
19)
1,14
0.04
(1,4
45.0
5)
6,10
1.42
(2,9
76.8
5)
9,52
7.79
(8,7
15.9
5)
5,93
8.42
(5,7
81.1
3)
835.
26
(673
.33)
59,7
30.0
7
(55,
926.
53)
32.5
3
(31.
90)
14.3
3
(14.
33)
2,99
8.61
(3,0
36.9
6)
3,04
5.47
(3,0
83.1
9)
-
(-)
816.
98 (-) -
(-)
415.
65
(13.
01)
267.
33
(466
.78)
162.
70
(199
.52)
40.4
8
(126
.30)
85.3
3
(60.
25)
1,78
8.47
(856
.86) -
(0.0
5) -
(-)
322.
44
(9.3
7)
322.
44
(9.4
2)
-
(-) -
(-) -
(-)
53.8
3
(78.
04)
115.
00
(238
.48)
83.2
0
(155
.75)
52.6
1
(114
.34)
1.88
(2.8
5)
306.
52
(589
.46) -
(-) -
(-)
118.
94
(145
.91)
118.
94
(145
.91)
-
(-) -
(130
.23) -
(2,6
70.0
3) -
(-) -
(-) -
(-) -
(-) -
(-) -
(2,8
00.2
6) -
(-) -
(-) -
(-) -
(-)
- (-)
336
.06
(-)
333
.84
(1,
967.
08)
56.
81
(26
2.65
)
3,2
76.9
0
(60
.99)
891
.34
(2,
677.
80)
145
.16
(1,
459.
30)
245
.38
(20
8.17
)
5,2
85.4
9
(6,
635.
99)
0.6
3
(1.
15) -
(-)
165
.15
(16
6.51
)
165
.78
(16
7.66
)
5,2
02.0
5
(5,
202.
05)
816
.98
(68
6.75
)
30,
315.
19
(25
,678
.08)
1,4
45.0
5
(1,
117.
37)
2,9
76.8
5
(3,
144.
16)
8,7
15.9
5
(6,
081.
92)
5,7
81.1
3
(4,
333.
79)
673
.33
(52
2.56
)
55,
926.
53
(46
,766
.68)
31.
90
(30
.80)
14.
33
(14
.33)
3,0
36.9
6
(2,
733.
91)
3,0
83.1
9
(2,
779.
04)
Cos
t as
at
31.
03.2
013
(` l
acs)

Financial Technologies (India) Ltd. | ANNUAL REPORT 2012-13
132
stforming part of the consolidated financial statements for the year ended 31 March, 2013
Notes
Long-term Investments (fully paid up, valued at cost)
A) In equity shares of associate companies (Refer Note 40)
Quoted
Unquoted
B) In equity shares of other Companies
Quoted
Unquoted
C) In warrants (Unquoted) [Refer Note 39 (b)]
D) In Government and Trust Securities (Unquoted)
[Includes 5.91 lacs (Previous Year 4.95 lacs) pledged with APMC and sales tax authority]
E) In Debentures and Bonds:
Quoted
Unquoted
F) In units of mutual funds (Unquoted)
TOTAL
Aggregate amount of quoted investments
Aggregate market value of quoted investments
Aggregate amount of unquoted investments
Unsecured, considered good
Capital advances
Security deposits
Loans and advances to employees
Loans related to NBFC activities
Prepaid expenses
Balances with government authorities
Advances for supply of goods and services
Taxes paid less provision there against including fringe benefit tax (other than deferred tax)
MAT credit entitlement
TOTAL
Unamortised ancillary borrowing costs
Interest accrued on bank deposits
Interest accrued on investments
Deposits with banks [Includes ` 35.81 lacs under lien with banks against bank guarantees
(Previous year ` 0.98 lacs)]
TOTAL
15. LONG-TERM LOANS AND ADVANCES
16. OTHER NON-CURRENT ASSETS
As at 31.03.2013 As at 31.03.2012
30,309.04
4,788.60
35,097.64
1.42
1,469.91
1,471.33
5,624.60
102.91
6,000.00
1,500.00
7,500.00
9,842.74
59,639.22
36,310.46
116,531.82
23,328.76
4,223.45
319.64
325.81
2,347.01
402.68
56.58
21.76
6,831.38
8,228.31
22,756.62
1,650.45
29.35
0.67
554.01
2,234.48
(` lacs)
28,076.49
4,132.73
32,209.22
1.42
1,782.06
1,783.48
5,624.60
101.95
2,005.20
1,500.00
3,505.20
9,001.51
52,225.96
30,083.11
170,371.91
22,142.85
1,524.38
422.45
656.10
2,278.91
140.35
35.43
64.83
12,807.71
8,976.50
26,906.66
2,901.38
38.80
0.64
591.35
3,532.17
14. NON - CURRENT INVESTMENTS

133
450.05
10,497.27
10,947.32
-
58.44
2,678.55
2,736.99
0.25
97,939.65
100,676.89
111,624.21
58.44
59.23
111,565.77
123.56
13.79
361.38
16.82
18,098.06
18,490.05
1,540.66
1,259.23
5,705.51
1.18
8,506.58
(1,260.41)
7,246.17
6.64
245.31
16,676.27
21,762.29
2,418.06
A) Current portion of long-term investments (at cost):
In Debentures and Bonds (Unquoted)
In units of mutual funds (Unquoted)
Total current portion of long - term investments (A)
B) Other current investments (fully paid up, valued at lower of cost and fair value)
In equity shares of associate companies (Refer Note 40 and 52)
Unquoted
In equity shares of other Companies
Quoted
Unquoted
In Government Securities (Unquoted) (pledged with APMC)
In units of mutual funds (Unquoted)
Total other current investments (B)
TOTAL
Aggregate amount of quoted investments
Aggregate market value of quoted investments
Aggregate amount of unquoted investments
Aggregate provision for diminution (write down) in the value of other current investments
(Valued at lower of cost and net realisable value)
Packing materials
Stores and spares
Finished goods - traded goods
Finished goods - procurement services
TOTAL
Unsecured, considered good unless stated otherwise
(a) Trade receivables outstanding for a period exceeding six months from the date they are
due for payment
(i) Considered good
(ii) Considered doubtful
(b) Other trade receivables
(i) Considered good
(ii) Considered doubtful
Less: Provision for doubtful receivables
TOTAL
Balances that meet the definition of Cash and Cash equivalents as per AS 3 -
Cash Flow Statements
Cash on hand
Cheques on hand
Balances with banks
In current accounts
In EEFC accounts
In deposit accounts with original maturity of less than 3 months
18. INVENTORIES
19. TRADE RECEIVABLES
20. Cash and cash equivalents
2,455.20
40,663.10
43,118.30
1,405.46
87.60
3,049.74
3,137.34
0.75
89,350.68
93,894.23
137,012.53
87.60
117.07
136,924.93
92.84
-
271.54
11.81
37,737.94
38,021.29
3,988.83
1,622.47
38,110.67
-
43,721.97
(1,622.47)
42,099.50
1.64
199.66
17,414.79
56.51
544.21
(` lacs)
Notesstforming part of the consolidated financial statements for the year ended 31 March, 2013
As at 31.03.2013 As at 31.03.2012 17. CURRENT INVESTMENTS
5 FINANCIALSConsolidated

Financial Technologies (India) Ltd. | ANNUAL REPORT 2012-13
134
29.04
9,775.93
50,913.54
51.09
14,759.65
1,024.43
71.06
15,906.23
66,819.77
1,182.21
1.61
(1.61)
1,182.21
208.33
4.54
(4.54)
208.33
944.81
1,338.66
1,556.87
1,516.86
98.20
3,374.06
434.24
(434.24)
3,374.06
10,220.00
306.07
1,325.92
275.71
168.78
199.25
610.25
14,476.76
404.82
(404.82)
14,476.76
-
-
17,362.74
In earmarked accounts
In current accounts
In deposit accounts with original maturity of less than 3 months [Includes 8,368.75 lacs
(Previous Year: Nil) under lien with bank against bank guarantees and cash credit facilities]
Other Bank Balances
In deposit accounts with original maturity of more than 12 months
[Includes ` 197.55 lacs (Previous Year: ` 4.00 lacs) under lien with bank against
bank guarantees and cash credit facilities]
In deposit accounts with original maturity of more than 3 months but less than 12 months
[Includes ` 15,518.97 lacs (Previous Year: ` 1,299.75 lacs) under lien with bank
against bank guarantees and cash credit facilities]
Deposits from members relating to Settlement Guarantee Fund (Refer Note 37)
In earmarked accounts
Unpaid dividend accounts
TOTAL
Unsecured, considered good unless stated otherwise
Security deposits
Considered good
Considered doubtful
Less: Provision for doubtful deposits
Loans and advances to employees
Considered good
Considered doubtful
Less: Provision for doubtful loans and advances
Loans related to NBFC activities
Prepaid expenses
Balances with government authorities
Taxes paid less provision there against including fringe benefit tax (other than deferred tax)
MAT credit entitlement
Advances for supply of goods and services
Considered good
Considered doubtful
Less: Provision for doubtful advances
TOTAL
Unbilled revenue
Unamortised ancillary borrowing costs
Interest accrued on bank deposits
Interest accrued on investments
Interest receivable on income-tax refund
Receivable on cancellation of forward exchange contracts
Contractually reimbursable expenses (Refer Note 35)
Considered good
Considered doubtful
Less: Provision for doubtful loans and advances
Rent receivable
Other receivables
TOTAL
21. SHORT-TERM LOANS AND ADVANCES
22. OTHER CURRENT ASSETS
33.99
10,025.65
28,276.45
4,044.51
30,845.23
1,051.40
78.09
36,019.23
64,295.68
1,103.76
15.25
(15.25)
1,103.76
103.84
19.22
(19.22)
103.84
1,085.33
454.33
1,182.61
1,760.04
83.02
5,790.92
-
-
5,790.92
11,563.85
693.33
1,366.69
877.07
290.68
0.39
-
33,610.99
850.41
(850.41)
33,610.99
134.36
1,391.65
38,365.16
(` lacs)
stforming part of the consolidated financial statements for the year ended 31 March, 2013
Notes
As at 31.03.2013 As at 31.03.2012

135
8,088.45
16,382.77
10,810.25
851.94
1,977.98
121.98
1,054.61
2,626.02
6,518.69
284.39
81.77
366.16
542.70
261.93
519.89
50,123.37
1,576.98
320.49
202.28
83.63
2,183.38
6.64
4,707.40
4,714.04
1,653.31
19,660.61
275.60
21,589.52
96.70
12.64
-
-
860.29
3,266.05
584.04
33,306.66
251.80
38.68
290.48
11.33
16.82
(5.49)
Income from software products (IPR based license)
Income from software services (Project based)
Storage and allied services
Income from procurement services (Refer Note 36)
Membership admission fees
Annual subscription fees
Delivery fees
Transaction fees
Service charges [Refer Note 2(K)(h)]
Sale of traded goods
Computer hardware
Computer software
Other operating revenues
Business support services
Income relating to NBFC activities
Others
TOTAL
Interest income on
On bank deposits
On long-term investments
On income-tax refund
Others
Dividend income from
Long-term investments
Current investments
Profit on sale of investments (net)
Long-term investments
In associates (Refer Note 33)
Current investments
Profit from derivatives on commodity futures/hedging (net)
Reversal of write down in value of current investments (net)
Provision for expenses no longer required written back
Profit on sale of fixed assets
Rental income from operating leases (Refer Note 32 b)
Exchange rate fluctuations (net)
Miscellaneous Income
TOTAL
Computer hardware
Computer software
TOTAL
Inventories at the beginning of the year-traded goods
Inventories at the end of the year-traded goods
TOTAL
24. OTHER INCOME
25. PURCHASES OF STOCK-IN-TRADE
26. CHANGES IN INVENTORY OF STOCK-IN-TRADE
6,410.95
27,328.35
13,085.60
1,859.45
847.07
199.50
106.31
3,614.56
20,485.86
59.32
32.37
91.69
509.17
338.38
316.12
75,193.01
2,208.88
458.02
646.02
4,045.44
7,358.36
4.36
4,894.73
4,899.09
53.51
-
4,719.32
4,772.83
-
35.44
377.28
422.02
891.83
-
1,649.43
20,406.28
39.24
17.41
56.65
16.82
11.81
5.01
(` lacs)
Notesstforming part of the consolidated financial statements for the year ended 31 March, 2013
Year Ended 31.03.2013
Year Ended 31.03.2012
23. REVENUE FROM OPERATIONS
5 FINANCIALSConsolidated

Financial Technologies (India) Ltd. | ANNUAL REPORT 2012-13
136
23,020.60
1,109.86
556.55
24,687.01
4,559.48
0.46
950.99
1,180.66
26.18
6,717.77
2,491.11
552.88
120.05
3,164.04
564.13
6,588.62
18.60
356.09
292.48
260.49
877.60
1,078.97
2,236.40
819.52
612.76
3,190.22
399.84
173.28
375.35
(104.61)
270.74
-
804.62
614.66
446.80
(63.89)
382.91
747.47
746.07
805.21
-
966.25
3,260.10
26,067.03
Salaries and wages
Contribution to provident fund and other funds (Refer Note 49)
Staff welfare expenses
TOTAL
Interest expense on:
Borrowings
Delayed payment of tax
Other borrowing costs:
Provision for estimated loss on interest rate swap contracts
Amortisation of ancillary borrowing costs
Others
TOTAL
Depreciation of tangible assets
Amortisation of intangible assets
Amortisation of consumables
TOTAL
Electricity
Rent [Refer Note 32(a)]
Repairs and maintenance-buildings
Repairs and maintenance-others
Insurance
Rates and taxes, excluding taxes on income
Travelling and conveyance
Communication expenses
Legal and professional charges (Refer Note 47)
Software development expenses and license fees
Stores, spares, consumables and packing materials
Advertisement and Business promotion/development expenses
Office expenses
Brokerage and commission charges
Loss on disposal/write off of fixed assets (net)
Less: Provision for impairment held
Impairment of fixed assets
Data feed expenses
Security charges
Bad trade receivables/advances written off
Less: Provision held
Provision for doubtful trade receivables/advances
Labour charges
Software support charges
Exchange rate fluctuations (net)
Donation
Miscellaneous expenses
TOTAL
28. FINANCE COSTS
29. DEPRECIATION AND AMORTISATION EXPENSE
30. OTHER EXPENSES
(` lacs)
23,373.22
1,070.95
564.35
25,008.52
7,574.20
35.81
648.87
1,437.84
103.11
9,799.83
2,726.28
411.48
130.39
3,268.15
638.33
6,957.70
41.16
455.91
389.80
340.44
939.63
997.09
2,209.57
1,175.93
659.35
3,374.13
454.94
333.18
27.84
-
27.84
47.28
1,122.87
570.97
809.79
(51.72)
758.07
1,343.44
1,113.19
912.81
615.84
856.00
4,194.76
30,530.23
stforming part of the consolidated financial statements for the year ended 31 March, 2013
Notes
Year Ended 31.03.2013
Year Ended 31.03.2012
27. EMPLOYEE BENEFITS EXPENSE

137
2,707.87
515.17
345.96
1,202.60
21.74
44.07
295.84
402.31
1 Contingent liabilities:
(a) Claims not acknowledged as debt
(i) Income tax demands against which the Group is in appeal [(including adjustable against
Securities Premium account 3,869.18 lacs (Previous Year ` 1,941.03 lacs)]
(ii) MVAT, Service tax and excise dues contested by the Parent Company.
(iii) Others
(b) Corporate guarantees given by subsidiaries
(c) Share of contingent liabilities of associates:
(i) Claims not acknowledged as debts
(ii) Income tax demands against which the associate is in appeal including interest thereon
(iii) Corporate guarantees given
Future cash outflows in respect of the above matters are determinable only on receipt
of judgements/decisions pending at various forums/authorities.
2 Capital and other commitments:
(i) Estimated amount of contracts to be executed on capital account and not
provided for (net of advances)
(ii) For commitments relating to lease arrangements, see Note 32(a) and for derivative
contracts, see Note 45(a).
Current Year Previous Year
5,352.61
551.56
*568.00
**4,463.28
10.47
78.89
94.90
12,150.49
*In a Group Company viz, NBHC has lodged eight insurance claims for ` 383.00 lacs under its fidelity, burglary and STFI policies. In all
these cases NBHC has taken necessary steps and believes that the claims are fully covered under the said policies. Six cases have been
filed against NBHC for claim of ` 185.00 lacs. In all these cases, NBHC has sufficient legal recourse to safeguard its interest.
**In a Group Company viz, NSEL has placed Fixed Deposits Receipts in the form of collateral for third party and the amount above is to
the extent, not covered by the securities available with NSEL. The Company viz NSEL, has acted as a collateral provider for
` 5,444.16 lacs in case of third party against which it has received a sum of ` 2,228.00 lacs as margin/security and the balance amount
is considered as contingent liability.
32. OPERATING LEASES
(a) The Group has entered into various cancellable and non cancellable operating lease agreements as a lessee for various premises
having lease term ranging from 12 months to 60 months. The lease rentals recognised as an expense in the statement of profit
and loss during the year are included in note 30 under the head rent. The future minimum lease payments under non-cancellable
operating lease are as follows:
Current YearParticulars Previous Year
2,278.50
1,590.64
1,756.11
112.46
4.58
-
2,338.34
2,183.88
2,237.81
170.83
6.31
-
(` lacs)
Lease Expenditure
Lease rentals (Refer Note 30 'Rent')
Obligations on non-cancellable leases
Not later than one year
Later than one year and not later than five years
Later than five years
Sublease Income (included in Note 23 'Storage and allied services')
Total Receivables on non-cancellable subleases
(` lacs)
Notesstforming part of the consolidated financial statements for the year ended 31 March, 2013
31. CONTINGENT LIABILITIES AND COMMITMENTS (TO THE EXTENT NOT PROVIDED FOR):
5 FINANCIALSConsolidated

Financial Technologies (India) Ltd. | ANNUAL REPORT 2012-13
138
(b) The Group has entered into operating lease agreements as a lessor for various premises having average lease term ranging from 22
months to 36 months. The lease rentals recognised as income in the statement of profit and loss during the year are included in note 24
under the head rental income from operating leases. The future minimum lease payments under non-cancellable operating lease are as
follows:
The Parent Company, as a part of its core business strategy, promotes and invests in new ventures that utilise its technological capabilities and
domain expertise towards creating world class enterprises. The investment in each such venture is assessed for its risks and is limited to a
pre-determined level and will generate returns after the ventures start ramping-up operations in varied time frame depending upon the line of
business. The Parent Company, as part of its non-linear business model, will endeavour to unlock value by broadening the investor base of its
ventures.
During the previous year, in terms of the compliance of FMC Equity Structure Guidelines dated July 29, 2009, the Company offered under “offer
for sale”, in initial public offer of equity by Multi Commodity Exchange of India Limited (MCX), an associate company, part of its investments
aggregating 2,643,916 equity shares of ` 10/- each of MCX at a price of ` 1,032 per equity share of ` 10/- each. The resultant profit of
` 19,660.61 lacs (net of directly attributable expenses of ` 2,091.58 lacs) is grouped under ‘Profit on sale of investments’ in Other income
(Refer Note 24). Subsequent to disinvestments, the Parent Company is holding 26% in the equity share capital of MCX.
(a) During the financial year 2011-12, Remuneration and Compensation Committee (“Committee”) of the Parent Company had granted 900,000
Stock Options (“Options”) each under the Employee Stock Option Scheme – 2009 and 2010 totaling to 1,800,000 options at a price of
` 770/- to the eligible employees/Directors of the parent Company (“Employees”) in terms of SEBI (Employee Stock Option Scheme and
Employee Stock Purchase Scheme) Guidelines, 1999 as amended from time to time and as approved by the Shareholders at the Annual th thGeneral Meetings of the Parent Company held on 25 September 2009 and 29 September 2010 respectively.
During the year under review, Remuneration and Compensation Committee (“Committee”) of the Parent Company at their meeting held on th5 March, 2013 has considered and approved the total grant of 186,630 Stock Options (“Options”) under the Employee Stock Option
Schemes ("scheme") of which 74,350 options are granted under scheme-2009 and 112,280 options under scheme-2010 at a price of
` 807.70 to the eligible employees/Directors of the Parent company (“Employees”) in terms of SEBI (Employee Stock Option Scheme and
Employee Stock Purchase Scheme) Guidelines, 1999 as amended from time to time.
Details of the Option granted under stock option plan are as under:
33.
34. STOCK BASED COMPENSATION:
Current Year Previous Year
Lease Income
Lease rentals
(Refer Note 24 ‘Rental income from operating leases’)
Receivables on non-cancellable leases
Not later than one year
Later than one year and not later than five years
Later than five years
Fixed Assets
Gross Carrying amount of leased assets
Accumulated depreciation
Depreciation recognised
891.83
621.75
178.38
-
11,924.57
470.84
194.37
860.29
887.00
876.17
-
11,924.57
276.47
194.37
Particulars
(` lacs)
Grant Date
770.00
770.00
770.00
770.00
770.00
770.00
807.70
807.70
807.70
807.70
807.70
807.70
14.03.2012 - 13.03.2013
14.03.2012 - 13.03.2014
14.03.2012 - 13.03.2015
14.03.2012 - 13.03.2013
14.03.2012 - 13.03.2014
14.03.2012 - 13.03.2015
05.03.2013 - 04.03.2014
05.03.2013 - 04.03.2015
05.03.2013 - 04.03.2016
05.03.2013 - 04.03.2014
05.03.2013 - 04.03.2015
05.03.2013 - 04.03.2016
Schemes
900,000
900,000
74,350
112,280
March 14, 2012
March 14, 2012
March 05, 2013
March 05, 2013
ESOP 2009
ESOP 2010
ESOP 2009
(reissue of lapsed / cancelled options)
ESOP 2010
(reissue of lapsed / cancelled options)
No. of Options Granted
Exercise Price in ` Vesting Period
stforming part of the consolidated financial statements for the year ended 31 March, 2013
Notes

139
Each option entitles the holder to exercise the right to apply for and seek allotment of one equity share of 2/- each. The Intrinsic value of
each option is nil, since the options were granted at the market price of the equity shares on the date of grant. The options shall vest in st nd rdthree installments of 20%, 30% and 50% at the end of 1 year, 2 year and 3 year respectively from the date of the grant and can be
exercised within three months from vesting of options or as may be determined by the Remuneration & Compensation Committee. The
tenure of the Schemes is for maximum period of five years from the date of grant of options.
The particulars of the options granted, lapsed and cancelled under aforementioned scheme are as follows:
(b) The Group has followed the intrinsic value-based method of accounting for stock option. Had the compensation cost of the Parent
Company's ‘stock based compensation plans been determined using the fair value approach, the Group’s net profit for the year would have
been lower by ` 2,006.40 lacs (Previous Year lower by ` 114.22 lacs) and earnings per share would have been lower as indicated below:
The weighted average fair value of each option on the date of grant/reissue is ` 249.05 / ` 238.67 under ESOP Scheme - 2009 and 2010
using the Black-Scholes Option Pricing Formula, considering the following parameters:
`
ESOP 2009 (Nos.) ESOP 2010 (Nos.)
Options outstanding as at the beginning of the year
Options granted during the year
Options exercised during the year
Options lapsed / forfeited / cancelled during the year
Options outstanding as at the year-end
Options exercisable as at the year-end
900,000
(-)
74,350
(900,000)
-
(-)
81,850
(-)
892,500
(900,000)
163,630
(-)
900,000
(-)
1,12,280
(900,000)
-
(-)
131,325
(-)
880,955
(900,000)
153,735
(-)
Particulars
42.18% to 45.94%
1.13 years - 3.13 years
0.68%
8.13% to 8.18%
38.57% to 39.27%
1.13 years - 3.13 years
0.74%
7.80% to 7.83%
PARENT COMPANY
ESOP 2009 & ESOP 2010
Options granted during F.Y. 2011-12
(i) Expected volatility
(ii) Option life
(iii) Dividend yield
(iv) Risk-free interest rate
(v) To allow for the effects of early exercise, it is assumed that the employees would exercise the options after vesting date.
(vi) Expected volatility is based on the historical volatility of the share prices over the period that is commensurate with the expected
term of the option.
Particulars
Options granted during F.Y. 2012-13
Current YearParticulars Previous Year
Net profit for the year (` lacs)
Less: Adjustment for stock options of associate company
Net profit for the year for Diluted EPS (` lacs)
Net profit for the year (` lacs)
Less: Total stock-based employee compensation expense determined under fair
value based method
Adjusted net profit for basic & diluted EPS
Weighted average no. of shares : Basic
: Diluted
Basic and diluted earnings per share (face value ` 2 /- per share)
- As reported (in `) : Basic
: Diluted
- As adjusted (in `) : Basic
: Diluted
22,743.89
243.35
22,500.54
22,743.89
2,006.40
20,494.14
46,078,537
46,470,444
49.36
48.42
44.48
44.10
26,405.24
-
26,405.24
26,405.24
114.22
26,291.02
46,078,537
46,078,537
57.30
57.30
57.06
57.06
(` lacs)
Notesstforming part of the consolidated financial statements for the year ended 31 March, 2013
5 FINANCIALSConsolidated

Financial Technologies (India) Ltd. | ANNUAL REPORT 2012-13
140
35.
36.
37.
38.
In a Group Company viz. NSEL, has entered into an agreement with National Agricultural Co-operative Marketing Federation of India Limited
(NAFED) to carry out the procurement and processing of cotton activity on their behalf as an agent. All the expenses related to procurement and
processing i.e. ginning, pressing, loading, unloading, transportation, interest on borrowed funds etc. incurred for the procurement and
processing of cotton activity, on behalf of the NAFED, will be reimbursed by NAFED to the company. Amount receivable from NAFED amounted
to ` 70,273.92 lacs towards payment to the farmers as per procurement agreement and ` 5,333.27 lacs towards reimbursement of expenses
incurred for ginning and pressing, labour charges etc. Out of this an amount of ` 47,886.40 lacs has been received and the balance
` 27,720.79 lacs is included under “Other current Assets” as receivable from NAFED. The procurement and processing of cotton activity carried
out by the company, is not in the nature of, trading and manufacturing activity. The risk and rewards to the company are operational,
executional and for the procurement services.
In a Group Company viz. NSEL, Other current assets include an amount of ` 850.41 lacs recoverable from NAFED in connection with
agreement dated December 30, 2008 entered into with NAFED by NSEL. Vide letter dated April 20, 2012 NAFED has agreed for the payment of
this amount. However, out of this amount, an amount of ` 404.82 lacs has been agreed for payment by NAFED subject to the examination and
approval of Department of Agricultural and Cooperative Ministry of Agriculture. Following the prudent accounting policy, a sum of ` 404.82 lacs
was provided for in the books of accounts in financial year 2011-2012 and balance of ` 445.59 lacs has been provided for in the books of
accounts in the current financial year, thereby providing for the whole of the amount recoverable from NAFED.
The Group Companies viz. NBHC and NSEL carry out the activities of procurement and/or processing of commodities on behalf of principals.
The activity yields a guaranteed price on delivery of these procured/processed commodities. Hence, the companies do not have to carry price
fluctuation risk related to market activity and therefore the procurement activity carried out is not in the nature of trading activity and the
processing activity outsourced by the companies to the processors is also not the manufacturing activity of the said companies. The
procurement activity carried out is by the companies own/borrowed funds. The risk and rewards to the companies are operational, executional
and incidental to the activities of procurement.
(a) In a Group Company viz. NSEL, various State Agriculture Produce Market Committee's (APMC’s) while issuing license for establishing
E-market / Private market / spot exchange, had laid down to maintain a Settlement Guarantee Fund ('SGF') to meet exchange obligations but
have not given any guidelines for the constitution of the SGF. In view of such a requirement an amount of ` 64.66 lacs had been
apportioned out of initial margins of the members to SGF A/C and shown under other current liabilities (Refer Note 11) in the financial year
2011-12. In the current year the said amount has been transferred back to initial margins from members account and an appropriation of
an equal amount has been done out of opening balance of Reserves and Surplus of the company. The company has appropriated for
Security Guarantee Fund (SGF) an additional amount of ` 20 lacs for the current financial year 2012-13.
(b) In a Group Company viz. SMX-CCL, the Settlement Guarantee Fund (SGF) is established under the clearing rules of the subsidiary company
SMX-CCL, a Designated Clearing House. The SGF shall be used by SMX-CCL upon occurrence of a Declared Default to ensure daily or a
final settlement as a result of failure of one or more Clearing Members to discharge the clearing members obligations and liabilities in
accordance with these Rules.
The SGF is made up of:
(i) Security deposit placements from Clearing Members to SMX-CCL.
(ii) Insurance cover taken up by SMX-CCL for meeting eventualities arising out of failure of one or more Clearing Members to discharge
the obligations and liabilities.
(iii) Clearing capital contributed by Clearing Members.
(iv) Other amounts as decided by SMX-CCL at its discretion.
The total contribution of USD 1 million [equivalent to ` 543.89 lacs (Pervious year ` 511.56 lacs)] was made by SMX-CCL during the stprevious year 31 March, 2012 and is included in Note 20 under cash and cash equivalents.
(c) In a Group Company viz. GBOT, deposits from members of USD 933,099 [equivalent to ` 507.51 lacs (Previous year ` 512.87 lacs)]
relate to settlement guarantee fund which is refundable to the members and is included in Note 11 under 'Members liabilities'. The bank
balance relating to the same is included in Note 20 under cash and cash equivalents.
In a Group Company viz. SMX, contribution is made towards Fidelity Fund.stFidelity Funds has an initial fund size of SGD 2 million [equivalent to ` 881.44 lacs as at 31 March, 2013 (Previous year ` 828.70 lacs)]. The
assets of the funds are kept separate from all other assets, and are held in trust for the purposes set out in the Securities and Futures Act,
Singapore.
The purposes of Fidelity Funds pursuant to Section 186 of the Securities and Futures Act, Singapore are as follows:
(a) to compensate any person (other than an accredited investor) who has suffered a pecuniary loss from any defalcation committed:
(i) in the course of, or in connection with the trading of a futures contract;
(ii) by a member of an approved exchange or by any agent of such member, and;
(iii) in relation to any money or other property entrusted to or received:
stforming part of the consolidated financial statements for the year ended 31 March, 2013
Notes

141
- by that member or any of its agents or
- by that member or any of its agents as trustee or on behalf of the trustees of that money or property.
(b) to pay the Official assignee or a trustee in bankruptcy within the meaning of the Bankruptcy Act (Cap. 20) if the available assets of a
bankrupt, who is a member of an approved exchange, are insufficient to satisfy any debts arising from trading in futures contracts which
have been proved in the bankruptcy by creditors of a bankrupt member.
(c) to pay a liquidator of a member of an approved exchange which is being wound up if the available assets of a member are insufficient to
satisfy any debts arising from trading in futures contracts which have been proved in the liquidation of a member.
During the previous year, SMX had transferred an amount of SGD 2 million (equivalent to ` 670.15 lacs) as contribution to Fidelity Fund.
(a) The Parent Company and MCX holds 54,330,000 Equity Shares of ` 1/- each in MCX Stock Exchange Limited (MCX-SX) having
aggregating cost of ` 543.30 lacs. As per the approval received from SEBI to MCX-SX, the groups equity holding along with MCX shall not
exceed 5% of the total paid up equity capital of MCX-SX. Considering the time available to adhere to the direction of SEBI as communicated
by MCX-SX, the Company has classified its portion of such investments under Current Investments (Refer Note 17) at this point of time till
both the entities together reduce the percentage of holding to 5% in MCX-SX. The Company intends to hold the remaining shares of
MCX-SX after bringing down the shareholding in MCX-SX to 5% put together with MCX, on a long term basis and accordingly the said
Investments will be reclassified under Non-Current Investments.
(b) Each warrant in MCX-SX entitles the holder to subscribe to one equity share of 1 each of MCX-SX at any time after six months from the
date of issue of warrants. The warrants are also freely transferable by endorsement and delivery. The warrants do not carry voting or
dividend rights.
The particulars of investment in associates as of March 31, 2013 are as follows:
The capital reserve and carrying amount of investment in associates as at March 31, 2013 is as follows:
Previous year figures are given in brackets.
A Group company viz. FTME holds 20% stake in Audit Control and Expertise Global Ltd., Audit Control and Expertise Ltd. and Commodity Risk
Management Technology Pte Ltd. Total carrying cost of such investment included in current investments in equity shares of other companies is
USD 5 million (equivalent to ` 2,718.50 lacs) [Previous Year USD 5 million (equivalent to ` 2,556.92 lacs)]. The shares have an embedded
‘purchaser put option’ exercisable from June 2009 – June 2010. Since the said companies were not able to meet the projections mentioned in
the share purchase agreement, management exercised the put option and called for money paid under share purchase agreement. Pursuant to
erstwhile shareholder viz. Dakin International Ltd.’s failure to repay said amount, management invoked the arbitration clause and filed an
arbitration claim with International Chamber of Commerce, London as per the share purchase agreement. The Arbitrator vide his award dated
April 14, 2011 allowed the Claim of FTME and directed Audit Control and Expertise Global Limited (ACE) and Mr. Andre Soumah, Chairman of
ACE to pay FTME USD 5 million along with legal cost, cost of arbitration and interest. The Arbitrator has also held that once the payment is
received by FTME, FTME shall transfer to ACE the 20% stake in CRM and the ACE Group currently owned by FTME. Pursuant to the award
passed, FTME has initiated proceedings in Switzerland, London and Paris for enforcement of the award. Considering the intention of
Management, to hold temporarily, the same has not been considered for equity method of accounting in Consolidated Financial Statements.
An associate company viz. MCX (in which the Parent Company has 26.00% equity shareholding and is accounted by the Parent Company under
the equity method of accounting) does not treat member’s margins and income thereon as part of Settlement Guarantee Fund ('SGF') as
contemplated under the Forward Market Commission (FMC) guidelines of SGF issued in 2006 and therefore credits the said income (amount
unascertained) to statement of profit and loss. Representations have been made to FMC and a response is awaited.
Goodwill on consolidation includes amount aggregating ` 745.53 lacs (Previous Year ` 745.53 lacs) in respect of certain subsidiaries acquired
in earlier years. These entities are at various stages of executing their business plans and have continuing losses. On an evaluation of business
plans for these entities, the Parent Company expects value of these investments to be unlocked at appropriate time and accordingly believes
there is no impairment of goodwill.
39.
40.
41.
42.
43.
Original Cost Capital ReserveName of the Associates Carrying Amount
Multi Commodity Exchange of India Limited (MCX)
Indian Energy Exchange Ltd. (IEX)
MCX-SX Clearing Corporation Ltd. (MCX-SX CCL)
SME Exchange Ltd. (SME)
-
(-)
1,092.61
(1,092.61)
-
(-)
-
(-)
30,309.04
(28,076.49)
5,544.02
(3,485.10)
645.49
(643.21)
4.54
(4.42)
1,060.77
(1,060.77)
914.03
(914.03)
575.00
(575.00)
4.90
(4.90)
(` lacs)
Notesstforming part of the consolidated financial statements for the year ended 31 March, 2013
5 FINANCIALSConsolidated

44. JOINT VENTURE DISCLOSURE
Name of the Entity : Dubai Gold and Commodities Exchange DMCC (‘DGCX’)
Country of Incorporation : United Arab Emirates
% Holding : 39.11% (Previous Year 39.11%)
Held by the Parent Company 18.58% and FTGIPL 20.53%: (Previous Year 18.58% and 20.53% respectively)
(a) Group’s share of interest in the assets, liabilities, income, expenses, contingent liabilities and commitments with respect to Jointly
Controlled Entity (JCE) (after elimination of the effect of transactions between the Group and JCE) on the basis of financial statements of
the JCE as at and for the year ended March 31, 2013:
The amounts are translated at the year end rate for assets and liabilities and average rate for income and expenses for DGCX.
Particulars ` lacs
I. Assets
1. Fixed Assets
2. Current Assets
(a) Trade receivables
(b) Cash and cash equivalents
(c) Short term loans and advances
(d) Other Current Assets
II. Liabilities
1. Trade payables
2. Other Current Liabilities
3. Provisions
III. Income
1. Admission Fees
2. Transaction Fees
3. Interest Income
4. Other Income
IV. Expenses
1. Employee benefits expense
2. Depreciation and amortisation expense
3. Other expenses
V. Contingent liabilities
VI. Capital and other commitments
Previous year figures are given in brackets.
40.42
(49.31)
24.18
(92.29)
17,033.92
(10,882.22)
213.97
(54.58)
173.89
(86.03)
1,840.55
(1,441.03)
16,130.31
(9,995.89)
508.42
(416.18)
83.43
(187.72)
1,592.99
(609.34)
314.18
(225.70)
46.71
(28.60)
939.86
(933.92)
20.26
(12.84)
994.31
(538.07)
-
(-)
-
(-)
Financial Technologies (India) Ltd. | ANNUAL REPORT 2012-13
142
stforming part of the consolidated financial statements for the year ended 31 March, 2013
Notes

143
(b) The movement in Group's share of post-acquisition reserves (loss) of jointly controlled entity is as follows:
a)
(b) Open Interest in Commodity Futures as at the Balance Sheet date:
(Refer Note 30) includes payments to auditors (net of service tax input credit):
45. DERIVATIVE INSTRUMENTS OUTSTANDING AS AT THE BALANCE SHEET DATE
(
46. EARNINGS PER SHARE IS CALCULATED AS FOLLOWS:
47. LEGAL AND PROFESSIONAL CHARGES
Current Year
Current Year
Particulars
Particulars
Previous Year
Previous Year
Proportionate Reserves and Surplus (loss) as at the beginning of the year
Proportionate deficit in statement of profit and (loss) for the year
Movement in Translation Reserve
Proportionate Reserves and Surplus (loss) as at the end of the year
(a) Net Profit/(Loss) for the year (for basic and diluted EPS)
Less: Adjustment for stock options of associate company
Net profit for the year for Diluted EPS (` lacs)
(b) Weighted average number of equity shares
Basic
Add: Effect of dilutive stock options
Diluted
(c) Basic earnings per share
(d) Diluted earnings per share (`)
(e) Face value ` per share
(5,546.07)
(156.26)
(367.37)
(6,069.70)
22,743.89
243.35
22,500.54
46,078,537
391,907
46,470,444
49.36
48.42
2/-
(4,579.03)
(660.21)
(306.83)
(5,546.07)
26,405.24
-
26,405.24
46,078,537
-
46,078,537
57.30
57.30
2/-
No. of contractsName of Commodity FutureSr. No. No.of Units InvolvedExpiry Date
Copper M
Gold
Gold M
Silver
Silver M
Nickel
Nickel M
Lead Mini
Zinc Mini
45250 kgs
205 kgs
8900 grams
150 kgs
345 kgs
6500 kgs
5200 kgs
23 Mt
24 Mt
1.
2.
3.
4.
6.
7.
8.
9.
10.
30/04/2013
05/04/2013
05/05/2013
04/05/2013
30/04/2013
30/04/2013
30/04/2013
30/04/2013
30/04/2013
181
205
89
5
69
26
52
23
24
Current YearParticulars Previous Year
As auditors - statutory audit
For taxation matters
For other services
Reimbursement of expenses
TOTAL
94.82
30.33
20.70
1.28
147.13
108.25
21.48
22.00
3.12
154.85
(` lacs)
(` lacs)
(` lacs)
31.03.2013
Nature of contract
31.03.2012Currency
Interest rate swap contracts (floating to fixed)
Forward exchange contracts
1,100.00
39.85
USD
Sell USD / Buy INR
500
-
Loan amount in foreign currency (USD in lacs)
Notesstforming part of the consolidated financial statements for the year ended 31 March, 2013
5 FINANCIALSConsolidated

Financial Technologies (India) Ltd. | ANNUAL REPORT 2012-13
144
48. RELATED PARTY DISCLOSURE
I. Names of related parties and nature of relationship:
(a) Associate Companies
1. Multi Commodity Exchange of India Limited (MCX)
2. Indian Energy Exchange Ltd. (IEX)
3. MCX Stock Exchange Clearing Corporation Limited (MCX-SX CCL) th4. SME Exchange of India Limited (SME) (w.e.f. 26 September, 2011)
(b) Joint Venture
Dubai Gold and Commodities Exchange DMCC (DGCX)
(c) Key Management Personnel
1. Mr. Jignesh Shah : Chairman and Managing director
2. Mr. Dewang Neralla : Whole time director
3. Mr. Manjay Shah* : Whole time director st*Appointed as whole time director w.e.f 1 April,2012
(d) Relative of the Key Management Personnel where transactions have taken place
Mr. Manjay Shah
(e) Entity over which key management personnel is able to exercise significant influence
La-fin Financial Services Pvt. Limited (La-fin)
II. Transactions with related parties
Current YearNature of Transactions Sr No Previous Year
Income from software products (IPR based license)
- MCX
Income from software services (Project based)
- MCX
- IEX
- DGCX
Service charges
- MCX
- IEX
Storage and allied services
- MCX
IT Infrastructure sharing Income
- MCX
- IEX
Sale of traded goods
- MCX
Other Operating revenue
(a) Business Support Services
- MCX
(b) Others
- MCX
Recoveries charged by the Group towards expenses:
- MCX
- IEX
- MCX-SX CCL
1.
2.
3.
4.
5.
6.
7.
8.
79.62
11,161.06
966.74
275.17
346.14
-
-
304.54
-
8.00
303.55
21.28
294.54
14.66
-
87.64
8,647.58
669.94
242.93
756.16
2.64
478.49
58.94
2.44
15.03
240.00
21.28
632.82
24.02
0.86
(` lacs)
stforming part of the consolidated financial statements for the year ended 31 March, 2013
Notes

145
Current YearNature of Transactions Sr No Previous Year
Reimbursement of expenses charged to the Group:
- by MCX relating to offer for Sale by the Parent Company as part of
the public issue of MCX
- other Expenses:
- MCX
- IEX
- MCX-SX CCL
Purchase of Tangible Assets - MCX
Sale of Tangible Assets
- MCX
- IEX
- MCX-SX CCL
Advances as at the close of the year:
- MCX
- IEX
- MCX-SX CCL
Income received in advance / Unearned Revenue:
- MCX
- IEX
- DGCX
Trade receivables
- MCX
- IEX
- DGCX
Investment made during the year
Equity/Ordinary shares
- SME
Dividend received
- MCX
- IEX
Remuneration (including professional fees)
- Jignesh Shah
- Dewang Neralla
- Manjay Shah
Dividend paid
- Jignesh Shah
- Dewang Neralla
- Manjay Shah
- La-Fin
Remuneration payable as at the end of the year
- Jignesh Shah
9.
10.
11.
12.
13.
14.
15.
16.
17.
18.
19.
-
253.55
6.86
16.80
14.53
1.12
0.22
0.06
4.26
0.19
773.43
125.43
-
13.78
50.87
3.98
-
4,773.44
182.81
1,802.82
176.62
177.47
666.37
4.83
6.15
986.40
-
1,500.00
1,375.51
221.52
0.51
-
3.31
1.63
0.24
0.09
-
-
-
46.56
113.11
33.91
-
-
263.34
4.90
795.18
91.40
1,551.38
176.33
60.00
666.37
4.83
6.15
983.63
-
1,250.00
Note:
The Parent Company has identified Key Managerial Personnel (KMP) of the reporting enterprise as the KMP of the Group.
(` lacs)
Notesstforming part of the consolidated financial statements for the year ended 31 March, 2013
5 FINANCIALSConsolidated

Financial Technologies (India) Ltd. | ANNUAL REPORT 2012-13
146
49. EMPLOYEE BENEFIT PLANS:
Defined contribution plans: Amounts recognized as expenses towards contributions to provident fund, employee state insurance corporation and
other funds by the Company are ` 674.17 lacs (Previous Year ` 702.97 lacs).
Post employment defined benefit plans:
Gratuity Plan: The Company makes annual contributions to the Employee’s Group Gratuity Assurance Scheme administered by the Life
Insurance Corporation of India (‘LIC’), a funded defined benefit plan for qualifying employees. The scheme provides for lump sum payment to
vested employees at retirement, death while in employment or on termination of employment of an amount equivalent to fifteen days salary
payable for each completed year of service or part thereof in excess of six months. Vesting occurs on completion of five years of service.
The following table sets out the status of the gratuity plan as required under AS -15 (Revised):
Current YearParticulars Previous Year
1,202.49
102.63
185.55
(93.94)
37.76
92.04
(28.91)
1,497.62
966.91
82.93
183.55
(93.94)
5.89
7.22
1,152.56
345.06
185.55
102.63
(82.93)
84.82
290.07
80.43
1,152.56
1,152.56
8.00% - 8.25%
7.50%
8.70%
1,018.19
84.00
235.69
(199.64)
2.77
32.50
28.98
1,202.49
805.21
66.43
284.62
(199.64)
-
10.29
966.91
235.58
235.69
84.00
(66.43)
22.21
275.47
75.18
966.91
966.91
8.00% - 8.75%
7.50%
8.25%
2010
860.95
592.50
268.44
(11.83)
4.86
2009
632.92
386.37
246.54
19.02
1.78
2011
1,018.19
805.21
212.98
68.54
6.87
2012
1,202.49
966.91
235.58
107.91
6.91
2013
1,497.62
1,152.56
345.06
(19.95)
7.27
(` lacs)
I.
II.
III.
IV.
V.
VI.
VII.
Change in benefit obligation:
Projected benefit obligation at the beginning of the year
Interest Cost
Current Service Cost
Benefits Paid
Cost of plan amendment / Liability Transfer In
Actuarial loss / (gain) on obligations
Obligation transferred / settled
Projected benefit obligation at the end of the year
Change in plan assets
Fair Value of the plan asset at beginning of the year
Expected return on plan assets
Contributions
Benefits paid
Cost of plan amendment / Liability Transfer In
Actuarial gain on plan assets
Fair value of plan assets at the end of the year
Excess of obligation over plan assets
Gratuity expense for the year
Current service cost
Interest cost
Expected return on plan assets
Net actuarial (gain) / loss recognized
TOTAL
Actual return on plan assets
Category of Assets as at end of the year
Insurer Managed Funds
Fund is managed by LIC of India as per IRDA guidelines,
category wise composition of planned asset is not available
TOTAL
Assumptions
Discount rate
Salary escalation rate
Expected rate of return on plan assets
Experience adjustments:
Defined benefit obligation
Fair value of planned assets
Surplus / deficit
Experience adjustment on plan liabilities [(Gain)/Loss]
Experience adjustment on plan assets [Gain/(Loss)]
stforming part of the consolidated financial statements for the year ended 31 March, 2013
Notes

147
Expected rate of return on plan assets is based on expectation of the average long term rate of return expected to prevail over the estimated
term of the obligation on the type of the investments assumed to be held by LIC, since the fund is managed by LIC.
The estimates of future salary increases, considered in actuarial valuation, takes into account inflation, seniority, promotions and other relevant
factors, such as supply and demand in the employment market.
The Group expect to contribute ` 441.51 lacs to the plan assets during financial year 2013-14.
The Group has identified Business segments as its primary segment and Geographical segments as its secondary segment taking into account
the nature of services, differing risks and returns, the organizational structure and the internal reporting system of the Group. Inter-company
transfers are accounted for at market/negotiated prices in case of transactions of special nature for which suitable alternative sources do not
exist.
Revenues and direct expenses in relation to segments are categorized based on items that are individually identifiable to that segment or those
which can be reasonably allocated to the segment. Depreciation and other expenses which relate to the group as a whole and which cannot be
reasonably allocated to any segment have been disclosed as unallocated expenses.
(a) Primary segment: Business segments
Notes:
1. Due to diversified nature of business, significant portion of assets are interchangeably used between segments and the management
believes that its segregation will not be meaningful.
2. The reportable segments are described as follows:
(a) STP Technologies/solutions segment represents straight through processing solutions and includes an integrated mix of various
products, projects and services incidental thereto. Exchange Based segment represents trading platform for multi asset class like
commodity, equity, equity derivatives and forex based derivatives etc. Storage and Allied services represents warehousing and
collateral management services.
(b) The businesses, which are not reportable segments during the year, have been grouped under the “Others” segment. This mainly
comprises of various services towards trading, procurement, process management, risk consultancy activities, Shared Business
Support Services, IT Infrastructure Sharing, NBFC related activities, internet telecommunication services and Training, Certification
and Franchise Fees.
50. SEGMENT REPORTING:
Others Exchange based
Storage & Allied Services
STP Technologies/solutions
Particulars Total Elimination
External revenue
Inter-segment revenue
Net Sales / Income from
operations
Segment result
Add: Unallocable income
Less: Unallocable expenses
Less: Finance costs
Add: Interest Income
Profit before tax
Less: Provision for taxation
(including taxes in respect
of earlier years)
Profit after tax before share
of results of associates
and minority interest
-
(-)
13,233.79
(19,005.31)
13,233.79
(19,005.31)
-13,053.25
(4,403.69)
75,193.01
(50,123.37)
-
(-)
75,193.01
(50,123.37)
28,352.58
(9,426.80)
13,047.92
(31,123.28)
11,374.60
(13,506.50)
9,799.83
(6,717.77)
7,358.36
(2,183.38)
26,930.90
(22,509.19)
14,254.63
(6,208.90)
12,676.27
(16,300.29)
10,735.03
(5,314.65)
808.47
(808.04)
11,543.51
(6,122.69)
5,692.95
(6,022.22)
18,918.25
(9,260.00)
-
(-)
18,918.25
(9,260.00)
-23,679.58
(-21,224.62)
32,449.75
(24,738.47)
12,424.62
(18,194.70)
44,874.37
(42,933.17)
28,927.66
(28,187.65)
13,089.98
(10,810.25)
0.70
(2.57)
13,090.68
(10,812.82)
4,358.30
(845.24)
(` lacs)
Notesstforming part of the consolidated financial statements for the year ended 31 March, 2013
5 FINANCIALSConsolidated

Financial Technologies (India) Ltd. | ANNUAL REPORT 2012-13
148
3. Previous year figures are given in brackets and are regrouped to confirm to current year’s classification and segment loss is indicated
by ‘-‘ve sign.
(b) Secondary Segment: Geographical segments:
The Group has two geographical segments viz, within India and outside India. Significant portion of segment operational assets are in India.
Revenue from geographical segments based on domicile of the customers is outlined below:
The aggregate amount of revenue expenditure incurred during the year on Research and Development and shown in the respective heads of the
account is ` 1,559.31 lacs (Previous Year ` 1,665.70 lacs).
As per the regulatory under Central Electricity Regulatory Commission (Power Market) Regulations 2010, the parent company need to bring thdown it's holding in an associate company viz. Indian Energy Exchange Limited (IEX) to 25% on or before 20 January 2014 and accordingly
holding in excess of 25% of the share capital of IEX i.e. 8.49% is shown under current investment.
51.
52.
stforming part of the consolidated financial statements for the year ended 31 March, 2013
Notes
Current YearParticulars Previous Year
Net Revenue/Income from Operations
Within India
Outside India
TOTAL
72,501.35
2,691.66
75,193.01
46,644.47
3,478.90
50,123.37
(` lacs)

149
Cap
ital
Res
erve
s T
otal
As
sets
(in
clud
ing
inve
stm
ent i
n su
bsid
iarie
s)
Tota
l Li
abili
ties
Det
ails
of
inve
stm
ent
(exc
ept i
n ca
se o
f in
vest
men
t in
subs
idia
ries)
Tur
nove
r P
rofit
/ (L
oss)
be
fore
taxa
tion
Pro
visi
on
for
taxa
tion
Pro
fit /
(L
oss)
af
ter
taxa
tion
Pro
pose
d di
vide
nd
Rep
ortin
g C
urre
ncy
Exch
ange
R
ate
as a
t Mar
ch
31, 2
013
Sr.
No.
1 2 3 4 5 6 7 8 9 10 11 12 13 14 15 16 17 18 19 20 21 22 23 24 25 26 27 28 29 30 31 32 33 34 35 36 37 38
IBS
For
ex L
imite
d
Ris
kraf
t C
onsu
lting
Lim
ited
atom
Tec
hnol
ogie
s Li
mite
d
Nat
iona
l S
pot
Exch
ange
Lim
ited
Indi
an B
ullio
n M
arke
t A
ssoc
iatio
n Li
mite
d
Wes
tern
Gha
ts A
gro
Gro
wer
s C
ompa
ny L
imite
d
Farm
er A
gric
ultu
ral
Inte
grat
ed D
evel
opm
ent
Alli
ance
Lim
ited
Nat
iona
l B
ulk
Han
dlin
g C
orpo
ratio
n Li
mite
d
Glo
bal
Paym
ent
Net
wor
ks L
imite
d
Fina
ncia
l Te
chno
logi
es C
omm
unic
atio
ns L
imite
d
FT K
now
ledg
e M
anag
emen
t C
ompa
ny L
imite
d
Tick
erP
lant
Lim
ited
Bou
rsa
Indi
a Li
mite
d
Taks
hash
ila A
cade
mia
of
Econ
omic
Res
earc
h Li
mite
d
Api
an F
inan
ce &
Inv
estm
ent
Lim
ited
Tran
s-G
loba
l C
redi
t an
d Fi
nanc
e Li
mite
d
Cre
dit
Mar
ket
Ser
vice
s Li
mite
d
FT P
roje
cts
Lim
ited
Kno
wle
dge
Ass
ets
Pri
vate
Lim
ited
Sin
gapo
re M
erca
ntile
Exc
hang
e P
te.L
td.
Sin
gapo
re M
erca
ntile
Exc
hang
e C
lear
ing
Cor
pora
tion
Pte.
Ltd
.
ICX
Pla
tform
(P
ty)
Lim
ited
Fina
ncia
l Te
chno
logi
es S
inga
pore
Pte
.Ltd
.
Fina
ncia
l Te
chno
logi
es P
roje
cts
Pri
vate
Lim
ited
FT G
roup
Inv
estm
ents
Pvt
. Lt
d.
Fina
ncia
l Te
chno
logi
es M
iddl
e Ea
st D
MC
C
Cap
rico
rn F
in-T
ech
(Pvt
.) L
td.
Glo
bal
Boa
rd o
f Tr
ade
Lim
ited
#G
BO
T C
lear
Ltd
.
Bah
rain
Fin
anci
al E
xcha
nge
BS
C (
c)*
Bou
rse
Afr
ica
Lim
ited
#B
ours
e A
fric
a (K
enya
) Li
mite
d
#B
ours
e Ta
nzan
ia L
imite
d
#B
ours
e Za
mbi
a Li
mite
d
#B
ours
e Ex
chan
ge N
iger
ia L
imite
d
#B
ours
e U
gand
a Li
mite
d
#B
ours
e S
outh
Afr
ica
Lim
ited
#IC
X A
fric
a Li
mite
d
-
-
-
-
-
-
-
-
-
-
-
-
-
-
-
-
-
-
-
-
-
-
-
-
-
-
-
-
-
-
-
-
-
-
-
-
-
-
8.
90
2.2
9
(1,
099.
75)
12,
479.
59
335
.98
(27
.11)
(0.
85)
1,4
50.1
1
7.2
3
126
.69
198
.83
(64
4.66
)
(0.
25)
(13
.15)
82.
44
(0.
39)
(2.
35)
(2.8
6)
(4.
21)
(6,
642.
50)
(2,
375.
96)
97.
70
(37
3.32
)
(0.
46)
(6,
303.
77)
(43
2.32
)
(0.
11)
(6,
249.
21)
(4.
64)
(10
,016
.85)
(1,
327.
24) -
-
-
-
-
-
-
-
-
-
5,4
64.2
5
223
.28 -
-
467
.14 -
63.
31
40.
58
-
-
-
36.
85
-
- -
-
1,9
84.3
3
493
.51 -
-
-
-
-
-
1,9
98.3
1 -
-
-
-
-
-
-
-
-
-
8.
90
2.2
9
(1,
099.
75)
17,
943.
84
559
.26
(27
.11)
(0.
85)
1,9
17.2
5
7.2
3
190
.00
239
.41
(64
4.66
)
(0.
25)
(13
.15)
119
.29
(0.
39)
(2.
35)
(2.8
6)
(4.
21)
(8,
626.
83)
(2,
869.
47)
97.
70
(37
3.32
)
(0.
46)
(6,
303.
77)
(43
2.32
)
(0.
11)
(8,
247.
52)
(4.
64)
(10
,016
.85)
(1,
327.
24) -
-
-
-
-
-
-
-
16.
50
1,0
90.3
6
47,
201.
85
117
,845
.90
4.9
1
4.1
5
15,
628.
79
-
617
.41
997
.01
2,1
55.7
0 -
7.0
0
338
.38 -
- -
-
1,8
57.8
3
57.
81
90.
24
-
-
617
.89
259
.15 -
60.
90
-
47.
82
-
-
-
-
-
-
-
-
53
6.83
64.
74
101
.50
2.2
0
0.4
6 -
-
3.8
0
109
.94
284
.04
368
.09 -
-
-
628
.84 -
- -
-
-
-
44.
86
-
-
4,5
63.0
3
6,2
76.8
0 -
-
-
-
-
-
-
-
-
-
-
-
2.
59
17.
46
739
.60
81,
084.
06
16,
137.
73
42.
00
2.5
2
29,
380.
01
0.2
8
109
.47
301
.54
1,8
96.4
0
0.2
2
139
.75
3,5
11.8
1
1.7
3
19.
39
2,50
0.43
24.
23
287
.20
533
.75
245
.89
10,
267.
48
1.4
8
100
,199
.24
698
.55
3.2
9
6,1
81.6
7
4.6
4
10,
856.
61
2,4
25.0
6 -
-
-
-
-
-
-
575
.70
88.
70
1,2
31.0
1
99,
668.
54
17,
935.
71
19.
89
11.
67
41,
596.
16
115
.08
364
.74
694
.63
1,2
78.5
2
3.7
0
17.
77
4,2
28.1
6
1.1
4
17.
87
2,5
00.8
6
2.6
9
24,
175.
93
4,5
84.1
8
104
.01
54,
652.
49
0.0
6
99,
363.
95
6,6
22.3
9
0.7
5
16,
851.
78
5.6
1
15,
717.
44
17,
032.
16
0.6
8
0.0
4
0.5
4
35.
90
2.7
2
0.03 -
(1
26.8
9)
(62
8.76
)
(1,
224.
81)
14,
084.
48
344
.09
(27
.11)
(0.
85)
4,0
16.1
5
14.
80
250
.27
18.
09
(1,
032.
13)
(1.
52)
(12
6.98
)
284
.91
(5.
59)
(52
6.52
)
(4.5
7)
(26
.98)
(29
,249
.62)
(5,
429.
00)
(14
1.89
)
(40
1.01
)
(1.
51)
(9,
026.
32)
(3,
899.
80)
(3.
43)
(17
,612
.33)
(4.
64)
(22
,782
.13)
(4,
440.
03) -
-
-
-
-
-
-
70
0.00
700
.00
1,7
16.2
2
4,5
00.0
0
1,4
53.8
9
5.0
0
10.
00
8,2
00.0
0
100
.00
5.0
0
375
.00
414
.25
5.0
0
5.0
0
431
.44
5.0
0
525
.00
5.00
5.4
4
53,
138.
35
9,4
79.4
3
0.0
1
44,
786.
02
0.0
9
8,1
91.0
3
9,8
23.6
4
0.8
9
28,
282.
44
5.6
1
27,
642.
96
19,
047.
13
0.6
8
0.0
4
0.5
4
35.
90
2.7
2
0.03 -
54.3
893
54.3
893
54.3
893
6.39
3
54.3
893
1.82
25
54.3
893
14.8
843
14.8
843
54.3
893
54.3
893
147.
037
54.3
893
54.3
893
54.3
893
54.3
893
54.3
893
54.3
893
54.3
893
54.3
893
IN
R
IN
R
IN
R
IN
R
IN
R
IN
R
IN
R
IN
R
IN
R
IN
R
IN
R
IN
R
IN
R
IN
R
IN
R
IN
R
IN
R
INR
US
D
US
D
US
D
ZA
R
US
D
MU
R
US
D
AED
AED
US
D
US
D
BH
D
US
D
US
D
US
D
US
D
US
D
US
D
US
D
US
D
Part
icul
ars
*Fig
ures
dis
clos
ed b
ased
on
the
Con
solid
ated
Fin
anci
al S
tate
men
ts o
f B
ahra
in F
inan
cial
Exc
hang
e B
SC
(c)
and
its s
ubsi
diar
y B
FX C
lear
ing
& D
epos
itory
Cor
pora
tion
BS
C(c
) #Fi
gure
s ar
e ba
sed
on u
naud
ited
finan
cial
sta
tem
ents
; ho
wev
er f
or t
he p
urpo
se o
f co
nsol
idat
ed f
inan
cial
sta
tem
ents
, th
e pa
rent
com
pany
has
rec
eive
d au
dite
d co
nsol
idat
ed f
inan
cial
sta
tem
ents
of
FT G
roup
Inv
estm
ents
Pvt
. Li
mite
d an
d its
sub
sidi
arie
s lis
ted
at S
r. N
o. 2
5 to
38.
stN
ote:
Ind
ian
rupe
e eq
uiva
lent
s of
the
fig
ures
in
fore
ign
curr
enci
es i
n th
e ac
coun
ts o
f th
e su
bsid
iary
com
pani
es,
are
base
d on
the
exc
hang
e ra
tes
as o
n 31
Mar
ch,
2013
.
th,
53.
Sta
tem
ent
rega
rdin
g su
bsid
iary
com
pani
es a
s re
quir
ed u
nder
sec
tion
212
of t
he C
ompa
nies
Act
, 19
56 p
ursu
ant
to G
ener
al C
ircu
lar
no.
2/20
11 d
ated
Feb
ruar
y 8
201
1 is
sued
by
the
Min
istr
y of
Cor
pora
te A
ffai
rs:
(` l
acs)

For and on behalf of the Board
Chairman & Managing Director Director
Sr. Vice President (Legal) & Company Secretary Chief Financial Officer
Place : Mumbai Place : Mumbaith thDate : 30 May, 2013 Date : 30 May, 2013
Jignesh Shah P. R. Barpande
Naishadh Desai Devendra Agrawal
54. Previous year's figures have been regrouped/reclassified wherever necessary to correspond with the current year's classification/disclosure.
Financial Technologies (India) Ltd. | ANNUAL REPORT 2012-13
150
stforming part of the consolidated financial statements for the year ended 31 March, 2013
Notes

NOTES

FINANCIAL TECHNOLOGIES (INDIA) LTD.
FT Tower, CTS No. 256 & 257, Suren Road, Chakala, Andheri (East), Mumbai – 400 093, India.
T: +91 22 6686 1010 F: +91 22 6686 1050 [email protected] www.ftindia.com | | |

FINANCIAL TECHNOLOGIES (INDIA) LIMITEDst Regd. Office: Doshi Towers, 1 Floor, 1A & B, 156, Periyar EVR Salai, Kilpauk, Chennai 600 010.
Addendum to Directors’ Report
Dear Shareholders,
(1) Your company would like to brief you about the developments of National Spot Exchange Limited
(“NSEL”), a subsidiary Company which is in the news in the recent past. Your Company would like put
forward the following facts:
• National Spot Exchange Ltd. (NSEL) is engaged in the business of providing electronic spot trading
platform for commodities, e-series contracts and procurement activities and is carrying out its
activities since last seven years by a team of professionals.
• NSEL commenced live trading on October 15, 2008 and all contracts traded on NSEL platform are
compulsory delivery contracts. At present NSEL is operational in 16 states across the country under
license from Agricultural Produce Market Committee (APMC) providing delivery based spot trading
in 52 commodities.
• The Ministry of Consumer Affairs issued a notification dated June 5, 2007 under Section 27 of the
Forward Contracts (Regulation) Act, 1952 (FCRA) exempting NSEL from operation of FCRA subject
to certain conditions mentioned therein.
• Forward Market Commission (FMC) was appointed as designated agency under a notification
issued under section 27 of FCRA.
• NSEL is engaged into various other activities to support and promote cause of the farmers, Farmer
Producer Organizations, State Marketing Federations as well as various Government agencies.
Some of such activities are as follows:
(a) NSEL carries out Minimum Support Price (MSP) cotton procurement on behalf of Government
viz. National Agricultural Cooperative Marketing Federation of India Limited (Nafed), Small
Farmers’ Agri-Business Consortium (SFAC) etc.
(b) NSEL has implemented Forward auction model for Food Corporation of India (FCI) and other
Government agencies: for sale of wheat under Open Market Sale Scheme (OMSS) by FCI. This
was a pilot project carried out for FCI, in which NSEL provided its services without charging any
fee from FCI. Based on our performance, now FCI is looking at expanding electronic auction of
wheat through NSEL across the country.
(c) NSEL has implemented Forward auction model for sale of cotton bales on behalf of Nafed.
(d) NSEL has conducted Electronic auction for Metals and Minerals Trading Corporation of India
Ltd. (MMTC), Project and Equipment Corporation of India Limited (PEC), Neelachal Ispat Nigam
Limited (NINL), State Trading Corporation (STC) and Nafed for pulses through its platform on
behalf of Government agencies engaged in import of pulses.
01
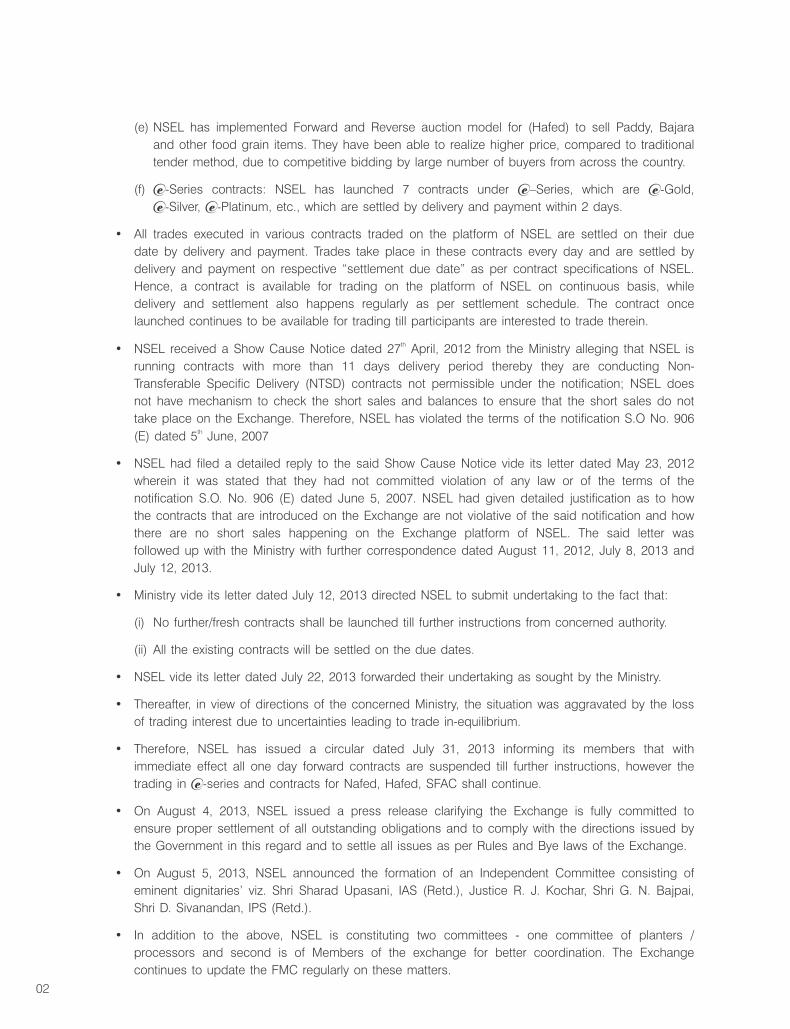
(e) NSEL has implemented Forward and Reverse auction model for (Hafed) to sell Paddy, Bajara
and other food grain items. They have been able to realize higher price, compared to traditional
tender method, due to competitive bidding by large number of buyers from across the country.
(f) e-Series contracts: NSEL has launched 7 contracts under e–Series, which are e-Gold,
e-Silver, e-Platinum, etc., which are settled by delivery and payment within 2 days.
• All trades executed in various contracts traded on the platform of NSEL are settled on their due
date by delivery and payment. Trades take place in these contracts every day and are settled by
delivery and payment on respective “settlement due date” as per contract specifications of NSEL.
Hence, a contract is available for trading on the platform of NSEL on continuous basis, while
delivery and settlement also happens regularly as per settlement schedule. The contract once
launched continues to be available for trading till participants are interested to trade therein.
th• NSEL received a Show Cause Notice dated 27 April, 2012 from the Ministry alleging that NSEL is
running contracts with more than 11 days delivery period thereby they are conducting Non-
Transferable Specific Delivery (NTSD) contracts not permissible under the notification; NSEL does
not have mechanism to check the short sales and balances to ensure that the short sales do not
take place on the Exchange. Therefore, NSEL has violated the terms of the notification S.O No. 906 th(E) dated 5 June, 2007
• NSEL had filed a detailed reply to the said Show Cause Notice vide its letter dated May 23, 2012
wherein it was stated that they had not committed violation of any law or of the terms of the
notification S.O. No. 906 (E) dated June 5, 2007. NSEL had given detailed justification as to how
the contracts that are introduced on the Exchange are not violative of the said notification and how
there are no short sales happening on the Exchange platform of NSEL. The said letter was
followed up with the Ministry with further correspondence dated August 11, 2012, July 8, 2013 and
July 12, 2013.
• Ministry vide its letter dated July 12, 2013 directed NSEL to submit undertaking to the fact that:
(i) No further/fresh contracts shall be launched till further instructions from concerned authority.
(ii) All the existing contracts will be settled on the due dates.
• NSEL vide its letter dated July 22, 2013 forwarded their undertaking as sought by the Ministry.
• Thereafter, in view of directions of the concerned Ministry, the situation was aggravated by the loss
of trading interest due to uncertainties leading to trade in-equilibrium.
• Therefore, NSEL has issued a circular dated July 31, 2013 informing its members that with
immediate effect all one day forward contracts are suspended till further instructions, however the
trading in e-series and contracts for Nafed, Hafed, SFAC shall continue.
• On August 4, 2013, NSEL issued a press release clarifying the Exchange is fully committed to
ensure proper settlement of all outstanding obligations and to comply with the directions issued by
the Government in this regard and to settle all issues as per Rules and Bye laws of the Exchange.
• On August 5, 2013, NSEL announced the formation of an Independent Committee consisting of
eminent dignitaries’ viz. Shri Sharad Upasani, IAS (Retd.), Justice R. J. Kochar, Shri G. N. Bajpai,
Shri D. Sivanandan, IPS (Retd.).
• In addition to the above, NSEL is constituting two committees - one committee of planters /
processors and second is of Members of the exchange for better coordination. The Exchange
continues to update the FMC regularly on these matters.
02

• All the information are available on NSEL’s website and all future action plan will be announced
through media in consultation with FMC and also uploaded on NSEL website from time to time.
• NSEL has notified to its Members regarding Settlement Schedule which will commence from Friday, th16 August 2013, there will be pay-in every Friday and pay-out every subsequent Tuesday, till it
completes all back log of pay-in and pay-out.
• NSEL has suspended the MD & CEO of NSEL along with senior professionals who are responsible
for the situation.
• Mr. Shreekant Javalgekar, Mr. R. Devarajan, Mr. Shankarlal Guru, Mr. B. D. Pawar resigned from the
Board of NSEL.
• Exchange is in the process of declaring defaults of Members who defaulted in pay-in obligations.
(2) Mr. R. Devarajan - Independent Director of your Company has resigned from the Board and its
committees for professional commitments and he ceases to be the Director of the Company.
(3) Mr. P. R. Barpande - Independent Director of your Company has resigned from the Board and its
committees and he ceases to be the Director of the Company.
(4) Mr. Ravi Sheth, Non-Independent Director of the Company has withdrawn his consent for
re-appointment as a Director at the ensuing Annual General Meeting.
(5) Mr. N. Balasubramanian has been appointed as Additional Director and he holds office upto the date
of forthcoming Annual General Meeting
The Directors report and the Corporate Governance Report of the Company for the FY 2012-13 be read in
conjunction with the above addendum.
Place: MumbaindDate: 22 August, 2013
Dewang Neralla
Whole-time Director
Chandrakant Kamdar
Director
For and on behalf of the Board
03

By Order of the Board
sd/-
Naishadh Desai
Sr. VP (Legal) & Company Secretary
Place: MumbaithDate: 27 August 2013
By Order of the Board
sd/-
Naishadh Desai
Sr. VP (Legal) & Company Secretary
Place: MumbaithDate: 27 August 2013
FINANCIAL TECHNOLOGIES (INDIA) LIMITEDstRegd. Office: Doshi Towers, 1 Floor, 1A & B, 156, Periyar EVR Salai, Kilpauk, Chennai 600 010.
th thADDENDUM to the Notice dated 30 July 2013 calling the 25 Annual General Meeting of Financial Technologies (India) thLimited on Wednesday, 25 September 2013 at 2:00 p.m. at Sri. P. Obul Reddy Hall (Vani Mahal), 103, G. N. Chetty Road,
T. Nagar, Chennai - 600 017.
thAttention of the members is invited to the Notice of 25 Annual General Meeting of the members of the Company scheduled on th25 September 2013. The following developments took place subsequent to the date of said Notice and addendum dated nd22 August, 2013;
1. The Company received letter from Mr. C. M. Maniar, Director of the Company, resigning from the Board.
2. The Company received letter from Mr. N. Balasubramanian, resigning from the Board. Mr. N. Balasubramanian was appointed ndas Additional Director of the Company on 22 August 2013.
In view of the resignation letters received from Mr. C. M. Maniar and Mr. N. Balasubramanian, item no. 4 covered under Ordinary thBusiness of the Notice dated 30 July 2013 and item no. 12 covered under Special Business of the addendum to Notice dated
nd22 August 2013 respectively, shall stand deleted. The following item no. 13 under Special Business also be considered as an
Addendum to the Notice;
SPECIAL BUSINESS:
13. To consider and, if thought fit, to pass, with or without modification, the following resolution as an Ordinary Resolution:
“RESOLVED THAT pursuant to the provisions of Section 256 and other applicable provisions, if any, of the Companies Act,
1956, the vacancy caused by the resigning director Mr. C. M. Maniar, be and is hereby not filled at this meeting or at any
adjournment thereof.”
th thThe Notice dated 30 July 2013 calling the 25 Annual General Meeting including Notes forming part thereof and the Para on
“Details of Directors seeking re-appointment at the forthcoming Annual General Meeting (pursuant to clause 49 of the Listing ndAgreement)” and Addendum dated 22 August 2013 be read in conjunction with the above addendum.
ANNEXURE TO THE ADDENDUM TO NOTICE
Explanatory Statement pursuant to section 173 of the Companies Act, 1956:
ITEM NO. 13
Pursuant to provisions of Section 256 of the Companies Act, 1956, Mr. C. M. Maniar, Director of the Company, is liable to retire thby rotation at the ensuing Annual General Meeting. The Company has received intimation from him on 26 August 2013
expressing his desire not to continue as a Director of the Company with immediate effect. The Company does not propose to fill
the vacancy arising from the resignation of Mr. C. M. Maniar. The Company appreciates his contribution and support extended
during his tenure as director on the Board of the Company.
Accordingly, the Board recommends the resolution for the approval of the members.

By Order of the Board
sd/-
Naishadh P. Desai
Sr. VP (Legal) & Company Secretary
Place: MumbaindDate: 22 August 2013
FINANCIAL TECHNOLOGIES (INDIA) LIMITEDstRegd. Office: Doshi Towers, 1 Floor, 1A & B, 156, Periyar EVR Salai, Kilpauk, Chennai 600 010.
th thADDENDUM to the Notice dated 30 July 2013 calling the 25 Annual General Meeting of Financial Technologies th(India) Limited on Wednesday, 25 September 2013 at 2:00 p.m. at Sri. P. Obul Reddy Hall (Vani Mahal), 103,
G. N. Chetty Road, T. Nagar, Chennai - 600 017.
thAttention of the members is invited to the Notice of 25 Annual General Meeting of the members of the Company thscheduled on 25 September 2013. The following developments took place subsequent to the date of Notice;
1. The Company received intimation from Mr. Ravi K. Sheth, Director of the Company withdrawing his consent for
re-appointment as a Director at the ensuing Annual General Meeting.
nd2. Mr. N. Balasubramanian was appointed as Additional Director of the Company on 22 August 2013. He holds office
upto the date of the forthcoming Annual General Meeting
In view of the Intimation received from Mr. Ravi K. Sheth, item no. 3 covered under Ordinary Business of the said Notice
shall stand deleted. The following item no. 11 and item no. 12 under Special Business be considered as an Addendum to
the Notice;
SPECIAL BUSINESS:
11. To consider and, if thought fit, to pass, with or without modification, the following resolution as an Ordinary Resolution:
“RESOLVED THAT pursuant to the provisions of Section 256 and other applicable provisions, if any, of the
Companies Act, 1956, the vacancy caused by the retiring director Mr. Ravi K. Sheth, not seeking re-appointment, be
and is hereby not filled at this meeting or at any adjournment thereof.”
12. To consider and, if thought fit, to pass, with or without modification, the following resolution as an Ordinary Resolution:
“RESOLVED THAT Mr. N. Balasubramanian who was appointed as an Additional Director pursuant to Section 260 of ndthe Companies Act, 1956 at the Board meeting held on 22 August 2013, and who holds office upto the date of the
Twenty fifth Annual General Meeting and in respect of whom notice under Section 257 of the Companies Act, 1956
has been received proposing Mr. N. Balasubramanian as a candidate for the office of Director of the Company, be
and is hereby appointed as a Director of the Company liable to retire by rotation.”
th thThe Notice dated 30 July 2013 calling the 25 Annual General Meeting, Notes forming part thereof and the Para on
“Details of Directors seeking re-appointment at the forthcoming Annual General Meeting (pursuant to clause 49 of the
Listing Agreement)” included therein be read in conjunction with the above addendum.

ANNEXURE TO THE ADDENDUM TO NOTICE
Explanatory Statement pursuant to section 173 of the Companies Act, 1956:
ITEM NO. 11
Pursuant to provisions of Section 256 of the Companies Act, 1956, Mr. Ravi K. Sheth, Director of the Company, is liable to thretire by rotation at the ensuing Annual General Meeting. The Company has received intimation from him on 13 August
2013 expressing his desire not to offer himself for re-appointment as a Director at the upcoming Annual General Meeting.
The Company does not propose to fill the vacancy arising from the retirement of Mr. Ravi Sheth. The Company
appreciates his contribution and support extended during his tenure as director on the Board of the Company.
None of the Directors, except Mr. Ravi Sheth is concerned or interested in the resolution.
Accordingly, the Board recommends the resolution for the approval of the members.
ITEM NO. 12
Mr. N. Balasubramanian was appointed as an Additional Director of the Company by the Board of Directors at their ndmeeting held on 22 August 2013, pursuant to the provisions contained in Article 67 of the Articles of Association of the
Company and Section 260 of the Companies Act, 1956. Accordingly, Mr. Balasubramanian will hold office upto the date of
this Annual General Meeting.
Mr. Balasubramanian is a Post Graduate in Science and a Post Graduate from Indian Institute of Management,
Ahmedabad, and has extensive experience in Banking and Finance. He has been associated with institutions like Small
Industries Development Bank of India (SIDBI), IFCI, Bank of Baroda etc. During his tenure as Chairman & Managing
Director of SIDBI, he gave new thrust to SME financing and created a strong linkage between commercial banks & SIDBI
for supporting SMEs cause. He has also served IFCI as Chairman for a short stint. He was associated with planning
commission in preparing 5 years plan documents, focused on SME Financing as Chairman of the Sub-Committee.
Your Directors recommend his appointment as a Director. Except Mr. N. Balasubramanian, none of the other Directors of
the Company is, in any way concerned or interested in the resolution.
By Order of the Board
sd/-
Naishadh P. Desai
Sr. VP (Legal) & Company Secretary
Place: MumbaindDate: 22 August 2013

NOTICE
FINANCIAL TECHNOLOGIES (INDIA) LIMITEDst Regd. Office: Doshi Towers, 1 Floor, 1A & B, 156, Periyar EVR Salai, Kilpauk, Chennai 600 010.
NOTICE is hereby given that the Twenty Fifth Annual General Meeting of the Members of Financial Technologies (India) thLimited will be held on Wednesday, the 25 September 2013 at 2.00 P.M. at Sri. P. Obul Reddy Hall (Vani Mahal), 103,
G. N. Chetty Road, T. Nagar, Chennai - 600 017 to transact the following business:
ORDINARY BUSINESS:
st1. To receive, consider and adopt the Audited Balance Sheet as at 31 March 2013 and the Profit & Loss Account for the
year ended on that date together with the Schedules attached thereto, and the Reports of the Board of Directors’ and
Auditors’ thereon.
2. To ratify the payment of Interim Dividend(s) and to declare a Final Dividend on Equity Shares.
3. To appoint a Director in place of Mr. Ravi K. Sheth, who retires by rotation, and being eligible, offers himself for
re-appointment.
4. To appoint a Director in place of Mr. C. M. Maniar, who retires by rotation, and being eligible, offers himself for
re-appointment.
5. To appoint M/s. Deloitte Haskins & Sells, Chartered Accountants (ICAI Registration No. 117366W), the retiring Statutory
Auditors of the Company, to hold office from the conclusion of this Annual General Meeting until the conclusion of the
next Annual General Meeting and to authorize the Board of Directors/Committee to fix their remuneration.
“RESOLVED THAT pursuant to the provisions of Section 224 and other applicable provisions, if any, of the
Companies Act, 1956, M/s Deloitte Haskins & Sells, Chartered Accountants, (ICAI Registration No. 117366W) be and
are hereby re-appointed as the Statutory Auditors of the Company, to hold office from the conclusion of this Annual
General Meeting till the conclusion of the next Annual General Meeting at a remuneration and reimbursement of out-of-
pocket expenses, if any, as may be mutually agreed to, between the Board of Directors/Committee and M/s. Deloitte
Haskins & Sells.”
SPECIAL BUSINESS:
6. To consider and, if thought fit, to pass, with or without modification, the following resolution as a Special Resolution:
“RESOLVED THAT pursuant to the provisions of Sections 198, 309 and all other applicable provisions, if any, of the
Companies Act, 1956, consent of the Company be and is hereby accorded for payment of commission to
Non-Executive Directors of the Company upto 1% of the Company’s net profits as computed in accordance with
Sections 349 and 350 of the Companies Act, 1956, from the Financial Year 2013-14 onwards, to be distributed
amongst the Non-Executive Directors as may be decided by the Board from time to time.
RESOLVED FURTHER that the Board of Directors be and is hereby authorized to do all such acts, deeds, matters
and things as may be considered necessary or expedient for giving effect to this resolution.”
7. To consider and, if thought fit, to pass, with or without modification, the following resolution as a Special Resolution:
“RESOLVED THAT pursuant to the provisions of Section 81(1A) and other applicable provisions, if any, of the
Companies Act, 1956 including any amendments thereto, and all other applicable provisions, if any, of the Companies
Act, 1956 ("the Act") and in accordance with the provisions of the Memorandum and Articles of Association of the
01

Company, provisions of the Securities & Exchange Board of India (Employee Stock Option Scheme and Employee
Stock Purchase Scheme) Guidelines, 1999 as amended from time to time (hereinafter referred to as "the Guidelines"),
the Listing Agreement entered into with the Stock Exchanges where the securities of the Company are listed or other
relevant authority from time to time, to the extent applicable and subject to such other conditions and modifications as
may be prescribed or imposed while granting such approvals, permissions and sanctions, which may be agreed to by
the Board of Directors of the Company (hereinafter referred to as "the Board" which term shall include a duly
authorized and constituted Committee of Directors), the consent and the approval of the Company be and is hereby
accorded to the Board to create, offer and grant, issue and allot at any time to or to the benefit of such person(s)
who are in permanent employment of the Company, including Directors of the Company, whether working in India or
abroad or otherwise, except the Promoter Directors under Employees Stock Option Scheme - 2013 ("the ESOP
Scheme - 2013") such number of equity linked instruments (including warrants / options / Restricted Stock Units
("RSU's") and/or performance options, exercisable into equity shares, hereinafter collectively referred to as "Securities"),
which shall not exceed 9,00,000 (Nine Lakhs) or 2% of the paid-up equity share capital of the Company as on the
date of grant of option(s) convertible into equivalent number of Securities (in case of bonus and rights issues and split
of shares, the aggregate number of stock options would increase in the proportion of bonus and rights and split of
shares), at such price, in one or more tranches and on such terms and conditions as may be fixed or determined by
the Board / Committee.
RESOLVED FURTHER THAT the said Securities may be granted / allotted directly to such employees / Directors of
the Company in accordance with the ESOP Scheme – 2013.
RESOLVED FURTHER THAT the issue of Securities to any non-resident employee(s), non-resident Director(s) shall be
subject to approval(s), permissions or consents as may be necessary from the Reserve Bank of India or any other
relevant authority in this regard, if any.
RESOLVED FURTHER THAT the new equity shares to be issued and allotted by the Company in the manner
aforesaid shall rank pari-passu in all respects with the existing equity shares of the Company.
RESOLVED FURTHER THAT the Company conform to the accounting policies prescribed from time to time under the
Guidelines.
RESOLVED FURTHER THAT the Board be and is hereby authorized to take necessary steps for listing of the
Securities allotted, on the exchanges where the Company's equity shares are listed as per the terms and conditions of
the listing agreement entered into with the stock exchanges and other applicable guidelines, rules and regulations.
RESOLVED FURTHER THAT the Board/Committee be and is hereby authorized to modify or amend any of the terms
and conditions of the ESOP Scheme - 2013 as it may deem fit from time to time in its sole and absolute discretion in
conformity with provisions of the Companies Act, 1956, the Memorandum and Articles of Association of the Company
and the Guidelines.
RESOLVED FURTHER THAT for the purpose of giving effect to the above Resolution, the Board be and is hereby
authorized to do all such acts, deeds and things and to execute all such deeds, documents, instruments and writings
as it may in its sole and absolute discretion deem necessary or expedient and to settle any question, difficulty or
doubt that may arise in regard thereto.”
8. To consider and, if thought fit, to pass, with or without modification, the following resolution as a Special Resolution:
“RESOLVED THAT pursuant to the provisions of Section 81(1A) and other applicable provisions, if any, of the
Companies Act, 1956 including any amendments thereto, and all other applicable provisions, if any, of the Companies
Act, 1956 ("the Act") and in accordance with the provisions of the Memorandum and Articles of Association of the
Company, provisions of the Securities & Exchange Board of India (Employee Stock Option Scheme and Employee
Stock Purchase Scheme) Guidelines, 1999 as amended from time to time (hereinafter referred to as "the Guidelines"),
the Listing Agreement entered into with the Stock Exchanges where the securities of the Company are listed or other
relevant authority from time to time, to the extent applicable and subject to such other conditions and modifications as
may be prescribed or imposed while granting such approvals, permissions and sanctions, which may be agreed to by
the Board of Directors of the Company (hereinafter referred to as "the Board" which term shall include a duly
authorized and constituted Committee of Directors) the consent and the approval of the Company be and is hereby
accorded to the Board to create, offer and grant, issue and allot at any time to or to the benefit of such person(s)
who are in permanent employment of the Subsidiary Company(ies), including Directors of the Subsidiary
02

Company(ies), whether working in India or abroad or otherwise, except the Promoter Directors under Employees Stock
Option Scheme- 2013 ("the ESOP Scheme - 2013") such number of equity linked instruments (including warrants /
options / Restricted Stock Units ("RSU's") and/or performance options, exercisable into equity shares, hereinafter
collectively referred to as "Securities"), which shall not in aggregate exceed 9,00,000 (Nine Lakhs) or 2% of the paid-up
equity share capital of the Company as referred to in resolution no. 7 above as on the date of grant of option(s)
convertible into equivalent number of Securities (in case of bonus and rights issues and split of shares, the aggregate
number of stock options would increase in the proportion of bonus and rights and split of shares), at such price, in
one or more tranches and on such terms and conditions as may be fixed or determined by the Board / Committee.
RESOLVED FURTHER THAT the said Securities may be granted / allotted directly to such employees / directors of
the Company in accordance with the ESOP Scheme – 2013.
RESOLVED FURTHER THAT the issue of Securities to any non-resident employee(s), non-resident Director(s) shall be
subject to approval(s), permissions or consents as may be necessary from the Reserve Bank of India or any other
relevant authority in this regard, if any.
RESOLVED FURTHER THAT the new equity shares to be issued and allotted by the Company in the manner
aforesaid shall rank pari-passu in all respects with the existing equity shares of the Company.
RESOLVED FURTHER THAT the Company conform to the accounting policies prescribed from time to time under the
Guidelines.
RESOLVED FURTHER THAT the Board be and is hereby authorized to take necessary steps for listing of the
Securities allotted, on the exchanges where the Company's equity shares are listed as per the terms and conditions of
the listing agreement entered into with the stock exchanges and other applicable guidelines, rules and regulations.
RESOLVED FURTHER THAT the Board / Committee be and is hereby authorized to modify or amend any of the
terms and conditions of the ESOP Scheme - 2013 as it may deem fit from time to time in its sole and absolute
discretion in conformity with provisions of the Companies Act, 1956, the Memorandum and Articles of Association of
the Company and the Guidelines.
RESOLVED FURTHER THAT for the purpose of giving effect to the above Resolution, the Board be and is hereby
authorized to do all such acts, deeds and things and to execute all such deeds, documents, instruments and writings
as it may in its sole and absolute discretion deem necessary or expedient and to settle any question, difficulty or
doubt that may arise in regard thereto.”
9. To consider and, if thought fit, to pass, with or without modification, the following resolution as a Special Resolution:
“RESOLVED THAT pursuant to the provisions of Section 81(1A) and other applicable provisions, if any, of the
Companies Act, 1956, ('the Act') (including any statutory amendments thereto or modifications or re-enactments
thereof for the time being in force) and in accordance with the provisions of the Memorandum and Articles of
Association of the Company and in accordance with the Regulations/Guidelines, if any, prescribed by the Securities
and Exchange Board of India (SEBI), the Reserve Bank of India (RBI), the Foreign Exchange Management Act, 1999
(FEMA), the provisions of the Issue of Foreign Currency Convertible Bonds (Through Depository Mechanism) Scheme,
1993 (including any statutory amendments thereto or modifications or re-enactments thereof for the time being in
force) and the Listing Agreement entered into by the Company with the Stock Exchanges where the shares of the
Company are listed and all other applicable Laws and Regulations framed/issued by any appropriate or statutory
authority and subject to the Company obtaining all approvals, consents, permissions and sanctions as may be
required from the Government of India (GOI) and RBI, SEBI, Stock Exchanges and any and all governmental or
regulatory authorities and subject to such conditions and modifications as may be prescribed or imposed whilst
granting such approvals, consents, permissions and sanctions; provided that such conditions and modifications as
may be prescribed or imposed whilst granting such approvals, permissions and sanctions are acceptable to the Board
of Directors of the Company (hereinafter referred to as "the Board" which term shall be deemed to include "Committee"
as may be constituted by the Board), the consent and approval of the Company be and is hereby accorded to the
Board for issuance of the Company's securities (as defined below) in pursuance of one or more International or
Domestic Public Offerings, by way of direct issuance and allotment of shares or other securities including in the form
of Global Depository Receipts (GDRs) and/or American Depository Receipts (ADRs); and/or any other security linked
to shares; and/or any other convertible instruments or securities such as Bonds, Convertible Debentures, Foreign
Currency Convertible Bonds (FCCBs), Convertible Warrants (hereinafter referred to as Securities) to be subscribed by
03

04
Foreign/Domestic Investors including but not limited to Non Resident Indians (NRIs), Foreign Institutional Investors
(FIIs), Qualified Institutional Buyers (QIBs), Mutual Funds, Foreign banks, Foreign nationals/companies and/or
Corporate Bodies and/or individuals or otherwise, whether or not such investors are Members of the Company, in any
Foreign Currency or Indian Rupees, subject to such conditions as the Board / Committee may consider appropriate,
provided that the amount for which the Securities are to be issued shall not exceed ` 10,000,000,000 (Rupees One
Thousand Crores) or its equivalent of any other Foreign currencies in one or more tranches and shall be in
accordance with all applicable laws and Regulations. The Board / Committee be and is hereby authorized subject to
applicable laws and regulations to issue, the aforesaid Securities to the investors, in such manner as they may deem
appropriate in their absolute discretion, including the pricing and conversion, the form and the persons to whom the
Securities may be issued and all other terms and conditions connected therewith, in one or more tranches and at a
market price and/or at a premium to market price(s), and if necessary, in consultation with the Lead Managers and/or
Underwriters and/or other Advisors of the Company concerned with the offering, as they may deem appropriate.
RESOLVED FURTHER THAT in the event of issue of equity shares and/or other convertible Securities by way of a
Qualified Institutions Placement, the 'Relevant Date' means (i) in case of allotment of equity shares, the date of the
meeting in which the Board of Directors of the Company or the committee of Directors duly authorised by the Board
of Directors of the Company decides to open the proposed issue; (ii) in case of allotment of eligible convertible
securities, either the date of the meeting in which the Board of Directors of the Company or the committee of
Directors duly authorised by the Board of Directors of the Company decides to open the issue of such convertible
securities or the date on which the holders of such convertible securities become entitled to apply for the equity
shares, subsequent to the receipt of Members' approval in terms of Section 81(1A) and other applicable provisions, if
any, of the Act and other applicable laws, regulations and guidelines in relation to the proposed issue of the Securities
and allowed under the SEBI Regulations from time to time.
RESOLVED FURTHER THAT in the event of issue of Securities other than through a Qualified Institutions Placement
to Qualified Institutional Buyers, the relevant date on the basis of which price of the resultant Securities shall be
determined, shall be as specified under the respective applicable laws prevalent at that time.
RESOLVED FURTHER THAT without prejudice to the generality, the issuance of the securities may have to be subject
to such terms or conditions as are in accordance with prevalent market practices and applicable Laws and
Regulations including but not limited to the terms and conditions relating to payment of dividend, premium, the terms
of issue of additional shares or variations in the price or period of conversion of securities into equity shares or terms
pertaining to voting rights or conversion rights and that the Company is also entitled to enter into and execute all such
arrangements with Lead Managers, Underwriters, Guarantors, Depositories, Custodians and all such Agencies as may
be involved or concerned in such offering of securities and to remunerate all such Agencies including by way of
commissions, brokerage, fees or the like, also to seek the listing of such securities or securities representing the same
in one or more Domestic/International Stock Exchanges, in accordance with all applicable laws and regulations.
RESOLVED FURTHER THAT the Company and/or any Agencies or Bodies as are authorized by the Board /
Committee may issue Depository Receipts (including by way of GDRs or ADRs or FCCBs) represented by underlying
shares in the capital of the Company or such other Securities as may be required with such features and attributes as
are prevalent in International / Domestic Capital Markets for instruments of this nature and to provide for the tradability
and free transferability thereof in accordance with market practices and subject to applicable laws and regulations and
the Articles of Association of the Company.
RESOLVED FURTHER THAT the Securities issued in foreign markets shall be deemed to have been made abroad
and/or in the market and/or at the place of issue of the securities in the International market and may be governed by
applicable laws.
RESOLVED FURTHER THAT the Board/Committee be and is hereby authorized to issue and allot such number of
Securities as may be required to be issued and allotted upon conversion of any Securities (referred to above) or as
may be necessary in accordance with the terms of the offering. The equity shares so issued and allotted upon
conversion of underlying Securities shall rank in all respects pari-passu with the existing equity shares of the Company.
RESOLVED FURTHER THAT for the purpose of giving effect to any issuances, offerings or allotments of Securities as
described above, the Board / Committee be and is hereby authorized, on behalf of the Company, to do all such acts,
deeds, matters and things as the Board may, in its absolute discretion, deem necessary or desirable, for such
purpose, including without limitation, entering into arrangements for managing, underwriting, marketing, listing, trading,
and appointing Lead Managers, Underwriters, Guarantors, Depositories, Custodians, Registrars and such other

05
agencies and to issue any Prospectus or Offering Documents and sign, deliver or modify the same and all other
required applications, filings, deeds, documents and writings and to pay any fees, commissions, remuneration and
expenses relating to the Offerings and with power on behalf of the Company to settle all questions, difficulties or
doubts, that may arise in regard to such Offerings as the Board may, in its absolute discretion, deem fit.
RESOLVED FURTHER THAT the Board be and is hereby authorized to delegate all or any of the powers described
above to any Directors and/or Officers and/or any Committee of Directors of the Company.”
10. To consider and, if thought fit, to pass, with or without modification, the following resolution as a Special Resolution:
“RESOLVED THAT pursuant to the provisions of Section 372A and all other applicable provisions, if any, of the
Companies Act, 1956 (including any statutory modification(s) or re-enactment thereof, for the time being in force) and
subject to such other approval / consent as may be required, the consent of the Company be and is hereby accorded
to the Board of Directors of the Company (hereinafter referred to as “the Board”, which term shall include any
committee constituted by the Board or any person(s) authorized by the Board to exercise the powers conferred on the
Board by this Resolution) to make investment, in one or more tranches, by way of subscription, purchase or otherwise,
in any securities comprising of equity shares, convertible or non-convertible preference shares and/or optionally
convertible debentures, in FT Projects Limited, for an amount not exceeding ` 50 Crores (Rupees Fifty Crores only).
RESOLVED FURTHER THAT in addition to the above investments, the Board be and is hereby authorised to give
loans and/or guarantees and/or provide security, under Section 372A and other applicable provisions of the
Companies Act, 1956, to or on behalf of FT Projects Limited upto an aggregate amount of ` 100 Crores (Rupees One
Hundred Crores only).
RESOLVED FURTHER THAT the Board be and is hereby authorized to negotiate and finalise the terms and
conditions of the said investments, loans, guarantees and provision of security on behalf of the Company as it may
deem fit in the interest of the Company, to take all such actions and to settle all matters arising out of and incidental
thereto, and to sign and execute all deeds, applications, documents and writings that may be required, on behalf of
the Company, in connection with such investments, loans, guarantees and provision of security and generally to do all
such acts, deeds and things that may be necessary, proper, expedient or incidental for the purpose of giving effect to
this Resolution.”
By Order of the Board
sd/-
Naishadh P. Desai
Sr. VP (Legal) & Company Secretary
Place: MumbaithDate: 30 July 2013
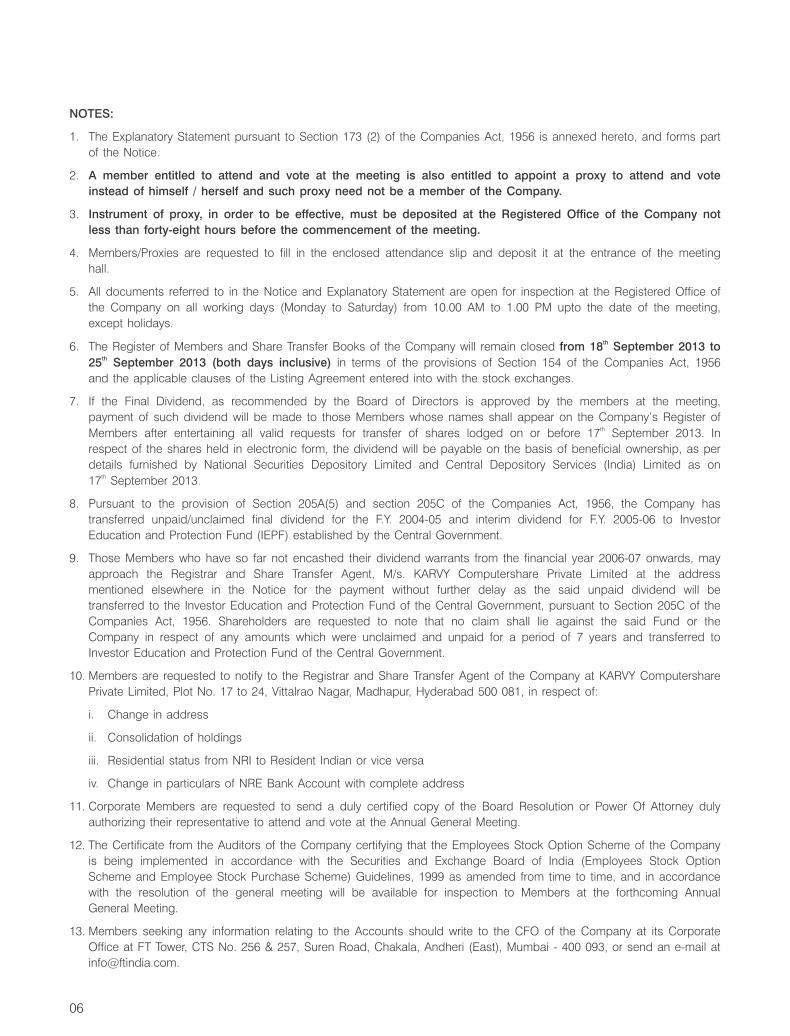
06
NOTES:
1. The Explanatory Statement pursuant to Section 173 (2) of the Companies Act, 1956 is annexed hereto, and forms part
of the Notice.
2. A member entitled to attend and vote at the meeting is also entitled to appoint a proxy to attend and vote
instead of himself / herself and such proxy need not be a member of the Company.
3. Instrument of proxy, in order to be effective, must be deposited at the Registered Office of the Company not
less than forty-eight hours before the commencement of the meeting.
4. Members/Proxies are requested to fill in the enclosed attendance slip and deposit it at the entrance of the meeting
hall.
5. All documents referred to in the Notice and Explanatory Statement are open for inspection at the Registered Office of
the Company on all working days (Monday to Saturday) from 10.00 AM to 1.00 PM upto the date of the meeting,
except holidays.
th6. The Register of Members and Share Transfer Books of the Company will remain closed from 18 September 2013 to th25 September 2013 (both days inclusive) in terms of the provisions of Section 154 of the Companies Act, 1956
and the applicable clauses of the Listing Agreement entered into with the stock exchanges.
7. If the Final Dividend, as recommended by the Board of Directors is approved by the members at the meeting,
payment of such dividend will be made to those Members whose names shall appear on the Company’s Register of thMembers after entertaining all valid requests for transfer of shares lodged on or before 17 September 2013. In
respect of the shares held in electronic form, the dividend will be payable on the basis of beneficial ownership, as per
details furnished by National Securities Depository Limited and Central Depository Services (India) Limited as on th17 September 2013.
8. Pursuant to the provision of Section 205A(5) and section 205C of the Companies Act, 1956, the Company has
transferred unpaid/unclaimed final dividend for the F.Y. 2004-05 and interim dividend for F.Y. 2005-06 to Investor
Education and Protection Fund (IEPF) established by the Central Government.
9. Those Members who have so far not encashed their dividend warrants from the financial year 2006-07 onwards, may
approach the Registrar and Share Transfer Agent, M/s. KARVY Computershare Private Limited at the address
mentioned elsewhere in the Notice for the payment without further delay as the said unpaid dividend will be
transferred to the Investor Education and Protection Fund of the Central Government, pursuant to Section 205C of the
Companies Act, 1956. Shareholders are requested to note that no claim shall lie against the said Fund or the
Company in respect of any amounts which were unclaimed and unpaid for a period of 7 years and transferred to
Investor Education and Protection Fund of the Central Government.
10. Members are requested to notify to the Registrar and Share Transfer Agent of the Company at KARVY Computershare
Private Limited, Plot No. 17 to 24, Vittalrao Nagar, Madhapur, Hyderabad 500 081, in respect of:
i. Change in address
ii. Consolidation of holdings
iii. Residential status from NRI to Resident Indian or vice versa
iv. Change in particulars of NRE Bank Account with complete address
11. Corporate Members are requested to send a duly certified copy of the Board Resolution or Power Of Attorney duly
authorizing their representative to attend and vote at the Annual General Meeting.
12. The Certificate from the Auditors of the Company certifying that the Employees Stock Option Scheme of the Company
is being implemented in accordance with the Securities and Exchange Board of India (Employees Stock Option
Scheme and Employee Stock Purchase Scheme) Guidelines, 1999 as amended from time to time, and in accordance
with the resolution of the general meeting will be available for inspection to Members at the forthcoming Annual
General Meeting.
13. Members seeking any information relating to the Accounts should write to the CFO of the Company at its Corporate
Office at FT Tower, CTS No. 256 & 257, Suren Road, Chakala, Andheri (East), Mumbai - 400 093, or send an e-mail at

14. Members are requested to bring their copies of Annual Report for the meeting. Members holding shares in physical
form are requested to get them dematerialized, as the shares of the Company are traded under compulsory demat
system.
15. The Securities and Exchange Board of India (SEBI) has notified that, submission of Permanent Account Number (PAN)
is compulsorily required for participating in the securities market, deletion of name of deceased shareholder or
transmission/transposition of shares. Members holding shares in dematerialized mode are requested to submit their
PAN details to their Depository Participant, whereas members holding shares in physical form are requested to submit
the PAN details to the Company’s Registrars and Transfer Agents.
16. Re-appointment of Directors: Mr. Ravi Sheth and Mr. C. M. Maniar retire by rotation at the ensuing Annual General
Meeting. Both the Directors, being eligible, offer themselves for re-appointment. The information relating to Mr. Ravi
Sheth and Mr. C. M. Maniar to be provided in terms of Clause 49 of the Listing Agreement entered into with the stock
exchanges is annexed herewith.
17. As per Green Initiative in Corporate Governance initiated by the Ministry of Corporate Affairs, members are requested
to register their e-mail address with the Company’s Registrar and Share Transfer Agent, M/s. KARVY Computershare
Private Limited to receive the Annual Report and other Communication(s) from the Company in electronic mode.
By Order of the Board
sd/-
Naishadh P. Desai
Sr. VP (Legal) & Company Secretary
Place: MumbaithDate: 30 July 2013
07

08
EXPLANATORY STATEMENT PURSUANT TO SECTION 173 OF THE COMPANIES ACT, 1956:
Item No. 6
The Company seeks the approval of shareholders for payment of commission to the Non-Executive Directors
considering their continuous valuable contribution in directing the strategy and growth of the Company, upto 1% of the
Company’s net profit as calculated under Section 349 and 350 of the Companies Act, 1956, from the financial year
2013-14 onwards to be distributed amongst the Directors as may be decided by the Board from time to time.
Accordingly, the Board commends passing of the resolution as set out at item no.6 of the accompanying notice.
Mr. Ravi Sheth, Mr. Chandrakant Kamdar, Mr. R. Devarajan, Mr. P. R. Barpande and Mr. C. M. Maniar, in their capacity
as Non-executive Directors may be deemed to be interested in the Resolution.
Item No. 7 & 8
Issue of ESOP to employees (including employees of Subsidiary Companies) under ESOP Scheme 2013.
Employee Stock Option Plans (ESOP) gives an opportunity to employees to participate in the growth of the Company
and is an effective means of recognizing and rewarding the employees. ESOP Schemes enhance retention of
employee talent and contribute to the success of the Organization.
As recommended by the Remuneration & Compensation Committee, the Board of Directors (hereinafter referred to as th‘the Board’) at its meeting held on 30 July 2013 has approved & recommended the Employees Stock Option
Scheme 2013 (‘the ESOP Scheme - 2013’) in accordance with the Employee Stock Option Scheme & Employee
Stock Purchase Scheme (‘Guidelines’) of the Securities and Exchange Board of India (SEBI).
Accordingly, approval of members is being sought to approve ESOP Scheme - 2013.

09
Disclosures as per Regulation 6.2 of the SEBI (Employee Stock Option Scheme and Employee Stock Purchase Scheme)
Guidelines, 1999 as amended:
Equity linked instruments (including warrants / options / Restricted
Stock Units (“RSU’s”) and performance options which shall not
exceed 9,00,000 (Nine Lakhs) or 2% of the paid up equity share
capital (each instrument after it is vested being exercisable for one
fully paid-up equity share on payment to the Company at price(s) to
be determined in accordance with the Scheme) will be available for
being granted to eligible employees and Directors of the Company. In
case of bonus & rights issues and split of shares, the aggregate
number of stock options would increase in the proportion of bonus &
rights and split of shares.
All the permanent employees (including employees of the subsidiary
companies) who have completed one year (12 months) of service in
the Company working in India or out of India and who continues to
be an employee upto the date of the grant including the Director(s)
of the Company shall be eligible to receive grants under the ESOP
Scheme, or as may be determined by the Committee, except the
Directors belonging to the promoter group who are not eligible to
participate in the ESOP Scheme as per the SEBI Guidelines. The
eligibility of any given employee or class of employees for the grant
of any option shall be as determined by the Remuneration &
Compensation Committee based on such parameters as it may deem
fit. The options granted to an employee will not be transferable to
any person.
Vesting shall commence on the expiry of twelve months from the date
of grant of stock option(s) and the entitlement to vesting will be in
the following manner; or as may be determined by the Committee
from time to time.
The options would be issued at the “Market Price” of the shares,
which would be the latest available closing price on the Stock
Exchange, which records the highest trading volume in the
Company’s equity shares on the date prior to the date of the meeting
of the Board / Remuneration & Compensation committee at which the
options are granted or at such price as may be determined by the
Remuneration & Compensation Committee.
Total number of Options to be
granted under the scheme
Identification of classes of
employees entitled to participate in
the ESOP
Vesting, Requirement of vesting
and maximum period of Vesting
Exercise Price of Pricing Formula
1.
2.
3.
4.
Sr. No Particulars Disclosures
End of 12 months
End of 24 months
End of 36 months
Period of service from the date of grant of Stock Options
Percentage of stock options that shall vest
20%
30%
50%

10
Approval of members is sought in terms of Section 81(1A) of the Companies Act, 1956 and also in terms of
Securities and Exchange Board of India (Employee Stock Option Scheme & Employee Stock Purchase Scheme)
Guidelines, 1999 for issue of equity shares of the Company under the Scheme.
All the Directors except Mr. Jignesh Shah, Chairman & Managing Director, Mr. Dewang Neralla and Mr. Manjay Shah,
Whole-time Directors of the Company may be deemed to be interested or concerned in the Resolutions to the extent
of stock options/equity shares that could be granted / issued to them under the Scheme.
The Board recommends the Resolutions for your approval.
The employees shall after vesting of the options, exercise the options
within a period of three months or within such time as may be
decided / allowed by the Remuneration & Compensation Committee
by making the application and the payment in such manner and on
such terms and conditions and on execution of such documents as
may be decided by the Board / Remuneration & Compensation
Committee.
Due to non-exercise or resignation of any employee or for any other
reason whatsoever, un-used stock options earmarked under this
scheme may be re-issued to the eligible employees of the Company
as may be decided by the Remuneration & Compensation
Committee.
The Remuneration & Compensation Committee will be entitled to
select employees in each grade, who shall be eligible for options
under ESOP scheme - 2013. The selection will be based on
employees performance, exceptional contribution, length of service,
present grade and compensation structure, integrity and behaviors
and or such other basis as the committee may deem fit.
The maximum number of options to be granted to any employee in
any one year shall not exceed 1% of the Issued equity share capital
of the Company.
Intrinsic Value method / or such other method as may be announced /
prescribed as per the Guidelines.
The Company shall conform to the accounting policies specified in
clause 13.1 of Securities and Exchange Board of India (Employee
Stock Option Scheme & Employee Stock Purchase Scheme)
Guidelines, 1999.
In case the Company calculates the Employee compensation cost
using the intrinsic value of the stock options, the difference between
the employee compensation cost so computed and the employee
compensation cost that shall have been recognized if it had used
the fair value of stock options, shall be disclosed in the Directors’
Report and also the impact of this difference on profits and on EPS
of the Company shall also be disclosed in the Directors’ Report.
Exercise period and process of
Exercise
Appraisal Process
Maximum number of options to be
granted per employee and in
aggregate
Method of Valuation of options
Disclosure and Accounting
5.
6.
7.
8.
9.
Sr. No Particulars Disclosures

11
Item no. 9:
The Company continues to explore growth opportunities in domestic/overseas market to establish itself as an
International player. The Company is exploring possibilities for acquisition of target companies in domestic/overseas
market, to cater to the future growth opportunities, the Company might require additional funds/resources for which an
enabling resolution is placed before this meeting for approval. Such funds would be used for meeting the expansion,
acquisitions, modernization, infrastructure projects, normal capital expenditure, general corporate purposes and
restructuring of debt as per the regulations of the authorities.
The detailed terms and conditions of the issue as and when made will be determined by the Board in consultation
with the Lead Managers, Advisors, Underwriters and other experts in accordance with the terms of approval of the
Government of India, Reserve Bank of India and such other authorities as may be required.
Section 81 of the Companies Act, 1956 provides inter alia that where it is proposed to increase the subscribed share
capital of the Company by allotment of further shares, such further shares should be offered to the persons who at
the date of the offer were holders of equity shares of the Company, in proportion to the capital paid up on those
shares as of that date unless the shareholders in a General Meeting decide otherwise. Thus the consent of the equity
shareholders is sought for authorizing the Board to make the proposed issue of Securities. In the event it is decided
to issue securities convertible into equity shares, authorization is also sought for issuing to the holders of such
convertible securities in such manner and such number of equity shares on conversion as may be required to be
issued in accordance with the terms of issue.
With respect to Qualified Institutions Placement, the Special Resolution also authorizes the Board of Directors of the
Company to undertake a Qualified Institutions Placement with Qualified Institutional Buyers (QIBs) in the manner as
prescribed under SEBI ICDR Regulations. The pricing of the Securities to be issued to QIBs pursuant to the said
SEBI Regulations shall be freely determined subject to such price not being less than the price calculated in
accordance with the relevant provisions of the said SEBI Regulations.
The Resolution gives adequate flexibility and discretion to the Board/Committee to finalize the terms of the issue, in
consultation with the Lead Managers, Legal Advisors, Underwriters and other Experts or such other Authorities as
need to be consulted including in relation to the pricing of the issue which will be a free market pricing and may be
at a premium to the market price in accordance with the normal practice. The Resolutions also give powers to the
Board/Committee to issue and market the Securities issued pursuant to the domestic/international offer including the
power to issue such Securities in such tranche or tranches with/without voting rights.
The Board recommends the Resolution for your approval.
None of the Directors of the Company are concerned or interested in the Resolution.
Item no.10:
FT Projects Limited (“FPL”), presently a wholly owned subsidiary (“WOS”) of your Company is mainly carrying on
business in infrastructure related activities to cater future expansion plans of the Company. The Board of Directors of
your Company has recommended collectively to invest and/or give loan and/or provide guarantee and/or Security upto
` 150 crores in FT Projects Ltd. in one or more tranches as and when required.
The Company is in compliance of provision of Section 372A of the Companies Act, 1956 and even though FPL being
a WOS of the Company, as a matter of prudence, this is being placed before the shareholders for their approval.
None of the Directors of the Company is deemed to be concerned or interested in the Resolution except Mr. Dewang
Neralla, who is the common Director on the Board of both the companies.
By Order of the Board
sd/-
Naishadh P. Desai
Sr. VP (Legal) & Company Secretary
Place: MumbaithDate: 30 July 2013

Details of Directors seeking re-appointment at the forthcoming Annual General Meeting
(Pursuant to Clause 49 of the Listing Agreement)
Name of the Director
Date of Birth
Date of appointment on the
Board
Qualifications
Expertise
Directorship held in other
companies (excluding
foreign and private
companies)
Membership / Chairmanship
of committees across
public companies
Number of shares held in
the Company
Mr. Ravi K. Sheth
02-04-1961
15-09-1994
B.Com. MBA (Babson College, Wellesley, USA)
Business experience of over 27 years
Greatship (India) Ltd.,
The Great Eastern Shipping co. Ltd.,
-
24,89,762
Mr. C. M. Maniar
04-12-1935
15-10-2010
B.Com., L.L.B., M.A. (Economics & Politics)
Over four decades of experience in
Legal Profession, Senior Partner of Crawford
Bayley & Co., Solicitors & Advocates.
Multi Commodity Exchange of India Ltd., Foods
& Inns Ltd, Godfrey Phillips India Ltd, Gujarat
Ambuja Exports Ltd, Hindalco Industries Ltd,
Indo-Euro Investment Company Ltd, The Indian
Card Clothing Company Ltd, Pioneer
Investcorp Ltd, Sudal Industries Ltd, TCPL
Packaging Ltd, Varun Shipping Company Ltd,
Utkal Alumina International Ltd.
Membership: 8
Nil
Directors retiring by rotation, being eligible, offering themselves for re-appointment
12

Full name of the Member attending
(in block letters)
Full name of the first joint holder
(to be filled in, if first named joint holder does not attend the meeting)
Name of the Proxy
(to be filled in, if the proxy form has been duly deposited with the company)
thI hereby record my presence at the Twenty Fifth Annual General Meeting of the Company to be held on Wednesday, the 25
day of September 2013 at Sri P. Obul Reddy Hall (Vani Mahal), 103, G. N. Chetty Road, T. Nagar, Chennai - 600 017 at 2.00 p.m.
No. of shares held :
Regd Folio No. :
DP ID/Client ID.* : Members/Proxy Signature
(To be signed at the time of handing over of this slip.)
*Applicable to the members whose shares are held in dematerialized form
Note: Shareholders are requested to bring their copies of Annual Report to the meeting.
Attendance Slip[To be handed over at the entrance of the meeting hall]
FINANCIAL TECHNOLOGIES (INDIA) LIMITEDstRegd. Office: Doshi Towers, 1 Floor, 1A & B, 156, Periyar EVR Salai, Kilpauk, Chennai – 600 010.
Proxy Form
FINANCIAL TECHNOLOGIES (INDIA) LIMITEDstRegd. Office: Doshi Towers, 1 Floor, 1A & B, 156, Periyar EVR Salai, Kilpauk, Chennai – 600 010.
I/We
of in the district of
being a member(s) of the above named Company, hereby appoint Mr./Ms.
of in the district of
or failing him/her Mr./Ms. of
in the district of as my/our proxy to vote for me/us on my/our behalf at the Twenty Fifth thAnnual General Meeting of the Company to be held on Wednesday, the 25 day of September 2013 at 2.00 p.m. and at
any adjournment thereof.
Signed this day of , 2013
No. of Shares held :
Regd. Folio No. :
DP ID/Client ID No* :
*Applicable to the members whose shares are held in dematerialized form
Affix15 paiseRevenueStamp
Signature