0610/63 Cambridge Assessment International Education ...
12
This document consists of 10 printed pages and 2 blank pages. DC (JP/CB) 173502/4 © UCLES 2019 [Turn over *3160326641* BIOLOGY 0610/63 Paper 6 Alternative to Practical October/November 2019 1 hour Candidates answer on the Question Paper. No Additional Materials are required. READ THESE INSTRUCTIONS FIRST Write your centre number, candidate number and name on all the work you hand in. Write in dark blue or black pen. You may use an HB pencil for any diagrams or graphs. Do not use staples, paper clips, glue or correction fluid. DO NOT WRITE IN ANY BARCODES. Answer all questions. Electronic calculators may be used. You may lose marks if you do not show your working or if you do not use appropriate units. At the end of the examination, fasten all your work securely together. The number of marks is given in brackets [ ] at the end of each question or part question. Cambridge Assessment International Education Cambridge International General Certificate of Secondary Education This syllabus is regulated for use in England, Wales and Northern Ireland as a Cambridge International Level 1/Level 2 Certificate.
-
Upload
khangminh22 -
Category
Documents
-
view
1 -
download
0
Transcript of 0610/63 Cambridge Assessment International Education ...
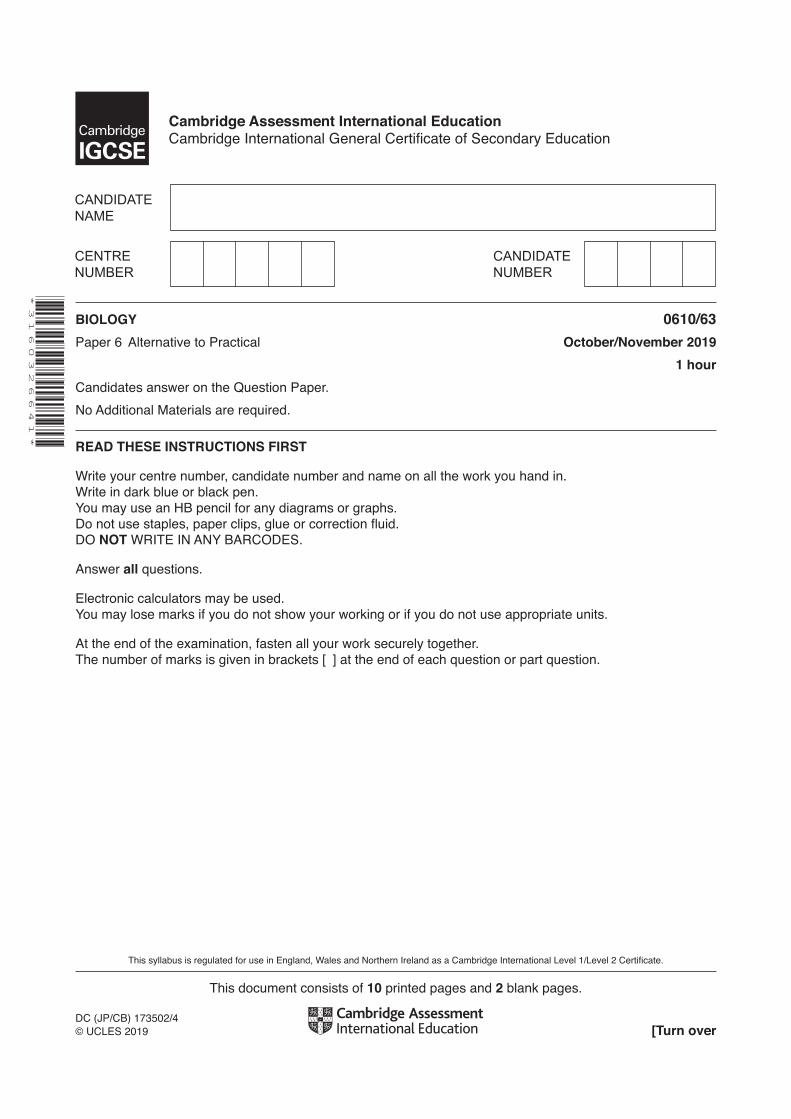
This document consists of 10 printed pages and 2 blank pages.
DC (JP/CB) 173502/4© UCLES 2019 [Turn over
*3160326641*
BIOLOGY 0610/63Paper 6 Alternative to Practical October/November 2019 1 hourCandidates answer on the Question Paper.No Additional Materials are required.
READ THESE INSTRUCTIONS FIRST
Write your centre number, candidate number and name on all the work you hand in.Write in dark blue or black pen.You may use an HB pencil for any diagrams or graphs.Do not use staples, paper clips, glue or correction fluid.DO NOT WRITE IN ANY BARCODES.
Answer all questions.
Electronic calculators may be used.You may lose marks if you do not show your working or if you do not use appropriate units.
At the end of the examination, fasten all your work securely together.The number of marks is given in brackets [ ] at the end of each question or part question.
Cambridge Assessment International EducationCambridge International General Certificate of Secondary Education
This syllabus is regulated for use in England, Wales and Northern Ireland as a Cambridge International Level 1/Level 2 Certificate.

2
0610/63/O/N/19© UCLES 2019
1 Photosynthesis occurs in chloroplasts. A chloroplast suspension can be made by extracting the chloroplasts from green leaves.
The blue dye DCPIP can be used to investigate photosynthesis. During photosynthesis the blue colour of the DCPIP changes and eventually disappears so that it becomes colourless. The remaining mixture appears green due to the chloroplast suspension.
A student investigated the effect of light on photosynthesis in a chloroplast suspension.
Step 1 The student crushed eight green leaves in an ice-cold buffer solution.
Step 2 The mixture of crushed leaves and buffer solution was then filtered to form a chloroplast suspension.
Step 3 The student was given two test-tubes. One test-tube was wrapped in aluminium foil to exclude light. The second test-tube was not covered in foil so that light could reach the contents of this test-tube.
Step 4 A plastic pipette was used to add 2 cm3 of the chloroplast suspension to each of the two test-tubes.
Step 5 A syringe was used to add 5 cm3 of DCPIP solution to both test-tubes. A stopper was placed in each test-tube.
Step 6 Both test-tubes were placed in a water-bath containing ice-cold water. The water-bath was positioned near a bright light.
Step 7 The test-tubes were left in the bright light for five minutes.
Step 8 After five minutes the student observed and noted the colour of the liquid in the test-tube that was not wrapped in foil. They removed the foil from the covered test-tube and observed the colour in this test-tube.
The student’s results are shown in Fig. 1.1.
Fig. 1.1
light
– green
dark
– blue

3
0610/63/O/N/19© UCLES 2019 [Turn over
(a) (i) Prepare a table and record the results from Fig. 1.1.
[2]
(ii) Identify the variable that was changed (independent variable) and the variable that was measured (dependent variable) in this investigation.
independent variable ..........................................................................................................
...........................................................................................................................................
dependent variable .............................................................................................................
........................................................................................................................................... [2] (iii) State two variables that were kept constant in this investigation.
1 .........................................................................................................................................
...........................................................................................................................................
2 .........................................................................................................................................
........................................................................................................................................... [2]
(iv) State a conclusion for these results.
...........................................................................................................................................
...........................................................................................................................................
..................................................................................................................................... [1]

4
0610/63/O/N/19© UCLES 2019
(b) In step 6 both test-tubes were placed in a water-bath containing ice-cold water for five minutes. A thermometer was also placed in the water-bath.
Fig. 1.2 shows the thermometer at the start of the investigation and after five minutes.
30
20
10
0
at the start ofthe investigation
30
20
10
0
after fiveminutes
Fig. 1.2
Record the temperatures shown in Fig. 1.2. Include the units.
temperature at the start of the investigation .............................................................................
temperature after five minutes .................................................................................................. [2]
(c) The investigation was not repeated.
(i) Suggest why it would be advisable to repeat the investigation.
...........................................................................................................................................
...........................................................................................................................................
..................................................................................................................................... [1]
5
0610/63/O/N/19© UCLES 2019 [Turn over
(ii) Identify one other source of error in this investigation and suggest an improvement for this error.
error ....................................................................................................................................
...........................................................................................................................................
improvement ......................................................................................................................
...........................................................................................................................................
........................................................................................................................................... [2]
(d) A student wanted to investigate the effect of temperature on the rate of photosynthesis in a chloroplast suspension.
Describe how the student could carry out this investigation using DCPIP.
...................................................................................................................................................
...................................................................................................................................................
...................................................................................................................................................
...................................................................................................................................................
...................................................................................................................................................
...................................................................................................................................................
...................................................................................................................................................
...................................................................................................................................................
...................................................................................................................................................
...................................................................................................................................................
...................................................................................................................................................
...................................................................................................................................................
............................................................................................................................................. [6]
[Total: 18]

6
0610/63/O/N/19© UCLES 2019
2 Fig. 2.1 is a photomicrograph of part of the lower epidermis of a leaf.
guard cell
M
N
stoma
epidermal cell
magnification ×400
Fig. 2.1
(a) (i) Make a large drawing of Fig. 2.1. Do not label your drawing.
[4]

7
0610/63/O/N/19© UCLES 2019 [Turn over
(ii) Measure the length of the line MN on Fig. 2.1.
length of line MN ................................................ mm
Calculate the actual width of the guard cells and the stoma indicated by line MN in Fig. 2.1. Use the equation and information in Fig. 2.1.
magnification = length of line MN on Fig. 2.1actual width of the guard cells and the stoma
Give your answer to two decimal places.
......................................................... mm [3]
(b) A student investigated the effect of sucrose concentration on stomatal opening.
Strips of epidermis from leaves were placed in different concentrations of sucrose solution for one hour.
The student measured the width of 10 stomatal openings from the epidermis in each sucrose solution.
The results are shown in Table 2.1.
Table 2.1
percentage concentration of
sucrose
width of stomatal opening / μm
1 2 3 4 5 6 7 8 9 10 average
0 5 6 7 5 5 6 7 5 7 6 5.9
5 3 4 3 3 4 3 2 3 3 2
20 1 2 1 2 1 1 5 1 2 1 1.7
(i) Circle one measurement in Table 2.1 that could be anomalous. [1]
(ii) Calculate the average width of stomatal opening in the 5% sucrose solution.
Include the unit.
................................................................ [2]

8
0610/63/O/N/19© UCLES 2019
(c) Pineapple plants are adapted to grow in hot dry conditions.
Scientists investigated the number of stomata open, in pineapple plants, at different times of day.
The data is shown in Table 2.2 (00:00 is midnight).
Table 2.2
time of day average number of stomata open per mm2
00:00 7704:00 6108:00 2212:00 416:00 1020:00 51
(i) Calculate the percentage change in the average number of open stomata per mm2 between 16:00 hours and 20:00 hours.
Space for working.
.............................................................% [2]

9
0610/63/O/N/19© UCLES 2019 [Turn over
(ii) Plot a bar chart on the grid to show the data in Table 2.2.
[3]
(iii) Describe, using your graph, how the average number of open stomata per mm2 changes throughout the day.
...........................................................................................................................................
...........................................................................................................................................
...........................................................................................................................................
...........................................................................................................................................
..................................................................................................................................... [2]

10
0610/63/O/N/19© UCLES 2019
(d) When fruit ripens the starch contained within it is converted into reducing sugars.
(i) State the name of the substance that is used to test for the presence of starch.
..................................................................................................................................... [1]
(ii) Describe how you could safely show a reducing sugar was present in a sample of pineapple fruit juice.
procedure ...........................................................................................................................
...........................................................................................................................................
...........................................................................................................................................
...........................................................................................................................................
...........................................................................................................................................
safety ..................................................................................................................................
..................................................................................................................................... [4]
[Total: 22]

11
0610/63/O/N/19© UCLES 2019
BLANK PAGE

12
0610/63/O/N/19© UCLES 2019
Permission to reproduce items where third-party owned material protected by copyright is included has been sought and cleared where possible. Every reasonable effort has been made by the publisher (UCLES) to trace copyright holders, but if any items requiring clearance have unwittingly been included, the publisher will be pleased to make amends at the earliest possible opportunity.
To avoid the issue of disclosure of answer-related information to candidates, all copyright acknowledgements are reproduced online in the Cambridge Assessment International Education Copyright Acknowledgements Booklet. This is produced for each series of examinations and is freely available to download at www.cambridgeinternational.org after the live examination series.
Cambridge Assessment International Education is part of the Cambridge Assessment Group. Cambridge Assessment is the brand name of the University of Cambridge Local Examinations Syndicate (UCLES), which itself is a department of the University of Cambridge.
BLANK PAGE