Annual Report - 2011 - CITIC Limited
220
Annual Report 2011
-
Upload
khangminh22 -
Category
Documents
-
view
0 -
download
0
Transcript of Annual Report - 2011 - CITIC Limited
Annual Report
2011
02 CITIC Pacific at a glance
04 Chairman’s Letter to Shareholders
Business Review
08 Special Steel
22 Iron Ore Mining
36 Property
48 Other Businesses
52 Financial Review
62 Risk Management
76 10 Year Statistics
77 Human Resources
80 Corporate Social Responsibility
82 Corporate Governance
98 Directors and Senior Managers
102 Directors’ Report
Financial Statements
121 Contents of Financial Statements and Notes
122 Consolidated Profit and Loss Account
123 Consolidated Statement of Comprehensive Income
124 Consolidated Balance Sheet
125 Balance Sheet
126 Consolidated Cash Flow Statement
128 Consolidated Statement of Changes in Equity
130 Notes to the Financial Statements
213 Independent Auditor’s Report
214 Major Properties Held by the Group
216 Definition of Terms
217 Corporate Information
1CITIC Pacific Annual Report 2011
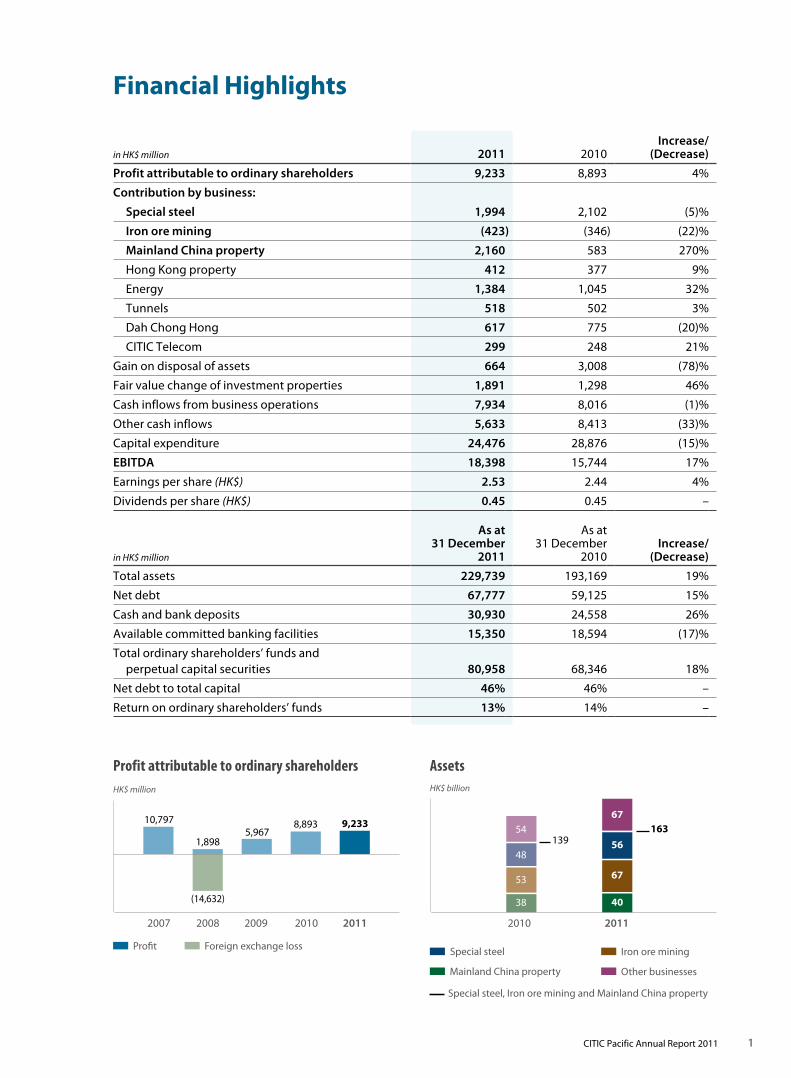
Financial Highlights
in HK$ million 2011 2010Increase/
(Decrease)
Profit attributable to ordinary shareholders 9,233 8,893 4%
Contribution by business:
Special steel 1,994 2,102 (5)%
Iron ore mining (423) (346) (22)%
Mainland China property 2,160 583 270%
Hong Kong property 412 377 9%
Energy 1,384 1,045 32%
Tunnels 518 502 3%
Dah Chong Hong 617 775 (20)%
CITIC Telecom 299 248 21%
Gain on disposal of assets 664 3,008 (78)%
Fair value change of investment properties 1,891 1,298 46%
Cash inflows from business operations 7,934 8,016 (1)%
Other cash inflows 5,633 8,413 (33)%
Capital expenditure 24,476 28,876 (15)%
EBITDA 18,398 15,744 17%
Earnings per share (HK$) 2.53 2.44 4%
Dividends per share (HK$) 0.45 0.45 –
in HK$ million
As at 31 December
2011
As at 31 December
2010Increase/
(Decrease)
Total assets 229,739 193,169 19%
Net debt 67,777 59,125 15%
Cash and bank deposits 30,930 24,558 26%
Available committed banking facilities 15,350 18,594 (17)%
Total ordinary shareholders’ funds and perpetual capital securities 80,958 68,346 18%
Net debt to total capital 46% 46% –
Return on ordinary shareholders’ funds 13% 14% –
48
53
38
139
20112010
Special steel Iron ore mining
Mainland China property
Special steel, Iron ore mining and Mainland China property
Other businesses
HK$ billion
56
54
67
40
67163
Assets
2007 2008 20102009 2011
Profit Foreign exchange loss
HK$ million
(14,632)
1,898
10,7975,967
8,893 9,233
Profit attributable to ordinary shareholders
2 CITIC Pacific Annual Report 2011
CITIC Pacific at a glance
Headquartered in Hong Kong, CITIC Pacific is 58% owned
by CITIC Group Corporation in Beijing and has shareholders
around the world.
CITIC Pacific is a diversified company, with a primary focus on
Special Steel manufacturing, Iron Ore Mining and
Property development in mainland China. These three
business areas together constituted over 70% of total assets at
the end of 2011.
We have a team of professionals who have deep knowledge of
and expertise in developing and operating businesses in China,
Australia and Hong Kong.
Major Businesses
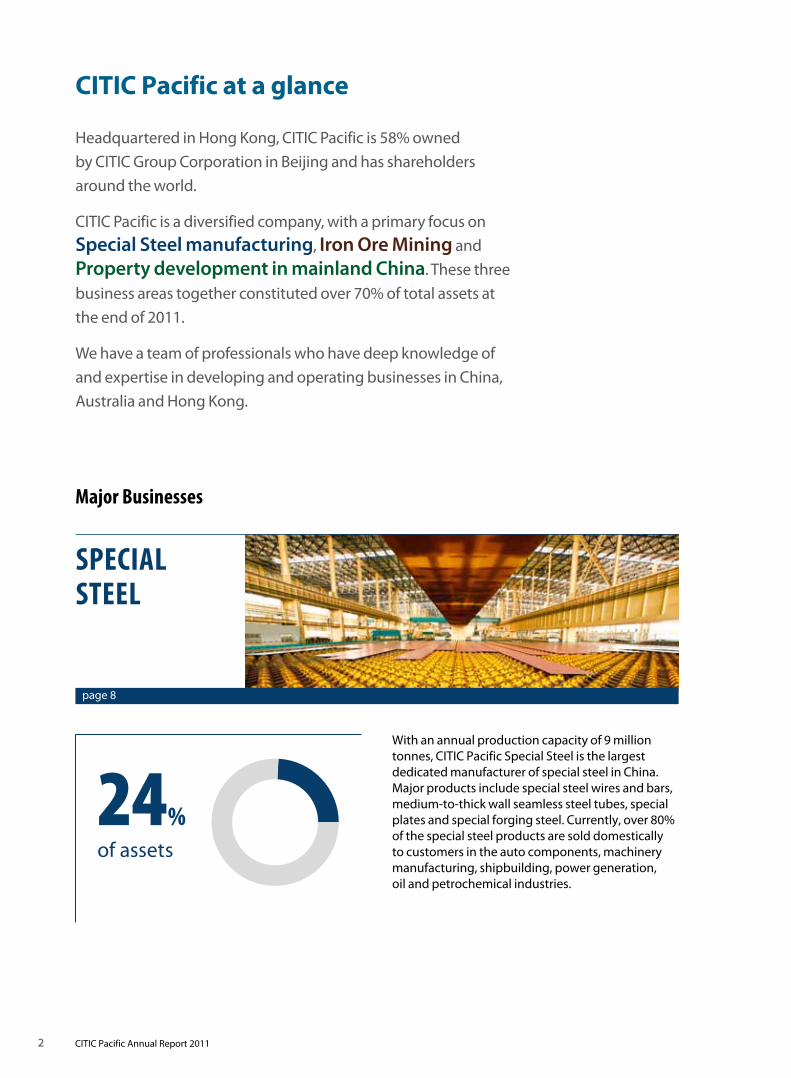
SPECIAL STEEL
page 8
24%of assets
With an annual production capacity of 9 million tonnes, CITIC Pacific Special Steel is the largest dedicated manufacturer of special steel in China. Major products include special steel wires and bars, medium-to-thick wall seamless steel tubes, special plates and special forging steel. Currently, over 80% of the special steel products are sold domestically to customers in the auto components, machinery manufacturing, shipbuilding, power generation, oil and petrochemical industries.
3CITIC Pacific Annual Report 2011
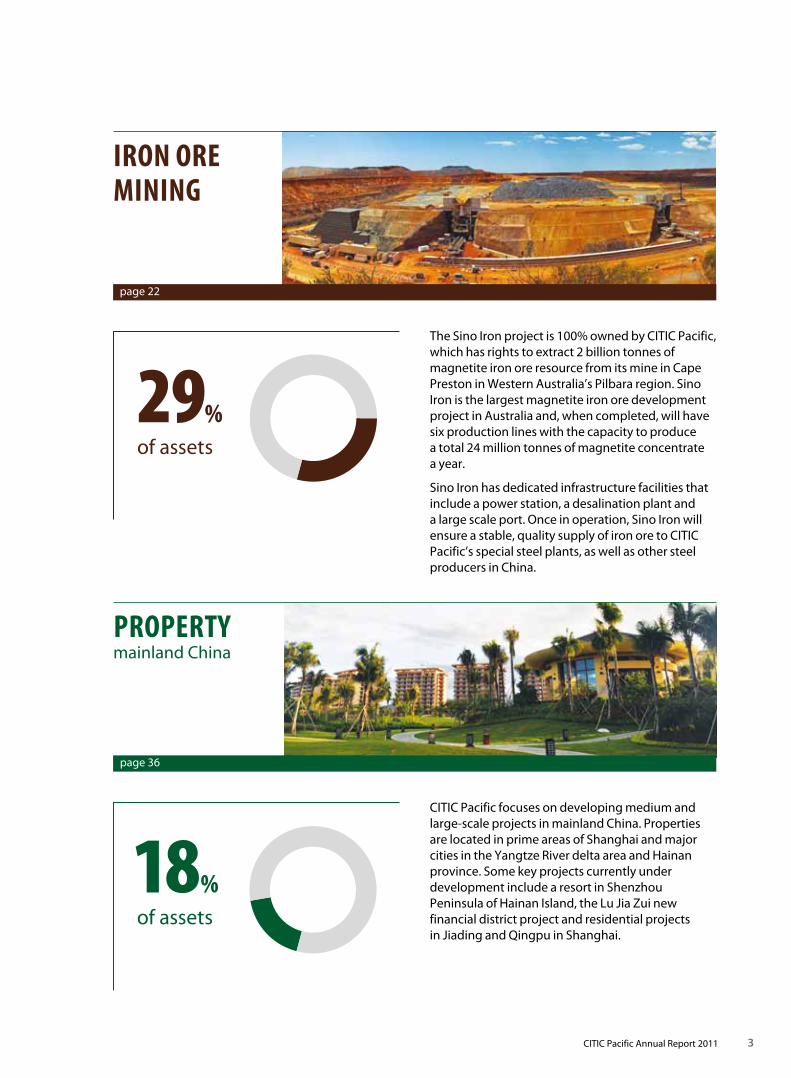
IRON ORE MINING
page 22
29%of assets
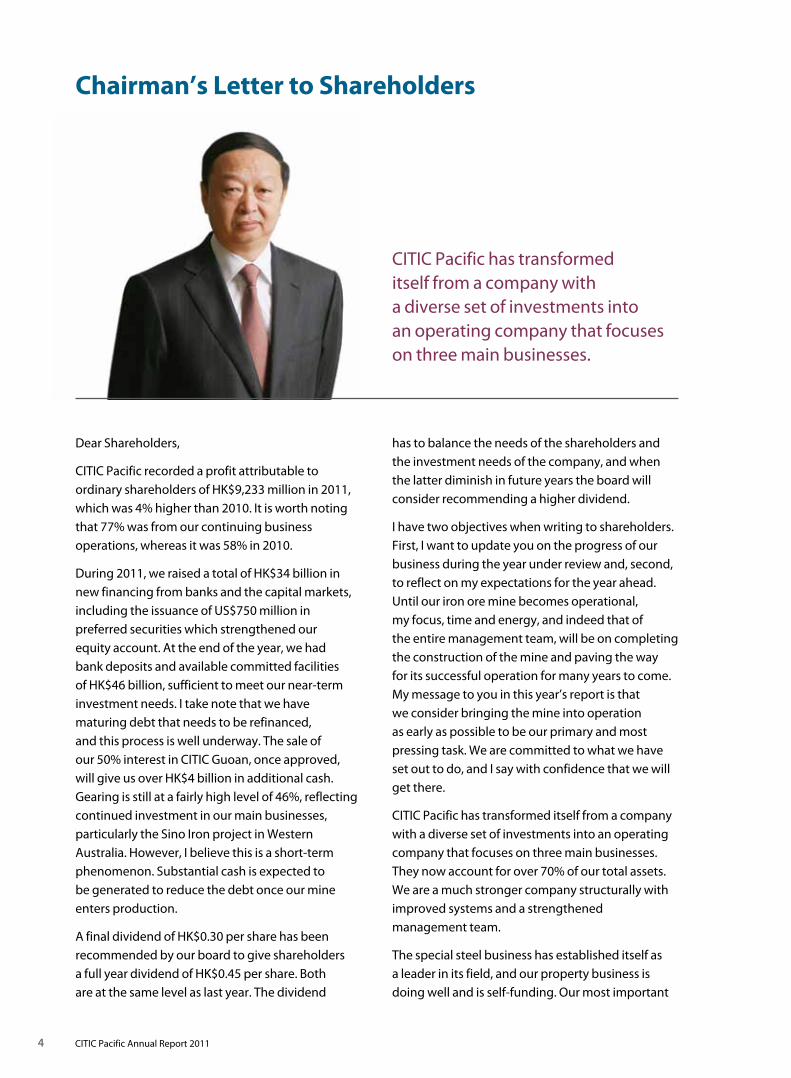
PROPERTymainland China
page 36
18% of assets
The Sino Iron project is 100% owned by CITIC Pacific, which has rights to extract 2 billion tonnes of magnetite iron ore resource from its mine in Cape Preston in Western Australia’s Pilbara region. Sino Iron is the largest magnetite iron ore development project in Australia and, when completed, will have six production lines with the capacity to produce a total 24 million tonnes of magnetite concentrate a year.
Sino Iron has dedicated infrastructure facilities that include a power station, a desalination plant and a large scale port. Once in operation, Sino Iron will ensure a stable, quality supply of iron ore to CITIC Pacific’s special steel plants, as well as other steel producers in China.
CITIC Pacific focuses on developing medium and large-scale projects in mainland China. Properties are located in prime areas of Shanghai and major cities in the Yangtze River delta area and Hainan province. Some key projects currently under development include a resort in Shenzhou Peninsula of Hainan Island, the Lu Jia Zui new financial district project and residential projects in Jiading and Qingpu in Shanghai.
4 CITIC Pacific Annual Report 2011
CITIC Pacific has transformed itself from a company with a diverse set of investments into an operating company that focuses on three main businesses.
Chairman’s Letter to Shareholders
Dear Shareholders,
CITIC Pacific recorded a profit attributable to ordinary shareholders of HK$9,233 million in 2011, which was 4% higher than 2010. It is worth noting that 77% was from our continuing business operations, whereas it was 58% in 2010.
During 2011, we raised a total of HK$34 billion in new financing from banks and the capital markets, including the issuance of US$750 million in preferred securities which strengthened our equity account. At the end of the year, we had bank deposits and available committed facilities of HK$46 billion, sufficient to meet our near-term investment needs. I take note that we have maturing debt that needs to be refinanced, and this process is well underway. The sale of our 50% interest in CITIC Guoan, once approved, will give us over HK$4 billion in additional cash. Gearing is still at a fairly high level of 46%, reflecting continued investment in our main businesses, particularly the Sino Iron project in Western Australia. However, I believe this is a short-term phenomenon. Substantial cash is expected to be generated to reduce the debt once our mine enters production.
A final dividend of HK$0.30 per share has been recommended by our board to give shareholders a full year dividend of HK$0.45 per share. Both are at the same level as last year. The dividend
has to balance the needs of the shareholders and the investment needs of the company, and when the latter diminish in future years the board will consider recommending a higher dividend.
I have two objectives when writing to shareholders. First, I want to update you on the progress of our business during the year under review and, second, to reflect on my expectations for the year ahead. Until our iron ore mine becomes operational, my focus, time and energy, and indeed that of the entire management team, will be on completing the construction of the mine and paving the way for its successful operation for many years to come. My message to you in this year’s report is that we consider bringing the mine into operation as early as possible to be our primary and most pressing task. We are committed to what we have set out to do, and I say with confidence that we will get there.
CITIC Pacific has transformed itself from a company with a diverse set of investments into an operating company that focuses on three main businesses. They now account for over 70% of our total assets. We are a much stronger company structurally with improved systems and a strengthened management team.
The special steel business has established itself as a leader in its field, and our property business is doing well and is self-funding. Our most important
5CITIC Pacific Annual Report 2011
investment, Sino Iron, will help shape our future. Building this mine has been no easy task. I, along with Zhang Jijing, our managing director, and Dr. Hua Dongyi, our senior project leader in Australia, have had many sleepless nights as we set out to do something no one else had done before on this scale, and not on our home territory. We have learned a tremendous amount and the insights we have gained on all fronts have been rich, strengthening our ability to run the company.
Iron Ore MiningLet me address two issues, which I am sure are on your mind: construction progress and the capital required to build the project. Construction of the Sino Iron project is divided into two parts. The first – mining, the building of the power station, desalination plant and port area – is managed directly by CITIC Pacific Mining. The second involves China Metallurgical Corporation (“MCC”), the engineering, procurement and construction contractor for the processing activities such as the concentrators, crushers, slurry pipeline, and related facilities. As mentioned in our December 2011 update, facilities under our direct responsibility are all ready for integrated commissioning. Many areas under MCC’s management have experienced delays. By design, the Sino Iron concentration activity will have six production lines. In the agreement signed in December, MCC committed to having the first and second production lines commence production no later than 31 August and 31 December of 2012.
Significant progress was made in 2011. In addition to getting the power station, desalination plant and port area ready, the 30-kilometre slurry pipeline was also completed. Construction and installation of the processing and dewatering plants for the first production line are in their final phases. Work remaining is mainly related to the installation and testing of instruments as well as electrical and control systems. For the second production line, work on the steel structure, equipment installation, piping and electrical systems has commenced. The four grinding mills that make up lines three and four are now on site.
CITIC Pacific Mining is in the process of taking over equipment procurement and forming a joint task force with MCC to direct work related to the commissioning and safety aspects of the project, even though all these remain the contractual responsibility of MCC.
We agreed in December to pay MCC an additional US$822 million, which brings the total contractual amount for MCC’s work to US$3,407 million. The additional amount is necessary for them to complete the construction and commissioning of the first two production lines as well as the shared facilities for all six lines. We are certainly unhappy about the increased costs. MCC told us that they underestimated the complexity and the amount of work involved in constructing and commissioning a project in Australia. The reality is that construction costs for all mining projects have risen significantly in the last few years due to rising equipment and labour costs as well as the increased value of the Australian dollar. At this point we are at a crucial stage of the project’s development, and we are convinced that changing contractors now would mean further delays and potentially even higher costs. Having given this matter great consideration, we believe that working with MCC to ensure the completion and commissioning of the first two lines is the optimal course.
I am often asked about my view on the future price of iron ore. No one can claim to predict market movements with certainty, and I do not pretend to be an expert on this subject. What I can say is that there are approximately seven billion people on the planet, and most of them are in developing countries. The industrialisation and urbanisation of these developing economies will drive demand for steel and thus for iron ore. CITIC Pacific will not only be selling iron ore, but we will also be using the material ourselves for our special steel plants
We consider bringing the mine into operation as early as possible to be our primary and most pressing task.
6 CITIC Pacific Annual Report 2011
in China, so we are on both ends of the market. This gives us a great strategic advantage in terms of vertical integration. The project will not only provide a secure source of iron ore to our steel plants but also to other steel manufacturers in China. As I am also the Chairman of CITIC Group, I can assure you that CITIC Group has and will continue to provide full support to the future development of the Sino Iron project.
In November 2011, there were two important developments in the Australian parliament. The Minerals Resource Rent Tax (“MRRT”) was passed by the lower house and, if approved by the upper house, will become law with effect from 1 July 2012. We were disappointed that magnetite iron ore was not excluded from the MRRT. However, the legislation sets the taxing at the first point of processing – the primary crusher – where the value of the material is low. Thus, the tax we are likely to pay should also be low.
The Clean Energy Act also became law in November, resulting in the imposition of a fixed price on carbon emissions beginning 1 July 2012 up until the point when Australia transitions to an emissions trading scheme. The introduction of this carbon charge will clearly have a financial impact on our project, but fortunately our gas fired power station – the primary source of CO2 emissions – has been built with one of the most energy-efficient designs available. The magnetite industry creates economic and employment benefits in Australia and reduces carbon emissions on a global basis. The government has agreed to provide some assistance, although this is insufficient in our view. We will continue to work with other magnetite producers to lobby the government for further assistance.
Special SteelThe first half of 2011 showed strong demand for steel products but the second half, particularly the last quarter of the year, was much weaker. Still, our special steel business was able to achieve HK$1,994 million in profit contribution. Excluding the loss incurred on eliminating outdated facilities, the contribution from our steel mills was 11% more than last year.
In China’s 12th Five-year Plan for the iron and steel industry published in late 2011, CITIC Pacific Special Steel was acknowledged as a leader in the special steel industry. As a relative newcomer, we are very proud of this recognition. When we went into special steel in 1993, the annual production capacity at the Jiangyin Xingcheng plant was just 210,000 tonnes. In the last 18 years, through organic growth and the addition of the Hubei Xin Yegang plant we have become the biggest dedicated special steel manufacturer in China with 9 million tonnes of annual production capacity. Despite facing a great deal of scepticism early on, we have persevered and proved to be an industry leader.
As in any industry, merely being the biggest is not enough; in order to stay ahead of the pack we must lead in technology. China’s 12th Five-year Plan for the steel industry encourages manufacturers to raise product quality, provide technological innovations, eliminate outdated facilities, and step up energy conservation and emission reduction. We have put a lot of effort into these areas over the years, and this work will continue. Our steel plants are now supplying over 3,000 different types and specifications of special steel to customers, and 39% of them in 2011 were high-end products. My colleagues running this business operate under the principle that each year a certain percentage of lower-end products should be substituted with higher ones. This effort has paid off as we are now producing some of the best quality products in the industry, and I am proud to say some of our steel has been put into orbit as a component part of China’s Shenzhou spacecrafts. I was told recently by my steel colleagues that we are now the only company in the world capable of producing one-metre diameter big casting round billet. To reduce emissions and increase efficiency, two smaller blast furnaces and one electric arc furnace were closed in 2011, and bigger, more efficient ones were built.
Chairman’s Letter to Shareholders
We are a much stronger company structurally with improved systems and a strengthened management team.
7CITIC Pacific Annual Report 2011
I am pleased at what we achieved in 2011 despite the challenging market. Looking at 2012, we believe that it will likely be another tough year for steel producers in China. A tightened credit policy and other measures taken at all levels of the government to moderate the rapid growth of the property market in China will filter down to impact the demand for steel in general, which will also put pressure on special steel prices. The global economic outlook remains unclear and thus may affect steel exports. However, despite these challenges my colleagues at the steel plants remain confident that the business can continue to be profitable by increasing the quality of our products and improving our ability to respond to market changes. These efforts, coupled with technology innovation and excellent customer relationships, will ensure our leadership position in the industry.
Property in mainland ChinaIn 2011, completed residential units in a number of our mainland China projects together with the twin office towers in Shanghai were delivered to buyers. However, sales of residential projects were markedly slower in the second half of 2011 as a result of measures put in place by the Chinese government to regulate the property market. We believe that the current situation is likely to continue for some time and affect the level of sales in 2012.
So what do we do in a slow market? Although property development is one of the key businesses of CITIC Pacific, we are not solely dependent on property development for our profit. The relatively low cost of our land banks, together with our financial strength, gives us the flexibility to adjust our development pace and sales strategy. Although residential sales have slowed, commercial properties have not been much affected. We continue to see strong interest in our Lu Jia Zui financial district project in Shanghai, where many financial institutions want to place their regional headquarters. We are now in negotiations with interested parties to do so.
In a difficult market, it is all the more important to differentiate ourselves from others by offering
customers quality products and superb services, thereby creating brand loyalty. In fact, in 2011 we re-positioned some of our developments and created the CITIC Pacific Property brand for all of our projects. Long term, we are still strong believers that the Chinese property market will grow and develop with the country’s economy.
At the board and senior management level, we continue to focus on building a culture of strong corporate governance, fiduciary responsibility and respect for all shareholders. We take seriously our mission to create long-term value for all our shareholders, and we strive to create a positive workplace for our employees and developing them to their fullest.
In closing, I want to thank our employees for all their hard work. I would also like to say thank you to our board, our investors and banks for their trust and support.
2012 is the year of the dragon in the Chinese zodiac. The dragon is feisty, dynamic and self-assured, and these are attributes I like to associate with CITIC Pacific, especially at this point in time. I strongly believe that at CITIC Pacific we have the spirit and the strength to succeed. I am very proud of what we have achieved both in business and as an organisation, and I am honoured and humbled to be leading this company.
Chang ZhenmingChairmanHong Kong, 1 March 2012
We have become the biggest dedicated special steel manufacturer in China with 9 million tonnes of annual production capacity.
8 CITIC Pacific Annual Report 2011
SPECIAL STEEL

Special Steel
Iron Ore M
iningProp
erty
9CITIC Pacific Annual Report 2011
10 CITIC Pacific Annual Report 2011
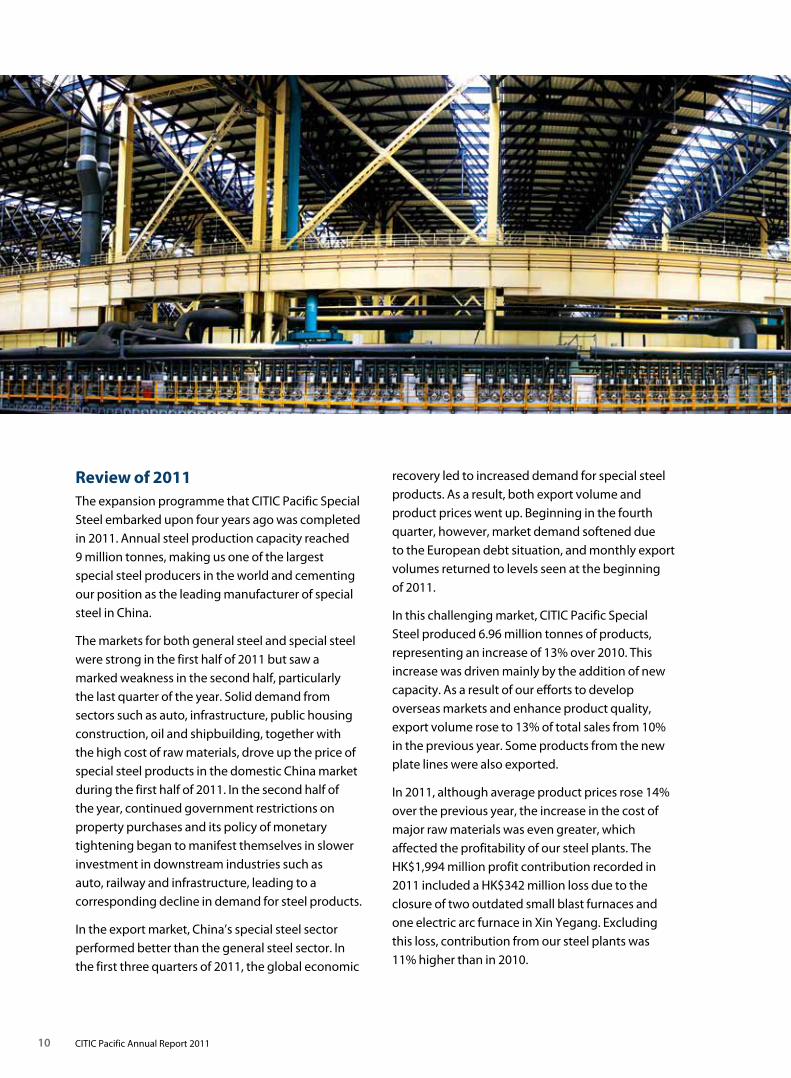
recovery led to increased demand for special steel products. As a result, both export volume and product prices went up. Beginning in the fourth quarter, however, market demand softened due to the European debt situation, and monthly export volumes returned to levels seen at the beginning of 2011.
In this challenging market, CITIC Pacific Special Steel produced 6.96 million tonnes of products, representing an increase of 13% over 2010. This increase was driven mainly by the addition of new capacity. As a result of our efforts to develop overseas markets and enhance product quality, export volume rose to 13% of total sales from 10% in the previous year. Some products from the new plate lines were also exported.
In 2011, although average product prices rose 14% over the previous year, the increase in the cost of major raw materials was even greater, which affected the profitability of our steel plants. The HK$1,994 million profit contribution recorded in 2011 included a HK$342 million loss due to the closure of two outdated small blast furnaces and one electric arc furnace in Xin Yegang. Excluding this loss, contribution from our steel plants was 11% higher than in 2010.
Review of 2011The expansion programme that CITIC Pacific Special Steel embarked upon four years ago was completed in 2011. Annual steel production capacity reached 9 million tonnes, making us one of the largest special steel producers in the world and cementing our position as the leading manufacturer of special steel in China.
The markets for both general steel and special steel were strong in the first half of 2011 but saw a marked weakness in the second half, particularly the last quarter of the year. Solid demand from sectors such as auto, infrastructure, public housing construction, oil and shipbuilding, together with the high cost of raw materials, drove up the price of special steel products in the domestic China market during the first half of 2011. In the second half of the year, continued government restrictions on property purchases and its policy of monetary tightening began to manifest themselves in slower investment in downstream industries such as auto, railway and infrastructure, leading to a corresponding decline in demand for steel products.
In the export market, China’s special steel sector performed better than the general steel sector. In the first three quarters of 2011, the global economic
Special Steel
Iron Ore M
iningProp
erty
11CITIC Pacific Annual Report 2011
Special steel21%
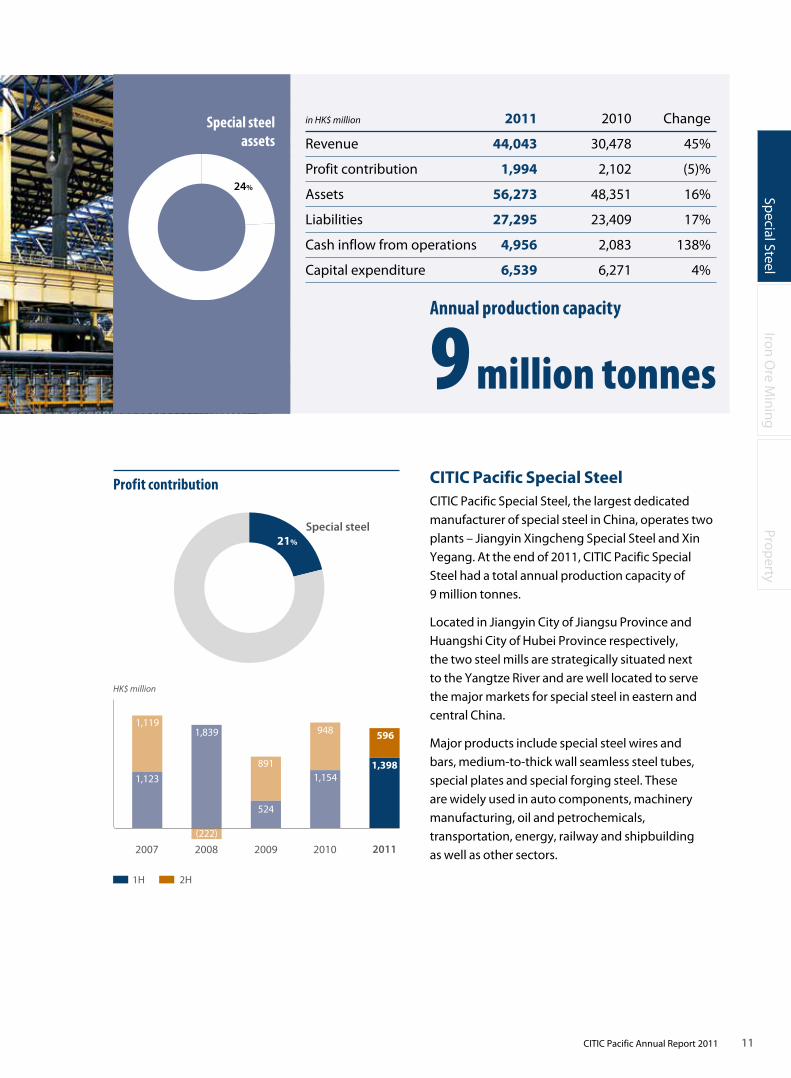
CITIC Pacific Special SteelCITIC Pacific Special Steel, the largest dedicated manufacturer of special steel in China, operates two plants – Jiangyin Xingcheng Special Steel and Xin Yegang. At the end of 2011, CITIC Pacific Special Steel had a total annual production capacity of 9 million tonnes.
Located in Jiangyin City of Jiangsu Province and Huangshi City of Hubei Province respectively, the two steel mills are strategically situated next to the Yangtze River and are well located to serve the major markets for special steel in eastern and central China.
Major products include special steel wires and bars, medium-to-thick wall seamless steel tubes, special plates and special forging steel. These are widely used in auto components, machinery manufacturing, oil and petrochemicals, transportation, energy, railway and shipbuilding as well as other sectors.
in HK$ million 2011 2010 Change
Revenue 44,043 30,478 45%
Profit contribution 1,994 2,102 (5)%
Assets 56,273 48,351 16%
Liabilities 27,295 23,409 17%
Cash inflow from operations 4,956 2,083 138%
Capital expenditure 6,539 6,271 4%
Special steel assets
24%
Profit contribution
HK$ million
2007
1,123
1,119
891
524
2009
1,154
948
2010
1,398
596
2011
1H 2H
1,839
(222)
2008
9 million tonnes
Annual production capacity
12 CITIC Pacific Annual Report 2011
5516
9
3
161
%
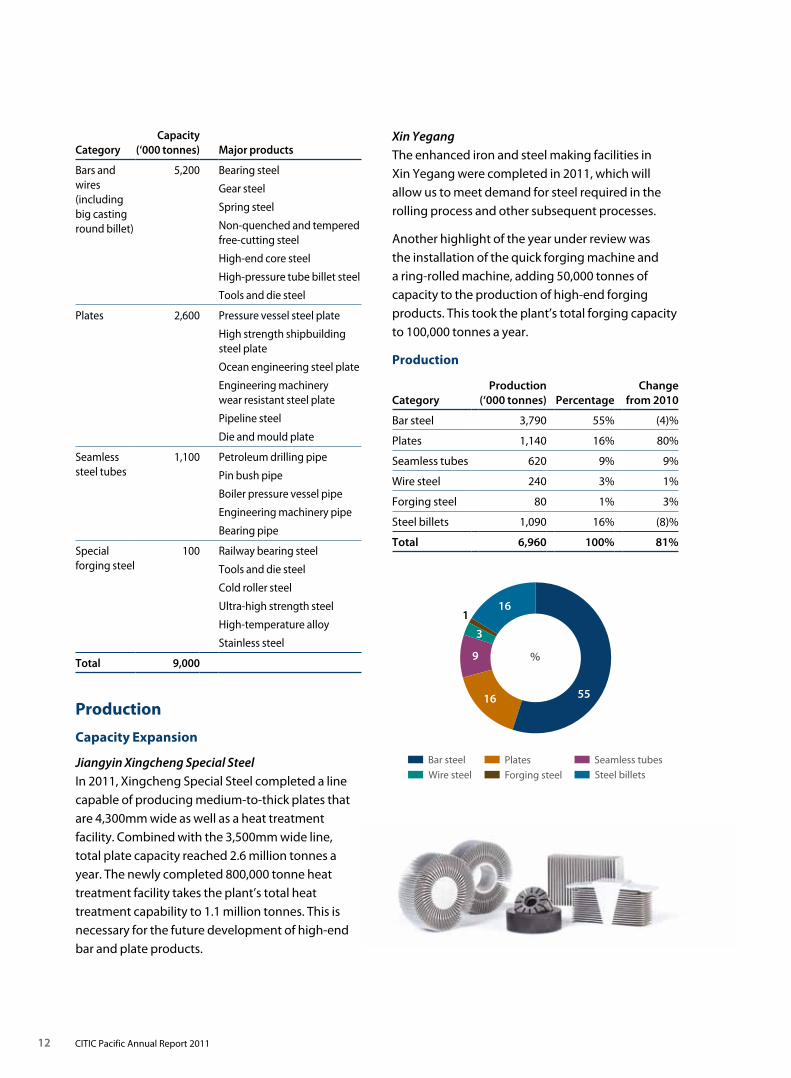
Bar steel Plates Seamless tubes
Wire steel Forging steel Steel billets
CategoryCapacity
(‘000 tonnes) Major products
Bars and wires (including big casting round billet)
5,200 Bearing steel
Gear steel
Spring steel
Non-quenched and tempered free-cutting steel
High-end core steel
High-pressure tube billet steel
Tools and die steel
Plates 2,600 Pressure vessel steel plate
High strength shipbuilding steel plate
Ocean engineering steel plate
Engineering machinery wear resistant steel plate
Pipeline steel
Die and mould plate
Seamless steel tubes
1,100 Petroleum drilling pipe
Pin bush pipe
Boiler pressure vessel pipe
Engineering machinery pipe
Bearing pipe
Special forging steel
100 Railway bearing steel
Tools and die steel
Cold roller steel
Ultra-high strength steel
High-temperature alloy
Stainless steel
Total 9,000
Production
Capacity Expansion
Jiangyin Xingcheng Special SteelIn 2011, Xingcheng Special Steel completed a line capable of producing medium-to-thick plates that are 4,300mm wide as well as a heat treatment facility. Combined with the 3,500mm wide line, total plate capacity reached 2.6 million tonnes a year. The newly completed 800,000 tonne heat treatment facility takes the plant’s total heat treatment capability to 1.1 million tonnes. This is necessary for the future development of high-end bar and plate products.
Xin YegangThe enhanced iron and steel making facilities in Xin Yegang were completed in 2011, which will allow us to meet demand for steel required in the rolling process and other subsequent processes.
Another highlight of the year under review was the installation of the quick forging machine and a ring-rolled machine, adding 50,000 tonnes of capacity to the production of high-end forging products. This took the plant’s total forging capacity to 100,000 tonnes a year.
Production
CategoryProduction
(‘000 tonnes) PercentageChange
from 2010
Bar steel 3,790 55% (4)%
Plates 1,140 16% 80%
Seamless tubes 620 9% 9%
Wire steel 240 3% 1%
Forging steel 80 1% 3%
Steel billets 1,090 16% (8)%
Total 6,960 100% 81%
Special Steel
Iron Ore M
iningProp
erty
13CITIC Pacific Annual Report 2011
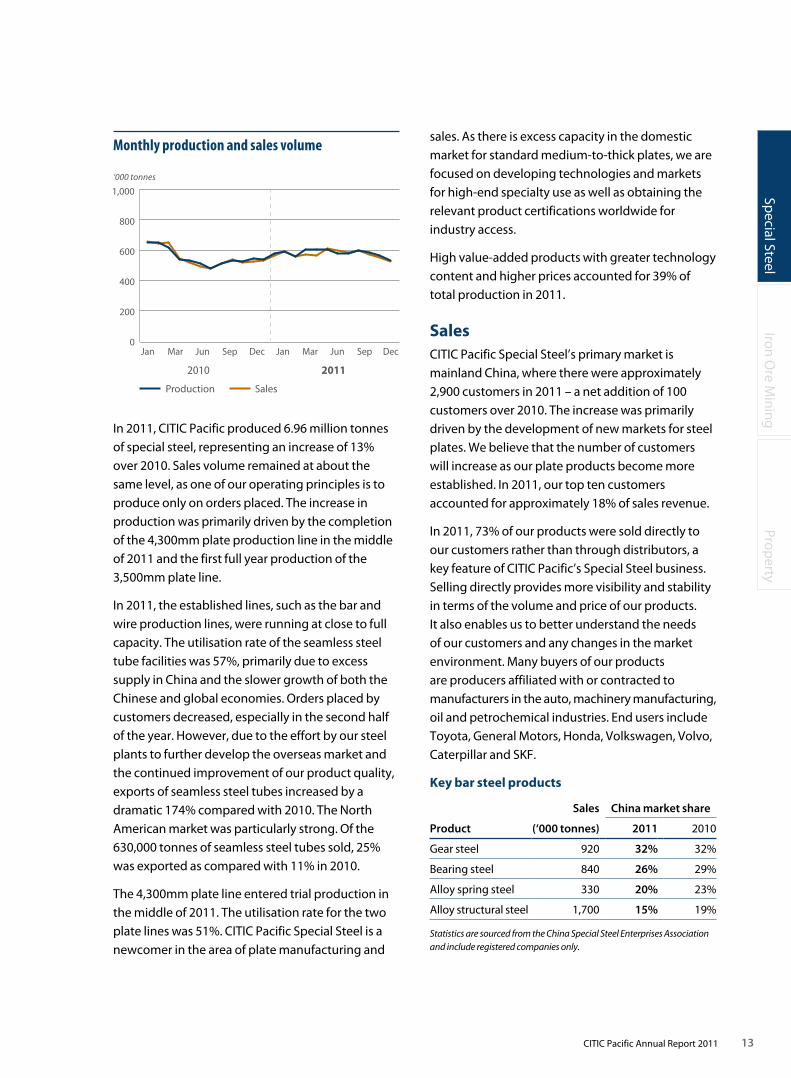
In 2011, CITIC Pacific produced 6.96 million tonnes of special steel, representing an increase of 13% over 2010. Sales volume remained at about the same level, as one of our operating principles is to produce only on orders placed. The increase in production was primarily driven by the completion of the 4,300mm plate production line in the middle of 2011 and the first full year production of the 3,500mm plate line.
In 2011, the established lines, such as the bar and wire production lines, were running at close to full capacity. The utilisation rate of the seamless steel tube facilities was 57%, primarily due to excess supply in China and the slower growth of both the Chinese and global economies. Orders placed by customers decreased, especially in the second half of the year. However, due to the effort by our steel plants to further develop the overseas market and the continued improvement of our product quality, exports of seamless steel tubes increased by a dramatic 174% compared with 2010. The North American market was particularly strong. Of the 630,000 tonnes of seamless steel tubes sold, 25% was exported as compared with 11% in 2010.
The 4,300mm plate line entered trial production in the middle of 2011. The utilisation rate for the two plate lines was 51%. CITIC Pacific Special Steel is a newcomer in the area of plate manufacturing and
sales. As there is excess capacity in the domestic market for standard medium-to-thick plates, we are focused on developing technologies and markets for high-end specialty use as well as obtaining the relevant product certifications worldwide for industry access.
High value-added products with greater technology content and higher prices accounted for 39% of total production in 2011.
SalesCITIC Pacific Special Steel’s primary market is mainland China, where there were approximately 2,900 customers in 2011 – a net addition of 100 customers over 2010. The increase was primarily driven by the development of new markets for steel plates. We believe that the number of customers will increase as our plate products become more established. In 2011, our top ten customers accounted for approximately 18% of sales revenue.
In 2011, 73% of our products were sold directly to our customers rather than through distributors, a key feature of CITIC Pacific’s Special Steel business. Selling directly provides more visibility and stability in terms of the volume and price of our products. It also enables us to better understand the needs of our customers and any changes in the market environment. Many buyers of our products are producers affiliated with or contracted to manufacturers in the auto, machinery manufacturing, oil and petrochemical industries. End users include Toyota, General Motors, Honda, Volkswagen, Volvo, Caterpillar and SKF.
Key bar steel products
Product
Sales China market share
(‘000 tonnes) 2011 2010
Gear steel 920 32% 32%
Bearing steel 840 26% 29%
Alloy spring steel 330 20% 23%
Alloy structural steel 1,700 15% 19%
Statistics are sourced from the China Special Steel Enterprises Association and include registered companies only.
Monthly production and sales volume
‘000 tonnes
Production Sales
2010 2011
Jan Mar Jun Sep Dec Jan Mar Jun Sep Dec0
200
400
600
800
1,000
14 CITIC Pacific Annual Report 2011
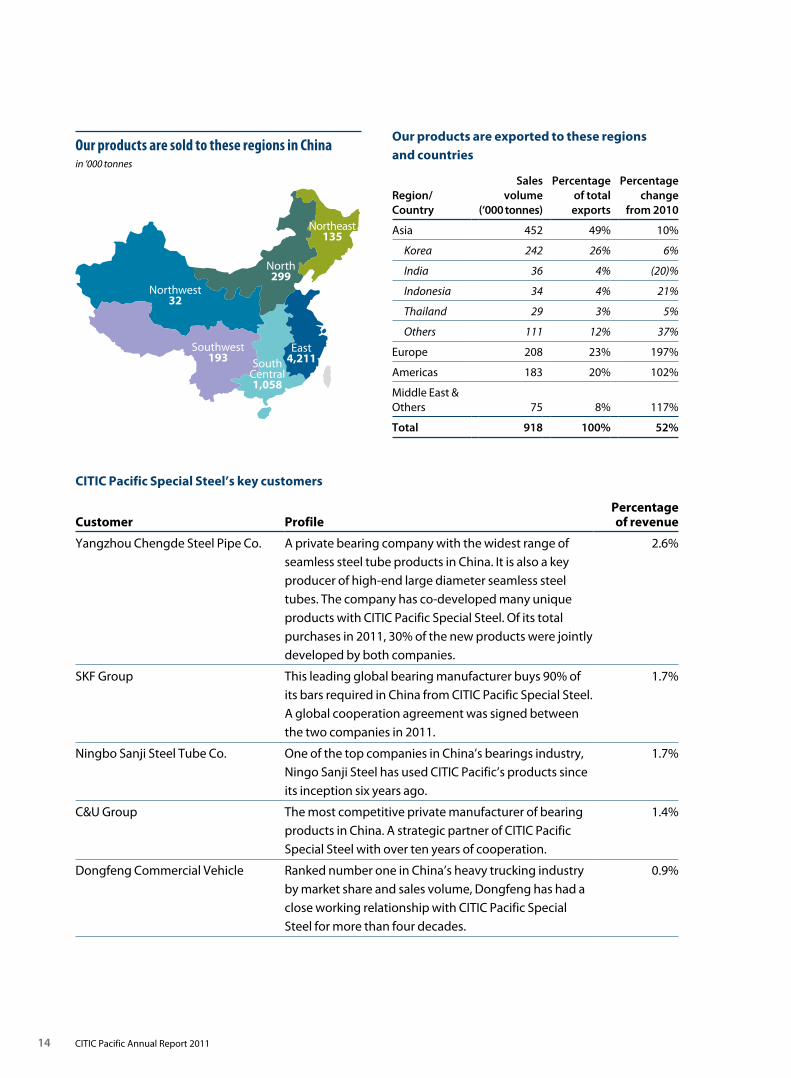
North299
Northeast135
East4,211South
Central1,058
Southwest193
Northwest32
Our products are sold to these regions in Chinain ‘000 tonnes
Our products are exported to these regions and countries
Region/Country
Sales volume
(‘000 tonnes)
Percentage of total exports
Percentage change
from 2010
Asia 452 49% 10%
Korea 242 26% 6%
India 36 4% (20)%
Indonesia 34 4% 21%
Thailand 29 3% 5%
Others 111 12% 37%
Europe 208 23% 197%
Americas 183 20% 102%
Middle East & Others 75 8% 117%
Total 918 100% 52%
CITIC Pacific Special Steel’s key customers
Customer Profile Percentage of revenue
Yangzhou Chengde Steel Pipe Co. A private bearing company with the widest range of seamless steel tube products in China. It is also a key producer of high-end large diameter seamless steel tubes. The company has co-developed many unique products with CITIC Pacific Special Steel. Of its total purchases in 2011, 30% of the new products were jointly developed by both companies.
2.6%
SKF Group This leading global bearing manufacturer buys 90% of its bars required in China from CITIC Pacific Special Steel. A global cooperation agreement was signed between the two companies in 2011.
1.7%
Ningbo Sanji Steel Tube Co. One of the top companies in China’s bearings industry, Ningo Sanji Steel has used CITIC Pacific’s products since its inception six years ago.
1.7%
C&U Group The most competitive private manufacturer of bearing products in China. A strategic partner of CITIC Pacific Special Steel with over ten years of cooperation.
1.4%
Dongfeng Commercial Vehicle Ranked number one in China’s heavy trucking industry by market share and sales volume, Dongfeng has had a close working relationship with CITIC Pacific Special Steel for more than four decades.
0.9%

Special Steel
Iron Ore M
iningProp
erty
15CITIC Pacific Annual Report 2011
Our products are sold to these industries
Industry
Sales (‘000 tonnes)
Percentage of total sales
2011 2010 2011 2010
Auto components 2,020 2,115 30% 34%
Machinery manufacturing
1,530 1,025 22% 17%
Shipbuilding 950 677 14% 11%
Power generation 900 619 13% 10%
Oil and petrochemicals
620 604 9% 10%
Metal works 390 570 6% 9%
Railway 140 156 2% 3%
Others 300 356 4% 6%
Total 6,850 6,122 100% 100%
Thirty percent of CITIC Pacific Special Steel’s products were sold to auto component manufacturers in 2011, compared with 34% in 2010. The change in percentage was due to the commencement of the steel plate production lines, which led to an increase in sales volume relating to shipbuilding plates and structural plates. This change broadened our exposure to the shipbuilding and machinery manufacturing industries.
Naturally, the production of special-use plates will create structural changes in the industries to which we sell our products. In 2011, sales to the shipbuilding industry were 14% compared with 11% the year before. In 2012, with the 3,500mm and 4,300mm special steel plate lines reaching their designed production capacity, we will be able to expand our markets in a variety of industries including shipbuilding, machinery manufacturing, petrochemicals and other specialised industries.
Product PricingPricing of special steel products is mainly driven by two factors: demand and the cost of raw materials. As approximately 80% of our steel plants’ production cost is directly attributable to the cost of raw materials, changes in the price of raw materials are a very important factor in determining the selling price of our products. Typically, at the end of each year agreements are reached with customers on their annual volume requirements, and these agreements make up approximately 60% of our annual sales volume. Pricing is not fixed until orders are formally placed or before products are delivered, which leaves room for adjustment based on changes in our production costs.
Historically, in a market where demand and supply are in balance, increases in the price of raw materials can usually be absorbed by increasing the price of the products. But when market supply exceeds demand, it is difficult to raise the price of products even though the cost of raw materials has increased. Nevertheless, as the operation of our steel plants is organised for production based on orders, the relatively short period of time required for product delivery reduces the impact caused by increases in the cost of raw materials and changes in the market.
In 2011, the average price of special steel products rose in the first half of the year and weakened in the second half. Overall, product prices increased 14% compared with 2010.
RMB/tonne
2010 2011
Bearing steel
Steel tubes
Gear steel
Steel billets
Spring steel
Jan Mar Jun Sep Dec Jan Mar Jun Sep Dec0
1,000
2,000
3,000
4,000
5,000
6,000
7,000
8,000
16 CITIC Pacific Annual Report 2011
Iron Ore
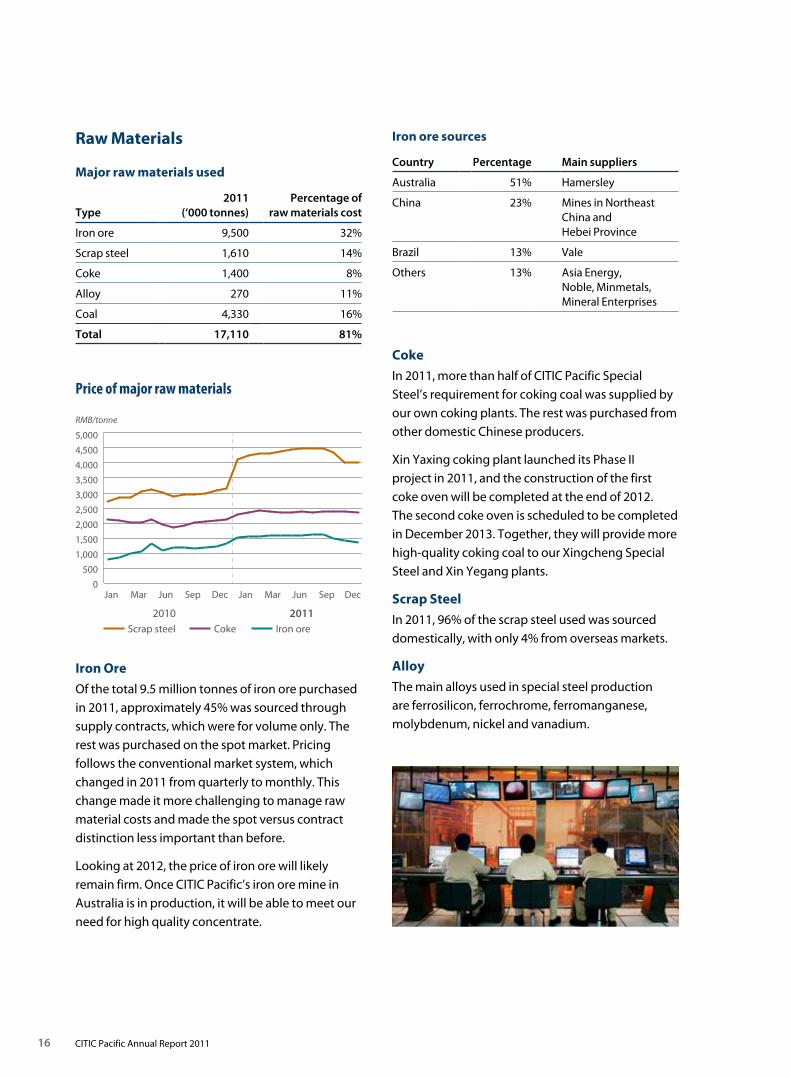
Of the total 9.5 million tonnes of iron ore purchased in 2011, approximately 45% was sourced through supply contracts, which were for volume only. The rest was purchased on the spot market. Pricing follows the conventional market system, which changed in 2011 from quarterly to monthly. This change made it more challenging to manage raw material costs and made the spot versus contract distinction less important than before.
Looking at 2012, the price of iron ore will likely remain firm. Once CITIC Pacific’s iron ore mine in Australia is in production, it will be able to meet our need for high quality concentrate.
Coke
In 2011, more than half of CITIC Pacific Special Steel’s requirement for coking coal was supplied by our own coking plants. The rest was purchased from other domestic Chinese producers.
Xin Yaxing coking plant launched its Phase II project in 2011, and the construction of the first coke oven will be completed at the end of 2012. The second coke oven is scheduled to be completed in December 2013. Together, they will provide more high-quality coking coal to our Xingcheng Special Steel and Xin Yegang plants.
Scrap Steel
In 2011, 96% of the scrap steel used was sourced domestically, with only 4% from overseas markets.
Alloy
The main alloys used in special steel production are ferrosilicon, ferrochrome, ferromanganese, molybdenum, nickel and vanadium.
Major raw materials used
Type2011
(‘000 tonnes)Percentage of
raw materials cost
Iron ore 9,500 32%
Scrap steel 1,610 14%
Coke 1,400 8%
Alloy 270 11%
Coal 4,330 16%
Total 17,110 81%
Raw Materials Iron ore sources
Country Percentage Main suppliers
Australia 51% Hamersley
China 23% Mines in Northeast China and Hebei Province
Brazil 13% Vale
Others 13% Asia Energy, Noble, Minmetals, Mineral Enterprises
Scrap steel Coke Iron ore
RMB/tonne
0
500
1,000
1,500
2,000
2,500
3,000
3,500
4,000
4,500
5,000
2010 2011
Jan Mar Jun Sep Dec Jan Mar Jun Sep Dec
Price of major raw materials
Special Steel
Iron Ore M
iningProp
erty
17CITIC Pacific Annual Report 2011
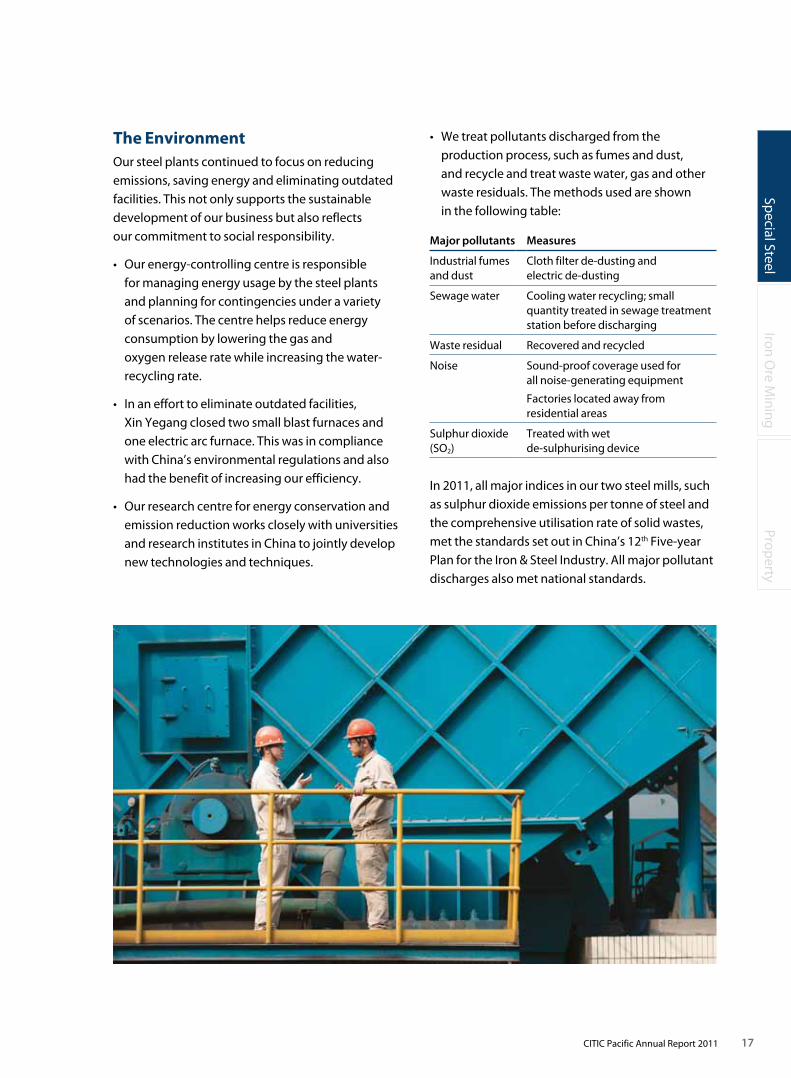
The EnvironmentOur steel plants continued to focus on reducing emissions, saving energy and eliminating outdated facilities. This not only supports the sustainable development of our business but also reflects our commitment to social responsibility.
• Ourenergy-controllingcentreisresponsible for managing energy usage by the steel plants and planning for contingencies under a variety of scenarios. The centre helps reduce energy consumption by lowering the gas and oxygen release rate while increasing the water-recycling rate.
• Inanefforttoeliminateoutdatedfacilities, Xin Yegang closed two small blast furnaces and one electric arc furnace. This was in compliance with China’s environmental regulations and also had the benefit of increasing our efficiency.
• Ourresearchcentreforenergyconservationandemission reduction works closely with universities and research institutes in China to jointly develop new technologies and techniques.
• Wetreatpollutantsdischargedfromtheproduction process, such as fumes and dust, and recycle and treat waste water, gas and other waste residuals. The methods used are shown in the following table:
Major pollutants Measures
Industrial fumes and dust
Cloth filter de-dusting and electric de-dusting
Sewage water Cooling water recycling; small quantity treated in sewage treatment station before discharging
Waste residual Recovered and recycled
Noise Sound-proof coverage used for all noise-generating equipment
Factories located away from residential areas
Sulphur dioxide (SO2)
Treated with wet de-sulphurising device
In 2011, all major indices in our two steel mills, such as sulphur dioxide emissions per tonne of steel and the comprehensive utilisation rate of solid wastes, met the standards set out in China’s 12th Five-year Plan for the Iron & Steel Industry. All major pollutant discharges also met national standards.
18 CITIC Pacific Annual Report 2011
traditional special steel manufacturers will gradually complete upgrades of their equipment and technologies. Given these factors, the special steel market will clearly become more competitive.
In this more competitive environment, CITIC Pacific Special Steel will focus on three key areas for 2012:
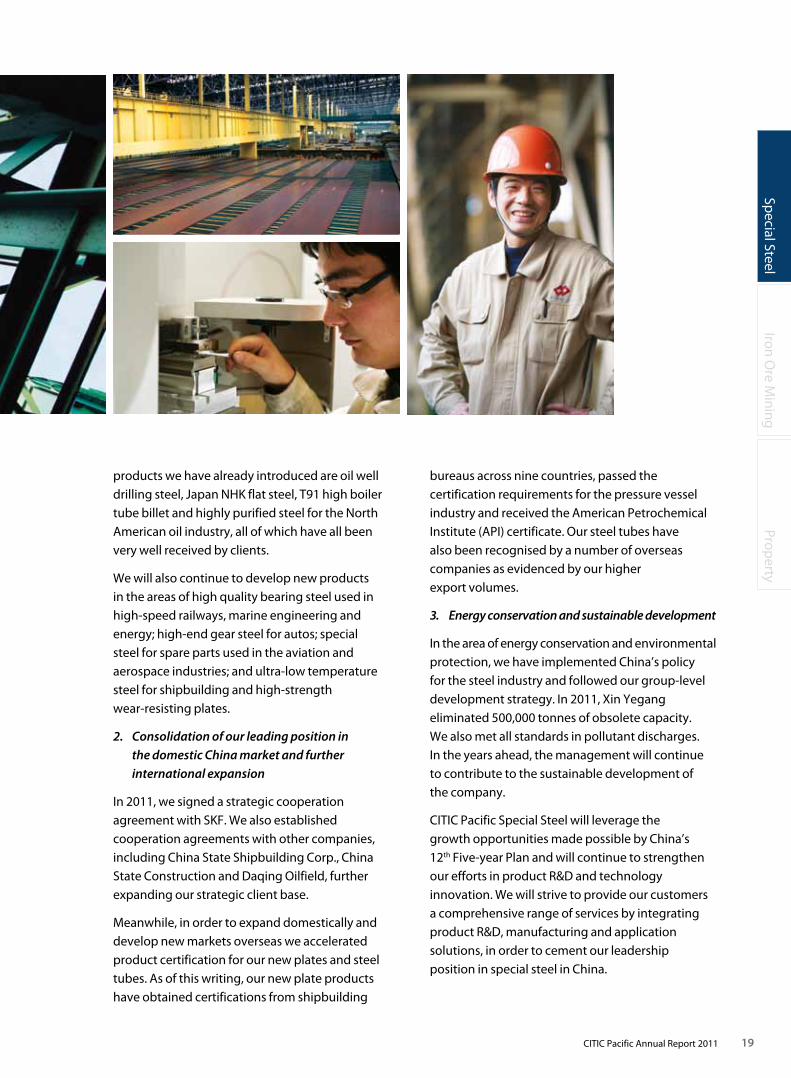
1. Further improvements in product quality, optimisation of the product mix and development of new products
Our new production lines and blast furnaces are better equipped to produce high-end products, with bar and wire products achieving new levels in quality and product mix in 2011. We are now the only manufacturer in the world that is capable of producing one-metre diameter big casting round billet. We also developed ultra-purified monocrystal cutting wire with a diameter of 0.12mm. Development of these high-end products improved our product mix.
We are also strengthening our ability in further processing our products. The heat treatment line currently under construction is a good example, as it will provide better hardware for the further processing of bars and steel tubes.
In addition to improving the quality of established products, CITIC Pacific Special Steel will be developing new products. Among the new
Looking AheadIn November 2011, China published its 12th Five-year Plan for the Iron and Steel Industry. The plan acknowledged CITIC Pacific Special Steel’s leadership position in the industry, and we were recognised for our long-term efforts to improve R&D and technological innovation in special steel.
Apart from increasing production capacity, over the past few years CITIC Pacific Special Steel has built two technical centres, a number of laboratories and a post-doctoral research centre, which are all nationally recognised for their industry expertise. Their work is focused on researching and developing new products and offering consulting services to clients on special steel applications. In 2011, 620,000 tonnes of new products were developed, and CITIC Pacific Special Steel was widely considered a leader in the industry.
In 2011 China’s domestic economy slowed, and the world economy recovered at a slower-than-expected pace. This is likely to affect market demand for steel in 2012. As prices of raw materials and fuel are expected to remain high, the steel industry will face greater challenges. Furthermore, after the launch of the 12th Five-year Plan a number of China’s general steel manufacturers will probably expand into the special steel sector, and other
Special Steel
Iron Ore M
iningProp
erty
19CITIC Pacific Annual Report 2011
products we have already introduced are oil well drilling steel, Japan NHK flat steel, T91 high boiler tube billet and highly purified steel for the North American oil industry, all of which have all been very well received by clients.
We will also continue to develop new products in the areas of high quality bearing steel used in high-speed railways, marine engineering and energy; high-end gear steel for autos; special steel for spare parts used in the aviation and aerospace industries; and ultra-low temperature steel for shipbuilding and high-strength wear-resisting plates.
2. Consolidation of our leading position in the domestic China market and further international expansion
In 2011, we signed a strategic cooperation agreement with SKF. We also established cooperation agreements with other companies, including China State Shipbuilding Corp., China State Construction and Daqing Oilfield, further expanding our strategic client base.
Meanwhile, in order to expand domestically and develop new markets overseas we accelerated product certification for our new plates and steel tubes. As of this writing, our new plate products have obtained certifications from shipbuilding
bureaus across nine countries, passed the certification requirements for the pressure vessel industry and received the American Petrochemical Institute (API) certificate. Our steel tubes have also been recognised by a number of overseas companies as evidenced by our higher export volumes.
3. Energy conservation and sustainable development
In the area of energy conservation and environmental protection, we have implemented China’s policy for the steel industry and followed our group-level development strategy. In 2011, Xin Yegang eliminated 500,000 tonnes of obsolete capacity. We also met all standards in pollutant discharges. In the years ahead, the management will continue to contribute to the sustainable development of the company.
CITIC Pacific Special Steel will leverage the growth opportunities made possible by China’s 12th Five-year Plan and will continue to strengthen our efforts in product R&D and technology innovation. We will strive to provide our customers a comprehensive range of services by integrating product R&D, manufacturing and application solutions, in order to cement our leadership position in special steel in China.
20 CITIC Pacific Annual Report 2011
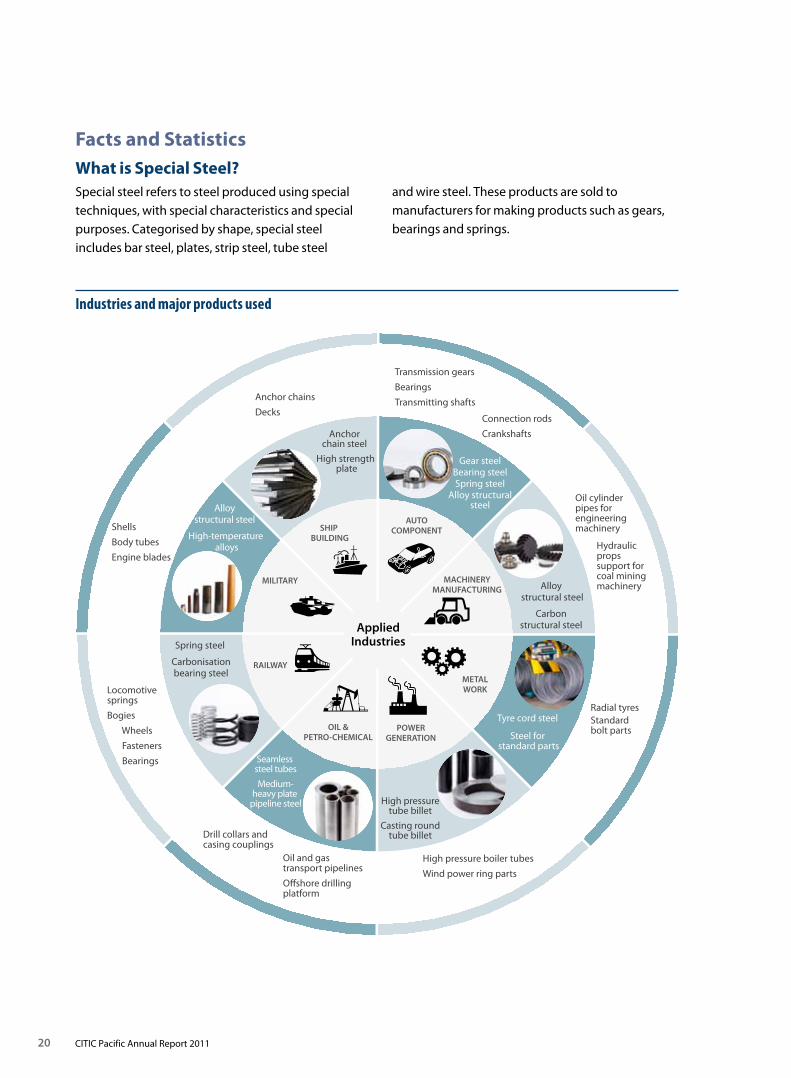
Facts and StatisticsWhat is Special Steel?Special steel refers to steel produced using special techniques, with special characteristics and special purposes. Categorised by shape, special steel includes bar steel, plates, strip steel, tube steel
Industries and major products used
Applied Industries
Anchor chains
Decks
Shells
Body tubes
Engine blades
Transmission gears
Bearings
Transmitting shafts
Oil cylinder pipes for engineeringmachinery
Radial tyres Standardbolt parts
Drill collars andcasing couplings
High pressure boiler tubes
Wind power ring parts
Anchor chain steel
High strength plate
Connection rods
Crankshafts
Hydraulic propssupport for coal mining machinery
Gear steelBearing steelSpring steel
Alloy structuralsteel
Alloy structural steel
Carbon structural steel
Tyre cord steel Steel for
standard parts
High pressuretube billet
Casting roundtube billet
Seamless steel tubes Medium-
heavy plate pipeline steel
Spring steel Carbonisationbearing steel
Alloy structural steel
High-temperature alloys
AUTOCOMPONENT
RAILWAY
OIL &PETRO-CHEMICAL
MACHINERYMANUFACTURING
METALWORK
POWERGENERATION
SHIP BUILDING
MILITARY
Oil and gas transport pipelines Offshore drilling platform
Locomotivesprings
Bogies
Wheels
Fasteners
Bearings
and wire steel. These products are sold to manufacturers for making products such as gears, bearings and springs.
Special Steel
Iron Ore M
iningProp
erty
21CITIC Pacific Annual Report 2011
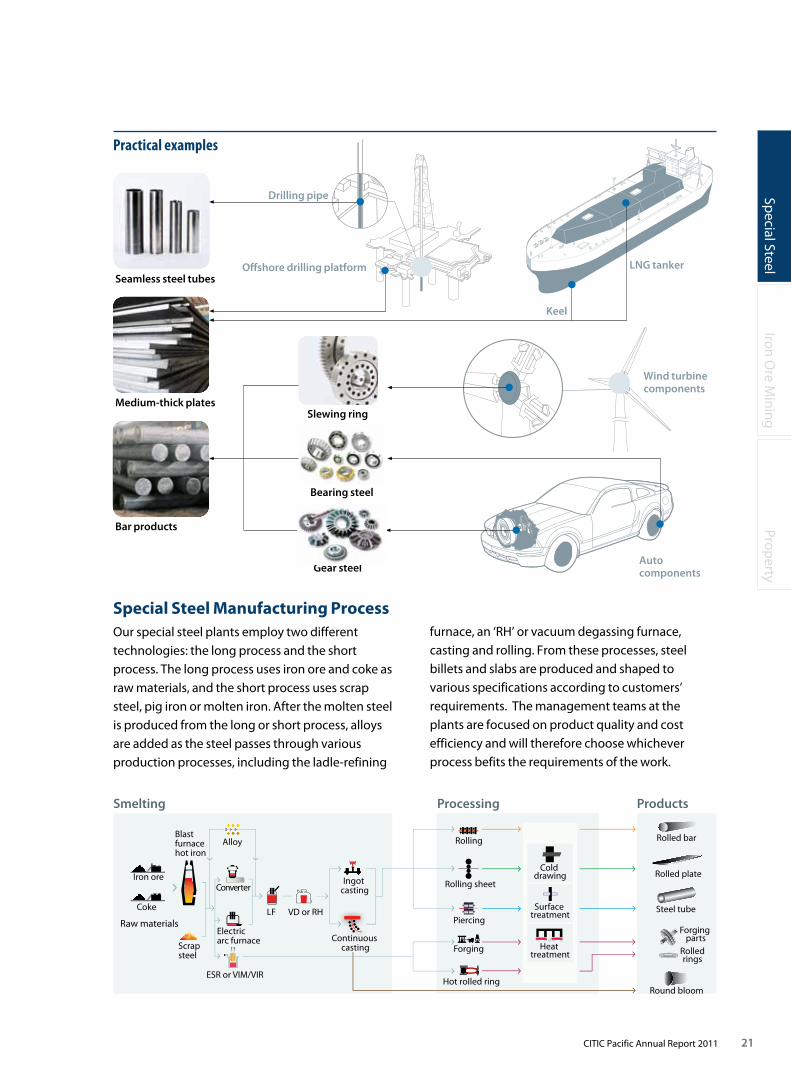
furnace, an ‘RH’ or vacuum degassing furnace, casting and rolling. From these processes, steel billets and slabs are produced and shaped to various specifications according to customers’ requirements. The management teams at the plants are focused on product quality and cost efficiency and will therefore choose whichever process befits the requirements of the work.
Special Steel Manufacturing ProcessOur special steel plants employ two different technologies: the long process and the short process. The long process uses iron ore and coke as raw materials, and the short process uses scrap steel, pig iron or molten iron. After the molten steel is produced from the long or short process, alloys are added as the steel passes through various production processes, including the ladle-refining
Practical examples
Smelting Processing Products
Piercing
ESR or VIM/VIR
Forging
Iron ore
LF VD or RHCoke
Blast furnacehot iron
Scrapsteel
Alloy
ConverterIngot
casting
Continuous casting
Rolling
Rolling sheet
Hot rolled ring
Rolled bar
Rolled plate
Steel tube
Forging parts
Rolled rings
Round bloom
Raw materialsElectric arc furnace
Cold drawing
Surface treatment
Heat treatment
Offshore drilling platform
Drilling pipe
Medium-thick plates
Seamless steel tubes
Bar products
Slewing ring
Wind turbine components
Gear steel
Bearing steel
Auto components
Keel
LNG tanker
22 CITIC Pacific Annual Report 2011
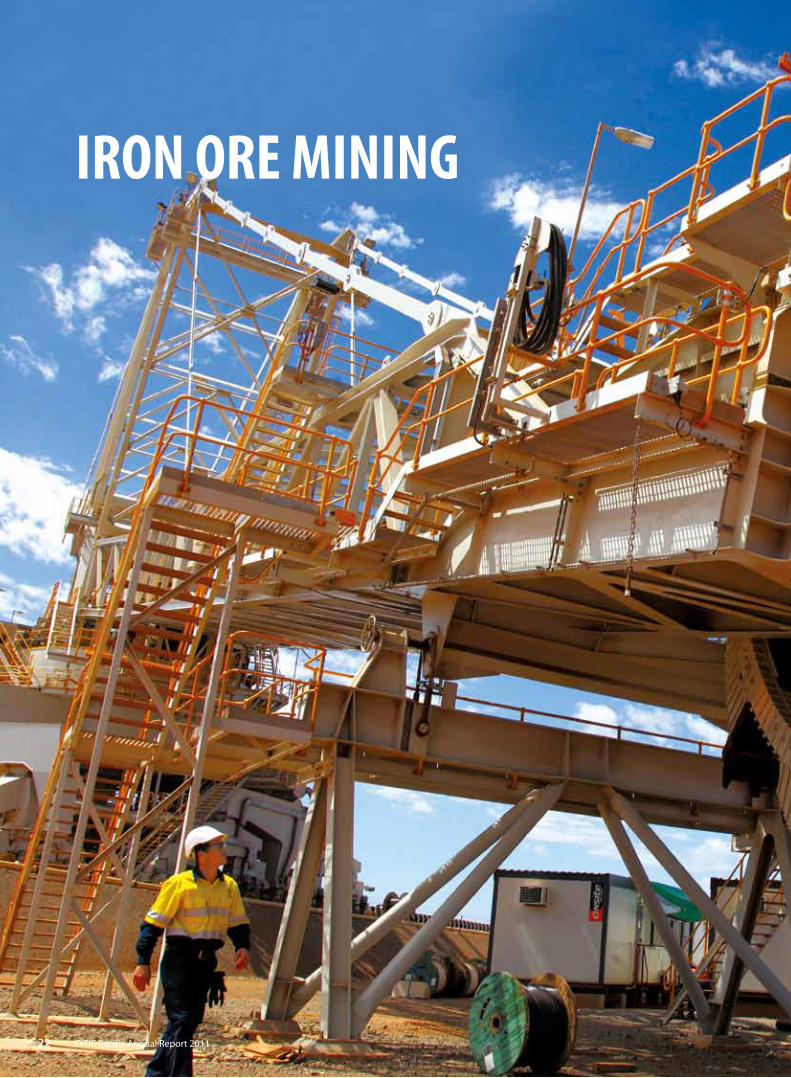
IRON ORE MINING
Special Steel
Iron Ore M
iningProp
erty
23CITIC Pacific Annual Report 2011
24 CITIC Pacific Annual Report 2011
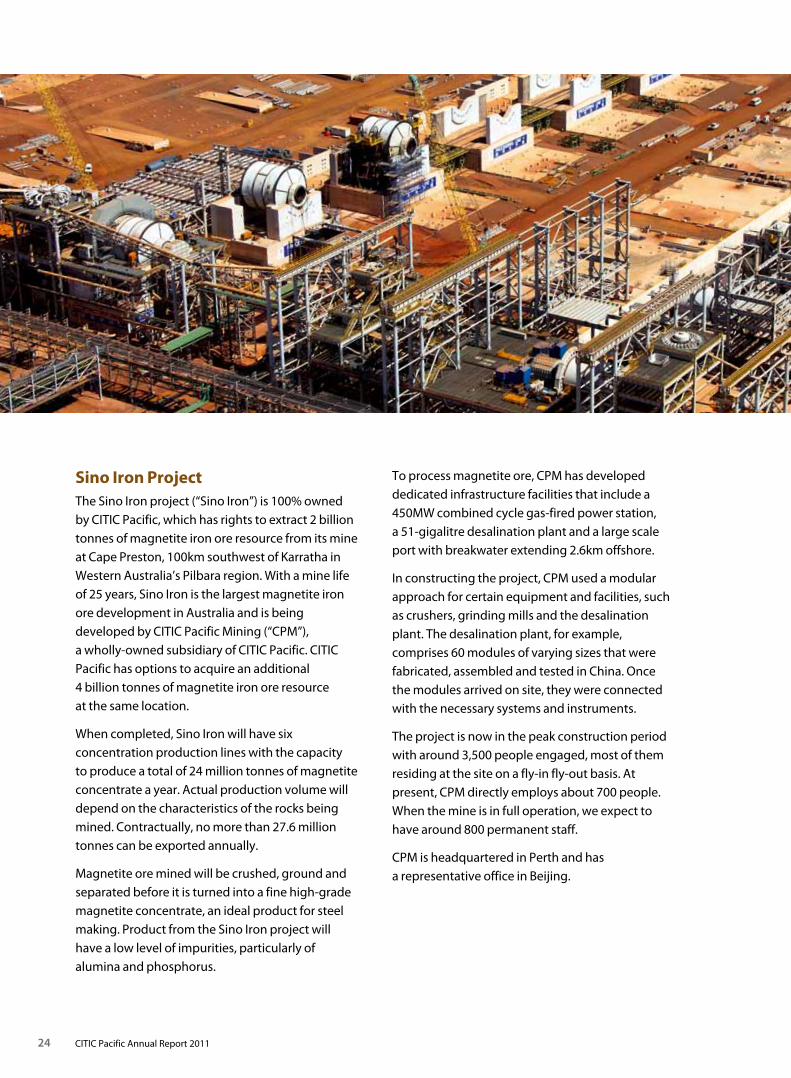
Sino Iron ProjectThe Sino Iron project (“Sino Iron”) is 100% owned by CITIC Pacific, which has rights to extract 2 billion tonnes of magnetite iron ore resource from its mine at Cape Preston, 100km southwest of Karratha in Western Australia’s Pilbara region. With a mine life of 25 years, Sino Iron is the largest magnetite iron ore development in Australia and is being developed by CITIC Pacific Mining (“CPM”), a wholly-owned subsidiary of CITIC Pacific. CITIC Pacific has options to acquire an additional 4 billion tonnes of magnetite iron ore resource at the same location.
When completed, Sino Iron will have six concentration production lines with the capacity to produce a total of 24 million tonnes of magnetite concentrate a year. Actual production volume will depend on the characteristics of the rocks being mined. Contractually, no more than 27.6 million tonnes can be exported annually.
Magnetite ore mined will be crushed, ground and separated before it is turned into a fine high-grade magnetite concentrate, an ideal product for steel making. Product from the Sino Iron project will have a low level of impurities, particularly of alumina and phosphorus.
To process magnetite ore, CPM has developed dedicated infrastructure facilities that include a 450MW combined cycle gas-fired power station, a 51-gigalitre desalination plant and a large scale port with breakwater extending 2.6km offshore.
In constructing the project, CPM used a modular approach for certain equipment and facilities, such as crushers, grinding mills and the desalination plant. The desalination plant, for example, comprises 60 modules of varying sizes that were fabricated, assembled and tested in China. Once the modules arrived on site, they were connected with the necessary systems and instruments.
The project is now in the peak construction period with around 3,500 people engaged, most of them residing at the site on a fly-in fly-out basis. At present, CPM directly employs about 700 people. When the mine is in full operation, we expect to have around 800 permanent staff.
CPM is headquartered in Perth and has a representative office in Beijing.
Special Steel
Iron Ore M
iningProp
erty
25CITIC Pacific Annual Report 2011
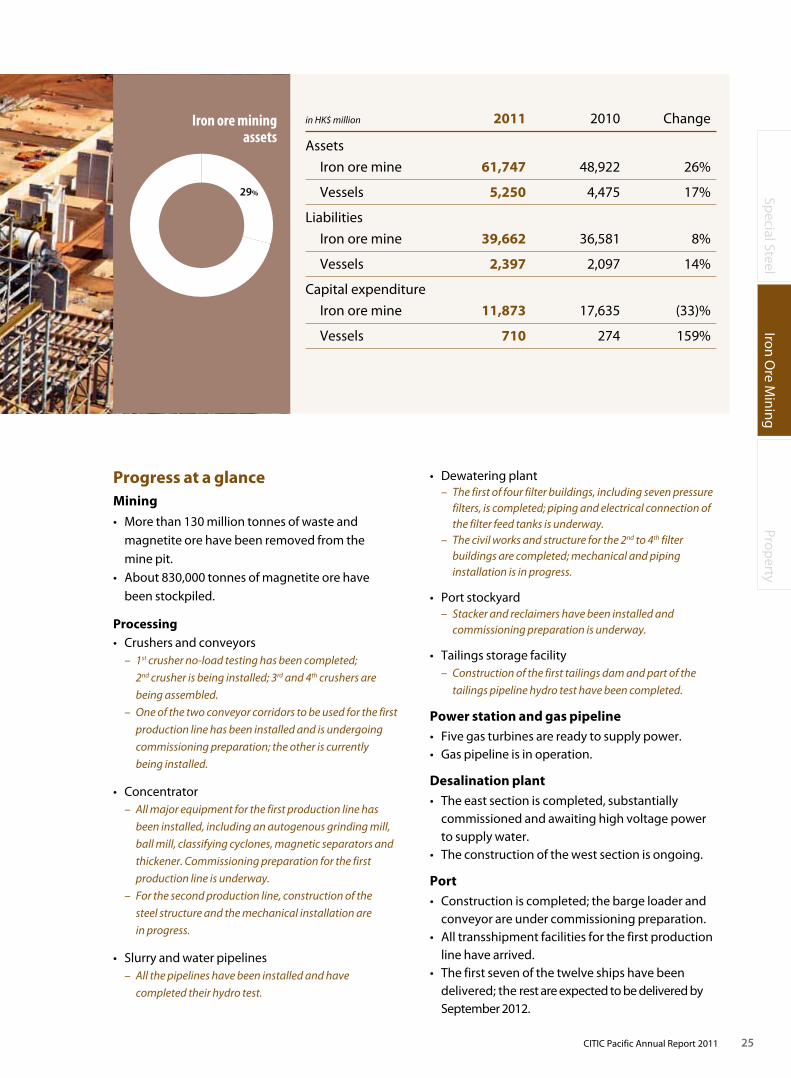
Iron ore mining assets
29%
in HK$ million 2011 2010 Change
Assets
Iron ore mine 61,747 48,922 26%
Vessels 5,250 4,475 17%
Liabilities
Iron ore mine 39,662 36,581 8%
Vessels 2,397 2,097 14%
Capital expenditure
Iron ore mine 11,873 17,635 (33)%
Vessels 710 274 159%
Progress at a glanceMining
• Morethan130milliontonnesofwasteandmagnetite ore have been removed from the mine pit.
• About830,000tonnesofmagnetiteorehave been stockpiled.
Processing• Crushers and conveyors
– 1st crusher no-load testing has been completed;
2nd crusher is being installed; 3rd and 4th crushers are
being assembled.
– One of the two conveyor corridors to be used for the first
production line has been installed and is undergoing
commissioning preparation; the other is currently
being installed.
• Concentrator– All major equipment for the first production line has
been installed, including an autogenous grinding mill,
ball mill, classifying cyclones, magnetic separators and
thickener. Commissioning preparation for the first
production line is underway.
– For the second production line, construction of the
steel structure and the mechanical installation are
in progress.
• Slurryandwaterpipelines– All the pipelines have been installed and have
completed their hydro test.
• Dewateringplant– The first of four filter buildings, including seven pressure
filters, is completed; piping and electrical connection of the filter feed tanks is underway.
– The civil works and structure for the 2nd to 4th filter buildings are completed; mechanical and piping installation is in progress.
• Portstockyard– Stacker and reclaimers have been installed and
commissioning preparation is underway.
• Tailingsstoragefacility– Construction of the first tailings dam and part of the
tailings pipeline hydro test have been completed.
Power station and gas pipeline• Five gas turbines are ready to supply power.• Gas pipeline is in operation.
Desalination plant• The east section is completed, substantially
commissioned and awaiting high voltage power to supply water.
• The construction of the west section is ongoing.
Port• Construction is completed; the barge loader and
conveyor are under commissioning preparation.• All transshipment facilities for the first production
line have arrived.• The first seven of the twelve ships have been
delivered; the rest are expected to be delivered by September 2012.

26 CITIC Pacific Annual Report 2011
The responsibility for constructing the Sino Iron project is divided into two parts. One group of tasks is directly managed by CPM, including the power station, desalination plant and port area. The other part of the project is assigned to an Engineering, Procurement and Construction (“EPC”) contractor responsible for the concentration processing area and related facilities, including the main slurry and water pipelines, power lines, roads and camps. The EPC contractor is the China Metallurgical Group Corporation (“MCC”). Other major construction contractors and sub-contractors include UGL, Nilsen,McConnellDowellandVDM/NRWJointVenture, BGC, Monadelphous Engineering and Programmed Construction. The majority of construction contractors and sub-contractors involved in the project are local Australian companies.
• Final design size: 5.5km long, 3km wide, 600m below sea level
Equipped with some of the world’s largest and most powerful machines, the mining team has removed over 130 million tonnes of material from the pit in order to access the magnetite ore body. Sufficient magnetite iron ore has already been stockpiled for commissioning and initial production.
Mine pit
Mine pitConveyor
Crusher
..
..
..
..
..
..
..
..
..
..
..
..
..
..
..
..
..
..
..
..
..
..
..
..
..
..
..
..
..
..
..
..
..
..
..
..
..
..
..
..
..
..
..
..
..
..
..
..
..
..
..
..
..
..
..
..
..
..
..
..
..
..
..
..
..
..
..
..
..
..
..
..
Desalination plant
Causeway
Slurry pipeline
Power station
East/West Road
Tailings storage facilities
North/South Road
Port Stockyard
Dewatering Plant
Power transmission
lines
Gas pipeline
Accommodation
Port
Accommodation
Concentrator
Mine pit
CPM Scope MCC Scope
Crusher
• Number: 4
• Size: 21m in height x 16m in width x 18m in length
• Weight: 1,500 tonnes per unit
• Capacity: 4,250 tonnes per hour per unit
These are some of the largest in-pit crushers in Australia. The crushed ore is transported by conveyors to the coarse ore stockpile before going into the autogenous grinding mill in the concentrator area. Testing of the first crusher has been completed, and
Construction Progress
Mine Pit Area
Special Steel
Iron Ore M
iningProp
erty
27CITIC Pacific Annual Report 2011
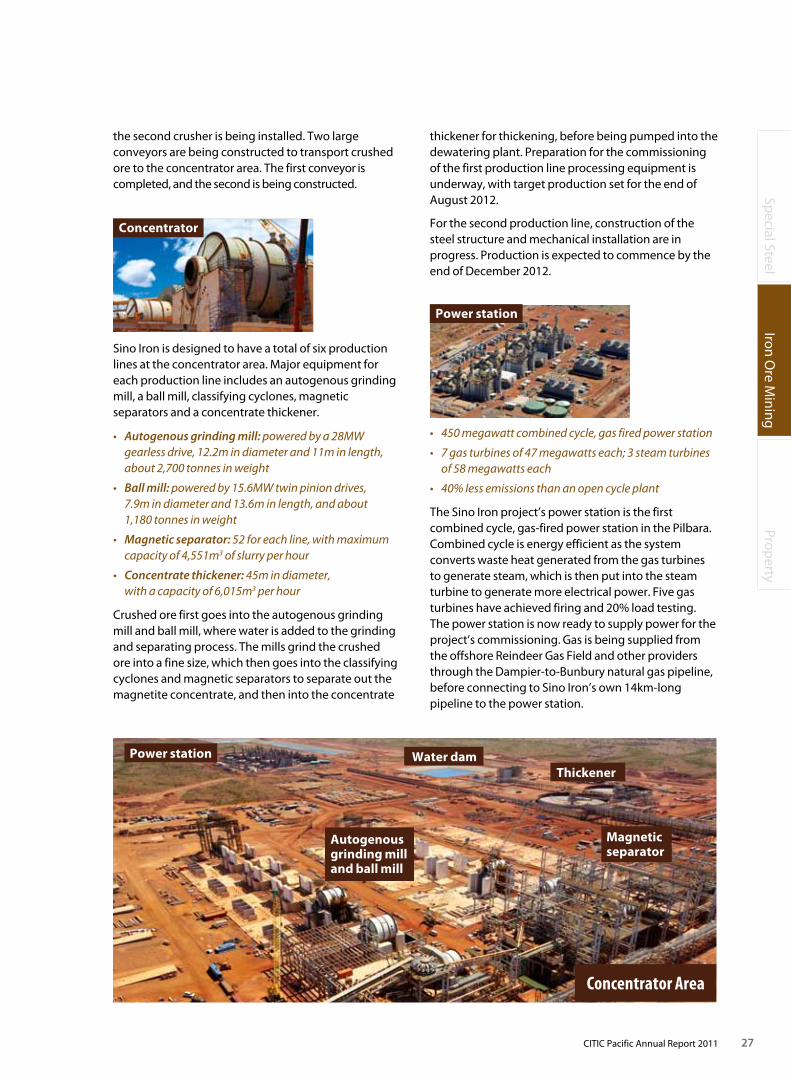
Sino Iron is designed to have a total of six production lines at the concentrator area. Major equipment for each production line includes an autogenous grinding mill, a ball mill, classifying cyclones, magnetic separators and a concentrate thickener.
• Autogenous grinding mill: powered by a 28MW gearless drive, 12.2m in diameter and 11m in length, about 2,700 tonnes in weight
• Ball mill: powered by 15.6MW twin pinion drives, 7.9m in diameter and 13.6m in length, and about 1,180 tonnes in weight
• Magnetic separator: 52 for each line, with maximum capacity of 4,551m3 of slurry per hour
• Concentrate thickener: 45m in diameter, with a capacity of 6,015m3 per hour
Crushed ore first goes into the autogenous grinding mill and ball mill, where water is added to the grinding and separating process. The mills grind the crushed ore into a fine size, which then goes into the classifying cyclones and magnetic separators to separate out the magnetite concentrate, and then into the concentrate
Concentrator
• 450megawattcombinedcycle,gasfiredpowerstation
• 7gasturbinesof47megawattseach;3steamturbinesof 58 megawatts each
• 40%lessemissionsthananopencycleplant
The Sino Iron project’s power station is the first combined cycle, gas-fired power station in the Pilbara. Combined cycle is energy efficient as the system converts waste heat generated from the gas turbines to generate steam, which is then put into the steam turbine to generate more electrical power. Five gas turbines have achieved firing and 20% load testing. The power station is now ready to supply power for the project’s commissioning. Gas is being supplied from the offshore Reindeer Gas Field and other providers throughtheDampier-to-Bunburynaturalgaspipeline,before connecting to Sino Iron’s own 14km-long pipeline to the power station.
Power station
ThickenerWater dam
Autogenous grinding milland ball mill
Magnetic separator
Power station
Concentrator Area
the second crusher is being installed. Two large conveyors are being constructed to transport crushed ore to the concentrator area. The first conveyor is completed, and the second is being constructed.
thickener for thickening, before being pumped into the dewatering plant. Preparation for the commissioning of the first production line processing equipment is underway, with target production set for the end of August 2012.
For the second production line, construction of the steel structure and mechanical installation are in progress. Production is expected to commence by the endofDecember2012.
28 CITIC Pacific Annual Report 2011
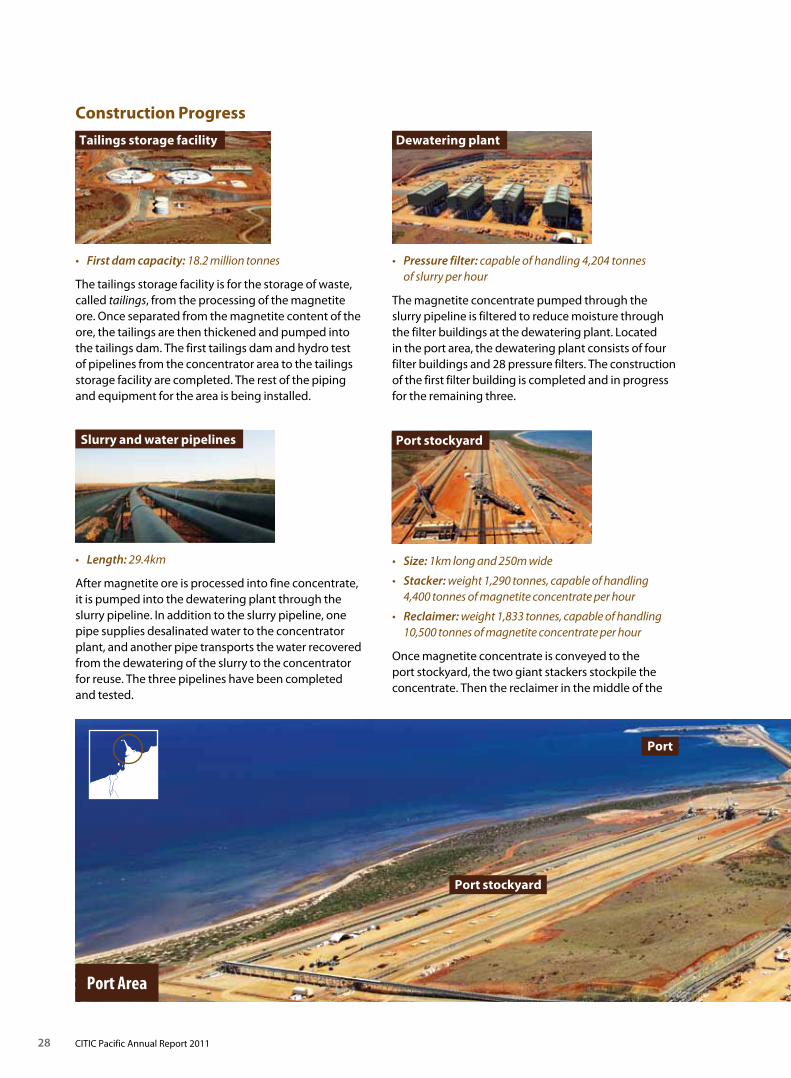
Port Area
• Size: 1km long and 250m wide
• Stacker: weight 1,290 tonnes, capable of handling 4,400 tonnes of magnetite concentrate per hour
• Reclaimer: weight 1,833 tonnes, capable of handling 10,500 tonnes of magnetite concentrate per hour
Once magnetite concentrate is conveyed to the port stockyard, the two giant stackers stockpile the concentrate. Then the reclaimer in the middle of the
Port stockyard
Port stockyard
Port
• Pressure filter: capable of handling 4,204 tonnes of slurry per hour
The magnetite concentrate pumped through the slurry pipeline is filtered to reduce moisture through the filter buildings at the dewatering plant. Located in the port area, the dewatering plant consists of four filter buildings and 28 pressure filters. The construction of the first filter building is completed and in progress for the remaining three.
Dewatering plant
• Length: 29.4km
After magnetite ore is processed into fine concentrate, it is pumped into the dewatering plant through the slurry pipeline. In addition to the slurry pipeline, one pipe supplies desalinated water to the concentrator plant, and another pipe transports the water recovered from the dewatering of the slurry to the concentrator for reuse. The three pipelines have been completed and tested.
Slurry and water pipelines
• First dam capacity: 18.2 million tonnes
The tailings storage facility is for the storage of waste, called tailings, from the processing of the magnetite ore. Once separated from the magnetite content of the ore, the tailings are then thickened and pumped into the tailings dam. The first tailings dam and hydro test of pipelines from the concentrator area to the tailings storage facility are completed. The rest of the piping and equipment for the area is being installed.
Tailings storage facility
Construction Progress
Special Steel
Iron Ore M
iningProp
erty
29CITIC Pacific Annual Report 2011
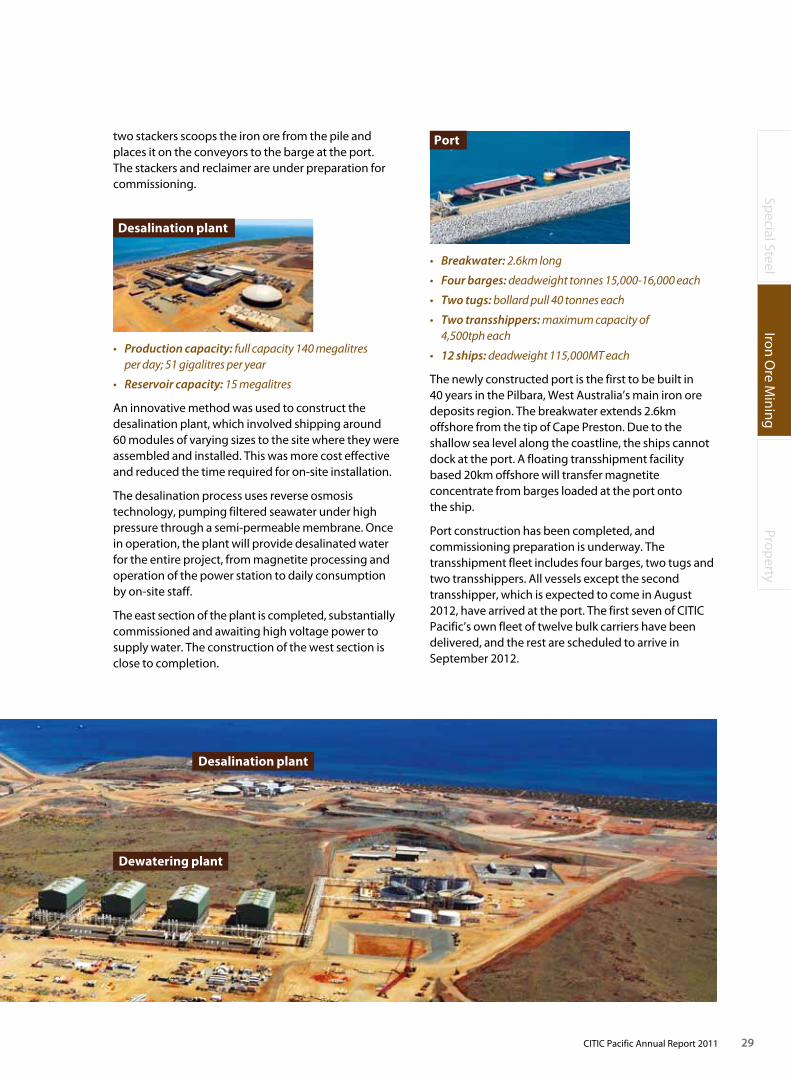
• Breakwater: 2.6km long
• Four barges: deadweight tonnes 15,000-16,000 each
• Two tugs: bollard pull 40 tonnes each
• Two transshippers: maximum capacity of 4,500tph each
• 12 ships: deadweight 115,000MT each
The newly constructed port is the first to be built in 40 years in the Pilbara, West Australia’s main iron ore deposits region. The breakwater extends 2.6km offshorefromthetipofCapePreston.Duetotheshallow sea level along the coastline, the ships cannot dock at the port. A floating transshipment facility based 20km offshore will transfer magnetite concentrate from barges loaded at the port onto the ship.
Port construction has been completed, and commissioning preparation is underway. The transshipment fleet includes four barges, two tugs and two transshippers. All vessels except the second transshipper, which is expected to come in August 2012, have arrived at the port. The first seven of CITIC Pacific’s own fleet of twelve bulk carriers have been delivered, and the rest are scheduled to arrive in September 2012.
• Production capacity: full capacity 140 megalitres per day; 51 gigalitres per year
• Reservoir capacity: 15 megalitres
An innovative method was used to construct the desalination plant, which involved shipping around 60 modules of varying sizes to the site where they were assembled and installed. This was more cost effective and reduced the time required for on-site installation.
The desalination process uses reverse osmosis technology, pumping filtered seawater under high pressure through a semi-permeable membrane. Once in operation, the plant will provide desalinated water for the entire project, from magnetite processing and operation of the power station to daily consumption by on-site staff.
The east section of the plant is completed, substantially commissioned and awaiting high voltage power to supply water. The construction of the west section is close to completion.
Dewatering plant
Desalination plant
Desalination plant
Porttwo stackers scoops the iron ore from the pile and places it on the conveyors to the barge at the port. The stackers and reclaimer are under preparation for commissioning.

30 CITIC Pacific Annual Report 2011
Health and SafetyCPM places great importance on the health and safety of our staff and contractors. A dedicated health and safety team is responsible for reviewing and improving procedures to ensure that CPM is ready to meet ongoing construction challenges. It is also responsible for supporting the operations team in preparation for first production.
An important health and safety issue is the existence of fibrous material in some parts of the mine, a substance that may pose significant health risks. Sino Iron has installed filtered-air-cab systems as well as decontamination facilities, which are regarded as world-class solutions by the industry. Only trained staff and contractors are licensed to work with substances that may contain fibrous material and to supervise others who are working with these substances. We closely monitor our fibrous material management and report to the regulators as required.
Issues Actions
Injury frequency Monthly safety improvement initiatives
Increased education for high-risk work activities
Increased frequency of site inspections and audits
Improved risk assessment, hazard identification and behaviour safety tools
Training for staff, with a focus on field safety
Injury treatment and compensation
Weekly injury management case reviews
Established close relationship with Perth-based medical team who specialise in the treatment of work-related injuries
Improved injury management processes, which resulted in fewer workers compensation claims
Hygiene, including
• fibrousmaterials
• drinkingwater
• food
Applying latest technology and innovations in fibrous materials management
Updating fibre management plan to be in line with government guidelines
Monthly fibre awareness training to stimulate employee awareness
Ongoing fibre monitoring to characterise employee exposure
Regular monitoring of drinking water to ensure water is free of disease-producing bacteria and fit for human consumption
Regular on-site food safety audits to prevent food-related illnesses
Emergency and crisis management
Contract doctors located on site
Enhanced cyclone procedures to minimise damage to plant and equipment
Creating an emergency response training ground
Providing emergency assistance to public areas near the site
Ongoing efforts to improve crisis and emergency procedures
Some of the key health and safety issues and the related actions taken are summarised below:

Special Steel
Iron Ore M
iningProp
erty
31CITIC Pacific Annual Report 2011
EnvironmentCPM strives to minimise the impact of construction and the future operation of the mine on the environment. In 2011, we complied with all regulatory requirements and demonstrated our ability to manage the site in an environmentally-responsible manner. Monitoring of vegetation, groundwater, corals, turtles, shorebirds, dust, noise, coastal stability and mangroves have all shown results in line with the approvals required by the government. While the project is being constructed, there will be unavoidable disturbances to the environment at the project site. However, this disturbance is managed in accordance with approval limits.
As the Sino Iron project advances towards production, the environment team is working closely with the regulators to ensure that the project obtains all the necessary approvals and fulfils all requirements before operation begins. Our Environment Management System (“EMS”) provides the framework for identifying and managing the environmental
aspects of the project. It is now being enhanced to prepare for first line production. Enhancements include dust and noise control, commissioning, quarantine and vegetation clearing. In 2012, our focus will be on ensuring a smooth transition from the commissioning period to obtaining all the necessary regulatory approvals to operate.
HeritageWe respect the cultural heritage of the land on which we operate and seek to minimise the impact of the project on areas of cultural value. Our heritage team continues to focus on complying with the Aboriginal Heritage Act and Ministerial conditions. These include monitoring all ground disturbances and salvage work, analysis of artefacts and identifying new heritage survey activities. We work closely with the indigenous peoples of the area to improve the livelihood of local communities. Together, we have developed and implemented training, employment, business and community programmes that will make a positive and lasting difference.
32 CITIC Pacific Annual Report 2011
harder material and must grind it much finer to produce the required product. This means that we will be substantially more emissions-intensive than the baseline companies, resulting in a lower overall percentage of assistance.
In an effort to reduce carbon emissions, we have built an energy-efficient combined cycle gas-fired power station. Its state-of-the-art technology makes use of the waste heat to generate more power. As a result, the power station produces at least 30% less carbon emissions than typical power stations in Western Australia, which operate with gas turbine, diesel and gas engines.
We are disappointed that the legislation only considers emissions in Australia and not the global effect of products made in Australia. Although magnetite iron ore processing produces more carbon in Australia, emissions are lower when used in steel making. This results in a net reduction of carbon emissions in the overall mine-to-steel value chain.
We will continue to work with other magnetite producers in lobbying the government to increase the level of assistance provided to new, more energy- intensive entrants to the magnetite industry and to recognise the benefits of this new industry in terms of job creation and carbon savings across the globe.
TaxIn late November 2011, the lower house of the Australian parliament approved the Minerals Resource Rent Tax (“MRRT”). The MRRT is likely to be approved by the upper house of parliament and becomelaw.Thetaxwilltakeeffectfrom1July2012and will apply to all coal and iron ore projects, including magnetite projects.
We are studying the legislation and the Australian Taxation Office guidance to determine the taxable value of the magnetite ore at the taxing point, which in our case will be at the primary crusher when the value of the mined material is low.
The Australian parliament passed The Clean Energy Act, which will impose a fixed price on Australiancarbonemissionsfrom1July2012 before transitioning to an emissions trading schemeon1July2015.
The government has indicated that magnetite projects, including Sino Iron, will receive assistance in the form of free carbon permits, which will reduce our carbon liability. The government introduced the regulation to confirm this assistance on 27 February 2012. The level of assistance for the magnetite industry is determined based on the processing activities of existing magnetite producers, which the government uses as reference to set the assistance baseline. At Sino Iron, we will be processing a much
Special Steel
Iron Ore M
iningProp
erty
33CITIC Pacific Annual Report 2011
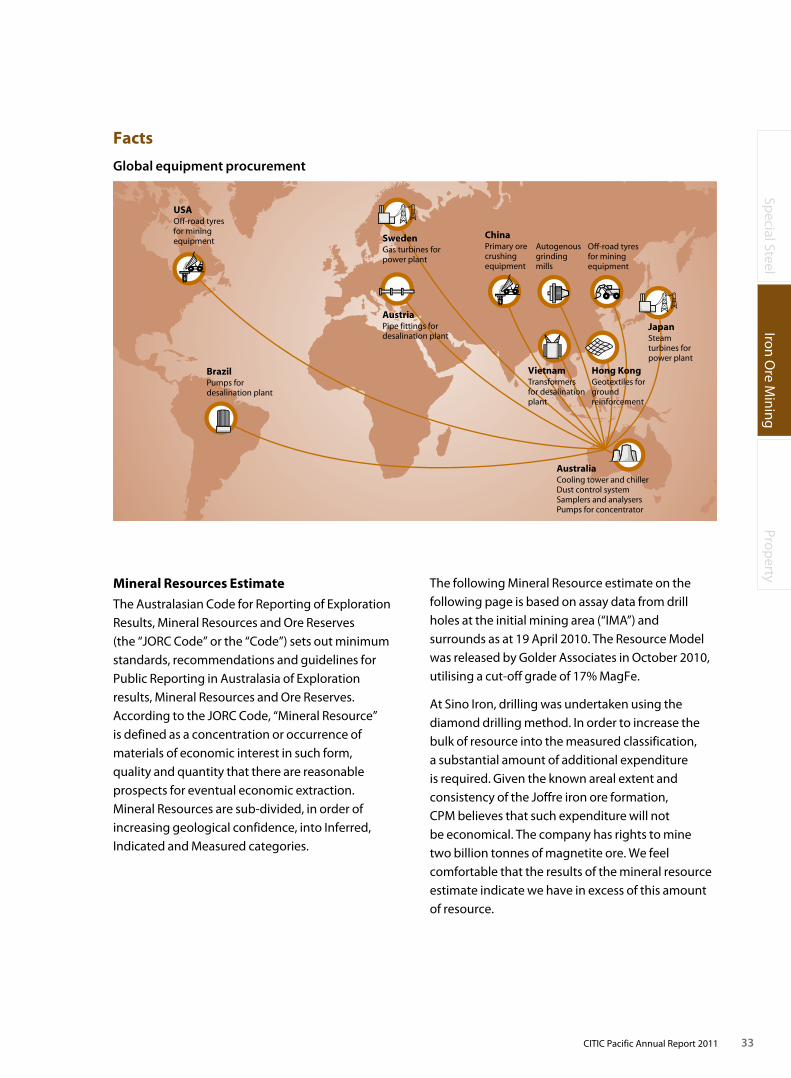
Global equipment procurement
ChinaPrimary ore crushing equipment
Off-road tyres for mining equipment
USAOff-road tyres for mining equipment
BrazilPumps for desalination plant
Autogenous grinding mills
AustriaPipe fittings for desalination plant
SwedenGas turbines for power plant
JapanSteam turbines for power plant
VietnamTransformers for desalination plant
Hong KongGeotextiles for ground reinforcement
AustraliaCooling tower and chiller Dust control system Samplers and analysers Pumps for concentrator
The following Mineral Resource estimate on the following page is based on assay data from drill holes at the initial mining area (“IMA”) and surrounds as at 19 April 2010. The Resource Model was released by Golder Associates in October 2010, utilising a cut-off grade of 17% MagFe.
At Sino Iron, drilling was undertaken using the diamond drilling method. In order to increase the bulk of resource into the measured classification, a substantial amount of additional expenditure is required. Given the known areal extent and consistencyoftheJoffreironoreformation, CPM believes that such expenditure will not be economical. The company has rights to mine two billion tonnes of magnetite ore. We feel comfortable that the results of the mineral resource estimate indicate we have in excess of this amount of resource.
Mineral Resources Estimate
The Australasian Code for Reporting of Exploration Results, Mineral Resources and Ore Reserves (the“JORCCode”orthe“Code”)setsoutminimumstandards, recommendations and guidelines for Public Reporting in Australasia of Exploration results, Mineral Resources and Ore Reserves. AccordingtotheJORCCode,“MineralResource” is defined as a concentration or occurrence of materials of economic interest in such form, quality and quantity that there are reasonable prospects for eventual economic extraction. Mineral Resources are sub-divided, in order of increasing geological confidence, into Inferred, Indicated and Measured categories.
Facts
34 CITIC Pacific Annual Report 2011
Total Joffre Resource
Classification
2010 results 2009 results
Million Tonnes Magnetic Fe (%) Total Fe (%) Million Tonnes
Measured 806 22.64 32.46 466
Indicated 1,489 22.94 31.90 1,158
Inferred 2,793 23.52 31.51 2,881
Total 5,089 23.21 31.77 4,504
Joffre is part of the Brockman Iron Formation, the main ore body for the project.
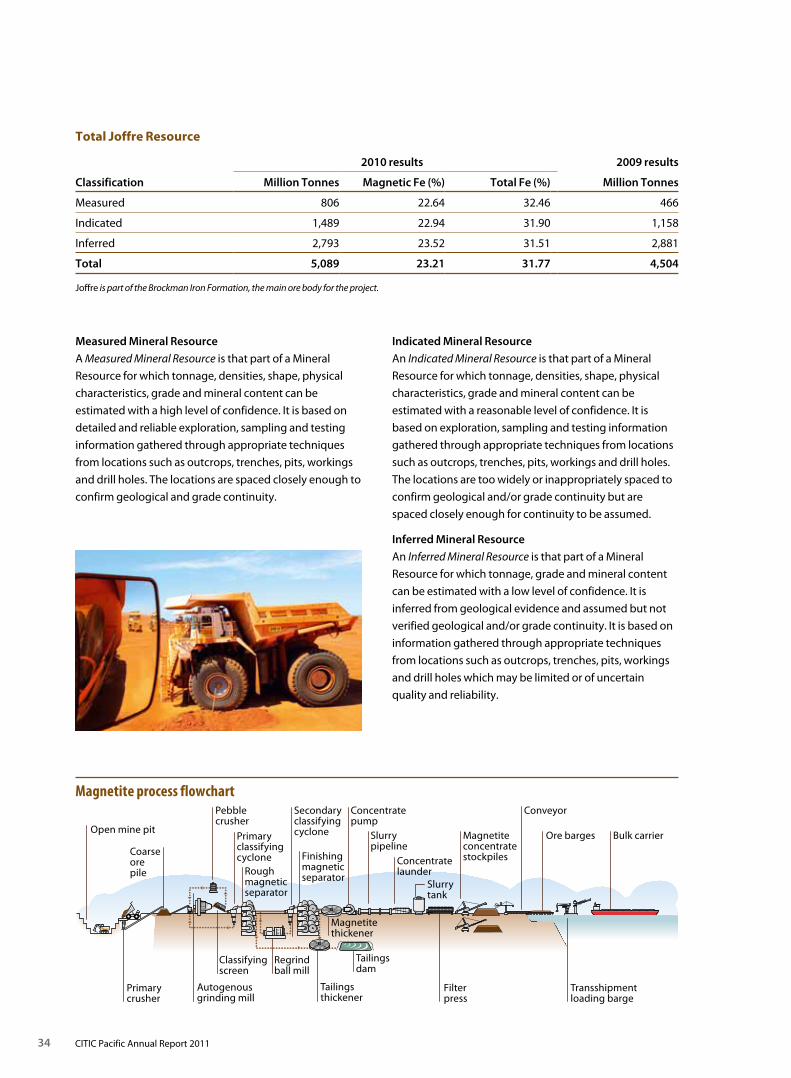
Measured Mineral Resource
A Measured Mineral Resource is that part of a Mineral
Resource for which tonnage, densities, shape, physical
characteristics, grade and mineral content can be
estimated with a high level of confidence. It is based on
detailed and reliable exploration, sampling and testing
information gathered through appropriate techniques
from locations such as outcrops, trenches, pits, workings
and drill holes. The locations are spaced closely enough to
confirm geological and grade continuity.
Indicated Mineral Resource
An Indicated Mineral Resource is that part of a Mineral
Resource for which tonnage, densities, shape, physical
characteristics, grade and mineral content can be
estimated with a reasonable level of confidence. It is
based on exploration, sampling and testing information
gathered through appropriate techniques from locations
such as outcrops, trenches, pits, workings and drill holes.
The locations are too widely or inappropriately spaced to
confirmgeologicaland/orgradecontinuitybutare
spaced closely enough for continuity to be assumed.
Inferred Mineral Resource
An Inferred Mineral Resource is that part of a Mineral
Resource for which tonnage, grade and mineral content
can be estimated with a low level of confidence. It is
inferred from geological evidence and assumed but not
verifiedgeologicaland/orgradecontinuity.Itisbasedon
information gathered through appropriate techniques
from locations such as outcrops, trenches, pits, workings
and drill holes which may be limited or of uncertain
quality and reliability.
Conveyor
Magnetite process flowchart
Open mine pit
Primary crusher
Autogenousgrinding mill
Secondaryclassifyingcyclone
Classifyingscreen
Filter press
Ore barges
Transshipment loading barge
Bulk carrier
Coarse ore pile
Primaryclassifyingcyclone
Regrindball mill
Tailingsthickener
Pebble crusher
Magnetitethickener
Slurrytank
Concentratepump
Concentratelaunder
Tailingsdam
Finishingmagneticseparator
Slurrypipeline
Roughmagneticseparator
Magnetite concentrate stockpiles
Special Steel
Iron Ore M
iningProp
erty
35CITIC Pacific Annual Report 2011
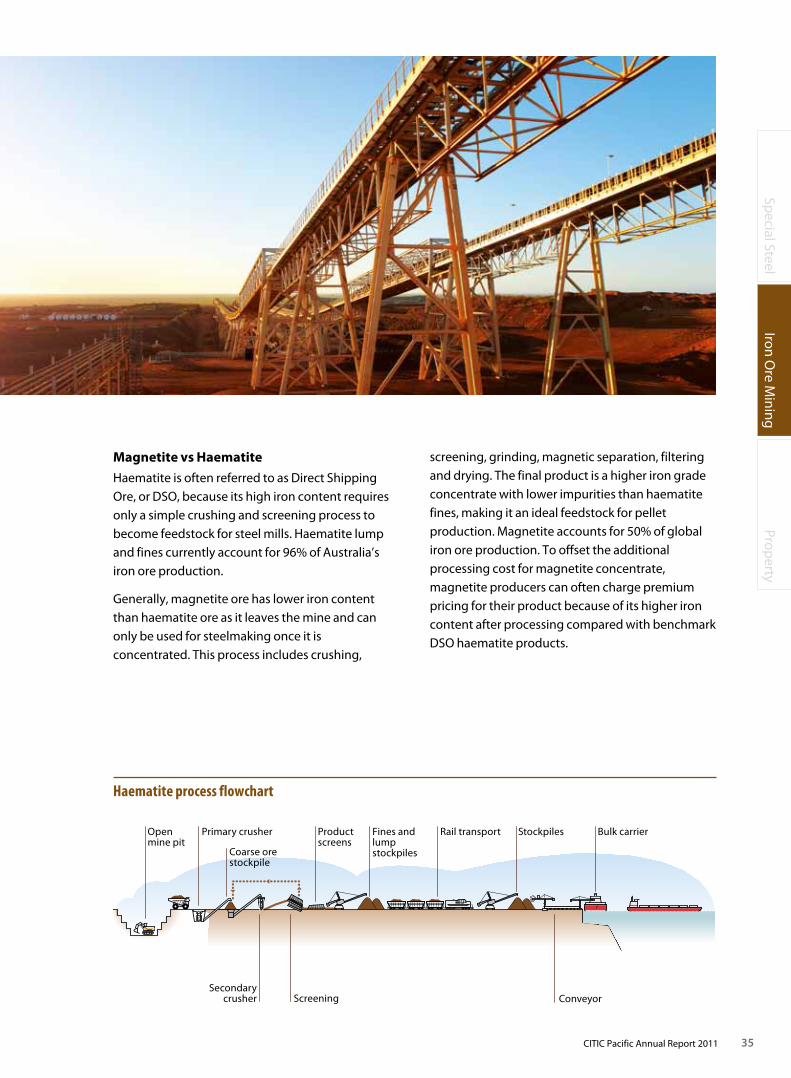
Open mine pit
Primary crusher
Coarse ore stockpile
Product screens
Secondary crusher Screening
Fines and lump stockpiles
Rail transport Stockpiles
Conveyor
Bulk carrier
Haematite process flowchart
Magnetite vs Haematite
HaematiteisoftenreferredtoasDirectShippingOre,orDSO,becauseitshighironcontentrequiresonly a simple crushing and screening process to become feedstock for steel mills. Haematite lump and fines currently account for 96% of Australia’s iron ore production.
Generally, magnetite ore has lower iron content than haematite ore as it leaves the mine and can only be used for steelmaking once it is concentrated. This process includes crushing,
screening, grinding, magnetic separation, filtering and drying. The final product is a higher iron grade concentrate with lower impurities than haematite fines, making it an ideal feedstock for pellet production. Magnetite accounts for 50% of global iron ore production. To offset the additional processing cost for magnetite concentrate, magnetite producers can often charge premium pricing for their product because of its higher iron content after processing compared with benchmark DSOhaematiteproducts.

CITIC Pacific Annual Report 201136
PROPERTY

Special Steel
Iron Ore M
iningProp
erty
37CITIC Pacific Annual Report 2011
38 CITIC Pacific Annual Report 2011
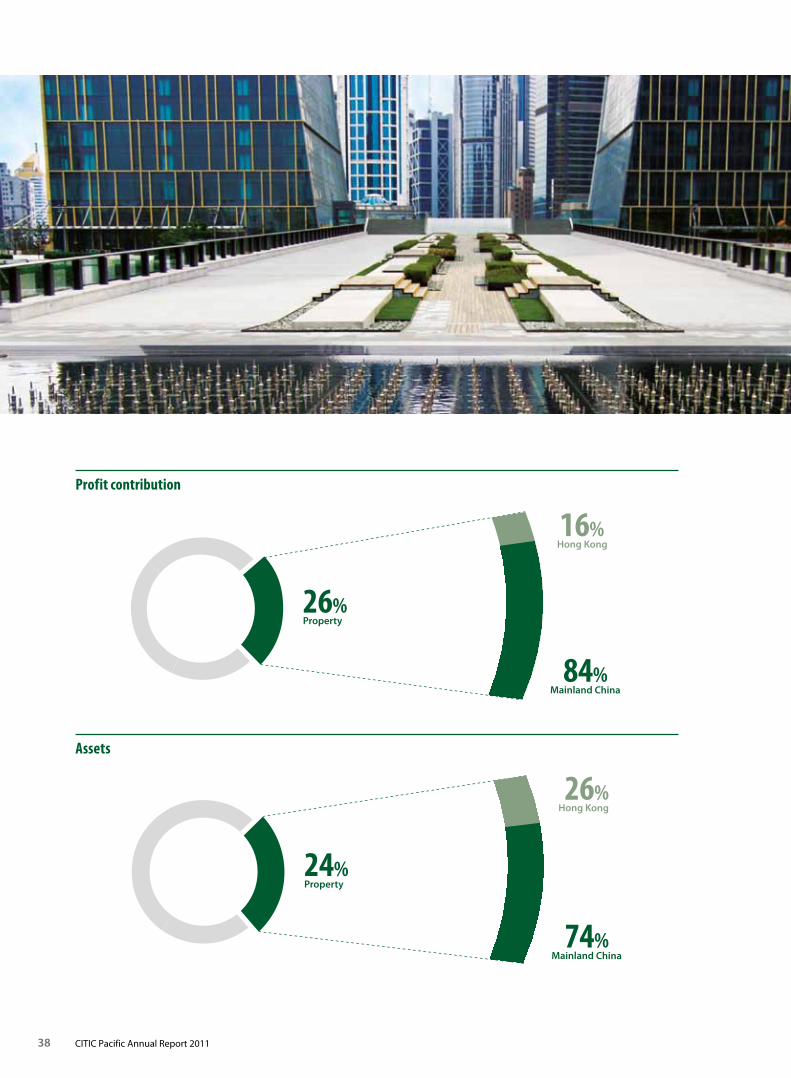
Property24%
Mainland China74%
Hong Kong26%
Property26%
Mainland China84%
Hong Kong16%
Profit contribution
Assets
Special Steel
Iron Ore M
iningProp
erty
39CITIC Pacific Annual Report 2011
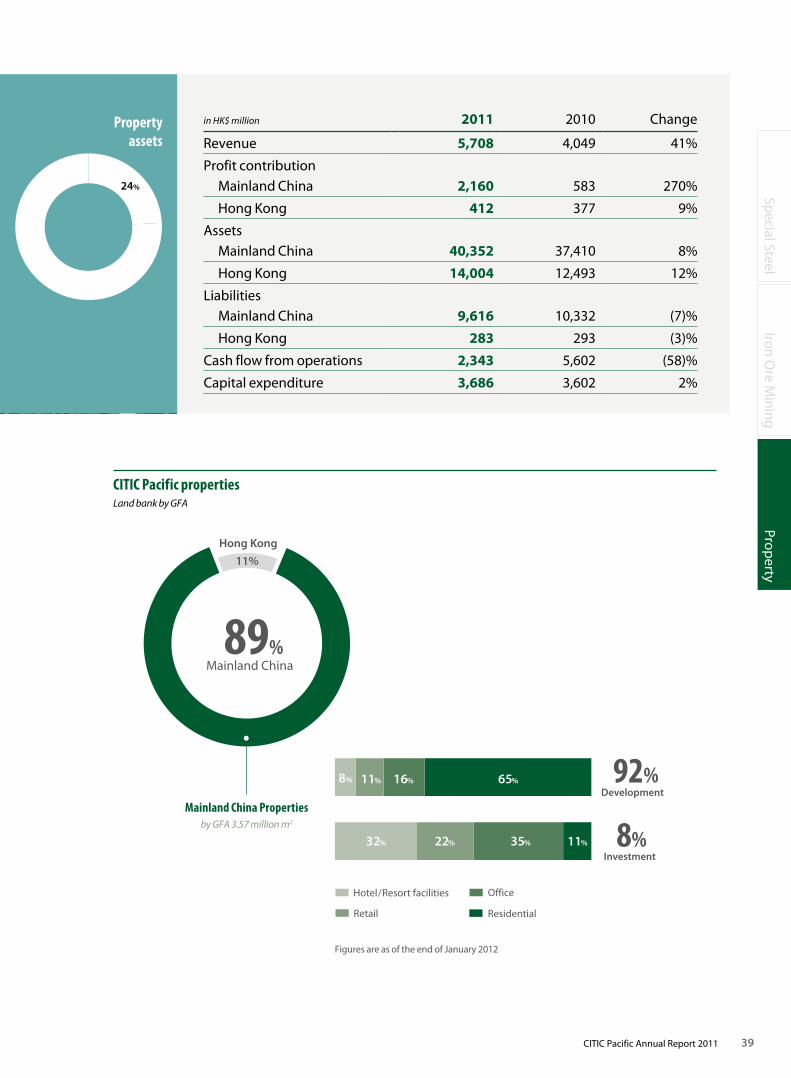
CITIC Pacific propertiesLand bank by GFA
Hotel/Resort facilities
Development92%
Investment8%
11% 16% 65%8%
89%Mainland China
11%
Hong Kong
32% 22% 35% 11%
ResidentialRetail
Office
Mainland China Propertiesby GFA 3.57 million m2
in HK$ million 2011 2010 Change
Revenue 5,708 4,049 41%
Profit contribution Mainland China 2,160 583 270%
Hong Kong 412 377 9%
Assets Mainland China 40,352 37,410 8%
Hong Kong 14,004 12,493 12%
Liabilities Mainland China 9,616 10,332 (7)%
Hong Kong 283 293 (3)%
Cash flow from operations 2,343 5,602 (58)%
Capital expenditure 3,686 3,602 2%
Propertyassets
24%
Figures are as of the end of January 2012
40 CITIC Pacific Annual Report 2011
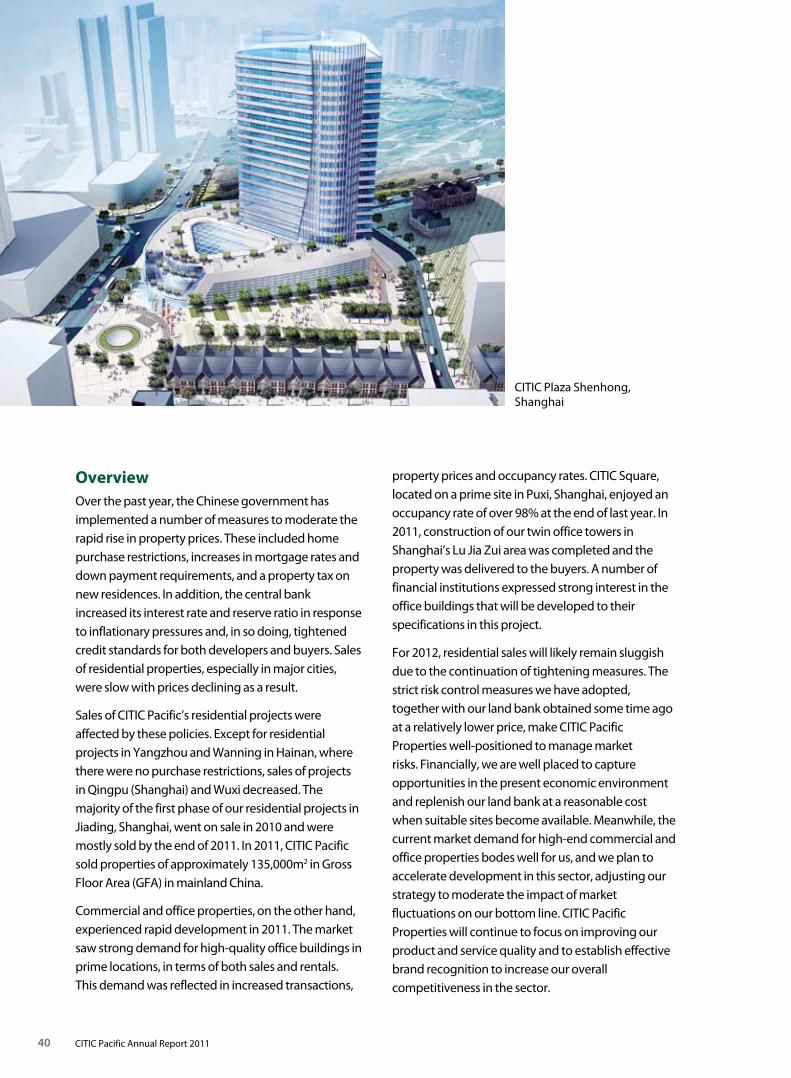
OverviewOver the past year, the Chinese government has implemented a number of measures to moderate the rapid rise in property prices. These included home purchase restrictions, increases in mortgage rates and down payment requirements, and a property tax on new residences. In addition, the central bank increased its interest rate and reserve ratio in response to inflationary pressures and, in so doing, tightened credit standards for both developers and buyers. Sales of residential properties, especially in major cities, were slow with prices declining as a result.
Sales of CITIC Pacific’s residential projects were affected by these policies. Except for residential projects in Yangzhou and Wanning in Hainan, where there were no purchase restrictions, sales of projects in Qingpu (Shanghai) and Wuxi decreased. The majority of the first phase of our residential projects in Jiading, Shanghai, went on sale in 2010 and were mostly sold by the end of 2011. In 2011, CITIC Pacific sold properties of approximately 135,000m2 in Gross Floor Area (GFA) in mainland China.
Commercial and office properties, on the other hand, experienced rapid development in 2011. The market saw strong demand for high-quality office buildings in prime locations, in terms of both sales and rentals. This demand was reflected in increased transactions,
property prices and occupancy rates. CITIC Square, located on a prime site in Puxi, Shanghai, enjoyed an occupancy rate of over 98% at the end of last year. In 2011, construction of our twin office towers in Shanghai’s Lu Jia Zui area was completed and the property was delivered to the buyers. A number of financial institutions expressed strong interest in the office buildings that will be developed to their specifications in this project.
For 2012, residential sales will likely remain sluggish due to the continuation of tightening measures. The strict risk control measures we have adopted, together with our land bank obtained some time ago at a relatively lower price, make CITIC Pacific Properties well-positioned to manage market risks. Financially, we are well placed to capture opportunities in the present economic environment and replenish our land bank at a reasonable cost when suitable sites become available. Meanwhile, the current market demand for high-end commercial and office properties bodes well for us, and we plan to accelerate development in this sector, adjusting our strategy to moderate the impact of market fluctuations on our bottom line. CITIC Pacific Properties will continue to focus on improving our product and service quality and to establish effective brand recognition to increase our overall competitiveness in the sector.
CITIC Plaza Shenhong,Shanghai
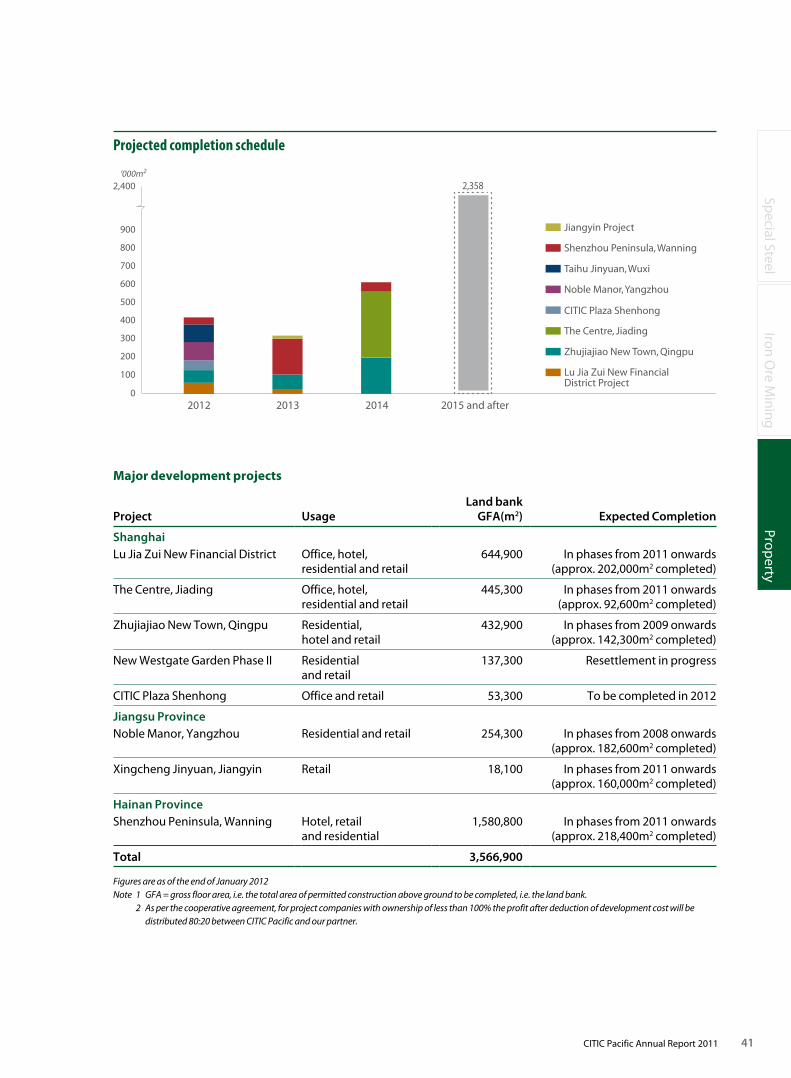
Special Steel
Iron Ore M
iningProp
erty
41CITIC Pacific Annual Report 2011
Major development projects
Project UsageLand bank
GFA(m2) Expected Completion
ShanghaiLu Jia Zui New Financial District Office, hotel,
residential and retail644,900 In phases from 2011 onwards
(approx. 202,000m2 completed)
The Centre, Jiading Office, hotel, residential and retail
445,300 In phases from 2011 onwards (approx. 92,600m2 completed)
Zhujiajiao New Town, Qingpu Residential, hotel and retail
432,900 In phases from 2009 onwards (approx. 142,300m2 completed)
New Westgate Garden Phase II Residential and retail
137,300 Resettlement in progress
CITIC Plaza Shenhong Office and retail 53,300 To be completed in 2012
Jiangsu ProvinceNoble Manor, Yangzhou Residential and retail 254,300 In phases from 2008 onwards
(approx. 182,600m2 completed)
Xingcheng Jinyuan, Jiangyin Retail 18,100 In phases from 2011 onwards (approx. 160,000m2 completed)
Hainan ProvinceShenzhou Peninsula, Wanning Hotel, retail
and residential1,580,800 In phases from 2011 onwards
(approx. 218,400m2 completed)
Total 3,566,900
Figures are as of the end of January 2012Note 1 GFA = gross floor area, i.e. the total area of permitted construction above ground to be completed, i.e. the land bank. 2 As per the cooperative agreement, for project companies with ownership of less than 100% the profit after deduction of development cost will be
distributed 80:20 between CITIC Pacific and our partner.
2015 and after
400
500
300
200
100
0
600
700
800
900
2,400
Lu Jia Zui New Financial District Project
The Centre, Jiading
Noble Manor, Yangzhou
Shenzhou Peninsula, Wanning
Zhujiajiao New Town, Qingpu
CITIC Plaza Shenhong
Taihu Jinyuan, Wuxi
Jiangyin Project
‘000m2
2012 2013 2014
2,358
Projected completion schedule
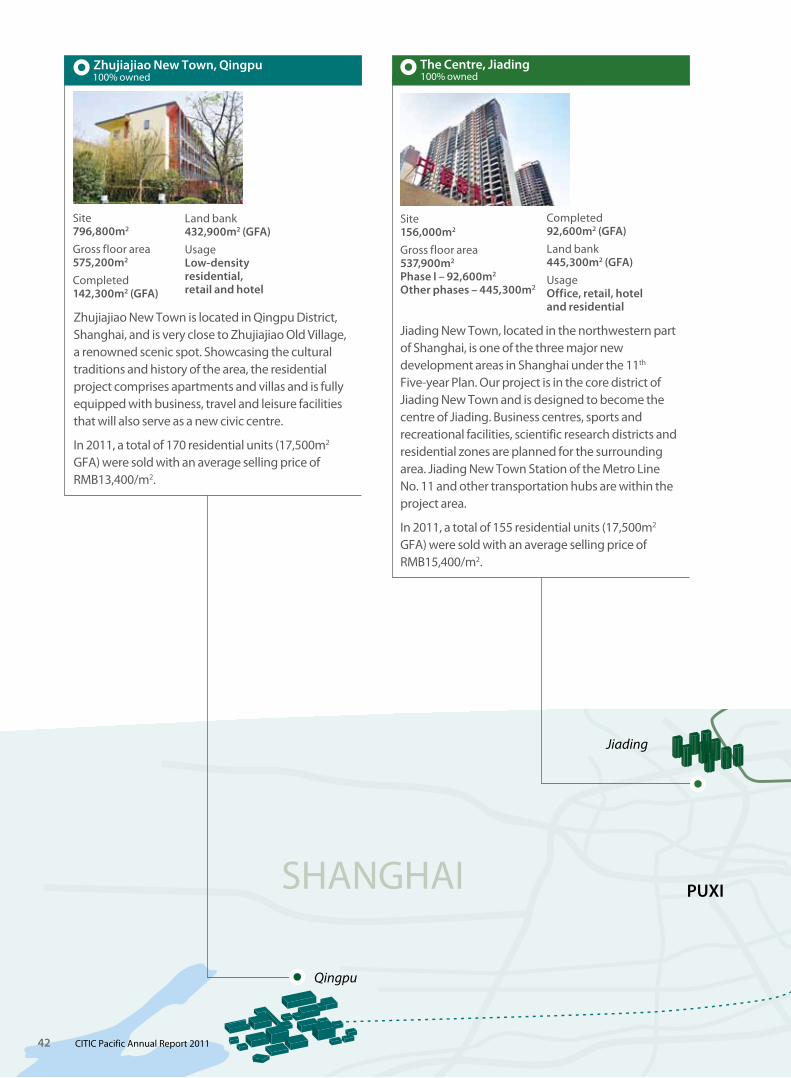
42 CITIC Pacific Annual Report 2011
Jiading
Putuo
Hongkou
Lu Jia Zui
Shanghai HongqiaoInternationalAirport
PUDONGPUXI
Qingpu
Xuhui
SHANGHAI
HUANGPU RIVER
Zhujiajiao New Town is located in Qingpu District, Shanghai, and is very close to Zhujiajiao Old Village, a renowned scenic spot. Showcasing the cultural traditions and history of the area, the residential project comprises apartments and villas and is fully equipped with business, travel and leisure facilities that will also serve as a new civic centre.
In 2011, a total of 170 residential units (17,500m2 GFA) were sold with an average selling price of RMB13,400/m2.
42 CITIC Pacific Annual Report 2011
Site 796,800m2
Gross floor area 575,200m2
Completed 142,300m2 (GFA)
Land bank 432,900m2 (GFA)
Usage Low-density residential, retail and hotel
Jiading New Town, located in the northwestern part of Shanghai, is one of the three major new development areas in Shanghai under the 11th Five-year Plan. Our project is in the core district of Jiading New Town and is designed to become the centre of Jiading. Business centres, sports and recreational facilities, scientific research districts and residential zones are planned for the surrounding area. Jiading New Town Station of the Metro Line No. 11 and other transportation hubs are within the project area.
In 2011, a total of 155 residential units (17,500m2 GFA) were sold with an average selling price of RMB15,400/m2.
The Centre, Jiading 100% owned
Site 156,000m2
Gross floor area 537,900m2
Phase I – 92,600m2
Other phases – 445,300m2
Completed 92,600m2 (GFA)
Land bank 445,300m2 (GFA)
Usage Office, retail, hotel and residential
Zhujiajiao New Town, Qingpu100% owned

Special Steel
Iron Ore M
iningProp
erty
43CITIC Pacific Annual Report 2011
Jiading
Putuo
Hongkou
Lu Jia Zui
Shanghai HongqiaoInternationalAirport
PUDONGPUXI
Qingpu
Xuhui
SHANGHAI
HUANGPU RIVER
Site 249,400m2
Gross floor area 847,100m2
Completed 202,200m2 (GFA)
Located in the Lu Jia Zui Financial District on the south shore of the Huangpu River, this multi-use project covering 10 sites will comprise office buildings, retail premises, a hotel and apartments. With riverside views and a convenient transport network, it is being developed in phases under a comprehensive master plan. The project, which has been named Lu Jia Zui Binjiang Financial City, has already become a prominent part of the Lu Jia Zui Financial District skyline along the Huangpu River.
The two office towers in Phase I were built to buyers’ specifications and were handed over to China Construction Bank and the Agricultural Bank of China in early 2011 as their respective regional headquarters. The completion and trial opening of the Mandarin Oriental Pudong hotel in Shanghai, which will feature 362 guestrooms and 210 serviced apartments, is scheduled for the end of 2012. We are currently negotiating with potential buyers for the sale of the office buildings, which will be built in other phases of the development.
The site is situated in central Shanghai city at the junction of Sichuan Beilu and Wujin Lu in Hongkou District right next to Sichuan Beilu Park. It enjoys easy access to the downtown and commercial areas such as the Bund, Nanjing Donglu and Lu Jia Zui financial district. The site is also a part of the commercial centre planned and being developed by Hongkou district. The project includes office and retail space and will be completed in 2012.
New Westgate Garden is the first urban renewal project in the Laoximen area of Shanghai. The development is located in a prime area bordering the traditional Yu Garden, vibrant Huaihai Road and the fashionable Xin Tiandi area. A convenient transportation network surrounds the development with multiple transportation options, including subways, bridges, tunnels and highways, providing easy access to every other part of the city.
Phase ll is in the process of relocating the local residents.
Site 35,300m2
Gross floor area Approx.137,300m2
(subject to government approval)
Usage Residential and retail
CITIC Pacific Annual Report 2011
Land bank 644,900m2 (GFA)
Usage Office, retail, hotel and residential
Lu Jia Zui New Financial District Project50% owned
Site 13,300m2
Gross floor area 53,300m2
Usage Office and retail
New Westgate Garden (Phase II), Huangpu100% owned
CITIC Plaza Shenhong, Hongkou 100% owned
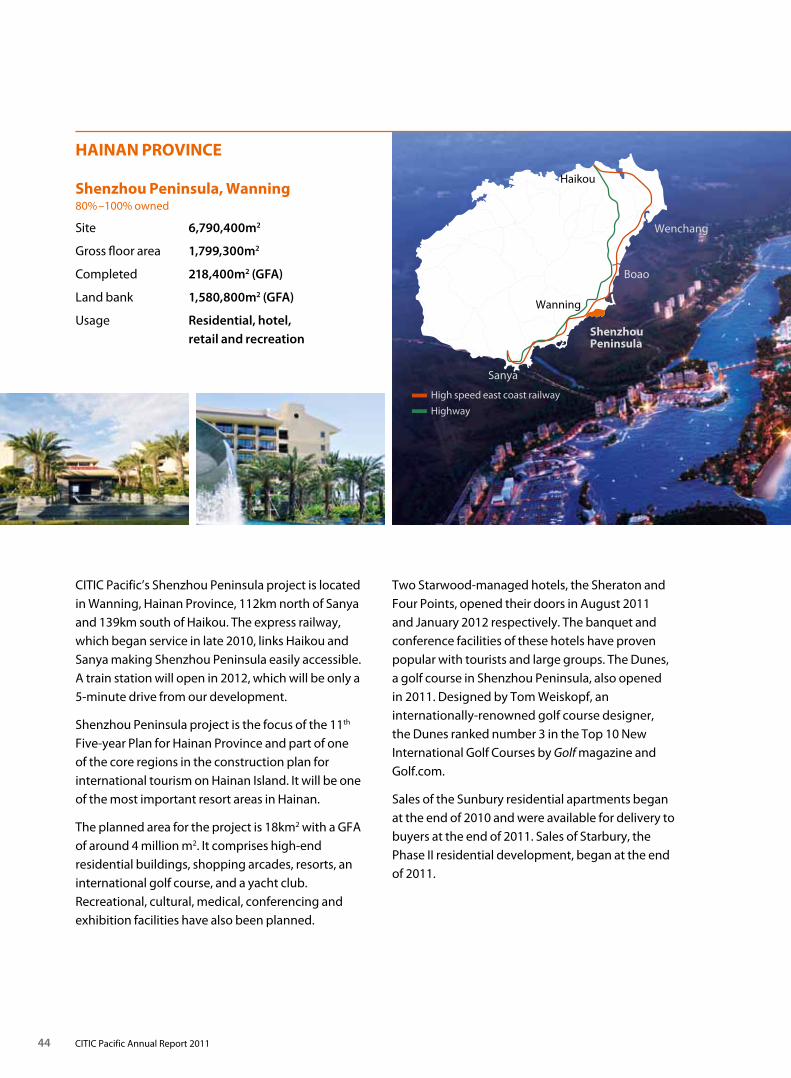
44 CITIC Pacific Annual Report 2011
CITIC Pacific’s Shenzhou Peninsula project is located in Wanning, Hainan Province, 112km north of Sanya and 139km south of Haikou. The express railway, which began service in late 2010, links Haikou and Sanya making Shenzhou Peninsula easily accessible. A train station will open in 2012, which will be only a 5-minute drive from our development.
Shenzhou Peninsula project is the focus of the 11th Five-year Plan for Hainan Province and part of one of the core regions in the construction plan for international tourism on Hainan Island. It will be one of the most important resort areas in Hainan.
The planned area for the project is 18km2 with a GFA of around 4 million m2. It comprises high-end residential buildings, shopping arcades, resorts, an international golf course, and a yacht club. Recreational, cultural, medical, conferencing and exhibition facilities have also been planned.
Two Starwood-managed hotels, the Sheraton and Four Points, opened their doors in August 2011 and January 2012 respectively. The banquet and conference facilities of these hotels have proven popular with tourists and large groups. The Dunes, a golf course in Shenzhou Peninsula, also opened in 2011. Designed by Tom Weiskopf, an internationally-renowned golf course designer, the Dunes ranked number 3 in the Top 10 New International Golf Courses by Golf magazine and Golf.com.
Sales of the Sunbury residential apartments began at the end of 2010 and were available for delivery to buyers at the end of 2011. Sales of Starbury, the Phase II residential development, began at the end of 2011.
HAINAN PROVINCE
Shenzhou Peninsula, Wanning 80%–100% owned
Site 6,790,400m2
Gross floor area 1,799,300m2
Completed 218,400m2 (GFA)
Land bank 1,580,800m2 (GFA)
Usage Residential, hotel, retail and recreation
High speed east coast railway
Highway
Wenchang
Boao
ShenzhouPeninsula
Haikou
Wanning
Sanya
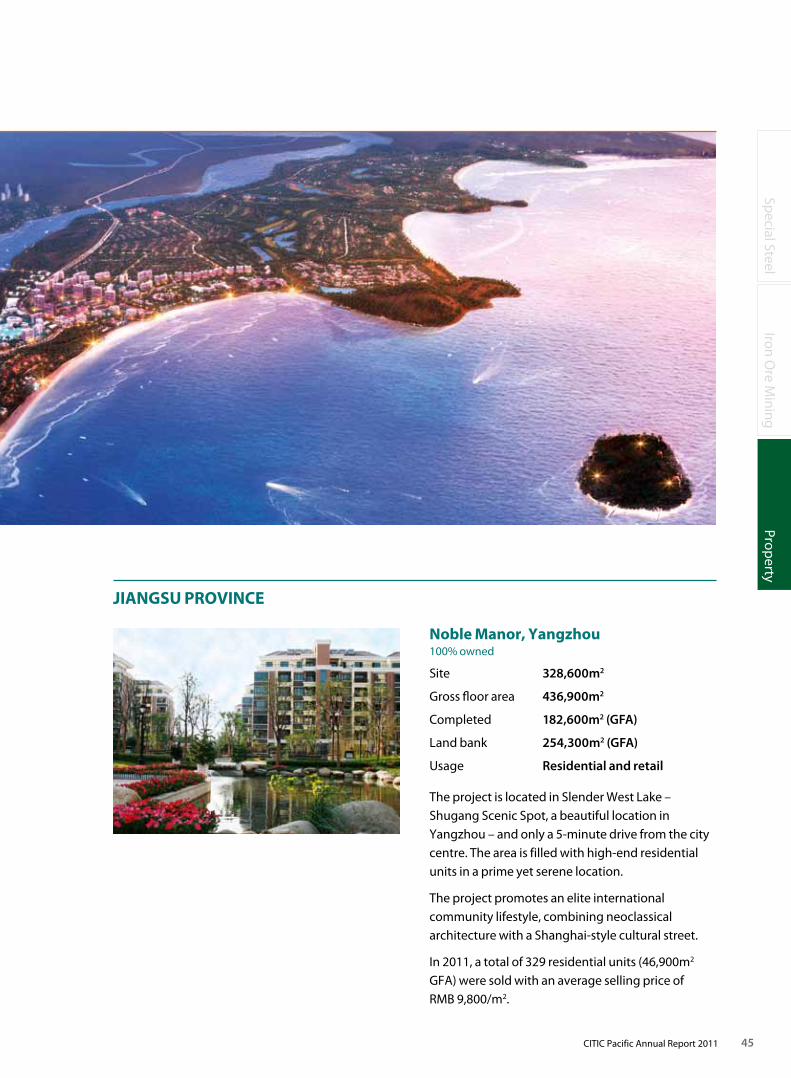
Special Steel
Iron Ore M
iningProp
erty
45CITIC Pacific Annual Report 2011
Noble Manor, Yangzhou 100% owned
Site 328,600m2
Gross floor area 436,900m2
Completed 182,600m2 (GFA)
Land bank 254,300m2 (GFA)
Usage Residential and retail
The project is located in Slender West Lake – Shugang Scenic Spot, a beautiful location in Yangzhou – and only a 5-minute drive from the city centre. The area is filled with high-end residential units in a prime yet serene location.
The project promotes an elite international community lifestyle, combining neoclassical architecture with a Shanghai-style cultural street.
In 2011, a total of 329 residential units (46,900m2 GFA) were sold with an average selling price of RMB 9,800/m2.
JIANGSU PROVINCE
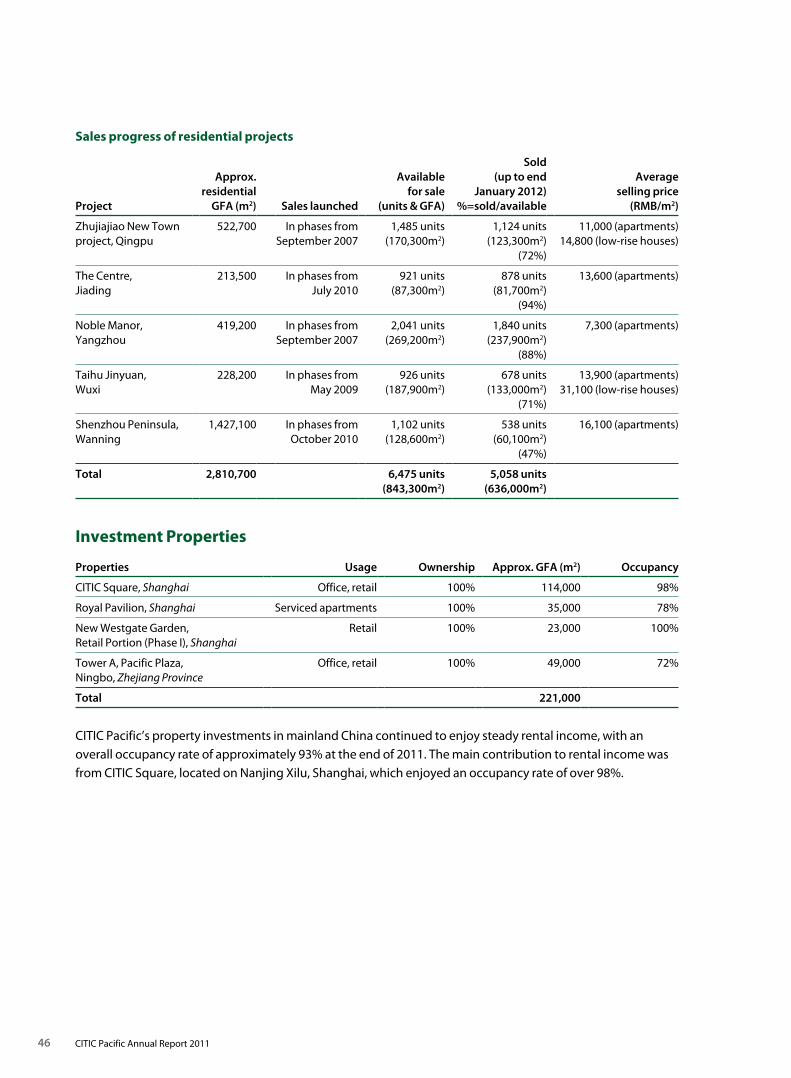
46 CITIC Pacific Annual Report 2011
Investment Properties
Properties Usage Ownership Approx. GFA (m2) Occupancy
CITIC Square, Shanghai Office, retail 100% 114,000 98%
Royal Pavilion, Shanghai Serviced apartments 100% 35,000 78%
New Westgate Garden, Retail Portion (Phase I), Shanghai
Retail 100% 23,000 100%
Tower A, Pacific Plaza, Ningbo, Zhejiang Province
Office, retail 100% 49,000 72%
Total 221,000
CITIC Pacific’s property investments in mainland China continued to enjoy steady rental income, with an overall occupancy rate of approximately 93% at the end of 2011. The main contribution to rental income was from CITIC Square, located on Nanjing Xilu, Shanghai, which enjoyed an occupancy rate of over 98%.
Sales progress of residential projects
Project
Approx. residential
GFA (m2) Sales launched
Available for sale
(units & GFA)
Sold (up to end
January 2012) %=sold/available
Average selling price
(RMB/m2)
Zhujiajiao New Town project, Qingpu
522,700 In phases from September 2007
1,485 units (170,300m2)
1,124 units (123,300m2)
(72%)
11,000 (apartments) 14,800 (low-rise houses)
The Centre, Jiading
213,500 In phases from July 2010
921 units (87,300m2)
878 units (81,700m2)
(94%)
13,600 (apartments)
Noble Manor, Yangzhou
419,200 In phases from September 2007
2,041 units (269,200m2)
1,840 units (237,900m2)
(88%)
7,300 (apartments)
Taihu Jinyuan, Wuxi
228,200 In phases from May 2009
926 units (187,900m2)
678 units(133,000m2)
(71%)
13,900 (apartments) 31,100 (low-rise houses)
Shenzhou Peninsula, Wanning
1,427,100 In phases from October 2010
1,102 units(128,600m2)
538 units(60,100m2)
(47%)
16,100 (apartments)
Total 2,810,700 6,475 units(843,300m2)
5,058 units (636,000m2)
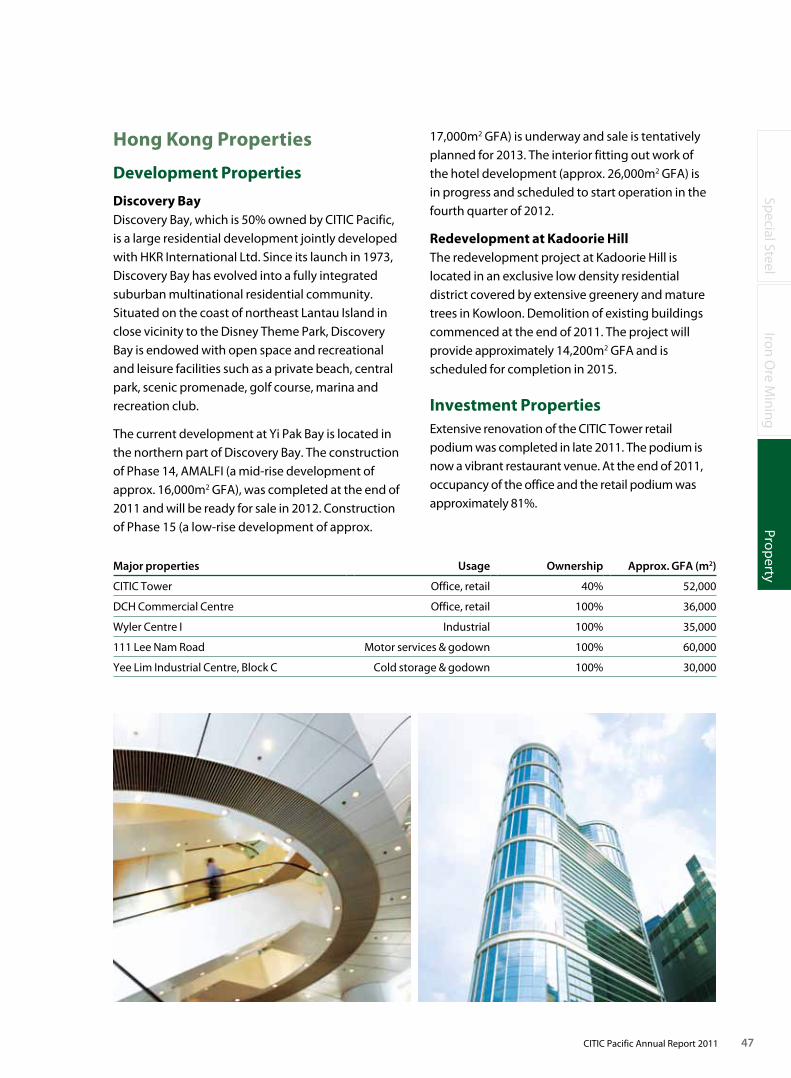
Special Steel
Iron Ore M
iningProp
erty
47CITIC Pacific Annual Report 2011
Hong Kong Properties
Development Properties
Discovery BayDiscovery Bay, which is 50% owned by CITIC Pacific, is a large residential development jointly developed with HKR International Ltd. Since its launch in 1973, Discovery Bay has evolved into a fully integrated suburban multinational residential community. Situated on the coast of northeast Lantau Island in close vicinity to the Disney Theme Park, Discovery Bay is endowed with open space and recreational and leisure facilities such as a private beach, central park, scenic promenade, golf course, marina and recreation club.
The current development at Yi Pak Bay is located in the northern part of Discovery Bay. The construction of Phase 14, AMALFI (a mid-rise development of approx. 16,000m2 GFA), was completed at the end of 2011 and will be ready for sale in 2012. Construction of Phase 15 (a low-rise development of approx.
Major properties Usage Ownership Approx. GFA (m2)
CITIC Tower Office, retail 40% 52,000
DCH Commercial Centre Office, retail 100% 36,000
Wyler Centre I Industrial 100% 35,000
111 Lee Nam Road Motor services & godown 100% 60,000
Yee Lim Industrial Centre, Block C Cold storage & godown 100% 30,000
17,000m2 GFA) is underway and sale is tentatively planned for 2013. The interior fitting out work of the hotel development (approx. 26,000m2 GFA) is in progress and scheduled to start operation in the fourth quarter of 2012.
Redevelopment at Kadoorie HillThe redevelopment project at Kadoorie Hill is located in an exclusive low density residential district covered by extensive greenery and mature trees in Kowloon. Demolition of existing buildings commenced at the end of 2011. The project will provide approximately 14,200m2 GFA and is scheduled for completion in 2015.
Investment PropertiesExtensive renovation of the CITIC Tower retail podium was completed in late 2011. The podium is now a vibrant restaurant venue. At the end of 2011, occupancy of the office and the retail podium was approximately 81%.
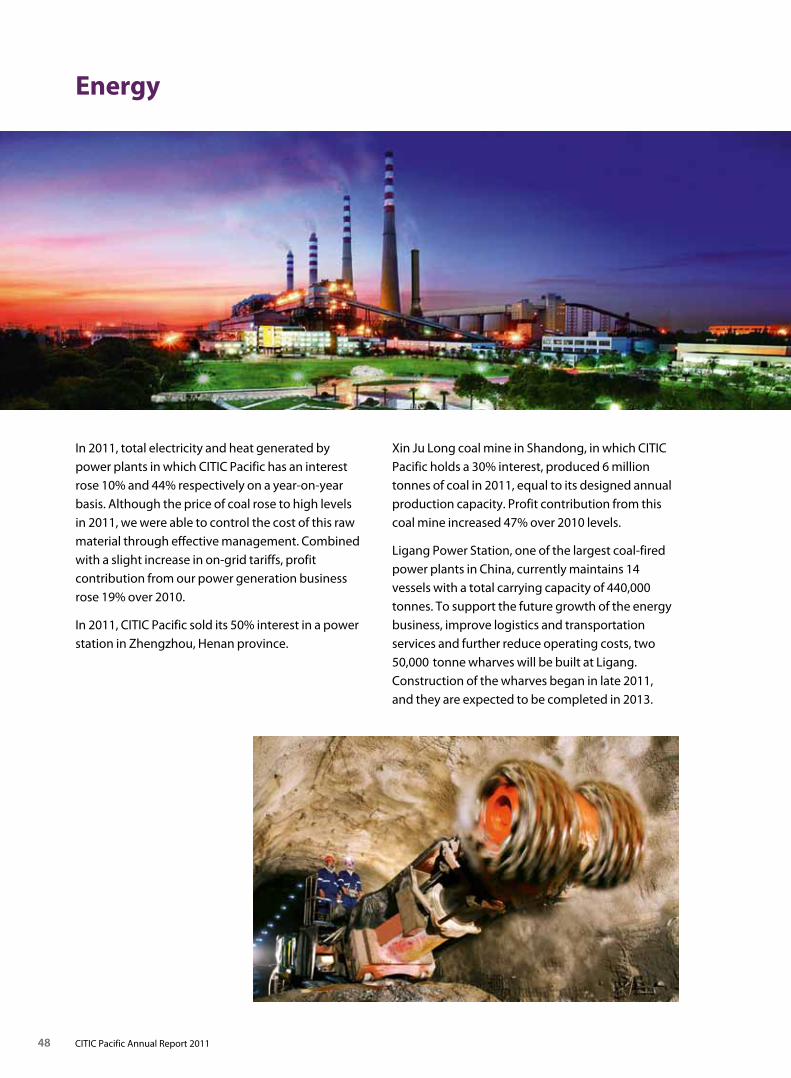
48 CITIC Pacific Annual Report 2011
Energy
In 2011, total electricity and heat generated by power plants in which CITIC Pacific has an interest rose 10% and 44% respectively on a year-on-year basis. Although the price of coal rose to high levels in 2011, we were able to control the cost of this raw material through effective management. Combined with a slight increase in on-grid tariffs, profit contribution from our power generation business rose 19% over 2010.
In 2011, CITIC Pacific sold its 50% interest in a power station in Zhengzhou, Henan province.
Xin Ju Long coal mine in Shandong, in which CITIC Pacific holds a 30% interest, produced 6 million tonnes of coal in 2011, equal to its designed annual production capacity. Profit contribution from this coal mine increased 47% over 2010 levels.
Ligang Power Station, one of the largest coal-fired power plants in China, currently maintains 14 vessels with a total carrying capacity of 440,000 tonnes. To support the future growth of the energy business, improve logistics and transportation services and further reduce operating costs, two 50,000 tonne wharves will be built at Ligang. Construction of the wharves began in late 2011, and they are expected to be completed in 2013.
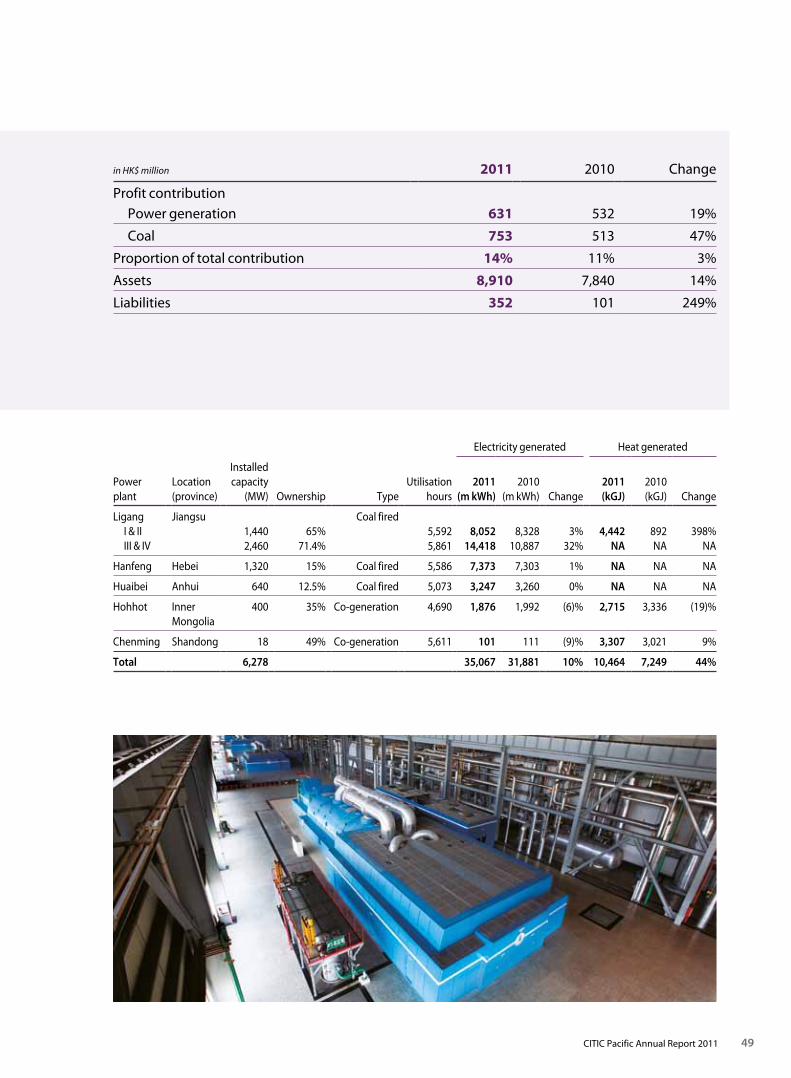
49CITIC Pacific Annual Report 2011
in HK$ million 2011 2010 Change
Profit contribution Power generation 631 532 19%
Coal 753 513 47%
Proportion of total contribution 14% 11% 3%
Assets 8,910 7,840 14%
Liabilities 352 101 249%
Electricity generated Heat generated
Power plant
Location (province)
Installed capacity
(MW) Ownership TypeUtilisation
hours2011
(m kWh)2010
(m kWh) Change2011 (kGJ)
2010 (kGJ) Change
Ligang I & II III & IV
Jiangsu 1,440
2,46065%
71.4%
Coal fired 5,592 5,861
8,052 14,418
8,328 10,887
3% 32%
4,442 NA
892 NA
398% NA
Hanfeng Hebei 1,320 15% Coal fired 5,586 7,373 7,303 1% NA NA NA
Huaibei Anhui 640 12.5% Coal fired 5,073 3,247 3,260 0% NA NA NA
Hohhot Inner Mongolia
400 35% Co-generation 4,690 1,876 1,992 (6)% 2,715 3,336 (19)%
Chenming Shandong 18 49% Co-generation 5,611 101 111 (9)% 3,307 3,021 9%
Total 6,278 35,067 31,881 10% 10,464 7,249 44%
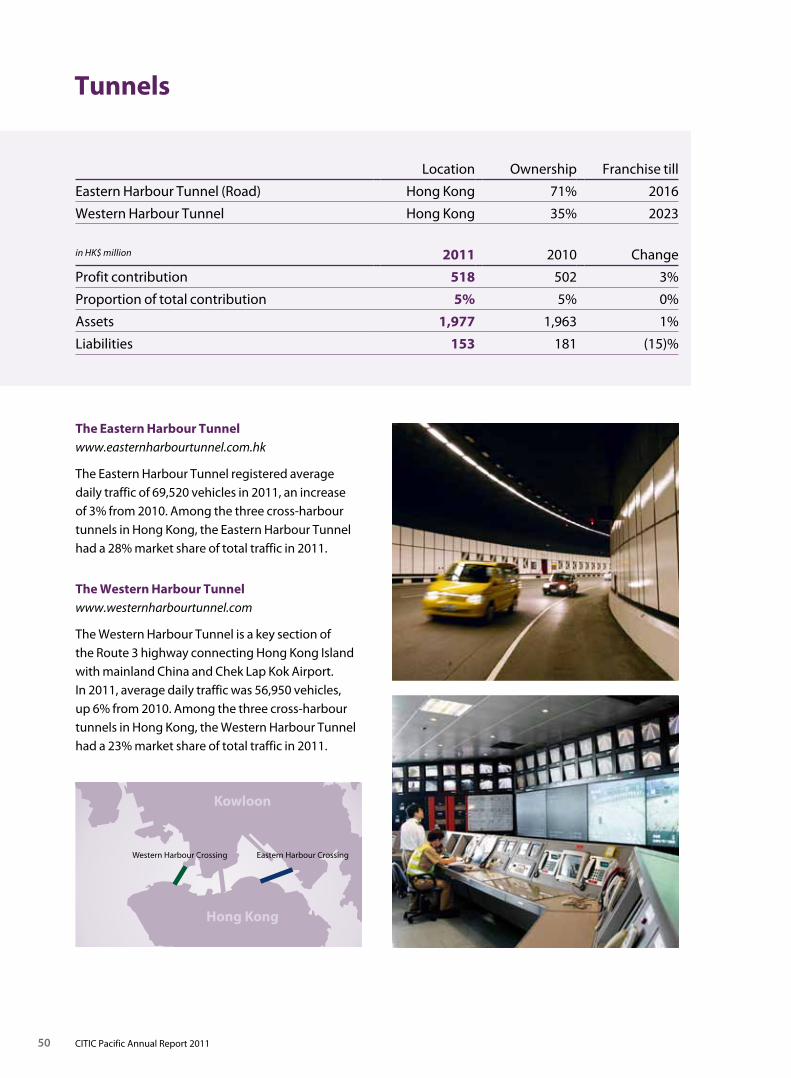
50 CITIC Pacific Annual Report 2011
Tunnels
The Eastern Harbour Tunnel www.easternharbourtunnel.com.hk
The Eastern Harbour Tunnel registered average daily traffic of 69,520 vehicles in 2011, an increase of 3% from 2010. Among the three cross-harbour tunnels in Hong Kong, the Eastern Harbour Tunnel had a 28% market share of total traffic in 2011.
Location Ownership Franchise till
Eastern Harbour Tunnel (Road) Hong Kong 71% 2016
Western Harbour Tunnel Hong Kong 35% 2023
in HK$ million 2011 2010 Change
Profit contribution 518 502 3%
Proportion of total contribution 5% 5% 0%
Assets 1,977 1,963 1%
Liabilities 153 181 (15)%
The Western Harbour Tunnel www.westernharbourtunnel.com
The Western Harbour Tunnel is a key section of the Route 3 highway connecting Hong Kong Island with mainland China and Chek Lap Kok Airport. In 2011, average daily traffic was 56,950 vehicles, up 6% from 2010. Among the three cross-harbour tunnels in Hong Kong, the Western Harbour Tunnel had a 23% market share of total traffic in 2011.
Kowloon
Western Harbour Crossing Eastern Harbour Crossing
Hong Kong
51CITIC Pacific Annual Report 2011
Dah Chong Hongwww.dch.com.hk
55.9% equity interest held by CITIC PacificListed on the Stock Exchange of Hong Kong – code: 01828
Dah Chong Hong is engaged in the sales of motor vehicles and related businesses and services, sales of food and consumer products, as well as logistics services. The company has well-established networks in Hong Kong, Macau and mainland
China, as well as operations in Taiwan, Japan, Singapore and Canada. Dah Chong Hong was a wholly-owned subsidiary of CITIC Pacific until its listing in October 2007.
CITIC Telecom Internationalwww.citictel.com
60.6% equity interest held by CITIC PacificListed on the Stock Exchange of Hong Kong – code: 01883
CITIC Telecom International is one of Asia’s leading hub-based service providers. Its main businesses include voice, SMS, mobile VAS, VPN and data services. CITIC Telecom owns and operates an independent telecoms hub that provides interoperability and interconnections
services to 596 telecoms operators in 71 countries and regions.
CITIC Telecom holds a 20% equity interest in Companhia de Telecomunicações de Macau S.A.R.L., the first and only integrated telecommunication service provider in Macau.
in HK$ million 2011 2010 Change
Profit contribution 617 775 (20)%
Proportion of total contribution 6% 8% (2)%
Assets 20,822 14,717 41%
Liabilities 12,347 7,562 63%
in HK$ million 2011 2010 Change
Profit contribution 299 248 21%
Proportion of total contribution 3% 3% 0%
Assets 3,354 3,060 10%
Liabilities 1,153 1,131 2%

52 CITIC Pacific Annual Report 2011
8,893
1,898
(14,632)
9,23310,797
5,967
2010 201120082007 2009
ProfitForeign exchange loss
HK$ million
Profit attributable to ordinary shareholders
Financial Review
The financial review provides certain key profit and loss, balance sheet and cashflow items as viewed from an operating perspective. Hence, the presentation of results from the various businesses may differ from those in the financial statements.
Summary of 2011A net profit of HK$9,233 million was attributable to ordinary shareholders for 2011. Results of 2011 were driven by improved profitability in our underlying businesses, along with HK$1,891 million arising from an upward revaluation in our investment properties. This compared with a net profit of HK$8,893 million for 2010, which included a one-time gain of HK$3,008 million from the disposal of non-core assets. The one-time gain from the disposal of core assets in 2011 was HK$664 million. Our continuing business operations contribution increased from HK$5,179 million to HK$7,129 million, a 38% increase from 2010.
Earnings per ShareEarnings per share were HK$2.53 in 2011 compared with HK$2.44 in 2010, an increase of 4%. The number of shares outstanding was 3,649,444,160 shares, with 756,000 shares being issued during 2011.
DividendsA final dividend of HK$0.30 per share has been recommended to ordinary shareholders for approval at the Annual General Meeting. This is on top of an interim dividend of HK$0.15 per share that had been declared for the first half of 2011. This equates to an aggregate cash distribution of HK$1,642 million.
Special dividend – interim
Final dividend
Interim dividend0.0
0.2
0.4
0.6
0.8
1.0
1.2
1.4
1.6
2007 2008 2009 2010 2011
HK$
Dividend per share
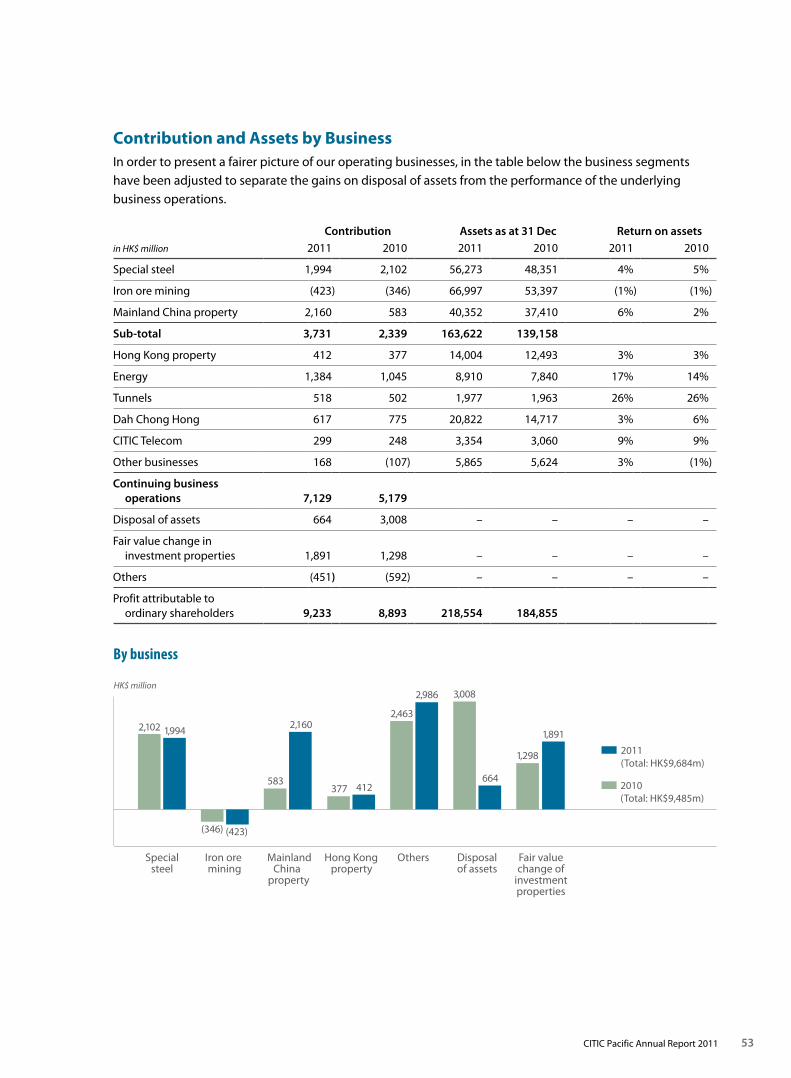
53CITIC Pacific Annual Report 2011
Contribution and Assets by BusinessIn order to present a fairer picture of our operating businesses, in the table below the business segments have been adjusted to separate the gains on disposal of assets from the performance of the underlying business operations.
Contribution Assets as at 31 Dec Return on assetsin HK$ million 2011 2010 2011 2010 2011 2010
Special steel 1,994 2,102 56,273 48,351 4% 5%
Iron ore mining (423) (346) 66,997 53,397 (1%) (1%)
Mainland China property 2,160 583 40,352 37,410 6% 2%
Sub-total 3,731 2,339 163,622 139,158
Hong Kong property 412 377 14,004 12,493 3% 3%
Energy 1,384 1,045 8,910 7,840 17% 14%
Tunnels 518 502 1,977 1,963 26% 26%
Dah Chong Hong 617 775 20,822 14,717 3% 6%
CITIC Telecom 299 248 3,354 3,060 9% 9%
Other businesses 168 (107) 5,865 5,624 3% (1%)
Continuing business operations 7,129 5,179
Disposal of assets 664 3,008 – – – –
Fair value change in investment properties 1,891 1,298 – – – –
Others (451) (592) – – – –
Profit attributable to ordinary shareholders 9,233 8,893 218,554 184,855
2010 (Total: HK$9,485m)
2011 (Total: HK$9,684m)
Hong Kongproperty
Others Fair valuechange of
investmentproperties
Disposalof assets
MainlandChina
property
Iron ore mining
Specialsteel
HK$ million
1,9942,102
(346) (423)
583
2,160
377 412
2,463
2,986 3,008
664
1,298
1,891
By business
Financial Review
54 CITIC Pacific Annual Report 2011
Special Steel The contribution for 2011 was HK$1,994 million compared with HK$2,102 million for 2010, a decrease of 5%. The actual business operation remained strong, and this decrease was mainly due to a HK$342 million loss incurred due to the closure of two small blast furnaces and one electric arc furnace in Xin Yegang from the retirement of outdated facilities. Excluding this loss, the contribution for 2011 increased 11% from the previous year. The volume of special steel products produced was around 6.96 million tonnes during 2011. Exports totalled 917,000 tonnes, accounting for approximately 13% of our sales. The growth in sales for 2011 was met by newly added capacity.
Iron Ore Mining Construction of the iron ore mine in Australia continued. A loss of HK$423 million was recorded in 2011, mainly due to a provision made for a mismatch between the supply of gas under the current contract and the revised timetable for the completion of the iron ore mine and non-capitalised bank loan interest.
Mainland China Property Net contribution increased to HK$2,160 million in 2011 compared with HK$583 million in 2010 due to the delivery of property to their buyers, including two office towers at our Lujiazui development in Shanghai and from the delivery of residential units in Qingpu in Shanghai, Wuxi, Yangzhou, Hainan and Jiading, and strata office units in Ningbo. Our investment properties, CITIC Square and Westgate, were fully leased and Royal Pavilion and Ningbo Pacific Plaza had occupancy rates of 78% and 72%.
in HK$ million 2011 2010
Sales 1,995 338
Leasing 383 352
Disposal of assets 164 –
Others and operating expenses (218) (107)
Total 2,324 583
Hong Kong Property Profits from leasing decreased slightly to HK$353 million in 2011 compared with HK$360 million in 2010, mainly attributable to lower occupancy rates, particularly in CITIC Tower where the occupancy of a major new tenant and the renovation of the retail podium were only completed in late 2011. The average occupancy rate of the properties in Hong Kong was 93% at the end of 2011. Property sales contribution was mainly from the Discovery Bay project by our associated company, Hong Kong Resorts. A non-recurring gain was made by the sale of Honest Motor Building.
in HK$ million 2011 2010
Sales 59 17
Leasing 353 360
Disposal of investment property 296 –
Total 708 377
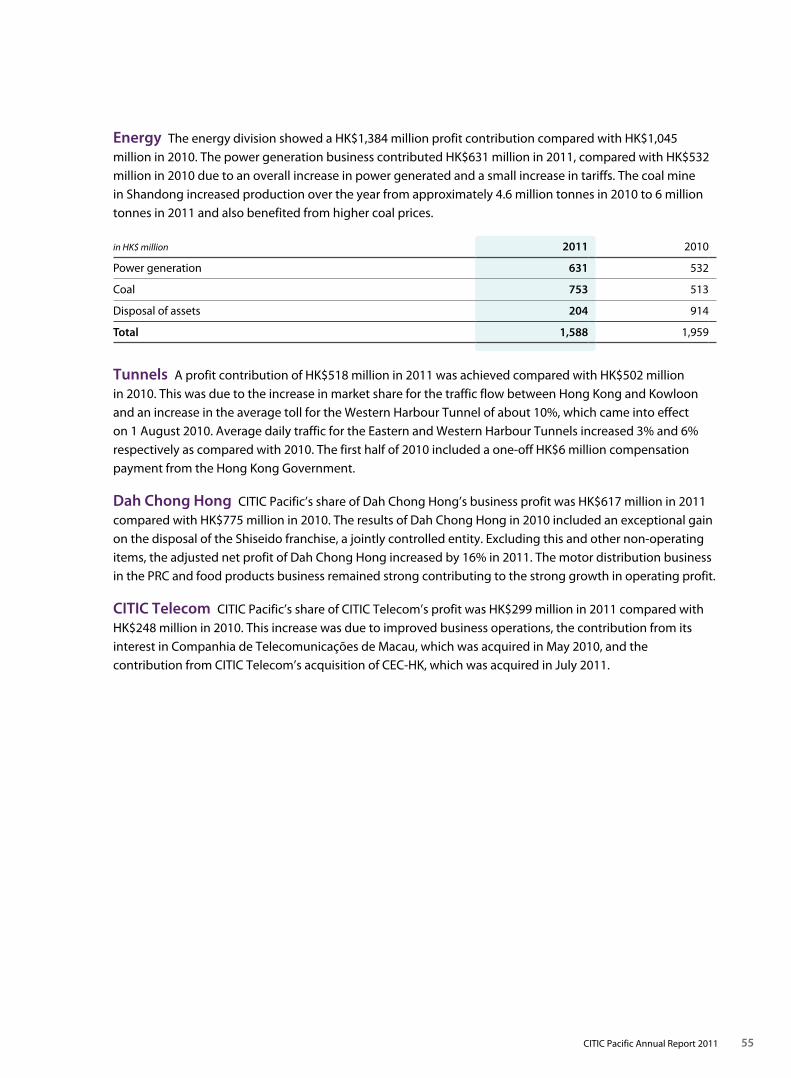
55CITIC Pacific Annual Report 2011
Energy The energy division showed a HK$1,384 million profit contribution compared with HK$1,045 million in 2010. The power generation business contributed HK$631 million in 2011, compared with HK$532 million in 2010 due to an overall increase in power generated and a small increase in tariffs. The coal mine in Shandong increased production over the year from approximately 4.6 million tonnes in 2010 to 6 million tonnes in 2011 and also benefited from higher coal prices.
in HK$ million 2011 2010
Power generation 631 532
Coal 753 513
Disposal of assets 204 914
Total 1,588 1,959
Tunnels A profit contribution of HK$518 million in 2011 was achieved compared with HK$502 million in 2010. This was due to the increase in market share for the traffic flow between Hong Kong and Kowloon and an increase in the average toll for the Western Harbour Tunnel of about 10%, which came into effect on 1 August 2010. Average daily traffic for the Eastern and Western Harbour Tunnels increased 3% and 6% respectively as compared with 2010. The first half of 2010 included a one-off HK$6 million compensation payment from the Hong Kong Government.
Dah Chong Hong CITIC Pacific’s share of Dah Chong Hong’s business profit was HK$617 million in 2011 compared with HK$775 million in 2010. The results of Dah Chong Hong in 2010 included an exceptional gain on the disposal of the Shiseido franchise, a jointly controlled entity. Excluding this and other non-operating items, the adjusted net profit of Dah Chong Hong increased by 16% in 2011. The motor distribution business in the PRC and food products business remained strong contributing to the strong growth in operating profit.
CITIC Telecom CITIC Pacific’s share of CITIC Telecom’s profit was HK$299 million in 2011 compared with HK$248 million in 2010. This increase was due to improved business operations, the contribution from its interest in Companhia de Telecomunicações de Macau, which was acquired in May 2010, and the contribution from CITIC Telecom’s acquisition of CEC-HK, which was acquired in July 2011.
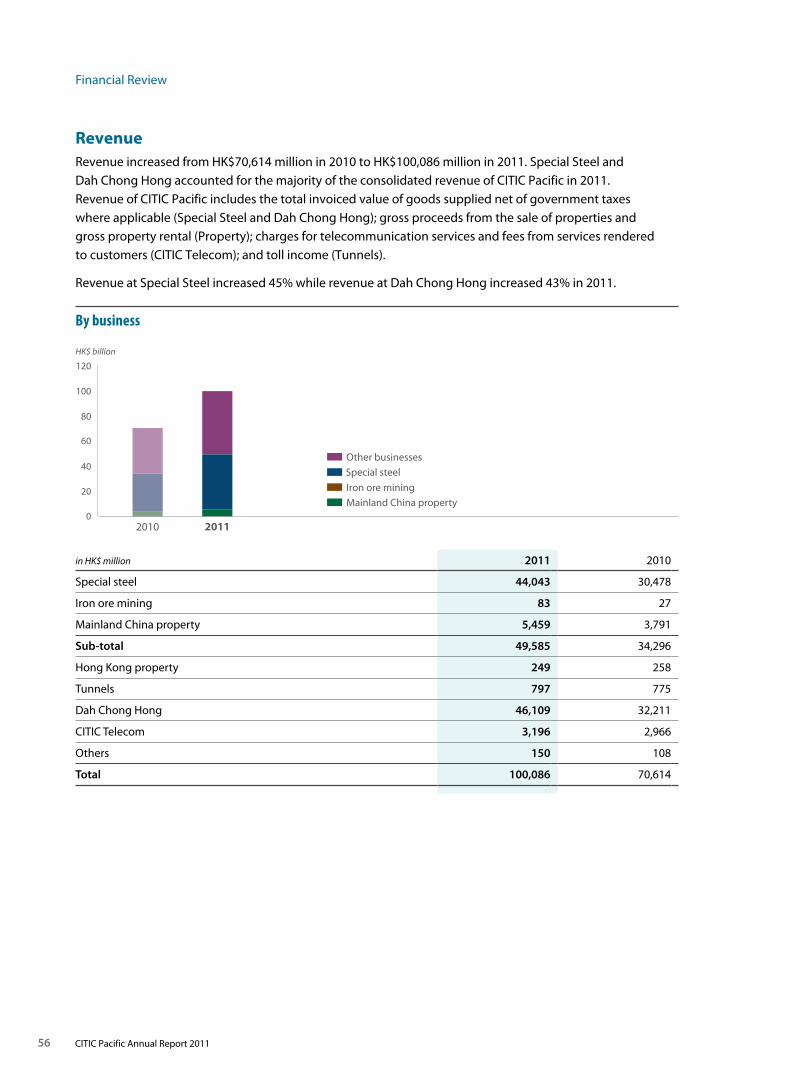
Financial Review
56 CITIC Pacific Annual Report 2011
RevenueRevenue increased from HK$70,614 million in 2010 to HK$100,086 million in 2011. Special Steel and Dah Chong Hong accounted for the majority of the consolidated revenue of CITIC Pacific in 2011. Revenue of CITIC Pacific includes the total invoiced value of goods supplied net of government taxes where applicable (Special Steel and Dah Chong Hong); gross proceeds from the sale of properties and gross property rental (Property); charges for telecommunication services and fees from services rendered to customers (CITIC Telecom); and toll income (Tunnels).
Revenue at Special Steel increased 45% while revenue at Dah Chong Hong increased 43% in 2011.
in HK$ million 2011 2010
Special steel 44,043 30,478
Iron ore mining 83 27
Mainland China property 5,459 3,791
Sub-total 49,585 34,296
Hong Kong property 249 258
Tunnels 797 775
Dah Chong Hong 46,109 32,211
CITIC Telecom 3,196 2,966
Others 150 108
Total 100,086 70,614
80
0
20
40
60
100
120
2010 2011
Special steel
Iron ore miningMainland China property
Other businesses
HK$ billion
By business
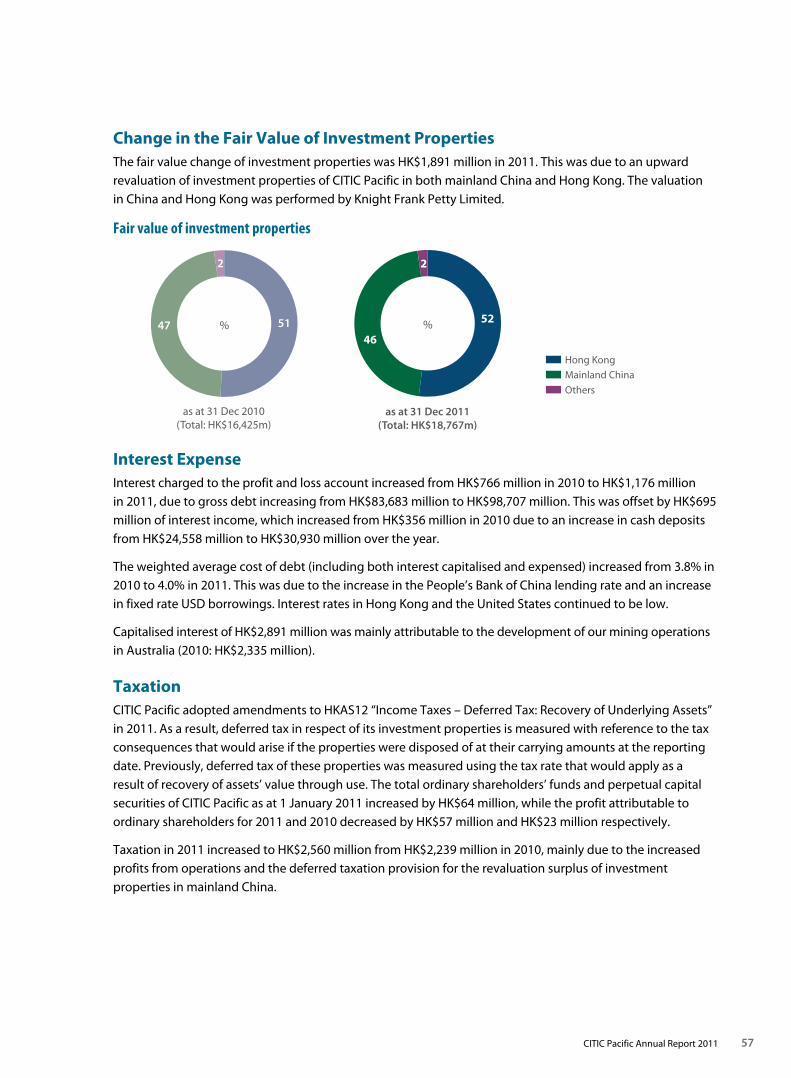
57CITIC Pacific Annual Report 2011
Change in the Fair Value of Investment PropertiesThe fair value change of investment properties was HK$1,891 million in 2011. This was due to an upward revaluation of investment properties of CITIC Pacific in both mainland China and Hong Kong. The valuation in China and Hong Kong was performed by Knight Frank Petty Limited.
Interest ExpenseInterest charged to the profit and loss account increased from HK$766 million in 2010 to HK$1,176 million in 2011, due to gross debt increasing from HK$83,683 million to HK$98,707 million. This was offset by HK$695 million of interest income, which increased from HK$356 million in 2010 due to an increase in cash deposits from HK$24,558 million to HK$30,930 million over the year.
The weighted average cost of debt (including both interest capitalised and expensed) increased from 3.8% in 2010 to 4.0% in 2011. This was due to the increase in the People’s Bank of China lending rate and an increase in fixed rate USD borrowings. Interest rates in Hong Kong and the United States continued to be low.
Capitalised interest of HK$2,891 million was mainly attributable to the development of our mining operations in Australia (2010: HK$2,335 million).
TaxationCITIC Pacific adopted amendments to HKAS12 “Income Taxes – Deferred Tax: Recovery of Underlying Assets” in 2011. As a result, deferred tax in respect of its investment properties is measured with reference to the tax consequences that would arise if the properties were disposed of at their carrying amounts at the reporting date. Previously, deferred tax of these properties was measured using the tax rate that would apply as a result of recovery of assets’ value through use. The total ordinary shareholders’ funds and perpetual capital securities of CITIC Pacific as at 1 January 2011 increased by HK$64 million, while the profit attributable to ordinary shareholders for 2011 and 2010 decreased by HK$57 million and HK$23 million respectively.
Taxation in 2011 increased to HK$2,560 million from HK$2,239 million in 2010, mainly due to the increased profits from operations and the deferred taxation provision for the revaluation surplus of investment properties in mainland China.
as at 31 Dec 2011(Total: HK$18,767m)
as at 31 Dec 2010(Total: HK$16,425m)
Hong Kong
Mainland China
Others
52
2
46%51
2
47 %
Fair value of investment properties
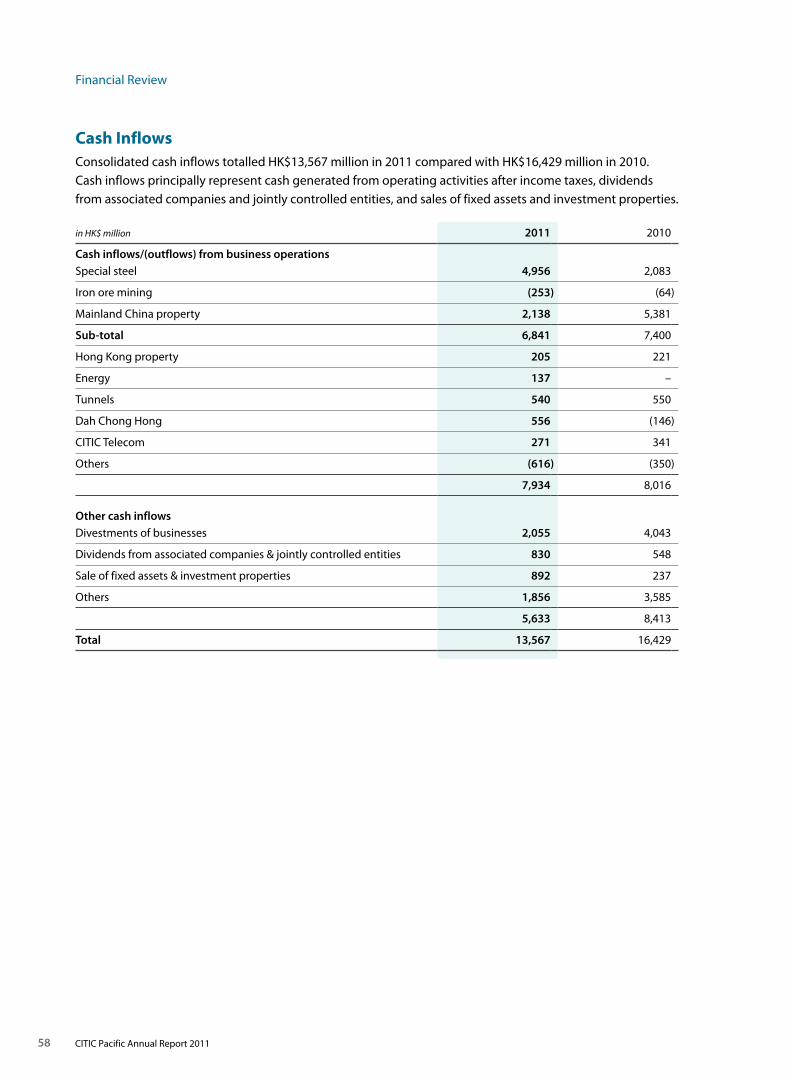
Financial Review
58 CITIC Pacific Annual Report 2011
Cash InflowsConsolidated cash inflows totalled HK$13,567 million in 2011 compared with HK$16,429 million in 2010. Cash inflows principally represent cash generated from operating activities after income taxes, dividends from associated companies and jointly controlled entities, and sales of fixed assets and investment properties.
in HK$ million 2011 2010
Cash inflows/(outflows) from business operationsSpecial steel 4,956 2,083
Iron ore mining (253) (64)
Mainland China property 2,138 5,381
Sub-total 6,841 7,400
Hong Kong property 205 221
Energy 137 –
Tunnels 540 550
Dah Chong Hong 556 (146)
CITIC Telecom 271 341
Others (616) (350)
7,934 8,016
Other cash inflowsDivestments of businesses 2,055 4,043
Dividends from associated companies & jointly controlled entities 830 548
Sale of fixed assets & investment properties 892 237
Others 1,856 3,585
5,633 8,413
Total 13,567 16,429
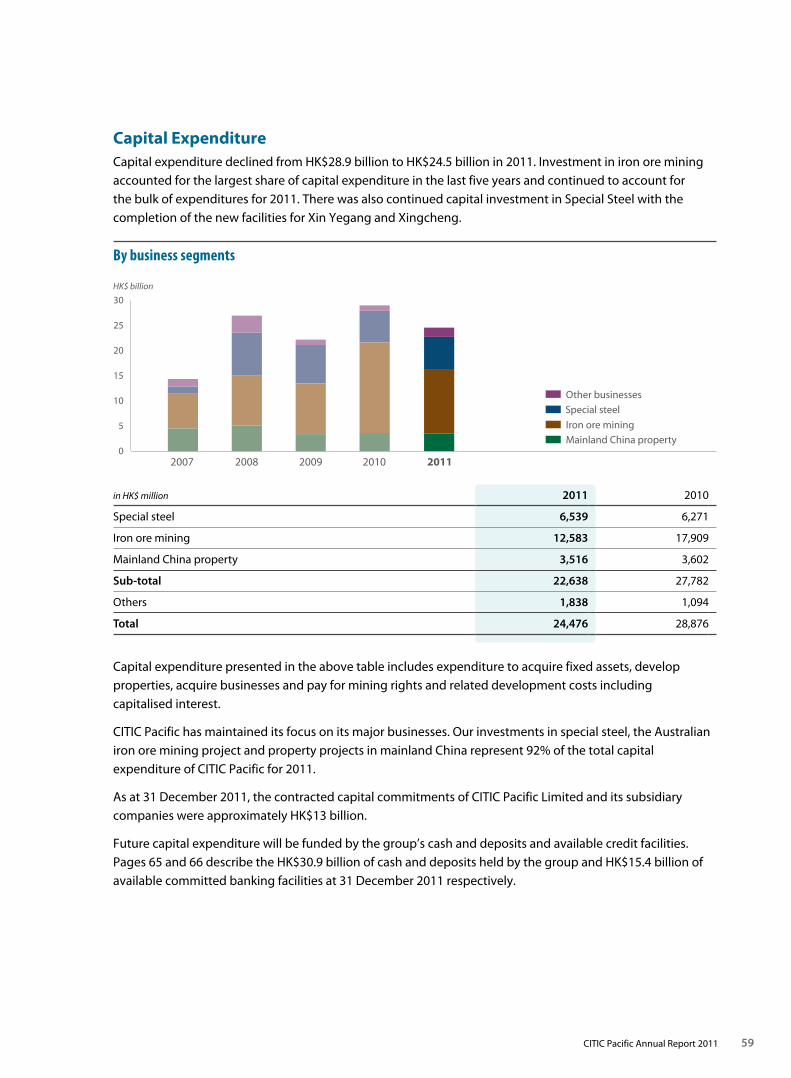
59CITIC Pacific Annual Report 2011
20
0
5
10
15
25
30
2009 2011201020082007
HK$ billion
Special steel
Iron ore miningMainland China property
Other businesses
By business segments
Capital ExpenditureCapital expenditure declined from HK$28.9 billion to HK$24.5 billion in 2011. Investment in iron ore mining accounted for the largest share of capital expenditure in the last five years and continued to account for the bulk of expenditures for 2011. There was also continued capital investment in Special Steel with the completion of the new facilities for Xin Yegang and Xingcheng.
in HK$ million 2011 2010
Special steel 6,539 6,271
Iron ore mining 12,583 17,909
Mainland China property 3,516 3,602
Sub-total 22,638 27,782
Others 1,838 1,094
Total 24,476 28,876
Capital expenditure presented in the above table includes expenditure to acquire fixed assets, develop properties, acquire businesses and pay for mining rights and related development costs including capitalised interest.
CITIC Pacific has maintained its focus on its major businesses. Our investments in special steel, the Australian iron ore mining project and property projects in mainland China represent 92% of the total capital expenditure of CITIC Pacific for 2011.
As at 31 December 2011, the contracted capital commitments of CITIC Pacific Limited and its subsidiary companies were approximately HK$13 billion.
Future capital expenditure will be funded by the group’s cash and deposits and available credit facilities. Pages 65 and 66 describe the HK$30.9 billion of cash and deposits held by the group and HK$15.4 billion of available committed banking facilities at 31 December 2011 respectively.
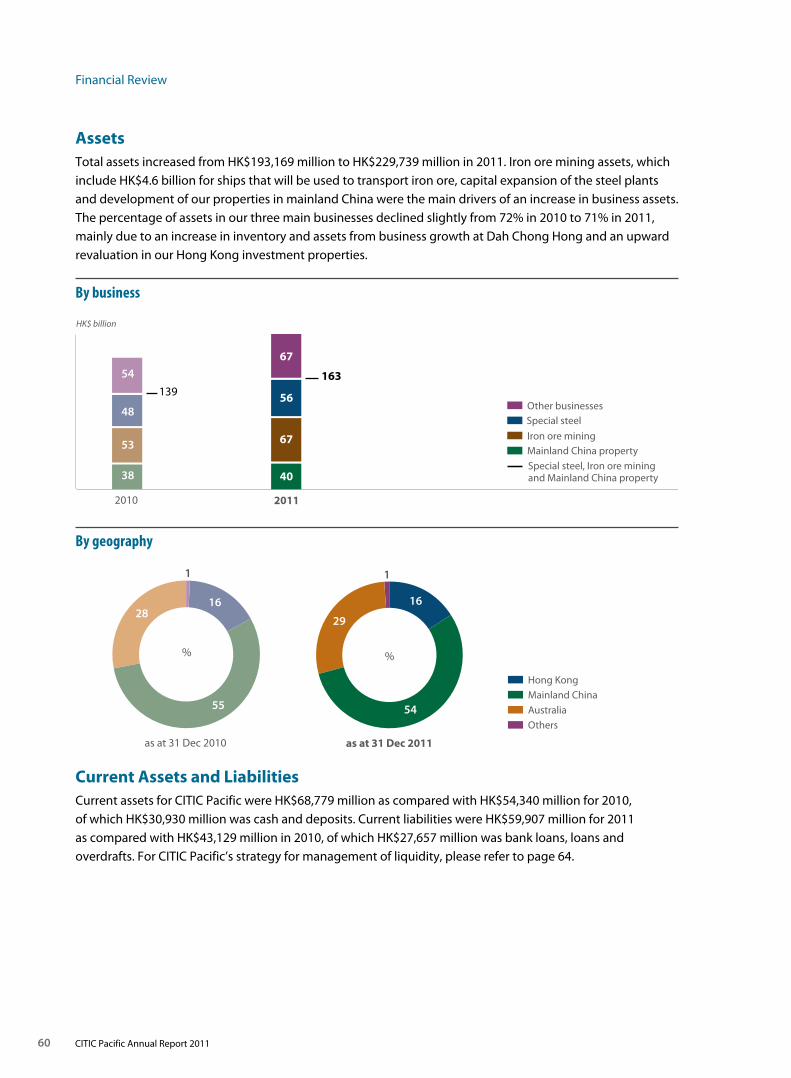
Financial Review
60 CITIC Pacific Annual Report 2011
20112010
Special steel
Iron ore miningMainland China property
Other businesses
HK$ billion
Special steel, Iron ore miningand Mainland China property
48
53
38
139 56
54
67
40
67
163
By business
as at 31 Dec 2011as at 31 Dec 2010
Hong KongMainland China
AustraliaOthers
54
16
1
29
%
55
1628
1
%
By geography
AssetsTotal assets increased from HK$193,169 million to HK$229,739 million in 2011. Iron ore mining assets, which include HK$4.6 billion for ships that will be used to transport iron ore, capital expansion of the steel plants and development of our properties in mainland China were the main drivers of an increase in business assets. The percentage of assets in our three main businesses declined slightly from 72% in 2010 to 71% in 2011, mainly due to an increase in inventory and assets from business growth at Dah Chong Hong and an upward revaluation in our Hong Kong investment properties.
Current Assets and LiabilitiesCurrent assets for CITIC Pacific were HK$68,779 million as compared with HK$54,340 million for 2010, of which HK$30,930 million was cash and deposits. Current liabilities were HK$59,907 million for 2011 as compared with HK$43,129 million in 2010, of which HK$27,657 million was bank loans, loans and overdrafts. For CITIC Pacific’s strategy for management of liquidity, please refer to page 64.
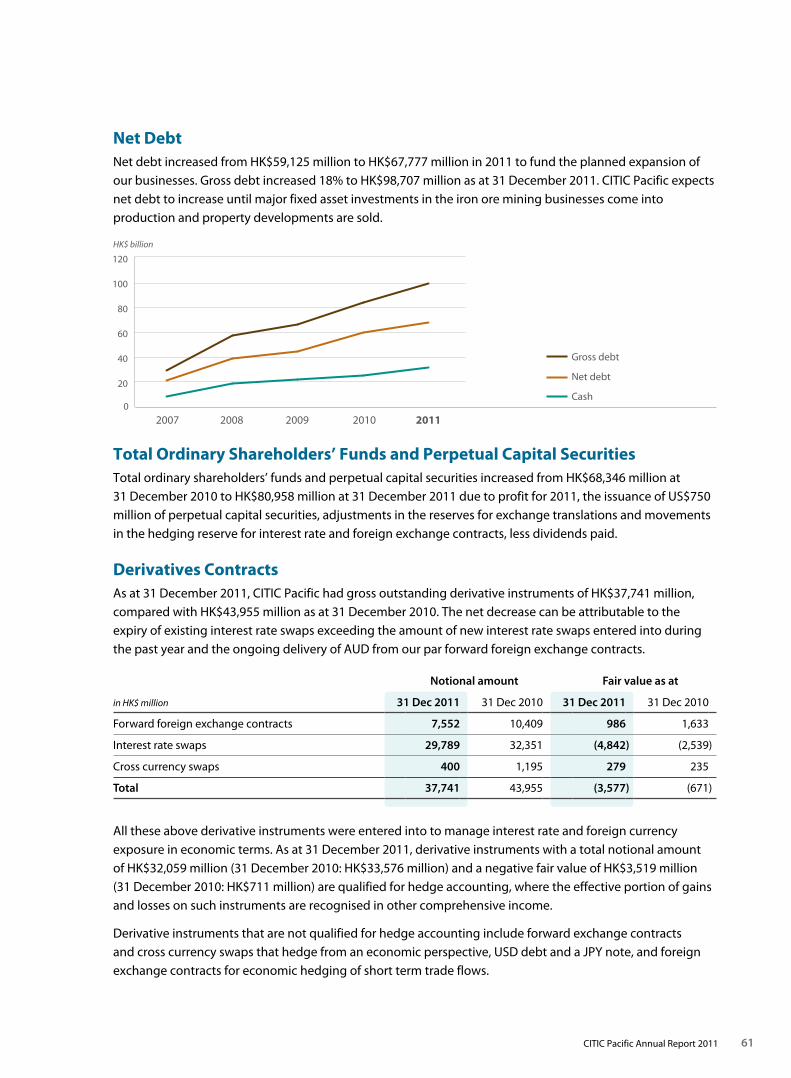
61CITIC Pacific Annual Report 2011
02007 2008 2009 2010 2011
Gross debt
Net debt
Cash
HK$ billion
20
40
60
80
100
120
Net DebtNet debt increased from HK$59,125 million to HK$67,777 million in 2011 to fund the planned expansion of our businesses. Gross debt increased 18% to HK$98,707 million as at 31 December 2011. CITIC Pacific expects net debt to increase until major fixed asset investments in the iron ore mining businesses come into production and property developments are sold.
Total Ordinary Shareholders’ Funds and Perpetual Capital SecuritiesTotal ordinary shareholders’ funds and perpetual capital securities increased from HK$68,346 million at 31 December 2010 to HK$80,958 million at 31 December 2011 due to profit for 2011, the issuance of US$750 million of perpetual capital securities, adjustments in the reserves for exchange translations and movements in the hedging reserve for interest rate and foreign exchange contracts, less dividends paid.
Derivatives ContractsAs at 31 December 2011, CITIC Pacific had gross outstanding derivative instruments of HK$37,741 million, compared with HK$43,955 million as at 31 December 2010. The net decrease can be attributable to the expiry of existing interest rate swaps exceeding the amount of new interest rate swaps entered into during the past year and the ongoing delivery of AUD from our par forward foreign exchange contracts.
Notional amount Fair value as at
in HK$ million 31 Dec 2011 31 Dec 2010 31 Dec 2011 31 Dec 2010
Forward foreign exchange contracts 7,552 10,409 986 1,633
Interest rate swaps 29,789 32,351 (4,842) (2,539)
Cross currency swaps 400 1,195 279 235
Total 37,741 43,955 (3,577) (671)
All these above derivative instruments were entered into to manage interest rate and foreign currency exposure in economic terms. As at 31 December 2011, derivative instruments with a total notional amount of HK$32,059 million (31 December 2010: HK$33,576 million) and a negative fair value of HK$3,519 million (31 December 2010: HK$711 million) are qualified for hedge accounting, where the effective portion of gains and losses on such instruments are recognised in other comprehensive income.
Derivative instruments that are not qualified for hedge accounting include forward exchange contracts and cross currency swaps that hedge from an economic perspective, USD debt and a JPY note, and foreign exchange contracts for economic hedging of short term trade flows.
62 CITIC Pacific Annual Report 2011
Risk Management
Each day, every business faces numerous risks, and one of the essential elements of both corporate governance and management is to ensure that these risks are both appropriate and controlled.
Many parts of this report refer directly or indirectly to risks faced by our businesses, but in this section the key financial and commercial risks are brought together.
The management of risk starts with the board of directors. At each meeting the board receives a report of the financial results and the financial position of the group, both current and projected. At every meeting, written reports are provided on all businesses in a form similar to those reviewed by management at the executive committee.
The board has established audit, asset and liability management, executive, investment and remuneration committees whose activities are important parts of the overall control of risk.
Treasury Risk ManagementFinancial risks are inherent in any business. Systems and procedures are in place to identify and report on a timely basis the liquidity, foreign exchange, interest rate and commodity risks arising from the activities of our existing and proposed businesses. Many of the current systems have a significant manual component, and an automated treasury management system is currently being installed.
Treasury policies are established by the Asset and Liability Management Committee (“ALCO”) and reported to the board. The group finance department, headed by the group treasurer, is responsible for implementing treasury policies, disseminating them to operating units, monitoring adherence to them, and preparing reports of the actual situation to be presented to ALCO, the executive committee and the board.
All business units, whether they are subsidiaries, associates or jointly controlled entities are responsible for managing their liquidity, interest rate, foreign exchange and commodity risks within the confines of the overall ALCO policies and specific delegations. They are responsible for identifying areas of risk within their organisations and reporting them to ALCO on a timely basis.
Listed subsidiaries CITIC Telecom International, Dah Chong Hong and Daye Special Steel manage their financial and treasury affairs themselves within the framework of the group’s treasury policies.
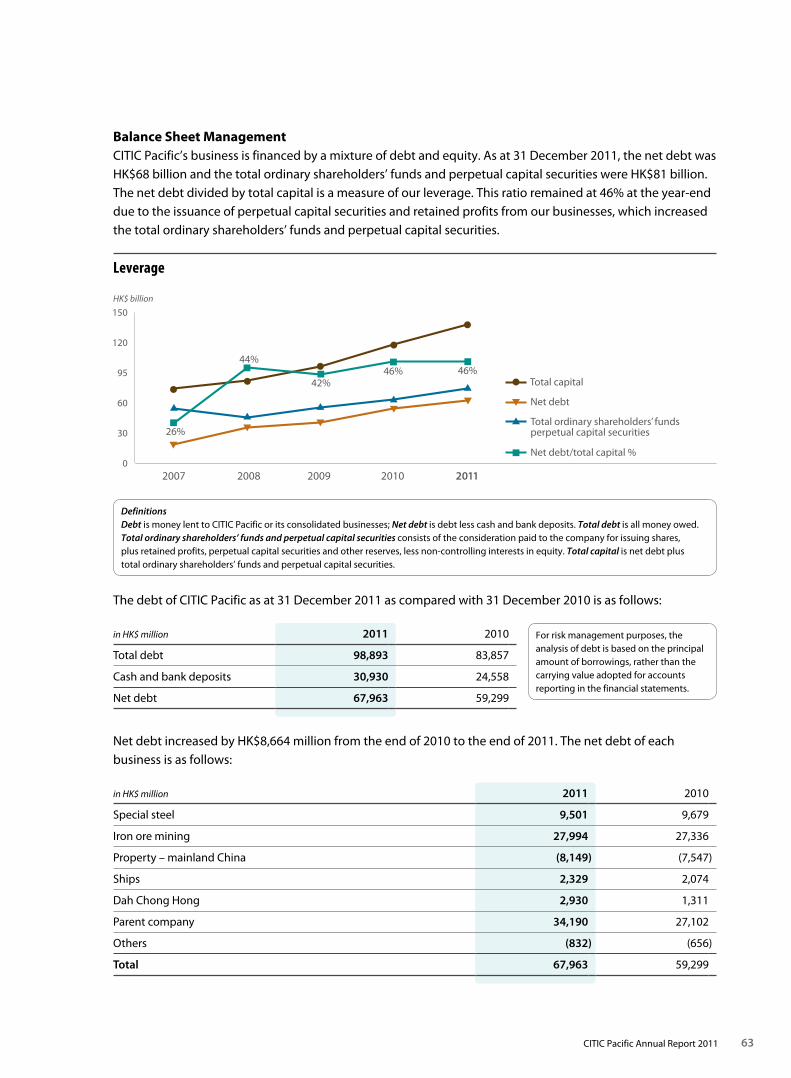
63CITIC Pacific Annual Report 2011
120
0
30
60
95
HK$ billion
150
2009 2011201020082007
26%
44%
42%46% 46%
Net debt
Total capital
Total ordinary shareholders’ fundsperpetual capital securities
Net debt/total capital %
Leverage
Balance Sheet ManagementCITIC Pacific’s business is financed by a mixture of debt and equity. As at 31 December 2011, the net debt was HK$68 billion and the total ordinary shareholders’ funds and perpetual capital securities were HK$81 billion. The net debt divided by total capital is a measure of our leverage. This ratio remained at 46% at the year-end due to the issuance of perpetual capital securities and retained profits from our businesses, which increased the total ordinary shareholders’ funds and perpetual capital securities.
The debt of CITIC Pacific as at 31 December 2011 as compared with 31 December 2010 is as follows:
in HK$ million 2011 2010
Total debt 98,893 83,857
Cash and bank deposits 30,930 24,558
Net debt 67,963 59,299
Net debt increased by HK$8,664 million from the end of 2010 to the end of 2011. The net debt of each business is as follows:
in HK$ million 2011 2010
Special steel 9,501 9,679
Iron ore mining 27,994 27,336
Property – mainland China (8,149) (7,547)
Ships 2,329 2,074
Dah Chong Hong 2,930 1,311
Parent company 34,190 27,102
Others (832) (656)
Total 67,963 59,299
For risk management purposes, the analysis of debt is based on the principal amount of borrowings, rather than the carrying value adopted for accounts reporting in the financial statements.
DefinitionsDebt is money lent to CITIC Pacific or its consolidated businesses; Net debt is debt less cash and bank deposits. Total debt is all money owed. Total ordinary shareholders’ funds and perpetual capital securities consists of the consideration paid to the company for issuing shares, plus retained profits, perpetual capital securities and other reserves, less non-controlling interests in equity. Total capital is net debt plus total ordinary shareholders’ funds and perpetual capital securities.
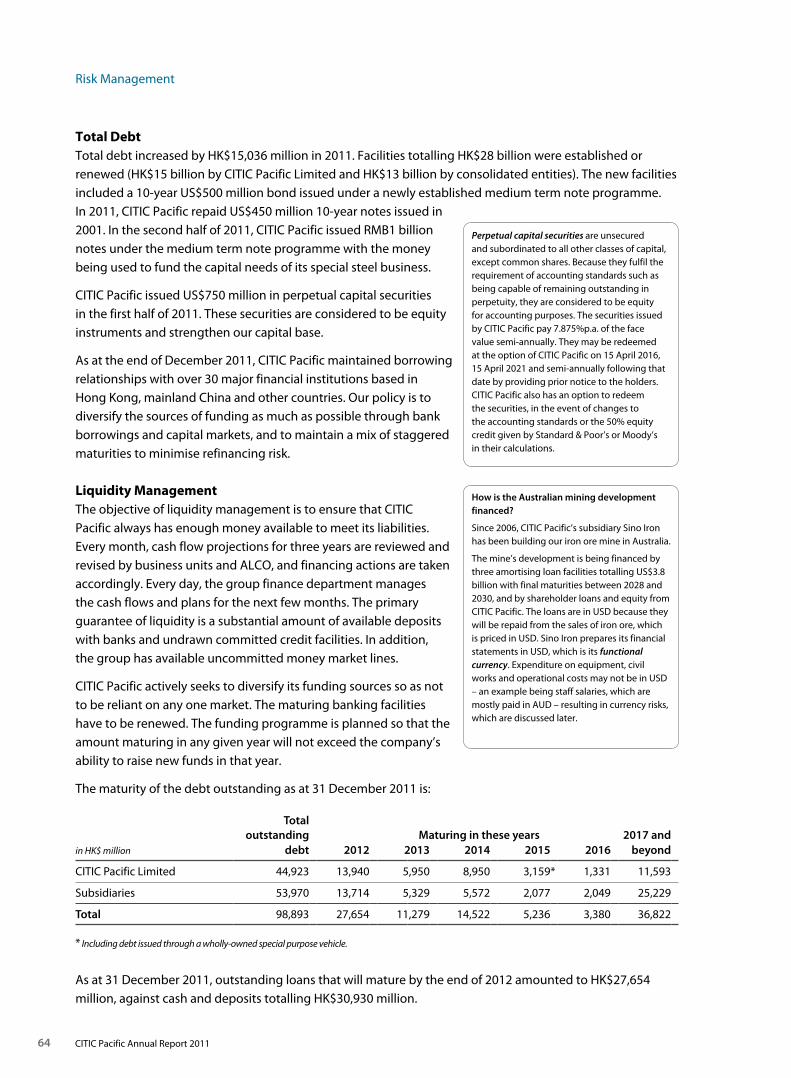
Risk Management
64 CITIC Pacific Annual Report 2011
Total DebtTotal debt increased by HK$15,036 million in 2011. Facilities totalling HK$28 billion were established or renewed (HK$15 billion by CITIC Pacific Limited and HK$13 billion by consolidated entities). The new facilities included a 10-year US$500 million bond issued under a newly established medium term note programme. In 2011, CITIC Pacific repaid US$450 million 10-year notes issued in 2001. In the second half of 2011, CITIC Pacific issued RMB1 billion notes under the medium term note programme with the money being used to fund the capital needs of its special steel business.
CITIC Pacific issued US$750 million in perpetual capital securities in the first half of 2011. These securities are considered to be equity instruments and strengthen our capital base.
As at the end of December 2011, CITIC Pacific maintained borrowing relationships with over 30 major financial institutions based in Hong Kong, mainland China and other countries. Our policy is to diversify the sources of funding as much as possible through bank borrowings and capital markets, and to maintain a mix of staggered maturities to minimise refinancing risk.
Liquidity ManagementThe objective of liquidity management is to ensure that CITIC Pacific always has enough money available to meet its liabilities. Every month, cash flow projections for three years are reviewed and revised by business units and ALCO, and financing actions are taken accordingly. Every day, the group finance department manages the cash flows and plans for the next few months. The primary guarantee of liquidity is a substantial amount of available deposits with banks and undrawn committed credit facilities. In addition, the group has available uncommitted money market lines.
CITIC Pacific actively seeks to diversify its funding sources so as not to be reliant on any one market. The maturing banking facilities have to be renewed. The funding programme is planned so that the amount maturing in any given year will not exceed the company’s ability to raise new funds in that year.
The maturity of the debt outstanding as at 31 December 2011 is:
Total outstanding Maturing in these years 2017 and
in HK$ million debt 2012 2013 2014 2015 2016 beyond
CITIC Pacific Limited 44,923 13,940 5,950 8,950 3,159* 1,331 11,593
Subsidiaries 53,970 13,714 5,329 5,572 2,077 2,049 25,229
Total 98,893 27,654 11,279 14,522 5,236 3,380 36,822
* Including debt issued through a wholly-owned special purpose vehicle.
As at 31 December 2011, outstanding loans that will mature by the end of 2012 amounted to HK$27,654 million, against cash and deposits totalling HK$30,930 million.
How is the Australian mining development financed?
Since 2006, CITIC Pacific’s subsidiary Sino Iron has been building our iron ore mine in Australia.
The mine’s development is being financed by three amortising loan facilities totalling US$3.8 billion with final maturities between 2028 and 2030, and by shareholder loans and equity from CITIC Pacific. The loans are in USD because they will be repaid from the sales of iron ore, which is priced in USD. Sino Iron prepares its financial statements in USD, which is its functional currency. Expenditure on equipment, civil works and operational costs may not be in USD – an example being staff salaries, which are mostly paid in AUD – resulting in currency risks, which are discussed later.
Perpetual capital securities are unsecured and subordinated to all other classes of capital, except common shares. Because they fulfil the requirement of accounting standards such as being capable of remaining outstanding in perpetuity, they are considered to be equity for accounting purposes. The securities issued by CITIC Pacific pay 7.875%p.a. of the face value semi-annually. They may be redeemed at the option of CITIC Pacific on 15 April 2016, 15 April 2021 and semi-annually following that date by providing prior notice to the holders. CITIC Pacific also has an option to redeem the securities, in the event of changes to the accounting standards or the 50% equity credit given by Standard & Poor’s or Moody’s in their calculations.
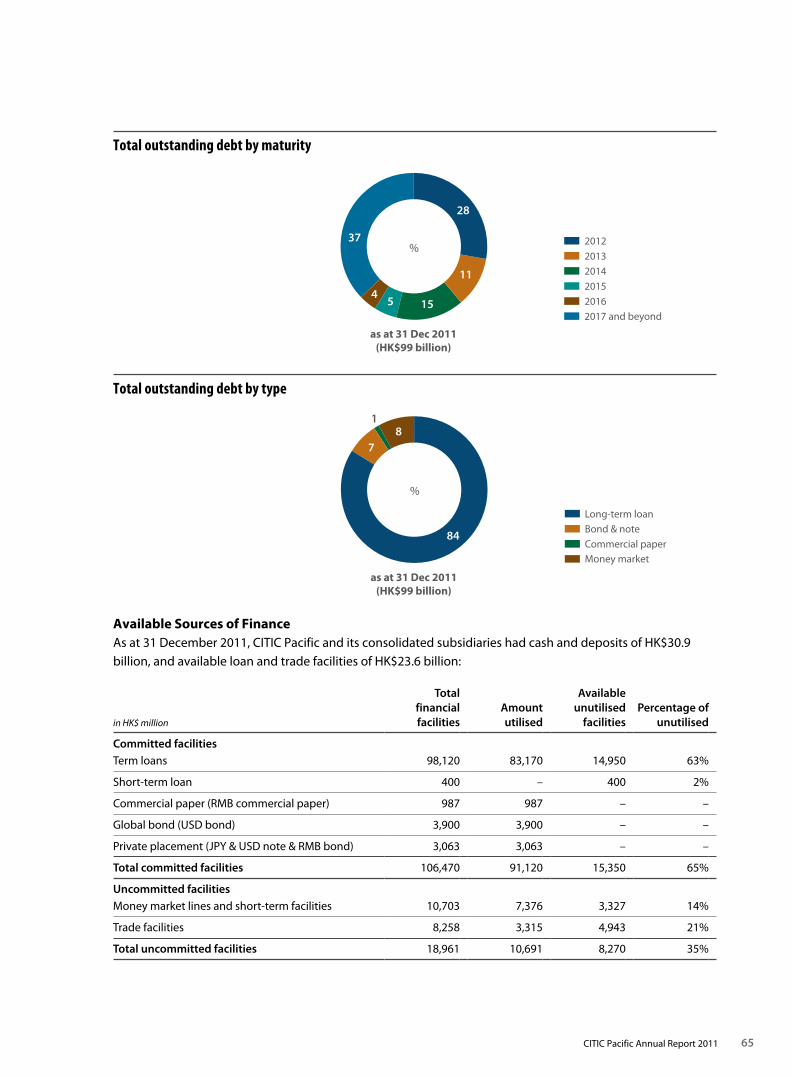
65CITIC Pacific Annual Report 2011
as at 31 Dec 2011(HK$99 billion)
7
18
84
%
Long-term loanBond & note
Commercial paperMoney market
Total outstanding debt by type
as at 31 Dec 2011(HK$99 billion)
2017 and beyond
28
11
1554
37%
2012
20132014
2015
2016
Total outstanding debt by maturity
Available Sources of FinanceAs at 31 December 2011, CITIC Pacific and its consolidated subsidiaries had cash and deposits of HK$30.9 billion, and available loan and trade facilities of HK$23.6 billion:
in HK$ million
Total financial facilities
Amount utilised
Available unutilised
facilitiesPercentage of
unutilised
Committed facilitiesTerm loans 98,120 83,170 14,950 63%
Short-term loan 400 – 400 2%
Commercial paper (RMB commercial paper) 987 987 – –
Global bond (USD bond) 3,900 3,900 – –
Private placement (JPY & USD note & RMB bond) 3,063 3,063 – –
Total committed facilities 106,470 91,120 15,350 65%
Uncommitted facilitiesMoney market lines and short-term facilities 10,703 7,376 3,327 14%
Trade facilities 8,258 3,315 4,943 21%
Total uncommitted facilities 18,961 10,691 8,270 35%
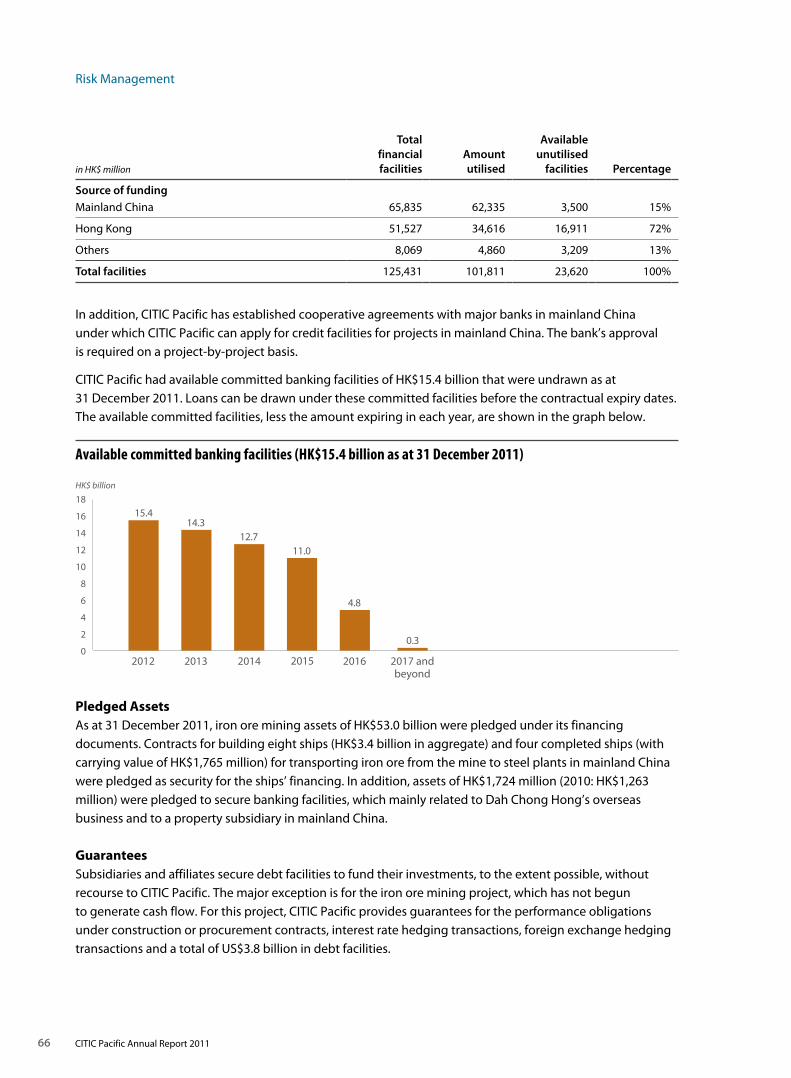
Risk Management
66 CITIC Pacific Annual Report 2011
2012
15.4
2014
12.7
2015
11.0
2016
4.8
2017 andbeyond
0.30
2
4
6
8
10
12
14
16
18
2013
14.3
HK$ billion
Available committed banking facilities (HK$15.4 billion as at 31 December 2011)
in HK$ million
Total financial facilities
Amount utilised
Available unutilised
facilities Percentage
Source of fundingMainland China 65,835 62,335 3,500 15%
Hong Kong 51,527 34,616 16,911 72%
Others 8,069 4,860 3,209 13%
Total facilities 125,431 101,811 23,620 100%
In addition, CITIC Pacific has established cooperative agreements with major banks in mainland China under which CITIC Pacific can apply for credit facilities for projects in mainland China. The bank’s approval is required on a project-by-project basis.
CITIC Pacific had available committed banking facilities of HK$15.4 billion that were undrawn as at 31 December 2011. Loans can be drawn under these committed facilities before the contractual expiry dates. The available committed facilities, less the amount expiring in each year, are shown in the graph below.
Pledged AssetsAs at 31 December 2011, iron ore mining assets of HK$53.0 billion were pledged under its financing documents. Contracts for building eight ships (HK$3.4 billion in aggregate) and four completed ships (with carrying value of HK$1,765 million) for transporting iron ore from the mine to steel plants in mainland China were pledged as security for the ships’ financing. In addition, assets of HK$1,724 million (2010: HK$1,263 million) were pledged to secure banking facilities, which mainly related to Dah Chong Hong’s overseas business and to a property subsidiary in mainland China.
GuaranteesSubsidiaries and affiliates secure debt facilities to fund their investments, to the extent possible, without recourse to CITIC Pacific. The major exception is for the iron ore mining project, which has not begun to generate cash flow. For this project, CITIC Pacific provides guarantees for the performance obligations under construction or procurement contracts, interest rate hedging transactions, foreign exchange hedging transactions and a total of US$3.8 billion in debt facilities.
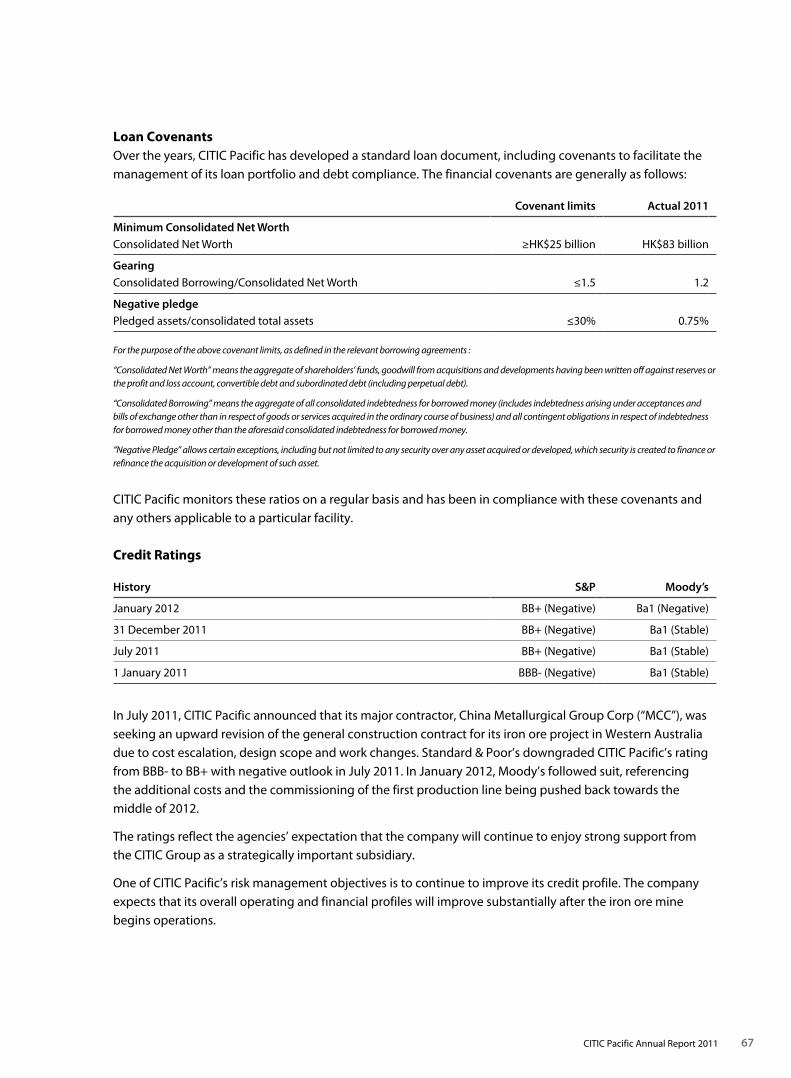
67CITIC Pacific Annual Report 2011
Loan CovenantsOver the years, CITIC Pacific has developed a standard loan document, including covenants to facilitate the management of its loan portfolio and debt compliance. The financial covenants are generally as follows:
Covenant limits Actual 2011
Minimum Consolidated Net WorthConsolidated Net Worth ≥HK$25 billion HK$83 billion
GearingConsolidated Borrowing/Consolidated Net Worth ≤1.5 1.2
Negative pledgePledged assets/consolidated total assets ≤30% 0.75%
For the purpose of the above covenant limits, as defined in the relevant borrowing agreements :
“Consolidated Net Worth” means the aggregate of shareholders’ funds, goodwill from acquisitions and developments having been written off against reserves or the profit and loss account, convertible debt and subordinated debt (including perpetual debt).
“Consolidated Borrowing” means the aggregate of all consolidated indebtedness for borrowed money (includes indebtedness arising under acceptances and bills of exchange other than in respect of goods or services acquired in the ordinary course of business) and all contingent obligations in respect of indebtedness for borrowed money other than the aforesaid consolidated indebtedness for borrowed money.
“Negative Pledge” allows certain exceptions, including but not limited to any security over any asset acquired or developed, which security is created to finance or refinance the acquisition or development of such asset.
CITIC Pacific monitors these ratios on a regular basis and has been in compliance with these covenants and any others applicable to a particular facility.
Credit Ratings
History S&P Moody’s
January 2012 BB+ (Negative) Ba1 (Negative)
31 December 2011 BB+ (Negative) Ba1 (Stable)
July 2011 BB+ (Negative) Ba1 (Stable)
1 January 2011 BBB- (Negative) Ba1 (Stable)
In July 2011, CITIC Pacific announced that its major contractor, China Metallurgical Group Corp (“MCC”), was seeking an upward revision of the general construction contract for its iron ore project in Western Australia due to cost escalation, design scope and work changes. Standard & Poor’s downgraded CITIC Pacific’s rating from BBB- to BB+ with negative outlook in July 2011. In January 2012, Moody’s followed suit, referencing the additional costs and the commissioning of the first production line being pushed back towards the middle of 2012.
The ratings reflect the agencies’ expectation that the company will continue to enjoy strong support from the CITIC Group as a strategically important subsidiary.
One of CITIC Pacific’s risk management objectives is to continue to improve its credit profile. The company expects that its overall operating and financial profiles will improve substantially after the iron ore mine begins operations.

Risk Management
68 CITIC Pacific Annual Report 2011
Net Debt and Cash in Jointly Controlled Entities and Associated CompaniesCITIC Pacific’s non-consolidated businesses are classified as jointly controlled entities and associated companies. Under Hong Kong generally accepted accounting standards, they are not consolidated in CITIC Pacific’s financial statements but recorded in the balance sheet as CITIC Pacific’s share of their net assets. The following table shows the net debt/cash position of jointly controlled entities and associated companies by business sector as at 31 December 2011.
in HK$ million Total net debt/(cash)Proportion of net debt/(cash)
attributable to CITIC Pacific
Special steel 7 (26)
Property Mainland China (5,130) (2,565)
Hong Kong and others (339) (166)
Energy 14,813 5,033
Tunnels 978 342
Dah Chong Hong (95) (53)
CITIC Telecom (712) (89)
Other investments 882 101
Total 10,404 2,577
The debt amounts shown in the above table were arranged by the jointly controlled entities and associated companies without recourse to their shareholders. None of these debts are guaranteed by CITIC Pacific or its subsidiaries. Certain of CITIC Pacific’s associates, such as Hong Kong Resort company Ltd which develops property projects in Discovery Bay, are 100% financed by their shareholders and do not have any external borrowings.
Derivatives PolicyFinancial derivatives are used to assist in the management of interest rate and exchange rate risks. To the extent possible, gains and losses of the derivatives offset the losses and gains on the assets, liabilities or transactions being hedged both in economic terms and under accounting rules.
CITIC Pacific has engaged Reval Inc., a derivative risk management and hedge accounting solutions firm, to provide software and consulting services to better monitor its derivatives portfolio and ensure compliance with accounting standards. The software provided by Reval generated the valuations that were used in the compilation of this report.
The use of financial instruments is currently restricted by ALCO to loans, bonds, deposits, interest rate swaps and plain vanilla foreign exchange contracts. It is CITIC Pacific’s policy not to enter into derivative transactions for speculative purposes. The use of structured derivatives and instruments or contracts that contain embedded options would require presentation to and the specific approval of ALCO. None have been submitted for approval or are outstanding in 2011. From a risk management perspective, simple, cost-efficient and HKAS 39 hedge effective instruments are preferred.
69CITIC Pacific Annual Report 2011
Foreign Exchange RiskThe company’s functional currency is Hong Kong dollar (“HKD”). CITIC Pacific has major operations in Hong Kong, mainland China and Australia and is subject to the risk of loss or profit due to changes in United States dollar (“USD”), Renminbi (“RMB”) and Australian dollar (“AUD”) exchange rates. There are also exposures to the Japanese Yen (“JPY”) (from operations and assets related to DCH), Euro (“EUR”) (from equipment and product purchases) and other currencies.
We strive to reduce currency exposures by matching assets with borrowings in the same currency to the extent possible. Our policy is to hedge transactions where value or time to execution will give rise to material currency exposure, provided that the cost of the hedging instrument is not prohibitively expensive in comparison to the underlying exposure.
CITIC Pacific’s material currency exposures arise from the following:
i) capital expenditures relating to its iron ore mining operations in Australia and steel operations in mainland China
ii) purchase of raw materials by steel and property operations in mainland China
iii) USD denominated debt
iv) RMB denominated debt
v) purchases of finished products for sale by DCH, and
vi) registered capital of investment in mainland China
Translation exposures from the consolidation of subsidiaries whose functional currency is not HKD are not hedged using derivative instruments, as this is a non-cash exposure.
US Dollar (USD) CITIC Pacific’s investment in businesses whose functional currency is USD is mostly from the iron ore mining business, which had USD gross assets of HK$66 billion. The company uses its USD borrowings to hedge these USD assets through a net investment hedge. As at 31 December 2011, CITIC Pacific had HK$58.1 billion equivalent of US dollar debt.
Renminbi (RMB) Businesses in mainland China had RMB gross assets of approximately HK$124 billion as at 31 December 2011, offset by debts and other liabilities of HK$47 billion. This gave the company an RMB net asset exposure of HK$77 billion (2010: RMB gross asset exposure of approximately HK$107 billion, offset by debt and other liabilities of HK$38 billion, with RMB net asset exposure of HK$69 billion). The Renminbi is currently not a freely convertible currency and “registered capital”, which usually accounts for at least one third of the total investment amount for projects in mainland China, may be required to be paid in foreign currency by foreign investors such as CITIC Pacific. As investment in mainland China is expanding, CITIC Pacific will have an increasing exposure to the Renminbi.
CITIC Pacific issued RMB1 billion notes in the second half of 2011 under the MTN programme, with the money being used to fund the capital needs of the special steel business. These notes will become due in 2016.
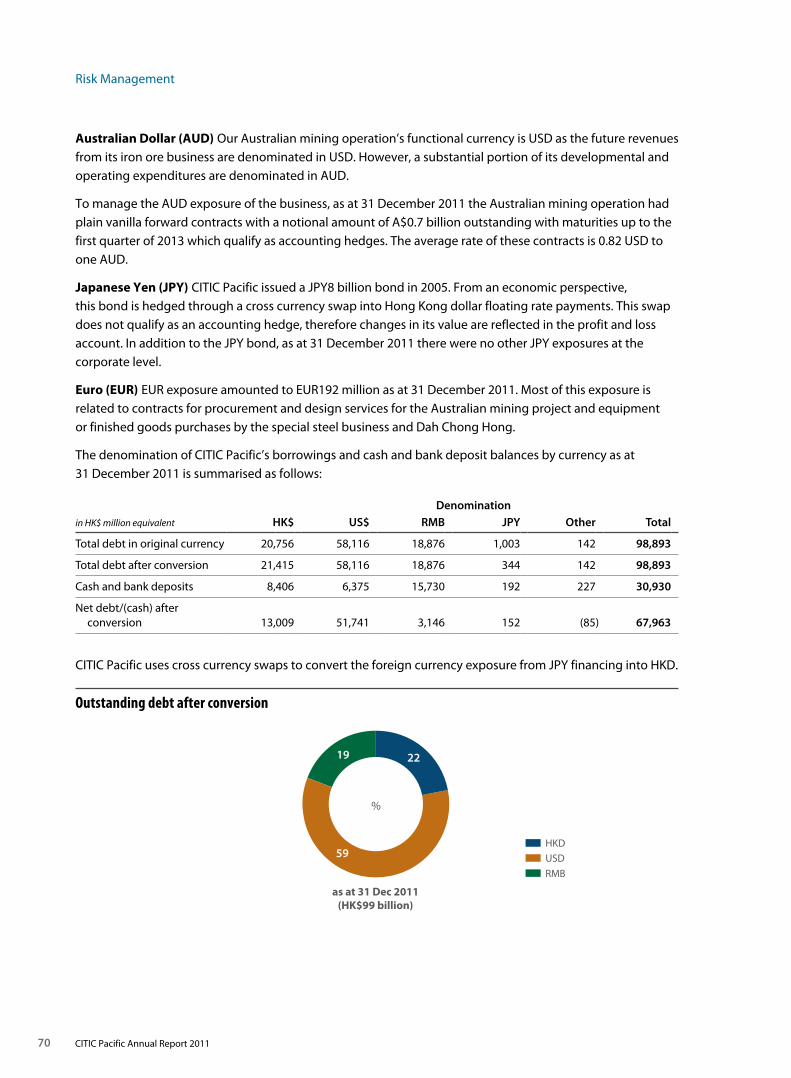
Risk Management
70 CITIC Pacific Annual Report 2011
Australian Dollar (AUD) Our Australian mining operation’s functional currency is USD as the future revenues from its iron ore business are denominated in USD. However, a substantial portion of its developmental and operating expenditures are denominated in AUD.
To manage the AUD exposure of the business, as at 31 December 2011 the Australian mining operation had plain vanilla forward contracts with a notional amount of A$0.7 billion outstanding with maturities up to the first quarter of 2013 which qualify as accounting hedges. The average rate of these contracts is 0.82 USD to one AUD.
Japanese Yen (JPY) CITIC Pacific issued a JPY8 billion bond in 2005. From an economic perspective, this bond is hedged through a cross currency swap into Hong Kong dollar floating rate payments. This swap does not qualify as an accounting hedge, therefore changes in its value are reflected in the profit and loss account. In addition to the JPY bond, as at 31 December 2011 there were no other JPY exposures at the corporate level.
Euro (EUR) EUR exposure amounted to EUR192 million as at 31 December 2011. Most of this exposure is related to contracts for procurement and design services for the Australian mining project and equipment or finished goods purchases by the special steel business and Dah Chong Hong.
The denomination of CITIC Pacific’s borrowings and cash and bank deposit balances by currency as at 31 December 2011 is summarised as follows:
Denominationin HK$ million equivalent HK$ US$ RMB JPY Other Total
Total debt in original currency 20,756 58,116 18,876 1,003 142 98,893
Total debt after conversion 21,415 58,116 18,876 344 142 98,893
Cash and bank deposits 8,406 6,375 15,730 192 227 30,930
Net debt/(cash) after conversion 13,009 51,741 3,146 152 (85) 67,963
CITIC Pacific uses cross currency swaps to convert the foreign currency exposure from JPY financing into HKD.
as at 31 Dec 2011(HK$99 billion)
19 22
59
%
HKD
USD
RMB
Outstanding debt after conversion
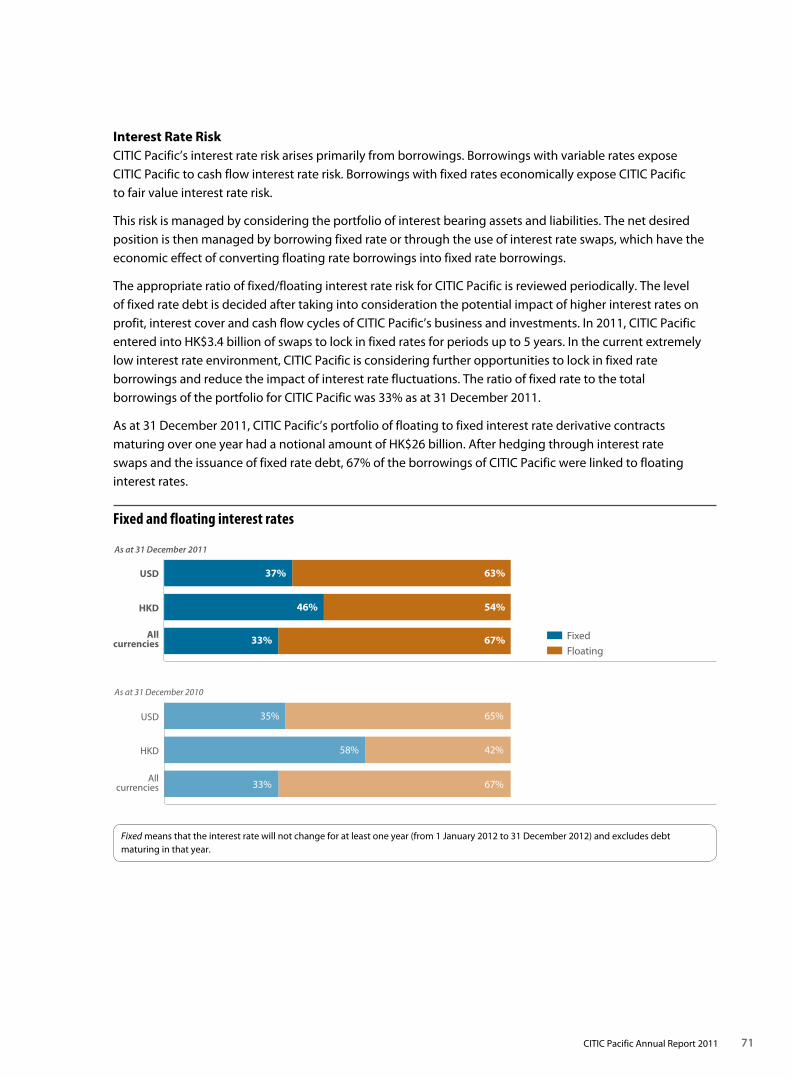
71CITIC Pacific Annual Report 2011
54%46%
65%35%
42%58%
67%33%
Allcurrencies
HKD
As at 31 December 2011
USD
FixedFloating
Allcurrencies
HKD
As at 31 December 2010
USD
63%37%
67%33%
Fixed and floating interest rates
Interest Rate RiskCITIC Pacific’s interest rate risk arises primarily from borrowings. Borrowings with variable rates expose CITIC Pacific to cash flow interest rate risk. Borrowings with fixed rates economically expose CITIC Pacific to fair value interest rate risk.
This risk is managed by considering the portfolio of interest bearing assets and liabilities. The net desired position is then managed by borrowing fixed rate or through the use of interest rate swaps, which have the economic effect of converting floating rate borrowings into fixed rate borrowings.
The appropriate ratio of fixed/floating interest rate risk for CITIC Pacific is reviewed periodically. The level of fixed rate debt is decided after taking into consideration the potential impact of higher interest rates on profit, interest cover and cash flow cycles of CITIC Pacific’s business and investments. In 2011, CITIC Pacific entered into HK$3.4 billion of swaps to lock in fixed rates for periods up to 5 years. In the current extremely low interest rate environment, CITIC Pacific is considering further opportunities to lock in fixed rate borrowings and reduce the impact of interest rate fluctuations. The ratio of fixed rate to the total borrowings of the portfolio for CITIC Pacific was 33% as at 31 December 2011.
As at 31 December 2011, CITIC Pacific’s portfolio of floating to fixed interest rate derivative contracts maturing over one year had a notional amount of HK$26 billion. After hedging through interest rate swaps and the issuance of fixed rate debt, 67% of the borrowings of CITIC Pacific were linked to floating interest rates.
Fixed means that the interest rate will not change for at least one year (from 1 January 2012 to 31 December 2012) and excludes debt maturing in that year.
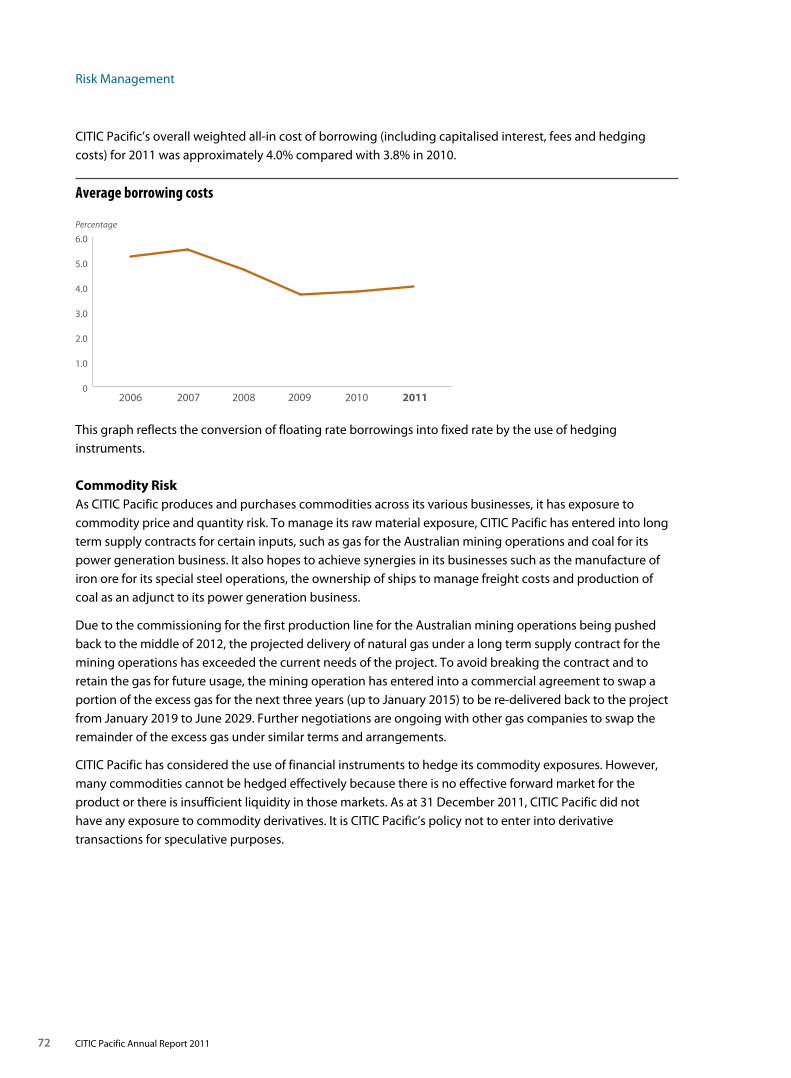
Risk Management
72 CITIC Pacific Annual Report 2011
Percentage
0
1.0
2.0
3.0
4.0
5.0
6.0
2006 2008 2009 2010 20112007
Average borrowing costs
CITIC Pacific’s overall weighted all-in cost of borrowing (including capitalised interest, fees and hedging costs) for 2011 was approximately 4.0% compared with 3.8% in 2010.
This graph reflects the conversion of floating rate borrowings into fixed rate by the use of hedging instruments.
Commodity RiskAs CITIC Pacific produces and purchases commodities across its various businesses, it has exposure to commodity price and quantity risk. To manage its raw material exposure, CITIC Pacific has entered into long term supply contracts for certain inputs, such as gas for the Australian mining operations and coal for its power generation business. It also hopes to achieve synergies in its businesses such as the manufacture of iron ore for its special steel operations, the ownership of ships to manage freight costs and production of coal as an adjunct to its power generation business.
Due to the commissioning for the first production line for the Australian mining operations being pushed back to the middle of 2012, the projected delivery of natural gas under a long term supply contract for the mining operations has exceeded the current needs of the project. To avoid breaking the contract and to retain the gas for future usage, the mining operation has entered into a commercial agreement to swap a portion of the excess gas for the next three years (up to January 2015) to be re-delivered back to the project from January 2019 to June 2029. Further negotiations are ongoing with other gas companies to swap the remainder of the excess gas under similar terms and arrangements.
CITIC Pacific has considered the use of financial instruments to hedge its commodity exposures. However, many commodities cannot be hedged effectively because there is no effective forward market for the product or there is insufficient liquidity in those markets. As at 31 December 2011, CITIC Pacific did not have any exposure to commodity derivatives. It is CITIC Pacific’s policy not to enter into derivative transactions for speculative purposes.
73CITIC Pacific Annual Report 2011
Counterparty RiskCITIC Pacific keeps a large amount of cash deposits at financial institutions. To mitigate the risk of non-recovery of cash deposits or financial instrument gains, CITIC Pacific deals with international financial institutions with a credit rating of investment grade A- (S&P) or A3 (Moody’s) and above unless special authorisation has been received from ALCO. For unrated mainland Chinese institutions, special authorisation is required from ALCO. A maximum deposit limit is set that does not exceed the amount borrowed from those institutions, unless special authorisation has been received from ALCO. Deposits are safe, liquid, interest-bearing and consistent with treasury and business purpose needs. Management monitors market developments, reviews the list of approved counterparties and closely monitors their credit quality, and revises deposit limits on an on-going basis.
The group finance department is responsible for allocating and monitoring the limits with the list of approved financial institutions. Management does not expect any losses from non-performance by our financial counterparties.
Capital Commitments and Contingent LiabilitiesOn 15 July 2011, CITIC Pacific announced that MCC, the iron ore mining project’s engineering, procurement and construction contractor, had put forward a proposal for an additional payment of approximately US$900 million, part of which they claimed to be due to design and scope of work changes made by CITIC Pacific. On 30 December 2011 CITIC Pacific signed a supplemental agreement with MCC, agreeing to pay MCC an additional sum of US$822 million to complete the construction and commissioning of the project’s first and second production lines, as well as common facilities for all six lines. MCC has also contractually committed that the first and second production lines will commence production no later than 31 August and 31 December 2012. CITIC Pacific is still working to determine the estimated completion and commissioning timetable for production lines three to six.
Details of CITIC Pacific’s capital commitments as at 31 December 2011 are listed under Note 35 to the financial statements.
Details of CITIC Pacific’s contingent liabilities as at 31 December 2011 are listed under Note 38 to the financial statements.
Risk Management
74 CITIC Pacific Annual Report 2011
Major External Risks and Uncertainties
Economic RisksCITIC Pacific’s businesses are all subject to the risks of negative developments in the economies in which they operate, which may be affected by global trends. The results of most of our businesses are closely linked to the success of the mainland Chinese economy as a whole, and in Hong Kong, Shanghai and other cities. The sales of special steel are substantially to customers in China, as are the vehicles and other products of Dah Chong Hong; the iron ore mine is expected to sell its output to steel mills in China; and our electricity is sold exclusively to users in mainland China. Our property developments are mainly in mainland China, and our infrastructure assets such as tunnels are in Hong Kong. Economic policies implemented to affect the whole economy, or sections of it, may adversely affect our business for periods of time.
In addition to its effects on our customers, changes to the global or local economies or regulations may adversely affect our relationship banks, joint venture partners, suppliers of goods, raw materials or power, and others on which our business depends.
Competitive MarketsSome of our businesses, particularly special steel, property, telecommunications and vehicle and other product sales, operate in highly competitive markets. Failure to compete in terms of product specification, service quality, reliability or price may adversely affect us. The iron ore market price is set primarily by international supply and demand, and if a surplus of supply occurs it could adversely affect the results of our business.
Agency RelationshipsDah Chong Hong sells vehicles and other products on behalf of numerous principals. Most of these arrangements can be cancelled at relatively short notice. If the relationship cannot be maintained due to a decision of the principal or inadequate performance, the concession may be lost which may adversely affect our business.
RegulationCITIC Pacific’s business mainly operates under three different systems of law, regulation and business practice: Australia, China and Hong Kong. Each has its own characteristics and may be subject to changes of substance or interpretation that could adversely affect our business. These may include tariffs, trade barriers, licenses, approvals, health and safety and environmental regulations, emission controls, taxation, exchange controls, employment legislation, and other matters. The electric power business is subject to price regulation, and if tariffs are not permitted to rise with cost increases, our results could be adversely affected.
The special steel, iron ore mining and power businesses are inherently likely to pollute the environment and be subject to stringent licensing and regulations. Failure to adhere to these may result in penalties or in extreme cases an inability to operate. The license terms or regulations may be changed at short notice, and it may be difficult to comply in a timely fashion causing an adverse effect on our business.
75CITIC Pacific Annual Report 2011
Capital ExpenditureThe nature of CITIC Pacific’s business is capital intensive, involving the construction and commissioning of major civil works and mechanical equipment. There may be difficulties in achieving this within time and budget resulting from inherent performance, disputes with contractors or their failure to perform to specification or contract, adverse weather conditions or other events.
Natural Disasters or Events, Terrorism and DiseaseOur business could be affected by such things as earthquakes, typhoons, cyclones or adverse weather conditions, or acts or threats of terrorism, or the outbreak of highly contagious disease, or either directly or indirectly through reductions in the supply of essential goods or services, or reduced economic activity on a local, regional or global scale.
Forward Looking StatementsThis whole report contains forward looking statements with respect to the financial condition, results of operations and businesses of CITIC Pacific. These forward looking statements represent the company’s expectations or beliefs concerning future events and involve known and unknown risks and uncertainty that could cause actual results, performance or events to differ materially from those expressed or implied in such statements.
Forward looking statements involve inherent risks and uncertainties. Readers should be cautioned that a number of factors could cause actual results to differ, in some cases materially, from those implied or anticipated in any forward looking statement or assessment of risk.
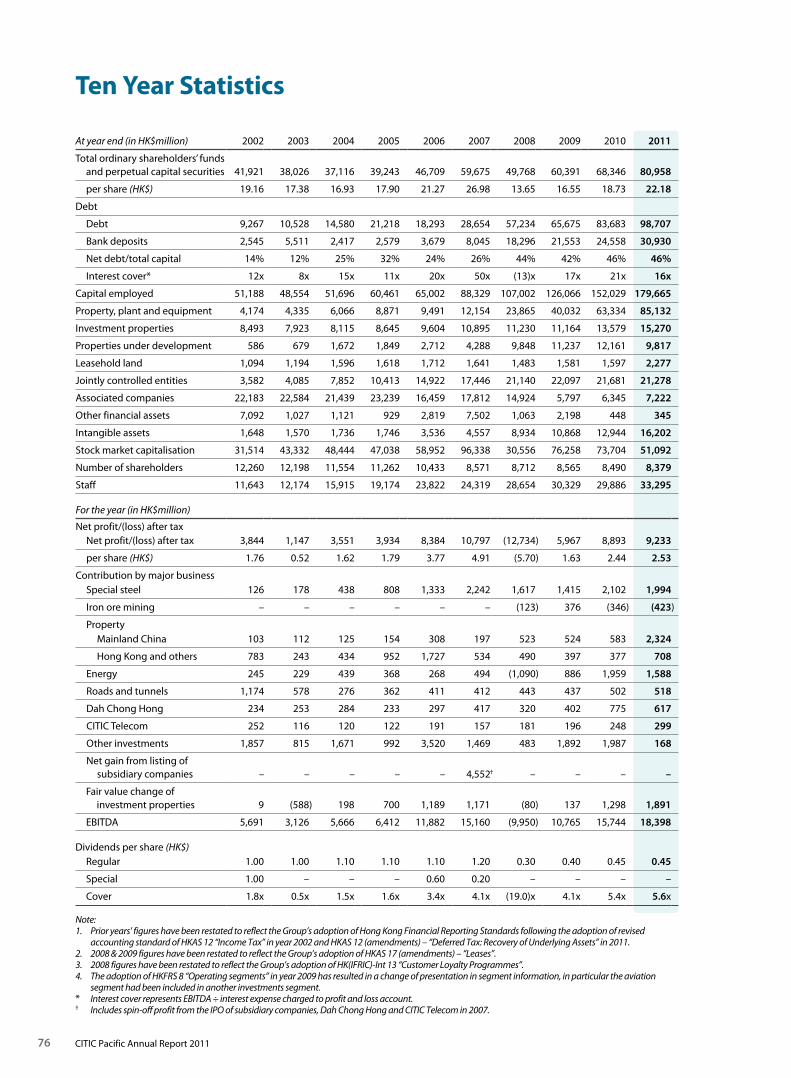
76 CITIC Pacific Annual Report 2011
Ten Year Statistics
At year end (in HK$million) 2002 2003 2004 2005 2006 2007 2008 2009 2010 2011
Total ordinary shareholders’ funds and perpetual capital securities 41,921 38,026 37,116 39,243 46,709 59,675 49,768 60,391 68,346 80,958
per share (HK$) 19.16 17.38 16.93 17.90 21.27 26.98 13.65 16.55 18.73 22.18
Debt
Debt 9,267 10,528 14,580 21,218 18,293 28,654 57,234 65,675 83,683 98,707
Bank deposits 2,545 5,511 2,417 2,579 3,679 8,045 18,296 21,553 24,558 30,930
Net debt/total capital 14% 12% 25% 32% 24% 26% 44% 42% 46% 46%
Interest cover* 12x 8x 15x 11x 20x 50x (13)x 17x 21x 16x
Capital employed 51,188 48,554 51,696 60,461 65,002 88,329 107,002 126,066 152,029 179,665
Property, plant and equipment 4,174 4,335 6,066 8,871 9,491 12,154 23,865 40,032 63,334 85,132
Investment properties 8,493 7,923 8,115 8,645 9,604 10,895 11,230 11,164 13,579 15,270
Properties under development 586 679 1,672 1,849 2,712 4,288 9,848 11,237 12,161 9,817
Leasehold land 1,094 1,194 1,596 1,618 1,712 1,641 1,483 1,581 1,597 2,277
Jointly controlled entities 3,582 4,085 7,852 10,413 14,922 17,446 21,140 22,097 21,681 21,278
Associated companies 22,183 22,584 21,439 23,239 16,459 17,812 14,924 5,797 6,345 7,222
Other financial assets 7,092 1,027 1,121 929 2,819 7,502 1,063 2,198 448 345
Intangible assets 1,648 1,570 1,736 1,746 3,536 4,557 8,934 10,868 12,944 16,202
Stock market capitalisation 31,514 43,332 48,444 47,038 58,952 96,338 30,556 76,258 73,704 51,092
Number of shareholders 12,260 12,198 11,554 11,262 10,433 8,571 8,712 8,565 8,490 8,379
Staff 11,643 12,174 15,915 19,174 23,822 24,319 28,654 30,329 29,886 33,295
For the year (in HK$million)
Net profit/(loss) after tax Net profit/(loss) after tax 3,844 1,147 3,551 3,934 8,384 10,797 (12,734) 5,967 8,893 9,233
per share (HK$) 1.76 0.52 1.62 1.79 3.77 4.91 (5.70) 1.63 2.44 2.53
Contribution by major business Special steel 126 178 438 808 1,333 2,242 1,617 1,415 2,102 1,994
Iron ore mining – – – – – – (123) 376 (346) (423)
Property Mainland China 103 112 125 154 308 197 523 524 583 2,324
Hong Kong and others 783 243 434 952 1,727 534 490 397 377 708
Energy 245 229 439 368 268 494 (1,090) 886 1,959 1,588
Roads and tunnels 1,174 578 276 362 411 412 443 437 502 518
Dah Chong Hong 234 253 284 233 297 417 320 402 775 617
CITIC Telecom 252 116 120 122 191 157 181 196 248 299
Other investments 1,857 815 1,671 992 3,520 1,469 483 1,892 1,987 168
Net gain from listing of subsidiary companies – – – – – 4,552† – – – –
Fair value change of investment properties 9 (588) 198 700 1,189 1,171 (80) 137 1,298 1,891
EBITDA 5,691 3,126 5,666 6,412 11,882 15,160 (9,950) 10,765 15,744 18,398
Dividends per share (HK$) Regular 1.00 1.00 1.10 1.10 1.10 1.20 0.30 0.40 0.45 0.45
Special 1.00 – – – 0.60 0.20 – – – –
Cover 1.8x 0.5x 1.5x 1.6x 3.4x 4.1x (19.0)x 4.1x 5.4x 5.6x
Note:1. Prior years’ figures have been restated to reflect the Group’s adoption of Hong Kong Financial Reporting Standards following the adoption of revised
accounting standard of HKAS 12 “Income Tax” in year 2002 and HKAS 12 (amendments) – “Deferred Tax: Recovery of Underlying Assets” in 2011.2. 2008 & 2009 figures have been restated to reflect the Group’s adoption of HKAS 17 (amendments) – “Leases”.3. 2008 figures have been restated to reflect the Group’s adoption of HK(IFRIC)-Int 13 “Customer Loyalty Programmes”.4. The adoption of HKFRS 8 “Operating segments” in year 2009 has resulted in a change of presentation in segment information, in particular the aviation
segment had been included in another investments segment.* Interest cover represents EBITDA ÷ interest expense charged to profit and loss account.† Includes spin-off profit from the IPO of subsidiary companies, Dah Chong Hong and CITIC Telecom in 2007.
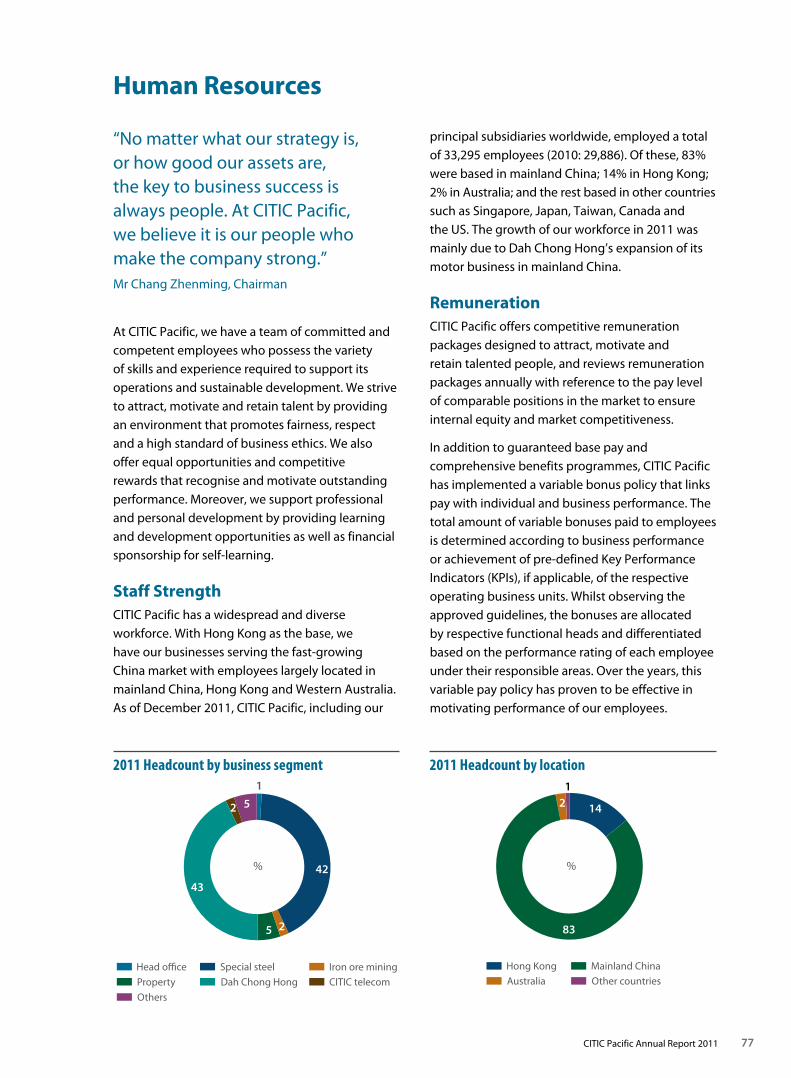
77CITIC Pacific Annual Report 2011
Human Resources
At CITIC Pacific, we have a team of committed and competent employees who possess the variety of skills and experience required to support its operations and sustainable development. We strive to attract, motivate and retain talent by providing an environment that promotes fairness, respect and a high standard of business ethics. We also offer equal opportunities and competitive rewards that recognise and motivate outstanding performance. Moreover, we support professional and personal development by providing learning and development opportunities as well as financial sponsorship for self-learning.
Staff StrengthCITIC Pacific has a widespread and diverse workforce. With Hong Kong as the base, we have our businesses serving the fast-growing China market with employees largely located in mainland China, Hong Kong and Western Australia. As of December 2011, CITIC Pacific, including our
principal subsidiaries worldwide, employed a total of 33,295 employees (2010: 29,886). Of these, 83% were based in mainland China; 14% in Hong Kong; 2% in Australia; and the rest based in other countries such as Singapore, Japan, Taiwan, Canada and the US. The growth of our workforce in 2011 was mainly due to Dah Chong Hong’s expansion of its motor business in mainland China.
RemunerationCITIC Pacific offers competitive remuneration packages designed to attract, motivate and retain talented people, and reviews remuneration packages annually with reference to the pay level of comparable positions in the market to ensure internal equity and market competitiveness.
In addition to guaranteed base pay and comprehensive benefits programmes, CITIC Pacific has implemented a variable bonus policy that links pay with individual and business performance. The total amount of variable bonuses paid to employees is determined according to business performance or achievement of pre-defined Key Performance Indicators (KPIs), if applicable, of the respective operating business units. Whilst observing the approved guidelines, the bonuses are allocated by respective functional heads and differentiated based on the performance rating of each employee under their responsible areas. Over the years, this variable pay policy has proven to be effective in motivating performance of our employees.
“No matter what our strategy is, or how good our assets are, the key to business success is always people. At CITIC Pacific, we believe it is our people who make the company strong.” Mr Chang Zhenming, Chairman
% 42
5 2
43
52
1
Head office Special steel Iron ore mining
Property Dah Chong Hong CITIC telecom
Others
2011 Headcount by business segment
Hong Kong Mainland China
Australia Other countries
%
1
142
83
2011 Headcount by location
78 CITIC Pacific Annual Report 2011
Human Resources
To support our performance-based remuneration principle, performance management tools are in place at CITIC Pacific to facilitate the setting of performance objectives, reviewing and managing performance as well as identifying training and development opportunities for personal growth. Depending on the mode of operation of the business units, reasonable performance measures or KPIs covering both financial and non-financial dimensions are set by the respective operating business units to effectively measure the performance of both the business and individual.
For senior management employees, on top of the variable bonus awards, share options are granted under the prevailing share options plan as part of the performance-based incentive award which aims to align management incentives with shareholder interests. Details of the CITIC Pacific Share Incentive Plan 2000 (“the Plan”) and the granting of options are reported on pages 108 to 110. In May 2011, CITIC Pacific adopted a new plan, namely, the CITIC Pacific Share Incentive Plan 2011 (“the Plan 2011”) following the expiry of the Plan on 30 May 2010. Details of the Plan 2011 are reported on pages 110 to 111.
Remuneration CommitteeThe Remuneration Committee, established in August 2003, comprises three independent non-executive directors. The committee meets at least once a year to review and approve the remuneration of executive directors and other key executives based on the following principles:
• Noindividualshouldbeinvolvedindecisionsrelating to his/her own remuneration;
• Remunerationshouldreasonablyreflectperformance, responsibilities and complexity as well as the time commitment in order to attract, motivate and retain high calibre employees;
• Remunerationshouldbedetermined with reference to the market pay levels of comparable listed companies as agreed by the Remuneration Committee and the top management.
In 2011, the total remuneration paid to the directors was HK$60 million (2010: HK$85 million). Further information on individual director’s emoluments can be found on page 155.
Major Remuneration Reviews for Year 2011In January 2011, the remuneration policy for employees of CITIC Pacific Limited serving on the boards of subsidiary or associated companies to represent the interests of the group was reviewed with reference to the practices of a number of prominent public listed companies in Hong Kong. It was concluded that they should not receive any additional remuneration from those companies, including share options.
In May 2011, in response to the new Minimum Wage Ordinance in Hong Kong, we reviewed our pay policies and procedures to ensure regulatory compliance. A total of 485 affected cases from different operating business units across the group were properly addressed. Work hours and pay levels of the employees likely to be affected have been monitored closely on an on-going basis.
In September 2011, Towers Watson (“TW”) was engaged to conduct a thorough review of our reward strategy and the pay position of directors and employees in the headquarters in Hong Kong with reference to relevant market information. With the approval of the Remuneration Committee, our management adopted the recommendations from TW to restructure the remuneration mix (i.e. the ratio of guaranteed pay to variable pay) of our directors and Hong Kong employees so as to enhance our market competitiveness in terms of guaranteed pay and bring our remuneration
79CITIC Pacific Annual Report 2011
mix more in line with prevailing market practices. Without causing any increase in total cash for an individual, part of the variable pay of our employees was shifted from variable pay to guaranteed pay, while maintaining the variable pay at an appropriate level to motivate the performance of our employees.
During the year, CITIC Pacific China Holdings, the headquarters of our property business in mainland China, engaged Aon Hewitt to conduct a thorough review of its grading structure, total rewards strategy and programmes as well as the performance management system. The ultimate objective of the review is to design a set of market competitive human resources-related policies and programmes that are applicable to all its subsidiaries and associate companies to ensure alignment of human resources management among the companies and better support the achievement of business objectives.
People DevelopmentCITIC Pacific is committed to providing an environment that is conducive to the development of its staff. With building organisational and employee excellence as our ultimate goal, we organise a wide range of internal and external training programmes to build leadership and management capability and to expand the business expertise, competencies and skill sets of staff to meet the ever-changing challenges of the marketplace. We also support and encourage a proactive learning culture and personal development through financial sponsorship.
This year, based on the demands of the headquarters and subsidiary companies across CITIC Pacific, we organised a number of professional/functional and generic skills training and sharing sessions covering employees in mainland China and Hong Kong and also launched a series of management training programmes across CITIC Pacific covering employees of subsidiary companies in Hong Kong. In the 3rd quarter of 2011, we again organised group conferences for the finance and human resources functions with an aim to enhance functional alignment and further improve functional effectiveness and efficiency within CITIC Pacific.
In January 2012, CITIC Pacific successfully completed its 1st CITIC Pacific Leadership Development Programme (CPLDP), with around 40 senior managers from headquarters and subsidiary companies graduating from the programme. CPLDP is a customised leadership development programme run in partnership with a prominent university in Hong Kong. The objective of the programme is to groom a group of high performing and potential senior managers within CITIC Pacific for senior leaders’ succession. In view of the successful implementation of the programme, CITIC Pacific will hold the 2nd CPLDP in the middle of 2012.
Employee RelationsTo enhance the sense of engagement, pride and community, CITIC Pacific and its subsidiaries continued their efforts to organise numerous activities and interest classes for employees and their families for fun, education, wellness and charity throughout 2011.
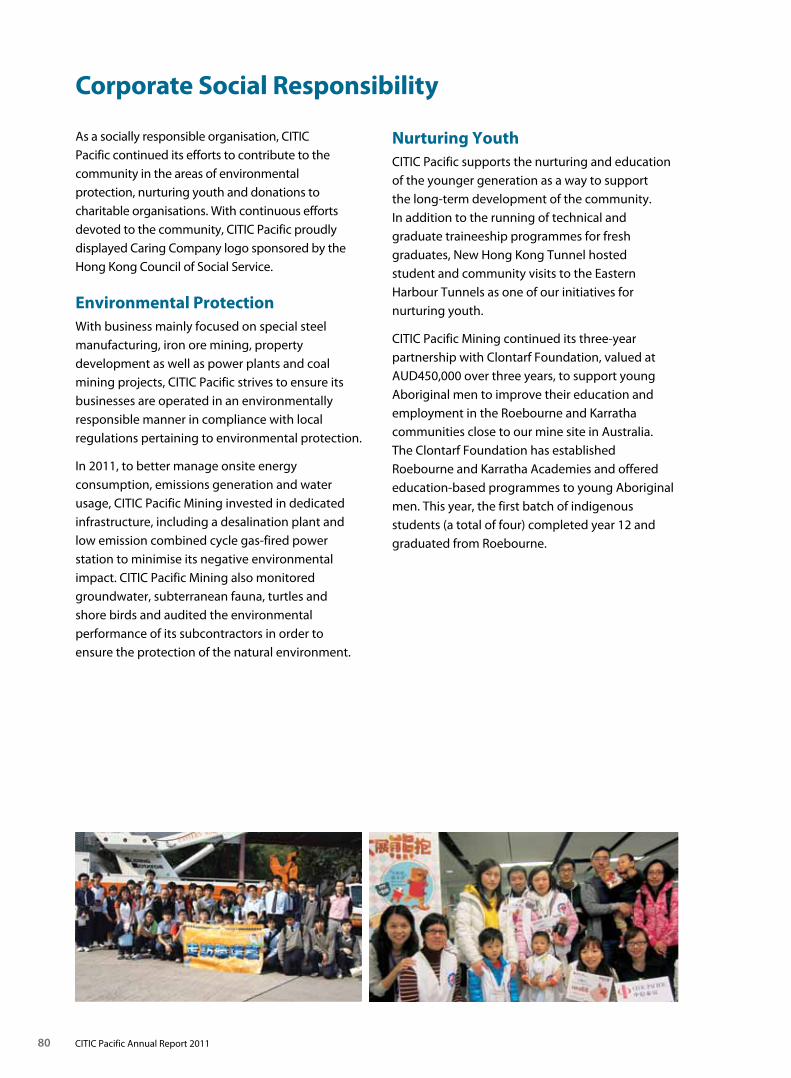
80 CITIC Pacific Annual Report 2011
Corporate Social Responsibility
As a socially responsible organisation, CITIC Pacific continued its efforts to contribute to the community in the areas of environmental protection, nurturing youth and donations to charitable organisations. With continuous efforts devoted to the community, CITIC Pacific proudly displayed Caring Company logo sponsored by the Hong Kong Council of Social Service.
Environmental ProtectionWith business mainly focused on special steel manufacturing, iron ore mining, property development as well as power plants and coal mining projects, CITIC Pacific strives to ensure its businesses are operated in an environmentally responsible manner in compliance with local regulations pertaining to environmental protection.
In 2011, to better manage onsite energy consumption, emissions generation and water usage, CITIC Pacific Mining invested in dedicated infrastructure, including a desalination plant and low emission combined cycle gas-fired power station to minimise its negative environmental impact. CITIC Pacific Mining also monitored groundwater, subterranean fauna, turtles and shore birds and audited the environmental performance of its subcontractors in order to ensure the protection of the natural environment.
Nurturing YouthCITIC Pacific supports the nurturing and education of the younger generation as a way to support the long-term development of the community. In addition to the running of technical and graduate traineeship programmes for fresh graduates, New Hong Kong Tunnel hosted student and community visits to the Eastern Harbour Tunnels as one of our initiatives for nurturing youth.
CITIC Pacific Mining continued its three-year partnership with Clontarf Foundation, valued at AUD450,000 over three years, to support young Aboriginal men to improve their education and employment in the Roebourne and Karratha communities close to our mine site in Australia. The Clontarf Foundation has established Roebourne and Karratha Academies and offered education-based programmes to young Aboriginal men. This year, the first batch of indigenous students (a total of four) completed year 12 and graduated from Roebourne.
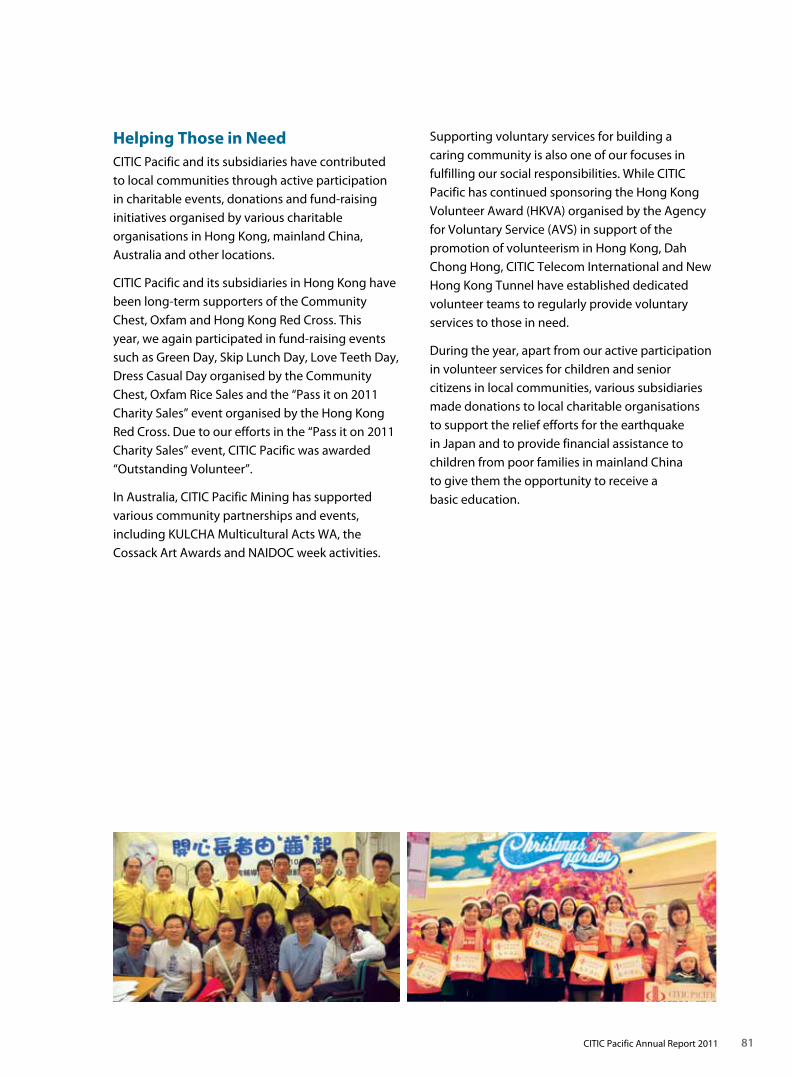
81CITIC Pacific Annual Report 2011
Helping Those in NeedCITIC Pacific and its subsidiaries have contributed to local communities through active participation in charitable events, donations and fund-raising initiatives organised by various charitable organisations in Hong Kong, mainland China, Australia and other locations.
CITIC Pacific and its subsidiaries in Hong Kong have been long-term supporters of the Community Chest, Oxfam and Hong Kong Red Cross. This year, we again participated in fund-raising events such as Green Day, Skip Lunch Day, Love Teeth Day, Dress Casual Day organised by the Community Chest, Oxfam Rice Sales and the “Pass it on 2011 Charity Sales” event organised by the Hong Kong Red Cross. Due to our efforts in the “Pass it on 2011 Charity Sales” event, CITIC Pacific was awarded “Outstanding Volunteer”.
In Australia, CITIC Pacific Mining has supported various community partnerships and events, including KULCHA Multicultural Acts WA, the Cossack Art Awards and NAIDOC week activities.
Supporting voluntary services for building a caring community is also one of our focuses in fulfilling our social responsibilities. While CITIC Pacific has continued sponsoring the Hong Kong Volunteer Award (HKVA) organised by the Agency for Voluntary Service (AVS) in support of the promotion of volunteerism in Hong Kong, Dah Chong Hong, CITIC Telecom International and New Hong Kong Tunnel have established dedicated volunteer teams to regularly provide voluntary services to those in need.
During the year, apart from our active participation in volunteer services for children and senior citizens in local communities, various subsidiaries made donations to local charitable organisations to support the relief efforts for the earthquake in Japan and to provide financial assistance to children from poor families in mainland China to give them the opportunity to receive a basic education.
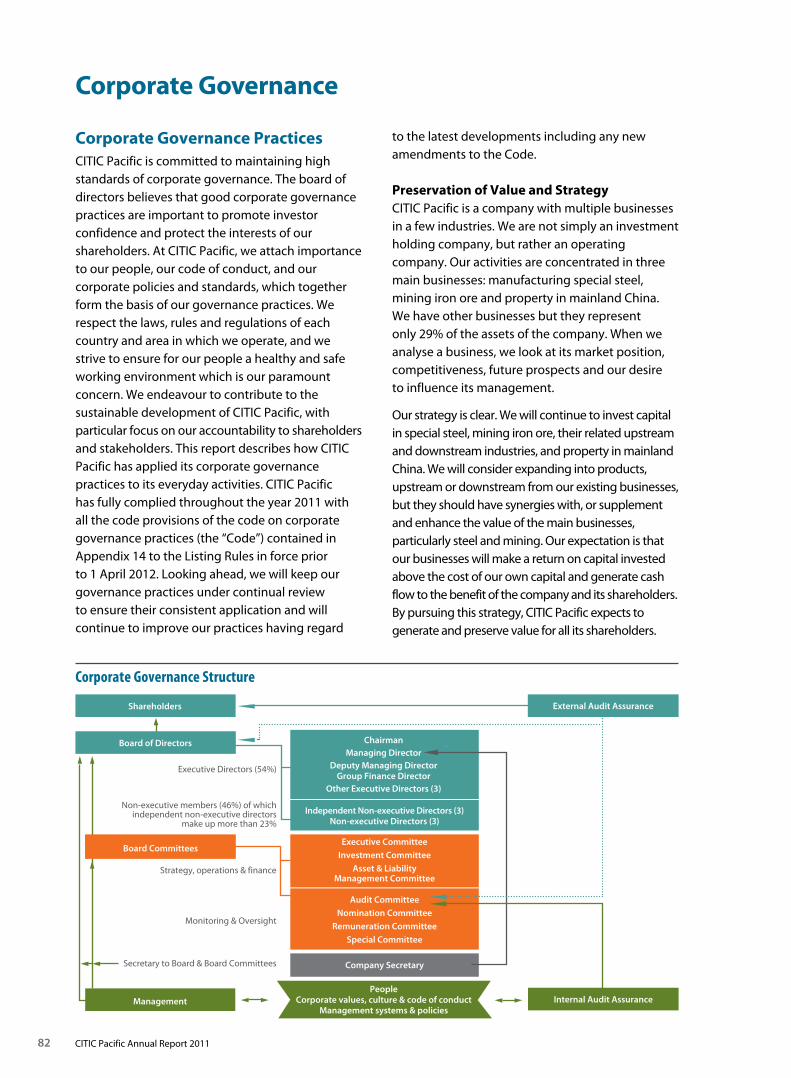
82 CITIC Pacific Annual Report 2011
Corporate Governance PracticesCITIC Pacific is committed to maintaining high standards of corporate governance. The board of directors believes that good corporate governance practices are important to promote investor confidence and protect the interests of our shareholders. At CITIC Pacific, we attach importance to our people, our code of conduct, and our corporate policies and standards, which together form the basis of our governance practices. We respect the laws, rules and regulations of each country and area in which we operate, and we strive to ensure for our people a healthy and safe working environment which is our paramount concern. We endeavour to contribute to the sustainable development of CITIC Pacific, with particular focus on our accountability to shareholders and stakeholders. This report describes how CITIC Pacific has applied its corporate governance practices to its everyday activities. CITIC Pacific has fully complied throughout the year 2011 with all the code provisions of the code on corporate governance practices (the “Code”) contained in Appendix 14 to the Listing Rules in force prior to 1 April 2012. Looking ahead, we will keep our governance practices under continual review to ensure their consistent application and will continue to improve our practices having regard
Corporate Governance
to the latest developments including any new amendments to the Code.
Preservation of Value and StrategyCITIC Pacific is a company with multiple businesses in a few industries. We are not simply an investment holding company, but rather an operating company. Our activities are concentrated in three main businesses: manufacturing special steel, mining iron ore and property in mainland China. We have other businesses but they represent only 29% of the assets of the company. When we analyse a business, we look at its market position, competitiveness, future prospects and our desire to influence its management.
Our strategy is clear. We will continue to invest capital in special steel, mining iron ore, their related upstream and downstream industries, and property in mainland China. We will consider expanding into products, upstream or downstream from our existing businesses, but they should have synergies with, or supplement and enhance the value of the main businesses, particularly steel and mining. Our expectation is that our businesses will make a return on capital invested above the cost of our own capital and generate cash flow to the benefit of the company and its shareholders. By pursuing this strategy, CITIC Pacific expects to generate and preserve value for all its shareholders.
Corporate Governance Structure
Independent Non-executive Directors (3)Non-executive Directors (3)
ManagementPeople
Corporate values, culture & code of conductManagement systems & policies
Shareholders External Audit Assurance
Internal Audit Assurance
Board of Directors
Board CommitteesExecutive Committee
Investment Committee
Asset & Liability Management Committee
Audit Committee
Nomination Committee
Remuneration Committee
Special Committee
Company Secretary
ChairmanManaging Director
Deputy Managing DirectorGroup Finance Director
Other Executive Directors (3)
Executive Directors (54%)
Non-executive members (46%) of which independent non-executive directors
make up more than 23%
Strategy, operations & finance
Monitoring & Oversight
Secretary to Board & Board Committees

83CITIC Pacific Annual Report 2011
Board of Directors
Overall AccountabilityThe members of the board of directors are individually and collectively accountable to the shareholders for the success and sustainable development of CITIC Pacific. The board provides direction and approval in relation to matters concerning CITIC Pacific’s business strategies, policies and plans, while the day-to-day business operations are delegated to the executive management. The board is accountable to the shareholders, and in discharging their corporate accountability, directors of CITIC Pacific are required to pursue excellence in the interests of the shareholders and fulfill their fiduciary duties by applying the required levels of skill, care and diligence to a standard in accordance with the statutory requirements.
Board Composition and Changes during 2011The board currently comprises seven executive directors, three independent non-executive directors and three non-executive directors. Non-executive directors (including independent non-executive directors) comprise more than 46% of the board, of which independent non-executive directors make up more than 23%. CITIC Pacific will comply with the revised Listing Rules requirement of independent non-executive directors representing at least one-third of the board before the end of 2012. Currently, three non-executive directors are not independent (as defined by the Stock Exchange), as one director is the president of a shareholder owning a stake of more than 1% in CITIC Pacific; one is a vice president of CITIC Limited (a substantial shareholder of CITIC Pacific); and one is a director of a company in which CITIC Limited is a substantial shareholder. CITIC Pacific has received from each independent non-executive director a confirmation of his independence pursuant to the independence guidelines set out in Rule 3.13 of the Listing Rules and considers that all independent non-executive directors are independent. Brief biographical particulars of the directors, together with information about the relationships among them, are set out on pages 98 to 100.
In 2011, Messrs Li Shilin and Wang Ande retired as executive directors of CITIC Pacific by rotation and did not seek re-election at the annual general meeting held on 12 May 2011 (the “2011 AGM”). In addition, due to personal commitments, Mr Willie Chang resigned as non-executive director of CITIC Pacific, and Messrs Hansen Loh Chung Hon and Norman Ho Hau Chong resigned as independent non-executive directors of CITIC Pacific, all effective from the conclusion of the 2011 AGM.
Messrs Gregory Lynn Curl and Francis Siu Wai Keung were appointed as independent non-executive directors of CITIC Pacific with effect from the conclusion of the 2011 AGM. They were re-elected at the general meeting of CITIC Pacific held on 29 September 2011. Induction materials and briefing sessions were given to the new directors during the year.
All directors, including the non-executive directors, have a specific term of appointment which is not more than three years since his re-election by shareholders at the general meeting. Under Article 104(A) of the articles of association of CITIC Pacific, every director, including the non-executive directors, shall be subject to retirement by rotation at least once every three years. Retiring directors are eligible for re-election at the annual general meeting during which they retire. Separate resolutions are proposed for the election of each director. One-third of the directors, or if their number is not a multiple of three then the number nearest to one-third, must retire from office at each annual general meeting and their re-election is subject to a vote by shareholders.
Mr Alexander Reid Hamilton has been an independent non-executive director of CITIC Pacific for more than 17 years and served as the chairman of the audit committee since 1995. Mr Alexander Reid Hamilton will retire by rotation at the forthcoming annual general meeting to be held on 18 May 2012 and, being eligible, offer himself for re-election. Independence is judged against the ability, integrity and willingness of the director to act. The board considers Mr Alexander Reid Hamilton to remain independent based on his annual confirmation that he continues to satisfy the independence criteria under the Listing Rules,
Corporate Governance
84 CITIC Pacific Annual Report 2011
as well as his objectivity and independent frame of mind exhibited throughout his tenure. Accordingly, the board would like to seek approval from the shareholders for the re-election of Mr Alexander Reid Hamilton as an independent non-executive director. He ceased to act as the chairman of the audit committee with effect from the conclusion of the board meeting held on 1 March 2012 but remains as a member of the audit committee. Mr Francis Siu Wai Keung, an independent non-executive director and a member of the audit committee since May 2011, was appointed as the chairman of the audit committee with effect from the conclusion of the board meeting held on 1 March 2012.
Nomination of DirectorsThe board of directors determines the nomination and appointment of new directors having regard to the relevant skills and experience of the proposed new directors. CITIC Pacific has on 1 March 2012 established a nomination committee, further details of which are set out below.
Board Responsibilities and DelegationThe board collectively determines the overall strategies of CITIC Pacific, monitors performance and the related risks and controls in pursuit of the strategic objectives of CITIC Pacific. Day-to-day management of CITIC Pacific is delegated to the executive director or officer in charge of each business unit and function, who reports back to the board. Each business unit leader and corporate functional leader is a member of the executive committee, which meets monthly to review the operating and financial performance of CITIC Pacific. All board members have separate and independent access to the management, and are provided with full and timely information about the conduct of the business and development of CITIC Pacific, including reports and recommendations on significant matters. Should separate independent professional advice be considered necessary by the directors, independent professional services would be made available to the directors upon request.
The board has delegated certain functions to the respective committees, the details of which are set out below. Matters specifically reserved for the board include approval of financial statements, dividend policy, significant changes in accounting policies, material contracts, selection of directors, changes to appointments such as company secretary and external auditor, remuneration policy for directors and senior management, terms of reference of board committees, as well as major corporate policies such as the code of conduct and whistle-blowing policy.
CITIC Pacific has arranged Directors & Officers Liability and Company Reimbursement Insurance for its directors and officers.
Details of the responsibilities, membership, attendance and activities during the year of each board committee are set out on pages 85 to 90.
Board Meetings and AttendanceThe board meets regularly to review financial and operating performance of CITIC Pacific and to discuss future strategy. Four board meetings were held in 2011. At the board meetings, the board reviewed significant matters including CITIC Pacific’s annual and half-year financial statements, annual budget, proposals for final and interim dividends, annual report and half-year report, and connected transactions. At each of its meetings, the board receives a written report from the managing director on CITIC Pacific’s major businesses, investments and projects, and corporate activities. During the year the board received detailed briefings on the progress of the Sino Iron project. The dates of the next regular board meetings are fixed at the close of each board meeting, and a schedule of board meetings dates is fixed for each year ahead whenever possible. At least 14 days’ notice of all regular board meetings is given to all directors, and all directors are given the opportunity to include matters for discussion in the agenda. The agenda and board papers for each meeting are sent to all directors at least three days in advance of every regular board meeting. All minutes of the board meetings are kept by the company secretary and are available to all directors for inspection.
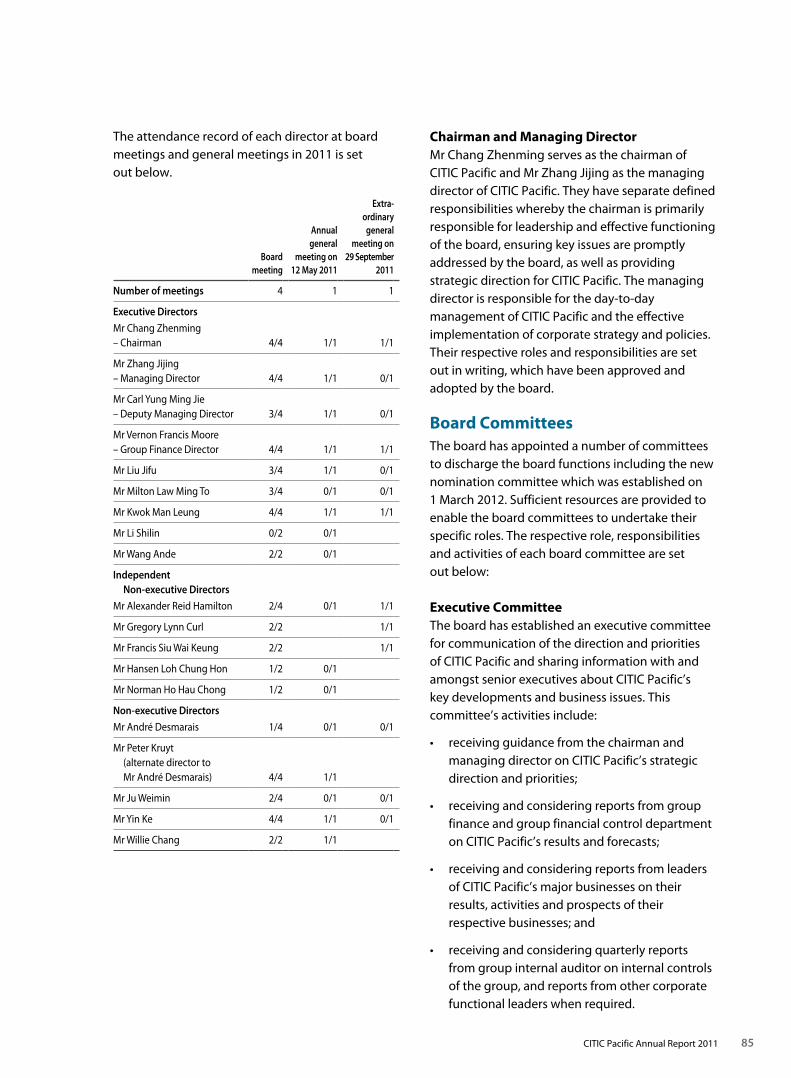
85CITIC Pacific Annual Report 2011
The attendance record of each director at board meetings and general meetings in 2011 is set out below.
Board meeting
Annual general
meeting on 12 May 2011
Extra-ordinary
general meeting on
29 September 2011
Number of meetings 4 1 1
Executive Directors
Mr Chang Zhenming – Chairman 4/4 1/1 1/1
Mr Zhang Jijing – Managing Director 4/4 1/1 0/1
Mr Carl Yung Ming Jie – Deputy Managing Director 3/4 1/1 0/1
Mr Vernon Francis Moore – Group Finance Director 4/4 1/1 1/1
Mr Liu Jifu 3/4 1/1 0/1
Mr Milton Law Ming To 3/4 0/1 0/1
Mr Kwok Man Leung 4/4 1/1 1/1
Mr Li Shilin 0/2 0/1
Mr Wang Ande 2/2 0/1
Independent Non-executive Directors
Mr Alexander Reid Hamilton 2/4 0/1 1/1
Mr Gregory Lynn Curl 2/2 1/1
Mr Francis Siu Wai Keung 2/2 1/1
Mr Hansen Loh Chung Hon 1/2 0/1
Mr Norman Ho Hau Chong 1/2 0/1
Non-executive Directors
Mr André Desmarais 1/4 0/1 0/1
Mr Peter Kruyt (alternate director to Mr André Desmarais) 4/4 1/1
Mr Ju Weimin 2/4 0/1 0/1
Mr Yin Ke 4/4 1/1 0/1
Mr Willie Chang 2/2 1/1
Chairman and Managing DirectorMr Chang Zhenming serves as the chairman of CITIC Pacific and Mr Zhang Jijing as the managing director of CITIC Pacific. They have separate defined responsibilities whereby the chairman is primarily responsible for leadership and effective functioning of the board, ensuring key issues are promptly addressed by the board, as well as providing strategic direction for CITIC Pacific. The managing director is responsible for the day-to-day management of CITIC Pacific and the effective implementation of corporate strategy and policies. Their respective roles and responsibilities are set out in writing, which have been approved and adopted by the board.
Board CommitteesThe board has appointed a number of committees to discharge the board functions including the new nomination committee which was established on 1 March 2012. Sufficient resources are provided to enable the board committees to undertake their specific roles. The respective role, responsibilities and activities of each board committee are set out below:
Executive CommitteeThe board has established an executive committee for communication of the direction and priorities of CITIC Pacific and sharing information with and amongst senior executives about CITIC Pacific’s key developments and business issues. This committee’s activities include:
• receiving guidance from the chairman and managing director on CITIC Pacific’s strategic direction and priorities;
• receiving and considering reports from group finance and group financial control department on CITIC Pacific’s results and forecasts;
• receiving and considering reports from leaders of CITIC Pacific’s major businesses on their results, activities and prospects of their respective businesses; and
• receiving and considering quarterly reports from group internal auditor on internal controls of the group, and reports from other corporate functional leaders when required.
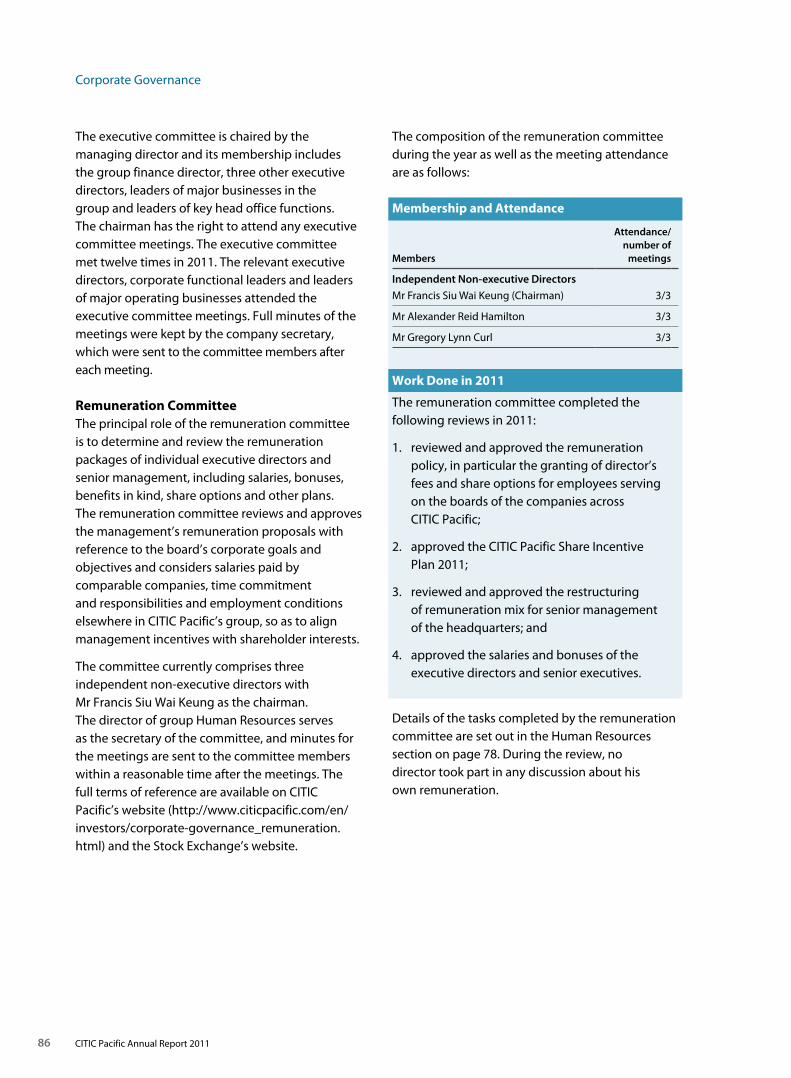
Corporate Governance
86 CITIC Pacific Annual Report 2011
The executive committee is chaired by the managing director and its membership includes the group finance director, three other executive directors, leaders of major businesses in the group and leaders of key head office functions. The chairman has the right to attend any executive committee meetings. The executive committee met twelve times in 2011. The relevant executive directors, corporate functional leaders and leaders of major operating businesses attended the executive committee meetings. Full minutes of the meetings were kept by the company secretary, which were sent to the committee members after each meeting.
Remuneration CommitteeThe principal role of the remuneration committee is to determine and review the remuneration packages of individual executive directors and senior management, including salaries, bonuses, benefits in kind, share options and other plans. The remuneration committee reviews and approves the management’s remuneration proposals with reference to the board’s corporate goals and objectives and considers salaries paid by comparable companies, time commitment and responsibilities and employment conditions elsewhere in CITIC Pacific’s group, so as to align management incentives with shareholder interests.
The committee currently comprises three independent non-executive directors with Mr Francis Siu Wai Keung as the chairman. The director of group Human Resources serves as the secretary of the committee, and minutes for the meetings are sent to the committee members within a reasonable time after the meetings. The full terms of reference are available on CITIC Pacific’s website (http://www.citicpacific.com/en/investors/corporate-governance_remuneration.html) and the Stock Exchange’s website.
The composition of the remuneration committee during the year as well as the meeting attendance are as follows:
Membership and Attendance
Members
Attendance/number of
meetings
Independent Non-executive Directors
Mr Francis Siu Wai Keung (Chairman) 3/3
Mr Alexander Reid Hamilton 3/3
Mr Gregory Lynn Curl 3/3
Work Done in 2011
The remuneration committee completed the following reviews in 2011:
1. reviewed and approved the remuneration policy, in particular the granting of director’s fees and share options for employees serving on the boards of the companies across CITIC Pacific;
2. approved the CITIC Pacific Share Incentive Plan 2011;
3. reviewed and approved the restructuring of remuneration mix for senior management of the headquarters; and
4. approved the salaries and bonuses of the executive directors and senior executives.
Details of the tasks completed by the remuneration committee are set out in the Human Resources section on page 78. During the review, no director took part in any discussion about his own remuneration.
87CITIC Pacific Annual Report 2011
During the year, the remuneration committee had communicated with the chairman and/or managing director about proposals relating to the remuneration packages of other executive directors and senior management.
In addition, the committee considered the proposed amendments to its terms of reference to take into account the new code provisions which will take effect from 1 April 2012 and recommended their adoption by the board.
Details of CITIC Pacific’s remuneration policies are set out in the Human Resources section on pages 77 to 79, and directors’ emoluments and retirement benefits are disclosed on pages 155 to 156. Share options granted under the CITIC Pacific Share Incentive Plan 2000 which ended on 30 May 2010 are disclosed on pages 108 to 110.
Audit CommitteeThe audit committee reviews financial information of CITIC Pacific, monitors the effectiveness of the external audit process and oversees the appointment, remuneration and terms of engagement of CITIC Pacific’s external auditor, as well as their independence. The audit committee is also responsible for reviewing the financial reporting process and the systems of internal controls and risk management, including the group’s internal audit function as well as arrangements for concerns raised by staff as to financial reporting and other relevant matters (“whistle-blowing”). On 1 March 2012, the board delegated certain corporate governance functions to the audit committee, including the review and monitoring of (a) the training and continuous professional development of directors and senior management; (b) CITIC Pacific’s policies and practices on compliance with legal and regulatory requirements; (c) the code of conduct of CITIC Pacific; and (d) CITIC Pacific’s compliance with the Code and disclosure in the Corporate Governance Report. The revised full terms of reference setting out the committee’s authority and its main role
and responsibilities are available on CITIC Pacific’s website (http://www.citicpacific.com/en/investors/corporate-governance_audit.html) and the Stock Exchange’s website. The committee reviews the terms of reference annually to ensure they continue to be in line with the requirements of the Code. Proposed amendments to the terms of reference are submitted to the board for approval.
The audit committee consists of three non-executive members, two of whom are independent non-executive directors having the relevant professional qualifications and expertise in accounting matters. With effect from the conclusion of the board meeting held on 1 March 2012, Mr Alexander Reid Hamilton ceased to act as the chairman of the audit committee but remains as a member while Mr Francis Siu Wai Keung was appointed as the chairman of the audit committee. The audit committee must meet at least twice a year with CITIC Pacific’s external auditor. The company secretary acts as secretary to the committee. Sufficient resources are made available to the committee when required.
The group finance director, group financial controller and the external and internal auditors attend the meetings, take part in the discussions and answer questions from the committee members. By invitation of the audit committee, other directors and senior executives may also attend the meetings. The audit committee chairman and other committee members also meet in separate private sessions with the external auditor and group internal auditor.
The audit committee held four meetings in 2011 with full attendance by the committee members in person or by telephone. An agenda and accompanying committee papers were sent to the committee members at least three days prior to each meeting. The company secretary prepared full minutes of the audit committee meetings with details of discussions and decisions reached. The draft minutes were sent to all committee members for comment after each meeting.
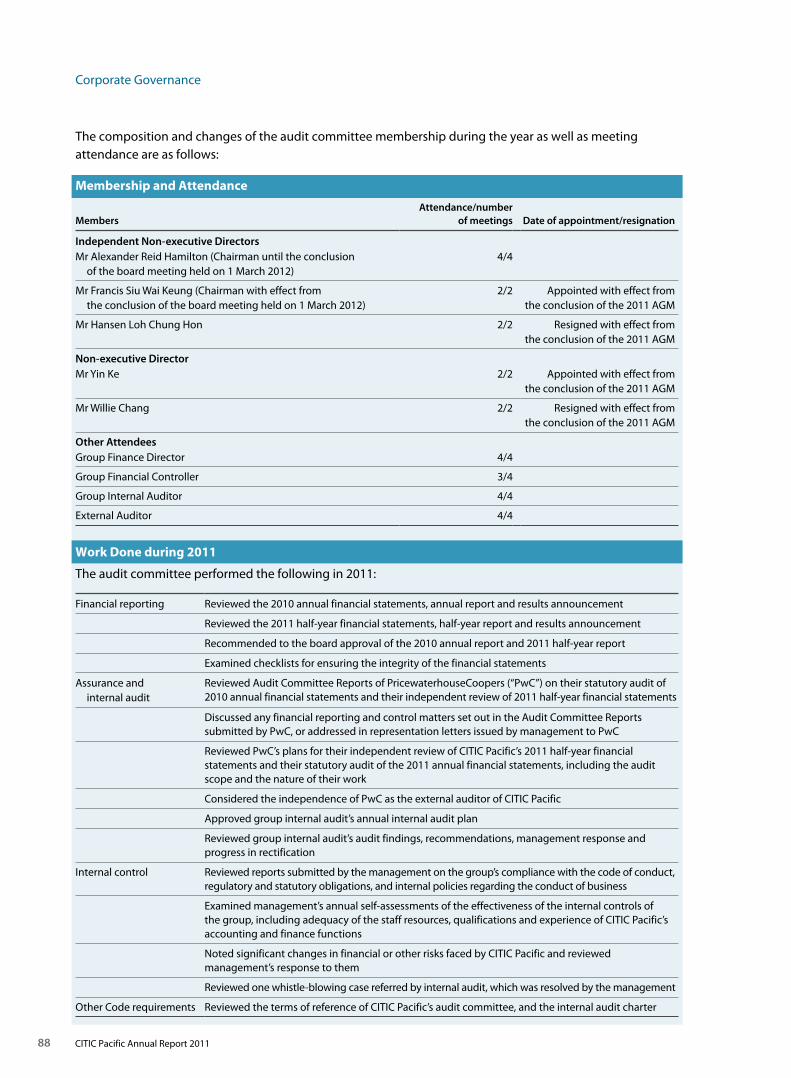
Corporate Governance
88 CITIC Pacific Annual Report 2011
The composition and changes of the audit committee membership during the year as well as meeting attendance are as follows:
Membership and Attendance
MembersAttendance/number
of meetings Date of appointment/resignation
Independent Non-executive DirectorsMr Alexander Reid Hamilton (Chairman until the conclusion of the board meeting held on 1 March 2012)
4/4
Mr Francis Siu Wai Keung (Chairman with effect from the conclusion of the board meeting held on 1 March 2012)
2/2 Appointed with effect from the conclusion of the 2011 AGM
Mr Hansen Loh Chung Hon 2/2 Resigned with effect from the conclusion of the 2011 AGM
Non-executive DirectorMr Yin Ke 2/2 Appointed with effect from
the conclusion of the 2011 AGM
Mr Willie Chang 2/2 Resigned with effect from the conclusion of the 2011 AGM
Other AttendeesGroup Finance Director 4/4
Group Financial Controller 3/4
Group Internal Auditor 4/4
External Auditor 4/4
Work Done during 2011
The audit committee performed the following in 2011:
Financial reporting Reviewed the 2010 annual financial statements, annual report and results announcement
Reviewed the 2011 half-year financial statements, half-year report and results announcement
Recommended to the board approval of the 2010 annual report and 2011 half-year report
Examined checklists for ensuring the integrity of the financial statements
Assurance and internal audit
Reviewed Audit Committee Reports of PricewaterhouseCoopers (“PwC”) on their statutory audit of 2010 annual financial statements and their independent review of 2011 half-year financial statements
Discussed any financial reporting and control matters set out in the Audit Committee Reports submitted by PwC, or addressed in representation letters issued by management to PwC
Reviewed PwC’s plans for their independent review of CITIC Pacific’s 2011 half-year financial statements and their statutory audit of the 2011 annual financial statements, including the audit scope and the nature of their work
Considered the independence of PwC as the external auditor of CITIC Pacific
Approved group internal audit’s annual internal audit plan
Reviewed group internal audit’s audit findings, recommendations, management response and progress in rectification
Internal control Reviewed reports submitted by the management on the group’s compliance with the code of conduct, regulatory and statutory obligations, and internal policies regarding the conduct of business
Examined management’s annual self-assessments of the effectiveness of the internal controls of the group, including adequacy of the staff resources, qualifications and experience of CITIC Pacific’s accounting and finance functions
Noted significant changes in financial or other risks faced by CITIC Pacific and reviewed management’s response to them
Reviewed one whistle-blowing case referred by internal audit, which was resolved by the management
Other Code requirements Reviewed the terms of reference of CITIC Pacific’s audit committee, and the internal audit charter
89CITIC Pacific Annual Report 2011
In the audit committee meeting of February 2012, the audit committee reviewed CITIC Pacific’s annual financial statements and annual report for the year ended 31 December 2011, and considered reports from the external and internal auditors. The audit committee recommended that the board approves the 2011 annual report.
Nomination CommitteeThe board established a nomination committee on 1 March 2012. The full terms of reference are available on CITIC Pacific’s website (http://www.citicpacific.com/en/investors/corporate-governance_nomination.html) and the Stock Exchange’s website.
The nomination committee is authorised by the board to determine the policy for the nomination of directors, to set out the nomination procedures and the process and criteria adopted to select and recommend candidates for directorship.
Membership
The nomination committee comprises three members, a majority of whom are independent non-executive directors, and is chaired by the chairman of the board.
Executive Director
Mr Chang Zhenming (Chairman)
Independent Non-executive Directors
Mr Alexander Reid Hamilton
Mr Gregory Lynn Curl
As the nomination committee was formed in March 2012, no meetings have yet been held.
Investment CommitteeThe investment committee was set up in May 2009 to provide advice to the chairman, the managing director and the board on:
• investment plans, feasibility studies and proposed disposals or divestments initiated by the businesses in the group or the committee itself;
• the strategy and planning of CITIC Pacific; and
• the annual operating and capital expenditure budgets and business plans of CITIC Pacific and businesses in the group, amendments to approved budgets and unbudgeted capital expenditure.
The committee is chaired by the chairman of the board; the other members are the managing director, group finance director and two other executive directors. Prior to the committee meetings, business proposals and feasibility studies are prepared by the proposing business, and the group’s business development department provides analysis to facilitate discussions. Depending on the availability of members, discussions are made either in physical meetings or in writing. Discussion results will be notified to people concerned with implementation for information and follow up.
The committee meets on an “as required” basis. In 2011, there were 15 discussions of the committee covering 23 topics attended by relevant executive directors and management personnel.
Asset and Liability Management CommitteeThe asset and liability management committee was established in October 2008 to review the financial position and financial risk management of CITIC Pacific. The principal responsibilities of the asset and liability management committee are to:
• review regularly the asset and liability balance of CITIC Pacific in aggregate and at subsidiary level;
• set limits on exposure at group, subsidiary or business unit level in relation to
– asset and liability structure
– counterparties
– currencies
– interest rates
– commitments and contingent liabilities;
• review and approve financing plans;
• approve the use of new financial products; and
• establish hedging policies.
Corporate Governance
90 CITIC Pacific Annual Report 2011
The committee is chaired by the group finance director. Other members include two executive directors, the group treasurer, group financial controller, and the executives with responsibility for treasury, treasury risk management and financial control.
The chief financial officers of major business units attend and report at the meetings of the asset and liability management committee from time to time. The committee met twelve times during 2011 to consider the matters within its terms of reference.
Special Committee to Deal with Matters Relating to Investigations of CITIC PacificA special committee to deal with matters relating to the investigations of CITIC Pacific was established in April 2009 to
• approve communications between CITIC Pacific and any relevant authorities or third parties in relation to the investigations by the Securities and Futures Commission and the Commercial Crime Bureau of the Hong Kong Police Force;
• consider the issue of legal professional privilege and to make decisions on behalf of CITIC Pacific in connection therewith; and
• seek legal and professional advice on behalf of CITIC Pacific as well as approve their fees.
The committee comprised two members upon inception, namely, Mr Zhang Jijing and Mr Ju Weimin. Following his appointment as independent non-executive director of CITIC Pacific, Mr Francis Siu Wai Keung was appointed to the special committee on 8 August 2011. The committee members reviewed the matters concerning the protection of legal professional privilege and received independent legal advice and had discussions on the matters with independent legal counsel.
On 18 March 2011, the Court of First Instance handed down judgment ruling that privilege had been lost in respect of six documents. CITIC Pacific is carefully considering the judgment and taking
legal advice on its position. CITIC Pacific’s appeal against the judgment was heard in the Court of Appeal in December 2011, and judgment is awaited.
In October 2011, approximately 1,600 further items were submitted to the court for adjudication. The majority of the remaining documents seized by the Commercial Crime Bureau over which CITIC Pacific had asserted legal professional privilege were unchallenged by the Commercial Crime Bureau of the Hong Kong Police Force. Judgment was handed down on 19 December 2011 to the effect that privilege had been lost in respect of most of the documents submitted for adjudication. CITIC Pacific filed a notice of appeal on 9 January 2012 against this part of the proceedings.
Accountability and Audit
Financial ReportingThe board of directors recognises the importance of integrity of financial information and acknowledges its responsibility for preparing financial statements that give a true and fair view of the group’s affairs and of its results and cash flows in accordance with Hong Kong Financial Reporting Standards and the Hong Kong Companies Ordinance. The board endeavours to present to shareholders a balanced and understandable assessment of CITIC Pacific’s performance, position and prospects. Accordingly, appropriate accounting policies are selected and applied consistently, and judgments and estimates made by the management for financial reporting purposes are prudent and reasonable.
The adoption of new or amended accounting standards that became effective or adopted early during the year has not had a significant impact on the accounts except for those disclosed in Note 1(a) on pages 130 to 131.
The responsibilities of the external auditor with respect to the accounts for the year ended 31 December 2011 are set out in the Independent Auditor’s Report on page 213.
91CITIC Pacific Annual Report 2011
External Auditors and their RemunerationThe external auditors perform independent review or audit of the financial statements prepared by the management. Since 1989, PwC has been engaged as CITIC Pacific’s external auditor. The audit engagement partner responsible for the audit of CITIC Pacific is generally changed every seven years to ensure independence. The current audit partner has been engaged since 2011 to replace the previous one who was first appointed in 2006. During the year, PwC’s fees for its services were approximately as follows:
Statutory audit fee: HK$26 million (2010: HK$25 million).
Fees for other services, including special audits, advisory services relating to user requirements for the new financial accounting consolidation system, review of systems of internal control, review of the half-year financial statements and tax compliance: HK$8 million (2010: HK$24 million).
Other audit firms provided recurring audit services to subsidiaries at a fee of approximately HK$27 million (2010: HK$28 million) and provided other services for fees of HK$21 million (2010: HK$10 million).
Internal ControlsThe board has overall responsibility for maintaining a sound and effective system of internal control, which is designed and operated to provide reasonable assurance that CITIC Pacific’s business objectives in the following areas are achieved:
• effectiveness and efficiency of operations, including the achievement of performance and operating targets and the safeguarding of assets by the management;
• reliability of financial and operating information provided by the management, including management accounts and statutory and public financial reports; and
• compliance with applicable laws and regulations by each business unit.
CITIC Pacific has put, and continues to place, considerable emphasis on maintaining and enhancing the effectiveness of its systems of internal control, which include the following major components:
1. Overall control environment, including code of conduct governing staff conduct within the group, and whistle-blowing policy (discussed further on page 94);
2. Management of financial and non-financial risks, including at the group level the financial risk oversight function of CITIC Pacific’s asset and liability management committee and risk management functions of other board committees; at the business unit level, management’s ongoing monitoring of operational and other risks through the establishment of various steering and management committees; and throughout the group, submissions and reviews of risk assessment reports, as well as a variety of insurance arrangements to manage insurable risks;
3. Major controls systems and processes, including budgetary and cost controls, re-engineering of the financial reporting systems and processes for timely and quality management reporting, corporate policies and procedures for approvals, reviews and segregation of duties in everyday activities; and
4. Ongoing compliance monitoring and internal control reviews: CITIC Pacific’s company secretary and group general counsel undertakes overall monitoring of compliance with the Listing Rules and other major regulations. Group internal audit reports directly to the audit committee and is engaged to conduct independent reviews on the internal controls and risk management.
Corporate Governance
92 CITIC Pacific Annual Report 2011
On behalf of the board, the audit committee has reviewed the adequacy and effectiveness of CITIC Pacific’s internal control system, including financial, operational and compliance controls and risk management. It has also considered the adequacy of resources, qualifications and experience of staff of the accounting and financial reporting functions, and their training programme and budget.
In conducting these reviews, the following reports and activities are considered:
• Self-assessments made by management of major subsidiaries and business units, and head office functional departments, of their material controls and risk management activities undertaken with reference to the COSO (The Committee of Sponsoring Organizations of the Treadway Commission) internal control framework. The documentation supporting the self assessments is subjected to review by group internal audit. The results of the self assessments were consolidated and reviewed by the audit committee. Whilst no material deficiencies were identified during the year, business units and head office functions have indicated some areas of internal control which they intend to further enhance;
• Letters of representation from executive management of business units confirming that their self assessments remain correct and that their accounts are prepared in accordance with the group’s accounting policies;
• Reports of group internal audit undertaken in accordance with the annual internal audit plan approved by the audit committee, which reviews the audit findings, recommendations, management’s response and remedial actions at each committee meeting and reports to the board on such reviews where appropriate;
• Self assessments made by business units, group financial control, group finance and group internal audit of the resources, qualifications and experience of staff of the accounting and financial reporting functions and their training programmes. The main conclusions are that:
– the resources in the accounting and finance functions are adequate;
– the qualifications and experience of the staff of the accounting and finance functions are satisfactory overall; and
– the training activities and budgets have been continually given considerable attention during the year and are satisfactory;
• Compliance declarations undertaken by major business units of CITIC Pacific, whereby cases of non-compliance with laws, the Listing Rules or other regulations, code of conduct or other corporate policies are required to be reported to the audit committee via the company secretary on an annual basis; no major non-compliance cases were reported during the year.
The board and management will continue to look into opportunities for further enhancing the effectiveness of the internal control systems of CITIC Pacific in the years ahead, including the proposed new changes to the integrated framework of internal control as recently announced by COSO, as well as the new internal control requirements promulgated by the five Chinese authorities which take effect from 2012 (i.e. Basic Standard for Enterprise Internal Control together with its application guidelines applicable to entities listed in mainland China, which are commonly called China-Sox, the fundamental concepts of which are derived from the COSO framework).
93CITIC Pacific Annual Report 2011
Internal AuditCITIC Pacific regards group internal audit as an important part of the board and audit committee’s oversight function, which is engaged to provide useful information and recommendations on internal control issues of the group. The group internal auditor directly reports to the audit committee, which reviews and assesses the annual internal audit work plan as well as the audit charter at least once a year. This reporting relationship enables the group internal audit to provide an objective assurance to the effectiveness of internal controls of CITIC Pacific.
Under the internal audit charter, group internal audit has unrestricted access to information, properties and all levels of management to facilitate the execution of its audit work. Reports are prepared after audit visits and summarised for review at each audit committee meeting. Follow-up work is undertaken by group internal audit to establish the extent of completion of remedial actions taken by the management, with follow-up results reviewed by the audit committee. Group internal audit also conducts ad hoc reviews and investigations into particular incidents when required.
Major features of the group internal audit activities during the year were to ensure that:
• Both the audit plan and audit work adopt a risk assessment methodology;
• The scope of reviews covers both head office functions and group businesses, including the two major listed subsidiaries Dah Chong Hong Holdings Limited and CITIC Telecom International Holdings Limited;
• The skill sets of group internal audit staff include appropriate industry and information systems auditing expertise;
• Internal audit teams are based respectively in head office, Shanghai and Perth to provide tailored audit services to various business units and functions and conduct special reviews when required; during the year, a new internal
audit office was set up in Guangzhou to cater for the increasing audit needs of the group; the group internal audit function is staffed with more than 20 audit professionals in total; staff resources were considered adequate and capable of undertaking the required audit work;
• The information technology (“IT”) audit function within group internal audit addresses the increasing IT governance needs among different operations, treasury and financial reporting systems, as well as enterprise resources planning systems;
• In preparation for a full compliance with the new internal control requirements under The Basic Standard for Enterprise Internal Control (the “Basic Standard”), which comes into effect from 2012 in China, the group internal audit has been working together with management of the special steel business as well as an independent consultancy firm as our appointed advisor to conduct a pilot project of the Basic Standard initiative, which includes ongoing assessments and enhancements of internal controls of relevant entities in China;
• Internal audit oversees the whistle-blowing channels whereby staff concerns about conduct of the business are raised and where appropriate investigations into reported cases are conducted;
• The group internal auditor attends monthly meetings of the executive committee to ensure that he stays abreast of all significant developments in the group and reports major audit findings on a quarterly basis;
• The group internal auditor has direct access to the chairman of the audit committee; they meet regularly to discuss major audit issues as well as relevant matters in relation to the remit of internal audit; and
• Audit team competencies through ongoing training and development programmes are developed and regularly reviewed by the audit committee.
Corporate Governance
94 CITIC Pacific Annual Report 2011
Business Ethics
Code of ConductAt CITIC Pacific, we consider ethical corporate culture and employees’ honesty and integrity to be important assets. We endeavour to comply with the laws and regulations of the countries in which we operate, and all directors and employees are required to act responsibly to ensure that the reputation of CITIC Pacific is not tarnished. To uphold a high standard of integrity in all aspects of everyday activities, CITIC Pacific adopts a Code of Conduct which provides employees with a set of defined ethical standards for adherence. The code of conduct is posted on CITIC Pacific’s intranet for reference by all staff. New employees are informed of the rules and standards set out in the Code of Conduct at the date of joining CITIC Pacific, and are required to acknowledge their understanding of the Code of Conduct. The heads of business units are charged with the responsibility of disseminating the code of conduct requirements to the people concerned, and are required to report the compliance status of the Code of Conduct on a bi-annual basis to the head of group Human Resources. The audit committee receives reports on the execution of the Code of Conduct and its compliance at least once a year and, where necessary, recommendations were made to the board and management for implementation.
Whistle-Blowing PolicyCITIC Pacific considers the whistle-blowing channels as a useful means of identifying possible misconduct or fraud risks of a particular operation or function by encouraging employees to raise concerns in good faith. CITIC Pacific has adopted a whistle-blowing policy setting out principles and procedures for guiding the directors and employees of CITIC Pacific in reporting cases of fraud, corruption or misconduct in a fair and proper manner.
According to the whistle-blowing policy, concerns can be raised in writing to the group internal auditor, chairman of the audit committee, managing director or the chairman of the board by post to a designated post box. In addition, emails and phone calls to confidential hotlines can be sent directly to the group internal auditor. Upon receipt of the report, group internal audit will undertake an initial enquiry and, if appropriate, subsequent investigation work. Where necessary, the head of human resources will be involved in handling relevant cases about staff conduct. Results of the enquiry and investigation are reported directly to the chairman of the audit committee or the managing director where appropriate. The whistle-blowing policy is posted on CITIC Pacific’s intranet. During 2011, group internal audit received one case concerning management issues of an operation in Hong Kong. It was handled according to CITIC Pacific’s whistle-blowing policy to the satisfaction of the audit committee, management and the whistle-blower.
Good Employment PracticesIn Hong Kong, CITIC Pacific has broadly followed the guide to good employment practices issued by the Employers’ Federation of Hong Kong to ensure legally compliant, non-discriminatory and professional employment practices are implemented.
Directors’ and Relevant Employees’ Securities TransactionsCITIC Pacific has adopted the model code for securities transactions by directors of listed companies (“model code”) contained in Appendix 10 of the Listing Rules. All directors confirmed that they have complied with the required standard set out in the model code throughout 2011. The interests held by individual directors in CITIC Pacific’s securities at 31 December 2011 are set out in the Directors’ Report on pages 116 to 117.
95CITIC Pacific Annual Report 2011
In addition to the requirements set out in CITIC Pacific’s code of conduct, the company secretary regularly writes to executive management and other relevant employees who are privy to unpublished price sensitive information, as reminders of their responsibility to comply with the provisions of the model code and keep the matter confidential until announced. They are also specifically reminded not to engage in any insider dealings as stipulated under Section 270 of the Securities and Futures Ordinance.
Communication with ShareholdersCITIC Pacific considers effective communication with shareholders essential to enable them to have a clear assessment of the enterprise performance as well as accountability of the board of directors. Major means of communication with shareholders of CITIC Pacific are as follows:
Information Disclosure at Corporate WebsiteCITIC Pacific endeavours to disclose all material information about the group to all interested parties as widely and as timely as possible. CITIC Pacific maintains a corporate website at http://www.citicpacific.com, where important information about CITIC Pacific’s activities and corporate matters such as annual reports and half-year reports to shareholders, announcements, business development and operations, corporate governance practices and other information is available for review by shareholders and other stakeholders.
When announcements are made through the Stock Exchange, the same information will be made available on CITIC Pacific’s website.
During 2011, CITIC Pacific issued press announcements in respect of a number of notifiable transactions and connected transactions, which can be viewed on CITIC Pacific’s website (http://www.citicpacific.com/en/investors/announce_index.php).
General Meetings with ShareholdersCITIC Pacific’s annual general meeting provides a useful platform for direct communication between the board and shareholders. Separate resolutions are proposed on each substantially separate issue at the general meetings.
Voting by PollResolutions put to vote at the general meetings of CITIC Pacific (other than on procedural matters) are taken by poll. Procedures regarding the conduct of the poll are explained to the shareholders at the commencement of each general meeting, and questions from shareholders regarding the voting procedures are answered. The poll results are posted on the websites of the Stock Exchange and CITIC Pacific respectively on the same day as the poll.
Investor RelationsCITIC Pacific aims to generate sustainable shareholder value over the long-term, and we recognise that effective management of stakeholder relationships, including those with investors, is key to realising that value. We believe that company objectives and shareholder objectives should be aligned for long-term value creation, and we hope that our shareholders agree with our conviction that sustainable long-term growth is more important than short-term gains.
CITIC Pacific acknowledges its responsibility to engage with shareholders and respond respectfully to their questions. We aspire to transparent and open communications and are committed to timely disclosure of relevant and material information. We meet with investors regularly to update them on our business progress and strategy. In addition, we attempt to respond promptly to questions received from the media and individual shareholders. We endeavour to share both financial and non-financial information that is
Corporate Governance
96 CITIC Pacific Annual Report 2011
relevant and material, and we attempt to clearly communicate our business strategy through biannual and other timely communications. In all cases, great care is taken to ensure that price sensitive information is not disclosed selectively. When announcements are made through the Stock Exchange, the same information will be made available on CITIC Pacific’s website.
When we achieve major business milestones, we will consider inviting groups of investors to visit our facilities, such as the Sino Iron project in Western Australia, our steel plants and property projects. These requests can be made through the company’s Investor Relations department and will be given due consideration, so long as they do not interfere with regular business operations.
Shareholders’ RightsSet out below is a summary of certain rights of the shareholders of CITIC Pacific as required to be disclosed pursuant to the mandatory disclosure requirement under Paragraph O of the Corporate Governance Code which is effective from 1 April 2012:
Convening of extraordinary general meeting on requisition by shareholdersIn accordance with Section 113 of the Companies Ordinance (Chapter 32 of the laws of Hong Kong), shareholder(s) holding at the date of the deposit of the requisition not less than one-twentieth of such of the paid-up capital of CITIC Pacific as at the date of the deposit carries the right of voting at general meetings of CITIC Pacific, may require the directors of CITIC Pacific to convene an extraordinary general meeting (“EGM”). The written requisition must state the objects of the meeting and must be signed by the shareholder(s) concerned and deposited at the registered office of CITIC Pacific at 32nd Floor, CITIC Tower, 1 Tim Mei Avenue, Central, Hong Kong for the attention of the company secretary.
The requisition may consist of several documents in like form, each signed by one or more of the shareholders concerned.
If the directors of CITIC Pacific do not within 21 days from the date of the deposit of the requisition proceed duly to convene an EGM for a day not more than 28 days after the date on which the notice convening the EGM is given, the shareholder(s) concerned, or any of them representing more than one-half of the total voting rights of all of them, may themselves convene an EGM, provided that the EGM so convened shall not be held after the expiration of 3 months from the date of the original requisition.
The EGM convened by shareholders shall be convened in the same manner, as nearly as possible, as that in which general meetings are to be convened by the directors of CITIC Pacific.
Procedures for directing shareholders’ enquiries to the boardShareholders may at any time send their enquiries and concerns to the board of directors of CITIC Pacific in writing through the company secretary whose contact details are as follows:
The Company SecretaryCITIC Pacific Limited32nd Floor, CITIC Tower, 1 Tim Mei Avenue, Central, Hong KongEmail [email protected] +852 2820 2184Fax +852 2918 4838
The company secretary will forward the shareholders’ enquiries and concerns to the board of directors and/or relevant board committees of CITIC Pacific, where appropriate, to answer the shareholders’ questions.
97CITIC Pacific Annual Report 2011
Procedures for putting forward proposals at general meetings by shareholdersShareholders are requested to follow Section 115A of the Companies Ordinance (Chapter 32 of the laws of Hong Kong) for including a resolution at an annual general meeting of CITIC Pacific (“AGM”). The requirements and procedures are set out below:
i) Any number of shareholders representing not less than one-fortieth of the total voting rights of all shareholders having at the date of the requisition a right to vote at an AGM to which the requisition relates, or not less than 50 shareholders holding shares in CITIC Pacific on which there has been paid up an average sum, per shareholder, of not less than HK$2,000, may submit a requisition in writing to put forward a resolution which may properly be moved at an AGM.
ii) CITIC Pacific shall not be bound by the Companies Ordinance to give notice of the proposed resolution or to circulate a statement of not more than 1,000 words with respect to the matter referred to in the proposed resolution to shareholders of CITIC Pacific entitled to receive notice of an AGM unless (a) a copy of the requisition signed by the shareholders concerned (or 2 or more copies which between them contain the signatures of all the shareholders concerned) is deposited at the registered office of CITIC Pacific at 32nd Floor, CITIC Tower, 1 Tim Mei Avenue, Central, Hong Kong for the attention of the company secretary not less than 6 weeks before an AGM in the case of a requisition requiring notice of a resolution and not less than 1 week before an AGM in the case of any other requisition; and (b) the concerned shareholders have deposited with the requisition a sum reasonably sufficient to meet CITIC Pacific’s expenses in giving effect thereto.
iii) However if, after a copy of a requisition requiring notice of a resolution has been deposited at the registered office of CITIC Pacific, an AGM is called for a date 6 weeks or less after the copy has been deposited, the copy though not deposited within the time required as referred to in the above shall be deemed to have been properly deposited.
Pursuant to Article 108 of CITIC Pacific’s Articles of Association, no person other than a retiring director shall, unless recommended by the board for election, be eligible for election to the office of director at any general meeting, unless a shareholder shall have given notice in writing of the intention to propose that person for election as a director and notice in writing by that person of his willingness to be elected shall have been given to CITIC Pacific in the period commencing no earlier than the day after the despatch of the notice of the meeting appointed for such election and ending no later than seven days prior to the date of such meeting, provided that such period shall be at least seven days. The written notice must state that person’s biographical details as required by Rule 13.51(2) of the Rules Governing the Listing of Securities on the Stock Exchange of Hong Kong Limited.
98 CITIC Pacific Annual Report 2011
Executive Directors
Chang ZhenmingAge 55: chairman of CITIC Pacific since 2009. From 2000 to 2005 he served as an executive director, and from 2006 as a non-executive director, of CITIC Pacific. He was appointed as the chairman of CITIC Group Corporation (formerly CITIC Group) in December 2010 and previously served as vice chairman and president of CITIC Group Corporation. He has been appointed as the chairman of CITIC Limited with effect from 27 December 2011. He has been the managing director of CITIC Hong Kong (Holdings) Limited (“CITIC HK”) since August 2009 and has been re-designated as the chairman of CITIC HK with effect from 9 May 2011. He is also the vice chairman of CITIC International Financial Holdings Limited (“CIFH”) and a non-executive director of CITIC Bank International Limited (“CITIC Bank International”). He resigned as the vice-chairman and a non-executive director of China CITIC Bank Corporation Limited (“China CITIC Bank”) with effect from 25 May 2011. He was a non-executive director and deputy chairman of Cathay Pacific Airways Limited (“Cathay”). Mr Chang is the chairman of both the investment committee and the nomination committee.
Zhang JijingAge 56: managing director of CITIC Pacific and re-designated as executive director since November 2009. He has been a non-executive director since April 2009. He has been appointed as a vice president and the head of the strategy and planning department of CITIC Limited with effect from 27 December 2011 and a director of CITIC HK with effect from 9 May 2011. He is also a non-executive director of CITIC Resources Holdings Limited and CITIC Securities Company Limited (“CITIC Securities”). He ceased to act as an executive director and a vice president of CITIC Group Corporation with effect from 27 December 2011. He resigned as a non-executive director of China CITIC Bank with effect from 8 November 2011. He was also the managing director of CITIC Australia Group and a director and vice president of CITIC Australia Pty. Ltd. He is the chairman of
Directors and Senior Managers
CITIC Pacific China Holdings Limited (“CP China”). Mr Zhang is the chairman of the executive committee and a member of both the investment committee and the special committee.
Carl Yung Ming JieAge 43: deputy managing director since 2007 and a director since 2000, joined CITIC Pacific in 1993. He is a director of certain group companies involved in property projects.
Vernon Francis MooreAge 65: group finance director and a director since 1990, transferring from CITIC HK. He is a director of CITIC Pacific Mining Management Pty Ltd (“CP Mining”), the chairman of New Hong Kong Tunnel Company Limited (“NHKTC”) and Western Harbour Tunnel Company Limited (“WHT”), and an independent non-executive director of CLP Holdings Limited. He was a non-executive director of Cathay, and from 1987 to 2007 an executive director of CITIC HK. Mr Moore is the chairman of the asset and liability management committee, and a member of both the executive committee and the investment committee.
Liu JifuAge 68: a director since 2001. He is a director of CITIC HK, and a non-executive director of CIFH and CITIC Telecom International Holdings Limited (“CITIC Telecom”). He was with the Financial and Economics Research Institute in the Chinese Academy of Social Sciences, an executive director of China Everbright Group Limited and the chairman of China Everbright Travel Inc and China PINGHE Import & Export Co., Ltd. Mr Liu is a member of the executive committee.
Milton Law Ming ToAge 48: a director since 2006, joined CITIC Pacific in 1992. He is a director of NHKTC, WHT and CP Mining and certain group companies involved in shipping trading and property projects in Hong Kong. He resigned as a director of Daye Special Steel Co., Ltd. (“Daye”) with effect from 13 April 2011. Mr Law is a member of the executive committee, the investment committee and the asset and liability management committee.
99CITIC Pacific Annual Report 2011
Kwok Man LeungAge 43: a director since 2008, joined CITIC Pacific in 1993. He is a non-executive director of Dah Chong Hong Holdings Limited (“DCH Holdings”). He is also a director of CP China, NHKTC and certain group companies involved in special steel and property projects in the PRC. He has been appointed as a director of Daye with effect from 13 April 2011. He was a non-executive director of CITIC Telecom until November 2010. Mr Kwok is a member of the executive committee, the investment committee and the asset and liability management committee.
Non-executive Directors
André DesmaraisAge 55: a director since 1997. He is deputy chairman, president and co-chief executive officer of Power Corporation of Canada and a senior advisor to the International Advisory Council of China Association for the Promotion of Industrial Development.
Ju WeiminAge 48: a director since 2009. He is the chairman of CITIC Trust Co. Ltd, a non-executive director of CITIC Securities, China CITIC Bank, Asia Satellite Telecommunications Holdings Limited, CIFH and CITIC Bank International. He has been appointed as a vice president and the chief financial officer of CITIC Limited with effect from 27 December 2011. He has also been appointed as a director of CITIC HK with effect from 9 May 2011. He ceased to act as an executive director and a vice president of CITIC Group Corporation with effect from 27 December 2011. Mr Ju is a member of the special committee.
Yin KeAge 48: a director since 2009. He is the chief executive officer, executive director and vice chairman of CITIC Securities International Company Limited, an executive director and vice chairman of CITIC Securities, and a non-executive director of DCH Holdings and Hui Xian Asset Management Limited (the manager of Hui Xian Real Estate Investment Trust, which was listed on the Hong Kong Stock Exchange in April 2011). He has been
appointed as a director of Hui Xian Investment Limited and Beijing Oriental Plaza Co., Ltd. with effect from 29 April 2011 and 5 August 2011 respectively. He was a non-executive director of Zhongxing Shenyang Commercial Building Group Co., Ltd. and resigned as a non-executive director of CITIC Dameng Holdings Limited with effect from 25 August 2011. Mr Yin is a member of the audit committee.
Peter KruytAge 56: an alternate director to André Desmarais since 2003. He is vice president of Power Corporation of Canada, chairman of Power Pacific Corporation Limited, the Canada China Business Council, and Concordia University, and president and chief executive officer of Victoria Square Ventures Inc.
Independent Non-executive Directors
Alexander Reid HamiltonAge 70: a director since 1994. He is an independent non-executive director of Shangri-La Asia Limited, Esprit Holdings Limited, Octopus Cards Limited, DBS Bank (Hong Kong) Limited, JF China Region Fund, Inc. and COSCO International Holdings Limited. He was a partner of PricewaterhouseCoopers. Mr Hamilton is a member of both the remuneration committee and the nomination committee. With effect from the conclusion of the board meeting held on 1 March 2012, he ceased to act as the chairman of the audit committee but remains as a member.
Gregory Lynn CurlAge 63: a director since May 2011. He joined Temasek Holdings (Private) Limited as President on 1 September 2010, following his retirement from Bank of America in March 2010. He was a director of the University of Virginia’s Jefferson Scholars Foundation, The Enstar Group, Inc., Grupo Financiero Santander Serfin, and a non-executive director of China Construction Bank Corporation. Mr Curl is a member of both the remuneration committee and the nomination committee.
Directors and Senior Managers
100 CITIC Pacific Annual Report 2011
Francis Siu Wai KeungAge 57: a director since May 2011. He is an independent non-executive director of GuocoLand Limited and Hua Xia Bank Co., Limited. He joined KPMG Manchester, UK in 1979 and returned to Hong Kong in 1986 and became a partner of KPMG Hong Kong in 1993. From 2000 to 2002, he was a senior partner of KPMG Shanghai Office. From 2002 to March 2010, he was a senior partner of KPMG Beijing Office, and a senior partner of Northern Region, KPMG China. Mr Siu is the chairman of the remuneration committee and a member of the special committee. He was appointed as the chairman of the audit committee with effect from the conclusion of the board meeting held on 1 March 2012.
Company Secretary and Group General Counsel
Ricky Choy Wing KayAge 37: company secretary, appointed in 2010 and group general counsel, appointed in 2011. He joined CITIC Pacific in 2008. He is a qualified solicitor in Hong Kong. He previously practised as a commercial lawyer in private practice in Hong Kong.
Corporate Functional Leaders
Fei YipingAge 48: group financial controller, appointed in 2009. He is a director and chief financial officer of CITIC HK, and a non-executive director of CITIC Telecom and DCH Holdings. He joined CITIC Group Corporation in 1991. He has over 12 years of experience in accounting and financial management. Mr Fei is a member of the asset and liability management committee.
Wei Yen Age 62: group treasurer, joined CITIC Pacific in 2009. He is a director of WHT. Before joining CITIC Pacific, he was a managing director with Nomura International and Lehman Brothers. From 2004 to 2006, Mr Yen was a managing director in financial institutions with Moody’s Asia Pacific. He has over 21 years of financial industry
experience in New York and Hong Kong. Mr Yen is a member of the asset and liability management committee.
Mr Yen has submitted his resignation from his position as group treasurer of CITIC Pacific with effect from 1 May 2012. A replacement has already been identified from within CITIC Group Corporation. The appointment of the replacement for Mr Yen will be made in due course.
Paul Lo Kai Sing Age 56: director of group human resources, joined CITIC Pacific Group in 2005. He has many years of experience in human resources management in a variety of industries and once served as the general manager, group human resources and communications, of DCH Holdings from 1997 to 2000.
Holly Chen Meng Age 45: director of group investor relations & corporate communications, joined CITIC Pacific in 2001. Prior to that, she worked for over 10 years at investment banks including Lehman Brothers, Merrill Lynch and Citibank, where she obtained extensive experience in corporate finance and corporate communications.
Raymond Ma Wai ManAge 45: group internal auditor, joined CITIC Pacific in 2008. He has over 23 years of experience in auditing and finance. He is a fellow member of The Association of Chartered Certified Accountants and a Certified Public Accountant of the Hong Kong Institute of Certified Public Accountants.
Operating Business Leaders
Special Steel
Yu YapengAge 56: president of CITIC Pacific Special Steel Co., Ltd., joined CITIC Pacific in 1993. From 1988 to June 2008, he has been the chief engineer, executive vice general manager and general manager of Jiangyin Xingcheng Special Steel Works Co., Ltd. He was the vice chairman of China Special Steel
101CITIC Pacific Annual Report 2011
Enterprises Association since 1997 and now is the chairman of China Special Steel Enterprises Association. He has been a director and the president of CITIC Pacific Special Steel Group since July 2008 and the chairman of Daye since April 2010.
Iron Ore Mining
Hua Dongyi PhD
Age 47: chairman of CP Mining, appointed in January 2010. He joined CITIC Group Corporation in 2002. During the past 20 years, Dr Hua has held executive management positions in international projects in the PRC, the Philippines, Pakistan, Angola and Algeria. He has extensive experience in project management, FIDIC contract management, and cost and risk management. Dr Hua is a member of the executive committee.
Property
Liu YongAge 48: managing director of CP China, which assumes the overall management responsibility of CITIC Pacific’s property business portfolio in the PRC. Mr Liu has more than 20 years’ business experience in real estate development and operation in mainland China. He has served as general manager of Shenzhen Changcheng Investment Holding Co., Ltd and the chairman of CITIC Real Estate Investment (Shanghai) Company. He is a senior professional manager. Mr Liu is a member of the executive committee.
Aaron Wong Ha HangAge 53: director, property department, joined CITIC Pacific in 1996. He is a director of NHKTC. Before that, he worked for an international consulting firm in the United Kingdom and Hong Kong. Mr Wong is a member of the executive committee.
Energy
Li YajunAge 48: general manager of CITIC Pacific energy department, joined the Ligang Power plant in 1987. He is the chairman of Sunburst Energy
Development Co., Ltd., Jiangsu Ligang Electric Power Company Limited and Jiangyin Ligang Electric Power Generation Company Limited. Mr Li has over 22 years’ practical experience in power plant management. In recent years, he has been involved in coal and other energy industries. He also has extensive experience in investment and capital management. Mr Li is a member of the executive committee.
Tunnels
Miranda Yip Siu WaiAge 48: general manager of NHKTC, joined NHKTC in 1999 as deputy general manager. She was appointed as executive director and general manager in 2004. She has extensive experience in public administration.
Listed Subsidiaries
DCH Holdings
Yip Moon TongAge 59: chief executive officer of DCH Holdings, joined DCH Holdings Group in 1992. He has over 30 years of experience in both the public and private sectors, in engineering and motor vehicle businesses.
CITIC Telecom
Xin Yue JiangAge 63: chairman of CITIC Telecom, joined CITIC Telecom in 2008. He possesses extensive knowledge and experience in science and technology information, business operation and management, and capital market operations.
Norman Yuen Kee TongAge 63: chief executive officer of CITIC Telecom, joined CITIC Pacific in 2001. Before that, he was the deputy chief executive of Hong Kong Telecommunications Limited and, later, Pacific Century CyberWorks Limited. He has more than 20 years of extensive experience in all aspects of the telecoms industry.
102 CITIC Pacific Annual Report 2011
Directors’ Report
The directors have pleasure in presenting to shareholders their report for the year ended 31 December 2011.
Principal ActivitiesThe principal activity of CITIC Pacific is to hold the subsidiaries, associates and joint ventures through which its
business operations are carried out, employing staff and raising finance. Their major areas of operation are set out
in the Business Review on pages 8 to 51.
DividendsThe directors declared an interim dividend of HK$0.15 per share for the year ended 31 December 2011, which was
paid on 23 September 2011. The directors are recommending to shareholders at the forthcoming annual general
meeting the payment of a final divided of HK$0.30 per share in respect of the year ended 31 December 2011,
payable on 6 June 2012 to shareholders on the Register of Members at the close of business on 28 May 2012.
This represents a total distribution for the year of HK$1,642 million.
ReservesThe amounts and particulars of transfer to and from reserves during the year are set out in Note 28 to the
financial statements.
DonationsDonations made by CITIC Pacific and its subsidiary companies during the year amounted to HK$6 million.
Fixed AssetsMovements of fixed assets are set out in the Financial Statements on pages 157 to 161.
Major Customers and Suppliers The aggregate percentage of purchases from CITIC Pacific and its subsidiary companies’ five largest suppliers is
less than 30%. The aggregate percentage of sales to CITIC Pacific Limited and its subsidiary companies’ five largest
customers is less than 30%.
None of the directors, their associates nor any shareholders (which to the knowledge of the directors own more
than 5% of CITIC Pacific’s share capital) were interested at any time in the year in the above suppliers or customers.
Subsidiary CompaniesThe names of the principal subsidiary companies, their principal places of operation, their countries of
incorporation and particulars of their issued share capital are set out in Note 43 to the financial statements.
Issue of Debt Securities On 1 June 2001, CITIC Pacific Finance (2001) Limited, a wholly-owned subsidiary of CITIC Pacific, issued and sold a
total of US$450 million principal amount of 7.625% guaranteed notes due 2011 (“Guaranteed Notes”) to investors
pursuant to purchase agreements dated 24 May 2001 and 1 June 2001. All of the Guaranteed Notes were repaid on
1 June 2011.
On 26 October 2005, CITIC Pacific Finance (2005) Limited, a wholly-owned subsidiary of CITIC Pacific, issued
and sold JPY8.1 billion in aggregate principal amount of guaranteed floating rate notes due 2035 (“JPY Notes”)
to investors for general corporate purposes pursuant to the subscription agreement dated 26 October 2005.
Each noteholder will have the right at such noteholder’s option to require the issuer to redeem all of such
noteholder’s JPY Notes on 28 October 2015 at 81.29% of the principal amount of such JPY Notes. All of the
JPY Notes remained outstanding at 31 December 2011.
103CITIC Pacific Annual Report 2011
On 8 June 2010, Jiangyin Xingcheng Special Steel Works Co., Ltd., a wholly-owned subsidiary of CITIC Pacific, issued
and sold a total of RMB800 million principal amount of 3.27% short term commercial paper due 2011 (“Commercial
Paper”) to investors. The Commercial Paper was repaid on 9 June 2011. Another Commercial Paper was issued and
sold in the sum of RMB800 million principal amount at 4.83% on 30 March 2011 due 2012. It remained outstanding
at 31 December 2011.
On 16 August 2010, CITIC Pacific issued and sold a total of US$150 million principal amount of 6.9% notes due 2022
(“Notes”), to an investor pursuant to the purchase agreement dated 11 August 2010. All of the Notes remained
outstanding at 31 December 2011.
On 15 April 2011, CITIC Pacific issued and sold a total of US$500 million principal amount of 6.625% Notes due
2021 (“US$ Notes”) under the US$2,000 million medium term note programme (“MTN Programme”) to investors
pursuant to the subscription agreement dated 8 April 2011. The US$ Notes issued under the MTN Programme
are listed on The Stock Exchange of Hong Kong Limited (“the Hong Kong Stock Exchange”). All of the US$ Notes
remained outstanding at 31 December 2011.
On 15 April 2011, CITIC Pacific issued and sold a total of US$750 million principal amount of 7.875% perpetual
subordinated capital securities (“Securities”) to investors pursuant to the subscription agreement dated 8 April
2011. The Securities are listed on the Hong Kong Stock Exchange. All of the Securities remained outstanding at
31 December 2011.
On 3 August 2011, CITIC Pacific also issued and sold a total of CNY1,000 million principal amount of 2.7% unlisted
notes due 2016 (“CNY Notes”) under the MTN Programme to investors pursuant to the subscription agreement
dated 27 July 2011. All of the CNY Notes remained outstanding at 31 December 2011.
BorrowingsParticulars of borrowings of CITIC Pacific and its subsidiary companies are set out in Note 29 to the
financial statements.
DirectorsWith effect from the conclusion of the 2011 annual general meeting on 12 May 2011 (“the 2011 AGM”), Messrs
Gregory Lynn Curl and Francis Siu Wai Keung were appointed as independent non-executive directors; Mr Willie
Chang resigned as a non-executive director; and Messrs Hansen Loh Chung Hon and Norman Ho Hau Chong
resigned as independent non-executive directors of CITIC Pacific. In addition, Messrs Li Shilin and Wang Ande
retired as executive directors of CITIC Pacific at the 2011 AGM.
Except for the above changes, the directors of CITIC Pacific whose names and biographical details appear on
pages 98 to 100 were the directors in office during the whole of the financial year ended 31 December 2011.
Pursuant to Article 104(A) of the Articles of Association of CITIC Pacific, Messrs Zhang Jijing, Milton Law Ming To,
Alexander Reid Hamilton and Ju Weimin shall retire by rotation in the forthcoming annual general meeting to be
held on 18 May 2012 and, being eligible, offer themselves for re-election.
Management ContractCITIC Pacific entered into a management agreement with CITIC Hong Kong (Holdings) Limited (“CITIC HK”) on
11 April 1991 but with retrospective effect from 1 March 1990 in which CITIC HK agreed to provide management
services to CITIC Pacific and its subsidiary companies for a management fee calculated on a cost basis to CITIC HK
payable quarterly in arrears. The management agreement is terminable by two months’ notice by either party.
Messrs Chang Zhenming, Zhang Jijing, Liu Jifu and Ju Weimin had indirect interests in the management
agreement as they are directors of CITIC HK. A copy of the management agreement will be available for
inspection at the annual general meeting of CITIC Pacific to be held on 18 May 2012.
Directors’ Report
104 CITIC Pacific Annual Report 2011
Directors’ Interests in Contracts of Significance None of the directors of CITIC Pacific has, or at any time during the year had, an interest which is or was material,
either directly or indirectly, in any contract with CITIC Pacific, any of its subsidiary companies, its holding company
or any of its fellow subsidiary companies, which was significant in relation to the business of CITIC Pacific, and
which was subsisting at the end of the year or which had subsisted at any time during the year.
Competing InterestsMr Zhang Jijing is a non-executive director of CITIC Resources Holdings Limited, a company listed on the main
board of the Hong Kong Stock Exchange. CITIC Resources Holdings Limited is a diversified energy and natural
resources investment holding company and through its subsidiaries has interests in aluminium smelting, coal,
import and export of commodities, manganese mining and processing and oil exploration, development and
production. Further details of its nature, scope and size of its business as well as its management can be found
in the latest annual report of CITIC Resources Holdings Limited. In the event that there are transactions between
CITIC Resources Holdings Limited and CITIC Pacific, Mr Zhang will abstain from voting. Save as disclosed above,
Mr Zhang is not directly or indirectly interested in any business that constitutes or may constitute a competing
business of CITIC Pacific.
Related Party Transactions CITIC Pacific and its subsidiary companies entered into certain transactions in the ordinary course of business and
on normal commercial terms which were “Related Parties Transactions”, the details of which are set out in Note 39
to the financial statements of CITIC Pacific. Some of these transactions also constitute “Continuing Connected
Transactions” and “Connected Transactions” under the Listing Rules as summarised below.
Connected TransactionsSet out below is information in relation to certain connected transactions involving CITIC Pacific and/or its
subsidiaries, particulars of which were previously disclosed in the announcements of CITIC Pacific and are required
under the Listing Rules to be disclosed in the Annual Report and Financial Statements of CITIC Pacific. The full text
of each announcement can be found on http://www.citicpacific.com/en/investors/announce_index.php.
1. On 11 March 2011, 萬寧仁和發展有限公司 (Wanning Renhe Development Company Limited) (“Wanning
Renhe”) (a non-wholly owned subsidiary of CITIC Pacific) as the vendor entered into a pre-sale contract with
中信國華國際工程承包有限責任公司 (CITIC International Contracting Co., Ltd.) (“CIC”, formerly CITIC International
Contracting Inc.) as the purchaser, pursuant to which Wanning Renhe agreed to sell its twelve-storey residential
building (T5A), which is one of the 11 blocks of residential buildings located at Shenzhou Peninsula, Wanning City,
Hainan Province, the PRC (“Shenzhou Peninsula”) to CIC for a consideration of RMB84,468,736.
CIC is a connected person of CITIC Pacific by virtue of its being a wholly-owned subsidiary of CITIC Group Corporation
(formerly CITIC Group), the controlling shareholder of CITIC Pacific.
2. Subsequent to the residential project contract (the “Residential Project Contract”) made on 8 January 2010
between Wanning Renhe as the employer and CIC as the contractor in relation to the construction of the 11 blocks
of residential towers in Lot C-22, Shenzhou Peninsula (the “Residential Project”), Wanning Renhe entered into a
supplemental agreement to the Residential Project Contract (the “Residential Project Supplemental Agreement”)
with CIC on 28 June 2011 to extend the scope of works to include the execution of the interior fitting-out works for
Blocks T9 and T11 of the Residential Project for an additional sum of RMB18,830,000. The total contract sum of the
Residential Project Contract as supplemented by the Residential Project Supplemental Agreement is
RMB134,229,966.41.
105CITIC Pacific Annual Report 2011
3. On 15 July 2011, Way Trend Investments Limited (a wholly-owned subsidiary of CITIC Pacific) (the “Vendor”)
and 中信國安集團公司 (CITIC Guoan Group) (the “Purchaser”) entered into a sale and purchase agreement for
the disposal of a 50% non-controlling interest in 中信國安有限公司 (CITIC Guoan Co., Ltd.) (“CITIC Guoan”) (the
“Disposal”), being CITIC Pacific’s non-core investment in cable television projects, system integration and software
development in the PRC, from the Vendor to the Purchaser for a consideration of RMB3.511 billion. The Disposal
was not yet completed as at 31 December 2011.
CITIC Guoan is an investment holding company, primarily holding a 41.42% interest in 中信國安信息產業股份有限公司 (CITIC Guoan Information Industry Co., Ltd.) (a Shenzhen Stock Exchange listed company) and CITIC Building
in Beijing, China.
The Purchaser is a connected person of CITIC Pacific by virtue of its being a wholly-owned subsidiary of CITIC
Group Corporation.
4. On 4 November 2011, certain subsidiaries of CITIC Pacific entered into the following contracts:
i) a badminton and swimming pool stadium contract executed between 萬寧百納發展有限公司 (Wanning
Baina Development Company Limited) (“Wanning Baina”) (a non-wholly owned subsidiary of CITIC Pacific) as the
employer and CIC as the contractor under which CIC was engaged by Wanning Baina to carry out the construction
works for the badminton and swimming pool stadium located at the staff quarters at the integrated service area of
Shenzhou Peninsula, Cove One for a contract sum of RMB4,445,566.10;
ii) a beach clubhouse contract (the “Beach Clubhouse Contract”) executed between 萬寧仁信發展有限公司
(Wanning Renxin Development Company Limited) (“Wanning Renxin”) (presently a wholly-owned subsidiary
of CITIC Pacific) as the employer and CIC as the contractor under which CIC was engaged by Wanning Renxin to
carry out the construction works for the beach clubhouse located at Shenzhou Peninsula Lot No. C04, Cove One
(the “Beach Clubhouse”) for a contract sum of RMB12,545,980.73;
iii) a supplemental agreement to the Beach Clubhouse Contract (the “Beach Clubhouse Supplemental Agreement”)
executed between Wanning Renxin as the employer and CIC as the contractor under which the scope of works of
the Beach Clubhouse Contract would be extended to include the execution of the interior fitting-out works for
the Beach Clubhouse. The contract sum of the Beach Clubhouse Supplemental Agreement is RMB3,750,000,
with an additional bonus payment of RMB120,000 payable to CIC upon completion of a certain stage of works in
accordance with the timeframe as set out in the Beach Clubhouse Supplemental Agreement. The total contract
sum of the Beach Clubhouse Contract as supplemented by the Beach Clubhouse Supplemental Agreement is
RMB16,295,980.73 or RMB16,415,980.73 including the bonus payment; and
iv) a D18 golf villa contract executed between 中信泰富萬寧(聯合)開發有限公司 (CITIC Pacific Wanning
United Development Company Limited) (“Wanning United”) (a non-wholly owned subsidiary of CITIC Pacific)
as the employer and CIC as the contractor under which CIC was engaged by Wanning United to carry out the
construction works for the golf villa located at Shenzhou Peninsula Lot No. D18, Cove One for a contract sum
of RMB3,468,812.12.
5. On 27 January 2012, Wanning Renxin as the employer entered into a construction contract (the “Construction
Contract”) with 中信國華國際工程承包有限責任公司海南分公司 (CITIC International Contracting Co., Ltd., Hainan
Subsidiary) (“CIC Hainan”) (a wholly-owned subsidiary of CIC) as the contractor, pursuant to which CIC Hainan
was engaged by Wanning Renxin to carry out the construction works for the main contract for Block T8 of the
residential project located at Shenzhou Peninsula Lot No. C13, Cove One for a contract sum of RMB72,000,000,
with additional bonus payments in the aggregate amount of RMB2,000,000 payable to CIC Hainan upon
completion of certain milestone stages of works and achievement of certain quality standard in accordance
with the requirement as set out in the Construction Contract.
CIC Hainan is a connected person of CITIC Pacific by virtue of its being a wholly-owned subsidiary of CITIC Group
Corporation, the controlling shareholder of CITIC Pacific.
Directors’ Report
106 CITIC Pacific Annual Report 2011
Non-Exempt Continuing Connected TransactionsSet out below is information in relation to certain non-exempt continuing connected transactions involving CITIC
Pacific and/or its subsidiaries, particulars of which were previously disclosed in the announcements of CITIC Pacific
and are required under the Listing Rules to be disclosed in the Annual Report and Financial Statements of CITIC
Pacific. The full text of each announcement can be found on http://www.citicpacific.com/en/investors/announce_
index.php.
1. CITIC Pacific as tenant has leased its Hong Kong headquarters at 29th to 33rd Floors, CITIC Tower, 1 Tim Mei
Avenue, Central, Hong Kong pursuant to a lease agreement dated 30 April 2008 (the “Lease Agreement”) entered
into with Goldon Investment Limited (“Goldon”). The term of the Lease Agreement is three years from 1 May 2008
to 30 April 2011 (both days inclusive).
The rental for the premises is HK$5,072,203.80 per month (exclusive of rates, service charge and government
rent) and a service charge of HK$359,383.20 was also payable each month. Accordingly, the aggregate rentals and
service charge to be paid by CITIC Pacific to Goldon for the two years ended 31 December 2010 and the four months
ended 30 April 2011 were expected not to exceed HK$66 million, HK$66 million and HK$22 million respectively.
Goldon is owned as to 40% by CITIC Pacific and 25% by CITIC Group Corporation. Goldon is a connected person of
CITIC Pacific when it became an associate of CITIC Group Corporation after CITIC Group Corporation became the
controlling shareholder of CITIC Pacific in December 2008.
The actual amount paid by CITIC Pacific to Goldon for the four months ended 30 April 2011 under the Lease
Agreement was approximately HK$21.70 million.
The Lease Agreement was renewed on 20 May 2011 for a term of three years and the applicable percentage ratios
as calculated with reference to the amount payable on an annual basis under the renewed lease agreement by
CITIC Pacific are below 0.1%. Thus, the renewed lease agreement is not subject to any disclosure requirement
under the Listing Rules.
2. In the ordinary and usual course of business, CITIC Pacific and its subsidiaries maintain bank balances with China
CITIC Bank Corporation Limited (“CITIC Bank”) and CITIC Bank International Limited (formerly CITIC Ka Wah Bank
Limited) (“CITIC Bank International”) on normal commercial terms. On 6 May 2010, CITIC Pacific entered into a
master agreement with CITIC Bank and CITIC Bank International setting out that the aggregate maximum bank
balance maintained by the group with CITIC Bank and CITIC Bank International on any given day for the period
from 31 May 2010 to 31 December 2010 and the two years ended 31 December 2011 and ending 31 December
2012 shall not exceed HK$1,400 million.
CITIC Bank and CITIC Bank International are subsidiaries of CITIC Group Corporation, a controlling shareholder of
CITIC Pacific, and are therefore connected persons of CITIC Pacific.
As at 31 December 2011, the aggregate bank balances maintained by the group with CITIC Bank and CITIC Bank
International totalled approximately HK$589 million.
3. On 24 November 2010, 中企網絡通信技術有限公司 (China Enterprise Communications Ltd.) (“CEC”), China
Enterprise Netcom Corporation Limited (“CEC-HK”) (presently a wholly-owned subsidiary of CITIC Telecom
International Holdings Limited (“CITIC Telecom”), which is a subsidiary of CITIC Pacific) and CITIC Telecom
International CPC Limited (“CPC”), a wholly-owned subsidiary of CITIC Telecom, entered into an exclusive service
agreement (the “Exclusive Service Agreement”), pursuant to which CEC shall provide technical and support services
to the customers of CEC-HK and CPC in the PRC for a term of three years to facilitate the provision of value-added
telecom services to these customers. CEC will be responsible for arranging, operating and maintaining all necessary
technical and support services exclusively in the PRC to service the customers of CEC-HK and CPC in the PRC.
A service fee shall be payable to CEC monthly with reference to CEC’s costs in servicing such customers provided
107CITIC Pacific Annual Report 2011
that CEC-HK and CPC shall be entitled to retain the first 30% of the corresponding sales proceeds from customers
such that the service fee shall not in any event exceed 70% of the relevant sales proceeds. If CEC’s costs shall be
less than 70% of the corresponding sales proceeds, CEC on one hand and CEC-HK and CPC on the other shall be
entitled to share the surplus equally. The annual caps for the transactions under the Exclusive Service Agreement
for the two years ending 31 December 2012, and the ten months ending 31 October 2013 are estimated to
be US$40,000,000 (approximately HK$312,000,000), US$55,000,000 (approximately HK$429,000,000) and
US$60,000,000 (approximately HK$468,000,000) respectively. In accordance with the Listing Rules, CEC is an
associate of CITIC Group Corporation, and therefore is a connected person of CITIC Pacific.
The aggregate service fee paid by CEC-HK and CPC to CEC under the Exclusive Service Agreement for the year
ended 31 December 2011 was approximately HK$138,663,000.
The independent non-executive directors of CITIC Pacific have reviewed the aforesaid continuing connected
transactions for the year ended 31 December 2011 (the “Transactions”) and confirm that
a. the Transactions have been entered into in the ordinary and usual course of business of CITIC Pacific;
b. the Transactions have been entered into on normal commercial terms or on terms no less favourable to CITIC
Pacific than terms available to or from (as appropriate) independent third parties; and
c. the Transactions were entered into, in all material respects, in accordance with the relevant agreements governing
them on terms that are fair and reasonable and in the interests of the shareholders of CITIC Pacific as a whole.
CITIC Pacific’s auditor was engaged to report on the group’s continuing connected transactions in accordance
with Hong Kong Standard on Assurance Engagements 3000 “Assurance Engagements Other Than Audits or
Reviews of Historical Financial Information” and with reference to Practice Note 740 “Auditor’s Letter on Continuing
Connected Transactions under the Hong Kong Listing Rules” issued by the Hong Kong Institute of Certified
Public Accountants. The auditor issued an unqualified letter containing findings and conclusions in respect of the
continuing connected transactions disclosed by the group in pages 106 to 107 of the annual report in accordance
with Rule 14A.38 of the Listing Rules. A copy of the auditor’s letter has been provided by CITIC Pacific to the Hong
Kong Stock Exchange.
On 20 August 2007, Catak Enterprises Corp. (a wholly-owned subsidiary of CITIC Pacific) entered into a sale and
purchase agreement with China Metallurgical Group Corp. (“MCC”) for the disposal of a 20% interest in Sino Iron
Pty Ltd (“Sino Iron”, a wholly owned subsidiary of CITIC Pacific) (“Disposal”) at cost, i.e. for a consideration
equivalent to 20% of all the funds provided to Sino Iron Holdings Pty Ltd (“Sino Iron Holdings”) by the group up to
the date of completion of the Disposal together with interest. The group’s shareholding in Sino Iron would be
reduced to 80% as a result of the Disposal if it proceeded to completion.
On 11 May 2010, Sino Iron entered into a second supplemental contract to the general construction contract dated
24 January 2007 (as amended on 20 August 2007) with MCC Mining (Western Australia) Pty Ltd (“MCC Mining”,
a wholly owned subsidiary of MCC), the lead construction contractor for the iron ore mining project, pursuant to
which Sino Iron agreed to pay an additional US$835 million to MCC Mining. The general construction contract
dated 24 January 2007 as amended on 20 August 2007 and supplemented by the second supplemental contract is
hereinafter referred to collectively as the “General Construction Contract”.
On 30 December 2011, Sino Iron further entered into a third supplemental contract to the General Construction
Contract with MCC Mining pursuant to which Sino Iron agreed to pay an additional US$822.1 million to MCC Mining
for the completion of the first two production lines and the common facilities for the whole six production lines.
Upon completion of the Disposal, MCC will, through MCCL, become a substantial shareholder of Sino Iron Holdings
and will become a connected person of CITIC Pacific. The General Construction Contract as further supplemented
by the third supplemental contract and the transactions contemplated thereunder will constitute a continuing
connected transaction for CITIC Pacific.
Directors’ Report
108 CITIC Pacific Annual Report 2011
As at 31 December 2011, the Disposal had not yet been completed. Accordingly, the General Construction
Contract as further supplemented by the third supplemental contract and the transactions contemplated
thereunder did not constitute a continuing connected transaction for CITIC Pacific during the year.
Share Option Plan Adopted by CITIC Pacific
CITIC Pacific Share Incentive Plan 2000CITIC Pacific adopted the CITIC Pacific Share Incentive Plan 2000 (“the Plan 2000”) on 31 May 2000 which expired
on 30 May 2010. The major terms of the Plan 2000 are as follows:
1. The purpose of the Plan 2000 is to promote the interests of CITIC Pacific and its shareholders by (i) providing the
participants with additional incentives to continue and increase their efforts in achieving success in the business of
CITIC Pacific, and (ii) attracting and retaining the best available personnel to participate in the on-going business
operation of CITIC Pacific.
2. The participants of the Plan 2000 are any director, executive or employee of CITIC Pacific or its subsidiaries as
invited by the board.
3. The maximum number of shares over which options may be granted under the Plan 2000 shall not exceed 10%
of (i) the issued share capital of CITIC Pacific from time to time or (ii) the issued share capital of CITIC Pacific as at
the date of adopting the Plan 2000, whichever is the lower.
4. The total number of shares issued and to be issued upon exercise of the options granted to each participant
(including both exercised and outstanding options) in any 12-month period must not exceed 1% of the shares of
CITIC Pacific in issue.
5. The exercise period of any option granted under the Plan 2000 must not be more than ten years commencing
on the date of grant.
6. The acceptance of an offer of the grant of the option must be made within 28 days from the date of grant with
a non-refundable payment of HK$1.00 from the grantee.
7. The exercise price determined by the board will be at least the higher of (i) the closing price of CITIC Pacific’s
shares as stated in the daily quotations sheet of the Hong Kong Stock Exchange on the date of grant; (ii) the
average closing price of CITIC Pacific’s shares as stated in the Hong Kong Stock Exchange’s daily quotations
sheets for the five business days immediately preceding the date of grant and (iii) the nominal value of CITIC
Pacific’s shares.
During the period between the adoption of the Plan 2000 and its expiry, CITIC Pacific has granted six lots of
share options:
Date of grant Number of share optionsExercise price
HK$
28 May 2002 11,550,000 18.20
1 November 2004 12,780,000 19.90
20 June 2006 15,930,000 22.10
16 October 2007 18,500,000 47.32
19 November 2009 13,890,000 22.00
14 January 2010 880,000 20.59
All options granted and accepted under the Plan 2000 can be exercised in whole or in part within 5 years from the
date of grant.
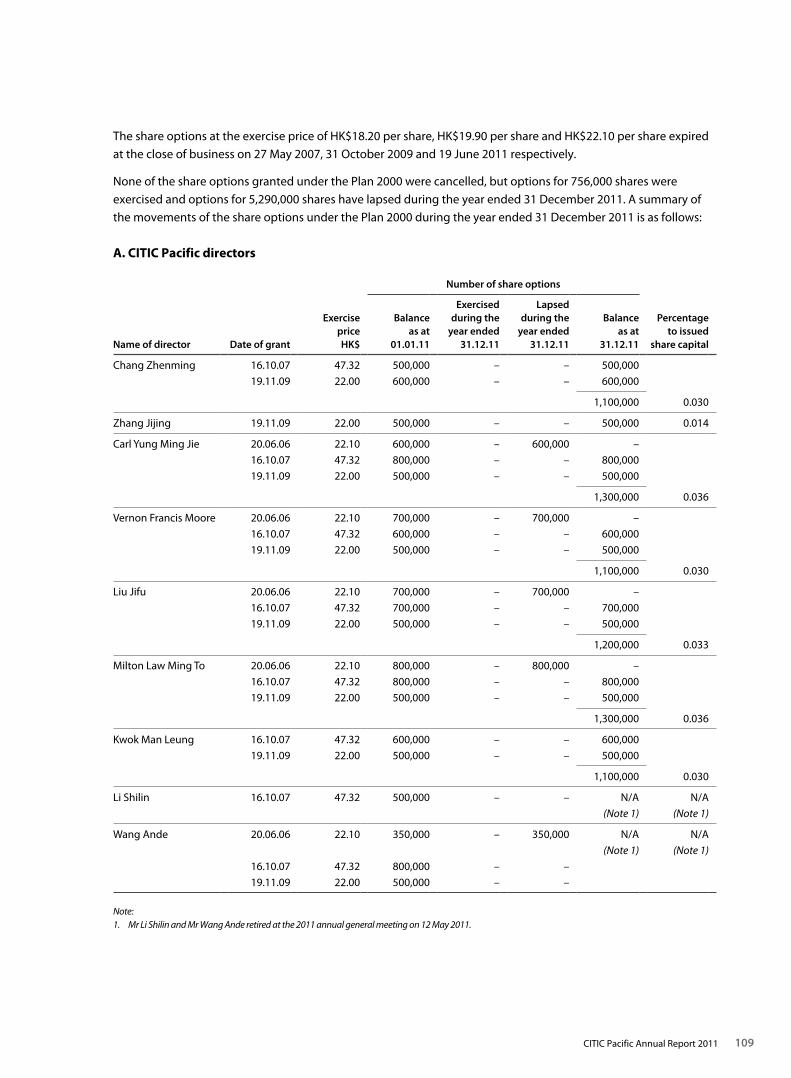
109CITIC Pacific Annual Report 2011
The share options at the exercise price of HK$18.20 per share, HK$19.90 per share and HK$22.10 per share expired
at the close of business on 27 May 2007, 31 October 2009 and 19 June 2011 respectively.
None of the share options granted under the Plan 2000 were cancelled, but options for 756,000 shares were
exercised and options for 5,290,000 shares have lapsed during the year ended 31 December 2011. A summary of
the movements of the share options under the Plan 2000 during the year ended 31 December 2011 is as follows:
A. CITIC Pacific directors
Number of share options
Name of director Date of grant
Exercise price HK$
Balance as at
01.01.11
Exercised during the
year ended 31.12.11
Lapsed during the
year ended 31.12.11
Balance as at
31.12.11
Percentage to issued
share capital
Chang Zhenming 16.10.07 47.32 500,000 – – 500,000
19.11.09 22.00 600,000 – – 600,000
1,100,000 0.030
Zhang Jijing 19.11.09 22.00 500,000 – – 500,000 0.014
Carl Yung Ming Jie 20.06.06 22.10 600,000 – 600,000 –
16.10.07 47.32 800,000 – – 800,000
19.11.09 22.00 500,000 – – 500,000
1,300,000 0.036
Vernon Francis Moore 20.06.06 22.10 700,000 – 700,000 –
16.10.07 47.32 600,000 – – 600,000
19.11.09 22.00 500,000 – – 500,000
1,100,000 0.030
Liu Jifu 20.06.06 22.10 700,000 – 700,000 –
16.10.07 47.32 700,000 – – 700,000
19.11.09 22.00 500,000 – – 500,000
1,200,000 0.033
Milton Law Ming To 20.06.06 22.10 800,000 – 800,000 –
16.10.07 47.32 800,000 – – 800,000
19.11.09 22.00 500,000 – – 500,000
1,300,000 0.036
Kwok Man Leung 16.10.07 47.32 600,000 – – 600,000
19.11.09 22.00 500,000 – – 500,000
1,100,000 0.030
Li Shilin 16.10.07 47.32 500,000 – – N/A N/A
(Note 1) (Note 1)
Wang Ande 20.06.06 22.10 350,000 – 350,000 N/A N/A
(Note 1) (Note 1)
16.10.07 47.32 800,000 – –
19.11.09 22.00 500,000 – –
Note: 1. Mr Li Shilin and Mr Wang Ande retired at the 2011 annual general meeting on 12 May 2011.
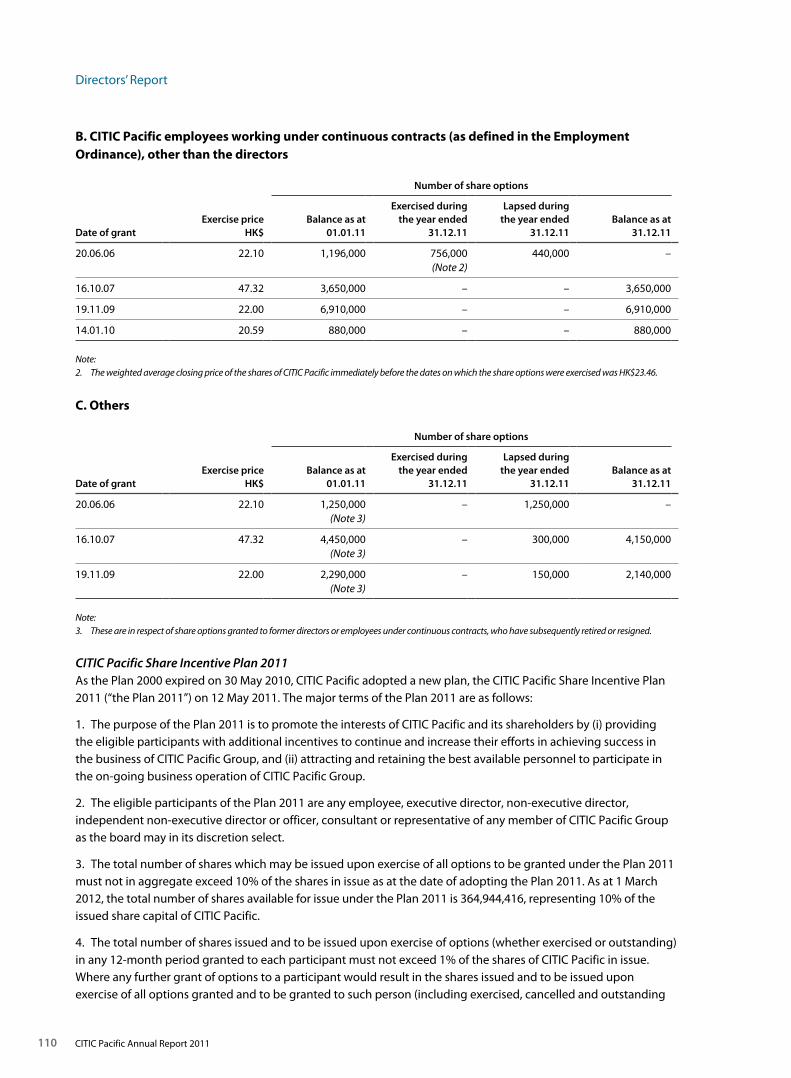
Directors’ Report
110 CITIC Pacific Annual Report 2011
B. CITIC Pacific employees working under continuous contracts (as defined in the Employment Ordinance), other than the directors
Number of share options
Date of grantExercise price
HK$Balance as at
01.01.11
Exercised during the year ended
31.12.11
Lapsed during the year ended
31.12.11Balance as at
31.12.11
20.06.06 22.10 1,196,000 756,000 440,000 –(Note 2)
16.10.07 47.32 3,650,000 – – 3,650,000
19.11.09 22.00 6,910,000 – – 6,910,000
14.01.10 20.59 880,000 – – 880,000
Note: 2. The weighted average closing price of the shares of CITIC Pacific immediately before the dates on which the share options were exercised was HK$23.46.
C. Others
Number of share options
Date of grantExercise price
HK$Balance as at
01.01.11
Exercised during the year ended
31.12.11
Lapsed during the year ended
31.12.11Balance as at
31.12.11
20.06.06 22.10 1,250,000 – 1,250,000 –(Note 3)
16.10.07 47.32 4,450,000 – 300,000 4,150,000(Note 3)
19.11.09 22.00 2,290,000 – 150,000 2,140,000(Note 3)
Note:3. These are in respect of share options granted to former directors or employees under continuous contracts, who have subsequently retired or resigned.
CITIC Pacific Share Incentive Plan 2011As the Plan 2000 expired on 30 May 2010, CITIC Pacific adopted a new plan, the CITIC Pacific Share Incentive Plan 2011 (“the Plan 2011”) on 12 May 2011. The major terms of the Plan 2011 are as follows:
1. The purpose of the Plan 2011 is to promote the interests of CITIC Pacific and its shareholders by (i) providing the eligible participants with additional incentives to continue and increase their efforts in achieving success in the business of CITIC Pacific Group, and (ii) attracting and retaining the best available personnel to participate in the on-going business operation of CITIC Pacific Group.
2. The eligible participants of the Plan 2011 are any employee, executive director, non-executive director, independent non-executive director or officer, consultant or representative of any member of CITIC Pacific Group as the board may in its discretion select.
3. The total number of shares which may be issued upon exercise of all options to be granted under the Plan 2011 must not in aggregate exceed 10% of the shares in issue as at the date of adopting the Plan 2011. As at 1 March 2012, the total number of shares available for issue under the Plan 2011 is 364,944,416, representing 10% of the issued share capital of CITIC Pacific.
4. The total number of shares issued and to be issued upon exercise of options (whether exercised or outstanding) in any 12-month period granted to each participant must not exceed 1% of the shares of CITIC Pacific in issue. Where any further grant of options to a participant would result in the shares issued and to be issued upon exercise of all options granted and to be granted to such person (including exercised, cancelled and outstanding
111CITIC Pacific Annual Report 2011
options) in the 12-month period up to and including the date of such further grant representing in aggregate over 1% of the shares of CITIC Pacific in issue, such further grant shall be subject to separate approval by the shareholders of CITIC Pacific in general meeting.
5. The exercise period of any option granted under the Plan 2011 must not be more than ten years commencing on the date of offer of the grant.
6. The acceptance of an offer of the grant of the option must be made within 28 days from the date of grant with a non-refundable payment of HK$1.00 from the grantee.
7. The subscription price determined by the board will be at least the higher of (i) the nominal value of CITIC Pacific’s shares; (ii) the closing price of CITIC Pacific’s shares as stated in the Hong Kong Stock Exchange’s daily quotations sheet on the date of offer of the grant; and (iii) the average of the closing prices of CITIC Pacific’s shares as stated in the Hong Kong Stock Exchange’s daily quotations sheets for the five business days immediately preceding the date of offer of the grant.
8. The Plan 2011 shall be valid and effective till 11 May 2021.
No share options were granted under the Plan 2011 during the year ended 31 December 2011.
Share Option Plans Adopted by Subsidiaries of CITIC Pacific
CITIC Telecom International Holdings Limited (“CITIC Telecom”)CITIC Telecom adopted a share option plan (“CITIC Telecom Share Option Plan”) on 17 May 2007. The major terms of the CITIC Telecom Share Option Plan are as follows:
1. The purpose of the CITIC Telecom Share Option Plan is to attract and retain the best quality personnel for the development of CITIC Telecom’s businesses; to provide additional incentives to CITIC Telecom Directors and CITIC Telecom Employees (both as defined herebelow); and to promote the long term financial success of CITIC Telecom by aligning the interests of grantees to shareholders of CITIC Telecom.
2. The grantees of the CITIC Telecom Share Option Plan are any person employed by CITIC Telecom or any of its subsidiaries (“CITIC Telecom Employees”) and any person who is an officer or director (whether executive or non-executive) of CITIC Telecom or any of its subsidiaries (“CITIC Telecom Directors”) as the board of CITIC Telecom may in its absolute discretion select.
3. The maximum number of shares of CITIC Telecom (“CITIC Telecom Shares”) over which options may be granted under the CITIC Telecom Share Option Plan must not exceed 10% of (i) the CITIC Telecom Shares in issue from time to time; or (ii) the CITIC Telecom Shares in issue as at the date of adopting the CITIC Telecom Share Option Plan, whichever is the lower. As at 1 March 2012, the maximum number of shares available for issue under the CITIC Telecom Share Option Plan is 93,405,500, representing approximately 3.91% of the issued share capital of CITIC Telecom.
4. The total number of CITIC Telecom Shares issued and to be issued upon exercise of options (whether exercised or outstanding) in any 12-month period granted to each grantee must not exceed 1% of the CITIC Telecom Shares in issue. Where any further grant of options to a grantee would result in the CITIC Telecom Shares issued and to be issued upon exercise of all options granted and to be granted to such person (including exercised, cancelled and outstanding options) in the 12-month period up to and including the date of such further grant representing in aggregate over 1% of the CITIC Telecom Shares in issue, such further grant shall be subject to separate approval by the shareholders of CITIC Telecom in its general meeting.
5. The exercise period of any option granted under the CITIC Telecom Share Option Plan must not be more than 10 years commencing on the date of grant.
6. The acceptance of an offer of the grant of the option must be made within 28 days from the date of grant with a non-refundable payment of HK$1.00 from the grantee.
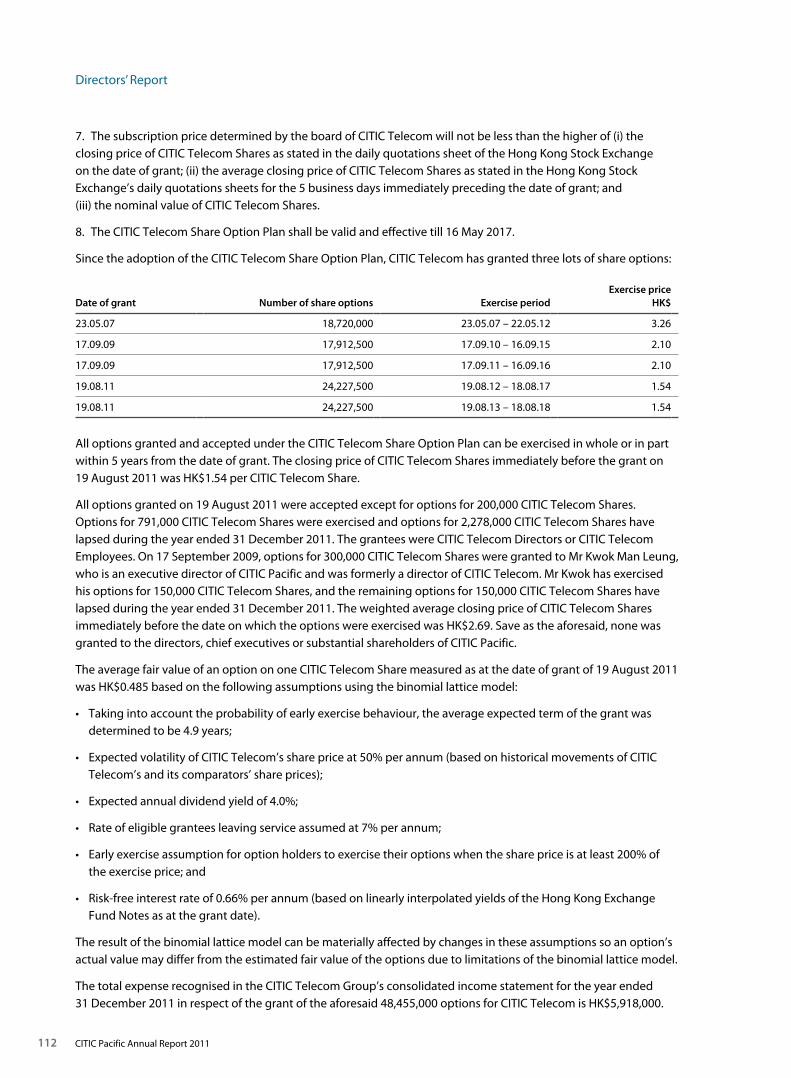
Directors’ Report
112 CITIC Pacific Annual Report 2011
7. The subscription price determined by the board of CITIC Telecom will not be less than the higher of (i) the closing price of CITIC Telecom Shares as stated in the daily quotations sheet of the Hong Kong Stock Exchange on the date of grant; (ii) the average closing price of CITIC Telecom Shares as stated in the Hong Kong Stock Exchange’s daily quotations sheets for the 5 business days immediately preceding the date of grant; and (iii) the nominal value of CITIC Telecom Shares.
8. The CITIC Telecom Share Option Plan shall be valid and effective till 16 May 2017.
Since the adoption of the CITIC Telecom Share Option Plan, CITIC Telecom has granted three lots of share options:
Date of grant Number of share options Exercise periodExercise price
HK$
23.05.07 18,720,000 23.05.07 – 22.05.12 3.26
17.09.09 17,912,500 17.09.10 – 16.09.15 2.10
17.09.09 17,912,500 17.09.11 – 16.09.16 2.10
19.08.11 24,227,500 19.08.12 – 18.08.17 1.54
19.08.11 24,227,500 19.08.13 – 18.08.18 1.54
All options granted and accepted under the CITIC Telecom Share Option Plan can be exercised in whole or in part within 5 years from the date of grant. The closing price of CITIC Telecom Shares immediately before the grant on 19 August 2011 was HK$1.54 per CITIC Telecom Share.
All options granted on 19 August 2011 were accepted except for options for 200,000 CITIC Telecom Shares. Options for 791,000 CITIC Telecom Shares were exercised and options for 2,278,000 CITIC Telecom Shares have lapsed during the year ended 31 December 2011. The grantees were CITIC Telecom Directors or CITIC Telecom Employees. On 17 September 2009, options for 300,000 CITIC Telecom Shares were granted to Mr Kwok Man Leung, who is an executive director of CITIC Pacific and was formerly a director of CITIC Telecom. Mr Kwok has exercised his options for 150,000 CITIC Telecom Shares, and the remaining options for 150,000 CITIC Telecom Shares have lapsed during the year ended 31 December 2011. The weighted average closing price of CITIC Telecom Shares immediately before the date on which the options were exercised was HK$2.69. Save as the aforesaid, none was granted to the directors, chief executives or substantial shareholders of CITIC Pacific.
The average fair value of an option on one CITIC Telecom Share measured as at the date of grant of 19 August 2011 was HK$0.485 based on the following assumptions using the binomial lattice model:
• Takingintoaccounttheprobabilityofearlyexercisebehaviour,theaverageexpectedtermofthegrantwasdetermined to be 4.9 years;
• ExpectedvolatilityofCITICTelecom’ssharepriceat50%perannum(basedonhistoricalmovementsofCITICTelecom’s and its comparators’ share prices);
• Expectedannualdividendyieldof4.0%;
• Rateofeligiblegranteesleavingserviceassumedat7%perannum;
• Earlyexerciseassumptionforoptionholderstoexercisetheiroptionswhenthesharepriceisatleast200%ofthe exercise price; and
• Risk-freeinterestrateof0.66%perannum(basedonlinearlyinterpolatedyieldsoftheHongKongExchangeFund Notes as at the grant date).
The result of the binomial lattice model can be materially affected by changes in these assumptions so an option’s actual value may differ from the estimated fair value of the options due to limitations of the binomial lattice model.
The total expense recognised in the CITIC Telecom Group’s consolidated income statement for the year ended 31 December 2011 in respect of the grant of the aforesaid 48,455,000 options for CITIC Telecom is HK$5,918,000.
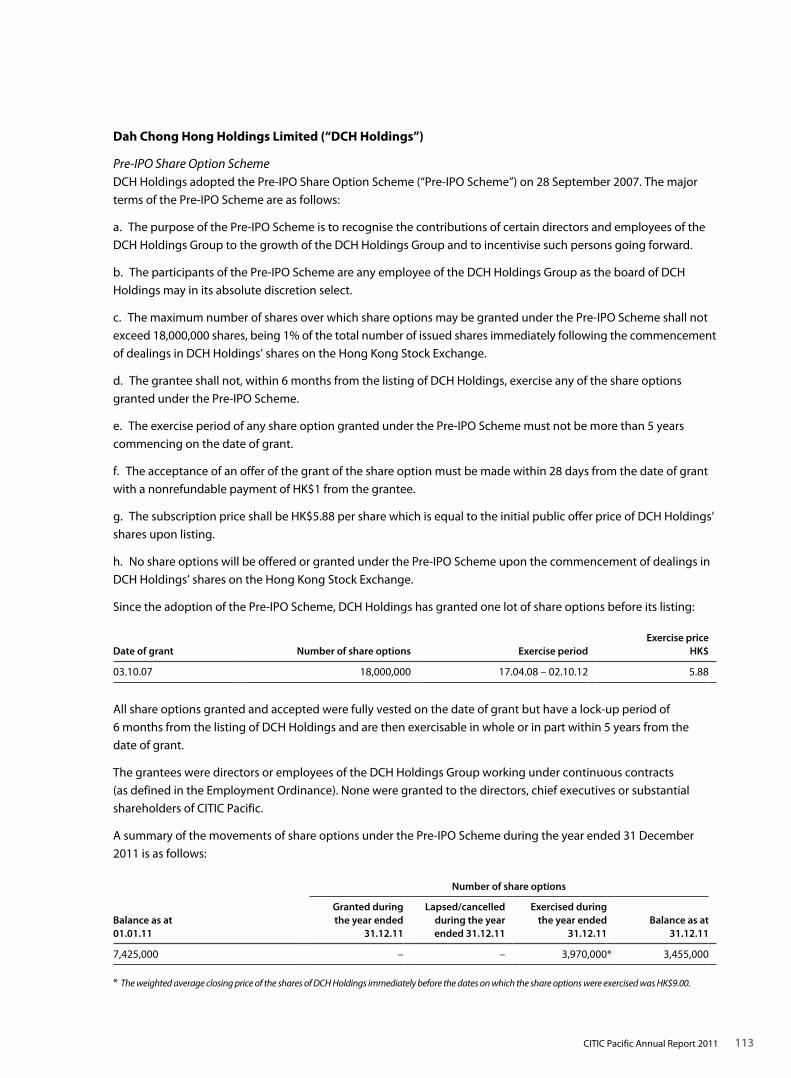
113CITIC Pacific Annual Report 2011
Dah Chong Hong Holdings Limited (“DCH Holdings”)
Pre-IPO Share Option SchemeDCH Holdings adopted the Pre-IPO Share Option Scheme (“Pre-IPO Scheme”) on 28 September 2007. The major
terms of the Pre-IPO Scheme are as follows:
a. The purpose of the Pre-IPO Scheme is to recognise the contributions of certain directors and employees of the
DCH Holdings Group to the growth of the DCH Holdings Group and to incentivise such persons going forward.
b. The participants of the Pre-IPO Scheme are any employee of the DCH Holdings Group as the board of DCH
Holdings may in its absolute discretion select.
c. The maximum number of shares over which share options may be granted under the Pre-IPO Scheme shall not
exceed 18,000,000 shares, being 1% of the total number of issued shares immediately following the commencement
of dealings in DCH Holdings’ shares on the Hong Kong Stock Exchange.
d. The grantee shall not, within 6 months from the listing of DCH Holdings, exercise any of the share options
granted under the Pre-IPO Scheme.
e. The exercise period of any share option granted under the Pre-IPO Scheme must not be more than 5 years
commencing on the date of grant.
f. The acceptance of an offer of the grant of the share option must be made within 28 days from the date of grant
with a nonrefundable payment of HK$1 from the grantee.
g. The subscription price shall be HK$5.88 per share which is equal to the initial public offer price of DCH Holdings’
shares upon listing.
h. No share options will be offered or granted under the Pre-IPO Scheme upon the commencement of dealings in
DCH Holdings’ shares on the Hong Kong Stock Exchange.
Since the adoption of the Pre-IPO Scheme, DCH Holdings has granted one lot of share options before its listing:
Date of grant Number of share options Exercise periodExercise price
HK$
03.10.07 18,000,000 17.04.08 – 02.10.12 5.88
All share options granted and accepted were fully vested on the date of grant but have a lock-up period of
6 months from the listing of DCH Holdings and are then exercisable in whole or in part within 5 years from the
date of grant.
The grantees were directors or employees of the DCH Holdings Group working under continuous contracts
(as defined in the Employment Ordinance). None were granted to the directors, chief executives or substantial
shareholders of CITIC Pacific.
A summary of the movements of share options under the Pre-IPO Scheme during the year ended 31 December
2011 is as follows:
Number of share options
Balance as at 01.01.11
Granted during the year ended
31.12.11
Lapsed/cancelled during the year ended 31.12.11
Exercised during the year ended
31.12.11Balance as at
31.12.11
7,425,000 – – 3,970,000* 3,455,000
* The weighted average closing price of the shares of DCH Holdings immediately before the dates on which the share options were exercised was HK$9.00.
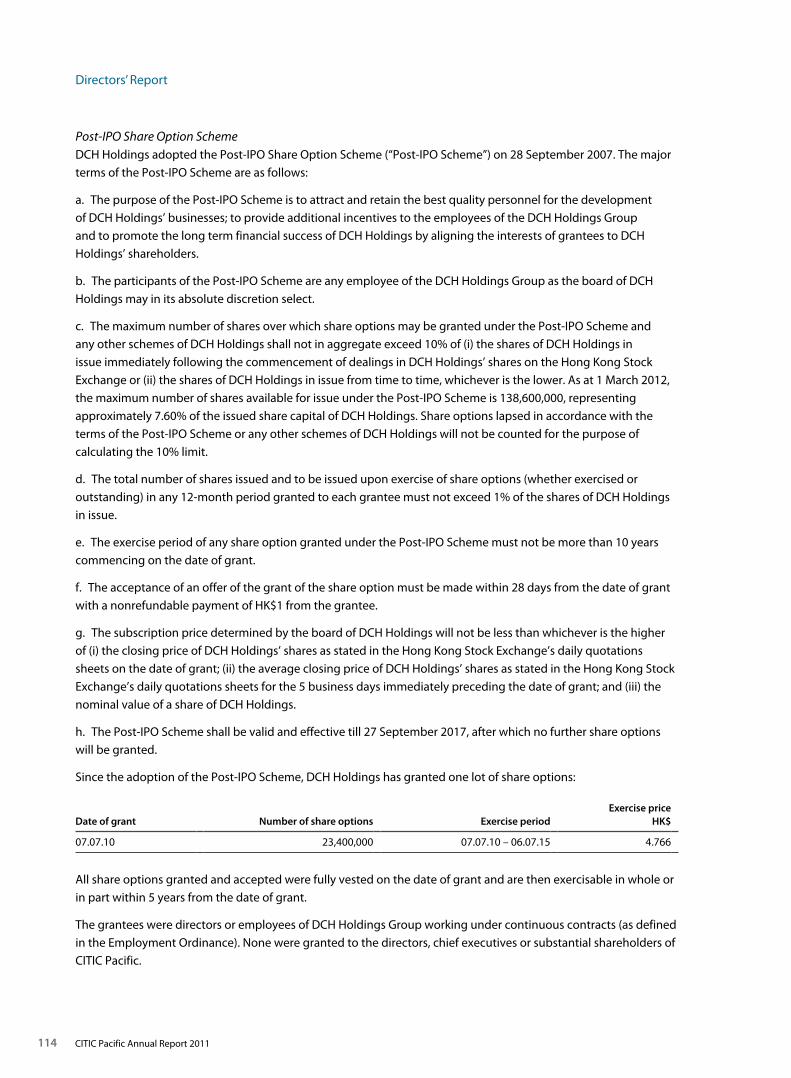
Directors’ Report
114 CITIC Pacific Annual Report 2011
Post-IPO Share Option SchemeDCH Holdings adopted the Post-IPO Share Option Scheme (“Post-IPO Scheme”) on 28 September 2007. The major
terms of the Post-IPO Scheme are as follows:
a. The purpose of the Post-IPO Scheme is to attract and retain the best quality personnel for the development
of DCH Holdings’ businesses; to provide additional incentives to the employees of the DCH Holdings Group
and to promote the long term financial success of DCH Holdings by aligning the interests of grantees to DCH
Holdings’ shareholders.
b. The participants of the Post-IPO Scheme are any employee of the DCH Holdings Group as the board of DCH
Holdings may in its absolute discretion select.
c. The maximum number of shares over which share options may be granted under the Post-IPO Scheme and
any other schemes of DCH Holdings shall not in aggregate exceed 10% of (i) the shares of DCH Holdings in
issue immediately following the commencement of dealings in DCH Holdings’ shares on the Hong Kong Stock
Exchange or (ii) the shares of DCH Holdings in issue from time to time, whichever is the lower. As at 1 March 2012,
the maximum number of shares available for issue under the Post-IPO Scheme is 138,600,000, representing
approximately 7.60% of the issued share capital of DCH Holdings. Share options lapsed in accordance with the
terms of the Post-IPO Scheme or any other schemes of DCH Holdings will not be counted for the purpose of
calculating the 10% limit.
d. The total number of shares issued and to be issued upon exercise of share options (whether exercised or
outstanding) in any 12-month period granted to each grantee must not exceed 1% of the shares of DCH Holdings
in issue.
e. The exercise period of any share option granted under the Post-IPO Scheme must not be more than 10 years
commencing on the date of grant.
f. The acceptance of an offer of the grant of the share option must be made within 28 days from the date of grant
with a nonrefundable payment of HK$1 from the grantee.
g. The subscription price determined by the board of DCH Holdings will not be less than whichever is the higher
of (i) the closing price of DCH Holdings’ shares as stated in the Hong Kong Stock Exchange’s daily quotations
sheets on the date of grant; (ii) the average closing price of DCH Holdings’ shares as stated in the Hong Kong Stock
Exchange’s daily quotations sheets for the 5 business days immediately preceding the date of grant; and (iii) the
nominal value of a share of DCH Holdings.
h. The Post-IPO Scheme shall be valid and effective till 27 September 2017, after which no further share options
will be granted.
Since the adoption of the Post-IPO Scheme, DCH Holdings has granted one lot of share options:
Date of grant Number of share options Exercise periodExercise price
HK$
07.07.10 23,400,000 07.07.10 – 06.07.15 4.766
All share options granted and accepted were fully vested on the date of grant and are then exercisable in whole or
in part within 5 years from the date of grant.
The grantees were directors or employees of DCH Holdings Group working under continuous contracts (as defined
in the Employment Ordinance). None were granted to the directors, chief executives or substantial shareholders of
CITIC Pacific.
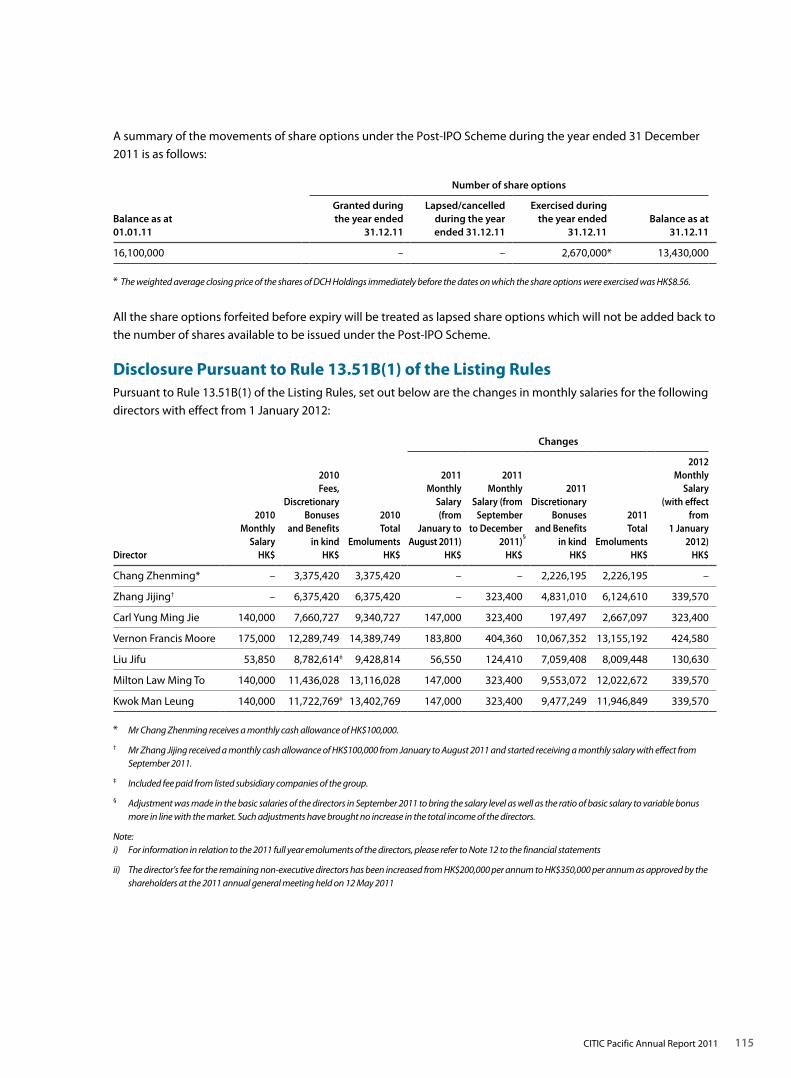
115CITIC Pacific Annual Report 2011
A summary of the movements of share options under the Post-IPO Scheme during the year ended 31 December
2011 is as follows:
Number of share options
Balance as at 01.01.11
Granted during the year ended
31.12.11
Lapsed/cancelled during the year ended 31.12.11
Exercised during the year ended
31.12.11Balance as at
31.12.11
16,100,000 – – 2,670,000* 13,430,000
* The weighted average closing price of the shares of DCH Holdings immediately before the dates on which the share options were exercised was HK$8.56.
All the share options forfeited before expiry will be treated as lapsed share options which will not be added back to
the number of shares available to be issued under the Post-IPO Scheme.
Disclosure Pursuant to Rule 13.51B(1) of the Listing RulesPursuant to Rule 13.51B(1) of the Listing Rules, set out below are the changes in monthly salaries for the following
directors with effect from 1 January 2012:
Changes
Director
2010 Monthly
Salary HK$
2010 Fees,
Discretionary Bonuses
and Benefits in kind
HK$
2010 Total
Emoluments HK$
2011 Monthly
Salary (from
January to August 2011)
HK$
2011 Monthly
Salary (from September
to December 2011)
HK$
§
2011 Discretionary
Bonuses and Benefits
in kind HK$
2011 Total
Emoluments HK$
2012 Monthly
Salary (with effect
from 1 January
2012) HK$
Chang Zhenming* – 3,375,420 3,375,420 – – 2,226,195 2,226,195 –
Zhang Jijing† – 6,375,420 6,375,420 – 323,400 4,831,010 6,124,610 339,570
Carl Yung Ming Jie 140,000 7,660,727 9,340,727 147,000 323,400 197,497 2,667,097 323,400
Vernon Francis Moore 175,000 12,289,749 14,389,749 183,800 404,360 10,067,352 13,155,192 424,580
Liu Jifu 53,850 8,782,614‡ 9,428,814 56,550 124,410 7,059,408 8,009,448 130,630
Milton Law Ming To 140,000 11,436,028 13,116,028 147,000 323,400 9,553,072 12,022,672 339,570
Kwok Man Leung 140,000 11,722,769‡ 13,402,769 147,000 323,400 9,477,249 11,946,849 339,570
* Mr Chang Zhenming receives a monthly cash allowance of HK$100,000.
† Mr Zhang Jijing received a monthly cash allowance of HK$100,000 from January to August 2011 and started receiving a monthly salary with effect from September 2011.
‡ Included fee paid from listed subsidiary companies of the group.
§ Adjustment was made in the basic salaries of the directors in September 2011 to bring the salary level as well as the ratio of basic salary to variable bonus more in line with the market. Such adjustments have brought no increase in the total income of the directors.
Note:i) For information in relation to the 2011 full year emoluments of the directors, please refer to Note 12 to the financial statements
ii) The director’s fee for the remaining non-executive directors has been increased from HK$200,000 per annum to HK$350,000 per annum as approved by the shareholders at the 2011 annual general meeting held on 12 May 2011
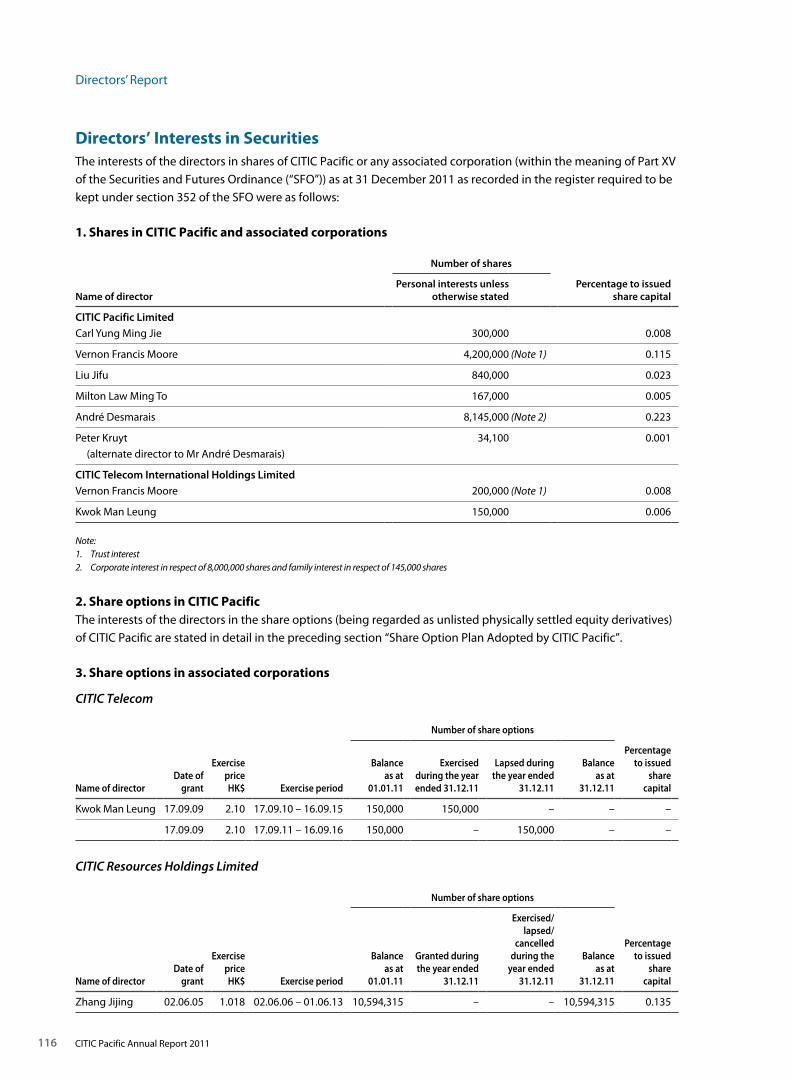
Directors’ Report
116 CITIC Pacific Annual Report 2011
Directors’ Interests in SecuritiesThe interests of the directors in shares of CITIC Pacific or any associated corporation (within the meaning of Part XV
of the Securities and Futures Ordinance (“SFO”)) as at 31 December 2011 as recorded in the register required to be
kept under section 352 of the SFO were as follows:
1. Shares in CITIC Pacific and associated corporations
Number of shares
Name of directorPersonal interests unless
otherwise statedPercentage to issued
share capital
CITIC Pacific LimitedCarl Yung Ming Jie 300,000 0.008
Vernon Francis Moore 4,200,000 (Note 1) 0.115
Liu Jifu 840,000 0.023
Milton Law Ming To 167,000 0.005
André Desmarais 8,145,000 (Note 2) 0.223
Peter Kruyt 34,100 0.001
(alternate director to Mr André Desmarais)
CITIC Telecom International Holdings LimitedVernon Francis Moore 200,000 (Note 1) 0.008
Kwok Man Leung 150,000 0.006
Note:1. Trust interest2. Corporate interest in respect of 8,000,000 shares and family interest in respect of 145,000 shares
2. Share options in CITIC PacificThe interests of the directors in the share options (being regarded as unlisted physically settled equity derivatives)
of CITIC Pacific are stated in detail in the preceding section “Share Option Plan Adopted by CITIC Pacific”.
3. Share options in associated corporations
CITIC Telecom
Number of share options
Name of directorDate of
grant
Exercise price HK$ Exercise period
Balance as at
01.01.11
Exercised during the year ended 31.12.11
Lapsed during the year ended
31.12.11
Balance as at
31.12.11
Percentage to issued
share capital
Kwok Man Leung 17.09.09 2.10 17.09.10 – 16.09.15 150,000 150,000 – – –
17.09.09 2.10 17.09.11 – 16.09.16 150,000 – 150,000 – –
CITIC Resources Holdings Limited
Number of share options
Name of directorDate of
grant
Exercise price HK$ Exercise period
Balance as at
01.01.11
Granted during the year ended
31.12.11
Exercised/lapsed/
cancelled during the
year ended 31.12.11
Balance as at
31.12.11
Percentage to issued
share capital
Zhang Jijing 02.06.05 1.018 02.06.06 – 01.06.13 10,594,315 – – 10,594,315 0.135
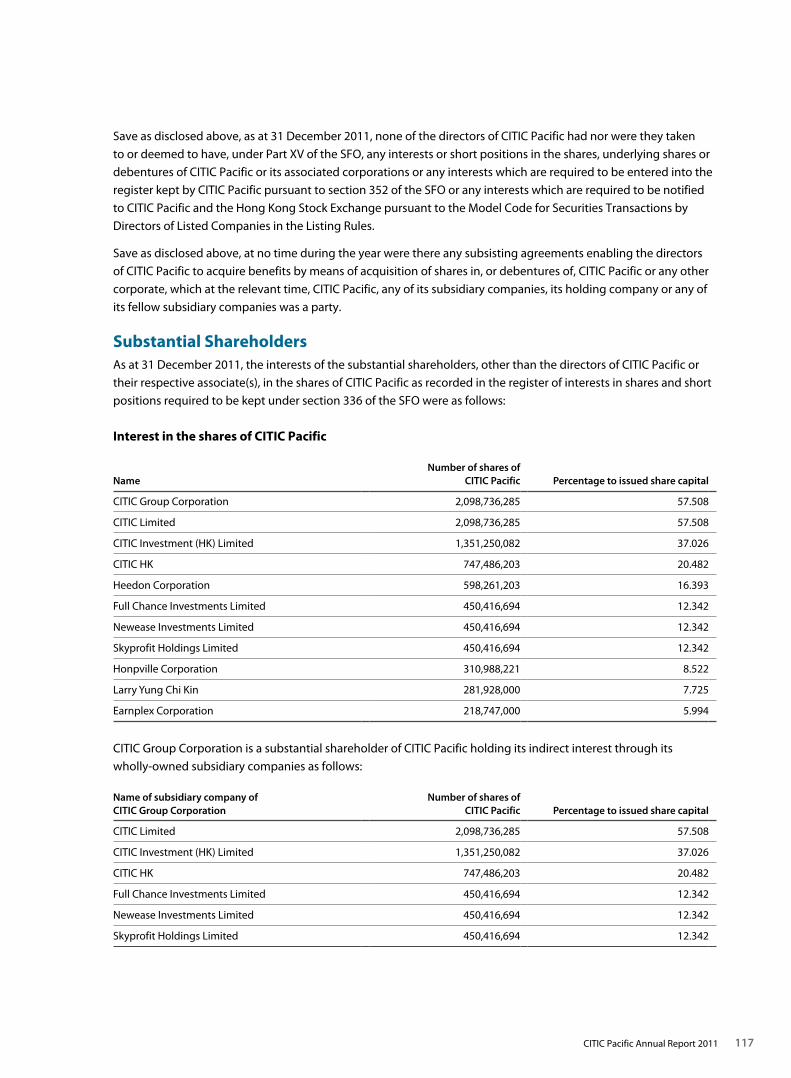
117CITIC Pacific Annual Report 2011
Save as disclosed above, as at 31 December 2011, none of the directors of CITIC Pacific had nor were they taken
to or deemed to have, under Part XV of the SFO, any interests or short positions in the shares, underlying shares or
debentures of CITIC Pacific or its associated corporations or any interests which are required to be entered into the
register kept by CITIC Pacific pursuant to section 352 of the SFO or any interests which are required to be notified
to CITIC Pacific and the Hong Kong Stock Exchange pursuant to the Model Code for Securities Transactions by
Directors of Listed Companies in the Listing Rules.
Save as disclosed above, at no time during the year were there any subsisting agreements enabling the directors
of CITIC Pacific to acquire benefits by means of acquisition of shares in, or debentures of, CITIC Pacific or any other
corporate, which at the relevant time, CITIC Pacific, any of its subsidiary companies, its holding company or any of
its fellow subsidiary companies was a party.
Substantial ShareholdersAs at 31 December 2011, the interests of the substantial shareholders, other than the directors of CITIC Pacific or
their respective associate(s), in the shares of CITIC Pacific as recorded in the register of interests in shares and short
positions required to be kept under section 336 of the SFO were as follows:
Interest in the shares of CITIC Pacific
NameNumber of shares of
CITIC Pacific Percentage to issued share capital
CITIC Group Corporation 2,098,736,285 57.508
CITIC Limited 2,098,736,285 57.508
CITIC Investment (HK) Limited 1,351,250,082 37.026
CITIC HK 747,486,203 20.482
Heedon Corporation 598,261,203 16.393
Full Chance Investments Limited 450,416,694 12.342
Newease Investments Limited 450,416,694 12.342
Skyprofit Holdings Limited 450,416,694 12.342
Honpville Corporation 310,988,221 8.522
Larry Yung Chi Kin 281,928,000 7.725
Earnplex Corporation 218,747,000 5.994
CITIC Group Corporation is a substantial shareholder of CITIC Pacific holding its indirect interest through its
wholly-owned subsidiary companies as follows:
Name of subsidiary company of CITIC Group Corporation
Number of shares of CITIC Pacific Percentage to issued share capital
CITIC Limited 2,098,736,285 57.508
CITIC Investment (HK) Limited 1,351,250,082 37.026
CITIC HK 747,486,203 20.482
Full Chance Investments Limited 450,416,694 12.342
Newease Investments Limited 450,416,694 12.342
Skyprofit Holdings Limited 450,416,694 12.342
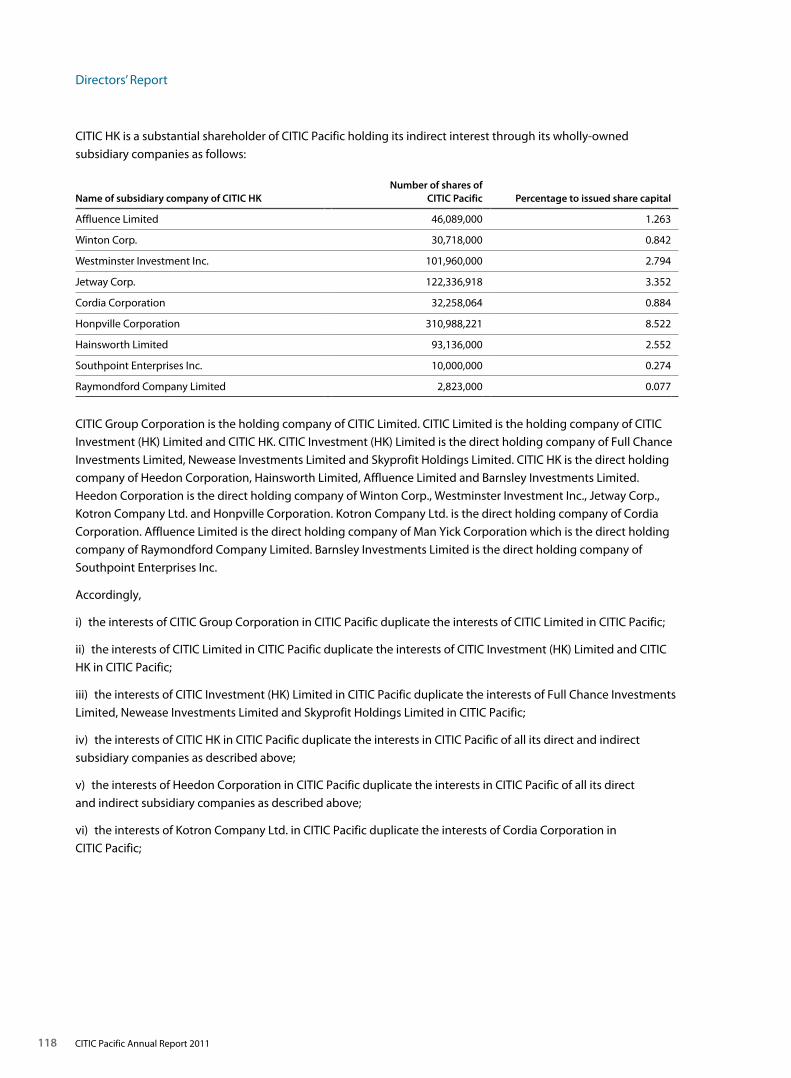
Directors’ Report
118 CITIC Pacific Annual Report 2011
CITIC HK is a substantial shareholder of CITIC Pacific holding its indirect interest through its wholly-owned
subsidiary companies as follows:
Name of subsidiary company of CITIC HKNumber of shares of
CITIC Pacific Percentage to issued share capital
Affluence Limited 46,089,000 1.263
Winton Corp. 30,718,000 0.842
Westminster Investment Inc. 101,960,000 2.794
Jetway Corp. 122,336,918 3.352
Cordia Corporation 32,258,064 0.884
Honpville Corporation 310,988,221 8.522
Hainsworth Limited 93,136,000 2.552
Southpoint Enterprises Inc. 10,000,000 0.274
Raymondford Company Limited 2,823,000 0.077
CITIC Group Corporation is the holding company of CITIC Limited. CITIC Limited is the holding company of CITIC
Investment (HK) Limited and CITIC HK. CITIC Investment (HK) Limited is the direct holding company of Full Chance
Investments Limited, Newease Investments Limited and Skyprofit Holdings Limited. CITIC HK is the direct holding
company of Heedon Corporation, Hainsworth Limited, Affluence Limited and Barnsley Investments Limited.
Heedon Corporation is the direct holding company of Winton Corp., Westminster Investment Inc., Jetway Corp.,
Kotron Company Ltd. and Honpville Corporation. Kotron Company Ltd. is the direct holding company of Cordia
Corporation. Affluence Limited is the direct holding company of Man Yick Corporation which is the direct holding
company of Raymondford Company Limited. Barnsley Investments Limited is the direct holding company of
Southpoint Enterprises Inc.
Accordingly,
i) the interests of CITIC Group Corporation in CITIC Pacific duplicate the interests of CITIC Limited in CITIC Pacific;
ii) the interests of CITIC Limited in CITIC Pacific duplicate the interests of CITIC Investment (HK) Limited and CITIC
HK in CITIC Pacific;
iii) the interests of CITIC Investment (HK) Limited in CITIC Pacific duplicate the interests of Full Chance Investments
Limited, Newease Investments Limited and Skyprofit Holdings Limited in CITIC Pacific;
iv) the interests of CITIC HK in CITIC Pacific duplicate the interests in CITIC Pacific of all its direct and indirect
subsidiary companies as described above;
v) the interests of Heedon Corporation in CITIC Pacific duplicate the interests in CITIC Pacific of all its direct
and indirect subsidiary companies as described above;
vi) the interests of Kotron Company Ltd. in CITIC Pacific duplicate the interests of Cordia Corporation in
CITIC Pacific;
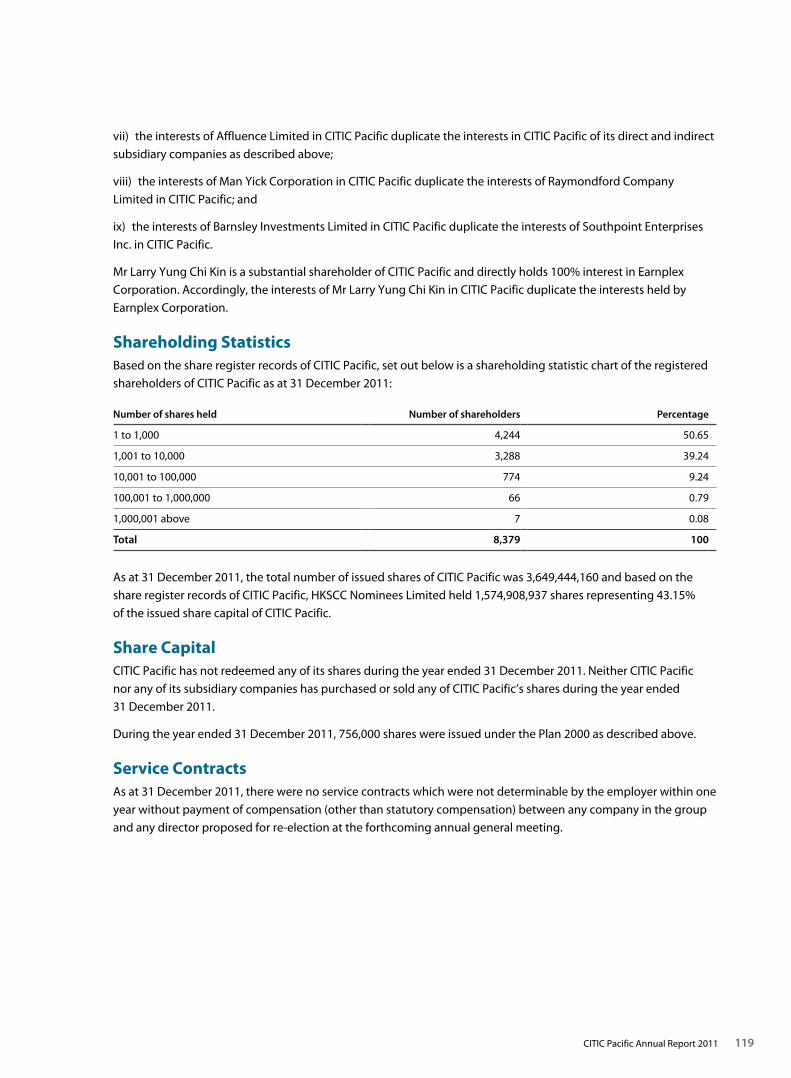
119CITIC Pacific Annual Report 2011
vii) the interests of Affluence Limited in CITIC Pacific duplicate the interests in CITIC Pacific of its direct and indirect
subsidiary companies as described above;
viii) the interests of Man Yick Corporation in CITIC Pacific duplicate the interests of Raymondford Company
Limited in CITIC Pacific; and
ix) the interests of Barnsley Investments Limited in CITIC Pacific duplicate the interests of Southpoint Enterprises
Inc. in CITIC Pacific.
Mr Larry Yung Chi Kin is a substantial shareholder of CITIC Pacific and directly holds 100% interest in Earnplex
Corporation. Accordingly, the interests of Mr Larry Yung Chi Kin in CITIC Pacific duplicate the interests held by
Earnplex Corporation.
Shareholding StatisticsBased on the share register records of CITIC Pacific, set out below is a shareholding statistic chart of the registered
shareholders of CITIC Pacific as at 31 December 2011:
Number of shares held Number of shareholders Percentage
1 to 1,000 4,244 50.65
1,001 to 10,000 3,288 39.24
10,001 to 100,000 774 9.24
100,001 to 1,000,000 66 0.79
1,000,001 above 7 0.08
Total 8,379 100
As at 31 December 2011, the total number of issued shares of CITIC Pacific was 3,649,444,160 and based on the
share register records of CITIC Pacific, HKSCC Nominees Limited held 1,574,908,937 shares representing 43.15%
of the issued share capital of CITIC Pacific.
Share CapitalCITIC Pacific has not redeemed any of its shares during the year ended 31 December 2011. Neither CITIC Pacific
nor any of its subsidiary companies has purchased or sold any of CITIC Pacific’s shares during the year ended
31 December 2011.
During the year ended 31 December 2011, 756,000 shares were issued under the Plan 2000 as described above.
Service ContractsAs at 31 December 2011, there were no service contracts which were not determinable by the employer within one
year without payment of compensation (other than statutory compensation) between any company in the group
and any director proposed for re-election at the forthcoming annual general meeting.
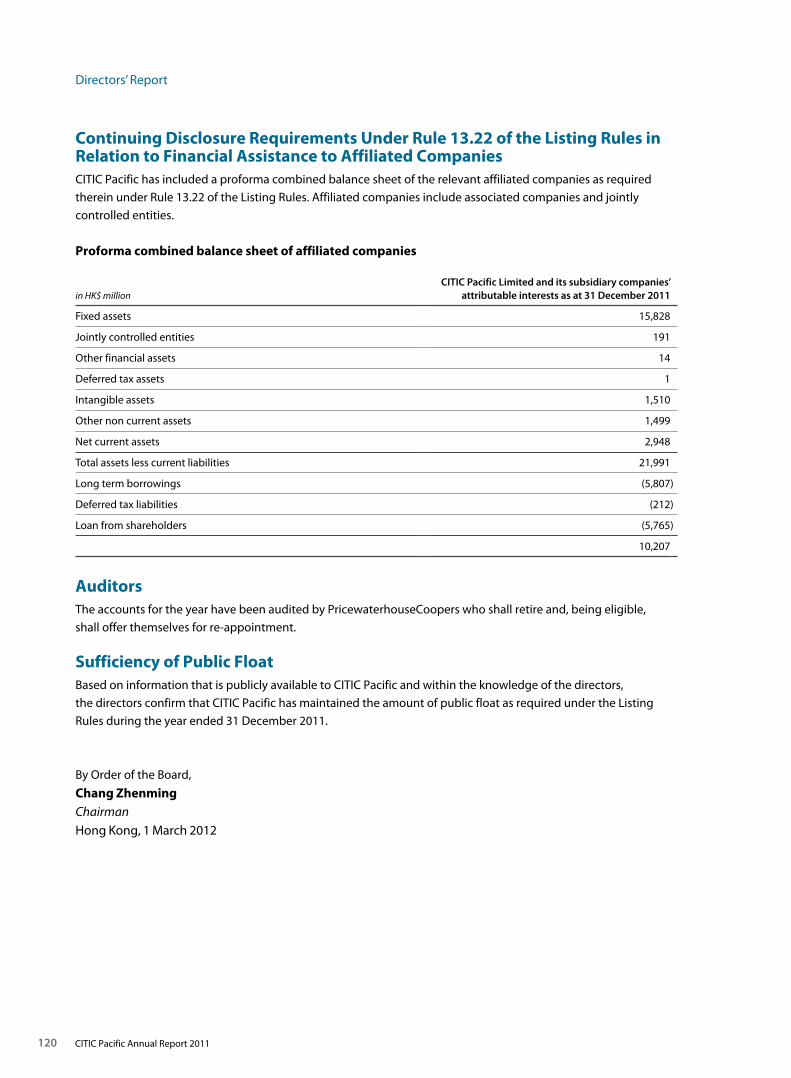
Directors’ Report
120 CITIC Pacific Annual Report 2011
Continuing Disclosure Requirements Under Rule 13.22 of the Listing Rules in Relation to Financial Assistance to Affiliated CompaniesCITIC Pacific has included a proforma combined balance sheet of the relevant affiliated companies as required
therein under Rule 13.22 of the Listing Rules. Affiliated companies include associated companies and jointly
controlled entities.
Proforma combined balance sheet of affiliated companies
in HK$ millionCITIC Pacific Limited and its subsidiary companies’
attributable interests as at 31 December 2011
Fixed assets 15,828
Jointly controlled entities 191
Other financial assets 14
Deferred tax assets 1
Intangible assets 1,510
Other non current assets 1,499
Net current assets 2,948
Total assets less current liabilities 21,991
Long term borrowings (5,807)
Deferred tax liabilities (212)
Loan from shareholders (5,765)
10,207
AuditorsThe accounts for the year have been audited by PricewaterhouseCoopers who shall retire and, being eligible,
shall offer themselves for re-appointment.
Sufficiency of Public FloatBased on information that is publicly available to CITIC Pacific and within the knowledge of the directors,
the directors confirm that CITIC Pacific has maintained the amount of public float as required under the Listing
Rules during the year ended 31 December 2011.
By Order of the Board,
Chang ZhenmingChairmanHong Kong, 1 March 2012

121
122 Consolidated Profit and Loss Account123 Consolidated Statement of Comprehensive Income124 Consolidated Balance Sheet125 Balance Sheet126 Consolidated Cash Flow Statement128 Consolidated Statement of Changes in Equity
Notes to the Financial Statements130 1 Significant Accounting Policies143 2 Critical Accounting Estimates and Judgements146 3 Turnover and Revenue146 4 Other Income and Net Gains147 5 Segment Information150 6 Profit from Consolidated Activities152 7 Net Finance Charges153 8 Taxation154 9 Profit Attributable to Shareholders of the Company154 10 Dividends154 11 Earnings per Share155 12 Directors’ Emoluments156 13 Individuals with Highest Emoluments156 14 Retirement Benefits157 15 Fixed Assets and Properties under Development161 16 Subsidiary Companies162 17 Jointly Controlled Entities164 18 Associated Companies165 19 Other Financial Assets166 20 Intangible Assets167 21 Non-Current Deposits and Prepayment167 22 Other Assets Held for Sale168 23 Inventories168 24 Debtors, Accounts Receivable, Deposits and Prepayments169 25 Creditors, Accounts Payable, Deposits and Accruals170 26 Share Capital171 27 Perpetual Capital Securities172 28 Reserves176 29 Borrowings179 30 Financial Risk Management and Fair Values190 31 Capital Risk Management190 32 Derivative Financial Instruments192 33 Deferred Taxation194 34 Provisions and Deferred Income195 35 Capital Commitments196 36 Operating Lease Commitments196 37 Business Combinations, Acquisitions and Disposals199 38 Contingent Liabilities200 39 Material Related Party Transactions203 40 Ultimate Holding Company203 41 Comparative Figures203 42 Approval of Financial Statements204 43 Principal Subsidiary Companies, Jointly Controlled Entities and Associated Companies
213 Independent Auditor’s Report
CITIC Pacific Annual Report 2011
Contents of Financial Statements and Notes
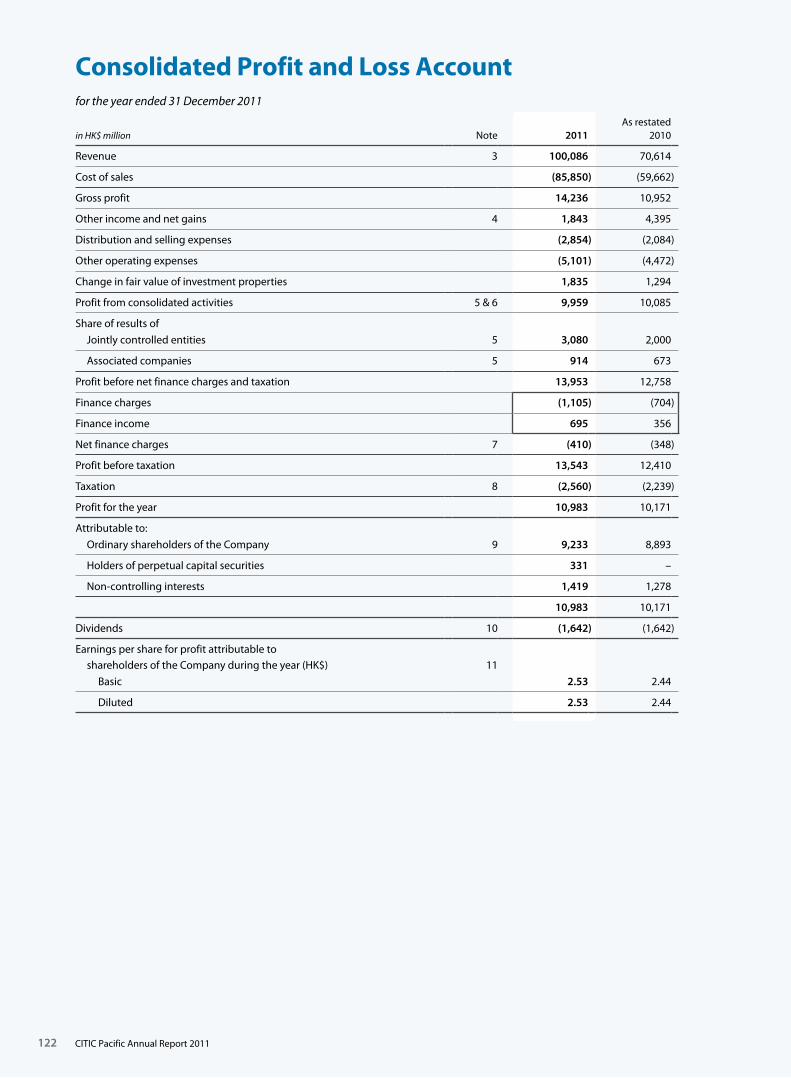
122
in HK$ million Note 2011As restated
2010
Revenue 3 100,086 70,614
Cost of sales (85,850) (59,662)
Gross profit 14,236 10,952
Other income and net gains 4 1,843 4,395
Distribution and selling expenses (2,854) (2,084)
Other operating expenses (5,101) (4,472)
Change in fair value of investment properties 1,835 1,294
Profit from consolidated activities 5 & 6 9,959 10,085
Share of results of
Jointly controlled entities 5 3,080 2,000
Associated companies 5 914 673
Profit before net finance charges and taxation 13,953 12,758
Finance charges (1,105) (704)
Finance income 695 356
Net finance charges 7 (410) (348)
Profit before taxation 13,543 12,410
Taxation 8 (2,560) (2,239)
Profit for the year 10,983 10,171
Attributable to:
Ordinary shareholders of the Company 9 9,233 8,893
Holders of perpetual capital securities 331 –
Non-controlling interests 1,419 1,278
10,983 10,171
Dividends 10 (1,642) (1,642)
Earnings per share for profit attributable to shareholders of the Company during the year (HK$) 11
Basic 2.53 2.44
Diluted 2.53 2.44
Consolidated Profit and Loss Accountfor the year ended 31 December 2011
CITIC Pacific Annual Report 2011
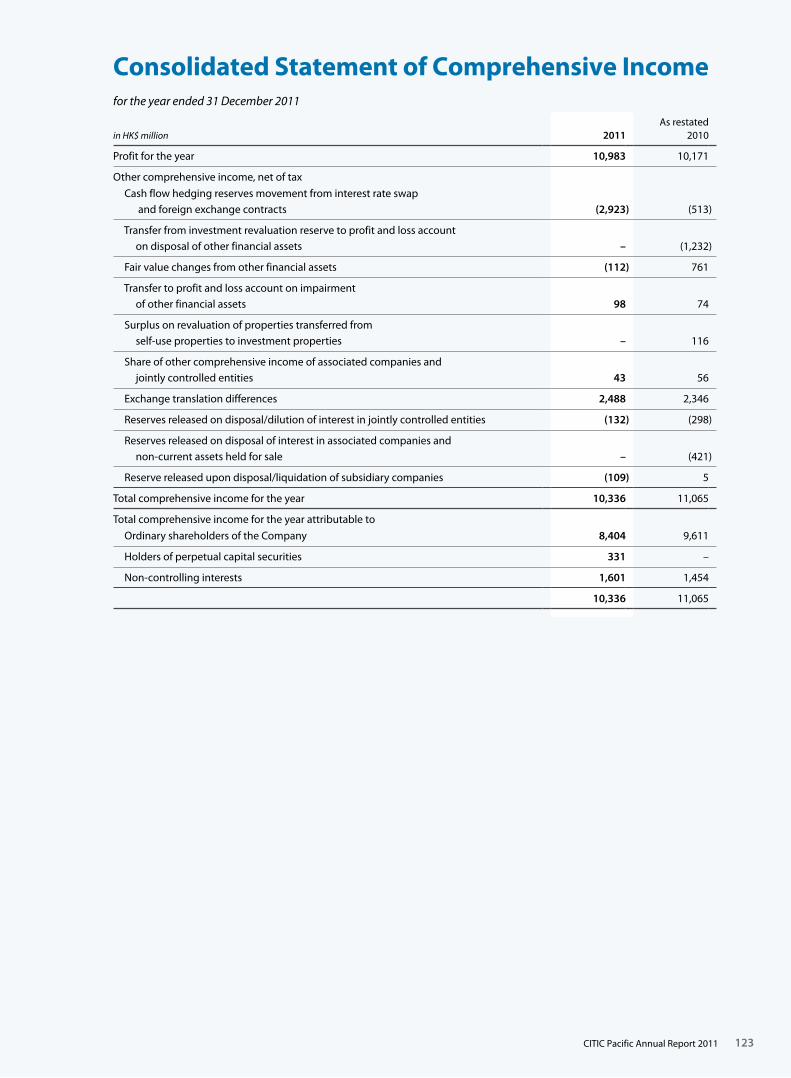
123
Consolidated Statement of Comprehensive Incomefor the year ended 31 December 2011
in HK$ million 2011As restated
2010
Profit for the year 10,983 10,171
Other comprehensive income, net of tax
Cash flow hedging reserves movement from interest rate swap and foreign exchange contracts (2,923) (513)
Transfer from investment revaluation reserve to profit and loss account on disposal of other financial assets – (1,232)
Fair value changes from other financial assets (112) 761
Transfer to profit and loss account on impairment of other financial assets 98 74
Surplus on revaluation of properties transferred from self-use properties to investment properties – 116
Share of other comprehensive income of associated companies and jointly controlled entities 43 56
Exchange translation differences 2,488 2,346
Reserves released on disposal/dilution of interest in jointly controlled entities (132) (298)
Reserves released on disposal of interest in associated companies and non-current assets held for sale – (421)
Reserve released upon disposal/liquidation of subsidiary companies (109) 5
Total comprehensive income for the year 10,336 11,065
Total comprehensive income for the year attributable to
Ordinary shareholders of the Company 8,404 9,611
Holders of perpetual capital securities 331 –
Non-controlling interests 1,601 1,454
10,336 11,065
CITIC Pacific Annual Report 2011
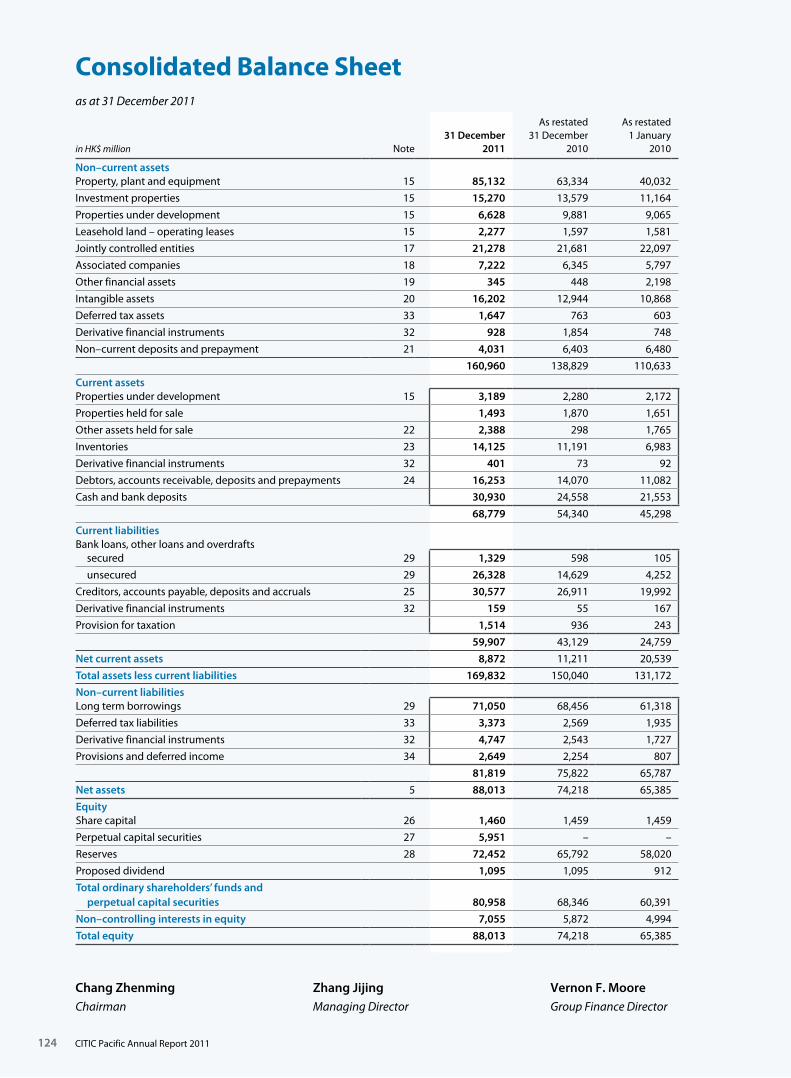
124
Consolidated Balance Sheet
in HK$ million Note31 December
2011
As restated31 December
2010
As restated1 January
2010
Non–current assetsProperty, plant and equipment 15 85,132 63,334 40,032
Investment properties 15 15,270 13,579 11,164
Properties under development 15 6,628 9,881 9,065
Leasehold land – operating leases 15 2,277 1,597 1,581
Jointly controlled entities 17 21,278 21,681 22,097
Associated companies 18 7,222 6,345 5,797
Other financial assets 19 345 448 2,198
Intangible assets 20 16,202 12,944 10,868
Deferred tax assets 33 1,647 763 603
Derivative financial instruments 32 928 1,854 748
Non–current deposits and prepayment 21 4,031 6,403 6,480
160,960 138,829 110,633
Current assetsProperties under development 15 3,189 2,280 2,172
Properties held for sale 1,493 1,870 1,651
Other assets held for sale 22 2,388 298 1,765
Inventories 23 14,125 11,191 6,983
Derivative financial instruments 32 401 73 92
Debtors, accounts receivable, deposits and prepayments 24 16,253 14,070 11,082
Cash and bank deposits 30,930 24,558 21,553
68,779 54,340 45,298
Current liabilitiesBank loans, other loans and overdrafts secured 29 1,329 598 105
unsecured 29 26,328 14,629 4,252
Creditors, accounts payable, deposits and accruals 25 30,577 26,911 19,992
Derivative financial instruments 32 159 55 167
Provision for taxation 1,514 936 243
59,907 43,129 24,759
Net current assets 8,872 11,211 20,539
Total assets less current liabilities 169,832 150,040 131,172
Non–current liabilities Long term borrowings 29 71,050 68,456 61,318
Deferred tax liabilities 33 3,373 2,569 1,935
Derivative financial instruments 32 4,747 2,543 1,727
Provisions and deferred income 34 2,649 2,254 807
81,819 75,822 65,787
Net assets 5 88,013 74,218 65,385
EquityShare capital 26 1,460 1,459 1,459
Perpetual capital securities 27 5,951 – –
Reserves 28 72,452 65,792 58,020
Proposed dividend 1,095 1,095 912
Total ordinary shareholders’ funds and perpetual capital securities 80,958 68,346 60,391
Non–controlling interests in equity 7,055 5,872 4,994
Total equity 88,013 74,218 65,385
Chang Zhenming Zhang Jijing Vernon F. MooreChairman Managing Director Group Finance Director
as at 31 December 2011
CITIC Pacific Annual Report 2011

125
as at 31 December 2011
Balance Sheet
in HK$ million Note 2011 2010
Non-current assets
Property, plant and equipment 15 10 7
Subsidiary companies 16 80,889 68,401
Jointly controlled entities 17 5,138 5,121
Associated companies 18 1,987 2,018
Derivative financial instruments 32 161 859
88,185 76,406
Current assets
Derivative financial instruments 32 326 15
Amounts due from subsidiary companies 16 4,896 3,960
Debtors, accounts receivable, deposits and prepayments 24 193 188
Cash and bank deposits 10,715 7,781
16,130 11,944
Current liabilities
Bank loans, other loans and overdrafts
unsecured 29 13,936 1,949
Amounts due to subsidiary companies 16 6,223 9,647
Creditors, accounts payable, deposits and accruals 25 293 291
Derivative financial instruments 32 419 37
Provision for taxation 1 1
20,872 11,925
Net current (liabilities)/assets (4,742) 19
Total assets less current liabilities 83,443 76,425
Non-current liabilities
Long term borrowings 29 30,221 28,723
Derivative financial instruments 32 2,739 2,276
32,960 30,999
Net assets 50,483 45,426
Equity
Share capital 26 1,460 1,459
Perpetual capital securities 27 5,951 –
Reserves 28 41,977 42,872
Proposed dividend 1,095 1,095
Total ordinary shareholders’ funds and perpetual capital securities 50,483 45,426
Chang Zhenming Zhang Jijing Vernon F. MooreChairman Managing Director Group Finance Director
CITIC Pacific Annual Report 2011

126
Consolidated Cash Flow Statementfor the year ended 31 December 2011
in HK$ million Note 2011As restated
2010
Cash flows from operating activities
Profit before taxation 13,543 12,410
Share of results of jointly controlled entities and associated companies (3,994) (2,673)
Net finance charges 410 348
Net exchange gain (348) (335)
Income from other financial assets (7) (53)
Depreciation and amortisation 2,180 1,630
Impairment losses 652 469
Net gain from sale of other financial assets – (1,228)
Provision for gas contract 109 468
Share-based payment 11 50
Gain on disposal of property, plant and equipment – (131)
Gain on disposal of investment properties (296) –
Change in fair value of investment properties (1,835) (1,294)
Net gain from disposal/deemed disposal of jointly controlled entities and associated companies (209) (2,117)
Net gain on disposal of subsidiary companies (230) –
Operating profit before working capital changes 9,986 7,544
Decrease in properties held for sale 2,777 2,143
Increase in inventories (2,468) (4,208)
Increase in debtors, accounts receivable, deposits and prepayments (2,182) (1,075)
Increase in creditors, accounts payable, deposits and accruals 1,121 4,568
Effect of foreign exchange rate changes 470 102
Cash generated from operating activities 9,704 9,074
Income taxes paid (1,770) (1,058)
Cash generated from operating activities after income taxes paid 7,934 8,016
Payment for leveraged foreign exchange contracts – (107)
Interest received 647 361
Interest paid (3,815) (3,051)
Realised exchange gain 70 138
Other finance charges and financial instruments (106) (187)
Net cash from consolidated activities before increase of properties under development 4,730 5,170
Increase in properties under development (2,065) (2,055)
Net cash generated from consolidated activities 2,665 3,115
CITIC Pacific Annual Report 2011
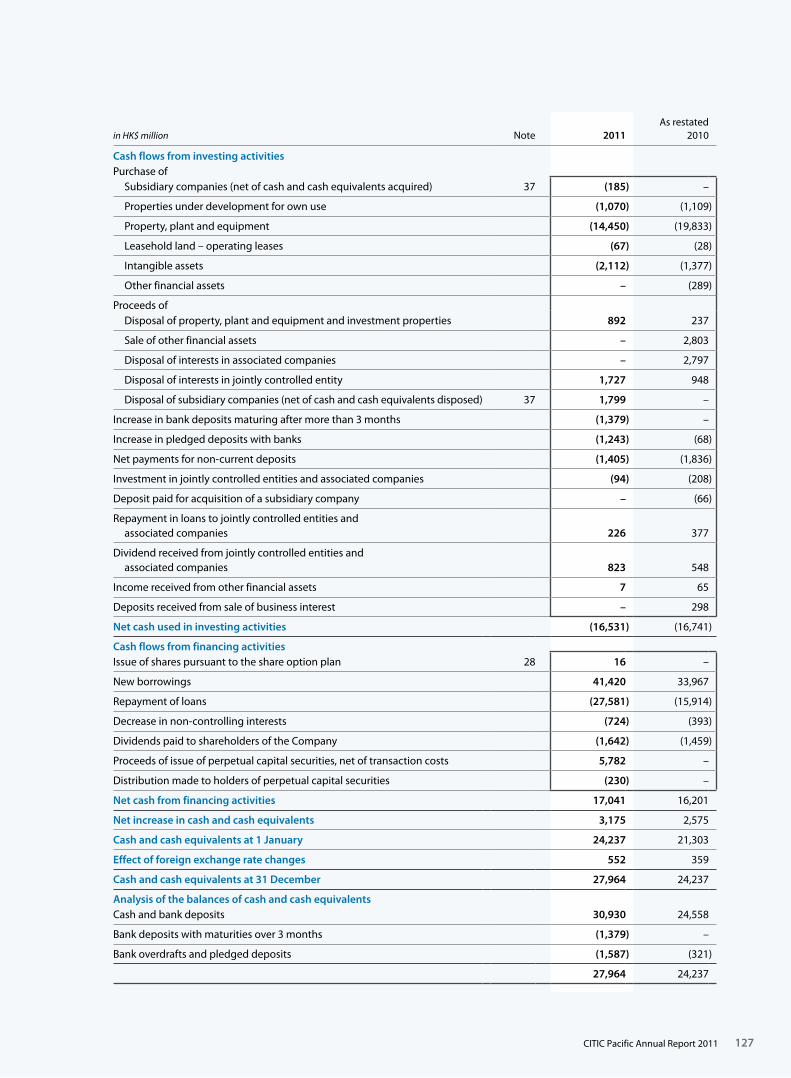
127
in HK$ million Note 2011As restated
2010
Cash flows from investing activitiesPurchase of Subsidiary companies (net of cash and cash equivalents acquired) 37 (185) –
Properties under development for own use (1,070) (1,109)
Property, plant and equipment (14,450) (19,833)
Leasehold land – operating leases (67) (28)
Intangible assets (2,112) (1,377)
Other financial assets – (289)
Proceeds of Disposal of property, plant and equipment and investment properties 892 237
Sale of other financial assets – 2,803
Disposal of interests in associated companies – 2,797
Disposal of interests in jointly controlled entity 1,727 948
Disposal of subsidiary companies (net of cash and cash equivalents disposed) 37 1,799 –
Increase in bank deposits maturing after more than 3 months (1,379) –
Increase in pledged deposits with banks (1,243) (68)
Net payments for non-current deposits (1,405) (1,836)
Investment in jointly controlled entities and associated companies (94) (208)
Deposit paid for acquisition of a subsidiary company – (66)
Repayment in loans to jointly controlled entities and associated companies 226 377
Dividend received from jointly controlled entities and associated companies 823 548
Income received from other financial assets 7 65
Deposits received from sale of business interest – 298
Net cash used in investing activities (16,531) (16,741)
Cash flows from financing activitiesIssue of shares pursuant to the share option plan 28 16 –
New borrowings 41,420 33,967
Repayment of loans (27,581) (15,914)
Decrease in non-controlling interests (724) (393)
Dividends paid to shareholders of the Company (1,642) (1,459)
Proceeds of issue of perpetual capital securities, net of transaction costs 5,782 –
Distribution made to holders of perpetual capital securities (230) –
Net cash from financing activities 17,041 16,201
Net increase in cash and cash equivalents 3,175 2,575
Cash and cash equivalents at 1 January 24,237 21,303
Effect of foreign exchange rate changes 552 359
Cash and cash equivalents at 31 December 27,964 24,237
Analysis of the balances of cash and cash equivalentsCash and bank deposits 30,930 24,558
Bank deposits with maturities over 3 months (1,379) –
Bank overdrafts and pledged deposits (1,587) (321)
27,964 24,237
CITIC Pacific Annual Report 2011
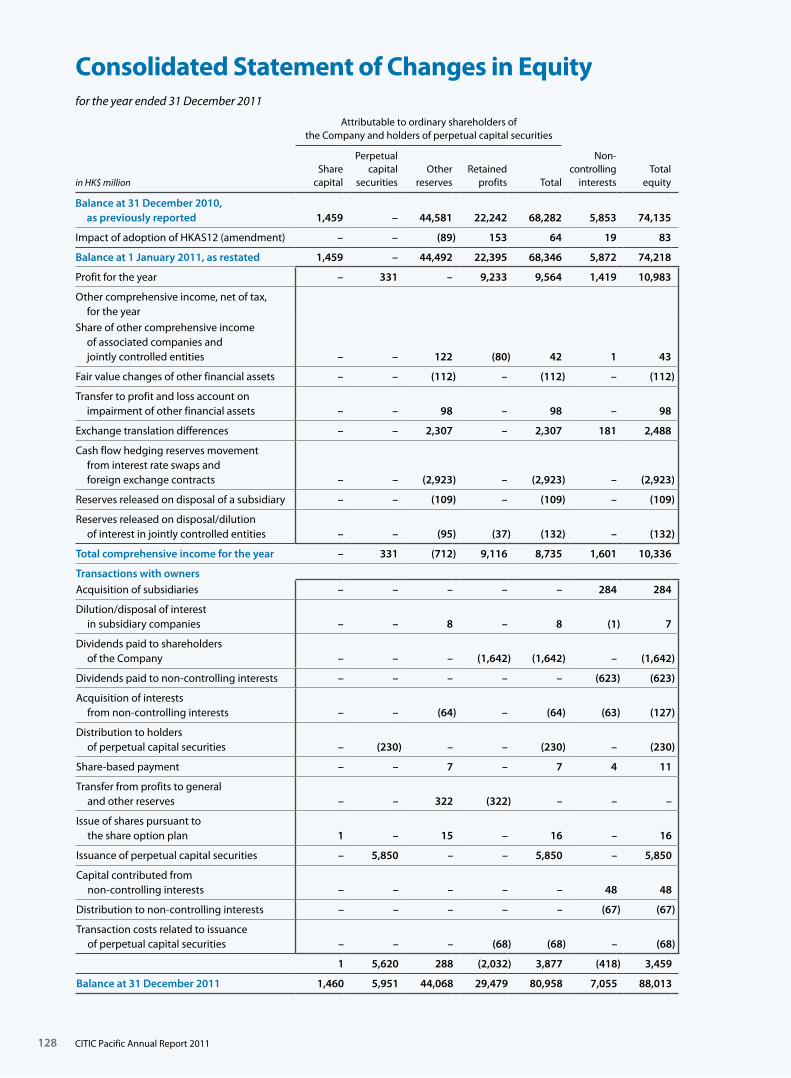
128
Consolidated Statement of Changes in Equityfor the year ended 31 December 2011
Attributable to ordinary shareholders of the Company and holders of perpetual capital securities
in HK$ millionShare
capital
Perpetual capital
securitiesOther
reservesRetained
profits Total
Non-controlling
interestsTotal
equity
Balance at 31 December 2010, as previously reported 1,459 – 44,581 22,242 68,282 5,853 74,135
Impact of adoption of HKAS12 (amendment) – – (89) 153 64 19 83
Balance at 1 January 2011, as restated 1,459 – 44,492 22,395 68,346 5,872 74,218
Profit for the year – 331 – 9,233 9,564 1,419 10,983
Other comprehensive income, net of tax, for the year
Share of other comprehensive income of associated companies and jointly controlled entities – – 122 (80) 42 1 43
Fair value changes of other financial assets – – (112) – (112) – (112)
Transfer to profit and loss account on impairment of other financial assets – – 98 – 98 – 98
Exchange translation differences – – 2,307 – 2,307 181 2,488
Cash flow hedging reserves movement from interest rate swaps and foreign exchange contracts – – (2,923) – (2,923) – (2,923)
Reserves released on disposal of a subsidiary – – (109) – (109) – (109)
Reserves released on disposal/dilution of interest in jointly controlled entities – – (95) (37) (132) – (132)
Total comprehensive income for the year – 331 (712) 9,116 8,735 1,601 10,336
Transactions with ownersAcquisition of subsidiaries – – – – – 284 284
Dilution/disposal of interest in subsidiary companies – – 8 – 8 (1) 7
Dividends paid to shareholders of the Company – – – (1,642) (1,642) – (1,642)
Dividends paid to non-controlling interests – – – – – (623) (623)
Acquisition of interests from non-controlling interests – – (64) – (64) (63) (127)
Distribution to holders of perpetual capital securities – (230) – – (230) – (230)
Share-based payment – – 7 – 7 4 11
Transfer from profits to general and other reserves – – 322 (322) – – –
Issue of shares pursuant to the share option plan 1 – 15 – 16 – 16
Issuance of perpetual capital securities – 5,850 – – 5,850 – 5,850
Capital contributed from non-controlling interests – – – – – 48 48
Distribution to non-controlling interests – – – – – (67) (67)
Transaction costs related to issuance of perpetual capital securities – – – (68) (68) – (68)
1 5,620 288 (2,032) 3,877 (418) 3,459
Balance at 31 December 2011 1,460 5,951 44,068 29,479 80,958 7,055 88,013
CITIC Pacific Annual Report 2011
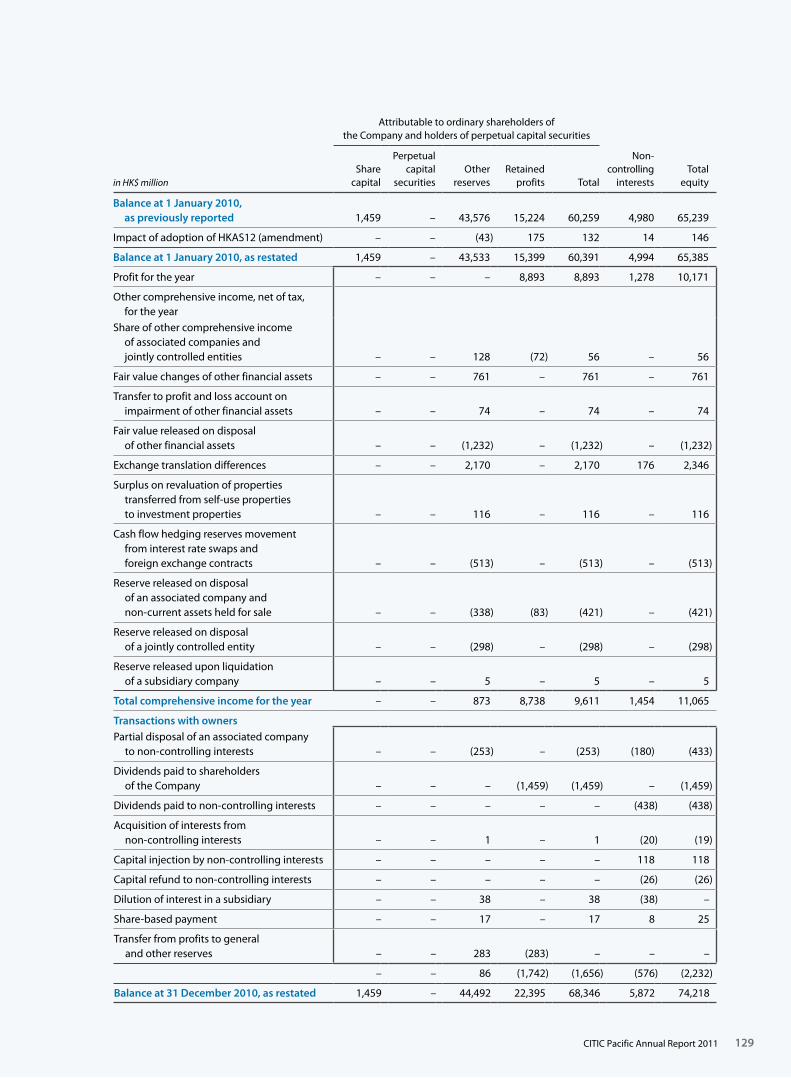
129
Attributable to ordinary shareholders of the Company and holders of perpetual capital securities
in HK$ millionShare
capital
Perpetual capital
securitiesOther
reservesRetained
profits Total
Non-controlling
interestsTotal
equity
Balance at 1 January 2010, as previously reported 1,459 – 43,576 15,224 60,259 4,980 65,239
Impact of adoption of HKAS12 (amendment) – – (43) 175 132 14 146
Balance at 1 January 2010, as restated 1,459 – 43,533 15,399 60,391 4,994 65,385
Profit for the year – – – 8,893 8,893 1,278 10,171
Other comprehensive income, net of tax, for the year
Share of other comprehensive income of associated companies and jointly controlled entities – – 128 (72) 56 – 56
Fair value changes of other financial assets – – 761 – 761 – 761
Transfer to profit and loss account on impairment of other financial assets – – 74 – 74 – 74
Fair value released on disposal of other financial assets – – (1,232) – (1,232) – (1,232)
Exchange translation differences – – 2,170 – 2,170 176 2,346
Surplus on revaluation of properties transferred from self-use properties to investment properties – – 116 – 116 – 116
Cash flow hedging reserves movement from interest rate swaps and foreign exchange contracts – – (513) – (513) – (513)
Reserve released on disposal of an associated company and non-current assets held for sale – – (338) (83) (421) – (421)
Reserve released on disposal of a jointly controlled entity – – (298) – (298) – (298)
Reserve released upon liquidation of a subsidiary company – – 5 – 5 – 5
Total comprehensive income for the year – – 873 8,738 9,611 1,454 11,065
Transactions with ownersPartial disposal of an associated company to non-controlling interests – – (253) – (253) (180) (433)
Dividends paid to shareholders of the Company – – – (1,459) (1,459) – (1,459)
Dividends paid to non-controlling interests – – – – – (438) (438)
Acquisition of interests from non-controlling interests – – 1 – 1 (20) (19)
Capital injection by non-controlling interests – – – – – 118 118
Capital refund to non-controlling interests – – – – – (26) (26)
Dilution of interest in a subsidiary – – 38 – 38 (38) –
Share-based payment – – 17 – 17 8 25
Transfer from profits to general and other reserves – – 283 (283) – – –
– – 86 (1,742) (1,656) (576) (2,232)
Balance at 31 December 2010, as restated 1,459 – 44,492 22,395 68,346 5,872 74,218
CITIC Pacific Annual Report 2011
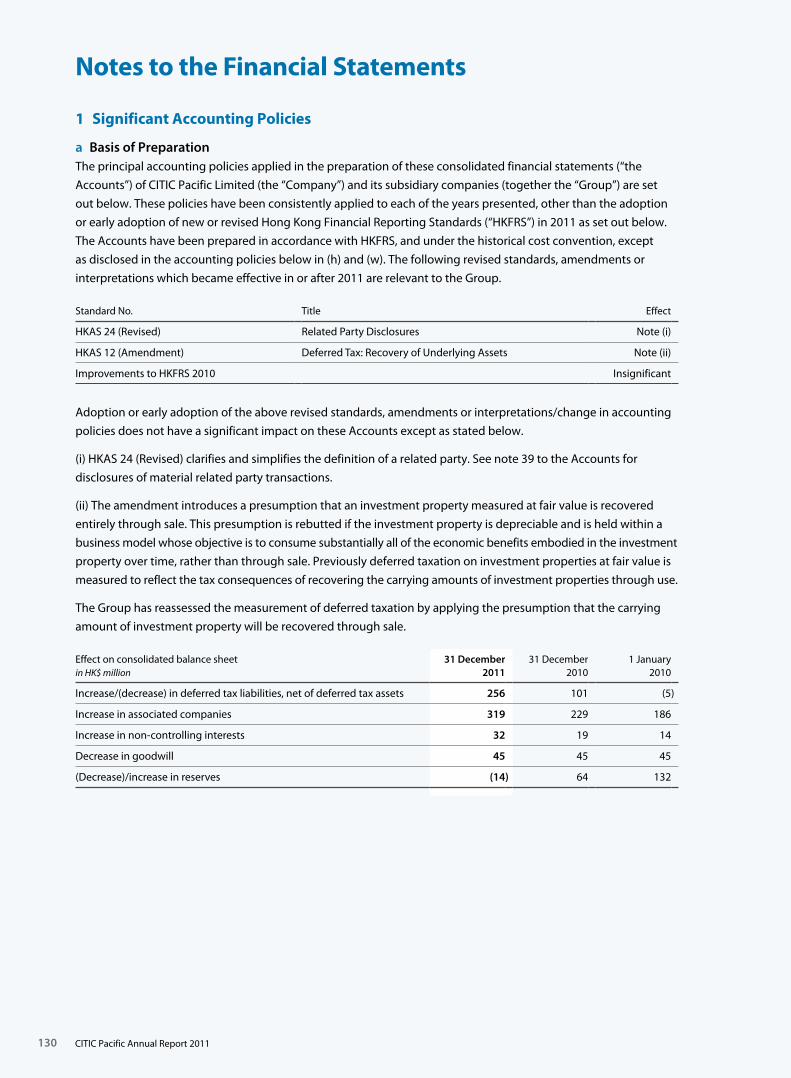
130
Notes to the Financial Statements
1 Significant Accounting Policies
a Basis of PreparationThe principal accounting policies applied in the preparation of these consolidated financial statements (“the
Accounts”) of CITIC Pacific Limited (the “Company”) and its subsidiary companies (together the “Group”) are set
out below. These policies have been consistently applied to each of the years presented, other than the adoption
or early adoption of new or revised Hong Kong Financial Reporting Standards (“HKFRS”) in 2011 as set out below.
The Accounts have been prepared in accordance with HKFRS, and under the historical cost convention, except
as disclosed in the accounting policies below in (h) and (w). The following revised standards, amendments or
interpretations which became effective in or after 2011 are relevant to the Group.
Standard No. Title Effect
HKAS 24 (Revised) Related Party Disclosures Note (i)
HKAS 12 (Amendment) Deferred Tax: Recovery of Underlying Assets Note (ii)
Improvements to HKFRS 2010 Insignificant
Adoption or early adoption of the above revised standards, amendments or interpretations/change in accounting
policies does not have a significant impact on these Accounts except as stated below.
(i) HKAS 24 (Revised) clarifies and simplifies the definition of a related party. See note 39 to the Accounts for
disclosures of material related party transactions.
(ii) The amendment introduces a presumption that an investment property measured at fair value is recovered
entirely through sale. This presumption is rebutted if the investment property is depreciable and is held within a
business model whose objective is to consume substantially all of the economic benefits embodied in the investment
property over time, rather than through sale. Previously deferred taxation on investment properties at fair value is
measured to reflect the tax consequences of recovering the carrying amounts of investment properties through use.
The Group has reassessed the measurement of deferred taxation by applying the presumption that the carrying
amount of investment property will be recovered through sale.
Effect on consolidated balance sheetin HK$ million
31 December 2011
31 December 2010
1 January 2010
Increase/(decrease) in deferred tax liabilities, net of deferred tax assets 256 101 (5)
Increase in associated companies 319 229 186
Increase in non-controlling interests 32 19 14
Decrease in goodwill 45 45 45
(Decrease)/increase in reserves (14) 64 132
CITIC Pacific Annual Report 2011

131
1 Significant Accounting Policies continued
a Basis of Preparation continued
Effect on consolidated profit and loss account and consolidated statement of comprehensive incomein HK$ million
For the year ended
2011 2010
Increase in income tax expense 134 61
Increase in share of profits less losses of associated companies 90 43
Decrease in profit attributable to the Company’s shareholders 57 23
Increase in profit attributable to the non-controlling interests 13 5
Decrease in other comprehensive income attributable to the Company’s shareholders 21 45
Notes:i) Adoption of the above revised standard does not have a significant impact on basic and diluted earnings per share for both years.
ii) If the investment properties were acquired as part of a business combination which took place in prior years, the related deferred tax would be adjusted against goodwill.
The following new standards, amendments and interpretation which have been issued by the Hong Kong Institute
of Certified Public Accountants (“HKICPA”) as of 31 December 2011 may impact the Group in future years but are
not yet effective for the year ended 31 December 2011:
Standard No. TitleApplicable accounting
period to the Group
HKAS 1 (Amendment) Presentation of financial statements 2012
HKFRS 9 Financial instruments 2015
HKFRS 10 Consolidated financial statements 2013
HKFRS 11 Joint arrangements 2013
HKFRS 12 Disclosures of interest in other entities 2013
HKFRS 13 Fair value measurements 2013
HK (IFRIC) Int 20 Stripping costs in the production phase of a surface mine
2013
HKAS 32 (Amendment) Financial instruments: presentation – offsetting financial assets and financial liabilities
2014
HKFRS 7 (Amendment) Financial instruments: disclosures – offsetting financial assets and financial liabilities
2013
The above standards, amendments or interpretation will be adopted in the years listed and the Group is in the
process of assessing their impact on future accounting periods.
b Basis of ConsolidationThe consolidated financial statements incorporate the accounts of the Company and all its subsidiary companies
made up to the balance sheet date. The results of subsidiary companies acquired or disposed of during the year
are included as from the effective dates of acquisition or up to the effective dates of disposal respectively.
Inter-company transactions, balances and unrealised gains on transactions between group companies are
eliminated. Unrealised losses are also eliminated. Accounting policies of subsidiary companies have been changed
where necessary in the consolidated accounts to ensure consistency with the policies adopted by the Group.
CITIC Pacific Annual Report 2011
Notes to the Financial Statements
132
1 Significant Accounting Policies continued
c Goodwill Goodwill arising on the acquisition of subsidiary companies, jointly controlled entities and associated companies
represents the excess of the consideration transferred, the amount of any non-controlling interest in the acquiree
and the fair value of any previous equity interest in the acquiree at the date of acquisition over the fair value of the
Group’s share of the identifiable net assets acquired is recorded as goodwill. If this is less than the fair value of the
net assets of the subsidiary acquired in the case of a bargain purchase, the difference is recognised directly in the
income statement.
Positive goodwill will be stated in the consolidated balance sheet as a separate asset or included within jointly
controlled entities and associated companies at cost less accumulated impairment losses and is subject to
impairment testing at least annually. Impairment losses on goodwill are not reversed. Negative goodwill is
recognised in profit and loss account immediately on acquisition.
d Subsidiary Companies and Non-Controlling InterestsA subsidiary company is a company which is controlled by the Company through share ownership or otherwise.
Control represents the power to govern the financial and operating policies of that company.
The acquisition method of accounting is used to account for the acquisition of subsidiary companies. The consideration
transferred for the acquisition is measured as the fair value of the assets given, equity instruments issued and
liabilities incurred or assumed at the date of exchange. The consideration transferred includes the fair value of any
asset or liability resulting from a contingent consideration arrangement. Acquisition-related costs are expensed as
incurred. Identifiable assets acquired and liabilities and contingent liabilities assumed in a business combination
are measured initially at their fair value at the acquisition date. There is a choice, on the basis of each acquisition
to measure the non-controlling interest in the acquiree either at fair value or at the non-controlling interest’s
proportionate share of the acquiree’s net assets.
Non-controlling interest is the equity in a subsidiary which is not attributable, directly or indirectly, to a parent.
The Group treats transactions with non-controlling interests (namely, acquisitions of additional interests and
disposals of partial interests in subsidiaries that do not result in a loss of control) as transactions with equity owners
of the Group, instead of transactions with parties not within the Group. For purchases of additional interests in
subsidiaries from non-controlling shareholders, the difference between any consideration paid and the relevant
share acquired of the carrying value of net assets of the subsidiary is recorded in equity. Gains or losses on disposals
of partial interests to non-controlling shareholders are also recorded in equity.
When control is lost, any remaining interest in the subsidiary company is re-measured to fair value and the
difference between the fair value and the carrying value is recognised in the profit and loss account.
Investments in subsidiary companies are carried in the Company’s balance sheet at cost less any impairment.
The results of subsidiary companies are accounted for by the Company on the basis of dividends received
and receivable.
CITIC Pacific Annual Report 2011

133
1 Significant Accounting Policies continued
e Jointly Controlled EntitiesA jointly controlled entity is a joint venture in which the Group and other parties undertake an economic activity
which is subject to joint control.
The consolidated profit and loss account includes the Group’s share of the results of the jointly controlled entities
for the year, unless the jointly controlled entity is classified as held for sale (or included in a disposal group held for
sale), and adjusted by impairment losses, if any. The consolidated balance sheet includes the Group’s share of the
net assets of the jointly controlled entities and goodwill on acquisition.
When the Group’s share of losses equals or exceeds its interest in the jointly controlled entity, including any
unsecured receivables, the Group does not recognise further losses, unless it has incurred obligations or made
payments on behalf of the jointly controlled entity.
Unrealised gains on transactions between the Group and its jointly controlled entities are eliminated to the extent
of the Group’s interest in the jointly controlled entities. Unrealised losses are also eliminated unless the transaction
provides evidence of an impairment of an asset transferred.
Share of results of jointly controlled entities have been adjusted where necessary to ensure consistency with the
accounting policies adopted by the Group.
In the Company’s balance sheet, the investments in jointly controlled entities are stated at cost less any impairment
losses. The results of jointly controlled entities are accounted for by the Company on the basis of dividends received
and receivable.
f Associated CompaniesAssociated companies are companies, other than subsidiary companies and jointly controlled entities, in which
the Group generally holds not more than 50 per cent of the equity share capital for the long term and over whose
management it can exercise significant influence.
The consolidated profit and loss account includes the Group’s share of the results of associated companies for
the year, unless the associated company is classified as held for sale (or included in a disposal group held for sale),
and adjusted by impairment losses, if any. The consolidated balance sheet includes the Group’s share of net assets
of the associated companies, after attributing fair values to the net assets at the date of acquisition.
When the Group’s share of losses in an associate equals or exceeds its interest in the associated company, including
any unsecured receivables, the Group does not recognise further losses, unless it has incurred obligations or made
payments on behalf of the associated company.
Unrealised gains on transactions between the Group and its associated companies are eliminated to the extent
of the Group’s interest in the associated companies. Unrealised losses are also eliminated unless the transaction
provides evidence of an impairment of an asset transferred.
Share of results of associated entities have been adjusted where necessary to ensure consistency with the
accounting policies adopted by the Group.
In the Company’s balance sheet, the investments in associated companies are stated at cost less any impairment.
The results of associated companies are only reflected to the extent dividends are received or are receivable.
CITIC Pacific Annual Report 2011
Notes to the Financial Statements
134
1 Significant Accounting Policies continued
g Property, Plant and EquipmentProperty, plant and equipment are carried at cost less accumulated depreciation and accumulated impairment.
Property, plant and equipment include leasehold land classified as finance leases. Please refer to note 1(m) for the
accounting policy on leasehold land classified as finance leases.
Assets in the course of construction for production, rental or administrative purposes are carried at cost, less any
impairment. Cost includes the cost of materials, direct labour, the initial estimate, where relevant, of the costs of
dismantling and removing the items and restoring the site on which they are located, and an appropriate
proportion of overheads.
Construction in progress in respect of the iron ore mining project includes expenditure such as bank charges,
interest costs, equipment hire costs, consultants’ costs and depreciation costs. Such costs are capitalised until
commencement of mine production and then amortised in accordance with note 1(o).
No depreciation is provided in respect of construction in progress. Upon completion and commissioning for
operation, depreciation will be provided at the appropriate rate specified below.
Property, plant and equipment are depreciated at rates sufficient to write off their cost, less impairment losses,
if any, to their estimated residual values, over their estimated useful lives on a straight line basis at the following
annual rates:
Freehold land is not amortised.
• Otherbuildings 2%-10%ortheremaininglease
period of the land where applicable
• Plantandmachinery 6%-20%
• Otherproperty,plantandequipment,comprisingvessels,
telecommunications equipment, traffic equipment,
cargo lighters, computer installations, motor vehicles,
furniture,fixtureandequipment 4%-25%
Assets’ useful lives and residual values are reviewed, and adjusted if appropriate, at each balance sheet date.
An asset’s carrying amount is written down immediately to its recoverable amount if the asset’s carrying amount is
greater than its estimated recoverable amount.
Gains and losses on disposals are determined by comparing the proceeds with the carrying amount and are
recognised within Note 4, in the consolidated profit and loss account.
h Investment PropertiesInvestment properties are interests in land and/or buildings which are held to earn rentals or for capital appreciation
or both. These include land held for a currently undetermined future use. Land held under operating leases is
classified and accounted for as investment property when the rest of the definition of investment property is met.
Investment properties are stated in the balance sheet at fair values which are reviewed annually. Any gain or loss
arising from a change in fair value or from the retirement or disposal of an investment property is recognised in the
consolidated profit and loss account.
CITIC Pacific Annual Report 2011
135
1 Significant Accounting Policies continued
i Properties under DevelopmentProperties under development consist of land for development and buildings under construction and development.
Properties under development for own use – investments in leasehold land are amortised over the lease term,
and are stated at cost less accumulated amortisation and any accumulated impairment. Amortisation of leasehold
land is capitalised as the cost of buildings during the construction period. The investments in buildings under
construction and development are stated at cost less any accumulated impairment losses.
Properties under development for sale are carried at the lower of cost and the estimated net realisable value.
Given the Group’s diverse portfolio of property development projects, there is presently not a uniform operating
cycle and hence properties under development for sale with the development expected to be completed within
one year from the balance sheet date are classified under current assets. Such development properties are
transferred to investment property when and only when there is a change in use as evidenced by the commencement
of an operating lease to another party.
Properties under development for investment purposes are stated in the balance sheet at fair values which are
reviewed annually. Any gain or loss arising from a change in fair value or from the retirement or disposal of an
investment property is recognised in profit or loss account.
j Capitalisation of Development CostsProperty development expenditure, including borrowing costs and professional fees, is capitalised as cost
of development.
Borrowing costs incurred on assets under development that take a substantial period of time to get ready for their
intended use or sale are capitalised into the carrying value of the assets under development.
The capitalisation rate applied to funds borrowed for the development of assets is based on the attributable cost of
funds to the Group.
All other borrowing costs are charged to the profit and loss account in the period in which they are incurred.
k Properties Held for Sale Properties held for sale consisting of leasehold land and buildings are classified under current assets and stated at
the lower of cost and net realisable value. Leasehold land is stated at cost less accumulated amortisation and any
impairment. Building costs are stated at cost less any impairment.
l Other Assets Held for SaleOtherassetsheldforsalearestatedattheircarryingamountwhichistoberecoveredprincipallythroughasale
transaction and a sale is considered highly probable. They are stated at the lower of carrying amount and fair
value less costs to sell if their carrying amount is to be recovered principally through a sale transaction rather
than through continuing use.
m Leasehold LandLeasehold land under operating lease and finance lease arrangements is stated at cost less accumulated
amortisation and impairment. Leasehold land is amortised on a straight-line basis over the lease term.
CITIC Pacific Annual Report 2011
Notes to the Financial Statements
136
1 Significant Accounting Policies continued
n Intangible AssetsIntangible assets are stated at cost less accumulated amortisation and impairment loss, if any. They comprise
goodwill, expenditure on mining rights, car dealerships and a vehicular tunnel concessions. The accounting
policies for goodwill and exploration, evaluation and development expenditure of mining rights are outlined in
accounting policies 1(c) and 1(o).
Amortisation of the vehicular tunnel concession is based on the actual traffic volume in the year compared to the
projected traffic volume for the remainder of the concession period.
o Mining Exploration, Evaluation and Development ExpenditureMining exploration, evaluation and development expenditures incurred are capitalised and carried forward in
respect of each identifiable area of interest where the rights to mine are current and:
• itisexpectedthattheexpenditurewillberecoupedbyfuturedevelopmentandcommercialexploitationor
sale; or,
• atthebalancesheetdate,explorationandevaluationactivitieshavereachedastage,whichpermitsa
reasonable assessment of the existence of economically recoverable reserves, and active and significant
operations are continuing.
Development costs represent costs accumulated for an area of interest where the decision has been made to
develop the mine. Development costs include such costs as plant hire, contractor site labour costs and resource
assessment costs. Exploration and evaluation assets are transferred to development costs when this decision has
been made. Development costs are tested for impairment in accordance with Note 1(y).
Amortisation of costs carried forward is not charged until production commences. When production commences,
capitalised expenditures on exploration, evaluation and development are amortised over the life of the area
of interest to which they relate. Amortisation is recognised in the consolidated profit or loss on a unit of
production method over the estimated useful lives of intangible assets from the date that they are available
for use. Unamortised expenditure relating to that area of interest is written off in the period that abandonment
is decided.
Provision for restoration costs is made at the time when the activities which give rise to the need for restoration
occur, and would form part of the costs of property, plant and equipment. The need for a provision is assessed
annually such that full provision is made by the end of the exploration life of each area.
The ultimate recoupment of costs carried forward for exploration, evaluation and development phases is
dependent on the successful development and commercial exploitation of sale of the respective areas of interest.
All costs carried forward are in respect of areas of interest in the exploration phase and accordingly, production has
not commenced.
Subsequent to the commencement of mining production, expenditure is capitalised only when it increases the
future economic benefits embodied in the specific asset to which it relates. All other expenditure is recognised in
consolidated profit or loss when incurred.
Mining exploration, evaluation and development expenditure is written down to its recoverable amount if it is
lower than its carrying amount.
CITIC Pacific Annual Report 2011
137
1 Significant Accounting Policies continued
p Trade and Other ReceivablesTrade and other receivables are recognised initially at fair value and subsequently measured at amortised cost
using the effective interest method, less provision for impairment. A provision for impairment of trade and other
receivables is established when there is objective evidence that the Group will not be able to collect all amounts
due according to the original terms of the receivables. The amount of the provision is the difference between the
asset’s carrying amount and the present value of estimated future cash flows, discounted at the original effective
interest rate. The amount of the provision is recognised in the profit and loss account.
q Cash and Cash EquivalentsCash and cash equivalents include cash in hand, deposits held at call with banks, other short-term highly liquid
investments with original maturities of three months or less. Bank overdrafts that are repayable on demand
and form an integral part of the group’s cash management are also included as a component of cash and cash
equivalents for the purpose of the consolidated cash flow statement.
r BorrowingsBorrowings are recognised initially at fair value, net of transaction costs incurred. Transaction costs are incremental
costs that are directly attributable to the acquisition, issue or disposal of a financial asset or financial liability,
including fees and commissions paid to agents, advisers, brokers and dealers, levies by regulatory agencies and
securities exchanges, and transfer taxes and duties. Borrowings are subsequently stated at amortised cost; any
difference between the proceeds (net of transaction costs) and the redemption value is recognised in the profit
and loss account over the period of the borrowings using the effective interest method.
Borrowings are classified as current liabilities unless the Group has an unconditional right to defer settlement of
the liability for at least 12 months after the balance sheet date.
s ProvisionsProvisions are made when the Group has a present legal or constructive obligation as a result of past events, it is
more likely than not that an outflow of resources will be required to settle the obligation and the amount has been
reliably estimated. Provisions are not made for future operating losses.
In respect of the Group’s iron ore mining operations:
i) Site restorationIn accordance with the iron ore mining group’s environmental policy and applicable legal requirements, the Group
has an obligation to conduct rehabilitation works in respect of disturbed areas comprising the waste rock dumps,
open areas, open pits and abandonment bunds. A non-current provision has been made for the site restoration
commitment with the corresponding property, plant and equipment increased by an equivalent amount.
ii) Mining rightsIn accordance with the mining rights/lease agreements entered into by two subsidiary companies of the Company,
the Group is committed to pay a defined royalty if either of the two subsidiary companies’ production is less
than 6 million tonnes by March 2013. A provision has been made for this commitment with the corresponding
intangible assets increased by an equivalent amount.
CITIC Pacific Annual Report 2011
Notes to the Financial Statements
138
1 Significant Accounting Policies continued
t Share CapitalShare capital issued by the Company is recorded at the proceeds received, net of direct issue costs.
u Segment ReportingOperatingsegments,andtheamountsofeachsegmentitemreportedinthefinancialstatements,areidentified
from the financial information provided regularly to the Group’s most senior executive management for the
purposes of allocating resources to, and assessing the performance of, the Group’s various lines of business and
geographical locations.
Geographically, management considers separate segments as mainland China, Hong Kong, Australia and others.
The performance of the operating segments is assessed on the profit attributable to the shareholders of the Company.
Gain from leveraged foreign exchange contracts and net exchange gain are attributable to the corporate segment,
as the cash position of the Group is managed centrally by the corporate treasury function.
Individually material operating segments are not aggregated for financial reporting purposes unless the segments
have similar economic characteristics and are similar in respect of the nature of products and services, the nature
of production processes, the type or class of customers, the methods used to distribute the products or provide the
services,andthenatureoftheregulatoryenvironment.Operatingsegmentswhicharenotindividuallymaterial
may be aggregated if they share a majority of these criteria.
v Revenue Recognitioni) Sales of goodsRevenue arising from the sales of goods is generally recognised on the delivery of goods to customers. Revenue is
after deduction of any trade discounts.
Revenue arising from the sale of motor vehicles is recognised when the registration document is issued or on
delivery of the vehicle, whichever is earlier. This is taken to be the point in time when the customer has accepted
the goods and the related risks and rewards of ownership. Revenue excludes any government taxes and is after
deduction of any trade discounts.
ii) Rendering of servicesCommission income is recognised when the goods concerned are sold to customers.
Revenue arising from the rendering of repairing services is recognised when the relevant work is completed.
Revenue from the provision of telecommunications services is recognised upon delivery of the service.
(iii) Sales of properties under development and properties held for saleRevenue from sales of properties under development is only recognised when the significant risks and rewards
of ownership have been transferred to the buyer. The Group considers that the significant risks and rewards of
ownership are transferred when the buildings contracted for sale are completed and the relevant permits essential
for the delivery of the properties have been issued by the authorities.
Revenue from completed properties held for sale is recognised at the date when the sales agreement is signed.
iv) Toll incomeToll income is recognised as revenue when the service is provided.
CITIC Pacific Annual Report 2011
139
1 Significant Accounting Policies continued
v Revenue Recognition continued
v) Rental incomeRental income is recognised as revenue on a straight-line basis over the period of the relevant lease.
vi) Dividend incomeDividend income is recognised when the right to receive the dividend is established.
Dividends proposed or declared after their balance sheet date by companies in which the Group has an investment
are not recognised as revenue at the balance sheet date but on the date when the right to receive the dividend
is established.
w Financial InstrumentsThe Group classifies its financial assets in the following categories: (i) financial assets at fair value through profit
or loss, (ii) loans and receivables, (iii) available-for-sale financial assets and, (iv) derivative financial instruments.
The classification depends on the purpose for which the financial asset was acquired. Management determines the
classification of its financial assets on initial recognition and re-evaluates this designation at every reporting date.
Purchases and sales of all categories financial assets are recognised on their trade-date – the date on which the
Group commits to purchase or sell the assets. Financial assets are initially recognised at fair value plus transaction
costs except financial assets carried at fair value through profit or loss.
Financial assets are derecognised when the rights to receive cash flows from the investments have expired or have
been legally transferred and the Group has transferred substantially all risks and rewards of ownership.
The Group assesses at each balance sheet date whether there is objective evidence that a financial asset or a group
of financial assets is impaired. In the case of equity investments classified as available-for-sale, a significant or
prolonged decline in the fair value of the investment below its cost is considered in determining whether the
investments are impaired. Impairment losses recognised in the profit and loss account on equity instruments are
not reversed through the profit and loss account.
i) Financial assets at fair value through profit or lossThis category has two sub-categories: financial assets held for trading, and those designated at fair value through
profit or loss at inception. A financial asset is classified in this category if acquired principally for the purpose of
selling in the short term. Derivatives are also categorised as held for trading unless they are designated as hedges.
Assets in this sub-category are classified as current assets if they are either held for trading or are expected to be
realised within 12 months of the balance sheet date.
Realised and unrealised gains and losses arising from changes in the fair value of the “financial assets at fair value
through profit or loss” category are included in the profit and loss account in the period in which they arise.
ii) Loans and receivablesLoans and receivables are non-derivative financial assets with fixed or determinable payments that are not quoted
in an active market. They arise when the Group provides money, goods or services directly to a debtor with no
intention of trading the receivables. They are included in current assets, unless maturity is greater than 12 months
after the balance sheet date. These are classified as non-current assets. Loans and receivables are included in debtors,
accounts receivable, deposits and prepayments in the balance sheet.
Loans and receivables and held-to-maturity investments are initially recognised at fair value plus transaction costs
and subsequently carried at amortised cost using the effective interest method.
CITIC Pacific Annual Report 2011
Notes to the Financial Statements
140
1 Significant Accounting Policies continued
w Financial Instruments continued iii) Available-for-sale financial assetsAvailable-for-sale financial assets are non-derivatives that are either designated in this category or not classified in
any of the other categories. They are included in non-current assets unless management intends to dispose of the
investment within 12 months of the balance sheet date.
Available-for-sale investments are carried at fair value, or cost less impairment loss if their fair value cannot be
reliably measured. Gains and losses arising from changes in fair value are recognised in investment revaluation
reserve.Onthedisposaloftheinvestmentorwhenaninvestmentisdeterminedtobeimpaired,thecumulative
gain or loss previously recognised in investment revaluation reserve will be transferred to the profit and loss account.
iv) Derivative financial instrumentsDerivatives are stated at fair value. The gain or loss on change in fair values is recognised in the profit and loss
account unless the derivative qualifies for hedge accounting.
Cash flow hedges Where a derivative qualifies for hedge accounting and is designated as a cash flow hedge, whether on the variability
in cash flows of a recognised asset or liability or a highly probable forecast transaction or the foreign currency risk
of a committed future transaction, the effective part of any unrealised gain or loss on the instrument is recognised
directly in hedging reserve and the ineffective part in the profit and loss account. The cumulative gain or loss
associated with the effective part of the cash flow hedge recorded in hedging reserve will be recognised in the
profit and loss account in the same period or periods during which the transaction it hedges is recognised in the
profit and loss account. However, when the forecast transaction that is hedged results in the recognition of a
non-financial asset (for example, inventory or fixed assets), the gains and losses previously deferred in equity are
transferred from equity and included in the initial measurement of the cost of the asset. The deferred amounts are
ultimately recognised in cost of goods sold in the case of inventory, or in depreciation in the case of fixed assets.
When a hedging instrument expires or is sold, terminated or exercised, or the designation of the hedge relationship
is revoked but the hedged forecast transaction is still expected to occur, the cumulative gain or loss at that point
remains in equity until the transaction occurs and it is recognised in accordance with the above policy. If the
hedged transaction is no longer expected to take place, the cumulative unrealised gain or loss is reclassified from
equity to profit or loss immediately.
Hedge of net investments in foreign operationsThe portion of the gain or loss on remeasurement to fair value of an instrument used to hedge a net investment
in a foreign operation that is determined to be an effective hedge is recognised in other comprehensive income
and accumulated separately in equity in the exchange reserve until the disposal of the foreign operation, at which
time the cumulative gain or loss is reclassified from equity to profit and loss. The ineffective portion is recognised
immediately in profit and loss.
The fair values of various derivative instruments used for hedging purposes are disclosed in Note 32. Movements
on the hedging reserve in shareholders’ equity are shown in Note 28. When the remaining maturity of the hedged
item is more than 12 months, the full fair value of a hedging derivative is classified as a non-current asset or liability.
x Operating LeasesLeases where substantially all the rewards and risks of ownership of assets remain with the lessor are accounted for
as operating leases. Rentals payable and receivable under operating leases are accounted for on a straight line
basis over the respective periods of the leases.
CITIC Pacific Annual Report 2011
141
1 Significant Accounting Policies continued
y Impairment of AssetsAssets that have an indefinite useful life are tested for impairment annually. Assets that are subject to amortisation
are reviewed for impairment to determine whether there is any indication the carrying value of these assets may
not be recoverable. If such assets are considered to be impaired, the impairment to be recognised in the profit
and loss account is measured by the amount by which the carrying amount of the assets exceeds the recoverable
amount. The recoverable amount is the higher of an asset’s fair value less costs to sell and value in use. For the
purposes of assessing impairment, assets are grouped at the lowest levels for which there are separately identifiable
cash inflows (called cash-generating units). Non-financial assets other than goodwill that suffered an impairment
are reviewed for possible reversal of the impairment at each reporting date.
z InventoriesInventories comprise mainly iron ore, scrap metal, steel, motor vehicles, spare parts, electrical appliances, food and
other trading items. They are valued at the lower of cost and net realisable value. Cost represents the actual cost of
purchase or production and is calculated on the first-in first-out, specific identification or weighted average basis
as appropriate. Net realisable value is the estimated selling price in the ordinary course of business, less applicable
variable selling expenses.
aa Foreign CurrenciesThe consolidated and the Company’s accounts are presented in Hong Kong dollars, which is the Company’s
functional and presentation currency. Items included in the financial statements of each of the Group’s entities
are measured using the currency of the primary economic environment in which the entity operates (the
“functional currency”).
Transactions in foreign currencies are translated into the functional currency at the rates ruling at the transaction
dates. Foreign exchange gains and losses resulting from the settlement of such transactions and from the translation
at year-end exchange rates of monetary assets and liabilities denominated in foreign currencies are recognised in
the profit and loss account, except when deferred in equity as a qualifying cash flow hedge or net investment hedge.
Assets and liabilities of subsidiary companies, jointly controlled entities and associated companies, together with
all other monetary assets and liabilities expressed in foreign currencies, are translated into Hong Kong dollars at
the rates of exchange at the balance sheet date. Results in foreign currencies are translated at the average rates
of exchange ruling during the year. All resulting exchange differences are recognised as a separate component of
equity – exchange fluctuation reserve.
Exchange differences arising from the translation of the net investment in foreign entities, and of financial
instruments which are designated as hedges of such investment, are taken directly to the exchange fluctuation
reserve.Onthedisposaloftheseinvestments,suchexchangedifferencesarerecognisedintheconsolidatedprofit
and loss account as part of the profit or loss on disposal.
When a gain or loss on a non-monetary item is recognised directly in equity, any translation difference on that gain
or loss is recognised directly in equity. When a gain or loss on a non-monetary item is recognised in the profit and
loss account any translation difference on that gain or loss is recognised in the profit and loss account.
Goodwill and fair value adjustments arising on acquisition of a foreign entity after 1 January 2005 are treated as
assets and liabilities of the foreign entity and translated at the rate of exchange ruling at the balance sheet date.
Such differences are taken directly to the exchange fluctuation reserve.
CITIC Pacific Annual Report 2011
Notes to the Financial Statements
142
1 Significant Accounting Policies continued
bb Deferred TaxationThe balance sheet liability method is adopted whereby deferred tax is recognised in respect of temporary
differences between the tax bases of assets and liabilities and their carrying amounts. However, the deferred tax
is not accounted for if it arises from initial recognition of an asset or liability in a transaction other than a business
combination that at the time of the transaction affects neither accounting nor taxable profit or loss; or in respect
of those temporary differences which arise either from goodwill not deductible for tax purposes, or relating to
investments in subsidiary companies to the extent that the Group controls the timing of the reversal and it is
probable that the temporary differences will not reverse in the foreseeable future, or in the case of deductible
differences, unless it is probable that they will reverse in the future.
Provision for withholding tax that will arise on the remittance of retained earnings is only made where there is a
current intention to remit such earnings.
Deferred tax assets are recognised to the extent that their future utilisation is probable. Deferred tax arising from
revaluation of investment properties is recognised on the rebuttable presumption that the recovery of the carrying
amount of the properties would be through sale and calculated at the applicable tax rates.
Deferred tax assets and liabilities are offset when there is a legally enforceable right to offset current tax assets
against current tax liabilities and when the deferred tax assets and liabilities relate to income taxes levied by the
same taxation authority on either the taxable entity or different taxable entities where there is an intention to
settle the balances on a net basis.
cc Employee Benefitsi) Short-term employee benefits and contributions to defined contribution retirement plansSalaries, annual bonuses, paid annual leave, contributions to defined contribution retirement plans and the cost of
non-monetary benefits are accrued in the year in which the associated services are rendered by employees. Where
payment or settlement is deferred and the effect would be material, these amounts are stated at their present values.
ii) Share-based paymentsThe Group operates a share option scheme. The fair value of the employee services received in exchange for the
grant of the options is recognised as an expense over the vesting period with a corresponding increase in capital
reserve. Fair values of share option awards, measured at the date of grant of the award, are calculated using a
binomial lattice model methodology that is based on the underlying assumptions of the Black-Scholes model.
The total amount to be expensed over the vesting period is determined by reference to the fair value of the
options granted. The fair value excludes the impact of any non-market services and performance vesting conditions
(for example, profitability, sales growth targets and remaining an employee of the entity over a specified time period).
Non-market vesting conditions are included in assumptions about the number of options that are expected to vest.
At each balance sheet date, the Group revises its estimates of the number of options that are expected to become
exercisable and recognises the impact of the revision, if any, in the consolidated profit and loss account.
iii) Termination benefitsTermination benefits are recognised when, and only when, the Group demonstrably commits itself to terminate
employment or to provide benefits as a result of voluntary redundancy by having a detailed formal plan which is
without realistic possibility of withdrawal.
CITIC Pacific Annual Report 2011
143
2 Critical Accounting Estimates and Judgements
Estimates and judgements are continually evaluated and are based on historical experience and other factors,
including expectations of future events that are believed to be reasonable under the circumstances.
The Group makes estimates and assumptions concerning the future. The resulting accounting estimates will, by
definition, seldom equal the actual results. The estimates and assumptions that have a significant risk of causing a
material adjustment to the carrying amounts of assets and liabilities within the next financial year are discussed below.
i) Investment propertiesThe fair values of investment properties are determined annually by independent qualified valuers on an open
market value at the balance sheet date on an existing use basis calculated on the net income allowing for
reversionary potential.
ii) Impairment of goodwillThe Group tests annually whether goodwill has suffered any impairment, in accordance with the accounting policy
stated in Note 1(y). For the purposes of impairment testing, goodwill acquired has been allocated to individual
cash-generating units which are reviewed for impairment based on forecast operating performance and cash flows.
The recoverable amount of an asset or a cash-generating unit is determined based on value-in-use calculations.
Cash flow projections are prepared on the basis of reasonable assumptions reflective of prevailing and future
market conditions, and are discounted appropriately.
iii) Impairment of assetsThe Group has made substantial investments in tangible and intangible assets. The Group considers impairment
assessment as an area requiring extensive application of judgement and estimation. Assets that have an indefinite
usefullifearetestedforimpairmentannually.Otherassetsarereviewedforimpairmentwhenthereisanindication
that the carrying value of these assets may not be recoverable. If such indication exists, the recoverable amount of
the asset is estimated in order to determine the extent of the impairment loss, if any. The recoverable amount is
the higher of an asset’s fair value less costs to sell and value in use. Such impairment loss is recognised in the profit
and loss account.
Mining operationThe Group’s mining operation is considered as a separate cash generating unit. Whenever events or circumstances
indicate an impairment may have occurred, the Group tests whether assets attributable to the Group’s mining
operations have suffered any impairment. The recoverable amount of the mining operation is determined based
on fair value less costs to sell which is based on cashflow projections that incorporate best estimates of selling prices,
ore grades, exchange rates, production rates, future capital expenditure and production costs over the life of the
mine. In line with normal practice in the mining industry, the cash flow projections are based on long term mine
plans covering the expected life of the operation. Therefore, the projections cover periods well in excess of five years.
Assumptions about selling prices, operating costs, exchange rates and discount rates are particularly important;
the determination of the recoverable amount is relatively sensitive to changes in these important assumptions.
CITIC Pacific Annual Report 2011
Notes to the Financial Statements
144
2 Critical Accounting Estimates and Judgements continued
iii) Impairment of assets continued
Property, plant and equipmentThe Group reviews property, plant and equipment for impairment whenever events or changes in circumstances
indicate that the related carrying amounts may not be recoverable. Determining whether an impairment has
occurred typically requires various estimates and assumptions, including determining which cash flows are directly
related to the potentially impaired asset, the useful life over which cash flows will occur, their amount, and the
asset’s residual value, if any. In turn, measurement of an impairment loss requires a determination of recoverable
amount, which is based on the best information available. The Group derives the required cash flow estimates
from historical experience and internal business plans. To determine recoverable amount, the Group uses cash
flow estimates discounted at an appropriate discount rate, quoted market prices when available and independent
appraisals, as appropriate.
Properties under developmentThe Group writes down properties under development to their recoverable amount based on the assessment
of recoverability which takes into account cost to completion based on past experience and cash flow estimates
discounted at an appropriate discount rate, quoted market prices when available and independent appraisals, as
appropriate. Write downs are recorded where events or changes in circumstances indicate that the balances may
not be fully realised. The identification of write downs requires the use of judgement and estimates. Where the
expectation is different from the original estimate, the carrying value of properties under development is adjusted
to profit and loss account in the period in which such estimate is changed.
Jointly controlled entities and associated companiesThe Group regularly reviews investments in jointly controlled entities and associated companies for impairment
based on both quantitative and qualitative criteria. Such analysis typically includes various estimates and
assumptions, the intent and ability to hold to maturity or until forecasted recovery, the financial health,
cash flow projections and future prospects of the companies.
Debtors, accounts receivables, deposits and prepaymentsDebtors, accounts receivables, deposits and prepayments are assessed and impairment provided based on regular
review of the ageing analysis and evaluation of collectability. A considerable level of judgement is exercised by
the management when assessing the credit worthiness and past collection history of each individual customer.
An increase or decrease in the impairment loss would affect the profit in future years.
CITIC Pacific Annual Report 2011
145
2 Critical Accounting Estimates and Judgements continued
iv) DepreciationDepreciation of operating assets constitutes a substantial operating cost for the Group. The cost of fixed assets
is charged as depreciation expense over the estimated useful life of the respective assets using the straight-line
method. The management periodically reviews changes in technology and industry conditions, asset retirement
activity and residual values to determine adjustments to estimated remaining useful lives and depreciation rates.
v) Provision for inventoriesThe Group reviews the carrying amounts of inventories at each balance sheet date to determine whether the
inventories are carried at lower of cost and net realisable value in accordance with the accounting policy set out
in Note 1(z). Management estimates the net realisable value based on the current market situation and historical
experience on similar inventories. Any change in the assumptions would increase or decrease the amount of
inventories write-down or the related reversals of write-down and affect the Group’s profit and net asset value.
vi) Fair value of derivative financial instrumentsThe fair values of outstanding derivative transactions are based on independent valuations by Reval Inc., a derivative
risk management and hedge accounting solutions firm, and are cross checked against fair values obtained from
major financial institutions. Judgement is required in determining such valuations. Changes in the underlying
assumptions could materially impact profit and loss or equity.
vii) Income taxesThe Group is subject to income taxes in numerous jurisdictions. Significant judgement is required in determining
the provision for income taxes. There are many transactions and calculations for which the ultimate tax determination
is uncertain during the ordinary course of business. Where the final tax outcome is different from the amounts that
were initially recorded, such differences will impact the income tax and deferred tax provisions in the period in
which such determination is made.
Recognition of deferred tax assets, which principally relate to tax losses, depends on the management’s expectation
that future taxable profit will be available against which the tax losses can be utilised. The outcome of their actual
utilisation may be different.
CITIC Pacific Annual Report 2011
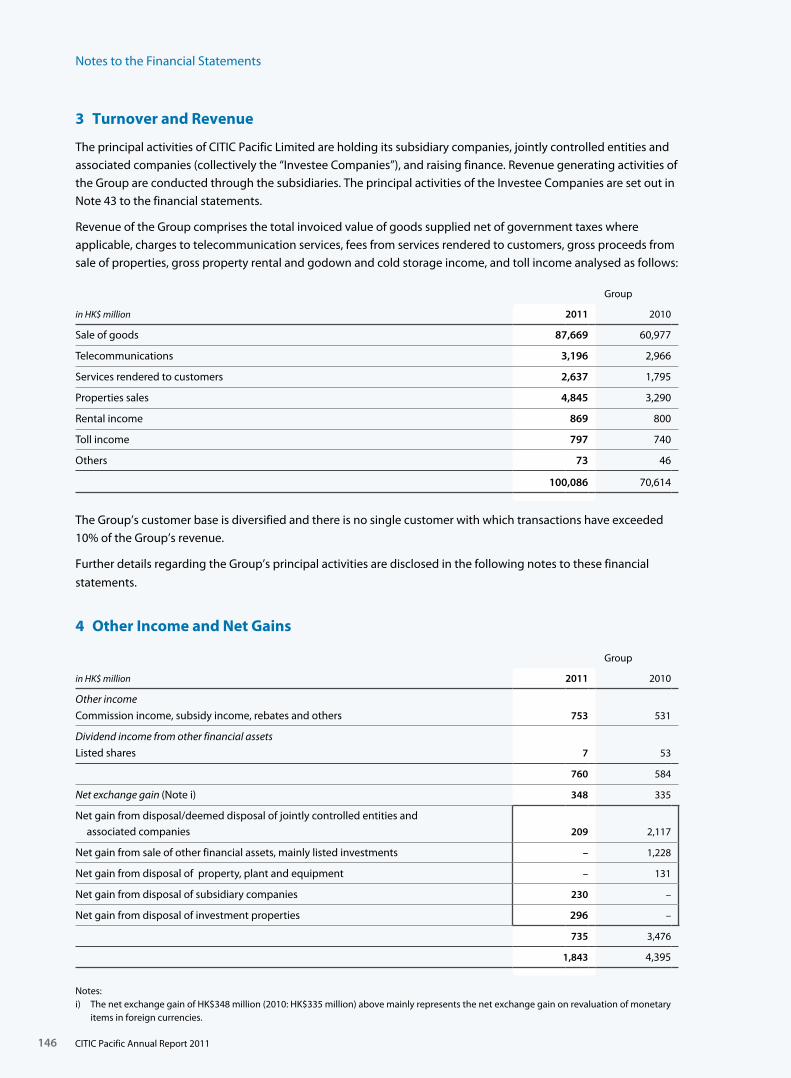
Notes to the Financial Statements
146
3 Turnover and Revenue
The principal activities of CITIC Pacific Limited are holding its subsidiary companies, jointly controlled entities and
associated companies (collectively the “Investee Companies”), and raising finance. Revenue generating activities of
the Group are conducted through the subsidiaries. The principal activities of the Investee Companies are set out in
Note 43 to the financial statements.
Revenue of the Group comprises the total invoiced value of goods supplied net of government taxes where
applicable, charges to telecommunication services, fees from services rendered to customers, gross proceeds from
sale of properties, gross property rental and godown and cold storage income, and toll income analysed as follows:
Group
in HK$ million 2011 2010
Sale of goods 87,669 60,977
Telecommunications 3,196 2,966
Services rendered to customers 2,637 1,795
Properties sales 4,845 3,290
Rental income 869 800
Toll income 797 740
Others 73 46
100,086 70,614
The Group’s customer base is diversified and there is no single customer with which transactions have exceeded
10% of the Group’s revenue.
Further details regarding the Group’s principal activities are disclosed in the following notes to these financial
statements.
4 Other Income and Net Gains
Group
in HK$ million 2011 2010
Other income
Commission income, subsidy income, rebates and others 753 531
Dividend income from other financial assets
Listed shares 7 53
760 584
Net exchange gain (Note i) 348 335
Net gain from disposal/deemed disposal of jointly controlled entities and associated companies 209 2,117
Net gain from sale of other financial assets, mainly listed investments – 1,228
Net gain from disposal of property, plant and equipment – 131
Net gain from disposal of subsidiary companies 230 –
Net gain from disposal of investment properties 296 –
735 3,476
1,843 4,395
Notes: i) The net exchange gain of HK$348 million (2010: HK$335 million) above mainly represents the net exchange gain on revaluation of monetary
items in foreign currencies.
CITIC Pacific Annual Report 2011
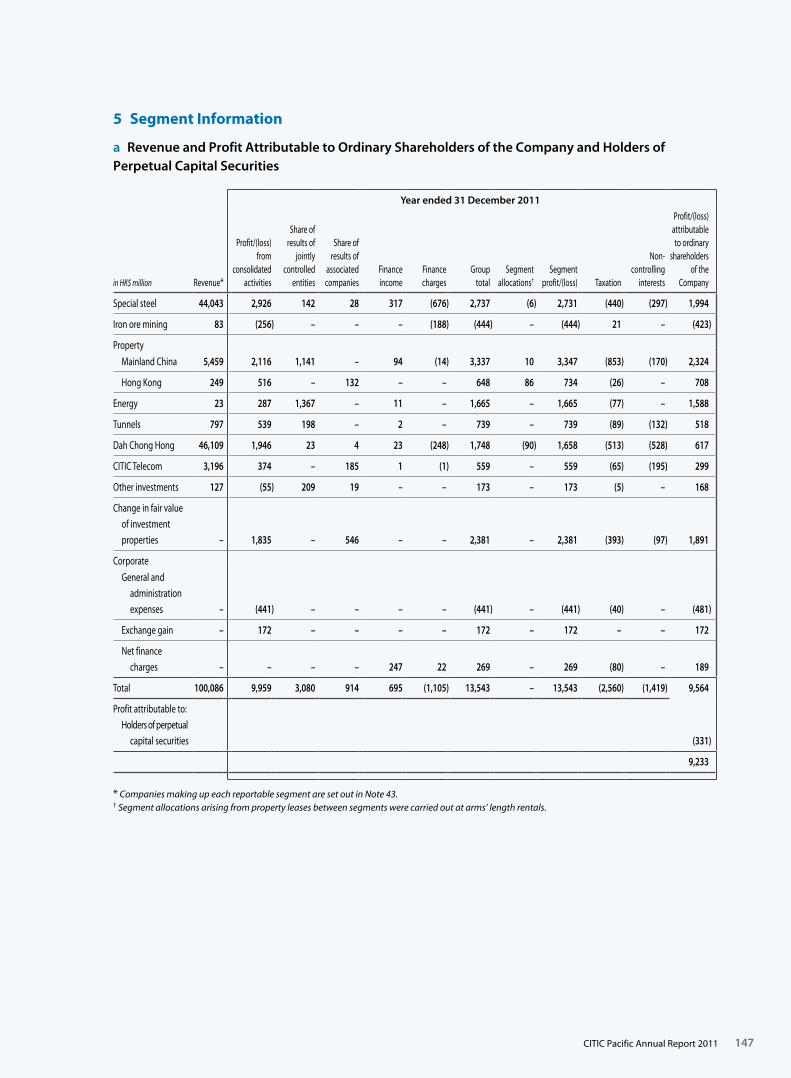
147
5 Segment Information
a Revenue and Profit Attributable to Ordinary Shareholders of the Company and Holders of Perpetual Capital Securities
Year ended 31 December 2011
in HK$ million Revenue*
Profit/(loss) from
consolidated activities
Share of results of
jointly controlled
entities
Share of results of
associated companies
Finance income
Finance charges
Group total
Segment allocations†
Segment profit/(loss) Taxation
Non- controlling
interests
Profit/(loss) attributable to ordinary
shareholders of the
Company
Special steel 44,043 2,926 142 28 317 (676) 2,737 (6) 2,731 (440) (297) 1,994
Iron ore mining 83 (256) – – – (188) (444) – (444) 21 – (423)
Property
Mainland China 5,459 2,116 1,141 – 94 (14) 3,337 10 3,347 (853) (170) 2,324
Hong Kong 249 516 – 132 – – 648 86 734 (26) – 708
Energy 23 287 1,367 – 11 – 1,665 – 1,665 (77) – 1,588
Tunnels 797 539 198 – 2 – 739 – 739 (89) (132) 518
Dah Chong Hong 46,109 1,946 23 4 23 (248) 1,748 (90) 1,658 (513) (528) 617
CITIC Telecom 3,196 374 – 185 1 (1) 559 – 559 (65) (195) 299
Other investments 127 (55) 209 19 – – 173 – 173 (5) – 168
Change in fair value of investment properties – 1,835 – 546 – – 2,381 – 2,381 (393) (97) 1,891
Corporate
General and administration expenses – (441) – – – – (441) – (441) (40) – (481 )
Exchange gain – 172 – – – – 172 – 172 – – 172
Net finance charges – – – – 247 22 269 – 269 (80) – 189
Total 100,086 9,959 3,080 914 695 (1,105) 13,543 – 13,543 (2,560) (1,419) 9,564
Profit attributable to: Holders of perpetual capital securities (331)
9,233
* Companies making up each reportable segment are set out in Note 43.† Segment allocations arising from property leases between segments were carried out at arms’ length rentals.
CITIC Pacific Annual Report 2011
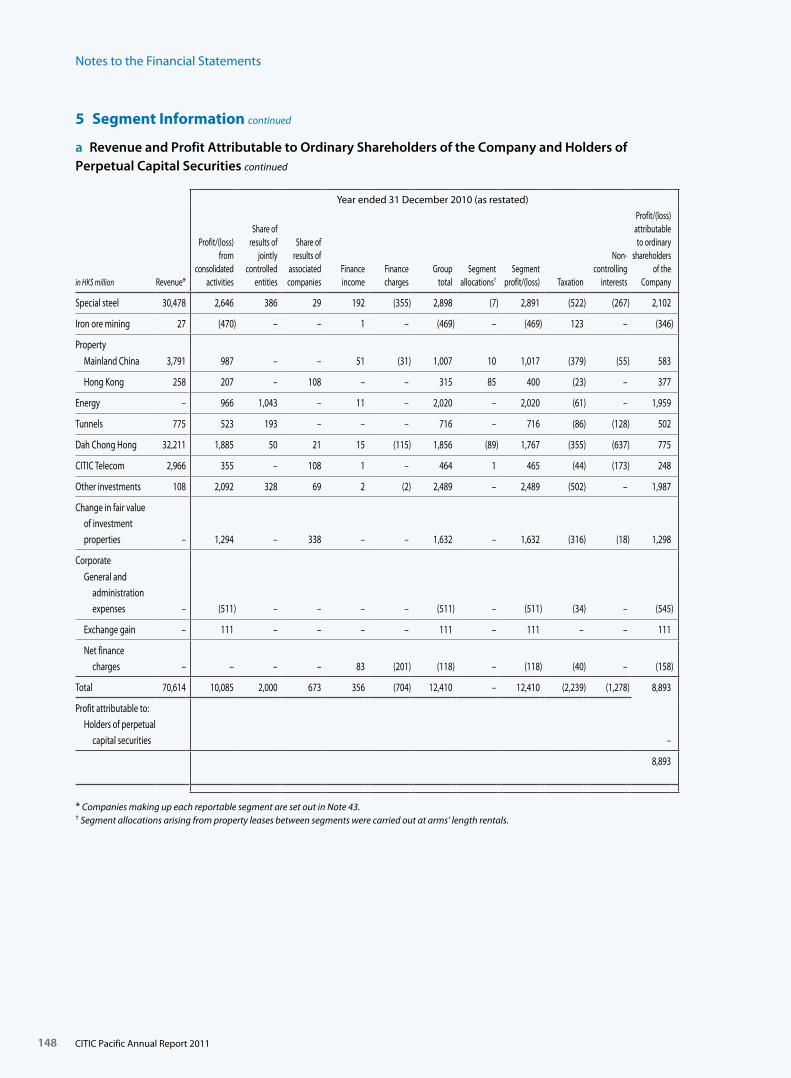
Notes to the Financial Statements
148
5 Segment Information continued
a Revenue and Profit Attributable to Ordinary Shareholders of the Company and Holders of Perpetual Capital Securities continued
Year ended 31 December 2010 (as restated)
in HK$ million Revenue*
Profit/(loss) from
consolidated activities
Share of results of
jointly controlled
entities
Share of results of
associated companies
Finance income
Finance charges
Group total
Segment allocations†
Segment profit/(loss) Taxation
Non- controlling
interests
Profit/(loss) attributable to ordinary
shareholders of the
Company
Special steel 30,478 2,646 386 29 192 (355) 2,898 (7) 2,891 (522) (267) 2,102
Iron ore mining 27 (470) – – 1 – (469) – (469) 123 – (346)
Property
Mainland China 3,791 987 – – 51 (31) 1,007 10 1,017 (379) (55) 583
Hong Kong 258 207 – 108 – – 315 85 400 (23) – 377
Energy – 966 1,043 – 11 – 2,020 – 2,020 (61) – 1,959
Tunnels 775 523 193 – – – 716 – 716 (86) (128) 502
Dah Chong Hong 32,211 1,885 50 21 15 (115) 1,856 (89) 1,767 (355) (637) 775
CITIC Telecom 2,966 355 – 108 1 – 464 1 465 (44) (173) 248
Other investments 108 2,092 328 69 2 (2) 2,489 – 2,489 (502) – 1,987
Change in fair value of investment properties – 1,294 – 338 – – 1,632 – 1,632 (316) (18) 1,298
Corporate
General and administration expenses – (511) – – – – (511) – (511) (34) – (545)
Exchange gain – 111 – – – – 111 – 111 – – 111
Net finance charges – – – – 83 (201) (118) – (118) (40) – (158)
Total 70,614 10,085 2,000 673 356 (704) 12,410 – 12,410 (2,239) (1,278) 8,893
Profit attributable to: Holders of perpetual capital securities –
8,893
* Companies making up each reportable segment are set out in Note 43.† Segment allocations arising from property leases between segments were carried out at arms’ length rentals.
CITIC Pacific Annual Report 2011

149
5 Segment Information continued
a Revenue and Profit Attributable to Ordinary Shareholders of the Company and Holders of Perpetual Capital Securities continued
An analysis of the Group’s revenue by geographical area is as follows:
Group
in HK$ million 2011 2010
Mainland China 78,804 54,102
Hong Kong 12,547 11,574
Other countries 8,735 4,938
100,086 70,614
b Assets and Liabilities An analysis of the Group’s segment assets and liabilities by operating segment is as follows:
Segment assets†
Investments in jointly
controlled entities
Investments in associated companies
Total assets
Segment liabilities†
Total net assets
Additions of non-current
assets* (other than
financial instruments and deferred
tax assets)
in HK$ million31 Dec
2011
Asrestated 31 Dec
2010
Asrestated
1 Jan2010
31 Dec 2011
31 Dec2010
1 Jan 2010
31 Dec 2011
Asrestated 31 Dec
2010
Asrestated
1 Jan2010
31 Dec 2011
Asrestated 31 Dec
2010
Asrestated
1 Jan2010
31 Dec 2011
Asrestated
31 Dec2010
Asrestated
1 Jan2010
31 Dec 2011
Asrestated 31 Dec
2010
Asrestated
1 Jan2010
31 Dec 2011
31 Dec2010
By principal
activities
Special steel 53,175 45,243 34,271 2,872 2,923 4,291 226 185 148 56,273 48,351 38,710 (27,295) (23,409) (18,146) 28,978 24,942 20,564 6,507 7,032
Iron ore mining 66,997 53,397 36,026 – – – – – – 66,997 53,397 36,026 (42,059) (38,678) (25,977) 24,938 14,719 10,049 13,672 19,434
Property
Mainland China 33,304 31,733 24,218 7,048 5,677 5,465 – – – 40,352 37,410 29,683 (9,616) (10,332) (7,428) 30,736 27,078 22,255 1,819 2,833
Hong Kong 7,685 6,959 6,438 – – – 6,319 5,534 4,890 14,004 12,493 11,328 (283) (293) (280) 13,721 12,200 11,048 300 285
Energy 2,011 1,181 301 6,899 6,659 6,567 – – – 8,910 7,840 6,868 (352) (101) (52) 8,558 7,739 6,816 4 –
Tunnels 956 972 980 1,021 991 948 – – – 1,977 1,963 1,928 (153) (181) (194) 1,824 1,782 1,734 2 4
Dah Chong Hong 20,355 14,158 11,072 239 356 258 228 203 130 20,822 14,717 11,460 (12,347) (7,562) (5,671) 8,475 7,155 5,789 2,088 888
CITIC Telecom 2,884 2,652 2,532 43 – – 427 408 – 3,354 3,060 2,532 (1,153) (1,131) (749) 2,201 1,929 1,783 320 330
Other investments 2,687 534 4,040 3,156 5,075 4,568 22 15 629 5,865 5,624 9,237 (571) (617) (113) 5,294 5,007 9,124 – 300
Corporate 11,185 8,314 8,159 – – – – – – 11,185 8,314 8,159 (47,897) (36,647) (31,936) (36,712) (28,333) (23,777) 7 1
Segment assets/ (liabilities) 201,239 165,143 128,037 21,278 21,681 22,097 7,222 6,345 5,797 229,739 193,169 155,931 (141,726) (118,951) (90,546) 88,013 74,218 65,385 24,719 31,107
Corporate segment assets and liabilities mainly represent financial instruments, cash and bank deposits and
borrowings which are managed centrally by the group treasury function and are not allocated to individually
reportable segments.
* Non-current assets are amounts expected to be recovered more than twelve months after the year end.† Segment assets and segment liabilities are presented with intercompany balances eliminated.
CITIC Pacific Annual Report 2011
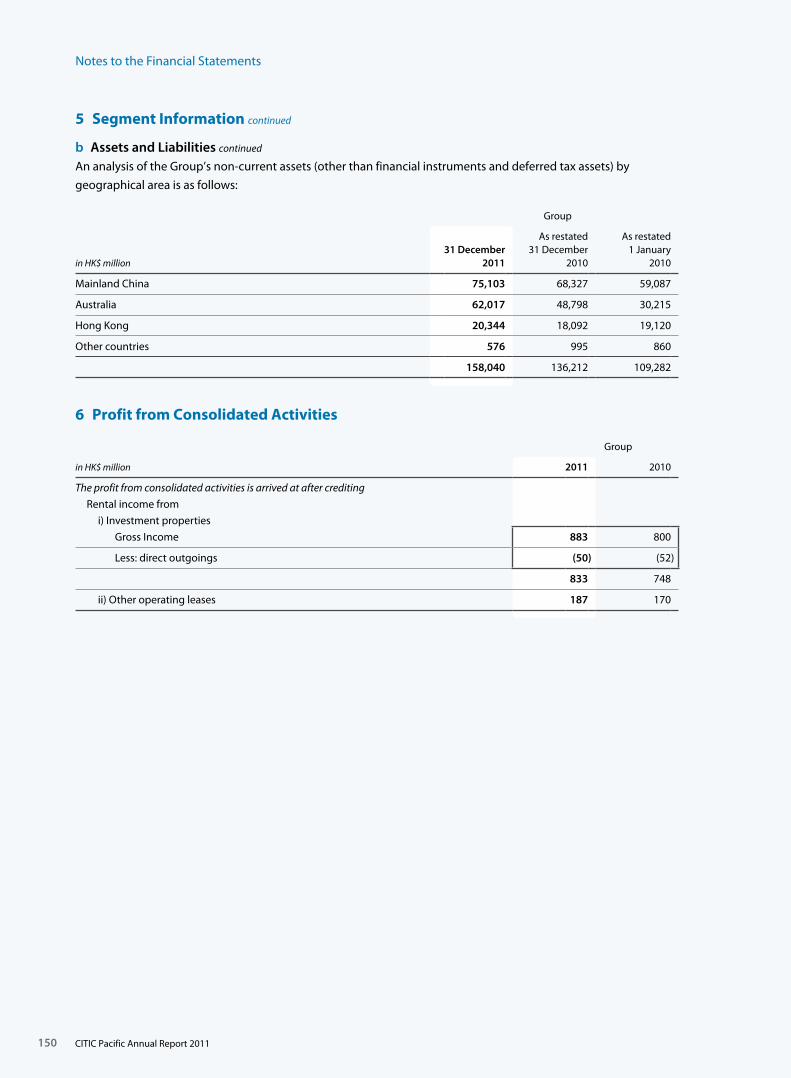
Notes to the Financial Statements
150
5 Segment Information continued
b Assets and Liabilities continued
An analysis of the Group’s non-current assets (other than financial instruments and deferred tax assets) by
geographical area is as follows:
Group
in HK$ million31 December
2011
As restated31 December
2010
As restated1 January
2010
Mainland China 75,103 68,327 59,087
Australia 62,017 48,798 30,215
Hong Kong 20,344 18,092 19,120
Other countries 576 995 860
158,040 136,212 109,282
6 Profit from Consolidated Activities
Group
in HK$ million 2011 2010
The profit from consolidated activities is arrived at after crediting
Rental income from
i) Investment properties
Gross Income 883 800
Less: direct outgoings (50) (52)
833 748
ii) Other operating leases 187 170
CITIC Pacific Annual Report 2011
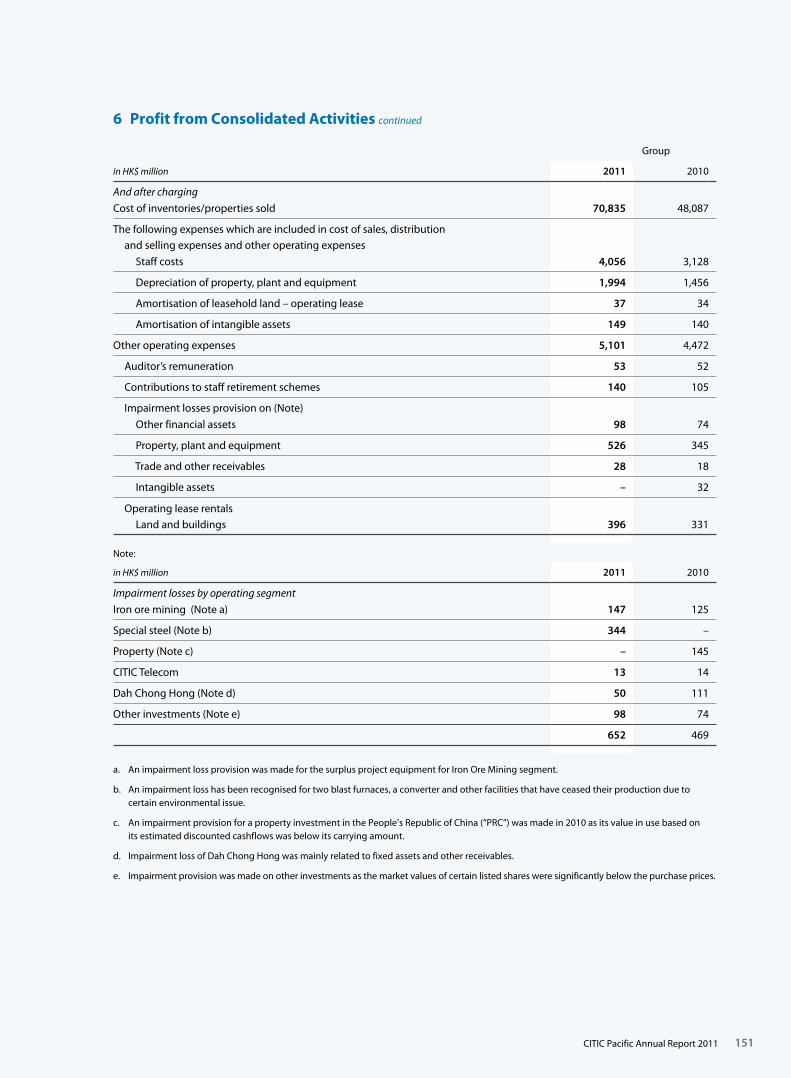
151
6 Profit from Consolidated Activities continued
Group
in HK$ million 2011 2010
And after charging
Cost of inventories/properties sold 70,835 48,087
The following expenses which are included in cost of sales, distribution and selling expenses and other operating expenses
Staff costs 4,056 3,128
Depreciation of property, plant and equipment 1,994 1,456
Amortisation of leasehold land – operating lease 37 34
Amortisation of intangible assets 149 140
Other operating expenses 5,101 4,472
Auditor’s remuneration 53 52
Contributions to staff retirement schemes 140 105
Impairment losses provision on (Note)
Other financial assets 98 74
Property, plant and equipment 526 345
Trade and other receivables 28 18
Intangible assets – 32
Operating lease rentals
Land and buildings 396 331
Note:
in HK$ million 2011 2010
Impairment losses by operating segment
Iron ore mining (Note a) 147 125
Special steel (Note b) 344 –
Property (Note c) – 145
CITIC Telecom 13 14
Dah Chong Hong (Note d) 50 111
Other investments (Note e) 98 74
652 469
a. An impairment loss provision was made for the surplus project equipment for Iron Ore Mining segment.
b. An impairment loss has been recognised for two blast furnaces, a converter and other facilities that have ceased their production due to certain environmental issue.
c. An impairment provision for a property investment in the People’s Republic of China (“PRC”) was made in 2010 as its value in use based on its estimated discounted cashflows was below its carrying amount.
d. Impairment loss of Dah Chong Hong was mainly related to fixed assets and other receivables.
e. Impairment provision was made on other investments as the market values of certain listed shares were significantly below the purchase prices.
CITIC Pacific Annual Report 2011
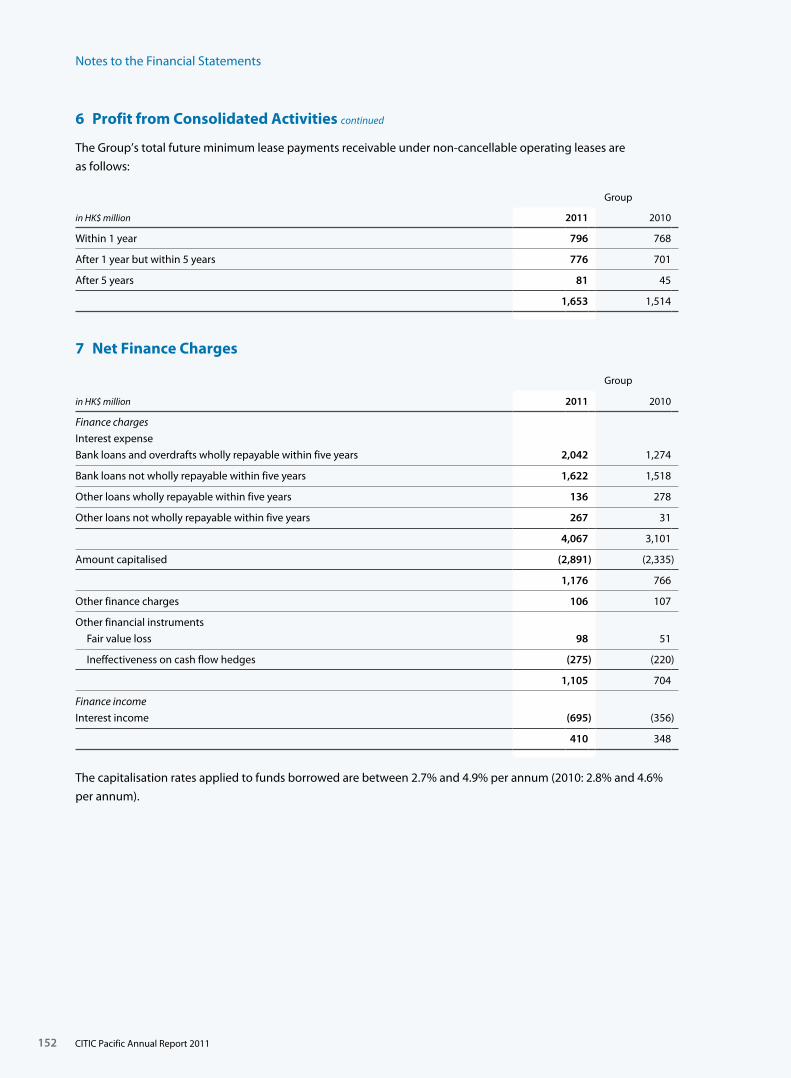
Notes to the Financial Statements
152
6 Profit from Consolidated Activities continued
The Group’s total future minimum lease payments receivable under non-cancellable operating leases are
as follows:
Group
in HK$ million 2011 2010
Within 1 year 796 768
After 1 year but within 5 years 776 701
After 5 years 81 45
1,653 1,514
7 Net Finance Charges
Group
in HK$ million 2011 2010
Finance charges
Interest expense
Bank loans and overdrafts wholly repayable within five years 2,042 1,274
Bank loans not wholly repayable within five years 1,622 1,518
Other loans wholly repayable within five years 136 278
Other loans not wholly repayable within five years 267 31
4,067 3,101
Amount capitalised (2,891) (2,335)
1,176 766
Other finance charges 106 107
Other financial instruments
Fair value loss 98 51
Ineffectiveness on cash flow hedges (275) (220)
1,105 704
Finance income
Interest income (695) (356)
410 348
The capitalisation rates applied to funds borrowed are between 2.7% and 4.9% per annum (2010: 2.8% and 4.6%
per annum).
CITIC Pacific Annual Report 2011
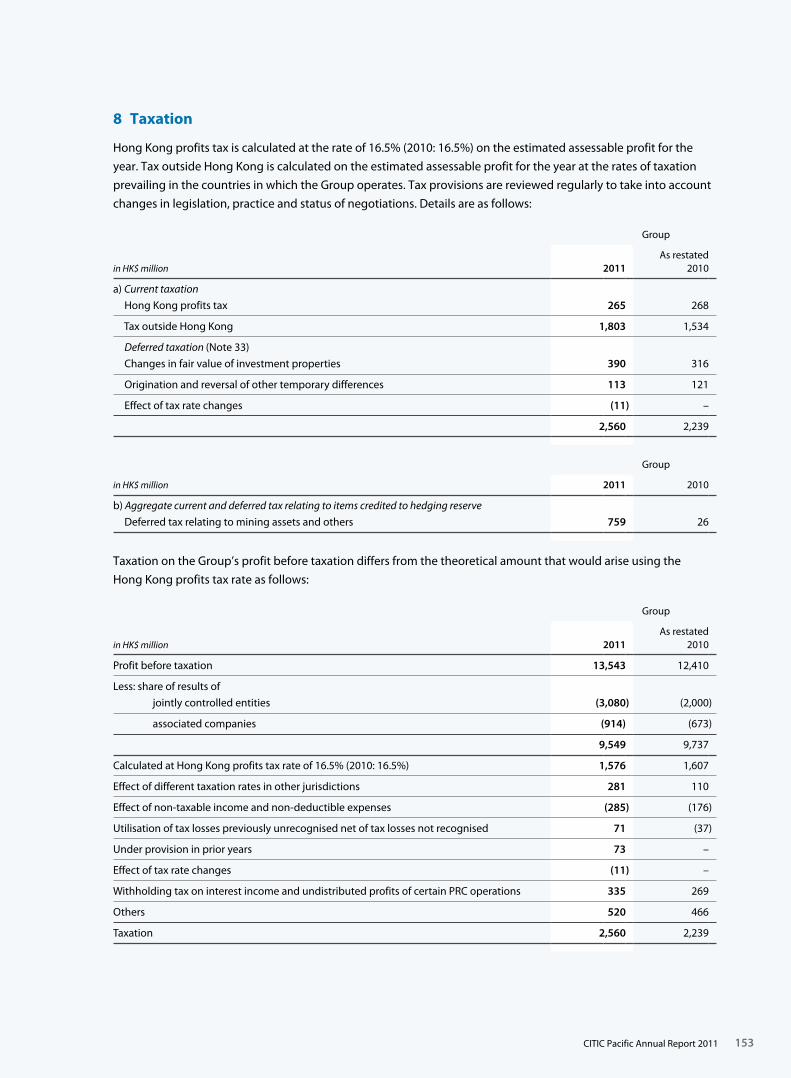
153
8 Taxation
Hong Kong profits tax is calculated at the rate of 16.5% (2010: 16.5%) on the estimated assessable profit for the
year. Tax outside Hong Kong is calculated on the estimated assessable profit for the year at the rates of taxation
prevailing in the countries in which the Group operates. Tax provisions are reviewed regularly to take into account
changes in legislation, practice and status of negotiations. Details are as follows:
Group
in HK$ million 2011As restated
2010
a) Current taxation
Hong Kong profits tax 265 268
Tax outside Hong Kong 1,803 1,534
Deferred taxation (Note 33)
Changes in fair value of investment properties 390 316
Origination and reversal of other temporary differences 113 121
Effect of tax rate changes (11) –
2,560 2,239
Group
in HK$ million 2011 2010
b) Aggregate current and deferred tax relating to items credited to hedging reserve
Deferred tax relating to mining assets and others 759 26
Taxation on the Group’s profit before taxation differs from the theoretical amount that would arise using the
Hong Kong profits tax rate as follows:
Group
in HK$ million 2011As restated
2010
Profit before taxation 13,543 12,410
Less: share of results of
jointly controlled entities (3,080) (2,000)
associated companies (914) (673)
9,549 9,737
Calculated at Hong Kong profits tax rate of 16.5% (2010: 16.5%) 1,576 1,607
Effect of different taxation rates in other jurisdictions 281 110
Effect of non-taxable income and non-deductible expenses (285) (176)
Utilisation of tax losses previously unrecognised net of tax losses not recognised 71 (37)
Under provision in prior years 73 –
Effect of tax rate changes (11) –
Withholding tax on interest income and undistributed profits of certain PRC operations 335 269
Others 520 466
Taxation 2,560 2,239
CITIC Pacific Annual Report 2011
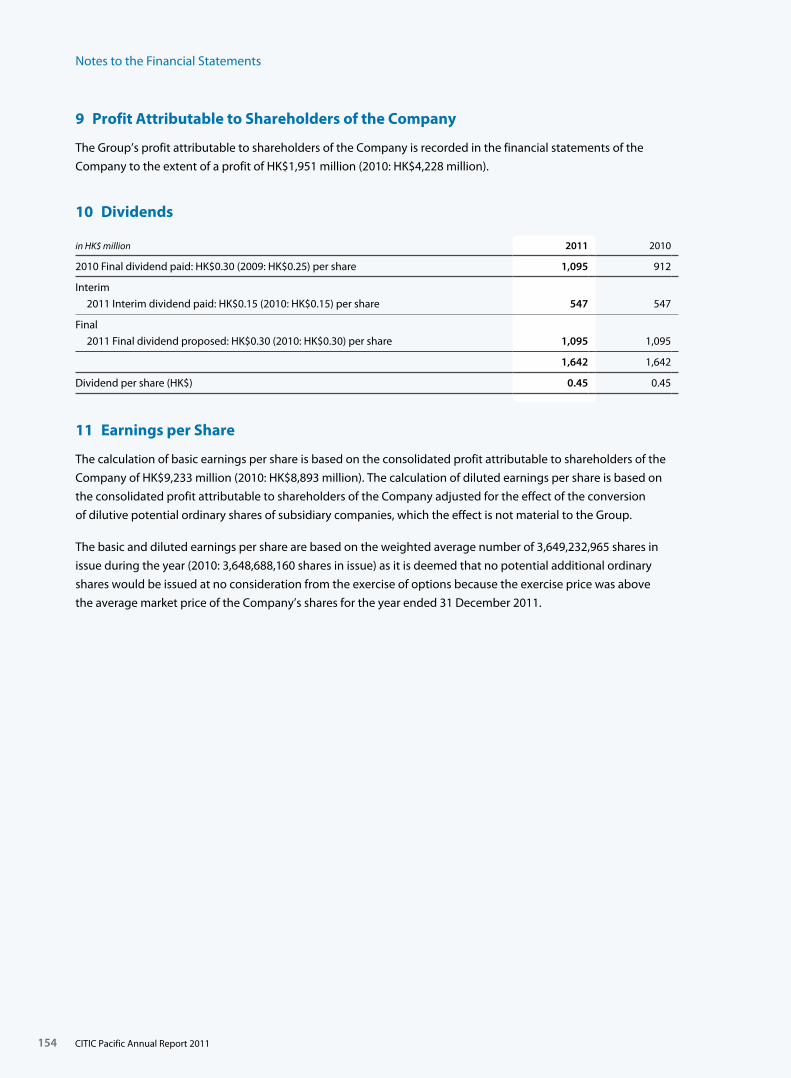
Notes to the Financial Statements
154
9 Profit Attributable to Shareholders of the Company
The Group’s profit attributable to shareholders of the Company is recorded in the financial statements of the
Company to the extent of a profit of HK$1,951 million (2010: HK$4,228 million).
10 Dividends
in HK$ million 2011 2010
2010 Final dividend paid: HK$0.30 (2009: HK$0.25) per share 1,095 912
Interim
2011 Interim dividend paid: HK$0.15 (2010: HK$0.15) per share 547 547
Final
2011 Final dividend proposed: HK$0.30 (2010: HK$0.30) per share 1,095 1,095
1,642 1,642
Dividend per share (HK$) 0.45 0.45
11 Earnings per Share
The calculation of basic earnings per share is based on the consolidated profit attributable to shareholders of the
Company of HK$9,233 million (2010: HK$8,893 million). The calculation of diluted earnings per share is based on
the consolidated profit attributable to shareholders of the Company adjusted for the effect of the conversion
of dilutive potential ordinary shares of subsidiary companies, which the effect is not material to the Group.
The basic and diluted earnings per share are based on the weighted average number of 3,649,232,965 shares in
issue during the year (2010: 3,648,688,160 shares in issue) as it is deemed that no potential additional ordinary
shares would be issued at no consideration from the exercise of options because the exercise price was above
the average market price of the Company’s shares for the year ended 31 December 2011.
CITIC Pacific Annual Report 2011
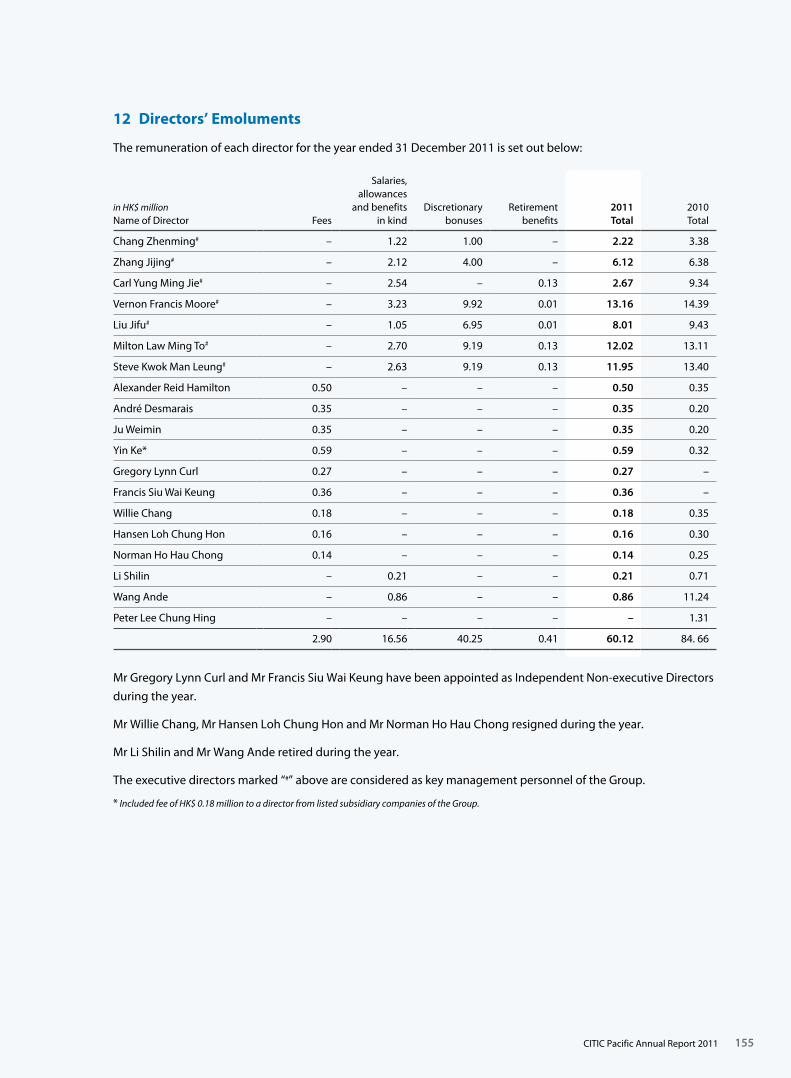
155
12 Directors’ Emoluments
The remuneration of each director for the year ended 31 December 2011 is set out below:
in HK$ million Name of Director Fees
Salaries, allowances
and benefits in kind
Discretionary bonuses
Retirement benefits
2011 Total
2010 Total
Chang Zhenming# – 1.22 1.00 – 2.22 3.38
Zhang Jijing# – 2.12 4.00 – 6.12 6.38
Carl Yung Ming Jie# – 2.54 – 0.13 2.67 9.34
Vernon Francis Moore# – 3.23 9.92 0.01 13.16 14.39
Liu Jifu# – 1.05 6.95 0.01 8.01 9.43
Milton Law Ming To# – 2.70 9.19 0.13 12.02 13.11
Steve Kwok Man Leung# – 2.63 9.19 0.13 11.95 13.40
Alexander Reid Hamilton 0.50 – – – 0.50 0.35
André Desmarais 0.35 – – – 0.35 0.20
Ju Weimin 0.35 – – – 0.35 0.20
Yin Ke* 0.59 – – – 0.59 0.32
Gregory Lynn Curl 0.27 – – – 0.27 –
Francis Siu Wai Keung 0.36 – – – 0.36 –
Willie Chang 0.18 – – – 0.18 0.35
Hansen Loh Chung Hon 0.16 – – – 0.16 0.30
Norman Ho Hau Chong 0.14 – – – 0.14 0.25
Li Shilin – 0.21 – – 0.21 0.71
Wang Ande – 0.86 – – 0.86 11.24
Peter Lee Chung Hing – – – – – 1.31
2.90 16.56 40.25 0.41 60.12 84. 66
Mr Gregory Lynn Curl and Mr Francis Siu Wai Keung have been appointed as Independent Non-executive Directors
during the year.
Mr Willie Chang, Mr Hansen Loh Chung Hon and Mr Norman Ho Hau Chong resigned during the year.
Mr Li Shilin and Mr Wang Ande retired during the year.
The executive directors marked “#” above are considered as key management personnel of the Group.
* Included fee of HK$ 0.18 million to a director from listed subsidiary companies of the Group.
CITIC Pacific Annual Report 2011
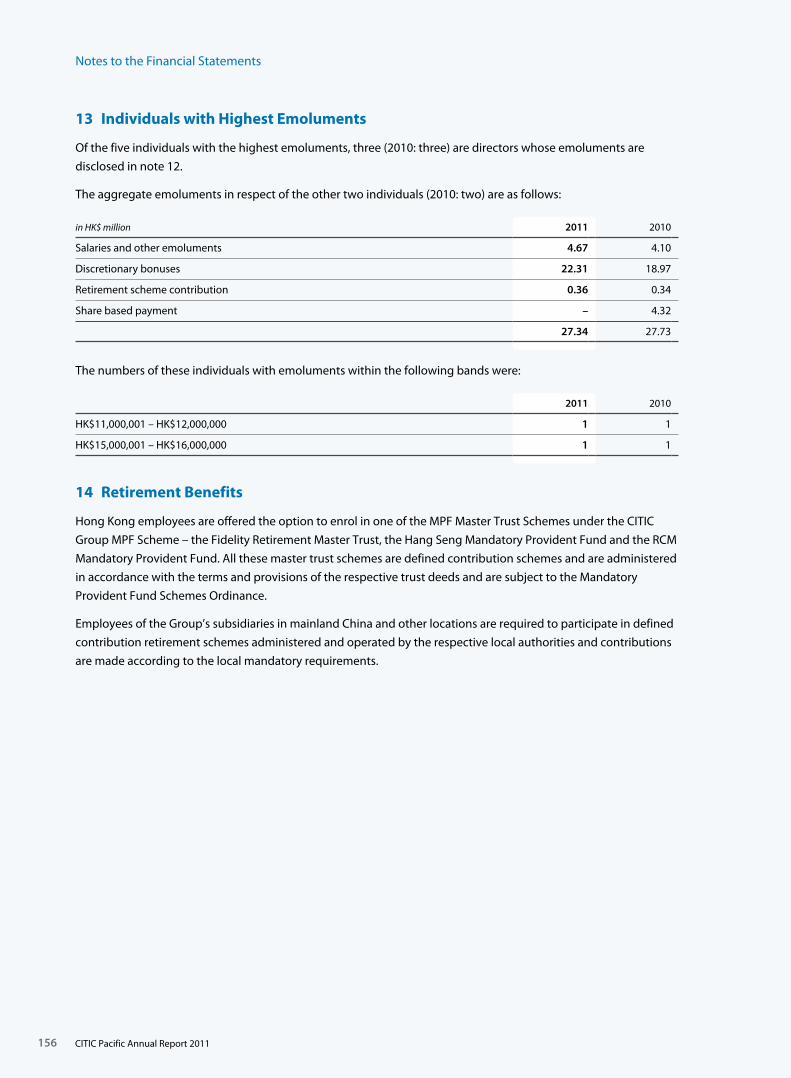
Notes to the Financial Statements
156
13 Individuals with Highest Emoluments
Of the five individuals with the highest emoluments, three (2010: three) are directors whose emoluments are
disclosed in note 12.
The aggregate emoluments in respect of the other two individuals (2010: two) are as follows:
in HK$ million 2011 2010
Salaries and other emoluments 4.67 4.10
Discretionary bonuses 22.31 18.97
Retirement scheme contribution 0.36 0.34
Share based payment – 4.32
27.34 27.73
The numbers of these individuals with emoluments within the following bands were:
2011 2010
HK$11,000,001 – HK$12,000,000 1 1
HK$15,000,001 – HK$16,000,000 1 1
14 Retirement Benefits
Hong Kong employees are offered the option to enrol in one of the MPF Master Trust Schemes under the CITIC
Group MPF Scheme – the Fidelity Retirement Master Trust, the Hang Seng Mandatory Provident Fund and the RCM
Mandatory Provident Fund. All these master trust schemes are defined contribution schemes and are administered
in accordance with the terms and provisions of the respective trust deeds and are subject to the Mandatory
Provident Fund Schemes Ordinance.
Employees of the Group’s subsidiaries in mainland China and other locations are required to participate in defined
contribution retirement schemes administered and operated by the respective local authorities and contributions
are made according to the local mandatory requirements.
CITIC Pacific Annual Report 2011
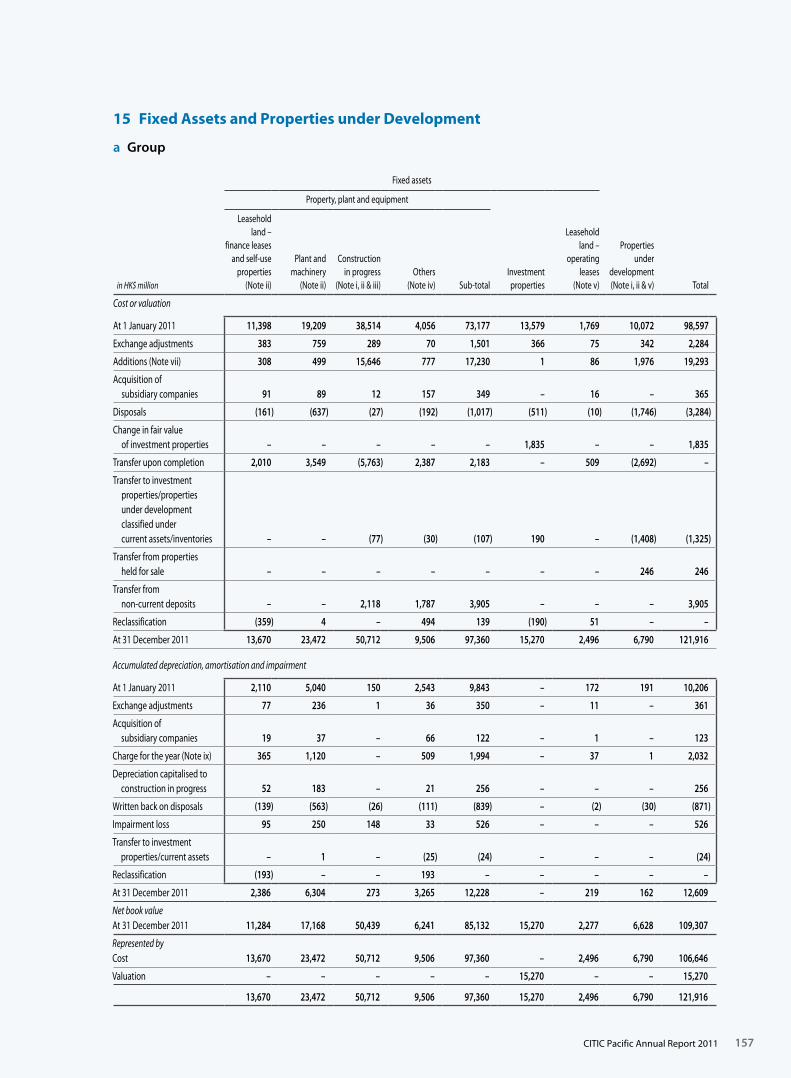
157
15 Fixed Assets and Properties under Development
a Group
Fixed assets
Property, plant and equipment
in HK$ million
Leasehold land –
finance leases and self-use
properties (Note ii)
Plant and machinery
(Note ii)
Construction in progress
(Note i, ii & iii)Others
(Note iv) Sub-totalInvestment properties
Leasehold land –
operating leases
(Note v)
Properties under
development (Note i, ii & v) Total
Cost or valuation
At 1 January 2011 11,398 19,209 38,514 4,056 73,177 13,579 1,769 10,072 98,597
Exchange adjustments 383 759 289 70 1,501 366 75 342 2,284
Additions (Note vii) 308 499 15,646 777 17,230 1 86 1,976 19,293
Acquisition of subsidiary companies 91 89 12 157 349 – 16 – 365
Disposals (161) (637) (27) (192) (1,017) (511) (10) (1,746) (3,284)
Change in fair value of investment properties – – – – – 1,835 – – 1,835
Transfer upon completion 2,010 3,549 (5,763 ) 2,387 2,183 – 509 (2,692) –
Transfer to investment properties/properties under development classified under current assets/inventories – – (77) (30) (107) 190 – (1,408) (1,325)
Transfer from properties held for sale – – – – – – – 246 246
Transfer from non-current deposits – – 2,118 1,787 3,905 – – – 3,905
Reclassification (359) 4 – 494 139 (190) 51 – –
At 31 December 2011 13,670 23,472 50,712 9,506 97,360 15,270 2,496 6,790 121,916
Accumulated depreciation, amortisation and impairment
At 1 January 2011 2,110 5,040 150 2,543 9,843 – 172 191 10,206
Exchange adjustments 77 236 1 36 350 – 11 – 361
Acquisition of subsidiary companies 19 37 – 66 122 – 1 – 123
Charge for the year (Note ix) 365 1,120 – 509 1,994 – 37 1 2,032
Depreciation capitalised to construction in progress 52 183 – 21 256 – – – 256
Written back on disposals (139) (563) (26) (111) (839) – (2) (30) (871)
Impairment loss 95 250 148 33 526 – – – 526
Transfer to investment properties/current assets – 1 – (25) (24) – – – (24)
Reclassification (193) – – 193 – – – – –
At 31 December 2011 2,386 6,304 273 3,265 12,228 – 219 162 12,609
Net book valueAt 31 December 2011 11,284 17,168 50,439 6,241 85,132 15,270 2,277 6,628 109,307
Represented byCost 13,670 23,472 50,712 9,506 97,360 – 2,496 6,790 106,646
Valuation – – – – – 15,270 – – 15,270
13,670 23,472 50,712 9,506 97,360 15,270 2,496 6,790 121,916
CITIC Pacific Annual Report 2011
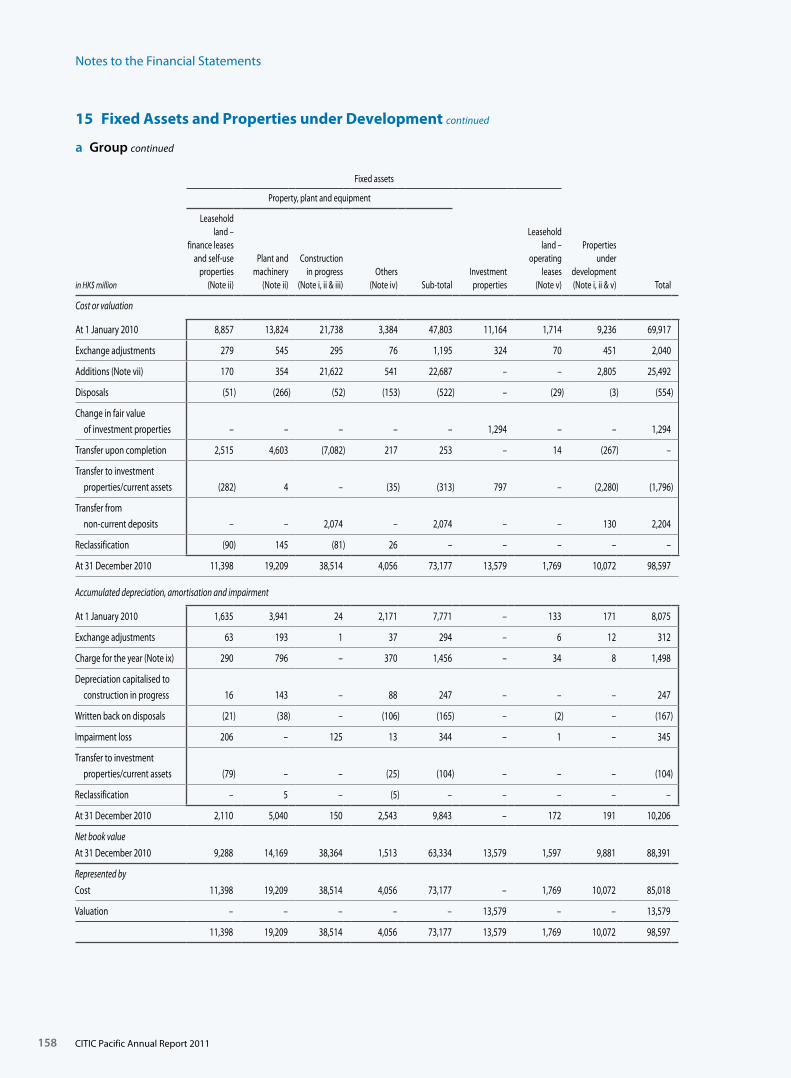
Notes to the Financial Statements
158
15 Fixed Assets and Properties under Development continued
a Group continued
Fixed assets
Property, plant and equipment
in HK$ million
Leasehold land –
finance leases and self-use
properties (Note ii)
Plant and machinery
(Note ii)
Construction in progress
(Note i, ii & iii)Others
(Note iv) Sub-totalInvestment properties
Leasehold land –
operating leases
(Note v)
Properties under
development (Note i, ii & v) Total
Cost or valuation
At 1 January 2010 8,857 13,824 21,738 3,384 47,803 11,164 1,714 9,236 69,917
Exchange adjustments 279 545 295 76 1,195 324 70 451 2,040
Additions (Note vii) 170 354 21,622 541 22,687 – – 2,805 25,492
Disposals (51) (266) (52) (153) (522) – (29) (3) (554)
Change in fair value of investment properties – – – – – 1,294 – – 1,294
Transfer upon completion 2,515 4,603 (7,082) 217 253 – 14 (267) –
Transfer to investment properties/current assets (282) 4 – (35) (313) 797 – (2,280) (1,796)
Transfer from non-current deposits – – 2,074 – 2,074 – – 130 2,204
Reclassification (90) 145 (81) 26 – – – – –
At 31 December 2010 11,398 19,209 38,514 4,056 73,177 13,579 1,769 10,072 98,597
Accumulated depreciation, amortisation and impairment
At 1 January 2010 1,635 3,941 24 2,171 7,771 – 133 171 8,075
Exchange adjustments 63 193 1 37 294 – 6 12 312
Charge for the year (Note ix) 290 796 – 370 1,456 – 34 8 1,498
Depreciation capitalised to construction in progress 16 143 – 88 247 – – – 247
Written back on disposals (21) (38) – (106) (165) – (2) – (167)
Impairment loss 206 – 125 13 344 – 1 – 345
Transfer to investment properties/current assets (79) – – (25) (104) – – – (104)
Reclassification – 5 – (5) – – – – –
At 31 December 2010 2,110 5,040 150 2,543 9,843 – 172 191 10,206
Net book value
At 31 December 2010 9,288 14,169 38,364 1,513 63,334 13,579 1,597 9,881 88,391
Represented by
Cost 11,398 19,209 38,514 4,056 73,177 – 1,769 10,072 85,018
Valuation – – – – – 13,579 – – 13,579
11,398 19,209 38,514 4,056 73,177 13,579 1,769 10,072 98,597
CITIC Pacific Annual Report 2011
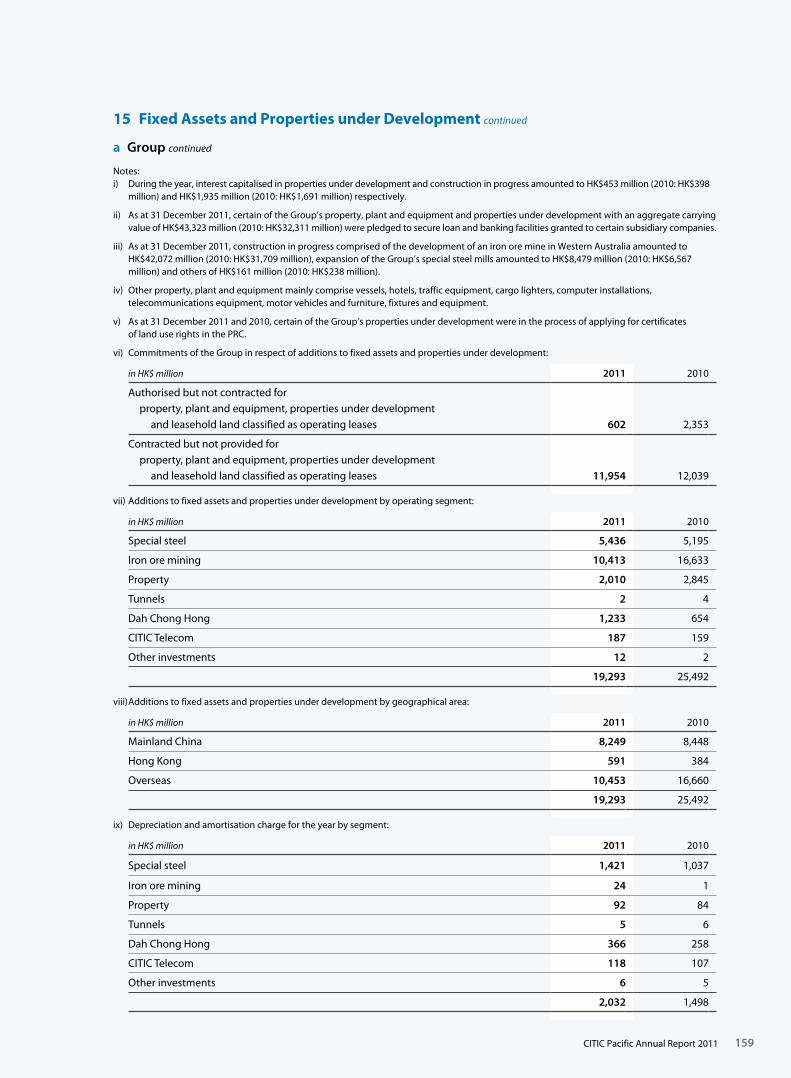
159
15 Fixed Assets and Properties under Development continued
a Group continued
Notes:i) During the year, interest capitalised in properties under development and construction in progress amounted to HK$453 million (2010: HK$398
million) and HK$1,935 million (2010: HK$1,691 million) respectively.
ii) As at 31 December 2011, certain of the Group’s property, plant and equipment and properties under development with an aggregate carrying value of HK$43,323 million (2010: HK$32,311 million) were pledged to secure loan and banking facilities granted to certain subsidiary companies.
iii) As at 31 December 2011, construction in progress comprised of the development of an iron ore mine in Western Australia amounted to HK$42,072 million (2010: HK$31,709 million), expansion of the Group’s special steel mills amounted to HK$8,479 million (2010: HK$6,567 million) and others of HK$161 million (2010: HK$238 million).
iv) Other property, plant and equipment mainly comprise vessels, hotels, traffic equipment, cargo lighters, computer installations, telecommunications equipment, motor vehicles and furniture, fixtures and equipment.
v) As at 31 December 2011 and 2010, certain of the Group’s properties under development were in the process of applying for certificates of land use rights in the PRC.
vi) Commitments of the Group in respect of additions to fixed assets and properties under development:
in HK$ million 2011 2010
Authorised but not contracted for property, plant and equipment, properties under development and leasehold land classified as operating leases 602 2,353
Contracted but not provided for property, plant and equipment, properties under development and leasehold land classified as operating leases 11,954 12,039
vii) Additions to fixed assets and properties under development by operating segment:
in HK$ million 2011 2010
Special steel 5,436 5,195
Iron ore mining 10,413 16,633
Property 2,010 2,845
Tunnels 2 4
Dah Chong Hong 1,233 654
CITIC Telecom 187 159
Other investments 12 2
19,293 25,492
viii) Additions to fixed assets and properties under development by geographical area:
in HK$ million 2011 2010
Mainland China 8,249 8,448
Hong Kong 591 384
Overseas 10,453 16,660
19,293 25,492
ix) Depreciation and amortisation charge for the year by segment:
in HK$ million 2011 2010
Special steel 1,421 1,037
Iron ore mining 24 1
Property 92 84
Tunnels 5 6
Dah Chong Hong 366 258
CITIC Telecom 118 107
Other investments 6 5
2,032 1,498
CITIC Pacific Annual Report 2011
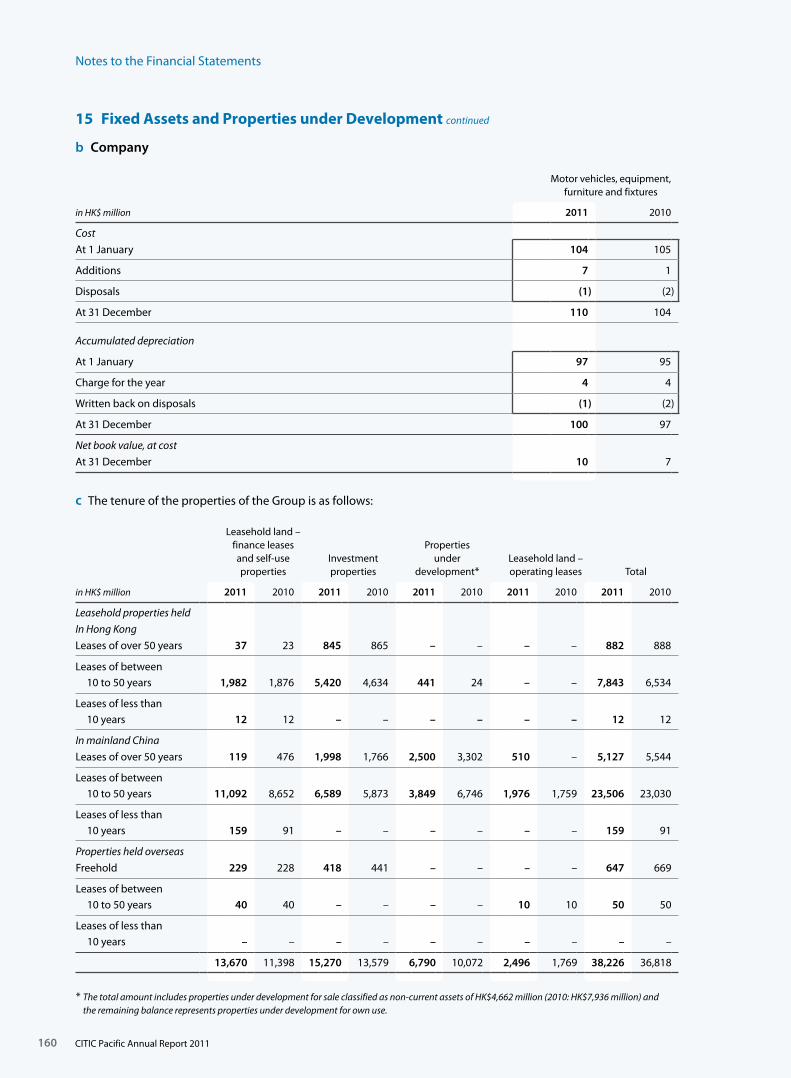
Notes to the Financial Statements
160
15 Fixed Assets and Properties under Development continued
b Company
Motor vehicles, equipment, furniture and fixtures
in HK$ million 2011 2010
Cost
At 1 January 104 105
Additions 7 1
Disposals (1) (2)
At 31 December 110 104
Accumulated depreciation
At 1 January 97 95
Charge for the year 4 4
Written back on disposals (1) (2)
At 31 December 100 97
Net book value, at cost
At 31 December 10 7
c The tenure of the properties of the Group is as follows:
Leasehold land – finance leases and self-use properties
Investmentproperties
Properties under
development*Leasehold land –operating leases Total
in HK$ million 2011 2010 2011 2010 2011 2010 2011 2010 2011 2010
Leasehold properties held
In Hong Kong
Leases of over 50 years 37 23 845 865 – – – – 882 888
Leases of between 10 to 50 years 1,982 1,876 5,420 4,634 441 24 – – 7,843 6,534
Leases of less than 10 years 12 12 – – – – – – 12 12
In mainland China
Leases of over 50 years 119 476 1,998 1,766 2,500 3,302 510 – 5,127 5,544
Leases of between 10 to 50 years 11,092 8,652 6,589 5,873 3,849 6,746 1,976 1,759 23,506 23,030
Leases of less than 10 years 159 91 – – – – – – 159 91
Properties held overseas
Freehold 229 228 418 441 – – – – 647 669
Leases of between 10 to 50 years 40 40 – – – – 10 10 50 50
Leases of less than 10 years – – – – – – – – – –
13,670 11,398 15,270 13,579 6,790 10,072 2,496 1,769 38,226 36,818
* The total amount includes properties under development for sale classified as non-current assets of HK$4,662 million (2010: HK$7,936 million) and the remaining balance represents properties under development for own use.
CITIC Pacific Annual Report 2011
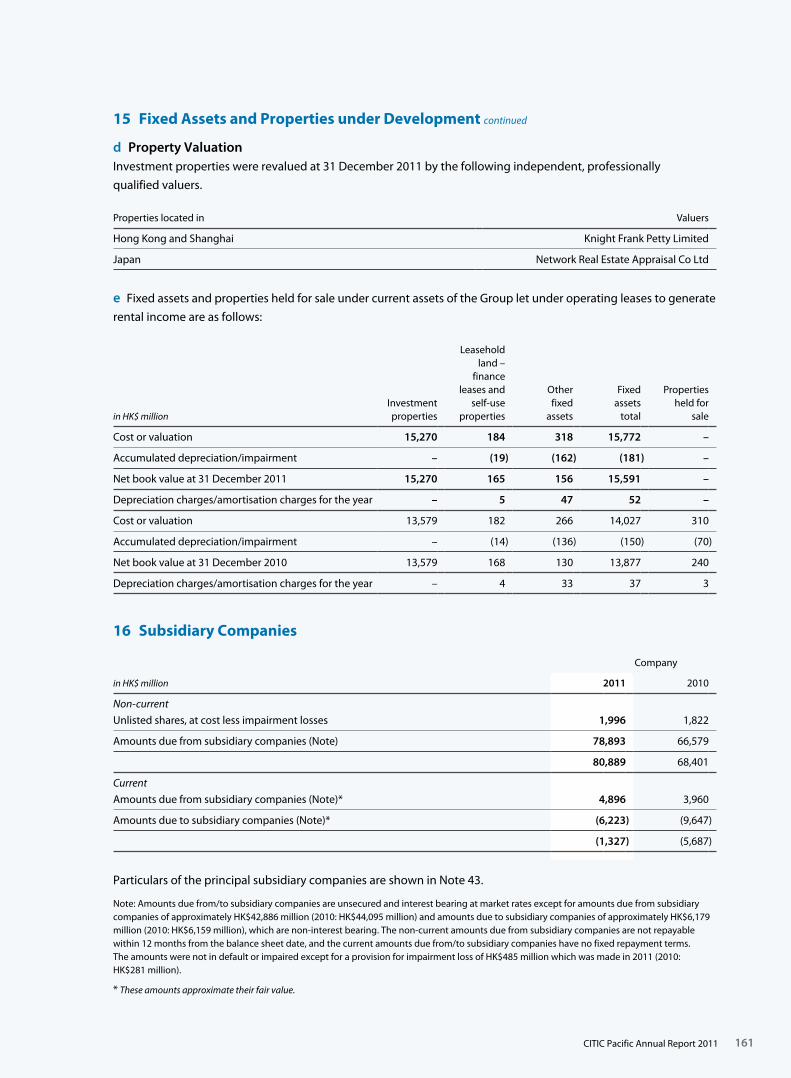
161
15 Fixed Assets and Properties under Development continued
d Property ValuationInvestment properties were revalued at 31 December 2011 by the following independent, professionally
qualified valuers.
Properties located in Valuers
Hong Kong and Shanghai Knight Frank Petty Limited
Japan Network Real Estate Appraisal Co Ltd
e Fixed assets and properties held for sale under current assets of the Group let under operating leases to generate
rental income are as follows:
in HK$ millionInvestment properties
Leasehold land –
finance leases and
self-use properties
Other fixed
assets
Fixed assets
total
Properties held for
sale
Cost or valuation 15,270 184 318 15,772 –
Accumulated depreciation/impairment – (19) (162) (181) –
Net book value at 31 December 2011 15,270 165 156 15,591 –
Depreciation charges/amortisation charges for the year – 5 47 52 –
Cost or valuation 13,579 182 266 14,027 310
Accumulated depreciation/impairment – (14) (136) (150) (70)
Net book value at 31 December 2010 13,579 168 130 13,877 240
Depreciation charges/amortisation charges for the year – 4 33 37 3
16 Subsidiary Companies
Company
in HK$ million 2011 2010
Non-current
Unlisted shares, at cost less impairment losses 1,996 1,822
Amounts due from subsidiary companies (Note) 78,893 66,579
80,889 68,401
Current
Amounts due from subsidiary companies (Note)* 4,896 3,960
Amounts due to subsidiary companies (Note)* (6,223) (9,647)
(1,327) (5,687)
Particulars of the principal subsidiary companies are shown in Note 43.
Note: Amounts due from/to subsidiary companies are unsecured and interest bearing at market rates except for amounts due from subsidiary companies of approximately HK$42,886 million (2010: HK$44,095 million) and amounts due to subsidiary companies of approximately HK$6,179 million (2010: HK$6,159 million), which are non-interest bearing. The non-current amounts due from subsidiary companies are not repayable within 12 months from the balance sheet date, and the current amounts due from/to subsidiary companies have no fixed repayment terms. The amounts were not in default or impaired except for a provision for impairment loss of HK$485 million which was made in 2011 (2010: HK$281 million).
* These amounts approximate their fair value.
CITIC Pacific Annual Report 2011
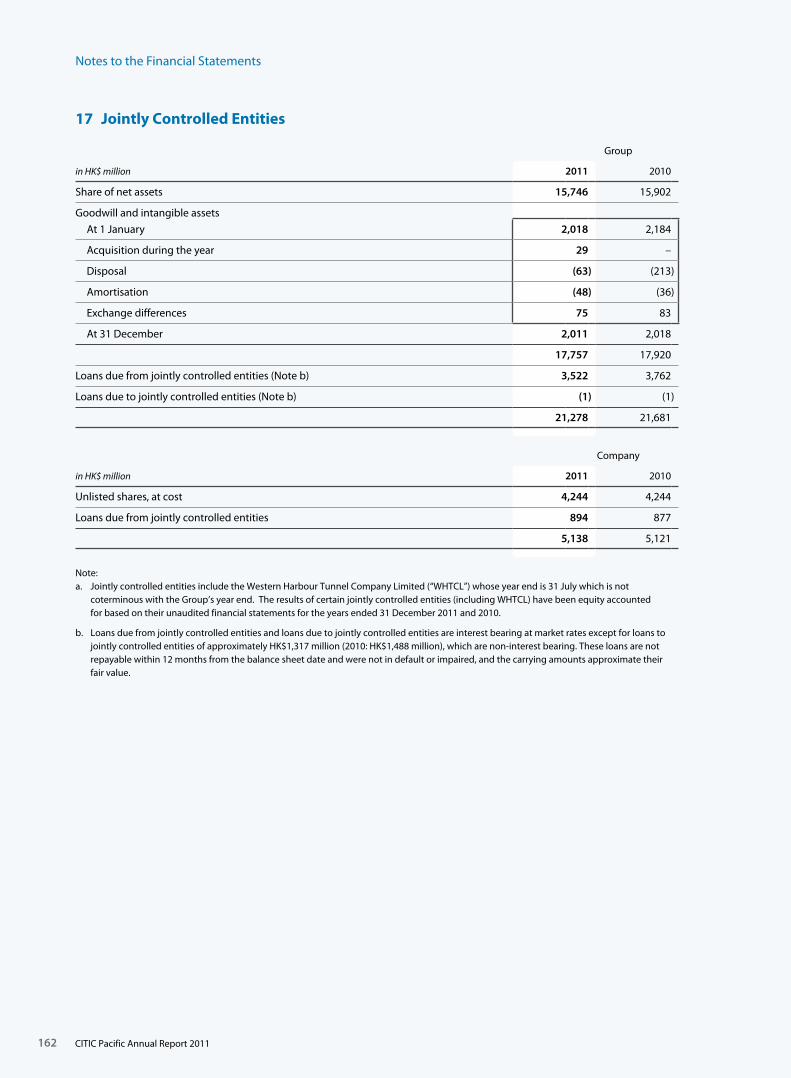
Notes to the Financial Statements
162
17 Jointly Controlled Entities
Group
in HK$ million 2011 2010
Share of net assets 15,746 15,902
Goodwill and intangible assets
At 1 January 2,018 2,184
Acquisition during the year 29 –
Disposal (63) (213)
Amortisation (48) (36)
Exchange differences 75 83
At 31 December 2,011 2,018
17,757 17,920
Loans due from jointly controlled entities (Note b) 3,522 3,762
Loans due to jointly controlled entities (Note b) (1) (1)
21,278 21,681
Company
in HK$ million 2011 2010
Unlisted shares, at cost 4,244 4,244
Loans due from jointly controlled entities 894 877
5,138 5,121
Note:a. Jointly controlled entities include the Western Harbour Tunnel Company Limited (“WHTCL”) whose year end is 31 July which is not
coterminous with the Group’s year end. The results of certain jointly controlled entities (including WHTCL) have been equity accounted for based on their unaudited financial statements for the years ended 31 December 2011 and 2010.
b. Loans due from jointly controlled entities and loans due to jointly controlled entities are interest bearing at market rates except for loans to jointly controlled entities of approximately HK$1,317 million (2010: HK$1,488 million), which are non-interest bearing. These loans are not repayable within 12 months from the balance sheet date and were not in default or impaired, and the carrying amounts approximate their fair value.
CITIC Pacific Annual Report 2011

163
17 Jointly Controlled Entities continued
c. The following amounts represent the Group’s share of the assets and liabilities, and revenue and results of jointly controlled entities and are included in the consolidated balance sheet and the consolidated profit and loss account using the equity method and after adjusting for goodwill and amortisation:
in HK$ million 2011 2010
Assets
Non-current assets 17,537 21,025
Current assets 15,746 20,313
33,283 41,338
Liabilities
Non-current liabilities (7,509) (11,523)
Current liabilities (9,477) (13,761)
(16,986) (25,284)
Net assets 16,297 16,054
Revenue 28,468 19,861
Expenses (24,361) (17,386)
4,107 2,475
Taxation (853) (413)
Profit for the year 3,254 2,062
Share of jointly controlled entities’ capital commitments (Note i)
authorised but not contracted for 346 386
contracted but not provided for 1,147 1,520
Note:i) The Group has fully contributed its attributable portion of capital and loans to the respective jointly controlled entities.ii) There are no material contingent liabilities for 2011 and 2010 to be shared by the Group.
d. Particulars of the principal jointly controlled entities are shown in Note 43.
CITIC Pacific Annual Report 2011
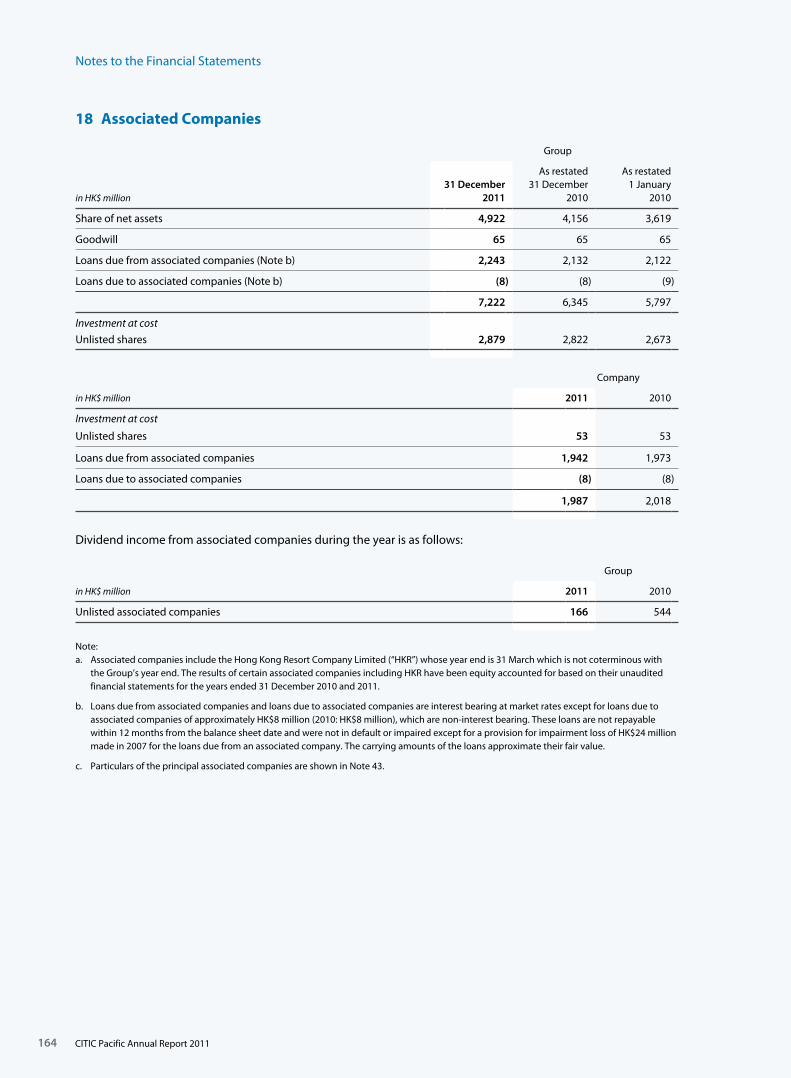
Notes to the Financial Statements
164
18 Associated Companies
Group
in HK$ million31 December
2011
As restated31 December
2010
As restated1 January
2010
Share of net assets 4,922 4,156 3,619
Goodwill 65 65 65
Loans due from associated companies (Note b) 2,243 2,132 2,122
Loans due to associated companies (Note b) (8) (8) (9)
7,222 6,345 5,797
Investment at cost
Unlisted shares 2,879 2,822 2,673
Company
in HK$ million 2011 2010
Investment at cost
Unlisted shares 53 53
Loans due from associated companies 1,942 1,973
Loans due to associated companies (8) (8)
1,987 2,018
Dividend income from associated companies during the year is as follows:
Group
in HK$ million 2011 2010
Unlisted associated companies 166 544
Note:a. Associated companies include the Hong Kong Resort Company Limited (“HKR”) whose year end is 31 March which is not coterminous with
the Group’s year end. The results of certain associated companies including HKR have been equity accounted for based on their unaudited financial statements for the years ended 31 December 2010 and 2011.
b. Loans due from associated companies and loans due to associated companies are interest bearing at market rates except for loans due to associated companies of approximately HK$8 million (2010: HK$8 million), which are non-interest bearing. These loans are not repayable within 12 months from the balance sheet date and were not in default or impaired except for a provision for impairment loss of HK$24 million made in 2007 for the loans due from an associated company. The carrying amounts of the loans approximate their fair value.
c. Particulars of the principal associated companies are shown in Note 43.
CITIC Pacific Annual Report 2011
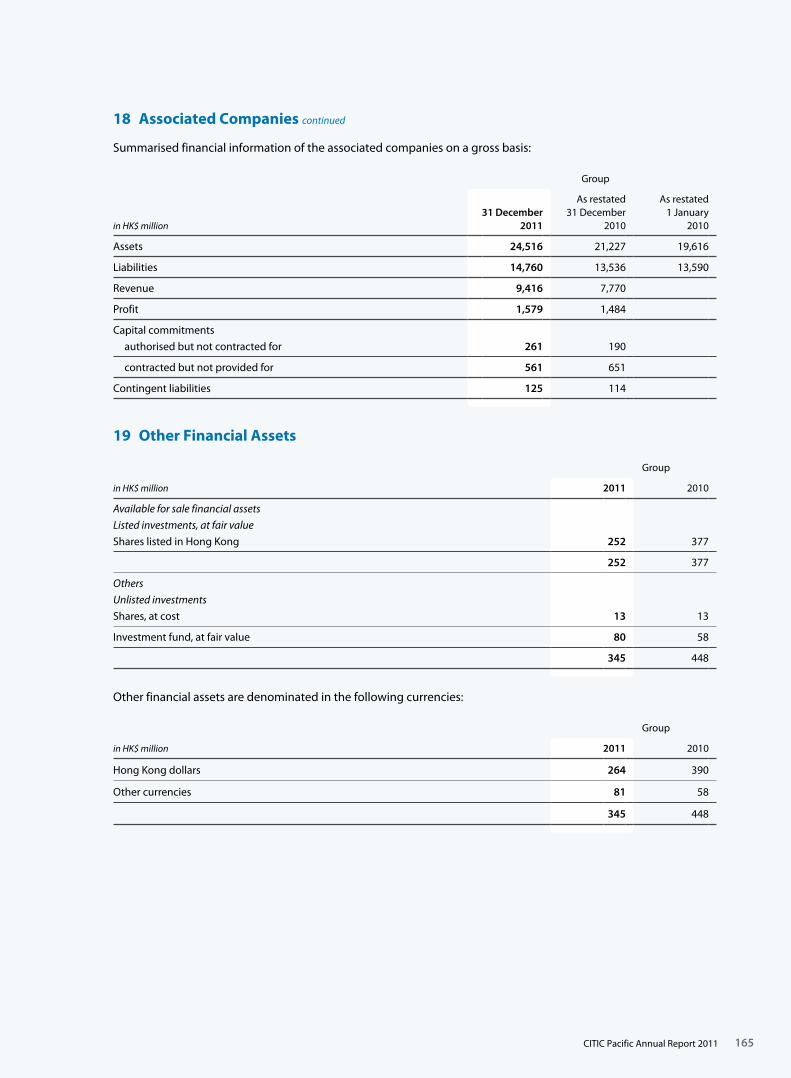
165
18 Associated Companies continued
Summarised financial information of the associated companies on a gross basis:
Group
in HK$ million31 December
2011
As restated31 December
2010
As restated1 January
2010
Assets 24,516 21,227 19,616
Liabilities 14,760 13,536 13,590
Revenue 9,416 7,770
Profit 1,579 1,484
Capital commitments
authorised but not contracted for 261 190
contracted but not provided for 561 651
Contingent liabilities 125 114
19 Other Financial Assets
Group
in HK$ million 2011 2010
Available for sale financial assets
Listed investments, at fair value
Shares listed in Hong Kong 252 377
252 377
Others
Unlisted investments
Shares, at cost 13 13
Investment fund, at fair value 80 58
345 448
Other financial assets are denominated in the following currencies:
Group
in HK$ million 2011 2010
Hong Kong dollars 264 390
Other currencies 81 58
345 448
CITIC Pacific Annual Report 2011
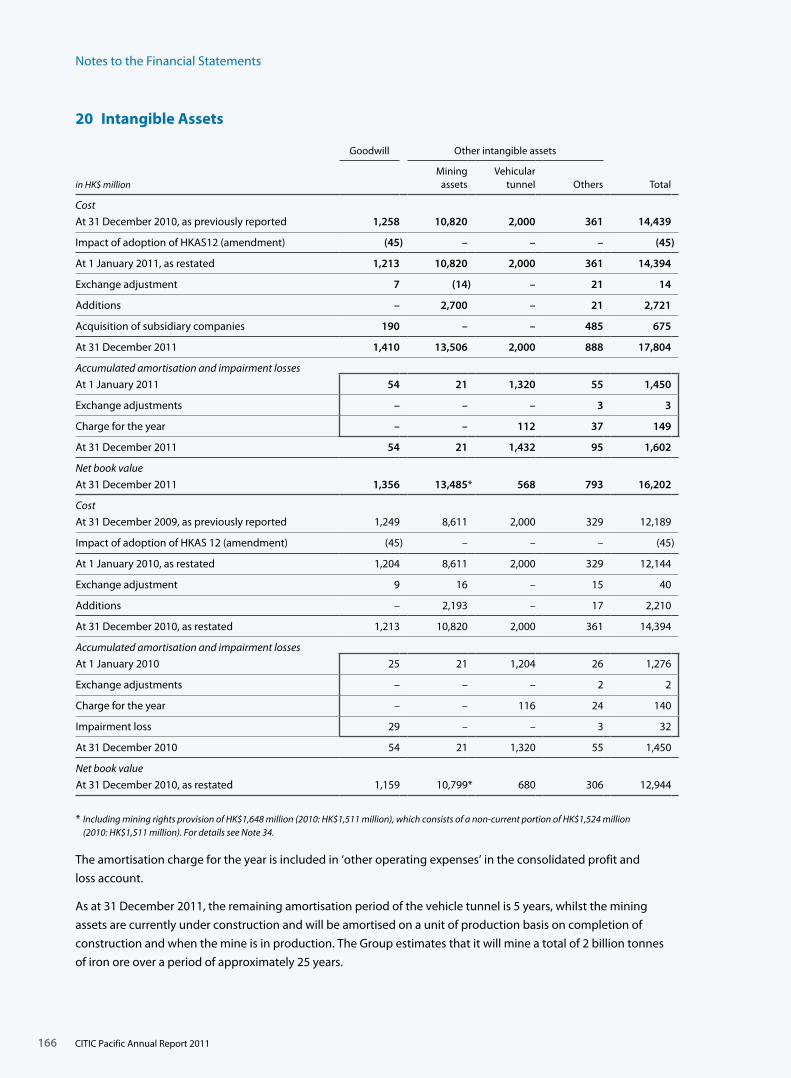
Notes to the Financial Statements
166
20 Intangible Assets
Goodwill Other intangible assets
in HK$ millionMining
assetsVehicular
tunnel Others Total
Cost
At 31 December 2010, as previously reported 1,258 10,820 2,000 361 14,439
Impact of adoption of HKAS12 (amendment) (45) – – – (45)
At 1 January 2011, as restated 1,213 10,820 2,000 361 14,394
Exchange adjustment 7 (14) – 21 14
Additions – 2,700 – 21 2,721
Acquisition of subsidiary companies 190 – – 485 675
At 31 December 2011 1,410 13,506 2,000 888 17,804
Accumulated amortisation and impairment losses
At 1 January 2011 54 21 1,320 55 1,450
Exchange adjustments – – – 3 3
Charge for the year – – 112 37 149
At 31 December 2011 54 21 1,432 95 1,602
Net book value
At 31 December 2011 1,356 13,485* 568 793 16,202
Cost
At 31 December 2009, as previously reported 1,249 8,611 2,000 329 12,189
Impact of adoption of HKAS 12 (amendment) (45) – – – (45)
At 1 January 2010, as restated 1,204 8,611 2,000 329 12,144
Exchange adjustment 9 16 – 15 40
Additions – 2,193 – 17 2,210
At 31 December 2010, as restated 1,213 10,820 2,000 361 14,394
Accumulated amortisation and impairment losses
At 1 January 2010 25 21 1,204 26 1,276
Exchange adjustments – – – 2 2
Charge for the year – – 116 24 140
Impairment loss 29 – – 3 32
At 31 December 2010 54 21 1,320 55 1,450
Net book value
At 31 December 2010, as restated 1,159 10,799* 680 306 12,944
* Including mining rights provision of HK$1,648 million (2010: HK$1,511 million), which consists of a non-current portion of HK$1,524 million (2010: HK$1,511 million). For details see Note 34.
The amortisation charge for the year is included in ‘other operating expenses’ in the consolidated profit and
loss account.
As at 31 December 2011, the remaining amortisation period of the vehicle tunnel is 5 years, whilst the mining
assets are currently under construction and will be amortised on a unit of production basis on completion of
construction and when the mine is in production. The Group estimates that it will mine a total of 2 billion tonnes
of iron ore over a period of approximately 25 years.
CITIC Pacific Annual Report 2011
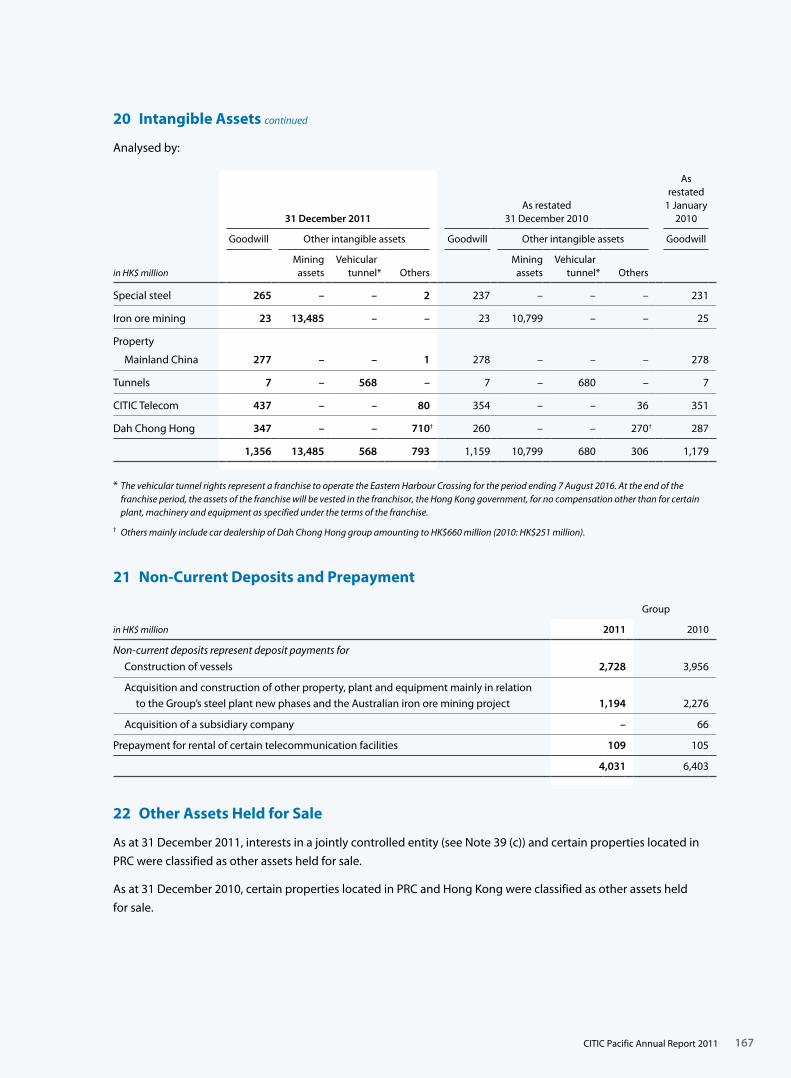
167
20 Intangible Assets continued
Analysed by:
31 December 2011As restated
31 December 2010
As restated
1 January 2010
Goodwill Other intangible assets Goodwill Other intangible assets Goodwill
in HK$ millionMining
assetsVehicular
tunnel* OthersMining
assetsVehicular
tunnel* Others
Special steel 265 – – 2 237 – – – 231
Iron ore mining 23 13,485 – – 23 10,799 – – 25
Property
Mainland China 277 – – 1 278 – – – 278
Tunnels 7 – 568 – 7 – 680 – 7
CITIC Telecom 437 – – 80 354 – – 36 351
Dah Chong Hong 347 – – 710 † 260 – – 270† 287
1,356 13,485 568 793 1,159 10,799 680 306 1,179
* The vehicular tunnel rights represent a franchise to operate the Eastern Harbour Crossing for the period ending 7 August 2016. At the end of the franchise period, the assets of the franchise will be vested in the franchisor, the Hong Kong government, for no compensation other than for certain plant, machinery and equipment as specified under the terms of the franchise.
† Others mainly include car dealership of Dah Chong Hong group amounting to HK$660 million (2010: HK$251 million).
21 Non-Current Deposits and Prepayment
Group
in HK$ million 2011 2010
Non-current deposits represent deposit payments for
Construction of vessels 2,728 3,956
Acquisition and construction of other property, plant and equipment mainly in relation to the Group’s steel plant new phases and the Australian iron ore mining project 1,194 2,276
Acquisition of a subsidiary company – 66
Prepayment for rental of certain telecommunication facilities 109 105
4,031 6,403
22 Other Assets Held for Sale
As at 31 December 2011, interests in a jointly controlled entity (see Note 39 (c)) and certain properties located in
PRC were classified as other assets held for sale.
As at 31 December 2010, certain properties located in PRC and Hong Kong were classified as other assets held
for sale.
CITIC Pacific Annual Report 2011
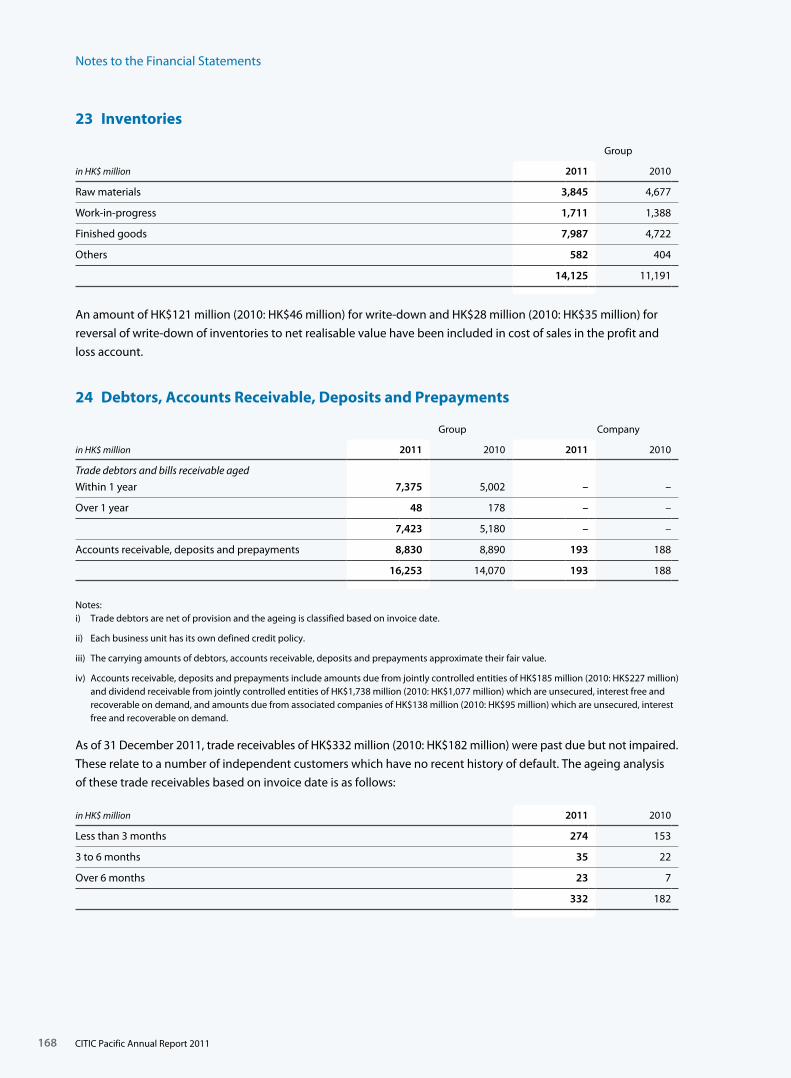
Notes to the Financial Statements
168
23 Inventories
Group
in HK$ million 2011 2010
Raw materials 3,845 4,677
Work-in-progress 1,711 1,388
Finished goods 7,987 4,722
Others 582 404
14,125 11,191
An amount of HK$121 million (2010: HK$46 million) for write-down and HK$28 million (2010: HK$35 million) for
reversal of write-down of inventories to net realisable value have been included in cost of sales in the profit and
loss account.
24 Debtors, Accounts Receivable, Deposits and Prepayments
Group Company
in HK$ million 2011 2010 2011 2010
Trade debtors and bills receivable aged
Within 1 year 7,375 5,002 – –
Over 1 year 48 178 – –
7,423 5,180 – –
Accounts receivable, deposits and prepayments 8,830 8,890 193 188
16,253 14,070 193 188
Notes:i) Trade debtors are net of provision and the ageing is classified based on invoice date.
ii) Each business unit has its own defined credit policy.
iii) The carrying amounts of debtors, accounts receivable, deposits and prepayments approximate their fair value.
iv) Accounts receivable, deposits and prepayments include amounts due from jointly controlled entities of HK$185 million (2010: HK$227 million) and dividend receivable from jointly controlled entities of HK$1,738 million (2010: HK$1,077 million) which are unsecured, interest free and recoverable on demand, and amounts due from associated companies of HK$138 million (2010: HK$95 million) which are unsecured, interest free and recoverable on demand.
As of 31 December 2011, trade receivables of HK$332 million (2010: HK$182 million) were past due but not impaired.
These relate to a number of independent customers which have no recent history of default. The ageing analysis
of these trade receivables based on invoice date is as follows:
in HK$ million 2011 2010
Less than 3 months 274 153
3 to 6 months 35 22
Over 6 months 23 7
332 182
CITIC Pacific Annual Report 2011
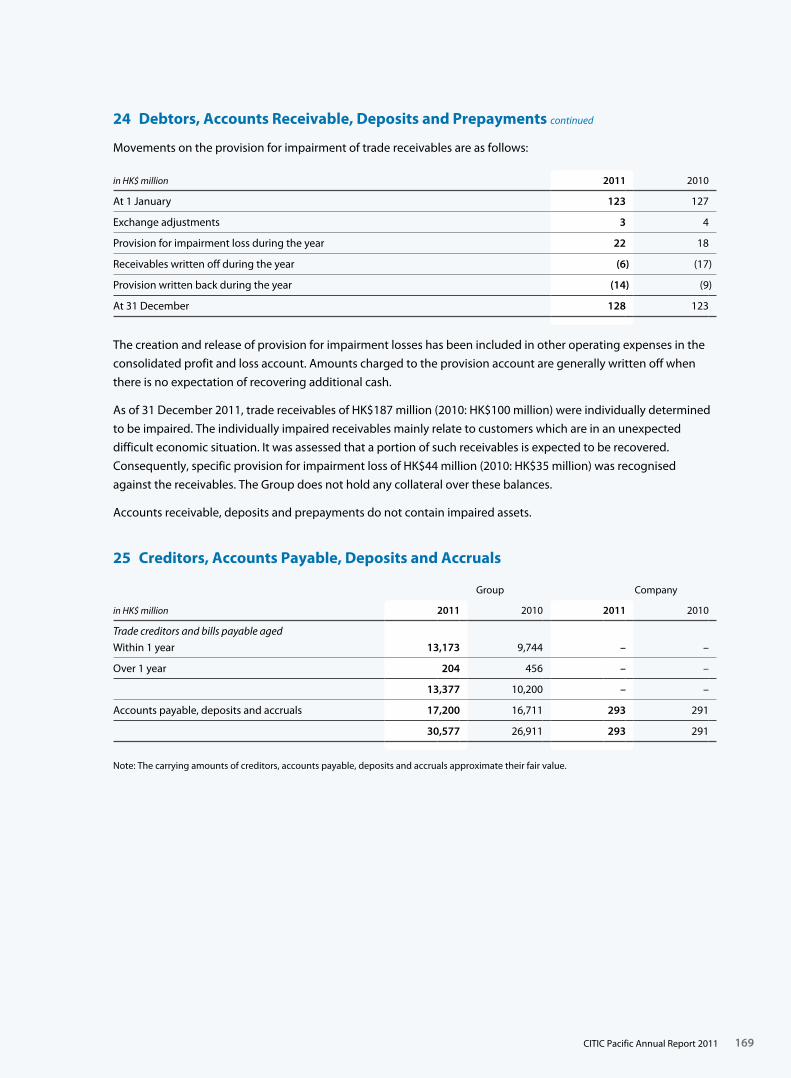
169
24 Debtors, Accounts Receivable, Deposits and Prepayments continued
Movements on the provision for impairment of trade receivables are as follows:
in HK$ million 2011 2010
At 1 January 123 127
Exchange adjustments 3 4
Provision for impairment loss during the year 22 18
Receivables written off during the year (6) (17)
Provision written back during the year (14) (9)
At 31 December 128 123
The creation and release of provision for impairment losses has been included in other operating expenses in the
consolidated profit and loss account. Amounts charged to the provision account are generally written off when
there is no expectation of recovering additional cash.
As of 31 December 2011, trade receivables of HK$187 million (2010: HK$100 million) were individually determined
to be impaired. The individually impaired receivables mainly relate to customers which are in an unexpected
difficult economic situation. It was assessed that a portion of such receivables is expected to be recovered.
Consequently, specific provision for impairment loss of HK$44 million (2010: HK$35 million) was recognised
against the receivables. The Group does not hold any collateral over these balances.
Accounts receivable, deposits and prepayments do not contain impaired assets.
25 Creditors, Accounts Payable, Deposits and Accruals
Group Company
in HK$ million 2011 2010 2011 2010
Trade creditors and bills payable aged
Within 1 year 13,173 9,744 – –
Over 1 year 204 456 – –
13,377 10,200 – –
Accounts payable, deposits and accruals 17,200 16,711 293 291
30,577 26,911 293 291
Note: The carrying amounts of creditors, accounts payable, deposits and accruals approximate their fair value.
CITIC Pacific Annual Report 2011
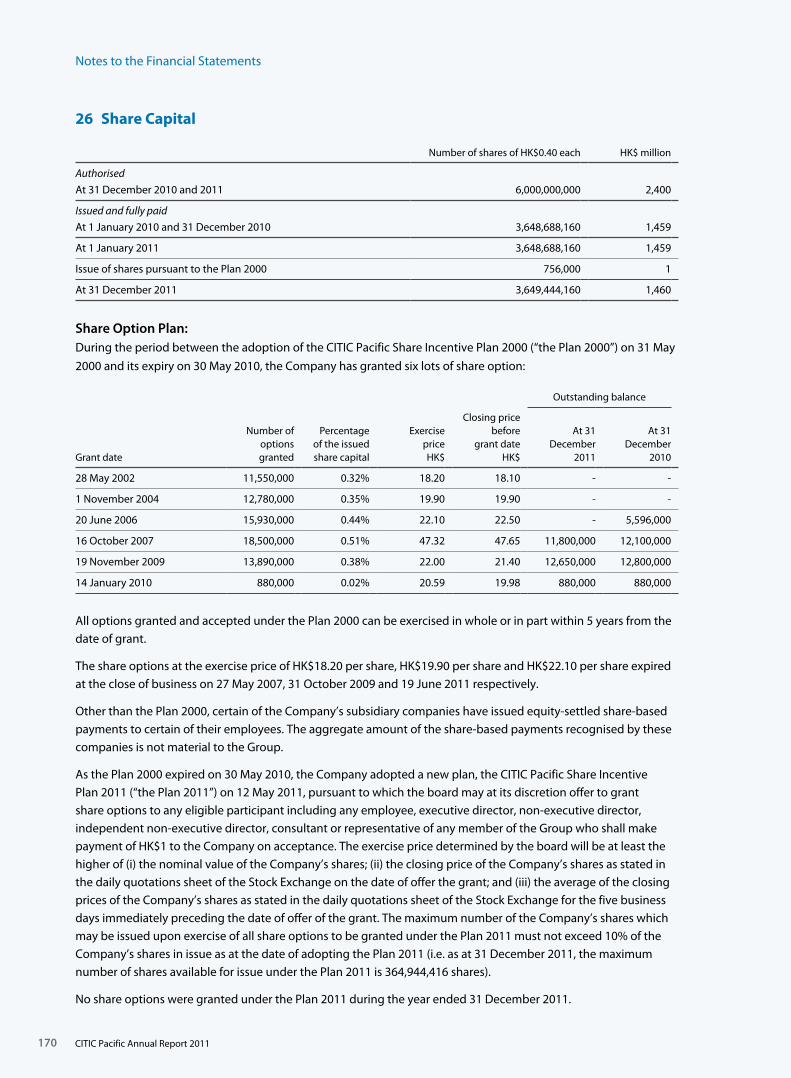
Notes to the Financial Statements
170
26 Share Capital
Number of shares of HK$0.40 each HK$ million
Authorised
At 31 December 2010 and 2011 6,000,000,000 2,400
Issued and fully paid
At 1 January 2010 and 31 December 2010 3,648,688,160 1,459
At 1 January 2011 3,648,688,160 1,459
Issue of shares pursuant to the Plan 2000 756,000 1
At 31 December 2011 3,649,444,160 1,460
Share Option Plan:During the period between the adoption of the CITIC Pacific Share Incentive Plan 2000 (“the Plan 2000”) on 31 May
2000 and its expiry on 30 May 2010, the Company has granted six lots of share option:
Outstanding balance
Grant date
Number of options granted
Percentage of the issued share capital
Exercise price HK$
Closing price before
grant date HK$
At 31 December
2011
At 31 December
2010
28 May 2002 11,550,000 0.32% 18.20 18.10 - -
1 November 2004 12,780,000 0.35% 19.90 19.90 - -
20 June 2006 15,930,000 0.44% 22.10 22.50 - 5,596,000
16 October 2007 18,500,000 0.51% 47.32 47.65 11,800,000 12,100,000
19 November 2009 13,890,000 0.38% 22.00 21.40 12,650,000 12,800,000
14 January 2010 880,000 0.02% 20.59 19.98 880,000 880,000
All options granted and accepted under the Plan 2000 can be exercised in whole or in part within 5 years from the
date of grant.
The share options at the exercise price of HK$18.20 per share, HK$19.90 per share and HK$22.10 per share expired
at the close of business on 27 May 2007, 31 October 2009 and 19 June 2011 respectively.
Other than the Plan 2000, certain of the Company’s subsidiary companies have issued equity-settled share-based
payments to certain of their employees. The aggregate amount of the share-based payments recognised by these
companies is not material to the Group.
As the Plan 2000 expired on 30 May 2010, the Company adopted a new plan, the CITIC Pacific Share Incentive
Plan 2011 (“the Plan 2011”) on 12 May 2011, pursuant to which the board may at its discretion offer to grant
share options to any eligible participant including any employee, executive director, non-executive director,
independent non-executive director, consultant or representative of any member of the Group who shall make
payment of HK$1 to the Company on acceptance. The exercise price determined by the board will be at least the
higher of (i) the nominal value of the Company’s shares; (ii) the closing price of the Company’s shares as stated in
the daily quotations sheet of the Stock Exchange on the date of offer the grant; and (iii) the average of the closing
prices of the Company’s shares as stated in the daily quotations sheet of the Stock Exchange for the five business
days immediately preceding the date of offer of the grant. The maximum number of the Company’s shares which
may be issued upon exercise of all share options to be granted under the Plan 2011 must not exceed 10% of the
Company’s shares in issue as at the date of adopting the Plan 2011 (i.e. as at 31 December 2011, the maximum
number of shares available for issue under the Plan 2011 is 364,944,416 shares).
No share options were granted under the Plan 2011 during the year ended 31 December 2011.
CITIC Pacific Annual Report 2011
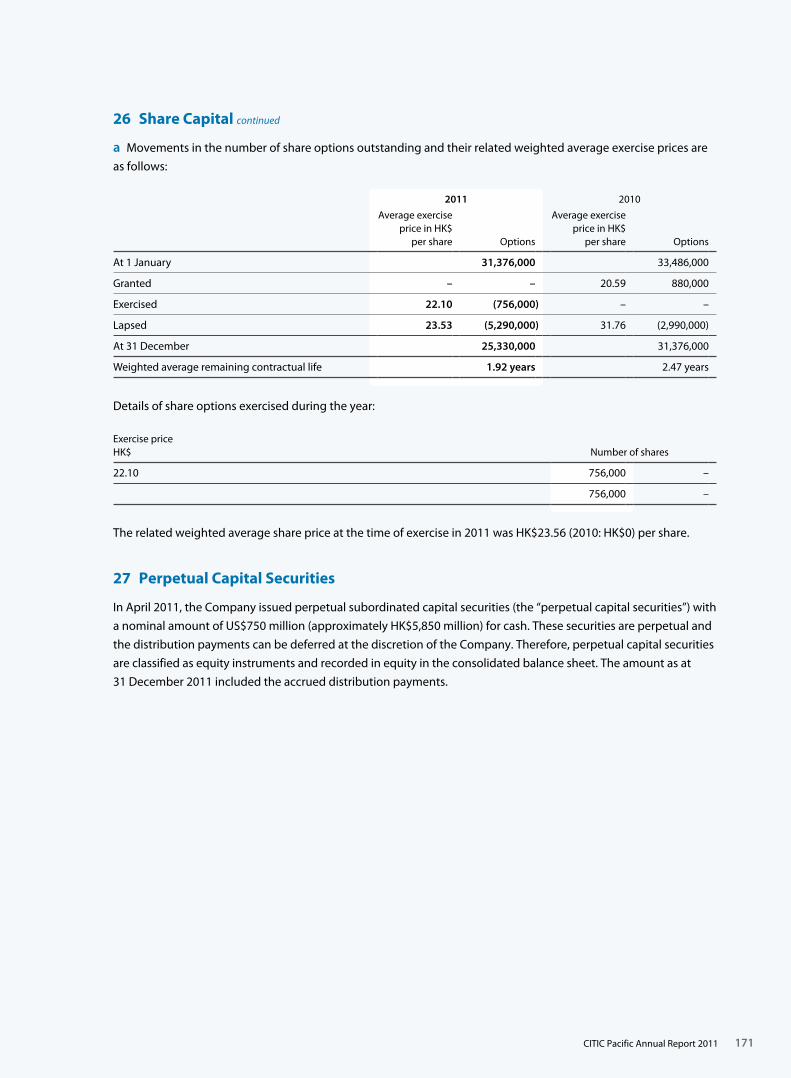
171
26 Share Capital continued
a Movements in the number of share options outstanding and their related weighted average exercise prices are
as follows:
2011 2010
Average exercise price in HK$
per share Options
Average exercise price in HK$
per share Options
At 1 January 31,376,000 33,486,000
Granted – – 20.59 880,000
Exercised 22.10 (756,000) – –
Lapsed 23.53 (5,290,000) 31.76 (2,990,000)
At 31 December 25,330,000 31,376,000
Weighted average remaining contractual life 1.92 years 2.47 years
Details of share options exercised during the year:
Exercise priceHK$ Number of shares
22.10 756,000 –
756,000 –
The related weighted average share price at the time of exercise in 2011 was HK$23.56 (2010: HK$0) per share.
27 Perpetual Capital Securities
In April 2011, the Company issued perpetual subordinated capital securities (the “perpetual capital securities”) with
a nominal amount of US$750 million (approximately HK$5,850 million) for cash. These securities are perpetual and
the distribution payments can be deferred at the discretion of the Company. Therefore, perpetual capital securities
are classified as equity instruments and recorded in equity in the consolidated balance sheet. The amount as at
31 December 2011 included the accrued distribution payments.
CITIC Pacific Annual Report 2011
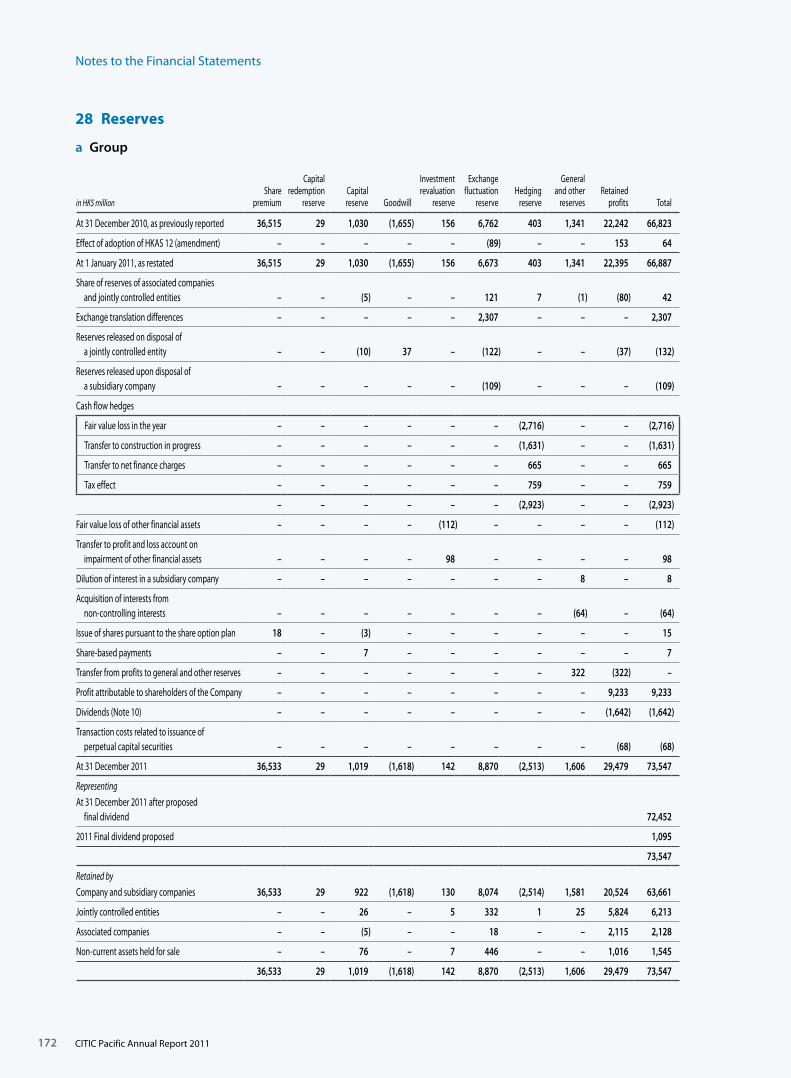
Notes to the Financial Statements
172
28 Reserves
a Group
in HK$ millionShare
premium
Capitalredemption
reserveCapitalreserve Goodwill
Investmentrevaluation
reserve
Exchangefluctuation
reserveHedging
reserve
Generaland other
reservesRetained
profits Total
At 31 December 2010, as previously reported 36,515 29 1,030 (1,655) 156 6,762 403 1,341 22,242 66,823
Effect of adoption of HKAS 12 (amendment) – – – – – (89) – – 153 64
At 1 January 2011, as restated 36,515 29 1,030 (1,655) 156 6,673 403 1,341 22,395 66,887
Share of reserves of associated companies and jointly controlled entities – – (5) – – 121 7 (1) (80) 42
Exchange translation differences – – – – – 2,307 – – – 2,307
Reserves released on disposal of a jointly controlled entity – – (10) 37 – (122) – – (37) (132)
Reserves released upon disposal of a subsidiary company – – – – – (109) – – – (109)
Cash flow hedges
Fair value loss in the year – – – – – – (2,716) – – (2,716)
Transfer to construction in progress – – – – – – (1,631) – – (1,631)
Transfer to net finance charges – – – – – – 665 – – 665
Tax effect – – – – – – 759 – – 759
– – – – – – (2,923) – – (2,923)
Fair value loss of other financial assets – – – – (112) – – – – (112)
Transfer to profit and loss account on impairment of other financial assets – – – – 98 – – – – 98
Dilution of interest in a subsidiary company – – – – – – – 8 – 8
Acquisition of interests from non-controlling interests – – – – – – – (64) – (64)
Issue of shares pursuant to the share option plan 18 – (3) – – – – – – 15
Share-based payments – – 7 – – – – – – 7
Transfer from profits to general and other reserves – – – – – – – 322 (322) –
Profit attributable to shareholders of the Company – – – – – – – – 9,233 9,233
Dividends (Note 10) – – – – – – – – (1,642) (1,642)
Transaction costs related to issuance of perpetual capital securities – – – – – – – – (68) (68)
At 31 December 2011 36,533 29 1,019 (1,618) 142 8,870 (2,513) 1,606 29,479 73,547
Representing
At 31 December 2011 after proposed final dividend 72,452
2011 Final dividend proposed 1,095
73,547
Retained by
Company and subsidiary companies 36,533 29 922 (1,618) 130 8,074 (2,514) 1,581 20,524 63,661
Jointly controlled entities – – 26 – 5 332 1 25 5,824 6,213
Associated companies – – (5) – – 18 – – 2,115 2,128
Non-current assets held for sale – – 76 – 7 446 – – 1,016 1,545
36,533 29 1,019 (1,618) 142 8,870 (2,513) 1,606 29,479 73,547
CITIC Pacific Annual Report 2011
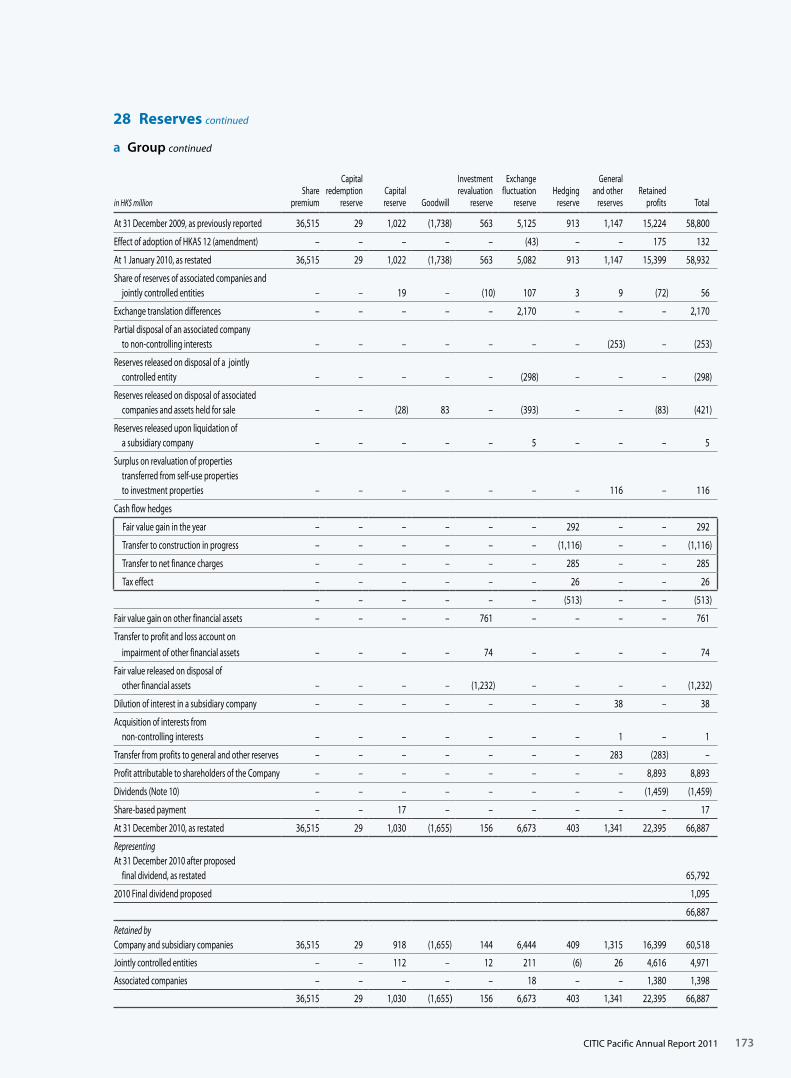
173
28 Reserves continued
a Group continued
in HK$ millionShare
premium
Capitalredemption
reserveCapitalreserve Goodwill
Investmentrevaluation
reserve
Exchangefluctuation
reserveHedging
reserve
Generaland other
reservesRetained
profits Total
At 31 December 2009, as previously reported 36,515 29 1,022 (1,738) 563 5,125 913 1,147 15,224 58,800
Effect of adoption of HKAS 12 (amendment) – – – – – (43) – – 175 132
At 1 January 2010, as restated 36,515 29 1,022 (1,738) 563 5,082 913 1,147 15,399 58,932
Share of reserves of associated companies and jointly controlled entities – – 19 – (10) 107 3 9 (72) 56
Exchange translation differences – – – – – 2,170 – – – 2,170
Partial disposal of an associated company to non-controlling interests – – – – – – – (253) – (253)
Reserves released on disposal of a jointly controlled entity – – – – – (298) – – – (298)
Reserves released on disposal of associated companies and assets held for sale – – (28) 83 – (393) – – (83) (421)
Reserves released upon liquidation of a subsidiary company – – – – – 5 – – – 5
Surplus on revaluation of properties transferred from self-use properties to investment properties – – – – – – – 116 – 116
Cash flow hedges
Fair value gain in the year – – – – – – 292 – – 292
Transfer to construction in progress – – – – – – (1,116) – – (1,116)
Transfer to net finance charges – – – – – – 285 – – 285
Tax effect – – – – – – 26 – – 26
– – – – – – (513) – – (513)
Fair value gain on other financial assets – – – – 761 – – – – 761
Transfer to profit and loss account on impairment of other financial assets – – – – 74 – – – – 74
Fair value released on disposal of other financial assets – – – – (1,232) – – – – (1,232)
Dilution of interest in a subsidiary company – – – – – – – 38 – 38
Acquisition of interests from non-controlling interests – – – – – – – 1 – 1
Transfer from profits to general and other reserves – – – – – – – 283 (283) –
Profit attributable to shareholders of the Company – – – – – – – – 8,893 8,893
Dividends (Note 10) – – – – – – – – (1,459) (1,459)
Share-based payment – – 17 – – – – – – 17
At 31 December 2010, as restated 36,515 29 1,030 (1,655) 156 6,673 403 1,341 22,395 66,887
RepresentingAt 31 December 2010 after proposed final dividend, as restated 65,792
2010 Final dividend proposed 1,095
66,887
Retained byCompany and subsidiary companies 36,515 29 918 (1,655) 144 6,444 409 1,315 16,399 60,518
Jointly controlled entities – – 112 – 12 211 (6) 26 4,616 4,971
Associated companies – – – – – 18 – – 1,380 1,398
36,515 29 1,030 (1,655) 156 6,673 403 1,341 22,395 66,887
CITIC Pacific Annual Report 2011
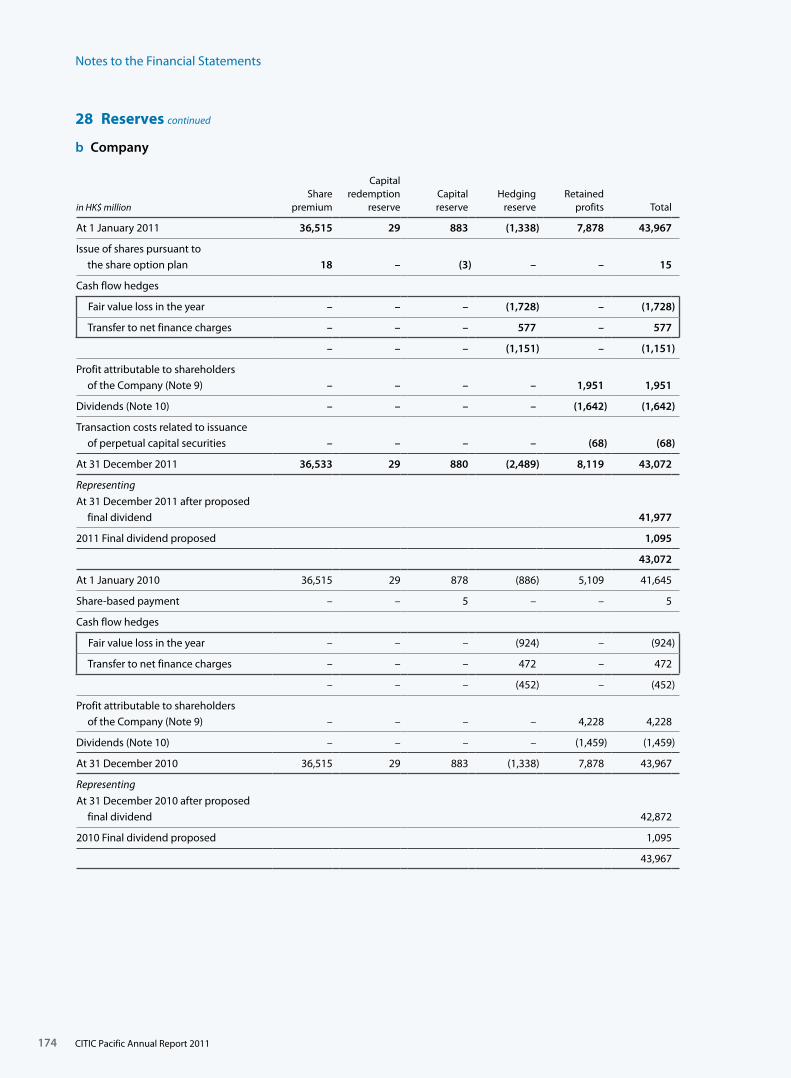
Notes to the Financial Statements
174
28 Reserves continued
b Company
in HK$ millionShare
premium
Capital redemption
reserveCapital reserve
Hedging reserve
Retained profits Total
At 1 January 2011 36,515 29 883 (1,338) 7,878 43,967
Issue of shares pursuant to the share option plan 18 – (3) – – 15
Cash flow hedges
Fair value loss in the year – – – (1,728) – (1,728)
Transfer to net finance charges – – – 577 – 577
– – – (1,151) – (1,151)
Profit attributable to shareholders of the Company (Note 9) – – – – 1,951 1,951
Dividends (Note 10) – – – – (1,642) (1,642)
Transaction costs related to issuance of perpetual capital securities – – – – (68) (68)
At 31 December 2011 36,533 29 880 (2,489) 8,119 43,072
Representing
At 31 December 2011 after proposed final dividend 41,977
2011 Final dividend proposed 1,095
43,072
At 1 January 2010 36,515 29 878 (886) 5,109 41,645
Share-based payment – – 5 – – 5
Cash flow hedges
Fair value loss in the year – – – (924) – (924)
Transfer to net finance charges – – – 472 – 472
– – – (452) – (452)
Profit attributable to shareholders of the Company (Note 9) – – – – 4,228 4,228
Dividends (Note 10) – – – – (1,459) (1,459)
At 31 December 2010 36,515 29 883 (1,338) 7,878 43,967
Representing
At 31 December 2010 after proposed final dividend 42,872
2010 Final dividend proposed 1,095
43,967
CITIC Pacific Annual Report 2011
175
28 Reserves continued
c Nature and Purpose of Reservesi) Share premium and capital redemption reserveThe application of the share premium account and the capital redemption reserve is governed by sections 48B
and 49H respectively of the Hong Kong Companies Ordinance.
ii) Capital reserveThe capital reserve comprises the portion of the grant date fair value of unexercised share options granted
to employees.
iii) GoodwillThe Goodwill reserve is as a result of goodwill arising on acquisitions prior to year 2001 which under the then
prevailing Accounting Standards was reflected in reserves rather than as a separate asset.
iv) Investment revaluation reserveThe investment revaluation reserve comprises the cumulative net change in the fair value of available-for-sale
securities held at the balance sheet date.
v) Exchange fluctuation reserveThe exchange fluctuation reserve comprises all foreign exchange differences arising from the translation of the
financial statements of foreign operations as well as the effective portion of any foreign exchange differences
arising from hedges of the net investment in these foreign operations.
vi) Hedging reserveThe hedging reserve comprises the effective portion of the cumulative net change in the fair value of hedging
instruments used in cash flow hedges pending subsequent recognition of the hedged cash flow.
vii) General and other reservesGeneral and other reserves comprise reserves of the mainland China subsidiaries appropriated according to the
articles of association of the relevant subsidiaries and the mainland China rules and regulations used for specific
purposes before distribution of dividend, and reserves arising from assets revaluation and transactions with
non-controlling interests.
viii) Distributable reserves At 31 December 2011, the aggregate amount of reserves available for distribution to equity shareholders of the
Company was HK$4,836 million (2010: HK$5,800 million).
CITIC Pacific Annual Report 2011
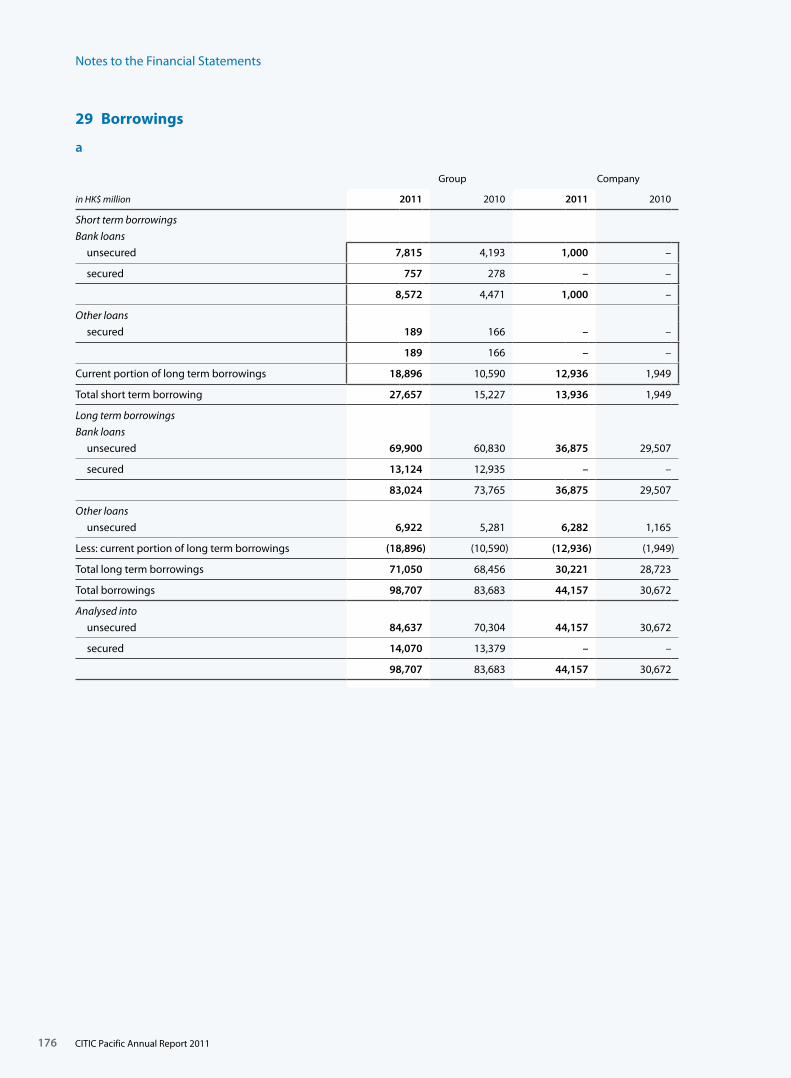
Notes to the Financial Statements
176
29 Borrowings
a
Group Company
in HK$ million 2011 2010 2011 2010
Short term borrowings
Bank loans
unsecured 7,815 4,193 1,000 –
secured 757 278 – –
8,572 4,471 1,000 –
Other loans
secured 189 166 – –
189 166 – –
Current portion of long term borrowings 18,896 10,590 12,936 1,949
Total short term borrowing 27,657 15,227 13,936 1,949
Long term borrowings
Bank loans
unsecured 69,900 60,830 36,875 29,507
secured 13,124 12,935 – –
83,024 73,765 36,875 29,507
Other loans
unsecured 6,922 5,281 6,282 1,165
Less: current portion of long term borrowings (18,896) (10,590) (12,936) (1,949)
Total long term borrowings 71,050 68,456 30,221 28,723
Total borrowings 98,707 83,683 44,157 30,672
Analysed into
unsecured 84,637 70,304 44,157 30,672
secured 14,070 13,379 – –
98,707 83,683 44,157 30,672
CITIC Pacific Annual Report 2011
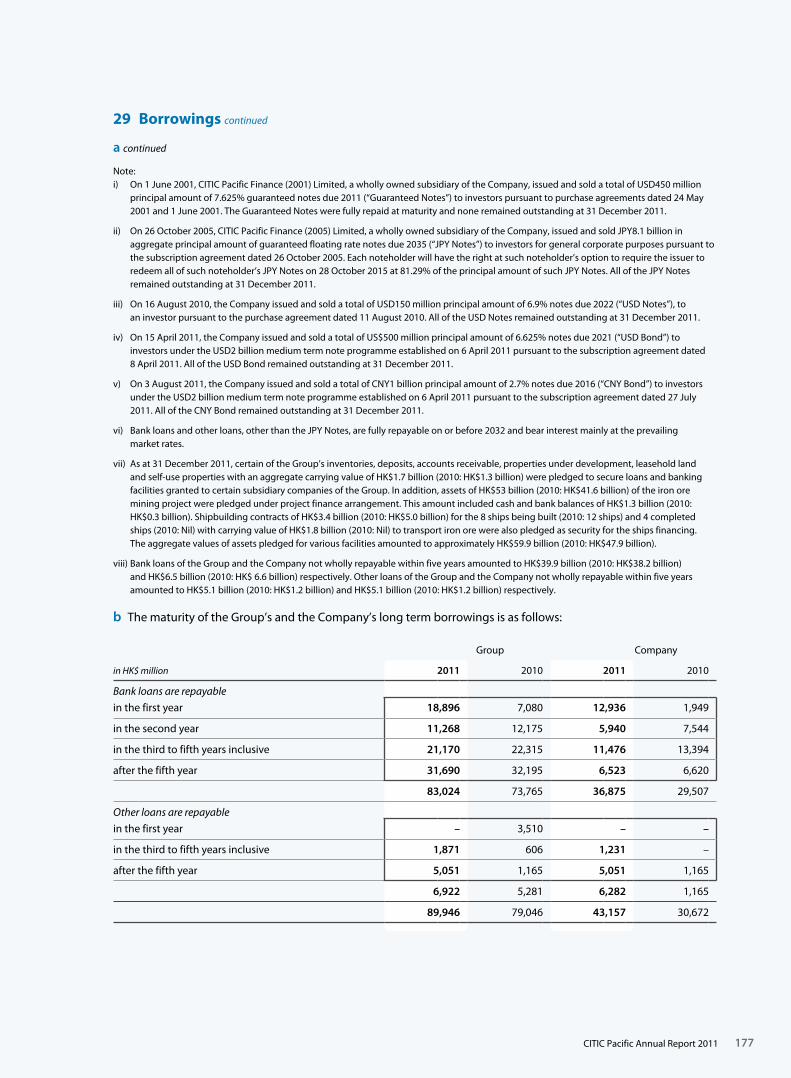
177
29 Borrowings continued
a continued
Note:i) On 1 June 2001, CITIC Pacific Finance (2001) Limited, a wholly owned subsidiary of the Company, issued and sold a total of USD450 million
principal amount of 7.625% guaranteed notes due 2011 (“Guaranteed Notes”) to investors pursuant to purchase agreements dated 24 May 2001 and 1 June 2001. The Guaranteed Notes were fully repaid at maturity and none remained outstanding at 31 December 2011.
ii) On 26 October 2005, CITIC Pacific Finance (2005) Limited, a wholly owned subsidiary of the Company, issued and sold JPY8.1 billion in aggregate principal amount of guaranteed floating rate notes due 2035 (“JPY Notes”) to investors for general corporate purposes pursuant to the subscription agreement dated 26 October 2005. Each noteholder will have the right at such noteholder’s option to require the issuer to redeem all of such noteholder’s JPY Notes on 28 October 2015 at 81.29% of the principal amount of such JPY Notes. All of the JPY Notes remained outstanding at 31 December 2011.
iii) On 16 August 2010, the Company issued and sold a total of USD150 million principal amount of 6.9% notes due 2022 (“USD Notes”), to an investor pursuant to the purchase agreement dated 11 August 2010. All of the USD Notes remained outstanding at 31 December 2011.
iv) On 15 April 2011, the Company issued and sold a total of US$500 million principal amount of 6.625% notes due 2021 (“USD Bond”) to investors under the USD2 billion medium term note programme established on 6 April 2011 pursuant to the subscription agreement dated 8 April 2011. All of the USD Bond remained outstanding at 31 December 2011.
v) On 3 August 2011, the Company issued and sold a total of CNY1 billion principal amount of 2.7% notes due 2016 (“CNY Bond”) to investors under the USD2 billion medium term note programme established on 6 April 2011 pursuant to the subscription agreement dated 27 July 2011. All of the CNY Bond remained outstanding at 31 December 2011.
vi) Bank loans and other loans, other than the JPY Notes, are fully repayable on or before 2032 and bear interest mainly at the prevailing market rates.
vii) As at 31 December 2011, certain of the Group’s inventories, deposits, accounts receivable, properties under development, leasehold land and self-use properties with an aggregate carrying value of HK$1.7 billion (2010: HK$1.3 billion) were pledged to secure loans and banking facilities granted to certain subsidiary companies of the Group. In addition, assets of HK$53 billion (2010: HK$41.6 billion) of the iron ore mining project were pledged under project finance arrangement. This amount included cash and bank balances of HK$1.3 billion (2010: HK$0.3 billion). Shipbuilding contracts of HK$3.4 billion (2010: HK$5.0 billion) for the 8 ships being built (2010: 12 ships) and 4 completed ships (2010: Nil) with carrying value of HK$1.8 billion (2010: Nil) to transport iron ore were also pledged as security for the ships financing. The aggregate values of assets pledged for various facilities amounted to approximately HK$59.9 billion (2010: HK$47.9 billion).
viii) Bank loans of the Group and the Company not wholly repayable within five years amounted to HK$39.9 billion (2010: HK$38.2 billion) and HK$6.5 billion (2010: HK$ 6.6 billion) respectively. Other loans of the Group and the Company not wholly repayable within five years amounted to HK$5.1 billion (2010: HK$1.2 billion) and HK$5.1 billion (2010: HK$1.2 billion) respectively.
b The maturity of the Group’s and the Company’s long term borrowings is as follows:
Group Company
in HK$ million 2011 2010 2011 2010
Bank loans are repayable
in the first year 18,896 7,080 12,936 1,949
in the second year 11,268 12,175 5,940 7,544
in the third to fifth years inclusive 21,170 22,315 11,476 13,394
after the fifth year 31,690 32,195 6,523 6,620
83,024 73,765 36,875 29,507
Other loans are repayable
in the first year – 3,510 – –
in the third to fifth years inclusive 1,871 606 1,231 –
after the fifth year 5,051 1,165 5,051 1,165
6,922 5,281 6,282 1,165
89,946 79,046 43,157 30,672
CITIC Pacific Annual Report 2011
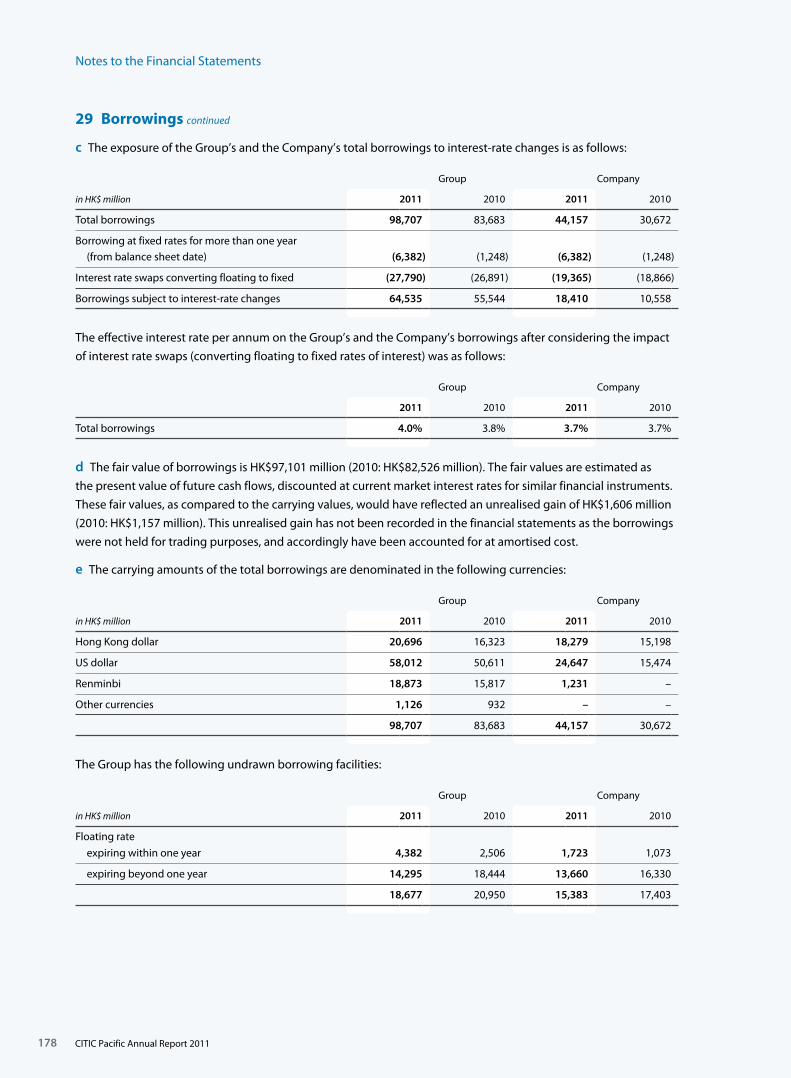
Notes to the Financial Statements
178
29 Borrowings continued
c The exposure of the Group’s and the Company’s total borrowings to interest-rate changes is as follows:
Group Company
in HK$ million 2011 2010 2011 2010
Total borrowings 98,707 83,683 44,157 30,672
Borrowing at fixed rates for more than one year (from balance sheet date) (6,382) (1,248) (6,382) (1,248)
Interest rate swaps converting floating to fixed (27,790) (26,891) (19,365) (18,866)
Borrowings subject to interest-rate changes 64,535 55,544 18,410 10,558
The effective interest rate per annum on the Group’s and the Company’s borrowings after considering the impact
of interest rate swaps (converting floating to fixed rates of interest) was as follows:
Group Company
2011 2010 2011 2010
Total borrowings 4.0% 3.8% 3.7% 3.7%
d The fair value of borrowings is HK$97,101 million (2010: HK$82,526 million). The fair values are estimated as
the present value of future cash flows, discounted at current market interest rates for similar financial instruments.
These fair values, as compared to the carrying values, would have reflected an unrealised gain of HK$1,606 million
(2010: HK$1,157 million). This unrealised gain has not been recorded in the financial statements as the borrowings
were not held for trading purposes, and accordingly have been accounted for at amortised cost.
e The carrying amounts of the total borrowings are denominated in the following currencies:
Group Company
in HK$ million 2011 2010 2011 2010
Hong Kong dollar 20,696 16,323 18,279 15,198
US dollar 58,012 50,611 24,647 15,474
Renminbi 18,873 15,817 1,231 –
Other currencies 1,126 932 – –
98,707 83,683 44,157 30,672
The Group has the following undrawn borrowing facilities:
Group Company
in HK$ million 2011 2010 2011 2010
Floating rate
expiring within one year 4,382 2,506 1,723 1,073
expiring beyond one year 14,295 18,444 13,660 16,330
18,677 20,950 15,383 17,403
CITIC Pacific Annual Report 2011
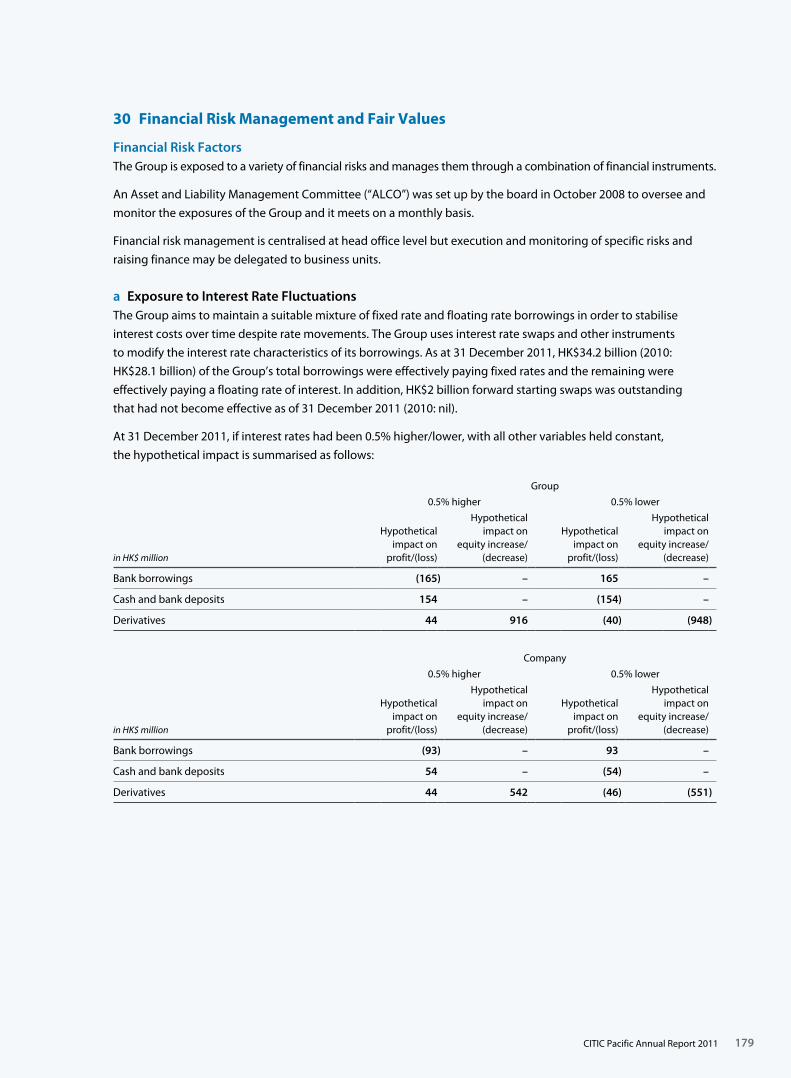
179
30 Financial Risk Management and Fair Values
Financial Risk FactorsThe Group is exposed to a variety of financial risks and manages them through a combination of financial instruments.
An Asset and Liability Management Committee (“ALCO”) was set up by the board in October 2008 to oversee and
monitor the exposures of the Group and it meets on a monthly basis.
Financial risk management is centralised at head office level but execution and monitoring of specific risks and
raising finance may be delegated to business units.
a Exposure to Interest Rate FluctuationsThe Group aims to maintain a suitable mixture of fixed rate and floating rate borrowings in order to stabilise
interest costs over time despite rate movements. The Group uses interest rate swaps and other instruments
to modify the interest rate characteristics of its borrowings. As at 31 December 2011, HK$34.2 billion (2010:
HK$28.1 billion) of the Group’s total borrowings were effectively paying fixed rates and the remaining were
effectively paying a floating rate of interest. In addition, HK$2 billion forward starting swaps was outstanding
that had not become effective as of 31 December 2011 (2010: nil).
At 31 December 2011, if interest rates had been 0.5% higher/lower, with all other variables held constant,
the hypothetical impact is summarised as follows:
Group
0.5% higher 0.5% lower
in HK$ million
Hypotheticalimpact on
profit/(loss)
Hypotheticalimpact on
equity increase/(decrease)
Hypotheticalimpact on
profit/(loss)
Hypotheticalimpact on
equity increase/(decrease)
Bank borrowings (165) – 165 –
Cash and bank deposits 154 – (154) –
Derivatives 44 916 (40) (948)
Company
0.5% higher 0.5% lower
in HK$ million
Hypotheticalimpact on
profit/(loss)
Hypotheticalimpact on
equity increase/(decrease)
Hypotheticalimpact on
profit/(loss)
Hypotheticalimpact on
equity increase/(decrease)
Bank borrowings (93) – 93 –
Cash and bank deposits 54 – (54) –
Derivatives 44 542 (46) (551)
CITIC Pacific Annual Report 2011
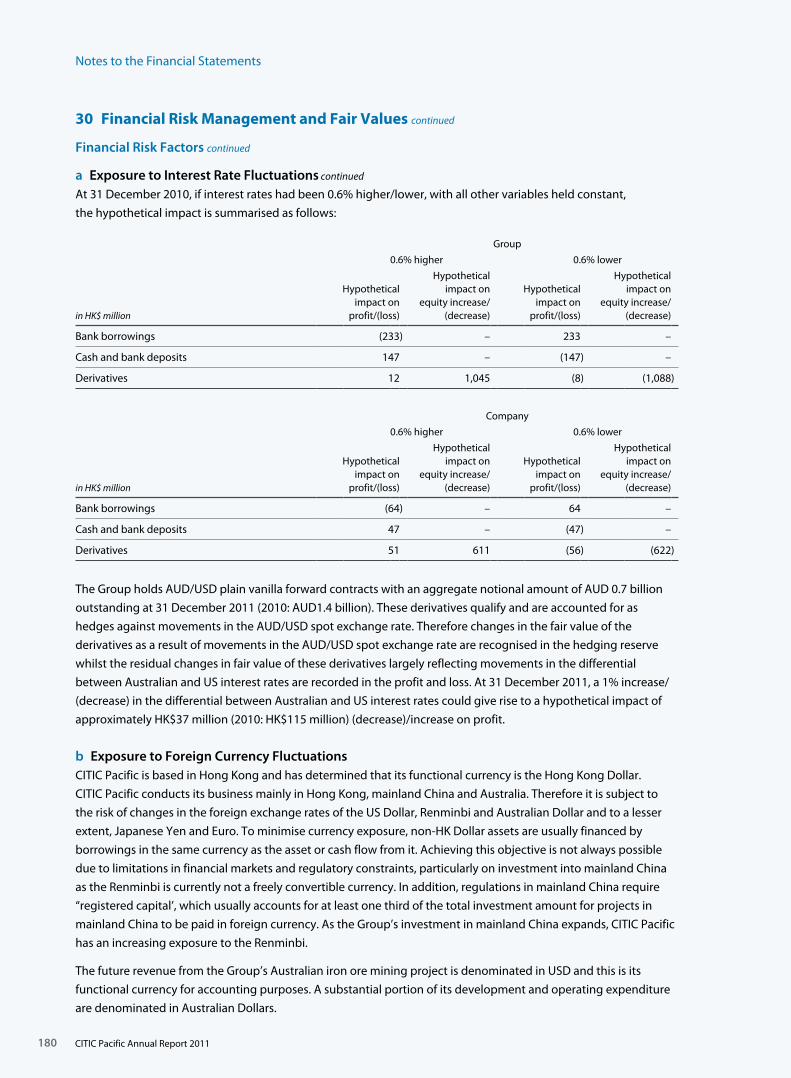
Notes to the Financial Statements
180
30 Financial Risk Management and Fair Values continued
Financial Risk Factors continued
a Exposure to Interest Rate Fluctuations continued
At 31 December 2010, if interest rates had been 0.6% higher/lower, with all other variables held constant,
the hypothetical impact is summarised as follows:
Group
0.6% higher 0.6% lower
in HK$ million
Hypotheticalimpact on
profit/(loss)
Hypotheticalimpact on
equity increase/(decrease)
Hypotheticalimpact on
profit/(loss)
Hypotheticalimpact on
equity increase/(decrease)
Bank borrowings (233) – 233 –
Cash and bank deposits 147 – (147) –
Derivatives 12 1,045 (8) (1,088)
Company
0.6% higher 0.6% lower
in HK$ million
Hypotheticalimpact on
profit/(loss)
Hypotheticalimpact on
equity increase/(decrease)
Hypotheticalimpact on
profit/(loss)
Hypotheticalimpact on
equity increase/(decrease)
Bank borrowings (64) – 64 –
Cash and bank deposits 47 – (47) –
Derivatives 51 611 (56) (622)
The Group holds AUD/USD plain vanilla forward contracts with an aggregate notional amount of AUD 0.7 billion
outstanding at 31 December 2011 (2010: AUD1.4 billion). These derivatives qualify and are accounted for as
hedges against movements in the AUD/USD spot exchange rate. Therefore changes in the fair value of the
derivatives as a result of movements in the AUD/USD spot exchange rate are recognised in the hedging reserve
whilst the residual changes in fair value of these derivatives largely reflecting movements in the differential
between Australian and US interest rates are recorded in the profit and loss. At 31 December 2011, a 1% increase/
(decrease) in the differential between Australian and US interest rates could give rise to a hypothetical impact of
approximately HK$37 million (2010: HK$115 million) (decrease)/increase on profit.
b Exposure to Foreign Currency FluctuationsCITIC Pacific is based in Hong Kong and has determined that its functional currency is the Hong Kong Dollar.
CITIC Pacific conducts its business mainly in Hong Kong, mainland China and Australia. Therefore it is subject to
the risk of changes in the foreign exchange rates of the US Dollar, Renminbi and Australian Dollar and to a lesser
extent, Japanese Yen and Euro. To minimise currency exposure, non-HK Dollar assets are usually financed by
borrowings in the same currency as the asset or cash flow from it. Achieving this objective is not always possible
due to limitations in financial markets and regulatory constraints, particularly on investment into mainland China
as the Renminbi is currently not a freely convertible currency. In addition, regulations in mainland China require
“registered capital’, which usually accounts for at least one third of the total investment amount for projects in
mainland China to be paid in foreign currency. As the Group’s investment in mainland China expands, CITIC Pacific
has an increasing exposure to the Renminbi.
The future revenue from the Group’s Australian iron ore mining project is denominated in USD and this is its
functional currency for accounting purposes. A substantial portion of its development and operating expenditure
are denominated in Australian Dollars.
CITIC Pacific Annual Report 2011
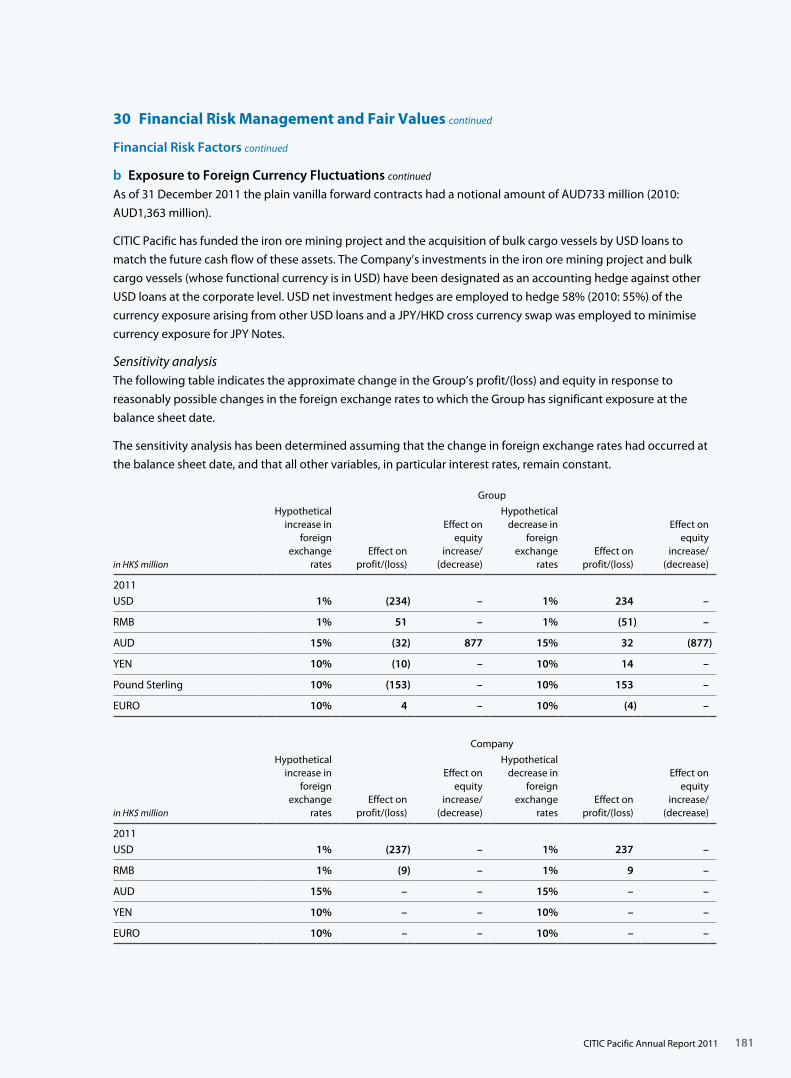
181
30 Financial Risk Management and Fair Values continued
Financial Risk Factors continued
b Exposure to Foreign Currency Fluctuations continued
As of 31 December 2011 the plain vanilla forward contracts had a notional amount of AUD733 million (2010:
AUD1,363 million).
CITIC Pacific has funded the iron ore mining project and the acquisition of bulk cargo vessels by USD loans to
match the future cash flow of these assets. The Company’s investments in the iron ore mining project and bulk
cargo vessels (whose functional currency is in USD) have been designated as an accounting hedge against other
USD loans at the corporate level. USD net investment hedges are employed to hedge 58% (2010: 55%) of the
currency exposure arising from other USD loans and a JPY/HKD cross currency swap was employed to minimise
currency exposure for JPY Notes.
Sensitivity analysisThe following table indicates the approximate change in the Group’s profit/(loss) and equity in response to
reasonably possible changes in the foreign exchange rates to which the Group has significant exposure at the
balance sheet date.
The sensitivity analysis has been determined assuming that the change in foreign exchange rates had occurred at
the balance sheet date, and that all other variables, in particular interest rates, remain constant.
Group
in HK$ million
Hypotheticalincrease in
foreignexchange
ratesEffect on
profit/(loss)
Effect onequity
increase/(decrease)
Hypotheticaldecrease in
foreignexchange
ratesEffect on
profit/(loss)
Effect onequity
increase/(decrease)
2011
USD 1% (234) – 1% 234 –
RMB 1% 51 – 1% (51) –
AUD 15% (32) 877 15% 32 (877)
YEN 10% (10) – 10% 14 –
Pound Sterling 10% (153) – 10% 153 –
EURO 10% 4 – 10% (4) –
Company
in HK$ million
Hypotheticalincrease in
foreignexchange
ratesEffect on
profit/(loss)
Effect onequity
increase/(decrease)
Hypotheticaldecrease in
foreignexchange
ratesEffect on
profit/(loss)
Effect onequity
increase/(decrease)
2011
USD 1% (237) – 1% 237 –
RMB 1% (9) – 1% 9 –
AUD 15% – – 15% – –
YEN 10% – – 10% – –
EURO 10% – – 10% – –
CITIC Pacific Annual Report 2011
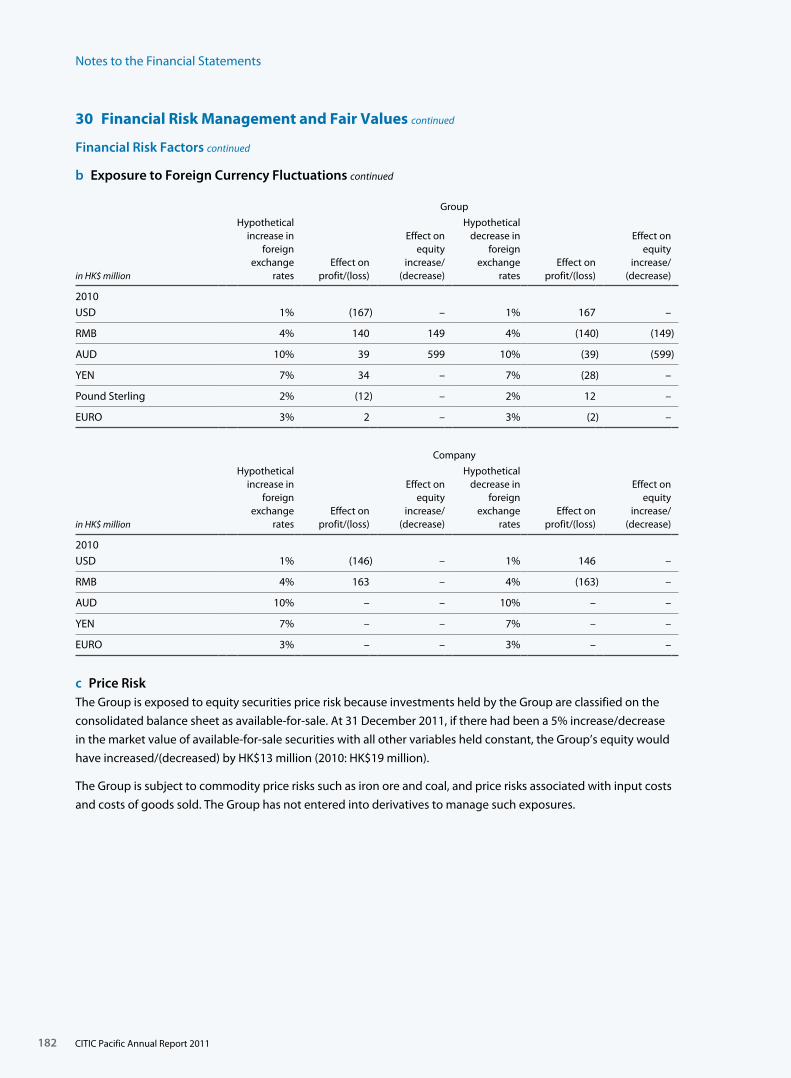
Notes to the Financial Statements
182
30 Financial Risk Management and Fair Values continued
Financial Risk Factors continued
b Exposure to Foreign Currency Fluctuations continued
Group
in HK$ million
Hypotheticalincrease in
foreignexchange
ratesEffect on
profit/(loss)
Effect onequity
increase/(decrease)
Hypotheticaldecrease in
foreignexchange
ratesEffect on
profit/(loss)
Effect onequity
increase/(decrease)
2010
USD 1% (167) – 1% 167 –
RMB 4% 140 149 4% (140) (149)
AUD 10% 39 599 10% (39) (599)
YEN 7% 34 – 7% (28) –
Pound Sterling 2% (12) – 2% 12 –
EURO 3% 2 – 3% (2) –
Company
in HK$ million
Hypotheticalincrease in
foreignexchange
ratesEffect on
profit/(loss)
Effect onequity
increase/(decrease)
Hypotheticaldecrease in
foreignexchange
ratesEffect on
profit/(loss)
Effect onequity
increase/(decrease)
2010
USD 1% (146) – 1% 146 –
RMB 4% 163 – 4% (163) –
AUD 10% – – 10% – –
YEN 7% – – 7% – –
EURO 3% – – 3% – –
c Price RiskThe Group is exposed to equity securities price risk because investments held by the Group are classified on the
consolidated balance sheet as available-for-sale. At 31 December 2011, if there had been a 5% increase/decrease
in the market value of available-for-sale securities with all other variables held constant, the Group’s equity would
have increased/(decreased) by HK$13 million (2010: HK$19 million).
The Group is subject to commodity price risks such as iron ore and coal, and price risks associated with input costs
and costs of goods sold. The Group has not entered into derivatives to manage such exposures.
CITIC Pacific Annual Report 2011
183
30 Financial Risk Management and Fair Values continued
Financial Risk Factors continued
d Credit ExposureThe Group’s credit risk is primarily related to deposits placed with banks and the continued ability of the banks to
deliver on foreign exchange and derivatives. Operating businesses have trade and accounts receivables.
The Group’s cash and deposits with banks are placed with major financial institutions. Counterparty limits are
closely monitored for all financial institutions with whom the Group is doing business. The Group only deals
with international financial institutions with an investment grade credit rating except for leading PRC financial
institutions that do not have an international credit rating. The amount of counterparties’ lending exposure to
the Group is an important consideration as a means to control credit risk.
Trade receivables are presented net of allowances for bad and doubtful debts. Credit risk in respect of trade and
accounts receivables is dispersed since the customers are large in number and spread across different industries
and geographical areas. Accordingly, the Group has no significant concentration of such credit risk. Each core
operating business has a policy of credit control in place under which credit evaluations are performed on all
customers requiring credit over a certain amount. Trade receivables are due within 15 to 90 days from the date
of billing. Normally, the Group does not obtain collateral from customers.
e Liquidity RiskLiquidity risk is managed by maintaining substantial undrawn committed credit facilities, money market lines
and cash deposits so as to avoid over reliance on any one source of funds. Refinancing is allocated such that there
is a reasonable amount coming due in any one period. In addition, the Company has established co-operative
agreements with major PRC banks.
The Group’s liquidity management procedures involve regularly projecting cashflows in major currencies, and
considering the level of liquid assets and new financings necessary to meet these cash flow requirements.
The Group seeks to secure financing from a diversified set of counterparties on the most competitive terms in
the market. At the end of 2011 CITIC Pacific had multiple borrowing relationships with financial institutions in
Hong Kong, PRC and other markets. The Group diversifies its funding mix through bank borrowings and accessing
the capital markets and seeks to maintain a mix of short-and long-term borrowings to stagger maturities and
minimise financing risk. In 2012 and 2013, the funding requirements of the Group are expected to continue be
met through cash flows generated from operating activities, drawdown of undrawn borrowing facilities, roll-over
of existing facilities as well as arrangement of new facilities. Based on the Group’s history of its ability to obtain
external financing, its operating performance and its expected future working capital requirements, management
believes that there are sufficient financial resources available to the Group to meet its liabilities as and when they
fall due.
CITIC Pacific Annual Report 2011
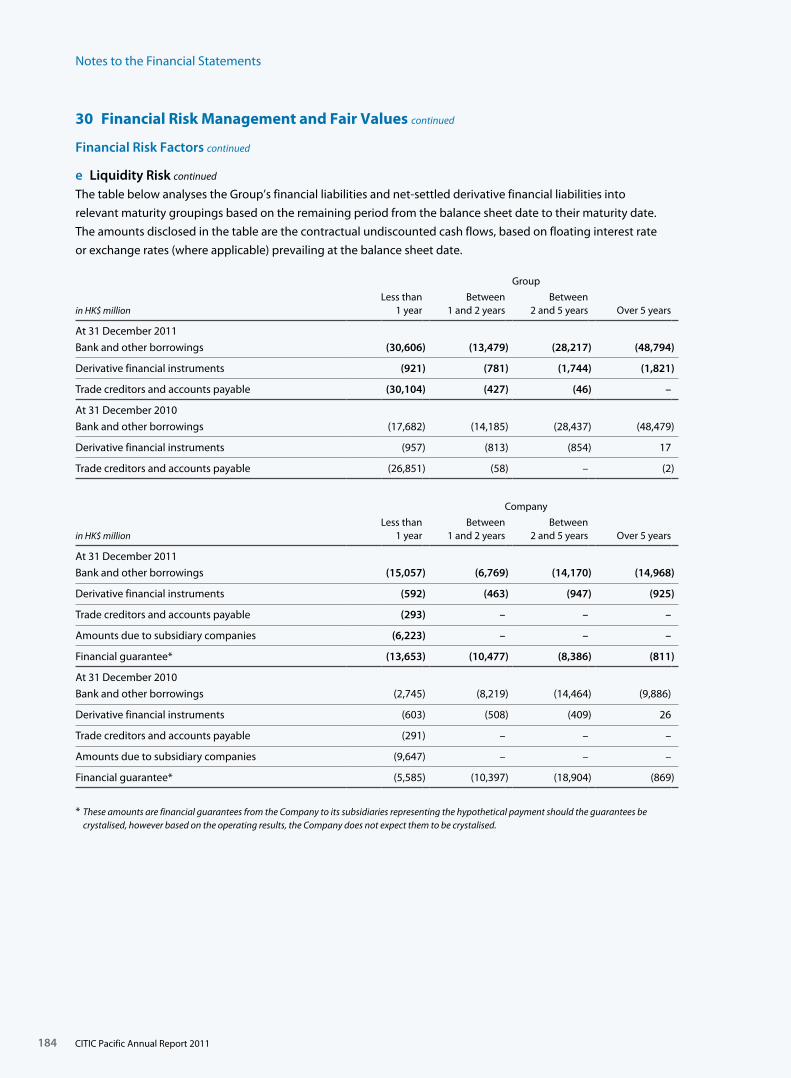
Notes to the Financial Statements
184
30 Financial Risk Management and Fair Values continued
Financial Risk Factors continued
e Liquidity Risk continued
The table below analyses the Group’s financial liabilities and net-settled derivative financial liabilities into
relevant maturity groupings based on the remaining period from the balance sheet date to their maturity date.
The amounts disclosed in the table are the contractual undiscounted cash flows, based on floating interest rate
or exchange rates (where applicable) prevailing at the balance sheet date.
Group
in HK$ millionLess than
1 yearBetween
1 and 2 yearsBetween
2 and 5 years Over 5 years
At 31 December 2011
Bank and other borrowings (30,606) (13,479) (28,217) (48,794)
Derivative financial instruments (921) (781) (1,744) (1,821)
Trade creditors and accounts payable (30,104) (427) (46) –
At 31 December 2010
Bank and other borrowings (17,682) (14,185) (28,437) (48,479)
Derivative financial instruments (957) (813) (854) 17
Trade creditors and accounts payable (26,851) (58) – (2)
Company
in HK$ millionLess than
1 yearBetween
1 and 2 yearsBetween
2 and 5 years Over 5 years
At 31 December 2011
Bank and other borrowings (15,057) (6,769) (14,170) (14,968)
Derivative financial instruments (592) (463) (947) (925)
Trade creditors and accounts payable (293) – – –
Amounts due to subsidiary companies (6,223) – – –
Financial guarantee* (13,653) (10,477) (8,386) (811)
At 31 December 2010
Bank and other borrowings (2,745) (8,219) (14,464) (9,886)
Derivative financial instruments (603) (508) (409) 26
Trade creditors and accounts payable (291) – – –
Amounts due to subsidiary companies (9,647) – – –
Financial guarantee* (5,585) (10,397) (18,904) (869)
* These amounts are financial guarantees from the Company to its subsidiaries representing the hypothetical payment should the guarantees be crystalised, however based on the operating results, the Company does not expect them to be crystalised.
CITIC Pacific Annual Report 2011
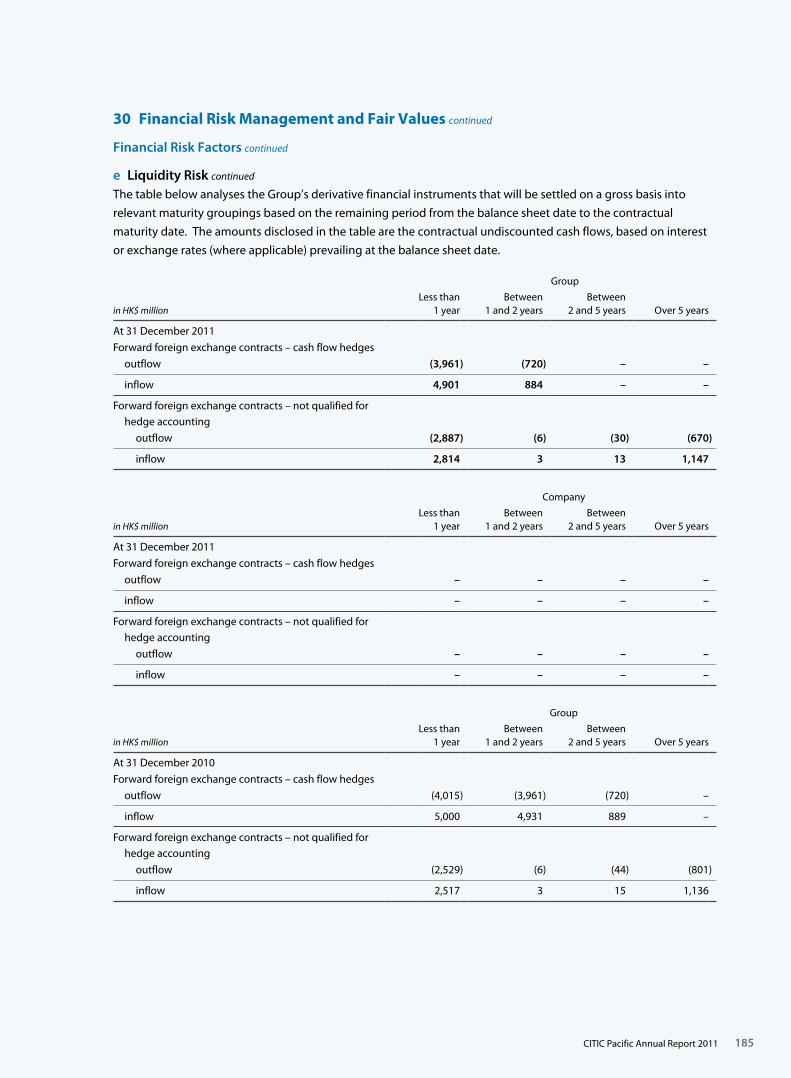
185
30 Financial Risk Management and Fair Values continued
Financial Risk Factors continued
e Liquidity Risk continued
The table below analyses the Group’s derivative financial instruments that will be settled on a gross basis into
relevant maturity groupings based on the remaining period from the balance sheet date to the contractual
maturity date. The amounts disclosed in the table are the contractual undiscounted cash flows, based on interest
or exchange rates (where applicable) prevailing at the balance sheet date.
Group
in HK$ millionLess than
1 yearBetween
1 and 2 yearsBetween
2 and 5 years Over 5 years
At 31 December 2011
Forward foreign exchange contracts – cash flow hedges
outflow (3,961) (720) – –
inflow 4,901 884 – –
Forward foreign exchange contracts – not qualified for hedge accounting
outflow (2,887) (6) (30) (670)
inflow 2,814 3 13 1,147
Company
in HK$ million Less than
1 yearBetween
1 and 2 yearsBetween
2 and 5 years Over 5 years
At 31 December 2011
Forward foreign exchange contracts – cash flow hedges
outflow – – – –
inflow – – – –
Forward foreign exchange contracts – not qualified for hedge accounting
outflow – – – –
inflow – – – –
Group
in HK$ millionLess than
1 yearBetween
1 and 2 yearsBetween
2 and 5 years Over 5 years
At 31 December 2010
Forward foreign exchange contracts – cash flow hedges
outflow (4,015) (3,961) (720) –
inflow 5,000 4,931 889 –
Forward foreign exchange contracts – not qualified for hedge accounting
outflow (2,529) (6) (44) (801)
inflow 2,517 3 15 1,136
CITIC Pacific Annual Report 2011
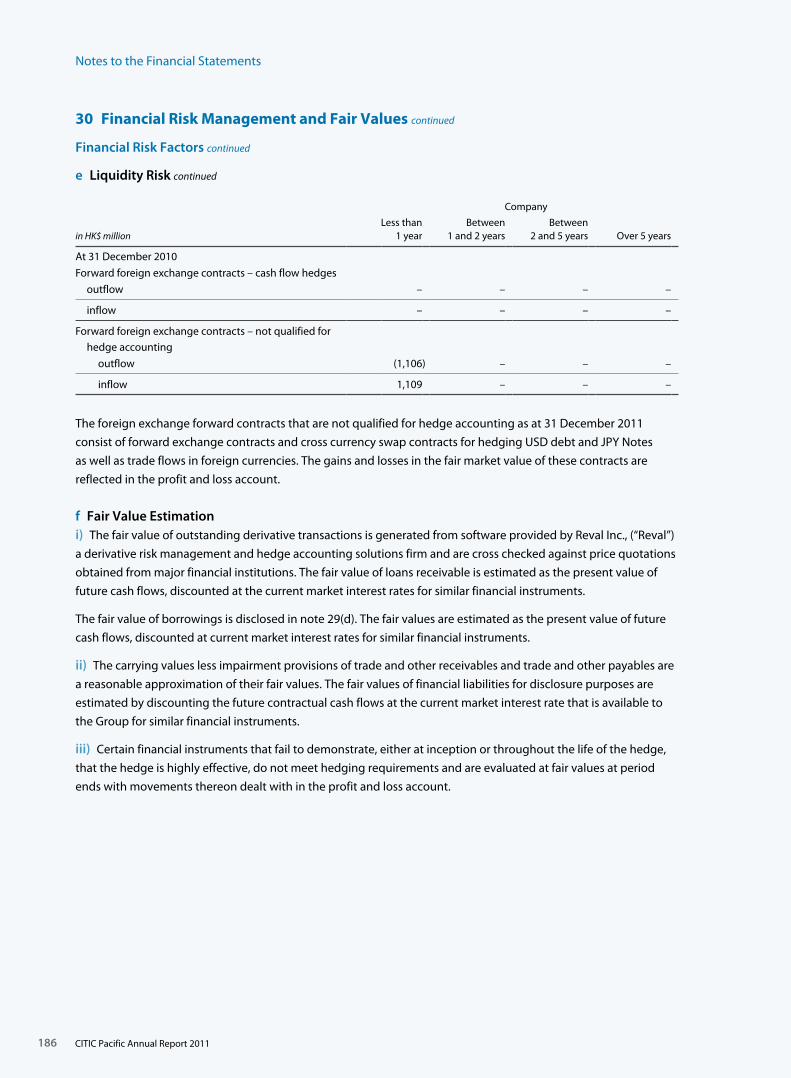
Notes to the Financial Statements
186
30 Financial Risk Management and Fair Values continued
Financial Risk Factors continued
e Liquidity Risk continued
Company
in HK$ millionLess than
1 yearBetween
1 and 2 yearsBetween
2 and 5 years Over 5 years
At 31 December 2010
Forward foreign exchange contracts – cash flow hedges
outflow – – – –
inflow – – – –
Forward foreign exchange contracts – not qualified for hedge accounting
outflow (1,106) – – –
inflow 1,109 – – –
The foreign exchange forward contracts that are not qualified for hedge accounting as at 31 December 2011
consist of forward exchange contracts and cross currency swap contracts for hedging USD debt and JPY Notes
as well as trade flows in foreign currencies. The gains and losses in the fair market value of these contracts are
reflected in the profit and loss account.
f Fair Value Estimationi) The fair value of outstanding derivative transactions is generated from software provided by Reval Inc., (“Reval”)
a derivative risk management and hedge accounting solutions firm and are cross checked against price quotations
obtained from major financial institutions. The fair value of loans receivable is estimated as the present value of
future cash flows, discounted at the current market interest rates for similar financial instruments.
The fair value of borrowings is disclosed in note 29(d). The fair values are estimated as the present value of future
cash flows, discounted at current market interest rates for similar financial instruments.
ii) The carrying values less impairment provisions of trade and other receivables and trade and other payables are
a reasonable approximation of their fair values. The fair values of financial liabilities for disclosure purposes are
estimated by discounting the future contractual cash flows at the current market interest rate that is available to
the Group for similar financial instruments.
iii) Certain financial instruments that fail to demonstrate, either at inception or throughout the life of the hedge,
that the hedge is highly effective, do not meet hedging requirements and are evaluated at fair values at period
ends with movements thereon dealt with in the profit and loss account.
CITIC Pacific Annual Report 2011
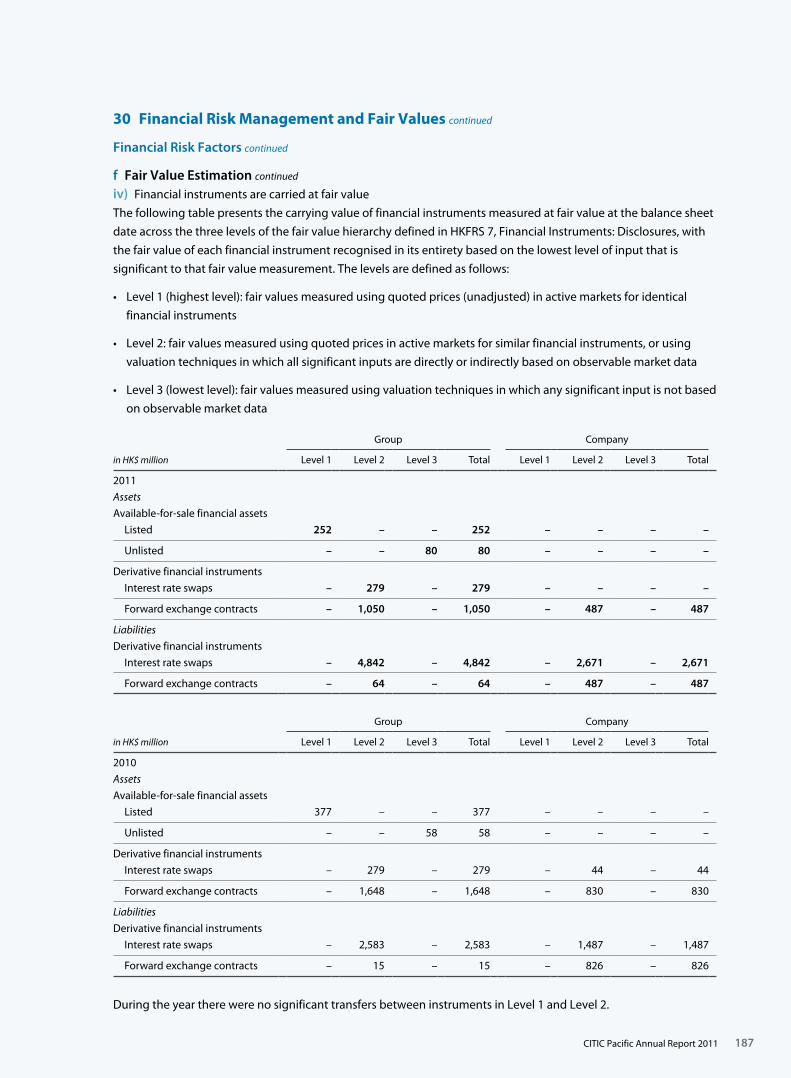
187
30 Financial Risk Management and Fair Values continued
Financial Risk Factors continued
f Fair Value Estimation continued
iv) Financial instruments are carried at fair value
The following table presents the carrying value of financial instruments measured at fair value at the balance sheet
date across the three levels of the fair value hierarchy defined in HKFRS 7, Financial Instruments: Disclosures, with
the fair value of each financial instrument recognised in its entirety based on the lowest level of input that is
significant to that fair value measurement. The levels are defined as follows:
• Level1(highestlevel):fairvaluesmeasuredusingquotedprices(unadjusted)inactivemarketsforidentical
financial instruments
• Level2:fairvaluesmeasuredusingquotedpricesinactivemarketsforsimilarfinancialinstruments,orusing
valuation techniques in which all significant inputs are directly or indirectly based on observable market data
• Level3(lowestlevel):fairvaluesmeasuredusingvaluationtechniquesinwhichanysignificantinputisnotbased
on observable market data
Group Company
in HK$ million Level 1 Level 2 Level 3 Total Level 1 Level 2 Level 3 Total
2011
Assets
Available-for-sale financial assets
Listed 252 – – 252 – – – –
Unlisted – – 80 80 – – – –
Derivative financial instruments
Interest rate swaps – 279 – 279 – – – –
Forward exchange contracts – 1,050 – 1,050 – 487 – 487
Liabilities
Derivative financial instruments
Interest rate swaps – 4,842 – 4,842 – 2,671 – 2,671
Forward exchange contracts – 64 – 64 – 487 – 487
Group Company
in HK$ million Level 1 Level 2 Level 3 Total Level 1 Level 2 Level 3 Total
2010
Assets
Available-for-sale financial assets
Listed 377 – – 377 – – – –
Unlisted – – 58 58 – – – –
Derivative financial instruments
Interest rate swaps – 279 – 279 – 44 – 44
Forward exchange contracts – 1,648 – 1,648 – 830 – 830
Liabilities
Derivative financial instruments
Interest rate swaps – 2,583 – 2,583 – 1,487 – 1,487
Forward exchange contracts – 15 – 15 – 826 – 826
During the year there were no significant transfers between instruments in Level 1 and Level 2.
CITIC Pacific Annual Report 2011
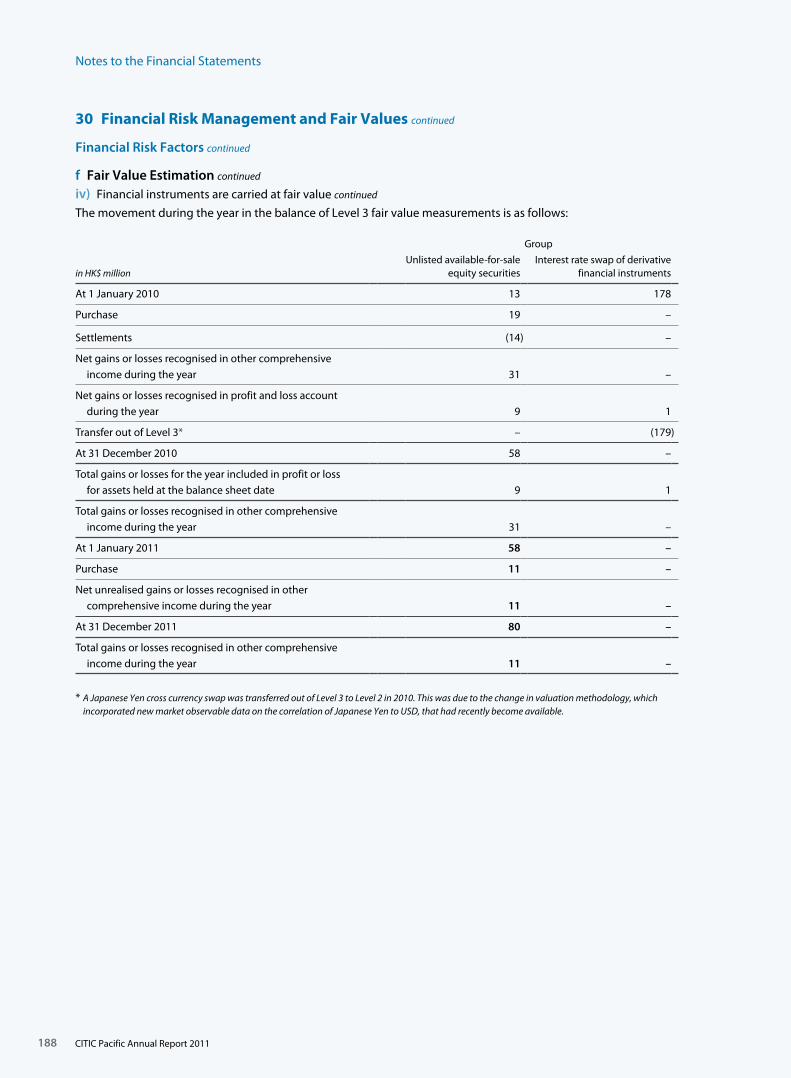
Notes to the Financial Statements
188
30 Financial Risk Management and Fair Values continued
Financial Risk Factors continued
f Fair Value Estimation continued
iv) Financial instruments are carried at fair value continued
The movement during the year in the balance of Level 3 fair value measurements is as follows:
Group
in HK$ millionUnlisted available-for-sale
equity securitiesInterest rate swap of derivative
financial instruments
At 1 January 2010 13 178
Purchase 19 –
Settlements (14) –
Net gains or losses recognised in other comprehensive income during the year 31 –
Net gains or losses recognised in profit and loss account during the year 9 1
Transfer out of Level 3* – (179)
At 31 December 2010 58 –
Total gains or losses for the year included in profit or loss for assets held at the balance sheet date 9 1
Total gains or losses recognised in other comprehensive income during the year 31 –
At 1 January 2011 58 –
Purchase 11 –
Net unrealised gains or losses recognised in other comprehensive income during the year 11 –
At 31 December 2011 80 –
Total gains or losses recognised in other comprehensive income during the year 11 –
* A Japanese Yen cross currency swap was transferred out of Level 3 to Level 2 in 2010. This was due to the change in valuation methodology, which incorporated new market observable data on the correlation of Japanese Yen to USD, that had recently become available.
CITIC Pacific Annual Report 2011
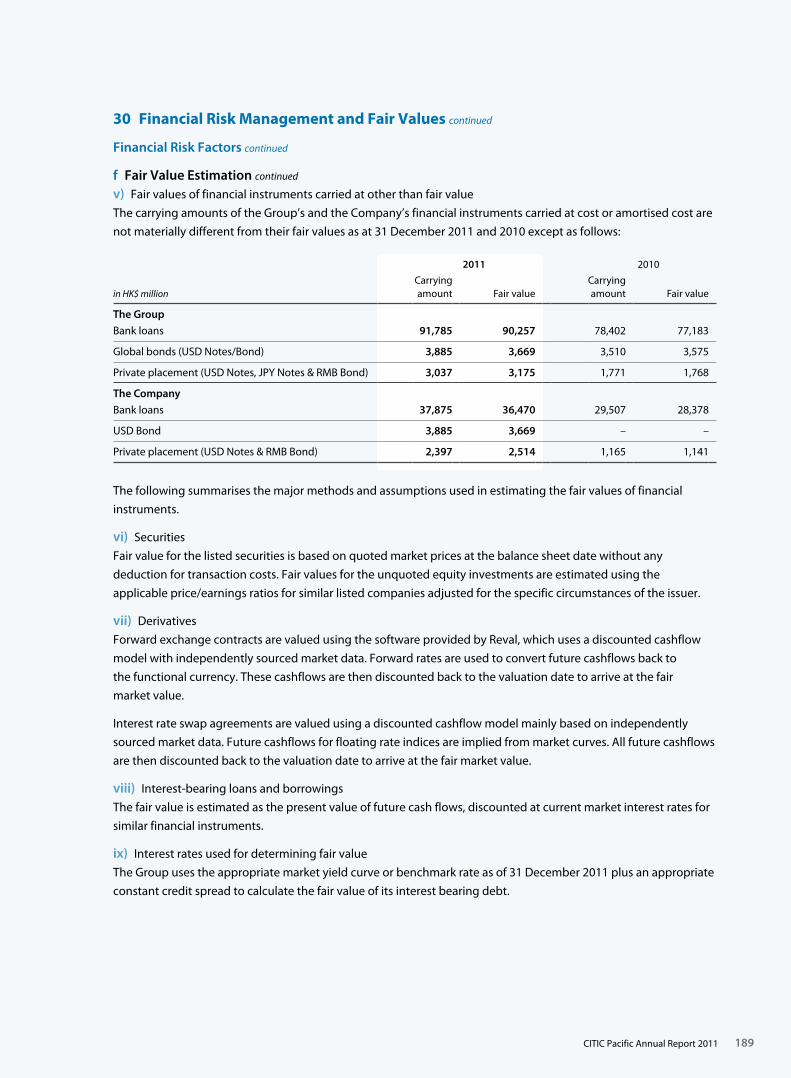
189
30 Financial Risk Management and Fair Values continued
Financial Risk Factors continued
f Fair Value Estimation continued
v) Fair values of financial instruments carried at other than fair value
The carrying amounts of the Group’s and the Company’s financial instruments carried at cost or amortised cost are
not materially different from their fair values as at 31 December 2011 and 2010 except as follows:
2011 2010
in HK$ millionCarrying amount Fair value
Carrying amount Fair value
The Group
Bank loans 91,785 90,257 78,402 77,183
Global bonds (USD Notes/Bond) 3,885 3,669 3,510 3,575
Private placement (USD Notes, JPY Notes & RMB Bond) 3,037 3,175 1,771 1,768
The Company
Bank loans 37,875 36,470 29,507 28,378
USD Bond 3,885 3,669 – –
Private placement (USD Notes & RMB Bond) 2,397 2,514 1,165 1,141
The following summarises the major methods and assumptions used in estimating the fair values of financial
instruments.
vi) Securities
Fair value for the listed securities is based on quoted market prices at the balance sheet date without any
deduction for transaction costs. Fair values for the unquoted equity investments are estimated using the
applicable price/earnings ratios for similar listed companies adjusted for the specific circumstances of the issuer.
vii) Derivatives
Forward exchange contracts are valued using the software provided by Reval, which uses a discounted cashflow
model with independently sourced market data. Forward rates are used to convert future cashflows back to
the functional currency. These cashflows are then discounted back to the valuation date to arrive at the fair
market value.
Interest rate swap agreements are valued using a discounted cashflow model mainly based on independently
sourced market data. Future cashflows for floating rate indices are implied from market curves. All future cashflows
are then discounted back to the valuation date to arrive at the fair market value.
viii) Interest-bearing loans and borrowings
The fair value is estimated as the present value of future cash flows, discounted at current market interest rates for
similar financial instruments.
ix) Interest rates used for determining fair value
The Group uses the appropriate market yield curve or benchmark rate as of 31 December 2011 plus an appropriate
constant credit spread to calculate the fair value of its interest bearing debt.
CITIC Pacific Annual Report 2011
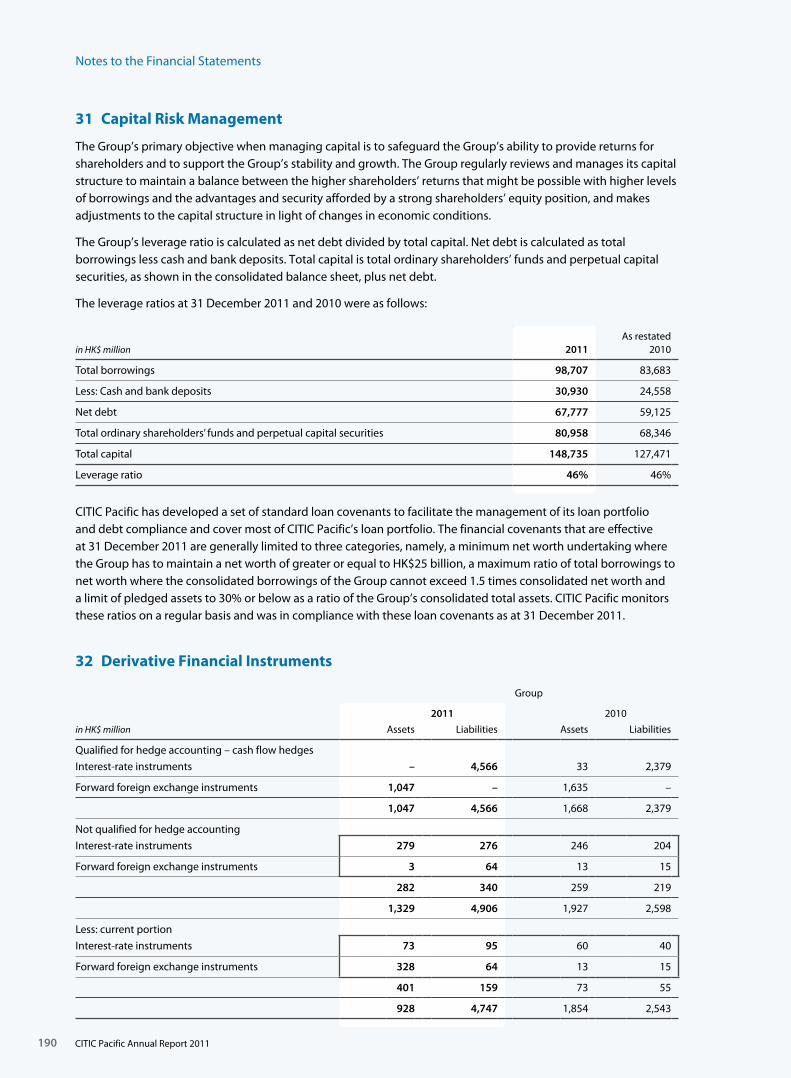
Notes to the Financial Statements
190
31 Capital Risk Management
The Group’s primary objective when managing capital is to safeguard the Group’s ability to provide returns for shareholders and to support the Group’s stability and growth. The Group regularly reviews and manages its capital structure to maintain a balance between the higher shareholders’ returns that might be possible with higher levels of borrowings and the advantages and security afforded by a strong shareholders’ equity position, and makes adjustments to the capital structure in light of changes in economic conditions.
The Group’s leverage ratio is calculated as net debt divided by total capital. Net debt is calculated as total borrowings less cash and bank deposits. Total capital is total ordinary shareholders’ funds and perpetual capital securities, as shown in the consolidated balance sheet, plus net debt.
The leverage ratios at 31 December 2011 and 2010 were as follows:
in HK$ million 2011As restated
2010
Total borrowings 98,707 83,683
Less: Cash and bank deposits 30,930 24,558
Net debt 67,777 59,125
Total ordinary shareholders’ funds and perpetual capital securities 80,958 68,346
Total capital 148,735 127,471
Leverage ratio 46% 46%
CITIC Pacific has developed a set of standard loan covenants to facilitate the management of its loan portfolio and debt compliance and cover most of CITIC Pacific’s loan portfolio. The financial covenants that are effective at 31 December 2011 are generally limited to three categories, namely, a minimum net worth undertaking where the Group has to maintain a net worth of greater or equal to HK$25 billion, a maximum ratio of total borrowings to net worth where the consolidated borrowings of the Group cannot exceed 1.5 times consolidated net worth and a limit of pledged assets to 30% or below as a ratio of the Group’s consolidated total assets. CITIC Pacific monitors these ratios on a regular basis and was in compliance with these loan covenants as at 31 December 2011.
32 Derivative Financial Instruments
Group
2011 2010
in HK$ million Assets Liabilities Assets Liabilities
Qualified for hedge accounting – cash flow hedges
Interest-rate instruments – 4,566 33 2,379
Forward foreign exchange instruments 1,047 – 1,635 –
1,047 4,566 1,668 2,379
Not qualified for hedge accounting
Interest-rate instruments 279 276 246 204
Forward foreign exchange instruments 3 64 13 15
282 340 259 219
1,329 4,906 1,927 2,598
Less: current portion
Interest-rate instruments 73 95 60 40
Forward foreign exchange instruments 328 64 13 15
401 159 73 55
928 4,747 1,854 2,543
CITIC Pacific Annual Report 2011
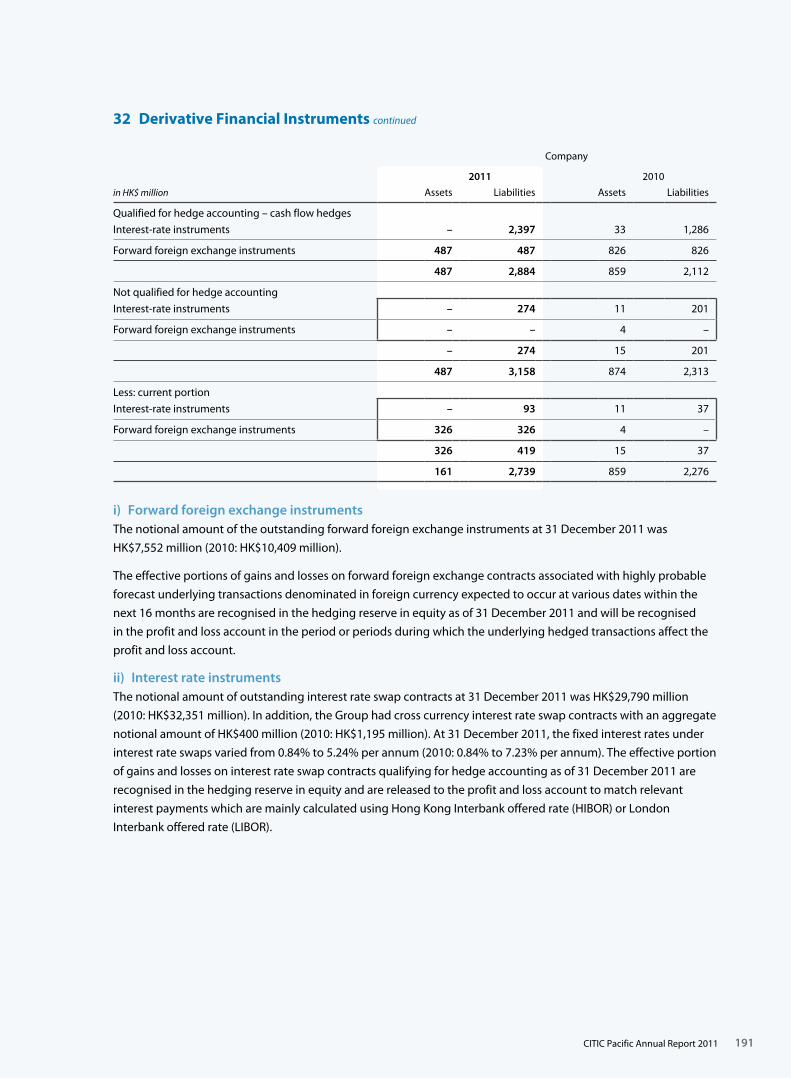
191
32 Derivative Financial Instruments continued
Company
2011 2010
in HK$ million Assets Liabilities Assets Liabilities
Qualified for hedge accounting – cash flow hedges
Interest-rate instruments – 2,397 33 1,286
Forward foreign exchange instruments 487 487 826 826
487 2,884 859 2,112
Not qualified for hedge accounting
Interest-rate instruments – 274 11 201
Forward foreign exchange instruments – – 4 –
– 274 15 201
487 3,158 874 2,313
Less: current portion
Interest-rate instruments – 93 11 37
Forward foreign exchange instruments 326 326 4 –
326 419 15 37
161 2,739 859 2,276
i) Forward foreign exchange instrumentsThe notional amount of the outstanding forward foreign exchange instruments at 31 December 2011 was
HK$7,552 million (2010: HK$10,409 million).
The effective portions of gains and losses on forward foreign exchange contracts associated with highly probable
forecast underlying transactions denominated in foreign currency expected to occur at various dates within the
next 16 months are recognised in the hedging reserve in equity as of 31 December 2011 and will be recognised
in the profit and loss account in the period or periods during which the underlying hedged transactions affect the
profit and loss account.
ii) Interest rate instrumentsThe notional amount of outstanding interest rate swap contracts at 31 December 2011 was HK$29,790 million
(2010: HK$32,351 million). In addition, the Group had cross currency interest rate swap contracts with an aggregate
notional amount of HK$400 million (2010: HK$1,195 million). At 31 December 2011, the fixed interest rates under
interest rate swaps varied from 0.84% to 5.24% per annum (2010: 0.84% to 7.23% per annum). The effective portion
of gains and losses on interest rate swap contracts qualifying for hedge accounting as of 31 December 2011 are
recognised in the hedging reserve in equity and are released to the profit and loss account to match relevant
interest payments which are mainly calculated using Hong Kong Interbank offered rate (HIBOR) or London
Interbank offered rate (LIBOR).
CITIC Pacific Annual Report 2011
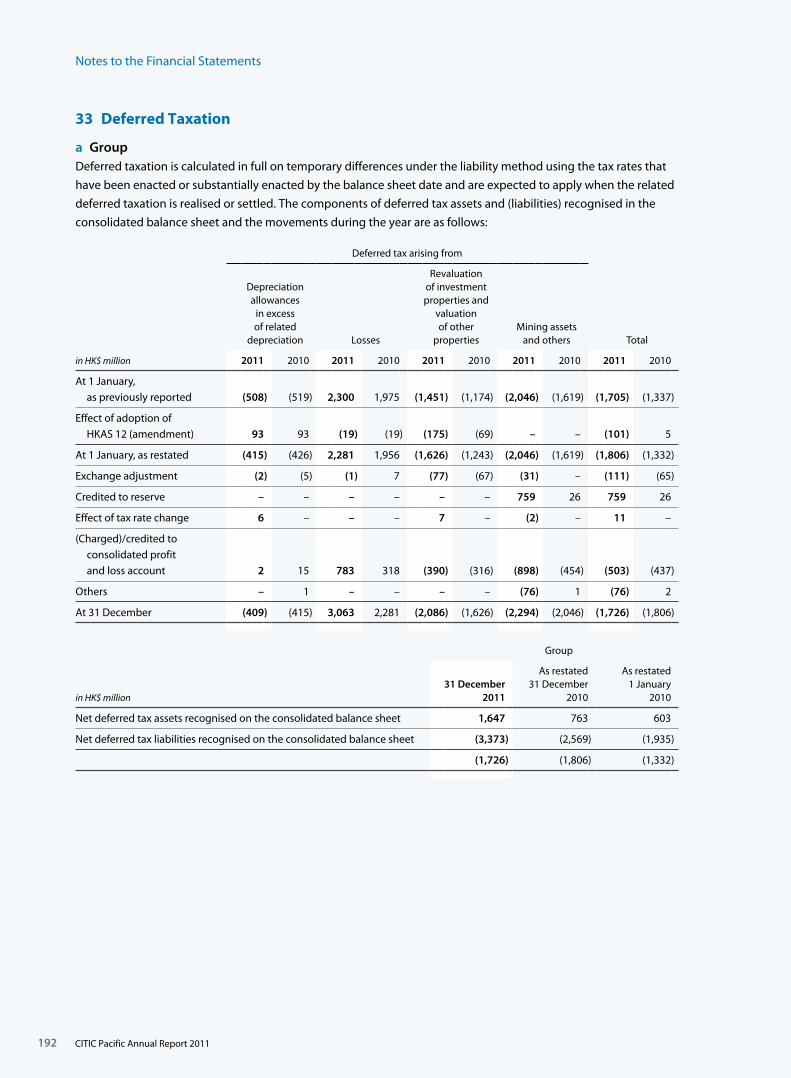
Notes to the Financial Statements
192
33 Deferred Taxation
a GroupDeferred taxation is calculated in full on temporary differences under the liability method using the tax rates that
have been enacted or substantially enacted by the balance sheet date and are expected to apply when the related
deferred taxation is realised or settled. The components of deferred tax assets and (liabilities) recognised in the
consolidated balance sheet and the movements during the year are as follows:
Deferred tax arising from
Depreciation allowances
in excess of related
depreciation Losses
Revaluation of investment properties and
valuation of other
propertiesMining assets
and others Total
in HK$ million 2011 2010 2011 2010 2011 2010 2011 2010 2011 2010
At 1 January, as previously reported (508) (519) 2,300 1,975 (1,451) (1,174) (2,046) (1,619) (1,705) (1,337)
Effect of adoption of HKAS 12 (amendment) 93 93 (19) (19) (175) (69) – – (101) 5
At 1 January, as restated (415) (426) 2,281 1,956 (1,626) (1,243) (2,046) (1,619) (1,806) (1,332)
Exchange adjustment (2) (5) (1) 7 (77) (67) (31) – (111) (65)
Credited to reserve – – – – – – 759 26 759 26
Effect of tax rate change 6 – – – 7 – (2) – 11 –
(Charged)/credited to consolidated profit and loss account 2 15 783 318 (390) (316) (898) (454) (503) (437)
Others – 1 – – – – (76) 1 (76) 2
At 31 December (409) (415) 3,063 2,281 (2,086) (1,626) (2,294) (2,046) (1,726) (1,806)
Group
in HK$ million31 December
2011
As restated31 December
2010
As restated1 January
2010
Net deferred tax assets recognised on the consolidated balance sheet 1,647 763 603
Net deferred tax liabilities recognised on the consolidated balance sheet (3,373) (2,569) (1,935)
(1,726) (1,806) (1,332)
CITIC Pacific Annual Report 2011

193
33 Deferred Taxation continued
b Deferred Tax Assets UnrecognisedThe Group has not recognised deferred tax assets in respect of the following items:
Group
in HK$ million31 December
2011
As restated31 December
2010
As restated1 January
2010
Deductible temporary differences 22 27 35
Tax losses 4,006 3,712 3,360
Taxable temporary differences (814) (638) (198)
3,214 3,101 3,197
Company
in HK$ million 2011 2010
Deductible temporary differences 18 22
Tax losses 757 678
775 700
Note: Tax losses in certain tax jurisdictions of HK$554 million (2010: HK$701 million) will expire within the next five years. The remaining amounts do not expire under current tax legislation.
c Deferred Tax Liabilities not RecognisedAt 31 December 2011, temporary differences relating to the undistributed profits of subsidiary companies
amounted to HK$2,425 million (2010: HK$2,193 million). Deferred tax liabilities of HK$124 million (2010: HK$245
million) have not been recognised in respect of the tax that would be payable on the distribution of these retained
profits as the Group controls the dividend policy of these subsidiary companies and it has been determined that it
is probable that profits will not be distributed in the foreseeable future.
CITIC Pacific Annual Report 2011
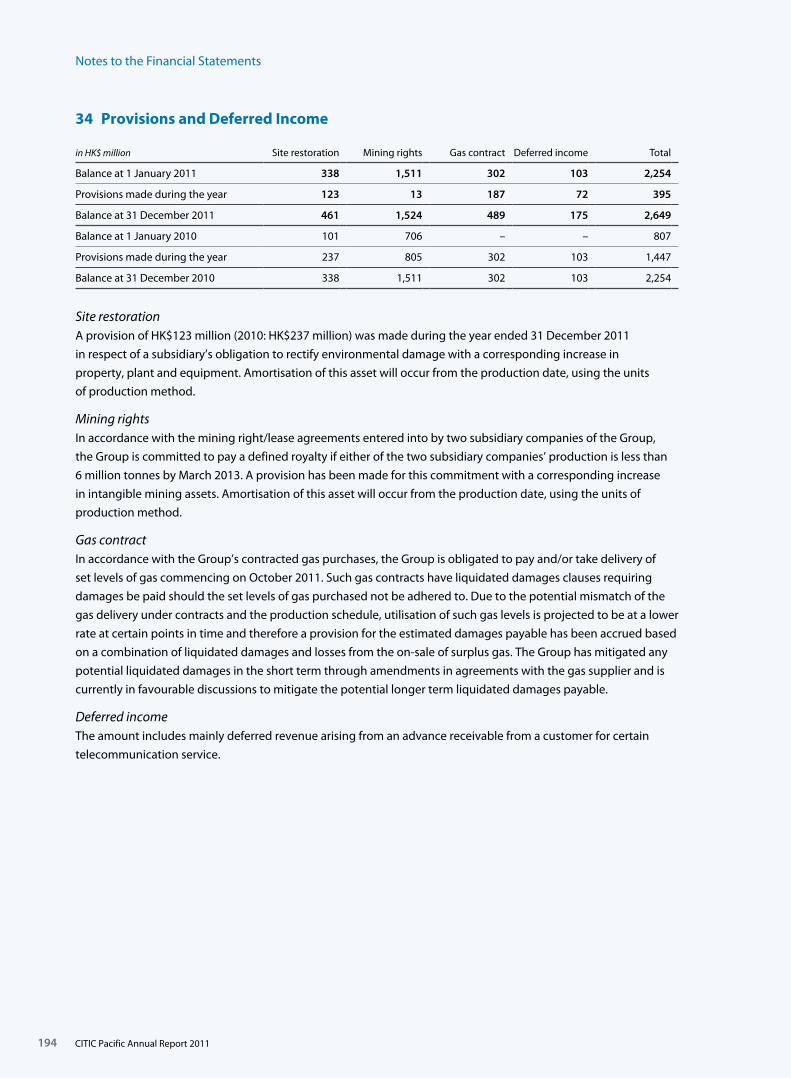
Notes to the Financial Statements
194
34 Provisions and Deferred Income
in HK$ million Site restoration Mining rights Gas contract Deferred income Total
Balance at 1 January 2011 338 1,511 302 103 2,254
Provisions made during the year 123 13 187 72 395
Balance at 31 December 2011 461 1,524 489 175 2,649
Balance at 1 January 2010 101 706 – – 807
Provisions made during the year 237 805 302 103 1,447
Balance at 31 December 2010 338 1,511 302 103 2,254
Site restorationA provision of HK$123 million (2010: HK$237 million) was made during the year ended 31 December 2011
in respect of a subsidiary’s obligation to rectify environmental damage with a corresponding increase in
property, plant and equipment. Amortisation of this asset will occur from the production date, using the units
of production method.
Mining rightsIn accordance with the mining right/lease agreements entered into by two subsidiary companies of the Group,
the Group is committed to pay a defined royalty if either of the two subsidiary companies’ production is less than
6 million tonnes by March 2013. A provision has been made for this commitment with a corresponding increase
in intangible mining assets. Amortisation of this asset will occur from the production date, using the units of
production method.
Gas contractIn accordance with the Group’s contracted gas purchases, the Group is obligated to pay and/or take delivery of
set levels of gas commencing on October 2011. Such gas contracts have liquidated damages clauses requiring
damages be paid should the set levels of gas purchased not be adhered to. Due to the potential mismatch of the
gas delivery under contracts and the production schedule, utilisation of such gas levels is projected to be at a lower
rate at certain points in time and therefore a provision for the estimated damages payable has been accrued based
on a combination of liquidated damages and losses from the on-sale of surplus gas. The Group has mitigated any
potential liquidated damages in the short term through amendments in agreements with the gas supplier and is
currently in favourable discussions to mitigate the potential longer term liquidated damages payable.
Deferred incomeThe amount includes mainly deferred revenue arising from an advance receivable from a customer for certain
telecommunication service.
CITIC Pacific Annual Report 2011
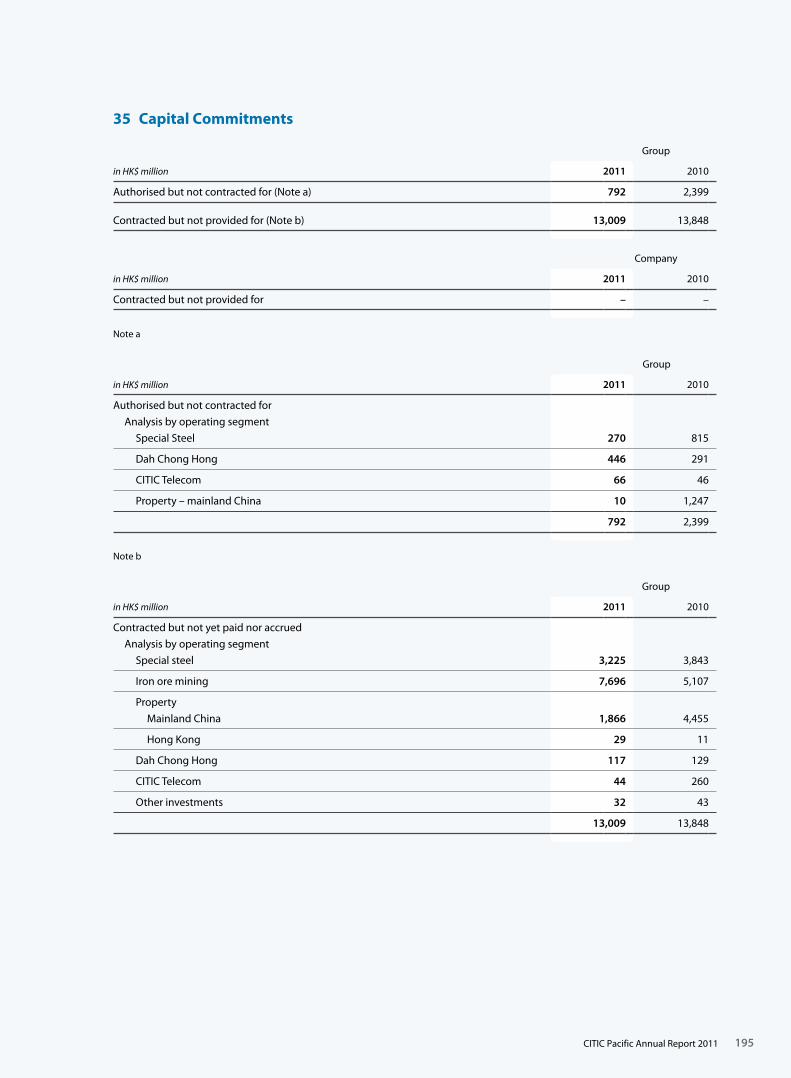
195
35 Capital Commitments
Group
in HK$ million 2011 2010
Authorised but not contracted for (Note a) 792 2,399
Contracted but not provided for (Note b) 13,009 13,848
Company
in HK$ million 2011 2010
Contracted but not provided for – –
Note a
Group
in HK$ million 2011 2010
Authorised but not contracted for
Analysis by operating segment
Special Steel 270 815
Dah Chong Hong 446 291
CITIC Telecom 66 46
Property – mainland China 10 1,247
792 2,399
Note b
Group
in HK$ million 2011 2010
Contracted but not yet paid nor accrued
Analysis by operating segment
Special steel 3,225 3,843
Iron ore mining 7,696 5,107
Property
Mainland China 1,866 4,455
Hong Kong 29 11
Dah Chong Hong 117 129
CITIC Telecom 44 260
Other investments 32 43
13,009 13,848
CITIC Pacific Annual Report 2011
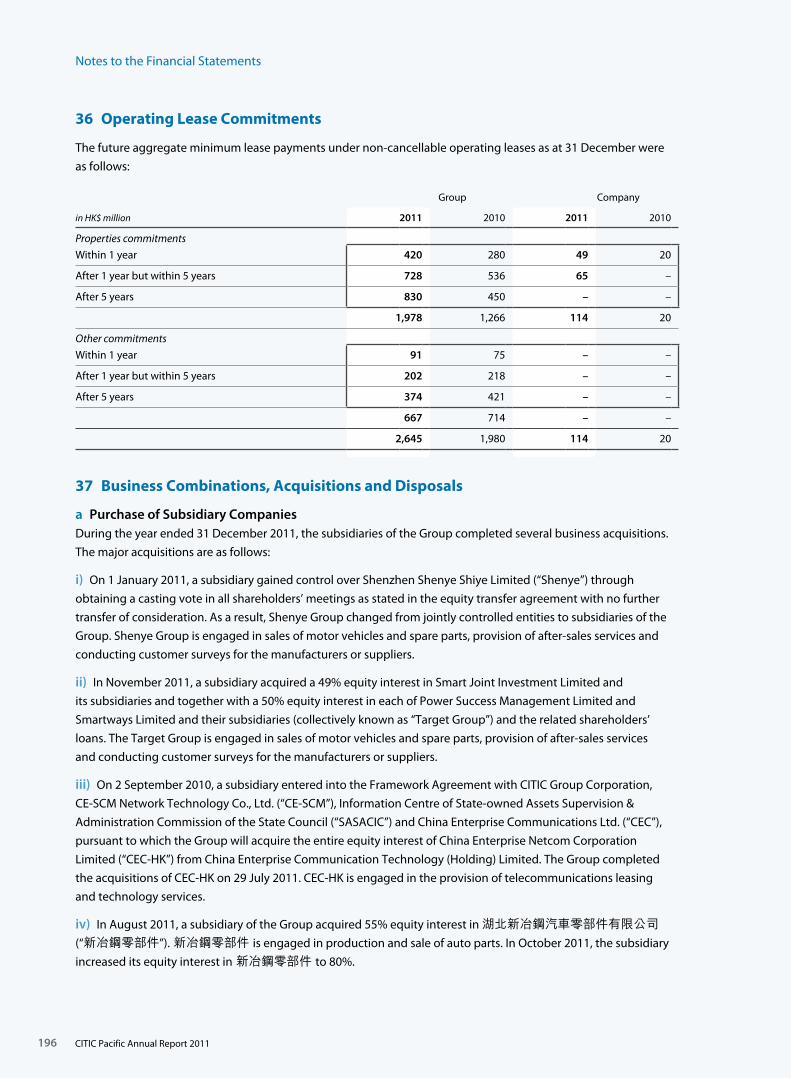
Notes to the Financial Statements
196
36 Operating Lease Commitments
The future aggregate minimum lease payments under non-cancellable operating leases as at 31 December were
as follows:
Group Company
in HK$ million 2011 2010 2011 2010
Properties commitments
Within 1 year 420 280 49 20
After 1 year but within 5 years 728 536 65 –
After 5 years 830 450 – –
1,978 1,266 114 20
Other commitments
Within 1 year 91 75 – –
After 1 year but within 5 years 202 218 – –
After 5 years 374 421 – –
667 714 – –
2,645 1,980 114 20
37 Business Combinations, Acquisitions and Disposals
a Purchase of Subsidiary CompaniesDuring the year ended 31 December 2011, the subsidiaries of the Group completed several business acquisitions.
The major acquisitions are as follows:
i) On 1 January 2011, a subsidiary gained control over Shenzhen Shenye Shiye Limited (“Shenye”) through
obtaining a casting vote in all shareholders’ meetings as stated in the equity transfer agreement with no further
transfer of consideration. As a result, Shenye Group changed from jointly controlled entities to subsidiaries of the
Group. Shenye Group is engaged in sales of motor vehicles and spare parts, provision of after-sales services and
conducting customer surveys for the manufacturers or suppliers.
ii) In November 2011, a subsidiary acquired a 49% equity interest in Smart Joint Investment Limited and
its subsidiaries and together with a 50% equity interest in each of Power Success Management Limited and
Smartways Limited and their subsidiaries (collectively known as “Target Group”) and the related shareholders’
loans. The Target Group is engaged in sales of motor vehicles and spare parts, provision of after-sales services
and conducting customer surveys for the manufacturers or suppliers.
iii) On 2 September 2010, a subsidiary entered into the Framework Agreement with CITIC Group Corporation,
CE-SCM Network Technology Co., Ltd. (“CE-SCM”), Information Centre of State-owned Assets Supervision &
Administration Commission of the State Council (“SASACIC”) and China Enterprise Communications Ltd. (“CEC”),
pursuant to which the Group will acquire the entire equity interest of China Enterprise Netcom Corporation
Limited (“CEC-HK”) from China Enterprise Communication Technology (Holding) Limited. The Group completed
the acquisitions of CEC-HK on 29 July 2011. CEC-HK is engaged in the provision of telecommunications leasing
and technology services.
iv) In August 2011, a subsidiary of the Group acquired 55% equity interest in 湖北新冶鋼汽車零部件有限公司 (“新冶鋼零部件”). 新冶鋼零部件 is engaged in production and sale of auto parts. In October 2011, the subsidiary
increased its equity interest in 新冶鋼零部件 to 80%.
CITIC Pacific Annual Report 2011
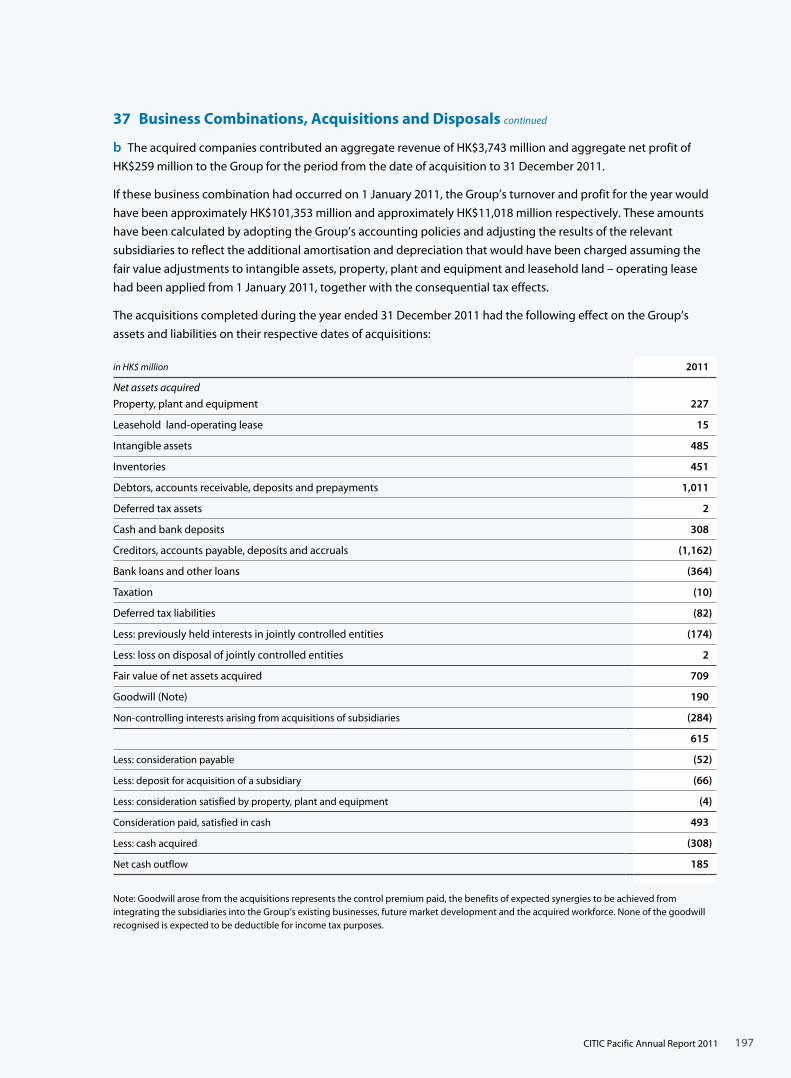
197
37 Business Combinations, Acquisitions and Disposals continued
b The acquired companies contributed an aggregate revenue of HK$3,743 million and aggregate net profit of
HK$259 million to the Group for the period from the date of acquisition to 31 December 2011.
If these business combination had occurred on 1 January 2011, the Group’s turnover and profit for the year would
have been approximately HK$101,353 million and approximately HK$11,018 million respectively. These amounts
have been calculated by adopting the Group’s accounting policies and adjusting the results of the relevant
subsidiaries to reflect the additional amortisation and depreciation that would have been charged assuming the
fair value adjustments to intangible assets, property, plant and equipment and leasehold land – operating lease
had been applied from 1 January 2011, together with the consequential tax effects.
The acquisitions completed during the year ended 31 December 2011 had the following effect on the Group’s
assets and liabilities on their respective dates of acquisitions:
in HK$ million 2011
Net assets acquired
Property, plant and equipment 227
Leasehold land-operating lease 15
Intangible assets 485
Inventories 451
Debtors, accounts receivable, deposits and prepayments 1,011
Deferred tax assets 2
Cash and bank deposits 308
Creditors, accounts payable, deposits and accruals (1,162)
Bank loans and other loans (364)
Taxation (10)
Deferred tax liabilities (82)
Less: previously held interests in jointly controlled entities (174)
Less: loss on disposal of jointly controlled entities 2
Fair value of net assets acquired 709
Goodwill (Note) 190
Non-controlling interests arising from acquisitions of subsidiaries (284)
615
Less: consideration payable (52)
Less: deposit for acquisition of a subsidiary (66)
Less: consideration satisfied by property, plant and equipment (4)
Consideration paid, satisfied in cash 493
Less: cash acquired (308)
Net cash outflow 185
Note: Goodwill arose from the acquisitions represents the control premium paid, the benefits of expected synergies to be achieved from integrating the subsidiaries into the Group’s existing businesses, future market development and the acquired workforce. None of the goodwill recognised is expected to be deductible for income tax purposes.
CITIC Pacific Annual Report 2011
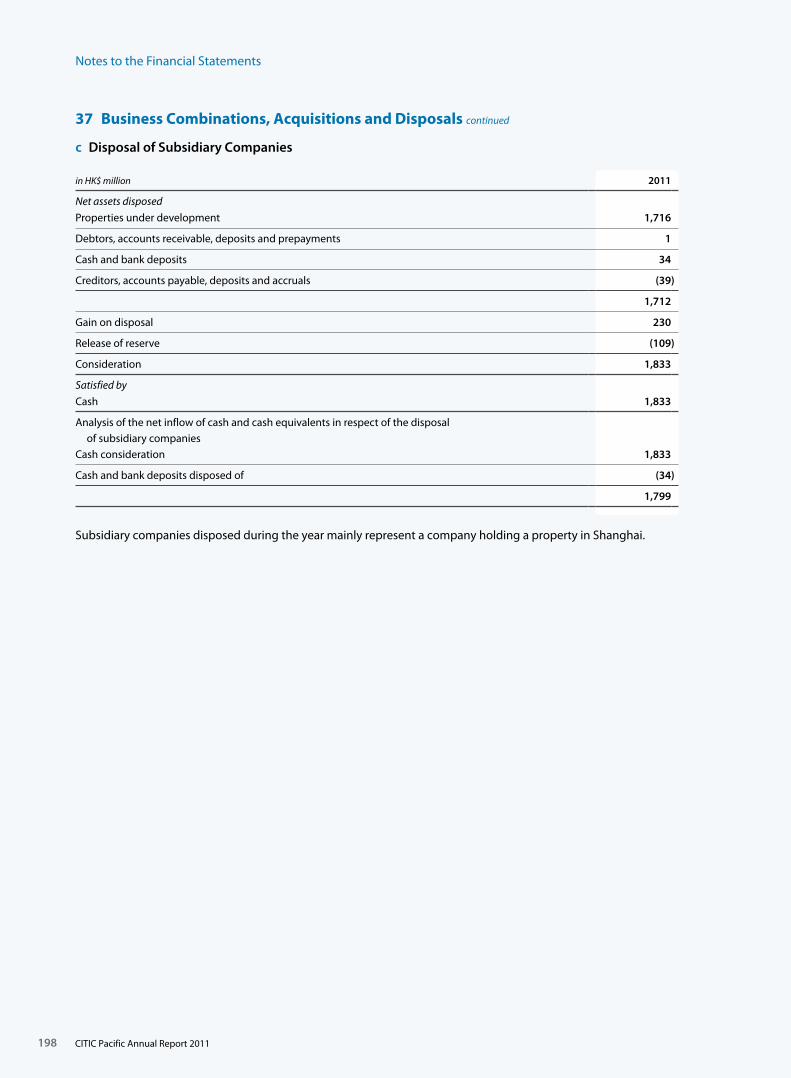
Notes to the Financial Statements
198
37 Business Combinations, Acquisitions and Disposals continued
c Disposal of Subsidiary Companies
in HK$ million 2011
Net assets disposed
Properties under development 1,716
Debtors, accounts receivable, deposits and prepayments 1
Cash and bank deposits 34
Creditors, accounts payable, deposits and accruals (39)
1,712
Gain on disposal 230
Release of reserve (109)
Consideration 1,833
Satisfied by
Cash 1,833
Analysis of the net inflow of cash and cash equivalents in respect of the disposal of subsidiary companies
Cash consideration 1,833
Cash and bank deposits disposed of (34)
1,799
Subsidiary companies disposed during the year mainly represent a company holding a property in Shanghai.
CITIC Pacific Annual Report 2011
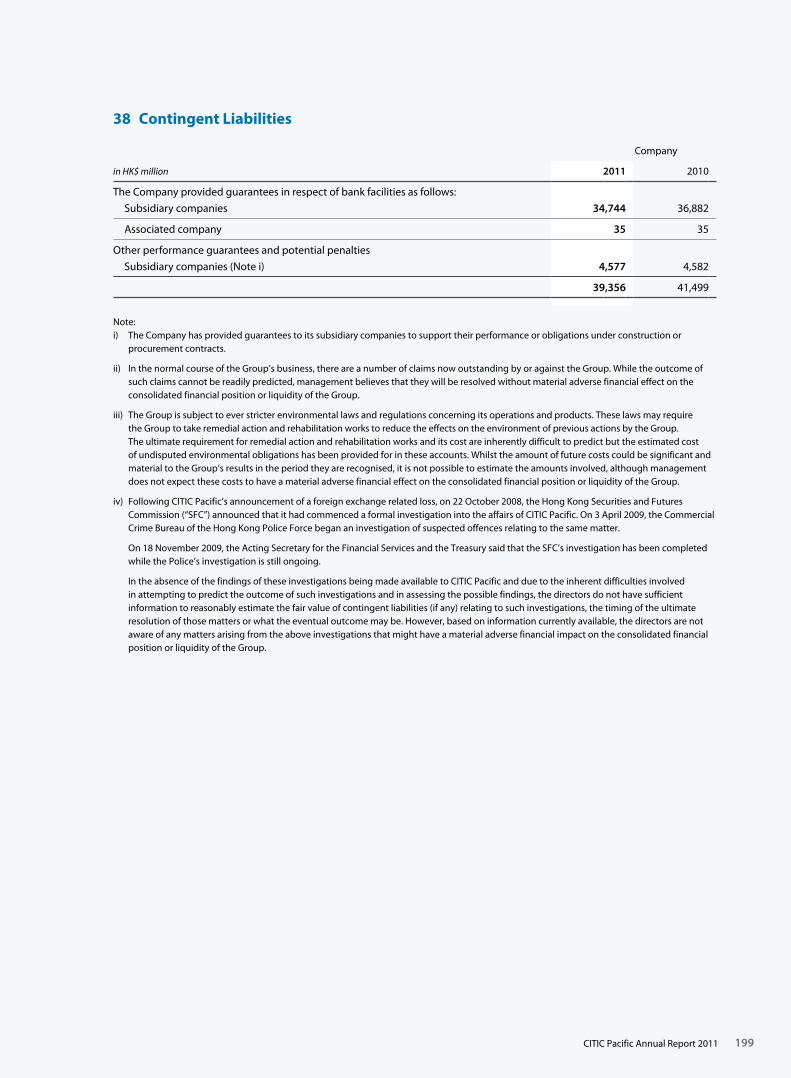
199
38 Contingent Liabilities
Company
in HK$ million 2011 2010
The Company provided guarantees in respect of bank facilities as follows:
Subsidiary companies 34,744 36,882
Associated company 35 35
Other performance guarantees and potential penalties
Subsidiary companies (Note i) 4,577 4,582
39,356 41,499
Note:i) The Company has provided guarantees to its subsidiary companies to support their performance or obligations under construction or
procurement contracts.
ii) In the normal course of the Group’s business, there are a number of claims now outstanding by or against the Group. While the outcome of such claims cannot be readily predicted, management believes that they will be resolved without material adverse financial effect on the consolidated financial position or liquidity of the Group.
iii) The Group is subject to ever stricter environmental laws and regulations concerning its operations and products. These laws may require the Group to take remedial action and rehabilitation works to reduce the effects on the environment of previous actions by the Group. The ultimate requirement for remedial action and rehabilitation works and its cost are inherently difficult to predict but the estimated cost of undisputed environmental obligations has been provided for in these accounts. Whilst the amount of future costs could be significant and material to the Group’s results in the period they are recognised, it is not possible to estimate the amounts involved, although management does not expect these costs to have a material adverse financial effect on the consolidated financial position or liquidity of the Group.
iv) Following CITIC Pacific’s announcement of a foreign exchange related loss, on 22 October 2008, the Hong Kong Securities and Futures Commission (“SFC”) announced that it had commenced a formal investigation into the affairs of CITIC Pacific. On 3 April 2009, the Commercial Crime Bureau of the Hong Kong Police Force began an investigation of suspected offences relating to the same matter.
On 18 November 2009, the Acting Secretary for the Financial Services and the Treasury said that the SFC’s investigation has been completed while the Police’s investigation is still ongoing.
In the absence of the findings of these investigations being made available to CITIC Pacific and due to the inherent difficulties involved in attempting to predict the outcome of such investigations and in assessing the possible findings, the directors do not have sufficient information to reasonably estimate the fair value of contingent liabilities (if any) relating to such investigations, the timing of the ultimate resolution of those matters or what the eventual outcome may be. However, based on information currently available, the directors are not aware of any matters arising from the above investigations that might have a material adverse financial impact on the consolidated financial position or liquidity of the Group.
CITIC Pacific Annual Report 2011
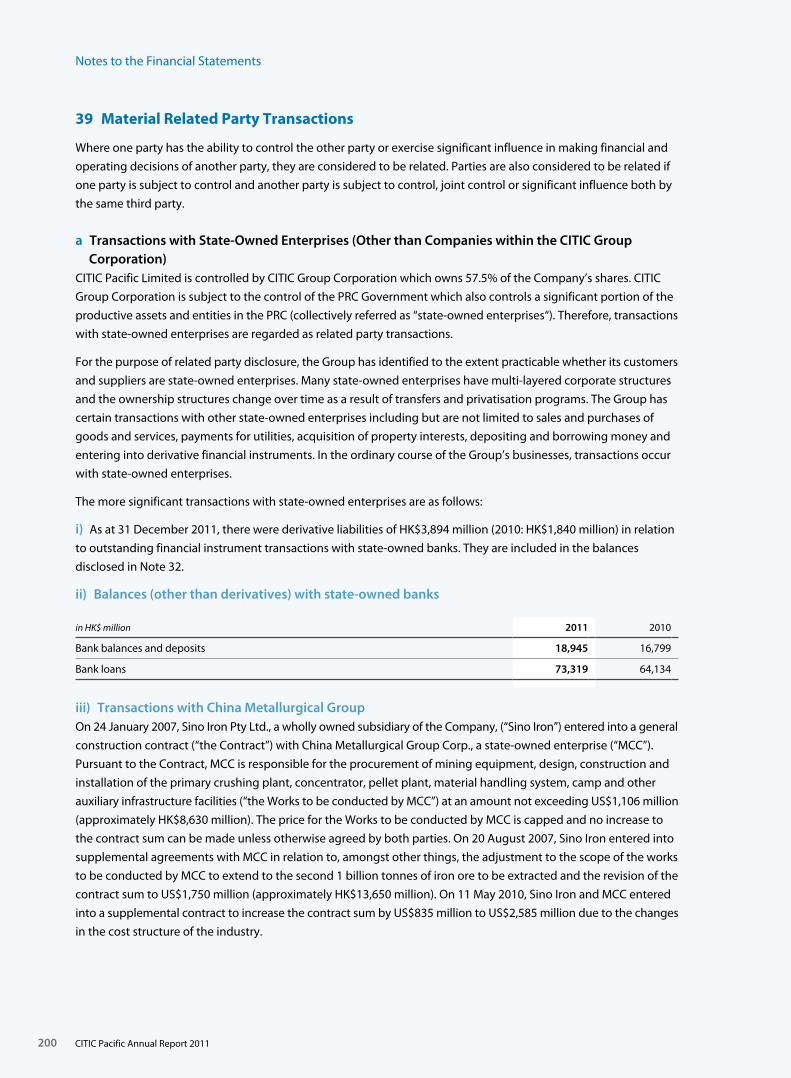
Notes to the Financial Statements
200
39 Material Related Party Transactions
Where one party has the ability to control the other party or exercise significant influence in making financial and
operating decisions of another party, they are considered to be related. Parties are also considered to be related if
one party is subject to control and another party is subject to control, joint control or significant influence both by
the same third party.
a Transactions with State-Owned Enterprises (Other than Companies within the CITIC Group Corporation)
CITIC Pacific Limited is controlled by CITIC Group Corporation which owns 57.5% of the Company’s shares. CITIC
Group Corporation is subject to the control of the PRC Government which also controls a significant portion of the
productive assets and entities in the PRC (collectively referred as “state-owned enterprises“). Therefore, transactions
with state-owned enterprises are regarded as related party transactions.
For the purpose of related party disclosure, the Group has identified to the extent practicable whether its customers
and suppliers are state-owned enterprises. Many state-owned enterprises have multi-layered corporate structures
and the ownership structures change over time as a result of transfers and privatisation programs. The Group has
certain transactions with other state-owned enterprises including but are not limited to sales and purchases of
goods and services, payments for utilities, acquisition of property interests, depositing and borrowing money and
entering into derivative financial instruments. In the ordinary course of the Group’s businesses, transactions occur
with state-owned enterprises.
The more significant transactions with state-owned enterprises are as follows:
i) As at 31 December 2011, there were derivative liabilities of HK$3,894 million (2010: HK$1,840 million) in relation
to outstanding financial instrument transactions with state-owned banks. They are included in the balances
disclosed in Note 32.
ii) Balances (other than derivatives) with state-owned banks
in HK$ million 2011 2010
Bank balances and deposits 18,945 16,799
Bank loans 73,319 64,134
iii) Transactions with China Metallurgical GroupOn 24 January 2007, Sino Iron Pty Ltd., a wholly owned subsidiary of the Company, (“Sino Iron”) entered into a general
construction contract (“the Contract”) with China Metallurgical Group Corp., a state-owned enterprise (“MCC”).
Pursuant to the Contract, MCC is responsible for the procurement of mining equipment, design, construction and
installation of the primary crushing plant, concentrator, pellet plant, material handling system, camp and other
auxiliary infrastructure facilities (“the Works to be conducted by MCC”) at an amount not exceeding US$1,106 million
(approximately HK$8,630 million). The price for the Works to be conducted by MCC is capped and no increase to
the contract sum can be made unless otherwise agreed by both parties. On 20 August 2007, Sino Iron entered into
supplemental agreements with MCC in relation to, amongst other things, the adjustment to the scope of the works
to be conducted by MCC to extend to the second 1 billion tonnes of iron ore to be extracted and the revision of the
contract sum to US$1,750 million (approximately HK$13,650 million). On 11 May 2010, Sino Iron and MCC entered
into a supplemental contract to increase the contract sum by US$835 million to US$2,585 million due to the changes
in the cost structure of the industry.
CITIC Pacific Annual Report 2011
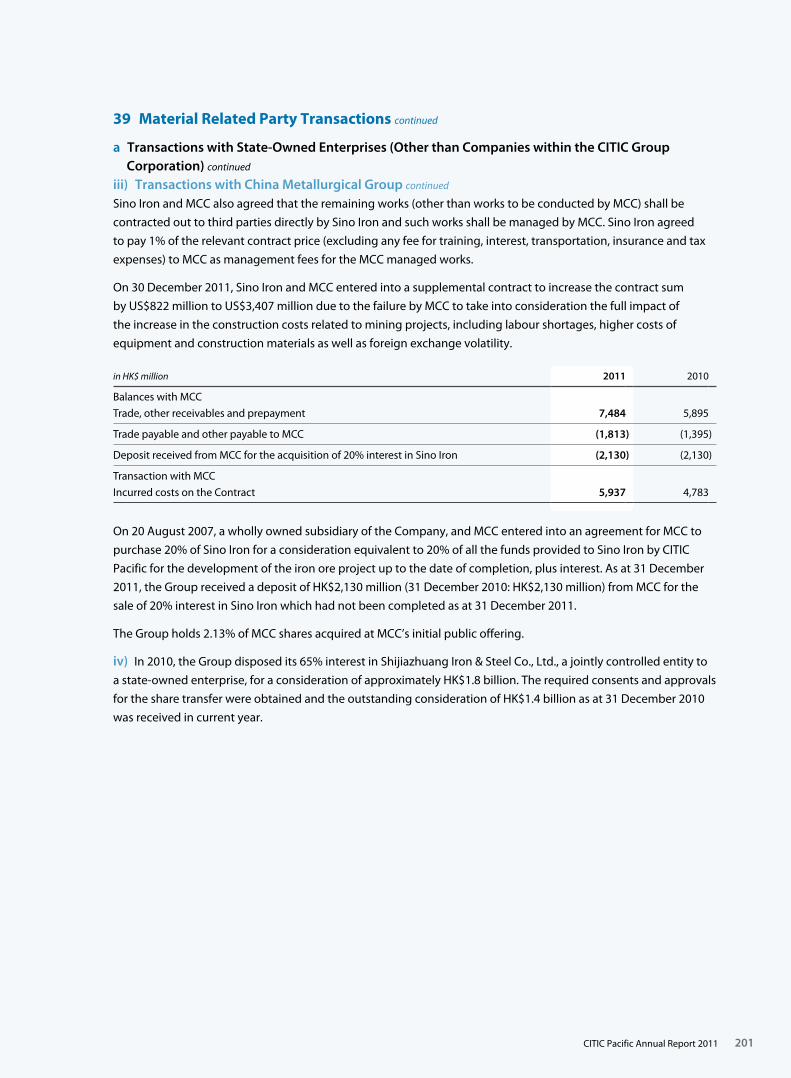
201
39 Material Related Party Transactions continued
a Transactions with State-Owned Enterprises (Other than Companies within the CITIC Group Corporation) continued
iii) Transactions with China Metallurgical Group continued
Sino Iron and MCC also agreed that the remaining works (other than works to be conducted by MCC) shall be
contracted out to third parties directly by Sino Iron and such works shall be managed by MCC. Sino Iron agreed
to pay 1% of the relevant contract price (excluding any fee for training, interest, transportation, insurance and tax
expenses) to MCC as management fees for the MCC managed works.
On 30 December 2011, Sino Iron and MCC entered into a supplemental contract to increase the contract sum
by US$822 million to US$3,407 million due to the failure by MCC to take into consideration the full impact of
the increase in the construction costs related to mining projects, including labour shortages, higher costs of
equipment and construction materials as well as foreign exchange volatility.
in HK$ million 2011 2010
Balances with MCC
Trade, other receivables and prepayment 7,484 5,895
Trade payable and other payable to MCC (1,813) (1,395)
Deposit received from MCC for the acquisition of 20% interest in Sino Iron (2,130) (2,130)
Transaction with MCC
Incurred costs on the Contract 5,937 4,783
On 20 August 2007, a wholly owned subsidiary of the Company, and MCC entered into an agreement for MCC to
purchase 20% of Sino Iron for a consideration equivalent to 20% of all the funds provided to Sino Iron by CITIC
Pacific for the development of the iron ore project up to the date of completion, plus interest. As at 31 December
2011, the Group received a deposit of HK$2,130 million (31 December 2010: HK$2,130 million) from MCC for the
sale of 20% interest in Sino Iron which had not been completed as at 31 December 2011.
The Group holds 2.13% of MCC shares acquired at MCC’s initial public offering.
iv) In 2010, the Group disposed its 65% interest in Shijiazhuang Iron & Steel Co., Ltd., a jointly controlled entity to
a state-owned enterprise, for a consideration of approximately HK$1.8 billion. The required consents and approvals
for the share transfer were obtained and the outstanding consideration of HK$1.4 billion as at 31 December 2010
was received in current year.
CITIC Pacific Annual Report 2011

Notes to the Financial Statements
202
39 Material Related Party Transactions continued
b Transactions with Other Related PartiesThe Group also had the following significant transactions and balances with other related parties:
in HK$ million 2011 2010
Transactions with jointly controlled entities
(i) Recurring transactions
Interest income 270 171
Dividend income 1,312 1,143
Sales 418 306
Service income 20 2
2,020 1,622
Purchases 303 1,336
Service charges 79 51
382 1,387
Transactions with associated companies
(i) Recurring transactions
Interest income – 7
Dividend income 166 537
Sales 733 518
Service income 15 18
914 1,080
Purchases 69 –
Rental charge 69 85
Service charge 7 6
145 91
CITIC Pacific Annual Report 2011
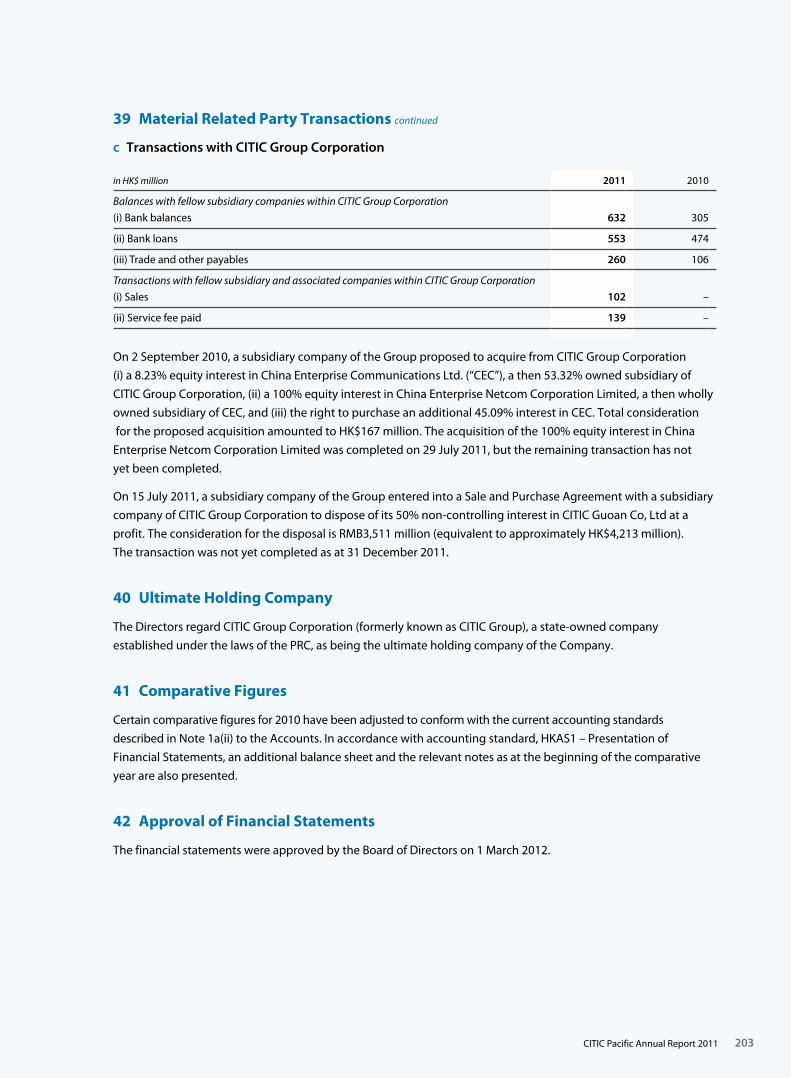
203
39 Material Related Party Transactions continued
c Transactions with CITIC Group Corporation
in HK$ million 2011 2010
Balances with fellow subsidiary companies within CITIC Group Corporation
(i) Bank balances 632 305
(ii) Bank loans 553 474
(iii) Trade and other payables 260 106
Transactions with fellow subsidiary and associated companies within CITIC Group Corporation
(i) Sales 102 –
(ii) Service fee paid 139 –
On 2 September 2010, a subsidiary company of the Group proposed to acquire from CITIC Group Corporation
(i) a 8.23% equity interest in China Enterprise Communications Ltd. (“CEC”), a then 53.32% owned subsidiary of
CITIC Group Corporation, (ii) a 100% equity interest in China Enterprise Netcom Corporation Limited, a then wholly
owned subsidiary of CEC, and (iii) the right to purchase an additional 45.09% interest in CEC. Total consideration
for the proposed acquisition amounted to HK$167 million. The acquisition of the 100% equity interest in China
Enterprise Netcom Corporation Limited was completed on 29 July 2011, but the remaining transaction has not
yet been completed.
On 15 July 2011, a subsidiary company of the Group entered into a Sale and Purchase Agreement with a subsidiary
company of CITIC Group Corporation to dispose of its 50% non-controlling interest in CITIC Guoan Co, Ltd at a
profit. The consideration for the disposal is RMB3,511 million (equivalent to approximately HK$4,213 million).
The transaction was not yet completed as at 31 December 2011.
40 Ultimate Holding Company
The Directors regard CITIC Group Corporation (formerly known as CITIC Group), a state-owned company
established under the laws of the PRC, as being the ultimate holding company of the Company.
41 Comparative Figures
Certain comparative figures for 2010 have been adjusted to conform with the current accounting standards
described in Note 1a(ii) to the Accounts. In accordance with accounting standard, HKAS1 – Presentation of
Financial Statements, an additional balance sheet and the relevant notes as at the beginning of the comparative
year are also presented.
42 Approval of Financial Statements
The financial statements were approved by the Board of Directors on 1 March 2012.
CITIC Pacific Annual Report 2011
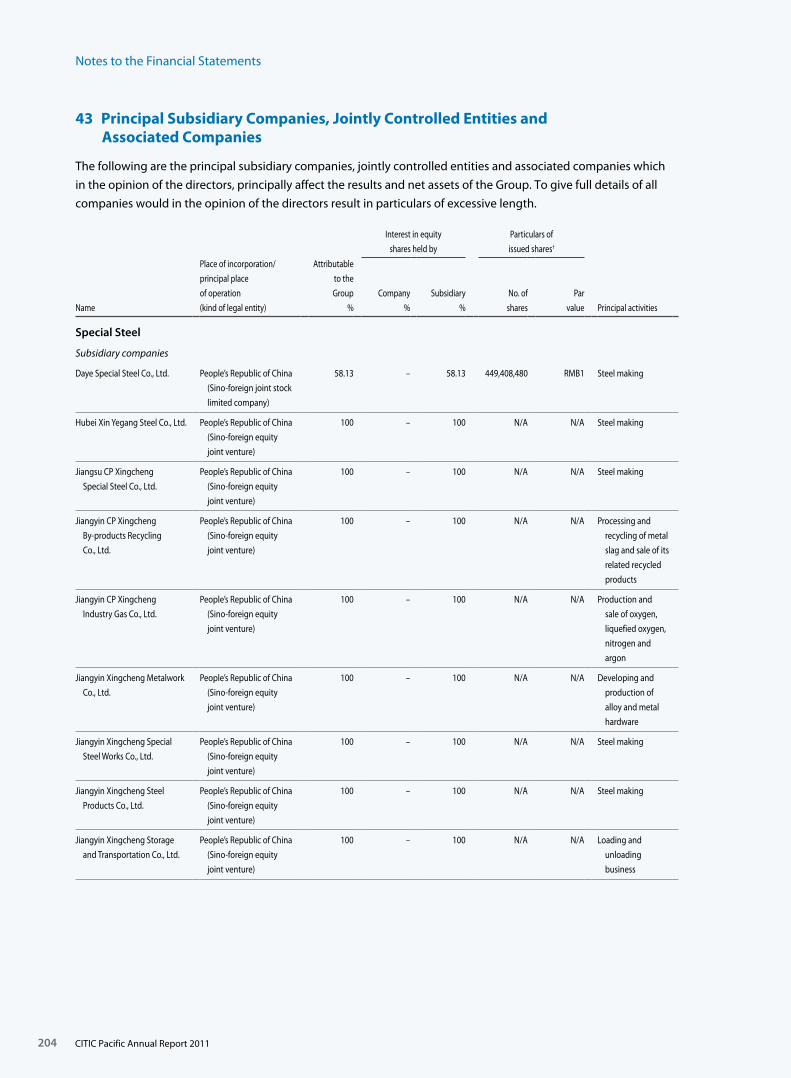
43 Principal Subsidiary Companies, Jointly Controlled Entities and Associated Companies
The following are the principal subsidiary companies, jointly controlled entities and associated companies which
in the opinion of the directors, principally affect the results and net assets of the Group. To give full details of all
companies would in the opinion of the directors result in particulars of excessive length.
Notes to the Financial Statements
204
Interest in equity
shares held by
Particulars of
issued shares†
Name
Place of incorporation/
principal place
of operation
(kind of legal entity)
Attributable
to the
Group
%
Company
%
Subsidiary
%
No. of
shares
Par
value Principal activities
Special Steel
Subsidiary companies
Daye Special Steel Co., Ltd. People’s Republic of China
(Sino-foreign joint stock
limited company)
58.13 – 58.13 449,408,480 RMB1 Steel making
Hubei Xin Yegang Steel Co., Ltd. People’s Republic of China
(Sino-foreign equity
joint venture)
100 – 100 N/A N/A Steel making
Jiangsu CP Xingcheng
Special Steel Co., Ltd.
People’s Republic of China
(Sino-foreign equity
joint venture)
100 – 100 N/A N/A Steel making
Jiangyin CP Xingcheng
By-products Recycling
Co., Ltd.
People’s Republic of China
(Sino-foreign equity
joint venture)
100 – 100 N/A N/A Processing and
recycling of metal
slag and sale of its
related recycled
products
Jiangyin CP Xingcheng
Industry Gas Co., Ltd.
People’s Republic of China
(Sino-foreign equity
joint venture)
100 – 100 N/A N/A Production and
sale of oxygen,
liquefied oxygen,
nitrogen and
argon
Jiangyin Xingcheng Metalwork
Co., Ltd.
People’s Republic of China
(Sino-foreign equity
joint venture)
100 – 100 N/A N/A Developing and
production of
alloy and metal
hardware
Jiangyin Xingcheng Special
Steel Works Co., Ltd.
People’s Republic of China
(Sino-foreign equity
joint venture)
100 – 100 N/A N/A Steel making
Jiangyin Xingcheng Steel
Products Co., Ltd.
People’s Republic of China
(Sino-foreign equity
joint venture)
100 – 100 N/A N/A Steel making
Jiangyin Xingcheng Storage
and Transportation Co., Ltd.
People’s Republic of China
(Sino-foreign equity
joint venture)
100 – 100 N/A N/A Loading and
unloading
business
CITIC Pacific Annual Report 2011
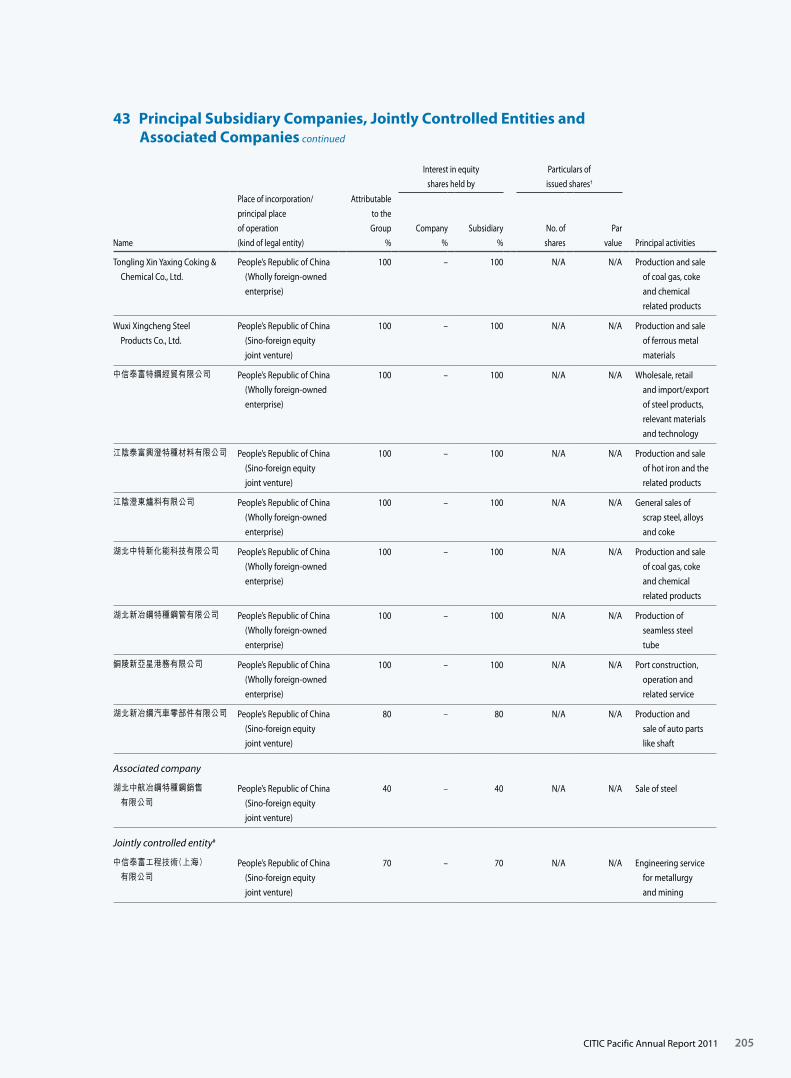
43 Principal Subsidiary Companies, Jointly Controlled Entities and Associated Companies continued
205
Interest in equity
shares held by
Particulars of
issued shares†
Name
Place of incorporation/
principal place
of operation
(kind of legal entity)
Attributable
to the
Group
%
Company
%
Subsidiary
%
No. of
shares
Par
value Principal activities
Tongling Xin Yaxing Coking &
Chemical Co., Ltd.
People’s Republic of China
(Wholly foreign-owned
enterprise)
100 – 100 N/A N/A Production and sale
of coal gas, coke
and chemical
related products
Wuxi Xingcheng Steel
Products Co., Ltd.
People’s Republic of China
(Sino-foreign equity
joint venture)
100 – 100 N/A N/A Production and sale
of ferrous metal
materials
中信泰富特鋼經貿有限公司 People’s Republic of China
(Wholly foreign-owned
enterprise)
100 – 100 N/A N/A Wholesale, retail
and import/export
of steel products,
relevant materials
and technology
江陰泰富興澄特種材料有限公司 People’s Republic of China
(Sino-foreign equity
joint venture)
100 – 100 N/A N/A Production and sale
of hot iron and the
related products
江陰澄東爐料有限公司 People’s Republic of China
(Wholly foreign-owned
enterprise)
100 – 100 N/A N/A General sales of
scrap steel, alloys
and coke
湖北中特新化能科技有限公司 People’s Republic of China
(Wholly foreign-owned
enterprise)
100 – 100 N/A N/A Production and sale
of coal gas, coke
and chemical
related products
湖北新冶鋼特種鋼管有限公司 People’s Republic of China
(Wholly foreign-owned
enterprise)
100 – 100 N/A N/A Production of
seamless steel
tube
銅陵新亞星港務有限公司 People’s Republic of China
(Wholly foreign-owned
enterprise)
100 – 100 N/A N/A Port construction,
operation and
related service
湖北新冶鋼汽車零部件有限公司 People’s Republic of China
(Sino-foreign equity
joint venture)
80 – 80 N/A N/A Production and
sale of auto parts
like shaft
Associated company
湖北中航冶鋼特種鋼銷售 有限公司
People’s Republic of China
(Sino-foreign equity
joint venture)
40 – 40 N/A N/A Sale of steel
Jointly controlled entity#
中信泰富工程技術(上海) 有限公司
People’s Republic of China
(Sino-foreign equity
joint venture)
70 – 70 N/A N/A Engineering service
for metallurgy
and mining
CITIC Pacific Annual Report 2011
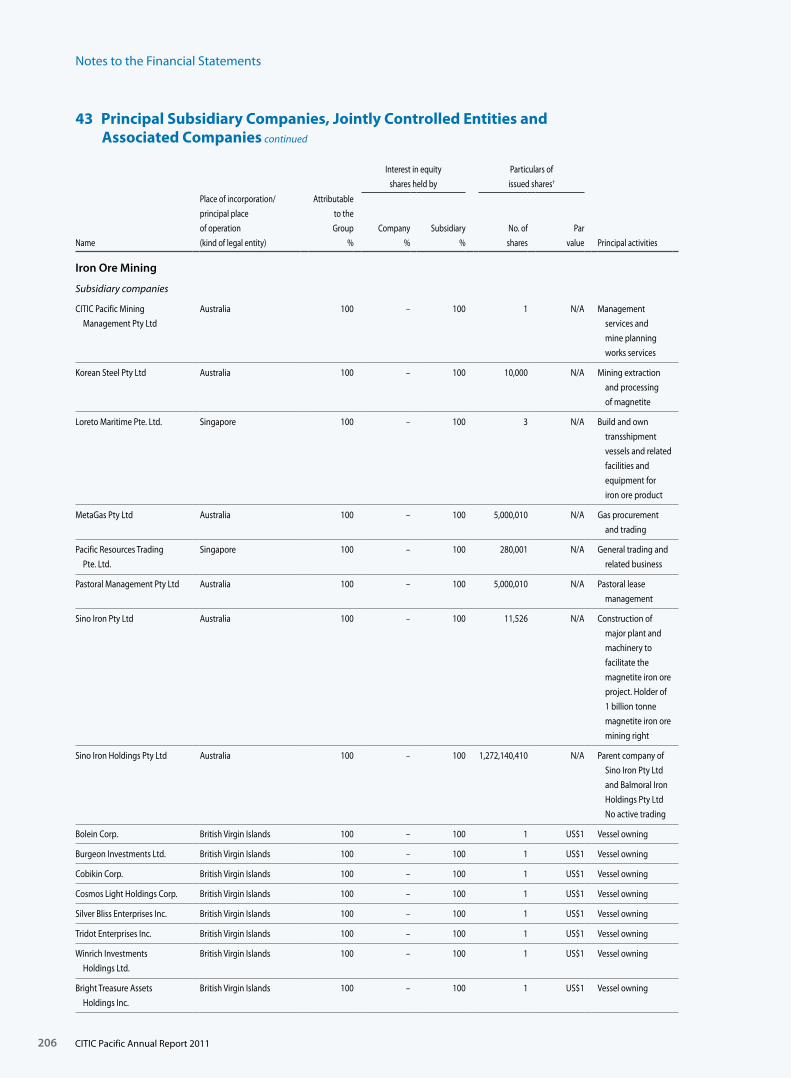
Notes to the Financial Statements
43 Principal Subsidiary Companies, Jointly Controlled Entities and Associated Companies continued
206
Interest in equity
shares held by
Particulars of
issued shares†
Name
Place of incorporation/
principal place
of operation
(kind of legal entity)
Attributable
to the
Group
%
Company
%
Subsidiary
%
No. of
shares
Par
value Principal activities
Iron Ore Mining
Subsidiary companies
CITIC Pacific Mining
Management Pty Ltd
Australia 100 – 100 1 N/A Management
services and
mine planning
works services
Korean Steel Pty Ltd Australia 100 – 100 10,000 N/A Mining extraction
and processing
of magnetite
Loreto Maritime Pte. Ltd. Singapore 100 – 100 3 N/A Build and own
transshipment
vessels and related
facilities and
equipment for
iron ore product
MetaGas Pty Ltd Australia 100 – 100 5,000,010 N/A Gas procurement
and trading
Pacific Resources Trading
Pte. Ltd.
Singapore 100 – 100 280,001 N/A General trading and
related business
Pastoral Management Pty Ltd Australia 100 – 100 5,000,010 N/A Pastoral lease
management
Sino Iron Pty Ltd Australia 100 – 100 11,526 N/A Construction of
major plant and
machinery to
facilitate the
magnetite iron ore
project. Holder of
1 billion tonne
magnetite iron ore
mining right
Sino Iron Holdings Pty Ltd Australia 100 – 100 1,272,140,410 N/A Parent company of
Sino Iron Pty Ltd
and Balmoral Iron
Holdings Pty Ltd
No active trading
Bolein Corp. British Virgin Islands 100 – 100 1 US$1 Vessel owning
Burgeon Investments Ltd. British Virgin Islands 100 – 100 1 US$1 Vessel owning
Cobikin Corp. British Virgin Islands 100 – 100 1 US$1 Vessel owning
Cosmos Light Holdings Corp. British Virgin Islands 100 – 100 1 US$1 Vessel owning
Silver Bliss Enterprises Inc. British Virgin Islands 100 – 100 1 US$1 Vessel owning
Tridot Enterprises Inc. British Virgin Islands 100 – 100 1 US$1 Vessel owning
Winrich Investments
Holdings Ltd.
British Virgin Islands 100 – 100 1 US$1 Vessel owning
Bright Treasure Assets
Holdings Inc.
British Virgin Islands 100 – 100 1 US$1 Vessel owning
CITIC Pacific Annual Report 2011
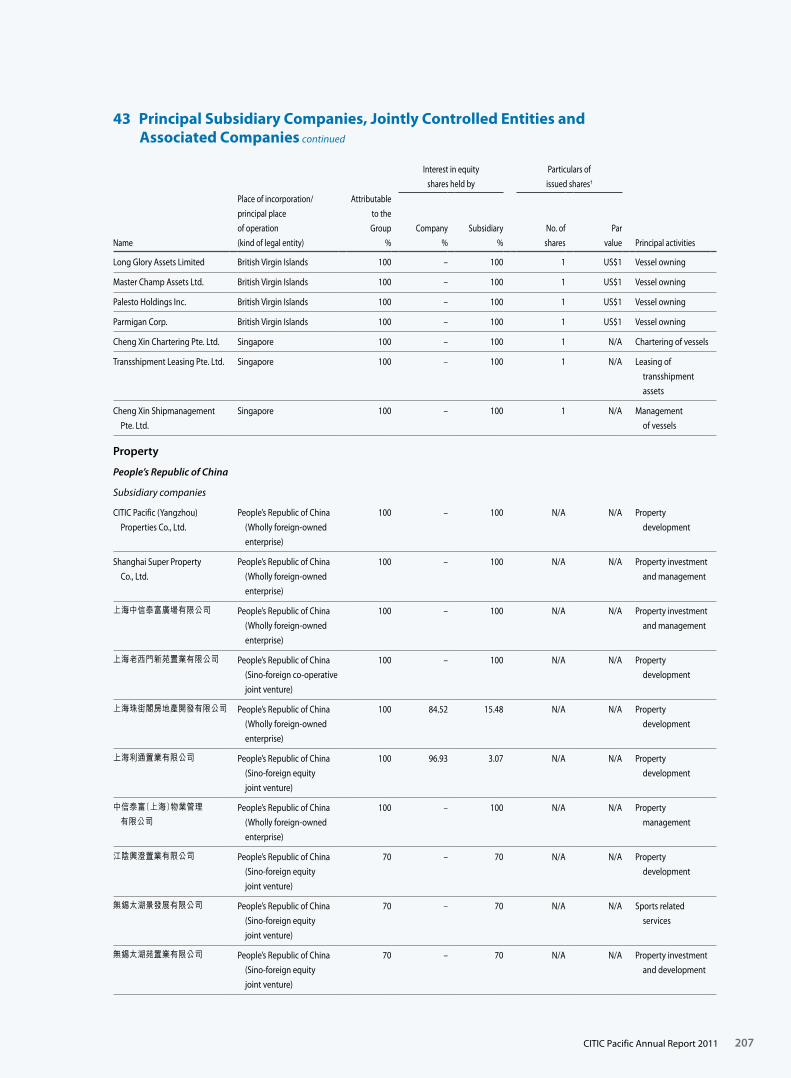
43 Principal Subsidiary Companies, Jointly Controlled Entities and Associated Companies continued
207
Interest in equity
shares held by
Particulars of
issued shares†
Name
Place of incorporation/
principal place
of operation
(kind of legal entity)
Attributable
to the
Group
%
Company
%
Subsidiary
%
No. of
shares
Par
value Principal activities
Long Glory Assets Limited British Virgin Islands 100 – 100 1 US$1 Vessel owning
Master Champ Assets Ltd. British Virgin Islands 100 – 100 1 US$1 Vessel owning
Palesto Holdings Inc. British Virgin Islands 100 – 100 1 US$1 Vessel owning
Parmigan Corp. British Virgin Islands 100 – 100 1 US$1 Vessel owning
Cheng Xin Chartering Pte. Ltd. Singapore 100 – 100 1 N/A Chartering of vessels
Transshipment Leasing Pte. Ltd. Singapore 100 – 100 1 N/A Leasing of
transshipment
assets
Cheng Xin Shipmanagement
Pte. Ltd.
Singapore 100 – 100 1 N/A Management
of vessels
Property
People’s Republic of China
Subsidiary companies
CITIC Pacific (Yangzhou)
Properties Co., Ltd.
People’s Republic of China
(Wholly foreign-owned
enterprise)
100 – 100 N/A N/A Property
development
Shanghai Super Property
Co., Ltd.
People’s Republic of China
(Wholly foreign-owned
enterprise)
100 – 100 N/A N/A Property investment
and management
上海中信泰富廣場有限公司 People’s Republic of China
(Wholly foreign-owned
enterprise)
100 – 100 N/A N/A Property investment
and management
上海老西門新苑置業有限公司 People’s Republic of China
(Sino-foreign co-operative
joint venture)
100 – 100 N/A N/A Property
development
上海珠街閣房地產開發有限公司 People’s Republic of China
(Wholly foreign-owned
enterprise)
100 84.52 15.48 N/A N/A Property
development
上海利通置業有限公司 People’s Republic of China
(Sino-foreign equity
joint venture)
100 96.93 3.07 N/A N/A Property
development
中信泰富(上海)物業管理 有限公司
People’s Republic of China
(Wholly foreign-owned
enterprise)
100 – 100 N/A N/A Property
management
江陰興澄置業有限公司 People’s Republic of China
(Sino-foreign equity
joint venture)
70 – 70 N/A N/A Property
development
無錫太湖景發展有限公司 People’s Republic of China
(Sino-foreign equity
joint venture)
70 – 70 N/A N/A Sports related
services
無錫太湖苑置業有限公司 People’s Republic of China
(Sino-foreign equity
joint venture)
70 – 70 N/A N/A Property investment
and development
CITIC Pacific Annual Report 2011
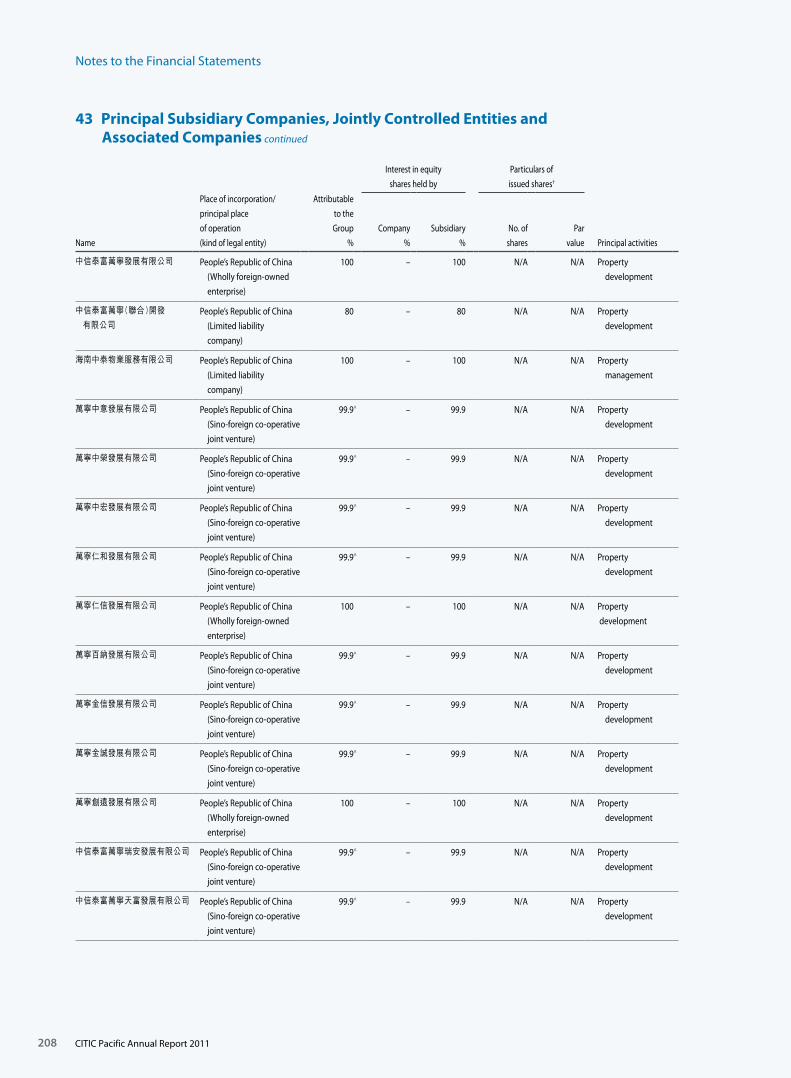
Notes to the Financial Statements
43 Principal Subsidiary Companies, Jointly Controlled Entities and Associated Companies continued
208
Interest in equity
shares held by
Particulars of
issued shares†
Name
Place of incorporation/
principal place
of operation
(kind of legal entity)
Attributable
to the
Group
%
Company
%
Subsidiary
%
No. of
shares
Par
value Principal activities
中信泰富萬寧發展有限公司 People’s Republic of China
(Wholly foreign-owned
enterprise)
100 – 100 N/A N/A Property
development
中信泰富萬寧(聯合)開發 有限公司
People’s Republic of China
(Limited liability
company)
80 – 80 N/A N/A Property
development
海南中泰物業服務有限公司 People’s Republic of China
(Limited liability
company)
100 – 100 N/A N/A Property
management
萬寧中意發展有限公司 People’s Republic of China
(Sino-foreign co-operative
joint venture)
99.9^ – 99.9 N/A N/A Property
development
萬寧中榮發展有限公司 People’s Republic of China
(Sino-foreign co-operative
joint venture)
99.9^ – 99.9 N/A N/A Property
development
萬寧中宏發展有限公司 People’s Republic of China
(Sino-foreign co-operative
joint venture)
99.9^ – 99.9 N/A N/A Property
development
萬寧仁和發展有限公司 People’s Republic of China
(Sino-foreign co-operative
joint venture)
99.9^ – 99.9 N/A N/A Property
development
萬寧仁信發展有限公司 People’s Republic of China
(Wholly foreign-owned
enterprise)
100 – 100 N/A N/A Property
development
萬寧百納發展有限公司 People’s Republic of China
(Sino-foreign co-operative
joint venture)
99.9^ – 99.9 N/A N/A Property
development
萬寧金信發展有限公司 People’s Republic of China
(Sino-foreign co-operative
joint venture)
99.9^ – 99.9 N/A N/A Property
development
萬寧金誠發展有限公司 People’s Republic of China
(Sino-foreign co-operative
joint venture)
99.9^ – 99.9 N/A N/A Property
development
萬寧創遠發展有限公司 People’s Republic of China
(Wholly foreign-owned
enterprise)
100 – 100 N/A N/A Property
development
中信泰富萬寧瑞安發展有限公司 People’s Republic of China
(Sino-foreign co-operative
joint venture)
99.9^ – 99.9 N/A N/A Property
development
中信泰富萬寧天富發展有限公司 People’s Republic of China
(Sino-foreign co-operative
joint venture)
99.9^ – 99.9 N/A N/A Property
development
CITIC Pacific Annual Report 2011
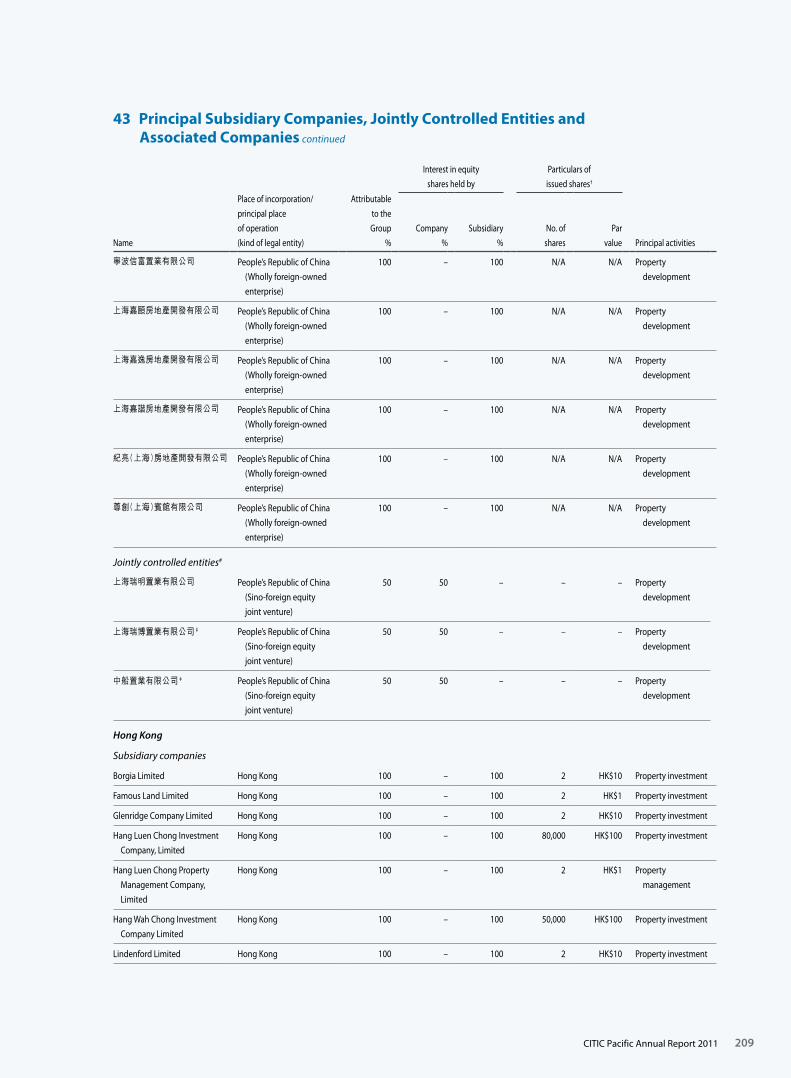
43 Principal Subsidiary Companies, Jointly Controlled Entities and Associated Companies continued
209
Interest in equity
shares held by
Particulars of
issued shares†
Name
Place of incorporation/
principal place
of operation
(kind of legal entity)
Attributable
to the
Group
%
Company
%
Subsidiary
%
No. of
shares
Par
value Principal activities
寧波信富置業有限公司 People’s Republic of China
(Wholly foreign-owned
enterprise)
100 – 100 N/A N/A Property
development
上海嘉頤房地產開發有限公司 People’s Republic of China
(Wholly foreign-owned
enterprise)
100 – 100 N/A N/A Property
development
上海嘉逸房地產開發有限公司 People’s Republic of China
(Wholly foreign-owned
enterprise)
100 – 100 N/A N/A Property
development
上海嘉諧房地產開發有限公司 People’s Republic of China
(Wholly foreign-owned
enterprise)
100 – 100 N/A N/A Property
development
紀亮(上海)房地產開發有限公司 People’s Republic of China
(Wholly foreign-owned
enterprise)
100 – 100 N/A N/A Property
development
尊創(上海)賓館有限公司 People’s Republic of China
(Wholly foreign-owned
enterprise)
100 – 100 N/A N/A Property
development
Jointly controlled entities#
上海瑞明置業有限公司 People’s Republic of China
(Sino-foreign equity
joint venture)
50 50 – – – Property
development
上海瑞博置業有限公司 ‡ People’s Republic of China
(Sino-foreign equity
joint venture)
50 50 – – – Property
development
中船置業有限公司 ‡ People’s Republic of China
(Sino-foreign equity
joint venture)
50 50 – – – Property
development
Hong Kong
Subsidiary companies
Borgia Limited Hong Kong 100 – 100 2 HK$10 Property investment
Famous Land Limited Hong Kong 100 – 100 2 HK$1 Property investment
Glenridge Company Limited Hong Kong 100 – 100 2 HK$10 Property investment
Hang Luen Chong Investment
Company, Limited
Hong Kong 100 – 100 80,000 HK$100 Property investment
Hang Luen Chong Property
Management Company,
Limited
Hong Kong 100 – 100 2 HK$1 Property
management
Hang Wah Chong Investment
Company Limited
Hong Kong 100 – 100 50,000 HK$100 Property investment
Lindenford Limited Hong Kong 100 – 100 2 HK$10 Property investment
CITIC Pacific Annual Report 2011
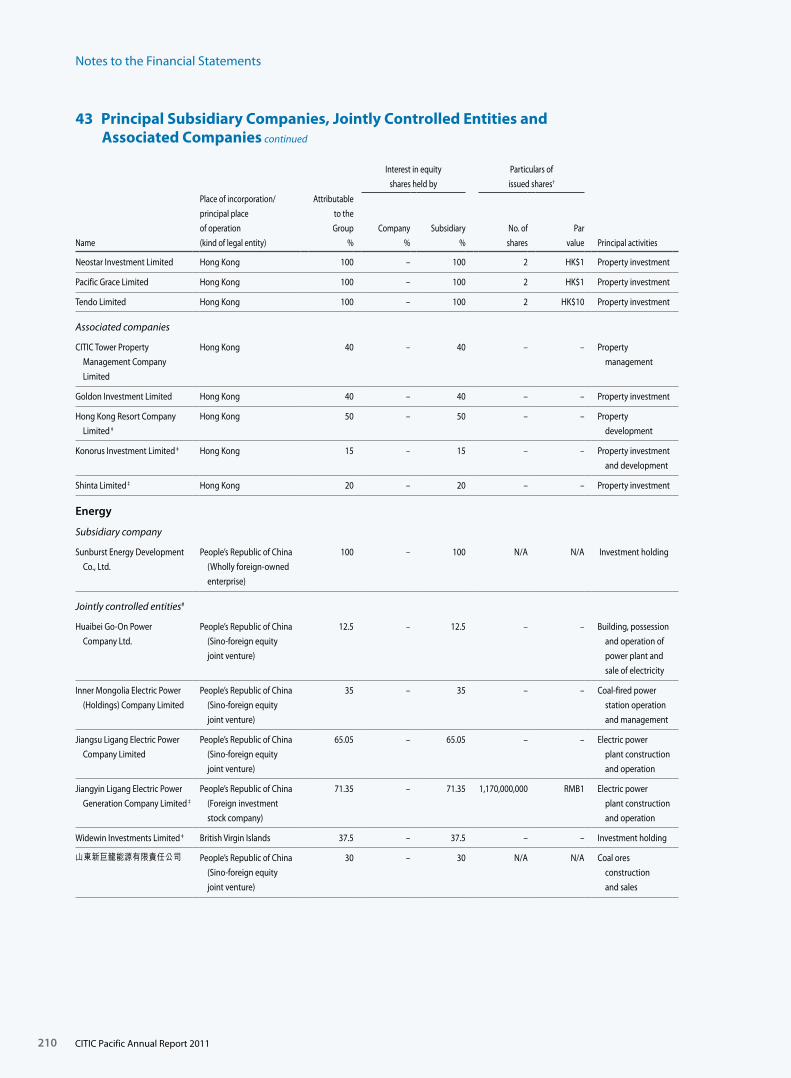
Notes to the Financial Statements
43 Principal Subsidiary Companies, Jointly Controlled Entities and Associated Companies continued
210
Interest in equity
shares held by
Particulars of
issued shares†
Name
Place of incorporation/
principal place
of operation
(kind of legal entity)
Attributable
to the
Group
%
Company
%
Subsidiary
%
No. of
shares
Par
value Principal activities
Neostar Investment Limited Hong Kong 100 – 100 2 HK$1 Property investment
Pacific Grace Limited Hong Kong 100 – 100 2 HK$1 Property investment
Tendo Limited Hong Kong 100 – 100 2 HK$10 Property investment
Associated companies
CITIC Tower Property
Management Company
Limited
Hong Kong 40 – 40 – – Property
management
Goldon Investment Limited Hong Kong 40 – 40 – – Property investment
Hong Kong Resort Company
Limited ‡Hong Kong 50 – 50 – – Property
development
Konorus Investment Limited ‡ Hong Kong 15 – 15 – – Property investment
and development
Shinta Limited ‡ Hong Kong 20 – 20 – – Property investment
Energy
Subsidiary company
Sunburst Energy Development
Co., Ltd.
People’s Republic of China
(Wholly foreign-owned
enterprise)
100 – 100 N/A N/A Investment holding
Jointly controlled entities#
Huaibei Go-On Power
Company Ltd.
People’s Republic of China
(Sino-foreign equity
joint venture)
12.5 – 12.5 – – Building, possession
and operation of
power plant and
sale of electricity
Inner Mongolia Electric Power
(Holdings) Company Limited
People’s Republic of China
(Sino-foreign equity
joint venture)
35 – 35 – – Coal-fired power
station operation
and management
Jiangsu Ligang Electric Power
Company Limited
People’s Republic of China
(Sino-foreign equity
joint venture)
65.05 – 65.05 – – Electric power
plant construction
and operation
Jiangyin Ligang Electric Power
Generation Company Limited ‡People’s Republic of China
(Foreign investment
stock company)
71.35 – 71.35 1,170,000,000 RMB1 Electric power
plant construction
and operation
Widewin Investments Limited ‡ British Virgin Islands 37.5 – 37.5 – – Investment holding
山東新巨龍能源有限責任公司 People’s Republic of China
(Sino-foreign equity
joint venture)
30 – 30 N/A N/A Coal ores
construction
and sales
CITIC Pacific Annual Report 2011
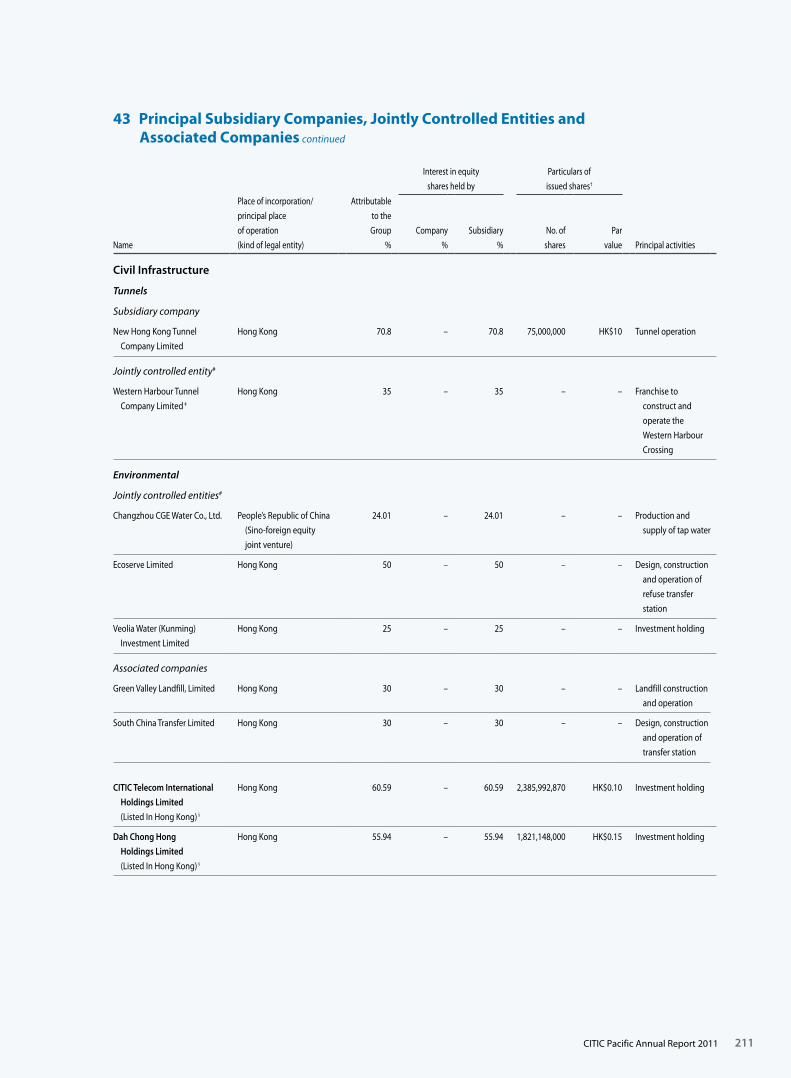
43 Principal Subsidiary Companies, Jointly Controlled Entities and Associated Companies continued
211
Interest in equity
shares held by
Particulars of
issued shares†
Name
Place of incorporation/
principal place
of operation
(kind of legal entity)
Attributable
to the
Group
%
Company
%
Subsidiary
%
No. of
shares
Par
value Principal activities
Civil Infrastructure
Tunnels
Subsidiary company
New Hong Kong Tunnel
Company Limited
Hong Kong 70.8 – 70.8 75,000,000 HK$10 Tunnel operation
Jointly controlled entity#
Western Harbour Tunnel
Company Limited ‡
Hong Kong 35 – 35 – – Franchise to
construct and
operate the
Western Harbour
Crossing
Environmental
Jointly controlled entities#
Changzhou CGE Water Co., Ltd. People’s Republic of China
(Sino-foreign equity
joint venture)
24.01 – 24.01 – – Production and
supply of tap water
Ecoserve Limited Hong Kong 50 – 50 – – Design, construction
and operation of
refuse transfer
station
Veolia Water (Kunming)
Investment Limited
Hong Kong 25 – 25 – – Investment holding
Associated companies
Green Valley Landfill, Limited Hong Kong 30 – 30 – – Landfill construction
and operation
South China Transfer Limited Hong Kong 30 – 30 – – Design, construction
and operation of
transfer station
CITIC Telecom International
Holdings Limited
(Listed In Hong Kong)§
Hong Kong 60.59 – 60.59 2,385,992,870 HK$0.10 Investment holding
Dah Chong Hong
Holdings Limited
(Listed In Hong Kong)§
Hong Kong 55.94 – 55.94 1,821,148,000 HK$0.15 Investment holding
CITIC Pacific Annual Report 2011
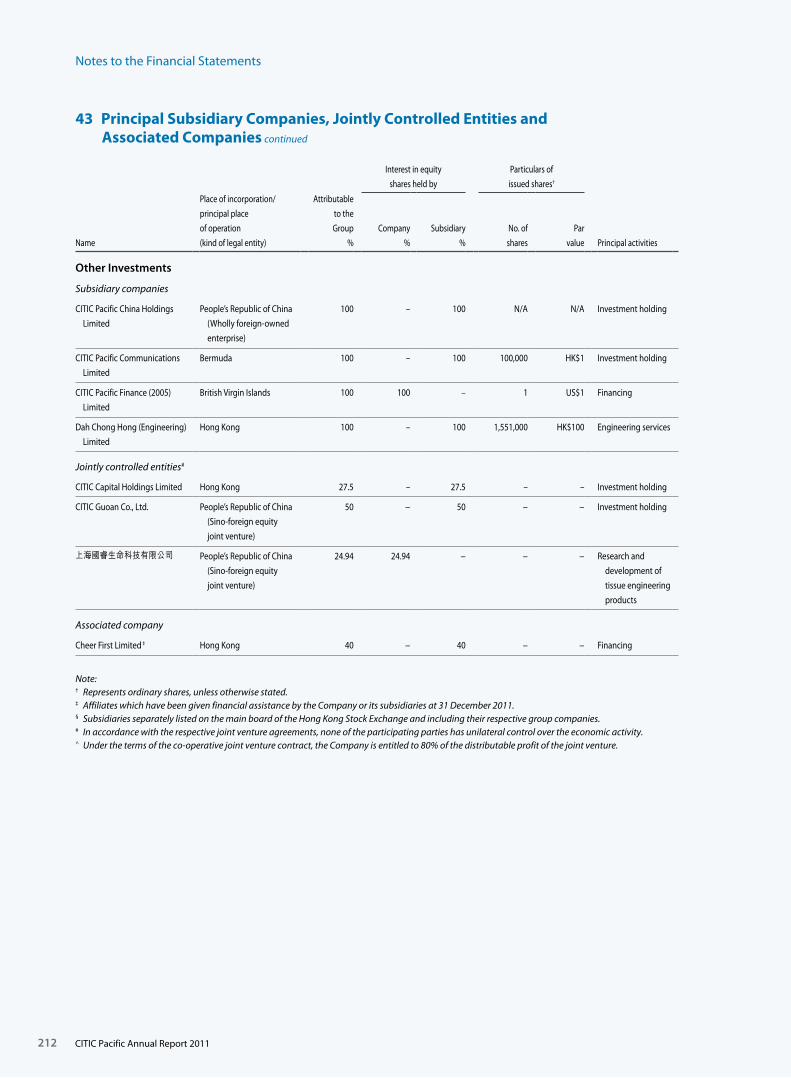
Notes to the Financial Statements
43 Principal Subsidiary Companies, Jointly Controlled Entities and Associated Companies continued
212
Interest in equity
shares held by
Particulars of
issued shares†
Name
Place of incorporation/
principal place
of operation
(kind of legal entity)
Attributable
to the
Group
%
Company
%
Subsidiary
%
No. of
shares
Par
value Principal activities
Other Investments
Subsidiary companies
CITIC Pacific China Holdings
Limited
People’s Republic of China
(Wholly foreign-owned
enterprise)
100 – 100 N/A N/A Investment holding
CITIC Pacific Communications
Limited
Bermuda 100 – 100 100,000 HK$1 Investment holding
CITIC Pacific Finance (2005)
Limited
British Virgin Islands 100 100 – 1 US$1 Financing
Dah Chong Hong (Engineering)
Limited
Hong Kong 100 – 100 1,551,000 HK$100 Engineering services
Jointly controlled entities#
CITIC Capital Holdings Limited Hong Kong 27.5 – 27.5 – – Investment holding
CITIC Guoan Co., Ltd. People’s Republic of China
(Sino-foreign equity
joint venture)
50 – 50 – – Investment holding
上海國睿生命科技有限公司 People’s Republic of China
(Sino-foreign equity
joint venture)
24.94 24.94 – – – Research and
development of
tissue engineering
products
Associated company
Cheer First Limited ‡ Hong Kong 40 – 40 – – Financing
Note:† Represents ordinary shares, unless otherwise stated.‡ Affiliates which have been given financial assistance by the Company or its subsidiaries at 31 December 2011.§ Subsidiaries separately listed on the main board of the Hong Kong Stock Exchange and including their respective group companies.# In accordance with the respective joint venture agreements, none of the participating parties has unilateral control over the economic activity.^ Under the terms of the co-operative joint venture contract, the Company is entitled to 80% of the distributable profit of the joint venture.
CITIC Pacific Annual Report 2011

213
Independent Auditor’s Report
To the shareholders of CITIC Pacific Limited
(incorporated in Hong Kong with limited liability)
We have audited the consolidated financial statements of CITIC Pacific Limited (the “Company”) and its subsidiaries
(together, the “Group”) set out on pages 122 to 212, which comprise the consolidated and company balance sheets
as at 31 December 2011, and the consolidated profit and loss account, the consolidated statement of comprehensive
income, the consolidated statement of changes in equity and the consolidated cash flow statement for the year
then ended, and a summary of significant accounting policies and other explanatory information.
Directors’ Responsibility for the Consolidated Financial StatementsThe directors of the Company are responsible for the preparation of consolidated financial statements that give a
true and fair view in accordance with Hong Kong Financial Reporting Standards issued by the Hong Kong Institute
of Certified Public Accountants, and the Hong Kong Companies Ordinance, and for such internal control as the
directors determine is necessary to enable the preparation of consolidated financial statements that are free from
material misstatement, whether due to fraud or error.
Auditor’s ResponsibilityOur responsibility is to express an opinion on these consolidated financial statements based on our audit and to
report our opinion solely to you, as a body, in accordance with section 141 of the Hong Kong Companies Ordinance
and for no other purpose. We do not assume responsibility towards or accept liability to any other person for the
contents of this report.
We conducted our audit in accordance with Hong Kong Standards on Auditing issued by the Hong Kong Institute
of Certified Public Accountants. Those standards require that we comply with ethical requirements and plan and
perform the audit to obtain reasonable assurance about whether the consolidated financial statements are free
from material misstatement.
An audit involves performing procedures to obtain audit evidence about the amounts and disclosures in the
consolidated financial statements. The procedures selected depend on the auditor’s judgement, including the
assessment of the risks of material misstatement of the consolidated financial statements, whether due to fraud or
error. In making those risk assessments, the auditor considers internal control relevant to the entity’s preparation
of the consolidated financial statements that give a true and fair view in order to design audit procedures that are
appropriate in the circumstances, but not for the purpose of expressing an opinion on the effectiveness of the
entity’s internal control. An audit also includes evaluating the appropriateness of accounting policies used and
the reasonableness of accounting estimates made by the directors, as well as evaluating the overall presentation
of the consolidated financial statements.
We believe that the audit evidence we have obtained is sufficient and appropriate to provide a basis for our
audit opinion.
OpinionIn our opinion, the consolidated financial statements give a true and fair view of the state of affairs of the Company
and of the Group as at 31 December 2011, and of the Group’s profit and cash flows for the year then ended in
accordance with Hong Kong Financial Reporting Standards and have been properly prepared in accordance with
the Hong Kong Companies Ordinance.
PricewaterhouseCoopersCertified Public Accountants
Hong Kong, 1 March 2012
CITIC Pacific Annual Report 2011
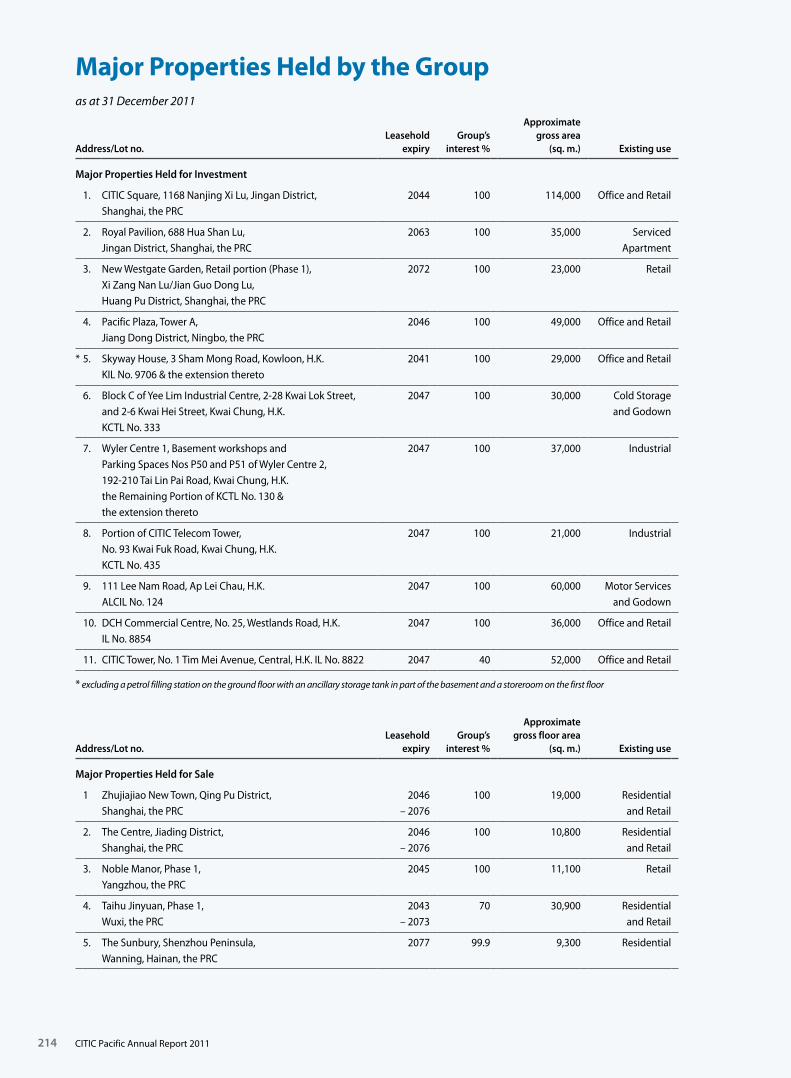
214 CITIC Pacific Annual Report 2011
Address/Lot no.Leasehold
expiryGroup’s
interest %
Approximate gross area
(sq. m.) Existing use
Major Properties Held for Investment
1. CITIC Square, 1168 Nanjing Xi Lu, Jingan District, Shanghai, the PRC
2044 100 114,000 Office and Retail
2. Royal Pavilion, 688 Hua Shan Lu,Jingan District, Shanghai, the PRC
2063 100 35,000 ServicedApartment
3. New Westgate Garden, Retail portion (Phase 1), Xi Zang Nan Lu/Jian Guo Dong Lu, Huang Pu District, Shanghai, the PRC
2072 100 23,000 Retail
4. Pacific Plaza, Tower A,Jiang Dong District, Ningbo, the PRC
2046 100 49,000 Office and Retail
* 5. Skyway House, 3 Sham Mong Road, Kowloon, H.K.KIL No. 9706 & the extension thereto
2041 100 29,000 Office and Retail
6. Block C of Yee Lim Industrial Centre, 2-28 Kwai Lok Street,and 2-6 Kwai Hei Street, Kwai Chung, H.K. KCTL No. 333
2047 100 30,000 Cold Storageand Godown
7. Wyler Centre 1, Basement workshops and Parking Spaces Nos P50 and P51 of Wyler Centre 2, 192-210 Tai Lin Pai Road, Kwai Chung, H.K.the Remaining Portion of KCTL No. 130 & the extension thereto
2047 100 37,000 Industrial
8. Portion of CITIC Telecom Tower, No. 93 Kwai Fuk Road, Kwai Chung, H.K.KCTL No. 435
2047 100 21,000 Industrial
9. 111 Lee Nam Road, Ap Lei Chau, H.K.ALCIL No. 124
2047 100 60,000 Motor Servicesand Godown
10. DCH Commercial Centre, No. 25, Westlands Road, H.K. IL No. 8854
2047 100 36,000 Office and Retail
11. CITIC Tower, No. 1 Tim Mei Avenue, Central, H.K. IL No. 8822 2047 40 52,000 Office and Retail
* excluding a petrol filling station on the ground floor with an ancillary storage tank in part of the basement and a storeroom on the first floor
Address/Lot no.Leasehold
expiryGroup’s
interest %
Approximate gross floor area
(sq. m.) Existing use
Major Properties Held for Sale
1 Zhujiajiao New Town, Qing Pu District, Shanghai, the PRC
2046– 2076
100 19,000 Residentialand Retail
2. The Centre, Jiading District, Shanghai, the PRC
2046– 2076
100 10,800 Residentialand Retail
3. Noble Manor, Phase 1,Yangzhou, the PRC
2045 100 11,100 Retail
4. Taihu Jinyuan, Phase 1,Wuxi, the PRC
2043– 2073
70 30,900 Residentialand Retail
5. The Sunbury, Shenzhou Peninsula, Wanning, Hainan, the PRC
2077 99.9 9,300 Residential
Major Properties Held by the Groupas at 31 December 2011
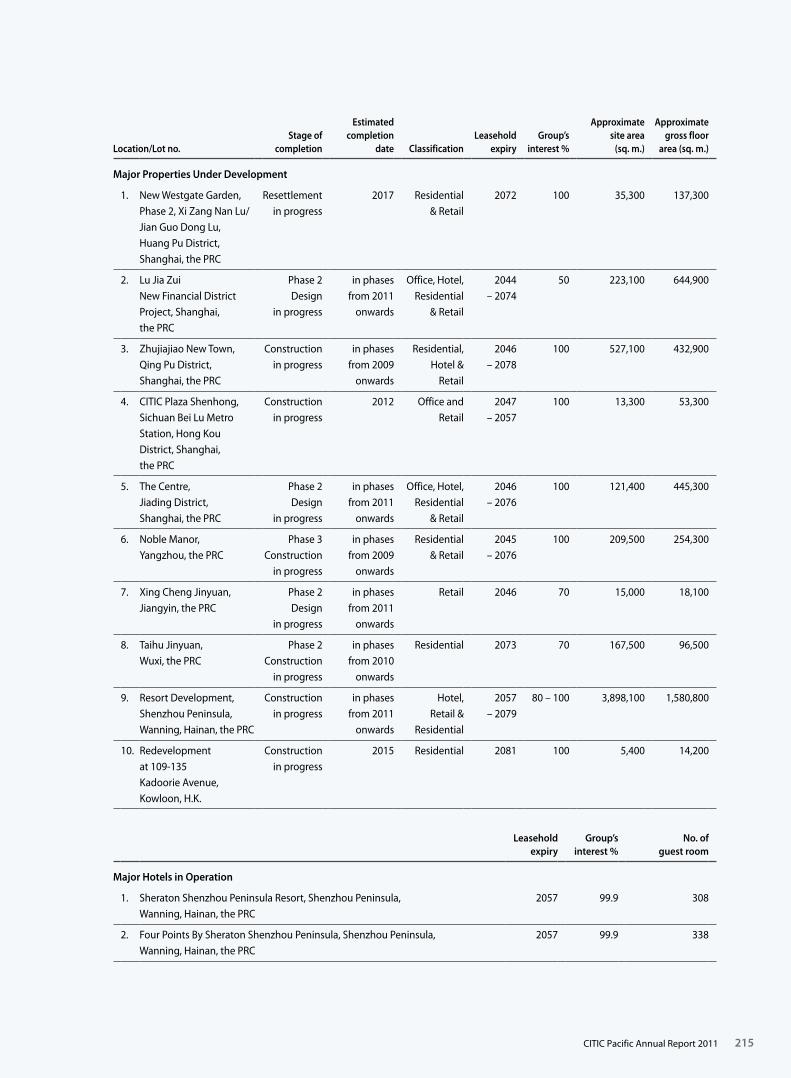
215CITIC Pacific Annual Report 2011
Location/Lot no.Stage of
completion
Estimated completion
date ClassificationLeasehold
expiryGroup’s
interest %
Approximate site area
(sq. m.)
Approximate gross floor
area (sq. m.)
Major Properties Under Development
1. New Westgate Garden, Phase 2, Xi Zang Nan Lu/Jian Guo Dong Lu,Huang Pu District,Shanghai, the PRC
Resettlementin progress
2017 Residential& Retail
2072 100 35,300 137,300
2. Lu Jia Zui New Financial DistrictProject, Shanghai, the PRC
Phase 2Design
in progress
in phasesfrom 2011
onwards
Office, Hotel,Residential
& Retail
2044– 2074
50 223,100 644,900
3. Zhujiajiao New Town,Qing Pu District, Shanghai, the PRC
Constructionin progress
in phasesfrom 2009
onwards
Residential,Hotel &
Retail
2046– 2078
100 527,100 432,900
4. CITIC Plaza Shenhong, Sichuan Bei Lu Metro Station, Hong Kou District, Shanghai, the PRC
Constructionin progress
2012 Office andRetail
2047– 2057
100 13,300 53,300
5. The Centre,Jiading District,Shanghai, the PRC
Phase 2Design
in progress
in phasesfrom 2011
onwards
Office, Hotel,Residential
& Retail
2046– 2076
100 121,400 445,300
6. Noble Manor,Yangzhou, the PRC
Phase 3Construction
in progress
in phasesfrom 2009
onwards
Residential& Retail
2045– 2076
100 209,500 254,300
7. Xing Cheng Jinyuan,Jiangyin, the PRC
Phase 2Design
in progress
in phasesfrom 2011
onwards
Retail 2046 70 15,000 18,100
8. Taihu Jinyuan, Wuxi, the PRC
Phase 2 Construction
in progress
in phasesfrom 2010
onwards
Residential 2073 70 167,500 96,500
9. Resort Development, Shenzhou Peninsula,Wanning, Hainan, the PRC
Constructionin progress
in phasesfrom 2011
onwards
Hotel,Retail &
Residential
2057– 2079
80 – 100 3,898,100 1,580,800
10. Redevelopment at 109-135 Kadoorie Avenue, Kowloon, H.K.
Constructionin progress
2015 Residential 2081 100 5,400 14,200
Leasehold expiry
Group’s interest %
No. of guest room
Major Hotels in Operation
1. Sheraton Shenzhou Peninsula Resort, Shenzhou Peninsula, Wanning, Hainan, the PRC
2057 99.9 308
2. Four Points By Sheraton Shenzhou Peninsula, Shenzhou Peninsula, Wanning, Hainan, the PRC
2057 99.9 338
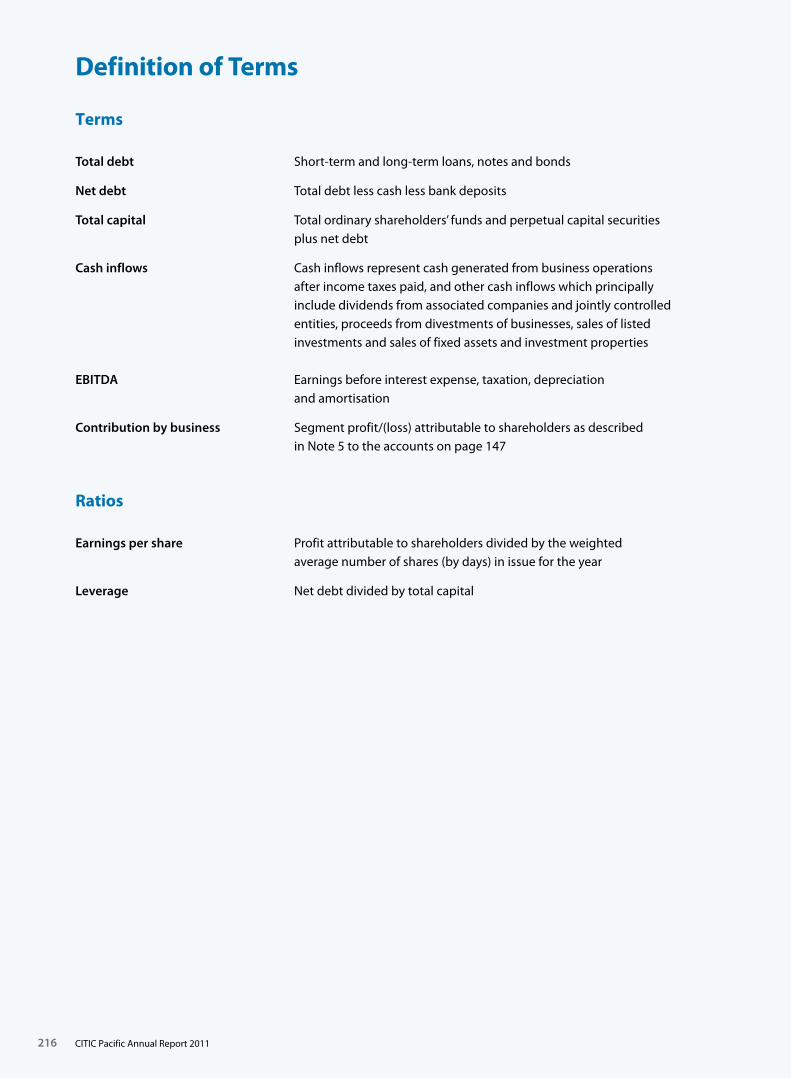
216 CITIC Pacific Annual Report 2011
Terms
Total debt Short-term and long-term loans, notes and bonds
Net debt Total debt less cash less bank deposits
Total capital Total ordinary shareholders’ funds and perpetual capital securities plus net debt
Cash inflows Cash inflows represent cash generated from business operations after income taxes paid, and other cash inflows which principally include dividends from associated companies and jointly controlled entities, proceeds from divestments of businesses, sales of listed investments and sales of fixed assets and investment properties
EBITDA Earnings before interest expense, taxation, depreciation and amortisation
Contribution by business Segment profit/(loss) attributable to shareholders as described in Note 5 to the accounts on page 147
Ratios
Earnings per share Profit attributable to shareholders divided by the weighted average number of shares (by days) in issue for the year
Leverage Net debt divided by total capital
Definition of Terms
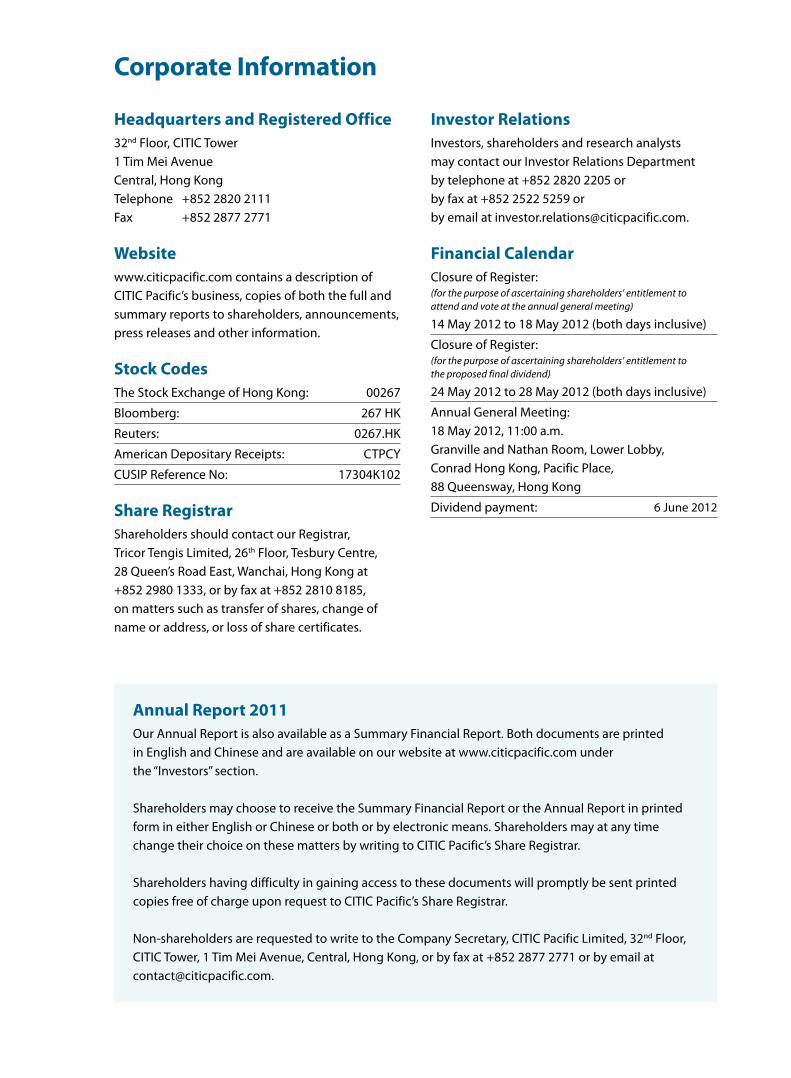
Corporate Information
Headquarters and Registered Office32nd Floor, CITIC Tower1 Tim Mei AvenueCentral, Hong KongTelephone +852 2820 2111Fax +852 2877 2771
Websitewww.citicpacific.com contains a description of CITIC Pacific’s business, copies of both the full and summary reports to shareholders, announcements, press releases and other information.
Stock CodesThe Stock Exchange of Hong Kong: 00267
Bloomberg: 267 HK
Reuters: 0267.HK
American Depositary Receipts: CTPCY
CUSIP Reference No: 17304K102
Share RegistrarShareholders should contact our Registrar, Tricor Tengis Limited, 26th Floor, Tesbury Centre, 28 Queen’s Road East, Wanchai, Hong Kong at +852 2980 1333, or by fax at +852 2810 8185, on matters such as transfer of shares, change of name or address, or loss of share certificates.
Investor RelationsInvestors, shareholders and research analysts may contact our Investor Relations Department by telephone at +852 2820 2205 or by fax at +852 2522 5259 or by email at [email protected].
Financial CalendarClosure of Register:(for the purpose of ascertaining shareholders’ entitlement to attend and vote at the annual general meeting)
14 May 2012 to 18 May 2012 (both days inclusive)
Closure of Register:(for the purpose of ascertaining shareholders’ entitlement to the proposed final dividend)
24 May 2012 to 28 May 2012 (both days inclusive)
Annual General Meeting:18 May 2012, 11:00 a.m.Granville and Nathan Room, Lower Lobby,Conrad Hong Kong, Pacific Place,88 Queensway, Hong Kong
Dividend payment: 6 June 2012
Annual Report 2011Our Annual Report is also available as a Summary Financial Report. Both documents are printed in English and Chinese and are available on our website at www.citicpacific.com under the “Investors” section.
Shareholders may choose to receive the Summary Financial Report or the Annual Report in printed form in either English or Chinese or both or by electronic means. Shareholders may at any time change their choice on these matters by writing to CITIC Pacific’s Share Registrar.
Shareholders having difficulty in gaining access to these documents will promptly be sent printed copies free of charge upon request to CITIC Pacific’s Share Registrar.
Non-shareholders are requested to write to the Company Secretary, CITIC Pacific Limited, 32nd Floor, CITIC Tower, 1 Tim Mei Avenue, Central, Hong Kong, or by fax at +852 2877 2771 or by email at [email protected].
CITIC Pacific Ltd32nd Floor CITIC Tower1 Tim Mei AvenueCentral, Hong Kong
Tel +852 2820 2111Fax +852 2877 2771
Stock code 00267
www.citicpacific.com