Annual Report 2010 - Philips Results
250
Annual Report 2010 Financial, social and environmental performance simply making a difference
-
Upload
khangminh22 -
Category
Documents
-
view
0 -
download
0
Transcript of Annual Report 2010 - Philips Results

Annual Report 2010Financial, social and environmental performance
simplymaking a difference
2 Annual Report 2010
ContentsPerformance highlights 4
President’s message 6
1 Our company 11
2 Vision 2015 - our strategic focus 13
3 Our strategy in action 153.1 Professional Healthcare 153.2 Home Healthcare 203.3 Healthy Life & Personal Care 233.4 Home Living & Lifestyle Entertainment 273.5 Home Lighting 313.6 Professional Lighting 35
4 Our planet, our partners, our people 404.1 Climate change 404.2 Our environmental footprint 434.3 Partnerships for progress 464.4 Supplier sustainability 494.5 Working at Philips 524.6 Working in our communities 55
5 Group performance 585.1 Management discussion and analysis 585.2 Liquidity and capital resources 665.3 Other performance measures 715.4 Sustainability 745.5 Proposed distribution to shareholders 795.6 Outlook 80
6 Sector performance 816.1 Healthcare 836.2 Consumer Lifestyle 896.3 Lighting 956.4 Group Management & Services 101
7 Risk management 1047.1 Our approach to risk management and business
control104
7.2 Risk categories and factors 1077.3 Strategic risks 1087.4 Operational risks 1097.5 Compliance risks 1117.6 Financial risks 112
8 Board of Management 116
9 Group Management Committee 118
10 Supervisory Board 119
11 Supervisory Board report 12011.1 Report of the Corporate Governance and Nomination
& Selection Committee123
11.2 Report of the Remuneration Committee 12411.3 Report of the Audit Committee 129
12 Corporate governance 13112.1 Board of Management 13112.2 Supervisory Board 13312.3 General Meeting of Shareholders 13512.4 Logistics of the General Meeting of Shareholders 13612.5 Investor Relations 137
IFRS basis of presentationThe financial information included in this document is based on IFRS, unlessotherwise indicated.
Forward-looking statements and other informationPlease refer to chapter 20, Forward-looking statements and otherinformation, of this Annual Report for more information about forward-looking statements, third-party market share data, fair value information,IFRS basis of preparation, use of non-GAAP information, statutory financialstatements and management report, and reclassifications.
Dutch Financial Markets Supervision ActThis document comprises regulated information within the meaning of theDutch Financial Markets Supervision Act (Wet op het Financieel Toezicht).
Statutory financial statements and management reportThe chapters Group financial statements and Company financial statementscontain the statutory financial statements of the Company. The introductionto the chapter Group financial statements sets out which parts of this AnnualReport form the Management report within the meaning of Section 2:391 ofthe Dutch Civil Code (and related Decrees).
Annual Report 2010 3
13 Group financial statements 14113.1 Management’s report on internal control 14113.2 Reports of the independent auditor 14213.3 Auditors’ report on internal control over financial
reporting142
13.4 Consolidated statements of income 14313.5 Consolidated statements of comprehensive income 14513.6 Consolidated balance sheets 14613.7 Consolidated statements of cash flows 14813.8 Consolidated statements of changes in equity 15013.9 Information by sector and main country 15113.10 Significant accounting policies 15413.11 Notes 161
1 Income from operations 1612 Financial income and expenses 1623 Income taxes 1624 Investments in associates 1665 Discontinued operations 1676 Acquisitions and divestments 1677 Property, plant and equipment 1718 Goodwill 1729 Intangible assets excluding goodwill 17310 Non-current receivables 17411 Other non-current financial assets 17412 Other non-current assets 17513 Inventories 17514 Current financial assets 17515 Other current assets 17516 Current receivables 17517 Shareholders’ equity 17618 Long-term debt and short-term debt 17719 Provisions 17820 Other non-current liabilities 17921 Accrued liabilities 17922 Other current liabilities 17923 Contractual obligations 18024 Contingent liabilities 18025 Cash from (used for) derivatives and securities 18226 Proceeds from non-current financial assets 18227 Assets in lieu of cash from sale of businesses 18228 Pensions and other postretirement benefits 18229 Share-based compensation 18730 Related-party transactions 18931 Information on remuneration 18932 Fair value of financial assets and liabilities 19533 Details of treasury risks 19634 Subsequent events 198
13.12 Independent auditor’s report - Group 199
14 Company financial statements 20014.1 Balance sheets before appropriation of results 20114.2 Statements of income 20214.3 Statements of changes in equity 20214.4 Notes 203
A Investments in affiliated companies 203B Other non-current financial assets 203C Receivables 203D Shareholders’ equity 203E Long-term debt and short-term debt 205F Other current liabilities 205G Net income 205H Employees 205I Contingent liabilities 205J Audit fees 205K Subsequent events 205
14.5 Independent auditor’s report - Company 206
15 Sustainability statements 20715.1 Economic indicators 21015.2 EcoVision5 21015.3 EcoVision4 21115.4 Green Manufacturing 2015 21215.5 Social indicators 21515.6 Supplier indicators 21715.7 Independent assurance report 22115.8 Global Reporting Initiative (GRI) table 222
16 Reconciliation of non-GAAP information 229
17 Five-year overview 233
18 Investor Relations 23618.1 The Philips investment proposition 23618.2 The year 2010 23718.3 Share information 23918.4 Risk management 24118.5 Performance in relation to market indices 24218.6 Philips’ acquisitions 24318.7 Financial calendar 24418.8 Investor contact 244
19 Definitions and abbreviations 246
20 Forward-looking statements and otherinformation
248
Performance highlights
4 Annual Report 2010
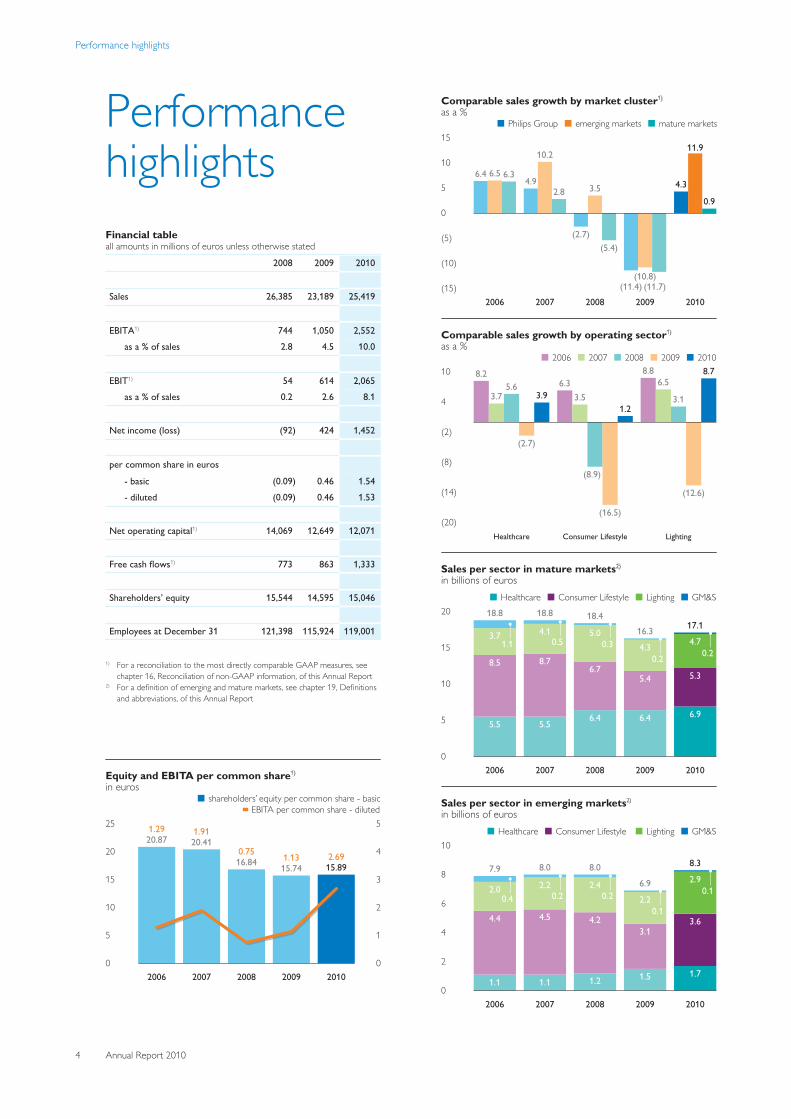
PerformancehighlightsFinancial tableall amounts in millions of euros unless otherwise stated
2008 2009 2010
Sales 26,385 23,189 25,419
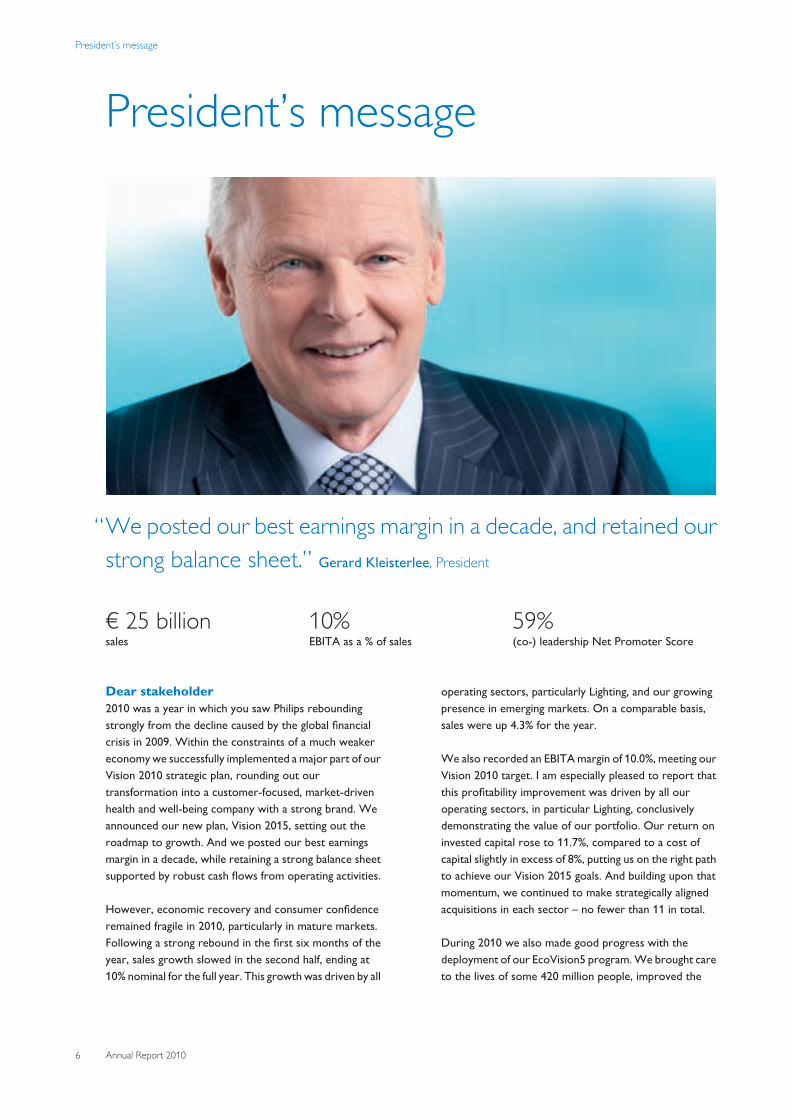
EBITA1) 744 1,050 2,552 as a % of sales 2.8 4.5 10.0
EBIT1) 54 614 2,065 as a % of sales 0.2 2.6 8.1
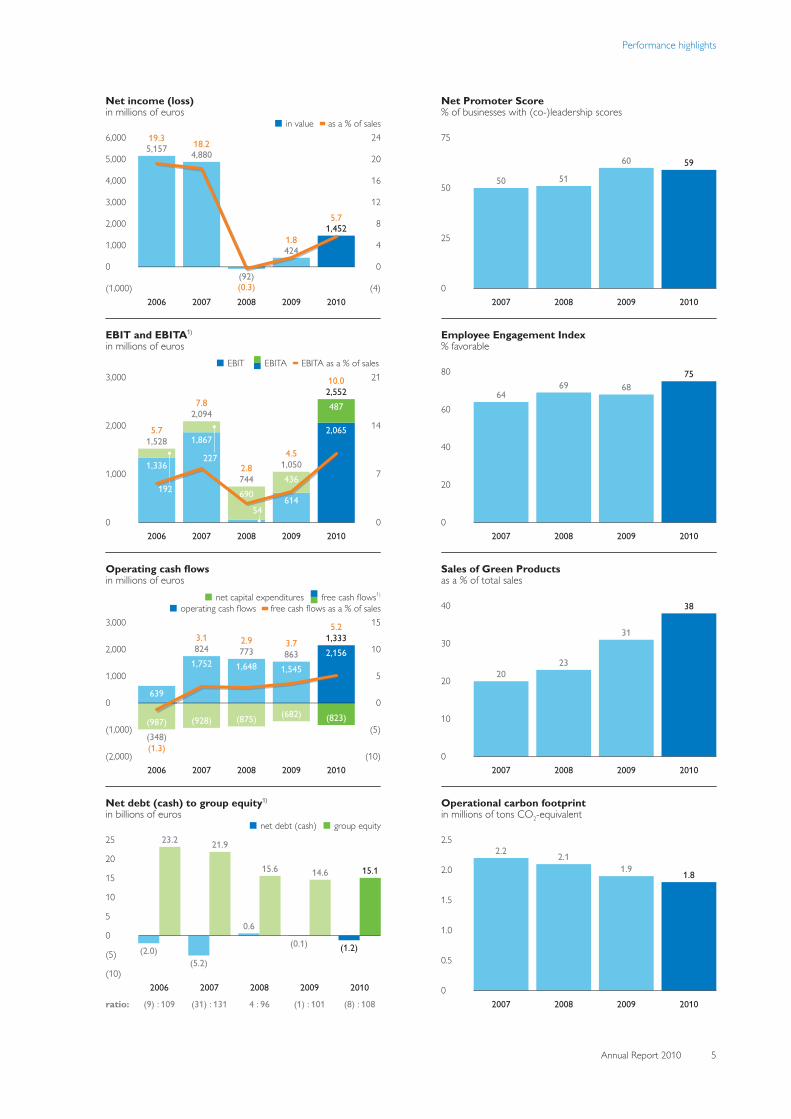
Net income (loss) (92) 424 1,452
per common share in euros
- basic (0.09) 0.46 1.54 - diluted (0.09) 0.46 1.53
Net operating capital1) 14,069 12,649 12,071
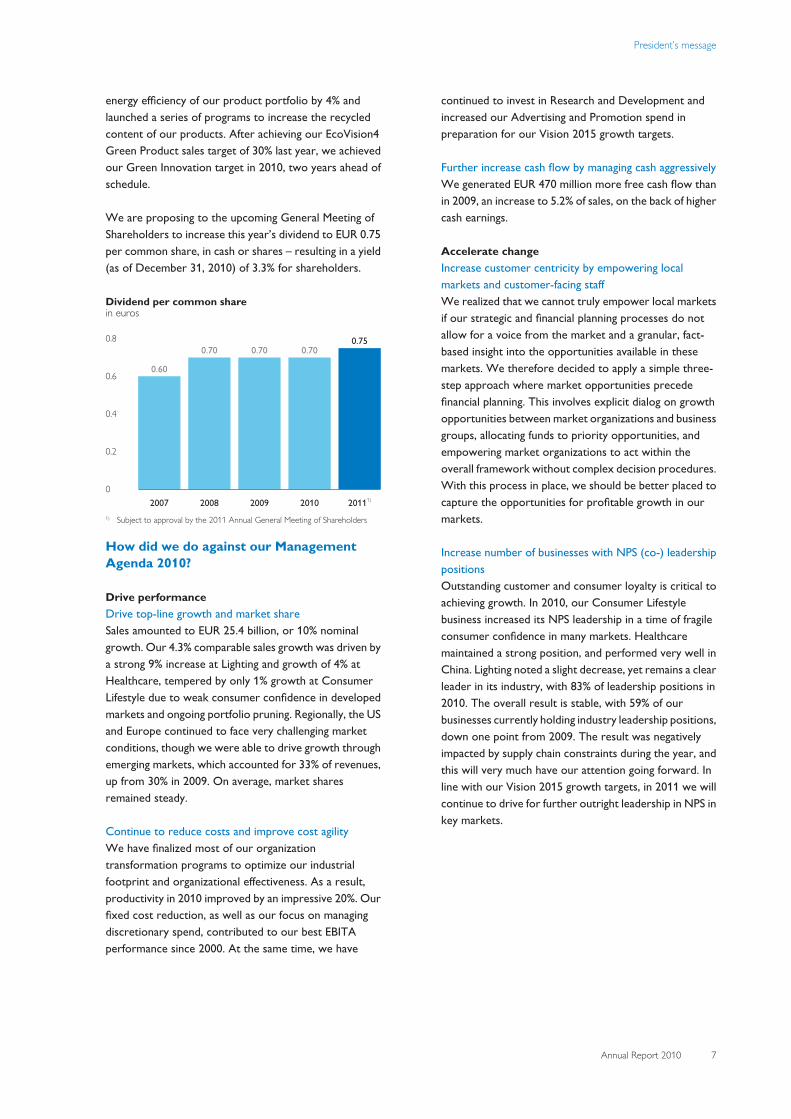
Free cash flows1) 773 863 1,333
Shareholders’ equity 15,544 14,595 15,046
Employees at December 31 121,398 115,924 119,001
1) For a reconciliation to the most directly comparable GAAP measures, seechapter 16, Reconciliation of non-GAAP information, of this Annual Report
2) For a definition of emerging and mature markets, see chapter 19, Definitionsand abbreviations, of this Annual Report
Equity and EBITA per common share1)
in euros■-shareholders’ equity per common share - basic
--EBITA per common share - diluted25
20
15
10
5
0
5
4
3
2
1
0
1.2920.87
2006
1.9120.41
2007
0.7516.84
2008
1.1315.74
2009
2.6915.89
2010
Comparable sales growth by market cluster1)
as a %■-Philips Group--■-emerging markets--■-mature markets
15
10
5
0
(5)
(10)
(15)
6.4 6.5 6.3
2006
4.9
10.2
2.8
2007
(2.7)
3.5
(5.4)
2008(11.4)
(10.8)(11.7)
2009
4.3
11.9
0.9
2010
Comparable sales growth by operating sector1)
as a %■-2006--■-2007--■-2008--■-2009--■-2010
10
4
(2)
(8)
(14)
(20)
8.2
3.75.6
(2.7)
3.9
Healthcare
6.33.5
(8.9)
(16.5)
1.2
Consumer Lifestyle
8.86.5
3.1
(12.6)
8.7
Lighting
Sales per sector in mature markets2)
in billions of euros■-Healthcare--■-Consumer Lifestyle--■-Lighting--■-GM&S
20
15
10
5
02006
5.5
8.5
3.71.1
18.8
2007
5.5
8.7
4.10.5
18.8
2008
6.4
6.7
5.00.3
18.4
2009
6.4
5.4
4.30.2
16.3
2010
6.9
5.3
4.70.2
17.1
Sales per sector in emerging markets2)
in billions of euros■-Healthcare--■-Consumer Lifestyle --■-Lighting--■-GM&S
10
8
6
4
2
02006
1.1
4.4
2.00.4
7.9
2007
1.1
4.5
2.20.2
8.0
2008
1.2
4.2
2.40.2
8.0
2009
1.5
3.1
2.20.1
6.9
2010
1.7
3.6
2.90.1
8.3
Performance highlights
Annual Report 2010 5
Net income (loss)in millions of euros
■-in value----as a % of sales6,000
5,000
4,000
3,000
2,000
1,000
0
(1,000)
24
20
16
12
8
4
0
(4)
19.35,157
2006
18.24,880
2007(0.3)(92)
2008
1.8424
2009
5.71,452
2010
EBIT and EBITA1)
in millions of euros■-EBIT --■■-EBITA----EBITA as a % of sales
3,000
2,000
1,000
0
21
14
7
0
1,336
192
1,5285.7
2006
1,867
227
2,0947.8
2007
54
6907442.8
2008
614
4361,0504.5
2009
2,065
4872,55210.0
2010
192 690
Operating cash flowsin millions of euros
■-net capital expenditures--■■-free cash flows1)
■-operating cash flows----free cash flows as a % of sales3,000
2,000
1,000
0
(1,000)
(2,000)
15
10
5
0
(5)
(10)
639
(987)(348)(1.3)
2006
1,752
(928)
8243.1
2007
1,648
(875)
7732.9
2008
1,545
(682)
8633.7
2009
2,156
(823)
1,3335.2
2010
Net debt (cash) to group equity1)
in billions of euros■-net debt (cash)--■-group equity
25
20
15
10
5
0
(5)
(10)
(2.0)
23.2
(9) : 109
2006
(5.2)
21.9
(31) : 131
2007
0.6
15.6
4 : 96
2008
(0.1)
14.6
(1) : 101
2009
(1.2)
15.1
(8) : 108
2010
ratio:
Net Promoter Score% of businesses with (co-)leadership scores
75
50
25
0
50
2007
51
2008
60
2009
59
2010
Employee Engagement Index% favorable
80
60
40
20
0
64
2007
69
2008
68
2009
75
2010
Sales of Green Productsas a % of total sales
40
30
20
10
0
20
2007
23
2008
31
2009
38
2010
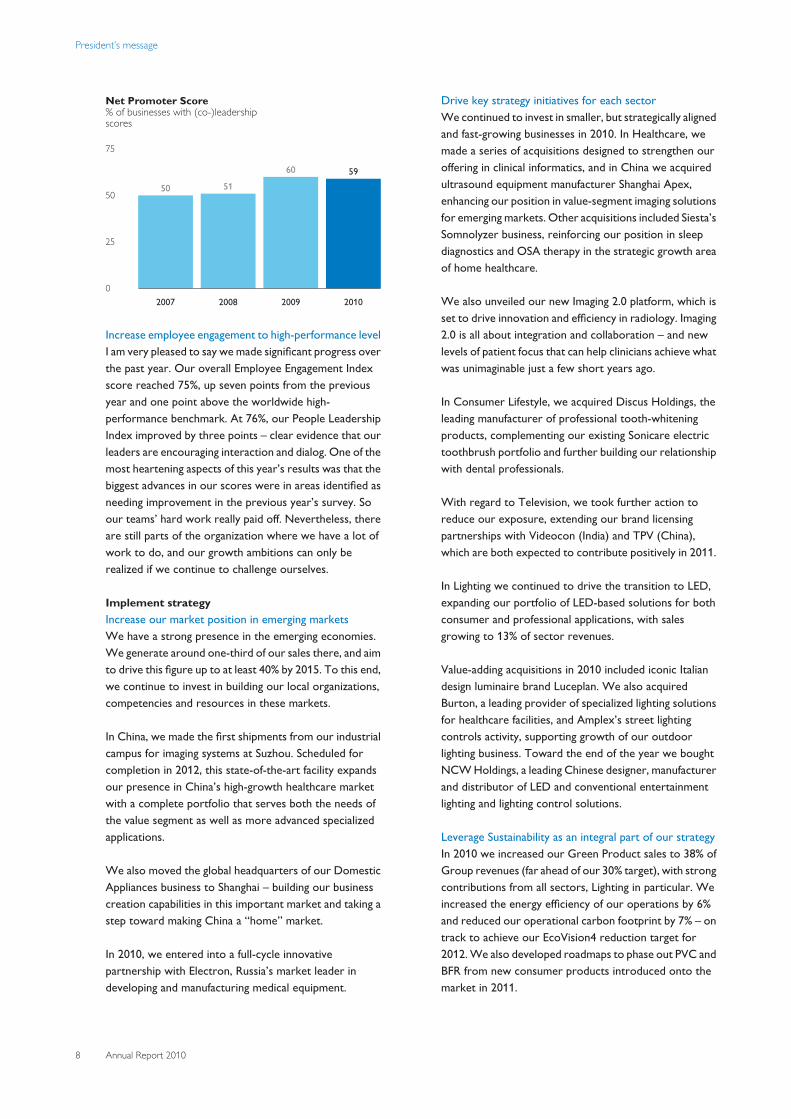
Operational carbon footprintin millions of tons CO2-equivalent
2.5
2.0
1.5
1.0
0.5
0
2.2
2007
2.1
2008
1.9
2009
1.8
2010
President’s message
6 Annual Report 2010
President’s message
“We posted our best earnings margin in a decade, and retained ourstrong balance sheet.” Gerard Kleisterlee, President
€ 25 billionsales
10%EBITA as a % of sales
59%(co-) leadership Net Promoter Score
Dear stakeholder2010 was a year in which you saw Philips reboundingstrongly from the decline caused by the global financialcrisis in 2009. Within the constraints of a much weakereconomy we successfully implemented a major part of ourVision 2010 strategic plan, rounding out ourtransformation into a customer-focused, market-drivenhealth and well-being company with a strong brand. Weannounced our new plan, Vision 2015, setting out theroadmap to growth. And we posted our best earningsmargin in a decade, while retaining a strong balance sheetsupported by robust cash flows from operating activities.
However, economic recovery and consumer confidenceremained fragile in 2010, particularly in mature markets.Following a strong rebound in the first six months of theyear, sales growth slowed in the second half, ending at10% nominal for the full year. This growth was driven by all
operating sectors, particularly Lighting, and our growingpresence in emerging markets. On a comparable basis,sales were up 4.3% for the year.
We also recorded an EBITA margin of 10.0%, meeting ourVision 2010 target. I am especially pleased to report thatthis profitability improvement was driven by all ouroperating sectors, in particular Lighting, conclusivelydemonstrating the value of our portfolio. Our return oninvested capital rose to 11.7%, compared to a cost ofcapital slightly in excess of 8%, putting us on the right pathto achieve our Vision 2015 goals. And building upon thatmomentum, we continued to make strategically alignedacquisitions in each sector – no fewer than 11 in total.
During 2010 we also made good progress with thedeployment of our EcoVision5 program. We brought careto the lives of some 420 million people, improved the
President’s message
Annual Report 2010 7
energy efficiency of our product portfolio by 4% andlaunched a series of programs to increase the recycledcontent of our products. After achieving our EcoVision4Green Product sales target of 30% last year, we achievedour Green Innovation target in 2010, two years ahead ofschedule.
We are proposing to the upcoming General Meeting ofShareholders to increase this year’s dividend to EUR 0.75per common share, in cash or shares – resulting in a yield(as of December 31, 2010) of 3.3% for shareholders.
Dividend per common sharein euros
0.8
0.6
0.4
0.2
0
0.60
2007
0.70
2008
0.70
2009
0.70
2010
0.75
20111)
1) Subject to approval by the 2011 Annual General Meeting of Shareholders
How did we do against our ManagementAgenda 2010?
Drive performanceDrive top-line growth and market shareSales amounted to EUR 25.4 billion, or 10% nominalgrowth. Our 4.3% comparable sales growth was driven bya strong 9% increase at Lighting and growth of 4% atHealthcare, tempered by only 1% growth at ConsumerLifestyle due to weak consumer confidence in developedmarkets and ongoing portfolio pruning. Regionally, the USand Europe continued to face very challenging marketconditions, though we were able to drive growth throughemerging markets, which accounted for 33% of revenues,up from 30% in 2009. On average, market sharesremained steady.
Continue to reduce costs and improve cost agilityWe have finalized most of our organizationtransformation programs to optimize our industrialfootprint and organizational effectiveness. As a result,productivity in 2010 improved by an impressive 20%. Ourfixed cost reduction, as well as our focus on managingdiscretionary spend, contributed to our best EBITAperformance since 2000. At the same time, we have
continued to invest in Research and Development andincreased our Advertising and Promotion spend inpreparation for our Vision 2015 growth targets.
Further increase cash flow by managing cash aggressivelyWe generated EUR 470 million more free cash flow thanin 2009, an increase to 5.2% of sales, on the back of highercash earnings.
Accelerate changeIncrease customer centricity by empowering localmarkets and customer-facing staffWe realized that we cannot truly empower local marketsif our strategic and financial planning processes do notallow for a voice from the market and a granular, fact-based insight into the opportunities available in thesemarkets. We therefore decided to apply a simple three-step approach where market opportunities precedefinancial planning. This involves explicit dialog on growthopportunities between market organizations and businessgroups, allocating funds to priority opportunities, andempowering market organizations to act within theoverall framework without complex decision procedures.With this process in place, we should be better placed tocapture the opportunities for profitable growth in ourmarkets.
Increase number of businesses with NPS (co-) leadershippositionsOutstanding customer and consumer loyalty is critical toachieving growth. In 2010, our Consumer Lifestylebusiness increased its NPS leadership in a time of fragileconsumer confidence in many markets. Healthcaremaintained a strong position, and performed very well inChina. Lighting noted a slight decrease, yet remains a clearleader in its industry, with 83% of leadership positions in2010. The overall result is stable, with 59% of ourbusinesses currently holding industry leadership positions,down one point from 2009. The result was negativelyimpacted by supply chain constraints during the year, andthis will very much have our attention going forward. Inline with our Vision 2015 growth targets, in 2011 we willcontinue to drive for further outright leadership in NPS inkey markets.
President’s message
8 Annual Report 2010
Net Promoter Score% of businesses with (co-)leadership scores
75
50
25
0
50
2007
51
2008
60
2009
59
2010
Increase employee engagement to high-performance levelI am very pleased to say we made significant progress overthe past year. Our overall Employee Engagement Indexscore reached 75%, up seven points from the previousyear and one point above the worldwide high-performance benchmark. At 76%, our People LeadershipIndex improved by three points – clear evidence that ourleaders are encouraging interaction and dialog. One of themost heartening aspects of this year’s results was that thebiggest advances in our scores were in areas identified asneeding improvement in the previous year’s survey. Soour teams’ hard work really paid off. Nevertheless, thereare still parts of the organization where we have a lot ofwork to do, and our growth ambitions can only berealized if we continue to challenge ourselves.
Implement strategyIncrease our market position in emerging marketsWe have a strong presence in the emerging economies.We generate around one-third of our sales there, and aimto drive this figure up to at least 40% by 2015. To this end,we continue to invest in building our local organizations,competencies and resources in these markets.
In China, we made the first shipments from our industrialcampus for imaging systems at Suzhou. Scheduled forcompletion in 2012, this state-of-the-art facility expandsour presence in China’s high-growth healthcare marketwith a complete portfolio that serves both the needs ofthe value segment as well as more advanced specializedapplications.
We also moved the global headquarters of our DomesticAppliances business to Shanghai – building our businesscreation capabilities in this important market and taking astep toward making China a “home” market.
In 2010, we entered into a full-cycle innovativepartnership with Electron, Russia’s market leader indeveloping and manufacturing medical equipment.
Drive key strategy initiatives for each sectorWe continued to invest in smaller, but strategically alignedand fast-growing businesses in 2010. In Healthcare, wemade a series of acquisitions designed to strengthen ouroffering in clinical informatics, and in China we acquiredultrasound equipment manufacturer Shanghai Apex,enhancing our position in value-segment imaging solutionsfor emerging markets. Other acquisitions included Siesta’sSomnolyzer business, reinforcing our position in sleepdiagnostics and OSA therapy in the strategic growth areaof home healthcare.
We also unveiled our new Imaging 2.0 platform, which isset to drive innovation and efficiency in radiology. Imaging2.0 is all about integration and collaboration – and newlevels of patient focus that can help clinicians achieve whatwas unimaginable just a few short years ago.
In Consumer Lifestyle, we acquired Discus Holdings, theleading manufacturer of professional tooth-whiteningproducts, complementing our existing Sonicare electrictoothbrush portfolio and further building our relationshipwith dental professionals.
With regard to Television, we took further action toreduce our exposure, extending our brand licensingpartnerships with Videocon (India) and TPV (China),which are both expected to contribute positively in 2011.
In Lighting we continued to drive the transition to LED,expanding our portfolio of LED-based solutions for bothconsumer and professional applications, with salesgrowing to 13% of sector revenues.
Value-adding acquisitions in 2010 included iconic Italiandesign luminaire brand Luceplan. We also acquiredBurton, a leading provider of specialized lighting solutionsfor healthcare facilities, and Amplex’s street lightingcontrols activity, supporting growth of our outdoorlighting business. Toward the end of the year we boughtNCW Holdings, a leading Chinese designer, manufacturerand distributor of LED and conventional entertainmentlighting and lighting control solutions.
Leverage Sustainability as an integral part of our strategyIn 2010 we increased our Green Product sales to 38% ofGroup revenues (far ahead of our 30% target), with strongcontributions from all sectors, Lighting in particular. Weincreased the energy efficiency of our operations by 6%and reduced our operational carbon footprint by 7% – ontrack to achieve our EcoVision4 reduction target for2012. We also developed roadmaps to phase out PVC andBFR from new consumer products introduced onto themarket in 2011.
President’s message
Annual Report 2010 9
Simply making a differenceIn September 2010 we announced our Vision 2015strategic plan, which focuses on fuelling growth, increasingbrand preference and strengthening our marketleadership in the domain of health and well-being.
This new five-year plan builds upon the achievements ofVision 2010. Through Vision 2010 we transformed Philipsinto a health and well-being company with a strongerfocus on emerging markets. We built a strong, balancedportfolio of businesses, simplified the company in order tocapitalize upon market opportunities, invested inmarketing and innovation to drive future growth, andstructurally lowered our cost base, thereby boostingprofitability.
Now we are ready for the next step – growth. We want tobecome the preferred health and well-being brand in mostof our chosen markets, as we leverage major global trendsto expand our leadership in key businesses such as homehealthcare, LED lighting solutions and healthy living andpersonal care. We will also focus even more strongly onemerging markets – as the number of middle-classhouseholds in these markets rises, we expect demand forour products to increase as people have more money tospend on feeling and staying healthy. Last but not least, weremain committed to leading the way in the area ofsustainability through the execution of our EcoVision5program.
With our understanding of global trends and people’sneeds and aspirations, as well as our strong brand, solidfinancial foundation and engaged workforce, I believe wewill continue to simply make a difference to people’s liveswith meaningful, sustainable innovations – and so deliverstructural top-line growth and consistently healthy profitmargins.
In concrete terms, we have set ourselves the followingchallenging, yet realistic medium-term goals for the2011-2015 period:
• Comparable sales growth on annual average basis atleast 2 percentage points higher than real GDP growth
• Reported EBITA margin between 10% and 13% of sales• Growth of EPS at double the rate of comparable annual
sales growth• Return on invested capital at least 4 percentage points
above weighted average cost of capital
Management Agenda 2011 – AcceleratinggrowthOur overall challenge for 2011 is to accelerate growth.This year we will take a series of firm steps towardsimplementing our longer-term Vision 2015 objectives.This will require us to accelerate our current course andperformance in order to seize the great opportunities wehave in most of our markets.
Under Drive performance we stress the need to urgentlyaccelerate the pace of growth, to take market share anddeliver on our financial and sustainability objectives.
Under Improve capabilities we outline what is required togrow faster: a customer-centric culture of growth, withgranular business/market plans and the resources torealize them, enabled by pragmatic teamwork across theorganization. If we succeed in bringing these elementstogether, we will deliver, with excellence and faster time-to-market.
The final column Implement strategy refers to the strategicbattles we want to win and underscores how crucial it isto succeed in the rapidly growing emerging markets.
Final thoughtsUpon approval by the Annual General Meeting ofShareholders, Frans van Houten will succeed me asPresident of Philips as of April 1, 2011. Frans knows Philipsvery well and brings strong qualities to the post – energy,strong leadership and a deep understanding of bothprofessional and consumer markets. Under his leadershipPhilips’ future is in very good hands.
I would like to take this opportunity to thank Pierre-JeanSivignon for his valuable contribution to Philips in his sixyears as our CFO. He has been a great colleague andbusiness partner to work with, and I wish him the verybest for the future. I am delighted that in RonWirahadiraksa we have found a highly qualified successorfrom within our own ranks.
I would also like to express my deep gratitude to Jan-Michiel Hessels, who is stepping down as Chairman of ourSupervisory Board, for his counsel and support during mytenure as President.
On a sadder note, toward the end of the year we lost afine colleague with the passing of Gerard Ruizendaal, ourChief Strategy Officer. Gerard played a key role indefining the strategic focus of the company and instrengthening our business portfolio. He is deeply missed.
President’s message
10 Annual Report 2010
It has been an honor to serve this great company asPresident and CEO. As I prepare to hand over the reins tomy successor, I see a people-focused, market-drivenPhilips providing innovative, simplicity-led solutions to keyglobal issues – the demand for affordable healthcare, thedesire for personal well-being and the need for energyefficiency. I see a financially sound Philips with a strongbrand and leading market positions, especially in emergingmarkets, as well as highly engaged employees. In short, Isee a Philips that is in good shape – and ready to fulfill itsambition of becoming a global leader in health and well-being.
In conclusion, I would like to thank our customers andsuppliers for their loyalty and support over the past tenyears, and our employees for their unstinting dedicationand efforts. I would particularly like to thank ourshareholders for their continued endorsement of ourstrategic direction. In executing our Vision 2015 program,
I know that Frans van Houten and his team will doeverything within their power to maximize Philips’ fullpotential and so grow the value of our shareholders’investment.
Gerard Kleisterlee, President
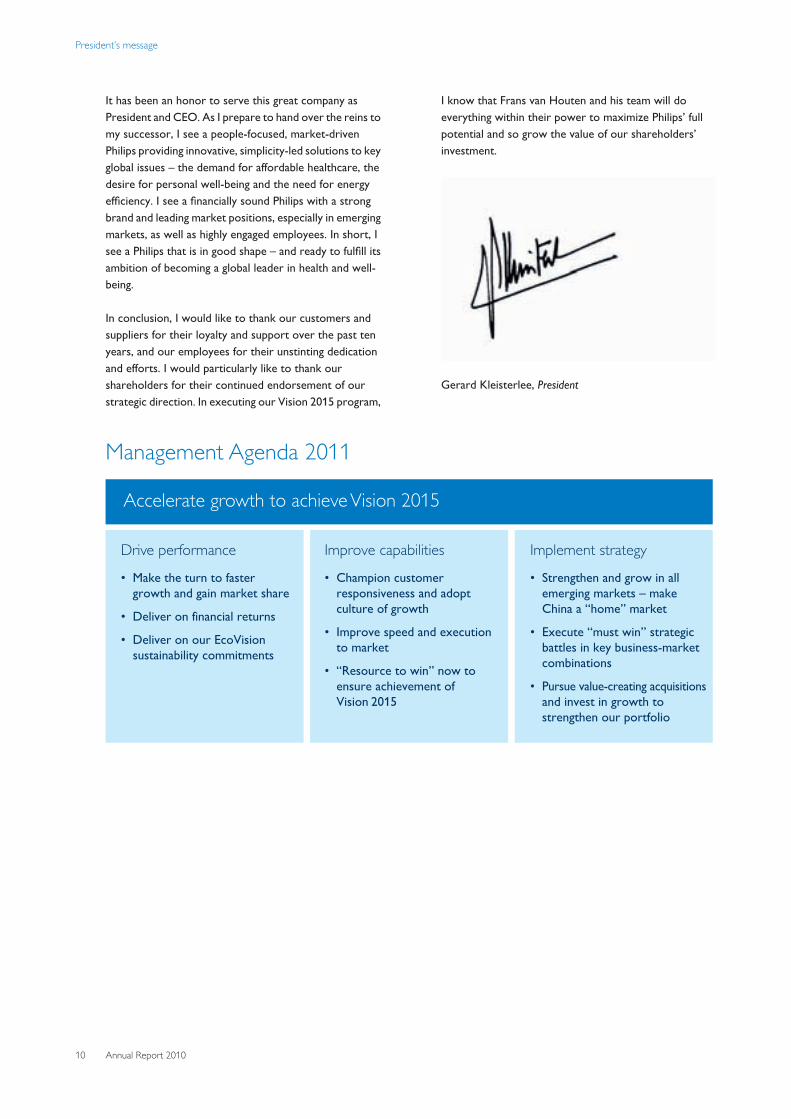
Accelerate growth to achieve Vision 2015
Drive performance Improve capabilities Implement strategy
Management Agenda 2011
• Make the turn to faster growth and gain market share
• Deliver on financial returns
• Deliver on our EcoVision sustainability commitments
• Champion customer responsiveness and adopt culture of growth
• Improve speed and execution to market
• “Resource to win” now to ensure achievement of Vision 2015
• Strengthen and grow in all emerging markets – make China a “home” market
• Execute “must win” strategic battles in key business-market combinations
• Pursue value-creating acquisitions and invest in growth to strengthen our portfolio
1 Our company 1 - 1
Annual Report 2010 11
1 Our companyPhilips is a people-focused, market-driven company that isorganized around customers and markets. Byunderstanding trends in society and obtaining deep insightinto issues confronting people in their daily lives, weensure that people’s needs remain at the heart ofeverything we do.
Our missionWe improve the quality of people’s lives through thetimely introduction of meaningful innovationsInnovation does not only mean “new technology”. It canalso mean an exciting application, a new business model ora unique customer proposition brought about by aninnovative partnership. In other words, an innovation isnot the same as an invention. Technology remains veryimportant, but insight into the needs and aspirations ofconsumers and customers is equally, if not moreimportant and must always be our starting point.
Our visionIn a world where complexity increasingly touches everyaspect of our daily lives, we will lead in bringing “sense andsimplicity” to peopleOur corporate vision describes what we see as one of thebiggest challenges facing people today – and how we canhelp them meet that challenge. We have identified thedifficulty of coping with complexity as a major challengefor people in our time. One of the things that makes lifetoday so complex is the fact that technological progresscomes to us very often in a way that is too difficult toexperience. We believe that this situation can be changed,and that we can help to make the benefits of our productsand solutions easier to access and more relevant topeople’s needs and aspirations.
Our domainWe operate in the health and well-being domainWe seek to improve the quality of people’s lives throughfocusing on their health and well-being. Quite simply, wewant to help people live a healthy, fulfilled life.
By “health” we mean not only medical aspects of health,but also keeping fit, having a healthy diet, and generallyliving a healthy lifestyle. By “well-being” we mean a generalsense of fulfillment, feeling good and at ease. “Well-being”also refers to the sense of comfort, safety and securitypeople feel in their environment – at home, at work, whenshopping or on the road. Our focus on health and well-being automatically implies that we contribute to buildinga sustainable society.
Our brand promiseWe promise “sense and simplicity”We differentiate ourselves through our brand promise“sense and simplicity”. Our brand promise is comprised ofthree pillars:
• We design our solutions around the needs of people.• We apply advanced thinking and technology to deliver a
better solution.• We ensure our solutions are easy to experience.
Our valuesOur values, the four Ds, are like a compass - guiding us inhow we behave every day, and reminding us of the attitudewe should have towards our work, our customers andour colleagues
Delight customersWe anticipate and exceed customer expectations
Deliver great resultsWe continually raise the bar
Develop peopleWe get the best from ourselves and each other
Depend on each otherWe deliver more value by working as One Philips
1 Our company 1 - 1
12 Annual Report 2010
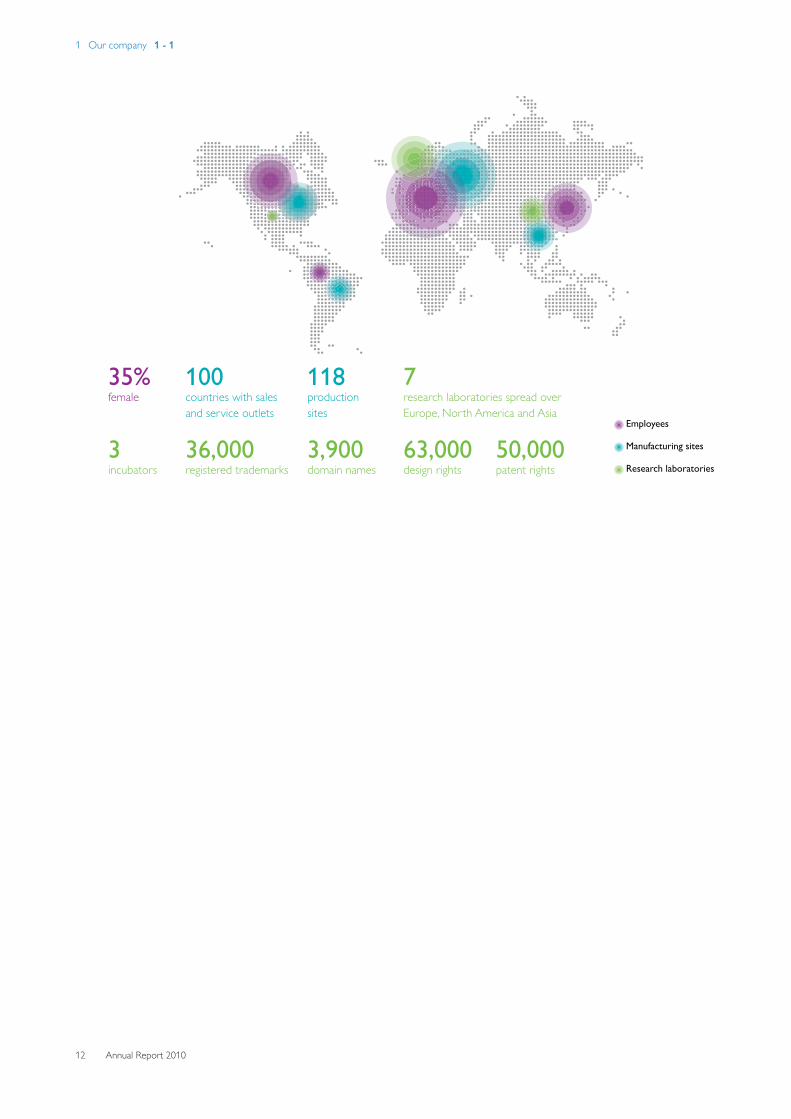
Employees
Manufacturing sites
Research laboratories
36,000registered trademarks
63,000design rights
3,900domain names
50,000patent rights
3incubators
7research laboratories spread over
Europe, North America and Asia
118production
sites
100countries with sales
and service outlets
35%female
2 Vision 2015 - our strategic focus 2 - 2
Annual Report 2010 13
2 Vision 2015 - our strategic focusIn 2007, Philips launched Vision 2010: a strategy to createa focused and globally leading health and well-beingcompany. With a clear idea of many of the longer-termchallenges our world faces, from aging populations to theneed for efficient energy usage, we set out to round off thetransformation of our company from a high-volumeelectronics group to a focused, market-driven globalplayer in healthcare, lighting and lifestyle – businesses inwhich many of today’s key challenges intersect.Vision 2015 is an evolution of this strategy. By furtherexpanding our existing leadership positions, strengtheningour brand and leading in sustainability, we believe we cancontinue to make a profitable contribution to people’slives. Our clearly articulated mission, our strong positionin many exciting and promising markets, coupled with ahighly engaged workforce and a deep desire to do theright thing for our world, puts us in an excellent positionfor the future.
Our ambition for 2015Philips wants to be a global leader in health and well-being,becoming the preferred brand in the majority of ourchosen markets. We believe Philips is uniquely positionedfor growth through its ability to simply make a differenceto people’s lives with meaningful, sustainable innovations.
Our sectorsOur health and well-being offering is powered by ourthree operating sectors: Healthcare, Consumer Lifestyleand Lighting.
Healthcare: The future of healthcare is one of the mostpressing global issues of our time. Our Healthcaresector’s vision is to improve the quality of clinicians’ andpatients’ lives by simplifying the delivery of healthcare,improving clinical outcomes and reducing healthcaresystem costs around the world. This includes helping toimprove the diagnosis, treatment and management ofmany of today’s deadly and debilitating diseases, such ascancer and heart disease.By approaching healthcare from the perspective of apatient or a physician, we believe we can betterunderstand clinical needs and create more innovative andmeaningful solutions. By understanding a medicalcondition through the entire “cycle of care” – fromprevention and screening, through diagnosis andtreatment, to recovery and, where needed, long-termmanagement – we can create more effective solutions. Byfocusing on enabling care in the hospital, in the home, or
wherever else the patient might be, we can improve thequality of life for patients and their care providers.Through our consistent focus on all of these aspects ofcare, we can ultimately create the best solutions –solutions that improve outcomes, save lives and reducecosts.
Consumer Lifestyle: Consumers are looking forsolutions and products that are easy to use and help themto live a better and healthier life. They are moreappearance-conscious and want to boost self-confidence;they want to be in charge of their health and lifestyle; theywant to create a home environment where they canescape life’s complexities; they want to share momentswith their family and friends. To achieve these goals, theyneed technology that is advanced and easy to use anddesigned around their specific needs. Our ConsumerLifestyle sector builds on a deep understanding of people’sneeds and aspirations to create innovations that helpthem achieve their lifestyle ambitions.
Lighting: Human life revolves around light. Light affectsour mood, improves our well-being, and enables us toexperience and achieve more. It is a vital part of makingour lives fuller, more productive and safer. Our Lightingsector focuses on innovative ways of using light to simplyenhance people’s lives where they live and work – in thehome, at school, at work, in shops and public places, aswell as on the road. Recognizing how resourceconservation and climate protection will play anincreasingly significant part in human health and well-being, we pay special attention to maximizing the effect oflighting while minimizing the energy required to produceit.
Our key priorities for 2015Be the preferred brand in health and well-being inthe majority of our chosen markets: We want to bethe preferred brand in health and well-being around theworld in the majority of our chosen markets, withsimplicity as our competitive edge. After five years ofcumulative growth in our brand value, we currently rankas one of the most valued brands in the world. We arecommitted to further strengthening our position andbuilding Philips into a leading health and well-being brandthat delivers on our brand promise of “sense andsimplicity”. We will measure our success by carefullymonitoring our brand value and the Net Promoter Scoreof our products and solutions.
2 Vision 2015 - our strategic focus 2 - 2
14 Annual Report 2010
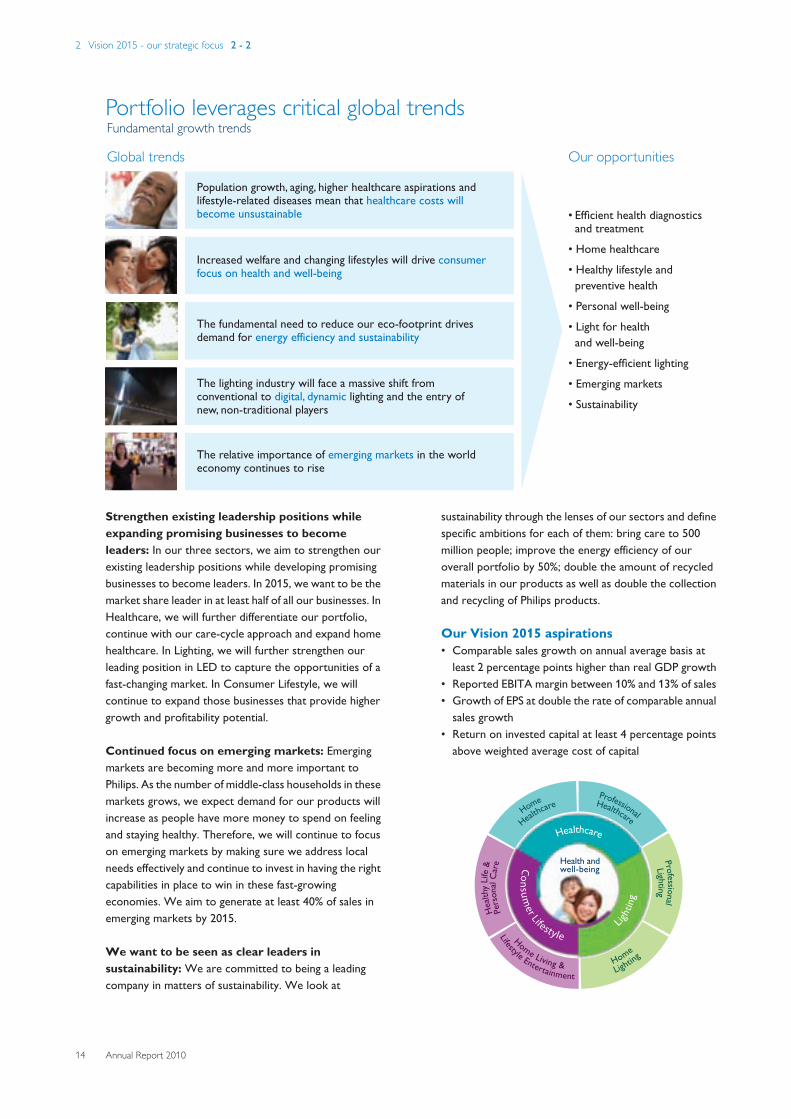
Population growth, aging, higher healthcare aspirations and lifestyle-related diseases mean that healthcare costs will become unsustainable
Increased welfare and changing lifestyles will drive consumer focus on health and well-being
The fundamental need to reduce our eco-footprint drives demand for energy efficiency and sustainability
The lighting industry will face a massive shift from conventional to digital, dynamic lighting and the entry of new, non-traditional players
The relative importance of emerging markets in the world economy continues to rise
Our opportunitiesGlobal trends
Portfolio leverages critical global trendsFundamental growth trends
• Ef�cient health diagnostics and treatment
• Home healthcare
• Healthy lifestyle and
preventive health
• Personal well-being
• Light for health
and well-being
• Energy-ef�cient lighting
• Emerging markets
• Sustainability
Strengthen existing leadership positions whileexpanding promising businesses to becomeleaders: In our three sectors, we aim to strengthen ourexisting leadership positions while developing promisingbusinesses to become leaders. In 2015, we want to be themarket share leader in at least half of all our businesses. InHealthcare, we will further differentiate our portfolio,continue with our care-cycle approach and expand homehealthcare. In Lighting, we will further strengthen ourleading position in LED to capture the opportunities of afast-changing market. In Consumer Lifestyle, we willcontinue to expand those businesses that provide highergrowth and profitability potential.
Continued focus on emerging markets: Emergingmarkets are becoming more and more important toPhilips. As the number of middle-class households in thesemarkets grows, we expect demand for our products willincrease as people have more money to spend on feelingand staying healthy. Therefore, we will continue to focuson emerging markets by making sure we address localneeds effectively and continue to invest in having the rightcapabilities in place to win in these fast-growingeconomies. We aim to generate at least 40% of sales inemerging markets by 2015.
We want to be seen as clear leaders insustainability: We are committed to being a leadingcompany in matters of sustainability. We look at
sustainability through the lenses of our sectors and definespecific ambitions for each of them: bring care to 500million people; improve the energy efficiency of ouroverall portfolio by 50%; double the amount of recycledmaterials in our products as well as double the collectionand recycling of Philips products.
Our Vision 2015 aspirations• Comparable sales growth on annual average basis at
least 2 percentage points higher than real GDP growth• Reported EBITA margin between 10% and 13% of sales• Growth of EPS at double the rate of comparable annual
sales growth• Return on invested capital at least 4 percentage points
above weighted average cost of capital
3 Our strategy in action 3 - 3.1
Annual Report 2010 15
3 Our strategy in action3.1 Professional Healthcare
Global demographic and environmentaltrends, such as aging populations and thespread of chronic diseases like obesity anddiabetes to the developing world, willrequire a fundamental shift in the wayhealthcare is provided.
In the professional domain, we are driven toimprove the way both patients andprofessionals experience healthcare, toimprove clinical outcomes, and to enablethe delivery of quality healthcare at lowercost.
By focusing on the range of medical issuesassociated with oncology, cardiology andwomen’s health, we can deliver better,more differentiated solutions that are moreclinically relevant.

3 Our strategy in action 3.1 - 3.1
16 Annual Report 2010
Opening the door to a new era inradiologyToday, people expect quality healthcare, yet invariablythere is less money to treat them. So we are helpingradiologists to go further – with a new way of working.
Based on feedback from clinicians across the globe, ouranswer to the dilemma of increased demand and fewerresources is simple: smarter teamwork throughinnovation.
Just as Web 2.0 redefined the way people connect, shareand use the internet, Philips has coined “Imaging 2.0” torefer to the new era in radiology science, which is openingup a world of possibilities for clinicians and patients.Imaging 2.0 encompasses the launch of a brand newportfolio of Philips imaging solutions across multiplemodalities.
For instance, with the IntelliSpace Portal, the radiologistcan now integrate information from CT, MR and NuclearMedicine to increase diagnostic confidence. Plus, itincludes a feature called Collaborator – an intelligent,rapid tool linking the radiologist to colleagues and peersvirtually anywhere in the world, enabling them to shareimages and data, and to discuss cases in real-time.
Efficient, personalized patient care – one of the key benefits deliveredby Imaging 2.0.
This level of collaboration and integration, combined withincreased patient focus and improved economic value, ishelping clinicians achieve what was unimaginable just a few
3 Our strategy in action 3.1 - 3.1
Annual Report 2010 17
short years ago – faster and more accurate diagnoses andtreatment, as well as lower costs for the healthcaresystem.
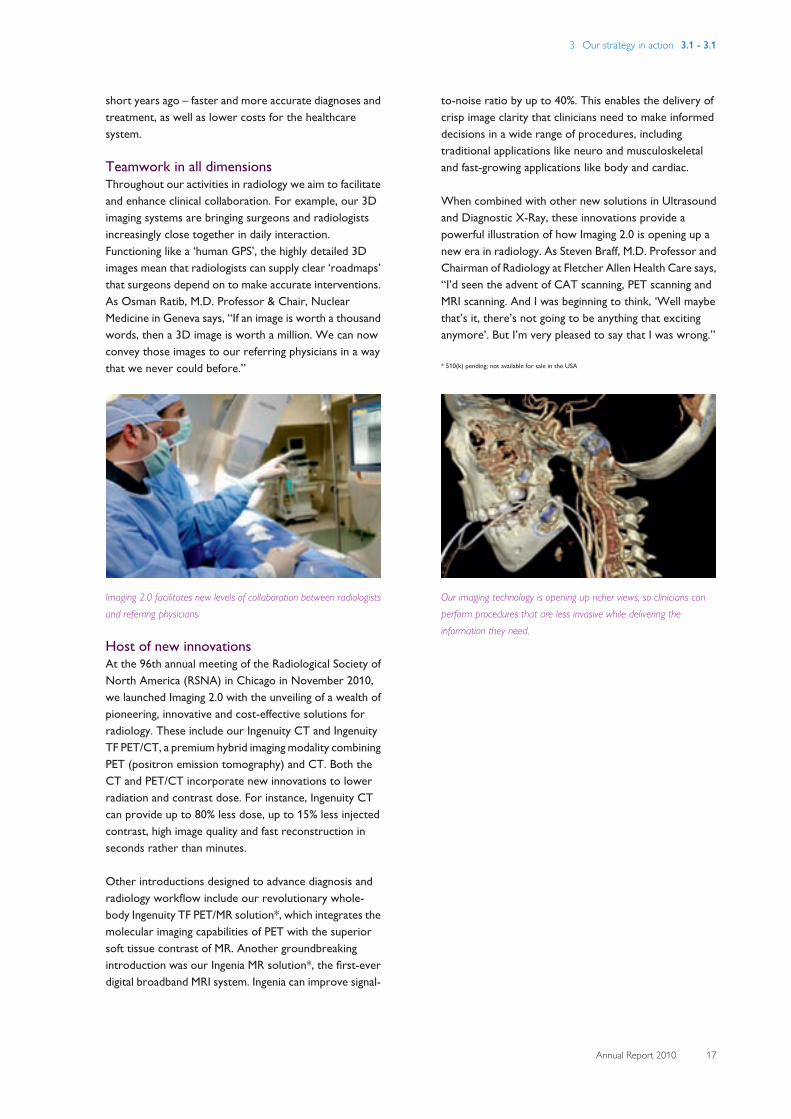
Teamwork in all dimensionsThroughout our activities in radiology we aim to facilitateand enhance clinical collaboration. For example, our 3Dimaging systems are bringing surgeons and radiologistsincreasingly close together in daily interaction.Functioning like a ‘human GPS’, the highly detailed 3Dimages mean that radiologists can supply clear ‘roadmaps’that surgeons depend on to make accurate interventions.As Osman Ratib, M.D. Professor & Chair, NuclearMedicine in Geneva says, “If an image is worth a thousandwords, then a 3D image is worth a million. We can nowconvey those images to our referring physicians in a waythat we never could before.”
Imaging 2.0 facilitates new levels of collaboration between radiologistsand referring physicians.
Host of new innovationsAt the 96th annual meeting of the Radiological Society ofNorth America (RSNA) in Chicago in November 2010,we launched Imaging 2.0 with the unveiling of a wealth ofpioneering, innovative and cost-effective solutions forradiology. These include our Ingenuity CT and IngenuityTF PET/CT, a premium hybrid imaging modality combiningPET (positron emission tomography) and CT. Both theCT and PET/CT incorporate new innovations to lowerradiation and contrast dose. For instance, Ingenuity CTcan provide up to 80% less dose, up to 15% less injectedcontrast, high image quality and fast reconstruction inseconds rather than minutes.
Other introductions designed to advance diagnosis andradiology workflow include our revolutionary whole-body Ingenuity TF PET/MR solution*, which integrates themolecular imaging capabilities of PET with the superiorsoft tissue contrast of MR. Another groundbreakingintroduction was our Ingenia MR solution*, the first-everdigital broadband MRI system. Ingenia can improve signal-
to-noise ratio by up to 40%. This enables the delivery ofcrisp image clarity that clinicians need to make informeddecisions in a wide range of procedures, includingtraditional applications like neuro and musculoskeletaland fast-growing applications like body and cardiac.
When combined with other new solutions in Ultrasoundand Diagnostic X-Ray, these innovations provide apowerful illustration of how Imaging 2.0 is opening up anew era in radiology. As Steven Braff, M.D. Professor andChairman of Radiology at Fletcher Allen Health Care says,“I’d seen the advent of CAT scanning, PET scanning andMRI scanning. And I was beginning to think, ‘Well maybethat’s it, there’s not going to be anything that excitinganymore’. But I’m very pleased to say that I was wrong.”
* 510(k) pending; not available for sale in the USA
Our imaging technology is opening up richer views, so clinicians canperform procedures that are less invasive while delivering theinformation they need.

3 Our strategy in action 3.1 - 3.1
18 Annual Report 2010
Confidence and speed in clinicaldiagnosisAll solutions start with insight. But groundbreaking onesstart with truly deep, expert understanding – as in thecase of the Stroke Navigator.
In the event of a stroke, some 2 million brain cells start todie every minute. Fast diagnosis and treatment is essential,as captured by the slogan ‘time is brain’. The best possiblecare requires hospitals to provide 24/7 access toneurological services. Small, rural hospitals however canoften not afford to have neurologists on staff around theclock. Such hospitals increasingly make use oftelemedicine centers that provide remote, 24/7neurological services to subscribers. To minimize time-to-treatment, and to help prevent clinical errors due tomiscommunication, efficient and reliable collaborationbetween bedside care providers and telemedicine centeris needed.
Both hospitals and telemedicine centers can now benefitfrom Stroke Navigator, a new clinical decision supporttool developed by Philips Research in close cooperationwith Philips Healthcare Visicu. As a collaborative tool, itprovides contextual forms that allow care providers onboth sides to efficiently access and exchange patient data.
A doctor performs an initial assessment of the presence/severity ofstroke.
It also assists them in following stroke care protocols, forexample, by helping to make sure that all relevant data iscollected and is known when, where and by whom it is

3 Our strategy in action 3.1 - 3.1
Annual Report 2010 19
needed; and progress bars indicate how much time is leftfor critical steps. In short, Stroke Navigator helps toimprove a stroke patient’s chances of successful recovery.
Stroke Navigator helps clinicians diagnose the correct stroke sub-type.
For several years our researchers worked closely with thePhilips business and healthcare professionals in Europeand the United States, designing the system and testing theresults in the field. It was a long and detailed process, ajourney of discovery and understanding.
“Sometimes groundbreaking solutions don’t require newtechnology,” says Charles Lagor of Philips Research.“What they do require is a thorough understanding ofusers’ needs.”
Medical staff conduct a patient re-assessment after treatment forischemic stroke.
Visicu utilized the diagnostic and therapeutic timers,societal guidelines and back-end reporting structure inStroke Navigator to develop its first version ofeConsultant. Visicu clients now have the best multipleuser software for managing remote stroke care that isintegrated into the eICU center and provides for acoordinated tele-stroke network.
3 Our strategy in action 3.2 - 3.2
20 Annual Report 2010
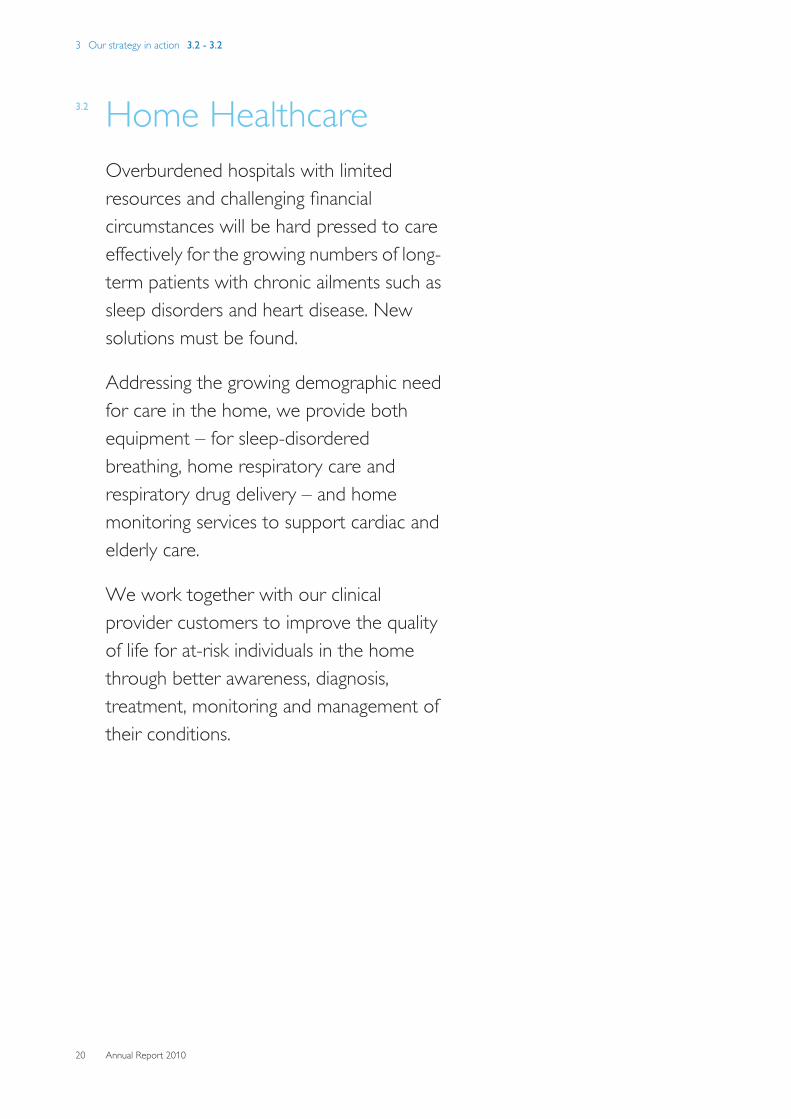
3.2 Home HealthcareOverburdened hospitals with limitedresources and challenging financialcircumstances will be hard pressed to careeffectively for the growing numbers of long-term patients with chronic ailments such assleep disorders and heart disease. Newsolutions must be found.
Addressing the growing demographic needfor care in the home, we provide bothequipment – for sleep-disorderedbreathing, home respiratory care andrespiratory drug delivery – and homemonitoring services to support cardiac andelderly care.
We work together with our clinicalprovider customers to improve the qualityof life for at-risk individuals in the homethrough better awareness, diagnosis,treatment, monitoring and management oftheir conditions.
3 Our strategy in action 3.2 - 3.2
Annual Report 2010 21
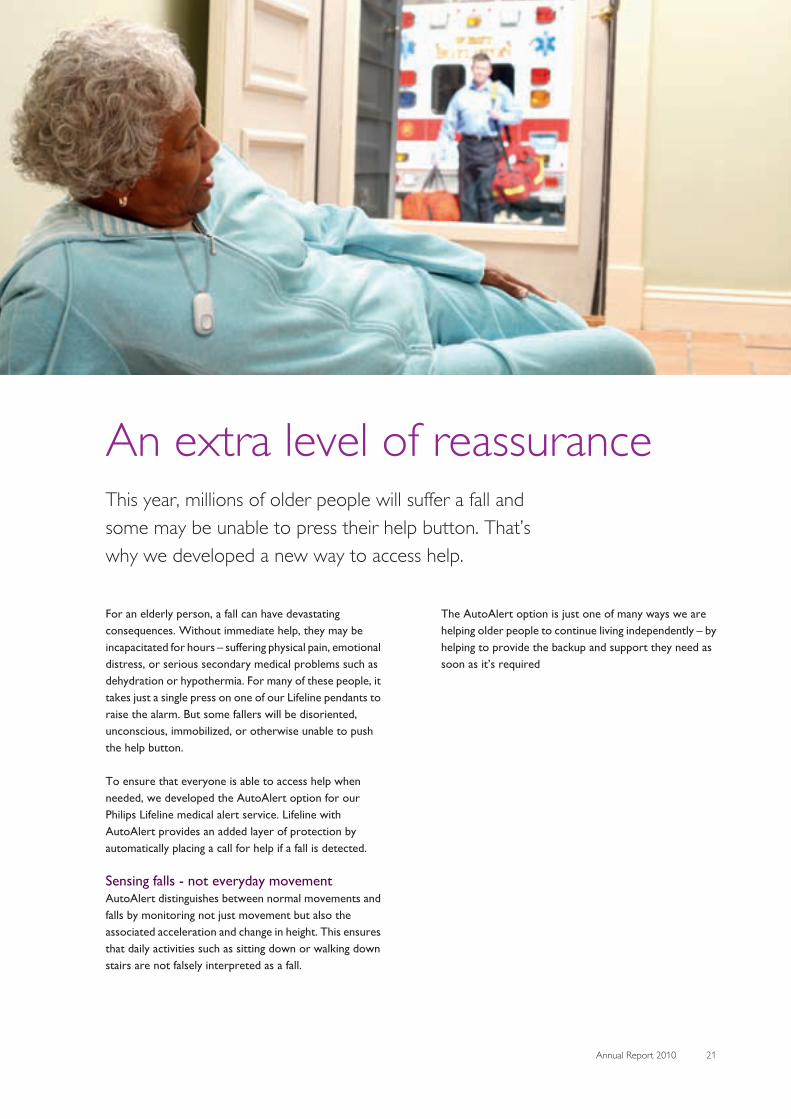
An extra level of reassuranceThis year, millions of older people will suffer a fall andsome may be unable to press their help button. That’swhy we developed a new way to access help.
For an elderly person, a fall can have devastatingconsequences. Without immediate help, they may beincapacitated for hours – suffering physical pain, emotionaldistress, or serious secondary medical problems such asdehydration or hypothermia. For many of these people, ittakes just a single press on one of our Lifeline pendants toraise the alarm. But some fallers will be disoriented,unconscious, immobilized, or otherwise unable to pushthe help button.
To ensure that everyone is able to access help whenneeded, we developed the AutoAlert option for ourPhilips Lifeline medical alert service. Lifeline withAutoAlert provides an added layer of protection byautomatically placing a call for help if a fall is detected.
Sensing falls - not everyday movementAutoAlert distinguishes between normal movements andfalls by monitoring not just movement but also theassociated acceleration and change in height. This ensuresthat daily activities such as sitting down or walking downstairs are not falsely interpreted as a fall.
The AutoAlert option is just one of many ways we arehelping older people to continue living independently – byhelping to provide the backup and support they need assoon as it’s required

3 Our strategy in action 3.2 - 3.2
22 Annual Report 2010
Helping people in India get agood night’s sleepIn enabling healthcare institutes to diagnose and treatsleeping disorders, we are having a positive impact onpeople’s quality of life – and much more.
Sleep is not optional – it is absolutely essential to people’shealth and well-being. There is growing evidence that lackof sleep affects our mental and physical health, workperformance, mood and personal relationships. So when anationwide survey in India found that 95% of the workingpopulation was sleep-deprived, we decided to take action.
Over the last year we helped establish around 120 sleeplabs across the country. Each lab contains a completediagnostic system, with various sensors for attachment tothe head and chest of a patient, who is monitored duringsleep. The collected data is then used to determine thetype and severity of the sleep disorder. Patients diagnosedwith Obstructive Sleep Apnea (OSA), for example, areoften given a Philips CPAP (Continuous Positive AirwayPressure) device, which ensures continual airflowthroughout the night and thereby a healthier sleep.
As a global leader in the sleep management market and thetreatment of OSA, Philips assists hospitals and clinicsacross the globe in setting up sleep labs. We provide notonly the required equipment, but also the specific training.
3 Our strategy in action 3.3 - 3.3
Annual Report 2010 23
3.3 Healthy Life & Personal CareWe look for opportunities where “senseand simplicity” can truly make a difference.
Our Healthy Life platform takes a holisticapproach to enhancing consumers’ health,addressing the need for mental and physicalhealth and for healthy relationships.
Our Personal Care platform addressesconsumers’ need to look and feel their best,and so helps people feel more confident.
3 Our strategy in action 3.3 - 3.3
24 Annual Report 2010
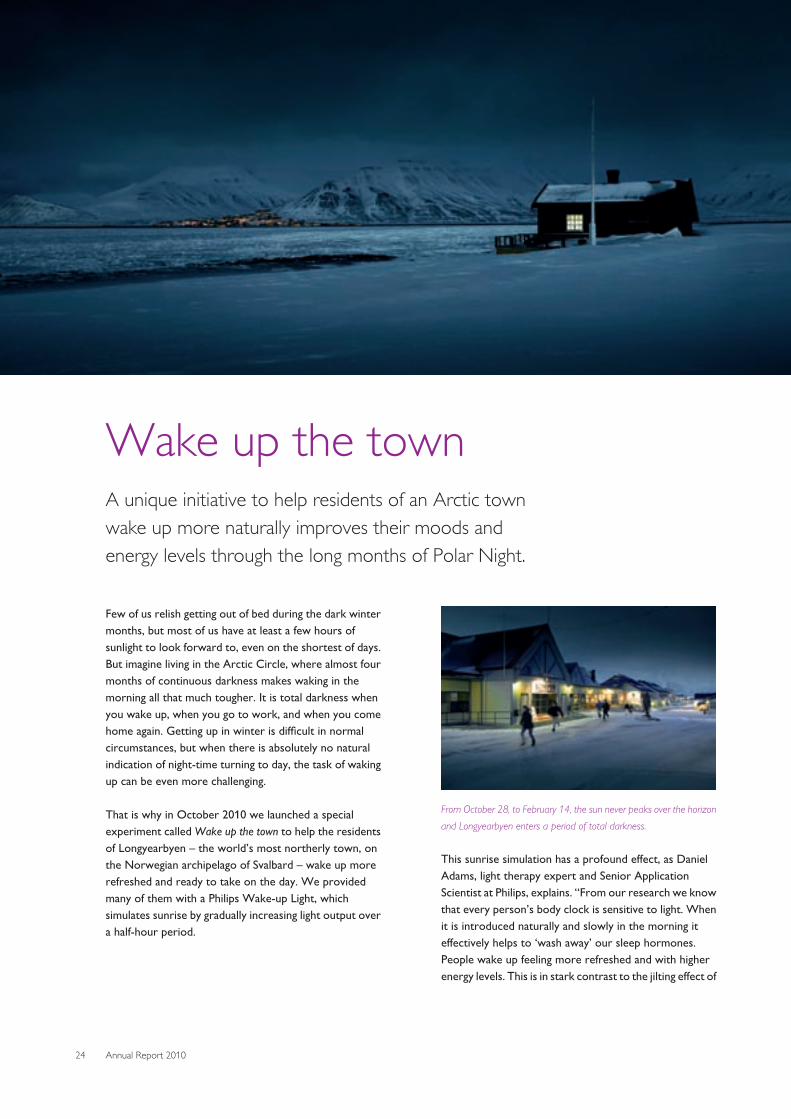
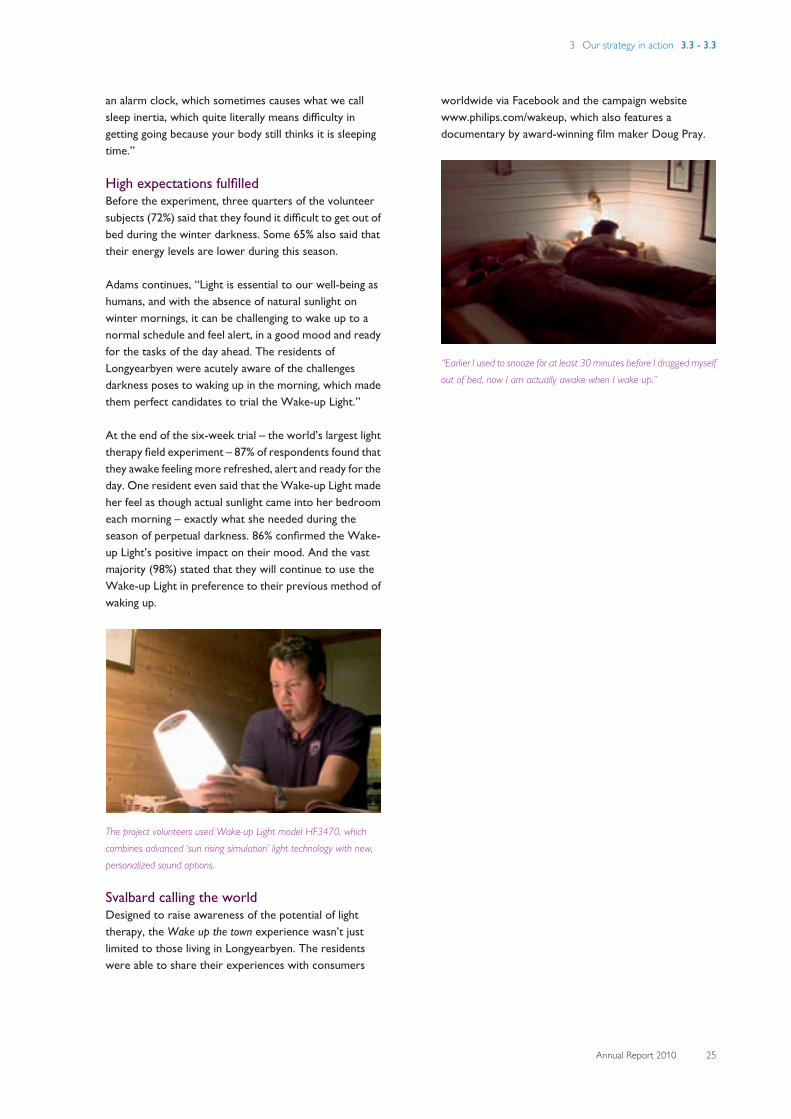
Wake up the townA unique initiative to help residents of an Arctic townwake up more naturally improves their moods andenergy levels through the long months of Polar Night.
Few of us relish getting out of bed during the dark wintermonths, but most of us have at least a few hours ofsunlight to look forward to, even on the shortest of days.But imagine living in the Arctic Circle, where almost fourmonths of continuous darkness makes waking in themorning all that much tougher. It is total darkness whenyou wake up, when you go to work, and when you comehome again. Getting up in winter is difficult in normalcircumstances, but when there is absolutely no naturalindication of night-time turning to day, the task of wakingup can be even more challenging.
That is why in October 2010 we launched a specialexperiment called Wake up the town to help the residentsof Longyearbyen – the world’s most northerly town, onthe Norwegian archipelago of Svalbard – wake up morerefreshed and ready to take on the day. We providedmany of them with a Philips Wake-up Light, whichsimulates sunrise by gradually increasing light output overa half-hour period.
From October 28, to February 14, the sun never peaks over the horizonand Longyearbyen enters a period of total darkness.
This sunrise simulation has a profound effect, as DanielAdams, light therapy expert and Senior ApplicationScientist at Philips, explains. “From our research we knowthat every person’s body clock is sensitive to light. Whenit is introduced naturally and slowly in the morning iteffectively helps to ‘wash away’ our sleep hormones.People wake up feeling more refreshed and with higherenergy levels. This is in stark contrast to the jilting effect of
3 Our strategy in action 3.3 - 3.3
Annual Report 2010 25
an alarm clock, which sometimes causes what we callsleep inertia, which quite literally means difficulty ingetting going because your body still thinks it is sleepingtime.”
High expectations fulfilledBefore the experiment, three quarters of the volunteersubjects (72%) said that they found it difficult to get out ofbed during the winter darkness. Some 65% also said thattheir energy levels are lower during this season.
Adams continues, “Light is essential to our well-being ashumans, and with the absence of natural sunlight onwinter mornings, it can be challenging to wake up to anormal schedule and feel alert, in a good mood and readyfor the tasks of the day ahead. The residents ofLongyearbyen were acutely aware of the challengesdarkness poses to waking up in the morning, which madethem perfect candidates to trial the Wake-up Light.”
At the end of the six-week trial – the world’s largest lighttherapy field experiment – 87% of respondents found thatthey awake feeling more refreshed, alert and ready for theday. One resident even said that the Wake-up Light madeher feel as though actual sunlight came into her bedroomeach morning – exactly what she needed during theseason of perpetual darkness. 86% confirmed the Wake-up Light’s positive impact on their mood. And the vastmajority (98%) stated that they will continue to use theWake-up Light in preference to their previous method ofwaking up.
The project volunteers used Wake-up Light model HF3470, whichcombines advanced ‘sun rising simulation’ light technology with new,personalized sound options.
Svalbard calling the worldDesigned to raise awareness of the potential of lighttherapy, the Wake up the town experience wasn’t justlimited to those living in Longyearbyen. The residentswere able to share their experiences with consumers
worldwide via Facebook and the campaign websitewww.philips.com/wakeup, which also features adocumentary by award-winning film maker Doug Pray.
“Earlier I used to snooze for at least 30 minutes before I dragged myselfout of bed, now I am actually awake when I wake up.”

3 Our strategy in action 3.3 - 3.3
26 Annual Report 2010
Fulfilling lifestyle aspirations inemerging marketsAs the growth of the urban middle class in emergingmarkets continues to accelerate, we are supportingtheir well-being with innovative lifestyle products.
With an estimated 200 million middle-class households inemerging markets by the year 2015, spending power forlifestyle products is set to explode – especially in China.Demand is expected to be high for lifestyle products thatoffer quality and style in answering the needs of thisconsumer group, which is increasingly focused onindividual self-expression. This was borne out by reactionto the recent launch of our new SensoTouch 3D electricshaver.
Building upon Philips’ 70-year heritage in electric shaving,the stylish SensoTouch 3D is our most advanced shaveryet, minimizing skin irritation. It was met with tremendousenthusiasm at its launch onto the key Chinese market inOctober last year. Road shows featuring 3D moviesensured high impact for thousands of consumers indepartment stores, while web-based and broadcastmarketing initiatives communicated the product benefitsto millions more across the country.
As always, during face-to-face touch-point events, wegathered a wealth of customer insight. Special productdemonstrations and interviews confirmed that our brand
scores high in consumer perception, and we are wellplaced to continue answering lifestyle needs in thedynamic emerging markets.

3 Our strategy in action 3.4 - 3.4
Annual Report 2010 27
3.4 Home Living & Lifestyle EntertainmentOur Home Living platform addressesconsumers’ pressing need to have moretime to spend on themselves or with familyand friends. We do this by creating high-quality solutions that enable quick andconvenient cooking, preparation ofbeverages, cleaning, caring and homecomfort.
Lifestyle Entertainment is about enjoyingentertainment and the little events ineveryday life: sharing time with family andfriends, having time off from a hecticschedule, and moments of comfort, fun andcaring.
3 Our strategy in action 3.4 - 3.4
28 Annual Report 2010
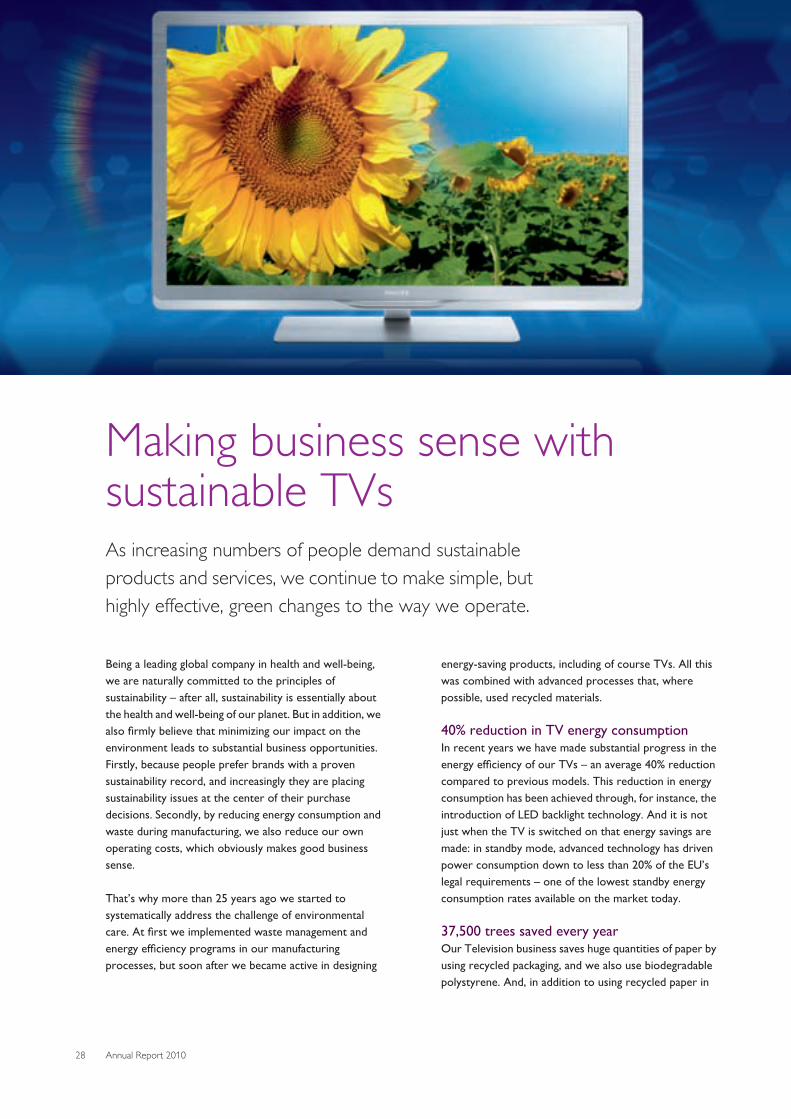
Making business sense withsustainable TVsAs increasing numbers of people demand sustainableproducts and services, we continue to make simple, buthighly effective, green changes to the way we operate.
Being a leading global company in health and well-being,we are naturally committed to the principles ofsustainability – after all, sustainability is essentially aboutthe health and well-being of our planet. But in addition, wealso firmly believe that minimizing our impact on theenvironment leads to substantial business opportunities.Firstly, because people prefer brands with a provensustainability record, and increasingly they are placingsustainability issues at the center of their purchasedecisions. Secondly, by reducing energy consumption andwaste during manufacturing, we also reduce our ownoperating costs, which obviously makes good businesssense.
That’s why more than 25 years ago we started tosystematically address the challenge of environmentalcare. At first we implemented waste management andenergy efficiency programs in our manufacturingprocesses, but soon after we became active in designing
energy-saving products, including of course TVs. All thiswas combined with advanced processes that, wherepossible, used recycled materials.
40% reduction in TV energy consumptionIn recent years we have made substantial progress in theenergy efficiency of our TVs – an average 40% reductioncompared to previous models. This reduction in energyconsumption has been achieved through, for instance, theintroduction of LED backlight technology. And it is notjust when the TV is switched on that energy savings aremade: in standby mode, advanced technology has drivenpower consumption down to less than 20% of the EU’slegal requirements – one of the lowest standby energyconsumption rates available on the market today.
37,500 trees saved every yearOur Television business saves huge quantities of paper byusing recycled packaging, and we also use biodegradablepolystyrene. And, in addition to using recycled paper in
3 Our strategy in action 3.4 - 3.4
Annual Report 2010 29
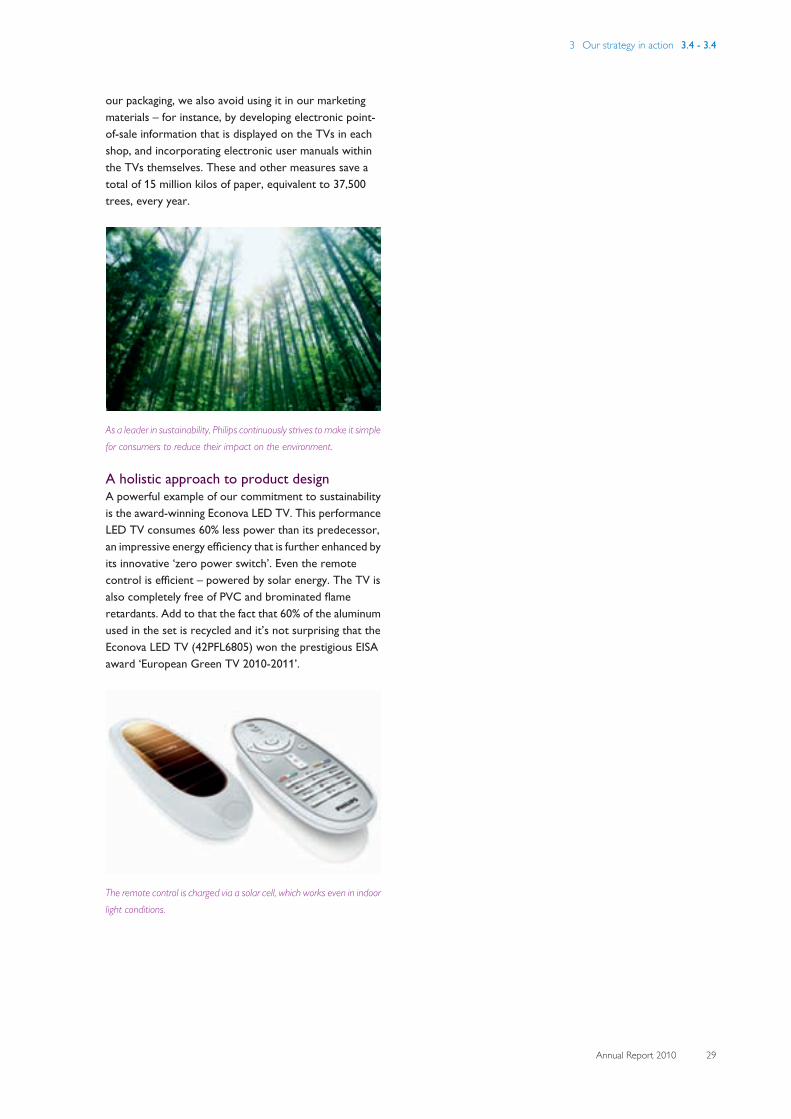
our packaging, we also avoid using it in our marketingmaterials – for instance, by developing electronic point-of-sale information that is displayed on the TVs in eachshop, and incorporating electronic user manuals withinthe TVs themselves. These and other measures save atotal of 15 million kilos of paper, equivalent to 37,500trees, every year.
As a leader in sustainability, Philips continuously strives to make it simplefor consumers to reduce their impact on the environment.
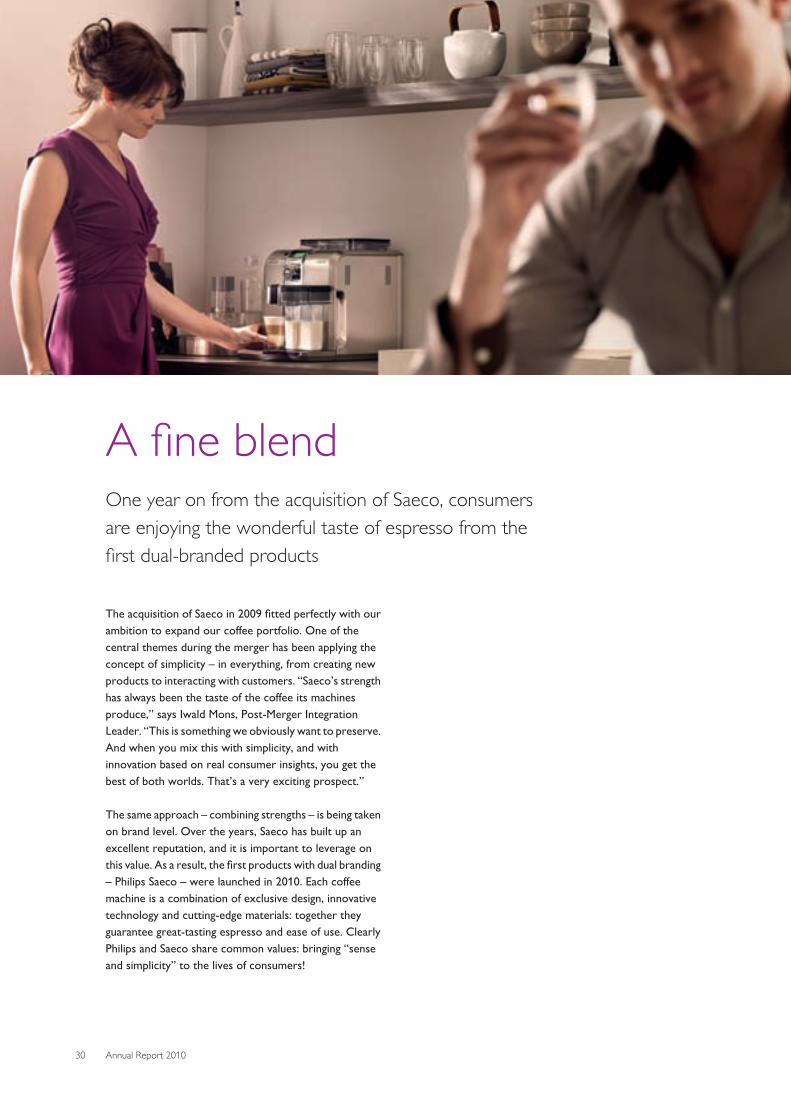
A holistic approach to product designA powerful example of our commitment to sustainabilityis the award-winning Econova LED TV. This performanceLED TV consumes 60% less power than its predecessor,an impressive energy efficiency that is further enhanced byits innovative ‘zero power switch’. Even the remotecontrol is efficient – powered by solar energy. The TV isalso completely free of PVC and brominated flameretardants. Add to that the fact that 60% of the aluminumused in the set is recycled and it’s not surprising that theEconova LED TV (42PFL6805) won the prestigious EISAaward ‘European Green TV 2010-2011’.
The remote control is charged via a solar cell, which works even in indoorlight conditions.
3 Our strategy in action 3.4 - 3.4
30 Annual Report 2010
A fine blendOne year on from the acquisition of Saeco, consumersare enjoying the wonderful taste of espresso from thefirst dual-branded products
The acquisition of Saeco in 2009 fitted perfectly with ourambition to expand our coffee portfolio. One of thecentral themes during the merger has been applying theconcept of simplicity – in everything, from creating newproducts to interacting with customers. “Saeco’s strengthhas always been the taste of the coffee its machinesproduce,” says Iwald Mons, Post-Merger IntegrationLeader. “This is something we obviously want to preserve.And when you mix this with simplicity, and withinnovation based on real consumer insights, you get thebest of both worlds. That’s a very exciting prospect.”
The same approach – combining strengths – is being takenon brand level. Over the years, Saeco has built up anexcellent reputation, and it is important to leverage onthis value. As a result, the first products with dual branding– Philips Saeco – were launched in 2010. Each coffeemachine is a combination of exclusive design, innovativetechnology and cutting-edge materials: together theyguarantee great-tasting espresso and ease of use. ClearlyPhilips and Saeco share common values: bringing “senseand simplicity” to the lives of consumers!
3 Our strategy in action 3.5 - 3.5
Annual Report 2010 31
3.5 Home LightingOur innovative home lighting solutionsbeautify and inspire, empoweringconsumers to define the ambience in theirpersonal spaces.
Lighting can enhance form and function,improve people’s sense of well-being andenable them to express their identity andstyle.
We believe that making homes morebeautiful, comfortable and functional – anddoing so responsibly – enhances lives.
3 Our strategy in action 3.5 - 3.5
32 Annual Report 2010
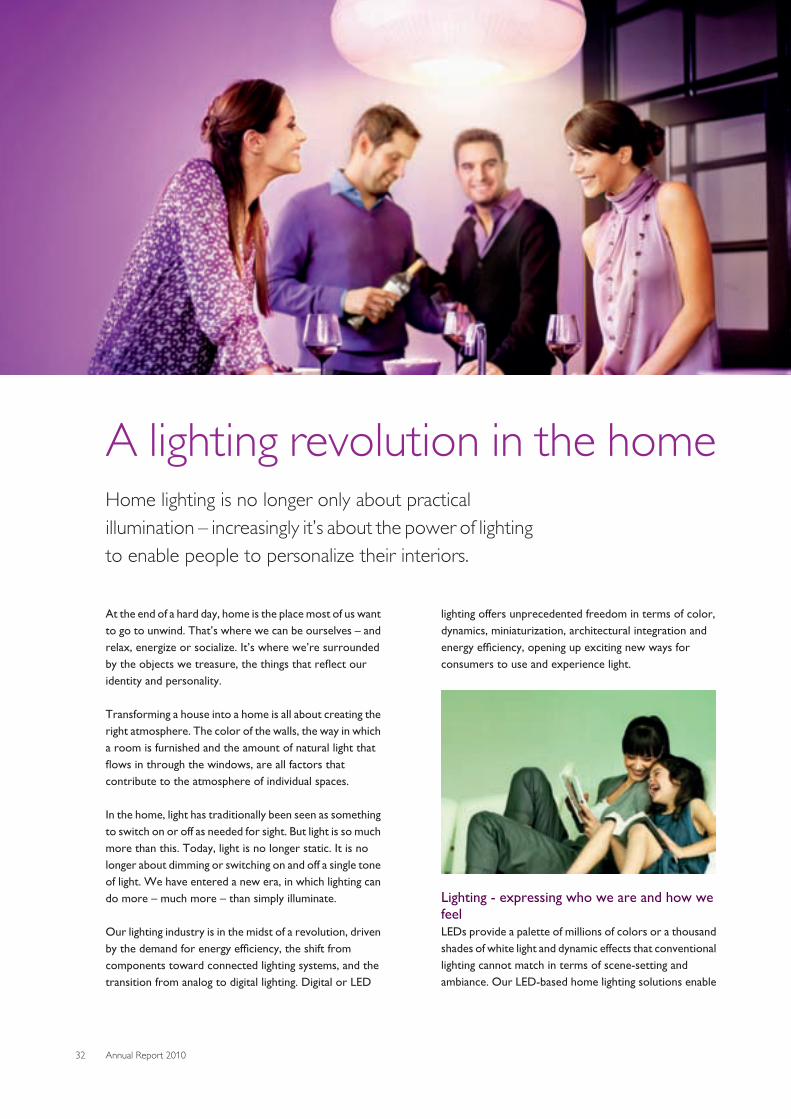
A lighting revolution in the homeHome lighting is no longer only about practicalillumination – increasingly it’s about the power of lightingto enable people to personalize their interiors.
At the end of a hard day, home is the place most of us wantto go to unwind. That’s where we can be ourselves – andrelax, energize or socialize. It’s where we’re surroundedby the objects we treasure, the things that reflect ouridentity and personality.
Transforming a house into a home is all about creating theright atmosphere. The color of the walls, the way in whicha room is furnished and the amount of natural light thatflows in through the windows, are all factors thatcontribute to the atmosphere of individual spaces.
In the home, light has traditionally been seen as somethingto switch on or off as needed for sight. But light is so muchmore than this. Today, light is no longer static. It is nolonger about dimming or switching on and off a single toneof light. We have entered a new era, in which lighting cando more – much more – than simply illuminate.
Our lighting industry is in the midst of a revolution, drivenby the demand for energy efficiency, the shift fromcomponents toward connected lighting systems, and thetransition from analog to digital lighting. Digital or LED
lighting offers unprecedented freedom in terms of color,dynamics, miniaturization, architectural integration andenergy efficiency, opening up exciting new ways forconsumers to use and experience light.
Lighting - expressing who we are and how wefeelLEDs provide a palette of millions of colors or a thousandshades of white light and dynamic effects that conventionallighting cannot match in terms of scene-setting andambiance. Our LED-based home lighting solutions enable
3 Our strategy in action 3.5 - 3.5
Annual Report 2010 33
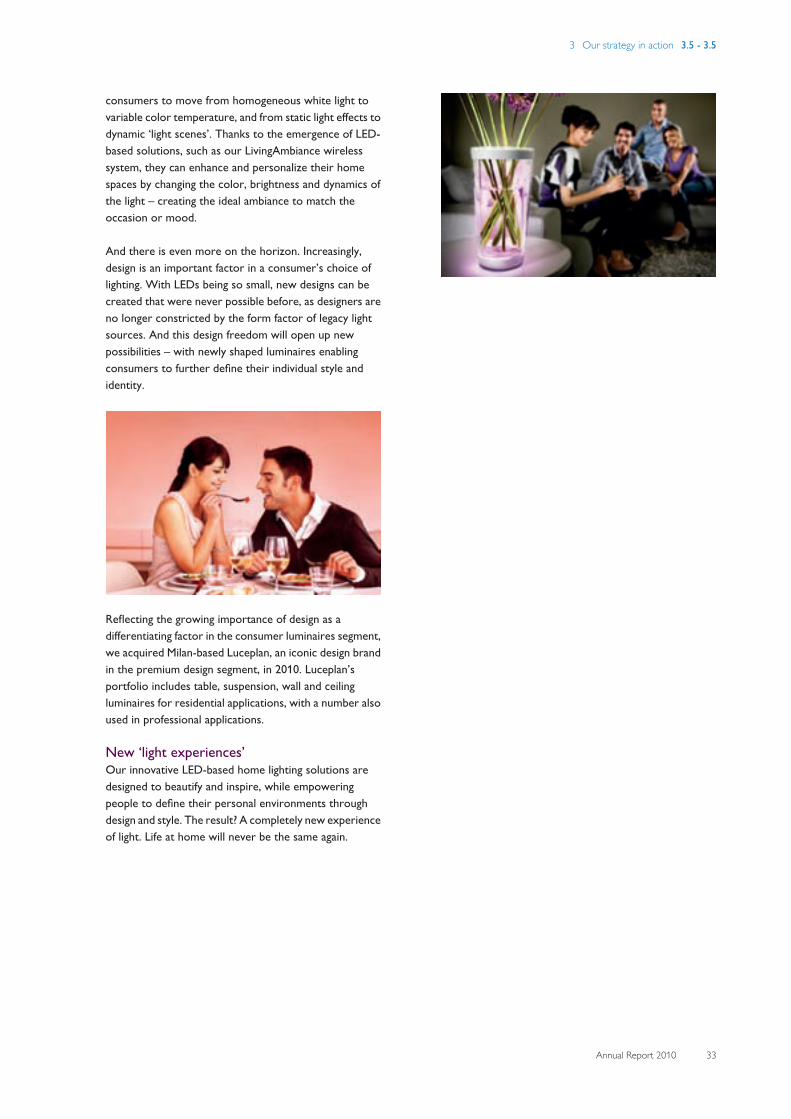
consumers to move from homogeneous white light tovariable color temperature, and from static light effects todynamic ‘light scenes’. Thanks to the emergence of LED-based solutions, such as our LivingAmbiance wirelesssystem, they can enhance and personalize their homespaces by changing the color, brightness and dynamics ofthe light – creating the ideal ambiance to match theoccasion or mood.
And there is even more on the horizon. Increasingly,design is an important factor in a consumer’s choice oflighting. With LEDs being so small, new designs can becreated that were never possible before, as designers areno longer constricted by the form factor of legacy lightsources. And this design freedom will open up newpossibilities – with newly shaped luminaires enablingconsumers to further define their individual style andidentity.
Reflecting the growing importance of design as adifferentiating factor in the consumer luminaires segment,we acquired Milan-based Luceplan, an iconic design brandin the premium design segment, in 2010. Luceplan’sportfolio includes table, suspension, wall and ceilingluminaires for residential applications, with a number alsoused in professional applications.
New ‘light experiences’Our innovative LED-based home lighting solutions aredesigned to beautify and inspire, while empoweringpeople to define their personal environments throughdesign and style. The result? A completely new experienceof light. Life at home will never be the same again.
3 Our strategy in action 3.5 - 3.5
34 Annual Report 2010
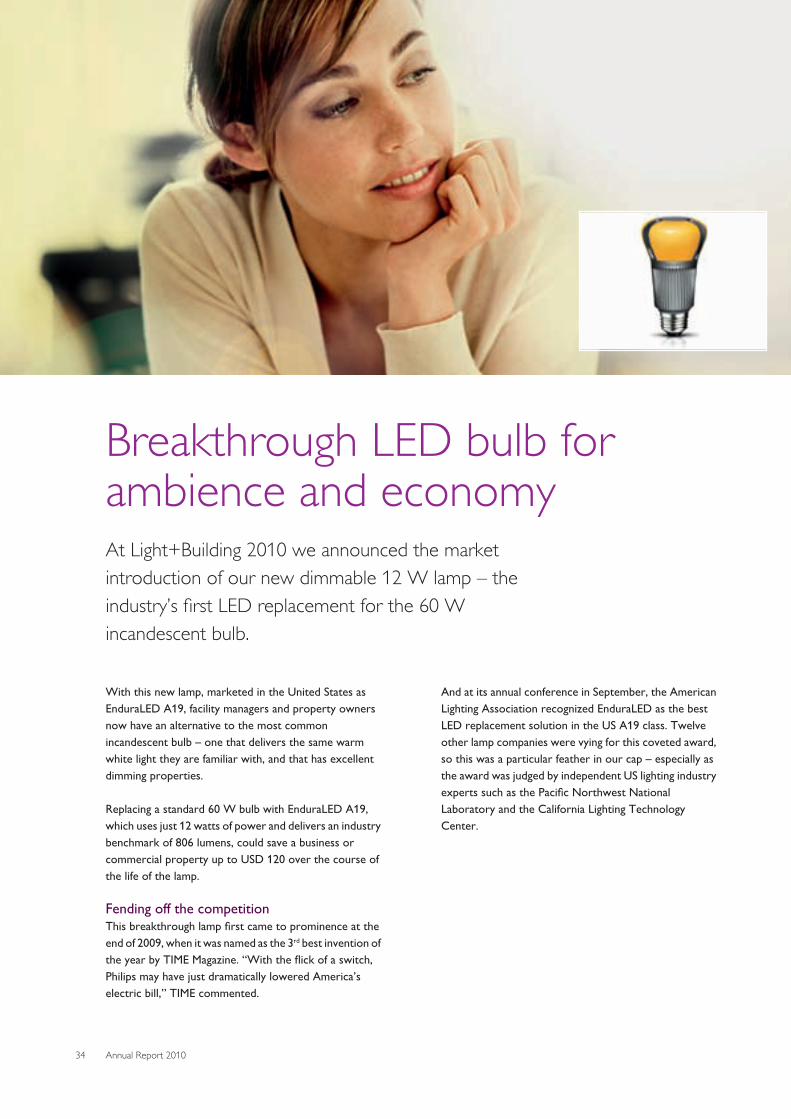
Breakthrough LED bulb forambience and economyAt Light+Building 2010 we announced the marketintroduction of our new dimmable 12 W lamp – theindustry’s first LED replacement for the 60 Wincandescent bulb.
With this new lamp, marketed in the United States asEnduraLED A19, facility managers and property ownersnow have an alternative to the most commonincandescent bulb – one that delivers the same warmwhite light they are familiar with, and that has excellentdimming properties.
Replacing a standard 60 W bulb with EnduraLED A19,which uses just 12 watts of power and delivers an industrybenchmark of 806 lumens, could save a business orcommercial property up to USD 120 over the course ofthe life of the lamp.
Fending off the competitionThis breakthrough lamp first came to prominence at theend of 2009, when it was named as the 3rd best invention ofthe year by TIME Magazine. “With the flick of a switch,Philips may have just dramatically lowered America’selectric bill,” TIME commented.
And at its annual conference in September, the AmericanLighting Association recognized EnduraLED as the bestLED replacement solution in the US A19 class. Twelveother lamp companies were vying for this coveted award,so this was a particular feather in our cap – especially asthe award was judged by independent US lighting industryexperts such as the Pacific Northwest NationalLaboratory and the California Lighting TechnologyCenter.
3 Our strategy in action 3.6 - 3.6
Annual Report 2010 35
3.6 Professional LightingThe professional lighting market is in themidst of a radical transformation, driven bythe energy efficiency imperative, the LEDlighting revolution and the increasing focuson application-based lighting solutions.
In our endeavor to meet the needs of ourcustomers in the office, outdoor, industry,retail, hospitality, entertainment, healthcareand automotive segments, we are deliveringnew, responsible forms of lighting –customer-centric, simplicity-led innovationsthat enhance people’s experience of light.

3 Our strategy in action 3.6 - 3.6
36 Annual Report 2010
Better light, better learningChildren are no different from adults – they feel better,and perform better, in an environment that is attractive,stimulating and designed around their specific needs.
We have conducted extensive research, together withleading German and Dutch universities, which shows thatour dedicated classroom lighting can promote learning byboosting children’s concentration, motivation andbehavior and supporting their general feeling of well-being.
SchoolVision is an innovative classroom lighting solution,which allows teachers to adjust both the brightness andwarmth of the light. Settings for different lighting moodscan be activated by a single button on a control panel. Theteachers can choose between four settings – Energy, Calm,Standard or Concentration. Energy corresponds to the lightof a bright, cloudless summer day around noon, whileCalm is the equivalent of gentle evening sunshine.
“Both teachers and children now enjoy working in the classrooms”, saysJane van der Heijden, Principal of Wintelre Primary School.
Dedicated lighting enhancing performanceIn collaboration with the Netherlands’ University ofTwente we carried out a pilot project in two classes atWintelre Primary School. The cool-white high-intensitylight in the Energy scene was used in the morning and afterlunch to give the children a boost. The standard light levelsin the Standard scene were used for regular classroomactivities. For more challenging tasks, the Concentration

3 Our strategy in action 3.6 - 3.6
Annual Report 2010 37
scene, with its cool-white, very bright light, created theright atmosphere to help the pupils focus. Finally, thewarm color and lower intensity of the Calm scene helpedto calm children down and encouraged them to work welltogether.
Both teachers and children enjoy working in theclassrooms lit with SchoolVision. “We begin in themorning with bright lighting that generates energy,”explains Jane van der Heijden, Principal of WintelrePrimary School, “and we normally end the day with warmlighting that offers calm and tranquility, and in which agood discussion can be held or creative activities can becarried out.” This change in lighting is appreciated by bothpupils and teachers. “We are noticing an increase in thelevel of concentration and calm in the class, and the pupilseven let us know if they would prefer to carry out acertain type of activity under a certain type of lighting.”
Good lighting can create a sense of well-being and help pupils to stayalert and concentrated.
Additional benefit - substantial energy savingsBesides having a positive impact on the learningenvironment and pupil performance, our innovativeschool lighting offers a further, extremely significantbenefit – substantial energy savings. At Elouges PrimarySchool in the Belgian district of Dour, for example, thecombination of intelligent lighting controls and the latestlow-energy light sources is helping to save as much as 80%of the electricity used by the old system. With budgetseverywhere under tremendous pressure, this ispotentially very good news for all schools.
With SchoolVision, different lighting moods can be activated at the pushof a button.
Win-win, today and going forwardOur future increasingly depends on our ability to generateand manage knowledge and innovation. This all starts withour children in schools. Our dedicated school lightinghelps teachers create the ideal learning atmosphere in theclassroom. In this way, we are helping deliver a dual gainfor this and future generations – better learning results forchildren, while at the same time saving energy.
3 Our strategy in action 3.6 - 3.6
38 Annual Report 2010
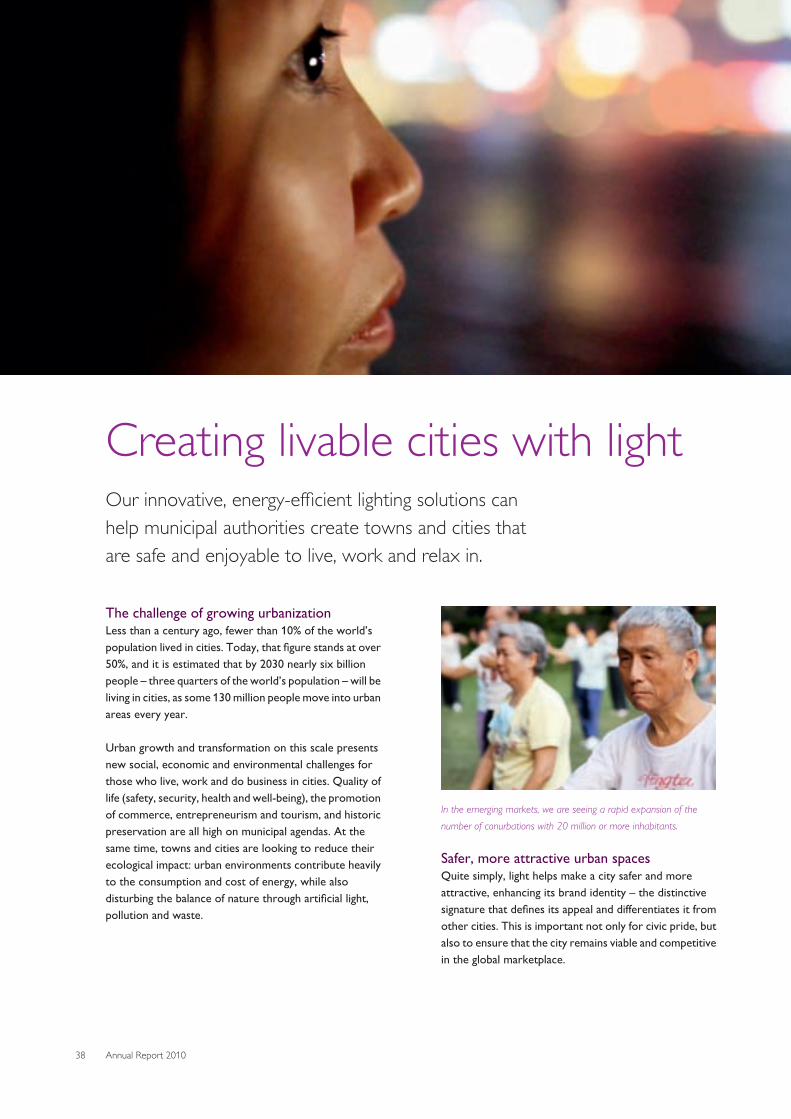
Creating livable cities with lightOur innovative, energy-efficient lighting solutions canhelp municipal authorities create towns and cities thatare safe and enjoyable to live, work and relax in.
The challenge of growing urbanizationLess than a century ago, fewer than 10% of the world’spopulation lived in cities. Today, that figure stands at over50%, and it is estimated that by 2030 nearly six billionpeople – three quarters of the world’s population – will beliving in cities, as some 130 million people move into urbanareas every year.
Urban growth and transformation on this scale presentsnew social, economic and environmental challenges forthose who live, work and do business in cities. Quality oflife (safety, security, health and well-being), the promotionof commerce, entrepreneurism and tourism, and historicpreservation are all high on municipal agendas. At thesame time, towns and cities are looking to reduce theirecological impact: urban environments contribute heavilyto the consumption and cost of energy, while alsodisturbing the balance of nature through artificial light,pollution and waste.
In the emerging markets, we are seeing a rapid expansion of thenumber of conurbations with 20 million or more inhabitants.
Safer, more attractive urban spacesQuite simply, light helps make a city safer and moreattractive, enhancing its brand identity – the distinctivesignature that defines its appeal and differentiates it fromother cities. This is important not only for civic pride, butalso to ensure that the city remains viable and competitivein the global marketplace.
3 Our strategy in action 3.6 - 3.6
Annual Report 2010 39
To retain both private and corporate citizens, cities mustmaintain safety and security, by preventing crime, and byproviding safer streets for both motorists andpedestrians. Choosing the right lighting can make a worldof difference. For example, at the same light level, morethan 80% of people feel safer with bright, white light thanwith traditional yellow street-lighting solutions. Whitelight’s high levels of perceived brightness and superiorcolor rendering help people feel safer and make it easierto distinguish objects, colors, shapes and other details.
Well-designed urban lighting not only provides cityresidents with safe, livable environments, but also urbanspaces that are unique and beautiful, and that welcomerecreation. This enriches the city fabric, attracting newresidents, new businesses and inward investment thatboosts tourism, retailing and other boons to economicgrowth and employment.
Commuters in Hong Kong enjoy brighter and safer journeys at nightthanks to our LED and ceramic metal-halide lighting on the newStonecutters Bridge.
The right light - no less, and no moreLighting must play a balanced role in the urban landscape.We believe that our lighting solutions, powered byinnovative technologies such as LED, can create morevalue, more beauty, more safety and more visibility – andyet can do so with less consumed power and lessenvironmental impact. City authorities could, forexample, save around EUR 3 billion in energy costs and 10million tons of CO2 a year, just by switching from olderroad lighting to our latest energy-efficient technology. Noless important, light is encroaching upon our natural habits– affecting both our human sleep patterns (and thereforeour health and well-being), as well as the reproductive andmigratory patterns of animals. Night skies in denselypopulated cities can, for example, be as much as 500 timesbrighter than our ‘natural’ night skies. We don’t want lightall the time, everywhere, so our flexible solutions offerexactly the right amount of light, in the right places, at theright time.
“To me, lighting design is not about just giving light to a space. It’s aboutgiving the best light to the people, to give them love of their own spaceand time.”
4 Our planet, our partners, our people 4 - 4.1
40 Annual Report 2010
4 Our planet, our partners, ourpeople
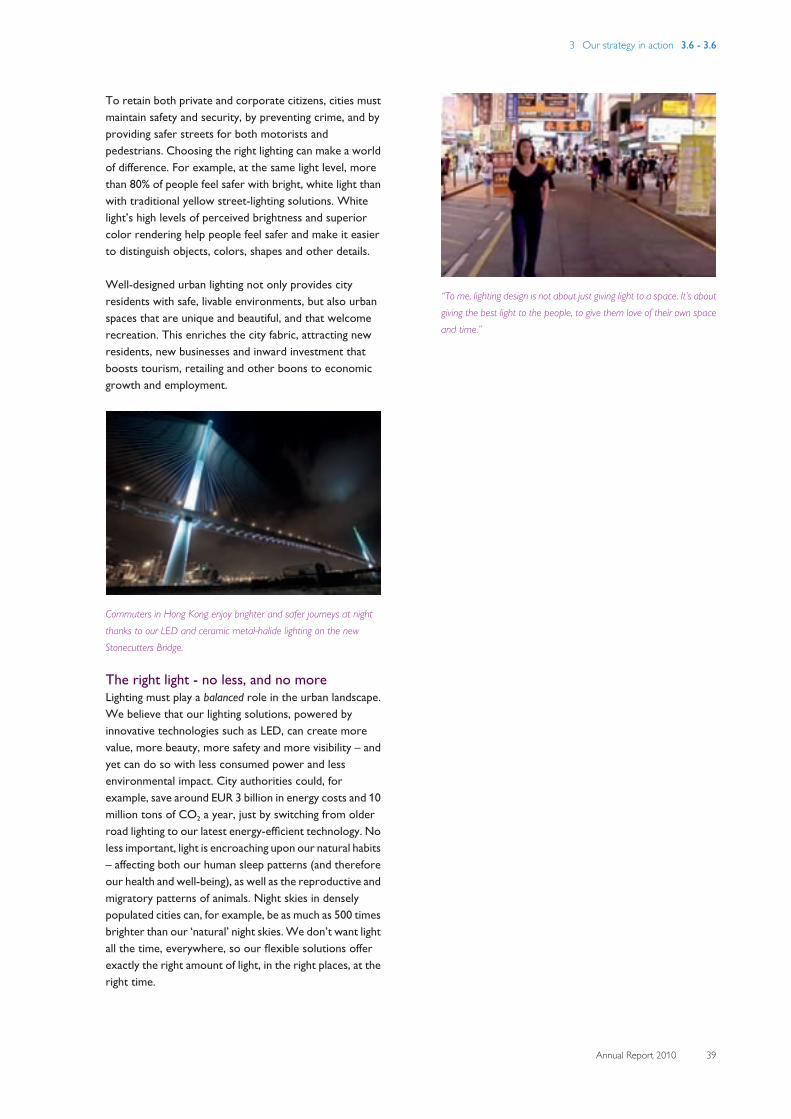
4.1 Climate changeRecognizing that energy efficiency is oneessential answer to climate change, we havemade a serious commitment to develop,promote and market more energy-efficientsolutions for people in all markets.
We meet this challenge with our GreenProducts and Green Innovations and byinspiring individuals to make simple changesthat can have profound results. We seek tofacilitate new solutions to drive responsibleenergy practices, and have long focused onthe energy efficiency of our products andproduction processes.
4 Our planet, our partners, our people 4.1 - 4.1
Annual Report 2010 41
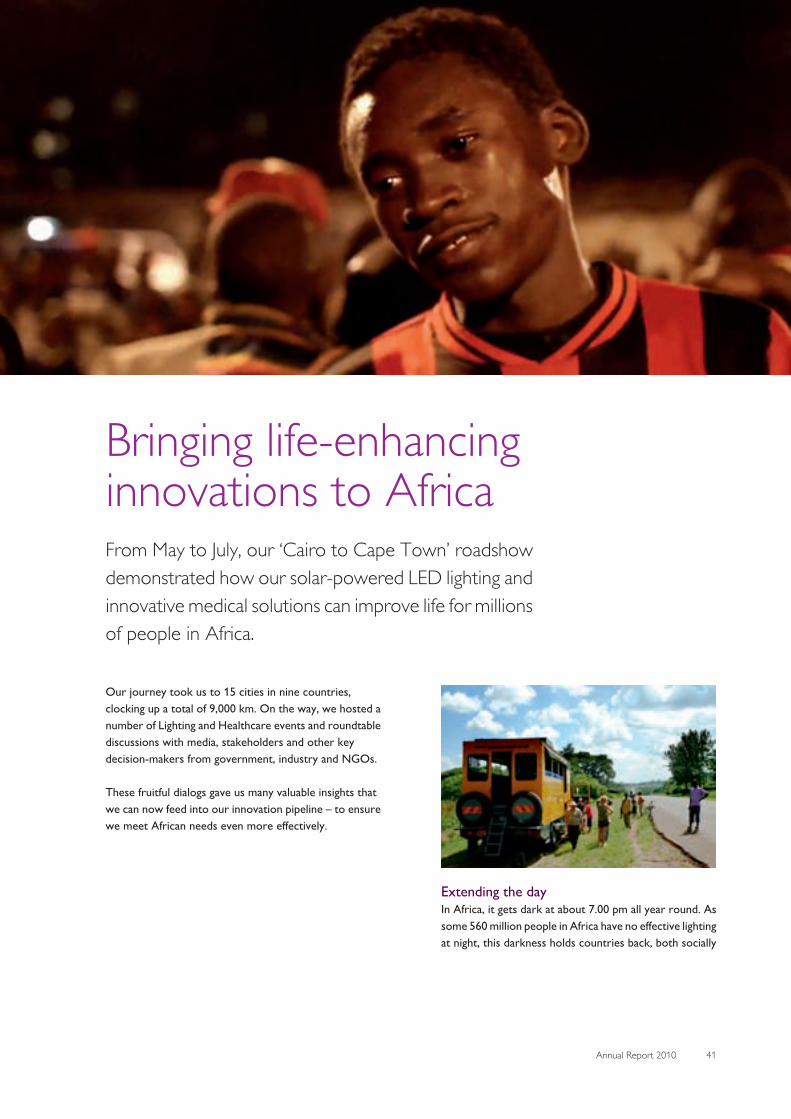
Bringing life-enhancinginnovations to AfricaFrom May to July, our ‘Cairo to Cape Town’ roadshowdemonstrated how our solar-powered LED lighting andinnovative medical solutions can improve life for millionsof people in Africa.
Our journey took us to 15 cities in nine countries,clocking up a total of 9,000 km. On the way, we hosted anumber of Lighting and Healthcare events and roundtablediscussions with media, stakeholders and other keydecision-makers from government, industry and NGOs.
These fruitful dialogs gave us many valuable insights thatwe can now feed into our innovation pipeline – to ensurewe meet African needs even more effectively.
Extending the dayIn Africa, it gets dark at about 7.00 pm all year round. Assome 560 million people in Africa have no effective lightingat night, this darkness holds countries back, both socially
4 Our planet, our partners, our people 4.1 - 4.1
42 Annual Report 2010
and economically. Sustainable solar lighting has thepotential to transform Africa’s economic, social,educational and cultural life.
We have developed solar lighting solutions to help peoplein Africa extend the day, including a small LED reading lightthat enables children to do their homework at night oradults to follow evening classes. These lights areaffordable and offer the potential for a major boost inliteracy across the continent.
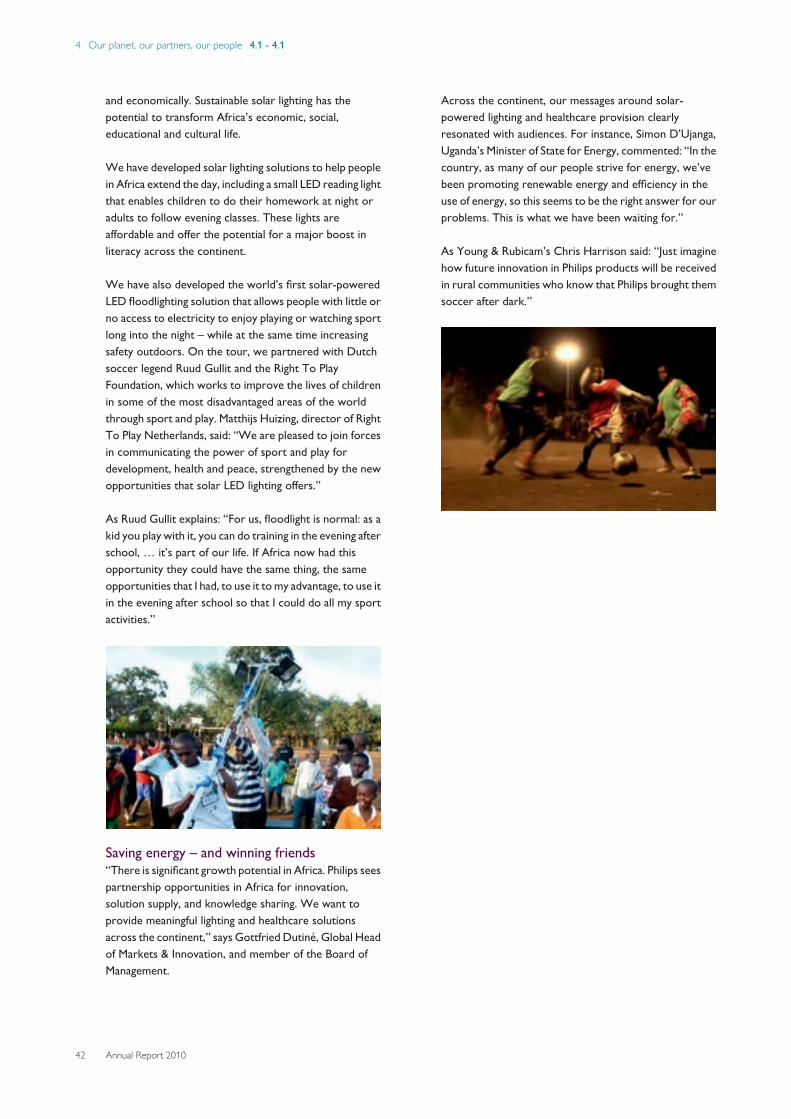
We have also developed the world’s first solar-poweredLED floodlighting solution that allows people with little orno access to electricity to enjoy playing or watching sportlong into the night – while at the same time increasingsafety outdoors. On the tour, we partnered with Dutchsoccer legend Ruud Gullit and the Right To PlayFoundation, which works to improve the lives of childrenin some of the most disadvantaged areas of the worldthrough sport and play. Matthijs Huizing, director of RightTo Play Netherlands, said: “We are pleased to join forcesin communicating the power of sport and play fordevelopment, health and peace, strengthened by the newopportunities that solar LED lighting offers.”
As Ruud Gullit explains: “For us, floodlight is normal: as akid you play with it, you can do training in the evening afterschool, … it’s part of our life. If Africa now had thisopportunity they could have the same thing, the sameopportunities that I had, to use it to my advantage, to use itin the evening after school so that I could do all my sportactivities.”
Saving energy – and winning friends“There is significant growth potential in Africa. Philips seespartnership opportunities in Africa for innovation,solution supply, and knowledge sharing. We want toprovide meaningful lighting and healthcare solutionsacross the continent,” says Gottfried Dutiné, Global Headof Markets & Innovation, and member of the Board ofManagement.
Across the continent, our messages around solar-powered lighting and healthcare provision clearlyresonated with audiences. For instance, Simon D’Ujanga,Uganda’s Minister of State for Energy, commented: “In thecountry, as many of our people strive for energy, we’vebeen promoting renewable energy and efficiency in theuse of energy, so this seems to be the right answer for ourproblems. This is what we have been waiting for.”
As Young & Rubicam’s Chris Harrison said: “Just imaginehow future innovation in Philips products will be receivedin rural communities who know that Philips brought themsoccer after dark.”
4 Our planet, our partners, our people 4.2 - 4.2
Annual Report 2010 43
4.2 Our environmental footprintThe significant issues for our company – andour industry – in the environmental areacontinue to be energy efficiency, chemicalcontent of products, and collection andrecycling. We remain committed to givingour full attention to these challenges.
To reduce our ecological footprint we aremaintaining our focus on overallenvironmental performance improvement,driven by our EcoVision programs.
Working with stakeholders, we aim to shareexpertise and co-create innovativesolutions that will make a difference tofuture generations.
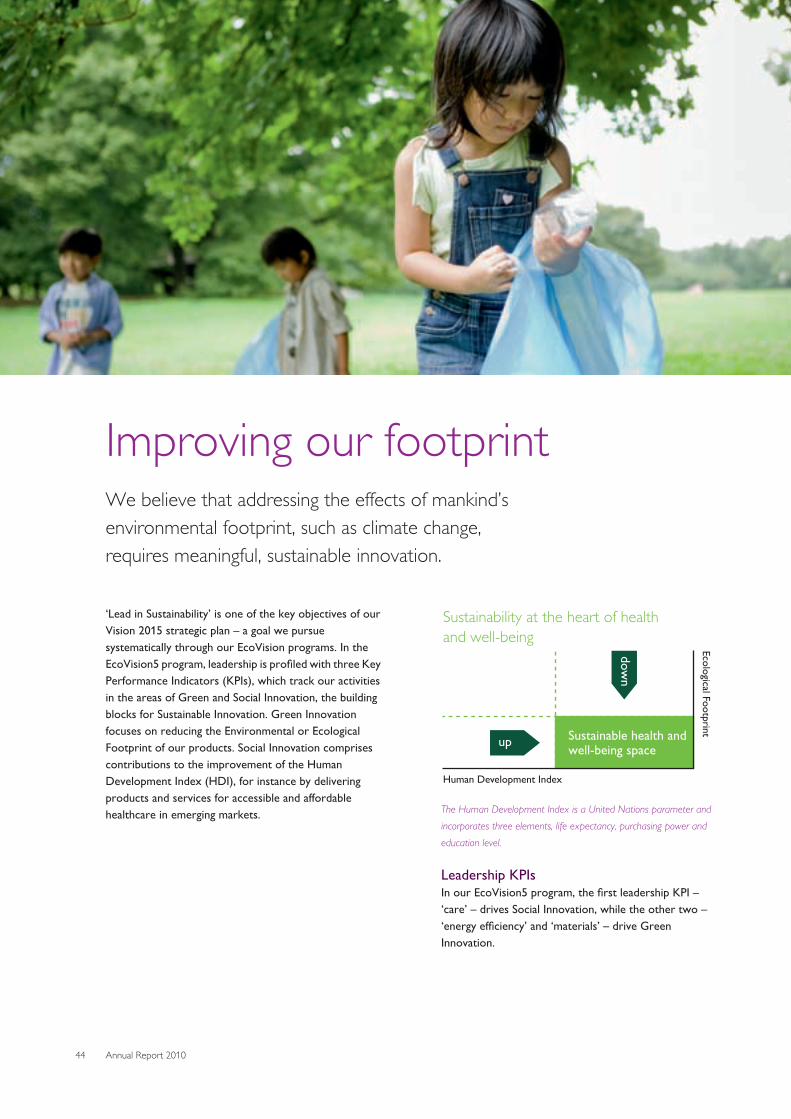
4 Our planet, our partners, our people 4.2 - 4.2
44 Annual Report 2010
Improving our footprintWe believe that addressing the effects of mankind’senvironmental footprint, such as climate change,requires meaningful, sustainable innovation.
‘Lead in Sustainability’ is one of the key objectives of ourVision 2015 strategic plan – a goal we pursuesystematically through our EcoVision programs. In theEcoVision5 program, leadership is profiled with three KeyPerformance Indicators (KPIs), which track our activitiesin the areas of Green and Social Innovation, the buildingblocks for Sustainable Innovation. Green Innovationfocuses on reducing the Environmental or EcologicalFootprint of our products. Social Innovation comprisescontributions to the improvement of the HumanDevelopment Index (HDI), for instance by deliveringproducts and services for accessible and affordablehealthcare in emerging markets.
Eco
logical Fo
otp
rint
up
dow
n
Human Development Index
Sustainability at the heart of health
and well-being
Sustainable health and well-being space
The Human Development Index is a United Nations parameter andincorporates three elements, life expectancy, purchasing power andeducation level.
Leadership KPIsIn our EcoVision5 program, the first leadership KPI –‘care’ – drives Social Innovation, while the other two –‘energy efficiency’ and ‘materials’ – drive GreenInnovation.
4 Our planet, our partners, our people 4.2 - 4.2
Annual Report 2010 45
Examples of such innovations can be found throughoutthis report, such as solar-powered LED lighting,EnduraLED and the Econova LED TV.
Greening our operationsWith energy, waste, water and emission reduction asperformance indicators, we drive a reduction of ourenvironmental footprint in our operations.
Philips was recognized as a leader in carbon disclosure andcarbon performance by the Carbon Disclosure Project(CDP) 2010 Global 500 report. The CDP collectsemissions data from over 3,000 organizations in 60countries. Philips received a score of 94 (out of 100) forcarbon disclosure results and was awarded an ‘A’ for itsoverall carbon performance, making it a company with“both higher degrees of maturity in their climate changeinitiatives and achievement of their objectives” accordingto the CDP.
Green Products and Green InnovationIn 2010, Green Products represented 38% of ourrevenues globally, compared to 20% in 2007, as a result ofinvestments of more than EUR 1 billion in GreenInnovation during the last three years.
In 2010 we set a target to further increase the share ofGreen Products to 50% of Group sales by 2015. We usethe Philips Green logo to identify an increasing number ofour Green Products. To further raise awareness andencourage individuals to make smart daily choices, wehave expanded the reach of our asimpleswitch.comwebsite.
Collection and recyclingIn 2009 we collected and recycled over 100,000 tons ofWaste Electrical and Electronic Equipment (WEEE). Morethan 90% of WEEE was collected and recycled in Europedue to the widespread implementation of product take-back legislation. We have also expanded our voluntarycollection and recycling activities in countries such as theUnited States, Argentina, Brazil and India. Furthermore,
we continued to actively advise on and support theintroduction or revision of product take-back legislationin countries like Argentina, Brazil, China, the EuropeanUnion, India, Russia, Thailand, Turkey and the UnitedStates.
Chemical content of productsIn 2010, Philips asked more than 3,000 suppliers todeclare their compliance with REACH, RoHS and otherchemical substances requirements by making BOMcheckdeclarations. BOMcheck is an online industry platformthat systematically collects declarations from suppliers inorder to fulfill REACH and other regulations.
Philips introduced a large number of consumer productsthat are free of polyvinyl chloride (PVC) and brominatedflame retardants (BFR) in 2010, including the EconovaLED TV, the first PVC/BFR-free television in the world.The lessons learned from the introduction of theseproducts in 2010 allowed us to create a detailed roadmapfor new PVC/BFR-free consumer products for 2011 andclearly identify where PVC/BFR-free alternatives are notyet possible due to technical, safety or regulatoryrequirements.
“The Econova TV puts Philips on track to meet itscommitment to phase out these hazardous substances bythe end of 2010, well ahead of other TV manufacturers.”Tom Dowdall, Greener electronics campaign co-ordinator, Greenpeace
4 Our planet, our partners, our people 4.3 - 4.3
46 Annual Report 2010
4.3 Partnerships for progressWorld leaders from rich and poor countriesalike, representing all United Nationsmember states, have pledged to achieve theeight Millennium Development Goals(MDGs) by the year 2015 – to significantlyreduce poverty, illiteracy, inequity, diseasesand improve environmental quality in poorcountries.
Our experience has shown that developingthese markets requires tailor-madesolutions, a different approach to marketingand distribution, and multi-sectorpartnerships. Multi-stakeholderengagement is needed to improve workingconditions in the supply chain – anotherimportant contribution towards the MDGs.

4 Our planet, our partners, our people 4.3 - 4.3
Annual Report 2010 47
Driving sustainability in the supplychainWe are committed to partnering with governmentaland civil society organizations and business partners tofurther embed sustainability in the supply chain.
As a responsible corporate citizen, we strive to conductour business with a high level of integrity. And, in keepingwith our brand values, we also support our suppliers tohelp them achieve higher standards. To this end, weactively seek dialog with industry partners, civil societyand governmental organizations, and we are an activemember of a number of initiatives implementingsustainability programs.
For example, we are a member of the Electronic IndustryCitizenship Coalition (EICC), an important sustainabilityalliance for the electronics industry. The EICC wasestablished in 2004 and promotes an industry code ofconduct for global supply chains to improve working andenvironmental conditions. Today, it includes more than50 global electronics companies and their suppliers.
Another initiative in which we are involved is the DutchSustainable Trade Initiative (IDH). IDH brings togethergovernment, frontrunner companies, civil societyorganizations and labor unions. The mission of IDH is toaccelerate and up-scale sustainable trade in mainstreamcommodity markets from the emerging countries toWestern Europe. In this way, IDH is working on theMillennium Development Goals for poverty reduction,environmental protection and an open trading andfinancial system.
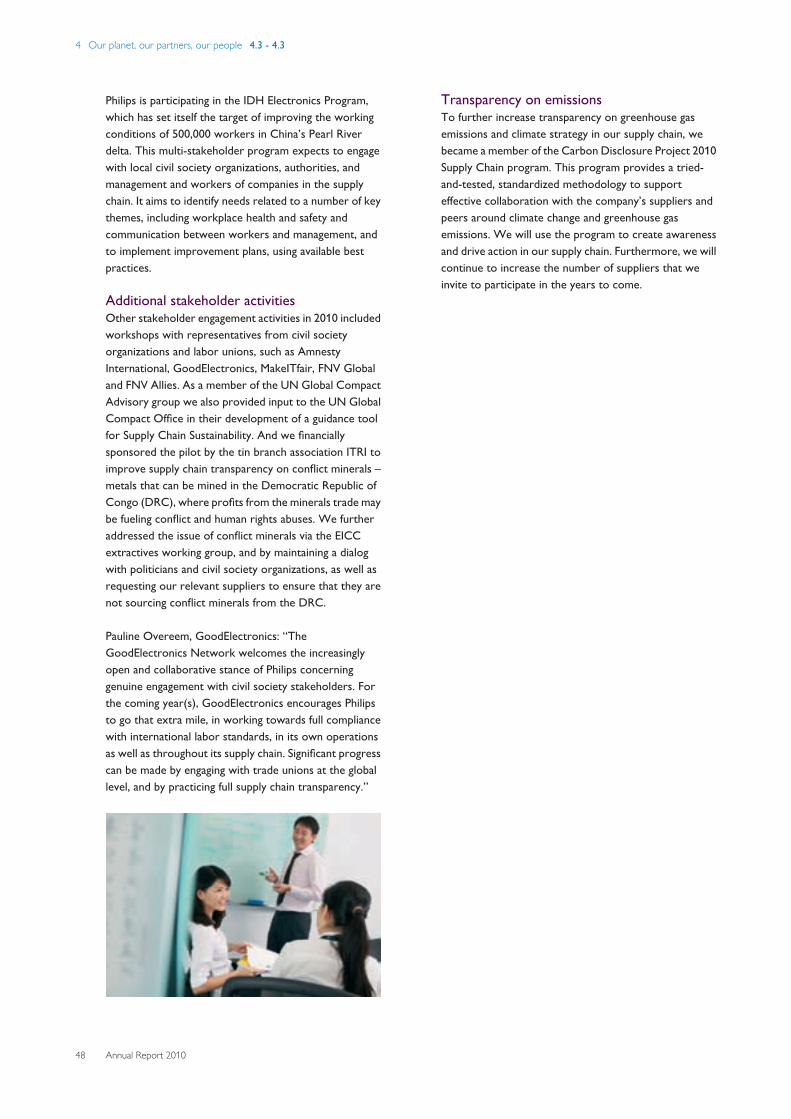
4 Our planet, our partners, our people 4.3 - 4.3
48 Annual Report 2010
Philips is participating in the IDH Electronics Program,which has set itself the target of improving the workingconditions of 500,000 workers in China’s Pearl Riverdelta. This multi-stakeholder program expects to engagewith local civil society organizations, authorities, andmanagement and workers of companies in the supplychain. It aims to identify needs related to a number of keythemes, including workplace health and safety andcommunication between workers and management, andto implement improvement plans, using available bestpractices.
Additional stakeholder activitiesOther stakeholder engagement activities in 2010 includedworkshops with representatives from civil societyorganizations and labor unions, such as AmnestyInternational, GoodElectronics, MakeITfair, FNV Globaland FNV Allies. As a member of the UN Global CompactAdvisory group we also provided input to the UN GlobalCompact Office in their development of a guidance toolfor Supply Chain Sustainability. And we financiallysponsored the pilot by the tin branch association ITRI toimprove supply chain transparency on conflict minerals –metals that can be mined in the Democratic Republic ofCongo (DRC), where profits from the minerals trade maybe fueling conflict and human rights abuses. We furtheraddressed the issue of conflict minerals via the EICCextractives working group, and by maintaining a dialogwith politicians and civil society organizations, as well asrequesting our relevant suppliers to ensure that they arenot sourcing conflict minerals from the DRC.
Pauline Overeem, GoodElectronics: “TheGoodElectronics Network welcomes the increasinglyopen and collaborative stance of Philips concerninggenuine engagement with civil society stakeholders. Forthe coming year(s), GoodElectronics encourages Philipsto go that extra mile, in working towards full compliancewith international labor standards, in its own operationsas well as throughout its supply chain. Significant progresscan be made by engaging with trade unions at the globallevel, and by practicing full supply chain transparency.”
Transparency on emissionsTo further increase transparency on greenhouse gasemissions and climate strategy in our supply chain, webecame a member of the Carbon Disclosure Project 2010Supply Chain program. This program provides a tried-and-tested, standardized methodology to supporteffective collaboration with the company’s suppliers andpeers around climate change and greenhouse gasemissions. We will use the program to create awarenessand drive action in our supply chain. Furthermore, we willcontinue to increase the number of suppliers that weinvite to participate in the years to come.
4 Our planet, our partners, our people 4.4 - 4.4
Annual Report 2010 49
4.4 Supplier sustainabilityWe believe in engaging with our suppliersto encourage them to share ourcommitment to sustainability. This includessound environmental and ethical standardsas well as providing working conditions fortheir employees that reflect both the PhilipsGeneral Business Principles and theElectronic Industry Citizenship Coalition(EICC) Code of Conduct.
We continue to focus on the PhilipsSupplier Sustainability InvolvementProgram, closely collaborating with oursupplier partners and relevant stakeholdersto drive progress. It’s about improvingconditions in the chain.

4 Our planet, our partners, our people 4.4 - 4.4
50 Annual Report 2010
Helping to identify areas forimprovementOur suppliers play a pivotal role in helping us achieveour EcoVision5 objectives. We continue to supportthem in their efforts to improve the overall sustainabilityof their business.
As a leading health and well-being company taking anintegrated approach to sustainability, we are committedto helping our suppliers achieve high standards thatbenefit their employees, the environment and, wherepossible, their profitability.
Supplier Sustainability and the road to Vision2015In October 2010 our Purchasing Leadership Board made astrategic change to the Supplier Sustainability InvolvementProgram – towards a more collaborative approach withour strategic and preferred suppliers. This has resulted ina more diversified approach on the reach and depth of ajoint supplier compliance program, as well as explorationof areas of (joint) sustainable innovation. At the sametime, the Program remains firm on the need for suppliersto show continued sustainable performance.
Going forward, coaching our suppliers will become anincreasingly important part of the Program, in order tofurther increase its effectiveness. “Within the next fiveyears we want to have not only strengthened ourreputation as a leader in supplier sustainability, but also tohave engaged our global supply base to help us achieve ourEcoVision5 and other sustainability objectives as definedin Vision 2015,” says Sonny Kwok, Head of SupplierSustainability.
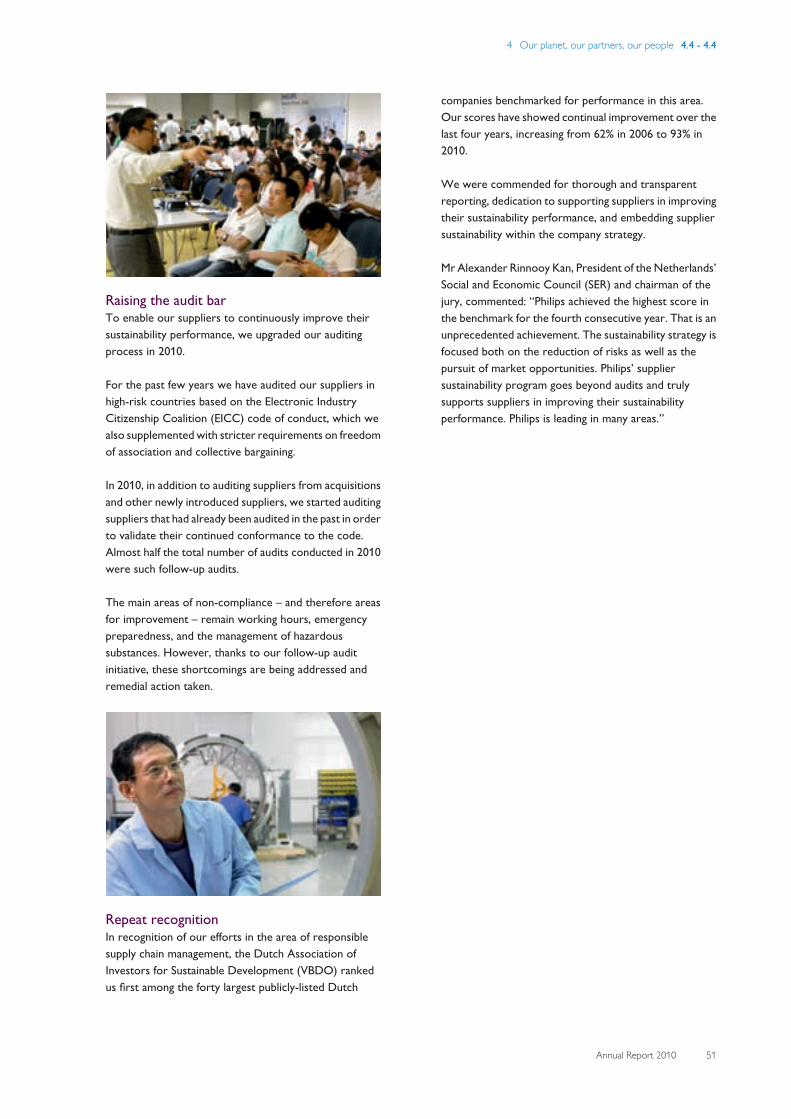
4 Our planet, our partners, our people 4.4 - 4.4
Annual Report 2010 51
Raising the audit barTo enable our suppliers to continuously improve theirsustainability performance, we upgraded our auditingprocess in 2010.
For the past few years we have audited our suppliers inhigh-risk countries based on the Electronic IndustryCitizenship Coalition (EICC) code of conduct, which wealso supplemented with stricter requirements on freedomof association and collective bargaining.
In 2010, in addition to auditing suppliers from acquisitionsand other newly introduced suppliers, we started auditingsuppliers that had already been audited in the past in orderto validate their continued conformance to the code.Almost half the total number of audits conducted in 2010were such follow-up audits.
The main areas of non-compliance – and therefore areasfor improvement – remain working hours, emergencypreparedness, and the management of hazardoussubstances. However, thanks to our follow-up auditinitiative, these shortcomings are being addressed andremedial action taken.
Repeat recognitionIn recognition of our efforts in the area of responsiblesupply chain management, the Dutch Association ofInvestors for Sustainable Development (VBDO) rankedus first among the forty largest publicly-listed Dutch
companies benchmarked for performance in this area.Our scores have showed continual improvement over thelast four years, increasing from 62% in 2006 to 93% in2010.
We were commended for thorough and transparentreporting, dedication to supporting suppliers in improvingtheir sustainability performance, and embedding suppliersustainability within the company strategy.
Mr Alexander Rinnooy Kan, President of the Netherlands’Social and Economic Council (SER) and chairman of thejury, commented: “Philips achieved the highest score inthe benchmark for the fourth consecutive year. That is anunprecedented achievement. The sustainability strategy isfocused both on the reduction of risks as well as thepursuit of market opportunities. Philips’ suppliersustainability program goes beyond audits and trulysupports suppliers in improving their sustainabilityperformance. Philips is leading in many areas.”
4 Our planet, our partners, our people 4.5 - 4.5
52 Annual Report 2010
4.5 Working at PhilipsTo become an even more market-drivenand people-centric company, we have beenworking to increase organizationaleffectiveness and simplify our structure.
We believe it is important that employeesare engaged – that they feel part of a team,know their ideas and suggestions count,trust their manager, and value diverseperspectives.
It is crucial that everyone is given fullopportunity to use their individual talents –and to grow with Philips, enabling them tosecure their future.

4 Our planet, our partners, our people 4.5 - 4.5
Annual Report 2010 53
Grow with PhilipsDeveloping our people is one of our core values, so in2010 we launched ‘Grow with Philips’, a program thatopens up more opportunities for change and growth.
We have always sought to develop our employees’ skills,so that they can maximize and reach their potential andincrease their contribution to the company’s success. Westart by encouraging staff to annually discuss and plan theirambitions with their departmental and HR managers.Employees are then encouraged to develop themselves bygaining new skills and competences on the job, using ourextensive training programs and supported by coachingand mentoring programs.
The new ‘Grow with Philips’ program adds to thoseefforts, with two new important components. The firstmakes it easier for our employees to grow their careersacross functions, business units and geographies. Bysimply ticking a special box on their online employeeprofile they indicate that they are interested in changingjobs within Philips. This enables our recruiters to pro-actively search for suitable people within our organizationbefore conducting an external search. Although vacanciesare still posted online for all Philips people to see, this newapproach makes internal recruiting faster and morethorough, with less dependence on people reacting to job
postings. By allowing every employee to easily indicatethey are available for a move, we create a transparentinternal labor market and promote internal mobility.
The second main component of ‘Grow with Philips’ is thenew training possibilities that are now available. Afterresearching the training needs of our people, we foundthat they prefer informal ‘bite-size’ training modules,which give them advice and information when they need it.Hence, in 2010 we created our Learning@Philips webportal, a wide-ranging database of training modules that
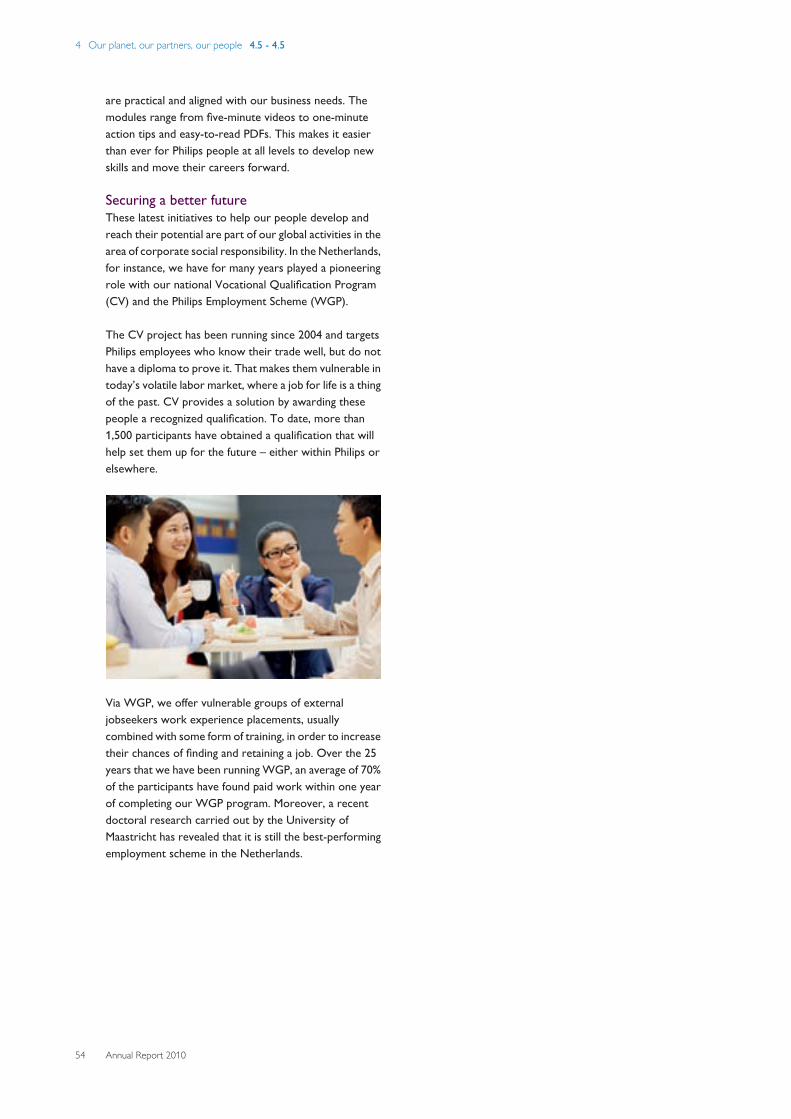
4 Our planet, our partners, our people 4.5 - 4.5
54 Annual Report 2010
are practical and aligned with our business needs. Themodules range from five-minute videos to one-minuteaction tips and easy-to-read PDFs. This makes it easierthan ever for Philips people at all levels to develop newskills and move their careers forward.
Securing a better futureThese latest initiatives to help our people develop andreach their potential are part of our global activities in thearea of corporate social responsibility. In the Netherlands,for instance, we have for many years played a pioneeringrole with our national Vocational Qualification Program(CV) and the Philips Employment Scheme (WGP).
The CV project has been running since 2004 and targetsPhilips employees who know their trade well, but do nothave a diploma to prove it. That makes them vulnerable intoday’s volatile labor market, where a job for life is a thingof the past. CV provides a solution by awarding thesepeople a recognized qualification. To date, more than1,500 participants have obtained a qualification that willhelp set them up for the future – either within Philips orelsewhere.
Via WGP, we offer vulnerable groups of externaljobseekers work experience placements, usuallycombined with some form of training, in order to increasetheir chances of finding and retaining a job. Over the 25years that we have been running WGP, an average of 70%of the participants have found paid work within one yearof completing our WGP program. Moreover, a recentdoctoral research carried out by the University ofMaastricht has revealed that it is still the best-performingemployment scheme in the Netherlands.
4 Our planet, our partners, our people 4.6 - 4.6
Annual Report 2010 55
4.6 Working in our communitiesWe at Philips have long been active in thecommunities where we live and work.Initiatives around the world bring “senseand simplicity” to people’s health and well-being in a number of local projects.
SimplyHealthy@Schools is the globalcommunity program we have been rollingout, with strong employee engagement, toinspire and educate children to improvetheir health and well-being.
By linking our social investment initiativeswith the scope of our business, we makeour core competencies available to simplymake a difference in people’s lives.

4 Our planet, our partners, our people 4.6 - 4.6
56 Annual Report 2010
SimplyHealthy@SchoolsOur SimplyHealthy@Schools program was born out ofa desire to make our health and well-being expertiseand resources available to a wider community.
Growing and aging populations, increasing healthcaredemands and the growing pressure of lifestyle-relateddiseases make current healthcare systems unsustainable.Some of us do not have a choice, simply having no accessto the essentials that many take for granted – clean air andwater, adequate nutrition, basic sanitation and access tohealthcare. Others do have a choice – to eat a diet lowerin saturated fats, do more exercise or give up smoking,and so reduce our risk of suffering cardiovascular disease,diabetes or cancer. But for most, old habits die hard,requiring innovative lifestyle solutions to help us change.
For the next generation we can make it much easier. Byeducating them from an early age about their lifestyle andwhat it takes to stay healthy – and hopefully nurturingattitudes and habits that will stay with them intoadulthood.
Inspiring schoolchildren around the worldOur SimplyHealthy@Schools community program buildson past experience where employees applied theirknowledge and volunteered in local schools to upgradelighting and educate children on energy efficiency. In 2010,we expanded the program into 38 countries, reachingalmost 63,000 students, going to over 660 schools andactively involving more than 3,500 employees fromaround the world on the ground and many thousandsmore online.
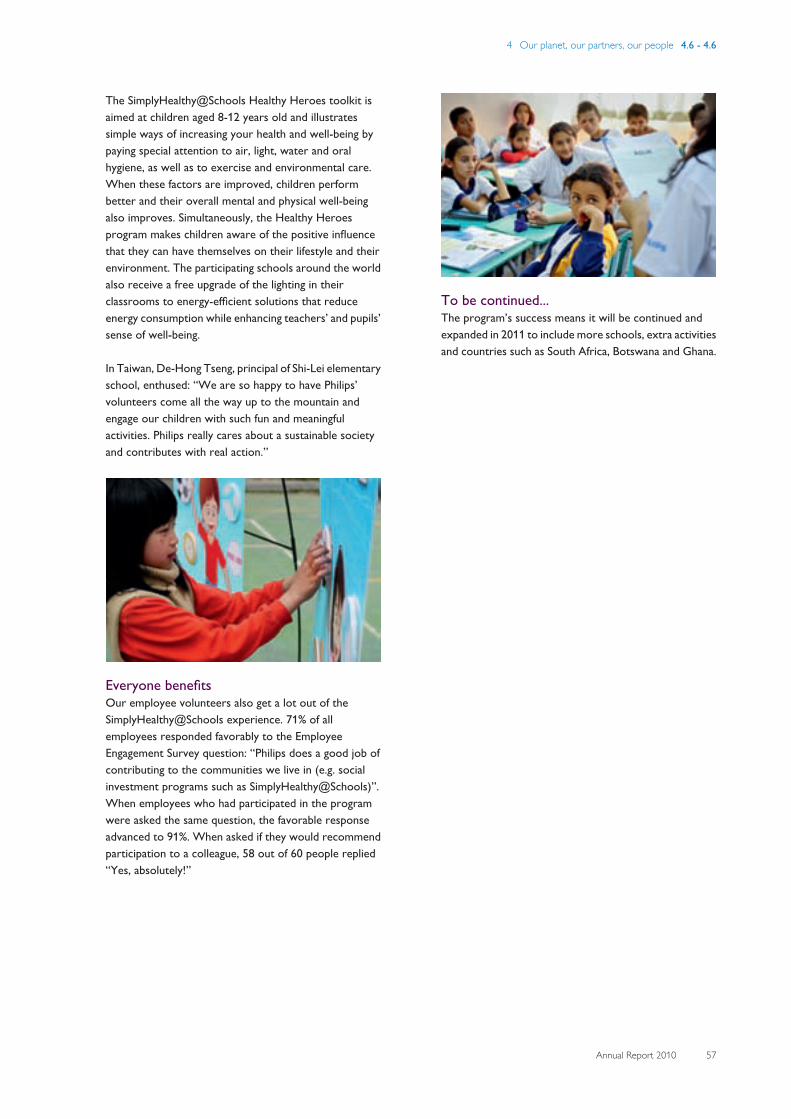
4 Our planet, our partners, our people 4.6 - 4.6
Annual Report 2010 57
The SimplyHealthy@Schools Healthy Heroes toolkit isaimed at children aged 8-12 years old and illustratessimple ways of increasing your health and well-being bypaying special attention to air, light, water and oralhygiene, as well as to exercise and environmental care.When these factors are improved, children performbetter and their overall mental and physical well-beingalso improves. Simultaneously, the Healthy Heroesprogram makes children aware of the positive influencethat they can have themselves on their lifestyle and theirenvironment. The participating schools around the worldalso receive a free upgrade of the lighting in theirclassrooms to energy-efficient solutions that reduceenergy consumption while enhancing teachers’ and pupils’sense of well-being.
In Taiwan, De-Hong Tseng, principal of Shi-Lei elementaryschool, enthused: “We are so happy to have Philips’volunteers come all the way up to the mountain andengage our children with such fun and meaningfulactivities. Philips really cares about a sustainable societyand contributes with real action.”
Everyone benefitsOur employee volunteers also get a lot out of theSimplyHealthy@Schools experience. 71% of allemployees responded favorably to the EmployeeEngagement Survey question: “Philips does a good job ofcontributing to the communities we live in (e.g. socialinvestment programs such as SimplyHealthy@Schools)”.When employees who had participated in the programwere asked the same question, the favorable responseadvanced to 91%. When asked if they would recommendparticipation to a colleague, 58 out of 60 people replied“Yes, absolutely!”
To be continued...The program’s success means it will be continued andexpanded in 2011 to include more schools, extra activitiesand countries such as South Africa, Botswana and Ghana.
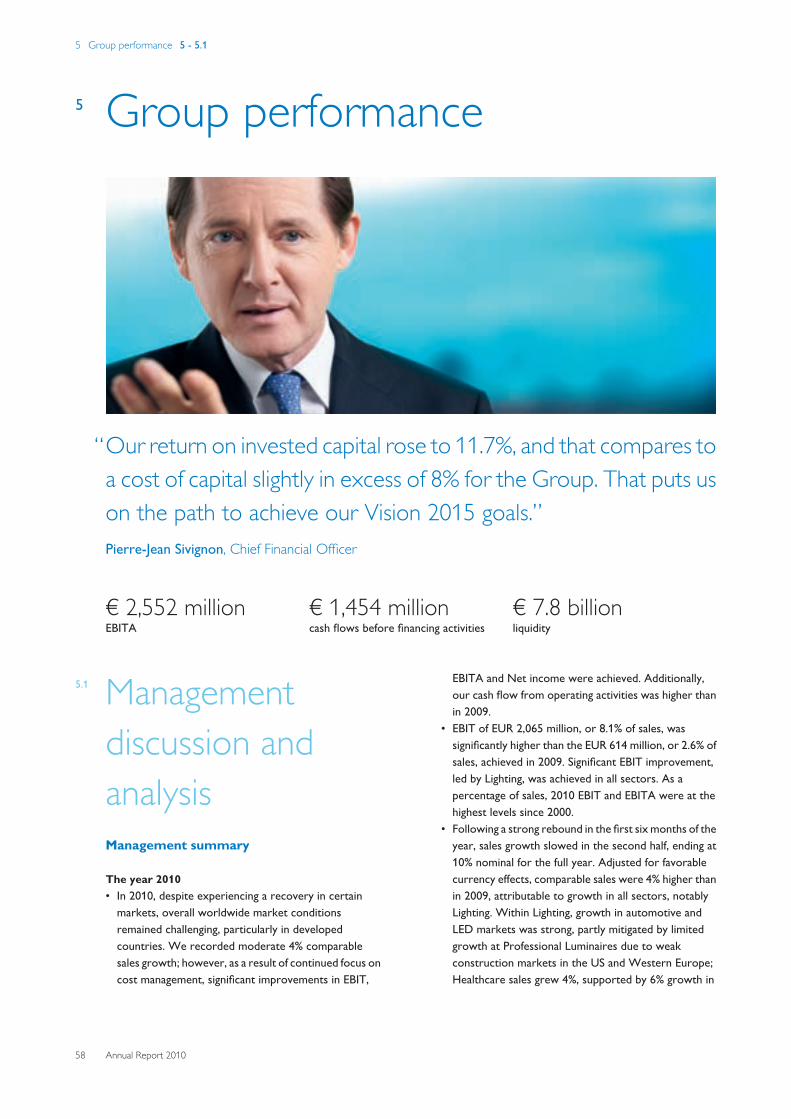
5 Group performance 5 - 5.1
58 Annual Report 2010
5 Group performance
“Our return on invested capital rose to 11.7%, and that compares toa cost of capital slightly in excess of 8% for the Group. That puts uson the path to achieve our Vision 2015 goals.”Pierre-Jean Sivignon, Chief Financial Officer
€ 2,552 millionEBITA
€ 1,454 millioncash flows before financing activities
€ 7.8 billionliquidity
5.1 Managementdiscussion andanalysisManagement summary
The year 2010• In 2010, despite experiencing a recovery in certain
markets, overall worldwide market conditionsremained challenging, particularly in developedcountries. We recorded moderate 4% comparablesales growth; however, as a result of continued focus oncost management, significant improvements in EBIT,
EBITA and Net income were achieved. Additionally,our cash flow from operating activities was higher thanin 2009.
• EBIT of EUR 2,065 million, or 8.1% of sales, wassignificantly higher than the EUR 614 million, or 2.6% ofsales, achieved in 2009. Significant EBIT improvement,led by Lighting, was achieved in all sectors. As apercentage of sales, 2010 EBIT and EBITA were at thehighest levels since 2000.
• Following a strong rebound in the first six months of theyear, sales growth slowed in the second half, ending at10% nominal for the full year. Adjusted for favorablecurrency effects, comparable sales were 4% higher thanin 2009, attributable to growth in all sectors, notablyLighting. Within Lighting, growth in automotive andLED markets was strong, partly mitigated by limitedgrowth at Professional Luminaires due to weakconstruction markets in the US and Western Europe;Healthcare sales grew 4%, supported by 6% growth in
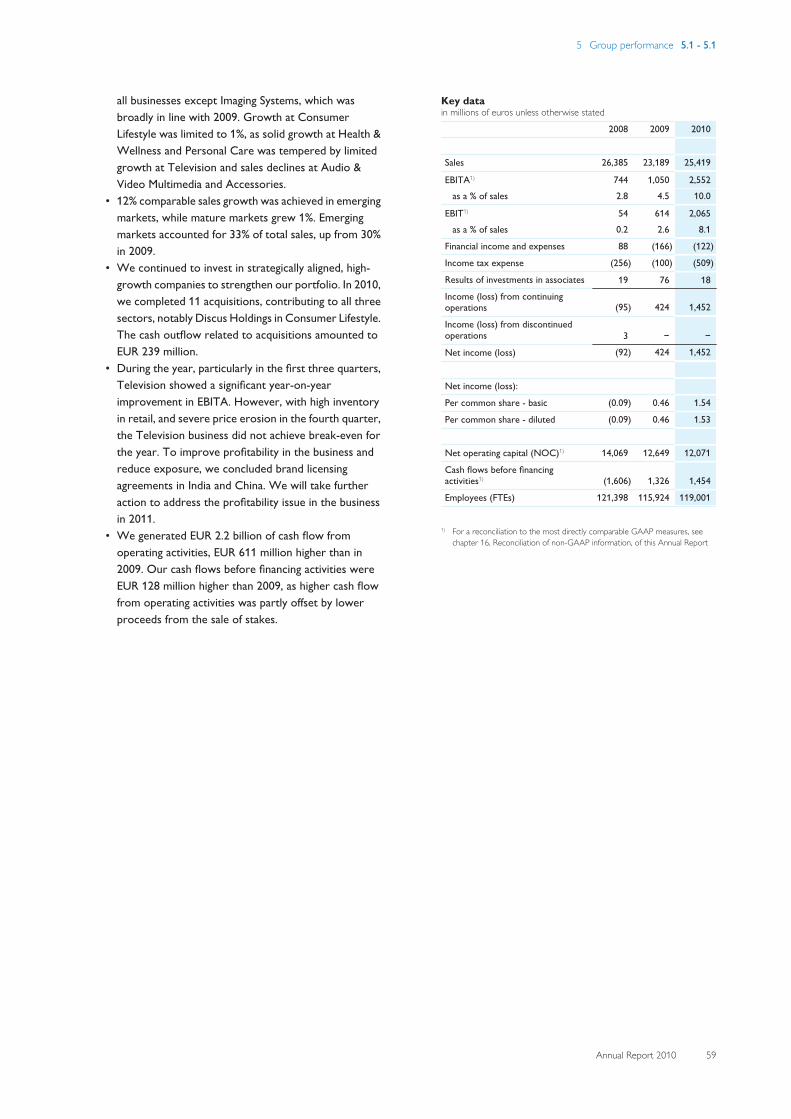
5 Group performance 5.1 - 5.1
Annual Report 2010 59
all businesses except Imaging Systems, which wasbroadly in line with 2009. Growth at ConsumerLifestyle was limited to 1%, as solid growth at Health &Wellness and Personal Care was tempered by limitedgrowth at Television and sales declines at Audio &Video Multimedia and Accessories.
• 12% comparable sales growth was achieved in emergingmarkets, while mature markets grew 1%. Emergingmarkets accounted for 33% of total sales, up from 30%in 2009.
• We continued to invest in strategically aligned, high-growth companies to strengthen our portfolio. In 2010,we completed 11 acquisitions, contributing to all threesectors, notably Discus Holdings in Consumer Lifestyle.The cash outflow related to acquisitions amounted toEUR 239 million.
• During the year, particularly in the first three quarters,Television showed a significant year-on-yearimprovement in EBITA. However, with high inventoryin retail, and severe price erosion in the fourth quarter,the Television business did not achieve break-even forthe year. To improve profitability in the business andreduce exposure, we concluded brand licensingagreements in India and China. We will take furtheraction to address the profitability issue in the businessin 2011.
• We generated EUR 2.2 billion of cash flow fromoperating activities, EUR 611 million higher than in2009. Our cash flows before financing activities wereEUR 128 million higher than 2009, as higher cash flowfrom operating activities was partly offset by lowerproceeds from the sale of stakes.
Key datain millions of euros unless otherwise stated
2008 2009 2010
Sales 26,385 23,189 25,419
EBITA1) 744 1,050 2,552 as a % of sales 2.8 4.5 10.0
EBIT1) 54 614 2,065 as a % of sales 0.2 2.6 8.1
Financial income and expenses 88 (166) (122)
Income tax expense (256) (100) (509)
Results of investments in associates 19 76 18 Income (loss) from continuingoperations (95) 424 1,452
Income (loss) from discontinuedoperations 3 − −
Net income (loss) (92) 424 1,452
Net income (loss):
Per common share - basic (0.09) 0.46 1.54
Per common share - diluted (0.09) 0.46 1.53
Net operating capital (NOC)1) 14,069 12,649 12,071
Cash flows before financingactivities1) (1,606) 1,326 1,454
Employees (FTEs) 121,398 115,924 119,001
1) For a reconciliation to the most directly comparable GAAP measures, seechapter 16, Reconciliation of non-GAAP information, of this Annual Report
5 Group performance 5.1.1 - 5.1.2
60 Annual Report 2010
5.1.1 SalesThe composition of sales growth in percentage terms in2010, compared to 2009, is presented in the table below.
Sales growth composition 2010 versus 2009in %
comparablegrowth
currencyeffects
consolida-tion
changes nominalgrowth
Healthcare 3.9 6.0 (0.2) 9.7
ConsumerLifestyle 1.2 4.7 (0.7) 5.2
Lighting 8.7 6.0 0.7 15.4
GM&S 6.4 3.0 (2.6) 6.8 Philips Group 4.3 5.5 (0.2) 9.6
Group sales amounted to EUR 25,419 million in 2010, 10%nominal growth compared to 2009. Excluding a 6%favorable currency effect, comparable sales were 4%above 2009. Comparable sales were 9% higher at Lightingand 4% higher at Healthcare, though were tempered by1% higher sales at Consumer Lifestyle.
Healthcare sales amounted to EUR 8,601 million, whichwas 4% higher than in 2009 on a comparable basis, drivenby 6% growth at Patient Care & Clinical Informatics,Home Healthcare Solutions, and Customer Services.Sales at Imaging Systems were broadly in line with 2009, asgrowth in emerging markets was largely offset by lowersales in North America.
Consumer Lifestyle reported sales of EUR 8,906 million,which was EUR 439 million higher than in 2009, or 1%higher on a comparable basis. We achieved double-digitgrowth at Health & Wellness and high single-digit growthat Personal Care. This was tempered by 1% comparablegrowth at Television and year-on-year sales declines atAudio & Video Multimedia and Accessories.
Lighting sales amounted to EUR 7,552 million, which wasEUR 1 billion higher than in 2009, or 9% higher on acomparable basis. Growth was largely driven by double-digit growth at Lumileds, Automotive Lighting, andLighting Systems & Controls. Ongoing weakness inresidential and commercial construction markets meantour Luminaires businesses yielded little growth.
5.1.2 EarningsIn 2010, Philips’ gross margin was EUR 9,546 million, or37.6% of sales, compared to EUR 8,079 million, or 34.8%of sales, in 2009. Gross margin in 2010 included EUR 111million restructuring and acquisition-related charges,whereas 2009 included EUR 268 million of restructuringand acquisition-related charges and net asbestos-related
recoveries of EUR 57 million. Gross margin percentagewas higher than in 2009 in all operating sectors, notablyLighting.
Selling expenses increased from EUR 5,159 million in 2009to EUR 5,246 million in 2010. 2010 included EUR 88million of restructuring and acquisition-related charges,compared to EUR 185 million in 2009. The year-on-yearincrease was mainly attributable to higher expenses aimedat supporting higher sales, and increased investments inadvertising and promotion. In relation to sales, sellingexpenses decreased from 22.2% to 20.6%. Expenses werelower than in 2009 in all sectors.
General and administrative expenses amounted to EUR735 million in 2010, compared to EUR 734 million in 2009.As a percentage of sales, costs improved from 3.2% in2009 to 2.9%.
Research and development costs declined from EUR1,631 million in 2009 to EUR 1,576 million in 2010. Theyear-on-year decline was largely attributable to lowerrestructuring and acquisition-related charges, whichamounted to EUR 13 million in 2010, compared to EUR 73million in 2009, and to the discontinuation of certainactivities in the field of Molecular Healthcare and 3DDisplays. As a percentage of sales, research anddevelopment costs decreased from 7.0% in 2009 to 6.2%.
The overview below shows sales, EBIT and EBITAaccording to the 2010 sector classifications.
Sales, EBIT and EBITA 2010in millions of euros unless otherwise stated
sales EBIT % EBITA1) %
Healthcare 8,601 922 10.7 1,186 13.8
Consumer Lifestyle 8,906 595 6.7 639 7.2
Lighting 7,552 695 9.2 869 11.5
GM&S 360 (147) − (142) − Philips Group 25,419 2,065 8.1 2,552 10.0
1) For a reconciliation to the most directly comparable GAAP measures, seechapter 16, Reconciliation of non-GAAP information, of this Annual Report
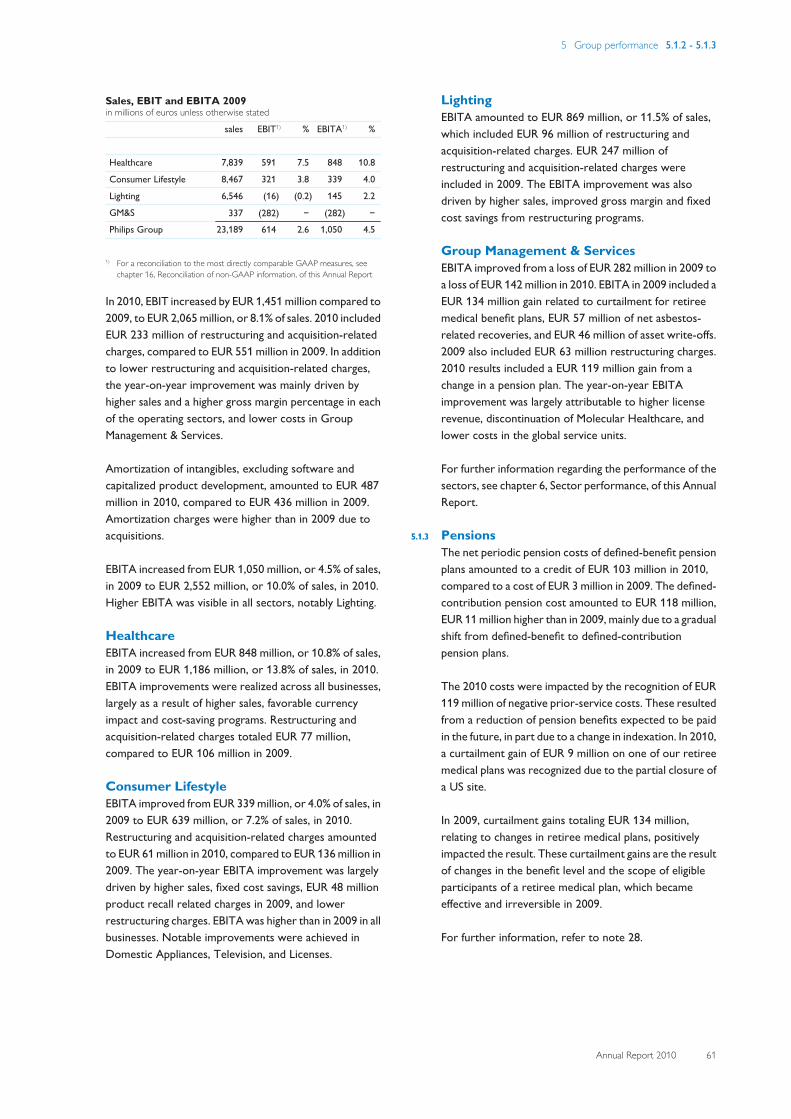
5 Group performance 5.1.2 - 5.1.3
Annual Report 2010 61
Sales, EBIT and EBITA 2009in millions of euros unless otherwise stated
sales EBIT1) % EBITA1) %
Healthcare 7,839 591 7.5 848 10.8
Consumer Lifestyle 8,467 321 3.8 339 4.0
Lighting 6,546 (16) (0.2) 145 2.2
GM&S 337 (282) − (282) − Philips Group 23,189 614 2.6 1,050 4.5
1) For a reconciliation to the most directly comparable GAAP measures, seechapter 16, Reconciliation of non-GAAP information, of this Annual Report
In 2010, EBIT increased by EUR 1,451 million compared to2009, to EUR 2,065 million, or 8.1% of sales. 2010 includedEUR 233 million of restructuring and acquisition-relatedcharges, compared to EUR 551 million in 2009. In additionto lower restructuring and acquisition-related charges,the year-on-year improvement was mainly driven byhigher sales and a higher gross margin percentage in eachof the operating sectors, and lower costs in GroupManagement & Services.
Amortization of intangibles, excluding software andcapitalized product development, amounted to EUR 487million in 2010, compared to EUR 436 million in 2009.Amortization charges were higher than in 2009 due toacquisitions.
EBITA increased from EUR 1,050 million, or 4.5% of sales,in 2009 to EUR 2,552 million, or 10.0% of sales, in 2010.Higher EBITA was visible in all sectors, notably Lighting.
HealthcareEBITA increased from EUR 848 million, or 10.8% of sales,in 2009 to EUR 1,186 million, or 13.8% of sales, in 2010.EBITA improvements were realized across all businesses,largely as a result of higher sales, favorable currencyimpact and cost-saving programs. Restructuring andacquisition-related charges totaled EUR 77 million,compared to EUR 106 million in 2009.
Consumer LifestyleEBITA improved from EUR 339 million, or 4.0% of sales, in2009 to EUR 639 million, or 7.2% of sales, in 2010.Restructuring and acquisition-related charges amountedto EUR 61 million in 2010, compared to EUR 136 million in2009. The year-on-year EBITA improvement was largelydriven by higher sales, fixed cost savings, EUR 48 millionproduct recall related charges in 2009, and lowerrestructuring charges. EBITA was higher than in 2009 in allbusinesses. Notable improvements were achieved inDomestic Appliances, Television, and Licenses.
LightingEBITA amounted to EUR 869 million, or 11.5% of sales,which included EUR 96 million of restructuring andacquisition-related charges. EUR 247 million ofrestructuring and acquisition-related charges wereincluded in 2009. The EBITA improvement was alsodriven by higher sales, improved gross margin and fixedcost savings from restructuring programs.
Group Management & ServicesEBITA improved from a loss of EUR 282 million in 2009 toa loss of EUR 142 million in 2010. EBITA in 2009 included aEUR 134 million gain related to curtailment for retireemedical benefit plans, EUR 57 million of net asbestos-related recoveries, and EUR 46 million of asset write-offs.2009 also included EUR 63 million restructuring charges.2010 results included a EUR 119 million gain from achange in a pension plan. The year-on-year EBITAimprovement was largely attributable to higher licenserevenue, discontinuation of Molecular Healthcare, andlower costs in the global service units.
For further information regarding the performance of thesectors, see chapter 6, Sector performance, of this AnnualReport.
5.1.3 PensionsThe net periodic pension costs of defined-benefit pensionplans amounted to a credit of EUR 103 million in 2010,compared to a cost of EUR 3 million in 2009. The defined-contribution pension cost amounted to EUR 118 million,EUR 11 million higher than in 2009, mainly due to a gradualshift from defined-benefit to defined-contributionpension plans.
The 2010 costs were impacted by the recognition of EUR119 million of negative prior-service costs. These resultedfrom a reduction of pension benefits expected to be paidin the future, in part due to a change in indexation. In 2010,a curtailment gain of EUR 9 million on one of our retireemedical plans was recognized due to the partial closure ofa US site.
In 2009, curtailment gains totaling EUR 134 million,relating to changes in retiree medical plans, positivelyimpacted the result. These curtailment gains are the resultof changes in the benefit level and the scope of eligibleparticipants of a retiree medical plan, which becameeffective and irreversible in 2009.
For further information, refer to note 28.
5 Group performance 5.1.4 - 5.1.5
62 Annual Report 2010
5.1.4 Restructuring and impairment chargesIn 2010, EBIT included net charges totaling EUR 162million for restructuring and related asset impairments.2009 included EUR 450 million of restructuring andrelated asset impairment charges. In addition to the annualgoodwill impairment tests for Philips, trigger-basedimpairment tests were performed during the year,resulting in no goodwill impairments.
For further information on sensitivity analysis, please referto note 8.
Restructuring and related chargesin millions of euros
2008 2009 2010
Restructuring charges per sector:
Healthcare 63 42 48
Consumer Lifestyle 198 120 42
Lighting 245 225 74 GM&S 35 63 (2)
541 450 162
Cost breakdown of restructuring charges:
Personnel lay-off costs 374 399 155
Release of provision (2) (81) (77)
Restructuring-related asset impairment 116 84 19 Other restructuring-related costs 53 481) 65
541 450 162
1) Includes EUR 22 million of costs which were expensed as incurred
The restructuring charges in 2010 were mainlyattributable to the operating sectors. Within Healthcare,the largest projects related to the reorganization of thecommercial organization in Imaging Systems (Germany,Netherlands, and the US). Consumer Lifestylerestructuring charges were mainly in Television,particularly in China due to the brand licensing agreementwith TPV. Restructuring projects in Lighting were focusedon reduction of production capacity in traditional lightingtechnologies, such as incandescent. The largest projectswere initiated in Brazil, France, and the US.
In 2009, the most significant restructuring projects relatedto Lighting and Consumer Lifestyle. Restructuringprojects at Lighting centered on Lamps. The largestrestructuring projects were in the Netherlands, Belgium,Poland and various locations in the US. ConsumerLifestyle restructuring projects focused on Television(primarily Belgium and France), Accessories (mainlyTechnology & Development in the Netherlands) andDomestic Appliances (mainly Singapore and China).Healthcare initiated various restructuring projects aimed
at reduction of the fixed cost structure, mainly impactingImaging Systems (Netherlands), Home HealthcareSolutions and Patient Care & Clinical Informatics (variouslocations in the US).
Other restructuring projects focused on reducing thefixed cost structure of Corporate Technologies, PhilipsInformation Technology, Philips Design, and CorporateOverheads within Group Management & Services.
For further information on restructuring, refer to note 19.
5.1.5 Financial income and expensesA breakdown of Financial income and expenses ispresented in the table below.
Financial income and expensesin millions of euros
2008 2009 2010
Interest expense (net) (105) (252) (225)
Sale of securities 1,406 126 162
Value adjustments on securities (1,148) (58) (2)
Other (65) 18 (57)88 (166) (122)
The net interest expense in 2010 was EUR 27 millionlower than in 2009, mainly as a result of lower interestexpense.
Sale of securitiesin millions of euros
2008 2009 2010
Gain on sale of NXP shares − − 154
Gain on sale of TSMC shares 1,205 − −
Gain on sale of LG Display shares 158 69 −
Gain on sale of D&M shares 20 − −
Gain on sale of Pace shares − 48 −
Others 23 9 8 1,406 126 162
In 2010, income from the sale of securities ofEUR 162 million was mainly attributable to the sale ofNXP shares. In 2009, income from the sale of securitiestotaled EUR 126 million. This included a EUR 69 milliongain from the sale of the remaining shares in LG Display,and a EUR 48 million gain from the sale of the remainingshares in Pace Micro Technology.
5 Group performance 5.1.5 - 5.1.10
Annual Report 2010 63
Value adjustments on securitiesin millions of euros
2008 2009 2010
NXP (599) (48) −
LG Display (448) − −
TPO Display (71) − −
Pace Micro Technology (30) − −
Prime Technology − (6) (2)
Other − (4) − (1,148) (58) (2)
2009 was impacted by impairment charges amounting toEUR 58 million, mainly from shareholdings in NXP.
Other financial expenses amounted to a EUR 57 millionexpense in 2010, compared to EUR 18 million income in2009. 2010 primarily consisted of a EUR 21 million lossrelated to the revaluation of the convertible bondsreceived from TPV Technology and CBaySystemsHoldings (CBAY), and a EUR 20 million accretion expensemainly associated with discounted provisions.
Other financial expenses in 2009 primarily consisted of aEUR 19 million gain related to the revaluation of theconvertible bonds received from TPV Technology andCBAY, and dividend income totaling EUR 16 million, EUR12 million of which related to holdings in LG Display.Other financial expenses included EUR 15 millionaccretion expenses, mainly associated with discountedasbestos provisions.
For further information, refer to note 2.
5.1.6 Income taxesIncome taxes amounted to EUR 509 million, compared toEUR 100 million in 2009. The year-on-year increase waslargely attributable to higher taxable earnings.
The tax burden in 2010 corresponded to an effective taxrate of 26.2%, compared to 22.3% in 2009. The increase inthe effective tax rate was attributable to a change in thecountry mix of income tax rates and a change in the mix ofprofits and losses in the various countries, as well as2009’s recognition of a deferred tax asset for Lumiledspreviously not recognized. This was partly offset by anumber of tax settlements.
For 2011, the effective tax rate excluding incidental non-taxable items is expected to be between 30% and 32%.
For further information, refer to note 3.
5.1.7 Results of investments in associatesThe results related to investments in associates declinedfrom EUR 76 million in 2009 to EUR 18 million in 2010.
Results of investments in associatesin millions of euros
2008 2009 2010
Company’s participation in income 81 23 14
Results on sale of shares (2) − 5
Gains arising from dilution effects 12 − −
(Reversal of) investment impairmentand guarantee charges (72) 53 (1)
19 76 18
The company’s participation in income declined from EUR23 million in 2009 to EUR 14 million in 2010, mainly due tothe sale of our remaining stake in TPV Technology.
In 2009, following recovery of the TPV share price, theaccumulated value adjustment of the shareholding in TPVrecognized in 2008 was reversed by EUR 55 million. Thecompany’s participation in income of EUR 23 million in2009 was mainly attributable to results on Intertrust.
For further information, refer to note 4.
5.1.8 Non-controlling interestsNet income attributable to non-controlling interestsamounted to EUR 6 million in 2010, compared to EUR 14million in 2009.
5.1.9 Net incomeNet income increased from EUR 424 million in 2009 toEUR 1,452 million. The improvement was driven by EUR1,451 million higher EBIT and EUR 44 million lower costsin Financial income and expenses, partly offset by EUR 409million higher income tax charges and EUR 58 millionlower income from our investments in associates.
Net income attributable to shareholders per commonshare increased from EUR 0.44 per common share in 2009to EUR 1.54 per common share in 2010.
5.1.10 Acquisitions and divestmentsIn 2010 Philips completed eleven strategically-alignedacquisitions, benefiting all three operating sectors.
In 2010, acquisitions resulted in integration and purchase-accounting charges totaling EUR 70 million: HealthcareEUR 29 million, Consumer Lifestyle EUR 19 million, andLighting EUR 22 million.
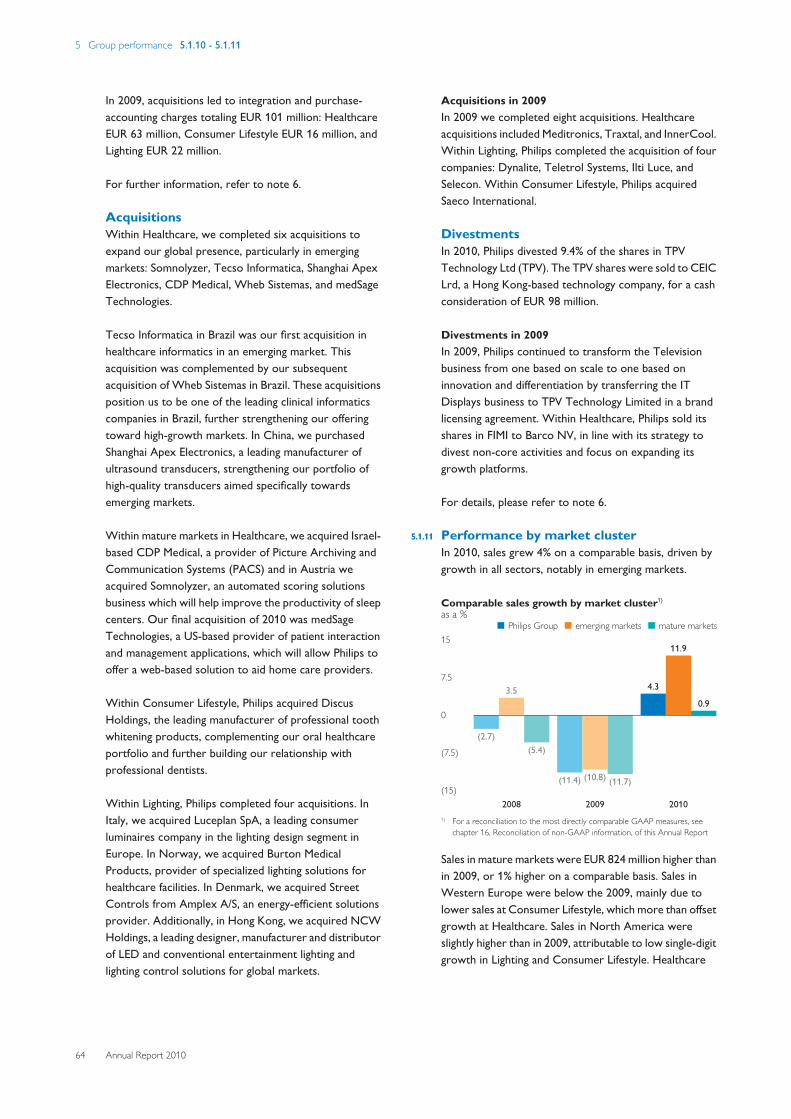
5 Group performance 5.1.10 - 5.1.11
64 Annual Report 2010
In 2009, acquisitions led to integration and purchase-accounting charges totaling EUR 101 million: HealthcareEUR 63 million, Consumer Lifestyle EUR 16 million, andLighting EUR 22 million.
For further information, refer to note 6.
AcquisitionsWithin Healthcare, we completed six acquisitions toexpand our global presence, particularly in emergingmarkets: Somnolyzer, Tecso Informatica, Shanghai ApexElectronics, CDP Medical, Wheb Sistemas, and medSageTechnologies.
Tecso Informatica in Brazil was our first acquisition inhealthcare informatics in an emerging market. Thisacquisition was complemented by our subsequentacquisition of Wheb Sistemas in Brazil. These acquisitionsposition us to be one of the leading clinical informaticscompanies in Brazil, further strengthening our offeringtoward high-growth markets. In China, we purchasedShanghai Apex Electronics, a leading manufacturer ofultrasound transducers, strengthening our portfolio ofhigh-quality transducers aimed specifically towardsemerging markets.
Within mature markets in Healthcare, we acquired Israel-based CDP Medical, a provider of Picture Archiving andCommunication Systems (PACS) and in Austria weacquired Somnolyzer, an automated scoring solutionsbusiness which will help improve the productivity of sleepcenters. Our final acquisition of 2010 was medSageTechnologies, a US-based provider of patient interactionand management applications, which will allow Philips tooffer a web-based solution to aid home care providers.
Within Consumer Lifestyle, Philips acquired DiscusHoldings, the leading manufacturer of professional toothwhitening products, complementing our oral healthcareportfolio and further building our relationship withprofessional dentists.
Within Lighting, Philips completed four acquisitions. InItaly, we acquired Luceplan SpA, a leading consumerluminaires company in the lighting design segment inEurope. In Norway, we acquired Burton MedicalProducts, provider of specialized lighting solutions forhealthcare facilities. In Denmark, we acquired StreetControls from Amplex A/S, an energy-efficient solutionsprovider. Additionally, in Hong Kong, we acquired NCWHoldings, a leading designer, manufacturer and distributorof LED and conventional entertainment lighting andlighting control solutions for global markets.
Acquisitions in 2009In 2009 we completed eight acquisitions. Healthcareacquisitions included Meditronics, Traxtal, and InnerCool.Within Lighting, Philips completed the acquisition of fourcompanies: Dynalite, Teletrol Systems, Ilti Luce, andSelecon. Within Consumer Lifestyle, Philips acquiredSaeco International.
DivestmentsIn 2010, Philips divested 9.4% of the shares in TPVTechnology Ltd (TPV). The TPV shares were sold to CEICLrd, a Hong Kong-based technology company, for a cashconsideration of EUR 98 million.
Divestments in 2009In 2009, Philips continued to transform the Televisionbusiness from one based on scale to one based oninnovation and differentiation by transferring the ITDisplays business to TPV Technology Limited in a brandlicensing agreement. Within Healthcare, Philips sold itsshares in FIMI to Barco NV, in line with its strategy todivest non-core activities and focus on expanding itsgrowth platforms.
For details, please refer to note 6.
5.1.11 Performance by market clusterIn 2010, sales grew 4% on a comparable basis, driven bygrowth in all sectors, notably in emerging markets.
Comparable sales growth by market cluster1)
as a %■-Philips Group--■-emerging markets--■-mature markets
15
7.5
0
(7.5)
(15)
(2.7)
3.5
(5.4)
2008
(11.4) (10.8) (11.7)
2009
4.3
11.9
0.9
20101) For a reconciliation to the most directly comparable GAAP measures, see
chapter 16, Reconciliation of non-GAAP information, of this Annual Report
Sales in mature markets were EUR 824 million higher thanin 2009, or 1% higher on a comparable basis. Sales inWestern Europe were below the 2009, mainly due tolower sales at Consumer Lifestyle, which more than offsetgrowth at Healthcare. Sales in North America wereslightly higher than in 2009, attributable to low single-digitgrowth in Lighting and Consumer Lifestyle. Healthcare
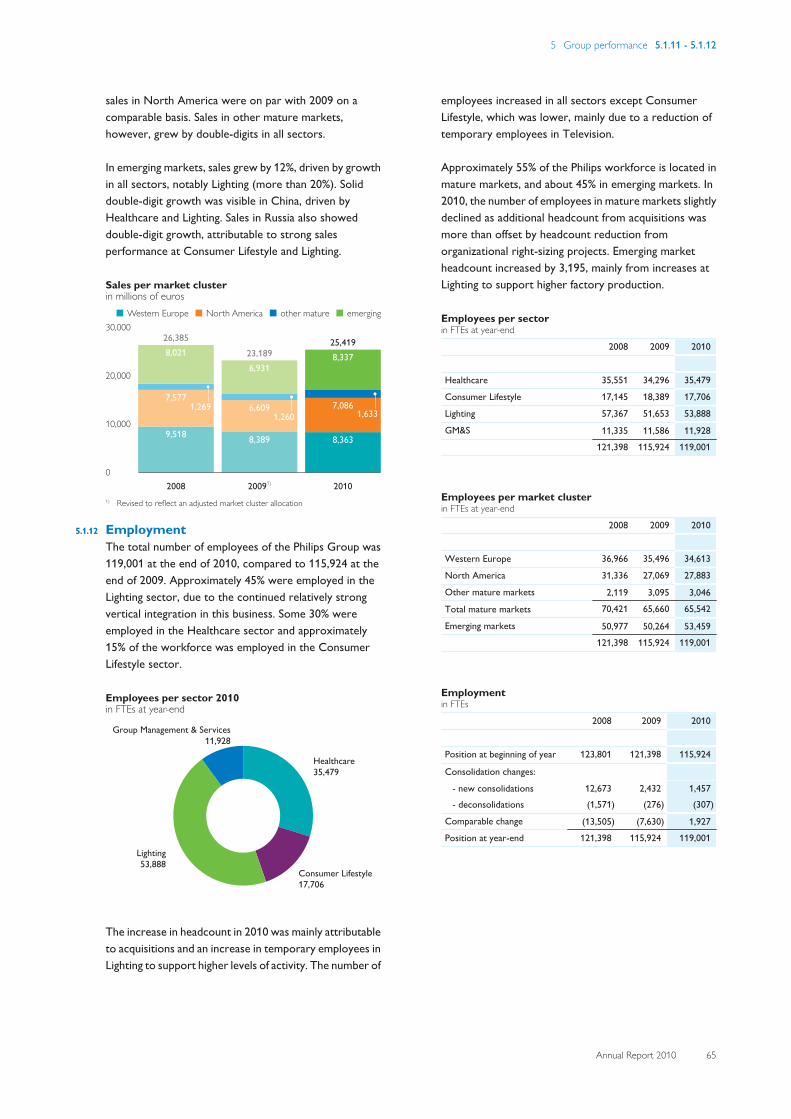
5 Group performance 5.1.11 - 5.1.12
Annual Report 2010 65
sales in North America were on par with 2009 on acomparable basis. Sales in other mature markets,however, grew by double-digits in all sectors.
In emerging markets, sales grew by 12%, driven by growthin all sectors, notably Lighting (more than 20%). Soliddouble-digit growth was visible in China, driven byHealthcare and Lighting. Sales in Russia also showeddouble-digit growth, attributable to strong salesperformance at Consumer Lifestyle and Lighting.
Sales per market clusterin millions of euros■-Western Europe--■-North America--■-other mature--■-emerging
30,000
20,000
10,000
02008
9,518
7,5771,269
8,02126,385
20091)
8,389
6,6091,260
6,93123,189
2010
8,363
7,0861,633
8,33725,419
1) Revised to reflect an adjusted market cluster allocation
5.1.12 EmploymentThe total number of employees of the Philips Group was119,001 at the end of 2010, compared to 115,924 at theend of 2009. Approximately 45% were employed in theLighting sector, due to the continued relatively strongvertical integration in this business. Some 30% wereemployed in the Healthcare sector and approximately15% of the workforce was employed in the ConsumerLifestyle sector.
Employees per sector 2010in FTEs at year-end
Healthcare35,479
Consumer Lifestyle17,706
Lighting53,888
Group Management & Services11,928
The increase in headcount in 2010 was mainly attributableto acquisitions and an increase in temporary employees inLighting to support higher levels of activity. The number of
employees increased in all sectors except ConsumerLifestyle, which was lower, mainly due to a reduction oftemporary employees in Television.
Approximately 55% of the Philips workforce is located inmature markets, and about 45% in emerging markets. In2010, the number of employees in mature markets slightlydeclined as additional headcount from acquisitions wasmore than offset by headcount reduction fromorganizational right-sizing projects. Emerging marketheadcount increased by 3,195, mainly from increases atLighting to support higher factory production.
Employees per sectorin FTEs at year-end
2008 2009 2010
Healthcare 35,551 34,296 35,479
Consumer Lifestyle 17,145 18,389 17,706
Lighting 57,367 51,653 53,888
GM&S 11,335 11,586 11,928 121,398 115,924 119,001
Employees per market clusterin FTEs at year-end
2008 2009 2010
Western Europe 36,966 35,496 34,613
North America 31,336 27,069 27,883
Other mature markets 2,119 3,095 3,046
Total mature markets 70,421 65,660 65,542
Emerging markets 50,977 50,264 53,459 121,398 115,924 119,001
Employmentin FTEs
2008 2009 2010
Position at beginning of year 123,801 121,398 115,924
Consolidation changes:
- new consolidations 12,673 2,432 1,457 - deconsolidations (1,571) (276) (307)
Comparable change (13,505) (7,630) 1,927 Position at year-end 121,398 115,924 119,001
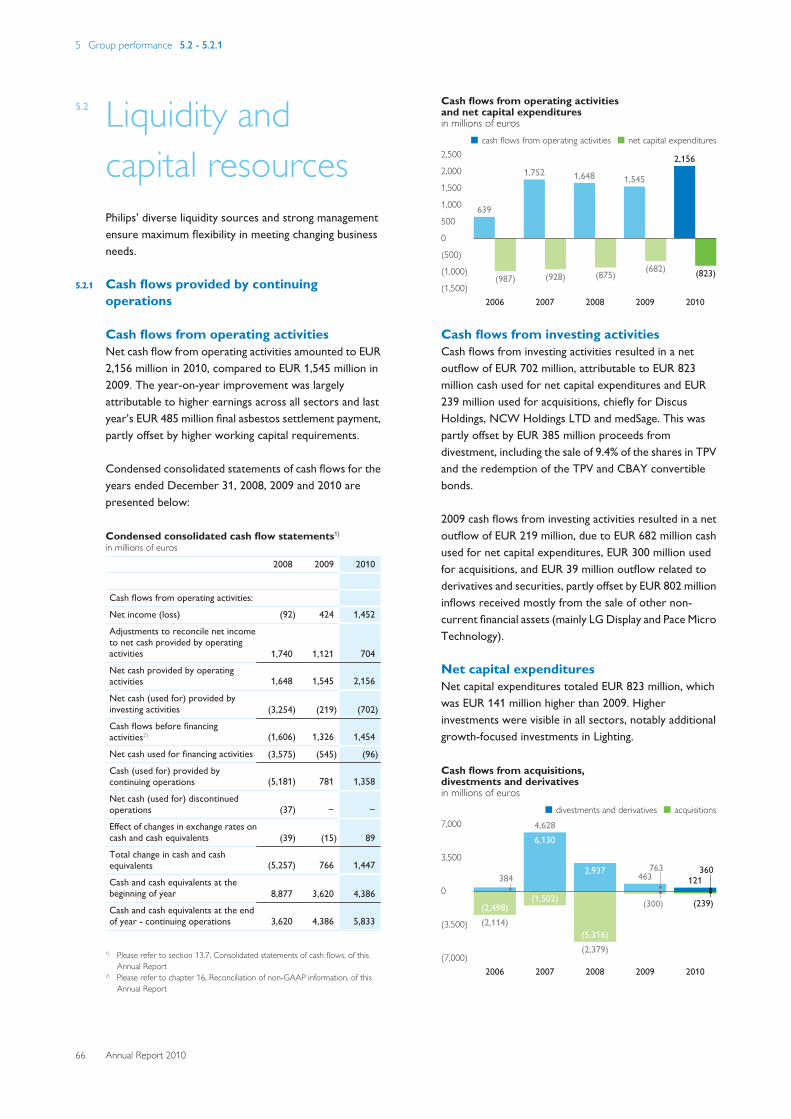
5 Group performance 5.2 - 5.2.1
66 Annual Report 2010
5.2 Liquidity andcapital resourcesPhilips’ diverse liquidity sources and strong managementensure maximum flexibility in meeting changing businessneeds.
5.2.1 Cash flows provided by continuingoperations
Cash flows from operating activitiesNet cash flow from operating activities amounted to EUR2,156 million in 2010, compared to EUR 1,545 million in2009. The year-on-year improvement was largelyattributable to higher earnings across all sectors and lastyear’s EUR 485 million final asbestos settlement payment,partly offset by higher working capital requirements.
Condensed consolidated statements of cash flows for theyears ended December 31, 2008, 2009 and 2010 arepresented below:
Condensed consolidated cash flow statements1)
in millions of euros
2008 2009 2010
Cash flows from operating activities:
Net income (loss) (92) 424 1,452
Adjustments to reconcile net incometo net cash provided by operatingactivities 1,740 1,121 704 Net cash provided by operatingactivities 1,648 1,545 2,156
Net cash (used for) provided byinvesting activities (3,254) (219) (702)Cash flows before financingactivities2) (1,606) 1,326 1,454
Net cash used for financing activities (3,575) (545) (96)Cash (used for) provided bycontinuing operations (5,181) 781 1,358
Net cash (used for) discontinuedoperations (37) − −
Effect of changes in exchange rates oncash and cash equivalents (39) (15) 89 Total change in cash and cashequivalents (5,257) 766 1,447
Cash and cash equivalents at thebeginning of year 8,877 3,620 4,386 Cash and cash equivalents at the endof year - continuing operations 3,620 4,386 5,833
1) Please refer to section 13.7, Consolidated statements of cash flows, of thisAnnual Report
2) Please refer to chapter 16, Reconciliation of non-GAAP information, of thisAnnual Report
Cash flows from operating activities and net capital expendituresin millions of euros
■-cash flows from operating activities--■-net capital expenditures2,500
2,000
1,500
1,000
500
0
(500)
(1,000)
(1,500)
639
(987)
2006
1,752
(928)
2007
1,648
(875)
2008
1,545
(682)
2009
2,156
(823)
2010
Cash flows from investing activitiesCash flows from investing activities resulted in a netoutflow of EUR 702 million, attributable to EUR 823million cash used for net capital expenditures and EUR239 million used for acquisitions, chiefly for DiscusHoldings, NCW Holdings LTD and medSage. This waspartly offset by EUR 385 million proceeds fromdivestment, including the sale of 9.4% of the shares in TPVand the redemption of the TPV and CBAY convertiblebonds.
2009 cash flows from investing activities resulted in a netoutflow of EUR 219 million, due to EUR 682 million cashused for net capital expenditures, EUR 300 million usedfor acquisitions, and EUR 39 million outflow related toderivatives and securities, partly offset by EUR 802 millioninflows received mostly from the sale of other non-current financial assets (mainly LG Display and Pace MicroTechnology).
Net capital expendituresNet capital expenditures totaled EUR 823 million, whichwas EUR 141 million higher than 2009. Higherinvestments were visible in all sectors, notably additionalgrowth-focused investments in Lighting.
Cash flows from acquisitions, divestments and derivativesin millions of euros
■-divestments and derivatives--■-acquisitions7,000
3,500
0
(3,500)
(7,000)
384
(2,498)(2,114)
2006
6,130
(1,502)
4,628
2007
2,937
(5,316)(2,379)
2008
763
(300)
463
2009
360
(239)
121
2010
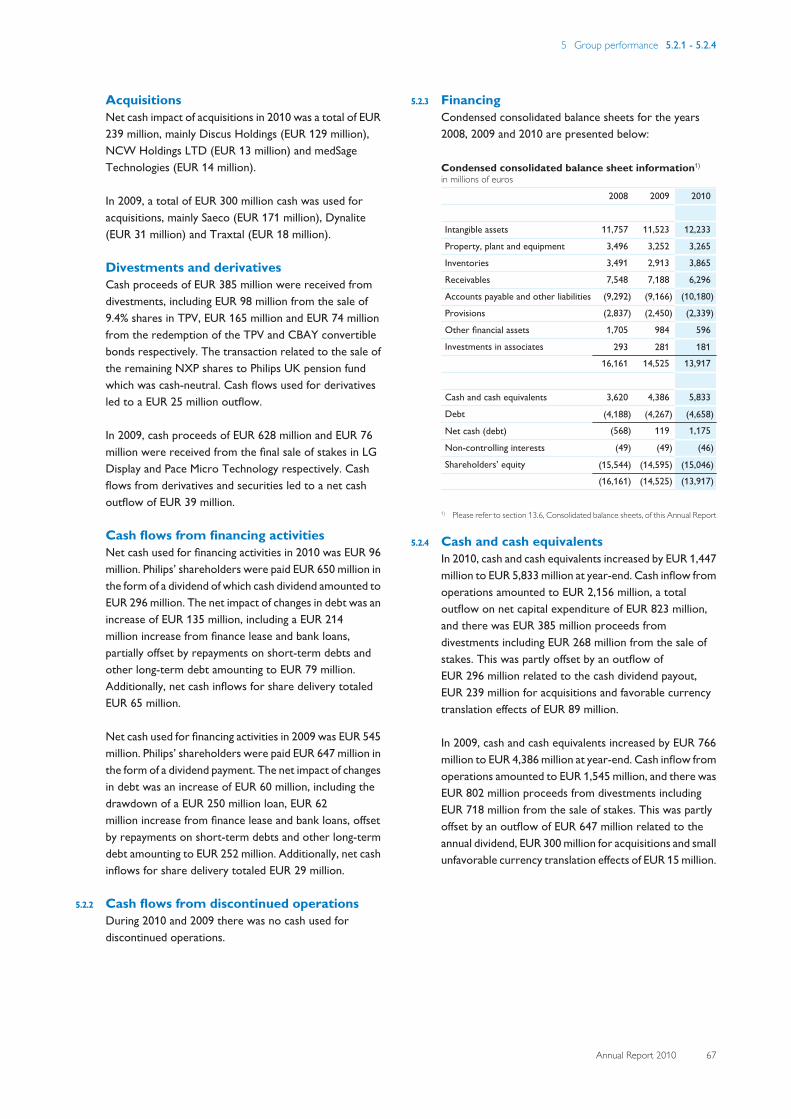
5 Group performance 5.2.1 - 5.2.4
Annual Report 2010 67
AcquisitionsNet cash impact of acquisitions in 2010 was a total of EUR239 million, mainly Discus Holdings (EUR 129 million),NCW Holdings LTD (EUR 13 million) and medSageTechnologies (EUR 14 million).
In 2009, a total of EUR 300 million cash was used foracquisitions, mainly Saeco (EUR 171 million), Dynalite(EUR 31 million) and Traxtal (EUR 18 million).
Divestments and derivativesCash proceeds of EUR 385 million were received fromdivestments, including EUR 98 million from the sale of9.4% shares in TPV, EUR 165 million and EUR 74 millionfrom the redemption of the TPV and CBAY convertiblebonds respectively. The transaction related to the sale ofthe remaining NXP shares to Philips UK pension fundwhich was cash-neutral. Cash flows used for derivativesled to a EUR 25 million outflow.
In 2009, cash proceeds of EUR 628 million and EUR 76million were received from the final sale of stakes in LGDisplay and Pace Micro Technology respectively. Cashflows from derivatives and securities led to a net cashoutflow of EUR 39 million.
Cash flows from financing activitiesNet cash used for financing activities in 2010 was EUR 96million. Philips’ shareholders were paid EUR 650 million inthe form of a dividend of which cash dividend amounted toEUR 296 million. The net impact of changes in debt was anincrease of EUR 135 million, including a EUR 214million increase from finance lease and bank loans,partially offset by repayments on short-term debts andother long-term debt amounting to EUR 79 million.Additionally, net cash inflows for share delivery totaledEUR 65 million.
Net cash used for financing activities in 2009 was EUR 545million. Philips’ shareholders were paid EUR 647 million inthe form of a dividend payment. The net impact of changesin debt was an increase of EUR 60 million, including thedrawdown of a EUR 250 million loan, EUR 62million increase from finance lease and bank loans, offsetby repayments on short-term debts and other long-termdebt amounting to EUR 252 million. Additionally, net cashinflows for share delivery totaled EUR 29 million.
5.2.2 Cash flows from discontinued operationsDuring 2010 and 2009 there was no cash used fordiscontinued operations.
5.2.3 FinancingCondensed consolidated balance sheets for the years2008, 2009 and 2010 are presented below:
Condensed consolidated balance sheet information1)
in millions of euros
2008 2009 2010
Intangible assets 11,757 11,523 12,233
Property, plant and equipment 3,496 3,252 3,265
Inventories 3,491 2,913 3,865
Receivables 7,548 7,188 6,296
Accounts payable and other liabilities (9,292) (9,166) (10,180)
Provisions (2,837) (2,450) (2,339)
Other financial assets 1,705 984 596
Investments in associates 293 281 181 16,161 14,525 13,917
Cash and cash equivalents 3,620 4,386 5,833
Debt (4,188) (4,267) (4,658)
Net cash (debt) (568) 119 1,175
Non-controlling interests (49) (49) (46)
Shareholders’ equity (15,544) (14,595) (15,046)(16,161) (14,525) (13,917)
1) Please refer to section 13.6, Consolidated balance sheets, of this Annual Report
5.2.4 Cash and cash equivalentsIn 2010, cash and cash equivalents increased by EUR 1,447million to EUR 5,833 million at year-end. Cash inflow fromoperations amounted to EUR 2,156 million, a totaloutflow on net capital expenditure of EUR 823 million,and there was EUR 385 million proceeds fromdivestments including EUR 268 million from the sale ofstakes. This was partly offset by an outflow ofEUR 296 million related to the cash dividend payout,EUR 239 million for acquisitions and favorable currencytranslation effects of EUR 89 million.
In 2009, cash and cash equivalents increased by EUR 766million to EUR 4,386 million at year-end. Cash inflow fromoperations amounted to EUR 1,545 million, and there wasEUR 802 million proceeds from divestments includingEUR 718 million from the sale of stakes. This was partlyoffset by an outflow of EUR 647 million related to theannual dividend, EUR 300 million for acquisitions and smallunfavorable currency translation effects of EUR 15 million.
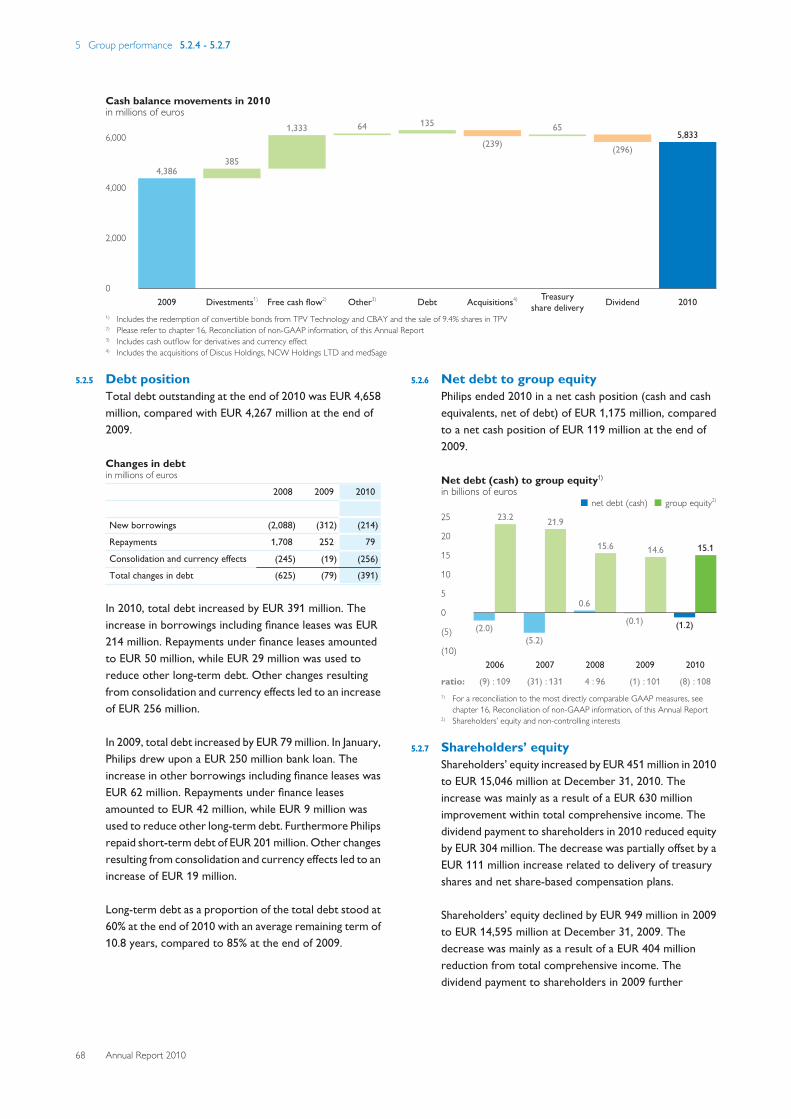
5 Group performance 5.2.4 - 5.2.7
68 Annual Report 2010
Cash balance movements in 2010in millions of euros
6,000
4,000
2,000
0
4,386
2009
385
Divestments1)
1,333
Free cash flow2)
64
Other3)
135
Debt
(239)
Acquisitions4)
65
Treasuryshare delivery
(296)
Dividend
5,833
20101) Includes the redemption of convertible bonds from TPV Technology and CBAY and the sale of 9.4% shares in TPV2) Please refer to chapter 16, Reconciliation of non-GAAP information, of this Annual Report3) Includes cash outflow for derivatives and currency effect4) Includes the acquisitions of Discus Holdings, NCW Holdings LTD and medSage
5.2.5 Debt positionTotal debt outstanding at the end of 2010 was EUR 4,658million, compared with EUR 4,267 million at the end of2009.
Changes in debtin millions of euros
2008 2009 2010
New borrowings (2,088) (312) (214)
Repayments 1,708 252 79
Consolidation and currency effects (245) (19) (256)Total changes in debt (625) (79) (391)
In 2010, total debt increased by EUR 391 million. Theincrease in borrowings including finance leases was EUR214 million. Repayments under finance leases amountedto EUR 50 million, while EUR 29 million was used toreduce other long-term debt. Other changes resultingfrom consolidation and currency effects led to an increaseof EUR 256 million.
In 2009, total debt increased by EUR 79 million. In January,Philips drew upon a EUR 250 million bank loan. Theincrease in other borrowings including finance leases wasEUR 62 million. Repayments under finance leasesamounted to EUR 42 million, while EUR 9 million wasused to reduce other long-term debt. Furthermore Philipsrepaid short-term debt of EUR 201 million. Other changesresulting from consolidation and currency effects led to anincrease of EUR 19 million.
Long-term debt as a proportion of the total debt stood at60% at the end of 2010 with an average remaining term of10.8 years, compared to 85% at the end of 2009.
5.2.6 Net debt to group equityPhilips ended 2010 in a net cash position (cash and cashequivalents, net of debt) of EUR 1,175 million, comparedto a net cash position of EUR 119 million at the end of2009.
Net debt (cash) to group equity1)
in billions of euros■-net debt (cash)--■-group equity2)
25
20
15
10
5
0
(5)
(10)
(2.0)
23.2
(9) : 109
2006
(5.2)
21.9
(31) : 131
2007
0.6
15.6
4 : 96
2008
(0.1)
14.6
(1) : 101
2009
(1.2)
15.1
(8) : 108
2010
ratio:1) For a reconciliation to the most directly comparable GAAP measures, see
chapter 16, Reconciliation of non-GAAP information, of this Annual Report2) Shareholders’ equity and non-controlling interests
5.2.7 Shareholders’ equityShareholders’ equity increased by EUR 451 million in 2010to EUR 15,046 million at December 31, 2010. Theincrease was mainly as a result of a EUR 630 millionimprovement within total comprehensive income. Thedividend payment to shareholders in 2010 reduced equityby EUR 304 million. The decrease was partially offset by aEUR 111 million increase related to delivery of treasuryshares and net share-based compensation plans.
Shareholders’ equity declined by EUR 949 million in 2009to EUR 14,595 million at December 31, 2009. Thedecrease was mainly as a result of a EUR 404 millionreduction from total comprehensive income. Thedividend payment to shareholders in 2009 further
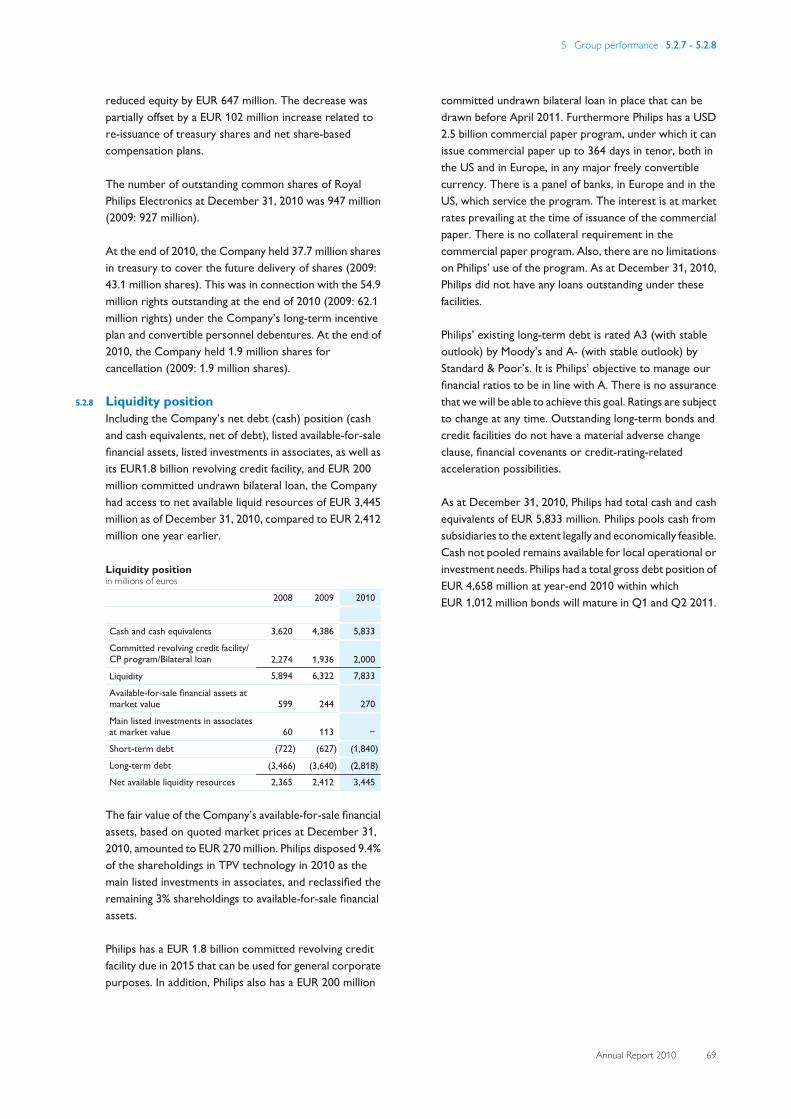
5 Group performance 5.2.7 - 5.2.8
Annual Report 2010 69
reduced equity by EUR 647 million. The decrease waspartially offset by a EUR 102 million increase related tore-issuance of treasury shares and net share-basedcompensation plans.
The number of outstanding common shares of RoyalPhilips Electronics at December 31, 2010 was 947 million(2009: 927 million).
At the end of 2010, the Company held 37.7 million sharesin treasury to cover the future delivery of shares (2009:43.1 million shares). This was in connection with the 54.9million rights outstanding at the end of 2010 (2009: 62.1million rights) under the Company’s long-term incentiveplan and convertible personnel debentures. At the end of2010, the Company held 1.9 million shares forcancellation (2009: 1.9 million shares).
5.2.8 Liquidity positionIncluding the Company’s net debt (cash) position (cashand cash equivalents, net of debt), listed available-for-salefinancial assets, listed investments in associates, as well asits EUR1.8 billion revolving credit facility, and EUR 200million committed undrawn bilateral loan, the Companyhad access to net available liquid resources of EUR 3,445million as of December 31, 2010, compared to EUR 2,412million one year earlier.
Liquidity positionin millions of euros
2008 2009 2010
Cash and cash equivalents 3,620 4,386 5,833
Committed revolving credit facility/CP program/Bilateral loan 2,274 1,936 2,000
Liquidity 5,894 6,322 7,833
Available-for-sale financial assets atmarket value 599 244 270
Main listed investments in associatesat market value 60 113 −
Short-term debt (722) (627) (1,840)
Long-term debt (3,466) (3,640) (2,818)Net available liquidity resources 2,365 2,412 3,445
The fair value of the Company’s available-for-sale financialassets, based on quoted market prices at December 31,2010, amounted to EUR 270 million. Philips disposed 9.4%of the shareholdings in TPV technology in 2010 as themain listed investments in associates, and reclassified theremaining 3% shareholdings to available-for-sale financialassets.
Philips has a EUR 1.8 billion committed revolving creditfacility due in 2015 that can be used for general corporatepurposes. In addition, Philips also has a EUR 200 million
committed undrawn bilateral loan in place that can bedrawn before April 2011. Furthermore Philips has a USD2.5 billion commercial paper program, under which it canissue commercial paper up to 364 days in tenor, both inthe US and in Europe, in any major freely convertiblecurrency. There is a panel of banks, in Europe and in theUS, which service the program. The interest is at marketrates prevailing at the time of issuance of the commercialpaper. There is no collateral requirement in thecommercial paper program. Also, there are no limitationson Philips’ use of the program. As at December 31, 2010,Philips did not have any loans outstanding under thesefacilities.
Philips’ existing long-term debt is rated A3 (with stableoutlook) by Moody’s and A- (with stable outlook) byStandard & Poor’s. It is Philips’ objective to manage ourfinancial ratios to be in line with A. There is no assurancethat we will be able to achieve this goal. Ratings are subjectto change at any time. Outstanding long-term bonds andcredit facilities do not have a material adverse changeclause, financial covenants or credit-rating-relatedacceleration possibilities.
As at December 31, 2010, Philips had total cash and cashequivalents of EUR 5,833 million. Philips pools cash fromsubsidiaries to the extent legally and economically feasible.Cash not pooled remains available for local operational orinvestment needs. Philips had a total gross debt position ofEUR 4,658 million at year-end 2010 within whichEUR 1,012 million bonds will mature in Q1 and Q2 2011.
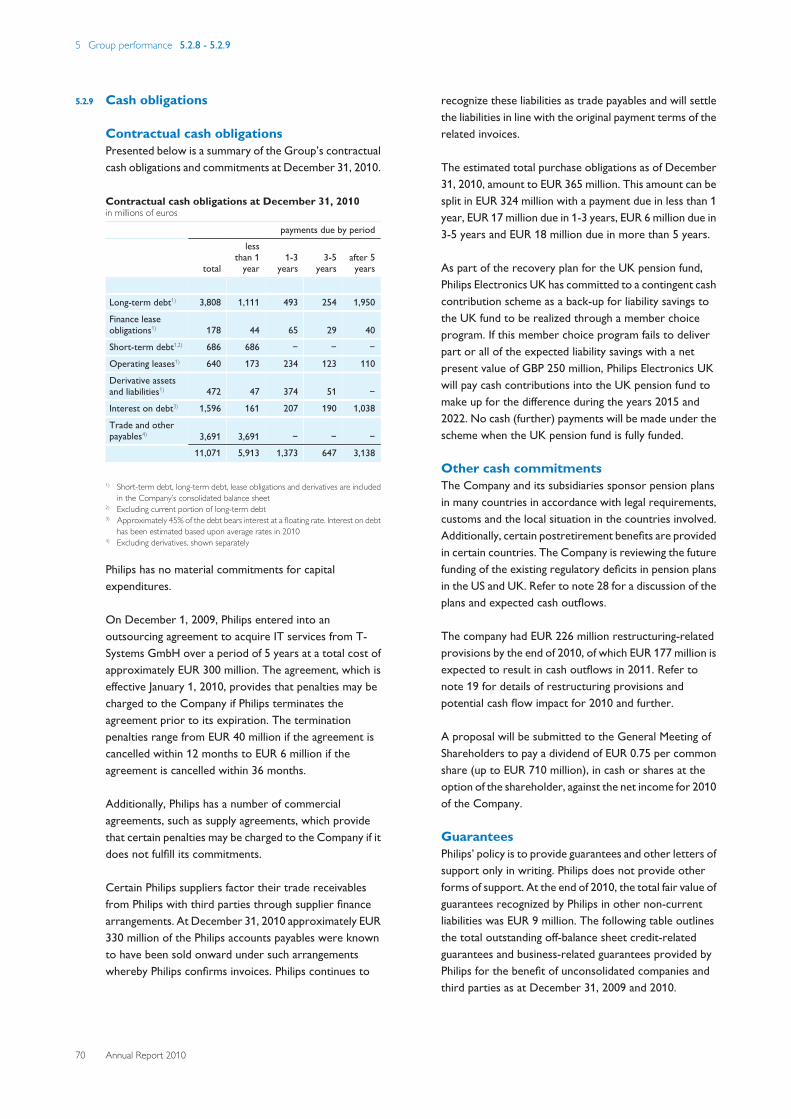
5 Group performance 5.2.8 - 5.2.9
70 Annual Report 2010
5.2.9 Cash obligations
Contractual cash obligationsPresented below is a summary of the Group’s contractualcash obligations and commitments at December 31, 2010.
Contractual cash obligations at December 31, 2010in millions of euros
payments due by period
total
lessthan 1
year 1-3
years 3-5
years after 5years
Long-term debt1) 3,808 1,111 493 254 1,950
Finance leaseobligations1) 178 44 65 29 40
Short-term debt1,2) 686 686 − − −
Operating leases1) 640 173 234 123 110
Derivative assetsand liabilities1) 472 47 374 51 −
Interest on debt3) 1,596 161 207 190 1,038
Trade and otherpayables4) 3,691 3,691 − − −
11,071 5,913 1,373 647 3,138
1) Short-term debt, long-term debt, lease obligations and derivatives are includedin the Company’s consolidated balance sheet
2) Excluding current portion of long-term debt3) Approximately 45% of the debt bears interest at a floating rate. Interest on debt
has been estimated based upon average rates in 20104) Excluding derivatives, shown separately
Philips has no material commitments for capitalexpenditures.
On December 1, 2009, Philips entered into anoutsourcing agreement to acquire IT services from T-Systems GmbH over a period of 5 years at a total cost ofapproximately EUR 300 million. The agreement, which iseffective January 1, 2010, provides that penalties may becharged to the Company if Philips terminates theagreement prior to its expiration. The terminationpenalties range from EUR 40 million if the agreement iscancelled within 12 months to EUR 6 million if theagreement is cancelled within 36 months.
Additionally, Philips has a number of commercialagreements, such as supply agreements, which providethat certain penalties may be charged to the Company if itdoes not fulfill its commitments.
Certain Philips suppliers factor their trade receivablesfrom Philips with third parties through supplier financearrangements. At December 31, 2010 approximately EUR330 million of the Philips accounts payables were knownto have been sold onward under such arrangementswhereby Philips confirms invoices. Philips continues to
recognize these liabilities as trade payables and will settlethe liabilities in line with the original payment terms of therelated invoices.
The estimated total purchase obligations as of December31, 2010, amount to EUR 365 million. This amount can besplit in EUR 324 million with a payment due in less than 1year, EUR 17 million due in 1-3 years, EUR 6 million due in3-5 years and EUR 18 million due in more than 5 years.
As part of the recovery plan for the UK pension fund,Philips Electronics UK has committed to a contingent cashcontribution scheme as a back-up for liability savings tothe UK fund to be realized through a member choiceprogram. If this member choice program fails to deliverpart or all of the expected liability savings with a netpresent value of GBP 250 million, Philips Electronics UKwill pay cash contributions into the UK pension fund tomake up for the difference during the years 2015 and2022. No cash (further) payments will be made under thescheme when the UK pension fund is fully funded.
Other cash commitmentsThe Company and its subsidiaries sponsor pension plansin many countries in accordance with legal requirements,customs and the local situation in the countries involved.Additionally, certain postretirement benefits are providedin certain countries. The Company is reviewing the futurefunding of the existing regulatory deficits in pension plansin the US and UK. Refer to note 28 for a discussion of theplans and expected cash outflows.
The company had EUR 226 million restructuring-relatedprovisions by the end of 2010, of which EUR 177 million isexpected to result in cash outflows in 2011. Refer tonote 19 for details of restructuring provisions andpotential cash flow impact for 2010 and further.
A proposal will be submitted to the General Meeting ofShareholders to pay a dividend of EUR 0.75 per commonshare (up to EUR 710 million), in cash or shares at theoption of the shareholder, against the net income for 2010of the Company.
GuaranteesPhilips’ policy is to provide guarantees and other letters ofsupport only in writing. Philips does not provide otherforms of support. At the end of 2010, the total fair value ofguarantees recognized by Philips in other non-currentliabilities was EUR 9 million. The following table outlinesthe total outstanding off-balance sheet credit-relatedguarantees and business-related guarantees provided byPhilips for the benefit of unconsolidated companies andthird parties as at December 31, 2009 and 2010.
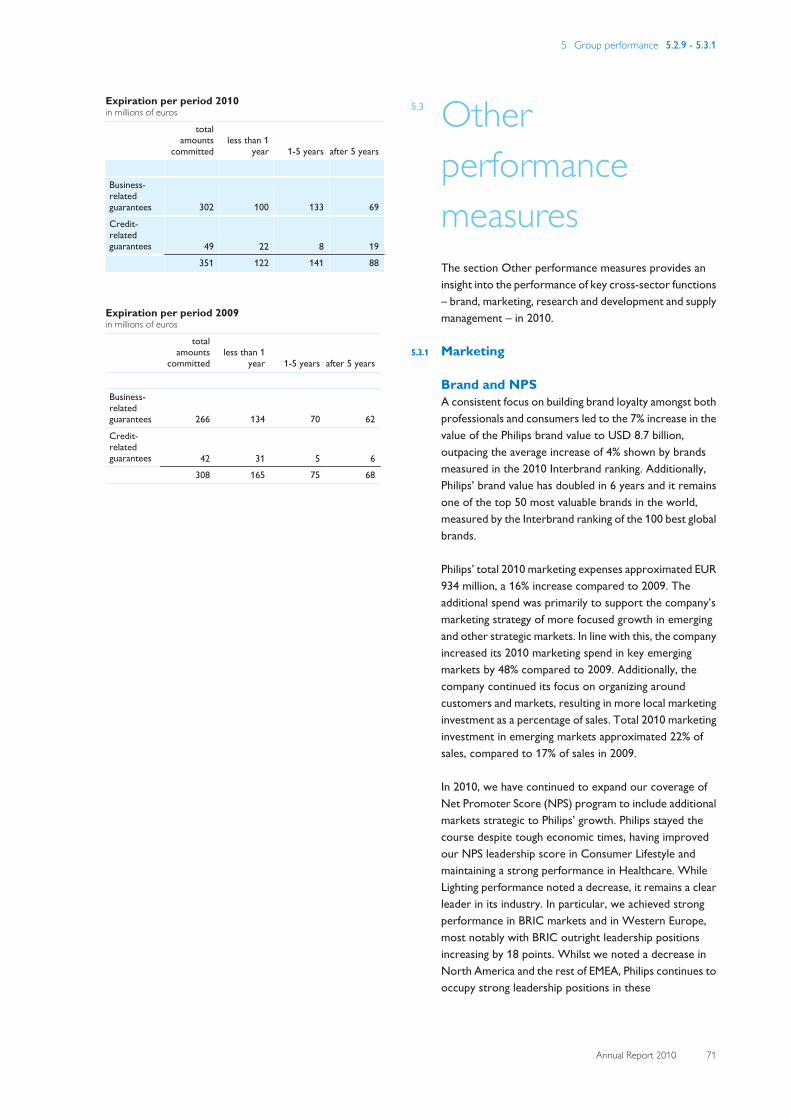
5 Group performance 5.2.9 - 5.3.1
Annual Report 2010 71
Expiration per period 2010in millions of euros
totalamounts
committed less than 1
year 1-5 years after 5 years
Business-relatedguarantees 302 100 133 69
Credit-relatedguarantees 49 22 8 19
351 122 141 88
Expiration per period 2009in millions of euros
totalamounts
committed less than 1
year 1-5 years after 5 years
Business-relatedguarantees 266 134 70 62
Credit-relatedguarantees 42 31 5 6
308 165 75 68
5.3 OtherperformancemeasuresThe section Other performance measures provides aninsight into the performance of key cross-sector functions– brand, marketing, research and development and supplymanagement – in 2010.
5.3.1 Marketing
Brand and NPSA consistent focus on building brand loyalty amongst bothprofessionals and consumers led to the 7% increase in thevalue of the Philips brand value to USD 8.7 billion,outpacing the average increase of 4% shown by brandsmeasured in the 2010 Interbrand ranking. Additionally,Philips’ brand value has doubled in 6 years and it remainsone of the top 50 most valuable brands in the world,measured by the Interbrand ranking of the 100 best globalbrands.
Philips’ total 2010 marketing expenses approximated EUR934 million, a 16% increase compared to 2009. Theadditional spend was primarily to support the company’smarketing strategy of more focused growth in emergingand other strategic markets. In line with this, the companyincreased its 2010 marketing spend in key emergingmarkets by 48% compared to 2009. Additionally, thecompany continued its focus on organizing aroundcustomers and markets, resulting in more local marketinginvestment as a percentage of sales. Total 2010 marketinginvestment in emerging markets approximated 22% ofsales, compared to 17% of sales in 2009.
In 2010, we have continued to expand our coverage ofNet Promoter Score (NPS) program to include additionalmarkets strategic to Philips’ growth. Philips stayed thecourse despite tough economic times, having improvedour NPS leadership score in Consumer Lifestyle andmaintaining a strong performance in Healthcare. WhileLighting performance noted a decrease, it remains a clearleader in its industry. In particular, we achieved strongperformance in BRIC markets and in Western Europe,most notably with BRIC outright leadership positionsincreasing by 18 points. Whilst we noted a decrease inNorth America and the rest of EMEA, Philips continues tooccupy strong leadership positions in these
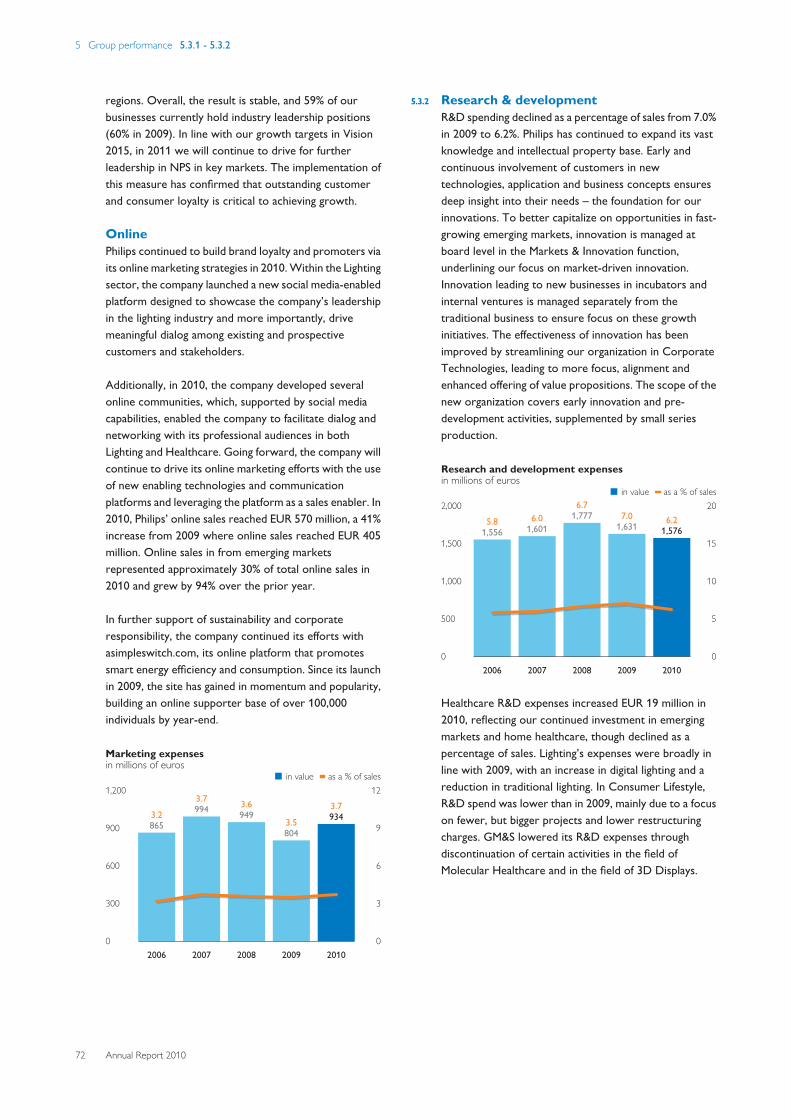
5 Group performance 5.3.1 - 5.3.2
72 Annual Report 2010
regions. Overall, the result is stable, and 59% of ourbusinesses currently hold industry leadership positions(60% in 2009). In line with our growth targets in Vision2015, in 2011 we will continue to drive for furtherleadership in NPS in key markets. The implementation ofthis measure has confirmed that outstanding customerand consumer loyalty is critical to achieving growth.
OnlinePhilips continued to build brand loyalty and promoters viaits online marketing strategies in 2010. Within the Lightingsector, the company launched a new social media-enabledplatform designed to showcase the company’s leadershipin the lighting industry and more importantly, drivemeaningful dialog among existing and prospectivecustomers and stakeholders.
Additionally, in 2010, the company developed severalonline communities, which, supported by social mediacapabilities, enabled the company to facilitate dialog andnetworking with its professional audiences in bothLighting and Healthcare. Going forward, the company willcontinue to drive its online marketing efforts with the useof new enabling technologies and communicationplatforms and leveraging the platform as a sales enabler. In2010, Philips’ online sales reached EUR 570 million, a 41%increase from 2009 where online sales reached EUR 405million. Online sales in from emerging marketsrepresented approximately 30% of total online sales in2010 and grew by 94% over the prior year.
In further support of sustainability and corporateresponsibility, the company continued its efforts withasimpleswitch.com, its online platform that promotessmart energy efficiency and consumption. Since its launchin 2009, the site has gained in momentum and popularity,building an online supporter base of over 100,000individuals by year-end.
Marketing expensesin millions of euros
■-in value----as a % of sales1,200
900
600
300
0
12
9
6
3
0
3.2865
2006
3.7994
2007
3.6949
2008
3.5804
2009
3.7934
2010
5.3.2 Research & developmentR&D spending declined as a percentage of sales from 7.0%in 2009 to 6.2%. Philips has continued to expand its vastknowledge and intellectual property base. Early andcontinuous involvement of customers in newtechnologies, application and business concepts ensuresdeep insight into their needs – the foundation for ourinnovations. To better capitalize on opportunities in fast-growing emerging markets, innovation is managed atboard level in the Markets & Innovation function,underlining our focus on market-driven innovation.Innovation leading to new businesses in incubators andinternal ventures is managed separately from thetraditional business to ensure focus on these growthinitiatives. The effectiveness of innovation has beenimproved by streamlining our organization in CorporateTechnologies, leading to more focus, alignment andenhanced offering of value propositions. The scope of thenew organization covers early innovation and pre-development activities, supplemented by small seriesproduction.
Research and development expensesin millions of euros
■-in value----as a % of sales2,000
1,500
1,000
500
0
20
15
10
5
0
5.81,556
2006
6.01,601
2007
6.71,777
2008
7.01,631
2009
6.21,576
2010
Healthcare R&D expenses increased EUR 19 million in2010, reflecting our continued investment in emergingmarkets and home healthcare, though declined as apercentage of sales. Lighting’s expenses were broadly inline with 2009, with an increase in digital lighting and areduction in traditional lighting. In Consumer Lifestyle,R&D spend was lower than in 2009, mainly due to a focuson fewer, but bigger projects and lower restructuringcharges. GM&S lowered its R&D expenses throughdiscontinuation of certain activities in the field ofMolecular Healthcare and in the field of 3D Displays.
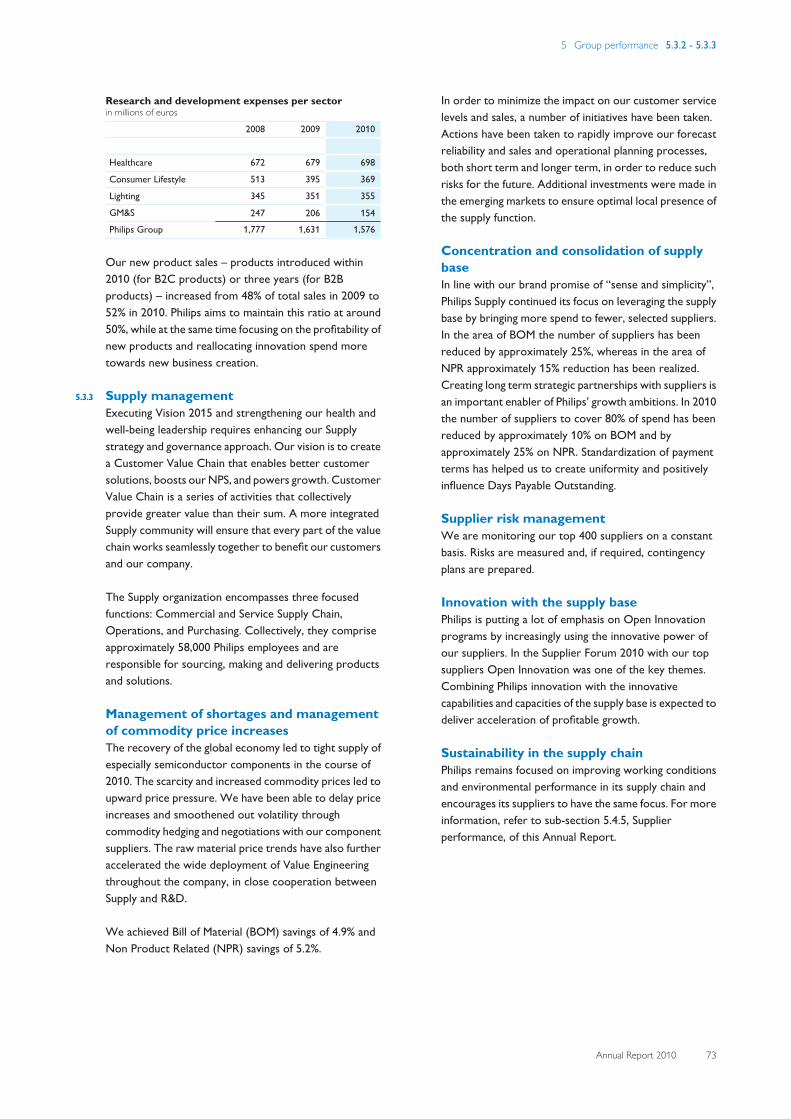
5 Group performance 5.3.2 - 5.3.3
Annual Report 2010 73
Research and development expenses per sectorin millions of euros
2008 2009 2010
Healthcare 672 679 698
Consumer Lifestyle 513 395 369
Lighting 345 351 355
GM&S 247 206 154 Philips Group 1,777 1,631 1,576
Our new product sales – products introduced within2010 (for B2C products) or three years (for B2Bproducts) – increased from 48% of total sales in 2009 to52% in 2010. Philips aims to maintain this ratio at around50%, while at the same time focusing on the profitability ofnew products and reallocating innovation spend moretowards new business creation.
5.3.3 Supply managementExecuting Vision 2015 and strengthening our health andwell-being leadership requires enhancing our Supplystrategy and governance approach. Our vision is to createa Customer Value Chain that enables better customersolutions, boosts our NPS, and powers growth. CustomerValue Chain is a series of activities that collectivelyprovide greater value than their sum. A more integratedSupply community will ensure that every part of the valuechain works seamlessly together to benefit our customersand our company.
The Supply organization encompasses three focusedfunctions: Commercial and Service Supply Chain,Operations, and Purchasing. Collectively, they compriseapproximately 58,000 Philips employees and areresponsible for sourcing, making and delivering productsand solutions.
Management of shortages and managementof commodity price increasesThe recovery of the global economy led to tight supply ofespecially semiconductor components in the course of2010. The scarcity and increased commodity prices led toupward price pressure. We have been able to delay priceincreases and smoothened out volatility throughcommodity hedging and negotiations with our componentsuppliers. The raw material price trends have also furtheraccelerated the wide deployment of Value Engineeringthroughout the company, in close cooperation betweenSupply and R&D.
We achieved Bill of Material (BOM) savings of 4.9% andNon Product Related (NPR) savings of 5.2%.
In order to minimize the impact on our customer servicelevels and sales, a number of initiatives have been taken.Actions have been taken to rapidly improve our forecastreliability and sales and operational planning processes,both short term and longer term, in order to reduce suchrisks for the future. Additional investments were made inthe emerging markets to ensure optimal local presence ofthe supply function.
Concentration and consolidation of supplybaseIn line with our brand promise of “sense and simplicity”,Philips Supply continued its focus on leveraging the supplybase by bringing more spend to fewer, selected suppliers.In the area of BOM the number of suppliers has beenreduced by approximately 25%, whereas in the area ofNPR approximately 15% reduction has been realized.Creating long term strategic partnerships with suppliers isan important enabler of Philips’ growth ambitions. In 2010the number of suppliers to cover 80% of spend has beenreduced by approximately 10% on BOM and byapproximately 25% on NPR. Standardization of paymentterms has helped us to create uniformity and positivelyinfluence Days Payable Outstanding.
Supplier risk managementWe are monitoring our top 400 suppliers on a constantbasis. Risks are measured and, if required, contingencyplans are prepared.
Innovation with the supply basePhilips is putting a lot of emphasis on Open Innovationprograms by increasingly using the innovative power ofour suppliers. In the Supplier Forum 2010 with our topsuppliers Open Innovation was one of the key themes.Combining Philips innovation with the innovativecapabilities and capacities of the supply base is expected todeliver acceleration of profitable growth.
Sustainability in the supply chainPhilips remains focused on improving working conditionsand environmental performance in its supply chain andencourages its suppliers to have the same focus. For moreinformation, refer to sub-section 5.4.5, Supplierperformance, of this Annual Report.
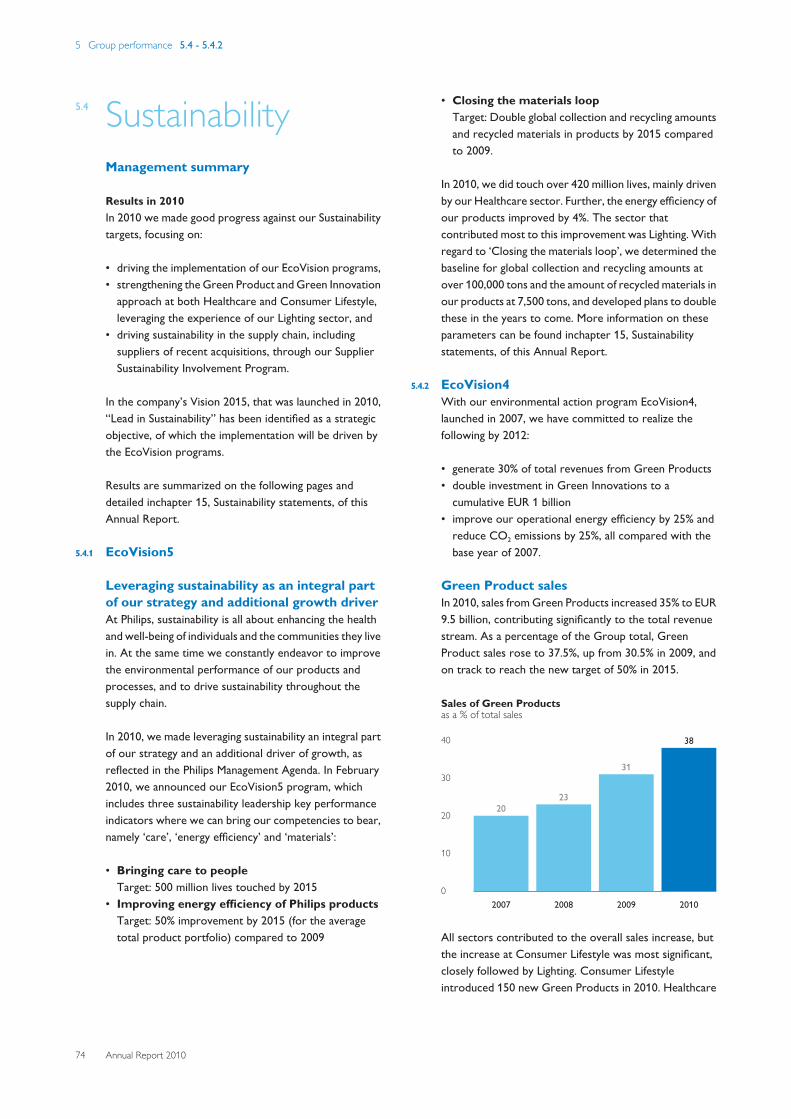
5 Group performance 5.4 - 5.4.2
74 Annual Report 2010
5.4 SustainabilityManagement summary
Results in 2010In 2010 we made good progress against our Sustainabilitytargets, focusing on:
• driving the implementation of our EcoVision programs,• strengthening the Green Product and Green Innovation
approach at both Healthcare and Consumer Lifestyle,leveraging the experience of our Lighting sector, and
• driving sustainability in the supply chain, includingsuppliers of recent acquisitions, through our SupplierSustainability Involvement Program.
In the company’s Vision 2015, that was launched in 2010,“Lead in Sustainability” has been identified as a strategicobjective, of which the implementation will be driven bythe EcoVision programs.
Results are summarized on the following pages anddetailed inchapter 15, Sustainability statements, of thisAnnual Report.
5.4.1 EcoVision5
Leveraging sustainability as an integral partof our strategy and additional growth driverAt Philips, sustainability is all about enhancing the healthand well-being of individuals and the communities they livein. At the same time we constantly endeavor to improvethe environmental performance of our products andprocesses, and to drive sustainability throughout thesupply chain.
In 2010, we made leveraging sustainability an integral partof our strategy and an additional driver of growth, asreflected in the Philips Management Agenda. In February2010, we announced our EcoVision5 program, whichincludes three sustainability leadership key performanceindicators where we can bring our competencies to bear,namely ‘care’, ‘energy efficiency’ and ‘materials’:
• Bringing care to peopleTarget: 500 million lives touched by 2015
• Improving energy efficiency of Philips productsTarget: 50% improvement by 2015 (for the averagetotal product portfolio) compared to 2009
• Closing the materials loopTarget: Double global collection and recycling amountsand recycled materials in products by 2015 comparedto 2009.
In 2010, we did touch over 420 million lives, mainly drivenby our Healthcare sector. Further, the energy efficiency ofour products improved by 4%. The sector thatcontributed most to this improvement was Lighting. Withregard to ‘Closing the materials loop’, we determined thebaseline for global collection and recycling amounts atover 100,000 tons and the amount of recycled materials inour products at 7,500 tons, and developed plans to doublethese in the years to come. More information on theseparameters can be found inchapter 15, Sustainabilitystatements, of this Annual Report.
5.4.2 EcoVision4With our environmental action program EcoVision4,launched in 2007, we have committed to realize thefollowing by 2012:
• generate 30% of total revenues from Green Products• double investment in Green Innovations to a
cumulative EUR 1 billion• improve our operational energy efficiency by 25% and
reduce CO2 emissions by 25%, all compared with thebase year of 2007.
Green Product salesIn 2010, sales from Green Products increased 35% to EUR9.5 billion, contributing significantly to the total revenuestream. As a percentage of the Group total, GreenProduct sales rose to 37.5%, up from 30.5% in 2009, andon track to reach the new target of 50% in 2015.
Sales of Green Productsas a % of total sales
40
30
20
10
0
20
2007
23
2008
31
2009
38
2010
All sectors contributed to the overall sales increase, butthe increase at Consumer Lifestyle was most significant,closely followed by Lighting. Consumer Lifestyleintroduced 150 new Green Products in 2010. Healthcare
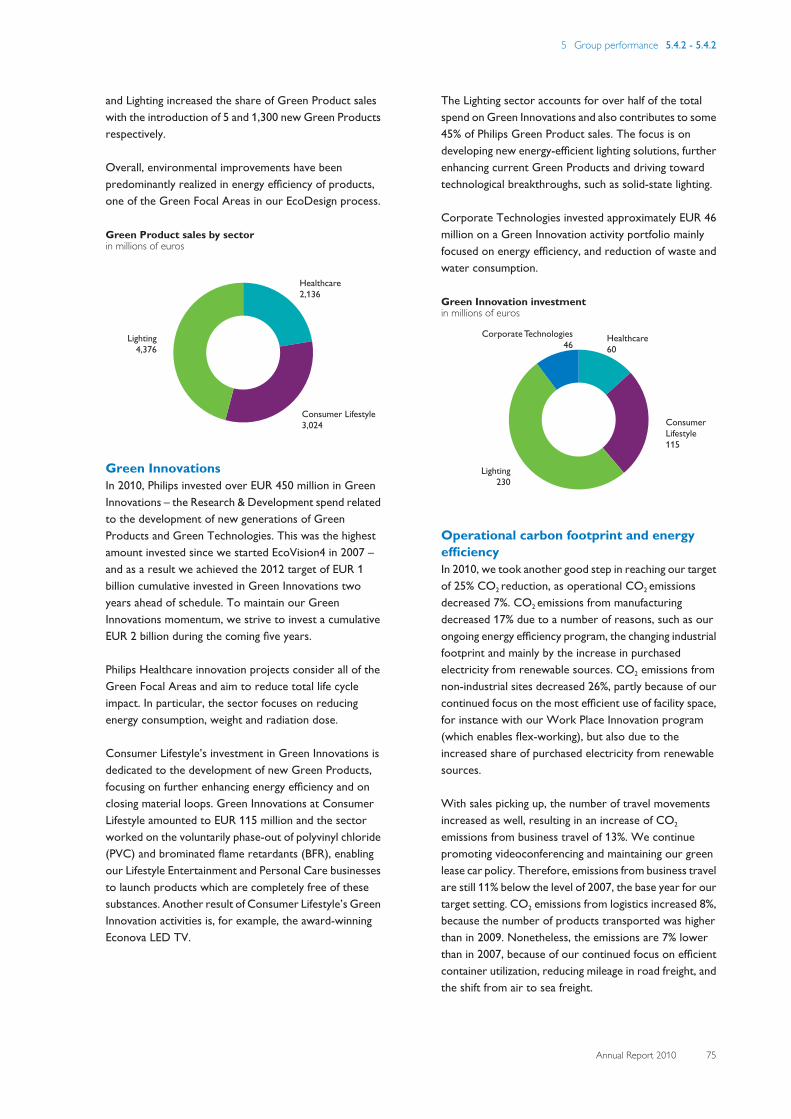
5 Group performance 5.4.2 - 5.4.2
Annual Report 2010 75
and Lighting increased the share of Green Product saleswith the introduction of 5 and 1,300 new Green Productsrespectively.
Overall, environmental improvements have beenpredominantly realized in energy efficiency of products,one of the Green Focal Areas in our EcoDesign process.
Green Product sales by sectorin millions of euros
Healthcare2,136
Consumer Lifestyle3,024
Lighting4,376
Green InnovationsIn 2010, Philips invested over EUR 450 million in GreenInnovations – the Research & Development spend relatedto the development of new generations of GreenProducts and Green Technologies. This was the highestamount invested since we started EcoVision4 in 2007 –and as a result we achieved the 2012 target of EUR 1billion cumulative invested in Green Innovations twoyears ahead of schedule. To maintain our GreenInnovations momentum, we strive to invest a cumulativeEUR 2 billion during the coming five years.
Philips Healthcare innovation projects consider all of theGreen Focal Areas and aim to reduce total life cycleimpact. In particular, the sector focuses on reducingenergy consumption, weight and radiation dose.
Consumer Lifestyle’s investment in Green Innovations isdedicated to the development of new Green Products,focusing on further enhancing energy efficiency and onclosing material loops. Green Innovations at ConsumerLifestyle amounted to EUR 115 million and the sectorworked on the voluntarily phase-out of polyvinyl chloride(PVC) and brominated flame retardants (BFR), enablingour Lifestyle Entertainment and Personal Care businessesto launch products which are completely free of thesesubstances. Another result of Consumer Lifestyle’s GreenInnovation activities is, for example, the award-winningEconova LED TV.
The Lighting sector accounts for over half of the totalspend on Green Innovations and also contributes to some45% of Philips Green Product sales. The focus is ondeveloping new energy-efficient lighting solutions, furtherenhancing current Green Products and driving towardtechnological breakthroughs, such as solid-state lighting.
Corporate Technologies invested approximately EUR 46million on a Green Innovation activity portfolio mainlyfocused on energy efficiency, and reduction of waste andwater consumption.
Green Innovation investmentin millions of euros
Healthcare60
ConsumerLifestyle115
Lighting230
Corporate Technologies46
Operational carbon footprint and energyefficiencyIn 2010, we took another good step in reaching our targetof 25% CO2 reduction, as operational CO2 emissionsdecreased 7%. CO2 emissions from manufacturingdecreased 17% due to a number of reasons, such as ourongoing energy efficiency program, the changing industrialfootprint and mainly by the increase in purchasedelectricity from renewable sources. CO2 emissions fromnon-industrial sites decreased 26%, partly because of ourcontinued focus on the most efficient use of facility space,for instance with our Work Place Innovation program(which enables flex-working), but also due to theincreased share of purchased electricity from renewablesources.
With sales picking up, the number of travel movementsincreased as well, resulting in an increase of CO2
emissions from business travel of 13%. We continuepromoting videoconferencing and maintaining our greenlease car policy. Therefore, emissions from business travelare still 11% below the level of 2007, the base year for ourtarget setting. CO2 emissions from logistics increased 8%,because the number of products transported was higherthan in 2009. Nonetheless, the emissions are 7% lowerthan in 2007, because of our continued focus on efficientcontainer utilization, reducing mileage in road freight, andthe shift from air to sea freight.
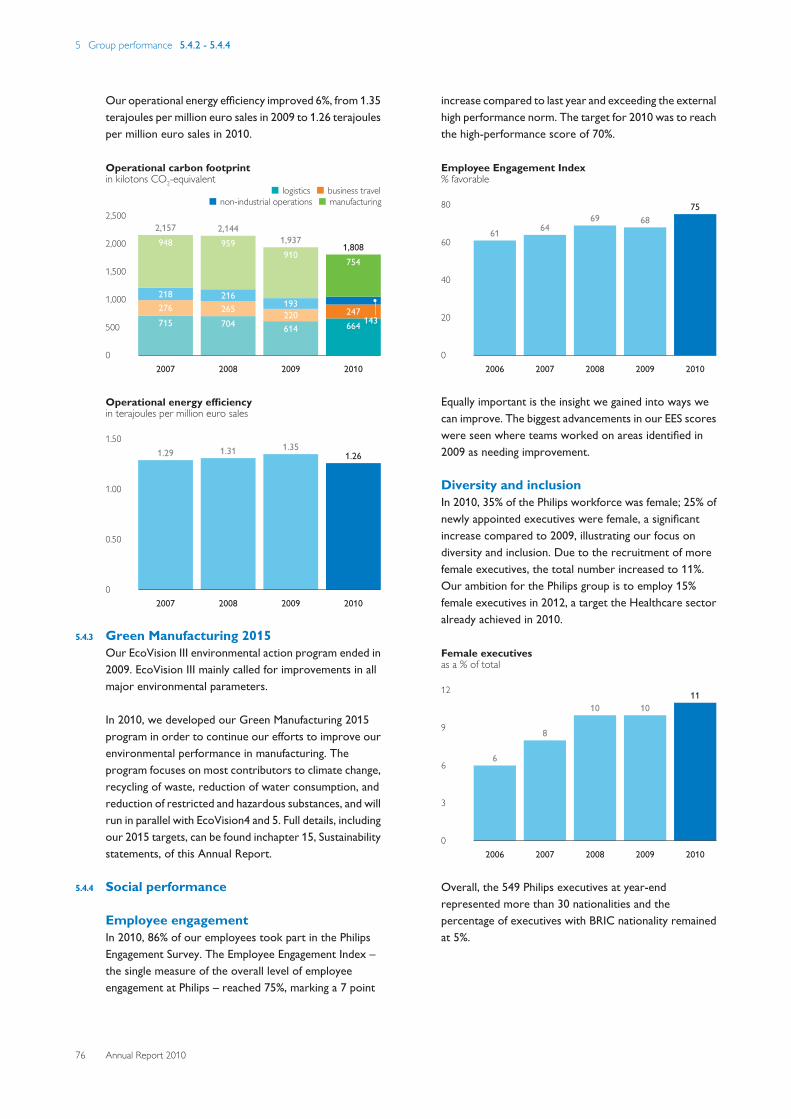
5 Group performance 5.4.2 - 5.4.4
76 Annual Report 2010
Our operational energy efficiency improved 6%, from 1.35terajoules per million euro sales in 2009 to 1.26 terajoulesper million euro sales in 2010.
Operational carbon footprintin kilotons CO2-equivalent
■-logistics--■-business travel■-non-industrial operations--■-manufacturing
2,500
2,000
1,500
1,000
500
02007
715276218
9482,157
2008
704265216
9592,144
2009
614220193
9101,937
2010
664247
143
7541,808
Operational energy efficiencyin terajoules per million euro sales
1.50
1.00
0.50
0
1.29
2007
1.31
2008
1.35
2009
1.26
2010
5.4.3 Green Manufacturing 2015Our EcoVision III environmental action program ended in2009. EcoVision III mainly called for improvements in allmajor environmental parameters.
In 2010, we developed our Green Manufacturing 2015program in order to continue our efforts to improve ourenvironmental performance in manufacturing. Theprogram focuses on most contributors to climate change,recycling of waste, reduction of water consumption, andreduction of restricted and hazardous substances, and willrun in parallel with EcoVision4 and 5. Full details, includingour 2015 targets, can be found inchapter 15, Sustainabilitystatements, of this Annual Report.
5.4.4 Social performance
Employee engagementIn 2010, 86% of our employees took part in the PhilipsEngagement Survey. The Employee Engagement Index –the single measure of the overall level of employeeengagement at Philips – reached 75%, marking a 7 point
increase compared to last year and exceeding the externalhigh performance norm. The target for 2010 was to reachthe high-performance score of 70%.
Employee Engagement Index% favorable
80
60
40
20
0
61
2006
64
2007
69
2008
68
2009
75
2010
Equally important is the insight we gained into ways wecan improve. The biggest advancements in our EES scoreswere seen where teams worked on areas identified in2009 as needing improvement.
Diversity and inclusionIn 2010, 35% of the Philips workforce was female; 25% ofnewly appointed executives were female, a significantincrease compared to 2009, illustrating our focus ondiversity and inclusion. Due to the recruitment of morefemale executives, the total number increased to 11%.Our ambition for the Philips group is to employ 15%female executives in 2012, a target the Healthcare sectoralready achieved in 2010.
Female executivesas a % of total
12
9
6
3
0
6
2006
8
2007
10
2008
10
2009
11
2010
Overall, the 549 Philips executives at year-endrepresented more than 30 nationalities and thepercentage of executives with BRIC nationality remainedat 5%.
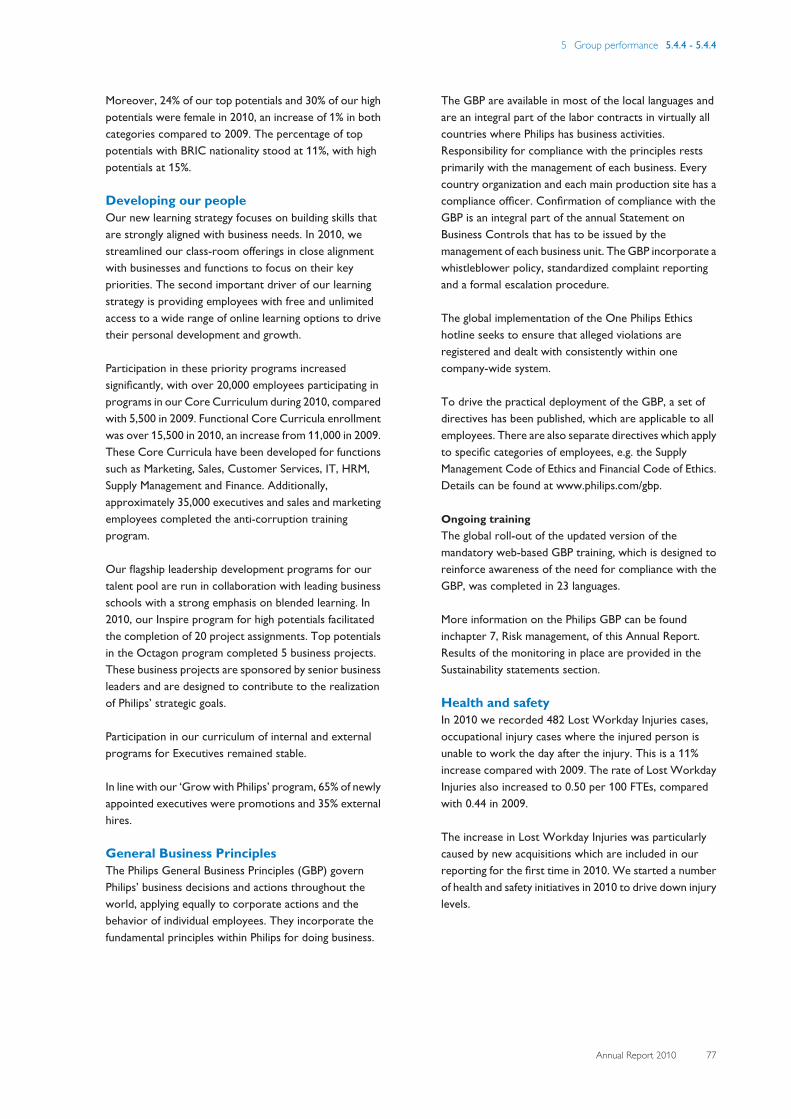
5 Group performance 5.4.4 - 5.4.4
Annual Report 2010 77
Moreover, 24% of our top potentials and 30% of our highpotentials were female in 2010, an increase of 1% in bothcategories compared to 2009. The percentage of toppotentials with BRIC nationality stood at 11%, with highpotentials at 15%.
Developing our peopleOur new learning strategy focuses on building skills thatare strongly aligned with business needs. In 2010, westreamlined our class-room offerings in close alignmentwith businesses and functions to focus on their keypriorities. The second important driver of our learningstrategy is providing employees with free and unlimitedaccess to a wide range of online learning options to drivetheir personal development and growth.
Participation in these priority programs increasedsignificantly, with over 20,000 employees participating inprograms in our Core Curriculum during 2010, comparedwith 5,500 in 2009. Functional Core Curricula enrollmentwas over 15,500 in 2010, an increase from 11,000 in 2009.These Core Curricula have been developed for functionssuch as Marketing, Sales, Customer Services, IT, HRM,Supply Management and Finance. Additionally,approximately 35,000 executives and sales and marketingemployees completed the anti-corruption trainingprogram.
Our flagship leadership development programs for ourtalent pool are run in collaboration with leading businessschools with a strong emphasis on blended learning. In2010, our Inspire program for high potentials facilitatedthe completion of 20 project assignments. Top potentialsin the Octagon program completed 5 business projects.These business projects are sponsored by senior businessleaders and are designed to contribute to the realizationof Philips’ strategic goals.
Participation in our curriculum of internal and externalprograms for Executives remained stable.
In line with our ‘Grow with Philips’ program, 65% of newlyappointed executives were promotions and 35% externalhires.
General Business PrinciplesThe Philips General Business Principles (GBP) governPhilips’ business decisions and actions throughout theworld, applying equally to corporate actions and thebehavior of individual employees. They incorporate thefundamental principles within Philips for doing business.
The GBP are available in most of the local languages andare an integral part of the labor contracts in virtually allcountries where Philips has business activities.Responsibility for compliance with the principles restsprimarily with the management of each business. Everycountry organization and each main production site has acompliance officer. Confirmation of compliance with theGBP is an integral part of the annual Statement onBusiness Controls that has to be issued by themanagement of each business unit. The GBP incorporate awhistleblower policy, standardized complaint reportingand a formal escalation procedure.
The global implementation of the One Philips Ethicshotline seeks to ensure that alleged violations areregistered and dealt with consistently within onecompany-wide system.
To drive the practical deployment of the GBP, a set ofdirectives has been published, which are applicable to allemployees. There are also separate directives which applyto specific categories of employees, e.g. the SupplyManagement Code of Ethics and Financial Code of Ethics.Details can be found at www.philips.com/gbp.
Ongoing trainingThe global roll-out of the updated version of themandatory web-based GBP training, which is designed toreinforce awareness of the need for compliance with theGBP, was completed in 23 languages.
More information on the Philips GBP can be foundinchapter 7, Risk management, of this Annual Report.Results of the monitoring in place are provided in theSustainability statements section.
Health and safetyIn 2010 we recorded 482 Lost Workday Injuries cases,occupational injury cases where the injured person isunable to work the day after the injury. This is a 11%increase compared with 2009. The rate of Lost WorkdayInjuries also increased to 0.50 per 100 FTEs, comparedwith 0.44 in 2009.
The increase in Lost Workday Injuries was particularlycaused by new acquisitions which are included in ourreporting for the first time in 2010. We started a numberof health and safety initiatives in 2010 to drive down injurylevels.
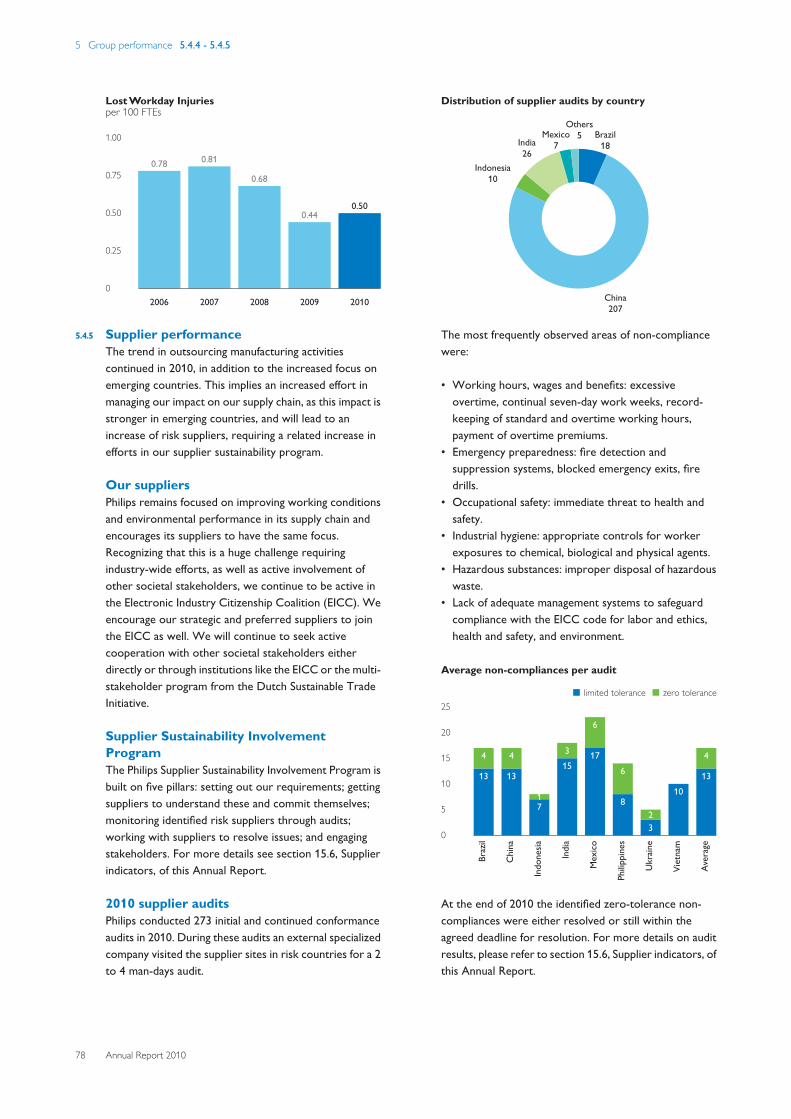
5 Group performance 5.4.4 - 5.4.5
78 Annual Report 2010
Lost Workday Injuriesper 100 FTEs
1.00
0.75
0.50
0.25
0
0.78
2006
0.81
2007
0.68
2008
0.44
2009
0.50
2010
5.4.5 Supplier performanceThe trend in outsourcing manufacturing activitiescontinued in 2010, in addition to the increased focus onemerging countries. This implies an increased effort inmanaging our impact on our supply chain, as this impact isstronger in emerging countries, and will lead to anincrease of risk suppliers, requiring a related increase inefforts in our supplier sustainability program.
Our suppliersPhilips remains focused on improving working conditionsand environmental performance in its supply chain andencourages its suppliers to have the same focus.Recognizing that this is a huge challenge requiringindustry-wide efforts, as well as active involvement ofother societal stakeholders, we continue to be active inthe Electronic Industry Citizenship Coalition (EICC). Weencourage our strategic and preferred suppliers to jointhe EICC as well. We will continue to seek activecooperation with other societal stakeholders eitherdirectly or through institutions like the EICC or the multi-stakeholder program from the Dutch Sustainable TradeInitiative.
Supplier Sustainability InvolvementProgramThe Philips Supplier Sustainability Involvement Program isbuilt on five pillars: setting out our requirements; gettingsuppliers to understand these and commit themselves;monitoring identified risk suppliers through audits;working with suppliers to resolve issues; and engagingstakeholders. For more details see section 15.6, Supplierindicators, of this Annual Report.
2010 supplier auditsPhilips conducted 273 initial and continued conformanceaudits in 2010. During these audits an external specializedcompany visited the supplier sites in risk countries for a 2to 4 man-days audit.
Distribution of supplier audits by country
Brazil18
China207
Indonesia10
India26
Mexico7
Others5
The most frequently observed areas of non-compliancewere:
• Working hours, wages and benefits: excessiveovertime, continual seven-day work weeks, record-keeping of standard and overtime working hours,payment of overtime premiums.
• Emergency preparedness: fire detection andsuppression systems, blocked emergency exits, firedrills.
• Occupational safety: immediate threat to health andsafety.
• Industrial hygiene: appropriate controls for workerexposures to chemical, biological and physical agents.
• Hazardous substances: improper disposal of hazardouswaste.
• Lack of adequate management systems to safeguardcompliance with the EICC code for labor and ethics,health and safety, and environment.
Average non-compliances per audit
■-limited tolerance--■-zero tolerance25
20
15
10
5
0
13
4
Braz
il
13
4
Chi
na
71
Indo
nesia
153
Indi
a
17
6
Mex
ico
8
6
Philip
pine
s
32
Ukr
aine
10
Viet
nam
13
4
Aver
age
At the end of 2010 the identified zero-tolerance non-compliances were either resolved or still within theagreed deadline for resolution. For more details on auditresults, please refer to section 15.6, Supplier indicators, ofthis Annual Report.
5 Group performance 5.4.5 - 5.5
Annual Report 2010 79
Roll-out in the supply chainThe EICC code requests suppliers to roll-out the code inthe supply chain to their next-tier suppliers. During theaudits at risk suppliers, it is checked whether the facilityimplemented an effective process to ensure that theirnext-tier suppliers implemented the Code and are awareof their ethical and legal requirements. A limited numberof second-tier suppliers were identified as high risksuppliers and audited in the 2010 program.
‘Conflict’ minerals: issues further down thechainPhilips acknowledges the issues concerning workingconditions at the base of the supply chain, specifically inthe extractives sector for metals such as tin, tantalum andtungsten. In particular, we are concerned about thesituation in the east of the Democratic Republic of Congo(DRC) where proceeds from the extractives sector aresometimes used to finance rebel conflicts in the region.
Although Philips does not directly source minerals fromthe DRC and the mines are typically seven or more tiersremoved from our direct suppliers, we address the issuethrough the means and influencing mechanisms availableto us. For more details, please refer to section 15.6,Supplier indicators, of this Annual Report.
5.5 Proposeddistribution toshareholdersPursuant to article 34 of the articles of association ofRoyal Philips Electronics, a dividend will first be declaredon preference shares out of net income. The remainder ofthe net income, after reservations made with the approvalof the Supervisory Board, shall be available for distributionto holders of common shares subject to shareholderapproval after year-end. As of December 31, 2010, theissued share capital consists only of common shares; nopreference shares have been issued. Article 33 of thearticles of association of Royal Philips Electronics gives theBoard of Management the power to determine whatportion of the net income shall be retained by way ofreserve, subject to the approval of the Supervisory Board.
A proposal will be submitted to the 2011 Annual GeneralMeeting of Shareholders to declare a dividend of EUR 0.75per common share (up to EUR 710 million), in cash or inshares at the option of the shareholder, against the netincome for 2010.
Shareholders will be given the opportunity to make theirchoice between cash and shares between April 7, 2011and April 29, 2011. If no choice is made during thiselection period the dividend will be paid in shares. OnApril 29, 2011 after close of trading, the number of sharedividend rights entitled to one new common share will bedetermined based on the volume weighted average priceof all traded common shares Koninklijke PhilipsElectronics N.V. at Euronext Amsterdam on 27, 28 and 29April 2011. The Company will calculate the number ofshare dividend rights entitled to one new common share,such that the gross dividend in shares will beapproximately 3% higher than the gross dividend in cash.Payment of the dividend and delivery of new commonshares, with settlement of fractions in cash, if required,will take place from May 4, 2011. The distribution ofdividend in cash to holders of New York registry shareswill be made in USD at the USD/EUR rate fixed by theEuropean Central Bank on May 2, 2011.
Dividend in cash is in principle subject to 15% Dutchdividend withholding tax, which will be deducted from thedividend in cash paid to the shareholders. Dividend inshares paid out of earnings and retained earnings is subject
5 Group performance 5.5 - 5.6
80 Annual Report 2010
to 15% dividend withholding tax, but only in respect of thepar value of the shares (EUR 0.20 per share). Thiswithholding tax in case of dividend in shares will be borneby Philips.
In 2010, a dividend of EUR 0.70 per common share waspaid in cash or shares, at the option of the shareholder.Approximately 53% elected for a share dividend resultingin the issue of 13,667,015 new common shares, leading toa 1.5% percent dilution. The remainder of the dividendwas paid in cash (EUR 296 million) against the retainedearnings of the Company.
The balance sheet presented in this report, as part of theCompany financial statements for the period endedDecember 31, 2010, is before dividend, which is subject toshareholder approval after year-end.
5.6 Outlook2011 will be a year of progress on our way to achieve theVision 2015 objectives. Our strong order book providesconfidence in our Healthcare business for the year ahead.We see first leading indicators of positive momentum inconstruction markets, which is expected to benefitLighting sales in the latter half of 2011, supported by theincrease adoption of LED products. We expect emergingmarkets to continue to support growth in all threesectors, while consumer sentiment in mature marketsremains subdued. We will continue our initiatives to ignitegrowth in Consumer Lifestyle.
Amsterdam, February 17, 2011
Board of Management
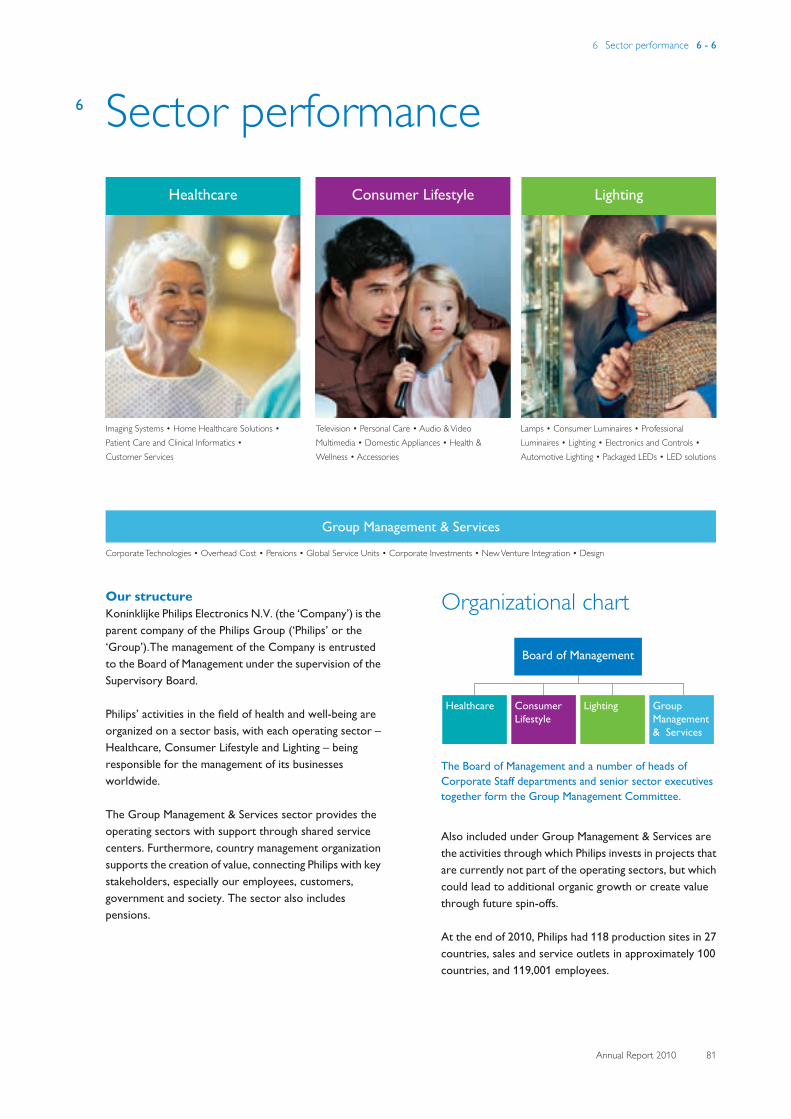
6 Sector performance 6 - 6
Annual Report 2010 81
6 Sector performance
Imaging Systems • Home Healthcare Solutions •
Patient Care and Clinical Informatics •
Customer Services
Corporate Technologies • Overhead Cost • Pensions • Global Service Units • Corporate Investments • New Venture Integration • Design
Television • Personal Care • Audio & Video
Multimedia • Domestic Appliances • Health &
Wellness • Accessories
Lamps • Consumer Luminaires • Professional
Luminaires • Lighting • Electronics and Controls •
Automotive Lighting • Packaged LEDs • LED solutions
Our structureKoninklijke Philips Electronics N.V. (the ‘Company’) is theparent company of the Philips Group (‘Philips’ or the‘Group’).The management of the Company is entrustedto the Board of Management under the supervision of theSupervisory Board.
Philips’ activities in the field of health and well-being areorganized on a sector basis, with each operating sector –Healthcare, Consumer Lifestyle and Lighting – beingresponsible for the management of its businessesworldwide.
The Group Management & Services sector provides theoperating sectors with support through shared servicecenters. Furthermore, country management organizationsupports the creation of value, connecting Philips with keystakeholders, especially our employees, customers,government and society. The sector also includespensions.
The Board of Management and a number of heads of
Corporate Staff departments and senior sector executives
together form the Group Management Committee.
Organizational chart
Board of Management
Group Management& Services
LightingConsumer Lifestyle
Healthcare
Also included under Group Management & Services arethe activities through which Philips invests in projects thatare currently not part of the operating sectors, but whichcould lead to additional organic growth or create valuethrough future spin-offs.
At the end of 2010, Philips had 118 production sites in 27countries, sales and service outlets in approximately 100countries, and 119,001 employees.
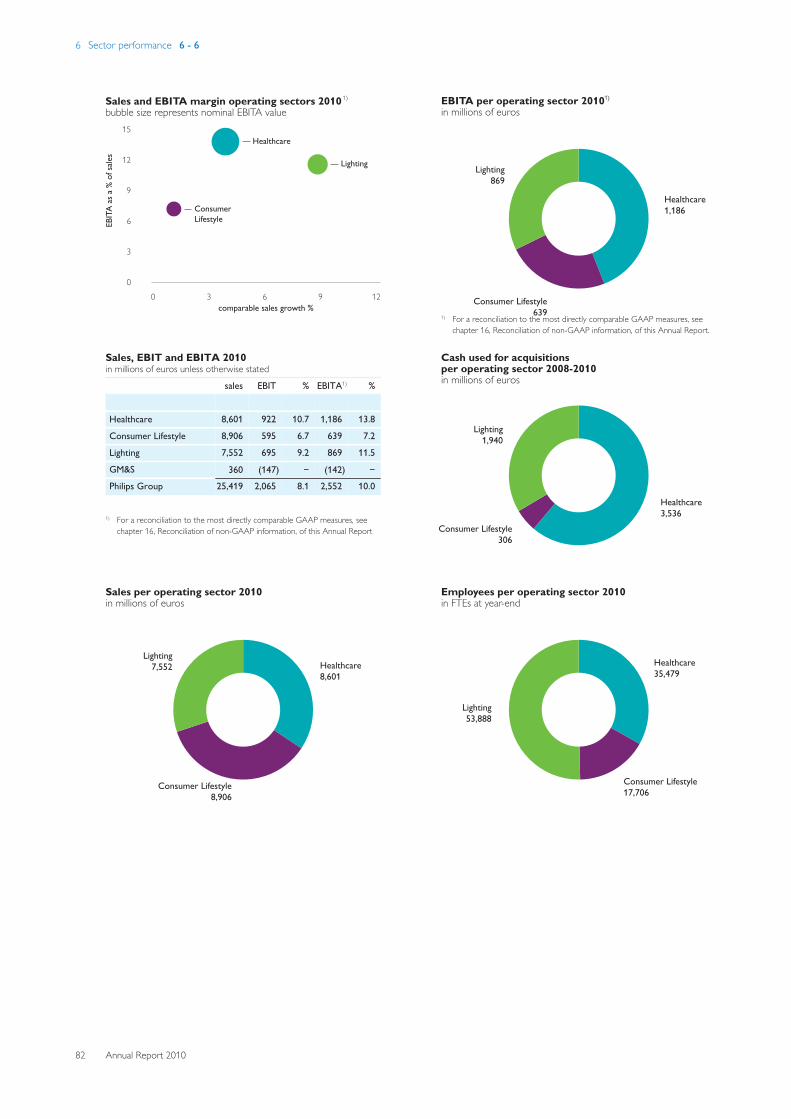
6 Sector performance 6 - 6
82 Annual Report 2010
Sales, EBIT and EBITA 2010in millions of euros unless otherwise stated
sales EBIT % EBITA1) %
Healthcare 8,601 922 10.7 1,186 13.8
Consumer Lifestyle 8,906 595 6.7 639 7.2
Lighting 7,552 695 9.2 869 11.5
GM&S 360 (147) − (142) − Philips Group 25,419 2,065 8.1 2,552 10.0
1) For a reconciliation to the most directly comparable GAAP measures, seechapter 16, Reconciliation of non-GAAP information, of this Annual Report
Sales per operating sector 2010in millions of euros
Healthcare8,601
Consumer Lifestyle8,906
Lighting7,552
EBITA per operating sector 20101)
in millions of euros
Healthcare1,186
Consumer Lifestyle639
Lighting869
1) For a reconciliation to the most directly comparable GAAP measures, seechapter 16, Reconciliation of non-GAAP information, of this Annual Report.
Cash used for acquisitions per operating sector 2008-2010in millions of euros
Healthcare3,536
Consumer Lifestyle306
Lighting1,940
Employees per operating sector 2010in FTEs at year-end
Healthcare35,479
Consumer Lifestyle17,706
Lighting53,888
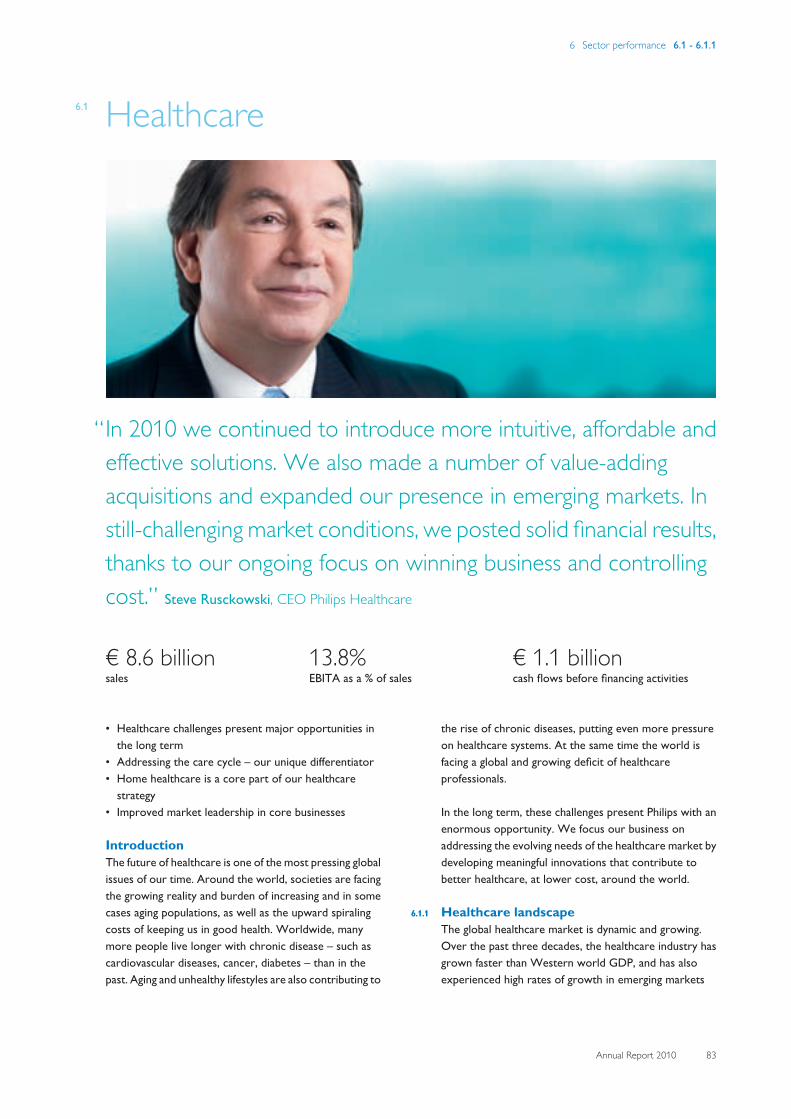
6 Sector performance 6.1 - 6.1.1
Annual Report 2010 83
6.1 Healthcare
“In 2010 we continued to introduce more intuitive, affordable andeffective solutions. We also made a number of value-addingacquisitions and expanded our presence in emerging markets. Instill-challenging market conditions, we posted solid financial results,thanks to our ongoing focus on winning business and controllingcost.” Steve Rusckowski, CEO Philips Healthcare
€ 8.6 billionsales
13.8%EBITA as a % of sales
€ 1.1 billioncash flows before financing activities
• Healthcare challenges present major opportunities inthe long term
• Addressing the care cycle – our unique differentiator• Home healthcare is a core part of our healthcare
strategy• Improved market leadership in core businesses
IntroductionThe future of healthcare is one of the most pressing globalissues of our time. Around the world, societies are facingthe growing reality and burden of increasing and in somecases aging populations, as well as the upward spiralingcosts of keeping us in good health. Worldwide, manymore people live longer with chronic disease – such ascardiovascular diseases, cancer, diabetes – than in thepast. Aging and unhealthy lifestyles are also contributing to
the rise of chronic diseases, putting even more pressureon healthcare systems. At the same time the world isfacing a global and growing deficit of healthcareprofessionals.
In the long term, these challenges present Philips with anenormous opportunity. We focus our business onaddressing the evolving needs of the healthcare market bydeveloping meaningful innovations that contribute tobetter healthcare, at lower cost, around the world.
6.1.1 Healthcare landscapeThe global healthcare market is dynamic and growing.Over the past three decades, the healthcare industry hasgrown faster than Western world GDP, and has alsoexperienced high rates of growth in emerging markets
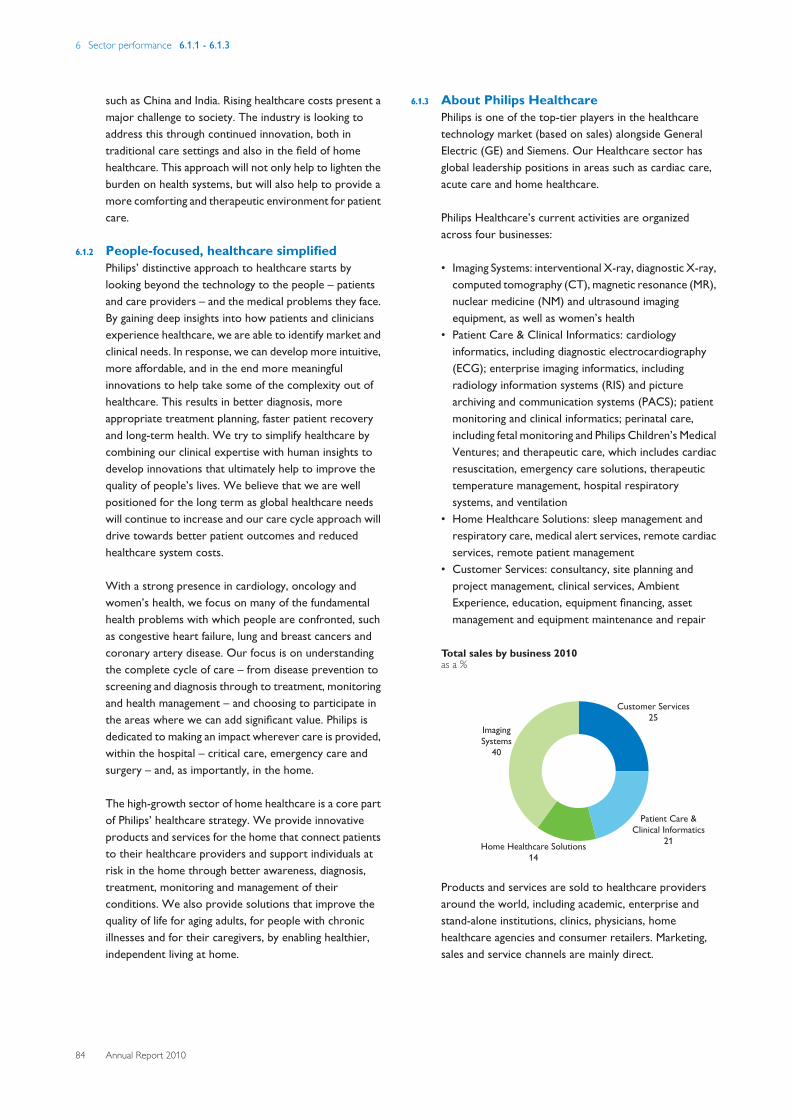
6 Sector performance 6.1.1 - 6.1.3
84 Annual Report 2010
such as China and India. Rising healthcare costs present amajor challenge to society. The industry is looking toaddress this through continued innovation, both intraditional care settings and also in the field of homehealthcare. This approach will not only help to lighten theburden on health systems, but will also help to provide amore comforting and therapeutic environment for patientcare.
6.1.2 People-focused, healthcare simplifiedPhilips’ distinctive approach to healthcare starts bylooking beyond the technology to the people – patientsand care providers – and the medical problems they face.By gaining deep insights into how patients and cliniciansexperience healthcare, we are able to identify market andclinical needs. In response, we can develop more intuitive,more affordable, and in the end more meaningfulinnovations to help take some of the complexity out ofhealthcare. This results in better diagnosis, moreappropriate treatment planning, faster patient recoveryand long-term health. We try to simplify healthcare bycombining our clinical expertise with human insights todevelop innovations that ultimately help to improve thequality of people’s lives. We believe that we are wellpositioned for the long term as global healthcare needswill continue to increase and our care cycle approach willdrive towards better patient outcomes and reducedhealthcare system costs.
With a strong presence in cardiology, oncology andwomen’s health, we focus on many of the fundamentalhealth problems with which people are confronted, suchas congestive heart failure, lung and breast cancers andcoronary artery disease. Our focus is on understandingthe complete cycle of care – from disease prevention toscreening and diagnosis through to treatment, monitoringand health management – and choosing to participate inthe areas where we can add significant value. Philips isdedicated to making an impact wherever care is provided,within the hospital – critical care, emergency care andsurgery – and, as importantly, in the home.
The high-growth sector of home healthcare is a core partof Philips’ healthcare strategy. We provide innovativeproducts and services for the home that connect patientsto their healthcare providers and support individuals atrisk in the home through better awareness, diagnosis,treatment, monitoring and management of theirconditions. We also provide solutions that improve thequality of life for aging adults, for people with chronicillnesses and for their caregivers, by enabling healthier,independent living at home.
6.1.3 About Philips HealthcarePhilips is one of the top-tier players in the healthcaretechnology market (based on sales) alongside GeneralElectric (GE) and Siemens. Our Healthcare sector hasglobal leadership positions in areas such as cardiac care,acute care and home healthcare.
Philips Healthcare’s current activities are organizedacross four businesses:
• Imaging Systems: interventional X-ray, diagnostic X-ray,computed tomography (CT), magnetic resonance (MR),nuclear medicine (NM) and ultrasound imagingequipment, as well as women’s health
• Patient Care & Clinical Informatics: cardiologyinformatics, including diagnostic electrocardiography(ECG); enterprise imaging informatics, includingradiology information systems (RIS) and picturearchiving and communication systems (PACS); patientmonitoring and clinical informatics; perinatal care,including fetal monitoring and Philips Children’s MedicalVentures; and therapeutic care, which includes cardiacresuscitation, emergency care solutions, therapeutictemperature management, hospital respiratorysystems, and ventilation
• Home Healthcare Solutions: sleep management andrespiratory care, medical alert services, remote cardiacservices, remote patient management
• Customer Services: consultancy, site planning andproject management, clinical services, AmbientExperience, education, equipment financing, assetmanagement and equipment maintenance and repair
Total sales by business 2010as a %
Customer Services25
Patient Care &Clinical Informatics
21Home Healthcare Solutions14
ImagingSystems
40
Products and services are sold to healthcare providersaround the world, including academic, enterprise andstand-alone institutions, clinics, physicians, homehealthcare agencies and consumer retailers. Marketing,sales and service channels are mainly direct.
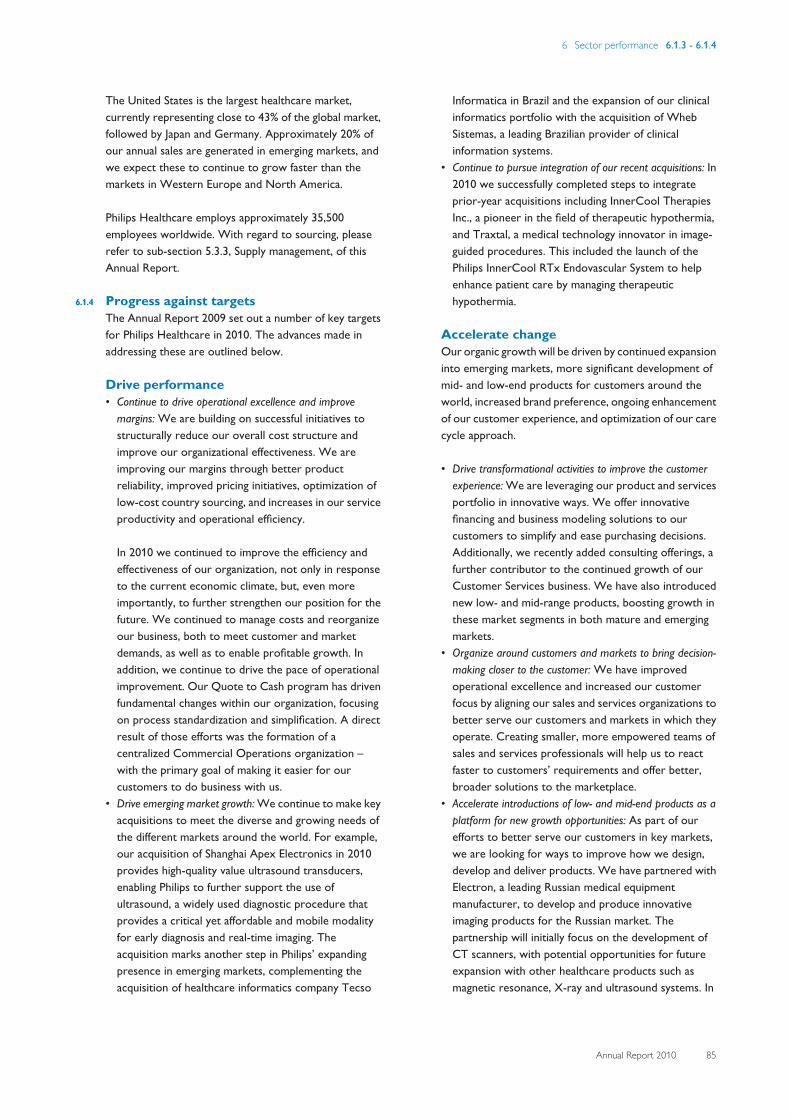
6 Sector performance 6.1.3 - 6.1.4
Annual Report 2010 85
The United States is the largest healthcare market,currently representing close to 43% of the global market,followed by Japan and Germany. Approximately 20% ofour annual sales are generated in emerging markets, andwe expect these to continue to grow faster than themarkets in Western Europe and North America.
Philips Healthcare employs approximately 35,500employees worldwide. With regard to sourcing, pleaserefer to sub-section 5.3.3, Supply management, of thisAnnual Report.
6.1.4 Progress against targetsThe Annual Report 2009 set out a number of key targetsfor Philips Healthcare in 2010. The advances made inaddressing these are outlined below.
Drive performance• Continue to drive operational excellence and improve
margins: We are building on successful initiatives tostructurally reduce our overall cost structure andimprove our organizational effectiveness. We areimproving our margins through better productreliability, improved pricing initiatives, optimization oflow-cost country sourcing, and increases in our serviceproductivity and operational efficiency.
In 2010 we continued to improve the efficiency andeffectiveness of our organization, not only in responseto the current economic climate, but, even moreimportantly, to further strengthen our position for thefuture. We continued to manage costs and reorganizeour business, both to meet customer and marketdemands, as well as to enable profitable growth. Inaddition, we continue to drive the pace of operationalimprovement. Our Quote to Cash program has drivenfundamental changes within our organization, focusingon process standardization and simplification. A directresult of those efforts was the formation of acentralized Commercial Operations organization –with the primary goal of making it easier for ourcustomers to do business with us.
• Drive emerging market growth: We continue to make keyacquisitions to meet the diverse and growing needs ofthe different markets around the world. For example,our acquisition of Shanghai Apex Electronics in 2010provides high-quality value ultrasound transducers,enabling Philips to further support the use ofultrasound, a widely used diagnostic procedure thatprovides a critical yet affordable and mobile modalityfor early diagnosis and real-time imaging. Theacquisition marks another step in Philips’ expandingpresence in emerging markets, complementing theacquisition of healthcare informatics company Tecso
Informatica in Brazil and the expansion of our clinicalinformatics portfolio with the acquisition of WhebSistemas, a leading Brazilian provider of clinicalinformation systems.
• Continue to pursue integration of our recent acquisitions: In2010 we successfully completed steps to integrateprior-year acquisitions including InnerCool TherapiesInc., a pioneer in the field of therapeutic hypothermia,and Traxtal, a medical technology innovator in image-guided procedures. This included the launch of thePhilips InnerCool RTx Endovascular System to helpenhance patient care by managing therapeutichypothermia.
Accelerate changeOur organic growth will be driven by continued expansioninto emerging markets, more significant development ofmid- and low-end products for customers around theworld, increased brand preference, ongoing enhancementof our customer experience, and optimization of our carecycle approach.
• Drive transformational activities to improve the customerexperience: We are leveraging our product and servicesportfolio in innovative ways. We offer innovativefinancing and business modeling solutions to ourcustomers to simplify and ease purchasing decisions.Additionally, we recently added consulting offerings, afurther contributor to the continued growth of ourCustomer Services business. We have also introducednew low- and mid-range products, boosting growth inthese market segments in both mature and emergingmarkets.
• Organize around customers and markets to bring decision-making closer to the customer: We have improvedoperational excellence and increased our customerfocus by aligning our sales and services organizations tobetter serve our customers and markets in which theyoperate. Creating smaller, more empowered teams ofsales and services professionals will help us to reactfaster to customers’ requirements and offer better,broader solutions to the marketplace.
• Accelerate introductions of low- and mid-end products as aplatform for new growth opportunities: As part of ourefforts to better serve our customers in key markets,we are looking for ways to improve how we design,develop and deliver products. We have partnered withElectron, a leading Russian medical equipmentmanufacturer, to develop and produce innovativeimaging products for the Russian market. Thepartnership will initially focus on the development ofCT scanners, with potential opportunities for futureexpansion with other healthcare products such asmagnetic resonance, X-ray and ultrasound systems. In
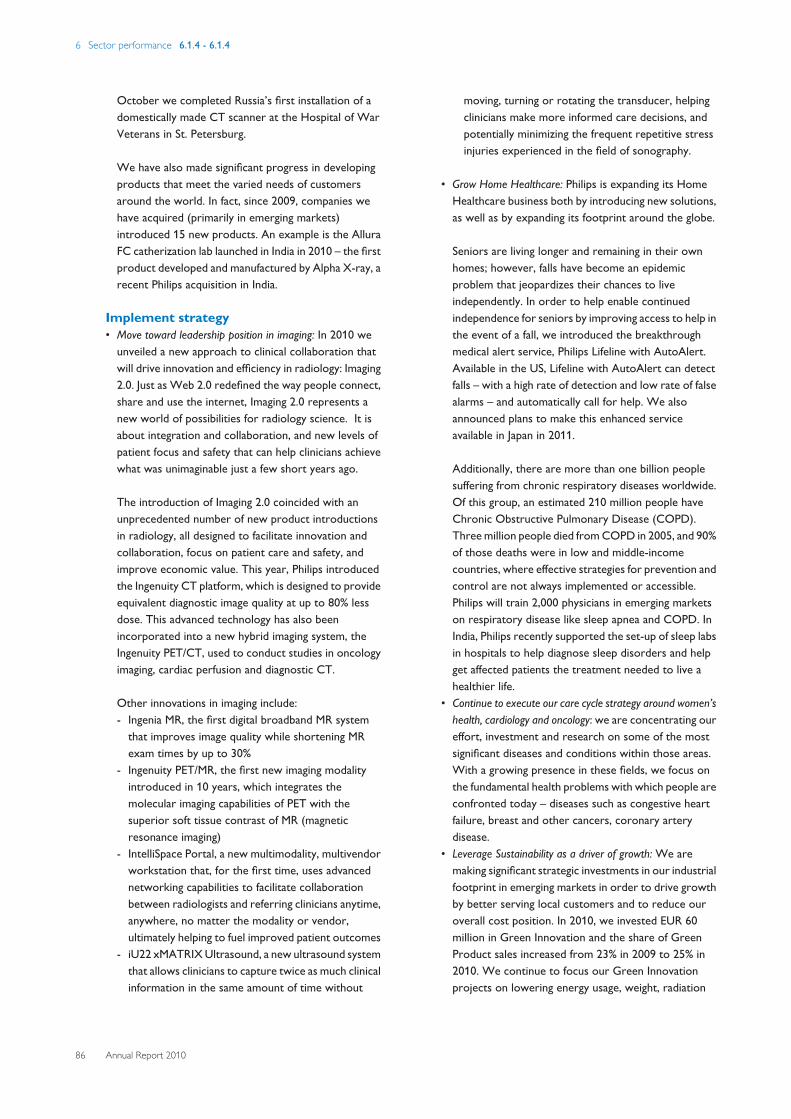
6 Sector performance 6.1.4 - 6.1.4
86 Annual Report 2010
October we completed Russia’s first installation of adomestically made CT scanner at the Hospital of WarVeterans in St. Petersburg.
We have also made significant progress in developingproducts that meet the varied needs of customersaround the world. In fact, since 2009, companies wehave acquired (primarily in emerging markets)introduced 15 new products. An example is the AlluraFC catherization lab launched in India in 2010 – the firstproduct developed and manufactured by Alpha X-ray, arecent Philips acquisition in India.
Implement strategy• Move toward leadership position in imaging: In 2010 we
unveiled a new approach to clinical collaboration thatwill drive innovation and efficiency in radiology: Imaging2.0. Just as Web 2.0 redefined the way people connect,share and use the internet, Imaging 2.0 represents anew world of possibilities for radiology science. It isabout integration and collaboration, and new levels ofpatient focus and safety that can help clinicians achievewhat was unimaginable just a few short years ago.
The introduction of Imaging 2.0 coincided with anunprecedented number of new product introductionsin radiology, all designed to facilitate innovation andcollaboration, focus on patient care and safety, andimprove economic value. This year, Philips introducedthe Ingenuity CT platform, which is designed to provideequivalent diagnostic image quality at up to 80% lessdose. This advanced technology has also beenincorporated into a new hybrid imaging system, theIngenuity PET/CT, used to conduct studies in oncologyimaging, cardiac perfusion and diagnostic CT.
Other innovations in imaging include:- Ingenia MR, the first digital broadband MR system
that improves image quality while shortening MRexam times by up to 30%
- Ingenuity PET/MR, the first new imaging modalityintroduced in 10 years, which integrates themolecular imaging capabilities of PET with thesuperior soft tissue contrast of MR (magneticresonance imaging)
- IntelliSpace Portal, a new multimodality, multivendorworkstation that, for the first time, uses advancednetworking capabilities to facilitate collaborationbetween radiologists and referring clinicians anytime,anywhere, no matter the modality or vendor,ultimately helping to fuel improved patient outcomes
- iU22 xMATRIX Ultrasound, a new ultrasound systemthat allows clinicians to capture twice as much clinicalinformation in the same amount of time without
moving, turning or rotating the transducer, helpingclinicians make more informed care decisions, andpotentially minimizing the frequent repetitive stressinjuries experienced in the field of sonography.
• Grow Home Healthcare: Philips is expanding its HomeHealthcare business both by introducing new solutions,as well as by expanding its footprint around the globe.
Seniors are living longer and remaining in their ownhomes; however, falls have become an epidemicproblem that jeopardizes their chances to liveindependently. In order to help enable continuedindependence for seniors by improving access to help inthe event of a fall, we introduced the breakthroughmedical alert service, Philips Lifeline with AutoAlert.Available in the US, Lifeline with AutoAlert can detectfalls – with a high rate of detection and low rate of falsealarms – and automatically call for help. We alsoannounced plans to make this enhanced serviceavailable in Japan in 2011.
Additionally, there are more than one billion peoplesuffering from chronic respiratory diseases worldwide.Of this group, an estimated 210 million people haveChronic Obstructive Pulmonary Disease (COPD).Three million people died from COPD in 2005, and 90%of those deaths were in low and middle-incomecountries, where effective strategies for prevention andcontrol are not always implemented or accessible.Philips will train 2,000 physicians in emerging marketson respiratory disease like sleep apnea and COPD. InIndia, Philips recently supported the set-up of sleep labsin hospitals to help diagnose sleep disorders and helpget affected patients the treatment needed to live ahealthier life.
• Continue to execute our care cycle strategy around women’shealth, cardiology and oncology: we are concentrating oureffort, investment and research on some of the mostsignificant diseases and conditions within those areas.With a growing presence in these fields, we focus onthe fundamental health problems with which people areconfronted today – diseases such as congestive heartfailure, breast and other cancers, coronary arterydisease.
• Leverage Sustainability as a driver of growth: We aremaking significant strategic investments in our industrialfootprint in emerging markets in order to drive growthby better serving local customers and to reduce ouroverall cost position. In 2010, we invested EUR 60million in Green Innovation and the share of GreenProduct sales increased from 23% in 2009 to 25% in2010. We continue to focus our Green Innovationprojects on lowering energy usage, weight, radiation
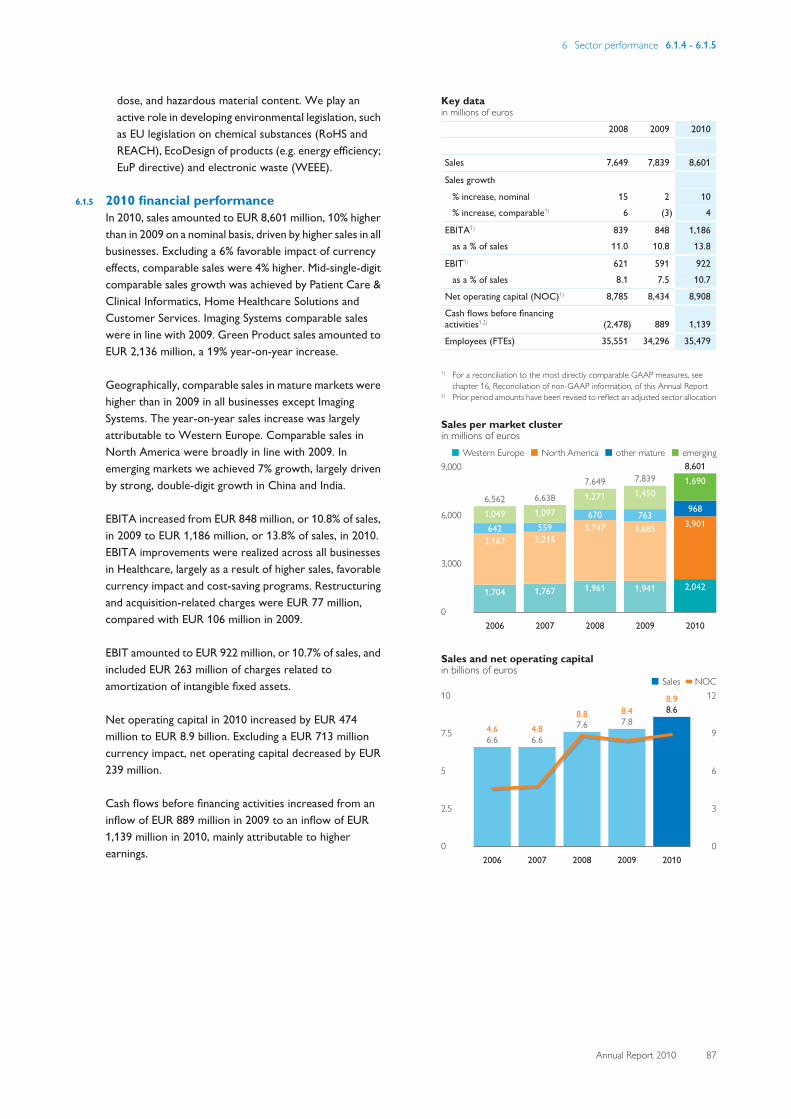
6 Sector performance 6.1.4 - 6.1.5
Annual Report 2010 87
dose, and hazardous material content. We play anactive role in developing environmental legislation, suchas EU legislation on chemical substances (RoHS andREACH), EcoDesign of products (e.g. energy efficiency;EuP directive) and electronic waste (WEEE).
6.1.5 2010 financial performanceIn 2010, sales amounted to EUR 8,601 million, 10% higherthan in 2009 on a nominal basis, driven by higher sales in allbusinesses. Excluding a 6% favorable impact of currencyeffects, comparable sales were 4% higher. Mid-single-digitcomparable sales growth was achieved by Patient Care &Clinical Informatics, Home Healthcare Solutions andCustomer Services. Imaging Systems comparable saleswere in line with 2009. Green Product sales amounted toEUR 2,136 million, a 19% year-on-year increase.
Geographically, comparable sales in mature markets werehigher than in 2009 in all businesses except ImagingSystems. The year-on-year sales increase was largelyattributable to Western Europe. Comparable sales inNorth America were broadly in line with 2009. Inemerging markets we achieved 7% growth, largely drivenby strong, double-digit growth in China and India.
EBITA increased from EUR 848 million, or 10.8% of sales,in 2009 to EUR 1,186 million, or 13.8% of sales, in 2010.EBITA improvements were realized across all businessesin Healthcare, largely as a result of higher sales, favorablecurrency impact and cost-saving programs. Restructuringand acquisition-related charges were EUR 77 million,compared with EUR 106 million in 2009.
EBIT amounted to EUR 922 million, or 10.7% of sales, andincluded EUR 263 million of charges related toamortization of intangible fixed assets.
Net operating capital in 2010 increased by EUR 474million to EUR 8.9 billion. Excluding a EUR 713 millioncurrency impact, net operating capital decreased by EUR239 million.
Cash flows before financing activities increased from aninflow of EUR 889 million in 2009 to an inflow of EUR1,139 million in 2010, mainly attributable to higherearnings.
Key datain millions of euros
2008 2009 2010
Sales 7,649 7,839 8,601
Sales growth
% increase, nominal 15 2 10 % increase, comparable1) 6 (3) 4
EBITA1) 839 848 1,186 as a % of sales 11.0 10.8 13.8
EBIT1) 621 591 922 as a % of sales 8.1 7.5 10.7
Net operating capital (NOC)1) 8,785 8,434 8,908
Cash flows before financingactivities1,2) (2,478) 889 1,139
Employees (FTEs) 35,551 34,296 35,479
1) For a reconciliation to the most directly comparable GAAP measures, seechapter 16, Reconciliation of non-GAAP information, of this Annual Report
2) Prior period amounts have been revised to reflect an adjusted sector allocation
Sales per market clusterin millions of euros■-Western Europe--■-North America--■-other mature--■-emerging
9,000
6,000
3,000
02006
1,704
3,167642
1,0496,562
2007
1,767
3,215559
1,0976,638
2008
1,961
3,747670
1,2717,649
2009
1,941
3,685763
1,4507,839
2010
2,042
3,901968
1,6908,601
Sales and net operating capitalin billions of euros
■-Sales----NOC10
7.5
5
2.5
0
12
9
6
3
0
4.66.6
2006
4.86.6
2007
8.87.6
2008
8.47.8
2009
8.98.6
2010
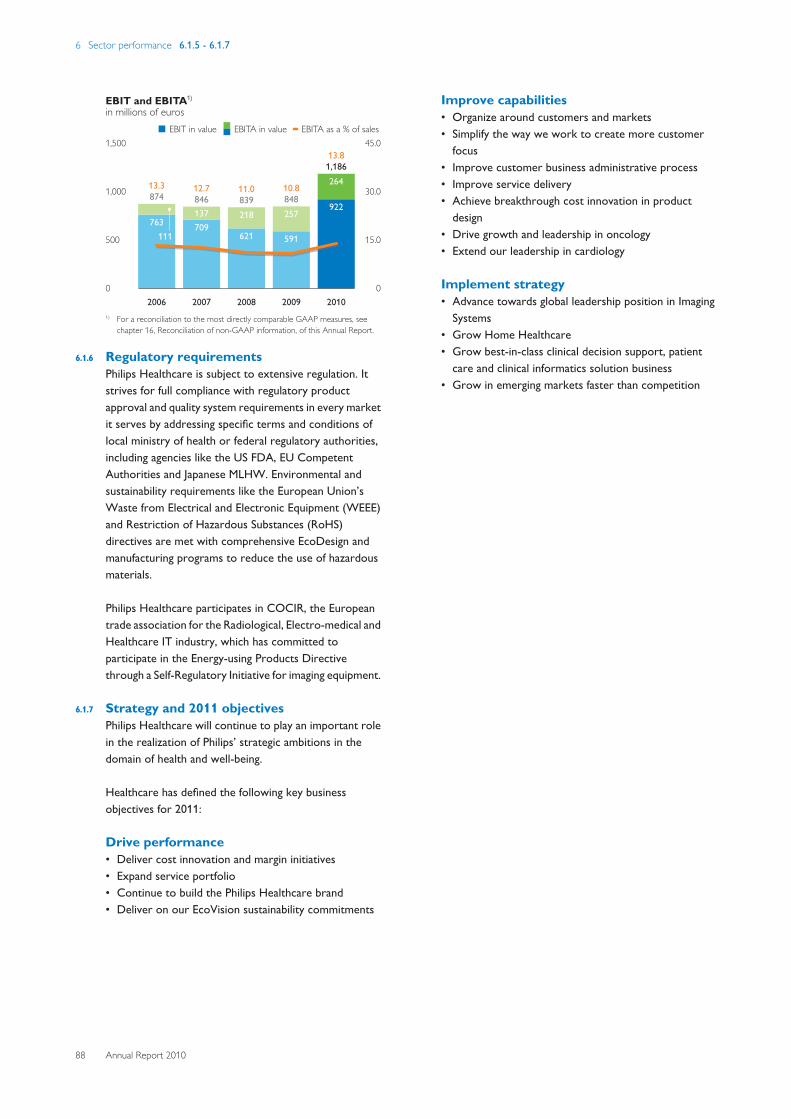
6 Sector performance 6.1.5 - 6.1.7
88 Annual Report 2010
EBIT and EBITA1)
in millions of euros■-EBIT in value--■■-EBITA in value----EBITA as a % of sales
1,500
1,000
500
0
45.0
30.0
15.0
0
763111
87413.3
2006
70913784612.7
2007
621
21883911.0
2008
591
25784810.8
2009
922
2641,18613.8
20101) For a reconciliation to the most directly comparable GAAP measures, see
chapter 16, Reconciliation of non-GAAP information, of this Annual Report.
6.1.6 Regulatory requirementsPhilips Healthcare is subject to extensive regulation. Itstrives for full compliance with regulatory productapproval and quality system requirements in every marketit serves by addressing specific terms and conditions oflocal ministry of health or federal regulatory authorities,including agencies like the US FDA, EU CompetentAuthorities and Japanese MLHW. Environmental andsustainability requirements like the European Union’sWaste from Electrical and Electronic Equipment (WEEE)and Restriction of Hazardous Substances (RoHS)directives are met with comprehensive EcoDesign andmanufacturing programs to reduce the use of hazardousmaterials.
Philips Healthcare participates in COCIR, the Europeantrade association for the Radiological, Electro-medical andHealthcare IT industry, which has committed toparticipate in the Energy-using Products Directivethrough a Self-Regulatory Initiative for imaging equipment.
6.1.7 Strategy and 2011 objectivesPhilips Healthcare will continue to play an important rolein the realization of Philips’ strategic ambitions in thedomain of health and well-being.
Healthcare has defined the following key businessobjectives for 2011:
Drive performance• Deliver cost innovation and margin initiatives• Expand service portfolio• Continue to build the Philips Healthcare brand• Deliver on our EcoVision sustainability commitments
Improve capabilities• Organize around customers and markets• Simplify the way we work to create more customer
focus• Improve customer business administrative process• Improve service delivery• Achieve breakthrough cost innovation in product
design• Drive growth and leadership in oncology• Extend our leadership in cardiology
Implement strategy• Advance towards global leadership position in Imaging
Systems• Grow Home Healthcare• Grow best-in-class clinical decision support, patient
care and clinical informatics solution business• Grow in emerging markets faster than competition
6 Sector performance 6.2 - 6.2
Annual Report 2010 89
6.2 Consumer Lifestyle
“In 2010 we continued to increase our profitability, driven by ourleading positions in health and well-being, our global footprint andour strong brand. We set out on a journey to sharpen our focus,taking a granular approach to key categories and markets to ignitetop-line growth.” Pieter Nota, CEO Philips Consumer Lifestyle
€ 8.9 billionsales
7.2%EBITA as a % of sales
€ 404 millioncash flows before financing activities
• Leading positions in categories such as male shaving andgrooming, coffee appliances and oral healthcare
• Further decisive action taken to reduce our exposure inthe Television business
• Increased focus on growth, taking a granular approachby making clear investment choices
• Expanded business creation capabilities in emergingmarkets and investment in key enablers to accelerategrowth
IntroductionAcross the world, consumers aspire to improve theirhealth and feeling of well-being, but struggle to balance thiswith the increasing complexity of their lives. This trend iscreating a large and growing market in the developed andespecially in the emerging economies, where Consumer
Lifestyle can benefit by delivering health and well-beingsolutions with advanced technology that meet people’sneeds.
We strive to understand consumer needs and translatethose insights into breakthrough, meaningful innovations.Our competitive advantage is our solutions that are easyto experience, advanced and designed around theconsumer. This strength is galvanized by our powerfulglobal brand, our understanding of the markets weoperate in and the many synergies with our channels,partners and supply chain.
6 Sector performance 6.2.1 - 6.2.3
90 Annual Report 2010
6.2.1 Lifestyle retail landscapeThe fragile economic environment in 2010 continued toaffect demand for many categories of consumer goods indeveloped markets. Whilst emerging markets sawconsumer demand impacted by the economicenvironment, they demonstrated greater resilience.
However, underlying consumer trends driving ourinnovation remained stable:
• People are increasingly appearance-conscious and wantto boost their self-confidence and self-identity throughhealth and beauty regimes
• People want to prepare food and drinks that are healthyand of good quality, and to do so quickly and withouthassle
• More and more consumers want to take control bymonitoring their health and lifestyle
• People want to create a home ‘haven’ – a space thatprovides a sense of well-being and comfort
• Consumers want to create a digital command center athome, which performs the role of a social digital hub
6.2.2 Helping people achieve a healthier andbetter lifeConsumer Lifestyle makes a difference to people’s lives bymaking it easier for them to achieve a healthier and betterlifestyle. We believe that “sense and simplicity” can be thegoal of technology and apply that principle to create life-enhancing solutions.
Tracking trends and identifying opportunitiesConsumer Lifestyle works together with Philips Design tomonitor trends ranging from consumer tastes to designaesthetics. With its global footprint, Consumer Lifestyle iswell positioned to understand emerging needs in localmarkets. Country organizations are our interface with theconsumer, allowing us to accurately identify local needs,tastes and commercial opportunities.
Applying insights to develop innovative solutionsWe apply a rigorous product development process whencreating new value propositions. At its heart are validatedconsumer insights, which show that the propositionsmeet a market need. The combination of insight, simplicityand innovation differentiates us from our competition andcreates a platform for sustainable business success.
Where we playWe are active in our four value spaces in health and well-being: Healthy Life, Personal Care, Home Living andLifestyle Entertainment, complemented by Accessories.This portfolio is aligned with our brand equity and enablesus to provide our retail customers with a highly relevant
and attractive product portfolio. We focus on premiumpropositions with our differentiating brand promise of“sense and simplicity”, relevant to the target group.
In focusing on the domain of health and well-being, we aretapping into significant trends – such as consumerempowerment, growth in emerging markets and agingpopulations – that will have a major impact on society inthe future.
Healthy LifeThe Healthy Life value space takes a holistic approach toenhancing consumers’ health, addressing the needs formental and physical health and for healthy relationships.
Personal CareThe Personal Care value space addresses the consumerneed to “look and feel your best” and so helps people feelmore confident.
Home LivingThe Home Living value space addresses consumers’pressing need to have more time to spend on themselvesor with family and friends. We do this by creating high-quality solutions that enable quick and convenientcooking, preparation of beverages, cleaning, caring andhome comfort.
Lifestyle EntertainmentLifestyle Entertainment is about enjoying entertainmentand the little events in everyday life: sharing time withfamily and friends, having time off from a hectic schedule,and moments of comfort, fun and caring.
6.2.3 About Consumer LifestyleThe Philips Consumer Lifestyle sector is organized aroundits markets, customers and consumers, and is focused onvalue creation through category development anddelivery through operational excellence.
The market-driven approach is applied with particularemphasis at local level, enabling Consumer Lifestyle toaddress a variety of market dynamics and allowing thesales organizations to operate with shorter lines ofcommunication with the sector’s six businesses. This alsopromotes customer-centricity in day-to-day operations.
In 2010 the sector consisted of the following areas ofbusiness:
• Health & Wellness: mother and child care, oralhealthcare
• Personal Care: shaving and grooming, female depilation,haircare, vitalight, skincare

6 Sector performance 6.2.3 - 6.2.4
Annual Report 2010 91
• Domestic Appliances: kitchen appliances, beverages/espresso, garment care, floor care, water, air
• Television• Audio & Video Multimedia: home audio, home video,
home cinema sound, portable audio and video• Accessories: on-the-go accessories, together@home
accessories, personal displays, speech processing
Total sales by business 2010as a %
Health & Wellness7
Television36
Audio & Video Multimedia13
Accessories10
Other incl.Licenses
4
DomesticAppliances
17
Personal Care13
We also partner with leading companies from other fields,such as Sara Lee/Douwe Egberts and Beiersdorf (NIVEA),in order to deliver customer-focused appliance/consumable combinations. Consumer Lifestyle continuesto focus on international key accounts, particularly inemerging markets. We have pioneered innovativeapproaches in online and social media to build our brandand drive sales.
We offer a broad range of products from high to lowprice/value quartiles, necessitating a diverse distributionmodel. We are expanding our portfolio to increase itsaccessibility, particularly for lower-tier cities in emergingmarkets. We are also developing new retail channels, forinstance selling our innovative Intense Pulsed Lightdepilation solution, Philips Lumea, in branches of Douglas,the pan-European beauty retailer.
Under normal economic conditions, the ConsumerLifestyle business experiences seasonality, with highersales in the fourth quarter resulting from the holiday sales.
Consumer Lifestyle employs approximately 17,700people worldwide. Our global sales and serviceorganization covers more than 50 mature and emergingmarkets. In addition, we operate manufacturing andbusiness creation organizations in the Netherlands,France, Belgium, Austria, Hungary, Singapore, Argentina,Brazil and China.
Consumer Lifestyle strives for full compliance withrelevant regulatory requirements.
With regard to sourcing, please refer to sub-section 5.3.3,Supply management, of this Annual Report.
6.2.4 Progress against targetsThe Annual Report 2009 set out a number of key targetsfor Philips Consumer Lifestyle in 2010. The progress madein addressing these targets is outlined below.
Drive performance• Further increase cash flow by aggressively managing cash
targets: We strictly managed working capital, which hasbeen negative in many recent quarters. We effectivelymanaged our credit and risk, including significantlyreducing overdue customer payments. There was anincrease in the number of suppliers using supplierfinance, which reduced total cost in the supply chain. Aspart of Philips’ drive to harmonize supplier terms, weimproved overall payment terms by 7 days.
• Continue to reduce fixed costs and improve the overall agilityof the cost base: We acted fast in the downturn and arebenefiting from improved gross margin and a lower costbase, supporting year-on-year EBITA marginimprovement. We continued to manage costs via ourEarn 2 Invest Program, reinvesting savings to drivegrowth.
• Strengthen excellence in execution and further develop“sense and simplicity” as a competitive edge: We haveimplemented an improved management decisionsupport system with granular insight into integralperformance per business, market and customer downto product level. We are also striving to install a returnon investment (ROI) culture in order to drive, andincrease resources for, more effective advertising andpromotional campaigns.
Accelerate change• Continually optimize the business portfolio, while prioritizing
profitable growth and success in selected new value spaces:We have driven double-digit growth in our Health &Wellness business and high single-digit growth inPersonal Care, as well as low single-digit growth inDomestic Appliances. We have taken a granularapproach to ignite growth, focusing investments at acategory/country level.
• Nourish existing leadership positions, and increaseleadership positions in other categories by delightingconsumers and winning their preference: We have marketshare leadership or co-leadership positions in 45% ofour businesses in emerging markets and 32% in maturemarkets. We have Net Promoter Score leadership – akey leading indicator for sales growth – in mother andchild care, power toothbrushes and male shaving andgrooming, as well as across a range of categories andcountries.
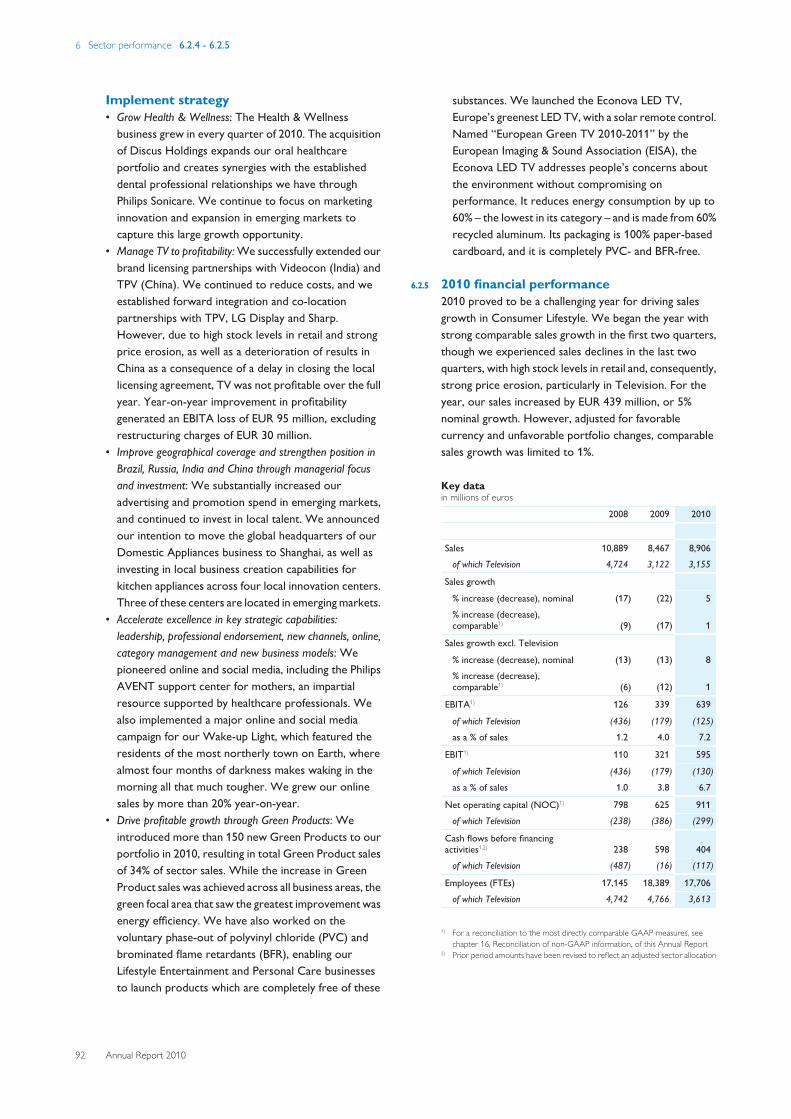
6 Sector performance 6.2.4 - 6.2.5
92 Annual Report 2010
Implement strategy• Grow Health & Wellness: The Health & Wellness
business grew in every quarter of 2010. The acquisitionof Discus Holdings expands our oral healthcareportfolio and creates synergies with the establisheddental professional relationships we have throughPhilips Sonicare. We continue to focus on marketinginnovation and expansion in emerging markets tocapture this large growth opportunity.
• Manage TV to profitability: We successfully extended ourbrand licensing partnerships with Videocon (India) andTPV (China). We continued to reduce costs, and weestablished forward integration and co-locationpartnerships with TPV, LG Display and Sharp.However, due to high stock levels in retail and strongprice erosion, as well as a deterioration of results inChina as a consequence of a delay in closing the locallicensing agreement, TV was not profitable over the fullyear. Year-on-year improvement in profitabilitygenerated an EBITA loss of EUR 95 million, excludingrestructuring charges of EUR 30 million.
• Improve geographical coverage and strengthen position inBrazil, Russia, India and China through managerial focusand investment: We substantially increased ouradvertising and promotion spend in emerging markets,and continued to invest in local talent. We announcedour intention to move the global headquarters of ourDomestic Appliances business to Shanghai, as well asinvesting in local business creation capabilities forkitchen appliances across four local innovation centers.Three of these centers are located in emerging markets.
• Accelerate excellence in key strategic capabilities:leadership, professional endorsement, new channels, online,category management and new business models: Wepioneered online and social media, including the PhilipsAVENT support center for mothers, an impartialresource supported by healthcare professionals. Wealso implemented a major online and social mediacampaign for our Wake-up Light, which featured theresidents of the most northerly town on Earth, wherealmost four months of darkness makes waking in themorning all that much tougher. We grew our onlinesales by more than 20% year-on-year.
• Drive profitable growth through Green Products: Weintroduced more than 150 new Green Products to ourportfolio in 2010, resulting in total Green Product salesof 34% of sector sales. While the increase in GreenProduct sales was achieved across all business areas, thegreen focal area that saw the greatest improvement wasenergy efficiency. We have also worked on thevoluntary phase-out of polyvinyl chloride (PVC) andbrominated flame retardants (BFR), enabling ourLifestyle Entertainment and Personal Care businessesto launch products which are completely free of these
substances. We launched the Econova LED TV,Europe’s greenest LED TV, with a solar remote control.Named “European Green TV 2010-2011” by theEuropean Imaging & Sound Association (EISA), theEconova LED TV addresses people’s concerns aboutthe environment without compromising onperformance. It reduces energy consumption by up to60% – the lowest in its category – and is made from 60%recycled aluminum. Its packaging is 100% paper-basedcardboard, and it is completely PVC- and BFR-free.
6.2.5 2010 financial performance2010 proved to be a challenging year for driving salesgrowth in Consumer Lifestyle. We began the year withstrong comparable sales growth in the first two quarters,though we experienced sales declines in the last twoquarters, with high stock levels in retail and, consequently,strong price erosion, particularly in Television. For theyear, our sales increased by EUR 439 million, or 5%nominal growth. However, adjusted for favorablecurrency and unfavorable portfolio changes, comparablesales growth was limited to 1%.
Key datain millions of euros
2008 2009 2010
Sales 10,889 8,467 8,906 of which Television 4,724 3,122 3,155
Sales growth
% increase (decrease), nominal (17) (22) 5 % increase (decrease),comparable1) (9) (17) 1
Sales growth excl. Television
% increase (decrease), nominal (13) (13) 8 % increase (decrease),comparable1) (6) (12) 1
EBITA1) 126 339 639
of which Television (436) (179) (125)as a % of sales 1.2 4.0 7.2
EBIT1) 110 321 595
of which Television (436) (179) (130)as a % of sales 1.0 3.8 6.7
Net operating capital (NOC)1) 798 625 911 of which Television (238) (386) (299)
Cash flows before financingactivities1,2) 238 598 404
of which Television (487) (16) (117)
Employees (FTEs) 17,145 18,389 17,706 of which Television 4,742 4,766 3,613
1) For a reconciliation to the most directly comparable GAAP measures, seechapter 16, Reconciliation of non-GAAP information, of this Annual Report
2) Prior period amounts have been revised to reflect an adjusted sector allocation
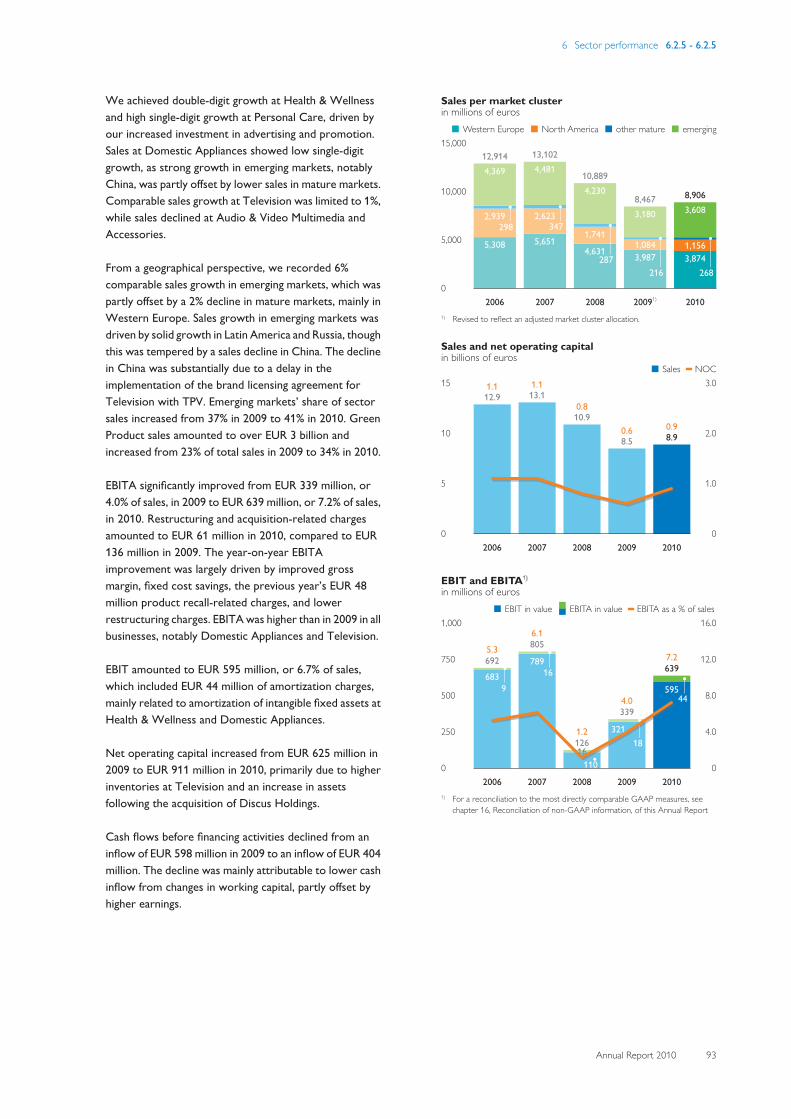
6 Sector performance 6.2.5 - 6.2.5
Annual Report 2010 93
We achieved double-digit growth at Health & Wellnessand high single-digit growth at Personal Care, driven byour increased investment in advertising and promotion.Sales at Domestic Appliances showed low single-digitgrowth, as strong growth in emerging markets, notablyChina, was partly offset by lower sales in mature markets.Comparable sales growth at Television was limited to 1%,while sales declined at Audio & Video Multimedia andAccessories.
From a geographical perspective, we recorded 6%comparable sales growth in emerging markets, which waspartly offset by a 2% decline in mature markets, mainly inWestern Europe. Sales growth in emerging markets wasdriven by solid growth in Latin America and Russia, thoughthis was tempered by a sales decline in China. The declinein China was substantially due to a delay in theimplementation of the brand licensing agreement forTelevision with TPV. Emerging markets’ share of sectorsales increased from 37% in 2009 to 41% in 2010. GreenProduct sales amounted to over EUR 3 billion andincreased from 23% of total sales in 2009 to 34% in 2010.
EBITA significantly improved from EUR 339 million, or4.0% of sales, in 2009 to EUR 639 million, or 7.2% of sales,in 2010. Restructuring and acquisition-related chargesamounted to EUR 61 million in 2010, compared to EUR136 million in 2009. The year-on-year EBITAimprovement was largely driven by improved grossmargin, fixed cost savings, the previous year’s EUR 48million product recall-related charges, and lowerrestructuring charges. EBITA was higher than in 2009 in allbusinesses, notably Domestic Appliances and Television.
EBIT amounted to EUR 595 million, or 6.7% of sales,which included EUR 44 million of amortization charges,mainly related to amortization of intangible fixed assets atHealth & Wellness and Domestic Appliances.
Net operating capital increased from EUR 625 million in2009 to EUR 911 million in 2010, primarily due to higherinventories at Television and an increase in assetsfollowing the acquisition of Discus Holdings.
Cash flows before financing activities declined from aninflow of EUR 598 million in 2009 to an inflow of EUR 404million. The decline was mainly attributable to lower cashinflow from changes in working capital, partly offset byhigher earnings.
Sales per market clusterin millions of euros■-Western Europe--■-North America--■-other mature--■-emerging
15,000
10,000
5,000
02006
5,308
2,939298
4,36912,914
2007
5,651
2,623347
4,48113,102
2008
4,631
1,741
287
4,23010,889
20091)
3,9871,084
216
3,1808,467
2010
3,8741,156
268
3,6088,906
1) Revised to reflect an adjusted market cluster allocation.
Sales and net operating capitalin billions of euros
■-Sales----NOC15
10
5
0
3.0
2.0
1.0
0
1.112.9
2006
1.113.1
2007
0.810.9
2008
0.68.5
2009
0.98.9
2010
EBIT and EBITA1)
in millions of euros■-EBIT in value--■■-EBITA in value----EBITA as a % of sales
1,000
750
500
250
0
16.0
12.0
8.0
4.0
0
6839
6925.3
2006
78916
8056.1
2007
110161261.2
2008
32118
3394.0
2009
59544
6397.2
2010
1616
1) For a reconciliation to the most directly comparable GAAP measures, seechapter 16, Reconciliation of non-GAAP information, of this Annual Report
6 Sector performance 6.2.5 - 6.2.6
94 Annual Report 2010
6.2.6 Strategy and 2011 objectivesPhilips Consumer Lifestyle will continue to play animportant role in the realization of Philips’ strategicambitions in the domain of health and well-being.
Consumer Lifestyle has defined the following key businessobjectives for 2011:
Drive performance• Accelerate top-line growth, growing market shares and
increasing market penetration in selected business/market combinations
• Maintain market share and optimize profitability inselected other business/market combinations
• Increase outright leadership positions in Net PromoterScore, underpinned by a strong focus on productperformance and quality
• Drive operational excellence end-to-end through thevalue chain
• Deliver on our EcoVision sustainability commitments
Improve capabilities• Champion consumer and retailer responsiveness,
organizing around customers and markets and movingdecision-making closer to markets
• Develop new go-to-market channels and opportunities• Accelerate high-impact innovation relevant to local
consumer needs to beat competition• Drive an agile organization with fast decision-making
and clear accountabilities
Implement strategy• Grow Personal Care, Health & Wellness, Domestic
Appliances and Coffee businesses• Continue to strengthen Television business and manage
it towards profitability• Maintain position in Audio & Video Multimedia and
Accessories while driving growth in selected business/market combinations
• Grow emerging markets and make China a global home,building business creation capabilities
• Strengthen our portfolio with targeted mergers andacquisitions
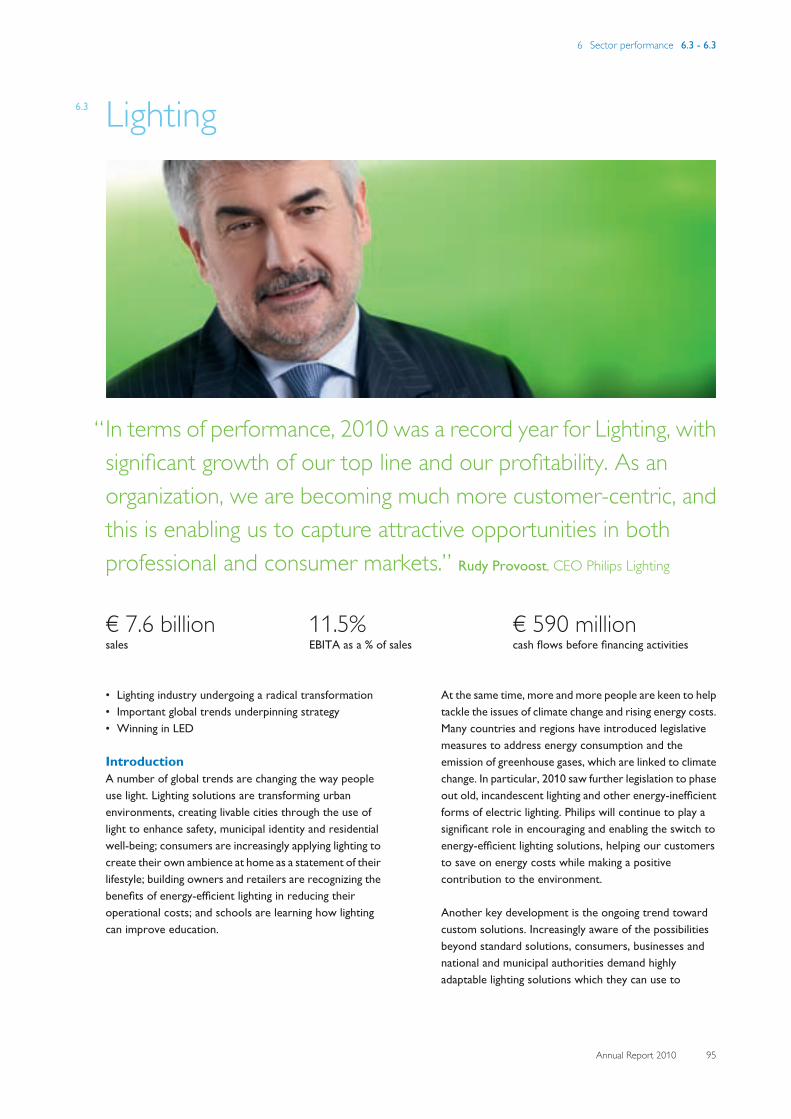
6 Sector performance 6.3 - 6.3
Annual Report 2010 95
6.3 Lighting
“In terms of performance, 2010 was a record year for Lighting, withsignificant growth of our top line and our profitability. As anorganization, we are becoming much more customer-centric, andthis is enabling us to capture attractive opportunities in bothprofessional and consumer markets.” Rudy Provoost, CEO Philips Lighting
€ 7.6 billionsales
11.5%EBITA as a % of sales
€ 590 millioncash flows before financing activities
• Lighting industry undergoing a radical transformation• Important global trends underpinning strategy• Winning in LED
IntroductionA number of global trends are changing the way peopleuse light. Lighting solutions are transforming urbanenvironments, creating livable cities through the use oflight to enhance safety, municipal identity and residentialwell-being; consumers are increasingly applying lighting tocreate their own ambience at home as a statement of theirlifestyle; building owners and retailers are recognizing thebenefits of energy-efficient lighting in reducing theiroperational costs; and schools are learning how lightingcan improve education.
At the same time, more and more people are keen to helptackle the issues of climate change and rising energy costs.Many countries and regions have introduced legislativemeasures to address energy consumption and theemission of greenhouse gases, which are linked to climatechange. In particular, 2010 saw further legislation to phaseout old, incandescent lighting and other energy-inefficientforms of electric lighting. Philips will continue to play asignificant role in encouraging and enabling the switch toenergy-efficient lighting solutions, helping our customersto save on energy costs while making a positivecontribution to the environment.
Another key development is the ongoing trend towardcustom solutions. Increasingly aware of the possibilitiesbeyond standard solutions, consumers, businesses andnational and municipal authorities demand highlyadaptable lighting solutions which they can use to
6 Sector performance 6.3 - 6.3.3
96 Annual Report 2010
customize their indoor and outdoor environments as andwhen they desire. Flexible and dynamic, our LED lightingsolutions allow a much higher degree of customizationand provide significantly greater possibilities for ambiencecreation than solutions based on conventionaltechnologies.
6.3.1 Lighting landscapeWe see three main transitions that will affect the lightingindustry in the years to come. The first is a move towardsenergy-efficient light sources, in response to rising energyprices and increased awareness of climate change.
The second transition is the move from traditionalvacuum-based technologies to solid-state lightingtechnology (LEDs). LED lighting is the most significantdevelopment in lighting since the invention of electric lightwell over a century ago. Offering unprecedented freedomin terms of color, dynamics, miniaturization, architecturalintegration and energy efficiency, LED lighting is openingup exciting new possibilities.
The third transition is from bulbs and components as thepoint of value creation to end-user-driven applicationsand solutions. Increasingly, these applications andsolutions will include lighting controls. We believe that,going forward, a key differentiator among lightingsuppliers will be the innovative strength to create systemsand solutions that are truly customer-centric.
Between now and 2015, we expect the value of the globallighting market to grow by 7% on a compound annualbasis, assuming global economic growth (GDP) of around4%. The majority of the value will be in LED-basedsolutions and products – heading towards 50% by 2015.As one of the global leaders in LED components,applications and solutions, with a strong global presenceacross the LED value chain, we believe we are wellpositioned for the changes at hand.
The lighting industry as a whole has been recovering in2010 from the global economic developments in 2009,though recovery is unevenly spread, with demand pickingup in emerging markets in particular. For example, theChinese authorities are expected to calibrate policy toensure that the economy continues to grow at around 8%in 2011, despite the slowdown in the West. Emergingmarkets have rebounded strongly (with the exception ofmuch of Eastern Europe, which is constrained by anongoing public- and private-sector balance-sheetadjustment), but indicators suggest that most of therebound is now over, with expansion expected to settleinto a more sustainable trajectory.
Automotive and Lumileds markets benefited most fromregained confidence and economic growth. Luminairesmarkets are still slow, particularly in the mature markets.Total world construction spend is expected to increase ata compound annual growth rate of about 5% over theperiod 2010-15. Early signs of revival in 2010 could beobserved in the infrastructure sector, with 1.5% growthyear-on-year.
6.3.2 Simply enhancing life with lightPhilips Lighting is dedicated to enhancing life with lightthrough the introduction of innovative and energy-efficient solutions or applications for lighting. Ourapproach is based on obtaining direct input both fromcustomers and from end-users/consumers. Through amarket segment-based approach, we can assess customerneeds in a targeted way, track changes over time anddefine new insights that fuel our innovation process andultimately increase the success rate of new propositionsintroduced onto the market.
We aim to be the true front-runner in design-led, marketand consumer-driven innovation – both in conventionallighting and in solid-state lighting – while continuing tocontribute to responsible energy use and sustainablegrowth.
We believe the rise of LED, coupled with our globalleadership, positions us well to continue to deliver on ourmission to simply enhance life with light.
6.3.3 About Philips LightingPhilips Lighting is a global market leader, with recognizedexpertise in the development, manufacturing andapplication of innovative lighting solutions. We havepioneered many of the key breakthroughs in lighting overthe past 100 years, laying the basis for our currentposition.
We address people’s lighting needs across a full range ofmarket segments. Indoors, we offer specialized lightingsolutions for homes, shops, offices, schools, hotels,factories and hospitals. Outdoors, we provide lighting forpublic spaces, residential areas and sports arenas. We alsohelp to make roads and streets safer for traffic and otherroad users (car lights and street lighting). In addition, weaddress the desire for light-inspired experiences througharchitectural projects. Finally, we offer specificapplications of lighting in specialized areas, such ashorticulture, refrigeration lighting and signage, as well asheating, air and water purification, and healthcare.
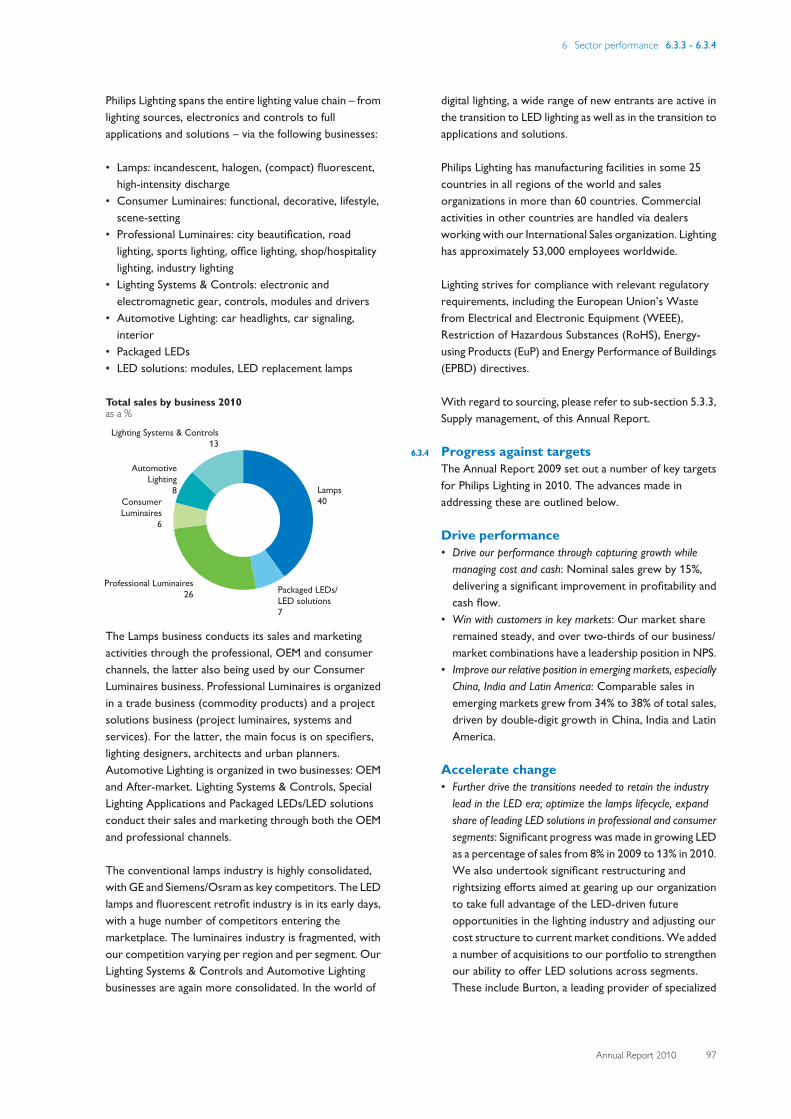
6 Sector performance 6.3.3 - 6.3.4
Annual Report 2010 97
Philips Lighting spans the entire lighting value chain – fromlighting sources, electronics and controls to fullapplications and solutions – via the following businesses:
• Lamps: incandescent, halogen, (compact) fluorescent,high-intensity discharge
• Consumer Luminaires: functional, decorative, lifestyle,scene-setting
• Professional Luminaires: city beautification, roadlighting, sports lighting, office lighting, shop/hospitalitylighting, industry lighting
• Lighting Systems & Controls: electronic andelectromagnetic gear, controls, modules and drivers
• Automotive Lighting: car headlights, car signaling,interior
• Packaged LEDs• LED solutions: modules, LED replacement lamps
Total sales by business 2010as a %
Lamps40
Packaged LEDs/LED solutions7
Professional Luminaires26
ConsumerLuminaires
6
AutomotiveLighting
8
Lighting Systems & Controls13
The Lamps business conducts its sales and marketingactivities through the professional, OEM and consumerchannels, the latter also being used by our ConsumerLuminaires business. Professional Luminaires is organizedin a trade business (commodity products) and a projectsolutions business (project luminaires, systems andservices). For the latter, the main focus is on specifiers,lighting designers, architects and urban planners.Automotive Lighting is organized in two businesses: OEMand After-market. Lighting Systems & Controls, SpecialLighting Applications and Packaged LEDs/LED solutionsconduct their sales and marketing through both the OEMand professional channels.
The conventional lamps industry is highly consolidated,with GE and Siemens/Osram as key competitors. The LEDlamps and fluorescent retrofit industry is in its early days,with a huge number of competitors entering themarketplace. The luminaires industry is fragmented, withour competition varying per region and per segment. OurLighting Systems & Controls and Automotive Lightingbusinesses are again more consolidated. In the world of
digital lighting, a wide range of new entrants are active inthe transition to LED lighting as well as in the transition toapplications and solutions.
Philips Lighting has manufacturing facilities in some 25countries in all regions of the world and salesorganizations in more than 60 countries. Commercialactivities in other countries are handled via dealersworking with our International Sales organization. Lightinghas approximately 53,000 employees worldwide.
Lighting strives for compliance with relevant regulatoryrequirements, including the European Union’s Wastefrom Electrical and Electronic Equipment (WEEE),Restriction of Hazardous Substances (RoHS), Energy-using Products (EuP) and Energy Performance of Buildings(EPBD) directives.
With regard to sourcing, please refer to sub-section 5.3.3,Supply management, of this Annual Report.
6.3.4 Progress against targetsThe Annual Report 2009 set out a number of key targetsfor Philips Lighting in 2010. The advances made inaddressing these are outlined below.
Drive performance• Drive our performance through capturing growth while
managing cost and cash: Nominal sales grew by 15%,delivering a significant improvement in profitability andcash flow.
• Win with customers in key markets: Our market shareremained steady, and over two-thirds of our business/market combinations have a leadership position in NPS.
• Improve our relative position in emerging markets, especiallyChina, India and Latin America: Comparable sales inemerging markets grew from 34% to 38% of total sales,driven by double-digit growth in China, India and LatinAmerica.
Accelerate change• Further drive the transitions needed to retain the industry
lead in the LED era; optimize the lamps lifecycle, expandshare of leading LED solutions in professional and consumersegments: Significant progress was made in growing LEDas a percentage of sales from 8% in 2009 to 13% in 2010.We also undertook significant restructuring andrightsizing efforts aimed at gearing up our organizationto take full advantage of the LED-driven futureopportunities in the lighting industry and adjusting ourcost structure to current market conditions. We addeda number of acquisitions to our portfolio to strengthenour ability to offer LED solutions across segments.These include Burton, a leading provider of specialized
6 Sector performance 6.3.4 - 6.3.5
98 Annual Report 2010
lighting solutions for healthcare facilities, and NCWHoldings, a leading Chinese provider of entertainmentlighting and lighting control solutions.
• Continue to invest in extending technological leadership inLED: We made significant R&D and capital investmentsin LED, including Lumileds, and made considerableprogress in creating an integrated LED value chainacross Lighting.
Implement strategy• Become the lighting solutions leader in the Outdoor segment:
We significantly expanded our LED road lightingportfolio in all regions. We have a healthy projectpipeline for LED road lighting in China and continue toinvest in R&D and our sales force to enhance ouroffering into turnkey projects. In 2010 we also acquiredAmplex’s street lighting controls business to furtherexpand our street lighting offering.
• Grow our Consumer Luminaires business: We madeconsiderable progress in expanding the businessoutside Europe. Overall, sales remained broadly in linewith 2009 due to ongoing weakness in the residentialmarket in Europe, the business’s core market. Theacquisition of Luceplan, a leading high-end design brandin consumer lighting has further strengthened ourportfolio.
• Implement our new Lighting mission, identity andsustainability story – “Simply enhancing life with light”: Wehave trained more than 85% of all our employees on ournew Lighting mission and have seen the uptake reflectedin our Employee Engagement Survey and in the positivereactions of external stakeholders, e.g. at Light +Building 2010 and our Capital Markets Day.
In 2010 we invested EUR 230 million in GreenInnovation, compared to EUR 185 million in 2009. Theenergy efficiency of our total product portfolioimproved by 9%.
6.3.5 2010 financial performanceSales amounted to EUR 7,552 million, a nominal increaseof 15% compared to 2009, driven by a rebound in sales ofgeneral and automotive lamps as well as ongoing growthof our Lumileds LED business. Excluding a 6% favorablecurrency impact and a 1% contribution from acquisitions,comparable sales increased by 9%.
The year-on-year sales increase was substantially drivenby growth in emerging markets, which grew over 20% on acomparable basis. Emerging market sales grew to over38% of total Lighting sales, driven by China, India andBrazil, compared to 34% in 2009. In mature markets, sales
growth was limited to low single-digits due to lowerdemand in North America and Western Europe,particularly for Professional and Consumer Luminaires.
A rebound in the global automotive market supportedsolid, double-digit sales growth in this business. Ourgeneral Lamps business also grew strongly compared to2009, buoyed by demand for high-end lamps in retail andemerging geographies. Ongoing softness in both theresidential and commercial construction markets –particularly in mature geographies – meant that sales inour Luminaires businesses remained broadly in line with2009. Sales of LED-based products grew to over 13% oftotal sales, up from 8% in 2009, driven by Lumileds, Lampsand Professional Luminaires. Sales of energy-efficientGreen Products exceeded EUR 4 billion, or 58% of sectorsales.
EBITA amounted to EUR 869 million, or 11.5% of sales,which included EUR 96 million of restructuring andacquisition-related charges. This compared to EUR 247million of restructuring and acquisition-related charges in2009. The EBITA improvement was driven by higher sales,improved gross margin and fixed cost savings fromrestructuring programs.
EBIT amounted to EUR 695 million, or 9.2% of sales,which included EUR 174 million of amortization ofintangible fixed assets, mainly from Lumileds and Genlyte.
Net operating capital increased by EUR 457 million toEUR 5.6 billion, due to unfavorable currency translation,higher activity levels and additional LED-related capitalexpenditures.
Cash flows before financing activities declined from EUR624 million in 2009 to EUR 590 million, reflecting highercash earnings which were more than offset by higherworking capital requirements and additional growth-focused investments in capital expenditures.
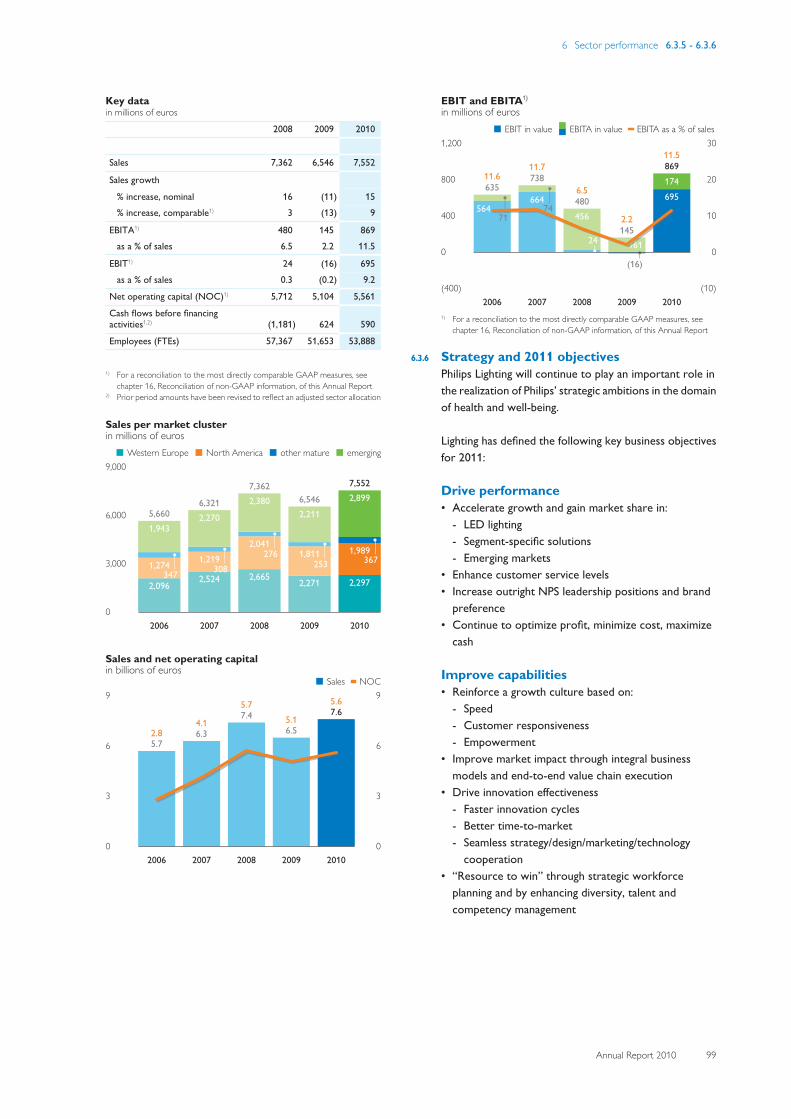
6 Sector performance 6.3.5 - 6.3.6
Annual Report 2010 99
Key datain millions of euros
2008 2009 2010
Sales 7,362 6,546 7,552
Sales growth
% increase, nominal 16 (11) 15 % increase, comparable1) 3 (13) 9
EBITA1) 480 145 869 as a % of sales 6.5 2.2 11.5
EBIT1) 24 (16) 695 as a % of sales 0.3 (0.2) 9.2
Net operating capital (NOC)1) 5,712 5,104 5,561
Cash flows before financingactivities1,2) (1,181) 624 590
Employees (FTEs) 57,367 51,653 53,888
1) For a reconciliation to the most directly comparable GAAP measures, seechapter 16, Reconciliation of non-GAAP information, of this Annual Report
2) Prior period amounts have been revised to reflect an adjusted sector allocation
Sales per market clusterin millions of euros■-Western Europe--■-North America--■-other mature--■-emerging
9,000
6,000
3,000
02006
2,096
1,274347
1,9435,660
2007
2,524
1,219308
2,2706,321
2008
2,665
2,041276
2,3807,362
2009
2,271
1,811253
2,2116,546
2010
2,297
1,989367
2,8997,552
Sales and net operating capitalin billions of euros
■-Sales----NOC9
6
3
0
9
6
3
0
2.85.7
2006
4.16.3
2007
5.77.4
2008
5.16.5
2009
5.67.6
2010
EBIT and EBITA1)
in millions of euros■-EBIT in value--■■-EBITA in value----EBITA as a % of sales
1,200
800
400
0
(400)
30
20
10
0
(10)
56471
63511.6
2006
66474
73811.7
2007
24
4564806.5
2008
(16)
1611452.2
2009
69517486911.5
2010
161
1) For a reconciliation to the most directly comparable GAAP measures, seechapter 16, Reconciliation of non-GAAP information, of this Annual Report
6.3.6 Strategy and 2011 objectivesPhilips Lighting will continue to play an important role inthe realization of Philips’ strategic ambitions in the domainof health and well-being.
Lighting has defined the following key business objectivesfor 2011:
Drive performance• Accelerate growth and gain market share in:
- LED lighting- Segment-specific solutions- Emerging markets
• Enhance customer service levels• Increase outright NPS leadership positions and brand
preference• Continue to optimize profit, minimize cost, maximize
cash
Improve capabilities• Reinforce a growth culture based on:
- Speed- Customer responsiveness- Empowerment
• Improve market impact through integral businessmodels and end-to-end value chain execution
• Drive innovation effectiveness- Faster innovation cycles- Better time-to-market- Seamless strategy/design/marketing/technology
cooperation• “Resource to win” through strategic workforce
planning and by enhancing diversity, talent andcompetency management
6 Sector performance 6.3.6 - 6.3.6
100 Annual Report 2010
Implement strategy• Lead in LED light sources while further optimizing
conventional lighting• Win in LED-powered lighting solutions, focusing on:
- Professional applications in Outdoor, Retail, Office,and specific local priorities
- Philips brand expansion in consumer lighting• Deliver on our EcoVision sustainability ambitions• Strengthen emerging markets
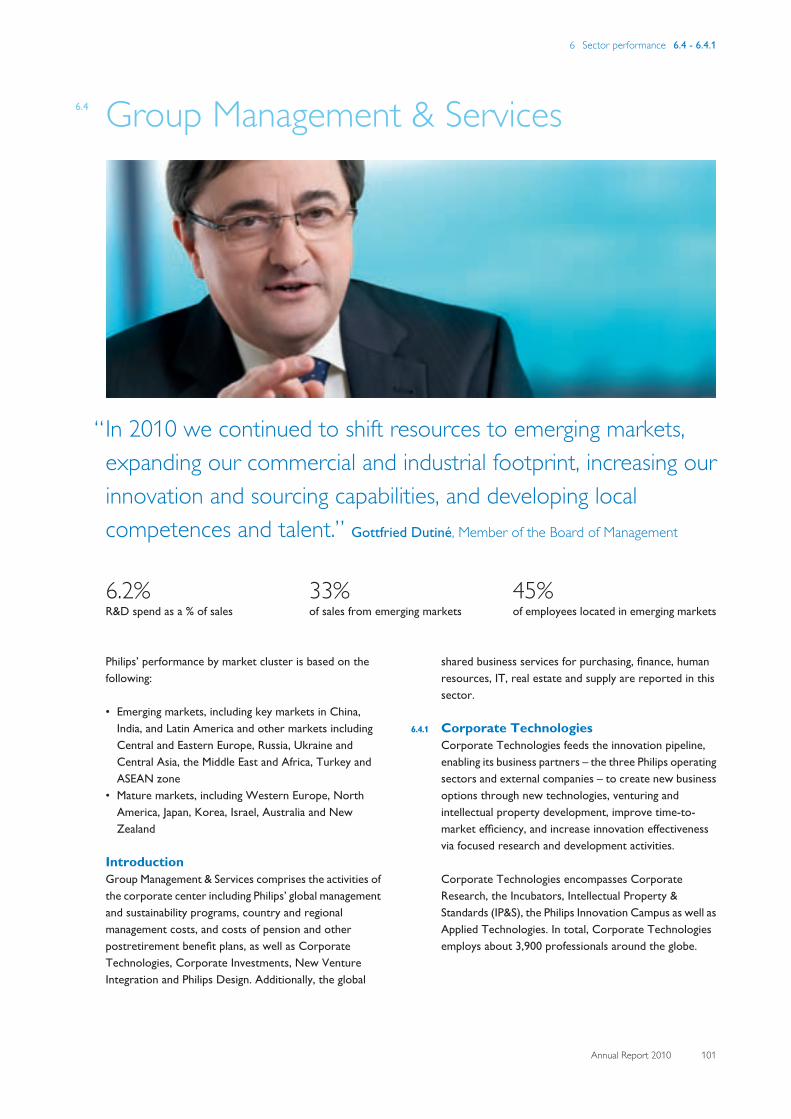
6 Sector performance 6.4 - 6.4.1
Annual Report 2010 101
6.4 Group Management & Services
“In 2010 we continued to shift resources to emerging markets,expanding our commercial and industrial footprint, increasing ourinnovation and sourcing capabilities, and developing localcompetences and talent.” Gottfried Dutiné, Member of the Board of Management
6.2%R&D spend as a % of sales
33%of sales from emerging markets
45%of employees located in emerging markets
Philips’ performance by market cluster is based on thefollowing:
• Emerging markets, including key markets in China,India, and Latin America and other markets includingCentral and Eastern Europe, Russia, Ukraine andCentral Asia, the Middle East and Africa, Turkey andASEAN zone
• Mature markets, including Western Europe, NorthAmerica, Japan, Korea, Israel, Australia and NewZealand
IntroductionGroup Management & Services comprises the activities ofthe corporate center including Philips’ global managementand sustainability programs, country and regionalmanagement costs, and costs of pension and otherpostretirement benefit plans, as well as CorporateTechnologies, Corporate Investments, New VentureIntegration and Philips Design. Additionally, the global
shared business services for purchasing, finance, humanresources, IT, real estate and supply are reported in thissector.
6.4.1 Corporate TechnologiesCorporate Technologies feeds the innovation pipeline,enabling its business partners – the three Philips operatingsectors and external companies – to create new businessoptions through new technologies, venturing andintellectual property development, improve time-to-market efficiency, and increase innovation effectivenessvia focused research and development activities.
Corporate Technologies encompasses CorporateResearch, the Incubators, Intellectual Property &Standards (IP&S), the Philips Innovation Campus as well asApplied Technologies. In total, Corporate Technologiesemploys about 3,900 professionals around the globe.
6 Sector performance 6.4.1 - 6.4.3
102 Annual Report 2010
Corporate Technologies actively participates in ‘openinnovation’ through relationships with academic andindustrial partners, as well as via European and regionalprojects, in order to improve innovation efficiency andshare the related financial exposure. The High TechCampus in Eindhoven, the Netherlands, the PhilipsInnovation Campus in Bangalore, India, and ResearchShanghai, China, are prime examples of environmentsenabling open innovation. In this way, we ensureproximity of innovation activities to emerging markets.
Philips Research is a key innovation partner for Philips’business sectors. It has three main roles. Firstly, it createsnew technologies that help to spur the growth of thePhilips businesses. Secondly, it develops uniqueintellectual property (IP), which will enable longer-termbusiness and creates standardization opportunities forPhilips. Lastly, it prepares the ground for the creation ofadjacent businesses in the sectors based on technology-enabled innovation in strategically aligned applicationareas.
In 2010, scientists from Philips Research developed thefirst-ever organic light-emitting diode (OLED) modulethat can be powered directly from a mains electricitysupply. The prototype opens the door to OLED systemsthat can be directly plugged into standard power outletswithout the need for bulky power management circuitry.This will reduce the bill of materials and simplify luminairedesign for future OLED-based systems aimed at mass-market general illumination applications. In the Healthcarearea, Philips Research is developing a Radio FrequencyAblation Cockpit, which covers preparation, planning andexecution of minimally invasive tumor ablationprocedures by clinicians. For therapy planning, the cockpitleverages the tumor visualization capabilities of pre-operative CT and/or PET imaging plus automatedgeneration of target ablation plans. For targeted needleplacement, it combines these with the real-time imagingcapabilities of ultrasound and precision needle-tipnavigation technology based on electromagnetic tracking.
Philips has three incubation organizations: the Healthcare,Consumer Lifestyle and Lighting & Cleantech Incubators.The main purpose of the Incubators is to create strategicgrowth opportunities for Philips. In some cases, spin-outor technology licensing is considered. In Healthcare,Philips made an anchor investment in the healthcaretechnology fund Gilde Healthcare III, which has a targetsize of EUR 200 million. In Consumer Lifestyle, DirectLife,launched in 2009, now has over 30,000 active users losingweight, getting fit and staying healthy. In the second half of2010, a new Skin Care venture became operational tohelp women who are confused about their skin type and
the products they should use. Our novel Crystalizeimaging technology gives women factual, objectiveinformation and better knowledge about their skin so theycan make smarter choices and achieve a more beautifulskin.
Philips further developed digital pathology solutions toease the workload and support decision making in centraland hospital-based pathology departments.
Philips IP&S proactively pursues the creation of newintellectual property in close co-operation with Philips’operating sectors and the other departments withinCorporate Technologies. IP&S is a leading industrial IPorganization providing world-class IP solutions to Philips’businesses to support their growth, competitiveness andprofitability. Philips’ IP portfolio currently consists ofabout 50,000 patent rights, 36,000 trademarks, 63,000design rights and 3,900 domain name registrations. Philipsfiled approximately 1,300 patents in 2010, with a strongfocus on the growth areas in health and well-being. IP&Sparticipates in the setting of standards to create newbusiness opportunities for the Healthcare, ConsumerLifestyle and Lighting sectors. A substantial portion ofrevenue and costs is allocated to the operating sectors.Philips believes its business as a whole is not materiallydependent on any particular patent or license, or anyparticular group of patents and licenses.
Applied Technologies is a showcase for our openinnovation approach, supporting customers both insideand outside Philips through new technologies, newbusiness ideas, consultancy and new productdevelopment and introduction services. AppliedTechnologies is an active player in solutions for thehealthcare sector and energy solutions, including solarcells and energy management.
6.4.2 Corporate InvestmentsThe remaining business within Corporate Investments –Assembléon – is a wholly owned subsidiary that develops,assembles, markets and distributes a diverse range ofsurface-mount technology placement equipment. In 2010we announced our attention to sell a majority stake inAssembléon to H2 Equity Partners, an independentprivate equity firm. Philips will retain a 20% stake inAssembléon once the transaction is completed.
6.4.3 New Venture IntegrationThe New Venture Integration group focuses on theintegration of newly acquired companies across allsectors.
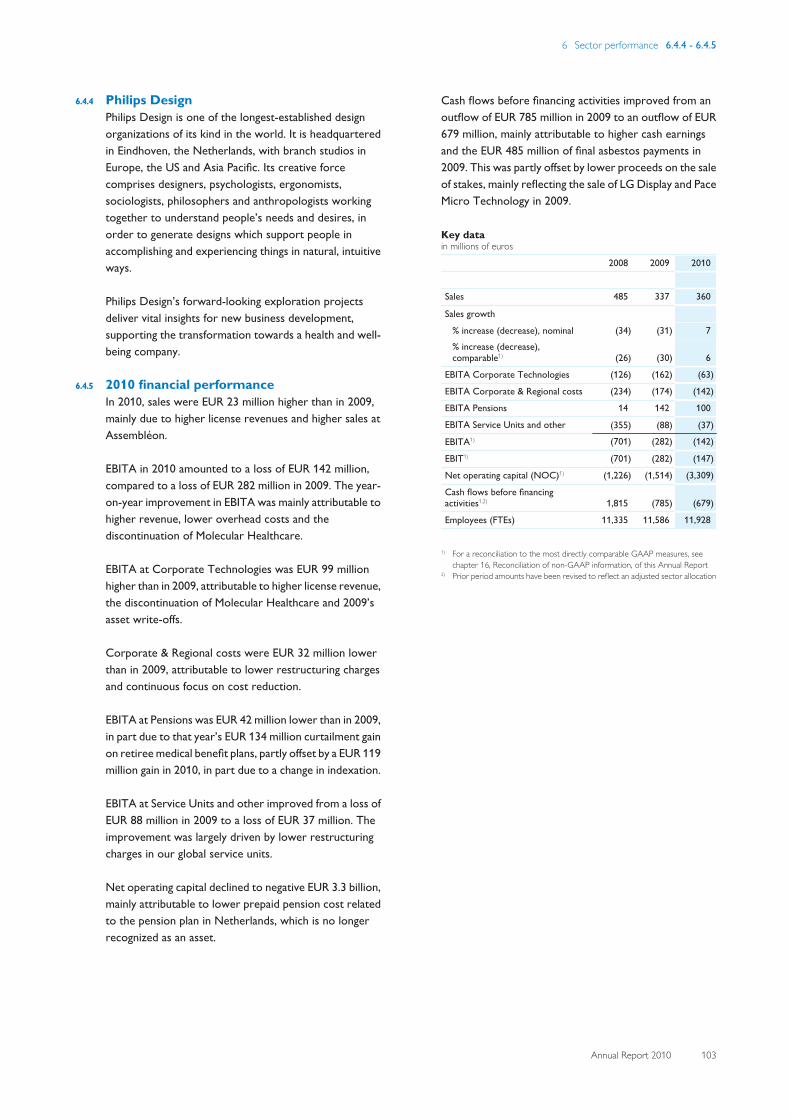
6 Sector performance 6.4.4 - 6.4.5
Annual Report 2010 103
6.4.4 Philips DesignPhilips Design is one of the longest-established designorganizations of its kind in the world. It is headquarteredin Eindhoven, the Netherlands, with branch studios inEurope, the US and Asia Pacific. Its creative forcecomprises designers, psychologists, ergonomists,sociologists, philosophers and anthropologists workingtogether to understand people’s needs and desires, inorder to generate designs which support people inaccomplishing and experiencing things in natural, intuitiveways.
Philips Design’s forward-looking exploration projectsdeliver vital insights for new business development,supporting the transformation towards a health and well-being company.
6.4.5 2010 financial performanceIn 2010, sales were EUR 23 million higher than in 2009,mainly due to higher license revenues and higher sales atAssembléon.
EBITA in 2010 amounted to a loss of EUR 142 million,compared to a loss of EUR 282 million in 2009. The year-on-year improvement in EBITA was mainly attributable tohigher revenue, lower overhead costs and thediscontinuation of Molecular Healthcare.
EBITA at Corporate Technologies was EUR 99 millionhigher than in 2009, attributable to higher license revenue,the discontinuation of Molecular Healthcare and 2009’sasset write-offs.
Corporate & Regional costs were EUR 32 million lowerthan in 2009, attributable to lower restructuring chargesand continuous focus on cost reduction.
EBITA at Pensions was EUR 42 million lower than in 2009,in part due to that year’s EUR 134 million curtailment gainon retiree medical benefit plans, partly offset by a EUR 119million gain in 2010, in part due to a change in indexation.
EBITA at Service Units and other improved from a loss ofEUR 88 million in 2009 to a loss of EUR 37 million. Theimprovement was largely driven by lower restructuringcharges in our global service units.
Net operating capital declined to negative EUR 3.3 billion,mainly attributable to lower prepaid pension cost relatedto the pension plan in Netherlands, which is no longerrecognized as an asset.
Cash flows before financing activities improved from anoutflow of EUR 785 million in 2009 to an outflow of EUR679 million, mainly attributable to higher cash earningsand the EUR 485 million of final asbestos payments in2009. This was partly offset by lower proceeds on the saleof stakes, mainly reflecting the sale of LG Display and PaceMicro Technology in 2009.
Key datain millions of euros
2008 2009 2010
Sales 485 337 360
Sales growth
% increase (decrease), nominal (34) (31) 7 % increase (decrease),comparable1) (26) (30) 6
EBITA Corporate Technologies (126) (162) (63)
EBITA Corporate & Regional costs (234) (174) (142)
EBITA Pensions 14 142 100
EBITA Service Units and other (355) (88) (37)
EBITA1) (701) (282) (142)
EBIT1) (701) (282) (147)
Net operating capital (NOC)1) (1,226) (1,514) (3,309)
Cash flows before financingactivities1,2) 1,815 (785) (679)
Employees (FTEs) 11,335 11,586 11,928
1) For a reconciliation to the most directly comparable GAAP measures, seechapter 16, Reconciliation of non-GAAP information, of this Annual Report
2) Prior period amounts have been revised to reflect an adjusted sector allocation
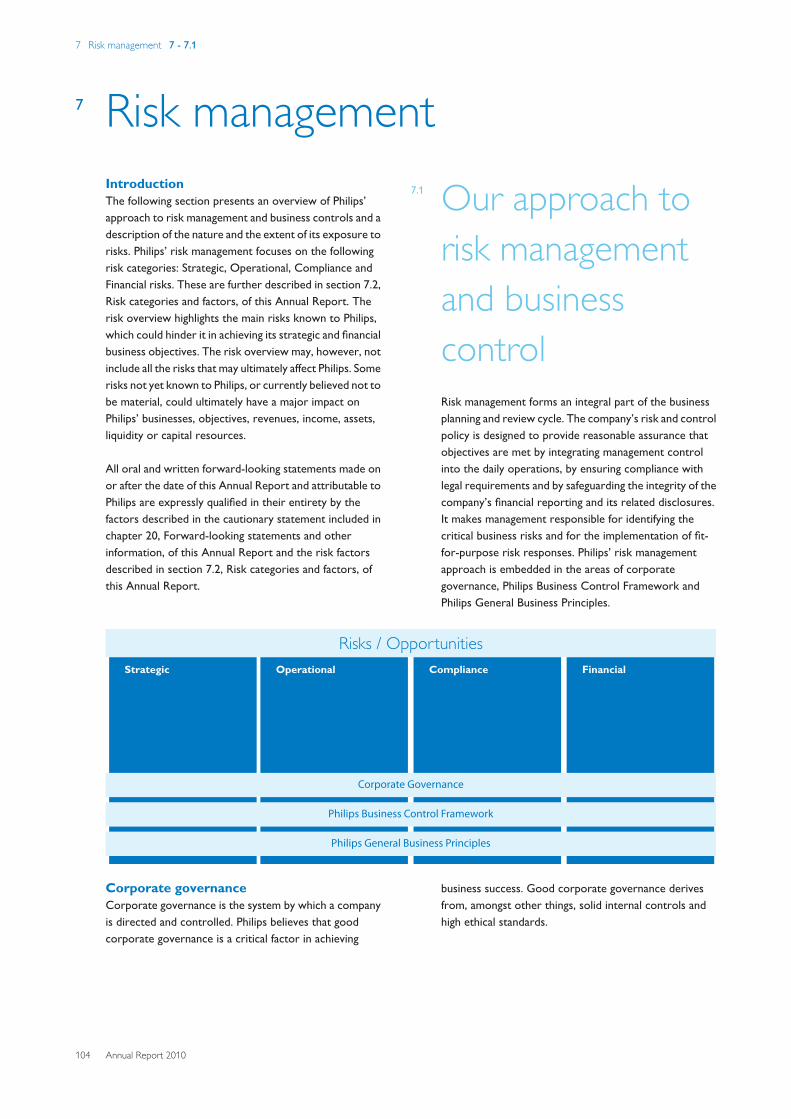
7 Risk management 7 - 7.1
104 Annual Report 2010
7 Risk managementIntroductionThe following section presents an overview of Philips’approach to risk management and business controls and adescription of the nature and the extent of its exposure torisks. Philips’ risk management focuses on the followingrisk categories: Strategic, Operational, Compliance andFinancial risks. These are further described in section 7.2,Risk categories and factors, of this Annual Report. Therisk overview highlights the main risks known to Philips,which could hinder it in achieving its strategic and financialbusiness objectives. The risk overview may, however, notinclude all the risks that may ultimately affect Philips. Somerisks not yet known to Philips, or currently believed not tobe material, could ultimately have a major impact onPhilips’ businesses, objectives, revenues, income, assets,liquidity or capital resources.
All oral and written forward-looking statements made onor after the date of this Annual Report and attributable toPhilips are expressly qualified in their entirety by thefactors described in the cautionary statement included inchapter 20, Forward-looking statements and otherinformation, of this Annual Report and the risk factorsdescribed in section 7.2, Risk categories and factors, ofthis Annual Report.
7.1 Our approach torisk managementand businesscontrolRisk management forms an integral part of the businessplanning and review cycle. The company’s risk and controlpolicy is designed to provide reasonable assurance thatobjectives are met by integrating management controlinto the daily operations, by ensuring compliance withlegal requirements and by safeguarding the integrity of thecompany’s financial reporting and its related disclosures.It makes management responsible for identifying thecritical business risks and for the implementation of fit-for-purpose risk responses. Philips’ risk managementapproach is embedded in the areas of corporategovernance, Philips Business Control Framework andPhilips General Business Principles.
Financial Compliance Strategic Operational
Corporate Governance
Philips Business Control Framework
Philips General Business Principles
Risks / Opportunities
Corporate governanceCorporate governance is the system by which a companyis directed and controlled. Philips believes that goodcorporate governance is a critical factor in achieving
business success. Good corporate governance derivesfrom, amongst other things, solid internal controls andhigh ethical standards.
7 Risk management 7.1 - 7.1
Annual Report 2010 105
The quality of Philips’ systems of business controls and thefindings of internal and external audits are reported to anddiscussed in the Audit Committee of the SupervisoryBoard. Internal auditors monitor the quality of thebusiness controls through risk-based operational audits,inspections of financial reporting controls and complianceaudits. Audit committees at the corporate level (Financeand IT/Supply) and the sector level (Healthcare, Lighting,Consumer Lifestyle, Group Management & Services) meetquarterly to address weaknesses in the business controlsinfrastructure as reported by internal and externalauditors or revealed by self-assessment of management,and to take corrective action where necessary. Theseaudit committees are also involved in determining thedesired company-wide internal audit planning as approvedby the Audit Committee of the Supervisory Board. An in-depth description of Philips’ corporate governancestructure can be found in chapter 12, Corporategovernance, of this Annual Report.
Philips Business Control FrameworkThe Philips Business Control Framework (BCF), derivedfrom the Committee of Sponsoring Organizations of theTreadway Commission (COSO) framework on internalcontrol, sets the standard for risk management andbusiness control in Philips. The objectives of the BCF areto maintain integrated management control of thecompany’s operations, in order to ensure integrity of thefinancial reporting, as well as compliance with laws andregulations.
As part of the BCF, Philips has implemented a globalstandard for internal control over financial reporting(ICS). The ICS, together with Philips’ establishedaccounting procedures, is designed to provide reasonableassurance that assets are safeguarded, that the books andrecords properly reflect transactions necessary to permitpreparation of financial statements, that policies andprocedures are carried out by qualified personnel and thatpublished financial statements are properly prepared anddo not contain any material misstatements. ICS has beendeployed in all main reporting units, where businessprocess owners perform an extensive number ofcontrols, document the results each quarter, and takecorrective action where necessary. ICS supports sectorand functional management in a quarterly cycle ofassessment and monitoring of its control environment.Findings of management’s evaluation are reported to theBoard of Management.
As part of the Annual Report process, management’saccountability for business controls is enforced throughthe formal issuance of a Statement on Business Controlsand a Letter of Representation by sector and functional
management to the Board of Management. Anydeficiencies noted in the design and operatingeffectiveness of controls over financial reporting whichwere not completely remediated are evaluated at year-end by the Board of Management. The Board ofManagement’s report, including its conclusions regardingthe effectiveness of internal control over financialreporting, can be found in section 13.1, Management’sreport on internal control, of this Annual Report.
Philips General Business PrinciplesThe Philips General Business Principles (GBP) governPhilips’ business decisions and actions throughout theworld, applying to corporate actions and the behavior ofindividual employees. They incorporate the fundamentalprinciples within Philips for doing business.
The GBP are available in most of the local languages andare an integral part of the labor contracts in virtually allcountries where Philips has business activities.Responsibility for compliance with the principles restsprimarily with the management of each business. Everycountry organization and each main production site has acompliance officer. Confirmation of compliance with theGBP is an integral part of the annual Statement onBusiness Controls that has to be issued by themanagement of each business unit. The GBP incorporate awhistleblower policy, standardized complaint reportingand a formal escalation procedure.
The global implementation of the One Philips Ethicshotline seeks to ensure that alleged violations areregistered and dealt with consistently within a company-wide system. To drive the practical deployment of theGBP, a set of directives has been published, which areapplicable to all employees. There are also separatedirectives which apply to specific categories of employees(e.g. the Supply Management Code of Ethics and FinancialCode of Ethics, refer to www.philips.com/gbp).
In January 2010 an updated and extended version of theGBP Directives came into force, reflecting the latestdevelopments in codes of conduct and business integritylegislation. Key new elements in this edition include amore detailed and explicit definition of the anti-corruption/anti-bribery guidelines and directives (inaccordance with the latest FCPA and OECDrequirements) and a number of changes designed tofurther clarify the existing GBP Directives. All employeesperforming important financial functions must complywith the Financial Code of Ethics which contains, amongstother things, standards to promote honest and ethicalconduct, as well as full, accurate and timely disclosure
7 Risk management 7.1 - 7.1
106 Annual Report 2010
procedures in order to avoid conflicts of interest. Philipsdid not grant any waivers of the Financial Code of Ethics in2010.
Philips implemented a global internal communicationprogram to support local management in theircommunications about the updated and extended GBPDirectives, thereby focusing on a consistent “tone at thetop”. A risk-based blueprint for the Compliance Officersorganization, which specifies – at country and operationalunit level – the time and profile (experience, seniority,functional expertise) required for the Compliance Officerfunction, was developed for implementation worldwide.
In the course of 2010 significant progress was made withthe roll-out of dedicated anti-corruption programs atbusiness and regional level:
• Standard guidelines for anti-corruption due diligenceprocedure for the selection of dealers, agents anddistributors: a mandatory procedure is in place anddeployment is nearing completion.
• Company-wide anti-corruption training program: theanti-corruption (FCPA) e-learning course wascompleted by the entire target audience of approx.35,000 executives and sales and marketing employees.
• Inventory of dealers/agents/distributors: risk-based,sector-specific processes have been developed forinventorying current agents and distributors, includingcontracts (terms of agreement) and policies forcommission payment and supervision thereof.
The global roll-out of the updated version of themandatory web-based GBP training, which is designed toreinforce awareness of the need for compliance with theGBP, was completed.
As of 2010, a GBP self-assessment process is fullyembedded in the Philips ICS tool, a workflow applicationsupporting sector/function management in monitoringinternal controls. Management of reporting units (with >10 employees) need to answer the questions in the ICSbefore year-end and report their findings via a dedicatedcontrol. Embedding GBP self-assessments in ICS ensuresthat GBP compliance is now part of sector/functionmanagement’s quarterly ICS/SOx monitoring process andthat GBP non-compliance issues, if significant, arereported to the Board of Management via the QuarterlyCertification Statement process.
For further details, please refer to the General BusinessPrinciples paragraph in chapter 15, Sustainabilitystatements, of this Annual Report.
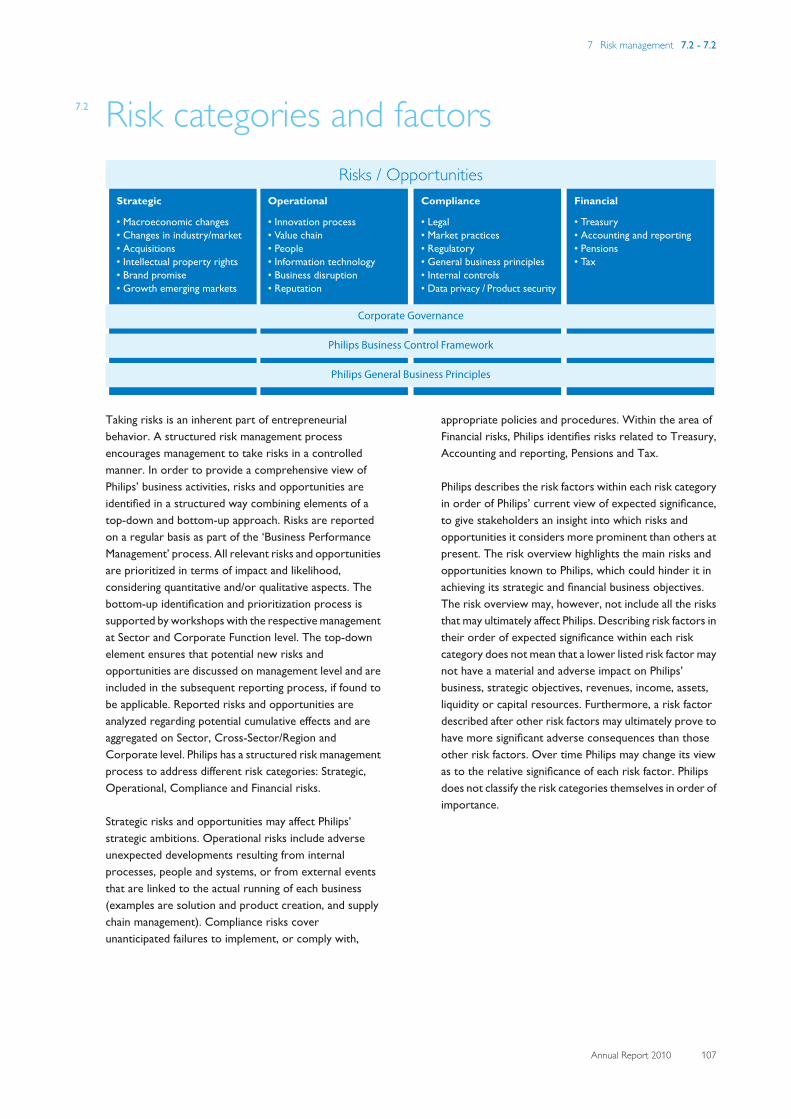
7 Risk management 7.2 - 7.2
Annual Report 2010 107
7.2 Risk categories and factors
Financial Compliance
• Legal
• Market practices
• Regulatory
• General business principles
• Internal controls
• Data privacy / Product security
• Treasury
• Accounting and reporting
• Pensions
• Tax
Strategic Operational
Corporate Governance
Philips Business Control Framework
Philips General Business Principles
• Innovation process
• Value chain
• People
• Information technology
• Business disruption
• Reputation
• Macroeconomic changes
• Changes in industry/market
• Acquisitions
• Intellectual property rights
• Brand promise
• Growth emerging markets
Risks / Opportunities
Taking risks is an inherent part of entrepreneurialbehavior. A structured risk management processencourages management to take risks in a controlledmanner. In order to provide a comprehensive view ofPhilips’ business activities, risks and opportunities areidentified in a structured way combining elements of atop-down and bottom-up approach. Risks are reportedon a regular basis as part of the ‘Business PerformanceManagement’ process. All relevant risks and opportunitiesare prioritized in terms of impact and likelihood,considering quantitative and/or qualitative aspects. Thebottom-up identification and prioritization process issupported by workshops with the respective managementat Sector and Corporate Function level. The top-downelement ensures that potential new risks andopportunities are discussed on management level and areincluded in the subsequent reporting process, if found tobe applicable. Reported risks and opportunities areanalyzed regarding potential cumulative effects and areaggregated on Sector, Cross-Sector/Region andCorporate level. Philips has a structured risk managementprocess to address different risk categories: Strategic,Operational, Compliance and Financial risks.
Strategic risks and opportunities may affect Philips’strategic ambitions. Operational risks include adverseunexpected developments resulting from internalprocesses, people and systems, or from external eventsthat are linked to the actual running of each business(examples are solution and product creation, and supplychain management). Compliance risks coverunanticipated failures to implement, or comply with,
appropriate policies and procedures. Within the area ofFinancial risks, Philips identifies risks related to Treasury,Accounting and reporting, Pensions and Tax.
Philips describes the risk factors within each risk categoryin order of Philips’ current view of expected significance,to give stakeholders an insight into which risks andopportunities it considers more prominent than others atpresent. The risk overview highlights the main risks andopportunities known to Philips, which could hinder it inachieving its strategic and financial business objectives.The risk overview may, however, not include all the risksthat may ultimately affect Philips. Describing risk factors intheir order of expected significance within each riskcategory does not mean that a lower listed risk factor maynot have a material and adverse impact on Philips’business, strategic objectives, revenues, income, assets,liquidity or capital resources. Furthermore, a risk factordescribed after other risk factors may ultimately prove tohave more significant adverse consequences than thoseother risk factors. Over time Philips may change its viewas to the relative significance of each risk factor. Philipsdoes not classify the risk categories themselves in order ofimportance.
7 Risk management 7.3 - 7.3
108 Annual Report 2010
7.3 Strategic risksAs Philips’ business is global, its operations are exposed toeconomic and political developments in countries acrossthe world that could adversely impact its revenues andincome.Philips’ business environment is influenced by economicconditions globally and in individual countries wherePhilips conducts business. The high degree ofunemployment in certain countries, the level of publicdebt in the US and certain European countries, as well asuncertainties with respect to the long-term high growthstability of the Chinese economy, may result in lowerdemand and more challenging market environmentsacross our Sectors. Political developments, for exampleHealthcare reforms in various countries – such as the USHealthcare Reform – may impose additional uncertaintiesby redistributing sector spending, changingreimbursement models and fiscal changes.
Numerous other factors, such as fluctuation of energy andraw material prices, as well as global political conflicts,including North Africa, the Middle East and other regions,could continue to impact macroeconomic factors and theinternational capital and credit markets. Economic andpolitical uncertainty may have a material adverse impacton Philips’ financial condition or results of operations andcan also make Philips’ budgeting and forecasting moredifficult.
Philips may encounter difficulty in planning and managingoperations due to unfavorable political factors, includingunexpected legal or regulatory changes such as foreignexchange import or export controls, increased healthcareregulation, nationalization of assets or restrictions on therepatriation of returns from foreign investments and thelack of adequate infrastructure. As emerging markets arebecoming increasingly important in Philips’ operations,the above-mentioned risks are also expected to grow andcould have an adverse impact on Philips’ financialcondition and operating results.
Philips may be unable to adapt swiftly to changes inindustry or market circumstances, which could have amaterial adverse impact on its financial condition andresults.Fundamental shifts in the industry, like the transition fromtraditional lighting to LED lighting, may drastically changethe business environment. If Philips is unable to recognizethese changes in good time, is too inflexible to rapidlyadjust its business models, or if circumstances arise, such
as pricing actions of competitors, growth ambitions,financial condition and operating results could be affectedmaterially.
Acquisitions could expose Philips to integration risks andchallenge management in continuing to reduce thecomplexity of the company.Philips has recently completed acquisitions, and maycontinue to do so in the future, exposing Philips tointegration risks in areas such as sales and service forceintegration, logistics, regulatory compliance, informationtechnology and finance. Integration difficulties andcomplexity may adversely impact the realization of anincreased contribution from acquisitions. Philips mayincur significant acquisition, administrative and othercosts in connection with these transactions, includingcosts related to the integration of acquired businesses.
Furthermore, organizational simplification and resultingcost savings may be difficult to achieve. Acquisitions mayalso lead to a substantial increase in long-lived assets,including goodwill. Write-downs of these assets due tounforeseen business developments may materiallyadversely affect Philips’ earnings, particularly inHealthcare and Lighting which have significant amounts ofgoodwill (see also note 8).
Philips’ inability to secure and retain intellectual propertyrights for products, whilst maintaining overallcompetitiveness, could have a material adverse effect onits results.Philips is dependent on its ability to obtain and retainlicenses and other intellectual property (IP) rightscovering its products and its design and manufacturingprocesses. The IP portfolio results from an extensivepatenting process that could be influenced by, amongstother things, innovation. The value of the IP portfolio isdependent on the successful promotion and marketacceptance of standards developed or co-developed byPhilips. This is particularly applicable to ConsumerLifestyle where third-party licenses are important and aloss or impairment could adversely impact Philips’financial condition and operating results.
7 Risk management 7.3 - 7.4
Annual Report 2010 109
Philips’ ongoing investments in the “sense and simplicity”brand campaign, with a focus on simplifying the interactionwith its customers, translating awareness into preferenceand improving its international brand recognition, couldhave less impact than anticipated.Philips has made large investments in the reshaping of theGroup into a more market-driven company focusing ondelivering advanced and easy-to-use products and easyrelationships with Philips for its customers. The brandpromise of “sense and simplicity” is important for bothexternal and internal development. If Philips fails to deliveron its “sense and simplicity” promise, its growthopportunities may be hampered, which could have amaterial adverse effect on Philips’ revenue and income.
Philips’ overall performance in the coming years isdependent on realizing its growth ambitions in emergingmarkets.Emerging markets are becoming increasingly important inthe global market. In addition, Asia is an importantproduction, sourcing and design center for Philips. Philipsfaces strong competition to attract the best talent in tightlabor markets and intense competition from localcompanies as well as other global players for market sharein emerging markets. Philips needs to maintain and growits position in emerging markets, invest in local talents,understand developments in end-user preferences andlocalize the portfolio in order to stay competitive. IfPhilips fails to achieve this, its growth ambitions, financialcondition and operating results could be affectedmaterially.
7.4 Operational risksFailure to achieve improvements in Philips’ solution andproduct creation process and/or increased speed ininnovation-to-market could hamper Philips’ profitablegrowth ambitions.Further improvements in Philips’ solution and productcreation process, ensuring timely delivery of newsolutions and products at lower cost and upgrading ofcustomer service levels to create sustainable competitiveadvantages, are important in realizing Philips’ profitablegrowth ambitions. The emergence of new low-costcompetitors, particularly in Asia, further underlines theimportance of improvements in the product creationprocess. The success of new solution and productcreation, however, depends on a number of factors,including timely and successful completion ofdevelopment efforts, market acceptance, Philips’s abilityto manage the risks associated with new products andproduction ramp-up issues, the availability of products inthe right quantities and at appropriate costs to meetanticipated demand, and the risk that new products andservices may have quality or other defects in the earlystages of introduction. Accordingly, Philips cannotdetermine in advance the ultimate effect that newsolutions and product creations will have on its financialcondition and operating results. If Philips fails to accelerateits innovation-to-market processes and fails to ensure thatend-user insights are fully captured and translated intosolution and product creations that improve product mixand consequently contribution, it may face an erosion ofits market share and competitiveness, which could have amaterial adverse affect on its financial condition andoperating results.
If Philips is unable to ensure effective supply chainmanagement, e.g. facing an interruption of its supply chain,including the inability of third parties to deliver parts,components and services on time, and if it is subject torising raw material prices, it may be unable to sustain itscompetitiveness in its markets.Philips is continuing the process of creating a leaner supplybase with fewer suppliers, while maintaining dual sourcingstrategies where possible. This strategy very muchrequires close cooperation with suppliers to enhance,amongst other things, time to market and quality. Inaddition, Philips is continuing its initiatives to reduceassets through outsourcing. These processes may result inincreased dependency. Although Philips works closelywith its suppliers to avoid supply-related problems, therecan be no assurance that it will not encounter supplyproblems in the future or that it will be able to replace a
7 Risk management 7.4 - 7.4
110 Annual Report 2010
supplier that is not able to meet its demand. Shortages ordelays could materially harm its business. Philips maintainsa regular review of its strategic and critical suppliers toassess financial stability.
Most of Philips’ activities are conducted outside of theNetherlands, and international operations bringchallenges. For example, production and procurement ofproducts and parts in Asian countries are increasing, andthis creates a risk that production and shipping ofproducts and parts could be interrupted by a naturaldisaster in that region.
Due to the fact that Philips is dependent on its personnelfor leadership and specialized skills, the loss of its ability toattract and retain such personnel would have an adverseeffect on its business.The attraction and retention of talented employees insales and marketing, research and development, financeand general management, as well as of highly specializedtechnical personnel, especially in transferring technologiesto low-cost countries, is critical to Philips’ success. This isparticularly valid in times of economic recovery. The lossof specialized skills could also result in businessinterruptions. There can be no assurance that Philips willcontinue to be successful in attracting and retaining all thehighly qualified employees and key personnel needed inthe future.
Diversity in information technology (IT) could result inineffective or inefficient business management. IToutsourcing and off-shoring strategies could result incomplexities in service delivery and contractmanagement. Furthermore, we observe a global increasein IT security threats and higher levels of professionalismin computer crime, posing a risk to the confidentiality,availability and integrity of data and information.Philips is engaged in a continuous drive to create a moreopen, standardized and consequently, more cost-effectiveIT landscape. This is leading to an approach involvingfurther outsourcing, off-shoring, commoditization andongoing reduction in the number of IT systems. The globalincrease in security threats and higher levels ofprofessionalism in computer crime have raised thecompany’s awareness of the importance of effective ITsecurity measures, including proper identity managementprocesses to protect against unauthorized systems access.Nevertheless, Philips’ systems, networks, products,solutions and services remain potentially vulnerable toattacks, which could potentially lead to the leakage ofconfidential information, improper use of its systems andnetworks or defective products, which could in turnadversely affect Philips’ financial condition and operatingresults. Additionally, the integration of new companies
and successful outsourcing of business processes arehighly dependent on secure and well-controlled ITsystems.
Warranty and product liability claims against Philips couldcause Philips to incur significant costs and affect Philips’results as well as its reputation and relationships with keycustomers.Philips is from time to time subject to warranty andproduct liability claims with regard to productperformance and effects. Philips could incur productliability losses as a result of repair and replacement costsin response to customer complaints or in connection withthe resolution of contemplated or actual legal proceedingsrelating to such claims. In addition to potential lossesarising from claims and related legal proceedings, productliability claims could affect Philips’ reputation and itsrelationships with key customers, both customers for endproducts and customers that use Philips’ products in theirproduction process. As a result, product liability claimscould materially impact Philips’ financial condition andoperating results.
Any damage to Philips’ reputation could have an adverseeffect on its businesses.Philips is exposed to developments which could affect itsreputation. Such developments could be of anenvironmental or social nature, or connected to thebehavior of individual employees or suppliers and couldrelate to adherence with regulations related to labor,health and safety, environmental and chemicalmanagement. Reputational damage could materiallyimpact Philips’ financial condition and operating results.
7 Risk management 7.5 - 7.5
Annual Report 2010 111
7.5 Compliance risksLegal proceedings covering a range of matters are pendingin various jurisdictions against Philips and its current andformer group companies. Due to the uncertainty inherentin legal proceedings, it is difficult to predict the finaloutcome.Philips, including a certain number of its current andformer group companies, is involved in legal proceedingsrelating to such matters as competition issues,commercial transactions, product liability, participationsand environmental pollution. Since the ultimate outcomeof asserted claims and proceedings, or the impact of anyclaims that may be asserted in the future, cannot bepredicted with certainty, Philips’ financial position andresults of operations could be affected materially byadverse outcomes.
Please refer to note 24 for additional disclosure relating tospecific legal proceedings.
Philips is exposed to governmental investigations and legalproceedings with regard to increased scrutiny of possibleanti-competitive market practices.Philips is facing increased scrutiny by national andEuropean authorities of possible anti-competitive marketpractices, especially in product segments where Philipshas significant market shares. For example, Philips andcertain of its (former) affiliates are involved ininvestigations by competition law authorities in severaljurisdictions into possible anti-competitive activities in theCathode-Ray Tubes (CRT) industry and are engaged inlitigation in this respect. Philips’ financial position andresults could be materially affected by an adverse finaloutcome of these investigations and litigation, as well asany potential claims relating to this matter. Furthermore,increased scrutiny may hamper planned growthopportunities provided by potential acquisitions (see alsonote 24).
Philips’ global presence exposes the company to regionaland local regulatory rules which may interfere with therealization of business opportunities and investments inthe countries in which Philips operates.Philips has established subsidiaries in over 80 countries.These subsidiaries are exposed to changes ingovernmental regulations and unfavorable politicaldevelopments, which may limit the realization of businessopportunities or impair Philips’ local investments. Philips’increased focus on the healthcare sector increases theexposure to highly regulated markets, where obtainingclearances or approvals for new products is of great
importance, and the dependency on the funding availablefor healthcare systems. In addition, changes inreimbursement policies may affect spending onhealthcare.
Philips is exposed to non-compliance with GeneralBusiness Principles.Philips’ attempts to realize its growth targets couldexpose it to the risk of non-compliance with the PhilipsGeneral Business Principles, in particular anti-briberyprovisions. This risk is heightened in emerging markets ascorporate governance systems, including informationstructures and the monitoring of ethical standards, areless developed in emerging markets compared to maturemarkets. Examples include commission payments to thirdparties, remuneration payments to agents, distributors,commissioners and the like (‘Agents’), or the acceptanceof gifts, which may be considered in some markets to benormal local business practice. (See also note 24.)
Defective internal controls would adversely affect ourfinancial reporting and management process.The reliability of reporting is important in ensuring thatmanagement decisions for steering the businesses andmanaging both top-line and bottom-line growth are basedon top-quality data. Flaws in internal control systemscould adversely affect the financial position and results andhamper expected growth.
The correctness of disclosures provides investors andother market professionals with significant informationfor a better understanding of Philips’ businesses.Imperfections or lack of clarity in the disclosures couldcreate market uncertainty regarding the reliability of thedata presented and could have a negative impact on thePhilips share price.
The reliability of revenue and expenditure data is key forsteering the business and for managing top-line andbottom-line growth. The long lifecycle of healthcare sales,from order acceptance to accepted installation, togetherwith the complexity of the accounting rules for whenrevenue can be recognized in the accounts presents achallenge to ensure there is consistency of application ofthe accounting rules over Philips Healthcare’s globalbusiness.
Compliance procedures have been adopted bymanagement to ensure that the use of resources isconsistent with laws, regulations and policies, and thatresources are safeguarded against waste, loss and misuse.Ineffective compliance procedures relating to the use ofresources could have an adverse effect on the financialcondition and operating results.
7 Risk management 7.5 - 7.6
112 Annual Report 2010
Philips is exposed to non-compliance with data privacyand product safety laws.Philips’ brand image and reputation would be adverselyimpacted by non-compliance with the various (patient)data privacy and (medical) product security laws. Privacyand product safety issues may arise with respect toremote access or monitoring of patient data or loss ofdata on customers’ systems. Philips Healthcare is furthersubject to various data privacy and safety laws. Privacy andproduct security issues may arise, especially with respectto remote access or monitoring of patient data or loss ofdata on our customers’ systems, although PhilipsHealthcare contractually limits liability, where permitted.
Philips Healthcare operates in a highly regulated productsafety and quality environment. Philips Healthcare’sproducts are subject to regulation by various governmentagencies, including the FDA (US) and comparable foreignagencies. Obtaining their approvals is costly and time-consuming, but a prerequisite for market introduction. Adelay or inability to obtain the necessary regulatoryapprovals for new products could have a material adverseeffect on its business. The risk exists that product safetyincidents or user concerns could trigger FDA businessreviews which if failed could lead to business interruptionwhich in turn could adversely affect Philips’ financialcondition and operating results.
7.6 Financial risksPhilips is exposed to a variety of treasury risks includingliquidity risk, currency risk, interest rate risk, commodityprice risk, credit risk, country risk and other insurablerisk.Negative developments impacting the global liquiditymarkets could affect the ability to raise or re-finance debtin the capital markets or could also lead to significantincreases in the cost of such borrowing in the future. If themarket expected a downgrade or downgrades by therating agencies or if such a downgrade has actually takenplace, it could increase our cost of borrowing, reduce ourpotential investor base and adversely affect our business.
Philips is exposed to fluctuations in exchange rates,especially between the US dollar and the euro, because ahigh percentage of its business volume is conducted in theUS and as exports from Europe. In addition, Philips isexposed to currency effects involving the currencies ofemerging markets such as China, India and Brazil.
Philips is also exposed to interest rate risk particularly inrelation to its long-term debt position; this risk can takethe form of either fair value or cash flow risk. Failure toeffectively hedge this risk can impact Philips’ financialcondition and operating results.
Philips’ supply chain is also exposed to fluctuations inenergy and raw material prices. In recent times,commodities such as oil have been subject to volatilemarkets and significant price increases from time to time.If Philips is not able to compensate for or pass on itsincreased costs to customers, such price increases couldhave an adverse impact on its financial condition andoperating results.
Credit risk of counterparties that have outstandingpayment obligations creates exposure for Philips,particularly in relation to accounts receivable and liquidassets and fair values of derivatives and insurancecontracts with financial counterparties. A default bycounterparties in such transactions can have a materialadverse effect on Philips’ financial condition and operatingresults.
For further analysis, please refer to note 33.
7 Risk management 7.6 - 7.6
Annual Report 2010 113
Corporate Control, together with Sector and Functionalmanagement, performs an assessment of financialreporting risks at least annually.For each risk identified a risk rating is assigned based onthe likelihood of occurrence and the potential impact ofthe risk on the financial statements and relateddisclosures. In determining the probability that a risk willresult in a misstatement of a more than inconsequentialamount or material nature, the following factors areconsidered to be critical: complexity of the associatedaccounting activity or transaction process, history ofaccounting and reporting errors, likelihood of significant(contingent) liabilities arising from activities, exposure tolosses, existence of related party transaction, volume ofactivity and homogeneity of the individual transactionsprocessed and changes to the prior period in accountingcharacteristics.
Important critical reporting risk areas identified withinPhilips following the risk assessment are:
• complex accounting for sales-related accruals, warrantyprovisions, tax assets and liabilities, pension benefits,and business combinations
• complex sales transactions regarding multi-elementdeliveries (combination of goods and services)
• valuation procedures with respect to assets (includinggoodwill and inventories)
• past experience of control failures regardingsegregation of duties
• significant (contingent) liabilities such as environmentalclaims and other litigation
• outsourcing of high volume/homogeneoustransactional finance and IT operations to third-partyservice providers.
Processes and controls related to the identified criticalrisk areas will be subject to a more detailed set ofrequirements regarding control documentation andcontrol evaluation (monitoring) by Sector and Functionalmanagement due to their importance for the reliability ofthe financial statements and disclosures of the Group.
Philips is exposed to a number of different fiscaluncertainties which could have a significant impact onlocal tax results.Philips is exposed to a number of different taxuncertainties which could result in double taxation,penalties and interest payments. These include, amongstothers, transfer pricing uncertainties on internal cross-border deliveries of goods and services, tax uncertaintiesrelated to acquisitions and divestments, tax uncertaintiesrelated to the use of tax credits and permanentestablishments, tax uncertainties due to losses carried
forward and tax credits carried forward and potentialchanges in tax law that could result in higher tax expenseand payments. Those uncertainties may have a significantimpact on local tax results which in turn could adverselyaffect Philips’ financial condition and operating results.
The value of the losses carried forward is not only subjectto having sufficient taxable income available within theloss-carried-forward period, but also subject to havingsufficient taxable income within the foreseeable future inthe case of losses carried forward with an indefinite carry-forward period. The ultimate realization of theCompany’s deferred tax assets, including tax losses andcredits carried forward, is dependent upon the generationof future taxable income in the countries where thetemporary differences, unused tax losses and unused taxcredits were incurred and during the periods in which thedeferred tax assets become deductible. Additionally, incertain instances, realization of such deferred tax assets isdependent upon the successful execution of tax planningstrategies. Accordingly, there can be no absoluteassurance that all (net) tax losses and credits carriedforward will be realized.
For further details, please refer to the fiscal risksparagraph in note 3.
Philips has defined-benefit pension plans in a number ofcountries. The funded status and the cost of maintainingthese plans are influenced by financial market anddemographic developments, creating volatility in Philips’financials.The majority of employees in Europe and North Americaare covered by defined-benefit pension plans. Theaccounting for defined-benefit pension plans requiresmanagement to determine discount rates, expected ratesof compensation and expected returns on plan assets.Changes in these variables can have a significant impact onthe projected benefit obligations and net periodic pensioncosts. A negative performance of the financial marketscould have a material impact on funding requirements andnet periodic pension costs and also affect the value ofcertain financial assets and liabilities of the company.
Details of pension risksWith pension obligations in more than thirty countries,Philips has devoted considerable attention and resourcesto ensure disclosure, awareness and control of theresulting exposures.
Dependent on the investment policy of the respectivepension plans, developments in financial markets may havesignificant effects on pension liabilities (DBO), pensionassets (MVA), resulting Funded Status and net periodic
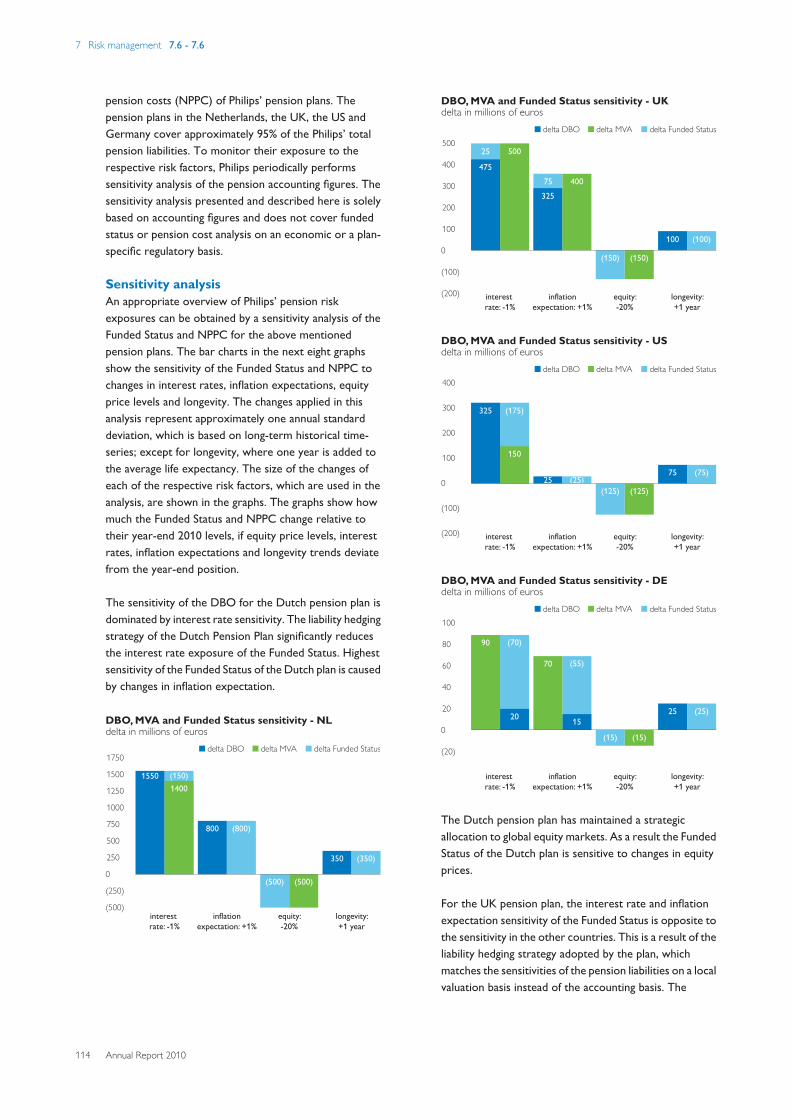
7 Risk management 7.6 - 7.6
114 Annual Report 2010
pension costs (NPPC) of Philips’ pension plans. Thepension plans in the Netherlands, the UK, the US andGermany cover approximately 95% of the Philips’ totalpension liabilities. To monitor their exposure to therespective risk factors, Philips periodically performssensitivity analysis of the pension accounting figures. Thesensitivity analysis presented and described here is solelybased on accounting figures and does not cover fundedstatus or pension cost analysis on an economic or a plan-specific regulatory basis.
Sensitivity analysisAn appropriate overview of Philips’ pension riskexposures can be obtained by a sensitivity analysis of theFunded Status and NPPC for the above mentionedpension plans. The bar charts in the next eight graphsshow the sensitivity of the Funded Status and NPPC tochanges in interest rates, inflation expectations, equityprice levels and longevity. The changes applied in thisanalysis represent approximately one annual standarddeviation, which is based on long-term historical time-series; except for longevity, where one year is added tothe average life expectancy. The size of the changes ofeach of the respective risk factors, which are used in theanalysis, are shown in the graphs. The graphs show howmuch the Funded Status and NPPC change relative totheir year-end 2010 levels, if equity price levels, interestrates, inflation expectations and longevity trends deviatefrom the year-end position.
The sensitivity of the DBO for the Dutch pension plan isdominated by interest rate sensitivity. The liability hedgingstrategy of the Dutch Pension Plan significantly reducesthe interest rate exposure of the Funded Status. Highestsensitivity of the Funded Status of the Dutch plan is causedby changes in inflation expectation.
800 (800)
(150)
(500)
350 (350)
(500)
1400
1550
0
(250)
(500)
1750
750
1000
1250
1500
500
250
DBO, MVA and Funded Status sensitivity - NLdelta in millions of euros
delta MVA delta Funded Statusdelta DBO
325
75 400
(150)
100 (100)
(150)
500
475
25
0
(100)
(200)
500
400
300
200
100
DBO, MVA and Funded Status sensitivity - UKdelta in millions of euros
delta MVA delta Funded Statusdelta DBO
25 (25)
325 (175)
(125)
75 (75)
(125)
150
0
(100)
(200)
400
300
200
100
DBO, MVA and Funded Status sensitivity - USdelta in millions of euros
delta MVA delta Funded Statusdelta DBO
(15)
25 (25)
(15)
90
20
(70)
15
70 (55)
0
(20)
100
80
60
40
20
DBO, MVA and Funded Status sensitivity - DEdelta in millions of euros
delta MVA delta Funded Statusdelta DBO
The Dutch pension plan has maintained a strategicallocation to global equity markets. As a result the FundedStatus of the Dutch plan is sensitive to changes in equityprices.
For the UK pension plan, the interest rate and inflationexpectation sensitivity of the Funded Status is opposite tothe sensitivity in the other countries. This is a result of theliability hedging strategy adopted by the plan, whichmatches the sensitivities of the pension liabilities on a localvaluation basis instead of the accounting basis. The
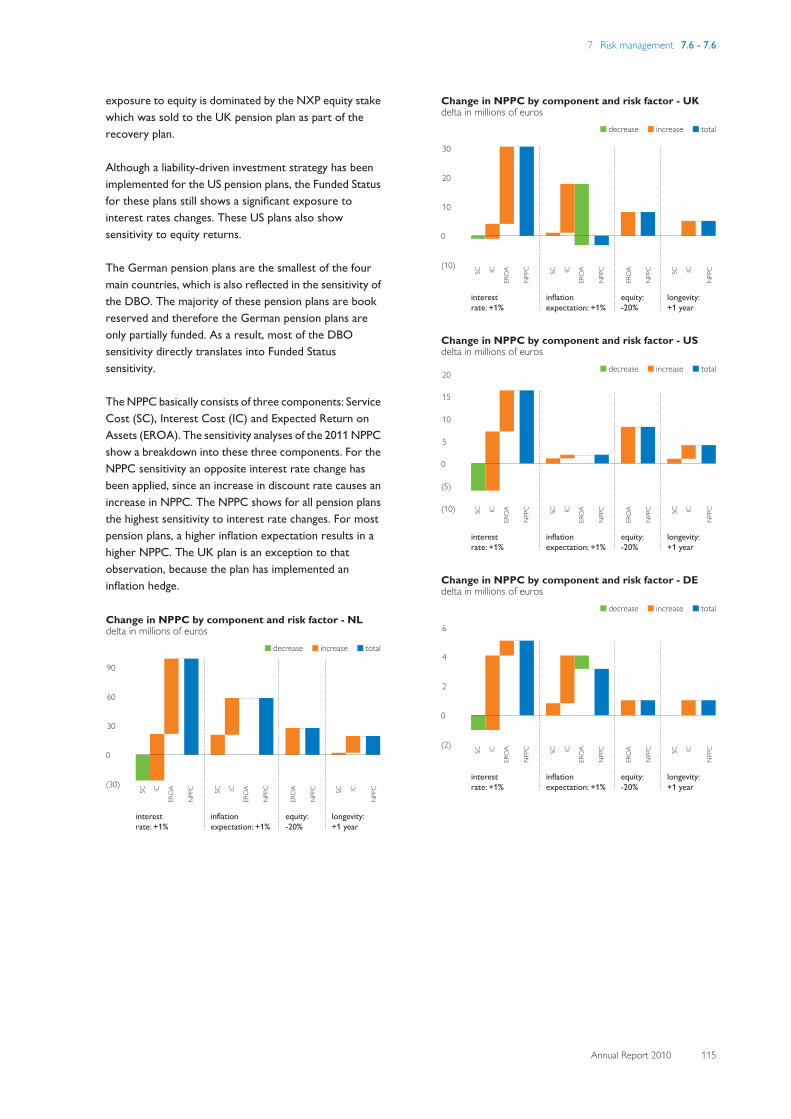
7 Risk management 7.6 - 7.6
Annual Report 2010 115
exposure to equity is dominated by the NXP equity stakewhich was sold to the UK pension plan as part of therecovery plan.
Although a liability-driven investment strategy has beenimplemented for the US pension plans, the Funded Statusfor these plans still shows a significant exposure tointerest rates changes. These US plans also showsensitivity to equity returns.
The German pension plans are the smallest of the fourmain countries, which is also reflected in the sensitivity ofthe DBO. The majority of these pension plans are bookreserved and therefore the German pension plans areonly partially funded. As a result, most of the DBOsensitivity directly translates into Funded Statussensitivity.
The NPPC basically consists of three components: ServiceCost (SC), Interest Cost (IC) and Expected Return onAssets (EROA). The sensitivity analyses of the 2011 NPPCshow a breakdown into these three components. For theNPPC sensitivity an opposite interest rate change hasbeen applied, since an increase in discount rate causes anincrease in NPPC. The NPPC shows for all pension plansthe highest sensitivity to interest rate changes. For mostpension plans, a higher inflation expectation results in ahigher NPPC. The UK plan is an exception to thatobservation, because the plan has implemented aninflation hedge.
SC
ER
OA
NPPCIC
ER
OA
NPPCSC
ER
OA
NPPCIC SC
NPPCIC
0
(30)
90
30
60
Change in NPPC by component and risk factor - NLdelta in millions of euros
increasedecrease total
SC
ER
OA
NPPCIC
ER
OA
NPPCSC
ER
OA
NPPCIC SC
NPPCIC
longevity:+1 year
0
(10)
30
10
20
Change in NPPC by component and risk factor - UKdelta in millions of euros
increasedecrease total
SC
ER
OA
NPPCIC
ER
OA
NPPCSC
ER
OA
NPPCIC SC
NPPCIC
longevity:+1 year
0
(10)
(5)
10
15
5
20
Change in NPPC by component and risk factor - USdelta in millions of euros
increasedecrease total
SC
ER
OA
NPPCIC
ER
OA
NPPCSC
ER
OA
NPPCIC SC
NPPCIC
0
(2)
6
2
4
Change in NPPC by component and risk factor - DEdelta in millions of euros
increasedecrease total
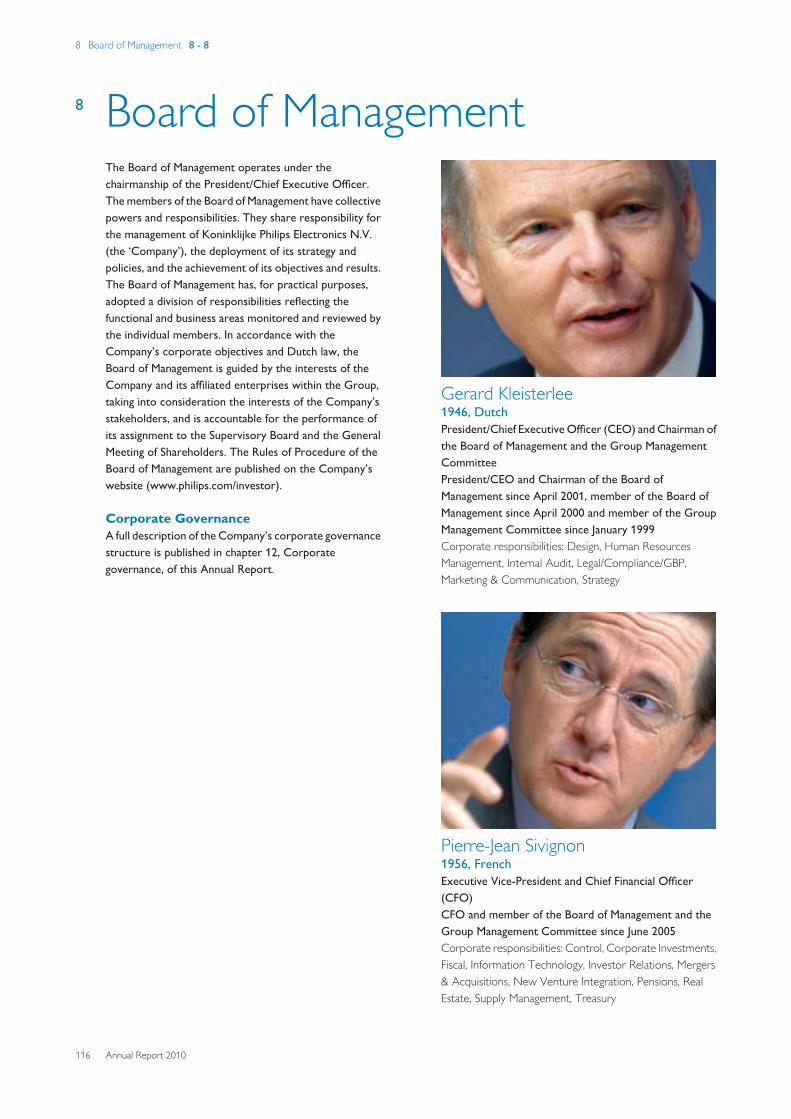
8 Board of Management 8 - 8
116 Annual Report 2010
8 Board of ManagementThe Board of Management operates under thechairmanship of the President/Chief Executive Officer.The members of the Board of Management have collectivepowers and responsibilities. They share responsibility forthe management of Koninklijke Philips Electronics N.V.(the ‘Company’), the deployment of its strategy andpolicies, and the achievement of its objectives and results.The Board of Management has, for practical purposes,adopted a division of responsibilities reflecting thefunctional and business areas monitored and reviewed bythe individual members. In accordance with theCompany’s corporate objectives and Dutch law, theBoard of Management is guided by the interests of theCompany and its affiliated enterprises within the Group,taking into consideration the interests of the Company’sstakeholders, and is accountable for the performance ofits assignment to the Supervisory Board and the GeneralMeeting of Shareholders. The Rules of Procedure of theBoard of Management are published on the Company’swebsite (www.philips.com/investor).
Corporate GovernanceA full description of the Company’s corporate governancestructure is published in chapter 12, Corporategovernance, of this Annual Report.
Gerard Kleisterlee1946, DutchPresident/Chief Executive Officer (CEO) and Chairman ofthe Board of Management and the Group ManagementCommitteePresident/CEO and Chairman of the Board ofManagement since April 2001, member of the Board ofManagement since April 2000 and member of the GroupManagement Committee since January 1999Corporate responsibilities: Design, Human ResourcesManagement, Internal Audit, Legal/Compliance/GBP,Marketing & Communication, Strategy
Pierre-Jean Sivignon1956, FrenchExecutive Vice-President and Chief Financial Officer(CFO)CFO and member of the Board of Management and theGroup Management Committee since June 2005Corporate responsibilities: Control, Corporate Investments,Fiscal, Information Technology, Investor Relations, Mergers& Acquisitions, New Venture Integration, Pensions, RealEstate, Supply Management, Treasury
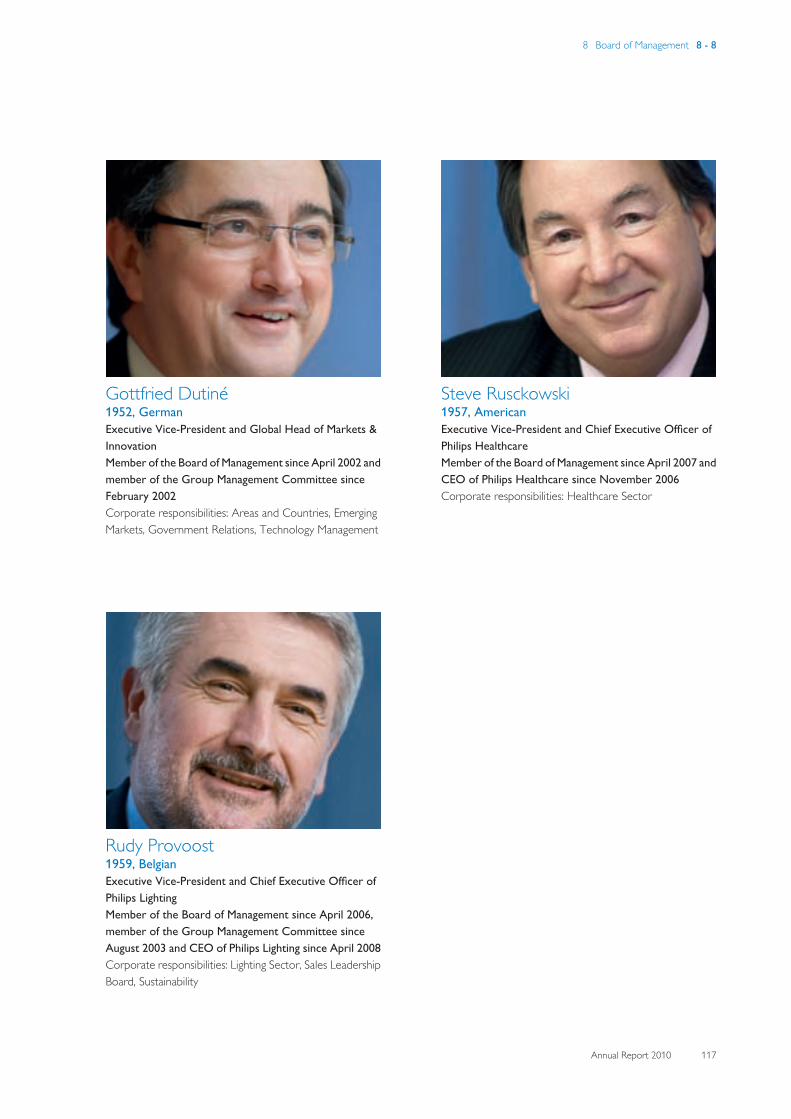
8 Board of Management 8 - 8
Annual Report 2010 117
Gottfried Dutiné1952, GermanExecutive Vice-President and Global Head of Markets &InnovationMember of the Board of Management since April 2002 andmember of the Group Management Committee sinceFebruary 2002Corporate responsibilities: Areas and Countries, EmergingMarkets, Government Relations, Technology Management
Rudy Provoost1959, BelgianExecutive Vice-President and Chief Executive Officer ofPhilips LightingMember of the Board of Management since April 2006,member of the Group Management Committee sinceAugust 2003 and CEO of Philips Lighting since April 2008Corporate responsibilities: Lighting Sector, Sales LeadershipBoard, Sustainability
Steve Rusckowski1957, AmericanExecutive Vice-President and Chief Executive Officer ofPhilips HealthcareMember of the Board of Management since April 2007 andCEO of Philips Healthcare since November 2006Corporate responsibilities: Healthcare Sector
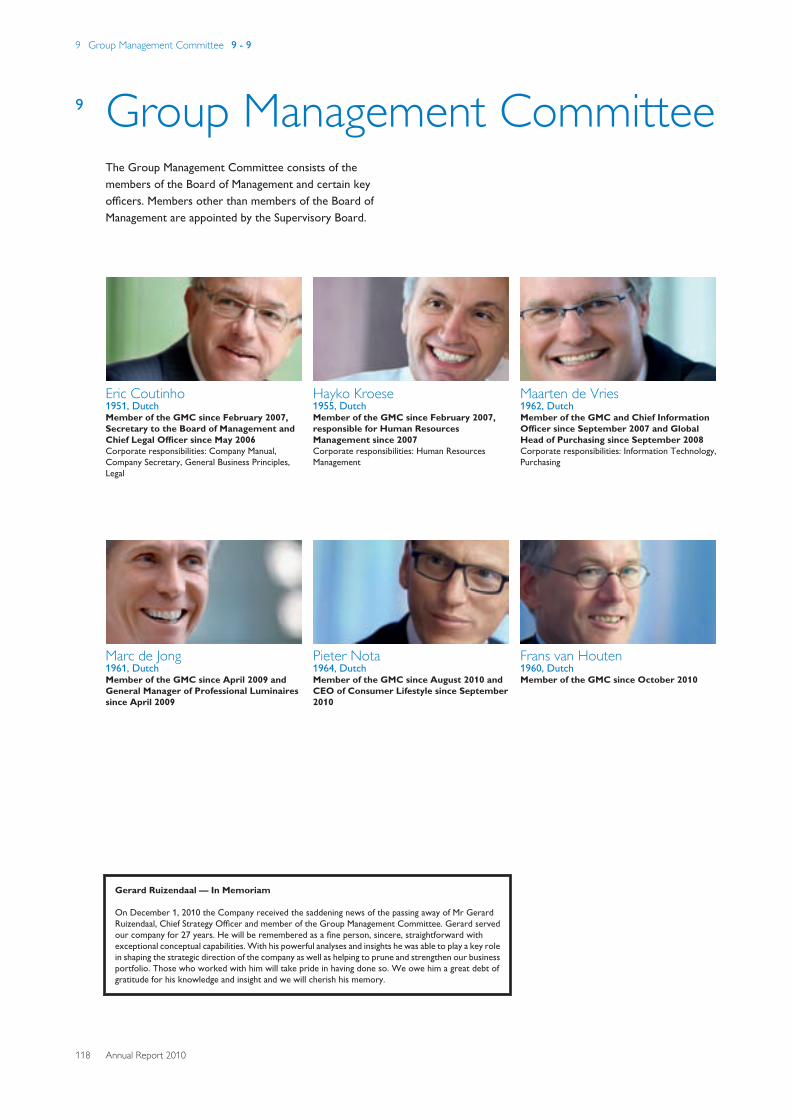
9 Group Management Committee 9 - 9
118 Annual Report 2010
9 Group Management CommitteeThe Group Management Committee consists of themembers of the Board of Management and certain keyofficers. Members other than members of the Board ofManagement are appointed by the Supervisory Board.
Eric Coutinho1951, DutchMember of the GMC since February 2007,Secretary to the Board of Management andChief Legal Officer since May 2006Corporate responsibilities: Company Manual,Company Secretary, General Business Principles,Legal
Marc de Jong1961, DutchMember of the GMC since April 2009 andGeneral Manager of Professional Luminairessince April 2009
Hayko Kroese1955, DutchMember of the GMC since February 2007,responsible for Human ResourcesManagement since 2007Corporate responsibilities: Human ResourcesManagement
Pieter Nota1964, DutchMember of the GMC since August 2010 andCEO of Consumer Lifestyle since September2010
Maarten de Vries1962, DutchMember of the GMC and Chief InformationOfficer since September 2007 and GlobalHead of Purchasing since September 2008Corporate responsibilities: Information Technology,Purchasing
Frans van Houten1960, DutchMember of the GMC since October 2010
Gerard Ruizendaal — In Memoriam
On December 1, 2010 the Company received the saddening news of the passing away of Mr GerardRuizendaal, Chief Strategy Officer and member of the Group Management Committee. Gerard servedour company for 27 years. He will be remembered as a fine person, sincere, straightforward withexceptional conceptual capabilities. With his powerful analyses and insights he was able to play a key rolein shaping the strategic direction of the company as well as helping to prune and strengthen our businessportfolio. Those who worked with him will take pride in having done so. We owe him a great debt ofgratitude for his knowledge and insight and we will cherish his memory.
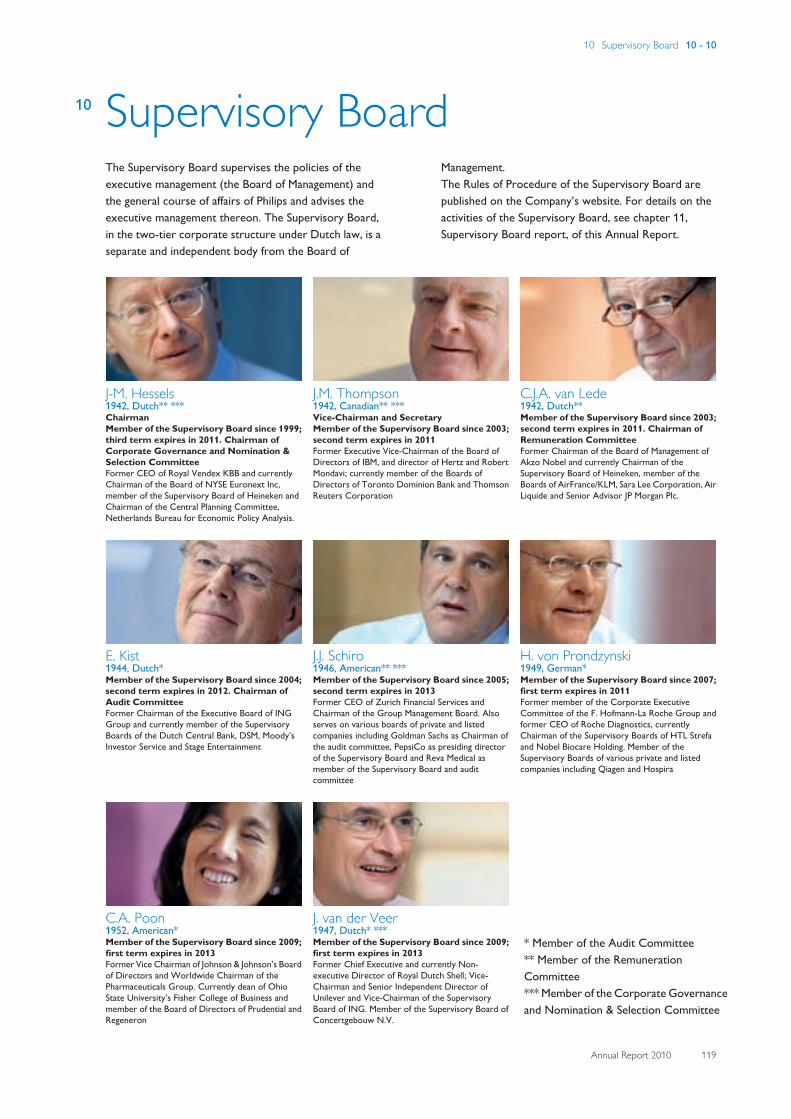
10 Supervisory Board 10 - 10
Annual Report 2010 119
10 Supervisory BoardThe Supervisory Board supervises the policies of theexecutive management (the Board of Management) andthe general course of affairs of Philips and advises theexecutive management thereon. The Supervisory Board,in the two-tier corporate structure under Dutch law, is aseparate and independent body from the Board of
Management. The Rules of Procedure of the Supervisory Board arepublished on the Company’s website. For details on theactivities of the Supervisory Board, see chapter 11,Supervisory Board report, of this Annual Report.
J-M. Hessels1942, Dutch** ***ChairmanMember of the Supervisory Board since 1999;third term expires in 2011. Chairman ofCorporate Governance and Nomination &Selection CommitteeFormer CEO of Royal Vendex KBB and currentlyChairman of the Board of NYSE Euronext Inc,member of the Supervisory Board of Heineken andChairman of the Central Planning Committee,Netherlands Bureau for Economic Policy Analysis.
E. Kist1944, Dutch*Member of the Supervisory Board since 2004;second term expires in 2012. Chairman ofAudit CommitteeFormer Chairman of the Executive Board of INGGroup and currently member of the SupervisoryBoards of the Dutch Central Bank, DSM, Moody’sInvestor Service and Stage Entertainment
C.A. Poon1952, American*Member of the Supervisory Board since 2009;first term expires in 2013Former Vice Chairman of Johnson & Johnson’s Boardof Directors and Worldwide Chairman of thePharmaceuticals Group. Currently dean of OhioState University’s Fisher College of Business andmember of the Board of Directors of Prudential andRegeneron
J.M. Thompson1942, Canadian** ***Vice-Chairman and SecretaryMember of the Supervisory Board since 2003;second term expires in 2011Former Executive Vice-Chairman of the Board ofDirectors of IBM, and director of Hertz and RobertMondavi; currently member of the Boards ofDirectors of Toronto Dominion Bank and ThomsonReuters Corporation
J.J. Schiro1946, American** ***Member of the Supervisory Board since 2005;second term expires in 2013Former CEO of Zurich Financial Services andChairman of the Group Management Board. Alsoserves on various boards of private and listedcompanies including Goldman Sachs as Chairman ofthe audit committee, PepsiCo as presiding directorof the Supervisory Board and Reva Medical asmember of the Supervisory Board and auditcommittee
J. van der Veer1947, Dutch* ***Member of the Supervisory Board since 2009;first term expires in 2013Former Chief Executive and currently Non-executive Director of Royal Dutch Shell; Vice-Chairman and Senior Independent Director ofUnilever and Vice-Chairman of the SupervisoryBoard of ING. Member of the Supervisory Board ofConcertgebouw N.V.
C.J.A. van Lede1942, Dutch**Member of the Supervisory Board since 2003;second term expires in 2011. Chairman ofRemuneration CommitteeFormer Chairman of the Board of Management ofAkzo Nobel and currently Chairman of theSupervisory Board of Heineken, member of theBoards of AirFrance/KLM, Sara Lee Corporation, AirLiquide and Senior Advisor JP Morgan Plc.
H. von Prondzynski1949, German*Member of the Supervisory Board since 2007;first term expires in 2011Former member of the Corporate ExecutiveCommittee of the F. Hofmann-La Roche Group andformer CEO of Roche Diagnostics, currentlyChairman of the Supervisory Boards of HTL Strefaand Nobel Biocare Holding. Member of theSupervisory Boards of various private and listedcompanies including Qiagen and Hospira
* Member of the Audit Committee ** Member of the RemunerationCommittee *** Member of the Corporate Governanceand Nomination & Selection Committee
11 Supervisory Board report 11 - 11
120 Annual Report 2010
11 Supervisory Board reportIntroduction
GeneralThe supervision of the policies and actions of theexecutive management (the ‘Board of Management’) ofKoninklijke Philips Electronics N.V. (the ‘Company’) isentrusted to the Supervisory Board, which, in the two-tiercorporate structure under Dutch law, is a separate bodyand fully independent of the Board of Management. Thisindependence is also reflected in the requirement thatmembers of the Supervisory Board are not a member ofthe Board of Management or an employee of theCompany. The Supervisory Board considers all itsmembers to be independent pursuant to the DutchCorporate Governance Code of December 2008 (the‘Dutch Corporate Governance Code’) and the applicableUS standards.
While retaining overall responsibility, the SupervisoryBoard assigns certain of its tasks to three permanentcommittees: the Corporate Governance and Nomination& Selection Committee, the Remuneration Committeeand the Audit Committee. The separate reports of thesecommittees are part of this report and are publishedbelow. The members (of the committees) of theSupervisory Board are listed in chapter 10, SupervisoryBoard, of this Annual Report.
For further information on the Company’s corporategovernance structure and a more detailed description ofthe duties and functioning of the Supervisory Board, seechapter 12, Corporate governance, of this Annual Report.
Activities of the Supervisory BoardSix regular meetings were held in 2010. All members werefrequently present at the regular meetings of theSupervisory Board. In addition to the regular meetings anad hoc meeting took place in November to discuss thesuccession of the Chief Financial Officer of the Company.The Audit Committee met five times. The CorporateGovernance and Nomination & Selection Committee hadfour regular meetings and several ad hoc meetings inconnection with succession matters. The RemunerationCommittee had four regular meetings.
During 2010 the Supervisory Board devoted considerabletime to discuss the Company’s strategy and discussed theperformance and, more in particular, the strategy of thethree Sectors. The discussions in respect of the Sectors
took place during visits of the Supervisory Board to eachSector, where in-depth discussions were held with theSector management teams. Furthermore, the SupervisoryBoard discussed the performance and integration ofacquisitions, the economic situation and impact thereofon Philips and the cost reduction and efficiencyimprovement measures taken to confront the recession,as well as the capital and financing structure of the PhilipsGroup extensively throughout the year.
In January the Supervisory Board discussed the financialperformance of the Philips Group in 2009, themanagement agenda 2010 of the Board of Management,the new strategy for BU Health & Wellness and theagenda for the 2010 General Meeting of Shareholders,including the proposed dividend to shareholders, thedividend policy and recommendations for(re)appointment of candidates for the Board ofManagement. Moreover, the Supervisory Board receivedan update on the M&A activities of the Company, andmade amendments to the Rules of Procedure of theSupervisory Board.
In February the Supervisory Board discussed the report ofthe external auditor of the Company and approved theAnnual Report 2009. Furthermore, the Supervisory Boardapproved revisions made to the General BusinessPrinciples and Directives of the Company.
In March the Supervisory Board received an update on theM&A activities and the sustainability policy of theCompany. The Remuneration Committee gave an updateto the full Supervisory Board on remuneration topics.
In June the Vision 2015 strategy of the Company and theSectors, including risks and opportunities, and a variety ofgrowth scenarios in mature and emerging markets, werediscussed during a one and a half day meeting.
In August the Supervisory Board discussed the financialresults and received an update with respect to theCompany’s M&A activities and ongoing legal proceedings.Further, the members of the Supervisory Board spent twodays with the Philips India leadership team and majorcustomers and business partners in New Delhi, India,where they discussed, among other things, theperformance and set-up of the Company’s activities inIndia and the local strategy going forward.
11 Supervisory Board report 11 - 11
Annual Report 2010 121
In October the Supervisory Board discussed the thirdquarter 2010 financial results, and pension developmentsand their effect on the Group.
In November the succession of the CFO of the Companywas discussed by the Supervisory Board.
In December the Supervisory Board discussed themanagement agenda 2011, the Annual Operating Plan2011, the operational performance of the TV business andreceived an update on supply management within theCompany.
Other discussion topics included:
• financial performance of the Philips Group and theSectors
• status of merger and acquisition projects• management development and succession planning,
especially with respect to the President/CEO and theCFO as well as the CEO of the Consumer LifestyleSector
• evaluation of the Board of Management and itsmembers
• geographic performance and growth opportunities inemerging markets, including the shift of resources frommature to emerging markets
• the situation and improvement measures at somebusinesses that did not perform according to plan
• the results of the Employee Engagement Survey• financial scenarios for 2011 and beyond• legal proceedings, including antitrust proceedings• the situation at the Philips Pension Fund in the
Netherlands and the governance and financial positionof the other major pension funds
• restructuring programs in all sectors
Composition and evaluation of the SupervisoryBoardThe Supervisory Board currently consists of eightmembers. The Supervisory Board aims for an appropriatecombination of knowledge and experience among itsmembers in relation to the global and multi-productcharacter of Philips’ businesses. Consequently, theSupervisory Board aims for an appropriate level ofexperience in marketing, technological, manufacturing,financial, economic, social and legal aspects ofinternational business and government and publicadministration. The full profile is described in the sectionCorporate governance. Members are appointed for fixedterms of four years and may be reappointed for twoadditional four-year terms.
All members of the Supervisory Board completed aquestionnaire to verify compliance in 2010 with applicablecorporate governance rules and the Rules of Procedure ofthe Supervisory Board. Based on written feedback fromeach Supervisory Board member, the Chairman of theSupervisory Board discussed the functioning of theSupervisory Board and its members in private discussions.He shared common themes and conclusions in a privatesession of the Supervisory Board; items discussed includethe follow-up to the evaluation regarding 2009, thecomposition and competencies of the Supervisory Board,and the set-up and content of meetings and meetingmaterials. In the same meeting the relationship with theBoard of Management was discussed. The threecommittees of the Supervisory Board reviewed theircharters and their functioning and reported thereon tothe full Supervisory Board.
Mr Hessels, who joined the Supervisory Board in 1999 andhas been Chairman since 2008, will resign as Chairmanand as a member of the Supervisory Board at the 2011General Meeting of Shareholders. We are thankful for hisvaluable contribution to Philips during his 12-year term asa member of our Board. The Supervisory Board hasappointed Mr Van der Veer as its Chairman as from theclosing of the 2011 General Meeting of Shareholders.
Further, we would like to express our sincereappreciation to Mr Kleisterlee and Mr Sivignon, who willresign as President/CEO and CFO respectively and asmembers of the Board of Management at the 2011General Meeting of Shareholders. Our Board would liketo thank them for their vision and outstanding leadershipin driving both strategic change and operationalimprovement within Philips. We wish them both all thebest for the future.
11 Supervisory Board report 11 - 11
122 Annual Report 2010
Changes Supervisory Board and committees2010
• Sir Richard Greenbury resigned as member of theSupervisory Board as from the closing of the 2010General Meeting of Shareholders.
• Ms Poon became a member of the AuditCommittee as from April 1, 2010.
• Mr Schiro relinquished his position as member ofthe Audit Committee and became a member ofthe Remuneration Committee as from April 1,2010.
• Mr Van der Veer became a member of theCorporate Governance and Nomination &Selection Committee as from April 1, 2010.
Changes and reappointments SupervisoryBoard 2011
• Mr Hessels will resign as Chairman and member ofthe Supervisory Board as from the closing of the2011 General Meeting of Shareholders.
• The Supervisory Board has appointed Mr Van derVeer as its Chairman as from the closing of the2011 General Meeting of Shareholders.
• It is proposed to reappoint Mr Thompson.*
• It is proposed to reappoint Mr Van Lede.*
• It is proposed to reappoint Mr Von Prondzynski.*
* Subject to approval by the General Meeting ofShareholders
Changes Board of Management and GroupManagement Committee 2010
• On December 1, 2010 the Company received thesad news of the passing away of Mr Ruizendaal,member of the Group Management Committeeand Chief Strategy Officer.
• Mr Provoost has been reappointed as member ofthe Board of Management.
• Mr Rusckowski has been reappointed as memberof the Board of Management.
• Mr Dutiné has been reappointed as member ofthe Board of Management.
• Mr Ragnetti has relinquished his position asmember of the Board of Management as fromSeptember 1, 2010.
• Mr Harwig has resigned as member of the GroupManagement Committee as from April 1, 2010, inconnection with his retirement.
• Mr Nota has been appointed as member of theGroup Management Committee as from August 1,2010.
• Mr Van Houten has been appointed as member ofthe Group Management Committee as fromOctober 1, 2010.
11 Supervisory Board report 11 - 11.1
Annual Report 2010 123
Changes Board of Management and GroupManagement Committee 2011
• Mr Kleisterlee will retire as President/CEO and asmember of the Board of Management as from theclosing of the 2011 General Meeting ofShareholders.
• Mr Sivignon has decided to relinquish his positionas CFO and as member of the Board ofManagement as from the closing of the 2011General Meeting of Shareholders.
• It is proposed to appoint Mr Van Houten asPresident/CEO and as member of the Board ofManagement.*
• It is proposed to appoint Mr Wirahadiraksa asmember of the Board of Management.*
• It is proposed to appoint Mr Nota as member ofthe Board of Management.*
* Subject to approval by the General Meeting ofShareholders
11.1 Report of theCorporateGovernance andNomination &SelectionCommitteeThe Corporate Governance and Nomination & SelectionCommittee, currently consisting of four members,reviews the corporate governance principles applicable tothe Company and the selection criteria and appointmentprocedures for the Board of Management, the GroupManagement Committee and the Supervisory Board andadvises the Supervisory Board thereon. Furthermore, itsupervises the policy of the Board of Management on theselection criteria and appointment procedures for Philips’senior management.
In 2010 the Committee discussed developments in thearea of corporate governance and relevant legislativechanges. It also discussed possible agenda items for theupcoming 2011 General Meeting of Shareholders.
The Committee consulted with the President/CEO andother members of the Board of Management on theappointment or reappointment of candidates to fillcurrent and future vacancies on the Board ofManagement, the Group Management Committee and theSupervisory Board, and prepared decisions and advisedthe Supervisory Board on the candidates for appointment.The Committee devoted specific attention to thesuccession of Mr Kleisterlee, who will resign as CEO andPresident of the Company as per the closing of the 2011General Meeting of Shareholders, the succession of MrSivignon who will resign as CFO and Executive VicePresident as per the same date, and the succession of MrRagnetti who resigned per August 31, 2010.
For the succession of Mr Kleisterlee, the Committeerecommended the procedure for the appointment of thesuccessor. This procedure was initiated in 2009 andincluded the following steps: profiling the role and the
11 Supervisory Board report 11.1 - 11.2.1
124 Annual Report 2010
ideal candidate, identifying qualified and availablecandidates from inside the Company and externally,assessing and selecting the best suitable candidate, andcommunicating the recommendation. Following therecommendation of the Committee the SupervisoryBoard came to a consensus on the candidate to beproposed for appointment by the shareholders. Thedecision was communicated mid 2010.
11.2 Report of theRemunerationCommitteeIntroductionThe Remuneration Committee, currently consisting offour members, is responsible for preparing decisions ofthe Supervisory Board on the remuneration of individualmembers of the Board of Management and the GroupManagement Committee. In performing its duties andresponsibilities the Remuneration Committee is assistedby an in-house remuneration expert acting on the basis ofa protocol which ensures that he acts on the instructionsof the Remuneration Committee and maintains anindependent position in which conflicts of interest areavoided. The Remuneration Committee’s tasks are laiddown in the Charter of the Remuneration Committeethat forms part of the Rules of Procedure of theSupervisory Board. Currently, no member of theRemuneration Committee is a member of themanagement board of another listed company.
11.2.1 General remuneration policyThe objective of the remuneration policy for members ofthe Board of Management is in line with that forexecutives throughout the Philips Group: to attract,motivate and retain qualified senior executives of thehighest caliber, with an international mindset andbackground essential for the successful leadership andeffective management of a large global company. TheBoard of Management remuneration policy isbenchmarked regularly against companies in the generalindustry and aims at the median market position.
One of the goals behind the policy is to focus on improvingthe performance of the company and enhance the value ofthe Philips Group. Consequently, the remunerationpackage includes a variable part in the form of an annualcash incentive and a long-term incentive consisting ofrestricted share rights and stock options. Philips hasshort-term and long-term incentives, the latterpredominantly linked to Philips’ long-term strategy. Thepolicy does not encourage inappropriate risk-taking.
The performance targets for the members of the Board ofManagement are determined annually at the beginning ofthe year. The Supervisory Board determines whetherperformance conditions have been met and can adjust the
11 Supervisory Board report 11.2.1 - 11.2.3
Annual Report 2010 125
pay-out of the annual cash incentive and the long-termincentive grant upward or downward if thepredetermined performance criteria were to produce an“unfair” result in extraordinary circumstances. Theauthority for such adjustments exists on the basis of theultimum remedium- and claw back clauses (in accordancewith best practice provisions II.2.10 and II.2.11 of theDutch Corporate Governance Code). Furtherinformation on the performance targets is given in thechapters on the Annual Incentive and the Long-TermIncentive Plan respectively.
11.2.2 Contracts of employmentThe main elements of the contracts are made public nolater than the date of the notice convening the GeneralMeeting of Shareholders at which the appointment of themember of the Board of Management will be proposed.
Term of appointmentThe members of the Board of Management are appointedfor a period of 4 years.
Contract terms for current members1)
end of term
G.J. Kleisterlee April 1, 2011
P-J. Sivignon April 1, 2013
G.H.A. Dutiné April 1, 2014
R.S. Provoost April 1, 2014
S.H. Rusckowski April 1, 2014
1) Reference date for board membership is December 31, 2010
Notice periodTermination of employment by a member of the Board ofManagement is subject to three months’ notice. A noticeperiod of six months will be applicable in the case oftermination by the Company.
Severance paymentThe severance payment is set at a maximum of one year’ssalary, or in case this is ‘manifestly unreasonable’ for amember of the Board of Management in his firstappointment period, the amount is maximized at twotimes the annual salary.
Share OwnershipTo further align the interests of the members of the Boardof Management and shareholders, restricted share rightsgranted to members of the Board of Management shall beretained for a period of at least five years or until at leastthe end of their employment, if this period is shorter.
Scenario analysisThe Remuneration Committee annually conductsscenario analysis. This includes the calculation ofremuneration under different scenarios, wherebydifferent Philips performance assumptions and corporateactions are looked at.
11.2.3 Remuneration costsThe table below gives an overview of the costs incurred bythe Company in the financial year in relation to theremuneration of the Board of Management. Costs relatedto stock option and restricted share right grants are takenby the Company over a number of years. As aconsequence, the costs mentioned below in the columnsstock options and restricted share rights are theaccounting cost of multi-year grants given to members ofthe Board of Management during their boardmembership.
Information on the individual remuneration of the(former) members of the Board of Management is shownin the tables below as well as in the table in note 31.
The previously granted stock options and restricted sharerights of Mr A. Ragnetti continue to vest in accordancewith the terms and conditions of the Long-Term IncentivePlan.
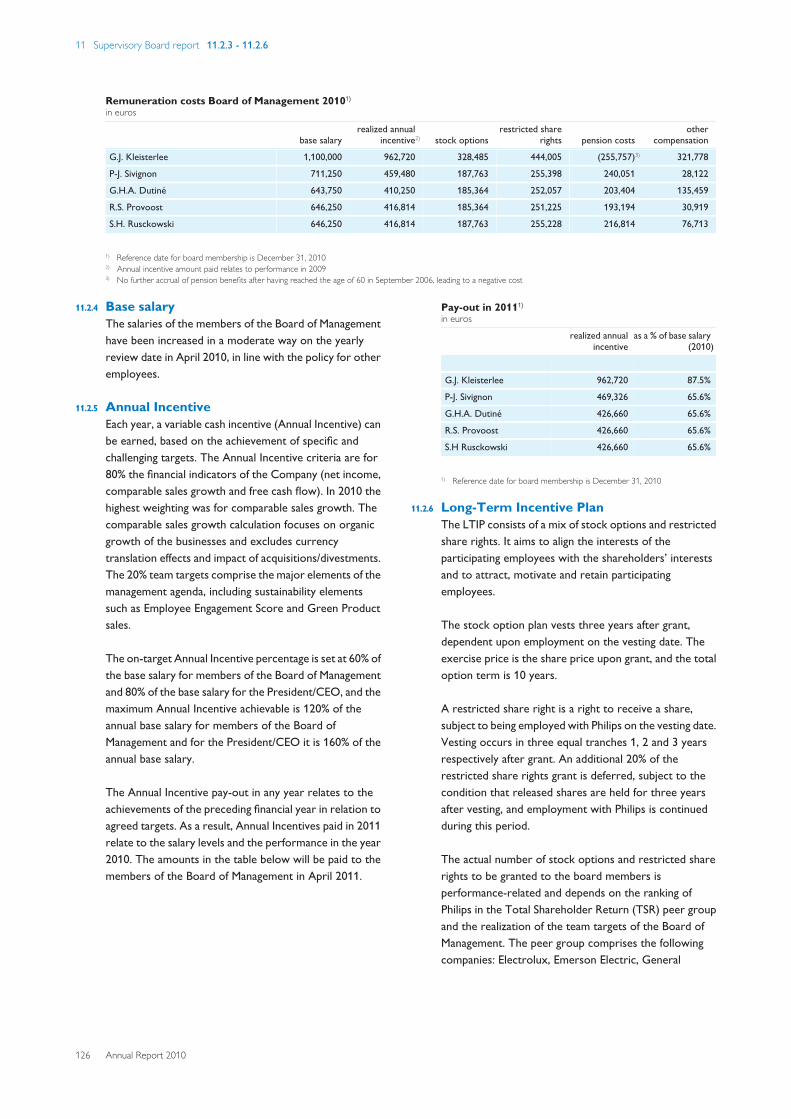
11 Supervisory Board report 11.2.3 - 11.2.6
126 Annual Report 2010
Remuneration costs Board of Management 20101)
in euros
base salary realized annual
incentive2) stock options restricted share
rights pension costs other
compensation
G.J. Kleisterlee 1,100,000 962,720 328,485 444,005 (255,757)3) 321,778
P-J. Sivignon 711,250 459,480 187,763 255,398 240,051 28,122
G.H.A. Dutiné 643,750 410,250 185,364 252,057 203,404 135,459
R.S. Provoost 646,250 416,814 185,364 251,225 193,194 30,919
S.H. Rusckowski 646,250 416,814 187,763 255,228 216,814 76,713
1) Reference date for board membership is December 31, 20102) Annual incentive amount paid relates to performance in 20093) No further accrual of pension benefits after having reached the age of 60 in September 2006, leading to a negative cost
11.2.4 Base salaryThe salaries of the members of the Board of Managementhave been increased in a moderate way on the yearlyreview date in April 2010, in line with the policy for otheremployees.
11.2.5 Annual IncentiveEach year, a variable cash incentive (Annual Incentive) canbe earned, based on the achievement of specific andchallenging targets. The Annual Incentive criteria are for80% the financial indicators of the Company (net income,comparable sales growth and free cash flow). In 2010 thehighest weighting was for comparable sales growth. Thecomparable sales growth calculation focuses on organicgrowth of the businesses and excludes currencytranslation effects and impact of acquisitions/divestments.The 20% team targets comprise the major elements of themanagement agenda, including sustainability elementssuch as Employee Engagement Score and Green Productsales.
The on-target Annual Incentive percentage is set at 60% ofthe base salary for members of the Board of Managementand 80% of the base salary for the President/CEO, and themaximum Annual Incentive achievable is 120% of theannual base salary for members of the Board ofManagement and for the President/CEO it is 160% of theannual base salary.
The Annual Incentive pay-out in any year relates to theachievements of the preceding financial year in relation toagreed targets. As a result, Annual Incentives paid in 2011relate to the salary levels and the performance in the year2010. The amounts in the table below will be paid to themembers of the Board of Management in April 2011.
Pay-out in 20111)
in euros
realized annualincentive
as a % of base salary(2010)
G.J. Kleisterlee 962,720 87.5%
P-J. Sivignon 469,326 65.6%
G.H.A. Dutiné 426,660 65.6%
R.S. Provoost 426,660 65.6%
S.H Rusckowski 426,660 65.6%
1) Reference date for board membership is December 31, 2010
11.2.6 Long-Term Incentive PlanThe LTIP consists of a mix of stock options and restrictedshare rights. It aims to align the interests of theparticipating employees with the shareholders’ interestsand to attract, motivate and retain participatingemployees.
The stock option plan vests three years after grant,dependent upon employment on the vesting date. Theexercise price is the share price upon grant, and the totaloption term is 10 years.
A restricted share right is a right to receive a share,subject to being employed with Philips on the vesting date.Vesting occurs in three equal tranches 1, 2 and 3 yearsrespectively after grant. An additional 20% of therestricted share rights grant is deferred, subject to thecondition that released shares are held for three yearsafter vesting, and employment with Philips is continuedduring this period.
The actual number of stock options and restricted sharerights to be granted to the board members isperformance-related and depends on the ranking ofPhilips in the Total Shareholder Return (TSR) peer groupand the realization of the team targets of the Board ofManagement. The peer group comprises the followingcompanies: Electrolux, Emerson Electric, General
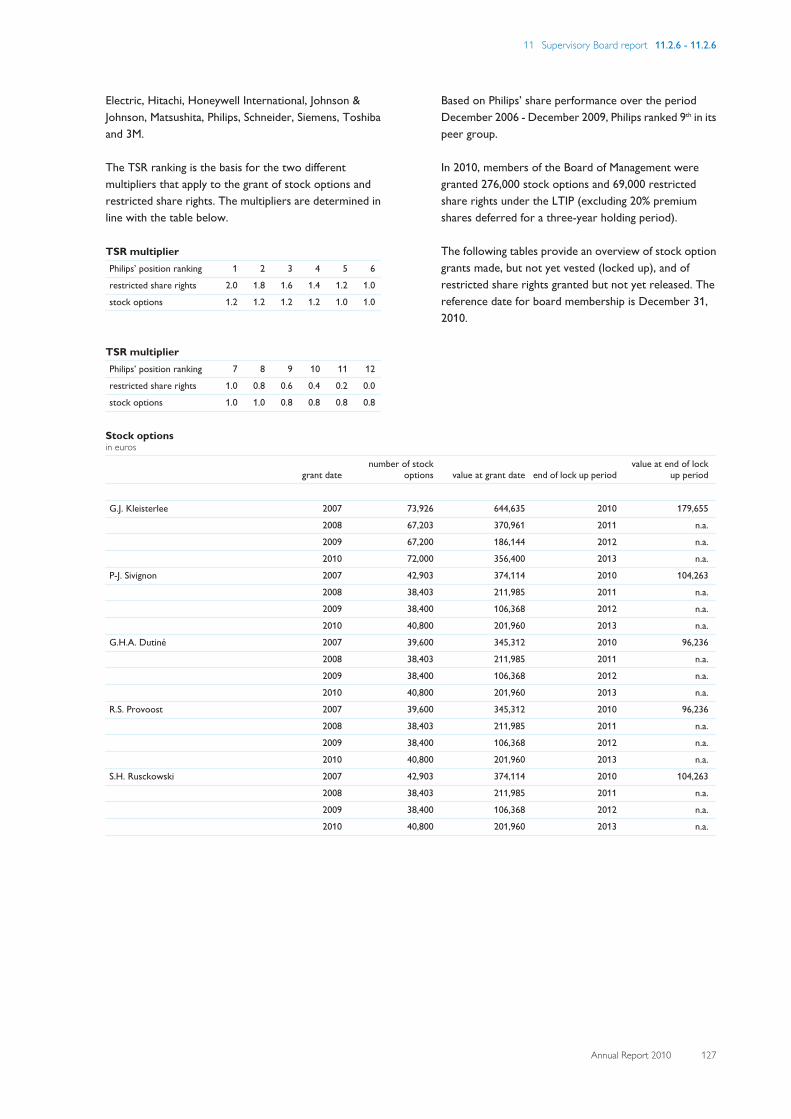
11 Supervisory Board report 11.2.6 - 11.2.6
Annual Report 2010 127
Electric, Hitachi, Honeywell International, Johnson &Johnson, Matsushita, Philips, Schneider, Siemens, Toshibaand 3M.
The TSR ranking is the basis for the two differentmultipliers that apply to the grant of stock options andrestricted share rights. The multipliers are determined inline with the table below.
TSR multiplierPhilips’ position ranking 1 2 3 4 5 6
restricted share rights 2.0 1.8 1.6 1.4 1.2 1.0
stock options 1.2 1.2 1.2 1.2 1.0 1.0
TSR multiplierPhilips’ position ranking 7 8 9 10 11 12
restricted share rights 1.0 0.8 0.6 0.4 0.2 0.0
stock options 1.0 1.0 0.8 0.8 0.8 0.8
Based on Philips’ share performance over the periodDecember 2006 - December 2009, Philips ranked 9th in itspeer group.
In 2010, members of the Board of Management weregranted 276,000 stock options and 69,000 restrictedshare rights under the LTIP (excluding 20% premiumshares deferred for a three-year holding period).
The following tables provide an overview of stock optiongrants made, but not yet vested (locked up), and ofrestricted share rights granted but not yet released. Thereference date for board membership is December 31,2010.
Stock optionsin euros
grant date number of stock
options value at grant date end of lock up period value at end of lock
up period
G.J. Kleisterlee 2007 73,926 644,635 2010 179,655
2008 67,203 370,961 2011 n.a.
2009 67,200 186,144 2012 n.a.
2010 72,000 356,400 2013 n.a.
P-J. Sivignon 2007 42,903 374,114 2010 104,263
2008 38,403 211,985 2011 n.a.
2009 38,400 106,368 2012 n.a.
2010 40,800 201,960 2013 n.a.
G.H.A. Dutiné 2007 39,600 345,312 2010 96,236
2008 38,403 211,985 2011 n.a.
2009 38,400 106,368 2012 n.a.
2010 40,800 201,960 2013 n.a.
R.S. Provoost 2007 39,600 345,312 2010 96,236
2008 38,403 211,985 2011 n.a.
2009 38,400 106,368 2012 n.a.
2010 40,800 201,960 2013 n.a.
S.H. Rusckowski 2007 42,903 374,114 2010 104,263
2008 38,403 211,985 2011 n.a.
2009 38,400 106,368 2012 n.a.
2010 40,800 201,960 2013 n.a.
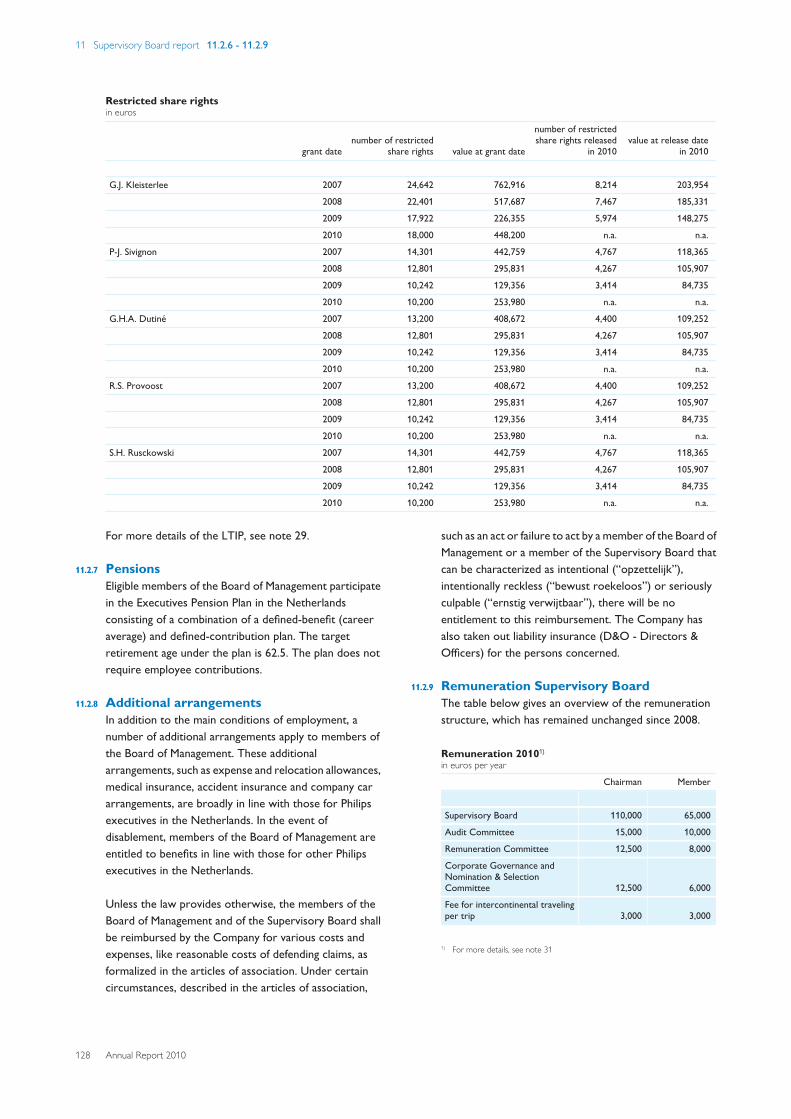
11 Supervisory Board report 11.2.6 - 11.2.9
128 Annual Report 2010
Restricted share rightsin euros
grant date number of restricted
share rights value at grant date
number of restrictedshare rights released
in 2010 value at release date
in 2010
G.J. Kleisterlee 2007 24,642 762,916 8,214 203,954
2008 22,401 517,687 7,467 185,331
2009 17,922 226,355 5,974 148,275
2010 18,000 448,200 n.a. n.a.
P-J. Sivignon 2007 14,301 442,759 4,767 118,365
2008 12,801 295,831 4,267 105,907
2009 10,242 129,356 3,414 84,735
2010 10,200 253,980 n.a. n.a.
G.H.A. Dutiné 2007 13,200 408,672 4,400 109,252
2008 12,801 295,831 4,267 105,907
2009 10,242 129,356 3,414 84,735
2010 10,200 253,980 n.a. n.a.
R.S. Provoost 2007 13,200 408,672 4,400 109,252
2008 12,801 295,831 4,267 105,907
2009 10,242 129,356 3,414 84,735
2010 10,200 253,980 n.a. n.a.
S.H. Rusckowski 2007 14,301 442,759 4,767 118,365
2008 12,801 295,831 4,267 105,907
2009 10,242 129,356 3,414 84,735
2010 10,200 253,980 n.a. n.a.
For more details of the LTIP, see note 29.
11.2.7 PensionsEligible members of the Board of Management participatein the Executives Pension Plan in the Netherlandsconsisting of a combination of a defined-benefit (careeraverage) and defined-contribution plan. The targetretirement age under the plan is 62.5. The plan does notrequire employee contributions.
11.2.8 Additional arrangementsIn addition to the main conditions of employment, anumber of additional arrangements apply to members ofthe Board of Management. These additionalarrangements, such as expense and relocation allowances,medical insurance, accident insurance and company cararrangements, are broadly in line with those for Philipsexecutives in the Netherlands. In the event ofdisablement, members of the Board of Management areentitled to benefits in line with those for other Philipsexecutives in the Netherlands.
Unless the law provides otherwise, the members of theBoard of Management and of the Supervisory Board shallbe reimbursed by the Company for various costs andexpenses, like reasonable costs of defending claims, asformalized in the articles of association. Under certaincircumstances, described in the articles of association,
such as an act or failure to act by a member of the Board ofManagement or a member of the Supervisory Board thatcan be characterized as intentional (“opzettelijk”),intentionally reckless (“bewust roekeloos”) or seriouslyculpable (“ernstig verwijtbaar”), there will be noentitlement to this reimbursement. The Company hasalso taken out liability insurance (D&O - Directors &Officers) for the persons concerned.
11.2.9 Remuneration Supervisory BoardThe table below gives an overview of the remunerationstructure, which has remained unchanged since 2008.
Remuneration 20101)
in euros per year
Chairman Member
Supervisory Board 110,000 65,000
Audit Committee 15,000 10,000
Remuneration Committee 12,500 8,000
Corporate Governance andNomination & SelectionCommittee 12,500 6,000
Fee for intercontinental travelingper trip 3,000 3,000
1) For more details, see note 31
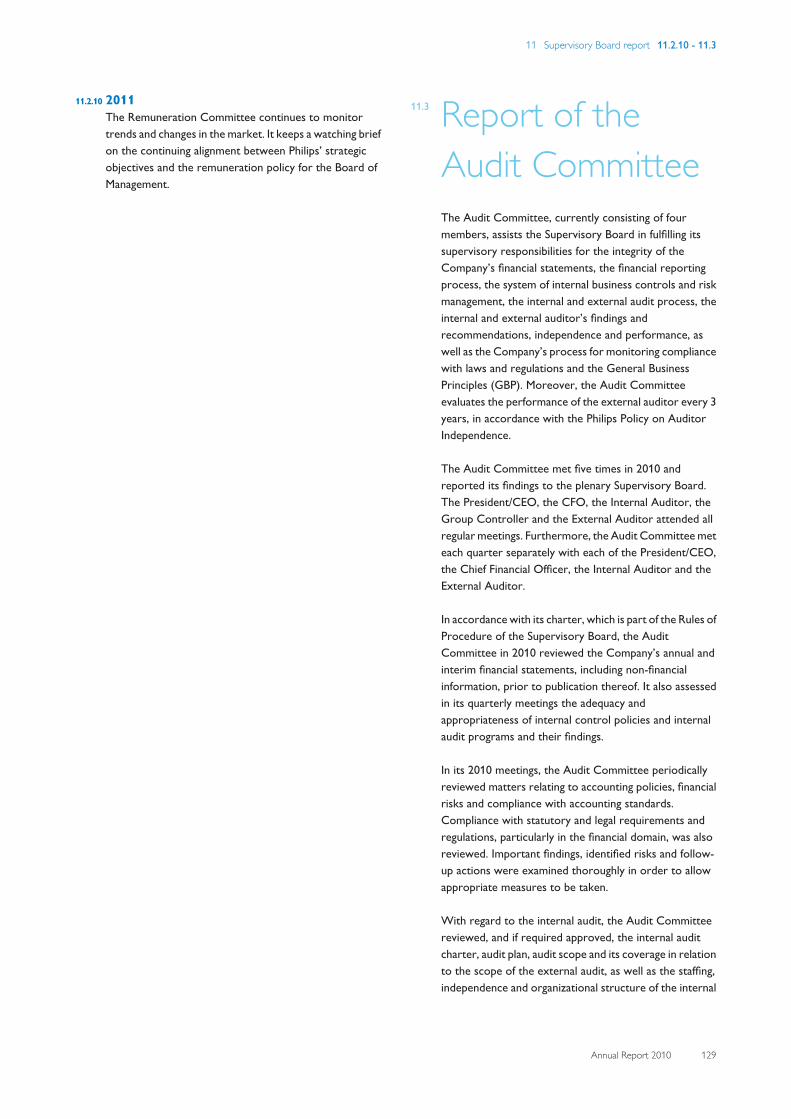
11 Supervisory Board report 11.2.10 - 11.3
Annual Report 2010 129
11.2.10 2011The Remuneration Committee continues to monitortrends and changes in the market. It keeps a watching briefon the continuing alignment between Philips’ strategicobjectives and the remuneration policy for the Board ofManagement.
11.3 Report of theAudit CommitteeThe Audit Committee, currently consisting of fourmembers, assists the Supervisory Board in fulfilling itssupervisory responsibilities for the integrity of theCompany’s financial statements, the financial reportingprocess, the system of internal business controls and riskmanagement, the internal and external audit process, theinternal and external auditor’s findings andrecommendations, independence and performance, aswell as the Company’s process for monitoring compliancewith laws and regulations and the General BusinessPrinciples (GBP). Moreover, the Audit Committeeevaluates the performance of the external auditor every 3years, in accordance with the Philips Policy on AuditorIndependence.
The Audit Committee met five times in 2010 andreported its findings to the plenary Supervisory Board.The President/CEO, the CFO, the Internal Auditor, theGroup Controller and the External Auditor attended allregular meetings. Furthermore, the Audit Committee meteach quarter separately with each of the President/CEO,the Chief Financial Officer, the Internal Auditor and theExternal Auditor.
In accordance with its charter, which is part of the Rules ofProcedure of the Supervisory Board, the AuditCommittee in 2010 reviewed the Company’s annual andinterim financial statements, including non-financialinformation, prior to publication thereof. It also assessedin its quarterly meetings the adequacy andappropriateness of internal control policies and internalaudit programs and their findings.
In its 2010 meetings, the Audit Committee periodicallyreviewed matters relating to accounting policies, financialrisks and compliance with accounting standards.Compliance with statutory and legal requirements andregulations, particularly in the financial domain, was alsoreviewed. Important findings, identified risks and follow-up actions were examined thoroughly in order to allowappropriate measures to be taken.
With regard to the internal audit, the Audit Committeereviewed, and if required approved, the internal auditcharter, audit plan, audit scope and its coverage in relationto the scope of the external audit, as well as the staffing,independence and organizational structure of the internal
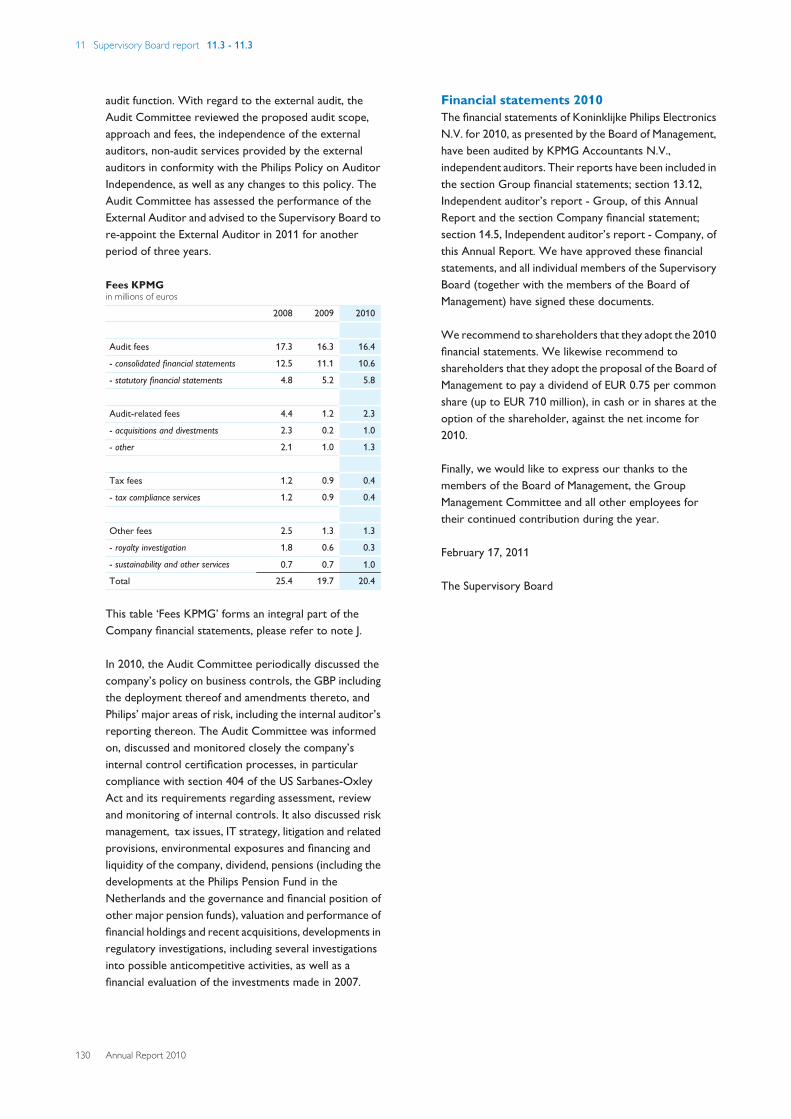
11 Supervisory Board report 11.3 - 11.3
130 Annual Report 2010
audit function. With regard to the external audit, theAudit Committee reviewed the proposed audit scope,approach and fees, the independence of the externalauditors, non-audit services provided by the externalauditors in conformity with the Philips Policy on AuditorIndependence, as well as any changes to this policy. TheAudit Committee has assessed the performance of theExternal Auditor and advised to the Supervisory Board tore-appoint the External Auditor in 2011 for anotherperiod of three years.
Fees KPMGin millions of euros
2008 2009 2010
Audit fees 17.3 16.3 16.4
- consolidated financial statements 12.5 11.1 10.6
- statutory financial statements 4.8 5.2 5.8
Audit-related fees 4.4 1.2 2.3
- acquisitions and divestments 2.3 0.2 1.0
- other 2.1 1.0 1.3
Tax fees 1.2 0.9 0.4
- tax compliance services 1.2 0.9 0.4
Other fees 2.5 1.3 1.3
- royalty investigation 1.8 0.6 0.3
- sustainability and other services 0.7 0.7 1.0 Total 25.4 19.7 20.4
This table ‘Fees KPMG’ forms an integral part of theCompany financial statements, please refer to note J.
In 2010, the Audit Committee periodically discussed thecompany’s policy on business controls, the GBP includingthe deployment thereof and amendments thereto, andPhilips’ major areas of risk, including the internal auditor’sreporting thereon. The Audit Committee was informedon, discussed and monitored closely the company’sinternal control certification processes, in particularcompliance with section 404 of the US Sarbanes-OxleyAct and its requirements regarding assessment, reviewand monitoring of internal controls. It also discussed riskmanagement, tax issues, IT strategy, litigation and relatedprovisions, environmental exposures and financing andliquidity of the company, dividend, pensions (including thedevelopments at the Philips Pension Fund in theNetherlands and the governance and financial position ofother major pension funds), valuation and performance offinancial holdings and recent acquisitions, developments inregulatory investigations, including several investigationsinto possible anticompetitive activities, as well as afinancial evaluation of the investments made in 2007.
Financial statements 2010The financial statements of Koninklijke Philips ElectronicsN.V. for 2010, as presented by the Board of Management,have been audited by KPMG Accountants N.V.,independent auditors. Their reports have been included inthe section Group financial statements; section 13.12,Independent auditor’s report - Group, of this AnnualReport and the section Company financial statement;section 14.5, Independent auditor’s report - Company, ofthis Annual Report. We have approved these financialstatements, and all individual members of the SupervisoryBoard (together with the members of the Board ofManagement) have signed these documents.
We recommend to shareholders that they adopt the 2010financial statements. We likewise recommend toshareholders that they adopt the proposal of the Board ofManagement to pay a dividend of EUR 0.75 per commonshare (up to EUR 710 million), in cash or in shares at theoption of the shareholder, against the net income for2010.
Finally, we would like to express our thanks to themembers of the Board of Management, the GroupManagement Committee and all other employees fortheir continued contribution during the year.
February 17, 2011
The Supervisory Board
12 Corporate governance 12 - 12.1
Annual Report 2010 131
12 Corporate governanceCorporate governance of the Philips group
IntroductionKoninklijke Philips Electronics N.V., a company organized under Dutchlaw (the ‘Company’), is the parent company of the Philips Group(‘Philips’ or the ‘Group’). The Company, which started as a limitedpartnership with the name Philips & Co in 1891, was converted into thecompany with limited liability N.V. Philips’ Gloeilampenfabrieken onSeptember 11, 1912. On May 6, 1994, the name was changed to PhilipsElectronics N.V., and on April 1, 1998, the name was changed toKoninklijke Philips Electronics N.V. Its shares have been listed on theAmsterdam Stock Exchange, Euronext Amsterdam, since 1913. Theshares have been traded in the United States since 1962 and have beenlisted on the New York Stock Exchange since 1987.
Over the last decades the Company has pursued a consistent policy toenhance and improve its corporate governance in line with Dutch, USand international (codes of) best practices. The Company hasincorporated a fair disclosure practice in its investor relations policy,has strengthened the accountability of its executive management and itsindependent supervisory directors, and has increased the rights andpowers of shareholders and the communication with investors. TheCompany is required to comply with, inter alia, Dutch CorporateGovernance rules, the US Sarbanes-Oxley Act, New York StockExchange rules and related regulations, insofar as applicable to theCompany. A summary of significant differences between the Company’scorporate governance structure and the New York Stock Exchangecorporate governance standards is published on the Company’swebsite (www.philips.com/investor).
In this report, the Company addresses its overall corporate governancestructure and states to what extent it applies the provisions of theDutch Corporate Governance Code of December 10, 2008 (the‘Dutch Corporate Governance Code’). This report also includes theinformation which the Company is required to disclose pursuant to thegovernmental decree on Article 10 Takeover Directive and thegovernmental decree on Corporate Governance. The SupervisoryBoard and the Board of Management, which are responsible for thecorporate governance structure of the Company, are of the opinionthat the principles and best practice provisions of the Dutch CorporateGovernance Code that are addressed to the Board of Management andthe Supervisory Board, interpreted and implemented in line with thebest practices followed by the Company, are being applied. Deviationsfrom aspects of the corporate governance structure of the Company,when deemed necessary in the interests of the Company, will bedisclosed in the Annual Report. Substantial changes in the Company’scorporate governance structure and in the Company’s compliance withthe Dutch Corporate Governance Code are submitted to the GeneralMeeting of Shareholders for discussion under a separate agenda item.
12.1 Board of ManagementIntroductionThe executive management of Philips is entrusted to its Board ofManagement under the chairmanship of the President/Chief ExecutiveOfficer and consists of at least three members (currently five). Themembers of the Board of Management have collective powers andresponsibilities. They share responsibility for the management of theCompany, the deployment of its strategy and policies, and theachievement of its objectives and results. The Board of Managementhas, for practical purposes, adopted a division of responsibilitiesindicating the functional and business areas monitored and reviewed bythe individual members. According to the Company’s corporateobjectives and Dutch law, the Board of Management is guided by theinterests of the Company and its affiliated enterprises within the Group,taking into consideration the interests of the Company’s stakeholders,and is accountable for the performance of its assignment to theSupervisory Board and the General Meeting of Shareholders. TheBoard of Management follows its own Rules of Procedure, which setforth procedures for meetings, resolutions, minutes and (vice-)chairmanship. These Rules of Procedure are published on theCompany’s website.
(Term of) Appointment, individual data and conflicts ofinterestsMembers of the Board of Management and the President/CEO areelected by the General Meeting of Shareholders upon a bindingrecommendation drawn up by the Supervisory Board after consultationwith the President/CEO. This binding recommendation may beoverruled by a resolution of the General Meeting of Shareholdersadopted by a simple majority of the votes cast and representing at leastone-third of the issued share capital. If a simple majority of the votescast is in favor of the resolution to overrule the bindingrecommendation, but such majority does not represent at least one-third of the issued share capital, a new meeting may be convened atwhich the resolution may be passed by a simple majority of the votescast, regardless of the portion of the issued share capital represented bysuch majority.
Members of the Board of Management and the President/CEO areappointed for a term of four years, it being understood that this termexpires at the end of the General Meeting of Shareholders to be held inthe fourth year after the year of their appointment. Reappointment ispossible for consecutive terms of four years or, if applicable, until a laterretirement date or other contractual termination date in the fourthyear, unless the General Meeting of Shareholders resolves otherwise.Members may be suspended by the Supervisory Board and the GeneralMeeting of Shareholders and dismissed by the latter.
Individual data on the members of the Board of Management arepublished in chapter 8, Board of Management, of this Annual Report.The acceptance by a member of the Board of Management ofmembership of the supervisory board of another company requires theapproval of the Supervisory Board. The Supervisory Board is requiredto be notified of other important positions (to be) held by a member ofthe Board of Management. No member of the Board of Managementholds more than two supervisory board memberships of listedcompanies, or is a chairman of such supervisory board, other than of aGroup company or participating interest of the Company, with theexception of Mr. Kleisterlee, who holds three board positions in listedcompanies in anticipation of his resignation as of April 1, 2011.
The Company has formalized its rules to avoid conflicts of interestsbetween the Company and members of the Board of Management. Thearticles of association state that in the event of a legal act or a lawsuitbetween the Company and a member of the Board of Management,certain of such member’s relatives, or certain (legal) entities in which amember of the Board of Management has an interest, and insofar as thelegal act is of material significance to the Company and/or to therespective member of the Board of Management, the respectivemember of the Board of Management shall not take part in the decision-making in respect of the lawsuit or the legal act. Resolutions concerningsuch legal acts or lawsuits require the approval of the SupervisoryBoard.
Legal acts as referred to above shall be mentioned in the Annual Reportfor the financial year in question. The Rules of Procedure of the Boardof Management establish further rules on the reporting of (potential)conflicts of interests. No legal acts as referred to above have occurredduring the financial year 2010.
Relationship between Board of Management and SupervisoryBoardThe Board of Management is supervised by the Supervisory Board andprovides the latter with all information the Supervisory Board needs tofulfill its own responsibilities. Major decisions of the Board ofManagement require the approval of the Supervisory Board; theseinclude decisions concerning (a) the operational and financial objectivesof the Company, (b) the strategy designed to achieve the objectives, (c)if necessary, the parameters to be applied in relation to the strategy and(d) corporate social responsibility issues that are relevant to theCompany.
Risk management approachWithin Philips, risk management forms an integral part of businessmanagement. The Board of Management is responsible for managing thesignificant risks that the Company is facing and has implemented a risk
12 Corporate governance 12.1 - 12.1
132 Annual Report 2010
management and internal control system that is designed to providereasonable assurance that strategic objectives are met by creatingfocus, by integrating management control over the Company’soperations, by ensuring compliance with applicable laws and regulationsand by safeguarding the reliability of the financial reporting and itsdisclosures. The Board of Management reports on and accounts forinternal risk management and control systems to the Supervisory Boardand its Audit Committee. The Company has designed its internalcontrol system in accordance with the recommendations of theCommittee of Sponsoring Organizations of the Treadway Commission(COSO).
The Company’s risk management approach is embedded in the periodicbusiness planning and review cycle and forms an integral part of businessmanagement. On the basis of risk assessments, managementdetermines the risks and appropriate risk responses related to theachievement of business objectives and critical business processes. Riskfactors and the risk management approach, as well as the sensitivity ofthe Company’s results to external factors and variables, are describedin more detail in chapter 7, Risk management, of this Annual Report.Significant changes and improvements in the Company’s riskmanagement and internal control system have been discussed with theSupervisory Board’s Audit Committee and the external auditor and aredisclosed in that section as well.
With respect to financial reporting a structured self-assessment andmonitoring process is used company-wide to assess, document, reviewand monitor compliance with internal control over financial reporting.Internal representations received from management, regularmanagement reviews, reviews of the design and effectiveness of internalcontrols and reviews in corporate and divisional audit committees areintegral parts of the Company’s risk management approach. On thebasis thereof, the Board of Management confirms that internal controlsover financial reporting provide a reasonable level of assurance that thefinancial reporting does not contain any material inaccuracies, andconfirms that these controls have properly functioned in 2010. Thefinancial statements fairly represent the financial condition and result ofoperations of the Company and provide the required disclosures.
It should be noted that the above does not imply that these systems andprocedures provide certainty as to the realization of operational andfinancial business objectives, nor can they prevent all misstatements,inaccuracies, errors, fraud and non-compliances with rules andregulations.
In view of the above the Board of Management believes that it is incompliance with the requirements of recommendation II.1.4. of theDutch Corporate Governance Code. The above statement on internalcontrols should not be construed as a statement in response to therequirements of section 404 of the US Sarbanes-Oxley Act. Thestatement as to compliance with section 404 is set forth in the sectionManagement’s report on internal control over financial reporting of thisAnnual Report.
Philips has a financial code of ethics which applies to certain seniorofficers, including the CEO and CFO, and to employees performing anaccounting or financial function (the financial code of ethics has beenpublished on the Company’s website). The Company, through theSupervisory Board’s Audit Committee, also has appropriateprocedures in place for the receipt, retention and treatment ofcomplaints received by the Company regarding accounting, internalaccounting controls or auditing matters and the confidential,anonymous submission by employees of concerns regardingquestionable accounting or auditing matters. Internal ‘whistleblowers’have the opportunity, without jeopardizing their position, to report onirregularities of a general, operational or financial nature and to reportcomplaints about members of the Board of Management to theChairman of the Supervisory Board.
In view of the requirements under the US Securities Exchange Act,procedures are in place to enable the CEO and the CFO to providecertifications with respect to the Annual Report on Form 20-F.
A Disclosure Committee is in place, which advises the various officersand departments involved, including the CEO and the CFO, on thetimely review, publication and filing of periodic and current (financial)reports. Apart from the certification by the CEO and CFO under USlaw, each individual member of the Supervisory Board and the Board ofManagement must under Dutch law, sign the Group and Companyfinancial statements being disclosed and submitted to the GeneralMeeting of Shareholders for adoption. If one or more of their signatures
is missing, this shall be stated, and the reasons given for this. The Boardof Management issues the responsibility statement with regard tochapter 13, Group financial statements, of this Annual Report, pursuantto requirements of Dutch civil and securities laws.
Amount and composition of the remuneration of the Board ofManagementThe remuneration of the individual members of the Board ofManagement is determined by the Supervisory Board on the proposal ofthe Remuneration Committee of the Supervisory Board, and isconsistent with the policies thereon as adopted by the General Meetingof Shareholders. The remuneration policy applicable to the Board ofManagement was adopted by the 2004 General Meeting ofShareholders, and lastly amended by the 2008 General Meeting ofShareholders and is published on the Company’s website. A full anddetailed description of the composition of the remuneration of theindividual members of the Board of Management is included in chapter11, Supervisory Board report, of this Annual Report.
The remuneration structure, including severance pay, is such that itpromotes the interests of the Company in the medium and long-term,does not encourage members of the Board of Management to act intheir own interests or take risks that are not in line with the adoptedstrategy, and does not reward failing members of the Board ofManagement upon termination of their employment. The level andstructure of remuneration shall be determined in the light of factorssuch as the results, the share price performance and otherdevelopments relevant to the Company. Deviations on elements of theremuneration policy in extraordinary circumstances, when deemednecessary in the interests of the Company, will be disclosed in theAnnual Report or, in case of an appointment, in good time prior to theappointment of the person concerned.
The main elements of the contract of employment of a new member ofthe Board of Management - including the amount of the fixed basesalary, the structure and amount of the variable remunerationcomponent, any severance plan, pension arrangements and the generalperformance criteria - shall be made public no later than at the time ofissuance of the notice convening the General Meeting of Shareholdersin which a proposal for appointment of that member of the Board ofManagement has been placed on the agenda. From August 1, 2003onwards, for new members of the Board of Management the term oftheir contract of employment is set at four years, and in case oftermination, severance payment is limited to a maximum of one year’sbase salary subject to mandatory Dutch law, to the extent applicable; ifthe maximum of one-year’s salary would be manifestly unreasonable fora member of the Board of Management who is dismissed during his firstterm of office, the member of the Board of Management shall be eligiblefor a severance payment not exceeding twice the annual salary. TheCompany does not grant personal loans, guarantees or the like tomembers of the Board of Management, and no such (remissions of)loans and guarantees were granted to such members in 2010, nor areoutstanding as per December 31, 2010.
In 2003, Philips adopted a Long-Term Incentive Plan (‘LTIP’ or the‘Plan’), lastly amended by the 2009 General Meeting of Shareholders,consisting of a mix of restricted shares rights and stock options formembers of the Board of Management, the Group ManagementCommittee, Philips executives and other key employees. This Plan wasapproved by the 2003 General Meeting of Shareholders. Futuresubstantial changes to the Plan applicable to members of the Board ofManagement will be submitted to the General Meeting of Shareholdersfor approval. As from 2002, the Company grants fixed stock optionsthat expire after ten years to members of the Board of Management(and other grantees). The options vest after three years and may not beexercised in the first three years after they have been granted. Optionsare granted at fair market value, based on the closing price of EuronextAmsterdam on the date of grant, and neither the exercise price nor theother conditions regarding the granted options can be modified duringthe term of the options, except in certain exceptional circumstances inaccordance with established market practice. The value of the optionsgranted to members of the Board of Management and other personneland the method followed in calculating this value are stated in the notesto the annual accounts. Philips is one of the first companies to haveintroduced restricted shares as part of the LTIP. A grantee will receivethe restricted shares in three equal installments in three successiveyears, provided he/she is still with Philips on the respective deliverydates. If the grantee still holds the shares after three years from thedelivery date, Philips will grant 20% additional (premium) shares,provided he/she is still with Philips. The Plan is designed to stimulatelong-term investment in Philips shares. To further align the interests of
12 Corporate governance 12.1 - 12.2
Annual Report 2010 133
members of the Board of Management and shareholders, restrictedshares granted to these members of the Board of Management shall beretained for a period of at least five years, or until at least the end ofemployment, if this period is shorter.
The actual number of long-term incentives (both stock options andrestricted shares rights) that are to be granted to the members of theBoard of Management will be determined by the Supervisory Board anddepends on the achievement of the set team targets in the areas ofresponsibility monitored by the individual members of the Board ofManagement and on the share performance of Philips. The shareperformance of Philips is measured on the basis of the Philips TotalShareholder Return (TSR) compared to the TSR of a peer group of 12leading multinational electronics/electrical equipment companies over athree-year period; the composition of this group is described in thesection Supervisory Board Report. With regard to stock options theTSR performance of Philips and the companies in the peer group isdivided into three groups: top 4, middle 4 and bottom 4. Based on thisrelative TSR position, the Supervisory Board establishes a multiplierwhich varies from 1.2 to 0.8 and depends on the group in which thePhilips TSR result falls. With regard to restricted share rights the TSRperformance of Philips and the companies in the peer group is rankedfrom 1 to 12. Based on this relative TSR position, the Supervisory Boardestablishes a multiplier which varies from 0.0 to 2.0 and depends on theTSR position of Philips within the peer group. Every individual grant, thesize of which depends on the positions and performance of theindividuals, will be multiplied by the TSR-multiplier.
The so-called ultimum remedium clause and claw-back clause of bestpractice provisions II.2.10 and II.2.11 of the Dutch CorporateGovernance Code is applicable to Annual Incentive payments and LTIPgrants for the year 2009 onwards to all members of the Board ofManagement. In respect of the LTIP grants, the ultimum remediumclause can be applied to the performance-related actual number ofstock options and restricted share rights that is (unconditionally)granted.
Members of the Board of Management hold shares in the Company forthe purpose of long-term investment and are required to refrain fromshort-term transactions in Philips securities. According to the PhilipsRules of Conduct on Inside Information, members of the Board ofManagement are only allowed to trade in Philips securities (including theexercise of stock options) during ‘windows’ of ten business daysfollowing the publication of annual and quarterly results (provided theperson involved has no ‘inside information’ regarding Philips at thattime) unless an exemption is available. Furthermore, the Rules ofProcedure of the Board of Management contain provisions concerningownership of and transactions in non-Philips securities by members ofthe Board of Management. Members of the Board of Management areprohibited from trading, directly or indirectly, in securities in any of thecompanies belonging to the above-mentioned peer group of 12 leadingmultinational electronics/electrical equipment companies.
Indemnification of members of the Board of Management andSupervisory BoardUnless the law provides otherwise, the members of the Board ofManagement and of the Supervisory Board shall be reimbursed by theCompany for various costs and expenses, such as the reasonable costsof defending claims, as formalized in the articles of association. Undercertain circumstances, described in the articles of association, such asan act or failure to act by a member of the Board of Management or amember of the Supervisory Board that can be characterized asintentional (‘opzettelijk’), intentionally reckless (‘bewust roekeloos’) orseriously culpable (‘ernstig verwijtbaar’), there will be no entitlement tothis reimbursement. The Company has also taken out liability insurance(D&O - Directors & Officers) for the persons concerned.
12.2 Supervisory BoardIntroductionThe Supervisory Board supervises the policies of the Board ofManagement and the general course of affairs of Philips and advises theexecutive management thereon. The Supervisory Board, in the two-tiercorporate structure under Dutch law, is a separate body that isindependent of the Board of Management. Its independent character isalso reflected in the requirement that members of the SupervisoryBoard can be neither a member of the Board of Management nor anemployee of the Company. The Supervisory Board considers all itsmembers to be independent pursuant to the Dutch CorporateGovernance Code and under the applicable US Securities and ExchangeCommission standards.
The Supervisory Board, acting in the interests of the Company and theGroup and taking into account the relevant interest of the Company’sstakeholders, supervises and advises the Board of Management inperforming its management tasks and setting the direction of theGroup’s business, including (a) achievement of the Company’sobjectives, (b) corporate strategy and the risks inherent in the businessactivities, (c) the structure and operation of the internal riskmanagement and control systems, (d) the financial reporting process,(e) compliance with legislation and regulations, (f) the operational andfinancial objectives, (g) the parameters to be applied in relation to thestrategy, (h) corporate social responsibility issues and (i) the company-shareholder relationship. Major management decisions and the Group’sstrategy are discussed with and approved by the Supervisory Board. Inits report, the Supervisory Board describes its activities in the financialyear, the number of committee meetings and the main items discussed.
Rules of Procedure of the Supervisory BoardThe Supervisory Board’s Rules of Procedure set forth its owngovernance rules (including meetings, items to be discussed,resolutions, appointment and re-election, committees, conflicts ofinterests, trading in securities, profile of the Supervisory Board). Itscomposition follows the profile, which aims for an appropriatecombination of knowledge and experience among its membersencompassing marketing, technological, manufacturing, financial,economic, social and legal aspects of international business andgovernment and public administration in relation to the global andmulti-product character of the Group’s businesses. The SupervisoryBoard attaches great importance to diversity in its composition. Moreparticularly, it aims at having members with a European and a non-European background (nationality, working experience or otherwise),one or more female members and one or more members with anexecutive or similar position in business or society no longer than 5years ago. In line with US and Dutch best practices, the Chairman of theSupervisory Board should be independent pursuant to the DutchCorporate Governance Code and under the applicable US standards.
The Rules of Procedure of the Supervisory Board are published on theCompany’s website. They include the charters of its committees, towhich the plenary Supervisory Board, while retaining overallresponsibility, has assigned certain tasks: the Corporate Governanceand Nomination & Selection Committee, the Audit Committee and theRemuneration Committee. A maximum of one member of eachcommittee need not be independent as defined by the DutchCorporate Governance Code. Each committee reports, and submits itsminutes for information, to the Supervisory Board.
The Supervisory Board is assisted by the General Secretary of theCompany. The General Secretary sees to it that correct procedures arefollowed and that the Supervisory Board acts in accordance with itsstatutory obligations and its obligations under the articles ofassociation. Furthermore the General Secretary assists the Chairman ofthe Supervisory Board in the actual organization of the affairs of theSupervisory Board (information, agenda, evaluation, introductoryprogram) and is the contact person for interested parties who want tomake concerns known to the Supervisory Board. The GeneralSecretary shall, either on the recommendation of the SupervisoryBoard or otherwise, be appointed by the Board of Management and maybe dismissed by the Board of Management, after the approval of theSupervisory Board has been obtained.
(Term of) Appointment, individual data and conflicts ofinterestsThe Supervisory Board consists of at least five members (currentlyeight), including a Chairman, Vice-Chairman and Secretary. The so-called Dutch ‘structure regime’ does not apply to the Company itself.Members are currently elected by the General Meeting of Shareholdersfor fixed terms of four years, upon a binding recommendation from theSupervisory Board. According to the Company’s articles of association,this binding recommendation may be overruled by a resolution of theGeneral Meeting of Shareholders adopted by a simple majority of thevotes cast and representing at least one-third of the issued share capital.If a simple majority of the votes cast is in favor of the resolution tooverrule the binding recommendation, but such majority does notrepresent at least one-third of the issued share capital, a new meetingmay be convened at which the resolution may be passed by a simplemajority of the votes cast, regardless of the portion of the issued sharecapital represented by such majority.
Members may be suspended and dismissed by the General Meeting ofShareholders. In the event of inadequate performance, structuralincompatibility of interests, and in other instances in which resignation
12 Corporate governance 12.2 - 12.2
134 Annual Report 2010
is deemed necessary in the opinion of the Supervisory Board, theSupervisory Board shall submit to the General Meeting of Shareholdersa proposal to dismiss the respective member of the Supervisory Board.There is no age limit applicable, and members may be re-elected twice.The date of expiration of the terms of Supervisory Board members ispublished on the Company’s website. Individual data on the members ofthe Supervisory Board are published in the Annual Report, and updatedon the Company’s website.
After their appointment, all members of the Supervisory Board shallfollow an introductory program, which covers general financial and legalaffairs, financial reporting by the Company, any specific aspects that areunique to the Company and its business activities, and theresponsibilities of a Supervisory Board member. Any need for furthertraining or education of members will be reviewed annually, also on thebasis of an annual evaluation survey.
In accordance with policies adopted by the Supervisory Board, nomember of the Supervisory Board shall hold more than five supervisoryboard memberships of Dutch listed companies, the chairmanship of asupervisory board counting as two regular memberships.
In compliance with the Dutch Corporate Governance Code, theCompany has formalized strict rules to avoid conflicts of interestsbetween the Company and members of the Supervisory Board; allinformation about a conflict of interests situation is to be provided tothe Chairman of the Supervisory Board. No decisions to enter intomaterial transactions in which there are conflicts of interest withmembers of the Supervisory Board have occurred during the financialyear 2010.
Meetings of the Supervisory BoardThe Supervisory Board meets at least six times per year, including ameeting on strategy. The Supervisory Board, on the advice of its AuditCommittee, also discusses, in any event at least once a year, the mainrisks of the business, and the result of the assessment by the Board ofManagement of the structure and operation of the internal riskmanagement and control systems, as well as any significant changesthereto. The members of the Board of Management attend meetings ofthe Supervisory Board except in matters such as the desired profile,composition and competence of the Supervisory Board, the Board ofManagement and the Group Management Committee, as well as theremuneration and performance of individual members of the Board ofManagement and the Group Management Committee and theconclusions that must be drawn on the basis thereof. In addition tothese items, the Supervisory Board, being responsible for the quality ofits own performance, discusses, at least once a year on its own, withoutthe members of the Board of Management being present, both its ownfunctioning and that of the individual members, and the conclusions thatmust be drawn on the basis thereof. The President/CEO and othermembers of the Board of Management have regular contacts with theChairman and other members of the Supervisory Board. The Board ofManagement is required to keep the Supervisory Board informed of allfacts and developments concerning Philips that the Supervisory Boardmay need in order to function as required and to properly carry out itsduties, to consult it on important matters and to submit certainimportant decisions to it for its prior approval. The Supervisory Boardand its individual members each have their own responsibility torequest from the Board of Management and the external auditor allinformation that the Supervisory Board needs in order to be able tocarry out its duties properly as a supervisory body. If the SupervisoryBoard considers it necessary, it may obtain information from officersand external advisers of the Company. The Company provides thenecessary means for this purpose. The Supervisory Board may alsorequire that certain officers and external advisers attend its meetings.
The Chairman of the Supervisory BoardThe Supervisory Board’s Chairman will see to it that: (a) the membersof the Supervisory Board follow their introductory program, (b) themembers of the Supervisory Board receive in good time all informationwhich is necessary for the proper performance of their duties, (c) thereis sufficient time for consultation and decision-making by theSupervisory Board, (d) the committees of the Supervisory Boardfunction properly, (e) the performance of the Board of Managementmembers and Supervisory Board members is assessed at least once ayear, and (f) the Supervisory Board elects a Vice-Chairman. The Vice-Chairman of the Supervisory Board shall deputize for the Chairmanwhen the occasion arises. The Vice-Chairman shall act as contact ofindividual members of the Supervisory Board or the Board ofManagement concerning the functioning of the Chairman of theSupervisory Board.
Remuneration of the Supervisory Board and share ownershipThe remuneration of the individual members of the Supervisory Board,as well as the additional remuneration for its Chairman and themembers of its committees is determined by the General Meeting ofShareholders. The remuneration of a Supervisory Board member is notdependent on the results of the Company. Further details are publishedin the Supervisory Board report. The Company shall not grant itsSupervisory Board members any personal loans, guarantees or similararrangements. No such (remissions of) loans and guarantees weregranted to such members in 2010, nor were any outstanding as perDecember 31, 2010.
Shares or rights to shares shall not be granted to a Supervisory Boardmember. In accordance with the Rules of Procedure of the SupervisoryBoard, any shares in the Company held by a Supervisory Board memberare long-term investments. The Supervisory Board has adopted a policyon ownership of transactions in non-Philips securities by members ofthe Supervisory Board. This policy is included in the Rules of Procedureof the Supervisory Board.
The Corporate Governance and Nomination & SelectionCommitteeThe Corporate Governance and Nomination & Selection Committeeconsists of at least the Chairman and Vice-Chairman of the SupervisoryBoard. The Committee reviews the corporate governance principlesapplicable to the Company at least once a year, and advises theSupervisory Board on any changes to these principles as it deemsappropriate. It also (a) draws up selection criteria and appointmentprocedures for members of the Supervisory Board, the Board ofManagement and the Group Management Committee; (b) periodicallyassesses the size and composition of the Supervisory Board, the Boardof Management and the Group Management Committee, and makes theproposals for a composition profile of the Supervisory Board, ifappropriate; (c) periodically assesses the functioning of individualmembers of the Supervisory Board, the Board of Management and theGroup Management Committee, and reports on this to the SupervisoryBoard. The Committee also consults with the President/CEO and theBoard of Management on candidates to fill vacancies on the SupervisoryBoard, the Board of Management and the Group ManagementCommittee, and advises the Supervisory Board on the candidates forappointment. It further supervises the policy of the Board ofManagement on the selection criteria and appointment procedures forPhilips Executives.
The Remuneration CommitteeThe Remuneration Committee meets at least twice a year and isresponsible for preparing decisions of the Supervisory Board on theremuneration of individual members of the Board of Management andthe Group Management Committee.
The Remuneration Committee prepares an annual remunerationreport. The remuneration report contains an account of the manner inwhich the remuneration policy has been implemented in the pastfinancial year, as well as an overview of the implementation of theremuneration policy planned by the Supervisory Board for the nextyear(s). The Supervisory Board aims to have appropriate experienceavailable within the Remuneration Committee. No more than onemember of the Remuneration Committee shall be an executive boardmember of another Dutch listed company.
In performing its duties and responsibilities the RemunerationCommittee is assisted by an in-house remuneration expert acting onthe basis of a protocol ensuring that the expert acts on the instructionsof the Remuneration Committee and on an independent basis in whichconflicts of interests are avoided.
The Audit CommitteeThe Audit Committee meets at least four times a year, before thepublication of the annual, semi-annual and quarterly results. All of themembers of the Audit Committee are considered to be independentunder the applicable US Securities and Exchange Commission rules andat least one of the members of the Audit Committee, which currentlyconsists of four members of the Supervisory Board, is a financial expertas set out in the Dutch Corporate Governance Code and each memberis financially literate. In accordance with this code, a financial expert hasrelevant knowledge and experience of financial administration andaccounting at the company in question. The Supervisory Boardconsiders the fact of being compliant with the Dutch CorporateGovernance Code, in combination with the knowledge and experienceavailable in the Audit Committee as well as the possibility to take advicefrom internal and external experts and advisors, to be sufficient for the
12 Corporate governance 12.2 - 12.3
Annual Report 2010 135
fulfillment of the tasks and responsibilities of the Audit Committee. TheSupervisory Board has determined that none of the members of theAudit Committee is designated as an Audit Committee financial expertas defined under the regulations of the US Securities and ExchangeCommission. The Audit Committee may not be chaired by theChairman of the Supervisory Board or by a (former) member of theBoard of Management.
All members of the Audit Committee are independentThe tasks and functions of the Audit Committee, as described in itscharter, which is published on the Company’s website as part of theRules of Procedure of the Supervisory Board, include the dutiesrecommended in the Dutch Corporate Governance Code. Morespecifically, the Audit Committee assists the Supervisory Board infulfilling its oversight responsibilities for the integrity of the Company’sfinancial statements, the financial reporting process, the system ofinternal business controls and risk management, the internal andexternal audit process, the internal and external auditor’s qualifications,its independence and its performance, as well as the Company’s processfor monitoring compliance with laws and regulations and the GeneralBusiness Principles (GBP). It reviews the Company’s annual and interimfinancial statements, including non-financial information, prior topublication and advises the Supervisory Board on the adequacy andappropriateness of internal control policies and internal audit programsand their findings.
In reviewing the Company’s annual and interim statements, includingnon-financial information, and advising the Supervisory Board oninternal control policies and internal audit programs, the AuditCommittee reviews matters relating to accounting policies andcompliance with accounting standards, compliance with statutory andlegal requirements and regulations, particularly in the financial domain.Important findings and identified risks are examined thoroughly by theAudit Committee in order to allow appropriate measures to be taken.With regard to the internal audit, the Audit Committee, in cooperationwith the external auditor, reviews the internal audit charter, audit plan,audit scope and its coverage in relation to the scope of the externalaudit, staffing, independence and organizational structure of the internalaudit function.
With regard to the external audit, the Audit Committee reviews theproposed audit scope, approach and fees, the independence of theexternal auditor, its performance and its (re-)appointment, audit andpermitted non-audit services provided by the external auditor inconformity with the Philips Policy on Auditor Independence, as well asany changes to this policy. The Audit Committee also considers thereport of the external auditor and its report with respect to the annualfinancial statements. According to the procedures, the AuditCommittee acts as the principal contact for the external auditor if theauditor discovers irregularities in the content of the financial reports. Italso advises on the Supervisory Board’s statement to shareholders inthe annual accounts. The Audit Committee periodically discusses theCompany’s policy on business controls, the GBP including thedeployment thereof, overviews on tax, IT, litigation and legalproceedings, environmental exposures, financial exposures in the areaof treasury, real estate, pensions, and the Group’s major areas of risk.The Company’s external auditor, in general, attends all AuditCommittee meetings and the Audit Committee meets separately atleast on a quarterly basis with each of the President/CEO, the CFO, theinternal auditor and the external auditor.
Group Management CommitteeThe Group Management Committee consists of the members of theBoard of Management and certain key officers. Members other thanmembers of the Board of Management are appointed by theSupervisory Board. The task of the Group Management Committee, thehighest consultative body within Philips, is to ensure that business issuesand practices are shared across Philips and to implement commonpolicies.
12.3 General Meeting of ShareholdersIntroductionA General Meeting of Shareholders is held at least once a year to discussthe Annual Report, including the report of the Board of Management,the annual financial statements with explanatory notes thereto andadditional information required by law, and the Supervisory Boardreport, any proposal concerning dividends or other distributions, theappointment of members of the Board of Management and SupervisoryBoard (if any), important management decisions as required by Dutchlaw, and any other matters proposed by the Supervisory Board, the
Board of Management or shareholders in accordance with theprovisions of the Company’s articles of association. The Annual Report,the financial statements and other regulated information such asdefined in the Dutch Act on Financial Supervision (Wet op hetFinancieel Toezicht), will solely be published in English. As a separateagenda item and in application of Dutch law, the General Meeting ofShareholders discusses the discharge of the members of the Board ofManagement and the Supervisory Board from responsibility for theperformance of their respective duties in the preceding financial year.However, this discharge only covers matters that are known to theCompany and the General Meeting of Shareholders when theresolution is adopted. The General Meeting of Shareholders is held inEindhoven, Amsterdam, Rotterdam, The Hague, Utrecht orHaarlemmermeer (Schiphol Airport) no later than six months after theend of the financial year.
Meetings are convened by public notice, via the Company’s website orother electronic means of communication and by letter or by the use ofelectronic means of communication, to registered shareholders.Extraordinary General Meetings of Shareholders may be convened bythe Supervisory Board or the Board of Management if deemednecessary and must be held if shareholders jointly representing at least10% of the outstanding share capital make a written request to thateffect to the Supervisory Board and the Board of Management,specifying in detail the business to be dealt with. The agenda of theGeneral Meeting of Shareholders shall contain such business as may beplaced thereon by the Board of Management or the Supervisory Board,and agenda items will be explained where necessary in writing. Theagenda shall list which items are for discussion and which items are to bevoted upon. Material amendments to the articles of association andresolutions for the appointment of members of the Board ofManagement and Supervisory Board shall be submitted separately tothe General Meeting of Shareholders, it being understood thatamendments and other proposals that are connected in the context of aproposed (part of the) governance structure may be submitted as oneproposal. In accordance with the articles of association and Dutch law,requests from shareholders for items to be included on the agenda willgenerally be honored, subject to the Company’s rights to refuse toinclude the requested agenda item under Dutch law, provided that suchrequests are made in writing at least 60 days before a General Meetingof Shareholders to the Board of Management and the SupervisoryBoard by shareholders representing at least 1% of the Company’soutstanding capital or, according to the official price list of EuronextAmsterdam, representing a value of at least EUR 50 million. Writtenrequests may be submitted electronically and shall comply with theprocedure stipulated by the Board of Management, which procedure isposted on the Company’s website.
Main powers of the General Meeting of ShareholdersAll outstanding shares carry voting rights. The main powers of theGeneral Meeting of Shareholders are to appoint, suspend and dismissmembers of the Board of Management and of the Supervisory Board, toadopt the annual accounts, declare dividends and to discharge theBoard of Management and the Supervisory Board from responsibilityfor the performance of their respective duties for the previous financialyear, to appoint the external auditor as required by Dutch law, to adoptamendments to the articles of association and proposals to dissolve orliquidate the Company, to issue shares or rights to shares, to restrict orexclude pre-emptive rights of shareholders and to repurchase or canceloutstanding shares. Following common corporate practice in theNetherlands, the Company each year requests limited authorization toissue (rights to) shares, to restrict or exclude pre-emptive rights and torepurchase shares. In compliance with Dutch law, decisions of theBoard of Management that are so far-reaching that they would greatlychange the identity or nature of the Company or the business requirethe approval of the General Meeting of Shareholders. This includesresolutions to (a) transfer the business of the Company, or almost theentire business of the Company, to a third party (b) enter into ordiscontinue long-term cooperation by the Company or a subsidiarywith another legal entity or company or as a fully liable partner in alimited partnership or ordinary partnership, if this cooperation or itsdiscontinuation is of material significance to the Company or (c) acquireor dispose of a participating interest in the capital of a company to thevalue of at least one-third of the amount of the assets according to thebalance sheet and notes thereto or, if the Company prepares aconsolidated balance sheet, according to the consolidated balance sheetand notes thereto as published in the last adopted annual accounts ofthe Company, by the Company or one of its subsidiaries. Thus theCompany applies principle IV.1 of the Dutch Corporate GovernanceCode within the framework of the articles of association and Dutch lawand in the manner as described in this corporate governance report.
12 Corporate governance 12.3 - 12.4
136 Annual Report 2010
The Board of Management and Supervisory Board are also accountable,at the Annual General Meeting of Shareholders, for the policy on theadditions to reserves and dividends (the level and purpose of theadditions to reserves, the amount of the dividend and the type ofdividend). This subject is dealt with and explained as a separate agendaitem at the General Meeting of Shareholders. Philips aims for asustainable and stable dividend distribution to shareholders in the longterm. A resolution to pay a dividend is dealt with as a separate agendaitem at the General Meeting of Shareholders.
The Board of Management and the Supervisory Board are required toprovide the General Meeting of Shareholders with all requestedinformation, unless this would be prejudicial to an overriding interest ofthe Company. If the Board of Management and the Supervisory Boardinvoke an overriding interest in refusing to provide information,reasons must be given. If a serious private bid is made for a business unitor a participating interest and the value of the bid exceeds a certainthreshold (currently one-third of the amount of the assets according tothe balance sheet and notes thereto or, if the Company prepares aconsolidated balance sheet, according to the consolidated balance sheetand notes thereto as published in the last adopted annual accounts ofthe Company), and such bid is made public, the Board of Managementshall, at its earliest convenience, make public its position on the bid andthe reasons for this position.
A resolution to dissolve the Company or change its articles ofassociation can be adopted at the General Meeting of Shareholders byat least three-fourths of the votes cast, at which meeting more than halfof the issued share capital is represented. If the requisite share capital isnot represented, a further meeting shall be convened, to be held withineight weeks of the first meeting, to which no quorum requirementapplies. Furthermore, the resolution requires the approval of theSupervisory Board. If the resolution is proposed by the Board ofManagement, the adoption needs an absolute majority of votes and noquorum requirement applies to the meeting.
Repurchase and issue of (rights to) own sharesThe 2010 General Meeting of Shareholders has resolved to authorizethe Board of Management, subject to the approval of the SupervisoryBoard, to acquire shares in the Company within the limits of the articlesof association and within a certain price range until September 25, 2011.The maximum number of shares the company may hold, will not exceed10% of the issued share capital as of March 25, 2010, which number maybe increased by 10% of the issued capital as of that same date inconnection with the execution of share repurchase programs for capitalreduction programs.
In addition, the 2010 General Meeting of Shareholders resolved toauthorize the Board of Management, subject to the approval of theSupervisory Board, to issue shares or grant rights to acquire shares inthe Company as well as to restrict or exclude the pre-emption rightaccruing to shareholders until September 25, 2011. This authorizationis limited to a maximum of 10% of the number of shares issued as ofMarch 25, 2010 plus 10% of the issued capital in connection with or onthe occasion of mergers and acquisitions.
12.4 Logistics of the General Meeting ofShareholders and provision of informationIntroductionThe Company will set a registration date for the exercise of the votingrights and the rights relating to General Meetings of Shareholders. Inaccordance with Dutch law this registration date is fixed at the 28th dayprior to the day of the meeting. Shareholders registered at such dateare entitled to attend the meeting and to exercise the othershareholder rights (in the meeting in question) notwithstandingsubsequent sale of their shares thereafter. This date will be published inadvance of every General Meeting of Shareholders. Shareholders whoare entitled to attend a General Meeting of Shareholders may berepresented by proxies.
Information which is required to be published or deposited pursuant tothe provisions of company law and securities law applicable to theCompany and which is relevant to the shareholders, is placed andupdated on the Company’s website, or hyperlinks are established. TheBoard of Management and Supervisory Board shall ensure that theGeneral Meeting of Shareholders is informed by means of a‘shareholders circular’ published on the Company’s website of facts andcircumstances relevant to the proposed resolutions.
Resolutions adopted at a General Meeting of Shareholders shall berecorded by a civil law notary and co-signed by the chairman of themeeting; such resolutions shall also be published on the Company’swebsite within 15 days after the meeting. A summary of the discussionsduring the General Meeting of Shareholders, in the language of themeeting, is made available to shareholders, on request, no later thanthree months after the meeting. Shareholders shall have theopportunity to respond to this summary for three months, after which afinal summary is adopted by the chairman of the meeting in question.Such summary shall be made available on the Company’s website.
Proxy voting and the Shareholders Communication ChannelPhilips was one of the key companies in the establishment of theShareholders Communication Channel, a project of EuronextAmsterdam, banks in the Netherlands and several major Dutchcompanies to simplify contacts between a participating company andshareholders that hold their shares through a Dutch securities accountwith a participating bank. The Company uses the ShareholdersCommunication Channel to distribute a voting instruction form for theAnnual General Meeting of Shareholders. By returning this form,shareholders grant power to an independent proxy holder who willvote according to the instructions expressly given on the votinginstruction form. Also other persons entitled to vote shall be given thepossibility to give voting proxies or instructions to an independent thirdparty prior to the meeting. The Shareholders Communication Channelcan also be used, under certain conditions, by participating Philipsshareholders to distribute – either by mail or by placing it on theCompany’s or Shareholders Communication Channel’s website –information directly related to the agenda of the General Meeting ofShareholders to other participating Philips shareholders.
Preference shares and the Stichting Preferente AandelenPhilipsAs a means to protect the Company and its stakeholders against anunsolicited attempt to obtain (de facto) control of the Company, theGeneral Meeting of Shareholders in 1989 adopted amendments to theCompany’s articles of association that allow the Board of Managementand the Supervisory Board to issue (rights to) preference shares to athird party. As a result, the Stichting Preferente Aandelen Philips (the‘Foundation’) was created, which was granted the right to acquirepreference shares in the Company. The mere notification that theFoundation wishes to exercise its rights, should a third party ever seemlikely in the judgment of the Foundation to obtain (de facto) control ofthe Company, will result in the preference shares being effectivelyissued. The Foundation may exercise this right for as many preferenceshares as there are ordinary shares in the Company outstanding at thattime. No preference shares have been issued as of December 31, 2010.In addition, the Foundation has the right to file a petition with theEnterprise Chamber of the Amsterdam Court of Appeal to commencean inquiry procedure within the meaning of section 2:344 Dutch CivilCode.
The object of the Foundation is to represent the interests of theCompany, the enterprises maintained by the Company and its affiliatedcompanies within the Group, in such a way that the interests of Philips,those enterprises and all parties involved with them are safeguarded aseffectively as possible, and that they are afforded maximum protectionagainst influences which, in conflict with those interests, mayundermine the autonomy and identity of Philips and those enterprises,and also to do anything related to the above ends or conducive to them.In the event of (an attempt at) a hostile takeover or other attempt toobtain (de facto) control of the Company this arrangement will allowthe Company and its Board of Management and Supervisory Board todetermine its position in relation to the third party and its plans, seekalternatives and defend Philips’ interests and those of its stakeholdersfrom a position of strength. The members of the self-electing Board ofthe Foundation are Messrs S.D. de Bree, F.J.G.M. Cremers and M.W.den Boogert. No Philips board members or officers are represented onthe board of the Foundation.
The Company does not have any other anti-takeover measures in thesense of other measures which exclusively or almost exclusively havethe purpose of frustrating future public bids for the shares in the capitalof the Company in case no agreement is reached with the Board ofManagement on such public bid. Furthermore, the Company does nothave measures which specifically have the purpose of preventing abidder who has acquired 75% of the shares in the capital of theCompany from appointing or dismissing members of the Board ofManagement and subsequently amending the articles of association ofthe Company. It should be noted that also in the event of (an attempt at)a hostile takeover or other attempt to obtain (de facto) control of the
12 Corporate governance 12.4 - 12.5
Annual Report 2010 137
Company, the Board of Management and the Supervisory Board areauthorized to exercise in the interests of Philips all powers vested inthem.
Audit of the financial reporting and the position of theexternal auditorThe annual financial statements are prepared by the Board ofManagement and reviewed by the Supervisory Board upon the advice ofits Audit Committee and taking into account the report of the externalauditor. Upon approval by the Supervisory Board, the accounts aresigned by all members of both the Board of Management and theSupervisory Board and are published together with the final opinion ofthe external auditor. The Board of Management is responsible, underthe supervision of the Supervisory Board, for the quality andcompleteness of such publicly disclosed financial reports. The annualfinancial statements are presented for discussion and adoption to theAnnual General Meeting of Shareholders, to be convened subsequently.Philips, under US securities regulations, separately files its AnnualReport on Form 20-F, incorporating major parts of the Annual Reportas prepared under the requirements of Dutch law.
Internal controls and disclosure policiesComprehensive internal procedures, compliance with which issupervised by the Supervisory Board, are in place for the preparationand publication of the Annual Report, the annual accounts, the quarterlyfigures and ad hoc financial information. As from 2003, the internalassurance process for business risk assessment has been strengthenedand the review frequency has been upgraded to a quarterly reviewcycle, in line with emerging best practices in this area.
As part of these procedures, a Disclosure Committee has beenappointed by the Board of Management to oversee the Company’sdisclosure activities and to assist the Board of Management in fulfillingits responsibilities in this respect. The Committee’s purpose is toensure that the Company implements and maintains internalprocedures for the timely collection, evaluation and disclosure, asappropriate, of information potentially subject to public disclosureunder the legal, regulatory and stock exchange requirements to whichthe Company is subject. Such procedures are designed to captureinformation that is relevant to an assessment of the need to disclosedevelopments and risks that pertain to the Company’s variousbusinesses, and their effectiveness for this purpose will be reviewedperiodically.
Auditor informationIn accordance with the procedures laid down in the Philips Policy onAuditor Independence and as mandatorily required by Dutch law, theexternal auditor of the Company is appointed by the General Meetingof Shareholders on the proposal of the Supervisory Board, after thelatter has been advised by the Audit Committee and the Board ofManagement. Under this Auditor Policy, once every three years theSupervisory Board and the Audit Committee conduct a thoroughassessment of the functioning of the external auditor. The mainconclusions of this assessment shall be communicated to the GeneralMeeting of Shareholders for the purposes of assessing the nominationfor the appointment of the external auditor. The current auditor of theCompany, KPMG Accountants N.V., was appointed by the 1995General Meeting of Shareholders. In 2002, when the Auditor Policy wasadopted, the appointment of KPMG Accountants N.V. was confirmedby the Supervisory Board for an additional three years. The 2008General Meeting of Shareholders resolved to re-appoint KPMGAccountants N.V. as auditor; re-appointment of KPMG AccountantsN.V. is proposed to the 2011 General Meeting of Shareholders. Mr M.A.Soeting is the current partner of KPMG Accountants N.V. in charge ofthe audit duties for Philips. In accordance with the rotation scheduledetermined in accordance with the Auditor Policy, he will be replacedby another partner of the auditing firm ultimately in 2012. The externalauditor shall attend the Annual General Meeting of Shareholders.Questions may be put to him at the meeting about his report. TheBoard of Management and the Audit Committee of the SupervisoryBoard shall report on their dealings with the external auditor to theSupervisory Board on an annual basis, particularly with regard to theauditor’s independence. The Supervisory Board shall take this intoaccount when deciding upon its nomination for the appointment of anexternal auditor.
The external auditor attends, in principle, all meetings of the AuditCommittee. The findings of the external auditor, the audit approachand the risk analysis are also discussed at these meetings. The externalauditor attends the meeting of the Supervisory Board at which thereport of the external auditor with respect to the audit of the annual
accounts is discussed, and at which the annual accounts are approved. Inits audit report on the annual accounts to the Board of Management andthe Supervisory Board, the external auditor refers to the financialreporting risks and issues that were identified during the audit, internalcontrol matters, and any other matters, as appropriate, requiringcommunication under the auditing standards generally accepted in theNetherlands and the US.
Auditor policyThe Company maintains a policy of auditor independence, and thispolicy restricts the use of its auditing firm for non-audit services, in linewith US Securities and Exchange Commission rules under which theappointed external auditor must be independent of the Company bothin fact and appearance. The policy is laid down in the comprehensivepolicy on auditor independence published on the Company’s website.
12.5 Investor RelationsIntroductionThe Company is continually striving to improve relations with itsshareholders. In addition to communication with its shareholders at theAnnual General Meeting of Shareholders, Philips elaborates its financialresults during (public) conference calls, which are broadly accessible. Itpublishes informative annual, semi-annual and quarterly reports andpress releases, and informs investors via its extensive website. TheCompany is strict in its compliance with applicable rules and regulationson fair and non-selective disclosure and equal treatment ofshareholders.
Each year the Company organizes Philips Capital Market Days andparticipates in several broker conferences, announced in advance onthe Company’s website and by means of press releases. Shareholderscan follow in real time, by means of webcasting or telephone lines, themeetings and presentations organized by the Company. Thus theCompany applies recommendation IV.3.1 of the Dutch CorporateGovernance Code, which in its perception and in view of marketpractice does not extend to less important analyst meetings andpresentations. It is Philips’ policy to post presentations to analysts andshareholders on the Company’s website. These meetings andpresentations will not take place shortly before the publication ofannual, semi-annual and quarterly financial information.
Furthermore, the Company engages in bilateral communications withinvestors. These communications either take place at the initiative ofthe Company or at the initiative of individual investors. During thesecommunications the Company is generally represented by its InvestorRelations department. However, on a limited number of occasions theInvestor Relations department is accompanied by one or moremembers of the Board of Management. The subject matter of thebilateral communications ranges from single queries from investors tomore elaborate discussions on the back of disclosures that theCompany has made such as its annual and quarterly reports. Also here,the Company is strict in its compliance with applicable rules andregulations on fair and non-selective disclosure and equal treatment ofshareholders.
The Company shall not, in advance, assess, comment upon or correct,other than factually, any analyst’s reports and valuations. No fee(s) willbe paid by the Company to parties for the carrying-out of research foranalysts’ reports or for the production or publication of analysts’reports, with the exception of credit-rating agencies.
Major shareholders and other information for shareholdersThe Dutch Act on Financial Supervision imposes a duty to disclosepercentage holdings in the capital and/or voting rights in the Companywhen such holdings reach, exceed or fall below 5%, 10%, 15%, 20%, 25%,30%, 40%, 50%, 60%, 75% and 95%. Such disclosure must be made to theNetherlands Authority for the Financial Markets (AFM) without delay.The AFM then notifies the Company.
As per December 31, 2010, no person is known to the Company to bethe owner of more than 5% of its common shares. The common sharesare held by shareholders worldwide in bearer and registered form. Asper December 31, 2010, approximately 93% of the common shareswere held in bearer form and approximately 7% of the common shareswere represented by registered shares of New York Registry issued inthe name of approximately 1,357 holders of record, including Cede &Co. Cede & Co acts as nominee for the Depository Trust Companyholding the shares (indirectly) for individual investors as beneficiaries.Citibank, N.A., 388 Greenwich Street, New York, New York 10013 isthe transfer agent and registrar.
12 Corporate governance 12.5 - 12.5
138 Annual Report 2010
Only bearer shares are traded on the stock market of EuronextAmsterdam. Only shares of New York Registry are traded on the NewYork Stock Exchange. Bearer shares and registered shares may beexchanged for each other. Since certain shares are held by brokers andother nominees, these numbers may not be representative of the actualnumber of United States beneficial holders or the number of Shares ofNew York Registry beneficially held by US residents.
The provisions applicable to all corporate bonds that have been issuedby the Company in March 2008 contain a ‘Change of Control TriggeringEvent’. This means that if the Company experienced such an event withrespect to a series of corporate bonds the Company might be requiredto offer to purchase the bonds of that series at a purchase price equal to101% of their principal amount, plus accrued and unpaid interest, if any.
Corporate seat and head officeThe statutory seat of the Company is Eindhoven, the Netherlands, andthe statutory list of all subsidiaries and affiliated companies, prepared inaccordance with the relevant legal requirements (Dutch Civil Code,Book 2, Sections 379 and 414), forms part of the notes to theconsolidated financial statements and is deposited at the office of theCommercial Register in Eindhoven, the Netherlands (file no.17001910).
The executive offices of the Company are located at the BreitnerCenter, Amstelplein 2, 1096 BC Amsterdam, the Netherlands,telephone 31 (0)20 59 77 777.
Compliance with the Dutch Corporate Governance CodeIn accordance with the governmental decree of December 10, 2009,the Company fully complies with the Dutch Corporate GovernanceCode and applies all its principles and best practice provisions that areaddressed to the Board of Management and the Supervisory Board,with the temporary exception of provision II.1.8 to the extent of theboard position held and accepted by Mr Kleisterlee, also in view of hisresignation as of April 1, 2011. The full text of the Dutch CorporateGovernance Code can be found at the website of the MonitoringCommission Corporate Governance Code(www.commissiecorporategovernance.nl).
February 17, 2011
Annual Report 2010 139
Performance Statements13 Group financial statements 14113.1 Management’s report on internal control 14113.2 Reports of the independent auditor 14213.3 Auditors’ report on internal control over financial
reporting142
13.4 Consolidated statements of income 14313.5 Consolidated statements of comprehensive income 14513.6 Consolidated balance sheets 14613.7 Consolidated statements of cash flows 14813.8 Consolidated statements of changes in equity 15013.9 Information by sector and main country 15113.10 Significant accounting policies 15413.11 Notes 16113.12 Independent auditor’s report - Group 199
14 Company financial statements 20014.1 Balance sheets before appropriation of results 20114.2 Statements of income 20214.3 Statements of changes in equity 20214.4 Notes 20314.5 Independent auditor’s report - Company 206
15 Sustainability statements 20715.1 Economic indicators 21015.2 EcoVision5 21015.3 EcoVision4 21115.4 Green Manufacturing 2015 21215.5 Social indicators 21515.6 Supplier indicators 21715.7 Independent assurance report 22115.8 Global Reporting Initiative (GRI) table 222
140 Annual Report 2010
Notes overviewGroup financial statements 1 Income from operations 1612 Financial income and expenses 1623 Income taxes 1624 Investments in associates 1665 Discontinued operations 1676 Acquisitions and divestments 1677 Property, plant and equipment 1718 Goodwill 1729 Intangible assets excluding goodwill 17310 Non-current receivables 17411 Other non-current financial assets 17412 Other non-current assets 17513 Inventories 17514 Current financial assets 17515 Other current assets 17516 Current receivables 17517 Shareholders’ equity 17618 Long-term debt and short-term debt 17719 Provisions 17820 Other non-current liabilities 17921 Accrued liabilities 17922 Other current liabilities 17923 Contractual obligations 18024 Contingent liabilities 18025 Cash from (used for) derivatives and securities 18226 Proceeds from non-current financial assets 18227 Assets in lieu of cash from sale of businesses 18228 Pensions and other postretirement benefits 18229 Share-based compensation 18730 Related-party transactions 18931 Information on remuneration 18932 Fair value of financial assets and liabilities 19533 Details of treasury risks 19634 Subsequent events 198
Company financial statements A Investments in affiliated companies 203B Other non-current financial assets 203C Receivables 203D Shareholders’ equity 203E Long-term debt and short-term debt 205F Other current liabilities 205G Net income 205H Employees 205I Contingent liabilities 205J Audit fees 205K Subsequent events 205
13 Group financial statements 13 - 13.1
Annual Report 2010 141
13 Group financial statementsIntroductionThis section of the Annual Report contains the audited consolidatedfinancial statements including the notes thereon that have beenprepared in accordance with International Financial ReportingStandards (IFRS) as adopted by the European Union (EU) and with thestatutory provisions of Part 9, Book 2 of the Dutch Civil Code. TheConsolidated financial statements in this section have been prepared inaccordance with International Financial Reporting Standards (IFRS) asendorsed by the European Union (EU). All standards andinterpretations issued by the International Accounting Standards Board(IASB) and the IFRS Interpretations Committee effective year-end 2010have been endorsed by the EU, except that the EU did not adopt someparagraphs of IAS 39 applicable to certain hedge transactions. Philips hasno hedge transactions to which these paragraphs are applicable.Consequently, the accounting policies applied by Philips also complyfully with IFRS as issued by the IASB.
Together with the section Company financial statements, this sectioncontains the statutory financial statements of the Company.
The following sections and chapters of this Annual Report:
• chapter 1, Our company, of this Annual Report• chapter 2, Vision 2015 - our strategic focus, of this Annual Report• chapter 3, Our strategy in action, of this Annual Report• chapter 4, Our planet, our partners, our people, of this Annual
Report• chapter 5, Group performance, of this Annual Report• chapter 6, Sector performance, of this Annual Report• chapter 7, Risk management, of this Annual Report• section 11.2, Report of the Remuneration Committee, of this Annual
Report• chapter 12, Corporate governance, of this Annual Report• chapter 20, Forward-looking statements and other information, of
this Annual Report
form the Management report within the meaning of section 2:391 of theDutch Civil Code (and related Decrees).
The sections Group performance and Sector performance provide anextensive analysis of the developments during the financial year 2010and the results. The term EBIT has the same meaning as Income fromoperations (IFO), and is used to evaluate the performance of thebusiness. These sections also provide information on the businessoutlook, investments, financing, personnel and research anddevelopment activities.
The Statement of income included in the section Company financialstatements has been prepared in accordance with section 2:402 of theDutch Civil Code, which allows a simplified Statement of income in theCompany financial statements in the event that a comprehensiveStatement of income is included in the consolidated Group financialstatements.
For ‘Additional information’ within the meaning of section 2:392 of theDutch Civil Code, please refer to section 13.12, Independent auditor’sreport - Group, of this Annual Report on the Group financialstatements, section 14.5, Independent auditor’s report - Company, ofthis Annual Report on the Company financial statements, section 5.5,Proposed distribution to shareholders, of this Annual Report, andnote 34 for subsequent events.
Please refer to chapter 20, Forward-looking statements and otherinformation, of this Annual Report for more information aboutforward-looking statements, third-party market share data, fair valueinformation, and revisions and reclassifications.
The Board of Management of the Company hereby declares that, to thebest of our knowledge, the Group financial statements and Companyfinancial statements give a true and fair view of the assets, liabilities,financial position and profit or loss of the Company and theundertakings included in the consolidation taken as a whole and that themanagement report referred to above gives a true and fair viewconcerning the position as per the balance sheet date, the development
and performance of the business during the financial year of theCompany and the undertakings included in the consolidation taken as awhole, together with a description of the principal risks that they face.
Board of Management
February 17, 2011
13.1 Management’s report on internal controlManagement’s report on internal control over financialreporting pursuant to section 404 of the US Sarbanes-OxleyAct
The Board of Management of Koninklijke Philips Electronics N.V. (theCompany) is responsible for establishing and maintaining an adequatesystem of internal control over financial reporting (as such term isdefined in Rule 13a-15(f) under the US Securities Exchange Act).Internal control over financial reporting is a process to providereasonable assurance regarding the reliability of our financial reportingfor external purposes in accordance with IFRS as issued by the IASB.
Internal control over financial reporting includes maintaining recordsthat, in reasonable detail, accurately and fairly reflect our transactions;providing reasonable assurance that transactions are recorded asnecessary for preparation of our financial statements; providingreasonable assurance that receipts and expenditures of company assetsare made in accordance with management authorization; and providingreasonable assurance that unauthorized acquisition, use or dispositionof company assets that could have a material effect on our financialstatements would be prevented or detected on a timely basis. Becauseof its inherent limitations, internal control over financial reporting is notintended to provide absolute assurance that a misstatement of ourfinancial statements would be prevented or detected.
The Board of Management conducted an assessment of the Company’sinternal control over financial reporting based on the “Internal Control-Integrated Framework” established by the Committee of SponsoringOrganizations of the Treadway Commission (COSO). Based on thatassessment, the Board of Management concluded that, as ofDecember 31, 2010, the Company’s internal control over Groupfinancial reporting is considered effective.
The effectiveness of the Company’s internal control over financialreporting as of December 31, 2010, as included in this section Groupfinancial statements, has been audited by KPMG Accountants N.V., anindependent registered public accounting firm, as stated in their reportwhich follows hereafter.
Board of Management
February 17, 2011
13 Group financial statements 13.1 - 13.3
142 Annual Report 2010
13.2 Reports of the independent auditorThe report set out below is provided in compliance with auditingstandards of the Public Company Accounting Oversight Board in the USand includes an opinion on the effectiveness of internal control overfinancial reporting as at December 31, 2010. Management’s report oninternal control over financial reporting is set out in section 13.1,Management’s report on internal control, of this Annual Report. KPMGAccountants N.V. has also issued reports on the consolidated financialstatements in accordance with Dutch law, including the Dutchstandards on auditing, which is set out in section 13.12, Independentauditor’s report - Group, of this Annual Report, and in accordance withauditing standards of the Public Company Accounting Oversight Boardin the US, which will be included in the Annual Report on Form 20-F tobe filed with the US Securities and Exchange Commission on February18, 2011. KPMG Accountants N.V. has also reported separately on theCompany Financial Statements of Koninklijke Philips Electronics N.V.This audit report is set out in section 14.5, Independent auditor’s report- Company, of this Annual Report.
13.3 Auditors’ report on internal control overfinancial reportingReport of Independent Registered Public Accounting Firm
To the Supervisory Board and Shareholders of Koninklijke PhilipsElectronics N.V.:
We have audited Koninklijke Philips Electronics N.V. and subsidiaries’internal control over financial reporting as of December 31, 2010,based on criteria established in Internal Control – Integrated Frameworkissued by the Committee of Sponsoring Organizations of the TreadwayCommission (COSO). Koninklijke Philips Electronics N.V.’s Board ofManagement is responsible for maintaining effective internal controlover financial reporting and for its assessment of the effectiveness ofinternal control over financial reporting, included in the accompanyingsection 13.1, Management’s report on internal control, of this AnnualReport. Our responsibility is to express an opinion on the Company’sinternal control over financial reporting based on our audit.
We conducted our audit in accordance with the standards of the PublicCompany Accounting Oversight Board (United States). Thosestandards require that we plan and perform the audit to obtainreasonable assurance about whether effective internal control overfinancial reporting was maintained in all material respects. Our auditincluded obtaining an understanding of internal control over financialreporting, assessing the risk that a material weakness exists, and testingand evaluating the design and operating effectiveness of internal controlbased on the assessed risk. Our audit also included performing suchother procedures as we considered necessary in the circumstances.We believe that our audit provides a reasonable basis for our opinion.
A company’s internal control over financial reporting is a processdesigned to provide reasonable assurance regarding the reliability offinancial reporting and the preparation of financial statements forexternal purposes in accordance with generally accepted accountingprinciples. A company’s internal control over financial reportingincludes those policies and procedures that (1) pertain to themaintenance of records that, in reasonable detail, accurately and fairlyreflect the transactions and dispositions of the assets of the company;(2) provide reasonable assurance that transactions are recorded asnecessary to permit preparation of financial statements in accordancewith generally accepted accounting principles, and that receipts andexpenditures of the company are being made only in accordance withauthorizations of management and directors of the company; and(3) provide reasonable assurance regarding prevention or timelydetection of unauthorized acquisition, use, or disposition of thecompany’s assets that could have a material effect on the financialstatements.
Because of its inherent limitations, internal control over financialreporting may not prevent or detect misstatements. Also, projectionsof any evaluation of effectiveness to future periods are subject to therisk that controls may become inadequate because of changes inconditions, or that the degree of compliance with the policies orprocedures may deteriorate.
In our opinion, Koninklijke Philips Electronics N.V. and subsidiariesmaintained, in all material respects, effective internal control overfinancial reporting as of December 31, 2010, based on criteriaestablished in Internal Control - Integrated Framework issued by theCommittee of Sponsoring Organizations of the Treadway Commission.
We also have audited, in accordance with the standards of the PublicCompany Accounting Oversight Board (United States), theconsolidated balance sheets of Koninklijke Philips Electronics N.V. andsubsidiaries as of December 31, 2010 and 2009, and the relatedconsolidated statements of income, comprehensive income, changes inequity, and cash flows for each of the years in the three-year periodended December 31, 2010. Our report dated February 17, 2011expressed an unqualified opinion on those consolidated financialstatements as will be included in the Annual Report on Form 20-F.
KPMG ACCOUNTANTS N.V.
Amsterdam, February 17, 2011
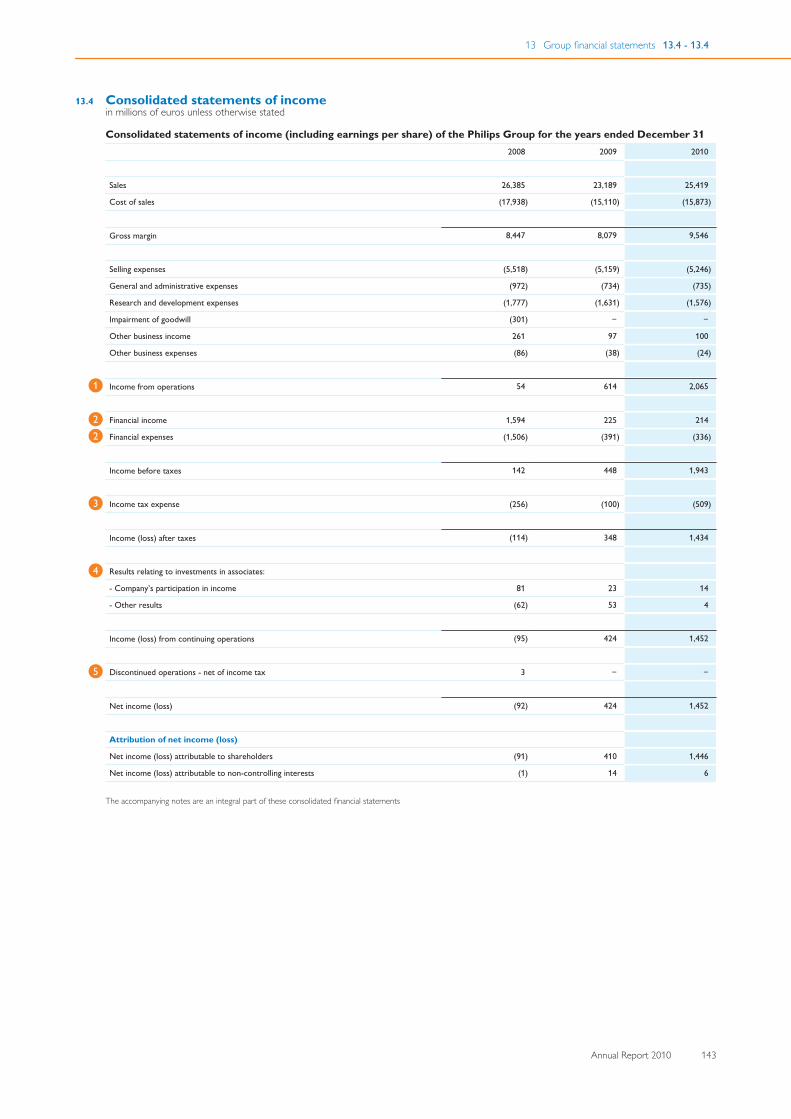
13 Group financial statements 13.4 - 13.4
Annual Report 2010 143
13.4 Consolidated statements of incomein millions of euros unless otherwise stated
Consolidated statements of income (including earnings per share) of the Philips Group for the years ended December 312008 2009 2010
Sales 26,385 23,189 25,419
Cost of sales (17,938) (15,110) (15,873)
Gross margin 8,447 8,079 9,546
Selling expenses (5,518) (5,159) (5,246)
General and administrative expenses (972) (734) (735)
Research and development expenses (1,777) (1,631) (1,576)
Impairment of goodwill (301) − −
Other business income 261 97 100
Other business expenses (86) (38) (24)
Income from operations1 54 614 2,065
Financial income2 1,594 225 214
Financial expenses2 (1,506) (391) (336)
Income before taxes 142 448 1,943
Income tax expense3 (256) (100) (509)
Income (loss) after taxes (114) 348 1,434
Results relating to investments in associates:4
- Company’s participation in income 81 23 14
- Other results (62) 53 4
Income (loss) from continuing operations (95) 424 1,452
Discontinued operations - net of income tax5 3 − −
Net income (loss) (92) 424 1,452
Attribution of net income (loss)
Net income (loss) attributable to shareholders (91) 410 1,446
Net income (loss) attributable to non-controlling interests (1) 14 6
The accompanying notes are an integral part of these consolidated financial statements
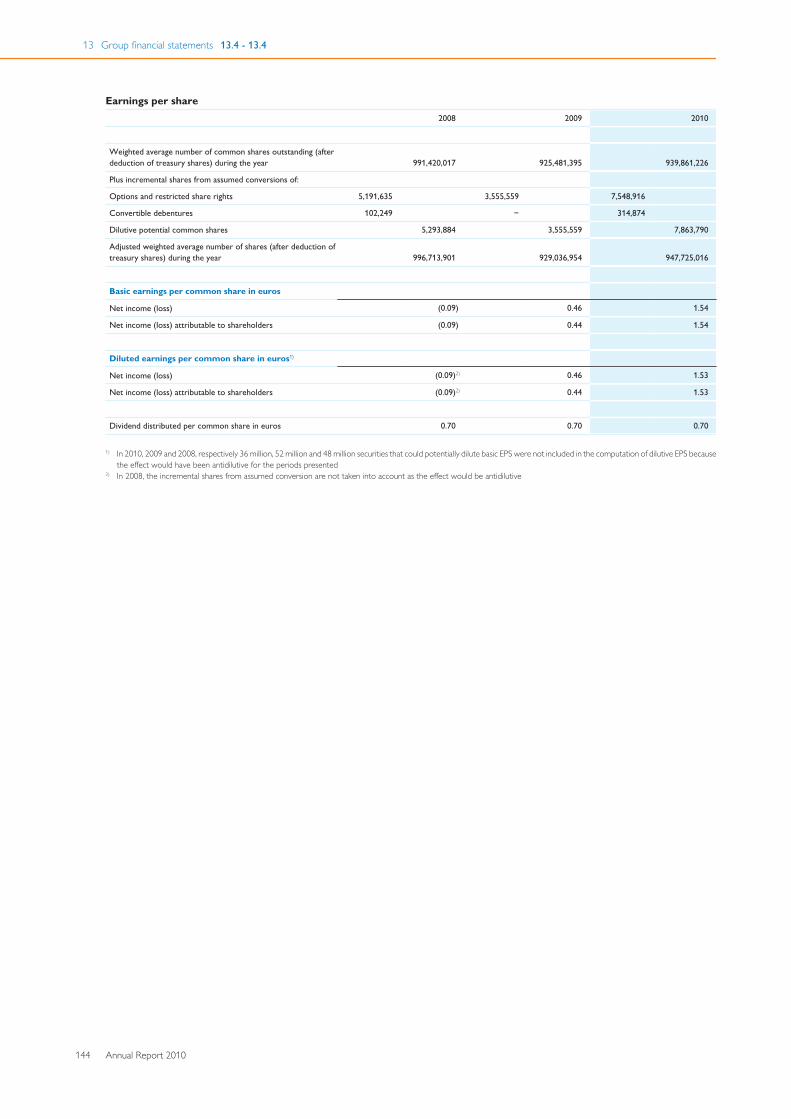
13 Group financial statements 13.4 - 13.4
144 Annual Report 2010
Earnings per share 2008 2009 2010
Weighted average number of common shares outstanding (afterdeduction of treasury shares) during the year 991,420,017 925,481,395 939,861,226
Plus incremental shares from assumed conversions of:
Options and restricted share rights 5,191,635 3,555,559 7,548,916
Convertible debentures 102,249 − 314,874
Dilutive potential common shares 5,293,884 3,555,559 7,863,790
Adjusted weighted average number of shares (after deduction oftreasury shares) during the year 996,713,901 929,036,954 947,725,016
Basic earnings per common share in euros
Net income (loss) (0.09) 0.46 1.54
Net income (loss) attributable to shareholders (0.09) 0.44 1.54
Diluted earnings per common share in euros1)
Net income (loss) (0.09)2) 0.46 1.53
Net income (loss) attributable to shareholders (0.09)2) 0.44 1.53
Dividend distributed per common share in euros 0.70 0.70 0.70
1) In 2010, 2009 and 2008, respectively 36 million, 52 million and 48 million securities that could potentially dilute basic EPS were not included in the computation of dilutive EPS becausethe effect would have been antidilutive for the periods presented
2) In 2008, the incremental shares from assumed conversion are not taken into account as the effect would be antidilutive
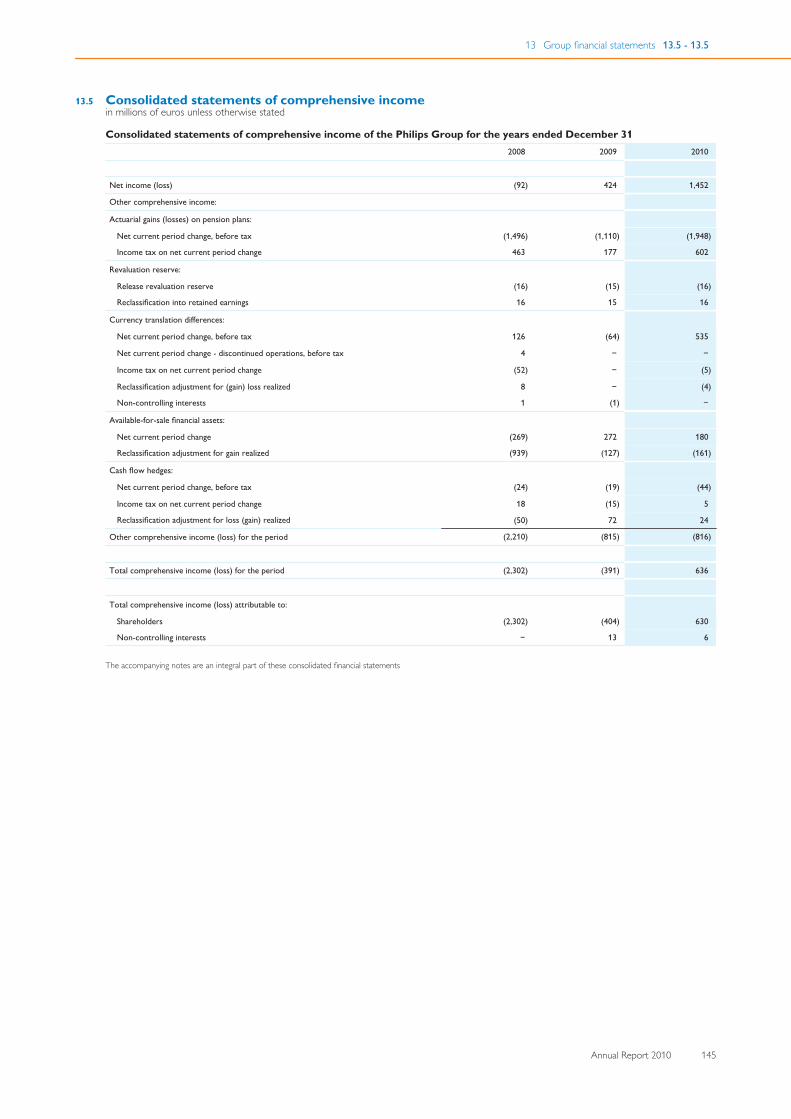
13 Group financial statements 13.5 - 13.5
Annual Report 2010 145
13.5 Consolidated statements of comprehensive incomein millions of euros unless otherwise stated
Consolidated statements of comprehensive income of the Philips Group for the years ended December 312008 2009 2010
Net income (loss) (92) 424 1,452
Other comprehensive income:
Actuarial gains (losses) on pension plans:
Net current period change, before tax (1,496) (1,110) (1,948)
Income tax on net current period change 463 177 602
Revaluation reserve:
Release revaluation reserve (16) (15) (16)
Reclassification into retained earnings 16 15 16
Currency translation differences:
Net current period change, before tax 126 (64) 535
Net current period change - discontinued operations, before tax 4 − −
Income tax on net current period change (52) − (5)
Reclassification adjustment for (gain) loss realized 8 − (4)
Non-controlling interests 1 (1) −
Available-for-sale financial assets:
Net current period change (269) 272 180
Reclassification adjustment for gain realized (939) (127) (161)
Cash flow hedges:
Net current period change, before tax (24) (19) (44)
Income tax on net current period change 18 (15) 5
Reclassification adjustment for loss (gain) realized (50) 72 24
Other comprehensive income (loss) for the period (2,210) (815) (816)
Total comprehensive income (loss) for the period (2,302) (391) 636
Total comprehensive income (loss) attributable to:
Shareholders (2,302) (404) 630
Non-controlling interests − 13 6
The accompanying notes are an integral part of these consolidated financial statements
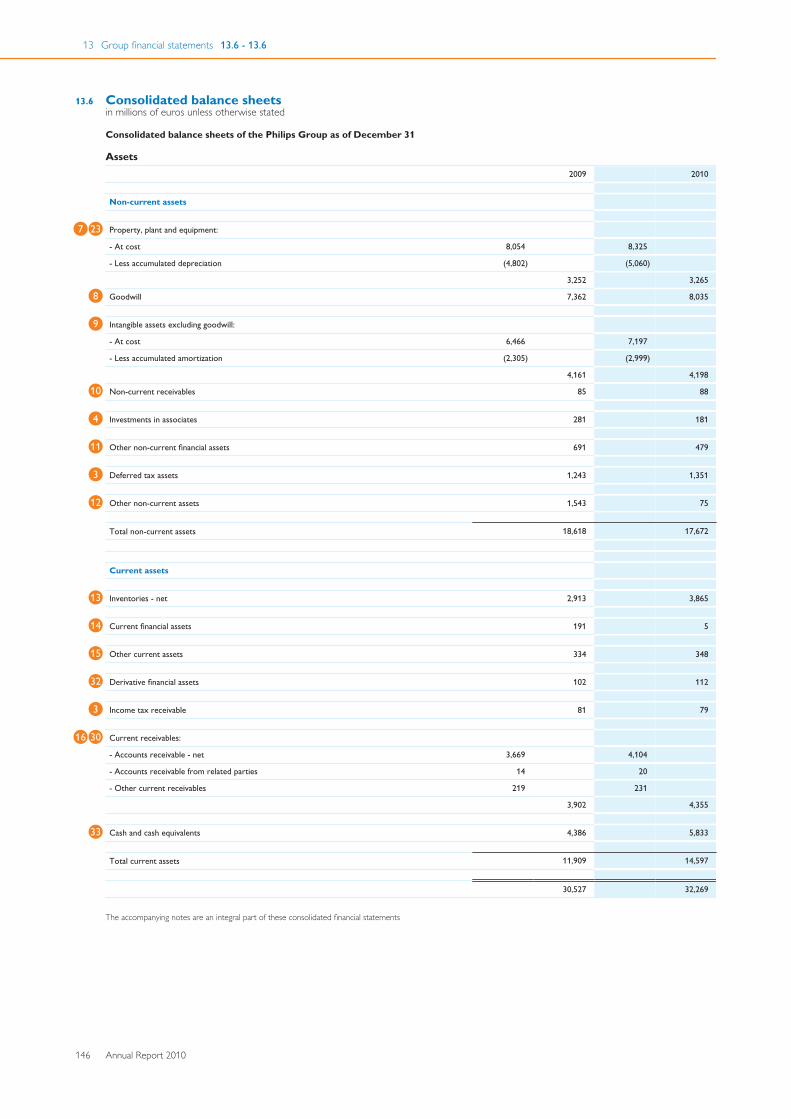
13 Group financial statements 13.6 - 13.6
146 Annual Report 2010
13.6 Consolidated balance sheetsin millions of euros unless otherwise stated
Consolidated balance sheets of the Philips Group as of December 31
Assets 2009 2010
Non-current assets
Property, plant and equipment:7 23
- At cost 8,054 8,325
- Less accumulated depreciation (4,802) (5,060)
3,252 3,265
Goodwill8 7,362 8,035
Intangible assets excluding goodwill:9
- At cost 6,466 7,197
- Less accumulated amortization (2,305) (2,999)
4,161 4,198
Non-current receivables10 85 88
Investments in associates4 281 181
Other non-current financial assets11 691 479
Deferred tax assets3 1,243 1,351
Other non-current assets12 1,543 75
Total non-current assets 18,618 17,672
Current assets
Inventories - net13 2,913 3,865
Current financial assets14 191 5
Other current assets15 334 348
Derivative financial assets32 102 112
Income tax receivable3 81 79
Current receivables:16 30
- Accounts receivable - net 3,669 4,104
- Accounts receivable from related parties 14 20
- Other current receivables 219 231
3,902 4,355
Cash and cash equivalents33 4,386 5,833
Total current assets 11,909 14,597
30,527 32,269
The accompanying notes are an integral part of these consolidated financial statements
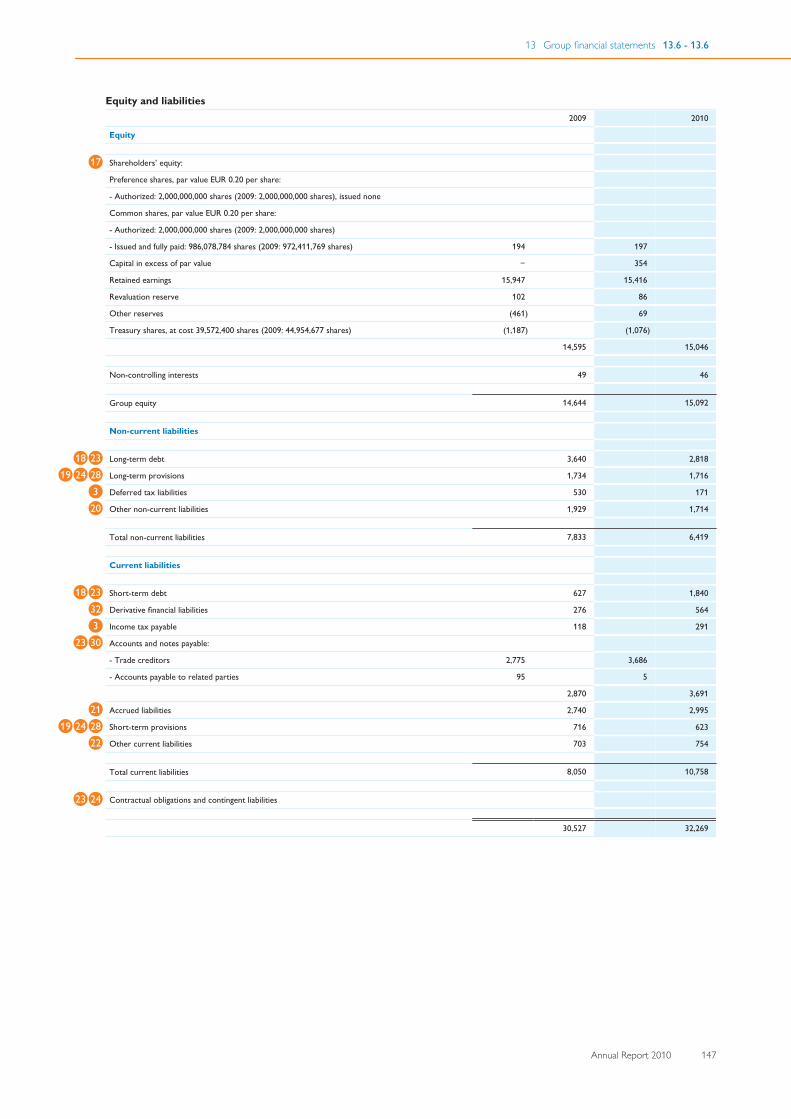
13 Group financial statements 13.6 - 13.6
Annual Report 2010 147
Equity and liabilities 2009 2010
Equity
Shareholders’ equity:17
Preference shares, par value EUR 0.20 per share:
- Authorized: 2,000,000,000 shares (2009: 2,000,000,000 shares), issued none
Common shares, par value EUR 0.20 per share:
- Authorized: 2,000,000,000 shares (2009: 2,000,000,000 shares)
- Issued and fully paid: 986,078,784 shares (2009: 972,411,769 shares) 194 197
Capital in excess of par value − 354
Retained earnings 15,947 15,416
Revaluation reserve 102 86
Other reserves (461) 69
Treasury shares, at cost 39,572,400 shares (2009: 44,954,677 shares) (1,187) (1,076)
14,595 15,046
Non-controlling interests 49 46
Group equity 14,644 15,092
Non-current liabilities
Long-term debt18 23 3,640 2,818
Long-term provisions19 24 28 1,734 1,716
Deferred tax liabilities3 530 171
Other non-current liabilities20 1,929 1,714
Total non-current liabilities 7,833 6,419
Current liabilities
Short-term debt18 23 627 1,840
Derivative financial liabilities32 276 564
Income tax payable3 118 291
Accounts and notes payable:23 30
- Trade creditors 2,775 3,686
- Accounts payable to related parties 95 5
2,870 3,691
Accrued liabilities21 2,740 2,995
Short-term provisions19 24 28 716 623
Other current liabilities22 703 754
Total current liabilities 8,050 10,758
Contractual obligations and contingent liabilities23 24
30,527 32,269
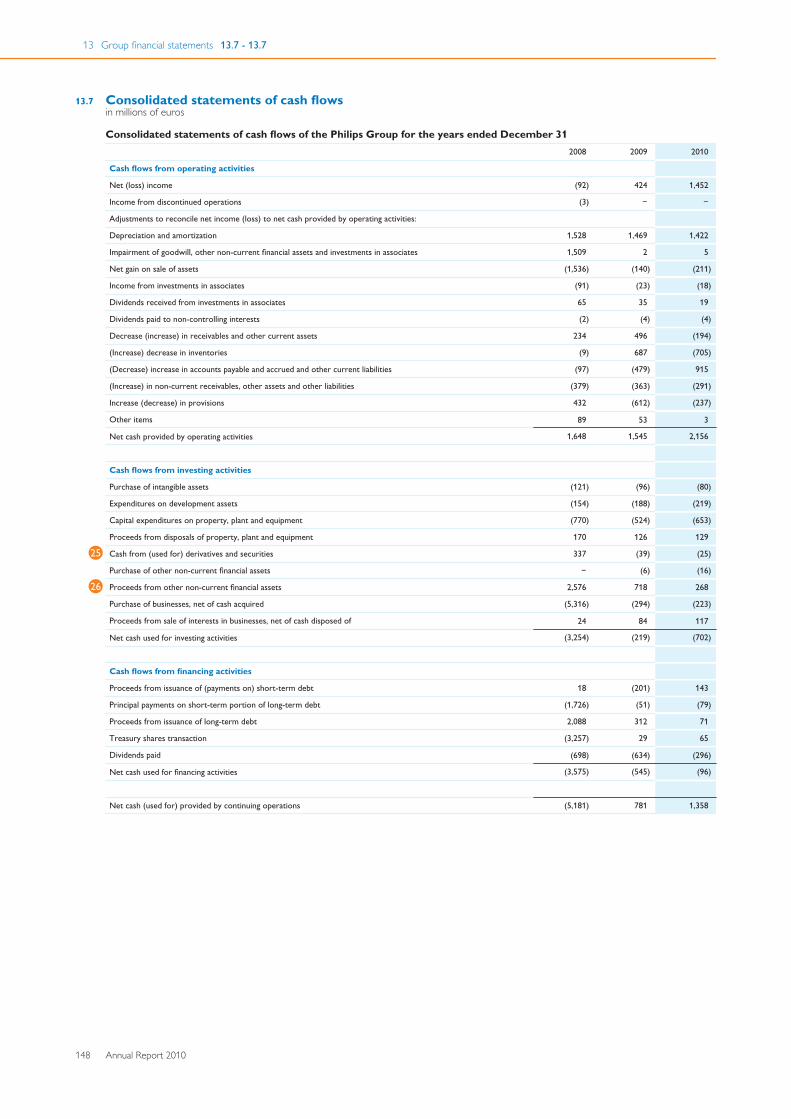
13 Group financial statements 13.7 - 13.7
148 Annual Report 2010
13.7 Consolidated statements of cash flowsin millions of euros
Consolidated statements of cash flows of the Philips Group for the years ended December 312008 2009 2010
Cash flows from operating activities
Net (loss) income (92) 424 1,452
Income from discontinued operations (3) − −
Adjustments to reconcile net income (loss) to net cash provided by operating activities:
Depreciation and amortization 1,528 1,469 1,422
Impairment of goodwill, other non-current financial assets and investments in associates 1,509 2 5
Net gain on sale of assets (1,536) (140) (211)
Income from investments in associates (91) (23) (18)
Dividends received from investments in associates 65 35 19
Dividends paid to non-controlling interests (2) (4) (4)
Decrease (increase) in receivables and other current assets 234 496 (194)
(Increase) decrease in inventories (9) 687 (705)
(Decrease) increase in accounts payable and accrued and other current liabilities (97) (479) 915
(Increase) in non-current receivables, other assets and other liabilities (379) (363) (291)
Increase (decrease) in provisions 432 (612) (237)
Other items 89 53 3
Net cash provided by operating activities 1,648 1,545 2,156
Cash flows from investing activities
Purchase of intangible assets (121) (96) (80)
Expenditures on development assets (154) (188) (219)
Capital expenditures on property, plant and equipment (770) (524) (653)
Proceeds from disposals of property, plant and equipment 170 126 129
Cash from (used for) derivatives and securities25 337 (39) (25)
Purchase of other non-current financial assets − (6) (16)
Proceeds from other non-current financial assets26 2,576 718 268
Purchase of businesses, net of cash acquired (5,316) (294) (223)
Proceeds from sale of interests in businesses, net of cash disposed of 24 84 117
Net cash used for investing activities (3,254) (219) (702)
Cash flows from financing activities
Proceeds from issuance of (payments on) short-term debt 18 (201) 143
Principal payments on short-term portion of long-term debt (1,726) (51) (79)
Proceeds from issuance of long-term debt 2,088 312 71
Treasury shares transaction (3,257) 29 65
Dividends paid (698) (634) (296)
Net cash used for financing activities (3,575) (545) (96)
Net cash (used for) provided by continuing operations (5,181) 781 1,358
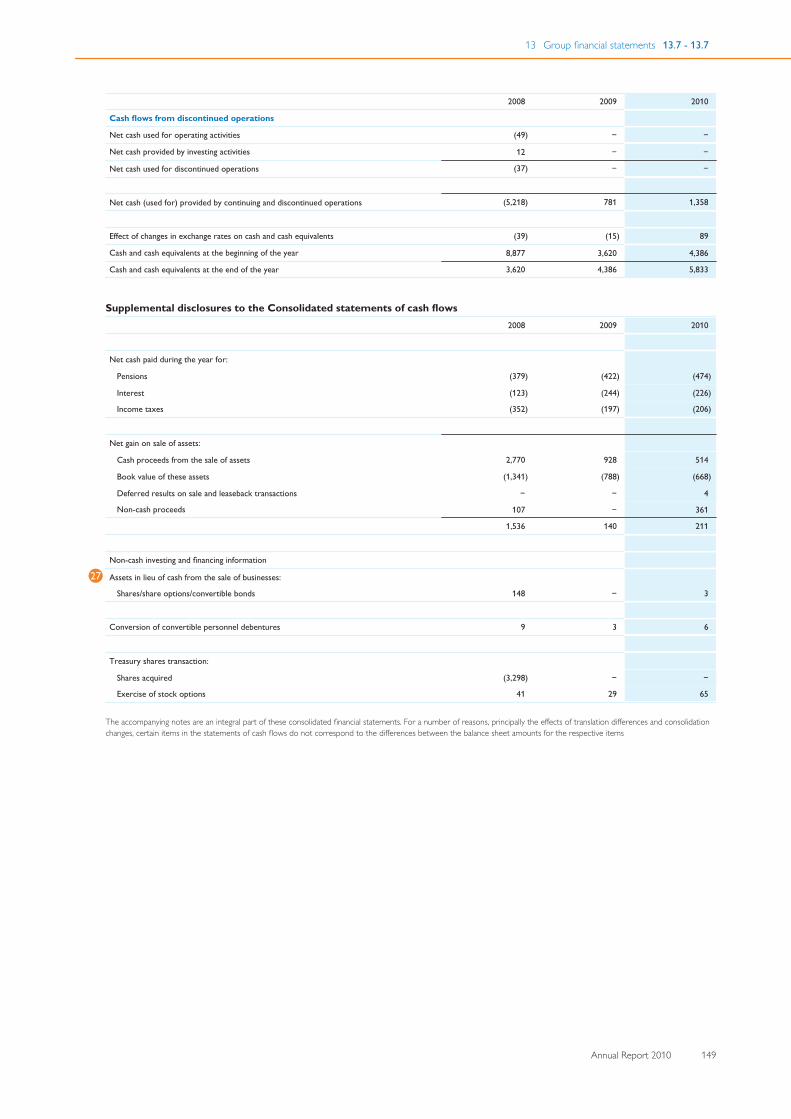
13 Group financial statements 13.7 - 13.7
Annual Report 2010 149
2008 2009 2010
Cash flows from discontinued operations
Net cash used for operating activities (49) − −
Net cash provided by investing activities 12 − −
Net cash used for discontinued operations (37) − −
Net cash (used for) provided by continuing and discontinued operations (5,218) 781 1,358
Effect of changes in exchange rates on cash and cash equivalents (39) (15) 89
Cash and cash equivalents at the beginning of the year 8,877 3,620 4,386
Cash and cash equivalents at the end of the year 3,620 4,386 5,833
Supplemental disclosures to the Consolidated statements of cash flows2008 2009 2010
Net cash paid during the year for:
Pensions (379) (422) (474)
Interest (123) (244) (226)
Income taxes (352) (197) (206)
Net gain on sale of assets:
Cash proceeds from the sale of assets 2,770 928 514
Book value of these assets (1,341) (788) (668)
Deferred results on sale and leaseback transactions − − 4
Non-cash proceeds 107 − 361
1,536 140 211
Non-cash investing and financing information
Assets in lieu of cash from the sale of businesses:27
Shares/share options/convertible bonds 148 − 3
Conversion of convertible personnel debentures 9 3 6
Treasury shares transaction:
Shares acquired (3,298) − −
Exercise of stock options 41 29 65
The accompanying notes are an integral part of these consolidated financial statements. For a number of reasons, principally the effects of translation differences and consolidationchanges, certain items in the statements of cash flows do not correspond to the differences between the balance sheet amounts for the respective items
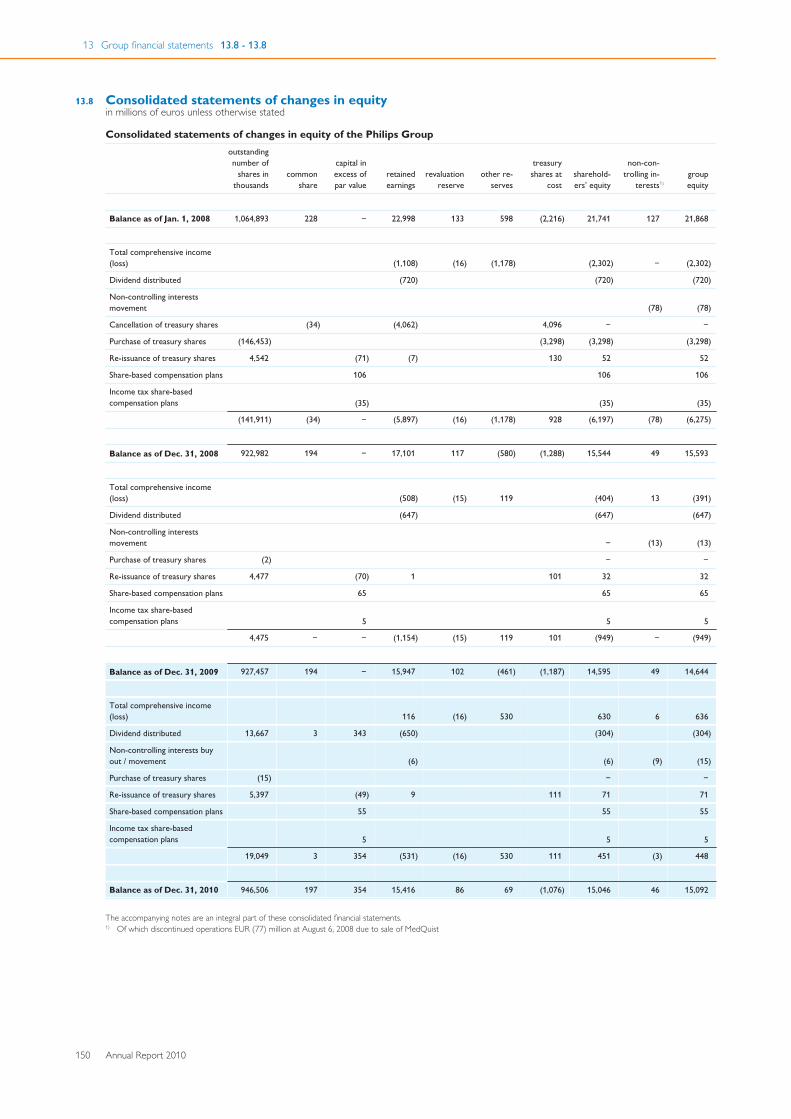
13 Group financial statements 13.8 - 13.8
150 Annual Report 2010
13.8 Consolidated statements of changes in equityin millions of euros unless otherwise stated
Consolidated statements of changes in equity of the Philips Groupoutstandingnumber of
shares inthousands
commonshare
capital inexcess ofpar value
retainedearnings
revaluationreserve
other re-serves
treasuryshares at
cost sharehold-ers’ equity
non-con-trolling in-
terests1)groupequity
Balance as of Jan. 1, 2008 1,064,893 228 − 22,998 133 598 (2,216) 21,741 127 21,868
Total comprehensive income(loss) (1,108) (16) (1,178) (2,302) − (2,302)
Dividend distributed (720) (720) (720)
Non-controlling interestsmovement (78) (78)
Cancellation of treasury shares (34) (4,062) 4,096 − −
Purchase of treasury shares (146,453) (3,298) (3,298) (3,298)
Re-issuance of treasury shares 4,542 (71) (7) 130 52 52
Share-based compensation plans 106 106 106
Income tax share-basedcompensation plans (35) (35) (35)
(141,911) (34) − (5,897) (16) (1,178) 928 (6,197) (78) (6,275)
Balance as of Dec. 31, 2008 922,982 194 − 17,101 117 (580) (1,288) 15,544 49 15,593
Total comprehensive income(loss) (508) (15) 119 (404) 13 (391)
Dividend distributed (647) (647) (647)
Non-controlling interestsmovement − (13) (13)
Purchase of treasury shares (2) − −
Re-issuance of treasury shares 4,477 (70) 1 101 32 32
Share-based compensation plans 65 65 65
Income tax share-basedcompensation plans 5 5 5
4,475 − − (1,154) (15) 119 101 (949) − (949)
Balance as of Dec. 31, 2009 927,457 194 − 15,947 102 (461) (1,187) 14,595 49 14,644
Total comprehensive income(loss) 116 (16) 530 630 6 636
Dividend distributed 13,667 3 343 (650) (304) (304)
Non-controlling interests buyout / movement (6) (6) (9) (15)
Purchase of treasury shares (15) − −
Re-issuance of treasury shares 5,397 (49) 9 111 71 71
Share-based compensation plans 55 55 55
Income tax share-basedcompensation plans 5 5 5
19,049 3 354 (531) (16) 530 111 451 (3) 448
Balance as of Dec. 31, 2010 946,506 197 354 15,416 86 69 (1,076) 15,046 46 15,092
The accompanying notes are an integral part of these consolidated financial statements.1) Of which discontinued operations EUR (77) million at August 6, 2008 due to sale of MedQuist
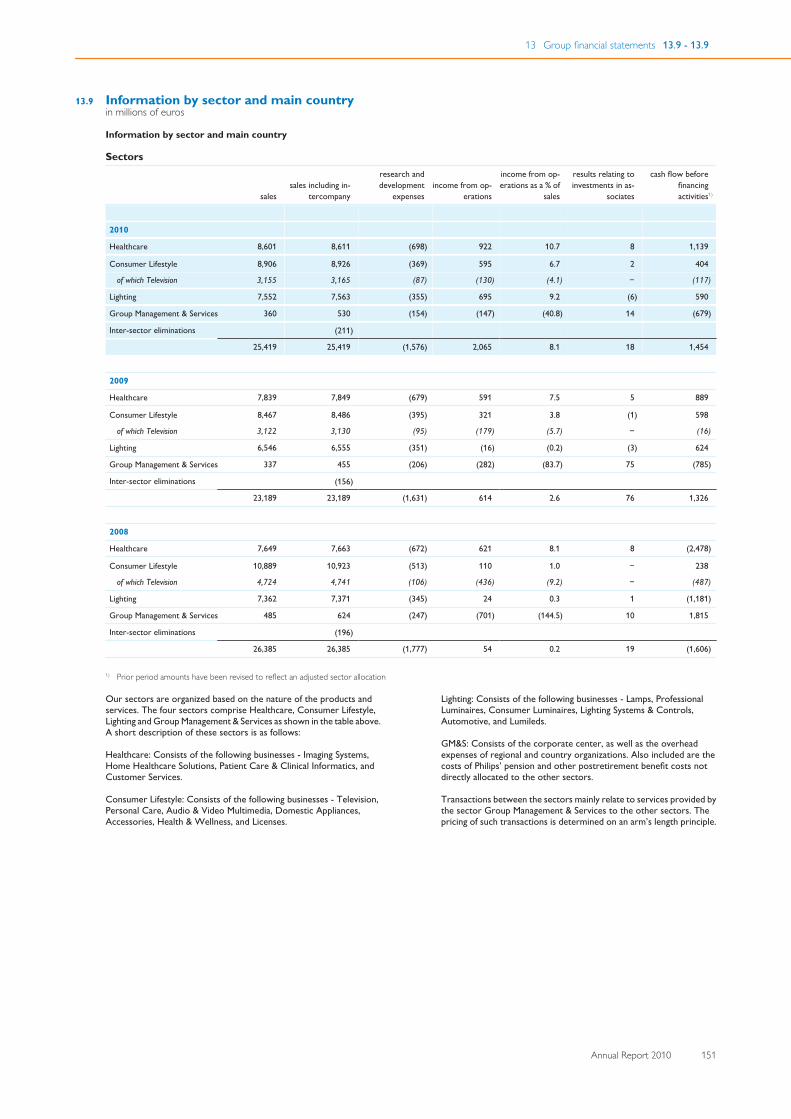
13 Group financial statements 13.9 - 13.9
Annual Report 2010 151
13.9 Information by sector and main countryin millions of euros
Information by sector and main country
Sectors
sales sales including in-
tercompany
research anddevelopment
expenses income from op-
erations
income from op-erations as a % of
sales
results relating toinvestments in as-
sociates
cash flow beforefinancingactivities1)
2010
Healthcare 8,601 8,611 (698) 922 10.7 8 1,139
Consumer Lifestyle 8,906 8,926 (369) 595 6.7 2 404
of which Television 3,155 3,165 (87) (130) (4.1) − (117)
Lighting 7,552 7,563 (355) 695 9.2 (6) 590
Group Management & Services 360 530 (154) (147) (40.8) 14 (679)
Inter-sector eliminations (211)
25,419 25,419 (1,576) 2,065 8.1 18 1,454
2009
Healthcare 7,839 7,849 (679) 591 7.5 5 889
Consumer Lifestyle 8,467 8,486 (395) 321 3.8 (1) 598
of which Television 3,122 3,130 (95) (179) (5.7) − (16)
Lighting 6,546 6,555 (351) (16) (0.2) (3) 624
Group Management & Services 337 455 (206) (282) (83.7) 75 (785)
Inter-sector eliminations (156)
23,189 23,189 (1,631) 614 2.6 76 1,326
2008
Healthcare 7,649 7,663 (672) 621 8.1 8 (2,478)
Consumer Lifestyle 10,889 10,923 (513) 110 1.0 − 238
of which Television 4,724 4,741 (106) (436) (9.2) − (487)
Lighting 7,362 7,371 (345) 24 0.3 1 (1,181)
Group Management & Services 485 624 (247) (701) (144.5) 10 1,815
Inter-sector eliminations (196)
26,385 26,385 (1,777) 54 0.2 19 (1,606)
1) Prior period amounts have been revised to reflect an adjusted sector allocation
Our sectors are organized based on the nature of the products andservices. The four sectors comprise Healthcare, Consumer Lifestyle,Lighting and Group Management & Services as shown in the table above.A short description of these sectors is as follows:
Healthcare: Consists of the following businesses - Imaging Systems,Home Healthcare Solutions, Patient Care & Clinical Informatics, andCustomer Services.
Consumer Lifestyle: Consists of the following businesses - Television,Personal Care, Audio & Video Multimedia, Domestic Appliances,Accessories, Health & Wellness, and Licenses.
Lighting: Consists of the following businesses - Lamps, ProfessionalLuminaires, Consumer Luminaires, Lighting Systems & Controls,Automotive, and Lumileds.
GM&S: Consists of the corporate center, as well as the overheadexpenses of regional and country organizations. Also included are thecosts of Philips’ pension and other postretirement benefit costs notdirectly allocated to the other sectors.
Transactions between the sectors mainly relate to services provided bythe sector Group Management & Services to the other sectors. Thepricing of such transactions is determined on an arm’s length principle.
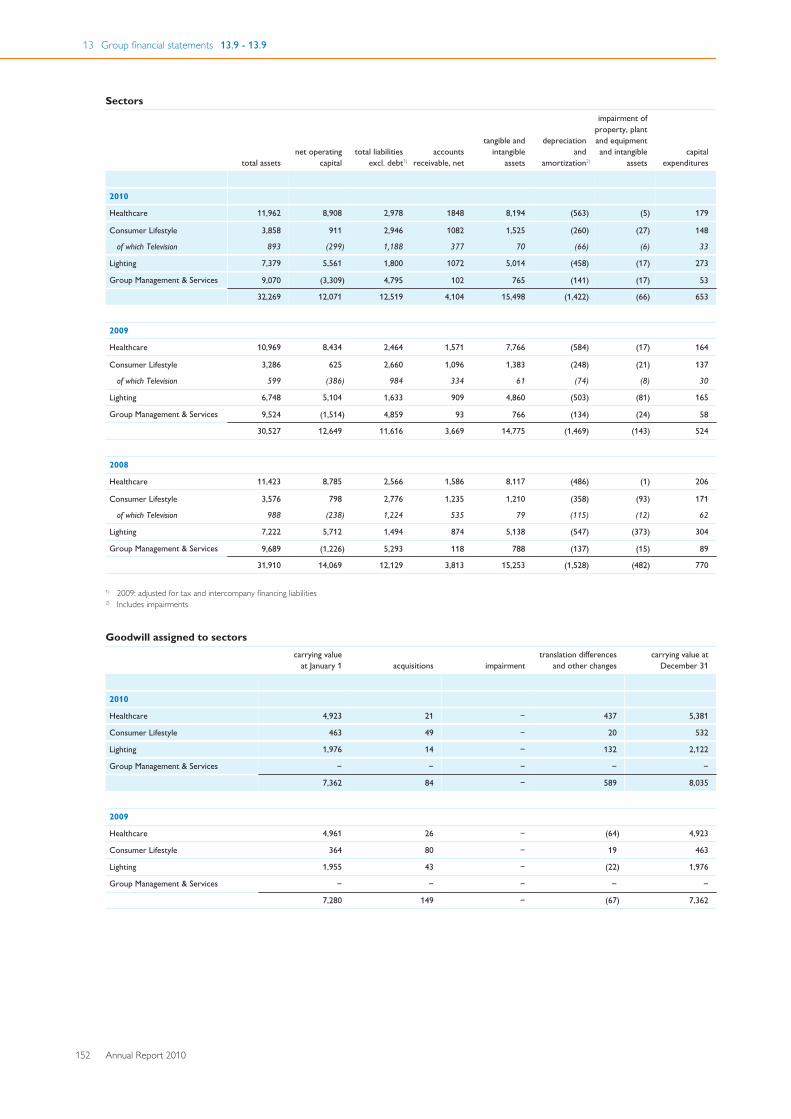
13 Group financial statements 13.9 - 13.9
152 Annual Report 2010
Sectors
total assets net operating
capital total liabilities
excl. debt1)accounts
receivable, net
tangible andintangible
assets
depreciationand
amortization2)
impairment ofproperty, plantand equipmentand intangible
assets capital
expenditures
2010
Healthcare 11,962 8,908 2,978 1848 8,194 (563) (5) 179
Consumer Lifestyle 3,858 911 2,946 1082 1,525 (260) (27) 148
of which Television 893 (299) 1,188 377 70 (66) (6) 33
Lighting 7,379 5,561 1,800 1072 5,014 (458) (17) 273
Group Management & Services 9,070 (3,309) 4,795 102 765 (141) (17) 53
32,269 12,071 12,519 4,104 15,498 (1,422) (66) 653
2009
Healthcare 10,969 8,434 2,464 1,571 7,766 (584) (17) 164
Consumer Lifestyle 3,286 625 2,660 1,096 1,383 (248) (21) 137
of which Television 599 (386) 984 334 61 (74) (8) 30
Lighting 6,748 5,104 1,633 909 4,860 (503) (81) 165
Group Management & Services 9,524 (1,514) 4,859 93 766 (134) (24) 58
30,527 12,649 11,616 3,669 14,775 (1,469) (143) 524
2008
Healthcare 11,423 8,785 2,566 1,586 8,117 (486) (1) 206
Consumer Lifestyle 3,576 798 2,776 1,235 1,210 (358) (93) 171
of which Television 988 (238) 1,224 535 79 (115) (12) 62
Lighting 7,222 5,712 1,494 874 5,138 (547) (373) 304
Group Management & Services 9,689 (1,226) 5,293 118 788 (137) (15) 89
31,910 14,069 12,129 3,813 15,253 (1,528) (482) 770
1) 2009: adjusted for tax and intercompany financing liabilities2) Includes impairments
Goodwill assigned to sectorscarrying value
at January 1 acquisitions impairment translation differences
and other changes carrying value at
December 31
2010
Healthcare 4,923 21 − 437 5,381
Consumer Lifestyle 463 49 − 20 532
Lighting 1,976 14 − 132 2,122
Group Management & Services − − − − −
7,362 84 − 589 8,035
2009
Healthcare 4,961 26 − (64) 4,923
Consumer Lifestyle 364 80 − 19 463
Lighting 1,955 43 − (22) 1,976
Group Management & Services − − − − −
7,280 149 − (67) 7,362
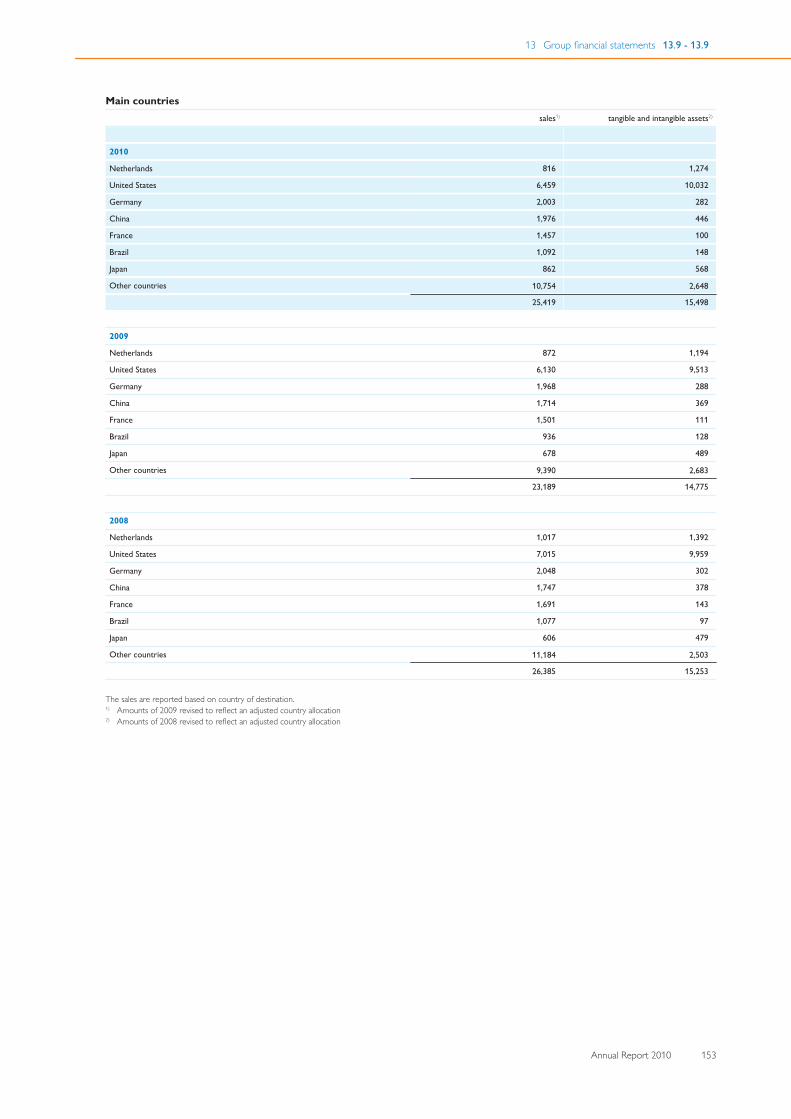
13 Group financial statements 13.9 - 13.9
Annual Report 2010 153
Main countriessales1) tangible and intangible assets2)
2010
Netherlands 816 1,274
United States 6,459 10,032
Germany 2,003 282
China 1,976 446
France 1,457 100
Brazil 1,092 148
Japan 862 568
Other countries 10,754 2,648
25,419 15,498
2009
Netherlands 872 1,194
United States 6,130 9,513
Germany 1,968 288
China 1,714 369
France 1,501 111
Brazil 936 128
Japan 678 489
Other countries 9,390 2,683
23,189 14,775
2008
Netherlands 1,017 1,392
United States 7,015 9,959
Germany 2,048 302
China 1,747 378
France 1,691 143
Brazil 1,077 97
Japan 606 479
Other countries 11,184 2,503
26,385 15,253
The sales are reported based on country of destination.1) Amounts of 2009 revised to reflect an adjusted country allocation2) Amounts of 2008 revised to reflect an adjusted country allocation
13 Group financial statements 13.10 - 13.10
154 Annual Report 2010
13.10 Significant accounting policiesThe Consolidated financial statements in this section have beenprepared in accordance with International Financial ReportingStandards (IFRS) as endorsed by the European Union (EU). Allstandards and interpretations issued by the International AccountingStandards Board (IASB) and the IFRS Interpretations Committeeeffective year-end 2010 have been endorsed by the EU, except that theEU did not adopt some paragraphs of IAS 39 applicable to certain hedgetransactions. Philips has no hedge transactions to which theseparagraphs are applicable. Consequently, the accounting policiesapplied by Philips also comply fully with IFRS as issued by the IASB.
The Consolidated financial statements have been prepared under thehistorical cost convention, unless otherwise indicated.
Basis of consolidationThe Consolidated financial statements include the accounts ofKoninklijke Philips Electronics N.V. (‘the Company’) and all subsidiariesthat fall under its power to govern the financial and operating policies ofan entity so as to obtain benefits from its activities. The existence andeffect of potential voting rights that are currently exercisable areconsidered when assessing whether the Company controls anotherentity. Subsidiaries are fully consolidated from the date that controlcommences until the date that control ceases. All intercompanybalances and transactions have been eliminated in the Consolidatedfinancial statements. Unrealized losses are eliminated in the same wayas unrealized gains, but only to the extent that there is no evidence ofimpairment.
From January 1, 2010 the Company has applied IFRS 3 BusinessCombinations (2008) in accounting for business combinations. Thechange in accounting policy has been applied prospectively; reference ismade to the subparagraph ‘IFRS accounting standards adopted as from2010’ included in this section.
Business combinations are accounted for using the acquisition method.Under the acquisition method, the identifiable assets acquired, liabilitiesassumed and any non-controlling interest in the acquiree arerecognized as at the acquisition date, which is the date on which controlis transferred to the Company. Control is the power to govern thefinancial and operating policies of an entity so as to obtain benefits fromits activities. In assessing control, the Company takes into considerationpotential voting rights that currently are exercisable.
Acquisitions on or after January 1, 2010For acquisitions on or after January 1, 2010, the Company measuresgoodwill at the acquisition date as:
• The fair value of the consideration transferred; plus• The recognized amount of any non-controlling interest in the
acquiree; plus if the business combination is achieved in stages, thefair value of the existing equity interest in the acquiree; less
• The net recognized amount (generally fair value) of the identifiableassets acquired and liabilities assumed.
The consideration transferred does not include amounts related to thesettlement of pre-existing relationships. Such amounts are generallyrecognized in the Statement of income.
Costs related to the acquisition, other than those associated with theissue of debt or equity securities, that the Company incurs inconnection with a business combination are expensed as incurred.
Any contingent consideration payable is recognized at fair value at theacquisition date. If the contingent consideration is classified as equity, itis not remeasured and settlement is accounted for within equity.Otherwise, subsequent changes to the fair value of the contingentconsideration are recognized in the Statement of income.
Acquisitions between January 1, 2004 and January 1, 2010For acquisitions between January 1, 2004 and January 1, 2010, goodwillrepresents the excess of the cost of the acquisition over the Company’sinterest in the recognized amount (generally fair value) of theidentifiable assets, liabilities and contingent liabilities of the acquiree.Transaction costs, other than those associated with the issue of debt orequity securities, that the Company incurred in connection withbusiness combinations were capitalized as part of the cost of theacquisition.
Loss of controlUpon the loss of control, the Company derecognizes the assets andliabilities of the subsidiary, any non-controlling interests and the othercomponents of equity related to the subsidiary. Any surplus or deficitarising on the loss of control is recognized in profit of loss. If theCompany retains any interest in the previous subsidiary, then suchinterest is measured at fair value at the date the control is lost.Subsequently it is accounted for as an investment in associate or as anavailable-for-sale financial asset depending on the level of influenceretained.
Use of estimatesThe preparation of the Consolidated financial statements in conformitywith IFRS requires management to make judgment, estimates andassumptions that affect the application of accounting policies and thereported amounts of assets, liabilities, income and expenses.
These estimates and assumptions affect the reported amounts of assetsand liabilities, the disclosure of contingent liabilities at the date of theConsolidated financial statements, and the reported amounts ofrevenues and expenses during the reporting period. We evaluate theseestimates and judgments on an ongoing basis and base our estimates onexperience, current and expected future conditions, third-partyevaluations and various other assumptions that we believe arereasonable under the circumstances. The results of these estimatesform the basis for making judgments about the carrying values of assetsand liabilities as well as identifying and assessing the accountingtreatment with respect to commitments and contingencies. Actualresults may differ from these estimates.
Estimates significantly impact goodwill and other intangibles acquired,tax on activities disposed, impairments, financial instruments, theaccounting for an arrangement containing a lease, revenue recognition(multiple elements arrangement), assets and liabilities from employeebenefit plans, other provisions and tax and other contingencies. The fairvalues of acquired identifiable intangibles are based on an assessment offuture cash flows. Impairment analyses of goodwill and indefinite-livedintangible assets are performed annually and whenever a triggeringevent has occurred to determine whether the carrying value exceedsthe recoverable amount. These analyses are based on estimates offuture cash flows.
The fair value of financial instruments that are not traded in an activemarket is determined by using valuation techniques. The Company usesits judgment to select from a variety of common valuation methodsincluding the discounted cash flow method and option valuation modelsand to make assumptions that are mainly based on market conditionsexisting at each balance sheet date.
Actuarial assumptions are established to anticipate future events andare used in calculating pension and other postretirement benefitexpense and liability. These factors include assumptions with respect tointerest rates, expected investment returns on plan assets, rates ofincrease in health care costs, rates of future compensation increases,turnover rates, and life expectancy.
Foreign currenciesThe Consolidated financial statements are presented in euros, which isthe Company’s functional and presentation currency.
Foreign currency transactionsForeign currency transactions are translated into the functionalcurrency using the exchange rates prevailing at the dates of thetransactions or valuation where items are remeasured. Foreignexchange gains and losses resulting from the settlement of suchtransactions and from the translation at year-end exchange rates ofmonetary assets and liabilities denominated in foreign currencies arerecognized in the Statement of income, except when deferred in othercomprehensive income as qualifying cash flow hedges and qualifying netinvestment hedges.
Changes in the fair value of financial assets denominated in foreigncurrency classified as available for sale are analyzed between translationdifferences resulting from changes in the amortized cost of the securityand other changes in the carrying amount of the security. Translationdifferences related to changes in amortized cost are recognized in theStatement of income, and other changes in carrying amount arerecognized in other comprehensive income.
13 Group financial statements 13.10 - 13.10
Annual Report 2010 155
Translation differences on non-monetary financial assets and liabilitiessuch as equities held at fair value through profit or loss are recognized inthe Statement of income as part of the fair value gain or loss. Translationdifferences on non-monetary financial assets, such as equities classifiedas available for sale, are included in other comprehensive income.
Foreign operationsThe assets and liabilities of foreign operations, including goodwill andfair value adjustments arising on acquisition, are translated to euro atexchange rates at the reporting date. The income and expenses offoreign operations, are translated to euro at exchange rates at the datesof the transactions.
Foreign currency differences arising on translation of foreign operationsinto the group’s presentation currency are recognized in othercomprehensive income, and presented in the foreign currencytranslation reserve (translation reserve) in equity. However, if theoperation is a non-wholly owned subsidiary, then the relevantproportionate share of the translation difference is allocated to thenon-controlling interests. When a foreign operation is disposed of suchthat control, significant influence or joint control is lost, the cumulativeamount is the translation reserve related to the foreign operation isreclassified to the Statements of income as part of the gain or loss ondisposal. When the Company disposes of only part of its interest in asubsidiary that includes a foreign operation while retaining control, therelevant proportion of the cumulative amount is reattributed to non-controlling interests. When the Company disposes of only part of itsinvestment in an associate or joint venture that includes a foreignoperation while retaining significant influence or joint control, therelevant proportion of the cumulative amount is reclassified to theStatements of income.
Discontinued operations and non-current assets held for saleNon-current assets (disposal groups comprising assets and liabilities)that are expected to be recovered primarily through sale rather thanthrough continuing use are classified as held for sale.
A discontinued operation is a component of an entity that either hasbeen disposed of, or that is classified as held for sale, and (a) representsa separate major line of business or geographical area of operations; and(b) is a part of a single coordinated plan to dispose of a separate majorline of business or geographical area of operations; or (c) is a subsidiaryacquired exclusively with a view to resale.
Non-current assets held for sale and discontinued operations arecarried at the lower of carrying amount or fair value less costs to sell.Any gain or loss from disposal of a business, together with the results ofthese operations until the date of disposal, is reported separately asdiscontinued operations. The financial information of discontinuedoperations is excluded from the respective captions in theConsolidated financial statements and related notes for all yearspresented.
Cash flow statementsCash flow statements are prepared using the indirect method. Cashflows in foreign currencies have been translated into euros using theweighted average rates of exchange for the periods involved. Cashflows from derivative instruments that are accounted for as fair valuehedges or cash flow hedges are classified in the same category as thecash flows from the hedged items. Cash flows from other derivativeinstruments are classified consistent with the nature of the instrument.
SegmentsOperating segments are components of the Company’s businessactivities about which separate financial information is available that isevaluated regularly by the chief operating decision maker (the Board ofManagement of the Company). The Board of Management decides howto allocate resources and assesses performance. Reportable segmentscomprise the operating sectors: Healthcare, Consumer Lifestyle,Lighting, and the business Television which is part of ConsumerLifestyle. Segment accounting policies are the same as the accountingpolicies as applied to the Group.
Earnings per shareThe Company presents basic and diluted earnings per share (EPS) datafor its common shares. Basic EPS is calculated by dividing the net incomeattributable to shareholders of the Company by the weighted averagenumber of common shares outstanding during the period, adjusted forown shares held. Diluted EPS is determined by adjusting the profit orloss attributable to shareholders and the weighted average number ofcommon shares outstanding, adjusted for own shares held, for the
effects of all dilutive potential common shares, which compriseconvertible personnel debentures, restricted shares and share optionsgranted to employees.
Revenue recognitionRevenue from the sale of goods in the course of the ordinary activities ismeasured at the fair value of the consideration received or receivable,net of returns, trade discounts and volume rebates. Revenue for sale ofgoods is recognized when the significant risks and rewards ofownership have been transferred to the buyer, recovery of theconsideration is probable, the associated costs and possible return ofthe goods can be estimated reliably, there is no continuing involvementwith goods, and the amount of revenue can be measured reliably. If it isprobable that discounts will be granted and the amount can bemeasured reliably, then the discount is recognized as a reduction ofrevenue as the sales are recognized.
Transfer of risks and rewards varies depending on the individual termsof the contract of sale. For consumer-type products in the SectorsLighting and Consumer Lifestyle, these criteria are met at the time theproduct is shipped and delivered to the customer and, depending on thedelivery conditions, title and risk have passed to the customer andacceptance of the product, when contractually required, has beenobtained, or, in cases where such acceptance is not contractuallyrequired, when management has established that all aforementionedconditions for revenue recognition have been met. Examples of theabove-mentioned delivery conditions are ‘Free on Board point ofdelivery’ and ‘Costs, Insurance Paid point of delivery’, where the pointof delivery may be the shipping warehouse or any other point ofdestination as agreed in the contract with the customer and where titleand risk in the goods pass to the customer.
Revenues of transactions that have separately identifiable componentsare recognized based on their relative fair values. These transactionsmainly occur in the Healthcare sector and include arrangements thatrequire subsequent installation and training activities in order tobecome operable for the customer. However, since payment for theequipment is contingent upon the completion of the installationprocess, revenue recognition is generally deferred until the installationhas been completed and the product is ready to be used by thecustomer in the way contractually agreed.
Revenues are recorded net of sales taxes, customer discounts, rebatesand similar charges. For products for which a right of return existsduring a defined period, revenue recognition is determined based onthe historical pattern of actual returns, or in cases where suchinformation is not available, revenue recognition is postponed until thereturn period has lapsed. Return policies are typically based oncustomary return arrangements in local markets.
For products for which a residual value guarantee has been granted or abuy-back arrangement has been concluded, revenue recognition takesplace when significant risks and rewards of ownership are transferredto the customer. The following are the principal factors that theCompany considers in determining that the Company has transferredsignificant risks and rewards:
• The period from the sale to the repurchase represents the major(normally at least 75%) part of the economic life of the asset;
• The difference between the proceeds received on the initial transferand the amount of any residual value or repurchase price, measuredon a present value basis, amounts to substantially all (normally atleast 90%) of the fair value of the asset at the sale date;
• Insurance risk is borne by the customer; however, if the customerbears the insurance risk but the Company bears the remaining risks,then risks and rewards have not been transferred to the customer;and
• The repurchase price is equal to the market value at the time of thebuy-back.
In case of loss under a sales agreement, the loss is recognizedimmediately.
Shipping and handling costs billed to customers are recognized asrevenues. Expenses incurred for shipping and handling costs of internalmovements of goods are recorded as cost of sales. Shipping andhandling costs related to sales to third parties are recorded as sellingexpenses and disclosed separately. Service revenue related to repairand maintenance activities for goods sold is recognized ratably over theservice period or as services are rendered.
13 Group financial statements 13.10 - 13.10
156 Annual Report 2010
A provision for product warranty is made at the time of revenuerecognition and reflects the estimated costs of replacement and free-of-charge services that will be incurred by the Company with respect tothe products. For certain products, the customer has the option topurchase an extension of the warranty, which is subsequently billed tothe customer. Revenue recognition occurs on a straight-line basis overthe contract period.
Revenue from services is recognized when the Company can reliablymeasure the amount of revenue and the associated cost related to thestage of completion of a contract or transaction, and the recovery ofthe consideration is considered probable.
Royalty income, which is generally earned based upon a percentage ofsales or a fixed amount per product sold, is recognized on an accrualbasis.
Grants from the government are recognized at their fair value wherethere is a reasonable assurance that the grant will be received and theCompany will comply with all attached conditions. Government grantsrelating to costs are deferred and recognized in the Statements ofincome over the period necessary to match them with the costs thatthey are intended to compensate.
Employee benefit accountingA defined contribution plan is a post-employment benefit plan underwhich an entity pays fixed contributions into a separate entity and willhave no legal or constructive obligation to pay further amounts.Obligations for contributions to defined contributions pension plansare recognized as an employee benefit expense in the Statement ofincome in the periods during which services are rendered byemployees.
A defined benefit plan is a post-employment benefit plan other than adefined contribution plan. The net pension asset or liability recognizedin the Consolidated balance sheet in respect of defined-benefitpostemployment plans is the fair value of plan assets less the presentvalue of the projected defined-benefit obligation at the balance sheetdate, together with adjustments for projected unrecognized past-service costs. The projected defined-benefit obligation is calculatedannually by qualified actuaries using the projected unit credit method.Recognized assets are limited to the present value of any reductions infuture contributions or any future refunds.
To the extent that post-employment benefits vest immediatelyfollowing the introduction of a change to a defined-benefit plan, theresulting past service costs are recognized immediately.
For the Company’s major plans, a full discount rate curve of high-qualitycorporate bonds (Bloomberg AA Composite) is used to determine thedefined-benefit obligation, whereas for the other plans a single-pointdiscount rate is used based on the plan’s maturity. Plans in countrieswithout a deep corporate bond market use a discount rate based on thelocal sovereign curve and the plan’s maturity.
Pension costs in respect of defined-benefit postemployment plansprimarily represent the increase of the actuarial present value of theobligation for postemployment benefits based on employee serviceduring the year and the interest on this obligation in respect ofemployee service in previous years, net of the expected return on planassets.
Actuarial gains and losses arise mainly from changes in actuarialassumptions and differences between actuarial assumptions and whathas actually occurred. The Company recognizes all actuarial gains andlosses directly in equity through the Consolidated statements ofcomprehensive income.
The Company recognizes gains and losses on the curtailment orsettlement of a defined benefit plan when the curtailment or settlementoccurs. The gain or loss on curtailment comprises any resulting changein the fair value of plan assets, change in the present value of definedbenefit obligation and any related actuarial gains and losses and pastservice cost that had not previously been recognized.
In certain countries, the Company also provides post-retirementbenefits other than pensions. The costs relating to such plans consistprimarily of the present value of the benefits attributed on an equal basisto each year of service and interest cost on the accumulatedpostretirement benefit obligation, which is a discounted amount.
The Company recognizes a liability and an expense for bonuses andprofit-sharing, based on a formula that takes into consideration theprofit attributable to the Company’s shareholders after certainadjustments. The Company recognizes a provision where contractuallyobliged or where there is a past practice that has created a constructiveobligation.
Share-based paymentThe Company recognizes the estimated fair value, measured as of grantdate of equity instruments granted to employees as personnel expenseover the vesting period on a straight-line basis, taking into accountexpected forfeitures. The Company uses the Black-Scholes option-pricing model to determine the fair value of equity instruments.
The fair value of the amount payable to employees in respect of shareappreciation rights, which are settled in cash, is recognized as anexpense, with a corresponding increase in liabilities, over the vestingperiod. The liability is remeasured at each reporting date and atsettlement date. Any changes in fair value of the liability are recognizedas personnel expense in the Statement of income.
Financial income and expensesFinancial income comprises interest income on funds invested(including available-for-sale financial assets), dividend income, net gainson the disposal of available-for-sale financial assets, net fair value gainson financial assets at fair value through profit or loss, net gains on theremeasurement to fair value of any pre-existing interest in an acquiree,and net gains on hedging instruments that are recognized in theStatement of income. Interest income is recognized on accrual basis inthe Statement of income, using the effective interest method. Dividendincome is recognized in the Statement of income on the date that theCompany’s right to receive payment is established, which in the case ofquoted securities is normally the ex-dividend date.
Financial expense comprise interest expense on borrowings, unwindingof the discount on provisions and contingent consideration, losses ondisposal of available-for-sale financial assets, net fair value losses onfinancial assets at fair value through profit or loss, impairment lossesrecognized on financial assets (other than trade receivables), and netlosses on hedging instruments that are recognized in the Statement ofincome.
Borrowing costs that are not directly attributable to the acquisition,construction or production of a qualifying asset are recognized in theStatement of income using the effective interest method.
Foreign currency gains and losses are reported on a net basis as eitherfinancial income or financial cost depending on whether foreigncurrency movements are in a net gain or net loss position.
Income taxIncome tax comprises current and deferred tax. Income tax isrecognized in the Statement of income except to the extent that itrelates to a business combination, or items recognized directly withinequity or in other comprehensive income. Current tax is the expectedtax payable on the taxable income for the year, using tax rates enactedor substantially enacted at the reporting date, and any adjustment to taxpayable in respect of previous years.
Deferred tax assets and liabilities are recognized, using the balancesheet method, for the expected tax consequences of temporarydifferences between the carrying amounts of assets and liabilities andthe amounts used for taxation purposes. Deferred tax is not recognizedfor the following temporary differences: the initial recognition ofgoodwill, the initial recognition of assets and liabilities in a transactionthat is not a business combination and that affects neither accountingnor taxable profit, and differences relating to investments in subsidiariesto the extent that they probably will not reverse in the foreseeablefuture. Deferred tax is measured at the tax rates that are expected tobe applied to temporary differences when they reverse, based on thelaws that been enacted or substantively enacted by the reporting date.Deferred tax assets and liabilities are offset if there is a legallyenforceable right to offset current tax liabilities and assets, and theyrelate to income taxes levied by the same tax authority on the sametaxable entity, or on different tax entities, but they intend to settlecurrent tax liabilities and assets on a net bases or their tax assets andliabilities will be realized simultaneously.
A deferred tax asset is recognized for unused tax losses, tax credits anddeductible temporary differences, to the extent that it is probable thatfuture taxable profits will be available against which they can be utilized.
13 Group financial statements 13.10 - 13.10
Annual Report 2010 157
The ultimate realization of deferred tax assets is dependent upon thegeneration of future taxable income in the countries where thedeferred tax assets originated and during the periods when the deferredtax assets become deductible. Management considers the scheduledreversal of deferred tax liabilities, projected future taxable income, andtax planning strategies in making this assessment.
Deferred tax liabilities for withholding taxes are recognized forsubsidiaries in situations where the income is to be paid out as dividendin the foreseeable future, and for undistributed earnings ofunconsolidated companies to the extent that these withholding taxesare not expected to be refundable or deductible. Changes in tax ratesare reflected in the period when the change has been enacted orsubstantively enacted by the reporting date.
LeasesLeases in which substantially all risks and rewards of ownership areretained by the lessor are classified as operating leases. Payments madeunder operating leases (net of any incentives received from the lessor)are recognized in the Statements of income on a straight-line basis overthe term of the lease. Leases in which the Company is the lessee and hassubstantially all the risks and rewards of ownership are classified asfinance leases. Finance leases are capitalized at the commencement ofthe lease at the lower of the fair value of the leased assets and thepresent value of the minimum lease payments. Each lease payment isallocated between the liability and finance charges. The interest elementof the finance cost is charged to the Statement of income over the leaseperiod so as to produce a constant periodic rate of interest on theremaining balance of the liability for each period. The correspondingrental obligations, net of finance charges, are included in other short-term and other non-current liabilities. The property, plant andequipment acquired under finance leases is depreciated over theshorter of the useful life of the assets and the lease term.
Derivative financial instruments, including hedgingaccountingThe Company uses derivative financial instruments principally tomanage its foreign currency risks and, to a more limited extent, formanaging interest rate and commodity price risks. All derivativefinancial instruments are classified as current assets or liabilities and areaccounted for at trade date. Embedded derivatives are separated fromthe host contract and accounted for separately if the economiccharacteristics and risks of the host contract and the embeddedderivative are not closely related. The Company measures all derivativefinancial instruments based on fair values derived from market prices ofthe instruments or from option pricing models, as appropriate. Gains orlosses arising from changes in fair value of derivatives are recognized inthe Statement of income, except for derivatives that are highly effectiveand qualify for cash flow or net investment hedge accounting.
Changes in the fair value of derivatives that are designated and qualify asfair value hedges are recorded in the Statement of income, togetherwith any changes in the fair value of the hedged asset or liability that areattributable to the hedged risk. For interest rate swaps designated as afair value hedge of an interest bearing asset or liability that are unwound,the amount of the fair value adjustment to the asset or liability for therisk being hedged is released to the Statement of income over theremaining life of the asset or liability based on the recalculated effectiveyield.
Changes in the fair value of a derivative that is highly effective and that isdesignated and qualifies as a cash flow hedge, are recorded in equity,until the Statement of income is affected by the variability in cash flowsof the designated hedged item. To the extent that the hedge isineffective, changes in the fair value are recognized in the Statement ofincome.
The Company formally assesses, both at the hedge’s inception and onan ongoing basis, whether the derivatives that are used in hedgingtransactions are highly effective in offsetting changes in fair values orcash flows of hedged items. When it is established that a derivative isnot highly effective as a hedge or that it has ceased to be a highlyeffective hedge, the Company discontinues hedge accountingprospectively. When hedge accounting is discontinued because it isexpected that a forecasted transaction will not occur, the Companycontinues to carry the derivative on the Balance sheet at its fair value,and gains and losses that were accumulated in equity are recognizedimmediately in the Statement of income. If there is a delay and it isexpected that the transaction will still occur, the amount in equityremains there until the forecasted transaction affects income. In allother situations in which hedge accounting is discontinued, the
Company continues to carry the derivative at its fair value on theBalance sheet, and recognizes any changes in its fair value in theStatements of income.
Foreign currency differences arising on the retranslation of a financialliability designated as a hedge of a net investment in a foreign operationare recognized directly as a separate component of equity, to the extentthat the hedge is effective. To the extent that the hedge is ineffective,such differences are recognized in the Statements of income.
Non-derivative financial instrumentsNon-derivative financial instruments are recognized initially at fair valuewhen the Company becomes a party to the contractual provisions ofthe instrument.
Regular way purchases and sales of financial instruments are accountedfor at trade date. Dividend and interest income are recognized whenearned. Gains or losses, if any, are recorded in financial income andexpenses.
Cash and cash equivalentsCash and cash equivalents include all cash balances and short-termhighly liquid investments with an original maturity of three months orless that are readily convertible into known amounts of cash.
ReceivablesReceivables are carried at the lower of amortized cost or the presentvalue of estimated future cash flows, taking into account discounts givenor agreed. The present value of estimated future cash flows isdetermined through the use of allowances for uncollectible amounts.As soon as individual trade accounts receivable can no longer becollected in the normal way and are expected to result in a loss, they aredesignated as doubtful trade accounts receivable and valued at theexpected collectible amounts. They are written off when they aredeemed to be uncollectible because of bankruptcy or other forms ofreceivership of the debtors. The allowance for the risk of non-collection of trade accounts receivable takes into account credit-riskconcentration, collective debt risk based on average historical losses,and specific circumstances such as serious adverse economicconditions in a specific country or region.
In the event of sale of receivables and factoring, the Companyderecognizes receivables when the Company has given up control orcontinuing involvement.
The Company derecognizes receivables in case of sale and factoringwhen:
• The Company has transferred its rights to receive cash flows fromthe receivables or has assumed an obligation to pay the received cashflows in full without any material delay to a third party under a ‘pass-through’ arrangement; and
• either (a) the Company has transferred substantially all of the risksand rewards of the ownership of the receivables, or (b) the Companyhas neither transferred nor retained substantially all of the risks andrewards, but has transferred control of the assets.
However, in case the company neither transfers nor retainssubstantially all the risks and rewards of ownership of the receivablesnor transfers control of the receivables, the receivable is recognized tothe extent of the Company’s continuing involvement in the assets. Inwhich case, the Company also recognizes an associated liability. Thetransferred receivable and associated liability are measured on a basisthat reflects the rights and obligations that the Company has retained.
Investments in associatesAssociates are all entities over which the group has significant influencebut not control, generally accompanying a shareholding of between 20%and 50% of the voting rights. Investments in associates are accountedfor using the equity method of accounting and are initially recognized atcost. The group’s investment in associates includes goodwill identifiedon acquisition, net of any accumulated impairment loss.
The Company’s share of the net income of these companies is includedin results relating to associates in the Consolidated statements ofincome. When the Company’s share of losses exceeds its interest in anassociate, the carrying amount of that interest (including any long-termloans) is reduced to nil and recognition of further losses is discontinuedexcept to the extent that the Company has incurred legal orconstructive obligations or made payments on behalf of an associate.Unrealized gains on transactions between the Company and its
13 Group financial statements 13.10 - 13.10
158 Annual Report 2010
associates are eliminated to the extent of the Company’s interest in theassociates. Unrealized losses are also eliminated unless the transactionprovides evidence of an impairment of the asset transferred.
Investments in associates include loans from the Company to theseinvestees.
Accounting for capital transactions of a consolidatedsubsidiary or an associateThe Company recognizes dilution gains or losses arising from the saleor issuance of stock by a consolidated subsidiary or an associate in theStatement of income, unless the Company or the subsidiary either hasreacquired or plans to reacquire such shares. In such instances, theresult of the transaction will be recorded directly in equity.
Dilution gains and losses arising in investments in associates arerecognized in the Consolidated statements of income under “Resultsrelating to investments in associates”.
Other non-current financial assetsOther non-current financial assets include held-to-maturityinvestments, loans and available-for-sale financial assets and financialassets at fair value through profit and loss.
Held-to-maturity investments are those debt securities which theCompany has the ability and intent to hold until maturity. Held-to-maturity debt investments are recorded at amortized cost, adjusted forthe amortization or accretion of premiums or discounts using theeffective interest method.
Loans receivable are stated at amortized cost, less the relatedallowance for impaired loans receivable.
Available-for-sale financial assets are non-derivatives financial assetsthat are designated as available-for-sale and that are not classified in anyof the other categories of financial assets. Subsequent to initialrecognition, they are measured at fair value and changes therein, otherthan impairment losses and foreign currency differences on available forsale-debt instruments are recognized in other comprehensive incomeand presented in the fair value reserve in equity. When an investment isderecognized, the gain or loss accumulated in equity is reclassified tothe Statements of income.
Available-for-sale financial assets including investments in privately heldcompanies that are not associates, and do not have a quoted marketprice in an active market and whose fair value could not be reliablydetermined, are carried at cost.
A financial asset is classified as at fair value through profit or loss if it isclassified as held for trading or is designated as such upon initialrecognition. Financial assets are designated at fair value through profitor loss if the Company manages such investments and makes purchaseand sale decisions based on their fair value in accordance with theCompany documented risk management or investment strategy.Attributable transaction costs are recognized in the Statement ofincome as incurred. Financial assets at fair value through the Statementof income are measured at fair value, and changes therein arerecognized as available for sale.
Impairment of financial assetsA financial asset is considered to be impaired if objective evidenceindicates that one or more events have had a negative effect on theestimated future cash flows of that asset. In case of available-for-salefinancial assets, a significant or prolonged decline in the fair value of thefinancial assets below its cost is considered an indicator that thefinancial assets are impaired. If any such evidence exists for available-for-sale financial assets, the cumulative loss - measured as the differencebetween the acquisition cost and the current fair value, less anyimpairment loss on that financial asset previously recognized in theStatement of income - is removed from equity and recognized in theStatement of income.
If objective evidence indicates that financial assets that are carried atcost need to be tested for impairment, calculations are based oninformation derived from business plans and other information availablefor estimating their fair value. Any impairment loss is charged to theStatement of income.
An impairment loss related to financial assets is reversed if in asubsequent period, the fair value increases and the increase can berelated objectively to an event occurring after the impairment loss was
recognized. The loss is reversed only to the extent that the asset’scarrying amount does not exceed the carrying amount that would havebeen determined, if no impairment loss had been recognized. Reversalsof impairment are recognized in the Statement of income except forreversals of impairment of available-for-sale equity securities, which arerecognized in other comprehensive income.
InventoriesInventories are stated at the lower of cost or net realizable value. Thecost of inventories comprises all costs of purchase, costs of conversionand other costs incurred in bringing the inventories to their presentlocation and condition. The costs of conversion of inventories includedirect labor and fixed and variable production overheads, taking intoaccount the stage of completion and the normal capacity of productionfacilities. Costs of idle facility and abnormal waste are expensed. Thecost of inventories is determined using the first-in, first-out (FIFO)method. Inventory is reduced for the estimated losses due toobsolescence. This reduction is determined for groups of productsbased on purchases in the recent past and/or expected future demand.
Property, plant and equipmentItems of property, plant and equipment are measured at cost lessaccumulated depreciation and accumulated impairment losses. Theuseful lives and residual values are evaluated every year.
Assets manufactured by the Company include direct manufacturingcosts, production overheads and interest charges incurred forqualifying assets during the construction period. Government grantsare deducted from the cost of the related asset. Depreciation iscalculated using the straight-line method over the useful life of the asset.Depreciation of special tooling is generally also based on the straight-line method. Gains and losses on the sale of property, plant andequipment are included in other business income. Costs related torepair and maintenance activities are expensed in the period in whichthey are incurred unless leading to an extension of the original lifetimeor capacity.
Plant and equipment under finance leases and leasehold improvementsare amortized using the straight-line method over the shorter of thelease term or the estimated useful life of the asset. The gain realized onsale and operating leaseback transactions that are concluded basedupon market conditions is recognized at the time of the sale.
The Company capitalizes interest as part of the cost of assets that take asubstantial period of time to become ready for use.
Intangible assets other than goodwillAcquired definite-lived intangible assets are amortized using thestraight-line method over their estimated useful life. The useful lives areevaluated every year. Patents and trademarks with a definite useful liveacquired from third parties either separately or as part of the businesscombination are capitalized at cost and amortized over their remaininguseful lives. Intangible assets acquired as part of a business combinationare capitalized at their acquisition-date fair value.
The Company expenses all research costs as incurred. Expenditure ondevelopment activities, whereby research findings are applied to a planor design for the production of new or substantially improved productsand processes, is capitalized as an intangible asset if the product orprocess is technically and commercially feasible and the Company hassufficient resources and the intention to complete development.
The development expenditure capitalized includes the cost of materials,direct labor and an appropriate proportion of overheads. Otherdevelopment expenditures and expenditures on research activities arerecognized in the Statement of income. Capitalized developmentexpenditure is stated at cost less accumulated amortization andimpairment losses. Amortization of capitalized developmentexpenditure is charged to the Statement of income on a straight-linebasis over the estimated useful lives of the intangible assets.
Costs relating to the development and purchase of software for bothinternal use and software intended to be sold are capitalized andsubsequently amortized over the estimated useful life.
Impairment of non-financial assets other than goodwill,inventories and deferred tax assetsNon-financial assets other than goodwill, inventories and deferred taxassets are reviewed for impairment whenever events or changes incircumstances indicate that the carrying amount of an asset may not berecoverable. Recoverability of assets to be held and used is recognized
13 Group financial statements 13.10 - 13.10
Annual Report 2010 159
and measured by a comparison of the carrying amount of an asset withthe greater of its value in use and its fair value less cost to sell. Value inuse is measured as the present value of future cash flows expected to begenerated by the asset. If the carrying amount of an asset is deemed notrecoverable, an impairment charge is recognized in the amount bywhich the carrying amount of the asset exceeds the recoverableamount. The review for impairment is carried out at the level wherediscrete cash flows occur that are independent of other cash flows.
Impairment losses recognized in prior periods are assessed at eachreporting date for any indications that the loss has decreased or nolonger exists. An impairment loss is reversed if and to the extent therehas been a change in the estimates used to determine the recoverableamount. The loss is reversed only to the extent that the asset’s carryingamount does not exceed the carrying amount that would have beendetermined, net of depreciation or amortization, if no impairment losshad been recognized. Reversals of impairment are recognized in theStatements of income.
GoodwillMeasurement of goodwill at initial recognition is described under ‘Basisof consolidation’. Goodwill is subsequently measured at cost lessaccumulated impairment losses. In respect of investment in associates,the carrying amount of goodwill is included in the carrying amount ofinvestment, and an impairment loss on such investment is not allocatedto any asset, including goodwill, that forms part of the carrying amountof investment in associates.
Impairment of goodwillGoodwill is not amortized but tested for impairment annually andwhenever impairment indicators require. In most cases the Companyidentified its cash generating units as one level below that of anoperating segment. Cash flows at this level are substantiallyindependent from other cash flows and this is the lowest level at whichgoodwill is monitored by the Board of Management. The Companyperformed and completed annual impairment tests in the same quarterof all years presented in the Consolidated Statements of income. Agoodwill impairment loss is recognized in the Statement of incomewhenever and to the extent that the carrying amount of a cash-generating unit exceeds the recoverable amount of that unit. Animpairment loss on an investment in associates is not allocated to anyasset, including goodwill, that forms part of the carrying amount of theinvestment in associates.
Share capitalCommon shares are classified as equity. Incremental costs directlyattributable to the issuance of shares are recognized as a deductionfrom equity. Where the Company purchases the Company’s equityshare capital (treasury shares), the consideration paid, including anydirectly attributable incremental costs (net of income taxes) isdeducted from equity attributable to the company’s equity holders untilthe shares are cancelled or reissued. Where such ordinary shares aresubsequently reissued, any consideration received, net of any directlyattributable incremental transaction costs and the related income taxeffects, is included in equity attributable to the company’s equityholders.
Debt and other liabilitiesDebt and liabilities other than provisions are stated at amortized cost.However, loans that are hedged under a fair value hedge areremeasured for the changes in the fair value that are attributable to therisk that is being hedged.
ProvisionsProvisions are recognized if, as a result of a past event, the Company hasa present legal or constructive obligation that can be estimated reliably,and it is probable that an outflow of economic benefits will be requiredto settle the obligation. Provisions are measured at the present value ofthe expenditures expected to be required to settle the obligation usinga pre-tax discount rate that reflects current market assessments of thetime value of money and the risks specific to the obligation. Theincrease in the provision due to passage of time is recognized as interestexpense.
A provision for warranties is recognized when the underlying productsor services are sold. The provision is based on historical warranty dataand a weighing of possible outcomes against their associatedprobabilities.
The Company accrues for losses associated with environmentalobligations when such losses are probable and can be estimated reliably.Measurement of liabilities is based on current legal and constructiverequirements. Liabilities and expected insurance recoveries, if any, arerecorded separately. The carrying amount of liabilities is regularlyreviewed and adjusted for new facts and changes in law.
The provision for restructuring relates to the estimated costs ofinitiated reorganizations that have been approved by the Board ofManagement, and which involve the realignment of certain parts of theindustrial and commercial organization. When such reorganizationsrequire discontinuance and/or closure of lines of activities, theanticipated costs of closure or discontinuance are included inrestructuring provisions. A liability is recognized for those costs onlywhen the Company has a detailed formal plan for the restructuring andhas raised a valid expectation with those affected that it will carry outthe restructuring by starting to implement that plan or announcing itsmain features to those affected by it.
GuaranteesThe Company recognizes a liability at the fair value of the obligation atthe inception of a financial guarantee contract. The guarantee issubsequently measured at the higher of the best estimate of theobligation or the amount initially recognized.
Accounting changesIn the absence of explicit transition requirements for new accountingpronouncements, the Company accounts for any change in accountingprinciple retrospectively.
ReclassificationsCertain items previously reported under specific financial statementcaptions have been reclassified to conform to the current yearpresentation.
IFRS accounting standards adopted as from 2010The accounting policies set out above have been applied consistently toall periods presented in these Consolidated financial statements exceptas explained below which addresses changes in accounting policies.
The Company has adopted the following new and amended IFRSs as ofJanuary 1, 2010.
Revision to IAS 27 ‘Consolidated and Separate Financial Statements’
The revised standard requires the effects of all transactions with non-controlling interests to be recorded in equity if there is no change incontrol and these transactions will no longer result in goodwill or gainsand losses. The standard also specifies the accounting when control islost. Any remaining interest in the entity is remeasured to fair value, anda gain or loss is recognized in profit or loss. The Company applied IAS27 (revised) prospectively to transactions with non-controllinginterests as from January 1, 2010.
Revision to IFRS 3, ‘Business Combinations’
The revised standard continues to apply the acquisition method tobusiness combinations, with some significant changes. For example, allpayments to purchase a business are to be recorded at fair value at theacquisition date, with contingent payments classified as debtsubsequently re-measured through the Statements of income. Thedefinition of a business has been broadened, which likely results in moreacquisitions being treated as business combinations. There is a choiceon an acquisition-by-acquisition basis to measure the non-controllinginterest in the acquiree at fair value or at the non-controlling interest’sproportionate share of the acquiree’s net assets. All acquisition-relatedcosts other than share and debt issuance costs, should be expensed.The Company applied IFRS 3 (revised) prospectively to all businesscombinations as from January 1, 2010.
IFRIC 17, ‘Distribution of Non-cash Assets to Owners’
The interpretation is part of the IASB’s annual improvements projectpublished in April 2009. This interpretation provides guidance onaccounting for arrangements whereby an entity distributes non-cashassets to shareholders either as a distribution of reserves or asdividends. IFRS 5 has also been amended to require that assets areclassified as held for distribution only when they are available fordistribution in their present condition and the distribution is highly
13 Group financial statements 13.10 - 13.10
160 Annual Report 2010
probable. The Company applied IFRIC 17 prospectively from January 1,2010, which did not have a material impact on the Company’sConsolidated financial statements.
Amendment to IAS 39 ‘Financial Instruments: Recognition and Measurement– Eligible Hedged Items’
The amendment to IAS 39 provides additional guidance on thedesignation of a hedged item. The amendment clarifies how the existingprinciples underlying hedge accounting should be applied in twoparticular situations. It clarifies the designation of a one-sided risk in ahedged item and inflation in a financial hedged item. This amendmentwas adopted on January 1, 2010 and did not have a material impact onthe Company’s Consolidated financial statements.
Amendments to IFRIC 9 and IAS 39 ‘Embedded Derivatives’
The amendments require entities to assess whether they need toseparate an embedded derivative from a hybrid (combined) financialinstrument when financial assets are reclassified out of the fair valuethrough profit or loss category. When the fair value of an embeddedderivative that would be separated cannot be measured reliably, thereclassification of the hybrid (combined) financial asset out of the fairvalue through profit or loss category is not permitted. The amendmentsdid not have a material impact on the Company’s Consolidated financialstatements.
Improvements to IFRSs 2009
In April 2009, the IASB issued ‘Improvements to IFRSs 2009‘, a collectionof amendments to twelve International Financial Reporting Standards,as part of its program of annual improvements to its standards, which isintended to make necessary, but non-urgent, amendments to standardsthat will not be included as part of another major project. Theamendments resulting from this standard mainly have effective dates forannual periods beginning on or after January 1, 2010. The improvementsdid not have a material impact on the Company’s Consolidated financialstatements.
Amendment to IFRS 2 ‘Group Cash-settled and Share-based PaymentTransactions’
In addition to incorporating IFRIC 8, ‘Scope of IFRS 2’, and IFRIC 11,‘IFRS 2 – Group and treasury share transactions’, the amendmentsexpand on the guidance in IFRIC 11 to address the classification ofgroup arrangements that were not covered by that interpretation. Thenew guidance had no material impact on the Company’s Consolidatedfinancial statements.
IFRS accounting standards adopted as from 2011 and onwardsThe following standards and amendments to existing standards havebeen published and are mandatory for the Company beginning on orafter January 1, 2011 or later periods, but the Company has not earlyadopted them:
IFRS 9 ‘Financial Instruments’
This standard introduces certain new requirements for classifying andmeasuring financial assets and liabilities. IFRS 9 divides all financial assetsthat are currently in the scope of IAS 39 into two classifications, thosemeasured at amortized cost and those measured at fair value. Thestandard along with proposed expansion of IFRS 9 for classifying andmeasuring financial liabilities, de-recognition of financial instruments,impairment, and hedge accounting will be applicable from the year 2013,although entities are permitted to adopt earlier. The Company iscurrently evaluating the impact that this new standard will have on theCompany’s Consolidated financial statements.
Amendments to IFRS 7 Financial Instruments: Disclosures
The revised standard addresses additional disclosure notes in situationswhere assets are reclassified. This amendment is applicable to theCompany on January 1, 2012. The change in accounting policy impactsdisclosures only.
Improvements to IFRSs 2010
In May 2010, the IASB issued ‘Improvements to IFRSs 2010‘, a collectionof amendments to seven International Financial Reporting Standards, aspart of its program of annual improvements to its standards, which isintended to make necessary, but non-urgent, amendments to standards
that will not be included as part of another major project. Theamendments resulting from this standard mainly have effective dates forannual periods beginning on or after January 1, 2011. The improvementsare not expected to have a material impact on the Company’sConsolidated financial statements.
Revised IAS 24 ‘Related Parties Disclosures’
The revised standard simplifies the definition of a related party,clarifying its intended meaning and eliminating inconsistencies from thedefinition. The Company will apply IAS 24 (revised) retrospectivelyfrom January 1, 2011. The change in accounting policy impactsdisclosures only.
Amendment to IAS 32 ‘Classification of Rights Issues’
The amendment addresses the accounting for rights issues (rights,options or warrants) that are denominated in a currency other than thefunctional currency of the issuer. Previously, such rights issues wereaccounted for as derivative liabilities. The amendment requires that,provided certain conditions are met, such rights issues are classified asequity regardless of the currency in which the exercise price isdenominated. This amendment is applicable to the Company on January1, 2011 and is not expected to have a material impact on the Company’sConsolidated financial statements.
Amendment to IFRIC 14 ‘Prepayments of a Minimum Funding Requirement’
This amendment allows for the recognition of an asset for any surplusarising from the voluntary prepayment of minimum fundingcontributions for defined-benefit plans in respect of future service. Theamendment to IFRIC 14 will be adopted on January 1, 2011, will beapplied retrospectively and is not expected to have a material impact onthe Company’s Consolidated financial statements.
IFRIC 19 ‘Extinguishing Financial Liabilities with Equity Instruments’
IFRIC 19 clarifies the accounting when the terms of debt arerenegotiated with the result that the liability is extinguished by thedebtor issuing its own equity instruments to the creditor (referred to asa ‘debt for equity swap’). The interpretation requires a gain or loss to berecognized in profit or loss when a liability is settled through theissuance of the entity’s own equity instruments. The reclassification ofthe carrying value of the existing financial liability into equity (with nogain or loss being recognized in profit or loss) is no longer permitted.IFRIC 19 is applicable on January 1, 2011 and will be appliedretrospectively. The application of this IFRIC is not expected to have amaterial impact on the Company’s Consolidated financial statements.
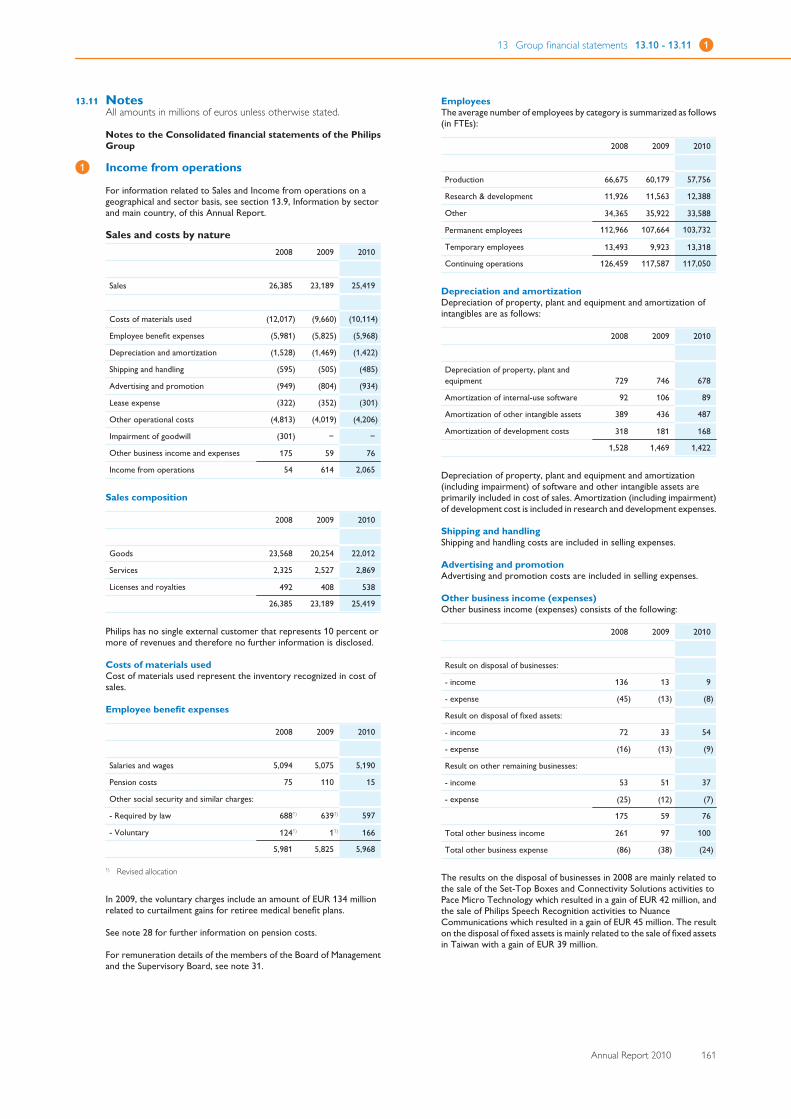
13 Group financial statements 13.10 - 13.11 1
Annual Report 2010 161
13.11 NotesAll amounts in millions of euros unless otherwise stated.
Notes to the Consolidated financial statements of the PhilipsGroup
1 Income from operations
For information related to Sales and Income from operations on ageographical and sector basis, see section 13.9, Information by sectorand main country, of this Annual Report.
Sales and costs by nature2008 2009 2010
Sales 26,385 23,189 25,419
Costs of materials used (12,017) (9,660) (10,114)
Employee benefit expenses (5,981) (5,825) (5,968)
Depreciation and amortization (1,528) (1,469) (1,422)
Shipping and handling (595) (505) (485)
Advertising and promotion (949) (804) (934)
Lease expense (322) (352) (301)
Other operational costs (4,813) (4,019) (4,206)
Impairment of goodwill (301) − −
Other business income and expenses 175 59 76
Income from operations 54 614 2,065
Sales composition
2008 2009 2010
Goods 23,568 20,254 22,012
Services 2,325 2,527 2,869
Licenses and royalties 492 408 538
26,385 23,189 25,419
Philips has no single external customer that represents 10 percent ormore of revenues and therefore no further information is disclosed.
Costs of materials usedCost of materials used represent the inventory recognized in cost ofsales.
Employee benefit expenses
2008 2009 2010
Salaries and wages 5,094 5,075 5,190
Pension costs 75 110 15
Other social security and similar charges:
- Required by law 6881) 6391) 597
- Voluntary 1241) 11) 166
5,981 5,825 5,968
1) Revised allocation
In 2009, the voluntary charges include an amount of EUR 134 millionrelated to curtailment gains for retiree medical benefit plans.
See note 28 for further information on pension costs.
For remuneration details of the members of the Board of Managementand the Supervisory Board, see note 31.
EmployeesThe average number of employees by category is summarized as follows(in FTEs):
2008 2009 2010
Production 66,675 60,179 57,756
Research & development 11,926 11,563 12,388
Other 34,365 35,922 33,588
Permanent employees 112,966 107,664 103,732
Temporary employees 13,493 9,923 13,318
Continuing operations 126,459 117,587 117,050
Depreciation and amortizationDepreciation of property, plant and equipment and amortization ofintangibles are as follows:
2008 2009 2010
Depreciation of property, plant andequipment 729 746 678
Amortization of internal-use software 92 106 89
Amortization of other intangible assets 389 436 487
Amortization of development costs 318 181 168
1,528 1,469 1,422
Depreciation of property, plant and equipment and amortization(including impairment) of software and other intangible assets areprimarily included in cost of sales. Amortization (including impairment)of development cost is included in research and development expenses.
Shipping and handlingShipping and handling costs are included in selling expenses.
Advertising and promotionAdvertising and promotion costs are included in selling expenses.
Other business income (expenses)Other business income (expenses) consists of the following:
2008 2009 2010
Result on disposal of businesses:
- income 136 13 9
- expense (45) (13) (8)
Result on disposal of fixed assets:
- income 72 33 54
- expense (16) (13) (9)
Result on other remaining businesses:
- income 53 51 37
- expense (25) (12) (7)
175 59 76
Total other business income 261 97 100
Total other business expense (86) (38) (24)
The results on the disposal of businesses in 2008 are mainly related tothe sale of the Set-Top Boxes and Connectivity Solutions activities toPace Micro Technology which resulted in a gain of EUR 42 million, andthe sale of Philips Speech Recognition activities to NuanceCommunications which resulted in a gain of EUR 45 million. The resulton the disposal of fixed assets is mainly related to the sale of fixed assetsin Taiwan with a gain of EUR 39 million.
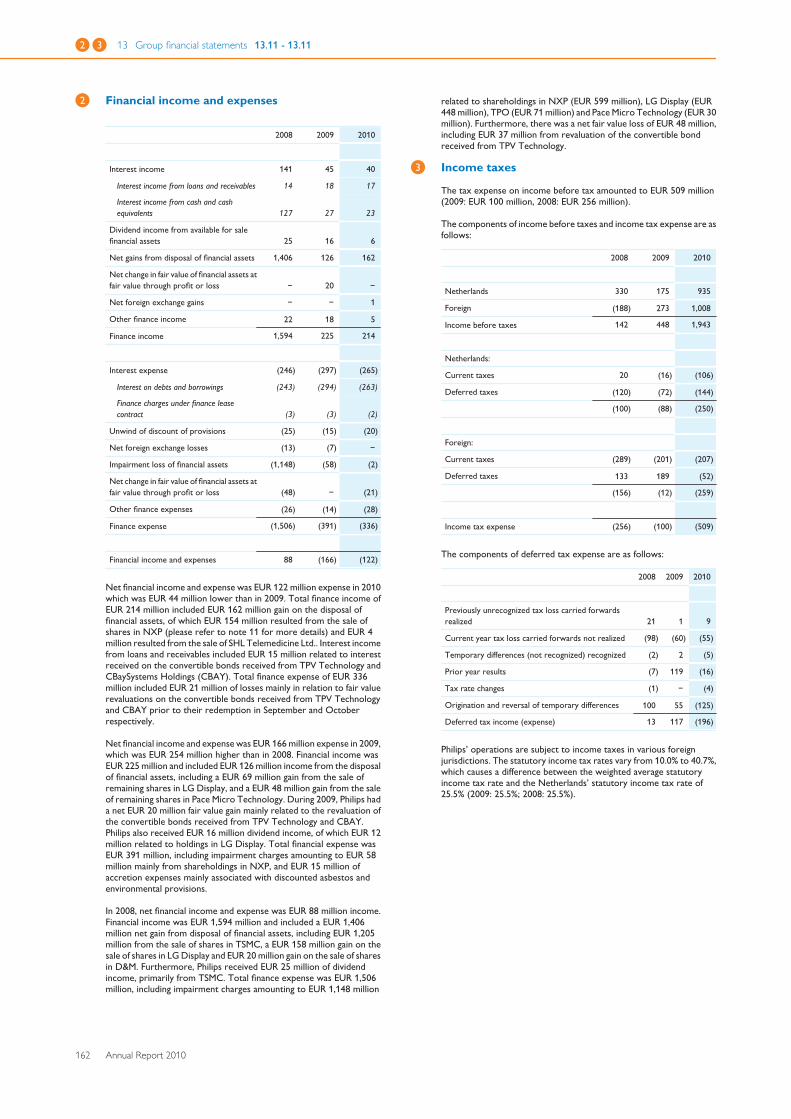
2 3 13 Group financial statements 13.11 - 13.11
162 Annual Report 2010
2 Financial income and expenses
2008 2009 2010
Interest income 141 45 40
Interest income from loans and receivables 14 18 17
Interest income from cash and cashequivalents 127 27 23
Dividend income from available for salefinancial assets 25 16 6
Net gains from disposal of financial assets 1,406 126 162
Net change in fair value of financial assets atfair value through profit or loss − 20 −
Net foreign exchange gains − − 1
Other finance income 22 18 5
Finance income 1,594 225 214
Interest expense (246) (297) (265)
Interest on debts and borrowings (243) (294) (263)
Finance charges under finance leasecontract (3) (3) (2)
Unwind of discount of provisions (25) (15) (20)
Net foreign exchange losses (13) (7) −
Impairment loss of financial assets (1,148) (58) (2)
Net change in fair value of financial assets atfair value through profit or loss (48) − (21)
Other finance expenses (26) (14) (28)
Finance expense (1,506) (391) (336)
Financial income and expenses 88 (166) (122)
Net financial income and expense was EUR 122 million expense in 2010which was EUR 44 million lower than in 2009. Total finance income ofEUR 214 million included EUR 162 million gain on the disposal offinancial assets, of which EUR 154 million resulted from the sale ofshares in NXP (please refer to note 11 for more details) and EUR 4million resulted from the sale of SHL Telemedicine Ltd.. Interest incomefrom loans and receivables included EUR 15 million related to interestreceived on the convertible bonds received from TPV Technology andCBaySystems Holdings (CBAY). Total finance expense of EUR 336million included EUR 21 million of losses mainly in relation to fair valuerevaluations on the convertible bonds received from TPV Technologyand CBAY prior to their redemption in September and Octoberrespectively.
Net financial income and expense was EUR 166 million expense in 2009,which was EUR 254 million higher than in 2008. Financial income wasEUR 225 million and included EUR 126 million income from the disposalof financial assets, including a EUR 69 million gain from the sale ofremaining shares in LG Display, and a EUR 48 million gain from the saleof remaining shares in Pace Micro Technology. During 2009, Philips hada net EUR 20 million fair value gain mainly related to the revaluation ofthe convertible bonds received from TPV Technology and CBAY.Philips also received EUR 16 million dividend income, of which EUR 12million related to holdings in LG Display. Total financial expense wasEUR 391 million, including impairment charges amounting to EUR 58million mainly from shareholdings in NXP, and EUR 15 million ofaccretion expenses mainly associated with discounted asbestos andenvironmental provisions.
In 2008, net financial income and expense was EUR 88 million income.Financial income was EUR 1,594 million and included a EUR 1,406million net gain from disposal of financial assets, including EUR 1,205million from the sale of shares in TSMC, a EUR 158 million gain on thesale of shares in LG Display and EUR 20 million gain on the sale of sharesin D&M. Furthermore, Philips received EUR 25 million of dividendincome, primarily from TSMC. Total finance expense was EUR 1,506million, including impairment charges amounting to EUR 1,148 million
related to shareholdings in NXP (EUR 599 million), LG Display (EUR448 million), TPO (EUR 71 million) and Pace Micro Technology (EUR 30million). Furthermore, there was a net fair value loss of EUR 48 million,including EUR 37 million from revaluation of the convertible bondreceived from TPV Technology.
3 Income taxes
The tax expense on income before tax amounted to EUR 509 million(2009: EUR 100 million, 2008: EUR 256 million).
The components of income before taxes and income tax expense are asfollows:
2008 2009 2010
Netherlands 330 175 935
Foreign (188) 273 1,008
Income before taxes 142 448 1,943
Netherlands:
Current taxes 20 (16) (106)
Deferred taxes (120) (72) (144)
(100) (88) (250)
Foreign:
Current taxes (289) (201) (207)
Deferred taxes 133 189 (52)
(156) (12) (259)
Income tax expense (256) (100) (509)
The components of deferred tax expense are as follows:
2008 2009 2010
Previously unrecognized tax loss carried forwardsrealized 21 1 9
Current year tax loss carried forwards not realized (98) (60) (55)
Temporary differences (not recognized) recognized (2) 2 (5)
Prior year results (7) 119 (16)
Tax rate changes (1) − (4)
Origination and reversal of temporary differences 100 55 (125)
Deferred tax income (expense) 13 117 (196)
Philips’ operations are subject to income taxes in various foreignjurisdictions. The statutory income tax rates vary from 10.0% to 40.7%,which causes a difference between the weighted average statutoryincome tax rate and the Netherlands’ statutory income tax rate of25.5% (2009: 25.5%; 2008: 25.5%).
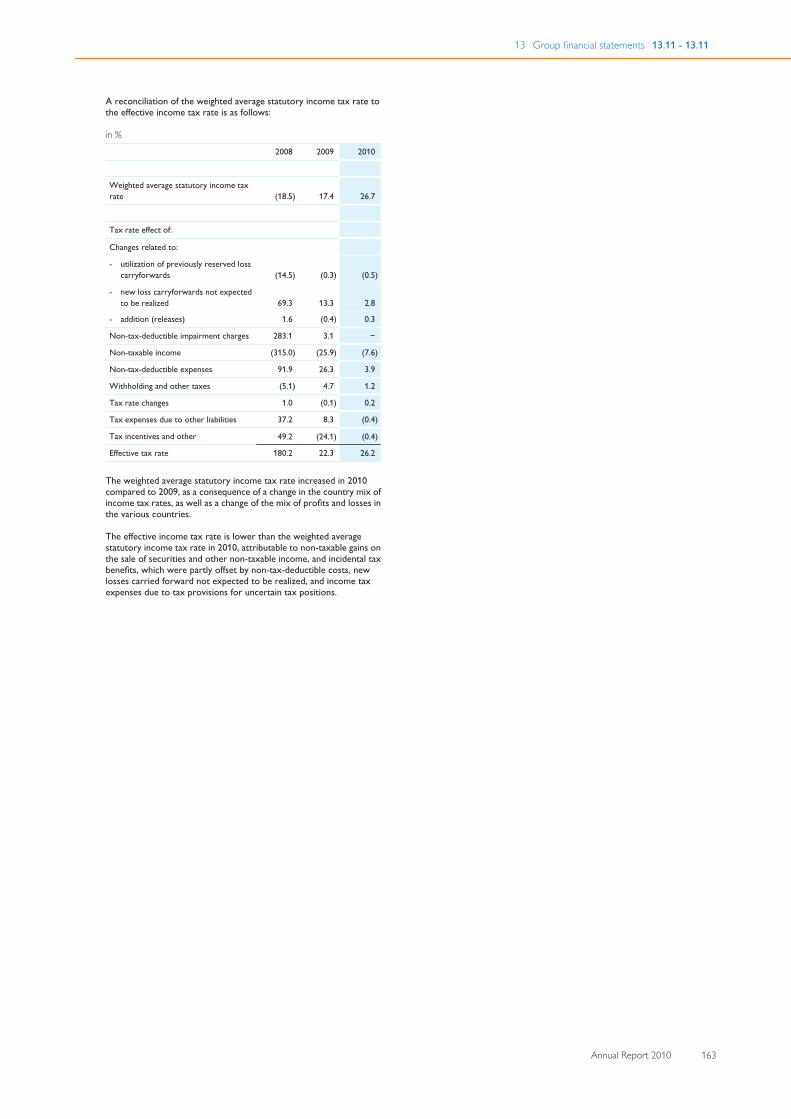
13 Group financial statements 13.11 - 13.11
Annual Report 2010 163
A reconciliation of the weighted average statutory income tax rate tothe effective income tax rate is as follows:
in %
2008 2009 2010
Weighted average statutory income taxrate (18.5) 17.4 26.7
Tax rate effect of:
Changes related to:
- utilization of previously reserved losscarryforwards (14.5) (0.3) (0.5)
- new loss carryforwards not expectedto be realized 69.3 13.3 2.8
- addition (releases) 1.6 (0.4) 0.3
Non-tax-deductible impairment charges 283.1 3.1 −
Non-taxable income (315.0) (25.9) (7.6)
Non-tax-deductible expenses 91.9 26.3 3.9
Withholding and other taxes (5.1) 4.7 1.2
Tax rate changes 1.0 (0.1) 0.2
Tax expenses due to other liabilities 37.2 8.3 (0.4)
Tax incentives and other 49.2 (24.1) (0.4)
Effective tax rate 180.2 22.3 26.2
The weighted average statutory income tax rate increased in 2010compared to 2009, as a consequence of a change in the country mix ofincome tax rates, as well as a change of the mix of profits and losses inthe various countries.
The effective income tax rate is lower than the weighted averagestatutory income tax rate in 2010, attributable to non-taxable gains onthe sale of securities and other non-taxable income, and incidental taxbenefits, which were partly offset by non-tax-deductible costs, newlosses carried forward not expected to be realized, and income taxexpenses due to tax provisions for uncertain tax positions.
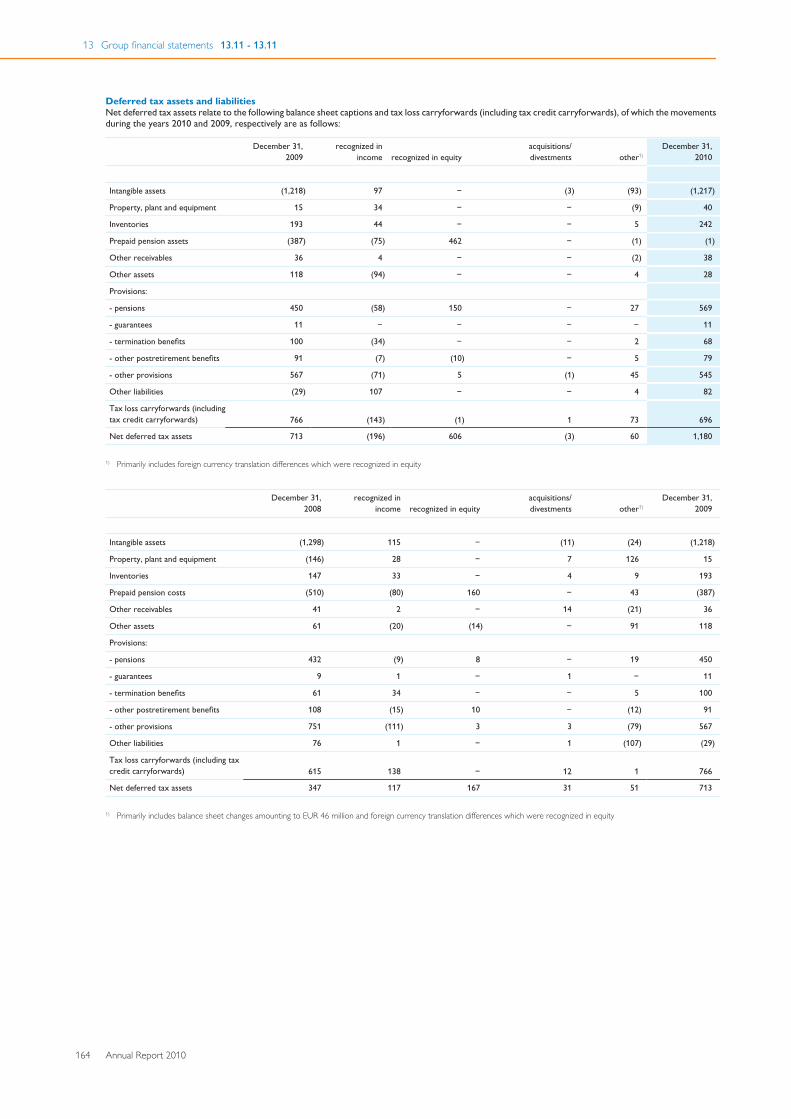
13 Group financial statements 13.11 - 13.11
164 Annual Report 2010
Deferred tax assets and liabilitiesNet deferred tax assets relate to the following balance sheet captions and tax loss carryforwards (including tax credit carryforwards), of which the movementsduring the years 2010 and 2009, respectively are as follows:
December 31,2009
recognized inincome recognized in equity
acquisitions/divestments other1)
December 31,2010
Intangible assets (1,218) 97 − (3) (93) (1,217)
Property, plant and equipment 15 34 − − (9) 40
Inventories 193 44 − − 5 242
Prepaid pension assets (387) (75) 462 − (1) (1)
Other receivables 36 4 − − (2) 38
Other assets 118 (94) − − 4 28
Provisions:
- pensions 450 (58) 150 − 27 569
- guarantees 11 − − − − 11
- termination benefits 100 (34) − − 2 68
- other postretirement benefits 91 (7) (10) − 5 79
- other provisions 567 (71) 5 (1) 45 545
Other liabilities (29) 107 − − 4 82
Tax loss carryforwards (includingtax credit carryforwards) 766 (143) (1) 1 73 696
Net deferred tax assets 713 (196) 606 (3) 60 1,180
1) Primarily includes foreign currency translation differences which were recognized in equity
December 31,2008
recognized inincome recognized in equity
acquisitions/divestments other1)
December 31,2009
Intangible assets (1,298) 115 − (11) (24) (1,218)
Property, plant and equipment (146) 28 − 7 126 15
Inventories 147 33 − 4 9 193
Prepaid pension costs (510) (80) 160 − 43 (387)
Other receivables 41 2 − 14 (21) 36
Other assets 61 (20) (14) − 91 118
Provisions:
- pensions 432 (9) 8 − 19 450
- guarantees 9 1 − 1 − 11
- termination benefits 61 34 − − 5 100
- other postretirement benefits 108 (15) 10 − (12) 91
- other provisions 751 (111) 3 3 (79) 567
Other liabilities 76 1 − 1 (107) (29)
Tax loss carryforwards (including taxcredit carryforwards) 615 138 − 12 1 766
Net deferred tax assets 347 117 167 31 51 713
1) Primarily includes balance sheet changes amounting to EUR 46 million and foreign currency translation differences which were recognized in equity
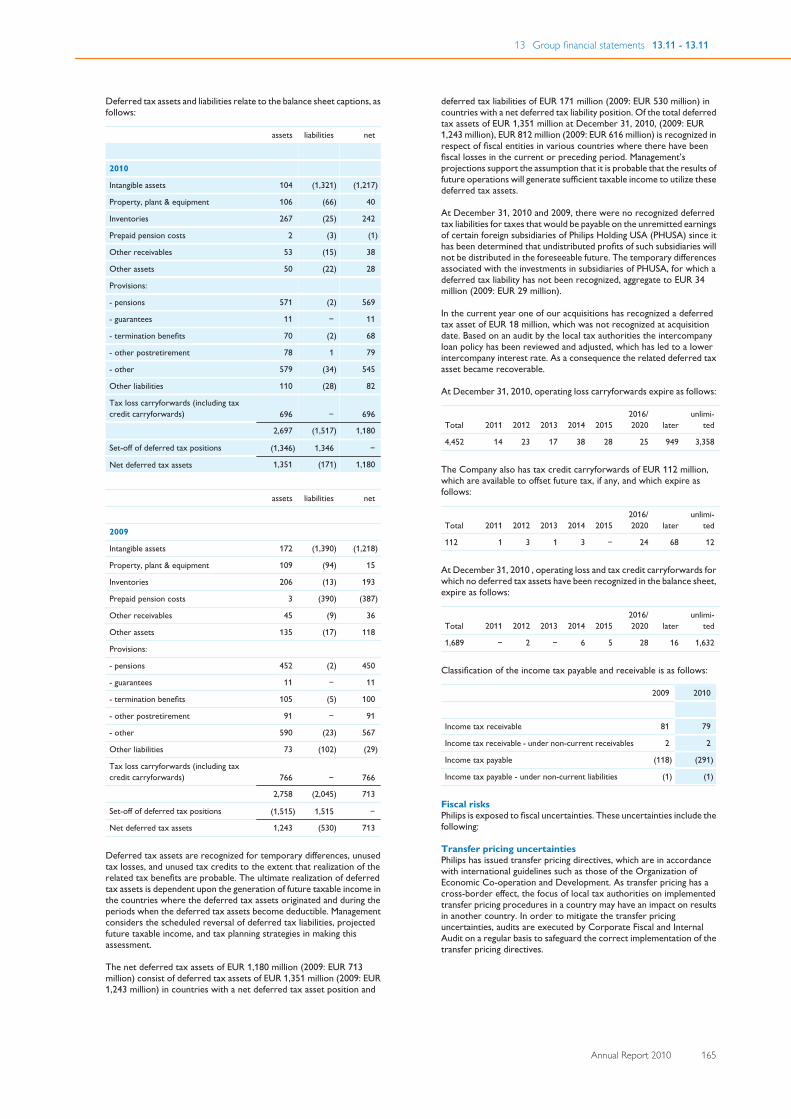
13 Group financial statements 13.11 - 13.11
Annual Report 2010 165
Deferred tax assets and liabilities relate to the balance sheet captions, asfollows:
assets liabilities net
2010
Intangible assets 104 (1,321) (1,217)
Property, plant & equipment 106 (66) 40
Inventories 267 (25) 242
Prepaid pension costs 2 (3) (1)
Other receivables 53 (15) 38
Other assets 50 (22) 28
Provisions:
- pensions 571 (2) 569
- guarantees 11 − 11
- termination benefits 70 (2) 68
- other postretirement 78 1 79
- other 579 (34) 545
Other liabilities 110 (28) 82
Tax loss carryforwards (including taxcredit carryforwards) 696 − 696
2,697 (1,517) 1,180
Set-off of deferred tax positions (1,346) 1,346 −
Net deferred tax assets 1,351 (171) 1,180
assets liabilities net
2009
Intangible assets 172 (1,390) (1,218)
Property, plant & equipment 109 (94) 15
Inventories 206 (13) 193
Prepaid pension costs 3 (390) (387)
Other receivables 45 (9) 36
Other assets 135 (17) 118
Provisions:
- pensions 452 (2) 450
- guarantees 11 − 11
- termination benefits 105 (5) 100
- other postretirement 91 − 91
- other 590 (23) 567
Other liabilities 73 (102) (29)
Tax loss carryforwards (including taxcredit carryforwards) 766 − 766
2,758 (2,045) 713
Set-off of deferred tax positions (1,515) 1,515 −
Net deferred tax assets 1,243 (530) 713
Deferred tax assets are recognized for temporary differences, unusedtax losses, and unused tax credits to the extent that realization of therelated tax benefits are probable. The ultimate realization of deferredtax assets is dependent upon the generation of future taxable income inthe countries where the deferred tax assets originated and during theperiods when the deferred tax assets become deductible. Managementconsiders the scheduled reversal of deferred tax liabilities, projectedfuture taxable income, and tax planning strategies in making thisassessment.
The net deferred tax assets of EUR 1,180 million (2009: EUR 713million) consist of deferred tax assets of EUR 1,351 million (2009: EUR1,243 million) in countries with a net deferred tax asset position and
deferred tax liabilities of EUR 171 million (2009: EUR 530 million) incountries with a net deferred tax liability position. Of the total deferredtax assets of EUR 1,351 million at December 31, 2010, (2009: EUR1,243 million), EUR 812 million (2009: EUR 616 million) is recognized inrespect of fiscal entities in various countries where there have beenfiscal losses in the current or preceding period. Management’sprojections support the assumption that it is probable that the results offuture operations will generate sufficient taxable income to utilize thesedeferred tax assets.
At December 31, 2010 and 2009, there were no recognized deferredtax liabilities for taxes that would be payable on the unremitted earningsof certain foreign subsidiaries of Philips Holding USA (PHUSA) since ithas been determined that undistributed profits of such subsidiaries willnot be distributed in the foreseeable future. The temporary differencesassociated with the investments in subsidiaries of PHUSA, for which adeferred tax liability has not been recognized, aggregate to EUR 34million (2009: EUR 29 million).
In the current year one of our acquisitions has recognized a deferredtax asset of EUR 18 million, which was not recognized at acquisitiondate. Based on an audit by the local tax authorities the intercompanyloan policy has been reviewed and adjusted, which has led to a lowerintercompany interest rate. As a consequence the related deferred taxasset became recoverable.
At December 31, 2010, operating loss carryforwards expire as follows:
Total 2011 2012 2013 2014 2015 2016/2020 later
unlimi-ted
4,452 14 23 17 38 28 25 949 3,358
The Company also has tax credit carryforwards of EUR 112 million,which are available to offset future tax, if any, and which expire asfollows:
Total 2011 2012 2013 2014 2015 2016/2020 later
unlimi-ted
112 1 3 1 3 − 24 68 12
At December 31, 2010 , operating loss and tax credit carryforwards forwhich no deferred tax assets have been recognized in the balance sheet,expire as follows:
Total 2011 2012 2013 2014 2015 2016/2020 later
unlimi-ted
1,689 − 2 − 6 5 28 16 1,632
Classification of the income tax payable and receivable is as follows:
2009 2010
Income tax receivable 81 79
Income tax receivable - under non-current receivables 2 2
Income tax payable (118) (291)
Income tax payable - under non-current liabilities (1) (1)
Fiscal risksPhilips is exposed to fiscal uncertainties. These uncertainties include thefollowing:
Transfer pricing uncertaintiesPhilips has issued transfer pricing directives, which are in accordancewith international guidelines such as those of the Organization ofEconomic Co-operation and Development. As transfer pricing has across-border effect, the focus of local tax authorities on implementedtransfer pricing procedures in a country may have an impact on resultsin another country. In order to mitigate the transfer pricinguncertainties, audits are executed by Corporate Fiscal and InternalAudit on a regular basis to safeguard the correct implementation of thetransfer pricing directives.
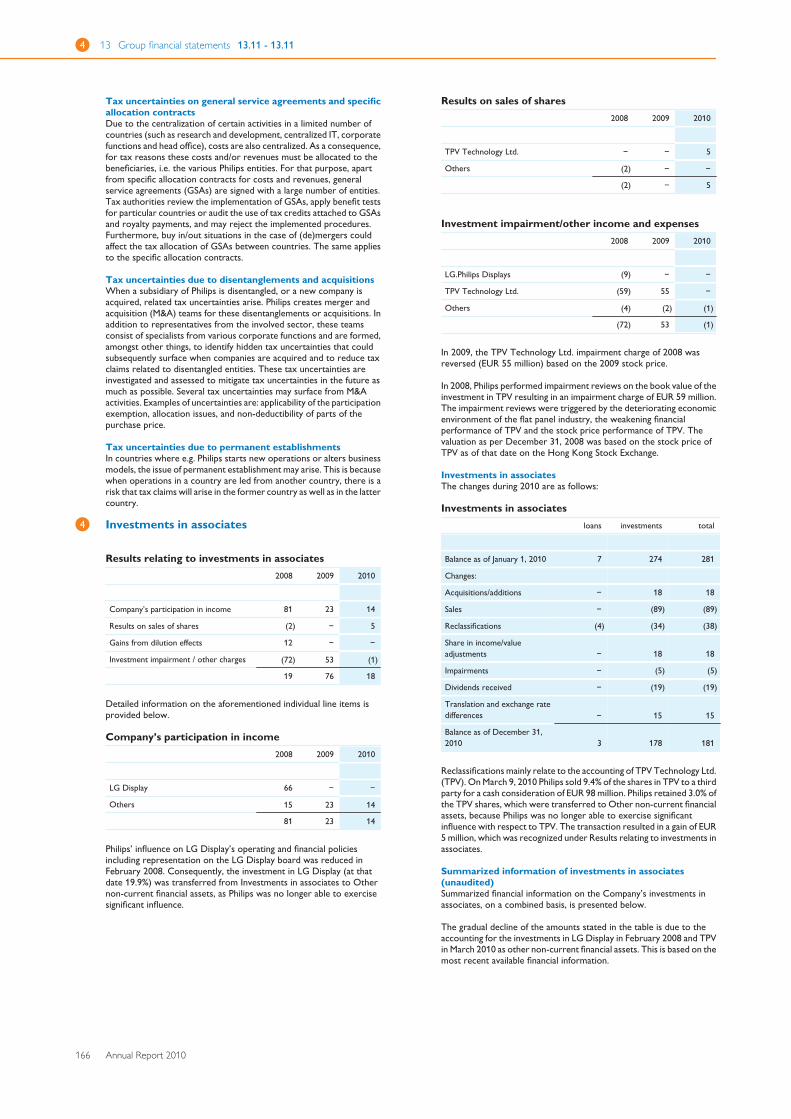
4 13 Group financial statements 13.11 - 13.11
166 Annual Report 2010
Tax uncertainties on general service agreements and specificallocation contractsDue to the centralization of certain activities in a limited number ofcountries (such as research and development, centralized IT, corporatefunctions and head office), costs are also centralized. As a consequence,for tax reasons these costs and/or revenues must be allocated to thebeneficiaries, i.e. the various Philips entities. For that purpose, apartfrom specific allocation contracts for costs and revenues, generalservice agreements (GSAs) are signed with a large number of entities.Tax authorities review the implementation of GSAs, apply benefit testsfor particular countries or audit the use of tax credits attached to GSAsand royalty payments, and may reject the implemented procedures.Furthermore, buy in/out situations in the case of (de)mergers couldaffect the tax allocation of GSAs between countries. The same appliesto the specific allocation contracts.
Tax uncertainties due to disentanglements and acquisitionsWhen a subsidiary of Philips is disentangled, or a new company isacquired, related tax uncertainties arise. Philips creates merger andacquisition (M&A) teams for these disentanglements or acquisitions. Inaddition to representatives from the involved sector, these teamsconsist of specialists from various corporate functions and are formed,amongst other things, to identify hidden tax uncertainties that couldsubsequently surface when companies are acquired and to reduce taxclaims related to disentangled entities. These tax uncertainties areinvestigated and assessed to mitigate tax uncertainties in the future asmuch as possible. Several tax uncertainties may surface from M&Aactivities. Examples of uncertainties are: applicability of the participationexemption, allocation issues, and non-deductibility of parts of thepurchase price.
Tax uncertainties due to permanent establishmentsIn countries where e.g. Philips starts new operations or alters businessmodels, the issue of permanent establishment may arise. This is becausewhen operations in a country are led from another country, there is arisk that tax claims will arise in the former country as well as in the lattercountry.
4 Investments in associates
Results relating to investments in associates2008 2009 2010
Company’s participation in income 81 23 14
Results on sales of shares (2) − 5
Gains from dilution effects 12 − −
Investment impairment / other charges (72) 53 (1)
19 76 18
Detailed information on the aforementioned individual line items isprovided below.
Company’s participation in income2008 2009 2010
LG Display 66 − −
Others 15 23 14
81 23 14
Philips’ influence on LG Display’s operating and financial policiesincluding representation on the LG Display board was reduced inFebruary 2008. Consequently, the investment in LG Display (at thatdate 19.9%) was transferred from Investments in associates to Othernon-current financial assets, as Philips was no longer able to exercisesignificant influence.
Results on sales of shares2008 2009 2010
TPV Technology Ltd. − − 5
Others (2) − −
(2) − 5
Investment impairment/other income and expenses2008 2009 2010
LG.Philips Displays (9) − −
TPV Technology Ltd. (59) 55 −
Others (4) (2) (1)
(72) 53 (1)
In 2009, the TPV Technology Ltd. impairment charge of 2008 wasreversed (EUR 55 million) based on the 2009 stock price.
In 2008, Philips performed impairment reviews on the book value of theinvestment in TPV resulting in an impairment charge of EUR 59 million.The impairment reviews were triggered by the deteriorating economicenvironment of the flat panel industry, the weakening financialperformance of TPV and the stock price performance of TPV. Thevaluation as per December 31, 2008 was based on the stock price ofTPV as of that date on the Hong Kong Stock Exchange.
Investments in associatesThe changes during 2010 are as follows:
Investments in associatesloans investments total
Balance as of January 1, 2010 7 274 281
Changes:
Acquisitions/additions − 18 18
Sales − (89) (89)
Reclassifications (4) (34) (38)
Share in income/valueadjustments − 18 18
Impairments − (5) (5)
Dividends received − (19) (19)
Translation and exchange ratedifferences − 15 15
Balance as of December 31,2010 3 178 181
Reclassifications mainly relate to the accounting of TPV Technology Ltd.(TPV). On March 9, 2010 Philips sold 9.4% of the shares in TPV to a thirdparty for a cash consideration of EUR 98 million. Philips retained 3.0% ofthe TPV shares, which were transferred to Other non-current financialassets, because Philips was no longer able to exercise significantinfluence with respect to TPV. The transaction resulted in a gain of EUR5 million, which was recognized under Results relating to investments inassociates.
Summarized information of investments in associates(unaudited)Summarized financial information on the Company’s investments inassociates, on a combined basis, is presented below.
The gradual decline of the amounts stated in the table is due to theaccounting for the investments in LG Display in February 2008 and TPVin March 2010 as other non-current financial assets. This is based on themost recent available financial information.
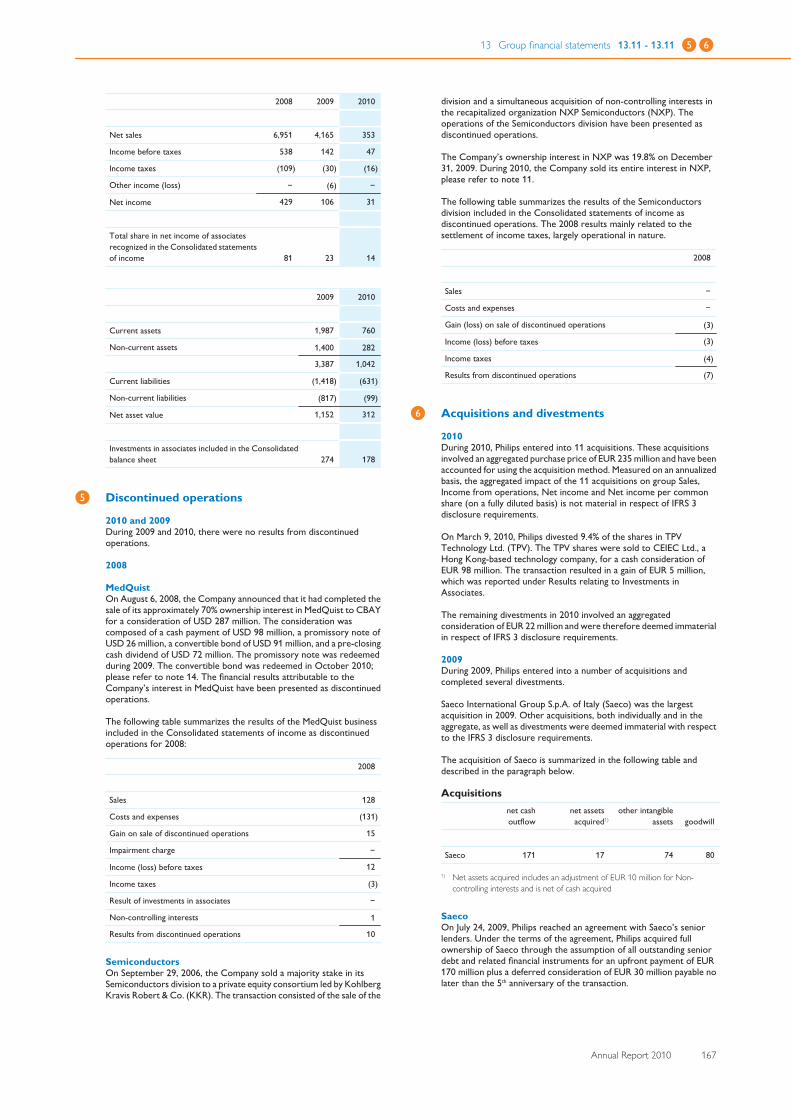
13 Group financial statements 13.11 - 13.11 5 6
Annual Report 2010 167
2008 2009 2010
Net sales 6,951 4,165 353
Income before taxes 538 142 47
Income taxes (109) (30) (16)
Other income (loss) − (6) −
Net income 429 106 31
Total share in net income of associatesrecognized in the Consolidated statementsof income 81 23 14
2009 2010
Current assets 1,987 760
Non-current assets 1,400 282
3,387 1,042
Current liabilities (1,418) (631)
Non-current liabilities (817) (99)
Net asset value 1,152 312
Investments in associates included in the Consolidatedbalance sheet 274 178
5 Discontinued operations
2010 and 2009During 2009 and 2010, there were no results from discontinuedoperations.
2008
MedQuistOn August 6, 2008, the Company announced that it had completed thesale of its approximately 70% ownership interest in MedQuist to CBAYfor a consideration of USD 287 million. The consideration wascomposed of a cash payment of USD 98 million, a promissory note ofUSD 26 million, a convertible bond of USD 91 million, and a pre-closingcash dividend of USD 72 million. The promissory note was redeemedduring 2009. The convertible bond was redeemed in October 2010;please refer to note 14. The financial results attributable to theCompany’s interest in MedQuist have been presented as discontinuedoperations.
The following table summarizes the results of the MedQuist businessincluded in the Consolidated statements of income as discontinuedoperations for 2008:
2008
Sales 128
Costs and expenses (131)
Gain on sale of discontinued operations 15
Impairment charge −
Income (loss) before taxes 12
Income taxes (3)
Result of investments in associates −
Non-controlling interests 1
Results from discontinued operations 10
SemiconductorsOn September 29, 2006, the Company sold a majority stake in itsSemiconductors division to a private equity consortium led by KohlbergKravis Robert & Co. (KKR). The transaction consisted of the sale of the
division and a simultaneous acquisition of non-controlling interests inthe recapitalized organization NXP Semiconductors (NXP). Theoperations of the Semiconductors division have been presented asdiscontinued operations.
The Company’s ownership interest in NXP was 19.8% on December31, 2009. During 2010, the Company sold its entire interest in NXP,please refer to note 11.
The following table summarizes the results of the Semiconductorsdivision included in the Consolidated statements of income asdiscontinued operations. The 2008 results mainly related to thesettlement of income taxes, largely operational in nature.
2008
Sales −
Costs and expenses −
Gain (loss) on sale of discontinued operations (3)
Income (loss) before taxes (3)
Income taxes (4)
Results from discontinued operations (7)
6 Acquisitions and divestments
2010During 2010, Philips entered into 11 acquisitions. These acquisitionsinvolved an aggregated purchase price of EUR 235 million and have beenaccounted for using the acquisition method. Measured on an annualizedbasis, the aggregated impact of the 11 acquisitions on group Sales,Income from operations, Net income and Net income per commonshare (on a fully diluted basis) is not material in respect of IFRS 3disclosure requirements.
On March 9, 2010, Philips divested 9.4% of the shares in TPVTechnology Ltd. (TPV). The TPV shares were sold to CEIEC Ltd., aHong Kong-based technology company, for a cash consideration ofEUR 98 million. The transaction resulted in a gain of EUR 5 million,which was reported under Results relating to Investments inAssociates.
The remaining divestments in 2010 involved an aggregatedconsideration of EUR 22 million and were therefore deemed immaterialin respect of IFRS 3 disclosure requirements.
2009During 2009, Philips entered into a number of acquisitions andcompleted several divestments.
Saeco International Group S.p.A. of Italy (Saeco) was the largestacquisition in 2009. Other acquisitions, both individually and in theaggregate, as well as divestments were deemed immaterial with respectto the IFRS 3 disclosure requirements.
The acquisition of Saeco is summarized in the following table anddescribed in the paragraph below.
Acquisitionsnet cashoutflow
net assetsacquired1)
other intangibleassets goodwill
Saeco 171 17 74 80
1) Net assets acquired includes an adjustment of EUR 10 million for Non-controlling interests and is net of cash acquired
SaecoOn July 24, 2009, Philips reached an agreement with Saeco’s seniorlenders. Under the terms of the agreement, Philips acquired fullownership of Saeco through the assumption of all outstanding seniordebt and related financial instruments for an upfront payment of EUR170 million plus a deferred consideration of EUR 30 million payable nolater than the 5th anniversary of the transaction.
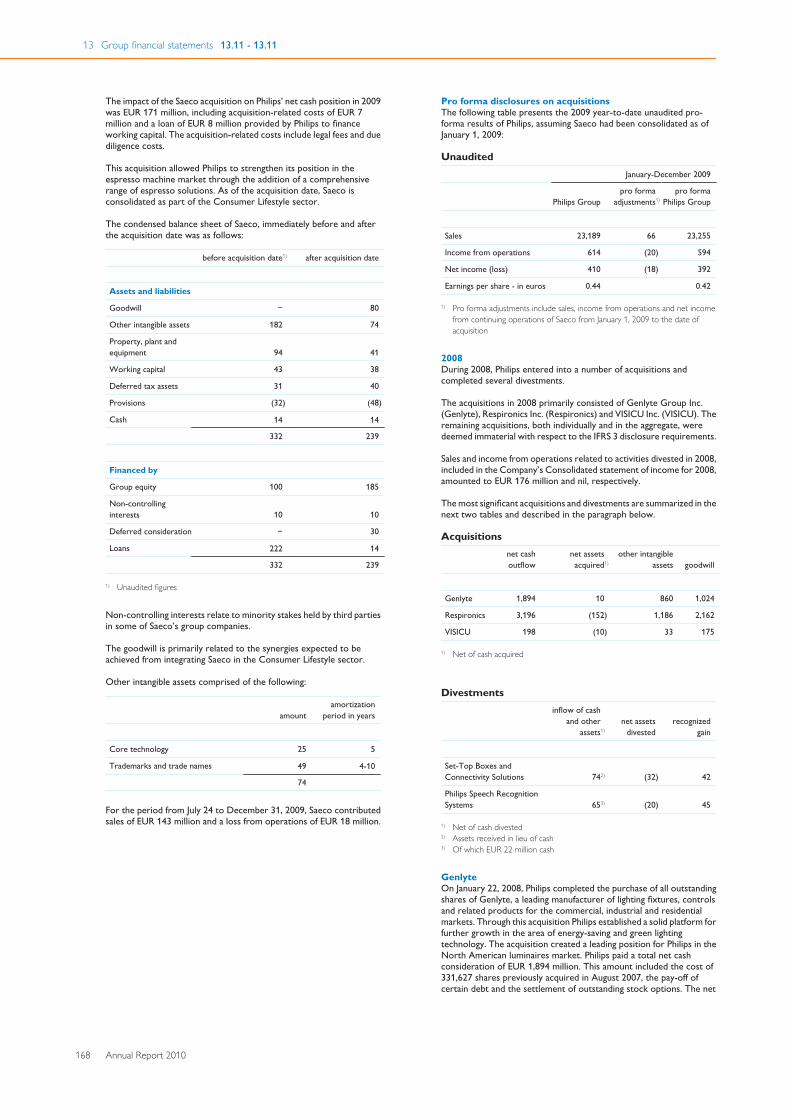
13 Group financial statements 13.11 - 13.11
168 Annual Report 2010
The impact of the Saeco acquisition on Philips’ net cash position in 2009was EUR 171 million, including acquisition-related costs of EUR 7million and a loan of EUR 8 million provided by Philips to financeworking capital. The acquisition-related costs include legal fees and duediligence costs.
This acquisition allowed Philips to strengthen its position in theespresso machine market through the addition of a comprehensiverange of espresso solutions. As of the acquisition date, Saeco isconsolidated as part of the Consumer Lifestyle sector.
The condensed balance sheet of Saeco, immediately before and afterthe acquisition date was as follows:
before acquisition date1) after acquisition date
Assets and liabilities
Goodwill − 80
Other intangible assets 182 74
Property, plant andequipment 94 41
Working capital 43 38
Deferred tax assets 31 40
Provisions (32) (48)
Cash 14 14
332 239
Financed by
Group equity 100 185
Non-controllinginterests 10 10
Deferred consideration − 30
Loans 222 14
332 239
1) Unaudited figures
Non-controlling interests relate to minority stakes held by third partiesin some of Saeco’s group companies.
The goodwill is primarily related to the synergies expected to beachieved from integrating Saeco in the Consumer Lifestyle sector.
Other intangible assets comprised of the following:
amount amortization
period in years
Core technology 25 5
Trademarks and trade names 49 4-10
74
For the period from July 24 to December 31, 2009, Saeco contributedsales of EUR 143 million and a loss from operations of EUR 18 million.
Pro forma disclosures on acquisitionsThe following table presents the 2009 year-to-date unaudited pro-forma results of Philips, assuming Saeco had been consolidated as ofJanuary 1, 2009:
UnauditedJanuary-December 2009
Philips Group pro forma
adjustments1)pro forma
Philips Group
Sales 23,189 66 23,255
Income from operations 614 (20) 594
Net income (loss) 410 (18) 392
Earnings per share - in euros 0.44 0.42
1) Pro forma adjustments include sales, income from operations and net incomefrom continuing operations of Saeco from January 1, 2009 to the date ofacquisition
2008During 2008, Philips entered into a number of acquisitions andcompleted several divestments.
The acquisitions in 2008 primarily consisted of Genlyte Group Inc.(Genlyte), Respironics Inc. (Respironics) and VISICU Inc. (VISICU). Theremaining acquisitions, both individually and in the aggregate, weredeemed immaterial with respect to the IFRS 3 disclosure requirements.
Sales and income from operations related to activities divested in 2008,included in the Company’s Consolidated statement of income for 2008,amounted to EUR 176 million and nil, respectively.
The most significant acquisitions and divestments are summarized in thenext two tables and described in the paragraph below.
Acquisitionsnet cashoutflow
net assetsacquired1)
other intangibleassets goodwill
Genlyte 1,894 10 860 1,024
Respironics 3,196 (152) 1,186 2,162
VISICU 198 (10) 33 175
1) Net of cash acquired
Divestmentsinflow of cash
and otherassets1)
net assetsdivested
recognizedgain
Set-Top Boxes andConnectivity Solutions 742) (32) 42
Philips Speech RecognitionSystems 653) (20) 45
1) Net of cash divested2) Assets received in lieu of cash3) Of which EUR 22 million cash
GenlyteOn January 22, 2008, Philips completed the purchase of all outstandingshares of Genlyte, a leading manufacturer of lighting fixtures, controlsand related products for the commercial, industrial and residentialmarkets. Through this acquisition Philips established a solid platform forfurther growth in the area of energy-saving and green lightingtechnology. The acquisition created a leading position for Philips in theNorth American luminaires market. Philips paid a total net cashconsideration of EUR 1,894 million. This amount included the cost of331,627 shares previously acquired in August 2007, the pay-off ofcertain debt and the settlement of outstanding stock options. The net
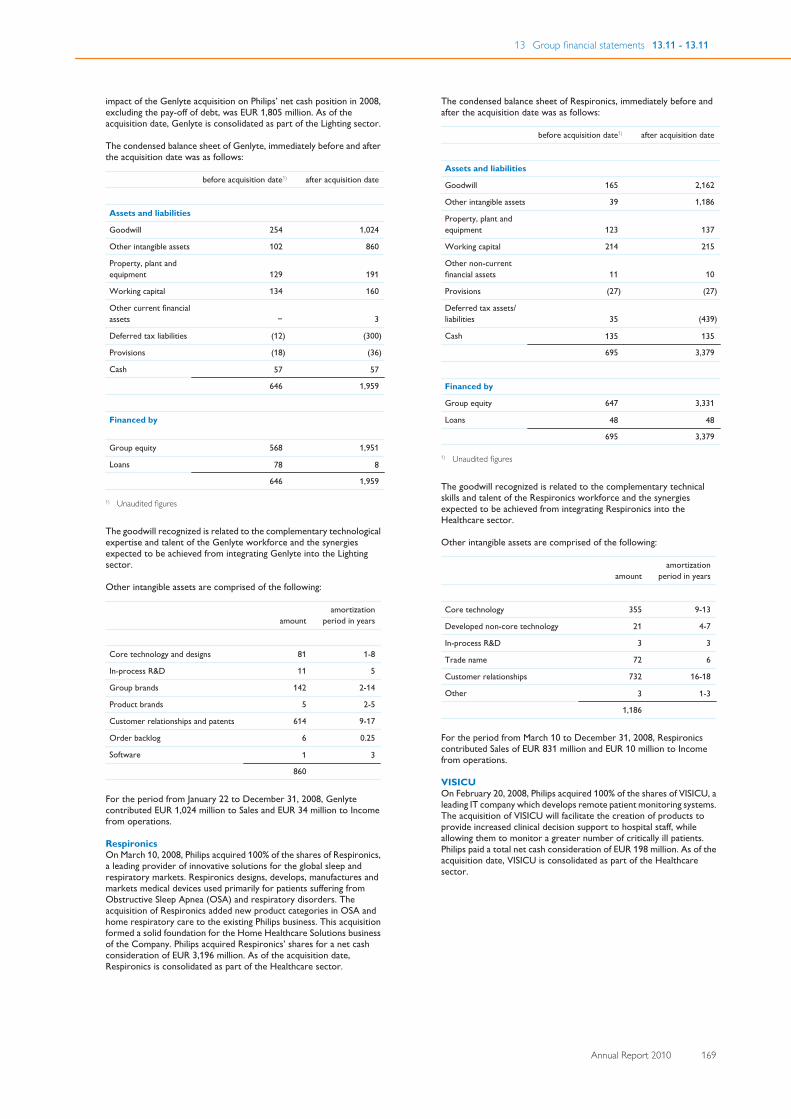
13 Group financial statements 13.11 - 13.11
Annual Report 2010 169
impact of the Genlyte acquisition on Philips’ net cash position in 2008,excluding the pay-off of debt, was EUR 1,805 million. As of theacquisition date, Genlyte is consolidated as part of the Lighting sector.
The condensed balance sheet of Genlyte, immediately before and afterthe acquisition date was as follows:
before acquisition date1) after acquisition date
Assets and liabilities
Goodwill 254 1,024
Other intangible assets 102 860
Property, plant andequipment 129 191
Working capital 134 160
Other current financialassets − 3
Deferred tax liabilities (12) (300)
Provisions (18) (36)
Cash 57 57
646 1,959
Financed by
Group equity 568 1,951
Loans 78 8
646 1,959
1) Unaudited figures
The goodwill recognized is related to the complementary technologicalexpertise and talent of the Genlyte workforce and the synergiesexpected to be achieved from integrating Genlyte into the Lightingsector.
Other intangible assets are comprised of the following:
amount amortization
period in years
Core technology and designs 81 1-8
In-process R&D 11 5
Group brands 142 2-14
Product brands 5 2-5
Customer relationships and patents 614 9-17
Order backlog 6 0.25
Software 1 3
860
For the period from January 22 to December 31, 2008, Genlytecontributed EUR 1,024 million to Sales and EUR 34 million to Incomefrom operations.
RespironicsOn March 10, 2008, Philips acquired 100% of the shares of Respironics,a leading provider of innovative solutions for the global sleep andrespiratory markets. Respironics designs, develops, manufactures andmarkets medical devices used primarily for patients suffering fromObstructive Sleep Apnea (OSA) and respiratory disorders. Theacquisition of Respironics added new product categories in OSA andhome respiratory care to the existing Philips business. This acquisitionformed a solid foundation for the Home Healthcare Solutions businessof the Company. Philips acquired Respironics’ shares for a net cashconsideration of EUR 3,196 million. As of the acquisition date,Respironics is consolidated as part of the Healthcare sector.
The condensed balance sheet of Respironics, immediately before andafter the acquisition date was as follows:
before acquisition date1) after acquisition date
Assets and liabilities
Goodwill 165 2,162
Other intangible assets 39 1,186
Property, plant andequipment 123 137
Working capital 214 215
Other non-currentfinancial assets 11 10
Provisions (27) (27)
Deferred tax assets/liabilities 35 (439)
Cash 135 135
695 3,379
Financed by
Group equity 647 3,331
Loans 48 48
695 3,379
1) Unaudited figures
The goodwill recognized is related to the complementary technicalskills and talent of the Respironics workforce and the synergiesexpected to be achieved from integrating Respironics into theHealthcare sector.
Other intangible assets are comprised of the following:
amount amortization
period in years
Core technology 355 9-13
Developed non-core technology 21 4-7
In-process R&D 3 3
Trade name 72 6
Customer relationships 732 16-18
Other 3 1-3
1,186
For the period from March 10 to December 31, 2008, Respironicscontributed Sales of EUR 831 million and EUR 10 million to Incomefrom operations.
VISICUOn February 20, 2008, Philips acquired 100% of the shares of VISICU, aleading IT company which develops remote patient monitoring systems.The acquisition of VISICU will facilitate the creation of products toprovide increased clinical decision support to hospital staff, whileallowing them to monitor a greater number of critically ill patients.Philips paid a total net cash consideration of EUR 198 million. As of theacquisition date, VISICU is consolidated as part of the Healthcaresector.
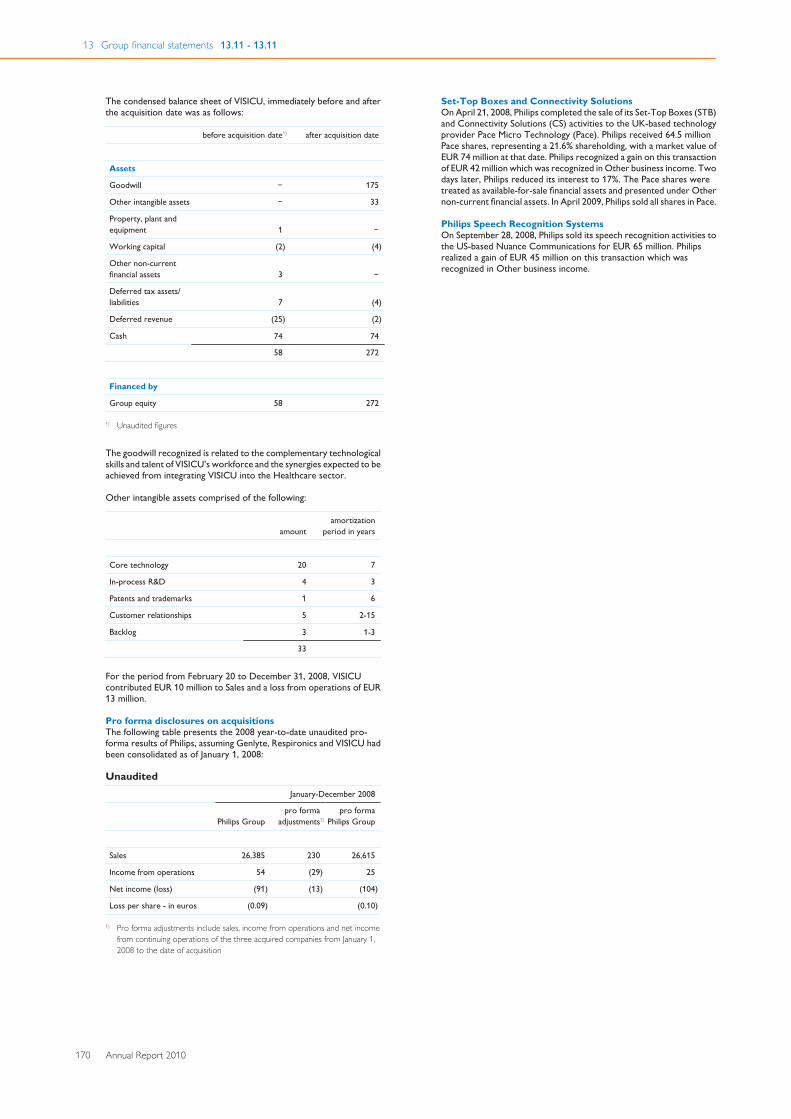
13 Group financial statements 13.11 - 13.11
170 Annual Report 2010
The condensed balance sheet of VISICU, immediately before and afterthe acquisition date was as follows:
before acquisition date1) after acquisition date
Assets
Goodwill − 175
Other intangible assets − 33
Property, plant andequipment 1 −
Working capital (2) (4)
Other non-currentfinancial assets 3 −
Deferred tax assets/liabilities 7 (4)
Deferred revenue (25) (2)
Cash 74 74
58 272
Financed by
Group equity 58 272
1) Unaudited figures
The goodwill recognized is related to the complementary technologicalskills and talent of VISICU’s workforce and the synergies expected to beachieved from integrating VISICU into the Healthcare sector.
Other intangible assets comprised of the following:
amount amortization
period in years
Core technology 20 7
In-process R&D 4 3
Patents and trademarks 1 6
Customer relationships 5 2-15
Backlog 3 1-3
33
For the period from February 20 to December 31, 2008, VISICUcontributed EUR 10 million to Sales and a loss from operations of EUR13 million.
Pro forma disclosures on acquisitionsThe following table presents the 2008 year-to-date unaudited pro-forma results of Philips, assuming Genlyte, Respironics and VISICU hadbeen consolidated as of January 1, 2008:
UnauditedJanuary-December 2008
Philips Group pro forma
adjustments1)pro forma
Philips Group
Sales 26,385 230 26,615
Income from operations 54 (29) 25
Net income (loss) (91) (13) (104)
Loss per share - in euros (0.09) (0.10)
1) Pro forma adjustments include sales, income from operations and net incomefrom continuing operations of the three acquired companies from January 1,2008 to the date of acquisition
Set-Top Boxes and Connectivity SolutionsOn April 21, 2008, Philips completed the sale of its Set-Top Boxes (STB)and Connectivity Solutions (CS) activities to the UK-based technologyprovider Pace Micro Technology (Pace). Philips received 64.5 millionPace shares, representing a 21.6% shareholding, with a market value ofEUR 74 million at that date. Philips recognized a gain on this transactionof EUR 42 million which was recognized in Other business income. Twodays later, Philips reduced its interest to 17%. The Pace shares weretreated as available-for-sale financial assets and presented under Othernon-current financial assets. In April 2009, Philips sold all shares in Pace.
Philips Speech Recognition SystemsOn September 28, 2008, Philips sold its speech recognition activities tothe US-based Nuance Communications for EUR 65 million. Philipsrealized a gain of EUR 45 million on this transaction which wasrecognized in Other business income.
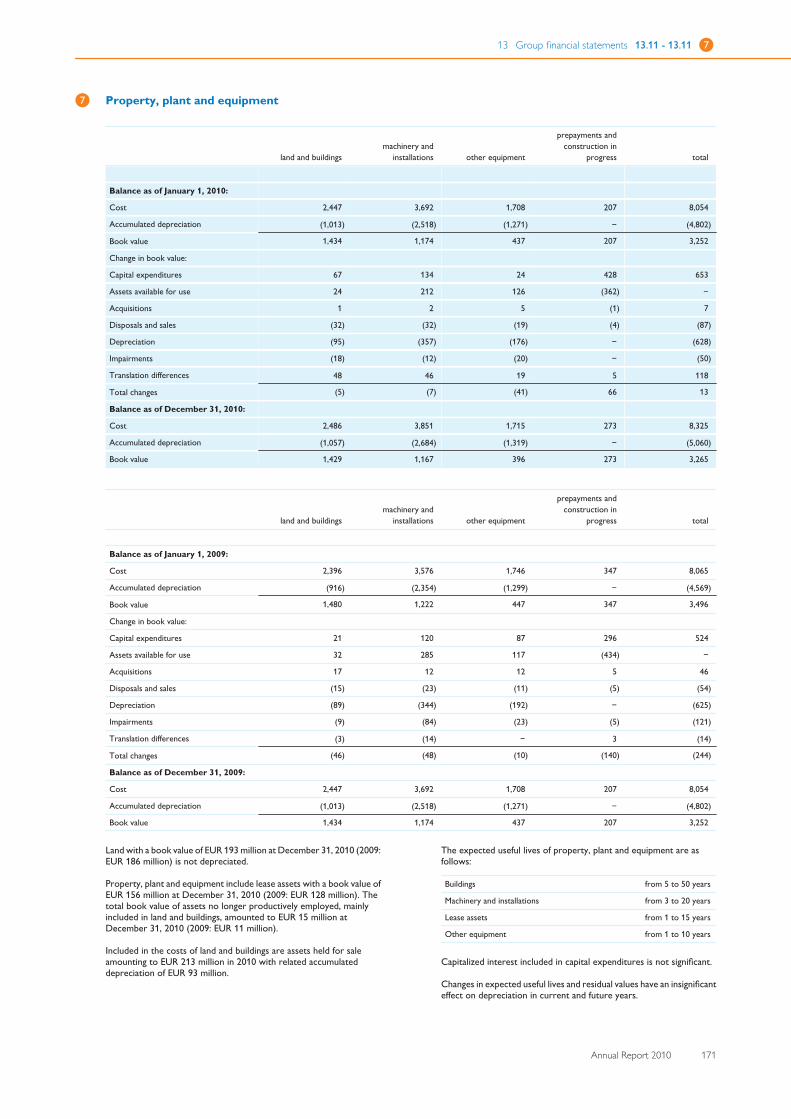
13 Group financial statements 13.11 - 13.11 7
Annual Report 2010 171
7 Property, plant and equipment
land and buildings machinery and
installations other equipment
prepayments andconstruction in
progress total
Balance as of January 1, 2010:
Cost 2,447 3,692 1,708 207 8,054
Accumulated depreciation (1,013) (2,518) (1,271) − (4,802)
Book value 1,434 1,174 437 207 3,252
Change in book value:
Capital expenditures 67 134 24 428 653
Assets available for use 24 212 126 (362) −
Acquisitions 1 2 5 (1) 7
Disposals and sales (32) (32) (19) (4) (87)
Depreciation (95) (357) (176) − (628)
Impairments (18) (12) (20) − (50)
Translation differences 48 46 19 5 118
Total changes (5) (7) (41) 66 13
Balance as of December 31, 2010:
Cost 2,486 3,851 1,715 273 8,325
Accumulated depreciation (1,057) (2,684) (1,319) − (5,060)
Book value 1,429 1,167 396 273 3,265
land and buildings machinery and
installations other equipment
prepayments andconstruction in
progress total
Balance as of January 1, 2009:
Cost 2,396 3,576 1,746 347 8,065
Accumulated depreciation (916) (2,354) (1,299) − (4,569)
Book value 1,480 1,222 447 347 3,496
Change in book value:
Capital expenditures 21 120 87 296 524
Assets available for use 32 285 117 (434) −
Acquisitions 17 12 12 5 46
Disposals and sales (15) (23) (11) (5) (54)
Depreciation (89) (344) (192) − (625)
Impairments (9) (84) (23) (5) (121)
Translation differences (3) (14) − 3 (14)
Total changes (46) (48) (10) (140) (244)
Balance as of December 31, 2009:
Cost 2,447 3,692 1,708 207 8,054
Accumulated depreciation (1,013) (2,518) (1,271) − (4,802)
Book value 1,434 1,174 437 207 3,252
Land with a book value of EUR 193 million at December 31, 2010 (2009:EUR 186 million) is not depreciated.
Property, plant and equipment include lease assets with a book value ofEUR 156 million at December 31, 2010 (2009: EUR 128 million). Thetotal book value of assets no longer productively employed, mainlyincluded in land and buildings, amounted to EUR 15 million atDecember 31, 2010 (2009: EUR 11 million).
Included in the costs of land and buildings are assets held for saleamounting to EUR 213 million in 2010 with related accumulateddepreciation of EUR 93 million.
The expected useful lives of property, plant and equipment are asfollows:
Buildings from 5 to 50 years
Machinery and installations from 3 to 20 years
Lease assets from 1 to 15 years
Other equipment from 1 to 10 years
Capitalized interest included in capital expenditures is not significant.
Changes in expected useful lives and residual values have an insignificanteffect on depreciation in current and future years.
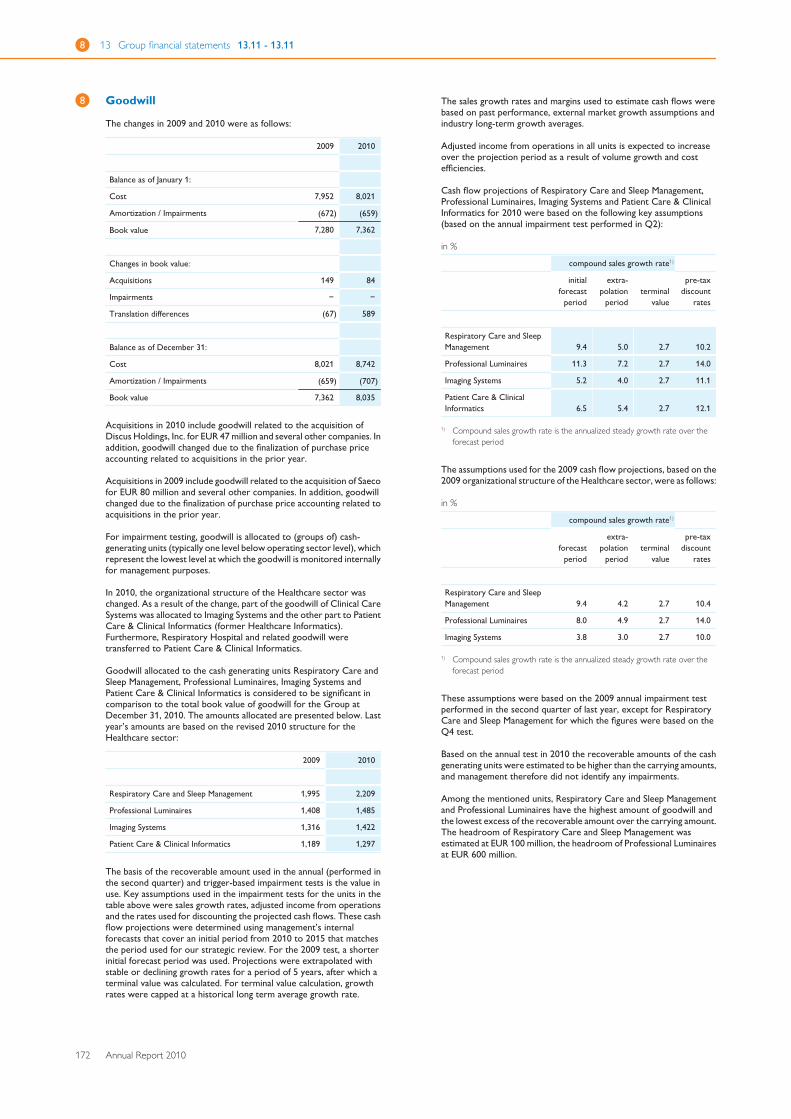
8 13 Group financial statements 13.11 - 13.11
172 Annual Report 2010
8 Goodwill
The changes in 2009 and 2010 were as follows:
2009 2010
Balance as of January 1:
Cost 7,952 8,021
Amortization / Impairments (672) (659)
Book value 7,280 7,362
Changes in book value:
Acquisitions 149 84
Impairments − −
Translation differences (67) 589
Balance as of December 31:
Cost 8,021 8,742
Amortization / Impairments (659) (707)
Book value 7,362 8,035
Acquisitions in 2010 include goodwill related to the acquisition ofDiscus Holdings, Inc. for EUR 47 million and several other companies. Inaddition, goodwill changed due to the finalization of purchase priceaccounting related to acquisitions in the prior year.
Acquisitions in 2009 include goodwill related to the acquisition of Saecofor EUR 80 million and several other companies. In addition, goodwillchanged due to the finalization of purchase price accounting related toacquisitions in the prior year.
For impairment testing, goodwill is allocated to (groups of) cash-generating units (typically one level below operating sector level), whichrepresent the lowest level at which the goodwill is monitored internallyfor management purposes.
In 2010, the organizational structure of the Healthcare sector waschanged. As a result of the change, part of the goodwill of Clinical CareSystems was allocated to Imaging Systems and the other part to PatientCare & Clinical Informatics (former Healthcare Informatics).Furthermore, Respiratory Hospital and related goodwill weretransferred to Patient Care & Clinical Informatics.
Goodwill allocated to the cash generating units Respiratory Care andSleep Management, Professional Luminaires, Imaging Systems andPatient Care & Clinical Informatics is considered to be significant incomparison to the total book value of goodwill for the Group atDecember 31, 2010. The amounts allocated are presented below. Lastyear’s amounts are based on the revised 2010 structure for theHealthcare sector:
2009 2010
Respiratory Care and Sleep Management 1,995 2,209
Professional Luminaires 1,408 1,485
Imaging Systems 1,316 1,422
Patient Care & Clinical Informatics 1,189 1,297
The basis of the recoverable amount used in the annual (performed inthe second quarter) and trigger-based impairment tests is the value inuse. Key assumptions used in the impairment tests for the units in thetable above were sales growth rates, adjusted income from operationsand the rates used for discounting the projected cash flows. These cashflow projections were determined using management’s internalforecasts that cover an initial period from 2010 to 2015 that matchesthe period used for our strategic review. For the 2009 test, a shorterinitial forecast period was used. Projections were extrapolated withstable or declining growth rates for a period of 5 years, after which aterminal value was calculated. For terminal value calculation, growthrates were capped at a historical long term average growth rate.
The sales growth rates and margins used to estimate cash flows werebased on past performance, external market growth assumptions andindustry long-term growth averages.
Adjusted income from operations in all units is expected to increaseover the projection period as a result of volume growth and costefficiencies.
Cash flow projections of Respiratory Care and Sleep Management,Professional Luminaires, Imaging Systems and Patient Care & ClinicalInformatics for 2010 were based on the following key assumptions(based on the annual impairment test performed in Q2):
in %
compound sales growth rate1)
initialforecast
period
extra-polation
period terminal
value
pre-taxdiscount
rates
Respiratory Care and SleepManagement 9.4 5.0 2.7 10.2
Professional Luminaires 11.3 7.2 2.7 14.0
Imaging Systems 5.2 4.0 2.7 11.1
Patient Care & ClinicalInformatics 6.5 5.4 2.7 12.1
1) Compound sales growth rate is the annualized steady growth rate over theforecast period
The assumptions used for the 2009 cash flow projections, based on the2009 organizational structure of the Healthcare sector, were as follows:
in %
compound sales growth rate1)
forecastperiod
extra-polation
period terminal
value
pre-taxdiscount
rates
Respiratory Care and SleepManagement 9.4 4.2 2.7 10.4
Professional Luminaires 8.0 4.9 2.7 14.0
Imaging Systems 3.8 3.0 2.7 10.0
1) Compound sales growth rate is the annualized steady growth rate over theforecast period
These assumptions were based on the 2009 annual impairment testperformed in the second quarter of last year, except for RespiratoryCare and Sleep Management for which the figures were based on theQ4 test.
Based on the annual test in 2010 the recoverable amounts of the cashgenerating units were estimated to be higher than the carrying amounts,and management therefore did not identify any impairments.
Among the mentioned units, Respiratory Care and Sleep Managementand Professional Luminaires have the highest amount of goodwill andthe lowest excess of the recoverable amount over the carrying amount.The headroom of Respiratory Care and Sleep Management wasestimated at EUR 100 million, the headroom of Professional Luminairesat EUR 600 million.
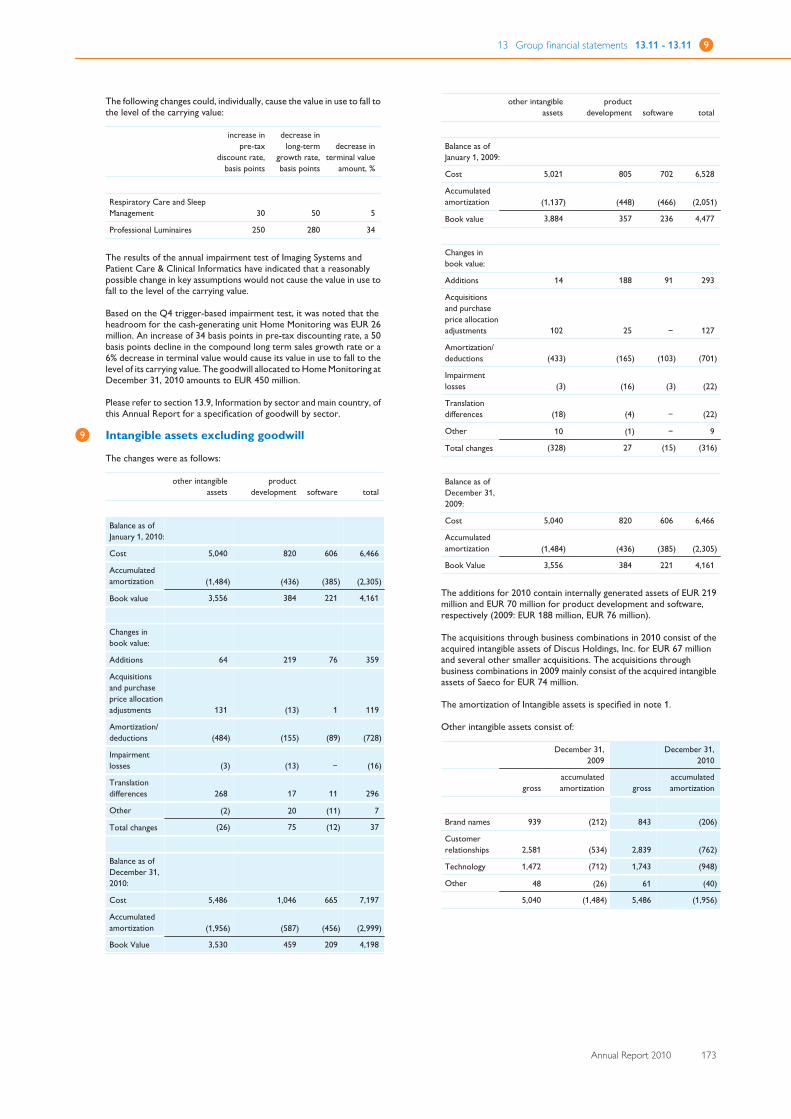
13 Group financial statements 13.11 - 13.11 9
Annual Report 2010 173
The following changes could, individually, cause the value in use to fall tothe level of the carrying value:
increase inpre-tax
discount rate,basis points
decrease inlong-term
growth rate,basis points
decrease interminal value
amount, %
Respiratory Care and SleepManagement 30 50 5
Professional Luminaires 250 280 34
The results of the annual impairment test of Imaging Systems andPatient Care & Clinical Informatics have indicated that a reasonablypossible change in key assumptions would not cause the value in use tofall to the level of the carrying value.
Based on the Q4 trigger-based impairment test, it was noted that theheadroom for the cash-generating unit Home Monitoring was EUR 26million. An increase of 34 basis points in pre-tax discounting rate, a 50basis points decline in the compound long term sales growth rate or a6% decrease in terminal value would cause its value in use to fall to thelevel of its carrying value. The goodwill allocated to Home Monitoring atDecember 31, 2010 amounts to EUR 450 million.
Please refer to section 13.9, Information by sector and main country, ofthis Annual Report for a specification of goodwill by sector.
9 Intangible assets excluding goodwill
The changes were as follows:
other intangibleassets
productdevelopment software total
Balance as ofJanuary 1, 2010:
Cost 5,040 820 606 6,466
Accumulatedamortization (1,484) (436) (385) (2,305)
Book value 3,556 384 221 4,161
Changes inbook value:
Additions 64 219 76 359
Acquisitionsand purchaseprice allocationadjustments 131 (13) 1 119
Amortization/deductions (484) (155) (89) (728)
Impairmentlosses (3) (13) − (16)
Translationdifferences 268 17 11 296
Other (2) 20 (11) 7
Total changes (26) 75 (12) 37
Balance as ofDecember 31,2010:
Cost 5,486 1,046 665 7,197
Accumulatedamortization (1,956) (587) (456) (2,999)
Book Value 3,530 459 209 4,198
other intangibleassets
productdevelopment software total
Balance as ofJanuary 1, 2009:
Cost 5,021 805 702 6,528
Accumulatedamortization (1,137) (448) (466) (2,051)
Book value 3,884 357 236 4,477
Changes inbook value:
Additions 14 188 91 293
Acquisitionsand purchaseprice allocationadjustments 102 25 − 127
Amortization/deductions (433) (165) (103) (701)
Impairmentlosses (3) (16) (3) (22)
Translationdifferences (18) (4) − (22)
Other 10 (1) − 9
Total changes (328) 27 (15) (316)
Balance as ofDecember 31,2009:
Cost 5,040 820 606 6,466
Accumulatedamortization (1,484) (436) (385) (2,305)
Book Value 3,556 384 221 4,161
The additions for 2010 contain internally generated assets of EUR 219million and EUR 70 million for product development and software,respectively (2009: EUR 188 million, EUR 76 million).
The acquisitions through business combinations in 2010 consist of theacquired intangible assets of Discus Holdings, Inc. for EUR 67 millionand several other smaller acquisitions. The acquisitions throughbusiness combinations in 2009 mainly consist of the acquired intangibleassets of Saeco for EUR 74 million.
The amortization of Intangible assets is specified in note 1.
Other intangible assets consist of:
December 31,
2009 December 31,
2010
gross accumulatedamortization gross
accumulatedamortization
Brand names 939 (212) 843 (206)
Customerrelationships 2,581 (534) 2,839 (762)
Technology 1,472 (712) 1,743 (948)
Other 48 (26) 61 (40)
5,040 (1,484) 5,486 (1,956)
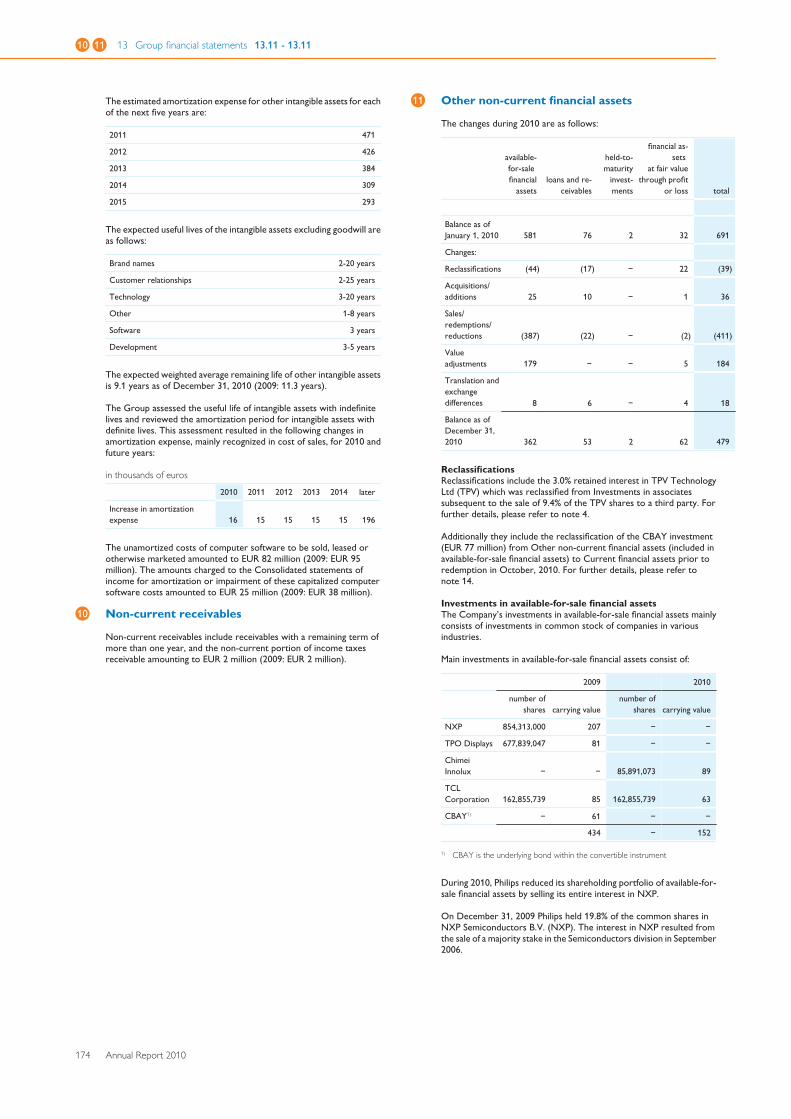
10 11 13 Group financial statements 13.11 - 13.11
174 Annual Report 2010
The estimated amortization expense for other intangible assets for eachof the next five years are:
2011 471
2012 426
2013 384
2014 309
2015 293
The expected useful lives of the intangible assets excluding goodwill areas follows:
Brand names 2-20 years
Customer relationships 2-25 years
Technology 3-20 years
Other 1-8 years
Software 3 years
Development 3-5 years
The expected weighted average remaining life of other intangible assetsis 9.1 years as of December 31, 2010 (2009: 11.3 years).
The Group assessed the useful life of intangible assets with indefinitelives and reviewed the amortization period for intangible assets withdefinite lives. This assessment resulted in the following changes inamortization expense, mainly recognized in cost of sales, for 2010 andfuture years:
in thousands of euros
2010 2011 2012 2013 2014 later
Increase in amortizationexpense 16 15 15 15 15 196
The unamortized costs of computer software to be sold, leased orotherwise marketed amounted to EUR 82 million (2009: EUR 95million). The amounts charged to the Consolidated statements ofincome for amortization or impairment of these capitalized computersoftware costs amounted to EUR 25 million (2009: EUR 38 million).
10 Non-current receivables
Non-current receivables include receivables with a remaining term ofmore than one year, and the non-current portion of income taxesreceivable amounting to EUR 2 million (2009: EUR 2 million).
11 Other non-current financial assets
The changes during 2010 are as follows:
available-for-sale financial
assets loans and re-
ceivables
held-to-maturity
invest-ments
financial as-sets
at fair valuethrough profit
or loss total
Balance as ofJanuary 1, 2010 581 76 2 32 691
Changes:
Reclassifications (44) (17) − 22 (39)
Acquisitions/additions 25 10 − 1 36
Sales/redemptions/reductions (387) (22) − (2) (411)
Valueadjustments 179 − − 5 184
Translation andexchangedifferences 8 6 − 4 18
Balance as ofDecember 31,2010 362 53 2 62 479
ReclassificationsReclassifications include the 3.0% retained interest in TPV TechnologyLtd (TPV) which was reclassified from Investments in associatessubsequent to the sale of 9.4% of the TPV shares to a third party. Forfurther details, please refer to note 4.
Additionally they include the reclassification of the CBAY investment(EUR 77 million) from Other non-current financial assets (included inavailable-for-sale financial assets) to Current financial assets prior toredemption in October, 2010. For further details, please refer tonote 14.
Investments in available-for-sale financial assetsThe Company’s investments in available-for-sale financial assets mainlyconsists of investments in common stock of companies in variousindustries.
Main investments in available-for-sale financial assets consist of:
2009 2010
number ofshares carrying value
number ofshares carrying value
NXP 854,313,000 207 − −
TPO Displays 677,839,047 81 − −
ChimeiInnolux − − 85,891,073 89
TCLCorporation 162,855,739 85 162,855,739 63
CBAY1) − 61 − −
434 − 152
1) CBAY is the underlying bond within the convertible instrument
During 2010, Philips reduced its shareholding portfolio of available-for-sale financial assets by selling its entire interest in NXP.
On December 31, 2009 Philips held 19.8% of the common shares inNXP Semiconductors B.V. (NXP). The interest in NXP resulted fromthe sale of a majority stake in the Semiconductors division in September2006.
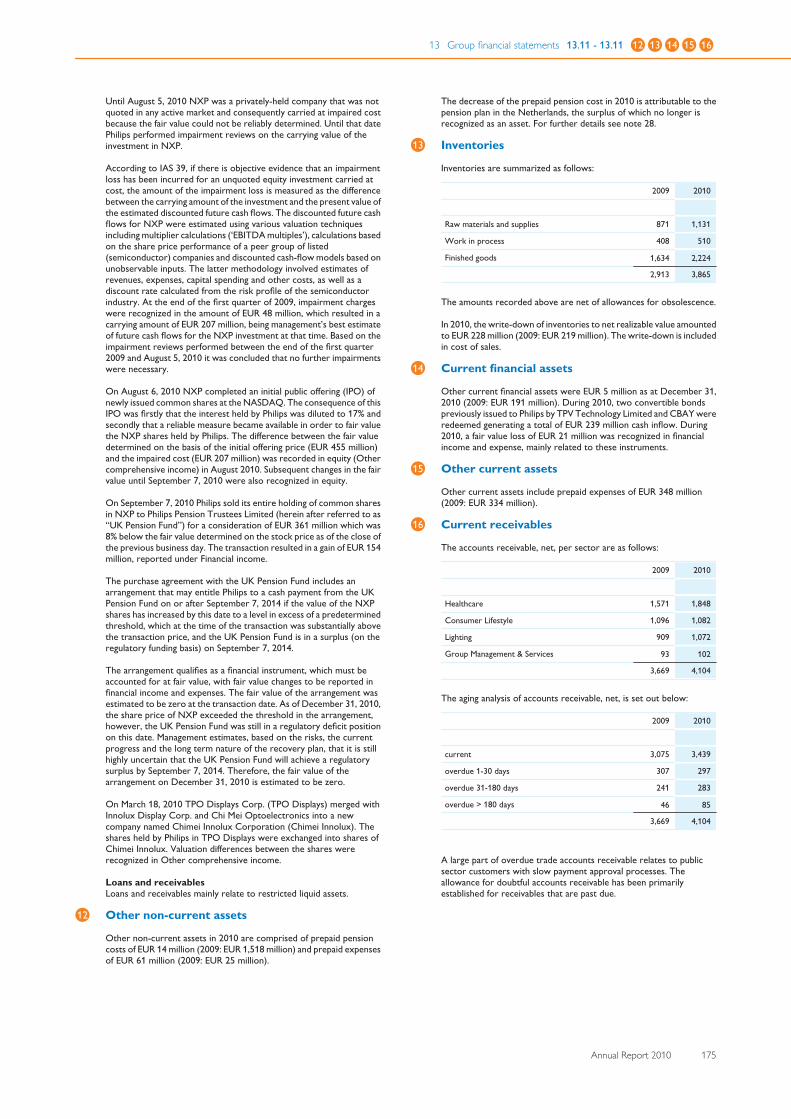
13 Group financial statements 13.11 - 13.11 12 13 14 15 16
Annual Report 2010 175
Until August 5, 2010 NXP was a privately-held company that was notquoted in any active market and consequently carried at impaired costbecause the fair value could not be reliably determined. Until that datePhilips performed impairment reviews on the carrying value of theinvestment in NXP.
According to IAS 39, if there is objective evidence that an impairmentloss has been incurred for an unquoted equity investment carried atcost, the amount of the impairment loss is measured as the differencebetween the carrying amount of the investment and the present value ofthe estimated discounted future cash flows. The discounted future cashflows for NXP were estimated using various valuation techniquesincluding multiplier calculations (‘EBITDA multiples’), calculations basedon the share price performance of a peer group of listed(semiconductor) companies and discounted cash-flow models based onunobservable inputs. The latter methodology involved estimates ofrevenues, expenses, capital spending and other costs, as well as adiscount rate calculated from the risk profile of the semiconductorindustry. At the end of the first quarter of 2009, impairment chargeswere recognized in the amount of EUR 48 million, which resulted in acarrying amount of EUR 207 million, being management’s best estimateof future cash flows for the NXP investment at that time. Based on theimpairment reviews performed between the end of the first quarter2009 and August 5, 2010 it was concluded that no further impairmentswere necessary.
On August 6, 2010 NXP completed an initial public offering (IPO) ofnewly issued common shares at the NASDAQ. The consequence of thisIPO was firstly that the interest held by Philips was diluted to 17% andsecondly that a reliable measure became available in order to fair valuethe NXP shares held by Philips. The difference between the fair valuedetermined on the basis of the initial offering price (EUR 455 million)and the impaired cost (EUR 207 million) was recorded in equity (Othercomprehensive income) in August 2010. Subsequent changes in the fairvalue until September 7, 2010 were also recognized in equity.
On September 7, 2010 Philips sold its entire holding of common sharesin NXP to Philips Pension Trustees Limited (herein after referred to as“UK Pension Fund”) for a consideration of EUR 361 million which was8% below the fair value determined on the stock price as of the close ofthe previous business day. The transaction resulted in a gain of EUR 154million, reported under Financial income.
The purchase agreement with the UK Pension Fund includes anarrangement that may entitle Philips to a cash payment from the UKPension Fund on or after September 7, 2014 if the value of the NXPshares has increased by this date to a level in excess of a predeterminedthreshold, which at the time of the transaction was substantially abovethe transaction price, and the UK Pension Fund is in a surplus (on theregulatory funding basis) on September 7, 2014.
The arrangement qualifies as a financial instrument, which must beaccounted for at fair value, with fair value changes to be reported infinancial income and expenses. The fair value of the arrangement wasestimated to be zero at the transaction date. As of December 31, 2010,the share price of NXP exceeded the threshold in the arrangement,however, the UK Pension Fund was still in a regulatory deficit positionon this date. Management estimates, based on the risks, the currentprogress and the long term nature of the recovery plan, that it is stillhighly uncertain that the UK Pension Fund will achieve a regulatorysurplus by September 7, 2014. Therefore, the fair value of thearrangement on December 31, 2010 is estimated to be zero.
On March 18, 2010 TPO Displays Corp. (TPO Displays) merged withInnolux Display Corp. and Chi Mei Optoelectronics into a newcompany named Chimei Innolux Corporation (Chimei Innolux). Theshares held by Philips in TPO Displays were exchanged into shares ofChimei Innolux. Valuation differences between the shares wererecognized in Other comprehensive income.
Loans and receivablesLoans and receivables mainly relate to restricted liquid assets.
12 Other non-current assets
Other non-current assets in 2010 are comprised of prepaid pensioncosts of EUR 14 million (2009: EUR 1,518 million) and prepaid expensesof EUR 61 million (2009: EUR 25 million).
The decrease of the prepaid pension cost in 2010 is attributable to thepension plan in the Netherlands, the surplus of which no longer isrecognized as an asset. For further details see note 28.
13 Inventories
Inventories are summarized as follows:
2009 2010
Raw materials and supplies 871 1,131
Work in process 408 510
Finished goods 1,634 2,224
2,913 3,865
The amounts recorded above are net of allowances for obsolescence.
In 2010, the write-down of inventories to net realizable value amountedto EUR 228 million (2009: EUR 219 million). The write-down is includedin cost of sales.
14 Current financial assets
Other current financial assets were EUR 5 million as at December 31,2010 (2009: EUR 191 million). During 2010, two convertible bondspreviously issued to Philips by TPV Technology Limited and CBAY wereredeemed generating a total of EUR 239 million cash inflow. During2010, a fair value loss of EUR 21 million was recognized in financialincome and expense, mainly related to these instruments.
15 Other current assets
Other current assets include prepaid expenses of EUR 348 million(2009: EUR 334 million).
16 Current receivables
The accounts receivable, net, per sector are as follows:
2009 2010
Healthcare 1,571 1,848
Consumer Lifestyle 1,096 1,082
Lighting 909 1,072
Group Management & Services 93 102
3,669 4,104
The aging analysis of accounts receivable, net, is set out below:
2009 2010
current 3,075 3,439
overdue 1-30 days 307 297
overdue 31-180 days 241 283
overdue > 180 days 46 85
3,669 4,104
A large part of overdue trade accounts receivable relates to publicsector customers with slow payment approval processes. Theallowance for doubtful accounts receivable has been primarilyestablished for receivables that are past due.
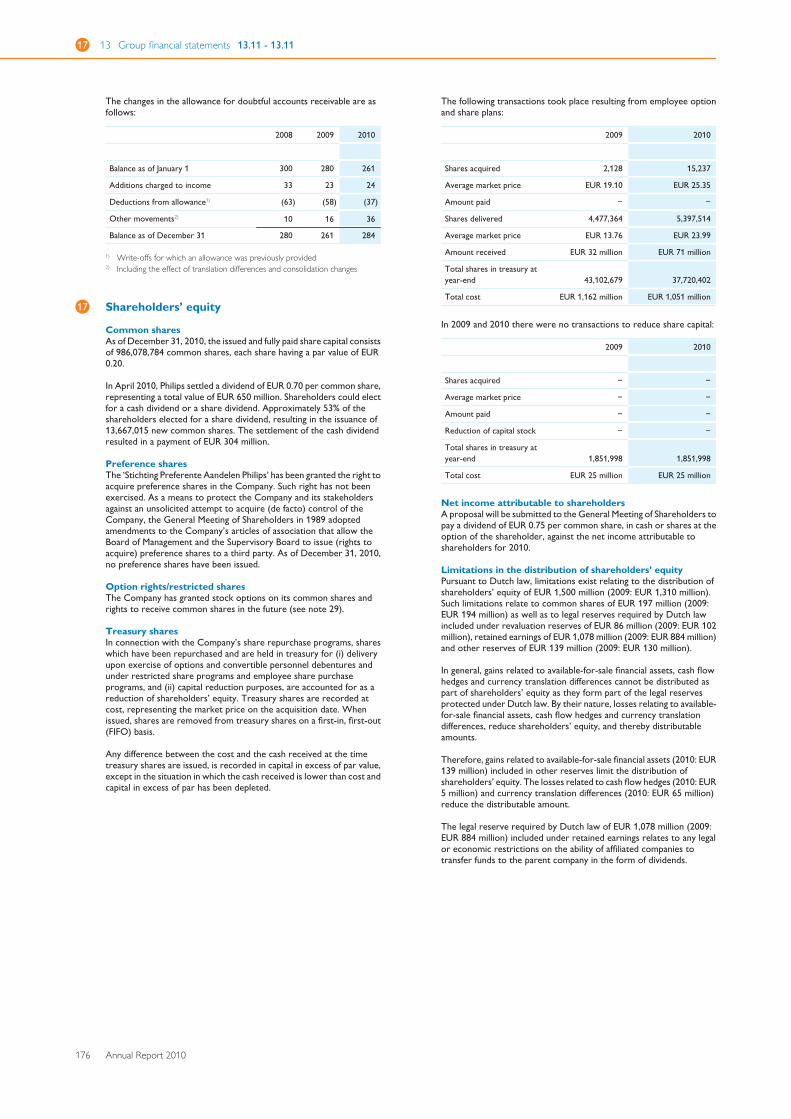
17 13 Group financial statements 13.11 - 13.11
176 Annual Report 2010
The changes in the allowance for doubtful accounts receivable are asfollows:
2008 2009 2010
Balance as of January 1 300 280 261
Additions charged to income 33 23 24
Deductions from allowance1) (63) (58) (37)
Other movements2) 10 16 36
Balance as of December 31 280 261 284
1) Write-offs for which an allowance was previously provided2) Including the effect of translation differences and consolidation changes
17 Shareholders’ equity
Common sharesAs of December 31, 2010, the issued and fully paid share capital consistsof 986,078,784 common shares, each share having a par value of EUR0.20.
In April 2010, Philips settled a dividend of EUR 0.70 per common share,representing a total value of EUR 650 million. Shareholders could electfor a cash dividend or a share dividend. Approximately 53% of theshareholders elected for a share dividend, resulting in the issuance of13,667,015 new common shares. The settlement of the cash dividendresulted in a payment of EUR 304 million.
Preference sharesThe ‘Stichting Preferente Aandelen Philips’ has been granted the right toacquire preference shares in the Company. Such right has not beenexercised. As a means to protect the Company and its stakeholdersagainst an unsolicited attempt to acquire (de facto) control of theCompany, the General Meeting of Shareholders in 1989 adoptedamendments to the Company’s articles of association that allow theBoard of Management and the Supervisory Board to issue (rights toacquire) preference shares to a third party. As of December 31, 2010,no preference shares have been issued.
Option rights/restricted sharesThe Company has granted stock options on its common shares andrights to receive common shares in the future (see note 29).
Treasury sharesIn connection with the Company’s share repurchase programs, shareswhich have been repurchased and are held in treasury for (i) deliveryupon exercise of options and convertible personnel debentures andunder restricted share programs and employee share purchaseprograms, and (ii) capital reduction purposes, are accounted for as areduction of shareholders’ equity. Treasury shares are recorded atcost, representing the market price on the acquisition date. Whenissued, shares are removed from treasury shares on a first-in, first-out(FIFO) basis.
Any difference between the cost and the cash received at the timetreasury shares are issued, is recorded in capital in excess of par value,except in the situation in which the cash received is lower than cost andcapital in excess of par has been depleted.
The following transactions took place resulting from employee optionand share plans:
2009 2010
Shares acquired 2,128 15,237
Average market price EUR 19.10 EUR 25.35
Amount paid − −
Shares delivered 4,477,364 5,397,514
Average market price EUR 13.76 EUR 23.99
Amount received EUR 32 million EUR 71 million
Total shares in treasury atyear-end 43,102,679 37,720,402
Total cost EUR 1,162 million EUR 1,051 million
In 2009 and 2010 there were no transactions to reduce share capital:
2009 2010
Shares acquired − −
Average market price − −
Amount paid − −
Reduction of capital stock − −
Total shares in treasury atyear-end 1,851,998 1,851,998
Total cost EUR 25 million EUR 25 million
Net income attributable to shareholdersA proposal will be submitted to the General Meeting of Shareholders topay a dividend of EUR 0.75 per common share, in cash or shares at theoption of the shareholder, against the net income attributable toshareholders for 2010.
Limitations in the distribution of shareholders’ equityPursuant to Dutch law, limitations exist relating to the distribution ofshareholders’ equity of EUR 1,500 million (2009: EUR 1,310 million).Such limitations relate to common shares of EUR 197 million (2009:EUR 194 million) as well as to legal reserves required by Dutch lawincluded under revaluation reserves of EUR 86 million (2009: EUR 102million), retained earnings of EUR 1,078 million (2009: EUR 884 million)and other reserves of EUR 139 million (2009: EUR 130 million).
In general, gains related to available-for-sale financial assets, cash flowhedges and currency translation differences cannot be distributed aspart of shareholders’ equity as they form part of the legal reservesprotected under Dutch law. By their nature, losses relating to available-for-sale financial assets, cash flow hedges and currency translationdifferences, reduce shareholders’ equity, and thereby distributableamounts.
Therefore, gains related to available-for-sale financial assets (2010: EUR139 million) included in other reserves limit the distribution ofshareholders’ equity. The losses related to cash flow hedges (2010: EUR5 million) and currency translation differences (2010: EUR 65 million)reduce the distributable amount.
The legal reserve required by Dutch law of EUR 1,078 million (2009: EUR 884 million) included under retained earnings relates to any legalor economic restrictions on the ability of affiliated companies totransfer funds to the parent company in the form of dividends.
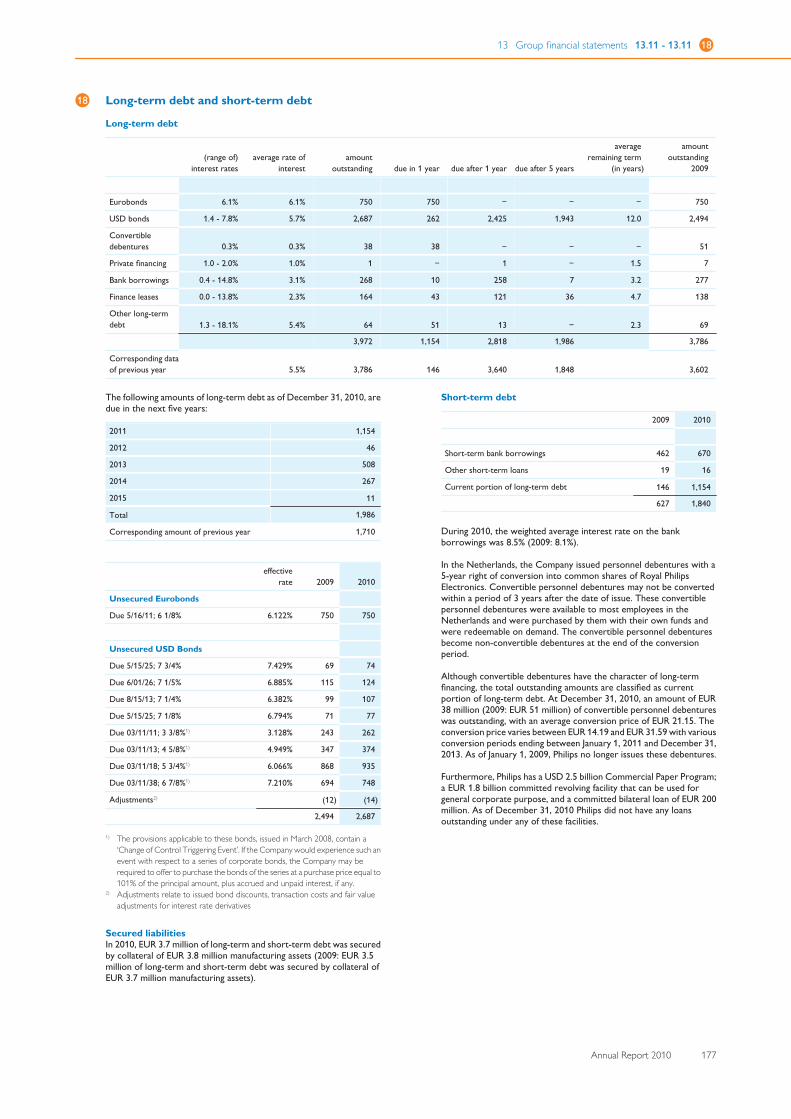
13 Group financial statements 13.11 - 13.11 18
Annual Report 2010 177
18 Long-term debt and short-term debt
Long-term debt
(range of)interest rates
average rate ofinterest
amountoutstanding due in 1 year due after 1 year due after 5 years
averageremaining term
(in years)
amountoutstanding
2009
Eurobonds 6.1% 6.1% 750 750 − − − 750
USD bonds 1.4 - 7.8% 5.7% 2,687 262 2,425 1,943 12.0 2,494
Convertibledebentures 0.3% 0.3% 38 38 − − − 51
Private financing 1.0 - 2.0% 1.0% 1 − 1 − 1.5 7
Bank borrowings 0.4 - 14.8% 3.1% 268 10 258 7 3.2 277
Finance leases 0.0 - 13.8% 2.3% 164 43 121 36 4.7 138
Other long-termdebt 1.3 - 18.1% 5.4% 64 51 13 − 2.3 69
3,972 1,154 2,818 1,986 3,786
Corresponding dataof previous year 5.5% 3,786 146 3,640 1,848 3,602
The following amounts of long-term debt as of December 31, 2010, aredue in the next five years:
2011 1,154
2012 46
2013 508
2014 267
2015 11
Total 1,986
Corresponding amount of previous year 1,710
effectiverate 2009 2010
Unsecured Eurobonds
Due 5/16/11; 6 1/8% 6.122% 750 750
Unsecured USD Bonds
Due 5/15/25; 7 3/4% 7.429% 69 74
Due 6/01/26; 7 1/5% 6.885% 115 124
Due 8/15/13; 7 1/4% 6.382% 99 107
Due 5/15/25; 7 1/8% 6.794% 71 77
Due 03/11/11; 3 3/8%1) 3.128% 243 262
Due 03/11/13; 4 5/8%1) 4.949% 347 374
Due 03/11/18; 5 3/4%1) 6.066% 868 935
Due 03/11/38; 6 7/8%1) 7.210% 694 748
Adjustments2) (12) (14)
2,494 2,687
1) The provisions applicable to these bonds, issued in March 2008, contain a‘Change of Control Triggering Event’. If the Company would experience such anevent with respect to a series of corporate bonds, the Company may berequired to offer to purchase the bonds of the series at a purchase price equal to101% of the principal amount, plus accrued and unpaid interest, if any.
2) Adjustments relate to issued bond discounts, transaction costs and fair valueadjustments for interest rate derivatives
Secured liabilitiesIn 2010, EUR 3.7 million of long-term and short-term debt was securedby collateral of EUR 3.8 million manufacturing assets (2009: EUR 3.5million of long-term and short-term debt was secured by collateral ofEUR 3.7 million manufacturing assets).
Short-term debt
2009 2010
Short-term bank borrowings 462 670
Other short-term loans 19 16
Current portion of long-term debt 146 1,154
627 1,840
During 2010, the weighted average interest rate on the bankborrowings was 8.5% (2009: 8.1%).
In the Netherlands, the Company issued personnel debentures with a5-year right of conversion into common shares of Royal PhilipsElectronics. Convertible personnel debentures may not be convertedwithin a period of 3 years after the date of issue. These convertiblepersonnel debentures were available to most employees in theNetherlands and were purchased by them with their own funds andwere redeemable on demand. The convertible personnel debenturesbecome non-convertible debentures at the end of the conversionperiod.
Although convertible debentures have the character of long-termfinancing, the total outstanding amounts are classified as currentportion of long-term debt. At December 31, 2010, an amount of EUR38 million (2009: EUR 51 million) of convertible personnel debentureswas outstanding, with an average conversion price of EUR 21.15. Theconversion price varies between EUR 14.19 and EUR 31.59 with variousconversion periods ending between January 1, 2011 and December 31,2013. As of January 1, 2009, Philips no longer issues these debentures.
Furthermore, Philips has a USD 2.5 billion Commercial Paper Program;a EUR 1.8 billion committed revolving facility that can be used forgeneral corporate purpose, and a committed bilateral loan of EUR 200million. As of December 31, 2010 Philips did not have any loansoutstanding under any of these facilities.
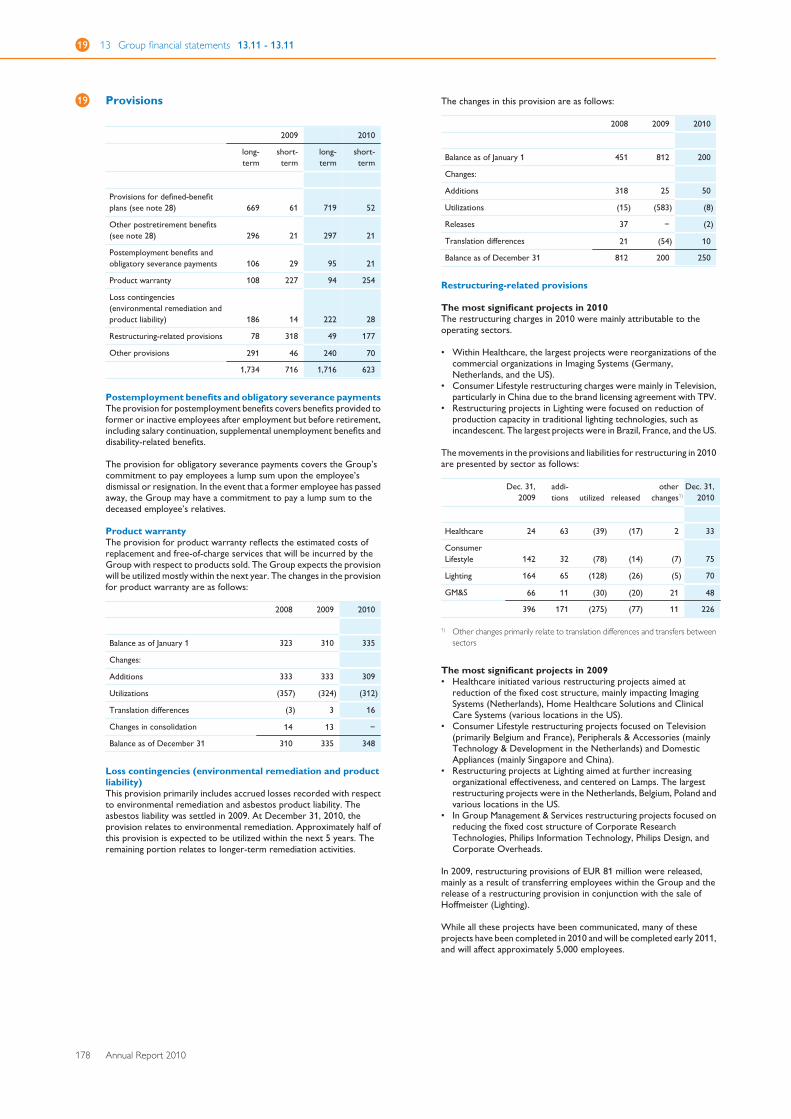
19 13 Group financial statements 13.11 - 13.11
178 Annual Report 2010
19 Provisions
2009 2010
long-term
short-term
long-term
short-term
Provisions for defined-benefitplans (see note 28) 669 61 719 52
Other postretirement benefits(see note 28) 296 21 297 21
Postemployment benefits andobligatory severance payments 106 29 95 21
Product warranty 108 227 94 254
Loss contingencies(environmental remediation andproduct liability) 186 14 222 28
Restructuring-related provisions 78 318 49 177
Other provisions 291 46 240 70
1,734 716 1,716 623
Postemployment benefits and obligatory severance paymentsThe provision for postemployment benefits covers benefits provided toformer or inactive employees after employment but before retirement,including salary continuation, supplemental unemployment benefits anddisability-related benefits.
The provision for obligatory severance payments covers the Group’scommitment to pay employees a lump sum upon the employee’sdismissal or resignation. In the event that a former employee has passedaway, the Group may have a commitment to pay a lump sum to thedeceased employee’s relatives.
Product warrantyThe provision for product warranty reflects the estimated costs ofreplacement and free-of-charge services that will be incurred by theGroup with respect to products sold. The Group expects the provisionwill be utilized mostly within the next year. The changes in the provisionfor product warranty are as follows:
2008 2009 2010
Balance as of January 1 323 310 335
Changes:
Additions 333 333 309
Utilizations (357) (324) (312)
Translation differences (3) 3 16
Changes in consolidation 14 13 −
Balance as of December 31 310 335 348
Loss contingencies (environmental remediation and productliability)This provision primarily includes accrued losses recorded with respectto environmental remediation and asbestos product liability. Theasbestos liability was settled in 2009. At December 31, 2010, theprovision relates to environmental remediation. Approximately half ofthis provision is expected to be utilized within the next 5 years. Theremaining portion relates to longer-term remediation activities.
The changes in this provision are as follows:
2008 2009 2010
Balance as of January 1 451 812 200
Changes:
Additions 318 25 50
Utilizations (15) (583) (8)
Releases 37 − (2)
Translation differences 21 (54) 10
Balance as of December 31 812 200 250
Restructuring-related provisions
The most significant projects in 2010The restructuring charges in 2010 were mainly attributable to theoperating sectors.
• Within Healthcare, the largest projects were reorganizations of thecommercial organizations in Imaging Systems (Germany,Netherlands, and the US).
• Consumer Lifestyle restructuring charges were mainly in Television,particularly in China due to the brand licensing agreement with TPV.
• Restructuring projects in Lighting were focused on reduction ofproduction capacity in traditional lighting technologies, such asincandescent. The largest projects were in Brazil, France, and the US.
The movements in the provisions and liabilities for restructuring in 2010are presented by sector as follows:
Dec. 31,2009
addi-tions utilized released
otherchanges1)
Dec. 31,2010
Healthcare 24 63 (39) (17) 2 33
Consumer Lifestyle 142 32 (78) (14) (7) 75
Lighting 164 65 (128) (26) (5) 70
GM&S 66 11 (30) (20) 21 48
396 171 (275) (77) 11 226
1) Other changes primarily relate to translation differences and transfers betweensectors
The most significant projects in 2009• Healthcare initiated various restructuring projects aimed at
reduction of the fixed cost structure, mainly impacting ImagingSystems (Netherlands), Home Healthcare Solutions and ClinicalCare Systems (various locations in the US).
• Consumer Lifestyle restructuring projects focused on Television(primarily Belgium and France), Peripherals & Accessories (mainlyTechnology & Development in the Netherlands) and DomesticAppliances (mainly Singapore and China).
• Restructuring projects at Lighting aimed at further increasingorganizational effectiveness, and centered on Lamps. The largestrestructuring projects were in the Netherlands, Belgium, Poland andvarious locations in the US.
• In Group Management & Services restructuring projects focused onreducing the fixed cost structure of Corporate ResearchTechnologies, Philips Information Technology, Philips Design, andCorporate Overheads.
In 2009, restructuring provisions of EUR 81 million were released,mainly as a result of transferring employees within the Group and therelease of a restructuring provision in conjunction with the sale ofHoffmeister (Lighting).
While all these projects have been communicated, many of theseprojects have been completed in 2010 and will be completed early 2011,and will affect approximately 5,000 employees.
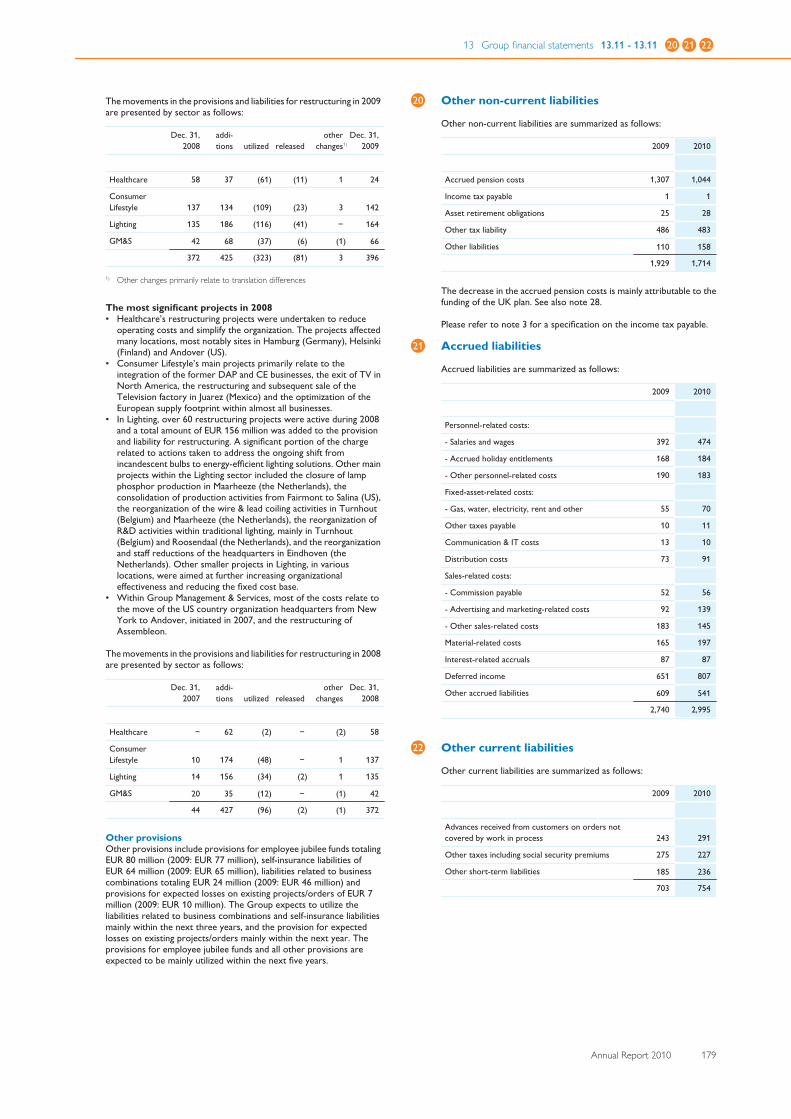
13 Group financial statements 13.11 - 13.11 20 21 22
Annual Report 2010 179
The movements in the provisions and liabilities for restructuring in 2009are presented by sector as follows:
Dec. 31,2008
addi-tions utilized released
otherchanges1)
Dec. 31,2009
Healthcare 58 37 (61) (11) 1 24
ConsumerLifestyle 137 134 (109) (23) 3 142
Lighting 135 186 (116) (41) − 164
GM&S 42 68 (37) (6) (1) 66
372 425 (323) (81) 3 396
1) Other changes primarily relate to translation differences
The most significant projects in 2008• Healthcare’s restructuring projects were undertaken to reduce
operating costs and simplify the organization. The projects affectedmany locations, most notably sites in Hamburg (Germany), Helsinki(Finland) and Andover (US).
• Consumer Lifestyle’s main projects primarily relate to theintegration of the former DAP and CE businesses, the exit of TV inNorth America, the restructuring and subsequent sale of theTelevision factory in Juarez (Mexico) and the optimization of theEuropean supply footprint within almost all businesses.
• In Lighting, over 60 restructuring projects were active during 2008and a total amount of EUR 156 million was added to the provisionand liability for restructuring. A significant portion of the chargerelated to actions taken to address the ongoing shift fromincandescent bulbs to energy-efficient lighting solutions. Other mainprojects within the Lighting sector included the closure of lampphosphor production in Maarheeze (the Netherlands), theconsolidation of production activities from Fairmont to Salina (US),the reorganization of the wire & lead coiling activities in Turnhout(Belgium) and Maarheeze (the Netherlands), the reorganization ofR&D activities within traditional lighting, mainly in Turnhout(Belgium) and Roosendaal (the Netherlands), and the reorganizationand staff reductions of the headquarters in Eindhoven (theNetherlands). Other smaller projects in Lighting, in variouslocations, were aimed at further increasing organizationaleffectiveness and reducing the fixed cost base.
• Within Group Management & Services, most of the costs relate tothe move of the US country organization headquarters from NewYork to Andover, initiated in 2007, and the restructuring ofAssembleon.
The movements in the provisions and liabilities for restructuring in 2008are presented by sector as follows:
Dec. 31,2007
addi-tions utilized released
otherchanges
Dec. 31,2008
Healthcare − 62 (2) − (2) 58
ConsumerLifestyle 10 174 (48) − 1 137
Lighting 14 156 (34) (2) 1 135
GM&S 20 35 (12) − (1) 42
44 427 (96) (2) (1) 372
Other provisionsOther provisions include provisions for employee jubilee funds totalingEUR 80 million (2009: EUR 77 million), self-insurance liabilities ofEUR 64 million (2009: EUR 65 million), liabilities related to businesscombinations totaling EUR 24 million (2009: EUR 46 million) andprovisions for expected losses on existing projects/orders of EUR 7million (2009: EUR 10 million). The Group expects to utilize theliabilities related to business combinations and self-insurance liabilitiesmainly within the next three years, and the provision for expectedlosses on existing projects/orders mainly within the next year. Theprovisions for employee jubilee funds and all other provisions areexpected to be mainly utilized within the next five years.
20 Other non-current liabilities
Other non-current liabilities are summarized as follows:
2009 2010
Accrued pension costs 1,307 1,044
Income tax payable 1 1
Asset retirement obligations 25 28
Other tax liability 486 483
Other liabilities 110 158
1,929 1,714
The decrease in the accrued pension costs is mainly attributable to thefunding of the UK plan. See also note 28.
Please refer to note 3 for a specification on the income tax payable.
21 Accrued liabilities
Accrued liabilities are summarized as follows:
2009 2010
Personnel-related costs:
- Salaries and wages 392 474
- Accrued holiday entitlements 168 184
- Other personnel-related costs 190 183
Fixed-asset-related costs:
- Gas, water, electricity, rent and other 55 70
Other taxes payable 10 11
Communication & IT costs 13 10
Distribution costs 73 91
Sales-related costs:
- Commission payable 52 56
- Advertising and marketing-related costs 92 139
- Other sales-related costs 183 145
Material-related costs 165 197
Interest-related accruals 87 87
Deferred income 651 807
Other accrued liabilities 609 541
2,740 2,995
22 Other current liabilities
Other current liabilities are summarized as follows:
2009 2010
Advances received from customers on orders notcovered by work in process 243 291
Other taxes including social security premiums 275 227
Other short-term liabilities 185 236
703 754
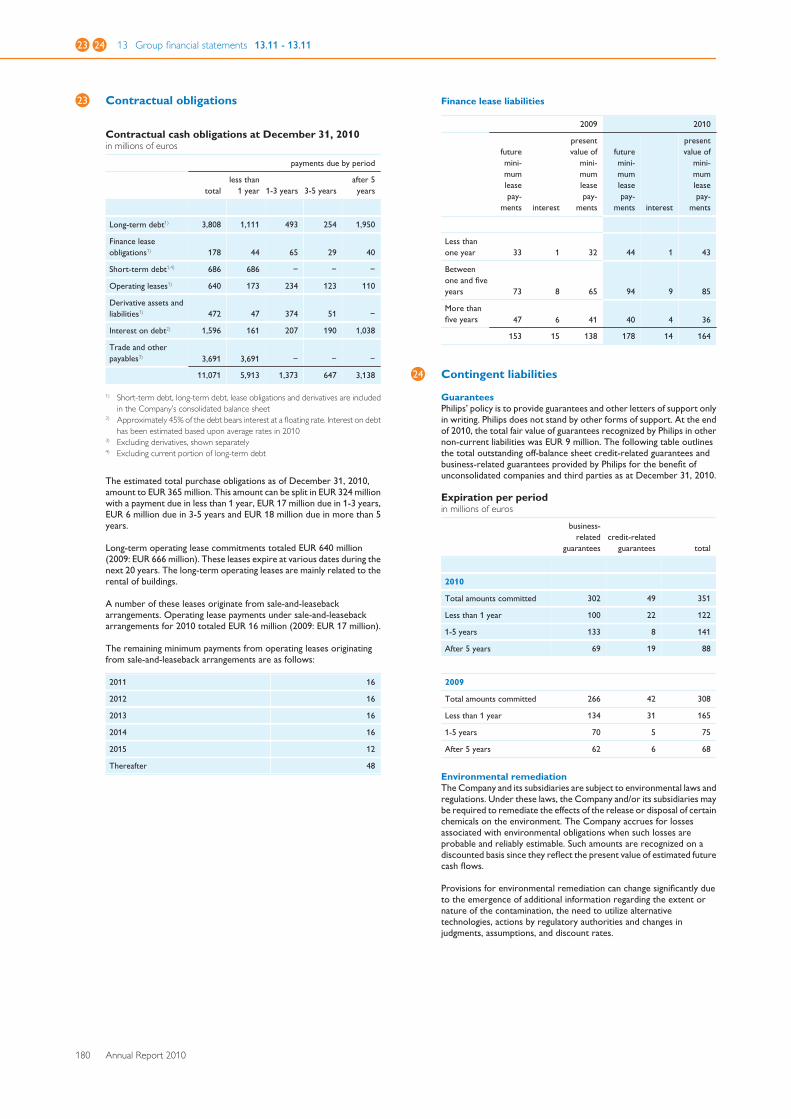
23 24 13 Group financial statements 13.11 - 13.11
180 Annual Report 2010
23 Contractual obligations
Contractual cash obligations at December 31, 2010in millions of euros
payments due by period
total less than
1 year 1-3 years 3-5 years after 5years
Long-term debt1) 3,808 1,111 493 254 1,950
Finance leaseobligations1) 178 44 65 29 40
Short-term debt1,4) 686 686 − − −
Operating leases1) 640 173 234 123 110
Derivative assets andliabilities1) 472 47 374 51 −
Interest on debt2) 1,596 161 207 190 1,038
Trade and otherpayables3) 3,691 3,691 − − −
11,071 5,913 1,373 647 3,138
1) Short-term debt, long-term debt, lease obligations and derivatives are includedin the Company’s consolidated balance sheet
2) Approximately 45% of the debt bears interest at a floating rate. Interest on debthas been estimated based upon average rates in 2010
3) Excluding derivatives, shown separately4) Excluding current portion of long-term debt
The estimated total purchase obligations as of December 31, 2010,amount to EUR 365 million. This amount can be split in EUR 324 millionwith a payment due in less than 1 year, EUR 17 million due in 1-3 years,EUR 6 million due in 3-5 years and EUR 18 million due in more than 5years.
Long-term operating lease commitments totaled EUR 640 million(2009: EUR 666 million). These leases expire at various dates during thenext 20 years. The long-term operating leases are mainly related to therental of buildings.
A number of these leases originate from sale-and-leasebackarrangements. Operating lease payments under sale-and-leasebackarrangements for 2010 totaled EUR 16 million (2009: EUR 17 million).
The remaining minimum payments from operating leases originatingfrom sale-and-leaseback arrangements are as follows:
2011 16
2012 16
2013 16
2014 16
2015 12
Thereafter 48
Finance lease liabilities
2009 2010
futuremini-mumleasepay-
ments interest
presentvalue of
mini-mumleasepay-
ments
futuremini-mumleasepay-
ments interest
presentvalue of
mini-mumleasepay-
ments
Less thanone year 33 1 32 44 1 43
Betweenone and fiveyears 73 8 65 94 9 85
More thanfive years 47 6 41 40 4 36
153 15 138 178 14 164
24 Contingent liabilities
GuaranteesPhilips’ policy is to provide guarantees and other letters of support onlyin writing. Philips does not stand by other forms of support. At the endof 2010, the total fair value of guarantees recognized by Philips in othernon-current liabilities was EUR 9 million. The following table outlinesthe total outstanding off-balance sheet credit-related guarantees andbusiness-related guarantees provided by Philips for the benefit ofunconsolidated companies and third parties as at December 31, 2010.
Expiration per periodin millions of euros
business-related
guarantees credit-related
guarantees total
2010
Total amounts committed 302 49 351
Less than 1 year 100 22 122
1-5 years 133 8 141
After 5 years 69 19 88
2009
Total amounts committed 266 42 308
Less than 1 year 134 31 165
1-5 years 70 5 75
After 5 years 62 6 68
Environmental remediationThe Company and its subsidiaries are subject to environmental laws andregulations. Under these laws, the Company and/or its subsidiaries maybe required to remediate the effects of the release or disposal of certainchemicals on the environment. The Company accrues for lossesassociated with environmental obligations when such losses areprobable and reliably estimable. Such amounts are recognized on adiscounted basis since they reflect the present value of estimated futurecash flows.
Provisions for environmental remediation can change significantly dueto the emergence of additional information regarding the extent ornature of the contamination, the need to utilize alternativetechnologies, actions by regulatory authorities and changes injudgments, assumptions, and discount rates.
13 Group financial statements 13.11 - 13.11
Annual Report 2010 181
The Company and/or its subsidiaries have recognized environmentalremediation provisions for sites in various countries. In the UnitedStates, subsidiaries of the Company have been named as potentiallyresponsible parties in state and federal proceedings for the clean-up ofcertain sites.
Legal proceedingsThe Company and certain of its group companies and former groupcompanies are involved as a party in legal proceedings, includingregulatory and other governmental proceedings, including discussionson potential remedial actions, relating to such matters as competitionissues, commercial transactions, product liability, participations andenvironmental pollution. In respect of antitrust laws, the Company andcertain of its (former) group companies are involved in investigations bycompetition law authorities in several jurisdictions and are engaged inlitigation in this respect. Since the ultimate disposition of asserted claimsand proceedings and investigations cannot be predicted with certainty,an adverse outcome could have a material adverse effect on theCompany’s consolidated financial position, results of operations andcash flows.
Provided below are disclosures of the more significant cases:
LG DisplayOn December 11, 2006, LG Display Co. Ltd (formerly LG Philips LCDCo. Ltd.), a company in which the Company then held a minoritycommon stock interest, announced that officials from the Korean FairTrade Commission had visited the offices of LG Display and that it hadreceived a subpoena from the United States Department of Justice(DOJ) and a similar notice from the Japanese Fair Trade Commission inconnection with inquiries by those regulators into possibleanticompetitive conduct in the LCD industry. The Company sold itsremaining shareholding in LG Display on March 11, 2009 andsubsequently no longer holds shares in LG Display.
On March 6, 2009, the Washington State Attorney General’s Office(the ‘Washington AG’) issued a Civil Investigative Demand (CID) toPhilips Electronics North America Corporation (PENAC) pursuant towhich PENAC was requested, among other things, to producedocuments and to provide answers to interrogatories concerning thesale of thin-film transistor liquid crystal display panels (TFT-LCD panels)and the sale of TFT-LCD products. PENAC was also requested toprovide to the Washington AG any documents previously produced tothe DOJ as part of the DOJ’s ongoing investigation into the TFT-LCDindustry. After discussions with the Washington AG, the WashingtonAG agreed to allow PENAC, instead of responding to the CID, toprovide the limited amount of aggregate sales data and component datathat was previously provided to the plaintiffs in the direct purchaserplaintiff’s class action. On March 27, 2009, PENAC produced thatinformation to the Washington AG. Thereafter, PENAC provided thesame information to the Missouri Attorney General’s Office and theIllinois Attorney General’s Office in response to a CID and subpoenaissued, respectively, on March 18, 2009 and April 2, 2009 to PENAC.
On May 28, 2009, the Company received a Statement of Objectionsfrom the European Commission. In this document the EuropeanCommission alleges that the Company is jointly and severally liable forthe anticompetitive conduct of LG Display, in the market of LCDs, forthe period in which the Company, according to the EuropeanCommission, exercised joint control. On July 28, 2009, the Companyfiled its Reply to the Statement of Objections, in which it vigorouslyopposed this allegation. On December 8, 2010, the EuropeanCommission announced its decision and imposed fines on six LCDpanel producers but not on the Company. No Philips group companywas an addressee of the decision and, as such, no finding of anti-competitive behavior has been made against any Philips group company.On February 11, 2011, the European Commission has formally closedthe proceedings against the Company.
Subsequent to the public announcement of these inquiries, certainPhilips group companies were named as defendants in a number of classaction antitrust complaints filed in the United States courts, seeking,among other things, damages on behalf of purchasers of productsincorporating TFT-LCD panels, based on alleged anticompetitiveconduct by manufacturers of such panels. Those lawsuits wereconsolidated in two master actions in the United States District Courtfor the Northern District of California: one, asserting a claim underfederal antitrust law, on behalf of direct purchasers of TFT-LCD panelsand products containing such panels, and another, asserting claimsunder federal antitrust law, as well as various state antitrust and unfaircompetition laws, on behalf of indirect purchasers of such panels and
products. On November 5, 2007 and September 10, 2008, theCompany and certain other companies within the Philips groupcompanies that were named as defendants in various of the originalcomplaints entered into agreements with the indirect purchaserplaintiffs and the direct purchaser plaintiffs, respectively, that generallytoll the statutes of limitations applicable to plaintiffs’ claims, followingwhich the plaintiffs agreed to dismiss without prejudice the claimsagainst the Philips defendants. On December 5, 2008, following thepartial grant of motions to dismiss consolidated class action complaintsin the master actions, the plaintiffs filed amended consolidated classaction complaints, asserting essentially the same legal claims as thosealleged in the prior complaints. On December 2, 2009, the directpurchaser plaintiffs filed a third consolidated class action complaintunder seal. None of the companies within the Philips group ofcompanies currently is named as a defendant in the pending amendedcomplaints, although the Company and PENAC are named as co-conspirators with named defendants in the indirect purchaser case, butthe litigation is continuing.
In addition, a number of plaintiffs have filed separate, individual actionsalleging essentially the same claims as those asserted in the class actions.The Company and PENAC are named as defendants in the actionsbrought by Best Buy Co. Inc. (and related entities) and CostcoWholesale Corporation, and PENAC also is named as a defendant inthe action brought by Nokia Corporation and Nokia, Inc. Most of theseactions have been designated as related to the consolidated actionsalready pending before Judge Illston in the United States District Courtfor the Northern District of California and have been consolidated forpre-trial purposes with the class actions.
On November 23, 2009, Nokia Corporation also filed a claim in the UKcourts against 25 defendants including three Philips entities (KoninklijkePhilips Electronics N.V., Philips Components B.V. and PhilipsComponents International B.V.). Nokia Corporation is seekingdamages in respect of alleged losses it suffered as a result of allegedanti-competitive behavior of manufacturers of LCD-TFT panels.
Due to the considerable uncertainty associated with these matters, onthe basis of current knowledge, the Company has concluded thatpotential losses cannot be reliably estimated with respect to thesematters. An adverse final resolution of these investigations and litigationcould have a materially adverse effect on the Company’s consolidatedfinancial position, results of operations and cash flows.
Cathode-Ray Tubes (CRT)On November 21, 2007, the Company announced that competition lawauthorities in several jurisdictions have commenced investigations intopossible anticompetitive activities in the Cathode-Ray Tubes, or CRTindustry. As one of the companies that formerly was active in the CRTbusiness, Philips is subject to a number of these ongoing investigations.The Company has assisted the regulatory authorities in theseinvestigations. In November 2009, the European Commission sent aStatement of Objections to Philips, indicating that it intends to holdPhilips liable for antitrust infringements in the CRT industry. On May, 26and May, 27, 2010, Philips presented its defense at the Oral Hearing.The EC decision is expected sometime in 2011. In the US, theDepartment of Justice has deferred Philips’ obligation to respond to thegrand jury subpoena Philips received in November of 2007. On August27, 2010, the Czech competition authority issued a decision in which itheld that the Company had been engaged in anticompetitive activitieswith respect to Color Picture Tubes in the Czech Republic betweenSeptember 21, 1999 and June 30, 2001. This decision is currently underappeal. No fine was imposed because the statute of limitation for theimposition of fine had expired.
Subsequent to the public announcement of these investigations in 2007,certain Philips group companies were named as defendants in over 50class action antitrust complaints filed in various federal district courts inthe United States. These actions allege anticompetitive conduct bymanufacturers of CRTs and seek treble damages on behalf of direct andindirect purchasers of CRTs and products incorporating CRTs. Thesecomplaints assert claims under federal antitrust law, as well as variousstate antitrust and unfair competition laws and may involve joint andseveral liability among the named defendants. These actions have beenconsolidated by the Judicial Panel for Multidistrict Litigation for pre-trialproceedings in the United States District Court for the NorthernDistrict of California.
On March 30, 2010, the District Court adopted the Special Master’sReport and Recommendation denying the bulk of the motions todismiss filed on behalf of all Philips entities in response to both the direct
25 26 27 28 13 Group financial statements 13.11 - 13.11
182 Annual Report 2010
and indirect purchaser actions in the federal class actions pending in theNorthern District of California. These cases have now proceeded todiscovery. The Court has not set a trial date and there is no timetablefor the resolution of these cases. Philips intends to continue tovigorously defend these lawsuits.
Certain Philips group companies have also been named as defendants, inproposed class proceedings in Ontario, Quebec and British Columbia,Canada and in proceedings in the UK Court, along with numerous otherparticipants in the industry. Philips intends to vigorously oppose theseclaims, and the proceedings remain at a preliminary stage. In Canada,the plaintiffs have reached a settlement with the Chunghwa defendants,and the settlement is awaiting final court approval. At this time, no classproceeding has been certified as against the Philips defendants and nostatement of defense has been filed.
Due to the considerable uncertainty associated with these matters, onthe basis of current knowledge, the Company has concluded thatpotential losses cannot be reliably estimated with respect to thesematters. An adverse final resolution of these investigations and litigationcould have a materially adverse effect on the Company’s consolidatedfinancial position, results of operations and cash flows.
Optical Disc Drive (ODD)On October 27, 2009, the Antitrust Division of the United StatesDepartment of Justice confirmed that it had initiated an investigationinto possible anticompetitive practices in the Optical Disc Drive (ODD)industry. Philips Lite-On Digital Solutions Corp. (PLDS), a joint ventureowned by the Company and Lite-On IT Corporation, as an ODDmarket participant, is included in this investigation. PLDS is also subjectto similar investigations outside the US relating to the ODD market.PLDS and Philips intend to cooperate with the authorities in theseinvestigations.
Subsequent to the public announcement of these investigations in 2009,the Company, PLDS and Philips & Lite-On Digital Solutions USA, Inc.,were named as defendants in eight class action antitrust complaints filedin various federal district courts in the United States. These actionsallege anticompetitive conduct by manufacturers of ODDs and seektreble damages on behalf of direct and indirect purchasers of ODDs andproducts incorporating ODDs. These complaints assert claims underfederal antitrust law, as well as various state antitrust and unfaircompetition laws and may involve joint and several liability among thenamed defendants. These actions have been consolidated by the JudicialPanel for Multidistrict Litigation for pre-trial proceedings in the UnitedStates District Court for the Northern District of California.
Consolidated amended complaints were filed on August 26, 2010.Motions to dismiss these complaints have been filed by various otherdefendants and a hearing has been set. The motions seek to dismiss allclaims against these defendants on various grounds. The Company,PLDS and Philips & Lite-On Digital Solutions USA, Inc. have not yet beenrequired to move to dismiss or otherwise respond to the consolidatedamended complaints. Discovery is being permitted to move forward,but is in preliminary stages. Philips intends to vigorously defend theseactions.
The Company and certain Philips group companies have also beennamed as defendants, in proposed class proceedings in Ontario,Quebec and British Columbia, Canada along with numerous otherparticipants in the industry. These complaints assert claims againstvarious ODD manufacturers under federal competition laws as well astort laws and may involve joint and several liability among the nameddefendants. Philips intends to vigorously defend these lawsuits.
These matters are in their initial stages and due to the considerableuncertainty associated with these matters, on the basis of currentknowledge, the Company has concluded that potential losses cannot bereliably estimated with respect to these matters. An adverse finalresolution of these investigations and litigation could have a materiallyadverse effect on the Company’s consolidated financial position, resultsof operations and cash flows.
Philips PolskaIn connection with an indictment issued by authorities in Poland inDecember 2009 against numerous individuals, including three formeremployees of Philips Polska sp. z.o.o., involved in the sale of medicalequipment to hospitals in Poland, Philips has been conducting a reviewof certain activities related to sales of medical equipment for potentialviolations of the U.S. Foreign Corrupt Practices Act (FCPA). Philips hasreported the review to the U.S. Department of Justice and the U.S.
Securities and Exchange Commission and is cooperating with theseauthorities in connection with the review. Potential penalties forviolations of the FCPA and related statutes and regulations includemonetary penalties and criminal sanctions. The Company cannot at thistime quantify meaningfully the possible loss or range of loss to whichthis matter may give rise.
25 Cash from (used for) derivatives and securities
A total of EUR 25 million cash was paid with respect to foreign exchangederivative contracts related to financing activities (2009: EUR 35 millioninflow; 2008: EUR 337 million inflow).
Cash flow from interest-related derivatives is part of cash flow fromoperating activities. During 2010, there was no cash flow in relation tothese derivatives (2009: EUR nil million; 2008: EUR 28 million cashoutflow).
26 Proceeds from non-current financial assets
In 2010, the redemption of TPV and CBAY convertible bonds generatedcash totaling EUR 239 million.
In 2009, the sale of Philips’ interests in LG Display and Pace MicroTechnology generated cash totaling EUR 704 million.
In 2008, the sale of TSMC shares, LG Display shares, D&M and PaceMicro Technology shares generated cash totaling EUR 2,553 million.
27 Assets in lieu of cash from sale of businesses
In August 2010, the Company acquired a 49.9% interest in ShapewaysInc. in exchange for the transfer of certain Consumer Lifestyleincubator activities, which represented a value of EUR 3 million at thedate of the closing of that transaction.
In 2009, the Company received only cash as consideration inconnection with the sale of businesses.
In April 2008, the Company acquired 64.5 million shares in Pace MicroTechnology in exchange for the transfer of the Company’s Set-TopBoxes and Connectivity Solutions activities, which represented a valueof EUR 74 million at the date of the closing of that transaction. The Paceshares were sold on April 17, 2009.
In August 2008, Philips transferred its 69.5% ownership in MedQuist toCBAY. A part of the consideration was settled through the issuance of aconvertible bond by CBAY which represented a fair value of EUR 53million at the date of the closing of the transaction. The convertiblebond, included in Other non-current financial assets, was redeemed onOctober 15, 2010.
In September 2008, Philips acquired a 33.5% interest in PrimeTechnology Ventures III in exchange for the transfer of seven incubatoractivities which represented a value of EUR 21 million at the date of theclosing of that transaction.
28 Pensions and other postretirement benefits
Defined-benefit plans: pensionsEmployee pension plans have been established in many countries inaccordance with the legal requirements, customs and the local situationin the countries involved. The Company also sponsors a number ofdefined-benefit pension plans. The benefits provided by these plans arebased on employees’ years of service and compensation levels. Themeasurement date for all defined-benefit plans is December 31.
The Company’s contributions to the funding of defined-benefit pensionplans are determined based upon various factors, including minimumcontribution requirements, as established by local government, legaland tax considerations as well as local customs.
Funding of the UK Pension planIn 2010, the employer contributions contain a cash neutral EUR 361million contribution being the value of the Company’s full NXP stakesold in September to the Philips UK Pension Fund as part of a recoveryplan. The purchase agreement includes an arrangement which is furtherdescribed in note 11.
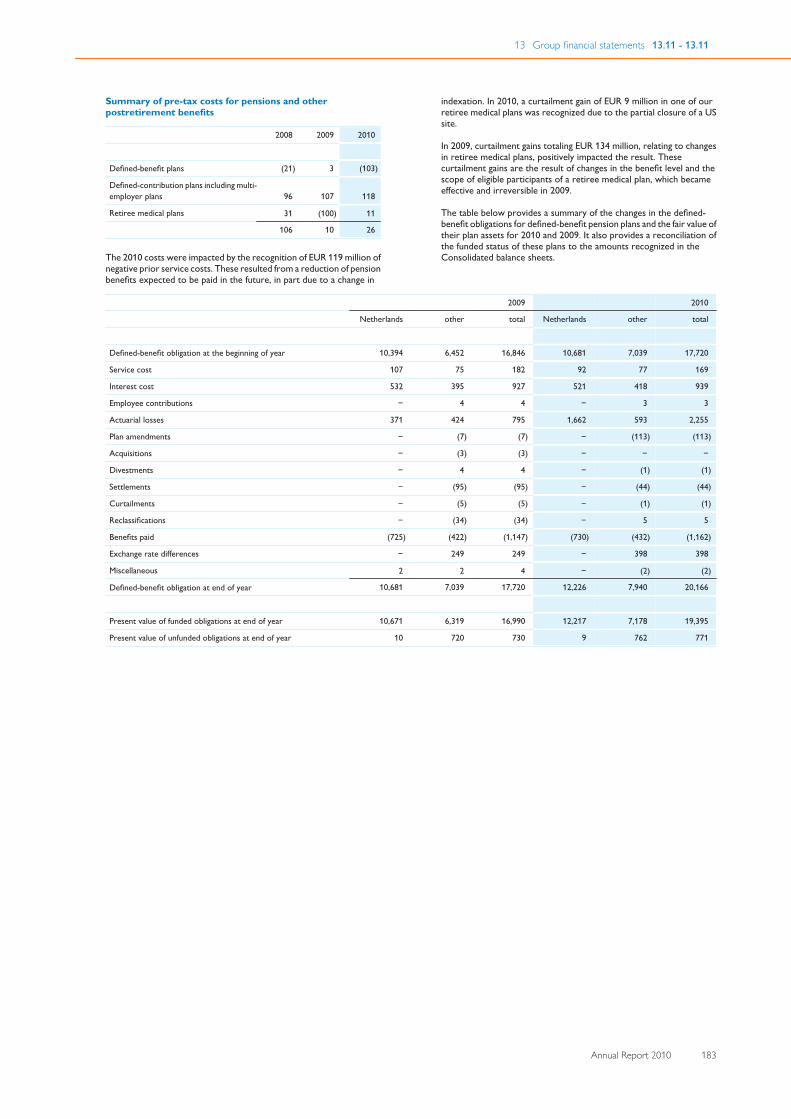
13 Group financial statements 13.11 - 13.11
Annual Report 2010 183
Summary of pre-tax costs for pensions and otherpostretirement benefits
2008 2009 2010
Defined-benefit plans (21) 3 (103)
Defined-contribution plans including multi-employer plans 96 107 118
Retiree medical plans 31 (100) 11
106 10 26
The 2010 costs were impacted by the recognition of EUR 119 million ofnegative prior service costs. These resulted from a reduction of pensionbenefits expected to be paid in the future, in part due to a change in
indexation. In 2010, a curtailment gain of EUR 9 million in one of ourretiree medical plans was recognized due to the partial closure of a USsite.
In 2009, curtailment gains totaling EUR 134 million, relating to changesin retiree medical plans, positively impacted the result. Thesecurtailment gains are the result of changes in the benefit level and thescope of eligible participants of a retiree medical plan, which becameeffective and irreversible in 2009.
The table below provides a summary of the changes in the defined-benefit obligations for defined-benefit pension plans and the fair value oftheir plan assets for 2010 and 2009. It also provides a reconciliation ofthe funded status of these plans to the amounts recognized in theConsolidated balance sheets.
2009 2010
Netherlands other total Netherlands other total
Defined-benefit obligation at the beginning of year 10,394 6,452 16,846 10,681 7,039 17,720
Service cost 107 75 182 92 77 169
Interest cost 532 395 927 521 418 939
Employee contributions − 4 4 − 3 3
Actuarial losses 371 424 795 1,662 593 2,255
Plan amendments − (7) (7) − (113) (113)
Acquisitions − (3) (3) − − −
Divestments − 4 4 − (1) (1)
Settlements − (95) (95) − (44) (44)
Curtailments − (5) (5) − (1) (1)
Reclassifications − (34) (34) − 5 5
Benefits paid (725) (422) (1,147) (730) (432) (1,162)
Exchange rate differences − 249 249 − 398 398
Miscellaneous 2 2 4 − (2) (2)
Defined-benefit obligation at end of year 10,681 7,039 17,720 12,226 7,940 20,166
Present value of funded obligations at end of year 10,671 6,319 16,990 12,217 7,178 19,395
Present value of unfunded obligations at end of year 10 720 730 9 762 771
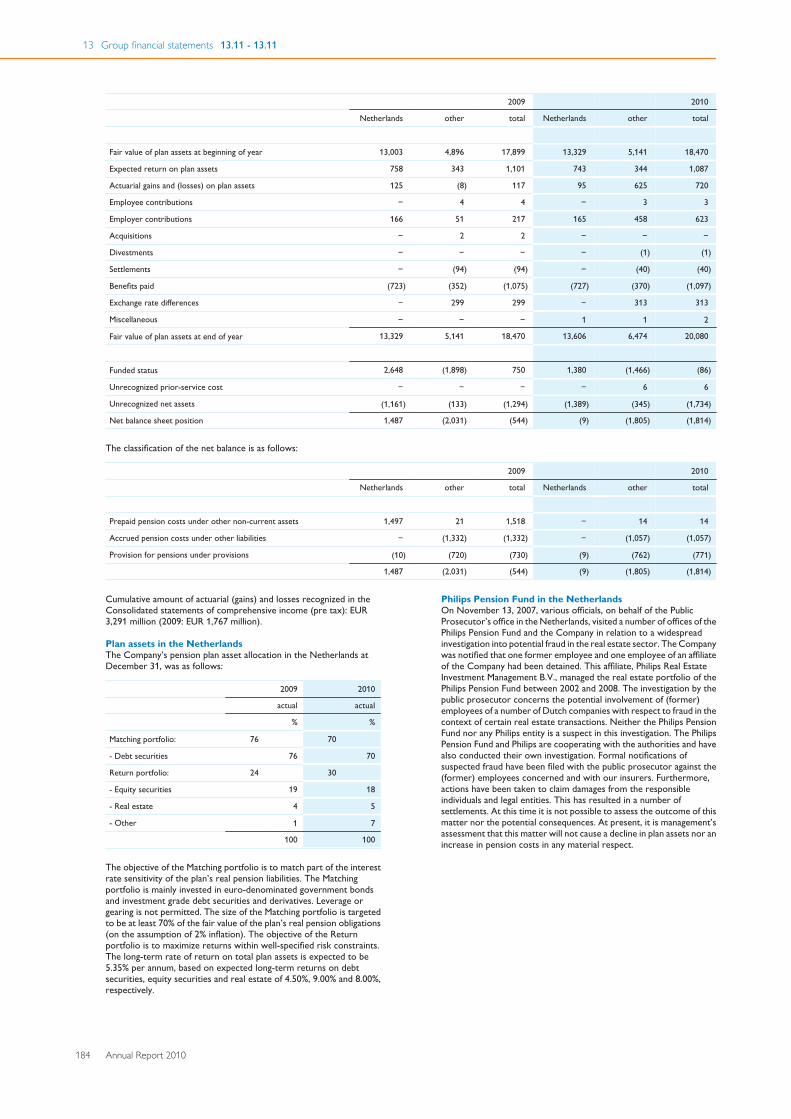
13 Group financial statements 13.11 - 13.11
184 Annual Report 2010
2009 2010
Netherlands other total Netherlands other total
Fair value of plan assets at beginning of year 13,003 4,896 17,899 13,329 5,141 18,470
Expected return on plan assets 758 343 1,101 743 344 1,087
Actuarial gains and (losses) on plan assets 125 (8) 117 95 625 720
Employee contributions − 4 4 − 3 3
Employer contributions 166 51 217 165 458 623
Acquisitions − 2 2 − − −
Divestments − − − − (1) (1)
Settlements − (94) (94) − (40) (40)
Benefits paid (723) (352) (1,075) (727) (370) (1,097)
Exchange rate differences − 299 299 − 313 313
Miscellaneous − − − 1 1 2
Fair value of plan assets at end of year 13,329 5,141 18,470 13,606 6,474 20,080
Funded status 2,648 (1,898) 750 1,380 (1,466) (86)
Unrecognized prior-service cost − − − − 6 6
Unrecognized net assets (1,161) (133) (1,294) (1,389) (345) (1,734)
Net balance sheet position 1,487 (2,031) (544) (9) (1,805) (1,814)
The classification of the net balance is as follows:
2009 2010
Netherlands other total Netherlands other total
Prepaid pension costs under other non-current assets 1,497 21 1,518 − 14 14
Accrued pension costs under other liabilities − (1,332) (1,332) − (1,057) (1,057)
Provision for pensions under provisions (10) (720) (730) (9) (762) (771)
1,487 (2,031) (544) (9) (1,805) (1,814)
Cumulative amount of actuarial (gains) and losses recognized in theConsolidated statements of comprehensive income (pre tax): EUR3,291 million (2009: EUR 1,767 million).
Plan assets in the NetherlandsThe Company’s pension plan asset allocation in the Netherlands atDecember 31, was as follows:
2009 2010
actual actual
% %
Matching portfolio: 76 70
- Debt securities 76 70
Return portfolio: 24 30
- Equity securities 19 18
- Real estate 4 5
- Other 1 7
100 100
The objective of the Matching portfolio is to match part of the interestrate sensitivity of the plan’s real pension liabilities. The Matchingportfolio is mainly invested in euro-denominated government bondsand investment grade debt securities and derivatives. Leverage orgearing is not permitted. The size of the Matching portfolio is targetedto be at least 70% of the fair value of the plan’s real pension obligations(on the assumption of 2% inflation). The objective of the Returnportfolio is to maximize returns within well-specified risk constraints.The long-term rate of return on total plan assets is expected to be5.35% per annum, based on expected long-term returns on debtsecurities, equity securities and real estate of 4.50%, 9.00% and 8.00%,respectively.
Philips Pension Fund in the NetherlandsOn November 13, 2007, various officials, on behalf of the PublicProsecutor’s office in the Netherlands, visited a number of offices of thePhilips Pension Fund and the Company in relation to a widespreadinvestigation into potential fraud in the real estate sector. The Companywas notified that one former employee and one employee of an affiliateof the Company had been detained. This affiliate, Philips Real EstateInvestment Management B.V., managed the real estate portfolio of thePhilips Pension Fund between 2002 and 2008. The investigation by thepublic prosecutor concerns the potential involvement of (former)employees of a number of Dutch companies with respect to fraud in thecontext of certain real estate transactions. Neither the Philips PensionFund nor any Philips entity is a suspect in this investigation. The PhilipsPension Fund and Philips are cooperating with the authorities and havealso conducted their own investigation. Formal notifications ofsuspected fraud have been filed with the public prosecutor against the(former) employees concerned and with our insurers. Furthermore,actions have been taken to claim damages from the responsibleindividuals and legal entities. This has resulted in a number ofsettlements. At this time it is not possible to assess the outcome of thismatter nor the potential consequences. At present, it is management’sassessment that this matter will not cause a decline in plan assets nor anincrease in pension costs in any material respect.
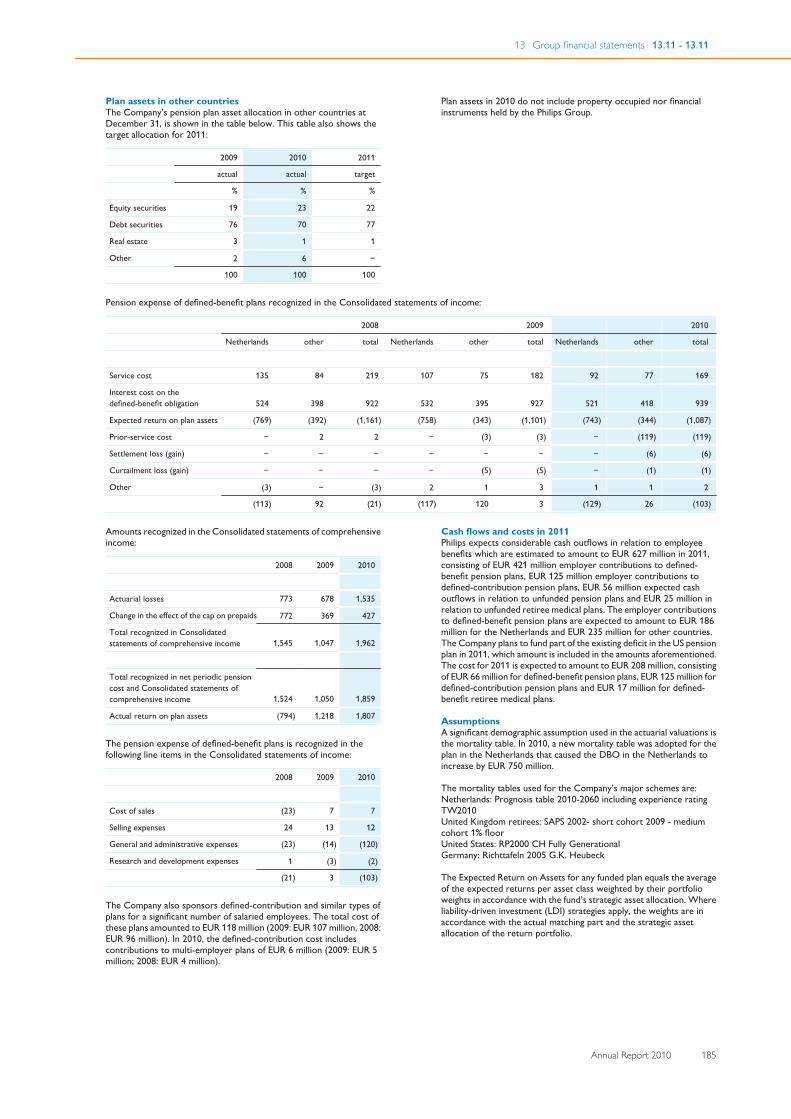
13 Group financial statements 13.11 - 13.11
Annual Report 2010 185
Plan assets in other countriesThe Company’s pension plan asset allocation in other countries atDecember 31, is shown in the table below. This table also shows thetarget allocation for 2011:
2009 2010 2011
actual actual target
% % %
Equity securities 19 23 22
Debt securities 76 70 77
Real estate 3 1 1
Other 2 6 −
100 100 100
Plan assets in 2010 do not include property occupied nor financialinstruments held by the Philips Group.
Pension expense of defined-benefit plans recognized in the Consolidated statements of income:
2008 2009 2010
Netherlands other total Netherlands other total Netherlands other total
Service cost 135 84 219 107 75 182 92 77 169
Interest cost on thedefined-benefit obligation 524 398 922 532 395 927 521 418 939
Expected return on plan assets (769) (392) (1,161) (758) (343) (1,101) (743) (344) (1,087)
Prior-service cost − 2 2 − (3) (3) − (119) (119)
Settlement loss (gain) − − − − − − − (6) (6)
Curtailment loss (gain) − − − − (5) (5) − (1) (1)
Other (3) − (3) 2 1 3 1 1 2
(113) 92 (21) (117) 120 3 (129) 26 (103)
Amounts recognized in the Consolidated statements of comprehensiveincome:
2008 2009 2010
Actuarial losses 773 678 1,535
Change in the effect of the cap on prepaids 772 369 427
Total recognized in Consolidatedstatements of comprehensive income 1,545 1,047 1,962
Total recognized in net periodic pensioncost and Consolidated statements ofcomprehensive income 1,524 1,050 1,859
Actual return on plan assets (794) 1,218 1,807
The pension expense of defined-benefit plans is recognized in thefollowing line items in the Consolidated statements of income:
2008 2009 2010
Cost of sales (23) 7 7
Selling expenses 24 13 12
General and administrative expenses (23) (14) (120)
Research and development expenses 1 (3) (2)
(21) 3 (103)
The Company also sponsors defined-contribution and similar types ofplans for a significant number of salaried employees. The total cost ofthese plans amounted to EUR 118 million (2009: EUR 107 million, 2008:EUR 96 million). In 2010, the defined-contribution cost includescontributions to multi-employer plans of EUR 6 million (2009: EUR 5million; 2008: EUR 4 million).
Cash flows and costs in 2011Philips expects considerable cash outflows in relation to employeebenefits which are estimated to amount to EUR 627 million in 2011,consisting of EUR 421 million employer contributions to defined-benefit pension plans, EUR 125 million employer contributions todefined-contribution pension plans, EUR 56 million expected cashoutflows in relation to unfunded pension plans and EUR 25 million inrelation to unfunded retiree medical plans. The employer contributionsto defined-benefit pension plans are expected to amount to EUR 186million for the Netherlands and EUR 235 million for other countries.The Company plans to fund part of the existing deficit in the US pensionplan in 2011, which amount is included in the amounts aforementioned.The cost for 2011 is expected to amount to EUR 208 million, consistingof EUR 66 million for defined-benefit pension plans, EUR 125 million fordefined-contribution pension plans and EUR 17 million for defined-benefit retiree medical plans.
AssumptionsA significant demographic assumption used in the actuarial valuations isthe mortality table. In 2010, a new mortality table was adopted for theplan in the Netherlands that caused the DBO in the Netherlands toincrease by EUR 750 million.
The mortality tables used for the Company’s major schemes are:Netherlands: Prognosis table 2010-2060 including experience ratingTW2010United Kingdom retirees: SAPS 2002- short cohort 2009 - mediumcohort 1% floorUnited States: RP2000 CH Fully Generational Germany: Richttafeln 2005 G.K. Heubeck
The Expected Return on Assets for any funded plan equals the averageof the expected returns per asset class weighted by their portfolioweights in accordance with the fund’s strategic asset allocation. Whereliability-driven investment (LDI) strategies apply, the weights are inaccordance with the actual matching part and the strategic assetallocation of the return portfolio.
13 Group financial statements 13.11 - 13.11
186 Annual Report 2010
The weighted averages of the assumptions used to calculate thedefined-benefit obligations as of December 31 were as follows:
2009 2010
Netherlands other Netherlands other
Discount rate 5.0% 5.7% 4.7% 5.3%
Rate ofcompensationincrease * 4.1% * 4.0%
The weighted averages of the assumptions used to calculate the netperiodic pension cost for years ended December 31:
2009 2010
Netherlands other Netherlands other
Discount rate 5.3% 6.0% 5.0% 5.7%
Expected returns onplan assets 5.9% 6.8% 5.7% 6.5%
Rate ofcompensationincrease * 3.4% * 4.1%
* The rate of compensation increase for the Netherlands consists of a generalcompensation increase and an individual salary increase based on merit, seniorityand promotion. The average individual salary increase for all active participants forthe remaining working lifetime is 0.75% annually. The assumed rate of generalcompensation increase for the Netherlands for calculating the projected benefitobligations amounts to 2.0% (2009: 2.0%). The indexation assumption used tocalculate the projected benefit obligations for the Netherlands is 1.0% (2009: 1.0%).
Historical data2006 2007 2008 2009 2010
Present value of defined-benefit obligations 20,410 18,679 16,846 17,720 20,166
Fair value of plan assets 21,352 20,200 17,899 18,470 20,080
Surplus 942 1,521 1,053 750 (86)
Experience adjustments in% on:
- defined-benefitobligations (gain) loss (0.9%) (0.8%) 1.2% (0.9%) 0.8%
- fair value of plan assets(gain) loss 0.8% 2.8% 10.9% (0.6%) (3.6%)
Defined-benefit plans: other postretirement benefitsIn addition to providing pension benefits, the Company provides otherpostretirement benefits, primarily retiree medical benefits, in certaincountries. The Company funds those other postretirement benefitplans as claims are incurred.
Movements in the net liability for other defined-benefit obligations:
2009 2010
Defined-benefit obligation at the beginning of year 353 295
Service cost 2 2
Interest cost 32 20
Actuarial (gains) or losses 63 (11)
Plan amendments (21) −
Curtailment gains (134) (9)
Changes in consolidation (6) −
Benefits paid (25) (25)
Exchange rate differences 31 24
Miscellaneous − 1
Defined-benefit obligation at end of year 295 297
Present value of funded obligations at end of year − −
Present value of unfunded obligations at end of year 295 297
Funded status (295) (297)
Unrecognized prior-service cost (22) (21)
Net balances (317) (318)
Classification of the net balance is as follows:
Provision for other postretirement benefits (317) (318)
Other postretirement benefit expense recognized in the Consolidatedstatements of income:
2008 2009 2010
Service cost 3 2 2
Interest cost on accumulatedpostretirement benefits 34 32 20
Prior-service cost (6) (1) (2)
Curtailment loss (gain) − (134) (9)
Other − 1 −
31 (100) 11
Amounts recognized in the Consolidated statements of comprehensiveincome:
2008 2009 2010
Actuarial (gains) losses (49) 63 (11)
Total recognized in net periodic pensioncost and Consolidated statements ofcomprehensive income (18) (37) −
The expense for other postretirement benefits is recognized in thefollowing line items in the Consolidated statements of income:
2008 2009 2010
Cost of sales 4 2 (7)
Selling expenses 3 (1) 1
General and administrative expenses 24 (101) 17
31 (100) 11
13 Group financial statements 13.11 - 13.11 29
Annual Report 2010 187
The weighted average assumptions used to calculate thepostretirement benefit obligations other than pensions as of December31 were as follows:
2009 2010
Discount rate 6.7% 6.6%
Compensation increase (where applicable) − −
The weighted average assumptions used to calculate the net cost foryears ended December 31:
2009 2010
Discount rate 9.7% 6.7%
Compensation increase (where applicable) − −
Assumed healthcare cost trend rates at December 31:
2009 2010
Healthcare cost trend rate assumed for next year 9.0% 8.4%
Rate that the cost trend rate will gradually reach 5.0% 4.8%
Year of reaching the rate at which it is assumed toremain 2018 2018
Sensitivity analysisAssumed healthcare trend rates have a significant effect on the amountsreported for the retiree medical plans. A one percentage-point changein assumed healthcare cost trend rates would have the following effectsas at December 31:
2009 2010
increaseof 1%
decreaseof 1%
increaseof 1%
decreaseof 1%
Effect on total of service and interest cost 1 (1) 1 (1)
Effect on postretirement benefit obligation 21 (18) 19 (17)
Historical data2006 2007 2008 2009 2010
Present value of defined-benefit obligation 373 413 353 295 297
Fair value of plan assets − − − − −
(Deficit) (373) (413) (353) (295) (297)
Experience adjustments in% on defined-benefitobligations; (gains) andlosses (1.6%) 0.2% 0.1% 4.9% (8.1%)
29 Share-based compensation
The Company has granted stock options on its common shares andrights to receive common shares in the future (restricted share rights)to members of the Board of Management and other members of theGroup Management Committee, Philips executives and certain selectedemployees. The purpose of the share-based compensation plans is toalign the interests of management with those of shareholders byproviding incentives to improve the Company’s performance on a long-term basis, thereby increasing shareholder value. Under the Company’splans, options are granted at fair market value on the date of grant.
In contrast to the year 2001 and certain prior years, when variable(performance) stock options were issued, the share-basedcompensation grants as from 2002 consider the performance of theCompany versus a peer group of multinationals.
USD-denominated stock options and restricted share rights aregranted to employees in the United States only.
Share-based compensation expense was EUR 83 million (EUR 66million, net of tax), EUR 94 million (EUR 86 million, net of tax) andEUR 78 million (EUR 106 million, net of tax) in 2010, 2009 and 2008,respectively.
Option plansThe Company grants stock options that expire after 10 years.Generally, the options vest after 3 years; however, a limited number ofoptions granted to certain employees of acquired businesses maycontain accelerated vesting. Of the total stock options that areoutstanding as of December 31, 2010, 2,500,000 options contain non-market performance conditions.
The fair value of the Company’s 2010, 2009 and 2008 option grants wasestimated using a Black-Scholes option valuation model and thefollowing weighted average assumptions:
EUR-denominated
2008 2009 2010
Risk-free interest rate 3.75% 2.88% 2.43%
Expected dividend yield 2.4% 4.3% 4.1%
Expected option life 6 yrs 6.5 yrs 6.5 yrs
Expected share price volatility 26% 32% 30%
USD-denominated
2008 2009 2010
Risk-free interest rate 3.17% 2.25% 2.43%
Expected dividend yield 2.8% 4.1% 3.9%
Expected option life 6 yrs 6.5 yrs 6.5 yrs
Expected share price volatility 27% 33% 32%
The assumptions were used for these calculations only and do notnecessarily represent an indication of Management’s expectations offuture developments.
The Black-Scholes option valuation model was developed for use inestimating the fair value of traded options which have no vestingrestrictions and are fully transferable. In addition, option valuationmodels require the input of subjective assumptions, including theexpected price volatility.
The Company has based its volatility assumptions on historicalexperience for a period equal to the expected life of the options. Theexpected life of the options is also based upon historical experience.
The Company’s employee stock options have characteristicssignificantly different from those of traded options, and changes in theassumptions can materially affect the fair value estimate.
13 Group financial statements 13.11 - 13.11
188 Annual Report 2010
The following tables summarize information about Philips stock optionsas of December 31, 2010 and changes during the year:
Option plans, EUR-denominated
shares weighted average
exercise price
Outstanding at January 1, 2010 35,375,485 27.16
Granted 3,246,371 24.83
Exercised 829,333 19.53
Forfeited 3,373,736 28.01
Expired 2,614,431 43.58
Outstanding at December 31, 2010 31,804,356 25.68
Exercisable at December 31, 2010 20,756,362 28.22
The exercise prices range from EUR 12.63 to 37.60 The weightedaverage remaining contractual term for options outstanding andoptions exercisable at December 31, 2010, was 4.8 years and 3.0 years,respectively. The aggregate intrinsic value of the options outstandingand options exercisable at December 31, 2010, was EUR 47 million andEUR 16 million, respectively.
The weighted average grant-date fair value of options granted during2010, 2009, and 2008 was EUR 4.95, EUR 2.78 and EUR 5.69,respectively. The total intrinsic value of options exercised during 2010,2009, and 2008 was approximately EUR 6 million, EUR 0 million andEUR 1 million, respectively.
Option plans, USD-denominated
shares weighted average
exercise price
Outstanding at January 1, 2010 20,675,005 31.10
Granted 2,059,830 33.35
Exercised 1,170,594 26.22
Forfeited 1,335,556 31.45
Expired 1,808,131 42.60
Outstanding at December 31, 2010 18,420,554 30.51
Exercisable at December 31, 2010 10,701,593 31.22
The exercise prices range from USD 16.41 to 44.15 The weightedaverage remaining contractual term for options outstanding andoptions exercisable at December 31, 2010, was 5.5 years and 3.6 years,respectively. The aggregate intrinsic value of the options outstandingand options exercisable at December 31, 2010, was USD 56 million andUSD 24 million, respectively.
The weighted average grant-date fair value of options granted during2010, 2009 and 2008 was USD 7.71, USD 3.83 and USD 7.97,respectively. The total intrinsic value of options exercised during 2010,2009 and 2008 was USD 7 million, USD 1 million and USD 13 million,respectively.
The outstanding options are categorized in exercise price ranges asfollows:
EUR-denominated
exercise price shares intrinsic value
in millions
weightedaverage
remainingcontractual
term
10-15 2,994,618 31 8.3 yrs
15-20 3,520,872 16 3.6 yrs
20-25 10,350,730 − 6.9 yrs
25-30 4,718,489 − 3.4 yrs
30-35 8,346,556 − 3.2 yrs
35-55 1,873,091 − 0.1 yrs
31,804,356 47 4.8 yrs
USD-denominated
exercise price shares intrinsic value
in millions
weightedaverage
remainingcontractual
term
15-20 2,864,670 39 6.9 yrs
20-25 380,635 3 1.6 yrs
25-30 3,353,104 14 3.1 yrs
30-35 7,368,684 − 5.4 yrs
35-40 2,248,560 − 7.2 yrs
40-50 2,204,901 − 6.3 yrs
18,420,554 56 5.5 yrs
The aggregate intrinsic value in the tables and text above represents thetotal pre-tax intrinsic value (the difference between the Company’sclosing share price on the last trading day of 2010 and the exerciseprice, multiplied by the number of in-the-money options) that wouldhave been received by the option holders if the options had beenexercised on December 31, 2010. At December 31, 2010, a total ofEUR 30 million of unrecognized compensation cost related to non-vested stock options. This cost is expected to be recognized over aweighted-average period of 1.9 years. Cash received from optionexercises under the Company’s option plans amounted to EUR 39million, EUR 4 million and EUR 24 million in 2010, 2009, and 2008,respectively. The actual tax deductions realized as a result of stockoption exercises totaled approximately EUR 2 million, nil and EUR 3million, in 2010, 2009, and 2008, respectively.
Restricted shares plansThe Company issues restricted share rights that vest in equal annualinstallments over a three-year period, starting one year after the date ofgrant. If the grantee still holds the shares after three years from thedelivery date, Philips will grant 20% additional (premium) shares,provided the grantee is still with the Company on the respectivedelivery dates.
13 Group financial statements 13.11 - 13.11 30 31
Annual Report 2010 189
A summary of the status of the Company’s restricted share plans as ofDecember 31, 2010 and changes during the year are presented below:
Restricted share rights, EUR-denominated1)
shares
weightedaverage grant-date fair value
Outstanding at January 1, 2010 2,028,565 18.56
Granted 826,577 23.42
Vested/Issued 1,037,427 21.86
Forfeited 120,347 17.89
Outstanding at December 31, 2010 1,697,368 18.96
1) Excludes 20% additional (premium) shares that may be received if sharesdelivered under the restricted share rights plan are not sold for a three-yearperiod
Restricted share rights, USD-denominated1)
shares
weightedaverage grant-date fair value
Outstanding at January 1, 2010 1,602,001 27.06
Granted 522,606 31.46
Vested/Issued 807,408 31.08
Forfeited 118,157 27.16
Outstanding at December 31, 2010 1,199,042 26.28
1) Excludes 20% additional (premium) shares that may be received if sharesdelivered under the restricted share rights plan are not sold for a three-yearperiod
At December 31, 2010, a total of EUR 35 million of unrecognizedcompensation cost related to non-vested restricted share rights. Thiscost is expected to be recognized over a weighted-average period of 2.0years.
Other plans
Employee share purchase planUnder the terms of employee stock purchase plans established by theCompany in various countries, substantially all employees in thosecountries are eligible to purchase a limited number of Philips shares atdiscounted prices through payroll withholdings, of which the maximumranges from 8.5% to 10% of total salary. Generally, the discountprovided to the employees is in the range of 10% to 20%. A total of1,411,956 shares were sold to employees in 2010 under the plan at anaverage price of EUR 22.54 (2009: 2,185,647 shares at EUR 13.30, 2008:1,051,206 shares at EUR 21.82).
Convertible personnel debenturesIn the Netherlands, the Company issued personnel debentures with a2-year right of conversion into common shares of Royal PhilipsElectronics starting three years after the date of issuance, with aconversion price equal to the share price on that date. The last issuanceof this particular plan was in December 2008. From 2009 onwards,employees in the Netherlands are able to join an employee sharepurchase plan as described in the previous paragraph. The fair value ofthe conversion option of EUR 2.13 in 2008 was recorded as
compensation expense. In 2010, 279,170 shares were issued inconjunction with conversions at an average price of EUR 20.86 (2009:183,330 shares at an average price of EUR 19.56, 2008: 485,331 sharesat an average price of EUR 19.13).
Lumileds planIn December 2006, the Company offered to exchange outstandingLumileds Depository Receipts and options for cash and shared-basedinstruments settled in cash. The amount to be paid to settle theobligation, with respect to share-based instruments, will fluctuate basedupon changes in the fair value of Lumileds. Substantially all of the holdersof the options and the depository receipts accepted the Company offer.The amount of the share-based payment liability, which is denominatedin US dollars, recorded at December 31, 2009 was EUR 31.6 million.During 2010, the Company paid EUR 17.6 million as a part of thesettlement of the liability. Additionally, an increase of EUR 24.1 millionwas recognized to reflect an adjustment to the value of the liability. Thebalance at December 31, 2010 amounted to EUR 38.1 million which willbe settled in 2011 and 2012.
30 Related-party transactions
In the normal course of business, Philips purchases and sells goods andservices from/to various related parties in which Philips typically holds a50% or less equity interest and has significant influence. Thesetransactions are generally conducted with terms comparable totransactions with third parties.
2008 2009 2010
Sales of goods and services 174 150 169
Purchases of goods and services 692 424 229
Receivables from related parties 24 14 20
Payables to related parties 112 95 5
For remuneration details of the members of the Board of Managementand the Supervisory Board see note 31.
For employee benefit plans see note 28.
In 2010, Philips sold its entire stake in NXP to Philips Pension TrusteesLimited. For further details of this related party transaction see note 11.
31 Information on remuneration
Remuneration of the Board of ManagementIn 2010, the remuneration costs relating to the members of the Boardof Management amounted to EUR 9,018,514 (2009: EUR 6,526,741;2008: EUR 7,611,602).
When pension rights are granted to members of the Board ofManagement, necessary payments (if insured) and all necessaryprovisions are made in accordance with the applicable accountingprinciples. In 2010, no (additional) pension benefits were granted toformer members of the Board of Management.
In addition, in 2010, the members of the Board of Management weregranted 276,000 stock options (2009: 259,200; 2008: 259,218) and69,000 restricted share rights (2009: 69,132; 2008: 86,406).
At December 31, 2010, the members of the Board of Management held1,957,282 stock options (2009: 2,064,872; 2008: 1,805,672) at aweighted average exercise price of EUR 24.94 (2009: EUR 25.47; 2008:EUR 27.31).
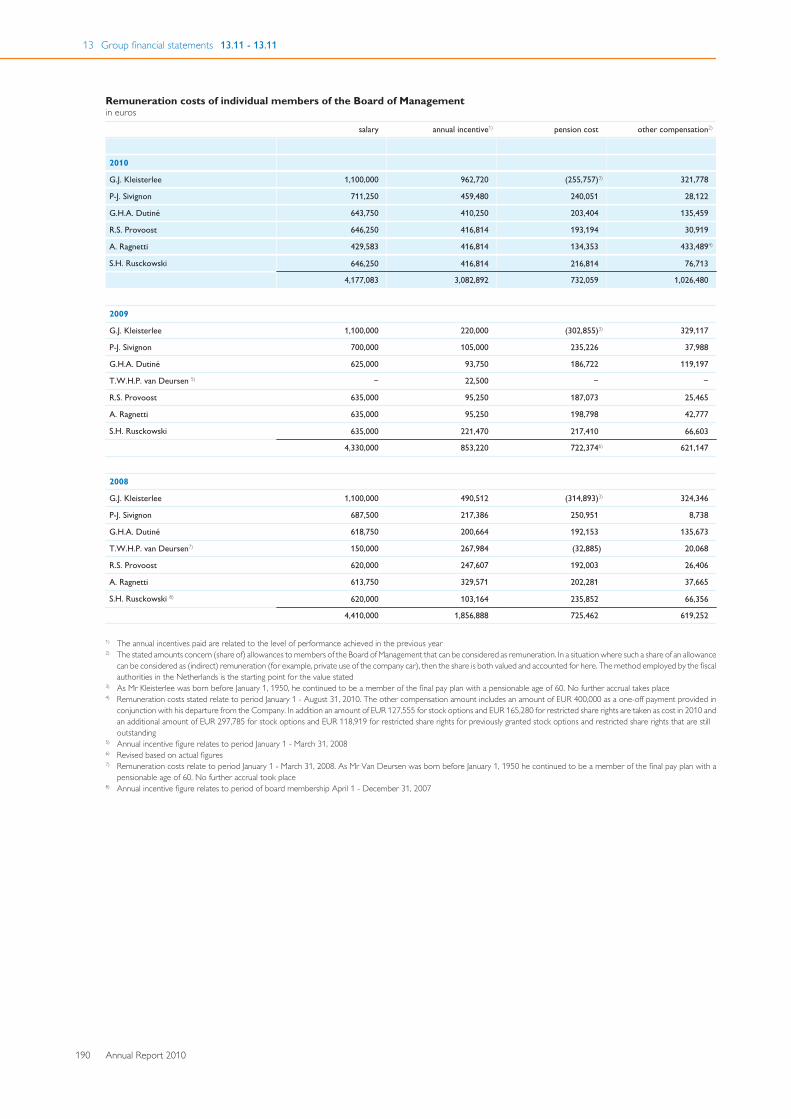
13 Group financial statements 13.11 - 13.11
190 Annual Report 2010
Remuneration costs of individual members of the Board of Managementin euros
salary annual incentive1) pension cost other compensation2)
2010
G.J. Kleisterlee 1,100,000 962,720 (255,757)3) 321,778
P-J. Sivignon 711,250 459,480 240,051 28,122
G.H.A. Dutiné 643,750 410,250 203,404 135,459
R.S. Provoost 646,250 416,814 193,194 30,919
A. Ragnetti 429,583 416,814 134,353 433,4894)
S.H. Rusckowski 646,250 416,814 216,814 76,713
4,177,083 3,082,892 732,059 1,026,480
2009
G.J. Kleisterlee 1,100,000 220,000 (302,855)3) 329,117
P-J. Sivignon 700,000 105,000 235,226 37,988
G.H.A. Dutiné 625,000 93,750 186,722 119,197
T.W.H.P. van Deursen 5) − 22,500 − −
R.S. Provoost 635,000 95,250 187,073 25,465
A. Ragnetti 635,000 95,250 198,798 42,777
S.H. Rusckowski 635,000 221,470 217,410 66,603
4,330,000 853,220 722,3746) 621,147
2008
G.J. Kleisterlee 1,100,000 490,512 (314,893)3) 324,346
P-J. Sivignon 687,500 217,386 250,951 8,738
G.H.A. Dutiné 618,750 200,664 192,153 135,673
T.W.H.P. van Deursen7) 150,000 267,984 (32,885) 20,068
R.S. Provoost 620,000 247,607 192,003 26,406
A. Ragnetti 613,750 329,571 202,281 37,665
S.H. Rusckowski 8) 620,000 103,164 235,852 66,356
4,410,000 1,856,888 725,462 619,252
1) The annual incentives paid are related to the level of performance achieved in the previous year2) The stated amounts concern (share of) allowances to members of the Board of Management that can be considered as remuneration. In a situation where such a share of an allowance
can be considered as (indirect) remuneration (for example, private use of the company car), then the share is both valued and accounted for here. The method employed by the fiscalauthorities in the Netherlands is the starting point for the value stated
3) As Mr Kleisterlee was born before January 1, 1950, he continued to be a member of the final pay plan with a pensionable age of 60. No further accrual takes place4) Remuneration costs stated relate to period January 1 - August 31, 2010. The other compensation amount includes an amount of EUR 400,000 as a one-off payment provided in
conjunction with his departure from the Company. In addition an amount of EUR 127,555 for stock options and EUR 165,280 for restricted share rights are taken as cost in 2010 andan additional amount of EUR 297,785 for stock options and EUR 118,919 for restricted share rights for previously granted stock options and restricted share rights that are stilloutstanding
5) Annual incentive figure relates to period January 1 - March 31, 20086) Revised based on actual figures7) Remuneration costs relate to period January 1 - March 31, 2008. As Mr Van Deursen was born before January 1, 1950 he continued to be a member of the final pay plan with a
pensionable age of 60. No further accrual took place8) Annual incentive figure relates to period of board membership April 1 - December 31, 2007
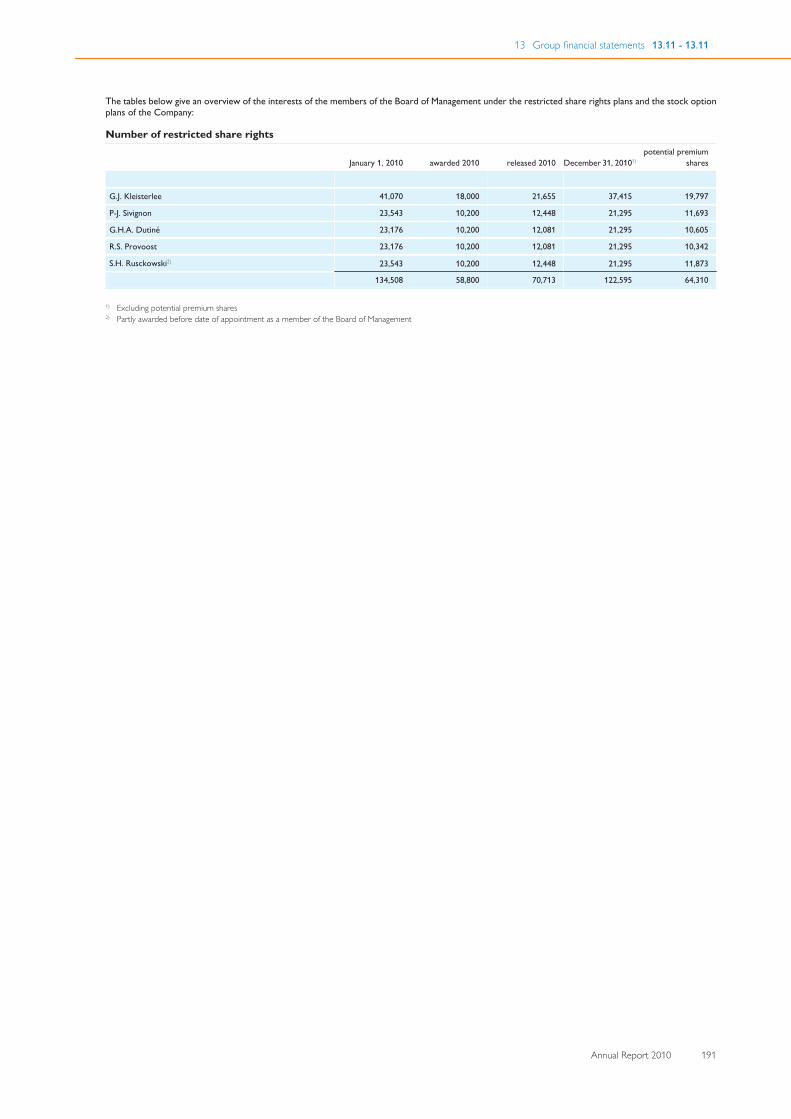
13 Group financial statements 13.11 - 13.11
Annual Report 2010 191
The tables below give an overview of the interests of the members of the Board of Management under the restricted share rights plans and the stock optionplans of the Company:
Number of restricted share rights
January 1, 2010 awarded 2010 released 2010 December 31, 20101)potential premium
shares
G.J. Kleisterlee 41,070 18,000 21,655 37,415 19,797
P-J. Sivignon 23,543 10,200 12,448 21,295 11,693
G.H.A. Dutiné 23,176 10,200 12,081 21,295 10,605
R.S. Provoost 23,176 10,200 12,081 21,295 10,342
S.H. Rusckowski2) 23,543 10,200 12,448 21,295 11,873
134,508 58,800 70,713 122,595 64,310
1) Excluding potential premium shares2) Partly awarded before date of appointment as a member of the Board of Management
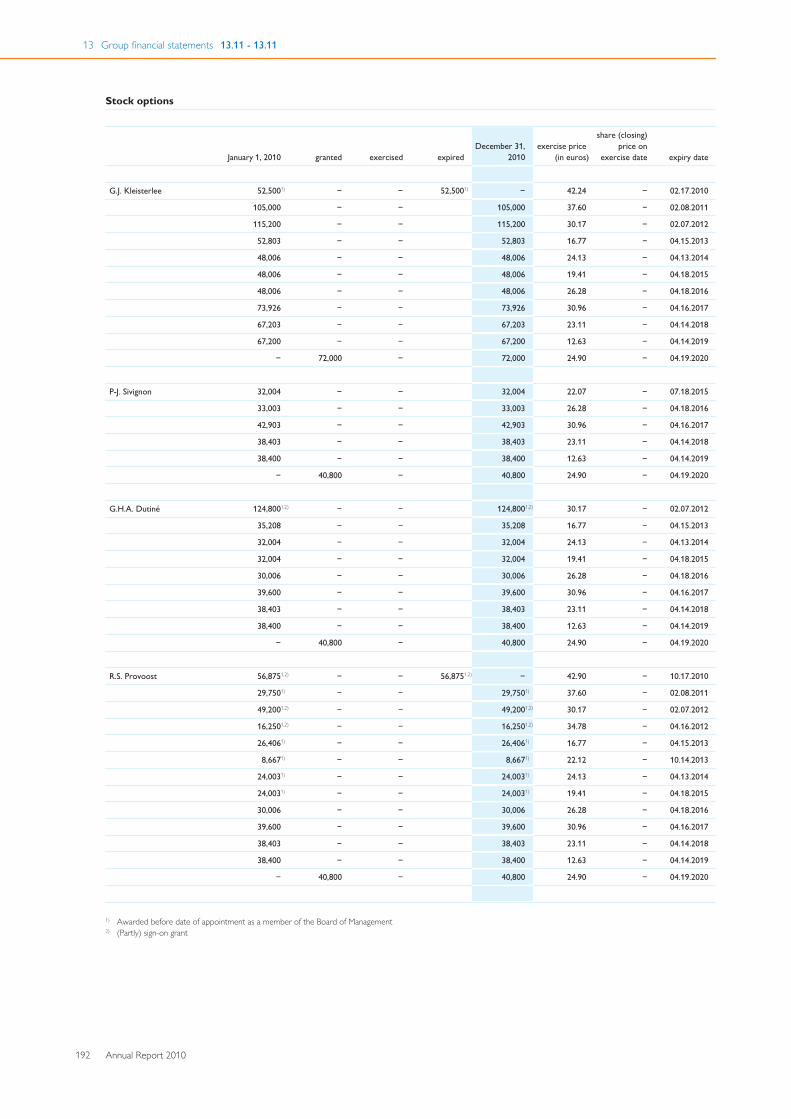
13 Group financial statements 13.11 - 13.11
192 Annual Report 2010
Stock options
January 1, 2010 granted exercised expired December 31,
2010 exercise price
(in euros)
share (closing)price on
exercise date expiry date
G.J. Kleisterlee 52,5001) − − 52,5001) − 42.24 − 02.17.2010
105,000 − − 105,000 37.60 − 02.08.2011
115,200 − − 115,200 30.17 − 02.07.2012
52,803 − − 52,803 16.77 − 04.15.2013
48,006 − − 48,006 24.13 − 04.13.2014
48,006 − − 48,006 19.41 − 04.18.2015
48,006 − − 48,006 26.28 − 04.18.2016
73,926 − − 73,926 30.96 − 04.16.2017
67,203 − − 67,203 23.11 − 04.14.2018
67,200 − − 67,200 12.63 − 04.14.2019
− 72,000 − 72,000 24.90 − 04.19.2020
P-J. Sivignon 32,004 − − 32,004 22.07 − 07.18.2015
33,003 − − 33,003 26.28 − 04.18.2016
42,903 − − 42,903 30.96 − 04.16.2017
38,403 − − 38,403 23.11 − 04.14.2018
38,400 − − 38,400 12.63 − 04.14.2019
− 40,800 − 40,800 24.90 − 04.19.2020
G.H.A. Dutiné 124,8001,2) − − 124,8001,2) 30.17 − 02.07.2012
35,208 − − 35,208 16.77 − 04.15.2013
32,004 − − 32,004 24.13 − 04.13.2014
32,004 − − 32,004 19.41 − 04.18.2015
30,006 − − 30,006 26.28 − 04.18.2016
39,600 − − 39,600 30.96 − 04.16.2017
38,403 − − 38,403 23.11 − 04.14.2018
38,400 − − 38,400 12.63 − 04.14.2019
− 40,800 − 40,800 24.90 − 04.19.2020
R.S. Provoost 56,8751,2) − − 56,8751,2) − 42.90 − 10.17.2010
29,7501) − − 29,7501) 37.60 − 02.08.2011
49,2001,2) − − 49,2001,2) 30.17 − 02.07.2012
16,2501,2) − − 16,2501,2) 34.78 − 04.16.2012
26,4061) − − 26,4061) 16.77 − 04.15.2013
8,6671) − − 8,6671) 22.12 − 10.14.2013
24,0031) − − 24,0031) 24.13 − 04.13.2014
24,0031) − − 24,0031) 19.41 − 04.18.2015
30,006 − − 30,006 26.28 − 04.18.2016
39,600 − − 39,600 30.96 − 04.16.2017
38,403 − − 38,403 23.11 − 04.14.2018
38,400 − − 38,400 12.63 − 04.14.2019
− 40,800 − 40,800 24.90 − 04.19.2020
1) Awarded before date of appointment as a member of the Board of Management2) (Partly) sign-on grant
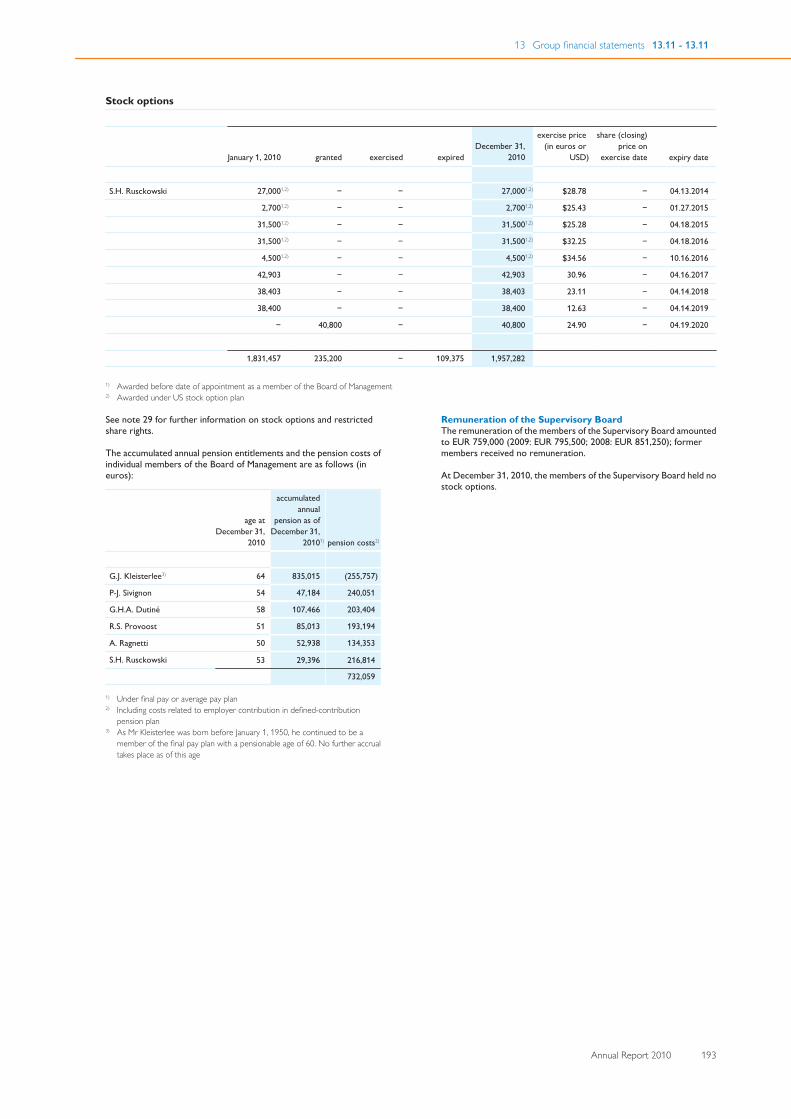
13 Group financial statements 13.11 - 13.11
Annual Report 2010 193
Stock options
January 1, 2010 granted exercised expired December 31,
2010
exercise price(in euros or
USD)
share (closing)price on
exercise date expiry date
S.H. Rusckowski 27,0001,2) − − 27,0001,2) $28.78 − 04.13.2014
2,7001,2) − − 2,7001,2) $25.43 − 01.27.2015
31,5001,2) − − 31,5001,2) $25.28 − 04.18.2015
31,5001,2) − − 31,5001,2) $32.25 − 04.18.2016
4,5001,2) − − 4,5001,2) $34.56 − 10.16.2016
42,903 − − 42,903 30.96 − 04.16.2017
38,403 − − 38,403 23.11 − 04.14.2018
38,400 − − 38,400 12.63 − 04.14.2019
− 40,800 − 40,800 24.90 − 04.19.2020
1,831,457 235,200 − 109,375 1,957,282
1) Awarded before date of appointment as a member of the Board of Management2) Awarded under US stock option plan
See note 29 for further information on stock options and restrictedshare rights.
The accumulated annual pension entitlements and the pension costs ofindividual members of the Board of Management are as follows (ineuros):
age atDecember 31,
2010
accumulatedannual
pension as ofDecember 31,
20101) pension costs2)
G.J. Kleisterlee3) 64 835,015 (255,757)
P-J. Sivignon 54 47,184 240,051
G.H.A. Dutiné 58 107,466 203,404
R.S. Provoost 51 85,013 193,194
A. Ragnetti 50 52,938 134,353
S.H. Rusckowski 53 29,396 216,814
732,059
1) Under final pay or average pay plan2) Including costs related to employer contribution in defined-contribution
pension plan3) As Mr Kleisterlee was born before January 1, 1950, he continued to be a
member of the final pay plan with a pensionable age of 60. No further accrualtakes place as of this age
Remuneration of the Supervisory BoardThe remuneration of the members of the Supervisory Board amountedto EUR 759,000 (2009: EUR 795,500; 2008: EUR 851,250); formermembers received no remuneration.
At December 31, 2010, the members of the Supervisory Board held nostock options.
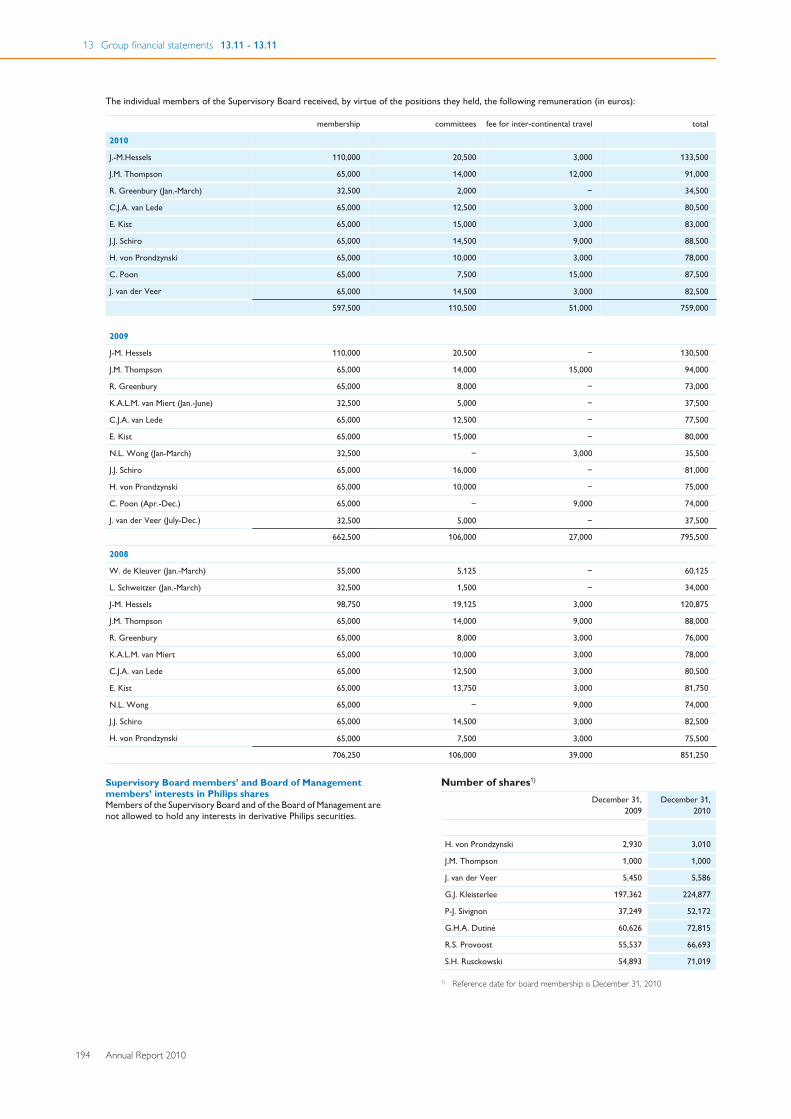
13 Group financial statements 13.11 - 13.11
194 Annual Report 2010
The individual members of the Supervisory Board received, by virtue of the positions they held, the following remuneration (in euros):
membership committees fee for inter-continental travel total
2010
J.-M.Hessels 110,000 20,500 3,000 133,500
J.M. Thompson 65,000 14,000 12,000 91,000
R. Greenbury (Jan.-March) 32,500 2,000 − 34,500
C.J.A. van Lede 65,000 12,500 3,000 80,500
E. Kist 65,000 15,000 3,000 83,000
J.J. Schiro 65,000 14,500 9,000 88,500
H. von Prondzynski 65,000 10,000 3,000 78,000
C. Poon 65,000 7,500 15,000 87,500
J. van der Veer 65,000 14,500 3,000 82,500
597,500 110,500 51,000 759,000
2009
J-M. Hessels 110,000 20,500 − 130,500
J.M. Thompson 65,000 14,000 15,000 94,000
R. Greenbury 65,000 8,000 − 73,000
K.A.L.M. van Miert (Jan.-June) 32,500 5,000 − 37,500
C.J.A. van Lede 65,000 12,500 − 77,500
E. Kist 65,000 15,000 − 80,000
N.L. Wong (Jan-March) 32,500 − 3,000 35,500
J.J. Schiro 65,000 16,000 − 81,000
H. von Prondzynski 65,000 10,000 − 75,000
C. Poon (Apr.-Dec.) 65,000 − 9,000 74,000
J. van der Veer (July-Dec.) 32,500 5,000 − 37,500
662,500 106,000 27,000 795,500
2008
W. de Kleuver (Jan.-March) 55,000 5,125 − 60,125
L. Schweitzer (Jan.-March) 32,500 1,500 − 34,000
J-M. Hessels 98,750 19,125 3,000 120,875
J.M. Thompson 65,000 14,000 9,000 88,000
R. Greenbury 65,000 8,000 3,000 76,000
K.A.L.M. van Miert 65,000 10,000 3,000 78,000
C.J.A. van Lede 65,000 12,500 3,000 80,500
E. Kist 65,000 13,750 3,000 81,750
N.L. Wong 65,000 − 9,000 74,000
J.J. Schiro 65,000 14,500 3,000 82,500
H. von Prondzynski 65,000 7,500 3,000 75,500
706,250 106,000 39,000 851,250
Supervisory Board members’ and Board of Managementmembers’ interests in Philips sharesMembers of the Supervisory Board and of the Board of Management arenot allowed to hold any interests in derivative Philips securities.
Number of shares1)
December 31,2009
December 31,2010
H. von Prondzynski 2,930 3,010
J.M. Thompson 1,000 1,000
J. van der Veer 5,450 5,586
G.J. Kleisterlee 197,362 224,877
P-J. Sivignon 37,249 52,172
G.H.A. Dutiné 60,626 72,815
R.S. Provoost 55,537 66,693
S.H. Rusckowski 54,893 71,019
1) Reference date for board membership is December 31, 2010
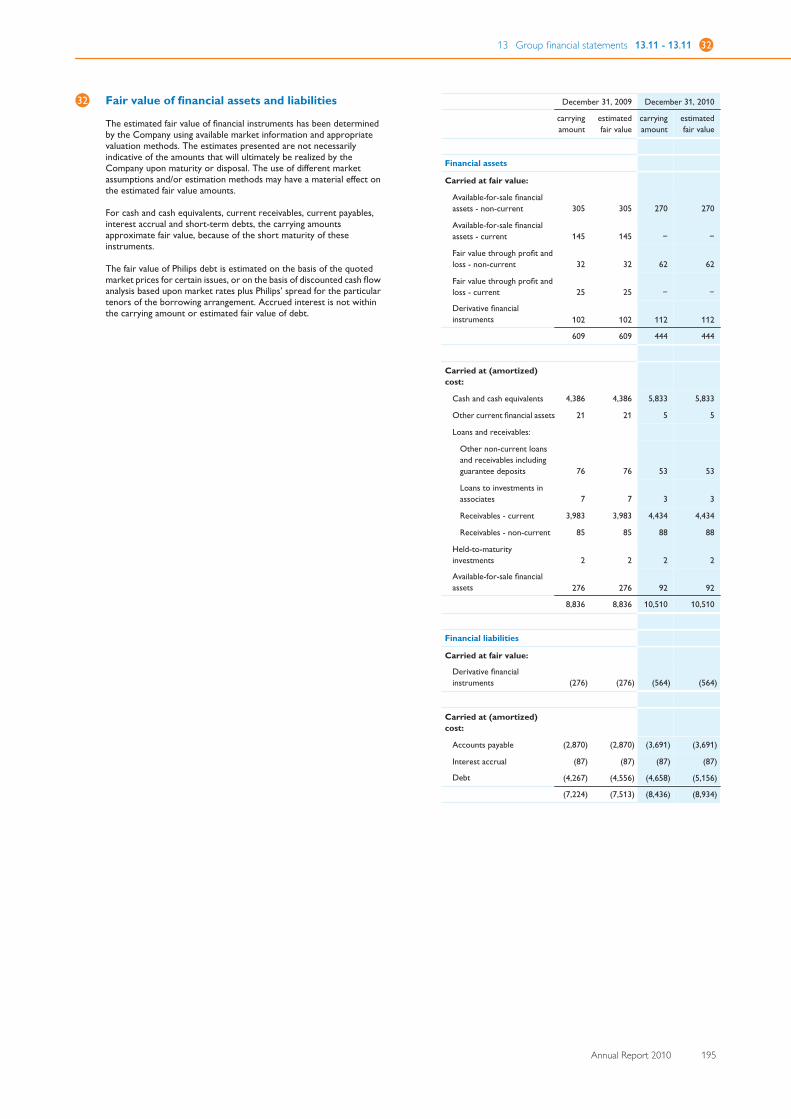
13 Group financial statements 13.11 - 13.11 32
Annual Report 2010 195
32 Fair value of financial assets and liabilities
The estimated fair value of financial instruments has been determinedby the Company using available market information and appropriatevaluation methods. The estimates presented are not necessarilyindicative of the amounts that will ultimately be realized by theCompany upon maturity or disposal. The use of different marketassumptions and/or estimation methods may have a material effect onthe estimated fair value amounts.
For cash and cash equivalents, current receivables, current payables,interest accrual and short-term debts, the carrying amountsapproximate fair value, because of the short maturity of theseinstruments.
The fair value of Philips debt is estimated on the basis of the quotedmarket prices for certain issues, or on the basis of discounted cash flowanalysis based upon market rates plus Philips’ spread for the particulartenors of the borrowing arrangement. Accrued interest is not withinthe carrying amount or estimated fair value of debt.
December 31, 2009 December 31, 2010
carryingamount
estimatedfair value
carryingamount
estimatedfair value
Financial assets
Carried at fair value:
Available-for-sale financialassets - non-current 305 305 270 270
Available-for-sale financialassets - current 145 145 − −
Fair value through profit andloss - non-current 32 32 62 62
Fair value through profit andloss - current 25 25 − −
Derivative financialinstruments 102 102 112 112
609 609 444 444
Carried at (amortized)cost:
Cash and cash equivalents 4,386 4,386 5,833 5,833
Other current financial assets 21 21 5 5
Loans and receivables:
Other non-current loansand receivables includingguarantee deposits 76 76 53 53
Loans to investments inassociates 7 7 3 3
Receivables - current 3,983 3,983 4,434 4,434
Receivables - non-current 85 85 88 88
Held-to-maturityinvestments 2 2 2 2
Available-for-sale financialassets 276 276 92 92
8,836 8,836 10,510 10,510
Financial liabilities
Carried at fair value:
Derivative financialinstruments (276) (276) (564) (564)
Carried at (amortized)cost:
Accounts payable (2,870) (2,870) (3,691) (3,691)
Interest accrual (87) (87) (87) (87)
Debt (4,267) (4,556) (4,658) (5,156)
(7,224) (7,513) (8,436) (8,934)
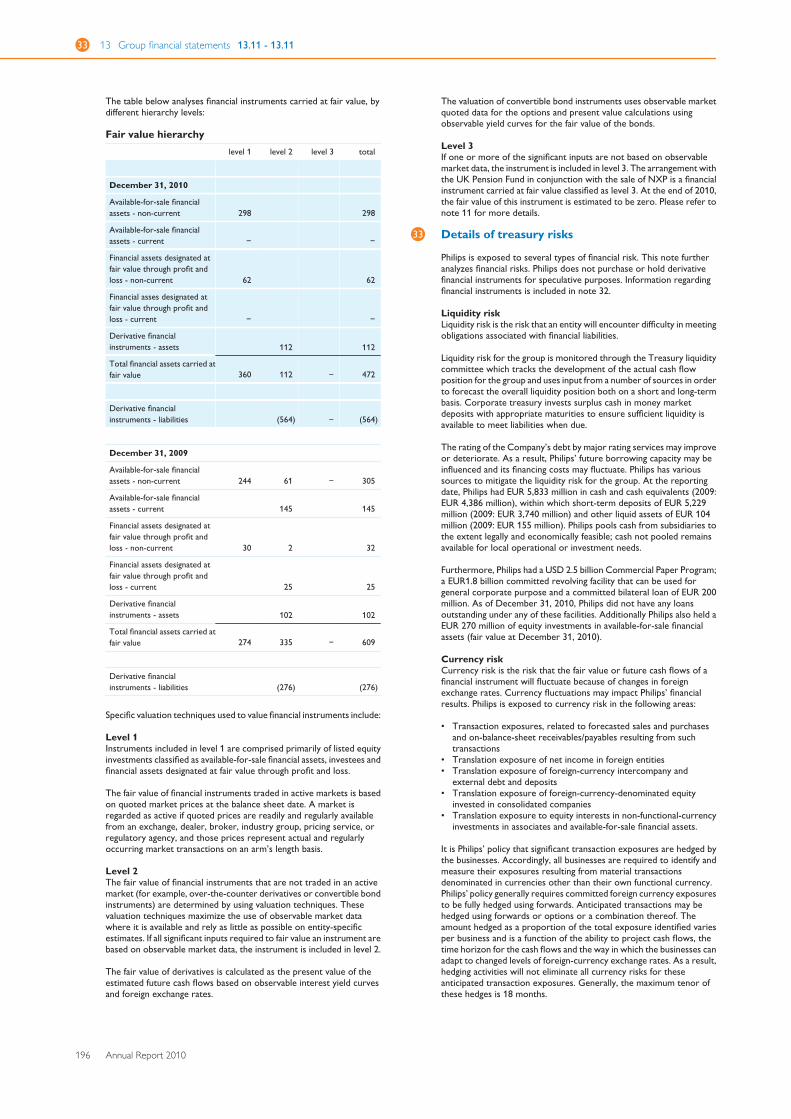
33 13 Group financial statements 13.11 - 13.11
196 Annual Report 2010
The table below analyses financial instruments carried at fair value, bydifferent hierarchy levels:
Fair value hierarchylevel 1 level 2 level 3 total
December 31, 2010
Available-for-sale financialassets - non-current 298 298
Available-for-sale financialassets - current − −
Financial assets designated atfair value through profit andloss - non-current 62 62
Financial asses designated atfair value through profit andloss - current − −
Derivative financialinstruments - assets 112 112
Total financial assets carried atfair value 360 112 − 472
Derivative financialinstruments - liabilities (564) − (564)
December 31, 2009
Available-for-sale financialassets - non-current 244 61 − 305
Available-for-sale financialassets - current 145 145
Financial assets designated atfair value through profit andloss - non-current 30 2 32
Financial assets designated atfair value through profit andloss - current 25 25
Derivative financialinstruments - assets 102 102
Total financial assets carried atfair value 274 335 − 609
Derivative financialinstruments - liabilities (276) (276)
Specific valuation techniques used to value financial instruments include:
Level 1Instruments included in level 1 are comprised primarily of listed equityinvestments classified as available-for-sale financial assets, investees andfinancial assets designated at fair value through profit and loss.
The fair value of financial instruments traded in active markets is basedon quoted market prices at the balance sheet date. A market isregarded as active if quoted prices are readily and regularly availablefrom an exchange, dealer, broker, industry group, pricing service, orregulatory agency, and those prices represent actual and regularlyoccurring market transactions on an arm’s length basis.
Level 2The fair value of financial instruments that are not traded in an activemarket (for example, over-the-counter derivatives or convertible bondinstruments) are determined by using valuation techniques. Thesevaluation techniques maximize the use of observable market datawhere it is available and rely as little as possible on entity-specificestimates. If all significant inputs required to fair value an instrument arebased on observable market data, the instrument is included in level 2.
The fair value of derivatives is calculated as the present value of theestimated future cash flows based on observable interest yield curvesand foreign exchange rates.
The valuation of convertible bond instruments uses observable marketquoted data for the options and present value calculations usingobservable yield curves for the fair value of the bonds.
Level 3If one or more of the significant inputs are not based on observablemarket data, the instrument is included in level 3. The arrangement withthe UK Pension Fund in conjunction with the sale of NXP is a financialinstrument carried at fair value classified as level 3. At the end of 2010,the fair value of this instrument is estimated to be zero. Please refer tonote 11 for more details.
33 Details of treasury risks
Philips is exposed to several types of financial risk. This note furtheranalyzes financial risks. Philips does not purchase or hold derivativefinancial instruments for speculative purposes. Information regardingfinancial instruments is included in note 32.
Liquidity riskLiquidity risk is the risk that an entity will encounter difficulty in meetingobligations associated with financial liabilities.
Liquidity risk for the group is monitored through the Treasury liquiditycommittee which tracks the development of the actual cash flowposition for the group and uses input from a number of sources in orderto forecast the overall liquidity position both on a short and long-termbasis. Corporate treasury invests surplus cash in money marketdeposits with appropriate maturities to ensure sufficient liquidity isavailable to meet liabilities when due.
The rating of the Company’s debt by major rating services may improveor deteriorate. As a result, Philips’ future borrowing capacity may beinfluenced and its financing costs may fluctuate. Philips has varioussources to mitigate the liquidity risk for the group. At the reportingdate, Philips had EUR 5,833 million in cash and cash equivalents (2009:EUR 4,386 million), within which short-term deposits of EUR 5,229million (2009: EUR 3,740 million) and other liquid assets of EUR 104million (2009: EUR 155 million). Philips pools cash from subsidiaries tothe extent legally and economically feasible; cash not pooled remainsavailable for local operational or investment needs.
Furthermore, Philips had a USD 2.5 billion Commercial Paper Program;a EUR1.8 billion committed revolving facility that can be used forgeneral corporate purpose and a committed bilateral loan of EUR 200million. As of December 31, 2010, Philips did not have any loansoutstanding under any of these facilities. Additionally Philips also held aEUR 270 million of equity investments in available-for-sale financialassets (fair value at December 31, 2010).
Currency riskCurrency risk is the risk that the fair value or future cash flows of afinancial instrument will fluctuate because of changes in foreignexchange rates. Currency fluctuations may impact Philips’ financialresults. Philips is exposed to currency risk in the following areas:
• Transaction exposures, related to forecasted sales and purchasesand on-balance-sheet receivables/payables resulting from suchtransactions
• Translation exposure of net income in foreign entities• Translation exposure of foreign-currency intercompany and
external debt and deposits• Translation exposure of foreign-currency-denominated equity
invested in consolidated companies• Translation exposure to equity interests in non-functional-currency
investments in associates and available-for-sale financial assets.
It is Philips’ policy that significant transaction exposures are hedged bythe businesses. Accordingly, all businesses are required to identify andmeasure their exposures resulting from material transactionsdenominated in currencies other than their own functional currency.Philips’ policy generally requires committed foreign currency exposuresto be fully hedged using forwards. Anticipated transactions may behedged using forwards or options or a combination thereof. Theamount hedged as a proportion of the total exposure identified variesper business and is a function of the ability to project cash flows, thetime horizon for the cash flows and the way in which the businesses canadapt to changed levels of foreign-currency exchange rates. As a result,hedging activities will not eliminate all currency risks for theseanticipated transaction exposures. Generally, the maximum tenor ofthese hedges is 18 months.
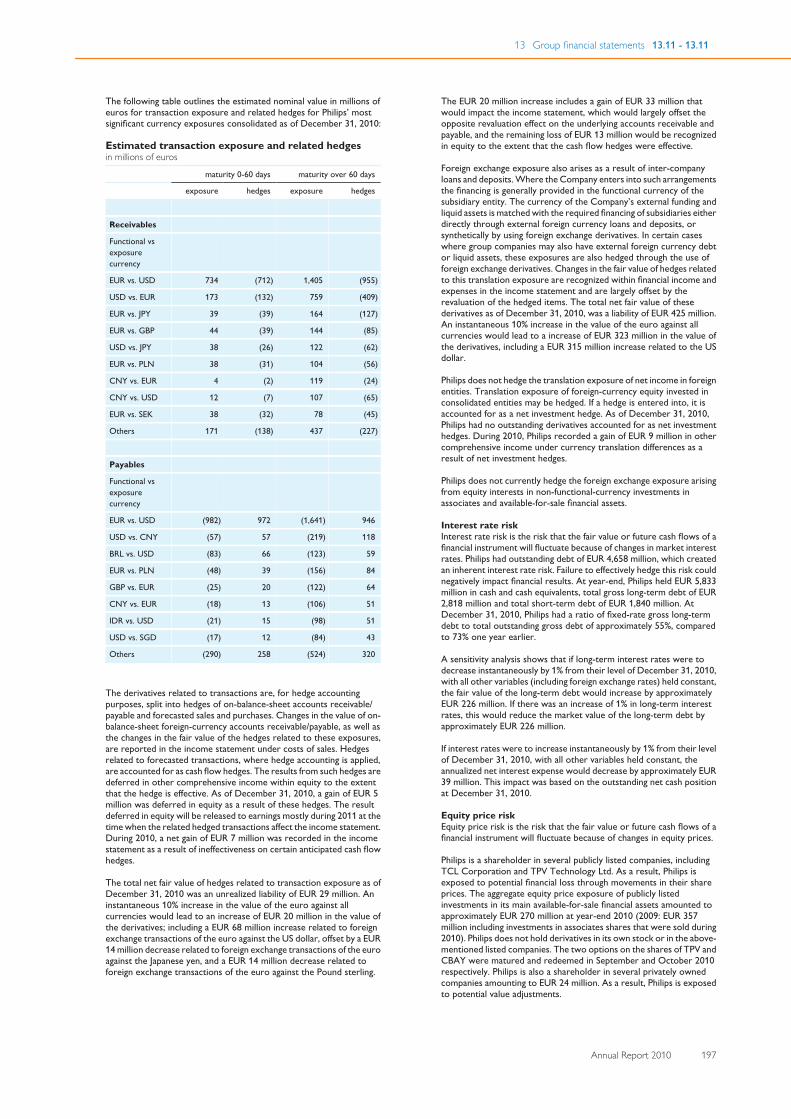
13 Group financial statements 13.11 - 13.11
Annual Report 2010 197
The following table outlines the estimated nominal value in millions ofeuros for transaction exposure and related hedges for Philips’ mostsignificant currency exposures consolidated as of December 31, 2010:
Estimated transaction exposure and related hedgesin millions of euros
maturity 0-60 days maturity over 60 days
exposure hedges exposure hedges
Receivables
Functional vsexposurecurrency
EUR vs. USD 734 (712) 1,405 (955)
USD vs. EUR 173 (132) 759 (409)
EUR vs. JPY 39 (39) 164 (127)
EUR vs. GBP 44 (39) 144 (85)
USD vs. JPY 38 (26) 122 (62)
EUR vs. PLN 38 (31) 104 (56)
CNY vs. EUR 4 (2) 119 (24)
CNY vs. USD 12 (7) 107 (65)
EUR vs. SEK 38 (32) 78 (45)
Others 171 (138) 437 (227)
Payables
Functional vsexposurecurrency
EUR vs. USD (982) 972 (1,641) 946
USD vs. CNY (57) 57 (219) 118
BRL vs. USD (83) 66 (123) 59
EUR vs. PLN (48) 39 (156) 84
GBP vs. EUR (25) 20 (122) 64
CNY vs. EUR (18) 13 (106) 51
IDR vs. USD (21) 15 (98) 51
USD vs. SGD (17) 12 (84) 43
Others (290) 258 (524) 320
The derivatives related to transactions are, for hedge accountingpurposes, split into hedges of on-balance-sheet accounts receivable/payable and forecasted sales and purchases. Changes in the value of on-balance-sheet foreign-currency accounts receivable/payable, as well asthe changes in the fair value of the hedges related to these exposures,are reported in the income statement under costs of sales. Hedgesrelated to forecasted transactions, where hedge accounting is applied,are accounted for as cash flow hedges. The results from such hedges aredeferred in other comprehensive income within equity to the extentthat the hedge is effective. As of December 31, 2010, a gain of EUR 5million was deferred in equity as a result of these hedges. The resultdeferred in equity will be released to earnings mostly during 2011 at thetime when the related hedged transactions affect the income statement.During 2010, a net gain of EUR 7 million was recorded in the incomestatement as a result of ineffectiveness on certain anticipated cash flowhedges.
The total net fair value of hedges related to transaction exposure as ofDecember 31, 2010 was an unrealized liability of EUR 29 million. Aninstantaneous 10% increase in the value of the euro against allcurrencies would lead to an increase of EUR 20 million in the value ofthe derivatives; including a EUR 68 million increase related to foreignexchange transactions of the euro against the US dollar, offset by a EUR14 million decrease related to foreign exchange transactions of the euroagainst the Japanese yen, and a EUR 14 million decrease related toforeign exchange transactions of the euro against the Pound sterling.
The EUR 20 million increase includes a gain of EUR 33 million thatwould impact the income statement, which would largely offset theopposite revaluation effect on the underlying accounts receivable andpayable, and the remaining loss of EUR 13 million would be recognizedin equity to the extent that the cash flow hedges were effective.
Foreign exchange exposure also arises as a result of inter-companyloans and deposits. Where the Company enters into such arrangementsthe financing is generally provided in the functional currency of thesubsidiary entity. The currency of the Company’s external funding andliquid assets is matched with the required financing of subsidiaries eitherdirectly through external foreign currency loans and deposits, orsynthetically by using foreign exchange derivatives. In certain caseswhere group companies may also have external foreign currency debtor liquid assets, these exposures are also hedged through the use offoreign exchange derivatives. Changes in the fair value of hedges relatedto this translation exposure are recognized within financial income andexpenses in the income statement and are largely offset by therevaluation of the hedged items. The total net fair value of thesederivatives as of December 31, 2010, was a liability of EUR 425 million.An instantaneous 10% increase in the value of the euro against allcurrencies would lead to a increase of EUR 323 million in the value ofthe derivatives, including a EUR 315 million increase related to the USdollar.
Philips does not hedge the translation exposure of net income in foreignentities. Translation exposure of foreign-currency equity invested inconsolidated entities may be hedged. If a hedge is entered into, it isaccounted for as a net investment hedge. As of December 31, 2010,Philips had no outstanding derivatives accounted for as net investmenthedges. During 2010, Philips recorded a gain of EUR 9 million in othercomprehensive income under currency translation differences as aresult of net investment hedges.
Philips does not currently hedge the foreign exchange exposure arisingfrom equity interests in non-functional-currency investments inassociates and available-for-sale financial assets.
Interest rate riskInterest rate risk is the risk that the fair value or future cash flows of afinancial instrument will fluctuate because of changes in market interestrates. Philips had outstanding debt of EUR 4,658 million, which createdan inherent interest rate risk. Failure to effectively hedge this risk couldnegatively impact financial results. At year-end, Philips held EUR 5,833million in cash and cash equivalents, total gross long-term debt of EUR2,818 million and total short-term debt of EUR 1,840 million. AtDecember 31, 2010, Philips had a ratio of fixed-rate gross long-termdebt to total outstanding gross debt of approximately 55%, comparedto 73% one year earlier.
A sensitivity analysis shows that if long-term interest rates were todecrease instantaneously by 1% from their level of December 31, 2010,with all other variables (including foreign exchange rates) held constant,the fair value of the long-term debt would increase by approximatelyEUR 226 million. If there was an increase of 1% in long-term interestrates, this would reduce the market value of the long-term debt byapproximately EUR 226 million.
If interest rates were to increase instantaneously by 1% from their levelof December 31, 2010, with all other variables held constant, theannualized net interest expense would decrease by approximately EUR39 million. This impact was based on the outstanding net cash positionat December 31, 2010.
Equity price riskEquity price risk is the risk that the fair value or future cash flows of afinancial instrument will fluctuate because of changes in equity prices.
Philips is a shareholder in several publicly listed companies, includingTCL Corporation and TPV Technology Ltd. As a result, Philips isexposed to potential financial loss through movements in their shareprices. The aggregate equity price exposure of publicly listedinvestments in its main available-for-sale financial assets amounted toapproximately EUR 270 million at year-end 2010 (2009: EUR 357million including investments in associates shares that were sold during2010). Philips does not hold derivatives in its own stock or in the above-mentioned listed companies. The two options on the shares of TPV andCBAY were matured and redeemed in September and October 2010respectively. Philips is also a shareholder in several privately ownedcompanies amounting to EUR 24 million. As a result, Philips is exposedto potential value adjustments.
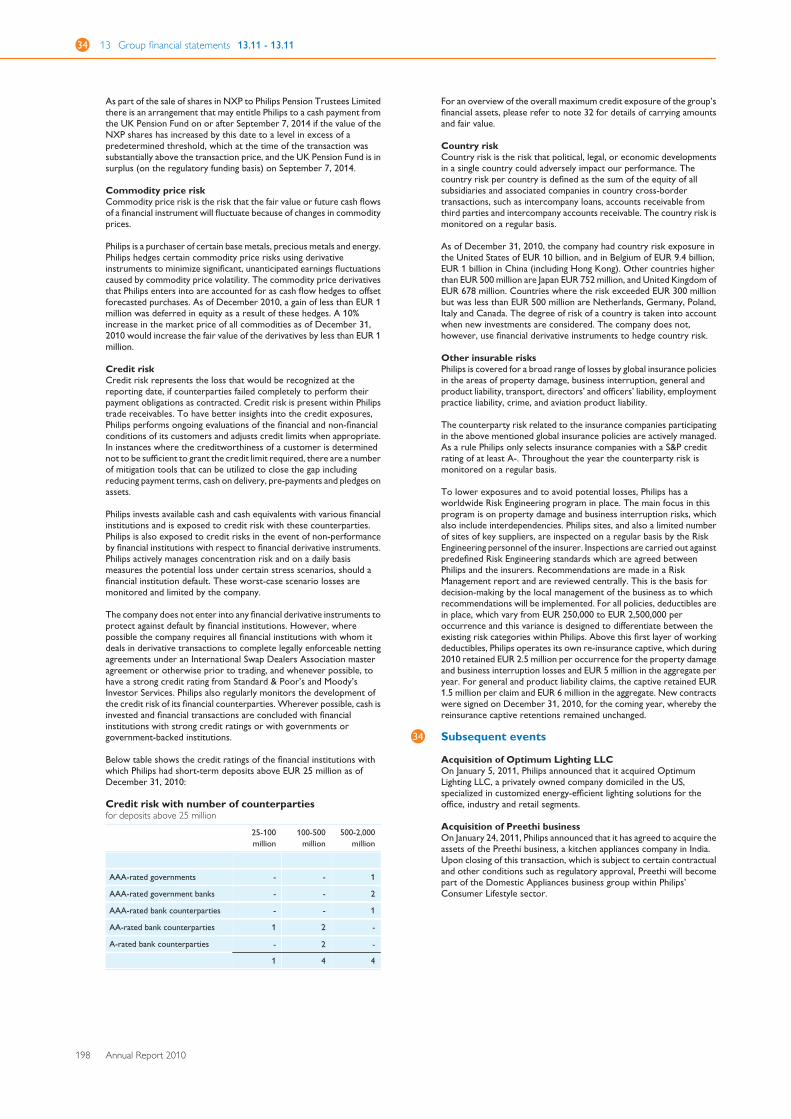
34 13 Group financial statements 13.11 - 13.11
198 Annual Report 2010
As part of the sale of shares in NXP to Philips Pension Trustees Limitedthere is an arrangement that may entitle Philips to a cash payment fromthe UK Pension Fund on or after September 7, 2014 if the value of theNXP shares has increased by this date to a level in excess of apredetermined threshold, which at the time of the transaction wassubstantially above the transaction price, and the UK Pension Fund is insurplus (on the regulatory funding basis) on September 7, 2014.
Commodity price riskCommodity price risk is the risk that the fair value or future cash flowsof a financial instrument will fluctuate because of changes in commodityprices.
Philips is a purchaser of certain base metals, precious metals and energy.Philips hedges certain commodity price risks using derivativeinstruments to minimize significant, unanticipated earnings fluctuationscaused by commodity price volatility. The commodity price derivativesthat Philips enters into are accounted for as cash flow hedges to offsetforecasted purchases. As of December 2010, a gain of less than EUR 1million was deferred in equity as a result of these hedges. A 10%increase in the market price of all commodities as of December 31,2010 would increase the fair value of the derivatives by less than EUR 1million.
Credit riskCredit risk represents the loss that would be recognized at thereporting date, if counterparties failed completely to perform theirpayment obligations as contracted. Credit risk is present within Philipstrade receivables. To have better insights into the credit exposures,Philips performs ongoing evaluations of the financial and non-financialconditions of its customers and adjusts credit limits when appropriate.In instances where the creditworthiness of a customer is determinednot to be sufficient to grant the credit limit required, there are a numberof mitigation tools that can be utilized to close the gap includingreducing payment terms, cash on delivery, pre-payments and pledges onassets.
Philips invests available cash and cash equivalents with various financialinstitutions and is exposed to credit risk with these counterparties.Philips is also exposed to credit risks in the event of non-performanceby financial institutions with respect to financial derivative instruments.Philips actively manages concentration risk and on a daily basismeasures the potential loss under certain stress scenarios, should afinancial institution default. These worst-case scenario losses aremonitored and limited by the company.
The company does not enter into any financial derivative instruments toprotect against default by financial institutions. However, wherepossible the company requires all financial institutions with whom itdeals in derivative transactions to complete legally enforceable nettingagreements under an International Swap Dealers Association masteragreement or otherwise prior to trading, and whenever possible, tohave a strong credit rating from Standard & Poor’s and Moody’sInvestor Services. Philips also regularly monitors the development ofthe credit risk of its financial counterparties. Wherever possible, cash isinvested and financial transactions are concluded with financialinstitutions with strong credit ratings or with governments orgovernment-backed institutions.
Below table shows the credit ratings of the financial institutions withwhich Philips had short-term deposits above EUR 25 million as ofDecember 31, 2010:
Credit risk with number of counterpartiesfor deposits above 25 million
25-100million
100-500million
500-2,000million
AAA-rated governments - - 1
AAA-rated government banks - - 2
AAA-rated bank counterparties - - 1
AA-rated bank counterparties 1 2 -
A-rated bank counterparties - 2 -
1 4 4
For an overview of the overall maximum credit exposure of the group’sfinancial assets, please refer to note 32 for details of carrying amountsand fair value.
Country riskCountry risk is the risk that political, legal, or economic developmentsin a single country could adversely impact our performance. Thecountry risk per country is defined as the sum of the equity of allsubsidiaries and associated companies in country cross-bordertransactions, such as intercompany loans, accounts receivable fromthird parties and intercompany accounts receivable. The country risk ismonitored on a regular basis.
As of December 31, 2010, the company had country risk exposure inthe United States of EUR 10 billion, and in Belgium of EUR 9.4 billion,EUR 1 billion in China (including Hong Kong). Other countries higherthan EUR 500 million are Japan EUR 752 million, and United Kingdom ofEUR 678 million. Countries where the risk exceeded EUR 300 millionbut was less than EUR 500 million are Netherlands, Germany, Poland,Italy and Canada. The degree of risk of a country is taken into accountwhen new investments are considered. The company does not,however, use financial derivative instruments to hedge country risk.
Other insurable risksPhilips is covered for a broad range of losses by global insurance policiesin the areas of property damage, business interruption, general andproduct liability, transport, directors’ and officers’ liability, employmentpractice liability, crime, and aviation product liability.
The counterparty risk related to the insurance companies participatingin the above mentioned global insurance policies are actively managed.As a rule Philips only selects insurance companies with a S&P creditrating of at least A-. Throughout the year the counterparty risk ismonitored on a regular basis.
To lower exposures and to avoid potential losses, Philips has aworldwide Risk Engineering program in place. The main focus in thisprogram is on property damage and business interruption risks, whichalso include interdependencies. Philips sites, and also a limited numberof sites of key suppliers, are inspected on a regular basis by the RiskEngineering personnel of the insurer. Inspections are carried out againstpredefined Risk Engineering standards which are agreed betweenPhilips and the insurers. Recommendations are made in a RiskManagement report and are reviewed centrally. This is the basis fordecision-making by the local management of the business as to whichrecommendations will be implemented. For all policies, deductibles arein place, which vary from EUR 250,000 to EUR 2,500,000 peroccurrence and this variance is designed to differentiate between theexisting risk categories within Philips. Above this first layer of workingdeductibles, Philips operates its own re-insurance captive, which during2010 retained EUR 2.5 million per occurrence for the property damageand business interruption losses and EUR 5 million in the aggregate peryear. For general and product liability claims, the captive retained EUR1.5 million per claim and EUR 6 million in the aggregate. New contractswere signed on December 31, 2010, for the coming year, whereby thereinsurance captive retentions remained unchanged.
34 Subsequent events
Acquisition of Optimum Lighting LLCOn January 5, 2011, Philips announced that it acquired OptimumLighting LLC, a privately owned company domiciled in the US,specialized in customized energy-efficient lighting solutions for theoffice, industry and retail segments.
Acquisition of Preethi businessOn January 24, 2011, Philips announced that it has agreed to acquire theassets of the Preethi business, a kitchen appliances company in India.Upon closing of this transaction, which is subject to certain contractualand other conditions such as regulatory approval, Preethi will becomepart of the Domestic Appliances business group within Philips’Consumer Lifestyle sector.
13 Group financial statements 13.12 - 13.12
Annual Report 2010 199
13.12 Independent auditor’s report - GroupIndependent auditor’s report
To the Supervisory Board and Shareholders of Koninklijke PhilipsElectronics N.V.:
Report on the consolidated financial statementsWe have audited the accompanying consolidated financial statements2010 which are part of the financial statements of Koninklijke PhilipsElectronics N.V., Eindhoven, the Netherlands, and comprise theconsolidated balance sheet as at December 31, 2010, the consolidatedstatements of income, comprehensive income, cash flows and changesin equity for the year then ended, and notes, comprising a summary ofthe significant accounting policies and other explanatory information asincluded in section 13.4 to 13.11.
Management’s responsibilityThe Board of Management is responsible for the preparation and fairpresentation of the consolidated financial statements in accordancewith International Financial Reporting Standards as adopted by theEuropean Union and with Part 9 of Book 2 of the Dutch Civil Code, andfor the preparation of the Management report in accordance with Part9 of Book 2 of the Dutch Civil Code. Furthermore, management isresponsible for such internal control as it determines is necessary toenable the preparation of the consolidated financial statements that arefree from material misstatement, whether due to fraud or error.
Auditor’s responsibilityOur responsibility is to express an opinion on these consolidatedfinancial statements based on our audit. We conducted our audit inaccordance with Dutch law, including the Dutch Standards on Auditing.This requires that we comply with ethical requirements and plan andperform the audit to obtain reasonable assurance about whether theconsolidated financial statements are free from material misstatement.
An audit involves performing procedures to obtain audit evidenceabout the amounts and disclosures in the consolidated financialstatements. The procedures selected depend on the auditor’sjudgment, including the assessment of the risks of materialmisstatement of the consolidated financial statements, whether due tofraud or error. In making those risk assessments, the auditor considersinternal control relevant to the entity’s preparation and fairpresentation of the consolidated financial statements in order to designaudit procedures that are appropriate in the circumstances, but not forthe purpose of expressing an opinion on the effectiveness of the entity’sinternal control. An audit also includes evaluating the appropriatenessof accounting policies used and the reasonableness of accountingestimates made by management, as well as evaluating the overallpresentation of the consolidated financial statements.
We believe that the audit evidence we have obtained is sufficient andappropriate to provide a basis for our audit opinion.
OpinionIn our opinion, the consolidated financial statements give a true and fairview of the financial position of Koninklijke Philips Electronics N.V. as atDecember 31, 2010, and of its result and its cash flows for the year thenended in accordance with International Financial Reporting Standards asadopted by the European Union and with Part 9 of Book 2 of the DutchCivil Code.
Report on other legal and regulatory requirementsPursuant to the legal requirements under Section 2:393 sub 5 at e and fof the Dutch Civil Code, we have no deficiencies to report as a result ofour examination whether the Management report, as defined in theintroduction paragraph of section 13 Group financial statements, and tothe extent we can assess, has been prepared in accordance with part 9of Book 2 of this Code, and if the information as required under Section2:392 sub 1 at b - h has been annexed. Further, we report that theManagement report, to the extent we can assess, is consistent with theconsolidated financial statements as required by Section 2:391 sub 4 ofthe Dutch Civil Code.
Amsterdam, February 17, 2011
KPMG ACCOUNTANTS N.V.
M.A. Soeting RA
14 Company financial statements 14 - 14
200 Annual Report 2010
14 Company financial statementsIntroduction
Statutory financial statementsThe sections Group financial statements and Company financialstatements contain the statutory financial statements of KoninklijkePhilips Electronics N.V. (the Company).
Accounting policies appliedThe financial statements of the Company included in this section areprepared in accordance with Part 9 of Book 2 of the Dutch Civil Code.Section 362 (8), Book 2, Dutch Civil Code, which allows companies thatapply IFRS as adopted by the European Union in their consolidatedfinancial statements to use the same measurement principles in theircompany financial statements. The Company has prepared theseCompany financial statements using this provision.
The accounting policies are described in section 13.10, Significantaccounting policies, of this Annual Report.
Subsidiaries are accounted for using the net equity value in theseCompany financial statements.
Presentation of Company financial statementsThe structure of the Company balance sheets is aligned with theConsolidated balance sheets in order to achieve optimal transparencybetween the Group financial statements and the Company financialstatements. Consequently, the presentation of the Company balancesheets deviates from Dutch regulations.
The Company balance sheet has been prepared before theappropriation of result.
The Company statement of income has been prepared in accordancewith Section 2:402 of the Dutch Civil Code, which allows a simplifiedStatement of income in the Company financial statements in the eventthat a comprehensive Statement of income is included in theconsolidated Group financial statements.
Additional informationFor ‘Additional information’ within the meaning of Section 2:392 of theDutch Civil Code, please refer to section 13.12, Independent auditor’sreport - Group, of this Annual Report, section 14.5, Independentauditor’s report - Company, of this Annual Report, and section 5.5,Proposed distribution to shareholders, of this Annual Report.
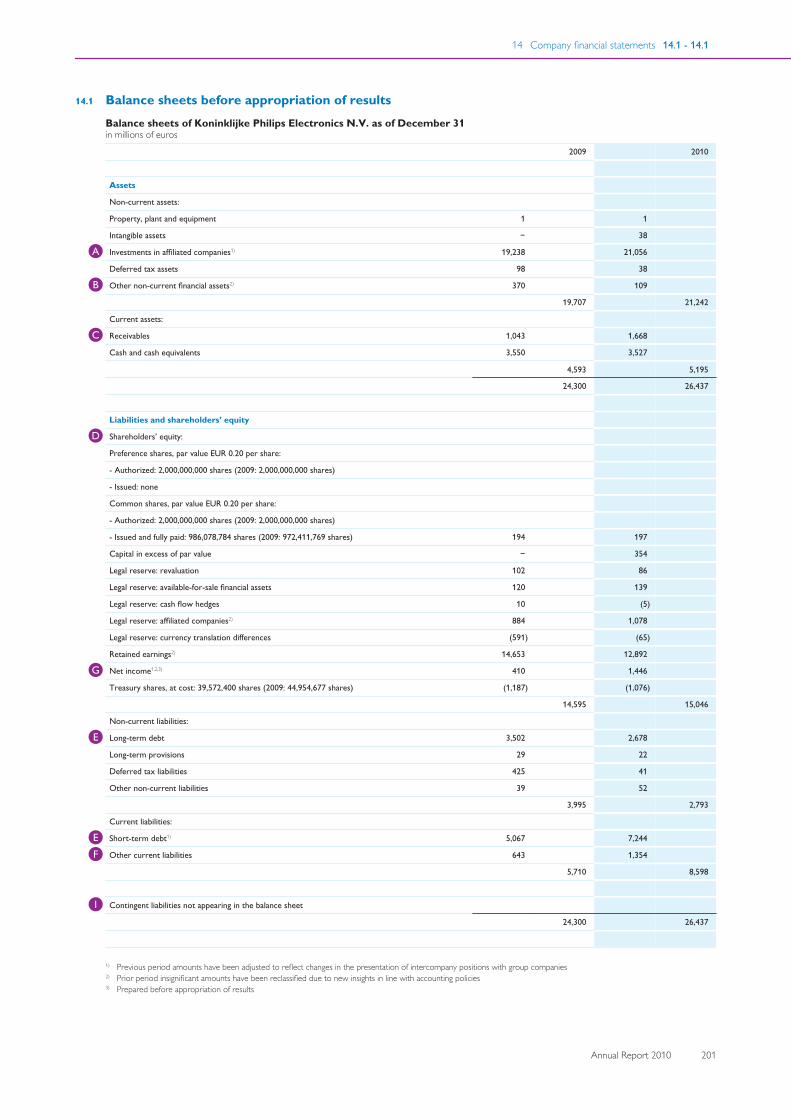
14 Company financial statements 14.1 - 14.1
Annual Report 2010 201
14.1 Balance sheets before appropriation of resultsBalance sheets of Koninklijke Philips Electronics N.V. as of December 31in millions of euros
2009 2010
Assets
Non-current assets:
Property, plant and equipment 1 1
Intangible assets − 38
Investments in affiliated companies1)A 19,238 21,056
Deferred tax assets 98 38
Other non-current financial assets2)B 370 109
19,707 21,242
Current assets:
ReceivablesC 1,043 1,668
Cash and cash equivalents 3,550 3,527
4,593 5,195
24,300 26,437
Liabilities and shareholders’ equity
Shareholders’ equity:D
Preference shares, par value EUR 0.20 per share:
- Authorized: 2,000,000,000 shares (2009: 2,000,000,000 shares)
- Issued: none
Common shares, par value EUR 0.20 per share:
- Authorized: 2,000,000,000 shares (2009: 2,000,000,000 shares)
- Issued and fully paid: 986,078,784 shares (2009: 972,411,769 shares) 194 197
Capital in excess of par value − 354
Legal reserve: revaluation 102 86
Legal reserve: available-for-sale financial assets 120 139
Legal reserve: cash flow hedges 10 (5)
Legal reserve: affiliated companies2) 884 1,078
Legal reserve: currency translation differences (591) (65)
Retained earnings2) 14,653 12,892
Net income1,2,3)G 410 1,446
Treasury shares, at cost: 39,572,400 shares (2009: 44,954,677 shares) (1,187) (1,076)
14,595 15,046
Non-current liabilities:
Long-term debtE 3,502 2,678
Long-term provisions 29 22
Deferred tax liabilities 425 41
Other non-current liabilities 39 52
3,995 2,793
Current liabilities:
Short-term debt1)E 5,067 7,244
Other current liabilitiesF 643 1,354
5,710 8,598
Contingent liabilities not appearing in the balance sheetI
24,300 26,437
1) Previous period amounts have been adjusted to reflect changes in the presentation of intercompany positions with group companies2) Prior period insignificant amounts have been reclassified due to new insights in line with accounting policies3) Prepared before appropriation of results
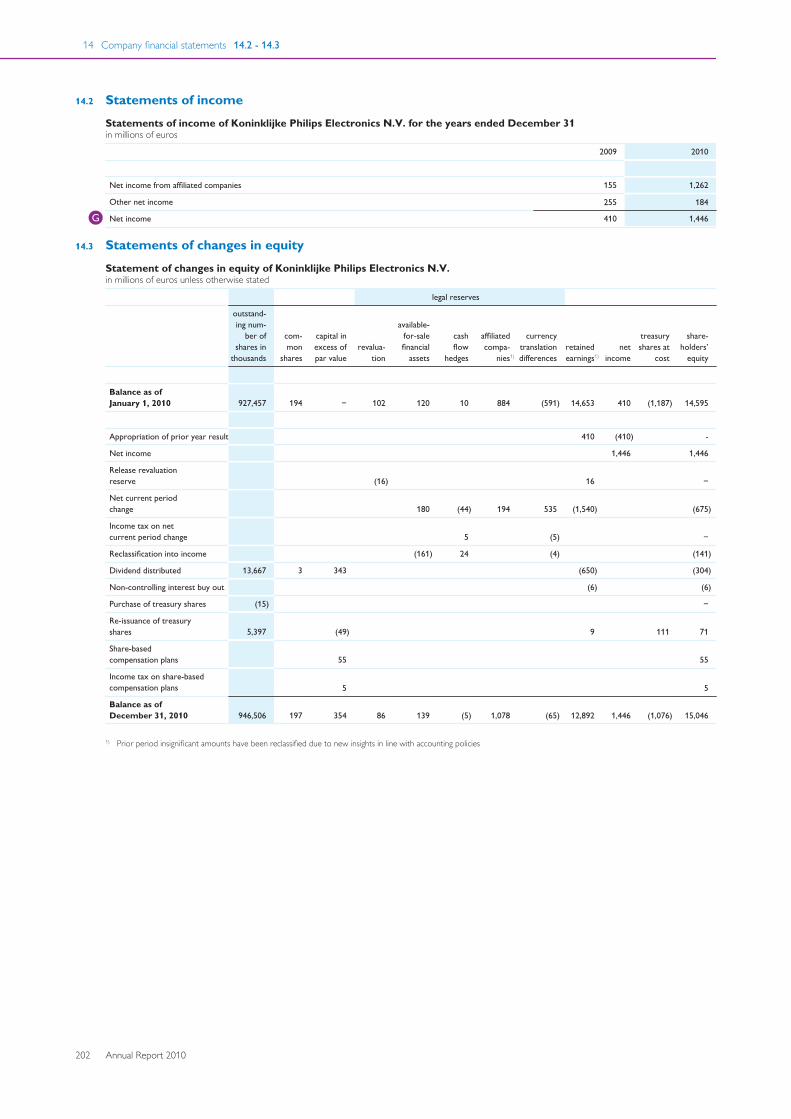
14 Company financial statements 14.2 - 14.3
202 Annual Report 2010
14.2 Statements of incomeStatements of income of Koninklijke Philips Electronics N.V. for the years ended December 31in millions of euros
2009 2010
Net income from affiliated companies 155 1,262
Other net income 255 184
Net incomeG 410 1,446
14.3 Statements of changes in equityStatement of changes in equity of Koninklijke Philips Electronics N.V.in millions of euros unless otherwise stated
legal reserves
outstand-ing num-
ber ofshares in
thousands
com-mon
shares
capital inexcess ofpar value
revalua-tion
available-for-salefinancial
assets
cashflow
hedges
affiliatedcompa-
nies1)
currencytranslationdifferences
retainedearnings1)
netincome
treasuryshares at
cost
share-holders’
equity
Balance as of January 1, 2010 927,457 194 − 102 120 10 884 (591) 14,653 410 (1,187) 14,595
Appropriation of prior year result 410 (410) -
Net income 1,446 1,446
Release revaluationreserve (16) 16 −
Net current periodchange 180 (44) 194 535 (1,540) (675)
Income tax on net current period change 5 (5) −
Reclassification into income (161) 24 (4) (141)
Dividend distributed 13,667 3 343 (650) (304)
Non-controlling interest buy out (6) (6)
Purchase of treasury shares (15) −
Re-issuance of treasuryshares 5,397 (49) 9 111 71
Share-based compensation plans 55 55
Income tax on share-based compensation plans 5 5
Balance as of December 31, 2010 946,506 197 354 86 139 (5) 1,078 (65) 12,892 1,446 (1,076) 15,046
1) Prior period insignificant amounts have been reclassified due to new insights in line with accounting policies
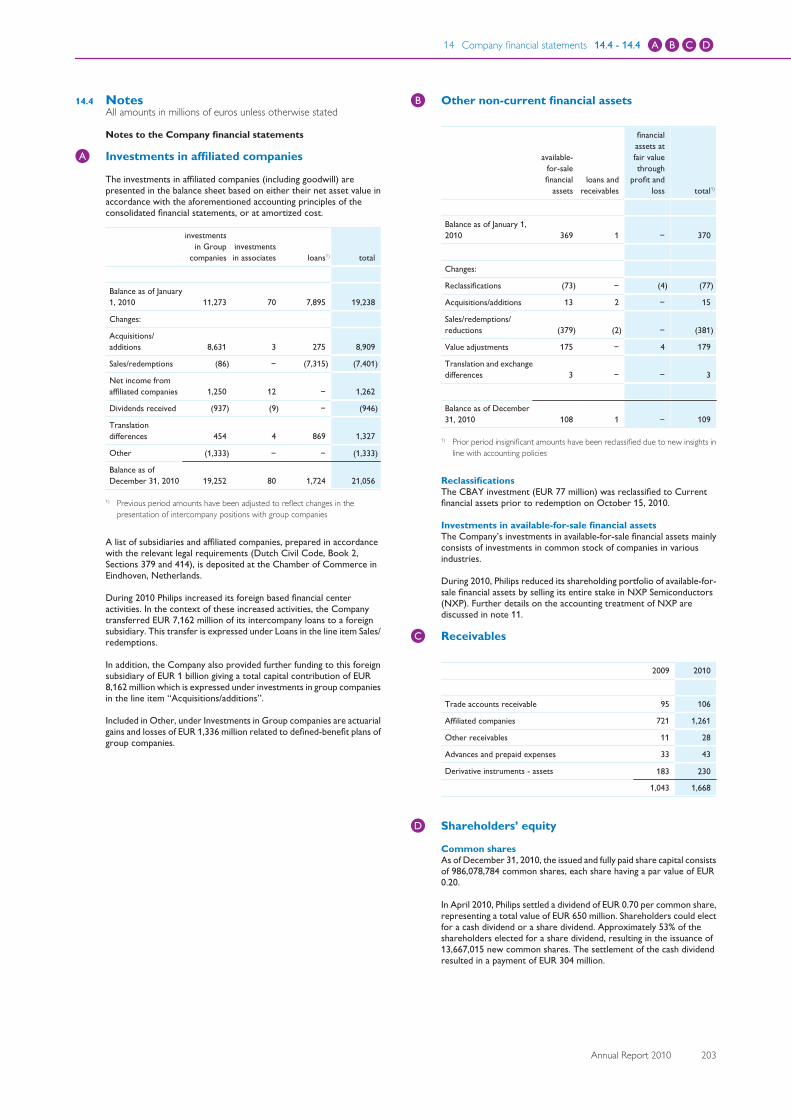
14 Company financial statements 14.4 - 14.4 A B C D
Annual Report 2010 203
14.4 NotesAll amounts in millions of euros unless otherwise stated
Notes to the Company financial statements
A Investments in affiliated companies
The investments in affiliated companies (including goodwill) arepresented in the balance sheet based on either their net asset value inaccordance with the aforementioned accounting principles of theconsolidated financial statements, or at amortized cost.
investmentsin Group
companies investmentsin associates loans1) total
Balance as of January1, 2010 11,273 70 7,895 19,238
Changes:
Acquisitions/additions 8,631 3 275 8,909
Sales/redemptions (86) − (7,315) (7,401)
Net income fromaffiliated companies 1,250 12 − 1,262
Dividends received (937) (9) − (946)
Translationdifferences 454 4 869 1,327
Other (1,333) − − (1,333)
Balance as ofDecember 31, 2010 19,252 80 1,724 21,056
1) Previous period amounts have been adjusted to reflect changes in thepresentation of intercompany positions with group companies
A list of subsidiaries and affiliated companies, prepared in accordancewith the relevant legal requirements (Dutch Civil Code, Book 2,Sections 379 and 414), is deposited at the Chamber of Commerce inEindhoven, Netherlands.
During 2010 Philips increased its foreign based financial centeractivities. In the context of these increased activities, the Companytransferred EUR 7,162 million of its intercompany loans to a foreignsubsidiary. This transfer is expressed under Loans in the line item Sales/redemptions.
In addition, the Company also provided further funding to this foreignsubsidiary of EUR 1 billion giving a total capital contribution of EUR8,162 million which is expressed under investments in group companiesin the line item “Acquisitions/additions”.
Included in Other, under Investments in Group companies are actuarialgains and losses of EUR 1,336 million related to defined-benefit plans ofgroup companies.
B Other non-current financial assets
available-for-salefinancial
assets loans and
receivables
financialassets atfair valuethrough
profit andloss total1)
Balance as of January 1,2010 369 1 − 370
Changes:
Reclassifications (73) − (4) (77)
Acquisitions/additions 13 2 − 15
Sales/redemptions/reductions (379) (2) − (381)
Value adjustments 175 − 4 179
Translation and exchangedifferences 3 − − 3
Balance as of December31, 2010 108 1 − 109
1) Prior period insignificant amounts have been reclassified due to new insights inline with accounting policies
ReclassificationsThe CBAY investment (EUR 77 million) was reclassified to Currentfinancial assets prior to redemption on October 15, 2010.
Investments in available-for-sale financial assetsThe Company’s investments in available-for-sale financial assets mainlyconsists of investments in common stock of companies in variousindustries.
During 2010, Philips reduced its shareholding portfolio of available-for-sale financial assets by selling its entire stake in NXP Semiconductors(NXP). Further details on the accounting treatment of NXP arediscussed in note 11.
C Receivables
2009 2010
Trade accounts receivable 95 106
Affiliated companies 721 1,261
Other receivables 11 28
Advances and prepaid expenses 33 43
Derivative instruments - assets 183 230
1,043 1,668
D Shareholders’ equity
Common sharesAs of December 31, 2010, the issued and fully paid share capital consistsof 986,078,784 common shares, each share having a par value of EUR0.20.
In April 2010, Philips settled a dividend of EUR 0.70 per common share,representing a total value of EUR 650 million. Shareholders could electfor a cash dividend or a share dividend. Approximately 53% of theshareholders elected for a share dividend, resulting in the issuance of13,667,015 new common shares. The settlement of the cash dividendresulted in a payment of EUR 304 million.

14 Company financial statements 14.4 - 14.4
204 Annual Report 2010
Preference sharesThe ‘Stichting Preferente Aandelen Philips’ has been granted the right toacquire preference shares in the Company. Such right has not beenexercised. As a means to protect the Company and its stakeholdersagainst an unsolicited attempt to (de facto) take over control of theCompany, the General Meeting of Shareholders in 1989 adoptedamendments to the Company’s articles of association that allow theBoard of Management and the Supervisory Board to issue (rights toacquire) preference shares to a third party. As of December 31, 2010,no preference shares have been issued.
Option rights/restricted sharesThe Company has granted stock options on its common shares andrights to receive common shares in the future. Please refer to note 29,which is deemed incorporated and repeated herein by reference.
Treasury sharesIn connection with the Company’s share repurchase programs, shareswhich have been repurchased and are held in treasury for (i) deliveryupon exercise of options and convertible personnel debentures andunder restricted share programs and employee share purchaseprograms, and (ii) capital reduction purposes, are accounted for as areduction of shareholders’ equity. Treasury shares are recorded atcost, representing the market price on the acquisition date. Whenissued, shares are removed from treasury shares on a FIFO basis.
Any difference between the cost and the cash received at the timetreasury shares are issued, is recorded in capital in excess of par value,except in the situation in which the cash received is lower than cost, andcapital in excess of par has been depleted.
The following transactions took place resulting from employee optionand share plans:
2009 2010
Shares acquired 2,128 15,237
Average market price EUR 19.10 EUR 25.35
Amount paid − −
Shares delivered 4,477,364 5,397,514
Average market price EUR 13.76 EUR 23.99
Amount received EUR 32 million EUR 71 million
Total shares in treasury atyear-end 43,102,679 37,720,402
Total cost EUR 1,162 million EUR 1,051 million
In 2009 and 2010 there were no transactions to reduce share capital:
2009 2010
Shares acquired − −
Average market price − −
Amount paid − −
Reduction of capital stock − −
Total shares in treasury atyear-end 1,851,998 1,851,998
Total cost EUR 25 million EUR 25 million
Net incomeA proposal will be submitted to the General Meeting of Shareholders topay a dividend of EUR 0.75 per common share, in cash or shares at theoption of the shareholder, against the net income for 2010.
Legal reservesAs of December 31, 2010, legal reserves relate to the revaluation ofassets and liabilities of acquired companies in the context of multi-stageacquisitions of EUR 86 million (2009: EUR 102 million), unrealized gainson available-for-sale financial assets of EUR 139 million (2009: EUR 120million), unrealized losses on cash flow hedges of EUR 5 million (2009:unrealized gains of EUR 10 million), ‘affiliated companies’ of EUR 1,078million (2009: EUR 884 million) and currency translation losses of EUR65 million (2009: EUR 591 million).
The item ‘affiliated companies’ relates to the ‘wettelijke reservedeelnemingen’, which is required by Dutch law.This reserve relates toany legal or economic restrictions on the ability of affiliated companiesto transfer funds to the parent company in the form of dividends.
Limitations in the distribution of shareholders’ equityPursuant to Dutch law, limitations exist relating to the distribution ofshareholders’ equity of EUR 1,500 million (2009: EUR 1,310 million). Asat December 31, 2010, such limitations relate to common shares ofEUR 197 million (2009: EUR 194 million) as well as to legal reservesincluded under ‘revaluation’ of EUR 86 million (2009: EUR 102 million),available-for-sale financial assets of EUR 139 million (2009: 120 million)and ‘affiliated companies’ of EUR 1,078 million (2009: EUR 884 million).In 2009, limitations in the distribution were also affected by gainsrelated to cash flow hedges of EUR 10 million.
In general, gains related to available-for-sale financial assets, cash flowhedges and currency translation differences cannot be distributed aspart of shareholders’ equity as they form part of the legal reservesprotected under Dutch law. By their nature, losses relating to available-for-sale financial assets, cash flow hedges and currency translationdifferences, reduce shareholders’ equity, and thereby distributableamounts.
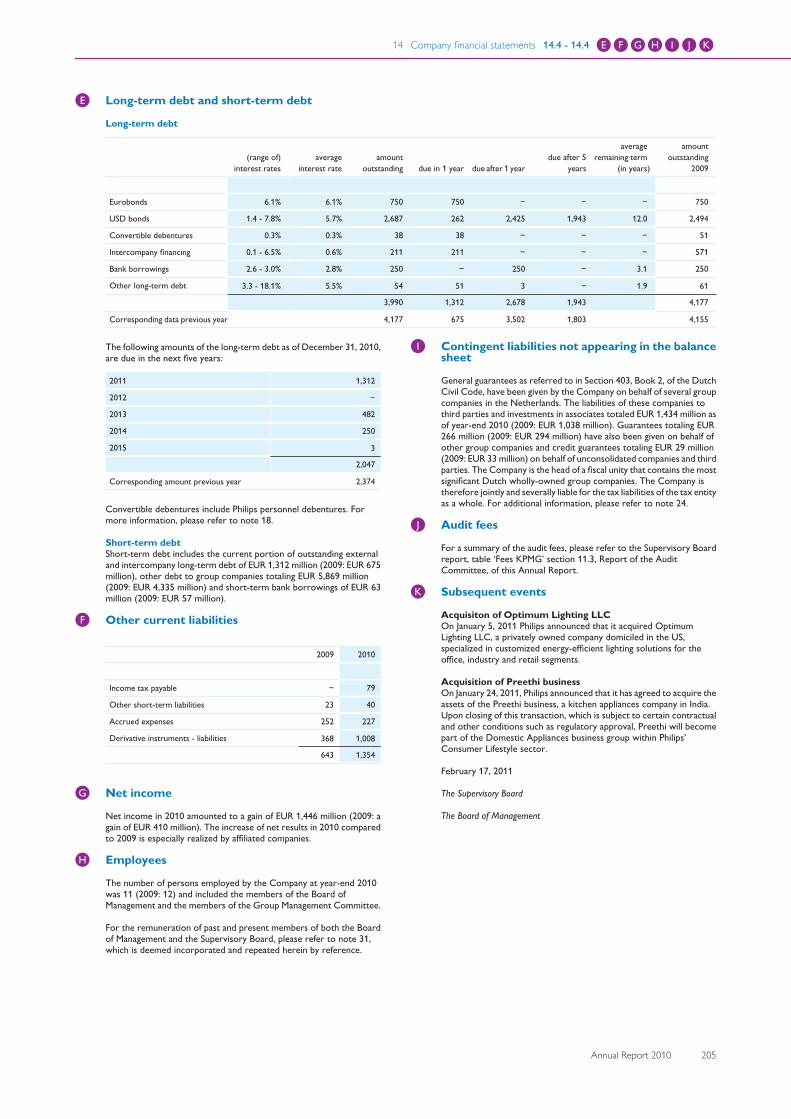
14 Company financial statements 14.4 - 14.4 E F G H I J K
Annual Report 2010 205
E Long-term debt and short-term debt
Long-term debt
(range of)interest rates
averageinterest rate
amountoutstanding due in 1 year due after 1 year
due after 5years
averageremaining term
(in years)
amountoutstanding
2009
Eurobonds 6.1% 6.1% 750 750 − − − 750
USD bonds 1.4 - 7.8% 5.7% 2,687 262 2,425 1,943 12.0 2,494
Convertible debentures 0.3% 0.3% 38 38 − − − 51
Intercompany financing 0.1 - 6.5% 0.6% 211 211 − − − 571
Bank borrowings 2.6 - 3.0% 2.8% 250 − 250 − 3.1 250
Other long-term debt 3.3 - 18.1% 5.5% 54 51 3 − 1.9 61
3,990 1,312 2,678 1,943 4,177
Corresponding data previous year 4,177 675 3,502 1,803 4,155
The following amounts of the long-term debt as of December 31, 2010,are due in the next five years:
2011 1,312
2012 −
2013 482
2014 250
2015 3
2,047
Corresponding amount previous year 2,374
Convertible debentures include Philips personnel debentures. Formore information, please refer to note 18.
Short-term debtShort-term debt includes the current portion of outstanding externaland intercompany long-term debt of EUR 1,312 million (2009: EUR 675million), other debt to group companies totaling EUR 5,869 million(2009: EUR 4,335 million) and short-term bank borrowings of EUR 63million (2009: EUR 57 million).
F Other current liabilities
2009 2010
Income tax payable − 79
Other short-term liabilities 23 40
Accrued expenses 252 227
Derivative instruments - liabilities 368 1,008
643 1,354
G Net income
Net income in 2010 amounted to a gain of EUR 1,446 million (2009: again of EUR 410 million). The increase of net results in 2010 comparedto 2009 is especially realized by affiliated companies.
H Employees
The number of persons employed by the Company at year-end 2010was 11 (2009: 12) and included the members of the Board ofManagement and the members of the Group Management Committee.
For the remuneration of past and present members of both the Boardof Management and the Supervisory Board, please refer to note 31,which is deemed incorporated and repeated herein by reference.
I Contingent liabilities not appearing in the balancesheet
General guarantees as referred to in Section 403, Book 2, of the DutchCivil Code, have been given by the Company on behalf of several groupcompanies in the Netherlands. The liabilities of these companies tothird parties and investments in associates totaled EUR 1,434 million asof year-end 2010 (2009: EUR 1,038 million). Guarantees totaling EUR266 million (2009: EUR 294 million) have also been given on behalf ofother group companies and credit guarantees totaling EUR 29 million(2009: EUR 33 million) on behalf of unconsolidated companies and thirdparties. The Company is the head of a fiscal unity that contains the mostsignificant Dutch wholly-owned group companies. The Company istherefore jointly and severally liable for the tax liabilities of the tax entityas a whole. For additional information, please refer to note 24.
J Audit fees
For a summary of the audit fees, please refer to the Supervisory Boardreport, table ‘Fees KPMG’ section 11.3, Report of the AuditCommittee, of this Annual Report.
K Subsequent events
Acquisiton of Optimum Lighting LLCOn January 5, 2011 Philips announced that it acquired OptimumLighting LLC, a privately owned company domiciled in the US,specialized in customized energy-efficient lighting solutions for theoffice, industry and retail segments.
Acquisition of Preethi businessOn January 24, 2011, Philips announced that it has agreed to acquire theassets of the Preethi business, a kitchen appliances company in India.Upon closing of this transaction, which is subject to certain contractualand other conditions such as regulatory approval, Preethi will becomepart of the Domestic Appliances business group within Philips’Consumer Lifestyle sector.
February 17, 2011
The Supervisory Board
The Board of Management
14 Company financial statements 14.5 - 14.5
206 Annual Report 2010
14.5 Independent auditor’s report - CompanyIndependent auditor’s report
To the Supervisory Board and Shareholders of Koninklijke PhilipsElectronics N.V.:
Report on the Company financial statementsWe have audited the accompanying Company financial statements 2010which are part of the financial statements of Koninklijke PhilipsElectronics N.V., Eindhoven, the Netherlands, and comprise theCompany balance sheet as at December 31, 2010, the Companystatements of income and changes in equity for the year then ended, andthe notes, comprising a summary of the accounting policies and otherexplanatory information as included in section 14 to 14.5.
Management’s responsibilityThe Board of Management is responsible for the preparation and fairpresentation of the Company financial statements and for thepreparation of the Management report, both in accordance with Part 9of Book 2 of the Dutch Civil Code. Furthermore, management isresponsible for such internal control as it determines is necessary toenable the preparation of the Company financial statements that arefree from material misstatement, whether due to fraud or error.
Auditor’s responsibilityOur responsibility is to express an opinion on these Company financialstatements based on our audit. We conducted our audit in accordancewith Dutch law, including the Dutch Standards on Auditing. Thisrequires that we comply with ethical requirements and plan andperform the audit to obtain reasonable assurance about whether theCompany financial statements are free from material misstatement.
An audit involves performing procedures to obtain audit evidenceabout the amounts and disclosures in the Company financialstatements. The procedures selected depend on the auditor’sjudgment, including the assessment of the risks of materialmisstatement of the Company financial statements, whether due tofraud or error. In making those risk assessments, the auditor considersinternal control relevant to the entity’s preparation and fairpresentation of the Company financial statements in order to designaudit procedures that are appropriate in the circumstances, but not forthe purpose of expressing an opinion on the effectiveness of the entity’sinternal control. An audit also includes evaluating the appropriatenessof accounting policies used and the reasonableness of accountingestimates made by management, as well as evaluating the overallpresentation of the Company financial statements.
We believe that the audit evidence we have obtained is sufficient andappropriate to provide a basis for our audit opinion.
OpinionIn our opinion, the Company financial statements give a true and fairview of the financial position of Koninklijke Philips Electronics N.V. as atDecember 31, 2010, and of its result for the year then ended inaccordance with Part 9 of Book 2 of the Dutch Civil Code.
Report on other legal and regulatory requirementsPursuant to the legal requirements under Section 2:393 sub 5 at e and fof the Dutch Civil Code, we have no deficiencies to report as a result ofour examination whether the Management report, as defined in theintroduction paragraph of section 13 Group financial statements, and tothe extent we can assess, has been prepared in accordance with part 9of Book 2 of this Code, and if the information as required under Section2:392 sub 1 at b - h has been annexed. Further, we report that theManagement report, to the extent we can assess, is consistent with theCompany financial statements as required by Section 2:391 sub 4 of theDutch Civil Code.
Amsterdam, February 17, 2011
KPMG ACCOUNTANTS N.V.
M.A. Soeting RA
15 Sustainability statements 15 - 15
Annual Report 2010 207
15 Sustainability statementsApproach to sustainability reportingPhilips has a long tradition of sustainability reporting, beginning in 1999when we published our first environmental annual report. Weexpanded our reporting in 2003 with the launch of our firstsustainability annual report, which provided details of our social andeconomic performance in addition to our environmental results.
In 2011 we published our third annual integrated financial, social andenvironmental report, reflecting the progress we have made to embedsustainability in our way of doing business. This is also supported by theinclusion of sustainability in the Philips Management Agenda and inVision 2015, our 5-year strategic plan.
Reporting standardsWe have followed relevant best practice standards and internationalguidelines while compiling the sustainability performance covered inthis report. Most important are the Global Reporting Initiative’s (GRI)G3 Sustainability Reporting Guidelines.
With regard to the GRI Application Levels system, we assessedourselves at the A+ level. A detailed overview of our ManagementApproach and the G3 Core Indicators is provided at the end of thissection.
We signed on to the United Nations Global Compact in March 2007,joining thousands of companies from all regions of the world as well asinternational labor and civil society organizations to advance 10universal principles in the areas of human rights, labor, the environmentand anti-corruption. Our General Business Principles, Sustainability andEnvironmental Policies, and our Supplier Sustainability Declaration arethe cornerstones that enable us to live up to the standards set by theGlobal Compact. This is closely monitored and reported, as illustratedthroughout this report, which is our annual Communication onProgress (COP) submitted to the UN Global Compact Office.
Tracking trendsWe continuously follow external trends to determine the issues mostrelevant for our company and those where we can make a positivecontribution to society at large. In addition to our own research, wemake use of a variety of sources, including the World Bank, WorldBusiness Council for Sustainable Development (WBCSD), WorldEconomic Forum and World Health Organization. Our work alsoinvolves tracking topics of concern to governments, regulatory bodies,academia, and non-governmental organizations, and following theresulting media coverage.
Stakeholder engagementAcross all our activities we seek to engage stakeholders to gain theirfeedback on specific areas of our business. Working in partnerships iscrucial in delivering on our commitment to bring “sense and simplicity”to people’s health and well-being. We participate in meetings and taskforces as a member of organizations including the WBCSD, ElectronicIndustry Citizenship Coalition (EICC), Carbon Disclosure ProjectSupply Chain, European Committee of Domestic EquipmentManufacturers (CECED), Federation of National ManufacturersAssociations for Luminaires and Electrotechnical Components forLuminaires in the European Union (CELMA), European CoordinationCommittee of the Radiological, Electromedical and Healthcare ITIndustry (COCIR), Digital Europe, European Lamp CompaniesFederation (ELC), European Roundtable of Industrialists (ERT),National Electrical Manufacturers Association (NEMA), EnvironmentalLeadership Council of the Information Technology Industry Council(ELC ITIC), Consumer Electronics Association (CEA) and Associationof Home Appliance Manufacturers (AHAM).
In 2010, we started a multi-stakeholder initiative with the DutchSustainable Trade Initiative (IDH), the leading Dutch labor union (FNV)and GoodElectronics focusing on improving working circumstances inthe electronics industry in China.
Furthermore, we engaged with a number of NGOs including Enough,MakeITfair, the Chinese Institute of Public and Environmental Affairs,SOMO, Amnesty International and Greenpeace.
In 2009 we established a dedicated Professional and Public Affairs teamto further steer and professionalize our stakeholder engagementactivities with key business influencers including government, non-governmental institutions, industry associations, industry partners,influencers and opinion formers.
The Philips Center for Health and Well-beingThrough the creation of the Philips Center for Health and Well-being,Philips seeks to address key societal issues and solutions on themessuch as healthy and active aging, livable cities and healthy lifestyles. TheCenter launched in December 2009 and brings together teams ofmultidisciplinary experts from all over the world in think tanks.Participants include EU Members of Parliament, NGOs such as theWorld Bank, UNICEF, Global Health Council, European Patient’sForum, ISOCARP (international association of urban planners), andWBCSD. The active aging think tank is working from the USA and isdebating how aging populations can remain independent and engagedthrough their life transitions. The livable cities think tank is workingfrom Singapore, and is taking a holistic view of a livable city – and isdefining “livability” which includes a city being resilient, sustainable,authentic and inclusive. Additionally, the Philips Index for Health &Well-being is a global research project being conducted by the Center.It aims to identify what citizens find important concerning their healthand well-being. The research examines the mega-trends that shape eachnation’s healthcare, lifestyle and who we are as a society, with a focus onwhat aspects of health and well-being are most important. It wasconducted in 23 countries during 2010, with over 31,000 consumerssurveyed. For more information on the work of the Center, go towww.philips-thecenter.org.
Working on global issuesIn 2010, Philips participated in the United Nations Climate ChangeConference in Cancun, Mexico. We partnered with other leadingindustry players, governmental organizations, NGOs (like The ClimateGroup) and the United Nations Environmental Program to create aglobal sectoral agreement on phasing out inefficient lighting. At COP16,this roll-out was welcomed by a range of different stakeholders given itstriple benefits for consumers, environment and economy.
Philips also signed the CEO Water Mandate acknowledging that inorder to operate in a more sustainable manner, and contribute to thevision of the UN Global Compact and the realization of the MillenniumDevelopment Goals, it has a responsibility to make water-resourcesmanagement a priority.
As part of Philips’ participation in the WBCSD Vision 2050 project,Philips Research joined the WBCSD Sustainable Consumptionactivities. Philips Research hosted a workshop with special focus onhealth at the High Tech Campus in Eindhoven, in addition toparticipating in a series of cross-industry meetings. Another activityrelated to the Vision 2050 project was Philips Research’s participationin the National Health Service Low Carbon Healthcare dialog inLondon. Different types of care providers, care purchasers, communityrepresentatives, and many other stakeholders explored scenariostowards a low carbon healthcare system by 2030.
BiodiversityBiodiversity is a complex phenomenon with different elements, such aspreservation of species and ecosystems as enablers for those species tolive in. Impact on biodiversity cannot be measured as easily as, forinstance, CO2 emissions or water consumption.
Furthermore, the impact is to a large extent dependent on the nature ofthe business activities, the space used and whether that space is locatedin or nearby protected areas. From that perspective the impact of ouroperations is very limited.
However, in general there is a trend noticeable that people expectindustry to pay more attention to biodiversity, not only taking intoaccount the impact of its operations but also the impact of its products.Our current policy focuses on the following:
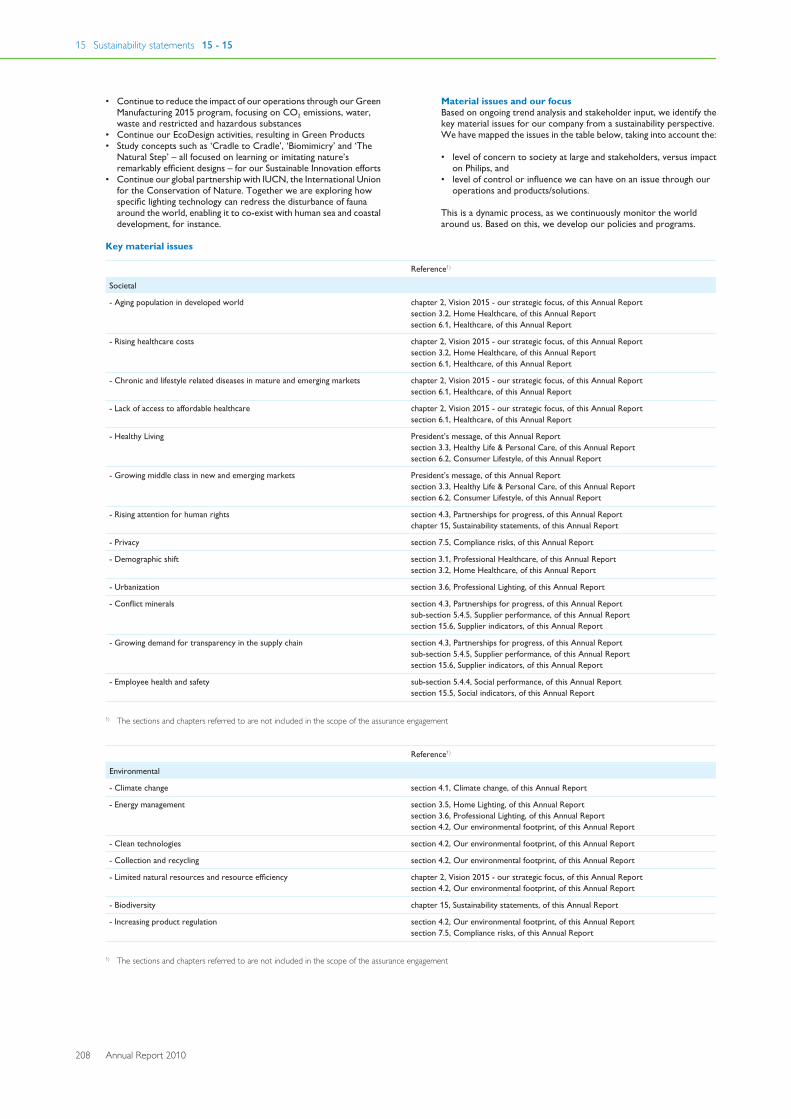
15 Sustainability statements 15 - 15
208 Annual Report 2010
• Continue to reduce the impact of our operations through our GreenManufacturing 2015 program, focusing on CO2 emissions, water,waste and restricted and hazardous substances
• Continue our EcoDesign activities, resulting in Green Products• Study concepts such as ‘Cradle to Cradle’, ‘Biomimicry’ and ‘The
Natural Step’ – all focused on learning or imitating nature’sremarkably efficient designs – for our Sustainable Innovation efforts
• Continue our global partnership with IUCN, the International Unionfor the Conservation of Nature. Together we are exploring howspecific lighting technology can redress the disturbance of faunaaround the world, enabling it to co-exist with human sea and coastaldevelopment, for instance.
Material issues and our focusBased on ongoing trend analysis and stakeholder input, we identify thekey material issues for our company from a sustainability perspective.We have mapped the issues in the table below, taking into account the:
• level of concern to society at large and stakeholders, versus impacton Philips, and
• level of control or influence we can have on an issue through ouroperations and products/solutions.
This is a dynamic process, as we continuously monitor the worldaround us. Based on this, we develop our policies and programs.
Key material issues
Reference1)
Societal
- Aging population in developed world chapter 2, Vision 2015 - our strategic focus, of this Annual Reportsection 3.2, Home Healthcare, of this Annual Reportsection 6.1, Healthcare, of this Annual Report
- Rising healthcare costs chapter 2, Vision 2015 - our strategic focus, of this Annual Reportsection 3.2, Home Healthcare, of this Annual Reportsection 6.1, Healthcare, of this Annual Report
- Chronic and lifestyle related diseases in mature and emerging markets chapter 2, Vision 2015 - our strategic focus, of this Annual Reportsection 6.1, Healthcare, of this Annual Report
- Lack of access to affordable healthcare chapter 2, Vision 2015 - our strategic focus, of this Annual Reportsection 6.1, Healthcare, of this Annual Report
- Healthy Living President’s message, of this Annual Reportsection 3.3, Healthy Life & Personal Care, of this Annual Reportsection 6.2, Consumer Lifestyle, of this Annual Report
- Growing middle class in new and emerging markets President’s message, of this Annual Reportsection 3.3, Healthy Life & Personal Care, of this Annual Reportsection 6.2, Consumer Lifestyle, of this Annual Report
- Rising attention for human rights section 4.3, Partnerships for progress, of this Annual Reportchapter 15, Sustainability statements, of this Annual Report
- Privacy section 7.5, Compliance risks, of this Annual Report
- Demographic shift section 3.1, Professional Healthcare, of this Annual Reportsection 3.2, Home Healthcare, of this Annual Report
- Urbanization section 3.6, Professional Lighting, of this Annual Report
- Conflict minerals section 4.3, Partnerships for progress, of this Annual Reportsub-section 5.4.5, Supplier performance, of this Annual Reportsection 15.6, Supplier indicators, of this Annual Report
- Growing demand for transparency in the supply chain section 4.3, Partnerships for progress, of this Annual Reportsub-section 5.4.5, Supplier performance, of this Annual Reportsection 15.6, Supplier indicators, of this Annual Report
- Employee health and safety sub-section 5.4.4, Social performance, of this Annual Reportsection 15.5, Social indicators, of this Annual Report
1) The sections and chapters referred to are not included in the scope of the assurance engagement
Reference1)
Environmental
- Climate change section 4.1, Climate change, of this Annual Report
- Energy management section 3.5, Home Lighting, of this Annual Reportsection 3.6, Professional Lighting, of this Annual Reportsection 4.2, Our environmental footprint, of this Annual Report
- Clean technologies section 4.2, Our environmental footprint, of this Annual Report
- Collection and recycling section 4.2, Our environmental footprint, of this Annual Report
- Limited natural resources and resource efficiency chapter 2, Vision 2015 - our strategic focus, of this Annual Reportsection 4.2, Our environmental footprint, of this Annual Report
- Biodiversity chapter 15, Sustainability statements, of this Annual Report
- Increasing product regulation section 4.2, Our environmental footprint, of this Annual Reportsection 7.5, Compliance risks, of this Annual Report
1) The sections and chapters referred to are not included in the scope of the assurance engagement
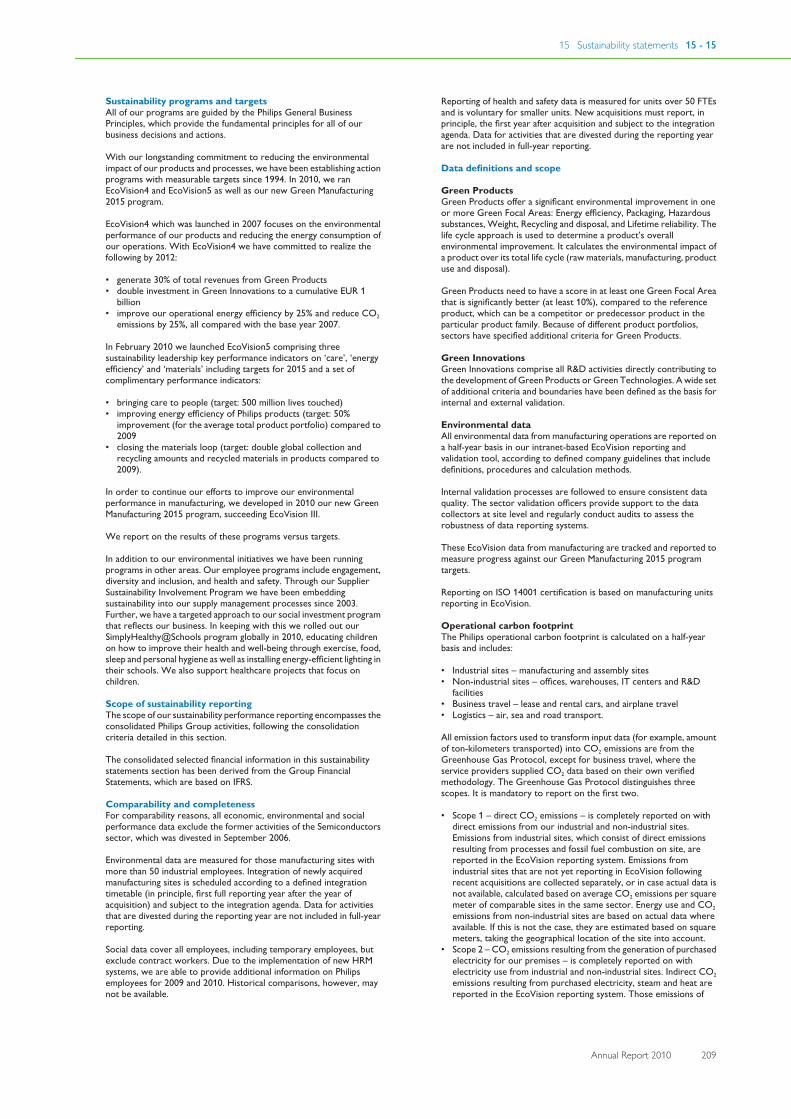
15 Sustainability statements 15 - 15
Annual Report 2010 209
Sustainability programs and targetsAll of our programs are guided by the Philips General BusinessPrinciples, which provide the fundamental principles for all of ourbusiness decisions and actions.
With our longstanding commitment to reducing the environmentalimpact of our products and processes, we have been establishing actionprograms with measurable targets since 1994. In 2010, we ranEcoVision4 and EcoVision5 as well as our new Green Manufacturing2015 program.
EcoVision4 which was launched in 2007 focuses on the environmentalperformance of our products and reducing the energy consumption ofour operations. With EcoVision4 we have committed to realize thefollowing by 2012:
• generate 30% of total revenues from Green Products• double investment in Green Innovations to a cumulative EUR 1
billion• improve our operational energy efficiency by 25% and reduce CO2
emissions by 25%, all compared with the base year 2007.
In February 2010 we launched EcoVision5 comprising threesustainability leadership key performance indicators on ‘care’, ‘energyefficiency’ and ‘materials’ including targets for 2015 and a set ofcomplimentary performance indicators:
• bringing care to people (target: 500 million lives touched)• improving energy efficiency of Philips products (target: 50%
improvement (for the average total product portfolio) compared to2009
• closing the materials loop (target: double global collection andrecycling amounts and recycled materials in products compared to2009).
In order to continue our efforts to improve our environmentalperformance in manufacturing, we developed in 2010 our new GreenManufacturing 2015 program, succeeding EcoVision III.
We report on the results of these programs versus targets.
In addition to our environmental initiatives we have been runningprograms in other areas. Our employee programs include engagement,diversity and inclusion, and health and safety. Through our SupplierSustainability Involvement Program we have been embeddingsustainability into our supply management processes since 2003.Further, we have a targeted approach to our social investment programthat reflects our business. In keeping with this we rolled out ourSimplyHealthy@Schools program globally in 2010, educating childrenon how to improve their health and well-being through exercise, food,sleep and personal hygiene as well as installing energy-efficient lighting intheir schools. We also support healthcare projects that focus onchildren.
Scope of sustainability reportingThe scope of our sustainability performance reporting encompasses theconsolidated Philips Group activities, following the consolidationcriteria detailed in this section.
The consolidated selected financial information in this sustainabilitystatements section has been derived from the Group FinancialStatements, which are based on IFRS.
Comparability and completenessFor comparability reasons, all economic, environmental and socialperformance data exclude the former activities of the Semiconductorssector, which was divested in September 2006.
Environmental data are measured for those manufacturing sites withmore than 50 industrial employees. Integration of newly acquiredmanufacturing sites is scheduled according to a defined integrationtimetable (in principle, first full reporting year after the year ofacquisition) and subject to the integration agenda. Data for activitiesthat are divested during the reporting year are not included in full-yearreporting.
Social data cover all employees, including temporary employees, butexclude contract workers. Due to the implementation of new HRMsystems, we are able to provide additional information on Philipsemployees for 2009 and 2010. Historical comparisons, however, maynot be available.
Reporting of health and safety data is measured for units over 50 FTEsand is voluntary for smaller units. New acquisitions must report, inprinciple, the first year after acquisition and subject to the integrationagenda. Data for activities that are divested during the reporting yearare not included in full-year reporting.
Data definitions and scope
Green ProductsGreen Products offer a significant environmental improvement in oneor more Green Focal Areas: Energy efficiency, Packaging, Hazardoussubstances, Weight, Recycling and disposal, and Lifetime reliability. Thelife cycle approach is used to determine a product’s overallenvironmental improvement. It calculates the environmental impact ofa product over its total life cycle (raw materials, manufacturing, productuse and disposal).
Green Products need to have a score in at least one Green Focal Areathat is significantly better (at least 10%), compared to the referenceproduct, which can be a competitor or predecessor product in theparticular product family. Because of different product portfolios,sectors have specified additional criteria for Green Products.
Green InnovationsGreen Innovations comprise all R&D activities directly contributing tothe development of Green Products or Green Technologies. A wide setof additional criteria and boundaries have been defined as the basis forinternal and external validation.
Environmental dataAll environmental data from manufacturing operations are reported ona half-year basis in our intranet-based EcoVision reporting andvalidation tool, according to defined company guidelines that includedefinitions, procedures and calculation methods.
Internal validation processes are followed to ensure consistent dataquality. The sector validation officers provide support to the datacollectors at site level and regularly conduct audits to assess therobustness of data reporting systems.
These EcoVision data from manufacturing are tracked and reported tomeasure progress against our Green Manufacturing 2015 programtargets.
Reporting on ISO 14001 certification is based on manufacturing unitsreporting in EcoVision.
Operational carbon footprintThe Philips operational carbon footprint is calculated on a half-yearbasis and includes:
• Industrial sites – manufacturing and assembly sites• Non-industrial sites – offices, warehouses, IT centers and R&D
facilities• Business travel – lease and rental cars, and airplane travel• Logistics – air, sea and road transport.
All emission factors used to transform input data (for example, amountof ton-kilometers transported) into CO2 emissions are from theGreenhouse Gas Protocol, except for business travel, where theservice providers supplied CO2 data based on their own verifiedmethodology. The Greenhouse Gas Protocol distinguishes threescopes. It is mandatory to report on the first two.
• Scope 1 – direct CO2 emissions – is completely reported on withdirect emissions from our industrial and non-industrial sites.Emissions from industrial sites, which consist of direct emissionsresulting from processes and fossil fuel combustion on site, arereported in the EcoVision reporting system. Emissions fromindustrial sites that are not yet reporting in EcoVision followingrecent acquisitions are collected separately, or in case actual data isnot available, calculated based on average CO2 emissions per squaremeter of comparable sites in the same sector. Energy use and CO2emissions from non-industrial sites are based on actual data whereavailable. If this is not the case, they are estimated based on squaremeters, taking the geographical location of the site into account.
• Scope 2 – CO2 emissions resulting from the generation of purchasedelectricity for our premises – is completely reported on withelectricity use from industrial and non-industrial sites. Indirect CO2emissions resulting from purchased electricity, steam and heat arereported in the EcoVision reporting system. Those emissions of
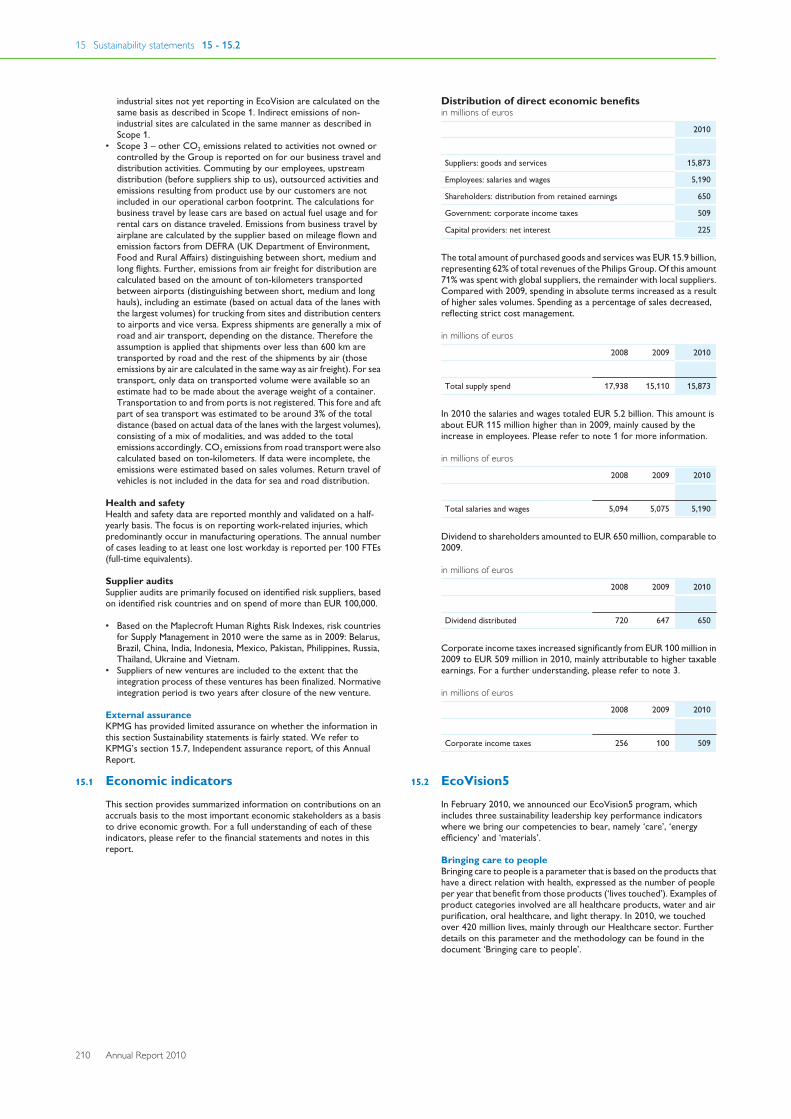
15 Sustainability statements 15 - 15.2
210 Annual Report 2010
industrial sites not yet reporting in EcoVision are calculated on thesame basis as described in Scope 1. Indirect emissions of non-industrial sites are calculated in the same manner as described inScope 1.
• Scope 3 – other CO2 emissions related to activities not owned orcontrolled by the Group is reported on for our business travel anddistribution activities. Commuting by our employees, upstreamdistribution (before suppliers ship to us), outsourced activities andemissions resulting from product use by our customers are notincluded in our operational carbon footprint. The calculations forbusiness travel by lease cars are based on actual fuel usage and forrental cars on distance traveled. Emissions from business travel byairplane are calculated by the supplier based on mileage flown andemission factors from DEFRA (UK Department of Environment,Food and Rural Affairs) distinguishing between short, medium andlong flights. Further, emissions from air freight for distribution arecalculated based on the amount of ton-kilometers transportedbetween airports (distinguishing between short, medium and longhauls), including an estimate (based on actual data of the lanes withthe largest volumes) for trucking from sites and distribution centersto airports and vice versa. Express shipments are generally a mix ofroad and air transport, depending on the distance. Therefore theassumption is applied that shipments over less than 600 km aretransported by road and the rest of the shipments by air (thoseemissions by air are calculated in the same way as air freight). For seatransport, only data on transported volume were available so anestimate had to be made about the average weight of a container.Transportation to and from ports is not registered. This fore and aftpart of sea transport was estimated to be around 3% of the totaldistance (based on actual data of the lanes with the largest volumes),consisting of a mix of modalities, and was added to the totalemissions accordingly. CO2 emissions from road transport were alsocalculated based on ton-kilometers. If data were incomplete, theemissions were estimated based on sales volumes. Return travel ofvehicles is not included in the data for sea and road distribution.
Health and safetyHealth and safety data are reported monthly and validated on a half-yearly basis. The focus is on reporting work-related injuries, whichpredominantly occur in manufacturing operations. The annual numberof cases leading to at least one lost workday is reported per 100 FTEs(full-time equivalents).
Supplier auditsSupplier audits are primarily focused on identified risk suppliers, basedon identified risk countries and on spend of more than EUR 100,000.
• Based on the Maplecroft Human Rights Risk Indexes, risk countriesfor Supply Management in 2010 were the same as in 2009: Belarus,Brazil, China, India, Indonesia, Mexico, Pakistan, Philippines, Russia,Thailand, Ukraine and Vietnam.
• Suppliers of new ventures are included to the extent that theintegration process of these ventures has been finalized. Normativeintegration period is two years after closure of the new venture.
External assuranceKPMG has provided limited assurance on whether the information inthis section Sustainability statements is fairly stated. We refer toKPMG’s section 15.7, Independent assurance report, of this AnnualReport.
15.1 Economic indicatorsThis section provides summarized information on contributions on anaccruals basis to the most important economic stakeholders as a basisto drive economic growth. For a full understanding of each of theseindicators, please refer to the financial statements and notes in thisreport.
Distribution of direct economic benefitsin millions of euros
2010
Suppliers: goods and services 15,873
Employees: salaries and wages 5,190
Shareholders: distribution from retained earnings 650
Government: corporate income taxes 509
Capital providers: net interest 225
The total amount of purchased goods and services was EUR 15.9 billion,representing 62% of total revenues of the Philips Group. Of this amount71% was spent with global suppliers, the remainder with local suppliers.Compared with 2009, spending in absolute terms increased as a resultof higher sales volumes. Spending as a percentage of sales decreased,reflecting strict cost management.
in millions of euros
2008 2009 2010
Total supply spend 17,938 15,110 15,873
In 2010 the salaries and wages totaled EUR 5.2 billion. This amount isabout EUR 115 million higher than in 2009, mainly caused by theincrease in employees. Please refer to note 1 for more information.
in millions of euros
2008 2009 2010
Total salaries and wages 5,094 5,075 5,190
Dividend to shareholders amounted to EUR 650 million, comparable to2009.
in millions of euros
2008 2009 2010
Dividend distributed 720 647 650
Corporate income taxes increased significantly from EUR 100 million in2009 to EUR 509 million in 2010, mainly attributable to higher taxableearnings. For a further understanding, please refer to note 3.
in millions of euros
2008 2009 2010
Corporate income taxes 256 100 509
15.2 EcoVision5In February 2010, we announced our EcoVision5 program, whichincludes three sustainability leadership key performance indicatorswhere we bring our competencies to bear, namely ‘care’, ‘energyefficiency’ and ‘materials’.
Bringing care to peopleBringing care to people is a parameter that is based on the products thathave a direct relation with health, expressed as the number of peopleper year that benefit from those products (‘lives touched’). Examples ofproduct categories involved are all healthcare products, water and airpurification, oral healthcare, and light therapy. In 2010, we touchedover 420 million lives, mainly through our Healthcare sector. Furtherdetails on this parameter and the methodology can be found in thedocument ‘Bringing care to people’.
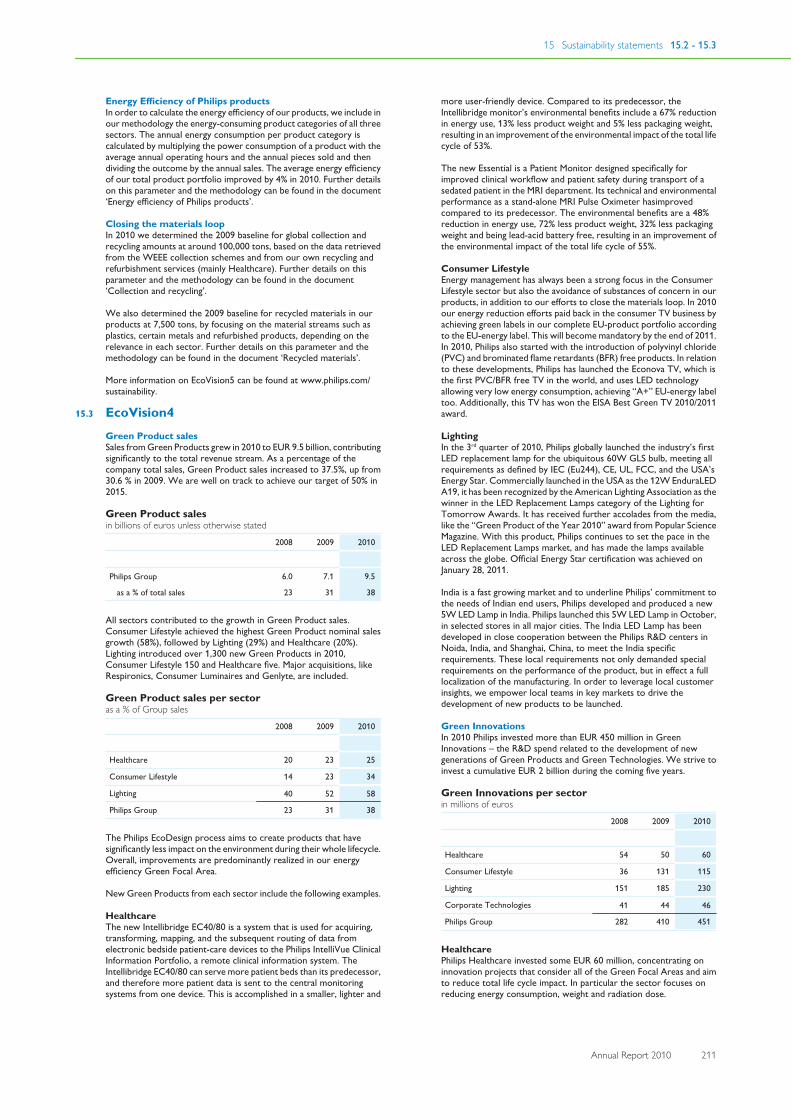
15 Sustainability statements 15.2 - 15.3
Annual Report 2010 211
Energy Efficiency of Philips productsIn order to calculate the energy efficiency of our products, we include inour methodology the energy-consuming product categories of all threesectors. The annual energy consumption per product category iscalculated by multiplying the power consumption of a product with theaverage annual operating hours and the annual pieces sold and thendividing the outcome by the annual sales. The average energy efficiencyof our total product portfolio improved by 4% in 2010. Further detailson this parameter and the methodology can be found in the document‘Energy efficiency of Philips products’.
Closing the materials loopIn 2010 we determined the 2009 baseline for global collection andrecycling amounts at around 100,000 tons, based on the data retrievedfrom the WEEE collection schemes and from our own recycling andrefurbishment services (mainly Healthcare). Further details on thisparameter and the methodology can be found in the document‘Collection and recycling’.
We also determined the 2009 baseline for recycled materials in ourproducts at 7,500 tons, by focusing on the material streams such asplastics, certain metals and refurbished products, depending on therelevance in each sector. Further details on this parameter and themethodology can be found in the document ‘Recycled materials’.
More information on EcoVision5 can be found at www.philips.com/sustainability.
15.3 EcoVision4Green Product salesSales from Green Products grew in 2010 to EUR 9.5 billion, contributingsignificantly to the total revenue stream. As a percentage of thecompany total sales, Green Product sales increased to 37.5%, up from30.6 % in 2009. We are well on track to achieve our target of 50% in2015.
Green Product salesin billions of euros unless otherwise stated
2008 2009 2010
Philips Group 6.0 7.1 9.5
as a % of total sales 23 31 38
All sectors contributed to the growth in Green Product sales.Consumer Lifestyle achieved the highest Green Product nominal salesgrowth (58%), followed by Lighting (29%) and Healthcare (20%).Lighting introduced over 1,300 new Green Products in 2010,Consumer Lifestyle 150 and Healthcare five. Major acquisitions, likeRespironics, Consumer Luminaires and Genlyte, are included.
Green Product sales per sectoras a % of Group sales
2008 2009 2010
Healthcare 20 23 25
Consumer Lifestyle 14 23 34
Lighting 40 52 58
Philips Group 23 31 38
The Philips EcoDesign process aims to create products that havesignificantly less impact on the environment during their whole lifecycle.Overall, improvements are predominantly realized in our energyefficiency Green Focal Area.
New Green Products from each sector include the following examples.
HealthcareThe new Intellibridge EC40/80 is a system that is used for acquiring,transforming, mapping, and the subsequent routing of data fromelectronic bedside patient-care devices to the Philips IntelliVue ClinicalInformation Portfolio, a remote clinical information system. TheIntellibridge EC40/80 can serve more patient beds than its predecessor,and therefore more patient data is sent to the central monitoringsystems from one device. This is accomplished in a smaller, lighter and
more user-friendly device. Compared to its predecessor, theIntellibridge monitor’s environmental benefits include a 67% reductionin energy use, 13% less product weight and 5% less packaging weight,resulting in an improvement of the environmental impact of the total lifecycle of 53%.
The new Essential is a Patient Monitor designed specifically forimproved clinical workflow and patient safety during transport of asedated patient in the MRI department. Its technical and environmentalperformance as a stand-alone MRI Pulse Oximeter hasimprovedcompared to its predecessor. The environmental benefits are a 48%reduction in energy use, 72% less product weight, 32% less packagingweight and being lead-acid battery free, resulting in an improvement ofthe environmental impact of the total life cycle of 55%.
Consumer LifestyleEnergy management has always been a strong focus in the ConsumerLifestyle sector but also the avoidance of substances of concern in ourproducts, in addition to our efforts to close the materials loop. In 2010our energy reduction efforts paid back in the consumer TV business byachieving green labels in our complete EU-product portfolio accordingto the EU-energy label. This will become mandatory by the end of 2011.In 2010, Philips also started with the introduction of polyvinyl chloride(PVC) and brominated flame retardants (BFR) free products. In relationto these developments, Philips has launched the Econova TV, which isthe first PVC/BFR free TV in the world, and uses LED technologyallowing very low energy consumption, achieving “A+” EU-energy labeltoo. Additionally, this TV has won the EISA Best Green TV 2010/2011award.
LightingIn the 3rd quarter of 2010, Philips globally launched the industry’s firstLED replacement lamp for the ubiquitous 60W GLS bulb, meeting allrequirements as defined by IEC (Eu244), CE, UL, FCC, and the USA’sEnergy Star. Commercially launched in the USA as the 12W EnduraLEDA19, it has been recognized by the American Lighting Association as thewinner in the LED Replacement Lamps category of the Lighting forTomorrow Awards. It has received further accolades from the media,like the “Green Product of the Year 2010” award from Popular ScienceMagazine. With this product, Philips continues to set the pace in theLED Replacement Lamps market, and has made the lamps availableacross the globe. Official Energy Star certification was achieved onJanuary 28, 2011.
India is a fast growing market and to underline Philips’ commitment tothe needs of Indian end users, Philips developed and produced a new5W LED Lamp in India. Philips launched this 5W LED Lamp in October,in selected stores in all major cities. The India LED Lamp has beendeveloped in close cooperation between the Philips R&D centers inNoida, India, and Shanghai, China, to meet the India specificrequirements. These local requirements not only demanded specialrequirements on the performance of the product, but in effect a fulllocalization of the manufacturing. In order to leverage local customerinsights, we empower local teams in key markets to drive thedevelopment of new products to be launched.
Green InnovationsIn 2010 Philips invested more than EUR 450 million in GreenInnovations – the R&D spend related to the development of newgenerations of Green Products and Green Technologies. We strive toinvest a cumulative EUR 2 billion during the coming five years.
Green Innovations per sectorin millions of euros
2008 2009 2010
Healthcare 54 50 60
Consumer Lifestyle 36 131 115
Lighting 151 185 230
Corporate Technologies 41 44 46
Philips Group 282 410 451
HealthcarePhilips Healthcare invested some EUR 60 million, concentrating oninnovation projects that consider all of the Green Focal Areas and aimto reduce total life cycle impact. In particular the sector focuses onreducing energy consumption, weight and radiation dose.
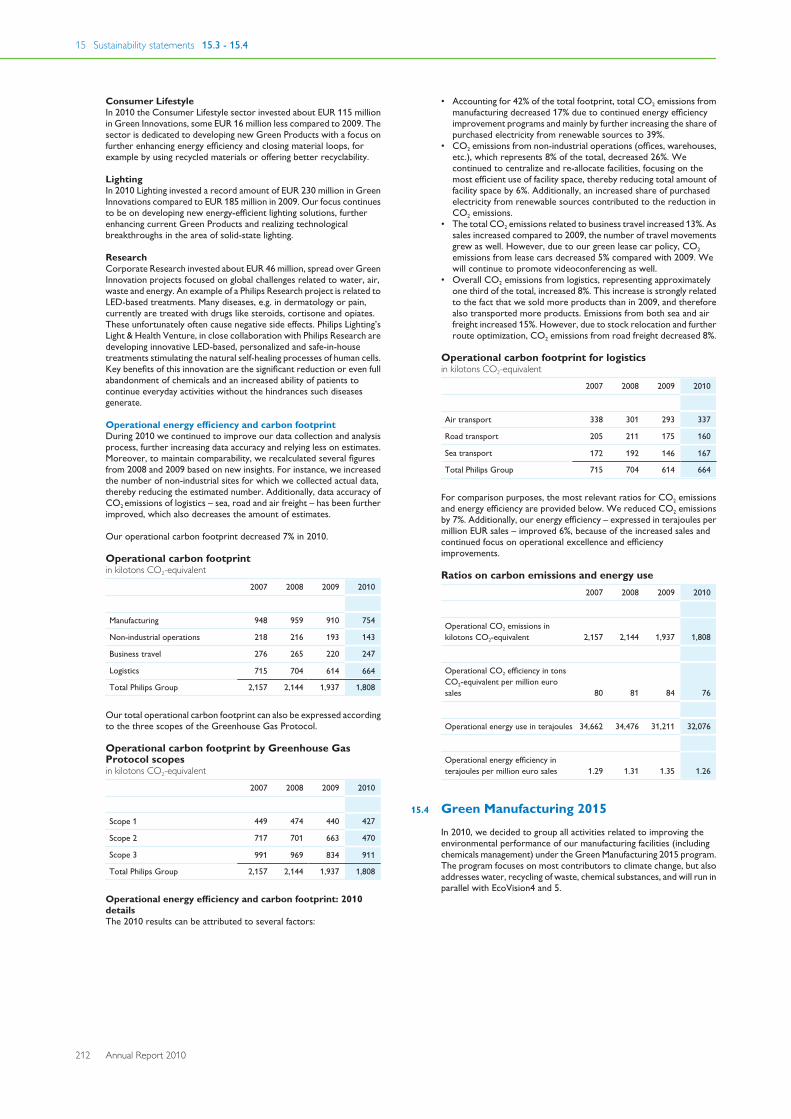
15 Sustainability statements 15.3 - 15.4
212 Annual Report 2010
Consumer LifestyleIn 2010 the Consumer Lifestyle sector invested about EUR 115 millionin Green Innovations, some EUR 16 million less compared to 2009. Thesector is dedicated to developing new Green Products with a focus onfurther enhancing energy efficiency and closing material loops, forexample by using recycled materials or offering better recyclability.
LightingIn 2010 Lighting invested a record amount of EUR 230 million in GreenInnovations compared to EUR 185 million in 2009. Our focus continuesto be on developing new energy-efficient lighting solutions, furtherenhancing current Green Products and realizing technologicalbreakthroughs in the area of solid-state lighting.
ResearchCorporate Research invested about EUR 46 million, spread over GreenInnovation projects focused on global challenges related to water, air,waste and energy. An example of a Philips Research project is related toLED-based treatments. Many diseases, e.g. in dermatology or pain,currently are treated with drugs like steroids, cortisone and opiates.These unfortunately often cause negative side effects. Philips Lighting’sLight & Health Venture, in close collaboration with Philips Research aredeveloping innovative LED-based, personalized and safe-in-housetreatments stimulating the natural self-healing processes of human cells.Key benefits of this innovation are the significant reduction or even fullabandonment of chemicals and an increased ability of patients tocontinue everyday activities without the hindrances such diseasesgenerate.
Operational energy efficiency and carbon footprintDuring 2010 we continued to improve our data collection and analysisprocess, further increasing data accuracy and relying less on estimates.Moreover, to maintain comparability, we recalculated several figuresfrom 2008 and 2009 based on new insights. For instance, we increasedthe number of non-industrial sites for which we collected actual data,thereby reducing the estimated number. Additionally, data accuracy ofCO2 emissions of logistics – sea, road and air freight – has been furtherimproved, which also decreases the amount of estimates.
Our operational carbon footprint decreased 7% in 2010.
Operational carbon footprintin kilotons CO2-equivalent
2007 2008 2009 2010
Manufacturing 948 959 910 754
Non-industrial operations 218 216 193 143
Business travel 276 265 220 247
Logistics 715 704 614 664
Total Philips Group 2,157 2,144 1,937 1,808
Our total operational carbon footprint can also be expressed accordingto the three scopes of the Greenhouse Gas Protocol.
Operational carbon footprint by Greenhouse GasProtocol scopesin kilotons CO2-equivalent
2007 2008 2009 2010
Scope 1 449 474 440 427
Scope 2 717 701 663 470
Scope 3 991 969 834 911
Total Philips Group 2,157 2,144 1,937 1,808
Operational energy efficiency and carbon footprint: 2010detailsThe 2010 results can be attributed to several factors:
• Accounting for 42% of the total footprint, total CO2 emissions frommanufacturing decreased 17% due to continued energy efficiencyimprovement programs and mainly by further increasing the share ofpurchased electricity from renewable sources to 39%.
• CO2 emissions from non-industrial operations (offices, warehouses,etc.), which represents 8% of the total, decreased 26%. Wecontinued to centralize and re-allocate facilities, focusing on themost efficient use of facility space, thereby reducing total amount offacility space by 6%. Additionally, an increased share of purchasedelectricity from renewable sources contributed to the reduction inCO2 emissions.
• The total CO2 emissions related to business travel increased 13%. Assales increased compared to 2009, the number of travel movementsgrew as well. However, due to our green lease car policy, CO2emissions from lease cars decreased 5% compared with 2009. Wewill continue to promote videoconferencing as well.
• Overall CO2 emissions from logistics, representing approximatelyone third of the total, increased 8%. This increase is strongly relatedto the fact that we sold more products than in 2009, and thereforealso transported more products. Emissions from both sea and airfreight increased 15%. However, due to stock relocation and furtherroute optimization, CO2 emissions from road freight decreased 8%.
Operational carbon footprint for logisticsin kilotons CO2-equivalent
2007 2008 2009 2010
Air transport 338 301 293 337
Road transport 205 211 175 160
Sea transport 172 192 146 167
Total Philips Group 715 704 614 664
For comparison purposes, the most relevant ratios for CO2 emissionsand energy efficiency are provided below. We reduced CO2 emissionsby 7%. Additionally, our energy efficiency – expressed in terajoules permillion EUR sales – improved 6%, because of the increased sales andcontinued focus on operational excellence and efficiencyimprovements.
Ratios on carbon emissions and energy use2007 2008 2009 2010
Operational CO2 emissions inkilotons CO2-equivalent 2,157 2,144 1,937 1,808
Operational CO2 efficiency in tonsCO2-equivalent per million eurosales 80 81 84 76
Operational energy use in terajoules 34,662 34,476 31,211 32,076
Operational energy efficiency interajoules per million euro sales 1.29 1.31 1.35 1.26
15.4 Green Manufacturing 2015In 2010, we decided to group all activities related to improving theenvironmental performance of our manufacturing facilities (includingchemicals management) under the Green Manufacturing 2015 program.The program focuses on most contributors to climate change, but alsoaddresses water, recycling of waste, chemical substances, and will run inparallel with EcoVision4 and 5.
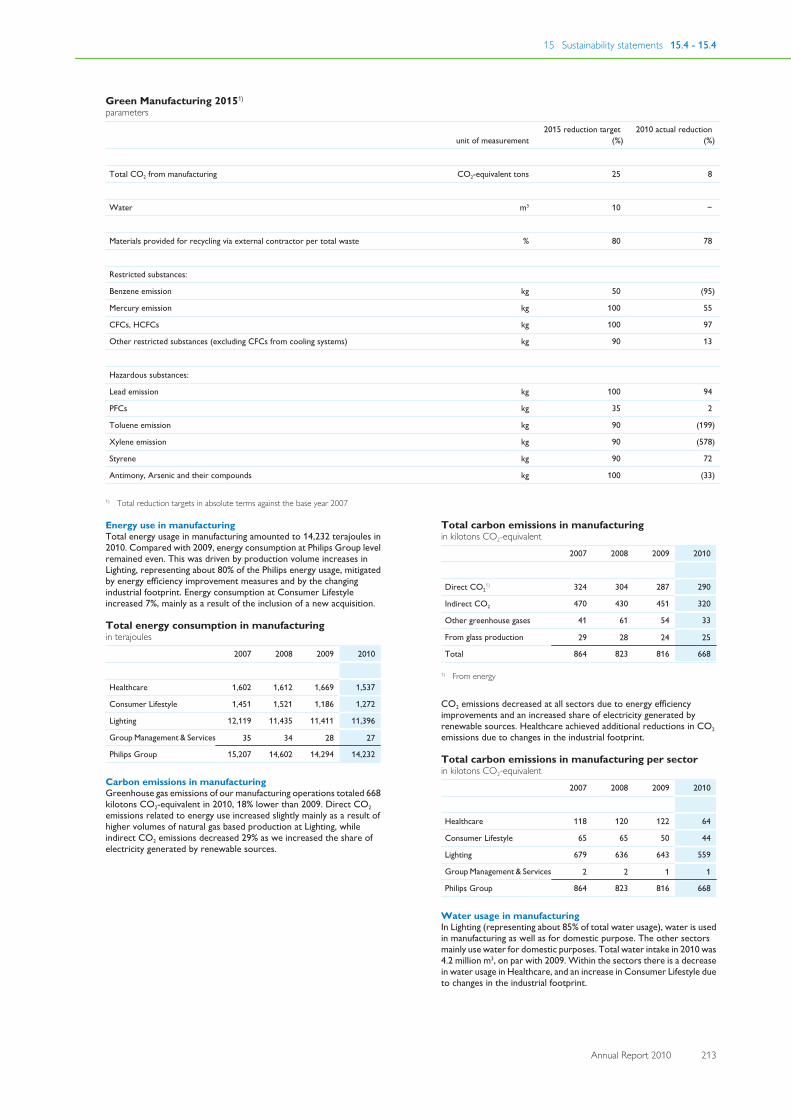
15 Sustainability statements 15.4 - 15.4
Annual Report 2010 213
Green Manufacturing 20151)
parameters
unit of measurement 2015 reduction target
(%)2010 actual reduction
(%)
Total CO2 from manufacturing CO2-equivalent tons 25 8
Water m3 10 −
Materials provided for recycling via external contractor per total waste % 80 78
Restricted substances:
Benzene emission kg 50 (95)
Mercury emission kg 100 55
CFCs, HCFCs kg 100 97
Other restricted substances (excluding CFCs from cooling systems) kg 90 13
Hazardous substances:
Lead emission kg 100 94
PFCs kg 35 2
Toluene emission kg 90 (199)
Xylene emission kg 90 (578)
Styrene kg 90 72
Antimony, Arsenic and their compounds kg 100 (33)
1) Total reduction targets in absolute terms against the base year 2007
Energy use in manufacturingTotal energy usage in manufacturing amounted to 14,232 terajoules in2010. Compared with 2009, energy consumption at Philips Group levelremained even. This was driven by production volume increases inLighting, representing about 80% of the Philips energy usage, mitigatedby energy efficiency improvement measures and by the changingindustrial footprint. Energy consumption at Consumer Lifestyleincreased 7%, mainly as a result of the inclusion of a new acquisition.
Total energy consumption in manufacturingin terajoules
2007 2008 2009 2010
Healthcare 1,602 1,612 1,669 1,537
Consumer Lifestyle 1,451 1,521 1,186 1,272
Lighting 12,119 11,435 11,411 11,396
Group Management & Services 35 34 28 27
Philips Group 15,207 14,602 14,294 14,232
Carbon emissions in manufacturingGreenhouse gas emissions of our manufacturing operations totaled 668kilotons CO2-equivalent in 2010, 18% lower than 2009. Direct CO2emissions related to energy use increased slightly mainly as a result ofhigher volumes of natural gas based production at Lighting, whileindirect CO2 emissions decreased 29% as we increased the share ofelectricity generated by renewable sources.
Total carbon emissions in manufacturingin kilotons CO2-equivalent
2007 2008 2009 2010
Direct CO21) 324 304 287 290
Indirect CO2 470 430 451 320
Other greenhouse gases 41 61 54 33
From glass production 29 28 24 25
Total 864 823 816 668
1) From energy
CO2 emissions decreased at all sectors due to energy efficiencyimprovements and an increased share of electricity generated byrenewable sources. Healthcare achieved additional reductions in CO2emissions due to changes in the industrial footprint.
Total carbon emissions in manufacturing per sectorin kilotons CO2-equivalent
2007 2008 2009 2010
Healthcare 118 120 122 64
Consumer Lifestyle 65 65 50 44
Lighting 679 636 643 559
Group Management & Services 2 2 1 1
Philips Group 864 823 816 668
Water usage in manufacturingIn Lighting (representing about 85% of total water usage), water is usedin manufacturing as well as for domestic purpose. The other sectorsmainly use water for domestic purposes. Total water intake in 2010 was4.2 million m3, on par with 2009. Within the sectors there is a decreasein water usage in Healthcare, and an increase in Consumer Lifestyle dueto changes in the industrial footprint.
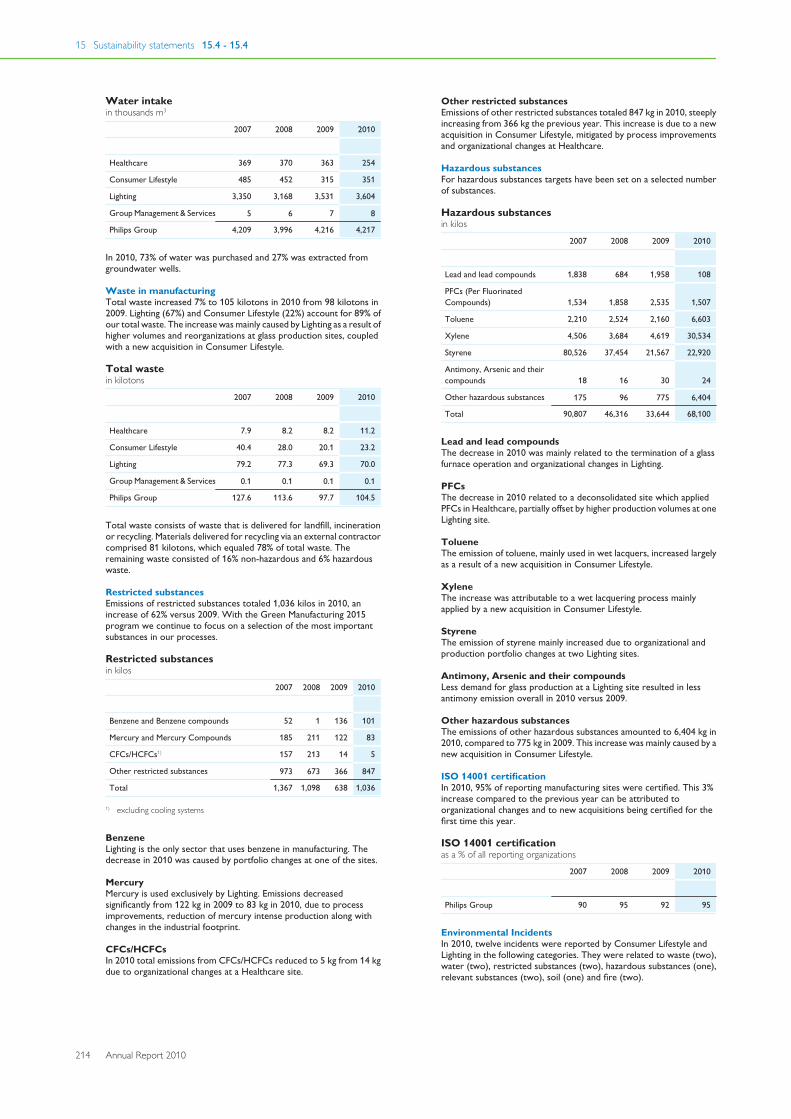
15 Sustainability statements 15.4 - 15.4
214 Annual Report 2010
Water intakein thousands m3
2007 2008 2009 2010
Healthcare 369 370 363 254
Consumer Lifestyle 485 452 315 351
Lighting 3,350 3,168 3,531 3,604
Group Management & Services 5 6 7 8
Philips Group 4,209 3,996 4,216 4,217
In 2010, 73% of water was purchased and 27% was extracted fromgroundwater wells.
Waste in manufacturingTotal waste increased 7% to 105 kilotons in 2010 from 98 kilotons in2009. Lighting (67%) and Consumer Lifestyle (22%) account for 89% ofour total waste. The increase was mainly caused by Lighting as a result ofhigher volumes and reorganizations at glass production sites, coupledwith a new acquisition in Consumer Lifestyle.
Total wastein kilotons
2007 2008 2009 2010
Healthcare 7.9 8.2 8.2 11.2
Consumer Lifestyle 40.4 28.0 20.1 23.2
Lighting 79.2 77.3 69.3 70.0
Group Management & Services 0.1 0.1 0.1 0.1
Philips Group 127.6 113.6 97.7 104.5
Total waste consists of waste that is delivered for landfill, incinerationor recycling. Materials delivered for recycling via an external contractorcomprised 81 kilotons, which equaled 78% of total waste. Theremaining waste consisted of 16% non-hazardous and 6% hazardouswaste.
Restricted substancesEmissions of restricted substances totaled 1,036 kilos in 2010, anincrease of 62% versus 2009. With the Green Manufacturing 2015program we continue to focus on a selection of the most importantsubstances in our processes.
Restricted substancesin kilos
2007 2008 2009 2010
Benzene and Benzene compounds 52 1 136 101
Mercury and Mercury Compounds 185 211 122 83
CFCs/HCFCs1) 157 213 14 5
Other restricted substances 973 673 366 847
Total 1,367 1,098 638 1,036
1) excluding cooling systems
BenzeneLighting is the only sector that uses benzene in manufacturing. Thedecrease in 2010 was caused by portfolio changes at one of the sites.
MercuryMercury is used exclusively by Lighting. Emissions decreasedsignificantly from 122 kg in 2009 to 83 kg in 2010, due to processimprovements, reduction of mercury intense production along withchanges in the industrial footprint.
CFCs/HCFCsIn 2010 total emissions from CFCs/HCFCs reduced to 5 kg from 14 kgdue to organizational changes at a Healthcare site.
Other restricted substancesEmissions of other restricted substances totaled 847 kg in 2010, steeplyincreasing from 366 kg the previous year. This increase is due to a newacquisition in Consumer Lifestyle, mitigated by process improvementsand organizational changes at Healthcare.
Hazardous substancesFor hazardous substances targets have been set on a selected numberof substances.
Hazardous substancesin kilos
2007 2008 2009 2010
Lead and lead compounds 1,838 684 1,958 108
PFCs (Per FluorinatedCompounds) 1,534 1,858 2,535 1,507
Toluene 2,210 2,524 2,160 6,603
Xylene 4,506 3,684 4,619 30,534
Styrene 80,526 37,454 21,567 22,920
Antimony, Arsenic and theircompounds 18 16 30 24
Other hazardous substances 175 96 775 6,404
Total 90,807 46,316 33,644 68,100
Lead and lead compoundsThe decrease in 2010 was mainly related to the termination of a glassfurnace operation and organizational changes in Lighting.
PFCsThe decrease in 2010 related to a deconsolidated site which appliedPFCs in Healthcare, partially offset by higher production volumes at oneLighting site.
TolueneThe emission of toluene, mainly used in wet lacquers, increased largelyas a result of a new acquisition in Consumer Lifestyle.
XyleneThe increase was attributable to a wet lacquering process mainlyapplied by a new acquisition in Consumer Lifestyle.
StyreneThe emission of styrene mainly increased due to organizational andproduction portfolio changes at two Lighting sites.
Antimony, Arsenic and their compoundsLess demand for glass production at a Lighting site resulted in lessantimony emission overall in 2010 versus 2009.
Other hazardous substancesThe emissions of other hazardous substances amounted to 6,404 kg in2010, compared to 775 kg in 2009. This increase was mainly caused by anew acquisition in Consumer Lifestyle.
ISO 14001 certificationIn 2010, 95% of reporting manufacturing sites were certified. This 3%increase compared to the previous year can be attributed toorganizational changes and to new acquisitions being certified for thefirst time this year.
ISO 14001 certificationas a % of all reporting organizations
2007 2008 2009 2010
Philips Group 90 95 92 95
Environmental IncidentsIn 2010, twelve incidents were reported by Consumer Lifestyle andLighting in the following categories. They were related to waste (two),water (two), restricted substances (two), hazardous substances (one),relevant substances (two), soil (one) and fire (two).
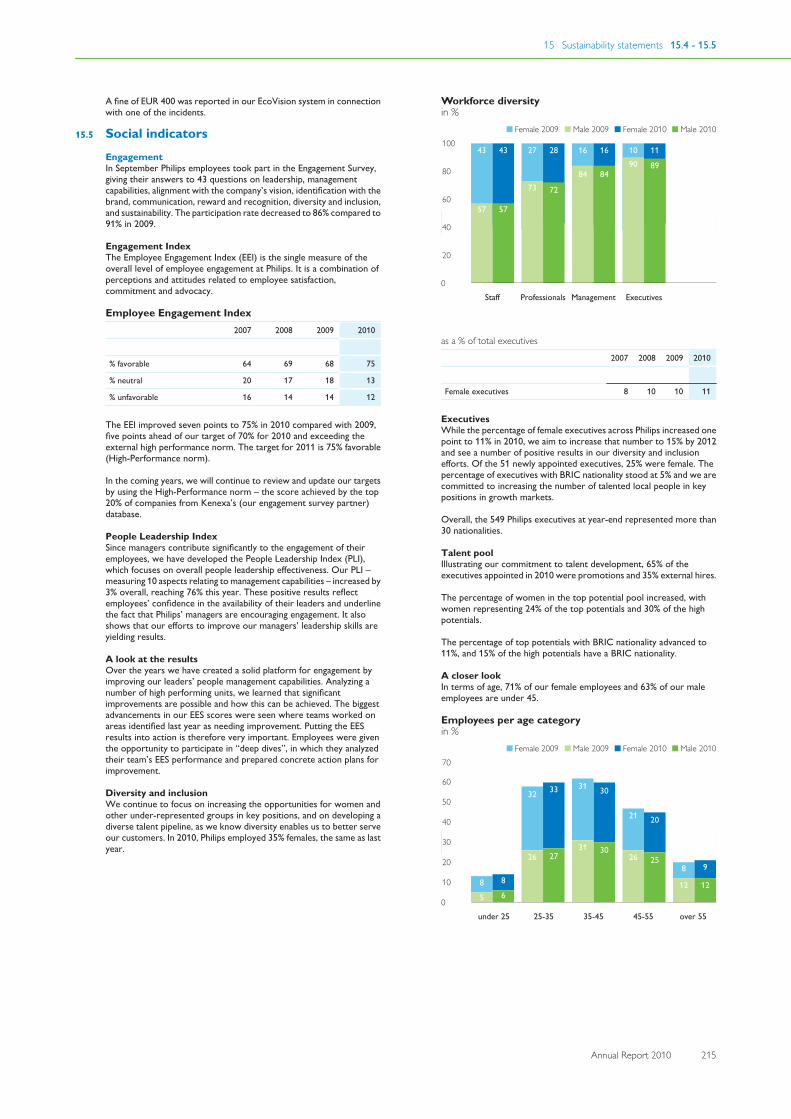
15 Sustainability statements 15.4 - 15.5
Annual Report 2010 215
A fine of EUR 400 was reported in our EcoVision system in connectionwith one of the incidents.
15.5 Social indicatorsEngagementIn September Philips employees took part in the Engagement Survey,giving their answers to 43 questions on leadership, managementcapabilities, alignment with the company’s vision, identification with thebrand, communication, reward and recognition, diversity and inclusion,and sustainability. The participation rate decreased to 86% compared to91% in 2009.
Engagement IndexThe Employee Engagement Index (EEI) is the single measure of theoverall level of employee engagement at Philips. It is a combination ofperceptions and attitudes related to employee satisfaction,commitment and advocacy.
Employee Engagement Index2007 2008 2009 2010
% favorable 64 69 68 75
% neutral 20 17 18 13
% unfavorable 16 14 14 12
The EEI improved seven points to 75% in 2010 compared with 2009,five points ahead of our target of 70% for 2010 and exceeding theexternal high performance norm. The target for 2011 is 75% favorable(High-Performance norm).
In the coming years, we will continue to review and update our targetsby using the High-Performance norm – the score achieved by the top20% of companies from Kenexa’s (our engagement survey partner)database.
People Leadership IndexSince managers contribute significantly to the engagement of theiremployees, we have developed the People Leadership Index (PLI),which focuses on overall people leadership effectiveness. Our PLI –measuring 10 aspects relating to management capabilities – increased by3% overall, reaching 76% this year. These positive results reflectemployees’ confidence in the availability of their leaders and underlinethe fact that Philips’ managers are encouraging engagement. It alsoshows that our efforts to improve our managers’ leadership skills areyielding results.
A look at the resultsOver the years we have created a solid platform for engagement byimproving our leaders’ people management capabilities. Analyzing anumber of high performing units, we learned that significantimprovements are possible and how this can be achieved. The biggestadvancements in our EES scores were seen where teams worked onareas identified last year as needing improvement. Putting the EESresults into action is therefore very important. Employees were giventhe opportunity to participate in “deep dives”, in which they analyzedtheir team’s EES performance and prepared concrete action plans forimprovement.
Diversity and inclusionWe continue to focus on increasing the opportunities for women andother under-represented groups in key positions, and on developing adiverse talent pipeline, as we know diversity enables us to better serveour customers. In 2010, Philips employed 35% females, the same as lastyear.
(150)
57
43
57
43
73
27
72
28
84
16
84
16
90
10
89
11
0
60
80
100
40
20
Staff Management ExecutivesProfessionals
Workforce diversityin %
Male 2010Female 2009 Male 2009 Female 2010
as a % of total executives
2007 2008 2009 2010
Female executives 8 10 10 11
ExecutivesWhile the percentage of female executives across Philips increased onepoint to 11% in 2010, we aim to increase that number to 15% by 2012and see a number of positive results in our diversity and inclusionefforts. Of the 51 newly appointed executives, 25% were female. Thepercentage of executives with BRIC nationality stood at 5% and we arecommitted to increasing the number of talented local people in keypositions in growth markets.
Overall, the 549 Philips executives at year-end represented more than30 nationalities.
Talent poolIllustrating our commitment to talent development, 65% of theexecutives appointed in 2010 were promotions and 35% external hires.
The percentage of women in the top potential pool increased, withwomen representing 24% of the top potentials and 30% of the highpotentials.
The percentage of top potentials with BRIC nationality advanced to11%, and 15% of the high potentials have a BRIC nationality.
A closer lookIn terms of age, 71% of our female employees and 63% of our maleemployees are under 45.
(150)
5
8
6
8
26
32
27
33
31
31
30
30
26
21
25
20
12
8
12
9
0
50
60
70
40
30
20
10
under 25 35-45 45-55 over 5525-35
Employees per age categoryin %
Male 2010Female 2009 Male 2009 Female 2010
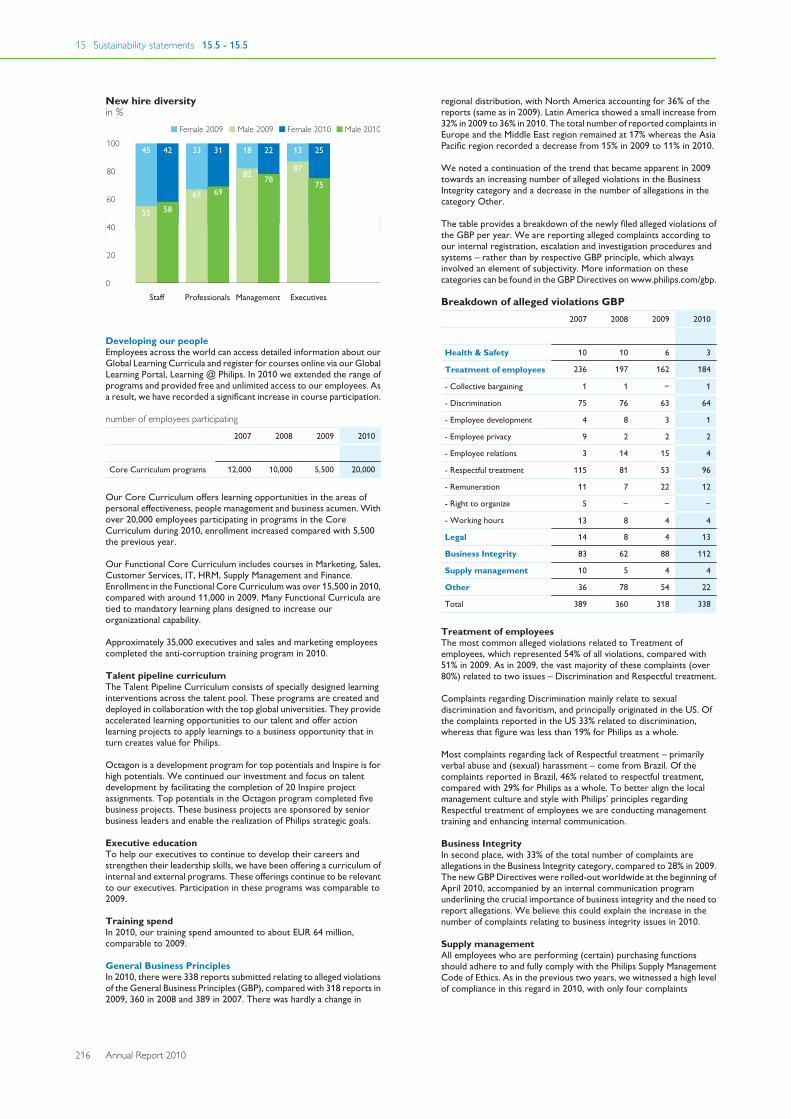
15 Sustainability statements 15.5 - 15.5
216 Annual Report 2010
(150)
55
45
58
42
67
33
69
31
82
18
78
22
87
13
75
25
0
60
80
100
40
20
Staff Management ExecutivesProfessionals
New hire diversityin %
Male 2010Female 2009 Male 2009 Female 2010
Developing our peopleEmployees across the world can access detailed information about ourGlobal Learning Curricula and register for courses online via our GlobalLearning Portal, Learning @ Philips. In 2010 we extended the range ofprograms and provided free and unlimited access to our employees. Asa result, we have recorded a significant increase in course participation.
number of employees participating
2007 2008 2009 2010
Core Curriculum programs 12,000 10,000 5,500 20,000
Our Core Curriculum offers learning opportunities in the areas ofpersonal effectiveness, people management and business acumen. Withover 20,000 employees participating in programs in the CoreCurriculum during 2010, enrollment increased compared with 5,500the previous year.
Our Functional Core Curriculum includes courses in Marketing, Sales,Customer Services, IT, HRM, Supply Management and Finance.Enrollment in the Functional Core Curriculum was over 15,500 in 2010,compared with around 11,000 in 2009. Many Functional Curricula aretied to mandatory learning plans designed to increase ourorganizational capability.
Approximately 35,000 executives and sales and marketing employeescompleted the anti-corruption training program in 2010.
Talent pipeline curriculumThe Talent Pipeline Curriculum consists of specially designed learninginterventions across the talent pool. These programs are created anddeployed in collaboration with the top global universities. They provideaccelerated learning opportunities to our talent and offer actionlearning projects to apply learnings to a business opportunity that inturn creates value for Philips.
Octagon is a development program for top potentials and Inspire is forhigh potentials. We continued our investment and focus on talentdevelopment by facilitating the completion of 20 Inspire projectassignments. Top potentials in the Octagon program completed fivebusiness projects. These business projects are sponsored by seniorbusiness leaders and enable the realization of Philips strategic goals.
Executive educationTo help our executives to continue to develop their careers andstrengthen their leadership skills, we have been offering a curriculum ofinternal and external programs. These offerings continue to be relevantto our executives. Participation in these programs was comparable to2009.
Training spendIn 2010, our training spend amounted to about EUR 64 million,comparable to 2009.
General Business PrinciplesIn 2010, there were 338 reports submitted relating to alleged violationsof the General Business Principles (GBP), compared with 318 reports in2009, 360 in 2008 and 389 in 2007. There was hardly a change in
regional distribution, with North America accounting for 36% of thereports (same as in 2009). Latin America showed a small increase from32% in 2009 to 36% in 2010. The total number of reported complaints inEurope and the Middle East region remained at 17% whereas the AsiaPacific region recorded a decrease from 15% in 2009 to 11% in 2010.
We noted a continuation of the trend that became apparent in 2009towards an increasing number of alleged violations in the BusinessIntegrity category and a decrease in the number of allegations in thecategory Other.
The table provides a breakdown of the newly filed alleged violations ofthe GBP per year. We are reporting alleged complaints according toour internal registration, escalation and investigation procedures andsystems – rather than by respective GBP principle, which alwaysinvolved an element of subjectivity. More information on thesecategories can be found in the GBP Directives on www.philips.com/gbp.
Breakdown of alleged violations GBP2007 2008 2009 2010
Health & Safety 10 10 6 3
Treatment of employees 236 197 162 184
- Collective bargaining 1 1 − 1
- Discrimination 75 76 63 64
- Employee development 4 8 3 1
- Employee privacy 9 2 2 2
- Employee relations 3 14 15 4
- Respectful treatment 115 81 53 96
- Remuneration 11 7 22 12
- Right to organize 5 − − −
- Working hours 13 8 4 4
Legal 14 8 4 13
Business Integrity 83 62 88 112
Supply management 10 5 4 4
Other 36 78 54 22
Total 389 360 318 338
Treatment of employeesThe most common alleged violations related to Treatment ofemployees, which represented 54% of all violations, compared with51% in 2009. As in 2009, the vast majority of these complaints (over80%) related to two issues – Discrimination and Respectful treatment.
Complaints regarding Discrimination mainly relate to sexualdiscrimination and favoritism, and principally originated in the US. Ofthe complaints reported in the US 33% related to discrimination,whereas that figure was less than 19% for Philips as a whole.
Most complaints regarding lack of Respectful treatment – primarilyverbal abuse and (sexual) harassment – come from Brazil. Of thecomplaints reported in Brazil, 46% related to respectful treatment,compared with 29% for Philips as a whole. To better align the localmanagement culture and style with Philips’ principles regardingRespectful treatment of employees we are conducting managementtraining and enhancing internal communication.
Business IntegrityIn second place, with 33% of the total number of complaints areallegations in the Business Integrity category, compared to 28% in 2009.The new GBP Directives were rolled-out worldwide at the beginning ofApril 2010, accompanied by an internal communication programunderlining the crucial importance of business integrity and the need toreport allegations. We believe this could explain the increase in thenumber of complaints relating to business integrity issues in 2010.
Supply managementAll employees who are performing (certain) purchasing functionsshould adhere to and fully comply with the Philips Supply ManagementCode of Ethics. As in the previous two years, we witnessed a high levelof compliance in this regard in 2010, with only four complaints
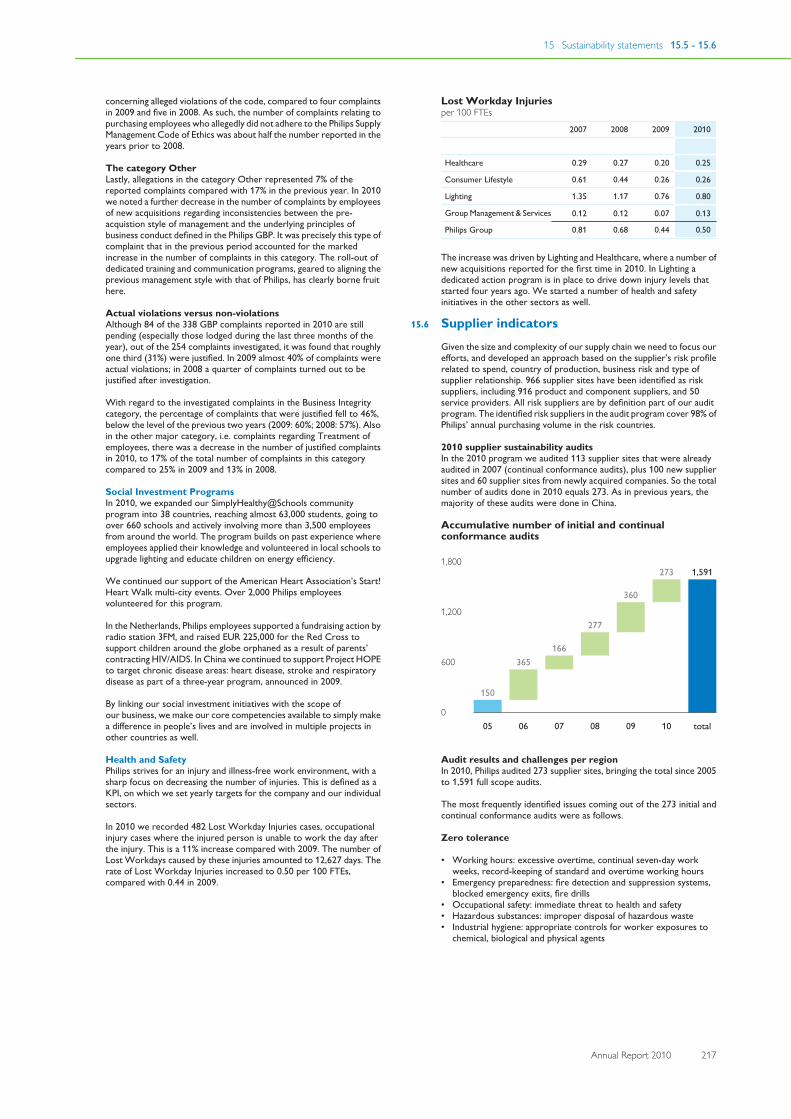
15 Sustainability statements 15.5 - 15.6
Annual Report 2010 217
concerning alleged violations of the code, compared to four complaintsin 2009 and five in 2008. As such, the number of complaints relating topurchasing employees who allegedly did not adhere to the Philips SupplyManagement Code of Ethics was about half the number reported in theyears prior to 2008.
The category OtherLastly, allegations in the category Other represented 7% of thereported complaints compared with 17% in the previous year. In 2010we noted a further decrease in the number of complaints by employeesof new acquisitions regarding inconsistencies between the pre-acquistion style of management and the underlying principles ofbusiness conduct defined in the Philips GBP. It was precisely this type ofcomplaint that in the previous period accounted for the markedincrease in the number of complaints in this category. The roll-out ofdedicated training and communication programs, geared to aligning theprevious management style with that of Philips, has clearly borne fruithere.
Actual violations versus non-violationsAlthough 84 of the 338 GBP complaints reported in 2010 are stillpending (especially those lodged during the last three months of theyear), out of the 254 complaints investigated, it was found that roughlyone third (31%) were justified. In 2009 almost 40% of complaints wereactual violations; in 2008 a quarter of complaints turned out to bejustified after investigation.
With regard to the investigated complaints in the Business Integritycategory, the percentage of complaints that were justified fell to 46%,below the level of the previous two years (2009: 60%; 2008: 57%). Alsoin the other major category, i.e. complaints regarding Treatment ofemployees, there was a decrease in the number of justified complaintsin 2010, to 17% of the total number of complaints in this categorycompared to 25% in 2009 and 13% in 2008.
Social Investment ProgramsIn 2010, we expanded our SimplyHealthy@Schools communityprogram into 38 countries, reaching almost 63,000 students, going toover 660 schools and actively involving more than 3,500 employeesfrom around the world. The program builds on past experience whereemployees applied their knowledge and volunteered in local schools toupgrade lighting and educate children on energy efficiency.
We continued our support of the American Heart Association’s Start!Heart Walk multi-city events. Over 2,000 Philips employeesvolunteered for this program.
In the Netherlands, Philips employees supported a fundraising action byradio station 3FM, and raised EUR 225,000 for the Red Cross tosupport children around the globe orphaned as a result of parents’contracting HIV/AIDS. In China we continued to support Project HOPEto target chronic disease areas: heart disease, stroke and respiratorydisease as part of a three-year program, announced in 2009.
By linking our social investment initiatives with the scope ofour business, we make our core competencies available to simply makea difference in people’s lives and are involved in multiple projects inother countries as well.
Health and SafetyPhilips strives for an injury and illness-free work environment, with asharp focus on decreasing the number of injuries. This is defined as aKPI, on which we set yearly targets for the company and our individualsectors.
In 2010 we recorded 482 Lost Workday Injuries cases, occupationalinjury cases where the injured person is unable to work the day afterthe injury. This is a 11% increase compared with 2009. The number ofLost Workdays caused by these injuries amounted to 12,627 days. Therate of Lost Workday Injuries increased to 0.50 per 100 FTEs,compared with 0.44 in 2009.
Lost Workday Injuriesper 100 FTEs
2007 2008 2009 2010
Healthcare 0.29 0.27 0.20 0.25
Consumer Lifestyle 0.61 0.44 0.26 0.26
Lighting 1.35 1.17 0.76 0.80
Group Management & Services 0.12 0.12 0.07 0.13
Philips Group 0.81 0.68 0.44 0.50
The increase was driven by Lighting and Healthcare, where a number ofnew acquisitions reported for the first time in 2010. In Lighting adedicated action program is in place to drive down injury levels thatstarted four years ago. We started a number of health and safetyinitiatives in the other sectors as well.
15.6 Supplier indicatorsGiven the size and complexity of our supply chain we need to focus ourefforts, and developed an approach based on the supplier’s risk profilerelated to spend, country of production, business risk and type ofsupplier relationship. 966 supplier sites have been identified as risksuppliers, including 916 product and component suppliers, and 50service providers. All risk suppliers are by definition part of our auditprogram. The identified risk suppliers in the audit program cover 98% ofPhilips’ annual purchasing volume in the risk countries.
2010 supplier sustainability auditsIn the 2010 program we audited 113 supplier sites that were alreadyaudited in 2007 (continual conformance audits), plus 100 new suppliersites and 60 supplier sites from newly acquired companies. So the totalnumber of audits done in 2010 equals 273. As in previous years, themajority of these audits were done in China.
Accumulative number of initial and continualconformance audits
1,800
1,200
600
0
150
05
365
06
166
07
277
08
360
09
273
10
1,591
total
Audit results and challenges per regionIn 2010, Philips audited 273 supplier sites, bringing the total since 2005to 1,591 full scope audits.
The most frequently identified issues coming out of the 273 initial andcontinual conformance audits were as follows.
Zero tolerance
• Working hours: excessive overtime, continual seven-day workweeks, record-keeping of standard and overtime working hours
• Emergency preparedness: fire detection and suppression systems,blocked emergency exits, fire drills
• Occupational safety: immediate threat to health and safety• Hazardous substances: improper disposal of hazardous waste• Industrial hygiene: appropriate controls for worker exposures to
chemical, biological and physical agents
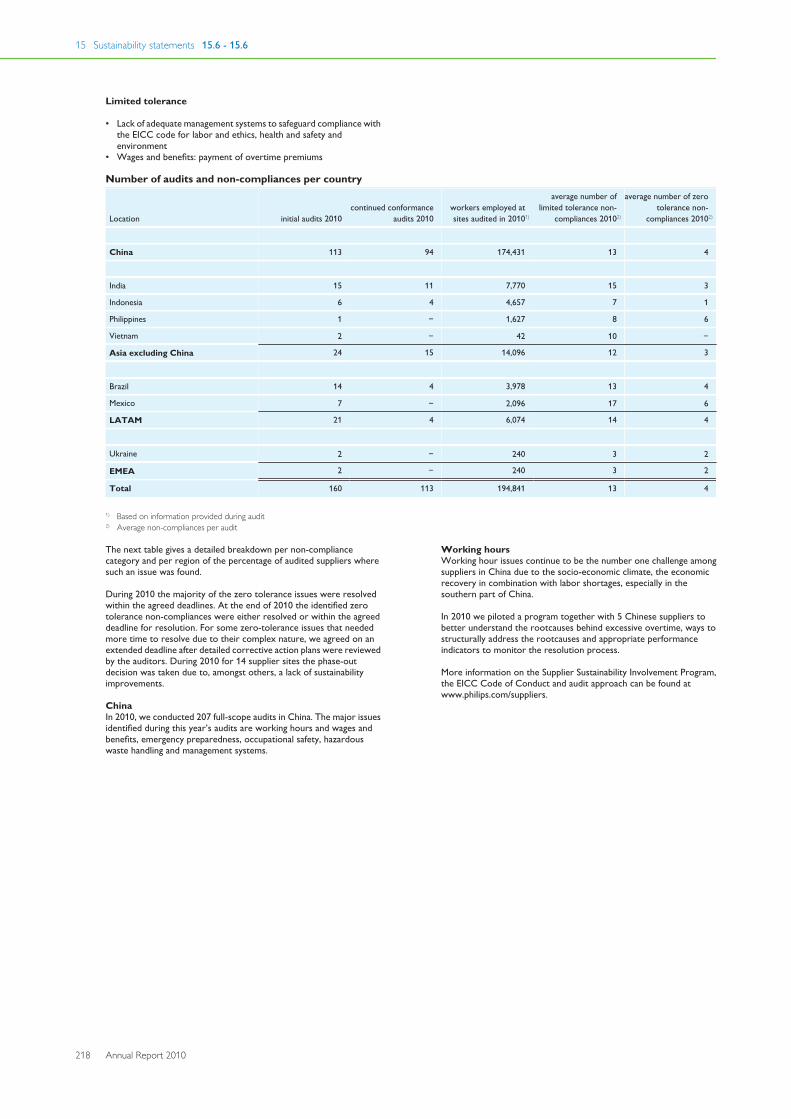
15 Sustainability statements 15.6 - 15.6
218 Annual Report 2010
Limited tolerance
• Lack of adequate management systems to safeguard compliance withthe EICC code for labor and ethics, health and safety andenvironment
• Wages and benefits: payment of overtime premiums
Number of audits and non-compliances per country
Location initial audits 2010
continued conformanceaudits 2010
workers employed atsites audited in 20101)
average number oflimited tolerance non-
compliances 20102)
average number of zerotolerance non-
compliances 20102)
China 113 94 174,431 13 4
India 15 11 7,770 15 3
Indonesia 6 4 4,657 7 1
Philippines 1 − 1,627 8 6
Vietnam 2 − 42 10 −
Asia excluding China 24 15 14,096 12 3
Brazil 14 4 3,978 13 4
Mexico 7 − 2,096 17 6
LATAM 21 4 6,074 14 4
Ukraine 2 − 240 3 2
EMEA 2 − 240 3 2
Total 160 113 194,841 13 4
1) Based on information provided during audit2) Average non-compliances per audit
The next table gives a detailed breakdown per non-compliancecategory and per region of the percentage of audited suppliers wheresuch an issue was found.
During 2010 the majority of the zero tolerance issues were resolvedwithin the agreed deadlines. At the end of 2010 the identified zerotolerance non-compliances were either resolved or within the agreeddeadline for resolution. For some zero-tolerance issues that neededmore time to resolve due to their complex nature, we agreed on anextended deadline after detailed corrective action plans were reviewedby the auditors. During 2010 for 14 supplier sites the phase-outdecision was taken due to, amongst others, a lack of sustainabilityimprovements.
ChinaIn 2010, we conducted 207 full-scope audits in China. The major issuesidentified during this year’s audits are working hours and wages andbenefits, emergency preparedness, occupational safety, hazardouswaste handling and management systems.
Working hoursWorking hour issues continue to be the number one challenge amongsuppliers in China due to the socio-economic climate, the economicrecovery in combination with labor shortages, especially in thesouthern part of China.
In 2010 we piloted a program together with 5 Chinese suppliers tobetter understand the rootcauses behind excessive overtime, ways tostructurally address the rootcauses and appropriate performanceindicators to monitor the resolution process.
More information on the Supplier Sustainability Involvement Program,the EICC Code of Conduct and audit approach can be found atwww.philips.com/suppliers.
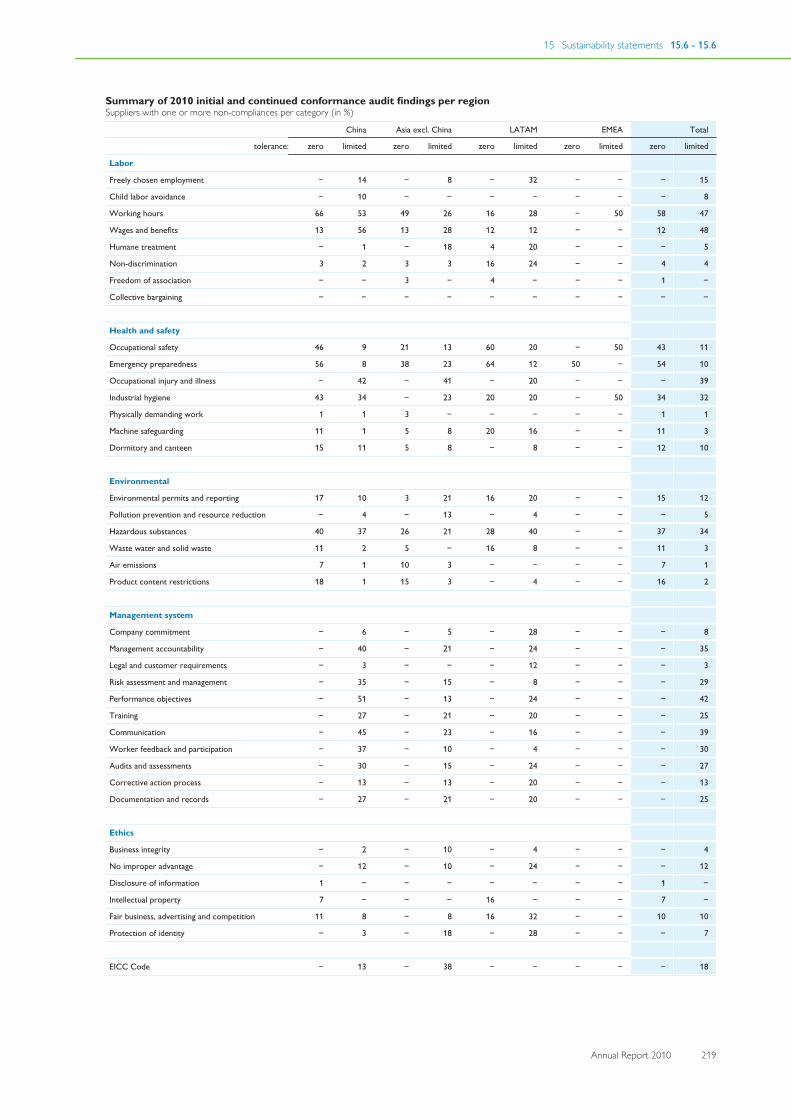
15 Sustainability statements 15.6 - 15.6
Annual Report 2010 219
Summary of 2010 initial and continued conformance audit findings per regionSuppliers with one or more non-compliances per category (in %)
China Asia excl. China LATAM EMEA Total
tolerance: zero limited zero limited zero limited zero limited zero limited
Labor
Freely chosen employment − 14 − 8 − 32 − − − 15
Child labor avoidance − 10 − − − − − − − 8
Working hours 66 53 49 26 16 28 − 50 58 47
Wages and benefits 13 56 13 28 12 12 − − 12 48
Humane treatment − 1 − 18 4 20 − − − 5
Non-discrimination 3 2 3 3 16 24 − − 4 4
Freedom of association − − 3 − 4 − − − 1 −
Collective bargaining − − − − − − − − − −
Health and safety
Occupational safety 46 9 21 13 60 20 − 50 43 11
Emergency preparedness 56 8 38 23 64 12 50 − 54 10
Occupational injury and illness − 42 − 41 − 20 − − − 39
Industrial hygiene 43 34 − 23 20 20 − 50 34 32
Physically demanding work 1 1 3 − − − − − 1 1
Machine safeguarding 11 1 5 8 20 16 − − 11 3
Dormitory and canteen 15 11 5 8 − 8 − − 12 10
Environmental
Environmental permits and reporting 17 10 3 21 16 20 − − 15 12
Pollution prevention and resource reduction − 4 − 13 − 4 − − − 5
Hazardous substances 40 37 26 21 28 40 − − 37 34
Waste water and solid waste 11 2 5 − 16 8 − − 11 3
Air emissions 7 1 10 3 − − − − 7 1
Product content restrictions 18 1 15 3 − 4 − − 16 2
Management system
Company commitment − 6 − 5 − 28 − − − 8
Management accountability − 40 − 21 − 24 − − − 35
Legal and customer requirements − 3 − − − 12 − − − 3
Risk assessment and management − 35 − 15 − 8 − − − 29
Performance objectives − 51 − 13 − 24 − − − 42
Training − 27 − 21 − 20 − − − 25
Communication − 45 − 23 − 16 − − − 39
Worker feedback and participation − 37 − 10 − 4 − − − 30
Audits and assessments − 30 − 15 − 24 − − − 27
Corrective action process − 13 − 13 − 20 − − − 13
Documentation and records − 27 − 21 − 20 − − − 25
Ethics
Business integrity − 2 − 10 − 4 − − − 4
No improper advantage − 12 − 10 − 24 − − − 12
Disclosure of information 1 − − − − − − − 1 −
Intellectual property 7 − − − 16 − − − 7 −
Fair business, advertising and competition 11 8 − 8 16 32 − − 10 10
Protection of identity − 3 − 18 − 28 − − − 7
EICC Code − 13 − 38 − − − − − 18
15 Sustainability statements 15.6 - 15.6
220 Annual Report 2010
‘Conflict’ minerals: issues further down the chainMinerals originating in conflict regions can end up in electronics andmany other products such as jewelry, airplanes, and automobiles.Greater awareness of these issues on the part of the public and end-useindustries has prompted leading companies in the electronics sector toinvestigate their supply chains to determine the steps to promoteresponsible sourcing of specific minerals.
The supply chain for the metals of concern consists of many tiers,including mines, traders, smelters, refiners, and componentmanufacturers, before reaching Philips’ direct suppliers. Thecombination of a lengthy and regularly changing supply chain andrefining process makes it difficult to track and trace the minerals back tothe mine of origin.
Philips believes that an industry-wide approach is necessary to addressthis issue and therefore we participate in the Electronic IndustryCitizenship Coalition (EICC) and The Global eSustainability Initiative(GeSI) Extractives Work Group. The EICC and GeSI represent over 65companies in the Electronics and Information and CommunicationsTechnology industries who have come together in the EICC-GeSIExtractives Work Group to positively influence the social andenvironmental conditions in the metals extractives supply chain.
In 2010 the research commissioned by the Extractives Work Group tomap the supply chain for tin, tantalum, and cobalt used in electronicswas completed. The research used a tracing method, starting withsuppliers from electronics companies, including Philips, and working upthe supply chain toward the mine. Companies at each step in the supplychain were contacted (e.g. component manufacturers, refiners,smelters) and were requested to provide contact information of theirsuppliers and their codes of conduct. In a limited number of instances itwas possible to identify a pathway from an electronics product to themine; however none of the mapped supply chains were traced back tothe conflict zones in the Democratic Republic of Congo (DRC).
We requested our relevant suppliers to state that they provide conflict-free minerals to Philips. While all suppliers stated that indeed, to theirknowledge, they provided us conflict-free minerals, we continue ourefforts to increase transparency and investigate additional ways todetermine the origin of the minerals used in cooperation with EICC-GeSI members.
Together with ITRI, the tin trading and smelting sector, the tantalumindustry, and downstream users of both tin and tantalum metal,including Philips, we financed a pilot to track minerals and provideverifiable provenance information from individual mine sites in easternDRC; something that has not been possible up to now.
In December 2010 EICC-GeSI announced the launch of the Conflict-Free Smelter program and completion of the first tantalum smelterassessment, enabling the identification of smelters that candemonstrate through an independent third party assessment that theraw materials they procured did not originate from sources thatcontribute to conflict in the Democratic Republic of Congo. This duediligence enables different parties in the supply chain to betterunderstand the origin of the materials in their supply chain.
15 Sustainability statements 15.7 - 15.7
Annual Report 2010 221
15.7 Independent assurance reportTo the Supervisory Board and Shareholders of Koninklijke PhilipsElectronics N.V.:
IntroductionWe have been engaged by the Supervisory Board of Koninklijke PhilipsElectronics N.V. to provide limited assurance on the sectionSustainability statements in the Annual Report 2010. The Board ofManagement is responsible for the preparation and fair presentation ofthe section Sustainability statements. Our responsibility is to providelimited assurance on this information contained in this Annual Report.
ScopeOur engagement was designed to provide limited assurance on whetherthe information in chapter 15, Sustainability statements, of this AnnualReport is fairly stated, in all material respects.
Procedures performed to obtain a limited level of assurance are aimedat determining the plausibility of data and are less extensive than thosefor a reasonable level of assurance. Our procedures included reviewingsystems and processes for data management, assessing theappropriateness of the accounting policies used, assessing the datacollection and reporting process at a limited number of sites andevaluating the overall presentation of sustainability information withinour scope.
We have also reviewed, to the extent of our competence, whether theinformation on sustainability in the Performance highlights, of thisAnnual Report, the Management report as defined in the introductionparagraph of chapter 13, Group financial statements, of this AnnualReport and section 18.1, The Philips investment proposition, of thisAnnual Report is consistent with the information in chapter 15,Sustainability statements, of this Annual Report.
Reporting criteriaKoninklijke Philips Electronics N.V. applies the Sustainability ReportingGuidelines of the Global Reporting Initiative (G3) supported byinternally developed guidelines, as detailed in Approach to sustainabilityreporting in chapter 15, Sustainability statements, of this AnnualReport. It is important to view the performance data in the context ofthis explanatory information. We believe that these criteria are suitablein view of the purpose of our assurance engagement.
StandardsWe conducted our engagement in accordance with the InternationalStandard for Assurance Engagements (ISAE) 3000: AssuranceEngagements other than Audits or Reviews of Historical FinancialInformation, issued by the International Auditing and AssuranceStandards Board. This standard requires, amongst others, that theassurance team possesses the specific knowledge, skills andprofessional competencies needed to understand and reviewsustainability information, and that they comply with the requirementsof the Code of Ethics for Professional Accountants from theInternational Federation of Accountants to ensure their independence.
ConclusionBased on our work described in this report, nothing came to ourattention to indicate that the information in chapter 15, Sustainabilitystatements, of this Annual Report is not fairly presented, in all materialrespects, in accordance with the reporting criteria as described inApproach to sustainability reporting in the section Sustainabilitystatements in the Annual Report 2010.
We also report, to the extent of our competence, that the informationon sustainability in the Performance highlights, of this Annual Report,the Management report as defined in the introduction paragraph ofchapter 13, Group financial statements, of this Annual Report andsection 18.1, The Philips investment proposition, of this Annual Reportis consistent with the information in chapter 15, Sustainabilitystatements, of this Annual Report.
Amstelveen, February 17, 2011
KPMG ACCOUNTANTS N.V.
M.A. Soeting RA
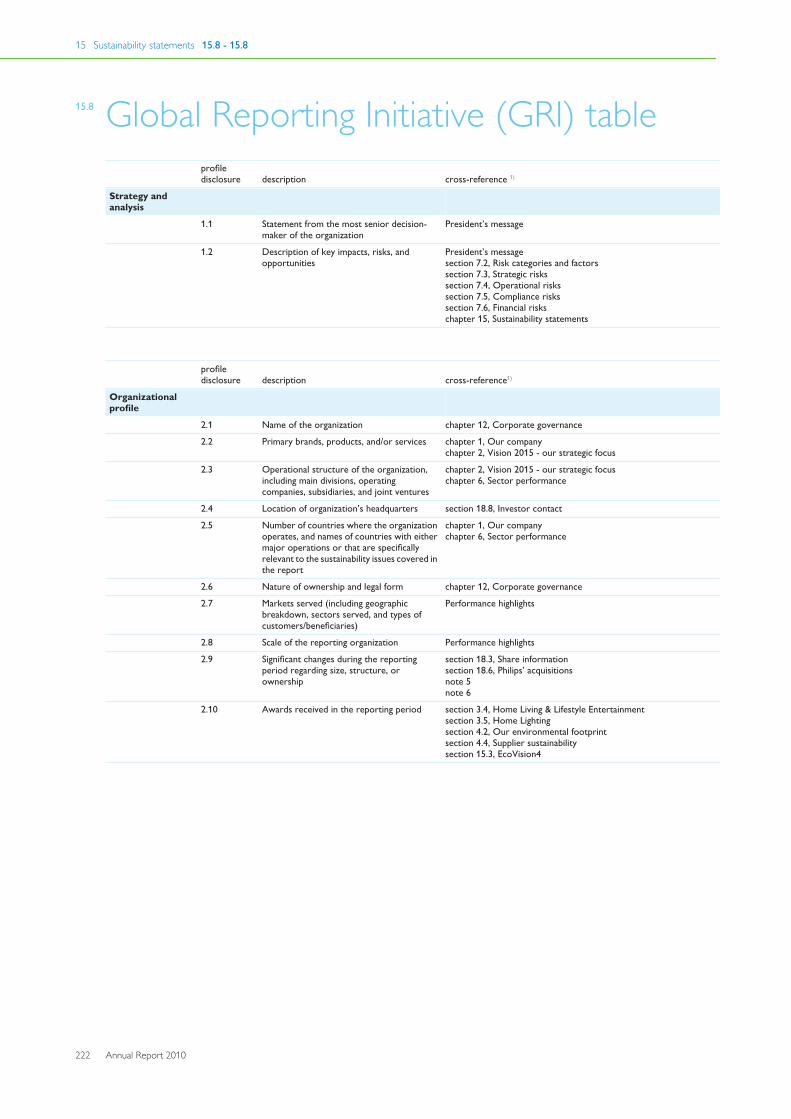
15 Sustainability statements 15.8 - 15.8
222 Annual Report 2010
15.8 Global Reporting Initiative (GRI) tableprofiledisclosure description cross-reference 1)
Strategy andanalysis
1.1 Statement from the most senior decision-maker of the organization
President’s message
1.2 Description of key impacts, risks, andopportunities
President’s messagesection 7.2, Risk categories and factorssection 7.3, Strategic riskssection 7.4, Operational riskssection 7.5, Compliance riskssection 7.6, Financial riskschapter 15, Sustainability statements
profiledisclosure description cross-reference1)
Organizationalprofile
2.1 Name of the organization chapter 12, Corporate governance
2.2 Primary brands, products, and/or services chapter 1, Our companychapter 2, Vision 2015 - our strategic focus
2.3 Operational structure of the organization,including main divisions, operatingcompanies, subsidiaries, and joint ventures
chapter 2, Vision 2015 - our strategic focuschapter 6, Sector performance
2.4 Location of organization’s headquarters section 18.8, Investor contact
2.5 Number of countries where the organizationoperates, and names of countries with eithermajor operations or that are specificallyrelevant to the sustainability issues covered inthe report
chapter 1, Our companychapter 6, Sector performance
2.6 Nature of ownership and legal form chapter 12, Corporate governance
2.7 Markets served (including geographicbreakdown, sectors served, and types ofcustomers/beneficiaries)
Performance highlights
2.8 Scale of the reporting organization Performance highlights
2.9 Significant changes during the reportingperiod regarding size, structure, orownership
section 18.3, Share informationsection 18.6, Philips’ acquisitionsnote 5note 6
2.10 Awards received in the reporting period section 3.4, Home Living & Lifestyle Entertainmentsection 3.5, Home Lightingsection 4.2, Our environmental footprintsection 4.4, Supplier sustainabilitysection 15.3, EcoVision4
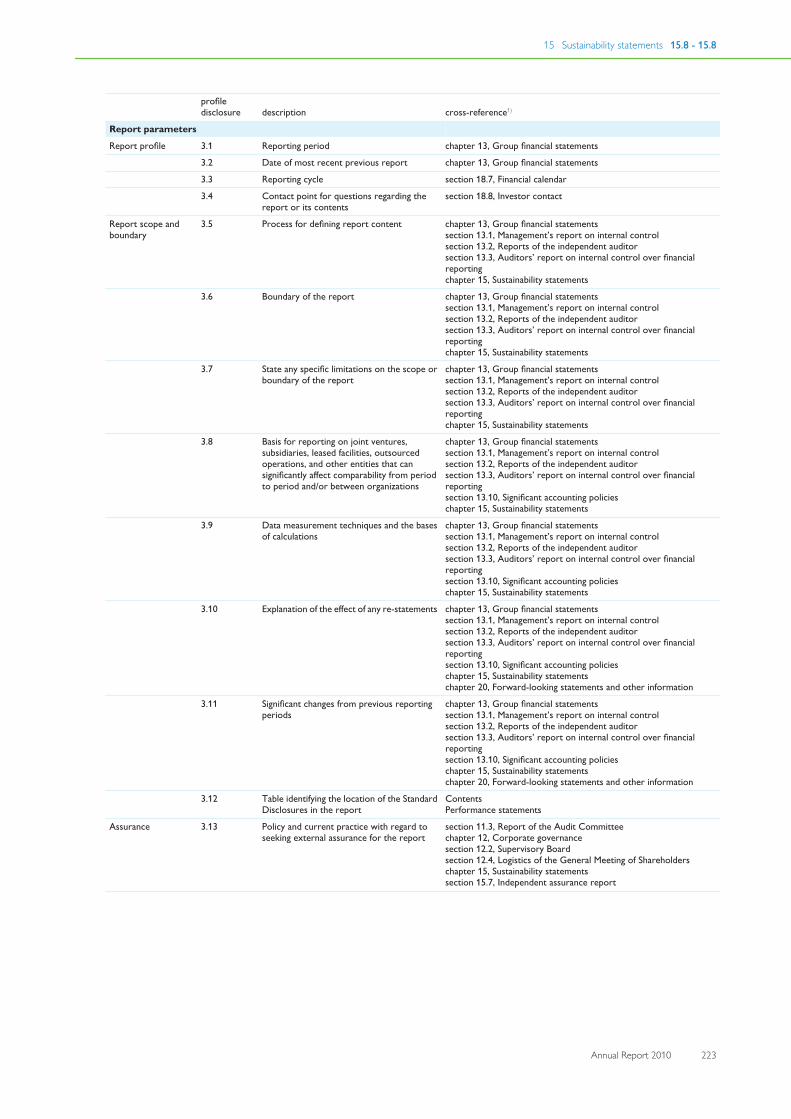
15 Sustainability statements 15.8 - 15.8
Annual Report 2010 223
profiledisclosure description cross-reference1)
Report parameters
Report profile 3.1 Reporting period chapter 13, Group financial statements
3.2 Date of most recent previous report chapter 13, Group financial statements
3.3 Reporting cycle section 18.7, Financial calendar
3.4 Contact point for questions regarding thereport or its contents
section 18.8, Investor contact
Report scope andboundary
3.5 Process for defining report content chapter 13, Group financial statementssection 13.1, Management’s report on internal controlsection 13.2, Reports of the independent auditorsection 13.3, Auditors’ report on internal control over financialreportingchapter 15, Sustainability statements
3.6 Boundary of the report chapter 13, Group financial statementssection 13.1, Management’s report on internal controlsection 13.2, Reports of the independent auditorsection 13.3, Auditors’ report on internal control over financialreportingchapter 15, Sustainability statements
3.7 State any specific limitations on the scope orboundary of the report
chapter 13, Group financial statementssection 13.1, Management’s report on internal controlsection 13.2, Reports of the independent auditorsection 13.3, Auditors’ report on internal control over financialreportingchapter 15, Sustainability statements
3.8 Basis for reporting on joint ventures,subsidiaries, leased facilities, outsourcedoperations, and other entities that cansignificantly affect comparability from periodto period and/or between organizations
chapter 13, Group financial statementssection 13.1, Management’s report on internal controlsection 13.2, Reports of the independent auditorsection 13.3, Auditors’ report on internal control over financialreportingsection 13.10, Significant accounting policieschapter 15, Sustainability statements
3.9 Data measurement techniques and the basesof calculations
chapter 13, Group financial statementssection 13.1, Management’s report on internal controlsection 13.2, Reports of the independent auditorsection 13.3, Auditors’ report on internal control over financialreportingsection 13.10, Significant accounting policieschapter 15, Sustainability statements
3.10 Explanation of the effect of any re-statements chapter 13, Group financial statementssection 13.1, Management’s report on internal controlsection 13.2, Reports of the independent auditorsection 13.3, Auditors’ report on internal control over financialreportingsection 13.10, Significant accounting policieschapter 15, Sustainability statementschapter 20, Forward-looking statements and other information
3.11 Significant changes from previous reportingperiods
chapter 13, Group financial statementssection 13.1, Management’s report on internal controlsection 13.2, Reports of the independent auditorsection 13.3, Auditors’ report on internal control over financialreportingsection 13.10, Significant accounting policieschapter 15, Sustainability statementschapter 20, Forward-looking statements and other information
3.12 Table identifying the location of the StandardDisclosures in the report
ContentsPerformance statements
Assurance 3.13 Policy and current practice with regard toseeking external assurance for the report
section 11.3, Report of the Audit Committeechapter 12, Corporate governancesection 12.2, Supervisory Boardsection 12.4, Logistics of the General Meeting of Shareholderschapter 15, Sustainability statementssection 15.7, Independent assurance report
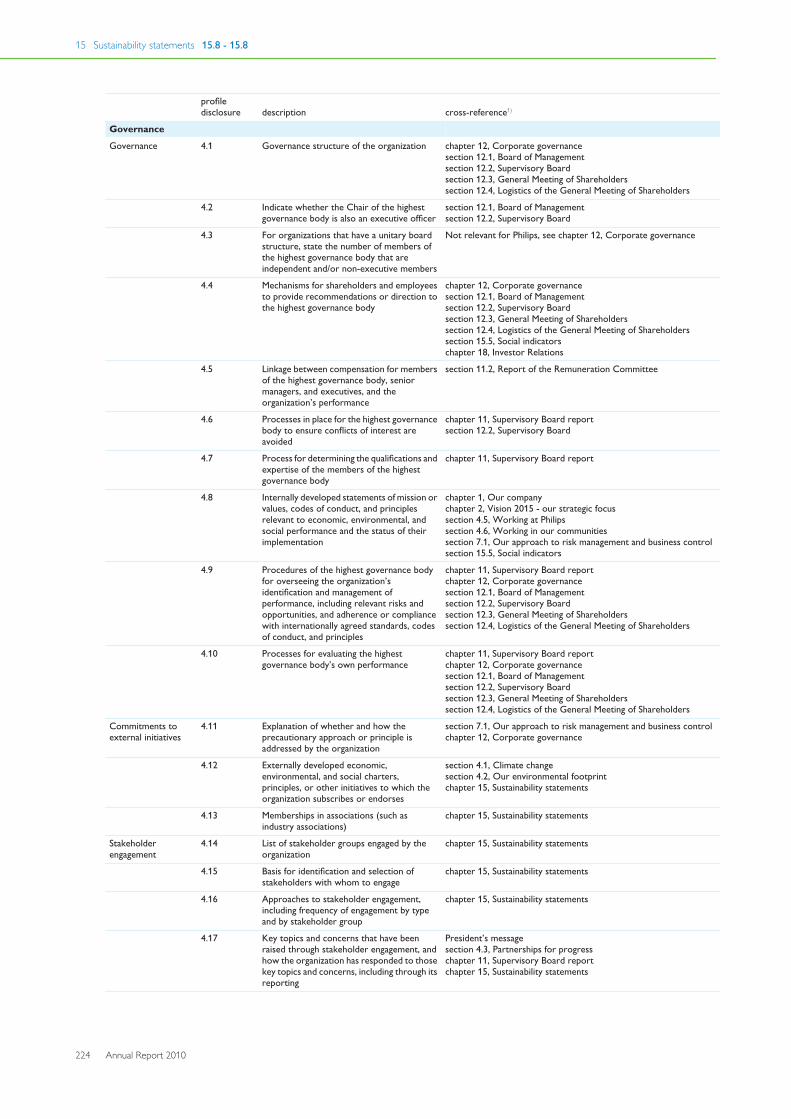
15 Sustainability statements 15.8 - 15.8
224 Annual Report 2010
profiledisclosure description cross-reference1)
Governance
Governance 4.1 Governance structure of the organization chapter 12, Corporate governancesection 12.1, Board of Managementsection 12.2, Supervisory Boardsection 12.3, General Meeting of Shareholderssection 12.4, Logistics of the General Meeting of Shareholders
4.2 Indicate whether the Chair of the highestgovernance body is also an executive officer
section 12.1, Board of Managementsection 12.2, Supervisory Board
4.3 For organizations that have a unitary boardstructure, state the number of members ofthe highest governance body that areindependent and/or non-executive members
Not relevant for Philips, see chapter 12, Corporate governance
4.4 Mechanisms for shareholders and employeesto provide recommendations or direction tothe highest governance body
chapter 12, Corporate governancesection 12.1, Board of Managementsection 12.2, Supervisory Boardsection 12.3, General Meeting of Shareholderssection 12.4, Logistics of the General Meeting of Shareholderssection 15.5, Social indicatorschapter 18, Investor Relations
4.5 Linkage between compensation for membersof the highest governance body, seniormanagers, and executives, and theorganization’s performance
section 11.2, Report of the Remuneration Committee
4.6 Processes in place for the highest governancebody to ensure conflicts of interest areavoided
chapter 11, Supervisory Board reportsection 12.2, Supervisory Board
4.7 Process for determining the qualifications andexpertise of the members of the highestgovernance body
chapter 11, Supervisory Board report
4.8 Internally developed statements of mission orvalues, codes of conduct, and principlesrelevant to economic, environmental, andsocial performance and the status of theirimplementation
chapter 1, Our companychapter 2, Vision 2015 - our strategic focussection 4.5, Working at Philipssection 4.6, Working in our communitiessection 7.1, Our approach to risk management and business controlsection 15.5, Social indicators
4.9 Procedures of the highest governance bodyfor overseeing the organization’sidentification and management ofperformance, including relevant risks andopportunities, and adherence or compliancewith internationally agreed standards, codesof conduct, and principles
chapter 11, Supervisory Board reportchapter 12, Corporate governancesection 12.1, Board of Managementsection 12.2, Supervisory Boardsection 12.3, General Meeting of Shareholderssection 12.4, Logistics of the General Meeting of Shareholders
4.10 Processes for evaluating the highestgovernance body’s own performance
chapter 11, Supervisory Board reportchapter 12, Corporate governancesection 12.1, Board of Managementsection 12.2, Supervisory Boardsection 12.3, General Meeting of Shareholderssection 12.4, Logistics of the General Meeting of Shareholders
Commitments toexternal initiatives
4.11 Explanation of whether and how theprecautionary approach or principle isaddressed by the organization
section 7.1, Our approach to risk management and business controlchapter 12, Corporate governance
4.12 Externally developed economic,environmental, and social charters,principles, or other initiatives to which theorganization subscribes or endorses
section 4.1, Climate changesection 4.2, Our environmental footprintchapter 15, Sustainability statements
4.13 Memberships in associations (such asindustry associations)
chapter 15, Sustainability statements
Stakeholderengagement
4.14 List of stakeholder groups engaged by theorganization
chapter 15, Sustainability statements
4.15 Basis for identification and selection ofstakeholders with whom to engage
chapter 15, Sustainability statements
4.16 Approaches to stakeholder engagement,including frequency of engagement by typeand by stakeholder group
chapter 15, Sustainability statements
4.17 Key topics and concerns that have beenraised through stakeholder engagement, andhow the organization has responded to thosekey topics and concerns, including through itsreporting
President’s messagesection 4.3, Partnerships for progresschapter 11, Supervisory Board reportchapter 15, Sustainability statements
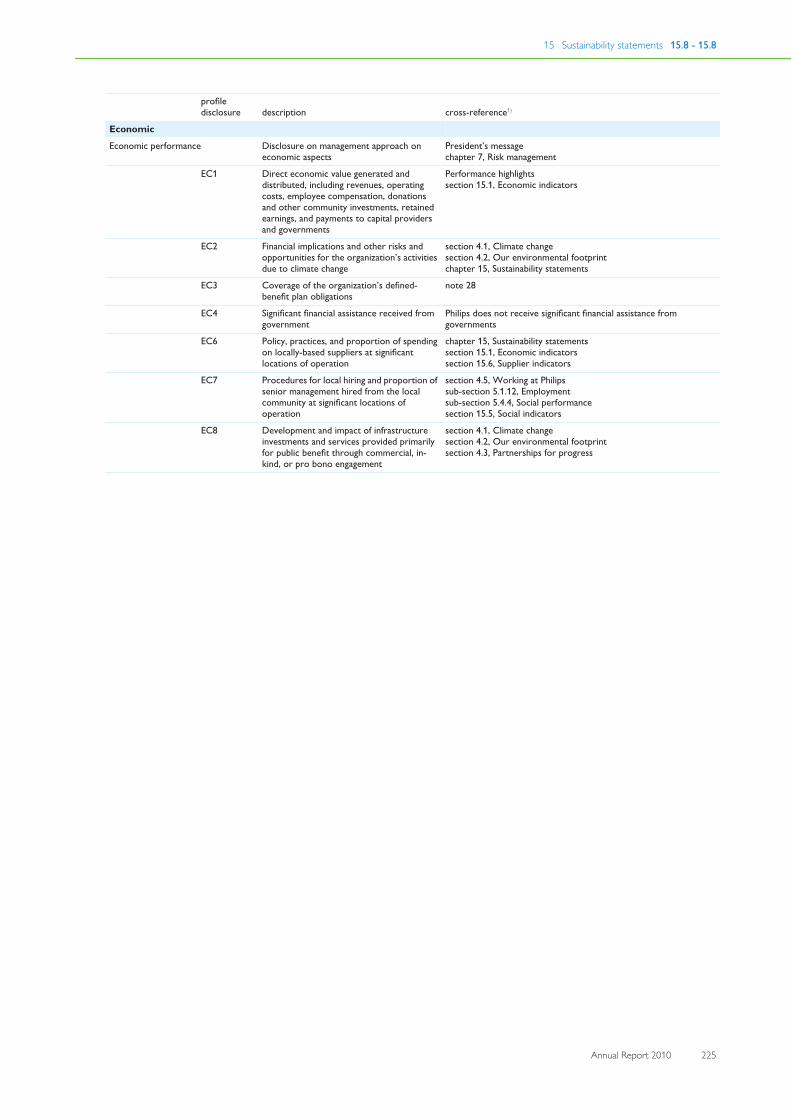
15 Sustainability statements 15.8 - 15.8
Annual Report 2010 225
profiledisclosure description cross-reference1)
Economic
Economic performance Disclosure on management approach oneconomic aspects
President’s messagechapter 7, Risk management
EC1 Direct economic value generated anddistributed, including revenues, operatingcosts, employee compensation, donationsand other community investments, retainedearnings, and payments to capital providersand governments
Performance highlightssection 15.1, Economic indicators
EC2 Financial implications and other risks andopportunities for the organization’s activitiesdue to climate change
section 4.1, Climate changesection 4.2, Our environmental footprintchapter 15, Sustainability statements
EC3 Coverage of the organization’s defined-benefit plan obligations
note 28
EC4 Significant financial assistance received fromgovernment
Philips does not receive significant financial assistance fromgovernments
EC6 Policy, practices, and proportion of spendingon locally-based suppliers at significantlocations of operation
chapter 15, Sustainability statementssection 15.1, Economic indicatorssection 15.6, Supplier indicators
EC7 Procedures for local hiring and proportion ofsenior management hired from the localcommunity at significant locations ofoperation
section 4.5, Working at Philipssub-section 5.1.12, Employmentsub-section 5.4.4, Social performancesection 15.5, Social indicators
EC8 Development and impact of infrastructureinvestments and services provided primarilyfor public benefit through commercial, in-kind, or pro bono engagement
section 4.1, Climate changesection 4.2, Our environmental footprintsection 4.3, Partnerships for progress
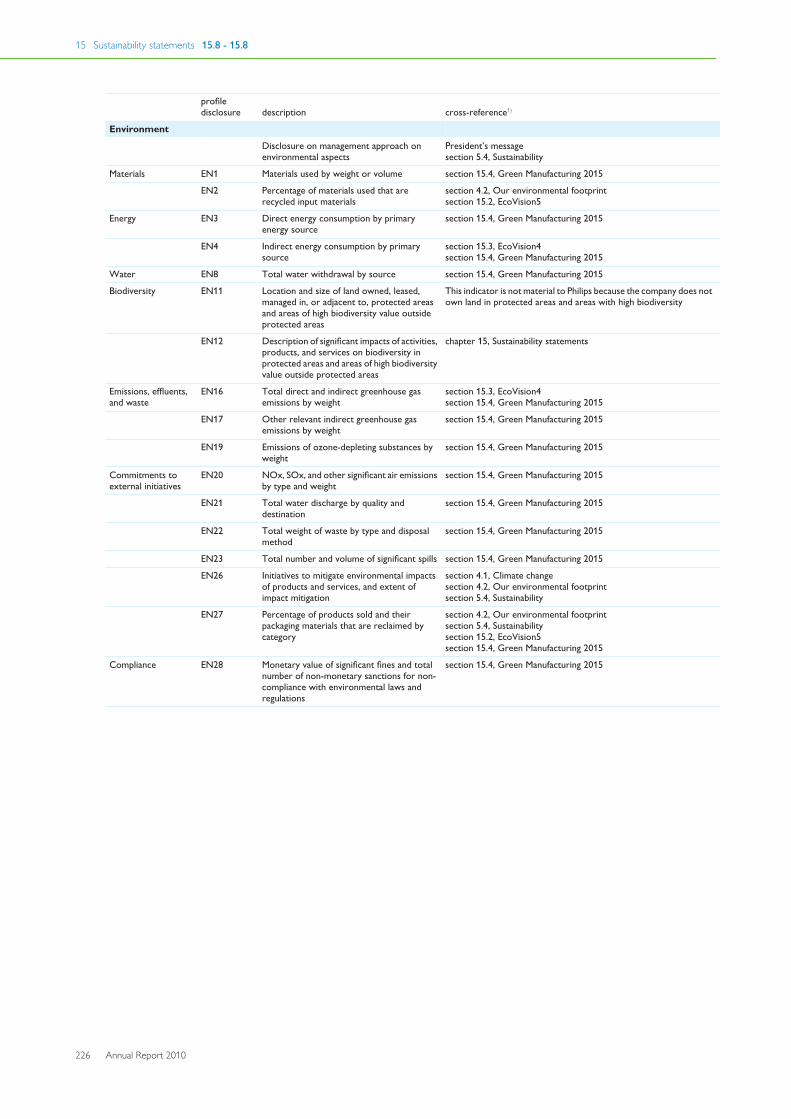
15 Sustainability statements 15.8 - 15.8
226 Annual Report 2010
profiledisclosure description cross-reference1)
Environment
Disclosure on management approach onenvironmental aspects
President’s messagesection 5.4, Sustainability
Materials EN1 Materials used by weight or volume section 15.4, Green Manufacturing 2015
EN2 Percentage of materials used that arerecycled input materials
section 4.2, Our environmental footprintsection 15.2, EcoVision5
Energy EN3 Direct energy consumption by primaryenergy source
section 15.4, Green Manufacturing 2015
EN4 Indirect energy consumption by primarysource
section 15.3, EcoVision4section 15.4, Green Manufacturing 2015
Water EN8 Total water withdrawal by source section 15.4, Green Manufacturing 2015
Biodiversity EN11 Location and size of land owned, leased,managed in, or adjacent to, protected areasand areas of high biodiversity value outsideprotected areas
This indicator is not material to Philips because the company does notown land in protected areas and areas with high biodiversity
EN12 Description of significant impacts of activities,products, and services on biodiversity inprotected areas and areas of high biodiversityvalue outside protected areas
chapter 15, Sustainability statements
Emissions, effluents,and waste
EN16 Total direct and indirect greenhouse gasemissions by weight
section 15.3, EcoVision4section 15.4, Green Manufacturing 2015
EN17 Other relevant indirect greenhouse gasemissions by weight
section 15.4, Green Manufacturing 2015
EN19 Emissions of ozone-depleting substances byweight
section 15.4, Green Manufacturing 2015
Commitments toexternal initiatives
EN20 NOx, SOx, and other significant air emissionsby type and weight
section 15.4, Green Manufacturing 2015
EN21 Total water discharge by quality anddestination
section 15.4, Green Manufacturing 2015
EN22 Total weight of waste by type and disposalmethod
section 15.4, Green Manufacturing 2015
EN23 Total number and volume of significant spills section 15.4, Green Manufacturing 2015
EN26 Initiatives to mitigate environmental impactsof products and services, and extent ofimpact mitigation
section 4.1, Climate changesection 4.2, Our environmental footprintsection 5.4, Sustainability
EN27 Percentage of products sold and theirpackaging materials that are reclaimed bycategory
section 4.2, Our environmental footprintsection 5.4, Sustainabilitysection 15.2, EcoVision5section 15.4, Green Manufacturing 2015
Compliance EN28 Monetary value of significant fines and totalnumber of non-monetary sanctions for non-compliance with environmental laws andregulations
section 15.4, Green Manufacturing 2015
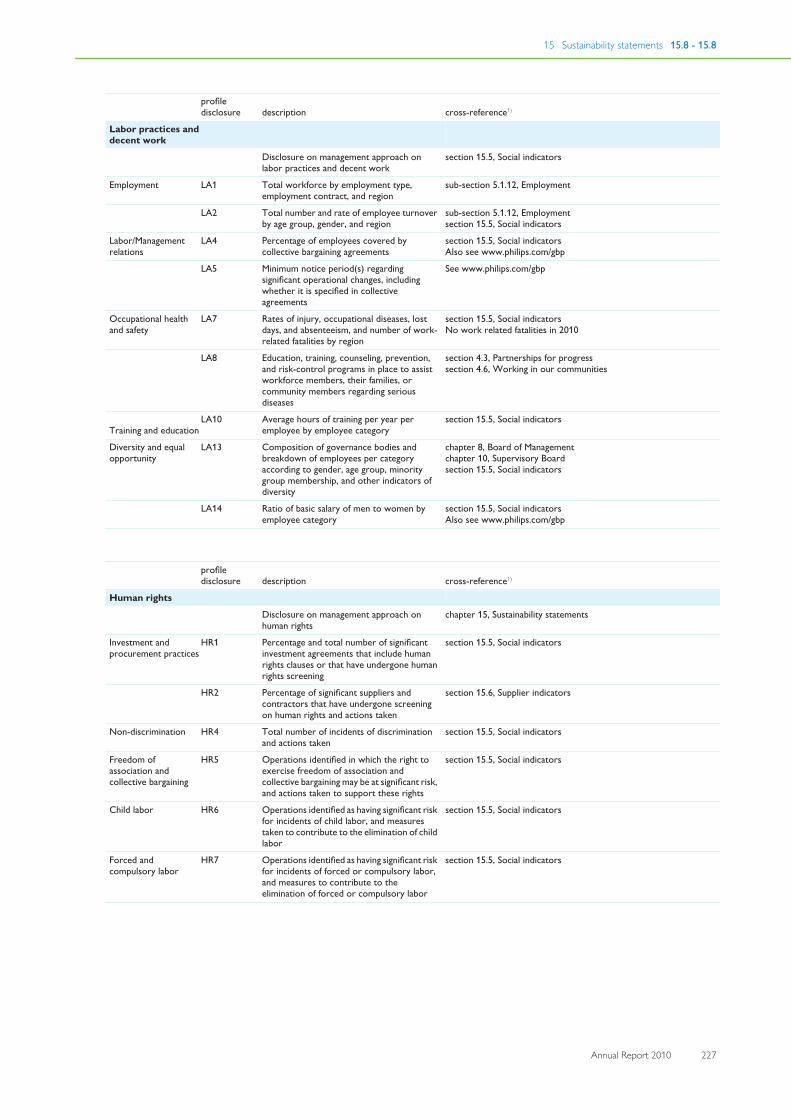
15 Sustainability statements 15.8 - 15.8
Annual Report 2010 227
profiledisclosure description cross-reference1)
Labor practices anddecent work
Disclosure on management approach onlabor practices and decent work
section 15.5, Social indicators
Employment LA1 Total workforce by employment type,employment contract, and region
sub-section 5.1.12, Employment
LA2 Total number and rate of employee turnoverby age group, gender, and region
sub-section 5.1.12, Employmentsection 15.5, Social indicators
Labor/Managementrelations
LA4 Percentage of employees covered bycollective bargaining agreements
section 15.5, Social indicatorsAlso see www.philips.com/gbp
LA5 Minimum notice period(s) regardingsignificant operational changes, includingwhether it is specified in collectiveagreements
See www.philips.com/gbp
Occupational healthand safety
LA7 Rates of injury, occupational diseases, lostdays, and absenteeism, and number of work-related fatalities by region
section 15.5, Social indicatorsNo work related fatalities in 2010
LA8 Education, training, counseling, prevention,and risk-control programs in place to assistworkforce members, their families, orcommunity members regarding seriousdiseases
section 4.3, Partnerships for progresssection 4.6, Working in our communities
Training and educationLA10 Average hours of training per year per
employee by employee category section 15.5, Social indicators
Diversity and equalopportunity
LA13 Composition of governance bodies andbreakdown of employees per categoryaccording to gender, age group, minoritygroup membership, and other indicators ofdiversity
chapter 8, Board of Managementchapter 10, Supervisory Boardsection 15.5, Social indicators
LA14 Ratio of basic salary of men to women byemployee category
section 15.5, Social indicatorsAlso see www.philips.com/gbp
profiledisclosure description cross-reference1)
Human rights
Disclosure on management approach onhuman rights
chapter 15, Sustainability statements
Investment andprocurement practices
HR1 Percentage and total number of significantinvestment agreements that include humanrights clauses or that have undergone humanrights screening
section 15.5, Social indicators
HR2 Percentage of significant suppliers andcontractors that have undergone screeningon human rights and actions taken
section 15.6, Supplier indicators
Non-discrimination HR4 Total number of incidents of discriminationand actions taken
section 15.5, Social indicators
Freedom ofassociation andcollective bargaining
HR5 Operations identified in which the right toexercise freedom of association andcollective bargaining may be at significant risk,and actions taken to support these rights
section 15.5, Social indicators
Child labor HR6 Operations identified as having significant riskfor incidents of child labor, and measurestaken to contribute to the elimination of childlabor
section 15.5, Social indicators
Forced andcompulsory labor
HR7 Operations identified as having significant riskfor incidents of forced or compulsory labor,and measures to contribute to theelimination of forced or compulsory labor
section 15.5, Social indicators
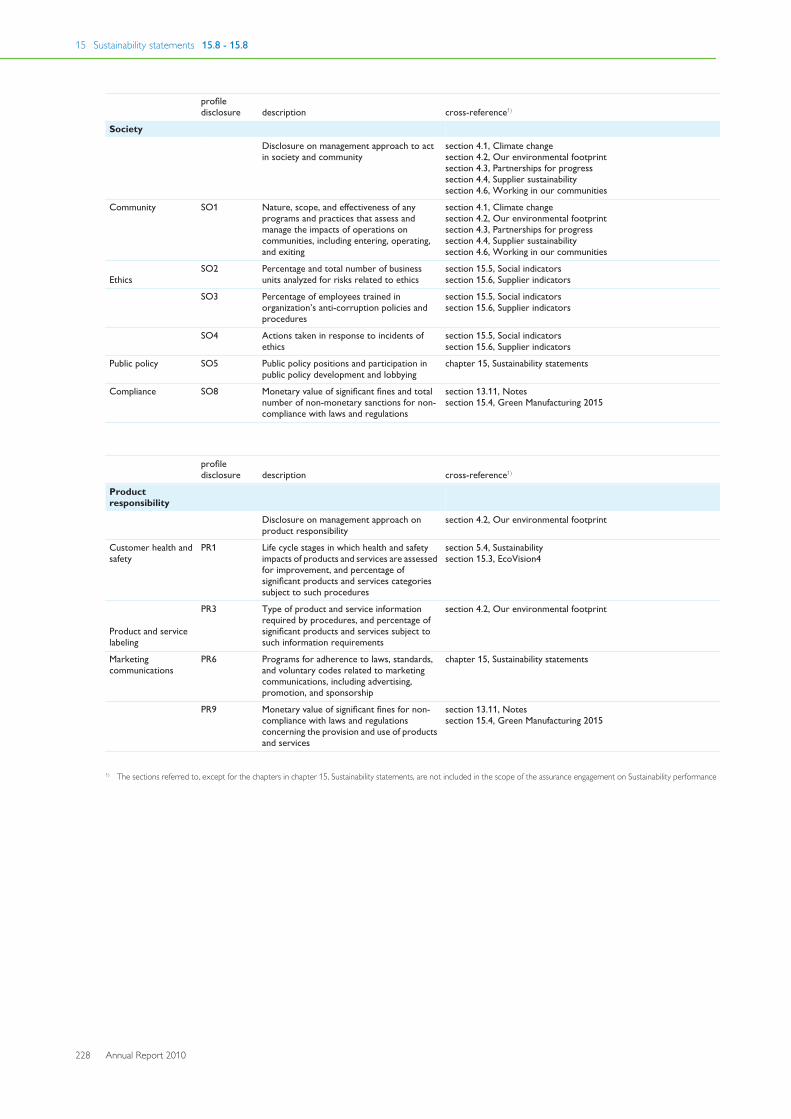
15 Sustainability statements 15.8 - 15.8
228 Annual Report 2010
profiledisclosure description cross-reference1)
Society
Disclosure on management approach to actin society and community
section 4.1, Climate changesection 4.2, Our environmental footprintsection 4.3, Partnerships for progresssection 4.4, Supplier sustainabilitysection 4.6, Working in our communities
Community SO1 Nature, scope, and effectiveness of anyprograms and practices that assess andmanage the impacts of operations oncommunities, including entering, operating,and exiting
section 4.1, Climate changesection 4.2, Our environmental footprintsection 4.3, Partnerships for progresssection 4.4, Supplier sustainabilitysection 4.6, Working in our communities
EthicsSO2 Percentage and total number of business
units analyzed for risks related to ethics section 15.5, Social indicators
section 15.6, Supplier indicators
SO3 Percentage of employees trained inorganization’s anti-corruption policies andprocedures
section 15.5, Social indicatorssection 15.6, Supplier indicators
SO4 Actions taken in response to incidents ofethics
section 15.5, Social indicatorssection 15.6, Supplier indicators
Public policy SO5 Public policy positions and participation inpublic policy development and lobbying
chapter 15, Sustainability statements
Compliance SO8 Monetary value of significant fines and totalnumber of non-monetary sanctions for non-compliance with laws and regulations
section 13.11, Notessection 15.4, Green Manufacturing 2015
profiledisclosure description cross-reference1)
Productresponsibility
Disclosure on management approach onproduct responsibility
section 4.2, Our environmental footprint
Customer health andsafety
PR1 Life cycle stages in which health and safetyimpacts of products and services are assessedfor improvement, and percentage ofsignificant products and services categoriessubject to such procedures
section 5.4, Sustainabilitysection 15.3, EcoVision4
Product and servicelabeling
PR3 Type of product and service informationrequired by procedures, and percentage ofsignificant products and services subject tosuch information requirements
section 4.2, Our environmental footprint
Marketingcommunications
PR6 Programs for adherence to laws, standards,and voluntary codes related to marketingcommunications, including advertising,promotion, and sponsorship
chapter 15, Sustainability statements
PR9 Monetary value of significant fines for non-compliance with laws and regulationsconcerning the provision and use of productsand services
section 13.11, Notessection 15.4, Green Manufacturing 2015
1) The sections referred to, except for the chapters in chapter 15, Sustainability statements, are not included in the scope of the assurance engagement on Sustainability performance
16 Reconciliation of non-GAAP information 16 - 16
Annual Report 2010 229
16 Reconciliation of non-GAAPinformationExplanation of Non-GAAP measuresKoninklijke Philips Electronics N.V. (the ‘Company’) believes that anunderstanding of sales performance is enhanced when the effects ofcurrency movements and acquisitions and divestments (changes inconsolidation) are excluded. Accordingly, in addition to presenting‘nominal growth’, ‘comparable growth’ is provided.
Comparable sales exclude the effects of currency movements andchanges in consolidation. As indicated in the Significant accountingpolicies, sales and income are translated from foreign currencies intothe Company’s reporting currency, the euro, at the exchange rate ontransaction dates during the respective years. As a result of significantcurrency movements during the years presented, the effects oftranslating foreign currency sales amounts into euros could have amaterial impact. Therefore, these impacts have been excluded inarriving at the comparable sales in euros. Currency effects have beencalculated by translating previous years’ foreign currency sales amountsinto euros at the following year’s exchange rates in comparison with thesales in euros as historically reported. Years under review werecharacterized by a number of acquisitions and divestments, as a result ofwhich activities were consolidated or deconsolidated. The effect ofconsolidation changes has also been excluded in arriving at thecomparable sales. For the purpose of calculating comparable salesgrowth, when a previously consolidated entity is sold or contributed toa venture that is not consolidated by the Company, relevant sales areexcluded from impacted prior-year periods. Similarly, when an entity isacquired, relevant sales are excluded from impacted periods.
The Company uses the term EBIT and EBITA to evaluate theperformance of the Philips Group and its operating sectors. The termEBIT has the same meaning as Income from operations (IFO).Referencing EBITA will make the underlying performance of ourbusinesses more transparent by factoring out the amortization ofacquired intangible assets. EBITA represents income from operations
excluding results attributable to non-controlling interests holders,results relating to investments in associates, income taxes, financialincome and expenses, amortization and impairment on intangible assets(excluding software and capitalized product development).
The Company believes that an understanding of the Philips Group’sfinancial condition is enhanced by the disclosure of net operating capital(NOC), as this figure is used by Philips’ management to evaluate thecapital efficiency of the Philips Group and its operating sectors. NOC isdefined as: total assets excluding assets from discontinued operationsless: (a) cash and cash equivalents, (b) deferred tax assets, (c) other(non-)current financial assets, (d) investments in associates, and afterdeduction of: (e) provisions excluding deferred tax liabilities, (f)accounts and notes payable, (g) accrued liabilities, (h) current/non-current liabilities, and (i) trading securities.
Net debt is defined as the sum of long- and short-term debt minus cashand cash equivalents. The net debt position as a percentage of the sumof group equity (shareholders’ equity and non-controlling interests) andnet debt is presented to express the financial strength of the Company.This measure is widely used by management and investment analystsand is therefore included in the disclosure.
Cash flows before financing activities, being the sum total of net cashfrom operating activities and net cash from investing activities, and freecash flow, being net cash from operating activities minus net capitalexpenditures, are presented separately to facilitate the reader’sunderstanding of the Company’s funding requirements.
Net capital expenditures comprise of purchase of intangible assets,expenditures on development assets, capital expenditures on property,plant and equipment and proceeds from disposals of property, plant andequipment. This measure is widely used by management to calculatefree cash flow.
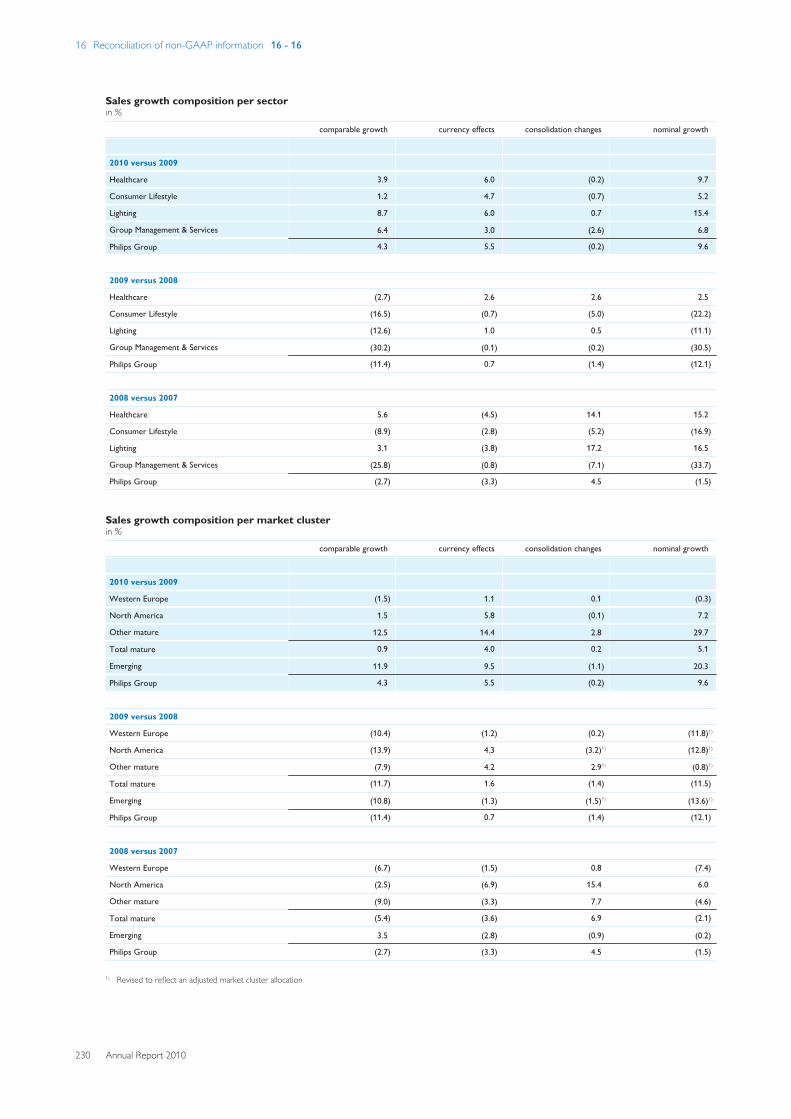
16 Reconciliation of non-GAAP information 16 - 16
230 Annual Report 2010
Sales growth composition per sectorin %
comparable growth currency effects consolidation changes nominal growth
2010 versus 2009
Healthcare 3.9 6.0 (0.2) 9.7
Consumer Lifestyle 1.2 4.7 (0.7) 5.2
Lighting 8.7 6.0 0.7 15.4
Group Management & Services 6.4 3.0 (2.6) 6.8
Philips Group 4.3 5.5 (0.2) 9.6
2009 versus 2008
Healthcare (2.7) 2.6 2.6 2.5
Consumer Lifestyle (16.5) (0.7) (5.0) (22.2)
Lighting (12.6) 1.0 0.5 (11.1)
Group Management & Services (30.2) (0.1) (0.2) (30.5)
Philips Group (11.4) 0.7 (1.4) (12.1)
2008 versus 2007
Healthcare 5.6 (4.5) 14.1 15.2
Consumer Lifestyle (8.9) (2.8) (5.2) (16.9)
Lighting 3.1 (3.8) 17.2 16.5
Group Management & Services (25.8) (0.8) (7.1) (33.7)
Philips Group (2.7) (3.3) 4.5 (1.5)
Sales growth composition per market clusterin %
comparable growth currency effects consolidation changes nominal growth
2010 versus 2009
Western Europe (1.5) 1.1 0.1 (0.3)
North America 1.5 5.8 (0.1) 7.2
Other mature 12.5 14.4 2.8 29.7
Total mature 0.9 4.0 0.2 5.1
Emerging 11.9 9.5 (1.1) 20.3
Philips Group 4.3 5.5 (0.2) 9.6
2009 versus 2008
Western Europe (10.4) (1.2) (0.2) (11.8)1)
North America (13.9) 4.3 (3.2)1) (12.8)1)
Other mature (7.9) 4.2 2.91) (0.8)1)
Total mature (11.7) 1.6 (1.4) (11.5)
Emerging (10.8) (1.3) (1.5)1) (13.6)1)
Philips Group (11.4) 0.7 (1.4) (12.1)
2008 versus 2007
Western Europe (6.7) (1.5) 0.8 (7.4)
North America (2.5) (6.9) 15.4 6.0
Other mature (9.0) (3.3) 7.7 (4.6)
Total mature (5.4) (3.6) 6.9 (2.1)
Emerging 3.5 (2.8) (0.9) (0.2)
Philips Group (2.7) (3.3) 4.5 (1.5)
1) Revised to reflect an adjusted market cluster allocation
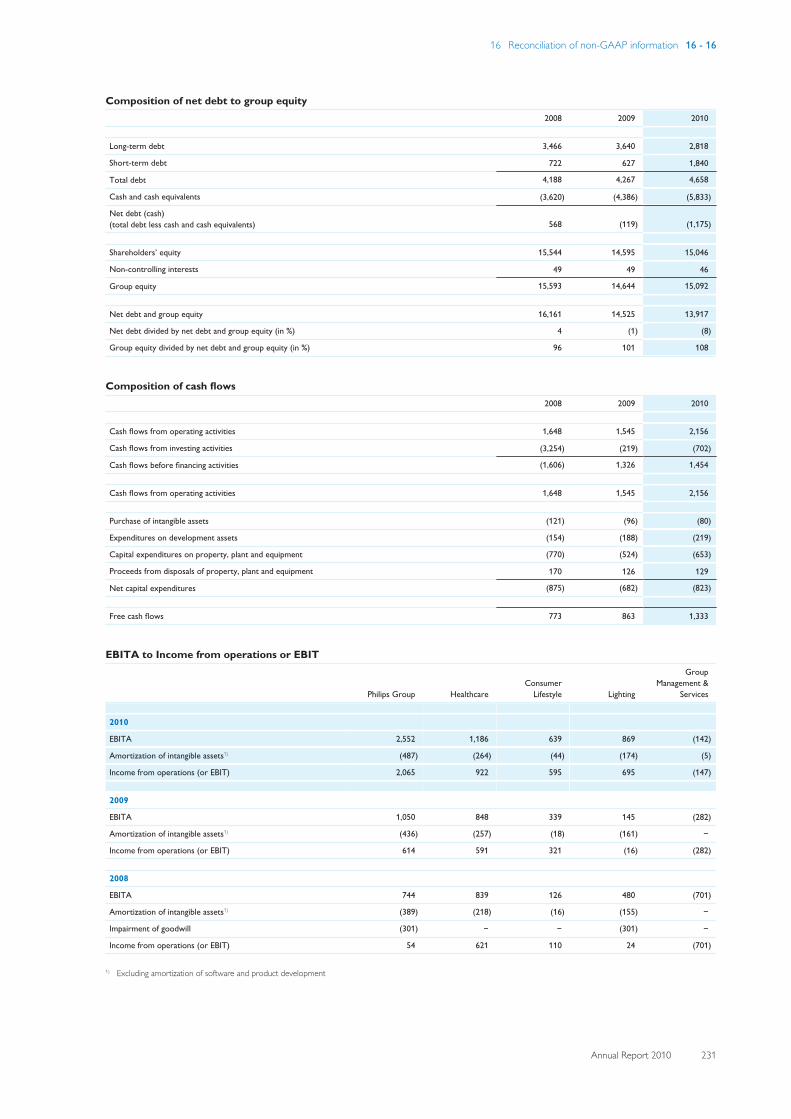
16 Reconciliation of non-GAAP information 16 - 16
Annual Report 2010 231
Composition of net debt to group equity2008 2009 2010
Long-term debt 3,466 3,640 2,818
Short-term debt 722 627 1,840
Total debt 4,188 4,267 4,658
Cash and cash equivalents (3,620) (4,386) (5,833)
Net debt (cash)(total debt less cash and cash equivalents) 568 (119) (1,175)
Shareholders’ equity 15,544 14,595 15,046
Non-controlling interests 49 49 46
Group equity 15,593 14,644 15,092
Net debt and group equity 16,161 14,525 13,917
Net debt divided by net debt and group equity (in %) 4 (1) (8)
Group equity divided by net debt and group equity (in %) 96 101 108
Composition of cash flows2008 2009 2010
Cash flows from operating activities 1,648 1,545 2,156
Cash flows from investing activities (3,254) (219) (702)
Cash flows before financing activities (1,606) 1,326 1,454
Cash flows from operating activities 1,648 1,545 2,156
Purchase of intangible assets (121) (96) (80)
Expenditures on development assets (154) (188) (219)
Capital expenditures on property, plant and equipment (770) (524) (653)
Proceeds from disposals of property, plant and equipment 170 126 129
Net capital expenditures (875) (682) (823)
Free cash flows 773 863 1,333
EBITA to Income from operations or EBIT
Philips Group Healthcare Consumer
Lifestyle Lighting
GroupManagement &
Services
2010
EBITA 2,552 1,186 639 869 (142)
Amortization of intangible assets1) (487) (264) (44) (174) (5)
Income from operations (or EBIT) 2,065 922 595 695 (147)
2009
EBITA 1,050 848 339 145 (282)
Amortization of intangible assets1) (436) (257) (18) (161) −
Income from operations (or EBIT) 614 591 321 (16) (282)
2008
EBITA 744 839 126 480 (701)
Amortization of intangible assets1) (389) (218) (16) (155) −
Impairment of goodwill (301) − − (301) −
Income from operations (or EBIT) 54 621 110 24 (701)
1) Excluding amortization of software and product development
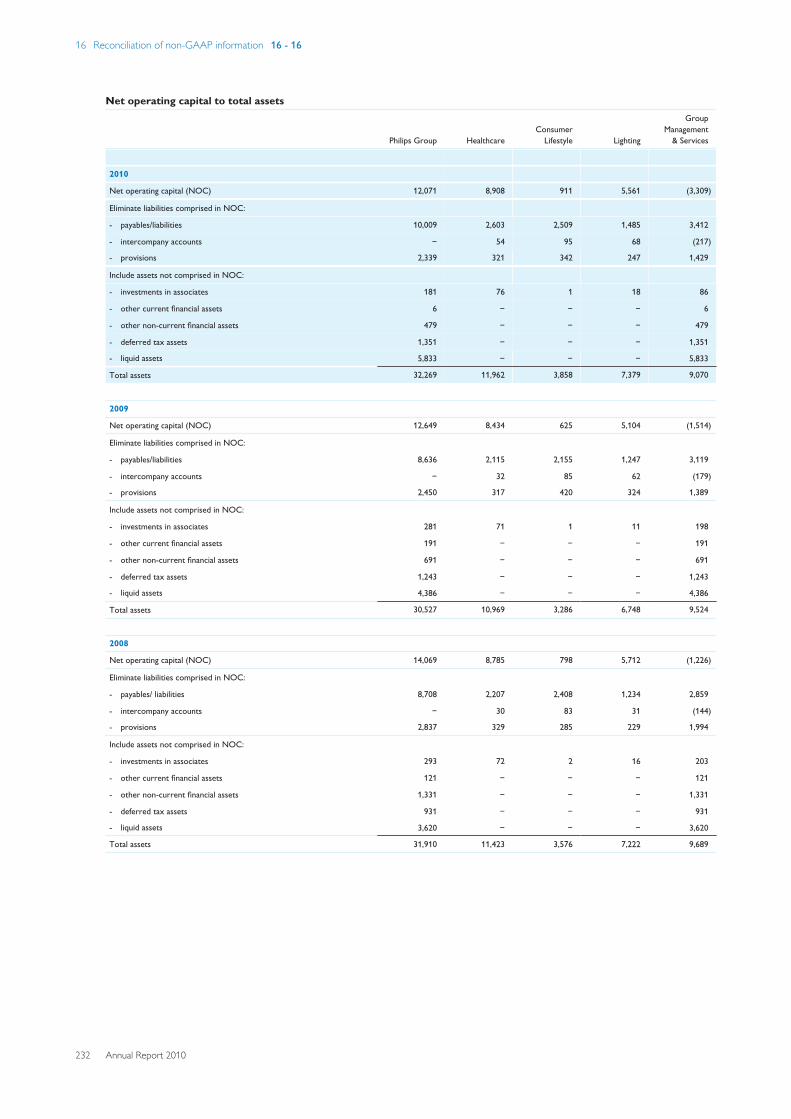
16 Reconciliation of non-GAAP information 16 - 16
232 Annual Report 2010
Net operating capital to total assets
Philips Group Healthcare Consumer
Lifestyle Lighting
GroupManagement
& Services
2010
Net operating capital (NOC) 12,071 8,908 911 5,561 (3,309)
Eliminate liabilities comprised in NOC:
- payables/liabilities 10,009 2,603 2,509 1,485 3,412
- intercompany accounts − 54 95 68 (217)
- provisions 2,339 321 342 247 1,429
Include assets not comprised in NOC:
- investments in associates 181 76 1 18 86
- other current financial assets 6 − − − 6
- other non-current financial assets 479 − − − 479
- deferred tax assets 1,351 − − − 1,351
- liquid assets 5,833 − − − 5,833
Total assets 32,269 11,962 3,858 7,379 9,070
2009
Net operating capital (NOC) 12,649 8,434 625 5,104 (1,514)
Eliminate liabilities comprised in NOC:
- payables/liabilities 8,636 2,115 2,155 1,247 3,119
- intercompany accounts − 32 85 62 (179)
- provisions 2,450 317 420 324 1,389
Include assets not comprised in NOC:
- investments in associates 281 71 1 11 198
- other current financial assets 191 − − − 191
- other non-current financial assets 691 − − − 691
- deferred tax assets 1,243 − − − 1,243
- liquid assets 4,386 − − − 4,386
Total assets 30,527 10,969 3,286 6,748 9,524
2008
Net operating capital (NOC) 14,069 8,785 798 5,712 (1,226)
Eliminate liabilities comprised in NOC:
- payables/ liabilities 8,708 2,207 2,408 1,234 2,859
- intercompany accounts − 30 83 31 (144)
- provisions 2,837 329 285 229 1,994
Include assets not comprised in NOC:
- investments in associates 293 72 2 16 203
- other current financial assets 121 − − − 121
- other non-current financial assets 1,331 − − − 1,331
- deferred tax assets 931 − − − 931
- liquid assets 3,620 − − − 3,620
Total assets 31,910 11,423 3,576 7,222 9,689
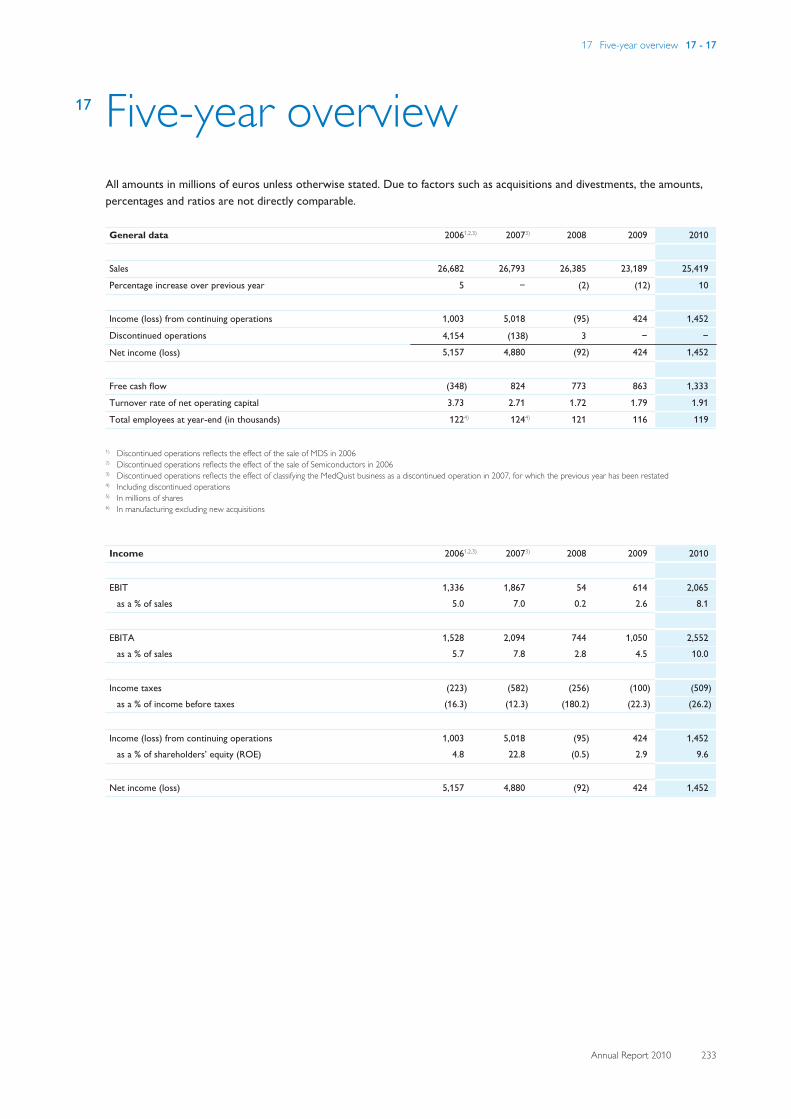
17 Five-year overview 17 - 17
Annual Report 2010 233
17 Five-year overviewAll amounts in millions of euros unless otherwise stated. Due to factors such as acquisitions and divestments, the amounts,percentages and ratios are not directly comparable.
General data 20061,2,3) 20073) 2008 2009 2010
Sales 26,682 26,793 26,385 23,189 25,419
Percentage increase over previous year 5 − (2) (12) 10
Income (loss) from continuing operations 1,003 5,018 (95) 424 1,452
Discontinued operations 4,154 (138) 3 − −
Net income (loss) 5,157 4,880 (92) 424 1,452
Free cash flow (348) 824 773 863 1,333
Turnover rate of net operating capital 3.73 2.71 1.72 1.79 1.91
Total employees at year-end (in thousands) 1224) 1244) 121 116 119
1) Discontinued operations reflects the effect of the sale of MDS in 20062) Discontinued operations reflects the effect of the sale of Semiconductors in 20063) Discontinued operations reflects the effect of classifying the MedQuist business as a discontinued operation in 2007, for which the previous year has been restated4) Including discontinued operations5) In millions of shares6) In manufacturing excluding new acquisitions
Income 20061,2,3) 20073) 2008 2009 2010
EBIT 1,336 1,867 54 614 2,065 as a % of sales 5.0 7.0 0.2 2.6 8.1
EBITA 1,528 2,094 744 1,050 2,552 as a % of sales 5.7 7.8 2.8 4.5 10.0
Income taxes (223) (582) (256) (100) (509)as a % of income before taxes (16.3) (12.3) (180.2) (22.3) (26.2)
Income (loss) from continuing operations 1,003 5,018 (95) 424 1,452 as a % of shareholders’ equity (ROE) 4.8 22.8 (0.5) 2.9 9.6
Net income (loss) 5,157 4,880 (92) 424 1,452
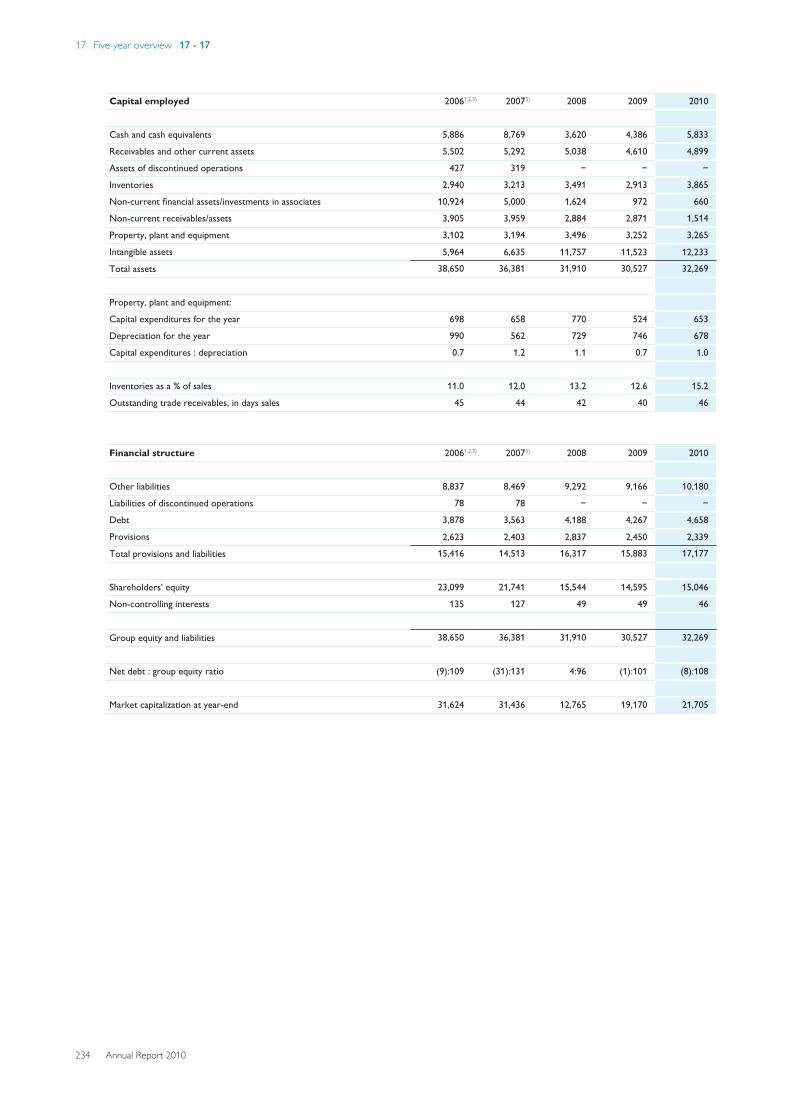
17 Five-year overview 17 - 17
234 Annual Report 2010
Capital employed 20061,2,3) 20073) 2008 2009 2010
Cash and cash equivalents 5,886 8,769 3,620 4,386 5,833
Receivables and other current assets 5,502 5,292 5,038 4,610 4,899
Assets of discontinued operations 427 319 − − −
Inventories 2,940 3,213 3,491 2,913 3,865
Non-current financial assets/investments in associates 10,924 5,000 1,624 972 660
Non-current receivables/assets 3,905 3,959 2,884 2,871 1,514
Property, plant and equipment 3,102 3,194 3,496 3,252 3,265
Intangible assets 5,964 6,635 11,757 11,523 12,233
Total assets 38,650 36,381 31,910 30,527 32,269
Property, plant and equipment:
Capital expenditures for the year 698 658 770 524 653
Depreciation for the year 990 562 729 746 678
Capital expenditures : depreciation 0.7 1.2 1.1 0.7 1.0
Inventories as a % of sales 11.0 12.0 13.2 12.6 15.2
Outstanding trade receivables, in days sales 45 44 42 40 46
Financial structure 20061,2,3) 20073) 2008 2009 2010
Other liabilities 8,837 8,469 9,292 9,166 10,180
Liabilities of discontinued operations 78 78 − − −
Debt 3,878 3,563 4,188 4,267 4,658
Provisions 2,623 2,403 2,837 2,450 2,339
Total provisions and liabilities 15,416 14,513 16,317 15,883 17,177
Shareholders’ equity 23,099 21,741 15,544 14,595 15,046
Non-controlling interests 135 127 49 49 46
Group equity and liabilities 38,650 36,381 31,910 30,527 32,269
Net debt : group equity ratio (9):109 (31):131 4:96 (1):101 (8):108
Market capitalization at year-end 31,624 31,436 12,765 19,170 21,705
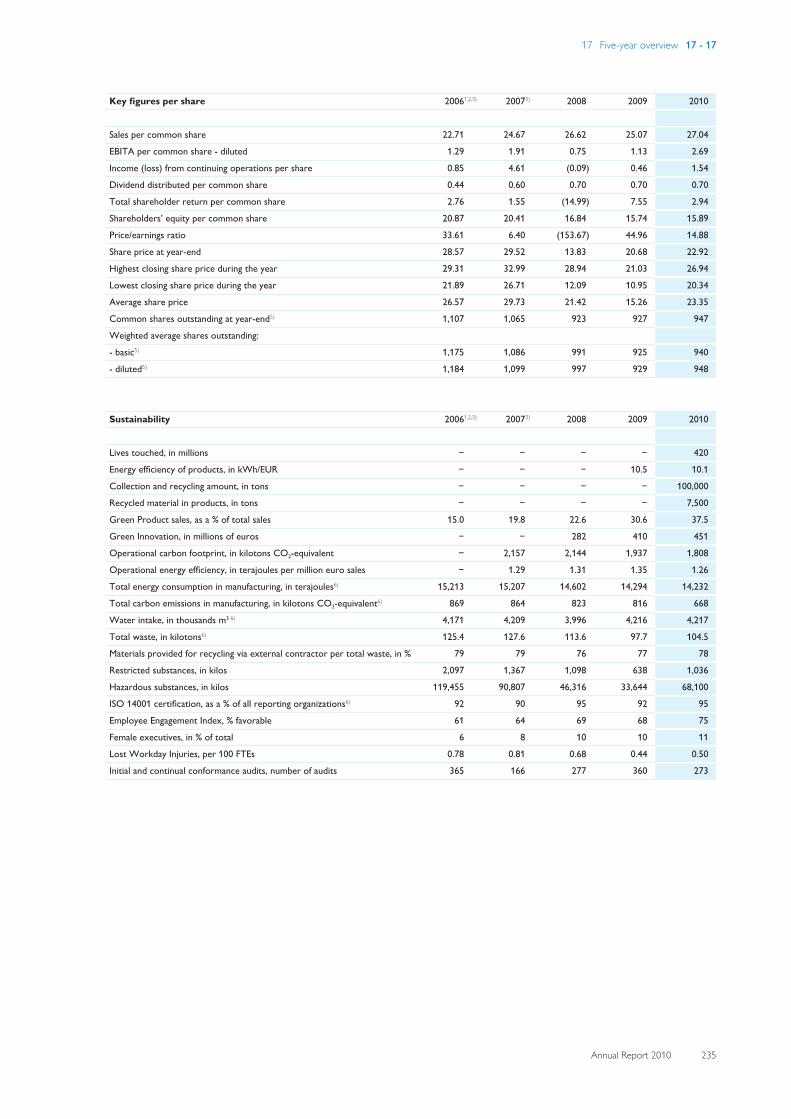
17 Five-year overview 17 - 17
Annual Report 2010 235
Key figures per share 20061,2,3) 20073) 2008 2009 2010
Sales per common share 22.71 24.67 26.62 25.07 27.04
EBITA per common share - diluted 1.29 1.91 0.75 1.13 2.69
Income (loss) from continuing operations per share 0.85 4.61 (0.09) 0.46 1.54
Dividend distributed per common share 0.44 0.60 0.70 0.70 0.70
Total shareholder return per common share 2.76 1.55 (14.99) 7.55 2.94
Shareholders’ equity per common share 20.87 20.41 16.84 15.74 15.89
Price/earnings ratio 33.61 6.40 (153.67) 44.96 14.88
Share price at year-end 28.57 29.52 13.83 20.68 22.92
Highest closing share price during the year 29.31 32.99 28.94 21.03 26.94
Lowest closing share price during the year 21.89 26.71 12.09 10.95 20.34
Average share price 26.57 29.73 21.42 15.26 23.35
Common shares outstanding at year-end5) 1,107 1,065 923 927 947
Weighted average shares outstanding:
- basic5) 1,175 1,086 991 925 940
- diluted5) 1,184 1,099 997 929 948
Sustainability 20061,2,3) 20073) 2008 2009 2010
Lives touched, in millions − − − − 420
Energy efficiency of products, in kWh/EUR − − − 10.5 10.1
Collection and recycling amount, in tons − − − − 100,000
Recycled material in products, in tons − − − − 7,500
Green Product sales, as a % of total sales 15.0 19.8 22.6 30.6 37.5
Green Innovation, in millions of euros − − 282 410 451
Operational carbon footprint, in kilotons CO2-equivalent − 2,157 2,144 1,937 1,808
Operational energy efficiency, in terajoules per million euro sales − 1.29 1.31 1.35 1.26
Total energy consumption in manufacturing, in terajoules6) 15,213 15,207 14,602 14,294 14,232
Total carbon emissions in manufacturing, in kilotons CO2-equivalent6) 869 864 823 816 668
Water intake, in thousands m3 6) 4,171 4,209 3,996 4,216 4,217
Total waste, in kilotons6) 125.4 127.6 113.6 97.7 104.5
Materials provided for recycling via external contractor per total waste, in % 79 79 76 77 78
Restricted substances, in kilos 2,097 1,367 1,098 638 1,036
Hazardous substances, in kilos 119,455 90,807 46,316 33,644 68,100
ISO 14001 certification, as a % of all reporting organizations6) 92 90 95 92 95
Employee Engagement Index, % favorable 61 64 69 68 75
Female executives, in % of total 6 8 10 10 11
Lost Workday Injuries, per 100 FTEs 0.78 0.81 0.68 0.44 0.50
Initial and continual conformance audits, number of audits 365 166 277 360 273
18 Investor Relations 18 - 18.1
236 Annual Report 2010
18 Investor RelationsThe goal of our Investor Relations department is toprovide easy access to information on Philips in atransparent, accurate and timely manner to shareholdersand bondholders, in compliance with the latestrequirements of national and international disclosureregulations. This should enable investors to makeinformed investment decisions.
18.1 The PhilipsinvestmentpropositionOur strategyPhilips is a leading company in health and well-being. Theyear 2010 was a significant year for our company. Itsignaled the completion of our Vision 2010 strategic plan,where we achieved most of our objectives. Based onthese successes, we have now built a solid platform, fromwhich we have developed our plans for the next fiveyears. Our Vision 2015 strategic plan is based on fivecritical global trends. We believe that the followinggrowth drivers:
• Accessible Healthcare: driven by population growth,aging, and higher healthcare aspirations
• Consumer focus on health and well-being: led byincreased prosperity and changing lifestyles
• Energy-efficient lighting solutions: enabled by a massiveshift from conventional to digital, dynamic lighting
• Expanding emerging markets: growing in relativeimportance in the world economy
• Sustainability: the fundamental need to reduce ourenvironmental footprint, which will enhance the drivefor energy efficiency
will enable Philips to achieve its growth and profitabilityambitions.
Our leading and focused portfolio is aligned to theseglobal trends, as evidenced by:
Our Healthcare business, which is a world leader in manyareas including cardiovascular X-ray, patient monitoringand home healthcare, which we see playing an increasinglyimportant role in the years ahead. Equally, our ConsumerLifestyle business is built on a portfolio of leadingbusinesses – including male shaving, oral healthcare, andmother and childcare. We are the world’s largest Lightingcompany with a leading position in LED lighting solutions –the future of this industry. We will continue to leverageour brand, with its promise of “sense and simplicity”, ourrich technological heritage and our advanced insight intothe needs of end-users to bring meaningful innovation toour customers.
This is solidly complemented by our long-standing, strongpresence in emerging markets, which already contribute athird of our revenues, with the target to take this figure toat least 40% by 2015.
Our financial targets Vision 2015:
• Comparable sales growth on annual average basis atleast 2 percentage points higher than real GDP growth
• Reported EBITA margin between 10% and 13% of sales,of which:- Healthcare 16-18%- Consumer Lifestyle 9-11%- Lighting 12-14%
• Growth of EPS at double the rate of comparable annualsales growth
• Return on invested capital at least 4 percentage pointsabove weighted average cost of capital
SustainabilityWe seek to make constant progress in the sustainability ofour business. A clear example of how we are drivingbusiness growth through sustainability is evidenced by theachievement of most of our EcoVision4 objectives, wellahead of schedule. Based on this we have furtherenhanced our objectives by launching our EcoVision5program.
18 Investor Relations 18.1 - 18.2
Annual Report 2010 237
Success of our EcoVision4 programTargets over the period 2007-2012
• Generate 30% of total revenues from Green Products• Double investment in Green Innovations to a
cumulative EUR 1 billion• Improve our operational energy efficiency by 25% and
reduce CO2 emissions by 25%, all compared with thebase year of 2007.
In 2009 we achieved the Green Product sales target threeyears ahead of schedule, with 31% of total sales fromGreen Products. Subsequently, we increased the target to50% in 2015. Green Product sales increased further in2010 to 38%. In 2010 our cumulative investment in GreenInnovations was over EUR 1.1 billion, two years ahead ofschedule. Our operational energy efficiency and carbonfootprint reduction are on track to reach the third targetas planned in 2012.
Launch of our EcoVision5 programIn 2010, ‘Lead in Sustainability’ became one of the keyobjectives of our Vision 2015 program, driven by thelaunch of the EcoVision5 program, comprising of thefollowing leadership KPIs:
• Bringing care to peopleTarget: 500 million lives touched by 2015
• Improving energy efficiency of Philips productsTarget: 50% improvement by 2015 (for the averagetotal product portfolio)
• Closing the materials loopTarget: Double global collection and recycling amountsand recycled materials in products by 2015 comparedto 2009
More information on the EcoVision programs can befound in section 5.4, Sustainability, of this Annual Report.
18.2 The year 2010Emerging stronger from the crisisWe finished a strong 2010 on a stable note, with growth inthe second half of the year being slower than the first half.We rebounded strongly from the economic downturncaused by the financial crisis. Within the constraints of amuch weaker economy, we successfully implemented amajor part of our Vision 2010 strategy. With that we setthe stage for a successful future as outlined by our Vision2015 strategy. Last but not least, we started to prepare fora seamless transition to a new leadership team.
For the whole year, we achieved revenues of EUR 25.4billion, a 10% increase compared to 2009. On acomparable basis, that represents growth of 4.3%. For thewhole year, we achieved an EBITA margin of 10%. Ouradjusted EBITA margin, excluding non-recurring items,was 10.5%, compared to 6.4% in 2009, significantly higherthan the target we set for ourselves as part of Vision 2010.Free cash flow, at EUR 1.3 billion, was almost EUR 500million up on 2009 driven by improvements in all sectors.Our return on invested capital (ROIC) continued thestrong recovery started in the second half of 2009 andreached 11.7% in the last quarter of 2010, which is veryclose to our Vision 2010 target of 12%, and well ahead ofour WACC of 8.1%.
We continued to make good strategic progress during2010. We kept our focus firmly on customer centricity,which resulted in a further 7% increase in the value of thePhilips brand. Our brand value, at USD 8.7 billion, hasdoubled since we launched our brand promise of “senseand simplicity” in 2004, a significant achievement. Ourfocus on becoming a leader in health and well-being is alsoresonating with our customer base, with 60% of our brandvalue being generated by our professional business. Wealso strengthened our position in emerging markets, thegrowth markets of the future. This is illustrated not onlyby the growth of our sales figures in our key emergingmarkets, i.e. China, India and Latin America, but also bythe outstanding growth in other emerging geographieslike the ASEAN countries, Ukraine, Central Europe,South Africa and the Middle East. We have acquiredcompanies all over the world to further strengthen ourportfolio, and have product propositions which arerelevant for local markets. The year 2010 saw us makingtwo acquisitions each in China and Brazil.
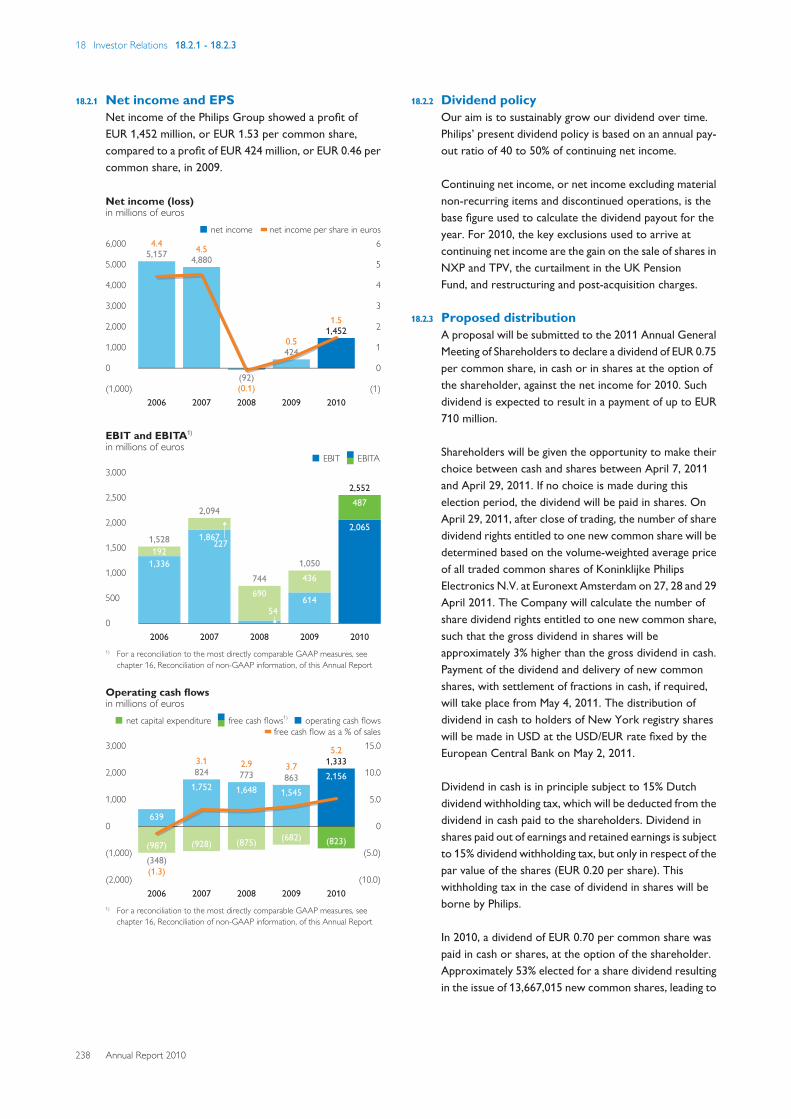
18 Investor Relations 18.2.1 - 18.2.3
238 Annual Report 2010
18.2.1 Net income and EPSNet income of the Philips Group showed a profit ofEUR 1,452 million, or EUR 1.53 per common share,compared to a profit of EUR 424 million, or EUR 0.46 percommon share, in 2009.
Net income (loss)in millions of euros
■-net income ----net income per share in euros6,000
5,000
4,000
3,000
2,000
1,000
0
(1,000)
6
5
4
3
2
1
0
(1)
4.45,157
2006
4.54,880
2007(0.1)(92)
2008
0.5424
2009
1.51,452
2010
424
EBIT and EBITA1)
in millions of euros■-EBIT--■■-EBITA
3,000
2,500
2,000
1,500
1,000
500
0
1,336192
1,528
2006
1,867227
2,094
2007
54
690744
2008
614
4361,050
2009
2,065
4872,552
20101) For a reconciliation to the most directly comparable GAAP measures, see
chapter 16, Reconciliation of non-GAAP information, of this Annual Report
Operating cash flowsin millions of euros■-net capital expenditure--■■-free cash flows1)--■-operating cash flows
--free cash flow as a % of sales3,000
2,000
1,000
0
(1,000)
(2,000)
15.0
10.0
5.0
0
(5.0)
(10.0)
639
(987)(348)(1.3)
2006
1,752
(928)
8243.1
2007
1,648
(875)
7732.9
2008
1,545
(682)
8633.7
2009
2,156
(823)
1,3335.2
20101) For a reconciliation to the most directly comparable GAAP measures, see
chapter 16, Reconciliation of non-GAAP information, of this Annual Report
18.2.2 Dividend policyOur aim is to sustainably grow our dividend over time.Philips’ present dividend policy is based on an annual pay-out ratio of 40 to 50% of continuing net income.
Continuing net income, or net income excluding materialnon-recurring items and discontinued operations, is thebase figure used to calculate the dividend payout for theyear. For 2010, the key exclusions used to arrive atcontinuing net income are the gain on the sale of shares inNXP and TPV, the curtailment in the UK PensionFund, and restructuring and post-acquisition charges.
18.2.3 Proposed distributionA proposal will be submitted to the 2011 Annual GeneralMeeting of Shareholders to declare a dividend of EUR 0.75per common share, in cash or in shares at the option ofthe shareholder, against the net income for 2010. Suchdividend is expected to result in a payment of up to EUR710 million.
Shareholders will be given the opportunity to make theirchoice between cash and shares between April 7, 2011and April 29, 2011. If no choice is made during thiselection period, the dividend will be paid in shares. OnApril 29, 2011, after close of trading, the number of sharedividend rights entitled to one new common share will bedetermined based on the volume-weighted average priceof all traded common shares of Koninklijke PhilipsElectronics N.V. at Euronext Amsterdam on 27, 28 and 29April 2011. The Company will calculate the number ofshare dividend rights entitled to one new common share,such that the gross dividend in shares will beapproximately 3% higher than the gross dividend in cash.Payment of the dividend and delivery of new commonshares, with settlement of fractions in cash, if required,will take place from May 4, 2011. The distribution ofdividend in cash to holders of New York registry shareswill be made in USD at the USD/EUR rate fixed by theEuropean Central Bank on May 2, 2011.
Dividend in cash is in principle subject to 15% Dutchdividend withholding tax, which will be deducted from thedividend in cash paid to the shareholders. Dividend inshares paid out of earnings and retained earnings is subjectto 15% dividend withholding tax, but only in respect of thepar value of the shares (EUR 0.20 per share). Thiswithholding tax in the case of dividend in shares will beborne by Philips.
In 2010, a dividend of EUR 0.70 per common share waspaid in cash or shares, at the option of the shareholder.Approximately 53% elected for a share dividend resultingin the issue of 13,667,015 new common shares, leading to
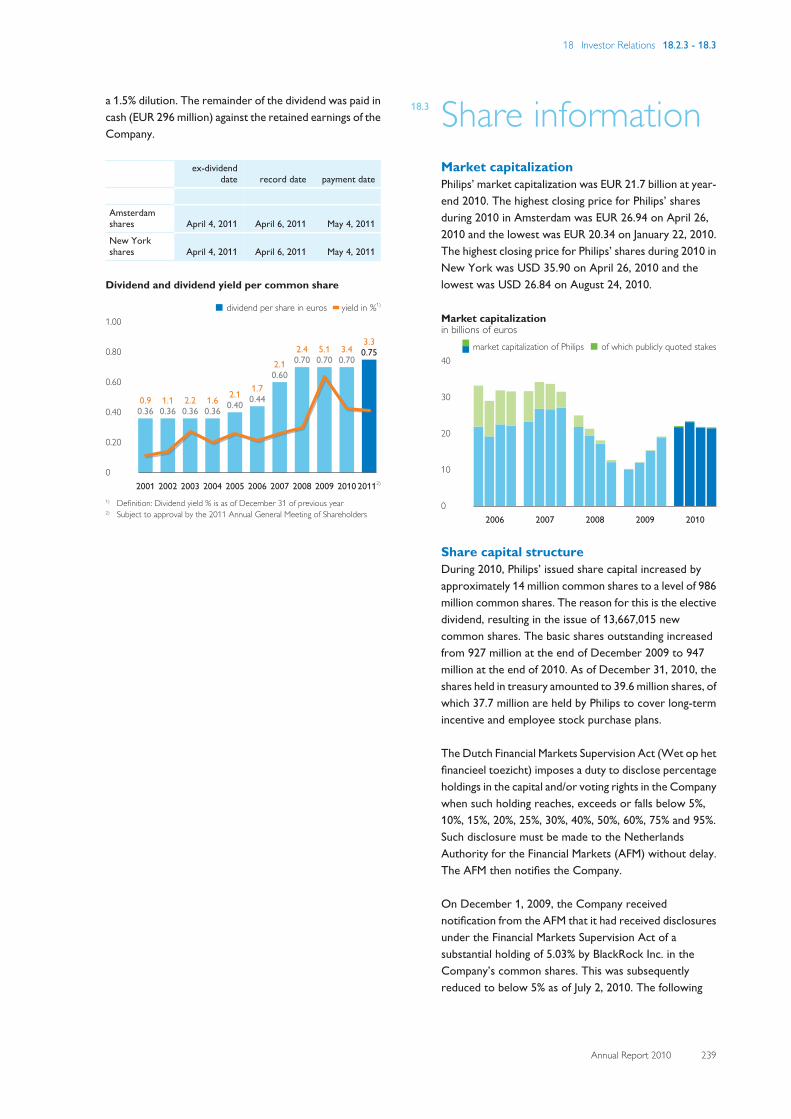
18 Investor Relations 18.2.3 - 18.3
Annual Report 2010 239
a 1.5% dilution. The remainder of the dividend was paid incash (EUR 296 million) against the retained earnings of theCompany.
ex-dividenddate record date payment date
Amsterdamshares April 4, 2011 April 6, 2011 May 4, 2011
New Yorkshares April 4, 2011 April 6, 2011 May 4, 2011
Dividend and dividend yield per common share
■-dividend per share in euros----yield in %1)
1.00
0.80
0.60
0.40
0.20
0
0.90.36
2001
1.10.36
2002
2.20.36
2003
1.60.36
2004
2.10.40
2005
1.70.44
2006
2.10.60
2007
2.40.70
2008
5.10.70
2009
3.40.70
2010
3.30.75
20112)
1) Definition: Dividend yield % is as of December 31 of previous year2) Subject to approval by the 2011 Annual General Meeting of Shareholders
18.3 Share informationMarket capitalizationPhilips’ market capitalization was EUR 21.7 billion at year-end 2010. The highest closing price for Philips’ sharesduring 2010 in Amsterdam was EUR 26.94 on April 26,2010 and the lowest was EUR 20.34 on January 22, 2010.The highest closing price for Philips’ shares during 2010 inNew York was USD 35.90 on April 26, 2010 and thelowest was USD 26.84 on August 24, 2010.
Market capitalizationin billions of euros
■■-market capitalization of Philips--■-of which publicly quoted stakes40
30
20
10
02006 2007 2008 2009 2010
Share capital structureDuring 2010, Philips’ issued share capital increased byapproximately 14 million common shares to a level of 986million common shares. The reason for this is the electivedividend, resulting in the issue of 13,667,015 newcommon shares. The basic shares outstanding increasedfrom 927 million at the end of December 2009 to 947million at the end of 2010. As of December 31, 2010, theshares held in treasury amounted to 39.6 million shares, ofwhich 37.7 million are held by Philips to cover long-termincentive and employee stock purchase plans.
The Dutch Financial Markets Supervision Act (Wet op hetfinancieel toezicht) imposes a duty to disclose percentageholdings in the capital and/or voting rights in the Companywhen such holding reaches, exceeds or falls below 5%,10%, 15%, 20%, 25%, 30%, 40%, 50%, 60%, 75% and 95%.Such disclosure must be made to the NetherlandsAuthority for the Financial Markets (AFM) without delay.The AFM then notifies the Company.
On December 1, 2009, the Company receivednotification from the AFM that it had received disclosuresunder the Financial Markets Supervision Act of asubstantial holding of 5.03% by BlackRock Inc. in theCompany’s common shares. This was subsequentlyreduced to below 5% as of July 2, 2010. The following
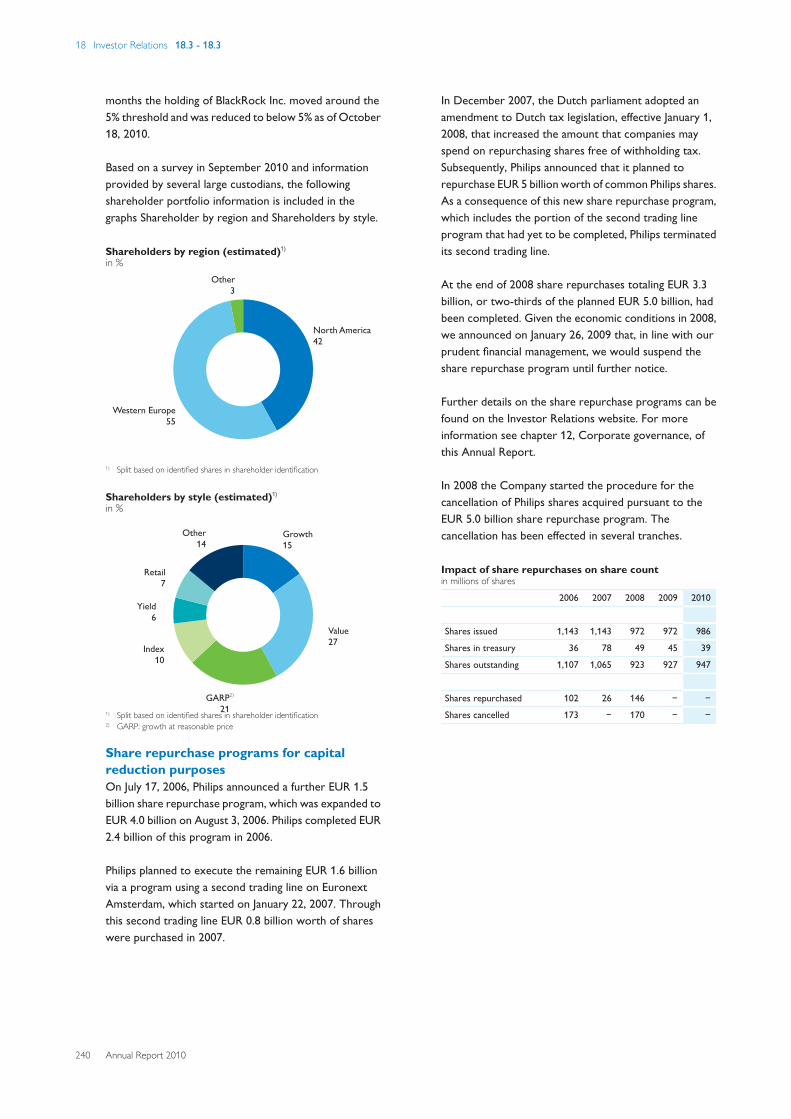
18 Investor Relations 18.3 - 18.3
240 Annual Report 2010
months the holding of BlackRock Inc. moved around the5% threshold and was reduced to below 5% as of October18, 2010.
Based on a survey in September 2010 and informationprovided by several large custodians, the followingshareholder portfolio information is included in thegraphs Shareholder by region and Shareholders by style.
Shareholders by region (estimated)1)
in %
North America42
Western Europe55
Other3
1) Split based on identified shares in shareholder identification
Shareholders by style (estimated)1)
in %
Growth15
Value27
GARP21
2)
Index10
Yield6
Retail7
Other14
1) Split based on identified shares in shareholder identification2) GARP: growth at reasonable price
Share repurchase programs for capitalreduction purposesOn July 17, 2006, Philips announced a further EUR 1.5billion share repurchase program, which was expanded toEUR 4.0 billion on August 3, 2006. Philips completed EUR2.4 billion of this program in 2006.
Philips planned to execute the remaining EUR 1.6 billionvia a program using a second trading line on EuronextAmsterdam, which started on January 22, 2007. Throughthis second trading line EUR 0.8 billion worth of shareswere purchased in 2007.
In December 2007, the Dutch parliament adopted anamendment to Dutch tax legislation, effective January 1,2008, that increased the amount that companies mayspend on repurchasing shares free of withholding tax.Subsequently, Philips announced that it planned torepurchase EUR 5 billion worth of common Philips shares.As a consequence of this new share repurchase program,which includes the portion of the second trading lineprogram that had yet to be completed, Philips terminatedits second trading line.
At the end of 2008 share repurchases totaling EUR 3.3billion, or two-thirds of the planned EUR 5.0 billion, hadbeen completed. Given the economic conditions in 2008,we announced on January 26, 2009 that, in line with ourprudent financial management, we would suspend theshare repurchase program until further notice.
Further details on the share repurchase programs can befound on the Investor Relations website. For moreinformation see chapter 12, Corporate governance, ofthis Annual Report.
In 2008 the Company started the procedure for thecancellation of Philips shares acquired pursuant to theEUR 5.0 billion share repurchase program. Thecancellation has been effected in several tranches.
Impact of share repurchases on share countin millions of shares
2006 2007 2008 2009 2010
Shares issued 1,143 1,143 972 972 986
Shares in treasury 36 78 49 45 39
Shares outstanding 1,107 1,065 923 927 947
Shares repurchased 102 26 146 − −
Shares cancelled 173 − 170 − −
18 Investor Relations 18.4 - 18.4
Annual Report 2010 241
18.4 Risk managementTaking risks is an inherent part of entrepreneurialbehavior. A structured risk management processencourages management to take risks in a controlledmanner. Philips has a structured risk management processin place that recognizes different risk categories atStrategic, Operational, Compliance and Financial level. Amore extensive explanation is published in chapter 7, Riskmanagement, of this Annual Report.
Philips’ ratingPhilips’ existing long-term debt is rated A3 (with stableoutlook) by Moody’s and A- (with stable outlook) byStandard & Poor’s. It is our objective to manage ourfinancial ratios to be in line with A3 / A-. There is noassurance that we will be able to achieve this goal andratings are subject to change at any time.
Credit rating summarylong-term
short-term outlook
Standard and Poor’s A- A-2 Stable
Moody’s A3 P-2 Stable
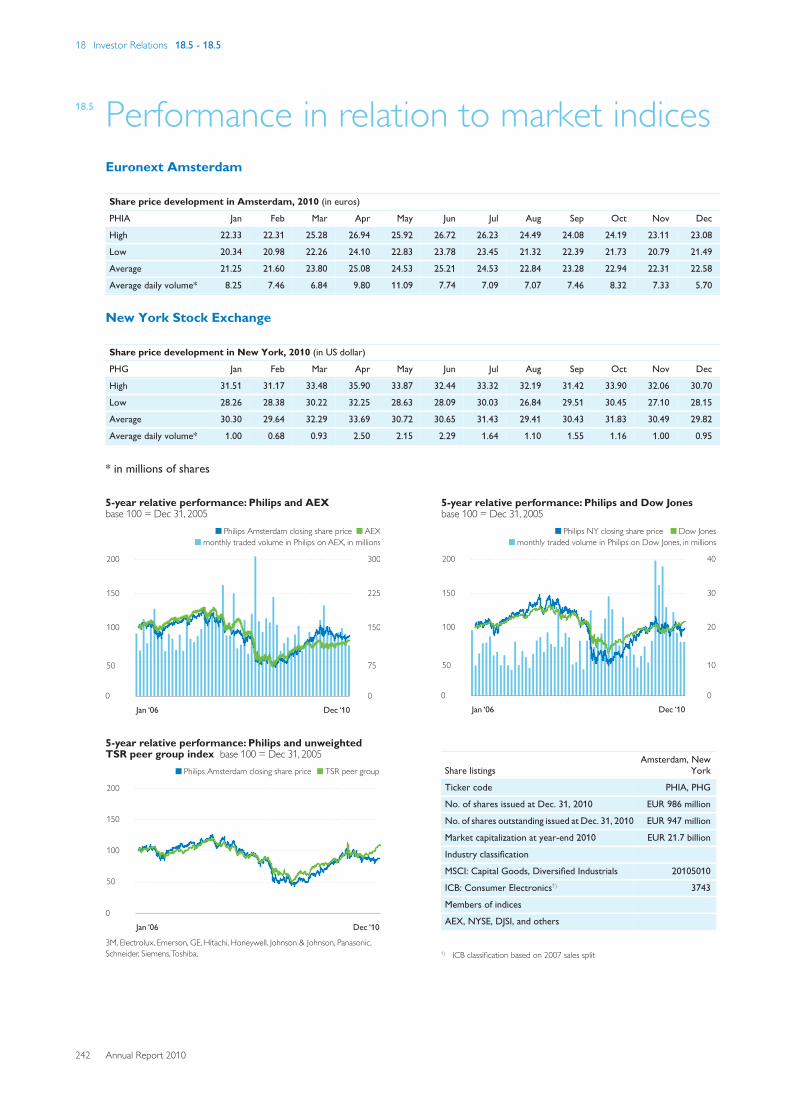
18 Investor Relations 18.5 - 18.5
242 Annual Report 2010
18.5 Performance in relation to market indicesEuronext Amsterdam
Share price development in Amsterdam, 2010 (in euros)
PHIA Jan Feb Mar Apr May Jun Jul Aug Sep Oct Nov Dec
High 22.33 22.31 25.28 26.94 25.92 26.72 26.23 24.49 24.08 24.19 23.11 23.08
Low 20.34 20.98 22.26 24.10 22.83 23.78 23.45 21.32 22.39 21.73 20.79 21.49
Average 21.25 21.60 23.80 25.08 24.53 25.21 24.53 22.84 23.28 22.94 22.31 22.58
Average daily volume* 8.25 7.46 6.84 9.80 11.09 7.74 7.09 7.07 7.46 8.32 7.33 5.70
New York Stock Exchange
Share price development in New York, 2010 (in US dollar)
PHG Jan Feb Mar Apr May Jun Jul Aug Sep Oct Nov Dec
High 31.51 31.17 33.48 35.90 33.87 32.44 33.32 32.19 31.42 33.90 32.06 30.70
Low 28.26 28.38 30.22 32.25 28.63 28.09 30.03 26.84 29.51 30.45 27.10 28.15
Average 30.30 29.64 32.29 33.69 30.72 30.65 31.43 29.41 30.43 31.83 30.49 29.82
Average daily volume* 1.00 0.68 0.93 2.50 2.15 2.29 1.64 1.10 1.55 1.16 1.00 0.95
* in millions of shares
Jan ‘06 Dec ‘10
0 0
10
30
20
40
50
150
100
200
5-year relative performance: Philips and Dow Jonesbase 100 = Dec 31, 2005
Dow JonesPhilips NY closing share price
monthly traded volume in Philips on Dow Jones, in millions
Share listingsAmsterdam, New
York
Ticker code PHIA, PHG
No. of shares issued at Dec. 31, 2010 EUR 986 million
No. of shares outstanding issued at Dec. 31, 2010 EUR 947 million
Market capitalization at year-end 2010 EUR 21.7 billion
Industry classification
MSCI: Capital Goods, Diversified Industrials 20105010
ICB: Consumer Electronics1) 3743
Members of indices
AEX, NYSE, DJSI, and others
1) ICB classification based on 2007 sales split
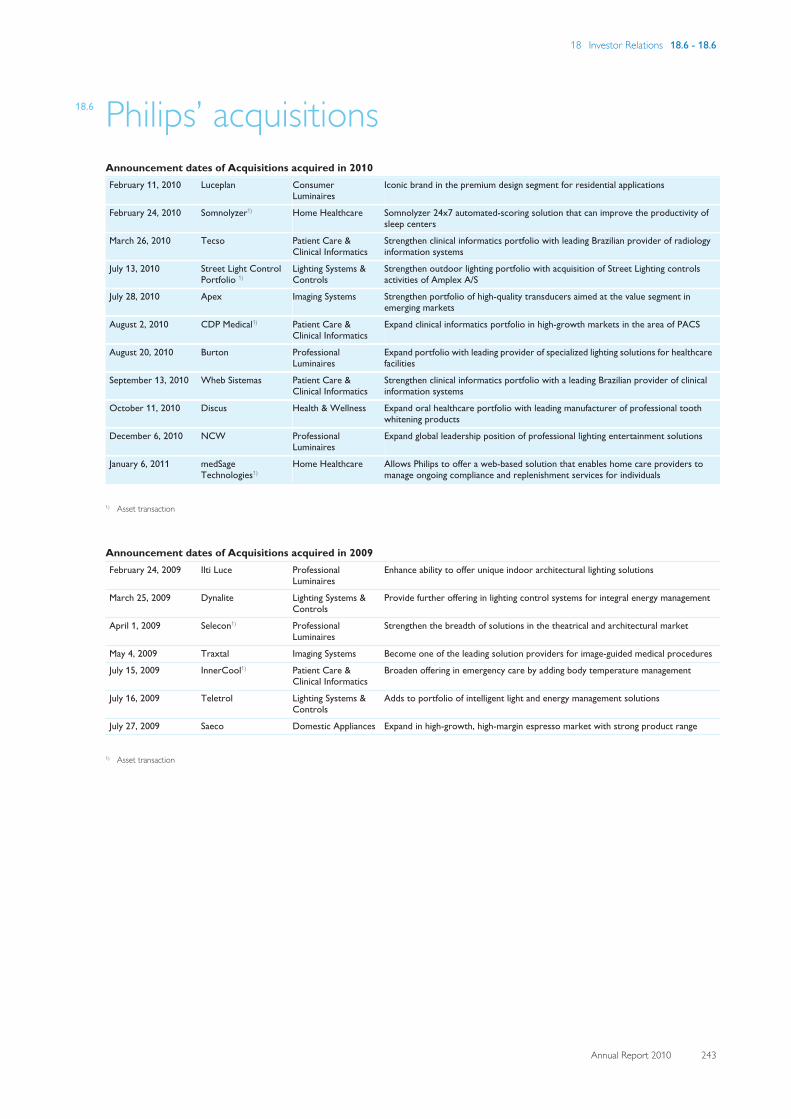
18 Investor Relations 18.6 - 18.6
Annual Report 2010 243
18.6 Philips’ acquisitionsAnnouncement dates of Acquisitions acquired in 2010February 11, 2010 Luceplan Consumer
Luminaires Iconic brand in the premium design segment for residential applications
February 24, 2010 Somnolyzer1) Home Healthcare Somnolyzer 24x7 automated-scoring solution that can improve the productivity ofsleep centers
March 26, 2010 Tecso Patient Care &Clinical Informatics
Strengthen clinical informatics portfolio with leading Brazilian provider of radiologyinformation systems
July 13, 2010 Street Light ControlPortfolio 1)
Lighting Systems &Controls
Strengthen outdoor lighting portfolio with acquisition of Street Lighting controlsactivities of Amplex A/S
July 28, 2010 Apex Imaging Systems Strengthen portfolio of high-quality transducers aimed at the value segment inemerging markets
August 2, 2010 CDP Medical1) Patient Care &Clinical Informatics
Expand clinical informatics portfolio in high-growth markets in the area of PACS
August 20, 2010 Burton ProfessionalLuminaires
Expand portfolio with leading provider of specialized lighting solutions for healthcarefacilities
September 13, 2010 Wheb Sistemas Patient Care &Clinical Informatics
Strengthen clinical informatics portfolio with a leading Brazilian provider of clinicalinformation systems
October 11, 2010 Discus Health & Wellness Expand oral healthcare portfolio with leading manufacturer of professional toothwhitening products
December 6, 2010 NCW ProfessionalLuminaires
Expand global leadership position of professional lighting entertainment solutions
January 6, 2011 medSageTechnologies1)
Home Healthcare Allows Philips to offer a web-based solution that enables home care providers tomanage ongoing compliance and replenishment services for individuals
1) Asset transaction
Announcement dates of Acquisitions acquired in 2009February 24, 2009 Ilti Luce Professional
Luminaires Enhance ability to offer unique indoor architectural lighting solutions
March 25, 2009 Dynalite Lighting Systems &Controls
Provide further offering in lighting control systems for integral energy management
April 1, 2009 Selecon1) ProfessionalLuminaires
Strengthen the breadth of solutions in the theatrical and architectural market
May 4, 2009 Traxtal Imaging Systems Become one of the leading solution providers for image-guided medical procedures
July 15, 2009 InnerCool1) Patient Care &Clinical Informatics
Broaden offering in emergency care by adding body temperature management
July 16, 2009 Teletrol Lighting Systems &Controls
Adds to portfolio of intelligent light and energy management solutions
July 27, 2009 Saeco Domestic Appliances Expand in high-growth, high-margin espresso market with strong product range
1) Asset transaction
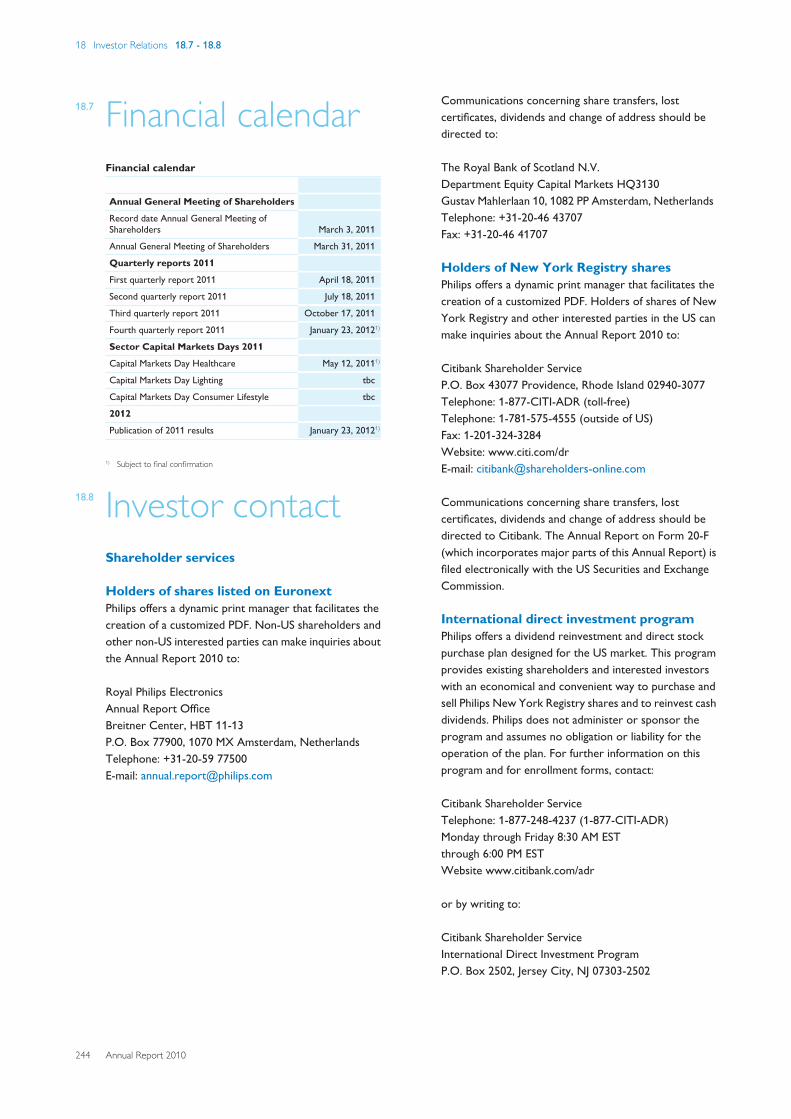
18 Investor Relations 18.7 - 18.8
244 Annual Report 2010
18.7 Financial calendarFinancial calendar
Annual General Meeting of Shareholders
Record date Annual General Meeting ofShareholders March 3, 2011
Annual General Meeting of Shareholders March 31, 2011
Quarterly reports 2011
First quarterly report 2011 April 18, 2011
Second quarterly report 2011 July 18, 2011
Third quarterly report 2011 October 17, 2011
Fourth quarterly report 2011 January 23, 20121)
Sector Capital Markets Days 2011
Capital Markets Day Healthcare May 12, 20111)
Capital Markets Day Lighting tbc
Capital Markets Day Consumer Lifestyle tbc
2012
Publication of 2011 results January 23, 20121)
1) Subject to final confirmation
18.8 Investor contactShareholder services
Holders of shares listed on EuronextPhilips offers a dynamic print manager that facilitates thecreation of a customized PDF. Non-US shareholders andother non-US interested parties can make inquiries aboutthe Annual Report 2010 to:
Royal Philips Electronics Annual Report Office Breitner Center, HBT 11-13 P.O. Box 77900, 1070 MX Amsterdam, Netherlands Telephone: +31-20-59 77500 E-mail: [email protected]
Communications concerning share transfers, lostcertificates, dividends and change of address should bedirected to:
The Royal Bank of Scotland N.V. Department Equity Capital Markets HQ3130Gustav Mahlerlaan 10, 1082 PP Amsterdam, Netherlands Telephone: +31-20-46 43707Fax: +31-20-46 41707
Holders of New York Registry sharesPhilips offers a dynamic print manager that facilitates thecreation of a customized PDF. Holders of shares of NewYork Registry and other interested parties in the US canmake inquiries about the Annual Report 2010 to:
Citibank Shareholder Service P.O. Box 43077 Providence, Rhode Island 02940-3077 Telephone: 1-877-CITI-ADR (toll-free) Telephone: 1-781-575-4555 (outside of US) Fax: 1-201-324-3284 Website: www.citi.com/drE-mail: [email protected]
Communications concerning share transfers, lostcertificates, dividends and change of address should bedirected to Citibank. The Annual Report on Form 20-F(which incorporates major parts of this Annual Report) isfiled electronically with the US Securities and ExchangeCommission.
International direct investment programPhilips offers a dividend reinvestment and direct stockpurchase plan designed for the US market. This programprovides existing shareholders and interested investorswith an economical and convenient way to purchase andsell Philips New York Registry shares and to reinvest cashdividends. Philips does not administer or sponsor theprogram and assumes no obligation or liability for theoperation of the plan. For further information on thisprogram and for enrollment forms, contact:
Citibank Shareholder Service Telephone: 1-877-248-4237 (1-877-CITI-ADR) Monday through Friday 8:30 AM EST through 6:00 PM EST Website www.citibank.com/adr
or by writing to:
Citibank Shareholder Service International Direct Investment Program P.O. Box 2502, Jersey City, NJ 07303-2502
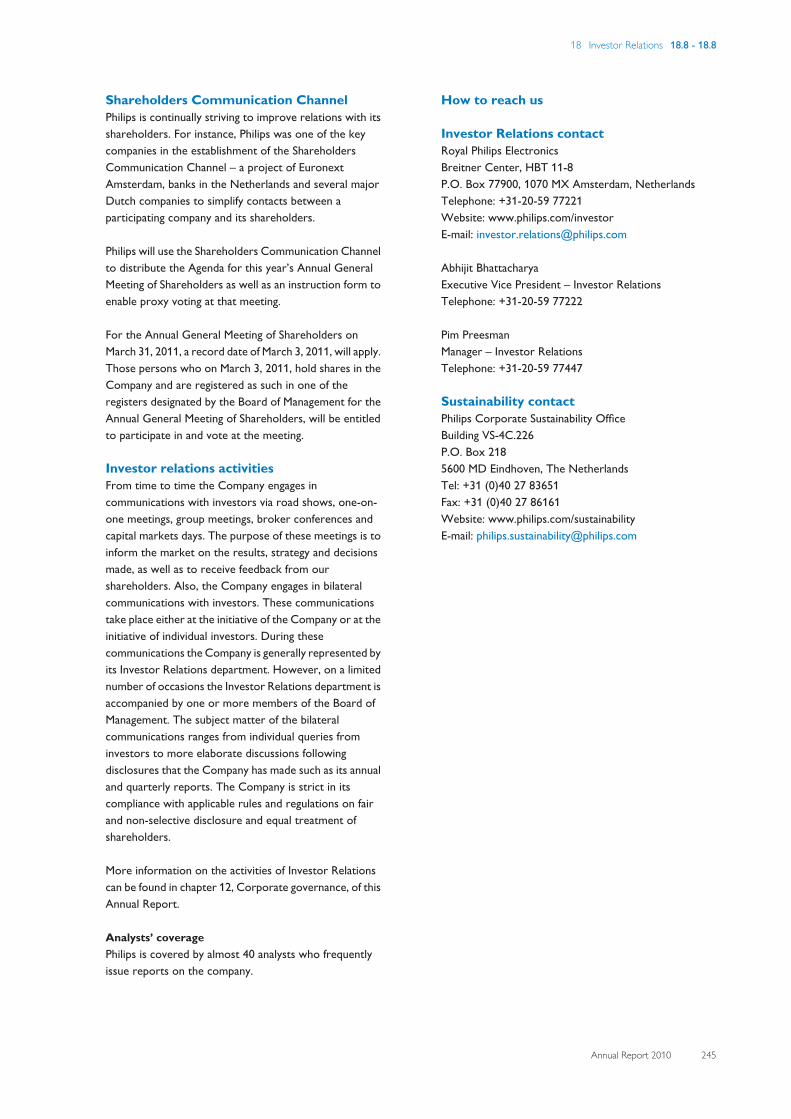
18 Investor Relations 18.8 - 18.8
Annual Report 2010 245
Shareholders Communication ChannelPhilips is continually striving to improve relations with itsshareholders. For instance, Philips was one of the keycompanies in the establishment of the ShareholdersCommunication Channel – a project of EuronextAmsterdam, banks in the Netherlands and several majorDutch companies to simplify contacts between aparticipating company and its shareholders.
Philips will use the Shareholders Communication Channelto distribute the Agenda for this year’s Annual GeneralMeeting of Shareholders as well as an instruction form toenable proxy voting at that meeting.
For the Annual General Meeting of Shareholders onMarch 31, 2011, a record date of March 3, 2011, will apply.Those persons who on March 3, 2011, hold shares in theCompany and are registered as such in one of theregisters designated by the Board of Management for theAnnual General Meeting of Shareholders, will be entitledto participate in and vote at the meeting.
Investor relations activitiesFrom time to time the Company engages incommunications with investors via road shows, one-on-one meetings, group meetings, broker conferences andcapital markets days. The purpose of these meetings is toinform the market on the results, strategy and decisionsmade, as well as to receive feedback from ourshareholders. Also, the Company engages in bilateralcommunications with investors. These communicationstake place either at the initiative of the Company or at theinitiative of individual investors. During thesecommunications the Company is generally represented byits Investor Relations department. However, on a limitednumber of occasions the Investor Relations department isaccompanied by one or more members of the Board ofManagement. The subject matter of the bilateralcommunications ranges from individual queries frominvestors to more elaborate discussions followingdisclosures that the Company has made such as its annualand quarterly reports. The Company is strict in itscompliance with applicable rules and regulations on fairand non-selective disclosure and equal treatment ofshareholders.
More information on the activities of Investor Relationscan be found in chapter 12, Corporate governance, of thisAnnual Report.
Analysts’ coveragePhilips is covered by almost 40 analysts who frequentlyissue reports on the company.
How to reach us
Investor Relations contactRoyal Philips Electronics Breitner Center, HBT 11-8 P.O. Box 77900, 1070 MX Amsterdam, Netherlands Telephone: +31-20-59 77221 Website: www.philips.com/investorE-mail: [email protected]
Abhijit Bhattacharya Executive Vice President – Investor Relations Telephone: +31-20-59 77222
Pim Preesman Manager – Investor Relations Telephone: +31-20-59 77447
Sustainability contactPhilips Corporate Sustainability Office Building VS-4C.226 P.O. Box 218 5600 MD Eindhoven, The Netherlands Tel: +31 (0)40 27 83651 Fax: +31 (0)40 27 86161 Website: www.philips.com/sustainabilityE-mail: [email protected]
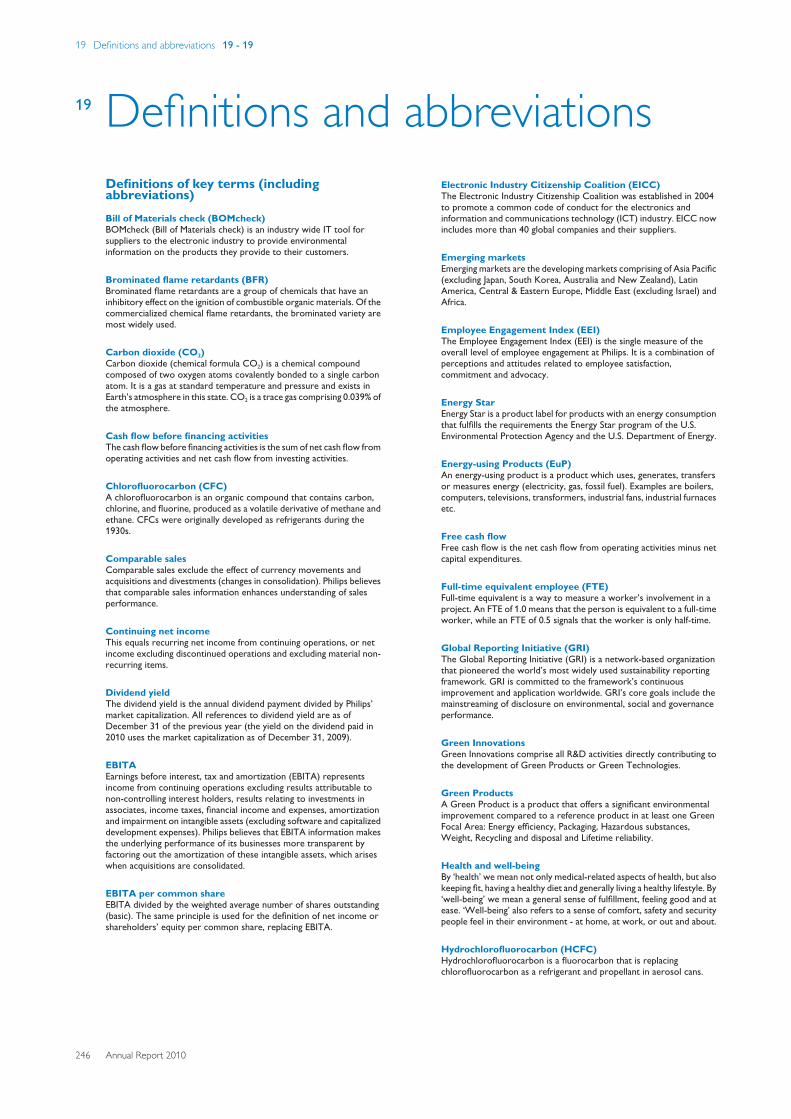
19 Definitions and abbreviations 19 - 19
246 Annual Report 2010
19 Definitions and abbreviationsDefinitions of key terms (includingabbreviations)Bill of Materials check (BOMcheck)BOMcheck (Bill of Materials check) is an industry wide IT tool forsuppliers to the electronic industry to provide environmentalinformation on the products they provide to their customers.
Brominated flame retardants (BFR)Brominated flame retardants are a group of chemicals that have aninhibitory effect on the ignition of combustible organic materials. Of thecommercialized chemical flame retardants, the brominated variety aremost widely used.
Carbon dioxide (CO2)Carbon dioxide (chemical formula CO2) is a chemical compoundcomposed of two oxygen atoms covalently bonded to a single carbonatom. It is a gas at standard temperature and pressure and exists inEarth’s atmosphere in this state. CO2 is a trace gas comprising 0.039% ofthe atmosphere.
Cash flow before financing activitiesThe cash flow before financing activities is the sum of net cash flow fromoperating activities and net cash flow from investing activities.
Chlorofluorocarbon (CFC)A chlorofluorocarbon is an organic compound that contains carbon,chlorine, and fluorine, produced as a volatile derivative of methane andethane. CFCs were originally developed as refrigerants during the1930s.
Comparable salesComparable sales exclude the effect of currency movements andacquisitions and divestments (changes in consolidation). Philips believesthat comparable sales information enhances understanding of salesperformance.
Continuing net incomeThis equals recurring net income from continuing operations, or netincome excluding discontinued operations and excluding material non-recurring items.
Dividend yieldThe dividend yield is the annual dividend payment divided by Philips’market capitalization. All references to dividend yield are as ofDecember 31 of the previous year (the yield on the dividend paid in2010 uses the market capitalization as of December 31, 2009).
EBITAEarnings before interest, tax and amortization (EBITA) representsincome from continuing operations excluding results attributable tonon-controlling interest holders, results relating to investments inassociates, income taxes, financial income and expenses, amortizationand impairment on intangible assets (excluding software and capitalizeddevelopment expenses). Philips believes that EBITA information makesthe underlying performance of its businesses more transparent byfactoring out the amortization of these intangible assets, which ariseswhen acquisitions are consolidated.
EBITA per common shareEBITA divided by the weighted average number of shares outstanding(basic). The same principle is used for the definition of net income orshareholders’ equity per common share, replacing EBITA.
Electronic Industry Citizenship Coalition (EICC)The Electronic Industry Citizenship Coalition was established in 2004to promote a common code of conduct for the electronics andinformation and communications technology (ICT) industry. EICC nowincludes more than 40 global companies and their suppliers.
Emerging marketsEmerging markets are the developing markets comprising of Asia Pacific(excluding Japan, South Korea, Australia and New Zealand), LatinAmerica, Central & Eastern Europe, Middle East (excluding Israel) andAfrica.
Employee Engagement Index (EEI)The Employee Engagement Index (EEI) is the single measure of theoverall level of employee engagement at Philips. It is a combination ofperceptions and attitudes related to employee satisfaction,commitment and advocacy.
Energy StarEnergy Star is a product label for products with an energy consumptionthat fulfills the requirements the Energy Star program of the U.S.Environmental Protection Agency and the U.S. Department of Energy.
Energy-using Products (EuP)An energy-using product is a product which uses, generates, transfersor measures energy (electricity, gas, fossil fuel). Examples are boilers,computers, televisions, transformers, industrial fans, industrial furnacesetc.
Free cash flowFree cash flow is the net cash flow from operating activities minus netcapital expenditures.
Full-time equivalent employee (FTE)Full-time equivalent is a way to measure a worker’s involvement in aproject. An FTE of 1.0 means that the person is equivalent to a full-timeworker, while an FTE of 0.5 signals that the worker is only half-time.
Global Reporting Initiative (GRI)The Global Reporting Initiative (GRI) is a network-based organizationthat pioneered the world’s most widely used sustainability reportingframework. GRI is committed to the framework’s continuousimprovement and application worldwide. GRI’s core goals include themainstreaming of disclosure on environmental, social and governanceperformance.
Green InnovationsGreen Innovations comprise all R&D activities directly contributing tothe development of Green Products or Green Technologies.
Green ProductsA Green Product is a product that offers a significant environmentalimprovement compared to a reference product in at least one GreenFocal Area: Energy efficiency, Packaging, Hazardous substances,Weight, Recycling and disposal and Lifetime reliability.
Health and well-beingBy ‘health’ we mean not only medical-related aspects of health, but alsokeeping fit, having a healthy diet and generally living a healthy lifestyle. By‘well-being’ we mean a general sense of fulfillment, feeling good and atease. ‘Well-being’ also refers to a sense of comfort, safety and securitypeople feel in their environment - at home, at work, or out and about.
Hydrochlorofluorocarbon (HCFC)Hydrochlorofluorocarbon is a fluorocarbon that is replacingchlorofluorocarbon as a refrigerant and propellant in aerosol cans.
19 Definitions and abbreviations 19 - 19
Annual Report 2010 247
Income as % of shareholders’ equity (ROE)This ratio measures income from continuing operations as percentageof average shareholders’ equity. ROE rates Philips’ overall profitabilityby evaluating how much profit the company generates with the moneyshareholders have invested.
Income from continuing operationsNet income from continuing operations, or net income excludingdiscontinued operations.
Initiatief Duurzame Handel (IDH)IDH is the Dutch Sustainable Trade Initiative. It brings togethergovernment, frontrunner companies, civil society organizations andlabor unions to accelerate and up-scale sustainable trade in mainstreamcommodity markets from the emerging countries to Western Europe.
International Standardization Organization (ISO)The International Standardization Organization (ISO)is the world’slargest developer and publisher of International Standards. ISO is anetwork of the national standards institutes of more than 160countries, one member per country, with a Central Secretariat inGeneva, Switzerland, that coordinates the system. ISO is a non-governmental organization that forms a bridge between the public andprivate sectors.
Light-Emitting Diode (LED)Light-Emitting Diode (LED), in electronics, a semiconductor device thatemits infrared or visible light when charged with an electric current.Visible LEDs are used in many electronic devices as indicator lamps, inautomobiles as rear-window and brake lights, and on billboards andsigns as alphanumeric displays or even full-color posters. Infrared LEDsare employed in autofocus cameras and television remote controls andalso as light sources in fiber-optic telecommunication systems.
Mature marketsMature markets are the highly developed markets comprising ofWestern Europe, North America, Japan, South Korea, Israel, Australiaand New Zealand.
Millennium Development Goals (MDG)Adopted by world leaders in the year 2000 and set to be achieved by2015, the Millennium Development Goals (MDGs) provide concrete,numerical benchmarks for tackling extreme poverty in its manydimensions. The MDGs also provide a framework for the entireinternational community to work together towards a common end –making sure that human development reaches everyone, everywhere.Goals include for example eradicating extreme poverty and hunger,achieving universal primary education and ensuring environmentalsustainability.
Net Promoter Score (NPS)The Net Promoter Score is a tool to measure the loyalty of Philips’customers to its products. It is measured through one question: “Basedon your experience with this product, how likely are you torecommend your Philips product to a friend, relative or colleague?”Philips categorizes the answers as ‘Promoters’, ‘Passives’ or‘Detractors’. The NPS is measured by deducting the percentage ofDetractors (score 0 to 6) from the percentage of customers who arePromoters (score 9 to 10).
Non-Governmental Organization (NGO)A non-governmental organization (NGO) is any non-profit, voluntarycitizens’ group which is organized on a local, national or internationallevel.
Operational carbon footprintA carbon footprint is the total set of greenhouse gas emissions causedby an organization, event, product or person; usually expressed inkilotons CO2-equivalent. The Philips operational carbon footprint iscalculated on a half-year basis and includes industrial sites(manufacturing and assembly sites), non-industrial sites (offices,warehouses, IT centers and R&D facilities), business travel (lease andrental cars, and airplane travel) and logistics (air, sea and roadtransport).
Organic Light-Emitting Diode (OLED)An organic light emitting diode (OLED) is a light-emitting diode (LED) inwhich the emissive electroluminescent layer is a film of organiccompounds which emit light in response to an electric current. Thislayer of organic semiconductor material is situated between twoelectrodes. Generally, at least one of these electrodes is transparent.OLEDs are used in television screens, computer monitors, small,portable system screens such as mobile phones and PDAs, watches,advertising, information and indication.
Perfluorinated compounds (PFC)A perfluorinated compound (PFC) is an organofluorine compound withall hydrogens replaced by fluorine on a carbon chain—but the moleculealso contains at least one different atom or functional group. PFCs haveunique properties to make materials stain, oil, and water resistant, andare widely used in diverse applications. PFCs persist in the environmentas persistent organic pollutants, but unlike PCBs, they are not known todegrade by any natural processes due to the strength of the carbon–fluorine bond.
Polyvinyl chloride (PVC)Polyvinyl chloride, better known as PVC or vinyl, is an inexpensiveplastic so versatile it has become completely pervasive in modernsociety. The list of products made from polyvinyl chloride is exhaustive,ranging from phonograph records to drainage and potable piping, waterbottles, cling film, credit cards and toys. More uses include windowframes, rain gutters, wall paneling, doors, wallpapers, flooring, gardenfurniture, binders and even pens.
ProductivityPhilips uses Productivity internally and as mentioned in this annualreport as a non-financial indicator of efficiency that relates the addedvalue, being income from operations adjusted for certain items such asrestructuring and acquisition-related charges etc. plus salaries andwages (including pension costs and other social security and similarcharges), depreciation of property, plant and equipment, andamortization of intangibles, to the average number of employees overthe past 12 months.
Registration, Evaluation, Authorization and Restriction ofChemical substances (REACH)REACH is the European Community Regulation on chemicals and theirsafe use (EC 1907/2006). It deals with the Registration, Evaluation,Authorisation and Restriction of Chemical substances. The law enteredinto force on June 1, 2007. The aim of REACH is to improve theprotection of human health and the environment through the betterand earlier identification of the intrinsic properties of chemicalsubstances.
Regulation on Hazardous Substances (RoHS)The RoHS Directive prevents all new electrical and electronicequipment placed on the market in the European Economic Area fromcontaining lead, mercury, cadmium, hexavalent chromium, poly-brominated biphenyls (PBB) or polybrominated diphenyl ethers(PBDE), except in certain specific applications, in concentrationsgreater than the values decided by the European Commission. Thesevalues have been established as 0.01% by weight per homogeneousmaterial for cadmium and 0.1% for the other five substances.
Waste Electrical and Electronic Equipment (WEEE)The Waste Electrical and Electronic Equipment Directive (WEEEDirective) is the European Community directive on waste electrical andelectronic equipment which became European Law in February 2003,setting collection, recycling and recovery targets for all types ofelectrical goods. The directive imposes the responsibility for thedisposal of waste electrical and electronic equipment on themanufacturers of such equipment.
20 Forward-looking statements and other information 20 - 20
248 Annual Report 2010
20 Forward-looking statements andother informationForward-looking statementsThis document contains certain forward-looking statements withrespect to the financial condition, results of operations and business ofPhilips and certain of the plans and objectives of Philips with respect tothese items, in particular section 5.6, Outlook, of this Annual Report.Examples of forward-looking statements include statements madeabout our strategy, estimates of sales growth, future EBITA and futuredevelopments in our organic business. By their nature, forward-lookingstatements involve risk and uncertainty because they relate to futureevents and circumstances and there are many factors that could causeactual results and developments to differ materially from thoseexpressed or implied by these forward-looking statements.
These factors include, but are not limited to, domestic and globaleconomic and business conditions, the successful implementation ofour strategy and our ability to realize the benefits of this strategy, ourability to develop and market new products, changes in legislation, legalclaims, changes in exchange and interest rates, changes in tax rates,pension costs and actuarial assumptions, raw materials and employeecosts, our ability to identify and complete successful acquisitions and tointegrate those acquisitions into our business, our ability to successfullyexit certain businesses or restructure our operations, the rate oftechnological changes, political, economic and other developments incountries where Philips operates, industry consolidation andcompetition. As a result, Philips’ actual future results may differmaterially from the plans, goals and expectations set forth in suchforward-looking statements. For a discussion of factors that could causefuture results to differ from such forward-looking statements, see alsochapter 7, Risk management, of this Annual Report.
Third-party market share dataStatements regarding market share, contained in this document,including those regarding Philips’ competitive position, are based onoutside sources such as specialized research institutes, industry anddealer panels in combination with management estimates. Where full-year information regarding 2010 is not yet available to Philips, thosestatements may also be based on estimates and projections prepared byoutside sources or management. Rankings are based on sales unlessotherwise stated.
Fair value informationIn presenting the Philips Group’s financial position, fair values are usedfor the measurement of various items in accordance with the applicableaccounting standards. These fair values are based on market prices,where available, and are obtained from sources that are deemed to bereliable. Readers are cautioned that these values are subject to changesover time and are only valid at the balance sheet date. When quotedprices or observable market values do not exist, fair values areestimated using valuation models, which we believe are appropriate fortheir purpose. They require management to make significantassumptions with respect to future developments which are inherentlyuncertain and may therefore deviate from actual developments. Criticalassumptions used are disclosed in the financial statements. In certaincases, independent valuations are obtained to support management’sdetermination of fair values.
IFRS basis of presentationThe financial information included in this document is based on IFRS,unless otherwise indicated. As used in this document, the term EBIT hasthe same meaning as Income from operations (IFO).
Use of non-GAAP informationIn presenting and discussing the Philips Group’s financial position,operating results and cash flows, management uses certain non-GAAPfinancial measures like: comparable growth; EBITA; NOC; net debt(cash); free cash flow; and cash flow before financing activities. Thesenon-GAAP financial measures should not be viewed in isolation asalternatives to the equivalent GAAP measures.
Further information on non-GAAP information and a reconciliation ofsuch measures to the most directly comparable GAAP measures can befound in chapter 16, Reconciliation of non-GAAP information, of thisAnnual Report.
Statutory financial statements and management reportThe chapters Group financial statements and Company financialstatements contain the statutory financial statements of the Company.The introduction to the chapter Group financial statements sets outwhich parts of this Annual Report form the management report withinthe meaning of Section 2:391 of the Dutch Civil Code (and relatedDecrees).
Analysis of 2009 compared to 2008The analysis of the 2009 financial results compared to 2008, and thediscussion of the critical accounting policies, have not been included inthis Annual Report. These sections are included in Philips’ Form 20-Ffor the financial year 2010, which will be filed electronically with the USSecurities and Exchange Commission.


www.philips.com/annualreport2010© 2011 Koninklijke Philips Electronics N.V.All rights reserved.