
Annual Report 2008 regarding its actions and the securities ...
344
Annual Report 2008 regarding its actions and the securities markets
-
Upload
khangminh22 -
Category
Documents
-
view
1 -
download
0
Transcript of Annual Report 2008 regarding its actions and the securities ...

Annual Report 2008regarding its actions and the securities markets
Ann
ual R
epor
t 200
7 re
gard
ing
its a
ctio
ns a
nd th
e se
curit
ies
mar
kets
CN
MV
cubierta.indd 1cubierta.indd 1 15/7/08 10:47:4215/7/08 10:47:42

00_Primeras_INGLES.qxd 24/7/09 18:47 Página 1

CNMV Annual Report regardingits actions and the securities markets.2008
00_Primeras_INGLES.qxd 24/7/09 18:47 Página 3

Comisión Nacional del Mercado de Valores
Serrano, 47
28001 Madrid
Passeig de Grácia, 19
08007 Barcelona
© Comisión Nacional del Mercado de Valores
The contents of this publication may be reproduced with attribution.
The CNMV distributes its reports and publications via the internet at www.cnmv.es.
Design: CROMOTEX
ISSN: 1989-5674
Translation: Versalia Traducción, S.L.
00_Creditos_INGLES web.qxd 24/7/09 19:20 Página 4

Abbreviations
ABS Asset Backed Securities
AIAF Asociación de Intermediarios de Activos Financieros (Spanish market in fixed-incomesecurities)
ANCV Agencia Nacional de Codificación de Valores (Spain’s national numbering agency)
ASCRI Asociación española de entidades de capital-riesgo (Association of Spanish venture capitalfirms)
AV Agencia de valores (broker)
AVB Agencia de valores y bolsa (broker and market member)
BME Bolsas y Mercados Españoles (operator of all stock markets and financial systems in Spain)
BTA Bono de titulización de activos (asset-backed bond)
BTH Bono de titulización hipotecaria (mortgage-backed bond)
CADE Central de Anotaciones de Deuda del Estado (public debt book-entry trading system)
CDS Credit Default Swap
CEBS Committee of European Banking Supervisors
CEIOPS Committee of European Insurance and Occupational Pensions Supervisors
CESFI Comité de Estabilidad Financiera (Spanish government committee for financial stability)
CESR Committee of European Securities Regulators
CMVM Comissão do Mercado de Valores Mobiliários (Portugal’s National Securities MarketCommission)
CNMV Comisión Nacional del Mercado de Valores (Spain’s National Securities Market Commission)
CSD Central Securities Depository
EAFI Empresa de Asesoramiento Financiero (financial advisory firm)
EC European Commission
ECB European Central Bank
ECLAC Economic Commission for Latin America and the Caribbean
ECR Entidad de capital-riesgo (venture capital firm)
EMU Economic and Monetary Union (euro area)
ETF Exchange traded fund
EU European Union
FI Fondo de inversión de carácter financiero (mutual fund)
FIAMM Fondo de inversión en activos del mercado monetario (money-market fund)
FII Fondo de Inversión Inmobiliaria (real estate investment fund)
FIICIL Fondo de instituciones de inversión colectiva de inversión libre (fund of hedge funds)
FIL Fondo de inversión libre (hedge fund)
FIM Fondo de inversión mobiliaria (securities investment fund)
FTA Fondo de titulización de activos (asset securitisation trust)
FTH Fondo de titulización hipotecaria (mortgage securitisation trust)
IAASB International Auditing and Assurance Standards Board
IAS International Accounting Standards
IASB International Accounting Standards Board
IFRS International Financial Reporting Standards
IIC Institución de inversión colectiva (UCITS)
IICIL Institución de inversión colectiva de inversión libre (hedge fund)
IIMV Instituto Iberoamericano del Mercado De Valores
IOSCO International Organization of Securities Commissions
ISIN International Securities Identification Number
LATIBEX Market in Latin American securities, based in Madrid
MAB Mercado Alternativo Bursátil (alternative stock market)
MEFF Spanish financial futures and options market 5
00_Primeras_INGLES.qxd 24/7/09 18:47 Página 5

MFAO Mercado de Futuros del Aceite de Oliva (olive oil futures market)
MIBEL Mercado Ibérico de Electricidad (Iberian electricity market)
MiFID Markets in Financial Instruments Directive
MMU CNMV Market Monitoring Unit
MoU Memorandum of Understanding
OECD Organisation for Economic Co-operation and Development
OICVM Organismo de inversión colectiva en valores mobiliarios (UCITS)
OMIP Operator of the Iberian energy derivatives market (Operador do Mercado Ibérico de Energía)
P/E Price/earnings ratio
RENADE Registro Nacional de los Derechos de Emisión de Gases de Efectos Invernadero (Spain’snational register of greenhouse gas emission permits)
ROE Return on Equity
SCLV Servicio de Compensación y Liquidación de Valores (Spain’s securities clearing andsettlement system)
SCR Sociedad de capital-riesgo (Venture capital company)
SENAF Sistema Electrónico de Negociación de Activos Financieros (electronic trading platform inSpanish government bonds)
SEPBLAC Servicio Ejecutivo de la Comisión de Prevención del Blanqueo de Capitales e infraccionesmonetarias (Bank of Spain unit to combat money laundering)
SGC Sociedad Gestora de Carteras (portfolio management company)
SGECR Sociedad gestora de entidades de capital-riesgo (venture capital firm managementcompany)
SGFT Sociedad Gestora de Fondo de Titulización (asset securitisation trust management company)
SGIIC Sociedad gestora de instituciones de inversión colectiva (UCITS management company)
SIBE Sistema de Interconexión Bursátil Español (Spain’s electronic market in securities)
SICAV Sociedad de Inversión de Carácter Financiero (open-end investment company)
SII Sociedad de Inversión Inmobiliaria (real estate investment company)
SIL Sociedad de Inversión Libre (hedge fund in the form of a company)
SIM Sociedad de Inversión Mobiliaria (securities investment company)
SME Small and medium-sized enterprise
SON Sistema Organizado de Negociación (multilateral trading facility)
SV Sociedad de Valores (broker-dealer)
SVB Sociedad de Valores y Bolsa (broker-dealer and market member)
TER Total expense ratio
UCITS Undertaking for Collective Investment in Tradable Securities
6
00_Primeras_INGLES.qxd 24/7/09 18:47 Página 6

General table of contents
Abbreviations 5
Index of boxes 11
Index of tables 13
Index of figures 15
Index of annexes 17
I Economic and financial situation 19
1 Economic and financial situation 21
1.1 International economic and financial situation 22
1.1.1 The world economy 22
1.1.2 The international financial markets 29
1.2 The economic and financial situation in Spain 36
1.3 Economic and financial outlook 48
II Markets and issuers 51
2 Equity markets 53
2.1 Market size 53
2.1.1 Market capitalisation 53
2.1.2 Listed companies 56
2.2 Listings, issues and public offerings 56
2.3 Trading 58
2.3.1 Spot trading 58
2.3.2 Margin trading and securities lending 61
2.4 Takeover bids 61
2.5 Multilateral trading facilities 64
2.5.1 Latibex 64
2.5.2 The Alternative Stock Market 64
2.6 Exchange-traded funds 65
3 Fixed-income markets 67
3.1 Public debt 68
3.1.1 Primary market 68
3.1.2 Secondary market 68
3.2 Private fixed-income 71
3.2.1 Primary market 71
3.2.2 Secondary market 73
4 Registry, counterparties, clearing and settlement 77
4.1 Iberclear 77
4.1.1 Iberclear - CADE 78
4.1.2 Iberclear - SCLV 79 7
00_Primeras_INGLES.qxd 24/7/09 18:47 Página 7

4.1.3 European integration initiatives 80
4.1.4 Technical enhancements 81
4.2 MeffClear 82
5 Derivatives markets 83
5.1 MEFF 84
5.1.1 New developments in MEFF 87
5.1.2 MEFF and the electricity market 87
5.2 Warrants and certificates 87
5.2.1 Issues 87
5.2.2 Trading 88
5.3 Other financial contracts 90
5.4 Olive Oil Futures Market (MFAO) 90
III Financial institutions and investment services 91
6 Collective investment (UCITS) 93
6.1 Mutual funds 94
6.2 Investment companies 99
6.3 Foreign UCITS marketed in Spain 99
6.4 UCITS management companies 102
6.5 UCITS depositories 104
7 Provision of investment services 105
7.1 Credit institutions 106
7.1.1 Authorisation and registration 106
7.1.2 Securities business at credit institutions 106
7.2 Broker-dealers and brokers 108
7.2.1 The industry’s profitability and solvency 109
7.2.2 Broker-dealers 112
7.2.3 Brokers 114
7.3 Portfolio management companies 116
8 Venture capital firms 119
8.1 Venture capital firms registered with the CNMV 119
8.2 Sector data 120
IV Regulation and supervision of the securities markets 121
9 Issuers’ financial and corporate governance disclosures 123
9.1 Financial disclosures 123
9.1.1 Auditors’ reports and financial statements 123
9.1.2 Half-yearly and quarterly reports 129
9.1.3 New regulation 130
9.2 Information about ownership structure 134
9.2.1 Communiqués filed with the official registers of the CNMV in 2008 134
9.2.2 Delays in filing communiqués, and actions taken 138
9.3 Corporate governance 139
9.3.1 Main aspects of listed companies’ governance structures 139
9.3.2 Constitution and composition of the audit committee 145
9.3.3 Companies’ internal regulations 145
9.4 Regulatory disclosures and other communiqués filed with the CNMV 147
10 Market supervision 149
10.1 Salient actions by the CNMV in the various markets 149
10.1.1 Equities 149
10.1.2 Fixed-income 153
10.1.3 Derivatives 154
10.1.4 Registry, counterparties, clearing and settlement 1558
00_Primeras_INGLES.qxd 24/7/09 18:47 Página 8

10.2 Market Monitoring Unit 156
10.3 Supervision of takeover bids 158
11 Supervision of entities 161
11.1 Supervision of codes of conduct in the provision of financial services 165
11.1.1 MiFID’s first year 165
11.1.2 Supervision of codes of conduct in the provision of financial services 167
11.2 Prudential supervision of investment firms 170
11.3 Supervision of UCITS 175
11.3.1 Supervision of prudential requirements regarding UCITS and their operators 177
11.3.2 Specific analyses 177
11.3.3 Investor information 182
11.3.4 Supervision of hedge fund operators and of funds of hedge funds 182
11.3.5 Supervision of UCITS depositories 182
11.3.6 Supervision of real estate UCITS 183
11.4 Supervision of venture capital firms 186
11.5 Supervision of securitisation trust management companies 186
11.6 Assistance in the prevention of money laundering 186
12 Investor assistance 187
12.1 Investor Assistance Office 187
12.1.1 Queries 188
12.1.2 Claims 192
12.1.3 Accusations 198
12.2 Investor education and information 198
12.2.1 Financial Education Plan 199
12.2.2 Investor’s Corner 200
12.2.3 New services of the IAO 200
12.2.4 Educational activities 201
12.2.5 International cooperation 204
12.3 Advertising of investment products and services 205
12.4 General Investment Guarantee Fund 206
13 Disciplinary action 209
13.1 Disciplinary proceedings 209
13.1.1 Statistics 209
13.1.2 Public register of penalties for serious and very serious violations 211
13.1.3 Criteria of interest 212
13.2 Litigation Department: judicial review of disciplinary proceedings and other actions 215
13.3 Warnings about unregistered firms 216
14 International activities 217
14.1 Introduction 217
14.2 Committee of European Securities Regulators (CESR) 218
14.3 International Organization of Securities Commissions (IOSCO) 222
14.4 International inter-sectoral forums 225
14.5 Instituto Iberoamericano del Mercado de Valores (IIMV) 227
14.6 Other forums and activities 227
V CNMV: organisation, finance and institutional aspects 233
15 Organisation 235
15.1 Human resources 235
15.2 Information systems 236
16 Finances 241
16.1 Revenues and expenses 241
16.2 Fee structure 241
17 National Securities Numbering Agency (ANCV) 243 9
00_Primeras_INGLES.qxd 24/7/09 18:47 Página 9

18 CNMV Advisory Committee 245
18.1 Introduction 245
18.2 Actions by the Committee in 2008 246
VI Report by the Internal Control Body 253
VII Financial statements of the CNMV 259
Annexes 267
Statistical annexes 269
Statistical annexes I 269
Statistical annexes II 273
Statistical Annexes III 295
Statistical annexes IV 305
Legislative annexes 321
CNMV Organisation 339
10
00_Primeras_INGLES.qxd 24/7/09 18:47 Página 10
Index of boxes
Measures to support the financial sector (Financial Asset Acquisition Fund and guarantees): role of the CNMV 42
International debate about the financial crisis and accounting standards 132
Short selling: measures implemented in Spain and other countries 152
CNMV criteria on the reporting of suspicious transactions 157
CNMV recommendations on rumours concerning securities 157
Impact of the Lehman and Madoff cases 163
The importance of internal control of client transactions in some products (OTC, CFDs, etc.) 172
Valuation and liquidity of fixed-income assets 178
Circular on UCITS categories by investment profile 180
Administrative procedures linked to situations of illiquidity. CNMV recommendations 183
Financial education in schools 199
International responses to the financial crisis 228
CNMV Activities Plan 2009: revision and update 237
CNMV 20th Anniversary 238
11
00_Primeras_INGLES.qxd 24/7/09 18:47 Página 11

00_Primeras_INGLES.qxd 24/7/09 18:47 Página 12

Index of tables
1.1 Equity markets: indices and returns 35
1.2 Spain’s economic indicators 37
1.3 Financial liabilities acquired by non-financial companies 38
1.4 Net financial assets acquired by households 39
1.5 Net financial assets acquired by the non-resident sector 41
1.6 Yields of the Spanish market’s equity indices (%) 46
1.7 Shareholder remuneration 47
2.1 Market capitalisation in Spanish stock markets 54
2.2 No. of listed companies and capitalisation by sector 54
2.3 Concentration of equity market capitalisation 55
2.4 Market capitalisation and trading as a percentage of nominal GDP 55
2.5 Number of companies listed on the Spanish stock exchanges 56
2.6 Primary and and secondary public offerings 57
2.7 Primary and and secondary public offerings: cash amount 57
2.8 Equity trading in Spanish stock markets 59
2.9 Trading on the electronic market by type 59
2.10 Concentration of equities trading on Spanish stock markets 60
2.11 Securities lending (crédito and préstamo systems) 60
2.12 Margin trading 61
2.13 Takeover bids 62
2.14 Companies listed on Latibex, by country 64
3.1 Gross issues and outstanding balances: breakdown by issuer 67
3.2 Trading in Central Government debt. Overall market. 69
3.3 Gross issues registered at the CNMV: detail by instrument 71
3.4 Gross private fixed-income issued by Spanish issuers in other countries 73
3.5 Issuers, issues and outstanding balances of fixed-income on AIAF 74
3.6 Issuers, issues and outstanding balances of fixed-income in the stock markets 74
3.7 Total trading on AIAF 75
3.8 Fixed-income trading on the stock exchanges 75
4.1 Iberclear members 78
4.2 Iberclear- CADE. Registry 78
4.3 Iberclear- CADE. Number of settled trades 79
4.4 Iberclear- CADE. Amount of settled trades 79
4.5 Iberclear- SCLV. Registry 79
4.6 Iberclear- SCLV. Trades settled 80
4.7 Activity in MeffClear 82
5.1 Trading on Spain’s derivatives markets 83
5.2 Trading on Europe’s derivatives markets 84
5.3 Trading in individual stock futures and options on MEFF RV 85
5.4 MEFF membership figures 86
5.5 Warrant issues registered with the CNMV 88
5.6 Certificate issues registered with the CNMV 88
5.7 Trading in warrants on the electronic market 89
5.8 Trading in certificates on the electronic market 89
5.9 Issues of call and put option contracts registered with the CNMV 90
5.10 MFAO membership figures 90
6.1 Securities mutual fund asset breakdown 96
6.2 Registrations and removals in 2008 98
6.3 Significant shareholdings held by UCITS management companies 98 13
00_Primeras_INGLES.qxd 24/7/09 18:47 Página 13

6.4 Investment company asset breakdown 100
6.5 Foreign UCITS marketed in Spain 100
6.6 The top 10 marketers of foreign UCITS in Spain 101
6.7 UCITS management companies. Number of companies and assets managed or under advice 102
6.8 UCITS management companies: profit and loss account 103
6.9 Income before taxes, ROE and the No. of loss-making firms 103
7.1 Credit institutions’ revenues from the provision of securities services and marketingnon-bank financial products 107
7.2 Investment services commission revenues. 2008 107
7.3 Securities deposited at credit institutions at 31 December 108
7.4 Registrations and removals in the register of firms 109
7.5 Loss-making firms: number and amount 111
7.6 Broker-dealers: income statement 113
7.7 Brokers: income statement 115
7.8 Assets managed by portfolio management companies 116
7.9 Portfolio management companies: income statement 117
8.1 Registration and removal of venture capital firms in 2008 119
9.1 Audits of issuers filed with the CNMV 125
9.2 Voting rights of significant shareholders: number of notifications received 135
9.3 Directors’ voting rights: number of notifications received 136
9.4 Own shares: number of communiqués and issuers 137
9.5 Own shares: number of issuers that presented disclosures, by final position 137
9.6 Related-party transactions by listed companies 141
9.7 Recommendations to which subpoenas referred and number of companies affected 143
9.8 Binding definition of independent director 145
9.9 Regulatory disclosures and other communiqués received by the CNMV 147
10.1 Summary of supervisory activity. 2008 149
10.2 Trading halts 150
10.3 Short positions in financial sector securities at 30 December 2008 152
10.4 Market Monitoring Unit’s actions 156
11.1 Summary of incidents detected at entities that provide investment services 162
11.2 Outcome of supervising codes of conduct 167
11.3 Supervision of investment firms: CNMV subpoenas in 2008 171
11.4 Surplus equity over solvency coefficient at investment firms 171
11.5 Supervision of UCITS: CNMV subpoenas in 2008 176
12.1 Total number of issues handled by the IAO 188
12.2 Breakdown of queries by channel 189
12.3 Documents of interest to investors 192
12.4 Outcome of complaints 193
12.5 Class of firm against which claims were made and type of outcome in 2008 194
12.6 Breakdown of issues in claims resolved in 2008 196
12.7 Accusations made in 2008 198
12.8 Investor factsheets and guides 201
12.9 Investor factsheets and guides: number of cooperation agreements and copies distributed 202
12.10 Number of advertising campaigns reviewed by the CNMV 205
12.11 Number of FOGAIN member firms 206
13.1 Proceedings initiated and completed in 2008 210
13.2 Violations addressed in disciplinary proceedings 210
13.3 Penalties imposed 210
13.4 Number of each type of violation pursued 211
13.5 Cases in which the CNMV participated in 2008 216
14.1 Attendance at international meetings and technical assistance 218
14.2 CESR: groups and subgroups 230
14.3 IOSCO: groups and subgroups 231
15.1 CNMV staff: composition by professional category 235
15.2 Breakdown of CNMV staff by division 235
15.3 Breakdown of CNMV staff by division (projection) 236
16.1 CNMV fee revenues 242
17.1 Number of securities and other financial instruments with an ISIN 244
17.2 Queries handled directly by the ANCV 244
18.1 Types of issues referred to the Advisory Committee 246
18.2 List of Advisory Committee actions in 2008 24714
00_Primeras_INGLES.qxd 24/7/09 18:47 Página 14

Index of figures
1.1 Economic sentiment 23
1.2 Annual GDP growth rates 24
1.3 Commodity price indices 25
1.4 Year-on-year change in consumer prices 26
1.5 Central bank base rates 26
1.6 Euro exchange rate vs. the dollar and yen 27
1.7 Short-term interest rates 30
1.8 Long-term bond yields 30
1.9 Private bond yield gap (BBB-AAA) 31
1.10 Corporate bonds: risk premium 32
1.11 Financial sector: risk premium 32
1.12 Analysts’ projections: number of companies for which projections were upgraded less number of companies downgraded (% of the total number of companies) 33
1.13 Performance by the world’s main stock indexes 33
1.14 Equity market volatility 34
1.15 International sector equity indices 35
1.16 Derivatives: national value of open interest 36
1.17 Financial assets held by households 40
1.18 Surplus (+)/borrowing(-) by the Spanish economy (% of PIB) 41
1.19 Financial assets held by non-residents 42
1.20 Yield on Spanish long-term government debt 44
1.21 Risk premium of Spanish issuers 45
1.22 Ibex 35 performance and implied volatility 46
1.23 Madrid Stock Exchange sector yields (%) 47
1.24 Dividends paid by Ibex 35 companies 48
1.25 Spain’s housing market. Production and prices 49
2.1 Liquidity - electronic market 58
2.2 FTSE Latibex All Share index performance 63
3.1 5Y CDS premiums of sovereign debt 70
3.2 Yield on Spanish medium- and long-term government debt 70
3.3 Asset- and mortgage-backed securities registered at the CNMV 72
3.4 Yields on three-month commercial paper, interbank deposits and repos. 76
3.5 Yield gap between private and public debt 76
6.1 Mutual fund assets in Spain and Europe 94
6.2 Financial mutual funds: breakdown of assets and yields by profile 95
6.3 Assets of foreign UCITS marketed in Spain 101
6.4 Histogram of pre-tax ROE at UCITS management companies 104
7.1 ROE before taxes of broker-dealers and brokers 110
7.2 Histogram of ROE before taxes at broker-dealers and brokers 110
7.3 Surplus equity over minimum requirements of independent brokers and broker-dealers 111
7.4 Broker-dealers that are stock exchange members:brokerage volume and average effective fees in Spanish equities 114
7.5 Assets under management, commission revenues and income before taxes of portfoliomanagement companies 117
9.1 Opinions in auditors’ reports (% of total) 124
9.2 Types of qualifications 124
9.3 Reasons for subpoenas as a result of the substantive review 126
9.4 Trend in communiqués 134
9.5 Notifications regarding directors and significant shareholders that were presented late 138
12.1 Subject matter of queries in 2008 190
15
00_Primeras_INGLES.qxd 24/7/09 18:47 Página 15

00_Primeras_INGLES.qxd 24/7/09 18:47 Página 16

17
Index of annexes
Statistical annexes 267
Statistical annexes I 269
I.1 International economic indicators 269
I.2 Composition of households’ financial assets 270
I.3 Composition of non-residents’ financial assets 270
I.4 Balance of public debt by holder 271
I.5 EBT of companies listed on the electronic market 271
I.6 Return on assets and equity of companies listed on the electronic market 272
Statistical annexes II 273
II.1 Capital increases and public offerings: cash amount 273
II.2 Delistings in 2008 275
II.3 Sector indices in the Madrid and Barcelona stock exchanges 276
II.4 Concentration of capitalisation by sector 277
II.5 Percentage of capitalisation by sector and largest companies with respectto the overall market 278
II.6 Capitalisation and trading volume of Ibex 35 companies 280
II.7 Market data of Ibex 35 companies 281
II.8 Takeover bids authorised in 2008 282
II.9 Companies listed on Latibex, by sector 282
II.10 Mutual funds listed on the Spanish stock exchange 283
II.11 Gross issues by the public administrations 285
II.12 Net issues by the public administrations 285
II.13 Public debt trading between account holders. Outright transactions, repos and sell-buybacks/buy-sellbacks 286
II.14 Letras trading between account holders. Breakdown by trade type 286
II.15 Bonos and Obligaciones trading between account holders. Breakdown by trade type 287
II.16 Public debt trading by account holders and third parties. Outright transactions,repos and sell/buybacks and buy/sellbacks 287
II.17 Number of issuers and issues filed with the CNMV: detail by instrument 288
II.18 Main fixed-income issuers registered with the CNMV in 2008 289
II.19 Main fixed-income issuers registered with the CNMV in 2008. Detail by instrument 290
II.20 Commercial paper issuers: largest outstanding balances at 31 December 2008 291
II.21 Main securitisation bond issuers in 2008 292
II.22 Securitisation bonds, by type of collateral 293
II.23 Proprietary trading on AIAF 294
Statistical annexes III 295
III.1 Numbers, investors, assets and breakdown of variation in assets of securities and real estate mutual funds 295
III.2 Fund portfolio as a percentage of the outstanding balance of Spanish securities 297
III.3 Expenses charged to financial mutual funds (excluding ETFs and hedge funds) 297
III.4 Expenses charged to ETFs 297
III.5 Expenses charged to hedge funds 298
III.6 Yields and net subscriptions of mutual funds 299
III.7 UCITS management companies (SGIIC): registrations and deregistrations in 2008 300
III.8 Foreign investment firms with community passport: Home Member State 300
00_Primeras_INGLES.qxd 24/7/09 18:47 Página 17

III.9 Broker-dealers, brokers and portfolio management companies. Registrations and deregistrations 301
III.10 Changes of control at broker-dealers, brokers and portfolio management companies. 2008 302
III.11 Spanish investment firms with Community passport. Host Member State 302
III.12 Foreign credit institutions with Community passport to provide investment services at 31 December 2008. Home Member State 303
Statistical annexes IV 305
IV.1 Number of shareholders of Ibex 35 companies with significant holdings 305
IV.2 Outcome of disciplinary proceedings in 2008 306
IV.3 Court judgments in 2008 in administrative appeals against penalties 307
IV.4 Public warnings about unauthorised firms 309
Legislative annexes 321
A Spanish legislation 321
A.1 Comisión Nacional del Mercado de Valores 321
A.2 Official secondary markets in securities and other trading systems 321
A.3 Transparency on the part of issuers of listed securities 322
A.4 Takeover bids 322
A.5 Investment firms and other entities in the securities market 323
A.6 UCITS 328
A.7 Measures with regard to the economic crisis 332
A.8 Other regulations 335
B European legislation 337
CNMV Organisation 339
Composition of the CNMV Board 339
Composition of the CNMV Executive Committee 339
Composition of the CNMV Advisory Committee 340
CNMV Organisation chart 342
18
00_Primeras_INGLES.qxd 24/7/09 18:47 Página 18

I Economic and financial situation
01_Capitulo 01_INGLES.qxd 24/7/09 18:49 Página 19

01_Capitulo 01_INGLES.qxd 24/7/09 18:49 Página 20

Economic and
financial situation
21
1 Economic and financial situation
This chapter analyses the main characteristics of the economic and financialsituation in which the securities markets operated in 2008. The purpose is not somuch to give a detailed description of how the world, European and Spanisheconomy performed as to provide the necessary background for reading subsequentchapters.
The world economy experienced a severe, generalized deterioration in 2008,fundamentally as a result of the exacerbation of the financial crisis thatcommenced in August the previous year. Harsher lending standards, sizeablelosses in the securities markets and the sharp deterioration in expectations all ledto a major reduction in private sector expenditure, which negatively impactedgrowth in the advanced economies, including Spain. The economic crisis spread tothe developing countries, basically as a result of a declining imports by thedeveloped world.
Both monetary authorities and governments intervened in the economy with anintensity not seen since the Great Depression. The monetary authorities drasticallycut interest rates and continued to inject liquidity into the financial system on amassive scale. And governments implemented support plans for the bankingindustry which, in some countries, involved partial or total nationalization ofcredit institutions in difficulties and with a high impact on systemic risk. In Spain,government support for the financial sector focused on the creation of the Fundfor the Acquisition of Financial Assets (Fondo de Adquisición de ActivosFinancieros) with the aim of promoting the supply of credit by acquiring high-quality assets and providing guarantees for issues by financial institutions, as wellas increasing the level of deposit insurance. Considerable importance was given tofiscal policies, including sizeable expenditure and tax refund plans financed byissuing public debt.
The securities markets were impacted by the difficulties in the economic andfinancial sphere, as reflected in a notable decline in trading, a slump in equityprices and a sharp increase in volatility. The public sector took on a major role inthe bond markets due to the sizeable increase in issuing. Government bond yieldsbegan to fall notably after the summer as a result of growing investor appetite forthese assets, but there was also a significant increase in the risk premium imposedon some sovereign issuers. Private-sector issuers, including financial institutions,faced a pronounced increase in risk premiums and their issuing volumes weresharply curtailed. Nevertheless, the volume of asset-backed issues in Spainremained high as they were retained by their originators for use as collateral infunding operations with the European Central Bank. Spanish equity pricesdeclined in line with those of the other big European markets, with all sectorsbeing affected.
01_Capitulo 01_INGLES.qxd 24/7/09 18:49 Página 21

CNMV
Annual Report regarding
its actions and the
securities markets. 2008
22
Performance by the economy and financial markets in the early part of 2009suggests that the coming months will continue to be very complicated for theeconomic agents, and there is persisting high uncertainty about the timing andintensity of the recovery, although there are some encouraging signs. Whereas themacroeconomic indicators are tending to confirm negative growth in thedeveloped countries, there were more encouraging signs in March, such as adegree of revival in the US housing market and a deceleration in the decline ofconsumer expenditure in Spain. Equities experienced sharp losses once again inthe first two months of the year, which were particularly intense in the bankingindustry; however, a significant recovery was observed in mid-March, fuelled bythe upgrades of earnings estimates by some US financial institutions andadditional massive injections of liquidity by the Federal Reserve. Also, issuingincreased in the private sector bond markets, although risk premiums remainedvery high.
The international agencies generally expect the world economy to decline further in2009, although some optimistic scenarios envisage initial signs of a recovery in thesecond half. In any event, the world economy’s recovery will depend on restorationof an appropriate level of confidence in the financial system. That restoration willdepend not only on government support for the financial sector but also onprogress with the reforms proposed by international forums in the areas ofregulation and supervision.
1.1 International economic and financial situation
1.1.1. The world economy
The financial crisis shaped world economic performance
The financial crisis that commenced in August 2007 attained unprecedented depthand a global dimension in 2008, with a decisive impact on world economicperformance. It influenced the economy basically in three ways: lending conditionsto the private sector, the impact on wealth, and the formation of expectations. Thesuccession of official interest-rate cuts and massive injections of liquidity by thecentral banks failed to avoid a notable increase in lending standards to the privatesector during the year, particularly from September onwards, following USgovernment intervention in the two big mortgage agencies and the collapse ofLehman Brothers. Faced with falling earnings and considerable difficulties withfunding via the markets, financial institutions imposed stricter conditions onlending. At the same time, the high perception of risk in the capital markets madeit more difficult for companies to raise funding by this avenue.
Mistrust of the financial sector also had a decisive influence on price performanceof corporate financial assets. The drastic slump in financial asset prices,accompanied in some countries by a decline in real estate prices, greatly erodedprivate-sector wealth, which contributed to hampering access to finance on the partof consumers and companies, because of the negative impact on the value ofcollateral and on borrower solvency, while also fostering an attitude of great cautionwith regard to spending. The expectations of the economic agents, which had beenclearly negative since the financial crisis began (Figure 1.1), worsened during the
01_Capitulo 01_INGLES.qxd 24/7/09 18:49 Página 22

Economic and
financial situation
23
year due to mounting difficulties with funding, declining wealth and the incessantflow of negative news with regard to companies and the financial markets, inaddition to the general deterioration of economic activity.
Trend towards recession in the industrialized countries
In this context of deep mistrust of the financial system and growing pessimismabout the performance of the world economy, practically all the industrializedcountries experienced a sharp reduction in economic growth in 2008. TheInternational Monetary Fund estimated that the aggregated GDP of the advancedeconomies increased by 1% during the year, compared with 2.7% in 2007. Withvery few exceptions, the industrialized countries experienced a slowdown, if not adecline, in domestic demand. The exporting economies, such as Japan and Germany,were also impacted by a substantial decline in exports. The economic indicators ofthe industrialized countries experienced accelerated deterioration during the yearwhich became particularly intense during the second half, coinciding with theexacerbation of the financial crisis. The available data show that the fourth quarterwas particularly negative, with a sharp decline in GDP with respect to the sameperiod of 2007 and sizeable increases in unemployment.
The US economy expanded by 1.1% in 2008, 0.9 points less than in 2007, but thatwas better than the decline experienced by its main competitors among theadvanced economies (Figure 1.2). During the first half of the year, the US economycontinued to grow due to the impact of tax rebates on private expenditure and tothe growth in exports as a result of the weak dollar. However, in the second half,private consumption expenditure shrank, companies ceased to accumulateinventories, and exports slowed due to the intense deceleration in world trade. Thedecline in imports enabled the foreign sector to maintain a positive contribution togrowth but could not avoid a decline in GDP, which was particularly acute in thefourth quarter: -0.8% with respect to the fourth quarter of 2007. The Japaneseeconomy began to shrink before that of the US due to weaker domestic demand andgreater dependence on the foreign sector. Year-on-year growth rates turned negativein the third quarter, but quarter-on-quarter rates had turned negative in the secondquarter, reflecting the shrinkage in domestic demand. The foreign sector managedto attenuate the decline in GDP until the summer as a result of rapid growth in
Economic sentiment FIGURE 1.1
Source: Ministry of Economy and Finance.
60
70
80
90
100
110
120
Dec-04 Jun-05 Dec-05 Jun-06 Dec-06 Jun-07 Dec-07 Jun-08 Dec-08
Spain Euro area France Germany Italy UK
Baseline 100 = average 1990-2008
01_Capitulo 01_INGLES.qxd 24/7/09 18:49 Página 23
creo

CNMV
Annual Report regarding
its actions and the
securities markets. 2008
24
exports; however, exports plummeted in the fourth quarter, leading to a 4.6%decline in GDP with respect to the fourth quarter 2007. Overall, the Japaneseeconomy shrank by 0.9% in 2008.
The euro area’s aggregated GDP increased by 0.7%, almost 2 points less than in2007. All countries in the euro area experienced a decline in growth rates, but onlytwo countries (Ireland and Italy) experienced a decline in GDP. The two largesteconomies in the area, Germany and France, expanded by 1% and 0.7%,respectively. Neither of the two economies experienced negative year-on-yeargrowth until the fourth quarter, but Germany’s GDP had begun to decline in quarter-on-quarter terms in the second quarter and France’s in the third quarter, due toweak domestic demand and, above all, falling exports. In both cases, the economydeclined as a result of weak domestic demand and falling exports. The decline inexports was particularly sharp in the fourth quarter, depressed GDP by 1.7% inGermany and 1% in France with respect to the same quarter of 2007. The Italianeconomy experienced negative growth in the full year of around 0.9%, againproving weaker than the other big European economies. The Spanish economy(discussed in more detail in section 1.2.1) saw an intense deterioration, even thoughthe rate of change in GDP was again higher than the euro area average. Outside theeuro area but still inside the European Union, the UK economy also flagged, withgrowth declining from 3% in 2007 to 0.7% to 2008. As in the case of Spain andIreland, the deterioration in the real estate market contributed considerably to thedeceleration. UK GDP declined by 1.9% in the fourth quarter of 2008 with respectto the same quarter of 2007.
The crisis extends to the emerging economies
The decline in economic growth was also evident in the developing economies,particularly in the second half of the year. The rapid deceleration of economicactivity in those countries, whose financial systems generally have little exposureto the assets that triggered the financial crisis, arose essentially from the sharpdecline in imports by the developed countries. Additionally, from the summeronwards, commodity-exporting countries were affected by a decline in commodity
Annual GDP growth rates FIGURE 1.2
Source: Ministry of Economy and Finance.
3.6
2.9 2.8
2.0
1.1
1.9 1.8
3.0
2.6
0.7
2.7
1.92.1
2.4
-0.7-1
0
1
2
3
4
2004 2005 2006 2007 2008
USA Euro area Japan%
01_Capitulo 01_INGLES.qxd 24/7/09 18:49 Página 24
creo

Economic and
financial situation
25
prices after a prolonged, intense rise in the preceding years. The IMF estimatesthat aggregated GDP of the emerging or developing economies grew by 6.3%, twopoints less than in 2007, with data from the fourth quarter evidencing a muchsharper deterioration. China, one of the world’s largest economies in terms ofGDP, managed to attain 9% growth in 2008, but that was four points lower thanin 2007. The Chinese economy, whose GDP is highly exposed to exports, wasparticularly hard-hit by negative performance in its foreign markets, particularlythe European Union and the US. GDP growth in the fourth quarter is estimated at6.8% year-on-year, compared with 11.2% in the same period of 2007. In LatinAmerica, a region of particular interest for the Spanish economy, the maineconomies (apart from Mexico) maintained relatively high growth rates duringthe first three quarters, but all of them were affected by the adverse performanceof the world economy from September onwards, particularly via the decline inexports and external capital flows. The economic situation also deteriorated inEastern Europe, including most of the countries that have joined the EuropeanUnion in recent years.
Rapid decline in inflation in the second half
After a prolonged, intense increase in recent years, commodity prices slumped inthe second half of 2008 (Figure 1.3). In the case of oil, the price of Brent slippedfrom over $145 in July to around $36 at the end of the year, a decline withoutprecedent since the summer of 2004. At the end of March 2009, the price of Brentappeared to have stabilized below $50. The decline in energy prices coupled withflagging consumer spending led to a turnaround in the trend of consumer prices,
which had been rising rapidly since autumn 2007. The year-on-year inflation rate inthe OECD, which includes most of the developed countries, fell from 4.9% in Julyto 1.5% in December. Available data from February 2009 confirm that inflation iscontinuing to fall. In particular, year-on-year inflation in February was 0.6% in theeuro area, 0.2% in the United States and -0.1% in Japan.
Commodity price indices1 FIGURE 1.3
Source: Datastream.1. Baseline 100: December 2004.
100
150
200
250
300
350
Dec-04 Jun-05 Dec-05 Jun-06 Dec-06 Jun-07 Dec-07 Jun-08 Dec-08
Food Energy Metals
01_Capitulo 01_INGLES.qxd 24/7/09 18:49 Página 25
creo

Sharp cuts in central bank base rates
Following the outbreak of the financial crisis in the summer of 2007, the monetaryauthorities in the industrialized countries moved quickly to attenuate liquiditytensions in the financial system and in the economy. In particular, both theEuropean Central Bank (ECB) and the US Federal Reserve made massive directinjections of liquidity into financial institutions, and continued to do so moreintensely and through a broader variety of mechanisms throughout 2008. However,as occurred in 2007, the Federal Reserve and ECB differed in their approach tointerest rates throughout most of 2008 due to their differing priorities as regardsprice stability. A succession of interest rates cuts by the Federal Reserve brought thebenchmark rate from 5.25% in September 2007 to 2% in May 2008, whereas theEuropean Central Bank, more focused on controlling inflation, kept the benchmarkrate stable at 4% until the beginning of July and then increased it by 25 basis pointsin order to offset the inflationary impact of rising energy prices (Figure 1.5). Onlyin October, when the Federal Reserve began to cut rates once again in view of the
26
CNMV
Annual Report regarding
its actions and the
securities markets. 2008
Year-on-year change in consumer prices FIGURE 1.4
Source: Ministry of Economy and Finance.
-1
0
1
2
3
4
5
6
Dec-04 Jun-05 Dec-05 Jun-06 Dec-06 Jun-07 Dec-07 Jun-08 Dec-08
USA Euro area Japan%
Central bank base rates FIGURE 1.5
Source: Datastream.
0
1
2
3
4
5
6
Dec-04 Jun-05 Dec-05 Jun-06 Dec-06 Jun-07 Dec-07 Jun-08 Dec-08
Euro area.Weekly auction minimum bid rate
USAFed-Funds rate
Japan. Target rate
%
01_Capitulo 01_INGLES.qxd 24/7/09 18:49 Página 26
creo
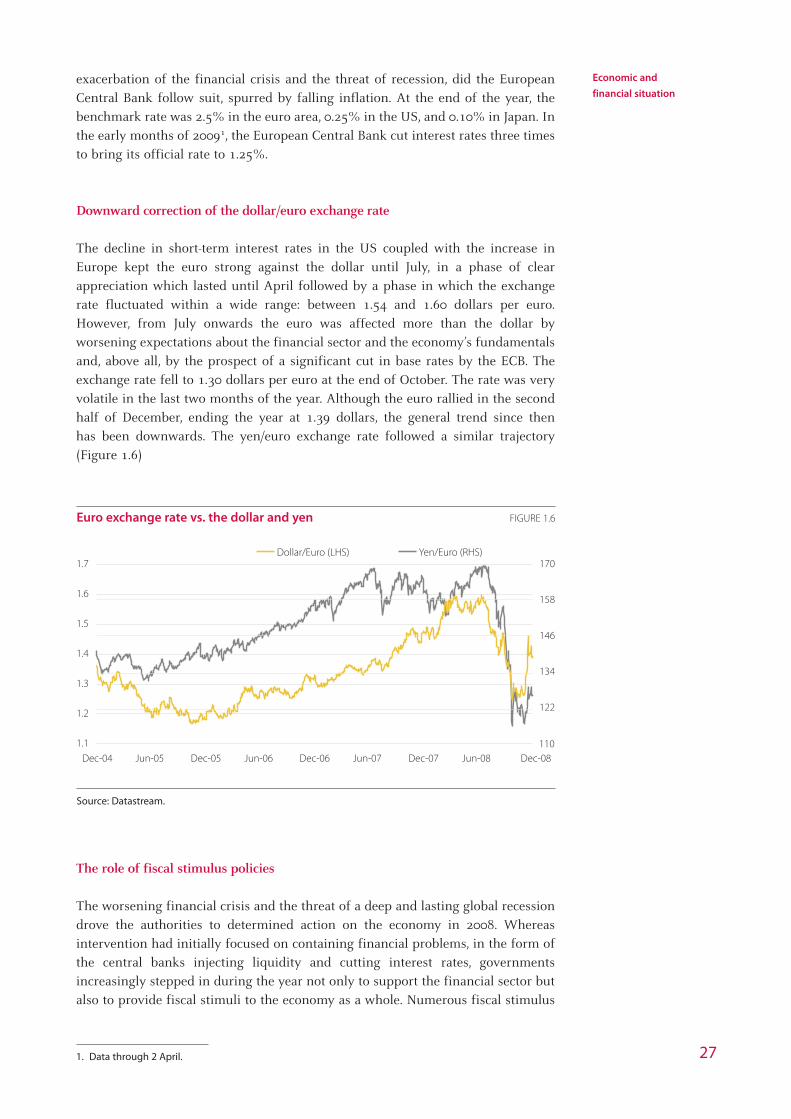
exacerbation of the financial crisis and the threat of recession, did the EuropeanCentral Bank follow suit, spurred by falling inflation. At the end of the year, thebenchmark rate was 2.5% in the euro area, 0.25% in the US, and 0.10% in Japan. Inthe early months of 20091, the European Central Bank cut interest rates three timesto bring its official rate to 1.25%.
Downward correction of the dollar/euro exchange rate
The decline in short-term interest rates in the US coupled with the increase inEurope kept the euro strong against the dollar until July, in a phase of clearappreciation which lasted until April followed by a phase in which the exchangerate fluctuated within a wide range: between 1.54 and 1.60 dollars per euro.However, from July onwards the euro was affected more than the dollar byworsening expectations about the financial sector and the economy’s fundamentalsand, above all, by the prospect of a significant cut in base rates by the ECB. Theexchange rate fell to 1.30 dollars per euro at the end of October. The rate was veryvolatile in the last two months of the year. Although the euro rallied in the secondhalf of December, ending the year at 1.39 dollars, the general trend since thenhas been downwards. The yen/euro exchange rate followed a similar trajectory(Figure 1.6)
The role of fiscal stimulus policies
The worsening financial crisis and the threat of a deep and lasting global recessiondrove the authorities to determined action on the economy in 2008. Whereasintervention had initially focused on containing financial problems, in the form ofthe central banks injecting liquidity and cutting interest rates, governmentsincreasingly stepped in during the year not only to support the financial sector butalso to provide fiscal stimuli to the economy as a whole. Numerous fiscal stimulus
27
Economic and
financial situation
1. Data through 2 April.
Euro exchange rate vs. the dollar and yen FIGURE 1.6
Source: Datastream.
Jun-08Jun-07
1.1
1.2
1.3
1.4
1.5
1.6
1.7
Dec-04 Jun-05 Dec-05 Jun-06 Dec-06 Dec-07 Dec-08
122
134
146
158
170Dollar/Euro (LHS) Yen/Euro (RHS)
110
01_Capitulo 01_INGLES.qxd 24/7/09 18:49 Página 27
creo

packages were adopted in the final months of 2008 and in early 2009 in view of thelimited scope for monetary policy to reactivate the economy after the intensereduction in base rates. Because of their ambition and the scale of the fundingpotentially being deployed, these Keynesian policies were an unprecedenteddeparture from the economic policy implemented by the developed countries sincethe 1980s, which was characterized by a tendency to limit public expenditure andthe State’s role in the economy.
The United States, a key country for the eventual recovery by the world economy,implemented its first big fiscal stimulus plan in February 2008. The plan, whichamounted to an estimated 152 billion dollars, i.e. approximately 1.1% of GDP,focused primarily on tax reductions and refunds for consumers. One year later, theObama administration designed a much larger plan: 787 billion dollars, equivalentto 5% of GDP, in a broader range of instruments. The Obama Plan will devote one-third of its funding to cutting taxes with the goal of boosting consumer spendingin the short term; the remainder is allocated mainly to investment in infrastructureand alternative energy programs, and to beginning a profound reform ofhealthcare.
In December 2008, the European Union approved the European EconomicRecovery Plan, conceived as a joint framework for action by the Member States andthe European institutions. The European plan envisages action by the Europeaninstitutions amounting to 30 billion euro, basically to finance investment in energy,transport and telecommunications infrastructure; it also envisages that nationalplans will total 170 billion euro, while emphasizing that the fiscal measuresadopted in each country must take account of the situation of its public finances.In March 2009, most of the Member States had approved some form of fiscalstimulus package. The packages vary both in size and in approach. As regards size,Germany’s plan amounts to 2.7% of GDP, the UK’s to 1.2%, and Spain’s to 2.4%.France’s and Italy’s fiscal stimulus plans amount to around 0.5% of GDP. As regardsapproaches, some countries such as the UK and Italy are focused on supportinghouseholds by cutting taxes and providing specific forms of aid, benefits, etc.whereas others, including Germany, France and Spain, place greater emphasis onpublic investment and on stimulating business. A large percentage of Spain’sstimulus plan is allocated to investment in public infrastructure, much of that to bespent by municipalities.
China and Japan have also announced fiscal stimulus packages. China’s planamounts to approximately 5% of GDP, focused principally on investment inhousing and infrastructure in rural areas, railways and airports. The measuresannounced in Japan amounted to 1.6% of GDP and focus, in large part, onsupporting families and small businesses through tax exemptions for the formerand tax benefits for the latter.
Because of their size, the announced plans will inevitably have a negative impact ongovernment indebtedness in 2009. Most of the leading industrialized countries sawtheir government deficit increase significantly in 2008 (Annex I.1) as a result ofrising expenditure and falling tax revenue caused by the deteriorating economicsituation. In particular, the United States’ deficit practically doubled with respect to2007 in terms of GDP. According to estimates by the Obama Administration, thedeficit could exceed 12% of GDP in 2009. Funding this and the other sizeablebudget imbalances expected this year evidently poses a challenge for publicfinances and will have an indisputable impact on the financial markets. 28
CNMV
Annual Report regarding
its actions and the
securities markets. 2008
01_Capitulo 01_INGLES.qxd 24/7/09 18:49 Página 28

1.1.2 The international financial markets
The economic deterioration worsened the situation of financial institutions
The negative interaction between the economy and the financial crisis led to asubstantial increase in systemic risk. At the core of the problem, financialinstitutions saw earnings decline steadily during the year, affected by falling assetvalues and the negative impact of the economic situation on demand for credit andon delinquency. Financial institutions reported a total of 1.09 trillion dollars inwritedowns in 2008, but the IMF’s November estimates put the total figure ataround 1.4 trillion dollars. Approximately half of reported losses were in thebanking sector and the remainder in other financial institutions (insurancecompanies, pension funds, mortgage agencies, etc.). Institutions located in theUnited States accounted for 69% of the losses, while European institutionsaccounted for 28%, and Asian institutions for the remainder.
In view of the difficulties being experienced by financial institutions, the monetaryauthorities expanded and intensified measures designed to ensure liquidity, andgovernments deployed a broad battery of measures designed essentially to increaseconfidence in the financial system; they included increasing deposit insurance,buying financial assets from the institutions, providing guarantees for fixed-incomesecurities issued by the latter, and even participating in recapitalization operations.The latter operations amounted to 987 billion dollars between the third quarter of2007 and the fourth quarter of 2008, of which 572 billion dollars were injected intoUS financial institutions (less than their recognized losses) and 359 billion euro intoEuropean institutions (more than their recognized losses). Governments supplied55% of total recapitalization funds in the United States and 46% in Europe. Equitywas increased primarily in the form of preferred stock in the United States, and ofcommon stock in Europe.
The performance of the financial sector in the first two months of 2009 suggeststhat the measures adopted to date may be insufficient to overcome the situation;therefore, further measures cannot be ruled out. In particular, since the lack oftransparency about the composition and real value of assets held by financialinstitutions is seen as one of the main factors impairing confidence in the financialsystem, both United States and Europe are considering the creation of “bad banks”,whose function would be to concentrate impaired assets held by financialinstitutions in order to enable the latter to return to a more normal form ofoperation. This approach is somewhat similar to the first design of the Paulson planin the United States, which involved the government buying impaired assets butwas finally discarded because of its complexity. As with the Paulson Plan, a badbank must solve such complex questions as which damaged assets to choose, howto value them, how to fund the acquisitions, etc.
Sharp decline in interbank interest rates from October onwards
Central bank interventions to ease liquidity tensions in the financial systemtemporarily put downward pressure on interbank market rates, a phenomenonwhich was more intense and longer lasting in the US than in Europe, in the firstquarter of 2008 (Figure 1.7). In the following two quarters, US short-term interestrates remained relatively constant while European rates regained their December2007 levels. The crisis at Lehman Brothers and other financial institutions triggered 29
Economic and
financial situation
01_Capitulo 01_INGLES.qxd 24/7/09 18:49 Página 29
CNMV
Annual Report regarding
its actions and the
securities markets. 2008
30
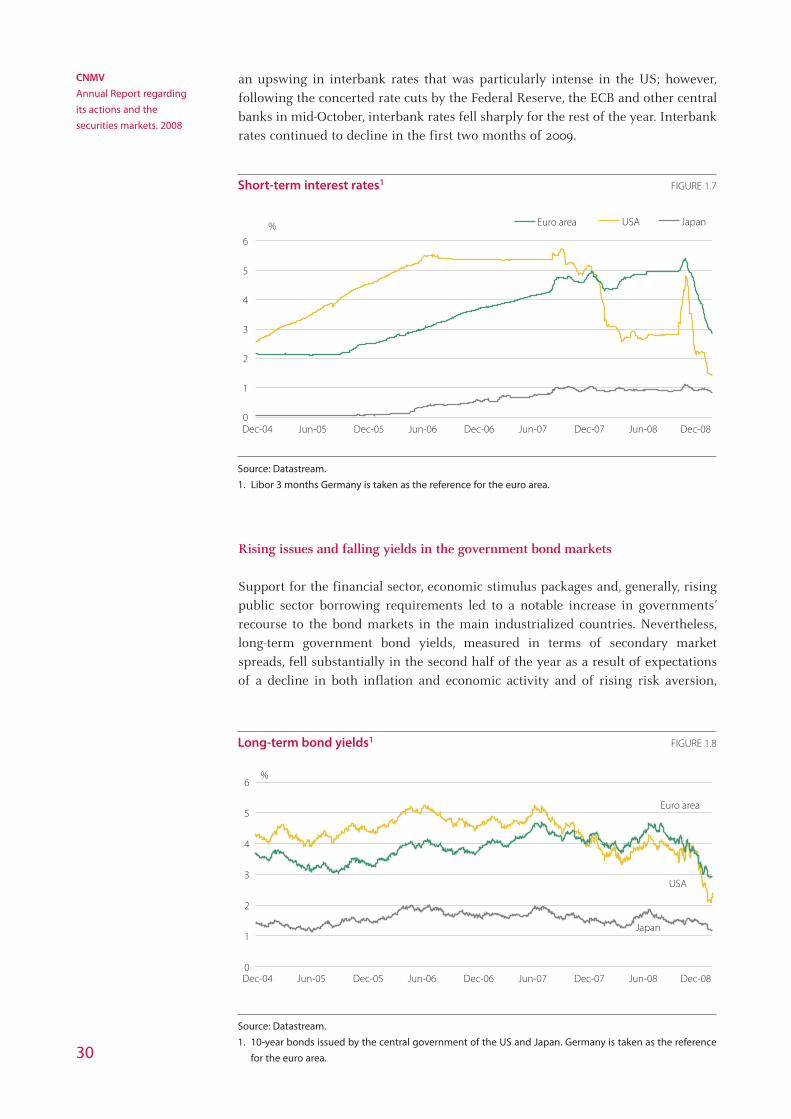
an upswing in interbank rates that was particularly intense in the US; however,following the concerted rate cuts by the Federal Reserve, the ECB and other centralbanks in mid-October, interbank rates fell sharply for the rest of the year. Interbankrates continued to decline in the first two months of 2009.
Rising issues and falling yields in the government bond markets
Support for the financial sector, economic stimulus packages and, generally, risingpublic sector borrowing requirements led to a notable increase in governments’recourse to the bond markets in the main industrialized countries. Nevertheless,long-term government bond yields, measured in terms of secondary marketspreads, fell substantially in the second half of the year as a result of expectationsof a decline in both inflation and economic activity and of rising risk aversion,
Short-term interest rates1 FIGURE 1.7
Source: Datastream.
1. Libor 3 months Germany is taken as the reference for the euro area.
0
1
2
3
4
5
6
Dec-04 Jun-05 Dec-05 Jun-06 Dec-06 Jun-07 Dec-07 Jun-08 Dec-08
Euro area USA Japan%
Long-term bond yields1 FIGURE 1.8
Source: Datastream.
1. 10-year bonds issued by the central government of the US and Japan. Germany is taken as the reference
for the euro area.
0
1
2
3
4
5
6
Dec-04 Jun-05 Dec-05 Jun-06 Dec-06 Jun-07 Dec-07 Jun-08 Dec-08
USA
Euro area
Japan
%
01_Capitulo 01_INGLES.qxd 24/7/09 18:49 Página 30
creo

Economic and
financial situation
31
which led investors to prefer government bonds from countries with better creditratings. At the end of the year, US 10-year bond yields were 2.25% while those inthe euro area were 2.94%, i.e. 178 and 139 basis points less than in December 2007,respectively. In the first two months of 2009, yields rose moderately, reflectingoverweighting of sovereign risk in view of the foreseeable significant increase ingovernment indebtedness. Some countries’ sovereign ratings were downgraded. Atthe end of March 2009, US bond yields were 2.7%, while euro area bond yields were3.0%. A greater focus on credit risk assessment also led to a significant widening ofthe yield gap between different issuers.
Shrinking issues and a sharp increase in yields in the private fixed-income markets
After several years of very intense activity, the private fixed-income marketsexperienced a notable slowdown in 2008. The primary markets, dominated by thefinancial sector, saw a substantial reduction in issuing as a result of the trendtowards deleveraging, the adoption of cautious policies with regard to investmentand increased investor risk perception. There was also a substantial decline inliquidity in the secondary markets. Yields demanded by investors in both theprimary and secondary markets rose sharply as a result of increased risk premiums.In particular, the yield with respect to government bonds widened considerably(Figure 1.9).
The trend in premiums traded in the credit derivatives markets is particularlyillustrative of the difficulties that private issuers faced in raising funding in thebond markets. The price of a hedge for investment-grade issues (BBB or higher onthe Standard & Poor’s scale) increased substantially in the first quarter, in parallelwith the turbulence in the equity markets during that period. Premiums easedsomewhat in the second quarter but surged again in the summer, peaking in thefourth quarter in a context of high volatility. At the end of the year, premiums stoodat 253 basis points in the United States and 233 in Europe, compared with 83 and51 basis points, respectively, at the end of 2007. Risk premiums for US investment-
Private bond yield gap (BBB-AAA)1 FIGURE 1.9
Source: Reuters.
1. 20-session moving average of the yield gap between 10-year issues at the bottom of investment grade
(BBB) and top-rated issues (AAA, generally sovereign issues).
50
100
150
200
250
300
350
400
450
500
550
Dec-04 Jun-05 Dec-05 Jun-06 Dec-06 Jun-07 Dec-07 Jun-08 Dec-08
Euro area USABasis points
01_Capitulo 01_INGLES.qxd 24/7/09 18:49 Página 31
creo

grade financial institutions rose particularly sharply, topping 600 basis points inNovember (Figure 1.11). Although premiums eased generally in December and theearly days of January, corporate earnings and negative growth reports drove themupwards again. At the end of March 2009, risk premiums for investment-gradecorporate bonds stood at 196 basis points in the US and 178 in Europe.
Slump in equity prices
During 2008, equity prices experienced a widespread decline that was withoutprecedent since the Great Depression. Problems in the financial sector andworsening economic expectations made investors extremely sensitive and triggeredwaves of mass selling at various points during the year. Corporate earnings reportstended to confirm analysts’ negative projections, and the pessimism increased32
CNMV
Annual Report regarding
its actions and the
securities markets. 2008
Corporate bonds: risk premium1 FIGURE 1.10
Source: Markit.
1. Credit derivatives market. Investment grade. 5-year maturity.
0
50
100
150
200
250
300
Jun-07 Dec-07 Jun-08 Dec-08
USA EuropeBasis points
Financial sector: risk premium1 FIGURE 1.11
Source: Markit
1. Credit derivatives market. Investment grade. 5-year maturity.
050
100150200250300350400450500550600650
Jun-07 Sep-07 Dec-07 Mar-08 Jun-08 Sep-08 Dec-08
25
50
75
100
125
150
175
200
USA (LHS) Europe (RHS)Basis points Basis points
0
01_Capitulo 01_INGLES.qxd 24/7/09 18:49 Página 32
creo

33
Economic and
financial situation
steadily during the year as projections were downgraded frequently, particularly inthe fourth quarter (Figure 1.12). Sales by institutional investors to reduce leverageand exposure contributed to maintaining bearish pressure on the market and mayhave exacerbated the declines in prices. Market performance led to a notableincrease in bearish strategies either directly in the market, via short selling, orthrough the derivatives markets, which accentuated the downward trend in prices.Regulators in many countries took a range of measures with regard to short sellingso as to increase market transparency and attenuate, as far as possible, itsdestabilizing effect in terms of systemic risk, particularly in the case of bank shares(see box in Chapter 10).
The best-known indices in the leading industrialized countries followed a similartrend (Figure 1.13). The sharpest declines in yields came in January, between mid-May and mid-July, and in October. The Dow Jones index lost nearly 34% of its value
Analysts' projections: number of companies for which FIGURE 1.12
projections were upgraded less number of companies downgraded (% of the total number of companies)1
Source: Datastream.
1. 12-month projections of earnings per share. Quarterly moving average.
-70
-60
-50
-40
-30
-20
-10
0
10
20
30
Dec-04 Jun-05 Dec-05 Jun-06 Dec-06 Jun-07 Dec-07 Jun-08 Dec-08
Dow Jones Euro Stoxx S&P 500 Topix (Japan)%
Performance by the world's main stock indexes FIGURE 1.13
Source: Datastream
60
80
100
120
140
160
180
Dec-04 Jun-05 Dec-05 Jun-06 Dec-06 Jun-07 Dec-07 Jun-08 Dec-08
Ibex 35 Euro Stoxx 50 Dow Jones I. Nikkei 225Baseline 100: 31/12/2004
01_Capitulo 01_INGLES.qxd 24/7/09 18:49 Página 33
creo

CNMV
Annual Report regarding
its actions and the
securities markets. 2008
34
in 2008, the Japanese Nikkei index 42% and the Euro Stoxx 50 lost 44%. WithinEurope, the top five markets (London Stock Exchange, Euronext, Deutsche Börse,Bolsa Italia and the Spanish markets) lost between 31% (UK) and 48% (Bolsa Italia).The Spanish Ibex 35 index lost 39%. Yields declined in a context of high volatility,falling fastest in October when share prices fell most sharply (Figure 1.14). Mostemerging markets also experienced a decline in prices after providing investorswith sizeable returns in recent years (Figure 1.1). The Chinese stock exchange loss65% while in Latin America, the Brazilian exchange lost 41%.
All segments of the stock market lost ground. As shown in Figure 1.15, which plotsthe return on the MSCI global sector indices, the greatest losses were in thefinancial sector, which lost 53% of its value worldwide in 2008. The other sectorsmost affected were those that are particularly sensitive to the economic cycle. Forexample, consumer discretionary, industrials, IT and materials lost close to or over40%2. Energy was also particularly hard hit. In the first three months of 2009,returns fell again in nearly all sectors, particularly the financial sector, which lostanother 20% in the period. The sector lost 67% of its value between August 2008and the end of March 2009.
Equity markets also experienced a considerable decline in trading volume(Figure 1.1). The most significant exception was New York, whose two mainmarkets (NYSE and NASDAQ) increased trading volume in 2008 as a result ofoutperforming in the first half of the year, when they may have been acting as safehavens, to an extent. In Europe, trading fell by between 16% (Germany) and 39%(Italy). Trading declined by 23% in the Spanish market.
The worsening economic and financial situation and, in particular, the adversetrend of share prices led to a sharp decline in the number of initial public offeringsworldwide. There were 338 IPOs in Europe in 2008, amounting to a total of 14.2billion euro, i.e. respectively 58% and 82% less than in 2007. There were 57 IPOs inthe United States, for a total of 19.4 billion euro, i.e. respectively 79% and 42% lessthan in 2007 (a single deal, the Visa flotation in the first quarter, accounted for 59%
Equity market volatility1 FIGURE 1.14
Source: Datastream
1. Quarterly average of annualised daily volatility (standard deviation of the last 20 days).
0
10
20
30
40
50
60
70
80
2004 IV 2005 IV 2006 IV 2007 IV 2008 IV
Euro Stoxx 50 Dow Jones I. Nikkei 225%
2. Basically chemicals, construction materials, metals and paper.
01_Capitulo 01_INGLES.qxd 24/7/09 18:49 Página 34
creo

Economic and
financial situation
35
of the total). The number of IPOs also declined, although less intensely, in emergingmarkets, particularly Hong Kong and Shanghai, two of the most active markets inrecent years.
Equity markets: indices and returns TABLE 1.1
Stock exchange Index Trading volume
Change (%)
Name 2007 2008 Billion euro Chg. (%)1
Developed countries
USA Dow Jones Ind. A. 6.4 -33.8 23,041.5 15.2
USA Nasdaq Composite 9.8 -40.5 25,064.1 29.6
Japan2 Nikkei -11.1 -42.1 3,975.3 -24.1
UK FTSE 100 3.8 -31.3 4,374.3 -33.0
Euro area3 Euro Stoxx 50 6.8 -44.4 9,475.5 -17.0
Euronext Euronext 100 3.4 -45.2 3,027.6 -26.2
Germany DAX 30 19.2 -40.4 2,648.5 -15.8
Italy MIB 30 -6.5 -48.4 1,029.1 -38.8
Spain Ibex 35 7.3 -39.4 1,228.6 -25.7
Latin America & Asia
Argentina Merval 2.9 -49.8 4.5 -8.5
Brazil Bovespa 43.7 -41.2 508.0 15.0
Chile IGPA 13.8 -19.6 25.0 -25.6
Mexico CPI 11.7 -24.2 76.5 -8.5
Peru IGBL 36.0 -59.8 4.3 -47.2
South Korea Korea Cmp Ex 30.1 -40.7 991.7 -14.3
Hong Kong Hang Seng 39.3 -48.3 1,107.0 -23.9
China4 Shanghai Composite 96.7 -65.4 2,591.5 -43.0
Source: International Federation of Stock Exchanges, Reuters and CNMV.
1. In local currency.
2. Tokyo and Osaka stock exchanges
3. Volume traded in euro area stock exchanges. Includes full OMX trading figures, though some markets do
not trade in euro.
4. Shanghai and Shenzhen stock exchanges
International sector equity indices1 FIGURE 1.15
Source: Datastream.
1. MSCI All Country Sector (World) indices.
2007 2008
Utilities
Telecommunications service
Materials
IT
Industrials
Health care
Financials
Energy
Consumer staples
Consumer discretionary
-60 -50 -40 -30 -20 -10 0 10 20
01_Capitulo 01_INGLES.qxd 24/7/09 18:49 Página 35
creo

Slight reduction in the notional value of open interest in credit derivatives
According to the Bank for International Settlements, the notional value of openinterest in OTC contracts in June was 32% higher than in the same month of 2007,and 15% higher than in December 2007, amounting to close to 684 trillion dollars.All segments clearly expanded with the exception of credit default swaps (CDS),whose notional value fell slightly with respect to December 2007 to somewhat over57 trillion dollars, mainly as a result of the decline in fixed-income issues and,generally, of funding transactions. The most significant increase in notional valuetook place in the largest segment, i.e. interest rates: from 393 trillion dollars inDecember 2007 to 458 trillion dollars in June 2008. The notional value of openinterest in exchange traded derivatives was considerably less than that of OTCproducts (Figure 1.16). They amounted to nearly 77 trillion dollars at the end of2008, 2.5% less than at the end of the previous year, and were concentrated mainlyin interest-rate futures.
1.2 The economic and financial situation in Spain
Sharp adjustment in the Spanish economy
In line with the other European economies, Spain experienced a sharp decelerationin 2008 fuelled by the performance of domestic demand. GDP growth was 1.2%,above the EU average. Internal demand, which had contributed decisively toeconomic growth in recent years, contributed just 0.1 point of GDP growth,hampered by the sharp deceleration of consumer expenditure and the decline ingross fixed capital formation. Conversely, external demand contributed 1.1 pointsof GDP growth, contrasting with its negative contribution in previous years. On thesupply side, there was an evident adjustment to activity in nearly all sectors,particularly in industrials, whose added value shrank by 2% Within industrials,construction experienced a 3% decline in added value. Services, the sector with thegreatest contribution to added value, continued to grow rapidly, by 3.1%, thoughthat was 1.5 points less than in 2007. 36
CNMV
Informe anual sobre los
mercados de valores y su
actuación. 2008
Derivatives: national value of open interest FIGURE 1.16
Source: Bank for International Settlements (BIS).
1. In 2008, the OTC figure is for June and the exchange-traded figure is for September
OTC Organized markets
0
100,000
200,000
300,000
400,000
500,000
600,000
700,000
800,000
2004 2005 2006 2007 20081
Billion dollars
01_Capitulo 01_INGLES.qxd 24/7/09 18:49 Página 36

Spain’s economic indicators TABLE 1.2
Annual rate of change, unless indicated otherwise
2004 2005 2006 2007 2008
GDP (at constant prices)1
GDP 3.3 3.6 3.9 3.7 1.2
Domestic demand2 4.8 5.1 5.1 4.4 0.1
Household spending 4.2 4.2 3.9 3.4 0.1
Government spending 6.3 5.5 4.6 4.9 5.3
Gross fixed capital formation 5.1 7.0 7.1 5.3 -3.0
Net external demand2 -1.7 -1.7 -1.5 -0.7 1.1
Exports 4.2 2.5 6.7 4.9 0.7
Imports 9.6 7.7 10.3 6.2 -2.5
Other indicators
CPI. (year-on-year in December) 3.2 3.7 2.7 4.2 1.4
Employment growth3 4.1 5.6 3.6 2.4 -3.0
Unemployment rate3 10.6 8.7 8.3 8.6 13.9
Current account balance (% of GDP) -5.3 -7.4 -8.9 -10.1 -9.6
Government lending/borrowing (% of GDP) -0.4 1.0 2.0 2.2 -3.8
Sources: INE, Bank of Spain and Ministry of Economy and Finance.
1. INE. National Accounts baseline 2000.
2. Contribution to GDP growth.
3. Labour Force Survey (LFS). Fourth quarter.
The Spanish economy maintained a clearly downward trend throughout the yeardue to the adverse impact of financing conditions and expectations about consumerand business performance. During the first three quarters, GDP growth was positivethough declining. Then, in the fourth quarter, GDP shrank by 0.8% with respect tothe same period of 2007. Rising unemployment and concerns about economicperformance impacted consumer expenditure, which shrank by 2.8% year-on-year inthe fourth quarter. Residential investment began to decline in the second quarter andinvestment in capital goods in the third; both registered negative growth rates, of10.9% and 9.7%, respectively, in the fourth quarter. External demand made a positiveand steadily rising contribution to economic growth during the year, primarily as aresult of the deceleration in the first half and the slump in imports in the second half.
The intense adjustment in the economy had a major impact on unemployment andinflation. The two most negative outcomes of the adjustment were, undoubtedly,job destruction and the sharp increase in unemployment. The unemployment ratereached 13.9% in the fourth quarter, up from 8.6% in 2007. The deterioration in thelabour market, which was initially confined to construction, spread to the otherindustrial segments and some segments of the services sector. Employmentdeclined by 0.6% year on year. Inflation rose steadily up to the summer, when itreached 5.3%. However, falling energy prices and shrinking consumer spendingtriggered a rapid decline in the final months of the year and inflation was 1.4% inDecember. Inflation fell more sharply in Spain than in the euro area with the resultthat the differential between them was a negative 0.1% at year-end. In February2009, annual inflation was 0.7%, confirming the downward trend and widening thenegative differential with respect to the euro area.
The negative trend in the economy also had an impact on public finances. Followingthree years of surplus, the public administrations incurred a deficit amounting to 37
Economic and
financial situation
01_Capitulo 01_INGLES.qxd 24/7/09 18:49 Página 37

3.8% of GDP as a result of both falling revenue and rising expenditure.Discretionary fiscal stimulus measures to palliate the impact of the crisis onhouseholds and business contributed decisively to the increase in the deficit. Thedeficit is expected to expand once again in 2009 as a result both of the direct impactof the economic cycle on government revenue and expenditure and of all theextraordinary measures adopted by the government to revive the economy (seeSection 1.1.1). However, in terms of indebtedness, Spain’s public finances are in abetter initial position than those of other countries. At the end of 2008, the publicadministrations’ debt amounted to 39.4% of GDP, almost 30 percentage points lessthan the euro area average.
Shrinking flows of finance and financial investment in the private residential sector
In contrast with the pattern of the preceding years, non-financial companies,financial institutions and households reduced external fund-raising intensely, whilethe public sector significantly increased borrowing. Non-residents continued to playan essential role in financing the Spanish economy, but they greatly reduced theirnet acquisition of financial assets issued by residents. There were also twoparticularly significant events for Spain’s securities markets. The first was a sharpreduction in fund-raising via fixed-income securities by financial institutions afterseveral years of intense issuing by this sector (particularly credit institutions andsecuritisation trusts).The second was the net divestment of mutual fund units byhouseholds, which commenced in 2007 and intensified in 2008, coupled with anincrease in households’ bank deposits.
Net financial liabilities acquired by non-financial companies fell by 60.2% inJanuary-September 2008 compared with the same period of 2007. The decline was
38
CNMV
Annual Report regarding
its actions and the
securities markets. 2008
Financial liabilities acquired by non-financial companies TABLE 1.3
Million euro
% chg.
2004 2005 2006 2007 2008 1 08/07 2
Securities other than shares -219 -242 1,212 1,792 -283 —
Short-term securities 418 -422 1,272 -235 158 —
Long-term securities -636 180 -316 2,171 445 -79.6
Financial derivatives 0 0 255 -144 -887 -725.4
Loans 91,670 141,022 225,422 177,970 57,292 -58.9
Short-term loans 21,120 40,343 37,845 14,189 3,805 -80.7
Long-term loans 70,550 100,679 187,577 163,782 53,487 -55.4
Shares and other equities 37,333 33,903 24,247 52,861 23,866 -37.1
Listed shares 934 2,252 4,545 24,749 2,229 -85.4
Unlisted shares 15,732 14,351 5,417 16,504 14,668 4.4
Other equities (excluding funds) 20,667 17,300 14,284 11,608 6,969 -18.9
Insurance underwriting reserves -81 532 4 0 0 —
Other accounts receivable 30,571 54,135 61,438 30,263 220 -99.1
Total 159,274 229,350 312,323 262,886 81,096 -60.2
Source: Bank of Spain, “Financial Accounts of the Spanish Economy”.
1. Figures for 9M08.
2. Percentage change in the first three quarters of 2008 with respect to the same period of 2007.
01_Capitulo 01_INGLES.qxd 24/7/09 18:49 Página 38

substantial (Table 1.3) both in instruments more related to funding investmentprojects (long-term loans and securities) and in those associated with financingworking capital (short-term loans and other accounts receivable).Loans wereagain the sector’s main funding source, accounting for 71% of total funds raisedin the period. In the area of securities, share issues accounted for almost 21% ofthe net liabilities acquired by the sector, predominantly by unlisted companies,whereas net issuing of fixed-income securities was negative (repaymentspredominated).
In the first three quarters of 2008, financial institutions raised 43.1% less than inthe same period of 2007.The reduction in net new liabilities was concentratedparticularly in fixed-income securities because of the difficulties in the internationalmarkets in these instruments since the financial crisis began. As a result, fundsraised through fixed-income issues fell by 67% in net terms during the period ofreference, from 34.1% of the total to 22.3%. In contrast, funding through depositswas similar to the same period of 2007 and increased as a share of the total from60.2% in 2007 to 81.9%.
Financial resources raised by households also declined significantly. Specifically,between January and September, they acquired 62% less net liabilities than in thesame period of 2007. The trend was positive in the first two quarters of the year butturned negative in the third. The reduction in households’ borrowing was reflectedboth in loans and in other forms of credit.
As for households’ financial investments, the trend observed in 2007 wasaccentuated as net acquisitions of financial assets fell by 70% (24.7% in 2007). Thecomposition of this flow reveals a substantial change in households’ behaviour(Table 1.5). Net acquisition of fixed-income securities, which had been rising rapidlysince 2004, declined in 2008, and acquisition of listed equities decelerated notablybut remained positive. Selling pressure was accentuated in mutual funds, and net
39
Economic and
financial situation
Net financial assets acquired by households1 TABLE 1.4
Million euro
% chg.
2004 2005 2006 2007 2008 2 08/07 3
Cash and deposits 42,497 50,152 82,457 59,839 50,380 21.4
Securities other than shares 835 1,339 5,138 12,267 -7,288 —
Shares and other equities 15,682 19,229 -8,151 -5,323 -29,047 -449.3
Listed shares -404 2,039 -4,278 11,453 5,730 209.4
Unlisted shares 147 -1,935 -7,297 -5,211 -5,171 -38.6
Other equities (excluding funds) 2,785 1,915 1,134 150 617 433.1
Mutual fund units 13,391 17,510 2,344 -12,725 -29,099 -598.6
Shares issued by investment companies -237 -300 -54 1,010 -1,154 —
Insurance underwriting reserves4 15,675 18,136 17,281 10,801 6,054 -25.6
Other accounts receivable 5,282 5,935 10,844 3,464 -4,558 —
Total 79,970 94,792 107,568 81,039 15,540 -70.1
Source: Bank of Spain, “Financial Accounts of the Spanish Economy”.
1. Includes NPISH (Non-Profit Institutions Serving Households).
2. Figures for 9M08.
3. Percentage change in the first three quarters of 2008 with respect to the same period of 2007.
4. Includes pension plans.
01_Capitulo 01_INGLES.qxd 24/7/09 18:49 Página 39

redemptions amounted to more than double the previous year’s figure. In contrast,deposits increased by 21.4%, which is very significant in view of the sharp declineworldwide in net financial investment by households. The shift towards depositswas favoured by rising yields on these instruments in contrast with alternativeinstruments and the rising perception of risk associated with the latter. The increaseof the ceiling on deposit insurance to 100,000 euro in October contributed tomaintaining deposits’ appeal to investors.
Households’ net investment in financial assets declined by 9.6% between December2007 and September 2008, mainly as a result of the decline in asset prices. Inparticular, falling share prices accounted for 33% of the decline in the value ofhouseholds’ equity holdings3. As shown in Figure 1.15, the composition ofhouseholds’ financial assets has changed significantly: cash and deposits accountfor 45% of the total, compared with 38.1% in 2007, while equities and collectiveinvestment declined in importance from 38.9% to 29.8% of the total. The weightingof fixed-income securities and insurance underwriting reserves and pension fundswere practically unchanged: 2.3% and 14.9%, respectively.
The non-resident sector continues to play an essential role in financing the Spanish economy
Overall, the Spanish economy is still heavily dependent on external borrowing sincesaving by resident sectors is insufficient. Nevertheless, the rising trend observed inthe economy’s borrowing requirement in recent years was curtailed (Figure 1.13),with the 2008 figure being similar to the 2007 figure (9.6% of GDP, compared with9.7% in 2007).This trend was driven primarily by households and non-financialcompanies, whose borrowing requirements declined significantly due to greater
40
CNMV
Annual Report regarding
its actions and the
securities markets. 2008
Financial assets held by households1 FIGURE 1.17
Source: Bank of Spain, "Financial Accounts of the Spanish Economy".
1. Includes NPISH (Non-Profit Institutions Serving Households).
2. The balances for 2008 refer to the first three quarters.
0
500
1,000
1,500
2,500 Billion euro
Cash and deposits Fixed-income SharesMutual funds Insurance underwriting reserves Other
2,000
2004 2005 2006 2007 20082
3. See Annex I.2.
01_Capitulo 01_INGLES.qxd 24/7/09 18:49 Página 40
creo

saving in both segments and to a significant decline in residential investment onthe part of households.
In line with the behaviour of the private resident sector, the acquisition ofdomestic financial assets by the non-resident sector declined by 28.1% inmonetary terms. And the composition of these holdings also changed substantially.Net investment in fixed-income continued the trend that commenced in 2007 andfell sharply, from 83% in 2006 to a mere 2% in 2008. In contrast, net investmentin deposits gained ground; deposits accounted for 65% of the total, up from 1% in2006 and 32% to 2007.
Net financial assets acquired by the non-resident sector TABLE 1.5
Million euro
% chg.
2004 2005 2006 2007 2008 2 08/07 3
Cash and deposits 1 14,140 51,284 3,133 76,514 91,295 103.2
Securities other than shares 104,055 143,478 212,869 83,069 2,984 -97.1
Loans 10,593 20,806 35,026 29,864 15,093 -15.4
Shares and other equities 22,866 7,870 -1,230 45,326 31,143 11.5
Listed shares 6,110 -6,556 -19,674 29,911 7,867 -53.5
Unlisted shares 9,473 11,984 12,839 10,288 19,551 183.7
Other equities (excluding funds) 6,672 5,926 4,954 5,549 4,574 11.3
Mutual fund units 612 -3,485 652 -421 -849 —
Other accounts receivable 1,317 5,752 5,176 3,551 520 -82.8
Total 152,972 229,191 254,973 238,324 141,035 -28.1
Source: Bank of Spain. “Financial Accounts of the Spanish Economy”.
1. Includes monetary gold and special drawing rights (SDR).
2. Figures for 9M08.
3. Percentage change in the first three quarters of 2008 with respect to the same period of 2007. 41
Economic and
financial situationSurplus (+)/borrowing(-) by the FIGURE 1.18
Spanish economy (% of PIB)
Source: Bank of Spain, "Financial Accounts of the Spanish Economy".
1. The figures for 2008 are the sum of the figures for the first three quarters of that year plus the fourth
quarter of 2007.
-10
-8
-6
-4
-2
0
2
4
Households and NPISHNon-financial companies
Public Administration
Financial institutions
National economy
-12
200812004 2005 2006 2007
-4.5
-7.1
-9.2
-11.1
-9.0
0.6 0.9 0.61.9 1.8
-0.7 -1.2 -1.9-2.7
-0.7-0.4
1.02.0 2.2
-1.6
01_Capitulo 01_INGLES.qxd 24/7/09 18:49 Página 41
creo
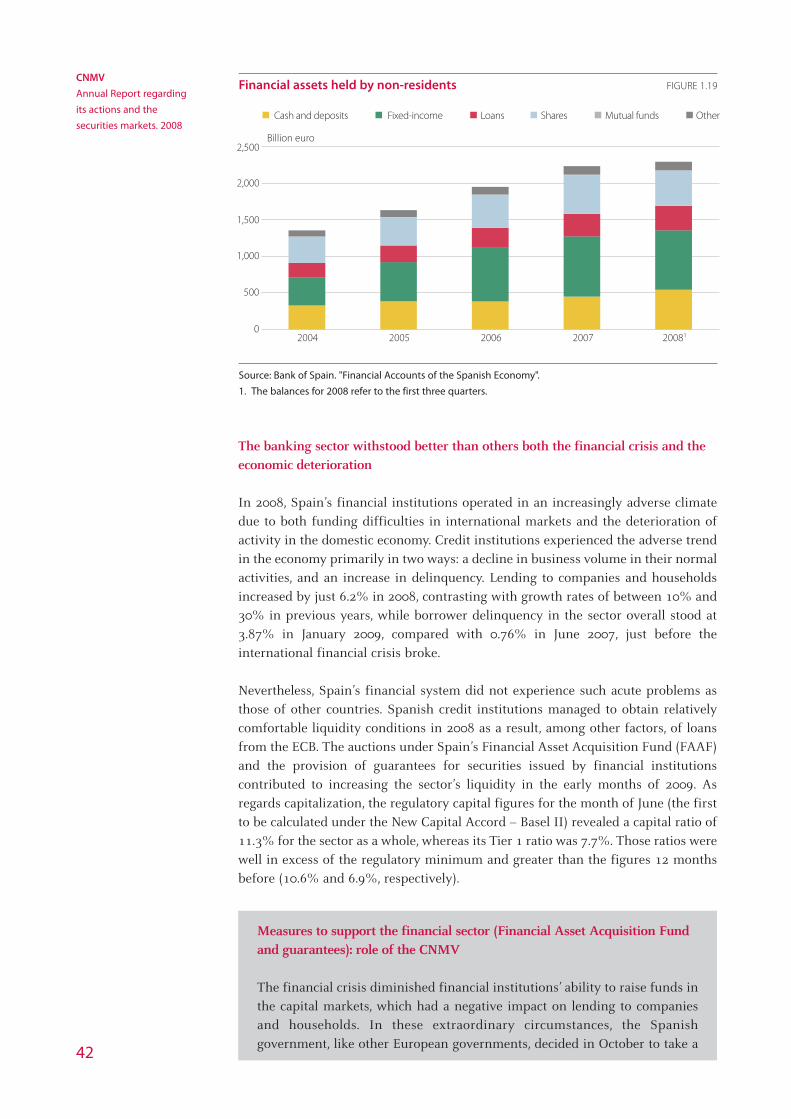
42
CNMV
Annual Report regarding
its actions and the
securities markets. 2008
The banking sector withstood better than others both the financial crisis and theeconomic deterioration
In 2008, Spain’s financial institutions operated in an increasingly adverse climatedue to both funding difficulties in international markets and the deterioration ofactivity in the domestic economy. Credit institutions experienced the adverse trendin the economy primarily in two ways: a decline in business volume in their normalactivities, and an increase in delinquency. Lending to companies and householdsincreased by just 6.2% in 2008, contrasting with growth rates of between 10% and30% in previous years, while borrower delinquency in the sector overall stood at3.87% in January 2009, compared with 0.76% in June 2007, just before theinternational financial crisis broke.
Nevertheless, Spain’s financial system did not experience such acute problems asthose of other countries. Spanish credit institutions managed to obtain relativelycomfortable liquidity conditions in 2008 as a result, among other factors, of loansfrom the ECB. The auctions under Spain’s Financial Asset Acquisition Fund (FAAF)and the provision of guarantees for securities issued by financial institutionscontributed to increasing the sector’s liquidity in the early months of 2009. Asregards capitalization, the regulatory capital figures for the month of June (the firstto be calculated under the New Capital Accord – Basel II) revealed a capital ratio of11.3% for the sector as a whole, whereas its Tier 1 ratio was 7.7%. Those ratios werewell in excess of the regulatory minimum and greater than the figures 12 monthsbefore (10.6% and 6.9%, respectively).
Measures to support the financial sector (Financial Asset Acquisition Fundand guarantees): role of the CNMV
The financial crisis diminished financial institutions’ ability to raise funds inthe capital markets, which had a negative impact on lending to companiesand households. In these extraordinary circumstances, the Spanishgovernment, like other European governments, decided in October to take a
Financial assets held by non-residents FIGURE 1.19
Source: Bank of Spain. "Financial Accounts of the Spanish Economy".
1. The balances for 2008 refer to the first three quarters.
0
500
1,000
1,500
2,500Billion euro
2004 2005 2006 2007 20081
Cash and deposits Fixed-income Loans Shares Mutual funds Other
2,000
01_Capitulo 01_INGLES.qxd 24/7/09 18:49 Página 42
creo

43
Economic and
financial situationnumber of measures to restore confidence in the financial system and boostlending to companies and households by financial institutions.
The first measure was the creation, under Royal Decree-Law 6/2008, of theFinancial Asset Acquisition Fund (FAAF), financed out of the CentralGovernment budget for an amount of 30 billion euro, with the possibility ofexpanding to 50 billion euro. The acquisition of assets (either in the form oftwo-year repos or outright purchases of assets with a maturity of three years)took place in the form of a system of auctions; by mid-March, four auctionshad taken place and the FAAF had acquired assets worth 19.3 billion eurofrom 54 institutions.
The second measure was the authorization, under Royal Decree-Law 7/2008.to grant guarantees for new funding transactions by credit institutionsresident in Spain. The maximum amount of guarantees was 100 billion euro;by mid-March there had been eight guaranteed bond issues amounting to atotal of 11.1 billion euro.
The CNMV advised the Directorate-General of the Treasury and FinancialPolicy on the practical implementation of these measures. The CNMV alsoprovided support to the issuers of these securities by expediting approval andsubsequent listing of the issues since one of conditions to qualify for aguarantee by the State or to be acquired by the FAAF is that the securitiesmust be listed on an organized market. The CNMV is also present on theTechnical Advisory Committee of the FAAF Executive Commission, where ithas two representatives out of the nine members.
Sharp increase in issues of public debt
As in the other industrialized countries, the rising public sector borrowingrequirement was reflected in a substantial increase in fixed-income issuing,particularly by the Central Government. Gross issues of public debt amounted to124.4 billion euro, more than twice the 2007 figure, and net issues amounted to 51.5billion euro (the net figure was negative in 2007). Gross issues by the CentralGovernment, which accounted for slightly over 90% of the total, increased both inthe short maturities (Letras del Tesoro) and in the long maturities (Bonos andObligaciones), and issuing was particularly intense from September onwards. Theincrease in the outstanding balance of public debt combined with investors’preference for liquidity and low-risk assets led to a sharp increase in secondary-market trading in all forms of the short-term segment (held-to-maturity, cash, reposand sell/buybacks and buy/sellbacks). However, the long term segment (whichrepresents the bulk of trading) saw a notable decline, particularly in cashtransactions, in the final months of the year, coinciding with the sharp increase inissues in the primary market. The performance of the domestic public debt markets,both primary and secondary, is analysed in greater detail in Chapter 3.
Public debt yields generally followed the same pattern as in the mainindustrialized countries. Yields on Letras rose steadily until July, driven byinflation and expectations of greater recourse to the market by the public sector inthe short term. However, after the summer, the change in the inflation trend andexpectations that the ECB would cut base rates, coupled with rising risk aversionand a preference for liquidity on the part of investors, exerted strong downward
01_Capitulo 01_INGLES.qxd 24/7/09 18:49 Página 43

pressure on the yield on Letras. As for Bonos and Obligaciones, yields rose steadilyuntil mid-year and then declined due to the downgrade of economic growthprospects. Overall, the yields on short-term assets fell more than those on long-term assets in 2008. At the end of the year, the yield on one-year Letras was 2.12%.whereas the yield on 10-year Bonos was 3.96%. The yield gap of long-term debtwith respect to Germany continued to widen (Figure 1.20). The gap continued toexpand during part of January 2009, peaking at 123 basis points when Standard &Poor’s downgraded the rating of Spain’s public debt (from AAA to AA+); fromthat point onwards, the gap eased and was slightly over 80 basis points at the endof March.
Decline in private fixed-income issues
There was a substantial reduction in 2008 in fund-raising through new bond issuesby the private sector. Overall, gross private fixed-income issues fell 21.7% to closeto 589 billion euro, while net issuing fell by 64.5% to 80.5 billion euro. As usual,financial institutions accounted for the bulk of issues (almost 98% of the total). Thedecline in gross issuing, which affected both short and long-term instruments.including commercial paper, was considerably lower in the ABS segment than inother segments (see, for example, Table 3.3). Nevertheless, the bulk of new asset-backed securities were acquired by the financial institutions that originated them inorder to accumulate assets that qualified as collateral for funding transactions withthe ECB. The main feature of secondary market trading was a sharp increase intrading volume in AIAF, Spain’s main private sector fixed-income market. Tradingthere increased by nearly 124% due to transactions by the Public Treasury fromMarch onwards, basically very short-term sell/buybacks and buy/sellbacks of ABSs.The Financial Asset Acquisition Fund also began to trade as a member of thatmarket in November (see Chapter 3 for more detail).
As occurred with public debt, yields on private fixed-income securities in the AIAFmarket rose until September in the case of commercial paper and until July in thecase of bonds and debentures. Those yields fell sharply in the final months of theyear. The higher risk perception led to a notable increase in the yield spread overTreasury securities, which was greater in the case of commercial paper than in the44
CNMV
Annual Report regarding
its actions and the
securities markets. 2008
Yield on Spanish long-term government debt FIGURE 1.20
Source: Datastream and CNMV.
0
1
2
3
4
5
6
Dec-04 Jun-05 Dec-05 Jun-06 Dec-06 Jun-07 Dec-07 Jun-08 Dec-08
-0.2
0.0
0.2
0.4
0.6
0.8
1.0
10-year bond IRR (LHS) Spain-Germany differential (RHS)
%%
01_Capitulo 01_INGLES.qxd 24/7/09 18:49 Página 44
creo

case of bonds. The risk premiums of Spanish issuers traded in the credit derivativesmarket increased even more, particularly during the second half of the year, due tothe weighting of the financial sector (Figure 1.21). The increase in premiums wasaccompanied by frequent rating downgrades of some financial institutions becauseof their exposure to the real estate market and of the economy’s performance.Downgrades were also frequent in the first two months of 2009 and CDS spreadswidened even more intensely.
Share prices fell in line with the main European bourses
The Ibex 35 index lost 39.4% in 2008, the largest year-on-year decline in itshistory. The index’s performance over time was similar to that of other indices.Declines, which predominated during the year, were particularly intense in theperiods when the international financial crisis was at its height (January, May-July, and October). In particular there was a drastic decline in October (close to20%) in the context of a general slump by international equity markets as aresult of deep distrust of the financial sector and uncertainty about its futurefollowing the collapse and government intervention of certain big USinstitutions. The October slump was accompanied by a very steep increase in thevolatility of Ibex 35 contracts that are traded on MEFF; it actually exceeded 100%in one session, compared with an average of 36% in 2008 (Figure 1.22). Theindex performance continued to be clearly negative in the first three months ofthe year, in line with the big international markets, and the 15% declineessentially reflected persisting worldwide distrust of the financial system andthe future of the economy.
All sectors of the stock exchange were affected by the declines, though not to thesame extent (Figure 1.23). The sharpest losses were experienced by the financialsector and the non-financial sectors most exposed to the economic cycle,particularly construction, materials, industry, and certain consumer services,especially those related to hospitality and tourism. Small- and mid-cap stocksexperienced a greater decline in price than did large caps, as reflected by theperformance of the Ibex index for this segment and by the Barcelona Stock 45
Economic and
financial situation
Risk premium of Spanish issuers1 FIGURE 1.21
Source: Markit
1. Credit derivatives market. All categories of credit risk. 5-year maturity. Simple average.
Dec-080
50
100
150
200
250
300
350
400
Jun-07 Dec-07 Jun-08
Financial institutions Non-financial entities TotalBasis points
01_Capitulo 01_INGLES.qxd 24/7/09 18:49 Página 45
creo
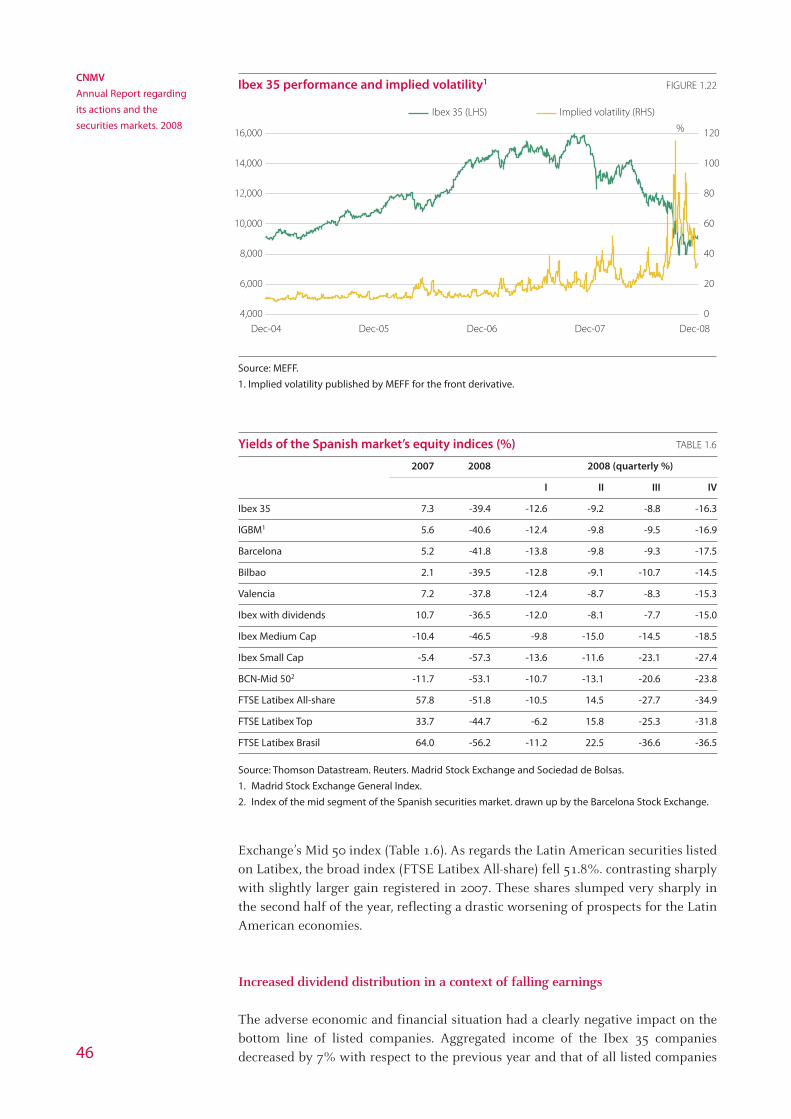
Exchange’s Mid 50 index (Table 1.6). As regards the Latin American securities listedon Latibex, the broad index (FTSE Latibex All-share) fell 51.8%. contrasting sharplywith slightly larger gain registered in 2007. These shares slumped very sharply inthe second half of the year, reflecting a drastic worsening of prospects for the LatinAmerican economies.
Increased dividend distribution in a context of falling earnings
The adverse economic and financial situation had a clearly negative impact on thebottom line of listed companies. Aggregated income of the Ibex 35 companiesdecreased by 7% with respect to the previous year and that of all listed companies46
CNMV
Annual Report regarding
its actions and the
securities markets. 2008
Ibex 35 performance and implied volatility1 FIGURE 1.22
Source: MEFF.
1. Implied volatility published by MEFF for the front derivative.
%
4,000
6,000
8,000
10,000
12,000
14,000
16,000
Dec-04 Dec-05 Dec-06 Dec-07 Dec-08
0
20
40
60
80
100
120
Ibex 35 (LHS) Implied volatility (RHS)
Yields of the Spanish market’s equity indices (%) TABLE 1.6
2007 2008 2008 (quarterly %)
I II III IV
Ibex 35 7.3 -39.4 -12.6 -9.2 -8.8 -16.3
IGBM1 5.6 -40.6 -12.4 -9.8 -9.5 -16.9
Barcelona 5.2 -41.8 -13.8 -9.8 -9.3 -17.5
Bilbao 2.1 -39.5 -12.8 -9.1 -10.7 -14.5
Valencia 7.2 -37.8 -12.4 -8.7 -8.3 -15.3
Ibex with dividends 10.7 -36.5 -12.0 -8.1 -7.7 -15.0
Ibex Medium Cap -10.4 -46.5 -9.8 -15.0 -14.5 -18.5
Ibex Small Cap -5.4 -57.3 -13.6 -11.6 -23.1 -27.4
BCN-Mid 502 -11.7 -53.1 -10.7 -13.1 -20.6 -23.8
FTSE Latibex All-share 57.8 -51.8 -10.5 14.5 -27.7 -34.9
FTSE Latibex Top 33.7 -44.7 -6.2 15.8 -25.3 -31.8
FTSE Latibex Brasil 64.0 -56.2 -11.2 22.5 -36.6 -36.5
Source: Thomson Datastream. Reuters. Madrid Stock Exchange and Sociedad de Bolsas.
1. Madrid Stock Exchange General Index.
2. Index of the mid segment of the Spanish securities market. drawn up by the Barcelona Stock Exchange.
01_Capitulo 01_INGLES.qxd 24/7/09 18:49 Página 46
creo

by 28.3%, suggesting that larger companies performed better in terms of earnings.Outside the financial sector, earnings in 2008 increased in the energy sector(basically as a result of the gains on the sale of Endesa assets) but fell significantlyin industrial and services sectors and turned negative in construction and realestate. The aggregated income of listed non-financial companies fell 38.2% withrespect to 2007. The financial sector experienced a smaller decline in aggregatedincome: approximately 12%. Tables 5 and 6 of Annex I offer greater detail ofearnings performance and the impact on returns, respectively.
Shareholder remuneration1 TABLE 1.7
Million euro
Reduction of
par value and Total/previous
refund of year’s
Issue premium capital capitalisation
Dividends refund contribution Total (%)
2001 8,474.4 42.0 217.2 8,733.6 2.0
2002 8,446.8 28.8 223.8 8,699.3 2.0
2003 9,411.5 2,480.8 273.0 12,165.2 3.7
2004 11,678.0 2,288.8 208.5 14,175.4 3.4
2005 14,435.7 4,463.8 224.0 19,123.5 3.8
2006 21,809.7 513.0 761.2 23,084.0 3.9
2007 23,338.9 126.6 — 23,465.5 3.2
2008 28,065.0 346.6 — 28,411.6 3.7
Source: Bolsas y Mercados Españoles (Madrid Stock Exchange magazine, January 2008) and CNMV.
1. Figures for companies listed on the Madrid Stock Exchange.
Despite a sharp decline in earnings, listed companies increased dividendssignificantly, by around 20%, probably in an attempt to compensateshareholders for the decline in share price while also giving the market a positivesignal about their prospects. If the Ibex 35 companies had reinvested thedividend, this would have curtailed the decline in the index by about 2.8% atyear-end (Figure 1.24). 47
Economic and
financial situationMadrid Stock Exchange sector yields FIGURE 1.23
Source: Datastream and Madrid Stock Exchange.
2007 2008
Financial services and real estate
Consumer services
Consumer goods
Technology and telecommunications
Commodities, industry and construction
Oil and energy
-60 -50 -40 -30 -20 -10 0 10 20 30 40
01_Capitulo 01_INGLES.qxd 24/7/09 18:49 Página 47
creo

Decline in stock market trading, capitalization, capital increases and initial public offerings
The sharp reduction in prices had a negative effect on the volume of stock markettrading, which fell 26% in monetary terms. However, other indicators, such as thenumber of securities traded (which increased by 8%) and the number of trades(+7%), reveal that activity in the secondary markets in equities remained very high,exceeding even that of 2007. The adverse price performance also depressedcapitalization, which fell by 37.8% with respect to the previous year. This decline incapitalization was not offset to any great extent by capital increases and IPOs. Infact, there were no IPOs in 2008 and capital increases fell sharply in terms of bothnumber and total amount.
1.3 Economic and financial outlook
The international agencies’ projections for the world in 2009 involve economicrecession, with varying degrees of intensity, in the industrialized countries, andweak (if not negative) growth in the developing countries. Some recent forecastseven point to negative growth by the world economy overall. The most optimisticscenarios suggest that the first signs of a recovery will be observed in the secondhalf of the year as a result of the measures adopted by the monetary and fiscalauthorities to support the economy and the financial system. In general, the currentforecasts agree that growth will begin to recover, albeit slowly at first, from 2010onwards.
In any event, recovery by the world economy would require a restoration ofconfidence in the financial sector, whose deterioration from August 2007 onwardswas indisputably the main trigger of the current economic crisis. In the first twomonths of 2009, the markets displayed an intense negative reaction to the releaseof further adverse figures with regard to North American and European financialinstitutions and to the uncertainty about the scope of government intervention tosupport them, revealing that this serious problem, which generates systemic48
CNMV
Annual Report regarding
its actions and the
securities markets. 2008
Dividends paid by Ibex 35 companies FIGURE 1.24
Source: Sociedad de Bolsas and CNMV.
1. Difference in annual yield between the Ibex 35 with dividends and the Ibex 35. Monthly moving average.
0
5,000
10,000
15,000
20,000
25,000
30,000
Dec-04 Dec-05 Dec-06 Dec-07 Dec-081.5%
2.0%
2.5%
3.0%
3.5%
4.0%
4.5%
Ibex 35 (LHS) Ibex 35 Dividends (LHS) Differences in yield (RHS)1
01_Capitulo 01_INGLES.qxd 24/7/09 18:49 Página 48

instability and weighs on the real economy, is persisting. In the coming months, itmay be necessary to maintain direct or indirect financial support by government tofinancial institutions (equity stakes, secured or unsecured loans, guarantees, etc.),but it will also be necessary to make progress with the reforms to regulation andsupervision envisaged by the international bodies in order to guarantee long-termconfidence in the financial system. Chapter 14 summarizes the main initiatives byinternational bodies in this area.
Fiscal policy is playing a central role in the strategies designed by governments inthe industrialized countries to stimulate the economy. The goal is to impacteconomic activity in the short term by using public expenditure to offset the declinein expenditure by consumers and companies or to stimulate the latter by tax cutsand financial aid. Therefore, the efficacy of these measures in reviving economicactivity should become visible in the next few months. However, they will also havelonger-term effects. A growing number of analysts are drawing attention to thelarge simultaneous increase in public debt issues throughout the world. Inparticular, they are expressing doubts about the sustainability of governmentindebtedness in some countries and suggest that the market may significantlyincrease the costs of public debt in countries with a greater fiscal imbalance and lessliquid debt markets. In the longer term, there is also uncertainty about the fiscalburden created by the current expenditure programs and the impact of public debton private-sector funding.
As for the Spanish economy, the current projections are for a recession which,according to the European Commission, may be somewhat more intense andlonger-lasting than in the rest of the euro area. A recovery by the Spanish economydepends necessarily on a recovery worldwide, but also on certain specific featuresof our economy. In particular, the Spanish economy already has a large number ofunemployed, far more than in neighbouring countries, and the number willprobably increase significantly in the coming months. This factor may continue todepress consumer expectations and favour a continuing cautious approach toexpenditure while also contributing to an increase in loan delinquency.
Another characteristic that may delay the process of recovery in Spain is theperformance of real estate prices, which are apparently more rigid than in other
49
Economic and
financial situation
Spain's housing market. Production and prices FIGURE 1.25
Source: INE and Datastream.
900,000
800,000
700,000
600,000
500,000
400,000
300,000
200,000
New homes. Thousands construction permits (RHS)
Price change. % difference with respect to CPI (LHS)%
15
10
5
0
-5
-10Dec-04 Jun-05 Dec-05 Jun-06 Dec-06 Jun-07 Dec-07 Jun-08 Dec-08
01_Capitulo 01_INGLES.qxd 24/7/09 18:49 Página 49
creo

economies. Although property prices have been falling steadily in the last fewmonths, the decline has yet to match expectations (Figure 1.25). The delay in theadjustment of property prices may, in turn, postpone the correction of the surplussupply in the sector and have a negative impact on loan delinquency, on lending,and on job creation and value-added in the real estate sector and in the broadeconomy.
However. Spain has some strengths with which to address the economic difficultiesin the coming months. One of these is the situation of the banking system, whichhas weathered the economic and financial difficulties in a better position than othercountries’ banking systems. To date, public-sector measures to support the financialsector have not included nationalization or direct equity stakes, and the amountsinvolved have been considerably smaller. A second factor that may favour thedevelopment of new active policies against the crisis is the public sector’s low levelof indebtedness, which would remain low in comparison with other countries evenin the worst-case scenario for growth in public debt. This fact will make it easier forthe Treasury to raise funding and will limit the negative impact of potential explicitor implicit downgrades of the sovereign rating.
50
CNMV
Annual Report regarding
its actions and the
securities markets. 2008
01_Capitulo 01_INGLES.qxd 24/7/09 18:49 Página 50

II Market and issuers
02_Capitulo 02_INGLES.qxd 24/7/09 18:50 Página 51

02_Capitulo 02_INGLES.qxd 24/7/09 18:50 Página 52

Markets and issuers
Equity Markets
53
2 Equity markets
The performance of Spain’s equity markets in 2008 reflected financial sectordifficulties and the economy’s downward spiral during the year. The Ibex 35 indexaccumulated the largest annual decline in its history, shedding 39.4%, in line withthe performance of the principal market indices worldwide. This slump impactedall sectors, although the hardest hit were financials and those with the greatestexposure to the economic cycle. The year’s most tumultuous moments were markedby falling prices accompanied by substantial upswings in volatility which, in thelast quarter of the year, exceeded the record set in other episodes of turbulence, suchas the 1998 financial crisis and the 2001 terrorist attacks.
Tumbling share prices pushed effective trading volume down from its 2007 recordhigh; however, there was a significant increase in both the number of transactionsand of securities traded, the latter rising for 24 of the 35 companies comprising theIbex. The negative market performance was also visible in the number of initialpublic offerings: there was one IPO in all of 2008. Moreover, both the number andsize of takeover bids declined substantially. The new regulatory framework fortakeover bids was applied for the first time in 2008.
2.1 Market size
2.1.1. Market capitalisation
The capitalisation of companies listed on Spanish stock exchanges amounted to476 billion euro at 2008 year-end, a 37.8% decline, similar to that experienced byother leading national equity indices (Table 2.1). Domestic companies trading onthe electronic and open outcry markets accounted for 98.7% and 1.2% of totalcapitalisation, respectively; the tiny remainder are foreign companies trading on theelectronic market and on the second market.
As shown in Table 2.2, banks experienced the greatest loss in capitalization,followed by transport and communications (due to the size of Telefónica) andenergy and water (losses by Iberdrola, Iberdrola Renovables and Endesa, though allthree by less than the Ibex 35). However, construction and real estate were hit evenharder in relative terms, losing over 50% of capitalisation in what proved to be avery difficult year. As regards real estate, six companies lost between 75% and 90%with respect to their peak capitalisation in January 2007. Table 2.2 also reflects adrastic reduction in the capitalisation of the food sector; however, this is broadlyattributable to the delisting of Altadis, which was worth 12 billion euro at the timeit was delisted.
02_Capitulo 02_INGLES.qxd 24/7/09 18:50 Página 53

CNMV
Annual Report regarding
its actions and the
securities markets. 2008
54
Market capitalisation1 in Spanish stock markets TABLE 2.1
Million euro
2005 2006 2007 2008 % chg. 08/07
All markets 595,353.1 728,698.5 764,751.6 476,031.7 -37.8
Electronic market 554,863.1 711,116.4 756,786.3 470,426.1 -37.8
Spanish 552,346.8 708,164.2 755,285.4 469,876.7 -37.8
Foreign2 2,516.3 2,952.2 1,501.0 549.4 -63.4
Open outcry3 40,045.9 17,189.4 7,678.4 5,495.7 -28.4
of which SICAV4 33,171.1 9,284.1 245.4 155.0 -36.8
Madrid 25,458.2 9,665.3 2,008.1 1,554.4 -22.6
Barcelona 9,573.2 6,285.8 4,657.8 3,609.8 -22.5
Bilbao 2,876.7 511.4 108.2 45.9 -57.6
Valencia 4,772.1 1,653.6 1,229.3 786.1 -36.1
2nd market 444.2 392.7 286.8 109.9 -61.7
Source: CNMV.
1. Includes only capitalisation of companies that were traded at some time during the year. Excludes Latibex,
MAB and ETFs.
2. The capitalisation of foreign companies listed on the Spanish exchanges is based on the number of shares
registered by Iberclear.
3. The market capitalisations of companies traded by open outcry in more than one market have been
included in the figures for each market at the price for that market. In the ‘open outcry’ total they have
been included only once.
4. Only includes investment companies registered as listed UCITS.
No. of listed companies and capitalisation by sector1 TABLE 2.2
Capitalisation in million euro
Sector 2007 2008 2007 2008 % chg. 08/07
Oil 2 2 48,762.5 36,523.1 -25.1
Energy & water 12 11 140,260.4 112,084.8 -20.1
Mining & base metals 9 9 8,429.4 4,622.2 -45.2
Cement and construction materials 5 5 5,138.7 2,535.2 -50.7
Chemicals 6 6 5,993.0 2,603.5 -56.6
Textiles and paper 20 20 36,586.8 24,194.2 -33.9
Metal-mechanical 17 17 16,527.6 9,299.0 -43.7
Food 16 14 22,217.0 7,180.4 -67.7
Construction 7 7 51,367.9 25,221.7 -50.9
Real estate 31 28 23,949.3 10,487.8 -56.2
Transport and communications 6 6 129,732.9 90,680.5 -30.1
Other non-financial 23 22 39,347.4 15,138.4 -61.5
Total non-financial sector 154 147 528,312.8 340,570.9 -35.5
Banks 13 11 202,851.2 114,506.5 -43.6
Insurance 2 2 9,597.9 8,328.8 -13.2
Portfolio companies 12 12 23,715.3 12,447.6 -47.5
SICAVs2 8 4 274.3 177.8 -35.2
Finance houses 0 0 0.0 0.0 —
Total financial sector 35 29 236,438.7 135,460.8 -42.7
Total 189 176 764,751.6 476,031.7 -37.8
Source: CNMV
1. Market capitalisation at end of year. Excludes Latibex, MAB and ETFs. The market capitalisation of foreign
companies is based on the number of shares registered with Iberclear.
2. Includes exchange-traded SICAVs only.
02_Capitulo 02_INGLES.qxd 24/7/09 18:50 Página 54

Markets and issuers
Equity Markets
55
The dearth of secondary public offerings, with the exception of Caja de Ahorros delMediterráneo’s participation share issue, eliminated this means of mitigating thedecline in capitalisation resulting from falling prices and delistings. Thecontribution from capital increases was weak and smaller than the previous year(see section 2.2).
At year-end, Telefónica was still the Spanish leader in terms of marketcapitalisation, followed by Banco Santander and BBVA; the three companiestogether accounted for 34% of the total. Large companies’ share of totalcapitalisation generally increased, reflecting a smaller decline in prices thanregistered by other companies. In 2008, six companies accounted for 50% and 16companies for 75% of the market capitalisation, i.e. fewer companies accounted fora larger share of the total than in 2007 (Table 2.3). Companies in the Ibex 35accounted for 85.3% of total market capitalisation, compared with 80.5% in 2007.
Concentration of equity market capitalisation1 TABLE 2.3
No. of companies required to attain a given percentage of total capitalisation
2007 2008
25% 50% 75% 100% 25% 50% 75% 100%
All markets 2 7 20 189 2 6 16 176
Electronic market 2 6 19 142 2 6 15 136
Spanish 2 6 19 137 2 6 15 131
Foreign2 1 2 2 5 1 2 2 5
Open outcry 1 2 5 36 1 3 7 32
2nd market 2 3 5 11 1 2 4 8
Source: CNMV.
1. Market capitalisation at end of year. Excludes Latibex, MAB and ETFs.
2. The market capitalisation of foreign companies is based on the number of shares registered by Iberclear.
The Spanish stock market is still one of the largest with respect to the size of theeconomy, in terms of capitalization and trading volume as a percentage of GDP. Infact, in the last year, the only market to exceed those ratios was London (Table 2.4).Total losses in capitalisation by European markets between August 2007 and 2008year-end are estimated at 16 trillion euro.
Market capitalisation and trading as a percentage of nominal GDP TABLE 2.4
%
Market capitalisation Trading volume
2007 2008 2007 2008
USA1 141.5 82,7 320,9 497,7
New York 111.1 64,9 207,4 237,0
Tokyo 93.8 64,0 147,4 114,8
London 139.7 65,9 372,0 228,5
Euronext2 99.9 47,1 141,9 99,
Germany 59.3 30,4 129,5 106,2
Italy 47.4 22,4 108,7 65,5
Spain 74.3 56,3 157,6 144,9
Source: International Federation of Stock Exchanges, Datastream and CNMV.
1. The numerator is the combined total of the NYSE, Nasdaq and American Stock Exchange.
2. The denominator is the sum of the nominal GDP of France, The Netherlands, Belgium and Portugal.
02_Capitulo 02_INGLES.qxd 24/7/09 18:50 Página 55

CNMV
Annual Report regarding
its actions and the
securities markets. 2008
56
2.1.2 Listed companies
Excluding SICAVs, there were a total of 173 companies listed on Spanish stockexchanges at the end of December 2008, nine less than in 2007. There were 136companies listed on the continuous market, six less than at 2007 year-end; justone company was admitted to trading on that market whereas seven weredelisted. That admission was particularly important as it was the first IPO ofparticipation shares issued by a savings bank, Caja de Ahorros del Mediterráneo.Altadis, Logista and Sogecable delisted as a result of the takeover bids by ImperialTobacco for the former two and by Prisa for the latter. Additionally, at end of2008, Banco Popular absorbed a significant number of subsidiaries, which led tothe delisting of Banco de Castilla, Banco de Crédito Balear, Banco de Galicia andBanco de Vasconia. Table 2.5 reflects listings and delistings on the open outcryand second markets.
2.2 Listings, issues and public offerings
The harsh economic and financial situation and the negative performance of shareprices created an inauspicious scenario for IPOs. In 2008 there was only onetransaction of this kind: a public offering and listing of Caja de Ahorros delMediterráneo participation shares. The offering was comprised of three tranches:65.6% for retail investors, 31% for qualified investors and the remainder foremployees. The shares, each with a par value of 2 euro, were issued with a premiumof 3.84 euro per share. The transaction raised 292 million euro.
In 2008, funds raised by companies via capital increases amounted to 16,339.7million euro, vs. 67 million euro raised in 2007. Capital increases without cashpayments barely exceeded 8,000 million euro, in contrast with 48,901 million euroin 2007. The largest such deal (over 4 billion euro) was the result of a merger ofItinere Infraestructuras (Sacyr subsidiary) into Europistas. As consideration, Itinereshareholders received newly-issued shares of Europistas with a nominal value of
Number of companies listed on the Spanish stock exchanges1 TABLE 2.5
All markets Electronic market Open outcry Second
Total Ex SICAVs Total Spanish Foreign Ex SICAVs SICAV market
Listed at 31/12/07 189 182 142 137 5 29 7 11
Listed at 31/12/08 176 173 136 131 5 29 3 8
New listings in 2008 2 2 1 1 — 1 — —
New listings 1 1 1 1 — — — —
Listed due to mergers — — — — — — — —
Change of market 1 1 — — — 1 — —
Delistings in 2008 15 11 7 7 — 1 4 3
Delistings 8 6 3 3 — 1 2 2
Delisted due to mergers 4 4 4 4 — — — —
Change of market 3 1 — — — — 2 1
Net change in 2008 -13 -9 -6 -6 0 0 -4 -3
Source: CNMV.
1. Totals do not include MAB, Latibex and ETFs.
02_Capitulo 02_INGLES.qxd 24/7/09 18:50 Página 56

Markets and issuers
Equity Markets
57
267 million euro. The second-largest non-monetary capital increase was performedby Banco Santander to finance the acquisition of UK bank Alliance & Leicester andamounted to 1.4 billion euro. Capital increases with cash payments amounted to7,474 million euro. Of special note is Banco Santander’s 7,194.6 million euro capitalincrease, as it was the largest-ever new share issue for cash in the history of Spain’sstock market.
Primary and secondary public offerings1 TABLE 2.6
Number of issuers Number of issues
2007 2008 Chg. 08/07 2007 2008 Chg. 08/07
Capital increases 40 25 -15 71 34 -37
of which primary offerings2 6 1 -5 8 1 -7
With Spanish tranche 6 1 -5 8 1 -7
With international tranche 2 0 -2 2 0 -2
Secondary offerings 7 1 -6 11 1 -10
Spanish tranche 7 1 -6 11 1 -10
International tranche 2 0 -2 2 0 -2
Total 44 26 -18 82 35 -47
Pro memoria: IPOs
Primary or secondary offering2 10 2 -8 19 2 -17
Others3 4 — — 4 — —
Source: CNMV.
1. Includes only transactions that succeeded, excluding those that were not completed.
2. Public offering of warrants after shareholders waived their preferential subscription rights. 2008 data
includes listing of Caja de Ahorros del Mediterráneo’s participation shares and the exercise of the green
shoe in the Laboratorios Rovi’s transaction.
3. 2007 data includes listings of ArcelorMittal (ex Arcelor), Reyal Urbis, Martinsa-Fadesa and Vértice 360.
Primary and secondary public offerings1: cash amount TABLE 2.7
Million euro
2007 2008 % change 08/07
Capital increases 67,581.8 16,339.7 -75.8
of which primary offerings2 8,502.7 292.0 -96.6
With Spanish tranche 4,821.3 292.0 -93.9
With international tranche 3,681.4 0.0 —
Secondary offerings 2,068.5 9.5 -99.5
Spanish tranche 1,517.1 9.5 -99.
International tranche 551.4 0.0 —
Total 69,650.3 16,349.2 -76.5
Pro memoria: IPOs
Primary or secondary offerings2 10,571.2 301.5 -97.1
Others3 74,207.1 — —
Source: CNMV.
1. Includes only transactions that succeeded, excluding those that were not completed.
2. Public offering of warrants after shareholders waived their preferential subscription rights. 2008 data
includes listing of Caja de Ahorros del Mediterráneo’s participation shares and the exercise of the green
shoe in the Laboratorios Rovi’s transaction.
3. 2007 data includes listings of ArcelorMittal (ex Arcelor), Reyal Urbis, Martinsa-Fadesa and Vértice 360.
02_Capitulo 02_INGLES.qxd 24/7/09 18:50 Página 57

2.3 Trading
2.3.1. Spot trading
Trading amounted to 1.23 trillion euro in 2008, down 26% with respect to theprevious year. Average daily trading dwindled during the year, from 8.3 billioneuro in January to 3.209 million euro in December. The significant slump intrading essentially reflected the decline in prices. This is the conclusion that can bedrawn from the fact that the number of securities that changed hands (120 billion)was 8% higher than in 2007, and that this figure increased in more than half of theIbex stocks. Turnover velocity, i.e. trading/capitalisation, suggests a similarinterpretation. This activity indicator rose moderately in 2008 (Figure 2.1). Data forthe first few months of 2009 suggests that trading declined not only in monetaryterms but also in volume. Trading volume fell 57% in monetary terms with respectto the same period of 2008, i.e. by significantly more than the decline in prices inthe period.
Certain indicators, such as Kyle’s Lambda (see figure 2.1) and the bid-ask spread,suggest that market liquidity worsened during the course of the year, especially inthe last quarter; however, the most recent data indicates a slight improvement, inconjunction with a reduction in volatility.
Practically all trading (99.8%) was conducted on the electronic market (Table 2.8).The average turnover per session fell from 6.5 billion euro in 2007 to 4.8 billion euroin 2008. However, the number of trades reached 36.9 million, up 7% on the figurefor 2007. The average cash value per trade was 33,262 euro in 2008, down from47,866 euro in 2007. This decline (30%) is primarily attributable to falling shareprices.
There was another substantial decline in trading on the open outcry market and anincrease in trading of exchange-traded funds (ETFs), in line with the trend in thissegment since its creation in 2006.
58
CNMV
Annual Report regarding
its actions and the
securities markets. 2008
Liquidity - electronic market FIGURE 2.1
Source: Sociedad de Bolsas and CNMV.
1. Percentage of total annual trading volume / average monthly market capitalization.
2. Percentage of market capitalization needed to change the Ibex 35 index by 1%.
% s/capitalization
0.00
0.01
0.02
0.03
0.04
Turnover velocity (LHS)1 Kyle’s Lambda for Ibex 35 (RHS)2
92.1
102.5106.5
188.5
198.7
162.7
88.488.2
113.0
60
90
120
150
180
210
2000 2001 2002 2003 2004 2005 2006 2007 2008
02_Capitulo 02_INGLES.qxd 24/7/09 18:50 Página 58
creo

The bulk of trading took place in the regular session, essentially through order-based trades and block-trading, a system which tends to be used by large foreigninstitutional investors (Table 2.9). There was a significant reduction in trading ofsecondary public offerings and an increase in hedging, most likely linked to futureson individual shares traded in MEFF Renta Variable.
Trading on the electronic market by type1 TABLE 2.9
Million euro
% chg.
2004 2005 2006 2007 2008 08/07
Regular trading 599,874.16 798,934.52 1,080,120.49 1,577,249.52 1,180,835.86 -25.13
Order-based 353,532.04 488,416.30 658,891.08 985,087.62 774,718.09 -21.36
Put-throughs 71,360.13 82,403.14 105,899.37 155,085.09 105,673.87 -31.86
Block trades 174,981.99 228,115.08 315,330.05 437,076.80 300,443.90 -31.26
Off-hours 26,037.32 27,863.00 11,648.76 18,301.45 10,175.15 -44.40
Authorised trades 1,367.17 4,773.43 4,052.07 4,189.58 3,183.17 -24.02
Transactions under
Securities Market
Act art. 36.1 826.00 1.33 6,439.69 0.00 0.00 —
Takeover bids 1,698.82 6,682.77 18,094.55 26,284.25 17,461.18 -33.57
Secondary offerings 3,057.16 226.35 3,263.99 11,177.45 292.00 -97.39
Pre-registered
off-market 278.50 2,298.89 10,347.91 2,954.39 1,066.80 -63.89
Exercise of options 3,388.25 5,268.01 8,279.81 10,240.38 9,661.89 -5.65
Hedging — 1,615.44 2,315.62 2,957.82 5,716.32 93.26
Source: CNMV.
1. Does not include figures for Latibex, MAB or ETFs.
59
Markets and issuers
Equity MarketsEquity trading in Spanish stock markets TABLE 2.8
Million euro
% chg.
2.004 2.005 2.006 2.007 2.008 08/07
All markets 641,742.37 853,588.12 1,149,930.31 1,654,702.11 1,228,631.52 -25.75
Electronic market 636,527.38 847,663.72 1,144,562.88 1,653,354.83 1,228,392.36 -25.70
Spanish 630,361.68 832,548.61 1,133.012.61 1,645,855.52 1,226,985.25 -25.45
Foreign 6,165.69 15,115.11 11,550.28 7,499.31 1,407.11 -81.24
Open outcry 5,193.68 5,898.46 5,318.15 1,154.43 207.46 -82.03
Madrid 3,316.03 3,671.08 3,231.49 515.51 94.43 -81.68
Bilbao 212.65 241.69 403.08 5.22 0.10 -98.16
Barcelona 1,123.63 1,560.22 1,192.26 444.37 106.96 -75.93
Valencia 541.38 425.47 491.32 189.33 5.97 -96.85
2nd market 21.31 25.94 49.28 192.85 31.71 -83.56
ETF — — 1,827.06 4,664.48 6,938.09 48.74
Alternative stock
market (MAB) — — 1,814.19 6,985.21 7,060.34 1.08
Latibex 366.42 556.73 723.28 868.23 757.74 -12.72
Source: CNMV.
02_Capitulo 02_INGLES.qxd 24/7/09 18:50 Página 59
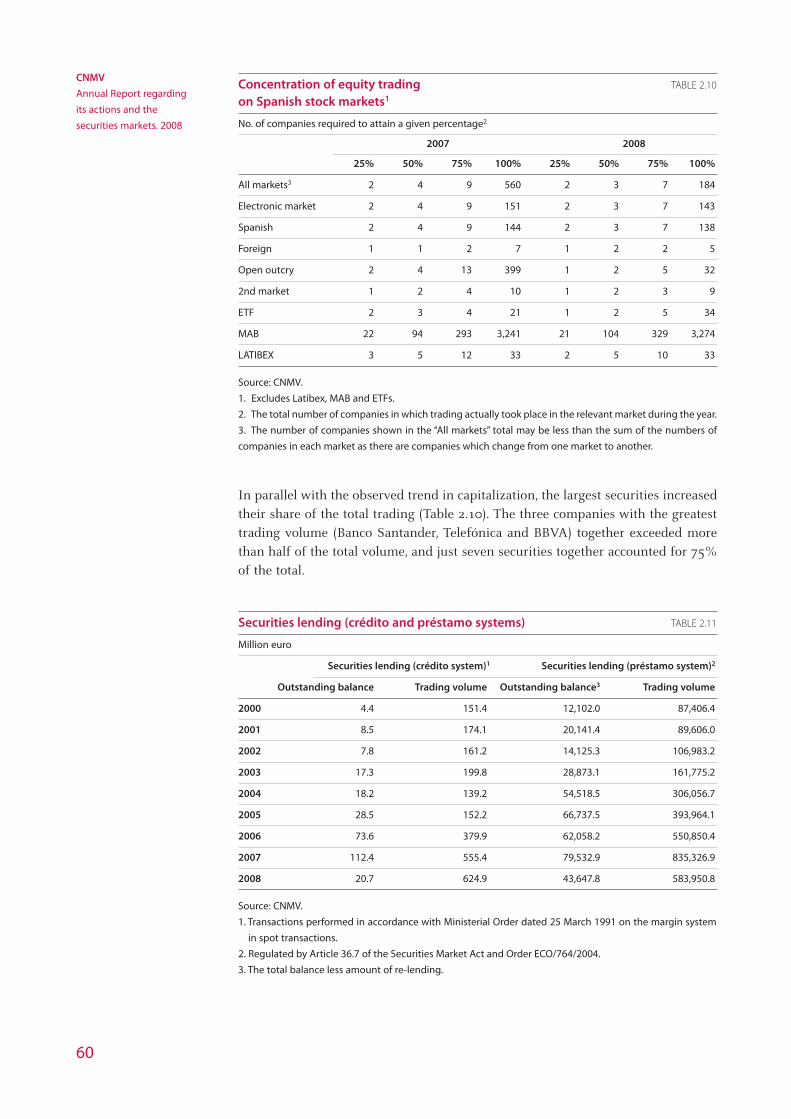
In parallel with the observed trend in capitalization, the largest securities increasedtheir share of the total trading (Table 2.10). The three companies with the greatesttrading volume (Banco Santander, Telefónica and BBVA) together exceeded morethan half of the total volume, and just seven securities together accounted for 75%of the total.
60
CNMV
Annual Report regarding
its actions and the
securities markets. 2008
Concentration of equity trading TABLE 2.10
on Spanish stock markets1
No. of companies required to attain a given percentage2
2007 2008
25% 50% 75% 100% 25% 50% 75% 100%
All markets3 2 4 9 560 2 3 7 184
Electronic market 2 4 9 151 2 3 7 143
Spanish 2 4 9 144 2 3 7 138
Foreign 1 1 2 7 1 2 2 5
Open outcry 2 4 13 399 1 2 5 32
2nd market 1 2 4 10 1 2 3 9
ETF 2 3 4 21 1 2 5 34
MAB 22 94 293 3,241 21 104 329 3,274
LATIBEX 3 5 12 33 2 5 10 33
Source: CNMV.
1. Excludes Latibex, MAB and ETFs.
2. The total number of companies in which trading actually took place in the relevant market during the year.
3. The number of companies shown in the “All markets” total may be less than the sum of the numbers of
companies in each market as there are companies which change from one market to another.
Securities lending (crédito and préstamo systems) TABLE 2.11
Million euro
Securities lending (crédito system)1 Securities lending (préstamo system)2
Outstanding balance Trading volume Outstanding balance3 Trading volume
2000 4.4 151.4 12,102.0 87,406.4
2001 8.5 174.1 20,141.4 89,606.0
2002 7.8 161.2 14,125.3 106,983.2
2003 17.3 199.8 28,873.1 161,775.2
2004 18.2 139.2 54,518.5 306,056.7
2005 28.5 152.2 66,737.5 393,964.1
2006 73.6 379.9 62,058.2 550,850.4
2007 112.4 555.4 79,532.9 835,326.9
2008 20.7 624.9 43,647.8 583,950.8
Source: CNMV.
1. Transactions performed in accordance with Ministerial Order dated 25 March 1991 on the margin system
in spot transactions.
2. Regulated by Article 36.7 of the Securities Market Act and Order ECO/764/2004.
3. The total balance less amount of re-lending.
02_Capitulo 02_INGLES.qxd 24/7/09 18:50 Página 60

2.3.2. Margin trading and securities lending
Spanish legislation allows margin trading (crédito system) and provides two differentsystems for securities lending (crédito and préstamo). The crédito system (for margintrading and securities borrowing) is commonly used by retail investors dealing in Ibex35 stocks. The préstamo system is more commonly used by institutional investors andcovers a broader range of securities, including shares traded on Latibex and ETFs.
Margin trading using the crédito system shrank significantly in 2008 as a result offalling prices: 9.8 million shares were bought, a 49% decline. In contrast, andfavoured by the decline in the Ibex 35, short selling using the crédito systemincreased significantly, from 27.3 million shares in 2007 to 49.3 million in 2008. Themain stocks that were borrowed using this method were Banco Santander and BBVA.
Securities lending under the préstamo system totalled 584 billion euro and theoutstanding balance at year end was 43.6 billion euro, a sharp decline with respectto 2007 in both cases (Table 2.11). However, this decline essentially reflects priceperformance, since the number of shares borrowed and returned was similar to lastyear’s figure. The main stocks borrowed under the préstamo system wereTelefónica, Banco Santander and BBVA.
One of the most noteworthy supervisory initiatives in 2008 was the adoption in anumber of countries of a range of measures relating to short selling (see box inchapter 10), an activity which may be conducted by borrowing securities, amongothers. The CNMV reiterated the prohibited naked short selling, i.e. the sale ofstocks without borrowing them or ensuring that they can be borrowed, and ittemporarily required the disclosure of net selling positions greater than 0.25% ofcapital in financial sector companies.
2.4 Takeover bids
The steady decline in economic expectations and the difficulties in obtainingfunding discouraged large mergers and acquisitions in 2008. The CNMV processedsubstantially fewer takeover bids than the previous year, and the average potential 61
Markets and issuers
Equity MarketsMargin trading1 TABLE 2.12
Million euro
Outstanding balance Trading volume
2000 54.7 1,121,3
2001 43.1 534,1
2002 31.5 382,9
2003 32.8 346,1
2004 46.7 401,8
2005 52.3 465,0
2006 70.1 511,9
2007 59.4 411,3
2008 7.0 154,7
Source: CNMV.
1. Transactions performed in accordance with Ministerial Order dated 25 March 1991 on the margin system
in spot transactions.
02_Capitulo 02_INGLES.qxd 24/7/09 18:50 Página 61
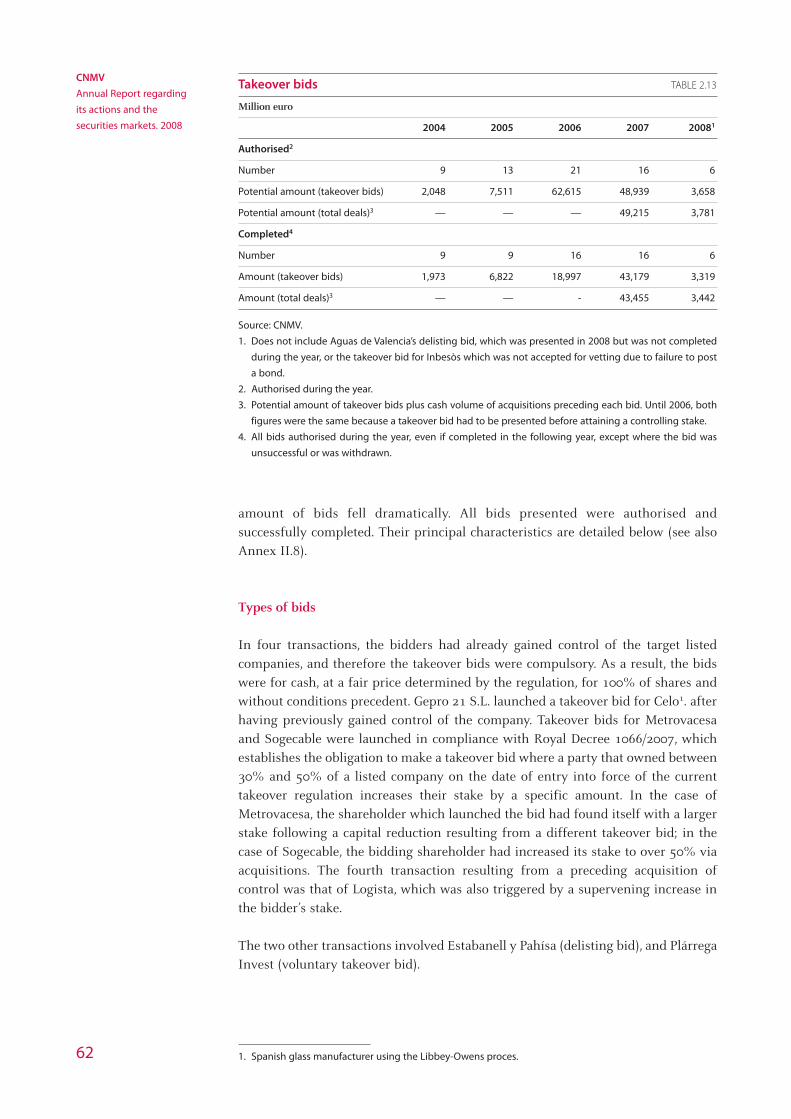
CNMV
Annual Report regarding
its actions and the
securities markets. 2008
62
amount of bids fell dramatically. All bids presented were authorised andsuccessfully completed. Their principal characteristics are detailed below (see alsoAnnex II.8).
Types of bids
In four transactions, the bidders had already gained control of the target listedcompanies, and therefore the takeover bids were compulsory. As a result, the bidswere for cash, at a fair price determined by the regulation, for 100% of shares andwithout conditions precedent. Gepro 21 S.L. launched a takeover bid for Celo1. afterhaving previously gained control of the company. Takeover bids for Metrovacesaand Sogecable were launched in compliance with Royal Decree 1066/2007, whichestablishes the obligation to make a takeover bid where a party that owned between30% and 50% of a listed company on the date of entry into force of the currenttakeover regulation increases their stake by a specific amount. In the case ofMetrovacesa, the shareholder which launched the bid had found itself with a largerstake following a capital reduction resulting from a different takeover bid; in thecase of Sogecable, the bidding shareholder had increased its stake to over 50% viaacquisitions. The fourth transaction resulting from a preceding acquisition ofcontrol was that of Logista, which was also triggered by a supervening increase inthe bidder’s stake.
The two other transactions involved Estabanell y Pahísa (delisting bid), and PlárregaInvest (voluntary takeover bid).
Takeover bids TABLE 2.13
Million euro
2004 2005 2006 2007 20081
Authorised2
Number 9 13 21 16 6
Potential amount (takeover bids) 2,048 7,511 62,615 48,939 3,658
Potential amount (total deals)3 — — — 49,215 3,781
Completed4
Number 9 9 16 16 6
Amount (takeover bids) 1,973 6,822 18,997 43,179 3,319
Amount (total deals)3 — — - 43,455 3,442
Source: CNMV.
1. Does not include Aguas de Valencia’s delisting bid, which was presented in 2008 but was not completed
during the year, or the takeover bid for Inbesòs which was not accepted for vetting due to failure to post
a bond.
2. Authorised during the year.
3. Potential amount of takeover bids plus cash volume of acquisitions preceding each bid. Until 2006, both
figures were the same because a takeover bid had to be presented before attaining a controlling stake.
4. All bids authorised during the year, even if completed in the following year, except where the bid was
unsuccessful or was withdrawn.
1. Spanish glass manufacturer using the Libbey-Owens proces.
02_Capitulo 02_INGLES.qxd 24/7/09 18:50 Página 62

Markets and issuers
Equity Markets
63
Transaction amount
Transaction amounts in 2008 were lower than in previous years. The largesttransaction was Prisa’s bid for Sogecable, which amounted to a potential total of 1.9billion euro (2.03 billion euro including shares acquired before the takeover bid).
Agreements between bidder and shareholders
The bids for Celo, Sogecable and Plárrega Invest included agreements by certainshareholders of the target companies to sell their shares to the respective bidders.An agreement in the bid for Celo was reached after the bidder acquired 92.05%from the controlling shareholder. In the case of Sogecable, the bidder increased itsstake to over 50% through an agreement with a shareholder owning 2.95% ofcapital following presentation of the bid but before it was authorised. In the case ofPlárrega Invest, several shareholders owning 94.02% of the capital reached anagreement to sell to the bidder.
Squeeze-outs and sell-outs and delisting
The bids for Logista and Sogecable attained more than 90% acceptance on the partof the target shares. This, together with previously-held stakes, enabled the biddersto obtain more than 90% of capital of the target companies and exercise thesqueeze-out rights envisaged in the regulation. In both cases, the squeeze-out pricewas the same as the takeover bid price. Once the squeeze-out was completed, thecompanies were delisted.
Estabanell y Pahísa was also delisted as a result of a delisting bid, while Celo iscurrently in the process of delisting.
FTSE Latibex All Share index performance FIGURE 2.2
Source: Madrid Stock Exchange.
FTSE Latibex All Share FTSE Latibex Brazil FTSE Latibex Top
40
50
60
70
80
90
100
110
120
130
140
Sep-07 Nov-07 Jan-08 Mar-08 May-08 Jul-08 Sep-08 Nov-08
02_Capitulo 02_INGLES.qxd 24/7/09 18:50 Página 63
creo
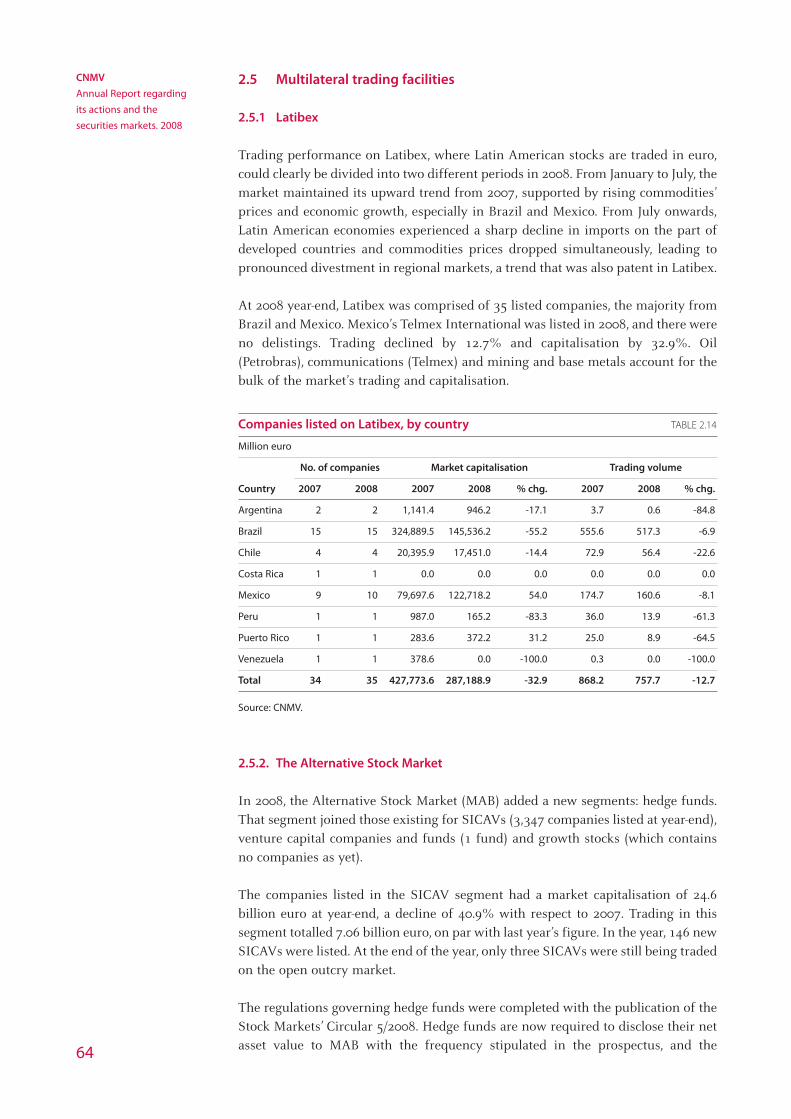
2.5 Multilateral trading facilities
2.5.1 Latibex
Trading performance on Latibex, where Latin American stocks are traded in euro,could clearly be divided into two different periods in 2008. From January to July, themarket maintained its upward trend from 2007, supported by rising commodities’prices and economic growth, especially in Brazil and Mexico. From July onwards,Latin American economies experienced a sharp decline in imports on the part ofdeveloped countries and commodities prices dropped simultaneously, leading topronounced divestment in regional markets, a trend that was also patent in Latibex.
At 2008 year-end, Latibex was comprised of 35 listed companies, the majority fromBrazil and Mexico. Mexico’s Telmex International was listed in 2008, and there wereno delistings. Trading declined by 12.7% and capitalisation by 32.9%. Oil(Petrobras), communications (Telmex) and mining and base metals account for thebulk of the market’s trading and capitalisation.
Companies listed on Latibex, by country TABLE 2.14
Million euro
No. of companies Market capitalisation Trading volume
Country 2007 2008 2007 2008 % chg. 2007 2008 % chg.
Argentina 2 2 1,141.4 946.2 -17.1 3.7 0.6 -84.8
Brazil 15 15 324,889.5 145,536.2 -55.2 555.6 517.3 -6.9
Chile 4 4 20,395.9 17,451.0 -14.4 72.9 56.4 -22.6
Costa Rica 1 1 0.0 0.0 0.0 0.0 0.0 0.0
Mexico 9 10 79,697.6 122,718.2 54.0 174.7 160.6 -8.1
Peru 1 1 987.0 165.2 -83.3 36.0 13.9 -61.3
Puerto Rico 1 1 283.6 372.2 31.2 25.0 8.9 -64.5
Venezuela 1 1 378.6 0.0 -100.0 0.3 0.0 -100.0
Total 34 35 427,773.6 287,188.9 -32.9 868.2 757.7 -12.7
Source: CNMV.
2.5.2. The Alternative Stock Market
In 2008, the Alternative Stock Market (MAB) added a new segments: hedge funds.That segment joined those existing for SICAVs (3,347 companies listed at year-end),venture capital companies and funds (1 fund) and growth stocks (which containsno companies as yet).
The companies listed in the SICAV segment had a market capitalisation of 24.6billion euro at year-end, a decline of 40.9% with respect to 2007. Trading in thissegment totalled 7.06 billion euro, on par with last year’s figure. In the year, 146 newSICAVs were listed. At the end of the year, only three SICAVs were still being tradedon the open outcry market.
The regulations governing hedge funds were completed with the publication of theStock Markets’ Circular 5/2008. Hedge funds are now required to disclose their netasset value to MAB with the frequency stipulated in the prospectus, and the64
CNMV
Annual Report regarding
its actions and the
securities markets. 2008
02_Capitulo 02_INGLES.qxd 24/7/09 18:50 Página 64

65
Markets and issuers
Equity Marketspossibility is provided of not making redemptions on all net asset value calculationdates. Additionally, MAB members are required to establish controls so that theminimum initial payment of 50,000 euro is respected in the subscription oracquisition of holdings.
As regards the rules for growth stocks, the goal for which is to facilitate SMEs’access to funding via the securities market, of special note is the creation of theregistered advisor, whose objective will be to advise companies on complying withdisclosure requirements for listing and remaining listed on the MAB. At the end ofthe year, a total of 20 advisors were registered in this segment, including broker-dealers, auditors, consulting firms and financial advisory firms. In 2008 the conceptof liquidity provider was created to assist in the search for counterparties andcontribute to more efficient price discovery.
2.6 Exchange-traded funds
ETFs have been on the Spanish market for two years now. Since their launch, boththe number of funds and the assets under management have grown, although thenumber of management companies remains low. At the end of the year there were30 listed funds, all belonging to management companies in the BBVA and SociétéGénérale groups, with a wide range of underlying indices in terms of countries,sectors, securities and strategies. On 19 September, four funds were delisted at therequest of Flame management company, which belongs to Banco Santander. Ofspecial note is the launch of the first inverse ETF on the Spanish market, whoseunderlying is the DJ Stoxx 600. The first listed inverse ETF on the Ibex 35 isexpected to begin trading in 2009.
Assets under management of the funds listed on the SIBE amounted to 10.6 billioneuro at 2008 year-end, an increase of 65% with respect to the previous year. Thebulk of those assets correspond to funds managed by Lyxor, in Société Généralegroup, which are also listed on other European markets. In Europe, total assetsunder management by ETFs amounted to 198.5 billion euro, 11% more than in2007.
Trading totalled 6.9 billion euro, an increase of 48% compared with 2007. The twofunds with the greatest trading volume were AFI Monetario Euro and Accion FTSELatibex Top, both from BBVA, which accounted for 41% and 14% of the total,respectively. Six of the 30 listed funds account for approximately 94% of totaltrading.
02_Capitulo 02_INGLES.qxd 24/7/09 18:50 Página 65

02_Capitulo 02_INGLES.qxd 24/7/09 18:50 Página 66

Markets and issuers
Fixed-income markets
67
3 Fixed-income markets
Activity in the fixed-income market was affected by the financial crisis and byadverse economic performance. Issues from the private sector, where banks play amajor role, declined noticeably (Table 3.1), reflecting both issuers’ desire to reducetheir debt and increased investor risk perception. However, the volume of asset-backed issues remained high, as they were generally retained by their originatorsfor use as collateral in funding operations with the European Central Bank. Incontrast with private fixed-income, public debt issues soared, the main issuer beingthe Spanish Central Government.
Gross issues and outstanding balances: breakdown by issuer TABLE 3.1
Nominal amount in million euro
Amount1 (% change) Pro memoria: EMU
% change
2007 2008 07/06 08/07 2008 08/07
Gross issues 812,927 713,265 18.0 -12.3 14,088,500 3.3
General government 60,139 124,423 -11.7 106.9 2,220,100 44.9
Financial institutions 743,567 579,324 21.4 -22.1 10,675,000 -1.1
Non-financial companies 9,221 9,518 12.2 3.2 1,193,400 -8.9
Net issues 222,374 131,928 -0.7 -40.7 1,133,100 12.9
General government -4,362 51,474 -59.5 — 389,400 196.8
Financial institutions 224,710 78,610 -0.4 -65.0 699,900 -14.9
Non-financial companies 2,026 1,843 104.0 -9.0 43,800 -11.5
Outstanding balance 1,291,346 1,421,619 20.0 10.1 13,140,200 8.9
General government 337,995 389,996 -1.4 15.4 5,239,600 8.1
Financial institutions 939,729 1,016,188 30.2 8.1 7,199,400 9.8
Non-financial companies 13,622 15,435 17.4 13.3 701,200 6.1
Source: Bank of Spain, CNMV and ECB.
1. Includes issues in and outside Spain.
As for secondary markets, the public debt book-entry market continued to be thelargest in terms of trading volume. Within that market, the short-term segment(Letras del Tesoro) registered significant growth in both outright trades and reposand sell-buybacks/buy-sellbacks, evidencing investors’ preference for very liquidassets with high credit quality. In contrast, trading in the long-term segment(bonos and obligaciones) declined sharply, in parallel with a significant increasein the sovereign risk premium. S&P downgraded the rating of the Kingdomof Spain in January 2009; Fitch and Moody’s, however, maintained the country’sAAA ratings.
03_Capitulo 03_INGLES.qxd 24/7/09 18:51 Página 67

CNMV
Annual Report regarding
its actions and the
securities markets. 2008
68
AIAF’s secondary market in private fixed-income securities saw a sharp increase insell-buybacks/buy-sellbacks, largely due to Treasury transactions in that market,which were concentrated in the asset-backed security segment. The volume of theother two classes of trade (outright trades and repos) shrank considerably. TheSpanish government’s Financial Asset Acquisition Fund (Fondo de Adquisición deActivos Financieros - FAAF) began to trade as a member of the AIAF in November.Fixed-income trading volume on AIAF exceeded that on the stock exchange (wherethe bulk of trading was concentrated in Barcelona, specifically in Catalan regionalgovernment bonds).
3.1 Public debt
3.1.1. Primary market
Gross issues by public administrations amounted to 124.4 billion euro, i.e. morethan double the 2007 figure (Table 3.1). The bulk of that increase is attributable tothe Spanish Central Government, which issued 52.09 billion euro in 2007 and 112.6billion euro in 2008. Gross issues by regional governments expanded 19.2% to 9.03billion euro.
As a result of the acute disparity between revenues and expenses resulting from thenegative performance of the economy and fiscal stimulus policies implemented tomitigate its effects, initial provisions for Central Government issues proved to begross underestimates. Gross issues in the long-term segment (bonos andobligaciones) amounted to 59.9 billion euro, compared with an initial projection of28.8 billion euro (i.e. slightly less than scheduled maturities). Net issues in the short-term segment (Letras del Tesoro) totalled 19.6 billion euro, compared with an initialprojection of 1.3 billion euro. Net Central Government issues amounted to 48.9billion euro, compared initial expectations of 800 million euro.
The increase in the outstanding balance of Letras del Tesoro was absorbed mainlyby foreign investors, who increased their exposure by 6.7 billion euro. As regardsinvestment in bonos and obligaciones, government holdings increased by 8.02billion euro and holdings by the rest of the world increased by 28.1 billion euro; incontrast, UCITS reduced their holdings by 7.8 billion euro and pension funds by5.01 billion euro.
Annexes II.11 and II.12 provide greater detail about gross and net issuing.
3.1.2. Secondary market
The Public Debt Book-Entry Market continued to be Spain’s largest organisedsecurities market in terms of trading volume. This market is comprised of two largeareas of trading: trading between market members and trading between registereddealers and third parties. There are two forms of trading between market members:via electronic platforms (SENAF, MTS-España, EuroMTS, etc.)1 and bilateral trading.Trading between market members and with third parties may be outright (spot or
1. SENAF and MTS-España are recognised as organised trading systems-a category expressly regulated by the
Securities Market Law and supervised by the CNMV. EuroMTS is domiciled in the UK, in accordance with
the authorisation and supervision requirements of that country.
03_Capitulo 03_INGLES.qxd 24/7/09 18:51 Página 68

Markets and issuers
Fixed-income markets
69
forward) or temporary (repos and sell-buybacks/buy-sellbacks). Within the electronicplatforms, SENAF provides spot trading in Bono, Obligación and Letra references, aswell as sell-buybacks/buy-sellbacks in bonos and obligaciones. EuroMTS and MTS-España provide principally spot trading in the main bonos and obligaciones.
Total trading on the Public Debt Book-Entry Market fell 12.0% in 2008 with respectto 2007 (Table 3.2). However, trading in Letras del Tesoro followed a different trendto trading in bonos and obligaciones: trading in Letras del Tesoro expanded by39.4% while trading in bonos and obligaciones declined by 15.9%. Growth in Letrasdel Tesoro trading was the result of investors’ growing preference for short-termassets with top-flight credit quality; however, as the year progressed, the avalanchein the primary market issues reduced secondary market trading. Trading in bonosand obligaciones was affected by the sharp decline in yields and the increase in riskperception, which was especially patent during the fourth quarter of 2008 in theperformance of sovereign risk premiums traded on CDS markets (Figure 3.1), aswell as in the widening of the yield spread with respect to German debt. AlthoughS&P downgraded Spain’s public debt from AAA to AA+, Moody’s and Fitchmaintained its triple-A rating.
The turnover velocity index calculated by the Bank of Spain, i.e. a ratio of outrighttrades in non-stripped debt to the value in circulation, declined sharply in the lastfew months of the year, reflecting both a reduction in trading and an increase in thevolume of securities available in the secondary market. The index declined from 101in 2007 to 67 in 2008.
Trading among market members, including outright trades and repos, declined by6.5% with respect to 2007. However, while trading in Letras del Tesoro expanded by57.3% (78.1% considering outright trades alone), trading in bonos and obligacionesfell 9.6% (13.5% in outright trades alone). Electronic platforms played a decisive rolein trading in both segments. In the Letras del Tesoro segment, the platforms increasedoutright trades by 157% with respect to 2007 and accounted for 43.3% of totaltrading; the volume of platform trading in bonos and obligaciones shrank 47.8%.
Trading in Central Government debt. Overall market TABLE 3.2
Million euro
2004 2005 2006 2007 2008 % change 08/07
Letras 2,273,364 2,230,370 1,695,552 1,594,556 2,222,226 39.4
Outright 115,549 116,478 93,332 57,925 115,260 99.0
Spot 114,951 116,087 92,831 57,363 114,581 99.7
Maturity 598 390 501 561 680 21.1
Repos 1,770,719 1,709,753 1,185,339 1,230,166 1,635,437 32.9
Sell-buybacks/Buy-sellbacks 387,095 404,139 416,881 306,466 471,529 53.9
Bonos and obligaciones 20,560,318 19,989,574 20,919,806 21,069,771 17,712,257 -15.9
Outright 2,133,892 2,531,614 3,137,244 3,413,112 2,342,943 -31.4
Spot 2,021,747 2,222,121 2,810,314 3,120,022 2,086,558 -33.1
Maturity 112,145 309,494 326,931 293,090 256,385 -12.5
Repos 10,707,375 9,700,501 9,850,419 9,741,672 8,474,523 -13.0
Sell-buybacks/Buy-sellbacks 7,719,051 7,757,459 7,932,144 7,914,986 6,894,791 -12.9
Total 22,833,682 22,219,944 22,615,358 22,664,327 19,934,484 -12.0
Source: Bank of Spain.
03_Capitulo 03_INGLES.qxd 24/7/09 18:51 Página 69

Annexes II.13 and II.16 provide more detail on trading in the Public Debt Book-Entry Market.
Yields on Letras del Tesoro and bonos and obligaciones rose until June, after whichthey plummeted during the rest of the year.
The higher yields on Letras del Tesoro in the first half of the year was the result ofpredominant expectations with regard to inflation, the fact that the ECB kept baserates unchanged, and the increase in government issuing, even when demand forthem as a safe haven in the financial crisis was evident. Yields peaked in July at 73basis points over December 2007 levels after the ECB raised interest rates. Yields onLetras slumped in the second half of the year after the shift towards a clearlyexpansive monetary policy. The 12-month Letra ended the year at 2.12%, 192 basispoints lower than at the end of 2007.
Yields on bonos and obligaciones in all maturities peaked mid-year, with 5-yearyields 65 basis points above their December 2007 level, and 30-year yields 25 basis
70
CNMV
Annual Report regarding
its actions and the
securities markets. 2008
Yield on Spanish medium- and long-term government debt FIGURE 3.2
Source: Bank of Spain.
2.0
2.5
3.0
3.5
4.0
4.5
5.0
5.5
Dec-03 Jun-04 Dec-04 Jun-05 Dec-05 Jun-06 Dec-06 Jun-07 Dec-07 Jun-08 Dec-08
3 years 5 years 10 years 30 years%
5Y CDS premiums of sovereign debt FIGURE 3.1
Source: Markit.
Dec-08
0
20
40
60
80
100
120
140
Jan-08 Mar-08 May-08 Jul-08 Sep-08 Nov-08
CDS Spanish Public Debt CDS German Public DebtBasis points
03_Capitulo 03_INGLES.qxd 24/7/09 18:51 Página 70
creo

71
Markets and issuers
Fixed-income marketspoints above that level. Later, worsening economic growth expectations drove yieldsdown further despite the increase in sovereign risk premiums (Figure 3.2). At theend of the year, yields were 3.00% for the 3-year maturity (106 basis points lowerthan in December 2007), 2.07% for the 5-year maturity (43 basis points lower) and3.96% for the 10-year maturity (39 basis points lower)
3.2 Private fixed-income
3.2.1. Primary market
Gross private fixed-income issues from Spanish issuers amounted to 588.8 billioneuro in 2008, down 21.8% with respect to 2008 (Table 3.1).The decline almostexclusively affected issues in Spain, which accounted for 81% of the total and shrankby 26.6%, whereas issues abroad increased 8.4%. Commercial paper accounted forthe bulk of the issuing volume, and the main issuers were in the financial sector.
Entities which issue fixed-income in Spain must submit a prospectus to the CNMV,or, if exempt, provide the documents required by regulation. Commercial paperaccounted for the bulk of short-term issues registered with the CNMV in 2008,while asset-backed securities accounted for the lion’s share of medium-long termissues (Table 3.3). Despite the reduction in both types of instruments (especially incommercial paper), they gained considerably as a percentage of total issues
registered: commercial paper accounted for 65.5% and asset-backed securities for28.3%. Issuance of non-convertible bonds and debentures, mortgage covered bonds(cédulas hipotecarias) and territorial covered bonds (cédulas territoriales) continuedthe downward trend that began in the second half of 2007. Although issuing of
Gross issues registered at the CNMV: detail by instrument TABLE 3.3
Nominal amount in million euro
2008
2004 2005 2006 2007 2008 1Q 2Q 3Q 4Q
Long term 115,359 149,894 188,674 206,323 164,537 31,627 48,350 17,686 66,874
Non-convertible bonds and debentures 38,094 41,907 46,688 27,416 10,490 604 3,744 4,215 1,927
- subordinated debt 4,395 1,905 6,555 2,381 1,545 200 125 300 920
Convertible bonds and debentures 97 163 68 0 1,429 0 0 0 1,429
Mortgage covered bonds 19,074 35,560 44,250 24,696 14,300 1,250 10,120 1,685 1,245
Territorial covered bonds 1,600 1,775 5,150 5,060 1,820 1,020 0 0 800
Securitisation bonds 50,525 69,044 91,608 141,627 135,253 28,657 34,386 11,736 60,473
- asset-backed (ABS) 45,635 62,194 87,308 136,887 134,453 28,657 34,386 10,936 60,473
- mortgage-backed (MBS) 4,890 6,850 4,300 4,740 800 0 0 800 0
Preference shares 5,542 1,356 911 225 1,246 96 100 50 1,000
Other issues 428 89 0 7,300 0 0 0 0 0
Short term 214,603 264,253 334,457 442,433 311,738 85,900 86,118 72,868 66,853
Commercial paper 214,603 264,253 334,457 442,433 311,738 85,900 86,118 72,868 66,853
- asset-backed 3,724 2,765 1,993 465 2,843 133 48 94 2,568
Total 329,962 414,147 523,131 648,757 476,276 117,527 134,468 90,554 133,727
Source: CNMV.
03_Capitulo 03_INGLES.qxd 24/7/09 18:51 Página 71

preference shares and convertible bonds and debentures rose, the overall amountwas small (Table 3.3). Tables 18, 19 and 20 of Annex II provide greater detail aboutissues registered at the CNMV.
Asset- and mortgage-backed securities
Contrasting with the major decline in issuance of other instruments, issuing of ABSand MBS shrank by just 4.5%, to 135.2 billion euro. Asset-backed securities accountedfor the bulk of those issues and amounted to 134.4 billion euro, down 1.8% withrespect to 2007. Issuing of mortgage-backed securities (MBS) shrank by 3.9 billioneuro to 800 billion euro. Mortgage-backed securities again accounted for most of theissues, increasing their weight from 59.4% of the total in 2007 to 72.4% in 2008 (seeAnnexe II.22 and Figure 3.3). The average size of the issues increased considerably. Ofthe 108 issues registered, 26 exceeded 1.5 billion euro, the average size being 3.5billion euro, and they accounted for 68% of total securitisation bonds issues.
Most securitisation bond issues were retained by their originators for use ascollateral in funding operations with the European Central Bank. Also, since thecreation of the FAAF in November 2008, financial institutions have also been ableto sell ABS and MBS to it in order to raise funding. Issuing of securitisation bondspeaked in the fourth quarter, when banks’ financial difficulties increased notablyfollowing the collapse of Lehman Brothers and government intervention in variousinstitutions in the United States and Europe (Table 3.3).
Tables 21 and 22 of Annex II provide additional information on securitisation bondissues registered at the CNMV.
Issues in foreign markets
In 2008, issues in foreign markets by Spanish issuers increased to 112.3 billion euro,from 103.6 billion euro in 2007. The rising trend in issuing activity seen in recentyears continued, although there was a significant change in its composition. While72
CNMV
Annual Report regarding
its actions and the
securities markets. 2008
Asset- and mortgage-backed securities registered at the CNMV FIGURE 3.3
Source: CNMV.
Million euro160,000
140,000
120,000
100,000
80,000
60,000
40,000
20,000
0
MBS Mortgage-backed ABS Other ABS
2003 2004 2005 2006 2007 2008
03_Capitulo 03_INGLES.qxd 24/7/09 18:51 Página 72
creo

long-term issues fell by 39.2% with respect to 2007, commercial paper issues rose90.7%, accounting for 64.5% of the total amount issued in foreign markets.Although bond and debenture issues abroad fell sharply, they still exceeded issuesin Spain (Tables 3.3 and 3.4).
Gross private fixed-income issued by Spanish issuers in other countries TABLE 3.4
Nominal amount in million euro
% change
2004 2005 2006 2007 2008 08/07
Long term 10,349 44,159 73,257 65,629 39,894 -39.2
Preference shares 1,230 2,165 1,504 2,581 0 —
Subordinated debt 2,250 1,487 5,758 8,984 70 -99.2
Bonds and debentures 6,595 39,308 64,292 53,327 39,360 -26.2
Securitisation bonds 274 1,199 1,703 736 464 -36.9
Short term 13,752 15,021 25,718 38,003 72,472 90.7
Commercial paper 13,752 15,021 25,718 38,003 72,472 90.7
- asset-backed 13,045 12,367 16,517 12,119 425 -96.5
Total 24,102 59,180 98,975 103,631 112,366 8.4
Source: Bank of Spain.
Financial institutions accounted for almost 90% of gross issues in other countries.Specifically, Santander Bank subsidiaries accounted for more than 50% and, amongnon-financial companies, the Telefónica group accounted for close to 10% of the total.Of the total, 51% were issued in London, and 46% in Luxembourg. Broken down bycurrency, 60% were issued in euro, 26% in US dollars, 10% in pounds sterling and theremaining 4% in other currencies (yen, Mexican pesos, Canadian dollars and Czechkoruna). All the commercial paper and securitisation bonds were issued in euro.
3.2.2. Secondary market
Spain has two official secondary markets in private fixed-income securities: AIAFand the stock exchange. The largest in terms of the volume of securities listed andtransaction volume is AIAF, where all kinds of private fixed-income instrumentsmay be traded (except for convertible bonds and debentures, which may only betraded on the exchanges). AIAF allows for both outright trades and repos and sell-buybacks/buy-sellbacks, whereas the stock exchanges only allow for outright trades.Another significant difference between the two markets is that, just like the publicdebt book-entry market, AIAF contains two distinct trading segments: one betweenmarket members, and one between market members and clients; in contrast, thereis only one trading segment in the stock exchanges.
The breakdown and trend in the number of issuers, the number of issues and theoutstanding balance listed in both markets are shown in Tables 3.5 and 3.6,respectively. The majority of listed issues are traded on the AIAF, which accountedfor 96.6% of the total outstanding balance at year-end. The outstanding balance ofdebt listed on AIAF grew 8% in 2008 (i.e. by less than the previous year, due tofewer new issues). Asset-backed securities (ABS, cédulas hipotecarias and cédulasterritoriales) accounted for 73.4% of the outstanding balance on AIAF. The increasein the outstanding balance of issues listed on the stock exchanges (Table 3.5) isentirely attributable to the Barcelona Stock Exchange’s move to list securitisationtrusts backed by loans to SMEs guaranteed by the Catalonia regional government 73
Markets and issuers
Fixed-income markets
03_Capitulo 03_INGLES.qxd 24/7/09 18:51 Página 73

(FTGENCAT trusts) and debt issued by the regional government itself. Theoutstanding balance on the other three stock exchanges declined.
Issuers, issues and outstanding balances of fixed-income on AIAF TABLE 3.5
Nominal amount in million euro
No. of issuers No. of issues Outstanding balance % chg.
2007 2008 2007 2008 2007 2008 08/07
Commercial paper 73 72 2,493 2,489 98,468 71,762 -27.1
Bonds and debentures 456 523 1,673 1,964 491,574 567,321 15.4
- securitisation bonds 316 383 1,157 1,436 328,925 422,011 28.3
Mortgage covered bonds 14 22 111 146 150,906 162,466 7.7
Territorial covered bonds 7 11 19 26 16,375 17,030 4.0
Matador bonds 15 12 18 14 1,238 1,059 14.5
Total 492 556 4,314 4,639 758,560 819,638 8.0
Source: AIAF and CNMV.
Issuers, issues and outstanding balances of fixed-income in TABLE 3.6
the stock markets
Nominal amount in million euro
No. of issuers No. of issues Outstanding balance % chg.
2007 2008 2007 2008 2007 2008 08/07
Total1 53 58 249 271 25.655 29.143 13,6
Regional government debt 3 3 83 82 8,863 9,973 12.5
Other 50 55 166 189 16,792 19,170 14.2
Barcelona Stock Exchange 44 48 188 214 16,726 20,459 22.3
Bilbao Stock Exchange 33 30 84 71 2,457 2,094 -14.8
Madrid Stock Exchange 28 26 74 63 8,965 8,678 -3.2
Valencia Stock Exchange 32 29 125 112 3,233 2,847 -12.0
Source: Stock exchanges and CNMV.
1. Does not include book-entry debt.
Total private fixed-income trading on the AIAF and stock exchanges (includingoutright trades, repos and sell-buybacks/buy-sellbacks) increased by 113.5% to atotal of 2.6 trillion euro. However, that increase was concentrated entirely amongsell-buybacks/buy-sellbacks, resulting from actions by the Treasury as from March,when it joined the market as a member. The Treasury’s trades on AIAF amountedto 1.2 trillion euro, the majority of which were one- and two-day sell-buybacks/buy-sellbacks on bonos and obligaciones. As from November, the FAAF also beganoperating on AIAF, where it had bought 3.2 billion euro in outright trades and 1.8billion euro in sell-buybacks/buy-sellbacks by year-end. Trading on AIAF, includingall categories, surpassed the 2.5 trillion euro mark, accounting for 97% of totalprivate fixed-income trading.
Almost all trading on the AIAF consisted of bonds and debentures and commercialpaper, even excluding the Treasury’s transactions (most of which were insecuritisation bonds). Retail banks conducted the bulk of trades in commercialpaper between market members and their clients (Table 23 of Annex II). In contrast,securitisation bond transactions were concentrated in the wholesale segment(trading among market members). 74
CNMV
Annual Report regarding
its actions and the
securities markets. 2008
03_Capitulo 03_INGLES.qxd 24/7/09 18:51 Página 74

75
Markets and issuers
Fixed-income markets
Including trades by the Treasury in this segment, trading on the AIAF increased seven-fold; excluding the Treasury, trading doubled. Trading shrank 11% in the retailbanking segment, reflecting private fixed-income’s lack of appeal among end investors.The retail trading segment on AIAF declined from 74% of total trading in 2007 to29.5% in 2008 (or 56% excluding trades by the Treasury in the wholesale segment).
Only trading in sell-buybacks/buy-sellbacks increased. Excluding the Treasury’stransactions, total trading in sell-buybacks/buy-sellbacks rose 104.1% with respectto 2007, whereas the volume of outright trades and repos fell by 6.9% and 13.6%,respectively.
Fixed-income trading on the stock exchanges TABLE 3.8
Nominal amount in million euro
% change
2004 2005 2006 2007 2008 08/07
Total 77,017 87,998 89,758 90,716 80,513 -11.2
Regional government debt1 76,259 83,204 84,261 83,866 70,075 -16.4
Other 717 4,758 5,462 6,816 10,392 52.5
Public debt book-entry securities 41 36 36 34 46 36.6
Source: Stock exchanges and CNMV.
1. The regional governments of Catalonia, Valencia and the Basque Country. Does not include: Instituto
Catalán de Finanzas, Diputación Foral de Vizcaya and Consorcio de Transportes de Vizcaya.
Trading of private fixed-income securities fell 11.2% with respect to 2007 (Table 3.8).Barcelona accounted for 96.2% of total trading on domestic stock exchanges, dueprimarily to Catalan government debt issues (68.7 billion euro) and asset-backedsecurities guaranteed by the Catalan government (7.6 billion euro).
Private sector issues of fixed-income securities experienced a sharp increase in therisk premium demanded by investors. The yield spread between commercial paperand repos on Letras del Tesoro was 148 basis points at year-end, the highest in 15
Total trading on AIAF TABLE 3.7
Nominal amount in million euro
% change
2004 2005 2006 2007 2008 08/07
Total 572,030 877,812 910,494 1,127,478 2,521,040 123.6
By type of asset
Commercial paper 291,903 408,185 489,069 568,010 591,944 4.2
Bonds and debentures 227,127 404,410 344,698 469,533 1,788,946 281.0
- securitisation bonds 171,725 313,778 257,629 378,005 1,704,342 350.9
Mortgage covered bonds 46,014 60,061 70,113 80,811 129,995 60.9
Territorial covered bonds 3,357 2,740 3,659 7,750 10,142 30.9
Matador bonds 3,629 2,416 2,954 1,374 13 -99.0
By type of transaction
Outright 242,333 322,819 386,369 416,478 387,897 -6.9
Repos 197,778 284,520 330,840 441,363 381,505 -13.6
Sell-buybacks/Buy-sellbacks 131,919 270,473 193,285 269,637 1,751,638 549.6
Source: AIAF and CNMV.
03_Capitulo 03_INGLES.qxd 24/7/09 18:51 Página 75

years. That spread was 48 basis points at the end of 2006. Nevertheless, yields onprivate commercial paper at year-end were much lower that at the end of 2007 dueto the ECB’s reduction of the base rate. The yield on 3-month commercial paper was3.30% at the end of December, 147 basis points lower than at the end of 2007.
As for long-term private fixed-income, yields on 10-year corporate bonds traded onAIAF ended 2008 at 4.73%, 21 basis points below the 2007 year-end figure. Yieldspeaked mid-year at close to 6% and declined from then onwards. However, the riskpremiums for Spanish issuers on CDS markets, where banks account for the bulk,increased significantly in the last few months of the year, reflecting the persistinghigh risk perception (Figure 3.6). Data for the first few months of 2009 show that,at mid-March, the yield on 10-year corporate debt traded on AIAF was similar to theyield at 2008 year-end, and risk premiums remained high. 76
CNMV
Annual Report regarding
its actions and the
securities markets. 2008
Yields on three-month commercial paper, interbank deposits FIGURE 3.4
and repos
Source: Bank of Spain.
5.0
4.5
4.0
3.5
3.0
2.5
2.0
1.5
% Commercial paper Deposits T-bills
Dec-03 Dec-04 Dec-05 Dec-06 Dec-07 Dec-08
Yield gap between private and public debt FIGURE 3.5
Source: Bank of Spain, AIAF, Datastream and Reuters.
1. Average calculated using at least 18 CDSs on financial and non-financial issuers.
20
60
100
140
180
220
260
Dec-06 Mar-07 Jun-07 Sep-07 Dec-07 Mar-08 Jun-08 Sep-08 Dec-08
Average 10Y CDS od Spanish issuers1
Spread between AIAF and Spanish public debtSpread between AIAF and German public debtBasis points
03_Capitulo 03_INGLES.qxd 24/7/09 18:51 Página 76
creo

Markets and issuers
Registry, counterparties,
clearing and settlement
77
4 Registry, counterparties, clearing and settlement
Spain has five technical platforms for clearing and settlement of securities tradedon spot markets. Those five platforms are managed by four central securitiesdepositories (CSD). Iberclear operates two platforms: CADE-Iberclear (forsecurities traded on the AIAF fixed-income market and the Public Debt Book-Entry market) and Iberclear-SCLV (for securities traded on stock exchanges, MABand Latibex), while the Barcelona, Bilbao and Valencia Stock Exchanges haveclearing and settlement services for securities traded exclusively on theirexchanges (SCLBarcelona, SCLBilbao and SCLValencia, respectively). Iberclearand the three exchanges act as a central registry for securities settled via theirplatforms.
Until November 2002 when the Law on Measures to Reform the Financial Systemwas passed, central counterparty services were confined to the realm of officialmarkets in derivatives, where MEFF itself acts as the counterparty for registeredcontracts. Since 2003, MeffClear (governed by MEFF RF) has provided centralcounterparty services for trades in fixed-income transactions in the securitiesmarkets, electronic systems or by other means between settling members and/orclients.
The CNMV is responsible for supervising Iberclear, while the other three centraldepositories are monitored by their respective regional governments. The CNMV isalso in charge of supervising MeffClear. This chapter summarises the activities ofIberclear (Section 4.1) and of MeffClear (Section 4.2) in 2008.
4.1 Iberclear
Sociedad de Gestión de los Sistemas de Registro, Compensación y Liquidación deValores, S.A. Unipersonal, whose trade name is Iberclear, is in charge of registering,clearing and settling securities in Spain. Iberclear is 100% owned by the Bolsas yMercados Españoles (BME) holding company and it mainly deals with securitiestraded in the stock exchanges, public debt market and AIAF.
At 2008 year-end, Iberclear had 208 members, eight less than at 2007 year-end(Table 4.1). In the year, eight participants deregistered from the public debt clearingand settlement system, and AIAF added six new members.
The activity indicators for the two platforms managed by Iberclear generally reflectthe trends in trading in the corresponding markets (see Chapters 2 and 3).
04_Capitulo 04_INGLES.qxd 24/7/09 18:52 Página 77

CNMV
Annual Report regarding
its actions and the
securities markets. 2008
78
4.1.1. Iberclear-CADE
At the end of the year, a total of 5,083 issues had been registered on this platform, witha nominal value of 1.2 billion euro; 94% were traded on the AIAF market, and theremainder on the public debt market. In terms of the nominal amount, 68% of thetotal were AIAF issues, and the remaining 32% were public debt market issues.
AIAF-traded issues saw moderate growth with respect to 2007, both in number andin nominal value. In contrast, the number of outstanding issues in the public debtmarket fell; however, the amount issued increased significantly due to the intenseissuing activity in the last few months of the year.
CADE settled a total of 8,261,592 trades, of which 79% were done on the Book-EntryDebt Market, compared with 84% in 2007. Both the number of trades on AIAF andthe volume settled increased considerably. Volume increased primarily due tosignificant growth in repos and sell-buybacks/buy-sellbacks. However, the bulk wereoutright trades, which increased in amount but not in number due to the greaterpresence of individual investors in the market.
In the public debt market, there was a sharp decline in all trade types andsettlement volumes with respect to 2007, except for securities transfers as collateral.The latter are essentially related to Spanish institutions’ applications for funding tothe European Central Bank. The most numerous trades on the public debt marketwere repos and sell-buybacks/buy-sellbacks.
The incidents in 2008 had little impact on settlements: there were 414, accountingfor 0.01% of total settled trades. Non-resident entities were responsible for 71% ofthe incidents, as short-sellers were unable to cover their positions at the end of theday due to the scarcity of paper in the system, especially government debt.
Iberclear members TABLE 4.1
2007 2008
Total Iberclear1 216 208
Members of:
Stock exchanges 93 90
Latibex 79 78
AIAF 74 80
Public Debt Book-Entry Market 174 166
Source: Iberclear.
1. The total is lower than the sum of the number of clearing members in the various markets since many firms
are members of more than one market.
Iberclear - CADE. Registry TABLE 4.2
Million euro
Public debt AIAF Total
Registered securities 2007 2008 2007 2008 2007 2008 % change
Number of issues 345 327 4,493 4,756 4,838 5,083 5.28
Nominal amount 350,350 400,647 779,953 840,439 1,130,303 1,241,086 9.80
Source: CNMV.
04_Capitulo 04_INGLES.qxd 24/7/09 18:52 Página 78

Markets and issuers
Registry, counterparties,
clearing and settlement
79
4.1.2 Iberclear-SCLV
In 2008, a total of 7,153 issues were registered with Iberclear - SCLV with anaggregate nominal value of 110.1 billion euro. Issues increased in both number andnominal value compared with 2007 (Table 4.5).
Iberclear-CADE. Number of settled trades TABLE 4.3
Public debt AIAF Total%
Type of transaction 2007 2008 2007 2008 2007 2008 change
Outright trades 242,656 208,910 919,277 1,217,626 1,161,933 1,426,536 22.77
Repos and sell/buybacand buy/sellbacks 6,392,623 5,733,333 174,366 199,202 6,566,989 5,932,535 -9.66
Outright transfers (betweenaccounts of the same owner) 179,748 144,600 209,382 215,808 816,814 360,408 -55.88
Temporary transfers (betweenaccounts of the same owner) 160,242 108,354 0 119 160,242 108,473 -32.31
Transfers of securities tomaturity (to a different owner) 363,978 325,734 63,706 72,438 427684 398,172 -6.90
Transfers for collateral(to a different owner) 1,454 2,684 32,953 30,776 34,407 33,460 -2.75
Total 7,342,708 6,525,623 1,401,691 1,737,977 8,742,392 8,261,592 -5.50
Source: CNMV.
Iberclear-CADE. Amount of settled trades1 TABLE 4.4
Million euro
Public debt AIAF Total %
Type of transaction 2007 2008 2007 2008 2007 2008 change
Outright trades 3,964,073 2,885,198 511,888 442,183 4,475,961 3,327,381 -25.66
Repos and sell/buybackand buy/sellbacks 47,506,147 39,240,986 1,374,130 4,056,696 48,880,277 43,297,682 -11.42
Outright transfers (betweenaccounts of the same owner) 14,190,191 2,025,069 3,449,720 2,202,459 17,639,911 4,227,528 -76.03
Temporary transfers (betweenaccounts of the same owner) 740,198 701,347 0 1,116 740,198 702,463 -5.10
Transfers of securities tomaturity (to a different owner) 9,896,096 7,128,755 841,889 794,106 10,737,985 7,922,861 -26.22
Transfers for collateral(to a different owner) 40,147 82,664 858,270 888,093 898,417 940,934 4.73
Total 63,536,539 52,064,013 4,797,824 8,354,830 68,334,363 60,420,857 -11.58
Source: CNMV.
1. Effective amount, in the case of outright trades, repos and sell-buybacks/buy-sellbacks; nominal amount,
in the case of temporary and held-to-maturity transfers.
Iberclear SCLV. Registry TABLE 4.5
Million euro
Stock exchange Latibex
Registered securities 2007 2008 % change 2007 2008 % change
Number of issues 6,005 7,153 19.1 39 38 -2.6
Registered amount1 106,589 110,127 3.32 258 195 -24.6
Source: CNMV.
1. Nominal amount, in the case of the stock exchange; effective amount, in the case of Latibex.
04_Capitulo 04_INGLES.qxd 24/7/09 18:52 Página 79

CNMV
Annual Report regarding
its actions and the
securities markets. 2008
80
Trading declined in 2008, and more sharply in the last few months of the year; thisreduced the number of trades settled on SCLV (Table 4.6). On the stock exchangesand Latibex combined, the amount settled shrank by 24.7% and the number oftransactions settled by 4.3%. In terms of daily averages, the effective amountsettled exceeded 4.9 billion euro and the number of transactions was close to47,500.
Total transfers settled on the platform (both delivery versus payment and free ofpayment) expanded by 4.4%, while deliveries versus payment fell by 29.8%
The system’s efficiency, measured as the amount over the total number of trades,improved slightly, from 99.5% in 2007 to 99.7% in 2008; in terms of the number oftrades, efficiency improved from 99.7% in 2007 to 99.8% in 2008. Failedsettlements declined in number, by 16.1%, and in amount, by 47.5%. As apercentage of the total amount of trades, they shrank from 0.5% to 0.35%. Buy-insfell by about 4.5% in number, but they amounted to 177 million euro, an increaseof 55.2% with respect to 2007.
4.1.3. European integration initiatives
Last year Iberclear continued participating in the various Europe-level private andpublic initiatives which were implemented in 2006 with a view to furtheringfinancial market integration in Europe.
Code of Conduct
In 2008, the CNMV advanced towards the objectives established in the Code ofConduct for equity clearing and settlement systems in Europe. Iberclear’s scale ofcharges along with a number of standard examples of how those charges areapplied have been available on its website since 1 January 2008.
The Code of Conduct also focuses on service unbundling and accountingseparation. Iberclear has complied with this principle since the beginning of2008.
Iberclear SCLV. Trades settled TABLE 4.6
Million euro
Stock exchange Latibex
No. of trades Amount No. of trades Amount
Trades 2007 2008 2007 2008 2007 2008 2007 2008
Purchases and sales 28.820.285 27.493.503 3.311.862 2.529.808 84.836 71.079 1.731 1.522
Failed settlements 77.233 65.042 19.724 10.354 2.363 1.717 99 46
Buy-ins 898 869 113 90 31 18 1 87
Transfers f.o.p. 228.384 247.739 0 0 1.720 1.784 0 0
Transfers v.p. 957.025 991.530 684.904 480.945 3.664 2.014 170 59
Total 30.005.694 28.732.772 3.996.766 3.010.753 90.220 74.877 1.901 1.580
Source: CNMV.
Transfers f.o.p. = transfers free of payment. Transfers v.p. = transfers versus payment.
04_Capitulo 04_INGLES.qxd 24/7/09 18:52 Página 80

Markets and issuers
Registry, counterparties,
clearing and settlement
81
The third objective focuses on access and interoperability conditions for Europeaninfrastructures. In this vein, Iberclear and seven other European CSDs created theLink Up Markets joint-venture in April 2008. The initiative aims initially toestablish a centralised tool for converting each CSD’s instruction and messagingformats for processing at the other CSDs, facilitating the interchange of settlementinstructions through a single CSD gateway.
Subsequently, the venture aims to enable each CSD to offer cross-border settlementand custody services for locally-registered securities to the other participants,providing a multilateral approach to interoperability between the CSDs whichadhere to the Code. This will improve access while eliminating the need to developand implement specific bilateral solutions. The venture also fosters directcompetition in settlement and custody services among central securitiesdepositories and big international custodians.
Target2-Securities (T2S)
Having completed the consultation phase on user requirements and obtained apositive opinion from the majority of CSDs, in July 2008 the Governing Council ofthe European Central Bank (ECB) decided to advance to the next phase of T2Sproject development. Only a few depositories made participation conditional uponfirst considering, from a technical and legal standpoint, the possibility of enablingusers to decide which platform to use in settling their trades. Therefore, T2S wouldnot necessarily be the only option, as it would compete with other settlementsystems.
Preliminary specifications for the general functioning of the project and its datamodel were drafted in the second half of 2008 and published on 22 January 2009;they will be validated over the course of 2009. The T2S advisory group already hasspecific subgroups working on the various aspects of this project. Iberclear and itsmain members continue to collaborate actively on this second phase.
The Eurosystem established a legal group in the fourth quarter of 2008 to specifythe nature of future contractual mechanisms between the institution ultimatelyproviding the settlement service and the CSD requesting it, together with thecorporate governance mechanisms of T2S. CSDs wishing to participate in T2S areexpected to submit individual declarations of interest in 2009. The formula willcomprise a collaboration agreement which will include mutual contributions to theproject by the Eurosystem and the CSDs, and establish parameters as regards thescope of future contractual mechanisms between the Eurosystem and the CSDs.
4.1.4. Technical enhancements
As a part of ongoing process of compliance with the conclusions of the specialgroup on loans, the procedure for disclosing to issuers of registered securities thecancellation of loans without returning securities entered into force on 13 October2008. The procedure to update the special register of loans resulting from financialtransactions that involve a distribution of shares or warrants entered into force on17 November 2008.
04_Capitulo 04_INGLES.qxd 24/7/09 18:52 Página 81

The new methodology for calculating collective and supplementary securitydeposits regulated in Iberclear’s Circular 7/2007 entered into force in April 2008.Complementing the improvements introduced by that Circular, IberclearInstruction 1/2009 entered into force on 2 February 2008, postponing thecalculation of the daily risk position of each clearing member by 30 minutes, from7:30 to 8:00 every working day. This enables member entities to process theinstructions received during the night and early in the morning, thereby reducingopen risk positions and strengthening the potential capacity to reducecomplementary security deposits.
4.2 MeffClear
In 2008, MeffClear registered 285 trades with a total market value of 43.8 billioneuro, a significant increase with respect to 2007 (Table 4.7), but less than in 2006.All the transactions cleared on MeffClear consisted of SENAF repo trades. Theaverage term of the transactions was 1.4 days (1.3 days in 2007).
The number of members shrank to 15 after Barclays Bank Plc London, CitibankInternational Plc. Suc. en España, Caixa d’Estalvis de Catalunya and Bancaja left theclearing house last year.
82
CNMV
Annual Report regarding
its actions and the
securities markets. 2008
Activity in MeffClear TABLE 4.7
Million euro
2007 2008
SENAF platform: trades cleared 38,385 43,853
Bilateral transactions: trades cleared 0 0
Total 38,385 43,853
SENAF platform: number of trades 233 285
Bilateral transactions: number of trades 0 0
Total 233 285
No. of members 19 15
Source: MeffClear.
04_Capitulo 04_INGLES.qxd 24/7/09 18:52 Página 82

Markets and issuers
Derivatives markets
83
5 Derivatives markets
In 2008, Spain's derivatives markets reflected the sharp increase in volatility in thecash markets, especially equities. There was no general trend in terms of tradingvolume, as the performance of different products varied.
Trading on Spain's derivatives markets* TABLE 5.1
No. of contracts, except where otherwise stated
Change (%)
2005 2006 2007 2008 2008/07
MEFF RF 46 15 13 12 -7.7
Debt futures 46 15 13 12 -7.7
Debt options — — — — —
Euribor futures — — — — —
MEFF RV 35,219,874 40,775,643 44,176,717 55,055,028 24.6
Ibex 35 futures 5,050,211 6,568,791 8,721,832 7,605,341 -12.8
Ibex 35 Plus 4,935,648 6,408,961 8,435,258 7,275,299 -13.8
Ibex 35 Mini1 114,563 159,830 286,574 330,042 15.2
Ibex 35 options 440,747 551,062 567,077 828,622 46.1
Stock futures 18,813,689 21,229,811 21,294,315 46,237,568 117.1
Stock options 10,915,227 12,425,979 13,593,493 18,317,249 34.8
Total MEFF 35,219,920 40,775,658 44,176,730 55,055,040 24.6
Electronic market 2,129,643 2,852,348 5,085,503 2,872,372 -43.5
Warrants2 2,129,643 2,852,348 5,085,503 2,872,372 -43.5
Pro-memoria:
Total EuroMEFF 2,521,171 2,541,397 2,430,363 2,038,164 -16.1
European debt futures3 1,440,370 1,117,956 1,059,113 869,105 -17.9
European index contracts4 1,080,801 1,423,441 1,371,250 1,169,059 -14.7
Other5 — — — — —
* Trading volume on MEFF and EuroMEFF is expressed in number of contracts. Differences in the value of theunderlying instruments prevent direct comparisons between products, but inter-year comparisons aremeaningful.
1. The number of Ibex 35 Mini futures (multiples of 1 euro) was standardised to the size of the Ibex 35 Plusfutures (multiples of 10 euro).
2. Premiums traded, in thousand euro, in the electronic market.3. Includes futures on German debt (Bund, Böbl and Schatz) traded on Eurex and futures on the notional 10-
year bond traded on Euronext Paris (until the connection was suspended on 30 December 2003).4. Includes futures on the DAX 30, DJ Eurostoxx 50 and DJ Stoxx 50 indexes traded on Eurex, futures on the
CAC 40, DJ Eurostoxx 50 and DJ Stoxx 50 indexes traded on Euronext Paris (until suspension of theconnection on 30 December 2003), and futures and options on the PSI 20 index traded on Euronext Lisbon(until suspension of the connection on 19 March 2004).
5. Includes futures on Euribor traded on Euronext Paris (until suspension of the connection on 30 December2003) and futures and options on individual stocks (Portugal Telecom and EDP) traded on Euronext Lisbon(until suspension of the connection on 19 March 2004).
05_Capitulo 05_INGLES.qxd 24/7/09 18:53 Página 83

CNMV
Annual Report regarding
its actions and the
securities markets. 2008
84
Trading of futures and options on individual equities increased considerably. Ibex35 options trading also increased sharply, while Ibex 35 futures trading contracted.
On a number of occasions, the very high volatility increased the daily margin callsand extraordinary margin calls during the session. However, the collapse inSeptember of Lehman Brothers, which was a trading member of MEFF, did not havea major impact on the Spanish market.
This chapter provides an overview of Spain's derivatives market performance in2008. Section 5.1 discusses MEFF, section 5.2 covers the warrants market, section 5.3explores other financial contracts and section 5.4 describes the olive oil futures market.
5.1 MEFF
Trading on MEFF (in terms of the number contracts) increased in 2008,outstripping Eurex and Euronext by 7.5 percentage points. The bulk of financialderivatives trading in Europe remained concentrated among the latter two, whichare among the world's three largest derivatives exchanges (the other is CME Group).
Trading in MEFF's two largest segments performed differently in 2008: trading inIbex 35 contracts declined by 10.9% overall, whereas trading in contracts onindividual stocks increased by 85%, in line with the pattern of the last three years.
With regard to the latter, over 46.2 million Spanish individual equity futures weretraded on MEFF, a 117.1% increase with respect to 2007. Futures on the most liquidand largest-cap stocks accounted for the bulk of trading (Table 5.3). Equity futureson Banco de Santander (15.9 million), Telefónica (13.0 million), BBVA (9.0 million)and Iberdrola (4.4 million) accounted for 92.2% of total trading.
Trading on Europe's derivatives markets* TABLE 5.2
Thousand contracts
Change (%)
2005 2006 2007 2008 2008/07
Eurex1 1,248,748 1,526,752 1,899,862 2,165,033 12.2
Euronext2 766,715 710,205 907,584 1,035,651 12.4
Euronext.Liffe3 416,689 497,354 656,134 795,763 17.5
Euronext París 232,334 86,017 91,622 97,751 6.3
Euronext Ámsterdam 117,692 126,834 159,828 142,137 -12.4
OM4 113,705 139,233 161,509 160,216 -0.8
MEFF 35,219 40,775 44,177 55,055 19.8
IDEM/MIF5 25,871 31,591 37,125 35,929 -3.3
Source: Eurex y CNMV.
* Trading volume is expressed in number of contracts. Differences in the value of the underlying instruments
traded on the various markets prevent direct comparisons between markets, but inter-year comparisons
are meaningful.
1. Deutsche Terminbörse (DTB) and Swiss Options & Futures Exchange.
2. Comprising the Paris, Amsterdam and Brussels cash markets and the Liffe, Lisbon and Porto derivatives
markets.
3. Formerly Liffe: London International Financial Futures Exchange.
4. Nordic & Baltic Exchange: Stockholm, Helsinki, Copenhagen, Iceland, Tallin, Vilnius and Riga stock exchanges.
5. Italian Derivatives Market/Mercato Italiano Futures.
05_Capitulo 05_INGLES.qxd 24/7/09 18:53 Página 84

Markets and issuers
Derivatives markets
85
Trading in individual stock futures and options on MEFF RVs TABLE 5.3
No. of contracts
Options Futures
Change (%) Change (%)
2007 2008 2008/07 2007 2008 2008/07
ABENGOA 0 72 — 0 42 —
ABERTIS 86,596 114,508 32.2 50,041 20,026 -60.0
ACCIONA 1,578 8,306 426.4 4,799 4,689 -2.3
ACERINOX 212,939 244,783 15.0 29,331 10,217 -65.2
ACS 25,825 28,800 11.5 11,911 43,707 266.9
ALTADIS 300,946 300 -99.9 120,098 0 -100.0
ANTENA 3 TV 710 239 -66.3 21,865 2,520 -88.5
B. SABADELL 103,978 109,789 5.6 76,746 203,614 165.3
BANESTO 10,813 4,191 -61.2 9,327 4,981 -46.6
BANKINTER 73,593 10,724 -85.4 22,801 107,678 372.3
BBVA 2,500,745 3,147,971 25.9 4,077,451 9,096,220 123.1
BME 200 4,394 2097.0 813 46,666 5640.0
CINTRA 7,107 29,545 315.7 8,694 1,855 -78.7
ENAGAS 34,740 43,601 25.5 53,082 44,859 -15.5
ENDESA 101,501 5,028 -95.0 441,661 129,364 -70.7
FCC 21,439 10,642 -50.4 27,527 16,766 -39.1
FERROVIAL 1,996 9,243 363.1 5,960 8,051 35.1
GAMESA 3,467 3,451 -0.5 9,782 3,847 -60.7
GAS NATURAL 104,001 42,281 -59.3 31,654 8,626 -72.7
GRIFOLS 0 1,273 — 0 180 —
IBERDR. RENOVABLES 0 92,887 — 0 1,057 —
IBERDROLA 1,650,628 3,907,945 136.8 1,143,885 4,454,310 289.4
IBERIA 77,887 1,635 -97.9 40,906 7,791 -81.0
INDITEX 124,372 124,341 0.0 90,952 30,180 -66.8
INDRA 32,749 18,356 -43.9 2,005 8,484 323.1
MAPFRE 997 7,087 610.8 21,612 18,792 -13.0
METROVACESA 6 0 -100.0 357 0 -100.0
NH HOTELES 56 0 -100.0 5,483 147 -97.3
POPULAR 415,405 1,161,600 179.6 270,861 562,960 107.8
PRISA 71,612 0 -100.0 31,220 10,156 -67.5
RED ELECTRICA 15,186 11,329 -25.4 28,300 35,283 24.7
REPSOL 944,762 1,341,491 42.0 1,110,222 2,167,863 95.3
SACYR VALLE. 4,972 2,893 -41.8 16,454 12,818 -22.1
SANTANDER 3,972,744 3,741,252 -5.8 6,431,387 15,974,776 148.4
SOGECABLE 43,388 355 -99.2 3,793 48 -98.7
TELECINCO 132 2,965 2146.2 9,645 13,384 38.8
TELEFONICA 2,475,688 4,002,266 61.7 6,826,659 13,074,850 91.5
U. FENOSA 170,735 81,706 -52.1 201,672 91,294 -54.7
TOTAL 13,593,493 18,317,249 34.8 21,238,956 46,218,101 117.6
Source: MEFF.
05_Capitulo 05_INGLES.qxd 24/7/09 18:53 Página 85

CNMV
Annual Report regarding
its actions and the
securities markets. 2008
86
Trading of equity options also increased sharply, by 34.8% with respect to 2007, toover 18.3 million contracts. The increased volatility in the cash price of theunderlyings increased the use of options to hedge risk. Moreover, greater perceptionof counterparty risk after Lehman Brothers collapsed may have caused an increasein transactions using regulated markets with a central counterparty, to thedetriment of OTC trading with bilateral settlement. As shown in Table 5.3, the mosttraded equity options were on Telefónica (4 million), Iberdrola (3.9 million), Bancode Santander (3.7 million), BBVA (3.1 million), Repsol (1.3 million) and BancoPopular (1.1 million). Equity options on the above-mentioned stocks accounted for94.5% of all trading.
Trading in Ibex 35 options and futures registered a mixed performance. Trading inIbex 35 futures declined 12.8% with respect to 2007, to slightly over 7.6 millioncontracts (Table 5.1). Whereas the Ibex 35 Plus future1 was the principal derivativein Spain’s securities market until last year, trading shrank 13.8% with respect to2007, and it was eclipsed by futures contracts on individual stocks. In contrast, Ibex35 Mini futures, which have a multiplier of 1 euro (vs. 10 euro for the Ibex 35 Plus)and are therefore aimed more at retail investors, saw trading increase by 15.2%.
In contrast with Ibex 35 futures, trading in options on the index grew by 46.1% toover 8 million contracts, the highest level in a decade.
The number of MEFF members in 2008 was on par with recent years. The numberof MEFF RV members rose due to the inclusion of proprietary traders; in contrast,the number of MEFF RF members declined (Table 5.4).
Trading by MEFF members via EuroMEFF declined in 2008, as occurred in 2007.EuroMEFF is a securities company through which MEFF members and their clientscan trade in some Eurex products. This company's purpose is to channel trading inforeign derivatives markets. Total trading via EuroMEFF fell 16.1% due to thedecline of 17.9% in trading of European debt futures and of 14.7% in trading ofEuropean stock index futures.
1. The underlying in Ibex 35 Plus futures contracts is the Ibex 35 index with a multiplier of 10 euro. These
contracts are also referred to simply as Ibex 35 futures.
MEFF membership figures TABLE 5.4
2007 2008
MEFF renta variable 110 114
Settling custodian members 30 29
Settling members 30 29
Trading members 33 31
Proprietary trading members 17 25
MEFF renta fija 52 49
Settling custodian members 31 30
Settling members 10 9
Trading members 11 10
Source: MEFF and CNMV.
05_Capitulo 05_INGLES.qxd 24/7/09 18:53 Página 86

5.1.1. New developments in MEFF
The main new feature in MEFF in 2008 was the increase in its range of equity options.On 21 April 2008, MEFF launched new, European-style options (which may beexercised only upon expiration), in addition to the pre-existing American-style options(which may be exercised at any time before expiration). These new European optionsare settled by delivery of the underlying stock. Expiration dates are the third Fridayof March, June, September and December, but contracts expiring in other monthsmay be admitted to trading. The new contracts are available on 55 Spanish stocks.
MEFF improved its electronic platform in 2008, upgrading to version 8.01. Workhas commenced on a newer version (9.0) with a view to standardising numberingfor all groups of listed products, preparing for the launch of contracts with flexibleexpiration dates and strike prices and increasing listed equity option durations to 5years. It implemented other technological improvements in its trading system andclearing house, tripling the central system's processing capacity.
MEFF collaborated with the Colombian market in 2008 to implement a central clearinghouse for Colombian derivatives using MEFF technology, just as it had done with theMexican derivatives market (MEXDER).
5.1.2. MEFF and the electricity market
As part of its diversification strategy, MEFF improved its position in the electricitymarket by offering new services. As a result of a 2006 agreement with Red EléctricaEspañola (REE), MEFF has been operating as central counter party by delegationfrom REE, managing the guarantees, collection and payments resulting from thenew settlement functions assigned to REE as electricity system operator. Thesettlement functions are performed in connection with certain electricity systemadjustment services for generators, distributors, marketers and other players in thewholesale electricity market. Since these settlements do not involve financialinstruments, they are not subject to CNMV supervision. MEFF provided settlementservices to more than 350 players in 2008.
MEFF continued to manage guarantees and payments for Endesa Distribución andIberdrola Distribución in auctions for bilateral contracts for baseload supply at thebundled tariff (CESUR), which accounted for around 70% of the auction volume.
The National Energy Commission (CNE) appointed MEFF by public tender to managethe sixth and seventh virtual power plant auctions, together with IBM. These auctionsare for options to buy electricity which may be settled by differences, in line with article2 of Securities Market Law and subject to CNMV supervision. The strike price andvolume are predetermined by the General Secretariat for Energy, while the premium isset by auction. In the sixth auction, held on 23 September, MEFF and IBM handled theregistration and qualification of interested parties, and managed the auction and theassociated settlement and guarantees. The seventh auction will be held in 2009.
5.2 Warrants and certificates
5.2.1. Issues
In 2008, the primary market in warrants expanded at a rapid pace in terms of bothpremiums and the number of issues, in line with the trend of recent years. Premiums 87
Markets and issuers
Derivatives markets
05_Capitulo 05_INGLES.qxd 24/7/09 18:53 Página 87

88
CNMV
Annual Report regarding
its actions and the
securities markets. 2008
increased by 37.2% with respect to 2007, to 12.2 billion euro, slightly more than halfof which were attributable to warrants on shares; that proportion was less than in2007, due to the sharp increase in warrant premiums on other underlyings(Table 5.5). The number of issues rose 39.8% to 9,790, while the number of issuersincreased by one to a total of eight at year-end2.
There were issues of certificates in 2008 (as in 2006 and 2007); however, the amountpremiums declined sharply, by 71.3% from 418.4 million euro in 2007 to 120.1million euro in 2008. Certificates on indices accounted for 73.7% of all premiums.The remainder were issued on stocks, and there were no issues of commoditiescertificates.
5.2.2. Trading
After reaching an all-time high in 2007, the secondary market in warrantscontracted sharply in 2008. Warrant premiums traded in the stock exchangedeclined 42.6%, returning to around the 2006 figure. However, the number ofwarrants traded in the year expanded 24.7%.
2. The eight issuers and the amounts issued (in parentheses, expressed in million euro) in 2008 were: Société
Générale Acceptance (4,596), Banco Santander Central Hispano (1,468), Commerzbank (1,420), BNP
Paribas Arbitrage Issuance (636, of which 97.6 were turbo warrants), Bankinter (451), BBVA (194) and Caja
de Ahorros y Pensiones de Barcelona (155).
Warrant issues registered with the CNMV TABLE 5.5
Thousand euro
Number Amount of premium
Issuers Issues Total Shares Indices1 Currencies Commodities
2004 7 1,600 1,525,250 929,005 554,887 31,710 9,648
20052 6 1,720 1,840,016 1,180,845 562,258 96,913 0
20062 8 4,063 5,144,333 3,697,600 1,070,119 320,015 56,600
20072, 3 7 7,005 8,920,269 6,215,075 2,313,222 163,201 228,772
20082, 3 8 9,790 12,234,336 6,914,044 4,552,107 425,336 342,850
Source: CNMV.1. Includes baskets of securities and of indices.2. Includes issues that do not require a prospectus, in accordance with the prospectus regulations. 3. The figures include turbo warrants.
Certificate issues registered with the CNMV TABLE 5.6
Thousand euro
Number Amount of premium
Issuers Issues Total Shares Indices1 Currencies Commodities
2002 1 1 200,000 0 200,000 0 0
20062 1 2 95,650 75,650 20,000 0 0
20072 2 8 418,390 0 385,000 0 33,390
20082 1 10 120,083 31,583 88,500 0 0
Source: CNMV.
1. Includes baskets of securities and of indices.
2. Includes issues that do not require a prospectus, in accordance with the prospectus regulations.
05_Capitulo 05_INGLES.qxd 24/7/09 18:53 Página 88

The decline in warrant trading volume was due to the sharp downswing (slightlyover 50%) in trading of warrants on individual stocks. Trading of warrants onindices also declined, although to a lesser degree. In contrast, trading of warrants oncurrencies and commodities grew sharply (by 141.3% and 61.75%, respectively),although they account for a much smaller volume than warrants on stocks andindices and, consequently, failed to offset the decline in the latter two. The sharpupswing in trading of warrants on currencies and commodities is attributable to the2007 launch of turbo warrants3, which have been heavily concentrated in indices,currencies and commodities.
Certificate premiums dropped sharply, by 66.3%, in line with the downward trendthat began in 2004. However, the number of issues traded increased by eight,from 18 to 26 (Table 5.8). The sharp reduction in premiums traded is attributableto the decline in the trading of certificates on indices (-71.8%). In contrast, therewas an increase in trading in certificates on shares and commodities (especiallythe latter).
89
Markets and issuers
Derivatives markets
3. The features of turbo warrants mean that their premiums perform similarly to futures since they are not
sensitive to changes in volatility of the underlying asset. Furthermore, they include a barrier which, if
reached before maturity, terminates the warrant.
Trading in warrants on the electronic market TABLE 5.7
Premiums traded, in thousand euro
Premiums traded, by type of underlying
Number Total
of issues1 Indices2 Shares Currencies Commodities premiums
2004 2,207 550,716 1,236,832 37,919 1,408 1,826,875
2005 2,698 516,788 1,587,593 25,262 12,734 2,142,377
2006 4,268 727,918 2,098,613 25,817 55,046 2,907,394
2007 7,837 1,378,286 3,674,848 32,369 44,123 5,129,626
2008 9,770 1,066,510 1,727,644 78,107 71,467 2,943,728
Source: CNMV.
1. The number refers to the number of issues which were traded in each period.
2. Includes baskets of securities and of indices.
Trading in certificates on the electronic market TABLE 5.8
Premiums traded, in thousand euro
Premiums traded, by type of underlying
Number Total
of issues1 Indices2 Shares Currencies Commodities premiums
2004 16 78,556.9 0 0 0 78,556.9
2005 15 69,760.1 0 0 0 69,760.1
2006 14 58,725.0 87.2 0 0 58,812.2
2007 18 48,494.6 1,299.0 0 0.1 49,793.7
2008 26 13,673.4 1,617.3 0 1513.8 16,804.5
Source: CNMV.
1. The number refers to the number of issues which were traded in each period.
2. Includes baskets of securities and of indices.
05_Capitulo 05_INGLES.qxd 24/7/09 18:53 Página 89

5.3 Other financial contracts
The registration of call and put option contracts (formerly called "atypical financialcontracts") with the CNMV fell 49.0% in 2008 (Table 5.9). The nominal amountissued was 77.0 million euro, all of which were contracts on shares. Just one issuer4
registered this type of contract in 2008, compared with three last year.
5.4 Olive Oil Futures Market (MFAO)
In 2008, trading on the olive oil futures market (MFAO) increased slightly to 60,141contracts5, compared with 58,870 the previous year, i.e. an increase of 2.2%.However, open interest declined in 2008, both at year-end (3,925 contracts vs. 5,170in 2007) and in average terms (6,713 contracts vs. 7,542). At all events, the MFAOconsolidated its position in 2008, considering that there was an increase in thenumber of futures traded in a context of fewer cash transactions, and the marketbecame a necessary benchmark for setting olive oil prices.
Of special note with regard to this market is that all maturities for which there isopen interest are traded in session (not just the front maturity). This creates areference for futures prices in all maturities, making it possible to plot a forwardolive oil price curve over more than one year.
At year-end, MFAO had 18 members, one less than in 2007, due to the merger of twosettling members, Caja El Monte and Caja de San Fernando (now Cajasol)
90
CNMV
Annual Report regarding
its actions and the
securities markets. 2008
4. Banco Guipuzcoano.
5. Each olive oil future contract represents one tonne.
Issues of call and put option contracts registered with the CNMV TABLE 5.9
Thousand euro
Number Amount of premium
Exchange
Issuers Issues Total Shares Indices1 Commodities rates
2004 8 31 247,717 195,305 52,412 0 0
2005 4 13 112,200 87,800 16,400 0 8,000
2006 4 12 206,840 196,240 10,600 0 0
2007 3 9 151,000 145,000 6,000 0 0
2008 1 4 77,000 77,000 0 0 0
Source: CNMV.
1. Includes baskets of securities and of indices.
MFAO membership figures TABLE 5.10
2007 2008
Settling custodian members 5 5
Settling members 7 6
Trading members 2 2
Industrial members 5 5
Total 19 18
Source: MFAO and CNMV.
05_Capitulo 05_INGLES.qxd 24/7/09 18:53 Página 90

III Financial institutionsand investment services
06_Capitulo 06_INGLES.qxd 24/7/09 18:54 Página 91

06_Capitulo 06_INGLES.qxd 24/7/09 18:54 Página 92
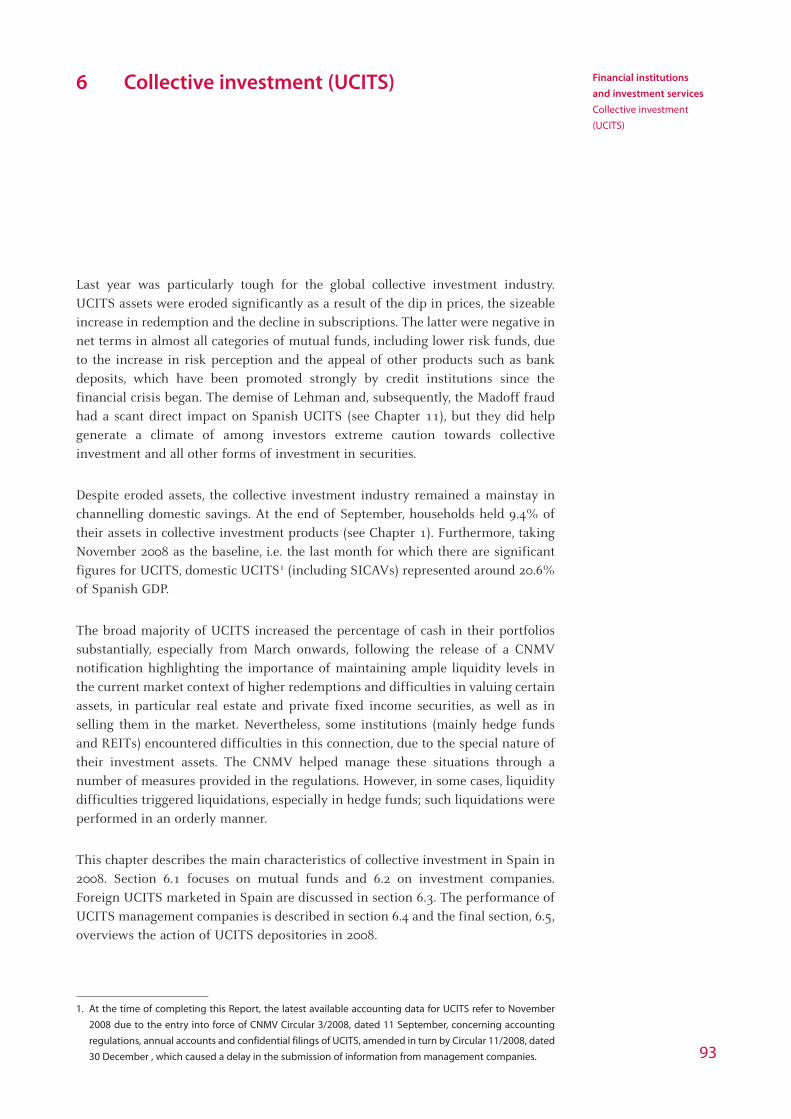
Financial institutions
and investment services
Collective investment
(UCITS)
93
6 Collective investment (UCITS)
Last year was particularly tough for the global collective investment industry.UCITS assets were eroded significantly as a result of the dip in prices, the sizeableincrease in redemption and the decline in subscriptions. The latter were negative innet terms in almost all categories of mutual funds, including lower risk funds, dueto the increase in risk perception and the appeal of other products such as bankdeposits, which have been promoted strongly by credit institutions since thefinancial crisis began. The demise of Lehman and, subsequently, the Madoff fraudhad a scant direct impact on Spanish UCITS (see Chapter 11), but they did helpgenerate a climate of among investors extreme caution towards collectiveinvestment and all other forms of investment in securities.
Despite eroded assets, the collective investment industry remained a mainstay inchannelling domestic savings. At the end of September, households held 9.4% oftheir assets in collective investment products (see Chapter 1). Furthermore, takingNovember 2008 as the baseline, i.e. the last month for which there are significantfigures for UCITS, domestic UCITS1 (including SICAVs) represented around 20.6%of Spanish GDP.
The broad majority of UCITS increased the percentage of cash in their portfoliossubstantially, especially from March onwards, following the release of a CNMVnotification highlighting the importance of maintaining ample liquidity levels inthe current market context of higher redemptions and difficulties in valuing certainassets, in particular real estate and private fixed income securities, as well as inselling them in the market. Nevertheless, some institutions (mainly hedge fundsand REITs) encountered difficulties in this connection, due to the special nature oftheir investment assets. The CNMV helped manage these situations through anumber of measures provided in the regulations. However, in some cases, liquiditydifficulties triggered liquidations, especially in hedge funds; such liquidations wereperformed in an orderly manner.
This chapter describes the main characteristics of collective investment in Spain in2008. Section 6.1 focuses on mutual funds and 6.2 on investment companies.Foreign UCITS marketed in Spain are discussed in section 6.3. The performance ofUCITS management companies is described in section 6.4 and the final section, 6.5,overviews the action of UCITS depositories in 2008.
1. At the time of completing this Report, the latest available accounting data for UCITS refer to November
2008 due to the entry into force of CNMV Circular 3/2008, dated 11 September, concerning accounting
regulations, annual accounts and confidential filings of UCITS, amended in turn by Circular 11/2008, dated
30 December , which caused a delay in the submission of information from management companies.
06_Capitulo 06_INGLES.qxd 24/7/09 18:54 Página 93

CNMV
Annual Report regarding
its actions and the
securities markets. 2008
94
6.1 Mutual funds
The year 2008 was a difficult one for the mutual funds industry worldwide. Inparticular, assets managed by the European industry declined substantially acrossthe board as a result of both falling prices and the fact that redemptionspredominated over subscriptions. According to the European Fund and AssetManagement Association - EFAMA, European mutual funds’ net assets declined by22.3%. In the seven countries with the biggest weighting in total assets(Luxembourg, France, Germany, Ireland, the UK, Italy and Spain, in that order), thedecline ranged from 12.5% (Germany) to 39% (UK).
In Spain, mutual funds’ assets totalled 188.9 billion euro in November 2008, i.e.down 28.7% from December 2007. Financial mutual funds accounted for 96% ofthis amount, and real estate funds accounted for the rest. The decline in assetsaffected both kinds of vehicle and, as in the rest of Europe, was due to the downturnin asset prices (especially significant in equities, private fixed income and realestate), as well as the increase in redemptions and the decline in subscriptions.Spanish funds have been reporting negative net subscriptions since 2006, initiallyas a result of changes in taxation on savings, and later because of the slump in yieldsand the increased risk perception. Last year, the gap between redemptions andsubscriptions widened considerably, evidencing a substantial increase in riskperception with respect to collective investment products and the greater appeal ofalternative products, such as bank deposits, as credit institutions vied to windeposits.
Household investment impacted strongly on the mutual funds industry in 2008. Inthe first three quarters of 2008, households substantially divested from collectiveinvestment products, and their investment in bank deposits rose by 21.4%, againstthe backdrop of a 70% reduction in this sector’s total investment in financial assets(see Chapter 1). As a result, collective investment products declined as a percentageof households’ financial portfolios from 11.4% to 9.4%.
Mutual funds assets in Spain and Europe FIGURE 6.1
Source: EFAMA.
Billion euro
0
1,000
2,000
3,000
4,000
5,000
6,000
7,000
8,000
2004 2005 2006 2007 20080.0
0.5
1.0
1.5
2.0
2.5
3.0
3.5
4.0
4.5
5.0
Total mutual funds in Europe (LHS) % Spain (RHS)
%
06_Capitulo 06_INGLES.qxd 24/7/09 18:54 Página 94
creo

Financial institutions
and investment services
Collective investment
(UCITS)
95
Financial mutual funds
Among financial funds, traditional securities funds accounted for 99% of total assets(179.6 billion euro) at the end of November 2008 and hedge funds accounted for therest (1.8 billion euro). The assets of the former of these two categories fell by 29.6%vs. December 2007, considerably more than the decline throughout the entireprevious year (5.6%), due to a faster pace of net divestment. In fact, during the first11 months of 2008, net negative subscriptions accounted for 25% of the reduction intotal assets, as compared to 8.5% in 2007. The net yield was also negative, as a resultof a 4.3% depreciation in the assets’ value. In 2007, the yield had been positive,contributing a 2.4% increase in asset value. Annex III.1 details the contribution ofnet subscriptions and yields to the change in assets in the various categories offinancial funds, including hedge funds, whose performance will be discussed below.
All traditional securities fund categories saw assets diminish, except for guaranteedfixed income and money-market funds, although in this latter case the increase cameon the back of the inclusion of a considerable number of short-term fixed-incomefunds which changed their profiles following the introduction of Circular 1/2007,dated 11 July, on the requirements regarding statistical information of EuropeanUnion UCITS. The profiles accounting for the largest volume of assets were, in thisorder, short-term fixed income, guaranteed funds and money-market funds which,together, represented more than 78% of all assets in traditional securities funds atthe end of November 2008 (Figure 6.2). The predominance of low-risk funds, evenmore noticeable than in 2007, reveals investors’ highly conservative approach.
Only fixed-income categories managed to accumulate positive (albeit small) year-on-year yields in November. In equities, losses were about 40% of net asset valueduring the reference period. Annex III.6 shows the trend in yields for the variouscategories in the last few years, as well as the trend in net subscriptions.
As for investment portfolio performance, there was a significant increase in liquidity.Traditional securities investment fund increased liquidity to 10.9% of total assets in
Financial mutual funds: FIGURE 6.2
breakdown of assets and yields by profile1
Source: CNMV.
1. Excluding hedge fund categories. For each profile, the graph shows the weighting of assets over total
assets in November 2008 and cumulative yields between November 2007 and November 2008.
Weighting (LHS)
%
Yields (RHS)
%
1.82 2.31
-12.92
-40.23-39.64
2.152.03
-6.50
-1.11
0
5
10
15
20
25
30
35
Mon
ey m
arke
t
Shor
t-te
rmfix
ed-in
com
e
Long
-ter
mfix
ed-in
com
e
Inte
rnat
iona
lfix
ed-in
com
e
Mix
ed fu
nds
Span
ish
equi
ty
Inte
rnat
iona
l equ
ity
Gua
rant
eed
Glo
bal -45
-40-35-30-25-20-15-10
-505
06_Capitulo 06_INGLES.qxd 24/7/09 18:54 Página 95
creo

CNMV
Annual Report regarding
its actions and the
securities markets. 2008
96
November 2008, from 5.2% one year previously (Table 6.1). In March, the CNMV senta communication to fund operators highlighting the need for an adequate liquiditypolicy in the current market context, especially because of the difficulties in realisingcertain private fixed-income assets at reasonable values and in a reasonable time-scale.
Foreign assets decreased from 42% of the total (November 2007) to 34.4%(November 2008). Government fixed-income securities increased as a percentage ofthe domestic portfolio, as did repos and, to a lesser extent, private fixed-income; theweighting of units in other funds declined sharply.
Hedge funds
Hedge funds, only recently introduced in Spain, totalled 1.8 billion euro inNovember, a 24.7% increase vs. December 2007. Despite this substantial increase,linked to the authorisation of new vehicles, 2008 was a difficult year for hedgefunds. Liquidity problems, deriving from the nature of the investment assets,coupled with a large number of redemption requests, affected the viability of somefunds and triggered the first deregistrations since this form of investment wasintroduced (overall it accounted for less than 1% of UCITS assets). Three hedgefunds and four funds of hedge funds were deregistered in 2008. Several funds werein the process of deregistration or liquidation during the first few months of 2009.
The adverse market conditions led to fewer vehicles registering with the CNMV.Specifically, in 2008, five funds, one company and 13 funds of funds wereregistered, vs. 16 funds and 29 funds of funds in 2007. Of the 53 operators that wereauthorised to manage hedge funds at year-end, 12 had not yet launched any productof that kind. Furthermore, some hedge funds were found to be encounteringdifficulties in marketing or attaining and maintaining the minimum assets andinvestor numbers required by law.
Securities mutual fund asset breakdown1 TABLE 6.1
Thousand euro
20072 % 20082 %
Cash 13,414,003 5.15 19,589,770 10.91
Portfolio investments 246,274,681 94.60 158,981,824 88.52
Spanish securities 136,925,609 52.59 97,159,700 54.10
Shares 12,412,311 4.77 4,141,497 2.31
Mutual fund units 19,012,689 7.30 10,527,779 5.86
Public fixed-income 11,056,080 4.25 12,210,379 6.80
Private fixed-income 61,337,138 23.56 44,032,124 24.52
Repos 32,431,830 12.46 26,011,784 14.48
Unlisted securities 356 0.00 957 0.00
Other 675,205 0.26 235,180 0.13
Foreign securities 109,349,072 42.00 61,822,124 34.42
Euro 98,047,627 37.66 58,493,333 32.57
Other 11,301,445 4.34 3,328,791 1.85
Net balance (debtors - creditors) 656,999 0.25 1,033,027 0.58
Assets 260,345,683 100.00 179,604,621 100.00
Source: CNMV.
1. Excluding hedge funds and funds of hedge funds.
2. At 30 November.
06_Capitulo 06_INGLES.qxd 24/7/09 18:54 Página 96

Financial institutions
and investment services
Collective investment
(UCITS)
97
Nordinvest, the first hedge fund company (SIL), which is managed by a broker-dealer, registered in early 2009. Until then, authorisation of hedge fund companieswas pending regulation of the Alternative Stock Market (MAB) to include therequirements and procedures for the listing this class of companies in that market.These regulations were completed in 2008 (see Chapter 2).
Real estate UCITS
Real estate UCITS’ assets totalled 7.5 billion euro in November 2008, i.e. down 13%vs. December 2007. Real estate investment funds accounted for 95.4% of the total,and real estate investment companies for the rest. As in the case of financial mutualfunds, subscriptions were negative in net terms, evidencing investors’ perception ofreal estate market performance, although real estate mutual funds obtained a 1.6%positive yield from November 2007 to November 2008. Annex III.6 shows the trendin yields and net subscriptions for these vehicles in the last few years.
Some real estate funds experienced difficulties in attending to redemptions in thescheduled liquidity windows because of the adverse market conditions and theincrease in redemption requests. Against this backdrop, some real estate UCITSasked the CNMV for approval, under the provisions of the regulations (see box inChapter 11), to perform certain operations such as the early sale of buildings (priorto the 3 years established by law), reduction of the frequency of redemptions (fromat least once a year to once every two years) or the performance of additionalappraisals of buildings, in order to adapt the net asset values to property marketperformance. In the first few months of 2009, the CNMV authorised a two-yearsuspension of redemptions of two real estate UCITS at the request of managementcompanies who were receiving reimbursement requests for very significantpercentages of assets (see Chapter 11).
Institutions and investors
In view of the marketing difficulties, management companies substantially cut thenumber of new collective investment products with respect to the previous year,while at the same time increasing the number of removals. There were slightlyfewer financial funds (excluding hedge funds) at year-end than at 2007 year-end(Table 6.2). In the case of hedge funds, growth in the number of UCITS is explainedby the initial inertia in this modality, which was only recently introduced. The totalnumber of real estate investment vehicles did not change.
The number of investors in mutual funds fell by almost 2 million, to around 6million in November 2008. Among the traditional securities funds, those with mostinvestors were, in this order, guaranteed equity funds, short-term fixed-incomefunds, money-market funds, guaranteed fixed-income funds and global funds.These profiles together accounted for 73.5% of all investors (see Annex III.1 for abreakdown of the investors by fund category).
In November 2008, natural persons accounted for 97% of all investors in financialfunds and for 77% of their assets. Average assets per investor for these collectiveinvestment institutions amounted to 30,000 euro, 1,800 euro less than in December2007. Average assets per fund fell from 86 million euro to 60 million euro in thesame period.
06_Capitulo 06_INGLES.qxd 24/7/09 18:54 Página 97

Funds’ holdings in the capital of listed companies
Article 81 of the UCITS Regulation2 establishes the obligation for managementcompanies to disclose, in their annual reports, their position with regard to exercisingthe voting rights associated with the securities acquired by the funds. In November2008, 12 UCITS operators were managing funds with a stake of more than 1% in theshare capital of companies listed in the Spanish stock market (Table 6.3).
98
CNMV
Annual Report regarding
its actions and the
securities markets. 2008
Registrations and removals in 2008 TABLE 6.2
UCITS UCITS
registered registered
Type of firm at 31/12/07 Registrations Removals at 31/12/08
Total financial mutual funds 6,296 302 244 6,354
Mutual funds 2,954 147 158 2,943
Investment companies 3,290 136 79 3,347
Funds of hedge funds 31 13 4 40
Hedge funds 21 6 3 24
Total real estate UCITS 18 1 1 18
Real estate mutual funds 9 0 0 9
Real estate investment companies 9 1 1 9
Foreign UCITS marketed in Spain 440 147 24 563
Foreign funds 225 104 17 312
Foreign companies 215 43 7 251
UCITS management companies 120 3 3 120
Depositories 126 0 1 125
Source: CNMV
Significant shareholdings held by UCITS management companies TABLE 6.3
Number of companies Range of holdings1 (%)
traded in the electronic
Management companies market Largest Smallest
BESTINVER GESTION 19 10.2 1.1
SANTANDER ASSET MANAGEMENT 3 1.5 1.1
ESPIRITO SANTO GESTION 2 2.0 1.1
POPULAR GESTION 2 1.2 1.0
INVERCAIXA GESTION 1 2.5 2.5
RENTA 4 GESTORA 1 1.3 1.3
BANSABADELL INVERSION 1 1.0 1.0
PRIVAT BANK PATRIMONIO 1 1.2 1.2
IBERCAJA GESTION 1 1.2 1.2
AHORRO CORPORACION GESTION 1 1.5 1.5
RIVA Y GARCIA GESTION 1 1.3 1.3
GESCOOPERATIVO 1 1.0 1.0
Source: CNMV.
1. Largest and smallest holdings of funds managed by the management companies in the capital of the
company listed on the electronic market. Data from November 2008.
2. Royal Decree 1309/2005, dated 4 November, approving the provisions of UCITS Law 35/2003, dated 4
November, and adapting the tax regime for UCITS.
06_Capitulo 06_INGLES.qxd 24/7/09 18:54 Página 98

Mutual funds owned significant shareholdings in 30 listed Spanish companies.Only one of them was listed on the Ibex 35; most were small- and mid-caps. At onecompany, Miquel y Costas & Miquel, the aggregate stakes held by mutual fundsexceeded 10% of capital.
Commissions
Commissions charged by traditional securities UCITS, excluding exchange-tradedfunds (ETFs), fell from 1.02% of average daily assets in December 2007 to 0.92% inSeptember 2008 (see Annex III.3). This decline is attributable mainly to thereduction in assets in funds with the highest commissions (equity funds), whichwas sharper than in the rest of funds. The deposit commission remained stable at0.09% of average daily assets in the same period.
ETFs also charged a lower management commission (down from 0.18% of average dailyassets in December 2007 to 0.15% in September 2008, see Annex III.4). The managementcommission for ETFs is considerably lower than that of traditional mutual funds, becauseETFs are passively managed products, with very low marketing costs.
At year-end, only 335 of the 2,943 traditional funds charged a combined commission(on both assets and yield), and another three charged a management commissionbased solely on yield. However, most hedge funds charged a combined commission.
Distribution costs still account for a significant proportion (around 70%) of funds’management commissions, since they are sold mainly through the branch networksof the banks in the groups. This weighting increased slightly in 2008.
6.2 Investment companies
Following the increase in the previous year, the number of SICAVs registered withthe CNMV increased more moderately in 2008, to 3,347 (Table 6.2). The number ofshareholders also increased slightly (Table 6.4), in particular among smallerinvestment companies.
Despite these increases, assets managed by investment companies fell by 20.7% inthe first 11 months of 2008, to 24.9 billion euro. Average assets per shareholder fellby a similar proportion, as did average assets per SICAV, to 57,000 euro and 7.5million euro, respectively. SICAVs increased as a proportion of financial UCITS’total assets (excluding hedge funds) to 13.7%.
As with the rest of UCITS, SICAVs considerably increased their proportion of cashin portfolio, especially from March 2008, after the CNMV released the notificationhighlighting some major concerns regarding liquidity. Specifically, in November2008, cash represented 9.5% of assets, vs. 3.6% in December 2007. As for the rest ofinvestments, domestic assets increased to 59.7% of total assets, while foreign assetsdeclined to 30.2%. Within the domestic portfolio, the investment in shares fellsignificantly in favour of fixed income (especially private-sector) and repos, whichrepresented more than 25% of the total.
6.3 Foreign UCITS marketed in Spain
The volume of foreign UCITS marketed in Spain in 2008 totalled 18.2 billion euro,a 51% decline on the previous year’s figure (considerably sharper than the decline 99
Financial institutions
and investment services
Collective investment
(UCITS)
06_Capitulo 06_INGLES.qxd 24/7/09 18:54 Página 99

in domestic UCITS). The decline in the volume of investment in foreign UCITS,which began in summer 2007 from the record high of 50 billion euro in June, wasdue mainly to divestment by investors and shareholders. The number of investorsalso dropped sharply (Table 6.5).
100
CNMV
Annual Report regarding
its actions and the
securities markets. 2008
Investment company asset breakdown1 TABLE 6.4
Thousand euro
2007 % 2008 %
Cash 1,139,506 3.56 2,367,426 9.49
Portfolio investments 30,684,091 95.84 22,423,941 89.90
Spanish securities 17,195,073 53.71 14,879,242 59.65
Shares 6,522,785 20.37 3,292,865 13.20
Mutual fund units 1,361,780 4.25 1,219,757 4.89
Public money-market assets 439,110 1.37 530,968 2.13
Other public fixed-income 684,213 2.14 493,928 1.98
Private money-market assets 1,360,655 4.25 1,820,478 7.30
Other private fixed-income 581,708 1.82 949,092 3.81
Spanish warrants and options 31,091 0.10 38,689 0.16
Repos 6,209,593 19.40 6,528,783 26.18
Unlisted securities 4,138 0.01 4,682 0.02
Foreign securities 13,489,018 42.13 7,544,699 30.25
Euro 9,726,532 30.38 5,856,312 23.48
Other 3,762,486 11.75 1,688,387 6.77
Net balance (debtors - creditors) 192,550 0.60 151,253 0.61
Assets 32,016,147 100.00 24,942,620 100.00
Pro-memoria: No. of shareholders 430,315 439,395
Source: CNMV.
1. Data at 30 November except for the number of shareholders, which is at 30 September.
Foreign UCITS marketed in Spain TABLE 6.5
2007 2008 Change (%)
No. of UCITS 440 563 27.95
No. of investors 850,931 587,032 -31.01
Investment volume (million euro) 37,092.70 18,181.36 -50.98
Breakdown by country of origin
Germany 15 16 7
Austria 5 28 460
Belgium 3 5 67
France 122 161 32
Netherlands 1 1 0
Ireland 52 63 21
Luxembourg 229 274 20
Malta 1 1 0
UK 12 14 17
Source: CNMV.
06_Capitulo 06_INGLES.qxd 24/7/09 18:54 Página 100
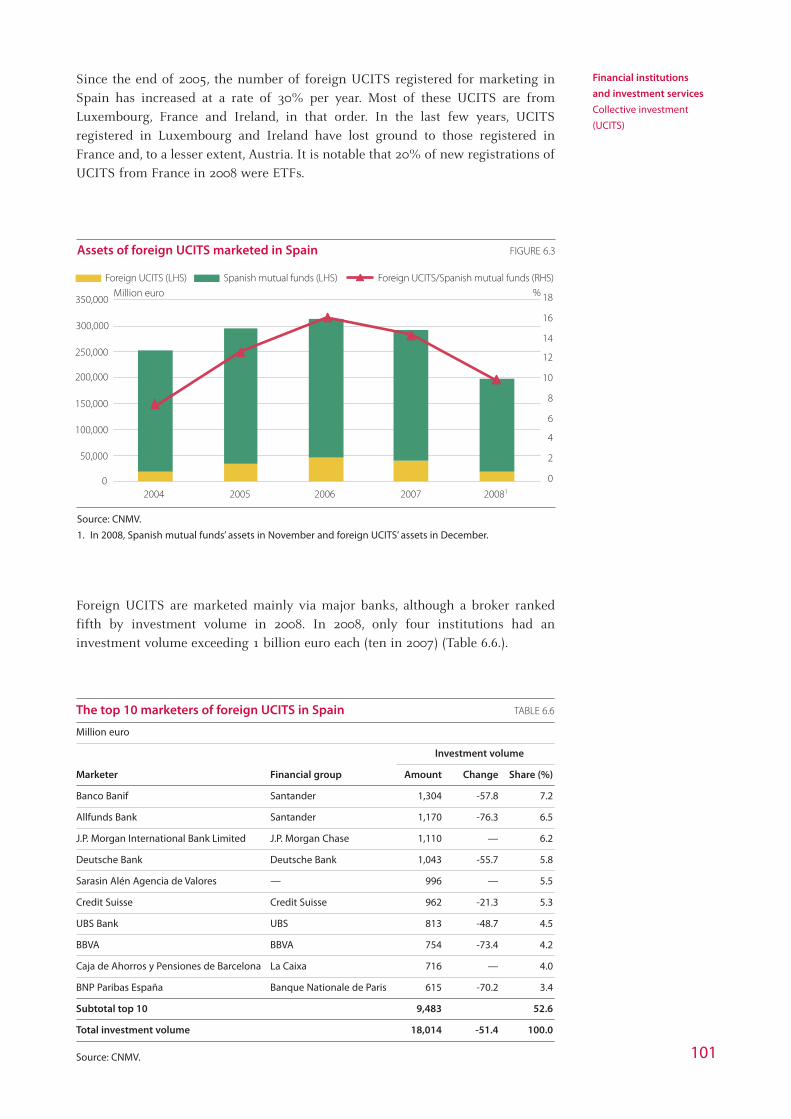
Since the end of 2005, the number of foreign UCITS registered for marketing inSpain has increased at a rate of 30% per year. Most of these UCITS are fromLuxembourg, France and Ireland, in that order. In the last few years, UCITSregistered in Luxembourg and Ireland have lost ground to those registered inFrance and, to a lesser extent, Austria. It is notable that 20% of new registrations ofUCITS from France in 2008 were ETFs.
Foreign UCITS are marketed mainly via major banks, although a broker rankedfifth by investment volume in 2008. In 2008, only four institutions had aninvestment volume exceeding 1 billion euro each (ten in 2007) (Table 6.6.).
101
Financial institutions
and investment services
Collective investment
(UCITS)
Assets of foreign UCITS marketed in Spain FIGURE 6.3
Source: CNMV.
1. In 2008, Spanish mutual funds’ assets in November and foreign UCITS’ assets in December.
Million euro %
0
50,000
100,000
150,000
200,000
250,000
300,000
350,000
Foreign UCITS (LHS) Spanish mutual funds (LHS)
2004 2005 2006 2007 20081
0
2
4
6
8
10
12
14
16
18
Foreign UCITS/Spanish mutual funds (RHS)
The top 10 marketers of foreign UCITS in Spain TABLE 6.6
Million euro
Investment volume
Marketer Financial group Amount Change Share (%)
Banco Banif Santander 1,304 -57.8 7.2
Allfunds Bank Santander 1,170 -76.3 6.5
J.P. Morgan International Bank Limited J.P. Morgan Chase 1,110 — 6.2
Deutsche Bank Deutsche Bank 1,043 -55.7 5.8
Sarasin Alén Agencia de Valores — 996 — 5.5
Credit Suisse Credit Suisse 962 -21.3 5.3
UBS Bank UBS 813 -48.7 4.5
BBVA BBVA 754 -73.4 4.2
Caja de Ahorros y Pensiones de Barcelona La Caixa 716 — 4.0
BNP Paribas España Banque Nationale de Paris 615 -70.2 3.4
Subtotal top 10 9,483 52.6
Total investment volume 18,014 -51.4 100.0
Source: CNMV.
06_Capitulo 06_INGLES.qxd 24/7/09 18:54 Página 101
creo

CNMV
Annual Report regarding
its actions and the
securities markets. 2008
102
6.4 UCITS management companies3
In December 2008 there were a total of 120 UCITS management companiesregistered with the CNMV, the same number as in 2007 (Table 6.7). There werethree registrations and three deregistrations in the year (Annex III.7). Of the threenew registrations, two included the management of hedge funds in theirprogramme of activities. During the year, 12 UCITS registered operators requestedan extension of their programme of activities to include hedge fund management.At the end of 2008, 53 UCITS management companies, i.e. 44.2% of the total, wereauthorised to manage hedge funds.
UCITS management companies managed all mutual fund assets and 96.4% ofSICAV assets at the end of November 2008. Assets under management slumped(Table 6.7), as discussed in previous sections.
UCITS operators’ earnings depend heavily on the performance of the assets theymanage. During the first half of 2008, the latest period for which figures areavailable, management commissions, which accounted for 93% of revenues fromservices, fell by 22.2% vs. the same period of 2007, and were crucial in theperformance of total net revenues, which fell by 16.1% (Table 6.8), despite anincrease in other commissions4 and a significant decline in marketing commissionspaid to other intermediaries. The 3% increase in operating expenses, coupled with
3. The latest available accounting data with regard to UCITS management companies refers to the first half
of 2008, due to the delay in receiving information because of the recent entry into force of CNMV Circular
7/2008, concerning accounting standards, annual accounts and confidential filings of investment services
companies, UCITS management companies and venture capital firm operators.
4. The slight increase in front-end and back-end fees was due mainly to the increase in the latter. The “Other”
heading in Table 6.8 includes mainly fees for discretionary management of portfolios and venture capital
firms, as well as commissions for marketing foreign UCITS and providing advisory services.
UCITS management companies. Number of companies and TABLE 6.7
assets managed or under advice
2007 2008 Change (%)
Number of companies1 120 120 0.0
Number of UCITS managed1 6,205 6,265 1.0
Mutual funds 2,954 2,943 -0.4
Funds of hedge funds 31 40 29.0
Hedge funds 21 24 14.3
Investment companies 3,181 3,240 1.9
Real estate UCITS 18 18 0.0
Assets2 (thousand euro) 302,033,980 213,273,948 -29.4
Mutual funds 260,345,683 179,604,621 -31.0
Funds of hedge funds 984,469 1,210,058 22.9
Hedge funds 418,721 550,250 31.4
Investment companies 30,804,488 24,054,251 -21.9
Real estate UCITS 9,480,619 7,854,768 -17.1
Source: CNMV.
1. Data at 31 December.
2. Data at 30 November.
06_Capitulo 06_INGLES.qxd 24/7/09 18:54 Página 102

Financial institutions
and investment services
Collective investment
(UCITS)
103
the performance of total net revenues, helped push operating income down by25.3%. Aggregate income before taxes at UCITS management companies fell by27.7% in the reference period.
Pre-tax return on equity (ROE) in the sector was 18.5%, vs. 31% in the first half of2007. This substantial reduction was due to both the sharp decline in income andthe considerable increase in equity (22% vs. June 2007). There was a significantreduction in the number of UCITS management companies obtaining a high ROE(above 20%) as compared with June 2007 (Figure 6.4). These operators managedjust over 50% of total assets, vs. 70% in the same month one year previously. Thenumber of loss-making firms soared from 19 at the end of 2007 to 31 in June 2008.Assets managed by these firms increased from 2.6% to 7.0% in the period.
UCITS management companies: profit and loss account1 TABLE 6.8
Thousand euro
2007 2008 Change (%)
Financial income 32,355 28,459 -12.0
Net income from securities 4,047 13,223 226.7
Net commission revenues 542,890 444,122 -18.2
Commission revenues 1,674,631 1,349,227 -19.4
UCITS management 1,616,912 1,257,352 -22.2
Front-end and back-end fees 38,015 39,521 4.0
Other 19,704 52,354 147.7
Commission expenses 1,131,741 905,105 -20.0
Total net revenues 579,292 485,804 -16.1
Operating expenses 187,247 192,906 3.0
Operating income 392,045 292,898 -25.3
Depreciation and amortisation and other provisions 7,594 6,297 -17.1
Other income 10,835 -660 —
Income before taxes 395,286 285,941 -27.7
Income tax 115,760 81,624 -29.5
Income after taxes 279,526 204,317 -26.9
Source: CNMV.
1. Data at 30 June.
Income before taxes, ROE and the No. of loss-making firms TABLE 6.9
Thousand euro
Income before Pre-tax No. of loss-making
taxes ROE firms
2004 512,288 49 17
2005 622,779 53 16
2006 743,961 69 12
2007 770,649 61 19
June 2007 395,286 31 18
June 2008 285,941 18 31
Source: CNMV.
06_Capitulo 06_INGLES.qxd 24/7/09 18:54 Página 103
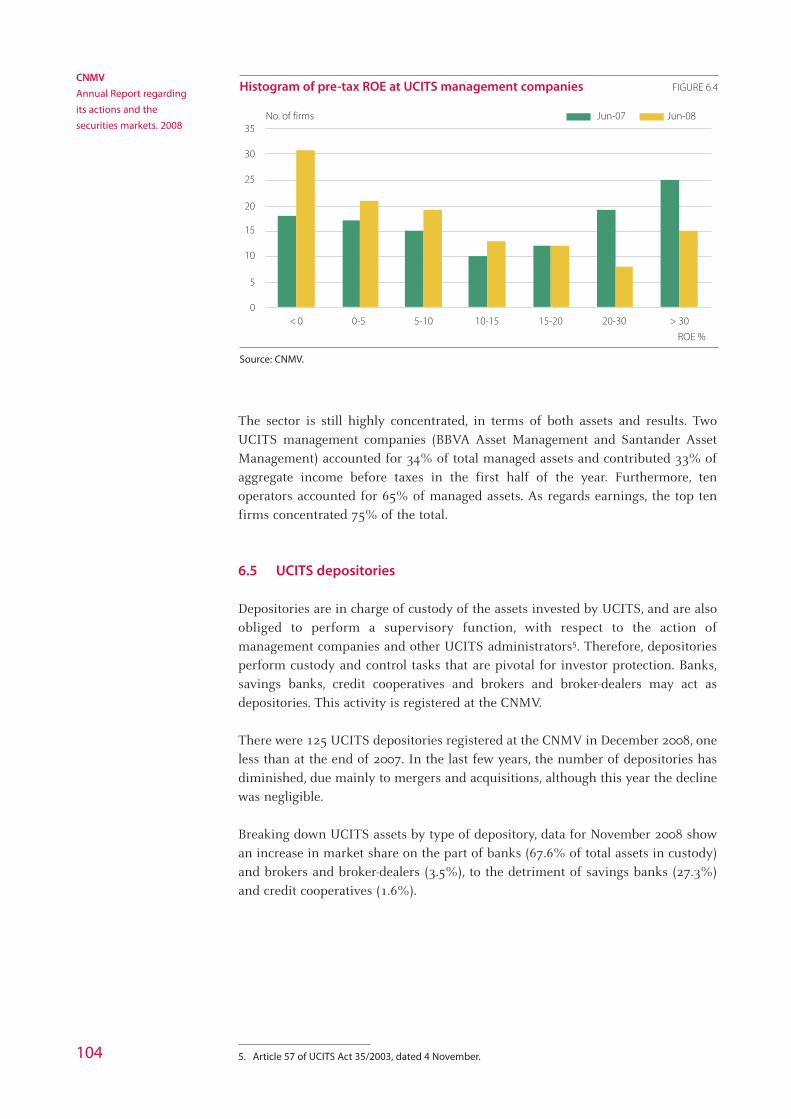
The sector is still highly concentrated, in terms of both assets and results. TwoUCITS management companies (BBVA Asset Management and Santander AssetManagement) accounted for 34% of total managed assets and contributed 33% ofaggregate income before taxes in the first half of the year. Furthermore, tenoperators accounted for 65% of managed assets. As regards earnings, the top tenfirms concentrated 75% of the total.
6.5 UCITS depositories
Depositories are in charge of custody of the assets invested by UCITS, and are alsoobliged to perform a supervisory function, with respect to the action ofmanagement companies and other UCITS administrators5. Therefore, depositoriesperform custody and control tasks that are pivotal for investor protection. Banks,savings banks, credit cooperatives and brokers and broker-dealers may act asdepositories. This activity is registered at the CNMV.
There were 125 UCITS depositories registered at the CNMV in December 2008, oneless than at the end of 2007. In the last few years, the number of depositories hasdiminished, due mainly to mergers and acquisitions, although this year the declinewas negligible.
Breaking down UCITS assets by type of depository, data for November 2008 showan increase in market share on the part of banks (67.6% of total assets in custody)and brokers and broker-dealers (3.5%), to the detriment of savings banks (27.3%)and credit cooperatives (1.6%).
104
CNMV
Annual Report regarding
its actions and the
securities markets. 2008
5. Article 57 of UCITS Act 35/2003, dated 4 November.
Histogram of pre-tax ROE at UCITS management companies FIGURE 6.4
Source: CNMV.
0
5
10
15
20
25
30
35
< 0 0-5 5-10 10-15 15-20 20-30 > 30
Jun-07 Jun-08No. of firms
ROE %
06_Capitulo 06_INGLES.qxd 24/7/09 18:54 Página 104
creo

Financial institutions
and investment services
Provision of investment
services
105
7 Provision of investment services
Under Spanish law, investment services may be provided by credit institutions,broker-dealers, brokers, portfolio management companies, UCITS managementcompanies and financial advisory firms (the latter introduced into the regulationonly recently). Authorisation and prudential supervision of credit institutions isentrusted to the Bank of Spain, but their activities in connection with investmentservices are supervised by the CNMV. The other institutions listed above aresupervised entirely by the CNMV. Additionally, firms authorised in other EuropeanUnion countries may provide investment services in Spain under the Europeanpassport system, and firms from non-EU countries may provide such services ifduly authorised by the CNMV.
Credit institutions are the main providers of investment services in Spain, sincetheir extensive branch networks guarantee them access to retail investorsthroughout the country. In fact, they have a relatively stable 75% share of totalrevenues from investment services, well ahead of broker-dealers (20%) and brokers(5%). Examining the structure of investment services revenues obtained by thosethree classes of firms reveals a degree of specialization. Whereas credit institutionsdominate the area of securities administration and custody and marketing mutualfunds, broker-dealers and brokers stand out particularly in processing and executingequity trade orders.
In 2008, the economic and financial crisis had a significant impact on income atinvestment firms1 that are subject to the prudential supervision of the CNMV.Revenues from order processing and execution and, generally, from brokeringsecurities declined notably due to the reduction in trading in monetary terms. Othermajor revenue sources, such as UCITS and new issues in the primary market, wereaffected also by greater risk-aversion on the part of investors and the decline insecurities trading generally. As a result, all classes of firms experienced a decline inearnings. Nevertheless, investment firms maintained a large volume of own funds,amply exceeding the regulatory requirements.
Some major regulatory changes affected this sector in 2008. Royal Decree 217/2008,which implements major aspects of regulation governing investment firms as aresult of the transposition of MiFID, came into force in February. In particular, thatDecree provided for the creation of a new class of investment firm, namelyinvestment advisory firms, as a result of the recognition of advice as an investmentservice under MiFID. It also allows broker-dealers and brokers to managemultilateral trading facilities. Another major regulatory change was the approval, inNovember, of CNMV Circular 7/2008, which amended the accounting standards,
1. The term “investment firm” covers broker-dealers and brokers, portfolio management companies and
investment advisory firms.
07_Capitulo 07_INGLES.qxd 24/7/09 19:00 Página 105

CNMV
Annual Report regarding
its actions and the
securities markets. 2008
106
financial statements and reserved disclosures of entities under the CNMV’ssupervision, which includes investment firms, to adapt them to the new accountingframework established in the General Accounting Plan approved by Royal Decree1514/2007, of 16 November. Chapter 11 (Supervision of entities) and the legislationannex offer more detailed information about these new regulations.
This chapter reviews the activities of investment firms during 2008 in the contextin which the CNMV has authority. Section 7.1 focuses on the provision ofinvestment services by credit institutions. Broker-dealers and brokers are analyzedin section 7.2. And section 7.3 deals with portfolio management companies. Theactivity of UCITS management companies is covered in Chapter 6; no investmentadvisory firms had been established at the end of 20082.
7.1 Credit institutions
7.1.1. Authorisation and registration
Credit institutions are allowed to provide all the investment services referred toin article 63 of the Securities Market Act, including ancillary services, providedthat their legislation, articles of association and specific authorisation allow. TheBank of Spain is the body in charge of authorising them and of informing theCNMV about the credit institutions that are authorised to provide investmentservices. At 31 December 2008, a total of 195 domestic credit institutions (banks,savings banks and cooperatives) were registered with the CNMV, six less thanin 2007.
Foreign credit institutions authorised to operate in Spain may also provideinvestment services provided that the rules governing their authorisation allow. Theymay operate with or without a physical establishment (branch). At the end of 2008,there were 414 foreign credit institutions in a position to provide investment servicesin Spain, 42 more than in 2007 (see Annex III.12). Most of those foreign creditinstitutions are authorized by another EU member state (405 in 2008, up from 363 in2007). There was a notable increase in the number of UK institutions, with a strongpreference for operation under the free provision of services. Of the 414 foreign creditinstitutions registered, 350 were under the free provision of services regime (38 morethan in 2007) whereas 64 had a branch in Spain (4 more than in 2007).
7.1.2. Securities business at credit institutions
The figures for 2008 reveal a significant decline in the revenues obtained by creditinstitutions for providing securities services and marketing mutual funds, incontrast with the growth registered in the preceding years (Table 7.1). These feesalso fell by proportionately more than other bank service fees, although they stillaccount for a significant proportion of the total (19.8% in 2008).
2. CNMV Circular 10/2008, of 30 December, on Investment Advisory Firms sets out the organizational
requirements and the documents to be filed with the CNMV for authorization and registration as an
investment advisory firm, and it clarifies the provisions applicable to certain amendments following
registration with the CNMV. That Circular came into force on 15 January 2009.
07_Capitulo 07_INGLES.qxd 24/7/09 19:00 Página 106

Financial institutions
and investment services
Provision of investment
services
107
Credit institutions are by far the leading providers of investment services. In thelast five years, credit institutions obtained between 73% and 77% of the totalrevenues generated by this activity, while broker-dealers obtained 17%-21% andbrokers 5%-6%. As Table 7.2 shows, credit institutions concentrate the bulk ofrevenues from administration and custody and mutual fund marketing, and theyalso lead in asset management and issue placement and underwriting (althoughtheir share of the latter market has fallen by more than eight percentage points).Broker-dealers and brokers maintain their leading position in order processing andexecution, where they accounted for 58.7% of total revenues in the first 11 monthsof 2008.
Credit institutions’ revenues from the provision of securitiesservices and marketing non-bank financial products TABLE 7.1
Million euro
% of credit
institutions’
2005 2006 2007 2008 total fees
Securities services 1,172 1,394 1,751 1,286 8.3
Placement and underwriting 97 143 340 124 0.8
Securities trading 365 472 608 467 3.0
Administration and custody 634 681 675 601 3.9
Asset management 76 98 128 94 0.6
Marketing of non-bank financial products 3,273 3,923 4,237 3,661 23.5
Mutual funds 2,179 2,498 2,530 1,801 11.6
Pension funds 371 433 483 482 3.1
Insurance 676 935 1,131 1,291 8.3
Other 47 57 93 87 0.6
Source: Bank of Spain and CNMV.
Investment services commission revenues. 2008 TABLE 7.2
Million euro
Broker-dealers Portfolio Credit
and management Credit institutions/
brokers1 companies1 institutions Total Total
Placement and underwriting 41 — 124 165 75.2
Securities trading 664 — 467 1,131 41.3
Asset management 35 18 94 147 63.9
Administration and custody 20 — 601 621 96.8
Mutual fund marketing 114 1 1,801 1,916 94.0
Source: CNMV and Bank of Spain.
1. Figures at November 2008.
07_Capitulo 07_INGLES.qxd 24/7/09 19:00 Página 107

CNMV
Annual Report regarding
its actions and the
securities markets. 2008
108
7.2 Broker-dealers and brokers3
There were a total of 101 firms registered as broker-dealers and brokers with theCNMV at the end of 2008, two more than in 2007. There were 12 registrations and10 deregistrations in the year (Table 7.4). In contrast with the slight increase in thenumber of Spanish firms, there was a substantial increase in the number of firmsauthorized in other EU member states that notified the CNMV of their intention toprovide investment services in Spain. The number of foreign institutions availingthemselves of the free provision of services system rose from 1,395 in 2007 to 1,781in 2008, while the number of foreign institutions with a branch increased from 29to 37. This increase is attributable basically to the entry into force of MiFID at theend of 2007 and the recognition of financial advice as an investment service; as aresult, a large number of firms engaging in that activity which were also authorizedin their home countries for other services such as order processing were able toavail themselves of the Community Passport.
Seven of the twelve newly-registered domestic firms (six broker-dealers and sixdealers) are independent in that no other financial firm or insurance companycontrols a majority of their capital (see Annex III.9). Four of the new registrationsarose due to conversion of brokers into broker-dealers. Another registration was dueto the conversion of a portfolio management company into a broker.
There were 10 deregistrations, one of which was due to merger into a Spanish creditinstitution. Because banks are allowed to provide investment services, the search forcost savings has led to them to integrate the activities of their broker-dealers andbrokers into the parent company, with the result that they are less interested inmaintaining those subsidiaries.
There were also four changes of control: three at brokers and one at a broker-dealer(see Annex III.10). Two of the brokers were acquired by two foreign credit institutionsand the third by a domestic broker-dealer. The broker-dealer which suffered a changeof control was acquired by a domestic credit institution.
Securities deposited at credit institutions at 31 December1 TABLE 7.3
Billion euro
% change
2005 2006 2007 20082 08/072
Fixed-income 1,071.0 1,126.6 1,174.3 1,211.2 3.1
Debt securities 982.1 1,026.3 1,051.3 1,093.5 4.0
Commercial paper and discounted notes 88.9 100.3 123.0 117.7 -4.3
Equities 749.5 964.7 1,001.8 716.1 -28.5
Listed shares 702.1 918.5 947.0 661.8 -30.1
Unlisted shares 47.4 46.2 54.8 54.3 -0.9
Total credit institutions 1,820.5 2,091.3 2,176.1 1,927.3 -11.4
Total broker-dealers and brokers 61.9 78.3 91.5 68.6 -25.0
Source: CNMV and Bank of Spain.
1. Listed securities are counted at their market value and unlisted securities at their nominal value.
2. Figures for credit institutions at 30 June 2008, and for brokers-dealers and brokers at 30 November 2008.
3. The latest accounting data available for broker-dealers and brokers and for UCITS management companies
referred to November as a result of the delay in reporting caused by the entry into force in December of
CNMV Circular 7/2008, on the accounting standards, financial statements and reserved disclosures of
investment firms, UCITS management companies and venture capital firm management companies.
07_Capitulo 07_INGLES.qxd 24/7/09 19:00 Página 108

Financial institutions
and investment services
Provision of investment
services
109
The number of agents or representatives of brokers and broker-dealers declined in2008 but is still very large. There were 6,679 agents or representatives at the end of2008, compared with 7,281 at the end of 2007. Much of the decline was due to thefact that a broker-dealer belonging to an insurance group deregistered its 516representatives in order to transfer them to its UCITS management company. Only46 firms had contracts with representatives at the end of the year, and the firms withthe largest numbers of representatives were connected with insurance companies.Just one firm, Mapfre Inversión, SV, accounts for 84% of all representatives.
Broker-dealers and brokers continued to make little use of the Community Passport(see Annex III.11). Just two Spanish firms had branches in other countries of theEuropean Union (the United Kingdom and Sweden) at the end of 2008, the samenumber as in 2007. The number of firms operating under the free provision ofservices regime, i.e. without a physical establishment, increased from 29 to 33. Themain host countries where Spanish firms operate under this regime are Portugal (19),Germany (16), France (13), Belgium (12), the United Kingdom (12) and Italy (12).
The number of foreign non-bank institutions authorized to provide investmentservices in Spain increased notably, mainly as a result of the recognition of adviceas an investment service (see Table 7.4). The foreign investment firms establishedin Spain are predominantly from the United Kingdom. Of the 37 branches in Spainof foreign investment firms, 27 belong to UK firms; also, of the 386 notifications ofthe provision of investment services in Spain without a branch that were receivedin 2008, 348 were from the UK (see Annex III.8).
7.2.1. The industry’s profitability and solvency
Broker-dealers and brokers display a broad dispersion in terms of specialization andrevenue structure. Apart from proprietary trading, broker-dealers tend to be morespecialized in order processing, which accounted for 71% of their fee revenuesbetween January and November 2008. Brokers evidence a broader range ofspecialisation, although order processing still accounts for a significant proportionof their fee revenues (37%). During that period of 2008, UCITS subscription and
Registrations and removals in the register of firms TABLE 7.4
Firms at Firms at
Type of firm 31/12/07 Registrations Removals 31/12/08
Domestic firms 99 12 10 101
Broker-dealers 46 6 1 51
Stock exchange members 36 2 1 37
Non-members 10 4 0 14
Brokers 53 6 9 50
Stock exchange members 8 0 1 7
Non-members 45 6 8 43
Foreign firms 1,424 431 37 1,818
With a branch 29 8 0 37
Free provision of services 1,395 423 37 1,781
Pro memoria:
Representatives 7,281 466 1,068 6,679
Source: CNMV.
07_Capitulo 07_INGLES.qxd 24/7/09 19:00 Página 109

redemption services accounted for 18% of total fee revenues and portfoliomanagement for 12%.
With the data through November, aggregated income before taxes fell by 78% in thecase of brokers and 34% in the case of broker-dealers. In both cases, adverse marketperformance had a pronounced negative impact on business activity and stronglyeroded ordinary revenues. In particular, the decline in share prices had a directnegative impact on brokerage fees and also led to losses on proprietary trading atbroker-dealers. The declining appeal of collective investment (Chapter 6) wasanother notable contributor to the decline in earnings as it resulted in a sharpreduction in fees from marketing those products.
The decline in earnings was reflected in a significant reduction in the return onequity (ROE) at the various categories of firms (Figure 7.1). A detailed analysis ofthe sector’s performance reveals a decline in earnings at 83% of firms betweenJanuary and November. There was a notable increase in the number of firms with110
CNMV
Annual Report regarding
its actions and the
securities markets. 2008
ROE before taxes of broker-dealers and brokers1 FIGURE 7.1
Source: CNMV.
1. Figures at 30 December.
%
0
10
20
30
40
50
60
70
ROE market members broker-dealer ROE non members broker-dealer
ROE market members broker ROE non members broker
2001 2002 2003 2004 2005 2006 2007 2008
Histogram of ROE before taxes of broker-dealers and brokers1 FIGURE 7.2
Source: CNMV.
1. Figures at 30 November.
Number of firms
0
10
15
20
30
402007 2008
5
25
35
Losses 0%-15% 15%-30% 30%-45% 45%-60% > 60%ROE, %
07_Capitulo 07_INGLES.qxd 24/7/09 19:00 Página 110
creo

relatively low ROE (under 15%) and a significant decline in the number of firmswith high ROE (over 60%) in comparison with November 2007. The number of loss-making firms also increased notably, from 8 in 2007 to 30 in 2008. The increase inthe number of loss-making broker-dealers that are market members and brokerswhich are not market members was particularly significant (Table 7.5).
Considering loss-making firms, the aggregate amount of losses increased notably,from 3.8 million euro in November 2007 to 29 million euro in November 2008(Table 7.5). Despite the increase, losses still account for only a small percentage ofthe sector’s aggregate income.
Adverse earnings performance did not prevent these firms from maintaining amplesurplus own funds with respect to the regulatory requirements. Using 2008 year-end figures, the surplus was 4.6 times the minimum equity requirements in the caseof broker-dealers (4.2 in 2007) and 2.1 in the case of brokers (the same proportionin 2007). 111
Financial institutions
and investment services
Provision of investment
services
Loss-making firms: number and amount1 TABLE 7.5
Thousand euro
No. of firms Amount
20072 20082 20072 20082
Broker-dealers that are members
of a stock exchange 0 6 0 6,017
Broker-dealers that are not members
of a stock exchange 1 5 1,816 13,258
Brokers that are members
of a stock exchange 0 3 0 2,075
Brokers that are not members
of a stock exchange 7 16 2,020 7,693
Total 8 30 3,836 29,043
Source: CNMV.
1. Before taxes.
2. Figures at 30 November.
Surplus equity over minimum requirements FIGURE 7.3
of independent brokers and broker-dealers
Source: CNMV.
2007 2008
0
5
10
15
20
25
30
35
< 25 25-50 50-100 100-200 200-500 500-1,000 > 1,000Surplus equity %
% of total number of firms
07_Capitulo 07_INGLES.qxd 24/7/09 19:00 Página 111
creo

Broker dealers and brokers not owned by financial institutions increased theirsurplus equity notably4. In this case, broker-dealers’ surplus equity increased from2.7 times the minimum requirement in 2007 to 4.7 in 2008. In the case of brokers,that ratio fell from 1.9 to 1.8 in 2008.
Also, the number of independent firms with a smaller surplus equity (less than 50%of the minimum) declined from eight in 2007 to five in 2008 (Figure 7.3). All fivewere brokers.
7.2.2. Broker-dealers
Broker-dealers that are stock exchange members (SVB)
Broker-dealers and that are market members can trade for their own account andprovide investment services to third parties; the main source of revenues for mostof them is securities brokerage, primarily in the domestic equity market, of whichthey are members. This category of investment firm is the most important one interms of business activity, revenues and earnings. They accounted for 78% of totalcomputable equity of broker-dealers and brokers at the end of December 2008, andfor 85% of total income before taxes in the first 11 months of the year.
Between January and November 2008, broker-dealers that are market membersobtained 427.9 million euro of aggregated income before taxes, a decrease of 35.8%with respect to the previous year. It is worth noting that 39% of that aggregated totalcorresponds to one firm which obtained sizable earnings from proprietary trading inOTC derivatives. Excluding that firm, the rest of this sector obtained 260.6 million euroin income before taxes, i.e. 56.7% less than in 2007. The income statement shown inTable 7.6 excludes the aforementioned firm in order to give a more representativepicture of the performance of this segment of broker-dealers. Also, except whereotherwise indicated, the comments on this segment which follow exclude that firm.
The decline in earnings by broker-dealers that are market members was due to bothrecurring and non-recurring activities. Excluding extraordinary earnings, there wasa 66% decline in income before taxes. The reduction in trading income and net feesfor services to third parties led to a 39% decline in total net revenues. Operatingexpenses fell by less (10%), leading to a 57% reduction in operating income5.Nevertheless, not all companies followed the same trend. Six broker-dealersincreased total net revenues, and seven increased operating income. Non-recurringincome (other gains and losses) fell by 29% overall, although half of the broker-dealers actually increased this line item.
The bulk of total net revenues was from activities for third parties (net fees),which accounted for nearly three-quarters of the total6. Income in this area fellby 31%, while income from proprietary trading (financial income and net gainson securities) fell by 61%. Order processing and execution accounted for three-
112
CNMV
Annual Report regarding
its actions and the
securities markets. 2008
4. There were 23 broker-dealers and 34 dealers in this situation at the end of 2008.
5. Including the figures for the firm referred to above, aggregated total net revenues of market members
broker-dealers increased by 177% and operating income by 744%.
6. Including the market members broker-dealer referred to earlier, activity for third parties accounted for a
little over one-third of total net revenues.
07_Capitulo 07_INGLES.qxd 24/7/09 19:00 Página 112

quarters of gross fee revenues. This item declined by 23% as a result of the sharpreduction in the size of Spanish equity brokerage deals (Table 7.6). Averagebrokerage fees declined slightly. The income from other non-proprietaryactivities by broker-dealers that are market members also declined. UCITSsubscription and redemption fees fell by 58%, and placement and underwritingfees by 35%.
As usual, these firms’ earnings were quite concentrated. For example, the five firmswith the most profits accounted for 61% of total profits in this segment7, comparedwith 53% in 2007. In general, these firms’ bottom lines worsened. Earningsdeclined at 89% of broker-dealers that are market members. Moreover, six of the36 firms in this group reported losses, whereas only one reported losses in 2007(Table 7.5).
113
Financial institutions
and investment services
Provision of investment
services
Broker-dealers: income statement1 TABLE 7.6
Thousand euro
Stock exchange members2 Non-members
% change % change
20083 08/074 20083 08/074
Financial income 118,307 13.28 29,972 156.43
Net income from securities trading -38,029 — -8,861 —
Net commission revenues 440,166 -30.93 103,222 11.48
Commission revenues 625,702 -28.32 156,450 30.80
Order processing and execution 468,801 -22.32 78,144 74.99
Issue placement and underwriting 35,551 -34.66 683 1,188.68
UCITS subscription and redemption 32,503 -58.00 52,523 7.70
Portfolio management 10,225 -44.67 5,919 -11.05
Other 78,622 -34.02 19,181 -1.52
Commission expenses 185,536 -21.26 53,228 97.05
Total net revenues 520,444 -38.89 124,333 13.31
Operating expenses 297,307 -10.32 62,043 18.24
Personnel 181,663 -10.77 43,691 9.16
General 115,644 -9.59 18,352 47.43
Operating income 223,137 -57.10 62,290 8.80
Depreciation and other charges 68,672 3.04 6,326 308.39
Other gains and losses 106,179 -28.61 -4,699 —
Income before taxes 260,644 -56.72 51,265 -20.24
Taxes — — — —
Income after taxes 260,644 -56.72 51,265 -20.24
Source: CNMV.1. Includes information on all the firms that were on the CNMV’s books at any time during the year, not justat year-end.2. To ensure that this summarised broker-dealers’ P&L account is more representative of the segment, onefirm that accounted for 39% of aggregated pre-tax income of this segment (due to proprietary trading in OTCderivatives) is excluded. 3. Figures at November 2008.4. Change year-on-year (November 2007 to November 2008).
7. Including the firm that was excluded from the analysis earlier, the top five firms concentrate 73% of
earnings.
07_Capitulo 07_INGLES.qxd 24/7/09 19:00 Página 113

CNMV
Annual Report regarding
its actions and the
securities markets. 2008
114
Broker-dealers that are not stock exchange members (SV)
Aggregated pre-tax income of broker-dealers that are not market members amountedto 51 million euro between January and November 2008, i.e. 20.2% less than in thesame period of 2007 (Table 7.6). As in the case of market members, the income wasvery concentrated. Just two firms accounted for 89% of aggregated pre-tax income.Five of the fourteen firms that are not market members were loss-making at the endof November (contrasting with just one firm at the end of November 2007).
The decline in aggregated pre-tax income in this segment through November wasdue basically to recurring activities and to a sizeable increase in depreciation andprovisions (Table 7.6). In contrast, their aggregated total net revenues increased by13.3% up to more than 124 million euro, although that was due to the addition oftwo firms that had previously operated as brokers. Excluding those two firms,aggregated total net revenues fell 21.2%, and pre-tax income fell 52.9%.
Net fee revenues from activities for third parties increased by 11.5%. However,excluding the aforementioned two firms, aggregated net fee revenues of the otherbroker-dealers that are not market members declined by 23%, in line with theoverall sector’s fee revenues. Most fee revenues were for UCITS subscription andredemption and order processing and execution (83.5% of the gross total). Netincome from proprietary trading in securities was negative, while financial incomeincreased sharply. Services to third parties made a much larger contribution to totalnet revenues than did proprietary trading, as they accounted for 83% of the total inthe period from January to November 2008.
7.2.3. Brokers
Brokers that are market members (AVB)
Unlike broker-dealers, brokers (agencias de valores) may not trade for their ownaccount; accordingly, the bulk of their ordinary revenues come from providinginvestment services to third parties. In particular, the main source of revenues inthis segment is equity brokerage.
Broker-dealers that are stock exchange members: brokerage volume and average effective fee in Spanish equities FIGURE 7.4
Fuente: CNMV.
0
400
800
1,200
2,000
Billion euro Brokered volume (LHS) Average effective commission (RHS)
200
600
1,000
1,400
1,600
1,800
Per mil
744635 614
1,108
1,485
1,916
1,429
776665
0.26
0.290.300.34
0.75
0.580.47
0.400.40
2000 2001 2002 2003 2004 2005 2006 2007 2008 (Nov)0.00
0.12
0.24
0.36
0.48
0.60
0.72
0.84
0.96
1.08
1.20
07_Capitulo 07_INGLES.qxd 24/7/09 19:00 Página 114
creo

Financial institutions
and investment services
Provision of investment
services
115
The aggregated income of brokers that are market members amounted to 3.6million euro in the first eleven months of 2008, i.e. 70% less than in the same periodof 2007. The sharp decline in income was due basically to a 20.2% reduction in netservice fees. Gross order processing and execution fees, which accounted for 90% oftotal revenues, declined by 23%.
Broker-dealers that are non-market members (AV)
Most brokers which are not market members are small and specialise in providingspecific services. Their contribution to the aggregated income of broker-dealers andbrokers is small: 4.3% of the total between January and November 2008.
Brokers that are not market members obtained 21.5 million euro in income beforetaxes in the first eleven months of the year, i.e. 79% less than in the same period of2007. Earnings were not uniformly distributed, since seven firms increasedearnings in the period and 16 were loss-making at the end of November 2008(compared with just six at the end of November 2007). Those losses amounted to35% of aggregated income before taxes (2.8% in 2007).
As in the case of brokers that are market members, the sharp decline in pre-taxincome was due basically to a 45% reduction in fee revenues between January andNovember with respect to the same period of 2007 (Table 7.7). In particular, gross
Brokers: income statement1 TABLE 7.7
Thousand euro
Stock exchange members Non-members
% change % change
20082 08/073 20082 08/073
Financial income 2,745 31.72 6,083 -48.50
Net income from securities trading -2,003 1,290.97 -1,345 —
Net commission revenues 18,818 -29.19 119,533 -35.95
Commission revenues 23,555 -28.39 135,667 -45.35
Order processing and execution 21,281 -23.10 37,648 -57.85
Issue placement and underwriting 0 — 4,745 99.29
UCITS subscription and redemption 562 -36.85 28,118 -58.62
Portfolio management 211 -85.69 18,747 -17.89
Other 1,501 -47.50 46,409 -29.43
Commission expenses 4,737 -25.05 16,134 -73.82
Total net revenues 19,560 -31.40 124,271 -37.56
Operating expenses 18,538 -3.74 106,575 -8.86
Personnel 9,994 -4.25 68,102 -7.65
General 8,544 -3.14 38,473 -10.92
Operating income 1,022 -88.96 17,696 -78.44
Depreciation and other charges 381 -12.61 5,207 -25.36
Other gains and losses 2,976 -6.06 8,998 -66.32
Income before taxes 3,617 -69.83 21,487 -78.90
Income tax — — — —
Income after taxes 3,617 -69.83 21,487 -78.90
Source: CNMV.
1. Includes information on all the firms that were on the CNMV’s books at any time during the year, not just
at year-end.
2. Figures at November 2008.
3. Year-on-year change (November 2007 to November 2008).
07_Capitulo 07_INGLES.qxd 24/7/09 19:00 Página 115

revenues from the two main activities—order processing and execution, and UCITSsubscription and redemption— fell by 58% and 59%, respectively. Brokers (bothmarket members and otherwise) experienced a moderate decline in operatingexpenses, but it was not enough to curtail the intense reduction in operating income.
7.3 Portfolio management companies8
Portfolio management companies essentially provide discretionary management ofsecurities portfolios, although they are also allowed to market UCITS and providefinancial advice. Financial institutions and all other investment firms exceptfinancial advisory firms are also allowed to engage in portfolio management. Thenumber of portfolio management companies has declined notably in recent yearsas a result of the process of restructuring by subsidiaries of finance groups and theincreased competition from other firms. At the end of 2008, there were ten portfoliomanagement companies registered with the CNMV; one firm deregistered duringthe year due to conversion into a broker.
Between January and November 2008, assets managed by portfolio managementcompanies declined by 33% as a result of both depreciation and a reduction in thenumber of managed portfolios. The latter effect was basically the result of twoportfolio management companies which are subsidiaries of banking groupstransferring part of their business to the parent company or other subsidiaries. Asa result, portfolio management fees (the main revenue source) fell by 20.6% in theperiod of reference, while total net revenues fell 18.5% (Table 7.9). A 12.2% increasein operating expenses and the aforementioned trend in ordinary revenues led to a61.9% decrease in operating income. Income before taxes amounted to 1.5 millioneuro, a 66.9% decline on the same period of 2007.
Despite the decline in earnings, most portfolio management companies increasedtheir computable equity and, overall, they amply exceeded the minimum capitalrequirements. At the end of 2008, portfolio management companies had an overallequity surplus amounting to 150% of the minimum requirements, compared with40% at the end of 2007.
116
CNMV
Annual Report regarding
its actions and the
securities markets. 2008
8. See Note 3.
Assets managed by portfolio management companies TABLE 7.8
Thousand euro
30/11/2007 30/11/2008 % change 08/07
Total
Number of portfolios 4,239 2,941 -30.6
Assets 4,637,379 3,107,628 -33.0
Breakdown by portfolio type
SICAV
Number 38 34 -10.5
Assets 298,772 185,197 -38.0
Other managed portfolios
Number 4,201 2,907 -30.8
Assets 4,338,607 2,922,431 -32.6
Source: CNMV.
07_Capitulo 07_INGLES.qxd 24/7/09 19:00 Página 116

117
Financial institutions
and investment services
Provision of investment
services
Portfolio management companies: income statement1 TABLE 7.9
Thousand euro
20072 20082 % change 08/073
Financial income 1,324 1,412 6.65
Net income from securities trading 68 -218 —
Net commission revenues 14,188 11,506 -18.90
Commission revenues 27,118 22,240 -17.99
Portfolio management 23,156 18,394 -20.56
UCITS subscription and redemption 1,582 1,079 -31.80
Other 2,380 2,767 16.26
Commission expenses 12,930 10,734 -16.98
Total net revenues 15,580 12,700 -18.49
Operating expenses 9,136 10,247 12.16
Personnel expenses 4,931 5,206 5.58
General expenses 4,205 5,041 19.88
Operating income 6,444 2,453 -61.93
Depreciation and other charges 1,923 832 -56.73
Other gains and losses 47 -107 —
Income before taxes 4,568 1,514 -66.86
Taxes — — —
Income after taxes 4,568 1,514 -66.86
Source: CNMV.1. Includes information on all the firms that were on the CNMV’s books at any time during the year, not just
at year-end.2. Figures at November.3. Year-on-year change (November 2007 to November 2008).
Assets under management, commission revenues and income FIGURE 7.5
before taxes of portfolio management companies
Source: CNMV.
Million euro Million euro
Managed assets (LHS)
Pre-tax income (RHS)
Commission revenues (RHS)
0
500
1,000
1,500
2,000
2,500
3,000
3,500
4,000
4,500
5,000
2001 2002 2003 2004 2005 2006 2007 Nov-20080
5
10
15
20
25
30
07_Capitulo 07_INGLES.qxd 24/7/09 19:00 Página 117
creo

07_Capitulo 07_INGLES.qxd 24/7/09 19:00 Página 118

Financial institutions
and investment services
Venture capital firms
119
8 Venture capital firms
8.1 Venture capital firms registered with the CNMV
The venture capital sector saw a slowdown in 2008, which was even more manifestafter two years of spectacular growth, during which time the total number ofregistered firms expanded by 66%.
There were 55 applications to the CNMV to register venture capital firms in 2008,up 19% with respect to 2007. Seventy per cent of the firms that registered did so inthe first six months of the year, exemplifying the reduction in venture capitalactivity due to the exacerbation of the crisis.
There was also a considerable increase in deregistrations, particularly as a result ofthe tough market situation and difficulties in finding new investors.
In net terms, the number of firms registered with the CNMV increased by 46 in2008, to 322. In 2008, 21 venture capital funds and 25 venture capital companieswere registered1, and there were 95 funds and 154 companies on the books at year-end (Table 8.1). The number of registered management firms also increased by 9, toa total of 73 at year-end2.
The main characteristics of the venture capital firms in 2008 were as follows:
– Most registered firms adopted the simplified system (more than 82%), partlybecause of the simplicity of the obligations imposed in this category and alsobecause of the possibility of granting special shares to promoters and founders.
– Almost all registered firms’ investment policies are pronouncedly domestic inscope. The number of firms confined to one autonomous community has grown
1. At 31 December 2008, there were 12 venture capital firms pending registration with the CNMV and in the
authorisation process.
2. At 31 December 2008, there were 4 management firms pending registration and in the authorisation
process.
Registration and removal of venture capital firms in 2008 TABLE 8.1
Situation at Situation at
31/12/2007 Registrations Removals 31/12/2008
Entities 276 55 9 322
Venture capital funds 76 21 2 95
Venture capital companies 134 25 5 154
Venture capital management companies 66 9 2 73
Source: CNMV.
08_Capitulo 08_INGLES.qxd 24/7/09 19:01 Página 119

CNMV
Annual Report regarding
its actions and the
securities markets. 2008
120
rapidly due to establishment of firms owned by regional governments andagencies whose aim is to increase productivity in their region.
– New entities’ investment policies are more specialised and focus on moretraditional sectors, such as services, and on low-risk opportunities which offerregular predictable returns. The technology sector, especially renewable energies,continues to attract significant investment.
– Investment was concentrated primarily in early-stage projects (seed and start-upcapital) and in expansion capital, while the number of leveraged deals declineddue to the lack of funding and tougher borrowing conditions.
– The size of the investments also contracted: 90% were less than 5 million euro.
8.2 Sector data
The sector has been very hard hit by the crisis. According to preliminary data fromASCRI3, which includes the majority of venture capital firms in Spain, venturecapital firms invested approximately 2.9 billion euro in 2008, i.e. 32% less than therecord high figure venture capital investment in Spain registered in 2007. Thenumber of deals completed in 2008 totalled 805, i.e. 5.7% less than in 2007 (854).
Seventy-five per cent of funds raised in 2008 were obtained in the first half of theyear, as funding contributions were very limited from summer onwards. Around2.6 billion euro were raised in the year, almost 50% less than in 2007; however, thesector has ample liquidity due to funds raised in previous years. In fact, there were6 billion euro available for investment at the end of 2008.
Divestments declined sharply to 604 million euro, a reduction of more than 62%with respect to 2007. The principal method of divestment was repurchases by theoriginal shareholders, followed by sales to third parties.
3. Asociación Española de Entidades de Capital Riesgo (Spanish Venture Capital Association).
08_Capitulo 08_INGLES.qxd 24/7/09 19:01 Página 120

IV Regulation and supervisionof the securities markets
09_Capitulo 09_INGLES.qxd 24/7/09 19:02 Página 121

09_Capitulo 09_INGLES.qxd 24/7/09 19:02 Página 122

Regulation
and supervision
of the securities markets
Issuers' financial
and corporate governance
disclosures
123
9 Issuers' financial and corporate governancedisclosures
This chapter discusses listed companies’ obligations with regard to disclosures tothe market, new regulations in this area and the CNMV’s actions to improvecompliance. Section 9.1 discusses financial disclosures, which are divided into twolarge blocks: annual reports (particularly auditors’ reports) and interim reports(half-yearly and quarterly). A box in this section addresses the international debatethat has arisen during the ongoing financial crisis about the pro-cyclical nature ofcurrent accounting regulations. Section 9.2 deals with disclosures of significantholdings. Section 9.3 summarises the main aspects of corporate governancereporting. And Section 9.4 deals with regulatory disclosures of significant events.
9.1 Financial disclosures
9.1.1. Auditors’ reports and financial statements1
Issuers of securities that are listed on an official secondary market or anotherregulated market that is domiciled in the European Union which have Spain as theirhome country are obliged to file an auditors’ report with their financial statements,directors’ report and declaration of liability for their content2.
In 2008, the CNMV received 875 auditors’ reports on separate and consolidatedfinancial statements and 34 special auditors’ reports3. Consequently, there was a3.6% increase in the number of auditors’ reports, basically due to the increase in thenumber of reports on securitisation trusts.
The percentage of unqualified auditors’ reports increased slightly with respect to2007 (Figure 9.1). The increase in the proportion of securitisation trusts within thesample played a decisive role in this context since their auditors’ reports were 100%
1. This information is available in the Spanish area of the CNMV website (www.cnmv.es) in the section
"Registro Oficial de las Cuentas Anuales Auditadas", under “Entidades emisoras”, “Informes de Auditorías y
Cuentas Anuales”.
2. Article 35 of Act 24/1988 on the Securities Market. This obligation does not apply to "[...] Member states of
the European Union, autonomous regional governments, local corporations and other analogous entities
[...], international public bodies of which at least one Member State of the European Union is a member,
the European Central Bank and the national Central Banks of the Member States [...], and issuers which only
have outstanding issues of debt securities listed in an official secondary market [...] whose unit nominal
value is at least 50,000 euro [...]”.
3. The purpose of special auditors' reports is to update the information in qualified auditors' reports. The
update is done as of the end of the first half of the year after the one to which the qualified auditors' report
refers.
09_Capitulo 09_INGLES.qxd 24/7/09 19:02 Página 123

CNMV
Annual Report regarding
its actions and the
securities markets. 2008
124
unqualified. Excluding securitisation trusts, the percentage of unqualified auditors’reports was the same as in 2006 (93.1%).
Four companies presented an auditors’ report with a qualified opinion or denial ofopinion with respect to their 2007 financial statements and trading is halted in twocompanies for which the auditor denied an opinion.
Figure 9.2 shows the trend in qualified auditors’ reports in the period 2003-2007,grouped by type.
Scope limitations are the type of qualification that is of greatest concern since theauditor is stating that he/she was unable to apply the Audit Technical Standardsbecause the reporting entity failed to supply sufficient information for a solidopinion to be formed. In these cases, the CNMV immediately issues a writtensubpoena demanding the immediate resolution of scope limitations that areattributable to the issuer itself.
Opinions in the auditors' report (% of total) FIGURE 9.1
Source: CNMV.
12
9
6
3
0
100
95
90
85
80
Unqualified (LHS)
2003 2004 2005 2006 2007
Lack of uniformity (RHS) Qualified (RHS)
89.0%
91.9%
96.0%
0.3%0.0%
10.6%
4.0%
89.1%
6.7%
4.3%
3.0%
5.1%
3.9%
0.6%
95.5%
Types of qualifications FIGURE 9.2
Source: CNMV.
Exceptions Uncertainties Scope limitations
3.8%
6.5%
1.8%
2.6%
4.1%
2.5%
6.2%
3.2%3.3%
0.3%0.0%0
2
4
6
8
2003 2004 2005 2006 2007
1.3%0.7% 0.7% 0.7%
%
09_Capitulo 09_INGLES.qxd 24/7/09 19:02 Página 124
creo

Regulation
and supervision
of the securities markets
Issuers' financial
and corporate governance
disclosures
125
Initially, eight auditors’ reports (relating to five securities issuers) from 2007 registeredwith the CNMV contained scope limitations. However, in response to demands issuedby the CNMV, and once the procedures required by the Audit Technical Standardswere applied, explicit communiqués were received from the auditors eliminating thescope limitations in five of the reports (relating to three issuers). Trading is halted inthe securities of one of the issuers which has failed to remove the scope limitation. Inanother of the cases, following audit work to overcome the scope limitation, theauditor registered an exception due to lack of information.
Audits of issuers filed with the CNMV TABLE 9.1
2005 2006 2007
Number % Number % Number %
Audits filed with the CNMV 766 100.0 845 100 875 100
Separate financial statements 553 72.2 621 73.5 671 76.7
Consolidated financial statements 213 27.8 224 26.5 204 23.3
Special reports under Ministerial Order 30/9/92 35 30 34
Auditors’ report
Unqualified opinion 704 91.9 807 95.5 840 96.0
Opinion with uniformity exception 23 3.0 5 0.6 0 0.0
Opinion with other qualifications 39 5.1 33 3.9 35 4.0
Types of qualifications1
Reports with exceptions 20 2.6 15 1.8 11 1.3
Reports with uncertainties, etc. 25 3.3 21 2.5 28 3.2
Reports with limitations 5 0.7 0 0.0 3 0.3
Effects of exceptions
Effects of exceptions on earnings
Reports with positive effects 2 0.3 0 0.0 2 0.2
Reports with negative effects 16 2.1 14 1.7 7 0.8
Effects of exceptions on equity
Reports with positive effects 5 0.7 8 0.9 0 0.0
Reports with negative effects 5 0.7 2 0.2 1 0.1
Nature of uncertainties, etc.
Going concern 6 0.8 4 0.5 12 1.4
Tax contingencies 4 0.5 3 0.4 1 0.1
Asset recovery 13 1.7 11 1.3 8 0.9
Litigation 9 1.2 8 0.9 5 0.6
Other uncertainties 5 0.7 2 0.2 4 0.5
Denial of opinion or adverse opinion 1 0.1 1 0.1 5 0.6
Source: CNMV. Refers to auditors’ reports on financial statements and to special reports filed with the CNMV
through 31 December each year. Percentages calculated with respect to the total number of auditors’ reports
filed.
1. Excludes uniformity exceptions.
The CNMV reviews and publishes all auditors’ reports and also supervises theaudited financial statements. The purpose is to check whether the accounting andvaluation standards have been applied appropriately, check that the financialstatements contain sufficient information for their proper interpretation andcomprehension, and ensure that they are published and disseminated by thedeadline established by current legislation.
09_Capitulo 09_INGLES.qxd 24/7/09 19:02 Página 125

CNMV
Annual Report regarding
its actions and the
securities markets. 2008
126
All audited financial statements received by the CNMV undergo a review of formalaspects and compliance with the requirements of current legislation. The review ofissuers’ interim financial disclosures makes it possible to anticipate issues that mayraise doubts with regard to the application of the accounting standards.
A specific number of audited financial statements also undergo a more substantivereview. Entities are chosen for this review using a mixed model in which a risk basedapproach is combined with a random rotation approach, in line with the principlesset out in Standard no. 1 of the Committee of European Securities Regulators(CESR).
The formal review of the financial statements and directors’ reports for 2007focused particularly on: (i) the application of IFRS 7: Financial Instruments:disclosures with respect to financial risks; (ii) disclosures about companies’ capitalmanagement (IAS 1.124A-C); and (iii) inclusion in the directors’ report of thedisclosures4 envisaged in article 116 bis of the Securities Market Act. As a result ofthese checks, the CNMV issued subpoenas to 30 companies.
Additionally, the substantive review of issuers’ financial statements and directors’report led to the issuance of subpoenas to 75 companies in connection with auditexceptions, omitted disclosures, and clarifications of the accounting and valuationstandards which they applied.
All the information about securities issuers which the CNMV reviews is madepublic on its website; specifically: the full texts of the issuer’s financial statements,directors’ report and auditors’ report, both separate and consolidated; a summary ofaudit exceptions; and responses to subpoenas, together with special auditors’reports. In accordance with CESR recommendations, an annual report is publishedon the content of the auditors’ reports received by the CNMV and the main issuesdetected in the audit of annual and interim financial statements.
4. Capital structure, restrictions on share transfer, significant holdings, restrictions on voting rights,
shareholder agreements, rules on director appointments, and directors' powers.
Reasons for subpoenas as a result of the substantive review FIGURE 9.3
Source: CNMV.
29
1823
57
66
12
20
12
17
5
41
28
0
10
20
30
40
50
60
70
Audit qualifications Accounting standards Disclosures Other issues
2006 20072005
09_Capitulo 09_INGLES.qxd 24/7/09 19:02 Página 126
creo
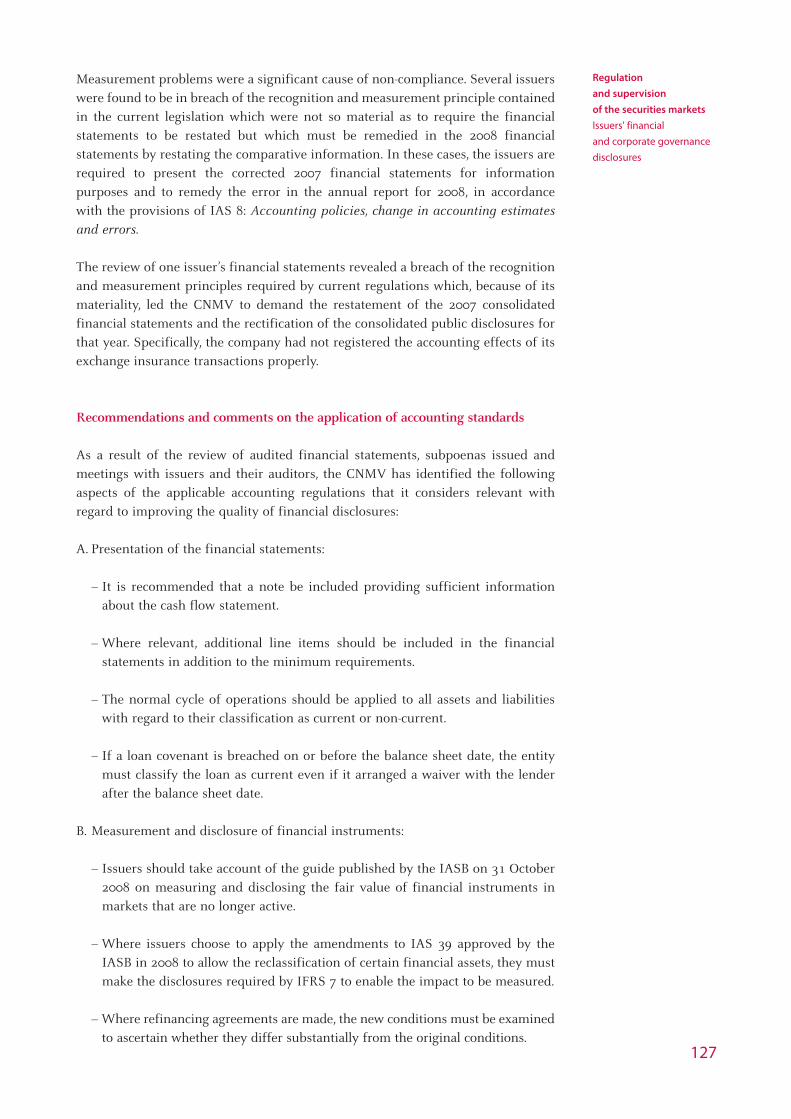
Regulation
and supervision
of the securities markets
Issuers' financial
and corporate governance
disclosures
127
Measurement problems were a significant cause of non-compliance. Several issuerswere found to be in breach of the recognition and measurement principle containedin the current legislation which were not so material as to require the financialstatements to be restated but which must be remedied in the 2008 financialstatements by restating the comparative information. In these cases, the issuers arerequired to present the corrected 2007 financial statements for informationpurposes and to remedy the error in the annual report for 2008, in accordancewith the provisions of IAS 8: Accounting policies, change in accounting estimatesand errors.
The review of one issuer’s financial statements revealed a breach of the recognitionand measurement principles required by current regulations which, because of itsmateriality, led the CNMV to demand the restatement of the 2007 consolidatedfinancial statements and the rectification of the consolidated public disclosures forthat year. Specifically, the company had not registered the accounting effects of itsexchange insurance transactions properly.
Recommendations and comments on the application of accounting standards
As a result of the review of audited financial statements, subpoenas issued andmeetings with issuers and their auditors, the CNMV has identified the followingaspects of the applicable accounting regulations that it considers relevant withregard to improving the quality of financial disclosures:
A. Presentation of the financial statements:
– It is recommended that a note be included providing sufficient informationabout the cash flow statement.
– Where relevant, additional line items should be included in the financialstatements in addition to the minimum requirements.
– The normal cycle of operations should be applied to all assets and liabilitieswith regard to their classification as current or non-current.
– If a loan covenant is breached on or before the balance sheet date, the entitymust classify the loan as current even if it arranged a waiver with the lenderafter the balance sheet date.
B. Measurement and disclosure of financial instruments:
– Issuers should take account of the guide published by the IASB on 31 October2008 on measuring and disclosing the fair value of financial instruments inmarkets that are no longer active.
– Where issuers choose to apply the amendments to IAS 39 approved by theIASB in 2008 to allow the reclassification of certain financial assets, they mustmake the disclosures required by IFRS 7 to enable the impact to be measured.
– Where refinancing agreements are made, the new conditions must be examinedto ascertain whether they differ substantially from the original conditions.
09_Capitulo 09_INGLES.qxd 24/7/09 19:02 Página 127

– On each balance sheet, reporting entities should consider whether there isobjective evidence of impairment of an asset or a group of financial assets. Inthe case of listed equity instruments, a prolonged or significant reduction is anindication of impairment and requires an exhaustive analysis of all otherrelevant factors.
– The information disclosed about credit, liquidity and market risk is general andqualitative and fails to comply sufficiently with the requirements of IFRS 7.
– Considering the potential effect of structured products, it appears to benecessary to disclose information about holdings of such products, theircharacteristics, fair values and impact on equity and profit or loss.
– Information should be disclosed to make it possible to evaluate the reportingentity’s capital management objectives, policies and processes.
C. Recognition of revenues: the criteria established in IAS 18 should be appliedrigorously, particularly when: (i) the contracts are subject to milestones orconditions precedent or subsequent; (ii) the amount collected from the transactionis not representative of the total transaction amount; and (iii) the sales arefinanced by the reporting entity itself and recovery is not reasonably assured.
D. Sale and lease-back: The transaction should be analysed carefully in order toensure that the conditions for recognising the profit are met.
E. Impairment of non-financial assets: reporting entities should provide a convincingexplanation in the notes to financial statements of how they conducted theimpairment tests.
F. Real estate investments and inventories:
– The valuation standards and main assumptions made to determine the fairvalue should be disclosed.
– Where management is aware of major uncertainties about the entity’scontinuance as a going concern, it must disclose them in the financial statementstogether with any factors that mitigate such uncertainties.
– With regard to hiring appraisers for real estate, listed companies should takeaccount of the recommendations which the CNMV published on its website on1 July 2008.
G. Business combinations: entities should be rigorous in applying IFRS 3 tocalculate the cost of a business combination where the payment includes equityinstruments. Disclosures in this area should also be improved.
H.Application of the new General Accounting Plan (NGAP): Two issues meritattention in this connection: (i) entities that decide to reverse part of the reservefor the portfolio of equity instruments of group, multigroup and associatedundertakings should justify their approach to measurement and impairment;and (ii) entities not obliged to present consolidated financial statements shouldanalyse the impact of the recognition and measurement rules for financialinstruments contained in the NGAP.128
CNMV
Annual Report regarding
its actions and the
securities markets. 2008
09_Capitulo 09_INGLES.qxd 24/7/09 19:02 Página 128

I. Other relevant disclosures:
– It is necessary to improve disclosures about taxes in notes to financialstatements, particularly with regard to recognition, changes in deferred taxassets and liabilities, etc.
– Entities should disclose all transactions and outstanding balance with relatedparties, breaking items down where necessary.
These recommendations were contained, in more detail, in the Report on the Auditsof 2007 Financial Statements, published on the CNMV’s website in December20085, which was sent in January 2009 to all the firms that audit listed companiesand to the three professional associations of auditors.
9.1.2. Half-yearly and quarterly reports
Issuers of securities that are listed on an official secondary market or another regularmarket domiciled in the European Union, where Spain is their home country, mustfile financial information with the CNMV every three and six months6.
The CNMV constantly reviews these interim disclosures to detect any issues thatmight contain or raise doubts about the application of the accounting standards.However, the review of periodic public disclosures has a smaller scope than that ofthe annual financial statements because the interim financial statements containabridged information.
In 2008, the CNMV reviewed and supervised financial disclosures for the secondhalf of 2007, the first half of 2008, and the interim reports for the first and thirdquarters of 2008.
The new half-yearly and quarterly established in Circular 1/20087 on periodicdisclosures by issuers came into force; the main new features it introduced are asfollows:
– Annual and half-yearly financial reports must include a declaration of liability forthe content, which must be signed by the directors.
– Issuers of shares and debt securities, listed on stock exchanges and on the AIAF,must publish a preliminary half-yearly financial report that will include, amongother information, summarised financial statements drafted on a consolidatedbasis in accordance with the International Financial Reporting Standardsadopted by the European Commission (IAS 34: Interim Financial Reporting) andan interim directors’ report.
– Issuers of shares must also publish a second half-yearly financial report andinterim directors’ reports in place of the current quarterly disclosure. The
129
Regulation
and supervision
of the securities markets
Issuers' financial
and corporate governance
disclosures
5. The report is available (in Spanish only) by following this route on the CNMV website: www.cnmv.es /
Publications and other documents / CNMV Publications / Annual report and other reports / Summary of
company auditors’ reports registered at the CNMV
6. Article 35 of Act 24/1988 on the Securities Market.
7. Under the powers granted by Royal Decree 1362/2007, on 30 January 2008 the Board of the CNMV
approved the half-yearly and quarterly reporting forms through Circular 1/2008.
09_Capitulo 09_INGLES.qxd 24/7/09 19:02 Página 129

publication of a second half-yearly report will not be obligatory when the issuerpublishes the annual financial report in the two months following the end of theyear in question.
– Issuers of shares which publish their annual financial report in the two monthsfollowing the end of the year in question and issuers of debt must submit to theCNMV the following financial information regarding the second half of the year:(i) main financial statements; (ii) dividends paid; (iii) average workforce; and (iv)net revenues by geographic area.
Following a review of this information, the CNMV wrote to 34 entities asking forclarifications or for the correction of errors in the financial statements for thesecond half of 2007; in the case of the report for the first half of 2008, it wrotesimilar requests to 88 entities. That increase is due to the application of the newreporting forms contained in Circular 1/2008 and the greater volume ofinformation that must be disclosed. Another 13 subpoenas were issued for avariety of reasons.
Issuers are not required to perform a full audit or limited review of their half-yearlyfinancial disclosures. However, if they voluntarily commission a full audit or limitedreview, the auditors’ report must be published in full. A total of 37.7% of issuerscommissioned an audit or limited review of their summarised annual financialstatements for the first half of 2008. That percentage rises to 64.7% considering justthe companies in the Ibex 35 index.
In the case of a full audit (11 entities), the auditors’ report offers reasonableassurance about the interim financial statements that are presented; in the case ofa limited review (82 entities), the degree of assurance is more moderate. Theauditors’ report and reports on limited review with regard to interim financialdisclosures contained a clean opinion in 90.3% of cases.
9.1.3. New regulation
Limited reviews of half-yearly financial statements by an external auditor falloutside the scope of the current Audit Act. Therefore, an auditor is subject to thediscipline of the ICAC (Spain’s accounting regulator) and the Audit TechnicalStandards when conducting an audit of half-yearly disclosures, but not whenconducting a limited review.
Given the absence of a Technical Standard on limited reviews, the CNMV took theinitiative of drafting a series of recommendations about the scope of the proceduresand tests to be performed by the auditor and the standard forms of the report onlimited review and in July 2008 it published a guide8 that was drafted by consensuswith the professional associations of auditors. The guide is based on theInternational Standards on Review Engagements (ISRE) issued by the InternationalAuditing and Assurance Standards Board (IAASB), and it distinguishes between thecase where the limited review is conducted by the company’s auditor (ISRE 2410)or by another auditor (ISRE 2400).
130
CNMV
Annual Report regarding
its actions and the
securities markets. 2008
8. “Modelos de informe y guías de actuación para trabajos de revisión limitada sobre estados financieros
intermedios”, available at www.cnmv.es.
09_Capitulo 09_INGLES.qxd 24/7/09 19:02 Página 130

Using professional judgement, the auditor determines the scope and nature of theprocedures to be applied and the need for additional work where there are doubtsabout material adjustments. The guide identifies certain issues which, because oftheir materiality, and in conformity with the ISRE, should be addressed by anauditor in a limited review: reasonable knowledge of the industry and business, ofthe organisation structure, accounting systems and the methods for drawing up thefinancial statements, as well as the accounting policies and the estimates andassumptions that are made. The auditor should also review the explanatory notesand analyse material and/or complex transactions.
The guide sets out a number of important clarifications to be taken into account bythe auditor when issuing a report on limited review, including: the issuance of areport under the ISRE entails compliance with the code of ethics of theInternational Federation of Accountants (IFAC); some considerations about thereport on limited review where there are uncertainties, with a view to avoidingdiscrepancies between the auditors’ reports on the annual financial statements andthe report on limited review of the interim disclosures, and a statement as towhether the accounting principles applied in the interim financial statements areconsistent/uniform with respect to those applied in the preceding period, asrequired by IAS 34 and the General Accounting Plan.
Another new feature of the regulation affects securitisation trusts as a result ofchanges in accounting regulations. Under the powers granted by Royal Decree926/1998, of 14 May, regulating asset securitisation trusts, and Order EHA/3536/2005of 10 November, the CNMV drafted a circular adapting the accounting standards,annual accounts, public financial statements and reserved statistical reports, whichwas approved by the CNMV Board in March 2009 and will be applied for the firsttime to the financial statements for 2008.
The circular was based on the Code of Commerce and respects the principlesestablished in the General Accounting Plan approved by Royal Decree 1514/2007, of16 November. That adaptation also took account of the special legal and operatingcharacteristics of securitisation trusts, including the fact that they have no equityand no legal personality. The main features of the draft circular are as follows:
-– The fact that trusts have no equity means that:
• Any gain from their activity is generally paid to the party that ceded thesecuritised assets, and any loss is allocated to the trust’s liabilities, respectingthe hierarchy of precedence in payment on each payment date that isestablished in the trust’s articles of constitution.
• The statement of changes in equity envisaged in the Commercial Code isreplaced by a statement of recognised revenues and expenses, which willpresent the items that, under the NGAP, should be recognised directly in equity.At the end of each period, the net balance of all the amounts recognised directlyin that statement will be recognised in the balance sheet.
– The establishment of a set of principles for determining impairment losses onsecuritised financial assets, based on the criteria contained in the NGAP.
– Greater disclosures are required, for two purposes: to provide greater transparencyvis-à-vis the market, and to allow the performance of these structures to be tracked 131
Regulation
and supervision
of the securities markets
Issuers' financial
and corporate governance
disclosures
09_Capitulo 09_INGLES.qxd 24/7/09 19:02 Página 131

CNMV
Annual Report regarding
its actions and the
securities markets. 2008
132
and monitored at European level. Consequently, disclosures are required half-yearly, the first half-year applying only to securitisation trusts required to presenta prospectus. Reserved statistical reports must be filed each quarter by all trusts,whether or not they are subject to a prospectus.
International debate about the financial crisis and accounting standards
The international financial crisis has led to an intense debate about theapplication of accounting standards worldwide and to the publication ofnumerous reports recommending changes of varying scope in order tocorrect errors that have been detected and to continue to provide users offinancial information with relevant, comparable information. Some of theproposed modifications seek to address the difficulty of measuring certainfinancial instruments when market liquidity declines sharply. Others havearisen in the debate over the role of fair value as a pro-cyclical factor inentities’ behaviour. In particular, the SEC issued a report on 30 December2008 in which it opposed the suspension of fair value accounting underFASB 157 Fair Value Measurements on the grounds that it is a very relevantmetric for investors, although it did propose some improvements.
In order to mitigate the effects of the crisis and reduce the risk of newepisodes, on 11 April 2008 the Financial Stability Forum published a numberof recommendations for strengthening markets and institutions; three ofthem refer to accounting improvements: reform of financial reporting on off-balance sheet entities, drafting of guides for measuring financial instrumentsin markets that are not active, and the adoption of financial disclosures onthe measurement of financial instruments.
The response from the IASB with regard to the consolidation of special-purpose entities is at a very advanced stage. In December 2008, a draftstandard was released which combines the current IAS 27 and SIC 12, and adraft on the derecognition of financial assets is expected in the second halfof 2009.
A number of additional guides have been issued regarding measurement oflisted financial instruments in inactive markets. Firstly, there was a joint SEC-FASB communiqué on 30 September 2008 with clarifications on fair valuemeasurements. This was followed by communiqués from the IASB1 declaringthose clarifications to be compatible with IFRS. There was also a declarationfrom the CESR on fair value measurements of illiquid financial instrumentsand their associated disclosures (CESR 08-713b), which served as a contributionto the production of guides by the IASB Panel of Experts2, an essential tool forfacilitating consistent application of the fair value accounting rules. As aresult, the CESR3 recommended that they be applied immediately forfinancial statements issued in or after the third quarter of 2008.
Moreover, the IASB and the FASB4 have made a joint commitment to worktogether on the necessary accounting reforms so as to correct and avoid thedeficiencies detected during the crisis. To that end, they announced thecreation of a Financial Crisis Advisory Group (FCAG), on which the Vice-President of the CNMV sits as an observer on behalf of CESR.
09_Capitulo 09_INGLES.qxd 24/7/09 19:02 Página 132
creo

Regulation
and supervision
of the securities markets
Issuers' financial
and corporate governance
disclosures
133
In response to the request from ECOFIN on 7 October that the IASB actrapidly to mitigate the effects of fair value accounting on certain financialinstruments, an amendment to IAS 39 and IFRS 7 was issued to permit, inthe context of the current liquidity crisis, certain trading instrumentsformerly measured at fair value to be transferred to portfolios that aremeasured at amortised cost, thus reducing the impact on profit or loss and orequity of fair value measurement in the third quarter of 2008 and thereafter.This eliminated the competitive disadvantage with respect to issuers thatapplied US GAAP, which already allowed that reclassification.
There are other proposals for improvement in accounting standards, as setout in a letter from the European Commission to the IASB dated 27 Octoberwhich are still being analyzed; they include the possibility of reclassifyinginstruments initially designated as being at fair value through profit or loss,the consideration of whether synthetic CDOs contained an embeddedderivative, and an evaluation of the rules for impairment of available-for-salefinancial assets.
On 7 January 2009, CESR published a statement (CESR 08-937) focused onthose three issues that were highlighted by the European Commission, andsurveying the practical application of the reclassification of financialinstruments in the third quarter (although somewhat over half of the selectedEuropean financial institutions made use of that option, none of the Spanishinstitutions included in the analysis did so). The impact of fair valuerecognition of securitised assets and other similar structured instrumentswas very limited in Spain. In its report, the CESR supports the adoption of aglobal set of accounting standards and notes the need to respect theprocedures established for issuing such standards, including an appropriateconsultation period, which may be shorter in situations of particular urgency.
The CNMV considers that, although the current economic situation hasimposed unprecedented stress on the entire accounting conceptualframework, it has also brought to light certain deficiencies and weaknesseswhose correction will contribute to more consistent application ofaccounting standards and, consequently, improve the transparency andrelevance of regulated financial disclosures.
It would therefore be desirable to have additional guides for determining thefair value of unlisted financial instruments and those which are listed inmarkets that are no longer active. Such guides should also address thedisclosures to be provided to investors regarding the main assumptions andhypotheses used and the uncertainties associated with the estimates.
The crisis has also revealed the need for accounting regulators to have firm,clear principles while retaining sufficient flexibility in their application inorder to respond to specific situations that may arise.
As regards fair value, one of the lessons of this crisis is that much workremains to be done on the theoretical foundations and with regard to thecontext and type of assets and liabilities where its application is mostappropriate. Joint development by the IASB and the FASB of a newConceptual Framework may be the appropriate context for this type of
09_Capitulo 09_INGLES.qxd 24/7/09 19:02 Página 133

analysis so as to provide the necessary theoretical and conceptual foundationsfor measurement methods.
The CNMV shares the goal of global convergence on a single set of high-quality accounting principles applicable in all securities markets so as tofacilitate comparison and contribute to efficiency in investment decisions. Tothat end, it is fundamental that the accounting regulators (IASB) maintaintheir independence while taking on greater responsibilities; a move in thisdirection is the recent decision to create a new Monitoring Board within thestructure of the International Accounting Standards Committee Foundation,entrusted with appointing the trustees and ensuring the establishedprocedures are complied with and that the IASB operates, and is viewed, asan independent body.
1. 2 October and subsequent dates.
2. 31 October 2008.
3. 5 November 2008.
4. 20 October 2008.
9.2 Information about ownership structure
9.2.1. Communiqués filed with the official registers of the CNMV in 2008
The process of transposing the Transparency Directive was completed in 2008 withthe enactment of Royal Decree 1362/2007, of 19 October (“Transparency Decree”)and of CNMV Circular 2/2007, of 19 December, approving the new forms fordisclosing significant holdings, directors and executives, own shares, etc.
The number of disclosures of significant holdings and others was expected to increasesharply as a result of that new legislation. However, a total of 4,841 communiquéswere validated, i.e. an increase of just 4.2% over 2007 (4,648). Figure 9.4 illustratesthe number of communiqués registered each year since 2000. Validatedcommuniqués accounted for 81.3% of the total received by the CNMV (5,957); the
134
CNMV
Annual Report regarding
its actions and the
securities markets. 2008
Trend in communiqués FIGURE 9.4
Source: CNMV.
2,348 2,360 2,420
2,828 2,7873,217
4,162
4,6484,841
2000 2001 2002 2003 2004 2005 2006 2007 20080
500
1,000
1,500
2,000
2,500
3,000
3,500
4,000
4,500
5,000
09_Capitulo 09_INGLES.qxd 24/7/09 19:02 Página 134

135
Regulation
and supervision
of the securities markets
Issuers' financial
and corporate governance
disclosures
others were annulled by the reporting entities since they contained errors whichrequired a new communiqué to be issued9.
65% of communiqués related to directors (59% in 2007); 18% to significantshareholders other than directors (26% in 2007); 10% to executives (8% in 2007);and the other 6% to transactions with own shares (5% in 2007).
Significant shareholders: disclosure of voting rights and financial instruments
The Transparency Decree reduced the threshold for disclosure of significantholdings from 5% to 3% of voting rights. If the shareholder is domiciled in a taxhaven, the threshold for disclosure is 1% and multiples thereof. Table 9.2 shows abreakdown of notifications received, grouped by levels of voting rights and marketcapitalisation of the companies involved.
Voting rights of significant shareholders: TABLE 9.2
number of notifications received
Voting rights
Companies Under 5% 5% to 30% 30% to 50% Over 50%
Ibex 35 169 70 6 7
Over 1 billion euro 41 14 3 13
Under 1 billion euro 268 217 10 23
Delisted 24 3 0 5
Total 502 304 19 48
% of total 58% 35% 2% 5%
Source: CNMV
Despite the increase in the number of notifications from significant shareholderswith under 3% (335 notifications), there was a 26.8% decline in the total number ofnotifications in 2008 as a result of the following factors:
i. The number of communiqués from custodians declined as a result of theexemption provided by article 33 of the Transparency Decree under whichcustodians that act as such and may exercise the voting rights of the shares incustody only with written instructions are not required to disclose significantholdings.
During the year, six large international custodians applied to be removed fromthe official register of notifications.
ii. The number of notifications from companies within the same group has alsodeclined. Under the previous regulations, both dependent companies and the groupcontrolling company were required to disclose significant holdings. Under the newregulation, only the controlling company is obliged to make that disclosure.
In 2008, a total of 46 groups availed themselves of this exception with respect to35 listed companies, under which only the group controlling company is requiredto present a notification (except where the dependent company is a director).
9. It is not possible to compare the number of annulled communiqués with previous years since no statistics
are available.
09_Capitulo 09_INGLES.qxd 24/7/09 19:02 Página 135

CNMV
Annual Report regarding
its actions and the
securities markets. 2008
136
iii. Controlling companies may also apply the exemption from notification whenany of their dependent companies is a UCITS management company or aninvestment firm that manages portfolios, subject to a number of conditions andprovided that the dependent company exercises the voting rights independentlyof its controlling company.
In 2008, a total of 25 group controlling companies applied for non-aggregationof the holdings in portfolios managed by their dependent companies. Most ofthem are Spanish companies which head financial groups.
Investors are also obliged to notify the CNMV of the acquisition or disposal offinancial instruments whose underlying are shares of listed companies where theyprovide the holder with the possibility of acquiring a significant holding in termsof voting rights. This information enables the market to be aware of significantshareholders that have acquired rights to increase their holdings, and others whomay become significant shareholders of listed companies in the future.
Although the notification threshold is now 3%10, the number of notifications withregard to financial instruments was very small. Only 18 notifications of financialinstruments were presented in 2008 by nine significant shareholders in eight listedcompanies.
Directors: disclosure of voting rights, financial instruments and proxiesfor shareholders’ meetings
Royal Decree 1333/2005, of 11 November (Market Abuse Decree) requires thatdirectors of listed companies disclose all transactions with shares of the listedcompany of which they are directors and with financial instruments whoseunderlying are such shares. Also, the Transparency Decree requires directors todisclose beneficial ownership possession of voting rights or financial instruments.In 2008, 999 directors presented 2,854 notifications with regard to voting rightsin 163 companies i.e. 6.1% more than the 2,690 notifications received in 2007(Table 9.3).
Directors’ voting rights: TABLE 9.3
number of notifications received
Number of
Companies issuers notifications directors
Ibex 33 743 294
Over 1 billion euro in market capitalisation 15 341 122
Under 1 billion euro in market capitalisation 106 1,632 540
Delisted 8 131 36
Participation shares 1 7 7
Total 163 2,854 999
Source: CNMV
10. The Transparency Decree does not require voting rights and financial instruments to be aggregated for
the purpose of calculating notification thresholds. This is the approach initially recommended by the
CESR, although some EU member states have opted for aggregation. The exception for notification of
instruments settled by differences is also under review.
09_Capitulo 09_INGLES.qxd 24/7/09 19:02 Página 136
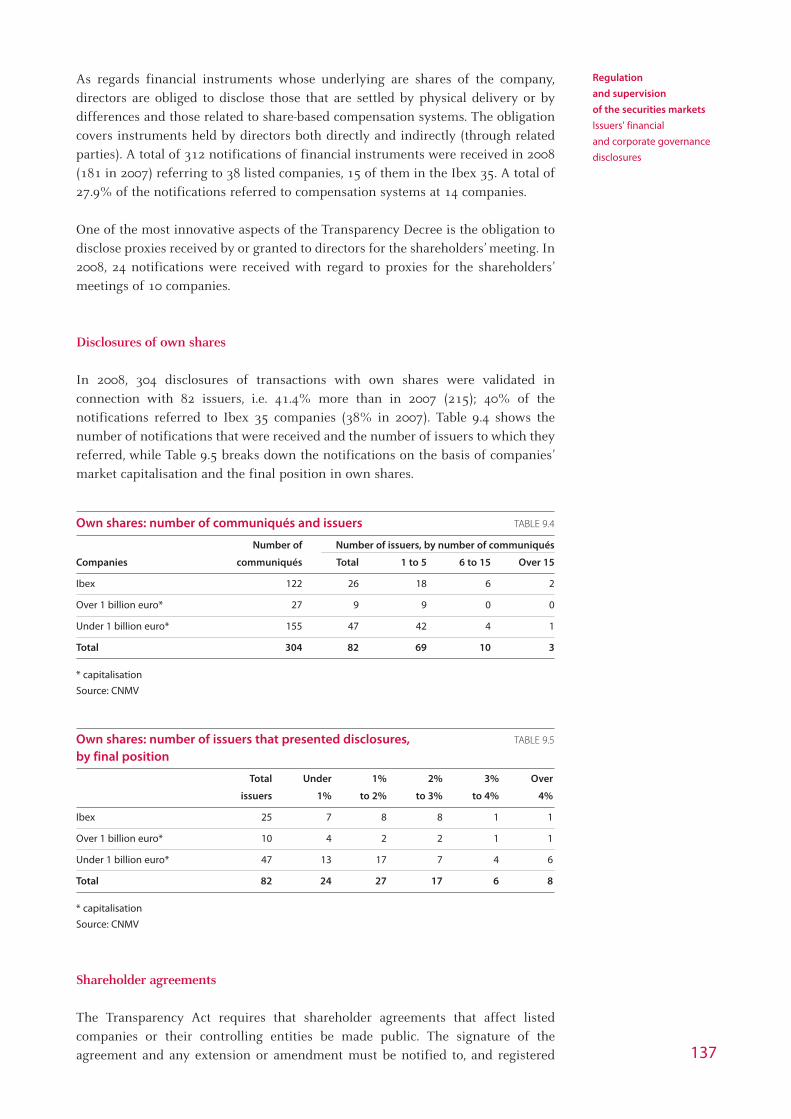
Regulation
and supervision
of the securities markets
Issuers' financial
and corporate governance
disclosures
137
As regards financial instruments whose underlying are shares of the company,directors are obliged to disclose those that are settled by physical delivery or bydifferences and those related to share-based compensation systems. The obligationcovers instruments held by directors both directly and indirectly (through relatedparties). A total of 312 notifications of financial instruments were received in 2008(181 in 2007) referring to 38 listed companies, 15 of them in the Ibex 35. A total of27.9% of the notifications referred to compensation systems at 14 companies.
One of the most innovative aspects of the Transparency Decree is the obligation todisclose proxies received by or granted to directors for the shareholders’ meeting. In2008, 24 notifications were received with regard to proxies for the shareholders’meetings of 10 companies.
Disclosures of own shares
In 2008, 304 disclosures of transactions with own shares were validated inconnection with 82 issuers, i.e. 41.4% more than in 2007 (215); 40% of thenotifications referred to Ibex 35 companies (38% in 2007). Table 9.4 shows thenumber of notifications that were received and the number of issuers to which theyreferred, while Table 9.5 breaks down the notifications on the basis of companies’market capitalisation and the final position in own shares.
Own shares: number of communiqués and issuers TABLE 9.4
Number of Number of issuers, by number of communiqués
Companies communiqués Total 1 to 5 6 to 15 Over 15
Ibex 122 26 18 6 2
Over 1 billion euro* 27 9 9 0 0
Under 1 billion euro* 155 47 42 4 1
Total 304 82 69 10 3
* capitalisation
Source: CNMV
Own shares: number of issuers that presented disclosures, TABLE 9.5
by final position
Total Under 1% 2% 3% Over
issuers 1% to 2% to 3% to 4% 4%
Ibex 25 7 8 8 1 1
Over 1 billion euro* 10 4 2 2 1 1
Under 1 billion euro* 47 13 17 7 4 6
Total 82 24 27 17 6 8
* capitalisation
Source: CNMV
Shareholder agreements
The Transparency Act requires that shareholder agreements that affect listedcompanies or their controlling entities be made public. The signature of theagreement and any extension or amendment must be notified to, and registered
09_Capitulo 09_INGLES.qxd 24/7/09 19:02 Página 137

with, the CNMV as a regulatory disclosure in accordance with articles 92 and 112of the Securities Market Act.
In 2008, a total of seven new shareholder agreements were notified (16 in 2007)which affect seven listed companies, and there were nine amendments to pre-existing agreements. The new agreements regulate the transfer of shares; moreover,four of them regulate voting rights and three establish a pre-emptive purchase price.
9.2.2. Delays in filing communiqués, and actions taken
A total of 543 communiqués were filed late in 2008, of which 463 (85.3%) referredto directors and significant shareholders, compared with 190 in 2007. A total of 306parties were subpoenaed for filing notifications late.
For comparison with previous years, figure 9.5 shows only notifications, both timelyand late, relating to directors and significant shareholders.
The most interesting aspects of the various types of communiqué are shown below:
– Notifications were filed late in connection with 251 directors. In 68 cases(27.1%), the notification referred to their appointment or removal.
– A total of 45 late notifications by 41 directors referred to transactions withfinancial instruments.
– Of the late notifications by significant shareholders, 19 referred to an increase ordecrease over or under the 3% threshold, and six referred to shareholdersresident in tax havens.
– The 52 late notifications referring to executives involved 30 listed companies.
– The 28 late notifications with regard to own shares referred to 17 listedcompanies and most of them were due to an interpretation of the regulations tothe effect that the 1% notification threshold referred to the final position ratherthan to acquisitions.138
CNMV
Informe anual sobre los
mercados de valores y su
actuación. 2008
Notifications regarding directors and significant shareholders FIGURE 9.5
that were presented late
Source: CNMV.
2,4792,816
3,7533,901 4,057
398199 219 190
463
16.1%
4.9%
11.4%
7.1%5.8%
0
500
1,000
1,500
2,000
2,500
3,000
3,500
4,000
2004 2005 2006 2007 20080
2
4
6
8
10
12
14
16
18
Total filings (LHS) Late filings (LHS) % late filings (RHS)
09_Capitulo 09_INGLES.qxd 24/7/09 19:02 Página 138
creo

Based on the responses received to subpoenas sent in 2008, the reasons for delayscan be broken down as follows:
i. 77% of the responses claimed errors in interpreting the new regulations (theTransparency and Market Abuse Decrees reduced the deadline for disclosingsignificant shareholders and directors from 7 days to 4 and 5 days, respectively)or administrative or internal control failures.
ii. 11% of the delays were attributed to forgetfulness or holiday periods.
iii. 6% were justified by the existence of corporate transactions relating to mergers,takeovers or similar.
iv. 4% were attributed to inheritance issues (difficulty in meeting the deadlinebecause of the paperwork involved) or personal reasons (death of spouse).
v. The other 2% referred to listed companies in a situation of insolvency.
9.3 Corporate governance
Article 116 of the Securities Market Act regulates the obligation upon listedcompanies to publish an annual corporate governance report and file it as aregulatory disclosure. The corporate governance report must provide full reasoneddisclosure of corporate governance practices at issuers of listed securities in orderto enable investors and other users of information to reach an informed opinion.
The coexistence of the two corporate governance codes —the Olivencia Code (1998)and the Aldama Code (2003)— created difficulties when disclosing the degree towhich the recommendations were being applied. The Unified Code, which isapplicable to corporate governance reports issued in 2008 and thereafter,established a single reference for listed companies’ corporate governance practices.
In 2008 a total of 174 listed companies, 43 savings banks and 22 issuers of fixed-income securities presented their corporate governance report for 2007. Only ninecompanies were subpoenaed for late filing.
From the corporate governance reports produced by issuers, the CNMV drafts andpublishes an annual report containing an analysis, on an aggregated basis, of themain governance practices at issuers together with a range of statistical data oneach entity. The CNMV is a pioneer among securities supervisors in publishing thistype of report.
9.3.1. Main aspects of listed companies’ governance structures
On an aggregated level, the main aspects of corporate governance practices at listedcompanies are as follows:
Ownership structure
The capital of listed companies increased by 13.1% in 2007 (Ibex: 7.3%). Marketcapitalisation was similar to 2006 except in the Ibex companies, where it increased 139
Regulation
and supervision
of the securities markets
Issuers' financial
and corporate governance
disclosures
09_Capitulo 09_INGLES.qxd 24/7/09 19:02 Página 139

by 5.1% The main variation was in real estate companies, whose capitalisationdeclined by 50.7%.
The free float averaged 34.9% (Ibex: 44.2%), compared with 38.3% in 2006 (Ibex:49.3%). This reduction is broadly due to the entry into force of the TransparencyDecree, which reduced the threshold for considering a stake to be significant from5% to 3%. Adjusting for the regulatory change, the average free float of listedcompanies was 36.2%.
Own shares increased on aggregate from 0.5% to 0.8%.
Board of Directors
The average board of directors at the analyzed entities ( 10.1 members) was slightlylater than in 2006 while still within the range recommended by the Unified Code(not less than 5 and not more than 15 members), and the number of companiescomplying with that recommendation rose from 79.8% in 2006 to 82.4% in 2007.
Independent directors experienced a reduction in importance within boards ofdirectors, from 30.3% in 2006 to 28.3% in 2007. Part of this reduction was due tothe gradual process of adjustment to the independence requirements established inthe Unified Code.
The number of companies where independent directors account for at least one-third of the board declined by 5.3 points to 38% of the total. The companiesattributed that reduction to the need to adapt the number of independent directorsto their capital structure.
The number of female directors increased from 118 in 2006 to 131 in 2007.However, there are still very few female directors in listed companies: a mere 7.5%(6.9% in 2006). 51.4% of companies have at least one female director and 39.6% ofthe companies with few or no female directors stated that they have not adoptedmeasures to correct this situation.
Director and senior management remuneration
Compensation averaged 2.68 million euro per board of directors and 267,000 europer director, i.e. an increase of 7% and 5.3%, respectively, with respect to 2006.
Fixed compensation increased by 15.9% on average and attendance fees by 10.9%on average with respect to 2006. Variable compensation increased by 5.4%.
Executive directors’ compensation increased by 5.3% on average, following the33.3% increase registered in 2006. A large number of incentive plans and stockoptions, whose main beneficiaries were executive directors, vested in 2006.
Director compensation policies and the degree of transparency in this connectioncontinue to be one of the most controversial aspects of listed companies’ corporategovernance. The recommendations of the Unified Code which are applied to the leastextent are those relating to transparency of director compensation ( less than 30% of140
CNMV
Annual Report regarding
its actions and the
securities markets. 2008
09_Capitulo 09_INGLES.qxd 24/7/09 19:02 Página 140

listed companies comply in full). Companies argue that the existing legislationalready requires detailed disclosure of director compensation to shareholders.
Board committees
In 2007, 20% of independent directors were not members of any subcommittee oftheir boards (23.2% in 2006). The number of companies where the chair of thesupervision and oversight committees is an independent director increased slightly,as did the degree of compliance with the Code’s other recommendations regardingcommittee composition.
However, the presence of independent directors declined on the Executivecommittee (20.5% vs. 22.8% in 2006), the audit committee (42.9% vs. 44.9%), andthe appointments and remuneration committee (44.8% vs. 47.9%).
Related-party transactions
It is necessary to continue insisting on the need to improve the transparency of thedisclosures in the corporate governance report. Companies should expand theinformation they supply about the nature of related-party transactions when theamount is significant. In general, companies state that the transactions wereconducted on arm’s-length basis in the normal course of business.
The aggregate amount of related party transactions with significant shareholderswas 119,745 million euro. Five entities accounted for 54.6% of the total amount.
A comparison of the figures for the first half of 2008 and 2007 reveals a 5.6% increasein the amount of related-party transactions that were disclosed. The bulk of thesetransactions were arranged with credit institutions that are related parties of the issuer. 141
Regulation
and supervision
of the securities markets
Issuers' financial
and corporate governance
disclosures
Related-party transactions by listed companies TABLE 9.6
Million euro
No. of companies Type of transaction1 No. of transactions3 Amount
1H08 1H07 1H08 1H07 1H08 1H07 1H08 1H07
Transactions with:
Significant shareholders 120 102 30 30 534 463 119,745 118,304
Directors and executives 91 86 21 25 296 288 1,929 1,895
Persons or entities in the group 112 104 29 28 544 467 68,863 65,572
Other related parties 88 79 28 25 350 302 24,349 17,617
Total 270 270 312 31 1,724 1,520 214,886 203,388
% of total
Significant shareholders 44.4 37.8 96.8 96.8 31.0 30.5 55.7 58.2
Directors and executives 33.7 31.9 67.7 80.6 17.2 18.9 0.9 0.9
Persons or entities in the group 41.5 38.5 93.5 90.3 31.6 30.7 32.0 32.2
Other related parties 32.6 29.3 90.3 80.6 20.3 19.9 11.3 8.7
Source: CNMV.
1. Number of types of transactions by each category of related party.
2. Total number of types of transaction contained in the half-yearly public disclosure form.
3. Number of transactions in each category.
09_Capitulo 09_INGLES.qxd 24/7/09 19:02 Página 141

Risk control systems
In the corporate governance report, companies must disclose the degree of exposureto risks, highlighting those that are significant or highly likely to materialize andthose which affect critical areas of their business.
The year 2007 was marked by major events and turbulence in the financial marketswhich affected companies of all types. Most companies disclose genericinformation about their financial or business risks and the systems implemented todetect, measure and manage them so as to control and mitigate their impact if theymaterialise.
However, the corporate governance report did not disclose information about thelikelihood of occurrence or the impact of the identified risks. Only 23 companiesidentified the risks that affected them in 2007; another 129 stated that none ofthe risks that might have affected them actually materialised, and the other 21merely stated that risks that are inherent to the Group companies’ business hadmaterialised.
In all cases, the company stated that the control systems in place had functionedcorrectly.
Shareholders’ Meeting
The average percentage attendance at shareholders’ meetings was 74.9% in 2007(73.8% in 2006). In recent years, listed companies have adopted measures toencourage minority shareholders to participate in shareholders’ meetings. However,the largest percentages of participation are found to correspond with lower averagefree floats, suggesting the need to persist with measures to encourage participationby minority shareholders. The effective use of distance voting by electronic meansis still very low.
The number of companies with caps on voting rights in their Articles of Associationcontinues to decline (16, four less than in 2006), as does the number of companiesthat require a minimum number of shares in order to attend the shareholders’meeting (57.8% of listed companies, down from 63% in 2006).
The “comply or explain” principle
CNMV Circular 4/2007 modified the standard form for listed companies’ corporategovernance reports to the new disclosure requirements introduced by the UnifiedCode. A number of new questions were added and the section dealing with thedegree of compliance with each recommendation was modified to make the“comply or explain” principle more transparent.
Following a review of the criteria used for disclosing the degree of compliancewith the Code’s recommendations in the corporate governance reports, whichcovered 100 companies including the entire Ibex 35, fifty subpoenas were issued(Ibex: 21). 142
CNMV
Annual Report regarding
its actions and the
securities markets. 2008
09_Capitulo 09_INGLES.qxd 24/7/09 19:02 Página 142

The subpoenas requested additional information or clarification about 39 of theCode’s 58 recommendations. In some cases, the reporting company was required torectify the information by presenting a new corporate governance report:
– The recommendations giving rise to the greatest proportion of subpoenas arethose relating to the board of directors and to directors.
– All the companies that were subpoenaed provided additional information andexplanations and 90% of them rectified their initial disclosure by presenting a newcorporate governance report. The amendments have been added to the CNMV website.
– A significant number of the incidents detected were due to errors orinconsistency in compliance since this was the first year in which the UnifiedCode was applied and also because of the change in the form of the corporategovernance report.
143
Regulation
and supervision
of the securities markets
Issuers' financial
and corporate governance
disclosures
Recommendations to which subpoenas referred and number of companies affected TABLE 9.7
Number and description of the recommendation in the Unified Code of
Corporate Governance No. of companies
1 2
2 1
5 1
8 5
11 4
12 5
13 9
14 4
15 10
17 8
18 5
19 1
20 3
22 1
23 1
24 8
25 4
26 3
27 1
28 18
29 4
30 1
Absence of limitations in the articles of association regarding the maximum
number of votes that a shareholder may cast, and other restrictions on control
Transparency in relations between the parent company and subsidiaries, and
mechanisms for resolving conflicts of interest
Separate voting of substantially independent matters in shareholders' meetings
Powers of the board of directors
Transparency with regard to related parties and relations with directors classified
as external who are neither proprietary nor independent
Proportion between the number of proprietary and independent directors and the
percentage of capital represented by the proprietary directors and the others
Independent directors should account for at least one-third
Explanation of each director's status to the shareholders' meeting, review of status,
and transparency with regard to proprietary directors representing less than 5%
Gender diversity and transparency with regard to initiatives
When the chairman is also the first executive, an independent director should be
empowered for certain issues
Functions of the secretary of the board
The board should meet with the necessary frequency
The number of absences at meetings should be reduced, and quantified
Regular evaluations of the board, of the chairman's performance, and of the
operations of the committees
Directors should be able to obtain additional information
Directors' right to obtain external advice in the discharge of their duties
Induction programs for new directors, and refresher programs for all directors
Directors' dedication and rules on the number of boards to which they may belong
Selection, appointment and reappointment of directors
Public information about directors
Rotation of independent directors in a period not exceeding 12 years
Removal or resignation of proprietary directors when the shareholder they
represent reduces or sells its stake
09_Capitulo 09_INGLES.qxd 24/7/09 19:02 Página 143

144
CNMV
Annual Report regarding
its actions and the
securities markets. 2008
Classification of directors as independent, and constitution of the appointmentscommittee
The review of the corporate governance reports for 2007 revealed that 38companies had not established an appointments committee by the end of the year.Nevertheless, four of those companies reappointed six directors classified asindependent and another three appointed seven directors classified as independent,resulting in subpoenas from the CNMV. In 2008, only five of those 38 companieshad established an appointments committee.
The degree of compliance with the binding definitions of the various directorcategories was analyzed. Specifically, the classification of 280 directors thatformed part of the sample was analyzed, leading to subpoenas to 29 companiesin connection with the application of the binding definitions to 33 independentdirectors, one proprietary director and four directors classified as “otherexternal”.
Table 9.8 contains a statistical summary of the conditions in the definition ofindependent director to which these subpoenas referred, together with the numberof companies subpoenaed in each case and the total number of directors affected.
Recommendations to which subpoenas referred and number of companies affected (continuation) TABLE 9.7
Number and description of the recommendation in the Unified Code of
Corporate Governance No. of companies
31 1
32 1
34 3
35 4
37 1
38 2
40 7
41 6
42 11
43 1
44 14
48 1
49 3
50 6
54 4
55 1
57 1
Source: CNMV.
The board may not propose the removal of an independent director before the
end of his term
Establishment of rules under which directors must disclose situations which might
discredit the company
Letter to the board describing the reasons for early removal or resignation of a
director
System for compensation approval and transparency
Remuneration of external directors should not compromise their status
Remuneration linked to earnings should take account of audit qualifications
The board should submit a report on compensation to a vote at the shareholders'
meeting
Itemised detail of compensation in the notes to the financial statements
Similar participation of the various director categories in the executive committee
and in the board
Informing the board of the business transacted by the executive committee
Rules on the composition and operation of the audit committee and the
appointments and remuneration committee
Presentation of the annual work plan by the head of internal audit to the audit
committee
Minimum content of the risk control and management policy
Powers of the audit committee
Majority of independent directors on the appointments committee
Functions of the appointments committee
Functions of the remuneration committee
09_Capitulo 09_INGLES.qxd 24/7/09 19:02 Página 144
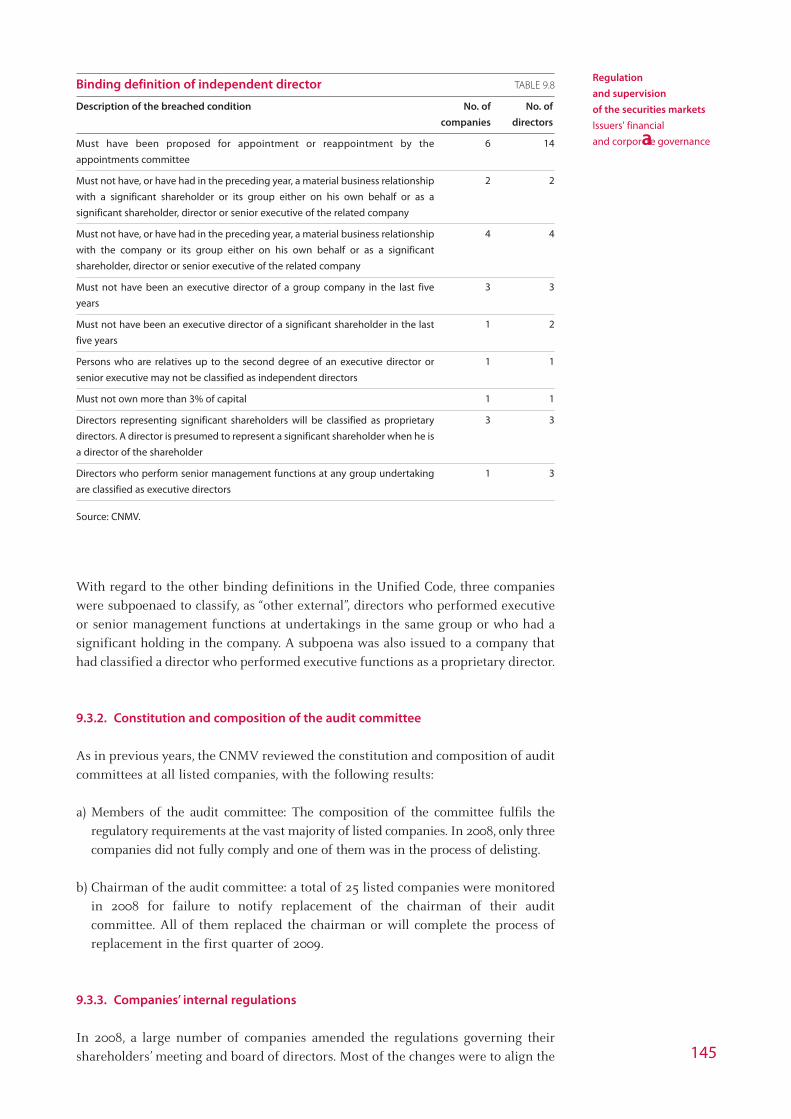
With regard to the other binding definitions in the Unified Code, three companieswere subpoenaed to classify, as “other external”, directors who performed executiveor senior management functions at undertakings in the same group or who had asignificant holding in the company. A subpoena was also issued to a company thathad classified a director who performed executive functions as a proprietary director.
9.3.2. Constitution and composition of the audit committee
As in previous years, the CNMV reviewed the constitution and composition of auditcommittees at all listed companies, with the following results:
a) Members of the audit committee: The composition of the committee fulfils theregulatory requirements at the vast majority of listed companies. In 2008, only threecompanies did not fully comply and one of them was in the process of delisting.
b) Chairman of the audit committee: a total of 25 listed companies were monitoredin 2008 for failure to notify replacement of the chairman of their auditcommittee. All of them replaced the chairman or will complete the process ofreplacement in the first quarter of 2009.
9.3.3. Companies’ internal regulations
In 2008, a large number of companies amended the regulations governing theirshareholders’ meeting and board of directors. Most of the changes were to align the 145
Regulation
and supervision
of the securities markets
Issuers' financial
and corporate governance
Binding definition of independent director TABLE 9.8
Description of the breached condition No. of No. of
companies directors
Must have been proposed for appointment or reappointment by the
appointments committee
Must not have, or have had in the preceding year, a material business relationship
with a significant shareholder or its group either on his own behalf or as a
significant shareholder, director or senior executive of the related company
Must not have, or have had in the preceding year, a material business relationship
with the company or its group either on his own behalf or as a significant
shareholder, director or senior executive of the related company
Must not have been an executive director of a group company in the last five
years
Must not have been an executive director of a significant shareholder in the last
five years
Persons who are relatives up to the second degree of an executive director or
senior executive may not be classified as independent directors
Must not own more than 3% of capital
Directors representing significant shareholders will be classified as proprietary
directors. A director is presumed to represent a significant shareholder when he is
a director of the shareholder
Directors who perform senior management functions at any group undertaking
are classified as executive directors
Source: CNMV.
6 14
2 2
4 4
3 3
1 2
1 1
1 1
3 3
1 3
09_Capitulo 09_INGLES.qxd 24/7/09 19:02 Página 145

146
CNMV
Annual Report regarding
its actions and the
securities markets. 2008
regulations with the recommendations of the Code. This process had commencedin 2006 following the approval of the Unified Code of Corporate Governance.
The main amendments to the Shareholders’ Meeting Regulations were as follows:
i. 51 companies included separate voting of items that are substantiallyindependent.
ii. 46 companies granted additional powers to their shareholders’ meeting.
iii. 45 companies allowed for fractional voting in their shareholders’ meetingregulation.
iv. Another 16 companies established that the detailed motions to be put before theshareholders’ meeting should be published at the same time as the notice ofmeeting.
V. Just five companies included the possibility of submitting a report on directors’remuneration to the shareholders’ meeting as a separate item on the agenda ona consultative basis.
An analysis of the amendments made by companies to their regulations revealsthat, since 2006, a large number of Spanish listed companies have adopted thepossibility of voting by electronic means at the shareholders’ meeting, inconformity with Directive 2007/36/EC on the exercise of certain rights ofshareholders in listed companies. The deadline for transposing this Directive is 20August 2009.
The main amendments to the board of directors regulations are summarised below:
i. A total of 56 companies amended the composition of the audit committee in linewith the recommendations of the Code.
ii. 51 companies added new powers for the board of directors.
iii. Another 51 established new functions for the appointments and remunerationcommittee in line with the Code’s recommendations.
iv. The board regulations of 41 companies established that the board secretary mustfocus particularly on ensuring that the board’s actions conform to currentregulations and the articles of association and take account of therecommendations on corporate governance.
v. A total of 36 companies have included binding definitions of the various directorcategories in the board regulation.
vi. 22 companies established that, once per year, the board must review the qualityand efficiency of its work and the performance of the chairman and thecompany’s chief executive, as well as the workings of the committees.
vii. At 19 companies where the chairman is also the first executive, an independentdirector was granted the power to call board meetings as a means of avoidingthe concentration of power.
09_Capitulo 09_INGLES.qxd 24/7/09 19:02 Página 146

viii. A total of 18 companies have established mechanisms to improve transparencywith regard to remuneration.
ix. Ten companies established that independent directors must account for at leastone-third of the board.
x. And six companies implemented mechanisms to correct the low or zeropresence of female directors.
Companies are not being diligent in pursuit of the goal of transparency with regardto remuneration policy (particularly the itemised breakdown of various classes ofremuneration) or of increasing the presence of women on the board.
9.4 Regulatory disclosures and other communiqués filed with the CNMV
In 2008, the CNMV received 11,320 regulatory disclosures from issuers, 16.6%more than in 2007 (Table 9.11). The Cifradoc procedure was used for 60.4% of theregulatory disclosures, enabling them to be published automatically on the CNMVwebsite.
147
Regulation
and supervision
of the securities markets
Issuers' financial
and corporate governance
disclosures
Regulatory disclosures and other communiqués received by the CNMV TABLE 9.9
Type 2007 2008 % chg. 08/07
Regulatory disclosures 7,779 9,478 21.8
Acquisitions or sales of holdings 814 454 -44.2
Notices and resolutions of shareholders’ meetings 584 602 3.1
Issuers’ advance results 865 912 5.4
Changes in the board or other governing bodies 357 344 -3.6
Audit committee (Act 44/2002) 9 5 -44.4
Periodical disclosure by asset securitisation trusts 2,475 3,554 43.6
Periodical disclosure by mortgage securitisation trusts 779 834 7.1
Annual corporate governance report 234 298 27.4
Suspensions and resumption of trading 119 85 -28.6
Delistings (including prior agreements) 28 20 -28.6
Disclosures of short positions — 71 —
Liquidity contracts — 28 —
Changes in credit ratings — 44 —
Other 1,515 2,227 47.0
Other notifications 1,929 1,842 -4.5
Announcement of coupon and dividend payments 264 257 -2.7
Meetings with analysts and investors. Notices of meetings 184 177 -38
Information about issuers’ results 377 342 -9.3
Presentations about companies 200 139 -30.5
Other 904 927 2.5
Total 9,708 11,320 16.6
Source: CNMV.
09_Capitulo 09_INGLES.qxd 24/7/09 19:02 Página 147

148
CNMV
Annual Report regarding
its actions and the
securities markets. 2008
The increase in the volume of regulatory disclosures was due mainly tocommuniqués of: (i) other disclosures, which increased by 47%, (ii) periodicdisclosures by asset securitisation trusts (43.6%), and (iii) annual corporategovernance reports (27.4%).
Three new types of disclosure were added to the register of regulatory disclosuresin 2008: (i) disclosures of short positions due to the obligation to disclose shortpositions amounting to more than 0.25% of 20 Spanish financial institutions (71disclosures were received); (ii) liquidity contracts, i.e. purchases and sales in thesecondary market of an issuer’s securities by an intermediary under a liquiditycontract arranged in accordance with CNMV Circular 7/2007 (28 were disclosed);and (iii) changes in credit rating (44 disclosures).
09_Capitulo 09_INGLES.qxd 24/7/09 19:02 Página 148

Regulation
and supervision
of the securities markets
Market supervision
149
10 Market supervision
The CNMV’s mandate is to supervise the markets in order to ensure their correctoperation. This chapter contains an overview of its actions in this sphere. Section10.1 analyses the surveillance activities performed in Spain’s various markets.Section 10.2 focuses on the activities of the Market Monitoring Unit, whichintervenes if there are signs of irregularities in a particular transaction. Lastly,section 10.3 focuses on the market in corporate control and outlines actions in casesof takeover bids.
To perform these tasks, the CNMV monitors transactions where there might besigns of market failure, distortions in price discovery processes and incidents intransaction settlement. In 2008, the CNMV analysed 78,318 transactions (one inevery thousand performed in the markets). Most of the transactions reviewed werein the equities market (Table 10.1).
Summary of supervisory activity. 2008 TABLE 10.1
Fixed-Equities income Derivatives Settlement Total
No. of transactions 36,937,580 825,086 6,055,902 34,923,653 78,742,221
Supervisory signals1 38,413 6,728 14,690 18,487 78,318
Subpoenas 411 19 11 13 454
Supervisory reports 160 13 19 5 197
Reports sent to other
directorates and bodies 6 17 7 0 30
Periodic reports 24 24 24 72
Source: CNMV.
1. Signals that identify transactions or groups of transactions in which there have been unusual movements
in certain parameters, flagging them for analysis for supervisory purposes.
10.1 Salient actions by the CNMV in the various markets
10.1.1. Equities
The CNMV focuses its supervision of Spanish equities on achieving two crucialobjectives for ensuring that markets work properly: preventing the use of insideinformation and preventing price manipulation.
To meet the first of these objectives, the CNMV conducts ex-ante or preventivesupervision to avoid situations of asymmetry in the dissemination of price-sensitive
10_Capitulo 10_INGLES.qxd 24/7/09 19:03 Página 149

information and to contain the spread of misleading information. To achieve theseaims, the CNMV has the power to suspend trading in the shares involved.Furthermore, it performs ex-post supervision by studying the trading of those shareswhich, as the subject of regulatory disclosures, have been exposed to possible leaks.
The second major block of activity focuses on detecting market manipulation. Tothis end, on its own initiative the CNMV examines trading in those shares where itdetects abnormal prices and volumes and those that, because of their scant liquidity,are more sensitive to practices that might send markets false or misleading signalsregarding demand, supply and price. The special circumstances affecting themarkets in 2008 obliged supervisors to increase the level of surveillance on tradingof certain kinds of securities, and particularly to monitor compliance withregulations concerning hedging and transparency in short positions.
As part of its preventive duties, in 2008 the CNMV implemented various initiativesthat were set out in decisions by the Executive Committee on short-selling and ondetecting and reporting suspicious transactions, which were disseminated via thewebsite. For the same purpose, market members were sent a letter on theprevention of practices that distort the price discovery process through theintroduction of small orders in non-liquid securities.
Trading halts due to disclosure of information
The CNMV can halt trading in a security if it suspects that there is significantinformation related to it that is not known to the market.
In 2008, the number of trading halts in equities was considerably lower than in2007, in terms of both the number of issuers and the number of issues affected(Table 10.2). In both cases, the numbers decreased by around 40%. The breakdownof trading halts by cause (Table 10.2) shows that the main reason was the disclosureof price-sensitive information, which accounted for more than 92% of all temporarysuspensions. Almost 25% of all trading halts were in the real estate sector, followedby trade and sundry services (12%), transport (10%), and food, beverages andtobacco (10%).
As a result of market conditions, there were practically no takeover bids, whichexplains why there was only one halt under the “Presentation of takeover bids”heading and none under the heading “Expiry of acceptance period for delistingoffers.”150
CNMV
Annual Report regarding
its actions and the
securities markets. 2008
Trading halts TABLE 10.2
2007 2008
No. of issuers halted 54 33
No. of halts 83 51
Presentation of takeover bids 23 1
Dissemination of price-sensitive information 56 47
Expiry of acceptance period for delisting offers 4 0
Other 0 3
Source: CNMV.
10_Capitulo 10_INGLES.qxd 24/7/09 19:03 Página 150

151
Regulation
and supervision
of the securities markets
Market supervision
Furthermore, there is a considerable degree of coordination in Europe in thisconnection. Since the introduction of MiFID, European regulators have establisheda mechanism to report trading halts, resumption of trading, and delistings.
Surveillance of research reports and presentations
The CNMV performs specific surveillance of presentations organised by issuers,based on guidelines issued by the CNMV in December 2005 concerning informativemeetings with analysts, institutional investors and other securities marketprofessionals. Due and timely announcement of the date and objective of theseactions, the simultaneous dissemination of the same information to all investors—and of any other which emerges during subsequent presentations or meetingswith the press or analysts— are the supervisor’s main concerns in this regard.
Study of additions and removals from the Ibex 35
Measures taken by the CNMV to monitor market activity included a systematicanalysis of securities added to and relegated from the Ibex 35 during the revisionsof the index that occurred in 2008.
Inclusion in the Ibex 35 index is very important for companies in Spain; advantagesinclude enhanced visibility and reputation and increased share liquidity, with theresult that the shares can be included in the portfolios of many institutionalinvestors (mainly index trackers). Inclusion in the index often gives a company anedge that translates into a higher share price.
Analysis of each change in the composition of the index focused on checkingwhether trading in shares of companies viewed as candidates for addition orremoval and those actually added or removed was orderly and legitimate, withoutdistortions that might reveal artificial trading aimed at ensuring that a shareremained in or was added to the index, to the detriment of other candidatesecurities. Furthermore, the CNMV checked that, following each review, thecomponents of the Ibex 35 complied with the technical regulations governing thecomposition and calculation of the index.
Short positions
At a special meeting on 22 September 2008, the CNMV Executive Committee decidedto require disclosure of short positions in 20 financial securities in excess of 0.25% ofa company’s share capital, as well as any increase in these positions or any reductionbelow the threshold of 0.25%. The new transparency obligation was established on atemporary basis, although it was still in place at the time of writing this report.
Furthermore, the Executive Committee reminded market participants of the ban onnaked short selling for all securities listed in the stock market and urged marketmembers to use the power granted to them under Article 39 of the Securities MarketAct to ensure that their clients actually own the securities before processing sell orders.
To facilitate compliance in practice, the agreement clarified the concepts of shortselling and naked short selling. In this regard, the decision emphasised that nakedshorting is a breach of existing trading rules.
10_Capitulo 10_INGLES.qxd 24/7/09 19:03 Página 151

Table 10.3 shows the aggregate short position in securities subject totransparency obligations. In general, the reminder of the ban on naked shortselling and of the obligation to disclose short positions has helped improve thesettlement discipline of all securities and has contributed to reducing intradaytrading activity.
A number of countries implemented restrictive measures (see table below).However, in the early months of 2009, supervisors such as the SEC and FSAwithdrew these measures and others eased them.
Short selling: measures implemented in Spain and other countries
In order to ensure orderly operation of the markets, at the end of September2008 most European regulators imposed restrictions on short selling andintroduced transparency obligations regarding net short positions. The tablebelow summarises the measures approved in different countries.
Summary of measures implemented in different countries
Country Measures
Spain (CNMV) – Reminder of the existing ban on naked short selling in all securities,
including intra-day transactions. Recognition of the needs of market-
makers and similar parties.
– Public disclosures: disclosure of short positions exceeding 0.25% of the
share capital of 20 financial securities.
Germany (BaFin) – Banned practices: naked short selling in 11 financial securities
(temporary ban until 31/12/08). BaFin extended the ban until 31/03/09.
– Exemptions: market makers and similar parties.
– Public disclosures: publication of short positions is not required.
Portugal (CMVM) – Naked short selling is generally banned in Portugal.
– Banned practices: normal short selling is allowed provided the seller or
broker can prove that they actually hold the securities they are selling.
– Exemptions: market makers and similar parties.
– Public disclosures: publication of short positions exceeding 0.25% of the
share capital of 8 financial securities (including Banco de Santander and
Banco Popular Español); for other PSI securities it is compulsory to notify
the CMVM of short positions exceeding the 0.25% figure. Furthermore,
stock market members were obliged to notify the CMVM of all naked
short selling transactions (this obligation was lifted on 8/01/09).
152
CNMV
Annual Report regarding
its actions and the
securities markets. 2008
Short positions in financial sector securities TABLE 10.3
at 30 December 2008
Security Number of shares Percentage of share capital
Popular 63,436,214 5.229
BBVA 41,975,668 1.120
MAPFRE 30,759,913 1.152
Santander 16,213,481 0.200
Sabadell 15,632,500 1.274
Bankinter 7,945,000 1.960
Banco de Valencia 993,656 0.210
Pastor 464,134 0.180
Source: CNMV.
10_Capitulo 10_INGLES.qxd 24/7/09 19:03 Página 152
creo

UK (FSA) – Banned practices: the ban on normal and naked short selling of financial
securities in place since 18/09/08 was lifted on 16/01/09
– Public disclosures: disclosure of short sales of financial securities exceeding
0.25% of the issuer’s share capital (except market makers). On 16/01/09, the
FSA extended this obligation until 30/06/09. The FSA is considering
increasing to 0.50% the percentage above which it will be compulsory to
disclose short positions and to include additional levels of 0.1% for
subsequent notifications. The FSA is also considering the possibility of
extending the obligation to disclose short positions to all listed companies.
Italy (CONSOB – Banned practices: initially, the ban referred to naked short selling of
financial securities. Later, it was extended to include normal short selling
and all securities (Italy extended the ban on short selling of financial
issuers’ securities and in capital increases to 31/05/09). For other
securities, they must be deemed to be available in order for short selling
to be allowable (borrowed securities are not considered to be available).
– Exemptions: market makers and similar parties.
– Public disclosures: publication of short positions is not required.
France (AMF) – Banned practices: temporary ban (3 months, until 19/12/08) on naked
short selling of 15 financial securities. On 19/12/08, the AMF extended
the measures indefinitely. On 23/02/09, France announced that it would
hold a public consultation to analyse the measures.
– Exemptions: market makers and similar parties.
– Public disclosures: disclosure of short positions in 15 financial securities
exceeding 0.25% of the issuer’s share capital. On 19/12/08, the AMF
extended the measures indefinitely.
10.1.2. Fixed-income
Supervision of fixed-income markets in 2008 continued with the actions launchedin previous years (protection of retail investors, surveillance of trading in asset-backed securities and mortgage covered bonds), although the worsening financialcrisis made it necessary to place particular emphasis on monitoring credit risk, aswell as prices and trading volumes.
One of the most notable supervision actions performed by the CNMV in 2008 wasits surveillance of issuers of subordinated debt and preferred shares, whichincreased significantly in the last few months of the year in order to raise fundsthat, under certain conditions, compute as credit institutions’ equity.
Many of the issues were aimed solely at retail investors. This was a potentialsource of conflicts of interest, since the issuer was also acting as placer via itsnetwork. Consequently, the CNMV paid particular attention to valuing this kindof financial product in the primary market, and especially to aspects linked to theapproach, methodology and objective of independent appraisal reports. In orderto assess these aspects, the valuations of 12 fixed-income issues aimed at retailinvestors were reviewed in 2008. Furthermore, on 17 February 2009, the CNMVsent a letter to the chairmen of Spain’s financial industry associations setting outthe guidelines for vetting fixed-income issues aimed at retail investors, includingthe content and approach of reports by independent experts, to determinewhether the conditions of issues aimed at retail investors are comparable to thosethat should apply for the adequate placement of a similar issue in the wholesalemarket. At all events, the CNMV can decide to include warnings in prospectusesregarding issue conditions. 153
Regulation
and supervision
of the securities markets
Market supervision
10_Capitulo 10_INGLES.qxd 24/7/09 19:03 Página 153

Market activity of issuers of this kind of product was also analysed with a view todetecting cases of discrimination between clients. This analysis led to 10 subpoenasand 5 supervision reports in the year. In 2008, as a result of a number of complaints,particular emphasis was placed on overseeing the activity of liquidity suppliers inthese issues; in most cases, they were found to be fulfilling the contractualconditions under which they were supposed to act in the market.
The CNMV individually monitored all transactions in ABS and mortgage coveredbonds in AIAF as a result of the crisis in these markets, in order to identify thespread levels prevailing at all times in 2008, the goal being to support checks on newissues and the surveillance of market conditions.
Furthermore, in 2008 the CNMV analysed the change in AIAF methodology forestimating theoretical benchmark prices for instruments listed in this market, andthe implications for the calculation of average daily prices published by the market.
Fixed-income issuers are also now obliged to report any rating actions to themarket, in order to enhance transparency and foster proper price discovery. Thisposition has been notified to issuers affected by rating actions, and in some casesthey were required to release regulatory disclosures. As a result, during the lastquarter of 2008, 22 regulatory disclosures were registered in this connection (notincluding those registered by securitisation trusts).
10.1.3. Derivatives
MEFF Renta variable
In 2008, the CNMV continued to supervise aspects of market operation. With thesupport of MEFF, analyses were conducted of transactions whose sole purpose iscash transfer between account holders or the discretionary allocation of earningsand losses between managed accounts for tax purposes. Daily supervision dutiesalso focused on matters linked to the regulations that govern prices for put-throughs, cancellations and regulations, among other aspects.
Also, specific analyses were conducted of MEFF activity on dates prior to thedisclosure of mergers and acquisitions where there had been an impact on theprices of contracts. Special attention was devoted to changes in account-holders’open interest close to the expiration maturity dates of futures and options contracts,with particular attention to the possible impact of these transactions on spotmarkets for the underlying shares.
As regards the Central Counterparty Service, emphasis was placed on monitoringregulatory compliance regarding guarantees provided by members, since theconsiderable volatility in the markets triggered the request for extraordinaryguarantees during the trading session as pre-set price fluctuation limits werereached in some cases. The high volatility led to numerous changes in theparameters for calculating daily guarantees. Because of the high levels of volatilityin the market, MEFF was obliged to draft twelve circulars in 2008 to adapt theseparameters (it drafted six in 2007), and this constituted the main regulatoryactivity in the market. Also in this connection, the CNMV, in coordination withMEFF, monitored non-compliance by Lehman Brothers, which had hitherto been154
CNMV
Annual Report regarding
its actions and the
securities markets. 2008
10_Capitulo 10_INGLES.qxd 24/7/09 19:03 Página 154

a trading member of MEFF. After Lehman went bankrupt, MEFF cancelled itstrading membership and transferred and settled its open interest in the Spanishmarket.
Olive Oil Futures Market (MFAO)
CNMV supervision focused particularly on analysing positions in the weeks priorto maturity and on monitoring settlement through physical delivery. Again, therewere no cases of non-compliance in the settlement of contracts by physical delivery.Furthermore, as in 2007, there were a significant number of deliveries outside theclearing house, as provided in the regulations. Both the deliveries outside theclearing house and those performed through MFAO follow procedures that arecomparable to standard practice in the olive oil sector.
Warrants, certificates and other products
In 2008, despite lower trading levels in this market segment, a record number ofissues were listed and the range of underlyings traded also reached a record high,thereby also increasing both the volume of information conveyed to the market andthe supervision of specialist members’ activities.
In October 2008, turbo warrants began trading with a broader variety ofunderlyings: futures on Brent oil, gold and, later, the EUR/USD exchange rate.Furthermore, the high volatility in the market, especially in the last quarter, causedmany cases of early redemption of these products. Both factors contributed to aconsiderable increase in notifications of knock-out barrier early redemptions androtation of these assets.
Issues of certificates with exotic components also continued; their supervisionrequires careful attention, particularly in situations of high volatility.
During 2008, supervisory activity in the warrants segment focused especially on daytrading in warrants with illiquid underlyings. The transactions in this kind ofwarrant and their respective underlyings were analysed jointly, and very smalltransactions in the latter were detected; this eventually affects the trading range ofthe warrant in question.
10.1.4. Registry, counterparties, clearing and settlement
Iberclear-SCLV
In the area of settlement supervision, particular attention was paid in 2008 todetecting naked short selling, either via the delivery of securities from loansregistered on the same date as the sale or on a later date, or in the context ofintraday transactions. In the first case, in order to check whether or not the sellerheld a sufficient position in the security, supervision focuses on verifying whetherthe loans used are arranged before or after the sale is ordered. In the second case,the analysis focuses on the performance of the position of each account holderthroughout the session, to verify whether there is a position in the security at all 155
Regulation
and supervision
of the securities markets
Market supervision
10_Capitulo 10_INGLES.qxd 24/7/09 19:03 Página 155

times prior to executing the sale or whether a sale is executed without first holdinga position in the security, and the naked short is then closed in the same session.The number of events of this type was not significant.
10.2 Market Monitoring Unit
The purpose of the Market Monitoring Unit (MMU) is to conduct investigations todetect practices that are contrary to market integrity. The MMU investigatessituations in which there may be market abuse, linked mainly to restrictedinformation (either its possible illegal use or the failure to comply with codes ofconduct by issuers and institutions providing investment or advisory services insecurities markets), and market manipulation, in respect of both transactions anddisclosure.
Table 10.4 details MMU interventions arising from investigations in 2007 and 2008:
Market Monitoring Unit’s Actions TABLE 10.4
2007 2008
Parties investigated 639 625
Natural persons 359 275
Legal persons 280 350
Actions during the investigations 1,848 2,311
Subpoenas 1,763 2,195
Requests to foreign institutions for assistance 46 50
Depositions 23 49
Visits 16 17
Subsequent actions 9 5
Prior notifications and warnings 5 2
Initiation of disciplinary proceedings 4 3
Source: CNMV.
The MMU’s investigations may lead to subsequent actions by the CNMV if it isconsidered that the investigated parties have engaged in practices that are partly orwholly in breach of current regulations. In 2008, these actions were as follows:
– Initiation of disciplinary proceedings: the CNMV Executive Committee decidedto initiate two disciplinary proceedings, involving four persons, for possible useof restricted information and for the disclosure of restricted information to thirdparties, plus one set of disciplinary proceedings against one person for marketmanipulation.
– The CNMV Executive Committee decided to notify the Public Prosecutor of twoinvestigations conducted by the MMU due to indications of possible criminalactivities in relation to the market. One case was related to the illicit use ofrestricted information resulting in a profit well above the limit of 600,000 eurofrom which point such conduct ceases to be an administrative infraction and isconsidered a criminal offence. The other case involved the manipulation ofinformation with a significant impact on trading of the shares of a Spanishissuer.156
CNMV
Annual Report regarding
its actions and the
securities markets. 2008
10_Capitulo 10_INGLES.qxd 24/7/09 19:03 Página 156

CNMV criteria on the reporting of suspicious transactions
In line with the guidelines set out in the Initiative against Market Abuse(ICAM), on 24 July 2008, the CNMV Executive Committee approved the CNMVcriteria regarding the detection and reporting of suspicious transactions, withthe aim of helping institutions that provide investment services to comply withthe obligation established under article 83 quater of the Securities Market Act.
The document includes not only the procedure (via established channels andformats) that must be followed when notifying the CNMV of a transaction thatis suspected of constituting market abuse, but also necessary recommendationsregarding organisational matters (unit in charge of performing these tasks,adequate human resources, sufficient material resources), internal procedures,employee training and IT equipment to detect such transactions.
Additionally, in order to assist financial institutions, guidelines were drawnup for interpreting regulations in areas where some degree of difficulty hasbeen encountered. As well as reporting transactions considered to besuspicious at the time of execution, institutions are also recommended toreport transactions that arouse suspicion subsequent to their execution, andeven transactions that have been rejected because they might potentiallyhave breached the regulations concerning market abuse.
The document also contains a list of some signs of possible market abuse, whichcan be used by institutions as a basis for detecting suspicious transactions (boththe improper use of restricted information and signs of market manipulation).
Following publication in mid-year of these CNMV criteria on detecting andreporting suspicious transactions, and the establishment of a channelexclusively for this purpose, there has been an increase in the number ofnotifications to the CNMV from financial intermediaries (in accordance withtheir legal obligation under Act 12/2006, of 16 May). These notifications areextremely useful for supervising market integrity. However, the number ofnotifications remains low, highlighting the need to insist on compliance withthis legal obligation by the sector as a whole.
CNMV recommendations on rumours concerning securities
Both the CNMV, as supervisor, and issuers of listed securities that areconsidering or negotiating any kind of legal or financial transaction areobliged to monitor the news which professional agencies and the mediadisseminate regarding listed securities.
The CNMV decided it was advisable to enhance the transparency of itsactions with regard to such news and rumours. In line withrecommendations issued by the CESR, the CNMV published a documentincluding not only its own guidelines but also the conduct expected of issuersthemselves when news or rumours appear (whether true or not) that mightaffect the price of their securities, as well as guidelines on the conductexpected of financial intermediaries in these circumstances.
157
Regulation
and supervision
of the securities markets
Market supervision
10_Capitulo 10_INGLES.qxd 24/7/09 19:03 Página 157
creo

For this purpose, on 12 February 2008, the CNMV Executive Committeeapproved the criteria for handling news and rumours with regard to listedsecurities, which establish a series of non-binding measures for:
– Firstly, monitoring and evaluating rumours (relevance, novelty, accuracyand credibility) to determine whether they are actual leaks and, therefore,require the publication of a regulatory disclosure, or simply rumoursaimed at manipulation or other equally illegal practices that constitutemarket abuse, and,
– Secondly, describing the recommended action for issuers and financialinstitutions when they encounter this kind of information.
10.3 Supervision of takeover bids
In 2007, the new takeover law came into force, introducing major changes in Spain’slegal framework in this connection. In 2008, the work to adapt supervision of takeoverbids to the new regulations continued, and parts of the new regulations were enforcedfor the first time. Some significant aspects regarding supervision were as follows:
Setting a fair price
Supervision of the regulatory criteria for setting the “fair price” is one of the mainnew features of the regulations concerning takeover bids approved in 2007.
Some of the takeovers authorised in the year met the conditions that enabled theCNMV to approve at a bid price other than the highest price paid by the bidder inthe twelve months prior to the announcement of the bid. This was the case of Prisa’sbid for Sogecable, in which a lower price than the highest price paid by a memberof the bidding group’s board was paid, since that was a one-off transactionperformed at market price for a very small volume.
In the Altadis bid for Logista, as well as considering the rule of the highest pricepaid in previous acquisitions by the bidder or persons acting in concert with thebidder, the bid price was ratified by an independent appraisal applying thevaluation rules appropriate to a delisting takeover. This valuation was requiredbecause it was a creeping takeover in which the bidder did not first acquire acontrolling stake, but obtained it indirectly by taking control of a company thatowned the controlling interest, via a previous takeover.
The price in the delisting bid of Estabanell y Pahísa was set taking account of thefact that, in this type of takeover, the bid price must be at least the higher of thecompany’s own appraisal and the fair value.
Squeeze-out and tag-along
The first three processes under the regulations for squeeze-out and tag-along wereperformed in 2008. One of these stemmed from a takeover filed the year before forAltadis, and the other two, Logista and Sogecable, from takeovers approved in 2008.The squeeze-out/tag-along transactions led to these three companies being delisted.158
CNMV
Annual Report regarding
its actions and the
securities markets. 2008
10_Capitulo 10_INGLES.qxd 24/7/09 19:03 Página 158

159
Regulation
and supervision
of the securities markets
Market supervision
Squeeze-out, which was non-existent in Spanish regulations until the reform in2007, enables the bidder to demand that all shareholders sell their shares in thethree months subsequent to the completion of a takeover bid. In parallel, if thebidder decides not to make use of this possibility, all the company’s shareholderscan exercise their right to tag along (i.e. to demand that the bidder buy their shares).The price of the transactions is the takeover bid price.
These rights are dependent upon the bidder owning at least 90% of voting capitalof the target company on the bid’s settlement date; at the same time, the takeovermust have been accepted by at least 90% of the voting rights which it targeted.
The necessary procedures for performing squeeze-out and tag-along are establishedin the takeover regulations, and they are detailed in the takeover prospectuses andpublished on the CNMV website.
Within the framework of supervision of squeeze-out and tag-along procedures, in2008 the CNMV published a communication relating to the collection of fees forthese transactions. This communication was a reminder that these fees must beborne not by the selling shareholders but by the bidder, and a series of expenses arelisted which the bidder is not bound to bear because they do not derive from thepurchase, exchange or settlement of the securities.
Acceptance of bids for vetting
Another new item introduced in regulations approved in 2007 is the acceptance oftakeover bids for vetting. This is a necessary pre-requisite for clearance of a takeoverbid. Acceptance must be notified by the CNMV within at most seven business daysfollowing receipt of the documents required to process the transaction.
A bid cannot be accepted for processing if the prospectus contains fundamentalerrors or does not contain the minimum information required by regulation, if thedocumentation accrediting the provision of the bond for the takeover or any othercompulsory supplementary documentation is missing, or if the request forauthorisation is manifestly in breach of the takeover regulations.
In 2008, the CNMV refused to vet a takeover bid filed by a group of bidders forInbesòs. The reason was the lack of documentation accrediting the provision ofbonds within the maximum period established by the regulation.
Because this was a compulsory bid, the consequence of the refusal was the suspensionof voting rights on shares already acquired by the bidders and the suspension of allthe directors of Inbesòs who had been appointed by those shareholders.
In accordance with the provisions of the takeover regulations, except whereunanimous and individually expressed consent is obtained from the rest of thecompany’s shareholders, the voting rights can be reinstated only by filing a takeoverbid in which the price is established based on the valuation criteria applicable to adelisting takeover, adding the interest accrued on the fair price at the legal interest rate.
Exemptions from compulsory takeovers due to mergers
In 2008, there were two cases of control being attained through mergers, whichwere exempted from compulsory takeovers in accordance with applicable
10_Capitulo 10_INGLES.qxd 24/7/09 19:03 Página 159

regulations. These were the merger in which Afirma Grupo Inmobiliario absorbeda number of investees and a company belonging to the Rayet group, and the mergerin which Campofrío absorbed Smithfield Foods (which was already a shareholderof Campofrío before the merger).
As a result of these mergers, the Rayet group attained a controlling stake in Afirmaand the Smithfield group in Campofrío.
Both shareholders applied for exemption from having to present a takeover bid, andexemption was granted by the CNMV in accordance with the provisions of article8.g of Royal Decree 1066/2007, after examining the case file in which, based onreports compiled by independent experts, justification was provided to support theclaim that the transactions were not mainly aimed at gaining control but weredesigned for an industrial or business purpose.
Cooperation with other bodies and authorities
In 2008, contacts were held with the French financial market regulator (AMF) tomonitor the separation agreement regarding the main shareholders of Metrovacesain France, which involved transactions with respect to the listed company Gecina.
Two of the takeovers in 2008 were aimed at companies listed only in the Barcelonastock exchange. One was the delisting bid for Estabanell y Pahísa, and the other bidwas for Celo, which decided to delist after the takeover. In these cases, the decisionon delisting lay with the Catalonia Regional Government’s Directorate-General ofFinance Policy, whereas the decision on the takeover and delisting procedure laywith the CNMV. Accordingly the necessary measures were taken to coordinateactions between the two bodies.
CNMV Circular on forms for announcements and requests for authorisation of bids
CNMV Circular 8/2008, approving the forms for announcements and applicationsfor authorisation of takeover bids, entered into force in the last few days of 2008.
Articles 16 and 17 of Royal Decree 1066/2007, dated 27 July, concerning takeovers,empowered the CNMV to design forms for the announcements and requests forauthorisation for takeover bids as referred to in those articles. The approved formsset out the essential information which these documents must contain.
Via these announcements, which are published on the CNMV website, bidders mustpublicly announce their decision to file a takeover bid, in the case of bothcompulsory and voluntary bids, and must provide information regarding the maincharacteristics of the transaction.
The request for authorisation may be filed at the same time as the bid or later, inthe terms established by the regulations, but at all events the information regulatedin the Circular and any other information which the bidder believes might benecessary must be included.
Announcements must state that the terms of the bid will be detailed in the prospectuswhich will be published once the bid has been duly authorised by the CNMV.160
CNMV
Annual Report regarding
its actions and the
securities markets. 2008
10_Capitulo 10_INGLES.qxd 24/7/09 19:03 Página 160

Regulation
and supervision
of the securities markets
Supervision of entities
161
11 Supervision of entities
This chapter examines the CNMV’s supervision of entities within its sphere ofcompetency, namely investment firms and UCITS-related firms. Section 11.1focuses on the supervision of compliance with codes of conduct in the provision ofinvestment services, section 11.2 overviews matters relating to prudential orsolvency supervision, section 11.3 focuses on collective investment, section 11.4looks at the supervision of venture capital firms and 11.5 deals with securitisationtrust operators. The last section details the CNMV’s work to prevent moneylaundering.
The CNMV’s supervisory work takes into consideration the findings of the variousreports drafted by international bodies in 2008 which indicate the need to improvecertain aspects of regulation and supervision, aimed at:
1. Enhancing firms’ solvency and improving risk management.
2. Improving transparency with regard to risks and valuation standards, especiallywhen the markets become illiquid.
3. Enhancing cooperation and convergence between supervisors to ensure efficientprudential control of major transnational groups.
4. Preventing crises and managing them when they arise.
5. Improving market operation, including the role of credit rating agencies andexisting incentive structures.
Many of these objectives are already being tackled by both regulatory initiatives(e.g. the proposal of a Directive to amend solvency regulations in certain matters)and supervisory measures (including the need for more coordination), which willvery likely lead to changes in the actions of national supervisors in the next fewyears.
For its part, in the medium term the CNMV plans to implement an integratedsupervision system with a largely preventive approach to cover investment andancillary services offered within the framework of MiFID. This will pose a majorchallenge in efficiency terms, and will require, among other measures, closercooperation with other supervisors, in particular the Bank of Spain, in view of theimportance of credit institutions in marketing financial instruments and securities.
Supervision of the conduct of institutions providing investment services isparticularly important for compliance with the objective of protecting investors,
11_Capitulo 11_INGLES.qxd 24/7/09 19:04 Página 161

which is part of the CNMV’s legal mandate. Furthermore, most incidentsdetected in the sector are linked to problems with the codes of conduct (Table11.1). Additionally, important work has been done in supervising possiblebreaches of codes of conduct with respect to marketing and reporting atSpanish institutions in relation to cases such as Lehman and Madoff (see boxbelow).
162
CNMV
Annual Report regarding
its actions and the
securities markets. 2008
Summary of incidents detected at entities that TABLE 11.1
provide investment services
Area analysed Main issues detected
Financial requirements – Insufficient equity.
– Deficiencies in calculating equity requirements.
– Incidents relating to accounting records and completion of confidential
financial and risk statements.
Organisational – Insufficient resources and procedures for appropriate control of activities
requirements and risks.
– Lack of independence and autonomy in decision-making between group
entities.
– Deficiencies in the process of delegating duties.
– Failure to implement policies to identify and manage conflicts of interest in
relation to separate areas.
– Inadequate management and documentation of conflicts of interest
triggered by the existence of put-throughs between clients.
– Inadequate management of conflict of interests originating when research
reports are published on a listed company that is, at the same time, a major
client, without properly disclosing this fact.
– Incidents in the content of trade and brokerage order records with respect to
the provisions of Regulation 1287/2006.
– Deficiencies concerning safekeeping of client documentation, client
profiling documents, contractual documentation or supporting
documentation for transactions ordered by clients.
Internal code of conduct – Non-compliance with provisions of the internal code of conduct or existence
of deficiencies in its contents because it is not in line with the nature of the
activities carried on by the entity or group.
Codes of conduct: – Failure to notify clients of the right to demand a different classification,
classification of clients indicating the potential limitations of the new classification in terms of client
protection.
– Incidents in procedures established for changing clients’ regulatory
classification.
– Lack of periodic procedures to review the assigned category.
Codes of conduct: – Deficiencies linked to the procedures for obtaining the information
suitability and necessary to evaluate suitability and appropriateness: incidents in the
appropriateness design of suitability and appropriateness tests or other processes
established by the entity to obtain this information, and in the effective
implementation of these processes.
– Periodic reviews of the information obtained to evaluate suitability and
appropriateness.
– Incidents in the design and effective implementation of warnings regarding
failure to evaluate inadvisability or inappropriateness of the financial
instrument.
– Adoption of the client’s initiative always in the case of non-complex
products.
– Incidents in the classification of complex and non-complex products and the
assignment of risk levels to certain products.
– Failure to adapt managed portfolios or personalised recommendations to
the client’s investment goals.
11_Capitulo 11_INGLES.qxd 24/7/09 19:04 Página 162

Impact of the Lehman and Madoff cases
The cases of investment bank Lehman and broker Bernard L. Madoff weretwo of the prime exponents of the financial crisis that gripped the globalmarkets during most of 2008. Indeed, it was the bankruptcy of US bankLehman Brothers in September 2008 that pushed markets over the edge andplaced the global financial system in an extremely precarious situation. A fewmonths later, in December 2008, the Ponzi scheme operated by BernardMadoff shocked the world because of its sheer scale (50 billion dollars).
These two cases were notorious not only because of their impact on marketconfidence and their scale, but also because of their many internationalramifications. Entities subject to CNMV supervision were not immune tothese cases.
The demise of Lehman affected 459 Spanish UCITS and had an impact of300 million euro (0.13% of the total managed assets) as a result of directinvestments held by these UCITS in debt securities issued by Lehman, ofOTC transactions with this counterparty and, to a much lesser extent, ofinvestment in Lehman shares. OTC derivative investments affected mainlyguaranteed funds; accordingly, the impact (averaging 3.21% per fund) will beabsorbed by the guarantor when the guarantee expires. The average impacton other entities was 0.9%.
163
Regulation
and supervision
of the securities markets
Supervision of entitiesArea analysed Main issues detected
Codes of conduct: – Incidents in the information provided to clients prior to the provision of
obligations concerning investment services in relation to the characteristics and inherent risks
reporting to clients involved in certain financial instruments.
– Failure to comply with provisions on information to be sent periodically to
clients in connection with the service provided.
– Deficiencies in the valuation of certain financial instruments in the periodic
information delivered to clients.
– Discrepancies between the information contained in prospectuses,
advertising and internal notifications or circulars sent to the commercial
network regarding the nature of products, their main features and risks.
Codes of conduct: – Charging of fees for investment services provided to clients without properly
inducements disclosing such fees.
Codes of conduct: – Failure to formally review the best execution policy and order execution
best execution contracts annually or whenever there is a significant change that affects an
entity’s capacity to continue to obtain the best possible results in the
execution.
Codes of conduct: – Insufficient procedures for certifying that investment decisions in favour of
client order transmission certain clients are taken prior to transfer to the intermediary, and the
existence of valid distribution or disclosure criteria to ensure that no client is
adversely affected when transactions are carried out for several of them.
Client support services: – Failure to include the possibility of filing a complaint with the CNMV in the
client complaints form for notification to clients of the conclusion of a complaint made to the
entity itself.
Source: CNMV.
Summary of incidents detected at entities that TABLE 11.1
provide investment services (continuation)
11_Capitulo 11_INGLES.qxd 24/7/09 19:04 Página 163
creo

With regard to investments exposed to Lehman, the CNMV has been in closecontact with the entities affected in order to ensure appropriate valuation ofthe assets affected and the due transparency vis-à-vis investors (particularlyby including specific information in the periodic reports issued by UCITS).
The Lehman Brothers bankruptcy led the CNMV to issue subpoenas to 20credit institutions for information, among other matters, about the numberof clients and their nominal position in products issued, referenced,guaranteed or structured by Lehman Brothers. Furthermore, they were askedto periodically report to the CNMV any claims filed with their client servicesor support departments in respect of these products. The idea was to detectsigns of breaches of regulations concerning the marketing of financialinstruments.
The information requested from the institutions evidenced the scope of theimpact of the Lehman Brothers bankruptcy on Spanish investors: morethan 11,000 of these institutions’ clients were affected. The total amountmarketed was 1.1 billion euro (75% by five institutions) linked to 314issues. The investors affected filed 733 complaints with the respectiveinstitutions involved in marketing these instruments between Septemberand December 2008.
On 24 September 2008, as a result of the numerous queries received fromSpanish investors interested in the effects on their investments stemmingfrom the difficulties then being experienced by Lehman Brothers HoldingInc., the CNMV drafted a document which it published on its website thatresponded to the most frequently-asked questions from investors.Furthermore, at the end of November 2008, as a result of the various queriesraised with the CNMV by investors, evidencing the difficulties investors wereencountering in obtaining a copy of the prospectus of the issues marketed bythe Lehman group in Spain, in order to ensure compliance with theirobligation to adequately inform investors at all times, regardless of thedistribution channel used, the CNMV demanded 29 credit institutions tosend the appropriate instructions to their networks.
The exposure of clients that had portfolio management contracts withinvestment firms was not very significant: eight entities had securities issuedby Lehman worth 3.2 million euro in portfolios managed for 87 clients.
After Lehman was declared bankrupt, the CNMV monitored trades in thedays preceding the announcement by Lehman group companies that werepending settlement in order to determine the final impact of this event onthe Spanish stock market, specifically the resulting losses. This affected 4entities.
In the case of the fraud by US brokerage house Bernard L. MadoffInvestment Securities LLC, exposure of Spanish UCITS due to theirinvestments in foreign UCITS directly affected by the scandal (mostlyinstitutions which might be described as hedge funds but also investmentsin one Luxembourg UCITS with an EU passport) totalled 106.9 million euro(0.05% of the total managed assets), at a total of 224 UCITS. Averageexposure was 4.73% in the case of funds and 3.24% for open-end investmentcompanies (SICAVs).
164
CNMV
Annual Report regarding
its actions and the
securities markets. 2008
11_Capitulo 11_INGLES.qxd 24/7/09 19:04 Página 164

As with Lehman, the CNMV supervised operators in order to guaranteeproper reporting and transparency to investors. Furthermore, UCITSmanagement companies were told that investments affected by the fraudshould be written off until further information became available, and theywere urged to implement measures to ensure that the amounts that mighteventually be recovered from the fund were used to mitigate the damage toaffected shareholders.
Furthermore, on 17 September and 16 December 2008, the CNMV publishedpress releases concerning the Lehman and Madoff cases. The CNMV was thefirst European supervisor to do so and it quantified the impact on SpanishUCITS in both cases and reminded the latter of their valuation andtransparency obligations.
As regards investment firms, four held funds managed by MadoffInvestment Securities LLC on behalf of clients, with a total market value of15 million euro.
Banco Santander was significantly affected by the Madoff fraud. This ledSantander to file a regulatory disclosure on 27 January 2009 regarding theissuance of preferred stock that was exchangeable for investments exposedto the Madoff fraud held by certain of the Santander group’s private bankingclients. In this connection, the CNMV published a document providinginformation regarding these preferred shares, their risks, and the conditionsof liquidity, remuneration, redemption, etc.
11.1 Supervision of codes of conduct in the provision of financial services
11.1.1. MiFID’s first year
MiFID was finally transposed into Spanish law in 2008 with the enactment ofimplementing regulations.
Following approval in 2007 of Act 47/2007, of 19 November, amending Act24/1988, of 28 July, on the Securities Market, which transposes Directive2004/39/EC (level I) and a small part of Directive 2006/73/EC (level II), inFebruary 2008 Royal Decree 217/2008, of 15 February, on the rules governinginvestment firms and other providers of investment services was enacted, therebycompleting the transposition into Spanish law of Directive 2006/73/EC. In 2008,the CNMV began work on various aspects included in the Securities Market Actand Royal Decree 217/2008 affecting codes of conduct and pending regulatorydevelopment.
These national laws must be supplemented by Regulation 1287/2006/EC,implementing Directive 2004/39/EC as regards record-keeping obligations forinvestment firms, transaction reporting, market transparency and admission offinancial instruments to trading.
MiFID introduced significant new features in various spheres linked to institutionsthat provide investment services, including: 165
Regulation
and supervision
of the securities markets
Supervision of entities
11_Capitulo 11_INGLES.qxd 24/7/09 19:04 Página 165

– The creation of a new category of investment firm: financial advisory firms.
– The inclusion of new investment services: management of a Multilateral TradingSystem (MTS) and investment advisory services. The latter is no longer anancillary service and is now considered an investment service.
– The establishment of new organisational requirements, to support companies’various control functions.
– New codes of conduct, including: client classification, evaluation of the suitabilityor appropriateness of the product or service, information to clients prior toproviding investment services, and the best execution principle.
Furthermore, although marketing investment services and winning new clients arenot themselves classified as financial services but as initial activities, the SecuritiesMarket Act provides that they may only be performed professionally, by the entitiesauthorised to provide investment services or by their agents.
All of these changes made it necessary to undertake a thorough and detailedreview of the supervision procedures and work programmes in order to bringthem into line with the new regulations. Furthermore, after this first year ofMiFID, it would be particularly advisable for firms to assess the degree ofcompliance with the new obligations in order to determine whether their plans toadapt to them have been duly implemented and the measures they have adoptedare achieving their purpose.
CESR published a number of documents in 2008 regarding supervision of key areasof MiFID so as to contribute to convergence in supervisory practices1 or informinvestors2. Some of them3 include sample questions for supervisors to use whenevaluating firms’ compliance with the regulations. The questions are designed insuch a way that each supervisor can use them as it sees fit within its ownsupervisory methodology.
As mentioned in the 2007 Annual Report, the CESR Intermediaries Subgroupreceived a mandate from the European Commission to draw up a MultilateralMemorandum of Understanding (MOU) containing practical agreements amongCESR members for the supervision of obligations defined by MiFID in connectionwith foreign branches. At the end of 2007 and during 2008, the CNMV contactedsome European supervisors in order to reach practical agreements regarding thesupervision of branches. As a result, at the end of 2008, the CNMV sent informationrequests to the 39 branches of credit institutions and investment firms fromGermany, Belgium and the UK that were registered on that date, asking them forinformation on the number of clients and amount of the investment servicesprovided via the branches, broken down by category. The analysis of thisinformation will determine the most suitable mechanism for cooperation betweenthe CNMV and other supervisors.
166
CNMV
Annual Report regarding
its actions and the
securities markets. 2008
1. Questions and answers on MiFID: Common positions agreed by CESR Members.
2. Consumers’ Guide to MiFID -Investing in Financial Products.
3. Supervisory briefings -Best execution, Supervisory briefings -Inducements y Supervisory briefings -Conflicts of
interest.
11_Capitulo 11_INGLES.qxd 24/7/09 19:04 Página 166

11.1.2 Supervision of codes of conduct in the provision of financial services
The provision of investment services and ancillary services is the sole activity ofinvestment firms, but credit institutions are the main providers of investmentservices in Spain, due primarily to their large branch networks.
Consequently, in Spain banks have traditionally played a major role in marketingfinancial instruments among retail investors. Moreover, products are becomingincreasingly complex and there has been a steady development of investmentculture, with the result that investors are starting to ask banks to recommend moresophisticated investment products. In addition to these factors, as observedthroughout 2008, investors are now making greater demands when it comes to theliability of marketers.
The CNMV supervises codes of conduct for the provision of investment services byboth credit institutions and investment firms. In 2008, this activity was shaped bythe entry into force of MiFID. This, and other aspects, brought the definitiveconsolidation of significant requirements for firms providing investment services.
These stricter requirements are particularly significant in respect of the informationto be provided to, and obtained from, clients. The information requirements arescaled at different standards according to the client’s classification, the nature of theservice and the kind of instrument or transaction. The ultimate objective is that theclient should have the information necessary to make well-founded investmentdecisions, especially with regard to the characteristics and risks of the financialinstruments and that, depending on the service provided, entities should be able toassess whether the service or product is right for the client.
The supervision objectives for 2008 granted priority to these aspects, which arefundamental in ensuring investor protection.
167
Regulation
and supervision
of the securities markets
Supervision of entities
Outcome of supervising codes of conduct TABLE 11.2
Area analysed Key supervision aims
Regulatory classification – Assignment of regulatory category to pre-existing clients.
of clients – Notification of the category assigned.
– Periodic review of categories.
– Processing of applications to change category.
Prior information – Content of advertising communication.
– Specific information on the nature and risk of financial instruments.
– Breakdown of cost, expenses and inducements.
Order receipt and – Execution only vs. advisability: complex products and initiative of the entity.
processing – Compilation of data to evaluate knowledge and experience.
– Evaluation of knowledge and experience and notification of the result to clients.
Investment advice – Personal vs. generic recommendations.
– Investment advice vs. marketing work.
– One-off vs. ongoing advice.
– Suitability of recommendations to the client’s investor profile.
Discretionary portfolio – Compilation of data to evaluate objectives, knowledge and experience, and
management – financial situation.
– Assessment of the client’s investor profile. Significance of investment
objectives.
– Suitability of managed portfolio to the client’s investor profile.
Source: CNMV
11_Capitulo 11_INGLES.qxd 24/7/09 19:04 Página 167

Regulatory classification of clients
One of the aims of supervision in 2008 was to analyse the classification of clientsinto the regulatory categories of professional and retail investors. Correctclassification is crucial, since it has a major impact on the degree of protectionwhich the codes of conduct afford clients, enabling entities to presuppose that theclient has particular knowledge and experience, or otherwise, and their financialsituation.
During the year, checks were run on the procedures for segmenting pre-existingclient databases and the correct notification of the category assigned as well as theprocedures for periodically reviewing the assigned regulatory category and anychanges in that category.
Only those clients who have the experience and knowledge necessary to make theirown informed investment decisions and are able to properly assess the risks ofthese investments for themselves should be classified as professionals. In order toguarantee that persons and small and medium-sized enterprises receive the utmostprotection possible, they are initially classified as retail investors by default.
However, this initial classification may be changed. Nevertheless, the regulationsestablish a very demanding procedure so as to ensure that clients who relinquishthe maximum degree of protection do so voluntarily and are aware of theconsequences. It is important to highlight the possibility of requesting a changeof category that entails less protection for a specific kind of product ortransaction.
Prior information about financial instruments
Checks in this area focused on the content of advertising referring to specificfinancial instruments and in the specific information about the nature and risk ofthe financial instruments.
Advertising must be clearly identifiable as such and must meet certainrequirements in regard to the presentation of potential profits as well as applicablerisks, inclusion of past or future results and a comparison of services andinstruments so that they may be considered impartial, clear and not misleading.
Moreover, sufficiently in advance of providing the investment service, the firmproviding the service must send their clients an explanation of the characteristicsand risks inherent to the financial instruments, with sufficient detail for clients tobe able to make well-founded investment decisions taking into account theirclassification as retail or professional investors.
Evidently, the financial instrument itself and its target public, significantlydetermine the requirements with regard to this information. Accordingly, it isconsidered necessary that the documentation which entities use to inform clientson the characteristics and risks of a particular financial instrument should includea specific section which sets out the risks affecting the product in a way that iscomprehensible. Furthermore, it is important to make every possible effort toensure that the documentation is written clearly, simply and briefly, so that it isintelligible to the kind of investor to whom it is addressed.168
CNMV
Annual Report regarding
its actions and the
securities markets. 2008
11_Capitulo 11_INGLES.qxd 24/7/09 19:04 Página 168

In this regard, the role of distribution channels is vital, and as part of the analysisthe procedures of information to them were examined. As a supplement to theinformation conveyed to the network with regard to the placement of specificproducts, it is considered necessary to implement training plans on the newfeatures introduced by MiFID and on the nature and characteristics of the variouskinds of financial instruments which the entity offers its clients.
Inducements from third parties
The regulations establish three requirements in order for the receipt ofinducements from third parties to be considered acceptable: (i) the existence, natureand amount or manner of calculating the inducement must be shown clearly to theclient prior to processing the transaction, (ii) receipt of the inducement mustenhance the quality of the service provided, and (iii) receipt of the inducement mustnot prevent the entity from acting in the client’s interest.
In 2008, the CNMV supervised the incentives received from third parties to ensurethat they were disclosed to clients prior to processing transactions. A very commoninducement is the retrocession of marketing fees by UCITS managed by operatorsoutside the marketer’s group. The CNMV verified disclosure of the nature andmanner of calculation to clients; generic references to the possible existence of thiskind of inducement was considered insufficient. Furthermore, checks wereperformed to ensure that clients were notified regarding the existence ofinducements for the distribution of certain financial instruments that are not listedin official markets or not subject to the obligation to register issue prospectuses, theuse of which has been widespread in the last few years.
Order receipt and transmission or execution.
The regulations establish three ways, all regulated differently, in which the serviceof order receipt and transmission or execution with respect to financial instrumentsmay be provided: execution only, evaluation of appropriateness, and combinedprovision with an investment advice service. This section details the objectives ofsupervision for the first two forms, while the third is left for the following section.
Since the two factors which determine the way in which order receipt andtransmission services are provided (excluding the analysis of the joint provisionwith an investment advice service) are the complexity (or otherwise) of the financialinstrument, and whose initiative it was to provide the service, supervisors mustmake every effort to verify that entities have established suitable procedures toassess the complexity of products and to identify the initiative in the contract.
The practice observed at some entities of assuming that the initiative in the case ofnon-complex products is always the client’s and that, therefore, there is no need toassess appropriateness is not suitable.
With respect to initiative, article 30 of Directive 2004/39/EC indicates that a serviceshould be considered to be provided at the initiative of a client unless the clientrequests it in response to a personalised communication, from or on behalf of the firmto that particular client, which contains an invitation or is intended to influencethe client in respect of a specific financial instrument or specific transaction.Consequently, the acquisition of a financial instrument must generally only be 169
Regulation
and supervision
of the securities markets
Supervision of entities
11_Capitulo 11_INGLES.qxd 24/7/09 19:04 Página 169

considered to be performed at the investor’s initiative in those cases where the clientasks for a transaction to be performed and the entity did not previously address itselfto that specific client in respect of the instrument acquired.
In supervising this area, the CNMV has taken into consideration the process chosenby entities for marketing the various financial instruments, based on factors such asthe distribution channel chosen, support from drives and promotions, guidelinessent out to distribution networks, etc.
Furthermore, the provision of brokerage services which demand prior evaluation oftheir appropriateness for the client requires that entities compile gatherinformation from the clients regarding their knowledge and experience.Accordingly, the 2008 objectives included the review of the procedures andmechanisms used to gather accurate information to evaluate appropriateness, andverification of the mechanisms to warn clients when the entity considers that theproduct or service is not appropriate.
Investment advice and discretionary portfolio management
The main objective of supervising advisory and management services was to makesure the recommendations and portfolios were suitable to the investor profiles. TheCNMV analysed and evaluated the procedures and mechanisms established byentities to compile the information necessary to evaluate appropriateness and themechanisms used to form an opinion with respect to the investor’s profile. TheCNMV verified not only whether or not entities evaluate all aspects established byregulations, but also that the evaluation mechanisms do in fact ensure that theinvestment objectives are respected in accordance with clients’ knowledge andexperience and their financial situation.
In the case of financial advice, the analysis was scaled, distinguishing between whetheror not it was a service provided recurrently (via periodic recommendations generallywith regard to an asset or portfolio) or a more specific service (linked generally tofinancial instruments issued, managed or marketed by the entity itself or its group).
As regards one-off advice, the CNMV reminded entities that a personalisedrecommendation (given to a particular person and presented in a way that issuitable to that person or based their personal circumstances, and referring to atransaction on a specific financial instrument) must only be offered within thecontext of investment advisory services. In this case, the initiative is not relevant.
With regard to this aspect, the CNMV also verified that entities had prepared theirdistribution networks by providing them with training, resources and guidelines toidentify when personalised recommendations might be issued. Once again, themarketing process is very relevant when discriminating between the variouscontexts in which investment services may be provided.
11.2 Prudential supervision of investment firms
At 31 December 2008, 111 investment firms were subject to CNMV supervision (101broker-dealers and brokers and 10 portfolio management companies). Also, the CNMVhad supervisory responsibilities over 48 consolidable groups of investment firms.170
CNMV
Annual Report regarding
its actions and the
securities markets. 2008
11_Capitulo 11_INGLES.qxd 24/7/09 19:04 Página 170

The supervision process is based on each firm’s risk profile. Much of thesupervision is based on information sent periodically to the CNMV: balance sheet,profit and loss account, information on risks and auditors’ reports, among others.This analysis is completed through on-site inspections. Accordingly, the distancemonitoring work is coordinated with the on-site inspections, thus achievingcontinuous supervision through systematic and updated knowledge of each entityand/or consolidable group.
Prudential supervision focuses on compliance with capital, risk diversification andliquidity requirements.
The number of subpoenas sent to institutions was 45% lower than in 2007. This isexplained by the decrease in the number of subpoenas for filing information late(down 45%), and the decline in the number of subpoenas urging the adoption ofcorrective measures or recommendations.
Based on the data available in 2008, covering the period January-November4,investment firms’ pre-tax earnings declined by 40% vs. the same period of 2007.
171
Regulation
and supervision
of the securities markets
Supervision of entities
Supervision of investment firms: CNMV subpoenas in 2008 TABLE 11.3
Actions
Type of subpoena Remote On-site Total
For filing information late 72 2 74
Requesting information 69 41 110
Corrective measures or recommendations 32 26 58
Other communications 5 11 16
Total 178 80 258
Source: CNMV.
Surplus equity over solvency coefficient at investment firms1 TABLE 11.4
Surplus Number of firms, in terms of surplus equity (%)
Amount2 %3 < 504 <100 <150 <200 <300 <400 <500 <750 <1,000 >1,000
Broker-dealers 1,297,449 465.42 2 1 3 2 11 3 9 4 3 13
Stock exchange members 1,102,782 494.94 1 1 2 2 6 2 5 4 2 12
Non-members 194,667 347.91 1 0 1 0 5 1 4 0 1 1
Brokers 81,700 211.03 8 7 9 7 6 1 3 6 0 3
Stock exchange members 23,851 474.93 1 0 1 2 0 0 0 2 0 1
Non-members 57,849 171.69 7 7 8 5 6 1 3 4 0 2
Portfolio management companies 21,736 150.15 1 1 4 0 2 0 1 0 0 1
Total 1,400,885 422.01 11 9 16 9 19 4 13 10 3 17
Source: CNMV.
1. Data at 31 December 2008.
2. Thousand euro.
3. Average percentage based on average weighted by each firm’s required equity. This is the ratio of surplus equity to average equity.
4. Includes registered broker-dealers and brokers which did not provide information.
4. At the date of writing this annual report, the data for December 2008 was not yet available, since the
recently-enacted Circular 7/2008 granted investment firms a transitory period in which to submit
accounting information.
11_Capitulo 11_INGLES.qxd 24/7/09 19:04 Página 171

Furthermore, the number of entities making a loss has increased substantially, from10 of the 110 firms in existence in 2007, to 33 of the 111 in existence in 2008. Thelosses are concentrated at a few firms, since the five firms with the largest lossesaccount for almost 70% of total losses in the sector. However, the economicprospects for the next few months suggest that the main business lines will remainsluggish, and the sector could therefore face the need to review its cost structureand make strategic decisions.
Nevertheless, the sector’s capital ratios are currently high. On aggregate, firms haveample surplus equity over requirements, after a 19% increase vs. the previous year.Consequently, except in specific cases, firms should generally be well-prepared totackle the crisis in the financial markets.
The importance of internal control of client transactions in some products(OTC, CFDs, etc.)
The financial crisis has had a negative impact on investment firms’ bottomlines, in addition to the general reduction in their activity and therefore intheir fees.
In fact, several investment firms reported substantial losses in relation totheir equity in this period as a result of the losses incurred by some of theirclients in contracts on OTC derivative instruments on shares of listedcompanies and which were eventually passed on to the investment firmsthemselves as their clients were unable to shoulder such losses.
A common feature of these cases has been that the underlying assets in theseOTC derivatives were companies belonging to the real estate andconstruction sectors, which were badly affected by the crisis. Anothercommon feature of these losses is the significant scale of the open interestOTC, in terms of both absolute size and in relation to the capital of thecompanies that constitute the underlying assets, since these clients chosethese instruments as a vehicle for exposure to these listed companies. It isprecisely the large size of these OTC positions that is the main reason whythe risk inherent to these positions was inadequately managed when clientsceased to attend to margin calls to cover the risk of their positions, since thismade it more difficult to close the positions quickly.
Furthermore, in all cases these were firms’ positions vis-à-vis clients whosemarket risk was hedged through opposing positions with counterparties thatare financial intermediaries. This shows the increasing importance in thecurrent environment of the adequate assessment and management ofcounterparty risk, which suggests that it is advisable to strengthen firms’control mechanisms.
In 2008, a review was performed of compliance with the risk concentrationlimits by the members of Iberclear. A thorough review of compliance withthe risk concentration limit seemed advisable because of (i) the increase intrading in the last few years, with the consequent increase in risk linked totransactions pending settlement and the guarantees required for thispurpose, (ii) the significant modifications to Iberclear’s internal regulations,
172
CNMV
Annual Report regarding
its actions and the
securities markets. 2008
11_Capitulo 11_INGLES.qxd 24/7/09 19:04 Página 172
creo

basically since 2006 and, also, (iii) the process of regulatory reform regardingequity. The conclusion was that the existence of risk concentration problemsderiving from the provision of security deposits to Iberclear is particularlysignificant at independent investment firms. Among the supervisory actionsperformed, at the end of November 2008 a document was sent to themembers of Iberclear to remind them that they are obliged at all times tocomply with regulations limiting major risks and, in the event, to implementcorrective measures.
Regulatory changes regarding solvency
Prudential supervision of investment firms and credit institutions is aimed atensuring the stability of the Spanish financial system as a whole. To conductefficient supervision of solvency in a context of increasingly globalised financialmarkets, it has been necessary to apply measures to harmonise the prudentialcriteria for equity at the financial intermediaries in each country.
In this connection, Directive 2006/48/EC, relating to the taking up and pursuit of thebusiness of credit institutions and Directive 2006/49/EC, on the capital adequacy ofinvestment firms and credit institutions, respectively (hereinafter, CAD II) wereenacted on 14 June 2006.
Amendments to Spain’s Securities Market Act, in November 2007, transposed CADII in respect of investment firms into Spanish law. Royal Decree 216/2008,concerning financial institutions, approved in 2008, implemented the SecuritiesMarket Act in connection with this Directive and on 30 December 2008 Circular12/2008 was published, concerning the equity requirements for investment firmsand their groups, thus culminating the transposition of EU regulations into Spanishlaw. Accordingly, in 2008 a special effort was made and considerable resources weredevoted to work on this Circular.
With the dual objective of avoiding regulatory arbitrage and facilitating theintegration of various kinds of entity into consolidable groups subject tosupervision, a parallel was established between the regulations concerning thecapital requirements at credit institutions and those contained in CNMV Circular12/2008.
However, as in the EU texts that are transposed, the specific characteristics ofinvestment firms were taken into account, such as the possible exceptions orlimitations applicable to certain requirements on firms that, due to their activity orscant complexity, do not require them, or the consideration of structural expensesas one of the thresholds to be taken into account in relation to equity requirements.
The Circular establishes the same reporting forms for both investment firms andcredit institutions, not only nationally but throughout the EU, since they weredeveloped specifically by the Committee of European Banking Supervisors(CEBS) at the direct proposal of the European Commission. The use of theseforms will make it easier to compile and disseminate information, not only fornational regulators but also for European solvency supervisors, making itpossible for the first time to compare figures between financial institutionsacross Europe. 173
Regulation
and supervision
of the securities markets
Supervision of entities
11_Capitulo 11_INGLES.qxd 24/7/09 19:04 Página 173

The main change for investment firms is the equity requirement for operationalrisk. The Circular establishes three methods for calculating equity requirementsranging from a simple percentage of net revenues, which is the basic indicator, tomore advanced methods based on internal models. In general, the use of internalmodels is aimed at incentivating risk analysis and surveillance through the possiblereduction of equity requirements; the more highly developed and sophisticated thesystems for measuring, controlling and managing risks, the lower the equityrequirements.
Notwithstanding its limitations, CNMV Circular 12/2008, based on Basel II, isa notable step forward in entities’ risk management and it will enable entitiesto become better acquainted with their risks and, therefore, to control thembetter.
On 26 November 2008, the CNMV published Circular 7/2008, which amended theaccounting system for investment firms to bring it into line with the newaccounting framework established under the New Spanish General Accounting Planapproved by Royal Decree 1514/2007, of 16 November.
The adaptation process focused basically on prioritising the specific nature ofinvestment firms as compared with other kinds of entities, financial or otherwise,thus allowing for adequate and efficient supervision of investment firms andguaranteeing investor protection. However, in some aspects it proved necessary andadvisable to maintain the criteria and approaches contained in the previousregulation, such as the consolidation obligation for horizontal groups.
As regards the new content introduced in the Circular, the definition of fair value isextended to include financial instruments with no market or with an inactivemarket. Accordingly, the use of fair value is encouraged when it helps achievecorrect risk management. The definitions of other new concepts like “effectiveinterest rate” or “impairment” were also expanded.
The Circular also established specific conditions for reclassifying assets amongthe various defined categories of financial assets. Very strict criteria areestablished for derecognising financial assets and recognising capital gains asadjustments to equity due to measurement of available-for-sale financial assetsclarifies their definition in solvency terms. The Circular also includes a specificrule on revenues from the provision of services and, in the event, financialexpenses and trading losses, which includes the criteria for recognition in profitor loss.
Lastly, it is essential to highlight the importance of transparency, which requiresmanagers of supervised entities to take responsibility for the accounting policy,explain it, disclose it to the market and supplement it with specific information asrequired. In this connection, the Annual Report and Directors’ Report include adescription of the financial risk assumed and the company’s risk management andhedging policy.
On 25 November 2008, FOGAIN, CNMV and INVERCO held a seminar todisseminate the content of that accounting Circular, placing particular emphasis onthe transitory framework for applying the new accounting regulation.174
CNMV
Annual Report regarding
its actions and the
securities markets. 2008
11_Capitulo 11_INGLES.qxd 24/7/09 19:04 Página 174

11.3 Supervision of UCITS
The context in which the supervision has been performed was shaped by theconsiderable number of regulatory changes in the form of CNMV circulars. Most ofthese Circulars (six in total) were implementations of the regulations on UCITS andadaptations to the New General Accounting Plan. The following Circulars wereapproved in 2008:
– Circular 2/2008, concerning electronic filing with the CNMV of certain data onthe appraisal of buildings belonging to real estate UCITS.
– Circular 3/2008, adapting the accounting of UCITS to the New GeneralAccounting Plan and introducing new forms for annual accounts andconfidential filings.
– Circular 4/2008, with the new structure of periodic public disclosures by UCITS.
– Circular 5/2008, concerning statistical requirements of UCITS for the purposes ofsubmitting information to the European Central Bank.
– Circular 6/2008, concerning the criteria for establishing the net asset value ofUCITS and the implementation of operating matters.
– Circular 7/2008, which includes the accounting regulations for UCITS managementcompanies.
As with investment firms, the supervision of UCITS is performed by analysing theinformation which they are obliged to submit periodically and also through on-siteinspections. At all events, the supervision focuses in particular on the followingaspects: compliance with legal coefficients and investment suitability, sufficiency ofresources and suitability of internal controls, prevention of conflicts of interest andcompliance with the oversight duties entrusted to the depository. There follows anoverview of these periodic checks:
– Regarding checks of legality, UCITS regulations establish minimumrequirements for portfolio diversification, limit the kind of assets in which it ispossible to invest and establish minimum liquidity coefficients to coverredemptions. Additionally, the regulations require entities of this kind tomaintain a minimum level of assets and have a minimum number of investorsto ensure their collective nature.
– Another aspect that is supervised is the sufficiency of resources and the existenceof internal controls at operators and depositories, since both are crucial to thecorrect discharge of the duties and obligations attributed to these entities underthe regulations. Noteworthy in this connection was the supervision of solvencyrequirements at management companies and compliance with the diversificationlimits of their own investments.
– Furthermore, because of the system in the Spanish market, where in most casesthe fund operator and depository belong to the same group and are part ofgroups whose parent companies’ scopes of operations are universal, many of thesupervisory actions are aimed at preventing potential conflicts of interest andensuring that operators’ decisions are made (as required by law) in the soleinterest of shareholders. 175
Regulation
and supervision
of the securities markets
Supervision of entities
11_Capitulo 11_INGLES.qxd 24/7/09 19:04 Página 175

– Finally, we highlight the importance of checking compliance with the functionsassigned to depositories, not only with regard to their standard asset safekeepingfunction, but also with regard to the function of supervising and monitoring theactions of fund management companies in connection with certain particularlysensitive areas, such as the review of net asset value calculation procedures, flowsof funds linked to subscription and redemption transactions, performance oftransactions at market prices, ratio compliance, and accuracy of informationprovided to the CNMV and investors.
As well as periodic controls, specific supervision spot-checks are also performed,normally in response to special circumstances at the entities or in the markets. Thefinancial crisis has made major demands on the supervisor, in particular in relationto overseeing liquidity in UCITS’ portfolios and their valuation, the impact of theLehman Brothers collapse and the Madoff fraud case on UCITS and specificsupervision of non-standard UCITS, which were severely affected by the crisis, suchas real estate UCITS, hedge funds and funds of hedge funds.
In 2008, as a result of all the aforementioned supervision actions, 1,127 notices weresent to supervised entities. Of all the notices, 136 were for filing information late.Considering the number of entities registered and their disclosure obligations to theCNMV (periodic reports, audits and confidential filings), compliance with theestablished deadlines was generally good.
A total of 436 requests for additional information necessary for the supervisory task(other than that generally available) were sent to entities subject to supervision. Thebulk of these (404) were issued by the Remote Oversight Area, since the analysesare conducted away from the entities’ registered offices and requests forinformation must therefore always be made in writing.
Lastly, 343 requests for the adoption of improvements were sent. Although mostof these (278) related to Remote Control area subpoenas, they usually refer toa single aspect (normally the object of the analysis), whereas subpoenas in theOn-site Control area usually reflect all the incidents detected during theinspection.
The main supervision actions performed in 2008 are set out below.
176
CNMV
Annual Report regarding
its actions and the
securities markets. 2008
Supervision of UCITS: CNMV subpoenas in 2008 TABLE 11.5
Actions
Type of subpoena Remote On-site Total
For filing information late 135 1 136
Requesting information 404 32 436
Corrective measures or recommendations 278 65 343
Other communications 137 75 212
Total 954 173 1,127
Siurce: CNMV.
11_Capitulo 11_INGLES.qxd 24/7/09 19:04 Página 176

11.3.1 Supervision of prudential requirements regarding UCITS and theirmanagement companies (SGIIC)
Legality
Checking compliance with the legal coefficients is one of the basic objectives ofUCITS supervision. As in previous years, the CNMV focused specifically oncompliance with minimum capital requirements and the rules governing equityand investors in mutual funds and capital funds and shareholders of SICAVs(including verifying own share trading limits). This aspect became particularsignificant in 2008 in view of the substantial redemptions and divestments in thecollective investment sector.
At the same time, the CNMV reviewed compliance with liquidity ratios (whichensure the availability of sufficient liquidity to cater for redemptions withoutforcing the UCITS to make unplanned divestments), diversification ratios and legallimits on transactions with derivatives.
Simultaneously, by reviewing the notifications of incidents periodically receivedfrom depositories, compliance with their obligations to supervise and monitorUCITS management companies’ actions was also checked.
UCITS management company solvency
Monitoring continued of entities’ financial position in order to pre-empt solvencyproblems and request plans to return to compliance. For these analyses, variousparameters were taken into account: (i) equity, (ii) the ratio of book equity to sharecapital, (iii) the profit and loss account (amount and source of losses and earningsobtained from activities other than normal UCITS operator activities), (iv) timeUCITS operator would take to present an equity deficiency or net worth imbalancedue to losses or a significant increase in equity requirements, and (v) possibility ofreduction in activity due to lower volume of assets managed.
Although no serious incidents were detected, there were substantial declines inasset management fee revenues as an obvious consequence of the lower volumesof managed assets. These declines affected the equity situation at some UCITSmanagement companies, obliging them to strengthen their situation via capitalincreases or participation loans.
These checks were supplemented by an analysis of compliance with legal coefficients.
11.3.2 Specific analyses
Yields analysis
This analysis is used to detect atypical or abnormal yields at UCITS. The procedureused to detect these yields consists in creating a daily benchmark index for eachUCITS, on the basis of which its theoretical yield is obtained. By analysingstatistically significant differences, net asset values are chosen for analysis to checktheir reasonableness and reliability. 177
Regulation
and supervision
of the securities markets
Supervision of entities
11_Capitulo 11_INGLES.qxd 24/7/09 19:04 Página 177

The benchmark index is based on the composition of the UCITS’ portfolio and itsbreakdown into asset classes, as well as the modified duration of each UCITS’ cashportfolio. These data, obtained from confidential filings, plus the daily performanceof market indices linked to the portfolio composition, makes it possible to obtaintheoretical daily yields for each UCITS.
Identifying incidents in net asset values makes it possible to detect deficiencies inUCITS operators’ internal procedures and controls. A particular procedure orcontrol is classed as deficient when atypical yields are detected repeatedly as a resultof the same error e.g., an accounting error or incorrect valuation of a particular assettype or misallocation of expenses. However, atypical yields may also be obtained asa result of the composition of the portfolio or the transactions performed that day,or they may be due to a one-time error in the accounts or in the valuation of anasset. In this last case, the impact on assets is quantified and, if it is material oraffects investors in the UCITS, the management company is asked to provideinformation on what measures it plans to adopt to remedy the situation.
This analysis also makes it possible to detect regulatory infringements, since anatypical yield may also arise from an investment in unsuitable assets or from non-compliance with the UCITS’ investment policy. In short, the findings of thisanalysis of UCITS’ yields is one of the main factors to be taken into account whenmapping UCITS operators’ risk.
Valuation and liquidity of fixed-income assets
The global economy’s liquidity problems have also taken their toll on fixed-income markets, generating problems at certain UCITS which, due to theirinvestment policy, are exposed primarily to this kind of asset. They haveexperienced difficulties in properly managing liquidity amid requests forsubscriptions and redemptions and in valuing these investments properly ona daily basis. The liquidity problem did not affect all fixed-income assets tothe same extent: the markets in asset-backed securities and financial sectorsubordinated issues were hardest hit overall.
On 30 November, mutual funds held approximately 15,457.8 million euro infixed-income assets which could present liquidity problems (i.e. 8.6% of totalmanaged assets).
For the last two years, CNMV has strengthened its supervision to ensureproper asset valuation and control of liquidity in managed portfolios. Inaddition to specific actions under the standard supervision functions, theCNMV issued two communications via its website, on 17 March and 11November, describing guidelines for managing and controlling liquidity andfor valuing fixed-income assets held by UCITS.
With regard to managing liquidity of fixed-income assets, the CNMV urgedentities to implement a policy specifically designed to control overallliquidity in the mutual fund portfolio and enable it to monitor the depth ofthe markets in which it is invested and plan the sale of positions in a gradualand orderly manner.
Furthermore, UCITS management companies were reminded that theymust always act in investors’ best interests and that they must avoid possible
178
CNMV
Annual Report regarding
its actions and the
securities markets. 2008
11_Capitulo 11_INGLES.qxd 24/7/09 19:04 Página 178
creo

conflicts of interest between investors who are withdrawing and those whoremain in the fund.
Accordingly, the CNMV underscored the fact that the current regulationestablishes certain mechanisms which could help manage portfolio liquidity,including setting minimum periods of notice for redemptions of more thana certain amount (article 48.6 of the UCITS Regulation) and performingpartial subscriptions and redemptions (article 48.7 of the UCITS Regulation).Furthermore, the CNMV placed special emphasis on the exceptional natureof sales between related UCITS, highlighting that UCITS operators muststrengthen the express authorisation procedures for these transactions so asto be able to prove that they were performed at market prices and in theinterests of both institutions (article 67 of the UCITS Act and article 99 of theUCITS Regulation).
With regard to the valuation of assets which might pose liquidity problemsand those which, accordingly, there is no active market, the aforementioneddocument reminded operators that they should have valuation procedures toensure the use of observable market data as far as possible. The CNMV urgedentities to use valuation techniques based on obtaining the pricesdisseminated by external sources, among others: AIAF transactions,indicative prices from information services (Bloomberg, Reuters, Markit,etc.), theoretical valuations by independent experts, etc., and to strengtheninternal controls, so that the source they eventually use to value the asset canbe considered to be representative, since it best reflects the current marketsituation in terms of yields, credit spreads and liquidity, and other factors. Ifthe valuation techniques used by the UCITS are based on internal models,they must also establish procedures which incorporate market spreads in away that reflects the current situation of the issuer or asset class as closely aspossible. For this purpose, information inferred from credit default swaps orfrom other debt securities issued by the entity or others of very similarcharacteristics, such as those belonging to the same geographical region orsector, of the same scale, credit rating, subordination, etc. should be givenpriority, provided that it is representative.
In short, entities must implement the necessary procedures and controls toshow that the valuation techniques they use are consistent with the situationof the market and of the investing UCITS, based on its structure and thepotential performance of subscriptions and redemptions, so as to avoidconflicts of interest between participants withdrawing from the UCITS andthose who choose to remain.
Investments in other UCITS
The CNMV has continued to track Spanish UCITS that may have been affected bythe suspension of subscriptions and redemptions by some foreign UCITS in whichthey invest, as a result of the financial crisis. Moreover, an analysis of the sector hasbeen launched to assess the degree of compliance with the recommendations issuedin the first half of 2008 relating to what to do in the event of it being impossible tocalculate the net asset value of a UCITS, as a result of the suspension of calculationof the net asset value of the underlying UCITS. 179
Regulation
and supervision
of the securities markets
Supervision of entities
11_Capitulo 11_INGLES.qxd 24/7/09 19:04 Página 179

Rating downgrades
In 2008, the CNMV commenced a specific analysis of the impact of downgrades ofthe ratings of mutual funds’ guarantors. In the event of a downgrade of a guarantor,managers were urged to submit a regulatory disclosure for publication by theCNMV and dissemination via the institution’s periodic public information, in orderto guarantee investor protection. Specifically, 17 guaranteed funds had to make adisclosure of this type. Furthermore, the CNMV posted a communication on itswebsite setting out the criteria for this disclosure.
Analysis of the investment in deposits and liquidity accounts by the UCITS,and the inherent expenses
The purpose of this analysis is to guarantee that the remuneration conditions ofcurrent accounts opened by UCITS, and the rates applied to overdrafts (whereapplicable) and bank fees on these accounts are within market standards andconditions. As a result, it may be concluded that the remuneration that is currentlypaid on current accounts held by UCITS at their depository entities, and the relatedexpenses, may be considered to be market rates.
Circular on UCITS categories by investment profile
Article 30.2 of UCITS Law 35/2003, dated 4 November, provides that theymust clearly define their investment profile so that investors can accuratelyascertain to which of the categories defined by the CNMV they belong.CNMV Circular 1/2009, dated 4 February, concerning UCITS categories byinvestment profile, implements that provision.
The category of a UCITS is understood to be the combination of its type andits investment profile. Types of UCITS are ordinary investment funds andcompanies, feeder UCITS (which invest mainly in other UCITS), UCITS thattrack or replicate a particular stock market or fixed-income index, andexchange-traded funds (ETFs).
The new classification of profiles contains the following new elements:
– Money-market funds: the definition is changed to require, among others,an average portfolio duration of less than 6 months, at least 90% of assetsinvested in assets with residual maturity of less than 2 years, no assets withresidual maturity of more than 5 years and a short-term credit rating of atleast A2 from S&P, or unrated assets, provided that the issuers have a short-term credit rating of at least A2. This change is aimed at correcting theeffects of the pre-existing definition, under which these funds could havehigh levels of volatility and invest in assets with low credit quality.
Furthermore, the use of the term “money market” or similar is allowed onlyfor those funds that fit this profile, and all those that match this profile mustnecessarily be classified as money-market funds; a fund can no longersimultaneously qualify as a money-market fund and a fixed-income fund.
– Fixed-income funds: there is no longer a distinction between fixed-incomeprofiles based on portfolio duration, the only distinguishing element now
180
CNMV
Annual Report regarding
its actions and the
securities markets. 2008
11_Capitulo 11_INGLES.qxd 24/7/09 19:04 Página 180
creo

being currency risk, although this may now account for up to 10% ofassets (previously 5%).
– Hybrid funds: the category of hybrid fixed-income/equity funds ismaintained, while incorporating a distinction in terms of the geographicalarea to which the equity securities issuer belongs. Furthermore, in the caseof hybrid fixed-income profiles, the threshold of 5% for classifying theUCITS as euro or international has been raised to 30%.
– Equity funds: the domestic equity category was eliminated and thoseUCITS are now classified as euro equity. International equity funds are nolonger distinguished by the geographical area in which they invest. Theeuro equity profile now includes UCITS that invest more than 60% inequity of issuers in the euro area and whose currency risk is at most 30%of assets. International equity funds are all other equity UCITS that do notbelong to the euro equity category.
The characteristic of investing mainly in a specific geographical area(Europe, US, Japan, emerging countries) will only be identified in theinternational equity fund’s name, and the same applies to those that investpredominantly in a specific economic sector.
– Passively-managed UCITS: this new category was created to distinguishthose UCITS that are passively managed (and not guaranteed) from thosethat are actively managed. This category profile includes the UCITS thattrack or replicate an index, ETFS and UCITS with a specific yield target(that is not guaranteed).
– Guaranteed UCITS: guaranteed fixed-income funds include UCITS thatguarantee the initial investment plus a fixed yield, while guaranteed equityfunds include those UCITS that guarantee 100% of the initial investment(variable yield guaranteed funds) and those that guarantee less than 100%of the initial investment (partial guarantee). These two categories alsoinclude UCITS that actively manage part of their assets.
– Absolute and overall return categories: the new category of absolute-yieldUCITS, with a non-guaranteed management objective which target a specificperiodic risk/return ratio, regardless of market performance, was split offfrom the global UCITS category. The global category is now confined toUCITS whose investment policy does not match any of the other profiles.
Among the criteria established in the Circular enabling each UCITS to beclassified in a specific category is the consideration of both the cash andderivatives portfolios, classification in a category on the basis of the policy statedin the prospectus and not the portfolio composition, admission of anexceptional departure from the investment policy stated in the prospectus byinvesting in lower risk assets for at most 3 months, calculation of the investmentpercentages that define the investment category on the basis of the UCITS’assets, classification in the higher risk profile when a UCITS straddles twoinvestment profiles or classification as global when it straddles three profiles.
The purpose of the Circular was to determine certain criteria and attain asmaller and more investor-friendly classification of profiles for UCITS, inaccordance with the situation of the collective investment industry.
181
Regulation
and supervision
of the securities markets
Supervision of entities
11_Capitulo 11_INGLES.qxd 24/7/09 19:04 Página 181

11.3.3. Investor information
Under UCITS regulations, UCITS are required to send to the CNMV their auditors’reports and financial statements, and this information must be delivered to theinvestors as part of the annual report. This information is supplemented with therecommendations of the auditors and the report on the degree of compliance withthe internal control memorandum. All of these documents are essential in order forthe CNMV to discharge its investor protection functions; accordingly, specialemphasis was placed on reviewing their form and content, as well as compliancewith the established submission deadlines.
11.3.4. Supervision of hedge fund operators and of funds of hedge funds
In 2008, supervision of these entities focused on guaranteeing orderly redemptionsor liquidations of several institutions, most notably funds of hedge funds, whosefuture viability has been severely hampered by the collapse or suspension of thehedge funds in their portfolios. Particular attention was also paid to verifying theseentities’ due diligence or investment selection procedures in order to guarantee thatthey address all the aspects required by the regulations.
11.3.5. Supervision of UCITS depositories
The regulations governing UCITS afford a pivotal role to depositories, as entitiesmandated with the custody of the UCITS assets and monitoring the actions ofUCITS management companies; these tasks must always be performed in theinterests of the UCITS’ shareholders.
Order EHA/596/2008, dated 5 March, regulating certain aspects of the legal regimeconcerning UCITS depositories, and specifying the content of the statements ofaccount, was published in the Official State Gazette on 7 March 2008. Aside fromspecifying the content of the statements of account, this Order was aimedfundamentally at updating the legal framework governing UCITS depositories toadapt it to UCITS Act 35/2003, and its secondary legislation contained in RoyalDecree 1309/2005.
To meet this objective, the Order substantially strengthens the function ofdepositories, specifying the obligations to supervise UCITS operators, and it stateshow to perform this task in more detail than the repealed Order of 30 July 1992,thereby strengthening depositories’ surveillance and oversight role.
The main new features of the Order that help strengthen and detail the depository’stasks are as follows:
– Depositories must have a control system that enables them to check theoperator’s valuation procedures.
– They are explicitly obliged to check that assets in which the UCITS is investedmatch the investment profile defined in the prospectus.
– Commercialisation supervision is introduced in cases where the UCITS ismarketed directly by the management company.182
CNMV
Annual Report regarding
its actions and the
securities markets. 2008
11_Capitulo 11_INGLES.qxd 24/7/09 19:04 Página 182

– Depositories are obliged to open current accounts with which UCITS willoperate; UCITS management companies and SICAV administrators are bannedfrom using the balance of these accounts.
– Custody functions are strengthened in cases where the UCITS invests in otherUCITS, so as to guarantee that the investing UCITS retains ownership and fullcontrol of the investment at all times.
The purpose of the new regulation is also to systematise the procedural aspects ofdepositories’ actions, for which they must have an internal procedural manualsetting out the scope, methods and frequency of reviews.
As in previous years, during 2008 the CNMV supervised the activities of UCITSdepositories with regard to settlement and custody of securities, and supervisionand oversight of the management duties performed by UCITS managementcompanies. Furthermore, in 2008 an analysis was conducted of compliance bydepositories with their functions since 2002, when the CNMV began specificreviews of depositories. This analysis led to significant changes at depositories,requiring the majority to take cognizance of their obligations as UCITS depositories(surveillance and oversight of the UCITS activity) and acquire the necessaryresources to comply with these obligations.
11.3.6. Supervision of real estate UCITS
In 2008, particular emphasis was placed on monitoring liquidity at real estateinvestment funds in view of the volume of redemptions, their projected performanceand the payment schedules due to the commitments for property they had acquired.Accordingly, the CNMV was in close contact with real estate UCITS managementcompanies and compiled specific information concerning the aforementionedaspects throughout the year. The operators were asked to submit an action plan foradverse situations. The findings of these analyses showed the situation to havedeteriorated, leading, at the end of 2008, to a two-year suspension of redemptions inthe second-largest real estate investment fund.
Administrative procedures linked to situations of illiquidity. CNMVrecommendations
UCITS’ capacity to realise their assets without incurring in unjustifieddiscounts was affected by the current financial crisis due to the shortage ofliquidity in some assets and the greater difficulty in obtaining financing.
Although many economic agents have encountered difficulties, the situationis even more serious for UCITS since they have had to face an increase inredemption requests from investors, partly in response to these sameproblems. To compound matters, the investors themselves are often UCITSwhich are also experiencing the same difficulties.
This situation made it necessary to assess the various administrativeprocedures available to managers to tackle liquidity problems. Whenassessing the various alternatives, particular attention should be paid toprotecting investors’ interests and avoiding conflicts of interest betweenthem. For example, this means that, to avoid conflicts of interest with 183
Regulation
and supervision
of the securities markets
Supervision of entities
11_Capitulo 11_INGLES.qxd 24/7/09 19:04 Página 183
creo

participants who choose to stay in the UCITS, redemptions must not lead tosubstantial changes in the composition of UCITS portfolios (and, therefore,in their exposure to less liquid assets).
The alternatives provided by the current regulations for managing the risksdescribed can be summarised as follows:
1. Adopt extraordinary measures to maintain liquidity
1.1 Recourse to debt
Real estate UCITS can seek third-party financing, up to at most 10% of thevalue of their assets at no more than 18 months, to overcome temporary cashdifficulties. Financial UCITS and funds of hedge funds can also obtain third-party financing up to that limit but with a term of less than one month.
The regulation is more flexible for hedge funds, since no specific purpose isrequired and the limit is five times the asset value (provided this is specifiedin the prospectus).
At all events, the management company must assess the implications, in termsof fairness to investors, of recourse to debt to meet redemption requests.
1.2 Redemptions in kind
The regulations expressly allow for redemptions in kind by financial UCITS,real estate UCITS and hedge funds, providing they receive CNMV approval.This is an exceptional measure which has never been applied to date, and itspractical application has evident technical drawbacks.
2. Establishing measures to restrict liquidity
2.1 Ordinary measures. Reducing redemption frequency.
Financial UCITS can extend the period for calculating the net asset value upto once per fortnight at most, if so required by the planned investments.
Because of their special characteristics, hedge funds and real estate mutualfunds have substantially more flexible liquidity conditions, and are givenmore time to realise the assets needed to cater for redemptions.
2.2 Extraordinary measures. Suspending redemptions.
The general regulations for all UCITS allow the CNMV to temporarily suspendsubscription or redemption of participations “in the event of other cases offorce majeure,” either at its own initiative or in response to a request by thefund manager, with the obligation to file a regulatory disclosure.
In these extraordinary cases, and particularly when there are requests forredemptions amounting to more than 10%, real estate mutual funds mayprovisionally suspend redemptions, although they must provide liquidity upto at least 10% of assets, pro rata among the applications made prior tosuspension, and establish a plan to liquidate the assets necessary to meet theredemption requests.
184
CNMV
Annual Report regarding
its actions and the
securities markets. 2008
11_Capitulo 11_INGLES.qxd 24/7/09 19:04 Página 184

Application of these measures requires the approval of the CNMV, whichmust check that the necessary conditions hold and that investors haveenough information in accordance with regulations.
3. Liquidation of the UCITS
The orderly liquidation of the UCITS requires the adoption of a liquidationand dissolution decision by the operator and depository, notification to theCNMV, publication of a regulatory disclosure and opening of a liquidationperiod in which subscriptions and redemptions are suspended.
The specific rule for real estate UCITS recognises that, “if it is not possible todispose of all the assets and rights on property belonging to the fund in aperiod of two years from the start of liquidation, the fund managementcompany will cancel the fund and register the assets and rights to theproperty in the Property Register in the name of all the shareholders.”
4. Splitting of assets
This alternative, along with the following two, enables subscriptions andredemptions to be covered at least in the liquid part of the portfolio. Basically,it consists of splitting the fund’s assets into two parts, assigned to twodifferent funds (or compartments): illiquid assets are assigned to one of theresulting funds, and assets without liquidity problems to the other fund.
The process is similar to the merger of two or more investment funds: aproposal must be approved which clearly sets out the manner of designatingand allocating all the components of the original fund’s assets which must beconveyed to the beneficiary funds, to ensure that there is no unwantedsegmentation of the assets and to adequately resolve conflicts of interest (forexample, by ensuring that the split funds are owned by the same investorsand in the same relative proportions). The existence of free redemptionrights in this alternative means that it is not very feasible in practice.
5. Compartmentalisation
This alternative is similar to the split except that, instead of creating a newfund, what is created is a compartment whose portfolio contains the illiquidassets. It has the same advantages and disadvantages as splitting the fund.
Another possibility is to establish side pockets. The need to set up sidepockets in a UCITS may arise as a result of a voluntary move by the operatorto invest part of the capital in illiquid assets, or when an investment turnsilliquid at a certain value. A side pocket is a UCITS constituted from theilliquid assets and owned in identical percentages by the investors in the“original” UCITS. A side pocket can be defined as a “special-purpose” UCITSor compartment.
Side pockets enable illiquid assets to be segregated within the same fund; assoon as they are set up, these assets cease to be valued until the illiquidity isovercome. Once the side pocket has been set up, subscriptions andredemptions are performed at the net asset value without taking account ofthe side pocket (i.e. partial settlements and subscriptions). When the liquidity
185
Regulation
and supervision
of the securities markets
Supervision of entities
11_Capitulo 11_INGLES.qxd 24/7/09 19:04 Página 185

problems are overcome, the side pocket is valued, and redemptions andsubscriptions performed during the period in which the side pocket existedare adjusted as necessary.
This alternative is not covered by Spanish UCITS legislation but it could beregulated if the competition problems are perceived vis-à-vis otherjurisdictions where it is allowed.
11.4 Supervision of venture capital firms
Last year, periodic supervision of venture capital firms continued to focus onreviewing annual financial statements and analysing compliance with legallyestablished coefficients, taking into consideration the special characteristics ofinvestors in this kind of entity.
Furthermore, CNMV Circular 11/2008, dated 30 December, concerning accountingregulations, annual financial statements and confidential reporting of venturecapital firms was published on 14 January 2009. This Circular establishes andmodifies the accounting standards and reporting forms to which these companies’annual financial statements for 2008 must conform. Because these firms’ mainpurpose is to take temporary stakes in companies, application of the new Circularwill have a significant impact on the value at which these stakes are carried in thefinancial statements of the venture capital companies and funds.
11.5 Supervision of securitisation trust management companies
In 2002, the CNMV launched an on-site supervision programme for securitisationtrust operators, focused particularly on checking that the entities had sufficientresources to conduct their business, with an adequate organisation and thenecessary internal control procedures.
The programme concluded in 2008 following on-site inspection of the onlysecuritisation trust operator of the eight registered with the CNMV that had not yetbeen inspected; as a result of the inspections, securitisation trust operators havenow set up organisational structures on a scale suited to the complexity of theactivity they perform.
11.6 Assistance in the prevention of money laundering
In application of the collaboration agreement signed in June 2003 by the CNMVand the Executive Service of the Commission for the Prevention of MoneyLaundering and Monetary Offences (SEPBLAC), in 2008 the CNMV reviewed thedegree of compliance with money laundering prevention obligations, in relation toUCITS operators agreed with SEPBLAC.
186
CNMV
Annual Report regarding
its actions and the
securities markets. 2008
11_Capitulo 11_INGLES.qxd 24/7/09 19:04 Página 186

Regulation
and supervision
of the securities markets
Investor assistance
187
12 Investor assistance
The CNMV continued to work on improving investor education, information andprotection in 2008. The goal is to enable investors to identify, find and assimilatethe available information so that their relationship with intermediaries is morebalanced and they can make financial decisions with full knowledge of the risks andpossible consequences.
This chapter describes the CNMV’s specific actions in the area of investorassistance. Section 12.1 describes actions channelled through the InvestorAssistance Office. The CNMV’s efforts at investor education are described in section12.2. Oversight of advertising for products is described in section 12.3. And theactions of the Investment Guarantee Fund are described in section 12.4.
The financial crisis has increased investors’ insecurity with regard to the productsin which they have invested their savings. This has been evident in theconsiderable increase in queries, complaints and claims to the CNMV, as describedin this chapter.
Many complaints were related to structured and other complex products that weresold to retail investors. These products pose serious comprehension difficulties tothe public, leading to expectations that are not supported by the product in reality.
Many queries arose from problems at firms or measures taken by the authorities,such as the worsening situation of the markets in the second half of the year, thecollapse of Lehman Brothers, the collapse of the Icelandic banks, the announcementof an extraordinary appraisal in the Santander Banif Inmobiliario real estateinvestment trust, and measures adopted with regard to short selling.
The first conclusion is that investor education has not advanced at the same pace asdevelopments in the financial markets. There has apparently been little effort toimprove the information available to retail investors, particularly given thecomplexity of the products being offered to them.
This chapter describes the actions of the CNMV in dealing with complaints andclaims, and the initiatives adopted to improve transparency and investor education.
12.1 Investor Assistance Office
The purpose of the Investor Assistance Office (IAO) is to handle queries, complaintsand claims by retail investors1. The number of claims made by investors increased
1. The CNMV publishes an annual report detailing the activities of the IAO.
12_Capitulo 12_INGLES.qxd 24/7/09 19:05 Página 187

by 30% in 2008 with respect to 2007. This increase occurred mainly from Juneonwards, as claims in the second half of the year exceeded those in the second halfof 2007 by 63%.
Investor queries increased by 12.5% with respect to 2007. Activity in this area roseparticularly in the fourth quarter, when there were 5,283 queries, compared with3,534 received in the same period of 2007. Most queries from investors were relatedto the situation in the financial markets.
Joining FIN-NET
During the year, the IAO joined FIN-NET, the European network of national out-of-court complaint schemes, which will make it easier for Spanish investors who dealwith firms registered in the European Economic Area to file complaints with regardto investment services.
FIN-NET is a European cooperation network created by the European Commissionin 2001. Its objective is to make it easier for users of financial services to make out-of-court complaints in cross-border disputes through cooperation and the exchangeof information between the agencies in charge of handling complaints in eachcountry.
To be a member of FIN-NET, it is necessary to fulfil the requirements set out inCommission Recommendation 98/257/EC on the principles applicable to the bodiesresponsible for out-of-court settlement of consumer disputes. The IAO fulfils thequality principles required of FIN-NET members in its complaints handlingprocedures: the independence, transparency, adversarial, efficacy, legality, libertyand representation principles.
Since January 2009, the IAO has been a member of the FIN-NET SteeringCommittee, which assists the European Commission in preparing plenary meetingsand ensures coordination with the network members.
12.1.1. Queries
The IAO handles queries relating to the CNMV’s registers, information availableon the website or its publications, and more complex issues that require aspecialised response. For this purpose, the Office has a hotline (902 149 200) torespond to queries for information that is accessible and public. More complexissues are handled by the IAO technical staff. The public can present queries by188
CNMV
Annual Report regarding
its actions and the
securities markets. 2008
Total number of issues handled by the IAO TABLE 12.1
2007 2008 % change
Number % of total Number % of total 08/07
Queries 10,945 93.10 12,313 92.09 12.5
Claims 809 6.88 1,058 7.91 30.8
Total 11,754 100 13,371 100 13.8
Source: CNMV.
12_Capitulo 12_INGLES.qxd 24/7/09 19:05 Página 188

any means (e-mail, ordinary mail or telephone) and the CNMV responds as quicklyas possible, with no need for administrative processes.
Cooperation between the Bank of Spain, the Directorate-General of Insuranceand Pensions and the CNMV was intensified in 2008 in order to provide a fasterand more effective response to queries from users of financial services. To thisend, mechanisms were established for transferring user queries betweensupervisors.
Amount and type of queries
The telephone is still the main channel used by investors to make queries. The callcentre handled 52.8% of total queries, and received another 16.1% that required amore specialised from the CNMV’s experts. The other 31.7% of queries were madeby e-mail or in person. Six per cent of queries were received at Bolsalia andBorsadiner, two fairs dealing with the stock exchange and financial markets, held inMadrid and Barcelona, respectively, at which the CNMV had a stand.
Main issues to which queries referred
Investors contact the CNMV to request information about its functions and services(publications aimed at investors, status of claim resolution, procedure for filing aclaim, or information contained in the Investor corner of the website), regulations,entities, investment services or products, and legal rights. Within these generalthemes, specific issues stand out each year, as shown in the figure.
The main issues in 2008 were:
– Many investors had queries about the squeeze-out process. This procedure wasused in Spain for the first time in the Imperial Tobacco bid for Altadis. Once thetakeover bid had been settled, the Altadis shareholders who had not accepted thebid were finally obliged to sell their shares to Imperial Tobacco. The regulatoryconditions for the bidder to acquire all the shares were met, as Imperial owned95.8% of Altadis after the takeover bid.
Investor queries revealed improper practices on the part of some intermediaries,which had charged fees for this transaction. Consequently, information wasposted in the Investor’s Corner noting that the squeeze-out process is free of 189
Regulation
and supervision
of the securities markets
Investor assistance
Breakdown of queries by channel TABLE 12.2
2007 2008 % change
Number % of total Number % of total 08/07
Telephone 7,414 67.7 8,411 68.3 13.4
E-mail 2,373 21.7 2,903 23.6 22.3
Postal mail 312 2.9 234 1.9 -25.0
In person 846 7.7 765 6.2 -9.6
Total 10,945 100.0 12,313 100.0 12.5
Source: CNMV.
12_Capitulo 12_INGLES.qxd 24/7/09 19:05 Página 189

charge, and a communiqué was sent to financial institution reminding them ofthe applicable regulations.
– Queries about unregistered firms that may be offering investment services are aconstant each year. The firms about which investors contacted the CNMV in 2008included notably Finanzas Forex, Tribu Internacional Invest, S.L. and GCIFinancial Ltd., both of which were warned by the Commission under article 13 ofthe Securities Market Act.
– With the entry into force of MiFID, investment advice, understood as theprofessional remunerated provision of personalised recommendations to clientsabout financial instruments, is a service restricted to the parties who areauthorised to provide it. Parties that were providing investment advice beforeMiFID have until February 2009 to apply for authorisation from the CNMV. Thismeasure led to numerous queries about specific persons and firms that wereproviding investment advice.
– Doubts about the changes introduced by MiFID in relations between clients andfinancial institutions were again a subject of many queries. Investors askedwhether a given product should be considered complex or not, how often firmsshould update their appropriateness tests, and who the tests should apply to,where a securities account has several co-owners.
To respond to the most frequent questions, an area was created in the Investor’sCorner of the CNMV website containing:
• A consumer’s guide to MiFID. Investing in financial products.
• A FAQ on the practical impact of MiFID on the protection of retail investors.
• The MiFID glossary, which clarifies the new terminology.190
CNMV
Annual Report regarding
its actions and the
securities markets. 2008
Subject matter of queries in 2008 FIGURE 12.1
Source: CNMV.
Primaryand
secondarymarkets
Functionsand
services ofthe CNMV
Queriesto officialregisters
Investmentfirms
and creditinstitutions
OthersUn-authorised
firms
Legislation UCITS
18.1
40.1
14.6
7.4
5.7 6.0 4.3 3.7
0
5
10
15
20
25
30
35
40
45%
12_Capitulo 12_INGLES.qxd 24/7/09 19:05 Página 190

– Media reports about the measures adopted by regulators in September 2008with respect to short selling led many investors to contact the CNMV withquestions.
In September 2008, the CNMV reminded all market participants, includinginvestors (via CNMV Communiqués and the Investor’s Corner) that naked shortselling is prohibited and penalised.
– The situation of Lehman Brothers and, subsequently, Icelandic banks Landsbankiand Kaupthing aroused considerable concern among Spanish investors, whocontacted the Commission to try to ascertain the consequences for theirinvestments.
To inform the general public, on 24 September the CNMV website (Investor’sCorner) published a note responding to the main questions received frominvestors affected by the situation of Lehman Brothers. Specifically, it referred tocoverage by investment protection schemes, potential liability on the part of theproduct’s marketer, and the steps to be taken to recover the investments.
Affected investors expressed disagreement with the way in which financialinstitutions had sold them the investment products issued by theaforementioned companies; in some cases, they were totally unaware of theidentity of the issuer or the risks inherent to the product. Claims have been filedwith the CNMV in this connection.
– With regard to the Madoff fraud, information was requested about affectedproducts, and investors sought guidance about how to proceed and about theproposal by Banco Santander, S.A. to its clients who were victims of fraud.
To respond to the most frequent questions, a document was published about theeffect of the fraud on Spanish investors and a note on the main characteristics ofthe product offered by Banco Santander to enable investors to assess the proposaland, in particular, the commitments, characteristics and risks of that product, andcompare the value of the instruments offered in exchange.
– There were numerous queries in the second half of the year about investorcompensation systems (FOGAIN and FGD). Responding to investor queries aboutthe security and coverage offered for savings deposited and investments madevia credit institutions and investment firms, a document was issued respondingto frequently asked questions.
– Other notable issues in 2008: trends in the prices of certain securities, pressreports about a takeover of Laboratorios Almirall, S.A. and of a merger betweenEuropistas Concesionaria Española, S.A. and Itínere Infraestructuras, S.A., andsubsequent communiqués about commitments to increase the mergedcompany’s trading volume and liquidity or delist it.
– Queries about UCITS in 2008 referred particularly to announcements bymanagement companies with regard to the value of the portfolio and, consequently,the net asset value. 191
Regulation
and supervision
of the securities markets
Investor assistance
12_Capitulo 12_INGLES.qxd 24/7/09 19:05 Página 191

– The announcement by the operator of real estate investment trust SantanderBanif Inmobiliaria FII that it would perform an additional appraisal to adapt thevalue of the trust to market reality. There was also the announcement by operatorof Segurfondo Monetario, FI that it was going to modify the valuation methodused to date because of the reduction in the liquidity of certain asset markets andthe large number of redemption requests.
– There is also a steady flow, year after year, of queries about automated tradingsystems, which are increasingly popular among individual investors.
Considering the broad range of tools available in the market, with differentcharacteristics and operational scopes, a document was published withrecommendations for users. It emphasised the need for investors to properlyassess a program’s scope, workings and characteristics before deciding to use it,and that they should feel capable of monitoring the trades that were performedand bearing the ensuing risks. It also emphasised that such programs were notrecommendable for novice investors.
The table below lists the documents of interest to investors that were published inresponse to emerging issues that led to the largest numbers of queries frominvestors in 2008.
Documents of interest to investors TABLE 12.3
Preguntas y respuestas sobre los efectos prácticos de la MiFID para los inversores minoristas.
Efectos de la situación de Lehman Brothers para los inversores españoles.
Preguntas y respuestas sobre los sistemas de trading automatizado (STA).
Preguntas y respuestas sobre los sistemas de indemnización de los inversores.
Preguntas y respuestas sobre el efecto del fraude de Bernard Madoff en los inversores españoles.
Información sobre las participaciones preferentes que emitirá el Grupo Santander.
Preguntas y respuestas sobre las medidas adoptadas por la gestora de Santander Banif Inmobiliario FII.
Source: CNMV.
12.1.2. Claims
The IAO handles claims by users of financial services in connection withmalfunction, delays or lack of service, or if they feel their interests have beenimpaired by a financial institution’s actions.
Prior to making a claim to the CNMV, investors must contact the institution’sCustomer Care Unit or Ombudsperson. If the investor does not receive a responsefrom the institution within two months, or if they are unsatisfied with the response,they may contact the IAO, which handles investors claims rapidly and free ofcharge.
Since 2008, the IAO has an internal instruction setting out the procedure forhandling investor claims within the scope of the CNMV, which simply reflects pre-existing practice. In general terms, it coincides with the provisions of the Regulationfor Financial Institutions’ Ombudspersons.192
CNMV
Annual Report regarding
its actions and the
securities markets. 2008
12_Capitulo 12_INGLES.qxd 24/7/09 19:05 Página 192

Key data for the year
In 2008, 47.4% of claims were resolved in less than four months from the date ofpresentation to the CNMV. Nevertheless, because of the increase in claims in thefinal months of the year, 390 (of the 1,058 received in the year) were unresolved atyear-end.
In 2008, the number of claims resolved with a report by the IAO increased by 18.7%with respect to 2007. At the same time, greater compliance with the formalrequirements for presenting claims led to a sharp decline in the percentage ofclaims that were not accepted.
There was a notable increase (28%) in the number of claims where the IAO resolvedin favour of the complainant. Overall, the number of cases of mutual agreement andwithdrawals of claims increased by 47% and, with claims resolved in favour of theinvestor, they accounted for nearly half of all resolved claims.
There was also an increase in the number of claims referred to other supervisors,such as the Bank of Spain and the Directorate-General of Insurance and PensionFunds, which were received by the CNMV under the administrative one-stop shopsystem or because the claims related to issues under their competency; nevertheless,claims declined as a percentage of total claims with respect to 2007.
Once again, the bulk of claims referred to credit institutions, since their commercialnetworks are the predominant channel for retail investors to acquire financialproducts and services. Credit institutions accounted for 92.5% of total claims, withbanks accounting for 69.3% of claims against credit institutions, three times morethan those against savings banks (21.3%). Credit cooperatives accounted for a muchsmaller proportion of claims (1.9%).
Of the 90 entities against which claims were made, 69 were credit institutions, 11were investment firms and 10 were UCITS management companies. Nevertheless,26 entities were the object of 5 or more claims each (11 had over 15 claims each). 193
Regulation
and supervision
of the securities markets
Investor assistance
Outcome of complaints TABLE 12.4
2007 2008 % change
Number % of total Number % of total 08/07
Resolved 610 77.4 724 80.3 18.7
CNMV report favourable
to complainant 176 22.3 226 25.1 28.4
CNMV report not favourable
to complainant 342 43.4 367 40.7 7.3
CNMV report without decision 7 0.9 10 1.1 42.9
Resolved by mutual agreement 76 9.6 112 12.4 47.4
Claim withdrawn 9 1.1 9 1 0
Unresolved 178 22.6 178 19.7 0
Under jurisdiction of another body 39 4.9 41 4.5 5.1
Claim not accepted 139 17.6 137 15.2 -1.4
Total claims processed 788 100.0 902 100 14.5
Total presented 809 — 1,058 — 30.8
Source: CNMV.
12_Capitulo 12_INGLES.qxd 24/7/09 19:05 Página 193

Monitoring firms’ responses
During 2008, the CNMV continued the work, which commenced in 2007, ofmonitoring the actions of entities after claims are resolved in favour of the claimant.Once a claim has been resolved, the CNMV asks the entity against which the claimwas made to provide information and documentary evidence of any actions inaccordance with the report’s conclusions. Improper action is considered to havebeen remedied when the firm proves that it attended to the matter at issue, eitherby paying indemnity to the complainant (whose amount is not addressed by theCNMV in any way) or when it accepts the position adopted by the CNMV in itsreport and takes measures to avoid a repetition of the improper conduct in thefuture. Where the entity fails to respond by the established deadline, the issue isclassified as unresolved for statistical purposes.
On aggregate, in 34.1% of the 226 claims resolved in favour of the claimant, theentity amended its actions (repayment of 80,800.38 euro to claimants); however, in65.9% of cases there was either no response or the response was to disagree withthe CNMV’s conclusions.
The process made it possible to assess the efficacy of the complaints handlingsystem and the degree to which firms accept the positions and recommendationsarising from the analysis of complaints. This is a form of encouraging entities toeliminate bad practices and improper actions and of favouring the adoption ofmeasures to remedy the situation and to avoid repetitions.
Most common claims
The claims on which the CNMV issued a decision in 2008 can be classified into twobroad groups: incidents in the provision of investment services (orders, fees andreporting requirements arising from securities administration), which accountedfor 53.7% of the total, and incidents relating to UCITS (information, net assetvalues, transfers, exercise of rights, etc.), which accounted for 46.3%.194
CNMV
Annual Report regarding
its actions and the
securities markets. 2008
Class of firm against which claims were made TABLE 12.5
and type of outcome in 2008
Mutual
Favourable Unfavourable agreement + No
to claimant to claimant withdrawal resolution Total
%
change
No. 08/07 No. % No. % No. % No. %
Credit institutions 204 28.2 343 47.3 113 15.6 10 1.4 670 92.5
Banks 158 21.9 246 33.9 90 12.4 8 1.1 502 69.3
Savings banks 42 5.8 91 12.6 20 2.8 1 0.1 154 21.3
Credit coops. 4 0.5 6 0.8 3 0.4 1 0.1 14 1.9
Investment firms 11 1.5 11 1.5 5 0.7 0 0 27 3.7
UCITS management co. 11 1.5 13 1.8 3 0.4 0 0 27 3.7
Other 0 0 0 0 0 0 0 0 0 0
Total 226 31.3 367 50.7 121 16.7 10 1.4 724 100
Source: CNMV.
12_Capitulo 12_INGLES.qxd 24/7/09 19:05 Página 194

The breakdown of claims was broadly in line with 2007, although the gap betweenthe two groups narrowed since claims against UCITS are growing in importance.
The claims received in 2008 referred to a very broad range of issues, but the mostimportant or novel were the following:
– Many complaints are related to the huge and rapid proliferation of complexproducts aimed at retail investors. The adverse market situation led to manyclaims about possible malpractice in commercialization, in the informationsupplied before, during and after the sale, and in the advice supplied by themarketer.
These products’ complexity makes it difficult to value and price them since theydo not have a deep liquid transparent market. Some case of improper practiceswere observed as certain firms were regularly informing their clients of aconstant market value equal to the issue nominal value without recognizing thelosses due to market trends.
– In the fourth quarter there was a surge in the number of claims due to theinformation supplied by firms during the process of selling structured financialproducts, such as assets issued by companies in the Lehman Brothers group, afirm whose collapse caused problems for many Spanish investors.
Nevertheless, Lehman Brothers is not the only case of problems arising from thecommercialization of financial instruments throughout Europe under the singlepassport and the common standards on public offerings, which often exempt theissuer from filing prospectus with the CNMV; in fact, such problems are commonwith this class of products and with many transactions arranged before MiFIDwas transposed into Spanish law.
In these cases, different placing entities have been observed to apply differentpractices with regard to the information supplied to clients at the time ofpurchase and subsequently, via periodical account statements.
The decisions with regard to these claims generally hinge on the quality of theinformation supplied, the appropriateness of the product to the client’s profile,and the way in which the transaction was arranged.
– In 2008, there were again many claims about delays in executing orders onsecurities listed on AIAF, many of which referred to actual failure to execute sellorders.
It is generally considered that a depository receiving client instructions to sellshares or bonds should seek a counterparty for the order by every reasonablemeans at its disposal, and its order execution policy should contemplate thiseventuality. This process should also be conducted without discriminatingbetween clients and without entering into conflicts of interest: i.e. searching forthe best buy order through its internal order matching system or, barring that,contacting the firm entrusted with providing liquidity for the issue.
195
Regulation
and supervision
of the securities markets
Investor assistance
12_Capitulo 12_INGLES.qxd 24/7/09 19:05 Página 195

– As is now common since the legal reform that allowed transfers between UCITSat no tax cost, there were numerous and repeated claims in this connection:
• Unjustified delays in situations where the source and target marketer are thesame, even if the UCITS are managed by different operators, which ultimatelyhas an impact on the net asset values of subscriptions and redemptions.
• Rejections of transfers by the target UCITS due to defects attributable tothe source UCITS, in terms of the tax information supplied, the reportedamounts, etc.
• Rejections of transfers due to deficiencies in the requests or other circumstancesenvisaged in the regulations, e.g. failure to reach the minimum number ofinvestors (which, in principle, could be considered allocable to the targetUCITS).
• A distinction between the age of the investor’s position in the UCITS (date offirst entry in the investor register book for the purpose of applyingcommissions) and the age for tax purposes (for calculating capital gains andapplying withholding tax, if appropriate), which is particularly important inthe case of transfers where the back-end fee depends on the period for whichthe investor has been invested.
– Complaints about interest-rate swap contracts are also a recurring theme.Interest-rate swaps with no formal or contractual link to any other previously-arranged banking product or security are interpreted as being complexderivatives.
As in the previous year, the complaints in this case were due to deficiencies informalizing the contract documents or the lack of relevant information aboutthe conditions for early cancellation (all cases preceded the transposition ofMiFID).
196
CNMV
Annual Report regarding
its actions and the
securities markets. 2008
Breakdown of issues in claims resolved in 2008 TABLE 12.6
2007 2008
Number % of total Number % of total
Provision of investment services 338 55.6 389 53.7
Order reception, transmission and execution 173 28.5 201 27.8
Information to clients 96 15.8 112 15.5
Fees and expenses 59 9.7 59 8.1
Other 10 1.6 17 2.3
Mutual funds and other UCITS 272 44.4 335 46.3
Information supplied 114 18.7 96 13.3
Subscription and redemption 65 10.4 103 14.2
Transfers 54 8.9 88 12.2
Fees and expenses 39 6.4 48 6.6
Total claims resolved 610 100 724 100
Source: CNMV.
12_Capitulo 12_INGLES.qxd 24/7/09 19:05 Página 196

197
Regulation
and supervision
of the securities markets
Investor assistance
Where such swaps are not connected to a banking product, they should beconsidered as complex and, since November 2007, their commercializationshould conform to the provisions of MiFID for such transactions.
– There were also complaints about allegedly improper actions in the supply ofessential information to clients in transactions via the internet: incorrectidentification of securities, failure to update the tools offered to the client, defectsin the information about the order processing status, etc. In some cases, theimproper actions may be reflected in the statement of account sent to clients andin the information offered via telephone banking services.
Additionally, there were a range of complaints which are repeated from year to yearand are inherent to the provision of investment services. Specifically:
– Incidents connected with the information that firms must supply to their clientsabout their investments, leading to claims where, due to lack of evidence, it is notalways possible to ascertain whether the firm acted improperly:
• delays in sending mutual fund statements,
• errors in tax information, or failure to send such information,
• failure to deliver transaction settlement information or regular statements ofaccount in the proper form and on a timely basis,
• defects in the information on how to enter instructions with regard tocorporate transactions (takeover bids or rights issues) or the exercise ofshareholder rights (attendance at the Shareholders’ Meeting, granting proxy orgrouping votes, etc.),
• failure to maintain records of orders and contracts.
– Claims relating to order processing and execution, both with mutual funds andother asset classes:
• breach of validity periods or of the limit price established as a condition forexecution of the order,
• delays in executing orders and mandates, e.g. changes in ownership due toinheritance,
• incidents with regard to investors’ access to their securities accounts,
• incidents with regard to pre-emptive subscription rights in the context of rightsissues by listed companies,
• disputes over commissions with which the client disagrees or about which theclient claims he was not informed,
• delays in terminating portfolio management contracts,
• incidents in actions by depositories where the clients did not give specificinstructions (rights issues, delisting takeovers).
12_Capitulo 12_INGLES.qxd 24/7/09 19:05 Página 197

– There were also claims about the actions of agents of banks and investment firmswith regard to the signature of blank orders, the signature of orders afterexecution of the trade, commissions, information, etc.
12.1.3. Accusations
Six formal accusations were presented to the CNMV by individual investors in2008; three were against banks (in connection with the securities market), twoagainst investment firms and one against an issuer. The number of accusationsdecreased considerably with respect to 2007, when there were 15 (split evenlybetween banks, investment firms and companies with listed securities).
Accusations made in 2008 TABLE 12.7
Accused parties No. of accusations
Banks 3
Broker-dealers and brokers 2
Securities issuers /listed companies 1
Total 6
Subject matter of accusations No. of accusations
Market transactions 2
UCITS 1
Codes of conduct 3
Total 6
Status of the accusations at 31-12-2008 No. of accusations
Under consideration 4
Dismissed 2
Total 6
Source: CNMV.
Three accusations referred to alleged breaches of codes of conduct (improper actionby a representative, failure to disclose conflicts of interest, and insufficient internalcontrol measures). Two accusations referred to market transactions affecting retailinvestors (a share placement and a rights issue), and one accusation referred toirregularities in the subscription of a mutual fund.
At 31 December 2008, after processing by the competent units of the CNMV, two ofthe accusations were dismissed without any penalties, independently of theregulator’s specific actions as result of the claims.
12.2 Investor education and information
Investor training and information activities were intense in 2008. In addition tocooperating with the Bank of Spain in the Financial Education Plan, major effortswere devoted to drafting new publications and the Commission participatedactively in courses, fairs and seminars addressed to retail investors and parties thatare in permanent contact with retail investors, such as the Municipal ConsumerOffices.198
CNMV
Annual Report regarding
its actions and the
securities markets. 2008
12_Capitulo 12_INGLES.qxd 24/7/09 19:05 Página 198

199
Regulation
and supervision
of the securities markets
Investor assistance
12.2.1. Financial Education Plan
The implementation phase of the Financial Education Plan commenced in 2008 andwill continue in 2009 as the Plan’s various initiatives are developed. Work in thisphase included drafting educational materials and informative instruments invarious media (mainly accessible via new technologies), and the development of aportal which will be an essential first stop for anyone seeking to improve theirfinancial culture.
Work was also done to finalize cooperation agreements with other institutions suchas the Ministry of Education, the National Institute of Consumer Affairs, and theDirectorate-General of Insurance and Pension Funds.
Financial education in schools
The Financial Education Plan for the period 2008-2012, promoted by theCNMV and Bank of Spain, was presented in May 2008. The project is veryambitious in terms of scope and objectives since it seeks to improve thefinancial culture of all segments of the population, both students and adults.
This objective is particularly important in the current context of the globalfinancial crisis. Although the plan had already been adopted, the current crisishas made it even more important to improve the population’s financial cultureas a means of fostering more responsible use of financial products based oninformed decisions that are appropriate to the consumer’s circumstances andneeds, and of strengthening confidence in the financial system.
It is particularly important to educate young people in this area, in accordancewith international recommendations on the advisability of including specificnotions in the school curriculum and, generally, so that financial knowledge isintegrated more and effectively into young people’s daily lives.
Accordingly, the CNMV is working with the education authorities to includefinancial matters in the curriculum; in parallel, it is seeking to implementspecific initiatives that interlock with existing curricula. This will enableprimary, secondary and vocational students to obtain a financial education asquickly as possible.
Cooperation with the Ministry of Education will focus on three main areas:
– Identifying the educational needs of students based on their age group,with specific emphasis on the concepts of saving, investment and debt,and on developing basic skills related to buying financial products.
– Defining the most effective tools for ensuring interest and motivation onthe part of both students and teachers, so as to maximize trainingeffectiveness. Particular attention will be paid to initiatives that favourinteraction and participation.
– Implementation of pilot educational actions in the network of schools thatdepend directly on the Ministry, and in the autonomous regions that sowish, from the beginning of the 2009/10 academic year.
12_Capitulo 12_INGLES.qxd 24/7/09 19:05 Página 199
creo

200
CNMV
Annual Report regarding
its actions and the
securities markets. 2008
12.2.2. Investor’s Corner
The Investor’s Corner is the area of the CNMV website specially for investors. Sinceit was created in 2003, it has been improved in terms of both content and tools toenable investors to find and compare relevant information for making investmentdecisions.
Improvements in 2008 include notably the following:
– The launch of the first interactive course on the internet, which is free of charge.It is a learning program about mutual funds. The course is structured so that it isuseful both to investors who are already familiar with funds and to those who areunfamiliar with this product. It includes numerous examples and interactiveexercises, as well as a self-assessment test at the end of each module.
– The “What’s new” section gained in importance. It serves to provide informationabout current issues of interest to investors, particularly retail investors. Notablenews published in 2008 included:
• The exceptional measures adopted in connection with the financial crisis andthe increase in the coverage provided by investor compensation schemes.
• The appearance in the market of new products aimed at retail investors, suchas participation shares (cuotas participativas).
• The launch of issues for retail investors where the CNMV warned about theirlimited liquidity and valuation difficulties (e.g. preferred shares).
• The publication of new documents, factsheets and guides for investors, andreplies to investors’ frequently asked questions.
• The CNMV’s joining FIN-NET, and the main events addressed to investors.
– The creation of new sections, such as the ones about MiFID and the FinancialEducation Plan.
– In 2008, work was done on developing a commission search engine to enableinvestors to compare the commissions charged by different financialintermediaries; it is scheduled to be available in 2009. This comparison enginewill accompany existing ones relating to registered entities and mutual funds.
– Work was also done in 2008 on two new interactive programs dealing with “markettrading” and “making investment decisions”, which will be rolled out in 2009.
12.2.3. New services of the IAO
Other projects developed in 2008 which will be unveiled in 2009 include a newInvestor Portal, which will be more intuitive and user-friendly than the existingInvestor’s Corner, and a new image for the Investor Assistance Office in line withthe CNMV corporate image.
The redefinition of the website for investors will provide enhanced search facilitiesand access to information as well as being more effective in communicating the
12_Capitulo 12_INGLES.qxd 24/7/09 19:05 Página 200

201
Regulation
and supervision
of the securities markets
Investor assistance
CNMV’s positions, recommendations, and best practices. It will also include tools formaking investment decisions, an e-learning area, and links of interest to investors.
The fact that small investors use the Internet and mobile telephony on a daily basishas made it possible to develop two new services using these technologies tofacilitate access to information and disseminate it faster: an electronic bulletin, andan SMS alert service, both of which will be fully operational in 2009. Subscriptionto both services will be free of charge.
The bulletin will be distributed in electronic form and containing information of interestto investors, including recommendations, new publications, interpretative documents,events, and warnings. It is expected to be quarterly. There will also be an SMS alertsservice to notify users of new information of interest on the Portal in real time.
12.2.4. Educational activities
Publications for investors
The factsheets and guides are aimed at providing non-professional investors withinformation about how the markets work, the agents that participate in them, andthe various products and services that are commercialized, all in a simple, readily-comprehensible way. The number of subscribers who receive all new publicationsby mail increased by over 20% in 2008 to more than 12,000.
The guides and factsheets are available on the CNMV website (www.cnmv.es) inEnglish and Spanish; a list of available titles is shown in table 12.8. In some cases,the publications are also available in Spain’s co-official languages. They may berequested free of charge by calling 902 149 200.
Investor factsheets and guides TABLE 12.8
Investor factsheets Investor guides
A consumer’s guide to MiFID. Investing in financial
Contracts for Differences (CFD) products
Guaranteed mutual funds Fly-by-night operations
New kinds of mutual funds Investor protection: making a complaint
Warrants and turbowarrants Fixed-income products
Investment Guarantee Fund (FOGAIN) Mutual funds and collective investment schemes
Investment service fees and charges Options and futures
Takeover bids: what they are and how to proceed What you should know about securities orders
Exchange-traded funds (ETFs) Investment firms
Public share offerings/Rights offerings
Transfers between mutual funds
CNMV investor services
How to make a complaint concerning financial
services
Source: CNMV.
Down through the years, the CNMV has observed that investors greatly appreciateour guides and factsheets; consequently, we seek to disseminate them as broadly as
12_Capitulo 12_INGLES.qxd 24/7/09 19:05 Página 201

possible. The CNMV seeks cooperation agreements with entities wishing todistribute these publications on condition that they are free of charge to investors.In 2008, 35 cooperation agreements were signed, i.e. 10% more than in 2007.
At the various events in which the Investor Assistance Office participates (courses,lectures, fairs, etc.), it publicizes the range of publications and provides attendeeswith full sets of guides and factsheets.
The guide entitled A consumer’s guide to MiFID. Investing in financial products,published early in 2008, was a notable success: over 122,000 copies have beendistributed, including 5,000 in Catalan.
Meetings with investors
In 2008, the CNMV participated in 41 events in Spain, compared with 26 in 2007,which evidences the major efforts being made to inform investors about theCNMV’s services and promote investor education.
These events are arranged in cooperation with both private and public institutions:public administrations, educational establishments, professional associations,financial institutions and the media. The events were aimed at investors andconsumers, consumer affairs professionals, students, and financial institutions,among others.
The following events were particularly noteworthy:
– The seminar entitled “Consumer protection in the area of finance andinvestment”, organised in cooperation with the National Institute of Consumer202
CNMV
Annual Report regarding
its actions and the
securities markets. 2008
Investor factsheets and guides: number of cooperation agreements TABLE 12.9
and copies distributed
Cooperation Copies distributed
agreements Factsheets Guides
2007 2008 2007 2008 2007 2008
Markets: Stock exchanges and MEFF 5 5 46,180 5,800 5,775 5,850
Investors (direct requests to the Investor
Assistance Office) — — 128,111 52,250 32,206 45,016
Consumer associations 11 15 3,550 1,220 500 1,714
Securities market institutions 187 196 20,423 52,558 11,528 32,133
Broker-dealers 30 31 3,240 10,580 1,495 5,280
Brokers 44 45 4,315 7,405 1,390 4,808
Portfolio management companies 18 20 4,678 1,800 1,564 1,822
UCITS management companies 89 92 7,992 31,173 7,005 18,943
Branches of foreign investment firms 6 8 198 1,600 74 1,280
Credit institutions 88 105 88,218 27,296 19,066 92,296
Universities and other education
institutions 38 39 3,025 3,064 4,120 2,338
Other — 4 — 11,888 828 16,267
Total 329 364 289,507 154,076 74,023 195,614
Source: CNMV.
12_Capitulo 12_INGLES.qxd 24/7/09 19:05 Página 202

Affairs and the consumer affairs departments of the Balearic Islands and BasqueCountry regional governments. It dealt with such issues as: personal financialplanning, precautions and preventing fraud and embezzlement, mutual funds,takeover bids, dispute resolution systems in the finance area, and problems withfees and commissions for investment services.
– The seminar organised by the Móstoles Municipal Office for Consumer Affairs todiscuss consumers as investors and users of financial services.
– Participation in the series of lectures on “Key issues and solutions for investingin times of crisis”, organised in León by Inversis and Diario de León, whichdiscussed the impact of the crisis on investors and the importance of financialeducation as the main form of investor protection.
– The presentation of the Financial Education Plan at the Corporate SocialResponsibility convention organised by CECA in La Coruña.
– 10th Convention on Savings Banks Customer Service, organised by CECA, wherethe CNMV gave a keynote speech under the title “Practical application ofcomplaints received by the CNMV on issues related to MiFID”.
– 2nd Course on Financial Services Customer Protection, organised by the Bank ofSpain for supervisors from Latin America.
– Participation in training courses for Spain’s National Police Force in connectionwith claim procedures in the financial area.
– Participation each year in the seminar for magistrates organised by Spain’sHigher Council of the Judiciary and Bolsas y Mercados Españoles.
– Participation each year in the National Distance University (UNED) summercourses on “Stock Exchanges and Financial Markets”, which last one week.
– As in previous years, the CNMV participated in the Bolsalia (Madrid) andBorsadiner (Barcelona) fairs on the securities markets. On this occasion, theCNMV responded to almost 800 queries from small investors and distributedover 23,000 factsheets and 10,250 guides.
Media appearances
The CNMV published a range of articles in the press and in specialised magazines,and granted interviews both to radio stations and the business and general press,both national and local, on MiFID, the Financial Education Plan, and the CNMV’sactivities to improve investor education and protection.
Cooperation with other bodies
In April 2008, the CNMV signed a cooperation agreement with the SpanishCommittee of Representatives of People with Disabilities (CERMI). Under theagreement, the CNMV will foster the employment of people with disabilities, makeits website accessible, and develop training content that takes account of the needsof people with disabilities. 203
Regulation
and supervision
of the securities markets
Investor assistance
12_Capitulo 12_INGLES.qxd 24/7/09 19:05 Página 203

The CNMV steadily increased the level of cooperation with the National Institute ofConsumer Affairs (INC) in 2008 and expects to continue this trend in 2009. TheCommission’s participation in the seminars organised by the INC is viewed as afundamental part of attaining the goal of improving financial knowledge on thepart of users of financial services and of consumer affairs advisers.
12.2.5. International cooperation
Two of the most notable developments in the area of international cooperation werethat the CNMV joined FIN-NET and its steering committee in 2008, as well as theOECD’s financial education network.
– As already mentioned FIN-NET is an initiative of the European Commissionwhose main goal is to provide consumers with easy access to out-of-courtcomplaint procedures in cross-border cases through cooperation and informationexchange between the authorities in each country.
The CNMV participated in two presentations at the meetings held in 2008:“CESR’s recent developments stepping towards convergence”, and “CNMV’sInvestors Assistance Office. Attending enquiries and complaints of investors”.
Among the main issues discussed was the financial crisis and its impact oninvestors as a result of the growing commercialisation of complex products, andclaims arising from the Lehman Brothers collapse and the Madoff fraud.
– The OECD, one of the international organizations that has insisted most on theneed for citizens to be educated in financial matters, has created a network aimedat enabling government bodies involved in financial education to exchangeexperience and information. To this end, it also created a special website:www.financial-education.org.
The CNMV and the Bank of Spain are members of that network and havecontributed to a range of initiatives such as questionnaires about OECDRecommendations and Principles regarding financial education, and financialeducation in the context of the financial crisis.
The main developments regarding the CNMV’s participation in groups and forumssuch as CESR and IOSCO are as follows:
– The CNMV played an active role in drafting the CESR’s first publication aimedat consumers: A consumer’s guide to MiFID. Investing in financial products.Coinciding with the document’s launch in Paris, the CNMV unveiled the Spanishversion of the guide, under the title Sus derechos como inversor: descubra laprotección que le da la MiFID.
– Active participation in the Intermediaries subgroup, which worked on MiFID-related issues in 2008, such as inducements, best execution and conflicts ofinterest, and organised workshops with the industry that focused on thewholesale and retail markets.
204
CNMV
Annual Report regarding
its actions and the
securities markets. 2008
12_Capitulo 12_INGLES.qxd 24/7/09 19:05 Página 204

During the year, the CNMV assisted in developing a new zone for investors onthe CESR website, the Investor Corner, and contributed to public consultationssuch as the one on the new simplified prospectus for UCITS.
– Participation in INFO 2008, the second annual conference of the InternationalNetwork of Financial Services Ombudsman Schemes. The main issues addressed atthe conference were the impact of the economic crisis on the activity of ombudsmen,as well as exchanging experiences in the area of inappropriate investments.
12.3 Advertising of investment products and services
Advertising has the function of providing investors with information about therange of investment products and services that are available. Because of theirnature, advertising messages present the product as attractively as possible and,consequently, drawbacks or limitations may go unnoticed. They can also generateconfusion or creation unrealistic expectations in investors if not accompanied bythe appropriate caveats.
The approval of the Spanish legislation transposing MiFID consolidated the criteriathat were being applied to reviewing advertising campaigns that financialinstitutions submitted voluntarily for CNMV vetting. This service has gained inimportance since the regulations require that all providers of investment servicesensure that the information they provide to retail clients or potential clients,including advertising messages, must be impartial, clear and not misleading. TheCNMV conveyed the message to all firms that it is essential for investors to examinethe official information about a product before taking an investment decision.
A total of 282 advertising campaigns were vetted beforehand in 2008, i.e. 27.92%less than in 2007 as a result of the smaller number of products launched on themarket in the year due to the adverse conditions.
Once again, campaigns to commercialize mutual funds predominated, accountingfor 50% of the total. Also, contrasting with the 10 initial public offerings in 2007,there was only one in 2008: the participation shares issued by Caja de Ahorros delMediterráneo.
A total of 63 campaigns for sophisticated products marketed in Spain under the EUpassport were vetted, i.e. 22% of the total. Reviewing these campaigns is particularlyimportant since they are often the only source of information for potential investors.
205
Regulation
and supervision
of the securities markets
Investor assistance
Number of adverstising campaigns reviewed by the CNMV TABLE 12.10
Prior vetting Subsequent oversight Total
2007 2008 2007 2008 2007 2008
UCITS 217 141 6 0 223 141
Foreign UCITS 2 6 0 0 2 6
Primary and secondary
offerings 136 97 4 1 140 98
Financial services 29 38 0 1 29 39
Total 384 282 10 2 394 284
Source: CNMV.
12_Capitulo 12_INGLES.qxd 24/7/09 19:05 Página 205

The growing variety of products, coupled with their complexity and the greatercompetition between entities, results in advertising having a considerable influenceon investors. Because of the different oversight and review rules and procedures thatapply to banking, securities and insurance, and of the proliferation of substituteproducts for retail investors with the same risk/return profile, it is advisable to makeprogress in standardizing the regulations, codes of conduct and oversight procedures.
12.4 General Investment Guarantee Fund
The number of entities which joined the General Investment Guarantee Fund(Fondo General de Garantía de Inversiones—FOGAIN) increased to 146 in 2008. Asoccurred in 2007, the increase was due primarily to the growing number of UCITSmanagement companies which are members due to including individualizeddiscretionary portfolio management in their schedule of activities. Also, the numberof brokers and broker-dealers that are members of FOGAIN increased slightly, forthe first time since 2002.
The Board of the FOGAIN management company made the necessary adjustmentsto capital in order to accommodate the new and departing member firms and thechanges in the percentage participation by member firms. The capital wasestablished at 164,983 euro.
During the year, FOGAIN continue to process applications for indemnity due toviolations by Ava Asesores de Valores, A.V., S.A., Gescartera Dinero, A.V., S.A., BrokerBalear, A.V., S.A., X.M. Patrimonios, A.V., S.A. and Bolsa 8, A.V.B., S.A. To date, over61 million euro have been paid out in indemnities in response to over 9,600 claims.Under current regulations, FOGAIN must be in a position to pay indemnities, toclients who are entitled, for claims received within the 15-year statute of limitationsperiod, except where specific regulation provides otherwise.
Royal Decree 1642/2008, of 10 October, extending the maximum coverage byFOGAIN from 20,000 euro to 100,000 euro, came into force in 2008. Nevertheless,the previous cap of 20,000 euro will still apply to breaches that occurred before theRoyal Decree came into force and are currently being indemnified (Ava Asesores deValores, A.V., S.A., Gescartera Dinero, A.V., S.A., X.M. Patrimonios, A.V., S.A., BrokerBalear, A.V., S.A., and BolsaA 8, Agencia de Valores y Bolsa, S.A.).
In 2008, the FOGAIN management company experienced a sharp increase in thenumber of queries about indemnity procedures and limits. The company provides206
CNMV
Annual Report regarding
its actions and the
securities markets. 2008
Number of FOGAIN member firms TABLE 12.11
Type of firm 2004 2005 2006 2007 2008
Broker-dealers and brokers 103 101 101 99 101
Portfolio management
companies 24 21 17 11 10
UCITS management companies — — 2 25 34
Branches of foreign investment
firms — 1 1 1 1
Total 127 123 121 136 146
Source: CNMV.
12_Capitulo 12_INGLES.qxd 24/7/09 19:05 Página 206

information by telephone and via its website www.fogain.com. In 2008, FOGAINcontinued the initiatives for informing the industry of the regulatory andsupervisory positions. Activities focused on identifying best practices in codes ofconduct and resolution of conflicts of interest, drafting an Internal Code of Conductfor investment firms, providing firms with feedback and support in theimplementation of the new accounting and solvency regulations, commenting ondraft regulations during the public consultation phase, and channelling theindustry’s concerns and opinions with regard to market operation and clearing andsettlement.
207
Regulation
and supervision
of the securities markets
Investor assistance
12_Capitulo 12_INGLES.qxd 24/7/09 19:05 Página 207

12_Capitulo 12_INGLES.qxd 24/7/09 19:05 Página 208

Regulation
and supervision
of the securities markets
Disciplinary action
209
13 Disciplinary action
The CNMV has the power to impose penalties for breaches of the securities marketregulations. Those regulations empower it to initiate and pursue investigations anddisciplinary proceedings, and to directly punish minor and serious violations.Penalties for very serious violations are imposed by the Minister of Economy andFinance at the proposal of the CNMV, following consultation with its AdvisoryCommittee. This chapter describes the CNMV’s disciplinary actions (section 13.1),the Litigation Department’s activities (section 13.2) and the warnings issued aboutunauthorised firms (section 13.3).
13.1 Disciplinary proceedings
13.1.1 Statistics
In 2008, the CNMV Executive Committee initiated 13 new disciplinary proceedings,investigating a total of 22 possible violations. As in previous years, most investigationsrelated to conduct classified as market abuse. Several disciplinary proceedingscommenced for breach of the rules requiring the disclosure of significant holdings inlisted companies. The others related mainly to defective disclosures to the CNMV andthe market of regulated financial information or of information during takeover bids.
In one case involving alleged manipulation of the share price of a listed company,at the same time as it commenced disciplinary proceedings the CNMV also referredthe matter to the public prosecutor’s office since there was potentially a breach ofarticle 284 of the Criminal Code. Once criminal proceedings commenced, theCNMV’s disciplinary proceedings were suspended pending a final court decision.
The CNMV also completed 7 proceedings, covering a total of 9 violations. One ofthose proceedings had commenced in 2002, one in 2006 and five in 2007 (Tables13.1 and 13.2). The most common violation to which the disciplinary decisionsreferred was misuse of inside information.
Also in 2008, a decision was issued on a disciplinary proceeding that commenced in2002 but was suspended because the matter was sub judice; once a final court decisionhad been issued, the CNMV disciplinary proceeding was resumed. The matter referredto filing inexact financial and accounting information with the CNMV.
Table 13.4 details the violations to which the disciplinary proceedings that commencedor concluded in 2008 refer.
A total of 11 penalties were imposed, all fines, for a total of 5,279.5 thousand euro(Table 13.3).
13_Capitulo 13_INGLES.qxd 24/7/09 19:06 Página 209

210
CNMV
Annual Report regarding
its actions and the
securities markets. 2008
Proceedings initiated and completed in 2008 TABLE 13.1
2007 2008
Number of proceedings initiated 4 13
Number of proceedings concluded 9 7
Of which:
– Initiated in 2002 — 1
– Initiated in 003 1 —
– Initiated in 2005 4 —
– Initiated in 2006 4 1
– Initiated in 2007 — 4
– Initiated in 2008 — 1
Source: CNMV.
Violations addressed in disciplinary proceedings TABLE 13.2
2007 2008
Violations leading to the initiation of proceedings 6 23
Very serious 4 17
Serious 2 5
Violations on which proceedings concluded 15 9
Very serious violations 10 6
proceedings initiated in 002 — 1
proceedings initiated in 2003 1 —
proceedings initiated in 2005 4 —
proceedings initiated in 2006 5 1
proceedings initiated in 2007 — 4
Serious violations 5 3
proceedings initiated in 2005 4 —
proceedings initiated in 2006 1 —
proceedings initiated in 2007 — 3
Source: CNMV.
Penalties imposed TABLE 13.3
2007 2008
No. Amount1 Period2 No. Amount1 Period2
Fines 14 18,630.4 — 11 5,279.5 —
Suspension / Limitation of activities — — — — — —
Removal / General disqualification 3 — 18 — — —
Source: CNMV.
1. Thousand euro.
2. Years.
13_Capitulo 13_INGLES.qxd 24/7/09 19:06 Página 210

13.1.2. Public register of penalties for serious and very serious violations
The following penalties for serious and very serious violations were incorporatedinto the public register of penalties in 2008:
– CNMV decision dated 27 March 2008, disclosing the imposition of penalties fora very serious violation by
as provided by articles 102 and 105 ofAct 24/1988, of 28 July, on the Securities Market.
– CNMV decision dated 27 March 2008, disclosing the imposition of penalties fora very serious violation by Caja de Ahorros de Salamanca y Soria (Caja Duero),as provided by article 102 of Act 24/1988, of 28 July, on the Securities Market. 211
Regulation
and supervision
of the securities markets
Disciplinary action
Number of each type of violation pursued TABLE 13.4
Opened Closed
2007 2008 2007 2008
VERY SERIOUS VIOLATIONS 4 17 10 6
Failure to disclose/incorrect disclosure of significant holdings — 5 2 —
Operating without authorisation — — 2 1
Market manipulation — 1 — —
Breach of coefficients — 1 — —
Failure to disclose significant events/provision of misleading, incorrect or
materially incomplete information — — 1 1
Breach of issuer's periodical disclosure requirements — 2 — —
Breach of rules on takeover bids — 3 — —
Violation of general securities market regulations — — — —
Violation of general UCITS regulations — 2 — —
Accounting irregularities — — 3 —
Unregistered issues — — — —
Insider dealing 3 3 2 3
Obstruction of inspection 1 — — 1
SERIOUS VIOLATIONS 2 5 5 3
Accounting irregularities — — — —
Operating without authorisation — — — —
Breach of coefficients — — — —
Corporate governance violations — 2 — 1
Market abuse violations — 1 — —
Violation of general securities market regulations — — — —
Violation of general UCITS regulations — — 3 —
Violation of rules of conduct — — — —
Market manipulation — — — —
Insider dealing 2 — 1 2
Failure to draft / publish / file mandatory reports by the deadlines — 1 1 —
Failure to respond to CNMV subpoenas — 1 — —
Source: CNMV.
13_Capitulo 13_INGLES.qxd 24/7/09 19:06 Página 211
– CNMV decision dated 27 March 2008, disclosing the imposition of penalties fora very serious violation by
as provided by articles 102 and 105 of Act 24/1988, of28 July, on the Securities Market.
– CNMV decision dated 27 March 2008, disclosing the imposition of penalties fora serious violation by
as provided by articles 103 and 106 of Act 24/1988, of 28 July, on theSecurities Market.
– CNMV decision of 4 December 2008, disclosing the imposition of penalties fora very serious violation by
as provided by articles102 and 105 of Act 24/1988, of 28 July, on the Securities Market.
– CNMV Resolution of 4 December 2008, disclosing the imposition of penalties fora very serious violation by , asprovided by article 102 of Act 24/1998, of 28 July, on the Securities Market.
13.1.3. Criteria of interest
Composition of Audit Committees: minimum number of members
In 2008, the CNMV imposed penalties on a listed company and its directors becausethe Audit Committee consisted of just two members despite having received twoprior warnings from the CNMV to bring the committee’s composition into line withthe regulations.
The obligation for issuers to have an Audit Committee arises from AdditionalProvision Eighteen of the Securities Market Act, introduced by article 47 of Act44/2002, of 22 November, on Measures to Reform the Financial System, andsubsequently amended by article 98.3 of Act 62/2003, of 30 December on Tax,Administrative and Labour Measures, the relevant parts of which read as follows:
“[...]
1. Issuing companies whose shares or bonds are listed on official secondarysecurities markets must have an Audit Committee,
2. which must consist of a majority of non-executive directors [...]
3. [...]
4. The number of members, the competencies and the working rules of thatCommittee shall be laid down by the company’s Articles of Association or therules that apply to the company, and must foster its independence. [...]”.
The Audit Committee is a body whose minimum functions are specified in theSecurities Market Act. Therefore, it is not a delegate body of the Board of Directorsbut, rather, is a body whose competencies are defined by law, even if it is an212
CNMV
Annual Report regarding
its actions and the
securities markets. 2008
13_Capitulo 13_INGLES.qxd 24/7/09 19:06 Página 212

ancillary or oversight committee linked to the Board of Directors and, consequently,made up solely of members of the Board.
Although the actual number of members of the Audit Committee is not literallystated in the law, as a collegiate body it can be deduced that it must consist of atleast three directors (in which case, two of them must be non-executives). It is notpossible to constitute an Audit Committee with just one or two members. TheSecurities Market Act also requires that the majority of the committee members benon-executive directors, which strengthens the idea that there must be at least three.
The penalty for breach of the obligation to have an Audit Committee in the requiredterms was introduced in Act 47/2007, of 19 December, amending the SecuritiesMarket Act, by classifying as a serious violation (article 100 bis) “(…)failure byissuers of securities listed in official secondary markets to have an Audit Committeein the terms of additional provision eighteen of this Act”.
The precise nature of inside information
In 2008, the CNMV imposed penalties on two natural persons for insider dealing inconnection with the acquisition of shares of a listed company while they wereaware of negotiations for a major partner to acquire a stake in the company.
Article 81 of the Securities Market Act prohibits the use of inside information,which paragraph 1 of the Act defines as follows: “all information of a precise naturewhich has not been made public, relating, directly or indirectly, to one or moretransferable securities [...] or to one or more issuers of such transferable securities[...] which has not been made public and which, if it were made public, might haveor might have had a significant effect on the prices of those securities in a regulatedmarket or multilateral trading facility”.
Article 1 of Royal Decree 1333/2005, of 11 November, implementing the SecuritiesMarket Act, in connection with market abuse, states that “[...] the information willbe considered to be of a precise nature if it indicates a series of circumstances thatarise or may be reasonably expected to arise, or an event that has occurred or mayreasonably be expected to occur, where that information is sufficiently specific tomake it possible to reach a conclusion regarding the possible effect of that series ofcircumstances or events on the prices of the transferable securities or financialinstruments in question or of any derivative financial instruments related to them.”
The precise nature of the information must be evaluated on a case-by-case basis anddepends on the nature, the context and the reliability of the source. In general, theprecise nature of information is determined by the events to which it refers, i.e.rumours and speculation about vague, diffuse or uncertain events do not count.
Nevertheless, the precise nature of the information, i.e. of the facts it contains,should not be confused or identified with the conviction, certainty or security of theresults or consequences that may arise from them.
In short, where the law requires that the information be of a precise nature, it is notrequiring that it be complete, i.e. that it comprise all details of an event, but merelythat it entail express knowledge of a specific fact above and beyond mere rumours,opinions or suppositions. 213
Regulation
and supervision
of the securities markets
Disciplinary action
13_Capitulo 13_INGLES.qxd 24/7/09 19:06 Página 213

In a context of negotiations for a takeover bid or a merger or acquisition, partieswho are aware of this process by virtue of participating in it have preciseinformation, even if they did not attend all the meetings between the parties, or areunaware of the specific status of negotiations or the tentative price, and regardlessof whether or not an agreement is ultimately reached.
Imposition of penalties: graduation criteria
The penalty to be imposed on a firm or person should be graduated in accordancewith the principle of proportionality. That principle is enshrined in article 131 of Act30/1992, of 26 November, on the Legal Regime of the Public Administrations and theCommon Administrative Procedure, which states that “ [...] when the PublicAdministrations impose penalties, they must be proportional to the severity of theviolation, considering in particular the following criteria when graduating the penalty:
a) The existence of intent or repetition.
b) The nature of the harm caused.
c) Recidivism, i.e. commission within one year of more than one violation of thesame type, when so declared by a final decision.”
In the case of violations of securities market regulations, the criteria set out inarticle 14 of the Act on Control and Supervision of Credit Institutions also applydue to express reference thereto in article 98 of the Securities Market Act: “thepenalties applicable in each case for very serious, serious or minor violations shallbe determined on the basis of the following criteria:
a) The nature and magnitude of the violation.
b) The seriousness of the danger or damage caused.
c) The gains obtained, if any, as a result of the acts or omissions constituting theviolation.
d) The importance of the credit institution in question, measured as a function ofthe size of its balance sheet.
e) The adverse consequences of the events for the national financial system oreconomy.
f) Whether the violation was remedied on the perpetrator’s own initiative.
g) In the event of an equity shortfall, the objective difficulties in attaining ormaintaining the legal minimum.
h) The entity’s prior conduct in connection with the rules of control andsupervision that affect it, having regard to any final penalties imposed on it inthe previous five years”.
Where directors or executives of the violating entity are involved, the regulationprovides the following additional criteria:214
CNMV
Annual Report regarding
its actions and the
securities markets. 2008
13_Capitulo 13_INGLES.qxd 24/7/09 19:06 Página 214

“a) The person’s degree of responsibility for the events.
b) The person’s prior conduct, in the same or in another credit institution, inconnection with the rules of control and supervision, considering final penaltiesimposed on him/her in the last five years.
c) The representative capacity in which the person acted”.
Based on those criteria, any attenuating circumstances should be reflected in thepenalty but they may not serve as exonerating circumstances leading to a declarationof no liability.
Moreover, not all the foregoing criteria act as attenuating or aggravatingcircumstances. It is necessary to analyse and assess the specific case to decidewhether it should mitigate or exacerbate the penalty. Therefore, where none of theaforementioned circumstances arise, the penalty should be neither aggravated norattenuated.
13.2 Litigation Department: judicial review of disciplinary proceedingsand other actions
The corollary of a penalty in our legal system is the possibility of a review by theadministrative tribunals (the Ministry of Economy and Finance) and by theadministrative appeals courts; the CNMV has standing to defend the generalinterests entrusted to its care before such instances.
Among these functions, the Litigation Department is in charge of taking the stepsenvisaged by the Act Governing the Administrative Appeals Jurisdiction and incooperating in the defence of penalties that have been challenged and of the otherdecisions made by the CNMV in the scope of its powers.
In this context, one appeal for review by a higher instance and five motions forreconsideration were presented to the Ministry of Economy and Finance in 2008,and the Ministry issued decisions on 4 motions for reconsideration of penalties(Table 13.5). The appealed decisions were upheld in all cases.
Additionally, nine appeals were filed with the administrative courts, four of themagainst penalty decisions, one against a decision to dismiss penalty proceedings, oneagainst a decision rejecting pecuniary liability, and three against CNMV decisions.Twenty-three administrative appeals against acts or decisions of the CNMV wereupheld by the courts, including 14 penalties imposed by the CNMV or the Ministryof Economy and Finance (Table 13.5 and Annex IV.3). Apart from one appeal, whichwas upheld, all the court decisions confirmed the penalties.
Also, in compliance with the general imperative principle of providing theassistance that may be required by the judges and the courts, the Litigation andPenalties Department provides assistance to judges and courts of all types,particularly the criminal courts, basically in cases of alleged fraud, embezzlementand insider dealing.
A total of 84 such requests for assistance were handled in 2008 (Table 13.5). The bulkof requests (45) were from the civil courts. Those requests related basically to notices 215
Regulation
and supervision
of the securities markets
Disciplinary action
13_Capitulo 13_INGLES.qxd 24/7/09 19:06 Página 215

of attachment (which are the competency of the market governing companies),identification of securities owned by persons (knowledge of which lies with thesecurities depositories) and obtainment of evidence in proceedings of various types.
13.3 Warnings about unregistered firms
Through its website, the CNMV issues warnings to investors about unauthorisedfirms that have been detected by it or by other supervisors.
The following warnings were issued in 2008 (see Annex IV.4):
– Ten warnings (about ten entities) were issued under article 13 of the SecuritiesMarket Act, which entrusts the CNMV with protecting investors bydisseminating any information that may be necessary to that end.
– In the area of international cooperation, 256 communiqués were received fromEuropean and other countries in connection with unauthorised firms, and therewere 24 warnings in connection with improper conduct or actions.
Among the warnings published by the CNMV itself, of particular note is the onedated 7 April 2008 in connection with Evolution Market Group Inc (an entitytrading under the name Finanzas Forex), Mr Germán Cardona Soler and MrSantiago Fuentes Jover.
Evolution Market Group, Inc is an entity incorporated and domiciled in Panamawhich purportedly provides investments in the currency markets while guaranteeingvery high returns. Its chairman is Mr Germán Cardona Soler, a Spanish national, andMr Santiago Fuentes Jover is its most active marketer in Spain.
The company approaches potential investors in Spain and other European countriessuch as France, The Netherlands, Austria and in Scandinavia, as well as in LatinAmerican countries such as Venezuela and Colombia. In addition to the warningissued by the CNMV, the supervisory authorities in France and Panama also issuedpublic warnings.
Given the company’s transnational nature and the high risk faced by potentialvictims, the CNMV made specific efforts to warn the public by disseminating all thedata that was available at the time of the warning with a view to enhancing investorprotection.216
CNMV
Annual Report regarding
its actions and the
securities markets. 2008
Cases in which the CNMV participated in 2008 TABLE 13.5
Presented Decided
Administrative appeals 6 4
Appeals to a higher instance 1 —
Appeals for reconsideration 5 4
Appeals to the courts against administrative decisions 9 23
Pro memoria Assistance to the courts
Requests received for assistance 84
Source: CNMV.
13_Capitulo 13_INGLES.qxd 24/7/09 19:06 Página 216

Regulation
and supervision
of the securities markets
International activities
217
14 International activities
14.1 Introduction
The CNMV’s international activity in 2008 was shaped by the world economiccrisis. The crisis led to a notable increase in activity by forums of securitiessupervisors both in Europe (CESR) and worldwide (IOSCO, Joint Forum, etc.),which devoted a considerable amount of their time and efforts to attempting toreach a consensus on recommendations and proposals to regulators. The result wasthat the CNMV’s participation in international meetings and conference callsincreased with respect to 2007, particularly in the fourth quarter of the year due tothe collapse of Lehman Brothers and the first meeting of the G20 Heads of Stateand Government.
This chapter describes the main work performed by the international bodies towhich the CNMV belongs and those on which it worked in international inter-sectoral forums. The goal is to provide a general overview rather than a detaileddescription of the work, which is covered in other chapters of this report. Section14.2 describes the activities performed by CESR, and section 14.3 is devoted toIOSCO. Section 14.4 summarizes the initiatives undertaken in industry forums suchas the Joint Forum and the Coordination Committee of the CEBS, CEIOPS and CESR(“3L3”). The activities of the Instituto Iberoamericano del Mercado de Valores(IIMV) are described in section 14.5. And the final section describes actions in otherforums and bodies.
The CNMV’s intensive participation in CESR and IOSCO increased in 2008 sincethe Commission has representatives in most of the new working groups1 created toanalyze the measures which governments have adopted in line with therecommendations of the Council of the European Union, the Financial StabilityForum (FSF) and G20. The CNMV also assisted the new cross-sectoral workinggroups established by the EU level 3 committees and, with the Bank of Spain,participated in the working groups of the Joint Forum (comprising the banking,insurance and securities supervisors of the world’s leading economies). The CNMV’sinternational activities also included working with Spain’s Directorate-General ofthe Treasury and Finance Policy to prepare sessions of the European SecuritiesCommittee, in the working groups to review company law in the framework of theEU, and in the recommendations on corporate governance for the OECD.
Table 14.1 shows the CNMV’s participation in international meetings and thetechnical assistance provided to other countries.
1. The structure of CESR and IOSCO are described in tables 14.2 and 14.3.
14_Capitulo 14_INGLES.qxd 24/7/09 19:07 Página 217

CNMV
Annual Report regarding
its actions and the
securities markets. 2008
218
14.2 Committee of European Securities Regulators (CESR)
CESR’s agenda in 2008 was shaped by review of the Lamfalussy process which, inline with the route map established by EcoFin in December 2007, made substantialchanges to the internal workings of the sectoral regulators’ committees (banking,securities and insurance) and strengthened cooperation and information exchangebetween them. The review culminated in January 2009 with the decisions by theEuropean Commission (EC) to modify the previous decisions to establish CESR andthe other sectoral committees.
CESR also continued to conduct its ordinary activities in 2008, focused on advisingthe EC on implementing second-level legislation (directives and regulations of theCommission itself) and on convergence in the application of EU regulations throughthe production of standards, recommendations and guides.
CESR’s main areas of action are described briefly below, distinguishing its ordinarywork from that which arose as a result of the financial crisis and the review of theLamfalussy process.
Financial crisis
The activities of financial market regulators were shaped to a considerable extentby the developing crisis. This section describes the activities of CESR that wereaffected, in one way or another, by the crisis.
Financial reporting
In October 2008, CESR (with CEBS and CEIOPS) issued a declaration supportingthe amendment of IAS 39 with regard to reclassification of assets from the tradingportfolio to other portfolios (e.g. loan portfolio or assets held to maturity). Thismeasure eliminates the competitive disadvantage of European issuers with respectto their US counterparts, since US accounting standards allowed such areclassification in extraordinary circumstances. It also contributed, with CEBS andCEIOPS, to drafting the guides for the IASB Expert Advisory Panel on measuringand disclosing the fair value of financial instruments in markets that are no longeractive.
Attendance at international meetings and technical assistance TABLE 14.1
Number of meetings
2007 2008
CESR 84 142
IOSCO 42 65
European Union 18 27
OECD 6 7
Other forums 30 48
Total 180 289
Technical assistance missions 4 4
Source: CNMV.
14_Capitulo 14_INGLES.qxd 24/7/09 19:07 Página 218

Short selling
CESR established an ad hoc subgroup to consider the possibility of establishing acommon method for disclosing short selling, and setting minimum disclosurepercentages. The report is expected to be approved in the next few months.
Lehman Brothers
The collapse of US bank Lehman Brothers led to the creation of a CESR workinggroup to analyse the impact of this situation. In particular, the working groupstudied issues related to the marketing of financial products, the informationcontained in prospectuses, the transparency of structured products, and post-tradeprocesses. Some of these issues will be reviewed in 2009.
Credit rating agencies
At the request of the EC, CESR analyzed the role of the credit rating agencies inrating structured financial products. It also presented the EC with its proposals forstrengthening the integrity and quality of the credit rating process, includingnotably the creation of a European body entrusted with authorizing and supervisingthe rating agencies. In parallel, CESR assessed the degree to which the ratingagencies comply with the IOSCO Code of Conduct.
And, considering the imminent regulation of credit rating agencies by the EuropeanUnion, CESR established a permanent group of experts to advise the EC in this areaand, as appropriate, establish the procedures for performing the tasks to be assignedunder the new regulation.
Transparency of corporate bonds, structured finance products and credit derivatives
CESR commenced a review of the August 2007 conclusions regarding transparencyin trading in the bond markets in the light of the turbulence in the financial crisis.This review was expanded to include transparency in trading structured financeproducts and credit derivatives. The resulting report will be published in thesummer of 2009 following the mandatory public consultation process.
Review of the Lamfalussy process
In line with the recommendations contained in the roadmap drafted by the EcoFinin December 2007, the level 3 committees of financial regulators worked on severalparallel initiatives to strengthen convergence in supervision. The following threeinitiatives are particularly noteworthy:
Review of the level 3 committees’ charters
The main amendment consisted of eliminating the need for unanimity fordecisions, replacing it with a qualified majority. Also, although it was decided thatthe decisions of the supervisors’ committee should continue to be non-binding, ifthe national authorities decide not to apply the committees’ decisions, they mustexplain their position. Measures were also adopted to strengthen cross-sectoralcooperation and exchange of information, particularly in the area of financialstability. 219
Regulation
and supervision
of the securities markets
International activities
14_Capitulo 14_INGLES.qxd 24/7/09 19:07 Página 219

Training initiative
With CEBS and CEIOPS, CESR continued to teach cross-sectoral courses, whichwere attended by staff members of the three committees and of competentauthorities. In particular, the course on reputational risk and internal control,organised by the Bank of Spain and including lectures by the CNMV, was a greatsuccess.
The EC has decided to finance this initiative from 2009 onwards. Accordingly, thethree committees will establish a permanent structure for training.
Delegation of tasks and responsibilities
CESR, in cooperation with CEBS and CEIOPS, established three general principlesfor the delegation of tasks between financial supervisors. Delegation of tasks, whichis considered to be fundamental in order to enhance supervisors’ efficiency and alsostrengthen convergence, does not imply the delegation of responsibilities. The threecommittees will continue working in this area in 2009.
The Larosière report
In view of the severity of the financial crisis at the end of 2008, it became clear thatit was necessary to review the degree of coordination between European authoritiesin the supervision and regulation of securities markets and banking entities. As aresult, in October 2008, the European Commission established a high level group ofexperts, chaired by Jacques de Larosière, to draft a report setting up the priorities ofthe future framework for financial supervision and regulation in Europe.
The main recommendations of the report, published in February 2009, included theestablishment of a European Systemic Risk Council (ESRC), chaired by thePresident of the ECB, and consisting of the chairmen of the coordination groups ofEurope’s banking, insurance and securities regulators and supervisors, whosefunction would be to implement an effective early warning system for systemicrisks, and also the establishment of a European System of Financial Supervisors(ESFS) to centralize coordination in application of regulations, although day-to-daysupervision would remain in the hands of the national authorities. The Larosièrereport recommends a preparation period (2009-2010) and an implementationperiod (2011-2012).
Ordinary activities
Financial information (CESR Fin)
CESR drafted a number of documents, the most significant of which are as follows:
a. CESR statement on the reclassification of financial instruments. This documentanalyzed the use, by European financial institutions, of the authorization toreclassify assets in the financial statements for the third quarter of 2008.
b. Final report to the EC on the equivalence of third countries’ accounting standards,recommending the acceptance of Indian GAAP in 2011. 220
CNMV
Annual Report regarding
its actions and the
securities markets. 2008
14_Capitulo 14_INGLES.qxd 24/7/09 19:07 Página 220
c. Comments regarding IASB’s Exposure Draft on amendments to InternationalFinancial Reporting Standards, such as the amendment to IAS 31 regarding jointly-controlled entities, the proposal to establish a new framework for distinguishingbetween equity and debt, and the proposal to reduce the complexity of reportingfinancial instruments.
d. CESR published key information from its database of enforcement decisionstaken by EU National Enforcers of financial information (IFRS).
Market integrity (CESR Pol)
Through CESR-Pol, CESR continued to coordinate the activities of supervision,inspection and discipline between the Member States of the European Union. Inaddition to the measures related to short selling, CESR developed a third set ofguidance and information on the common operation of the Market Abuse Directive.Specifically, it addressed the drafting of lists of insiders, reports of suspicioustransactions, stabilization and share buyback programmes, and inside information.
Also, in coordination with the SEC, CESR established a procedure for informinginvestors how to proceed if affected by the Madoff fraud.
Review of CESR standards and guides and of the application of EU regulations(Review Panel)
Continuing with the self-assessment by regulators of the degree of implementationof the European financial regulations, which commenced in 2007, CESR reviewedthe degree of application of the guides for simplifying procedures for notificationabout UCITS between regulators in different Member States.
CESR also drafted a mapping methodology which was used in the review conductedduring 2008 (completed early in 2009) of the supervisory powers and practices andthe administrative and criminal disciplinary regimes of the various Member Statesin connection with MiFID.
MiFID
Following the entry into force of MiFID in November 2007, CESR has been workingintensely on level 3 regulation through two subgroups: one on markets and one onintermediaries (chaired by the CNMV).
The activities of the subgroup on intermediaries included notably theimplementation of a protocol for supervising branches, the drafting of a MiFIDGuide for retail investors, the production of FAQ documents on particular aspectsof applying MiFID, and the publication of supervision manuals on best execution,conflicts of interest and inducements.
In addition to analyzing transparency in the markets in bonds, structured productsand credit derivatives, the markets subgroup also drafted a protocol for trading haltsand exclusions of financial instruments and an analysis of (i) the impact of MiFIDon secondary markets in securities, (ii) calculation methods for determining netasset values, and (iii) discretionary orders.
The entry into force of MiFID also led to the implementation of the TransactionExchange Mechanism (TREM) for the exchange of information on transactions in 221
Regulation
and supervision
of the securities markets
International activities
14_Capitulo 14_INGLES.qxd 24/7/09 19:07 Página 221

financial instruments listed in regulated markets in the Member States. CESR decidedto expand the capacity of the TREM to include information on OTC transactions infinancial instruments. This project will have specific funding from the EC.
Undertakings for Collective Investment in Tradable Securities (UCITS)
In the area of collective investment, CESR addressed the following issues:
– Advising the EC on the passport for management companies. This will beincluded in the amendment to the UCITS Directive.
– Drafting the principles of risk management for UCITS management companies,which were approved in 2009.
– Continuing with the work to design Key Investor Information, which willreplace the simplified prospectus.
– Commencement of an analysis of the situation in Europe of money marketfunds, hedge funds and real estate investment trusts in the context of the currentfinancial crisis.
Other actions
In the area of post-trade, the IOSCO recommendations on clearing and settlementsystems and central counterparties were adapted to the European regulatoryenvironment, based on the recommendations of the Basel Committee on Paymentand Settlement Systems (CPSS) and IOSCO. Also in this area, CESR is advising theEC on mapping existing agreements for access and interoperability in post-tradinginfrastructures.
CESR has also been working in parallel with the EC on mutual recognition ofregulated markets and financial institutions with other jurisdictions, e.g. theUnited States. Finally, CESR provided advice to the EC on two areas related tocommodities:
a) Working with CEBS on the review that the EC must perform of the exceptionscontained in the MiFID and the Capital Requirements Directive for membersthat trade in commodities.
b) Working with the European Regulators’ Group for Electricity and Gas (ERGEG)on the ongoing review by the EC of the Electricity and Gas Directives within theThird Energy Package. The review covered market abuse, transparency,information storage and exchange of information between energy and securitiesregulators.
14.3 International Organization of Securities Commissions (IOSCO)
Since 1990, the CNMV has been an ordinary member of IOSCO, whoseheadquarters are located in Madrid, and it participates actively in its Executive,Technical and European Region committees. In 2008, the CNMV was re-elected fora further two years as the representative of the European Regional Committee onthe Executive Committee.222
CNMV
Annual Report regarding
its actions and the
securities markets. 2008
14_Capitulo 14_INGLES.qxd 24/7/09 19:07 Página 222

The CNMV also participates in the working groups organised by those committees,both the permanent groups and those established ad hoc for specific issues. IOSCO’smain activities in 2008 were as follows:
The financial crisis and the role of IOSCO
The international financial crisis had a substantial impact on IOSCO’s work plan.
At a meeting of the Financial Stability Forum in April 2008, in which the BaselCommittee on Banking Supervision, the International Association of InsuranceSupervisors (IAIS) and IOSCO participated, recommendations were made for workin the following five areas: a) Strengthening prudential supervision of financialinstitutions, particularly in the areas of capital, liquidity and risk management; b)Strengthening transparency and asset valuation; c) Changes in the role played bycredit rating agencies; d) Strengthening the authorities’ capacity of response tosituations of risk; and e) Stronger agreements for managing crises in the financialsystem.
From the perspective of IOSCO, the FSF’s most significant recommendations werethose addressed to securities regulators urging them, in conjunction with marketparticipants, to strengthen and improve transparency at each stage of thesecuritisation process, and the implementation of the Code of Conduct (revised) forthe rating agencies, especially in handing conflicts of interest and improving thequality and transparency of the rating process.
In 2008, IOSCO published two documents on issues raised by the crisis: subprimemortgages, and credit rating agencies.
The report on subprime mortgages2 analyzed the causes of the crisis, drewconclusions on the need to enhance and amend the IOSCO Code of Conduct forrating agencies, and drew up 11 recommendations in the form of mandates fordevelopment by permanent working groups reporting to the Technical Committee.
In May, IOSCO approved the new Code of Conduct for credit rating agencies3. Thereview focused on their activity with regard to structured financial products. IOSCOis to establish a permanent committee on ratings to liaise continuously with theindustry with regard to new legislation and to increase cooperation in this area.
Prior to the G20 meeting in Washington in November 2008, the chairs of theExecutive, Technical and Emerging Markets Committee, in representation of IOSCO,sent an open letter to the chairman of the Financial Stability Forum and otherrepresentatives at the G20 setting out their views on the agenda. Following the G20meeting, which set the general lines for the reform of the international financialsystem, IOSCO established a number of working groups to analyse the issues thatare related to the securities markets. Specifically, it set up four working groups onthe following issues: transparency of short selling; unregulated or insufficiently-regulated entities, focused on hedge funds; unregulated products and markets(trading in structured finance products and credit default swaps); and a working
223
Regulation
and supervision
of the securities markets
International activities
2. Report on the Subprime Crisis. IOSCO, Technical Committee. May 2008.
3. Code of Conduct Fundamentals for Credit Rating Agencies. IOSCO, Technical Committee. May 2008.
14_Capitulo 14_INGLES.qxd 24/7/09 19:07 Página 223
group to develop a new strategic plan for the organisation. The conclusions of thiswork will be released early in 2009.
Accounting, auditing and dissemination of information
In the accounting area, IOSCO issued a public statement, through its TechnicalCommittee, supporting the efforts of the International Accounting Standards Board(IASB) and the Financial Accounting Standards Board (FASB) in the search formeasures on fair value and asset reclassification.
With regard to auditing, IOSCO monitored the new international standards issuedby the International Auditing and Assurance Standards Board (IAASB) with the goalof increasing their clarity and homogeneity (Clarity Project). This project concludedrecently.
IOSCO also published a Contingency Plan to prepare for the eventuality of an auditfirm finding itself in difficulties that might affect the issuance of auditors’ report.The plan includes guides for regulators, which can draw up the necessaryprocedures as a function of powers in the area of audit.
Two projects are still under way. One is to develop principles for periodical disclosureby listed companies with the goal of improving those disclosures on an internationallevel. The second deals with the development of principles for disclosures whenissuing asset-backed securities.
Secondary markets and intermediaries
These groups did a range of work in 2008 which will be released for publicconsultation early in 2009. The markets group drew up principles on direct accessto markets and on outsourcing services. The intermediaries group worked with theUCITS group to analyse obligatory disclosures to investors when commercialisingmutual funds or similar products.
Cooperation and exchange of information. IOSCO Multilateral MOU
In line with the decision adopted by IOSCO in its strategic plan, all its membersmust be signatories of the Multilateral Memorandum concerning Consultation andCooperation and the Exchange of Information by 2010. Nevertheless, thosejurisdictions where material changes in legislation are required in order to fulfil therequirements of the MoU must undertake to make all necessary efforts to completethem. At the end of 2008, 51 jurisdictions had signed the Memorandum and other21 had undertaken to sign it once their legislation allowed. That is, approximately63% of the membership have completed the process, and a significant number ofmembers are in the process.
In 2008, the CNMV continued to provide technical assistance to jurisdictions whichrequested it, principally in Latin America.
Another important task performed in 2008, supported by the Financial StabilityForum, was dialogue with jurisdictions with which there are difficulties in the area224
CNMV
Annual Report regarding
its actions and the
securities markets. 2008
14_Capitulo 14_INGLES.qxd 24/7/09 19:07 Página 224

of cooperation and the exchange of information. The goal was to identify the factorspreventing cooperation, such as lack of resources or the lack of specific regulationsgoverning corporation. Once the causes were identified, technical assistance wasprovided in an attempt to overcome them.
UCITS
IOSCO’s work in this area led to the publication of the following documents:
Review of the regulatory issues relating to real estate funds
This document reviews regulatory issues of real estate funds and sets out the repliesby a range of jurisdictions to a questionnaire on this issue. The report indicateswhether or not a jurisdiction has specific regulations in this area and identifiessignificant aspects such as asset valuation, conflicts of interest, liquiditymanagement, and ownership of the properties.
Funds of hedge funds
The purpose of this report was to assess whether the principles set out in previousreports needed to be amended or updated. It focused on examining the regulationor draft regulation on funds of hedge funds in member jurisdictions, identifying anyaspect of risk for regulators, and developing standards for these funds based on bestpractices. The report concludes that it is necessary to establish principles in twospecific areas: liquidity risk, and the characteristics required of the due diligenceprocess.
Other actions
In 2008, the Presidents’ committee adopted a specific plan of action for reviewingand updating IOSCO’s principles and objectives, which is scheduled for completionin 2011. The plan will consist of two phases: (1) a review of the principles andmethodology for self-assessment issued since the last review in 2003, and (2)maintaining the current structure of the principles in order to complete and improvethe texts.
14.4 International inter-sectoral forums
The CNMV participated actively in inter-sectoral international forums of financialsupervisors during the year.
Joint Forum
As occurred with other forums and committees of financial regulators andsupervisors, the financial crisis affected the activities of the Joint Forum (JF)4. Inaddition to the standard mandates from international associations of regulators
225
Regulation
and supervision
of the securities markets
International activities
4. The Joint Forum groups banking, securities and insurance regulators; the CNMV has been a member since
its foundation in 1999.
14_Capitulo 14_INGLES.qxd 24/7/09 19:07 Página 225

(Basel Committee on Banking Supervision, IOSCO, the International Association ofInsurance Supervisors), the Joint Forum is also working more intensely as a result ofmandates from the Financial Stability Forum. In this context, the most significantactions by the Joint Forum in 2008 (some of which will be continued in 2009) wereas follows:
Work completed in 2008
1. Evaluation of the degree of compliance with the Joint Forum’s principles on thesupervision of financial conglomerates.
2. Identification and management, by financial institutions, of concentration riskand the use of stress tests.
3. Risk management in commercialization of financial products (legal, reputationaland operating risks).
Work performed at the request of the Financial Stability Forum
1. Update of the report on credit risk transfer.
2. The use of agency ratings by regulators and investors
3. Treatment of the transfer or retention of risk in off-balance sheet vehicles.
Finally, in response to a request from the G20 meeting in November 2008, the JointForum will evaluate differences and loopholes in existing financial regulation.
CEBS-CEIOPS-CESR coordination committee (3L3)
The working protocol of the 3L3, the group comprising the presidents andgeneral secretaries of the three level 3 supervisors, was revised in November 2008to enhance the group’s activities (the protocol had been in force since 2005). Ashort- and medium-term work plan for 3L3 was sent to the EC. In line with thework plan, a number of the tasks envisaged in the review of the Lamfalussyprocess, such as joint training initiatives and the establishment of generalprinciples for task delegation between European Union financial supervisors,were undertaken.
Other areas of action by 3L3 in 2008 were:
1. Principles for the fit and proper criteria in cross-border mergers and acquisitionsof financial institutions.
2. Internal Governance: evaluation of regulatory differences in the MiFID, CRD andUCITS Directive.
3. Study on issues related to money laundering.
A mandate was approved in 2008 for 3L3 to work in 2009 on developing commonrisk management criteria and, based on its work plan, it will foreseeably conduct asurvey of remuneration and compensation policies for financial institutionexecutives. 226
CNMV
Annual Report regarding
its actions and the
securities markets. 2008
14_Capitulo 14_INGLES.qxd 24/7/09 19:07 Página 226

14.5 Instituto Iberoamericano del Mercado de Valores (IIMV)
The IIMV is a legal person with full functional independence. The CNMV chairs itsBoard of Trustees and works closely with the IIMV to promote Latin America’ssecurities markets through joint training and cooperation programmes.
During the year, the IIMV undertook 13 training and cooperation activities (two on-line and the other 11 face-to-face), covering such important areas of interest to LatinAmerica as: (1) regulation of the markets in corporate control, (2) takeover bids andprotecting the interests of minority shareholders, (3) IFRS/IAS, focusing particularlyon the accounting regulations for financial instruments, (4) the regulatoryframework for valuing assets, (5) supervision of the new forms of collectiveinvestment, legislative development to support venture capital, (6) dissemination ofthe XBRL standard, (7) information system security and the development of newapplications and tools for disseminating information, and (8) processes and actionsin the oversight, inspection and discipline of entities.
Additionally, the Forum on models of supervision in Latin America’s financialmarkets was attended by the top-level supervisory authorities from Argentina,Bolivia, Brazil, Costa Rica, Colombia, Chile, El Salvador, Spain, Mexico, Panama,Portugal, the Dominican Republic, Uruguay and Venezuela.
14.6 Other forums and activities
Iberian Electricity Market (MIBEL)
The international convention between the Kingdom of Spain and the Republic ofPortugal which regulates the Iberian market in electricity (MIBEL) was updated in2008. In the first half of 2009, the CNMV became chairman of MIBEL’s Board ofRegulators, comprising the two countries’ securities and energy regulator (the chairis rotated).
The strictly financial issues addressed by the MIBEL Board of Regulators in 2008included notably the conversion of the forward or derivatives market (OMIP) into aregulated market in accordance with MiFID, increasing the capital of OMIP and ofits clearing house (OMIClear), and a range of regulations in the market and theclearing house aimed at increasing market liquidity (which is still relatively low).
Organisation for Economic Cooperation and Development
The CNMV has been providing regular assistance to Spain’s Directorate-General ofthe Treasury and Finance Policy in the OECD working groups and committees toreview the OECD Principles of Corporate Governance.
In 2008, considerable work was done to implement the new work methodology forexamining the application of these principles in the various national jurisdictions.The CNMV worked actively with the OECD Secretariat in drawing up frameworkdocumentation that will serve as a basis for examining and evaluating theimplementation of the OECD principles in the countries wishing to join theorganisation in 2009. The Spanish delegation also cooperated in the annual LatinAmerican corporate governance conference, held in Mexico in December 2008. 227
Regulation
and supervision
of the securities markets
International activities
14_Capitulo 14_INGLES.qxd 24/7/09 19:07 Página 227

International responses to the financial crisis
Responding to the economic and financial situation, a number ofinternational bodies have been working to attenuate the crisis and preventfuture crises. To provide a global response to the events that resulted fromthe September 2008 collapse of Lehman Brothers, the G20 held its firstmeeting in November 2008. The meeting established some principles withregard to working to improve the financial markets:
– Strengthening transparency of financial markets and products.
– Enhancing sound regulation.
– Promoting integrity in financial markets.
– Reinforcing international cooperation.
– Reforming international financial institutions.
The conclusions of the work performed since then will be analysed andreleased at the next G20 meeting, in April 2009. The recommendations to bepresented at the summit were outlined by the Ministers of Finance and theGovernors of the Central Banks, focusing on the following principles:
– All financial institutions, markets and instruments that have the potentialto generate systemic risk should be regulated and supervised.
– Greater regulation should be accompanied by strengthenedmacroprudential supervision.
– Financial regulation must ensure that capital requirements arestrengthened in the expansive phase of the economic cycle.
– There should be more international cooperation between supervisors toprevent and resolve crises, and the IMF and FSF should establish earlywarning systems.
In 2008, the FSF drafted reports containing recommendations on thefollowing issues, among others: prudential supervision, risk management andliquidity, the role of credit rating agencies, and greater cooperation andexchange of information between financial supervisors.
Within the EU, work was done in 2008 on developing legislation related tothe financial crisis, which will be submitted for approval in the first half of2009. The main measures are:
– Review of the Capital Requirements Directive to limit the risk whichcredit institutions can assume.
– Regulation, registration and supervision of the credit rating agenciesthat operate within the EU.
228
CNMV
Annual Report regarding
its actions and the
securities markets. 2008
14_Capitulo 14_INGLES.qxd 24/7/09 19:07 Página 228
creo

229
Regulation
and supervision
of the securities markets
International activities
– Increase of the minimum guarantee on customer deposits at creditinstitutions.
– Review of the criteria for setting executive remuneration at financialinstitutions.
In October 2008, the President of the European Commission entrusted a groupof experts headed by Jacques de Larosière with the task of drawing uprecommendations to strengthen financial supervision in Europe. The grouppresented its conclusions on 25 February and the recommendations and theirimplementation are currently being considered by the European institutions.
International Support Unit (Litigation and Penalties Department)
The CNMV’s Litigation and Penalties Department handles cooperation with othersupervisors in the area of investigation. In 2008, it issued 65 requests to regulatorsin other countries (55 in 2007) and handled 28 incoming requests for cooperation(44 in 2007). Approximately half of incoming requests for assistance related toinvestigations of market abuse and the other half to investigations of activities beingperformed in the securities markets by unauthorised parties. Approximately three-quarters of outgoing requests for assistance to foreign regulators were related tomarket abuse and the remainder to unauthorised firms.
14_Capitulo 14_INGLES.qxd 24/7/09 19:07 Página 229

230
CNMV
Annual Report regarding
its actions and the
securities markets. 2008
CES
R: g
roup
s an
d s
ubg
roup
sTA
BLE
14.2
Hie
rarc
hica
l dep
ende
ncy
Inst
itutio
nal r
elat
ions
hip
FIN
-NET
Take
over
bids
net
wor
kPr
ospe
ctus
es
Cre
dit r
atin
gag
enci
es
UC
ITS-
Port
folio
man
agem
ent
Stan
ding
Com
mitt
ees RE
VIEW
PA
NEL
Surv
eilla
nce
& In
telli
genc
e
UC
ITS
FIN
ALI
TYA
ND
SET
TLEM
ENT
CA
PITA
LA
DEQ
UA
CY
CA
PITA
LRE
QU
IREM
ENTS
CRE
DIT
RATI
NG
AG
ENC
IES
CES
R-FI
N
CES
R-PO
L
Cha
irman
:Ro
drig
o Bu
enav
entu
raH
ead
of S
econ
dary
Mar
kets
Dep
arta
men
t CN
MV
Cha
irman
:Fe
rnan
do R
esto
yVi
ce-P
resi
dent
CN
MV
EEC
S
Equi
vale
nce
Fair
Valu
e
Euro
pean
Sec
uriti
es C
omm
ittee
Cons
ulta
tive
Com
mitt
eePr
esid
ents
' Com
mitt
ee
Inte
rmed
iatio
n
ECO
NET
3L3
Trai
ning
Initi
ativ
e
Tran
sact
ion
Repo
rtin
g on
OTC
3L3
Del
egat
ion
Cons
umer
Net
wor
k
Mut
ual
Reco
gniti
on
Cle
arin
gan
d Se
ttle
men
t
CES
R TE
CH
Hum
anre
sour
ces
Med
ia
Corp
orat
eG
over
nanc
eN
etw
ork
COU
NC
IL
Tran
spar
ency
Dis
clos
ure
of s
igni
fican
tho
ldin
gs
MiF
ID
Inte
rmed
iarie
s
Ope
raci
onal
Key
inve
stor
Dis
clos
ure
Tem
pora
rygr
oups
Cha
irwom
an:
M.ª
José
Góm
ez Y
uber
oH
ead
of In
vest
ors
Dep
artm
ent C
NM
V
SEC
RETA
RIA
TC
ESR
Mar
kets
Tran
spar
ency
of s
truc
ture
dfin
ance
pro
duct
s
DIR
ECTI
VES/
REG
ULA
TIO
NS
EURO
PEA
N C
OM
MIS
SIO
NPA
RLIA
MEN
T
14_Capitulo 14_INGLES.qxd 24/7/09 19:07 Página 230
creo

231
Regulation
and supervision
of the securities markets
International activities
IOSC
O: g
roup
s an
d s
ubg
roup
sTA
BLE
14.3
Hie
rarc
hica
l dep
ende
ncy
Inst
itutio
nal r
elat
ions
hip
Join
t For
um
Tech
nica
l Com
mitt
ee
IOSC
OSe
cret
aria
t
Wor
king
gro
ups
Pres
iden
ts' C
omm
ittee
Exec
utiv
e Co
mm
ittee
Regi
onal
Com
mitt
ees
Emer
ging
Mar
kets
Com
mitt
ee
Euro
pean
Regi
onal
Com
mitt
ee
COSR
A
Vice
-Cha
irman
:Fe
rnan
do R
esto
yVi
ce-P
resi
dent
CN
MV
Scre
enin
Gro
up
Verif
icat
ion
2.º G
ROU
P
Impl
emen
tatio
n
TASK
FORC
ES
Subp
rime
Aud
iting
Corp
orat
ego
vern
ance
Cre
dit r
atin
gag
enci
es
Priv
ate
Equi
ty
STA
ND
ING
COM
MIT
TEES
SC1
Acc
ount
ing
Acc
ount
ing
Dis
clos
ure
Aud
iting
IFRS
SC2
Mar
kets
SC3
Inte
rmed
iarie
s
Tran
spar
ency
of s
truc
ture
dfin
ance
pro
duct
s
Poin
t of s
ale
disc
losu
re
SC4
Enf
orce
men
t
SC5
Inve
stm
ent
man
agem
ent
Hed
ge F
unds
14_Capitulo 14_INGLES.qxd 24/7/09 19:07 Página 231
creo

14_Capitulo 14_INGLES.qxd 24/7/09 19:07 Página 232

V CNMV: organisation, finance and institutional aspects
15_Capitulo 15_INGLES.qxd 24/7/09 19:08 Página 233

15_Capitulo 15_INGLES.qxd 24/7/09 19:08 Página 234

CNMV:
organisation, finance
and institutional aspects
Organisation
235
15 Organisation
15.1 Human resources
The CNMV had 369 employees at the end of 2008, i.e. 18 more than at 2007 year-end.The net growth in the workforce is the result of 38 new hires and 20 departures.
The Public Sector Hiring Process of 2008, which included 45 positions for theCNMV, is expected to be completed in the first half of 2009. Assuming that thosepositions are filled, the workforce will have expanded by approximately 18% (Table15.3).
CNMV staff: composition by professional category TABLE 15.1
Number of employees at 31 December
2007 2008
Total Men Women Total Men Women
Services 9 8 1 9 8 1
Clerical/Computer operators 63 12 51 66 14 52
Technical 258 122 136 274 131 143
Management 21 14 7 20 13 7
Total 351 156 195 369 166 203
Source: CNMV.
Breakdown of CNMV staff by division TABLE 15.2
Number of employees at 31 December
2007 2008
Total Men Women Total Men Women
Line Directorates-General: 219 92 127 234 100 134
Entities 97 39 58 103 42 61
Markets 90 40 50 98 45 53
Legal Counsel 32 13 19 33 13 20
Directorates 116 60 56 119 63 56
Board 16 4 12 16 3 13
Total 351 156 195 369 166 203
Source: CNMV.
15_Capitulo 15_INGLES.qxd 24/7/09 19:08 Página 235

CNMV
Annual Report regarding
its actions and the
securities markets. 2008
236
The following human resources policy initiatives were implemented in 2008:
– A Development Programme for University Graduates was implemented, with tencandidates to be selected in the 2008 Public Sector Hiring Process. TheProgramme aims to provide selected candidates with a comprehensiveunderstanding of how the CNMV works. During the two-year Programme,participants will receive specific training adapted to the needs of each CNMVdepartment, where they will rotate for periods of six months to one year. Theprogramme will begin in the first half of 2009 once the current selection processhas been completed. The programme is scheduled to be repeated in the 2009.
– The needs of each Department were analysed with a view to drafting an internaltraining plan to be implemented in 2009. Moreover, another edition of theTraining Programme was launched in English, the goal being to continuedeveloping English-language communication skills.
– Negotiation with the Works Committee as regards the first Collective Agreementfor CNMV employees who are not civil servants, which began in 2007, madesignificant progress in 2008, approximately 75% of the agreement having beencompleted.
– The first agreement with the Committee of European Securities Regulators(CESR) came into force, implementing the programme to promote professionalexchanges between the various European supervisors in the form of temporarysecondments.
– Due to review of the Safety Plan for the building on Calle Marqués de Villamagna,3, the Emergency, Evacuation, and First Aid Plan for the CNMV offices locatedthere was revised and updated.
15.2 Information systems
The CNMV had two main goals for its IT networks in 2008: (i) to implement thenecessary software to support the application of the new Circulars that entered into
Breakdown of CNMV staff by division (projection) TABLE 15.3
Projected number of employees at 31 December 2008, including the 45 positions offered in the
Public Sector Hiring Process
2007 2008
Total Total Total
actual actual Positions projected
staff staff announced staff
Line Directorates-General: 219 234 32 266
Entities 97 103 23 126
Markets 90 98 8 106
Legal Counsel 32 33 1 34
Directorates 116 119 13 132
Board 16 16 0 16
Total 351 369 45 414
Source: CNMV.
15_Capitulo 15_INGLES.qxd 24/7/09 19:08 Página 236
CNMV:
organisation, finance
and institutional aspects
Organisation
237
force, and (ii) as part of the General Contingency Plan, to implement newinfrastructure in the main and backup data centres and the users’ backup centre.The plan to promote e-administration continued as seven new procedures wereadded to the electronic registry.
As regards regulated information from issuers, new software was implemented toreceive, register and disseminate disclosures of significant holdings, annualcorporate governance reports and interim financial reports (quarterly and half-yearly reports) with a new IPP taxonomy in XBRL.
New processes were also implemented to receive, use and, if appropriate,disseminate periodic disclosures by UCITS to the CNMV. The implementation of anew version of the electronic prospectus for UCITS was completed.
The implementation was completed of procedures for electronic reception, byvarious methods and from various sources, of disclosures relating to transactionsin financial instruments, now including data on the person conducting thetransaction.
The pilot project within the plant for comprehensive management of documents inimage format was completed and the new system was rolled out for all proceduresat the Entities Authorisation and Registration Department.
CNMV Activities Plan 2009: revision and update
Last February, as it has done since October 2007, the CNMV presented itsActivities Plan for 2009. The only other European supervisory body topublish a similar plan is the UK’s FSA; the CNMV Plan is an exercise intransparency and accountability that goes beyond legal requirements, since itdetails objectives established until the first quarter of 2010 and trackscommitments included in the first Plan (2007-2008), disclosing their degreeof fulfilment and explaining the reasons for any changes or delays.
The degree of execution of plans envisaged for 2008 was shaped by thecomplexity of the global financial situation. Due to the heightening of thecrisis and the succession of unexpected events, the CNMV had to re-evaluatepriorities and redefine objectives to adapt to new requirements.
The collapse of Lehman Brothers and the Madoff fraud required resources tobe re-allocated with a view to ensuring maximum transparency as regards theimpact of those events and conducting adequate supervision. In 2008,collaboration intensified with the Government on issues such as theimplementation of the Financial Assets Acquisition Fund (FAAF) andgovernment guarantees. That collaboration also expanded to encompassdefining and coordinating positions at an international level due to thegrowing debate about the financial crisis in various international forums.
Various objectives required more resources than initially estimated. Forexample, special efforts were necessary to review asset valuation in illiquidmarkets, both in UCITS portfolios and on corporate balance sheets. Moreresources were allocated to establishing and applying criteria with regard to
15_Capitulo 15_INGLES.qxd 24/7/09 19:08 Página 237
creo

CNMV
Annual Report regarding
its actions and the
securities markets. 2008
238
securities issued by banks for sale to their customers, the goal being to ensurethat investors receive adequate information regarding the issue conditions,guarantee fair valuation and monitor compliance with best practices in thecommercialisation of those issues.
In this context, the CNMV fulfilled a large percentage of the 67 objectivesinitially envisaged in the 2007-2008 Plan. Specifically, the CNMV completed85% of its goals, including those that were finalised in the first quarter of2009. Of those, 41 (61% of the total) were completed within the originaldeadlines. Including the 11 that were fulfilled in the first quarter of 2009, andexcluding those whose completion did not depend solely on the CNMV, just10 objectives (15% of the total) were not completed in the period initiallyenvisaged. The CNMV completed a large number of regulatory projects in thelast year. Of the 21 Circulars included in the Plan, 16 were drafted andapproved (the same as the number of Circulars drafted in the last six years).
The Activities Plan for 2009 maintains the strategic lines identified in theSecurities Market Act, placing special emphasis on lessons from the crisis andthe need to revive confidence in the financial system. Under the Plan, theCNMV undertakes to approve nine additional Circulars; accordingly, in thelast two years, the Commission will have approved two-thirds of the Circularsdrafted in its 21 years of existence. The Plan emphasizes improvingtransparency as one of its principal goals, while also maintaining rigorousoversight of listed companies’ financial information and the quality ofinformation provided to retail investors. The 2009 Plan seeks to improvequality in the provision of investment services, enhance investor training andprotection, and detect potential cases of market abuse. It also recognises theneed to strengthen mechanisms for cooperation between supervisoryauthorities, particularly to monitor global groups and institutions (e.g. ratingagencies) while establishing a set of objectives aimed at improving theorganisation internally and strengthening its human capital so as to increasethe Commission’s flexibility and effectiveness.
CNMV 20th Anniversary
The CNMV celebrated its 20th anniversary in 2008, since it was established byvirtue of Act 24/1988, of 28 July, on the Securities Market Law, and played afundamental role in the reform of Spain’s securities market which began in1988. A series of commemorative activities were organised in 2008 to reflect onthe transformation of the securities markets and on the challenges that remainin terms of financial integration and the adaptation of supervisory structures.
Most of the events were held in September 2008, coinciding with the meetingof the International Organization of Securities Commissions (IOSCO), towhich the CNMV belongs and whose headquarters are located in Madrid.
In particular, the 20th Anniversary International Conference broughttogether representatives of the world’s leading financial market regulators todiscuss global prospects, the challenges facing the securities markets, and thestatus and outlook for integration of Europe’s securities markets.
15_Capitulo 15_INGLES.qxd 24/7/09 19:08 Página 238
creo

The conference was attended by experts such as EU Economic and MonetaryAffairs Commissioner, Joaquín Almunia, Chairman of the New ZealandSecurities Commission and of IOSCO’s Executive Committee, Jane Diplock,and Chairman of CESR, Eddy Wymeersch. Spain’s Second Vice-President ofthe Government and Minister of Economy and Finance, Pedro Solbes, gave aclosing lunchtime address.
The Conference speeches have been compiled in a special bookcommemorating the CNMV’s 20th Anniversary, which also includes adetailed analysis of the transformation of Spain’s financial markets over thelast two decades by Gonzalo Gil entitled: “The Spanish Financial System:current situation and medium term prospects”.
The Latin American Forum on Supervision Models was also held inSeptember. It was organised jointly with the Instituto Iberoamericano delMercado de Valores (IIMV) and brought together leading Latin Americansupervisors to reflect on the various models for institutional supervision;participants included Corporación Andina de Fomento (CAF) and Spain’sDirectorate-General of the Treasury and Finance Policy.
A number of celebratory events were also held with CNMV employees andformer members of the CNMV Board of Directors, the goal being to recognisethe importance of human capital in the institution’s ongoing development.
239
CNMV:
organisation, finance
and institutional aspects
Organisation
15_Capitulo 15_INGLES.qxd 24/7/09 19:08 Página 239

15_Capitulo 15_INGLES.qxd 24/7/09 19:08 Página 240
CNMV:
organisation, finance
and institutional aspects
Finances
241
16 Finances
16.1 Revenues and expenses
In 2008, the CNMV obtained 61.6 million euro in revenues and incurred 42.2 millioneuro in expenses; therefore, the surplus for the year amounted to 19.4 million euro.
The bulk of revenues were from fees: 55.6 million euro, 1.4% more than in 2007.The other revenues were mainly from interest and, to a lesser extent, from the saleof publications and other sources (professional information disseminators, recoveryof expenses for announcement of tenders, etc.).
Total expenses increased by 14.4% with respect to 2007. Personnel expenses, whichaccounted for 56.5% of the total, increased by 4.5% with respect to 2007, and theaverage headcount increased by 1.7%. Other expenses increased by 30.6%. Thisincrease was due mainly to other management expenses (up 33.8% year-on-year) asa result of higher spending on leases and the acquisition of non-capitalisablematerials. Increased lease expenses are due to new office rentals in order to relocatestaff during the scheduled renovation work at the headquarters building. Theincrease in non-capitalisable materials reflects the computer, security and otherfittings installed in 2008 in the new leased offices.
On 5 December 2008, at the proposal of the CNMV, the government resolved toallocate the 2007 surplus to the Treasury.
16.2 Fee structure
Table 16.1 shows the fees for the various services that the CNMV performs; feerevenues rose by 1.4% in 2008.
This increase is due largely to the growing pace of revenues from Sociedad deSistemas member supervision fees (16.6%), which offset the decline in revenuesfrom prospectus and entity registration fees (-6.1%) and from UCITS supervisionfees (-14.2%).
16_Capitulo 16_INGLES.qxd 24/7/09 19:09 Página 241

CNMV
Annual Report regarding
its actions and the
securities markets. 2008
242
CNMV fee revenues TABLE 16.1
Thousand euro
Activity or service 2007 2008 % chg. 08/07
Registration of prospectuses and
market participants 11,449.1 10,755.1 -6.1
Prospectus registration 9,535.3 9,881.0 3.6
Issue prospectuses 7,461.7 7,973.4 6.9
Listing prospectuses 590.9 339.4 -42.6
Vetting of AIAF listing requirements 1,482.6 1,568.2 5.8
Market participant registration 1,166.1 660.0 -43.4
Authorisation of takeover bids 747.8 214.1 -71.4
Market supervision 29,549.3 32,739.0 10.8
AIAF members 237.3 270.6 14.0
Sociedad de Sistemas members 17,237.4 20,093.6 16.6
Stock exchange members 11,650.6 11,853.8 1.7
MEFF RF members 2.5 2.4 -6.1
MEFF RV members 420.2 517.3 23.1
MFAO members 1.1 1.3 12.8
Market participant supervision 13,874.9 12.139,7 -12.5
UCITS supervision 12,766.7 10,959.5 -14.2
Mutual funds 10,922.3 9,077.5 -16.9
Investment companies 1,471.8 1,529.1 3.9
Real estate investment trusts 352.1 337.3 -4.2
Real estate investment companies 20.4 15.6 -23.5
Supervision of UCITS and mortgage securitisation
trust management companies 260.7 270.6 3.8
UCITS management companies 246.7 255.8 3.7
Asset securitisation trust management companies 14.0 14.8 5.8
Supervision of investment firms 847.5 909.7 7.3
Portfolio management companies 17.0 14,5 -14.5
Broker-dealers and brokers 830.5 895.1 7.8
Issuance of certificates 3.5 4.2 22.6
Total 54,876.7 55,638.1 1.4
Source: CNMV.
16_Capitulo 16_INGLES.qxd 24/7/09 19:09 Página 242
CNMV:
organisation, finance
and institutional aspects
National Securities
Numbering Agency
243
17 National Securities Numbering Agency
The CNMV discharges the functions of the Spanish National Securities NumberingAgency (ANCV), whose main goal is to assign and administer International SecuritiesIdentification Numbers (ISIN)1 and Classification of Financial Instruments (CFI)2
codes to facilitate their dissemination and use. In Spain, the ISIN code is used as theprimary identifier in securities trading, clearing and settlement. The CNMV is afounder and full member of the Association of National Numbering Agencies(ANNA); at 2008 year-end, ANNA had a total of 78 full member countries and 23associates representing 35 countries.
As a result of the requirements regarding the exchange and dissemination ofinformation contained in the new European directives and of the EuropeanCommission’s goal of using international standards, ANNA is being forced toreconsider the scope of securities numbering, particularly regarding derivativesand structured products. In connection with these new requirements, and inaccordance with Commission Regulation 1287/2006 implementing the Markets inFinancial Instruments Directive (MiFID), the CNMV (as the competent authority inSpain) drafts and provides daily updates of a list of financial instruments listed onSpain’s regulated markets. The list includes each financial instrument’s ISIN code,as the primary identifier of the security, and the competent authority in accordancewith MiFID.
In 2008, the ANCV data base increased by 4.5% in relation to 2007, to 34,550references. This increase was due primarily to fixed-income securities, such asbonds and covered bonds.
The primary market in fixed-income securities was very dynamic, especially inmedium- and long-term issues such as asset-backed securities and mortgage coveredbonds, contributing to a significant increase in the number of ISIN codes assignedto these types of securities (Table 17.1). In the financial derivatives market, therewas also an increase in the volume of options contracts with ISINs. In contrast, thenumber of warrant issues with ISINs declined.
At year-end, there were 22,495 financial instruments with a current ISIN, i.e. 0.8%more than in 2007. Listed securities and instruments accounted for 55% of the total.
1. International Securities Identification Number.
2. Classification of Financial Instruments.
17_Capitulo 17_INGLES.qxd 24/7/09 19:10 Página 243

CNMV
Annual Report regarding
its actions and the
securities markets. 2008
244
In 2008, the number of queries to the ANCV decreased by 18.9% with respect to2007 (Table 17.2). The decline in queries about Spanish codes (38%) was broadlyattributable to the fact that the information is available on the CNMV website.However, queries about foreign codes increased considerably (by 45.8%), atestament to the universal nature of the ISIN code for identifying securities andfinancial instruments. There were 893 queries in total in 2008, compared with 1,101in 2007. Of the total queries, 59% referred to Spanish codes, and the remainder toforeign codes.
Queries handled directly by the ANCV TABLE 17.2
2007 2008 % var.
Spanish codes 850 527 -38.0
Foreign codes 251 366 45.8
Total 1,101 893 -18.9
Number of securities and other financial instruments with an ISIN1 TABLE 17.1
Listed Total
2007 2008 % var. 2007 2008 % Chg.
Public debt2 257 263 2.33% 261 265 1.5
Equities3 3.531 3,578 1.33% 13,483 13,435 -0.4
Debentures 387 367 -5.17% 452 426 -5.8
Bonds 1,386 1,711 23.45% 1,468 1,768 20.4
Covered bonds 144 184 27.78% 185 238 28.7
Commercial paper 2,562 2,556 -0.23% 2,562 2,556 -0.2
Warrants 1,407 1,480 5.19% 1,753 1,564 -10.7
Treasury Bills 11 12 9.09% 11 12 9.1
Options 2,051 2,158 5.22% 2,051 2,158 5.2
Futures 82 73 -10.98% 82 73 -11.0
Total 11,818 12,382 4.77% 22,308 22,495 0.84
1. ANCV data base. ISIN code.
2. Except Treasury Bills.
3. Shares, mutual fund units and other equities.
17_Capitulo 17_INGLES.qxd 24/7/09 19:10 Página 244

CNMV:
organisation, finance
and institutional aspects
CNMV Advisory Board
245
18 CNMV Advisory Board
18.1 Introduction
The CNMV Advisory Board is the Board’s consultative body, as provided in article22 of the Securities Market Act; it is composed of representatives of the officialsecondary markets, issuers and investors, as well as the Autonomous Regions withofficial secondary markets. The Committee, which is chaired by the CNMV’s Vice-President, was established by Act 24/1988, on the Securities Market, and, inaccordance with article 23 of the Act, it must be consulted obligatorily in thefollowing matters:
– Approval of CNMV Circulars.
– Imposition of penalties for very serious violations.
– Authorisation, revocation, mergers and takeovers of investment firms.
– Authorisation, revocation, mergers and takeovers of branches of investment firmsfrom non-EU Member States.
In addition to its consultative role to the Board, the Advisory Committee providesadvice on draft regulations relating generally to the securities markets which arereferred to it by the Government or the Ministry of Economy and Finance. It thusfulfils the principle of consulting the affected sectors when new regulations arebeing drafted.
Also, in order to promote greater participation on the part of the industry and inline with international recommendations on analysing the impact of regulation,the CNMV decided to enhance the advisory role of the Advisory Committeeby extending its scope in international issues and matters relating to marketworkings. As a result, the Committee’s agenda regularly includes issues referredto it voluntarily (not by legal mandate) that relate to consultations frominternational bodies such as CESR as well as initiatives of the CNMV or theCommittee itself. Tables 18.1 and 18.2 summarise the Committee’s actionsin 2008.
The Advisory Committee also underwent the following changes in 2008:
– The Committee’s members were replaced on 1 April 2008, since they had beenappointed in 2004 and the four-year term established by regulation had expired.The composition of the Advisory Committee is set out in the OrganisationAnnexes.
18_Capitulo 18_INGLES.qxd 24/7/09 19:11 Página 245

CNMV
Annual Report regarding
its actions and the
securities markets. 2008
246
– The President of the CNMV was re-appointed on 6 October 2008 and a new Vice-President, Mr Fernando Restoy, was appointed; he thus became chairman of theAdvisory Committee since Mr Carlos Arenillas Lorente’s mandate as Vice-Presidentof the CNMV had expired.
Royal Decree 504/2003, of 2 May, is the regulation governing the composition andworkings of the Advisory Committee and the way in which its members areappointed.
The Advisory Committee has 16 members, 6 representing the official secondarymarkets, 4 representing securities issuers, 4 representing investors, and one for eachAutonomous Region which has devolved powers over securities markets and has a(regulated) official market in its territory. There are also 16 substitutes. Thesemembers are appointed in accordance with the procedure detailed in Royal Decree504/2003, of 2 May.
On 30 January 2008, the CNMV Board decided to commence the process of renewaland, on 24 March 2008, the appointment of candidates was approved effective 1April 2008.
18.2 Actions by the Committee in 2008
The Advisory Committee addressed a total of 41 issues in 2008, compared with 49in 2007 and 39 in 2006. Those issues are detailed in table 18.1.
As a result of the considerable regulatory activity arising from the transpositionand implementation of European legislation, there was a notable increase, inboth absolute and relative terms, in the number of matters referred obligatorilyto the Committee, accounting for almost 60% of the business transacted by theCommittee in the year. The number of cases of authorization, revocation, mergerand takeover of investment firms referred to the Committee declinedsignificantly.
Types of issues referred to the Advisory Committee TABLE 18.1
Number
2007 2008
Mandatory reports on standards 14 24
Proposals for very serious penalties 6 3
Authorisations, revocations, mergers and takeovers of investment firms 15 4
Voluntary consultations (IOSCO, CESR, etc.) 14 10
Total 49 41
Source: CNMV
18_Capitulo 18_INGLES.qxd 24/7/09 19:11 Página 246

247
CNMV:
organisation, finance
and institutional aspects
CNMV Advisory Board
List of Advisory Committee actions in 2008 TABLE 18.2
Corporate
Mandatory Proposals transactions of
reports for very serious investment firms
Date on regulations penalties and branches Other matters
January: 21/01/08
February: 18/02/08
Draft Royal
Decree on the legal
regime for
investment firms
and other entities
providing
investment
services.
Draft Order on
financial
transactions in
financial derivatives
by UCITS.
Draft Royal Decree
amending article
59 of the
Regulation
implementing
Act 35/2003, of 4
November,
governing UCITS.
Draft Order
regulating certain
aspects of the rules
governing UCITS
depositories.
Draft Royal Decree
on the equity of
financial
institutions.
Draft Order
amending Order
ECO/805/2003,
of 27 March,
on valuation
standards for real
estate and certain
rights for certain
financial purposes.
Authorisation
of SARASIN ALÉN,
AGENCIA DE
VALORES, S.A.
Authorisation
of ALLFUNDS
ALTERNATIVE,
SOCIEDAD DE
VALORES, S.A.
Authorisation for
the transformation
of TRESSIS,
AGENCIA DE
VALORES, S.A. into
a broker-dealer and
amendments to its
scheme of
operations.
18_Capitulo 18_INGLES.qxd 24/7/09 19:11 Página 247

March: 17/03/08
April: 14/04/08
June: 09/06/08
248
CNMV
Annual Report regarding
its actions and the
securities markets. 2008
List of Advisory Committee actions in 2008 (continuation) TABLE 18.2
Corporate
Mandatory Proposals transactions of
reports for very serious investment firms
Date on regulations penalties and branches Other matters
Draft Order
EHA/XX/2008
on securities
lending by
UCITS.
Draft CNMV
Circular partly
amending
Circular 4/1994,
of 14 December,
on accounting
rules, reporting
obligations,
calculation of the
net asset value,
investment and
operational
coefficients, and
actions in
appraising real
estate, applicable
to real estate
UCITS.
Draft Royal
Decree to
implement
certain aspects
of Act 2/1981,
of 25 March,
regulating the
mortgage
market.
Draft Circular
governing the
accounting of
UCITS.
Draft Circular on
quarterly, half-
yearly and annual
reports of UCITS
and the position
statement.
Penalty 1 for filing
financial and
accounting
information
containing
inaccurate or false
data or omitting
material
information.
Penalty 2 for
rejection or
obstruction
of the CNMV
inspectorate’s
activities.
Authorisation
of FINANCIAL LAB,
A.V., S.A.
IOSCO
consultation
on the role of
the credit rating
agencies in the
markets in
structured
products.
Draft form of
report and
guides for
limited reviews
of interim
financial
statements.
Draft criteria
for drafting
special reports
on financial
statements.
18_Capitulo 18_INGLES.qxd 24/7/09 19:11 Página 248

249
CNMV:
organisation, finance
and institutional aspects
CNMV Advisory Board
List of Advisory Committee actions in 2008 (continuation) TABLE 18.2
Corporate
Mandatory Proposals transactions of
reports for very serious investment firms
Date on regulations penalties and branches Other matters
July: 15/07/08
September:
22/09/08
Draft Act
amending
Act 24/1988,
of 28 July, on the
Securities Market,
and Act 26/1988,
of 29 July, on
discipline and
intervention
of credit
institutions.
Draft Act on
Payment
Services.
Draft CNMV
Circular regarding
the determination
of the net asset
value and
operational
aspects of UCITS.
Draft Ministerial
Order
implementing
article 82.5 of Act
24/1988, of 28 July,
on the Securities
Market, in
connection with
the disclosure of
price-sensitive
information.
Proposed
amendment to
the legislation
to overcome the
block on
attached
securities in
the case of a
squeeze-out
following a
takeover bid.
Consultation
by the European
Commission
on amendments
to Commission
decisions
establishing
CESR, CEBS
and CEIOPS.
CESR consultation
on the draft third
set of CESR
Guidance on the
operation of the
Market Abuse
Directive.
Consultation
on CESR’s technical
advice to the
European
Commission on
the review of the
commodities
business.
Draft Criteria and
Guidelines to apply
in detecting and
reporting
suspicious
transactions.
CESR, CEBS and
CEIOPS
consultation on the
prudential
assessment of
acquisitions and
increase of
holdings in the
financial sector.
18_Capitulo 18_INGLES.qxd 24/7/09 19:11 Página 249

250
CNMV
Annual Report regarding
its actions and the
securities markets. 2008
October:
20/10/08
November:
17/11/08
Draft Circular on
the accounting
of investment
firms, UCITS
management
companies and
venture capital firm
operators.
Draft Circular
on investment
firm solvency.
Draft Circular
on UCITS
categories
by investment
profile.
Draft CNMV
Circular on the
statistical
reporting
requirements
with regard to
assets and
liabilities of
European Union
UCITS.
Draft CNMV
Circular on the
accounting
standards,
confidential and
public disclosures
and annual
accounts of the
governing
companies of
official secondary
markets, of
governing
companies of
multilateral trading
facilities, of the
Sociedad de
Sistemas, of central
counterparties and
of the Sociedad
de Bolsas.
Draft CNMV
Circular approving
the forms for
announcements
and applications
for authorisation of
takeover bids.
Penalty 3 for delays
in disclosure of
significant
holdings in a
listed company.
CESR Consultation
on UCITS
management
company passport.
List of Advisory Committee actions in 2008 (continuation) TABLE 18.2
Corporate
Mandatory Proposals transactions of
reports for very serious investment firms
Date on regulations penalties and branches Other matters
18_Capitulo 18_INGLES.qxd 24/7/09 19:11 Página 250

251
CNMV:
organisation, finance
and institutional aspects
CNMV Advisory Board
December:
15/12/08
Draft CNMV
Circular on
investment
advisory firms.
Draft CNMV
Circular on
accounting
standards, annual
accounts and
confidential
disclosures of
venture capital
firms.
Draft CNMV
Circular on
accounting
standards, annual
accounts, public
financial
statements and
confidential
statistical reports
of asset
securitisation
trusts.
List of Advisory Committee actions in 2008 (continuation) TABLE 18.2
Corporate
Mandatory Proposals transactions of
reports for very serious investment firms
Date on regulations penalties and branches Other matters
18_Capitulo 18_INGLES.qxd 24/7/09 19:11 Página 251

18_Capitulo 18_INGLES.qxd 24/7/09 19:11 Página 252

VI Report by the Internal Control Body
19 Carta Auditores ingles.qxd 24/7/09 19:11 Página 253

19 Carta Auditores ingles.qxd 24/7/09 19:11 Página 254

255
AUDITORS’ REPORT, AS PROVIDED UNDER ACT44/2002, ON MEASURES TO REFORM THE FINANCIALSYSTEM. - YEAR 2008
19 Carta Auditores ingles.qxd 24/7/09 19:11 Página 255

256
1. Introduction
The Comisión Nacional del Mercado de Valores’s Internal Control Department hasperformed an internal audit of the degree to which the decisions adopted by the governingbodies conform to the procedural regulations applicable in each case, in implementationof the Audit and Internal Control Action Plan approved by the Board of the Commissionon 21 January 2009, thus complying with Additional Provision Two of Act 44/2002,of 22 November, on Measures to Reform the Financial System (gazetted on 23 November).
The work was performed in accordance with the International Standards for theProfessional Practice of Internal Auditing, issued by the Institute of Internal Auditors (IIA),as provided in the CNMV’s Internal Audit Rules approved by the Board on 21 January 2009.
2. Objectives and scope of the work
The objective of this work is to ascertain the degree to which the decision by the governingbodies of the Comisión Nacional del Mercado de Valores in 2008 conformed to theapplicable procedural rules.
The specific regulations applicable to the procedures of the CNMV were as follows:
■ Securities Market Act (24/1998, of 28 July).
■ The Act on the Legal Regime of the Public Administrations and the CommonAdministrative Procedure (Act 30/1992, of 26 November)
■ The CNMV Internal Regulation
The decision adopted on 24 October 2007 to delegate powers to the President,the Vice-President and the Executive Committee of the Comisión Nacional del Mercado de Valores was also considered.
There were no scope limitations in the performance of the work.
Auditors’ Report, Act 44/2002 - Internal Control Unit 2
19 Carta Auditores ingles.qxd 24/7/09 19:11 Página 256

257
3. Opinion
In our opinion, having completed the audit work, it can be concluded that, in 2008,the governing bodies of the Comisión Nacional del Mercado de Valores, in the scope of supervision entrusted by the Securities Market Act and other regulations, complied with the requirements established in the current legislation that is applicable in each case,in terms of both procedure and competence.
Madrid, 26 March 2009.Head of Internal Control
Signed: Margarita García Muñoz
Auditors’ Report, Act 44/2002 - Internal Control Unit 3
19 Carta Auditores ingles.qxd 24/7/09 19:11 Página 257

19 Carta Auditores ingles.qxd 24/7/09 19:11 Página 258

VII Financial statements of the CNMV
20_Cuentas CNMV_INGLES.qxd 24/7/09 19:12 Página 259

20_Cuentas CNMV_INGLES.qxd 24/7/09 19:12 Página 260

261
Summary of Financial Statements 2008
1 Balance sheet
Account no. Assets Current year Previous year
A) FIXED ASSETS 33,960,081.31 32,037,537.61
II. Intangible assets 2,531,027.73 1,937,318.59
215 3. Computer software 5,211,709.90 4,266,013.27
281 7. Amortisation -2,680,682.17 -2,328,694.68
III. Property, plant and equipment 31,427,817.71 30,098,983.15
220, 221 1. Land and structures 28,748,375.47 28,646,223.02
226 3. Tools and furniture 3,059,881.77 2,602,672.30
227, 228 4. Other fixed assets 5,635,594.22 4,092,755.28
282 5. Depreciation -6,016,033.75 -5,242,667.45
V. Permanent financial assets 1,235.87 1,235.87
250 1. Long-term securities portfolio 935.36 935.36
265 3. Long-term deposits and guarantees provided 300.51 300.51
C) CURRENT ASSETS 134,240,025.50 115,906,610.05
II. Accounts receivable 5,541,986.08 11,706,566.54
460, 469 1. Sundry accounts receivable 5,522,542.01 11,711,840.78
471 3. General government 337.74 0.00
555, 558 4. Other accounts receivable 57,268.80 27,190.65
490 5. Provisions -38,162.47 -32,464.89
III. Short-term financial assets 121,848,325.04 102,336,341.86
541, 546 1. Short-term securities portfolio 121,816,094.17 102,319,169.42
544, 547 2. Other short-term assets and receivables 32,230.87 17,172.44
57 IV. Cash 6,624,250.39 1,644,951.16
480 V. Accruals 225,463.99 218,750.49
GRAND TOTAL (A+B+C) 168,200,106.81 147,944,147.66
20_Cuentas CNMV_INGLES.qxd 24/7/09 19:12 Página 261

262
1 Balance sheet (continuation)
N.º Cuentas Liabilities Current year Previous year
A) EQUITY 140,156,281.94 143,315,175.70
I. Own funds 5,173,331.12 5,118,213.34
100 1. Own equity 4,204,102.67 4,204,102.67
101 2. Equity received in assignment 1,181,768.61 1,181,768.61
108 6. Equity delivered in assignment -212,540.16 -267,657.94
117, 113 II. Reserves 115,544,040.07 115,544,040.07
129 IV. Surplus for the year 19,438,910.75 22,652,922.29
142 B) PROVISIONS FOR CONTINGENCIES AND EXPENSES 1,597,850.34 1,535,085.59
D) CURRENT LIABILITIES 26,445,974.53 3,093,886.37
III. Accounts payable 26,445,974.53 3,093,886.37
420, 429 1. Sundry accounts payable 2,024,911.20 2,111,885.33
475, 476 3. General government 993,993.25 948,182.28
554, 521,523 4. Other accounts payable 23,427,070.08 33,818.76
GRAND TOTAL (A+B+C+D) 168,200,106.81 147,944,147.66
20_Cuentas CNMV_INGLES.qxd 24/7/09 19:12 Página 262

263
2 Statement of revenues and expenditure
Account no. Debit Current year Previous year
A) EXPENSES 42,167,301.30 36,846,151.49
3. Service operating expenses 41,509,522.19 36,266,210.82
a) Personnel expenses: 23,830,538.75 22,807,302.51
640, 641 a.1) Wages, salaries and similar 19,195,025.61 18,368,667.14
642, 643, 644 a.2) Employee welfare expenses 4,635,513.14 4,438,635.37
681, 682 c) Period depreciation and amortisation charge 1,248,101.93 1,146,537.78
d) Change in operating provisions 47,940.96 59,797.89
675, 694, (794) d.2) Change in provisions for, and losses on,
bad debts 47,940.96 59,797.89
e) Other operating expenses 16,355,245.01 12,220,010.92
62 e.1) Outside services 16,297,707.58 12,168,978.11
630, 632 e.2) Taxes 50,379.86 45,229.67
676 e.3) Other current operating expenses 7,157.57 5,803.14
f ) Financial and similar expenses 27,378.84 32,047.31
669 f.1) On debts 27,378.84 32,047.31
668 h) Exchange losses 316.70 514.41
4. Transfers and subsidies 403,868.69 350,957.63
651 b) Current subsidies 403,868.69 350,957.63
5. Extraordinary losses and expenses 253,910.42 228,983.04
670, 671 a) Losses on fixed assets 215,144.28 10,464.14
678 c) Extraordinary expenses 15,542.62 0.00
679 d) Expenses and losses from other years 23,223.52 218,518.90
SURPLUS 19,438,910.75 22,652,922.29
20_Cuentas CNMV_INGLES.qxd 24/7/09 19:12 Página 263

264
2 Statement of revenues and expenditure (continuación)
Account no. Credit Current year Previous year
B) REVENUES 61,606,212.05 59,499,073.78
3. Ordinary revenues 55,638,111.31 54,876,680.69
a) Fee revenues 55,638,111.31 54,876,680.69
740 a1) Fees for the provision of services
or the performance of activities 55,638,111.31 54,876,680.69
4. Other ordinary revenues 5,925,766.91 4,519,084.77
78 b) In-house work 843,979.98 554,871.33
c) Other ordinary revenues 179,595.60 185,404.68
776, 777 c.1) Ancillary and other ordinary revenues
761 e) Revenues from other transferable securities
and fixed asset loans 4,574,343.09 3,543,977.11
f ) Other interest and similar revenues 327,765.86 234,797.52
769 f.1) Other interest 327,765.86 234,797.52
768 g) Exchange gains 82.38 34.13
6. Extraordinary gains and revenues 42,333.83 103,308.32
771 a) Gains on fixed assets 0.00 1,719.50
778 c) Extraordinary revenues 2,891.13 0.00
779 d) Revenues and income from other years 39,442.70 101,588.82
20_Cuentas CNMV_INGLES.qxd 24/7/09 19:12 Página 264

265
3 Cash Flow Statement. Source and application of funds
Funds applied Current year Previous year
1. Funds applied in operations 40,285,976.32 35,227,189.37
c) Outside services 16,297,707.58 12,168,978.11
d) Taxes 50,379.86 45,229.67
e) Personnel expenses 23,412,459.98 22,414,233.07
g) Transfers and subsidies 403,868.69 350,957.63
h) Financial expenses 27,695.54 32,561.72
i) Other current losses and extraordinary expenses 45,923.71 155,431.28
j) Provision for current assets 47,940.96 59,797.89
4. Fixed asset acquisitions and other additions 3,401,838.26 907,164.09
b) Intangible assets 1,241,273.70 578,763.05
c) Property, plant and equipment 2,160,564.56 328,401.04
5. Direct decrease in equity 22,654,048.90 0.00
b) Assignments 1,126.61 0.00
c) Delivered for general use 22,652,922.29 0.00
7. Provisions for contingencies and expenses 355,314.02 410,011.68
TOTAL FUNDS APPLIED 66,697,177.50 36,544,365.14
FUNDS OBTAINED IN EXCESS OF FUNDS APPLIED (INCREASE IN WORKING CAPITAL) 0.00 22,954,788.64
Funds obtained Current year Previous year
1. Funds from operations 61,606,212.05 59,497,354.28
e) Fees, charges and special levies 55,638,111.31 54,876,680.69
g) Financial revenues 4,902,191.33 3,778,808.76
h) Other current revenues and extraordinary expenses 1,065,909.41 841,864.83
3. Direct increase in equity 49,869.13 0.00
b) Assignments 49,869.13 0.00
5. Fixed asset disposals and other retirements 22,423.61 1,799.50
c) Property, plant and equipment 22,423.61 1,799.50
TOTAL FUNDS OBTAINED 61,678,504.79 59,499,153.78
FUNDS APPLIED IN EXCESS OF FUNDS OBTAINED (DECREASE IN WORKING CAPITAL) 5,018,672.71 0.00
20_Cuentas CNMV_INGLES.qxd 24/7/09 19:12 Página 265

266
3 Cash Flow Statement. Change in working capital
Current year Previous year
Change in working capital (Summary) Increase Decrease Increase Decrease
2. Accounts receivable 337.74 6,194,996.35 151,974.08 0.00
a) Operational accounts receivable 0.00 6,194,996.35 151,974.08 0.00
b) Other accounts receivable 337.74 0.00 0.00 0.00
3. Accounts payable 86,974.13 23,456,669.76 622,922.41 0.00
a) Operational accounts payable 86,974.13 0.00 111,552.96 0.00
b) Other accounts payable 0.00 23,456,669.76 511,369.45 0.00
4. Short-term financial assets 19,511,983.18 0.00 21,846,657.29 0.00
6. Other non-bank accounts 47,685.62 0.00 11,235.23 0.00
7. Cash 4,981,723.28 2,424.05 275,698.33 821.98
a) Cash on hand 0.00 2,424.05 0.00 821.98
c) Cash at banks and other credit institutions 4,981,723.28 0.00 275,698.33 0.00
8. Accruals 6,713.50 0.00 47,123.28 0.00
TOTAL 24,635,417.45 29,654,090.16 22,955,610.62 821.98
CHANGE IN WORKING CAPITAL 0.00 5,018,672.71 22,954,788.64 0.00
20_Cuentas CNMV_INGLES.qxd 24/7/09 19:12 Página 266

Annexes
21_AnexoI_INGLES.qxd 24/7/09 19:13 Página 267

21_AnexoI_INGLES.qxd 24/7/09 19:13 Página 268
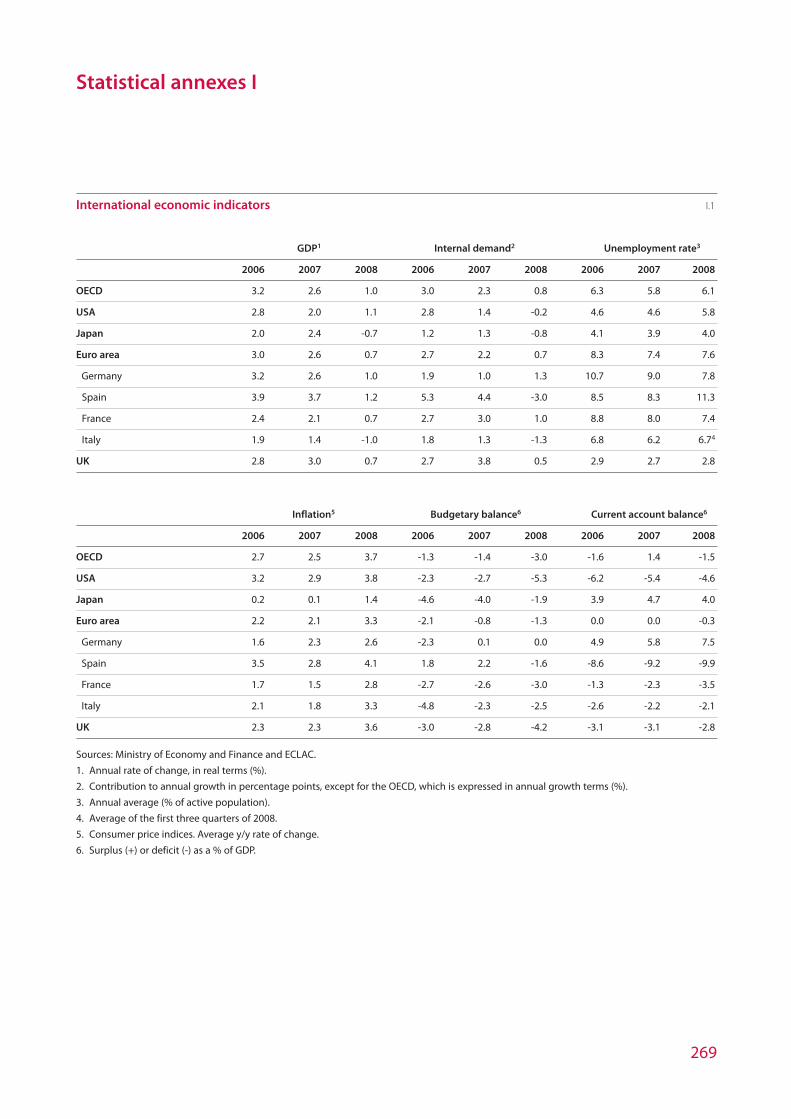
269
International economic indicators I.1
GDP1 Internal demand2 Unemployment rate3
2006 2007 2008 2006 2007 2008 2006 2007 2008
OECD 3.2 2.6 1.0 3.0 2.3 0.8 6.3 5.8 6.1
USA 2.8 2.0 1.1 2.8 1.4 -0.2 4.6 4.6 5.8
Japan 2.0 2.4 -0.7 1.2 1.3 -0.8 4.1 3.9 4.0
Euro area 3.0 2.6 0.7 2.7 2.2 0.7 8.3 7.4 7.6
Germany 3.2 2.6 1.0 1.9 1.0 1.3 10.7 9.0 7.8
Spain 3.9 3.7 1.2 5.3 4.4 -3.0 8.5 8.3 11.3
France 2.4 2.1 0.7 2.7 3.0 1.0 8.8 8.0 7.4
Italy 1.9 1.4 -1.0 1.8 1.3 -1.3 6.8 6.2 6.74
UK 2.8 3.0 0.7 2.7 3.8 0.5 2.9 2.7 2.8
Inflation5 Budgetary balance6 Current account balance6
2006 2007 2008 2006 2007 2008 2006 2007 2008
OECD 2.7 2.5 3.7 -1.3 -1.4 -3.0 -1.6 1.4 -1.5
USA 3.2 2.9 3.8 -2.3 -2.7 -5.3 -6.2 -5.4 -4.6
Japan 0.2 0.1 1.4 -4.6 -4.0 -1.9 3.9 4.7 4.0
Euro area 2.2 2.1 3.3 -2.1 -0.8 -1.3 0.0 0.0 -0.3
Germany 1.6 2.3 2.6 -2.3 0.1 0.0 4.9 5.8 7.5
Spain 3.5 2.8 4.1 1.8 2.2 -1.6 -8.6 -9.2 -9.9
France 1.7 1.5 2.8 -2.7 -2.6 -3.0 -1.3 -2.3 -3.5
Italy 2.1 1.8 3.3 -4.8 -2.3 -2.5 -2.6 -2.2 -2.1
UK 2.3 2.3 3.6 -3.0 -2.8 -4.2 -3.1 -3.1 -2.8
Sources: Ministry of Economy and Finance and ECLAC.
1. Annual rate of change, in real terms (%).
2. Contribution to annual growth in percentage points, except for the OECD, which is expressed in annual growth terms (%).
3. Annual average (% of active population).
4. Average of the first three quarters of 2008.
5. Consumer price indices. Average y/y rate of change.
6. Surplus (+) or deficit (-) as a % of GDP.
Statistical annexes I
21_AnexoI_INGLES.qxd 24/7/09 19:13 Página 269

270
Composition of households’ financial assets1 l.2
Amounts in percentages except for balance, expressed in million euro
Mutual
Fixed- funds and Insurance
Cash and income investment underwriting
Balance deposits securities Shares companies reserves Other
1999 1,029,597 36.4 2.4 27.3 16.7 12.0 5.2
2000 1,048,790 39.8 2.5 23.9 13.7 13.9 6.2
2001 1,105,066 40.3 2.3 23.6 12.8 14.6 6.4
2002 1,116,987 42.3 2.5 20.4 12.0 15.7 7.1
2003 1,272,704 39.2 3.0 23.6 12.3 15.0 7.0
2004 1,386,672 39.0 2.3 23.3 12.5 15.1 7.5
2005 1,570,453 37.6 2.1 25.1 12.7 14.7 7.5
2006 1,822,366 36.8 2.5 27.5 11.7 13.8 7.6
2007 1,915,050 38.1 2.7 27.5 11.4 13.6 7.4
20082 1,731,762 45.0 2.3 20.4 9.4 14.9 8.0
Pro memoria: breakdown of change in the portfolio between December 2007 and September 2008
(% change) -9.6 6.8 -20.8 -33.0 -20.4 -1.0 -2.8
Change (million euro) -183,289 49,360 -10,618 -173,585 -41,840 -2,646 -3,959
- net acquisition of assets 15,540 50,380 -7,288 559 -30,223 6,054 -3,941
- approximate price effect3 -198,829 -1,020 -3,330 -174,144 -11,617 -8,700 -18
Source: Bank of Spain “Financial accounts of the Spanish economy”, and CNMV.
1. Includes NPISH (Non-Profit Institutions Serving Households).
2. Data at September 2008.
3. The price effect is approximated using data from the “Financial accounts of the Spanish economy”. For its effect on UCITS with CNMV data, see
chapter 6.
Composition of non-residents’ financial assets 1.3
Amounts in percentages except for balance, expressed in million euro
Mutual
Fixed- funds and
Cash and income investment
Balance deposits securities Loans Shares companies Other
1999 670,739 28.5 18.7 11.3 33.1 0.6 7.8
2000 823,791 28.6 20.3 12.3 31.1 0.4 7.3
2001 919,557 28.0 20.9 14.3 29.4 0.3 7.1
2002 989,658 27.7 23.2 15.4 26.0 0.7 7.1
2003 1,142,173 27.8 23.2 16.0 25.7 0.6 6.7
2004 1,352,948 24.1 28.2 14.7 26.1 0.6 6.2
2005 1,630,248 23.6 32.7 14.0 23.6 0.3 5.8
2006 1,947,698 19.6 38.0 13.7 23.0 0.3 5.4
2007 2,228,194 20.0 37.0 13.9 23.8 0.2 5.2
20081 2,290,015 23.5 35.6 14.6 21.1 0.2 5.2
Source: Bank of Spain “Financial accounts of the Spanish economy”, and CNMV.
1. Data at September 2008.
21_AnexoI_INGLES.qxd 24/7/09 19:13 Página 270

271
Annexes
Statistical annexes IBalance of public debt by holder l.4
Source: Directorate-General of the Treasury and Financial Policy.
100%
80%
60%
40%
20%
0%2004 2005 2006 2007 2008
Individuals
Non-financial institutions
Other financial institutions
Pension funds
Mutual funds
Insurance companies
Public administrations
Credit institutions
Non residents
EBT of companies listed on the electronic market1 l.5
Million euro
CNMV sector 2007 % Chg. 07/062 20083 % Chg. 08/072
Oil 6,885.88 1.3 5,306.16 -23.1
Energy & water 11,395.65 15.0 13,399.27 17.5
Mining & base metals 766.38 -30.9 290.06 -62.7
Cement and construction materials 727.53 14.5 461.44 -36.0
Chemicals 87.60 -30.2 -54.54 —
Textiles and paper 1,776.06 31.8 1,549.17 -24.5
Metal-mechanical 1,047.95 42.1 557.06 -13.6
Food 422.15 -17.5 218.44 -42.5
Construction 6,431.74 8.9 1,897.89 -63.1
Real estate 1,348.47 -59.6 -7,423.36 —
Transport and communications 12,125.11 49.5 11,921.73 -1.6
Other non-financial 2,872.34 15.5 1,758.41 -29.6
Banks 25,422.13 24.3 22,381.45 -12.5
Insurance 330.52 77.1 1,408.80 -19.1
Portfolio companies 1,903.91 -35.3 893.81 -52.9
Total 73,543.40 13.8 54,565.78 -25.7
Source: CNMV.
1. According to IFRS for companies with a consolidated group and national GAAP for companies that do not present consolidated data. Only
information from domestic issuers is included.
2. Percentage change calculated using periodic financial information issued by the companies. The information issued with respect to the
previous year is used for each rate of change.
3. Does not include companies that had not filed earnings for the second half of 2008.
21_AnexoI_INGLES.qxd 24/7/09 19:13 Página 271
creo
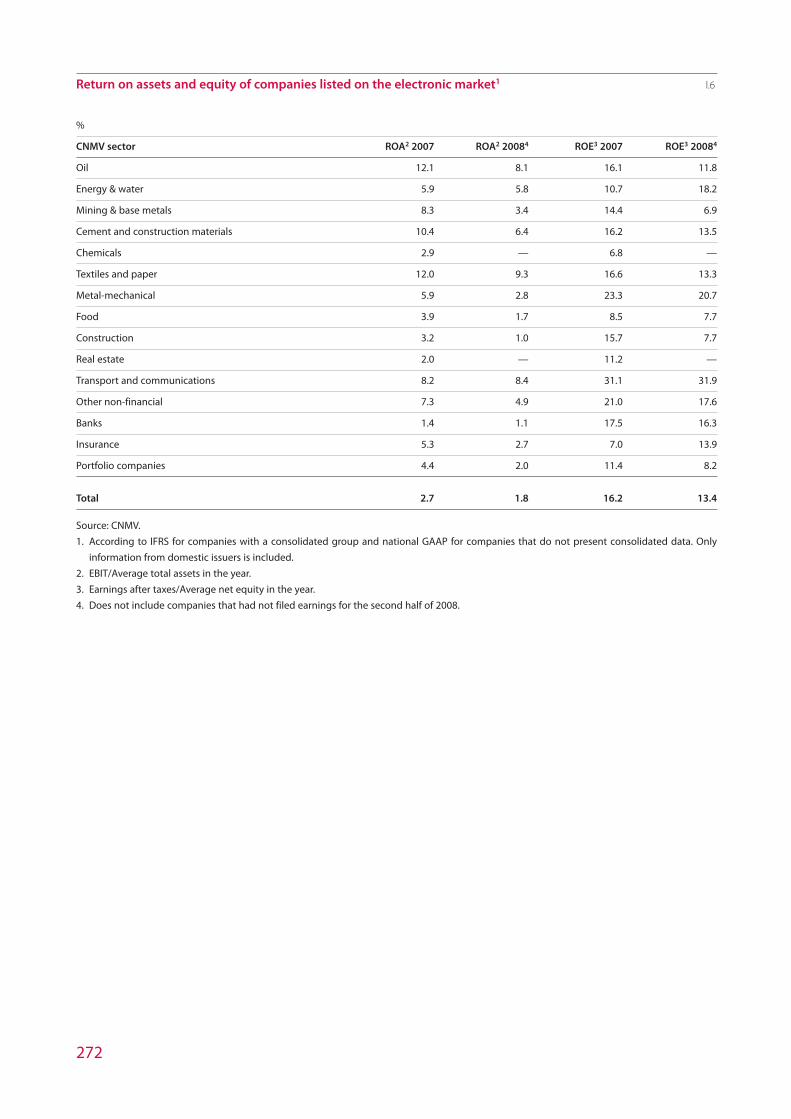
272
Return on assets and equity of companies listed on the electronic market1 l.6
%
CNMV sector ROA2 2007 ROA2 20084 ROE3 2007 ROE3 20084
Oil 12.1 8.1 16.1 11.8
Energy & water 5.9 5.8 10.7 18.2
Mining & base metals 8.3 3.4 14.4 6.9
Cement and construction materials 10.4 6.4 16.2 13.5
Chemicals 2.9 — 6.8 —
Textiles and paper 12.0 9.3 16.6 13.3
Metal-mechanical 5.9 2.8 23.3 20.7
Food 3.9 1.7 8.5 7.7
Construction 3.2 1.0 15.7 7.7
Real estate 2.0 — 11.2 —
Transport and communications 8.2 8.4 31.1 31.9
Other non-financial 7.3 4.9 21.0 17.6
Banks 1.4 1.1 17.5 16.3
Insurance 5.3 2.7 7.0 13.9
Portfolio companies 4.4 2.0 11.4 8.2
Total 2.7 1.8 16.2 13.4
Source: CNMV.
1. According to IFRS for companies with a consolidated group and national GAAP for companies that do not present consolidated data. Only
information from domestic issuers is included.
2. EBIT/Average total assets in the year.
3. Earnings after taxes/Average net equity in the year.
4. Does not include companies that had not filed earnings for the second half of 2008.
21_AnexoI_INGLES.qxd 24/7/09 19:13 Página 272

273
Annexes
Statistical annexes IIStatistical annexes II
Capital increases and public offerings: cash amount II.1
Million euro
Issuer Cash amount1 Type of transaction Date registered with the CNMV
Vidrala, S.A. 0.00 Bonus issue 15/01/08
Laboratorios Farmacéuticos Rovi, S.A. 9.53 Extension of IPO by exercising green shoe option 15/01/08
Bankinter, S.A. 2.71 Capital increase by conversion 24/01/08
Avanzit, S.A. 5.22 Capital increase without trading warrants 24/01/08
Service Point Solutions, S.A. 1.15 Capital increase by conversion 31/01/08
Jazztel, Plc. 0.30 Capital increase without trading warrants 07/02/08
Sogecable, S.A. 0.57 Capital increase without trading warrants 07/02/08
Azkoyen, S.A. 0.00 Bonus issue 13/02/08
Dogi International Fabrics, S.A. 0.10 Capital increase by conversion 06/03/08
Itínere Infraestructuras, S.A. 4,174.06 Capital increase for non-monetary consideration 27/03/08
Service Point Solutions, S.A. 0.00 Bonus issue 15/04/08
Tecnocom, Telecomunicaciones y Energía, S.A. 1.58 Capital increase without trading warrants 17/04/08
Tavex Algodonera, S.A. 39.93 Capital increase with pre-emptive subscription rights 22/04/08
Itínere Infraestructuras, S.A. 0.00 Bonus issue 22/04/08
Afirma Grupo Inmobiliario, S.A. 395.50 Capital increase for non-monetary consideration 30/04/08
European Aeronautic Defence 0.61 Capital increase without trading warrants 30/04/08and Space Company Eads, N.V.
Promotora de Informaciones, S.A. 4.33 Capital increase without trading warrants 13/05/08
Iberia Líneas Aéreas de España, S.A. 0.31 Capital increase by conversion 27/05/08
Faes Farma, S.A. 0.00 Bonus issue 03/06/08
Fersa Energías Renovables, S.A. 280.54 Capital increase for non-monetary consideration 03/06/08
Abertis Infraestructuras, S.A. 0.00 Bonus issue 10/06/08
Cartera Industrial Rea, S.A. 24.71 Capital increase with pre-emptive subscription rights 17/06/08
Banco de Valencia, S.A. 0.00 Bonus issue 24/06/08
Inmobiliaria Colonial, S.A. 0.00 Bonus issue 24/06/08
Caja de Ahorros del Mediterráneo 292.00 Participation shares 26/06/08
Indo Internacional, S.A. 16.70 Capital increase with pre-emptive subscription rights 01/07/08
Mapfre, S.A. 1,208.60 Capital increase for non-monetary consideration 01/07/08
Dogi International Fabrics, S.A. 4.28 Capital increase with pre-emptive subscription rights 03/07/08
Prim, S.A. 0.00 Bonus issue 08/07/08
Service Point Solutions, S.A. 3.29 Capital increase for non-monetary consideration 24/07/08
Zardoya Otis, S.A. 0.00 Bonus issue 05/08/08
European Aeronautic Defence and 23.77 Capital increase without trading warrants 05/08/08Space Company Eads, N.V.
Tecnocom, Telecomunicaciones y Energía, S.A. 24.66 Capital increase for non-monetary consideration 10/09/08
Inbesòs, S.A. 635.33 Capital increase for non-monetary consideration 12/09/08
22_AnexoII_INGLES.qxd 24/7/09 19:14 Página 273

274
Jazztel, Plc. 0.01 Capital increase without trading warrants 02/10/08
Jazztel, Plc. 14.05 Capital increase without trading warrants 07/10/08
Ahorro Familiar, S.A. 50.77 Capital increase with pre-emptive subscription rights 09/10/08
Inypsa Informes y Proyectos, S.A. 0.00 Bonus issue 09/10/08
Banco Santander, S.A. 1,436.29 Capital increase for non-monetary consideration 13/10/08
Vértice Trescientos Sesenta Grados, S.A. 1.81 Capital increase for non-monetary consideration 14/10/08
Iberdrola, S.A. 54.67 Capital increase without trading warrants 28/10/08
Tecnocom, Telecomunicaciones y Energía, S.A. 0.00 Bonus issue 30/10/08
Sacyr Vallehermoso, S.A. 0.00 Bonus issue 06/11/08
Banco Santander, S.A. 7,194.65 Capital increase with pre-emptive subscription rights 11/11/08
Mapfre, S.A. 151.69 Capital increase with pre-emptive subscription rights 11/11/08
Azkoyen, S.A. 0.00 Bonus issue 20/11/08
Cintra Concesiones de Infraestructuras 0.00 Bonus issue 04/12/08de Transporte, S.A.
Vértice Trescientos Sesenta Grados, S.A. 8.71 Capital increase with pre-emptive subscription rights 11/12/08
Mecalux, S.A. 168.04 Capital increase without trading warrants 11/12/08
Compañía Levantina de Edificación 0.00 Bonus issue 16/12/08y Obras Públicas, S.A.
Inmobiliaria del Sur, S.A. 0.00 Bonus issue 16/12/08
Prim, S.A. 0.00 Bonus issue 18/12/08
Banco Popular Español, S.A. 118.80 Capital increase for non-monetary consideration 22/12/08
Source: CNMV
1. Issues of new shares not paid for in cash have been valued at market prices.
Capital increases and public offerings: cash amount (continuation) II.1
Million euro
Issuer Cash amount1 Type of transaction Date registered with the CNMV
22_AnexoII_INGLES.qxd 24/7/09 19:14 Página 274

Delistings in 20081 II.2
Company Market2 Reason. Procedure Date
Banco de Castilla SIBE Merged into Banco Popular Español, S.A.-
Madrid Stock Exchange Bulletin 19/12/08 22/12/2008
Banco de Crédito Balear SIBE Merged into Banco Popular Español, S.A.-
Madrid Stock Exchange Bulletin 19/12/08 22/12/2008
Banco de Galicia SIBE Merged into Banco Popular Español, S.A.-
Madrid Stock Exchange Bulletin 19/12/08 22/12/2008
Banco de Vasconia SIBE Merged into Banco Popular Español, S.A.-
Madrid Stock Exchange Bulletin 19/12/08 22/12/2008
Distribución Integral Logista SIBE Delisted as of 16/06/08 following the squeeze out 15/06/2008
Altadis SIBE Madrid Stock Exchange Bulletin 22/02/08.
Settlement of the takeover bid, effective 25/02/08 24/02/2008
Sogecable SIBE Madrid Stock Exchange Bulletin of 19 June, following squeeze-out
by Prisa as part of the takeover bid for Sogecable 20/06/2008
Flame ETF Ibex 35, FI SIBE Decision by the CNMV, 22/09/08 22/09/2008
Flame ETF Monetario, FI SIBE Decision by the CNMV, 22/09/08 22/09/2008
Flame ETF Ibex Small Caps, FI SIBE Decision by the CNMV, 22/09/08 22/09/2008
Flame ETF Ibex Mid Caps, FI SIBE Decision by the CNMV, 22/09/08 22/09/2008
Leucan Open outcry Bilbao Stock Exchange Bulletin of 26 March.
Extraordinary Shareholders’ Meeting resolution 18/02/2008 27/03/2008
Macamju, Sicav Open outcry, UCITS Madrid Stock Exchange 14/01/08. Dissolution and liquidation 14/01/2008
Serfiex Europa Open outcry, UCITS Extraordinary Shareholders’ Meeting resolution 18/04/07
RD 82017 05/07/07. Madrid Stock Exchange Bulletin 01/07/08.
Conversion into a corporation 03/07/2008
Estabanell y Pahisa, S.A. Second market Barcelona Stock Exchange Bulletin 16/06/08 17/06/2008
Inmobiliaria Carroggio, S.A. Third market Catalonia Reg. Gov’t Resolution of 11 April; Reg. discl 18 April 18/04/2008
Source: CNMV.
1. Delistings due to change of market are not included.
2. Companies which are UCITS are indicated as such.
275
22_AnexoII_INGLES.qxd 24/7/09 19:14 Página 275

276
Sector indices in the Madrid and Barcelona stock exchanges II.3
Yield in the period (%)
2008
2005 2006 2007 2008 1Q 2Q 3Q 4Q
Madrid Stock Exchange
Oil and energy 28.0 33.3 13.0 -33.3 -8.0 -5.5 -14.3 -10.6
Commodities, industry and construction 43.4 61.9 -3.2 -50.5 -11.3 -7.4 -22.8 -21.9
Consumer goods 24.2 31.9 6.1 -25.7 -4.9 -5.9 -8.1 -9.6
Consumer services 21.2 8.6 -8.0 -45.1 -8.9 -23.6 -7.5 -14.7
Financial and real estate services 22.7 34.9 -5.5 -49.2 -13.8 -13.0 -8.2 -26.2
Banking 16.6 27.3 -3.6 -49.0 -13.8 -12.3 -7.5 -27.1
Real estate and others -14.7 111.2 -40.6 -68.0 -12.2 -26.1 -28.7 -30.9
Technology and telecommunications -6.6 28.4 34.3 -28.8 -17.7 -7.5 -1.0 -5.6
Madrid Stock Exchange General Index 20.6 34.5 5.6 -40.6 -12.4 -9.8 -9.5 -16.9
Barcelona Stock Exchange
Electricity 29.9 48.3 12.3 -26.2 -7.0 -10.3 -11.5 0.0
Banks 19.4 26.0 -0.8 -49.6 -14.3 -10.7 -8.1 -28.3
Chemicals 29.1 7.2 -10.4 -41.5 -11.3 9.9 -16.8 -27.9
Cement, construction and real estate 56.9 85.6 -32.0 -61.5 -22.9 -19.4 -23.5 -18.9
Metallurgy 17.7 77.9 8.0 -47.9 -4.0 -4.3 -19.7 -29.3
Food, agriculture and forestry 35.6 32.4 -14.0 -23.1 0.0 -5.3 -11.6 -8.1
Textiles and paper 32.5 42.0 -8.5 -30.2 -15.7 -17.7 -0.5 0.9
Trade and finance 26.7 34.4 -9.6 -37.7 -0.8 -9.0 -11.5 -22.0
Sundry services -2.2 20.6 23.3 -32.6 -14.9 -11.0 -5.1 -6.2
BCN Global 100 12.7 29.3 5.2 -41.8 -13.8 -9.8 -9.3 -17.5
Source: Bolsas y Mercados Españoles.
22_AnexoII_INGLES.qxd 24/7/09 19:14 Página 276
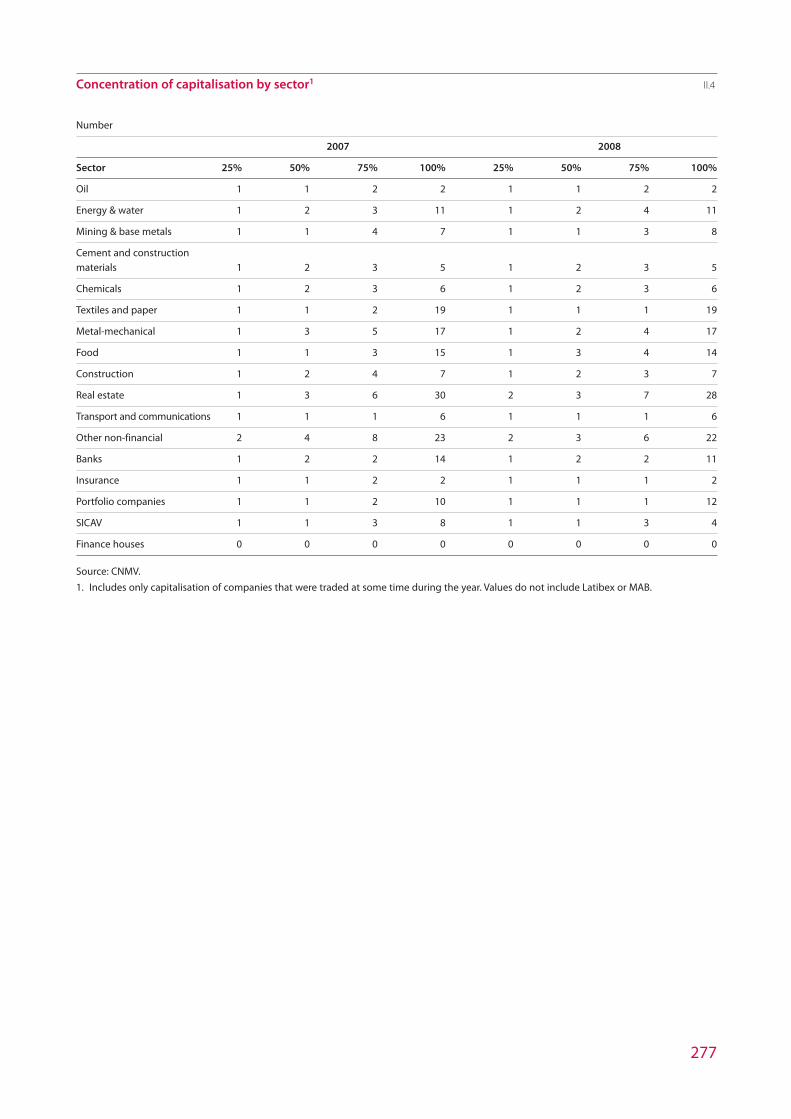
277
Concentration of capitalisation by sector1 II.4
Number
2007 2008
Sector 25% 50% 75% 100% 25% 50% 75% 100%
Oil 1 1 2 2 1 1 2 2
Energy & water 1 2 3 11 1 2 4 11
Mining & base metals 1 1 4 7 1 1 3 8
Cement and construction materials 1 2 3 5 1 2 3 5
Chemicals 1 2 3 6 1 2 3 6
Textiles and paper 1 1 2 19 1 1 1 19
Metal-mechanical 1 3 5 17 1 2 4 17
Food 1 1 3 15 1 3 4 14
Construction 1 2 4 7 1 2 3 7
Real estate 1 3 6 30 2 3 7 28
Transport and communications 1 1 1 6 1 1 1 6
Other non-financial 2 4 8 23 2 3 6 22
Banks 1 2 2 14 1 2 2 11
Insurance 1 1 2 2 1 1 1 2
Portfolio companies 1 1 2 10 1 1 1 12
SICAV 1 1 3 8 1 1 3 4
Finance houses 0 0 0 0 0 0 0 0
Source: CNMV.
1. Includes only capitalisation of companies that were traded at some time during the year. Values do not include Latibex or MAB.
22_AnexoII_INGLES.qxd 24/7/09 19:14 Página 277

278
Percentage of capitalisation by sector and largest companies with respect to the overall market1 II.5
Sector % sector/market2 Companies with the largest capitalisation in the sector % company/market3
Oil 9.4 Repsol YPF 4.7
CEPSA 4.6
Energy & water 28.7 Iberdrola 8.4
Endesa 7.8
Gas Natural 4.2
Mining & base metals 1.2 Acerinox 0.7
Tubos Reunidos 0.1
Duro Felguera 0.1
Cement and construction materials 0.6 Cementos Portland Valderrivas 0.2
Cementos Molins 0.2
Uralita 0.2
Chemicals 0.7 Laboratorios Almirall 0.2
Zeltia 0.2
Faes Farma 0.1
Textiles and paper 6.2 Industria de Diseño Textil 5.0
Grífols 0.7
Solaria 0.1
Metal-mechanical 2.4 Zardoya Otis 1.0
Técnicas Reunidas 0.3
Abengoa 0.3
Food 1.8 Altadis 0.5
Damm 0.4
Ebro Puleva 0.4
Construction 6.5 ACS 2.8
Acciona 1.5
Sacyr Vallehermoso 0.8
Real estate 2.7 Metrovacesa 0.7
Inmobiliaria Colonial 0.5
Royal Urbis 0.4
Transport and communications 23.2 Telefónica 19.1
Abertis Infraestructuras 2.2
Cintra 0.8
Other non-financial 3.9 Gamesa 0.8
Telecinco 0.7
BME 0.5
Banks 29.3 Santander 13.8
BBVA 8.3
Banco Popular 1.9
Insurance 2.1 Mapfre 1.7
Grupo Catalana Occidente 0.5
Portfolio companies 3.2 Criteria CaixaCorp 2.4
22_AnexoII_INGLES.qxd 24/7/09 19:14 Página 278

279
Corporación Financiera Alba 0.4
Unión Europea de Inversiones 0.1
SICAV4 0.05 Financiera Ponferrada SICAV 0.03
CAT Patrimonis SICAV 0.01
Mulinsar SICAV 0.01
Source: CNMV.
1. Capitalisation at year-end.
2. Capitalisation of the sector as a percentage of the overall market.
3. Capitalisation of the company as a percentage of the overall market.
4. Includes open-end securities investment companies traded in the open outcry market at 2008 year-end.
Percentage of capitalisation by sector and largest companies with respectto the overall market1 (continuation) II.5
Sector % sector/market2 Companies with the largest capitalisation in the sector % company/market3
22_AnexoII_INGLES.qxd 24/7/09 19:14 Página 279

280
Capitalisation and trading volume of Ibex 35 companies1 II.6
Million euro
Market capitalisation2 Trading volume
Company 2007 2008 % of total3 2007 2008 % of total3
Telefónica 106,067.1 74,574.19 15.7 286,907.1 239,510.8 19.3
Banco Santander Central Hispano 92,501.0 53,959.90 11.3 301,115.9 282,374.9 22.7
Iberdrola 51,934.9 32,715.20 6.9 200,229.7 99,339.0 8.0
Iberdrola Renovables4 51,934.9 32,715.20 6.9 200,229.7 99,339.0 8.0
Banco Bilbao Vizcaya Argentaria 62,816.0 32,457.41 6.8 229,852.0 171,660.1 13.8
Endesa 38,485.6 30,280.31 6.4 123,332.4 6,962.4 0.6
Inditex 26,192.3 19,528.94 4.1 28,355.8 26,516.3 2.1
Repsol YPF 29,764.7 18,435.04 3.9 78,668.4 76,363.7 6.1
Unión Fenosa 14,073.1 16,205.89 3.4 19,581.7 46,887.7 3.8
ACS 14,344.3 10,950.50 2.3 22,572.1 14,538.0 1.2
Criteria CaixaCorp5 17,386.1 9,348.83 2.0 5,842.9 5,515.6 0.4
Gas Natural 17,920.0 8,637.60 1.8 15,648.8 11,833.3 1.0
Abertis Infraestructuras 14,070.5 8,446.15 1.8 12,234.7 10,854.0 0.9
Banco Popular Español 14,220.6 7,513.30 1.6 31,798.1 30,350.9 2.4
Corporación Mapfre 6,848.7 6,587.60 1.4 6,968.9 6,994.1 0.6
Banco de Sabadell 9,069.9 5,820.00 1.2 17,785.4 7,649.1 0.6
Acciona 13,780.8 5,655.95 1.2 15,843.2 12,147.1 1.0
Banesto 9,241.5 5,554.09 1.2 4,813.4 2,195.5 0.2
Red Eléctrica de España 5,849.1 4,869.72 1.0 15,241.6 12,768.1 1.0
Enagás 4,772.3 3,714.71 0.8 13,950.3 9,719.4 0.8
Gamesa Corporación Tecnológica 7,780.7 3,099.64 0.7 14,461.8 15,638.3 1.3
Cintra Conc. Infr. y Transp. 5,593.2 3,024.57 0.6 7,853.1 6,234.3 0.5
FCC 6,711.2 2,969.99 0.6 11,549.3 6,727.6 0.5
Acerinox 4,367.4 2,891.39 0.6 12,169.2 7,060.0 0.6
Grupo Ferrovial 6,749.5 2,746.38 0.6 16,675.4 11,248.6 0.9
Indra Sistemas 3,049.6 2,657.31 0.6 5,538.0 5,272.1 0.4
Grífols6 3,283.3 2,622.83 0.6 4,288.1 6,430.9 0.5
Bankinter 4,980.8 2,561.19 0.5 12,168.0 5,639.9 0.5
Sacyr Vallehermoso 7,571.3 1,942.64 0.4 6,114.7 3,087.9 0.2
Iberia Líneas Aéreas de España 2,858.7 1,887.14 0.4 11,199.8 6,056.7 0.5
Gestevisión Telecinco 4,318.7 1,862.15 0.4 7,676.8 4,908.8 0.4
BME 3,896.5 1,537.69 0.3 6,932.5 6,486.9 0.5
Abengoa7 2,187.6 1,067.54 0.2 3,837.3 2,102.4 0.2
Técnicas Reunidas8 2,447.1 1,029.05 0.2 2,857.2 3,466.6 0.3
Obrascón Huarte Lain9 2,014.9 871.42 0.2 3,555.7 2,097.8 0.2
Source: CNMV.
1. Companies in the Ibex 35 at 30 December 2008.
2. Capitalisation on the last day of the year.
3. With respect to the market total.
4. Included in the index on 04/02/2008.
5. Included in the index on 04/02/2008.
6. Included in the index on 04/01/2008.
7. Included in the index on 04/01/2008.
8. Included in the index on 13/04/2008.
9. Included in the index on 01/07/2008.
22_AnexoII_INGLES.qxd 24/7/09 19:14 Página 280

281
Market data of Ibex 35 companies II.7
Dividend Price/earnings
Yield Volatility1 yield (%)2 ratio3
2007 2008 2007 2008 2007 2008 2007 2008
Telefónica 37.8 -28.7 20.6 37.6 2.9 5.7 13.5 10.1
Banco Santander Central Hispano 4.6 -51.1 21.5 54.9 3.9 11.8 9.8 5.4
Iberdrola 25.6 -37.1 22.3 58.1 2.5 4.6 23.3 8.1
Banco Bilbao Vizcaya Argentaria -8.1 -48.3 20.9 50.8 4.2 9.0 8.9 5.0
Repsol YPF -7.0 -38.1 21.4 49.5 3.5 6.8 8.3 4.1
Unión Fenosa 23.2 15.1 21.8 32.6 2.7 3.5 13.2 11.8
Inditex 3.0 -25.4 25.5 47.8 2.0 3.4 44.3 23.8
ACS -4.8 -19.7 26.4 40.5 3.9 5.8 5.4 4.5
Banco Popular -14.8 -48.0 19.3 53.8 3.8 8.3 10.9 5.2
Abertis Infraestructuras 2.8 -40.0 19.6 40.2 2.4 4.6 20.3 11.6
Banco de Sabadell -12.6 -34.6 19.9 36.2 3.3 6.4 10.8 6.8
Gas Natural 33.4 -51.8 25.0 45.2 2.6 6.2 16.2 7.0
Red Eléctrica de España 33.1 -16.7 23.5 37.4 2.2 3.2 23.3 16.1
Acciona 53.7 -59.0 36.8 62.3 1.5 4.1 18.5 6.8
Criteria4 -1.5 -46.2 17.4 47.8 — 7.2 — 7.1
Enagás 13.5 -22.2 22.9 36.5 2.6 4.0 20.4 14.3
Gamesa Corporación Tecnológica 53.4 -60.2 32.9 69.6 0.7 1.8 61.7 7.8
Acerinox -27.0 -32.4 29.8 44.1 2.7 4.0 5.1 9.1
Indra Sistemas -0.2 -12.9 21.2 36.6 2.3 3.1 19.6 12.9
Corporación Mapfre -11.8 -20.1 27.2 53.8 3.7 5.8 7.6 5.7
Grífols 52.6 -20.1 36.2 40.7 0.4 1.3 35.9 21.0
Iberdrola Renovables5 9.7 -46.0 45.5 56.6 — — — 32.1
Bankinter 5.3 -49.7 34.0 51.3 2.3 4.7 9.9 9.7
Grupo Ferrovial -34.9 -59.3 32.2 61.6 2.2 6.5 4.0 94.6
Iberia 8.7 -34.0 36.2 66.5 1.2 8.6 19.1 45.5
Cintra -14.6 -45.9 28.9 53.0 — 1.8 — —
FCC -33.4 -54.6 29.0 44.4 4.1 7.9 5.9 5.4
BME 48.7 -60.5 28.9 48.7 3.3 10.9 18.9 7.5
Endesa 1.5 -21.3 14.4 40.4 3.5 5.4 11.9 2.3
Gestevisión Telecinco -18.9 -56.9 23.9 46.2 7.3 17.3 10.2 4.8
Banesto -20.6 -39.3 23.2 42.1 2.7 8.9 11.9 6.2
Abengoa -13.1 -51.2 38.5 53.4 0.7 1.4 17.5 6.5
Técnicas Reunidas 50.3 -58.0 38.9 59.2 1.8 6.3 24.7 8.3
Sacyr Vallehermoso -40.9 -74.3 40.8 68.4 2.4 9.4 6.2 —
Obrascón Huarte Lain -1.6 -56.8 39.0 54.7 — 4.0 25.6 5.2
Source: Datastream and BME.
1. Historical volatility annualised for the period.
2. Dividends distributed/price.
3. Year-end closing price/EBT.
4. Began trading on 10/10/2007 after primary offering.
5. Began trading on 13/12/2007 after primary offering.
22_AnexoII_INGLES.qxd 24/7/09 19:14 Página 281

282
Takeover bids authorised in 2008 II.8
Million euro
% capital Cash
addressed by amount
Company Offeror Purpose the bid paid Result (%)1
Compañía española para la Gepro XXI, S.L. Merger by absorption 8.0 0.6 6.5
fabricación mecánica
del vidrio, S.A.
Metrovacesa Undertake Options, S.L. Increase in stake 13.4 585.8 10.1
Sogecable Promotora Takeover 49.6 1,845.4 47.6
de informaciones, S.A.
Compañía de distribución Altadis, S.A. Takeover 40.4 866.5 37.3
integral logística, S.A.
Estabanell y Pahisa, S.A. Estabanell y Pahisa, S.A. Delisting 20.9 15.7 17.2
Plarrega Invest 2000, S.A. Vancouver gestión, S.L. Takeover 100.0 5.0 100.0
Total amount 3,318.89
Source: CNMV.
1. Percentage of capital. In the event of pro-rating, the coefficient is indicated.
Companies listed on Latibex, by sector II.9
Million euro, unless indicated otherwise
No. of companies Market capitalisation Trading volume
% chg. % chg.
2007 2008 2007 2008 08/07 2007 2008 08/07
Oil 2 2 174,775 73,216 -58.11 91.8 118.1 28.53
Energy & water 5 5 26,416 22,600 -14.45 61.4 67.6 10.09
Mining & base metals 5 5 117,331 47,440 -59.57 286.0 250.7 -12.36
Chemicals 1 1 1,361 540 -60.31 14.4 4.1 -71.81
Textiles and paper 2 2 3,465 421 -87.84 14.7 12.7 -13.63
Metal-mechanical 1 1 2,688 919 -65.83 26.8 15.0 -44.08
Food 2 2 3,788 1,785 -52.89 126.4 93.9 -25.74
Real estate 2 2 1,381 503 -63.58 19.3 2.4 -87.39
Transport and communications 4 5 68,712 113,149 64.67 107.2 112.1 4.55
Other non-financial 2 2 3,535 2,471 -30.11 16.6 10.3 -37.94
Banks 6 6 16,132 14,961 -7.26 74.1 53.8 -27.47
Portfolio companies 1 1 3,264 2,032 -37.76 26.4 12.4 -53.15
Finance houses 1 1 4,925 7,153 45.23 3.0 4.9 61.04
Total 34 35 427,774 287,189 -32.86 868.2 757.7 -12.72
Source: CNMV.
22_AnexoII_INGLES.qxd 24/7/09 19:14 Página 282

283
Mut
ual f
und
s lis
ted
on
th
e Sp
anis
h s
tock
exc
han
ge
II.10
Thou
sand
eur
o
Trad
ing
vol
ume
Man
aged
ass
ets
Net
ass
et v
alue
% c
hg.
% c
hg.
% c
hg.
Issu
erN
ame
Un
der
lyin
g in
dex
2007
2008
08/0
720
0720
0808
/07
2007
2008
08/0
7
BBVA
Acc
ión
DJ
Euro
Sto
xx 5
0 ET
F FI
DJ
Euro
Sto
xx 5
058
8,06
4 62
5,17
0 6.
318
3,98
4 16
2,65
1 -1
1.6
44.1
2 25
.94
-41.
2
BBVA
Acc
ión
FTSE
Lat
ibex
Bra
sil E
TF F
IFT
SE L
atib
ex B
rasi
l27
,810
21
,987
-2
0.9
11,2
10
5,64
6 -4
9.6
141.
54
71.2
9 -4
9.6
BBVA
Acc
ión
FTSE
Lat
ibex
Top
ETF
FI
FTSE
Lat
ibex
Top
17,1
91
967,
217
5,52
6.2
7,62
0 25
7,82
6 3,
283.
551
31
.95
-37.
1
BBVA
Acc
ión
Ibex
35
ETF
FIIb
ex 3
51,
098,
304
801,
168
-27.
123
0,62
9 14
3,54
7 -3
7.8
15
9.83
-3
5.6
BBVA
Acc
ión
Ibex
Top
Div
iden
do E
TF F
IIb
ex T
op D
ivid
endo
9,38
7 12
,150
29
.44,
990
3,04
2 -3
9.0
37
22.5
3 -3
9.0
BBVA
AFI
Bon
os M
edio
Pla
zo E
uro
ETF
FIA
FI B
onos
Med
io P
lazo
Eur
o10
1,27
9 14
7,20
3 45
.350
,397
90
,769
80
.110
3 11
0.09
6.
8
BBVA
AFI
Mon
etar
io E
uro
ETF
FIA
FI M
onet
ario
Eur
o49
1,49
1 2,
784,
778
466.
625
0,17
2 87
0,32
2 24
7.9
102
106.
98
4.7
BBVA
FTSE
4G
ood
Ibex
ETF
FI
FTSE
4Goo
d IB
EX—
6,
325
——
1,
215
——
8.
68
—
Lyxo
rLy
xor E
TF B
razi
l (Ib
oves
pa)
FI
IBO
VESP
A—
7,
094
——
20
9 —
—
13.0
4 —
Lyxo
rLy
xor E
TF C
hina
Ent
erp
rise
FIH
ang
Seng
13,2
08
17,2
42
30.5
908
662
-27.
114
2 82
.72
-41.
7
Lyxo
rLy
xor E
TF D
J Eu
ro S
toxx
50
FID
J Eu
ro S
toxx
50
280,
565
578,
053
106.
08,
926
55,1
28
517.
644
25
.68
-41.
8
Lyxo
rLy
xor E
TF D
J St
oxx
600
Bank
s FI
DO
W J
ON
ES S
TOXX
600
BA
NKS
—
19,3
27
——
1,
275
——
16
.03
—
Lyxo
rLy
xor E
TF D
J St
oxx
Sel D
iv 3
0 FI
DJ
Euro
Sto
xx S
elec
t Div
iden
d 30
—
5,53
0 —
—
90
——
12
.21
—
Lyxo
rLy
xor E
TF D
ow J
ones
IA F
ID
J In
dust
rial A
vera
ge24
,958
18
,320
-2
6.6
265
1,32
5 40
0.0
91
66.0
9 -2
7.5
Lyxo
rLy
xor E
TF E
aste
rn E
urop
e FI
East
ern
Euro
pe
(CEC
E Eu
r)30
,609
17
,876
-4
1.6
337
355
5.3
28
13.7
5 -5
1.2
Lyxo
rLy
xor E
TF E
uro
Cas
h FI
Euro
MTS
EO
NIA
Inve
stab
le—
97
,614
—
—
10,8
19
——
10
5.08
—
Lyxo
rLy
xor E
TF Ib
ex 3
5 FI
Ibex
35
743,
863
544,
972
-26.
755
,551
19
,217
-6
5.4
153
97.7
3 -3
6.0
Lyxo
rLy
xor E
TF J
apan
(Top
ix) F
ITO
PIX
IND
EX—
11
,370
—
—
1,97
7 —
—
69.0
5 —
Lyxo
rLy
xor E
TF L
ever
aged
DJ
Stox
x 50
FI
Dow
Jon
es E
uro
Stox
x 50
Lev
erag
ed—
37
,831
—
—
1,73
4 —
—
14.7
5 —
Lyxo
rLy
xor E
TF M
SCI E
M L
atin
Am
eric
a FI
MSC
I EM
Lat
in A
mer
ica
4,96
6 4,
294
-13.
533
5 33
8 0.
930
16
.82
-44.
5
Lyxo
rLy
xor E
TF M
SCI E
mer
ging
Mkt
s A
FIM
SCI E
mer
ging
Mar
kets
3,25
1 24
,837
66
3.9
245
715
191.
89
4.41
-4
8.6
Lyxo
rLy
xor E
TF M
SCI E
MU
Gro
wth
FI
MSC
I EM
U G
row
th—
6,
087
——
2
——
62
.04
—
Lyxo
rLy
xor E
TF M
SCI E
mu
Smal
l Cap
FI
MSC
I EM
U S
mal
l Cap
22,0
02
7,12
9 -6
7.6
336
40
-88.
119
8 10
1.69
-4
8.6
Sour
ce: B
ME
and
CN
MV.
22_AnexoII_INGLES.qxd 24/7/09 19:14 Página 283

284
Mut
ual f
und
s lis
ted
on
th
e Sp
anis
h s
tock
exc
han
ge
(con
tinu
atio
n)II.
10
Thou
sand
eur
o
Trad
ing
vol
ume
Man
aged
ass
ets
Net
ass
et v
alue
% c
hg.
% c
hg.
% c
hg.
Issu
erN
ame
Un
der
lyin
g in
dex
2007
2008
08/0
720
0720
0808
/07
2007
2008
08/0
7
Lyxo
rLy
xor E
TF M
SCI E
MU
Val
ue F
IM
SCI E
MU
Val
ue—
13
,065
—
—
21
——
93
.57
—
Lyxo
rLy
xor E
TF M
SCI I
ndia
FI
MSC
I Ind
ia
9,76
5 5,
854
-40.
099
7 56
6 -4
3.2
15
6.00
-5
9.7
Lyxo
rLy
xor E
TF N
asda
q 10
0 FI
Nas
daq
100
6,31
2 10
,399
64
.760
4 38
2 -3
6.8
6 3.
73
-34.
8
Lyxo
rLy
xor E
TF N
ew E
nerg
y FI
Wor
ld A
ltern
ativ
e En
ergy
Inde
x—
4,
818
——
14
3 —
—
21.2
7 —
Lyxo
rLy
xor E
TF R
ussi
a FI
Dow
Jon
es R
usin
dex
Tita
ns 1
06,
230
7,08
9 13
.887
6 20
2 -7
6.9
44
13.9
9 -6
8.2
Lyxo
rLy
xor E
TF S
hort
Str
ateg
y Eu
rop
e FI
Base
d on
Dow
Jon
es S
toxx
600
—
3,49
1 —
—
104
——
11
1.00
—
Lyxo
rLy
xor E
TF W
orld
Wat
er F
IW
orld
Wat
er In
dex
—
1,14
4 —
—
12
——
12
.91
—
Sant
ande
r1Fl
ame
ETF
Ibex
35
FIIb
ex 3
51,
131,
723
102,
023
-91.
064
,092
—
—
15.2
6 —
—
Sant
ande
rFl
ame
ETF
Ibex
Mid
Cap
s FI
Ibex
Med
ium
Cap
22,9
85
10,4
21
-54.
76,
891
—
—18
—
—
Sant
ande
rFl
ame
ETF
Ibex
Sm
all C
aps
FIIb
ex S
mal
l Cap
30,5
14
9,85
4 -6
7.7
6,56
6 —
—
15
—
—
Sant
ande
rFl
ame
ETF
Mon
etar
io F
IM
L Sp
anis
h G
over
nmen
t Bill
Inde
x—
6,
355
——
—
—
—
—
—
Tota
l4,
664,
477
6,75
0,35
7 44
.788
5,93
1 1,
630,
335
84.0
—
—
—
Sour
ce: B
ME
and
CN
MV.
1.Sa
ntan
der’s
ETF
’s w
ere
liqui
date
d an
d de
liste
d on
18/
12/2
008.
22_AnexoII_INGLES.qxd 24/7/09 19:14 Página 284

285
Gross issues by the public administrations II.11
Nominal amount in million euro
Amount % year-on-year change
2005 2006 2007 2008 06/05 07/06 08/07
Central Government 67,802 57,962 52,091 115,181 -14.5 -10.1 121.1
Short term 29,512 25,891 26,971 52,657 -12.3 4.2 95.2
Long term 38,290 32,071 25,120 62,523 -16.2 -21.7 148.9
Autonomous Communities 10,170 9,523 7,553 9,035 -6.4 -20.7 19.6
Short term 4,132 4,586 4,004 5,054 11.0 -12.7 26.2
Long term 6,037 4,937 3,548 3,981 -18.2 -28.1 12.2
Local government 200 590 496 208 194.7 -16.0 -58.1
Short term — — — — — — —
Long term 200 590 496 208 194.7 -16.0 -58.1
Total 78,172 68,075 60,139 124,423 -12.9 -11.7 106.9
Source: Bank of Spain and CNMV.
Net issues by the public administrations II.12
Nominal amount in million euro
Amount % year-on-year change
2005 2006 2007 2008 06/05 07/06 08/07
Central Government 3,890 -4,789 -4,716 50,208 — 1.5 —
Short term -3,819 -1,993 1,144 19,630 47.8 — 1.616.6
Long term 7,709 -2,796 -5,860 30,578 — -109.6 —
Autonomous Communities 2,797 1,827 223 1,280 -34.7 -87.8 473.4
Short term 276 -141 283 430 — — 51.8
Long term 2,521 1,968 -60 851 -21.9 — —
Local government -5 228 131 -14 — -42.4 —
Short term 0 0 0 0 — — —
Long term -5 228 131 -14 — -42.4 —
Total 6,682 -2,734 -4,362 51,474 — -59.5 —
Source: Bank of Spain and CNMV.
22_AnexoII_INGLES.qxd 24/7/09 19:14 Página 285

286
Public debt trading between account holders. Outright transactions, II.13
repos and sell-buybacks/buy-sellbacks
Nominal amount in million euro
% year-on-year
Amount change
2003 2004 2005 2006 2007 2008 07/06 08/07
Letras 508,880 472,518 484,161 480,711 339,956 534,889 -29.3 57.3
Outright 62,075 85,222 82,515 64,164 35,894 63,929 -44.1 78.1
Spot 61,662 84,833 82,389 63,694 35,868 63,885 -43.7 78.1
Maturity 413 389 126 470 27 44 -94.3 64.9
Repos 7,030 1,990 411 0 0 0 — —
Sell-buybacks/
Buy-sellbacks 439,775 385,306 401,234 416,547 304,062 470,959 -27.0 54.9
Bonos and Obligaciones 7,217,128 7,308,084 7,260,528 7,062,437 7,142,097 6,458,962 1.1 -9.6
Outright 901,582 562,627 491,550 447,211 418,761 362,235 -6.4 -13.5
Spot 882,482 552,418 481,854 444,083 417,749 359,633 -5.9 -13.9
Maturity 19,099 10,209 9,696 3,128 1,012 2,602 -67.7 157.2
Repos 58,550 94,254 69,327 96 0 0 — —
Sell-buybacks/
Buy-sellbacks 6,257,002 6,651,203 6,699,650 6,615,129 6,723,337 6,096,727 1.6 -9.3
Total 7,726,013 7,780,602 7,744,688 7,543,148 7,482,053 6,993,851 -0.8 -6.5
Source: Bank of Spain and CNMV.
Letras trading between account holders. Breakdown by trade type II.14
Nominal amount in million euro
% year-on-year
Amount change
2003 2004 2005 2006 2007 2008 07/06 08/07
Outright1 62,075 85,222 82,515 64,164 35,894 63,929 -44.1 78.1
Senaf 27,093 36,350 13,119 5,111 2,790 10,511 54.5 511.6
MTS-España 13,103 13,580 16,959 12,464 7,896 17,063 -77.6 33.1
EuroMTS 0 180 170 260 80 109 -69.2 36.3
Bilateral trading 21,879 35,112 52,267 46,329 25,128 36,246 -45.8 44.2
Repos2 446,806 387,297 401,646 416,547 304,062 470,959 -27.0 54.9
Senaf 30,527 18,211 25,543 7,579 4,723 13,343 -37.7 182.5
MTS-España 243 0 0 53 0 0 — —
EuroMTS 0 0 0 0 0 0 — —
Bilateral trading 416,036 369,086 376,103 408,915 299,339 457,616 -26.8 52.9
Total 508,880 472,518 484,161 480,711 339,956 534,889 -29.3 57.3
Source: Bank of Spain, Directorate-General of the Treasury and Financial Policy, and CNMV.
1. Outright trades include spot and forward trades.
2. The figure for repos includes sell-buybacks/buy-sellbacks.
22_AnexoII_INGLES.qxd 24/7/09 19:14 Página 286

287
Bonos and Obligaciones trading between account holders. II.15
Breakdown by trade type
Nominal amount in million euro
% year on
Amount year change
2003 2004 2005 2006 2007 2008 07/06 08/07
Outright1 899,445 562,290 491,238 447,211 418,761 362,235 -6.4 -13.5
Senaf 253,653 69,758 57,554 89,118 55,049 27,925 -38.2 -49.3
MTS-España 183,208 85,265 83,830 72,581 66,484 34,111 -8.4 -48.7
EuroMTS 111,705 47,503 24,462 11,170 10,746 6,943 -3.8 -35.4
Bilateral trading 350,879 359,764 325,392 274,343 286,482 293,257 4.4 2.4
Repos2 6,315,551 6,745,457 6,768,978 6,615,226 6,723,337 6,096,727 1.6 -9.3
Senaf 436,455 277,358 127,478 76,788 33,662 30,511 -56.2 -9.4
MTS-España 7,501 388 0 1,949 2,668 0 36.9 -100.0
EuroMTS 0 0 0 0 0 0 — —
Bilateral trading 5,871,595 6,467,711 6,641,500 6,536,489 6,687,007 6,066,216 2.3 -9.3
Total 7,214,996 7,307,747 7,260,216 7,062,437 7,142,097 6,458,962 1.1 -9.6
Source: Bank of Spain, Directorate-General of the Treasury and Financial Policy, and CNMV.
1. Outright trades include spot and forward trades.
2. The figure for repos includes sell-buybacks/buy-sellbacks.
Public debt trading by account holders and third parties. Outright transactions, II.16
repos and sell/buybacks and buy/sellbacks
Nominal amount in million euro
% year-on-year
Amount change
2003 2004 2005 2006 2007 2008 07/06 08/07
Letras 2,098,975 1,800,846 1,746,209 1,214,840 1,254,600 1,687,338 3.3 34.5
Outright 28,120 30,328 33,963 29,167 22,030 51,331 -24.5 133.0
Spot 28,089 30,119 33,698 29,137 21,496 50,695 -26.2 135.8
Maturity 31 209 265 31 534 636 1,624.2 18.9
Repos 2,069,898 1,768,729 1,709,341 1,185,339 1,230,166 1,635,437 3.8 32.9
Sell-buybacks/Buy-sellbacks 957 1,789 2,905 334 2,404 570 620.2 -76.3
Bonds and debentures 11,465,342 13,252,235 12,729,047 13,857,369 13,927,674 11,253,295 0.5 -19.2
Outright 1,318,652 1,571,265 2,040,064 2,690,033 2,994,352 1,980,708 11.3 -33.9
Spot 1,274,648 1,469,329 1,740,267 2,366,230 2,702,273 1,726,925 14.2 -36.1
Maturity 44,004 101,936 299,797 323,803 292,079 253,783 -9.8 -13.1
Repos 9,042,194 10,613,122 9,631,174 9,850,322 9,741,672 8,474,523 -1.1 -13.0
Sell-buybacks/Buy-sellbacks 1,104,496 1,067,848 1,057,808 1,317,014 1,191,650 798,064 -9.5 -33.0
Total 13,564,317 15,053,081 14,475,256 15,072,210 15,182,274 12,940,633 0.7 -14.8
Source: Bank of Spain and CNMV.
22_AnexoII_INGLES.qxd 24/7/09 19:14 Página 287
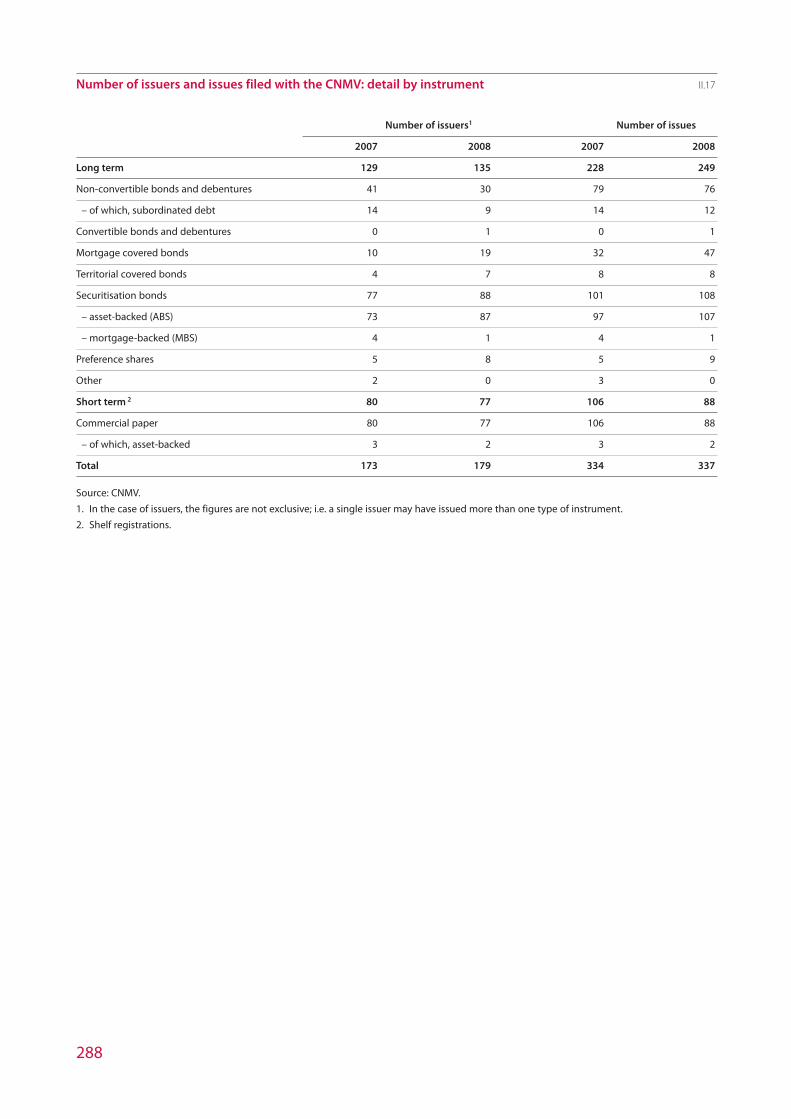
288
Number of issuers and issues filed with the CNMV: detail by instrument II.17
Number of issuers1 Number of issues
2007 2008 2007 2008
Long term 129 135 228 249
Non-convertible bonds and debentures 41 30 79 76
– of which, subordinated debt 14 9 14 12
Convertible bonds and debentures 0 1 0 1
Mortgage covered bonds 10 19 32 47
Territorial covered bonds 4 7 8 8
Securitisation bonds 77 88 101 108
– asset-backed (ABS) 73 87 97 107
– mortgage-backed (MBS) 4 1 4 1
Preference shares 5 8 5 9
Other 2 0 3 0
Short term 2 80 77 106 88
Commercial paper 80 77 106 88
– of which, asset-backed 3 2 3 2
Total 173 179 334 337
Source: CNMV.
1. In the case of issuers, the figures are not exclusive; i.e. a single issuer may have issued more than one type of instrument.
2. Shelf registrations.
22_AnexoII_INGLES.qxd 24/7/09 19:14 Página 288

289
Main fixed-income issuers1 registered with the CNMV in 2008 II.18
Nominal amount in million euro
Name of issuing company Nominal amount issued
Total Short term2 Long term
AYT Cédulas Cajas Global Fondo de Titulización de Activos 19,190 0 19,190
Caja de Ahorros de Valencia, Castellón y Alicante, Bancaja 15,375 13,000 2,375
Caja de Ahorros y Pensiones de Barcelona 14,800 12,000 2,800
Caja de Ahorros y Monte de Piedad de Madrid 11,664 7,000 4,664
BBVA Banco de Financiación, S.A. 10,000 10,000 0
Santander Consumer Finance, S.A. 10,000 10,000 0
Banco de Sabadell, S.A. 9,973 8,500 1,473
Banco Popular Español, S.A. 9,900 9,900 0
Bankinter, S.A. 8,775 7,000 1,775
BBVA RMBS 7, Fondo de Titulización de Activos 8,500 0 8,500
Caixa d’Estalvis de Catalunya 7,649 5,000 2,649
Banco Pastor, S.A. 7,050 6,000 1,050
Banesto Banco de Emisiones, S.A. 7,000 7,000 0
Caja de Ahorros del Mediterráneo 6,150 5,000 1,150
Fondo de Titulización de Activos Santander 2 6,000 6,000 0
IM Banco Popular MBS 1, Fondo de Titulización de Activos 6,000 0 6,000
Caja de Ahorros de Galicia 5,925 5,000 925
Bankinter Sociedad de Financiación, S.A. 5,000 5,000 0
Barclays Bank, S.A. 5,000 5,000 0
BBVA RMBS 5, Fondo de Titulización de Activos 5,000 0 5,000
Cédulas TDA 11, Fondo de Titulización de Activos 5,000 0 5,000
BBVA RMBS 6, Fondo de Titulización de Activos 4,995 0 4,995
Cédulas TDA 10, Fondo de Titulización de Activos 4,750 0 4,750
Telefónica, S.A. 4,000 4,000 0
Source: CNMV.
1. Issuers that registered issues exceeding 4 billion euro in 2008.
2. Shelf registrations.
22_AnexoII_INGLES.qxd 24/7/09 19:14 Página 289

290
Main fixed-income issuers1 registered with the CNMV in 2008. Detail by instrument II.19
Million euro
Type of asset2 Issuer Amount
Non-convertible bonds and debentures Caja de Ahorros y Monte de Piedad de Madrid 4,149
Mortgage covered bonds Caja de Ahorros y Pensiones de Barcelona 2,600
Caja de Ahorros de Valencia, Castellón y Alicante, Bancaja 2,375
Caixa d’Estalvis de Catalunya 1,975
Bankinter, S.A. 1,725
Commercial paper3 Caja de Ahorros de Valencia, Castellón y Alicante, Bancaja 13,000
Caja de Ahorros y Pensiones de Barcelona 12,000
BBVA Banco de Financiación, S.A. 10,000
Santander Consumer Finance, S.A. 10,000
Banco Popular Español, S.A. 9,900
Banco de Sabadell, S.A. 8,500
Banesto Banco de Emisiones, S.A. 7,000
Bankinter, S.A. 7,000
Caja de Ahorros y Monte de Piedad de Madrid 7,000
Banco Pastor, S.A. 6,000
Bankinter Sociedad de Financiación, S.A. 5,000
Barclays Bank, S.A. 5,000
Caixa d’Estalvis de Catalunya, S.A. 5,000
Caja de Ahorros de Galicia 5,000
Caja de Ahorros del Mediterráneo 5,000
Telefónica, S.A. 4,000
Banco de Andalucía, S.A. 3,600
BBK Empréstitos, S.A.U. 3,000
Caja de Ahorros Municipal de Burgos 3,000
Caja España de Inversiones, Caja de Ahorros y Monte de Piedad 3,000
Iberdrola, S.A. 3,000
Banco Guipuzcoano, S.A. 2,500
Caja de Ahorros de Murcia 2,500
Caja de Ahorros y Monte de Piedad de Navarra 2,500
Montes de Piedad y Caja de Ahorros de Ronda, Cádiz, Almería, Málaga y Antequera 2,500
Caja de Ahorros de Salamanca y Soria 2,250
Banco Espirito Santo, S.A. 2,000
Caixa d’Estalvis del Penedès 2,000
Caixa de Aforros de Vigo, Ourense e Pontevedra, Caixanova 2,000
Cajamar Caja Rural, Sociedad Cooperativa de Crédito 2,000
Endesa Capital, S.A. 2,000
Banca March, S.A. 1,500
Caja de Ahorros de Castilla-La Mancha 1,500
Caja de Ahorros y Monte de Piedad de Zaragoza, Aragón y La Rioja, Ibercaja 1,500
ABCP Fondo de Titulización de Activos Santander 2 6,000
Source: CNMV.
1. Issuers which issued more than 1.5 billion euro in 2007, in the corresponding financial instrument.
2. Convertible bonds and debentures and preference shares do not appear as no issuer issued more than 1.5 billion euro in these instruments.
3. Amount of shelf registrations.
22_AnexoII_INGLES.qxd 24/7/09 19:14 Página 290

291
Commercial paper issuers: largest outstanding balances1 at 31 December 2008 II.20
Million of euro
Issuer Amount % of total % accum.
Banesto Banco de Emisiones 8,338 11.6 11.6
BBVA Banco de Financiación 5,115 7.1 18.7
Banco Popular 4,457 6.2 25.0
Santander Consumer Finance 3,638 5.1 30.0
Caja de Ahorros y Monte de Piedad de Madrid 3,570 5.0 35.0
Caja de Ahorros y Pensiones de Barcelona 3,568 5.0 40.0
Bankinter Sociedad de Financiación 2,950 4.1 44.1
Banco Sabadell 2,727 3.8 47.9
Bankinter 2,598 3.6 51.5
Fondo de Titulización de Activos Santander 2 2,525 3.5 55.0
Caixa d’Estalvis de Catalunya 2,318 3.2 58.2
BBK Empréstitos 2,228 3.1 61.4
Banco Pastor 1,959 2.7 64.1
Iberdrola 1,702 2.4 66.5
Caja de Ahorros y Monte de Piedad de Zaragoza, Aragón y La Rioja, Ibercaja 1,279 1.8 68.2
Unicaja 1,247 1.7 70.0
Banco Guipuzcoano 1,244 1.7 71.7
Caja de Ahorros y Monte de Piedad de Navarra 1,202 1.7 73.4
Caja Municipal de Burgos 1,153 1.6 75.0
Caixa Galicia 1,060 1.5 76.5
Source: CNMV.
1. Issuers with an outstanding balance greater than 1.5 billion euro.
22_AnexoII_INGLES.qxd 24/7/09 19:14 Página 291

292
Main securitisation bond issuers1 in 2008 II.21
Million euro
Issuer Amount Assets securitised
AYT Cédulas Cajas Global, FTA 19,190 Mortgage covered bonds
BBVA RMBS 7, FTA 8,500 Mortgage loans
IM Banco Popular MBS I, FTA 6,000 Mortgage loans
BBVA RMBS 5, FTA 5,000 Mortgage loans
Cédulas TDA 11, FTA 5,000 Mortgage covered bonds
BBVA RMBS 6, FTA 4,995 Mortgage loans
Cédulas TDA 10, TDA 4,750 Mortgage covered bonds
AYT Colaterales Global Hipotecario, FTA 3,400 Mortgage loans
Bancaja 13, FTA 2,895 Mortgage loans
Empresas Banesto 3, FTA 2,300 Corporate loans
Cédulas TDA 13, FTA 2,260 Mortgage covered bonds
Cédulas TDA 12, FTA 2,200 Mortgage covered bonds
Bancaja 12, FTA 2,100 Mortgage loans
Bankinter 16, FTA 2,043 Mortgage loans
Empresas Banesto 2, FTA 2,000 Corporate loans
IM Cajamar 6, FTA 2,000 Mortgage loans
Rural Hipotecario X, FTA 1,880 Mortgage loans
MBS Bancaja 5, FTA 1,850 Mortgage loans
IM Sabadell Empresas 3, FTA 1,740 Corporate loans
FTA UCI 18 1,723 Mortgage loans
TDA CAM 11, FTA 1,716 Mortgage loans
Madrid Activos Corporativos I, FTA 1,682 Loans to large companies
IM Grupo Banco Popular Leasing I, FTA 1,680 Financial leases
TDA Ibercaja 6, FTA 1,521 Mortgage loans
Bankinter 18, FTA 1,500 Mortgage loans
Source: CNMV.
1. Issuers with CNMV-registered issued of more than 1.5 billion euro in 2008, in the corresponding financial instrument.
22_AnexoII_INGLES.qxd 24/7/09 19:14 Página 292

293
Securitisation bonds, by type of collateral II.22
Nominal amount in million euro
2003 2004 2005 2006 2007 2008
Total asset-backed bonds issued 36,745 50,525 69,044 91,608 141,627 135,253
Via FTH (a) 5,030 4,890 6,850 4,300 4,740 800
Via FTA 31,715 45,635 62,194 87,308 136,887 134,453
Mortgage loans (b) 11,832 13,967 22,314 34,663 57,550 63,615
Mortgage covered bonds (c) 10,650 18,685 24,280 25,670 26,655 34,400
Real estate developer loans (d) 0 475 730 0 0 0
Mortgage subtotal (a+b+c+d) 27,512 38,017 54,175 64,633 88,945 98,815
FTPYME1 5,303 8,964 2,944 7,956 6,474 7,276
FTGENCAT1 950 0 2,177 1,860 2,020 3,391
Other SME1 0 0 1,250 2,979 2,485 1,350
Loans to companies2 0 0 3,100 5,536 19,250 10,500
Subtotal SMEs and Companies 6,253 8,964 9,471 18,331 30,230 22,517
Loans to large companies3 0 0 556 0 0 1,682
Territorial covered bonds 1,400 0 665 0 0 450
Treasury bonds 0 0 1,180 1,450 0 765
Subordinated debt 0 0 0 298 0 0
Government loans 0 1,850 0 0 0 0
Consumer loans 1,280 235 0 5,527 3,592 6,459
Auto loans 0 1,000 2,598 1,360 2,840 1,485
Financial leases 0 0 0 0 2,500 3,080
Other loans4 300 458 400 307 13,521 0
Total asset-backed commercial paper5 3,870 3,724 2,767 1,993 465 2,843
Total bonds and commercial paper 40,614 54,248 71,811 93,600 142,092 138,096
Source: CNMV.
1. Includes trusts whose pools include almost all loans to SMEs.
2. Includes trusts whose pools include loans to any type of business: self-employed, micro-enterprises, SMEs, and larger companies.
3. Includes trusts whose pools are comprised only of loans to large companies.
4. Includes: in 2003, an accounts receivable fund; in 2004 and 2005, loans for agricultural and livestock activities; in 2004 and 2006, AYT Fondo
Eólico, FTA (infrastructure); in 2006, AYT Deuda Subordinada I, FTA (special subordinated debentures); in 2007, Mediación I AYT, FTA (mediation
lines granted by ICO to financial institutions) and IM Préstamos Fondos Cédulas, FTA (loans granted to mortgage covered bond securitisation
trusts to cover their reserve fund).
5. Gross issues by FTAs under asset-backed commercial paper programmes.
22_AnexoII_INGLES.qxd 24/7/09 19:14 Página 293

294
Proprietary trading on AIAF II.23
Nominal amount in million euro
% change
2003 2004 2005 2006 2007 2008 08/07
Commercial paper 2,946 9,440 28,474 41,916 41,243 84,841 105.7
Bonds and debentures 48,875 122,989 249,375 155,960 231,942 1,606,100 592.5
– of which, asset-backed securities 41,334 102,885 219,722 130,624 205,044 1,570,686 666.0
Mortgage covered bonds 184 5,950 5,651 7,071 14,572 84,033 476.7
Territorial covered bonds 4 4 111 23 1,050 1,413 34.6
Matador bonds 2,992 3,519 2,363 2,915 1,363 0 -100.0
Total 55,001 141,902 285,975 207,885 290,169 1,776,388 512.2
Source: CNMV.
22_AnexoII_INGLES.qxd 24/7/09 19:14 Página 294

295
Statistical Annexes IIIN
umb
ers,
inve
stor
s, a
sset
s an
d b
reak
dow
n o
f var
iati
on in
ass
ets
of s
ecur
itie
s an
d r
eal e
stat
e m
utua
l fun
ds1
III.1
Mill
ion
euro
Ch
ang
e in
ass
ets
due
to
sub
scri
pti
ons
No.
of f
und
sN
o. o
f inv
esto
rsA
sset
san
d n
et y
ield
Pro
-mem
oria
Am
oun
tN
etN
et
Cat
egor
y20
08C
han
ge
2008
Ch
ang
e20
08C
han
ge
2A
mou
nt
sub
scri
p.yi
eld
Shor
t-te
rm fi
xed-
inco
me
(RFC
P)30
9-2
51,
034,
403
-473
,814
58,8
26-2
6.5
-9,0
70-1
0,37
31,
303
-16.
2
Long
-ter
m fi
xed-
inco
me
(RFL
P)14
4-6
170,
113
-149
,247
5,65
7-2
2.9
-1,5
40-1
,816
276
-2.8
Mix
ed fi
xed-
inco
me
(RFM
)12
7-9
172,
656
-118
,983
3,93
3-5
0.9
-4,0
43-3
,644
-399
-5.7
Mix
ed e
quit
y (R
VM)
133
-216
2,05
6-8
3,86
92,
966
-52.
6-3
,250
-2,1
28-1
,122
-3.3
Span
ish
equi
ty (R
VN)
117
-616
9,76
5-1
18,4
452,
749
-64.
9-5
,102
-2,8
97-2
,206
-4.5
Fore
ign
fixed
-inco
me
(RFI
)66
-366
,984
3,42
798
5-2
7.7
-487
-490
2-0
.8
Fore
ign
mix
ed fi
xed-
inco
me
(RFM
I)69
110
7,33
3-9
4,81
42,
064
-58.
7-2
,787
-2,3
60-4
27-3
.7
Fore
ign
mix
ed e
quit
y (R
VMI)
71-1
54,2
29-3
1,06
01,
137
-56.
0-1
,495
-1,0
68-4
27-1
.7
Euro
equ
ity
(RVE
)12
2-2
209,
901
-79,
411
3,26
6-6
2.7
-5,4
84-2
,705
-2,7
79-4
.2
Gua
rant
eed
fixed
-inco
me
(GRF
)26
110
546,
583
-2,5
2521
,469
21.5
3,85
72,
807
1,05
14.
4
Gua
rant
eed
equi
ty (G
RV)
593
31,
422,
055
-293
,089
31,1
77-2
5.8
-13,
094
-10,
855
-2,2
39-1
6.9
Glo
bal
fund
s47
22
472,
373
-349
,904
11,9
76-5
9.7
-15,
285
-14,
680
-605
-22.
9
Fore
ign
equi
ty E
urop
e (R
VIE)
70-1
126,
997
-135
,562
1,57
9-7
5.5
-4,8
38-3
,289
-1,5
49-5
.1
Fore
ign
equi
ty J
apan
(RVI
J)27
-131
,850
-19,
806
171
-62.
8-2
90-1
74-1
16-0
.3
Fore
ign
equi
ty U
SA (R
VIU
)38
-541
,277
-7,2
7651
0-4
2.9
-381
-102
-279
-0.2
23_AnexoIII_INGLES.qxd 24/7/09 19:15 Página 295

296
Num
ber
s, in
vest
ors,
ass
ets
and
bre
akd
own
of v
aria
tion
in a
sset
s of
sec
urit
ies
and
rea
l est
ate
mut
ual f
und
s (c
onti
nuat
ion)
III.1
Mill
ion
euro
Ch
ang
e in
ass
ets
due
to
sub
scri
pti
ons
No.
of f
und
sN
o. o
f inv
esto
rsA
sset
san
d n
et y
ield
Pro
-mem
oria
Am
oun
tN
etN
et
Cat
egor
y20
08C
han
ge
2008
Ch
ang
e20
08C
han
ge
2A
mou
nt
sub
scri
p.yi
eld
Fore
ign
equi
ty e
mer
ging
cou
ntrie
s (R
VIM
)65
380
,333
-76,
604
757
-65.
6-1
,442
-504
-938
-0.8
Oth
er fo
reig
n eq
uity
(RVI
O)
141
-12
201,
171
-79,
680
1,57
3-6
0.3
-2,3
76-1
,155
-1,2
21-1
.8
Mon
ey m
arke
t fun
ds11
164
956,
781
84,4
7328
,810
17.6
-8,3
29-8
,792
463
-13.
7
Tota
l mut
ual f
und
s2,
936
106,
026,
860
-2,0
26,1
8917
9,60
5-2
9.6
-75,
436
-64,
223
-11,
213
-100
.2
Fund
s of
hed
ge fu
nds
409
9,59
65,
699
1,25
225
.325
3n.
a.n.
a.n.
a.
Hed
ge fu
nds
254
1576
449
550
23.4
259
131
128
0.2
Tota
l sec
urit
ies
fun
ds
3,00
123
6,03
8,03
2-2
,020
,041
181,
407
-29.
3-7
5,17
7-6
4,09
2-1
1,08
5-1
00.0
Real
est
ate
fun
ds
9-1
97,7
84-4
8,56
97,
490
-13.
0-1
,119
-1,2
6714
8
Fore
ign
UC
ITS3
563
123
585,
627
-265
,304
18,0
14-5
1.4
Sour
ce: C
NM
V.
n.a.
: no
t ava
ilab
le.
1A
ll da
ta to
Nov
emb
er 2
008,
exc
ept f
or fo
reig
n U
CIT
S, to
Dec
emb
er.
2Va
riatio
n in
ass
ets
is d
ue t
o ne
t su
bsc
riptio
ns, n
et y
ield
s on
ass
ets
and
the
net
asse
t b
alan
ce r
esul
ting
from
cha
nges
in in
vest
men
t p
olic
y. S
pec
ifica
lly, p
art
of t
he in
crea
se in
ass
ets
in 2
008
in m
anag
emen
t
fund
s is
att
ribut
able
to th
e re
clas
sific
atio
n of
ap
pro
xim
atel
y 12
.5 b
illio
n eu
ro, p
rimar
ily fr
om s
hort
-ter
m fi
xed-
inco
me
fund
s.
3Th
e lin
e on
fore
ign
UC
ITS
incl
udes
bot
h co
mp
anie
s an
d fu
nds.
The
ass
et d
ata
for
fore
ign
UC
ITS
refe
r to
the
vol
ume
of in
vest
men
t, i.e
. the
pro
duct
of t
he n
umb
er o
f sha
res
and
units
mar
kete
d in
Sp
ain
and
thei
r yea
r-en
d va
lue.
.
23_AnexoIII_INGLES.qxd 24/7/09 19:15 Página 296
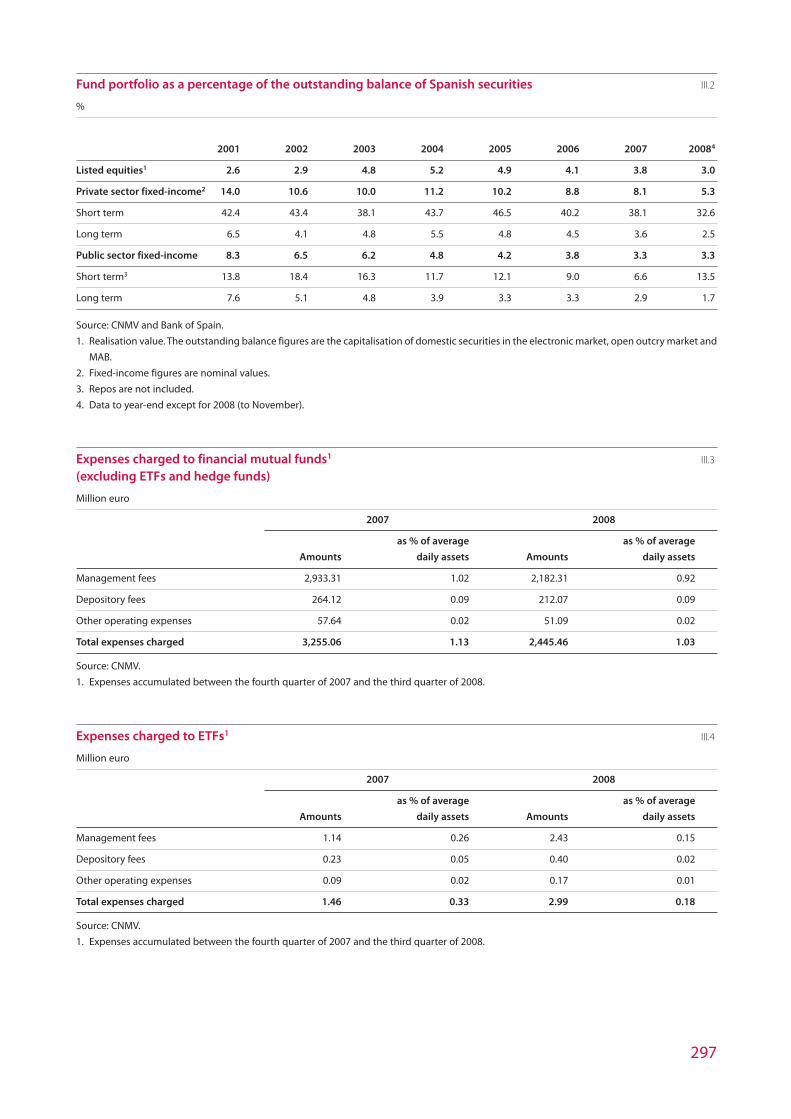
297
Fund portfolio as a percentage of the outstanding balance of Spanish securities III.2
%
2001 2002 2003 2004 2005 2006 2007 20084
Listed equities1 2.6 2.9 4.8 5.2 4.9 4.1 3.8 3.0
Private sector fixed-income2 14.0 10.6 10.0 11.2 10.2 8.8 8.1 5.3
Short term 42.4 43.4 38.1 43.7 46.5 40.2 38.1 32.6
Long term 6.5 4.1 4.8 5.5 4.8 4.5 3.6 2.5
Public sector fixed-income 8.3 6.5 6.2 4.8 4.2 3.8 3.3 3.3
Short term3 13.8 18.4 16.3 11.7 12.1 9.0 6.6 13.5
Long term 7.6 5.1 4.8 3.9 3.3 3.3 2.9 1.7
Source: CNMV and Bank of Spain.
1. Realisation value. The outstanding balance figures are the capitalisation of domestic securities in the electronic market, open outcry market and
MAB.
2. Fixed-income figures are nominal values.
3. Repos are not included.
4. Data to year-end except for 2008 (to November).
Expenses charged to financial mutual funds1 III.3
(excluding ETFs and hedge funds)
Million euro
2007 2008
as % of average as % of average
Amounts daily assets Amounts daily assets
Management fees 2,933.31 1.02 2,182.31 0.92
Depository fees 264.12 0.09 212.07 0.09
Other operating expenses 57.64 0.02 51.09 0.02
Total expenses charged 3,255.06 1.13 2,445.46 1.03
Source: CNMV.
1. Expenses accumulated between the fourth quarter of 2007 and the third quarter of 2008.
Expenses charged to ETFs1 III.4
Million euro
2007 2008
as % of average as % of average
Amounts daily assets Amounts daily assets
Management fees 1.14 0.26 2.43 0.15
Depository fees 0.23 0.05 0.40 0.02
Other operating expenses 0.09 0.02 0.17 0.01
Total expenses charged 1.46 0.33 2.99 0.18
Source: CNMV.
1. Expenses accumulated between the fourth quarter of 2007 and the third quarter of 2008.
23_AnexoIII_INGLES.qxd 24/7/09 19:15 Página 297

298
Expenses charged to hedge funds1 III.5
Million euro
2007 2008
as % s/ of average as % of average
Amounts monthly assets Amounts monthly assets
Management fees 2.01 1.24 12.87 2.30
Funding expenses 0.89 0.55 1.02 0.18
Other 1.37 0.85 34.48 6.17
Total expenses charged 4.26 2.64 48.36 8.66
Source: CNMV.
1. Expenses accumulated between the fourth quarter of 2007 and the third quarter of 2008.
23_AnexoIII_INGLES.qxd 24/7/09 19:15 Página 298

299
Yields and net subscriptions of mutual funds1 III.6
Yield (%) and net subscriptions (million euro)
2003 2004 2005 2006 2007 2008
Net Net Net Net Net Net
Yield subs. Yield subs. Yield subs. Yield subs. Yield subs. Yield subs.
Short-term fixed-income 1.89 12,011 1.78 6,842 1.63 5,607 2.26 49,005 2.87 -3,194 1.82 -10,373
Long-term fixed-income 2.58 -383 3.4 889 2.14 -461 0.47 -3,267 1.19 -1,425 2.15 -1,816
Mixed fixed-income 5.14 -323 3.95 15 4.78 1,657 4.87 910 2.30 -1,053 -5.80 -3,644
Mixed equity 11.34 -877 6.87 -852 11.62 -475 13.06 -955 3.68 —840 -22.62 -2,128
Spanish equity 29.02 511 19.51 1,130 20.61 276 33.25 -2,219 8.02 -2,314 -39.64 -2,897
International fixed-income 1.66 101 1.82 192 3.67 177 -0.11 -533 -0.22 -65 2.31 -490
International mixed fixed-income 2.39 -1,597 2.98 -456 5.4 689 3.11 629 1.31 -889 -8.81 -2,360
International mixed equity 7.55 -576 4.29 -257 12.42 -70 4.71 101 0.34 -437 -20.91 -1,068
Euro equity 16.91 472 9.23 11 22.35 344 19.16 382 3.78 -442 -40.97 -2705
Guaranteed fixed-income 2.39 -2,262 2.5 1,853 1.65 -354 0.83 1,019 2.78 2,715 3.12 2,807
Guaranteed equity 2.66 12,873 3.92 1,222 4.02 4,694 4.66 -3,021 2.44 -3,602 -3.27 -10,855
Global funds 5.79 4,367 2.31 8,070 6.16 3,928 4.09 7,301 1.48 -6,259 -6.50 -14,680
International equity Europe 13.36 167 8.61 345 22.23 1,174 17.35 899 -0.24 -1,141 -38.92 -3,289
International equity Japan 11.84 -1 5.94 173 40.9 681 -5.61 -395 -16.15 -482 -34.16 -174
International equity USA 10.03 314 0.37 -130 12.14 138 4.24 155 -1.77 -497 -31.38 -102
International equity Emerging countries 26.48 -18 22.86 137 52.75 368 22.16 78 23.76 165 -48.96 -504
International equity Other 11.77 -252 4.7 -21 21.46 -51 12.13 15 -0.93 -948 -38.40 -1,155
Money market funds — — — — — — — — 0.72 -1,063 2.03 -8,792
Total securities funds 5.22 24,528 4.13 19,164 6.13 18,319 5.85 50,103 2.72 -21,772 -4.30 -64,223
Funds of hedge funds — — — — — — — 1 -0.95 1,006 -15.86 n.a.
Hedge funds — — — — — — — — 2.21 378 -5.42 131
Total 5.22 24,528 4.13 19,164 6.13 18,319 5.85 — 2.71 -20,388 -6.87 -64,092
FIAMM (money market) 2.42 8,350 1.5 3,843 1.18 -739 1.17 -3,878 2.06 -54,629 — —
Real Estate Funds 7.87 459 6.89 559 6.7 1,304 5.35 1,808 5.98 1,673 1.63 -1,267
Pro memoria: amount marketed by Spanish firms and Spanish-resident foreign firms
Foreign UCITS 6,766 — 11,770 — 6,435 — -10,016
Source: CNMV.
1. Date to November 2008, except for foreign UCITS, to December.
23_AnexoIII_INGLES.qxd 24/7/09 19:15 Página 299

300
CNMV
Annual Report regarding
its actions and the
securities markets. 2008
UCITS operators (SGIIC): registrations and deregistrations in 2008 III.7
UCITS operators Controlling group
Registrations
Alpha Plus Gestora SGIIC, S.A. Independent
Epsilón Gestión Alternativa SGIIC, S.A. Independent
Valira Capital Asset Management, SGIIC, S.A. Crédito Andorrá
Deregistrations
Gesdiner, S.A., SGIIC Bankpyme
Gesmutual, S.A., SGIIC Mutualidad Divina Pastora
La Caixa Gestión de Activos, SGIIC, S.A. La Caixa
Source: CNMV.
Foreign investment firms with community passport: Home Member State1 III.8
2007 2008
No. of firms operating in Spain
Free provision of services 1,395 1,781
Branches 29 37
Breakdown according to origin
Free provision of services
Austria 28 28
Belgium 8 9
Cyprus 10 15
Denmark 8 9
Finland 5 5
France 41 44
Germany 28 31
Greece 8 8
Ireland 29 39
Italy 4 4
Liechtenstein 0 1
Luxembourg 11 15
Malta 1 1
Netherlands 54 60
Norway 20 23
Portugal 8 8
Slovenia 1 1
Sweden 8 9
UK 1,123 1,471
Branches
France 2 2
Germany 0 1
Luxembourg 0 2
Netherlands 2 2
Poland 0 1
Portugal 1 2
UK 24 27
Source: CNMV.
1. Countries stated in the communiqués by investment firms from EU Member States and in authorisations
of investment firms from non-EU countries.
23_AnexoIII_INGLES.qxd 24/7/09 19:15 Página 300

301
Broker-dealers, brokers and portfolio management companies. Registrations and deregistrations III.9
Firm Controlling group
Broker-dealers and brokers
Registrations
Altura Markets, SV, S.A. BBVA / Calyon / Société Générale
Arcalia Patrimonios, SV, S.A. Bancaja
Tactical Global Advisory, AV, S.A. Caja Castilla la Mancha
M&B Capital Markets, SV, S.A. Independent
Tressis, SV, S.A. Independent
Allfunds Alternative, SV, S.A. Banco Banif, S.A. / Intesa San Paolo SPA
Sarasín Alén, AV, S.A. Rabobank, NV
Capital Strategies Partners, AV, S.A. Independent
GBS Finanzas Investcapital, AV, S.A. Independent
Financial Lab, AV, S.A. Independent
Capital At Work, AV, S.A. Independent
GVC Gaesco Valores, SV, S.A. Independent
Deregistrations
Altura Markets, AV, S.A. BBVA / Calyon / Société Générale
Arcalia Valores, AV, S.A. Bancaja
Arcalia Patrimonios, AV, S.A. Bancaja
Tressis, AV, S.A. Independent
Alpha Finanzas, AV Independent
La Caixa Gestión de Patrimonios, SV, S.A. La Caixa
Interdín Mercados, AV, S.A. Cajas de Ahorros
Hermes Bolsa, AV, S.A. Independent
Estubroker, AV, S.A. Independent
Money Brok-2, AV, S.A. Banque Degroof
Portfolio management companies
Deregistrations
Capital At Work Int’l, SGC, S.A. Independent
Foreign investment firms with branch
Registrations
European Capital Financial Services Limited, Sucursal en España European Capital
X-Trade Brokers Dom Maklerski, S.A., Sucursal en España X-Trade Brokers
Vontobel Europe S.A., Sucursal en España Vontobel
Allianz Global Investors Europe Gmbh, Sucursal en España Allianz
Scottish Widows Investment Partnership Limited, Sucursal en España Scottish Widows
Skandia Invest, S.A., Sucursal en España Skandia
CMC Markets UK Plc, Sucursal en España CMC
Orey Valores - Sociedade Corretora, S.A., Sucursal en España Orey
Source: CNMV.
23_AnexoIII_INGLES.qxd 24/7/09 19:15 Página 301

302
CNMV
Annual Report regarding
its actions and the
securities markets. 2008
Changes of control at broker-dealers, brokers and portfolio III.10
management companies. 2008
Firm Buyer
Acquisitions of control by Spanish financial institutions
Morgan Stanley Wealth Management, SV, S.A. La Caixa
Estubroker, AV, S.A. Independent1
Acquisitions of control by foreign financial institutions
Asesores y Gestores Financieros, AV EFG
Gottardo Patrimonios, AV, S.A. BSI2
Source: CNMV.
1. Spin-off from Gaesco Bolsa, S.V., S.A. and General de Valores y Cambios, S.V., S.A., both to GVC Gaesco
Valores, Sociedad de Valores, S.A. (previously Estubroker, AV, S.A.).
2. BSI, S.A. acquired 100% of Banca del Gottardo thus attaining a 99.99% stake indirectly in Gottardo
Inversiones Financieras S.A. and consequently in Gottardo Patrimonios A.V. S.A.
Spanish investment firms with community passport. Host Member State1 III.11
2007 2008
Number of firms with cross-border transactions
Free provision of services 29 33
Branches 2 2
Breakdown of Spanish investment firms providing cross-border services2
Free provision of services
Austria 5 5
Belgium 12 12
Denmark 5 5
Finland 5 5
France 12 13
Germany 16 16
Greece 5 6
Iceland 3 3
Ireland 7 9
Italy 11 12
Liechtenstein 1 1
Luxembourg 9 11
Netherlands 11 11
Norway 3 3
Portugal 17 19
Sweden 5 6
UK 10 12
Branches
Portugal 1 0
Sweden 0 1
UK 1 1
Source: CNMV.
1. Countries stated in the communiqués relating to free provision of services and in authorisations of
branches.
2. Number of Spanish investment firms providing services in other countries. A single firm may provide
services in more than one country.
23_AnexoIII_INGLES.qxd 24/7/09 19:15 Página 302
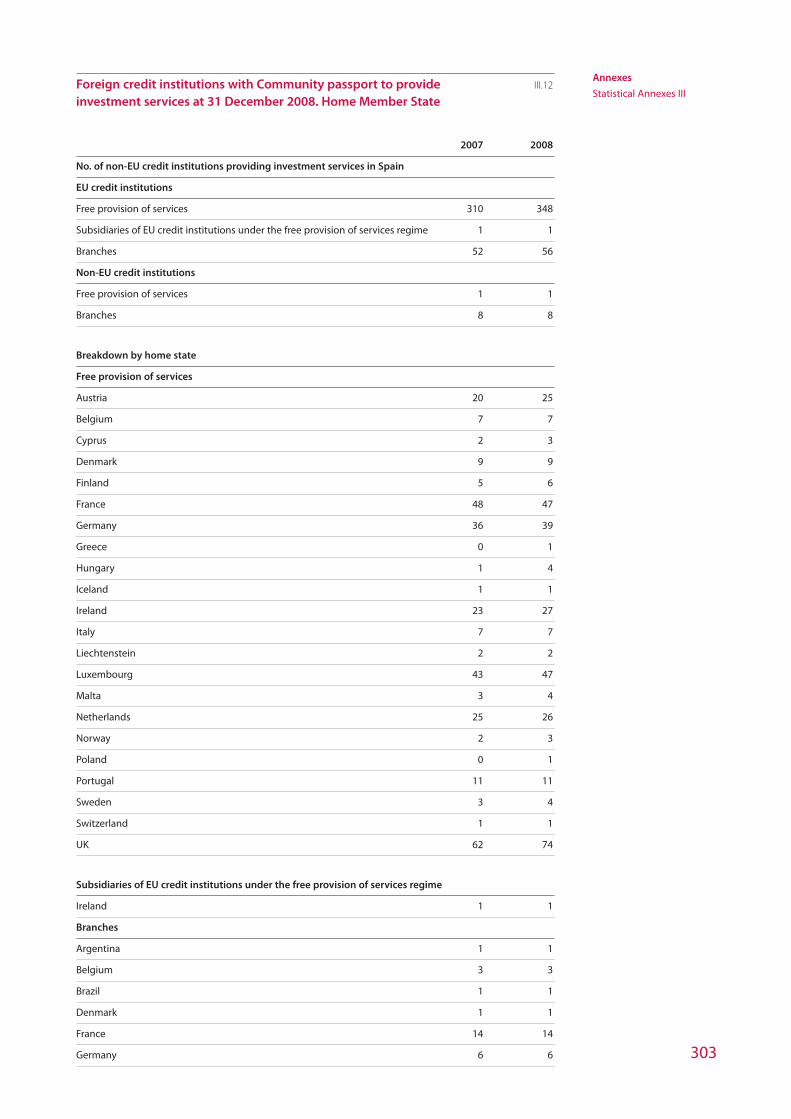
303
Annexes
Statistical Annexes IIIForeign credit institutions with Community passport to provide III.12
investment services at 31 December 2008. Home Member State
2007 2008
No. of non-EU credit institutions providing investment services in Spain
EU credit institutions
Free provision of services 310 348
Subsidiaries of EU credit institutions under the free provision of services regime 1 1
Branches 52 56
Non-EU credit institutions
Free provision of services 1 1
Branches 8 8
Breakdown by home state
Free provision of services
Austria 20 25
Belgium 7 7
Cyprus 2 3
Denmark 9 9
Finland 5 6
France 48 47
Germany 36 39
Greece 0 1
Hungary 1 4
Iceland 1 1
Ireland 23 27
Italy 7 7
Liechtenstein 2 2
Luxembourg 43 47
Malta 3 4
Netherlands 25 26
Norway 2 3
Poland 0 1
Portugal 11 11
Sweden 3 4
Switzerland 1 1
UK 62 74
Subsidiaries of EU credit institutions under the free provision of services regime
Ireland 1 1
Branches
Argentina 1 1
Belgium 3 3
Brazil 1 1
Denmark 1 1
France 14 14
Germany 6 6
23_AnexoIII_INGLES.qxd 24/7/09 19:15 Página 303

304
CNMV
Annual Report regarding
its actions and the
securities markets. 2008
Foreign credit institutions with Community passport to provide III.12
investment services at 31 December 2008. Home Member State (continuation)
2007 2008
Iceland 1 1
Ireland 3 3
Italy 1 2
Japan 1 1
Luxembourg 2 4
Netherlands 5 5
Portugal 8 8
Sweden 0 1
Switzerland 1 1
UK 8 8
United States 4 4
Source: Bank of Spain and CNMV.
23_AnexoIII_INGLES.qxd 24/7/09 19:15 Página 304

305
Statistical annexes IV
Number of shareholders of Ibex 35 companies1 with significant holdings IV.1
Stake
Company 3%-5% 5%-10% 10%-25% 25%-50% 50%-100%
Abengoa — — — — 1
Abertis — 1 — 2 —
Acciona — — — — 1
Acerinox 2 1 3 — —
ACS — 2 3 — —
B. Popular — 4 1 — —
B. Sabadell 1 4 — — —
B. Santander 1 1 — — —
Banesto — — — — 1
Bankinter 1 1 2 — —
BBVA 2 — — — —
BME 2 4 — — —
Cintra 2 1 — — 1
Criteria — — — — 1
Enagás 1 5 — — —
Endesa — — — — 12
FCC 1 — 1 — 1
Ferrovial — — — — 1
Gamesa 3 1 1 — —
Gas Natural 1 — 1 2 —
Grífols 1 5 1 — —
Iberdrola Renovables — — — — 1
Iberdrola — 4 — — —
Iberia 1 1 2 — —
Inditex — 2 — — 1
Indra — 3 2 — —
Mapfre — — 1 — 1
OHL — 1 — — 1
REE — 1 1 — —
Repsol YPF — 2 2 — —
Sacyr Vallehermoso 3 5 3 — —
Técnicas Reunidas — 1 — — 1
Telecinco 1 2 1 — 1
Telefónica — 3 — — —
Unión Fenosa 1 — 1 1 —
Total 24 55 26 5 14
Source: CNMV.
1. Composition of the Ibex 35 index at year-end.
2. Concerted action between Enel and Acciona.
Note: In accordance with the new regulation, custodians are exempt from disclosing significant holdings, and most of them have applied to be
removed from the CNMV register of holdings.
24_AnexoIV_INGLES.qxd 24/7/09 19:16 Página 305

306
Outcome of disciplinary proceedings in 2008 IV.2
Reference Resolution
(1/08) Ministerial Order of of 24 January 2008
Resolution on disciplinary proceedings against a limited company and the three members of its Board of Directors for an alleged
very serious breach of article 99 q) of the Securities Market Act (performance of reserved activities without authorisation).
The company and its managing director were fined 300,506.05 euro, and the other two directors were fined 150,253.02 euro each.
(2/08) Ministerial Order of 4 February 2008
Resolution on disciplinary proceedings against a natural person for alleged very serious breach of article 99 o) of the Securities
Market Act (insider dealing). Fine: 1,760,000 euro.
(3/08) Ministerial Order of 7 February 2008
Resolution on disciplinary proceedings against a natural person for alleged very serious breach of article 99 o) of the Securities
Market Act (insider dealing). Fine: 600,000 euro.
(4/08) Ministerial Order of 4 July 2008
Resolution to dismiss disciplinary proceedings against a natural person for alleged very serious breach of article 99 t) of the
Securities Market Act (obstruction of the CNMV inspectorate).
(5/08) Ministerial Order of 18 July 2008
Resolution on disciplinary proceedings against a listed credit institution for alleged very serious breach of article 99 ñ) of the
Securities Market Act (filing of financial information with the CNMV that was inexact or false or contained material omissions). Fine:
2 million euro.
(6/08) CNMV Board Resolution dated 11 September 2008
Resolution on disciplinary proceedings against two natural persons for alleged very serious breach, by one of them, of article 99 o)
of the Securities Market Act (disclosure of inside information) and two alleged serious breaches, by the other, of article 100 x) of the
Securities Market Act (insider dealing). The accusations were dismissed.
(7/08) CNMV Board Resolution dated 26 November 2008
Resolution on disciplinary proceedings against a listed corporation and the members of its Board of Directors for an alleged serious
breach of article 100 b) bis of the Securities Market Act (failure to have an Audit Committee in the terms established by law). The
company was fined 9,000 euro and each of the three directors was fined 3,000 euro.
Source: CNMV.
24_AnexoIV_INGLES.qxd 24/7/09 19:16 Página 306

307
Court judgments in 2008 in administrative appeals against penalties IV.3
No. Date Court Appeal no. Appealed order
1 21/01/2008 National Court 304/2005 Order MEH 29/03/2005
Upheld the penalties imposed by Ministry of Economy and Finance Order dated 29 March 2005 for a very serious breach of article 99 q) of the
Securities Market Act.
2 24/01/2008 Supreme Court 552/2001 National Court decision 02/06/2004
Upheld, on appeal, the National Court decision of 2 June 2004 rejecting administrative appeal number 552/2001 against the Order of the Ministry
of the Economy dated 7 March 2001, imposing a penalty for a very serious breach of article 99 p) of the Securities Market Act.
3 25/04/2008 National Court 512/2006 Order MEH 10/02/2006
Upheld the penalties imposed by Ministry of Economy and Finance Order dated 24 October 2005, which had been confirmed on appeal on
10 February 2006, for a very serious breach of article 99 l) of the Securities Market Act.
4 14/05/2008 Supreme Court 290/2006 National Court Order 28/03/2007
Upheld, on appeal, the National Court Order of 28 March 2007, which in turn confirmed, on appeal, an order of 4 Deceber 2006 that denied
precautionary suspension of the publication of a penalty decision relating to a very serious breach of article 99 o) of the Securities Market Act.
5 10/06/2008 National Court 210/2005 Order MEH 14/02/2005
Upheld the penalty imposed by Ministry of Economy and Finance Order dated 14 February 2005 for a very serious breach of article 99 p) of the
Securities Market Act.
6 10/06/2008 National Court 166/2005 Order MEH 14/02/2005
Upheld the penalty imposed by Ministry of Economy and Finance Order dated 14 February 2005 for a very serious breach of article 99 p) of the
Securities Market Act.
7 17/06/2008 National Court 346/2005 Order MEH 15/04/2005
Upheld the penalty imposed by Ministry of Economy and Finance Order dated 14 January 2005, confirmed on appeal by an order of 15 April 2006,
for a very serious breach of article 99 o) of the Securities Market Act.
8 01/07/2008 Supreme Court 147/2004 National Court decision 28/07/2005
Upheld, on appeal, the National Court decision of 28 July 2005 rejecting administrative appeal number 147/2004 against the Order of the Ministry
of the Economy dated 23 January 2004, imposing a penalty for a very serious breach of article 99 q) of the Securities Market Act.
9 01/07/2008 Supreme Court 87/2004 National Court decision 22/06/2005
Upheld, on appeal, the National Court decision of 22 June 2006 rejecting administrative appeal number 147/2001 against the Orders of the
Ministry of the Economy dated 18 and 19 December 2003, which imposed penalties for serious breaches of articles 100 o) and 100 t) of the
Securities Market Act and very serious breaches of articles 99 e) and 99 l) of the Securities Market Act..
10 17/07/2008 National Court 220/2005 Order MEH 14/02/2005
Upheld the penalty imposed by Ministry of Economy and Finance Order dated 14 February 2005 for a very serious breach of article 99 l) of the
Securities Market Act.
11 17/07/2008 National Court 176/2005 Order MEH 18/02/2005
Upheld the penalties imposed by Ministry of Economy and Finance Order dated 18 February 2005 for very serious breaches of articles 99 o) and
99 t) of the Securities Market Act.
24_AnexoIV_INGLES.qxd 24/7/09 19:16 Página 307

308
12 17/07/2008 National Court 150/2005 Order MEH 24/01/2005
Upheld the penalties imposed by Resolution of the CNMV Board dated 14 September 2004, confirmed on appeal by Ministry of Economy and
Finance Order dated 24 January 2005, in connection with three serious breaches of the Securities Market Act -art. 100 c), 100 h) and 100 o).
13 21/10/2008 National Court 290/2006 Order MEH 16/06/2006
Upheld the penalty imposed by Ministry of Economy and Finance Order dated 10 March 2006, confirmed on appeal by another dated 16 June
2006, for a very serious breach of article 99 o) of the Securities Market Act.
14 31/10/2008 National Court 123/2007 Order MEH 30/01/2007
Upheld the penalty imposed by Resolution of the CNMV Board for a serious breach of article 100 t) of the Securities Market Act, confirmed on
appeal by Ministry of Economy and Finance Order dated 30 January 2007.
Source: CNMV.
Court judgments in 2008 in administrative appeals against penalties (continuation) IV.3
No. Date Court Appeal no. Appealed order
24_AnexoIV_INGLES.qxd 24/7/09 19:16 Página 308

309
Anexos
Statistical annexes IVPublic warnings about unauthorised firms IV.4
Date Firm Regulator/Supervisor
CNMV warnings about unauthorised firms
21/01/2008 Hibber Bothwell Capital Partners CNMV
www.hibber-bothwell.com
11/02/2008 GRAN CANARIA CONSULTORES Y ASESORES, S.L. CNMV
07/04/2008 EVOLUTION MARKET GROUP INC (FINANZAS FOREX) CNMV
GERMAN CARDONA SOLER
SANTIAGO FUENTES JOVER
07/04/2008 SANTIAGO FUENTES JOVER CNMV
GERMAN CARDONA SOLER
EVOLUTION MARKET GROUP INC (FINANZAS FOREX)
07/04/2008 GERMAN CARDONA SOLER CNMV
EVOLUTION MARKET GROUP INC (FINANZAS FOREX)
SANTIAGO FUENTES JOVER
21/07/2008 TRIBU INTERNATIONAL INVEST, S.L. CNMV
28/07/2008 AKEMAN CAPITAL CNMV
AKEMAN ALLAN CAPITAL
WWW.AKEMANCAPITAL.COM
20/10/2008 ATLANTIS FINANCIAL CNMV
WWW.ATLANTIS-FINANCIAL.COM
20/10/2008 GCI FINANCIAL, LTD. CNMV
WWW.GCITRADING.COM
CAPITAL RESOURCES SYSTEMS, LTD.
27/10/2008 CAPITAL MANAGEMENT SCHOTTS, S.L. CNMV
ROBERT MITCHELL MCMILLAN ALLAN
Brookfield Partners, S.L. CNMV
Public warnings from foreign regulators
23/01/2008 UK MAN INTERNATIONAL INVESTMENT FINANCIAL SFC - HONG KONG
GROUP CO., LTD.
WWW.MANAHL.CO.UK
WWW.MANASIA.COM.CN
23/01/2008 MACAO MANAGEMENT SFC - HONG KONG
WWW.MACAOMGMT.HK
23/01/2008 TRANSCORP PLC JFSC - JERSEY
WWW.TRANSCORPINTL.COM
23/01/2008 TRANSCORP INTERNATIONAL JFSC - JERSEY
WWW.TRANSCORPINTL.COM
23/01/2008 OPEN TRADE INTERNATIONAL, INC. CONAVAL - PANAMA
WWW.OPENTRADE.NET
23/01/2008 SCOTT FITZGERALD GROUP FSAN - NORWAY
WWW.SCOTTFITZGERALDGROUP.COM
23/01/2008 CYRRUS CAPITAL VENTURE CBFA - BELGIUM
WWW.CYRRUSCAPITAL.COM
23/01/2008 HANNOVER HOLDINGS CBFA - BELGIUM
WWW.HANNOVERHOLDINGS.COM
23/01/2008 ROBINSON ASSET MANAGEMENT CBFA - BELGIUM
WWW.ROBINSONAM.COM
23/01/2008 JOHNSON AND BROWN CBFA - BELGIUM
WWW.JOHNSONANDBROWN.COM
24_AnexoIV_INGLES.qxd 24/7/09 19:16 Página 309

310
CNMV
Annual Report regarding
its actions and the
securities markets. 2008
23/01/2008 TALBOT REESE CBFA - BELGIUM
WWW.TALBOTREESE.COM
23/01/2008 MAXON FINANCIAL (H.K.) CO. LTD SFC - HONG KONG
WWW.MAXONFINANCIAL.COM
23/01/2008 MFA INTERNATIONAL HOLDINGS LIMITED SFC - HONG KONG
WWW.MORGAN-ADVISORS.COM
23/01/2008 MORGAN FINANCIAL ADVISORS SFC - HONG KONG
WWW.MORGAN-ADVISORS.COM
23/01/2008 PANCISCO INTERNATIONA, INC. SFC - HONG KONG
WWW.PIIEAST.COM
23/01/2008 SOUTHERN CROSS MERGERS AND ACQUISITIONS SFC - HONG KONG
WWW.SOUTHERNCROSSMA.COM
23/01/2008 U.S.A. ICII INTERNATIONAL CONSULTANT LIMITED SFC - HONG KONG
WWW.IICI.BIZ
WWW.USAICII.BIZ
WWW.USAICI.BIZ
23/01/2008 WWW.HDLI.NET SFC - HONG KONG
23/01/2008 AIBWT NOMINEES LIMITED JFSC - JERSEY
HTTP://AIBWT.COM
JAMAL WEHBEH
HTTP://WWW.AIBWT-NOMINEES.COM
23/01/2008 LANCASTER MANAGEMENT CORPORATION HCMC - GREECE
23/01/2008 MOUNT REAL CORPORATION HCMC - GREECE
06/02/2008 OICU LIMITED FSC - ISLE OF MAN
06/02/2008 WWW.ALIANCE-LEICESTER-UK.COM FSC - ISLE OF MAN
06/02/2008 ISLE OF MAN LOTTO PROMOTIONS UK FSC - ISLE OF MAN
06/02/2008 ARTEMIS FINANCIAL AMF - FRANCE
06/02/2008 BANK NATIONAL TSB OFFSHORE LIMITED JFSC - JERSEY
06/02/2008 HAMILTON HASTINGS & ASSOCIATES SFSA - SWEDEN
WWW.HAMILTONHASTINGS.COM
06/02/2008 AKEMAN CAPITAL SFSA - SWEDEN
WWW.AKEMANCAPITAL.COM
06/02/2008 THE ALLIANCE GROUP SFSA - SWEDEN
WWW.ALLIANCEGROUPTRUST.COM
06/02/2008 ERNEST GREENE GROUP, LTD. SFSA - SWEDEN
WWW.ERNEST-GREENE.COM
WWW.E-GREENE.COM
06/02/2008 CAPITAL VENTURE GROUP, CVG SFSA - SWEDEN
WWW.CAPITALVENTUREGROUP.NET
13/02/2008 AKEMAN CAPITAL DFSA - DENMARK
WWW.AKEMANCAPITAL.COM
13/02/2008 PRESTIGE ASSET MANAGEMENT CSSF - LUXEMBOURG
13/02/2008 CRICKMORE & LUTZ CSSF - LUXEMBOURG
13/02/2008 GLOBAL PENSION PLAN SSMA - SLOVENIA
13/02/2008 WORLDWIDE RESEARCH GROUP CBFA - BELGIUM
WWW.WORLDWIDERG.COM
13/02/2008 PALLADIUM CATHAY INTERMEDIARIES SFSA - SWEDEN
WWW.PALLADIUMCATHAY.COM
Public warnings about unauthorised firms (continuation) IV.4
Date Firm Regulator/Supervisor
24_AnexoIV_INGLES.qxd 24/7/09 19:16 Página 310

311
Anexos
Statistical annexes IV
13/02/2008 DAVIS & RUDELL LLC SFSA - SWEDEN
WWW.DAVIS-RUDELL.COM
27/02/2008 629 PLAN AMF - FRANCE
27/02/2008 AKEMAN CAPITAL DFSA - DENMARK
WWW.AKEMANCAPITAL.COM
27/02/2008 AKEMAN ALLAN CAPITAL DFSA - DENMARK
WWW.AKEMANCAPITAL.COM
27/02/2008 CFM TRADING SFSA - SWEDEN
WWW.CFMTRADINGS.COM
27/02/2008 STRATEGIC INVESTMENT GROUP, SIG SFSA - SWEDEN
WWW.SIGADVISOR.COM
27/02/2008 HEDGES MERGERS & ACQUISITIONS SFSA - SWEDEN
WWW.HMAWORLD.COM
27/02/2008 CONCEPTS SOLUTIONS, S.A. HCMC - GREECE
27/02/2008 CONCEPTS FINANCIAL CONSULTANTS, S.A. HCMC - GREECE
27/02/2008 FIA CORPORATION, S.A. HCMC - GREECE
06/03/2008 WWW.HK-GUOCO.COM SFC - HONG KONG
06/03/2008 MAXON & ASSOCIATES SECURITIES LIMITED SFC - HONG KONG
WWW.MAXON-ASSOCIATES.COM
06/03/2008 MANCHUKUO TEMPORARY GOVERNMENT SFC - HONG KONG
WWW.MANCHUKUO.ORG
06/03/2008 HOWELL SCHINE & CO SFC - HONG KONG
WWW.HOWELLSCHINE.COM
12/03/2008 HACHIRO MERGERS AND ACQUISITIONS SFSA - SWEDEN
WWW.HACHIRO.ORG
12/03/2008 OKAMURA ASSET MANAGEMENT AFM - NETHERLANDS
19/03/2008 BLACKSTONE, NELSON, NEWHOUSE SFC - HONG KONG
WWW.BNNSERVICES.COM
19/03/2008 ABERDEEN LYLE GROUP SFC - HONG KONG
WWW.ABERDEENLYLE.COM
19/03/2008 WESTGATE CAPITAL MANAGEMENT JFSC - JERSEY
WWW.WESTGATECM.COM
19/03/2008 NOMURA FINANCIAL GROUP SFSA - SWEDEN
WWW.NOMURAGRP.COM
19/03/2008 ASHLEY PARTNERS MERGERS & ACQUISITIONS SFSA - SWEDEN
WWW.ASHLEYPARTNERS.COM
19/03/2008 WALLSTREET MANAGEMENT INCORPORATED SFSA - SWEDEN
WWW.WM-INCORPORATED.COM
16/04/2008 VARIOS ISLA DE MAN FSC - ISLE OF MAN
16/04/2008 VARIOS ISLA DE MAN FSC - ISLE OF MAN
16/04/2008 KELVIN DUNCAN & BORIS OLEG FSC - ISLE OF MAN
16/04/2008 PIERRE WALKER FSC - ISLE OF MAN
16/04/2008 LOTS FINANCIAL GROUP LIMITED SFC - HONG KONG
WWW.LOTSFX.COM
Public warnings about unauthorised firms (continuation) IV.4
Date Firm Regulator/Supervisor
24_AnexoIV_INGLES.qxd 24/7/09 19:16 Página 311

312
CNMV
Annual Report regarding
its actions and the
securities markets. 2008
16/04/2008 WALSH, ATKINS & ASSOCIATES SFSA - SWEDEN
WWW.WALSHATKINSASSOC.COM
16/04/2008 7M MANAGEMENT SERVICES, LTD. HCMC - GREECE
CHRIS MELAS
KONSTANTINOS KALLONIATIS
16/04/2008 GOLDEN PURSE FUND HCMC - GREECE
KONSTANTINOS KALLONIATIS
CHRIS MELAS
16/04/2008 SOLID GOLD FINANCE LIMITED SFC - HONG KONG
16/04/2008 IBIA DFSA - DENMARK
WWW.IBIA.INFO
16/04/2008 CUNNINGHAM HYATT MERGERS & ACQUISITIONS, LLP SFSA - SWEDEN
WWW.CUNNINGHAMHYATT.COM
16/04/2008 HABERMAN BROTHERS INTERNATIONAL SFSA - SWEDEN
WWW.HABERMANBROTHERS.COM
16/04/2008 BERKLEY LIQUIDATION & ADMINISTRATION SFSA - SWEDEN
WWW.BERKLEYLIQUIDATION.COM
16/04/2008 KAGOSHIMA SECURITIES FINANCE SFSA - SWEDEN
WWW.KAGOFIN.NET
16/04/2008 ALLIANCE GLOBAL INVESTORS FUND MANAGEMENT LLC SFSA - SWEDEN
WWW.AGIFUNDMGM.COM
16/04/2008 MINERVA MANAGEMENT SFSA - SWEDEN
WWW.MINERVAMANAGEMENT.COM
16/04/2008 J. S. Knight & Co, Ltd. IFSRA - IRELAND
16/04/2008 MCANTHONY INVESTMENTS CBFA - BELGIUM
WWW.MCANTHONYINVESTMENTS.COM
30/04/2008 [email protected] JFSC - JERSEY
30/04/2008 NAKAMISHI FINANCIAL, INC. SFSA - SWEDEN
WWW.NAKAMISHIFINANCIAL.COM
30/04/2008 MCKINLEY & CO, LTD. SFSA - SWEDEN
WWW.MCKINLEYCOLTD.COM
30/04/2008 EMPIRE STATE CONSULTANTS SFSA - SWEDEN
WWW.EMPIRESTATECONSULTANTS.COM
14/05/2008 RAFIQ AHMED PETKAR JFSC - JERSEY
FIREBIRD HOLDINGS LLC (FB HOLDINGS)
14/05/2008 THOMAS CASTLE MANAGEMENT DFSA - DENMARK
WWW.THOMAS-CASTLE.COM
14/05/2008 ATLANTIS FINANCIAL SFSA - SWEDEN
Edzell Ventures
WWW.ATLANTIS-FINANCIAL.COM
21/05/2008 AB HUTTON GLOBAL HOLDINGS CYSEC - CYPRUS
WWW.ABHGLOBAL.COM
21/05/2008 EURO MONUMENT HOUSE & FINANCE PLC FSC - ISLE OF MAN
HTTP://EUROMONUMENTHOUSEFINANCE.COM/EHF
ALLEN LUCADO
21/05/2008 CORPORATE FINANCE FSC - ISLE OF MAN
CHARLES BURNHAM
21/05/2008 VARIOS ISLA DE MAN FSC - ISLE OF MAN
Public warnings about unauthorised firms (continuation) IV.4
Date Firm Regulator/Supervisor
24_AnexoIV_INGLES.qxd 24/7/09 19:16 Página 312

313
Anexos
Statistical annexes IV
21/05/2008 COLEMAN, PETERSON & ASSOCIATES (CPA) SFSA - SWEDEN
WWW.CPA-ADVISORS.COM
21/05/2008 SCANDINAVIAN TRADE SFSA - SWEDEN
WWW.SCANDINAVIAN-TRADE.COM
28/05/2008 FUTURE TRADING CLUB SFSA - SWEDEN
WWW.FUTURETRADINGCLUB.COM
28/05/2008 STRATEGIC CAPITAL PARTNERS PORTFOLIO MANAGEMENT AG CBFA - BELGIUM
WWW.STRATEGICCAPITAL.CH
28/05/2008 VARIOS ISLA DE MAN FSC - ISLE OF MAN
ROLAND MANTU
CHUDY MORRISON
11/06/2008 CAPITAL ACCESS LIMITED SFSA - SWEDEN
WWW.CAPITALACCESSLIMITED.COM
18/06/2008 BULL AND BEAR ADVISORY (IRELAND) IFSRA - IRELAND
18/06/2008 BAYSIDE EQUITY GROUP SFSA - SWEDEN
WWW.BAYSIDEEQUITYGROUP.COM
18/06/2008 HANNOVER STERLING, LTD. SFSA - SWEDEN
WWW.HANNOVERSTERLINGLTD.COM
(WARNING: CONTAINS VIRUS)
18/06/2008 EVOLUTION MARKET GROUP INC.
(FINANZAS FOREX) AMF - FRANCE
02/07/2008 BLUE BAYOU PROSPECT MANAGEMENT SFSA - SWEDEN
WWW.BBPROSPECT.COM
02/07/2008 BULLMAN ASSET MANAGEMENT SFSA - SWEDEN
WWW.BULLMANASSETMANAGEMENT.COM
02/07/2008 PATERSON & CO, LTD. SFSA - SWEDEN
WWW.PATERSONCOLTD.COM
09/07/2008 AVERY KINGSTON CAPITAL SFSA - SWEDEN
WWW.AVERYKINGSTON.COM
09/07/2008 DAUPHIN ASSET EUROPE SFSA - SWEDEN
WWW.DAUPHINEUROPE.COM
09/07/2008 FIRST PRIME GROUP SFSA - SWEDEN
WWW.FIRSTPRIMEGROUP.NET
09/07/2008 REYNOLDS GROUP LIMITED SFSA - SWEDEN
WWW.REYNOLDSFINANCE.COM
09/07/2008 RICHMOND CAPITAL MANAGEMENT SFSA - SWEDEN
WWW.RICHMONDCONSULTANCY.COM
09/07/2008 KIMURA FINANCIAL DFSA - DENMARK
WWW.KIMURAFINANCIAL.COM
23/07/2008 DAVIS MAYER GROUP CBFA - BELGIUM
WWW.DAVISMAYER.COM
23/07/2008 ROYAL ASSETS AND RESEARCH CBFA - BELGIUM
WWW.ROYALASSETSANDRESEARCH.COM
23/07/2008 ABEYSINGHE SUMINDRA FSC - ISLE OF MAN
23/07/2008 LASHORNDA YOUNG FSC - ISLE OF MAN
23/07/2008 HTTP://INVESTEC-B.COM FSC - ISLE OF MAN
Public warnings about unauthorised firms (continuation) IV.4
Date Firm Regulator/Supervisor
24_AnexoIV_INGLES.qxd 24/7/09 19:16 Página 313

314
CNMV
Annual Report regarding
its actions and the
securities markets. 2008
23/07/2008 MOHAMMED M. HOQUE FSC - ISLE OF MAN
HTTP://MRLAWCHAMBERS.COM/FEES.HTM
HTTP://MRLAWCHAMBERS.COM/LEGALTEAM.HTM
23/07/2008 CANARY TRUST SECURITY FSC - ISLE OF MAN
30/07/2008 COMMISSION FEDERALE DES MARCHES FINANCIERS CBFA - BELGIUM
WWW.CFMF.GOVT.BE
30/07/2008 SOLVAY FINANCIAL CBFA - BELGIUM
30/07/2008 CITY PRIVATE BANKING & WEALTH MANAGEMENT FSC - ISLA DE MAN
JAMES SHERMAN
30/07/2008 GLOBE FINANCE GROUP FSC - ISLE OF MAN
HTTP://GLOBEFINANCEINVESTMENTS.EN.ECPLAZA.NET
WWW.GLOBEFINANCEINVESTMENTS
30/07/2008 LIGHTHOUSE FINANCE LLC FSC - ISLE OF MAN
WWW.WEBNOW.COM/LIGHTHOUSELIVE-COM
WWW.LIGHTHOUSE.INVESTMENT.COM
30/07/2008 CENTURION CAPITAL INTERNATIONAL, INC. SFSA - SWEDEN
WWW.CENTURIONCAPITALONLINE.COM
13/08/2008 INVESTMENT SOLUTIONS, LTD. HCMC - GREECE
CHRISTOS STERGIOU
13/08/2008 SUMMIT CAPITAL MANAGEMENT CBFA - BELGIUM
13/08/2008 ADVANTAGE SECURITIES, INC. SFC - HONG KONG
WWW.ADVANTAGESECURITIES.COM
13/08/2008 MIRACLE ASSET, LTD. SFC - HONG KONG
13/08/2008 SABIN COMMODITIES, INC. SFC - HONG KONG
WWW.SABIN-COMMODITIES.COM
13/08/2008 STANDARD UNITED CORPORATION SFC - HONG KONG
WWW.STANDARDUNITED.COM
13/08/2008 WWW.SHEEP669.CN SFC - HONG KONG
13/08/2008 TRUST FINANCE FIDELITY BANK JFSC - JERSEY
HTTP://TRUSTFINANCEFIDELITYBANK.ORG
13/08/2008 BAC MINING SOUTH AFRICA FUND HCMC - GREECE
13/08/2008 BAC SOLAR HCMC - GREECE
13/08/2008 BAC AFRICA NATURAL RESOURCES HCMC - GREECE
13/08/2008 BAC HYDROGEN HCMC - GREECE
13/08/2008 BEST ASSET CLASS AG (BAC) HCMC - GREECE
20/08/2008 MASARU ASSOCIATES SFC - HONG KONG
WWW.MASARUASSOCIATES.COM
20/08/2008 REYNOLDS GROUP LIMITED SFC - HONG KONG
WWW.REYNOLDSFINANCE.COM
20/08/2008 SCOTT FITZGERALD GROUP SFC - HONG KONG
WWW.SCOTTFITZGERALDGROUP.COM
20/08/2008 WILMINGTON FINANCIAL GROUP SFC - HONG KONG
WWW.WORFINGRP.COM
20/08/2008 WORTHINGTON FINANCIAL GROUP SFC - HONG KONG
WWW.WORFINGRP.COM
17/09/2008 E-HOLDING LIMITED GFSC - GIBRALTAR
Public warnings about unauthorised firms (continuation) IV.4
Date Firm Regulator/Supervisor
24_AnexoIV_INGLES.qxd 24/7/09 19:16 Página 314

315
Anexos
Statistical annexes IV
17/09/2008 WORLD OWNERS INSTANT PAYMENTS (WOIP) GFSC - GIBRALTAR
17/09/2008 CAPITAL MANAGEMENT FOUNDATION OF NORTH AMF - FRANCE
AMERICA INC. (CMF)
17/09/2008 EURO CAPITAL MARKET SERVICES AMF - FRANCE
17/09/2008 THOMAS CASTLE MANAGEMENT FSAN - NORWAY
WWW.THOMAS-CASTLE.COM
17/09/2008 DAVIS MAYER GROUP FSAN - NORWAY
WWW.DAVISMAYER.COM
17/09/2008 HAWKINS & DOYLE FSAN - NORWAY
WWW.HAWKINSDOYLE.COM
17/09/2008 IMG AS - INTERNETMARKET GLOBAL FSAN - NORWAY
WWW.FIN-ENERGY.NO
17/09/2008 WALL STREET MANAGEMENT CORP FSAN - NORWAY
WWW.WALLSTREETMGT.COM
17/09/2008 METROPOLITAN CREDIT CORP AFM - NETHERLANDS
17/09/2008 BKR-KREDIET AFM - NETHERLANDS
17/09/2008 ENSCHEDE FINANCE AFM - NETHERLANDS
17/09/2008 DAUPHIN ASSET EUROPE AFM - NETHERLANDS
17/09/2008 POLLIA VENTURES SFSA - SWEDEN
WWW.POLLIAVENTURES.COM
17/09/2008 ABERDEEN PACIFIC GROUP SFSA - SWEDEN
WWW.ABERDEENPACIFICGROUP.COM
17/09/2008 PORTWAY CAPITAL SFSA - SWEDEN
WWW.PORTWAYCAPITAL.COM
17/09/2008 HEINTZMAN, WARREN, WISE & FORNELLA, P.C. SFSA - SWEDEN
WWW.HWWLAW.COM
17/09/2008 HIGHLAND INTERNATIONAL ADVISORS SFSA - SWEDEN
WWW.HIGHLANDINTADV.COM
17/09/2008 THE LYON GROUP, INC. SFSA - SWEDEN
WWW.THELYONGROUPINC.COM
17/09/2008 POLLIA VENTURES FMA - AUSTRIA
WWW.POLLIAVENTURES.COM
17/09/2008 KIMURA FINANCIAL FMA - AUSTRIA
WWW.KIMURAFINANCIAL.COM
17/09/2008 INCENTIVE BREIL/BRIGELS, S.A. FMA - AUSTRIA
17/09/2008 MOHOON INTERNATIONAL INVESTMENT, LTD. SFC - HONG KONG
WWW.MOHOON.COM
17/09/2008 HONGKONG GXFOREX CO., LTD. SFC - HONG KONG
WWW.JXCM138.COM
17/09/2008 ADVANTAGE SECURITIES, INC. SFC - HONG KONG
WWW.ADVANTAGESECURITIES.COM
24/09/2008 EDENBOURG ADVISORY SERVICES CBFA - BELGIUM
WWW.EDENBOURGAS.COM
24/09/2008 WORLD CAPITAL SOLUTIONS SFSA - SWEDEN
WWW.WORLDCAPITALSOLUTIONS.COM
01/10/2008 FAIRFIELD AND HAYES FSAN - NORWAY
WWW.FAIRFIELDHAYS.COM
01/10/2008 AUGMENTUM MACAU FSAN - NORWAY
WWW.AUGMENTUMMACAU.COM
Public warnings about unauthorised firms (continuation) IV.4
Date Firm Regulator/Supervisor
24_AnexoIV_INGLES.qxd 24/7/09 19:16 Página 315

01/10/2008 HAMILTON TRADING, LTD. CBFA - BELGIUM
WWW.HAMILTON-TRADING.COM
01/10/2008 INDIGO FUTURES LIMITED GFSC - GIBRALTAR
01/10/2008 GOLDMAN SACHS ASIA INVESTMENT MANAGEMENT SFC - HONG KONG
(HONG KONG) LIMITED
01/10/2008 Global Options Group SFC - HONG KONG
WWW.GLOBALOPTIONS.ORG
WWW.GLOBALCGP.COM
WWW.GLOBALOPTIONS.BE
01/10/2008 Global Commodities ,Inc. SFC - HONG KONG
WWW.GLOBALOPTIONS.ORG
WWW.GLOBALOPTIONS.BE
WWW.GLOBALCGP.COM
01/10/2008 GLOBE ALLIANCE LIMITED SFC - HONG KONG
WWW.GLOBALCGP.COM
WWW.GLOBALOPTIONS.ORG
WWW.GLOBALOPTIONS.BE
01/10/2008 ELECTRONIC CAPITAL MARKETS LIMITED SFC - HONG KONG
WWW.ECMFOREX.COM
01/10/2008 ECM TRADING LIMITED SFC - HONG KONG
WWW.ECMFOREX.COM
01/10/2008 MANHATTAN FUJIWARA INTERNATIONAL SFSA - SWEDEN
WWW.MANHATTANFUJI.JP
01/10/2008 INTERNATIONAL EQUITY PORTFOLIO SFSA - SWEDEN
01/10/2008 ROSS-PARKINSON SFSA - SWEDEN
01/10/2008 WIDE BERTH INTERNATIONAL, INC. SFSA - SWEDEN
15/10/2008 Morley Thompson, Inc. DFSA - DENMARK
www.morleythompson.com
15/10/2008 WITTER WALWYN DFSA - DENMARK
WWW.WITTERWALWYN.NET
15/10/2008 BOULTON CAPITAL PARTNERS IFSRA - IRELAND
15/10/2008 GOTTHARD CAPITAL PARTNERS IFSRA - IRELAND
15/10/2008 OMEGA CAPITAL MANAGEMENT IFSRA - IRELAND
15/10/2008 WESTCOMB CAPITAL MANAGEMENT IFSRA - IRELAND
15/10/2008 CANARY TRUST SECURITY FSC - ISLE OF MAN
15/10/2008 DAN WILLIAMS FSC - ISLE OF MAN
15/10/2008 MONEDA MANAGEMENT LLC FSC - ISLE OF MAN
WWW.MONEDAMANAGEMENT.COM/MONEDA.HTM
15/10/2008 BANQUE DE PRINKIPO FSC - ISLE OF MAN
WWW.KREDISGLAMA.COM
WWW.BANQUEDEPRINKIPOS.COM
15/10/2008 PRINKIPO CONSULTING AND TRADE LIMITED FSC - ISLE OF MAN
WWW.KREDISGLAMA.COM
WWW.BANQUEDEPRINKIPOS.COM
15/10/2008 PC & T (IOM) LIMITED FSC - ISLE OF MAN
WWW.KREDISGLAMA.COM
WWW.BANQUEDEPRINKIPOS.COM
15/10/2008 ROYAL CANARY TRUST FSC - ISLE OF MAN316
CNMV
Annual Report regarding
its actions and the
securities markets. 2008
Public warnings about unauthorised firms (continuation) IV.4
Date Firm Regulator/Supervisor
24_AnexoIV_INGLES.qxd 24/7/09 19:16 Página 316

15/10/2008 ROYAL CANARY TRUST FSC - ISLE OF MAN
15/10/2008 ROYAL CANARY TRUST BANK FSC - ISLE OF MAN
15/10/2008 ROYAL CANARY TRUST, LTD. FSC - ISLE OF MAN
15/10/2008 LIMBAUGH AND YORK ASSOCIATES FSC - ISLE OF MAN
WWW.LIMBAUGHANDYORKASSOCIATES.COM
15/10/2008 ANTIQUES SUPERMARKET.COM FSC - ISLE OF MAN
HTTP://WWW.ANTIQUESSUPERMARKET.COM
22/10/2008 WINDRIVER CAPITAL FSA - UNITED KINGDOM
22/10/2008 AVERY KINGSTON CAPITAL FSA - UNITED KINGDOM
22/10/2008 CANTWELL INTERNATIONAL FSA - UNITED KINGDOM
22/10/2008 COHEN HAYWARD INTERNATIONAL FSA - UNITED KINGDOM
22/10/2008 CROSBY CAPITAL PARTNERS FSA - UNITED KINGDOM
WWW.CROSBYCP.COM
22/10/2008 EDENBOURG ADVISORY SERVICES FSA - UNITED KINGDOM
22/10/2008 FINANCIAL INVESTMENT SOLUTIONS FSA - UNITED KINGDOM
22/10/2008 GREYSON MANAGEMENT FSA - UNITED KINGDOM
22/10/2008 HUNTER ROWE FSA - UNITED KINGDOM
22/10/2008 JOHNSON MATTHEWS ASSOCIATES FSA - UNITED KINGDOM
22/10/2008 JUVET MANAGEMENT FSA - UNITED KINGDOM
22/10/2008 KENSINGTON CAPITAL FSA - UNITED KINGDOM
22/10/2008 MAGANURA MERGERS & ACQUISITIONS FSA - UNITED KINGDOM
22/10/2008 PEARL ASSOCIATES FSA - UNITED KINGDOM
22/10/2008 PEARLMAN & SINCLAIR FSA - UNITED KINGDOM
22/10/2008 PETERSON MCCORMACK ASSOCIATES FSA - UNITED KINGDOM
22/10/2008 TROY LANSDOWNE FSA - UNITED KINGDOM
22/10/2008 VISION COMMODITIES FSA - UNITED KINGDOM
22/10/2008 MORGAN FINCH INTERNATIONAL DFSA - DENMARK
WWW.MORGANFINCH.NET
22/10/2008 PACIFIC EQUITY MANAGEMENT SFSA - SWEDEN
WWW.PACIFICEM.COM
22/10/2008 SAKUMA GROUP SFSA - SWEDEN
WWW.SAKUMAGROUP.COM
22/10/2008 DOMINION ROYAL EKONOMISK FÖRENING SFSA - SWEDEN
(ECONOMIC ASSOCIATION)
WWW.DOMINIONROYAL.COM
22/10/2008 ATLANTIS MERGERS & ACQUISITIONS SFSA - SWEDEN
WWW.ATLANTISMA.COM
22/10/2008 GREYHILL CONSULTANTS SFSA - SWEDEN
22/10/2008 ROSSFORD MERGERS & ACQUISITIONS FSA - UNITED KINGDOM
19/11/2008 OVETII HCMC - GREECE
19/11/2008 GOTTHARD CAPITAL PARTNERS FSA - UNITED KINGDOM
WWW.GOTTHARDCP.COM
19/11/2008 BARRINGTON SECURITIES FSA - UNITED KINGDOM
19/11/2008 BOULTON CAPITAL PARTNERS FSA - UNITED KINGDOM
19/11/2008 BRIDGESTONE TRADING FSA - UNITED KINGDOM 317
Anexos
Statistical annexes IVPublic warnings about unauthorised firms (continuation) IV.4
Date Firm Regulator/Supervisor
24_AnexoIV_INGLES.qxd 24/7/09 19:16 Página 317

19/11/2008 CANTWELL INTERNATIONAL FSA - UNITED KINGDOM
19/11/2008 CK INVESTMENTS (CK GROUP) FSA - UNITED KINGDOM
19/11/2008 CROMWELL AND PIERCE INTERNATIONAL FSA - UNITED KINGDOM
19/11/2008 DELTA GROUP LLC FSA - UNITED KINGDOM
19/11/2008 EX TRADE FSA - UNITED KINGDOM
19/11/2008 EXECUTIVE GROUP FSA - UNITED KINGDOM
19/11/2008 FLEETWOOD ASSOCIATES FSA - UNITED KINGDOM
19/11/2008 GLOBAL WEALTH MANAGEMENT FSA - UNITED KINGDOM
19/11/2008 GLOBAL WEALTH PARTNERS PLC FSA - UNITED KINGDOM
19/11/2008 HARRINGTON LLOYD FSA - UNITED KINGDOM
19/11/2008 HEINZ HOKKAIDO INTERNATIONAL FSA - UNITED KINGDOM
19/11/2008 HEMMINGWAYS FSA - UNITED KINGDOM
19/11/2008 INTERACTIVE WORLD TRADING, LTD. FSA - UNITED KINGDOM
19/11/2008 INTERNATIONAL DIGITAL SPORTS TECHNOLOGIES FSA - UNITED KINGDOM
19/11/2008 KAUFFMAN HATHERWAY / K H CORPORATE FSA -UNITED KINGDOM
19/11/2008 LIMBAUGH AND YORK ASSOCIATES FSA - UNITED KINGDOM
19/11/2008 PARKER FORRESTER, LTD. FSA - UNITED KINGDOM
19/11/2008 SAKUMA GROUP FSA - UNITED KINGDOM
19/11/2008 SOVEREIGN PACIFIC, INC. FSA - UNITED KINGDOM
19/11/2008 VANZANDT FSA - UNITED KINGDOM
19/11/2008 WESTERN ROYAL FSA - UNITED KINGDOM
19/11/2008 WORLD CAPITAL SECURITIES FSA - UNITED KINGDOM
19/11/2008 AKER FINANCIAL AS FSAN - NORWAY
WWW.AKERFINANCIAL.COM
19/11/2008 SEISMA OIL RESEARCH LLC FSAN - NORWAY
WWW.SEISMARESEARCH.COM
19/11/2008 HCS WORLDWIDE DFSA - DENMARK
WWW.HCSWORLDWIDE.COM
19/11/2008 HCS WORLDWIDE SFSA - SWEDEN
WWW.HCSWORLDWIDE.COM
19/11/2008 EURO SPARKASSA EKONOMISK FÖRENING SFSA - SWEDEN
19/11/2008 JAMES B. CLARKE ET CO, LTD. JFSC - JERSEY
WWW.JBC-CO.COM
19/11/2008 SOCIETE FINANCE GROUP JFSC - JERSEY
HTTP://SOCFINGROUP.COM
19/11/2008 JD ABRAMS & ASSOCIATES SFC - HONG KONG
WWW.JDABRAMSASSOCIATES.COM
19/11/2008 PARKER MONROE SFC - HONG KONG
WWW.PARKERMONROE.COM
19/11/2008 SKY PRIVATE BANK & TRUST (GIBRALTAR) LIMITED GFSC - GIBRALTAR
19/11/2008 PRESTIGE MANAGEMENT PLC GFSC - GIBRALTAR
26/11/2008 JAMES B. CLARKE ET CO. LTD. GFSC - GIBRALTAR
26/11/2008 CORE MARKET RESEARCH GFSC - GIBRALTAR
26/11/2008 FINANSTJENESTER FSAN - NORWAY
WWW.FINANSTJENESTER.NET318
CNMV
Annual Report regarding
its actions and the
securities markets. 2008
Public warnings about unauthorised firms (continuation) IV.4
Date Firm Regulator/Supervisor
24_AnexoIV_INGLES.qxd 24/7/09 19:16 Página 318

26/11/2008 GOLDBERG HECHE ASSOCIATES FSAN - NORWAY
HTTP://GOLDBERGHECHE.COM/INDEX.HTML
26/11/2008 CES FUTURES BROKERAGE CO. LTD. SFC - HONG KONG
WWW.CESFUTURES.COM
26/11/2008 MORGAN CAPITAL PARTNERS SFC - HONG KONG
WWW.MORGANCP.COM
26/11/2008 RIVE FINANCIAL SFC - HONG KONG
WWW.RIVEFINANCIAL.CH
26/11/2008 VENTURE ALLIANCE PARTNERS (VENPAR) SFSA - SWEDEN
WWW.VENPAR.COM
26/11/2008 LYLAND FINANCE SFSA - SWEDEN
WWW.LYLANDFINANCE.COM
26/11/2008 FALON GROUP LIMITED SFSA - SWEDEN
WWW.FALON-GROUP.COM
26/11/2008 DAVIS MAYER GROUP FMA - AUSTRIA
WWW.DAVISMAYER.COM
10/12/2008 FINURBA CORPORATE FINANCE FSAN - NORWAY
10/12/2008 BARCLAYS GROUP FINANCIAL, INC. SFSA - SWEDEN
10/12/2008 HAMPSHIRE CONSULTANTS LLC FSAN - NORWAY
HTTP://HAMPSHIRECONSULTANTSLLC.COM
10/12/2008 SKYLINE ADVISORY GROUP SFSA - SWEDEN
10/12/2008 PACIFIC CAPITAL PARTNERS SFSA - SWEDEN
10/12/2008 HIGHLAND INTERNATIONAL ADVISORS FSAN - NORWAY
WWW.HIGHLANDINTADV.COM
10/12/2008 LINCOLN VENTURES IFSRA - IRELAND
10/12/2008 BAER INNES STOCK BROKING AND WEALTH FSAN - NORWAY
MANAGEMENT
WWW.BAERINNES.COM
10/12/2008 SAVOY ADVISORS LLC FSAN - NORWAY
Wakefield & Stern Corporation JFSC - JERSEY
Source: CNMV.
319
Anexos
Statistical annexes IVPublic warnings about unauthorised firms (continuation) IV.4
Date Firm Regulator/Supervisor
24_AnexoIV_INGLES.qxd 24/7/09 19:16 Página 319

24_AnexoIV_INGLES.qxd 24/7/09 19:16 Página 320

Legislative annexes
A Spanish legislation
Main domestic legislation approved in 2008.
A.1 Comisión Nacional del Mercado de Valores
CNMV Board Resolution dated 10 November 2008, approving the CNMV InternalRegulation.
This resolution made some amendments to the CNMV Internal Regulation, whoseapproval is the competency of the CNMV itself in accordance with article 14.10 ofthe Securities Market Act. The main purpose of the amendment was to introduceformal and technical improvements.
In particular, the President is allowed to delegate his own functions to any organ ofthe CNMV provided that this is done in accordance with the provisions of the Act.The regulations governing the status of the President, Vice-President and executivepersonnel of the CNMV after they step down were also completed. The formerdirectorates and divisions are now called departments, and regulations governingthe functions of the Internal Control Department and the Department of theAssistant to the President were expressly included.
With regard to the various administrative procedures, a reference to the electronicregister was added and references to the regulation governing penalty proceedingswere completed. The amendment also provided for participation by the InternalControl Department in drafting internal procedures, and the regulation governingstaff hiring was revised to adapt it to Act 7/2007, of 12 April, on the Basic Statute ofCivil Servants.
A.2 Official secondary markets in securities and other trading systems
CNMV Circular 9/2008, of 10 December, on the accounting standards, confidentialand public disclosures and annual accounts of the governing companies of officialsecondary markets, excluding the Bank of Spain, of governing companies ofmultilateral trading facilities, of the Sociedad de Sistemas, of central counterparties,of the Sociedad de Bolsas, of companies that own all the shares of governingcompanies of official secondary markets and multilateral trading facilities, andother market clearing and settlement systems created in accordance with theSecurities Market Act.
321
Annexes
Legislative annexes
25_Anexos_Legis_INGLES.qxd 24/7/09 19:17 Página 321

This accounting Circular applies to all securities market trading and post-tradinginfrastructures that are resident in Spain, with the exception of the Public Debt Book-Entry Market. Its goal is to update the pre-existing regulations and forms for theconfidential and public financial statements in order to adapt them to the changesin accounting regulations in Spain in the last year for the purpose of attaininginternational harmonisation on the basis of the European Union regulations and,specifically, in the framework of the New General Accounting Plan (NGAP).
The amendment of the accounting regulations was addressed by considering thespecific legal and operational features of the various trading and post-tradinginfrastructures in Spain and the accounting principles and standards contained inthe NGAP. For that reason, this Circular does not contain accounting regulations fortransactions and events that are covered by the NGAP; it merely sets out theaccounting rules to be applied by those infrastructures to transactions and eventswhich, because of their specific nature, are not covered by the detailed rules ofmercantile legislation.
In short, this Circular, which applies to the monthly, quarterly and annualconfidential and public disclosures drafted on or after 1 January 2009 and the year-end closing information for 2008 of companies or entities under its scope, seeks tostandardize and adapt the accounting and operational information which thosecompanies must submit to the CNMV or publish to the accounting principles andstandards now in force.
A.3 Transparency on the part of issuers of listed securities
CNMV Circular 1/2008, of 30 January, on periodical reporting by issuers ofsecurities listed on regulated markets, regarding half-yearly financial reports,interim management reports and quarterly financial reports.
This Circular arises from the reform of the regulations governing transparency on thepart of issuers of listed securities, which was included in the Securities Market Act andimplemented by means of Royal Decree 1362/2007, of 19 October, on regulateddisclosures. The Circular sets out the forms for periodical disclosure with regard tosummarised annual accounts, separate and consolidated half-yearly accounts, interimmanagement reports, and the content of quarterly financial reports, where required.The forms conform to the International Financial Reporting Standards adopted by theEuropean Union, in the case of summarised accounts of consolidated groups, and toSpanish accounting regulations in the case of summarised separate annual accounts;specific forms were established for credit institutions and insurance undertakings.
One of the new features is that the half-yearly report form includes a statement ofliability on the part of the issuer’s directors, as required by Royal Decree 1362/2007;moreover, quarterly reports have been replaced by interim management statementsexcept where the issuer voluntarily publishes quarterly financial statements; theCircular sets out the minimum information that such interim reports must contain.
A.4 Takeover bids
CNMV Circular 8/2008, of 10 December, approving the forms for announcementsand applications for authorisation of takeover bids.322
CNMV
Annual Report regarding
its actions and the
securities markets. 2008
25_Anexos_Legis_INGLES.qxd 24/7/09 19:17 Página 322

Implementing Royal Decree 1066/2007, of 27 July, on the rules governing takeoverbids, this Circular established the form of announcement of takeover bids for theshares of listed companies so as to ensure that, from the outset, all investors havethe necessary information to form an appropriate opinion of the transaction. Thebasic principle was established that the announcement must be truthful, clear,complete and, where the information requires, quantified. It was decided toestablish a single form for all classes of takeover bid, and to allow directpresentation of the application for authorisation of a takeover bid instead of filingthe announcement, provided that practically the same information required by theCircular for the announcement is contained in the application.
Firstly, the Circular established that the announcement must state that the takeoverbid is dependent upon authorisation by the CNMV, which is a necessaryrequirement. Secondly, the Circular establishes the content of the announcement: itmust identify the bidder and the person or body that made the decision to make thebid; it must indicate the approximate period envisaged for applying forauthorisation for the bid, and the type of bid involved; it must disclose the bidder’sstake in the target company, if any, the characteristics of the target company, thenumber of securities and percentage of capital targeted by the bid, and theconsideration being offered, indicating if shares are being offered in exchange and,if so, providing some information about them. The announcement must alsodisclose any conditions to which the bid is the subject; whether any administrativeauthorisation must be obtained; the existence of agreements with othershareholders of the target company, with its board of directors or with any of itsdirectors; the bidder’s intentions as regards delisting the target company andexercising squeeze-out rights. All this information must be adapted appropriately tothe situation where there are competing bids, delisting bids and bids to acquire ownshares for the purposes of redemption. The announcement must also contain anotice regarding the obligation to disclose significant holdings and transactionswith shares that apply in the case of a takeover bid, as well as the suspension of anyliquidity contract arranged by the target company.
A.5 Investment firms and other entities in the securities market
Royal Decree 216/2008, of 15 February, on the equity of financial institutions.
This rule implements the regulations on financial institutions’ equity following thelatest amendments to Act 13/1985, of 25 May, on investment coefficients, ownfunds and reporting obligations of financial intermediaries and other regulationsfor the financial system, and of Act 24/1988, of 28 July, on the Securities Market,which transposed two European directives that were inspired by the Basel II CapitalAccord of 2004.
The regulations on own funds generally hinge on three pillars or supervisoryapproaches that are mutually reinforcing. Firstly, there are uniform rules fordetermining minimum capital requirements; secondly, a system of supervisoryreview is established in order to encourage internal risk management by firms; and,thirdly, firms are required to disclose to the market information about key aspectsof their business profile, risk exposure and risk management methods. The mostnovel aspect of the new regulations is the importance attached to internal riskmeasurement mechanisms at financial institutions (the capital adequacyregulations no longer consist of compliance with preset ratios). 323
Annexes
Legislative annexes
25_Anexos_Legis_INGLES.qxd 24/7/09 19:17 Página 323

The Royal Decree is structured into titles, the first of which regulates capitalrequirements for credit institutions, while the second addresses investment firms;an additional provision regulates equity requirements for reciprocal guaranteecompanies and rebonding companies.
With regards to credit institutions, credit risk is regulated by allowing them tochoose, on the basis of their size and degree of sophistication, between the standardapproach and the internal ratings-based (IRB) approach. Under the standardapproach, risk positions are weighted by reference to ratings established by externalrating agencies or, in certain cases, by export credit agencies. Under the IRBmethod, which must be approved by the Bank of Spain, institutions calculate theirequity requirements using credit ratings which they calculate themselves usinginternal risk models based on past experience with each type of exposure. Theregulation envisages techniques for reducing credit risk and specifies how riskweightings for more complex exposures, particularly asset-backed securities, shouldbe calculated.
In addition to credit risk, the Royal Decree regulates the risk to credit institutions ofadverse movements by exchange rates, the price of gold and positions in financialinstruments and commodities in their trading portfolio, as well as the risk of lossesdue to events in the normal course of business (operational risk). Limits to riskconcentration are also established: no single counterparty may account for risks thatexceed 25% of equity, nor may an institution take on risks that account for morethan 10% of equity individually or 800% taken together. The decree also regulatesthe measures to be taken by credit institutions if they breach any of the equityrequirements under the Royal Decree.
Although most of the regulations regarding investment firms are analogous to thosefor credit institutions, their equity must be equal to or greater than the largest offour items: the sum of the equity requirements related to the various risks (tradingportfolio risk, exchange rate risk, credit risk, operational risk), one-fourth of thestructural expenses in the preceding year, two-thirds of the minimum capitalrequirement to establish the corresponding class of investment firm, or five per milof the volume of managed portfolios.
The Royal Decree also delimits the powers of the Bank of Spain and the CNMV inconnection with the supervision of financial institutions’ equity requirements.
Royal Decree 217/2008, of 15 February, on the legal regime for investment firmsand other entities that provide investment services, which partly amends theRegulation under the UCITS Act 35/2003, of 4 November, approved by Royal Decree1309/2005, of 4 November.
Act 47/2007, of 19 December, amending Act 24/1988, of 28 July, on the SecuritiesMarket, transposed into Spanish law Directive 2004/39/EC of the EuropeanParliament and of the Council, of 21 December, which was implemented by Directive2006/73/EC of the Commission, of 10 August, and by Regulation 1287/2006/EC, of 10August. Royal Decree 217/2008, of 15 February, advances with the process oftransposition and implements the rules governing entities providing investmentservices, while revoking the previous rules contained in Royal Decree 867/2001, of 20July, on the legal regime for investment firms and in Royal Decree 629/1993, of 3May, on rules of action. This Royal Decree distinguishes between investment firms,to which the entire text applies, and other entities that provide investment services324
CNMV
Annual Report regarding
its actions and the
securities markets. 2008
25_Anexos_Legis_INGLES.qxd 24/7/09 19:17 Página 324
(specifically credit institutions and UCITS management companies), to whichcertain rules on internal organisation and codes of conduct apply.
Regarding the definition of investment services and types of investment firm, theRoyal Decree specifies the distinction between financial advice, which is aninvestment service, and non-personalized recommendation, which is an ancillaryservice; the latter category includes recommendations disseminated solely viadistribution channels or to the public. With respect to the new category ofinvestment advisory firm which was established in the Securities Market Act, theRoyal Decree sets out the financial requirements: initial capital of 50,000 euro orprofessional liability insurance with a minimum coverage of 1.5 million euro or anequivalent combination of initial capital and professional liability insurance; thesefirms have one year from the entry into force of the Royal Decree to register withthe CNMV. Another new feature is that brokers that do not plan to becomesecondary members or join a securities clearing and settlement system and whichare authorized only to receive and transmit orders without holding clients’ funds orfinancial instruments are required to have capital of 120,000 euro or professionalliability insurance with a minimum coverage of 1.5 million euro.
As regards cross-border activity by investment firms, the rules contained in theSecurities Market Act were implemented so as to allow the cross-border provisionof investment services throughout the European Union on the basis of supervisionby the Home member state although, in the case of branches, the Host member stateretains supervisory powers in some areas referring to codes of conduct:communications with clients, records of contracts, order management andexecution, and disclosure of trades.
The Royal Decree also fleshes out the new organisational requirements provided inthe Securities Market Act with regard to conflicts of interest, delegation of essentialfunctions, maintenance of records of activities and trades, oversight of employees’personal trades, protection of clients’ funds and financial instruments, andprocessing and executing client orders, adjusting the requirements on the basis ofthe characteristics of each firm’s activity and also taking account of the differentneeds of professional and retail clients, using the classification provided in theSecurities Market Act. In particular, the Royal Decree introduces the Europeanregulations on inducements under which companies providing investment services,including credit institutions, may only collect inducements from third parties orpay inducements to third parties where such inducements are disclosed to the clientand enhance the quality of the service provided to the client.
The Royal Decree also amended the Regulation under the UCITS Act 35/2003, of 4November, adapting it to the new rules of conduct under the MiFID and alsoamending some rules relating to eligible assets.
Order EHA/3064/2008, of 28 October, amending the Ministry of Economy andFinance Order of 26 July 1989 which implemented article 86 of the SecuritiesMarket Act, and Ministry of Economy and Finance Order of 24 September 1993, onthe real estate investment trusts and companies, in order to empower the CNMV tomake detailed rules on certain aspects of supervised entities’ accounting and thecalculation of coefficients and limits for UCITS.
This order regulates two distinct aspects of securities market legislation. On the onehand, it amends Ministry of Economy and Finance Order of 26 July 1989, which 325
Annexes
Legislative annexes
25_Anexos_Legis_INGLES.qxd 24/7/09 19:17 Página 325

implemented article 86 of the Securities Market Act, in order to extend the CNMV’spowers to implement accounting standards for all the entities identified in article84.1 of the Securities Market Act: governing companies of official secondarymarkets, the Sociedad de Sistemas, central counterparties, the Sociedad de Bolsas,investment firms and their agents, the managing company of the investmentguarantee fund, and members of official secondary markets, as well as the entitythat clears and settles their trades.
It also amended the Ministry of Economy and Finance Order dated 24 September1993 on real estate investment trusts and companies, empowering the CNMV tospecify certain aspects of the accounting and calculation of coefficients and limitsfor this class of UCITS.
CNMV Circular 7/2008, of 26 November, on accounting standards, annual accounts,and confidential reports by investment firms, UCITS management companies andventure capital firm operators.
The Circular amended the accounting rules for investment firms, UCITSmanagement companies (SGIIC) and venture capital firm operators (SGECR) toadapt them to the new accounting framework established by the GeneralAccounting Plan approved by Royal Decree 1514/2007, of 16 November, whiletaking account of those entities’ specific legal and operational features. However, insome cases it was necessary and advisable to maintain criteria and approaches fromthe preceding regulations, such as the obligation to consolidate horizontal groups.
A new feature of the Circular was that it extended the definition of fair value tofinancial instruments without a market or with an inactive market, the goal beingto encourage the use of fair value where it facilitates proper risk management. Thedefinitions of other new concepts such as “effective interest rate” and “impairment”were also expanded. The Circular also established specific conditions forreclassifying assets among the various defined categories of financial assets. Verystrict criteria were established for derecognising financial assets and recognisingcapital gains due to measurement of available-for-sale financial assets asadjustments to equity, and their definition in solvency terms was clarified. TheCircular includes a specific rule on revenues from the provision of services and, inthe event, financial expenses and trading losses, which includes the criteria forrecognition in profit or loss.
The Circular also contains a specimen balance sheet in which financial assets areclassified on the basis of their nature as a function of measurement standards.Lastly, it is essential to highlight the importance of transparency, which requiresmanagers of supervised entities to take responsibility for their accounting policy,explain it, disclose it to the market and supplement it with specific information asrequired. In this connection, the annual report and directors’ report include adescription of the financial risk assumed and the company’s risk management andhedging policy.
CNMV Circular 10/2008, of 30 December, on investment advisory firms.
This Circular regulates certain aspects of the organisational requirements that applyto financial advisory firms and the documentation that must be provided to theCNMV for authorisation and registration in this category; it also systematizes theregulations on financial advisory firms contained in the Securities Market Act and in326
CNMV
Annual Report regarding
its actions and the
securities markets. 2008
25_Anexos_Legis_INGLES.qxd 24/7/09 19:17 Página 326

Royal Decree 217/2008, on investment firms and other entities providing investmentservices.
The Circular specifies firstly that it is not necessary to establish and register afinancial advisory firm in order to provide advisory services: (a) in the frameworkof another professional activity not regulated under the Securities Market Actprovided that the provision of that advice is not specifically remunerated; (b) on anancillary basis in the framework of a professional activity provided that the latter isregulated by laws or regulations or a professional code of ethics which does notpreclude the provision of that service.
With regard to authorisation of a financial advisory firm, if the latter chooses acombination of the two financial requirements established by the Royal Decree(capital and professional liability insurance), a report by an independent expert mustbe presented accrediting compliance with the financial requirements. Regarding theknowledge and experience required of directors and general managers of investmentadvisory firms, and of investment advisory firms which are natural persons,experience must be in investment advisory functions or others related to thesecurities markets, whereas knowledge may be accredited by the possession ofdegrees and certificates accrediting knowledge of these areas.
CNMV Circular 11/2008, of 30 December, on accounting standards, annual accountsand confidential disclosures of venture capital firms.
The purpose of this accounting Circular regarding venture capital firms is to adaptthese firms to the new General Accounting Plan while also introducing specificaccounting standards that take account of these firms’ characteristics. This adaptationtakes account of the various classifications of financial assets used by venture capitalfirms and methods are established for measuring fair value, particularly for unlistedsecurities, which are the standard components of a venture capital firm’s portfolio.Rules were also introduced about the structure and content of venture capital firms’annual accounts and confidential reports.
CNMV Circular 12/2008, of 30 December, on the solvency of investment firms andtheir consolidable groups.
The Circular seeks to adapt the regulatory framework for solvency of financialinstitutions in the European Union to Spanish investment firms and theirconsolidable groups. The New Capital Accord of the Committee on BankingSupervision at the Bank for International Settlements is reflected in Directive2006/49/EC of the European Parliament and of the Council of 14 June 2006 on thecapital adequacy of investment firms and credit institutions (recast) and Directive2006/48/EC of the European Parliament and of the Council of 14 June 2006 relatingto the taking up and pursuit of the business of credit institutions.
With the dual objective of avoiding regulatory arbitrage and facilitating theintegration of various kinds of entity into consolidable groups subject tosupervision, a parallel was established between the regulations concerning thecapital requirements at credit institutions and those contained in this Circular.Nevertheless, the specific features of investment firms are reflected in the Circular.
In particular, this Circular establishes the same reporting forms as are used forcredit institutions, which will facilitate information gathering and dissemination 327
Annexes
Legislative annexes
25_Anexos_Legis_INGLES.qxd 24/7/09 19:17 Página 327
not only on the part of national supervisors but also on the part of Europeansolvency supervisors, making it possible for the first time to compare financialinstitutions’ data at a European scale.
A.6 UCITS
Order EHA/35/2008, of 14 January, implementing the regulations governing UCITS’accounting, determination of equity, and calculation of risk diversificationcoefficients and certain aspects of UCITS whose investment policy consists ofreproducing, replicating or tracking an equity or fixed-income index, andempowering the CNMV to issue detailed rules.
This Order empowers the CNMV to issue accounting rules for UCITS, as the Orderconfines itself, as regards determining a UCITS equity and calculating thediversification coefficient, to regulating the concept of fair value, defined as theestimated realizable value of the financial assets and instruments comprising theUCITS portfolio.
Secondly, it establishes that for UCITS with compartments, the diversificationcoefficient will be measured for each compartment. The rules for risk diversificationof index-tracking UCITS [article 38.2.e) of the UCITS Regulation] are brought into linewith those for UCITS that replicate an index [article 38.2.d) of the UCITS Regulation].
Finally, the CNMV is empowered to regulate the following aspects of internalcontrol systems and risk management and control systems of UCITS managementcompanies:
– modulation of the requirements on the basis of the size, scale and nature of theUCITS,
– functions and responsibilities of the management company’s Board of Directorswith regard to designing and implementing internal control systems and riskmanagement and control systems,
– existence of a control unit in charge of supervising the proper functioning of theinternal control and risk management and control procedures and systems.
Royal Decree 362/2007, of 15 March, amending article 59 of the Regulationimplementing UCITS Act 35/2003, of 4 November, approved by Royal Decree1309/2005, of 4 November.
This decree introduced flexibility into the rules governing borrowing by real estateUCITS. To this end, it amended the UCITS Regulation (Royal Decree 1309/2005, of4 November) by establishing that real estate UCITS need not count the debt relatingto government housing protection plans when calculating their indebtedness limits.Secondly, it clarified the rules governing debt taken on to overcome treasurydifficulties by explicitly capping it at 10% of assets and establishing a maximumperiod of 18 months.
Order EHA/596/2009, of 5 March, determining certain aspects of the rulesgoverning UCITS depositories, and specifying the content of their financialstatements. 328
CNMV
Annual Report regarding
its actions and the
securities markets. 2008
25_Anexos_Legis_INGLES.qxd 24/7/09 19:17 Página 328

This order updates the rules governing UCITS depositors by adapting them to theexpanded operating scope of UCITS and their operators as a result of the enactmentof the UCITS Act in 2003 and the UCITS Regulation in 2005. Accordingly, the orderregulates the vigilance and supervisory functions in relation to new aspects:marketing of UCITS by operators; the growing investment by UCITS in otherUCITS and OTC, and the consequent importance of asset valuation procedures; newforms of UCITS such as hedge funds and funds of hedge funds, etc. It also explicitlyacknowledges that the depositary may delegate the vigilance and supervisoryfunctions, and establishes the obligation that depositories verify that the assets inwhich the UCITS invests conform to its investment policy as stated in itsprospectus, and the depository’s obligation to open the accounts with which theUCITS will operate. The order also tries to systematize the procedures fordepositories, requiring them to implement an internal procedures manual.
And it regulates the content of the position statements that UCITS managementcompanies or depositories must send to each investor, and authorizes the CNMV toestablish the corresponding forms and implement additional content in thosestatements by issuing a Circular for this purpose.
CNMV Circular 2/2008, of 26 March, partly amending Circular 4/1994, of 14December, on accounting rules, reporting obligations, calculation of the net assetvalue, investment and operational coefficients, and actions in appraising real estate,applicable to real estate UCITS.
This Circular requires that real estate appraisal certificates to be filed with theCNMV by real estate investment companies and trusts be submitted using theCifradoc/CNMV electronic system. It also specifies certain information regardingproperty valuations that must be contained in appraisal reports and sent to theCNMV since they are necessary for determining the net asset value of real estateUCITS or linking it to the information presented by the UCITS; additionalinformation is also requested through other forms, such as the technical parameterson the discount rate for the cash flows from real estate, the express reasonedstatement by an appraisal company when the conditions imposed on an appraisal(which prevent it from being legally valid) are removed, the management company’sdeclaration when there are such conditions, and the dates on which new propertiesare regularly appraised (appraisal calendar).
Order EHA/888/2008, of 27 March, on transactions by financial UCITS with financialderivatives and clarifying certain items in the Regulation under Act 35/2003, of 4November, on UCITS, approved by Royal Decree 1309/2005, of 4 November.
This order sets out the process for introducing flexibility into the framework foraction by UCITS that invest in derivatives, implementing the provisions of UCITSAct 35/2003, of 4 November and its implementing regulations. Firstly, it expandsthe range of qualifying underlyings set out in the Regulation, while clarifyingcertain concepts and introducing specific requirements for underlyings such ascredit risk and financial indices. The Order categorizes derivatives into two groupsbased on complexity, and this classification has implications for the purposes forwhich UCITS can use these instruments: investment, hedging or pursuit of aspecific target yield.
The Order also transposes Directive 2007/16/EC, of 19 March, by expanding therange of financial assets considered appropriate for cash investments by UCITS, 329
Annexes
Legislative annexes
25_Anexos_Legis_INGLES.qxd 24/7/09 19:17 Página 329

provided that they fulfil certain conditions, mainly in connection with the availableinformation, their valuation, and the existence of a representative market price.
CNMV Circular 3/2008, of 11 September, on accounting rules, financial statementsand confidential reports by UCITS.
This Circular amends the accounting rules applicable to UCITS (both financial andreal estate) with the dual goal of adapting the rules to the new General AccountingPlan while also taking account of UCITS’ specific features as compared with otherentities. The Circular is based on the idea that UCITS accounting should take accountof the need to determine their assets, which makes it possible to determine their netasset value. The need to value UCITS assets in order to determine the price ofinvestors’ units makes it necessary to consider unrealized capital gains on the assetsheld in portfolio. The forms of UCITS financial statements are defined: balancesheets, income statement, statement of changes in equity, and notes to financialstatements, which maintain the structure and content set out in the GeneralAccounting Plan with a number of adaptations to the specific nature of UCITS,complemented by the confidential accounting statements, which are not publishedand are filed with the CNMV, whose forms are also defined in this Circular.
Broadly speaking, the financial assets and liabilities in a UCITS portfolio are measuredat their fair value, and changes in that value (even if not realized) are recognized inprofit and loss. However, a UCITS’ other financial assets and liabilities, such as cash,fee revenues receivable and current-account overdrafts to attend to redemptions aremeasured at amortized cost, i.e. discounting cash flows to the initial date of thetransaction. The real estate in the portfolio of real estate UCITS is valued at itsappraised value. Although shares and units in UCITS are not fully equivalent to sharesin the equity of mercantile companies and are reimbursable at the request of theshareholder or investor, they are classified as equity instruments and not as financialliabilities. On that basis, the Circular includes specific criteria and mechanisms foraccounting for specific transactions and provides more detail of the aforementionedvaluation criteria. As a transitional measure, it is established that adjustments arisingdue to application of the new accounting rules will be recognized in reserves.
As for UCITS with compartments, separate accounting to distinguish between theassets, liabilities, revenues and expenses of one compartment with respect to othersis allowed, even though each UCITS has a unique set of accounts and covers variouscompartments.
The Circular also establishes that the rules on business combinations and consolidationdo not apply to investments by UCITS since the latter cannot exert a notable influencewith respect to the assets in which they invest; accordingly, the accounting rules onbusiness combinations apply only in the case of mergers between UCITS.
CNMV Circular 4/2008, of 11 September, on the content of UCITS quarterly, half-yearly and annual reports and their position statements.
This Circular establishes the reporting documents to be published by managementcompanies for each UCITS that they manage, and also by investment companies. Inparticular, the Circular establishes the content of the annual, half-yearly andquarterly reports and position statements, revoking CNMV Circular 1/1991, of 23January on the content of quarterly reports by UCITS to their investors and CNMVCircular 1/1999, of 14 January, on mutual funds’ prospectuses and quarterly reports.330
CNMV
Annual Report regarding
its actions and the
securities markets. 2008
25_Anexos_Legis_INGLES.qxd 24/7/09 19:17 Página 330

As regards quarterly reports, the Circular distinguishes between the simplified andfull reports; the simplified report is addressed to investors while the full reportmust be filed with the CNMV and published in the pre-stated places; they differ inthat the simplified report does not detail the UCITS portfolio but merely indicatestotals and subtotals. The Circular details that the annual report is divided into twoparts: the first part is the public report for the second half of the year, and thesecond part consists of the financial statements, directors’ report and auditors’report. The Circular also regulates the form of accrediting compliance with theobligation to deliver reports, investors’ waiver of delivery of reports, andapplications from investors for delivery of some of these reports which are notdelivered by default. It also establishes the content of the position statement thatmust be sent to investors and shareholders.
CNMV Circular 5/2008, of 5 November, on the statistical reporting requirementswith regard to assets and liabilities of European Union UCITS.
CNMV Circular 2/1998, of 27 July, as amended, established the statistical reportsthat money market UCITS must file with the CNMV to enable that information tobe used by the ECB in tracking monetary policy within Economic and MonetaryUnion. Regulation (EC) No 958/2007 of the European Central Bank extended therequirement to file periodical statistical information to UCITS that were not obligedto do so under CNMV Circular 1/2007.
This Circular is applicable to all compartments or uncompartmentalised UCITS thatare registered with the CNMV whose investment policy is not monetary and is notto invest in monetary compartments or UCITS or in those contained in the list ofmonetary financial institutions (MFI) published by the ECB. The information refersto balances of securities in portfolio and to transactions, security by security (i.e.disclosing the portfolio breakdown by individual security), generally on a monthlybasis although quarterly filing is admissible for institutions that represent only asmall percentage of the sector.
Order EHA/3465/2008, of 26 November, amending Order EHA/2688/2006, of 28July, on cooperation agreements relating to Government Debt Investment Funds.
This ministerial order amends some aspects of Order EHA/2688/2006, of 28 July, oncooperation agreements relating to Government Debt Investment Funds so as toenable funds that invest in government debt (Fondtesoro) to classify thegovernment-backed bonds issued by FTPymes as government debt for the purposesof the established investment coefficients.
CNMV Circular 6/2008, of 26 November, regarding the determination of the netasset value and operational aspects of UCITS.
The Circular on UCITS net asset value establishes the rules for calculating thatfigure, which is the price of the units or shares into which a UCITS is divided. Forthese purposes, the Circular determines the assets of the UCITS from accountingmagnitudes and then calculates the net asset value, focusing particularly on caseswhere there are compartments and classes of units or series of shares in the UCITS.The Circular also regulates a number of operational aspects of UCITS, such as therules on applying management fees based on yields, the legal coefficients, andparameters for action by UCITS that replicate or track indices. 331
Annexes
Legislative annexes
25_Anexos_Legis_INGLES.qxd 24/7/09 19:17 Página 331

A.7 Measures with regard to the economic crisis
Order PRE/2424/2008, of 14 August, publicizing the Cabinet decision of 14 August2008 on measures of structural reform and to promote financing of small andmedium-sized enterprises.
This Cabinet decision, taken in the context of the economic crisis, adopts aprogramme of actions in strategic sectors which establishes obligations for variousministerial departments. They include the decision that the Ministry of Economyand Finance will grant guarantees with the backing of the State up to at most 3billion euro in 2009 and 2010 for fixed-income securities issued by securitisationtrusts collateralized by loans or credit granted to small or medium-sized enterprises.It also established that the Official Credit Institute (ICO) will implement amediation line to finance investment projects by medium-sized enterprises up to atmost 2 billion euro in 2009 and 2010.
Royal Decree-Act 6/2008, of 10 October, establishing the Fund for the Acquisition ofFinancial Assets (FAAF).
With a view to promoting bank lending to companies and individuals, this RoyalDecree-Act established the Fund for the Acquisition of Financial Assets (FAAF),attached to the Ministry of Economy and Finance, which governs it through aGoverning Board and an Executive Committee, subject to oversight by Parliamentand the State Comptroller’s Office. With an initial allocation of 30 billion euro outof the Central Government budget, which may be increased to 50 billion euro, theFAAF will invest in financial instruments issued by credit institutions andsecuritisation trusts that are collateralized by loans to individuals, companies andnon-financial institutions. The financial instruments in which the FAAF will investwill be of the maximum quality, on the basis of the principles of objectivity,transparency, efficiency, profitability and diversification.
Royal Decree 1642/2008, of 10 October, establishing the guaranteed amountsreferred to in Royal Decree 2606/1996, of 20 December, regarding the CreditInstitutions’ Deposit Guarantee Fund, and Royal Decree 948/2001, of 3 August, oninvestor compensation systems.
The Economic and Financial Affairs Council of the European Union decided on 7October 2008 to increase the minimum threshold of coverage by the depositguarantee systems to 50,000 euro per account holder and bank. In this line, thisRoyal Decree increases to 100,000 euro per account holder and bank theprotection provided by the Credit Institutions’ Deposit Guarantee Fundestablished in Royal Decree 2606/1996, of 20 December, and the InvestmentGuarantee Fund established by Royal Decree 948/2001, of 3 August, for brokerdealers and brokers.
Royal Decree-Act 7/2008, of 13 October, on Urgent Financial and EconomicMeasures in connection with the Concerted European Action Plan of the Euro AreaCountries.
In coordination with the other member states of the euro area, this Royal Decree-Act authorizes two types of measures: State guarantees for new fundingtransactions arranged by credit institutions, and the acquisition by the State ofsecurities that qualify to reinforce credit institutions’ equity.332
CNMV
Annual Report regarding
its actions and the
securities markets. 2008
25_Anexos_Legis_INGLES.qxd 24/7/09 19:17 Página 332

Regarding the guarantee program, and without prejudice to the fact that aMinisterial Order implementing this Royal Decree-Act was subsequently issued, thelatter established a maximum of 100 billion euro for State guarantees for theissuance of commercial paper, bonds and debentures listed on official secondarymarkets in Spain by credit institutions that are resident in Spain and branches offoreign institutions that carry on significant activity in Spain. The guarantee mayalso be extended to other banking instruments, such as interbank deposits.
The acquisition by the State of securities to strengthen the equity of creditinstitutions, which is classified as an exceptional measure, will be adopted at therequest of the institution in question and following consultation with the Bank ofSpain; the limits provided by law for computing equity will not apply in this case.
Order EHA/3118/2008, of 31 October, implementing Royal Decree-Act 6/2008, of 10October, establishing the Fund for the Acquisition of Financial Assets (FAAF).
This order implements some aspects of the organisation and functioning of theFund for the Acquisition of Financial Assets (FAAF). It establishes that the assetsto be acquired by the FAAF will be chosen by auction. It also determines the bidsthat can be made by credit institutions and securitisation trusts, which may becompetitive (i.e. indicating the yield at which they are willing to offer the assets)or non-competitive (i.e. being awarded at the lowest yield accepted in the auction).And it established the obligation to publicize the decisions by the FAAFGoverning Board, and to publish the decisions regarding the FAAF’s investmentguidelines, among others, in the Official State Gazette. Additionally, a technicalcommittee comprising specialists from various institutions was established toadvise the FAAF.
Directorate-General of the Treasury and Finance Policy Resolution of 31 October,providing for the publication of decisions adopted by the Fund for the Acquisitionof Financial Assets on 27 October 2008 regarding the composition of the ExecutiveCommittee and the Fund’s investment guidelines.
This resolution, issued in implementation of Royal Decree-Act 6/2008, of 10October, establishing the Fund for the Acquisition of Financial Assets (FAAF),determines the composition of the FAAF’s Executive Committee, consistingbasically of a number of bodies of the Ministry of Economy and Finance, anddeciding the FAAF’s investment guidelines.
Regarding the investment guidelines or criteria to be applied, it provides that theFAAF may make outright purchases of mortgage covered bonds and asset-backedsecurities collateralized by mortgage covered bonds issued after the constitution ofthe FAAF, provided that they are listed in a regulated market and rated AAA. It alsoprovides for the possibility of the FAAF engaging in sell-buybacks/buy-sellbacks ofmortgage covered bonds, asset-backed securities and mortgage securitisation bondscollateralized by loans granted to individuals, companies and non-financialinstitutions provided that they are listed in regulated markets, were issued on orafter 1 August 2007, fulfil the conditions to be listed as eligible assets by theEuropean Central Bank, have at least an A rating, and mature at over 12 months.
Order EHA/3364/2008, of 21 November, implementing article 1 of Royal Decree-Act7/2008, of 13 October, on Urgent Financial and Economic Measures in connectionwith the Concerted European Action Plan of the Euro Area Countries. 333
Annexes
Legislative annexes
25_Anexos_Legis_INGLES.qxd 24/7/09 19:17 Página 333

This order, issued in implementation of Royal Decree-Act 7/2008, of 13 October,regulates certain aspects of granting State guarantees for new funding transactionsby credit institutions resident in Spain.
Firstly, it specifies the characteristics of the guarantees with respect to theregulation contained in the Royal Decree-Act: they are granted with a waiver of thebenefit of discussion, are deemed to be irrevocable and unconditional and, in issuesin foreign currency, do not cover the currency risk, which is for the account of theissuer in all cases.
Secondly, it specifies the characteristics of the transactions that qualify for theseguarantees: they must be issues of commercial paper, bonds or debentures that areneither subordinated nor guaranteed; they must mature at not less than threemonths and not more than three years; amortisation is in the form of a balloonpayment with no options or other derivatives or any other element that hampers themeasurement of the risk; and each issue may not be for less than 10 million euro.
Thirdly, it regulates the procedure for applying for guarantees, specifying that theyare granted to each credit institution in proportion to its share of total lending toSpanish residents other than banks; finally it establishes that the Directorate-General of the Treasury and Finance Policy must notify the Bank of Spain if any ofthe guarantees are executed, and establishes the fees earned by the State for theguarantees which it provides.
Royal Decree-Act 10/2008, of 12 December, adopting financial measures to improveliquidity for small and medium-sized enterprises, and other supplementaryeconomic measures.
In view of the credit crunch and the financial crisis, this Royal Decree-Act adopts anumber of measures. In particular, it’s sole additional provision and first finalprovision make major amendments to mercantile legislation. Firstly, it establishesthat, for the two business years running from the date of entry into force,impairment losses on property, plant and equipment, investment property andinventories do not count for determining cases of obligatory capital reduction underthe Corporations Act or for determining the cases of dissolution established in theCorporations Act and the Limited Liability Companies Act. Secondly, it amendedarticle 36 of the Commerce Code so that the calculation of equity will not takeaccount of variations in the value of the instruments used in cash flow hedges, i.e.they would not affect the distribution of income or cases where the company isobliged to reduce capital or dissolve.
This Royal Decree-Act also established a mediation line at the Official CreditInstitute amounting to 5 billion euro to attend to working capital needs of small andmedium-sized enterprises which, while being solvent and viable, face a temporarycredit crunch.
Order EHA/3748/2008, of 23 December, amending Order EHA/3364/2008, of 21November, implementing article 1 of Royal Decree-Act 7/2008, of 13 October, onUrgent Financial and Economic Measures in connection with the ConcertedEuropean Action Plan of the Euro Area Countries.
This Ministerial Order amends certain aspects of Order EHA/3364/2008, of 21November, with regard to providing State guarantees for new issues of commercial334
CNMV
Annual Report regarding
its actions and the
securities markets. 2008
25_Anexos_Legis_INGLES.qxd 24/7/09 19:17 Página 334

paper, bonds and debentures by credit institutions. Firstly, the Order establishesthat the State guarantee may cover the exchange rate risk of issues in foreigncurrencies. Secondly, it corrects the preceding order in that the provision of theState guarantee will not be conditional upon the credit institution having issuedpreviously in Spain, it being sufficient for it to have its registered offices in Spain.Thirdly, the deadline for issuing securities that qualify for the guarantee wasextended to 15 December 2009.
Finally, by means of an additional provision, this Order also amended some aspectsof Order EHA/3118/2008, of 31 October, implementing Royal Decree-Act 6/2008, of10 October, establishing the Fund for the Acquisition of Financial Assets (FAAF). Inparticular, it provides that the regional registry, clearing and settlement servicesmay participate in the settlement of acquisitions by the FAAF of securities that arelisted on a single stock exchange.
A.8 Other regulations
Order EHA/114/2008, of 29 January, regulating compliance with certain obligationsof notaries in connection with preventing money laundering.
Notaries’ participation in economic and financial transactions carries the risk thattheir activity may be used as part of money laundering processes; as a result, theyhave a duty to cooperate with the Central Government in this area, as provided inAct 19/1993, of 28 December, on certain measures to prevent money laundering,approved by Royal Decree 925/1995, of 9 June. This Order specifies the form inwhich notaries must comply with the requirement to identify their clients, keepdocumentation and apply oversight and evaluation procedures aimed at preventingmoney laundering; the Order also provides that notaries must notify the competentauthorities if any of the participants in a transaction are on the lists drafted for thispurpose by any international body or the European Union.
Order EHA/564/2008, of 28 February, amending Order ECO/805/2003, of 27 March,on valuation standards for real estate and certain rights for certain financial purposes.
This order is related to the appraisal of real estate for certain financial purposes.Specifically, with regard to the securities markets, the order affects the appraisals ofreal estate for the purpose of mortgage loans that are to form part of the collateral poolof mortgage-backed securities and for the purpose of determining the assets of UCITS.
In particular, the Order amends Order ECO/805/2003, of 27 March, on rules for theappraisal of real estate and certain rights for certain financial purposes, and itregulates the cases where the appraisal of a property must take account of thepossibility of compulsory purchase, under the principle of prudence, in which casethe criteria established in the Land Act 8/2007, of 28 May, must be applied if theygive rise to a valuation that is lower than that resulting from applying the criteriaset out in this Order.
Royal Decree 322/2008, of 29 February, on the legal regime of electronic moneyentities.
Article 21 of Act 44/2002, of 22 November, on Measures to Reform the FinancialSystem, regulates the activity of electronic money entities, the conditions for 335
Annexes
Legislative annexes
25_Anexos_Legis_INGLES.qxd 24/7/09 19:17 Página 335
carrying on this activity, and the rules governing their authorisation, supervisionand discipline. This Royal Decree implements that regulation.
Electronic money is defined as the monetary value represented by credit stored inan electronic medium, issued upon receipt of funds whose value is not less than themonetary value issued and accepted as a means of payment by companies otherthan the issuer. Only credit institutions may issue electronic money, and amongthem are electronic money entities, whose activities must be confined basically tothe issuance of electronic money, although they may provide other services that areclosely related to that activity, such as the issuance and management of other meansof payment. This Royal Decree refers to other credit institutions only as regards theprohibition on issuing electronic money in excess of the amount of funds receivedin consideration. Entities that issue electronic money that will be accepted only bycompanies controlled by the issuer of the electronic money may be exempted fromthis Royal Decree.
The Ministry of Economy and Finance is entrusted with the authorisation andregistration of the creation of electronic money entities, subject to priorconsultation with the Bank of Spain and the Commission for the Prevention ofMoney Laundering (SEPBLAC), and a system of tacit denial is established. Thestandard requirements for the financial sector apply: the entity must be acorporation (sociedad anónima); a special minimum capital stock of 1 million euro;additional equity requirements; board of directors; suitability of shareholders,general managers and directors; good administrative and accounting organisationand mechanisms for preventing money laundering. If an electronic money entity iscontrolled by a financial institution in the EU, the Bank of Spain must consult withthe corresponding supervisory authority; if the electronic money entity is controlledby an entity domiciled or authorised in a State that is not a member of the EU, theBank of Spain may require the presentation of a bond. Amendments to the Articlesof Association and mergers of electronic money entities with other creditinstitutions will also require administrative authorisation.
As regards equity requirements and operational limits, electronic money entitiesmust have equity in excess of 2% of the electronic money issued. Funds raised as aresult of the issuance of electronic money may be converted only into demanddeposits and certain low risk credit securities; investment in derivatives is confinedto hedging risks assumed in the rest of the portfolio. The Bank of Spain mayauthorise other types of investment for up to 5% of the funds raised. There are alsolimits on concentration of risk in a single person or economic group.
The Royal Decree also regulates the revocation of authorisation for electronicmoney entities (this power is attributed to the Bank of Spain). Generally, theauthorisation is revoked for breach of any of the conditions that led to the originalauthorisation; however, there are certain restrictive conditions: lack of suitability onthe part of directors, general managers or similar will not lead to revocation if theyare removed by a given deadline; and breach of the equity requirements will notlead to revocation if certain conditions are met.
The disciplinary regime for electronic money entities is that provided in the Act onDiscipline and Intervention of Credit Institutions, as provided in the Act onMeasures to Reform the Financial System, and it is also applicable to the directorsof those entities, their general managers and similar, and holders of at least 5% ofthe voting rights or capital.336
CNMV
Annual Report regarding
its actions and the
securities markets. 2008
25_Anexos_Legis_INGLES.qxd 24/7/09 19:17 Página 336

Order EHA/3291/2008, of 7 November, establishing the procedure for depositaryfinancial institutions to disclose abandoned realty and balances.
Article 18 of Act 33/2003, of 3 November, on the Assets of the PublicAdministrations, attributes to the Central Government the ownership ofsecurities, money and other personalty deposited at financial institutions iftwenty years elapse without any action entailing exercise of ownership rights bythe owners. This order, which is not applicable to the State Cashier’s Office (CajaGeneral de Depósitos), regulates the obligations in this connection of Spanishfinancial institutions and branches in Spain of financial institutions from otherEU Member States. The Order establishes the following obligations, in particular:it establishes the content of disclosures of balances to be made to the Ministry ofEconomy and Finance in the first quarter of each year; it requires financialinstitutions to contact the client at his/her last known address three monthsbefore the 20-year period is reached; and it entitles individuals to obtain acertificate from a financial institution accrediting the delivery of assets to theCentral Government.
B European legislation
Directives 2008/10, 2008/11, 2008/18, 2008/22, 2008/23, 2008/24, 2008/25 y 2008/26of the European Parliament and the Council, of 11 March 2008, amending variousdirectives with regard to the executive powers attributed to the Commission.
These directives refer to the way in which the institutions of the European Unionexercise the powers under the following directives:
– Directive 2004/39/EC, on markets in financial instruments (MiFID).
– Directive 2003/71/EC, on the prospectus to be published when securities areoffered to the public or admitted to trading.
– Council Directive 85/611/EEC, on the coordination of laws, regulations andadministrative provisions relating to undertakings for collective investment intransferable securities (UCITS Directive).
– Directive 2004/109/EC, on the harmonisation of transparency requirements inrelation to information about issuers whose securities are admitted to trading ona regulated market (Transparency Directive).
– Directive 2006/49/EC, on the capital adequacy of investment firms and creditinstitutions (Capital Requirements Directive).
– Directive 2006/48/EC, relating to the taking up and pursuit of the business ofcredit institutions.
– Directive 2002/87/CE, on the supplementary supervision of credit institutions,insurance undertakings and investment firms in a financial conglomerate(Financial Conglomerates Directive).
– Directive 2003/6/EC, on insider dealing and market manipulation (Market AbuseDirective). 337
Annexes
Legislative annexes
25_Anexos_Legis_INGLES.qxd 24/7/09 19:17 Página 337

Decision 2006/512/EC, introduced the “regulatory procedure with scrutiny”,regulating the adoption of measures with a general scope aimed at amending non-essential features of certain EU regulations. Specifically, the regulatory procedurewith scrutiny allows both the European Parliament and the Council to overseemeasures implementing the aforementioned Directives.
338
CNMV
Annual Report regarding
its actions and the
securities markets. 2008
25_Anexos_Legis_INGLES.qxd 24/7/09 19:17 Página 338

CNMV Organisation
Composition of the CNMV Board
Chairman Mr. Julio Segura Sánchez
Vice-Chairman Mr. Fernando Restoy Lozano1
Commissioners Ms. Soledad Núñez Ramos
Mr. Francisco Javier Aríztegui Yáñez2
Ms. Rosa Rodríguez Moreno
Ms. Soledad Abad Rico
Secretary Mr. Javier Rodríguez Pellitero
Composition of the CNMV Executive Committee3
Chairman Mr. Julio Segura Sánchez
Vice-Chairman Mr. Fernando Restoy Lozano
Members Ms. Rosa Rodríguez Moreno
Ms. Soledad Abad Rico
Secretary Mr. Javier Rodríguez Pellitero
339
Annexes
CNMV Organisation
1. Appointed by Royal Decree 1628/2008, of 3 October. Took the place of Mr. Carlos Arenillas Lorente.
2. Appointed by Royal Decree 438/2009, of 27 March. Took the place of Mr. José Viñals Íñiguez.
3. The creation, constitution and functions of the Executive Committee are regulated by article 18 of
Securities Market Act 24/1988, of 28 July, as amended by Act 44/2002, of 22 November, on Measures to
Reform the Financial System.
26_Anexos_org_CNMV_INGLES.qxd 24/7/09 19:18 Página 339

Composition of the CNMV Advisory Committee4
Chairman Mr. Fernando Restoy Lozano
Secretary Mr. Javier Rodríguez Pellitero
Technical Secretary Mr. Víctor Rodríguez Quejido
Members
Representatives of the members of the official secondary markets
Member Mr. Ignacio Santillán Fraile
Alternate Mr. José Ignacio García-Junceda Fernández
Member Mr. Jaime Aguilar Fernández-Hontoria
Alternate Mr. José María Antúnez Xaus
Member Mr. Manuel Ardanza Fresno
Alternate Mr. Antonio Gallego González
Member Mr. Francisco Oña Navarro
Alternate Mr. Ignacio Solloa Mendoza
Member Mr. José María Méndez Álvarez-Cedrón
Alternate Mr. Julio Alcántara Lera
Member Ms. Ana Ibáñez Díaz-Bustamante
Alternate Ms. Aránzazu Ullibarri Royuela
Representatives of the issuers
Member Mr. Francisco Uría Fernández
Alternate Mr. Ángel Antonio del Valle Suárez
Member Mr. Juan A. Margenat Padrós
Alternate Ms. Ana Delgado Alcaide
Member Mr. Luis Miralles García
Alternate Mr. Manuel González Escudero
Member Mr. José Manuel González Porro
Alternate Mr. Manuel Ángel Romero Rey
340
CNMV
Annual Report regarding
its actions and the
securities markets. 2008
4. Royal Decree 504/2003, of 2 May, regulating the CNMV Advisory Committee.
26_Anexos_org_CNMV_INGLES.qxd 24/7/09 19:18 Página 340

Composition of the CNMV Advisory Committee (continuation)
Representatives of the investors
Member Mr. Manuel Pardos Vicente
Alternate Ms. Ana Isabel Ceballo Sierra
Member Ms. Pilar González de Frutos
Alternate Ms. M.ª Aránzazu del Valle Schaan
Member Mr. Antonio M.ª Malpica Muñoz
Alternate Mr. José Manuel Pomarón Bagües
Member Mr. Mariano Rabadán Forniés
Alternate Mr. Ángel Martínez-Aldama Hervás
Representatives of the Autonomous Regions with an official secondary market
Basque Country
Member Mr. Juan Miguel Bilbao Garai
Alternate Mr. Miguel Bengoechea Romero
Catalonia
Member Mr. Ferrán Sicart i Ortí
Alternate Mr. Josep María Sánchez i Pascual
Valencia
Member Mr. Enrique Pérez Boada
Alternate Mr. Nicolás Jannone Bellot
341
Annexes
CNMV Organisation
26_Anexos_org_CNMV_INGLES.qxd 24/7/09 19:18 Página 341

342
CNMV
Annual Report regarding
its actions and the
securities markets. 2008
CN
MV
Boar
d
Exec
utiv
e Co
mm
ittee
Pres
iden
t
Vice
-Pre
side
nt
Mar
kets
Secu
ritie
sM
arke
t Par
ticip
ant
Lega
l Affa
irs
Pres
iden
t'sO
ffice
Adv
isor
y Co
mm
ittee
Com
mun
icat
ion
Inte
rnal
Con
trol
Dep
artm
ent
Stud
ies,
Stat
istic
san
d Pu
blic
atio
nsD
epar
tmen
t
Ass
ista
ntto
the
Pres
iden
tD
epar
tmen
t
Inve
stor
Dep
artm
ent
Inte
rnat
iona
lRe
latio
nsD
epar
tmen
t
Gen
eral
Secr
etar
iat
Info
rmat
ion
Syst
ems
Dep
artm
ent
Stat
istic
s
Stud
ies
and
Publ
icat
ions
Fina
ncia
lSt
abili
ty
Barc
elon
aO
ffice
Que
ries
and
Com
plai
nts
Inve
stor
Educ
atio
n
Fina
nce
Offi
cial
Regi
ster
s
Hum
anRe
sour
ces
Inte
rnal
Regu
latio
ns
Dev
elop
men
tan
d A
NC
V
Infra
stru
ctur
e
Inve
st. F
irm a
ndC
redi
t & S
avin
gsIn
st. S
uper
. Dep
UC
ITS
and
Vent
ure
Cap
ital F
irm S
uper
.D
epar
tmen
t
Mar
ket P
artic
ipan
tA
utho
risat
ion
and
Regi
stra
tion
Dep
art.
Seco
ndar
yM
arke
tsD
epar
tmen
t
Prim
ary
Mar
kets
Dep
artm
ent
Fina
ncia
l Rep
orts
and
Acc
ount
ing
Dep
artm
ent
Lega
l Affa
irsD
epar
tmen
tLi
tigat
ion
Dep
artm
ent
Inve
stm
ent
Firm
Insp
ectio
nC
redi
t & S
avin
gsIn
st. I
nspe
ctio
n
Dis
tanc
e ov
ersi
ght
of In
vest
men
tFi
rms
and
Cre
dit &
Sav
ings
Inst
itutio
ns
Dist
ance
ove
rsig
ht o
f UCI
TSD
ista
nce
over
sigh
tof
Ven
ture
Cap
ital F
irms
and
UC
ITS
man
ag.
com
p.
UC
ITS
insp
ectio
n
Inve
stm
ent f
irms
UCI
TS a
ndVe
ntur
e Ca
pita
l firm
UC
ITS
man
ag.
com
pani
es
MM
U
Fixe
d-in
com
e
Equi
ties
Der
ivat
ives
Take
over
bid
s
Issu
ers
Fina
ncia
lre
port
sCo
rpor
ate
gove
rnan
ce
Cont
ract
san
d Fe
es
CN
MV
Org
anis
atio
n C
har
t
26_Anexos_org_CNMV_INGLES.qxd 24/7/09 19:18 Página 342
creo

26_Anexos_org_CNMV_INGLES.qxd 24/7/09 19:18 Página 343

26_Anexos_org_CNMV_INGLES.qxd 24/7/09 19:18 Página 344