ANNUAL BUDGET - Leesburg, FL
525
ANNUAL BUDGET Fiscal Year 2021 - 22 City of Leesburg, Florida
-
Upload
khangminh22 -
Category
Documents
-
view
0 -
download
0
Transcript of ANNUAL BUDGET - Leesburg, FL

ANNUAL BUDGET
Fiscal Year 2021 - 22
City of Leesburg, Florida

TABLE OF CONTENTS
INTRODUCTORY SECTION
TRANSMITTAL LETTER 1 CITY OFFICIALS 5 ORGANIZATIONAL CHART 6 MISSION AND ORGANIZATIONAL VALUES 7 EXECUTIVE SUMMARY 9 CERTFICATE OF ACHIEVEMENT 17 COMMUNITY PROFILE 18 LOCAL ECONOMY 20 GOVERNMENT STRUCTURE 23
FUND TYPES AND DESCRIPTION 23 MUNICIPAL SERVICES 25 FINANCIAL PLANNING 28
SHORT TERM 28 LONG TERM 28
BUDGET PREPARATION PROCESS 31 BUDGET CALENDAR 36 SIGNIFICANT POLICIES 39
BUDGET POLICY 39 BUDGET ADJUSTMENT PROCESS 39 CASH POLICY 41 IDENTITY THEFT PREVENTION POLICY 41 DEPOSIT POLICY 41 INVESTMENT POLICY 41 CASH RESERVE POLICY 42 UTILITY TRANSFER POLICY 43 SPECIAL TRANSFER POLICY 43 PROCUREMENT POLICY 44 CAPITAL ASSET POLICY 45 DEBT POLICY 46
BUDGET SUMMARY 49 BUDGET REVIEW 53
REVENUE OVERVIEW 53 REVENUE FORECAST 53 APPROPRIATIONS OVERVIEW 57 CAPITAL OUTLAY 62 DEBT 63
BUDGET SUMMARY/ADVERTISEMENT 81 GOVERNMENTAL FUNDS SUMMARY OF ESTIMATED FINANCIAL SOURCES & USES 82
ENTERPRISE FUNDS SUMMARY OF REVENUES, EXPENSES & CHANGE IN NET ASSETS 83
INTERNAL SERVICE FUNDS SUMMARY OF REVEUES, EXPENSES & CHANGE IN NET ASSETS 84

TABLE OF CONTENTS (CONTINUED)
BUDGET SECTION
RECAP OF ALL FUNDS 85 PERSONAL SERVICES 90
GENERAL FUND 93 CITY COMMISSION 103 EXECUTIVE 109 FINANCE 129 HUMAN RESOURCES 147 INFORMATION TECHNOLOGY 153 GEOGRAPHIC INFORMATION SYSTEMS 159 POLICE 165 FIRE 171 PUBLIC WORKS 177 COMMUNITY DEVELOPMENT 195 HOUSING & ECONOMIC DEVELOPMENT 201 LIBRARY 207 RECREATION 213
SPECIAL REVENUE FUNDS 223 GREATER LEESBURG COMMUNITY REDEVELOPMENT AGENCY 223 CARVER HEIGHTS COMMUNITY REDEVELOPMENT AGENCY 229 US HWY 441/27 COMMUNITY REDEVELOPMENT AGENCY 237 POLICE FORFEITURE FUND 243 POLICE EDUCATION RECEIPTS 249 DISCRETIONARY SALES TAX FUND 255 GAS TAX FUND 261 POLICE IMPACT FEES 267 FIRE IMPACT FEES 273 RECREATION IMPACT FEES 279 BUILDING PERMITS FUND 285 HOUSING ASSISTANCE FUND 293
DEBT SERVICE 299
CAPITAL PROJECTS FUND 303
ENTERPRISE FUNDS 309 ELECTRIC UTILITY FUND 309 GAS UTILITY FUND 333 WATER UTILITY FUND 351 WASTEWATER UTILITY FUND 371 SOLID WASTE FUND 399 AIRPORT FUND 415 STORMWATER FUND 427

TABLE OF CONTENTS (CONTINUED)
BUDGET SECTION (CONTINUED)
PENSION TRUST FUNDS 441 POLICE PENSION TRUST FUND 441 FIREFIGHTERS’ PENSION TRUST FUND 445 GENERAL EMPLOYEES’ PENSION TRUST FUND 449
INTERNAL SERVICE FUNDS 453 HEALTH INSURANCE FUND 453 WORKERS’ COMPENSATION INSURANCE FUND 459 RISK MANAGEMENT FUND 465 FLEET SERVICES FUND 469
GENERAL INFORMATION
RESOLUTION 482 CAPITAL IMPROVEMENT PROGRAM 490 CAPITAL PROGRAM OPERATING COSTS 496 PAYGRADES 498 ELEMENT/OBJECT CODE LISTING 506 GLOSSARY OF ACRONYMS 508 GLOSSARY OF BUDGETARY TERMS 511 APPENDIX 516

This page intentionally left blank
Fiscal Year 2021 - 22 Annual Budget
1
Date: December 10, 2021
To: Honorable Mayor and City Commission of the City of
Leesburg, Florida
From: Al Minner, City Manager
Subject: Fiscal Year 21-22 Budget
Introduction
It is my privilege to present you the adopted Fiscal Year 2021-22 Budget (FY 22) for the
City of Leesburg. The City’s annual budget determines the manner in which services will
be provided to the community during the coming year and its adoption is one of the most
important actions that the City Commission considers.
The budget was further developed by analyzing financial conditions of the past, present
and future. Frameworks were established using financial principles that will sustain
fundamental functions of the City for years to come. These guiding principles are as
follows:
➢ Maintain or enhance the provision of services and do so in ways that are
observable and beneficial to the community;
➢ Provide vision for our future by investing in planning efforts that will invigorate
our City’s economy;
➢ Provide employees with market competitive compensation and benefits that are
sustainable, while also building a quality workforce;
➢ Implement organizational modifications that promote and enhance efficiencies,
while better using financial resources; and
➢ Review and monitor rate and taxing structures.

Fiscal Year 2021 - 22 Annual Budget
2
The FY 22 Budget is compliant with all financial policies set forth by the City Commission.
The total operating budget for all funds equals $176,643,255, which is an increase of 5%
over last year’s total operating budget. The General Fund budget equals $28,528,392,
representing a 5% increase from FY 21. The current real property tax rate of 4.1086 per
$1,000 of assessed valuation was a decrease from the prior year. This rate is commonly
known as the “roll back rate” and not considered a “tax increase” under TRIM guidelines.
The budget submitted is legally balanced as required and meets the following goals:
➢ Continues to seek organizational efficiencies;
➢ Implements a “roll back” tax rate;
➢ Maintains competitive employment compensation benefits;
➢ Provides additional funding for increased maintenance operations;
➢ Ensures that non-recurring revenues are directed to funding non-recurring
expenditures; and
➢ Provides quality frontline services to the community.
This balanced budget requires implementation of many strategies including when available
holding job vacancies, using savings from FY 21, reducing expenditures and establishing
goals to reorganize the workforce.
Concerning organizational restructuring, the FY 22 Budget increased by 9 positions over FY
21 bringing the total position count to 502. There was a total of 1 position added to the
General Fund, 1 position was added to Police and 1 position to Customer Service, and
conversely there was a reduction of 1 position in IT. Due to continued ongoing growth in
Leesburg, 5 positions were added to the Utilities, specifically 2 were added to Solid Waste
and 3 were added to Electric. Additionally, 3 positions were added to the Building
department.
Citywide budget activities are funded from multiple sources that include restricted enterprise
funds (Electric, Gas, Water, Wastewater, Solid Waste, Airport) and other restricted funds (i.e.
public housing, federal/state funding). These restricted funds total $148,114,863 or 84% of
the total adopted budget, while the General Fund, which totals $28,528,392 million,
represents 16%.

Fiscal Year 2021 - 22 Annual Budget
3
General Fund Approach to balancing the Budget
The City of Leesburg is heavily reliant on enterprise fund transfers, local sales tax and state
shared revenues to fund basic services. Recognizing this dynamic, the FY 22 Budget places
continued emphasis on General Fund independence, while seeking opportunities for the
organization to be a competitive utility provider. Toward this goal 3 actions are monitored:
1) The FY 22 Fire Assessment program remained the same (the program was reviewed and
recalibrated in FY 21)
2) The City adopted the “roll back” rate of 4.0192 mills per $1,000, this is the second
consecutive year the City has adopted the “roll back” rate
3) Over the last seven fiscal years the Electric transfer has been reduced by $2,156,459 or
42%
Budget Goal
The FY 22 Budget takes proactive approaches to control costs and improve Leesburg’s
quality of life, while protecting itself from financial uncertainties that always exist. Such
approaches are seen in (1) maintaining cash reserves well above the GFOA
recommendations; (2) reluctance to increases taxes; (3) continually reviewing the
organization for operational efficiencies; and, (4) all the while taking a “pay-as-you-go”
approach to capital and redevelopment investments.
Conclusion
This budget achieves the City Commission’s policies and priorities within the resources that
are available. It is consistent with the City’s goals and maintains reserves. The City has
continued its proactive approach to containing operating expenditures so that sufficient
monies exist to preserve current service levels and address the identified short-term and
long-term infrastructure needs.
The financial policies of the past few years have begun to make a positive impact on the
City’s overall financial position, thereby allowing reinvestment in a sustainable manner.
Such steps include continued allocated reinvestments in the downtown area, the Leesburg
International Airport, Gas, Wastewater and Electric expansions. Additionally, the City will
open the Aquatics Center which was a $5.5 million dollar project and the Teen Center which
was a $3.2 million dollar project. Both of these major projects were funded without any
additional Debt. With these goals accomplished, FY 23 is poised to set Leesburg in a
positive financial and operational direction.

Fiscal Year 2021 - 22 Annual Budget
4
In closing, I would be remiss not to thank the employees, department heads and Finance
Department for their efforts in putting together this important document. I would like to
thank the City Commission for their continued leadership and commitment to the
betterment of Leesburg. The City Commission continues to fulfill their fiduciary
obligation to the citizens of Leesburg by adopting sound budgetary plans. Through
annual processes like these, I am confident that the City of Leesburg will regain
prominence in the Central Florida region and be recognized as a progressive community
and one where people desire to live, work and play.
Respectfully submitted,
Al Minner
City Manager

Fiscal Year 2021 - 22 Annual Budget
5
CITY OF LEESBURG
ANNUAL BUDGET
F i s c a l Y e a r 2 0 2 1 - 2 2
JOHN CHRISTIAN Mayor
Seat 2, District 2
MIKE PEDERSON Mayor-Pro Tem
Seat 4, At-Large
H. D. ROBUCK, III Commissioner
Seat 5, At-Large
JIMMY BURRY Commissioner
Seat 1, District 1
JAY CONNELL Commissioner
Seat 3, District 3
AL MINNER City Manager
FRED MORRISON City Attorney
McLin & Burnsed
JAMES WILLIAMS Finance Director
BRANDY MCDANIEL Budget Manager
TINO ANTHONY Information Technology
Director
MELISSA ARRIAGA Director of Human
Resources
BRAD CHASE Electric Director
LUCY GANGONE Library Director
ROB HICKS Police Chief
DAVID JOHNSON Fire Chief
CLIFF KELSEY Director of
Public Works
DAN MILLER Planning & Zoning Director
J. ANDI PURVIS City Clerk
TRAVIS RIMA Recreation Director
JACK ROGERS Gas Director
KEN THOMAS Director of Housing

Fiscal Year 2021 - 22 Annual Budget
6
ORGANIZATION CHART
Citizens
City Commission
(5)
City Attorney
City Manager
(2.90)
Airport
(2.10)
City Clerk
(2)
Community
Development
Building
(13)
Planning &
Zoning
(6)
Electric
(48)
Stormwater
(6.01)
Wastewater
(41.29)
Water
(27.75)
Finance
(43)
Fire
(51)
Gas
(23)
Housing
(1)
Human
Resources
(5)
Information
Technology
(10.50)
Library
(32)
Police
(104)
Public Works
(27.85)
Solid Waste
(18.10)
Recreation
(19)
GIS
(4.50)
Fleet Services
(8)
Housing Assistance
(1)

Fiscal Year 2021 - 22 Annual Budget
7
VISION, MISSION AND ORGANIZATIONAL GOALS
OF THE CITY OF LEESBURG
VISION STATEMENT
A diverse community energetically working in collaboration to ensure that the City of Leesburg
upholds its history, ambiance and natural resources to become and stay a vibrant community.
MISSION STATEMENT
To provide effective and efficient municipal services that promote public safety, economic
growth and quality of life.
Goal #1 Eliminate blight and stimulate growth by investing in neighborhood redevelopment, while also pursuing new economic opportunities. Goal #2 Lead the industry in providing high quality, low cost, customer driven utility services. Goal #3 Deliver the highest level of professional public safety service that ensures security for Leesburg’s residents and businesses. Goal #4 Utilize Leesburg’s natural resources and slogan as the “Lakefront City” to enhance recreational and leisure amenities. Goal #5 Foster an environment where local governance is collaborative, transparent and fiscally sound.

This page intentionally left blank
Fiscal Year 2021 - 22 Annual Budget
8

Fiscal Year 2021 - 22 Annual Budget
9
Executive
Summary
Executive Summary
The City of Leesburg’s Fiscal Year 2021-22 combined budget includes revenues and expenditures totaling $176,643,255. This represents an increase of $8,483,411 over the previous fiscal year budget of $168,159,844.
Millage Rate – The millage rate included in this proposed budget is 4.0192 mills or the roll back rate which is less than the prior millage rate of 4.1086 mills.
General16%
Electric40%
Gas 5%
Water7%
Wastewater9% Other
21%
Solid Waste3%
TOTAL CITY EXPENDITURES Fiscal Year 2021-22 Budget
AD VALOREM REVENUES FOR THE
LAST 5 YEARS
$4,200,000
$4,400,000
$4,600,000
$4,800,000
$5,000,000
$5,200,000
$5,400,000
$5,600,000
17-18 18-19 19-20 20-21 21-22
Fund FY 20-21 FY 21-22 Change
Governmental Funds 42,441,845$ 46,066,659$ 3,624,814$
Internal Service Funds 12,809,663 12,958,115 148,452
Electric Utility 68,251,793 69,950,194 1,698,401
Wastewater 16,874,313 15,850,657 (1,023,656)
Water 11,268,193 12,196,324 928,131
Gas 6,857,165 8,555,791 1,698,626
Solid Waste 4,745,637 5,104,880 359,243
Storm water 1,754,762 1,699,040 (55,722)
Airport 3,156,473 4,261,595 1,105,122
Total $168,159,844 $176,643,255 $8,483,411

Fiscal Year 2021 - 22 Annual Budget
10
Executive
Summary
For comparison, the millage rates for all Lake County cities have been included below:
The following table illustrates the effect of the changes in taxable values on the respective CRA’s:
Utility Services Tax — Budgeted revenue for the Utility Service Tax totals $3,980,000, which is an increase of $185,000 from the prior year’s budget.
Communications Service Tax – Based on estimated taxable sales of $17,951,469, the City expects to realize $835,000, which is a 5.22% levy on telecommunications services.
Business Tax – This revenue was eliminated in FY 21 or a reduction of approximately $195,000. Permit Revenues – Permit revenues increased from $566,500 to $990,000, or 75%. These fees have been significantly reduced but building has increased in the area which directly relates to the increase in revenue.
Taxable Value
TIF Revenue
Other Agency Revenue
Fund 2020-21 2021-22 2020-21 2021-22 2020-21 2021-22
GLCRA $ 144,416,932 $ 146,340,953 $ 225,923 $ 229,869 $ 323,988 $ 334,650
CHCRA 105,251,563 115,623,566 170,441 206,256 244,423 300,276
441/27CRA $ 456,296,296 $ 478,361,989 $ 494,549 $ 554,173 $ 709,216 $ 806,784
2012-13 2013-14 2014-15 2015-16 2016-17 2017-18 2018-19 2019-20 2020-21 2020-22
Eustis 6.7158 7.5810 7.5810 7.5810 7.5810 7.5810 7.5810 7.5810 7.5810 7.5810
Howey-in-the- Hills 8.6965 9.6147 9.5177 9.5177 9.2750 9.2750 9.2750 8.9180 7.5000 7.5000
Astatula 6.2500 6.2500 7.5000 7.5000 7.5000 7.5000 7.5000 7.5000 7.5000 7.5000
Umatilla 8.2480 8.2480 7.2980 7.2980 7.1089 7.1089 7.1089 7.1089 7.1089 7.1089
Tavares 6.4462 6.9064 7.1569 6.6166 7.1000 7.0000 7.1119 6.9500 6.9000 6.7579
Mount Dora 5.6667 5.6667 5.9970 5.9970 5.9970 6.3000 6.3000 6.2000 5.9603 5.9603
Minneola 6.3000 6.3676 6.2500 6.2069 6.1483 6.2795 6.1900 6.1800 6.1000 5.9000
Mascotte 9.6147 9.6147 9.3000 8.8138 8.3289 7.9316 7.6291 7.5500 7.1323 5.7500
Groveland 5.6000 5.4700 5.9900 5.9900 5.6000 5.2000 5.2000 5.2000 5.2000 5.2000
Clermont 3.1420 3.7290 3.7290 4.2061 4.2061 4.2061 4.2061 4.2061 4.2061 4.2061
Leesburg 4.3179 4.3179 4.3179 4.2678 4.2678 4.2678 4.2678 4.2678 4.1086 4.0192
Fruitland Park 4.6442 4.7371 4.7371 4.7371 3.9863 3.9863 3.9134 3.9134 3.9134 3.9134
Lady Lake 3.2808 3.2808 3.7500 3.5510 3.3962 3.3962 3.3962 3.3962 3.3962 3.3962
Montverde 2.8300 2.8300 2.8300 2.8300 2.8300 2.8300 2.8300 2.8300 2.8300 2.8300
Millage Rate Comparisons
All Cities in Lake County
0.0000
1.0000
2.0000
3.0000
4.0000
5.0000
6.0000
7.0000
8.0000
Eust
is
Ho
we
y-in
-th
e-
Hill
s
Ast
atu
la
Um
atill
a
Tava
res
Mo
un
t D
ora
Min
neo
la
Mas
cott
e
Gro
vela
nd
Cle
rmo
nt
Lees
bu
rg
Fru
itla
nd
Par
k
Lad
y La
ke
Mo
ntv
erd
e
2021-22 Millage Rates for Lake County Cities
4.0192
7.5810
2.8300

Fiscal Year 2021 - 22 Annual Budget
11
Executive
Summary
Fire Assessment Fee- The rates will remain the same for FY 21 and the revenue reflects a slight increase from $1,500,000 to $1,542,770 in FY 22. Intergovernmental Revenues – Estimated revenues include: funding from Lake County to operate the Leesburg Library as part of the County Library System of $262,891, $200,000 from Lake County for the Sleepy Hollow Grandstands and funding from the Lake Sumter EMS for costs associated with Advanced Life Support (ALS) service provided by the Fire department of $145,000. Additionally, the budget includes use of the American Rescue Plan funds for a Sports Marketing Plan $100,000 and Rails to Trails Projects $350,000. Charges for Services – Projected revenues in the Electric utility were based on current rates and projected usage. Power supply cost projections, which include St. Lucie and Florida Municipal Power Agency (FMPA), reflect an increase of $1,858,748, or 5%, from the previous fiscal year. Projected revenue for the Gas utility is based on adjusted rates, projected usage and projected growth. Revenues have also been adjusted to consider the projected change in the costs of Natural Gas. This budget reflects a cost increase in Natural Gas of $437,509 or 24%. Projected revenue for the Water and Wastewater utility funds are based on current rates adjusted for the net change in the GDPIPDI. The Solid Waste residential revenues remained flat increasing only slightly from $4,612,213 to $4,614,620, or less than 1%. Miscellaneous Revenues – Rental and lease revenues, primarily associated with the operation of the Leesburg International Airport, decreased slightly or by $37,770 over the previous fiscal year. Interest revenues, which are driven by rates and available cash to invest, have decreased. The decrease is primarily attributable to decreasing interest rates. The following table illustrates actual investment income through 2019-20 with budgeted income reflected in 2020-21 and 2021-22.
Interfund Transfers – Interfund transfers represent a major source of funding in the General Fund. The amount of transfer is determined by applying the percentage reflected in the table below against charges for services excluding surcharge revenue, gross receipts tax and franchise fees. Interfund transfers of the utility funds are reflected below:
Operating Interest Capital Interest Total
2018-19 $ 2,003,432 $-0- $ 2,003,432
2019-20 1,700,009 -0- 1,700,009
2020-21 1,379,024 -0- 1,379,024
2021-22 $ 948,501 -0- $ 948,501
2020-21 2021-22 Fund Percent Amount Percent Amount
Electric 7.00% $ 3,603,405 6.00% $ 3,027,198
Gas 10.00% 622,004 10.00% 620,989
Water 8.75% 718,582 8.75% 739,232
Wastewater 8.25% 955,243 8.25% 987,324
Solid Waste 10.00% 426,288 10.00% 438,571
TOTAL $ 6,325,522 $ 5,813,314

Fiscal Year 2021 - 22 Annual Budget
12
Executive
Summary
Fund Balance – For the Electric Utility, the minimum cash balance level will be determined by the following formula: (Total Revenues - Cost of Purchased Power - Operating Transfers to the General Fund - Cost of Surcharge Transfers)/ 365 days X 120 days. For the Gas Utility, the minimum cash balance level will be determined by the following formula: (Total Revenues - Cost of Purchased Gas - Operating Transfers to the General Fund - Cost of Surcharge Transfers)/ 365 days X 90 days. The following table illustrates the required calculations:
Positions – Budgeted positions include both full and some part time positions. The total position count increased by 9 positions or to 502 over the previous fiscal year position count of 493. There was 1 position added in the General Fund and 8 positions added to the Other Funds. Please refer to the tables on pages 90-92 for additional information.
Projected Fund Balance Projected Increase/ Projected
Fund Budget Percent Requirement 09/30/21 (Decrease) 09/30/22
General Fund $28,528,392 20% $5,705,678 $13,500,000 $-0- $12,550,000 Water 12,196,324 25% 3,049,081 6,650,000 500,000 7,150,000 Wastewater 15,850,657 25% 3,962,664 17,850,000 1,364.857 19,214,857 Solid Waste $5,104,880 25% $ 1,276,220 $ 2,300,000 $(462,788) $1,837,212
Total Revenues
Cost of Energy
Operating Transfers
Surcharge Transfers
Total
Required Reserves
Projected Reserves
Electric $ 69,950,194 ($39,831,485) ($3,027,198) ($1,624,943) $25,466,568 $8,372,520 $16,000,000
Gas $ 8,555,791 ($2,295,535) ($620,989) ($181,973) $4,457,294 $1,345,634 $ 3,500,000
INTERFUND TRANSFERS TO THE GENERAL FUND
$0
$500,000
$1,000,000
$1,500,000
$2,000,000
$2,500,000
$3,000,000
$3,500,000
$4,000,000
2020-212021-22
Electric
Gas
Water
Wastewater
Solid Waste

Fiscal Year 2021 - 22 Annual Budget
13
Executive
Summary
Personal services – Personal services are comprised of three components:
• Salaries which include regular salaries, wages and standby pay • Other salaries which include temporary labor, overtime, special pay, bonuses and
incentives • Fringes and benefits which include FICA and Medicare, retirement, insurance, workers
compensation, deferred compensation and wellness
Overall, salaries and wages in fiscal year 2021-22 increased $1,153,360 from $24,463,209 in fiscal year 2020-21 to $25,616,569. Other salaries increased by $140,690 from $2,129,088 to $2,269,778. Fringe benefit costs are projected to increase $664,562 from $11,258,450 to $11,923,012. Items included in the current fringe benefits package are: • The fiscal year 2021-22 budget includes increases in salaries. Specific positions were
evaluated and adjusted for marketability and retention. The majority of the employees received a 3% increase.
• The City contributes to the frozen general employees retirement plan and the defined contribution 401a plan a total of 14.82% and 5% of wages, respectively. The defined contribution plan remained unchanged at 5% in the Fiscal Year 2021-22 budget. City contributions for the municipal police and firemen’s plans total 11.03% and 31.73% of eligible payroll, respectively. Based on current actuarial projections, the contributions are expected to adequately fund the respective plans.
• A self-insured health care program provides for payment of employee health and medical claims, and is managed by the City and a third party administrator. Key components of the primary program include a prescription pharmaceutical plan, a Preferred Provider Organization (PPO) and a Health Maintenance Organization (HMO) for medical treatment and an on-site Employee Wellness Center. The following rate categories are available to employees for health care coverage: employee only, employee and children, employee and spouse and employee and family. The fiscal year 2021-22 budget includes increases on the City’s, Employee’s and Retiree’s contribution to the plan. The Health Insurance fund is constantly monitored and evaluated to ensure the fund remains healthy.
• A PTO buy back policy allows employees to sell their unused accrued PTO time back to
the City. Employees can earn a maximum accrual of 560 PTO hours or risk losing additional accruals. The employee may not sell back more PTO time than they used in the previous year. The budget includes an appropriation of $100,000 for General Fund buybacks; mostly all of the proposed budget is attributable to Police and Fire and are covered under the Collective Bargaining Agreements (CBA).
Operating Expenses – Overall, this category increased $6,498,980, or 6.8%. Significant changes include: Energy and Gas Costs for the Electric and Gas utilities increased a combined $2,296,257 with Electric being $1,858,748 of the total increase and Gas being the remaining increase of $437,509. The fleet services division charges every department a lease fee to purchase vehicles and equipment replacements. The purchases are recorded in capital outlay of the fleet internal services fund budget. The internal fleet lease charges increased slightly from $1,342,374 to $1,390,131, or an increase of $47,757 or 3.56%. The fleet lease fees represent 75% of the amortized replacement values, which is the same as last year. Estimated maintenance fees for vehicles, which are also charged to each department, decreased slightly or by $39,936, or 3.79%.

Fiscal Year 2021 - 22 Annual Budget
14
Executive
Summary
Additionally, the fleet overhead charge to the departments, which totals $307,125, increased slightly from the prior year budget of $298,584. This charge is to cover shop supplies, utilities and other administrative costs incurred by the fleet fund and is allocated based on the number of vehicles a department has. Utilities across all funds are projected to increase slightly from $3,168,975 to $3,232,248, an increase of $63,273, or 2%. The General Fund cost allocations increased $319,284, or 5% to the utility funds. The allocation percentages remained relatively unchanged from the prior year. Other significant items to note: Contract services increased by $367,352. Overall maintenance, which is spread among the various maintenance categories, has increased by $402,556, and training expenses increased by $21,205. Additionally, the budget also includes depreciation expense of $8,565,254, which is an increase of $504,657 over the $8,060,607 budgeted for fiscal year 2020-21. As a final note, the Communications Utility was sold to Summit Broadband in January of 2018. Capital Projects – The 2021-22 budget includes capital projects from the proposed 5-year Capital Improvement Plan. There has been an increase in capital projects of $892,440 from the fiscal year 2020-21 budget of $15,441,969, or less than 5.8%. The capital projects breakdown shown below is by fund; detail can be found within the document: Local government infrastructure sales surtax represents a significant source of revenue to fund capital improvement needs of general government activities. The FY 22 budget includes $1,660,374 of funding for capital improvement. Revenues from this source, which was renewed in 2015 and are available until December 2032, are projected to total $2,298,165. Capital Operations and Maintenance Expense- Prior to fiscal year 2007-08, budgetary policy determined fiscal policy. Currently, the capital operations and maintenance expenses are reviewed yearly and categorized by available funding. Each fund completes a 5-year Capital Improvement Plan. The City’s capital improvement plan requires the submission of all cost components including ongoing O&M. Management realizes they have to assess the financial impact of recurring expenditures associated with the capital plan. The City also adopted financial policies to establish ongoing renewal and replacement funds for its utilities. Those funds have accumulated significant balances since the implementation of the policies and are now used to fund ongoing O&M related expenditures. The City has a fund balance and a cash reserve policy which clarify the language associated with the definition of fund balance and available cash on hand. These policies create a minimum required reserve as well as establish a margin and establish cash reserves to fund O&M associated with capital infrastructure placed in service.
Fund Amount
Electric $5,599,200 Airport 3,450,720
Water 2,030,000
Wastewater 1,755,000
Capital Projects 1,575,000
Fleet 1,589,650
Gas 861,259
Stormwater 470,000
Solid Waste 250,000
General 248,200
Total $ 17,829,029

Fiscal Year 2021 - 22 Annual Budget
15
Executive
Summary
Debt Service – Debt service includes the costs of liquidating long-term liabilities of the City, such as principal and interest on bond issues, notes and contracts payable. The changes in Debt service are reflected below by fund:
Budget Review Calendar – The City Commission Budget Workshops were held July 6
th, 8
th
and 13th at the Venetian Center. The Commission established the maximum millage rate for
fiscal year 2021-22 at the July 12th regular Commission meeting. The first public hearing to
consider adoption of the budget was held September 16th The public hearing to consider final
adoption of the budget was held Monday, September 27th at the regular City Commission
meeting. Distinguished Budget Presentation Award – The Government Finance Officers Association of the United States and Canada (GFOA), through the Distinguished Budget Presentation Awards Program, recognizes exemplary budget documents. Entities submit their operating budget for review, which is evaluated using a comprehensive checklist. On June 11, 2021 the GFOA awarded the City of Leesburg the Distinguished Budget Presentation Award for the fiscal year 2020-21 budget which is the 23rd consecutive year (1999-2021). We believe that the current budget document continues to conform with the program requirements and will be submitted to the GFOA to determine its eligibility for another award.
Final Fund Type Payment 2020-21 2021-22
Electric: 2007 Bonds 2038 $929,785 $ 932,630 2016 Note 2032 600,053 600,384 2016 Bonds 2037 1,120,300 1,117,850 2020 Note 2036 1,181,063 779,548 3,831,201 3,430,412 Capital Improvement: 2009 Promissory Note 2030 477,168 477,386 2013 Bonds 2035 1,010,263 1,008,538 2018 Capital Lease 2027 34,984 34,983 2018 Capital Lease 2027 90,119 87,298
2021 Capital Lease 2026 -0- 138,165 1,612,534 1,746,370
CRA’s: GLCRA 2015 Note 2026 100,330 100,870 CHCRA 2016 Bonds 2031 96,018 96,018 Hwy 441/27 CRA 2016 Note 2036 498,993 890,553 695,341 1,087,441 Water: 2007/ 2013 Bonds 2035/2038 472,452 473,411 2010 Revenue Note 2026 378,305 375,101 2016 Bonds 2037 741,772 741,966 1,592,529 1,590,478 Wastewater: 2007/ 2013 Bonds 2035/2038 736,568 737,537 2010 Revenue Note 2026 454,828 450,977 2016 Bonds 2037 272,418 272,489 2020 Note 2036 1,140,000 1,124,955 2,605,814 2,585,958 Gas 2007/ 2013 Bonds 2035/2038 227,132 227,592 2016 Bonds 2037 129,462 129,495
356,594 357,087
TOTAL $ 10,694,013 $ 10,797,746

This page intentionally left blank
Fiscal Year 2021 - 22 Annual Budget
16

Fiscal Year 2021 - 22 Annual Budget
17
The Government Finance Officers Association of the United States and Canada (GFOA) presented a Distinguished Budget Presentation Award to the City of Leesburg, Florida for its annual budget for the fiscal year beginning October 1, 2020. In order to receive this award, a governmental unit must publish a budget that meets the program criteria as a policy document, as an operations guide, as a financial plan, and a communications device. This award is valid for one year only. The City of Leesburg has received the Distinguished Budget Presentation Award for the last twenty-two consecutive years (fiscal years 1999-2021). We believe our current budget continues to conform to program requirements, and we are submitting it to GFOA to determine is eligibility for another award.

Fiscal Year 2021 - 22 Annual Budget
18
Community
Profile
Evander & Susan Lee City Hall (circa 1940)
LOCATION
Located in the center of the state, Leesburg is conveniently intersected by U.S. Highways 441 and 27 and Florida’s Turnpike. Leesburg is known as the “Lakefront City” with the Harris Chain of Lakes providing a scenic backdrop for daily life, work and play.
The City occupies a land area of 43.00 square miles and has a population exceeding 24,000. Leesburg is located about 40 miles northwest of Orlando, Walt Disney World, Universal Studios and other major attractions. The City of Leesburg is approximately 200 miles southeast of the state capital, Tallahassee, 80 miles northeast of Tampa, and 70 miles southwest of Daytona Beach. The Florida Legislature created Lake County from portions of Sumter and Orange counties in 1887. From that day forward, the City of Leesburg has been a part of Lake County. It is the oldest of the 14 incorporated municipalities in Lake County, which include Astatula, Clermont, Eustis, Fruitland Park, Groveland, Howey-in-the-Hills, Lady Lake, Mascotte, Minneola, Montverde, Mount Dora, Tavares and Umatilla.
HISTORY
Leesburg was founded and settled in 1857 by Evander H. Lee - a native of Sumter, South Carolina. The City received its name as a result of shipping directions given by Calvin Lee, Evander’s brother, during a merchandising trip to New York City in 1866. By a citizen vote of 23 to 2, the City of Leesburg was incorporated on July 12, 1875. The City was originally part of Sumter County and served as the county seat until 1882.

Fiscal Year 2021 - 22 Annual Budget
19
Community
Profile
QUALITY OF LIFE/AMENITIES
The City of Leesburg is known for its scenic beauty, relaxed lifestyle, recreational facilities, temperate climate, extensive waterways and affordable housing. Waterfront living is a way of life with 1,400 beautiful lakes located in Lake County. The City provides a full complement of public utilities including electric, natural gas, water, wastewater, stormwater and solid waste. Leesburg’s beautiful 65-acre Venetian Gardens Park has been transformed in recent years. Improvements include the creation of the Ski Beach area with a new restroom, walking paths and a new docks and a boat ramp. Additionally, the Kid’s Korner playground was replaced and a Splash Pad was added. The new Venetian Center opened in November 2019 and is near the restaurant which will be added near the Venetian Cove Marina. There are several recreational complexes in Leesburg. The City of Leesburg has three athletic complex locations. Sleepy Hollow Sports Complex has 8 baseball/softball fields, two multipurpose fields, a playground, concessions, restrooms and locker rooms. The Susan Street Complex includes four youth baseball fields, one regulation football field, four tennis courts, four outdoor racquetball courts, concessions and restrooms. Pat Thomas Stadium has one regulation high school/college field with a full stadium, locker rooms, concessions and restrooms. The Palmetto Street Complex features four tennis courts as well as 24 shuffleboard courts. The H.O. Dabney Aquatic Center is nearing completion with an estimated Winter 2021 completion. The new facility will consist of a 25 yard competition pool, a beach entry pool, kids play area, two story slide, and basketball/volleyball area. The new facility will also include a bath house, guard house and concession stand. Other quality
recreational facilities throughout the City include Rogers Park & Rogers Park Splash Pad, Berry Park, Veterans Park, John L. Johnson Park, Leesburg’s Dog Park and the Towne Square, which serves as the focal point during major festivals hosted within the City. In 2018, the City opened the Leesburg Resource Center. This newly constructed 7,500 square foot building offers a variety of services and resources to help individuals and families become more self-sufficient. It features meeting rooms, computer training space, a café, book depository, resource offices and a teaching kitchen. Leesburg Public Library is the second busiest location in Lake County’s library system. Staff at
the 45,000-square-foot facility help patrons with their reading, information and/or educational needs. Circulation of physical and digital items totaled 242,700 for the year and library programs were attended by over 16,600 people. Leesburg International Airport is an approximately 850-acre controlled-access, general aviation airport that caters primarily to recreational and corporate aircraft with 65,000 take-offs and landings a year. There are 115 fixed-wing, 27 helicopters and 7 jets that are permanently based at KLEE. The Airport has a U.S. Customs and Border Protection office, a federally contracted air traffic control tower and an aircraft rescue firefighting station. Businesses located on the airport property employ over 111 people in various capacities, the majority of which are working in aviation-related positions. The airport features two runways, tie downs, hangar facilities, a flight school and maintenance shops.

Fiscal Year 2021 - 22 Annual Budget
20
Community
Profile
Many social and cultural events are normally held in Leesburg throughout the year, attracting tens of thousands of people to the area. As a result of COVID-19 events are being evaluated and adjusted as necessary. The usual events include: Mardi Gras, Bikefest, 4th of July celebration, the Dr. Martin Luther King, Jr. Celebration, Beast Feast, Chili Cook Off, the Leesburg Christmas House, Juneteenth Celebration, Fine Arts Festival, Leesburg Lightning Summer baseball league and the Main Street Christmas Parade.
LOCAL ECONOMY
Leesburg has been a center of commerce for more than a century. Emerging from its agricultural roots, the City has blossomed to a population of more than 24,000 with employment emphasis on health care, personal services, retail and education. Leesburg continues to grow as a medical destination, influenced largely by more than 150,000 residents who live nearby in The Villages retirement community. University of Florida Health Leesburg employs 1,696. Other notable job centers in Leesburg include: LifeStream Behavioral Center, Lake County School District and the City of Leesburg. Below are the principal employers with 150 employees or more in the City of Leesburg:
The labor market in Central Florida continues to recover from the effects of the COVID-19 pandemic. Central Florida’s unemployment rate dropped to 4.9% in September 2021, down from 11.0% which was reported a year ago. Lake County’s unemployment rate of 4.3% in September 2021 was lower than the State of Florida’s jobless rate of 4.9%. Conversely, Florida’s rate of 4.9% remained slightly higher than the United State’s figure of 4.8% according to the Florida Department of Economic Opportunity. Filling jobs still remains a problem in healthcare, retail and food service which offer lower wages. Following a second summer wave of COVID-19 key indicators suggest economic activity will continue to rebound. Construction activity in the industrial sector continues to ramp up. Throughout the Central Florida industrial market, over 1.5 million square feet remained under construction, much of which has been preleased, at the end of the quarter. The retail sector continues to recover after some negative impacts from the pandemic. The overall vacancy rate dropped to a pre-pandemic level of 5.4%, down from last year’s rate of 6.1%. Although many businesses were affected by the national shutdown, the market seems to have bounced back. The market is showing signs of confidence in the long-term outlook. However, increased pricing, along with staffing shortages, supply chain issues are still major hurdles to tackle. Tourism continues to grow due to events like Leesburg Bikefest and annual sports events such as Bassmasters, Florida BASS nation and FLW Fishing. Additionally, the City recently added the Northern Lights Softball and the Spring Games utilizing the Sleepy Hollow Complex. These major events draw visitors from around the country.
Name of Employer Employees Type of Business
UF Health Leesburg 1,525 Hospital
Lake County School District 737 Education Institution
Publix (3 stores) 521 Grocery Stores
City of Leesburg 502 City Governmental Services
LifeStream Behavioral Center 407 Mental Health Service Provider
Wal-Mart 360 Retail Store
First Baptist Church of Leesburg 327 Church Ministry Services
Lake Port Properties 298 Retirement Community
Leware Construction 185 Construction
Cutrale Citrus Juices USA Inc. 165 Citrus Processing
Lake Sumter Community College 165 Higher Education Institution
Lowe’s 154 Retail Store

Fiscal Year 2021 - 22 Annual Budget
21
Community
Profile
Leesburg continues to encourage economic development through economic incentives such as the opportunity zone and tax abatement, on the job training (OJT) and paid internship programs in conjunction with Career source. Leesburg has developed a Landscape, Sign and façade grant encouraging redevelopment of properties. Some demographic and economic statistics are presented: Leesburg International Airport continues to add tenants and improve facilities. A foreign trade zone was also added to benefit area businesses that import and export products internationally. Leesburg International Airport is also home to Lake County’s first Sea Plane ramp valued at over $2.6 million. In 2017, the City sold approximately 1,127 acres near the Florida Turnpike and County Road 470 to The Villages. Approximately 3,000 retirement homes are to be built on this property, with construction starting in the Summer of 2022. This will have a major economic impact on the City and other neighboring organizations. As a residential destination, Leesburg is considered one of country’s top locations for retirees, offering plenty of recreational areas, shopping and entertainment. The area includes a large number of rental properties. A variety of new, single-family homes is available, although the area lacks high-end properties often sought by upper-income workers. Leesburg area public schools consist of three elementary schools, two middle schools, and one high school. Lake-Sumter State College offers a variety of associate degrees and a baccalaureate degree program. Through cooperative agreements, the University of Central Florida and St. Leo University offer bachelor degree programs at the Lake-Sumter campus. Beacon College, the nation’s only four-year college for learning disabled students, continues to grow and expand in downtown Leesburg.
Lake County unemployment rate (September 2021) 4.3%
State unemployment rate (September 2021) 4.9%
Median age (Lake County) 47
Average median household income (Leesburg) $37,092
Median home value (Leesburg) $161,399

This page intentionally left blank
Fiscal Year 2021 - 22 Annual Budget
22

Fiscal Year 2021 - 22 Annual Budget
23
Government
Structure
IN GENERAL
The City of Leesburg is a political subdivision of the State of Florida. As such, it is governed by and derives its operating authority from the constitution and laws of the State of Florida. The City is empowered to levy a property tax on both real and personal properties located within its boundaries. It also is empowered by State statute to extend its corporate limits by annexation, which occurs periodically when deemed appropriate by the governing body. The City operates under a commission/manager form of government, with a governing body consisting of five City Commissioners elected to staggered four-year terms. All five of the commission members must meet district residency requirements. One of the Commissioners is selected by the other four as Mayor on an annual basis.
FUND TYPES AND DESCRIPTION
The City of Leesburg uses funds and account groups to report its financial position and the results of its operations. A fund is used to maintain control over resources that have been segregated for specific activities or functions. The City, like other state and local governments, uses fund accounting to ensure and demonstrate legal compliance. A fund is a separate accounting entity with a self-balancing set of accounts. All of the funds of the City can be divided into the following three categories: Governmental funds - Governmental funds are used to account for essentially the same functions reported as governmental activities. Governmental fund financial statements are reported using the current financial resources measurement, which focuses primarily on near-term sources and uses and available balances of spendable resources, at the end of the fiscal year. Such information may be useful in evaluating a government’s near-term financing requirements. The City maintains several individual governmental funds and adopts an annual appropriated budget for all governmental funds. Budgetary comparison schedules for these funds are provided in the annual financial report to demonstrate budgetary compliance. Proprietary funds - The proprietary funds account for operations similar to private business with the intent to recover costs to provide utility services that extend outside the City limits in all cases except Solid Waste. Electric and Gas utilities provide service to Fruitland Park residents. Revenues are derived from user charges imposed on residential and commercial customers. The City maintains two different types of proprietary funds. Enterprise funds are used to report the same functions presented as business-type activities in the financial statements. The City uses enterprise funds to account for its Electric, Gas, Water and Reuse Water, Wastewater, Solid Waste, Stormwater and Airport operations. Internal service funds are an accounting device used to accumulate and allocate costs internally among the City’s various functions. The City uses internal service funds to account for its self-insurance health, workers’ compensation programs, Risk Management and Fleet Services. Fiduciary funds - Fiduciary funds are used to account for resources held for the benefit of parties outside the government. The accounting used for fiduciary funds is similar to proprietary funds. The fiduciary funds include pension trust funds for police, fire and general employees. The City reports major funds, as described in the glossary. Major funds must meet two tests and can be reported if the government believes they are important to the financial statement user. The City operates the following major governmental funds:
General Fund - the government’s primary operating fund, accounts for all financial resources
of the general government, except those required to be accounted for in another fund.

Fiscal Year 2021 - 22 Annual Budget
24
Government
Structure
Capital Projects Fund - accounts for financial resources used for the acquisition or
construction of major capital facilities (other than those financed by proprietary funds and
trust funds).
The City budgets the following major proprietary funds:
Electric Utility Fund - accounts for the purchase and distribution of electric services.
Gas Utility Fund - accounts for the purchase and distribution of gas services.
Water Utility Fund - accounts for costs of collection, treatment and distribution of water and reuse water services.
Wastewater Utility Fund - accounts for costs to provide wastewater and sanitary sewer services.
Solid Waste Fund - accounts for the collection, transportation and disposal of solid waste, yard waste and construction debris. Stormwater Fund – accounts for revenues and expenditures related to stormwater management. Airport Fund – accounts for revenues and expenditures related to airport operations. Additionally, the City reports the following fund types:
Special Revenue Funds - account for proceeds of specific revenue sources that are
legally restricted to expenditure for specified purposes, which include:
Community Redevelopment Funds – Three funds were created pursuant to Section 163, Florida Statutes, to account for income generated from tax increment revenues generated by Community Redevelopment Districts; the Greater Leesburg Community Redevelopment Fund, Carver Heights Community Redevelopment Fund and US Highway 441/27 Community Redevelopment Fund. Expenditures must be approved by the respective agencies composed of the City Commission plus two members appointed by the City Commission. These component units (separate reporting entities) are financially accountable to the City.
Police Forfeiture Fund– accounts for funds associated with Municipal and Federal Seizures. Police Education Receipts Fund– accounts for funds created by Criminal Justice Education Funding. Discretionary Sales Tax Fund– accounts for income associated with the discretionary local government infrastructure sales surtax (LOOP) for the purposes of funding Infrastructure. Gas Tax Fund– accounts for income associated with Ninth-cent Fuel Tax, Local Option Fuel Tax and Revenue Sharing Gas Tax which are restricted for specific uses. Police Impact Fees Fund– accounts for the Municipal Impact Fees collected on land developed within the City for the provision of Municipal Services Capital Facilities related to police services due to new development. Fire Impact Fees Fund- accounts for the Municipal Impact Fees collected on land developed within the City for the provision of Municipal Services Capital Facilities related to fire services due to new development.

Fiscal Year 2021 - 22 Annual Budget
25
Government
Structure
Recreation Impact Fees Fund– accounts for the Municipal Impact Fees collected on land developed within the City for the provision of Municipal Services Capital Facilities related to recreation services due to new development. Building Permits Fund– accounts for fees collected on building development within the City. Housing Assistance Fund– accounts for grants and fees associated with providing affordable housing within the City. Internal Service Funds - accounts for the financing of goods and services provided by one department to other departments of the governmental unit on a cost-reimbursement basis. Two funds included in this type are: Health Insurance Fund - accounts for the costs of providing major medical coverage to all eligible City employees, qualified dependents and retirees.
Workers’ Compensation Insurance Fund - accounts for the costs of providing workers’ compensation coverage to all eligible City employees. Risk Management Fund - accounts for the costs of liability, property/casualty, auto, public official and employment practices insurance. Fleet Services Fund– accounts for the costs of leasing and maintaining City vehicles. Other Governmental Funds: Debt Service Funds - accounts for the accumulation of resources for, and the payment of, general long-term debt principal and interest. Fiduciary Funds: Pension Trust Funds - accounts for the activities of the assets held by the City in a trustee capacity for public employee retirement systems. The City maintains the following three funds which accumulate resources for pension benefit payments to qualified retiring employees:
Police Pension Trust Fund - This defined benefit plan was created pursuant to Chapter 185, Florida Statutes. Resources are contributed by the participating employees and the State of Florida. Members of the Police Pension Trust Fund are also members of the General Employees Pension Trust.
Firemen’s Pension Trust Fund - This defined benefit plan was created pursuant to the provisions of Chapter 175, Florida Statutes. Resources are contributed by the City, participating employees and the State of Florida.
General Employees Pension Trust Fund – This defined benefit plan provides pension benefits to eligible full time employees, except commissioners and firefighters. Resources are contributed by the City. The General Employees Pension Trust Fund was frozen as of September 30, 2008.
MUNICIPAL SERVICES
The City provides a traditional mix of general government services including police and fire protection, library, construction and maintenance of streets and infrastructure, storm water drainage, recreational activities, cultural events, planning, zoning, housing and administrative services. In addition to general government activities, the City also provides a full range of utility services, including Electric, Natural Gas, Solid Waste, Water, Wastewater treatment and Stormwater. Detail about each system is found in their respective section of the budget.

Fiscal Year 2021 - 22 Annual Budget
26
Government
Structure
The rates charged for the use of all the utility systems are reasonably comparable to rates charged by similar utilities. The rates of the Electric system are established by ordinance of the City Commission. The current rate structure of the City (as opposed to the actual rates) is reviewed by the Public Service Commission (PSC). Rates for the use of the Natural Gas, Water, Wastewater and Solid Waste utilities are established by ordinance of the City Commission and are not regulated by any other agency. The City has an active maintenance program and considers all systems to be in good condition. The following table reflects the customer distributions of the various utility systems when compared to the population and area in square miles of Leesburg totaling 24,539 and 43.00 respectively:
Residential Commercial Municipal Total Area Square
System Established Customers Customers Customers Customers Miles
Electric 1921 22,672 2,947 254 24,203 55.0
Gas 1959 12,164 424 40 12,628 180.0
Water 1928 21,826 2,157 220 23,189 87.5
Wastewater 1931 15,449 1,636 38 17,123 87.5
Solid Waste 1925 8,617 1,418 40 10,075 43
Stormwater 1991 11,463 1,687 54 13,204 38.4
0
5,000
10,000
15,000
20,000
25,000
30,000
Customers by System
Municipal
Commercial
Residential

This page intentionally left blank
Fiscal Year 2021 - 22 Annual Budget
27

Fiscal Year 2021 - 22 Annual Budget
28
Financial
Planning
SHORT TERM
The priorities of the current budget have been discussed in the budget message. A balanced budget has been adopted by the Commission, which includes an appropriation of fund balance in the General Fund, Housing Assistance, Police Forfeiture, Police Education Receipts, Police Impact Fees, Fire Impact Fees, Recreation Impact Fees, Building Permits, Electric, Water, Wastewater, Solid Waste, Airport and Fleet Services Funds. The City has adjusted the economically driven revenues back to pre COVID-19 estimates. Revenues which are tied to sales seem to have also recovered. Currently, property values have continued to increase which directly impacts Ad Valorem Revenue collections in the General Fund and each of the City’s three CRA’s. Ad Valorem revenue proceeds are projected to increase by approximately $312,234 in total. During the downturn in the economy, the property values in the Hwy 441/27 CRA fell below the base year taxable property values that were used to establish the base measuring the incremental property values. In fiscal year 2015-16, the City was able to re-base the Hwy 441/27 CRA. This allowed the floor to be lowered to 2015 property values. The City of Leesburg was only the second City in the state to accomplish this. This change will also allow the City to restructure existing debt and reduce any General Fund impact. Short term financial planning always includes a revenue analysis in the utilities to determine if rates are sufficient to meet the operational needs of the system. The City received a 20 year extension of its Consumptive Use Permit (CUP) from the St. Johns Water Management District. Included in the CUP were certain conditions that will need to be supported by new ordinances and rate adjustments. Additionally, Electric, Gas, Water and Wastewater conducted rate studies. These studies allowed the utilities to analyze what their maintenance and capital needs will be going forward and adjust the rate structure if needed in upcoming years. Every effort has been made to maximize the use of grants for general government capital projects, especially the airport, which are 95% funded by State and Federal grants. In addition, grants are sought to meet a variety of needs within recreation and public safety. General government capital spending and improvements are increasing as the City continues major projects such as constructing a Teen Center, continuing work on the Leesburg Aquatic center (which is expected to open in Winter 2022) and improvements to the Downtown corridor. Other projects in the adopted budget include replacement of existing equipment or refurbishment of existing assets. Replacement of existing equipment is closely monitored and performed at the end of its useful life before failure due to fatigue or obsolescence. Grants and other sources are sought for airport maintenance and upkeep. Fleet purchases and maintenance are made through the Fleet Services Fund. Costs associated with Fleet Services are funded through service contracts with those utilizing Fleet assets. Capital assets purchased and placed in service by the City’s enterprise funds are maintained through renewal and replacement funds set aside in restricted cash accounts within the respective enterprise operation. Conversely, the City is preparing for growth in the 470 area and is nearing completion on Phase I to expand the Turnpike Wastewater Plant. Additionally, the Electric department is working on two major reconductoring lines servicing south Leesburg and the Villages expansion.
LONG TERM
The vision & mission statements along with the goals adopted by the City Commission drive the long-term planning process. The mission statement is truly the leading factor which is “To provide effective and efficient municipal services that promote public safety, economic growth and quality of life”. One of the goals; Goal #5 Foster an environment where local governance is collaborative, transparent and fiscally sound, shows the commitment of the City Commission and City Manager to the proper use of fiscal resources addressing current operations and community needs.

Fiscal Year 2021 - 22 Annual Budget
29
Financial
Planning
Planning for growth is an ongoing challenge, as the City expects a population growth of 24,000 to 40,000 over the next 15 years. The City developed an annexation policy to keep growth diversified. In an effort to continue to make growth pay its appropriate cost of additional infrastructure, the City adopted an impact fee for police, fire and recreation. To promote redevelopment, the City Commission approved waiving impact fees for downtown redevelopment and for buildings that have not been occupied for a minimum of six months. The City also collects a library county impact fee and applies for additional resources to meet current and ongoing needs. The 5-year Capital Improvement Plan was developed to maximize the “pay as you go” approach while recognizing the benefit of financing. Utility improvements and replacements are scheduled and completed with consideration of the street paving work plan. The plan includes detailed explanations regarding development of revenue projections and assumptions regarding the capital needs. Interdepartmental coordination is vital to the success of developing an accurate Capital forecast. The City typically extends services beyond what is presently needed based on a calculation to recoup the initial investment within a 5-7 year period. Additional long range planning for the following utilities is listed below:
Electric – The department consistently evaluates the costs of outsourcing specific activities. Currently, there is an Electric distribution contactor working on a reconductoring and feeder extension project on CR 468 and the substation team frequently uses contract labor to augment their construction workforce. Past trending, growth projections, outputs from on Contingency Analysis and developer’s input are used to create the 5-year Capital Plan. The Capital Plan incorporates reconductoring, area improvements and feeder extensions as well as new residential, subdivisions and commercial construction projects. During the next fiscal year we will be deploying new S&C Trip Saver devices to help isolate permanent outages to smaller areas without interrupting services to the rest of our customers. These types of changes coupled with out continuing design and construction practices ensures that a safe, reliable and affordable electric distribution system is in place to meet the needs of our customers. The Electric department has a 10 year capital plan for replacing equipment in the field. This plan is based on age, condition and load of the equipment. Current loading and future load forecasts are used as well to design the plan. All new construction is designed based on the National Electrical Safety Code (NESC) requirements, which includes “storm hardening” of the system. The current system is approximately 70% underground. The long range plans look at both costs and performance of both overhead and underground facilities. Automation of field devices is part of the 10 year plan to help mitigate outages for customers.
Gas – With the approval of Section 25-501 of the City Code of Ordinances in April of 2006, Natural Gas is required in all new subdivisions within the city limits. In addition, the cost of infrastructure is to be borne by the developer. Implementation of this ordinance has significantly reduce future capital outlay. Currently, the Gas department is working on numerous developments throughout Leesburg as the City continues to expand.
Water & Wastewater – Aging infrastructure and capacity issues continue to be a
priority for both utilities. Future utility expansion and recapitalization will be based on the five-year utility Master Plan and growth forecast models. The Water Utility is evaluating long-term capacity solutions for increased water consumption driven by population growth and in accordance with the SJRWMD Regional Water Supply Plan. The last three budgets have include funding to expand the Turnpike Wastewater Plant to accommodate the increased growth in the Southern Sewer Shed and future expansion will meet sewer demand forecasts through 2035.
Solid Waste – The Solid Waste Division has a long term disposal agreement with
Covanta Lake II, Inc. a waste to energy facility that produces electricity by burning municipal solid waste. The five year agreement included an option to extend the contract for three additional five year terms. The negotiated disposal fee is considerably less than the fees associated with alternative disposal options and

Fiscal Year 2021 - 22 Annual Budget
30
represents a significant savings in operating expenses for the duration of the contract. The utility will continue to replace semi-automated residential side loading trucks with larger, fully automated trucks and will increase resources as necessary to fulfill the workload requirements. The utility is strong enough to transfer cash reserves, if necessary, for Capital Projects. Information and technology (IT) is an important part of the City’s operations, thus long term financial planning includes preparing to replace computers as they become obsolete. The IT department owns all computer equipment, including desktop computers, laptops, copiers and printers and recovers the cost of equipment from departments based on a five year lease period. The Fleet Services Fund owns and leases all City vehicles and charges departments a lease fee based on the useful life of the equipment. The City maintains a vehicle replacement plan for all City-owned vehicles and updates it annually. Planning for future vehicle purchases is the joint responsibility of the Fleet Services Fund and leasing department. Although not included in this budget, some future financial challenges to the City include:
▪ Economic Development
▪ Customer Service Excellence
▪ Recreational Programs and Facilities
▪ Reasonable Utility Rates
▪ Diversified General Fund Revenues Each year the short-term and long-term goals are evaluated to ensure the long range plan is as accurate as possible.
Financial
Planning

Fiscal Year 2021 - 22 Annual Budget
31
Budget
Preparation
Process
Budget Preparation Process
The fiscal year 2021-22 budget adoption process began at the February 8, 2021, regular City Commission meeting when the Commission adopted the budget calendar.
CAPITAL IMPROVEMENT PLAN
The City added a valuable element to the budget planning process regarding the Capital Improvement Plan (CIP). The capital improvement budget requires interdepartmental coordination between the utilities and public works in planning service upgrades in conjunction with street resurfacing. Each year departments submitted their CIP’s to the Budget Manager with their regular budget submission on April 5, 2021. In addition to the CIP, department directors were required to provide a detailed description on each capital project request form, as well as the reasonably quantifiable additional costs and savings (direct or indirect) or other service impacts that would result from the capital purchase. This information further explains the: • Direct benefit of the improvement to the City • Impact on maintenance and operational costs • Direct or indirect effect on revenue The CIP documents were reviewed by the City Manager and the departments during the fiscal year 2021-22 budget review. The CIP will be adopted subsequent to the budget. Although departments were challenged to use only the amounts included in the 5-year CIP, certain adjustments were necessary. The 2021-22 capital requests were presented by the departments to the Commission during the budget workshops held in July. Capital requests for fiscal year 2021-22 were adopted on September 27, 2021.
CITY COMMISSION VISION, MISSION AND ORGANIZATIONAL GOALS
In 2018 the Vision, Mission and Organizational Goals were reestablished. This document includes the Vision, Mission and Organizational Goals which were adopted with the adoption of the 2018-19 budget. In the adopted Vision Statement, “A diverse community energetically working in collaboration to ensure that the City of Leesburg upholds its history, ambiance and natural resources to become and stay a vibrant community,” The Mission statement complements the Vision Statement as follows: To provide effective and efficient municipal services that promote public safety, economic growth and quality of life. The following are the goals which drive the vision and mission for the City:
Goal #1 Eliminate blight and stimulate growth by investing in neighborhood redevelopment,
while also pursuing new economic opportunities Goal #2 Lead the industry in providing high quality, low cost, customer driven utility
services Goal #3 Deliver the highest level of professional public safety service that ensures security
for Leesburg’s residents and businesses Goal #4 Utilize Leesburg’s natural resources and slogan as the “Lakefront City” to
enhance recreational and leisure amenities Goal #5 Foster an environment where local governance is collaborative, transparent and
fiscally sound

Fiscal Year 2021 - 22 Annual Budget
32
Budget
Preparation
Process
BASIS OF BUDGETING
Budgets for governmental funds are adopted using the modified accrual basis of accounting. Revenues are recognized when they become measurable and available. Expenditures are recognized in the period in which the fund liability is incurred (except matured interest on general long-term debt, which is recognized when due). While budgets for the proprietary fund types are not required by generally accepted accounting principles (GAAP) or by state or local law, they are adopted using the modified accrual basis of accounting to provide for comparability with the other funds. Actual expenses for the utility funds are recorded on the full accrual basis, while other funds are reported on the modified accrual basis. Comparing a budget prepared on the cash basis to actual expenses recorded on the accrual basis can be misleading in a budget document. When comparing fiscal year 2020-21 actual expense to fiscal year 2021-22 adopted budget, the following three items are presented on a different basis:
• Capital project expenses: Capital projects in the enterprise funds are budgeted on a cash basis, and the actual expenses are zero because they are recorded as assets on the balance sheet.
• Debt service: Debt service expenses, related to principal payments are budgeted in the fiscal year in which they occur; yet they are recorded as a reduction to a liability account.
• Reserve for future capital: Reserves that are budgeted may not be expended in that fiscal year but are appropriated (set aside) for future capital improvements.
To put this in perspective, the actual expenses for fiscal year, when compared to the cash budget versus the accrual budget produce the following results:
Department
Goal #1
Goal #2
Goal #3
Goal #4
Goal #5
City Commission X
Administration X
Finance X X X
Human Resources X
Information Technology X
Geographic Information Systems X
Police X Fire X
Public Works X X X
Community Development X X
Housing X X
Library X X
Recreation & Parks X X Carver Heights CRA X X
Electric X Gas X Water X Wastewater X
Solid Waste X
Airport X X
Stormwater X
Actual Expenses 2020-21
Adopted Budget 2021-22
Average Annual Change
Cash Basis $160,793,107 $176,643,255 9.86
Accrual Basis $160,793,107 $151,583,785 5.73
Although these goals are the ultimate responsibility of all departments, the following list demonstrates which are specifically assigned to a department:

Fiscal Year 2021 - 22 Annual Budget
33
Budget
Preparation
Process
The graph below depicts the difference between recording actual expenses compared to the budget as presented:
Departmental Budget Meeting
To kick off the budget process the core vision and mission statement along with the goals are reviewed. As stated in Goal #5 the City strives to foster an environment where local governance is collaborative, transparent and fiscally sound. Additionally, the City strives to achieve excellence in customer service in every aspect of City operations. These key initiatives along with the other goals set the framework for the budget process. A copy of the budget calendar, procedures manual, forms and budget entry instructions are available to help departments with the budget process. During the budget process, emphasis is placed on departments to: • Use the instruction manual and formats that are provided • Submit requests in a timely manner • Be consistent with capital project titles • Provide accurate documentation and justification of needs • Request computer equipment through the IT Department • Request vehicles and heavy equipment through the Fleet Services Division
Budget Preparation
Individual departments are responsible for the original entry of operating expenses, capital outlay budget information and associated expense detail into the budgetary data base. The Budget Manager after reviewing personnel requests with Human Resources and the City Manager produced the budget for the personal services category. Other information was transmitted to the budget office via computer using a common directory in Microsoft Word or Excel format and was subsequently merged into one document. Following the submission deadlines, departments were prevented from making any changes to the proposed budget.
Review
The Budget Manager compiled all the budget information, assisted each department in completing their goals/tasks and major accomplishments and utilized information from IT, Fleet Services and Accounting Divisions to formulate accurate budget requests and capital project detail expenditures. The City Manager, Finance Director, and Budget Manager met with department representatives to review budget requests. Revisions were made as necessary and included in the proposed budget document presented to the City Commission.
$0
$50,000,000
$100,000,000
$150,000,000
$200,000,000
2018-19 2019-20 2020-21 2020-22
Fiscal Year
Compare Actual to Budget
Actual Expenses
Adopted Budget

Fiscal Year 2021 - 22 Annual Budget
34
Budget
Preparation
Process
Approval
Pursuant to Florida law, two public hearings are required prior to the adoption of a millage rate and budget. At the conclusion of the first Public Hearing held on Thursday, September 16, 2021, the City Commission adopted a resolution to tentatively adopt the millage rate, and another resolution to tentatively adopt the budget. At the first final hearing on September 27, 2021, the City Commission approved a resolution to adopt the final millage rate and a resolution to adopt the 2021-22 annual budget. Once approved, the budget becomes the basis for operations and capital expenses during the ensuing fiscal year.
Budget Process
Since the City of Leesburg has automated the input and correspondence portion of the process, departments can review a budget preparation manual which provides guidance on where to find the following items:
• Budget calendar
• Budget checklist
• Common directory and location address for all forms and worksheets that are available between the departments and the budget office
• Budget entry instructions for access to the budgeting software to input budget requests The draft budget was available on the intranet for City departments and on the City website (internet) for citizens to review. The chart below summarizes the budget process.
City Commissionsets parameters
Departments submit
personnel requests
Budget Manager distributes budget
package instructions
Departments submit goals, tasks & major
accomplishments
City Manager approves requests
Budget Manager reviews requests
Departments submit budget
requests
City Manager approves goals and objectives
City Commission receives proposed
budget
City Commission conducts budget work sessions
City Commission establishes
maximum millage rate
Citizens receive notices of
proposed property taxes
Budget document is compiled
City Manager notifies property
appraiser
City Commission approves budget
at Final Public Hearing
City Commission conducts 1st Public
Hearing

Fiscal Year 2021 - 22 Annual Budget
35
Budget Calendar at a Glance
Phase I – Planning January – February
• City Commission adopts budget calendar and establishes Citywide core values
• City Commission prioritizes capital projects for 5-year Capital Improvement Plan
Phase II – Department Preparation March - April
• Departments submit requests for personnel, reclassifications and promotions
• Human Resources Department evaluates job descriptions, pay grades and salary ranges
• Budget Manager distributes forms and information to departments regarding budget requests
• Departments submit values, goals and updated performance measures
Phase III – City Manager Budget Review May - June
• Budget Manager and City Manager meet to review values, goals and department requests
Phase IV – City Commission Budget Review July
• Under the direction of the City Manager, the Budget Manager finalizes the budget document that will be presented to the City Commission in July
• Property Appraiser submits estimate of current year total assessed values
• City Commission conducts budget workshops and approves changes, which are recapped and approved at the final budget session
• City Commission approves proposed millage rate August
• City notifies Property Appraiser of proposed millage rate and date, time and place of the first budget adoption hearing
Phase V – Final Review and Budget Adoption September
• Finance Director presents tentative Citywide and Community Redevelopment Agency budgets
• Budget Manager finalizes budget document and prepares for budget adoption
• City Commission tentatively adopts budget and millage rate
• City advertises Public Hearing and notice of property tax increase, if applicable
• City Commission conducts final hearing to adopt the budget
• City notifies Property Appraiser and files TRIM compliance

Fiscal Year 2021 - 22 Annual Budget
36
Budget Calendar
2021 Date,
Day
Responsible
Party
Required
Activity
Requirement
Reference
February 8,
Monday City Commission
Adopt budget calendar for the fiscal year 2021-22
budget
March 31,
Wednesday Department Directors
Deadline for submission to the Budget Manager
of Utility Revenue Projections for fiscal year 2021-
22
April 5,
Monday Department Directors
Deadline for submission to the Budget Manager
of budget requests for fiscal year 2021-22
April 26-May 21,
Monday- Friday City Manager
Meet with governmental fund departments to
discuss fiscal year 2021-22 budget requests,
including goals and tasks
May 24-June 4,
Monday-Friday City Manager
Meet with Utility funds to discuss fiscal year 2021-
22 budget requests, including goals and tasks
On or before June 1,
Tuesday Property Appraiser
Provide an estimate of 2021 total assessed values
of nonexempt property for budget planning
purposes
Section 200.065 (7),
Florida Statutes
June 14,
Monday Budget Manager
Present the draft budget for fiscal year 2021-22
to the City Manager for review and analysis
June 25,
Friday City Manager
Present the draft budget for fiscal year 2021-22
to the City Commission for review and analysis
Section 200.065 (2)(a)2,
Florida Statutes, Section
28, Leesburg City Charter
June 28,
Monday City Commission
Adopt Preliminary Fire Assessment Resolution for
fiscal year 2021-22
Section 197.3632, Florida
Statutes
On or before July 1,
Thursday Property Appraiser
Submit 2021 certified taxable values to the City
Commission
Section 193.023 (1),
Florida Statutes, Section
200.065 (1), Florida
Statutes
July 6 & 8,
Tuesday & Thursday City Commission
Conduct budget/capital improvement work
session regarding the proposed budget for fiscal
year 2021-22
July 12,
Monday City Commission
Establish the maximum millage rate for fiscal year
2021-22
July 13,
Tuesday City Commission
Conduct budget/capital improvement work
session regarding the proposed budget for fiscal
year 2021-22
On or before August 2,
Monday City Commission
Notify the Property Appraiser of:
1. The Proposed millage rate for 2021;
2. The rolled back millage rate for 2021;
3. The date, time and place of the public hearings
to consider the proposed millage rates and
tentative budgets
Section 200.065 (2)(b),
Florida Statutes
CITY OF LEESBURG, FLORIDA
BUDGET CALENDAR
FISCAL YEAR 2021-22

Fiscal Year 2021 - 22 Annual Budget
37
Budget Calendar (Continued)
2021 Date,
Day
Responsible
Party
Required
Activity
Requirement
Reference
On or before August 23,
Monday
Finance Director/
City Clerk
Advertise public hearing to adopt the Final Fire
Assessment Resolution for 2021-22
Section 197.3632,
Florida Statutes
On or before August 24,
Tuesday Property Appraiser
Mail notices of proposed property taxes for 2021
to each taxpayer listed on the current year
assessment roll
Section 200.065 (2)(b),
Florida Statutes, Section
200.069, Florida Statutes
September 13,
Monday City Commission
Conduct public hearing to adopt Annual Fire
Assessment Resolution for fiscal year 2021-22
Section 197.3632,
Florida Statutes
September 16,
Thursday CRA Board
Establish budgets for Community Redevelopment
Agencies
September 16,
Thursday City Commission
Conduct public hearings to consider adoption of
the tentative millage rate for fiscal year 2021-22.
All hearings must begin after 5:00 P.M.
Section 166.241 (3),
Florida Statutes,
Section 200.065 (2)(c)-(e),
Florida Statutes
September 23,
Thursday
Finance Director/
City Clerk
Advertise public hearings to consider final
adoption of the budgets, increases in property
taxes and operating expenditures (if applicable),
and adoption of millage rate for fiscal year 2021-
22
Section 200.065 (2)(d),
Florida Statutes,
Sections 200.065
(3),(a),(b) and (h)-(l),
Florida Statutes
September 27,
Monday City Commission
Conduct public hearings to consider final
adoption of the budget/capital improvement
plan, and millage rate for fiscal year 2021-22. All
hearings must be after 5:00 P.M.
Section 166.241 (3),
Florida Statutes,
Section 200.065 (2)(d), (e),
Florida Statutes
September 28,
Tuesday City Commission
Certify to the Property Appraiser the adopted
millage rate for fiscal year 2021-22.
Section 200.065 (4),
Florida Statutes
December Budget Manager Begin Distribution of final budget documents
FISCAL YEAR 2021-22
CITY OF LEESBURG, FLORIDA
BUDGET CALENDAR

This page intentionally left blank
Fiscal Year 2021 - 22 Annual Budget
38

Fiscal Year 2021 - 22 Annual Budget
39
Significant
Policies
Significant Policies
Budget
On September 28, 1998, the City Commission adopted Resolution 5535, which established a formal budget policy for the City of Leesburg. The policy embellishes the budget guidance previously available in the City Charter, as well as that provided in Florida Statutes Chapters 166 and 200. The City follows these procedures in adopting the budget:
• The City Manager submits a proposed budget to the City Commission for the upcoming fiscal year
• Public Hearings are held to obtain citizen input • The budget is adopted by resolution prior to October 1 of each fiscal year • The budget may be amended to reflect changes in available resources and appropriations • Departments are authorized to spend within the major categories; however, changes to
the adopted appropriations between major categories require approval from the City Manager. Major categories are defined as personal services, operating expenses, capital outlay, debt service, grants and aids and other uses
• The City Manager is authorized to amend the budget for any department, provided the total amount appropriated for the affected fund does not change
• The City Commission, through the adoption of a resolution, must approve amendments that result in a change to the total amount appropriated within the fund
• The City Manager is authorized to expend beyond budget limits in emergency situations and notify the City Commission at the next meeting. Budget amendments incorporating this action will be processed and approved by the City Commission, as necessary
• Unexpended balances of appropriations lapse at year-end unless funds are carried forward
Budget Adjustment Process
When circumstances change the funding needs, the department head will request a budget amendment. The department head is authorized to approve changes of expenditures between line items within a category and from one division to another within the respective department.
The City Manager may amend appropriations in any fund, provided that the total appropriation of the fund is not changed and does not alter a department’s work program. The City Manager can also approve the following: • Additional funding required for an item approved based on an estimated cost • New items necessary for the operation of the department • Capital substitution or changes with no fiscal impact • Appropriations from reserve to increase an appropriation in the same fund for any lawful purpose The Finance Department can adjust a line item that is approved within the budget, if money is appropriated to the incorrect classification of accounts established under the State Uniform Chart of Accounts. The steps necessary to complete the amendment process are illustrated on the following flow chart.
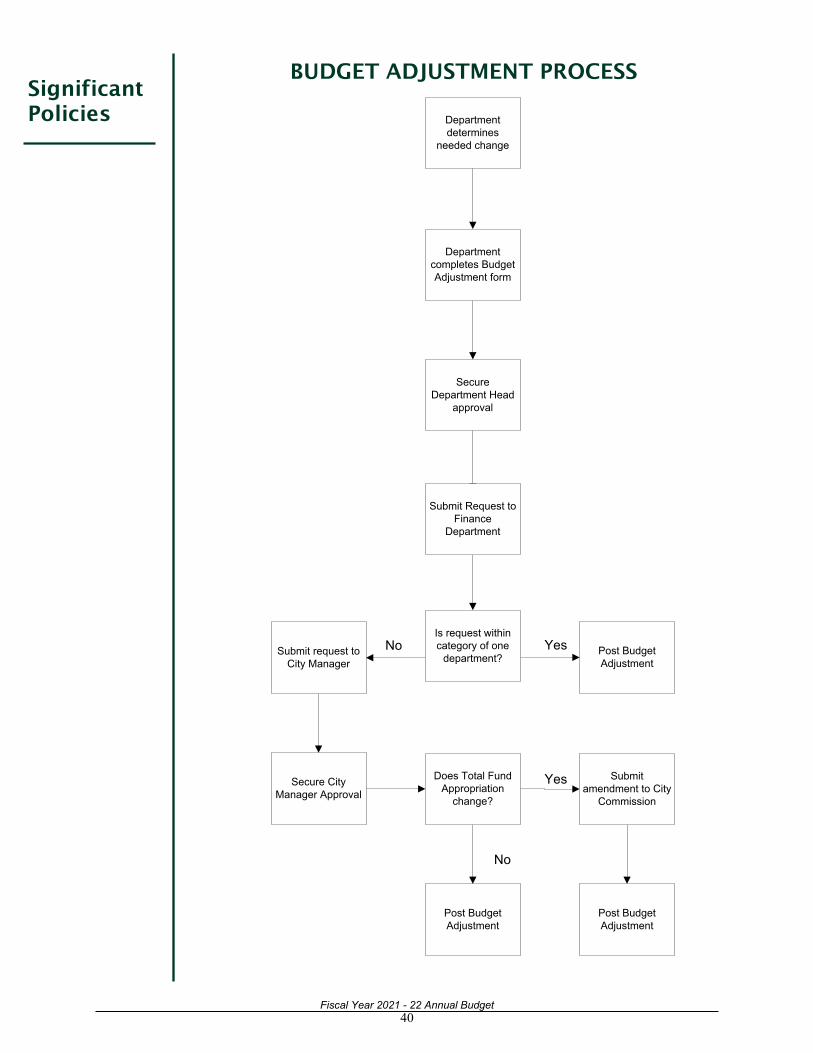
Fiscal Year 2021 - 22 Annual Budget
40
Significant
Policies
BUDGET ADJUSTMENT PROCESS
Department
determines
needed change
Secure
Department Head
approval
Post Budget
Adjustment
Secure City
Manager Approval
Post Budget
Adjustment
Post Budget
Adjustment
No Yes
Yes
No
Department
completes Budget
Adjustment form
Submit Request to
Finance
Department
Submit request to
City Manager
Is request within
category of one
department?
Does Total Fund
Appropriation
change?
Submit
amendment to City
Commission

Fiscal Year 2021 - 22 Annual Budget
41
Significant
Policies
Cash Policy
• All cash, checks, money orders and cashier’s checks are receipted on the date received and forwarded to the bank for deposit
• All checks, money orders, etc. are endorsed with the City’s endorsement stamp upon receipt
• Daily cash reports must be presented to the Finance Department
• Cash drawers in all locations are counted and balanced daily
• Cash received at remote locations is forwarded to the collection’s department daily
• Receipts are validated and submitted to Accounting for verification
• Cash collection entries are recorded in the appropriate computer application
• A receipt is provided to every customer
• The Collections Department verifies all transactions and posts information to the system prior to making the bank deposit
Identity Theft Prevention Policy
The Fair and Accurate Credit Transaction Act (FACTA) of 2003 mandated utility service providers to develop and implement an Identity Theft Program to identify, mitigate and prevent identity theft. The program will identify “RED flags” which include pattern, practice, or specific activity that indicates possible existence of identity theft. On April 13, 2009 the City Commission approved the FACTA program and Implementation which went into effect on May 1, 2009.
Deposit Policy
On April 27, 2009 the City Commission approved ordinance 09-19 amending sections 22-181 of the Code of Ordinances pertaining to utility deposits and section 22-263 pertaining to nonpayment of utility bills. On September 24, 2009 the City Commission approved ordinance 09-50 which made some changes to the April 27, 2009 ordinance. Additionally, on October 13, 2014 the City Commission approved an amendment to section 22-181 creating a new residential utility deposit policy. The policy reduced residential deposit amounts and established flat deposit fees, allowed deposits to be returned to customers after 24 months if they have a good credit history, waived deposits to customers if they sign up for 12 months of auto pay and granted the ability to provide waivers of deposits for customers with two accounts. Implementation of these changes could have an increase in receivables and bad debt.
Investment Policy
The investment policy was amended and approved by City Commission on August 12, 2013. Resolution 9244 replaced all prior resolutions. The Investment Policy includes updates from Florida Statutes 163, 218.415 and 280. Florida Statute 163, Intergovernmental Programs, provides guidance with respect to Local Government Investment Pools (LGIP’s). Florida Statute 218.415, Financial Matters pertaining to Political Subdivisions, provides guidance to local governments regarding investment policies. Florida Statute chapter 280, Security for Public Deposits, provides definitions and guidance with respect to public deposits. Subsequent changes in these policies since the last update have been incorporated into the new policy. Staff also reviewed the Government Finance Officers Association (GFOA) best practices for guidance. The revised policy also incorporated the addition of high quality corporate notes and municipal securities, while refining the diversification criteria and a few other suggestions. The policy includes a continuing education requirement of a minimum of eight hours per year for the Finance Director or his designee, The policy in all respects provides for the highest standards of integrity and ethical conduct and reinforces the highest priority of the safety of principal and liquidity of funds. Optimization of investment returns is considered secondary to the requirements of safety and liquidity.

Fiscal Year 2021 - 22 Annual Budget
42
Significant
Policies
Authorized Investments and Diversification Percent of Portfolio U.S. Treasury Obligations (Bills, Notes, Bonds) 100% U.S. Government Agency Securities and Instrumentalities of Government Sponsored Corporations 80% U.S. Government Securities 50% Bankers Acceptances 25% Repurchase Agreements 50% Certificates of Deposit (CD’s) 30% Local Government Investment Pools (LGIP) 15% Money Market Mutual Funds 50% State and/or Local Government Taxable and/or Taxable Debt 20% Commercial Paper 35% Corporate Notes 20% Short-term Bond Funds 25%
Responsibility
The Finance Director is responsible for the implementation of the investment policy. Risk Avoidance
• Minimize the risk of unreturned principal and interest through short term and conservative investments
• Require delivery vs. payment.
Investment Techniques
Future levels of interest rates are impossible to predict with any certainty. Therefore, Finance Department staff examines market prices daily and studies trends to enable them to make prudent investment decisions. Funds are invested in accordance with the Investment Policy utilizing short-term maturities (over-night repurchase agreements) to 5 year maturities, which is the maximum maturity allowed by the policy. In addition, the City has contracted with Davidson Fixed Income Management (DFIM) and Chandler Investments to assist with investment strategy. On March 14, 1986, the City Commission adopted Resolution 4128 to execute a Master Repurchase Agreement with SunTrust Bank, NA to invest funds held in the City’s bank account. Idle funds are invested overnight and on weekends.
Cash Reserve Policy
On July 23, 2007, the City Commission adopted ordinances 07-80, 07-81 and 07-82 substantially changing the Fund Balance Policy, Utility Fund Transfer Policy and the Special Transfer Policy. The Fund Balance Policy was changed to clearly define terminology used in the policy and to tailor to the particular needs of the City with respect to each Fund in order to maintain adequate reserves and capacity to:
• Provide sufficient cash flow for daily financial needs
• Secure and maintain investment grade bond ratings
• Offset significant economic downturns or revenue shortfalls
• Provide funds for unforeseen expenditures related to emergencies
Creation of Reserves– Ordinance 07-80 (see pages 516-519 for a actual graphs)
The reservation of cash reserves is in addition to all other reserves or designations of fund balance and is created by fund type, as follows:
• General Fund – 20% of the current fiscal year budget
• Special Revenue Funds – none
• Debt Service Fund – as required by bond covenants
• Capital Projects Fund – none

Fiscal Year 2021 - 22 Annual Budget
43
Significant
Policies
• Enterprise Funds – -Electric Utility- (Total Revenues– Cost of Purchased Power + Operating Transfers to the General Fund + Revenue Surcharge Transfers)/ 365 days X 120 days -Gas Utility- (Total Revenues– Cost of Purchased Gas + Operating Transfers to the General Fund + Revenue Surcharge Transfers)/ 365 days X 90 days -Water, Wastewater, Communications and Solid Waste– 25% of current fiscal year budget
• Internal Service Funds – greater than or equal to zero (break even)
Utility Transfer Policy
The City assumes all financial risk associated with operating each utility, with the goal of providing superior service at the lowest possible cost. The City Commission adopted ordinance 07-81 on July 14, 2007 which established a policy to accomplish this goal and provide additional financial support to general government functions. On June 23, 2014 the City Commission adopted ordinance 14-20 amending the Utility Transfer Policy. The Utility Fund Transfer Policy describes transfers of funds from all six Utility Funds: Electric, Natural Gas, Water, Wastewater, Communications, and Solid Waste. The ambiguity of the previous policy allowed for transfers much larger than fiscally prudent. The ordinance provides the following guidance:
• Shall not exceed 10% of the estimated operating revenues excluding utility surcharge fees included in the adopted budget for that fund
• Ten percent (10%) limit excludes franchise fees imposed by the City against itself paid to other jurisdictions Calculation of utility transfer- The latest fiscal year audited charges for services (from the CAFR Statement of Activities) Less:
• Franchise Fees imposed by the City against itself
• Regulatory Assessment Fees
• Franchise Fees paid to other jurisdictions
• Gross Receipts Taxes paid to the State of Florida
• Surcharge Revenues on Electric, Gas, and Water Remaining revenue is then multiplied against the respective dividend applicable to the utility.
Special Transfer Policy
The definition of Special Projects Transfer is the transfer of cash from an enterprise fund to fund the costs of non-enterprise fund expenditures. The purpose of this policy is to provide adequate oversight to special transfers. Special transfers are subject to the following:
• A five year impact on cash flows taking into consideration the results of all financial activities
• Determination of excess cash and sustainability of cash reserve after transfer is made Replenishment of Reserve Deficits If a reserve amount falls below the required levels, the City Manager shall submit a plan to replenish any deficit reserve by the end of the second fiscal year following its occurrence.

Fiscal Year 2021 - 22 Annual Budget
44
GENERAL FUND 2018-19 2019-20 2020-21 2021-22
Total Adopted Budget $26,873,816 $30,543,123 $27,189,358 $28,528,392
Beginning Fund Balance 11,749,735 11,198,492 12,144,461 13,560,778
Ending Fund Balance * 11,198,492 12,537,191 13,560,778 12,604,778
Percentage of Ending Fund Balance to Total Budget
41.7%
41.1%
49.9%
44.2%
Fund Balance Appropriated $0 $0 $0 $956,000
* The ending fund balance for fiscal years 2020-21 and 2021-22 are projected based on estimated revenues and will be adjusted during the year after the audit has been completed.
Significant
Policies
Annual Review A review is required as part of the annual budget adoption process. Based on the fiscal year 2021-22 adopted budget, the minimum level of cash required in the general fund is $5,705,678 (20% of $28,528,392). Direct cost allocation from the utilities, as well as payments for IT services and fleet services are recorded as a reduction to expense in the appropriate division. During the budget cycles for the years listed below, it appears that the fund balance in the general fund is healthy and improving. It is important to utilize the money available for the citizens as well as maintain a fund balance sufficient to meet the needs of the organization if an emergency arises. The general fund receives a utility transfer of 6% from Electric, and 8.75% from Water utility funds. The Wastewater utility fund contributes 8.25% and Gas and Solid Waste utility funds contribute 10%. Historically, the amount of fund balance appropriated, and its relationship to the general fund budget as a whole may be stated as follows:
Procurement Policy
On April 13, 2020, the City Commission adopted Resolution 10619 revising the purchasing limits. To facilitate daily operations and increase efficiency, the purchasing threshold categories were modified as indicated here and carry the specified signature authority: Category I & II: All Funds – Under $5,000 – Purchasing Manager
Departments are authorized to purchase items or services using a City issued procurement card in accordance with City Purchasing Policy.
Category III: All Funds - $5,000 to $10,000 – Purchasing Manager The department must obtain written quotes and submit a purchase request prior to purchase.
Category IV: All Funds - $10,000 to $25,000 – Purchasing manager The department must obtain three (3) written quotes for City Manager Approval and submit a purchase request prior to purchase.
Category V: General Fund - $25,000 to $50,000 – City Manager Proprietary Funds - $25,000 to $75,000 – City Manager
The Purchasing Department will determine the most advantageous solicitation method which may include using of a cooperative contract or issuance of an informal/solicitation.
Category VI: General Fund - $50,000 and over – City Commission Proprietary Funds - $75,000 and over – City Commission
The department must submit a purchase request prior to purchase. The Procurement Division will determine the most advantageous procurement method. The Procurement Division will seek commission approval of the award and purchase request.
.

Fiscal Year 2021 - 22 Annual Budget
45
Significant
Policies
The City Commission has adopted a Local Vendor Preference policy. The policy has a tiered percentage preference based on the location of the business for purchases over $25,000. The preference amount is capped at $25,000. The Procurement Process for formal solicitations can take anywhere from 8 to 13 weeks depending on solicitation type (IFB, RFP, RFQ) and complexity. The Procurement Division uses an e-procurement platform that has reduced the amount of time it takes to accomplish many tasks in the procurement process. All solicitations are issued electronically through the platform and all responses must be submitted electronically by the responding suppliers.
Capital Asset Policy
The original capital asset policy was adopted on August 22, 2005 by Resolution 7427. This policy was established to provide guidance, achieve consistency in recording assets and to implement controls that would prevent or promptly detect a loss of an asset. On July 27, 2009 Resolution 8492 was approved by the Commission and revised the original policy and authorized asset management and procedures. The new policy also increased the capital asset threshold from $1,000 to $5,000. Key components of the revised policy are summarized below:
Purpose
The purpose of the property asset management program is to establish responsibility for property, provide for better utilization of property, facilitate the physical inventory and to establish a framework for accountability. Definition Capital or fixed assets are defined as land, buildings, equipment, fixtures and other tangible personal property of a non-consumable and non-expendable nature, which meets the following conditions: the value or cost of an asset is $5,000 or more and has a normal life expectancy of one year or more. Attractive items such as wireless mobile devices, personal digital assistants (PDA’s), projectors, scanners, tools and printers, all digital cameras, radios, personal computers and laptops, are tracked regardless of cost. Certain capital assets of the enterprise funds are recorded as a group utilizing average unit costing. Depreciation expense is computed on the straight-line basis over the estimated useful life of the asset.
Inventory and Internal Control
The accounting division shall maintain an accurate inventory of all assets and update annually. Policies and procedures are designed to prevent misappropriation of public funds. Each department director has ultimate responsibility for their assets. Authority The Finance Director shall develop and maintain written administrative procedures to properly account for all capital assets of the City. Annual Review When preparing the 5-year capital improvement plan, revenue projections are analyzed to determine if the plan is financially sound. All capital items are described in this document. A summary of all capital purchases by fund as compared to fiscal year 2017-18 follows:

Fiscal Year 2021 - 22 Annual Budget
46
Significant
Policies
A capital improvement plan is developed each year. The plan includes capital projects, vehicles and equipment. The annual capital improvement plan discusses the impact each purchase will have on the operating budget. Capital purchases impact the operating budget in the following three areas: • New purchases – it is necessary to purchase additional capital items to function properly.
For example, upon hiring a police officer to fill a newly created position, the department would purchase another vehicle, computer and related equipment to place the officer in service
• Replacements – it is necessary to purchase additional capital items to function
efficiently. Although the City maintains and uses capital items beyond their useful life, purchases are necessary periodically due to wear and tear. Thus, purchasing new assets decreases maintenance costs and provides an indirect savings which allows staff to operate more efficiently. The utility departments replace infrastructure to maintain a safe system for the citizens. Computer systems are replaced periodically to keep pace with technology.
• Improvements – it is necessary to purchase additional capital items to expand
operations. Improvements to current assets have a clear impact on operating costs. When improvements are made the incremental costs have to be clearly identified.
Debt Policy
On June 14, 2004, the City Commission adopted Resolution 7101 establishing a debt management policy as follows:
Purpose
• Manage issuance of debt obligations • Maintain the ability to incur debt at favorable interest rates • Assure that the capital improvement program is based on cash flow needs
Authority
The City Commission Legal Debt Limits As prescribed by State Statute and at levels consistent with creditworthiness objectives. Limitations on Indebtedness The City will maintain a conservative debt position and debt will be issued only if the benefits outweigh the costs of the debt.
Fund
Adopted 2020-21
Adopted 2021-22
General $ 217,200 $ 248,200 Building Permits 95,365 -0-
Fleet Services 1,540,900 1,589,650
Stormwater 540,000 470,000
Capital Projects 600,000 1,575,000
Electric 4,372,500 5,599,200
Gas 534,001 861,259
Water 2,275,000 2,030,000
Wastewater 2,992,000 1,755,000
Airport 2,295,000 3,450,720
Solid Waste -0- 250,000
Police Impact Fees 80,000 -0-
Total $ 15,541,966 $ 17,829,029

Fiscal Year 2021 - 22 Annual Budget
47
Significant
Policies
Types of Debt Short term and interim debt can include line of credit, pooled financing, interfund and internal borrowing, commercial paper, lease-backed debt and anticipation notes. Long term debt can include general obligation and revenue bonds, master lease agreements and pooled financing. Structure • Tax-Exempt Debt – usually, but it can be taxable • Maturity – shall not exceed 30 years or the life of the benefit being financed • Bond insurance – shall be acquired • Debt Service Reserve Funds – evaluated on a case-by-case basis, utilize the best
method • Coverage Requirements – financing team determines at the time of a new bond issue • Variable-rate Securities – an acceptable option • Validation – may seek judicial validation if there is a risk of legal challenge Investment of Bond Proceeds As prescribed by existing state law, the City’s investment policy and bond covenants. Refinancing Outstanding Debt • Advance or Current Refundings – when advantageous, legally permissible and a net
present value savings is achieved • Restructuring of Debt – when existing bond covenants impinge on sound financial
management Credit Objectives Maintain or improve its bond rating of “A” or higher from one of the major rating agencies. If a minimum “A” rating cannot be met, credit enhancement shall be considered to carry a AAA rating. Bonds may be issued without a rating. Methods of Sale The City shall seek to issue debt in a negotiated sale unless the Finance Director determines it would not produce the best results. A competitive sale or private placements may be used when appropriate. Financing Team • Bond Counsel – provide advice regarding resolutions, trust indentures, official statements,
validation and litigation • Disclosure Counsel – render an opinion of validity of facts in bond documents • Underwriters – purchases securities from issuer for resale in a negotiated sale • Financial Advisor – consultant to advise issuer on structure, sizing, timing, marketing,
pricing, terms and bond ratings Market Disclosure The City will provide complete financial disclosure and continuing disclosure as required by the SEC Rule 15c2-12. Arbitrage Requirements The City will minimize the cost of arbitrage rebate and yield restriction to comply with applicable federal tax codes.

This page intentionally left blank
Fiscal Year 2021 - 22 Annual Budget
48

Fiscal Year 2021 - 22 Annual Budget
49
Budget
Summary
Budget Summary
The City adopted a balanced budget. The total estimated revenues are equal to total appropriations, which includes an appropriation from reserves and reserves for future capital. The major issues addressed in the adopted budget for fiscal year 2021-22 by fund are as follows:
General Fund
There is a $950,000 appropriation of fund balance in the General Fund. The Interfund transfers from the utilities decreased by $512,208 from the previous fiscal year. During the past fiscal year, the City annexed 242 acres. In the past 10 years, the City's boundaries increased by 2,205 acres or from 25,317 to 27,522 acres. In fiscal year 2014-15, the City and several other cities in Lake County approved Interlocal Boundary Service Area (ISBA) agreements to define annexable property and help manage future development in areas subject to annexation as the City grows. The geographic area is similar to the utility services area and provides the opportunity for the City and County to work toward coordination of services such as Police, Emergency services and managing growth. Future annexations will be encouraged to continue “infill” strategies to square up the outer boundaries and also to take advantage of the economies of scale provided by increased density. As annexed properties are developed, they will require increased levels of City services including police and fire protection. Utilities are available to some of the annexed areas; however, development of other properties will require utility extensions.
Stormwater
The Stormwater Division maintains existing ditch lines, drains, catch basins and retention/detention ponds to prevent local flooding. The operating budget reflects a continuing emphasis on restoration and cleaning of various stormwater ponds around the City and improving the quality of our waterways by removing nutrients from runoff. Capital projects are designed and executed to (1) prevent local flooding; (2) improve the quality of water discharged to local lakes; (3) reduce maintenance costs and (4) improve appearance. Projects are prioritized, planned and executed according to the Stormwater Master Plan. Capital projects for the next few years will focus on cleaning up some of the large lakes in the City. Our primary effort this year is to update our Stormwater Master Plan and execute a restoration project for Lake Hollywood. .
Community Redevelopment Agency
Pursuant to Section 163.512, Florida Statutes, the City Commission created the Greater Leesburg Community Redevelopment Agency (GLCRA) by Resolution 6994 on May 28, 1996. In compliance with the authorizing statute, tax increment financing is used to provide funding for specific capital improvements within the designated area. The base year was
$2,000,000
$4,000,000
$6,000,000
$8,000,000
2018-19 2019-20 2020-21 2020-22
Fiscal Year
Utility Contributions to General FundSolid Waste
Wastewater
Water
Gas
Electric

Fiscal Year 2021 - 22 Annual Budget
50
Budget
Summary
established in 1995 with an assessed value of $86,757,505. The GLCRA is composed of two components, Main Street and Pine Street. All sources of revenue are split equally between the two. In 2015, the GLCRA acquired a $1,000,000 bond to complete the Streetscape project from 9th Street to 14th Street. The Main Street component of the GLCRA fund balance as of September 30, 2021 will be approximately $100,000. The Community Development Corporation (CDC) was formed to assist development in the Pine Street area and later expanded their services to the Carver Heights area. The unreserved undesignated fund balance associated with the Pine Street area as of September 30, 2018 will be zero. On May 24, 2004, the Commission signed an agreement to allow the CDC to request payment of the available funds pursuant to paragraph 18 of the Consent Decree dated February 25, 1999. Therefore, expenditure of the funds will be recorded by the CDC and reported to the City. The GLCRA major projects include: implanting business development programs and rehabilitation of existing structures. The City of Leesburg created the Carver Heights and Vicinity Community Redevelopment Agency (CHCRA) on December 10, 2001 (Ordinance 01-61). The trust fund was effective for 15 years expiring on September 30, 2016 pursuant to Section 163.512 Florida Statutes. On July 13, 2015 Resolution 9630 was passed by the City Commission expanding the CRA by 327 acres for a total of 1,492 acres. In addition, the initial Redevelopment Plan was replaced by the “Carver Heights Redevelopment Plan of 2015” and extended by thirty years to 2046. The trust generates the majority of its annual income from tax increment revenues. The unreserved, undesignated fund balance associated with the Carver Heights area as of September 30, 2021 will be approximately $376,626. The City of Leesburg created Highway 441/27 Redevelopment agency on February 13, 2006 (Ordinance 06-45). A Trust Fund was created on May 22, 2006 and is effective for 30 years. On November 23, 2015 Resolution 9712 was passed by the City Commission expanding the CRA by 106 acres for a total of 2,648 acres. In addition, the initial Redevelopment Plan was replaced by the “Highway 441/27 Redevelopment Plan of 2015” and extended by thirty years. Subsequently, on November 7, 2015 Ordinance 15-49 was passed by the City Commission amending the Highway 441/27 Trust Fund to create a new base year, 2015, to be used for the calculation of the tax increment. The City of Leesburg was only the second City in the state to accomplish re-basing the floor for the tax incremental revenue.
Capital Projects Fund
The Capital Projects Fund budget increased by $975,000 from $600,000 to $1,575,000 in fiscal year 2021-22. The City is working on completing several major projects including the H.O. Dabney Aquatics Center which is under construction and estimated to be completed in the Winter of 2021 and a new Teen Center which is estimated to be completed in early 2022. The projects included are Road Resurfacing $100,000 which is funded with Gas Tax, Rails to Trails projects totaling $375,000 which is funded with a transfer from the General Fund and available Recreation Impact Fees. Additionally, Marina Slips were included for $250,000 with funding from Discretionary Sales Tax, Sleepy Hollow Grandstands were included for $400,000 which is funded with a County Grant, available Recreation Impact Fees and Discretionary Sales Tax. Improvements to the Pat Thomas Stadium were included for $400,000 and funded with Discretionary Sales Tax and a transfer from Solid Waste. With the completion of the H.O. Dabney Aquatics Center, the Dabney Pool is slated to be removed, demolition has been included for $50,000 and funded with a transfer from the Solid Waste Fund.
Electric
The infrastructure serving The Villages of St. Catherine, as well as, the underground primary upgrades from CR 44 has been completed. Work continues on building the backup feed to St. Catherine, as well as, the reconductoring projects along CR 468. Later in the fiscal year, the construction services contract will be used to construct the reconductoring projects on US 27 from Center Street to South Street. There are two major reconductoring projects slated for FY 2022. One will be reconductoring 1/2 of L67 from the North

Fiscal Year 2021 - 22 Annual Budget
51
Budget
Summary
Substation on CR 468 to Lewis Road and along Lewis Road to Whitney Road. The second project will be a portion along Whitney from Lewis to SR 44. Additionally, the FDOT has begun talks again related to the widening of Highway 441 from Newell Hill Road to Perkins Street. The plan for FY 22 is to build the necessary underground conduit and pull box infrastructure to allow from the removal of the overhead distribution feeders off of Highway 441 and convert to underground feeders along the neighboring streets. Growth in the service area is booming with the installation of new subdivisions, commercial projects and individual meter sets. The last of four aging substation transformers will be replaced in January of 2022 at the Picciola Substation. Additionally, substation crews will change out the bus tie breaker at the Picciola Substation and various feeder breakers throughout the service territory.
Gas
New customer service installations increased in fiscal year 2020-21 by over 60% with the addition of 355 residential and commercial services located outside of The Villages developments. Leesburg’s natural gas prices remained among the lowest in the state providing our customers with a clean economical energy alternative. The City has remained a member of the Florida Gas Utility. In April 2006 ,Section 25-501 of the City Code of Ordinances was passed, where natural gas began to be required in all new developments within the City limits that contain more than five units. The complete cost of installation is borne by the developer. Eight new developments were started in fiscal year 2020-21 and an additional four remain in various stages of developments for fiscal year 2021-22 which this ordinance applies to. This ordinance significantly reduces the Gas utility’s capital outlay in future fiscal years. Department staff began a complete rebuild of the Newell Hill regulator station in fiscal year 2019-20 to utilize more modern, reliable equipment to be completed in fiscal year 2021-22. New service installations continue in multiple developments around the City. In July of 2018, the City began serving residential and commercial customers in The Villages of Southern Oaks. In June of 2020. the City and TECO/Peoples Gas entered in to a Public Service Commission approved territorial agreement. The City transferred 3,625 Villages customers in Sumter County to TECO/Peoples Gas; in return, Leesburg will be the exclusive provider of natural gas to all future Villages expansion South and East of the existing development in both Sumter and Lake County. The new territory will accommodate approximately 50,000 homes and commercial establishments. Service to the first home in the settled Leesburg territory was established in October of 2020.
Water
In addition to providing award winning, high quality, safe potable water on demand every day, the Water Division plans and executes capital improvements to insure sufficient potable water will be available to customers well into the future. Our strategic priorities are: (1) Maintenance of existing infrastructure; we must take care of what we have; (2) Improve system flexibility, we must interconnect the existing water plants in order to be able to move water supply to where it’s needed; (3) Reduction of our per-capita potable water usage; supplies are limited, as we grow each person must use less. We must get better at water conservation and we must expand our use of reclaimed water and alternate water supplies. Our operating budget provides the necessary personnel and funding to meet regulatory requirements and produce high quality water throughout the budget year. The capital program contains projects that support strategic priorities. The budget includes funding for repairs to the treatment and distribution systems to ensure they are operating safely and efficiently. Major efforts include; Design efforts for the utilities relocation to support the widening of US 441 from Perkins Street to Newell Hill Road, Cottonwood Subdivision watermain replacement, Treadway School Road watermain loop installation and Fire Protection Improvements throughout the City. In addition, we continue to promote our water conservation incentive and rebate program for customers who wish to upgrade their existing plumbing fixture or irrigation system.

Fiscal Year 2021 - 22 Annual Budget
52
Budget
Summary
Wastewater
As Lake County continues to grow, so does the requirement to provide wastewater services to support that growth. With all the new development within our wastewater service area the capacity of our treatment facilities is quickly being depleted. In order to provide increased capacity for the projected growth, Phase I to expand the Turnpike facility is almost complete and Phase II will begin shortly. The capital budget for the next 3-5 years will focus on expanding the Turnpike Facility to meet this demand. Several scheduled equipment replacements and repairs, including pump repairs and controller upgrades, will be completed to ensure all systems are operating efficiently and effectively.
Solid Waste
The Solid Waste Division provides garbage collection and disposal services to approximately 8,500 residential households and 1,500 commercial establishments within the City limits. Residential customers receive either a 65 or 90-gallon container for household garbage and either a 35 or 65-gallon container for recyclable materials. Residential garbage is collected twice weekly; recyclables are collected once per week. Commercial service is based on the needs of the customer. During fiscal year 2021, the utility collected 27,610 tons of solid waste. The garbage is transported to the Covanta waste-to-energy incinerator where it is used as fuel to produce electricity. In addition, Solid Waste purchased an Air Curtain Burner in order to reduce disposal costs. The Air Curtain Burner will allow Solid Waste to burn vegetative debris that accumulates from residential landscape maintenance, City grounds maintenance efforts and storm recovery efforts. The Division maintains and monitors the closed 92-acre landfill throughout the year. The Florida Department of Environmental Protection (FDEP) also requires the City to monitor an additional 35.5-acre site in the southwest corner of this area. Monitoring includes groundwater sampling, as well as air sampling. Groundwater samples are tested for toxic chemicals quarterly, leachate readings are taken monthly and fence lines are inspected weekly and repaired as needed. In addition, the Solid Waste Division manages the Adopt-A-Street program. Civic-minded organizations, service groups, churches and businesses are encouraged to demonstrate civic pride and join with other organizations to participate in efforts to beautify Leesburg. Any organization participating in the Adopt-A-Street program will have a signature sign placed on opposite ends of their adopted street.
Overall
The budget document format for the City of Leesburg includes goals and tasks that can be measured based on departmental needs. Organizational charts reflect the structure of each department as it relates to the entire organization. A brief description of the department and the responsibilities and function of each division within the department is included. Each department/division consists of an appropriations detail by line item and an appropriations summary by category that shows the percentage increase/decrease from the adopted fiscal year 2020-21 budget to the adopted fiscal year 2021-22 budget. The appropriations summary page in each division addresses the significant budget changes to make the information clearer to the reader. The document should present a concise picture of the direction of each department within the City of Leesburg.

Fiscal Year 2021 - 22 Annual Budget
53
Budget
Review
Budget Review
Revenue Overview
A balanced budget is presented for each of the City’s twenty-seven active funds. Appropriations of fund balance were used for the following funds: General Fund, Housing Assistance, Police Forfeiture, Police Education Receipts, Police Impact Fees, Fire Impact Fees, Recreation Impact Fees, Building Permits, Electric, Water, Wastewater, Solid Waste, Airport and Fleet Services Funds. Generally accepted accounting principles as applicable to local government units are followed in the preparation of financial statements and reports. The report is separated by fund type with a brief description of each fund listed on the face of the divider.
Revenue Forecast
Pursuant to the uniform classification of accounts prescribed by the State Comptroller's office, governmental fund revenues are classified as follows:
Taxes – Includes property (ad valorem) tax, local option gas tax, local option infrastructure surtax, public service tax, communications services tax, other local tax and franchise fees.
Ad valorem property tax – The specific formula used to estimate current ad valorem tax revenues is calculated by multiplying the approved millage rate (4.1092) per $1,000 times the aggregate assessed property value (as certified by the County Property Appraiser) times 95%. Local option gas tax and the one cent voted gas tax – This tax, approved in a referendum election, is a levy of one cent per gallon tax on motor fuel and special fuel sold in the County and taxed pursuant to the provisions of Section 206, Florida Statutes. Utilization of the proceeds of this tax is limited to the costs of acquisition, construction, reconstruction, and maintenance of roads and streets, and the costs of establishing, operating, and maintaining a transportation system and related facilities. Nearly 30% of the collected one cent voted gas tax as well as the six cent local option gas tax are shared with the municipalities based on a cooperative agreement between Lake County and the fourteen incorporated Lake County municipalities. Local option infrastructure surtax – Lake County voters renewed the levy of an additional one cent tax on sales in the County pursuant to the provisions of Section 212.055, Florida Statutes. The City receives a portion of the tax based on an interlocal agreement with Lake County and the fourteen incorporated Lake County municipalities, which expires December 31, 2032. Utilization of the proceeds of this tax is limited to infrastructure improvements and related debt service, long-term maintenance costs associated with landfill closure and vehicles and necessary equipment to outfit vehicles with a life expectancy of at least 5 years.
Public Service Tax – Pursuant to the provisions of Section 166.231 Florida Statutes, the City Commission approved a 10% public service tax for electric, natural gas and water service sold to customers in the incorporated limits of the City of Leesburg. The tax was implemented on April 1, 2000. A public service tax was budgeted based on eligible estimated revenues in Electric, Gas and Water funds. Communications Services Tax – The “Communications Services Tax Simplification Law" became effective October 1, 2001. The City Commission authorized the levy of the maximum discretionary communications services tax of 5.22% and elected not to collect right-of-way permit fees. Projected revenues were calculated based on the state projected revenues from telecommunications services. Licenses and Permits – Includes franchise fees, fire assessment fee, business license tax and permits
Franchise fees – Franchise fees from Electric and Solid Waste utilities are included in this category and are estimated based on projections.

Fiscal Year 2021 - 22 Annual Budget
54
Budget
Review
Fire Assessement Fee – This fee was adopted June 22, 2015. It is an annual assessment starting October 1, 2015 for fire protection services using the tax bill collection method. The five year study was conducted and the fiscal year 2020-21 budget includes those recalibrated rates as follows: the residential rate is $87.00 per dwelling, commercial $0.05 per square foot, industrial/warehouse $0.02 per square foot, institutional $0.15 per square foot and church $0.04 per square foot. Business License Tax – This category, previously labeled licenses and permits, was changed to Business Taxes. Former collections of occupational licenses are now collected as business taxes. The change was made to create distinction between holding a qualified license to perform a specific occupation versus the collection of a business tax. The revenues for this category were projected based on historical data and present economic conditions. Permits – Includes building, zoning, utility, right of way and other permits of a local nature. Revenues from this category are heavily dependent on the market and overall health of the economy. Intergovernmental Revenues – Includes federal, state and local grants, and revenue sharing such as the City's share of state collected motor fuel taxes and sales taxes. The grant portion of this funding source is not reflected in the budget until the grant has been awarded and the appropriate legal documents are signed. For grants that are pending during the budget process, a budget adjustment must be made once the grant is approved, which also includes the match portion. The City utilizes grant revenues for planned projects rather than allowing grant approval to skew priorities. The City’s portion of revenue generated from state taxes is based on the state forecasts as reported in the Local Government Financial Information Handbook.
Charges for Services – Includes utility service user fees, parks and recreation fees, recreational activity fees, fuel sales, certification and copy of city documents and records, sale of official maps and publications, Stormwater utility fees, building and other user charges. Utility revenue projections are done by using trending analysis in Microsoft Excel. Gas, Water, and Wastewater trends are analyzed based on actual consumption for each customer category for the past five years and Solid Waste revenues also used five years of history . Electric revenues were based on extensive modeling and discussions in order to reduce the rate. All other utility revenues include the automatic rate increase approved by the City Commission on June 28, 2004 per Ordinance 04-38. The increase is based on the percent change in the Gross Domestic Product Implicit Price Deflator Index from the year of implementation based on the second quarter- “June” index as of September. Rental rates for the Mote-Morris house and pavilion, as well as rates for recreation activities, marina and airport hangar rental are established by resolution. The Health Insurance fund revenues are derived from payroll deductions and City contributions based on approved positions using the adopted rates. The Workers’ Compensation revenues are generated on the basis of approved positions in payroll budget multiplied by a certain percentage (based on an average of the last 3 years expenses versus revenues) of the state established manual premium rates (by standard industry code). Fines and Forfeitures – Includes court fines and fees (including police officers’ educational funding), the proceeds from the sale of judicially confiscated property and library fines. These estimates are developed from historical data trends, which remain relatively constant from year to year. Miscellaneous Revenues – Includes interest on investments, rents, impact fees, sales of surplus property, insurance proceeds from lost or destroyed property, street paving assessments, refunds, contributions and revenues which cannot be recognized in other classifications. The revenues in this category are examined based on economic conditions and a variety of methods are used to develop good estimates. Revenues for Impact fees (Water, Wastewater, Police, Fire and Recreation) only reflect funds that have already been received. Rental income from City owned property is determined by contracts that are

Fiscal Year 2021 - 22 Annual Budget
55
Budget
Review
currently in effect with a minimal growth rate based on availability. Projections of interest income are based on estimates of the amount, which is expected to be available for investment, coupled with an expected short-term interest rate. The employee and employer contributions to the pension plans are actuarially determined. Other Sources – Includes operating transfers and other funding sources for capital purchases. Operating transfers from the enterprise funds are calculated as a percentage (not to exceed 10%) of estimated operating revenues excluding certain fees and taxes. Fund Balance/Net Assets – Includes fund balance/net assets appropriated for operating or capital expenditures. Based on the preceding classifications, the estimated revenue sources for the last four fiscal years can be viewed in the following table and graph:
Overall the budget increased by $8,483,711 or from $168,159,844 to $176,643,255. Taxes, Licenses & Permits Taxes, Licenses & Permits increased $1,374,497. The following graph demonstrates the
revenue stream from the five major tax categories.
2018-19 2019-20 2020-21 2021-22Taxes 13,663,523$ 13,987,776$ 13,275,492$ 14,598,690$ Business License Taxes & Permits 2,634,474 2,211,699 3,059,772 3,486,977Building Permits 974,000 850,000 566,500 990,000Intergovernmental Revenue 4,755,839 7,503,627 7,767,433 7,160,875Charges for Services 109,469,395 111,983,480 108,620,048 112,901,358Fines & Forfeits 183,000 208,700 189,000 165,000Miscellaneous Revenue 9,528,256 10,316,522 10,630,567 10,143,690Other Sources 16,125,088 18,729,849 14,871,658 22,710,024 Fund Balance/Net Assets 11,262,833 14,265,679 9,179,374 4,486,641
TOTAL SOURCES 168,596,408$ 180,057,332$ 168,159,844$ 176,643,255$
$0
$25,000,000
$50,000,000
$75,000,000
$100,000,000
$125,000,000
$150,000,000
2018-19 2019-20 2020-21 2021-22
Fiscal Year
Estimated Revenues and Other SourcesFund Balance/Net Assets
Other Sources
Miscellaneous Revenue
Fines & Forfeits
Charges for Services
Intergovernmental Revenue
Building Permits
Business License Taxes & Permits
Taxes
$0
$4,000,000
$8,000,000
$12,000,000
$16,000,000
2018-19 2019-20 2020-21 2021-22
Fiscal Year
Taxes, Licenses & Permits
Fire Assessment Fee
Communications Srvs Tax
Public Service Tax
Sales & Use Taxes
Ad Valorem Taxes

Fiscal Year 2021 - 22 Annual Budget
56
Budget
Review
Ad Valorem Taxes The current millage rate of 4.0192 (“roll back’ rate) is a decrease from the previous fiscal year. Legislation which was adopted January 29, 2008 allows for an increase in the millage rate based on the change in per capita net income, however the homestead exemption was doubled from $25,000 to $50,000; resulting in a decrease of total taxes levied. Property values seem to have stabilized.
Sales & Use Tax – This tax is generated from sales taxes on the purchase of goods. This category is projected to increase by $854,647, or 35.2%. The increase is directly attributable to restoring the revenue estimates back to pre-COVID-19 pandemic values. Public Service Tax – The revenue collected from this source is deposited directly into the General Fund. This funding source is directly related to charges for services and increased $185,000 from the prior fiscal year. Communication Services Tax – The maximum percentage of 5.22% remained the same. Projections from the State estimated sales of $15,425,070 based on unpredictable revenues from the state this amount was decreased by $20,154 from the prior fiscal year. Building Permits– The construction market continues to increase and the amount of available cash in the Building Permits Fund continues to grow. As a result of a compounding health reserve the City decreased building permit fees in FY 20. The decreased fees are still in place but due to volume the revenue was increased by $423,500 in FY 22.
2018-19 2019-20 2020-21 2021-22 Millage Rate (per $1,000)
4.2678 Mills 4.2678 Mills 4.1086 Mills 4.0192 Mills
Taxable Property Value $1,339,490,497 $1,430,585,490 $1,591,924,526 $1,709,108,240
Total Taxes Levied 5,716,678 6,105,453 6,540,581 6,869,240
*Amount Collected 5,487,014 5,932,210 6,213,552 6,525,786
*Percentage Collected 96.0% 97.2% 96.5% 95.0%
* For fiscal year 2021-22, the amount collected and percentage collected are estimates only, based on a projected collection rate of 95% of the taxable value times the millage rate of 4.0192 mills.
$500,000,000
$625,000,000
$750,000,000
$875,000,000
$1,000,000,000
$1,125,000,000
$1,250,000,000
$1,375,000,000
2015-16 2016-17 2017-18 2018-19 2019-20 2020-21 2021-22
Fiscal Year
Taxable Property Value
974,000 850,000
566,500
990,000
0
400,000
800,000
1,200,000
2018-19 2019-20 2020-21 2021-22
Fiscal Year
Building Permits

Fiscal Year 2021 - 22 Annual Budget
57
Budget
Review
Intergovernmental Revenue Intergovernmental revenue decreased by $606,558 or 7.8% from $7,767,433 to $7,190,875. The decrease is primarily attributable to Capital Projects and the grants associated with projects. Charges for Services Charges for Services increased $4,281,310 or 3.9% from $108,620,048 to $112,901,358 which is directly related to the increase in Power and Gas supply cost projections. Fiscal year comparisons of charges for services are presented below. Since electric revenues approximate 56% of the revenues in this category, the following table excludes them in order to not skew the graph:
Fund Balance/Net Assets Appropriated Although this is not a revenue source, fund balance/net asset appropriations represent a use of revenues previously accumulated in the fund. The 2021-22 budget includes an appropriations of fund balance in the following; General $950,000, Housing Assistance $55,098, Police Forfeiture $5,000, Police Education Receipts $6,000, Police Impact Fees $10,500, Fire Impact Fees $250, Recreation Impact Fees $181,000, Building Permits $426,977, Electric $5,210,600, Water $2,105,000, Wastewater $1,830,000, Solid Waste $462,788, Airport $321,344 and Fleet Services $192,050.
Appropriations Overview
Pursuant to the uniform classification of accounts prescribed by the State Comptroller’s office, appropriations are classified as follows: General Government – Includes legislative and administrative services provided by the following departments for the benefit of the public and the governmental body as a whole: City Commission, Executive, City Attorney, Finance, Human Resources, Purchasing, Information Technology, Debt Service, Fleet Services, Grounds, Facility Services, Planning & Zoning, Health Insurance, Workers’ Compensation, Risk Management and Pension Trust funds.
$0
$5,000,000
$10,000,000
$15,000,000
$20,000,000
$25,000,000
$30,000,000
$35,000,000
$40,000,000
$45,000,000
2018-19 2019-20 2020-21 2021-22
Fiscal Year
Charges for Services by Fund (excluding Electric)
Internal Service Funds
Solid Waste
Communication
Wastewater
Water
Gas
General, Airport & Stormwater

Fiscal Year 2021 - 22 Annual Budget
58
Budget
Review
Public Safety – Includes services for the security of persons and property provided by police, fire and building services. Physical Environment – Includes cost of services provided for the primary purpose of achieving a satisfactory living environment by controlling and utilizing elements of the environment. This classification includes: GIS, Stormwater, Electric, Gas, Water, Wastewater and Solid Waste. Transportation – Includes cost of services for safe and adequate flow of vehicles, travelers and pedestrians as reflected in the Streets and Airport divisions. Economic Environment – Includes cost of providing services which develop and improve the economic condition of the community and its citizens, which is more particularly described in Housing & Economic Development, Community Development and Community
Redevelopment funds. Human Services – Includes cost of providing service for the welfare of the community as a whole and the line item associated with C.U.R.E. Culture/Recreation – Includes cost of providing and maintaining cultural and recreational facilities and activities for the benefit of citizens and visitors, which are provided by the Library and Recreation departments. Other Uses - Includes the following activities: debt service, other financing uses and reserves for future capital. Utilizing the functional categories listed above, the 4 year appropriation history is presented in the following table and graph:
SUMMARY OF APPROPRIATIONS BY FUNCTION
2018-19 2019-20 2020-21 2021-22General Government 21,385,312$ 21,967,249$ 21,495,538$ 21,869,915$ Public Safety 16,139,847 17,060,312 17,172,397 18,128,633 Physical Environment 95,161,661 98,142,063 90,747,938 94,649,511 Transportation 5,111,407 6,685,867 5,012,368 5,656,511 Economic Environment 638,104 793,493 828,916 1,091,956 Human Services 6,000 6,600 6,600 6,600 Culture & Recreation 3,506,423 6,765,064 3,723,363 5,564,846 Other Financing Uses 15,526,574 18,381,922 14,358,695 14,553,913 Debt Service 8,120,162 8,105,821 10,548,996 10,652,729 Fund Balance/Reserves 3,000,918 2,148,941 4,265,033 4,468,641
TOTAL APPROPRIATIONS 168,596,408$ 180,057,332$ 168,159,844$ 176,643,255$
$0
$25,000,000
$50,000,000
$75,000,000
$100,000,000
$125,000,000
$150,000,000
$175,000,000
2018-19 2019-20 2020-21 2021-22
Fiscal Year
Appropriations
Fund Balance/Reserves
Debt Service
Other Financing Uses
Culture & Recreation
Human Services
Economic Environment
Transportation
Physical Environment
Public Safety
General Government

Fiscal Year 2021 - 22 Annual Budget
59
Budget
Review
The Culture & Recreation category increased of $1,841,483 which is attributable to increased Capital Projects. The general government category minimally increased $374,377 of 1.7%. Transportation expenditures increased $644,143 or 13% which is due to a increase in Airport Capital Projects. The public safety category had the largest increase of $956,236 or 5.6%. This increase is directly related to increases in the Police and Fire budgets. The Debt Service category slightly increased $103,733. This is directly related to new debt associated with the Police Department Body Camera project. There was an increase in Economic Environment of $263,040 or 31.7%. This increase is related the three CRA’s. Physical Environment increased by $3,901,573 or 4.3% this category has the various Utility fund budgets which includes the budgets for Power and Gas supply costs. The Fund Balance/Reserves category increased slightly or by $203,608 or 4.8%. As presented in the following graph, 56% of the appropriations are related to operating expenses associated with day-to-day services for Leesburg’s citizens. Capital outlay and personal services comprise 9% and 22% of the overall budget which can vary from year to year. Other Uses and Debt Service make up the remainder with 7% and 6%. It is important to note that the Grants & Aids category was not presented as it makes up less than 1%.
Personal Services22%
Other Uses7%
Operating Expenses
56%
Capital Outlay9%
Debt Service6%
Expenditures by Category

Fiscal Year 2021 - 22 Annual Budget
60
Budget
Review
Personal Services Total personal services costs increased from $37,850,747 to $39,809,359, an increase of $1,958,612 or 5.2%. Components of the increase are reflected below:
Salaries and fringes increased in the general fund from $23,518,304 to $24,363,344 reflecting a increase of $845,040 or 3.6%. All other funds also experienced an increase in appropriations for salaries and fringes totaling $1,113,572 or 7.8%. The changes are shown graphically as follows:
The fiscal year 2021-22 budget reflects an increase in positions, from 493 positions to 502 which include both full and some part time personnel. Of the additional 9 positions, 1 position was added to the General Fund and the remaining 8 were added to the Utilities which is attributable to growth. The General Employee Pension Plan was frozen effective September 30, 2008. The required contribution is $1,135,409 for fiscal year 2021-22. The City will be making a 5% contribution to an ICMA 401 (a) plan for each employee which remains unchanged since last year. Police and Fire pension contributions of $600,339 and $867,105 respectively are included in this year’s budget. Operating Expenses Operating expenses increased $6,498,980 or 6.8% from $95,381,432 to $102,180,412. This is mainly attributable to increases in the cost of power. Utility Cost Allocation The General Fund provides a variety of services that are funded by the seven enterprise funds and one special revenue fund. A prorated share of the total operating budget is allocated directly to the appropriate fund operating expense budget. Several factors are used to determine the percentage applicable to the operation of the fund. Expenses related to the costs of services provided are allocated to the various funds and recorded as a contra expense in the General Fund division which provides operational support. The amounts expensed in the General Fund (GF) and allocated (AL) are summarized on the organization page for each department. The total services provided by department/division is listed in the following table:
2020-21 2021-22 % Change Salaries $26,592,297 $27,886,347 4.87%
Fringes 11,258,450 11,923,012 5.90%
Total $37,850,747 $39,809,359 5.17%
150 250 350 450 550
2018-19
2019-20
2020-21
2021-22
Fiscal Year
Authorized Positions
General Fund Other Funds
$10,000 $18,000 $26,000 $34,000 $42,000
2018-19
2019-20
2020-21
2021-22
(in thousands)
Fiscal Year
Salaries and Fringes
General Fund Other Funds

Fiscal Year 2021 - 22 Annual Budget
61
Budget
Review
The General Fund total expenses increased by $1,339,034. This increase directly affects the utility cost allocation based on the increases in the departments above. As a result of the allocated department expenses increasing, the cost allocation also increased $319,284. The utility cost allocation and transfers to the General Fund account for 46% of the funding sources in the General Fund. The breakdown of the types of funding sources in the General Fund can be viewed graphically as follows:
Department Percentage
City Commission 75%
Executive:
Administration 85%
City Clerk 75%
City Attorney 37%
Finance:
Accounting 85%
Customer Service 98%
Purchasing 73%
Warehouse 90%
Human Resources 37%
Information Technology 90%
GIS 90%
Public Works:
Administration 35%
Facility Services 5%
Community Development– Planning 55%
Program Revenues
11%
Taxes30%
General Revenues/
Fund Balance11%
Utility Transfers
29%
Utility Cost Allocation
19%
General Fund Appropriationby Funding Source

Fiscal Year 2021 - 22 Annual Budget
62
Budget
Review
Capital Outlay
Capital projects in all funds increased from $15,541,966 in fiscal year 2020-21 to $17,829,029 in fiscal year 2021-22 or an increase of $2,287,063 or 15%. The major increases were in the Capital Projects Fund which increased by $975,000 and in the Airport Fund which increased $1,155,720. See page 46 for fund detail. New Capital Projects– The City is finishing up the new H.O. Dabney Aquatics Center which is estimated to open in Winer 2021. Additionally, the City is continuing construction on a new Teen Center adjacent to the Gymnasium which is estimated to open in Early 2022. The fiscal year 2021-22 includes funding for several Recreation projects including adding Grandstands at Sleepy Hollow and rehabilitating the Pat Thomas Stadium. The Airport Fund budget includes funding to build hangars including taxiways and parking. Expansion – Expansion of City limits, population growth and infill drive the need for additional infrastructure and the related purchases necessary to provide the required services. The Gas Department is continuing its expansion into The Villages of development. Wastewater is completing the expansion of the Turnpike plant and Electric is extending new and rebuilding existing infrastructure to serve The Villages of St. Catherine and eventually the new portions of The Villages project. The City collects impact fees for Police, Fire, Recreation, Water and Wastewater. Replacement – Beyond the specific utility expansions and general government services, the majority of City capital purchases represent replacements of equipment and vehicles that are more costly to maintain than to replace. The following graph represents the total capital improvements by fund: The following is a schedule of major capital outlay for the entire City by type:
Wastewater10%
Water11%
Gas5%
Capital Projects9%
General Fund1%
Electric32%
Stormwater3%
Fleet Services9%
Airport19%
Solid Waste1%
Capital Outlay by Fund
Buildings, 28%
Improvements Other than
Buildings, 42%
Machinery and Equipment,
30%
Capital Outlay by Type

Fiscal Year 2021 - 22 Annual Budget
63
Budget
Review
Debt Service
The Debt Service category increased by $103,733 from $10,548,996 in fiscal year 2020-21 to $10,652,729 in fiscal year 2021-22. The changes are summarized below:
Other Uses
Other Uses increased slightly or by $21,581 from $12,142,796 to $12,164,377. This budget includes a transfer from the Discretionary Sales Tax Special Revenue Fund of $1,012,174 to Fleet for vehicle purchases. Additionally, the General Fund is transferring $1,489,560 to the Debt Service Fund for the various debt payments. Increases were also made in several of the Utilities with budgeted reserve accounts which increased this category.
Debt
There is no legal debt margin established for the City of Leesburg pursuant to the Constitution of the State of Florida, Florida Statutes, City ordinances or other laws applicable to the City of Leesburg. Each of the issuances were fully insured at the time of issuance and thus received an insured rating of AAA. However, due to the recent downgrades of the individual bond insurers one may look at the standalone or underlying rating of the issuer. The table below reflects the standalone underlying ratings by rating agency:
Description Amount
CRA’s $ 392,100 Capital Projects 133,836 Utility bond issues (422,203) TOTAL $ 103,733
Type Moody’s S&P Fitch
Capital A1 N/A** AA
Electric Aa3 A A+
Utility Aa3 AA- AA
* City has no G.O. debt but this is used by the markets as a standard ** Rating agency did not rate this issuance
Category Amount Land & Buildings 3,199,100 Improvements other than buildings 4,759,786 Machinery and Equipment 3,377,917 TOTAL $ 11,336,803

Fiscal Year 2021 - 22 Annual Budget
64
Budget
Review
All bonds are fully registered bonds in denominations of $5,000 or integral multiples thereof and are collateralized by a pledge of various sources as shown below. As of September 30, 2020, the debt coverage ratio and debt per capita based on the population of 24,539 (BEBR 2021) can be stated as follows:
Below is a summary of debt service including principal and interest (excluding fees) for the next five years in all funds:
Type
Debt Ratio
Debt per Capita Collateralized by Pledge
Capital Improvement Promissory Note, Series 2009
3.53 $142.12 Local government half-cent sales tax, and a guaranteed portion of state revenue sharing
Capital Improvement Bonds, Series 2013
4.93 $427.28 Public Service tax, sales tax and guaranteed entitlement, which are subordinate to the 1999 bonds
Electric Revenue Bonds, Series 2007B Refunding Bonds, 2013 Refunding Note, 2016 Revenue Note, 2020 Combined
4.54
$267.74 705.82 253.27 592.32
$1,819.15
Net Electric system revenues
Utility Revenue Bonds, Series 2007B Refunding Note, 2010 Bonds, Series, 2013 Bonds, Series 2016 Revenue Note, 2020 Combined
3.87 $28.73 122.87 585.80 681.57 575.21
$1,994.18
Net Gas, Water and Wastewater revenues
Issue 2022 2023 2024 2025 2026
GLCRA, Revenue Bond, Series 2015
$ 102,121 $ 101,619 $ 102,058 $ 102,410 $ 101,674
Hwy 441/27 CRA TI Revenue Note, 2016
890,553 889,832 889,722 890,198 890,233
Capital Improvement Bonds, Series 2009
477,386 476,895 475,695 478,667 475,811
Capital Improvement Bonds, Series 2013
1,018,412 1,021,912 1,023,662 1,020,662 1,021,662
Electric Revenue Bonds, Series 2007B
962,630
958,705
963,010
964,955
959,540
Electric Revenue Note, Series 2016
600,052
600,383
600,456
601,270
599,802
Electric Revenue Bonds, Series 2016
1,132,850
1,129,950
1,132,350
1,128,950
1,129,950
Electric Revenue Note, Series 2020
1,244,643
1,244,515
1,243,960
1,247,980
1,246,467
Utility Revenue Bonds, Series 2007B
81,595
84,235
81,580
83,925
85,975
Utility Revenue Bonds, Series 2013
1,396,944
1,396,544
1,399,744
1,396,744
1,396,594
Utility Revenue Bonds, Series 2016
1,158,650
1,158,950
1,163,800
1,162,800
1,156,000
Utility Revenue Note, Series 2020
1,139,955
1,139,655
1,144,100
1,143,205
1,142,055
WA/WWT Utility Revenue Note, 2010
812,410
814,498
810,526
815,400
-0-
TOTAL $11,018,201 $11,017,693 $11,030,663 $11,037,166 $10,205,763

Fiscal Year 2021 - 22 Annual Budget
65
Budget
Review
The next thirteen pages provide debt service detail of principal and interest payments over the life of the outstanding debt following the appropriate headings:
AMT FY PRIN BAL
DESCRIPTION PURPOSE ISSUED RATES RETIREMENT 11/30/21
CRA FUND2015 GLCRA Note Street Scape 1,000,000 2.91% 2026 468,000
2016 US 441/27 CRA Note Refund 2009 TI Bonds 11,563,000 2.59% 2036 10,341,000
2018 Carver Note (From Electric) Resource Center 1,200,000 2.50% 2033 963,485
TOTAL CRAs 13,763,000 11,772,485
GOVERNMENTAL
2009 Capital Impr Revenue Note Refund 1999 Bonds 6,227,400 4.73% 2030 3,167,400
2013 Capital Imp Refunding Revenue Bonds Refund 2004 Bonds 15,345,000 2%-5% 2035 10,485,000
2018 MSA Capital Lease (Fire SCBA's) Replace Fire SCBA 209,243 4.09% 2025 126,704
2018 Radio Capital Lease (ER Network Radios) Upgrade FD & PD Radios 780,683 3.37% 2028 476,913
TOTAL GOVERMENTAL FUND 22,562,325 14,256,017
ELECTRIC FUND
2007B Electric System Revenue Bonds Fund Balance 11,710,000 5.64% - 5.90% 2032 6,570,000
2016 Electric System Refunding Revenue Note Refund 2013 SG 8,318,000 2.35% 2032 5,761,000
2016 Electric System Refunding Revenue Bonds Refund 2007A Bonds & 2014 Note 19,290,000 2%-5% 2037 17,320,000
2020 Electric System Revenue Note Villages Expansion 15,000,000 2.13% 2036 15,000,000
TOTAL ELECTRIC FUND 54,318,000 44,651,000
GAS FUND
2013 Utility System Refunding Revenue Bonds Refund 2004 Bonds 3,523,881 2.00% - 5.00% 2035 2,411,031
2016 Utility System Refunding Revenue Bonds Refund 2007A (not completely) 2,050,618 2.00% - 5.00% 2037 1,855,424
TOTAL GAS FUND 5,574,499 4,266,455
WATER FUND
2013 Utility System Refunding Revenue Bonds Refund 2004 Bonds 7,329,969 2.00% - 5.00% 2035 5,015,149
2010 Utility System Revenue Refunding Note Plantation 3,632,600 3.85% 2026 1,369,034
2016 Utility System Refunding Revenue BondsRefund 2007A (not
completely)11,749,389 2.00% - 5.00% 2037 10,630,992
TOTAL WATER FUND 22,711,958 17,015,175
WASTE WATER FUND
2013 Utility System Refunding Revenue Bond Refund 2004 Bonds 10,156,150 2.00% - 5.00% 2035 6,948,830
2007B Utility System Revenue Bond Fund Balance 1,070,000 5.90% 2034 705,000
2010 Utility System Revenue Refunding Note Plantation 4,367,400 3.85% 2026 1,645,966
2016 Utility System Refunding Revenue BondsRefund 2007A (not
completely)4,314,993 2.00% - 5.00% 2037 3,904,259
2020 Utilty System Revenue NoteRefund 2007A (not
completely)15,000,000 1.70% 2036 14,115,000
TOTAL WASTE WATER FUND 34,908,543 27,319,055
Total 153,838,325$ 119,280,187$

Fiscal Year 2021 - 22 Annual Budget
66
Budget
Review
Greater Leesburg CRA, Redevelopment Revenue Note, Series 2015
The funds from the Series 2015 Redevelopment Revenue Note were used to pay the costs of acquisition, construction, and improvements of street improvements, undergrounding relocation and replacement of all City provided electric, water, wastewater, storm water and fiber optic on Main Street from U.S. 27 to 9th Street all within the Community Redevelopment Area.
Issue
Year
Principal
Interest
Total
Redevelopment Revenue Note, 2015 0 6,224 6,224
Series 2015 2016 52,000 20,774 72,774
Original Issue Amount: $1,000,000 2017 74,000 27,587 101,587
Original Issue Date: January 15, 2015 2018 77,000 25,433 102,433
Final Maturity: October 1, 2026 2019 79,000 23,193 102,193
Interest Rate: 2.91% 2020 81,000 20,894 101,894
2021 83,000 18,537 101,537 2022 86,000 16,121 102,121 2023 88,000 13,619 101,619 2024 91,000 11,058 102,058
2025 94,000 8,410 102,410
2026 96,000 5,674 101,674
2027 99,000 1,440 100,440
TOTAL 1,000,000 198,964 1,198,964

Fiscal Year 2021 - 22 Annual Budget
67
Budget
Review
Carver Heights/Montclair Area CRA, Internal Loan from Electric
Department
Funds from this internal Loan from the Electric Department was used to construct the Leesburg Resource Center.
Issue
Year Principal Interest Total
Internal Loan with Electric Department 2019 97,874 17,425 115,299
Original Amount $1,200,000 2020 68,465 27,553 96,018
Original Initiation Date: May 1, 2019 2021 70,176 25,842 96,018
Final Payment: May 1, 2033 2022 71,931 24,087 96,018
Interest Rate: 2.50% 2023 73,729 22,289 96,018
2024 75,572 20,446 96,018
2025 77,462 18,556 96,018
2026 79,398 16,620 96,018
2027 81,383 14,635 96,018
2028 83,418 12,600 96,018
2029 85,503 10,515 96,018
2030 87,641 8,377 96,018
2031 89,832 6,186 96,018
2032 92,078 3,940 96,018
2033 65,538 1,639 67,177
TOTAL 1,200,000 230,710 1,430,710

Fiscal Year 2021 - 22 Annual Budget
68
Budget
Review
Highway 441/27 CRA, Tax Increment Refunding Revenue Note, Series
2016
Funds from the Refunding Note were used for the acquisition and construction of redevelopment projects including demolition of existing structures and required improvements pursuant to the Redevelopment Plan.
Issue
Year Principal Interest Total
Community Redevelopment Agency 2017 60,000 118,961 178,961
for US Highway 441/27 Area Tax 2018 70,000 297,928 367,928
Increment Refunding Revenue Note, 2019 80,000 296,115 376,115
Series 2016 2020 195,000 294,043 489,043
Original Issue Amount: $11,563,000 2021 210,000 288,992 498,992
Original Issue Date: December 8, 2016 2022 607,000 283,553 890,553
Final Maturity: May 1, 2036 2023 622,000 267,832 889,832
Interest Rate: 2.59% 2024 638,000 251,722 889,722
2025 655,000 235,198 890,198
2026 672,000 218,233 890,233
2027 689,000 200,829 889,829
2028 707,000 182,983 889,983
2029 725,000 164,672 889,672
2030 744,000 145,895 889,895
2031 764,000 126,625 890,625
2032 783,000 106,838 889,838
2033 804,000 86,558 890,558
2034 824,000 65,734 889,734
2035 846,000 44,393 890,393
2036 868,000 22,481 890,481
TOTAL 11,563,000 3,699,585 15,262,585

Fiscal Year 2021 - 22 Annual Budget
69
Budget
Review
Capital Improvement Revenue Bonds, Series 2009
The purpose of the refunding was to take advantage of interest expense savings due to historically low interest rates. Debt service associated with the Refunding and Capital Improvement Revenue Bonds, Series 1999, is recorded in the debt service fund. The refunded portion of the 1999 bond proceeds ($4,334,211), were originally issued to expand City Hall, develop the industrial park, close the landfill and provide other capital items for airport development, recreational facilities, and public safety. The new money portion of the 1999 bonds was used to offset the cost of constructing a new police department building.
Issue
Year
Principal
Interest
Total
Capital Improvement Refunding 2010 0 95,731 95,731
Promissory Note, Series 2009 2011 240,000 288,880 528,880
(Refunding of Series 1999 Senior Lien 2012 200,000 278,474 478,474
Bonds) 2013 210,000 268,778 478,778
Original Issue Amount: $6,227,400 2014 220,000 258,608 478,608
Original Issue Date: December 4, 2009 2015 230,000 247,966 477,966
Final Maturity: April 1, 2030 2016 240,000 236,850 476,850
Interest Rate: 4.73% 2017 255,000 225,143 480,143 2018 265,000 212,845 477,845 2019 280,000 199,956 479,956 2020 295,000 186,357 481,357
2021 305,000 172,167 477,167
2022 320,000 157,386 477,386
2023 335,000 141,895 476,895
2024 350,000 125,695 475,695
2025 370,000 108,667 478,667
2026 385,000 90,811 475,811
2027 405,000 72,128 477,128
2028 420,000 52,617 472,617
2029 440,000 32,278 472,278
2030 462,400 10,936 473,336
TOTAL 6,227,400 3,464,168 9,691,568

Fiscal Year 2021 - 22 Annual Budget
70
Budget
Review
Capital Improvement Refunding Promissory Note, Series 2013
The funds from the Series 2013 were issued for the purpose of providing funds to advance the City’s outstanding Utility Revenue Bonds, Series 2004, is recorded in the debt service fund. The refunded portion of the 2004 bond proceeds were originally issued to construct a new library, upgrade the public works facility, construct Canal Street, renovate the old library for general government use, and construct a gymnasium and community center.
Issue
Year Principal Interest Total
Capital Improvement Refunding 2013 520,000 202,834 722,834
Promissory Note, Series 2013 2014 495,000 526,612 1,021,612
(Refunding of Series 2004 Senior Lien 2015 505,000 516,612 1,021,612
Bonds) 2016 515,000 506,512 1,021,512
Original Issue Amount: $15,345,000 2017 530,000 491,062 1,021,062
Original Issue Date: May 15, 2013 2018 545,000 475,162 1,020,162
Final Maturity: October 1, 2034 2019 565,000 458,812 1,023,812
Interest Rate: 2 - 5% 2020 580,000 441,862 1,021,862
2021 605,000 418,662 1,023,662
2022 630,000 388,412 1,018,412
2023 665,000 356,912 1,021,912
2024 700,000 323,662 1,023,662
2025 725,000 295,662 1,020,662
2026 755,000 266,662 1,021,662
2027 775,000 244,012 1,019,012
2028 800,000 219,794 1,019,794
2029 830,000 193,794 1,023,794
2030 860,000 164,744 1,024,744
2031 890,000 134,644 1,024,644
2032 915,000 103,494 1,018,494
2033 955,000 70,325 1,025,325
2034 985,000 35,706 1,020,706
TOTAL 15,345,000 3,835,953 22,180,953

Fiscal Year 2021 - 22 Annual Budget
71
Budget
Review
Electric System Revenue Bonds, Series 2007 B
The funds from the Electric System Revenue Bonds, Series 2007 B were used to provide funds for the purpose of funding a deposit reimbursing the Electric System for prior years ’ capital expenditures related to certain Florida Department of Transportation (FDOT) mandated State Road 441 projects.
Issue
Year Principal Interest Total
Electric System Revenue Bonds, 2008 0 682,713 682,713
Series 2007B 2009 280,000 682,713 962,713
Original Issue Amount: $11,710,000 2010 295,000 666,921 961,921
Original Issue Date: August 15, 2007 2011 310,000 650,283 960,283
Final Maturity: October 1, 2031 2012 325,000 632,799 957,799
Interest Rate: 5.64%- 5.90% 2013 345,000 614,469 959,469
2014 365,000 595,011 960,011
2015 390,000 574,425 964,425
2016 405,000 552,429 957,429
2017 430,000 529,587 959,587
2018 455,000 505,335 960,335
2019 485,000 478,490 963,490
2020 510,000 449,875 959,875
2021 545,000 419,785 964,785
2022 575,000 387,630 962,630
2023 605,000 353,705 958,705
2024 645,000 318,010 963,010
2025 685,000 279,955 964,955
2026 720,000 239,540 959,540
2027 765,000 197,060 962,060
2028 810,000 151,925 961,925
2029 855,000 104,135 959,135
2030 905,000 53,690 958,690
2031 5,000 295 5,295
TOTAL 11,710,000 10,120,780 21,830,780

Fiscal Year 2021 - 22 Annual Budget
72
Budget
Review
Electric System Refunding Revenue Note, Series 2016
The funds from the Electric System Revenue Note, Series 2016 were issued for the purpose of providing funds to retire the Electric System Revenue Note, Series 2013. The original note was used to make improvements to the City owned and operated Electric system.
Issue
Year Principal Interest Total
Electric System Refunding Revenue 2017 387,000 57,013 444,013
Note, Series 2016 2018 415,000 186,378 601,378
Original Issue Amount: $8,318,000 2019 423,000 176,626 599,626
Original Issue Date: June 16, 2016 2020 434,000 166,685 600,685
Final Maturity: October 1, 2032 2021 444,000 156,486 600,486
Interest Rate: 2.35% 2022 454,000 146,052 600,052
2023 465,000 135,383 600,383
2024 476,000 124,456 600,456
2025 488,000 113,270 601,270
2026 498,000 101,802 599,802
2027 510,000 90,099 600,099
2028 522,000 78,114 600,114
2029 535,000 65,847 600,847
2030 547,000 53,274 600,274
2031 560,000 40,420 600,420
2032 573,000 27,260 600,260
2033 587,000 13,795 600,795
TOTAL 8,318,000 1,732,960 10,050,960

Fiscal Year 2021 - 22 Annual Budget
73
Budget
Review
Electric System Revenue Refunding Bond, Series 2016
The funds from the Electric Revenue Bonds, Series 2016 were issued for the purposed of providing funds to retire the outstanding Electric System Revenue Bonds, Series 2007 A which were issued to acquire and construct additions, extensions and the make improvements and or repairs to the various components of the Electric System.
Issue
Year Principal Interest Total
Electric System Refunding Revenue 2016 0 205,351 205,351
Bonds, Series 2016 2017 375,000 754,350 1,129,350
Original Issue Amount: $19,290,000 2018 385,000 746,850 1,131,850
Original Issue Date: June 23, 2016 2019 390,000 739,150 1,129,150
Final Maturity: October 1, 2037 2020 405,000 727,450 1,132,450
Interest Rate: 2% - 5% 2021 415,000 715,300 1,130,300
2022 430,000 702,850 1,132,850
2023 440,000 689,950 1,129,950
2024 460,000 672,350 1,132,350
2025 475,000 653,950 1,128,950
2026 495,000 634,950 1,129,950
2027 515,000 615,150 1,130,150
2028 535,000 594,550 1,129,550
2029 560,000 573,150 1,133,150
2030 580,000 550,750 1,130,750
2031 1,565,000 527,550 2,092,550
2032 1,640,000 449,300 2,089,300
2033 1,780,000 367,300 2,147,300
2034 1,855,000 296,100 2,151,100
2035 1,930,000 221,900 2,151,900
2036 1,980,000 164,000 2,144,000
2037 2,080,000 65,000 2,145,000
TOTAL 19,290,000 11,667,251 30,957,251

Fiscal Year 2021 - 22 Annual Budget
74
Budget
Review
Electric System Revenue Note, Series 2020
The funds from the Electric System Revenue Note, Series 2020 were used for expansion of the distribution system for The Villages development, various reconductoring projects and to replace four (4) aging substation transformers.
Issue
Year Principal Interest Total
Electric System Revenue Note, 2020 0 226,312 226,312
Series 2020 2021 465,000 319,500 784,500
Original Issue Amount: $15,000,000 2022 940,000 304,643 1,244,643
Original Issue Date: July 16, 2020 2023 960,000 284,515 1,244,515
Final Maturity: October 1, 2035 2024 980,000 263,960 1,243,960
Interest Rate: 2.13% 2025 1,005,000 242,980 1,247,980
2026 1,025,000 221,467 1,246,467
2027 1,040,000 199,528 1,239,528
2028 1,070,000 177,216 1,247,216
2029 1,090,000 154,319 1,244,319
2030 1,110,000 130,995 1,240,995
2031 1,140,000 107,192 1,247,192
2032 1,165,000 82,804 1,247,804
2033 1,185,000 57,883 1,242,883
2034 1,210,000 32,483 1,242,483
2035 615,000 6,550 621,550
TOTAL 15,000,000 2,812,347 17,812,347

Fiscal Year 2021 - 22 Annual Budget
75
Utility System Revenue Bonds, Series 2007 B
The funds from the Utility System Revenue Bonds, Series 2007B were used to provide funds for the purpose of funding a deposit reimbursing the Wastewater System operating reserve fund.
Budget
Review
Issue
Year Principal Interest Total
Utility System Revenue Bonds, 2008 0 63,130 63,130
Series 2007B 2009 15,000 63,130 78,130
Original Issue Amount: $1,070,000 2010 20,000 62,245 82,245
Original Issue Date: August 15, 2007 2011 20,000 61,065 81,065
Final Maturity: October 1, 2033 2012 20,000 59,885 79,885
Interest Rate: 5.90% 2013 25,000 58,705 83,705
2014 25,000 57,230 82,230
2015 30,000 55,755 85,755
2016 30,000 53,985 83,985
2017 30,000 52,215 82,215
2018 35,000 50,445 85,445
2019 35,000 48,380 83,380
2020 40,000 46,315 86,315
2021 40,000 43,955 83,955
2022 40,000 41,595 81,595
2023 45,000 39,235 84,235
2024 45,000 36,580 81,580
2025 50,000 33,925 83,925
2026 55,000 30,975 85,975
2027 55,000 27,730 82,730
2028 60,000 24,485 84,485
2029 65,000 20,945 85,945
2030 65,000 17,110 82,110
2031 70,000 13,275 83,275
2032 75,000 9,145 84,145
2033 80,000 4,720 84,720
TOTAL 1,070,000 1,076,160 2,146,160

Fiscal Year 2021 - 22 Annual Budget
76
Budget
Review
Utility System Revenue Refunding Note, Series 2010
Funds from the Utility System Revenue Refunding Note Series 2010 were used to refinance the sellers note for the purchase of the Plantation Water and Wastewater facilities. The refinancing lowered the interest rate from 4.5% to 3.85%.
Issue
Year Principal Interest Total
Utility System Revenue Refunding 2010 10,000 224,819 234,819
Note, Series 2010 2011 50,000 306,653 356,653
(Refunding of Plantation Seller Note) 2012 55,000 304,631 359,631
Original Issue Amount: $8,000,000 2013 55,000 302,514 357,514
Original Issue Date: July 8, 2010 2014 525,000 291,349 816,349
Final Maturity: October 1, 2025 2015 545,000 270,751 815,751
Interest Rate: 3.85% 2016 565,000 249,384 814,384
2017 590,000 227,150 817,150
2018 610,000 204,050 814,050
2019 635,000 180,084 815,084
2020 660,000 155,155 815,155
2021 685,000 129,264 814,264
2022 710,000 102,410 812,410
2023 740,000 74,498 814,498
2024 765,000 45,526 810,526
2025 800,000 15,400 815,400
TOTAL 8,000,000 3,083,638 11,083,638

Fiscal Year 2021 - 22 Annual Budget
77
Utility System Refunding Revenue Bonds, Series 2013
The funds from the Series 2013 were issued for the purpose of providing funds to advance the City’s outstanding Utility Revenue Bonds, Series 2004. The refunded portion of the 2004 bond proceeds were used to convert existing gas and water metering to an automated meter reading system, to construct gas and water mains and line extensions, to purchase gas regulators and services, to construct and rehabilitate collection sewers, sewer treatment plant facilities, to design and construct reclaimed water storage tanks, pumps, mains and lines for the disposal of effluent, and other capital improvements to the water facilities.
Budget
Review
Issue
Year Principal Interest Total
Utility System Revenue Bonds, 2013 705,000 281,985 986,985
Series 2013 2014 665,000 732,331 1,397,331
(Refunding of Series 2004 Bonds) 2015 675,000 719,031 1,394,031
Original Issue Amount: $21,010,000 2016 695,000 698,781 1,393,781
Original Issue Date: May 15, 2013 2017 725,000 670,981 1,395,981
Final Maturity: October 1, 2034 2018 755,000 641,981 1,396,981
Interest Rate: 2 - 5% 2019 770,000 624,994 1,394,994
2020 800,000 594,194 1,394,194
2021 845,000 554,194 1,399,194
2022 885,000 511,944 1,396,944
2023 920,000 476,544 1,396,544
2024 960,000 439,744 1,399,744
2025 1,005,000 391,744 1,396,744
2026 1,035,000 361,594 1,396,594
2027 1,065,000 330,544 1,395,544
2028 1,095,000 298,594 1,393,594
2029 1,130,000 264,375 1,394,375
2030 1,165,000 227,650 1,392,650
2031 1,210,000 185,419 1,395,419
2032 1,255,000 141,556 1,396,556
2033 1,300,000 96,062 1,396,062
2034 1,350,000 48,937 1,398,937
TOTAL 21,010,000 9,293,179 30,303,179

Fiscal Year 2021 - 22 Annual Budget
78
Budget
Review
Utility System Revenue Refunding Bonds, Series 2016
Funds from the Utility System Revenue Refunding Note, Series 2016 were issued for the purpose of providing funds to retire the outstanding Utility System Revenue Bonds, Series 2007 A. The funds were originally used to make improvements or repairs to various components of the Gas, Water and Wastewater Systems.
Issue
Year Principal Interest Total
Utility System Refunding Revenue 2017 0 194,109 194,109
Bonds, Series 2016 2018 0 705,850 705,850
Original Issue Amount: $18,115,000 2019 450,000 705,850 1,155,850
Original Issue Date: June 23, 2016 2020 465,000 696,850 1,161,850
Final Maturity: October 1, 2037 2021 475,000 682,900 1,157,900
Interest Rate: 2% - 5% 2022 490,000 668,650 1,158,650
2023 505,000 653,950 1,158,950
2024 525,000 638,800 1,163,800
2025 545,000 617,800 1,162,800
2026 560,000 596,000 1,156,000
2027 585,000 573,600 1,158,600
2028 615,000 544,350 1,159,350
2029 640,000 519,750 1,159,750
2030 665,000 494,150 1,159,150
2031 690,000 467,550 1,157,550
2032 720,000 439,950 1,159,950
2033 755,000 403,950 1,158,950
2034 790,000 366,200 1,156,200
2035 905,000 326,700 1,231,700
2036 2,470,000 281,450 2,751,450
2037 2,595,000 157,950 2,752,950
2038 2,670,000 80,100 2,750,100
TOTAL 18,115,000 10,816,459 28,931,459

Fiscal Year 2021 - 22 Annual Budget
79
Utility System Revenue Note, Series 2020
Funds from the Utility System Revenue Refunding Note, Series 2020 were issued for the purpose of expanding the WWT Turnpike Treatment Plant.
Budget
Review
Issue
Year Principal Interest Total
Utility System Refunding Revenue 2020 0 116,875 116,875
Note, Series 2020 2021 885,000 255,000 1,140,000
Original Issue Amount: $15,000,000 2022 900,000 239,955 1,139,955
Original Issue Date: April 16, 2020 2023 915,000 224,655 1,139,655
Final Maturity: October 1, 2035 2024 935,000 209,100 1,144,100
Interest Rate: 1.70% 2025 950,000 193,205 1,143,205
2026 965,000 177,055 1,142,055
2027 980,000 160,650 1,140,650
2028 1,000,000 143,990 1,143,990
2029 1,015,000 126,990 1,141,990
2030 1,030,000 109,735 1,139,735
2031 1,050,000 92,225 1,142,225
2032 1,065,000 74,375 1,139,375
2033 1,085,000 56,270 1,141,270
2034 1,105,000 37,825 1,142,825
2035 1,120,000 19,040 1,139,040
TOTAL 15,000,000 2,236,945 17,236,945

This page intentionally left blank
Fiscal Year 2021 - 22 Annual Budget
80

Fiscal Year 2021 - 22 Annual Budget
81
Budget Summary
General Fund: 4.0192 Mills SPECIAL DEBT CAPITAL TRUST & INTERNAL
GENERAL REVENUE SERVICE PROJECTS ENTERPRISE AGENCY SERVICE TOTAL
FUND FUNDS FUND FUND FUNDS FUNDS FUNDS BUDGET
ESTIMATED REVENUES
Taxes Millage per $1,000
Current Ad Valorem Taxes 4.0192 @ 95% 5,535,488 990,298 0 0 0 0 0 6,525,786
Other Taxes 0 0 0 0 0 379,739 0 379,739
Sales & Use Taxes 0 2,878,165 0 0 0 0 0 2,878,165
Utility Taxes 4,815,000 0 0 0 0 0 0 4,815,000
Licenses & Permits 1,950,770 990,000 0 0 1,536,207 0 0 4,476,977
Intergovernmental Revenue 2,816,685 1,616,790 0 200,000 2,527,400 0 0 7,160,875
Charges for Services 1,098,666 6,500 0 0 100,501,876 0 11,294,316 112,901,358
Fines & Forfeitures 165,000 0 0 0 0 0 0 165,000
Miscellaneous Revenue 908,830 127,850 0 0 2,141,391 6,506,044 459,575 10,143,690
Other Financing Sources 0 33,050 0 0 981,875 0 0 1,014,925
TOTAL SOURCES 17,290,439 6,642,653 0 200,000 107,688,749 6,885,783 11,753,891 150,461,515
Transfers In 10,281,953 0 1,750,006 1,375,000 0 0 1,012,174 14,419,133
Debt Proceeds 0 0 0 0 0 0 0 0
Fund Balances/Reserves/Net Assets 956,000 684,825 0 0 9,929,732 0 192,050 11,762,607TOTAL REVENUES, TRANSFERS & BALANCES 28,528,392 7,327,478 1,750,006 1,575,000 117,618,481 6,885,783 12,958,115 176,643,255
EXPENDITURES
General Government 4,220,722 0 0 0 0 5,757,000 11,892,193 21,869,915
Public Safety 16,651,106 1,477,527 0 0 0 0 0 18,128,633
Physical Environment 120,557 0 0 0 94,528,954 0 0 94,649,511
Transportation 1,294,916 0 0 100,000 4,261,595 0 0 5,656,511
Economic Environment 186,964 904,992 0 0 0 0 0 1,091,956
Human Services 6,600 0 0 0 0 0 0 6,600
Culture / Recreation 4,089,846 0 0 1,475,000 0 0 0 5,564,846
Other Financing Uses 118,121 0 0 0 0 0 0 118,121
TOTAL EXPENDITURES 26,688,832 2,382,519 0 1,575,000 98,790,549 5,757,000 11,892,193 147,086,093
Transfers Out 1,839,560 3,244,995 0 0 8,339,063 0 1,012,174 14,435,792
Debt Service 0 1,089,174 1,750,006 0 7,813,549 0 0 10,652,729
Fund Balances/Reserves/Net Assets 0 610,790 0 0 2,675,320 1,128,783 53,748 4,468,641TOTAL APPROPRIATED EXPENDITURES 28,528,392 7,327,478 1,750,006 1,575,000 117,618,481 6,885,783 12,958,115 176,643,255
TRANSFERS, RESERVES & BALANCES
THE TENTATIVE, ADOPTED, AND/OR FINAL BUDGETS ARE ON FILE IN THE OFFICE OF THE ABOVE MENTIONED TAXING AUTHORITY AS A PUBLIC RECORD.
BUDGET SUMMARY
City of Leesburg - Fiscal Year 2021-22 BUDGET
ARE 5.0% HIGHER THAN LAST YEAR'S TOTAL OPERATING EXPENDITURES.
THE PROPOSED OPERATING BUDGET EXPENDITURES OF THE CITY OF LEESBURG, FLORIDA

Fiscal Year 2021 - 22 Annual Budget
82
Governmental Funds
Summary of Estimated Financial Sources & Uses
Enterprise Funds
Summary of Revenues, Expenses & Changes in Net Assets
Actual Adopted Adopted Actual Adopted Adopted
2019-20 2020-21 2021-22 2019-20 2020-21 2021-22
Financial Sources 16,782,477 16,348,219 17,290,439 5,995,027 5,094,563 6,631,470
Financial Uses (24,673,175) (25,698,291) (26,688,832) (2,343,999) (1,795,526) (1,442,546)
Sources over (under) Uses (7,890,698) (9,350,072) (9,398,393) 3,651,028 3,299,037 5,188,924
Operating Transfers In (Out) 5,075,611 9,350,072 8,442,393 (2,763,348) (2,789,199) (3,234,245)
Debt Proceeds 0 0 0 0 (697,074) (697,614)
Change in Net Assets Balance (2,815,087) 0 (956,000) 887,680 (187,236) 1,257,065
Net Assets Balance-October 1 15,720,135 12,905,048 12,905,048 5,171,811 6,059,491 5,872,255
Net Assets Balance-September 30 12,905,048 12,905,048 11,949,048 6,059,491 5,872,255 7,129,320
Actual Adopted Adopted Actual Adopted Adopted
2019-20 2020-21 2021-22 2019-20 2020-21 2021-22
Financial Sources 0 0 0 365,410 0 0
Financial Uses (1,535,057) (1,616,170) (1,750,006) (4,703,107) (600,000) (1,575,000)
Sources over (under) Uses (1,535,057) (1,616,170) (1,750,006) (4,337,697) (600,000) (1,575,000)
Operating Transfers In (Out) 1,535,199 1,616,170 1,750,006 4,986,301 600,000 1,575,000
Debt Proceeds 0 0 0 0 0 0
Change in Net Assets Balance 142 0 0 648,604 0 0
Net Assets Balance-October 1 1,183,513 1,183,655 1,183,655 7,731,691 8,380,295 8,380,295
Net Assets Balance-September 30 1,183,655 1,183,655 1,183,655 8,380,295 8,380,295 8,380,295
Debt Service Fund Capital Projects Fund
General Fund Special Revenue Funds
($ in Thousands) Actual Adopted Adopted Actual Adopted Adopted2019-20 2020-21 2021-22 2019-20 2020-21 2021-22
Operating Revenues 58,098 62,384 63,969 6,731 6,730 8,419Operating Expenses (51,006) (59,282) (61,878) (4,975) (5,645) (6,900)
Operating Income (Loss) 7,092 3,102 2,091 1,756 1,085 1,519Nonoperating Revenues (Expenses) (514) 1,566 2,041 (84) (225) (216)
Income Before Operating Transfers 6,578 4,668 4,132 1,672 860 1,303Operating Transfers In (Out) (4,478) (4,668) (4,132) (156) (783) (803)
Net Income (Loss) 2,100 0 0 1,516 77 500Net Assets-October 1 93,197 85,712 85,712 12,642 14,158 14,235
Net Assets-September 30 95,297 85,712 85,712 14,158 14,235 14,735
Electric Utility Fund Gas Utility Fund

Fiscal Year 2021 - 22 Annual Budget
83
Enterprise Funds (Cont.)
Summary of Revenues, Expenses & Changes in Net Assets
($ in Thousands) Actual Adopted Adopted Actual Adopted Adopted2019-20 2020-21 2021-22 2019-20 2020-21 2021-22
Operating Revenues 8,947 9,371 10,007 12,176 12,246 13,758Operating Expenses (5,966) (8,551) (8,757) (8,448) (15,434) (10,919)
Operating Income (Loss) 2,981 820 1,250 3,728 (3,188) 2,839Nonoperating Revenues (Expenses) (505) 359 654 681 356 (487)
Income Before Operating Transfers 2,476 1,179 1,904 4,409 (2,832) 2,352Operating Transfers In (Out) 416 (1,077) (1,108) 686 (897) (987)
Net Income (Loss) 2,892 102 796 5,095 (3,729) 1,365Net Assets-October 1 29,247 32,139 32,241 50,314 55,409 51,680
Net Assets-September 30 32,139 32,241 33,037 55,409 51,680 53,045
($ in Thousands) Actual Adopted Adopted Actual Adopted Adopted2019-20 2020-21 2021-22 2019-20 2020-21 2021-22
Operating Revenues 1,583 1,692 1,664 4,387 4,612 4,615Operating Expenses (1,018) (1,734) (1,684) (3,625) (3,919) (4,316)
Operating Income (Loss) 565 (42) (20) 762 693 299Nonoperating Revenues (Expenses) 42 63 35 321 7 28
Income Before Operating Transfers 607 21 15 1,083 700 327Operating Transfers In (Out) 744 0 0 (582) (826) (789)
Net Income (Loss) 1,351 21 15 501 (126) (462)Net Assets-October 1 12,984 14,335 14,356 1,936 1,539 1,413
Net Assets-September 30 14,335 14,356 14,371 2,437 1,413 951
($ in Thousands) Actual Adopted Adopted
2019-20 2020-21 2021-22
Operating Revenues 1,199 3,157 3,941
Operating Expenses (2,172) (3,083) (4,261)
Operating Income (Loss) (973) 74 (320)
Nonoperating Revenues (Expenses) 153 0 0
Income Before Operating Transfers (820) 74 (320)
Operating Transfers In (Out) 1,032 0 0
Net Income (Loss) 212 74 (320)
Net Assets-October 1 26,606 26,818 26,892
Net Assets-September 30 26,818 26,892 26,572
Airport Fund
Stormwater Fund
Water Utility Fund Wastewater Utility Fund
Solid Waste Fund

Fiscal Year 2021 - 22 Annual Budget
84
Internal Service Funds
Summary of Revenues, Expenses & Changes in Net Assets
Actual Adopted Adopted2019-20 2020-21 2021-22
Operating Revenues 6,661,207 7,249,565 7,487,925Operating Expenses (7,419,748) (7,268,565) (7,500,000)
Operating Income (Loss) (758,541) (19,000) (12,075)Nonoperating Revenues (Expenses) 24,394 19,000 12,075
Income Before Operating Transfers (734,147) 0 0Operating Transfers In (Out) 204,183 0 0
Net Income (Loss) (529,964) 0 0Net Assets-October 1 1,229,181 699,217 699,217
Net Assets-September 30 699,217 699,217 699,217
Actual Adopted Adopted2019-20 2020-21 2021-22
Operating Revenues 674,863 684,017 672,050Operating Expenses (570,282) (616,473) (618,302)
Operating Income (Loss) 104,581 67,544 53,748Nonoperating Revenues (Expenses) 40,519 0 0
Income Before Operating Transfers 145,100 67,544 53,748Operating Transfers In (Out) (204,183) 0 0
Net Income (Loss) (59,083) 67,544 53,748Net Assets-October 1 522,251 463,168 530,712
Net Assets-September 30 463,168 530,712 584,460
Actual Adopted Adopted
2019-20 2020-21 2021-22
Operating Revenues 3,088,053 2,643,458 2,679,955
Operating Expenses (2,653,338) (2,846,278) (2,897,005)
Operating Income (Loss) 434,715 (202,820) (217,050)
Nonoperating Revenues (Expenses) (246,406) 50,000 25,000
Income Before Operating Transfers 188,309 (152,820) (192,050)
Operating Transfers In (Out) 135,099 0 0
Net Income (Loss) 323,408 (152,820) (192,050)
Net Assets-October 1 9,959,833 10,283,241 10,130,421
Net Assets-September 30 10,283,241 10,130,421 9,938,371
Fleet Services
Health Insurance
Workers' Compensation

Fiscal Year 2021 - 22 Annual Budget
85
All Funds
Summary of
Revenue
Sources
Summary of Revenue Sources
ACTUAL ACTUAL ADOPTED ADOPTED
2018-19 2019-20 2020-21 2021-22
REVENUE SOURCES
Taxes 13,446,700 13,852,251 13,275,492 14,598,690
Licenses and Permits 3,664,319 4,460,122 3,626,272 4,476,977
Intergovernmental Revenue 5,617,858 6,159,952 7,767,433 7,160,875
Charges for Services 106,100,914 103,466,828 108,620,048 112,901,358
Fines and Forfeitures 200,030 151,779 189,000 165,000
Miscellaneous Revenue 16,647,250 15,294,533 10,630,567 10,143,690
Other Sources 16,937,574 23,678,935 24,051,032 27,196,665
TOTAL REVENUE SOURCES 162,614,645 167,064,400 168,159,844 176,643,255

Fiscal Year 2021 - 22 Annual Budget
86
Summary of Appropriations
All Funds
Summary of
Appropriations
ACTUAL ACTUAL ADOPTED ADOPTED
2018-19 2019-20 2020-21 2021-22
001 GENERAL FUND
Personal Services 22,119,285 22,148,548 23,518,304 24,363,344
Operating Expenses 7,796,429 8,494,361 8,469,069 8,953,567
Capital Outlay 1,154,213 339,614 217,200 248,200
Debt Service 90,116 90,116 0 0
Grants and Aids 266,710 255,000 50,000 0
Other Uses (3,836,388) (1,093,264) (5,065,215) (5,386,719)
TOTAL GENERAL FUND 27,590,365 30,234,375 27,189,358 28,178,392
016 GREATER LEESBURG CRA
Operating Expenses 223,315 224,362 283,475 290,529
Capital Outlay 0 42,660 0 0
Debt Service 101,043 100,715 100,330 100,870
Grants & Aids 70,927 98,120 74,106 75,000
Other Uses 625,000 0 200,000 100,620
TOTAL GLCRA 1,020,285 465,857 657,911 567,019
017 CARVER HEIGHTS CRA
Personal Services 2,068 0 0 0
Operating Expenses 96,989 104,201 110,755 137,970
Capital Outlay 64,749 62,844 0 0
Debt Service 17,425 27,553 96,018 96,018
Grants and Aids 5,000 22,800 0 100,000
Other Uses 0 141,958 214,591 176,294
TOTAL CHCRA 186,231 359,356 421,364 510,282
018 US HWY 441/27 CRA
Operating Expenses 4,271 3,855 7,345 7,195
Debt Service 377,848 491,275 500,726 892,286
Grants and Aids 53,664 10,000 50,000 142,600
Other Uses 0 0 660,694 333,876
TOTAL 441/27CRA 435,783 505,130 1,218,765 1,375,957
121 POLICE FORFEITURE
Operating Expenses 4,400 0 7,000 0
Capital Outlay 0 9,890 0 5,000
TOTAL POLICE FORFEITURE 4,400 9,890 7,000 5,000
122 POLICE EDUCATION RECEIPTS
Operating Expenses 5,680 5,851 6,000 6,000
TOTAL POLICE EDUCATION RECEIPTS 5,680 5,851 6,000 6,000
132 DISCRETIONARY SALES TAX
Other Uses 1,713,907 2,362,082 1,624,534 2,298,165
TOTAL DISCRETIONARY SALES TAX 1,713,907 2,362,082 1,624,534 2,298,165
133 GAS TAX
Other Uses 799,168 827,125 964,665 755,080
TOTAL GAS TAX 799,168 827,125 964,665 755,080

Fiscal Year 2021 - 22 Annual Budget
87
Summary of Appropriations (Continued)
Summary of
Appropriations
(Continued)
All Funds ACTUAL ACTUAL ADOPTED ADOPTED
2018-19 2019-20 2020-21 2021-22
141 POLICE IMPACT FEES
Operating Expenses 0 4,595 5,000 0
Capital Outlay 0 5,381 80,000 0
Other Uses 7,180 13,360 7,500 10,500
TOTAL POLICE IMPACT FEES 7,180 23,336 92,500 10,500
142 FIRE IMPACT FEES
Other Uses 100 240 0 250
TOTAL FIRE IMPACT FEES 100 240 0 250
143 RECREATION IMPACT FEES
Other Uses 28,600 248,780 0 181,000
TOTAL RECREATION IMPACT FEES 28,600 248,780 0 181,000
151 BUILDING PERMITS FUND
Personal Services 605,249 737,146 728,673 1,032,358
Operating Expenses 192,817 214,694 203,753 434,169
Capital Outlay 40,777 52,725 95,365 0
TOTAL BUILDING PERMITS FUND 838,843 1,004,565 1,027,791 1,466,527
013 HOUSING ASSISTANCE FUND
Personal Services 50,147 52,757 53,996 55,442
Operating Expenses 87,176 72,575 82,558 96,256
TOTAL HOUSING ASSISTANCE FUND 137,323 125,332 136,554 151,698
021 DEBT SERVICE
Debt Service 1,530,806 1,535,057 1,616,170 1,750,006
TOTAL DEBT SERVICE 1,530,806 1,535,057 1,616,170 1,750,006
031 CAPITAL PROJECTS
Operating Expenses 189,773 250,693 100,000 0
Capital Outlay 8,282,211 4,452,414 500,000 1,575,000
Other Uses 0 796,097 0 0
TOTAL CAPITAL PROJECTS 8,471,984 5,499,204 600,000 1,575,000
041 ELECTRIC
Personal Services 5,119,687 5,004,366 5,304,882 5,704,038
Operating Expenses 53,234,696 51,463,451 52,590,768 54,300,369
Capital Outlay 2,487,002 2,422,364 1,223,927 1,710,453
Debt Service 1,298,256 1,300,781 3,746,482 3,345,693
Other Uses (1,495,602) (2,425,292) 5,385,734 4,889,641
TOTAL ELECTRIC 60,644,039 57,765,670 68,251,793 69,950,194

Fiscal Year 2021 - 22 Annual Budget
88
All Funds
Summary of
Appropriations
(Continued)
Summary of Appropriations (Continued)
ACTUAL ACTUAL ADOPTED ADOPTED
2018-19 2019-20 2020-21 2021-22
042 GAS
Personal Services 1,745,651 1,651,222 1,679,177 1,764,978
Operating Expenses 4,636,166 3,908,725 4,208,237 5,383,478
Capital Outlay 2,614,176 67,033 5,450 13,500
Debt Service 178,688 172,031 351,748 352,241
Grants and Aides 161,975 0 0 0
Other Uses (2,705,555) 102,105 612,553 1,041,594
TOTAL GAS 6,631,101 5,901,116 6,857,165 8,555,791
043 WATER
Personal Services 1,924,080 1,421,749 1,726,494 1,832,994
Operating Expenses 4,369,632 4,561,840 4,434,667 5,983,441
Capital Outlay 6,152,397 555,860 2,275,000 855,000
Debt Service 722,118 688,542 1,538,456 1,536,405
Other Uses (5,137,563) 445,505 1,293,576 1,988,484
TOTAL WATER 8,030,664 7,673,496 11,268,193 12,196,324
044 WASTEWATER
Personal Services 2,296,894 2,235,996 2,624,333 2,678,567
Operating Expenses 5,554,428 7,018,497 5,734,694 6,660,699
Capital Outlay 3,315,486 769,739 2,992,000 1,505,000
Debt Service 637,084 658,586 2,599,066 2,579,210
Other Uses (2,645,836) (605,167) 2,924,220 2,427,181
TOTAL WASTEWATER 9,158,056 10,077,651 16,874,313 15,850,657
046 SOLID WASTE
Personal Services 968,581 938,236 1,069,680 1,228,116
Operating Expenses 2,437,849 2,505,317 2,652,744 2,656,218
Capital Outlay 0 0 0 250,000
Grants & Aids 0 181,975 196,925 181,975
Other Uses 403,523 582,345 826,288 788,571
TOTAL SOLID WASTE 3,809,953 4,207,873 4,745,637 5,104,880
048 AIRPORT
Personal Services 150,568 140,468 143,076 149,294
Operating Expenses 2,410,551 2,305,688 844,419 897,301
Capital Outlay 581,587 1,293,444 2,095,000 3,215,000
Other Uses (873,013) (1,526,343) 73,978 0
TOTAL AIRPORT 2,269,693 2,213,257 3,156,473 4,261,595
014 STORMWATER
Personal Services 367,380 183,689 356,056 335,252
Operating Expenses 1,794,736 899,056 838,307 978,653
Capital Outlay 347,701 1,530,253 540,000 370,000
Other Uses (344,776) (1,594,459) 20,399 15,135
TOTAL STORMWATER 2,165,041 1,018,539 1,754,762 1,699,040

Fiscal Year 2021 - 22 Annual Budget
89
All Funds
Summary of
Appropriations
(Continued)
Summary of Appropriations (Continued)
ACTUAL ACTUAL ADOPTED ADOPTED
2018-19 2019-20 2020-21 2021-22
061 POLICE PENSION
Operating Expenses 1,410,222 1,122,913 1,238,500 1,222,000
Other Uses 0 0 670,272 741,389
TOTAL POLICE PENSION 1,410,222 1,122,913 1,908,772 1,963,389
062 FIRE PENSION
Operating Expenses 1,439,857 1,440,654 1,453,000 1,515,000
Other Uses 0 0 182,047 161,985
TOTAL FIRE PENSION 1,439,857 1,440,654 1,635,047 1,676,985
063 GENERAL EMPLOYEES PENSION
Operating Expenses 2,967,510 2,993,464 3,020,000 3,020,000
Other Uses 0 0 315,414 225,409
TOTAL GENERAL EMPLOYEE 2,967,510 2,993,464 3,335,414 3,245,409
064 HEALTH INSURANCE
Personal Services 49,517 68,183 69,096 69,815
Operating Expenses 6,783,278 7,351,565 7,199,469 7,430,185
TOTAL HEALTH INSURANCE 6,832,795 7,419,748 7,268,565 7,500,000
065 WORKERS' COMPENSATION
Personal Services 31,446 52,419 51,473 53,302
Operating Expenses 606,878 517,863 565,000 565,000
Other Uses 0 204,183 42,544 53,748
TOTAL WORKERS' COMP 638,324 774,465 659,017 672,050
066 RISK MANAGEMENT
Operating Expenses 693,990 775,160 896,801 876,886
TOTAL RISK MANAGEMENT 693,990 775,160 896,801 876,886
510 FLEET FUND
Personal Services 474,922 474,094 525,507 541,859
Operating Expenses 1,877,809 2,621,190 729,871 765,496
Capital Outlay 1,779,712 2,454,272 1,540,900 1,589,650
Other Uses (1,300,404) (1,154,432) 1,189,002 1,012,174
TOTAL FLEET FUND 2,832,039 4,395,124 3,985,280 3,909,179
ALL FUNDS
Personal Services 35,905,475 35,108,873 37,850,747 39,809,359
Operating Expenses 98,818,452 98,860,570 95,681,432 102,180,412
Capital Outlay 26,820,011 14,058,493 11,564,842 11,336,803
Debt Service 4,953,384 5,064,656 10,548,996 10,652,729
Grants and Aids 558,276 567,895 371,031 499,575
Other Uses (14,761,659) (2,675,177) 12,142,796 11,814,377
TOTAL APPROPRIATIONS 152,293,939 150,985,310 168,159,844 176,293,255

Fiscal Year 2021 - 22 Annual Budget
90
Personal
Services
Change in
Authorized
Positions by
Fund/
Department
Change in Authorized Positions by Fund/Department
DEPARTMENT/DIVISION 2020-21 2021-22 NET REASON FOR CHANGE
GENERAL FUND
Legislative 5.00 5.00 0.00
Executive 4.90 4.90 0.00
Finance 41.35 42.35 1.00 Customer Service Operations Supervisor (+1)
Human Resources 4.20 4.20 0.00
Information Technology 11.50 10.50 (1.00) IT Administrative Specialist (-1)
Geographic Information Systems 4.50 4.50 0.00
Police 103.00 104.00 1.00 Forensic Digital Evidence Specialist (+1)
Fire 51.00 51.00 0.00
Public Works 27.85 27.85 0.00
Planning & Zoning 6.00 6.00 0.00
Housing & Economic 1.00 1.00 0.00
Library 32.00 32.00 0.00
Recreation 19.00 19.00 0.00
GENERAL FUND TOTAL 311.30 312.30 1.00
Electric 45.00 48.00 3.00 Groundsman (+2), Assistant Service Planner (+1)
Gas 23.00 23.00 0.00
Water 27.75 27.75 0.00
Wastewater 41.29 41.29 0.00
Stormwater 6.01 6.01 0.00
Solid Waste 16.10 18.10 2.00 Solid Waste Operator I (+2)
Airport 2.10 2.10 0.00
Health Insurance 0.80 0.80 0.00
Workers Compensation 0.65 0.65 0.00
Fleet Services 8.00 8.00 0.00
Affordable Housing 1.00 1.00 0.00
Building Permits 10.00 13.00 3.00 Building Inspector III (+1), Permit Specialist I (+1)
Plans Examiner III (+1)
OTHER FUNDS TOTAL 181.70 189.70 8.00
ALL FUNDS TOTAL 493.00 502.00 9.00

Fiscal Year 2021 - 22 Annual Budget
91
Authorized
Positions by
Fund/
Department
Personal
Services
Authorized Positions by Fund/Department
DEPARTMENT/DIVISION 2018-19 2019-20 2020-21 2021-22
GENERAL FUND
Legislative 5.00 5.00 5.00 5.00
Executive 5.90 5.65 4.90 4.90
Finance 41.35 42.35 41.35 42.35
Human Resources 4.20 4.20 4.20 4.20
Information Technology 11.50 11.50 11.50 10.50
Geographic Information Systems 4.50 4.50 4.50 4.50
Police 100.00 101.00 103.00 104.00
Fire 48.00 51.00 51.00 51.00
Public Works 25.60 25.85 27.85 27.85
Planning & Zoning 6.25 6.25 6.00 6.00
Housing & Economic Development 1.00 1.00 1.00 1.00
Library 32.00 32.00 32.00 32.00
Recreation 16.00 19.00 19.00 19.00
GENERAL FUND TOTAL 301.30 309.30 311.30 312.30
Electric 45.00 45.00 45.00 48.00
Gas 23.00 23.00 23.00 23.00
Water 27.70 27.75 27.75 27.75
Wastewater 41.04 41.29 41.29 41.29
Stormwater 5.66 6.01 6.01 6.01
Solid Waste 17.00 16.10 16.10 18.10
Airport 2.10 2.10 2.10 2.10
Health Insurance 0.80 0.80 0.80 0.80
Workers Compensation 0.65 0.65 0.65 0.65
Fleet Services 8.00 8.00 8.00 8.00
Affordable Housing 1.00 1.00 1.00 1.00
Building Permits 8.75 10.00 10.00 13.00
OTHER FUNDS TOTAL 180.70 181.70 181.70 189.70
ALL FUNDS TOTAL 482.00 491.00 493.00 502.00

Fiscal Year 2021 - 22 Annual Budget
92
Personal
Services
Cost
Authorized
Positions by
Fund/
Department
Authorized Positions by Fund/Department
AUTH OTHER
SALARIESGENERAL FUND
POS *SALARIES SALARIES FRINGES TOTAL
1100 Legislative 5.00 61,345 6,632 64,470 132,447
1200 Executive 4.90 468,164 107,371 175,138 750,673
1300 Finance 42.35 1,859,823 31,500 833,617 2,724,940
1400 Human Resources 4.20 191,252 6,000 79,833 277,085
1600 Information Technology 10.50 722,215 15,000 262,152 999,367
1700 Geographic Information Systems 4.50 268,174 3,200 111,485 382,859
2100 Police 104.00 5,710,672 546,280 2,722,022 8,978,974
2200 Fire 51.00 2,996,208 511,178 1,919,716 5,427,102
5100 Public Works 27.85 952,983 41,500 510,008 1,504,491
6100 Planning & Zoning 6.00 328,307 1,800 124,141 454,248
6200 1.00 94,910 0 46,909 141,819
7100 Library 32.00 850,400 35,200 344,791 1,230,391
8100 Recreation 19.00 744,765 206,039 408,144 1,358,948
GENERAL FUND TOTAL 312.30 15,249,218 1,511,700 7,602,426 24,363,344
5171 Stormwater Fund 6.01 213,136 5,000 117,116 335,252
1000 Electric Fund 48.00 4,023,301 386,900 1,293,837 5,704,038
2000 Gas Fund 23.00 1,149,178 82,628 533,172 1,764,978
3000 Water Fund 27.75 1,203,708 65,500 563,786 1,832,994
4000 Wastewater Fund 41.29 1,725,163 101,800 851,604 2,678,567
5140 Solid Waste Fund 18.10 721,471 60,500 446,145 1,228,116
8100 Airport 2.10 109,847 0 39,447 149,294
1340 Health Insurance Fund 0.80 55,484 0 14,331 69,815
1350 Workers Compensation Fund 0.65 40,222 0 13,080 53,302
5110 Fleet Services Fund 8.00 382,449 2,250 157,160 541,859
6255 Affordable Housing 1.00 35,277 4,500 15,665 55,442
6100 Building Permits Fund 13.00 708,115 49,000 275,243 1,032,358
OTHER FUNDS TOTAL 189.70 10,367,351 758,078 4,320,586 15,446,015
ALL FUNDS TOTAL 502.00 25,616,569 2,269,778 11,923,012 39,809,359
*Salaries include wages and standby pay
This schedule does not include temporary employees.
Housing & Economic Development
DEPARTMENT/DIVISION

Fiscal Year 2021 - 22 Annual Budget
93
Revenue Sources
and
Appropriations
General
Fund
Revenue Sources and Appropriations
ACTUAL ACTUAL ADOPTED ADOPTED
2018-19 2019-20 2020-21 2021-22
REVENUE SOURCES
Taxes 9,829,048 10,104,335 9,972,793 10,350,488
Licenses and Permits 1,605,500 1,634,859 1,880,000 1,950,770
Intergovernmental 2,812,548 2,982,822 2,402,101 2,916,685
Charges for Services 840,324 885,765 934,643 1,098,666
Fines and Forfeitures 168,245 146,227 189,000 165,000
Miscellaneous 1,176,663 1,071,393 969,682 908,830
Other Sources 10,870,749 10,593,887 10,841,139 10,787,953
TOTAL REVENUE SOURCES 27,303,077 27,419,288 27,189,358 28,178,392
APPROPRIATIONS
City Commission 74,167 40,027 41,067 42,709
Executive 2,998,620 6,250,020 2,087,139 2,019,245
Finance 496,504 305,178 336,251 262,422
Human Resources 217,189 241,065 230,266 235,000
Information Technology 247,481 217,429 346,996 369,584
Geographic Information Systems 32,857 36,513 37,314 39,757
Police 9,889,103 9,223,464 9,850,225 10,258,584
Fire 6,221,672 6,105,521 6,196,381 6,392,522
Public Works 3,643,365 3,853,850 3,941,984 4,027,036
Community Development 228,674 226,347 231,691 254,723
Economic Development 173,565 258,409 166,681 186,964
Library 1,561,644 1,600,050 1,661,063 1,770,643
Recreation 1,805,524 1,876,502 2,062,300 2,319,203
TOTAL APPROPRIATIONS 27,590,365 30,234,375 27,189,358 28,178,392

This page intentionally left blank
Fiscal Year 2021 - 22 Annual Budget
94

Fiscal Year 2021 - 22 Annual Budget
95
General
Fund
Revenue
Detail
Revenue Detail
ACTUAL ACTUAL ADOPTED ADOPTED2018-19 2019-20 2020-21 2021-22
TAXES
31101 Current Property Taxes 4,964,040 5,288,606 5,322,639 5,535,488
31102 Delinquent Property Taxes 6,731 1,889 0 0
31410 Electric - Utility Services Tax 3,127,653 3,084,734 3,110,000 3,245,000
31430 Water - Utility Services Tax 377,969 392,074 375,000 395,000
31440 Gas - Utility Services Tax 244,396 254,524 245,000 260,000
31490 Reuse Water - Services Tax 66,648 76,655 65,000 80,000
31502 Communication Services Tax 855,154 833,150 855,154 835,000
31601 Business Tax Receipts 186,457 172,703 0 0
TOTAL TAXES 9,829,048 10,104,335 9,972,793 10,350,488
LICENSES AND PERMITS
32310 Electric - Franchise Fees 266,022 271,808 265,000 275,000
32370 Solid Waste - Franchise Fees 111,729 126,334 110,000 130,000
32521 Fire Assessment Fee 1,224,099 1,234,217 1,500,000 1,542,770
32921 Foreclosure Reg. Fee 3,650 2,500 5,000 3,000
TOTAL LICENSES & PERMITS 1,605,500 1,634,859 1,880,000 1,950,770
INTERGOVERNMENTAL REVENUES
33121 Public Safety - Police (Federal) 147,902 147,060 47,231 0
33171 ERATE 14,400 7,200 14,400 14,400
33191 Federal- Emergency Mgmt. 0 137,180 0 0
33422 Fire Department 21,673 0 0 0
33473 Joint Partnership Agreement 35,881 132,056 132,056 132,056
33512 Revenue Sharing 612,975 586,695 506,154 606,338
33514 Mobile Home Licenses 78,308 75,377 79,000 76,000
33515 Alcoholic Beverage License 23,642 19,824 24,500 20,000
33518 Half Cent Sales Tax 1,365,903 1,402,403 1,114,633 1,450,000
33522 Fire Supplemental Comp 15,998 13,835 16,500 14,000
33541 Rebate/Vehicles - Gas 45,565 48,590 45,500 46,000
33722 Public Safety - Fire 14,969 0 0 0
33743 Lake County 0 0 0 50,000
33803 ALS-Lake County 133,020 143,666 133,000 145,000
33807 Library-Lake County 281,106 264,769 267,927 262,891
33811 County Licenses 21,206 4,167 21,200 0
TOTAL INTERGOVERNMENTAL 2,812,548 2,982,822 2,402,101 2,816,685

Fiscal Year 2021 - 22 Annual Budget
96
General
Fund
Revenue
Detail
(Continued)
Revenue Detail (Continued)
ACTUAL ACTUAL ADOPTED ADOPTED
2018-19 2019-20 2020-21 2021-22
CHARGES FOR SERVICES
34111 Credit Report Fees 2,258 0 0 0
34130 General Fund 19,600 34,000 19,500 30,000
34191 Zoning Fees 68,888 64,758 55,000 65,000
34194 Qualifying Fees-Elections 0 2,142 0 0
34195 Certification & Copying 11,273 7,320 9,000 8,000
34196 County Fire Response 52,950 86,000 0 85,000
34202 Reimb. Co. Resource Officer 80,000 123,467 253,867 245,827
34209 Other Public Safety 74,378 45,612 67,000 56,000
34493 FDOT St Light/ Traffic Signals 304,753 316,358 316,356 327,422
34711 Library Card Fees 179 288 200 200
34712 Library Passport Accept 18,348 9,515 16,000 18,000
34721 Activities Fees 1,249 232 500 500
34721 Non Resident Fees 3,670 3,678 2,500 3,700
34721 Gymnasium 12,433 12,662 12,740 13,585
34721 Susan Street/ Canal Street 5,835 335 5,950 6,500
34721 Sleepy Hollow Complex 13,243 6,668 13,550 14,800
34722 Splash Pad 22,145 10,931 25,000 20,000
34723 Swimming Pool - Venetian Gardens 25 0 10,000 71,750
34724 Swimming Pool - Dabney 17,682 6,050 9,050 0
34727 Special Events 3,752 3,641 7,180 2,500
34729 Other Recreation Fees 0 0 2,500 5,120
34755 Marina/Sale - Merchandise 4,255 2,119 3,500 3,000
34756 Marina Fuel Sales 120,256 146,864 105,000 121,462
34757 Marina - Services 3,152 3,125 250 300
TOTAL CHARGES FOR SERVICES 840,324 885,765 934,643 1,098,666
FINES AND FORFEITURES
35120 Court Fines (Traffic) 50,485 35,587 50,500 40,000
35120 Investigative Fees 23,248 25,367 22,000 28,000
35120 Criminal Fines & Forfeits 482 337 500 500
35201 Library Fines 14,375 9,206 13,000 8,000
35401 Code Enforcement Fines 75,600 71,860 100,000 85,000
35403 Other Fine/Parking Ticket 4,055 3,870 3,000 3,500
TOTAL FINES AND FORFEITURES 168,245 146,227 189,000 165,000
MISCELLANEOUS REVENUE
36110 Interest on Investments 301,916 209,334 250,000 185,000
36130 Gain/Loss Investments 134,589 62,349 0 0
36201 Rents and Royalties 28,006 31,631 28,000 30,000
36201 Incubator Rentals 7,600 3,450 5,000 4,000
36205 Cultural Arts Bldg. Fees 7,386 4,043 6,000 5,500
36206 Mote Morris Fees 0 0 0 0

Fiscal Year 2021 - 22 Annual Budget
97
General
Fund
Revenue
Detail
(Continued)
Revenue Detail (Continued)
ACTUAL ACTUAL ADOPTED ADOPTED
2018-19 2019-20 2020-21 2021-22
MISCELLANEOUS REVENUE (CONT)
36207 Venetian Center Fees 9,100 60,716 80,000 80,000
36208 Marina Operating Lease 6,600 6,600 6,600 6,600
36208 Marina Dry Slip Rental 229,581 221,399 220,000 225,000
36208 Marina Wet Slip Rental 77,528 84,631 78,000 85,000
36208 Marina Trailer Storage 10,281 10,311 10,000 10,500
36208 Marina Late Fees 2,280 1,531 1,400 1,500
36208 Marina Utility Revenue 1,413 1,561 1,400 1,600
36208 Marina Boat Rentals 1,038 440 500 300
36209 Park Facility Rentals 28,413 22,556 15,000 25,000
36209 Pat Thomas Stadium 1,130 5,985 3,000 5,000
36209 Susan Street/ Canal Street 6,200 6,760 4,500 6,500
36209 Sleepy Hollow Complex 48,215 61,385 60,000 60,000
36211 Library Rentals 10,735 11,318 13,000 11,000
36245 Antenna Tower Fees 155,931 55,276 100,000 60,000
36403 Sale-Furniture/Equipment/Land 4,526 2,772 0 2,500
36404 Recovery from Losses (20,374) 3,461 0 0
36429 Sale of Real Estate 31,048 36,690 0 0
36501 Sale of Surplus Materials 101 0 0 0
36609 Contributions/Donations 4,500 24,860 3,000 3,000
36611 Friends of the Library 5,313 0 8,082 7,555
36691 Mote- Morris 50 200 0 0
36694 Contributions-C.U.R.E. 4,837 55,968 5,500 5,500
36695 School Bus Lights 647 652 700 675
36906 Misc. Reimbursement 71,835 83,405 70,000 85,000
36908 Cash Over and Short (34) 8 0 0
36909 Other Income 2,083 2,101 0 2,100
36925 Misc.Jobbing Revenue 4,184 0 0 0
36990 Misc Non-Operating Revenue 5 0 0 0
TOTAL MISCELLANEOUS 1,176,663 1,071,393 969,682 908,830
OTHER SOURCES
38161 Transfer from Fleet (510) 479,308 1,299,840 1,139,002 1,012,174
38191 From Discretionary Tax (132) 459,598 413,446 360,429 625,545
38191 From Gas Tax (133) 724,167 427,125 964,665 655,080
38201 Electric Utility Contribution 4,000,000 4,000,000 3,603,405 3,027,198
38201 Electric - Surcharge 1,393,720 1,392,360 1,544,829 1,624,943
38202 Gas Utility Contribution 606,204 632,906 622,004 620,989
38202 Gas - Surcharge 115,917 115,646 148,712 181,973
38203 Water Utility Contribution 674,296 644,618 718,582 739,232
38203 Water - Surcharge 344,430 359,963 357,980 368,924
38204 Wastewater Utility Contribution 888,998 897,152 955,243 987,324
38205 Solid Waste Contribution 403,428 410,831 426,288 438,571
38401 Capital Fire Lease 780,683 0 0 0
38830 Lakefront TV Reserve Account 0 0 0 6,000
38891 Fund Balance Appropriated 0 0 0 950,000
TOTAL OTHER SOURCES 10,870,749 10,593,887 10,841,139 11,237,953
TOTAL REVENUES 27,303,077 27,419,288 27,189,358 28,528,392

Fiscal Year 2021 - 22 Annual Budget
98
General
Fund
Departmental
Summary of
Appropriations
Departmental Summary of Appropriations
ACTUAL ACTUAL ADOPTED ADOPTED
2018-19 2019-20 2020-21 2021-22
1100 CITY COMMISSION
Personal Services 112,237 129,903 125,505 132,447
Operating Expenses 36,094 30,202 38,764 38,391
Other Uses (74,164) (120,078) (123,202) (128,129)
TOTAL CITY COMMISSION 74,167 40,027 41,067 42,709
1200 EXECUTIVE
Personal Services 726,767 724,003 760,935 750,673
Operating Expenses 377,476 392,604 386,565 402,300
Grants & Aids 266,710 255,000 50,000 0
Other Uses 1,627,667 4,878,413 889,639 866,272
TOTAL EXECUTIVE 2,998,620 6,250,020 2,087,139 2,019,245
1300 FINANCE
Personal Services 2,515,809 2,462,985 2,579,636 2,724,940
Operating Expenses 763,070 845,520 808,222 796,764
Capital Outlay 32,661 31,834 0 0
Other Uses (2,815,036) (3,035,161) (3,051,607) (3,259,282)
TOTAL FINANCE 496,504 305,178 336,251 262,422
1400 HUMAN RESOURCES
Personal Services 242,524 269,786 262,700 277,085
Operating Expenses 91,614 95,463 97,091 95,931
Other Uses (116,949) (124,184) (129,525) (138,016)
TOTAL HUMAN RESOURCES 217,189 241,065 230,266 235,000
1600 INFORMATION TECHNOLOGY
Personal Services 972,490 967,196 1,019,164 999,367
Operating Expenses 914,926 1,001,284 1,033,575 1,093,229
Capital Outlay 136,898 176,168 132,200 132,000
Other Uses (1,776,833) (1,927,219) (1,837,943) (1,855,012)
TOTAL INFORMATION TECH 247,481 217,429 346,996 369,584

Fiscal Year 2021 - 22 Annual Budget
99
General
Fund
Departmental
Summary of
Appropriations
(Continued)
Departmental Summary of Appropriations (Continued)
ACTUAL ACTUAL ADOPTED ADOPTED
2018-19 2019-20 2020-21 2021-22
1700 GIS
Personal Services 314,799 347,452 357,070 382,859
Operating Expenses 13,771 17,659 16,069 14,713
Other Uses (295,713) (328,598) (335,825) (357,815)
TOTAL GIS 32,857 36,513 37,314 39,757
2100 POLICE
Personal Services 8,166,672 7,967,775 8,624,094 8,978,974
Operating Expenses 1,147,703 1,188,070 1,226,131 1,279,610
Capital Outlay 515,251 8,142 0 0
Debt Service 59,477 59,477 0 0
TOTAL POLICE 9,889,103 9,223,464 9,850,225 10,258,584
2200 FIRE
Personal Services 5,018,918 5,168,289 5,316,889 5,427,102
Operating Expenses 758,798 906,593 844,492 915,420
Capital Outlay 413,317 0 35,000 50,000
Debt Service 30,639 30,639 0 0
TOTAL FIRE 6,221,672 6,105,521 6,196,381 6,392,522
5100 PUBLIC WORKS
Personal Services 1,271,902 1,242,246 1,414,973 1,504,491
Operating Expenses 2,426,520 2,745,064 2,670,586 2,725,953
Capital Outlay 50,810 26,947 50,000 0
Other Uses (105,867) (160,407) (193,575) (203,408)
TOTAL PUBLIC WORKS 3,643,365 3,853,850 3,941,984 4,027,036
6100 COMMUNITY DEVELOPMENT
Personal Services 434,165 448,400 444,418 454,248
Operating Expenses 74,002 53,977 70,450 111,804
Other Uses (279,493) (276,030) (283,177) (311,329)
TOTAL COMMUNITY DEVELOP 228,674 226,347 231,691 254,723
6200 ECONOMIC DEVELOPMENT
Personal Services 131,777 127,947 129,160 141,819
Operating Expenses 41,788 130,462 37,521 45,145
TOTAL ECONOMIC DEVELOP 173,565 258,409 166,681 186,964

Fiscal Year 2021 - 22 Annual Budget
100
General
Fund
Departmental
Summary of
Appropriations
(Continued)
Departmental Summary of Appropriations (Continued)
ACTUAL ACTUAL ADOPTED ADOPTED
2018-19 2019-20 2020-21 2021-22
7100 LIBRARY
Personal Services 1,092,054 1,095,413 1,176,980 1,230,391
Operating Expenses 469,590 448,327 484,083 491,652
Capital Outlay 0 56,310 0 48,600
TOTAL LIBRARY 1,561,644 1,600,050 1,661,063 1,770,643
8100 RECREATION
Personal Services 1,119,171 1,197,153 1,306,780 1,358,948
Operating Expenses 681,077 639,136 755,520 942,655
Capital Outlay 5,276 40,213 0 17,600
TOTAL RECREATION 1,805,524 1,876,502 2,062,300 2,319,203
GRAND TOTAL
Personal Services 22,119,285 22,148,548 23,518,304 24,363,344
Operating Expenses 7,796,429 8,494,361 8,469,069 8,953,567
Capital Outlay 1,154,213 339,614 217,200 248,200
Debt Service 90,116 90,116 0 0
Grants and Aids 266,710 255,000 50,000 0
Other Uses (3,836,388) (1,093,264) (5,065,215) (5,386,719)
TOTAL APPROPRIATIONS 27,590,365 30,234,375 27,189,358 28,178,392

Fiscal Year 2021 - 22 Annual Budget
101
General
Fund
Schedule of
Appropriations
by Funding
Source
Schedule of General Fund Appropriations by Funding Source
Appropriations
funded from
non-program
Revenues
Grants and Charges for Miscellaneous
Functions/Programs Appropriations Contributions Services Revenue Total
General fund activities:
City Commission 42,709$ (42,709)$
Executive 2,019,245 8,000 8,500 (2,002,745)
Reserve(s) for cash carried forward 0 0
Finance 262,422 (262,422)
Human Resources 235,000 (235,000)
Information Technology 369,584 (369,584)
GIS/Engineering 39,757 (39,757)
Police 10,258,584 - 301,827 157,000 (9,799,757)
Fire 6,392,522 159,000 85,000 1,542,770 (4,605,752)
Public Works 4,027,036 132,056 327,422 60,000 (3,507,558)
Community Development 254,723 65,000 (189,723)
Housing and Economic Development 186,964 (186,964)
Library 1,770,643 312,891 18,200 26,555 (1,412,997)
Recreation 2,037,295 100,000 138,455 182,000 (1,616,840)
Marina 281,908 124,762 330,500 173,354
Total general fund activities 28,178,392$ 703,947$ 1,068,666$ 2,307,325$ (24,098,454)$
General fund revenues not attributable to specific programs:
Taxes:
Property taxes 5,535,488$
Utility service taxes 4,815,000
Occupational & county licenses 3,000
State shared revenues 2,212,738
Investment income 185,000
Miscellaneous revenue 559,275
Subtotal, general fund revenues before transfers 13,310,501
Transfers from other funds 10,781,953
Appropriate Reserves 6,000
Fund balance appropriated -
Total general fund revenues not attributable to specific programs 24,098,454$
Program Revenues

This page intentionally left blank
Fiscal Year 2021 - 22 Annual Budget
102

Fiscal Year 2021 - 22 Annual Budget
103
Organization
Total
Budget
Legislative
Department
CITY COMMISSION
John Christian, Mayor Mike Pederson, Mayor Pro-Tem/Commissioner H.D. Robuck, III, Commissioner Jimmy Burry, Commissioner Jay Connell, Commissioner The City Commission, composed of 5 residents, is the legislative and policy-making body of the City. Elections are held in conjunction with county, state, and federal elections. Two of the Commissioners are elected at large and three by districts. The Mayor is the presiding officer at official meetings and the ceremonial head of the City. The responsibilities include: enact ordinances and resolutions necessary for governing the City’s affairs, review and adopt annual budget, appoint City Attorney, City Manager and members to boards and committees and promote health, welfare and safety of Leesburg residents. Responsibilities: Boards & Committees Members Of
Organizational Chart
$ 42,709 GF
128,129 AL
$170,838
• Personnel Committee • Lake County League of Cities • Leesburg Partnership • St. Johns River Water Management District • Leesburg Area Chamber of Commerce • Florida League of Cities • Metropolitan Planning Organization (MPO) • Leesburg Center for the Arts • Lake Community Action Agency • Florida Municipal Electric Association (FMEA)
• Florida Municipal Power Agency (FMPA) • FMPA Policy Makers Committee Liaison
• Planning & Zoning Commission • Recreation & Parks Advisory Board • Leesburg International Airport Advisory Board • Library Advisory Board • Firemen's Pension Board • Police Officers' Pension Board • General Employees' Pension Board • Greater Leesburg Community Redevelopment Agency • Carver Heights & Vicinity Community Redevelopment Agency
• Highway 27/441 Community Redevelopment Agency • Historic Preservation Board • Code Enforcement Special Magistrate
Citizens
Boards &
CommitteesCity AttorneyCity Manager
City Commission

Fiscal Year 2021 - 22 Annual Budget
104
Legislative
Department
City
Commission
Division
Goals & Tasks
Goals & Tasks
Goal: Foster an environment where local governance is collaborative, transparent and fiscally sound.
Task:
Seek and develop partnerships with Lake County, Lake Sumter State College, Lake Tech, and the
Lake County School Board for shared benefits and returns to our community
Maintain open relationships with other governing bodies, business groups, media and citizens
Seek economic development opportunities that encourage business expansion and or retention
Work with Florida Department of Transportation to identify and solve transportation problems and
identify opportunities to improve the aesthetics of the community gateways
Support Master Planning activities which improve service delivery, infrastructure and facilities
Attend meetings of the Lake County League of Cities and MPO; attend the Florida League of Cities
and FMEA/FMPA conference annually
Participate in Lake Legislative Days
Create and preserve an environmentally health, clean and beautiful community
Create an atmosphere of safety throughout the community
Support an environment which provides for the diverse housing needs of the community
Seek opportunities to improve the “Quality of Life” for residents
Seek and spend resources as good fiduciary stewards of the public’s investment
Major Accomplishments:
Sunset Business License Tax
Established low revenue forecast in preparation for impacts from COVID-19
Continued Enterprise Fund Independence

Fiscal Year 2021 - 22 Annual Budget
105
Legislative
Department
City
Commission
Division
Personnel
Schedule
Personnel Schedule
Classification 2021 Change 2022 Amount
City Commissioners 4.00 0.00 4.00 45,457
Mayor 1.00 0.00 1.00 15,888
Total 5.00 0.00 5.00 61,345

Fiscal Year 2021 - 22 Annual Budget
106
Legislative
Department
City
Commission
Division
Appropriations
Detail
Appropriations Detail Account # 001-1111-511
ACTUAL ACTUAL ADOPTED ADOPTED
2018-19 2019-20 2020-21 2021-22
PERSONAL SERVICES
1110 Salaries 56,682 58,181 59,559 61,345
1510 Special Pay 6,632 6,632 6,632 6,632
2110 FICA 3,066 3,230 3,249 3,288
23xx Insurance 45,360 61,364 55,592 60,702
2410 Workers' Compensation 159 162 167 171
26xx Other Payroll Benefits 338 334 306 309
TOTAL PERSONAL SERVICES 112,237 129,903 125,505 132,447
OPERATING EXPENSES
4010 Travel 2,987 1,785 3,744 4,010
4110 Communication 360 120 500 420
4210 Postage 49 38 60 40
4310 Utilities 2,894 3,103 2,900 3,000
4510 Insurance 840 886 975 941
46xx Repairs & Maintenance- Equipment 1,400 1,400 1,610 1,410
4710 Printing & Binding 108 0 150 150
4810 Promotional Activities 17,300 18,250 18,750 18,750
4920 Other Current Charges 305 0 500 500
4930 Recognitions 130 195 200 75
5180 Minor Furniture & Equipment 132 0 200 200
5210 Operating Supplies 1,772 312 1,850 1,850
5410 Publications & Memberships 4,917 4,113 5,275 4,995
5520 Training 2,900 0 2,050 2,050
TOTAL OPERATING EXPENSES 36,094 30,202 38,764 38,391
OTHER USES
9941 Utilities Allocation (74,164) (120,078) (123,202) (128,129)
TOTAL OTHER USES (74,164) (120,078) (123,202) (128,129)
TOTAL GENERAL FUND APPROPRIATIONS 74,167 40,027 41,067 42,709

Fiscal Year 2021 - 22 Annual Budget
107
Legislative
Department
City
Commission
Division
Appropriations
Summary
Appropriations Summary
ADOPTED ADOPTED INCREASE/
2020-21 2021-22 (DECREASE) PERCENTAGE
Personal Services 125,505 132,447 6,942 5.53%
Operating Expenses 38,764 38,391 (373) -0.96%
Other Uses (123,202) (128,129) (4,927) 4.00%
TOTALS 41,067 42,709 1,642 4.00%

This page intentionally left blank
Fiscal Year 2021 - 22 Annual Budget
108

Fiscal Year 2021 - 22 Annual Budget
109
Organization
Total
Budget
Executive
Department
Al Minner, City Manager
The City Manager is the Chief Administrative Officer of the City. Position responsibilities include planning and organizing of all departments in accordance with the City Commission policies, the Municipal Charter, and the City Ordinances. The City Manager represents the City in relations with the public, press, and other governmental units. The City Attorney is hired by the City Commission to provide professional legal service and assistance to the City Commission, Mayor and various boards. The City Clerk is responsible for recording and maintaining official records of the City. Other activities of the department include providing funding for various organizations. Responsibilities: Administration City Clerk City Attorney Miscellaneous ·Personnel activities ·Agenda ·Legal services ·Citizen participation ·Department operations ·Minutes ·Litigation ·Civic functions ·Financial conditions ·Contracts ·Research cases ·Grants and Aids ·Capital needs ·Ordinances ·Correspondence ·C.U.R.E. ·Public relations ·Resolutions Organizational Chart
$ 2,369,245 GF
623,288 AL
$ 2,992,533
Citizens
City Commission
City Attorney
City Manager
Airport
City Clerk
Community
Development
Building
Planning &
Zoning
Electric
Stormwater WastewaterWater
Finance Fire
GasHousing
Human
Resources
Information
Technology
Library
Police
Public Works
Solid Waste
Recreation
GIS
Fleet ServicesHousing Assistance
Budget Manager
Executive Office
Manager
Redevelopment

Fiscal Year 2021 - 22 Annual Budget
110
Executive
Department
Public Outreach
& Lakefront TV
Goals & Tasks
Goals & Tasks
Goal: Foster an environment where local governance is collaborative, transparent and fiscally sound.
Task:
Inform the public about accomplishments of the organization
Promote the City of Leesburg on a local, regional and statewide level
Disseminate information to the public, media outlets and other governmental and non-governmental
organizations
Major Accomplishments:
Began livestreaming select programming on LakeFront TV including City Commission meetings,
Planning & Zoning meetings and the Leesburg Christmas Parade
Reached an agreement with Lake County to broadcast County Commission meetings on LakeFront
TV
Took measures to ensure that all broadcasts on LakeFront TV are ADA compliant
Continued outreach through website postings and social media

Fiscal Year 2021 - 22 Annual Budget
111
Executive
Department
Public Outreach
& Lakefront TV
Personnel
Schedule
Personnel Schedule
Classification 2021 Change 2022 Amount
Executive Office Manager1 0.20 0.00 0.20 14,439
Total 0.20 0.00 0.20 14,439
Notes: Allocations
Executive Office Manager1
20%-1220, 70%-1221, 10% 048-8021

Fiscal Year 2021 - 22 Annual Budget
112
Executive
Department
Public Outreach
& Lakefront TV
Appropriations
Detail
Appropriations Detail Account # 001-1220-512
ACTUAL ACTUAL ADOPTED ADOPTED
2018-19 2019-20 2020-21 2021-22
PERSONAL SERVICES
12xx Regular Salaries & Wages 13,644 14,094 14,435 14,439
1410 Overtime 591 215 0 0
2110 FICA 1,017 1,042 1,029 1,059
221x Retirement 682 2,283 2,119 722
23xx Insurance 1,996 1,991 2,286 1,557
2410 Workers' Compensation 39 40 40 40
26xx Other Employee Benefits 42 7 7 7
TOTAL PERSONAL SERVICES 18,011 19,672 19,916 17,824
OPERATING EXPENSES
3110 Professional Services 1,212 1,200 1,200 0
341x Contract Services 131,465 154,418 158,577 166,200
3411 Production Expenses 1,200 0 0 0
4110 Communication 703 771 793 1,728
4210 Postage 0 0 50 50
4310 Utilities 2,432 2,776 2,300 2,880
4510 Insurance 21 24 25 25
46xx Repairs & Maintenance- Equipment 1,320 920 1,560 960
4710 Printing & Binding 8,260 8,876 9,630 9,710
481x Promotional Activities 7,500 4,000 0 4,000
5180 Minor Furniture/Equipment 2,777 0 0 10,475
5210 Operating Supplies 37 1,502 100 250
5410 Publications & Memberships 2,296 4,044 2,800 2,475
TOTAL OPERATING EXPENSES 159,223 178,531 177,035 198,753
TOTAL GENERAL FUND APPROPRIATIONS 177,234 198,203 196,951 216,577

Fiscal Year 2021 - 22 Annual Budget
113
Executive
Department
Public Outreach
& Lakefront TV
Appropriations
Summary
Appropriations Summary
ADOPTED ADOPTED INCREASE/
2020-21 2021-22 (DECREASE) PERCENTAGE
Personal Services 19,916 17,824 (2,092) -10.50%
Operating Expenses 177,035 198,753 21,718 12.27%
TOTALS 196,951 216,577 19,626 9.96%
Significant Budget Changes:
The change in Operating Expenses is due to the Facci Bella contract in Contract Services (3410).
Additionally, Promotional Activities (4810) increased due to a TV sponsorship fee and Minor Furniture/
Equipment (5180) increased due to Commission Chamber Camera Upgrade project, $6,000 in
revenue is also included in the budget for this project.

Fiscal Year 2021 - 22 Annual Budget
114
Executive
Department
Administration
Division
Goals & Tasks
Goals & Tasks
Goal: Foster an environment where local governance is collaborative, transparent and fiscally sound.
Task:
Assist the organization in developing, planning and maintaining infrastructure/general services
sufficient to meet the needs of the community, as established by the City Commission
Continue to assist the Community Development Corporation and the CRA’s
Establish organizational operating processes and support systems to meet the needs of the
community in an efficient and cost-effective manner
Provide operational recommendations to the City Commission
Execute the direction of the City Commission
Keep the Commission informed on daily operations and long term strategies of the organization
Seek opportunities to implement the mission and core values adopted by the City Commission
Adhere to the International City Management Association Code of Ethics
Develop and implement policies which ensure the City’s long term financial stability
Remain current on issues and legislation which affect the City
Major Accomplishments:
Executed the direction of the City Commission pursuant to the ideas and standards of the
International City Manager Association

Fiscal Year 2021 - 22 Annual Budget
115
Executive
Department
Administration
Division
Personnel
Schedule
Personnel Schedule
Classification 2021 Change 2022 Amount
City Manager 1.00 0.00 1.00 196,976
Executive Office Manager1 0.70 0.00 0.70 50,537
Budget Manager 1.00 0.00 1.00 86,570
Total 2.70 0.00 2.70 334,083
Notes: Allocations
Executive Office Manager1
20%-1220, 70%-1221, 10% 048-8021

Fiscal Year 2021 - 22 Annual Budget
116
Executive
Department
Administration
Division
Appropriations
Detail
Appropriations Detail Account # 001-1221-512
ACTUAL ACTUAL ADOPTED ADOPTED
2018-19 2019-20 2020-21 2021-22
PERSONAL SERVICES
1xxx Regular Salaries & Wages 402,052 400,929 325,812 334,083
1410 Overtime 2,069 752 1,800 750
15xx Bonuses/Incentives 0 2,028 0 0
1641 Vacation/ Terms & Buyout 15,117 10,634 0 0
2110 FICA 27,736 27,978 24,275 24,986
221x Retirement 35,061 34,393 28,994 32,501
23xx Insurance 52,519 44,046 38,985 37,207
2410 Workers' Compensation 1,173 1,160 913 935
26xx Other Employee Benefits 8,505 6,711 5,271 4,925
TOTAL PERSONAL SERVICES 544,232 528,631 426,050 435,387
OPERATING EXPENSES
3110 Professional Services 2,800 0 500 500
341x Contract Services 0 0 500 500
4010 Travel 5,078 1,492 2,000 1,900
4110 Communication 881 1,025 876 1,170
4210 Postage 71 5 125 75
4310 Utilities 3,537 3,792 3,550 3,675
4410 Rentals 0 0 200 200
4510 Insurance 2,239 2,391 2,424 2,375
4625 Repairs & Maintenance- Non Buildings 2,682 0 0 0
46xx Repairs & Maintenance- Equipment 5,771 4,622 5,460 5,460
4710 Printing & Binding 371 0 300 300
481x Promotional Activities 29,780 31,063 32,450 31,900
49xx Advertising 463 1,600 150 150
5180 Minor Furniture/Equipment 132 0 100 200
5210 Operating Supplies 2,402 2,936 3,000 3,000
5215 Uniforms 37 296 150 150
5410 Publications & Memberships 13,718 14,427 13,000 14,500
5520 Training 1,195 680 1,000 975
TOTAL OPERATING EXPENSES 71,157 64,329 65,785 67,030
OTHER USES
994x Utilities Allocation (400,002) (504,014) (418,060) (427,054)
9990 Contingency Fund 0 0 0 0
TOTAL OTHER USES (400,002) (504,014) (418,060) (427,054)
TOTAL GENERAL FUND APPROPRIATIONS 215,387 88,946 73,775 75,363

Fiscal Year 2021 - 22 Annual Budget
117
Executive
Department
Administration
Division
Appropriations
Summary
Appropriations Summary
ADOPTED ADOPTED INCREASE/
2020-21 2021-22 (DECREASE) PERCENTAGE
Personal Services 426,050 435,387 9,337 2.19%
Operating Expenses 65,785 67,030 1,245 1.89%
Other Uses (418,060) (427,054) (8,994) 2.15%
TOTALS 73,775 75,363 1,588 2.15%

Fiscal Year 2021 - 22 Annual Budget
118
Executive
Department
City Clerk
Division
Goals & Tasks
Goals & Tasks
Goal: Foster an environment where local governance is collaborative, transparent and fiscally sound.
Task:
Provide an amicable and knowledgeable atmosphere for citizens to increase customer satisfaction
through good communication and service
Process all official record requests in compliance with Florida Public Records Law (F.S. Chapter 119)
Provide access to City Commission meeting agenda (on the City’s website) five (5) days prior to
meetings on the City’s website
Prepare newspaper ads for ordinances and legal notices as required
Record, transcribe and compose City Commission meeting minutes within two weeks
Record legal documents, including annexations, vacates, easements, developer agreements, etc. in
the Public Records of Lake County
Provide organized, safe document storage and destroy records on a yearly basis in accordance with
state and/or local policies
Provide record access to all employees through document imaging software
Provide to applicable departments, on a monthly basis, a list of contracts expiring within three months
Maintain a responsible budget by evaluating expenditures throughout the year
Take advantage of “in house” training to reduce costs and improve knowledge and proficiency
Major Accomplishments:
Prepared agendas, recorded and transcribed minutes for 38 City Commission, Community
Redevelopment Agency meetings, workshops and budget meetings
Coordinated the destruction of 169 boxes of obsolete records and placed 253 boxes into the records
retention system
Implemented improvements to ensure dissemination of public information is ADA compliant
Implemented a new agenda software program to provide easier public access to all agendas and
meetings
Performance Measures:
2019-20 2020-21 2021-22
Public record requests received 748 650 650
Public record requests processed 727 650 650
Indexing transactions processed 1,280 1,000 1,000
Prepared legal ads for newspaper 115 60 60

Fiscal Year 2021 - 22 Annual Budget
119
Executive
Department
City Clerk
Division
Personnel
Schedule
Personnel Schedule
Classification 2021 Change 2022 Amount
City Clerk 1.00 0.00 1.00 76,794
Deputy City Clerk I 1.00 0.00 1.00 42,848
Total 2.00 0.00 2.00 119,642

Fiscal Year 2021 - 22 Annual Budget
120
Executive
Department
City Clerk
Division
Appropriations
Detail
Appropriations Detail Account # 001-1222-512
ACTUAL ACTUAL ADOPTED ADOPTED
2018-19 2019-20 2020-21 2021-22
PERSONAL SERVICES
12xx Regular Salaries & Wages 101,207 106,712 109,262 119,642
1410 Overtime 373 245 500 500
1641 Vacation/ Terms & Buyout 2,703 2,784 0 0
2110 FICA 7,691 8,111 8,078 8,963
221x Retirement 13,134 13,509 12,700 15,964
23xx Insurance 25,966 25,660 27,763 32,570
2410 Workers' Compensation 292 307 306 335
26xx Other Payroll Benefits 3,429 3,493 3,486 3,367
TOTAL PERSONAL SERVICES 154,795 160,821 162,095 181,341
OPERATING EXPENSES
3410 Contract Services 10,279 7,504 10,000 9,700
4010 Travel 634 1,286 1,300 1,400
4110 Communication 397 469 450 450
4210 Postage 374 314 275 275
4310 Utilities 2,572 2,758 2,600 2,800
4510 Insurance 423 660 690 772
46xx Repairs & Maintenance- Equipment 3,578 3,937 3,420 3,550
4810 Promotional Activities 0 100 150 150
4911 Advertising 12,219 24,294 10,000 10,000
4920 Other Current Charges 293 2,661 700 1,000
5180 Minor Furniture/Equipment 0 0 200 200
5210 Operating Supplies 494 855 750 700
5410 Publications & Memberships 792 965 3,000 2,820
5520 Training 675 0 1,100 1,100
TOTAL OPERATING EXPENSES 32,730 45,803 34,635 34,917
OTHER USES
9941 Utilities Allocation (140,643) (154,968) (147,548) (162,194)
TOTAL OTHER USES (140,643) (154,968) (147,548) (162,194)
TOTAL GENERAL FUND APPROPRIATIONS 46,882 51,656 49,182 54,064

Fiscal Year 2021 - 22 Annual Budget
121
Executive
Department
City Clerk
Division
Appropriations
Summary
Appropriations Summary
ADOPTED ADOPTED INCREASE/
2020-21 2021-22 (DECREASE) PERCENTAGE
Personal Services 162,095 181,341 19,246 11.87%
Operating Expenses 34,635 34,917 282 0.81%
Other Uses (147,548) (162,194) (14,646) 9.93%
TOTALS 49,182 54,064 4,882 9.93%

Fiscal Year 2021 - 22 Annual Budget
122
Executive
Department
Elections
Division
Goals & Tasks
Goals & Tasks
Goal: Foster an environment where local governance is collaborative, transparent and fiscally sound.
Task:
Conduct elections in compliance with all laws, rules and regulations
Prepare election calendar for distribution by March 1 of election year
Provide candidate packets for distribution beginning March 1 of election year
Proclaim election at the second City Commission meeting in June of election year as required by the
City of Leesburg Code of Ordinances
Accept qualifying packets, administer and notarize oaths for all candidates for the City Commission
seats from pre-filing through end of qualifying period
Receive and publish, via the City’s website, all treasurer reports
Receive political sign deposits from any candidate who posts signs in the City of Leesburg
Continue to improve communication with citizens on the City of Leesburg’s election procedures by
advertising qualifying dates, via electronic and published media, answering all telephone inquiries and
speaking engagements
Major Accomplishments:
Coordinated with Supervisor of Elections to secure polling locations
Received and returned signed deposits for 14 candidates
Leesburg citizens passed referendum to create 5 single Commission districts (6,975 Yes votes, 3,335
No votes for a total of 10,310 votes)
Administered Oath of Office to Commissioner Jimmy Burry, Seat 1, District 1 and Commissioner Jay
Connell, Seat 3, District 3
Presented Certificate of Election at the November 23, 2020 City Commission meeting
Performance Measures:
2019-20 2020-21 2021-22
Seats available N/A 2 N/A
Number of candidates N/A 5 N/A
Total votes cast N/A 7,869 N/A
Candidate packets prepared 10 N/A 10
Political sign deposits received N/A 14 N/A
Treasurer’s reports received N/A 79 N/A
Installed Commissioners N/A 2 N/A

Fiscal Year 2021 - 22 Annual Budget
123
Executive
Department
Elections
Division
Appropriations
Detail &
Summary
Appropriations Detail Account # 001-1227-513
Appropriations Summary
ACTUAL ACTUAL ADOPTED ADOPTED
2018-19 2019-20 2020-21 2021-22
OPERATING EXPENSES
4911 Advertising-Other Ads 0 0 500 500
4920 Other Current Charges 0 0 500 500
TOTAL OPERATING EXPENSES 0 0 1,000 1,000
TOTAL GENERAL FUND APPROPRIATIONS 0 0 1,000 1,000
ADOPTED ADOPTED INCREASE/
2020-21 2021-22 (DECREASE) PERCENTAGE
Operating Expenses 1,000 1,000 0 0.00%
TOTALS 1,000 1,000 0 0.00%

Fiscal Year 2021 - 22 Annual Budget
124
Executive
Department
City Attorney
Division
Goals & Tasks
Goals & Tasks
Goal: Foster an environment where local governance is collaborative, transparent and fiscally sound.
Task:
Review agendas and related documents for regular and special City Commission meetings and
provide necessary or requested legal information to the City Manager, City Commissioners and the
City Clerk’s office prior to each City Commission meeting
Attend all regular City Commission meetings, special meetings as requested, Planning Commission,
meetings of the Greater Leesburg Community Redevelopment Agency; attend, as requested,
proceedings of the Code Enforcement Special Magistrate and other City of Leesburg meetings
Maintain current information on personnel law to aid the Human Resources Department and attend
personnel meetings and proceedings as necessary or requested
Represent the City of Leesburg, its officers and public officials in litigation arising out of or in
connection with their official duties or in the normal course of City operations
Prepare contracts, deeds, and other instruments, obtain and evaluate title information, and otherwise
represent the City in the purchase or sale of real property, and in the foreclosure of liens against real
property
Provide services for instructional seminars as needed
Prepare and review contracts by which the City’s utilities and other enterprise funds; review or
prepare contracts for acquisition of other utility services areas and sale of utilities
Assist the Police department with issues pertaining to civil forfeiture cases and prosecute such cases
upon request
Provide advice and counsel to the City in connection with issuance, redemption or refinancing of
bonds, notes and other evidences of indebtedness
Advise the City Clerk and other City officials concerning open records, open meetings and other laws
governing public meetings and documents
Performance Measures:
2019-20 2020-21 2021-22
Contracts prepared of reviewed 35 40 48
Resolutions prepared 40 40 48
Ordinances prepared 25 30 25
Public Notices prepared 24 15 10
Easements prepared 50 45 48
Meetings attended 75 75 75
Property transactions 20 25 15
Cases Tried 1 1 2

Fiscal Year 2021 - 22 Annual Budget
125
Executive
Department
City Attorney
Division
Appropriations
Detail &
Summary
Appropriations Detail Account # 001-1241-514
Appropriations Summary
ACTUAL ACTUAL ADOPTED ADOPTED
2018-19 2019-20 2020-21 2021-22
OPERATING EXPENSES
3110 Professional Services 94,440 70,013 99,500 92,000
TOTAL OPERATING EXPENSES 94,440 70,013 99,500 92,000
OTHER USES
9941 Utilities Allocation (33,054) (23,804) (35,820) (34,040)
TOTAL OTHER USES (33,054) (23,804) (35,820) (34,040)
TOTAL GENERAL FUND APPROPRIATIONS 61,386 46,209 63,680 57,960
ADOPTED ADOPTED INCREASE/
2020-21 2021-22 (DECREASE) PERCENTAGE
Operating Expenses 99,500 92,000 (7,500) -7.54%
Other Uses (35,820) (34,040) 1,780 -4.97%
TOTALS 63,680 57,960 (5,720) -8.98%

Fiscal Year 2021 - 22 Annual Budget
126
Executive
Department
Miscellaneous
Division
Description
Description
The Citizens Utility Relief Effort (CURE) was established in October 1991 to provide monetary assistance to customers who are unable to pay their utility bills due to loss of employment or an unexpected illness or injury. Employees and utility customers contribute throughout the year. Local agencies approved by Commission will collectively determine who needs assistance and provide vouchers up to $100 per year per customer to the Customer Service department at the City of Leesburg. This division contains expenditures that do not relate to budgets of any other City operating department. A contingency account has been established to provide funds for expenditures which cannot be anticipated during the budget preparation process. Appropriations from the reserve for contingencies may be made to increase the appropriation for any particular expense in the same fund, or to create an appropriation in the fund for any lawful purpose, but expenditures may not be charged directly to the reserve for contingencies. This division reflects reserve for future capital, which allows the City to maintain fund balance at an appropriate level. Performance Measures: 2019-20 2020-21 2021-22
CURE donations (including $6,000 from Commission) 55,968 20,000 10,000 CURE vouchers issued 405 350
250

Fiscal Year 2021 - 22 Annual Budget
127
Executive
Department
Miscellaneous
Division
Appropriations
Detail
Appropriations Detail Account # 001-1295-XXX
ACTUAL ACTUAL ADOPTED ADOPTED
2018-19 2019-20 2020-21 2021-22
PERSONAL SERVICES
1249 Vacation Buy Back 0 0 149,374 106,121
2510 Unemployment Compensation 9,729 14,879 3,500 10,000
TOTAL PERSONAL SERVICES 9,729 14,879 152,874 116,121
OPERATING EXPENSES
3110 Professional Services 5,816 5,816 0 0
3410 Contract Services 0 0 0 0
4510 Insurance 100 100 500 500
4810 Promotional Activities 2,995 0 0 0
4930 PD Community Services 1,500 1,500 1,500 1,500
4934 CA Warehouse Over/Short 65 (9,188) 0 0
4990 C.U.R.E. Payments 9,450 35,700 6,600 6,600
5440 Education Reimbursement 0 0 10 0
TOTAL OPERATING EXPENSES 19,926 33,928 8,610 8,600
GRANTS AND AIDS
8210 Local Contributions 0 0 50,000 0
8213 Housing Rehab Program 0 0 0 0
8214 Matching Landscape/Façade 16,710 5,000 0 0
8216 MEC/FSL Grant 250,000 250,000 0 0
TOTAL GRANTS AND AIDS 266,710 255,000 50,000 0
OTHER USES
9112 Homelessness Reserve 0 0 0 0
9121 Debt Service 1,548,449 1,535,199 1,491,067 1,489,560
9131 Transfer to Capital Projects Fund 652,917 4,026,000 0 350,000
9161 Reserve/Cash Carried Forward 0 0 0 0
9221 Transfer to CHCRA Fund 0 0 0 0
TOTAL OTHER USES 2,201,366 5,561,199 1,491,067 1,839,560
TOTAL GENERAL FUND APPROPRIATIONS 2,497,731 5,865,006 1,702,551 1,964,281

Fiscal Year 2021 - 22 Annual Budget
128
Executive
Department
Miscellaneous
Division
Appropriations
Summary
Appropriations Summary
ADOPTED ADOPTED INCREASE/
2020-21 2021-22 (DECREASE) PERCENTAGE
Personal Services 152,874 116,121 (36,753) -24.04%
Operating Expenses 8,610 8,600 (10) -0.12%
Grants and Aids 50,000 0 (50,000) -100.00%
Other Uses 1,491,067 1,839,560 348,493 23.37%
TOTALS 1,702,551 1,964,281 261,730 15.37%

Fiscal Year 2021 - 22 Annual Budget
129
Organization
Total
Budget
Finance
Department
James Williams, Finance Director
The Finance Department is responsible for maintaining financial records based on standards prescribed by the Governmental Accounting Standards Board (GASB), and preparing financial statements in conformity with generally accepted accounting principles (GAAP). The Finance Director oversees the Customer Service, Accounting and Purchasing Divisions. The services of the Purchasing Division are conducted in an open, competitive manner to provide maximum return on the dollar to benefit the City and the community. The warehouse function of the Purchasing Division maintains efficient storage and distribution of materials and supplies. Responsibilities: Accounting Customer Service Procurement Inventory & Materials Mgmt. ·Cash Receipts ·Utility Payments ·Bids ·Receive shipments ·Fixed Assets ·Cash Receipts ·Requisitions ·Distribution to city depts. ·Payroll ·Switchboard ·Purchase orders ·Fuel inventory, monitoring ·Debt Service ·Delinquencies ·Auction and reports ·Accounts Payable ·Collection Reports ·Annual Contracts ·Surplus disposal ·Cash Management ·Generate Bills ·Investments ·Customer Inquiries ·Financial Reporting ·New Accounts ·Miscellaneous Billing ·Terminated Accounts ·Work Orders ·Monitor Meter Reading ·Risk Management ·Disconnects ·Reconnects
Organizational Chart
$ 262,422 GF
3,259,282 AL
$ 3,521,704
Finance Director
Accounting
Financial Reporting
Manager
Accounting
Operations
Supervisor
Risk & Payroll
Technician
Customer
Accounts
Manager
Purchasing
Manager
Senior
Buyer
Warehouse
Supervisor
Warehouse
Specialists
Accounting
Specialist II
Administrative
Assistant II
Assistant Customer
Accounts Manager
Customer Relations
Supervisor
Customer Service
Operations
Supervisor
Customer Service
Specialists
Utility Service
TechnicianCustomer Service
Speciaists
Customer Relations
Specialist
Accounting
Specialist I
Accountants
Utility Billing
Supervisor
Customer Service
Specialists
Utility Billing
Specialist II
Payroll
Administrator

Fiscal Year 2021 - 22 Annual Budget
130
Finance
Department
Accounting
Division
Goals & Tasks
Goals & Tasks
Goal: Foster an environment where local governance is collaborative, transparent and fiscally sound.
Task:
Earn at least 50% of the 1-year Treasury Bills return monthly, while meeting the City’s investment
policy guidelines
Strive to reply to all public information requests within one business day and to provide any requested
data within three business days
Complete the annual Comprehensive Annual Financial Report (CAFR) no later than the same day the
previous year with no Management letter comments from the auditors
Complete and close the monthly financial reports by the 22nd of each month
To apply for and obtain the Government Finance Officer’s Association’s Certificate of Achievement for
Excellence in Financial Reporting for the City’s annual CAFR
Increase governmental and interdepartmental efficiency
Major Accomplishments:
Completed the CAFR in-house, including implementing the new OPEB standard, saving the City
consultant expenses
Performance Measures:
2019-20 2020-21 2021-22
Management Letter Comments 0 0 0
GFOA award for financial reporting (consecutive
years)
30 31 32

Fiscal Year 2021 - 22 Annual Budget
131
Finance
Department
Accounting
Division
Personnel
Schedule
Personnel Schedule
Classification 2021 Change 2022 Amount
Accountant I 1.00 0.00 1.00 34,341
Accountant III 1.00 0.00 1.00 56,222
Accounting Operations Supervisor 1.00 0.00 1.00 66,206
Accounting Specialist I 1.00 0.00 1.00 31,200
Accounting Specialist II 1.00 0.00 1.00 39,416
Finance Director1 0.85 0.00 0.85 101,041
Financial Reporting Manager 1.00 0.00 1.00 72,114
Payroll Administrator 1.00 0.00 1.00 52,896
Payroll & Risk Technician2 0.50 0.00 0.50 22,392
Total 8.35 0.00 8.35 475,828
Note: Allocations
Finance Director1
15%-1350 & 85%-1331
Payroll & Risk Technician2
50%-1350 & 50%-1331

Fiscal Year 2021 - 22 Annual Budget
132
Finance
Department
Accounting
Division
Appropriations
Detail
Appropriations Detail Account # 001-1331-513
ACTUAL ACTUAL ADOPTED ADOPTED
2018-19 2019-20 2020-21 2021-22
PERSONAL SERVICES
12xx Regular Salaries & Wages 521,982 424,206 456,535 475,828
1410 Overtime 469 3,992 1,000 1,000
15xx Bonuses/Incentives 2,033 2,864 0 0
1641 Vacation/Terms & Buyout 21,299 9,116 0 0
2110 FICA 38,573 30,621 32,548 34,341
221x Retirement 46,410 41,669 40,955 66,667
23xx Insurance 112,314 112,687 119,689 113,973
2410 Workers' Compensation 1,529 1,228 1,280 1,332
26xx Other Payroll Benefits 3,258 3,408 3,520 3,257
TOTAL PERSONAL SERVICES 747,867 629,791 655,527 696,398
OPERATING EXPENSES
3110 Professional Services 964 32 100 100
3210 Auditing 78,000 90,578 77,000 91,700
3410 Contract Services 629 669 20,650 1,000
4010 Travel 2,987 0 3,360 3,360
4210 Postage 4,323 4,671 4,515 4,750
4310 Utilities 10,290 11,031 10,500 12,000
4510 Insurance 3,313 3,276 3,175 2,813
46xx Repairs & Maintenance Equipment 8,482 7,195 8,880 8,760
4710 Printing & Binding 39 0 100 250
4810 Promotional Activities 150 100 150 150
49xx Other Current Charges 639 630 660 660
5180 Minor Furniture/Equipment 0 514 300 520
52xx Operating Supplies 2,993 3,006 3,000 3,000
5410 Publications & Memberships 1,318 1,370 1,920 1,920
5520 Training 1,269 40 2,615 2,615
TOTAL OPERATING EXPENSES 115,396 123,112 136,925 133,598
OTHER USES
9941 Utilities Allocation (517,958) (639,965) (673,584) (705,497)
TOTAL OTHER USES (517,958) (639,965) (673,584) (705,497)
TOTAL GENERAL FUND APPROPRIATIONS 345,305 112,938 118,868 124,499

Fiscal Year 2021 - 22 Annual Budget
133
Finance
Department
Accounting
Division
Appropriations
Summary
Appropriations Summary
ADOPTED ADOPTED INCREASE/
2020-21 2021-22 (DECREASE) PERCENTAGE
Personal Services 655,527 696,398 40,871 6.23%
Operating Expenses 136,925 133,598 (3,327) -2.43%
Other Uses (673,584) (705,497) (31,913) 4.74%
TOTALS 118,868 124,499 5,631 4.74%

Fiscal Year 2021 - 22 Annual Budget
134
Finance
Department
Goals & Tasks
Customer
Service
Division
Goals & Tasks
Goal: Foster an environment where local governance is collaborative, transparent and fiscally sound.
Task:
Increase Click2Gov and IVR payments to a minimum of 15,000 transactions per month
Increase the number of electronic billing customers to 10,000 from 6,000
Maintain hold times to less than 5 minutes per call
Continue to provide customer education on how to manage utility consumption through bill inserts
and customer workshops
In conjunction with the Electric department, establish an in-home Energy Audit Program with an
FMEA approved third-party contractor
Major Accomplishments:
Continued our educational campaign to inform our residents of the different services available and
how they can save time and money
The electronic billing campaign has saved the City over $35,000 annually in utility billing production
costs
Performance Measures:
2019-20 2020-21 2021-22
Educational insert into bills (times per year) 2 2 2
Customer workshops (times per year) 2 2 2
In-home Energy Audits 0 200 200

Fiscal Year 2021 - 22 Annual Budget
135
Finance
Department
Customer
Service
Division
Personnel
Schedule
Personnel Schedule
Classification 2021 Change 2022 Amount
Administrative Assistant II 1.00 0.00 1.00 34,715
Assistant Customer Accounts Manager 1.00 0.00 1.00 61,797
Customer Accounts Manager 1.00 0.00 1.00 90,397
Customer Relations Specialist 1.00 0.00 1.00 35,714
Customer Relations Supervisor 1.00 0.00 1.00 41,018
Customer Service Operations Supervisor 1.00 1.00 2.00 84,406
Customer Service Specialist 17.00 0.00 17.00 583,856
Utility Billing Specialist II 1.00 0.00 1.00 35,714
Utility Billing Supervisor 1.00 0.00 1.00 38,542
Utility Service Technician 2.00 0.00 2.00 85,737
Standby 4,000
Total 27.00 1.00 28.00 1,095,896

Fiscal Year 2021 - 22 Annual Budget
136
Finance
Department
Customer
Service
Division
Appropriations
Detail
Appropriations Detail Account # 001-1334-513
ACTUAL ACTUAL ADOPTED ADOPTED
2018-19 2019-20 2020-21 2021-22
PERSONAL SERVICES
12xx Regular Salaries & Wages 891,080 963,412 1,032,412 1,095,896
1310 Temporary Labor 1,769 0 0 0
1410 Overtime 28,012 27,600 30,000 30,000
1641 Vacation/Terms & Buyout 23,842 12,495 0 0
2110 FICA 66,715 71,309 72,032 78,118
221x Retirement 68,051 73,156 73,702 107,797
23xx Insurance 289,119 285,228 297,623 296,687
2410 Workers' Compensation 3,794 3,923 3,992 4,199
26xx Other Payroll Benefits 1,312 1,816 1,560 1,945
TOTAL PERSONAL SERVICES 1,373,694 1,438,939 1,511,321 1,614,642
OPERATING EXPENSES
3xxx Professional Services 99,065 103,180 121,544 121,814
4010 Travel 169 378 2,500 2,500
41xx Communication 10,747 10,461 10,990 10,990
4210 Postage 148,791 154,181 154,000 155,040
4310 Utilities 8,039 8,618 8,550 8,550
4410 Rentals 2,626 4,262 3,600 3,600
4415 Internal Fleet Lease 8,614 11,601 8,787 8,898
4510 Insurance 6,794 7,555 8,429 9,133
461x Repairs & Maintenance- Vehicles 8,818 26,216 7,825 11,379
46xx Repairs & Maintenance- Equipment 22,629 21,798 16,290 15,390
4710 Printing & Binding 617 191 1,000 1,000
4810 Promotional Activities 178 156 400 400
49xx Other Current Charges 255,470 294,902 215,700 215,700
5180 Minor Furniture/Equipment 2,172 3,085 2,900 4,305
521x Operating Supplies 29,629 27,304 36,000 36,000
5230 Fuel Purchase 6,560 6,211 7,000 5,400
5410 Publications & Memberships 315 498 1,000 1,000
5520 Training 1,496 528 3,000 3,000
TOTAL OPERATING EXPENSES 612,729 681,125 609,515 614,099
CAPITAL OUTLAY
6410 Machinery & Equipment 32,661 31,834 0 0
TOTAL CAPITAL OUTLAY 32,661 31,834 0 0
OTHER USES
9941 Utilities Allocation (1,990,895) (2,127,431) (2,085,684) (2,187,413)
TOTAL OTHER USES (1,990,895) (2,127,431) (2,085,684) (2,187,413)
TOTAL GENERAL FUND APPROPRIATIONS 28,189 24,467 35,152 41,328

Fiscal Year 2021 - 22 Annual Budget
137
Finance
Department
Customer
Service
Division
Appropriations
Summary
Appropriations Summary
ADOPTED ADOPTED INCREASE/
2020-21 2021-22 (DECREASE) PERCENTAGE
Personal Services 1,511,321 1,614,642 103,321 6.84%
Operating Expenses 609,515 614,099 4,584 0.75%
Capital Outlay 0 0 0 0.00%
Other Uses (2,085,684) (2,187,413) (101,729) 4.88%
TOTALS 35,152 41,328 6,176 17.57%

Fiscal Year 2021 - 22 Annual Budget
138
Finance
Department
Goals & Tasks
Procurement
Division
Goals & Tasks
Goal: Eliminate blight and stimulate growth by investing in neighborhood redevelopment, while also
pursuing new economic opportunities.
Task:
At a minimum, obtain annual renewal of contracts for demolition, board-up of buildings and mowing
Increase the number of local suppliers registered with the City
Provide at least 2 hours per month of supplier training targeted specifically at local suppliers
Recruit small businesses and Historically Underutilized Businesses (HUB) as suppliers of
commodities to the City
Promote the City’s Disadvantage Business Enterprise (DBE)/Small Business Enterprise (SBE)
program for the Leesburg International Airport
Goal: Foster an environment where local governance is collaborative, transparent and fiscally sound.
Task:
Use an on-line system to promote transparency of the solicitation process and all activities of
procurement
Strive to obtain no less than 3 responses to all competitive sealed bids
Strive to enroll at least 1 new supplier in the e-payables system to reduce costs associated with
accounts payable
Major Accomplishments:
Completed procurement activities for City capital projects, specifically the new Venetian Garden
Docks and Community Development Software Acquisition
Completed the Leesburg International Airport DBE Plan
Have continued with a 100% electronic e-Bid/RFx software platform for all competitive solicitations
Performance Measures:
2019-20 2020-21 2021-22
Supplier training, targeting local suppliers (hours) 15 10 20
Department user training (hours) 15 5 40

Fiscal Year 2021 - 22 Annual Budget
139
Finance
Department
Personnel
Schedule
Procurement
Division
Personnel Schedule
Classification 2021 Change 2022 Amount
Purchasing Manager 1.00 0.00 1.00 90,397
Senior Buyer 2.00 0.00 2.00 92,496
Total 3.00 0.00 3.00 182,893

Fiscal Year 2021 - 22 Annual Budget
140
Finance
Department
Procurement
Division
Appropriations
Detail
Appropriations Detail Account # 001-1366-513
ACTUAL ACTUAL ADOPTED ADOPTED
2018-19 2019-20 2020-21 2021-22
PERSONAL SERVICES
12xx Regular Salaries & Wages 166,697 169,743 173,784 182,893
1410 Overtime 198 0 2,647 500
15xx Bonuses/Incentives 2,558 2,558 0 0
1641 Vacation/Terms & Buyout 3,962 7,216 0 0
2110 FICA 12,543 12,945 12,544 13,390
221x Retirement 18,418 18,395 17,462 22,424
23xx Insurance 50,594 44,256 48,225 40,352
2410 Workers' Compensation 486 501 487 512
262x Other Payroll Benefits 753 734 753 776
TOTAL PERSONAL SERVICES 256,209 256,348 255,902 260,847
OPERATING EXPENSES
3410 Contract Services 10,926 15,961 16,850 16,850
4010 Travel 1,383 124 2,240 400
41xx Communication 362 780 480 480
4210 Postage 23 9 50 0
4310 Utilities 3,901 3,595 4,500 4,000
4510 Insurance 943 1,070 1,162 1,201
463x Repairs & Maintenance- Equipment 3,829 3,287 3,180 3,160
4710 Printing & Binding 0 0 100 0
4810 Promotional Activities 0 0 400 400
5180 Minor Furniture/Equipment 318 2,159 1,000 1,000
5210 Operating Supplies 2,301 1,867 2,800 2,300
5410 Publications & Memberships 1,193 1,181 1,385 1,385
5520 Training 150 1,505 3,850 3,850
TOTAL OPERATING EXPENSES 25,329 31,538 37,997 35,026
OTHER USES
9941 Utilities Allocation (168,923) (132,429) (126,377) (215,987)
TOTAL OTHER USES (168,923) (132,429) (126,377) (215,987)
TOTAL GENERAL FUND APPROPRIATIONS 112,615 155,457 167,522 79,886

Fiscal Year 2021 - 22 Annual Budget
141
Finance
Department
Appropriations
Summary
Procurement
Division
Appropriations Summary
ADOPTED ADOPTED INCREASE/
2020-21 2021-22 (DECREASE) PERCENTAGE
Personal Services 255,902 260,847 4,945 1.93%
Operating Expenses 37,997 35,026 (2,971) -7.82%
Other Uses (126,377) (215,987) (89,610) 70.91%
TOTALS 167,522 79,886 (87,636) -52.31%
Significant Budget Changes:
The change in Other Uses is directly related to the Cost Allocation (9941) and the update of the PO's
that were issued for the year before which drives this allocation and changes yearly.

Fiscal Year 2021 - 22 Annual Budget
142
Finance
Department
Goals & Tasks
Warehouse
Division
Goals & Tasks
Goal: Lead the industry in providing high quality, low cost, customer driven utility services
Task:
Efficiently operate the warehouse and implement best practice inventory management practices
Warehouse inventory accuracy to be greater than 98%
Closely work with the Electric Department to monitor projects and manage required materials to
eliminate overstocking of material
Major Accomplishments:
Maintained a warehouse inventory discrepancy of less than 1%
Continue to efficiently procure inventory materials for large projects
Manage material ordering and stocking for large high-profile projects for all of the utilities
Performance Measures:
2019-20 2020-21 2021-22
Warehouse inventory accuracy 99.7% 99.8% 99.8%
Revenue from sale of scrap materials $90,000 $80,000 $120,000

Fiscal Year 2021 - 22 Annual Budget
143
Finance
Department
Personnel
Schedule
Warehouse
Division
Personnel Schedule
Classification 2021 Change 2022 Amount
Warehouse Specialist 2.00 0.00 2.00 63,024
Warehouse Supervisor 1.00 0.00 1.00 42,182
Total 3.00 0.00 3.00 105,206

Fiscal Year 2021 - 22 Annual Budget
144
Finance
Department
Appropriations
Detail
Warehouse
Division
Appropriations Detail Account # 001-1369-513
ACTUAL ACTUAL ADOPTED ADOPTED
2018-19 2019-20 2020-21 2021-22PERSONAL SERVICES
12xx Regular Salaries & Wages 91,569 91,016 103,022 105,206
1641 Vacation/Terms & Buyout 578 595 0 0
211x FICA 6,598 6,517 7,145 7,574
221x Retirement 12,465 12,534 12,219 11,723
23xx Insurance 22,954 23,286 30,094 24,139
2410 Workers' Compensation 3,829 3,807 4,286 4,377
26xx Other Employee Benefits 46 152 120 34
TOTAL PERSONAL SERVICES 138,039 137,907 156,886 153,053
OPERATING EXPENSES
3410 Contract Services 384 0 0 0
4010 Travel 531 0 0 0
41xx Communication 286 266 200 400
4415 Internal Fleet Lease 2,212 3,036 2,300 2,323
4510 Insurance 933 1,214 1,170 1,217
461x Repairs & Maintenance- Vehicles 1,939 465 1,565 1,576
4620 Repairs & Maintenance- Building 118 0 13,100 2,000
46xx Repairs & Maintenance- Equipment 729 733 2,100 1,900
5180 Minor Furniture/Equipment 905 2,800 1,500 2,800
5210 Operating Supplies 809 390 1,000 1,000
5215 Uniforms 760 832 800 800
5230 Fuel Purchases 10 9 50 25
TOTAL OPERATING EXPENSES 9,616 9,745 23,785 14,041
OTHER USES
9941 Utilities Allocation (137,260) (135,336) (165,962) (150,385)
TOTAL OTHER USES (137,260) (135,336) (165,962) (150,385)
TOTAL GENERAL FUND APPROPRIATIONS 10,395 12,316 14,709 16,709

Fiscal Year 2021 - 22 Annual Budget
145
Finance
Department
Appropriations
Summary
Warehouse
Division
Appropriations Summary
ADOPTED ADOPTED INCREASE/
2020-21 2021-22 (DECREASE) PERCENTAGE
Personal Services 156,886 153,053 (3,833) -2.44%
Operating Expenses 23,785 14,041 (9,744) -40.97%
Other Uses (165,962) (150,385) 15,577 -9.39%
TOTALS 14,709 16,709 2,000 13.60%
Significant Budget Changes:
The reduction in Operating Expenses is due to a decrease in R&M/Buildings (4620). Additionally, the
were pulled out of the warehouse the year before which drives the allocation and changes yearly.
change in Other Uses is directly related to the Cost Allocation (9941) and the update of the items that

This page intentionally left blank
Fiscal Year 2021 - 22 Annual Budget
146

Fiscal Year 2021 - 22 Annual Budget
147
Organization
Total
Budget
Human
Resources
Department
Melissa Arriaga, Director of Human Resources
The Human Resources Department is responsible for recruitment, employment, workers’ and unemployment compensation, training, firefighter union negotiations, personnel policies and procedures and training. Other services include: monitor/coordinate with contracted agencies for surveys and studies of salaries and fringe benefits, representing the City in personnel matters, and provide administrative service to the City Manager. Responsibilities: Management ·Recruitment & testing ·Insurance administration ·Employment ·Workers’ compensation ·Performance appraisal system ·Wage & salary administration ·Employee & retiree benefits ·Counseling ·Federal employment law compliance ·Management training
Organizational Chart
$ 235,000 GF
138,016 AL
$ 373,016
Director of Human
Resources
HR
Administrative
Specialist
Benefits &
Compensation
Coordinator
Human
Resources
Analysts

Fiscal Year 2021 - 22 Annual Budget
148
Human
Resources
Department
Human
Resources
Division
Goals & Tasks
Goals & Tasks
Goal: Foster an environment where local governance is collaborative, transparent and fiscally sound.
Task:
Attract and ensure a diverse workforce through an improved online application process
Create a simplified performance evaluation process that fosters the City’s vision and goals while
incorporating improved communication and feedback
Strengthen our employee wellness program in order to improve the overall group health and wellness
profile of our employees
Provide training and development in areas of: effective leadership and career development of
employees, employment law and government regulation and litigation avoidance
Identify the best and most cost effective recruitment sources to promote job opportunities
Maintain continuous open lines of communication between management and staff
Major Accomplishments:
Implemented new online application process
Implemented online open enrollment process
Successfully coordinated the City’s Supervisory Leadership Academy
Performance Measures:
2019-20 2020-21 2021-22
Days to process applications 2 2 1
Days positions advertised 30 31 30
Days from employment offer to start date 14 18 16
Percentage of positions vacant 4.1 4.0 5.0

Fiscal Year 2021 - 22 Annual Budget
149
Human
Resources
Department
Human
Resources
Division
Personnel
Schedule
Personnel Schedule
Classification 2021 Change 2022 Amount
Benefits & Compensation Coordinator1 0.70 0.00 0.70 35,017
Director of Human Resources2 0.50 0.00 0.50 40,477
Human Resources Analyst 2.00 0.00 2.00 79,338
HR Administrative Specialist 1.00 0.00 1.00 36,420
Total 4.20 0.00 4.20 191,252
Note: Allocations
Benefits & Compensation Coordinator1
70%-1437, 30%-1340
Director of Human Resources2
50%-1437, 50%-1340

Fiscal Year 2021 - 22 Annual Budget
150
Human
Resources
Department
Human
Resources
Division
Appropriations
Detail
Appropriations Detail Account # 001-1437-513
ACTUAL ACTUAL ADOPTED ADOPTED
2018-19 2019-20 2020-21 2021-22
PERSONAL SERVICES
12xx Regular Salaries & Wages 155,945 182,118 185,677 191,252
1410 Overtime 5,642 3,968 6,000 6,000
1641 Vacation/Terms & Buyout 1,842 1,900 0 0
2110 FICA 11,434 13,210 12,993 13,386
221x Retirement 18,396 14,532 14,350 22,282
23xx Insurance 46,882 51,544 41,203 42,135
2410 Workers' Compensation 452 523 520 535
26xx Other Payroll Benefits 1,931 1,991 1,957 1,495
TOTAL PERSONAL SERVICES 242,524 269,786 262,700 277,085
OPERATING EXPENSES
31xx Professional Services 44,528 36,451 35,000 35,000
3410 Contract Services 0 20,163 12,500 1,000
4010 Travel 646 99 750 750
41xx Communication 252 1,478 685 800
4210 Postage 822 1,312 850 850
4310 Utilities 3,537 3,792 3,600 3,800
4510 Insurance 1,097 1,212 1,246 1,381
46xx Repairs & Maintenance- Equipment 9,993 7,580 10,160 21,450
4710 Printing & Binding 0 0 2,500 2,000
4810 Promotional Activities 2,632 2,172 3,250 3,000
49xx Advertising 6,722 1,301 4,300 3,650
4920 Other Current Charges 0 45 100 100
4930 Recognitions & Awards 9,996 7,392 10,000 10,000
5180 Minor Furniture/Equipment 538 3,157 750 750
5210 Operating Supplies 6,658 5,862 6,600 6,600
5215 Uniforms 0 0 300 300
5410 Publications & Memberships 938 1,467 1,500 1,500
552x Training 3,255 1,980 3,000 3,000
TOTAL OPERATING EXPENSES 91,614 95,463 97,091 95,931
OTHER USES
9941 Utilities Allocation (116,949) (124,184) (129,525) (138,016)
TOTAL OTHER USES (116,949) (124,184) (129,525) (138,016)
TOTAL GENERAL FUND APPROPRIATIONS 217,189 241,065 230,266 235,000

Fiscal Year 2021 - 22 Annual Budget
151
Human
Resources
Department
Human
Resources
Division
Appropriations
Summary
Appropriations Summary
ADOPTED ADOPTED INCREASE/
2020-21 2021-22 (DECREASE) PERCENTAGE
Personal Services 262,700 277,085 14,385 5.48%
Operating Expenses 97,091 95,931 (1,160) -1.19%
Other Uses (129,525) (138,016) (8,491) 6.56%
TOTALS 230,266 235,000 4,734 2.06%
Significant Budget Changes:
The increase in 46xx is attributable to the maintenance costs for the Online Application Software.

This page intentionally left blank
Fiscal Year 2021 - 22 Annual Budget
152

Fiscal Year 2021 - 22 Annual Budget
153
Organization
Total
Budget
Information
Technology
Department
Tino Anthony, Information Technology Director
The Information Technology (IT) Department supports City operations through the application of effective and efficient technology. IT provides current information and communications technologies for the decision making process in an accurate and timely manner. Services include web-site development, system maintenance, training, City-wide computer and communications access, hardware installation, setup, maintenance, and coordination of all computer software and telephone related expenditures.
Responsibilities: • Hardware and software standards • Integration of information systems • Data integrity • Communications systems • Pagers, telephones, cellular phones, remote portable devices, and modems • Specifications and installation of all computer equipment • PC repairs and maintenance • Portable personal information manager • Customized reporting • Software installation • Assist and train users • Analyze and recommend new systems as required Organizational Chart
$ 369,584 GF
1,685,022 AL
$2,054,606
Information Technology
Director
IT Network/GIS
Manager
Network Systems
Analyst I
GIS
(See Div)
Help Desk Manager
System Analyst IIComputer
Technician
System Admin/Security Officer
Network Systems Analyst II
Senior Systems
Analyst
Business Analyst
Operations Manager
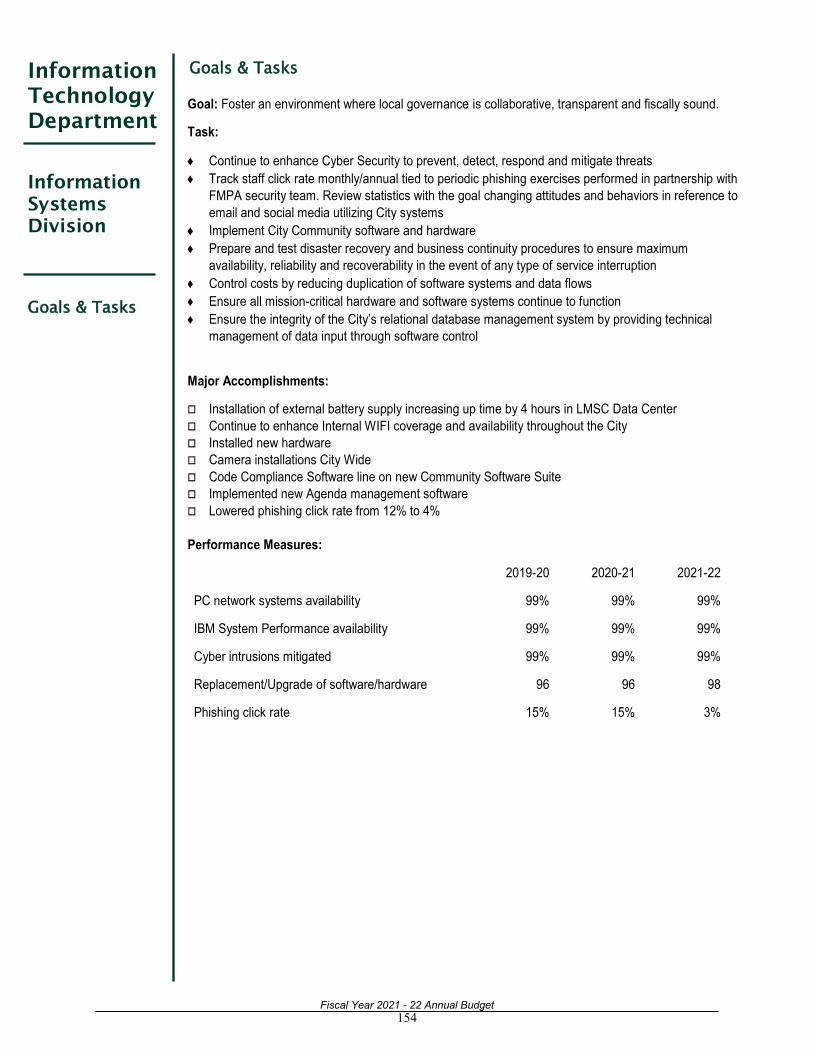
Fiscal Year 2021 - 22 Annual Budget
154
Goals & Tasks
Information
Technology
Department
Information
Systems
Division
Goals & Tasks
Goal: Foster an environment where local governance is collaborative, transparent and fiscally sound.
Task:
Continue to enhance Cyber Security to prevent, detect, respond and mitigate threats
Track staff click rate monthly/annual tied to periodic phishing exercises performed in partnership with
FMPA security team. Review statistics with the goal changing attitudes and behaviors in reference to
email and social media utilizing City systems
Implement City Community software and hardware
Prepare and test disaster recovery and business continuity procedures to ensure maximum
availability, reliability and recoverability in the event of any type of service interruption
Control costs by reducing duplication of software systems and data flows
Ensure all mission-critical hardware and software systems continue to function
Ensure the integrity of the City’s relational database management system by providing technical
management of data input through software control
Major Accomplishments:
Installation of external battery supply increasing up time by 4 hours in LMSC Data Center
Continue to enhance Internal WIFI coverage and availability throughout the City
Installed new hardware
Camera installations City Wide
Code Compliance Software line on new Community Software Suite
Implemented new Agenda management software
Lowered phishing click rate from 12% to 4%
Performance Measures:
2019-20 2020-21 2021-22
PC network systems availability 99% 99% 99%
IBM System Performance availability 99% 99% 99%
Cyber intrusions mitigated 99% 99% 99%
Replacement/Upgrade of software/hardware 96 96 98
Phishing click rate 15% 15% 3%

Fiscal Year 2021 - 22 Annual Budget
155
Personnel &
Capital Outlay
Schedules
Information
Technology
Department
Information
Systems
Division
Personnel Schedule
Capital Outlay Schedule
Description Information Technology Equipment
Funding/Work order
Amount
Copiers (2) 15,000 VMWare Servers (2) 60,000 City Hall Backup Power 30,000
Switches (2) 12,000
Fiber Diagnosis Repair Equipment 15,000 Total 132,000
Classification 2021 Change 2022 Amount
Business Analyst 1.00 0.00 1.00 48,241
Computer Systems Analyst 1.00 (1.00) 0.00 0
Computer Technician 1.00 0.00 1.00 42,390
Help Desk Manager 1.00 0.00 1.00 64,043
Information Technology Director 1.00 0.00 1.00 128,606
IT Administrative Specialist 1.00 (1.00) 0.00 0
IT Network Manager 0.50 0.00 0.50 46,509
Network System Analyst I 1.00 0.00 1.00 53,207
Network System Analyst II 0.00 1.00 1.00 60,341
Operations Manager 1.00 0.00 1.00 75,067
Senior Systems Analyst 1.00 0.00 1.00 61,568
Systems Analyst II 1.00 0.00 1.00 60,501
Sys Admin/Security Office 1.00 0.00 1.00 78,042
Standby 3,700
Total 11.50 (1.00) 10.50 722,215
Note: Allocations
IT Network Manager
50% 1633, 50% 1731

Fiscal Year 2021 - 22 Annual Budget
156
Appropriations
Detail
Information
Technology
Department
Information
Systems
Division
Appropriations Detail Account #001-1633-513
ACTUAL ACTUAL ADOPTED ADOPTED
2018-19 2019-20 2020-21 2021-22
PERSONAL SERVICES
12xx Regular Salaries & Wages 657,016 648,910 747,847 722,215
1310 Temporary Labor 22,746 46,594 0 0
1410 Overtime 11,355 10,947 15,000 15,000
15xx Bonuses/Incentives 2,184 5,294 0 0
1641 Vacation/Terms & Buyout 30,922 18,313 0 0
2110 FICA 52,690 53,280 54,162 53,302
221x Retirement 61,549 61,239 62,863 89,091
23xx Insurance 124,530 113,073 129,645 110,322
2410 Workers' Compensation 2,019 2,037 2,084 2,012
26xx Other Payroll Benefits 7,479 7,509 7,563 7,425
TOTAL PERSONAL SERVICES 972,490 967,196 1,019,164 999,367
OPERATING EXPENSES
3xxx Professional Services 44,614 57,270 111,900 157,600
4010 Travel 599 331 2,500 2,500
41xx Communication 14,377 28,226 16,488 18,888
4210 Postage 0 1 100 100
4310 Utilities 33,607 30,018 20,400 20,400
4410 Rentals 37,602 39,482 41,500 0
4415 Internal Fleet Lease 9,443 12,717 9,633 9,730
4510 Insurance 10,367 11,232 12,194 12,954
461x Repairs & Maintenance- Vehicles 2,691 5,352 2,795 3,427
46xx Repairs & Maintenance- Equipment 627,561 678,260 681,190 717,530
4710 Printing & Binding 100 100 100 100
49xx Advertising-Other Ads 600 0 0 0
51xx Minor Furniture/Equipment 108,431 118,534 106,500 136,750
52xx Operating Supplies 2,527 2,750 2,500 2,000
5230 Fuel Purchases 206 147 250 225
5410 Publications & Memberships 300 200 625 625
5520 Training 21,901 11,050 24,900 10,400
5540 Education Reimbursement 0 5,614 0 0
TOTAL OPERATING EXPENSES 914,926 1,001,284 1,033,575 1,093,229
CAPITAL OUTLAY
6410 Machinery & Equipment 136,898 176,168 132,200 132,000
TOTAL CAPITAL OUTLAY 136,898 176,168 132,200 132,000
OTHER USES
9916 Computer Maintenance Charges (165,650) (173,120) (172,860) (169,990)
9941 Utilities Allocation (1,611,183) (1,754,099) (1,665,083) (1,685,022)
TOTAL OTHER USES (1,776,833) (1,927,219) (1,837,943) (1,855,012)
TOTAL GENERAL FUND APPROPRIATIONS 247,481 217,429 346,996 369,584

Fiscal Year 2021 - 22 Annual Budget
157
Appropriations
Summary
Information
Technology
Department
Information
Systems
Division
Appropriations Summary
ADOPTED ADOPTED INCREASE/
2020-21 2021-22 (DECREASE) PERCENTAGE
Personal Services 1,019,164 999,367 (19,797) -1.94%
Operating Expenses 1,033,575 1,093,229 59,654 5.77%
Capital Outlay 132,200 132,000 (200) -0.15%
Other Uses (1,837,943) (1,855,012) (17,069) 0.93%
TOTALS 346,996 369,584 22,588 6.51%
Significant Budget Changes:
The reduction in Personal Services is due to eliminating a position. Operating Expenses increased
due to including additional Cyber Security funds of $50,000 in Professional Services (3xxx).

This page intentionally left blank
Fiscal Year 2021 - 22 Annual Budget
158

Fiscal Year 2021 - 22 Annual Budget
159
Organization
Total
Budget
Tino Anthony, Information Technology Director
The GIS Division provides design, drafting, mapping, and technical support to the city’s utility systems, which include Electric, Gas, Water & Reuse Water, Wastewater, and Stormwater. Field surveying and project stake out services are provided in support of city capital projects, airport leases, transportation planning, and for the utilities.
Responsibilities: • GIS System • Mapping • Field surveys • Easements • AutoCAD Organizational Chart
Geographic
Information
Systems
Department
$ 39,757 GF
357,815 AL
$397,572
Information Technology
Director
IT Network/GIS
Manager
GIS Utility
Specialist IGIS Analyst GIS Technician
GIS Planning
Specialist

Fiscal Year 2021 - 22 Annual Budget
160
Goals & Tasks
Geographic
Information
Systems
Department
GIS
Division
Goals & Tasks
Goal: Foster an environment where local governance is collaborative, transparent and fiscally sound
Tasks:
Develop and maintain an accurate, comprehensive and up-to-date Geographic Information System
Securely and reliably provide quick and easy to access GIS information
Generate and centralize training resources to enhance GIS data usage across City departments
Promote use of GIS to expedite work processes
Process work orders in a timely manner
Major Activities:
➢ GIS Data Management and Maintenance
Establish and maintain accuracy standards and procedures, coordinate data sharing with state, local
and federal government, create and develop new GIS data.
➢ GIS Applications Development
Develop custom applications and solutions, interactive maps and projects for accurate analysis and
inquiry of GIS information.
➢ GIS Training and Assistance
Conduct training classes to GIS users, tutor and assist GIS users on specific applications and
projects, respond to technical questions and requests
Major Accomplishments:
Fully staffed GIS team
Communicating frequently with stakeholders from City departments on projects
Providing new solutions and procedures for integrating with internal and external entities, increasing
accuracy of GIS data (Addressing, Utility Locating and Redlining, Utility data updates)
Performance Measures:
2019-20 2020-21 2021-22
Days to complete work orders <5 <5 <5
Work requests >50 >50 >50
Completed work requests 866 900 900

Fiscal Year 2021 - 22 Annual Budget
161
Personnel
Schedule
Geographic
Information
Systems
Department
GIS
Division
Personnel Schedule
Classification 2021 Change 2022 Amount
GIS Analyst 1.00 0.00 1.00 72,197
GIS Planning Specialist 1.00 0.00 1.00 52,000
GIS Technician 1.00 0.00 1.00 38,542
GIS Utility Specialist I 1.00 0.00 1.00 58,926
IT Network Manager 0.50 0.00 0.50 46,509
Total 4.50 0.00 4.50 268,174
Note: Allocations
IT Network Manager
50% 1633, 50% 1731

Fiscal Year 2021 - 22 Annual Budget
162
Appropriations
Detail
Geographic
Information
Systems
Department
GIS
Division
Appropriations Detail Account # 001-1731-539
ACTUAL ACTUAL ADOPTED ADOPTED
2018-19 2019-20 2020-21 2021-22PERSONAL SERVICES
12xx Regular Salaries & Wages 222,870 255,760 261,321 268,174
1410 Overtime 3,260 1,825 3,200 3,200
1530 Bonuses 0 239 0 0
1641 Vacation/Terms & Buyout 965 2,087 0 0
2110 FICA 16,954 19,317 19,334 19,947
221x Retirement 18,789 20,499 19,918 37,672
23xx Insurance 50,092 46,014 51,596 52,267
2410 Workers' Compensation 633 728 732 752
262x Other Payroll Benefits 1,236 983 969 847
TOTAL PERSONAL SERVICES 314,799 347,452 357,070 382,859
OPERATING EXPENSES
3410 Contract Services 0 4,375 0 0
4010 Travel 2,130 327 4,400 4,400
41xx Communication 1,007 1,306 1,000 1,000
4210 Postage 0 28 100 100
4510 Insurance 1,498 1,402 1,579 1,713
46xx Repairs & Maintenance- Equipment 7,471 7,203 7,600 5,800
4710 Printing & Binding 0 156 0 0
5180 Minor Furniture/Equipment 512 231 500 500
5210 Operating Supplies 378 1,963 290 600
5520 Training 775 668 600 600
TOTAL OPERATING EXPENSES 13,771 17,659 16,069 14,713
OTHER USES
9941 Utilities Allocation (295,713) (328,598) (335,825) (357,815)
TOTAL OTHER USES (295,713) (328,598) (335,825) (357,815)
TOTAL GENERAL FUND APPROPRIATIONS 32,857 36,513 37,314 39,757

Fiscal Year 2021 - 22 Annual Budget
163
Appropriations
Summary
Geographic
Information
Systems
Department
GIS
Division
Appropriations Summary
ADOPTED ADOPTED INCREASE/
2020-21 2021-22 (DECREASE) PERCENTAGE
Personal Services 357,070 382,859 25,789 7.22%
Operating Expenses 16,069 14,713 (1,356) -8.44%
Other Uses (335,825) (357,815) (21,990) 6.55%
TOTALS 37,314 39,757 2,443 6.55%

This page intentionally left blank
Fiscal Year 2021 - 22 Annual Budget
164

Fiscal Year 2021 - 22 Annual Budget
165
Organization
Total
Budget
Police
Department
Rob Hicks, Police Chief
The Police Department is responsible for providing professional law enforcement services to the citizens of Leesburg by preserving peace, maintaining order, enforcing the law, and protecting life and property. The Police Department must work with residents to improve the quality of life, increase public awareness, and eliminate opportunities for criminal activity.
Responsibilities: Patrol Criminal Investigation Support Services ·Enforce traffic regulations ·Investigate felony cases ·Record activities ·Proactive patrol ·Domestic Violence follow up ·Operate 9-1-1 ·Respond to citizen’s requests ·Collect data & intelligence ·Citizens Academy ·Make arrests ·Process major crime scenes ·Code Enforcement ·Investigate accidents ·Search warrants ·Community Awareness & crime prevention Organizational Chart
$ 10,258,584 GF
Police Chief
Administrative
Assistant IIAccountant II
Patrol Sergeants
Code Enforcement
Supervisor
Accreditation
Commander
(Lieutenant)
Uniform Patrol
Commander
(Captain)
Patrol Corporals
Patrol Senior
Officers
Patrol Officers
Administrative
Services Commander
(Major)
Crime Analyst
Records Section
Supervisor
Emergency Services
Dispatch
ManagerPatrol Lieutenant
Criminal
Investigators Commader
(Captain)
Citizens on Patrol/
Volunteers
Emergency Services
Dispatcher
Supervisors
School Crossing
Guards
Detective
Corporal
Vice DetectiveSenior Detectives
Detectives
Patrol Lieutenant
Community
Services
(Sergeant)
Emergency
Services Dispatchers
Quartermaster
Evidence
Technician
Police Records
Tech I & II
Civilian
InvestigatorSchool Crossing
Guards
Administrative
Assistant I
Forensic Digital
Evidence Specialist

Fiscal Year 2021 - 22 Annual Budget
166
Goals & Tasks
Administration
Division
Goals & Tasks
Police
Department Goal: Deliver the highest level of professional public safety service that ensures security for Leesburg’s
residents and businesses.
Task:
Maintain the reduction of Part I crimes by utilizing problem solving techniques aided by crime analysis
Monitor traffic patterns and frequency of high crash intersections
Re-establish community meetings and partner with businesses and charities on community events
while still navigating the realities of the pandemic
Conduct Citizens Academy at least once a year
Create and maintain innovative and interactive community engagement and outreach programs
Provide up-to-date training for sworn and non-sworn personnel
Use Code Enforcement to partner with citizens to enhance the quality of life in our community
Stress minority hiring needs through career day presentations and active recruitment
Maintain departmental policies based on best practices on current policing models
Major Accomplishments:
Reduced Part I crimes by more than 22%*
Received first re-accreditation from the Commission of Florida Law Enforcement Accreditation
Maintained high level of service throughout the pandemic
Fatal traffic crashes reduced from 11 the previous year to 2 this fiscal year
Performance Measures:
2019-20 2020-21 2021-22
Police CAD calls for Service 68,000 62,983 70,000
Part I crimes 1,312 1,108 1,200
Traffic crashes 1,204 1,186 1,200
Community Meetings/events 45* 25 50
Employee training hours 9,000 9,000 9,000
Code Enforcement actions 1,000 1,585 1,600
*affected by COVID-19 pandemic

Fiscal Year 2021 - 22 Annual Budget
167
Personnel
Schedule
Police
Department
Administration
Division
Personnel Schedule
Classification 2021 Change 2022 Amount
Non-Sworn
Accountant II 1.00 0.00 1.00 43,888
Administrative Assistant I 1.00 0.00 1.00 33,093
Administrative Assistant II 1.00 0.00 1.00 34,050
Clerical Assistant 3.00 (3.00) 0.00 0
Code Enforcement Officer 3.00 0.00 3.00 111,218
Code Enforcement Supervisor 1.00 0.00 1.00 47,299
Crime Analyst 1.00 0.00 1.00 40,102
Emergency Services Dispatcher I 9.00 (1.00) 8.00 275,266
Emergency Services Dispatcher II 1.00 2.00 3.00 119,329
Emergency Services Dispatcher III 4.00 (1.00) 3.00 142,709
Emergency Services Dispatcher Manager 1.00 0.00 1.00 58,281
Evidence Technician 1.00 0.00 1.00 36,878
Office Specialist 1.00 (1.00) 0.00 0
Records Section Supervisor 1.00 0.00 1.00 46,488
Records Tech I 0.00 3.00 3.00 95,346
Records Tech II 0.00 1.00 1.00 38,230
Forensic Digital Evidence Specialist 0.00 1.00 1.00 40,884
Total Non-Sworn 29.00 1.00 30.00 1,163,061
Sworn
Police Captain 2.00 0.00 2.00 189,820
Police Chief 1.00 0.00 1.00 128,606
Police Corp/Detective Corp 6.00 0.00 6.00 423,525
Police Lieutenant 3.00 0.00 3.00 259,830
Police Major 1.00 0.00 1.00 102,648
Police Officer/Det 33.00 2.00 35.00 1,727,221
Police Senior/Senior Det 20.00 (2.00) 18.00 1,119,453
Police Serg/Det Serg 7.00 0.00 7.00 551,550
Sworn Total 73.00 0.00 73.00 4,502,653
Part Time
Civilian Investigator 1.00 0.00 1.00 28,158
Total Part Time 1.00 0.00 1.00 28,158
Standby 16,800
Total 103.00 1.00 104.00 5,710,672

Fiscal Year 2021 - 22 Annual Budget
168
Appropriations
Detail
Police
Department
Administration
Division
Appropriations Detail Account # 001-2111-521
ACTUAL ACTUAL ADOPTED ADOPTED
2018-19 2019-20 2020-21 2021-22PERSONAL SERVICES
12xx Regular Salaries & Wages 4,881,919 4,954,392 5,511,103 5,710,672
1310 Temporary Labor 68,080 46,623 75,000 75,000
1410 Overtime 424,279 383,575 380,000 400,000
15xx Special Pay 89,177 106,530 69,692 71,280
1641 Vacation/Terms & Buyout 126,244 96,249 0 0
2110 FICA 406,146 405,677 402,478 418,603
221x Retirement 956,859 852,026 864,591 941,003
23xx Insurance 1,036,323 945,967 1,143,290 1,181,424
2410 Workers' Compensation 165,659 164,990 166,663 170,410
26xx Other Payroll Benefits 11,986 11,746 11,277 10,582
TOTAL PERSONAL SERVICES 8,166,672 7,967,775 8,624,094 8,978,974
OPERATING EXPENSES
3xxx Professional Services 16,968 16,772 40,000 40,000
3410 Contract Services 8,014 8,074 9,000 9,000
4010 Travel 14,597 9,719 15,000 15,000
41xx Communication 47,135 54,807 51,600 57,100
4210 Postage 3,806 4,332 3,200 3,200
4310 Utilities 74,720 69,734 100,000 100,000
44xx Fleet Lease 186,451 251,874 209,597 220,854
4510 Insurance 56,147 66,014 73,233 74,296
461x Repairs & Maintenance- Vehicles 257,557 209,399 208,752 210,000
4620 Repairs & Maintenance- Building 156 412 3,500 3,500
4625 Repairs & Maintenance- Non-Build 1,365 71,200 4,000 4,000
4627 Repairs & Maintenance- Code Enfrcmt 5,991 12,364 15,000 15,000
46xx Repairs & Maintenance- Equipment 59,982 70,960 72,189 71,239
4710 Printing & Binding 1,441 2,241 3,000 3,000
4810 Promotional Activities 746 109 1,000 1,000
4911 Advertising 114 0 500 500
4920 Other Current Charges 7,893 (5,130) 8,000 8,000
4930 Community Services (other than forfeit) 0 0 1,560 1,560
4945 Injury/Damage to Others 0 806 0 0
4964 Investigative Funds 6,506 8,352 15,000 10,000
51xx Minor Furniture/Equipment 43,021 35,396 15,500 43,361
5188 Automation Expense Only 668 250 4,000 4,000
521x Operating Supplies 56,713 53,316 60,000 60,000
5215 Uniforms 74,158 64,219 75,000 75,000
5230 Fuel Purchases 170,088 139,433 180,000 200,000
5410 Publications & Memberships 6,868 4,343 5,000 5,000
5520 Training 43,123 37,078 52,500 45,000
5540 Education Reimbursement 3,475 1,996 0 0
TOTAL OPERATING EXPENSES 1,147,703 1,188,070 1,226,131 1,279,610
CAPITAL OUTLAY
6410 Machinery & Equipment 515,251 8,142 0 0
TOTAL CAPITAL OUTLAY 515,251 8,142 0 0
DEBT SERVICE
7115 Principal- Capital Lease 59,477 59,477 0 0
TOTAL DEBT SERVICE 59,477 59,477 0 0
TOTAL GENERAL FUND APPROPRIATIONS 9,889,103 9,223,464 9,850,225 10,258,584

Fiscal Year 2021 - 22 Annual Budget
169
Appropriations
Summary
Police
Department
Administration
Division
Appropriations Summary
ADOPTED ADOPTED INCREASE/
2020-21 2021-22 (DECREASE) PERCENTAGE
Personal Services 8,624,094 8,978,974 354,880 4.11%
Operating Expenses 1,226,131 1,279,610 53,479 4.36%
Capital Outlay 0 0 0 0.00%
Debt Service 0 0 0 0.00%
TOTALS 9,850,225 10,258,584 408,359 4.15%

This page intentionally left blank
Fiscal Year 2021 - 22 Annual Budget
170

Fiscal Year 2021 - 22 Annual Budget
171
Organization
Total
Budget
Fire
Department
David Johnson, Fire Chief
The Fire Department is committed to protecting the people and property within the community. The Fire Department responds to the needs of the citizens by providing rapid, professional, and humanitarian services essential to the health, safety, and well being of the community. Department members participate in the community, serve as role models, and strive to effectively utilize all of the resources necessary to provide services on a 24-hour basis. Activities include: prevention, education, fire suppression, emergency medical services, and other related emergency and non-emergency activities. Responsibilities: Life Safety Services Training - Administration Fire – Rescue ·Public education ·Fire training ·Fire Suppression ·Inspections ·EMS training ·Rescue ·Arson investigation ·Testing– Physicals ·ALS First responder ·Safety classes ·Budgeting ·Extrication ·Emergency Management ·Certification/records ·Airport fire rescue ·SCBA ·Uniforms Organizational Chart
$ 6,392,522 GF Fire Chief &
EOC Commander
Executive
Assistant Aide II
Fire Battalion
Chief
Fire Lieutenant
Firefighter/
Paramedic
Firefighter/
EngineerFirefighter
Deputy Fire
Chief
Fire Captain
Division Chief
Administrative
Assistant II

Fiscal Year 2021 - 22 Annual Budget
172
Goals & Tasks
Fire Rescue
Division
Fire
Department
Goals & Tasks
Goal: Deliver the highest level of professional public safety service that ensures security for Leesburg’s
residents and businesses.
Task:
Continue to reevaluate zone response times and models to establish target response times that meet
or exceed National Fire Protection Association (NFPA) standards
Initiate design and implementation of a program to assist the department in meeting NFPA response
and staffing standards
Encourage and provide in-house and outside training opportunities to personnel
Provide our firefighters and professionals with knowledge, support and opportunities to improve their
physical health, wellness and fitness in order to enhance job performance, reduce injuries and
encourage an overall healthy personal lifestyle
Enhance public safety by minimizing the impact of fire, medical events, personal injury and hazardous
conditions by conducting fire safety inspections, public education, injury preventions and disaster
preparedness
Provide a comprehensive and integrated emergency management system that coordinates City and
community resources to protect lives, property and the environment through mitigation,
preparedness, response and recovery from natural and man-made hazards that may impact the City
Improve collection of building fire pre-plan information and ensure integration into mobile based
computers
Major Accomplishments:
Maintained (2020 evaluation) our public fire protection classification of ISO Class II, which places the
Leesburg Fire Department in the top 0.7% of fire departments in the U.S.A.
Budget was enhanced through Federal and State grants for capital expenditures
Annual fire inspection program moving forward
Continued to keep our aging fire stations operational by making many repairs in house and keeping
expenditures low
Entered into an automatic aid agreement with The Villages Fire Department
Deployed Automatic External Defibrillators (AED’s) throughout city owned facilities
Developed a community AED program for Assembly Occupancies (50/50 grant)
Performance Measures:
2019-20 2020-21 2021-22
Calls for service 9,900 9,332 10,000
Training hours 9,752 9,572 9,800
School fire safety program contacts 250 0 500
Inspections/reviews/meetings 115 96 200
Pre-fire plans 162 160 250
Average response time (min:sec) 6:53 7:19 <5:00

Fiscal Year 2021 - 22 Annual Budget
173
Personnel
& Capital
Schedules
Fire
Department
Fire Rescue
Division
Personnel Schedule
Capital Outlay Schedule
Description
Funding/Work order
Amount
Extrication Tools (5) 50,000
Total 50,000
Classification 2021 Change 2022 Amount
Fire Chief & EOC Commander 1.00 0.00 1.00 124,654
Deputy Fire Chief 1.00 0.00 1.00 97,427
Fire Division Chief 1.00 0.00 1.00 94,910
Fire Battalion Chief 3.00 0.00 3.00 225,330
Fire Captain 1.00 0.00 1.00 69,368
Fire Lieutenant 12.00 (1.00) 11.00 773,290
Firefighter Engineer 12.00 0.00 12.00 612,537
Firefighter 18.00 1.00 19.00 761,737
Executive Assistant/Admin. Aide I 1.00 (1.00) 0.00 0
Executive Assistant/Admin. Aide II 0.00 1.00 1.00 53,486
Administrative Assistant II 1.00 0.00 1.00 37,981
Incentive Pay 15,840
Working out of Class 24,300
Holiday Pay 105,348
Total Full Time 51.00 0.00 51.00 2,996,208

Fiscal Year 2021 - 22 Annual Budget
174
Appropriations
Detail
Fire
Department
Fire Rescue
Division
Appropriations Detail Account # 001-2220-522
ACTUAL ACTUAL ADOPTED ADOPTED2018-19 2019-20 2020-21 2021-22
PERSONAL SERVICES121x Regular Salaries & Wages 2,675,669 2,766,622 2,958,437 2,996,2081220 Permanent/Part time 0 0 3,136 01310 Temporary Labor 3,472 0 0 01410 Overtime 454,514 423,658 233,000 248,29315xx Special Pay 201,047 205,795 227,752 262,8851641 Vacation/Terms & Buyout 43,414 62,697 0 02110 FICA 242,985 249,381 209,025 212,673221x Retirement 676,009 728,472 835,521 883,58323xx Insurance 595,551 602,460 738,230 711,2652410 Workers' Compensation 115,861 118,825 101,129 102,01726xx Other Payroll Benefits 10,396 10,379 10,659 10,178
TOTAL PERSONAL SERVICES 5,018,918 5,168,289 5,316,889 5,427,102
OPERATING EXPENSES3410 Contract Services 56,718 77,932 69,999 71,0884010 Travel 4,376 1,088 4,000 6,8004110 Communication 10,200 9,987 9,500 11,5374210 Postage 86 131 250 2504310 Utilities 51,505 47,160 68,500 69,0004410 Rentals 8,001 5,154 9,200 10,5604415 Internal Fleet Lease 135,883 180,413 137,182 156,5974510 Insurance 26,389 34,321 37,395 37,797461x Repairs & Maintenance- Vehicles 169,657 235,128 199,308 199,4814620 Repairs & Maintenance- Building 16,682 5,163 13,000 15,0004625 Repairs & Maintenance- Non-Build 525 240 1,000 1,00046xx Repairs & Maintenance- Equipment 28,278 41,852 42,380 50,1804710 Printing & Binding 1,077 135 1,100 1,1004810 Promotional Activities 4,429 4,848 9,750 9,25049xx Other Current Charges 184 105 0 5,2504945 Injury/ Damage to Others 0 111 0 05180 Minor Furniture/Equipment 58,395 59,051 44,300 46,8005210 Operating Supplies 49,573 38,419 42,300 42,3005215 Uniforms 52,337 66,398 73,000 80,9805230 Fuel Purchases 48,355 44,567 47,500 47,5005410 Publications & Memberships 6,000 5,298 4,828 5,9505520 Training 30,148 31,804 30,000 47,0005540 Education Reimbursement 0 17,288 0 0
TOTAL OPERATING EXPENSES 758,798 906,593 844,492 915,420
CAPITAL OUTLAY
6210 Buildings 11,780 0 0 06410 Machinery & Equipment 401,537 0 35,000 50,000
TOTAL CAPITAL OUTLAY 413,317 0 35,000 50,000
DEBT SERVICE
7115 Principal- Capital Lease 30,639 23,065 0 0
7215 Interest- Capital Lease 0 7,574 0 0
TOTAL DEBT SERVICE 30,639 30,639 0 0
TOTAL GENERAL FUND APPROPRIATIONS 6,221,672 6,105,521 6,196,381 6,392,522

Fiscal Year 2021 - 22 Annual Budget
175
Appropriations
Summary
Fire
Department
Fire Rescue
Division
Appropriations Summary
ADOPTED ADOPTED INCREASE/
2020-21 2021-22 (DECREASE) PERCENTAGE
Personal Services 5,316,889 5,427,102 110,213 2.07%
Operating Expenses 844,492 915,420 70,928 8.40%
Capital Outlay 35,000 50,000 15,000 42.86%
TOTALS 6,196,381 6,392,522 196,141 3.17%

This page intentionally left blank
Fiscal Year 2021 - 22 Annual Budget
176

Fiscal Year 2021 - 22 Annual Budget
177
Organization
Total
Budget
Public Works
Department
Cliff Kelsey, Director of Public Works
The Public Works Department is responsible for streets, right-of-ways, capital projects management, facility maintenance, landscaping and maintenance of city-owned parks, and right-of-ways and intergovernmental coordination of transportation projects. The Director supervises these General Fund Public Works divisions: Project Management, Streets, Facilities Maintenance and Grounds Maintenance.
Responsibilities: Streets Administration Project Management ·Street/parking striping ·Clerical ·Capital Project Management ·Sidewalks ·Reports ·Project Scope Development ·Signs for events ·Administration ·Design Management ·Facility programming ·Contracts ·Inspections & acceptance ·Street maintenance ·Personnel activity Grounds Facilities ·Landscape maintenance ·Maintenance & & beautification of all repair of all City City owned property & owned facilities parks ·Custodial services ·Athletic fields’ preservation ·Irrigation Organizational Chart
$ 4,027,036 GF
107,971 AL
$ 4,135,007
Director of Public Works
Deputy Director
of PW
Fleet
(See Dept.)Solid Waste
(See Dept)
Streets
Street
Supervisor
Maintenance
Worker I
Project Mgr.
Utility Inspectors
Deputy Director
of PW
Maintenance
Worker II
Maintenance
Worker I
Facilities &
Grounds
Maintenance
Manager
Maintenance
Worker II
Maintenance
Worker I
Trades
Technician
Nursery
Technican
Facilities
Maintenance
Lead
Grounds
Maintenance
Lead
Customer
Relations
Specialist

Fiscal Year 2021 - 22 Annual Budget
178
Goals & Tasks
Public Works
Department
Street
Maintenance
Division
Goals & Tasks
Goal: Eliminate blight and stimulate growth by investing in neighborhood development, while pursuing
new economic opportunities.
Task:
Continue to repair streets to insure multi-modal travel
Continue to survey and repair sidewalks ensuring they are safe for pedestrians
Install sidewalks in established neighborhoods
Ensure signs are replaced when needed to ensure safe traffic operations
Perform tree maintenance in City right-of-way
Maintain right-of-way vegetation to allow proper sight distance
Major Accomplishments:
Completed a condition assessment on all City paved roads, 91.6% of the roads are graded Good to
Satisfactory and created a plan to get remaining 8.4% of the paved road to a Good to Satisfactory
pavement condition rating within the next five years
Repaired 2,000 linear feet of sidewalks, citywide
Raised tree canopies citywide
Laid limerock, graded and maintained unpaved roads
Performance Measures:
2019-20 2020-21 2021-22
Regulatory signs replaced 250 200 200
Non-regulatory signs replaced 650 500 400
Reported sidewalk falls 1 0 0
Average pavement condition rating 75 75 80

Fiscal Year 2021 - 22 Annual Budget
179
Personnel
Schedule
Public Works
Department
Street
Maintenance
Division
Personnel Schedule
Classification 2021 Change 2022 Amount
Maintenance Worker I 2.00 0.00 2.00 50,689
Street Supervisor 1.00 0.00 1.00 45,053
Standby 3,650
Total 3.00 0.00 3.00 99,392

Fiscal Year 2021 - 22 Annual Budget
180
Appropriations
Detail
Public Works
Department
Street
Maintenance
Division
Appropriations Detail Account # 001-5112-541
ACTUAL ACTUAL ADOPTED ADOPTED
2018-19 2019-20 2020-21 2021-22
PERSONAL SERVICES
12xx Regular Salaries & Wages 92,423 86,731 101,535 99,392
1410 Overtime 2,010 2,915 1,500 1,500
2110 FICA 6,502 6,367 6,738 7,086
221x Retirement 7,491 7,234 7,622 11,411
23xx Insurance 25,901 26,084 29,866 30,752
2410 Workers' Compensation 7,617 7,199 7,870 7,698
26xx Other Payroll Benefits 115 3 0 34
TOTAL PERSONAL SERVICES 142,059 136,533 155,131 157,873
OPERATING EXPENSES
31xx Professional Services 19,514 16,447 15,000 0
3410 Contract Services 3,900 0 5,720 40,000
4010 Travel 268 0 600 0
41xx Communication 573 590 700 700
4210 Postage 1 0 50 0
4310 Utilities 633,970 632,290 650,000 650,000
4410 Rentals 0 6,272 3,000 3,000
4415 Internal Fleet Lease 14,371 19,352 14,660 13,158
4510 Insurance 8,523 9,559 9,511 10,194
461x Repairs & Maintenance- Vehicles 207,920 243,689 215,141 212,145
462x Repairs & Maintenance- Non-Build 205,891 198,726 230,000 180,000
463x Repairs & Maintenance- Equipment 520 520 360 360
4911 Advertising-Other Ads 0 39 200 200
4945 Injury/Damage to Others 12,240 2,500 2,500 2,500
5180 Minor Furniture/Equipment 89 5,287 2,500 2,500
5210 Operating Supplies 4,892 5,188 8,000 5,000
5215 Uniforms 353 764 1,950 1,950
5230 Fuel Purchases 3,549 3,155 4,500 4,836
5310 Materials & Supplies 3,326 2,905 5,000 5,000
5311 Materials - Street Signs 7,142 8,758 5,000 5,000
5520 Training 349 81 350 500
TOTAL OPERATING EXPENSES 1,127,391 1,156,122 1,174,742 1,137,043
TOTAL GENERAL FUND APPROPRIATIONS 1,269,450 1,292,655 1,329,873 1,294,916

Fiscal Year 2021 - 22 Annual Budget
181
Appropriations
Summary
Public Works
Department
Street
Maintenance
Division
Appropriations Summary
ADOPTED ADOPTED INCREASE/
2020-21 2021-22 (DECREASE) PERCENTAGE
Personal Services 155,131 157,873 2,742 1.77%
Operating Expenses 1,174,742 1,137,043 (37,699) -3.21%
TOTALS 1,329,873 1,294,916 (34,957) -2.63%

Fiscal Year 2021 - 22 Annual Budget
182
Goals & Tasks
Public Works
Department
Facilities
Maintenance
Division
Goals & Tasks
Goal: Foster an environment where local governance is collaborative, transparent and fiscally sound.
Task:
Install LED lights throughout the City to reduce energy costs
Conduct annual energy audits to determine equipment and performance
Continue to perform preventative maintenance service according to the manufacturer’s
recommendations
Continue to charge time properly to provide accurate cost estimates by facility
Maintain all City facilities to ensure safe and proper functioning conditions
Provide timely support for special events
Major Accomplishments:
Reassigned the staff in order to provide better service to our customers
Established new maintenance programs at facilities in order to be more proactive
Renovated the Mote Morris house to pre-fire condition
Completed building surveys to weatherproof City Hall, the Library and the Police department
Performance Measures:
2019-20 2020-21 2021-22
Complete facility maintenance site
Inspections (54 locations)
22 36 40
% of staff’s available time charged directly to
facility maintenance tasks
75% 75% 77%
% of preventative maintenance performed 70% 75% 75%

Fiscal Year 2021 - 22 Annual Budget
183
Personnel
Schedule
Public Works
Department
Facilities
Maintenance
Division
Personnel Schedule
Classification 2021 Change 2022 Amount
Deputy Director of Public Works1 0.50 0.00 0.50 38,283
Facilities Maintenance Lead 1.00 0.00 1.00 39,478
Facilities & Grounds Maintenance Manager 1.00 0.00 1.00 66,955
Maintenance Worker I 3.00 0.00 3.00 79,769
Maintenance Worker II 3.00 0.00 3.00 85,591
Trades Technician 3.00 0.00 3.00 95,805
Standby 3,650
Total 11.50 0.00 11.50 409,531
Notes: Allocations
Deputy Director of Public Works1
50%-5193, 50%-5194

Fiscal Year 2021 - 22 Annual Budget
184
Appropriations
Detail
Public Works
Department
Facilities
Maintenance
Division
Appropriations Detail Account # 001-5193-519
ACTUAL ACTUAL ADOPTED ADOPTED
2018-19 2019-20 2020-21 2021-22
PERSONAL SERVICES
12xx Regular Salaries & Wages 298,949 319,930 391,569 409,531
1310 Temporary Labor 499 0 0 0
1410 Overtime 46,962 28,628 26,000 36,000
1530 Bonuses 1,082 0 0 0
1641 Vacation/Terms & Buyouts 4,817 5,274 0 0
211x FICA 25,343 25,671 28,457 29,814
221x Retirement 34,215 26,618 28,926 54,219
23xx Insurance 120,283 103,467 130,342 125,730
2410 Workers Compensation 12,739 13,035 14,961 15,825
262x Other Payroll Benefits 882 789 869 822
TOTAL PERSONAL SERVICES 545,771 523,412 621,124 671,941
OPERATING EXPENSES
3110 Professional Services 9,100 12,403 0 0
3410 Contract Services 55,712 65,410 114,360 100,000
4010 Travel 1,185 109 200 0
4110 Communication 5,806 5,049 3,992 4,000
4210 Postage 0 0 10 0
4310 Utilities 93,442 127,709 100,000 125,000
4410 Rentals 1,550 2,046 2,000 2,000
4415 Internal Fleet Lease 17,557 23,643 17,909 22,948
4510 Insurance 27,484 32,459 37,440 47,452
461x Repairs & Maintenance- Vehicles 25,507 31,558 28,229 30,942
4620 Repairs & Maintenance- Buildings 191,596 146,043 77,500 117,500
4625 Repairs & Maintenance- Non-Build 122,479 110,096 55,800 87,800
46xx Repairs & Maintenance- Equipment 3,177 703 570 460
4920 Other Current Charges 10,807 1,299 375 375
4980 Taxes 843 843 850 850
5180 Minor Furniture/Equipment 30,875 26,997 55,000 37,500
5210 Operating Supplies 75,662 170,356 98,000 103,000
5215 Uniforms 2,016 4,325 6,150 6,150
52xx Fuel Purchases 12,127 9,059 13,000 12,798
5520 Training 189 250 500 500
TOTAL OPERATING EXPENSES 687,114 770,357 611,885 699,275
CAPITAL OUTLAY
6210 Buildings 32,000 16,284 0 0
6310 Improvements other than Bldgs 0 314 0 0
6410 Machinery & Equipment 7,550 10,349 50,000 0
TOTAL CAPITAL OUTLAY 39,550 26,947 50,000 0
OTHER USES
9941 Utilities Allocation (66,172) (63,427) (60,233) (64,464)
9950 Contra Expenses 0 (50,054) (78,354) (81,937)
TOTAL OTHER USES (66,172) (113,481) (138,587) (146,401)
TOTAL GENERAL FUND APPROPRIATIONS 1,206,263 1,207,235 1,144,422 1,224,815

Fiscal Year 2021 - 22 Annual Budget
185
Appropriations
Summary
Public Works
Department
Facilities
Maintenance
Division
Appropriations Summary
ADOPTED ADOPTED INCREASE/
2020-21 2021-22 (DECREASE) PERCENTAGE
Personal Services 621,124 671,941 50,817 8.18%
Operating Expenses 611,885 699,275 87,390 14.28%
Capital Outlay 50,000 0 (50,000) -100.00%
Other Uses (138,587) (146,401) (7,814) 5.64%
TOTALS 1,144,422 1,224,815 80,393 7.02%
Significant Budget Changes:
The increase in Operating Expenses is related to increased R&M projects (4620 & 4625).

Fiscal Year 2021 - 22 Annual Budget
186
Goals & Tasks
Public Works
Department
Grounds
Maintenance
Division
Goals & Tasks
Goal: Utilize Leesburg’s natural resources and slogan as the “Lakefront City” to enhance recreational and
leisure amenities.
Task:
Improve the appearance of city owned green space including parks, trails and highway median right-
of ways
Implement an irrigation maintenance and water conservation program
Implement “Florida Friendly Landscaping” in several locations throughout the City
Maintain Tree City USA certification
Major Accomplishments:
Improved the appearance of the trailhead at CR 473 and Blue Grill Road
Installed new landscaping at the rebuilt Mote Morris house
Changed the method of how annuals are installed to now allow for designs at some locations
Worked with community members to enhance several different sites throughout the area
Performance Measures:
2019-20 2020-21 2021-22
Annual flowers replaced each year 16,016 25,600 25,600
Debris and litter removed from sites
(cubic yards)
280 360 360
Tree City USA member (consecutive years) 21 22 23

Fiscal Year 2021 - 22 Annual Budget
187
Personnel
Schedule
Public Works
Department
Grounds
Maintenance
Division
Personnel Schedule
Classification 2021 Change 2022 Amount
Deputy Director of Public Works1 0.50 0.00 0.50 38,281
Grounds Maintenance Lead 1.00 0.00 1.00 39,478
Maintenance Worker I 8.00 0.00 8.00 201,512
Maintenance Worker II 2.00 0.00 2.00 59,509
Nursery Technician 1.00 0.00 1.00 38,397
Total 12.50 0.00 12.50 377,177
Notes: Allocations
50%-5193, 50%-5194
Deputy Director of Public Works2

Fiscal Year 2021 - 22 Annual Budget
188
Appropriations
Detail
Public Works
Department
Grounds
Maintenance
Division
Appropriations Detail Account # 001-5194-519
ACTUAL ACTUAL ADOPTED ADOPTED
2018-19 2019-20 2020-21 2021-22PERSONAL SERVICES12xx Regular Salaries & Wages 334,337 333,526 366,475 377,1771310 Temporary Labor 2,341 0 2,284 01410 Overtime 2,231 2,004 2,000 4,0001641 Vacation/Terms & Buyout 6,873 6,118 0 0211x FICA 24,589 24,633 27,054 27,9172210 Retirement 26,407 24,304 25,078 23,74223xx Insurance 114,104 99,159 114,212 125,7082410 Workers' Compensation 13,232 12,908 13,933 14,341262x Other Payroll Benefits 2,838 2,627 2,075 2,037
TOTAL PERSONAL SERVICES 526,952 505,279 553,111 574,922
OPERATING EXPENSES31xx Professional Services 0 995 0 03410 Contract Services 242,750 417,176 486,269 500,0004010 Travel 908 0 300 041xx Communication 247 530 252 5004210 Postage 27 3 10 04310 Utilities 81,019 101,964 100,000 100,0004410 Rentals 3,955 2,535 3,520 2,9404415 Internal Fleet Lease 28,207 39,421 29,056 28,6014425 Land Leases 900 900 900 9004510 Insurance 13,856 16,702 18,110 15,844461x Repairs & Maintenance- Vehicles 62,419 52,077 44,477 48,5684620 Repairs & Maintenance- Building 0 0 500 5004625 Repairs & Maintenance- Non-Build 117,374 120,592 120,000 120,00046xx Repairs & Maintenance- Equipment 404 320 680 5804710 Printing & Binding 0 0 40 04810 Promotional Acitivities 1,662 622 2,000 2,0004945 Injury/ Damage to Others 341 0 500 5005180 Minor Furniture/Equipment 4,794 6,687 3,500 3,5005210 Operating Supplies 17,913 20,130 20,000 20,0005215 Uniforms 3,577 3,928 6,150 6,15052xx Fuel Purchases 12,436 13,523 13,000 13,0005410 Publications & Memberships 0 0 265 05520 Training 1,500 1,540 1,500 1,500
TOTAL OPERATING EXPENSES 594,289 799,645 851,029 865,083
CAPITAL OUTLAY6410 Machinery & Equipment 11,260 0 0 0
TOTAL CAPITAL OUTLAY 11,260 0 0 0
OTHER USES
9950 Contra- Expense (13,500) (13,500) (13,500) (13,500)
TOTAL OTHER USES (13,500) (13,500) (13,500) (13,500)
TOTAL GENERAL FUND APPROPRIATIONS 1,119,001 1,291,424 1,390,640 1,426,505

Fiscal Year 2021 - 22 Annual Budget
189
Appropriations
Summary
Public Works
Department
Grounds
Maintenance
Division
Appropriations Summary
ADOPTED ADOPTED INCREASE/
2020-21 2021-22 (DECREASE) PERCENTAGE
Personal Services 553,111 574,922 21,811 3.94%
Operating Expenses 851,029 865,083 14,054 1.65%
Capital Outlay 0 0 0 0.00%
Other Uses (13,500) (13,500) 0 0.00%
TOTALS 1,390,640 1,426,505 35,865 2.58%

Fiscal Year 2021 - 22 Annual Budget
190
Goals & Tasks
Public Works
Department
Administration
Division
Goals & Tasks
Goal: Foster and environment where local governance is collaborative, transparent and fiscally sound.
Task:
Monitor revenues and expenditures to evaluate financial condition on a continuous basis
Execute Capital Improvement Projects on schedule and within budget to minimize budget rollovers
Conduct department side quarterly safety meetings
Increase information published on the Public Works Department website and other social media
accounts
Major Accomplishments:
Completed the City Hall Restroom Renovation, Venetian Gardens Pathway Extension, Corrine
Williams Park Restroom facility, demolition of the 6th Street (Water Distribution Building), Resource
Center & Lift Station Emergency Backup Power Generator Project
Executed over $100K and awarded over $290K of construction improvement projects to city parks
and recreation sites
Executed over $600K and awarded over $430K in infrastructure improvement projects
Awarded over $8M in new construction projects
Performance Measures:
2019-20 2020-21 2021-22
Projects completed 90% 90% 88%
Projects not completed, funds rolled forward $1,500,000 $1,500,000 $1,179,500

Fiscal Year 2021 - 22 Annual Budget
191
Personnel
Schedule
Public Works
Department
Administration
Division
Personnel Schedule
Classification 2021 Change 2022 Amount
Director of Public Works 1 0.25 0.00 0.25 29,177
Deputy Director of Public Works 2 0.10 0.00 0.10 9,491
Project Manager I 3 0.50 0.00 0.50 28,215
Total 0.85 0.00 0.85 66,883
Notes: Allocations
Director of Public Works 1
Deputy Director of Public Works 2
10%-5197,45%-3021,45%-4021
Project Manager I 3
25%-3021, 25%-4021, 50%-5197
25%-5197, 25%-3021, 25%-4021, 15%-5171, 5%-5143, 5%-5144

Fiscal Year 2021 - 22 Annual Budget
192
Public Works
Department
Administration
Division
Appropriations
Detail
Appropriations Detail Account # 001-5197-539
ACTUAL ACTUAL ADOPTED ADOPTED
2018-19 2019-20 2020-21 2021-22
PERSONAL SERVICES
12xx Regular Salaries & Wages 37,089 53,931 65,011 66,883
1410 Overtime 18 54 100 0
1641 Vacation/Terms & Buyout 0 2,471 0 0
2110 FICA 2,789 4,258 5,109 4,725
221x Retirement 1,867 2,696 3,918 13,079
23xx Insurance 14,124 12,405 9,878 13,802
2410 Workers' Compensation 746 833 1,256 910
262x Other Payroll Benefits 487 374 335 356
TOTAL PERSONAL SERVICES 57,120 77,022 85,607 99,755
OPERATING EXPENSES
3110 Professional Services 565 45 0 100
3130 Engineering Services 0 0 10,000 100
3410 Contract Services 2,700 3,593 3,695 3,383
4010 Travel 0 0 100 100
4110 Communication 68 85 250 250
4210 Postage 9 4 50 50
4310 Utilities 5,794 5,955 9,500 9,500
4415 Internal Fleet Lease 1,591 2,142 1,623 1,639
4510 Insurance 564 569 547 649
461x Repairs & Maintenance- Vehicles 256 1,595 465 1,951
4620 Repairs & Maintenance- Building 0 0 300 300
463x Repairs & Maintenance- Equipment 1,114 459 1,500 1,500
4710 Printing & Binding 150 78 100 80
4810 Promotional Activities 181 188 250 200
4911 Advertising 0 0 100 100
4920 Other Current Charges 0 0 0 0
5180 Minor Furniture/Equipment 758 17 500 200
5210 Operating Supplies 2,798 2,539 2,000 2,500
5230 Fuel Purchases 478 772 550 750
5410 Publications & Memberships 700 700 700 700
5520 Training 0 199 700 500
TOTAL OPERATING EXPENSES 17,726 18,940 32,930 24,552
OTHER USES
9941 Utilities Allocation (26,195) (33,426) (41,488) (43,507)
TOTAL OTHER USES (26,195) (33,426) (41,488) (43,507)
TOTAL GENERAL FUND APPROPRIATIONS 48,651 62,536 77,049 80,800

Fiscal Year 2021 - 22 Annual Budget
193
Appropriations
Summary
Public Works
Department
Administration
Division
Appropriations Summary
ADOPTED ADOPTED INCREASE/
2020-21 2021-22 (DECREASE) PERCENTAGE
Personal Services 85,607 99,755 14,148 16.53%
Operating Expenses 32,930 24,552 (8,378) -25.44%
Other Uses (41,488) (43,507) (2,019) 4.87%
TOTALS 77,049 80,800 3,751 4.87%
Significant Budget Changes:
The change in Operating Expenses is mainly due to reducing Engineering Services (3130).

This page intentionally left blank
Fiscal Year 2021 - 22 Annual Budget
194

Fiscal Year 2021 - 22 Annual Budget
195
Organization
Total
Budget
Community
Development
Department
The Community Development Department is responsible for long and short range planning, zoning and land use controls, building and code enforcement. The department provides service to the public in the permit review and issue process and coordination of the City annexation program. Responsibilities: ·Comprehensive planning ·Conditional use permits ·Engineering Services ·Site plan reviews ·Development plans ·Annexation ·Grants ·Land uses ·Impact fees ·Zoning analyses ·Historic preservation Organizational Chart
$ 254,723 GF
311,329 AL
$ 566,052
Dan Miller, Planning & Zoning Director
Planning & Zoning
Director
Administrative
Assisstant IISenior Planner Planner

Fiscal Year 2021 - 22 Annual Budget
196
Goals & Tasks
Community
Development
Department
Planning &
Zoning
Division
Goals & Tasks
Goal: Eliminate blight and stimulate growth by investing in neighborhood redevelopment, while also
pursuing new economic opportunities.
Task:
Recommend appropriate, sustainable uses of land and structures for Planning Commission, Historic
Preservation Board and City Commission
Analyze City development patterns annually, utilizing GIS software, to identify new development and
redevelopment opportunities and to identify appropriate opportunities to annex commercial and
industrial land
Encourage the elimination of blight through regular assessments of City-sponsored grant programs,
to include the Façade, Sign and Landscape grants and home improvement grants
Goal: Foster an environment where local governance is collaborative, transparent and fiscally sound.
Task:
Provide professional, timely and accurate reviews and recommendations to the City Commission,
Planning Commission and Historic Preservation Board
Provide site plan review and comments through the Site Plan Development Review process, within
fifteen calendar days, to ensure consistency with City codes, requirements and procedures
Prepare an update of the 2035 Comprehensive Plan to reflect changes/updates made since 2012
Propose at least four new reductions in unnecessary or redundant regulation by the end of the fiscal
year by amending the Land Development Code (Chapter 25)
Educate citizens on common planning, zoning and development questions by completing a series of
paper and online brochures, covering topics such as Impact Fees, Site Plan processing and
variances
Provide clear communication to clients and citizens by updating the Planning & Zoning website within
seven days of approval of revisions to codes, procedures and information
Major Accomplishments:
Amended Comp Plan and Land Development Regulations (LDR’s) to create a density bonus program
in City’s historic district
Utilized annexation to expand the city’s tax base and utility fees for future development along major
cooridors
Utilized Planned Unit Development (PUD) to create livable housing and commercial development
opportunities
Utilized Impact Fee waiver on redevelopment projects to encourage economic development
Continued successful management of FSL (Façade, Sign and Landscape) and HIG (Home
Improvement Grant) grant opportunities
Exceeded requirements for compliance with Chapter 163, F.S. for review of Large-Scale Comp Plan
Map Amendments
Worked to reduce insurance costs for homeowners by utilizing the FEMA flood maps to more clearly
define properties located within flood prone areas
Provided accurate flood mapping information to homeowners, banks, insurance and mortgage
companies
Performance Measures:
2019-20 2020-21 2021-22
Annexation Cases 6 6 8
Planned Unit Development Cases (PUD/SPUD) 15 15 16
Rezoning Cases 5 5 8
Site Plans Reviewed 32 35 40
Sign Grants reviewed 30 25 33

Fiscal Year 2021 - 22 Annual Budget
197
Community
Development
Department
Planning &
Zoning
Division
Personnel
Schedule
Personnel Schedule
Classification 2021 Change 2022 Amount
Planning & Zoning Director 0.00 1.00 1.00 87,755
Administrative Assistant II 1.00 0.00 1.00 40,997
Development Review Coordinator 1.00 (1.00) 0.00 0
Planning & Zoning Manager 1.00 (1.00) 0.00 0
Senior Planner 1.00 1.00 2.00 112,861
Planner 2.00 0.00 2.00 86,694
Total 6.00 0.00 6.00 328,307

Fiscal Year 2021 - 22 Annual Budget
198
Appropriations
Detail
Planning &
Zoning
Division
Community
Development
Department
Appropriations Detail Account # 001-6151-515
ACTUAL ACTUAL ADOPTED ADOPTED
2018-19 2019-20 2020-21 2021-22
PERSONAL SERVICES
12xx Regular Salaries & Wages 312,478 335,092 336,024 328,307
1410 Overtime 1,760 1,532 2,000 1,800
15xx Bonuses/Incentives 832 2,558 0 0
1641 Vacation/Terms & Buyout 838 0 0 0
2110 FICA 23,164 24,958 24,715 23,903
221x Retirement 27,298 28,541 27,611 37,875
23xx Insurance 65,904 53,743 52,128 61,075
2410 Workers' Compensation 884 954 941 919
26xx Other Payroll Benefits 1,007 1,022 999 369
TOTAL PERSONAL SERVICES 434,165 448,400 444,418 454,248
OPERATING EXPENSES
31xx Professional Services 725 1,075 1,200 51,200
3410 Contract Services 11,008 0 11,500 0
4010 Travel 1,152 0 2,000 2,500
4110 Communication 961 1,435 1,000 1,500
4210 Postage 3,540 2,755 3,500 4,000
4310 Utilities 5,844 5,385 6,500 6,000
4415 Internal Fleet Lease 4,089 5,506 4,171 4,213
4510 Insurance 1,793 1,974 2,409 2,455
461x Repairs & Maintenance- Vehicles 4,709 2,193 1,930 2,451
463x Repairs & Maintenance- Equipment 9,268 10,260 7,190 8,085
4710 Printing & Binding 75 117 1,000 250
4810 Promotional Activities 165 110 200 150
4911 Advertising 17,570 11,469 15,000 16,000
4920 Other Current Charges 1,303 3,934 2,000 2,500
4930 Recognitions & Awards 249 0 200 0
5180 Minor Furniture/Equipment 2,531 0 500 0
5210 Operating Supplies 4,317 4,398 4,000 4,500
5215 Uniforms 0 0 150 0
5230 Fuel Purchases 1,414 1,486 1,500 2,000
5410 Publications & Memberships 1,857 1,880 2,500 2,000
5520 Training 1,432 0 2,000 2,000
TOTAL OPERATING EXPENSES 74,002 53,977 70,450 111,804
OTHER USES
9941 Utilities Allocation (279,493) (276,030) (283,177) (311,329)
TOTAL OTHER USES (279,493) (276,030) (283,177) (311,329)
TOTAL GENERAL FUND APPROPRIATIONS 228,674 226,347 231,691 254,723

Fiscal Year 2021 - 22 Annual Budget
199
Appropriations
Summary
Planning &
Zoning
Division
Community
Development
Department
Appropriations Summary
ADOPTED ADOPTED INCREASE/
2020-21 2021-22 (DECREASE) PERCENTAGE
Personal Services 444,418 454,248 9,830 2.21%
Operating Expenses 70,450 111,804 41,354 58.70%
Other Uses (283,177) (311,329) (28,152) 9.94%
TOTALS 231,691 254,723 23,032 9.94%
Significant Budget Changes:
The change in Operating Expenses is due to the increase in Professional Services (3110) to update the
Comprehensive Plan $50,000.

This page intentionally left blank
Fiscal Year 2021 - 22 Annual Budget
200

Fiscal Year 2021 - 22 Annual Budget
201
Organization
Total
Budget
Housing
Department
The Housing Department serves to assist, stimulate and facilitate public and private development resulting in creation of new value-added jobs, increase in per-capita income, improvements in the tax base, preservation of the economic value of property, the quality of life, increase home ownership, rehabilitate existing housing stock, and provide better services to residents and investors in the City. The department’s strategies include economic diversification, business attraction and retention, community economic development business assistance, and creating economic development partnerships. The housing office will coordinate with the Community Redevelopment Agencies to increase the viability of existing neighborhoods and promote infill housing. Responsibilities: Housing Economic Development • 1st Time Homebuyers Program • Technical assistance to businesses • Coordinate housing subsidies • Listing of available properties • Technical assistance on grant applications • Demographic information • Leverage partnership dollars • Advertising program • Affordable housing programs • Committee participation • Operate Neighborhood Stabilization Program • Operation of Business Incubator • Housing Rehabilitation Organizational Chart
$ 186,964 GF
Kenneth L. Thomas, Director of Housing
Director of Housing

Fiscal Year 2021 - 22 Annual Budget
202
Housing
Department
Administration
Division
Goals & Tasks
Goals & Tasks
Goal: Eliminate blight and stimulate growth by investing in neighborhood redevelopment, while also
pursuing new economic opportunities.
Task:
Create home choices for single home development
Identify lots within the City that can accommodate single home development
Goal: Foster an environment where local governance is collaborative, transparent and fiscally sound.
Task:
Create Housing Rehabilitation Program
Offer affordable rental properties to provide a stepping stone for home ownership
Educate, equip and assist families to be financially responsible
Create programs in conjunction with Lake Technical College, LSSC, LCAA and other local entities
Major Accomplishments:
Increased home buying counseling to potential homebuyers
Created partnership with West Leesburg CDC to assist with homebuyers approvals
Performance Measures:
2019-20 2020-21 2021-22
Development of in-fill lots 2 8 8
Housing Assistance Counseling Provided 128 120 120
Neighborhood meetings (West Leesburg, etc.) 5 12 12
Conducted Workshops/Conferences for new home
buyers
5 12 12

Fiscal Year 2021 - 22 Annual Budget
203
Housing
Department
Personnel
Schedule
Personnel Schedule
Administration
Division
Classification 2021 Change 2022 Amount
Director of Housing 1.00 0.00 1.00 94,910
Total 1.00 0.00 1.00 94,910

Fiscal Year 2021 - 22 Annual Budget
204
Housing
Department
Administration
Division
Appropriations
Detail
Appropriations Detail Account # 001-6254-554
ACTUAL ACTUAL ADOPTED ADOPTED
2018-19 2019-20 2020-21 2021-22
PERSONAL SERVICES
12xx Regular Salaries & Wages 92,357 92,676 94,910 94,910
1310 Temporary Labor 639 0 0 0
1530 Bonuses 2,766 2,766 0 0
1641 Vacation/Terms & Buyouts 3,234 0 0 0
2110 FICA 7,301 7,028 6,956 6,946
221x Retirement 4,618 4,634 4,746 16,976
23xx Insurance 17,834 17,814 19,549 19,987
2410 Workers' Compensation 278 268 266 266
26xx Other Payroll Benefits 2,750 2,761 2,733 2,734
TOTAL PERSONAL SERVICES 131,777 127,947 129,160 141,819
OPERATING EXPENSES
3410 Contract Services 3,953 98,483 0 7,000
4010 Travel 959 766 2,000 2,000
4110 Communication 1,656 1,606 2,500 2,500
4210 Postage 475 40 500 500
4310 Utilities 13,747 12,686 20,000 20,000
4410 Rentals 1,669 0 200 200
4510 Insurance 1,525 1,360 1,361 1,685
462x Repairs & Maintenance- Buildings 1,000 809 200 1,000
46xx Repairs & Maintenance- Equipment 4,154 2,739 3,160 3,160
4710 Printing & Binding 292 0 300 300
48xx Promotional Activities 1,080 106 500 500
49xx Advertising 32 0 100 100
492x Other Current Charges 0 8,175 0 0
4980 Taxes 4,664 1,173 1,000 1,000
5180 Minor Furniture/Equipment 14 0 0 0
52xx Operating Supplies 3,394 2,024 2,200 2,200
5410 Publications & Memberships 967 0 2,000 2,000
5520 Training 2,207 495 1,500 1,000
TOTAL OPERATING EXPENSES 41,788 130,462 37,521 45,145
TOTAL GENERAL FUND APPROPRIATIONS 173,565 258,409 166,681 186,964
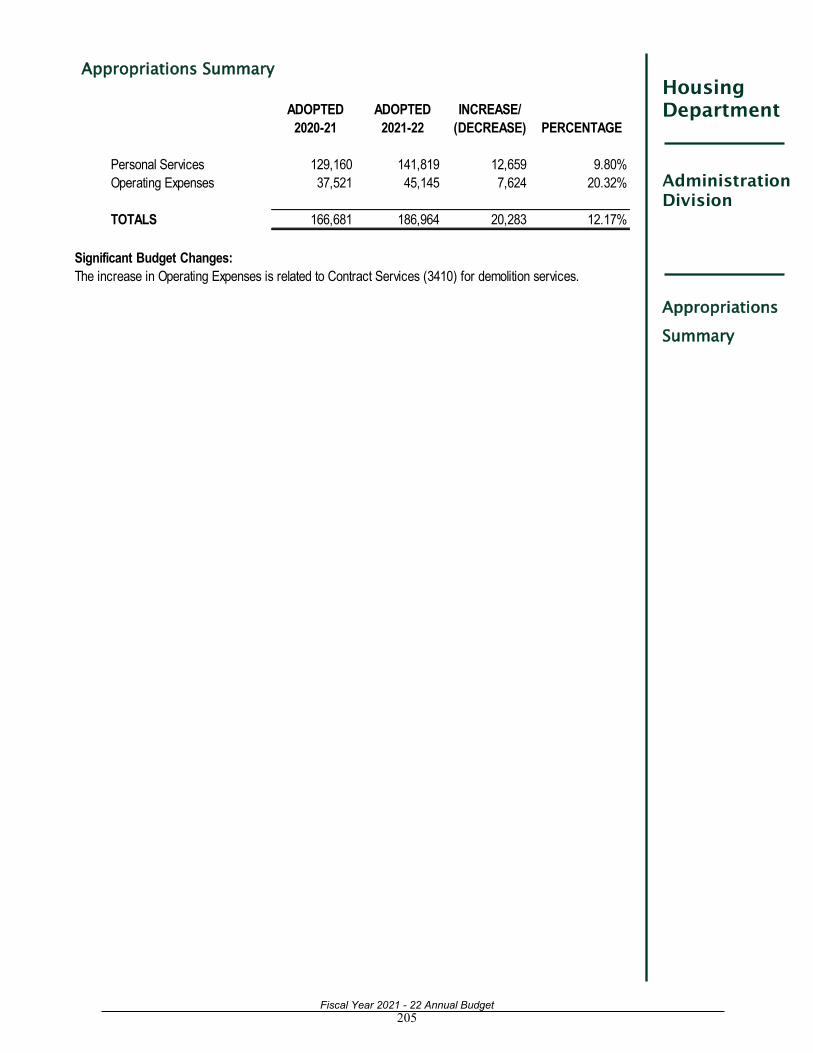
Fiscal Year 2021 - 22 Annual Budget
205
Housing
Department
Administration
Division
Appropriations
Summary
Appropriations Summary
ADOPTED ADOPTED INCREASE/
2020-21 2021-22 (DECREASE) PERCENTAGE
Personal Services 129,160 141,819 12,659 9.80%
Operating Expenses 37,521 45,145 7,624 20.32%
TOTALS 166,681 186,964 20,283 12.17%
Significant Budget Changes:
The increase in Operating Expenses is related to Contract Services (3410) for demolition services.

This page intentionally left blank
Fiscal Year 2021 - 22 Annual Budget
206

Fiscal Year 2021 - 22 Annual Budget
207
Organization
Total
Budget
Library
Department
Lucy B. Gangone, MLS, Library Director
The Library serves as the primary source of all types of information for both city and county residents, provides access to a wide range of informational and recreational materials in a variety of print, non-print, and electronic formats, supports both the formal and informal educational needs of patrons, and encourages children and adults to develop an interest in reading and learning.
Responsibilities: Adult Services Support Services Youth Services Programs ·Collection Development ·Business operations ·Programs ·Adult Programs ·Reference ·Technical Services ·Reference ·Promotion ·Genealogy & Local ·Circulation Services ·Collection Development ·Marketing History ·Volunteers ·Reader’s advisory ·Community Outreach ·Reader’s advisory ·Collection Management ·Public Computers ·Public Computers ·Community Outreach ·Adult Literacy ·Early & Family Literacy ·Community Outreach ·Technology Classes ·Passport Acceptance Center ·Leesburg Digital Collections Organizational Chart
$ 1,770,643 GF
Library Director
Administrative
Assistant II
Youth Services
Supervisor
Library Assistant
Librarian
Library Page Library Assistant
Adult Services
Supervisor
Support Services
Manager
Book Store
Manager
Librarian
Library
Program
Coordinator
Library Assistant
Library Assistant

Fiscal Year 2021 - 22 Annual Budget
208
Goals & Tasks
Library
Department
Library
Division
Goals & Tasks
Goal: Utilize Leesburg’s natural resources and slogan as the “Lakefront City” to enhance recreational and
leisure amenities.
Task:
Provide a safe and welcoming environment for all citizens to enjoy
Provide programming that entertains, inspires and imparts new knowledge and skills to people of all
ages
Provide a current and comprehensive collection of materials that meets the information, educational
and lifelong learning needs of citizens in a variety of formats
Goal: Foster an environment where local governance is collaborative, transparent and fiscally sound.
Task:
Foster academic success of youth through programs of service to build literacy
Foster education, job preparedness and self-sufficiency through adult literacy programs of service
Foster job readiness and improve job skills through technology instruction
Engage in partnerships with local agencies and non-profit organizations to connect residents with
services and help
Major Accomplishments:
Leesburg Public Library was the only library in Lake County to provide continuous curbside
service for the loan of library items from March 2020 to date, with 10,000 items picked up at
curbside
Successfully converted all in-person adult & youth programs, book clubs and technology classes
to virtual formats reaching 15,100 people through Facebook Live, YouTube and Zoom
Created and launched the Leesburg Digital Collections project to identify and preserve material
with local significance and provide access to digital surrogates of archival material
Performance Measures:
2019-20 2020-21 2021-22
Number of library visits 114,200 175,000 210,000
Hours of public computer use/wireless access 31,330 40,000 56,000
Program attendance 21,830 24,000 31,000
Print/non print checkouts 220,500 230,000 245,000
Digital resources downloaded or streamed 57,740 75,000 90,000
Youth reached through programs 13,070 15,000 18,500
Youth check outs 67,310 70,000 77,000
Users receiving technology instruction 18,200 21,000 27,000
People assisted with socio-economic programs 3,626 1,500 4,500

Fiscal Year 2021 - 22 Annual Budget
209
Library
Department
Library
Division
Personnel &
Capital Outlay
Schedules
Personnel Schedule
Classification 2021 Change 2022 Amount
Administrative Assistant II 1.00 0.00 1.00 47,091
Adult Services Supervisor 1.00 0.00 1.00 41,330
Librarian 2.00 0.00 2.00 72,592
Library Assistant 9.00 0.00 9.00 249,766
Library Assistant/Adult Services 2.00 0.00 2.00 60,279
Library Director 1.00 0.00 1.00 97,406
Library Program Coordinator 1.00 0.00 1.00 37,627
Support Services Manager 1.00 0.00 1.00 46,405
Youth Services Supervisor 1.00 0.00 1.00 45,261
Total Full Time 19.00 0.00 19.00 697,757
Library Assistant 6.00 0.00 6.00 84,177
Library Assistant/Adult Services 1.00 0.00 1.00 15,205
Library Page 3.00 0.00 3.00 53,261
Total Part Time 10.00 0.00 10.00 152,643
Book Store Manager (Paid Thru Friends) 1.00 0.00 1.00 7,000
Library Assistant Temp 2.00 0.00 2.00 23,200
Total Temporary Labor 3.00 0.00 3.00 30,200
Total Number of Positions 32.00 0.00 32.00 880,600
Description
Funding/Work order
Amount
Meeting room partition 48,600
Total 48,600
Capital Outlay Schedule

Fiscal Year 2021 - 22 Annual Budget
210
Appropriations
Detail
Library
Department
Library
Division
Appropriations Detail Account # 001-7111-571
ACTUAL ACTUAL ADOPTED ADOPTED
2018-19 2019-20 2020-21 2021-22PERSONAL SERVICES
1210 Regular Salaries & Wages 646,208 670,515 691,558 697,757
1220 Permanent/ Part time Salaries & Wages 118,642 108,201 136,587 152,643
1310 Temporary Labor 26,819 19,409 30,778 30,200
1410 Overtime 9,763 6,652 11,500 5,000
15xx Bonuses/Incentives 1,269 374 0 0
1641 Vacation/Terms & Buyout 18,898 15,002 0 0
2110 FICA 59,416 59,281 62,203 63,984
221x Retirement 50,298 51,513 50,800 73,913
23xx Insurance 154,861 158,234 187,344 200,571
2410 Workers' Compensation 2,291 2,291 2,340 2,466
26xx Other Employee Benefits 3,589 3,941 3,870 3,857
TOTAL PERSONAL SERVICES 1,092,054 1,095,413 1,176,980 1,230,391
OPERATING EXPENSES
31xx Professional Services 3,360 2,010 5,400 5,400
3410 Contract Services 4,773 14,651 14,765 15,442
4010 Travel 997 376 968 968
4110 Communication 3,679 3,586 3,310 3,425
4210 Postage 2,539 821 2,900 1,530
4310 Utilities 131,782 117,576 139,474 139,592
4410 Rentals 15,138 15,407 14,348 20,790
4510 Insurance 16,231 18,397 19,490 17,133
4620 Repairs & Maintenance- Building 10,903 10,172 14,976 13,492
46xx Repairs & Maintenance- Equipment 16,582 18,442 18,799 18,005
4710 Printing & Binding 8,564 7,382 10,970 11,070
4810 Promotional Activities 499 1,210 1,000 1,000
4911 Advertising 33 0 240 240
4920 Other Current Charges 1,349 2,511 2,275 2,375
5180 Minor Furniture/Equipment 8,375 8,692 7,000 7,000
5210 Operating Supplies 35,094 28,291 30,000 30,000
5410 Publications & Memberships 49,925 43,504 41,668 47,690
541x Library Materials 158,533 152,221 155,000 155,000
5520 Training 1,234 557 1,500 1,500
5540 Education Reimbursement 0 2,521 0 0
TOTAL OPERATING EXPENSES 469,590 448,327 484,083 491,652
CAPITAL OUTLAY
6210 Buildings 0 0 0 48,600
6410 Machinery & Equipment 0 56,310 0 0
TOTAL CAPITAL OUTLAY 0 56,310 0 48,600
TOTAL GENERAL FUND APPROPRIATIONS 1,561,644 1,600,050 1,661,063 1,770,643

Fiscal Year 2021 - 22 Annual Budget
211
Appropriations
Summary
Library
Department
Library
Division
Appropriations Summary
ADOPTED ADOPTED INCREASE/
2020-21 2021-22 (DECREASE) PERCENTAGE
Personal Services 1,176,980 1,230,391 53,411 4.54%
Operating Expenses 484,083 491,652 7,569 1.56%
Capital Outlay 0 48,600 48,600 100.00%
TOTALS 1,661,063 1,770,643 109,580 6.60%

This page intentionally left blank
Fiscal Year 2021 - 22 Annual Budget
212

Fiscal Year 2021 - 22 Annual Budget
213
Organization
Total
Budget
Recreation
Department
Travis Rima, Recreation Director
The Recreation Department provides the public with a wide variety of activities through athletic, cultural and leisure programming, pools, playgrounds, active and passive parks. The rental facilities are rented on a first come first serve basis which includes the Community Building, Cultural Arts Building and the Mote-Morris House. The Marina provides excellent services to the boating public.
Responsibilities
Programs Marina
·Provide athletic, cultural, and ·Operation
Leisure programs Organizational Chart
$ 2,319,203 GF
Recreation Director
Administrative
Assistant I
Athletic
Supervisor
Part Time
Personnel
Contract
Personnel
Marina
Mobile
Equipment
Operator I
Office Specialist
Administrative
Assistant II
Recreation Manager
(Programs & Teens)
Recreation
Aide
Aquatics Staff
Athletic Facilities
Manager
Maintenance
Worker II
Athletic Facilities
Lead
Maintenance
Worker I
Recreation
Supervisor
Part Time
Personnel
Recreation Manager
(Facilites)

Fiscal Year 2021 - 22 Annual Budget
214
Goals & Tasks
Recreation
Department
Programs
Goals & Tasks
Goal: Eliminate blight and stimulate growth by investing in neighborhood redevelopment, creating new
economic opportunities and investing in infrastructure
Task:
Identify areas of blight where redevelopment opportunities can be enhanced through recreation
programs and facilities
Create interconnecting facilities by linking city and recreation properties via city trails and sidewalks
Goal: Promote Leesburg’s Natural Resources and slogan as the “Lakefront City” to enhance recreational
and leisure opportunities
Task:
Continue facilitation of fundraisers to assist with the funding of Recreation Scholarship Program
Promote the City’s natural resources by creating a regional advertising campaign
Increase all youth participation in recreation programs by 5% the upcoming fiscal year
Attract and retain a minimum of three mid to high level fishing events per year
Attract and retain a minimum of twenty-four tournament rentals at athletic facilities per year
Major Accomplishments:
Collaborated to bring in Power 5 (Big 10) softball to Sleepy Hollow for two weekends and two other
weekends of Division 1 softball
Awarded FRPA Excellence in Sports Tourism Small Market
Increased athletic field rental and facility rental revenue for 4th consecutive year
Completed the 3rd Annual Recreation Scholarship Golf Tournament raising funds for program
scholarships for underprivileged children
Hosted high level (Fishing League Worldwide (FLW), Major League Fishing (MLF), Bass Pro Shop
Series, Fishers of Men and Florida BASS Nation)
Processed over 80 special event permits
Performance Measures:
2019-20 2020-21 2021-22
Youth participation in recreation programs 1,551 1,300* 1,600
Number of recreation programs offered 62 57* 63
Amount of scholarships offered $2,000 $1,500* $2,200
Splash pad attendance 10,920 6,000* 11,000
Number of tournament rentals at athletic fields 34 30* 35
Revenue from tournament rentals at athletic fields $54,000 $58,000 $60,000
Number of fishing tournaments hosted 5 12 12
* Decrease due to COVID-19

Fiscal Year 2021 - 22 Annual Budget
215
Recreation
Department
Programs
Personnel &
Capital Outlay
Schedules
Personnel Schedule
Classification 2021 Change 2022 Amount
Administrative Assistant I 1.00 0.00 1.00 32,427
Administrative Assistant II 1.00 0.00 1.00 36,816
Athletic Facilities Lead 1.00 0.00 1.00 45,760
Athletic Facilities Manager 1.00 0.00 1.00 60,778
Athletic Supervisor 1.00 0.00 1.00 39,645
Maintenance Worker I 4.00 0.00 4.00 104,624
Maintenance Worker II 3.00 0.00 3.00 92,104
Recreation Aide 1.00 0.00 1.00 30,888
Recreation Director 1.00 0.00 1.00 82,098
Recreation Manager 1.00 1.00 2.00 127,897
Recreation Supervisor 1.00 (1.00) 0.00 0
Spray Technician 1.00 0.00 1.00 33,093
Total 17.00 0.00 17.00 686,130
Capital Outlay Schedule
Description
Funding/Work order
Amount
Box Blade Laser Level for Athletic Fields 17,600 Total 17,600

Fiscal Year 2021 - 22 Annual Budget
216
Programs
Recreation
Department
Appropriations
Detail
Appropriations Detail Account # 001-8125-572
ACTUAL ACTUAL ADOPTED ADOPTED
2018-19 2019-20 2020-21 2021-22
PERSONAL SERVICES
12xx Regular Salaries & Wages 529,503 619,793 662,121 686,130
1310 Temporary Labor 112,776 84,931 115,429 144,039
1410 Overtime 30,264 23,381 33,250 38,000
1530 Bonuses/Incentives 1,040 3,224 0 0
1641 Vacation/Terms & Buyout 19,618 13,243 0 0
2110 FICA 49,745 52,696 46,655 48,539
221x Retirement 62,051 66,256 64,891 81,166
23xx Insurance 180,528 204,161 245,363 217,130
2410 Workers' Compensation 20,472 22,404 19,366 20,134
262x Other Payroll Benefits 6,581 6,762 6,819 7,042
TOTAL PERSONAL SERVICES 1,012,578 1,096,851 1,193,894 1,242,180
OPERATING EXPENSES
3410 Contract Services 42,632 51,044 63,508 162,586
4010 Travel 713 0 1,850 1,850
41xx Communication 1,625 2,664 2,130 2,130
4210 Postage 67 231 250 250
4310 Utilities 201,400 172,456 222,600 242,100
4410 Rentals 180 657 4,100 3,650
4415 Internal Fleet Lease 26,349 36,835 27,854 31,723
4510 Insurance 10,806 12,591 20,761 19,091
461x Repairs & Maintenance- Vehicles 30,508 33,855 25,559 30,649
46xx Repairs & Maintenance- Equipment 28,329 12,072 33,910 30,800
4710 Printing & Binding 4,228 4,029 4,900 4,800
4810 Promotional Activities 414 260 250 250
4911 Advertising- Other Ads 310 177 1,500 1,500
4920 Other Current Charges 3,387 3,349 2,200 2,200
4930 Recognitions & Awards 8,429 5,718 9,785 9,920
5180 Minor Furniture/Equipment 27,237 12,396 20,000 18,600
5210 Operating Supplies 98,771 92,094 93,300 158,011
5215 Uniforms 5,780 6,380 7,615 8,500
5216 Team Uniforms 22,623 16,588 20,700 19,325
5230 Fuel Purchases 12,397 8,948 11,000 12,000
5280 Chemicals 9,904 9,830 9,500 10,000
5410 Publications & Memberships 1,747 2,234 2,110 2,770
5520 Training 2,487 973 5,000 4,810
TOTAL OPERATING EXPENSES 540,323 485,381 590,382 777,515
CAPITAL OUTLAY
6410 Machinery & Equipment 5,276 40,213 0 17,600
TOTAL CAPITAL OUTLAY 5,276 40,213 0 17,600
TOTAL GENERAL FUND APPROPRIATIONS 1,558,177 1,622,445 1,784,276 2,037,295

Fiscal Year 2021 - 22 Annual Budget
217
Recreation
Department
Programs
Appropriations
Summary
Appropriations Summary
ADOPTED ADOPTED INCREASE/
2020-21 2021-22 (DECREASE) PERCENTAGE
Personal Services 1,193,894 1,242,180 48,286 4.04%
Operating Expenses 590,382 777,515 187,133 31.70%
Capital Outlay 0 17,600 17,600 100.00%
TOTALS 1,784,276 2,037,295 253,019 14.18%
Significant Budget Changes:
The change in Operating Expenses is attributable to an increase in Contract Services (3410) for a Sports
Marketing Contract $100,000, a cooresponding revenue is budgeted with American Rescue Plan funds.
Additionally, Operating Supplies increased (5210) for additional Field maintenance supplies.

Fiscal Year 2021 - 22 Annual Budget
218
Goals & Tasks
Recreation
Department
Marina
Division
Goals & Tasks
Goal: Utilize Leesburg’s natural resources and slogan as the “Lakefront City” to enhance recreational and
leisure amenities.
Task:
Promote healthy, safe and recreational waterways through literature available at the Marina such as
maps, fishing hot spots, safety guides, activities, current boating standards, regulations and trends
Remain in good standing through the Department of Environmental Protection (DEP) for the Clean
Marina, Clean Boatyard and Clean/Resilient Marina certifications
Promote City’s natural resources by creating a regional advertising campaign
Major Accomplishments:
Recertified as a Clean Marina, Clean Boatyard and Clean/Resilient Marina status through the
Department of Environmental Protection (DEP)
Added kayaks to the rentable watercraft options
Performance Measures:
2019-20 2020-21 2021-22
Literature distributed at the Marina 325 350 350
Programs developed to introduce Leesburg’s
natural resources
2 4 4
Wet slips available 44 44 44
Wet slip occupancy 100% 100% 100%
Dry slips available 147 147 147
Dry slip occupancy 83% 90% 90%
Gallons sold-unleaded 29,500 35,000 38,000

Fiscal Year 2021 - 22 Annual Budget
219
Personnel
Schedule
Recreation
Department
Marina
Division
Personnel Schedule
Classification 2021 Change 2022 Amount
Mobile Equipment Operator II 1.00 0.00 1.00 28,309
Office Specialist 1.00 0.00 1.00 30,326
Total 2.00 0.00 2.00 58,635

Fiscal Year 2021 - 22 Annual Budget
220
Appropriations
Detail
Recreation
Department
Marina
Division
Appropriations Detail Account # 001-8151-575
ACTUAL ACTUAL ADOPTED ADOPTED
2018-19 2019-20 2020-21 2021-22
PERSONAL SERVICES
12xx Regular Salaries & Wages 53,438 55,502 56,930 58,635
1310 Temporary Labor 23,329 15,487 22,500 22,000
1410 Overtime 511 589 3,500 2,000
2110 FICA 5,384 4,951 3,808 3,938
221x Retirement 2,664 2,775 2,846 6,202
23xx Insurance 19,475 19,448 22,032 22,685
2410 Workers' Compensation 1,741 1,489 1,237 1,274
26xx Other Payroll Benefits 51 61 33 34
TOTAL PERSONAL SERVICES 106,593 100,302 112,886 116,768
OPERATING EXPENSES
3410 Contract Services 2,525 4,574 6,075 7,867
4210 Postage 974 999 500 1,000
4310 Utilities 10,323 10,784 12,000 10,000
4415 Internal Fleet Lease 8,899 11,192 11,670 11,785
4510 Insurance 9,441 10,200 10,542 10,655
461x Repairs & Maintenance- Vehicles 2,834 2,916 9,015 5,627
4620 Repairs & Maintenance- Building 2,854 2,850 6,000 5,000
4625 Repairs & Maintenance- Non-Build 351 936 2,800 3,250
46xx Repairs & Maintenance- Equipment 1,151 628 1,430 1,020
4710 Printing & Binding 339 0 500 300
4911 Advertising 0 0 100 100
4920 Other Current Charges 5,306 5,396 5,090 5,090
4945 Injury/ Damage to Others 2,645 3,930 5,000 4,500
4980 Taxes 31 0 31 31
5180 Minor Furniture/Equipment 947 2,970 1,500 4,350
5210 Operating Supplies 2,836 2,874 3,500 3,780
5215 Uniforms 325 309 385 385
52xx Fuel Purchases 88,973 93,197 89,000 90,400
TOTAL OPERATING EXPENSES 140,754 153,755 165,138 165,140
TOTAL GENERAL FUND APPROPRIATIONS 247,347 254,057 278,024 281,908

Fiscal Year 2021 - 22 Annual Budget
221
Appropriations
Summary
Recreation
Department
Marina
Division
Appropriations Summary
ADOPTED ADOPTED INCREASE/
2020-21 2021-22 (DECREASE) PERCENTAGE
Personal Services 112,886 116,768 3,882 3.44%
Operating Expenses 165,138 165,140 2 0.00%
TOTALS 278,024 281,908 3,884 1.40%

This page intentionally left blank
Fiscal Year 2021 - 22 Annual Budget
222
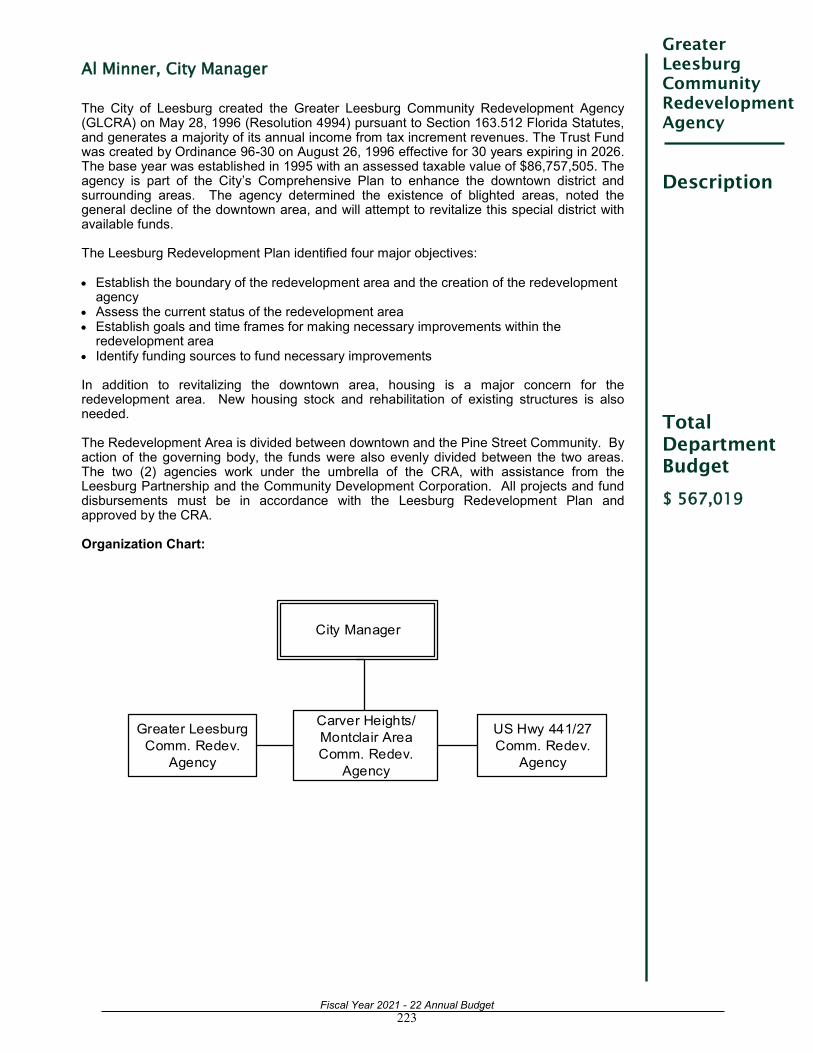
Fiscal Year 2021 - 22 Annual Budget
223
Greater
Leesburg
Community
Redevelopment
Agency
Total
Department
Budget
Description
Al Minner, City Manager
The City of Leesburg created the Greater Leesburg Community Redevelopment Agency (GLCRA) on May 28, 1996 (Resolution 4994) pursuant to Section 163.512 Florida Statutes, and generates a majority of its annual income from tax increment revenues. The Trust Fund was created by Ordinance 96-30 on August 26, 1996 effective for 30 years expiring in 2026. The base year was established in 1995 with an assessed taxable value of $86,757,505. The agency is part of the City’s Comprehensive Plan to enhance the downtown district and surrounding areas. The agency determined the existence of blighted areas, noted the general decline of the downtown area, and will attempt to revitalize this special district with available funds. The Leesburg Redevelopment Plan identified four major objectives: • Establish the boundary of the redevelopment area and the creation of the redevelopment
agency • Assess the current status of the redevelopment area • Establish goals and time frames for making necessary improvements within the
redevelopment area • Identify funding sources to fund necessary improvements In addition to revitalizing the downtown area, housing is a major concern for the redevelopment area. New housing stock and rehabilitation of existing structures is also needed. The Redevelopment Area is divided between downtown and the Pine Street Community. By action of the governing body, the funds were also evenly divided between the two areas. The two (2) agencies work under the umbrella of the CRA, with assistance from the Leesburg Partnership and the Community Development Corporation. All projects and fund disbursements must be in accordance with the Leesburg Redevelopment Plan and approved by the CRA. Organization Chart:
$ 567,019
Carver Heights/
Montclair Area
Comm. Redev.
Agency
Greater Leesburg
Comm. Redev.
Agency
US Hwy 441/27
Comm. Redev.
Agency
City Manager

Fiscal Year 2021 - 22 Annual Budget
224
Greater
Leesburg
CRA Fund
Revenue
Sources &
Appropriations
Revenue Sources and Appropriations
ACTUAL ACTUAL ADOPTED ADOPTED
2018-19 2019-20 2020-21 2021-22
REVENUE SOURCES
Taxes 179,769 180,714 225,923 229,869
Intergovernmental Revenue 254,818 248,674 323,988 334,650
Miscellaneous Revenue 8,214 4,730 5,000 2,500
Other Sources 0 78,120 103,000 0
TOTAL REVENUE SOURCES 442,801 512,238 657,911 567,019
APPROPRIATIONS
CRA 1,020,285 465,857 657,911 567,019
TOTAL APPROPRIATIONS 1,020,285 465,857 657,911 567,019

Fiscal Year 2021 - 22 Annual Budget
225
Greater
Leesburg
CRA Fund
Revenue
Detail
Revenue Detail
ACTUAL ACTUAL ADOPTED ADOPTED
2018-19 2019-20 2020-21 2021-22
TAXES
31101 Current Property Taxes 179,769 180,714 225,923 229,869
TOTAL TAXES 179,769 180,714 225,923 229,869
INTERGOVERNMENTAL REVENUES
33731 Lake County/Redevelopment 254,818 248,674 323,988 334,650
TOTAL INTERGOVERNMENTAL 254,818 248,674 323,988 334,650
MISCELLANEOUS REVENUE
36110 Interest on Investments 2,556 3,756 5,000 2,500
36130 Gain/Loss Investments 5,658 974 0 0
TOTAL MISCELLANEOUS REVENUE 8,214 4,730 5,000 2,500
OTHER SOURCES
38131 Transfer from Capital Projects 0 78,120 0 0
38891 Fund Balance Appropriated 0 0 103,000 0
TOTAL OTHER SOURCES 0 78,120 103,000 0
TOTAL RESOURCES 442,801 512,238 657,911 567,019

Fiscal Year 2021 - 22 Annual Budget
226
Greater
Leesburg
CRA Fund
Appropriations
Detail
Appropriations Detail Account # 016-6189-5xx
ACTUAL ACTUAL ADOPTED ADOPTED
2018-19 2019-20 2020-21 2021-22
OPERATING EXPENSES
3110 Professional Services 3,839 7,352 0 1,000
3210 Auditing 0 0 3,000 3,000
4510 Insurance 2,946 3,020 3,020 3,020
4625 Repairs & Maintenance- Non Build 0 65 0 0
4920 Other Current Charges-CDC 216,530 213,925 277,455 283,509
TOTAL OPERATING EXPENSES 223,315 224,362 283,475 290,529
CAPITAL OUTLAY
6110 Land Costs 0 42,660 0 0
TOTAL CAPITAL OUTLAY 0 42,660 0 0
DEBT SERVICE
71xx Principal 79,000 81,000 83,000 86,000
72xx Interest 22,043 19,715 17,330 14,870
TOTAL DEBT SERVICE 101,043 100,715 100,330 100,870
GRANTS & AIDS
8210 Local Contributions 0 78,120 0 0
8213 Housing Rehab Program 0 10,000 37,053 0
8214 Matching Landscape/Façade Grt 70,927 10,000 37,053 75,000
TOTAL GRANTS & AIDS 70,927 98,120 74,106 75,000
OTHER USES
9131 Transfer to Capital Projects 625,000 0 200,000 0
9910 Reserve for Future 0 0 0 100,620
TOTAL OTHER USES 625,000 0 200,000 100,620
TOTAL APPROPRIATIONS 1,020,285 465,857 657,911 567,019

Fiscal Year 2021 - 22 Annual Budget
227
Greater
Leesburg
CRA Fund
Appropriations
Summary
Appropriations Summary
ADOPTED ADOPTED INCREASE/
2020-21 2021-22 (DECREASE) PERCENTAGE
Operating Expenses 283,475 290,529 7,054 2.49%
Debt Service 100,330 100,870 540 0.54%
Grants & Aids 74,106 75,000 894 1.21%
Other Uses 200,000 100,620 (99,380) -49.69%
TOTALS 657,911 567,019 (90,892) -13.82%
Significant Budget Changes:
The change in Other Uses is due to the Transfer to Capital Projects (9131) being eliminated and a
Reserve for Future (9910) being included.

This page intentionally left blank
Fiscal Year 2021 - 22 Annual Budget
228
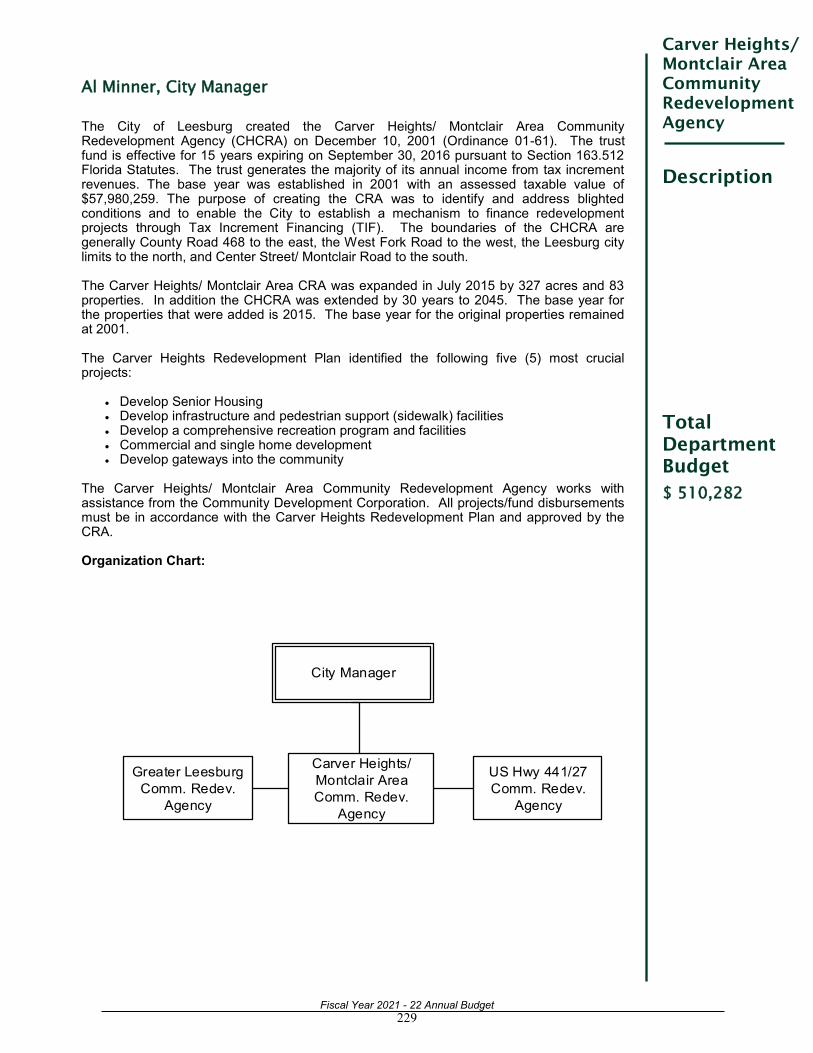
Fiscal Year 2021 - 22 Annual Budget
229
Carver Heights/
Montclair Area
Community
Redevelopment
Agency
Description
Total
Department
Budget
Al Minner, City Manager
The City of Leesburg created the Carver Heights/ Montclair Area Community Redevelopment Agency (CHCRA) on December 10, 2001 (Ordinance 01-61). The trust fund is effective for 15 years expiring on September 30, 2016 pursuant to Section 163.512 Florida Statutes. The trust generates the majority of its annual income from tax increment revenues. The base year was established in 2001 with an assessed taxable value of $57,980,259. The purpose of creating the CRA was to identify and address blighted conditions and to enable the City to establish a mechanism to finance redevelopment projects through Tax Increment Financing (TIF). The boundaries of the CHCRA are generally County Road 468 to the east, the West Fork Road to the west, the Leesburg city limits to the north, and Center Street/ Montclair Road to the south. The Carver Heights/ Montclair Area CRA was expanded in July 2015 by 327 acres and 83 properties. In addition the CHCRA was extended by 30 years to 2045. The base year for the properties that were added is 2015. The base year for the original properties remained at 2001. The Carver Heights Redevelopment Plan identified the following five (5) most crucial projects:
• Develop Senior Housing • Develop infrastructure and pedestrian support (sidewalk) facilities • Develop a comprehensive recreation program and facilities • Commercial and single home development • Develop gateways into the community
The Carver Heights/ Montclair Area Community Redevelopment Agency works with assistance from the Community Development Corporation. All projects/fund disbursements must be in accordance with the Carver Heights Redevelopment Plan and approved by the CRA. Organization Chart:
$ 510,282
Carver Heights/
Montclair Area
Comm. Redev.
Agency
Greater Leesburg
Comm. Redev.
Agency
US Hwy 441/27
Comm. Redev.
Agency
City Manager

Fiscal Year 2021 - 22 Annual Budget
230
Carver Heights/
Montclair Area
CRA Fund
Goals & Tasks
Goals & Tasks
Goal: Eliminate blight and stimulate growth by investing in neighborhood redevelopment, while also pursuing new economic opportunities. Task:
Implement In-fill Lot Housing Program
Seek funding to acquire additional lots in the Carver Heights CRA
Improve the housing conditions in the Carver Heights CRA
Increase single family home development Goal: Foster an environment where local governance is collaborative, transparent and fiscally sound. Task:
Partner with non-profit organizations, government agencies, churches and civic groups to offer classes/programs at the Leesburg Resource Center to increase the education and employability skills of our residents
Coordinate with commercial developers to expand and build new construction in the area
Develop partnerships for redevelopment of residential and commercial properties
Hold meetings to discuss needs, concerns and issues affecting the Carver Heights/Montclair Community
Provide information to CRA community on potential redevelopment project/programs Major Accomplishments: Secured $820,000 in funding for the Teen Center Established job training network with Career Source and Kids Central Created a partnership with West Leesburg CDC to increase homeownership opportunities
Performance Measures:
2019-20 2020-21 2021-22
Land Acquired (lots/homes/units) 2 2 2
Community Meetings 28 35 35
Assist West Leesburg CDC Board Meetings 5 12 12
Community Cleanup projects 1 1 1
Conducted Workshops/Conferences for community 3 12 12
Resource Center Programs/Classes 15 20 20

Fiscal Year 2021 - 22 Annual Budget
231
Revenue
Sources and
Appropriations
& Revenue
Detail
Carver Heights/
Montclair Area
CRA Fund
Revenue Sources and Appropriations
Revenue Detail
ACTUAL ACTUAL ADOPTED ADOPTED
2018-19 2019-20 2020-21 2021-22
REVENUE SOURCES
Taxes 112,067 135,438 170,441 206,256
Intergovernmental Revenue 158,086 185,729 244,423 300,276
Miscellaneous Revenues 15,483 7,633 6,500 3,750
Other Sources 0 0 0 0
TOTAL REVENUE SOURCES 285,636 328,800 421,364 510,282
APPROPRIATIONS
Operations 128,085 260,803 346,199 432,102
Resource Center 58,146 98,553 75,165 78,180
TOTAL APPROPRIATIONS 186,231 359,356 421,364 510,282
ACTUAL ACTUAL ADOPTED ADOPTED
2018-19 2019-20 2020-21 2021-22
TAXES
33101 Current Property Taxes 112,067 135,438 170,441 206,256
TOTAL TAXES 112,067 135,438 170,441 206,256
INTERGOVERNMENTAL REVENUES
33731 Lake County/Redevelopment 158,086 185,729 244,423 300,276
TOTAL INTERGOVERNMENTAL 158,086 185,729 244,423 300,276
MISCELLANEOUS REVENUES
36110 Interest on Investments 6,040 5,162 2,500 1,250
36130 Gain/Loss Investments 4,818 641 0 0
36201 Resource Center 4,625 1,830 4,000 2,500
TOTAL MISCELLANEOUS REVENUES 15,483 7,633 6,500 3,750
OTHER SOURCES
38891 Fund Balance Appropriated 0 0 0 0
TOTAL OTHER SOURCES 0 0 0 0
TOTAL RESOURCES 285,636 328,800 421,364 510,282

Fiscal Year 2021 - 22 Annual Budget
232
Appropriations
Detail
Appropriations Detail Account # 017-6190-559 Carver Heights/
Montclair Area
CRA Fund
Operations
ACTUAL ACTUAL ADOPTED ADOPTED
2018-19 2019-20 2020-21 2021-22
OPERATING EXPENSES
3110 Professional Services 19,277 16,809 11,400 11,400
3130 Engineering Services 0 0 0 25,000
3210 Auditing 0 0 3,000 3,000
4010 Travel 0 6 0 0
4210 Postage 116 23 50 50
4310 Utilities 2,551 5,303 4,000 3,000
4510 Insurance 2,946 3,020 3,020 3,020
4620 Repairs & Maint/Building 898 485 1,500 1,500
4625 Repairs & Maint/Non Buildings 11,915 15,174 9,000 9,000
4631 Repairs & Maint/Internal IS Maint 819 1,019 900 900
4710 Printing & Binding 263 1,603 0 200
4810 Promotional Activities 1,150 0 750 750
4920 Other Current Charges 175 175 175 175
5210 Operating Supplies 331 161 350 350
5410 Publications & Memberships 0 620 695 695
5520 Training 470 0 750 750
TOTAL OPERATING EXPENSES 40,911 44,398 35,590 59,790
CAPITAL OUTLAY
6110 Land Costs 0 24,094 0 0
6210 Buildings 62,754 0 0 0
6410 Machinery & Equipment 1,995 0 0 0
TOTAL CAPITAL OUTLAY 64,749 24,094 0 0
DEBT SERVICE
71xx 2016 Debt 0 0 70,176 71,931
7214 Debt Service\Other 17,425 27,553 25,842 24,087
TOTAL DEBT SERVICE 17,425 27,553 96,018 96,018
GRANTS AND AIDS
8212 BRAGG- Business Redevelop 0 0 0 0
8213 Housing Rehab Program 0 19,800 0 50,000
8214 Matching Landscape/Façade 5,000 3,000 0 50,000
TOTAL GRANTS & AIDS 5,000 22,800 0 100,000
OTHER USES
9131 Transfer to Capital Projects 0 141,958 0 0
9910 Reserve for Future 0 0 214,591 176,294
TOTAL OTHER USES 0 141,958 214,591 176,294
TOTAL APPROPRIATIONS 128,085 260,803 346,199 432,102

Fiscal Year 2021 - 22 Annual Budget
233
Appropriations
Summary
Appropriations Summary Carver Heights/
Montclair Area
CRA Fund
Operations
ADOPTED ADOPTED INCREASE/
2020-21 2021-22 (DECREASE) PERCENTAGE
Operating Expenses 35,590 59,790 24,200 68.00%
Debt Service 96,018 96,018 0 0.00%
Grants and Aids 0 100,000 100,000 100.00%
Other Uses 214,591 176,294 (38,297) -17.85%
TOTALS 346,199 432,102 85,903 24.81%
Significant Budget Changes:
The increase in Operating Expenses is related to additional Engineering Services (3130). Grants and
Aids includes funds for the Housing Rehab Program and Façade, Sign/Landscape (FSL)
Grants. The change in Other Uses is direclty related to a reduced Reserve for Future (9910) budget.

Fiscal Year 2021 - 22 Annual Budget
234
Appropriations
Detail
Appropriations Detail Account # 017-6192-559 Carver Heights/
Montclair Area
CRA Fund
Resource
Center
ACTUAL ACTUAL ADOPTED ADOPTED
2018-19 2019-20 2020-21 2021-22
PERSONAL SERVICES
1310 Temporary Labor 1,916 0 0 0
2110 FICA 147 0 0 0
2410 Workers' Compensation 5 0 0 0
TOTAL PERSONAL SERVICES 2,068 0 0 0
OPERATING EXPENSES
31xx Professional Services 60 263 3,500 3,500
3410 Contract Services 4,560 11,624 11,716 12,251
4110 Communication 1,224 1,610 1,200 1,530
4310 Utilities 13,050 12,093 15,000 15,000
4410 Rentals 330 0 330 330
4620 Repairs & Maintenance/Buildings 10,622 5,059 17,129 17,129
4625 Repairs & Maintenance/Non Building 11,298 9,824 8,030 10,000
463x Repairs & Maint/Internal IS Maint 1,920 2,652 3,020 2,700
4710 Printing & Binding 0 39 200 200
4810 Promotional Activities 203 722 1,000 1,500
5180 Minor Furniture & Equipment 2,231 2,586 2,500 2,500
5210 Operating Supplies 9,810 7,444 10,040 10,040
5410 Publications & Memberships 770 887 1,000 1,000
5520 Training 0 5,000 500 500
TOTAL OPERATING EXPENSES 56,078 59,803 75,165 78,180
CAPITAL OUTLAY
6410 Machinery & Equipment 0 38,750 0 0
TOTAL CAPITAL OUTLAY 0 38,750 0 0
TOTAL APPROPRIATIONS 58,146 98,553 75,165 78,180

Fiscal Year 2021 - 22 Annual Budget
235
Appropriations
Summary
Appropriations Summary Carver Heights/
Montclair Area
CRA Fund
Resource
Center
ADOPTED ADOPTED INCREASE/
2020-21 2021-22 (DECREASE) PERCENTAGE
Operating Expenses 75,165 78,180 3,015 4.01%
Capital Outlay 0 0 0 0.00%
TOTALS 75,165 78,180 3,015 4.01%

This page intentionally left blank
Fiscal Year 2021 - 22 Annual Budget
236

Fiscal Year 2021 - 22 Annual Budget
237
US Highway
441/27
Community
Redevelopment
Agency
Description
Total
Department
Budget
Al Minner, City Manager
The City of Leesburg created the U.S. Highway 441/27 Redevelopment Agency on February 13, 2006 (Ordinance 06-13). A Trust Fund was created to receive CRA proceeds on May 22, 2006 (Ordinance 06-45) and is effective for 30 years. The fund generates a majority of its annual income from tax increment revenues. The base year was established as 2005 with an assessed taxable value of $352,255,087. The CRA is part of the City’s plan to improve conditions within the U.S. 441/27 corridor areas. The boundaries of the CRA are generally described as ½ mile on both sides of U.S. 27 from MLK Boulevard to C.R. 48, and U.S. 441 from C.R. 473 on the east to U.S. 27 on the west. The agency determined the existence of blighted areas, noted the infrastructure improvements that contributed to the decline, and will make improvements utilizing available funds. The U.S. Highway 441/27 CRA was expanded in December 2015 by 106 acres and 46 properties. In addition, the CRA was extended by 30 years to 2045. The base year was revised for all properties, both the original and expanded to 2015. Organization Chart:
$ 1,375,957
Carver Heights/
Montclair Area
Comm. Redev.
Agency
Greater Leesburg
Comm. Redev.
Agency
US Hwy 441/27
Comm. Redev.
Agency
City Manager

Fiscal Year 2021 - 22 Annual Budget
238
US Highway
441/27
CRA Fund
Revenue
Sources &
Appropriations
Revenue Sources & Appropriations
ACTUAL ACTUAL ADOPTED ADOPTED
2018-19 2019-20 2020-21 2021-22
REVENUE SOURCES
Taxes 231,139 327,452 494,549 554,173
Intergovernmental Revenue 321,946 444,693 709,216 806,784
Miscellaneous Revenue 42,501 36,974 15,000 15,000
Other Sources 0 0 0 0
TOTAL REVENUE SOURCES 595,586 809,119 1,218,765 1,375,957
APPROPRIATIONS
Economic Development 435,783 505,130 1,218,765 1,375,957
TOTAL APPROPRIATIONS 435,783 505,130 1,218,765 1,375,957

Fiscal Year 2021 - 22 Annual Budget
239
US Highway
441/27
CRA Fund
Revenue
Detail
Revenue Detail
ACTUAL ACTUAL ADOPTED ADOPTED
2018-19 2019-20 2020-21 2021-22
TAXES
33101 Current Property Taxes 231,139 327,452 494,549 554,173
TOTAL TAXES 231,139 327,452 494,549 554,173
INTERGOVERNMENTAL REVENUES
33731 Lake County/Redevelopment 321,946 444,693 709,216 806,784
TOTAL INTERGOVERNMENTAL 321,946 444,693 709,216 806,784
MISCELLANEOUS REVENUES
36110 Interest on Investments 28,288 28,115 15,000 15,000
36130 Gain/Loss Investment 14,213 8,859 0 0
TOTAL MISCELLANEOUS 42,501 36,974 15,000 15,000
OTHER SOURCES
38891 Fund Balance Appropriated 0 0 0 0
TOTAL OTHER SOURCES 0 0 0 0
TOTAL RESOURCES 595,586 809,119 1,218,765 1,375,957

Fiscal Year 2021 - 22 Annual Budget
240
US Highway
441/27
CRA Fund
Appropriations
Detail
Appropriations Detail Account # 018-6191-559
ACTUAL ACTUAL ADOPTED ADOPTED
2018-19 2019-20 2020-21 2021-22
OPERATING EXPENSES
3210 Auditing 0 0 3,000 3,000
4510 Insurance 2,946 3,020 3,020 3,020
4625 Repairs & Maintenance-Non-Build 1,150 660 1,150 1,000
4920 Other Current Charges 175 175 175 175
TOTAL OPERATING EXPENSES 4,271 3,855 7,345 7,195
DEBT SERVICE
71xx Principal 80,000 195,000 210,000 607,000
72xx Interest 296,115 294,042 288,993 283,553
73xx Issue Costs 1,733 2,233 1,733 1,733
TOTAL DEBT SERVICE 377,848 491,275 500,726 892,286
GRANTS AND AIDS
8211 Matching Grants 53,664 0 25,000 0
8213 Housing Rehab 0 10,000 25,000 42,600
8214 Matching Landscape/Façade 0 0 0 100,000
TOTAL GRANTS AND AIDS 53,664 10,000 50,000 142,600
OTHER USES
9910 Reserve for Future 0 0 660,694 333,876
TOTAL OTHER USES 0 0 660,694 333,876
TOTAL APPROPRIATIONS 435,783 505,130 1,218,765 1,375,957

Fiscal Year 2021 - 22 Annual Budget
241
US Highway
441/27
CRA Fund
Appropriations
Summary
Appropriations Summary
ADOPTED ADOPTED INCREASE/
2020-21 2021-22 (DECREASE) PERCENTAGE
Operating Expenses 7,345 7,195 (150) -2.04%
Debt Service 500,726 892,286 391,560 78.20%
Grants and Aids 50,000 142,600 92,600 185.20%
Other Uses 660,694 333,876 (326,818) -49.47%
TOTALS 1,218,765 1,375,957 157,192 12.90%
Significant Budget Changes:
Debt Service increased for the upcoming year. The change in Grants and Aids is due to an increase in
the Housing Rehab Program and the Façade, Sign/Landscape Grants. Additionally, Other Uses
decreased due to a reduction in the Reserve for Future (9910).

This page intentionally left blank
Fiscal Year 2021 - 22 Annual Budget
242

Fiscal Year 2021 - 22 Annual Budget
243
Police
Forfeiture
Fund
Description
Total
Department
Budget
Police Forfeiture Fund The Police Forfeiture Fund has been established to record funds associated with Municipal and Federal seizures. Federal seizures are separated between Justice and Treasury. Municipal Seizures Sections 932.701-932.707, Florida Statutes state that any contraband article, vessel, motor vehicle, aircraft, personal property, or real property used in violation of its terms may be seized and shall be forfeited. The act provides that when a seizing agency is a municipality, after payment of certain liens and costs, the remaining proceeds shall be deposited in a special law enforcement trust fund established by the governing body of the municipality. Section 932.7055 (5) (a), Florida Statutes, requires that the proceeds used from a forfeiture and the interest earned be used only for school resource officers, crime prevention, safe neighborhood, drug abuse education and prevention programs, or other law enforcement purposes, which include defraying the cost of protracted or complex investigations, providing additional equipment or expertise and providing matching funds to obtain federal grants. Funds may be expended upon the request of the police chief of the governing body of the municipality and must be accompanied by a written certification that the request is in compliance with the provisions of section 932.7055 (5). Funds cannot be the source of revenue to meet normal operating needs of the law enforcement agency. Any local law enforcement agency that acquires at least $15,000 pursuant to the Florida Contraband Forfeiture Act within a fiscal year must expend or donate no less than 15 percent of such proceeds. Federal Seizures The City is required to separate federal seizures between Justice and Treasury. Justice funds include shared cash or proceeds received from the Drug Enforcement Administration (DEA), Federal Bureau of Investigation (FBI), U.S. Attorney’s Office, U.S. Postal Inspection Service, Food and Drug Administration and the U.S. Department of Agriculture. Treasury funds include shared cash or proceeds received from the Bureau of Alcohol, Tobacco, Firearms and Explosives (ATF), Internal Revenue Service (IRS), U.S. Immigration and Customs Enforcement (ICE), U.S. Customs and Border Protection, U.S. Secret Service and U.S. Coast Guard. Shared monies can be spent on salaries for new, temporary (employees not to exceed one year), overtime, informant or buy money, travel and training, communications and computers, firearms and weapons, body armor and protective gear, electronic surveillance equipment, building and improvements, education and awareness programs, other law enforcement programs, transfers to other state and local law enforcement agencies, matching grants, and drug abuse treatment and prevention programs. The Department of Justice permits state and local law enforcement agencies to use up to 15 percent of shared funds received during the last two years to support drug abuse treatment, drug and crime prevention education, housing and job skills programs, or other nonprofit community-based programs or activities, which are formally approved by the chief law enforcement officer as being supportive of and consistent with a law enforcement effort, policy or initiative.
Rob Hicks, Police Chief
$ 5,000

Fiscal Year 2021 - 22 Annual Budget
244
Revenue
Sources &
Appropriations
Police
Forfeiture
Fund
Revenue Sources & Appropriations
ACTUAL ACTUAL ADOPTED ADOPTED
2018-19 2019-20 2020-21 2021-22
REVENUE SOURCES
Fines & Forfeitures 25,145 865 0 0
Miscellaneous Revenues 2,035 1,516 0 0
Other Sources 0 0 7,000 5,000
TOTAL REVENUE SOURCES 27,180 2,381 7,000 5,000
APPROPRIATIONS
Fines & Forfeitures 4,400 9,890 7,000 5,000
TOTAL APPROPRIATIONS 4,400 9,890 7,000 5,000

Fiscal Year 2021 - 22 Annual Budget
245
Police
Forfeiture
Fund
Revenue
Detail
Revenue Detail
ACTUAL ACTUAL ADOPTED ADOPTED
2018-19 2019-20 2020-21 2021-22
FINES AND FORFEITURES
35630 State Forfeitures 25,145 865 0 0
35820 Sale Forfeited Property 0 0 0 0
TOTAL FINES AND FORFEITURES 25,145 865 0 0
MISCELLANEOUS REVENUES
36103 Interest- Police Forfeiture 822 803 0 0
36105 Interest- Federal Forfeiture 529 384 0 0
36130 Change in Fair Value 684 329 0 0
TOTAL MISCELLANEOUS REVENUES 2,035 1,516 0 0
OTHER SOURCES
38891 Fund Balance Appropriated 0 0 7,000 5,000
TOTAL OTHER SOURCES 0 0 7,000 5,000
TOTAL RESOURCES 27,180 2,381 7,000 5,000

Fiscal Year 2021 - 22 Annual Budget
246
Police
Forfeiture
Fund
Appropriations
Detail
Appropriations Detail Account # 121-xxxx-xxx
ACTUAL ACTUAL ADOPTED ADOPTED
2018-19 2019-20 2020-21 2021-22
OPERATING EXPENSES
4810 Promotional Activities 0 0 2,500 0
4981 Forfeiture Costs 4,400 0 4,500 0
TOTAL OPERATING EXPENSES 4,400 0 7,000 0
CAPITAL OUTLAY
6480 Forfeiture Proceeds 0 9,890 0 5,000
TOTAL CAPITAL OUTLAY 0 9,890 0 5,000
TOTAL APPROPRIATIONS 4,400 9,890 7,000 5,000

Fiscal Year 2021 - 22 Annual Budget
247
Police
Forfeiture
Fund
Appropriations
Summary
Appropriations Summary
ADOPTED ADOPTED INCREASE/
2020-21 2021-22 (DECREASE) PERCENTAGE
Operating Expenses 7,000 0 (7,000) -100.00%
Other Uses 0 5,000 5,000 100.00%
TOTALS 7,000 5,000 (2,000) -28.57%

This page intentionally left blank
Fiscal Year 2021 - 22 Annual Budget
248

Fiscal Year 2021 - 22 Annual Budget
249
Police
Education
Receipts
Fund
Description
Total
Department
Budget
$ 6,000
Police Education Fund A Special Revenue Fund is used to account for fund balances created by Criminal Justice Ed-ucation Funding. The Florida Statute listed below describes the authority and usage for the funding. 938.15 Criminal justice education for local government- In addition to the costs provided for in s. 938.01, municipalities and counties may assess an additional $2 for expenditures for criminal justice education degree programs and training courses, including basic recruit training, for their respective officers and employing agency support personnel, provided such education degree programs and training courses are approved by the employing agency administrator, on a form provided by the commission, for local funding. (1) Workshops, meetings, conferences, and conventions shall, on a form approved by the commission for use by the employing agency, be individually approved by the employing agency administrator prior to attendance. The form shall include, but not be limited to, a demonstration by the employing agency of the purpose of the workshop, meeting, conference, or convention; the direct relationship of the training to the officer's job; the direct benefits the officer and agency will receive; and all anticipated costs. (2) The Commission may inspect and copy the documentation of independent audits conducted of the municipalities and counties which make such assessments to ensure that such assessments have been made and that expenditures are in conformance with the requirements of this subsection and with other applicable procedures.
Rob Hicks, Police Chief

Fiscal Year 2021 - 22 Annual Budget
250
Revenue
Sources &
Appropriations
Revenue Sources & Appropriations Police
Education
Receipts
Fund
ACTUAL ACTUAL ADOPTED ADOPTED
2018-19 2019-20 2020-21 2021-22
REVENUE SOURCES
Fines & Forfeitures 6,640 4,687 0 0
Miscellaneous Revenues 65 18 0 0
Other Sources 0 0 6,000 6,000
TOTAL REVENUE SOURCES 6,705 4,705 6,000 6,000
APPROPRIATIONS
Police Education Receipts 5,680 5,851 6,000 6,000
TOTAL APPROPRIATIONS 5,680 5,851 6,000 6,000

Fiscal Year 2021 - 22 Annual Budget
251
Police
Education
Receipts
Fund
Revenue
Detail
Revenue Detail
ACTUAL ACTUAL ADOPTED ADOPTED
2018-19 2019-20 2020-21 2021-22
FINES AND FORFEITURES
35120 Police Education - 2nd $ 6,640 4,687 0 0
TOTAL FINES & FORFEITURES 6,640 4,687 0 0
MISCELLANEOUS REVENUES
36110 Interest on Investments 34 7 0 0
36130 Change in Fair Value 31 11 0 0
TOTAL MISCELLANEOUS REVENUES 65 18 0 0
OTHER SOURCES
38891 Fund Balance Appropriated 0 0 6,000 6,000
TOTAL OTHER SOURCES 0 0 6,000 6,000
TOTAL RESOURCES 6,705 4,705 6,000 6,000

Fiscal Year 2021 - 22 Annual Budget
252
Police
Education
Receipts
Fund
Appropriations
Detail
Appropriations Detail Account # 122-xxxx-xxx
ACTUAL ACTUAL ADOPTED ADOPTED
2018-19 2019-20 2020-21 2021-22
OPERATING EXPENSES
5470 2nd $ Training 5,680 5,851 6,000 6,000
TOTAL OPERATING EXPENSES 5,680 5,851 6,000 6,000
TOTAL APPROPRIATIONS 5,680 5,851 6,000 6,000

Fiscal Year 2021 - 22 Annual Budget
253
Police
Education
Receipts
Fund
Appropriations
Summary
Appropriations Summary
ADOPTED ADOPTED INCREASE/
2020-21 2021-22 (DECREASE) PERCENTAGE
Operating Expenses 6,000 6,000 0 0.00%
TOTALS 6,000 6,000 0 0.00%

This page intentionally left blank
Fiscal Year 2021 - 22 Annual Budget
254

Fiscal Year 2021 - 22 Annual Budget
255
Discretionary
Sales Tax
Fund
Description
Total
Department
Budget
Chapter 163, Section 212.055, Florida Statutes authorizes the Lake County Board of Commissioners to levy a discretionary local government infrastructure sales surtax for purposes of funding infrastructure. On September 4, 2001 Lake County conducted a public hearing and adopted Ordinance No. 2001-123 which provides for the extension and levy of the one cent infrastructure sales surtax within the geographical boundaries of Lake County. Upon adoption of the Ordinance for a period not to exceed 15 years the surtax shall be distributed during the period from January 1, 2003 through December 31, 2017. The voters renewed this tax and is now in effect from January 1, 2018 to December 31, 2032 and is dis-tributed as follows: • The School Board shall receive disbursements equaling one third (33.3%) of the net proceeds of the Surtax revenue per year • Lake County shall receive disbursements equaling one third (33.3%) of the net proceeds of the Surtax revenue per year • The Cities combined shall receive disbursements equaling one third (33.3%) of the net
proceeds of the Surtax revenue per year to be divided among them based on population At its regular meeting on October 22, 2001 the City Commission approved Resolution 6343 authorizing the mayor and city clerk to execute an inter-local agreement of local government infrastructure surtax between Lake County, the School Board of Lake County, the City of Leesburg and various local cities. The term of the agreement is for a period of 15 years expiring on December 31, 2017. This tax was also renewed and is now in effect from January 1, 2018 to December 31, 2032. Section 212.055 (2) (d) 2. defines infrastructure to mean: a. Any fixed capital expenditure or fixed capital outlay associated with the construction, reconstruction, or improvement of public facilities which have a life expectancy of 5 or more years and any land acquisition, land improvement, design and related engineering costs b. A fire department vehicle, an emergency medical service vehicle, a sheriff’s office vehicle, a police department vehicle, or any other vehicle, and such equipment necessary to outfit the vehicle for its official use or equipment that has a life expectancy of at least 5 years c. Any expenditure for the construction, lease, or maintenance of, or provision of utilities or
security for, facilities as defined in s.29.008 Section 212.055 (3) (e) provides that municipalities receiving proceeds may pledge such proceeds for the purpose of servicing new bond indebtedness incurred pursuant to law.
James Williams, Finance Director
$ 2,298,165

Fiscal Year 2021 - 22 Annual Budget
256
Discretionary
Sales Tax
Fund
Revenue
Sources &
Appropriations
Revenue Sources & Appropriations
ACTUAL ACTUAL ADOPTED ADOPTED
2018-19 2019-20 2020-21 2021-22
REVENUE SOURCES
Taxes 2,123,574 2,155,466 1,624,534 2,298,165
Miscellaneous Revenue 5,072 211 0 0
Other Sources 0 0 0 0
TOTAL REVENUE SOURCES 2,128,646 2,155,677 1,624,534 2,298,165
APPROPRIATIONS
Discretionary Sales Tax 1,713,907 2,362,082 1,624,534 2,298,165
TOTAL APPROPRIATIONS 1,713,907 2,362,082 1,624,534 2,298,165

Fiscal Year 2021 - 22 Annual Budget
257
Discretionary
Sales Tax
Fund
Revenue
Detail
Revenue Detail
ACTUAL ACTUAL ADOPTED ADOPTED
2018-19 2019-20 2020-21 2021-22
TAXES
31261 Local Option Sales Tax 2,123,574 2,155,466 1,624,534 2,298,165
TOTAL TAXES 2,123,574 2,155,466 1,624,534 2,298,165
MISCELLANEOUS REVENUE
36110 Interest on Investments 3,607 (406) 0 0
36130 Gain/Loss Investment 1,465 617 0 0
TOTAL MISCELLANEOUS REVENUE 5,072 211 0 0
OTHER SOURCES
38891 Fund Balance Appropriated 0 0 0 0
TOTAL OTHER SOURCES 0 0 0 0
TOTAL RESOURCES 2,128,646 2,155,677 1,624,534 2,298,165

Fiscal Year 2021 - 22 Annual Budget
258
Discretionary
Sales Tax
Fund
Appropriations
Detail
Appropriations Detail Account # 132-xxxx-xxx
ACTUAL ACTUAL ADOPTED ADOPTED
2018-19 2019-20 2020-21 2021-22
OTHER USES
9101 Transfer to General Fund 459,598 413,446 360,429 625,545
9121 Debt Service 0 0 125,103 260,446
9131 Transfer to Capital Project 775,001 648,796 0 400,000
9152 Transfer to Fleet Fund 479,308 1,299,840 1,139,002 1,012,174
9160 Reserve/ Future Capital 0 0 0 0
TOTAL OTHER USES 1,713,907 2,362,082 1,624,534 2,298,165
TOTAL APPROPRIATIONS 1,713,907 2,362,082 1,624,534 2,298,165

Fiscal Year 2021 - 22 Annual Budget
259
Discretionary
Sales Tax
Fund
Appropriations
Summary
Appropriations Summary
ADOPTED ADOPTED INCREASE/
2020-21 2021-22 (DECREASE) PERCENTAGE
Other Uses 1,624,534 2,298,165 673,631 41.47%
TOTALS 1,624,534 2,298,165 673,631 41.47%

This page intentionally left blank
Fiscal Year 2021 - 22 Annual Budget
260

Fiscal Year 2021 - 22 Annual Budget
261
Gas Tax
Fund
Description
Total
Department
Budget
The Gas Tax Fund encompasses three sources of revenue which are restricted to specific uses. Ninth-Cent Fuel Tax Chapter 336, Section .021, Florida Statues authorizes the Lake County Commissioners to levy an additional one cent on every net gallon of motor and diesel fuel sold within a county. The governing body of the county, may, by joint agreement with one or more of the municipalities located therein, provide for the transportation purposes authorized and the distribution of the proceeds of this tax within both the unincorporated and incorporated areas of the county. Generally, the proceeds may be used to fund transportation expenditures. Local Option Fuel Tax Chapter 336, Section 0.25, Florida Statutes authorizes the Lake County Commissioners to levy a local option fuel tax on motor fuel and diesel fuel for purposes of construction of new roads, the reconstruction or resurfacing of existing paved roads, or the paving of existing graded roads, not including routine maintenance of roads.
Revenue Sharing Gas Tax Chapter 206, Section 206.605, Florida Statutes authorizes a municipal revenue sharing
program administered by the Department of Revenue (DOR). The program includes receipts
of the 1¢ municipal tax on motor fuel for purposes of funding the purchase of transportation
facilities and road and street right-of-way; construction, reconstruction, and maintenance of
roads, streets, bicycle paths, and pedestrian pathways; adjustment of city-owned utilities as
required by road and street construction; and construction, reconstruction, transportation
related public safety activities, maintenance, and operation of transportation facilities. The
funds are distributed monthly to eligible municipal governments.
James Williams, Finance Director
$ 755,080

Fiscal Year 2021 - 22 Annual Budget
262
Gas Tax
Fund
Revenue
Sources &
Appropriations
Revenue Sources & Appropriations
ACTUAL ACTUAL ADOPTED ADOPTED
2018-19 2019-20 2020-21 2021-22
REVENUE SOURCES
Taxes 612,835 569,107 428,984 580,000
Intergovernmental 182,512 171,703 127,705 175,080
Miscellaneous Revenues 9,308 5,445 0 0
Other Sources/Installments 0 717,977 407,976 0
TOTAL REVENUE SOURCES 804,655 1,464,232 964,665 755,080
APPROPRIATIONS
Gas Tax Expenses 799,168 827,125 964,665 755,080
TOTAL APPROPRIATIONS 799,168 827,125 964,665 755,080

Fiscal Year 2021 - 22 Annual Budget
263
Gas Tax
Fund
Revenue
Detail
Revenue Detail
ACTUAL ACTUAL ADOPTED ADOPTED
2018-19 2019-20 2020-21 2021-22
TAXES
31230 Ninth-Cent Fuel Tax (County) 222,337 210,040 155,636 215,000
31241 Local Option Fuel Tax 390,498 359,067 273,348 365,000
TOTAL TAXES 612,835 569,107 428,984 580,000
INTERGOVERNMENTAL REVENUE
33512 Revenue Sharing- Gas Tax 182,512 171,703 127,705 175,080
TOTAL INTERGOVERNMENTAL REVENUE 182,512 171,703 127,705 175,080
MISCELLANEOUS REVENUES
36110 Interest on Investments 9,308 5,445 0 0
TOTAL MISCELLANEOUS REVENUES 9,308 5,445 0 0
OTHER SOURCES/INSTALLMENT
38131 Transfer from Cap'l Proj 0 717,977 0 0
38893 Fund Balance Appropriated 0 0 407,976 0
TOTAL OTHER SOURCES/INSTALLMENT 0 717,977 407,976 0
TOTAL RESOURCES 804,655 1,464,232 964,665 755,080

Fiscal Year 2021 - 22 Annual Budget
264
Gas Tax
Fund
Appropriations
Detail
Appropriations Detail Account # 133-xxxx-xxx
ACTUAL ACTUAL ADOPTED ADOPTED
2018-19 2019-20 2020-21 2021-22
OTHER USES
9101 Transfer to General Fund 724,167 427,125 964,665 655,080
9131 Transfer to Capital Projects 75,001 400,000 0 100,000
9160 Reserve/ Future Capital 0 0 0 0
TOTAL OTHER USES 799,168 827,125 964,665 755,080
TOTAL APPROPRIATIONS 799,168 827,125 964,665 755,080

Fiscal Year 2021 - 22 Annual Budget
265
Gas Tax
Fund
Appropriations
Summary
Appropriations Summary
ADOPTED ADOPTED INCREASE/
2020-21 2021-22 (DECREASE) PERCENTAGE
Other Uses 964,665 755,080 (209,585) -21.73%
TOTALS 964,665 755,080 (209,585) -21.73%

This page intentionally left blank
Fiscal Year 2021 - 22 Annual Budget
266

Fiscal Year 2021 - 22 Annual Budget
267
Police
Impact Fees
Fund
Description
Total
Department
Budget
$ 10,500
Police Impact Fee On August 9, 2004 the City Commission approved Ordinance 04-52 authorizing the City to collect Municipal Impact Fees on land developed within the City of Leesburg for the provision of Municipal Services Capital Facilities related to Police services necessitated by new development. In Fiscal Year 2005 the City began tracking these Impact Fees as if they were their own individual entities within the General Fund. This process required that revenues, expenditures and any resulting excess or deficiency be tracked manually. In Fiscal Year 2007 a Special Revenue Fund was created to account for fund balances created by Impact Fees. On June 1
st of each year, impact fees are adjusted upward, if appropriate, by the same
percentage that the construction price index-20 cities average, as published in the magazine “Engineering News Record,” has increased between May 1
st of the year in which the
adjustment is being made and May 1st of the prior year. At no time shall the Schedule of
Impact Fees be adjusted downward. Historically, the City has budgeted and appropriated current year projected revenues. This year’s budget employs a conservative approach where appropriations will not exceed available fund balance. In order to promote economic activity, the City Commission suspended the collection of impact fees for several years. The collection of impact fees was reinstated on October 1, 2013. Additionally, in order to promote reinvestment in blighted areas of the community and encourage the redevelopment of existing parcels the City Commission approved a waiver on impact fees for projects that redevelop vacant properties in the City of Leesburg until September 30, 2018.
Rob Hicks, Police Chief

Fiscal Year 2021 - 22 Annual Budget
268
Police
Impact Fees
Fund
Revenue
Sources &
Appropriations
Revenue Sources & Appropriations
ACTUAL ACTUAL ADOPTED ADOPTED
2018-19 2019-20 2020-21 2021-22
REVENUE SOURCES
Licenses & Permits 93,010 171,615 0 0
Miscellaneous Revenue 7,260 8,141 0 0
Other Sources 0 0 92,500 10,500
TOTAL REVENUE SOURCES 100,270 179,756 92,500 10,500
APPROPRIATIONS
Operating Expenses 0 4,595 5,000 0
Capital Outlay 0 5,381 80,000 0
Other Uses 7,180 13,360 7,500 10,500
TOTAL APPROPRIATIONS 7,180 23,336 92,500 10,500

Fiscal Year 2021 - 22 Annual Budget
269
Police
Impact Fees
Fund
Revenue
Detail
Revenue Detail
ACTUAL ACTUAL ADOPTED ADOPTED
2018-19 2019-20 2020-21 2021-22
LICENSES & PERMITS
32411 Impact Fees 93,010 171,615 0 0
TOTAL LICENSES & PERMITS 93,010 171,615 0 0
MISCELLANEOUS REVENUE
36101 Interest on Investments 7,260 8,141 0 0
TOTAL MISCELLANEOUS REVENUE 7,260 8,141 0 0
OTHER SOURCES
38891 Fund Balance Appropriated 0 0 92,500 10,500
TOTAL OTHER SOURCES 0 0 92,500 10,500
TOTAL RESOURCES 100,270 179,756 92,500 10,500

Fiscal Year 2021 - 22 Annual Budget
270
Police
Impact Fees
Fund
Appropriations
Detail
Appropriations Detail Account # 141-xxxx-xxx
ACTUAL ACTUAL ADOPTED ADOPTED
2018-19 2019-20 2020-21 2021-22
OPERATING EXPENSES
5180 Minor Furniture & Equipment 0 4,595 5,000 0
TOTAL OPERATING EXPENSES 0 4,595 5,000 0
CAPITAL OUTLAY
6410 Machinery & Equipment 0 5,381 80,000 0
TOTAL CAPITAL OUTLAY 0 5,381 80,000 0
OTHER USES
9115 Transfer to Building Fund 7,180 13,360 7,500 10,500
TOTAL OTHER USES 7,180 13,360 7,500 10,500
TOTAL APPROPRIATIONS 7,180 23,336 92,500 10,500

Fiscal Year 2021 - 22 Annual Budget
271
Police
Impact Fees
Fund
Appropriations
Summary
Appropriations Summary
ADOPTED ADOPTED INCREASE/
2020-21 2021-22 (DECREASE) PERCENTAGE
Operating Expenses 5,000 0 (5,000) -100.00%
Capital Outlay 80,000 0 (80,000) -100.00%
Other Uses 7,500 10,500 3,000 40.00%
TOTALS 92,500 10,500 (82,000) -88.65%

This page intentionally left blank
Fiscal Year 2021 - 22 Annual Budget
272

Fiscal Year 2021 - 22 Annual Budget
273
Fire
Impact Fees
Fund
Description
Total
Department
Budget
$ 250
Fire Impact Fee On August 9, 2004 the City Commission approved Ordinance 04-52 authorizing the City to collect Municipal Impact Fees on land developed within the City of Leesburg for the provision of Municipal Services Capital Facilities related to Fire services necessitated by new development. In Fiscal Year 2005 the City began tracking these Impact Fees as if they were their own individual entities within the General Fund. This process required that revenues, expenditures and any resulting excess or deficiency be tracked manually. In Fiscal Year 2007 a Special Revenue Fund was created to account for fund balances created by Impact Fees. On June 1
st of each year, impact fees are adjusted upward, if appropriate, by the same
percentage that the construction price index-20 cities average, as published in the magazine “Engineering News Record,” has increased between May 1
st of the year in which the
adjustment is being made and May 1st of the prior year. At no time shall the Schedule of
Impact Fees be adjusted downward. Historically, the City has budgeted and appropriated current year projected revenues. This year’s budget employs a conservative approach where appropriations will not exceed available fund balance. In order to promote economic activity, the City Commission suspended the collection of impact fees for several years. The collection of impact fees was reinstated on October 1, 2013. Additionally, in order to promote reinvestment in blighted areas of the community and encourage the redevelopment of existing parcels the City Commission approved a waiver on impact fees for projects that redevelop vacant properties in the City of Leesburg until September 30, 2018.
David Johnson, Fire Chief

Fiscal Year 2021 - 22 Annual Budget
274
Fire
Impact Fees
Fund
Revenue
Sources &
Appropriations
Revenue Sources & Appropriations
ACTUAL ACTUAL ADOPTED ADOPTED
2018-19 2019-20 2020-21 2021-22
REVENUE SOURCES
Licenses & Permits 2,350 17,996 0 0
Miscellaneous Revenue 129 401 0 0
Other Sources 0 0 0 250
TOTAL REVENUE SOURCES 2,479 18,397 0 250
APPROPRIATIONS
Other Uses 100 240 0 250
TOTAL APPROPRIATIONS 100 240 0 250

Fiscal Year 2021 - 22 Annual Budget
275
Fire
Impact Fees
Fund
Revenue
Detail
Revenue Detail
ACTUAL ACTUAL ADOPTED ADOPTED
2018-19 2019-20 2020-21 2021-22
LICENSES & PERMITS
32411 Impact Fees 2,350 17,996 0 0
TOTAL LICENSES & PERMITS 2,350 17,996 0 0
MISCELLANEOUS REVENUE
36101 Interest on Investments 129 401 0 0
TOTAL MISCELLANEOUS REVENUE 129 401 0 0
OTHER SOURCES
38891 Fund Balance Appropriated 0 0 0 250
TOTAL OTHER SOURCES 0 0 0 250
TOTAL RESOURCES 2,479 18,397 0 250

Fiscal Year 2021 - 22 Annual Budget
276
Fire
Impact Fees
Fund
Appropriations
Detail
Appropriations Detail Account # 142-xxxx-xxx
ACTUAL ACTUAL ADOPTED ADOPTED
2018-19 2019-20 2020-21 2021-22
OTHER USES
9115 Transfer to Building Fund 100 240 0 250
TOTAL OTHER USES 100 240 0 250
TOTAL APPROPRIATIONS 100 240 0 250

Fiscal Year 2021 - 22 Annual Budget
277
Fire
Impact Fees
Fund
Appropriations
Summary
Appropriations Summary
ADOPTED ADOPTED INCREASE/
2020-21 2021-22 (DECREASE) PERCENTAGE
Other Uses 0 250 250 100.00%
TOTALS 0 250 250 100.00%

This page intentionally left blank
Fiscal Year 2021 - 22 Annual Budget
278

Fiscal Year 2021 - 22 Annual Budget
279
Recreation
Impact Fees
Fund
Description
Total
Department
Budget
$ 181,000
Recreation Impact Fee On August 9, 2004 the City Commission approved Ordinance 04-52 authorizing the City to collect Municipal Impact Fees on land developed within the City of Leesburg for the provision of Municipal Services Capital Facilities related to recreational services necessitated by new development. In Fiscal Year 2005 the City began tracking these Impact Fees as if they were their own individual entities within the General Fund. This process required that revenues, expenditures and any resulting excess or deficiency be tracked manually. In Fiscal Year 2007 a Special Revenue Fund was created to account for fund balances created by Impact Fees. On June 1
st of each year, impact fees are adjusted upward, if appropriate, by the same
percentage that the construction price index-20 cities average, as published in the magazine “Engineering News Record,” has increased between May 1
st of the year in which the
adjustment is being made and May 1st of the prior year. At no time shall the Schedule of
Impact Fees be adjusted downward. Historically, the City has budgeted and appropriated current year projected revenues. This year’s budget employs a conservative approach where appropriations will not exceed available fund balance. In order to promote economic activity, the City Commission suspended the collection of impact fees for several years. The collection of impact fees was reinstated on October 1, 2013. Additionally, in order to promote reinvestment in blighted areas of the community and encourage the redevelopment of existing parcels the City Commission approved a waiver on impact fees for projects that redevelop vacant properties in the City of Leesburg until September 30, 2018.
Travis Rima, Recreation Director

Fiscal Year 2021 - 22 Annual Budget
280
Recreation
Impact Fees
Fund
Revenue
Sources &
Appropriations
Revenue Sources & Appropriations
ACTUAL ACTUAL ADOPTED ADOPTED
2018-19 2019-20 2020-21 2021-22
REVENUE SOURCES
Licenses & Permits 80,274 135,456 0 0
Miscellaneous Revenue 3,455 1,798 0 0
Other Sources 0 0 0 181,000
TOTAL REVENUE SOURCES 83,729 137,254 0 181,000
APPROPRIATIONS
Operating Expenses 0 0 0 0
Other Uses 28,600 248,780 0 181,000
TOTAL APPROPRIATIONS 28,600 248,780 0 181,000

Fiscal Year 2021 - 22 Annual Budget
281
Recreation
Impact Fees
Fund
Revenue
Detail
Revenue Detail
ACTUAL ACTUAL ADOPTED ADOPTED
2018-19 2019-20 2020-21 2021-22
LICENSES & PERMITS
32461 Impact Fees 80,274 135,456 0 0
TOTAL LICENSES & PERMITS 80,274 135,456 0 0
MISCELLANEOUS REVENUE
36101 Interest on Investments 2,310 1,852 0 0
36130 Gain/Loss Investment 1,145 (54) 0 0
TOTAL MISCELLANEOUS REVENUE 3,455 1,798 0 0
OTHER SOURCES
38891 Fund Balance Appropriated 0 0 0 181,000
TOTAL OTHER SOURCES 0 0 0 181,000
TOTAL RESOURCES 83,729 137,254 0 181,000

Fiscal Year 2021 - 22 Annual Budget
282
Recreation
Impact Fees
Fund
Appropriations
Detail
Appropriations Detail Account # 143-xxxx-xxx
ACTUAL ACTUAL ADOPTED ADOPTED
2018-19 2019-20 2020-21 2021-22
OTHER USES
9115 Transfer to Building Fund 3,600 6,780 0 6,000
9131 Transfer to Capital Projects 25,000 242,000 0 175,000
TOTAL OTHER USES 28,600 248,780 0 181,000
TOTAL APPROPRIATIONS 28,600 248,780 0 181,000

Fiscal Year 2021 - 22 Annual Budget
283
Recreation
Impact Fees
Fund
Appropriations
Summary
Appropriations Summary
ADOPTED ADOPTED INCREASE/
2020-21 2021-22 (DECREASE) PERCENTAGE
Other Uses 0 181,000 181,000 100.00%
TOTALS 0 181,000 181,000 100.00%
Significant Budget Changes:
The change in Other Uses is attributable to Transfer to Building Fund (9115) for administering the impact
and Rails to Trails ($25,000).
fee collection and the Transfer to Capital Projects (9131) for Sleepy Hollow Grand stands ($150,000)

This page intentionally left blank
Fiscal Year 2021 - 22 Annual Budget
284

Fiscal Year 2021 - 22 Annual Budget
285
Building
Permits
Fund
Description
Total
Department
Budget
Organizational Chart
$ 1,466,527
In February of 2005 the City received correspondence from its attorney advising that local governments may provide a schedule of fees, as authorized by Title XXXIII Regulation of Trade, Commerce, Investments, and Solicitations, Chapter 553 Building Construction Standards, 553.80 Enforcement, last paragraph of (1): 553.80 Enforcement as authorized by s. 125.26(2) or s. 166.222. Such fees shall be used solely for the carrying out of the local government’s responsibilities in enforcing the Florida Building Code. If the building division takes in more money than it costs to run the division, the money has to be earmarked for building use only.
Al Minner, City Manager
City Manager
Building Official
Permit Specialist
I
Building
Inspector II
Plan Examiner
Trainee
Permit
Supervisor
Deputy Building
Official
Permit Specialist
II
Building
Inspector IIIPlan Examiner III

Fiscal Year 2021 - 22 Annual Budget
286
Building
Permits
Fund
Revenue
Sources &
Appropriations
Revenue Sources & Appropriations
ACTUAL ACTUAL ADOPTED ADOPTED
2018-19 2019-20 2020-21 2021-22
REVENUE SOURCES
Licenses & Permits 1,097,464 1,028,410 566,500 990,000
Intergovernmental Reveune 0 224 0 0
Charges for Services 0 5,748 4,500 6,500
Miscellaneous Revenue 61,664 48,414 20,000 10,000
Other Sources 17,920 34,100 436,791 460,027
TOTAL REVENUE SOURCES 1,177,048 1,116,896 1,027,791 1,466,527
APPROPRIATIONS
Building Permits 838,843 1,004,565 1,027,791 1,466,527
TOTAL APPROPRIATIONS 838,843 1,004,565 1,027,791 1,466,527

Fiscal Year 2021 - 22 Annual Budget
287
Building
Permits
Fund
Revenue
Detail
Revenue Detail
ACTUAL ACTUAL ADOPTED ADOPTED
2018-19 2019-20 2020-21 2021-22
LICENSES & PERMITS
32201 Building Permits 571,625 608,117 390,000 620,000
32202 Plans Review-Building 228,879 90,867 0 0
32901 Plumbing Permits 63,243 81,433 35,000 88,000
32902 Electric Permits 73,958 81,416 45,000 88,000
32903 Gas Permits 25,504 38,103 20,000 50,000
32904 Fire Fees 43,608 34,150 22,000 40,000
32905 Mechanical Permits 78,577 81,117 45,000 90,000
32906 Irrigation Permits 0 38 0 0
32907 Mobile Home Permits 4,320 4,522 5,000 5,000
32908 Sign Permits 7,750 8,647 4,500 9,000
TOTAL LICENSES & PERMITS 1,097,464 1,028,410 566,500 990,000
INTERGOVERNMENTAL REVENUE
33191 Emergency Management 0 224 0 0
TOTAL INTERGOVERNMENTAL REVENUE 0 224 0 0
CHARGES FOR SERVICES
34920 Administrative Fee 0 5,748 4,500 6,500
TOTAL CHARGES FOR SERVICES 0 5,748 4,500 6,500
MISCELLANEOUS REVENUE
36110 Interest on Investments 40,118 35,985 20,000 10,000
36130 Gain/ Loss Investments 20,423 12,429 0 0
36403 Sale of Furniture/Equipment 1,123 0 0 0
36908 Cash Over and Short 0 0 0 0
TOTAL MISCELLANEOUS REVENUE 61,664 48,414 20,000 10,000
OTHER SOURCES
382xx Impact Administration Fee 17,920 34,100 17,950 33,050
38891 Fund Balance Appropriated 0 0 418,841 426,977
TOTAL OTHER SOURCES 17,920 34,100 436,791 460,027
TOTAL RESOURCES 1,177,048 1,116,896 1,027,791 1,466,527

Fiscal Year 2021 - 22 Annual Budget
288
Building
Permits
Fund
Goals & Tasks
Goals & Tasks
Goal: Foster a Building Division which is efficient, collaborative, transparent and fiscally sound.
Task:
Provide courteous personal attention to all applicants, owners and contractors with precise detailed
information regarding online and website navigation for timely and efficient permitting and tracking
Finalize installation of a new program to allow full online plan reviews and inspections for the City
Streamline current procedures as much as possible with aide of new software
Update and maintain all applicable forms with current code and detailed instructions for ease of use
Process permits in an accurate, efficient and timely manner
Intake all fax, email and hand delivered permit applications within 48 hours
Perform most building and fire permit reviews within twenty days
Ensure safe-build environment within the City of Leesburg
Continue to provide courtesy site visits when necessary
Maintain quality next-day inspections and plan review to assure life safety as a priority
Implement new digital storage of all new and old permits, eventually to eliminate warehouse files
Provide opportunities for staff training, development and education to ensure continued excellent
customer service, including Department of Building and Professional Regulation (DBPR) license to
accommodate internship program
Continue participation with Building Official Association of Florida, Home Builders Association and
Lake County Building Officials
Improve ISO rating and move towards applying to be an accredited municipality
Major Accomplishments:
Educated and trained staff to enhance customer service and improve the building permit process
3 staff members achieved new DBPR or NFPA licenses
City is now a licensed Internship provider for 8 DBPR licenses for Building and the trades
Continue to improve distribution and tracking system for building permit applications
Developed innovative procedures to promote safety and continued production during crisis
Reduced Building Permit fees to the lowest in the area
Performance Measures:
2019-20 2020-21 2021-22
Commercial permits issued 25 25 35
Residential permits issued 200 240 350
Mobile home permits issued 10 10 5
Miscellaneous permits issued 2,600 2,700 4,600
Demolition residential permits issued 20 20 20
Demolition commercial permits issued 30 30 30
Value of construction- commercial $20,000,000 $22,000,000 $36,000,000
Value of construction- residential $30,000,000 $35,000,000 $60,000,000

Fiscal Year 2021 - 22 Annual Budget
289
Building
Permits
Fund
Personnel
Schedule
Personnel Schedule
Classification 2021 Change 2022 Amount
Building Inspector II 3.00 0.00 3.00 192,567
Building Inspector III 0.00 1.00 1.00 64,043
Building Official 1.00 0.00 1.00 102,648
Deputy Building Official 1.00 0.00 1.00 72,114
Permit Specialist I 2.00 1.00 3.00 95,534
Permit Specialist II 1.00 0.00 1.00 35,235
Permit Supervisor 1.00 0.00 1.00 39,208
Plans Examiner Trainee 1.00 0.00 1.00 38,126
Plans Examiner III 0.00 1.00 1.00 68,640
Total 10.00 3.00 13.00 708,115

Fiscal Year 2021 - 22 Annual Budget
290
Building
Permits
Fund
Appropriations
Detail
Appropriations Detail Account # 151-xxxx-xxx
ACTUAL ACTUAL ADOPTED ADOPTED
2018-19 2019-20 2020-21 2021-22
PERSONAL SERVICES
12xx Regular Salaries & Wages 372,860 499,655 523,722 708,115
1310 Temporary Labor 5,262 0 0 0
1410 Overtime 11,639 10,938 8,000 20,000
15xx Bonuses/Incentives 7,818 7,764 6,000 29,000
1641 Vacation/Terms & Buyout 30,931 10,746 0 0
2110 FICA 31,968 39,251 39,282 53,334
221x Retirement 33,345 39,817 37,483 53,741
23xx Insurance 100,291 115,778 100,967 153,801
2410 Workers' Compensation 9,312 10,829 11,636 12,758
26xx Other Payroll Benefits 1,823 2,368 1,583 1,609
TOTAL PERSONAL SERVICES 605,249 737,146 728,673 1,032,358
OPERATING EXPENSES
3110 Professional Services 7,208 1,357 1,000 2,000
3410 Contract Services 54,000 727 5,000 5,000
4010 Travel 369 452 2,000 3,800
4110 Communication 923 2,013 3,000 3,300
4210 Postage 167 190 500 250
4310 Utilities 3,312 3,052 3,750 4,000
4410 Rentals 20,000 20,000 20,000 20,000
4415 Internal Fleet Lease 8,081 11,101 9,798 9,354
4510 Insurance 3,317 3,907 4,879 5,686
461x Repairs & Maintenance- Vehicles 7,246 7,944 7,790 18,054
462x Repairs & Maintenance- Building 0 33,133 5,000 95,000
463x Repairs & Maintenance- Equipment 6,807 5,545 11,860 102,625
4710 Printing & Binding 818 281 1,000 1,000
4810 Promotional Activities 141 150 500 800
4920 Other Current Charges 4,288 46,494 5,000 20,500
5001 Cost Allocation- City Commission 1,371 2,016 1,220 2,103
5002 Cost Allocation- City Manager 7,373 8,886 4,138 7,010
5003 Cost Allocation- City Clerk 2,613 2,729 1,461 2,663
5004 Cost Allocation- City Attorney 1,889 700 1,990 2,760
5005 Cost Allocation- Accounting 9,148 11,035 6,668 11,581
5009 Cost Allocation- Human Resources 6,683 3,652 7,196 11,190
5010 Cost Allocation- Information Technology 27,849 27,399 17,533 35,493
5180 Minor Furniture/Equipment 1,253 3,160 35,720 20,000
5210 Operating Supplies 3,096 4,335 3,800 5,000
5215 Uniforms 2,265 1,272 3,000 4,000
5230 Fuel Purchases 6,349 6,182 7,950 9,000
5410 Publications & Memberships 3,758 3,499 12,000 12,000
5520 Training 2,493 3,483 20,000 20,000
TOTAL OPERATING EXPENSES 192,817 214,694 203,753 434,169
CAPITAL OUTLAY
6410 Machinery & Equipment 40,777 52,725 95,365 0
TOTAL CAPITAL OUTLAY 40,777 52,725 95,365 0
OTHER USES
9160 Reserve/ Future Capital 0 0 0 0
TOTAL OTHER USES 0 0 0 0
TOTAL APPROPRIATIONS 838,843 1,004,565 1,027,791 1,466,527

Fiscal Year 2021 - 22 Annual Budget
291
Building
Permits
Fund
Appropriations
Summary
Appropriations Summary
ADOPTED ADOPTED INCREASE/
2020-21 2021-22 (DECREASE) PERCENTAGE
Personal Services 728,673 1,032,358 303,685 41.68%
Operating Expenses 203,753 434,169 230,416 113.09%
Capital Outlay 95,365 0 (95,365) -100.00%
TOTALS 1,027,791 1,466,527 438,736 42.69%
Significant Budget Changes:
The change in Personal Services is due to adding 3 positions to this division. Operating Expenses
increased due to adding funds to improve the building for additional staff (4620) and the maintenance
costs associated with the software that was added in FY 21 (4633).

This page intentionally left blank
Fiscal Year 2021 - 22 Annual Budget
292

Fiscal Year 2021 - 22 Annual Budget
293
Housing
Assistance
Fund
Description
Total
Department
Budget
$ 151,698
Kenneth L. Thomas, Director of Housing
This fund was established to create affordable housing for low, moderate and middle income (LMMI) households. The income requirements are administered according to the Community Development Block Grant (CDBG) and the Neighborhood Stabilization Program (NSP). The City acquired two grants Neighborhood Stabilization Program 1 (NSP 1) and Neighborhood Stabilization Program 3 (NSP 3). These programs allowed the City to purchase and rehabilitate several homes. Some of these homes have actually been resold to qualified buyers. All proceeds from any sales remain in this fund and be used for additional Housing Assistance programs. Currently, the City is renting out two single family homes and the Mispah/Simmons apartment complex (12 units). These properties are being rented to individuals who meet certain LMMI criteria. The income is also restricted to being used on Housing Assistance programs.
Organizational Chart
Director of Housing
Administrative
Assistant II

Fiscal Year 2021 - 22 Annual Budget
294
Housing
Assistance
Fund
Revenue
Sources &
Appropriations
Revenue Sources & Appropriations
ACTUAL ACTUAL ADOPTED ADOPTED
2018-19 2019-20 2020-21 2021-22
REVENUE SOURCES
Miscellaneous Revenue 111,417 95,769 109,350 96,600
Other Sources 0 0 27,204 55,098
TOTAL REVENUE SOURCES 111,417 95,769 136,554 151,698
APPROPRIATIONS
Housing Assistance 137,323 125,332 136,554 151,698
TOTAL APPROPRIATIONS 137,323 125,332 136,554 151,698

Fiscal Year 2021 - 22 Annual Budget
295
Housing
Assistance
Fund
Revenue
Detail &
Personnel
Schedule
Revenue Detail
Personnel Schedule
ACTUAL ACTUAL ADOPTED ADOPTED
2018-19 2019-20 2020-21 2021-22
MISCELLANEOUS REVENUE
36110 Interest on Investments 9,035 6,348 7,250 3,600
36130 Gain/Loss Investments 4,393 1,591 0 0
36210 Rental Property- Housing 95,189 82,390 100,000 90,000
36613 Sponsorships/NSP 0 1,000 0 0
36909 Other Income 2,800 4,440 2,100 3,000
TOTAL MISCELLANEOUS REVENUE 111,417 95,769 109,350 96,600
OTHER SOURCES
38891 Fund Balance Appropriated 0 0 27,204 55,098
TOTAL OTHER SOURCES 0 0 27,204 55,098
TOTAL RESOURCES 111,417 95,769 136,554 151,698
Classification 2021 Change 2022 Amount
Administrative Assistant II 1.00 0.00 1.00 35,277
Total 1.00 0.00 1.00 35,277

Fiscal Year 2021 - 22 Annual Budget
296
Housing
Assistance
Fund
Appropriations
Detail
Appropriations Detail Account # 013-6255-xxx
ACTUAL ACTUAL ADOPTED ADOPTED
2018-19 2019-20 2020-21 2021-22
PERSONAL SERVICES
12xx Regular Salaries & Wages 32,649 33,455 34,258 35,277
1310 Temporary Labor 0 0 0 0
1410 Overtime 4,518 4,193 4,500 4,500
1641 Vacation/Terms & Buyouts 0 847 0 0
2110 FICA 2,644 2,698 2,377 2,422
221x Retirement 1,632 1,673 1,713 1,764
23xx Insurance 8,554 9,726 11,019 11,346
2410 Workers' Compensation 100 104 129 99
26xx Other Payroll Benefits 50 61 0 34
TOTAL PERSONAL SERVICES 50,147 52,757 53,996 55,442
OPERATING EXPENSES
31xx Professional Services 1,246 3,111 2,500 3,200
3410 Contract Services 17,850 13,050 21,890 21,890
4010 Travel 0 0 1,000 1,000
4210 Postage 83 43 200 200
4310 Utilities 7,915 10,012 5,800 7,000
4510 Insurance 632 723 768 766
462x Repairs & Maintenance- Buildings 56,005 44,408 43,400 55,200
4950 Uncollectible Accounts 0 0 2,000 2,000
4980 Taxes 0 0 0 0
5180 Minor Furniture/Equipment 3,445 983 3,500 3,500
52xx Operating Supplies 0 245 500 500
5215 Uniforms 0 0 0 0
5520 Training 0 0 1,000 1,000
TOTAL OPERATING EXPENSES 87,176 72,575 82,558 96,256
TOTAL APPROPRIATIONS 137,323 125,332 136,554 151,698

Fiscal Year 2021 - 22 Annual Budget
297
Housing
Assistance
Fund
Appropriations
Summary
Appropriations Summary
ADOPTED ADOPTED INCREASE/
2020-21 2021-22 (DECREASE) PERCENTAGE
Personal Services 53,996 55,442 1,446 2.68%
Operating Expenses 82,558 96,256 13,698 16.59%
TOTALS 136,554 151,698 15,144 11.09%
Significant Budget Changes:
Operating Expenses increased due to 462x Repairs & Maintenance- Buildings to add security cameras.

This page intentionally left blank
Fiscal Year 2021 - 22 Annual Budget
298

Fiscal Year 2021 - 22 Annual Budget
299
Debt
Service
Fund
Description
Total
Department
Budget
James Williams, Finance Director
The Debt Service Fund is used to record debt service payments for general government (non-utility) debt. This fund includes the Debt Service associated with the Capital Improvement Bonds, Series 2009 and 2013 and the Capital Improvement Fire Lease, 2018.
$ 1,750,006

Fiscal Year 2021 - 22 Annual Budget
300
Debt
Service
Fund
Revenue
Sources &
Appropriations
Revenue Sources & Appropriations
ACTUAL ACTUAL ADOPTED ADOPTED
2018-19 2019-20 2020-21 2021-22
REVENUE SOURCES
Other Sources 1,548,449 1,535,199 1,616,170 1,750,006
TOTAL REVENUE SOURCES 1,548,449 1,535,199 1,616,170 1,750,006
APPROPRIATIONS
Debt Service 1,530,806 1,535,057 1,616,170 1,750,006
TOTAL APPROPRIATIONS 1,530,806 1,535,057 1,616,170 1,750,006

Fiscal Year 2021 - 22 Annual Budget
301
Debt
Service
Fund
Revenue
Detail
Revenue Detail
ACTUAL ACTUAL ADOPTED ADOPTED
2018-19 2019-20 2020-21 2021-22
OTHER SOURCES
38111 From General Fund 1,548,449 1,535,199 1,491,067 1,489,560
38191 From Discretionary Tax 0 0 125,103 260,446
38891 Fund Balance Appropriated 0 0 0 0
TOTAL OTHER SOURCES 1,548,449 1,535,199 1,616,170 1,750,006
TOTAL RESOURCES 1,548,449 1,535,199 1,616,170 1,750,006

Fiscal Year 2021 - 22 Annual Budget
302
Debt
Service
Fund
Appropriations
Detail &
Summary
Appropriations Detail Account # 021-1326-517
Appropriations Summary
ACTUAL ACTUAL ADOPTED ADOPTED
2018-19 2019-20 2020-21 2021-22
DEBT SERVICE
71xx Principal Payments 851,417 887,498 982,732 1,165,178
72xx Interest Payments 675,510 644,180 629,802 581,192
73xx Fees 3,879 3,379 3,636 3,636
TOTAL DEBT SERVICE 1,530,806 1,535,057 1,616,170 1,750,006
OTHER USES
9160 Reserve/Future Capital 0 0 0 0
TOTAL OTHER USES 0 0 0 0
TOTAL APPROPRIATIONS 1,530,806 1,535,057 1,616,170 1,750,006
ADOPTED ADOPTED INCREASE/
2020-21 2021-22 (DECREASE) PERCENTAGE
Debt Service 1,616,170 1,750,006 133,836 8.28%
Other Uses 0 0 0 0.00%
TOTALS 1,616,170 1,750,006 133,836 8.28%
Significant Budget Changes:
The increase in Debt Service is directly related to the Police Body Camera purchase payments which
will be funded with Discretionary Sales Tax funds.
Fiscal Year 2021 - 22 Annual Budget
303
Capital
Projects
Fund
Description
Total
Department
Budget
CAPITAL PROJECTS FUND
The Capital Projects Fund is used to account for financial resources used for the acquisition or construction of major capital facilities. The primary sources of revenue in this fund are Gas Tax and Discretionary Sales Tax revenue along with transfers from other funds. Capital Projects must be reviewed and approved by the City Commission prior to the expenditure of any funds. Included in this budget are projects proposed for Public Works totaling $100,000 for Road Resurfacing which is funded with Gas Tax funds. The remaining Recreation projects include additional funds for Marina slips $250,000 funded with Discretionary Sales Tax, Sleepy Hollow Grand Stands $400,000 funded with a County Grant of $200,000, $150,000 of Recreation Impact Fees and $50,000 of Discretionary Sales Tax funds, Rails to Trails $375,000 which is funded with $25,000 of Recreation Impact Fees and $350,000 from the Federal American Rescue Plan proceeds, Pat Thomas Rehabilitation Project $400,000 which is funded with $100,000 of Discretionary Sales Tax and $300,000 from a transfer from Solid Waste $50,000 for the Dabney Pool Demolition which is also funded with a transfer from Solid Waste.
$ 1,575,000

Fiscal Year 2021 - 22 Annual Budget
304
Capital
Projects
Fund
Revenue
Sources &
Appropriations
Revenue Sources & Appropriations
ACTUAL ACTUAL ADOPTED ADOPTED
2018-19 2019-20 2020-21 2021-22
REVENUE SOURCES
Intergovernmental Revenue 151,657 191,693 0 200,000
Miscellaneous Revenue 320,067 325,894 0 0
Other Sources 2,152,919 5,630,222 600,000 1,375,000
TOTAL REVENUE SOURCES 2,624,643 6,147,809 600,000 1,575,000
APPROPRIATIONS
Public Works 8,130,356 4,853,066 600,000 100,000
Recreation 341,628 646,138 0 1,475,000
TOTAL APPROPRIATIONS 8,471,984 5,499,204 600,000 1,575,000

Fiscal Year 2021 - 22 Annual Budget
305
Capital
Projects
Fund
Revenue
Detail
Revenue Detail
ACTUAL ACTUAL ADOPTED ADOPTED
2018-19 2019-20 2020-21 2021-22
INTERGOVERNMENTAL REVENUE
33123 Federal Grant- Generator 0 6,765 0 0
33449 Joint Participation Agmt 151,657 147,469 0 0
33743 Lake County 0 37,459 0 200,000
TOTAL INTERGOVERNMENTAL 151,657 191,693 0 200,000
MISCELLANEOUS REVENUE
36110 Interest on Investments 197,196 137,051 0 0
36130 Gain/Loss Investments 122,871 36,667 0 0
36404 Recovery from Losses 0 152,176 0 0
TOTAL MISCELLANEOUS 320,067 325,894 0 0
OTHER SOURCES
38111 From General Fund 652,917 4,026,000 0 350,000
38114 Recreation Impact Fees 25,000 242,000 0 175,000
38116 From GLCRA Fund 625,000 0 200,000 0
38117 From Carver Heights CRA Fund 0 141,958 0 0
38146 Transfer from Solid Waste (046) 0 171,468 400,000 350,000
38191 From Discretionary Tax 775,001 648,796 0 400,000
38191 From Gas Tax 75,001 400,000 0 100,000
TOTAL OTHER SOURCES 2,152,919 5,630,222 600,000 1,375,000
TOTAL RESOURCES 2,624,643 6,147,809 600,000 1,575,000

Fiscal Year 2021 - 22 Annual Budget
306
Capital
Projects
Fund
Appropriations
Detail
Appropriations Detail Account # 031-xxxx-xxx
ACTUAL ACTUAL ADOPTED ADOPTED
2018-19 2019-20 2020-21 2021-22
PUBLIC WORKS
STREET MAINTENANCE (5112)
OPERATING EXPENSES
31xx Professional Services 101,630 106,321 100,000 0
TOTAL OPERATING EXPENSES 101,630 106,321 100,000 0
CAPITAL OUTLAY
6310 Improvements Other Than Bldgs 445,008 434,883 500,000 100,000
TOTAL CAPITAL OUTLAY 445,008 434,883 500,000 100,000
OTHER USES
9516 Transfer to GLCRA Fund 0 78,120 0 0
9533 Transfer to Gas Tax Fund 0 717,977 0 0
TOTAL OTHER USES 0 796,097 0 0
TOTAL STREET MAINTENANCE 546,638 1,337,301 600,000 100,000
FACILITY MAINTENANCE (5193)
OPERATING EXPENSES
3110 Professional Services 80,319 103,155 0 0
3130 Engineering Services 1,991 0 0 0
4410 Rentals 2,889 4,230 0 0
4710 Printing & Binding 663 0 0 0
4911 Advertising- Other Ads 291 0 0 0
4920 Other Current Charges 212 0 0 0
5180 Minor Furniture/Equipment 0 31,687 0 0
5210 Operating Supplies 0 272 0 0
TOTAL OPERATING EXPENSES 86,365 139,344 0 0
CAPITAL OUTLAY
6210 Buildings 6,998,177 3,090,438 0 0
6310 Improve Other Than Bldgs 499,176 271,393 0 0
6410 Machinery & Equipment 0 14,590 0 0
TOTAL CAPITAL OUTLAY 7,497,353 3,376,421 0 0
TOTAL FACILITY MAINTENANCE 7,583,718 3,515,765 0 0

Fiscal Year 2021 - 22 Annual Budget
307
Capital
Projects
Fund
Appropriations
Detail
(Continued)
Appropriations Detail (Continued) Account # 031-xxxx-xxx
RECREATION
ATHLETIC FIELDS (8125)
OPERATING EXPENSES
3110 Professional Services 1,778 5,028 0 0
TOTAL OPERATING EXPENSES 1,778 5,028 0 0
CAPITAL OUTLAY
6110 Land 312,339 350,502 0 0
6210 Buildings 0 45,076 0 0
6310 Improve Other Than Bldgs 27,511 245,532 0 1,475,000
TOTAL CAPITAL OUTLAY 339,850 641,110 0 1,475,000
TOTAL ATHLETIC FIELDS 341,628 646,138 0 1,475,000
TOTAL RECREATION 341,628 646,138 0 1,475,000
TOTAL CAPITAL PROJECTS 8,471,984 5,499,204 600,000 1,575,000
ACTUAL ACTUAL ADOPTED ADOPTED
2018-19 2019-20 2020-21 2021-22
PUBLIC WORKS (Continued)
GROUNDS (5194)
OPERATING EXPENSES
3110 Professional Services 0 0 0 0
TOTAL OPERATING EXPENSES 0 0 0 0
TOTAL GROUNDS 0 0 0 0
TOTAL PUBLIC WORKS 8,130,356 4,853,066 600,000 100,000

Fiscal Year 2021 - 22 Annual Budget
308
Capital
Projects
Fund
Project
Schedule
Project Schedule
WF/ Job Title Funding Source Amount
310051 Public Works
Road Resurfacing Gas Tax 100,000
Subtotal Public Works 100,000
310081 Recreation
Rails to Trails ($375,000) Recreation Impact Fees 25,000
Federal Grant (ARP) 350,000
Marina Slips ($500,000 Total, $250,000 in FY 21) Discretionary Sales Tax 250,000
Sleepy Hollow Grandstands ($400,000) County Grant 200,000
Recreation Impact Fees 150,000
Discretionary Sales Tax 50,000
Pat Thomas Rehab ($100,000) Transfer from Solid Waste Fund 300,000
Discretionary Sales Tax 100,000
Dabney Pool Demolition Transfer from Solid Waste Fund 50,000
Subtotal Recreation 1,475,000
Source of Funds
County Grant 200,000
Federal Grant (ARP) 350,000
Transfer from Solid Waste 350,000
Discretionary Sales Tax 400,000
Gas Tax 100,000
Recreation Impact Fees 175,000
TOTAL 1,575,000

Fiscal Year 2021 - 22 Annual Budget
309
Organization
Total
Budget
Electric
Fund
Brad Chase, Director of Electric
The Electric Fund constructs, operates and maintains substation facilities and electric distribution facilities within the retail electric service territory which includes the City of Leesburg, the City of Fruitland Park and portions of Lake County. The department plans, engineers, constructs, operates and maintains substation and distribution system additions and expansions. This includes power transformers, breakers, circuit switchers, capacitor banks, regulators, distribution structures, conductor, service drops, meters, an automated meter reading system and a smart grid system.
Responsibilities: • Retail Service Planning • System Expansion Planning • Engineering • Construction • Maintenance/repair • Distribution System Operations • Outage Restoration • Environmental Stewardship • Safety Organizational Chart
$ 69,950,194
Director of Electric
Electric System
Operator
Electric System
Senior
Operator
Electric
Technician II
Substation
Technician II
Deputy Director/
Electric
Superintenant
Electric Lineman
Groundsman
Electric Meter
Supervisor
Business Analyst
Electric Service
Technician
Substation
Technician I Apprentice
Lineman
Electric Service
Planning
Supervisor
Apprentice Meter
Technician
Electric Service
Planner
Contract
Supervisor
Electric Line
Crew Leader
Administrative
Assistant II
Electric
Substation
Supervisor
Lead System
Operator/ NERC
Compliance
Officer
Administrative
Assistant I
Deputy Director
Operations &
Technical Services
Assistant
Service
Planner

Fiscal Year 2021 - 22 Annual Budget
310
Electric
Fund
Electric System
Description
Electric System Description
The City of Leesburg electric system consists of 5 distribution substations,25 feeders, and 523.5 miles of 7,200 Volt distribution lines, of which 346 miles (66%) are underground circuits, serving approximately 26,700 active customers.
The City of Leesburg purchases power from the Florida Municipal Power Agency (FMPA)
as an all-requirements member. FMPA was created pursuant to Florida Statutes Chapter
163, Part I and Chapter 361, Part II (The Florida Interlocal Cooperation Act of 1969 and The
Joint Electric Power Supply Projects Act) to, among other things, provide a means for the
Florida municipal corporations to cooperate with each other to provide for their present and
projected energy needs. The City has limited oversight authority over the operation of
FMPA. This oversight is manifested through the appointment of one voting member to the
31-member Board of Directors of FMPA and one voting member to the FMPA All-
Requirements Project 13-member Executive Committee. Furthermore, the City, by the terms
of FMPA’s project agreements, has no equity interest in any of the assets owned by FMPA.
The City participates in the following FMPA projects:
1. St. Lucie No. 2 Power Purchase Agreement
The City, through FMPA’s joint ownership agreement with Florida Power and Light
Corporation has an entitlement share for approximately 1.9 Megawatts of the output
of the St. Lucie No. 2 nuclear power plant. The City’s entitlement share averaged
2.095 megawatt hours of energy per month. The annual entitlement shares amount
is based on the City’s percent participation in the St. Lucie FMPA Project applied to
the output of the plant over the same period. The operating license for Unit No. 2 is
due to expire in 2043. 2. All-Requirement Power Supply Project Agreement
The City has an agreement with FMPA whereby the City purchases all of its electric
power from FMPA on an all-requirement basis over and above the City’s entitlement
share of the St. Lucie No. 2 output. The agreement remains in effect on an
evergreen 30 year basis. FMPA’s power supply rates are subject to a super majority
vote of the Executive Committee of FMPA. The Florida Public Service Commission (FPSC) approved electric service Territorial Agreements with Duke Energy June 2015 and with Sumter Electric Cooperative May 2012. The agreements will remain in effect for 30 years and 20 years from those dates respectively. A territorial swap was approved by the FPSC on January 15, 2021 with Duke Energy and the City of Leesburg whereby similar sections of property and growth potential were exchanged in order for a portion of The Villages not to be split between two electric utility providers. As a result of the territorial swap, the City of Leesburg entered into a Franchise Agreement with the City of Wildwood, effective July 13, 2020 to provide electric and energy service within the City of Wildwood for a period of 30 years. At any time within the last twelve months of the term of the Franchise Agreement, the City of Wildwood, shall have the right to purchase the electric system within the city limits. If the City of Wildwood elects not to purchase the Franchise Agreement is automatically extended another 30 years. The City of Leesburg also has a long standing Franchise Agreement with the City of Fruitland Park.

Fiscal Year 2021 - 22 Annual Budget
311
Electric
Fund
Budget
Summary -
Operating
Statement
Budget Summary - Operating Statement
ACTUAL ACTUAL ADOPTED ADOPTED
2018-19 2019-20 2020-21 2021-22
OPERATING REVENUE
Charges For Services 61,566,225 57,905,625 62,163,893 63,730,376
Other Operating Revenue 1,749,746 920,611 645,400 489,218
TOTAL OPERATING REVENUE 63,315,971 58,826,236 62,809,293 64,219,594
OPERATING APPROPRIATIONS
St. Lucie 1,246,115 1,091,538 1,200,852 1,067,558
Purchase Power 37,353,966 34,679,160 36,771,885 38,763,927
Administration 451,428 633,803 645,692 616,634
Distribution 4,402,729 4,165,910 5,543,258 5,074,980
Smart Grid 1,163,921 1,204,442 1,327,400 1,458,201
Other Operating Expenses 10,506,576 10,531,891 13,166,972 12,642,553
TOTAL APPROPRIATIONS (55,124,735) (52,306,744) (58,656,059) (59,623,853)
NET INCOME FROM OPERATIONS 8,191,236 6,519,492 4,153,234 4,595,741
Non-Operating Revenue 928,494 354,585 800,000 0
Non-Operating Appropriations (117,025) (66,569) (75,000) (75,000)
NET OTHER INCOME 811,469 288,016 725,000 (75,000)
NET INCOME BEFORE TRANSFERS 9,002,705 6,807,508 4,878,234 4,520,741
Transfers to other funds (5,402,277) (5,392,360) (5,148,234) (4,652,141)
NET INCOME AFTER TRANSFERS 3,600,428 1,415,148 (270,000) (131,400)
Other Sources 460,587 685,632 4,642,500 5,730,600
Capital Projects (2) 3 (4,372,500) (5,599,200)
NET OTHER SOURCES 460,585 685,635 270,000 131,400
UNAPPROPRIATED BALANCE 4,061,013 2,100,783 0 0

Fiscal Year 2021 - 22 Annual Budget
312
Electric
Fund
Revenue
Detail
Revenue Detail
ACTUAL ACTUAL ADOPTED ADOPTED
2018-19 2019-20 2020-21 2021-22
INTERGOVERNMENTAL REVENUE
33191 Federal Emergency Mgmt Reimb 490,783 125,358 0 0
33491 State Emergency Mgmt Reimb 74,428 443 0 0
33460 FDOT Hwy 441 363,283 228,784 800,000 0
TOTAL INTERGOVERNMENTAL REVENUE 928,494 354,585 800,000 0
CHARGES FOR SERVICES
34311 Residential 33,548,031 32,804,362 34,077,451 36,820,776
34312 Commercial Non Demand 7,440,325 6,881,774 7,403,480 7,080,155
34313 Commercial Demand 17,058,725 15,412,721 17,255,404 16,475,114
34314 Public Lighting 601,521 600,329 649,168 627,181
34315 Public Authority (Fruitland Park) 262,743 250,654 293,198 207,912
34316 Municipal Non Demand 395,886 380,956 405,066 506,645
34317 Municipal Demand 1,194,504 897,069 1,217,369 1,084,206
34905 Penalties 587,475 273,895 337,361 504,000
34910 Misc Operating Revenue 15,165 12,705 16,000 16,000
34915 Pole Rentals 102,059 127,434 137,187 137,187
34918 Misc Service Revenue 359,985 263,775 372,209 271,200
34990 Cash Over & Short (194) (49) 0 0
TOTAL CHARGES FOR SERVICES 61,566,225 57,905,625 62,163,893 63,730,376
MISCELLANEOUS REVENUES
36110 Interest on Investments 547,485 431,401 425,000 249,718
36130 Gain/Loss Investments 303,032 110,061 0 0
36402 Gain From Sale of Fixed Assets 253,950 33,360 0 0
36404 Recovery From Losses 28,495 152,947 35,000 35,000
36501 Sale of Surplus Materials 31,531 42,745 31,300 35,000
36906 Misc. Reimbursement 2,479 0 0 0
36925 Misc Jobbing Revenue 488,189 105,017 85,000 100,000
36990 Misc Non-Operating Revenue 94,585 45,080 69,100 69,500
TOTAL MISCELLANEOUS REVENUES 1,749,746 920,611 645,400 489,218
OTHER SOURCES
38893 Appropriate Fund Balance 0 0 0 0
38950 Contributions - Cust/Dev 460,587 685,632 480,000 520,000
38962 Appropriated Renewal & Replacement 0 0 4,162,500 5,210,600
TOTAL OTHER SOURCES 460,587 685,632 4,642,500 5,730,600
TOTAL RESOURCES 64,705,052 59,866,453 68,251,793 69,950,194

Fiscal Year 2021 - 22 Annual Budget
313
Electric
Fund
Division
Summary of
Appropriations
Division Summary of Appropriations
ACTUAL ACTUAL ADOPTED ADOPTED
2018-19 2019-20 2020-21 2021-22
1012 ST. LUCIEOperating Expenses 1,246,115 1,091,538 1,200,852 1,067,558
TOTAL ST. LUCIE 1,246,115 1,091,538 1,200,852 1,067,558
1013 PURCHASE POWEROperating Expenses 37,353,966 34,679,160 36,771,885 38,763,927
TOTAL PURCHASE POWER 37,353,966 34,679,160 36,771,885 38,763,927
1021 ADMINISTRATIONPersonal Services 198,736 286,040 271,451 245,137Operating Expenses 252,692 347,763 374,241 371,497
TOTAL ADMINISTRATION 451,428 633,803 645,692 616,634
1045 JOBBINGPersonal Services 198,270 23,632 62,042 60,292Operating Expenses 144,728 11,630 10,000 10,000
TOTAL JOBBING 342,998 35,262 72,042 70,292
1062 DISTRIBUTIONPersonal Services 3,346,337 3,159,127 4,136,147 3,862,041Operating Expenses 989,717 983,900 1,344,611 1,150,439Other Uses 66,675 22,883 62,500 62,500
TOTAL DISTRIBUTION 4,402,729 4,165,910 5,543,258 5,074,980
1070 SMARTGRIDOperating Expenses 1,163,921 1,204,442 1,327,400 1,458,201
TOTALSMART GRID 1,163,921 1,204,442 1,327,400 1,458,201
1088 OTHEROperating Expenses 8,865,322 9,195,848 9,248,448 9,126,568Debt Service 1,298,256 1,300,781 3,746,482 3,345,693Other Uses 5,519,302 5,458,929 5,323,234 4,827,141
TOTAL OTHER 15,682,880 15,955,558 18,318,164 17,299,402
1099 CAPITAL PROJECTSPersonal Services 1,376,344 1,535,567 835,242 1,536,568Operating Expenses 3,218,235 3,949,170 2,313,331 2,352,179Capital Outlay 2,487,002 2,422,364 1,223,927 1,710,453Other Uses (7,081,579) (7,907,104) 0 0
TOTAL CAPITAL PROJECTS 2 (3) 4,372,500 5,599,200
GRAND TOTALPersonal Services 5,119,687 5,004,366 5,304,882 5,704,038Operating Expenses 53,234,696 51,463,451 52,590,768 54,300,369Capital Outlay 2,487,002 2,422,364 1,223,927 1,710,453Debt Service 1,298,256 1,300,781 3,746,482 3,345,693Other Uses (1,495,602) (2,425,292) 5,385,734 4,889,641
TOTAL APPROPRIATIONS 60,644,039 57,765,670 68,251,793 69,950,194

Fiscal Year 2021 - 22 Annual Budget
314
Electric
Fund
Goals & Tasks
Goals & Tasks
Goal: Lead the industry in providing high quality, low cost, customer driven utility services.
Task:
Provide reliable electric power through system maintenance, inspections and selective capital
improvement projects
Provide a safe environment for Electric department employees and communities we serve
Be prepared with storm preparation and disaster response plans
Provide affordable electric power
Update mutual aid agreements, disaster restoration plans and complete storm response plan
Promote employee development, continued education and learning center programs
Major Accomplishments:
Revised the Meter Treater program by adjusting rates to allow for replacement of infrastructure at end
of life
Installation of new Automated Meter Infrastructure in The Villages of St. Catherine
Completed the new underground feeder extension along transmission Right of Way from SR44 to
The Villages
Partnered with Leidos Engineering using the established Municipal Services Area for reconductoring
designs needed to support growth in the Southwest portion of our service area
Partnered with Purchasing to identify and select contractors needed to build and construct a
reconductoring project on CR 468 from Marcella Way to Casteen Road
Replaced three substation distribution transformers and upgraded associated protective relaying
equipment
Completed a reconductoring project on Dixie Avenue in Fruitland Park from Urick Street to Miller
Street
Completed Phase I of Venetian Isle providing service to the Marriott Hotel and providing the
infrastructure needed for future growth within the project
Performance Measures:
2019-20 2020-21 2021-22
Pole inspections 2,500 1,200 N/A
Pole replacements 225 200 200
Undergrounding (feet) 7,200 10,000 10,000
Remove/ Replace aged Overhead Conductors
(feet)
10,000 10,000 10,000
Electric system SAIFI (System Average
Interruption Frequency Index)
<1.900 <1.900 <1.300
Safety meetings and trainings 14 14 14
Electric Rate (% below Florida Investor owned
average)
5% 5% 5%

Fiscal Year 2021 - 22 Annual Budget
315
Personnel Schedule
Electric
Fund
Personnel
Schedule
Classification 2021 Change 2022 Amount
Administration 1021
Administrative Assistant I 1.00 0.00 1.00 33,030
Business Analyst 1.00 0.00 1.00 38,542
Director of Electric 1.00 0.00 1.00 137,926
Total Administration 3.00 0.00 3.00 209,498
Jobbing 1045
Time charged directly to Jobbing 45,000
Total Jobbing 45,000
Distribution 1062
Administrative Assistant II 1.00 0.00 1.00 37,544
Apprentice Lineman 2.00 (2.00) 0.00 0
Apprentice Substation 1.00 0.00 1.00 49,525
Deputy Director/ Electric Superintenant 1.00 0.00 1.00 108,888
Deputy Director/ Operations & Technical Srvcs 1.00 0.00 1.00 100,797
Assistant Service Planner 1.00 1.00 2.00 93,724
Contract Supervisor 1.00 0.00 1.00 99,840
Electric Groundsman 0.00 2.00 2.00 58,864
Electric Lead System Operator/NERC Comp 1.00 0.00 1.00 87,755
Electric Line Crew Leader 5.00 0.00 5.00 499,200
Electric Lineman 12.00 2.00 14.00 1,333,985
Electric Meter Supervisor 1.00 0.00 1.00 99,840
Electric Meter Tech 1.00 1.00 2.00 190,569
Electric Meter Apprentice 1.00 (1.00) 0.00 0
Electric Senior Systems Operator 5.00 1.00 6.00 441,398
Electric Service Planning Supervisor 1.00 0.00 1.00 99,840
Electric Service Planner 1.00 0.00 1.00 52,707
Electric Service Technician 1.00 0.00 1.00 97,573
Electric Substation Supervisor 1.00 0.00 1.00 99,840
Electric Substation Technician II 2.00 0.00 2.00 190,570
Electric System Operator 1.00 (1.00) 0.00 0
Electric Technician II 1.00 0.00 1.00 52,894
Standby 18,450
Time charged directly to Jobbing Division (45,000)
Time charged directly to Capital Projects (1,021,500)
Total Distribution 42.00 3.00 45.00 2,747,303
Capital Projects 1099
Time charged directly to Capital Projects 1,021,500
Total Capital Projects 1,021,500
Total 45.00 3.00 48.00 4,023,301

Fiscal Year 2021 - 22 Annual Budget
316
Appropriations
Detail
Electric
Fund
St. Lucie
Division
Appropriations Detail Account # 041-1012-531
ACTUAL ACTUAL ADOPTED ADOPTED
2018-19 2019-20 2020-21 2021-22
OPERATING EXPENSES
3451 St. Lucie 1,246,115 1,091,538 1,200,852 1,067,558
TOTAL OPERATING EXPENSES 1,246,115 1,091,538 1,200,852 1,067,558
TOTAL APPROPRIATIONS 1,246,115 1,091,538 1,200,852 1,067,558

Fiscal Year 2021 - 22 Annual Budget
317
Appropriations
Summary
Electric
Fund
St. Lucie
Division
Appropriations Summary
ADOPTED ADOPTED INCREASE/
2020-21 2021-22 (DECREASE) PERCENTAGE
Operating Expenses 1,200,852 1,067,558 (133,294) -11.10%
TOTALS 1,200,852 1,067,558 (133,294) -11.10%

Fiscal Year 2021 - 22 Annual Budget
318
Appropriations
Detail
Electric
Fund
Power Supply
Division
Appropriations Detail Account # 041-1013-531
ACTUAL ACTUAL ADOPTED ADOPTED
2018-19 2019-20 2020-21 2021-22
OPERATING EXPENSES
3441 Purchase Power- Customer 44,400 44,400 44,400 44,400
3442 Power Purchase- Demand 21,289,218 20,864,367 22,309,314 23,987,480
3443 Purchase Power- Energy 12,984,673 10,361,729 11,196,885 11,474,379
3444 Purchase Power- Transmission 3,183,832 3,555,425 3,371,819 3,411,991
3447 Load Retention Funding (148,157) (146,761) (150,533) (154,323)
TOTAL OPERATING EXPENSES 37,353,966 34,679,160 36,771,885 38,763,927
TOTAL APPROPRIATIONS 37,353,966 34,679,160 36,771,885 38,763,927

Fiscal Year 2021 - 22 Annual Budget
319
Appropriations
Summary
Electric
Fund
Power Supply
Division
Appropriations Summary
ADOPTED ADOPTED INCREASE/
2020-21 2021-22 (DECREASE) PERCENTAGE
Operating Expenses 36,771,885 38,763,927 1,992,042 5.42%
TOTALS 36,771,885 38,763,927 1,992,042 5.42%

Fiscal Year 2021 - 22 Annual Budget
320
Appropriations
Detail
Electric
Fund
Administration
Division
Appropriations Detail Account # 041-1021-531
ACTUAL ACTUAL ADOPTED ADOPTED2018-19 2019-20 2020-21 2021-22
PERSONAL SERVICES
12xx Regular Salaries & Wages 182,507 215,857 215,550 209,498
1410 Overtime 110 40 400 400
1641 Vacation/Terms & Buyout 22,394 898 0 0
2110 FICA 15,131 15,951 15,833 14,659
221x Retirement 14,554 15,907 15,590 17,589
23xx Insurance 57,273 61,795 56,484 68,428
2410 Workers' Compensation 580 589 603 587
26xx Other Payroll Benefits (1,114) (7,001) 2,799 2,769
2999 Allocated Labor Expense (92,699) (17,996) (35,808) (68,793)
TOTAL PERSONAL SERVICES 198,736 286,040 271,451 245,137
OPERATING EXPENSES
3xxx Professional Services 13,329 21,805 14,700 25,200
4010 Travel 1,696 129 2,600 2,600
41xx Communication 17,481 19,001 26,750 27,530
421x Postage 781 1,605 8,000 8,000
4310 Utilities 60,075 69,332 70,000 70,000
4510 Insurance 176,176 199,575 215,440 219,873
46xx Repairs & Maintenance- Equipment 9,098 6,503 5,790 8,260
4710 Printing & Binding 39 0 100 100
4810 Promotional Activities 1,571 810 150 3,150
4911 Advertising 0 0 100 100
4920 Other Current Charges 1,200 0 100 1,500
4945 Injury/Damage to Others 326 6,061 2,000 2,000
5180 Minor Furniture/Equipment 412 0 3,250 500
5210 Operating Supplies 5,241 8,418 7,500 8,000
5299 Allocated Material Expense (71,978) (28,936) (25,564) (47,016)
5410 Publications & Memberships 36,015 43,460 40,325 38,700
5520 Training 1,230 0 3,000 3,000
TOTAL OPERATING EXPENSES 252,692 347,763 374,241 371,497
TOTAL APPROPRIATIONS 451,428 633,803 645,692 616,634

Fiscal Year 2021 - 22 Annual Budget
321
Appropriations
Summary
Electric
Fund
Administration
Division
Appropriations Summary
ADOPTED ADOPTED INCREASE/
2020-21 2021-22 (DECREASE) PERCENTAGE
Personal Services 271,451 245,137 (26,314) -9.69%
Operating Expenses 374,241 371,497 (2,744) -0.73%
TOTALS 645,692 616,634 (29,058) -4.50%

Fiscal Year 2021 - 22 Annual Budget
322
Appropriations
Detail
Electric
Fund
Jobbing
Division
Appropriations Detail Account # 041-1045-531
ACTUAL ACTUAL ADOPTED ADOPTED
2018-19 2019-20 2020-21 2021-22
PERSONAL SERVICES
1210 Regular Salaries & Wages 40,147 16,938 45,000 45,000
1410 Overtime 114,132 214 1,000 1,000
2110 FICA 11,566 1,249 3,442 3,442
221x Retirement 2,145 847 3,500 2,250
23xx Insurance 7,570 1,841 7,100 6,600
2410 Workers' Compensation 2,216 262 2,000 2,000
26xx Other Payroll Benefits 121 16 0 0
2999 Allocated Labor Expense 20,373 2,265 0 0
TOTAL PERSONAL SERVICES 198,270 23,632 62,042 60,292
OPERATING EXPENSES
3410 Contract Services 0 0 0 0
4010 Travel 3,256 0 0 0
4499 Allocated Equip Rental 94,855 3,340 0 0
462x Repairs & Maintenance-Non Bldg 25,917 981 0 0
4920 Other Current Charges 202 267 0 0
5210 Operating Supplies 19,666 6,756 10,000 10,000
5299 Allocated Material Expense 832 286 0 0
TOTAL OPERATING EXPENSES 144,728 11,630 10,000 10,000
OTHER USES
9950 Contra Expense 0 0 0 0
TOTAL OTHER USES 0 0 0 0
TOTAL APPROPRIATIONS 342,998 35,262 72,042 70,292

Fiscal Year 2021 - 22 Annual Budget
323
Appropriations
Summary
Electric
Fund
Jobbing
Division
Appropriations Summary
ADOPTED ADOPTED INCREASE/
2020-21 2021-22 (DECREASE) PERCENTAGE
Personal Services 62,042 60,292 (1,750) -2.82%
Operating Expenses 10,000 10,000 0 0.00%
TOTALS 72,042 70,292 (1,750) -2.43%

Fiscal Year 2021 - 22 Annual Budget
324
Appropriations
Detail
Electric
Fund
Distribution
Division
Appropriations Detail Account # 041-1062-531
ACTUAL ACTUAL ADOPTED ADOPTED2018-19 2019-20 2020-21 2021-22
PERSONAL SERVICES
12xx Regular Salaries & Wages 2,044,681 2,226,647 2,888,012 2,747,303
1410 Overtime 393,033 393,148 369,500 385,500
15xx Bonuses/Incentives 6,635 2,870 0 0
1641 Vacation/Terms & Buyout 47,150 49,055 0 0
2110 FICA 180,135 194,084 204,771 193,673
221x Retirement 331,008 340,558 289,267 284,267
23xx Insurance 411,907 299,364 377,123 278,284
2410 Workers' Compensation 31,021 33,312 38,009 35,584
26xx Other Payroll Benefits (40,634) (254,140) 3,868 3,526
2999 Allocated Labor Expense (58,599) (125,771) (34,403) (66,096)
TOTAL PERSONAL SERVICES 3,346,337 3,159,127 4,136,147 3,862,041
OPERATING EXPENSES
31xx Professional Services 0 17,479 6,000 3,000
3410 Contract Services 87,634 99,039 151,276 104,406
3499 Inter Dept Contract Oblig 128,489 126,641 135,386 139,932
4010 Travel 11,411 2,349 10,000 13,800
41xx Communication 7,444 13,517 19,163 21,200
4310 Utilities 5,410 4,912 3,251 3,251
4410 Rentals 801 1,318 3,351 3,351
4415 Internal Fleet Lease 227,244 378,772 266,622 281,314
4499 Allocated Equip Rental (958,853) (1,003,206) (583,945) (814,466)
4510 Insurance 16,448 18,341 21,023 21,475
461x Repairs & Maintenance- Vehicles 230,877 162,559 181,042 186,976
4620 Repairs & Maintenance- Buildings 12,159 7,580 5,300 5,300
4625 Repairs & Maintenance-Non Bldg 642,163 660,445 580,000 616,138
46xx Repairs & Maintenance- Equipment 21,418 26,966 18,440 15,980
4633 Computer Contracts 31,358 31,509 34,500 38,500
4670 Repairs & Maintainance-Office Equipment 2,502 4,369 10,500 8,500
4710 Printing & Binding 5,159 3,541 6,750 7,050
4810 Promotional Activities 0 0 1,500 1,000
49xx Other Current Charges 4,781 64,484 1,600 1,600
5180 Minor Furniture/Equipment 24,938 23,454 10,000 20,950
521x Operating Supplies 402,670 336,866 330,000 348,755
5215 Uniforms 47,616 56,734 72,600 68,850
5230 Fuel Purchases 69,608 54,676 70,000 70,000
5299 Allocated Material Expense (48,724) (121,407) (27,648) (48,933)
5410 Publications & Membership 678 145 1,400 1,400
5520 Training 16,486 12,817 16,500 31,110
TOTAL OPERATING EXPENSES 989,717 983,900 1,344,611 1,150,439
OTHER USES
950x Energy Efficiency Rebates 66,675 22,883 62,500 62,500
TOTAL OTHER USES 66,675 22,883 62,500 62,500
TOTAL APPROPRIATIONS 4,402,729 4,165,910 5,543,258 5,074,980

Fiscal Year 2021 - 22 Annual Budget
325
Appropriations
Summary
Electric
Fund
Distribution
Division
Appropriations Summary
ADOPTED ADOPTED INCREASE/
2020-21 2021-22 (DECREASE) PERCENTAGE
Personal Services 4,136,147 3,862,041 (274,106) -6.63%
Operating Expenses 1,344,611 1,150,439 (194,172) -14.44%
Other Uses 62,500 62,500 0 0.00%
TOTALS 5,543,258 5,074,980 (468,278) -8.45%
Significant Budget Changes:
Capital Projects division. Operating Expenses decreased due to and increase in Allocated Equip. Rental
(4499) which is also related to the Capital Projects budget.
The decrease in Personal Services is directly related to an increase in budgeted labor expenses in the

Fiscal Year 2021 - 22 Annual Budget
326
Appropriations
Detail
Electric
Fund
Smart Grid
Division
Appropriations Detail Account # 041-1070-531
ACTUAL ACTUAL ADOPTED ADOPTED
2018-19 2019-20 2020-21 2021-22
OPERATING EXPENSES
3110 Professional Services 0 150 0 0
3410 Contract Services 1,163,921 1,204,292 1,327,400 1,458,201
TOTAL OPERATING EXPENSES 1,163,921 1,204,442 1,327,400 1,458,201
TOTAL APPROPRIATIONS 1,163,921 1,204,442 1,327,400 1,458,201

Fiscal Year 2021 - 22 Annual Budget
327
Appropriations
Summary
Electric
Fund
Smart Grid
Division
Appropriations Summary
ADOPTED ADOPTED INCREASE/
2020-21 2021-22 (DECREASE) PERCENTAGE
Operating Expenses 1,327,400 1,458,201 130,801 9.85%
TOTALS 1,327,400 1,458,201 130,801 9.85%

Fiscal Year 2021 - 22 Annual Budget
328
Appropriations
Detail
Electric
Fund
Other
Appropriations Detail Account # 041-1088-5xx
ACTUAL ACTUAL ADOPTED ADOPTED
2018-19 2019-20 2020-21 2021-22
OPERATING EXPENSES
4950 Uncollectible Accounts 179,596 414,175 430,965 210,940
4970 Regulatory Assessment 9,790 9,155 10,000 10,000
4980 Taxes 1,473,413 1,393,425 1,497,529 1,517,032
4982 Franchise Fees 551,713 535,304 481,312 493,445
5001 Cost Allocation- City Commission 30,649 45,668 49,493 50,774
5002 Cost Allocation- City Manager 166,329 180,412 167,945 169,232
5003 Cost Allocation- City Clerk 58,804 58,838 59,274 64,274
5004 Cost Allocation- City Attorney 9,444 7,001 9,950 9,200
5005 Cost Allocation- Accounting 211,365 242,925 270,596 279,573
5006 Cost Allocation- Customer Service 850,590 840,550 864,659 899,000
5007 Cost Allocation- Purchasing 84,461 57,578 61,719 106,514
5008 Cost Allocation- Warehouse 97,579 95,194 118,352 118,925
5009 Cost Allocation- Human Resources 33,414 36,525 35,979 37,302
5010 Cost Allocation- IT 727,312 773,631 700,791 691,226
5013 Cost Allocation- Facilities 13,234 12,685 12,047 12,893
5015 Cost Allocation- Planning & Zoning 76,225 75,281 77,230 84,908
5910 Depreciation Expense 4,291,404 4,417,501 4,400,607 4,371,330
TOTAL OPERATING EXPENSES 8,865,322 9,195,848 9,248,448 9,126,568
DEBT SERVICE
71xx Principal-Long Term Debt 0 0 2,164,000 1,890,000
721x Interest-Long Term Debt 1,384,326 1,334,255 1,667,201 1,540,412
7311 Fees 11,117 9,663 12,468 12,468
732x Amortize Debt Discount/Premium (97,187) (43,137) (97,187) (97,187)
TOTAL DEBT SERVICE 1,298,256 1,300,781 3,746,482 3,345,693
OTHER USES
9101 Transfer to General Fund 4,000,000 4,000,000 3,603,405 3,027,198
9102 Surcharge Transfer 1,393,720 1,392,360 1,544,829 1,624,943
9150 R & R Reserve 0 0 100,000 100,000
9152 Transfer to Fleet Fund 8,557 0 0 0
9160 Reserve/Future Capital 0 0 0 0
9960 Interest-Customer Deposit 117,025 66,569 75,000 75,000
TOTAL OTHER USES 5,519,302 5,458,929 5,323,234 4,827,141
TOTAL APPROPRIATIONS 15,682,880 15,955,558 18,318,164 17,299,402

Fiscal Year 2021 - 22 Annual Budget
329
Appropriations
Summary
Electric
Fund
Other
Appropriations Summary
ADOPTED ADOPTED INCREASE/
2020-21 2021-22 (DECREASE) PERCENTAGE
Operating Expenses 9,248,448 9,126,568 (121,880) -1.32%
Debt Service 3,746,482 3,345,693 (400,789) -10.70%
Other Uses 5,323,234 4,827,141 (496,093) -9.32%
TOTALS 18,318,164 17,299,402 (1,018,762) -5.56%
Significant Budget Changes:
There was a reduction in programmed Debt Service for FY 22. The change in Other Uses is related to
reducing the Transfer to General Fund (9101) from 7% to 6%.

Fiscal Year 2021 - 22 Annual Budget
330
Appropriations
Detail
Electric
Fund
Capital
Projects
Appropriations Detail Account # 041-1099-531
ACTUAL ACTUAL ADOPTED ADOPTED
2018-19 2019-20 2020-21 2021-22
PERSONAL SERVICES
1210 Regular Salaries & Wages 971,128 1,040,259 531,700 1,021,500
1410 Overtime 24,369 73,134 0 0
2110 FICA 72,327 80,859 40,675 78,145
221x Retirement 48,563 52,016 85,731 49,825
23xx Insurance 112,303 123,952 98,365 235,763
2410 Workers' Compensation 15,181 17,023 8,560 16,446
26xx Other Payroll Benefits 1,547 1,335 0 0
2999 Allocated Labor Expense 130,926 146,989 70,211 134,889
TOTAL PERSONAL SERVICES 1,376,344 1,535,567 835,242 1,536,568
OPERATING EXPENSES
31xx Professional Services 113,204 379,132 115,000 57,000
3410 Contract Services 0 94,368 215,000 0
4210 Postage 0 27 0 0
4410 Rentals 0 551 0 1,500
4499 Allocated Equip Rental 863,998 999,849 583,945 814,466
4920 Other Current Charges 124 215 0 300
5210 Operating Supplies 2,121,040 2,330,457 1,345,174 1,382,964
5299 Allocated Material Expense 119,869 144,571 54,212 95,949
TOTAL OPERATING EXPENSES 3,218,235 3,949,170 2,313,331 2,352,179
CAPITAL OUTLAY
6110 Land 404 103 0 500
6210 Buildings 257,837 7,359 0 0
6310 Improvements Other Than Bldgs 1,361,144 1,038,530 617,667 984,786
6410 Machinery & Equipment 104,715 211,629 253,160 206,567
6460 Taxable Material & Supply 712,992 1,088,545 330,000 485,000
647x Use Tax 49,910 76,198 23,100 33,600
TOTAL CAPITAL OUTLAY 2,487,002 2,422,364 1,223,927 1,710,453
OTHER USES
9999 WIP Contra (7,081,579) (7,907,104) 0 0
TOTAL OTHER USES (7,081,579) (7,907,104) 0 0
TOTAL APPROPRIATIONS 2 (3) 4,372,500 5,599,200

Fiscal Year 2021 - 22 Annual Budget
331
Appropriations
Summary
Electric
Fund
Capital
Projects
Appropriations Summary
ADOPTED ADOPTED INCREASE/
2020-21 2021-22 (DECREASE) PERCENTAGE
Personal Services 835,242 1,536,568 701,326 83.97%
Operating Expenses 2,313,331 2,352,179 38,848 1.68%
Capital Outlay 1,223,927 1,710,453 486,526 39.75%
Other Uses 0 0 0 0.00%
TOTALS 4,372,500 5,599,200 1,226,700 28.05%

Fiscal Year 2021 - 22 Annual Budget
332
Electric
Fund
Project
Schedule
Capital
Projects
Project Schedule
Project
WF/Job Title Funding Source Amount
410001 Meters Renewal & Replacement 58,000
410002 Transformers ($761,000) Renewal & Replacement 751,000
Customer Contribution 10,000
410003 Capacitors Renewal & Replacement 81,000
410004 Distribution lines ($1,847,000) Customer Contribution 415,000
Renewal & Replacement 1,432,000
410005 Sectionalizing Equipment Renewal & Replacement 165,000
410006 Lights ($762,000) Customer Contribution 75,000
Renewal & Replacement 687,000
410008 Other equipment Renewal & Replacement 306,000
410010 Subdivisions ($480,000) Customer Contribution 20,000
Renewal & Replacement 460,000
410011 Reconductoring Renewal & Replacement 944,200
410012 Substations Renewal & Replacement 195,000
TOTAL 5,599,200
Source of Funds
Renewal & Replacement 5,079,200
Customer Contribution 520,000
TOTAL 5,599,200
Electric Fund

Fiscal Year 2021 - 22 Annual Budget
333
Organization
Total
Budget
Gas
Fund
Jack Rogers, Director of Gas
The Gas Fund provides a safe, high quality product and professional service at a low cost. Monitoring gas pressure and responding to gas leaks are an important part of the day-to-day routine.
Responsibilities: Distribution • Install services and mains • Monitor gate stations • Monitor gas mains and services • Remove meters and services • Check/repair gas leaks • Service calls – service and repair appliances, activate services • Comply with Public Service Commission rules and regulations Organizational Chart
$ 8,555,791
Director of Gas
Distribution
Foreman
Gas Equipment Operator
Gas Compliance Specialist
Utility LocatorsDistribution
Technician
Gas Service
Technician
Field Operations
Supervisor
(Distribution)
Executive Admin. Aide II
Field Operations
Supervisor
(Service/Locators)

Fiscal Year 2021 - 22 Annual Budget
334
Gas
Fund
Gas System
Description
Gas System Description
The natural gas system is composed of 300 miles of steel and polyethylene gas mains and 13,000 steel and polyethylene services. The areas served include the City of Leesburg, the area west along SR 44 including the Municipal Industrial Park and Pennbrooke Fairways, the area east of the City which includes the Lake Square Mall and Bassville Park and is bounded by Dead River, the City of Fruitland Park to the north including the 3 clubhouses in the Villages of Fruitland Park and the area west of US Highway 27, which includes Okahumpka and extends along CR 470 to the Coleman Federal Correction Facility, north along County Road 501 to areas south of 468, serving the Villages of South Sumter and the area along US Highway 27 South including Legacy, Highland Lakes, and ending at Royal Highlands just south of the Florida Turnpike. In December 2014, a new natural gas franchise agreement with the City of Fruitland Park was approved. The initial term of the agreement is for 25 years. In February 2018, the City of Wildwood granted the City of Leesburg a natural gas franchise agreement to serve the Villages of South Sumter. The initial term of the agreement is for 30 years. In October of 2019, the construction was complete on the Sabal Trail Gate Station on Hwy 470. The station connects the Sabal Trail’s interstate pipeline and will provide emergency redundancy as well as supply capacity for future growth of the gas system. On June 9th, 2020 the Florida Public Service Commission approved a Territorial Agreement between The City of Leesburg and TECO/Peoples Gas, settling a dispute between the parties and defining the area to be served by each in Sumter County. Installation and maintenance of all gas mains and service lines are the responsibility of the City Gas Department. Mains that are 4 inches in diameter and larger are generally installed by outside contractors, as well as all Villages infrastructure. The City of Leesburg is a member of the Florida Gas Utility (FGU) consortium. FGU purchases natural gas for its members from various suppliers and coordinates day-to-day nominations with Florida Gas Transmission Company (FGT, an interstate pipeline company) for delivery of natural gas to the City’s 2 gate stations. The scheduled volumes are based on the weather forecast, daily consumption needs not related to weather, and FGT system constraints.

Fiscal Year 2021 - 22 Annual Budget
335
Gas
Fund
Budget
Summary-
Operating
Statement
Budget Summary - Operating Statement
ACTUAL ACTUAL ADOPTED ADOPTED
2018-19 2019-20 2020-21 2021-22
OPERATING REVENUE
Charges For Services 6,707,497 6,723,588 6,725,290 8,412,816
Other Operating Revenue 143,287 97,677 85,000 56,100
TOTAL OPERATING REVENUE 6,850,784 6,821,265 6,810,290 8,468,916
OPERATING APPROPRIATIONS
Gas Purchases 2,018,994 1,532,632 1,858,026 2,295,535
Administration 1,100,281 453,044 427,359 466,819
Distribution 1,347,809 1,298,893 1,385,093 1,431,658
Other Operating Expenses 1,434,356 1,862,832 1,792,867 2,197,649
TOTAL APPROPRIATIONS (5,901,440) (5,147,401) (5,463,345) (6,391,661)
NET INCOME FROM OPERATIONS 949,344 1,673,864 1,346,945 2,077,255
Non-Operating Revenue 5,386 2,818 0 0
Non-Operating Appropriations (7,540) (5,164) 0 0
NET OTHER INCOME (2,154) (2,346) 0 0
NET INCOME BEFORE TRANSFERS 947,190 1,671,518 1,346,945 2,077,255
Transfers to other funds (722,121) (748,552) (770,716) (802,871)
NET INCOME AFTER TRANSFERS 225,069 922,966 576,229 1,274,384
Other Sources 135,078 592,307 46,875 86,875
Capital Projects 0 1 (534,001) (861,259)
NET OTHER SOURCES 135,078 592,308 (487,126) (774,384)
UNAPPROPRIATED BALANCE 360,147 1,515,274 89,103 500,000

Fiscal Year 2021 - 22 Annual Budget
336
Gas
Fund
Revenue
Detail
Revenue Detail
ACTUAL ACTUAL ADOPTED ADOPTED
2018-19 2019-20 2020-21 2021-22
INTERGOVERNMENTAL REVENUE
33191 Federal Emergency Mgmt 4,677 2,818 0 0
33491 State Emergency Mgmt 709 0 0 0
TOTAL INTERGOVERNMENTAL REVENUE 5,386 2,818 0 0
.
CHARGES FOR SERVICES
34311 E Statement One-time Credit (2,430) (3,750) 0 0
34321 Residential 3,225,189 3,376,588 3,235,755 4,806,435
34322 Residential Heat Only 102,700 85,587 93,046 101,176
34323 Small Commercial 2,533,456 2,293,834 2,561,226 2,594,566
34324 Commercial Heat Only 22,773 23,540 21,524 32,090
34325 Large Commercial 187,025 295,581 253,771 299,714
34326 Large Interruptible 436,896 367,603 394,469 401,274
34327 Public Authority 937 2,605 0 0
34328 Municipal 9,673 16,998 17,193 27,044
34361 Commercial 1 4,873 58,349 3,306 15,517
34362 Commercial 2 8,857 8,755 0 0
34363 Commercial 3 0 675 0 0
34905 Penalties 44,546 21,038 45,000 35,000
34910 Misc Operating Revenue 0 14,600 0 0
34918 Misc Service Revenue 133,002 161,585 100,000 100,000
TOTAL CHARGES FOR SERVICES 6,707,497 6,723,588 6,725,290 8,412,816
MISCELLANEOUS REVENUE
36110 Interest Income 77,402 63,981 75,000 47,600
36130 Gain/Loss Investments 56,291 25,986 0 0
36402 Gain/Sale of Fixed Assets 0 3 0 0
36925 Misc Jobbing Revenue 4,397 7,514 5,000 6,000
36990 Misc Non-Op Revenue 5,197 193 5,000 2,500
TOTAL MISCELLANEOUS REVENUE 143,287 97,677 85,000 56,100
OTHER SOURCES
38893 Appropriated Retained Earnings 0 0 0 0
38950 Contributions- Cust/Dev 135,078 592,307 0 40,000
38969 Appropriated ECA Incentives 0 0 46,875 46,875
TOTAL OTHER SOURCES 135,078 592,307 46,875 86,875
TOTAL RESOURCES 6,991,248 7,416,390 6,857,165 8,555,791

Fiscal Year 2021 - 22 Annual Budget
337
Gas
Fund
Division
Summary of
Appropriations
Division Summary of Appropriations
ACTUAL ACTUAL ADOPTED ADOPTED
2018-19 2019-20 2020-21 2021-22
2013 GAS PURCHASES
Operating Expenses 2,018,994 1,532,632 1,858,026 2,295,535
TOTAL GAS PURCHASES 2,018,994 1,532,632 1,858,026 2,295,535
2021 ADMINISTRATION
Personal Services 309,356 299,601 300,806 344,804
Operating Expenses 628,950 153,443 126,553 122,015
Grants and Aides 161,975 0 0 0
TOTAL ADMINISTRATION 1,100,281 453,044 427,359 466,819
2081 DISTRIBUTION
Personal Services 1,280,525 1,211,902 1,270,986 1,311,028
Operating Expenses 302,915 328,474 361,373 381,907
Other Uses (235,631) (241,483) (247,266) (261,277)
TOTAL DISTRIBUTION 1,347,809 1,298,893 1,385,093 1,431,658
2088 OTHER
Operating Expenses 1,255,668 1,690,801 1,441,119 1,845,408
Debt Service 178,688 172,031 351,748 352,241
Other Uses 729,661 753,716 859,819 1,302,871
TOTAL OTHER 2,164,017 2,616,548 2,652,686 3,500,520
2099 CAPITAL PROJECTS
Personal Services 155,770 139,719 107,385 109,146
Operating Expenses 429,639 203,375 421,166 738,613
Capital Outlay 2,614,176 67,033 5,450 13,500
Other Uses (3,199,585) (410,128) 0 0
TOTAL CAPITAL PROJECTS 0 (1) 534,001 861,259
GRAND TOTAL
Personal Services 1,745,651 1,651,222 1,679,177 1,764,978
Operating Expenses 4,636,166 3,908,725 4,208,237 5,383,478
Capital Outlay 2,614,176 67,033 5,450 13,500
Debt Service 178,688 172,031 351,748 352,241
Grants and Aides 161,975 0 0 0
Other Uses (2,705,555) 102,105 612,553 1,041,594
TOTAL APPROPRIATIONS 6,631,101 5,901,116 6,857,165 8,555,791

Fiscal Year 2021 - 22 Annual Budget
338
Gas
Fund
Goals & Tasks
Goals & Tasks
Goal: Lead the industry in providing high quality, low cost, customer driven utility services.
Task:
Perform a leak survey of 33% of the gas distribution system each year and incorporate corrosion
survey at the same time
Provide service for non-emergency calls within 24 hours and after hours emergency calls within 45
minutes
Provide 900 hours of education for all personnel through seminars, operator qualification training, City
education courses and Central Florida area natural gas schools
Continue to fully comply with all Public Service Commission (PSC) rules and regulations including:
odorization, valve maintenance, leak surveys, monthly cathodic protection and regulator station
maintenance with no violations
Oversee the installation of 2,300 Villages services, 500 new development services and 110
miscellaneous services for residential and commercial customers
Maintain an effective Public Awareness and Distribution Integrity Management Program (DIMP),
through a minimum of 48 separate mailings for informational events, which exceeds the PSC
requirements
Continue to seek the most economical wholesale gas purchases through Florida Gas Utility (FGU),
which is our gas purchasing agent
Participate with South Sumter Gas Company to expand and grow the system creating higher
customer base revenues
Major Accomplishments:
Completed Phase 2 rebuild of Newell Hill regulator station which upgrades the station components
and improves reliability
Installed or took ownership of 1,968 new services
Installed mains in Spring Creek, Lake Griffin Preserve, Leesburg Landing, Liberty Preserve, Hu’s
Landing, Bradford Ridge and Lake Griffin Reserve development
Resumed development in new phases of the Villages
Performance Measures:
2019-20 2020-21 2021-22
New services installed 1,533 1,968 2,910
Service removals 3,705 100 100
PSC violations 0 0 0
Distribution leak reports 239 250 250
Employee training man hours 900 900 900
Public awareness notifications (service line,
Newspaper, utility bills, etc.)
47 48 47

Fiscal Year 2021 - 22 Annual Budget
339
Gas
Fund
Personnel
Schedule
Personnel Schedule
Classification 2021 Change 2022 Amount
Administration 2021
Executive Asst/Admin Aide II 1.00 0.00 1.00 43,389
Gas Compliance Specialist 1.00 0.00 1.00 49,462
Gas Director 1.00 0.00 1.00 121,222
Total Administration 3.00 0.00 3.00 214,073
Distribution 2081
Distribution Foreman 4.00 0.00 4.00 207,023
Distribution Technician 1.00 0.00 1.00 47,070
Field Operations Supervisor 2.00 0.00 2.00 141,211
Gas Equipment Operator 5.00 0.00 5.00 207,336
Gas Service Technician 4.00 0.00 4.00 156,810
Utility Locator 4.00 0.00 4.00 168,375
Time charged directly to Capital Projects (68,338)
Standby 7,280
Total Distribution 20.00 0.00 20.00 866,767
Capital Projects 2099
Time charged directly to Capital Projects 68,338
Total Capital Projects 68,338
Total 23.00 0.00 23.00 1,149,178

Fiscal Year 2021 - 22 Annual Budget
340
Appropriations
Detail
Gas
Fund
Gas Purchases
Division
Appropriations Detail Account # 042-2013-532
ACTUAL ACTUAL ADOPTED ADOPTED
2018-19 2019-20 2020-21 2021-22
OPERATING EXPENSES
3470 Gas Purchases 2,018,994 1,532,632 1,858,026 2,295,535
TOTAL OPERATING EXPENSES 2,018,994 1,532,632 1,858,026 2,295,535
TOTAL APPROPRIATIONS 2,018,994 1,532,632 1,858,026 2,295,535

Fiscal Year 2021 - 22 Annual Budget
341
Appropriations
Summary
Gas
Fund
Gas
Purchases
Division
Appropriations Summary
ADOPTED ADOPTED INCREASE/
2020-21 2021-22 (DECREASE) PERCENTAGE
Operating Expenses 1,858,026 2,295,535 437,509 23.55%
TOTALS 1,858,026 2,295,535 437,509 23.55%

Fiscal Year 2021 - 22 Annual Budget
342
Appropriations
Detail
Gas
Fund
Administration
Division
Appropriations Detail Account # 042-2021-532
ACTUAL ACTUAL ADOPTED ADOPTED
2018-19 2019-20 2020-21 2021-22PERSONAL SERVICES
1210 Regular Salaries & Wages 197,032 205,367 204,485 214,073
1310 Temporary Labor 0 0 0 19,628
1410 Overtime 2,894 4,739 4,000 3,000
1641 Vacation/Terms & Buyouts 8,644 4,296 0 0
2110 FICA 15,046 15,357 14,583 20,297
221x Retirement 26,930 27,753 25,984 25,503
23xx Insurance 62,892 59,478 63,004 74,773
2410 Workers' Compensation 1,529 1,579 1,562 1,674
26xx Other Payroll Benefits 16,615 (2,184) 1,179 965
2999 Allocated Labor Expense (22,226) (16,784) (13,991) (15,109)
TOTAL PERSONAL SERVICES 309,356 299,601 300,806 344,804
OPERATING EXPENSES
3110 Professional Services 517,303 47,216 10,000 6,000
3130 Engineering Services 1,409 0 0 0
3410 Contract Services 3,157 2,407 2,426 2,536
4010 Travel 2,247 0 3,700 3,700
41xx Communication 135 169 135 135
4210 Postage 681 1,515 2,500 2,200
4510 Insurance 25,398 30,454 35,019 38,821
46xx Repairs & Maintenance- Equipment 2,418 3,129 4,560 6,360
4710 Printing & Binding 0 0 100 100
48xx Promotional Activities 56,864 56,794 50,375 48,875
4911 Advertising 145 145 200 350
5180 Minor Furniture & Equip 1,995 69 500 1,000
5210 Operating Supplies 1,735 1,144 1,460 1,400
5215 Uniforms 24 62 100 150
5299 Allocated Material Exp (15,718) (2,033) (18,022) (23,112)
5410 Publications & Memberships 29,782 12,097 32,000 32,000
5520 Training 1,375 275 1,500 1,500
TOTAL OPERATING EXPENSES 628,950 153,443 126,553 122,015
GRANTS AND AIDS
8210 Local Contributions 70,215 0 0 0
8215 Local Contributions- Cemetary 91,760 0 0 0
TOTAL GRANTS AND AIDES 161,975 0 0 0
TOTAL APPROPRIATIONS 1,100,281 453,044 427,359 466,819

Fiscal Year 2021 - 22 Annual Budget
343
Appropriations
Summary
Gas
Fund
Administration
Division
Appropriations Summary
ADOPTED ADOPTED INCREASE/
2020-21 2021-22 (DECREASE) PERCENTAGE
Personal Services 300,806 344,804 43,998 14.63%
Operating Expenses 126,553 122,015 (4,538) -3.59%
TOTALS 427,359 466,819 39,460 9.23%
Significant Budget Changes:
The increase in Personal Services is related to including Temporary Labor (1310) plus benefits for the
change in the Gas Director position.

Fiscal Year 2021 - 22 Annual Budget
344
Appropriations
Detail
Gas
Fund
Distribution
Division
Appropriations Detail Account # 042-2081-532
ACTUAL ACTUAL ADOPTED ADOPTED
2018-19 2019-20 2020-21 2021-22PERSONAL SERVICES
12xx Regular Salaries & Wages 751,674 790,825 850,294 866,767
1410 Overtime 70,175 43,807 50,000 60,000
15xx Bonuses/Incentives 2,891 4,493 0 0
1641 Vacation/Terms & Buyouts 7,120 12,562 0 0
2110 FICA 59,328 60,580 59,354 60,218
221x Retirement 94,662 100,126 96,735 89,180
23xx Insurance 161,800 162,790 189,979 209,606
2410 Workers' Compensation 18,680 19,393 19,725 20,114
26xx Other Payroll Benefits 114,195 17,326 4,899 5,143
TOTAL PERSONAL SERVICES 1,280,525 1,211,902 1,270,986 1,311,028
OPERATING EXPENSES
3130 Engineering Services 2,850 0 3,000 5,000
3410 Contract Services 1,588 9,708 19,500 20,250
4010 Travel 2,176 831 3,000 4,000
41xx Communication 8,257 8,174 8,500 8,500
4210 Postage 635 625 700 700
4310 Utilities 15,483 15,463 20,000 20,000
44xx Rentals 0 1,369 1,400 1,600
4415 Internal Fleet Lease 49,706 67,182 56,587 55,064
4499 Allocated Equip. Rental (62,587) (74,996) (12,904) (13,000)
4510 Insurance 6,526 7,647 10,118 10,866
461x Repairs & Maintenance- Vehicles 74,577 98,826 69,932 82,087
4620 Repairs & Maintenance- Buildings 0 4,386 0 2,000
4625 Repairs & Maintenance- Non-Build 8,241 328 2,300 2,300
46xx Repairs & Maintenance- Equipment 4,160 4,240 3,840 2,040
4710 Printing & Binding 9,521 10,591 12,000 10,000
4xxx Promotional Activities/Advertising 145 0 0 0
4920 Other Current Charges 8,995 7,775 11,400 10,000
4945 Injury/ Damage to Others 2,069 5,316 1,000 1,000
5180 Minor Furniture & Equip 43,911 49,025 48,000 43,000
521x Operating Supplies 72,504 58,129 45,000 50,000
5215 Uniforms 13,144 11,200 13,000 13,000
5230 Fuel Purchases 31,768 35,026 36,000 40,000
5280 Chemicals 4,699 0 2,500 3,000
5410 Publications & Memberships 75 0 0 0
5520 Training 4,472 6,045 6,500 6,500
5540 Education 0 1,584 0 4,000
TOTAL OPERATING EXPENSES 302,915 328,474 361,373 381,907
OTHER USES
9950 Contra- Expense (235,631) (241,483) (247,266) (261,277)
TOTAL OTHER USES (235,631) (241,483) (247,266) (261,277)
TOTAL APPROPRIATIONS 1,347,809 1,298,893 1,385,093 1,431,658

Fiscal Year 2021 - 22 Annual Budget
345
Appropriations
Summary
Gas
Fund
Distribution
Division
Appropriations Summary
ADOPTED ADOPTED INCREASE/
2020-21 2021-22 (DECREASE) PERCENTAGE
Personal Services 1,270,986 1,311,028 40,042 3.15%
Operating Expenses 361,373 381,907 20,534 5.68%
Other Uses (247,266) (261,277) (14,011) 5.67%
TOTALS 1,385,093 1,431,658 46,565 3.36%

Fiscal Year 2021 - 22 Annual Budget
346
Appropriations
Detail
Gas
Fund
Other
Appropriations Detail Account # 042-2088-5xx
ACTUAL ACTUAL ADOPTED ADOPTED
2018-19 2019-20 2020-21 2021-22
OPERATING EXPENSES
4930 South Sumter 59,490 234,605 93,567 317,056
4950 Uncollectible Accounts 6,984 29,681 17,000 25,000
4970 Regulatory Assessments 12,630 10,965 15,000 13,000
4980 Taxes 156,445 166,402 176,728 195,775
4982 Franchise Fees 26,337 49,335 34,014 68,351
5001 Cost Allocation- City Commission 5,929 9,721 10,478 12,996
5002 Cost Allocation- City Manager 31,494 43,809 35,556 43,318
5003 Cost Allocation- City Clerk 11,011 12,820 12,549 16,452
5004 Cost Allocation- City Attorney 3,778 3,501 4,975 4,600
5005 Cost Allocation- Accounting 42,003 53,394 57,288 71,561
5006 Cost Allocation- Customer Service 165,164 180,118 183,056 230,113
5007 Cost Allocation- Purchasing 0 2,879 17,634 8,876
5008 Cost Allocation- Warehouse 9,441 13,756 16,861 11,996
5009 Cost Allocation- Human Resources 13,366 18,262 17,990 18,651
5010 Cost Allocation- IT 113,003 128,574 140,261 159,717
5011 Cost Allocation- GIS 65,714 73,022 74,628 79,514
5013 Cost Allocation- Facilities 13,234 12,685 12,047 12,893
5015 Cost Allocation- Planning & Zoning 50,817 50,187 51,487 56,605
5910 Depreciation Expense 468,828 597,085 470,000 498,934
TOTAL OPERATING EXPENSES 1,255,668 1,690,801 1,441,119 1,845,408
DEBT SERVICE
711x Principal-Long Term Debt 0 0 187,950 197,195
721x Interest-Long Term Debt 183,709 176,965 168,644 159,892
7311 Fees 1,799 1,886 1,974 1,974
732x Amortize Debt Discount/Premium (18,724) (18,724) (18,724) (18,724)
7330 Amortize Debt Issue Cost 11,904 11,904 11,904 11,904
TOTAL DEBT SERVICE 178,688 172,031 351,748 352,241
OTHER USES
9101 Transfer to General Fund 606,204 632,906 622,004 620,898
9102 Surcharge Transfer 115,917 115,646 148,712 181,973
9160 Reserve/Future Capital 0 0 89,103 500,000
9960 Interest-Customer Deposit 7,540 5,164 0 0
TOTAL OTHER USES 729,661 753,716 859,819 1,302,871
TOTAL APPROPRIATIONS 2,164,017 2,616,548 2,652,686 3,500,520

Fiscal Year 2021 - 22 Annual Budget
347
Appropriations
Summary
Gas
Fund
Other
Appropriations Summary
ADOPTED ADOPTED INCREASE/
2020-21 2021-22 (DECREASE) PERCENTAGE
Operating Expenses 1,441,119 1,845,408 404,289 28.05%
Debt Service 351,748 352,241 493 0.14%
Other Uses 859,819 1,302,871 443,052 51.53%
TOTALS 2,652,686 3,500,520 847,834 31.96%
Significant Budget Changes:
directly related to the increase in the Transfer to General Fund (9101).
Operating Expenses increased due to the South Sumter payment (4930). The change in Other Uses is

Fiscal Year 2021 - 22 Annual Budget
348
Appropriations
Detail
Gas
Fund
Capital
Projects
Appropriations Detail Account # 042-2099-532
ACTUAL ACTUAL ADOPTED ADOPTED
2018-19 2019-20 2020-21 2021-22
PERSONAL SERVICES
1210 Regular Salaries & Wages 96,292 89,833 63,283 68,338
1410 Overtime 4,218 33 0 0
2110 FICA 7,239 6,368 4,841 5,228
221x Retirement 4,815 4,492 9,474 3,417
23xx Insurance 18,373 19,901 14,314 15,456
2410 Workers' Compensation 2,295 2,090 1,482 1,598
26xx Other Payroll Benefits 312 218 0 0
2999 Allocated Labor Expense 22,226 16,784 13,991 15,109
TOTAL PERSONAL SERVICES 155,770 139,719 107,385 109,146
OPERATING EXPENSES
31xx Professional Services 9,767 (669) 0 0
3410 Contract Services 151 5,405 0 202,000
4499 Allocated Equip Rental 62,764 75,598 12,904 13,000
4625 R & M/Non-Buildings (OTB) 865 3,194 0 0
5180 Minor Furniture/Equipment 0 2,466 0 0
5210 Operating Supplies 340,374 115,348 390,240 500,500
5299 Allocated Material Exp 15,718 2,033 18,022 23,113
TOTAL OPERATING EXPENSES 429,639 203,375 421,166 738,613
CAPITAL OUTLAY
6310 Improvements Other than Bldgs 1,898,534 60,788 0 0
6410 Machinery & Equipment 715,642 6,245 5,450 13,500
TOTAL CAPITAL OUTLAY 2,614,176 67,033 5,450 13,500
OTHER USES
9999 WIP Contra (3,199,585) (410,128) 0 0
TOTAL OTHER USES (3,199,585) (410,128) 0 0
TOTAL APPROPRIATIONS 0 (1) 534,001 861,259

Fiscal Year 2021 - 22 Annual Budget
349
Appropriations
Summary
Gas
Fund
Capital
Projects
Appropriations Summary
ADOPTED ADOPTED INCREASE/
2020-21 2021-22 (DECREASE) PERCENTAGE
Personal Services 107,385 109,146 1,761 1.64%
Operating Expenses 421,166 738,613 317,447 75.37%
Capital Outlay 5,450 13,500 8,050 147.71%
TOTALS 534,001 861,259 327,258 61.28%

Fiscal Year 2021 - 22 Annual Budget
350
Project
Schedule
Gas
Fund
Capital
Projects
Project Schedule
Project
WF/Job Title Funding Source Amount
420001 Meters ($350,614)
Regular meters Current Revenue 51,694
ERT meters Current Revenue 298,920
420002 Mains ($309,108)
CR 470 Tunnel Relocate Current Revenue 149,108
McEleay 6" Extension ($160,000) Current Revenue 120,000
Customer Contribution 40,000
420003 Tools & Equipment
Pneumatic Mole Current Revenue 5,500
420004 Vehicles & Equipment
Mini Ex Trailer Current Revenue 8,000
420008 Regulators Current Revenue 14,647
420009 Farm Tap/ Industrial Equip Current Revenue 25,136
420010 Services Current Revenue 148,254
TOTAL
861,259
Source of Funds
Current Revenue 821,259
Customer Contribution 40,000
TOTAL
861,259

Fiscal Year 2021 - 22 Annual Budget
351
Organization
Total
Budget
Water
Fund
Cliff Kelsey, Director of Public Works
The Water Fund provides a safe, high quality water with prompt, professional service at a low cost to the customer. Preventive maintenance is important to continue services.
Responsibilities: Water Distribution Water Treatment ·Install service ·Monitor plants ·Install and maintain water mains ·Water quality ·Install and maintain water meters ·Preventive maintenance
·Monitor wells ·Oversee planning/design/construction of new water facilities Organizational Chart
$ 12,196,324
Director of Public Works
Deputy Director
Operations
Supervisor
(Distribution)
Administrative
Assistant II
Crew Leader
Distribution
Operator III
Distribution
Operator
Apprentice
Plant Manager
Chief Plant
Operator
Lead Operator
Water Operator
Apprentice
Water Operator B
Water Operator C
Plant Tech
Apprentice
Maintenance
Worker II

Fiscal Year 2021 - 22 Annual Budget
352
Water
Fund
Water System
Description
Water System Description
The Water distribution system is composed of 378 miles of water mains, 3 elevated storage tanks and 5 ground storage tanks. The elevated storage tanks, located at Lake Square Mall, Newell Hill, and on College Street have capacities of 150,000, 200,000 and 500,000 gallons, respectively. The ground storage tanks located at the main treatment plant (2), Highland Lakes, Royal Highlands and Plantation have a total capacity of 2.85 million gallons. The City preforms routine inspections and maintenance on the system and executed a project to sandblast and re-paint the College Street elevated storage tank in Fiscal Year 2021. The City has two 20 year consumptive use permits from St. Johns River Water Management District; City of Leesburg Public Supply (CUP # 94) and City of Leesburg, Plantation (CUP #2718). For calendar year 2020, the District authorizes the use of 9.13 million gallons per day (mgd) from CUP #94 and 1.41 mgd from CUP #2718. Water is drawn from 19 Floridian aquifer wells and chlorinated for disinfection prior to distribution. Treatment of the raw water is accomplished at the main water treatment plant and five satellite facilities. The City anticipates having capacity to meet the needs of existing and future customers through the year 2025. The City meets all Federal and State drinking water standards. Reuse water is high quality, treated water produced as a byproduct of the wastewater treatment process. It is suitable for irrigation and a number of industrial cooling operations. By reducing the use of potable water by maximizing reuse for irrigation purposes, the City is extending the life of the drinking water aquifer. Reuse is a valuable resource not only for residential customers but also for commercial customers requiring high volumes of water at reasonable rates. The City began distribution of reuse in fiscal year 2009-10. The City currently produces approximately 2.2 mgd of reuse quality water each day. The City continues to add new customers to the reuse system. All new communities are required to install dual distribution systems.

Fiscal Year 2021 - 22 Annual Budget
353
Water
Fund
Budget
Summary-
Operating
Statement
Budget Summary - Operating Statement
ACTUAL ACTUAL ADOPTED ADOPTED
2018-19 2019-20 2020-21 2021-22
OPERATING REVENUE
Charges for Services 8,723,419 8,934,682 8,870,687 9,166,981
Other Operating Revenue 525,565 604,158 513,984 549,343
TOTAL REVENUE SOURCES 9,248,984 9,538,840 9,384,671 9,716,324
OPERATING APPROPRIATIONS
Administration 304,071 354,246 471,328 428,551
Treatment 1,564,930 1,151,517 1,438,433 1,481,968
Reuse 472,441 352,606 384,739 392,773
Distribution 1,544,638 1,302,245 1,431,148 1,585,984
Other Operating Expenses 3,109,701 3,494,075 4,088,969 4,373,564
TOTAL APPROPRIATIONS (6,995,781) (6,654,689) (7,814,617) (8,262,840)
NET INCOME FROM OPERATIONS 2,253,203 2,884,151 1,570,054 1,453,484
Non-Operating Revenue 27,639 34,338 0 0
Non-Operating Appropriations (12,617) (7,346) 0 0
NET OTHER INCOME 15,022 26,992 0 0
NET INCOME BEFORE TRANSFERS 2,268,225 2,911,143 1,570,054 1,453,484
Transfers to other funds (1,022,266) (1,011,461) (1,076,562) (1,108,156)
NET INCOME AFTER TRANSFERS 1,245,959 1,899,682 493,492 345,328
Other Sources 361,689 991,810 1,883,522 2,480,000
Capital Projects 0 0 (2,275,000) (2,030,000)
NET OTHER SOURCES 361,689 991,810 (391,478) 450,000
UNAPPROPRIATED BALANCE 1,607,648 2,891,492 102,014 795,328

Fiscal Year 2021 - 22 Annual Budget
354
Water
Fund
Revenue
Detail
Revenue Detail
ACTUAL ACTUAL ADOPTED ADOPTED
2018-19 2019-20 2020-21 2021-22
LICENSES & PERMITS
32421 Impact Fees - Residential 220,995 386,179 274,694 396,219
32422 Impact Fees - Commercial 9,035 49,594 74,062 50,883
TOTAL LICENSES & PERMITS 230,030 435,773 348,756 447,102
INTERGOVERNMENTAL REVENUE
33191 Federal Emergency Mgmt Reimb 24,002 34,338 0 0
33491 State Emergency Mgmt Reimb 3,637 0 0 0
TOTAL INTERGOVERNMENTAL REVENUE 27,639 34,338 0 0
CHARGES FOR SERVICES
34331 Residential Sales 5,809,969 6,011,739 5,968,209 6,168,043
34332 Commercial Sales 1,921,710 1,840,088 1,948,108 1,887,930
34336 Municipal Sales 103,687 147,848 129,487 151,692
34338 Private Fire Protection Sales 32,192 33,644 34,497 34,518
3433x Reuse Water 689,861 774,869 641,914 794,731
34905 Penalties 61,640 31,539 69,952 32,644
34918 Misc Service Revenue 104,360 94,955 78,520 97,423
TOTAL CHARGES FOR SERVICES 8,723,419 8,934,682 8,870,687 9,166,981
MISCELLANEOUS REVENUE
36110 Interest on Investments 169,019 137,494 155,177 89,671
36130 Gain/Loss Investments 119,219 53,783 0 0
36402 Gain From Sale of Fixed Assets 0 (35,103) 0 0
36501 Sale of Surplus Materials 6,102 3,552 5,051 3,644
36925 Misc Jobbing Revenue 1,195 8,700 5,000 8,926
36990 Misc Non-Operating Revenue 0 (41) 0 0
TOTAL MISCELLANEOUS 295,535 168,385 165,228 102,241
OTHER SOURCES
38893 Appropriated Ret Earnings 0 0 0 0
38950 Contributions - Cust/Dev 361,689 991,810 130,522 375,000
38962 Appropriated Renewal & Replacement 0 0 1,753,000 2,105,000
TOTAL OTHER SOURCES 361,689 991,810 1,883,522 2,480,000
TOTAL RESOURCES 9,638,312 10,564,988 11,268,193 12,196,324

Fiscal Year 2021 - 22 Annual Budget
355
Water
Fund
Division
Summary of
Appropriations
Division Summary of Appropriations
ACTUAL ACTUAL ADOPTED ADOPTED
2018-19 2019-20 2020-21 2021-22
3021 ADMINISTRATION
Personal Services 173,897 224,299 257,839 263,853
Operating Expenses 130,174 129,567 173,489 154,698
Other Uses 0 380 40,000 10,000
TOTAL ADMINISTRATION 304,071 354,246 471,328 428,551
3051 TREATMENT
Personal Services 710,999 476,404 557,688 590,187
Operating Expenses 853,931 675,113 880,745 891,781
TOTAL TREATMENT 1,564,930 1,151,517 1,438,433 1,481,968
3072 REUSE
Personal Services 165,820 114,283 133,139 144,048
Operating Expenses 306,621 238,323 251,600 248,725
TOTAL REUSE 472,441 352,606 384,739 392,773
3081 DISTRIBUTION
Personal Services 873,067 606,763 777,828 834,906
Operating Expenses 671,571 695,482 653,320 751,078
TOTAL DISTRIBUTION 1,544,638 1,302,245 1,431,148 1,585,984
3088 OTHER
Operating Expenses 2,387,583 2,805,533 2,475,513 2,762,159
Debt Service 722,118 688,542 1,538,456 1,536,405
Other Uses 1,034,883 1,018,807 1,253,576 1,978,484
TOTAL OTHER 4,144,584 4,512,882 5,267,545 6,277,048
3099 CAPITAL PROJECTS
Personal Services 297 0 0 0
Operating Expenses 19,752 17,822 0 1,175,000
Capital Outlay 6,152,397 555,860 2,275,000 855,000
Other Uses (6,172,446) (573,682) 0 0
TOTAL CAPITAL PROJECTS 0 0 2,275,000 2,030,000
GRAND TOTAL
Personal Services 1,924,080 1,421,749 1,726,494 1,832,994
Operating Expenses 4,369,632 4,561,840 4,434,667 5,983,441
Capital Outlay 6,152,397 555,860 2,275,000 855,000
Debt Service 722,118 688,542 1,538,456 1,536,405
Other Uses (5,137,563) 445,505 1,293,576 1,988,484
TOTAL APPROPRIATIONS 8,030,664 7,673,496 11,268,193 12,196,324

Fiscal Year 2021 - 22 Annual Budget
356
Water
Fund
Goals & Tasks
Goals & Tasks
Goal: Lead the industry in providing high quality, low cost, customer driven utility services.
Task:
Continue to promote water conservation
Ensure proper water quality
Continue to maintain and improve the system’s infrastructure
Provide excellent customer service
Extend Reuse systems into various subdivisions
Execute Water Conservation rebate program
Change out failing/aged water meters and data logging equipment for better accuracy and billing
efficiency
Major Accomplishments:
Installed new control panel, Variable Frequency Drive (VFD) and motor for Sleepy Hollow Sports
Complex irrigation system
Installed new control panels at the Lake Pointe Booster Station and Highland Lakes water treatment
facility
Completed Sodium Hypochlorite conversion for the Lake Square Mall and the Airport water treatment
facilites
Replaced high service pump #4 at the main water treatment facility
Completed the 10-year report for St. Johns River Water Management District (SJRWD) for
Consumptive Use permit (CUP) #94
Rehabbed Collge Street and Newell Hill altitude valves
Installed 967 new water meters (potable and irrigation)
Completed a water meter audit
Significantly reduced the average of afterhours call outs from 53 to 12 per month
Performance Measures:
2019-20 2020-21 2021-22
High consumption letters issued 2,000 2,400 2,600
Water conservation promotions 13 19 8
Main Water Treatment Plant (per capita
consumption)
122 120 120
Plantation Water Treatment Plant (per capita
consumption)
240 240 230

Fiscal Year 2021 - 22 Annual Budget
357
Water
Fund
Personnel
Schedule
Personnel Schedule
Classification 2021 Change 2022 Amount
Administration 3021
Admin. Services Coordinator 1 0.50 0.00 0.50 29,879
Customer Relations Specialist 2 0.80 0.00 0.80 31,899
Deputy Director of Public Works 3 & 4 0.95 0.00 0.95 86,460
Director of Public Works 5 0.25 0.00 0.25 29,177
Project Manager I 6 0.25 0.00 0.25 14,108
Total Administration 2.75 0.00 2.75 191,523
Treatment 3051
Chief Plant Operator 1.00 0.00 1.00 72,051
Lead Plant Operator 1.00 0.00 1.00 52,811
Plant Manager 7 0.50 0.00 0.50 47,455
Water Operator Apprentice 3.00 0.00 3.00 88,296
Water Operator C 3.00 0.00 3.00 100,403
Plant Tech C 1.00 0.00 1.00 33,030
Standby 3,650
Total Treatment 9.50 0.00 9.50 397,696
Reuse 3072
Wastewater Operator B 1.00 0.00 1.00 50,877
Wastewater Operator C 1.00 0.00 1.00 43,763
Standby 1,825
Total Reuse 2.00 0.00 2.00 96,465
Distribution 3081
Administrative Assistant II 1.00 0.00 1.00 36,338
Crew Leader 1.00 0.00 1.00 51,480
Distribution Tech III 3.00 3.00 6.00 212,242
Distribution Tech II 2.00 (1.00) 1.00 35,714
Distribution Tech I 0.00 1.00 1.00 40,102
Distribution Tech Apprentice 5.00 (3.00) 2.00 56,618
Operations Supervisor 1.00 0.00 1.00 65,978
Utility Inspector 8 0.50 0.00 0.50 15,902
Standby 3,650
Total Distribution 13.50 0.00 13.50 518,024
Total 27.75 0.00 27.75 1,203,707
Note: Allocations
Utility Inspector 8
50%-3081, 50%- 4081
Admin. Services Coordinator 1 50%-3021, 50%-4021
Deputy Director of Public Works 3 45%-3021, 45%-4021, 10%-5197
Project Manager I 6 25%-3021, 25%-4021, 50%-5197
Plant Manager 7 50%-3051, 25%-4051, 25%-4052
Customer Relations Specialist 2 80%-3021, 20%-5171
Deputy Director of Public Works 4 50%-3021, 50%- 4020
Director of Public Works 5 25%-5197, 25%-3021, 25%- 4021, 15%-5171, 5%-5143, 5%-5144

Fiscal Year 2021 - 22 Annual Budget
358
Appropriations
Detail
Water
Fund
Administration
Division
Appropriations Detail Account # 043-3021-533
ACTUAL ACTUAL ADOPTED ADOPTED
2018-19 2019-20 2020-21 2021-22PERSONAL SERVICES
1210 Regular Salaries & Wages 100,407 152,603 179,833 191,523
1310 Temporary Labor 2,593 0 0 0
1410 Overtime 22 166 500 500
1530 Bonuses 312 0 0 0
1641 Vacation/Terms & Buyout 0 15,079 0 0
2110 FICA 7,738 12,445 12,670 13,983
221x Retirement 11,393 8,437 9,326 9,576
23xx Insurance 34,695 45,530 51,442 46,937
2410 Workers' Compensation 654 853 2,064 898
26xx Employee Benefits 16,120 (10,814) 2,004 436
2999 Allocated Labor Expense (37) 0 0 0
TOTAL PERSONAL SERVICES 173,897 224,299 257,839 263,853
OPERATING EXPENSES
31xx Professional Services 36,845 18,029 35,000 30,000
3410 Contract Services 2,277 25 5,000 0
4010 Travel 0 0 250 250
41xx Communication 68 106 250 250
4210 Postage 73 35 1,000 500
4310 Utilities 5,901 5,521 6,000 6,000
4415 Internal Fleet Lease 1,020 2,409 2,087 2,107
4510 Insurance 74,567 84,091 90,492 97,283
461x Repairs & Maintenance- Vehicles 1,271 3,874 1,275 793
4620 Repairs & Maintenance- Buildings 0 0 5,000 5,000
463x Repairs & Maintenance- Equipment 2,000 2,232 1,460 1,300
4710 Printing & Binding 0 0 2,000 500
4810 Promotional Activities 938 6,885 10,000 2,500
4911 Advertising-Other Ads 0 0 1,600 0
4934 ZW Warehouse Over/Short (5) 0 0 0
5180 Minor Furniture & Equip 191 0 5,000 0
521x Operating Supplies 595 1,438 1,075 1,515
5230 Fuel Purchases 457 981 500 1,200
5410 Publications & Memberships 3,976 3,941 4,000 4,000
5520 Training 0 0 1,500 1,500
TOTAL OPERATING EXPENSES 130,174 129,567 173,489 154,698
OTHER USES
9501 Water Conservation Rebate 0 380 40,000 10,000
TOTAL OTHER USES 0 380 40,000 10,000
TOTAL APPROPRIATIONS 304,071 354,246 471,328 428,551

Fiscal Year 2021 - 22 Annual Budget
359
Appropriations
Summary
Water
Fund
Administration
Division
Appropriations Summary
ADOPTED ADOPTED INCREASE/
2020-21 2021-22 (DECREASE) PERCENTAGE
Personal Services 257,839 263,853 6,014 2.33%
Operating Expenses 173,489 154,698 (18,791) -10.83%
Other Uses 40,000 10,000 (30,000) -75.00%
TOTALS 471,328 428,551 (12,777) -2.71%
Significant Budget Changes:
The change in Operating Expenses is due a reduction in Engineering Services (3130), Contract Services
(3410), Promotional Activities (4810) and Minor Furniture/Equipment (5180). Other Uses decreased
due to a reduction in the Water Conservation Rebate (9501) budget.

Fiscal Year 2021 - 22 Annual Budget
360
Appropriations
Detail
Water
Fund
Treatment
Division
Appropriations Detail Account # 043-3051-533
ACTUAL ACTUAL ADOPTED ADOPTED
2018-19 2019-20 2020-21 2021-22PERSONAL SERVICES
12xx Regular Salaries & Wages 367,503 378,625 388,897 397,696
1410 Overtime 13,851 13,084 15,000 15,000
1530 Bonuses/Incentives 1,383 1,383 0 0
1641 Vacation/Terms & Buyout 6,930 5,381 0 0
2110 FICA 28,493 29,268 28,236 28,749
221x Retirement 36,840 37,432 35,772 40,936
23xx Insurance 99,520 79,775 69,512 87,048
2410 Workers' Compensation 17,825 20,042 19,518 19,971
26xx Other Payroll Benefits 138,654 (88,586) 753 787
TOTAL PERSONAL SERVICES 710,999 476,404 557,688 590,187
OPERATING EXPENSES
31xx Professional Services 34,225 16,006 61,000 85,000
3410 Contract Services 62,387 47,698 98,900 86,500
4010 Travel 2,602 178 5,000 500
41xx Communication 3,357 3,871 4,000 4,500
4210 Postage 3,177 2,043 4,000 2,500
4310 Utilities 409,193 383,369 460,000 450,000
4415 Internal Fleet Lease 11,081 16,955 13,198 13,330
4510 Insurance 4,846 5,126 5,809 5,722
461x Repairs & Maintenance- Vehicles 96,374 87,672 92,588 86,369
4620 Repairs & Maintenance- Buildings 2,113 3,385 19,000 21,500
4625 Repairs & Maintenance- Non-Build 2,784 8,056 3,000 5,000
46xx Repairs & Maintenance- Equipment 120,369 2,429 3,250 3,150
4710 Printing & Binding 0 0 500 500
48xx Promotional Activites 12,006 0 0 0
4911 Advertising 0 0 200 200
4920 Other Current Charges 50 50 2,000 3,000
518x Minor Furniture & Equip 0 1,398 800 8,200
5210 Operating Supplies 9,303 16,734 12,000 14,000
5215 Uniforms 1,481 2,842 6,500 7,610
5230 Fuel Purchases 12,784 12,424 13,000 15,000
5231 Diesel Fuel 1,076 1,558 3,000 3,000
5280 Chemicals 59,989 59,614 67,000 69,000
5410 Publications & Memberships 1,103 2,040 1,000 2,200
5520 Training 3,631 1,665 5,000 5,000
TOTAL OPERATING EXPENSES 853,931 675,113 880,745 891,781
TOTAL APPROPRIATIONS 1,564,930 1,151,517 1,438,433 1,481,968

Fiscal Year 2021 - 22 Annual Budget
361
Appropriations
Summary
Water
Fund
Treatment
Division
Appropriations Summary
ADOPTED ADOPTED INCREASE/
2020-21 2021-22 (DECREASE) PERCENTAGE
Personal Services 557,688 590,187 32,499 5.83%
Operating Expenses 880,745 891,781 11,036 1.25%
TOTALS 1,438,433 1,481,968 43,535 3.03%

Fiscal Year 2021 - 22 Annual Budget
362
Appropriations
Detail
Water
Fund
Reuse
Division
Appropriations Detail Account # 043-3072-533
ACTUAL ACTUAL ADOPTED ADOPTED
2018-19 2019-20 2020-21 2021-22
PERSONAL SERVICES
1210 Regular Salaries & Wages 85,185 75,422 89,310 96,465
1410 Overtime 11,261 9,079 5,000 5,000
1530 Bonuses 1,061 1,477 0 0
1641 Vacation/ Terms & Buyout 1,900 7,474 0 0
2110 FICA 7,187 6,799 6,263 6,753
2210 Retirement 10,091 9,642 9,460 8,212
23xx Insurance 16,843 16,631 19,075 22,970
2410 Workers' Compensation 4,322 4,179 3,911 4,528
26xx Other Payroll Benefits 27,970 (16,420) 120 120
TOTAL PERSONAL SERVICES 165,820 114,283 133,139 144,048
OPERATING EXPENSES
3130 Engineering Services 0 21,550 0 0
3410 Contract Services 8,929 8,072 12,400 12,400
4010 Travel 0 0 800 800
4110 Communication 215 167 0 0
4310 Utilities 157,951 81,465 120,000 100,000
461x Repairs & Maintenance-Vehicles 9,709 7,363 6,000 7,700
4620 R & M Buildings 1,279 134 500 500
4625 Repairs & Maintenance- Non Bldg 27,174 0 300 300
4920 Other Current Charges 75 25 0 0
5180 Minor Furniture/Equipment 346 328 800 1,500
521x Operating Supplies 88,155 93,193 86,000 96,000
5215 Uniforms 190 450 1,300 1,525
5230 Fuel Purchases 0 543 1,000 1,000
5280 Chemicals 12,523 25,000 22,000 26,500
5410 Publications & Memberships 75 0 0 0
5520 Training 0 33 500 500
TOTAL OPERATING EXPENSES 306,621 238,323 251,600 248,725
TOTAL APPROPRIATIONS 472,441 352,606 384,739 392,773

Fiscal Year 2021 - 22 Annual Budget
363
Appropriations
Summary
Water
Fund
Reuse
Division
Appropriations Summary
ADOPTED ADOPTED INCREASE/
2020-21 2021-22 (DECREASE) PERCENTAGE
Personal Services 133,139 144,048 10,909 8.19%
Operating Expenses 251,600 248,725 (2,875) -1.14%
TOTALS 384,739 392,773 8,034 2.09%

Fiscal Year 2021 - 22 Annual Budget
364
Appropriations
Detail
Water
Fund
Distribution
Division
Appropriations Detail Account # 043-3081-533
ACTUAL ACTUAL ADOPTED ADOPTED
2018-19 2019-20 2020-21 2021-22
PERSONAL SERVICES
12xx Regular Salaries & Wages 409,539 445,745 486,377 518,024
1410 Overtime 35,406 53,837 45,000 45,000
15xx Bonuses/Incentives 42 1,373 0 0
1641 Vacation/ Terms & Buyout 1,366 136 0 0
2110 FICA 31,681 35,234 33,769 36,069
221x Retirement 44,434 39,140 39,682 60,472
23xx Insurance 149,681 120,188 149,115 149,564
2410 Workers' Compensation 20,385 22,714 23,144 25,181
26xx Employee Benefits 180,533 (111,604) 741 596
TOTAL PERSONAL SERVICES 873,067 606,763 777,828 834,906
OPERATING EXPENSES
3110 Professional Services 3,000 0 0 0
3130 Engineering Services 0 2,930 10,000 3,000
3410 Contract Services 98,217 76,979 99,500 99,500
3499 Inter Dept Contract Oblig 54,234 55,085 56,738 58,944
4010 Travel 856 3,504 4,950 4,950
4110 Communication 3,068 2,493 3,010 3,500
4210 Postage 22 0 250 50
4310 Utilities 10,852 8,324 12,000 10,000
4410 Rentals 0 106 0 0
4415 Internal Fleet Lease 28,571 37,336 26,546 28,507
4510 Insurance 6,119 6,930 6,227 6,408
461x Repairs & Maintenance- Vehicles 42,518 35,438 44,014 53,466
462x Repairs & Maintenance- Buildings 87 0 500 0
4625 Repairs & Maintenance- Non-Build 37,732 50,754 35,500 47,500
46xx Repairs & Maintenance- Equipment 2,250 2,630 2,630 2,270
4710 Printing & Binding 173 0 250 250
49xx Other Current Charges 404 1,256 3,750 4,750
5180 Minor Furniture & Equip 11,065 13,618 10,500 15,000
521x Operating Supplies 104,287 137,097 100,000 140,000
521x Meters 214,223 216,118 180,000 220,000
5215 Uniforms 3,716 4,086 5,850 9,135
522x Hydrants 22,682 19,187 17,500 5,000
5230 Fuel Purchases 23,887 20,343 25,000 25,000
5410 Publications & Memberships 455 598 555 598
5520 Training 3,153 670 8,050 13,250
TOTAL OPERATING EXPENSES 671,571 695,482 653,320 751,078
TOTAL APPROPRIATIONS 1,544,638 1,302,245 1,431,148 1,585,984

Fiscal Year 2021 - 22 Annual Budget
365
Appropriations
Summary
Water
Fund
Distribution
Division
Appropriations Summary
ADOPTED ADOPTED INCREASE/
2020-21 2021-22 (DECREASE) PERCENTAGE
Personal Services 777,828 834,906 57,078 7.34%
Operating Expenses 653,320 751,078 97,758 14.96%
TOTALS 1,431,148 1,585,984 154,836 10.82%
Significant Budget Changes:
The increase in Operating Expenses is related to increases in Operating Supplies (5210) and New Meters
(5212).

Fiscal Year 2021 - 22 Annual Budget
366
Appropriations
Detail
Water
Fund
Other
Appropriations Detail Account # 043-3088-5xx
ACTUAL ACTUAL ADOPTED ADOPTED
2018-19 2019-20 2020-21 2021-22
OPERATING EXPENSES
4950 Uncollectible Accounts 26,407 57,223 25,000 36,000
5001 Cost Allocation- City Commission 11,385 19,172 19,097 19,476
5002 Cost Allocation- City Manager 61,742 85,259 64,801 64,913
5003 Cost Allocation- City Clerk 21,641 25,298 22,870 24,654
5004 Cost Allocation- City Attorney 4,722 3,501 5,970 5,520
5005 Cost Allocation- Accounting 79,934 102,823 104,408 107,237
5006 Cost Allocation- Customer Service 318,655 353,753 333,624 344,833
5007 Cost Allocation- Purchasing 5,631 14,394 8,817 11,835
5008 Cost Allocation- Warehouse 24,494 20,067 22,664 9,788
5009 Cost Allocation- Human Resources 16,707 18,262 21,587 22,381
5010 Cost Allocation- IT 234,901 258,640 245,456 248,449
5011 Cost Allocation- GIS 98,571 109,533 111,942 119,272
5013 Cost Allocation- Facilities 13,234 12,685 12,047 12,893
5015 Cost Allocation- Planning & Zoning 76,225 75,281 77,230 84,908
5910 Depreciation Expense 1,393,334 1,649,642 1,400,000 1,650,000
TOTAL OPERATING EXPENSES 2,387,583 2,805,533 2,475,513 2,762,159
DEBT SERVICE
7110 Principal-Long Term Debt 0 0 886,879 923,659
721x Interest-Long Term Debt 776,154 742,868 705,650 666,819
7311 Fees 2,822 2,532 2,785 2,785
7320 Amortize Debt Discount/Premium (81,619) (81,619) (81,619) (81,619)
7330 Amortize Debt Issue Cost 24,761 24,761 24,761 24,761
TOTAL DEBT SERVICE 722,118 688,542 1,538,456 1,536,405
OTHER USES
9101 Transfer to General Fund 674,296 644,618 718,582 739,232
9102 Surcharge Transfer 344,430 359,963 357,980 368,924
9115 Transfer to Building Fund 3,540 6,880 0 0
9150 R&R Reserve 0 0 75,000 75,000
9160 Reserve/Future Capital 0 0 102,014 795,328
9960 Interest-Customer Deposit 12,617 7,346 0 0
TOTAL OTHER USES 1,034,883 1,018,807 1,253,576 1,978,484
TOTAL APPROPRIATIONS 4,144,584 4,512,882 5,267,545 6,277,048

Fiscal Year 2021 - 22 Annual Budget
367
Appropriations
Summary
Water
Fund
Other
Appropriations Summary
ADOPTED ADOPTED INCREASE/
2020-21 2021-22 (DECREASE) PERCENTAGE
Operating Expenses 2,475,513 2,762,159 286,646 11.58%
Debt Service 1,538,456 1,536,405 (2,051) -0.13%
Other Uses 1,253,576 1,978,484 724,908 57.83%
TOTALS 5,267,545 6,277,048 1,009,503 19.16%
Significant Budget Changes:
The change in Operating Expenses is related to Depreciation Expense (5910). Other Uses increased
due to an increase in the Reserve/Future Capital (9160).

Fiscal Year 2021 - 22 Annual Budget
368
Appropriations
Detail
Water
Fund
Capital
Projects
Appropriations Detail Account # 043-3099-533
ACTUAL ACTUAL ADOPTED ADOPTED
2018-19 2019-20 2020-21 2021-22
PERSONAL SERVICES
1210 Regular Salaries & Wages 202 0 0 0
2110 FICA 15 0 0 0
221x Retirement 10 0 0 0
23xx Insurance 25 0 0 0
2410 Workers' Compensation 8 0 0 0
26xx Other Payroll Benefits 37 0 0 0
TOTAL PERSONAL SERVICES 297 0 0 0
OPERATING EXPENSES
31xx Professional Services 18,073 17,513 0 1,175,000
4310 Utilities 135 0 0 0
5180 Minor Furniture/Equipment 1,544 276 0 0
5210 Operating Supplies 0 30 0 0
5299 Allocated Material Expense 0 3 0 0
TOTAL OPERATING EXPENSES 19,752 17,822 0 1,175,000
CAPITAL OUTLAY
6210 Buildings 395,965 6,727 0 0
6310 Improvements Other Than Bldgs 5,679,539 163,498 2,275,000 500,000
6410 Machinery & Equipment 76,893 385,635 0 355,000
TOTAL CAPITAL OUTLAY 6,152,397 555,860 2,275,000 855,000
OTHER USES
9999 WIP- Contra (6,172,446) (573,682) 0 0
TOTAL OTHER USES (6,172,446) (573,682) 0 0
TOTAL APPROPRIATIONS 0 0 2,275,000 2,030,000

Fiscal Year 2021 - 22 Annual Budget
369
Appropriations
Summary
Water
Fund
Capital
Projects
Appropriations Summary
ADOPTED ADOPTED INCREASE/
2020-21 2021-22 (DECREASE) PERCENTAGE
Personal Services 0 0 0 0.00%
Operating Expenses 0 1,175,000 1,175,000 100.00%
Capital Outlay 2,275,000 855,000 (1,420,000) -62.42%
TOTALS 2,275,000 2,030,000 (245,000) -10.77%

Fiscal Year 2021 - 22 Annual Budget
370
Water
Fund
Project
Schedule
Project Schedule
WF/Job Title Funding Source Amount
430002 Mains ($1,625,000)
US Hwy 27 South St. to Citizens Blvd Renewal & Replacement 125,000
Carver Heights- Thomas to Hwy 27 Renewal & Replacement 500,000
Replace 10" Main on Hwy 27 Renewal & Replacement 500,000
Stock Subdivision Renewal & Replacement 500,000
430006 Plant & Storage ($405,000)
Storage Tank Highland Lakes Renewal & Replacement 50,000
Well Rehabilitation Renewal & Replacement 75,000
Elevated Tank Inspection & Rehab Renewal & Replacement 75,000
Water Treatment Facility Replacements Renewal & Replacement 100,000
Fire Protection Hydrant Replacement Renewal & Replacement 25,000
MOV Turnpike reuse/reject valve Renewal & Replacement 80,000
TOTAL 2,030,000
Source of Funds
Renewal & Replacement 2,030,000
TOTAL 2,030,000

Fiscal Year 2021 - 22 Annual Budget
371
Organization
Total
Budget
Wastewater
Fund
$ 15,850,657
Cliff Kelsey, Director of Public Works
The Wastewater Fund is responsible for providing the proper conveyance, treatment, and disposal of reclamation of wastewater within the City’s service area, and meeting all regulatory agency requirements and protecting the environment from untreated waste streams.
Responsibilities: Treatment Plant Collection ·Maintain Proper Treatment ·Install new wastewater ·Preventive maintenance conveyance lines ·Monitor/operate/maintain ·Repair/replace lift stations reclamation sites ·Repair/replace force main collection system ·Repair/replace maintain gravity collection system Organizational Chart
Director of Public Works
Ex. Admin. Aide II
Maintenance
Supervisor
Network Tech I
Lift Station Tech B
Lift Station Tech
C
Sprayfield
Maintenance
Worker II
Operations Supervisor
Crew Leader
Wastewater
Collection Tech A
Wastewater
Collection Tech B
Utility Inspector
Plant Manager
Chief Plant
Operator
Lead Plant
Operator
Turnpike Plant
WWT/WA Dual C
Wastewater Operator C
IWM Technician
Wastewater Operator C
Canal Street
Plant
Deputy Director
WWT/WA Dual C Operator
WWT/WA Dual Operator A/B
Crew Leader
Heavy Equipment
Operator
IPP Inspector
Plant Technician
B
WWT Operator Apprentice
Plant TechnicianApprentice
Lift Station Tech Apprentice
Wastewater Collection Tech C
Wastewater
Collection Apprentice

Fiscal Year 2021 - 22 Annual Budget
372
Wastewater
Fund
Wastewater
System
Description
Wastewater System Description
The wastewater collection system consists of 180 lift stations, 90 miles of force mains, and
180 miles of gravity sewer lines. The system consists of primarily gravity sewer lines and
force mains that range from 4 to 24 inches in diameter based on flow requirements. The
City has two Florida Department of Environmental Protection (FDEP) permitted wastewater
treatment plants: the Canal Street Plant, which is rated at 3.5 million gallons per day
(mgd), and the Turnpike Plant, rated at 3.0 mgd. The Turnpike facility is in the process of a
substantial upgrade to increase the daily capacity to 4.5 mgd. This upgrade is scheduled
to be completed during the 3rd quarter of 2022. The wastewater system is in compliance
with all State and Federal regulations. The City treats its wastewater influent to an
advanced secondary standard (unrestricted public access reuse quality) and provides
reuse water for irrigation to several areas of the City, Lake and Sumter counties. In 2019,
the City transitioned from land application of stabilized liquid biosolids to disposal of
dewatered biosolids via belt filter press constructed at both wastewater facilities. As the
City continues to expand the Turnpike WWTF, it provides the City the opportunity to
provide regional support of development in west Lake County. Based on projected growth,
the Turnpike and Canal Street Wastewater Treatment Facilities will have the capacity to
aide in this growth and through the year 2030.

Fiscal Year 2021 - 22 Annual Budget
373
Wastewater
Fund
Budget
Summary-
Operating
Statement
Budget Summary - Operating Statement
ACTUAL ACTUAL ADOPTED ADOPTED
2018-19 2019-20 2020-21 2021-22
OPERATING REVENUE
Charges for Services 11,804,816 12,174,656 12,423,435 12,687,901
Other Operating Revenue 4,921,880 2,357,432 2,528,878 1,332,756
TOTAL REVENUE SOURCES 16,726,696 14,532,088 14,952,313 14,020,657
OPERATING APPROPRIATIONS
Administration 339,837 422,566 417,659 453,720
Canal Street Treatment Plant 1,104,435 1,043,538 1,164,432 1,324,266
Turnpike Treatment 881,191 935,376 963,848 1,071,345
Laboratory 153,530 186,249 202,758 220,076
Sprayfield 68,536 0 0 0
Collections 950,165 966,534 1,139,390 1,197,002
Lift Stations 1,324,099 1,439,353 1,537,029 1,590,148
Other Operating Expenses 3,443,708 4,112,114 5,607,977 5,886,919
TOTAL APPROPRIATIONS (8,265,501) (9,105,730) (11,033,093) (11,743,476)
NET INCOME FROM OPERATIONS 8,461,195 5,426,358 3,919,220 2,277,181
Non-Operating Revenue 0 0 0 0
Non-Operating Appropriations (57) (30) 0 0
NET OTHER INCOME (57) (30) 0 0
NET INCOME BEFORE TRANSFERS 8,461,138 5,426,328 3,919,220 2,277,181
Transfers to other funds (892,498) (903,992) (955,243) (987,324)
NET INCOME AFTER TRANSFERS 7,568,640 4,522,336 2,963,977 1,289,857
Other Sources 705,086 638,022 1,922,000 1,830,000
Capital Projects 0 (1) (2,992,000) (1,755,000)
NET OTHER SOURCES 705,086 638,021 (1,070,000) 75,000
UNAPPROPRIATED BALANCE 8,273,726 5,160,357 1,893,977 1,364,857

Fiscal Year 2021 - 22 Annual Budget
374
Wastewater
Fund
Revenue
Detail
Revenue Detail
ACTUAL ACTUAL ADOPTED ADOPTED
2018-19 2019-20 2020-21 2021-22
LICENSES & PERMITS
32421 Impact Fees - Residential 516,972 907,504 738,800 953,445
32422 Impact Fees - Commercial 21,302 110,765 75,514 116,372
TOTAL LICENSES & PERMITS 538,274 1,018,269 814,314 1,069,817
INTERGOVERNMENTAL REVENUE
33191 Emergency Management 0 2,257 0 0
33738 St Johns River Water Mgmt Dist. 0 0 1,400,000 0
TOTAL INTERGOVERNMENTAL 0 2,257 1,400,000 0
CHARGES FOR SERVICES
34351 Residential 7,938,889 8,185,117 8,173,368 8,397,930
34352 Commercial Class 1 752,788 716,662 780,038 735,295
34352 Commercial Class 2 148,618 145,022 154,178 148,793
34352 Commercial Class 3 965,798 986,232 1,096,306 1,011,874
34352 Commercial Class 4 68,948 70,203 73,080 72,028
34352 Industrial 16,904 16,816 17,400 17,253
34353 Misc Bill - Combined Rate 1,310,524 1,315,878 1,339,584 1,350,091
34354 Multi-Family 197,200 195,349 211,904 200,428
34356 Bulk Use Charge- SSUC 149,120 295,610 298,384 500,000
34356 Municipal 29,917 40,680 37,758 41,738
34905 Penalties 88,624 45,525 96,315 46,709
34911 Oil & Grease Management 73,627 74,871 76,315 76,817
34918 Misc Service Revenue 63,859 86,691 68,805 88,945
TOTAL CHARGES FOR SERVICES 11,804,816 12,174,656 12,423,435 12,687,901
MISCELLANEOUS REVENUE
36110 Interest on Investments 405,914 496,676 312,500 260,000
36130 Gain/Loss Investments 206,514 230,031 0 0
36402 Gain From Sale of Fixed Assets 3,724,213 609,591 0 0
36404 Recovery From Losses 45,382 1,090 0 1,118
36501 Sale of Surplus Materials 1,548 1,087 0 1,115
36925 Misc Jobbing Revenue 0 0 0 0
36990 Misc Non-Operating Revenue 35 688 2,064 706
TOTAL MISCELLANEOUS 4,383,606 1,339,163 314,564 262,939
OTHER SOURCES
38950 Contributions - Cust/Dev 205,086 638,022 0 0
38962 Appropriated Renewal & Replacement 0 0 1,922,000 1,830,000
38980 Private Sources- Villages Sale & Capacity 500,000 0 0 0
TOTAL OTHER SOURCES 705,086 638,022 1,922,000 1,830,000
TOTAL RESOURCES 17,431,782 15,172,367 16,874,313 15,850,657

Fiscal Year 2021 - 22 Annual Budget
375
Wastewater
Fund
Division
Summary of
Appropriations
Division Summary of Appropriations
ACTUAL ACTUAL ADOPTED ADOPTED 2018-19 2019-20 2020-21 2021-22
4021 ADMINISTRATION Personal Services 241,423 273,273 285,403 296,687
Operating Expenses 98,414 149,293 132,256 157,033
TOTAL ADMINISTRATION 339,837 422,566 417,659 453,720
4051 CANAL ST. TREATMENTPersonal Services 412,768 383,852 475,942 495,672Operating Expenses 691,667 659,686 688,490 828,594
TOTAL CANAL ST. PLANT 1,104,435 1,043,538 1,164,432 1,324,266
4052 TURNPIKE TREATMENT Personal Services 319,919 317,417 378,390 376,315Operating Expenses 561,272 617,959 585,458 695,030
TOTAL TURNPIKE PLANT 881,191 935,376 963,848 1,071,345
4061 LABORATORYPersonal Services 97,360 118,188 121,436 127,371Operating Expenses 56,170 68,061 81,322 92,705
TOTAL LABORATORY 153,530 186,249 202,758 220,076
4071 SPRAYFIELDPersonal Services 36,423 0 0 0Operating Expenses 32,113 0 0 0
TOTAL SPRAYFIELD 68,536 0 0 0
4081 COLLECTIONSPersonal Services 523,595 501,043 650,150 670,812Operating Expenses 426,570 465,491 489,240 526,190
TOTAL COLLECTIONS 950,165 966,534 1,139,390 1,197,002
4082 LIFT STATIONSPersonal Services 664,232 640,848 713,012 711,710Operating Expenses 659,867 798,505 824,017 878,438
TOTAL LIFT STATIONS 1,324,099 1,439,353 1,537,029 1,590,148
4088 OTHERPersonal Services 0 1,375 0 0Operating Expenses 2,806,624 3,453,528 2,933,911 3,232,709Debt Service 637,084 658,586 2,599,066 2,579,210Other Uses 892,555 970,545 2,924,220 2,427,181
TOTAL OTHER 4,336,263 5,084,034 8,457,197 8,239,100
4099 CAPITAL PROJECTSPersonal Services 1,174 0 0 0Operating Expenses 221,731 805,974 0 250,000Capital Outlay 3,315,486 769,739 2,992,000 1,505,000Other Uses (3,538,391) (1,575,712) 0 0
TOTAL CAPITAL PROJECTS 0 1 2,992,000 1,755,000
GRAND TOTALPersonal Services 2,296,894 2,235,996 2,624,333 2,678,567Operating Expenses 5,554,428 7,018,497 5,734,694 6,660,699Capital Outlay 3,315,486 769,739 2,992,000 1,505,000Debt Service 637,084 658,586 2,599,066 2,579,210Other Uses (2,645,836) (605,167) 2,924,220 2,427,181
TOTAL APPROPRIATIONS 9,158,056 10,077,651 16,874,313 15,850,657

Fiscal Year 2021 - 22 Annual Budget
376
Wastewater
Fund
Goals & Tasks
Goals & Tasks
Goal: Lead the industry in providing high quality, low cost, customer driven utility services.
Task:
Expand the system to satisfy growth projections
Develop a program to reduce system inflow and infiltration
Reduce sewer overflows using aggressive root control programs
Expand Turnpike Water Reclamation Facilities (WRF) treatment capacity from 3.0 to 4.5 million
gallons per day (MGD)
Continue manhole rehabilitation program
Improve supervisory control and data acquisition (SCADA) monitoring reliability
Promote Industrial Pretreatment Program (IPP) awareness
Major Accomplishments:
Rehabilitated lift stations 17 & 35
Installed belt filter press for biosolids dewatering at treatment plant
Deactivated the North spray site and land application site
Began accepting wastewater from the Villages and returning reuse water to the Villages
Smoke tested 173,105 linear feet of lines and identified/repaired 140 faults
Installed 6 emergency generators at high flow lift stations using Federal Emergency Management
Agency (FEMA) grant funding
Installed odor control at lift station 106T
Replaced 17 controllers for SCADA
Performance Measures:
2019-20 2020-21 2021-22
Install/repair clean-outs 157 137 140
IPP customers passing monthly compliance
inspections
100% 100% 100%
Minor (<1,000 gallons) spills/discharges 5 36 5
Major (>1,000 gallons) spills/discharges
5 0 0

Fiscal Year 2021 - 22 Annual Budget
377
Wastewater
Fund
Personnel
Schedule
Personnel Schedule
Continued to next page
Classification 2021 Change 2022 Amount
Administration 4021
Admin. Services Coordinator1 0.50 0.00 0.50 29,879
Deputy Director of Public Works 2 & 3 0.95 0.00 0.95 86,460
Director of Public Works 4 0.25 0.00 0.25 29,177
Executive Admin. II 1.00 0.00 1.00 46,134
Project Manager I 5 0.25 0.00 0.25 14,108
Total Administration 2.95 0.00 2.95 205,758
Canal Street 4051
Chief Plant Operator 6 0.50 0.00 0.50 30,503
Heavy Equipment Operator 7 0.50 0.00 0.50 17,025
Lead Plant Operator 1.00 0.00 1.00 48,734
Plant Manager 8 0.25 0.00 0.25 23,728
Plant Technician A 1.00 0.00 1.00 42,162
Wastewater Operator C 2.00 0.00 2.00 73,860
WWT/WA Dual Oper C 2.00 0.00 2.00 74,194
Standby 2,394
Total Canal Street 7.25 0.00 7.25 312,600
Turnpike 4052
Chief Plant Operator 6 0.50 0.00 0.50 30,503
Heavy Equipment Operator 7 1.50 0.00 1.50 47,601
Plant Manager 8 0.25 0.00 0.25 23,728
Plant Technician Apprentice 1.00 0.00 1.00 28,309
WWT/WA Dual Operator B/C 1.00 (1.00) 0.00 0
WWT/WA Dual Operator C 1.00 0.00 1.00 38,230
Wastewater Oper Apprentice 0.00 1.00 1.00 29,432
Wastewater Oper C 1.00 0.00 1.00 36,150
Standby 1,256
Total Turnpike 6.25 0.00 6.25 235,209
Laboratory 4061
Industrial Waste Monitoring Technician 1.00 0.00 1.00 42,973
Industrial Pretreatment Inspector 1.00 0.00 1.00 45,760
Total Laboratory 2.00 0.00 2.00 88,733

Fiscal Year 2021 - 22 Annual Budget
378
Wastewater
Fund
Personnel
Schedule
Personnel Schedule
(Continued)
Classification 2021 Change 2022 Amount
Collections 4081
Crew Leader 9 0.67 0.00 0.67 33,614
Operations Supervisor 10 0.67 0.00 0.67 40,832
Utility Inspector 11 1.50 0.00 1.50 51,408
Wastewater Collection Tech Apprentice 3.00 0.00 3.00 84,927
Wastewater Collection Tech A 1.00 0.00 1.00 42,598
Wastewater Collection Tech B 2.00 0.00 2.00 71,428
Wastewater Collection Tech C 3.00 0.00 3.00 99,090
Standby 3,650
Total Collections 11.84 0.00 11.84 427,547
Lift Stations 4082
Crew Leader 1.00 0.00 1.00 45,198
Lift Station Tech Apprentice 2.00 (1.00) 1.00 28,309
Lift Station Tech A 2.00 0.00 2.00 80,204
Lift Station Tech B 2.00 0.00 2.00 87,485
Lift Station Tech C 2.00 1.00 3.00 99,093
Maintenance Supervisor 1.00 0.00 1.00 72,197
Network Technician I 1.00 0.00 1.00 39,270
Standby 3,560
Total Lift Stations 11.00 0.00 11.00 455,316
Total 41.29 0.00 41.29 1,725,162
Note: Allocations
Crew Leader 9 67%-4081, 33%-5171
Operations Supervisor 10
67%-4081, 33%-5171
Utility Inspector 11
50%-3081, 50%-4081
Admin. Service Coordinator 1 50%-3021, 50%-4021
Deputy Director of Public Works 2 45%-3021, 45%-4021, 10%-5197
Project Manager I 5 25%-3021, 25%-4021, 50%-5197
Plant Manager 8 50%-3051, 25%-4051, 25%-4052
Chief Plant Operator 6
50%-4051, 50%-4052
Heavy Equipment Operator 7 50%-4051, 50%-4052
Deputy Director of Public Works 3 50%-3021, 50%-4021
Director of Public Works 4 25%-5197, 25%-3021, 25%-4021, 15%-5171, 5%-5143, 5%-5144
This page intentionally left blank
Fiscal Year 2021 - 22 Annual Budget
379

Fiscal Year 2021 - 22 Annual Budget
380
Appropriations
Detail
Wastewater
Fund
Administration
Division
Appropriations Detail Account # 044-4021-535
ACTUAL ACTUAL ADOPTED ADOPTED
2018-19 2019-20 2020-21 2021-22PERSONAL SERVICES
121x Regular Salaries & Wages 160,329 183,704 193,648 205,758
1310 Temporary Labor 960 0 0 0
1410 Overtime 298 380 250 300
1530 Bonuses/Incentives 312 0 0 0
1641 Vacation/Terms & Buyout 0 15,079 0 0
2110 FICA 11,956 14,678 13,579 15,055
221x Retirement 13,318 9,137 10,017 10,288
23xx Insurance 57,317 54,415 63,566 63,708
2410 Workers' Compensation 758 892 2,102 938
26xx Other Payroll Benefits (3,825) (5,012) 2,241 640
TOTAL PERSONAL SERVICES 241,423 273,273 285,403 296,687
OPERATING EXPENSES
31xx Professional Services 6,471 45,293 20,000 45,000
4010 Travel 247 0 50 0
41xx Communication 529 1,007 550 0
4210 Postage 8 1 20 0
4510 Insurance 85,200 97,132 104,731 107,593463x Repairs & Maintenance- Equipment 4,400 4,600 4,860 4,440
4710 Printing & Binding 39 0 100 0
4810 Promotional Activites 0 0 150 0
4911 Advertising 267 0 70 0
5180 Minor Furniture & Equip 75 0 0 0
5210 Operating Supplies 463 519 400 0
5215 Uniforms 156 105 325 0
5410 Publications & Memberships 210 20 500 0
5520 Training 349 99 500 0
5540 Education Reimbursement 0 517 0 0
TOTAL OPERATING EXPENSES 98,414 149,293 132,256 157,033
TOTAL APPROPRIATIONS 339,837 422,566 417,659 453,720

Fiscal Year 2021 - 22 Annual Budget
381
Appropriations
Summary
Wastewater
Fund
Administration
Division
Appropriations Summary
ADOPTED ADOPTED INCREASE/
2020-21 2021-22 (DECREASE) PERCENTAGE
Personal Services 285,403 296,687 11,284 3.95%
Operating Expenses 132,256 157,033 24,777 18.73%
TOTALS 417,659 453,720 36,061 8.63%
Significant Budget Changes:
The change in Operating Expenses is attributable to increased Professional Services (3110) for a Flow
Modeling Study.

Fiscal Year 2021 - 22 Annual Budget
382
Appropriations
Detail
Wastewater
Fund
Canal Street
Treatment
Plant Division
Appropriations Detail Account # 044-4051-535
ACTUAL ACTUAL ADOPTED ADOPTED
2018-19 2019-20 2020-21 2021-22
PERSONAL SERVICES
12xx Regular Salaries & Wages 261,479 260,547 304,249 312,600
1410 Overtime 20,933 17,065 13,000 15,000
15xx Bonuses/Incentives 692 692 0 0
1641 Vacation/Terms & Buyout 1,423 1,134 0 0
2110 FICA 19,853 19,467 21,159 21,742
221x Retirement 33,972 34,680 34,267 39,838
23xx Insurance 79,569 77,773 89,213 91,947
2410 Workers' Compensation 12,108 12,293 13,493 13,866
26xx Other Payroll Benefits (17,261) (39,799) 561 679
TOTAL PERSONAL SERVICES 412,768 383,852 475,942 495,672
OPERATING EXPENSES
3110 Professional Services 3,997 2,130 20,000 20,000
3130 Engineering Services 0 52,062 0 0
3410 Contract Services 57,016 50,457 45,635 93,383
4010 Travel 3,468 2,004 5,000 4,800
41xx Communication 1,440 1,642 1,800 1,800
4210 Postage 769 1,195 600 600
4310 Utilities 311,375 275,407 310,000 310,000
4410 Rentals 0 31 1,000 1,000
4415 Internal Fleet Lease 16,857 22,700 18,180 19,803
4510 Insurance 6,174 6,356 6,840 6,513
461x Repairs & Maintenance- Vehicles 123,389 98,837 89,509 147,326
4620 Repairs & Maintenance- Buildings 1,544 10,678 3,000 5,000
4625 Repairs & Maintenance- Non-Build 659 3,917 2,000 4,000
46xx Repairs & Maintenance- Equipment 4,783 4,244 6,100 4,600
4710 Printing & Binding 0 0 150 150
4810 Promotional Activities 180 0 250 250
4911 Advertising 0 0 200 200
4920 Other Current Charges 50 85 100 100
5180 Minor Furniture & Equip 11,215 15,110 8,000 8,000
5210 Operating Supplies 8,455 12,210 15,000 14,500
5215 Uniforms 1,876 2,440 5,526 7,469
5230 Fuel Purchases 11,109 12,657 17,000 25,000
5280 Chemicals 126,019 83,768 125,000 150,000
5410 Publications & Memberships 694 128 3,800 300
5520 Training 598 1,628 3,800 3,800
TOTAL OPERATING EXPENSES 691,667 659,686 688,490 828,594
TOTAL APPROPRIATIONS 1,104,435 1,043,538 1,164,432 1,324,266

Fiscal Year 2021 - 22 Annual Budget
383
Appropriations
Summary
Wastewater
Fund
Canal Street
Treatment
Plant Division
Appropriations Summary
ADOPTED ADOPTED INCREASE/
2020-21 2021-22 (DECREASE) PERCENTAGE
Personal Services 475,942 495,672 19,730 4.15%
Operating Expenses 688,490 828,594 140,104 20.35%
TOTALS 1,164,432 1,324,266 159,834 13.73%
Significant Budget Changes:
The increase in Operating Expenses is related to Contract Services (3410) for increased slude hauling,
R&M Machinery & Equip (461x) for more aggressive equipment change outs at the Canal Plant and
increased Fuel Purchases budget (5230).

Fiscal Year 2021 - 22 Annual Budget
384
Appropriations
Detail
Wastewater
Fund
Turnpike
Treatment
Plant Division
Appropriations Detail Account # 044-4052-535
ACTUAL ACTUAL ADOPTED ADOPTED
2018-19 2019-20 2020-21 2021-22
PERSONAL SERVICES
12xx Regular Salaries & Wages 190,508 206,913 237,903 235,209
1410 Overtime 11,605 15,856 15,000 15,000
15xx Bonuses/Incentives 692 692 0 0
1641 Vacation/Terms & Buyouts 16,114 1,827 0 0
2110 FICA 15,341 16,028 16,884 16,653
221x Retirement 23,697 24,117 24,190 17,616
23xx Insurance 65,993 74,784 73,049 81,085
2410 Workers' Compensation 10,429 10,072 10,833 10,458
26xx Other Payroll Benefits (14,460) (32,872) 531 294
TOTAL PERSONAL SERVICES 319,919 317,417 378,390 376,315
OPERATING EXPENSES
31xx Professional Services 32,058 55,687 20,000 20,000
3410 Contract Services 94,383 43,721 41,555 78,383
4010 Travel 853 1,000 4,000 4,000
41xx Communication 1,008 1,521 950 1,500
4210 Postage 58 115 500 200
4310 Utilities 271,737 288,194 300,000 325,000
4415 Internal Fleet Lease 10,231 23,825 19,250 18,933
4510 Insurance 1,559 3,536 3,543 4,052
461x Repairs & Maintenance- Vehicles 58,544 95,289 53,024 61,412
4620 Repairs & Maintenance- Buildings 905 1,122 1,000 4,000
4625 Repairs & Maintenance- Non-Build 661 2,900 3,000 15,000
46xx Repairs & Maintenance- Equipment 1,658 1,725 3,360 3,860
4710 Printing & Binding 198 0 200 200
4810 Promotional Activities 0 0 200 200
4911 Advertising-Other Ads 0 0 500 300
4920 Other Current Charges 1,025 1,025 3,000 1,500
5180 Minor Furniture & Equip 3,515 8,580 20,500 6,000
5210 Operating Supplies 8,904 7,696 8,000 9,000
5215 Uniforms 1,344 1,937 3,576 4,190
5230 Fuel Purchases 18,665 17,559 20,500 21,000
5280 Chemicals 52,934 60,293 73,000 112,500
5410 Publications & Memberships 747 713 800 800
5520 Training 285 1,521 5,000 3,000
TOTAL OPERATING EXPENSES 561,272 617,959 585,458 695,030
TOTAL APPROPRIATIONS 881,191 935,376 963,848 1,071,345

Fiscal Year 2021 - 22 Annual Budget
385
Appropriations
Summary
Wastewater
Fund
Turnpike
Treatment
Plant Division
Appropriations Summary
ADOPTED ADOPTED INCREASE/
2020-21 2021-22 (DECREASE) PERCENTAGE
Personal Services 378,390 376,315 (2,075) -0.55%
Operating Expenses 585,458 695,030 109,572 18.72%
TOTALS 963,848 1,071,345 107,497 11.15%
Significant Budget Changes:
Utilities (4310), R&M Non-Buildings (4625) for sprayheads for sprayfields and Chemicals (5280).
The change in Operating Expenses is related to increases in Contract Services (3410) for sludge hauling,

Fiscal Year 2021 - 22 Annual Budget
386
Appropriations
Detail
Wastewater
Fund
Laboratory
Division
Appropriations Detail Account # 044-4061-535
ACTUAL ACTUAL ADOPTED ADOPTED
2018-19 2019-20 2020-21 2021-22
PERSONAL SERVICES
1210 Regular Salaries & Wages 62,691 91,441 86,154 88,733
1410 Overtime 1,113 1,511 1,500 1,500
1641 Vacation/Terms & Buyouts 6,300 0 0 0
2110 FICA 5,033 6,776 6,239 6,491
221x Retirement 7,944 8,717 8,359 10,689
23xx Insurance 16,514 16,665 15,117 15,563
2410 Workers' Compensation 3,376 3,748 3,851 3,966
26xx Other Payroll Benefits (5,611) (10,670) 216 429
TOTAL PERSONAL SERVICES 97,360 118,188 121,436 127,371
OPERATING EXPENSES
3110 Professional Services 0 1,530 0 0
3410 Contract Services 38,863 44,558 52,000 60,000
4010 Travel 0 0 500 500
41xx Communication 174 552 450 920
4210 Postage 2,564 1,307 1,700 2,700
4415 Internal Fleet Lease 3,356 4,519 3,423 3,217
4510 Insurance 0 478 519 557
46xx Repairs & Maintenance- Vehicles 3,288 8,138 9,230 8,951
462x Repairs & Maintenance- Buildings 475 0 500 500
4631 Repairs & Maintenance- Equipment 830 539 770 1,005
4710 Printing & Binding 209 210 220 220
4911 Advertising 0 0 200 200
4920 Other Current Charges 0 0 2,000 2,000
518x Minor Furniture & Equip 470 0 2,000 3,500
5210 Operating Supplies 2,391 3,059 2,600 2,600
5215 Uniforms 519 499 1,300 1,525
5230 Fuel Purchases 2,206 2,587 3,100 3,500
5410 Publications & Memberships 825 0 460 460
5520 Training 0 85 350 350
TOTAL OPERATING EXPENSES 56,170 68,061 81,322 92,705
TOTAL APPROPRIATIONS 153,530 186,249 202,758 220,076

Fiscal Year 2021 - 22 Annual Budget
387
Appropriations
Summary
Wastewater
Fund
Laboratory
Division
Appropriations Summary
ADOPTED ADOPTED INCREASE/
2020-21 2021-22 (DECREASE) PERCENTAGE
Personal Services 121,436 127,371 5,935 4.89%
Operating Expenses 81,322 92,705 11,383 14.00%
TOTALS 202,758 220,076 17,318 8.54%
Significant Budget Changes:
The increase in Operating Expenses is related to Contract Services (3410).

Fiscal Year 2021 - 22 Annual Budget
388
Appropriations
Detail
Wastewater
Fund
Sprayfield
Division
Appropriations Detail Account # 044-4071-535
ACTUAL ACTUAL ADOPTED ADOPTED
2018-19 2019-20 2020-21 2021-22
PERSONAL SERVICES
12xx Regular Salaries & Wages 19,454 0 0 0
1410 Overtime 402 0 0 0
2110 FICA 1,423 0 0 0
221x Retirement 997 0 0 0
23xx Insurance 13,011 0 0 0
2410 Workers' Compensation 901 0 0 0
26xx Employee Benefits 235 0 0 0
TOTAL PERSONAL SERVICES 36,423 0 0 0
OPERATING EXPENSES
3410 Contract Services 0 0 0 0
41xx Communication 270 0 0 0
4310 Utilities 2,935 0 0 0
4415 Internal Fleet Lease 6,975 0 0 0
4510 Insurance 2,040 0 0 0
461x Repairs & Maintenance- Vehicles 10,534 0 0 0
4620 Repairs & Maintenance- Buildings 0 0 0 0
4625 Repairs & Maintenance- Non-Build 24 0 0 0
46xx Repairs & Maintenance- Equipment 0 0 0 0
5180 Minor Furniture/Equipment 1,661 0 0 0
5210 Operating Supplies 1,008 0 0 0
5215 Uniforms 148 0 0 0
5230 Fuel Purchases 6,518 0 0 0
5520 Training 0 0 0 0
TOTAL OPERATING EXPENSES 32,113 0 0 0
TOTAL APPROPRIATIONS 68,536 0 0 0

Fiscal Year 2021 - 22 Annual Budget
389
Appropriations
Summary
Wastewater
Fund
Sprayfield
Division
Appropriations Summary
ADOPTED ADOPTED INCREASE/
2020-21 2021-22 (DECREASE) PERCENTAGE
Personal Services 0 0 0 0.00%
Operating Expenses 0 0 0 0.00%
TOTALS 0 0 0 0.00%
Significant Budget Changes:
This division was eliminated in FY 20. The expenses were redistributed to other divisions.

Fiscal Year 2021 - 22 Annual Budget
390
Appropriations
Detail
Wastewater
Fund
Collection
Division
Appropriations Detail Account # 044-4081-535
ACTUAL ACTUAL ADOPTED ADOPTED
2018-19 2019-20 2020-21 2021-22
PERSONAL SERVICES
12xx Regular Salaries & Wages 354,905 360,643 415,184 427,547
1410 Overtime 23,776 16,732 25,000 25,000
1641 Vacation/Terms & Buyouts 6,723 0 0 0
2110 FICA 27,609 26,483 29,420 29,923
221x Retirement 38,119 38,868 39,285 44,747
23xx Insurance 88,199 96,985 120,695 122,210
2410 Workers' Compensation 17,010 16,600 18,735 19,758
26xx Other Payroll Benefits (32,746) (55,268) 1,831 1,627
TOTAL PERSONAL SERVICES 523,595 501,043 650,150 670,812
OPERATING EXPENSES
31xx Professional Services 3,038 7,628 7,500 5,000
3410 Contract Services 96,935 100,426 103,000 113,300
3499 Inter Dept Contract Oblig 52,907 59,756 55,142 62,401
4010 Travel 1,865 0 4,000 2,000
41xx Communication 2,904 4,127 4,500 4,200
4210 Postage 22 0 200 250
4410 Rentals 2,913 99 4,000 4,000
4415 Internal Fleet Lease 53,179 92,740 70,150 69,677
4510 Insurance 5,303 6,213 6,227 6,966
461x Repairs & Maintenance- Vehicles 36,306 53,173 44,561 53,305
4620 Repairs & Maintenance- Buildings 306 217 1,500 1,500
462x Repairs & Maintenance- Non-Build 83,228 74,910 120,000 125,000
46xx Repairs & Maintenance- Equipment 1,955 1,707 2,460 2,720
4710 Printing & Binding 39 0 40 40
4911 Advertising 0 0 100 100
4920 Other Current Charges 433 0 450 450
4945 Injury/ Damage to Others 25,174 16,753 5,000 5,000
5180 Minor Furniture & Equip 4,698 8,762 6,000 6,000
5210 Operating Supplies 14,084 13,756 12,000 15,000
5215 Uniforms 4,097 3,694 4,500 8,371
5230 Fuel Purchases 23,591 20,501 25,000 25,000
5280 Chemicals 11,481 135 5,000 5,000
5410 Publications & Memberships 30 72 330 330
5520 Training 2,082 822 7,580 10,580
TOTAL OPERATING EXPENSES 426,570 465,491 489,240 526,190
TOTAL APPROPRIATIONS 950,165 966,534 1,139,390 1,197,002

Fiscal Year 2021 - 22 Annual Budget
391
Appropriations
Summary
Wastewater
Fund
Collection
Division
Appropriations Summary
ADOPTED ADOPTED INCREASE/
2020-21 2021-22 (DECREASE) PERCENTAGE
Personal Services 650,150 670,812 20,662 3.18%
Operating Expenses 489,240 526,190 36,950 7.55%
TOTALS 1,139,390 1,197,002 57,612 5.06%

Fiscal Year 2021 - 22 Annual Budget
392
Appropriations
Detail
Wastewater
Fund
Lift Station
Division
Appropriations Detail Account # 044-4082-535
ACTUAL ACTUAL ADOPTED ADOPTED
2018-19 2019-20 2020-21 2021-22
PERSONAL SERVICES
1210 Regular Salaries & Wages 410,523 420,671 438,807 455,316
1410 Overtime 58,578 58,254 45,000 45,000
1641 Vacation/Terms & Buyouts 13,505 9,633 0 0
2110 FICA 34,085 34,543 30,620 31,536
221x Retirement 54,745 56,192 53,054 44,465
23xx Insurance 104,329 110,943 126,639 115,622
2410 Workers' Compensation 19,301 19,418 17,854 18,548
26xx Other Payroll Benefits (30,834) (68,806) 1,038 1,223
TOTAL PERSONAL SERVICES 664,232 640,848 713,012 711,710
OPERATING EXPENSES
3410 Contract Services 51,716 99,228 102,000 102,000
4010 Travel 645 2,326 3,990 3,300
41xx Communication 4,186 5,277 8,540 8,800
4210 Postage 147 73 500 500
4310 Utilities 262,241 267,377 250,000 280,000
4410 Rentals 304 0 300 0
4415 Internal Fleet Lease 37,480 55,200 43,580 42,414
4510 Insurance 3,467 3,823 4,670 5,294
461x Repairs & Maintenance- Vehicles 216,081 168,305 171,682 172,639
4620 Repairs & Maintenance- Buildings 523 5,630 4,640 6,500
4625 Repairs & Maintenance- Non-Build 10,170 19,900 30,000 40,000
46xx Repairs & Maintenance- Equipment 2,076 1,980 2,280 3,160
4710 Printing & Binding 0 60 1,500 500
4911 Advertising- Other Ads 244 0 300 300
4920 Other Current Charges 124 0 200 700
4945 Injury/Damage to Others 0 2,728 5,000 5,000
518x Minor Furniture & Equip 9,004 110,182 126,000 130,000
5210 Operating Supplies 16,800 13,973 15,000 15,000
5215 Uniforms 3,775 4,848 5,535 8,371
5230 Fuel Purchases 29,186 25,189 30,000 30,000
5280 Chemicals 7,931 7,651 10,000 10,000
5410 Publications & Memberships 60 72 300 300
5520 Training 3,707 4,683 8,000 13,660
TOTAL OPERATING EXPENSES 659,867 798,505 824,017 878,438
TOTAL APPROPRIATIONS 1,324,099 1,439,353 1,537,029 1,590,148

Fiscal Year 2021 - 22 Annual Budget
393
Appropriations
Summary
Wastewater
Fund
Lift Station
Division
Appropriations Summary
ADOPTED ADOPTED INCREASE/
2020-21 2021-22 (DECREASE) PERCENTAGE
Personal Services 713,012 711,710 (1,302) -0.18%
Operating Expenses 824,017 878,438 54,421 6.60%
TOTALS 1,537,029 1,590,148 53,119 3.46%
Significant Budget Changes:
The change in Operating Expenses is related to Utilities (4310) and R&M Non-Build (4625).

Fiscal Year 2021 - 22 Annual Budget
394
Appropriations
Detail
Wastewater
Fund
Other
Appropriations Detail Account # 044-4088-5xx
ACTUAL ACTUAL ADOPTED ADOPTED
2018-19 2019-20 2020-21 2021-22
PERSONAL SERVICES
2510 Unemployment Compensation 0 1,375 0 0
TOTAL PERSONAL SERVICES 0 1,375 0 0
OPERATING EXPENSES
4920 Other Current Charges 0 138,320 0 0
4950 Uncollectible Accounts 39,373 78,544 40,000 50,000
5001 Cost Allocation- City Commission 15,861 30,164 26,745 26,956
5002 Cost Allocation- City Manager 85,375 121,399 90,754 89,845
5003 Cost Allocation- City Clerk 29,777 36,212 32,030 34,123
5004 Cost Allocation- City Attorney 8,500 6,301 8,955 8,280
5005 Cost Allocation- Accounting 113,686 153,539 146,224 148,425
5006 Cost Allocation- Customer Service 446,626 534,000 467,242 477,278
5007 Cost Allocation- Purchasing 14,077 40,304 17,634 53,257
5008 Cost Allocation- Warehouse 3,324 3,956 5,075 6,720
5009 Cost Allocation- Human Resources 30,073 32,872 32,381 33,571
5010 Cost Allocation- IT 321,396 371,733 350,652 337,181
5011 Cost Allocation- GIS 98,571 109,533 111,942 119,272
5013 Cost Allocation- Facilities 13,234 12,685 12,047 12,893
5015 Cost Allocation- Planning & Zoning 76,225 75,281 77,230 84,908
5910 Depreciation Expense 1,510,526 1,708,685 1,515,000 1,750,000
TOTAL OPERATING EXPENSES 2,806,624 3,453,528 2,933,911 3,232,709
DEBT SERVICE
7110 Principal-Long Term Debt 0 0 1,785,173 1,824,147
721x Interest-Long Term Debt 644,086 607,589 820,641 761,811
7311 Fees 3,558 3,557 3,812 3,812
7320 Amortize Debt Discount/Premium (44,868) (44,868) (44,868) (44,868)
7350 Amortize Debt Extngmt Costs 34,308 92,308 34,308 34,308
TOTAL DEBT SERVICE 637,084 658,586 2,599,066 2,579,210
OTHER USES
9101 Transfer to General Fund 888,998 897,152 955,243 987,324
9115 Transfer to Building Fund 3,500 6,840 0 0
9150 R&R Reserve 0 0 75,000 75,000
9152 Transfer to Fleet Fund 0 66,523 0 0
9160 Reserve/Future Capital 0 0 1,893,977 1,364,857
9960 Interest-Customer Deposit 57 30 0 0
TOTAL OTHER USES 892,555 970,545 2,924,220 2,427,181
TOTAL APPROPRIATIONS 4,336,263 5,084,034 8,457,197 8,239,100

Fiscal Year 2021 - 22 Annual Budget
395
Appropriations
Summary
Wastewater
Fund
Other
Appropriations Summary
ADOPTED ADOPTED INCREASE/
2020-21 2021-22 (DECREASE) PERCENTAGE
Operating Expenses 2,933,911 3,232,709 298,798 10.18%
Debt Service 2,599,066 2,579,210 (19,856) -0.76%
Other Uses 2,924,220 2,427,181 (497,039) -17.00%
TOTALS 8,457,197 8,239,100 (218,097) -2.58%
Significant Budget Changes:
The change in Operating Expenses is mainly attributable to Depreciation Expense (5910). The decrease
in Other Uses is related to the reduction in Reserve/Future Capital (9160).

Fiscal Year 2021 - 22 Annual Budget
396
Appropriations
Detail
Wastewater
Fund
Capital
Projects
Appropriations Detail Account # 044-4099-535
ACTUAL ACTUAL ADOPTED ADOPTED
2018-19 2019-20 2020-21 2021-22
PERSONAL SERVICES
1210 Regular Salaries & Wages 800 0 0 0
2110 FICA 57 0 0 0
221x Retirement 40 0 0 0
231X Insurance 237 0 0 0
2410 Workers' Compensation 40 0 0 0
TOTAL PERSONAL SERVICES 1,174 0 0 0
OPERATING EXPENSES
31xx Professional Services 207,060 805,974 0 250,000
3410 Contract Services 7,871 0 0 0
4310 Utilities 90 0 0 0
4920 Other Current Charges 0 0 0 0
5180 Minor Furniture & Equipment 6,698 0 0 0
5210 Operating Supplies 12 0 0 0
TOTAL OPERATING EXPENSES 221,731 805,974 0 250,000
CAPITAL OUTLAY
6210 Buildings 388,575 0 0 0
6310 Improvements Other than Bldgs 1,725,126 606,056 2,850,000 1,350,000
6410 Machinery & Equipment 1,201,785 163,683 142,000 155,000
TOTAL CAPITAL OUTLAY 3,315,486 769,739 2,992,000 1,505,000
OTHER USES
9999 WIP Contra (3,538,391) (1,575,712) 0 0
TOTAL OTHER USES (3,538,391) (1,575,712) 0 0
TOTAL APPROPRIATIONS 0 1 2,992,000 1,755,000

Fiscal Year 2021 - 22 Annual Budget
397
Appropriations
Summary
Wastewater
Fund
Capital
Projects
Appropriations Summary
ADOPTED ADOPTED INCREASE/
2020-21 2021-22 (DECREASE) PERCENTAGE
Operating Expenses 0 250,000 250,000 100.00%
Capital Outlay 2,992,000 1,505,000 (1,487,000) -49.70%
TOTALS 2,992,000 1,755,000 (1,237,000) -41.34%

Fiscal Year 2021 - 22 Annual Budget
398
Wastewater
Fund
Project
Schedule
Project Schedule
WF/Job Title Funding Source Amount
440002 Collecting Sewers ($1,350,000)
Line under Building Renewal & Replacement 200,000
Forcemain South 27 Renewal & Replacement 500,000
IPP Program Local Limits Evaluation Renewal & Replacement 50,000
Lift Station Rehabilitation Renewal & Replacement 500,000
Vitrified Clay Pipe Renewal & Replacement 100,000
440003 Other Equipment ($155,000)
Tools & Equipment Renewal & Replacement 95,000
Pump Packages Renewal & Replacement 60,000
440006 Treatment Plant ($250,000)
Canal Street Renewal & Replacement 100,000
Turnpike Plant Renewal & Replacement 100,000
Discharge Pipe Replacement/Line Wet Wells Renewal & Replacement 50,000
TOTAL 1,755,000
Source of Funds
Renewal & Replacement 1,755,000
TOTAL 1,755,000

Fiscal Year 2021 - 22 Annual Budget
399
Organization
Total
Budget
Solid Waste
Fund
Cliff Kelsey, Director of Public Works
The Solid Waste Fund is responsible for collecting and transporting refuse generated by residential, commercial, and municipal facilities within the City limits. This department also handles recycling, bulk pickup, and roll-off service for construction and demolition debris. Residential garbage is collected semi-weekly, while commercial garbage is collected based on the customer’s needs and billed accordingly. Two closed landfills are maintained by the City as required by the Florida Department of Environmental Protection Closure Permits. Responsibilities: • Refuse collection • Recycle collection • Landfill maintenance • Gas and groundwater sampling and reporting to satisfy DEP requirements of the closed
landfills Organizational Chart
$ 5,104,880
Director of Public Works
Administrative
Assistant II
Commercial
Solid Waste
Operator III
Senior Deputy
Director
Residential
Solid Waste
Operator I
Solid Waste
Operator II
Solid Waste
Supervisor
Solid Waste
Operator II
Landfill Long
Term Care
Solid Waste
Manager

Fiscal Year 2021 - 22 Annual Budget
400
Solid Waste
Fund
Solid Waste
System
Description
Solid Waste System Description
The Solid Waste Utility serves residential and commercial customers in the City of Leesburg. These services include regular refuse pick-up and disposal, single stream recycling, support of special events and neighborhood clean up. Residential customers use 95 and/or 65 gallon garbage and 65 and/or 35 gallon recycle containers for pick-up with side-load trucks. Commercial customers that generate small quantities of solid waste are serviced by 95-gallon roll-outs also, but the majority of commercial accounts use front-load dumpsters. Commercial dumpsters are available in various sizes, from two cubic yards to eight cubic yards. The utility offers roll-off service for construction and demolition debris with containers ranging from 10 cubic yards to 40 cubic yards. In addition, the City offers compactor services with sizes up to 40 cubic yards. Leesburg has approximately 8,517 residential accounts which is an increase of 9.1% and 1,436 commercial accounts which is an increase of 1.1% as compared to Fiscal Year 2021. The Solid Waste Division maintains two permitted, closed landfills that require on-going monitoring and maintenance. A self-contained Air Curtain Burner for disposal of vegetative waste is being procured and is anticipated to be operational prior to the end of Fiscal Year 2021. It will require a Part 70 air permit that is currently being developed for subsequent approval. This will be a new capability to the landfill allowing in-house burning of forest/agricultural green waste, land clearing debris, storm debris and other waste streams in compliance with the requirements of US EPA 40CRF60. The permits are administered through the State of Florida Department of Environmental Protection.

Fiscal Year 2021 - 22 Annual Budget
401
Solid Waste
Fund
Budget
Summary-
Operating
Statement
Budget Summary - Operating Statement
ACTUAL ACTUAL ADOPTED ADOPTED
2018-19 2019-20 2020-21 2021-22
OPERATING REVENUE
Charges for Services 4,250,273 4,291,067 4,545,218 4,517,103
Other Operating Revenues 63,352 92,637 66,995 97,517
TOTAL OPERATING REVENUE 4,313,625 4,383,704 4,612,213 4,614,620
OPERATING APPROPRIATIONS
Long-Term Care 37,393 32,452 44,668 73,328
Residential 1,579,371 1,520,622 1,675,035 2,057,787
Commercial 1,354,370 1,379,053 1,500,558 1,482,841
Other Operating Expenses 435,296 511,426 502,163 520,378
TOTAL APPROPRIATIONS (3,406,430) (3,443,553) (3,722,424) (4,134,334)
NET INCOME FROM OPERATIONS 907,195 940,151 889,789 480,286
Non-Operating Revenue 408,293 325,246 6,891 27,472
Non-Operating Appropriations (95) (182,021) (196,925) (181,975)
NET OTHER INCOME 408,198 143,225 (190,034) (154,503)
NET INCOME BEFORE TRANSFERS 1,315,393 1,083,376 699,755 325,783
Transfers to other funds (403,428) (582,299) (826,288) (788,571)
NET INCOME AFTER TRANSFERS 911,965 501,077 (126,533) (462,788)
Other Sources 0 0 0 0
Capital Projects 0 0 0 0
NET OTHER SOURCES 0 0 0 0
UNAPPROPRIATED BALANCE 911,965 501,077 (126,533) (462,788)

Fiscal Year 2021 - 22 Annual Budget
402
Solid Waste
Fund
Revenue
Detail
Revenue Detail
ACTUAL ACTUAL ADOPTED ADOPTED
2018-19 2019-20 2020-21 2021-22
INTERGOVERNMENTAL REVENUE
33191 Federal Emergency Mgmt Reimb 311,190 251,884 0 0
33491 State Emergency Mgmt Reimb 33,824 13,034 0 0
TOTAL INTERGOVERNMENTAL REVENUE 345,014 264,918 0 0
CHARGES FOR SERVICES
34341 Residential Refuse 1,669,047 1,707,659 1,856,525 1,797,612
34342 Commercial Dumpster 1,867,861 1,872,510 1,931,343 1,971,146
34343 Commercial Manual Refuse 256,540 255,461 242,185 268,917
34344 Roll-Off/ Compactors 169,024 176,782 218,090 186,095
34345 Commercial Compactor Pickup Fees 249,563 258,398 256,920 272,009
34346 Interdept/Refuse 47,764 54,182 53,702 57,036
34905 Penalties 38,238 20,257 40,155 21,324
34910 Misc Operating Revenue 15,588 38,455 13,293 40,481
TOTAL CHARGES FOR SERVICES 4,313,625 4,383,704 4,612,213 4,614,620
MISCELLANEOUS REVENUE
36110 Interest on Investments 40,323 41,598 3,870 25,000
36130 Gain/Loss Investments 20,331 14,942 0 0
36501 Sale of Surplus Materials 2,512 2,006 1,200 2,112
36945 Recyclables - County 113 0 1,821 360
36990 Misc Non-Operating Rev 0 1,782 0 0
TOTAL MISCELLANEOUS REVENUE 63,279 60,328 6,891 27,472
OTHER SOURCES
38893 Appropriated Retained Earnings 0 0 126,533 462,788
TOTAL OTHER SOURCES 0 0 126,533 462,788
TOTAL RESOURCES 4,721,918 4,708,950 4,745,637 5,104,880

Fiscal Year 2021 - 22 Annual Budget
403
Solid Waste
Fund
Division
Summary of
Appropriations
Division Summary of Appropriations
ACTUAL ACTUAL ADOPTED ADOPTED
2018-19 2019-20 2020-21 2021-22
5142 LONG-TERM CARE
Operating Expenses 37,393 32,452 44,668 73,328
TOTAL LONG-TERM CARE 37,393 32,452 44,668 73,328
5143 RESIDENTIAL
Personal Services 479,943 451,485 547,538 689,798
Operating Expenses 1,099,428 1,069,137 1,127,497 1,117,989
Capital Outlay 0 0 0 250,000
TOTAL RESIDENTIAL 1,579,371 1,520,622 1,675,035 2,057,787
5144 COMMERCIAL
Personal Services 488,638 486,751 522,142 538,318
Operating Expenses 865,732 892,302 978,416 944,523
Other Uses 95 46 0 0
TOTAL COMMERCIAL 1,354,465 1,379,099 1,500,558 1,482,841
6088 OTHER
Operating Expenses 435,296 511,426 502,163 520,378
Grants & Aids 0 181,975 196,925 181,975
Other Uses 403,428 582,299 826,288 788,571
TOTAL OTHER 838,724 1,275,700 1,525,376 1,490,924
GRAND TOTAL
Personal Services 968,581 938,236 1,069,680 1,228,116
Operating Expenses 2,437,849 2,505,317 2,652,744 2,656,218
Capital Outlay 0 0 0 250,000
Grants & Aids 0 181,975 196,925 181,975
Other Uses 403,523 582,345 826,288 788,571
TOTAL APPROPRIATIONS 3,809,953 4,207,873 4,745,637 5,104,880

Fiscal Year 2021 - 22 Annual Budget
404
Solid Waste
Fund
Goals & Tasks
Goals & Tasks
Goal: Lead the industry in providing high quality, low cost, customer driven utility services.
Task:
Continue to cross train and qualify drivers on secondary equipment
Constantly evaluate routes and adjust as necessary to increase efficiency
Run routes properly to ensure no curbside garbage or recycling is overlooked
Promote safety and incorporate hands free communication capabilities for all drivers
Conduct weekly safety meetings on timely topics
Promote and encourage the recycling program
Increase information published on the Solid Waste website and other social media accounts
Major Accomplishments:
Passed the final annual Florida DEP inspection for the Long-term Care permit at both of the City’s
120-acre site and 40-acre landfill sites
Reduced monitoring cost at the City’s closed landfill
Distributed new containers to Legacy and Arlington Ridge Developments
Performance Measures:
2019-20 2020-21 2021-22
Number of accidents/ 1,000 miles 0 5 0
Tons of solid waste collected 25,212 23,149 24,770
Tons of scrap metal recycled 25 35 35
Tons of recycled material collected 722 717 767
Number of pickups for special needs citizens 2 0 0

Fiscal Year 2021 - 22 Annual Budget
405
Solid Waste
Fund
Personnel
Schedule
Personnel Schedule
Classification 2021 Change 2022 Amount
Residential 5143
Administrative Assistant II 1 0.50 0.00 0.50 18,762
Director of Public Works 2 0.05 0.00 0.05 5,835
Solid Waste Manager 3 0.50 0.00 0.50 36,099
Solid Waste Operator I 6.00 2.00 8.00 250,827
Solid Waste Operator II 1.00 0.00 1.00 48,693
Solid Waste Supervisor 4 0.50 0.00 0.50 30,389
Total Residential 8.55 2.00 10.55 390,604
Commercial 5144
Administrative Assistant II 1 0.50 0.00 0.50 18,762
Director of Public Works 2 0.05 0.00 0.05 5,835
Solid Waste Manager 3 0.50 0.00 0.50 36,099
Solid Waste Operator II 3.00 0.00 3.00 104,936
Solid Waste Operator III 3.00 0.00 3.00 134,847
Solid Waste Supervisor 4 0.50 0.00 0.50 30,389
Total Commercial 7.55 0.00 7.55 330,867
Total 16.10 2.00 18.10 721,471
Note: Allocations
Administrative Assistant II 1 50%-5143, 50%-5144
Solid Waste Manager 3 50%-5143, 50%-5144
³
Solid Waste Supervisor 4 50%-5143, 50%-5144
4
Director of Public Works 2 25%-5197, 25%-3021, 25%-4021, 15%-5171, 5%-5143, 5%-5144

Fiscal Year 2021 - 22 Annual Budget
406
Appropriations
Detail
Solid Waste
Fund
Landfill Long-
Term Care
Division
Appropriations Detail Account # 046-5142-534
ACTUAL ACTUAL ADOPTED ADOPTED
2018-19 2019-20 2020-21 2021-22
OPERATING EXPENSES
31xx Professional Services 14,739 14,609 20,000 50,000
4310 Utilities 8,374 8,340 8,400 8,400
4410 Rentals 975 750 0 0
4415 Fleet Lease 4,293 4,676 3,438 3,471
4510 Insurance 1,361 1,500 1,435 1,514
461x Fleet Maintenance 6,408 2,542 8,412 6,808
4625 R&M/Non-Building (OTB) 0 0 800 400
4920 Other Current Charges 0 35 50 35
52xx Operating Supplies 0 0 400 200
5230 Fuel Purchases 1,243 0 1,733 2,500
TOTAL OPERATING EXPENSES 37,393 32,452 44,668 73,328
TOTAL APPROPRIATIONS 37,393 32,452 44,668 73,328

Fiscal Year 2021 - 22 Annual Budget
407
Appropriations
Summary
Solid Waste
Fund
Landfill Long-
Term Care
Division
Appropriations Summary
ADOPTED ADOPTED INCREASE/
2020-21 2021-22 (DECREASE) PERCENTAGE
Operating Expenses 44,668 73,328 28,660 64.16%
TOTALS 44,668 73,328 28,660 64.16%
Significant Budget Changes:
The increse in Operating Expenses is related to Professional Services (31xx) for the 5 year permit
renewal which is required for the closed landfill.

Fiscal Year 2021 - 22 Annual Budget
408
Appropriations
Detail
Solid Waste
Fund
Residential
Division
Appropriations Detail Account # 046-5143-5xx
ACTUAL ACTUAL ADOPTED ADOPTED2018-19 2019-20 2020-21 2021-22
PERSONAL SERVICES1210 Regular Salaries & Wages 303,057 306,398 321,836 390,6041410 Overtime 24,882 9,917 30,500 30,5001530 Bonuses/Incentives 1,383 728 0 01641 Vacation/Terms & Buyout 12,217 16,045 0 02110 FICA 24,091 23,408 22,549 27,948221x Retirement 34,913 40,706 38,742 45,19623xx Insurance 88,267 84,335 99,554 153,3492410 Workers' Compensation 35,125 35,288 33,974 41,720262x Other Payroll Benefits (43,992) (65,340) 383 481
TOTAL PERSONAL SERVICES 479,943 451,485 547,538 689,798
OPERATING EXPENSES3xxx Contract Services 398,322 425,182 418,775 400,0004010 Travel 0 0 200 20041xx Communication 797 899 800 2,0004415 Internal Fleet Lease 143,888 203,754 152,816 153,8954510 Insurance 7,618 9,346 8,703 9,342461x Repairs & Maintenance- Vehicles 211,991 229,404 205,695 211,068463x Repairs & Maintenance- Equipment 1,591 1,510 1,260 1,2604710 Printing & Binding 1,134 4,271 1,500 3,0004810 Promotional Activities 132 66 500 049xx Advertising/Other Current Charge 178 5,324 170 1,0855180 Minor Furniture/Equipment 17 0 150 1505210 Operating Supplies 234,277 97,848 210,000 210,0005215 Uniforms 2,265 2,833 5,850 5,2005230 Fuel Purchases 96,750 88,454 120,000 120,0005410 Publications & Memberships 314 246 578 2895520 Training 154 0 500 500
TOTAL OPERATING EXPENSES 1,099,428 1,069,137 1,127,497 1,117,989
CAPITAL OUTLAY6410 Machinery & Equipment 0 0 0 250,000
TOTAL CAPITAL OUTLAY 0 0 0 250,000
TOTAL APPROPRIATIONS 1,579,371 1,520,622 1,675,035 2,057,787

Fiscal Year 2021 - 22 Annual Budget
409
Appropriations
Summary
Solid Waste
Fund
Residential
Division
Appropriations Summary
ADOPTED ADOPTED INCREASE/
2020-21 2021-22 (DECREASE) PERCENTAGE
Personal Services 547,538 689,798 142,260 25.98%
Operating Expenses 1,127,497 1,117,989 (9,508) -0.84%
Capital Outlay 0 250,000 250,000 100.00%
TOTALS 1,675,035 2,057,787 382,752 22.85%
Significant Budget Changes:
The increase in Personal Services is mainly due to adding 2 positions. The Capital Outlay increase
is due to purchasing a new Solid Waste truck.

Fiscal Year 2021 - 22 Annual Budget
410
Appropriations
Detail
Solid Waste
Fund
Commercial
Division
Appropriations Detail Account # 046-5144-5xx
ACTUAL ACTUAL ADOPTED ADOPTED
2018-19 2019-20 2020-21 2021-22PERSONAL SERVICES
12xx Regular Salaries & Wages 300,060 318,204 323,167 330,867
1410 Overtime 29,363 17,841 30,000 30,000
1530 Bonuses/Incentives 1,383 208 0 0
1641 Vacation/Terms & Buyout 9,274 7,646 0 0
2110 FICA 23,955 24,471 22,802 23,532
221x Retirement 34,360 25,182 24,611 28,611
23xx Insurance 88,402 89,596 86,786 89,940
2410 Workers' Compensation 33,099 35,498 34,126 34,922
26xx Other Payroll Benefits (31,258) (31,895) 650 446
TOTAL PERSONAL SERVICES 488,638 486,751 522,142 538,318
OPERATING EXPENSES
3xxx Contract Services 475,200 516,303 520,475 520,000
4010 Travel 0 0 200 200
41xx Communication 730 814 710 1,900
4210 Postage 25 16 100 100
4310 Utilities 5,901 5,521 6,650 6,650
4415 Internal Fleet Lease 114,759 137,009 100,700 101,706
4510 Insurance 7,061 8,925 7,711 7,788
461x Repairs & Maintenance- Vehicles 155,966 103,659 164,332 129,380
462x Repairs & Maintenance- Non-Build 20,845 25,449 35,300 36,300
463x Repairs & Maintenance- Equipment 660 520 610 660
4710 Printing & Binding 1,097 168 3,000 3,000
4920 Other Current Charges 0 70 0 0
4945 Injury/ Damage to Others 0 5,523 0 1,000
5180 Minor Furniture & Equipment 0 406 0 500
5210 Operating Supplies 20,232 28,654 65,000 56,255
5215 Uniforms 1,502 1,964 4,550 3,295
5230 Fuel Purchases 61,507 57,055 68,000 75,000
5410 Publications & Memberships 247 246 578 289
5520 Training 0 0 500 500
TOTAL OPERATING EXPENSES 865,732 892,302 978,416 944,523
OTHER USES
9960 Interest- Customer Deposits 95 46 0 0
TOTAL OTHER USES 95 46 0 0
TOTAL APPROPRIATIONS 1,354,465 1,379,099 1,500,558 1,482,841

Fiscal Year 2021 - 22 Annual Budget
411
Appropriations
Summary
Solid Waste
Fund
Commercial
Division
Appropriations Summary
ADOPTED ADOPTED INCREASE/
2020-21 2021-22 (DECREASE) PERCENTAGE
Personal Services 522,142 538,318 16,176 3.10%
Operating Expenses 978,416 944,523 (33,893) -3.46%
TOTALS 1,500,558 1,482,841 (17,717) -1.18%
Significant Budget Changes:
The reduction in Operating Expenses is mainly attributable to a reduction in Fleet Maintenance (4611)
as several trucks have been replaced and these costs are trending down.

Fiscal Year 2021 - 22 Annual Budget
412
Appropriations
Detail
Solid Waste
Fund
Other
Appropriations Detail Account # 046-6088-5xx
ACTUAL ACTUAL ADOPTED ADOPTED
2018-19 2019-20 2020-21 2021-22
OPERATING EXPENSES
4950 Uncollectible Accounts 15,558 44,460 15,000 30,000
5001 Cost Allocation- City Commission 5,592 8,464 9,929 9,804
5002 Cost Allocation- City Manager 29,745 40,006 33,692 32,677
5003 Cost Allocation- City Clerk 10,473 11,914 11,891 12,411
5004 Cost Allocation- City Attorney 3,778 2,100 2,985 2,760
5005 Cost Allocation- Accounting 38,712 47,888 54,286 53,982
5006 Cost Allocation- Customer Service 154,106 161,588 173,464 173,587
5007 Cost Allocation- Purchasing 2,815 8,637 2,939 2,959
5008 Cost Allocation-Warehouse 1,680 1,584 1,944 1,830
5009 Cost Allocation- Human Resources 13,366 10,957 10,794 11,190
5010 Cost Allocation- IT 113,232 120,796 122,728 124,225
5013 Cost Allocation- Facilities 6,617 6,343 6,023 6,446
5014 Cost Allocation- PW Office 26,195 33,426 41,488 43,507
5910 Depreciation Expense 13,427 13,263 15,000 15,000
TOTAL OPERATING EXPENSES 435,296 511,426 502,163 520,378
GRANTS AND AIDS8210 Local Contributions 0 70,215 85,165 70,215
8215 Local Contributions- Cemetary 0 111,760 111,760 111,760
TOTAL GRANTS AND AIDS 0 181,975 196,925 181,975
OTHER USES
9101 Transfer to General Fund 403,428 410,831 426,288 438,571
9160 Reserve/Future Capital 0 0 0 0
9131 Transfer to Capital Projects 0 171,468 400,000 350,000
TOTAL OTHER USES 403,428 582,299 826,288 788,571
TOTAL APPROPRIATIONS 838,724 1,275,700 1,525,376 1,490,924

Fiscal Year 2021 - 22 Annual Budget
413
Appropriations
Summary
Solid Waste
Fund
Other
Appropriations Summary
ADOPTED ADOPTED INCREASE/
2020-21 2021-22 (DECREASE) PERCENTAGE
Operating Expenses 502,163 520,378 18,215 3.63%
Grants & Aids 196,925 181,975 (14,950) -7.59%
Other Uses 826,288 788,571 (37,717) -4.56%
TOTALS 1,525,376 1,490,924 (34,452) -2.26%

This page intentionally left blank
Fiscal Year 2021 - 22 Annual Budget
414

Fiscal Year 2021 - 22 Annual Budget
415
Organization
Total
Budget
Airport
Fund The Airport Fund is responsible for management of the Leesburg International Airport as well as long and short-range planning. Responsibilities: Operations Maintenance ·Planning and development ·Landscape ·Leases ·Hangars ·Out parcels ·Facilities ·FAA & FDOT compliance ·Runways ·Grant administration ·Capital project coordination Organizational Chart
$ 4,261,595
Al Minner, City Manager
City Manager
Airport Manager
Maintenance
Technician

Fiscal Year 2021 - 22 Annual Budget
416
Revenue
Sources &
Appropriations
Revenue Sources and Appropriations Airport
Fund ACTUAL ACTUAL ADOPTED ADOPTED
2018-19 2019-20 2020-21 2021-22
REVENUE SOURCES
Licenses & Permits 17,417 17,744 16,702 19,288
Intergovernmental Revenue 429,758 1,073,187 1,760,000 2,527,400
Charges for Services 136,350 96,073 173,438 225,000
Miscellaneous Revenue 1,158,899 1,238,457 1,206,333 1,168,563
Other Sources 0 0 0 321,344
TOTAL REVENUE SOURCES 1,742,424 2,425,461 3,156,473 4,261,595
APPROPRIATIONS
Airport 727,368 581,794 714,822 717,959
Other 1,542,325 1,631,462 146,651 92,916
Capital Projects 0 1 2,295,000 3,450,720
TOTAL APPROPRIATIONS 2,269,693 2,213,257 3,156,473 4,261,595

Fiscal Year 2021 - 22 Annual Budget
417
Revenue
Detail
Revenue Detail Airport
Fund ACTUAL ACTUAL ADOPTED ADOPTED
2018-19 2019-20 2020-21 2021-22
LICENSES & PERMITS
32918 Security Access Fees 1,500 1,065 360 500
32918 Parking & Storage Fees 9,675 9,728 9,600 12,228
32918 Airport Operating Permit 6,242 6,951 6,742 6,560
TOTAL LICENSES & PERMITS 17,417 17,744 16,702 19,288
INTERGOVERNMENTAL REVENUE
33141 Federal Grants- Airport Improvements 189,381 181,714 0 117,000
33441 State Grants- Airport Improvements 240,377 891,473 1,760,000 2,410,400
TOTAL INTERGOVERNMENTAL REVENUE 429,758 1,073,187 1,760,000 2,527,400
CHARGES FOR SERVICES
34410 Custom Fees/Villages 136,350 96,073 173,438 225,000
TOTAL CHARGES FOR SERVICES 136,350 96,073 173,438 225,000
MISCELLANEOUS REVENUE
36110 Interest on Investments 50,035 43,840 0 15,000
36130 Gain/ Loss Investments 32,763 11,933 0 0
36201 Rental Property- Airport 536,330 542,948 594,735 584,432
36202 Hangar Rentals 499,140 511,763 581,691 539,344
36202 Airport Rent- Fuel Sales 26,340 24,286 24,000 24,000
36202 Tie Down Rents 5,933 6,009 5,907 5,787
36402 Gain/ Loss Assets (12,016) (7,332) 0 0
36404 Recovery from Losses 20,374 0 0 0
36909 Other Income 0 105,010 0 0
TOTAL MISCELLANEOUS REVENUE 1,158,899 1,238,457 1,206,333 1,168,563
OTHER SOURCES
38891 Fund Balance Appropriated 0 0 0 321,344
TOTAL OTHER SOURCES 0 0 0 321,344
TOTAL RESOURCES 1,742,424 2,425,461 3,156,473 4,261,595

Fiscal Year 2021 - 22 Annual Budget
418
Goals & Tasks
Airport
Fund
Operations
Division
Goals & Tasks
Goal: Eliminate blight and stimulate growth by investing in neighborhood redevelopment, while also
pursuing economic opportunities.
Task:
Enhance the airport as an economic engine for the City of Leesburg and surrounding areas to
increase its economic impact on the community by building positive relationships with current and
prospective businesses and aircraft owners
Promote/Market the airport and amenities to increase airport operations and encourage growth of
new and current businesses
Continue to operate and maintain the airport in a safe and efficient manner to encourage use by
based and transient aircraft users and attract new users
Goal: Foster an environment where local governance is collaborative, transparent and fiscally sound.
Task:
Maintain status as a self-sustaining Enterprise Fund
Continue to lease all city-owned airport properties and adjust renewal lease rates to fair market value
as opportunities arise
Maximize available Federal and State grants under aviation programs for airport development
Major Accomplishments:
Runway 13/31 Rehabilitation construction completed
Completed Customs interior rehabilitation
Main Apron/Ramp design, bid, construct completed
Air Traffic Control Tower equipment upgrades installed
Performance Measures:
2019-20 2020-21 2021-22
Airport activity operations 78,828 75,000 78,000
Revenue amount of City hangars leased 511,763 581,691 604,000
Revenue of commercial property leased 542,948 594,735 584,432
Fuel sales by gallons (AvGas & Jet A) 607,143 600,000 600,000
Airport employment, actual 120 125 115
Airport employment economic impact 556 575 529
Construction projects completed 1 3 1
Estimated number of based aircraft 129 147 156

Fiscal Year 2021 - 22 Annual Budget
419
Personnel
Schedule
Airport
Fund
Operations
Division
Personnel Schedule
Classification 2021 Change 2022 Amount
Airport Maintenance Technician 1.00 0.00 1.00 30,638
Airport Manager 1.00 0.00 1.00 71,989
Executive Office Manager1 0.10 0.00 0.10 7,220
Total 2.10 0.00 2.10 109,847
Notes: Allocations
Executive Office Manager1
20%-1220, 70%-1221, 10%-048-8021

Fiscal Year 2021 - 22 Annual Budget
420
Appropriations
Detail
Airport
Fund
Operations
Division
Appropriations Detail Account #048-8021-542
ACTUAL ACTUAL ADOPTED ADOPTED
2018-19 2019-20 2020-21 2021-22PERSONAL SERVICES12xx Regular Salaries & Wages 102,807 107,308 106,413 109,8471410 Overtime 296 107 0 01530 Bonuses/Incentives 0 1,435 0 01641 Vacation/Terms & Buyout 4,565 2,334 0 02110 FICA 8,747 8,112 7,575 8,000221x Retirement 5,749 5,985 6,020 8,30723xx Insurance 17,559 17,363 19,805 19,9922410 Workers' Compensation 2,859 2,890 2,837 2,87026xx Other Payroll Benefits 7,986 (5,066) 426 278
TOTAL PERSONAL SERVICES 150,568 140,468 143,076 149,294
OPERATING EXPENSES31xx Professional Services 35,489 11,478 14,500 11,4403410 Contract Services 138,118 105,654 179,038 229,5974010 Travel 133 49 0 041xx Communication 8,694 18,256 16,018 17,0184210 Postage 225 50 150 1004310 Utilities 51,410 50,985 54,000 54,0004410 Rentals 417 0 300 04415 Internal Fleet Lease 10,575 15,205 11,517 11,6324510 Insurance 39,819 44,993 51,969 52,369461x Repairs & Maintenance- Vehicles 9,624 8,524 9,474 8,4644620 Repairs & Maintenance- Building 131,336 39,370 90,130 69,0504625 Repairs & Maintenance- Non- Build 97,126 84,620 81,980 50,60046xx Repairs & Maintenance- Equipment 13,306 14,127 15,200 13,9004710 Printing & Binding 150 291 0 04810 Promotional Activities 0 0 300 04911 Advertising 151 251 300 0492x Other Current Charges 275 825 1,045 1,0454945 Injury/ Damage to Others 932 0 0 04980 Taxes 30,099 31,080 35,000 41,5005180 Minor Furniture/Equipment 432 8,998 3,450 500521x Operating Supplies 4,127 2,648 2,650 2,5005230 Fuel Purchases 3,737 3,297 4,100 4,0005410 Publications & Memberships 625 625 625 950
TOTAL OPERATING EXPENSES 576,800 441,326 571,746 568,665
TOTAL APPROPRIATIONS 727,368 581,794 714,822 717,959

Fiscal Year 2021 - 22 Annual Budget
421
Appropriations
Summary
Airport
Fund
Operations
Division
Appropriations Summary
ADOPTED ADOPTED INCREASE/
2020-21 2021-22 (DECREASE) PERCENTAGE
Personal Services 143,076 149,294 6,218 4.35%
Operating Expenses 571,746 568,665 (3,081) -0.54%
TOTALS 714,822 717,959 3,137 0.44%

Fiscal Year 2021 - 22 Annual Budget
422
Appropriations
Detail
Airport
Fund
Other
Appropriations Detail Account #048-8088-542
ACTUAL ACTUAL ADOPTED ADOPTED
2018-19 2019-20 2020-21 2021-22OPERATING EXPENSES5001 Cost Allocation- City Commission 1,353 1,904 2,597 2,4835002 Cost Allocation- City Manager 7,160 9,839 8,812 8,2755003 Cost Allocation- City Clerk 2,528 2,881 3,110 3,1435005 Cost Allocation- Accounting 9,123 11,311 14,199 13,6705007 Cost Allocation- Purchasing 36,600 5,758 5,878 26,6295010 Cost Allocation- IT 28,708 29,057 35,065 35,4935013 Cost Allocation- Facilities 3,309 3,171 3,012 3,2235910 Depreciation Expense 1,453,544 1,526,239 0 0
TOTAL OPERATING EXPENSES 1,542,325 1,590,160 72,673 92,916
OTHER USES9160 Reserve/Future Use 0 0 73,978 09152 Transfer to Fleet Fund 0 41,302 0 0
TOTAL OTHER USES 0 41,302 73,978 0
TOTAL APPROPRIATIONS 1,542,325 1,631,462 146,651 92,916

Fiscal Year 2021 - 22 Annual Budget
423
Appropriations
Summary
Airport
Fund
Other
Appropriations Summary
ADOPTED ADOPTED INCREASE/
2020-21 2021-22 (DECREASE) PERCENTAGE
Operating Expenses 72,673 92,916 20,243 27.85%
Other Uses 73,978 0 (73,978) -100.00%
TOTALS 146,651 92,916 (53,735) -36.64%
Significant Budget Changes:
The change in Operating Expenses is directly related to the Cost Allocation- Purchasing (5007) and the
yearly reallocation based on prior year PO's issued which related to the Constuction of Storage Hangars.

Fiscal Year 2021 - 22 Annual Budget
424
Appropriations
Detail
Airport
Fund
Capital
Projects
Appropriations Detail Account #048-8099-542
ACTUAL ACTUAL ADOPTED ADOPTED
2018-19 2019-20 2020-21 2021-22OPERATING EXPENSES3110 Professional Services 195 180 0 03130 Engineering Services 291,231 273,829 200,000 235,7204911 Advertising 0 193 0 0
TOTAL OPERATING EXPENSES 291,426 274,202 200,000 235,720
CAPITAL OUTLAY6210 Buildings 77,221 1,116,587 0 3,150,0006310 Improvements other than Bldgs 460,246 55,001 2,000,000 06410 Machinery & Equipment 44,120 121,856 95,000 65,000
TOTAL CAPITAL OUTLAY 581,587 1,293,444 2,095,000 3,215,000
OTHER USES9999 WIP Contra (Expense) (873,013) (1,567,645) 0 0
TOTAL OTHER USES (873,013) (1,567,645) 0 0
TOTAL APPROPRIATIONS 0 1 2,295,000 3,450,720

Fiscal Year 2021 - 22 Annual Budget
425
Appropriations
Summary
Airport
Fund
Capital
Projects
Appropriations Summary
ADOPTED ADOPTED INCREASE/
2020-21 2021-22 (DECREASE) PERCENTAGE
Operating Expenses 200,000 235,720 35,720 17.86%
Capital Outlay 2,095,000 3,215,000 1,120,000 53.46%
TOTALS 2,295,000 3,450,720 1,155,720 50.36%

Fiscal Year 2021 - 22 Annual Budget
426
Airport
Fund
Project
Schedule
Project Schedule
Project
WF/Job Title Funding Source Amount
480002 Buildings ($3,255,720)
Roof Replacement- T Hangar 32800 Echo Drive Current Revenue 150,000
Hangar Design Current Revenue 105,720
Hangar Buildings Taxiways & Parking State Grant 2,400,000
Current Revenue 600,000
480003 Improvements ($130,000)
Develop New Wildlife Hazard Assessment Federal Grant 117,000
State Grant 10,400
Current Revenue 2,600
480004 Other Equipment
Tractor Upgrade Current Revenue 65,000
TOTAL 3,450,720
Source of Funds
Current Revenue 923,320
State Grant 2,410,400
Federal Grant 117,000
TOTAL 3,450,720

Fiscal Year 2021 - 22 Annual Budget
427
Organization
Total
Budget
Stormwater
Fund
Cliff Kelsey, Director of Public Works
The Stormwater Fund is responsible for development of the stormwater management plan, improvement of stormwater drainage quality, and maintaining the city owned drainage system. The employees report to supervisors in the Public Works Department. Responsibilities: • Operation & Maintenance • Street sweeping • Mowing & Stormwater ditch cleaning • Stormwater Main Line Cleaning • Implement State mandated Stormwater regulations • Maintain the National Pollutant Discharge Elimination System (NPDES) program • Maintain Total Maximum Daily Load (TMDL) program Organizational Chart
$ 1,699,040
Director of Public Works
Deputy Director
Operations
Supervisor
Stormwater
Tech C
Stormwater Tech
Apprentice
Crew Leader

Fiscal Year 2021 - 22 Annual Budget
428
Stormwater
Fund
Stormwater
System
Description
Stormwater System Description
The Stormwater system is a combination of manmade structures/open ditch lines and natural terrain. All of the City’s Stormwater naturally flows to Lakes Griffin, Harris, Denham and the Palatlakaha River but is detained in several areas to enhance water quality. There are 17 distinct drainage sub-basins with a total area of 82 square miles within the City limits. The division funds and oversees projects identified and prioritized in the Stormwater Master Plan. Cleaning up the ponds throughout the City is an ongoing priority for the Stormwater Division. We have partnered with DRMP, Inc. engineers to update the City’s Stormwater Master Best Management Plan (BMP) from 2014 in order to identify and prioritize future stormwater projects. Future projects will further improve our stormwater quality and allow us to achieve pollutant reductions established by a total maximum daily load (TMDL). The Stormwater Division consists of a small in-house staff dedicated to cleaning and mowing Stormwater ditches, repairing or replacing damaged/worn out Stormwater pipes and outfall structures and controlling aquatic weed growth in City ponds, canals and retention ponds. Additionally, the Stormwater Division manages the City’s street sweeping program. The City’s system is located in and regulated by the St. Johns River Water Management District. The City’s Stormwater management fee is based on the square footage of impervious area at a rate of $5.50 per month per calculated equivalent residential unit (ERU). One ERU is equivalent to 2,000 square feet.

Fiscal Year 2021 - 22 Annual Budget
429
Stormwater
Fund
Budget
Summary–
Operating
Statement
Budget Summary– Operating Statement
ACTUAL ACTUAL ADOPTED ADOPTED
2018-19 2019-20 2020-21 2021-22
OPERATING REVENUE
Charges For Services 1,569,934 1,582,861 1,692,108 1,664,182
Other Operating Revenue 91,409 243,988 62,654 34,858
TOTAL OPERATING REVENUE 1,661,343 1,826,849 1,754,762 1,699,040
OPERATING APPROPRIATIONS
Stormwater 1,703,364 546,968 715,101 719,129
Other Operating Expenses 461,678 471,570 479,262 494,776
TOTAL APPROPRIATIONS (2,165,042) (1,018,538) (1,194,363) (1,213,905)
NET INCOME FROM OPERATIONS (503,699) 808,311 560,399 485,135
Non-Operating Revenue 0 542,538 0 0
Non-Operating Appropriations 0 0 0 0
NET OTHER INCOME 0 542,538 0 0
NET INCOME BEFORE TRANSFERS (503,699) 1,350,849 560,399 485,135
Transfers to other funds 0 0 0 0
NET INCOME AFTER TRANSFERS (503,699) 1,350,849 560,399 485,135
Other Sources 0 0 0 0
Capital Projects 1 (1) (540,000) (470,000)
NET OTHER SOURCES 1 (1) (540,000) (470,000)
UNAPPROPRIATED BALANCE (503,698) 1,350,848 20,399 15,135

Fiscal Year 2021 - 22 Annual Budget
430
Stormwater
Fund
Revenue
Detail
Revenue Detail
ACTUAL ACTUAL ADOPTED ADOPTED
2018-19 2019-20 2020-21 2021-22
INTERGOVERNMENTAL REVENUE
33191 Emergency Management 0 601 0 0
33737 Lake County Water Authority 0 212,250 0 0
33738 St Johns River WMD 0 (10,700) 0 0
TOTAL INTERGOVERNMENTAL REVENUE 0 202,151 0 0
CHARGES FOR SERVICES
34306 Stormwater Utility Fees 11,627 1,955 0 0
34370 Conservation & Resource Mgmt 1,544,446 1,573,903 1,676,801 1,656,810
34905 Penalties 13,861 7,003 15,307 7,372
TOTAL CHARGES FOR SERVICES 1,569,934 1,582,861 1,692,108 1,664,182
MISCELLANEOUS REVENUE
36110 Interest on Investments 58,100 33,114 62,654 34,858
36130 Gain/Loss Investments 33,060 8,723 0 0
36501 Sale of Surplus Materials 249 0 0 0
TOTAL MISCELLANEOUS REVENUE 91,409 41,837 62,654 34,858
OTHER SOURCES
38891 Fund Balance Appropriated 0 0 0 0
38950 Contribution/Customer Dev 0 542,538 0 0
TOTAL OTHER SOURCES 0 542,538 0 0
TOTAL RESOURCES 1,661,343 2,369,387 1,754,762 1,699,040

Fiscal Year 2021 - 22 Annual Budget
431
Stormwater
Fund
Division
Summary of
Appropriations
Division Summary of Appropriations
ACTUAL ACTUAL ADOPTED ADOPTED
2018-19 2019-20 2020-21 2021-22
5171 STORMWATER
Personal Services 367,380 183,689 356,056 335,252
Operating Expenses 1,335,984 363,279 359,045 383,877
TOTAL STORMWATER 1,703,364 546,968 715,101 719,129
7088 OTHER
Operating Expenses 461,678 471,570 479,262 494,776
Other Uses 0 0 20,399 15,135
TOTAL OTHER 461,678 471,570 499,661 509,911
7099 CAPITAL PROJECTS
Personal Services 0 0 0 0
Operating Expenses (2,926) 64,207 0 100,000
Capital Outlay 347,701 1,530,253 540,000 370,000
Other Uses (344,776) (1,594,459) 0 0
TOTAL CAPITAL PROJECTS (1) 1 540,000 470,000
GRAND TOTAL
Personal Services 367,380 183,689 356,056 335,252
Operating Expenses 1,794,736 899,056 838,307 978,653
Capital Outlay 347,701 1,530,253 540,000 370,000
Other Uses (344,776) (1,594,459) 20,399 15,135
TOTAL APPROPRIATIONS 2,165,041 1,018,539 1,754,762 1,699,040

Fiscal Year 2021 - 22 Annual Budget
432
Stormwater
Fund
Goals & Tasks
Stormwater
Division
Goals & Tasks
Goal: Eliminate blight and stimulate growth by investing in neighborhood redevelopment, while also
pursuing new economic opportunities.
Task:
Continue to cleanup the stormwater ponds
Maintain National Pollutant Discharge Elimination System (NPDES) permit compliance
Meet Federal Department of Environmental Protection (FDEP) basin management action plan
Improve the quality of water discharged in City lakes
Maintain stormwater infrastructure
Major Accomplishments:
Completed Stormwater Master Plan update
Completed Venetian Center canal and pond cleanup
Design of Stormwater Improvement projects from Marshall Drive, North Shore Drive, West Main
Street and South Lone Oak Drive
Performance Measures:
2019-20 2020-21 2021-22
Streets swept (miles) 4,100 4,800 4,850
Swept debris collected (cubic yards) 1,100 2,000 2,100
Main lines cleaned (feet) 1,200 1,500 1,600
Ditches/swales/pond banks restored (linear feet) 400,000 500,000 500,000
Inlets cleaned 1,300 1,000 1,100

Fiscal Year 2021 - 22 Annual Budget
433
Stormwater
Fund
Stormwater
Division
Personnel
Schedule
Personnel Schedule
Classification 2021 Change 2022 Amount
Director of Public Works 1 0.15 0.00 0.15 17,506
Crew Leader 2 0.33 0.00 0.33 16,556
Customer Relations Specialist 3 0.20 0.00 0.20 7,975
Operations Supervisor 4 0.33 0.00 0.33 20,112
Stormwater Tech Apprentice 1.00 2.00 3.00 84,927
Stormwater Tech A 1.00 (1.00) 0.00 0
Stormwater Tech C 3.00 (1.00) 2.00 66,060
Total 6.01 0.00 6.01 213,136
Notes: Allocations
Director of Public Works 1
Crew Leader 2
33%-5171, 67%-4081
Customer Relations Specialist 3
20%-5171, 80%-3021
Operations Supervisor 4
33%-5171, 67%-4081
25%-5197, 25%-3021, 25%-4021, 15%-5171, 5%-5143, 5%-5144

Fiscal Year 2021 - 22 Annual Budget
434
Stormwater
Fund
Appropriations
Detail
Appropriations Detail Account # 014-5171-537
Stormwater
Division
ACTUAL ACTUAL ADOPTED ADOPTED2018-19 2019-20 2020-21 2021-22
PERSONAL SERVICES12xx Regular Salaries & Wages 202,964 167,367 222,977 213,1361410 Overtime 7,270 1,776 5,000 5,0001641 Vacation/Terms & Buyout 1,760 6,349 0 02110 FICA 14,321 11,412 14,821 14,210221x Retirement 18,949 17,712 19,317 18,47223xx Insurance 63,724 60,681 84,255 75,2242410 Workers' Compensation 8,924 7,109 8,931 8,460262x Other Payroll Benefits 49,468 (88,717) 755 750
TOTAL PERSONAL SERVICES 367,380 183,689 356,056 335,252
OPERATING EXPENSES31xx Professional Services 20,506 16,251 20,500 21,0003410 Contract Services 1,010,858 98,030 84,000 104,0004010 Travel 2,694 0 3,000 3,0004110 Communication 184 119 1,050 1,4084210 Postage 67 0 300 3004310 Utilities 138 0 0 04410 Rentals 2,098 4,108 2,000 18,0004415 Internal Fleet Lease 110,226 115,689 87,902 80,6004510 Insurance 9,656 10,543 15,631 10,914461x Repairs & Maintenance- Vehicles 105,197 77,770 87,232 82,695462x Repairs & Maintenance- Non-Build 10,211 4,802 16,500 16,500463x Repairs & Maintenance- Equip 461 160 660 66049xx Other Current Charges 281 57 250 2504945 Injury/ Damage to Others 3,316 0 2,500 2,5004950 Uncollectible Accounts 38 6,461 0 05180 Minor Furniture/Equipment 4,225 1,158 3,000 3,0005210 Operating Supplies 30,385 4,963 6,500 6,5005215 Uniforms 1,949 1,903 2,275 3,8055230 Fuel Purchases 21,626 19,019 22,000 24,0005410 Publications & Memberships 30 72 125 1255520 Training 1,838 2,174 3,620 4,620
TOTAL OPERATING EXPENSES 1,335,984 363,279 359,045 383,877
TOTAL APPROPRIATIONS 1,703,364 546,968 715,101 719,129

Fiscal Year 2021 - 22 Annual Budget
435
Stormwater
Fund
Summary of
Appropriations
Appropriations Summary
Stormwater
Division
ADOPTED ADOPTED INCREASE/
2020-21 2021-22 (DECREASE) PERCENTAGE
Personal Services 356,056 335,252 (20,804) -5.84%
Operating Expenses 359,045 383,877 24,832 6.92%
TOTALS 715,101 719,129 4,028 0.56%
Significant Budget Changes:
The increase in Operating Expenses is related to Contract Services (3410).

Fiscal Year 2021 - 22 Annual Budget
436
Stormwater
Fund
Appropriations Detail Account # 014-7088-537
Appropriations
Detail
Other
ACTUAL ACTUAL ADOPTED ADOPTED
2018-19 2019-20 2020-21 2021-22
OPERATING EXPENSES
4950 Uncollectible Accounts 5,000 5,000 5,000 5,000
5001 Cost Allocation- City Commission 2,025 2,969 3,643 3,536
5002 Cost Allocation- City Manager 10,784 14,405 12,361 11,784
5003 Cost Allocation- City Clerk 3,795 4,276 4,363 4,476
5004 Cost Allocation- City Attorney 944 700 995 920
5005 Cost Allocation- Accounting 13,988 17,051 19,916 19,468
5006 Cost Allocation- Customer Service 55,755 57,423 63,640 62,601
5007 Cost Allocation- Purchasing 25,338 2,879 11,756 5,917
5008 Cost Allocation- Warehouse 743 779 1,066 1,125
5009 Cost Allocation- Human Resources 3,341 3,652 3,598 3,730
5010 Cost Allocation- IT 44,781 44,268 52,598 53,239
5011 Cost Allocation- GIS 32,857 36,511 37,314 39,757
5013 Cost Allocation- Facilities 3,309 3,171 3,012 3,223
5910 Depreciation Expense 259,018 278,486 260,000 280,000
TOTAL OPERATING EXPENSES 461,678 471,570 479,262 494,776
OTHER USES
9160 Reserve/ Future Capital 0 0 20,399 15,135
TOTAL OTHER USES 0 0 20,399 15,135
TOTAL APPROPRIATIONS 461,678 471,570 499,661 509,911

Fiscal Year 2021 - 22 Annual Budget
437
Stormwater
Fund
Appropriations Summary
Other
Appropriations
Summary
ADOPTED ADOPTED INCREASE/
2020-21 2021-22 (DECREASE) PERCENTAGE
Operating Expenses 479,262 494,776 15,514 3.24%
Other Uses 20,399 15,135 (5,264) -25.81%
TOTALS 499,661 509,911 10,250 2.05%
Significant Budget Changes:
The increase in Operating Expenses is attributable to increased Depreciation Expense (5910). Other
Uses decreased due to a reduction in Reserve/Future Capital (9160).

Fiscal Year 2021 - 22 Annual Budget
438
Stormwater
Fund
Appropriations Detail Account # 014-7099-537
Appropriations
Detail
Capital
Projects
ACTUAL ACTUAL ADOPTED ADOPTED2018-19 2019-20 2020-21 2021-22
OPERATING EXPENSES31xx Professional Services (2,926) 64,207 0 100,000
TOTAL OPERATING EXPENSES (2,926) 64,207 0 100,000
CAPITAL OUTLAY6110 Land Costs 278 53 0 06210 Buildings 79 0 0 06310 Improvements Other Than Bldgs 347,344 1,530,200 540,000 350,0006410 Machinery & Equipment 0 0 0 20,000
TOTAL CAPITAL OUTLAY 347,701 1,530,253 540,000 370,000
OTHER USES9999 WIP Contra (344,776) (1,594,459) 0 0
TOTAL OTHER USES (344,776) (1,594,459) 0 0
TOTAL APPROPRIATIONS (1) 1 540,000 470,000

Fiscal Year 2021 - 22 Annual Budget
439
Stormwater
Fund
Appropriations Summary
Capital
Projects
Appropriations
Summary
ADOPTED ADOPTED INCREASE/
2020-21 2021-22 (DECREASE) PERCENTAGE
Operating Expenses 0 100,000 100,000 100.00%
Capital Outlay 540,000 370,000 (170,000) -31.48%
TOTALS 540,000 470,000 (70,000) -12.96%

Fiscal Year 2021 - 22 Annual Budget
440
Stormwater
Fund
Project
Schedule
Capital
Projects
Project Schedule
140002 Drainage Improvements ($450,000)
Curbs, gutters & inlets Current Revenue 25,000
Lake Hollywood Design Current Revenue 100,000
Canal St. & Hwy 441 (Paulings) Current Revenue 200,000
Lake Robinhood Improvements Current Revenue 125,000
140004 Equipment
Harvesting Machine Current Revenue 20,000
TOTAL 470,000
Current Revenue 470,000
TOTAL 470,000

Fiscal Year 2021 - 22 Annual Budget
441
Police
Pension
Trust
POLICE PENSION TRUST
The Municipal Police Pension Trust covers police officers (other police department employees are covered in the General Employee 401(a) Plan). The actuarial funding rate as a percentage of pensionable wages is 24.29% for the fiscal year 2021-22 budget. Employees contribute 7.65% of their annual compensation, including overtime and educational incentive pay. The State of Florida collects and remits a 1% excise tax on gross premiums from casualty insurance policies covering property within the corporate limits to the fund pursuant to the provisions of Chapter 185, Florida Statutes. The City must fund any actuarial shortfalls associated with the plan. The fiscal year 2021-22 actuarial shortfall is projected to be 11.03% of pensionable wages, or $600,339. Participants who have completed ten years of credited service are 100% vested in plan benefits at age 45 or later, reduced by 3% per year for each year they retire before their normal retirement date. Participants whose service is terminated prior to completing ten years of credited service are entitled to the return of their employee contributions without interest. Normal retirement benefits are payable to participants who have reached the earlier of age 50 with 25 years of credited service, or age 55 with 10 years of credited service. Such benefits are payable at a rate of 2% of average final compensation times the number of years of credited service. The plan also provides for early retirement, disability retirement and death benefits at rates defined in the plan document. The investment return for Fiscal Year 2019-20 of 9.10% was more than the actuarial assumption of 7.40% or a difference of 1.70%. The City’s Police, Fire and General Employee pension plans will require contributions of $600,339, $867,105 and $1,135,409, respectively.
Description
Total
Department
Budget
$ 1,963,389
$0
$100,000
$200,000
$300,000
$400,000
$500,000
$600,000
$700,000
$800,000
2012 2013 2014 2015 2016 2017 2018 2019 2020 2021 2022
Employer Contributions to Plan
0%
2%
4%
6%
8%
10%
12%
14%
16%
2012 2013 2014 2015 2016 2017 2018 2019 2020 2021 2022
% of Payroll

Fiscal Year 2021 - 22 Annual Budget
442
Police
Pension
Trust
Revenue
Sources &
Appropriations
Revenue Sources and Appropriations
ACTUAL ACTUAL ADOPTED ADOPTED
2018-19 2019-20 2020-21 2021-22
REVENUE SOURCES
Taxes 213,641 227,475 213,641 227,475
Miscellaneous Revenue 2,202,533 2,944,078 1,695,131 1,735,914
TOTAL REVENUE SOURCES 2,416,174 3,171,553 1,908,772 1,963,389
APPROPRIATIONS
Police Pension Trust 1,410,222 1,122,913 1,908,772 1,963,389
TOTAL APPROPRIATIONS 1,410,222 1,122,913 1,908,772 1,963,389

Fiscal Year 2021 - 22 Annual Budget
443
Police
Pension
Trust
Revenue
Detail
Revenue Detail
ACTUAL ACTUAL ADOPTED ADOPTED
2018-19 2019-20 2020-21 2021-22
TAXES
31252 Insurance Premium Tax (State) 213,641 227,475 213,641 227,475
TOTAL TAXES 213,641 227,475 213,641 227,475
MISCELLANEOUS REVENUE
36111 Miscellaneous Interest 154,046 150,784 155,000 155,000
361xx Gain/Loss Investments 1,010,954 1,837,613 600,000 600,000
36801 Employee Contributions 328,464 314,104 368,686 380,575
36802 Employer Contributions 626,706 542,732 571,445 600,339
36909 Other Income 82,363 98,845 0 0
TOTAL MISCELLANEOUS REVENUE 2,202,533 2,944,078 1,695,131 1,735,914
TOTAL RESOURCES 2,416,174 3,171,553 1,908,772 1,963,389

Fiscal Year 2021 - 22 Annual Budget
444
Appropriations
Detail
Police
Pension
Trust
Appropriations Detail Account # 061-1310-51x
ACTUAL ACTUAL ADOPTED ADOPTED
2018-19 2019-20 2020-21 2021-22
OPERATING EXPENSES
311x Professional Services 99,138 123,674 113,500 122,000
3610 Retirement Benefit Payment 966,399 924,307 975,000 950,000
3611 Refund of Contributions 344,685 74,932 150,000 150,000
TOTAL OPERATING EXPENSES 1,410,222 1,122,913 1,238,500 1,222,000
OTHER USES
9940 Reserve For Employee Benefits 0 0 670,272 741,389
TOTAL OTHER USES 0 0 670,272 741,389
TOTAL APPROPRIATIONS 1,410,222 1,122,913 1,908,772 1,963,389

Fiscal Year 2021 - 22 Annual Budget
445
Firefighter’s
Pension
Trust
FIREFIGHTERS’ PENSION TRUST
The Municipal Firefighters’ Retirement Trust Fund covers firefighters. The actuarial funding rate as a percentage of pensionable wages is 43.8% for the fiscal year 2021-22 budget. Firefighters contribute 6.5% of their annual compensation to the plan. The State of Florida remits a 1% excise tax on fire insurance premiums sold within the corporate limits of the City to the fund pursuant to the provisions of Chapter 175, Florida Statutes. The City is required to fund any actuarial shortfall associated with the plan. The fiscal year 2021-22 actuarial shortfall is projected to be 31.73% of pensionable wages, or $867,105.
Participants who have completed ten years of credited service are 100% vested in their accrued retirement benefits. Participants whose service is terminated prior to completing ten years of credited service are entitled to the return of their contributions plus interest at the rate of 5% compounded annually. Normal retirement benefits are payable to participants who have reached the earlier of age 52 with 25 years of credited service, or age 55 with ten years of credited service. Such benefits are payable at a rate of 3% of average final monthly compensation times the number of years of credited service. The plan also provides for early retirement, disability retirement, and death benefits at rates defined in the plan document. The investment return for Fiscal Year 2019-20 of 12.19% was more than the actuarial assumption of 7.5% or a difference of 4.69%. The City’s Police, Fire and General Employee pension plans will require contributions of $600,339, $867,105 and $1,135,409, respectively.
Description
Total
Department
Budget
$ 1,676,985
$0
$200,000
$400,000
$600,000
$800,000
$1,000,000
2012 2013 2014 2015 2016 2017 2018 2019 2020 2021 2022
Employer Contributions to Plan
0%
5%
10%
15%
20%
25%
30%
35%
2012 2013 2014 2015 2016 2017 2018 2019 2020 2021 2022
% of Payroll

Fiscal Year 2021 - 22 Annual Budget
446
Firefighter’s
Pension
Trust
Revenue
Sources &
Appropriations
Revenue Sources and Appropriations
ACTUAL ACTUAL ADOPTED ADOPTED
2018-19 2019-20 2020-21 2021-22
REVENUE SOURCES
Taxes 144,627 152,264 144,627 152,264
Miscellaneous Revenue 1,760,507 3,478,833 1,490,420 1,524,721
TOTAL REVENUE SOURCES 1,905,134 3,631,097 1,635,047 1,676,985
APPROPRIATIONS
Fire Pension Trust 1,439,857 1,440,654 1,635,047 1,676,985
TOTAL APPROPRIATIONS 1,439,857 1,440,654 1,635,047 1,676,985

Fiscal Year 2021 - 22 Annual Budget
447
Firefighter’s
Pension
Trust
Revenue
Detail
Revenue Detail
ACTUAL ACTUAL ADOPTED ADOPTED
2018-19 2019-20 2020-21 2021-22
TAXES
31251 Insurance Premium Tax (State) 144,627 152,264 144,627 152,264
TOTAL TAXES 144,627 152,264 144,627 152,264
MISCELLANEOUS REVENUE
36111 Miscellaneous Interest 181,137 167,963 182,000 180,000
361xx Salem Trust/ ICC 619,993 2,273,069 320,000 300,000
36801 Employee Contributions 166,141 177,275 162,178 177,616
36820 Salem Trust 658,780 760,104 826,242 867,105
36909 Other Income 134,456 100,422 0 0
TOTAL MISCELLANEOUS REVENUE 1,760,507 3,478,833 1,490,420 1,524,721
TOTAL RESOURCES 1,905,134 3,631,097 1,635,047 1,676,985

Fiscal Year 2021 - 22 Annual Budget
448
Appropriations
Detail
Firefighter’s
Pension
Trust
Appropriations Detail Account # 062-1320-51x
ACTUAL ACTUAL ADOPTED ADOPTED
2018-19 2019-20 2020-21 2021-22
OPERATING EXPENSES
311x Professional Services 171,540 160,795 183,000 175,000
3610 Retirement Benefit Payment 1,179,132 1,239,160 1,180,000 1,250,000
3611 Refund of Contributions 89,185 40,699 90,000 90,000
TOTAL OPERATING EXPENSES 1,439,857 1,440,654 1,453,000 1,515,000
OTHER USES
9940 Reserve For Employee Benefits 0 0 182,047 161,985
TOTAL OTHER USES 0 0 182,047 161,985
TOTAL APPROPRIATIONS 1,439,857 1,440,654 1,635,047 1,676,985

Fiscal Year 2021 - 22 Annual Budget
449
General
Employees’
Pension
Trust
Fund
GENERAL EMPLOYEES’ PENSION TRUST FUND
The General Employees’ Pension Plan was frozen as of September 30, 2008. Members of the plan will continue to accrue vesting rights in the plan however; benefits were frozen as of September 30, 2008. New members are no longer added to the plan. The City is required to fund any actuarial shortfalls associated with the plan. The fiscal year 2021-22 actuarial shortfall is projected to be 14.82%, or $1,135,409. The City of Leesburg Retirement plan for General Employees is a 100% employer contributory defined benefit plan. It covers all full time permanent employees as a condition of employment except firefighters. Participants in the plan who have completed five years of credited service are 100% vested in the plan. Normal retirement benefits are paid to participants who have reached age 65 and who have completed five years of credited service. Benefits are payable at the rate of 2% of average compensation times the number of years of credited service prior to October 1, 2008 up to a maximum of 45 years. The plan provides for early retirement, late retirement, disability retirement, and death benefits at rates defined in the plan document. In addition, the plan also provides for an annual 2% COLA beginning three years after normal retirement age. The City accrues and contributes an amount, as determined by the plan actuary, to fund the annual, normal cost and prior service cost using the entry age normal method amortized over thirty years. The investment return for Fiscal Year 2019-20 of 3.95% was less than the actuarial assumption of 7.25% or a difference of 3.3%. The City’s Police, Fire and General Employee pension plans will require contributions of $600,339, $867,105 and $1,135,409, respectively.
Description
Total
Department
Budget
$ 3,245,409
$0
$200,000
$400,000
$600,000
$800,000
$1,000,000
$1,200,000
$1,400,000
$1,600,000
2012 2013 2014 2015 2016 2017 2018 2019 2020 2021 2022
Employer Contributions to Plan
0%
2%
4%
6%
8%
10%
12%
14%
16%
2012 2013 2014 2015 2016 2017 2018 2019 2020 2021 2022
% of Payroll

Fiscal Year 2021 - 22 Annual Budget
450
Revenue
Sources &
Appropriations
Revenue Sources and Appropriations
General
Employees’
Pension
Trust
Fund
ACTUAL ACTUAL ADOPTED ADOPTED
2018-19 2019-20 2020-21 2021-22
REVENUE SOURCES
Miscellaneous Revenue 2,297,253 2,708,513 3,335,414 3,245,409
Other Sources 0 0 0 0
TOTAL REVENUE SOURCES 2,297,253 2,708,513 3,335,414 3,245,409
APPROPRIATIONS
General Employees Pension Trust 2,967,510 2,993,464 3,335,414 3,245,409
TOTAL APPROPRIATIONS 2,967,510 2,993,464 3,335,414 3,245,409

Fiscal Year 2021 - 22 Annual Budget
451
Revenue
Detail
Revenue Detail
General
Employees’
Pension
Trust
Fund
ACTUAL ACTUAL ADOPTED ADOPTED
2018-19 2019-20 2020-21 2021-22
MISCELLANEOUS REVENUE
361xx Miscellaneous Interest 649,347 599,649 650,000 610,000
36130 Gain/Loss Sale Investment (724,921) (750,478) 500,000 0
36140 Gain/Loss Sale of Security 1,255,670 1,829,609 1,275,000 1,500,000
36802 Employer Contributions 1,065,288 1,028,808 910,414 1,135,409
36909 Other Income 51,869 925 0 0
TOTAL MISCELLANEOUS REVENUE 2,297,253 2,708,513 3,335,414 3,245,409
OTHER SOURCES
38891 Fund Balance Appropriated 0 0 0 0
TOTAL OTHER SOURCES 0 0 0 0
TOTAL RESOURCES 2,297,253 2,708,513 3,335,414 3,245,409

Fiscal Year 2021 - 22 Annual Budget
452
Appropriations
Detail
Appropriations Detail Account # 063-1330-51x
General
Employees’
Pension
Trust
Fund
ACTUAL ACTUAL ADOPTED ADOPTED
2018-19 2019-20 2020-21 2021-22
OPERATING EXPENSES
311x Professional Services 78,157 79,702 80,000 80,000
3114 Financial Investment 201,318 200,055 205,000 205,000
3610 Retirement Benefit Payment 2,688,035 2,666,556 2,700,000 2,700,000
3611 Refund of Contributions 0 47,151 35,000 35,000
TOTAL OPERATING EXPENSES 2,967,510 2,993,464 3,020,000 3,020,000
OTHER USES
9940 Reserve For Employee Benefits 0 0 315,414 225,409
TOTAL OTHER USES 0 0 315,414 225,409
TOTAL APPROPRIATIONS 2,967,510 2,993,464 3,335,414 3,245,409

Fiscal Year 2021 - 22 Annual Budget
453
Health
Insurance
Fund
HEALTH INSURANCE FUND
Effective October 1, 1984, the City established a self-insurance program for the payment of employee health and medical claims. For a period from October 1, 1999 through May 31, 2000 the City elected to change to a fully insured program. Effective June 1, 2000, the City returned to a self-insurance program that provides for the payment of City and employee contributions into a self-insurance fund, which is managed by the City, a third party administrator, and a local insurance agent. The fund is operated on a cost reimbursement or break even basis. The City’s specific stop loss coverage provides that claims in excess of $165,000, up to an unlimited maximum per covered individual per year, are paid by the reinsurer. The aggregate stop loss reinsurance policy indemnifies the City up to $1,000,000 if total claims paid during the year exceed the aggregate attachment point, which is calculated as a moving monthly average (to compensate for the number of covered individuals in the program). 2021-22 fiscal year monthly rates have increased as follows: Blue Options Plan
Blue Care Plan
Employee deductions for health care coverage are paid on a pre-tax basis unless the employee elects not to have the benefit deducted pre-tax. Retirees pay the same rate monthly rates listed above. Supplemental coverage is offered to participants over age 65 at the following rate. The city pays $400.00 of eligible Retiree cost only.
Additionally, the City currently offers the following options for employees:
➢ Dental ➢ Vision ➢ Flexible Spending Account ➢ Other Ancillary Products
Type of Coverage City
Contribution Employee
Deduction Total Monthly
Cost Employee Only $761.85 $110.00 $871.85 Employee and Children $942.23 $287.81 $1,230.04 Employee and Spouse $949.22 $315.80 $1,265.02 Employee and Family $1,218.62 $403.15 $1,621.77
Type of Coverage Monthly Cost Retiree Supplemental $697.48 Child Supplemental $1,055.67
Spouse Supplemental $1,090.65
Family Supplemental $1,447.40
Description
Total
Department
Budget
$ 7,500,000
Type of Coverage City
Contribution Employee
Deduction Total Monthly
Cost Employee Only $719.41 $65.00 $784.41 Employee and Children $907.73 $235.31 $1,143.04 Employee and Spouse $926.22 $252.80 $1,179.02 Employee and Family $1,195.62 $340.16 $1,535.78

Fiscal Year 2021 - 22 Annual Budget
454
Description,
Revenue
Sources &
Appropriations
Revenue Sources and Appropriations
Health
Insurance
Fund
Health Insurance Fund Description (Continued)
The city opened a Wellness Center during the second quarter of fiscal year 2010-11 and has aggressively campaigned to capture employee participation. Employees, retirees, and dependents utilizing the City’s Wellness facility do not pay for their doctor visits, pharmacy or lab work.
ACTUAL ACTUAL ADOPTED ADOPTED
2018-19 2019-20 2020-21 2021-22
REVENUE SOURCES
Charges for Services 6,568,452 6,266,637 6,845,565 7,077,925
Miscellaneous Revenue 445,039 418,964 423,000 422,075
Other Sources/Installment 0 204,183 0 0
TOTAL REVENUE SOURCES 7,013,491 6,889,784 7,268,565 7,500,000
APPROPRIATIONS
Health Insurance 6,063,111 6,726,997 6,409,096 6,654,581
Wellness Center 769,684 692,751 859,469 845,419
TOTAL APPROPRIATIONS 6,832,795 7,419,748 7,268,565 7,500,000
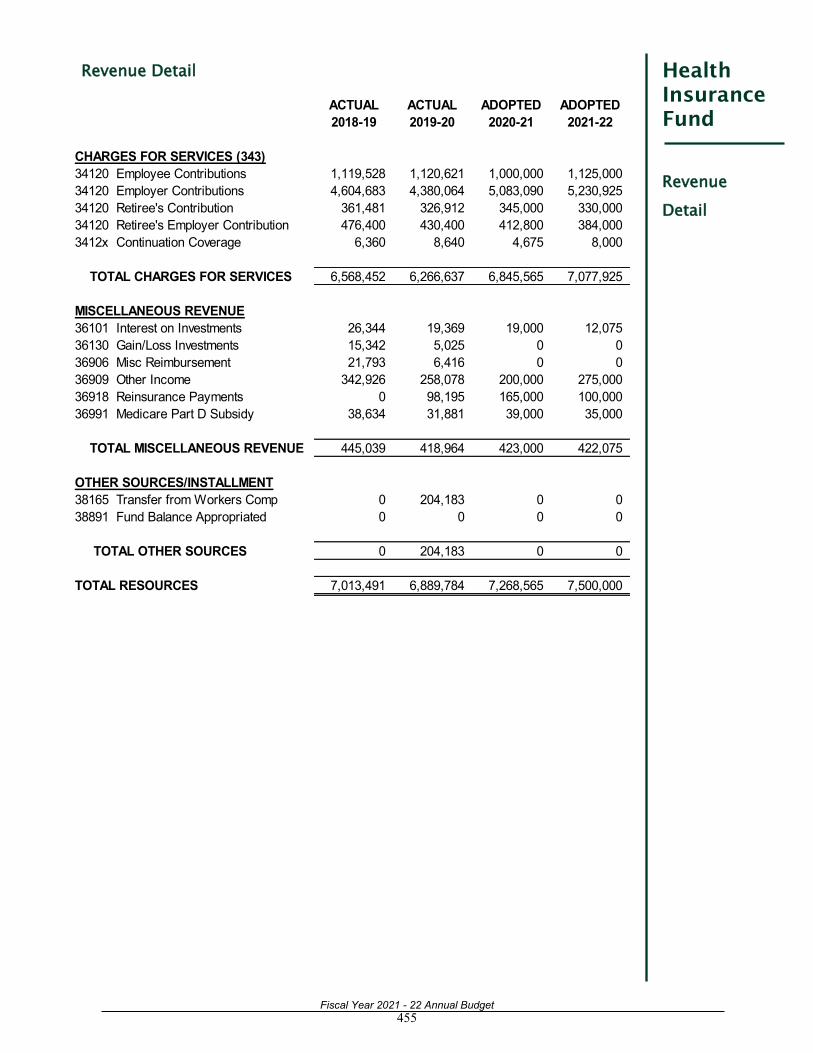
Fiscal Year 2021 - 22 Annual Budget
455
Revenue
Detail
Revenue Detail Health
Insurance
Fund
ACTUAL ACTUAL ADOPTED ADOPTED
2018-19 2019-20 2020-21 2021-22
CHARGES FOR SERVICES (343)
34120 Employee Contributions 1,119,528 1,120,621 1,000,000 1,125,000
34120 Employer Contributions 4,604,683 4,380,064 5,083,090 5,230,925
34120 Retiree's Contribution 361,481 326,912 345,000 330,000
34120 Retiree's Employer Contribution 476,400 430,400 412,800 384,000
3412x Continuation Coverage 6,360 8,640 4,675 8,000
TOTAL CHARGES FOR SERVICES 6,568,452 6,266,637 6,845,565 7,077,925
MISCELLANEOUS REVENUE
36101 Interest on Investments 26,344 19,369 19,000 12,075
36130 Gain/Loss Investments 15,342 5,025 0 0
36906 Misc Reimbursement 21,793 6,416 0 0
36909 Other Income 342,926 258,078 200,000 275,000
36918 Reinsurance Payments 0 98,195 165,000 100,000
36991 Medicare Part D Subsidy 38,634 31,881 39,000 35,000
TOTAL MISCELLANEOUS REVENUE 445,039 418,964 423,000 422,075
OTHER SOURCES/INSTALLMENT
38165 Transfer from Workers Comp 0 204,183 0 0
38891 Fund Balance Appropriated 0 0 0 0
TOTAL OTHER SOURCES 0 204,183 0 0
TOTAL RESOURCES 7,013,491 6,889,784 7,268,565 7,500,000

Fiscal Year 2021 - 22 Annual Budget
456
Personnel
Schedule
Health
Insurance
Fund
Health
Insurance
Personnel Schedule
Classification 2021 Change 2022 Amount
Benefits & Compensation Coordinator1 0.30 0.00 0.30 15,007
Director of Human Resources2 0.50 0.00 0.50 40,477
Total 0.80 0.00 0.80 55,484
Note: Allocations
Benefits & Compensation Coordinator1
70%-1437, 30%-1340
Director of Human Resources2
50%-1437, 50%-1340

Fiscal Year 2021 - 22 Annual Budget
457
Appropriations Detail Account # 064-1340-519 Health
Insurance
Fund
Health
Insurance
Appropriations
Detail
ACTUAL ACTUAL ADOPTED ADOPTED
2018-19 2019-20 2020-21 2021-22
PERSONAL SERVICES
1210 Regular Salaries & Wages 52,063 53,779 54,958 55,484
1410 Overtime 1,249 612 0 0
1641 Vacation/Terms & Buyout 1,298 464 0 0
2110 FICA 4,047 4,057 4,070 4,140
221x Retirement 2,570 2,657 2,748 2,830
23xx Insurance 4,945 4,999 5,658 5,824
2410 Workers' Compensation 152 153 154 159
26xx Other Employee Benefits (16,807) 1,462 1,508 1,378
TOTAL PERSONAL SERVICES 49,517 68,183 69,096 69,815
OPERATING EXPENSES
3110 Professional Services 302,172 315,872 315,000 320,000
4540 Insurance Premiums 401,853 409,683 425,000 425,000
4570 Insurance Claims 3,664,261 4,288,861 4,000,000 4,239,766
4572 Prescription Claims 1,627,831 1,539,477 1,600,000 1,600,000
4575 IBNR 17,477 104,921 0 0
TOTAL OPERATING EXPENSES 6,013,594 6,658,814 6,340,000 6,584,766
OTHER USES
9940 Reserve for Employee Benefits 0 0 0 0
TOTAL OTHER USES 0 0 0 0
TOTAL APPROPRIATIONS 6,063,111 6,726,997 6,409,096 6,654,581

Fiscal Year 2021 - 22 Annual Budget
458
Appropriations
Detail
Appropriations Detail Account # 064-1341-519 Health
Insurance
Fund
Wellness
Center
ACTUAL ACTUAL ADOPTED ADOPTED
2018-19 2019-20 2020-21 2021-22
OPERATING EXPENSES
3110 Professional Services 217,645 186,944 226,889 226,889
3410 Contract Services 392,273 363,729 459,850 459,850
4110 Communication 5,810 6,525 5,900 6,600
4310 Utilities 2,627 2,547 2,650 2,650
46xx Repairs & Maint Office Equip 3,460 3,460 3,680 3,430
4920 Other Current Charges 184 158 500 1,000
5180 Minor Furniture/Equipment 430 1,577 0 0
5210 Operating Supplies 65,102 51,749 75,000 60,000
5218 Pharmaceuticals 82,153 76,062 85,000 85,000
TOTAL OPERATING EXPENSES 769,684 692,751 859,469 845,419
TOTAL APPROPRIATIONS 769,684 692,751 859,469 845,419

Fiscal Year 2021 - 22 Annual Budget
459
WORKERS’ COMPENSATION INSURANCE FUND
The City maintains a self-funded Workers’ Compensation program that is used to pay wage loss and medical benefits to employees that have sustained an on-the-job injury or illness in compliance with Florida Statutes, Chapter 440. The City self-funds claims up to a self-insurance retention (SIR) level of $500,000 per claim and then purchases excess workers’ compensation insurance to protect itself from the financial impact of catastrophic claims. In addition, the City contracts with a third party claims administrator (TPA) that provides claims administration, risk control services, litigation and medical case management, medical claims review, and state and federal reporting. Each year, the City obtains an actuarial review of its workers’ compensation insurance fund in order to assure the adequacy of the fund. Because of the volatility inherent in a self-funded workers’ compensation program, the City elects to fund their expected liabilities at a very conservative 90% probability level in order to maintain the integrity and stability of its workers’ compensation insurance fund.
Workers’
Compensation
Insurance
Fund
Description
Total
Department
Budget
$ 672,050

Fiscal Year 2021 - 22 Annual Budget
460
Revenue
Sources &
Appropriations
Revenue Sources and Appropriations Workers’
Compensation
Insurance
Fund
ACTUAL ACTUAL ADOPTED ADOPTED
2018-19 2019-20 2020-21 2021-22
REVENUE SOURCES
Charges for Services 632,441 645,119 634,017 659,550
Miscellaneous Revenue 68,682 70,263 25,000 12,500
Other Sources 0 0 0 0
TOTAL REVENUE SOURCES 701,123 715,382 659,017 672,050
APPROPRIATIONS
Workers' Compensation Administration 638,324 774,465 659,017 672,050
TOTAL APPROPRIATIONS 638,324 774,465 659,017 672,050

Fiscal Year 2021 - 22 Annual Budget
461
Revenue
Detail
Revenue Detail Workers’
Compensation
Insurance
Fund
ACTUAL ACTUAL ADOPTED ADOPTED
2018-19 2019-20 2020-21 2021-22
CHARGES FOR SERVICES
2020 Employer Contributions 632,441 645,119 634,017 659,550
TOTAL CHARGES FOR SERVICES 632,441 645,119 634,017 659,550
MISCELLANEOUS REVENUE
36101 Interest on Investments 34,409 30,196 25,000 12,500
36130 Gain/Loss Investments 19,163 10,323 0 0
36909 Other Income 591 29,744 0 0
36919 Subrogation Payments 14,519 0 0 0
TOTAL MISCELLANEOUS REVENUE 68,682 70,263 25,000 12,500
OTHER SOURCES
38891 Fund Balance Appropriated 0 0 0 0
TOTAL OTHER SOURCES 0 0 0 0
TOTAL RESOURCES 701,123 715,382 659,017 672,050

Fiscal Year 2021 - 22 Annual Budget
462
Personnel
Schedule
Workers’
Compensation
Insurance
Fund
Personnel Schedule
Classification 2021 Change 2022 Amount
Finance Director1 0.15 0.00 0.15 17,831
Payroll & Risk Technician2 0.50 0.00 0.50 22,392
Total 0.65 0.00 0.65 40,222
Note: Allocations
Finance Director1
15%-1350, 85%-1331
Payroll & Risk Technician2
50%-1350, 50%-1331

Fiscal Year 2021 - 22 Annual Budget
463
Appropriations Detail Account # 065-1350-519 Workers’
Compensation
Insurance
Fund
Appropriations
Detail
ACTUAL ACTUAL ADOPTED ADOPTED
2018-19 2019-20 2020-21 2021-22
PERSONAL SERVICES
1210 Regular Salaries & Wages 29,782 38,289 38,749 40,222
1410 Overtime 23 0 0 0
1530 Bonuses/Incentives 359 505 0 0
1641 Vacation/Terms & Buyout 846 1,661 0 0
2110 FICA 2,242 2,833 2,731 2,812
22xx Retirement 1,496 1,914 1,953 2,011
23xx Insurance 5,221 6,571 7,403 7,622
2410 Workers' Compensation 87 113 109 113
26xx Other Employee Benefits (8,610) 533 528 522
TOTAL PERSONAL SERVICES 31,446 52,419 51,473 53,302
OPERATING EXPENSES
3110 Professional Services 60,455 42,898 60,000 60,000
4540 Insurance Premiums 115,199 96,748 115,000 120,000
4570 Insurance Claims 423,147 372,607 375,000 375,000
4580 Self Insurance Assessment 8,077 5,610 15,000 10,000
TOTAL OPERATING EXPENSES 606,878 517,863 565,000 565,000
OTHER USES
9565 Transfer to Health Insurance Fund 0 204,183 0 0
9940 Reserve for Employee Benefits 0 0 42,544 53,748
TOTAL OTHER USES 0 204,183 42,544 53,748
TOTAL APPROPRIATIONS 638,324 774,465 659,017 672,050

This page intentionally left blank
Fiscal Year 2021 - 22 Annual Budget
464

Fiscal Year 2021 - 22 Annual Budget
465
Risk
Management
Fund
Description
Total
Department
Budget
$ 876,886
RISK MANAGEMENT FUND
The City has established a Risk Management Fund which charges the various departments an Insurance fee for all costs related to General Liability, Excess Liability, Property/Casualty, Auto Physical Damage, Public Official and Employment Practices Liability. Risk management charges the departments based on factors such as number of vehicles, value of assets, and operating budget.

Fiscal Year 2021 - 22 Annual Budget
466
Revenue
Sources &
Appropriations
Revenue Sources and Appropriations Risk
Management
Fund ACTUAL ACTUAL ADOPTED ADOPTED
2018-19 2019-20 2020-21 2021-22
REVENUE SOURCES
Charges for Services 678,884 775,160 896,801 876,886
Miscellaneous Revenue 4,261 2,865 0 0
TOTAL REVENUE SOURCES 683,145 778,025 896,801 876,886
APPROPRIATIONS
Insurance 693,990 775,160 896,801 876,886
TOTAL APPROPRIATIONS 693,990 775,160 896,801 876,886

Fiscal Year 2021 - 22 Annual Budget
467
Revenue
Detail
Revenue Detail Risk
Management
Fund ACTUAL ACTUAL ADOPTED ADOPTED
2018-19 2019-20 2020-21 2021-22
CHARGES FOR SERVICES
34120 Employer Contributions 678,884 775,160 896,801 876,886
TOTAL CHARGES FOR SERVICES 678,884 775,160 896,801 876,886
MISCELLANEOUS REVENUE
36101 Interest on Investments 2,681 2,174 0 0
36130 Gain/Loss Investments 1,580 691 0 0
TOTAL MISCELLANEOUS REVENUE 4,261 2,865 0 0
TOTAL RESOURCES 683,145 778,025 896,801 876,886

Fiscal Year 2021 - 22 Annual Budget
468
Appropriations
Detail
Appropriations Detail Account # 066-1360-519 Risk
Management
Fund ACTUAL ACTUAL ADOPTED ADOPTED
2018-19 2019-20 2020-21 2021-22
OPERATING EXPENSES
4510 Insurance 693,273 775,160 896,801 876,886
4920 Other Current Charges 717 0 0 0
TOTAL OPERATING EXPENSES 693,990 775,160 896,801 876,886
OTHER USES
9940 Reserve for Future Use 0 0 0 0
TOTAL OTHER USES 0 0 0 0
TOTAL APPROPRIATIONS 693,990 775,160 896,801 876,886

Fiscal Year 2021 - 22 Annual Budget
469
Cliff Kelsey, Director of Public Works
The Fleet Services Internal Service Fund was established October 1, 2012. Originally this division was setup in the General Fund. During the development of the FY 2012-13 budget, after extensive modeling and research it became apparent that this division needed to be restricted and reflected as an Internal Service Fund.
Fleet Services is responsible for maintaining and purchasing all City vehicles. The various departments pay lease, maintenance and overhead (MRU) fees for their vehicles. Additionally, Fleet Services is responsible for two fueling sites and the truck wash facility.
Organizational Chart
Fleet
Services
Fund
Description
Total
Department
Budget
$ 3,909,179
Director of Public Works
Fleet Manager
Customer
Relations
Specialist
Shop Supervisor
Mechanic II
Mechanic I
Deputy
Director
Senior
Emergency
Technician

Fiscal Year 2021 - 22 Annual Budget
470
Fleet
Services
Fund
Revenue
Sources &
Appropriations
Revenue Sources & Appropriations
ACTUAL ACTUAL ADOPTED ADOPTED
2018-19 2019-20 2020-21 2021-22
REVENUE SOURCES
Intergovernmental Reveune 0 160 0 0
Charges for Services 2,558,947 3,087,210 2,643,458 2,679,955
Miscellaneous Revenue 219,881 196,222 50,000 25,000
Other Sources 685,097 1,434,938 1,291,822 1,204,224
TOTAL REVENUE SOURCES 3,463,925 4,718,530 3,985,280 3,909,179
APPROPRIATIONS
Maintenance 938,878 963,040 939,035 982,398
Administration 760,022 1,999,786 1,505,345 1,337,131
Capital Purchases 1,133,139 1,432,298 1,540,900 1,589,650
TOTAL APPROPRIATIONS 2,832,039 4,395,124 3,985,280 3,909,179

Fiscal Year 2021 - 22 Annual Budget
471
Fleet
Services
Fund
Revenue
Detail
Revenue Detail
ACTUAL ACTUAL ADOPTED ADOPTED
2018-19 2019-20 2020-21 2021-22
INTERGOVERNMENTAL REVENUE
33191 Emergency Management 0 160 0 0
TOTAL INTERGOVERNMENTAL REVENUE 0 160 0 0
CHARGES FOR SERVICES
34120 Fuel Surcharge 3,312 2,893 0 0
34120 Non Contract Maintenance Labor 524,574 513,704 525,000 525,000
34120 Lease Fees 1,272,356 1,774,929 1,342,374 1,390,131
34120 Non Contract Maintenance Parts 464,903 501,212 475,000 455,199
34120 Overhead/MRU Fee 291,156 292,393 298,584 307,125
34190 Pool Vehicle Revenue 2,646 2,079 2,500 2,500
TOTAL CHARGES FOR SERVICES 2,558,947 3,087,210 2,643,458 2,679,955
MISCELLANEOUS REVENUE
36110 Interest on Investments 74,995 48,193 50,000 25,000
36130 Gain/ Loss Investments 41,695 14,618 0 0
36403 Sale of Furniture/Equipment 64,648 111,048 0 0
36404 Recovery from Losses 35,743 21,520 0 0
36909 Other Income 2,800 843 0 0
TOTAL MISCELLANEOUS REVENUE 219,881 196,222 50,000 25,000
OTHER SOURCES
38110 Transfer from General Fund 197,232 27,274 0 0
38191 Transfer from Disc. Sales Tax 479,308 1,299,840 1,139,002 1,012,174
38141 Transfer from Electric 8,557 29,601 0 0
38144 Transfer from Wastewater 0 36,921 0 0
38148 Transfer from Airport 0 41,302 0 0
38891 Fund Balance Appropriated 0 0 152,820 192,050
TOTAL OTHER SOURCES 685,097 1,434,938 1,291,822 1,204,224
TOTAL RESOURCES 3,463,925 4,718,530 3,985,280 3,909,179

Fiscal Year 2021 - 22 Annual Budget
472
Goals & Tasks
Fleet
Services
Fund
Goals & Tasks
Goal: Deliver the highest level of professional public safety service that ensures security for Leesburg’s
residents and businesses.
Task:
Maintain technician production rate of 80% minimum
Ensure hourly labor rate reflects actual cost of service
Have all technicians Automated Service Excellence (ASE)/Emergency Vehicle Technician (EVT)
certified to ensure safety and proper knowledge for job
Complete preventative maintenance on all fleet vehicles and equipment on schedule
Identify underutilized vehicles and develop a program to reduce the overall Fleet size
Keep road call breakdowns to a minimum through comprehensive preventative and scheduled
maintenance
Major Accomplishments:
Zero defects on Department of Environmental Protection (DEP) fuel site inspections
No accidents, injuries or incidents during Fleet maintenance operations
Performance Measures:
2019-20 2020-21 2021-22
Amount of mechanic’s time spent on vehicle
maintenance (%)
84% 81% 83%
Yearly preventative maintenance performed on
vehicles (#)
1,053 966 1,000
Road call breakdowns compared to all
maintenance activities (%)
5% 5% 4%

Fiscal Year 2021 - 22 Annual Budget
473
Personnel
Schedule
Fleet
Services
Fund
Personnel Schedule
Classification 2021 Change 2022 Amount
Maintenance 5110
Mechanic I 1.00 0.00 1.00 31,491
Mechanic II 3.00 0.00 3.00 124,009
Senior Emergency Technician 1.00 0.00 1.00 53,976
Shop Supervisor1 0.50 0.00 0.50 28,590
Total Maintenance 5.50 0.00 5.50 238,066
Administration 5121
Customer Relations Specialist 1.00 0.00 1.00 50,877
Fleet Manager 1.00 0.00 1.00 64,917
Shop Supervisor1 0.50 0.00 0.50 28,589
Total Administration 2.50 0.00 2.50 144,383
Total 8.00 0.00 8.00 382,448
Note: Allocations
Shop Supervisor1 50% 5110, 50% 5121

Fiscal Year 2021 - 22 Annual Budget
474
Appropriations
Detail
Maintenance
Fleet
Services
Fund
Appropriations Detail Account # 510-5110-519
ACTUAL ACTUAL ADOPTED ADOPTED
2018-19 2019-20 2020-21 2021-22PERSONAL SERVICES
12xx Regular Salaries & Wages 221,569 229,671 231,951 238,066
1410 Overtime 463 1,130 1,500 1,500
15xx Bonuses/Incentives 0 94 0 0
1641 Vacation/Terms & Buyout 3,370 1,957 0 0
2110 FICA 16,387 16,822 16,733 17,222
221x Retirement 10,959 25,677 24,304 18,611
23xx Insurance 56,478 50,801 56,900 59,099
2410 Workers' Compensation 7,042 7,256 7,330 7,523
262x Other Payroll Benefits (16,034) (12,769) 317 377
TOTAL PERSONAL SERVICES 300,234 320,639 339,035 342,398
OPERATING EXPENSES
3410 Contract Services 100 0 0 0
4210 Postage 0 17 0 0
461x Repairs & Maintenance- Vehicles 625,976 638,175 600,000 640,000
46xx Repairs & Maintenance- Equipment 12,280 3,736 0 0
4920 Other Current Charges 0 0 0 0
4932 FM Inventory Over/Short 238 423 0 0
5230 Fuel Purchases 50 0 0 0
5410 Publications & Memberships 0 50 0 0
TOTAL OPERATING EXPENSES 638,644 642,401 600,000 640,000
TOTAL APPROPRIATIONS 938,878 963,040 939,035 982,398

Fiscal Year 2021 - 22 Annual Budget
475
Appropriations
Summary
Maintenance
Fleet
Services
Fund
Appropriations Summary
ADOPTED ADOPTED INCREASE/
2020-21 2021-22 (DECREASE) PERCENTAGE
Personal Services 339,035 342,398 3,363 0.99%
Operating Expenses 600,000 640,000 40,000 6.67%
TOTALS 939,035 982,398 43,363 4.62%
Significant Budget Changes:
The increase in Operating Expenses is attributable to increased R&M Machinery & Equipment (4612).

Fiscal Year 2021 - 22 Annual Budget
476
Appropriations
Detail
Administration
Fleet
Services
Fund
Appropriations Detail Account # 510-5121-519
ACTUAL ACTUAL ADOPTED ADOPTED
2018-19 2019-20 2020-21 2021-22PERSONAL SERVICES
12xx Regular Salaries & Wages 133,726 138,125 141,430 144,383
1410 Overtime 197 30 1,000 750
15xx Bonuses/Incentives 0 94 0 0
1641 Vacation/Terms & Buyout 6,416 1,860 0 0
2110 FICA 10,444 10,382 10,417 10,643
221x Retirement 23,970 10,051 9,855 19,906
23xx Insurance 21,075 18,998 22,234 22,234
2410 Workers' Compensation 1,190 1,209 1,219 1,228
262x Other Payroll Benefits (22,330) (27,294) 317 317
TOTAL PERSONAL SERVICES 174,688 153,455 186,472 199,461
OPERATING EXPENSES
3410 Contract Services 10,581 13,854 19,235 21,883
4010 Travel 329 100 200 200
41xx Communication 634 762 910 910
4210 Postage 38 327 100 200
4310 Utilities 20,778 20,281 30,000 25,000
4510 Insurance 15,070 17,440 21,619 18,861
461x Repairs & Maintenance- Vehicles 24,369 23,402 20,000 19,000
4620 Repairs & Maintenance- Building 0 0 2,500 2,000
4625 Repairs & Maintenance- Non-Build 4,991 908 500 500
46xx Repairs & Maintenance- Equipment 3,945 2,717 4,450 4,565
4710 Printing & Binding 0 0 100 100
4911 Advertising- Other Ads 150 338 400 300
4932 FM Inventory Over/Short 177 442,226 0 0
5180 Minor Furniture/Equipment 3,666 3,489 4,000 4,000
5210 Operating Supplies 12,831 12,343 13,300 13,300
5215 Uniforms 1,621 2,814 4,557 5,327
5230 Fuel Purchases 5,652 5,440 7,000 8,500
5410 Publications & Memberships 0 50 250 100
5520 Training 1,194 0 750 750
TOTAL OPERATING EXPENSES 106,026 546,491 129,871 125,496
OTHER USES
9150 Auction Reserve 0 0 50,000 0
9101 Transfer to General Fund 479,308 1,299,840 1,139,002 1,012,174
9145 Transfer to Communication 0 0 0 0
TOTAL OTHER USES 479,308 1,299,840 1,189,002 1,012,174
TOTAL APPROPRIATIONS 760,022 1,999,786 1,505,345 1,337,131

Fiscal Year 2021 - 22 Annual Budget
477
Appropriations
Summary
Administration
Fleet
Services
Fund
Appropriations Summary
ADOPTED ADOPTED INCREASE/
2020-21 2021-22 (DECREASE) PERCENTAGE
Personal Services 186,472 199,461 12,989 6.97%
Operating Expenses 129,871 125,496 (4,375) -3.37%
Other Uses 1,189,002 1,012,174 (176,828) -14.87%
TOTALS 1,505,345 1,337,131 (168,214) -11.17%

Fiscal Year 2021 - 22 Annual Budget
478
Appropriations
Detail
Capital
Projects
Fleet
Services
Fund
Appropriations Detail Account # 510-5199-519
ACTUAL ACTUAL ADOPTED ADOPTED
2018-19 2019-20 2020-21 2021-22OPERATING EXPENSES
5910 Depreciation 1,133,139 1,432,298 0 0
TOTAL OPERATING EXPENSES 1,133,139 1,432,298 0 0
CAPITAL OUTLAY
6410 Machinery & Equipment 6,228 0 0 0
6413 Fleet Replace 1,773,484 2,454,272 1,540,900 1,589,650
6414 Fleet Refurbish 0 0 0 0
TOTAL CAPITAL OUTLAY 1,779,712 2,454,272 1,540,900 1,589,650
OTHER USES
9160 Reserve/Future Capital 0 0 0 0
9999 WIP Contra (1,779,712) (2,454,272) 0 0
TOTAL OTHER USES (1,779,712) (2,454,272) 0 0
TOTAL APPROPRIATIONS 1,133,139 1,432,298 1,540,900 1,589,650

Fiscal Year 2021 - 22 Annual Budget
479
Appropriations
Summary
Capital
Projects
Fleet
Services
Fund
Appropriations Summary
ADOPTED ADOPTED INCREASE/
2020-21 2021-22 (DECREASE) PERCENTAGE
Operating Expenses 0 0 0 0.00%
Capital Outlay 1,540,900 1,589,650 48,750 3.16%
Other Uses 0 0 0 0.00%
TOTALS 1,540,900 1,589,650 48,750 3.16%

Fiscal Year 2021 - 22 Annual Budget
480
Project
Schedule
Project Schedule Fleet
Services
Fund Replacement Vehicles
Electric-
2007 Altec Bucket (#4039) $ 253,000
1998 Arrowboard (#470) 5,500
Gas-
2012 F-550 Utility (#508) 61,000
2012 F-550 Utility (#509) 61,000
2004 Trencher (#4020) 80,000
Police-
2012 Charger (#8111) 52,400
2012 Charger (#8114) 52,400
2013 Charger (#8002) 52,400
2013 Charger (#8003) 52,400
2013 Charger (#8004) 52,400
2013 Charger (#8007) 52,400
2013 Charger (#8008) 52,400 2013 Charger (#8131) 52,400
2014 Charger (#8132) 52,400
2017 Explorer K-9 (#8157) 55,350
Fire-
2003 Explorer (#647) 35,000
Water-
2005 F-150 Truck (#2022) 27,500
2005 F-150 Ext Cab (#9072) 27,500
2012 Kubota Zero Turn (#301) 7,700
Wastewater-
2001 F-150 Truck (#739) 27,500
2002 S-10 Truck (#724) 27,500
2007 Kubota ATV (#7058) 12,000
2002 C2500 Utility (#723) 38,000
Fleet-
2001 F-350 Utility (#637) 45,000
Solid Waste-
2013 Automated Truck (#9095) 280,000
Recreation-
1993 John Deere Tractor (#200) 35,000
2002 1/2 Ton Truck (#222) 27,500
12,000 2010 Kubota UTV (#291)
Total FY 21-22 $ 1,589,650

This page intentionally left blank
Fiscal Year 2021 - 22 Annual Budget
481

Fiscal Year 2021 - 22 Annual Budget
482

Fiscal Year 2021 - 22 Annual Budget
483

Fiscal Year 2021 - 22 Annual Budget
484

Fiscal Year 2021 - 22 Annual Budget
485

Fiscal Year 2021 - 22 Annual Budget
486

Fiscal Year 2021 - 22 Annual Budget
487

Fiscal Year 2021 - 22 Annual Budget
488

This page intentionally left blank
Fiscal Year 2021 - 22 Annual Budget
489

Fiscal Year 2021 - 22 Annual Budget
490
Capital Improvement Program
INFORMATION TECHNOLOGY
Project # W F # Project Description Funding Source Amount
GFASST 1380062/1 Planning & Zoning Copier Discretionary Sales Tax 7,500
GFASST 1380062/2 Electric Copier Discretionary Sales Tax 7,500
GFASST 1380074 VMWARE Servers (2) Discretionary Sales Tax 60,000
GFASST 1380076 City Hall Backup Power Discretionary Sales Tax 30,000
GFASST 1380078 Switches (2) Discretionary Sales Tax 12,000
GFASST 1380081 Fiber Diagnostics Repair Equipment Discretionary Sales Tax 15,000
Total Information Technology Department 132,000
FIRE
Project # W F # Project Description Funding Source Amount
GFASST Extrication Tool Discretionary Sales Tax 50,000
Total Fire Department 50,000
PUBLIC WORKS
Project # W F # Project Description Funding Source Amount
Streets
310051 1380258 Road Resurfacing Gas Tax 100,000
Total Public Works Department 100,000
LIBRARY
Project # W F # Project Description Funding Source Amount
GFASST 1380083 Meeting Room Operable Partition Replacement Discretionary Sales Tax 48,600
Total Library Department 48,600
RECREATION
Project # W F # Project Description Funding Source Amount
GFASST 1380084 Box Blade Laser Level for Athletic Fields Discretionary Sales Tax 17,600
310081 1380262 Rails to Trails ($375,000) Recreation Impact Fees 25,000
Federal Grant (ARP) 350,000
310081 1380263 Marina Slips ($500,000 Total, $250,000 in FY21) Discretionary Sales Tax 250,000
310051 1380266 Sleepy Hollow Grandstands ($400,000) County Grant 200,000
Recreation Impact Fees 150,000
Discretionary Sales Tax 50,000
310081 1380267 Pat Thomas Rehab ($400,000) Transfer from Solid Waste Fund 300,000
Discretionary Sales Tax 100,000
310081 1380302 Dabney Pool Demolition Transfer from Solid Waste Fund 50,000
Total Recreation Department 1,492,600
General Government
This capital improvement program includes the purchase of all capital items as well as major capital projects for all funds. The
funding sources are identified by line and recapped at the end of the fund.
These items are included in general fund and the capital projects fund. Governmental Revenue is the funding source for
general fund and the capital projects fund which also includes funding from grants and Gas tax.

Fiscal Year 2021 - 22 Annual Budget
491
Capital Improvement Program (Continued)
Funding Source
Discretionary Sales Tax 648,200
Transfer from Solid Waste Fund 350,000
Recreation Impact Fees 175,000
Gas Tax 100,000
County Grant 200,000
Federal Grant (ARP) 350,000
Total General Government Funding Sources 1,823,200
STORMWATER
Project # W F # Project Description Funding Source Amount
Drainage Improvements
140002 Lake Hollywood Design Stormwater Fees 100,000
140002 Curbs, gutters & inlets Stormwater Fees 25,000
140002 Canal St & Hwy 441 Stormwater Fees 200,000
140002 Lake Robinhood Improvement Stormwater Fees 125,000
Total Stormwater Department 450,000
Funding Source
Stormwater Fees 450,000
Total Stormwater Funding Sources 450,000
ELECTRIC
Project # W F # Project Description Funding Source Amount
410001 Various Meters Renewal & Replacement 58,000
410002 Various Transformers ($761,000) Renewal & Replacement 751,000
Customer Contribution 10,000
410003 Various Capacitors Renewal & Replacement 81,000
410004 Various Distribution Lines ($1,847,000) Customer Contribution 415,000
Renewal & Replacement 1,432,000
410005 Various Sectionalizing Equipment Renewal & Replacement 165,000
410006 Various Lights ($762,000) Customer Contribution 75,000
Renewal & Replacement 687,000
410008 Various Other equipment Renewal & Replacement 306,000
410010 Various Subdivisions ($480,000) Customer Contribution 20,000Renewal & Replacement 460,000
410011 Various Reconductoring Renewal & Replacement 944,200
410012 Various Substations Renewal & Replacement 195,000
Total Electric Department 5,599,200
Funding Source
Customer Contribution 520,000
Renewal & Replacement 5,079,200
Total Electric Funding Sources 5,599,200
Enterprise Funds
General Fund (cont.)

Fiscal Year 2021 - 22 Annual Budget
492
Capital Improvement Program (Continued)
GAS
Project # W F # Project Description Funding Source Amount
420001 Various Meters ($350,614)
Regular meters Current Revenue 51,694
ERT meters Current Revenue 298,920
420002 Mains ($309,108)
CR 470 Tunnel Relocation Current Revenue 149,108
McEleay 6" Extension Customer Contribution 40,000
Current Revenue 120,000
420003 Various Tools & Equipment
Pneumatic Mole Current Revenue 5,500
420004 Various Vehicles & Equipment
Mini Ex Trailer Current Revenue 8,000
420008 Various Regulators Current Revenue 14,647
420009 Various Farm Tap/ Industrial Equip Current Revenue 25,136
420010 Various Services Current Revenue 148,254
Total Gas Department 861,259
Funding Source
Current Revenue 821,259
Customer Contribution 40,000
Total Gas Funding Sources 861,259
WATER
Project # W F # Project Description Funding Source Amount
430002 Mains ($1,625,000)
US Hwy 27 South St. to Citizen Blvd. Renewal & Replacement 125,000
Carver Heights- Thomas to Hwy 27 Renewal & Replacement 500,000
Replace 10" Main to Hwy 27 Renewal & Replacement 500,000
Stock Subdivision Renewal & Replacement 500,000
430006 Plant & Storage ($405,000)
Storage Tank Highland Lakes Renewal & Replacement 50,000
Well Rehabilitation Renewal & Replacement 75,000
Elevated Tank Inspection & Rehab Renewal & Replacement 75,000
Water Treatment Facility Replacements Renewal & Replacement 100,000
Fire Protection Hydrant Replacement Renewal & Replacement 25,000
MOV Turnpike reuse/reject valve Renewal & Replacement 80,000
Total Water Department 2,030,000
Funding Source
Renewal & Replacement 2,030,000
Total Water Funding Sources 2,030,000

Fiscal Year 2021 - 22 Annual Budget
493
Capital Improvement Program (Continued)
WASTEWATER
Project # W F # Project Description Funding Source Amount
440002 Collecting Sewers ($1,350,000)
Line under Building Renewal & Replacement 200,000
Forcemain South 27 Renewal & Replacement 500,000
IPP Program Local Limits Evaluation Renewal & Replacement 50,000
Lift Station Rehabilitation Renewal & Replacement 500,000
Vitrified Clay Pipe Renewal & Replacement 100,000
440003 Other Equipment ($155,000)
Tools & Equipment Renewal & Replacement 95,000
Pump Packages Renewal & Replacement 60,000
440006 Treatment Plant ($250,000)
Canal Street Renewal & Replacement 100,000
Turnpike Plant Renewal & Replacement 100,000
Discharge Pipe Replacement/Line Wet Wells Renewal & Replacement 50,000
Total Wastewater Department 1,755,000
Funding Source
Renewal & Replacement 1,755,000
Total Wastewater Funding Sources 1,755,000
AIRPORT
Project # W F # Project Description Funding Source Amount
480002 Buildings ($3,255,720)
1383896 Roof Replacement- T Hangar 32800 Echo Drive Current Revenue 150,000
Hangar Design Current Revenue 105,720
Hangar Building Taxiways and Parking ($3,000,000) State Grant 2,400,000
Current Revenue 600,000
480003 Improvements ($130,000)1383903 Develop New Wildlife Hazard Assessment Federal Grant 117,000
State Grant 10,400
Current Revenue 2,600
480004 Other Equipment
Tractor Upgrade Current Revenue 65,000
Total Airport Department 3,450,720
Funding Source
Federal Grant 117,000
State Grant 2,410,400
Current Revenue 923,320
Total Airport Funding Sources 3,450,720

Fiscal Year 2021 - 22 Annual Budget
494
Capital Improvement Program (Continued)
SOLID WASTE
Project # W F # Project Description Funding Source Amount
GFASST New Solid Waste Truck Current Revenue 250,000
Total Building Permits 250,000
Funding Source
Current Revenue 250,000
Total Solid Waste Funding Sources 250,000
FLEET
Project # W F # Project Description Funding Source Amount
FLEET Replacement Vehicles ($1,589,650)
1380720 Electric- 2007 Altec Bucket (#4039) Discretionary Sales Tax 253,000
1380721 Electric- 1998 Arrowboard (#470) Discretionary Sales Tax 5,500
1380722 Gas- 2012 F550 Utility (#508) Discretionary Sales Tax 61,000
1380723 Gas- 2012 F550 Utility (#509) Discretionary Sales Tax 61,000
1380724 Gas- 2004 Trencher (#4020) Discretionary Sales Tax 80,000
1380726 Police- 2012 Charger (#8111) Current Revenue 52,400
1380727 Police- 2012 Charger (#8114) Current Revenue 52,400
1380729 Police- 2013 Charger (#8002) Current Revenue 52,400
1380730 Police- 2013 Charger (#8003) Current Revenue 52,400
1380734 Police- 2013 Charger (#8004) Current Revenue 52,400
1380737 Police- 2013 Charger (#8007) Current Revenue 52,400
1380738 Police- 2013 Charger (#8008) Current Revenue 52,400
1380740 Police- 2013 Charger (#8131) Current Revenue 52,400
1380742 Police- 2014 Charger (#8132) Current Revenue 52,400
1380744 Police- 2017 Explorer K-9 (#8157) Current Revenue 55,350
1380745 Fire- 2003 Explorer (#647) Current Revenue 35,000
1380748 Water- 2005 F150 Truck (#2022) Discretionary Sales Tax 27,500
1380752 Water- 2005 F150 Ext Cab (#9072) Discretionary Sales Tax 27,500
1380753 Water- 2012 Kubota Zero Turn (#301) Discretionary Sales Tax 7,700
1380755 Wastewater- 2001 F150 Truck (#739) Discretionary Sales Tax 27,500
1380757 Wastewater- 2002 S10 Truck (#724) Discretionary Sales Tax 27,500
1380760 Wastewater- 2007 Kubota ATV (#7058) Discretionary Sales Tax 12,000
1380763 Wastewater- 2002 C2500 Utility (#723) Discretionary Sales Tax 38,000
1380766 Fleet- 2001 F350 Utility (#637) Discretionary Sales Tax 45,000
1380769 Solid Waste- 2013 Automated Truck (#9095) Discretionary Sales Tax 280,000
1380770 Recreation- 1993 John Deere Tractor (#200) Discretionary Sales Tax 35,000
1380773 Recreation- 2002 1/2 Ton Truck (#222) ($27,500) Discretionary Sales Tax 23,974
Current Revenue 3,526
1380777 Recreation- Kubota UTV (#291) Current Revenue 12,000
Total Fleet Department 1,589,650
Funding Source
Current Revenue 577,476
Discretionary Sales Tax 1,012,174
Total Fleet Funding Sources 1,589,650
Special Revenue Fund

Fiscal Year 2021 - 22 Annual Budget
495
Capital Improvement Program (Continued)
TOTAL COSTS
General Government 1,823,200
Stormwater 450,000
Electric 5,599,200
Gas 861,259
Water 2,030,000
Wastewater 1,755,000
Airport 3,450,720
Fleet 1,589,650
Total Costs 17,809,029
Funding Source
Current Revenue 2,572,055
Stormwater Fees 450,000
Discretionary Sales Tax 1,660,374
Federal Grant 117,000
Federal Grant (ARP) 350,000
State Grant 2,410,400
County Grant 200,000
Renewal & Replacement 8,864,200
Transfer from Solid Waste Fund 350,000
Recreation Impact Fees 175,000
Gas Tax 100,000
Customer Contribution 560,000
Total Funding Sources 17,809,029

Fiscal Year 2021 - 22 Annual Budget
496
Capital Improvement Program Operating Costs
Department Item Description Long-term Operating Costs Associated Amount 2021-22 2022-23 2023-24 2024-25 2025-26 5-Year Totals
Information Technology Planning & Zoning Copier Ongoing maintenance fees 7,500$ 500$ 500$ 500$ 500$ 500$ 2,500$
Information Technology Electric Copier Ongoing maintenance fees 7,500$ 500$ 500$ 500$ 500$ 500$ 2,500$
Information Technology VMWARE Servers (2) Ongoing operating and maintenance fees 60,000$ 5,000$ 5,000$ 10,000$
Information Technology City Hall Backup Power No impact to operating budget 30,000$ -$
Information Technology Switches (2) No impact to operating budget 12,000$ -$
Information Technology Fiber Diagnostics Repair Equipment No impact to operating budget 15,000$ -$
Fire Extrication Tool Ongoing maintenance fees 50,000$ 2,500$ 2,500$ 2,500$ 2,500$ 10,000$
Public Works Road Resurfacing No impact to operating budget 100,000$ -$
Library Meeting Room Operable Partition Replacement No impact to operating budget 48,600$ -$
Recreation Box Blade Laser Level Ongoing maintenance fees 17,600$ 1,700$ 1,700$ 1,700$ 1,700$ 1,700$ 8,500$
Recreation Rails to Trails No impact to operating budget 375,000$ -$
Recreation Marina Slips No impact to operating budget 250,000$ -$
Recreation Sleepy Hollow Grandstands No impact to operating budget 400,000$ -$
Recreation Pat Thomas Rehab No impact to operating budget 400,000$ -$
Recreation Dabney Pool Demolition No impact to operating budget 50,000$ -$
Stormwater Lake Hollywood Design No impact to operating budget 100,000$ -$
Stormwater Curbs, gutters & Inlets No impact to operating budget 25,000$ -$
Stormwater Canal St & Hwy 441 No impact to operating budget 200,000$ -$
Stormwater Lake Robinhood Improvements No impact to operating budget 125,000$ -$
Electric Meters Ongoing maintenance fees 58,000$ 500$ 500$ 500$ 500$ 500$ 2,500$
Electric Transformers Ongoing maintenance fees 761,000$ 20,000$ 20,000$ 25,000$ 25,000$ 25,000$ 115,000$
Electric Capacitors Ongoing maintenance fees 81,000$ 2,000$ 2,250$ 2,500$ 2,750$ 3,000$ 12,500$
Electric Distribution Lines Ongoing maintenance fees 1,847,000$ 28,000$ 28,000$ 30,000$ 32,500$ 35,000$ 153,500$
Electric Sectionalizing Equipment Ongoing maintenance fees 165,000$ 2,000$ 3,000$ 3,000$ 3,500$ 3,500$ 15,000$
Electric Lights Ongoing maintenance fees 762,000$ 3,000$ 3,000$ 3,500$ 3,500$ 4,000$ 17,000$
Electric Other Equipment Ongoing maintenance fees 306,000$ 5,000$ 10,000$ 12,000$ 15,000$ 15,000$ 57,000$
Electric Subdivisions Ongoing maintenance fees 480,000$ 10,000$ 20,000$ 20,000$ 25,000$ 25,000$ 100,000$
Electric Reconductoring Ongoing maintenance fees 944,200$ 5,000$ 5,000$ 5,000$ 7,500$ 7,500$ 30,000$
Electric Substations Ongoing maintenance fees 195,000$ 5,000$ 5,000$ 7,500$ 10,000$ 10,000$ 37,500$

Fiscal Year 2021 - 22 Annual Budget
497
Capital Improvement Program Operating Costs (Continued)
Department Item Description Long-term Operating Costs Associated Amount 2021-22 2022-23 2023-24 2024-25 2025-26 5-Year Totals
Gas Meters Leak survey, meter reading costs 350,614$ 3,506$ 3,506$ 10,518$ 3,506$ 3,506$ 24,543$
Gas Mains Annual patrol of lines 309,108$ 6,182$ 6,182$ 6,182$ 6,182$ 6,182$ 30,911$
Gas Tools & Equipment Annual calibration 5,500$ 50$ 50$ 50$ 50$ 50$ 250$
Gas Mini Ex Trailer Ongoing operating & maintenance fees 8,000$ 100$ 100$ 100$ 100$ 100$ 500$
Gas Regulators Leak survey 14,647$ 350$ 350$
Gas Farm/Tap/Industrial Equipment Inspections 25,136$ 600$ 600$ 600$ 600$ 600$ 3,000$
Gas Services Leak survey 148,254$ 1,483$ 1,483$
Water US Hwy 27 South St to Citizen Blvd. Ongoing maintenance fees 125,000$ (2,000)$ (2,000)$ (2,000)$ (2,000)$ (2,000)$ (10,000)$
Water Carver Heights- Thomas to Hwy 27 Ongoing maintenance fees 500,000$ 10,000$ 10,000$ 10,000$ 10,000$ 10,000$ 50,000$
Water Replace 10" Main to Hwy 27 No impact to operating budget 500,000$ -$
Water Stock Subdivision Ongoing maintenance fees 500,000$ (1,000)$ (1,000)$ (1,000)$ (1,000)$ (1,000)$ (5,000)$
Water Storage Tank Highland Lakes No impact to operating budget 50,000$
Water Elevated Tank Inspection & Rehab No impact to operating budget 75,000$ -$
Water Well Rehabilitation Ongoing maintenance fees 75,000$ (4,000)$ (4,000)$ (4,000)$ (4,000)$ (4,000)$ (20,000)$
Water Water Treatment Facility Replacements Ongoing maintenance fees 100,000$ (1,000)$ (1,000)$ (1,000)$ (1,000)$ (1,000)$ (5,000)$
Water Fire Protection Hydrant Replacement Ongoing maintenance fees 25,000$ 2,500$ 2,500$ 2,500$ 2,500$ 2,500$ 12,500$
Water MOV Turnpike reuse/reject valve No impact to operating budget 80,000$ -$
Wastewater Line Under Building No impact to operating budget 200,000$ -$
Wastewater Forcemain South 27 No impact to operating budget 500,000$ -$
Wastewater IPP Program Local Limit Evaluation No impact to operating budget 50,000$ -$
Wastewater Lift Station Rehabilitation Ongoing operating & maintenance fees 500,000$ 5,000$ 5,000$ 5,000$ 5,000$ 5,000$ 25,000$
Wastewater Vitrified Clay Pipe No impact to operating budget 100,000$ -$
Wastewater Other Equipment Ongoing maintenance fees 155,000$ 2,500$ 2,500$ 2,500$ 2,500$ 2,500$ 12,500$
Wastewater Treatment Plant (Canal Street) Ongoing maintenance fees 100,000$ 1,000$ 1,000$ 1,000$ 1,000$ 1,000$ 5,000$
Wastewater Treatment Plant (Turnpike) Ongoing maintenance fees 100,000$ 1,000$ 1,000$ 1,000$ 1,000$ 1,000$ 5,000$
Wastewater Discharge Pipe Replacement/Line Wet Wells No impact to operating budget 50,000$ -$
Airport Roof Replacement- T hangar 32800 Echo Dr No impact to operating budget 150,000$ -$
Airport Hangar- Design No impact to operating budget 105,720$ -$
Airport Hangar Bldg Taxiways & Parking Ongoing operating & maintenance fees 3,000,000$ 45,000$ 45,000$ 90,000$
Airport Develop New Wildlife Hazard Assessment No impact to operating budget 130,000$ -$
Airport Tractor Upgrade Upgrading current model, no impact to budget 65,000$ -$
Solid Waste New Solid Waste Truck Ongoing operating & maintenance fees 250,000$ 5,000$ 5,000$ 5,000$ 5,000$ 5,000$ 25,000$
Fleet Replacement vehicles Routine maintenance 1,589,650$ 25,000$ 35,000$ 45,000$ 50,000$ 60,000$ 215,000$
Total 17,809,029$ 1,034,536$

Fiscal Year 2021 - 22 Annual Budget
498
2021-22 PAYGRADES
Pay Old Pay Hourly Hourly Annual Annual
Job Classification/Title Grade Grade Min Max Min Max
Accountant I 120 16.51 22.86 34,340.80 47,548.80
Accountant II 122 17.83 24.69 37,086.40 51,355.20
Accountant III 124 19.28 26.69 40,102.40 55,515.20
Accountant IV 126 20.84 28.84 43,347.20 59,987.20
Accounting Operations Supervisor 128 22.53 31.18 46,862.40 64,854.40
Accounting Specialist I 114 13.09 18.10 27,227.20 37,648.00
Accounting Specialist II 117 14.70 20.34 30,576.00 42,307.20
Administrative Assistant I 117 14.70 20.34 30,576.00 42,307.20
Administrative Assistant II 119 15.88 21.98 33,030.40 45,718.40
Administrative Services Coordinator 126 20.84 28.84 43,347.20 59,987.20
Airport Maintenance Technician 115 13.61 18.81 28,308.80 39,124.80
Airport Manager 139 129 34.61 47.91 71,988.80 99,652.80
Alternate Crossing Guard 999 10.00
Assistant Customer Accounts Manager 126 20.84 28.84 43,347.20 59,987.20
Assistant Service Planner 128 22.53 31.18 46,862.40 64,854.40
Athletic Fields Lead 120 16.51 22.86 34,340.80 47,548.80
Athletic Fields Manager 130 24.36 33.70 50,668.80 70,096.00
Athletic Supervisor 123 18.53 25.67 38,542.40 53,393.60
Benefits & Compensation Coordinator 126 123 20.84 28.84 43,347.20 59,987.20
Book Store Manager 999 10.00
Budget Manager 136 30.79 42.59 64,043.20 88,587.20
Building Inspector I 131 25.34 35.04 52,707.20 72,883.20
Building Inspector II 132 26.32 36.43 54,745.60 75,774.40
Building Inspector III 136 30.79 42.59 64,043.20 88,587.20
Building Inspector Trainee 121 17.17 23.75 35,713.60 49,400.00
Building Official 142 139 38.92 53.87 80,953.60 112,049.60
Business Analyst 123 18.53 25.67 38,542.40 53,393.60
Chief Plant Operator 130 24.36 33.70 50,668.80 70,096.00
City Clerk 139 137 34.61 47.91 71,988.80 99,652.80
Civilian Investigator 127 21.66 30.00 45,052.80 62,400.00
Clerical Assistant 112 12.11 16.74 25,188.80 34,819.20
Code Enforcement Officer 121 17.17 23.75 35,713.60 49,400.00
Code Enforcement Supervisor 127 21.66 30.00 45,052.80 62,400.00
Computer System Analyst 128 22.53 31.18 46,862.40 64,854.40
Computer Technician 123 18.53 25.67 38,542.40 53,393.60
Contract Supervisor L4 48.00 48.00 99,840.00 99,840.00
Crew Leader 127 21.66 30.00 45,052.80 62,400.00
Crime Analyst 124 19.28 26.69 40,102.40 55,515.20
Customer Accounts Manager 137 32.01 44.30 66,580.80 92,144.00
Customer Relations Specialist 121 17.17 23.75 35,713.60 49,400.00
Customer Relations Supervisor 123 18.53 25.67 38,542.40 53,393.60
Customer Service Operations Supervisor 123 18.53 25.67 38,542.40 53,393.60
Customer Service Specialist 119 15.88 21.98 33,030.40 45,718.40
Deputy Building Official 137 32.01 44.30 66,580.80 92,144.00
Deputy City Clerk 120 16.51 22.86 34,340.80 47,548.80
Deputy Director of Electric/Electric Superintendent 141 37.43 51.80 77,854.40 107,744.00
Deputy Director of Electric/Operations & Tech Svcs 141 37.43 51.80 77,854.40 107,744.00
Deputy Director of Public Works 137 32.01 44.30 66,580.80 92,144.00
Deputy Finance Director 139 34.61 47.91 71,988.80 99,652.80
Deputy Fire Chief 139 34.61 47.91 71,988.80 99,652.80
Director of Electric 148 49.17 68.13 102,273.60 141,710.40
Director of Housing 142 137 38.92 53.87 80,953.60 112,049.60
Director of Human Resources 142 38.92 53.87 80,953.60 112,049.60

Fiscal Year 2021 - 22 Annual Budget
499
2021-22 PAYGRADES (Continued)
Pay Old Pay Hourly Hourly Annual Annual
Job Classification/Title Grade Grade Min Max Min Max
Director of Public Works 148 49.17 68.13 102,273.60 141,710.40
Distribution Foreman 127 21.66 30.00 45,052.80 62,400.00
Distribution Technician 116 14.15 19.57 29,432.00 40,705.60
Electric Apprentice Lineman 401 Included in apprentice standards
Electric Apprentice Substation 401 Included in apprentice standards
Electric Lead Systems Operator/NERC Comp Officer 135 29.60 40.96 61,568.00 85,196.80
Electric Line Crew Leader L4 48.00 48.00 99,840.00 99,840.00
Electric Lineman L2 45.81 45.81 95,284.80 95,284.80
Electric Meter Supervisor L4 48.00 48.00 99,840.00 99,840.00
Electric Meter Tech Apprentice 401 Included in apprentice standards
Electric Meter Technician L2 45.81 45.81 95,284.80 95,284.80
Electric Senior Systems Operator 133 27.38 37.88 56,950.40 78,790.40
Electric Service Planner 131 25.34 35.04 52,707.20 72,883.20
Electric Service Planning Supervisor L4 48.00 48.00 99,840.00 99,840.00
Electric Service Technician L3 46.91 46.91 97,572.80 97,572.80
Electric Substation Supervisor L4 48.00 48.00 99,840.00 99,840.00
Electric Substation Technician II L2 45.81 45.81 95,284.80 95,284.80
Electric System Operator 131 25.34 35.04 52,707.20 72,883.20
Electric Technician I 120 16.51 22.86 34,340.80 47,548.80
Electric Technician II 122 17.83 24.69 37,086.40 51,355.20
Emergency Services Dispatch Manager 125 124 20.04 27.74 41,683.20 57,699.20
Emergency Services Dispatcher I 120 119 16.51 22.86 34,340.80 47,548.80
Emergency Services Dispatcher II 121 120 17.17 23.75 35,713.60 49,400.00
Emergency Services Dispatcher III 123 122 18.53 25.67 38,542.40 53,393.60
Evidence Technician 120 114 16.51 22.86 34,340.80 47,548.80
Executive Assistant/Administrative Aide I 122 17.83 24.69 37,086.40 51,355.20
Executive Assistant/Administrative Aide II 124 19.28 26.69 40,102.40 55,515.20
Executive Office Manager 130 24.36 33.70 50,668.80 70,096.00
Facilities Maintenance Lead 120 16.51 22.86 34,340.80 47,548.80
Facilities & Grounds Maintenance Manager 130 24.36 33.70 50,668.80 70,096.00
Finance Director 147 144 47.32 65.44 98,425.60 136,115.20
Financial Reporting Manager 135 29.60 40.96 61,568.00 85,196.80
Fire Battalion Chief ** 532 22.35 30.92 61,596.60 85,215.52
Fire Captain 134 28.46 39.39 59,196.80 81,931.20
Fire Chief & EOC Commander 147 47.32 65.44 98,425.60 136,115.20
Fire Division Chief/Support Services 137 32.01 44.30 66,580.80 92,144.00
Fire Lieutenant * 529 19.75 28.69 53,404.00 77,577.76
Firefighter * 520 14.39 20.86 38,910.56 56,405.44
Firefighter/Engineer * 524 16.37 23.70 44,264.48 64,084.80
Firefighter Recruit * 503 11.51 16.37 31,123.04 44,264.48
Fleet Manager 130 24.36 33.70 50,668.80 70,096.00
Forensic Digital Evidence Specialist 124 19.28 26.69 40,102.40 55,515.20
Gas Compliance Specialist 124 19.28 26.69 40,102.40 55,515.20
Gas Director 147 144 47.32 65.44 98,425.60 136,115.20
Gas Equipment Operator 119 15.88 21.98 33,030.40 45,718.40
Gas Field Operations Supervisor 131 25.34 35.04 52,707.20 72,883.20
Gas Service Technician 123 18.53 25.67 38,542.40 53,393.60
GIS Analyst 130 24.36 33.70 50,668.80 70,096.00
GIS Planning Specialist 124 19.28 26.69 40,102.40 55,515.20
GIS Technician 123 18.53 25.67 38,542.40 53,393.60
GIS Utility Specialist I 126 20.84 28.84 43,347.20 59,987.20
GIS Utility Specialist II 127 21.66 30.00 45,052.80 62,400.00
Grounds Maintenance Lead 120 16.51 22.86 34,340.80 47,548.80

Fiscal Year 2021 - 22 Annual Budget
500
2021-22 PAYGRADES (Continued)
Pay Old Pay Hourly Hourly Annual Annual
Job Classification/Title Grade Grade Min Max Min Max
Groundsman L1 14.15 19.57 29,432.00 40,705.60
Heavy Equipment Operator 117 14.70 20.34 30,576.00 42,307.20
Help Desk Manager 136 132 30.79 42.59 64,043.20 88,587.20
HR Administrative Specialist 121 17.17 23.75 35,713.60 49,400.00
Human Resources Analyst 123 122 18.53 25.67 38,542.40 53,393.60
Industrial Pretreatment Inspector 121 17.17 23.75 35,713.60 49,400.00
Industrial Waste Monitoring (IWM) Technician 121 17.17 23.75 35,713.60 49,400.00
Information Technology Director 147 47.32 65.44 98,425.60 136,115.20
IT Network Manager 139 136 34.61 47.91 71,988.80 99,652.80
Lead Plant Operator 127 21.66 30.00 45,052.80 62,400.00
Librarian 120 16.51 22.86 34,340.80 47,548.80
Library Adult Services Supervisor 122 17.83 24.69 37,086.40 51,355.20
Library Assistant 112 12.11 16.74 25,188.80 34,819.20
Library Director 142 139 38.92 53.87 80,953.60 112,049.60
Library Page 112 12.11 16.74 25,188.80 34,819.20
Library Program Coordinator 120 16.51 22.86 34,340.80 47,548.80
Library Reference Assistant 114 13.09 18.10 27,227.20 37,648.00
Library Support Services Manager 125 20.04 27.74 41,683.20 57,699.20
Library Youth Services Supervisor 122 17.83 24.69 37,086.40 51,355.20
Lift Station Tech A 124 19.28 26.69 40,102.40 55,515.20
Lift Station Tech Apprentice 115 13.61 18.81 28,308.80 39,124.80
Lift Station Tech B 121 17.17 23.75 35,713.60 49,400.00
Lift Station Tech C 119 15.88 21.98 33,030.40 45,718.40
Maintenance Supervisor 130 24.36 33.70 50,668.80 70,096.00
Maintenance Worker I 112 12.11 16.74 25,188.80 34,819.20
Maintenance Worker II 113 12.61 17.41 26,228.80 36,212.80
Mechanic I 117 14.70 20.34 30,576.00 42,307.20
Mechanic II 119 15.88 21.98 33,030.40 45,718.40
Mobile Equipment Operator I 113 12.61 17.41 26,228.80 36,212.80
Mobile Equipment Operator II 115 13.61 18.81 28,308.80 39,124.80
Network Systems Analyst I 130 24.36 33.70 50,668.80 70,096.00
Network Systems Analyst II 132 26.32 36.43 54,745.60 75,774.40
Network Technician I 123 18.53 25.67 38,542.40 53,393.60
Nursery Technician 117 14.70 20.34 30,576.00 42,307.20
Office Specialist 114 13.09 18.10 27,227.20 37,648.00
Operations Manager 131 25.34 35.04 52,707.20 72,883.20
Operations Supervisor 130 24.36 33.70 50,668.80 70,096.00
Payroll Administrator 122 17.83 24.69 37,086.40 51,355.20
Payroll & Risk Technician 124 19.28 26.69 40,102.40 55,515.20
Permit Supervisor 123 18.53 25.67 38,542.40 53,393.60
Permit Specialist I 117 14.70 20.34 30,576.00 42,307.20
Permit Specialist II 119 15.88 21.98 33,030.40 45,718.40
Planner 126 20.84 28.84 43,347.20 59,987.20
Planning & Zoning Director 142 135 38.92 53.87 80,953.60 112,049.60
Plans Examiner I 131 25.34 35.04 52,707.20 72,883.20
Plans Examiner II 132 26.32 36.43 54,745.60 75,774.40
Plans Examiner III 136 30.79 42.59 64,043.20 88,587.20
Plans Examiner Trainee 121 17.17 23.75 35,713.60 49,400.00
Plant Manager 137 32.01 44.30 66,580.80 92,144.00
Plant Tech A 124 19.28 26.69 40,102.40 55,515.20
Plant Tech Apprentice 115 13.61 18.81 28,308.80 39,124.80
Plant Tech B 121 17.17 23.75 35,713.60 49,400.00
Plant Tech C 119 15.88 21.98 33,030.40 45,718.40

Fiscal Year 2021 - 22 Annual Budget
501
2021-22 PAYGRADES (Continued)
Pay Old Pay Hourly Hourly Annual Annual
Job Classification/Title Grade Grade Min Max Min Max
Police Captain 310 137 31.08 46.78 64,646.40 97,302.40
Police Chief 147 47.32 65.44 98,425.60 136,115.20
Police Corporal *** 304 22.63 34.53 50,012.30 76,311.30
Police Detective *** 300 20.72 30.41 45,791.20 67,206.10
Police Detective Corporal *** 304 22.63 34.53 50,012.30 76,311.30
Police Detective Sergeant *** 306 23.75 37.34 52,487.50 82,521.40
Police Interns 403 17.16 17.47 35,692.80 36,337.60
Police Lieutenant *** 308 27.51 40.33 60,797.10 89,129.30
Police Major 312 139 33.60 50.52 69,888.00 105,081.60
Police Officer *** 300 20.72 30.41 45,791.20 67,206.10
Police Officer Recruit 403 17.16 17.47 35,692.80 36,337.60
Police Records Tech I 118 15.29 21.15 31,803.20 43,992.00
Police Records Tech II 121 17.17 23.75 35,713.60 49,400.00
Police Reserve Officer 999 10.00
Police Senior Detective *** 302 21.34 32.88 47,161.40 72,664.80
Police Senior Police Officer ** 302 21.34 32.88 47,161.40 72,664.80
Police Sergeant *** 306 23.75 37.34 52,487.50 82,521.40
Project Manager I 127 21.66 30.00 45,052.80 62,400.00
Purchasing Manager 137 32.01 44.30 66,580.80 92,144.00
Records Section Supervisor 124 120 19.28 26.69 40,102.40 55,515.20
Recreation Aide 115 13.61 18.81 28,308.80 39,124.80
Recreation Director 142 139 38.92 53.87 80,953.60 112,049.60
Recreation Manager 130 24.36 33.70 50,668.80 70,096.00
School Crossing Guard 999 10.00
Senior Buyer 124 19.28 26.69 40,102.40 55,515.20
Senior Code Enforcement Officer 123 18.53 25.67 38,542.40 53,393.60
Senior ER Technician 123 18.53 25.67 38,542.40 53,393.60
Senior Planner 130 24.36 33.70 50,668.80 70,096.00
Senior Systems Analyst 135 29.60 40.96 61,568.00 85,196.80
Shop Supervisor 124 19.28 26.69 40,102.40 55,515.20
Solid Waste Manager 130 24.36 33.70 50,668.80 70,096.00
Solid Waste Operator I 117 14.70 20.34 30,576.00 42,307.20
Solid Waste Operator II 120 16.51 22.86 34,340.80 47,548.80
Solid Waste Operator III 121 17.17 23.75 35,713.60 49,400.00
Solid Waste Supervisor 127 21.66 30.00 45,052.80 62,400.00
Spray Technician 117 14.70 20.34 30,576.00 42,307.20
Stormwater Tech A 124 19.28 26.69 40,102.40 55,515.20
Stormwater Tech Apprentice 115 13.61 18.81 28,308.80 39,124.80
Stormwater Tech B 121 17.17 23.75 35,713.60 49,400.00
Stormwater Tech C 119 15.88 21.98 33,030.40 45,718.40
Street Supervisor 127 21.66 30.00 45,052.80 62,400.00
System Admin/Security Officer 132 26.32 36.43 54,745.60 75,774.40
Systems Analyst I 128 22.53 31.18 46,862.40 64,854.40
Systems Analyst II 130 24.36 33.70 50,668.80 70,096.00
Trades Technician 117 14.70 20.34 30,576.00 42,307.20
Utility Billing Specialist II 121 17.17 23.75 35,713.60 49,400.00
Utility Billing Supervisor 123 18.53 25.67 38,542.40 53,393.60
Utility Inspector 118 15.29 21.15 31,803.20 43,992.00
Utility Locator 118 15.29 21.15 31,803.20 43,992.00
Utility Service Technician 119 15.88 21.98 33,030.40 45,718.40
Warehouse Specialist 114 13.09 18.10 27,227.20 37,648.00
Warehouse Supervisor 120 16.51 22.86 34,340.80 47,548.80
Wastewater Operator A 124 19.28 26.69 40,102.40 55,515.20

Fiscal Year 2021 - 22 Annual Budget
502
2021-22 PAYGRADES (Continued)
Pay Old Pay Hourly Hourly Annual Annual
Job Classification/Title Grade Grade Min Max Min Max
Wastewater Operator Apprentice 116 14.15 19.57 29,432.00 40,705.60
Wastewater Operator B 121 17.17 23.75 35,713.60 49,400.00
Wastewater Operator C 119 15.88 21.98 33,030.40 45,718.40
Wastewater/Water Dual Operator A 128 22.53 31.18 46,862.40 64,854.40
Wastewater/Water Dual Operator A/B 126 20.84 28.84 43,347.20 59,987.20
Wastewater/Water Dual Operator A/C 125 20.04 27.74 41,683.20 57,699.20
Wastewater/Water Dual Operator B 125 20.04 27.74 41,683.20 57,699.20
Wastewater/Water Dual Operator B/C 123 18.53 25.67 38,542.40 53,393.60
Wastewater/Water Dual Operator C 120 16.51 22.86 34,340.80 47,548.80
Water Distribution Tech Apprentice 115 13.61 18.81 28,308.80 39,124.80
Water Distribution Tech I 124 19.28 26.69 40,102.40 55,515.20
Water Distribution Tech II 121 17.17 23.75 35,713.60 49,400.00
Water Distribution Tech III 119 15.88 21.98 33,030.40 45,718.40
Water Operator A 124 19.28 26.69 40,102.40 55,515.20
Water Operator Apprentice 116 14.15 19.57 29,432.00 40,705.60
Water Operator B 121 17.17 23.75 35,713.60 49,400.00
Water Operator B/Cross Connection 121 17.17 23.75 35,713.60 49,400.00
Water Operator C 119 15.88 21.98 33,030.40 45,718.40
WW Coll Tech A 124 19.28 26.69 40,102.40 55,515.20
WW Coll Tech Apprentice 115 13.61 18.81 28,308.80 39,124.80
WW Coll Tech B 121 17.17 23.75 35,713.60 49,400.00
WW Coll Tech C 119 15.88 21.98 33,030.40 45,718.40
Add Pay Notes:
Standby pay is an additional $10 a day -- (Police Standby is an additional $25 a day, per CBA)
Shift differential is an additional 10¢ per hour where applicable -- (Police Shift Differential is an additional $1.00 per hour, per CBA)
Car Allowance is provided to some department heads that use their car for city business rate at a rate of $2,700 per year
Police Clothing Allowance is provided to detectives for professional clothing at a rate of $1,000.00 per detective per year
Police K-9 Allowance is provided to officers assigned a departmental dog at 3.5 hours per week at the officer's regular hourly
rate of pay for completion of such duties
Police EMT Incentive Pay is provided to an officer to compensate for EMT specialized training at a rate of $1,250 per year
Police FTO Supervisor Incentive Pay is provided to an officer who performs supervisory work coordinating the FTO program at a
rate of $1,250 per year
Police Incentive Pay is a State unfunded mandate, provided to police officers, for advanced training at a maximum rate of
Police K-9 Supervisor Incentive Pay is provided to an officer who performs supervisory duties overseeing the operations/care of
departmental dogs at a rate of $1,250 per year
Police SWAT Pay is provided to members of the SWAT team at a rate of 2% of their annual salary per year
Fire Misc Special Pay is an additional amount provided to Fire Battalion chiefs for covering shifts.
Fire Paramedic Incentive Pay is provided to a firefighter who has a paramedic license at a rate of $3.41 per hour for actual hours
worked and scheduled shift time
Fire Field Training Officer/EMS Training Officer Pay is provided to a firefighter who has the appropriate credentials and assists
with training and remedial activities at a rate of $0.74 per hour for actual hours worked and scheduled shift time
Fire and EMS Training Coordinators Pay is provided to a firefighter who performs supervisory work in coordinating, preparing,
and delivering instructional programs on basic or specialized firefighting or emergency medical techniques to professional
emergency personnel at a rate of $1.11 per hour for actual hours worked and scheduled shift time.
* Annual salary for firefighters are calculated at 2704 hours/year rather than the standard 2080 hours/year.
** Annual salary for Battalion Chiefs are calculated at 2756 hours/year rather than the standard 2080 hours/year.
*** Annual salary for Police Officers, Corporals, Detectives, Sergeants & Lieutenants are calculated at 2210 hours/year rather than
the standard 2080 hours/year.

Fiscal Year 2021 - 22 Annual Budget
503
2021-22 PAYGRADES (Continued)
TitlePay Grade Rate Per
Game
Per
Hour
College Help 999 N/A 10.00$
Summer Help 999 N/A 10.00$
Temporary Slot* 999 N/A 10.00$
*If, due to a staffing necessity, a temporary employee must be hired in a certain position, the rate of pay
will be the minimum hourly rate of that position's pay grade.
Recreation Part-Time/Temporary Rates
Title Duties Skill Pay Grade Per Game Per HourTemp 1 D 250 10.00$
Temp 3 Splash Pad/Pool/Concession Attendant F 252 11.00$
Special ProjectsPromotional ActivitiesAdventure Program
Special Events - Rentals
Temp 4 Program Instructor G 253 11.50$
Field Maintenance (Including Tourn)
Venetian Center Attendant
Open Gym Attendant
Temp 5 Lifeguard H 254 12.00$
Pool Maintenance (Non-Seasonal)
Temp 6 Water Safety Instructor I 255 12.50$
Temp 7 Head Lifeguard J 256 13.00$
Temp 8 Assistant Pool Manager K 257 13.50$
Temp 10 Pool Manager L 258 14.00$
Official 1 Adult Volleyball Referee 5 270 25.00$
Youth Baskeball refereeOfficial 2 Youth Football Referee 6 271 27.00$
Rookie Baseball/Softball UmpirePrep Basketball
Adult Kickball/Soccer Official
Youth Soccer RefereeEnrichment
Official 3 Adult Football Referee 7 273 38.00$
Minors Baseball UmpireAdult Basketball Referee10U Softball UmpireAdult Softball
Official 4 Majors Baseball Umpire 8 274 45.00$
12U/14U/16U Softball UmpireBabe Ruth Baseball Umpire
2021-22 Part Time Pay Grades

Fiscal Year 2021 - 22 Annual Budget
504
2021-22 PAYGRADES (Continued)
Pay Hourly Hourly Annual Annual
Grade Min Max Min Max
L1 14.15 19.57 29,432.00 40,705.60
L2 45.81 45.81 95,284.80 95,284.80
L3 46.91 46.91 97,572.80 97,572.80
L4 48.00 48.00 99,840.00 99,840.00
101 9.58 10.93 19,926.40 22,734.40
102 9.58 11.36 19,926.40 23,628.80
103 9.58 11.81 19,926.40 24,564.80
104 9.58 12.29 19,926.40 25,563.20
105 9.63 12.76 20,030.40 26,540.80
106 9.62 13.28 20,009.60 27,622.40
107 9.99 13.79 20,779.20 28,683.20
108 10.39 14.34 21,611.20 29,827.20
109 10.82 14.90 22,505.60 30,992.00
110 11.24 15.50 23,379.20 32,240.00
111 11.66 16.11 24,252.80 33,508.80
112 12.11 16.74 25,188.80 34,819.20
113 12.61 17.41 26,228.80 36,212.80
114 13.09 18.10 27,227.20 37,648.00
115 13.61 18.81 28,308.80 39,124.80
116 14.15 19.57 29,432.00 40,705.60
117 14.70 20.34 30,576.00 42,307.20
118 15.29 21.15 31,803.20 43,992.00
119 15.88 21.98 33,030.40 45,718.40
120 16.51 22.86 34,340.80 47,548.80
121 17.17 23.75 35,713.60 49,400.00
122 17.83 24.69 37,086.40 51,355.20
123 18.53 25.67 38,542.40 53,393.60
124 19.28 26.69 40,102.40 55,515.20
125 20.04 27.74 41,683.20 57,699.20
126 20.84 28.84 43,347.20 59,987.20
127 21.66 30.00 45,052.80 62,400.00
128 22.53 31.18 46,862.40 64,854.40
129 23.41 32.42 48,692.80 67,433.60
130 24.36 33.70 50,668.80 70,096.00
131 25.34 35.04 52,707.20 72,883.20
132 26.32 36.43 54,745.60 75,774.40
133 27.38 37.88 56,950.40 78,790.40
134 28.46 39.39 59,196.80 81,931.20
135 29.60 40.96 61,568.00 85,196.80
136 30.79 42.59 64,043.20 88,587.20
137 32.01 44.30 66,580.80 92,144.00
138 33.29 46.07 69,243.20 95,825.60
139 34.61 47.91 71,988.80 99,652.80
140 36.00 49.82 74,880.00 103,625.60
141 37.43 51.80 77,854.40 107,744.00
142 38.92 53.87 80,953.60 112,049.60
143 40.46 56.03 84,156.80 116,542.40
144 42.08 58.28 87,526.40 121,222.40
145 43.75 60.58 91,000.00 126,006.40
146 45.51 62.91 94,660.80 130,852.80
147 47.32 65.44 98,425.60 136,115.20
148 49.17 68.13 102,273.60 141,710.40

Fiscal Year 2021 - 22 Annual Budget
505
2021-22 PAYGRADES (Continued)
Pay Hourly Hourly Annual Annual
Grade Min Max Min Max
300 20.72 30.41 45,791.20 67,206.10
302 21.34 32.88 47,161.40 72,664.80
304 22.63 34.53 50,012.30 76,311.30
306 23.75 37.34 52,487.50 82,521.40
308 27.51 40.33 60,797.10 89,129.30
310 31.08 46.78 64,646.40 97,302.40
312 33.60 50.52 69,888.00 105,081.60
403 17.16 17.47 35,692.80 36,337.60
503 11.51 16.37 31,123.04 44,264.48
520 14.39 20.86 38,910.56 56,405.44
524 16.37 23.70 44,264.48 64,084.80
529 19.75 28.69 53,404.00 77,577.76
532 22.35 30.92 61,596.60 85,215.52
999 10.00
401* 18.34 34.36 38,147.20 71,468.80
* Included in apprentice standards

Fiscal Year 2021 - 22 Annual Budget
506
ELEMENT/OBJECT CODES
PERSONAL SERVICES Salaries and Wages (1XXX) 1210 Salaries - posted directly from payroll 1230 Sick pay - wages paid for employee using sick time, final pay of accumulated sick
time 1240 Vacation pay - wages paid for employee using vacation time 1260 Stand by pay - the extra amount paid to employees on call 1280 Comp time pay - wages paid when employee uses comp time 1310 Temporary help – wages paid to employees who are not full time 1410 Overtime pay - wages paid for overtime worked 1510 Special pay - incentive pay, retired commissioner 1530 Bonuses 1641 Vacation/Terms & Buyouts- amount paid for PTO bought out by employees Fringes (2XXX) 2110 FICA - employer portion of social security and Medicare taxes 221x Retirement - City’s contribution to the appropriate pension plan and contribution to defined benefit plan 231x Health insurance - City’s portion of health and life insurance premiums 2410 Workers’ compensation - payments to workers’ compensation fund 26xx Other Payroll Benefits- employer portion of deferred compensation, wellness facilities, car allowances and cell phone stipend OPERATING EXPENSES Professional and Contractual Services (3XXX)
3110 Professional services - architects, appraisals, attorneys, bond rating companies, veterinarians
3111 Medical services – employee assistance program, random drug testing only, 3112 Pre-employment physical and psychological testing 3130 Engineering services 3210 Auditing 3410 Contractual services - contracts with outside agents Other Operating Expenses (4XXX) 4010 Travel - hotel, meals, tolls, parking, and incidental travel expenses 4110 Communication - telephone, cellular and mobile phones 4210 Postage - freight, postage 4310 Utilities - electric, gas, water, wastewater, sanitation, communications stormwater expenses 4410 Rentals 4415 Fleet Lease charges 4510 Insurance 4610 Repairs/Maintenance - vehicles and heavy equipment 4611 Fleet Maintenance charges 4612 Repairs/Maintenance - machinery and equipment 4615 Fleet Overhead MRU charge 4620 Repairs/Maintenance – buildings 4625 Repairs/Maintenance – other than buildings (OTB) 4630 Repairs/Maintenance - communication equipment
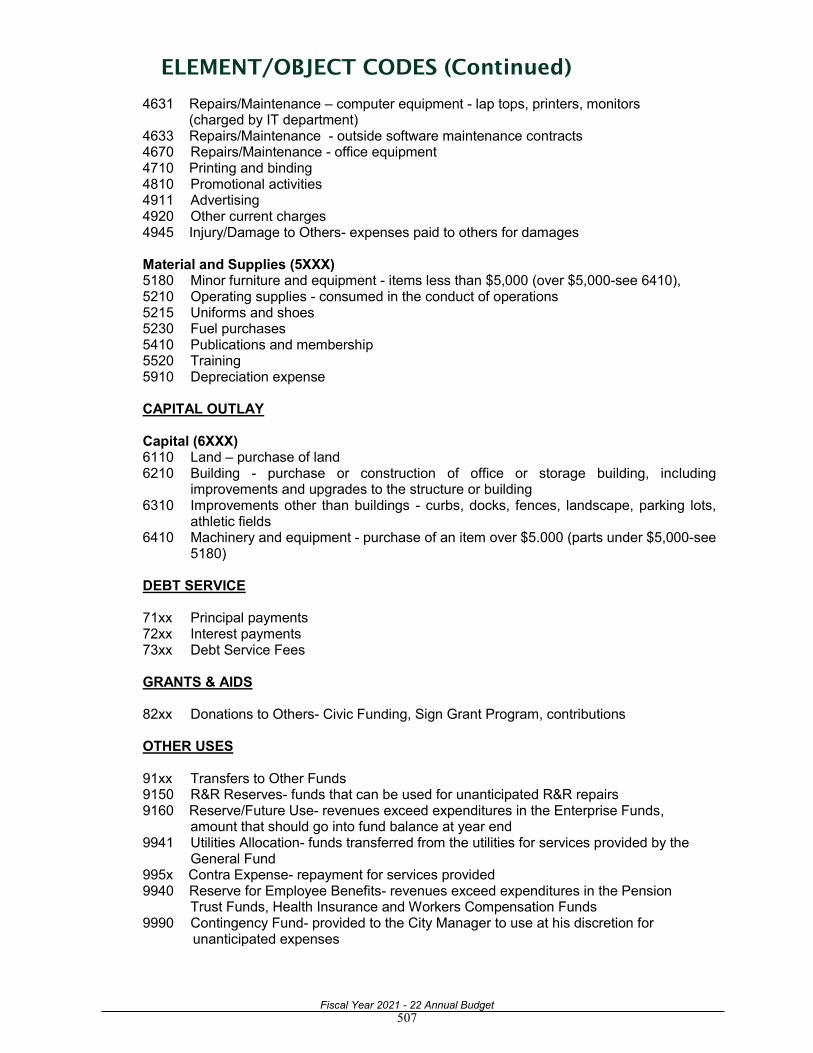
Fiscal Year 2021 - 22 Annual Budget
507
ELEMENT/OBJECT CODES (Continued)
4631 Repairs/Maintenance – computer equipment - lap tops, printers, monitors (charged by IT department) 4633 Repairs/Maintenance - outside software maintenance contracts 4670 Repairs/Maintenance - office equipment 4710 Printing and binding 4810 Promotional activities 4911 Advertising 4920 Other current charges 4945 Injury/Damage to Others- expenses paid to others for damages Material and Supplies (5XXX) 5180 Minor furniture and equipment - items less than $5,000 (over $5,000-see 6410), 5210 Operating supplies - consumed in the conduct of operations 5215 Uniforms and shoes 5230 Fuel purchases 5410 Publications and membership 5520 Training 5910 Depreciation expense CAPITAL OUTLAY Capital (6XXX) 6110 Land – purchase of land 6210 Building - purchase or construction of office or storage building, including
improvements and upgrades to the structure or building 6310 Improvements other than buildings - curbs, docks, fences, landscape, parking lots,
athletic fields 6410 Machinery and equipment - purchase of an item over $5.000 (parts under $5,000-see
5180) DEBT SERVICE 71xx Principal payments 72xx Interest payments 73xx Debt Service Fees GRANTS & AIDS 82xx Donations to Others- Civic Funding, Sign Grant Program, contributions OTHER USES 91xx Transfers to Other Funds 9150 R&R Reserves- funds that can be used for unanticipated R&R repairs 9160 Reserve/Future Use- revenues exceed expenditures in the Enterprise Funds, amount that should go into fund balance at year end 9941 Utilities Allocation- funds transferred from the utilities for services provided by the
General Fund 995x Contra Expense- repayment for services provided 9940 Reserve for Employee Benefits- revenues exceed expenditures in the Pension
Trust Funds, Health Insurance and Workers Compensation Funds 9990 Contingency Fund- provided to the City Manager to use at his discretion for unanticipated expenses

Fiscal Year 2021 - 22 Annual Budget
508
GLOSSARY OF ACRONYMS
AL Allocated
ALS Advanced Life Support
AMR Automated Meter Readers
APPA American Public Power Association
ARRA American Recovery & Reinvestment Act
ARV Air Release Valve
ASE Automotive Service Excellence
ATF Bureau of Alcohol, Tobacco, Firearms & Explosives
AutoCAD Computer Aided Drafting
BAN Bond Anticipation Note
BBIF Black Business Investment Fund
BOSS Business Owners Success Summit
BRAGG Business Redevelopment Assistance and Guidance Group
CDBG Community Development Block Grant
CDC Community Development Corporation
CEU Continuing Education Units
CGFO Certified Government Finance Officer
CIP Capital Improvement Plan
CHCRA Carver Heights Community Redevelopment Agency
COLA Cost of Living Adjustment
CR County Road
CRA Community Redevelopment Agency
CT Current Transformer
CUP Consumptive Use Permit
C.U.R.E. Citizens Utility Relief Effort
DEA Drug Enforcement Agency
DEP Department of Environmental Protection
DIMP Distribution Integrity Management Programs
DNS Domain Name System
DO Dissolved Oxygen
DOE Department of Energy
DOT Department of Transportation
DOR Department of Revenue
DR Demand Response
DRC Department Review Committee
DSM Demand Side Management
EAR Evaluation and Appraisal Report
EMS Emergency Medical Service
ERAU-W Embry Riddle Aeronautical University-Worldwide
ERT Electronic Remote Transmitter
ERU Equivalent Residential Unit
FAA Federal Aviation Administration
FACTA Fair and Accurate Credit Transactions Act
FBI Federal Bureau of Investigation
FCCMA Florida City/County Managers Association

Fiscal Year 2021 - 22 Annual Budget
509
GLOSSARY OF ACRONYMS (Continued)
FCSL Florida Collegiate Summer League
FDCA Florida Department of Community Affairs
FDEP Florida Department of Environmental Protection
FDOT Florida Department of Transportation
FEAT Florida Energy Aerospace Technology
FEMA Federal Emergency Management Agency
FERC Federal Energy Regulatory Commission
FGFOA Florida Government Finance Officers Association
FGU Florida Gas Utility
FICA Federal Insurance Contributions Act
FMEA Florida Municipal Electric Association
FMPA Florida Municipal Power Agency
FPL Florida Power & Light
FPSC Florida Public Service Commission
FTP File Transfer Protocol
GAAP Generally Accepted Accounting Principles
GASB Governmental Accounting Standards Board
GF General Fund
GFOA Government Finance Officers Association
GIS Geographical Information System
GLCRA Greater Leesburg Community Redevelopment Agency
GDPIPDI Gross Domestic Product Implicit Price Deflator Index
GO General Obligation
GPS Global Positioning Satellite
H2S Hydrogen Sulfide
HSP High Service Pump
IBNR Incurred But Not Reported
ICE US Immigration & Customs Enforcement
ICMA International City Management Association
IP Industrial Pretreatment
IPP Industrial Pretreatment Program
IRS Internal Revenue Service
ISO Insurance Services Office
IT Information Technology
IVR Interactive Voice Response
ISBA Interlocal Service Boundary Agreement
LEAP Leesburg Enterprise Aerospace Plan
LF Linear Foot
LGIP Local Government Investment Pools
LHS Leesburg High School
LMMI Low, Moderate and Middle Income
LSCC Lake Sumter Community College
MG Millions Gallons
MGD Million Gallons per Day
MS4 Municipal Separate Storm Sewer System

Fiscal Year 2021 - 22 Annual Budget
510
GLOSSARY OF ACRONYMS (Continued)
MWTP Main Water Treatment Plant
MPO Metropolitan Planning Organization
NDB Non Directional Beacon
NERC North American Electric Reliability Corporation
NPDES National Pollution Discharge Elimination System
NOV Notice of Violations
NPDES National Pollutant Discharge Elimination System
NSF Non Sufficient Funds
NSP Neighborhood Stabilization Program
O&M Operations & Maintenance
OSHA Occupational Safety & Health Administration
P&Z Planning & Zoning
PBX Private Branch Exchange
PEF Progress Energy- Florida
POOL Purchasing Officers of Lake
PPC Public Protection Classification
PPO Preferred Provider Organization
PSC Public Service Commission
PTO Paid Time Off
RFP Request for Proposal
SAFER Staffing for Adequate Fire & Emergency Response
SBA Small Business Association
SBDC Small Business Development Center
SCADA Supervisory Control and Data Acquisition
SCBA Self Contained Breathing Apparatus
SGIG Smart Grid Investment Grant
SMS Short Message System
SOP Standard Operating Procedure
TIF Tax Increment Financing
TMDL Total Maximum Daily Load
TRIM Truth in Millage
TSS Total Suspended Solids
TWWTP Turnpike Wastewater Treatment Plant
UCF University of Central Florida
USSSA United States Specialty Sports Association
VoIP Voice Over Internet Protocol
VT Voltage Transformer
WA Water
WRF Water Reclamation Facility
WWT Wastewater
WWTF Wastewater Treatment Facility
WWTP Wastewater Treatment Plant

Fiscal Year 2021 - 22 Annual Budget
511
GLOSSARY OF BUDGETARY TERMS
ACCRUAL BASIS - The basis of accounting un-der which transactions are recognized when they occur, regardless of the timing of related cash flows. AD VALOREM TAXES - Taxes based on value. A tax levied by local government on the assessed value of real property. This tax is commonly re-ferred to as “property tax.” AMENDMENT - A change to an adopted budget that has been approved by the Leesburg City Commission which may increase or decrease a fund total. AMORTIZATION - (1) Gradual reduction or liqui-dation of the balance of an intangible asset or lia-bility according to specified times and amounts. (2) Provision for the extinguishment of a debt by means of periodic payments. APPROPRIATION - A specific amount of money authorized by the City Commission for the pur-chase of goods and services or incurs obligations for specific purposes. An appropriation is usually limited in amount and as to the time when it may be expended. ASSESSED VALUATION - A valuation estab-lished by the Lake County Property Appraiser for real estate or other property to establish a basis for levying property taxes. AVAILABLE - Revenue that is collectible within current period, or soon after, to pay liabilities of the current period. BALANCE SHEET – Basic financial statement, usually accompanied by disclosures that describe the basis of accounting used in its preparation and presentation of a specified date the entity’s assets, liabilities and the equity of its owners. Also known as a “Statement of Financial Condition” or a “Statement of Net Position” (on the governmental side). Presentation of City Financial and Capital Assets which equals current and long-term liabili-ties plus equity. BOND - A written promise to pay a sum of money on a specific date at a specific interest rate as de-tailed in a bond ordinance. BUDGET - A financial plan for the operation of a program or organization for a specified period of time (fiscal year) that matches anticipated reve-nues with proposed expenditures.
BUDGET ADJUSTMENT - A revision to the adopted budget occurring during the affected fiscal year as approved by the City Commission via an amendment or a transfer. BUDGETARY CONTROL - The control or management of a government or enterprise in accordance with an approved budget for the purpose of keeping expenditures within the limitations of available appropriations and available revenues. CAPITAL OUTLAY - The cost of acquiring land, buildings, equipment, machinery, furnishings, etc. with a unit cost in excess of $5,000 and a useful life greater than one (1) year. CAPITAL PROJECTS FUND - Accounts for acquisition or construction of major capital facilities which are not funded from proprietary funds, but rather financed by bonds, intergovernmental revenues, donations or other restricted revenues. CASH BASIS - A method of determining if a budget is balanced. The cash basis of accounting is not in conformance with the accrual and modified accrual bases prescribed by the Governmental Accounting Standards Board. CHART OF ACCOUNTS - A way of recording revenues and expenditures, using a unique number, which includes all types of transactions within the organizational structure. COMMUNICATIONS SERVICE TAX - A tax levied by cities on the customers industry, including cable television and telephone. CONTINGENCY - A budgetary reserve to provide for emergency or unanticipated expenditures during the fiscal year. COST ALLOCATION - The method used to charge Enterprise Funds for their share of central administration costs. DEBT SERVICE - The City's obligation of principal and interest payments required to retire bonds and other instruments used as a financing source. DEPARTMENT - A major organizational unit of the city, which indicates overall management responsibility for related activities. DEPRECIATION - The non-cash expense related to the periodic expiration of an asset’s useful life. Depreciation is a requirement in proprietary-type

Fiscal Year 2021 - 22 Annual Budget
512
funds, such as enterprises and internal service funds. Depreciation is a non-cash expense; however, it should be budgeted in proprietary funds to ensure that there is sufficient revenue being collected from rates to cover this expense. Most bond rate covenants require that all operating and maintenance expenses including depreciation be covered by revenue from rates. DIVISION - A sub-unit of a department, which is a basic organizational unit of the city that uniquely functions in its service delivery. ENCUMBRANCES - Commitments of funds for contracts and services to be performed. When encumbrances are recorded, available appropriations are correspondingly reduced. ENTERPRISE FUND - A self-supporting fund designed to account for activities supported by user charges similar to business-like enterprise. EXPENDITURE - Decreases in (uses of) financial resources other than through interfund transfers. EXPENSE - A use of financial resources to obtain goods and services in the proprietary funds, which are accounted for on the full accrual basis, which is consistent with the business accounting model. FIDUCIARY FUND - A fund used to account for activity of the city as a trustee over funds allotted to meet a current or future financial obligation, usually on an actuarially sound basis. Example: Pension funds. FISCAL YEAR - A 12-month period to which the annual operating budget applies and at the end of which a government determines its financial position and the results of its operations. For the City of Leesburg, the fiscal year begins October 1 and ends September 30. FIXED ASSETS - Assets of a long-term character which are not intended to be sold for profit, but which are to be used in an organization’s normal course of business, such as land, buildings, and improvements other than buildings, machinery and equipment. FRANCHISE - A special privilege granted by a government permitting the continuing use of public property, such as city streets and usually involving the elements of monopoly and regulation. FRANCHISE FEES - A fee assessed on a business, usually a public utility, in return for its exclusive right to operate inside the city limits. The City of Leesburg has granted franchises for electric, gas and Solid Waste services. An agreement between the city and a provider of public services imparts certain
standards on the provider and is a contract which requires payments to the City. FRINGE BENEFITS - These employee benefits include social security, retirement, group health, dental and life insurance. FTE - Full-time equivalent. The hourly equivalent of a full-time employee. An FTE can be made up of either a full-time employee or two (2) or more part-time employees whose total hours equal 40 per week. FUNCTION - A major class or grouping of activities established by the State of Florida, whereby the financial reports must be grouped according to those established functions. These categories describe groups of tasks directed toward a common goal, such as executive, financial and administrative, to use in budgetary analysis. FUND - A fiscal and accounting entity with a self balancing set of accounts to record and segregate specific activities or objectives. FUND BALANCE - The fund equity (excess of assets over liabilities) of governmental funds and trust funds. GFOA - Government Finance Officer’s Association, a professional association of state and local finance officers in the United States who are dedicated to the sound management of government financial resources. The Association sets program standards for the GFOA’s Certificate of Achievement for Excellence in Financial Reporting and Budgeting. GENERAL FUND - A fund supported by revenues, such as property taxes, not designed by law for a special purpose. If there are no legal or sound financial reasons to classify an activity within another fund, use the General Fund. GENERALLY ACCEPTED ACCOUNTING PRINCIPLES (GAAP) - Uniform minimum standards for financial recording and reporting established by the accounting profession through such independent entities as the Governmental Accounting Standards Board. GENERAL OBLIGATION BONDS - Bonds for the payment of which the full faith and credit of the issuing government are pledged. GOALS - A statement of direction, purpose or intent based on the needs of the community.

Fiscal Year 2021 - 22 Annual Budget
513
GOVERNMENTAL ACCOUNTING STANDARDS BOARD (GASB) - The body that sets accounting standards specifically for governmental entities at the state and local level. GOVERNMENTAL FUNDS - Governmental funds are used to account for all or most of a government's general activities not accounted for in some other fund and use the modified accrual basis of accounting. GRANT - A contribution of assets (usually cash) by a governmental unit or other organization to another made for a specific purpose. IMPACT FEES - Fees charged to developers and individuals to cover, in whole or part, the anticipated cost of improvements that will be necessary as a result of the development. INDIRECT COSTS - Costs associated with, but not directly attributed to, providing a product or service, which are usually incurred by another department to support the operating department. INFRASTRUCTURE - Public support structures such as roads, street lighting, and water and sewer lines. INTERFUND TRANSFERS - All interfund transactions, except loans, quasi-external transactions and reimbursements. Budgeted amounts transferred from one governmental accounting fund to another for work or services provided. These represent a “double counting” of expenditures. Therefore, these amounts are deducted from the total operating budget to calculate the “net” budget. INTERNAL SERVICE FUNDS - Funds established for the financing of goods or service provided by one department to other departments within the City on a cost-reimbursement basis. MAJOR FUND – The General Fund is always a major fund. Any governmental fund that meets both of the following criteria: 1) An individual fund that reports at least 10% of
the total governmental funds in any of the following categories: assets, liabilities, revenues, and expenditures, and
2) 5% of the total for both governmental and enterprise funds in any one of the categories that met the 10% test
Enterprise funds apply the same criteria compared to governmental funds, but do not include extraordinary items in revenues and expenses. Internal service funds are never major. A government may elect to always report a fund as major to enhance consistency.
MEASURABLE - The amount of a transaction or event that can be determined. MILL - 1/1000 of one (1) dollar used in computing taxes by multiplying the rate times the taxable value divided by 1,000. taxable value X millage rate = taxes $1,000 $50,000 X $4.500 = $225.00 $1,000 MILLAGE - Rate used in calculating taxes based upon the value of property expressed in mills per dollar of property value. MODIFIED ACCRUAL - Revenues are recorded when both measurable and available (within 60 days of year end) to pay current liabilities. Expenditures are recognized when a transaction draws upon current spend able resources. NON-OPERATING EXPENDITURES – Types of expenditures that do not represent direct operating costs to the fund; include transfers out, transfers to Constitutional Officers, and reserves for contingency. NON-OPERATING REVENUES - Financial support for funds that are classified separately from revenues; includes transfers in and internal service fund receipts. OPERATING COSTS - Operating and maintenance expenses of day-to-day operations excluding personal services and capital outlay. PERFORMANCE MEASURES - Specific qualitative and/or quantitative measures of work performed as an objective of service divisions within the departments includes performance measures to identify the planned target levels for services in the fiscal year. Performance measures include workload indicators, effectiveness and efficiency standards. PERSONAL SERVICES - Costs related to compensating employees including salaries, wages, and fringe benefits. PROPERTY TAX - Refer to definition for ad valorem tax. PROPRIETARY FUNDS - Used to account for a government's business-type activities on the full accrual basis. The two (2) fund types in this category are the enterprise funds and internal service funds.

Fiscal Year 2021 - 22 Annual Budget
514
RESERVE - Funds that have been identified for a particular purpose or a portion of fund equity legally segregated for a specific future use. Reserve for working capital is a budgetary reserve appropriated to meet unexpected cash flow needs, emergencies, or revenue shortfalls. RETAINED EARNINGS - An equity account reflecting the accumulated net earnings of a proprietary fund. REVENUE BONDS - Bonds whose principal and interest are payable exclusively from earnings of an enterprise fund. Bonds payable from a specific revenue source and do not pledge the full faith and credit of the issuer. REVENUE SHARING - State money allocated to local governments. ROLLBACK RATE - The millage necessary to raise the same amount of ad valorem tax revenue as the previous year, excluding taxes from new construction. SPECIAL REVENUE FUND - A governmental accounting fund used to account for the proceeds of specific revenue sources that are legally restricted to expenditures for specified purposes. TAX BASE - The total property valuations on
which each taxing agency levies its tax rates.
TAX ROLL - The certification of assessed/taxable values prepared by the Property Appraiser and presented to the taxing authority by July 1 of each year. TRANSFERS IN/OUT - Amounts transferred from one fund to another to assist in financing the services of the recipient fund. Transfers do not constitute revenues or expenditures of the fund and are budgeted separately from other revenues and expenditures. TRUTH IN MILLAGE LAW - Also called the “TRIM BILL”, refers to a 1980 law that changed the budget process of local taxing agencies. It was designed to keep the public informed about the taxing intentions of the agencies. UNIFORM ACCOUNTING - The chart of accounts prescribed by the Office of the State Comptroller System designed to standardize financial information to facilitate comparison and evaluation of reports. USES - OTHER - Total expenditures and transfers to other funds that decrease net financial resources. UTILITY SERVICES TAX - A tax levied by cities on the consumers of various utilities such as electricity, gas, or water.

This page intentionally left blank
Fiscal Year 2021 - 22 Annual Budget
515

Fiscal Year 2021 - 22 Annual Budget
516

Fiscal Year 2021 - 22 Annual Budget
517

Fiscal Year 2021 - 22 Annual Budget
518

Fiscal Year 2021 - 22 Annual Budget
519

This page intentionally left blank
Fiscal Year 2021 - 22 Annual Budget
520