2022 Annual Budget document - Burnsville, MN
232
-
Upload
khangminh22 -
Category
Documents
-
view
0 -
download
0
Transcript of 2022 Annual Budget document - Burnsville, MN


This page intentionally left blank.

City Council
Burnsville City Council
Term Expires
Mayor Elizabeth B. Kautz December 31, 2024
Council Member Dan Gustafson December 31, 2024
Council Member Dan Kealey December 31, 2022
Council Member Cara Schulz December 31, 2024
Council Member Vince Workman December 31, 2022
City of Burnsville 2022 Budget 1 City Council

Table of ContentsCity Council ....................................................................................................... 1Table of Contents ............................................................................................. 2Guide to Using the Budget Document ............................................................... 4
Introductory SectionCity Manager Budget Message ...................................................................... 5City Council Governance Model and Strategic Priorities ................................. 7Organization of Services .................................................................................. 9Community Profile ............................................................................................. 11Financial Management & Fund Structure .......................................................... 14Budget Process & Calendar .............................................................................. 19
Budget Summary 212022 Budget Summary - All Funds ................................................................... 222022 Budget Overview & Analysis .................................................................. 28
Financial Plans 31General Fund ................................................................................................... 33
Special Revenue Funds ..................................................................................... 44Cable Franchise Fee Fund ...................................................................... 45Youth Center Fund .................................................................................. 48Sustainability Fund ................................................................................. 51Grant Fund ............................................................................................. 53Economic Development Authority (EDA) Fund ......................................... 56Forestry Fund ......................................................................................... 59Forfeiture Fund ....................................................................................... 61
Capital Projects Funds ...................................................................................... 63Parks Capital Fund ................................................................................. 64Equipment & Vehicle Fund ...................................................................... 67Facilities Fund ......................................................................................... 70Information Technology (I.T.) Capital Fund ............................................ 73Infrastructure Trust Fund ......................................................................... 75Street Maintenance Fund ....................................................................... 78Improvement Construction Fund .............................................................. 81
G O Debt Funds ............................................................................................... 83
City of Burnsville 2022 Budget 2 Table of Contents

Enterprise Funds ................................................................................................ 87Water & Sewer Fund ............................................................................. 88Storm Water Fund ................................................................................. 92Ice Center Fund ...................................................................................... 95Golf Course Fund ................................................................................... 98Street Lighting Fund ............................................................................... 100Ames Center Fund .................................................................................. 103
Capital & Debt 107Capital Improvements Program 2022-2026 .................................................... 108Special Revenue Funds ..................................................................................... 115Parks Capital .................................................................................................... 116Equipment & Vehicle Fund ................................................................................ 117Facilities Fund ................................................................................................... 120I.T. Capital ........................................................................................................ 124Enterprise Funds ................................................................................................ 127Debt Analysis .................................................................................................... 138
Fees & Charges ......................................................................................................... 143
Financial Policies 183Financial Management Plan and Policies .......................................................... 184Glossary of Terms ........................................................................................... 201
Supplemental InformationSupplemental Information Tables ..................................................................... 205Employee FTE Information ................................................................................ 221
TIF Financial Plans 225TIF District 7 - Minnesota River Quadrant (MRQ) ............................................. 226TIF District 9 ...................................................................................................... 228
City of Burnsville 2022 Budget 3 Table of Contents

Guide to Using the Budget Document
This document presents the City of Burnsville’s approved budget.
1) Introductory Section
Includes basic information on the budget process, the City’s organizational structure and the City Council’s vision, values and strategic priorities.
2) Budget Summary
An overview of the total budgeted revenue and expenditures for all funds. There is a narrative of the highlights of the budget including some comparative charts.
3) Financial Plans
This section includes a five-year finance plan for each of the City’s major funds. Each finance plan includes a narrative summary of the financial condition of the fund, including an explanation of major sources and uses of funds. Following the narrative summary is a single page of financial data. The financial data includes actual data for the year 2020; the 2021 projected year-end estimate; the 2022 adopted budget; and projections for years 2023 through 2026.
4) Capital Improvement Program (CIP) & Debt
The five year 2022-2026 Capital Improvement Program is included in this section. A debt study report provides a projection of future debt consistent with the CIP projections.
5) Fees and Charges
All approved fees and charges are listed.
6) Financial Policies
This section includes the Governance Policy and the Financial Management Plan. The City of Burnsville has an adopted Financial Management Plan that helps guide the City’s annual budget development. In addition to the guidance provided by this Plan, annually the Council also provides very specific direction on the maximum amount of property taxes that the Council will consider. The Council also provided some specific direction concerning fees, especially utility fees.
A glossary and acronym listing can be found at the end of the Financial Management Plan.
7) Supplemental Information
This section includes additional statistical tables and comparison information.
8) TIF Financial Plans (Economic Development Authority)
Five-year financial plans for each of the City’s Economic Development Authority’s (EDA) TIF Districts. Each finance plan includes a narrative summary of the financial condition of the fund, including an explanation of major sources and uses of funds. Following the narrative summary is a single page of financial data. The financial data includes actual data for the year 2020; the 2021 projected year-end estimate; the 2022 adopted budget; and projections for years 2023 through 2026.
City of Burnsville 2022 Budget 4 Guide to Using the Budget Document

2022 Welcome Message from City Manager
Greetings!
In Burnsville, we believe our public service makes a difference through collaboration, innovation and excellence. The 2022 budget is a summary of the identified Council priorities and City staff’s direction for the upcoming year. Working in the public sector means taking a long view, being cognizant that we get to help make our community better for our residents, businesses, and visitors.
In 2021, we continued the slow road to recovery from the COVID-19 pandemic, focusing on how we can continue to serve the community as creatively and responsively as possible. This resulted in some highlights we would like to share:
• We created a Community Engagement and Behavioral Health Unit to assist individuals as well as their families during and outside of a crisis situation.
• We also recognized the toll on our own staff, and have expanded the wellness initiatives to help keep our staff healthy, safe, and engaged to best serve the community.
• We put our Communications & Engagement strategic plan to work – with an increased emphasis on actively receiving feedback on programs and services.
• We continued to lean into adopting new policies and practices to engage our diverse community and using our internal inclusion efforts as a model to make connections.
• Burnsville is OPEN for business! The tax values of new development payable in 2022 is $37.8 million, and we have issued building permits for four separate multi-family projects with 433 new units and 108,708 square feet of commercial space of $6.6 million.
• We leveraged a $125,000 grant to implement a new Grow Burnsville initiative that includes community organics recycling, a market garden, a food forest, and another community garden.
• We reinvested in our flagship Nicollet Commons Park to repair damaged infrastructure and enhance the interactive elements including new lighting and sound systems.
Employees make up 70% of our expenses; we are in the people and experience business and we expect excellence. In 2021, we continued to reevaluate our people manager processes to enhance all aspects of being part of our team. From creative recruitment to reimagined onboarding, from a focus on
City of Burnsville 2022 Budget 5 City Manager Budget Message

Strengths development and learning more about Belonging and Equity – our goal is to invest in our staff to provide the very best service the community has come to expect.
Our 2022 budget theme is Towards Community and Organizational Health, recognizing that when we invest in each other that good things can happen; that we can continue to make decisions in alignment with our vision; and that we will continue to evolve to the changing needs of our community.
To the City Council, thank you for your service and your policy direction. My humble gratitude to our Senior Leadership team for being a model of servant leadership. My deepest appreciation to our entire team for committing to innovation, collaboration, and excellence. In Burnsville, You Belong Here!
Respectfully,
Melanie Mesko LeeCity Manager
City of Burnsville 2022 Budget 6 City Manager Budget Message

City Council Governance Model
The City Council has adopted a fundamentally different approach to governing by focusing on policy, instead of getting involved in organizational management. This initiative begins with establishing a broad framework of Strategic Priorities. Following are the adopted expectations of the Burnsville City Council.
In reviewing the 2022 budget document, strong emphasis has been placed on the City Council’s Governance Model. The Council governs by presenting strategic leadership and articulating a collective community vision, rather than focusing on internal operations. As a result, budget information strives to remain at the broadest policy level by concentrating on achieving desired results instead of emphasizing detailed line items and number of employees.
As in previous years, the budget reflects the hard work and dedication of many people. The attention to detail and demonstrated interest in quality services ensures that the recommended budget exists as a realistic target for 2022, striving to fulfill the Council’s broadest and highest policy directives.
The City Council’s Vision, Values and Strategic Priorities are included in the following pages.
VisionThe Council’s Vision that "Burnsville is a vibrant city, boldly leading, welcoming to all.", guides the following six strategic priorities set forth:
• Safety - Burnsville is committed to community safety.• Community Engagement - Burnsville is committed to be welcoming to all through community
engagement.• Community Development - Burnsville is committed to residential and commercial activities that will
enhance the community.• Sustainability - Burnsville is committed to environmental stewardship through creative and
innovative approaches to natural resource conservation.• Transportation & Infrastructure - Burnsville is committed to an effective, multi-modal transportation
system that safely connects people and goods• Organizational Services - Burnsville is committed to high-quality public service with respect for
resources. City services provide a positive community value.
City of Burnsville 2022 Budget 7 City Council Governance Model

City of Burnsville 2022 Budget 8 City Council Governance Model

Organization of City Services and Departments
Burnsville is a “Plan B” form of government, in which residents elect a mayor and four city council members with equal voting authority. The mayor and council are responsible for making policy and legislative decisions that govern the City, while relying on a city manager and staff to handle the administrative and day-to-day operations at City Hall.
As chief executive officer, the city manager is the sole employee of the city council. The City’s current organizational structure is described as a “molecular model,” which seeks to emphasize the relationship of work groups while de-emphasizing hierarchy. The current structure is the result of a gradual evolution over the life of the City and will continue to evolve as the needs of the community change.
City of Burnsville 2022 Budget 9 Organization of Services

Leadership Team and People Managers
Even under the “molecular model,” the demands and complexities of local government require lines of accountability. The organizational structure is delegated by the city manager. The City strives to reduce the layers of reporting (“flattening the organization”) with two only layers between front line service providers and the management team.
Senior Leadership Team
The first level of responsibility lies with the group of employees who assist the city manager with overall guidance of the organization:
• City Manager - Melanie Mesko Lee• Deputy City Manager - Gregg Lindberg• Public Works Director - Ryan Peterson• Fire Chief - BJ Jungmann• Police Chief - Tanya Schwartz• Community Development Director - Jenni Faulkner• Director of Parks, Recreation & Facilities - Garrett Beck
Leadership Team
The next level of responsibility lies with the primary managers of service areas:
• City Engineer - Jen Desrude• Assistant Public Works Director - Jeff Radick• Recreation and Facilities Superintendent - JJ Ryan• City Clerk - Macheal Collins• Finance Director - (open)• Assistant Finance Director - Stephanie Kilian• Human Resources Director - Karissa Bartholomew• Assistant Human Resource Director, Beth Wacholz• Information Technology Director - Tom Venables• Communications & Community Engagement Director - Carissa Larsen • Assistant Community Development Director - Regina Dean• Building Official - Chris Faste• Licensing and Code Enforcement Coordinator - Chris Forslund• Assistant Fire Chief - Terry Ritchie• Assistant Fire Chief - Doug Nelson• Assistant Fire Chief - Neal Dwyer• Police Captain - Chris Wicklund• Police Captain - Don Stenger• Police Captain - Matt Smith
People Managers
The next level of responsibility lies with the direct supervisors of front line employees and service providers throughout the organization.
City of Burnsville 2022 Budget 10 Organization of Services

Community Profile
The City of Burnsville is a southern second-tier suburb in the Twin Cities metropolitan area just twenty minutes from the downtown areas of both Minneapolis and St. Paul and a short distance from the Minneapolis / St. Paul International Airport. It was incorporated in 1964 and covers 27 square miles.
The City is a Plan B Statutory City with a City Council / City Manager form of government. The City Council consists of a Mayor and four Council Members elected at-large. The City has 289.6 full-time equivalents (FTE) in full-time and regular part-time positions, as well as seasonal employees and volunteers.
With a population of approximately 64,317, Burnsville is the third largest city in Dakota County, ninth largest suburb, and the fourteenth largest city in Minnesota. In August 2021, an estimated 34,942 residents were employed in the labor force which was 1,772 more than the 33,170 in August of 2020. The unemployment rate decreased over the past year, it was estimated at 3.9 percent in August 2021 compared to 9.2 percent in August of 2020 (Minnesota Department of Employment & Economic Development). The state-wide unemployment rate was 3.4 percent for August while the U.S. unemployment rate was 5.3 percent.
BOND RATING
Moody's and S&P Global Ratings has assigned the City’s bonds a rating of AAA. This rating is the highest rating available and is held by less than 200 municipalities in the nation.
TAX BASE
Burnsville’s tax base is balanced between residential and commercial property. Total market value has fluctuated over the past 10 years consistent with the state-wide and nation-wide trend in the housing market. The total taxable market value has increased 60.3 percent over the past ten years from $4.8 billion in 2012 to $7.8 billion in 2021. In the six years 2016-2021, the market value growth averaged 6.1 percent per year. Burnsville continues to monitor valuation trends.
Assessed Year
Taxable Market Value 2012 - 2021
2012 2013 2014 2015 2016 2017 2018 2019 2020 2021$4,000,000,000
$5,000,000,000
$6,000,000,000
$7,000,000,000
$8,000,000,000
Businesses contribute 34 percent of the City’s total tax base. Approximately 2,500 businesses are located in Burnsville. The County Road 42 shopping corridor includes Burnsville Center, one of the largest shopping centers in the Midwest. Other popular retailers are also located in the corridor making it a regional drawing area. While the city is known for retail shopping, ranking eighth in Minnesota, the City also ranks tenth in manufacturing and health care, ninth in information, and twelfth in scientific companies.
City of Burnsville 2022 Budget 11 Community Profile

DEVELOPMENT / REDEVELOPMENT
Since 2018, the City has approved 1,500 total multiple family housing units including memory care, senior and market rate. Three of the apartment buildings are located within the City’s Heart of the City area. Three buildings are located near the future Orange Line Bus Rapid Transit Stations which are set to open in December of 2021. The remainder of the housing developments are located on the cusp of the Center Village just east of I-35 W and I-35 E, near Crystal Lake, and near County Road 5 and Burnsville Parkway.
The City’s Northwest River Quadrant along the Minnesota River (MRQ) is the city’s largest area for future development and redevelopment. The City has been preparing for the long-term future development of this 1,700 acre area for several years. The City has received special legislation from the State for Tax Increment Financing (TIF) districts in this area. Street improvements and soil remediation in the area continued in 2019. The City estimates future construction value for this area will exceed $1.0 billion. Construction improvements will happen over the next 10-15 years. The most recent effort includes preparing for a new alignment for Cliff Road exit ramp from southbound I-35W. The project includes constructing a new roundabout and connection to Dupont Avenue. The City leveraged a federal grant, Department of Employment and Economic Development (DEED) Grant, TIF funds, and City and County cost share contributions for this effort. In 2021, the City was successful in obtaining grants from DEED, the Metropolitan Council and Dakota County to assist a developer with site cleanup, remediation, and infrastructure relocation to facilitate new development between Dupont Avenue and Ladybird Lane. Two new industrial buildings with a total of 232,000 square feet is expected to be built by early 2022.
Additionally, in December of 2018 the City Council adopted the Center Village Vision redevelopment plan to address the evolving County Road 42 retail corridor and the Burnsville Center. The plan outlines short, mid- and long-range goals for redevelopment of the retail area west of I-35W, south of McAndrews Road, east of Burnhaven Drive and north of Southcross Drive - including the Burnsville Center. It is meant to help guide future policy decisions and spark reinvestment into the area. The plan envisions new neighborhoods and housing mixed with retail uses; as well as other uses such as parks, hotels, clinics, co-sharing work places, start-up offices, brew pubs and maker spaces. The Center Village Vision Plan was developed through a collaborative effort with the consultant and their team of industry experts, along with City representatives, area stakeholders and property owners. The draft plan calls for a future mixed-use pedestrian friendly area. To further implementation of this plan in 2019 the City began working on a Traffic Study which was led by a consultant and involved city, county and state staff serving in a technical advisory capacity to identify issues, concerns, potential roadway improvements and traffic capacity in the area. This Traffic Study was made possible through a Department of Employment and Economic Development (DEED) Host grant. The Traffic Study was adopted by the City Council in 2020. In 2021 the City was successful in obtaining special legislation from the State to consider the area as a Tax Increment Financing (TIF) district area. The area, particularly the mall, has seen a decline in foot traffic, mass vacancies and obsolete building types. Further work in 2019 included starting the process to change the land use from Business to Mixed use to support to support further implementation and setting the table for redevelopment which are planning and economic development priorities. In 2021, the City completed an Alternative Urban Areawide Review (AUAR) for the Center Village Vision area to understand the environmental implications of future redevelopment. This step creates the opportunity to anticipate and manage impacts before projects are built and any future development proposals that are in full conformance with the AUAR and mitigation plan will not need to conduct their own environmental reviews. The City received a planning grant from the Dakota County Community Development Agency to complete a portion of the AUAR work.
On November 5, 2018, Council adopted the Economic Development Strategic Plan. Specifically, Goal 5--Continue the City’s position as a Regional Destination as a strategy which includes the development of a brand for the City. The plan in general calls for increased marketing of the city to attract development and redevelopment opportunities and to enhance the image of the City and ISD 191. In January, 2019, the City issued a Request for Qualifications (RFQ) for branding and marketing services. AE2s was selected out of seven firms responding. AE2s conducted an in-depth discovery process receiving input from over 1400 respondents about what they liked about
City of Burnsville 2022 Budget 12 Community Profile

Burnsville. In August, 2019 the tagline “You Belong Here” was adopted by Council and was incorporated with the City logo to form the new brand. The brand was officially unveiled at the Fire Muster in September. The unveiling was highlighted by four-foot-high letters spelling out “You Belong Here” at the Wednesday block party and at the entrance to the Fire Muster grounds for the weekend. Council and staff participated in the community parade, giving away swag promoting the new brand. AE2s will continue to work with city staff team to create a marketing plan to best utilize and get the brand message out to target markets. The final step was the completion of an Integrated Marketing & Communications Plan to outline how to use/promote the brand in upcoming years. The plan addresses each of the five goals of the Economic Development Strategic Plan with tactics, target audience, and action items. The city staff project team actively promotes the new brand internally and works with all departments to utilize the brand in their promotions, and work with local groups and organizations to utilize the brand whenever possible.
PUBLIC SAFETY
The City’s public safety services include a police department employing 73 police officers and a fire department employing 44 full-time firefighters/paramedics to provide fire protection and emergency medical ambulance service for the City of Burnsville.
PARKS
Burnsville is home to 76 parks spanning more than 1,750 acres. Approximately one-third of the parkland is developed for active uses including playgrounds, ballfields, turf fields, tennis and pickleball courts, splashpads, beaches, and archery range, and more. The other two-thirds are preserved as natural areas that support native plant habitats, prairies, and wetlands. Burnsville also provides miles of paved and natural trails great for walking, running, hiking, mountain biking, and cross country skiing.
WATER
The City’s Water & Sewer public utility provides water to over 16,700 residential and business accounts. The City operates 17 wells and two surface water intakes along with ground water and surface water treatment plants to provide more than 3 billion gallons of potable water annually. The surface water treatment plant completed in 2009 was a public/private partnership to use ground water that seeps into a Burnsville quarry. Previously, the water was pumped out of the quarry into the Minnesota River. As part of this partnership, the City provides more than 600 million gallons of water annually to the City of Savage, which accounts for more than 80% of their annual water use. Wastewater treatment and disposal is provided by the Metropolitan Council Environmental Services (MCES).
SCHOOLS
The City of Burnsville is served primarily by the Burnsville - Eagan - Savage School District (ISD 191), which has a 2020/2021 K-12 enrollment of 7,569 students. A portion of the City on the south end is served by ISD 194 (Lakeville) and ISD 196 (Rosemount - Apple Valley - Eagan).
City of Burnsville 2022 Budget 13 Community Profile

Financial Management
The City of Burnsville Finance Department is responsible for maintaining the accounting system and monitoring compliance with the budgetary controls and financial policies established by the City Manager and City Council.
FINANCIAL MANAGEMENT PLAN
The City’s Financial Management Plan is a financial policy document that establishes principles to guide both staff and City Council to make consistent and informed financial decisions. The plan is reviewed annually and adopted by the City Council.
BASIS OF ACCOUNTING
The accounting system provides for a complete, self-balancing account group for each fund of the City. Accounting records are maintained on the modified accrual basis for the governmental type funds and trust and agency funds. The modified accrual basis of accounting recognizes revenues that are available to finance expenditures in the current fiscal year. Similarly, debt service payments and a number of specific accrued liabilities are only recognized as expenditures when payment is due because it is only at that time that they normally are liquidated with expendable available financial resources. The budgetary basis of accounting is the same basis of accounting used to prepare the City’s financial statements as included in the City’s Annual Comprehensive Financial Report at the fund statement level.
The full accrual basis of accounting is used for the proprietary type funds as defined in the notes to the City’s financial statements. The full accrual basis of accounting recognizes revenues as they are earned and expenses as soon as a liability is incurred, regardless of related cash inflows and outflows. For budget purposes, the funds use the accrual basis except for capital assets and debt payments which are budgeted on a modified accrual basis within each finance plan. Depreciation is noted at the bottom of the finance plans.
ANNUAL COMPREHENSIVE FINANCIAL REPORT (ACFR)
The City reports its annual financial position in an Annual Comprehensive Financial Report (ACFR) that is available on the City's website. The City's finances are audited on an annual basis by independent auditors. The City has received a national award from the Government Finance Officers Association (GFOA) annually for excellence in financial reporting for many years.
BUDGETARY CONTROLS
Public trust in accounting is essential, and the City has adopted rigorous budget controls that include monitoring activity to budgeted amounts and bringing unbudgeted items to the City Council for approval.
INTERNAL CONTROLS
The City has adopted reasonable internal controls to safeguard public assets from misuse. These internal controls are independently reviewed by independent auditors and through continual process improvement evaluation by City staff.
CASH MANAGEMENT
The City's investment portfolio is designed to attain an average rate of return that regularly exceeds the average return on three-month U.S. Treasury bills. Portfolio diversification is considered so City investments are not concentrated.
City of Burnsville 2022 Budget 14 Financial Management

RISK MANAGEMENT
The City's risk management policy is intended to maintain the financial integrity and stability of the City, protect from personal injury, and reduce operational costs. An employee led safety committee focuses on education and training to reduce exposure. Insurance coverage is provided by the League of Minnesota Cities Insurance Trust (LMCIT) and includes blanket coverage for buildings, personal property, contractors, crime, employee performance bonds, auto, and general liability.
City of Burnsville 2022 Budget 15 Financial Management

Fund Structure
The accounting system maintains a standard fund structure for a typical Minnesota city government. Following is a description of the funds included that are subject to appropriation, for which financial plans and budget appropriations are prepared annually. These funds are the General, Enterprise, Capital Projects, Special Revenue, and Debt Service.
GENERAL FUND
The General Fund accounts for most basic governmental services in the areas of public safety, parks and public works, recreation and facilities, development and redevelopment, and general operations.
SPECIAL REVENUE FUNDS
The Special Revenue Funds are governmental funds used where revenue is restricted for a designated purpose. The City maintains seven Special Revenue Funds and all are budgeted funds using the modified accrual basis for both financial statement and budgeting purposes.
None of the Special Revenue Funds are major funds.
• Cable Franchise Fee Fund - includes franchise fee revenue received from cable television restricted for City communications related use.
• Youth Center Fund - reflects operations of THE GARAGE, the City’s teen center. The majority of revenues come from grants.
• Sustainability (Recycling) Fund - is Dakota County grant revenue for the operations of the Burnsville, Eagan, Apple Valley, and Lakeville partnership for recycling and sustainability efforts.
• Grant Fund - accounts for revenue and expenditures related to federal, state and other financial assistance programs.
• EDA Fund - is the general fund for the Burnsville Economic Development Authority (EDA). The main revenue is the EDA tax levy for the purpose of funding development needs.
• Forestry Fund - includes revenue and expenditures associated with managing diseased and distressed trees and preparing for the next outbreak including an infestation of the Emerald Ash Borer (EAB). Revenue is from the tax levy.
• Forfeiture Fund - is revenue received from court fines and is legally restricted for the purchase of otherwise unbudgeted police equipment.
ENTERPRISE FUNDS
Enterprise Funds are used for business-type activities - those activities provide services for which most or all of the costs are recovered through direct user fees and charges. The City has seven Enterprise Funds. The Enterprise Funds use the accrual basis of accounting for financial statement purposes. For budget purposes the funds use the accrual basis except for capital assets and debt payments which are budgeted on a modified accrual basis within each finance plan. Depreciation is noted at the bottom of the finance plans.
• Water and Sewer Fund - receives its revenues from charges to all property owners to provide water and sanitary sewer utilities, fund operations and maintenance and capital improvements. (major fund)
• Storm Water Fund - receives its revenues from charges to all property owners to fund water quality projects, operations and maintenance, and capital improvements. (major fund)
• Ice Center Fund - provides for operations at the City of Burnsville Ice Center which has two indoor
City of Burnsville 2022 Budget 16 Financial Management

sheets of ice.
• Golf Course Fund - accounts for the Birnamwood Golf Course, a nine-hole course operation supported by user fees.
• Street Lighting Fund - provides for the annual operations and maintenance of existing streetlights.
• Ames Center Fund - reflects the operation of the Ames Center, a performing arts facility. (major fund)
CAPITAL PROJECTS FUNDS
Capital Projects Funds are governmental funds used to account for the acquisition and construction of major capital facilities and equipment with an extended useful life. This includes expenditures relating to capital projects and large capital outlay purchases. The City has six budgeted funds in this category. The Capital Project Funds use the modified accrual basis for both financial statement and budgeting purposes.
• Parks Capital Fund - is used for development of new City parks and improvement of existing parks. Revenue is primarily from tax levy and park development fees.
• Equipment & Vehicle Fund - records capital purchases of equipment and vehicles. The resources are provided by issuance of Certificates of Indebtedness, sale of existing equipment, and transfers from other funds.
• Facilities Fund - records facilities replacements and improvements. The resources are provided by utility franchise fees, bond proceeds, and transfers from other funds. (major fund)
• Information Technology Capital Equipment Fund - includes capital purchases of Information Technology (IT) equipment and software development. The resources are provided by issuance of Certificates of Indebtedness, franchise fees and transfers from other funds.
• Street Maintenance Construction Fund - reflects revenues and expenditures for street rehabilitation projects, major street maintenance projects, and small traffic control issues.
• Improvement Construction Fund - includes receipt and disbursement of bond proceeds or other sources obtained to finance improvements and additions to the City’s infrastructure.
• Infrastructure Trust Fund (ITF) - includes property tax revenue for the purpose of replacing streets and park facilities. (major fund)
DEBT SERVICE FUNDS
Debt Service Funds account for the accumulation of resources for the payment of general long-term debt principal and interest. The City maintains individual debt service funds for each bond issue. The City has established annual financial plans for all general obligation bond funds and certificate of indebtedness funds which is shown in total as the GO Debt Funds. The Debt Funds use the modified accrual basis for both financial statement and budgeting purposes.
TAX INCREMENT CAPITAL PROJECTS AND DEBT SERVICE FUNDS
The City’s Economic Development Authority (EDA) maintains capital projects and Debt Service Funds for each Tax Increment Financing (TIF) District. Each TIF district has approved a budget for the district over the life of the district. Financial plans for each TIF district are included in this document. The TIF Funds use the modified accrual basis for both financial statement and budgeting purposes.
City of Burnsville 2022 Budget 17 Financial Management

INTERNAL SERVICE FUNDS
The City has two internal service funds for the City’s vested compensated absence balances and dental self insurance. There is not an annual budget for these funds. The expense related to the accrual of vested sick and vacation hours is budgeted in each fund with employee services and transferred to the internal service fund. Vested balances are paid to terminated employees from this fund. Activity related to dental self insurance is accounted for in the fund.
The following table shows the relationship between functional departments and funds. For example, the Natural Resources department has authorized expenditures in the General Fund, the Storm Water enterprise fund, the Equipment Vehicle & Facilities Capital Projects Fund and two Special Revenue Funds.
Special Revenue Funds Capital Projects Funds Enterprise Funds
FunctionalDepartments G
ener
al F
und
Cab
le F
ranc
hise
Forf
eitu
res
You
th C
ente
r
Sust
ain
ab
ility
Gra
nt
EDA
Fore
stry
Park
s C
apita
l
Equi
p &
Veh
icle
Faci
lity
IT C
apita
l
ITF
Stre
et R
evol
ving
Impro
vem
ent C
onst
r.
Wate
r &
Sew
er
Stor
m W
ate
r
Ice
Cen
ter
Gol
f C
ours
e
Stre
et L
ight
ing
Am
es C
ente
r
Police X X X X X
Fire & EMS X X X X
Economic Dev X
Community Dev X
Prot. Inspections X
Engineering X X X X X X X X
Parks X X X X
Public Works X X X X X X X
Fleet X X
Natural Resources X X X X X
Recreation X X X X X
Ames Center X
Admin & Council X X X
Finance X X
Information Tech X X X
Facilities X X X
Legal X
HR X
Cable Franchise X
Insurance X
City of Burnsville 2022 Budget 18 Financial Management

Budget Process and Calendar
The City of Burnsville budget development is not just an annual process that occurs at a set time every year. In actuality, the entire process is an on-going approach that fits into an overall framework of the four primary principles of sound local government budgeting, which are:
1. Establish broad goals to guide government decision making
2. Develop approaches to achieve goals
3. Develop a budget consistent with approaches to achieve goals
4. Evaluate performance and make adjustments.
The City’s budget process is built on a strong foundation of financial policies and goal setting. The City’s budget process begins with a review of the City’s Financial Management Plan which is the policy document that provides the framework for financial decision making. The City Council’s Strategic Priorities define the Council’s goals.
In June and August, the City Council reviewed information on projections for the 2022 budget. The Finance Director presented an overview of the financial challenges and a multi-year summary of demands and pressures on the City’s property tax levy.
City of Burnsville 2022 Budget 19 Budget Process

With these actions providing the foundation, the City Manager leads the budget development through each of the various steps, including a number of opportunities for adjusting the course of the budget. With completion of this budget document, the City has aligned department budget appropriations with the City Council Strategic Priorities, including the integration of performance measurement information.
Each year the City Council is required to adopt a maximum tax levy ceiling and preliminary budget by Sept. 30. The tax levy figure establishes the maximum tax levy increase that the Council can consider for the next budget year and is the amount used for the individual parcel specific Truth-in-Taxation notices. Historically, the City has used the maximum tax levy as a means for preserving flexibility in decision making until later in the year when considering final budget adoption.
During the October 26 City Council work session, each City division will present information on the activities and budget pressures of the division. The City Council will meet on Nov. 9 to review the recommended 2022 budget in preparation for the final adoption of the budget. The meetings are open to the public and the public is invited to comment on the budget at each meeting. Communications and Community Engagement will be created to help provide residents with information regarding the City budget and services. The public may comment on the 2022 Budget on the City’s website or at any of the public meetings.
On December 7, the City Council will consider adoption of the final budget.
City of Burnsville2022 Financial Planning and Budget Calendar
Meeting Dates Discussion Topics
June 15 2022 Preliminary Budget Projections
August 10 Review of Max Tax Proposal/CIP
September 7 2022 Budget Discussion
September 21 Council Adopts Maximum Tax Levy (City & EDA)
November 8-12 Budget Discussions
December 7 Council Adopts Final Tax Levies and Budget
City of Burnsville 2022 Budget 20 Budget Process

City of Burnsville 2022 BudgetBudget Summary
2022 Budget Summary
21

City of Burnsville 2022 Budget Summary
All Budgeted Funds
2021 2022
2019 2020 Original Amended Estimate Budget % Chg
Revenues / Sources
Property Taxes 35,797,563 37,679,396 38,966,552 38,966,552 38,964,552 40,920,455 5 %
Other Taxes 2,597,162 3,721,867 6,173,000 6,173,000 6,319,000 6,357,000 3 %
Special Assessments 2,297,285 1,932,087 1,781,003 1,781,003 1,463,813 2,569,351 44 %
License & Permits 3,369,080 2,028,388 2,269,650 2,269,650 2,632,777 2,440,178 8 %
Fines & Forfeits 358,417 205,089 323,170 323,170 218,070 220,170 (32) %
Investment Income 1,503,583 588,088 612,794 612,794 599,726 690,415 13 %
Rents 906,650 869,985 852,184 852,184 927,692 828,151 (3) %
Intergovernmental 5,736,397 9,637,051 7,585,621 14,543,502 16,636,864 12,058,462 59 %
Charges for Services 31,139,026 29,191,512 30,433,556 30,433,556 31,283,008 32,617,979 7 %
Sale of Capital Assets 196,974 54,401 100,000 100,000 — 100,000 0 %
Other Revenues 4,073,387 2,576,386 1,267,994 1,596,622 5,325,075 3,317,338 162 %
Bond Proceeds 8,485,945 21,556,514 3,414,000 3,414,000 3,990,294 3,544,000 4 %
Transfers from other funds 5,390,604 2,770,874 4,122,922 4,122,922 3,946,857 5,299,503 29 %
Total Revenues / Sources 101,852,073 112,811,638 97,902,446 105,188,955 112,307,728 110,963,002 13 %
Expenditures / Uses
Employee Services 35,172,564 36,823,570 40,091,180 40,133,200 40,123,245 41,954,880 5 %
Current Expenditures 23,053,083 22,789,762 25,034,039 25,434,292 24,791,377 27,427,572 10 %
Capital Outlay 1,739,320 2,917,926 3,029,992 4,095,573 3,670,573 3,060,802 1 %
Capital Improvements 19,894,709 27,593,003 18,917,987 43,950,454 43,454,342 26,193,558 38 %
Transfers to other funds 5,387,604 2,927,364 4,122,922 4,122,922 3,946,857 5,299,503 29 %
Interest / Debt 11,974,858 9,761,251 9,371,988 9,371,988 9,192,652 9,452,426 1 %
Total Expenditures / Uses 97,222,138 102,812,876 100,568,108 127,108,429 125,179,046 113,388,741 13 %
Change in Fund Balance 4,629,935 9,998,762 (2,665,662) (21,919,474) (12,871,318) (2,425,739) (9) %
City of Burnsville 2022 Budget 22 Budget Summary

City of Burnsville 2022 Budget Summary
General Operating Funds
General Fund
Special Revenue
Capital Projects
Total General Operating
BudgetDebt Service
FundsEnterprise
FundsTotal All Funds
Revenues / Sources
Property Taxes 30,689,856 547,500 7,044,354 38,281,710 2,638,745 — 40,920,455
Other Taxes 285,000 972,000 5,100,000 6,357,000 — — 6,357,000
Special Assessments — — 1,493,201 1,493,201 1,061,150 15,000 2,569,351
License & Permits 2,438,198 1,980 — 2,440,178 — — 2,440,178
Fines & Forfeits 195,170 25,000 — 220,170 — — 220,170
Investment Income 325,880 19,900 125,639 471,419 50,345 168,651 690,415
Rents 828,151 — — 828,151 — — 828,151
Intergovernmental 1,938,176 4,410,613 5,709,673 12,058,462 — — 12,058,462
Charges for Services 6,090,416 6,600 15,000 6,112,016 — 26,505,963 32,617,979
Sale of Capital Assets — — 100,000 100,000 — — 100,000
Other Revenues 58,400 — 844,000 902,400 — 2,414,938 3,317,338
Bond Proceeds — — — — — 3,544,000 3,544,000
Transfers from other funds 2,000,000 114,058 1,329,040 3,443,098 1,856,405 — 5,299,503
Total Revenues / Sources 44,849,247 6,097,651 21,760,907 72,707,805 5,606,645 32,648,552 110,963,002
Expenditures / Uses
Employee Services 33,774,461 1,204,342 — 34,978,803 — 6,976,077 41,954,880
Current Expenditures 11,414,093 1,562,996 680,000 13,657,089 8,014 13,762,469 27,427,572
Capital Outlay — 141,500 2,728,302 2,869,802 — 191,000 3,060,802
Capital Improvements — — 18,127,558 18,127,558 — 8,066,000 26,193,558
Transfers to other funds 869,558 2,000,000 1,881,405 4,750,963 — 548,540 5,299,503
Interest / Debt — — — — 6,021,828 3,430,598 9,452,426
Total Expenditures / Uses 46,058,112 4,908,838 23,417,265 74,384,215 6,029,842 32,974,684 113,388,741
Use of Fund Balance (1,208,865) 1,188,813 (1,656,358) (1,676,410) (423,197) (326,132) (2,425,739)
City of Burnsville 2022 Budget 23 Budget Summary

City of Burnsville 2022 Budget Summary
Special Revenue Funds
2022 Budget
Cable Franchise
Youth Center Sustainability Grant EDA Fund Forestry Forfeiture
Special Revenue
Total
Revenues / Sources
Property Taxes — — — — 297,500 250,000 — 547,500
Other Taxes 972,000 — — — — — — 972,000
Special Assessments — — — — — — — —
License & Permits — — — — — 1,980 — 1,980
Fines & Forfeits — — — — — — 25,000 25,000
Investment Income 7,000 — — 400 5,300 7,200 — 19,900
Rents — — — — — — — —
Intergovernmental — 53,000 338,622 4,018,991 — — — 4,410,613
Charges for Services 6,600 — — — — — — 6,600
Sale of Capital Assets — — — — — — — —
Other Revenues — — — — — — — —
Bond Proceeds — — — — — — — —
Transfers from other funds — 10,000 104,058 — — — — 114,058
Total Revenues / Sources 985,600 63,000 442,680 4,019,391 302,800 259,180 25,000 6,097,651
Expenditures / Uses
Employee Services 912,146 — 292,196 — — — — 1,204,342
Current Expenditures 311,407 63,000 150,484 — 708,105 300,000 30,000 1,562,996
Capital Outlay 141,500 — — — — — — 141,500
Capital Improvements — — — — — — — —
Transfers to other funds — — — 2,000,000 — — — 2,000,000
Interest / Debt — — — — — — — —
Total Expenditures / Uses 1,365,053 63,000 442,680 2,000,000 708,105 300,000 30,000 4,908,838
Change in Fund Balance (379,453) — — 2,019,391 (405,305) (40,820) (5,000) 1,188,813
City of Burnsville 2022 Budget 24 Budget Summary

City of Burnsville 2022 Budget Summary Capital Projects Funds
2022 Budget
Parks Capital
Equipment & Vehicle Facilities
I.T. Capital Fund
Infra-structure
Street Maintenance
Improvement Construction
Capital Projects Total
Revenues / Sources
Property Taxes 1,462,000 1,992,000 — 344,000 3,246,354 — — 7,044,354
Other Taxes — — 5,100,000 — — — — 5,100,000
Special Assessments — — — — — — 1,493,201 1,493,201
License & Permits — — — — — — — —
Fines & Forfeits — — — — — — — —
Investment Income 48,000 5,000 28,000 6,000 33,639 5,000 — 125,639
Rents — — — — — — — —
Intergovernmental — — — — 2,062,673 — 3,647,000 5,709,673
Charges for Services — — — — — 15,000 — 15,000
Sale of Capital Assets — 100,000 — — — — — 100,000
Other Revenues 844,000 — — — — — — 844,000
Bond Proceeds — — — — — — — —
Transfers from other funds — 383,500 95,200 191,890 — 658,450 — 1,329,040
Total Revenues / Sources 2,354,000 2,480,500 5,223,200 541,890 5,342,666 678,450 5,140,201 21,760,907
Expenditures / Uses
Employee Services — — — — — — — —
Current Expenditures — — — — — 680,000 — 680,000
Capital Outlay — 2,728,302 — — — — — 2,728,302
Capital Improvements 3,548,296 — 3,730,000 709,400 4,999,661 — 5,140,201 18,127,558
Transfers to other funds — — 1,856,405 — 25,000 — — 1,881,405
Interest / Debt — — — — — — — —
Total Expenditures / Uses 3,548,296 2,728,302 5,586,405 709,400 5,024,661 680,000 5,140,201 23,417,265
Change in Fund Balance (1,194,296) (247,802) (363,205) (167,510) 318,005 (1,550) — (1,656,358)
City of Burnsville 2022 Budget 25 Budget Summary

City of Burnsville 2022 Budget Summary
Enterprise Funds
2022 Budget
Water & Sewer Storm Water Ice Center Golf Course
Street Lighting
Ames Center
Enterprise Total
Revenues / Sources
Property Taxes — — — — — — —
Other Taxes — — — — — — —
Special Assessments — 15,000 — — — — 15,000
License & Permits — — — — — — —
Fines & Forfeits — — — — — — —
Investment Income 118,451 45,000 100 100 5,000 — 168,651
Rents — — — — — — —
Intergovernmental — — — — — — —
Charges for Services 17,975,671 4,615,152 1,120,410 295,500 568,467 1,930,763 26,505,963
Sale of Capital Assets — — — — — — —
Other Revenues 2,177,138 42,800 — — 10,000 185,000 2,414,938
Bond Proceeds 3,544,000 — — — — — 3,544,000
Transfers from other funds — — — — — — —
Total Revenues / Sources 23,815,260 4,717,952 1,120,510 295,600 583,467 2,115,763 32,648,552
Expenditures / Uses
Employee Services 4,753,168 1,298,636 691,174 233,099 — — 6,976,077
Current Expenditures 9,755,322 961,343 379,382 72,456 399,432 2,194,534 13,762,469
Capital Outlay — — — 44,000 — 147,000 191,000
Capital Improvements 4,971,000 2,925,000 — — 170,000 — 8,066,000
Transfers to other funds 463,915 84,625 — — — — 548,540
Interest / Debt 3,430,598 — — — — — 3,430,598
Total Expenditures / Uses 23,374,003 5,269,604 1,070,556 349,555 569,432 2,341,534 32,974,684
Change in Fund Balance 441,257 (551,652) 49,954 (53,955) 14,035 (225,771) (326,132)
City of Burnsville 2022 Budget 26 Budget Summary

City of Burnsville 2022 Budget Summary
Projected Changes in Fund Balance
Fund
Estimated Fund Balance
January 1 2022
Revenues 2022
Expenditures
Fund Balance
December 31 Increase
(Decrease)
% Change in Fund Balance
Greater than Ten Percent
Variance
General Fund 27,304,151 44,849,247 46,058,112 26,095,286 (1,208,865) (4.4) %
Special Revenue Funds
Cable Franchise 496,513 985,600 1,365,053 117,060 (379,453) (76.4) % A
Youth Center 2,813 63,000 63,000 2,813 — — %
Sustainability 288,912 442,680 442,680 288,912 — — %
Grant 4,029,706 4,019,391 2,000,000 6,049,097 2,019,391 50.1 % A
EDA 533,837 302,800 708,105 128,532 (405,305) (75.9) % A
Forestry 669,330 259,180 300,000 628,510 (40,820) (6.1) %
Forfeiture 25,144 25,000 30,000 20,144 (5,000) (19.9) % B
Capital Projects Funds
Parks Capital 4,899,106 2,354,000 3,548,296 3,704,810 (1,194,296) (24.4) % CEquipment & Vehicle 719,363 2,480,500 2,728,302 471,561 (247,802) (34.4) % C
Facilities 2,848,777 5,223,200 5,586,405 2,485,572 (363,205) (12.7) % C
I.T. Capital Fund 605,703 541,890 709,400 438,193 (167,510) (27.7) % C
Infrastructure 3,363,947 5,342,666 5,024,661 3,681,952 318,005 9.5 %
Street Maintenance 577,969 678,450 680,000 576,419 (1,550) (0.3) %
Improvement Construction (68,452) 5,140,201 5,140,201 (68,452) — — %
Debt Funds
G.O. Debt Funds 5,119,057 5,606,645 6,029,842 4,695,860 (423,197) (8.3) %
Enterprise Funds
Water & Sewer 60,204,493 23,815,260 23,374,003 60,645,750 441,257 0.7 %
Storm Water 40,076,270 4,717,952 5,269,604 39,524,618 (551,652) (1.4) %
Ice Center 4,366,281 1,120,510 1,070,556 4,416,235 49,954 1.1 %
Golf Course 1,214,165 295,600 349,555 1,160,210 (53,955) (4.4) %
Street Lighting 1,703,887 583,467 569,432 1,717,922 14,035 0.8 %
Ames Center 17,079,094 2,115,763 2,341,534 16,853,323 (225,771) (1.3) %
Total All Funds 176,060,066 110,963,002 113,388,741 173,634,327 (2,425,739) (1.4) %
Reason for Greater than Ten Percent Variance:
A: Planned use of fund balance for operations.
B: Planned use of fund balance for capital items.
C: Capital projects vary by year. The City strives to pay cash for capital projects that can be anticipated and planned for in advance of purchase. Therefore the City’s fund balance levels fluctuate, in part, based on capital project plans.
City of Burnsville 2022 Budget 27 Budget Summary

2022 Budget Overview & Analysis
A budget is a reflection of a community’s priorities, and staff has prepared a budget that aligns with the Council’s updated Vision, Values, and Strategic Priorities.
Following the 2021 budget roadmap to recovery, staff built the 2022 budget focused on growing toward community and organizational health. Our purpose is simple, to continue the high-touch level of service our community expects as we apply the lessons learned from our experience and recovery from a global pandemic.
The City’s overall market value increased 5.1% for Pay 2022 with apartments showing the most growth. At the June work session, the City Council reviewed a preliminary budget which presented a high-level analysis of continuing current operations and discussed a preliminary 9.7% total levy increase.
Since June, the City Council has affirmed a plan to reduce the overall levy increase to 4.8% by using $2 million annually in American Rescue Plan Act (ARPA) revenue recovery Funds and one-time uses of fund balance annually for 3 Years. Results include a lower levy increase and evens out those increases over 5 years. This approach leaves $2 million of ARPA funds available to be used for other projects or priorities in the next 5 years.
Growing Community and Organizational HealthThe City’s budget reflects the priorities of the City Council and community. As we build community and organizational health, the value of the community’s investment in the services provided. We believe a healthy community and organization starts with our taxpayers understanding their investment, and more importantly the value of that investment in their daily lives.
City of Burnsville 2022 Budget 28 Budget Overview & Analysis

Based on council discussions and feedback, four long-term budget priorities and projects have emerged to better inform and develop our financial planning:
1. A comprehensive community visioning process2. Addressing staffing and workforce needs3. Considering priority based budgeting4. A possible two-year budget cycle
City of Burnsville 2022 Budget 29 Budget Overview & Analysis

Engagement and ParticipationStaff will continue our multi-year strategy to enhance transparency and get the community involved in the creation and implementation of our budget. We will continue to enhance community communication and engagement, including:
a. Our updated budget landing page at www.Burnsvillemn.gov/budget.b. Our 2021 Budget Transparency Portal to allow anyone to dig deeply into our budget.c. A new 2022 budget dashboard to help the community interact and work with us through the
process.
Property TaxesThe adopted tax levy is $41,209,755, a 4.8% percent increase over the 2021 levy. This increase is inclusive of all City Council adopted levies as well as the Economic Development Authority (EDA) special levy. This is consistent with the maximum property tax levy the Council adopted in September which was a 4.8 percent increase.
The table that follows provides a comparison of the 2022 adopted property tax levy to the 2021 adopted levy.
2022 Adopted Tax Levy
Tax Levies by Fund 2021 Levy2022 Levy -
Adopted $ Change % Change
General Fund 29,973,845 30,979,156 1,005,311 2.6 %
Debt 2,006,707 2,638,745 632,038 1.6 %
Infrastructure Trust Fund 3,151,800 3,246,354 94,554 0.2 %
Forestry 300,000 250,000 (50,000) (0.1) %
Equipment & Vehicle Capital 1,879,000 1,992,000 113,000 0.3 %
IT Capital 334,000 344,000 10,000 — %
Parks Capital 1,413,000 1,462,000 49,000 0.1 %
Total City Levy 39,058,352 40,912,255 1,853,903 4.7 %
EDA 247,500 297,500 50,000 0.1 %
Total City + EDA Levy 39,305,852 41,209,755 1,903,903 4.8 %
City of Burnsville 2022 Budget 30 Budget Overview & Analysis

City of Burnsville 2022 BudgetFive-Year Financial Plans
General Fund
Special Revenue FundsCable Franchise Fee Fund
Youth Center (THE GARAGE) Fund Sustainability Fund
Grant Fund Economic Development Authority (EDA) Fund
Forestry Fund Forfeiture Fund
Capital Projects FundsParks Capital
Equipment & VehicleFacilities
Information Technology Capital Equipment Street Maintenance
Improvement Construction Infrastructure Trust
Debt Service Funds G O Debt Funds
Enterprise Funds Water & Sewer
Storm Water Ice Center
Golf CourseStreet LightingAmes Center
31

This page intentionally left blank.
32

City of Burnsville 2022 BudgetFive-Year Financial Plan
General Fund
33

General FundFinancial Plan Year 2022
FUND DESCRIPTIONThe General Fund is used to account for the revenues and expenditures necessary to provide basic governmental services for the city. The principal sources of revenues are property taxes, intergovernmental revenue, and charges for municipal services. Expenditures are for general government, public safety, streets, recreation, and other functions.
BACKGROUNDThe General Fund has consistently remained in sound financial condition from year to year due to effective management of sources and uses within this fund.
The Fund had $28.8 million in total fund balance at year end 2020. The 2020 budget included planned use of fund balance of $1,027,791; however, actual results were a positive $3,021,176 addition to fund balance.
CARES funding in 2020 was used to offset the City's eligible COVID-19 expenditures and helped to stabilize fund balance that would have otherwise declined substantially. Estimated fund balance at the end of 2021 is projected to decrease by $1,549,000.
Below is a summary of past and recent year-end fund balance reserves as well as a projection for future balance.
Fund Balance (in millions) 2017 2018 2019 20202021
Estimate2022
Projection
Nonspendable $ 1.2 $ 1.2 $ 1.2 $ 0.4 $ — $ —
Restricted $ 1.9 $ 1.7 $ 1.5 $ 1.2 $ 1.0 $ 0.9
Assigned for Ice Center Debt Service $ 0.6 $ 0.4 $ 0.3 $ 0.2 $ — $ —
Assigned for subsequent year's budget $ 0.3 $ 0.6 $ 0.5 $ 1.6 $ 1.9 $ 1.2
Unassigned $ 18.3 $ 18.7 $ 22.3 $ 25.4 $ 24.4 $ 23.9
Total Fund Balance $ 22.3 $ 22.6 $ 25.8 $ 28.8 $ 27.3 $ 26.0
Unassigned Fund Balance Policy:
Total next year's budget for minimum 40% calculation $ 38.4 $ 40.1 $ 42.6 $ 43.8 $ 46.0 $ 47.8
Policy Minimum Requirement (40%) $ 13.4 $ 14.0 $ 14.9 $ 17.5 $ 18.4 $ 19.1
Balance over Policy Mininum $ 4.9 $ 4.7 $ 7.4 $ 7.9 $ 6.0 $ 4.8
Total Unassigned $ 18.3 $ 18.7 $ 22.3 $ 25.4 $ 24.4 $ 23.9
City of Burnsville 2022 Budget 34 Financial Plan - General Fund

SOURCE OF FUNDSThe primary source of funding for the General Fund is the property tax. Property taxes represent well over half of total revenues in the General Fund. Services such as police and fire, which are the largest expenditure areas in the General Fund, are highly dependent on the property tax for funding. About half of the total property tax levy the City collects goes toward support of public safety. The following pie-chart provides a break-down of General Fund revenues.
General Fund Revenue
Property taxes 68%
Charges for Services 14%
Intergovernmental 4%
Licenses & permits 5%
Other 8%
The sum of all non-property tax revenue totals around a third of all revenue in the General Fund. The majority of the non-property tax revenue comes from charges for services and licenses and permits. The City has historically set charges for services and licenses and permits at a level sufficient to cover the full cost of services provided. All fees and charges are reviewed annually to ensure they remain at both a reasonable and competitive level. The following provides information on the General Fund revenue sources, including future projections, summarized by major category.
Property taxes The adopted property tax levy for the General Fund is $30,979,156. The General Fund levy is a $1,005,311 increase from 2021. This is an approximately 2.6 percent increase over 2021 for the General Fund.
The City’s average residential values increased by 6.3 percent for pay 2022. Commercial/Industrial (C/I) values average values increased 1.0 percent from 2021.
For planning purposes, future property tax revenues shown in the Five-year Financial Plan are calculated to show the level of tax funding needed to balance the annual budget assuming that the present level of services are provided. The future property tax amounts shown in the Five-year Financial Plan are for projection purposes only to show the demand for additional levy before other decisions are made to determine final levy by year.
City of Burnsville 2022 Budget 35 Financial Plan - General Fund
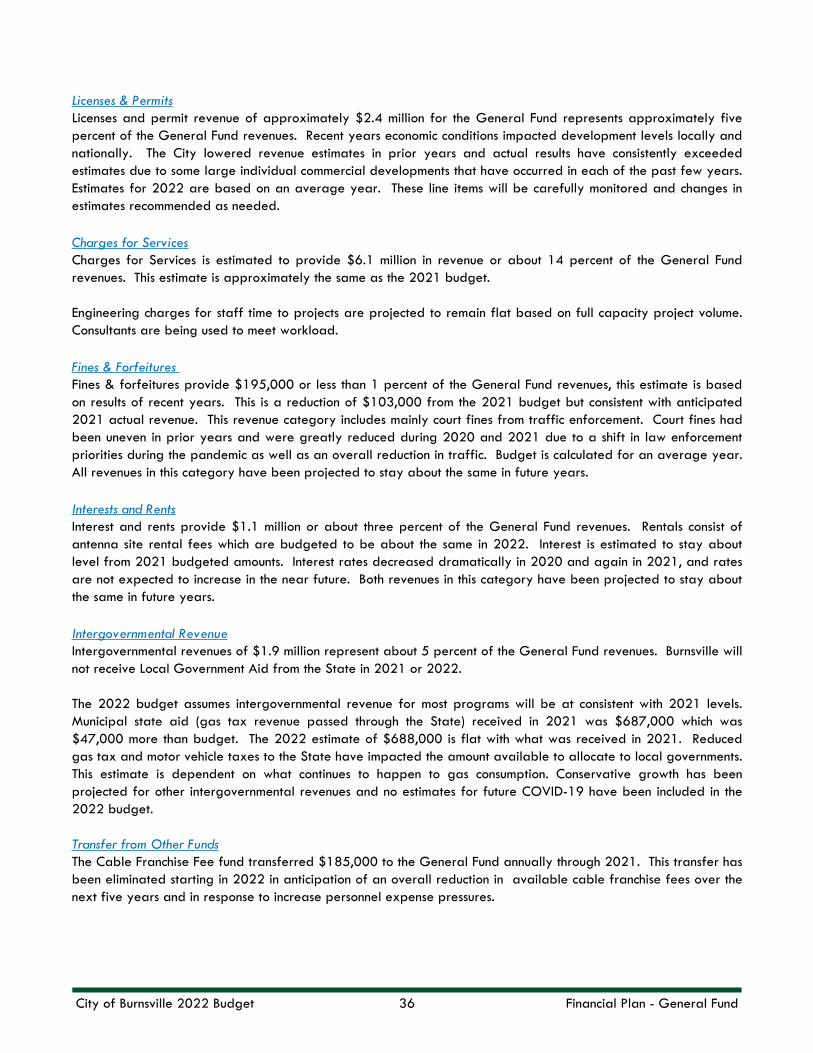
Licenses & Permits Licenses and permit revenue of approximately $2.4 million for the General Fund represents approximately five percent of the General Fund revenues. Recent years economic conditions impacted development levels locally and nationally. The City lowered revenue estimates in prior years and actual results have consistently exceeded estimates due to some large individual commercial developments that have occurred in each of the past few years. Estimates for 2022 are based on an average year. These line items will be carefully monitored and changes in estimates recommended as needed.
Charges for Services Charges for Services is estimated to provide $6.1 million in revenue or about 14 percent of the General Fund revenues. This estimate is approximately the same as the 2021 budget.
Engineering charges for staff time to projects are projected to remain flat based on full capacity project volume. Consultants are being used to meet workload.
Fines & Forfeitures Fines & forfeitures provide $195,000 or less than 1 percent of the General Fund revenues, this estimate is based on results of recent years. This is a reduction of $103,000 from the 2021 budget but consistent with anticipated 2021 actual revenue. This revenue category includes mainly court fines from traffic enforcement. Court fines had been uneven in prior years and were greatly reduced during 2020 and 2021 due to a shift in law enforcement priorities during the pandemic as well as an overall reduction in traffic. Budget is calculated for an average year. All revenues in this category have been projected to stay about the same in future years.
Interests and Rents Interest and rents provide $1.1 million or about three percent of the General Fund revenues. Rentals consist of antenna site rental fees which are budgeted to be about the same in 2022. Interest is estimated to stay about level from 2021 budgeted amounts. Interest rates decreased dramatically in 2020 and again in 2021, and rates are not expected to increase in the near future. Both revenues in this category have been projected to stay about the same in future years.
Intergovernmental Revenue Intergovernmental revenues of $1.9 million represent about 5 percent of the General Fund revenues. Burnsville will not receive Local Government Aid from the State in 2021 or 2022.
The 2022 budget assumes intergovernmental revenue for most programs will be at consistent with 2021 levels. Municipal state aid (gas tax revenue passed through the State) received in 2021 was $687,000 which was $47,000 more than budget. The 2022 estimate of $688,000 is flat with what was received in 2021. Reduced gas tax and motor vehicle taxes to the State have impacted the amount available to allocate to local governments. This estimate is dependent on what continues to happen to gas consumption. Conservative growth has been projected for other intergovernmental revenues and no estimates for future COVID-19 have been included in the 2022 budget.
Transfer from Other Funds The Cable Franchise Fee fund transferred $185,000 to the General Fund annually through 2021. This transfer has been eliminated starting in 2022 in anticipation of an overall reduction in available cable franchise fees over the next five years and in response to increase personnel expense pressures.
City of Burnsville 2022 Budget 36 Financial Plan - General Fund

American Rescue Plan Act (ARPA) grant funds of $8 million were awarded to the City in 2021 for use through 2024. These grant funds have been recorded in the Grant Fund and will be transferred to the General Fund when appropriated. City Council has affirmed a plan to reduce the overall levy increase by using $2 million annually in American Rescue Plan Act revenue recovery funds and one-time uses of fund balance annually for three years to lower the levy increase and even out those increases over 5 years. The 2022 budget reflects the plan to transfer ARPA funds from the Grant fund in each of the next three years.
Use of Fund Balance Budgeted use of fund balance in 2022 is $1,208,865. In the year 2012, Council assigned $1,400,000 of fund balance to be used to fund an annual transfer of $140,000 to the Ice Center Debt Service Fund to pay the lease revenue annual payments on the 2010 Ice Center Improvements. The 2021 budget included the final installment of the $140,000 annual transfer. The budget includes a $154,365 use of restricted fund balance from tipping fees to pay for eligible costs. This includes operating expenses for recycling in the parks and sustainability programming.
The City has consistently used fund balance to offset election year costs in the even years. In 2022, the City plans for $286,000 of election expense. The 2022 expense reflects the addition of an Elections position for a one-year appointment. In 2022 the budget includes one-time costs for Community Development and Community Engagement vehicles totaling of $112,500. The City is using fund balance for the continued overhaul of City Code Title 10 and 11, planned for $85,000. The 2022 budget includes $271,000 for a one-time use for police radios. Additionally, the city has planned for the use of $300,000 for Inclusion and Belonging and Visioning initiatives.
2021 Budget
Amended Budget 2022 Budget 2023 2024 2025 2026
Planned Use of Restricted and Assigned Fund Balance:
Use of Restricted for Landfill 151,544 151,544 154,365 163,751 170,173 176,765 183,835
Ice Center Debt Service 140,000 140,000 — — — — —
One-time Uses of Unreserved Fund Balance:
Police Radios — — 271,000 — — — —
Operations — — — 59,119 — 596,798 42,957
For following year operations — — — — (416,391) — —
Elections — — 286,000 — 220,000 — 220,000
Community Development Software 290,000 290,000 — — — — —
Community Development Equipment & Vehicle 96,000 96,000 32,500 — — — —
Community Engagement Vehicle — — 80,000 — — — —
City Code Overhaul 125,000 125,000 85,000 — — — —
Monuments/ 35W Aesthetic Improvements — — — 180,000 190,000 450,000 —
Visioning — — 150,000 — — — —
Inclusion and Belonging — — 150,000 — — — —
Comprehensive Study — — — 500,000 — — —
Carry forward amendments/additional one-time use of fund balance 1,100,382 1,149,339 — — — — —
1,902,926 1,951,883 1,208,865 902,870 163,782 1,223,563 446,792
City of Burnsville 2022 Budget 37 Financial Plan - General Fund

USE OF FUNDSExpenditures from the General Fund are for general governmental services such as police, fire, emergency medical services, street maintenance, regulatory services, recreation, parks, planning and zoning, and general administration. Police and fire comprise the largest share, 57 percent, of the total expenditure budget in the General Fund. The following chart provides a break-down by major service areas within the General Fund excluding transfers.
General Fund Expense by Department (excluding transfers)
Public Safety 57%
Parks, Natural Resources, &Facilities 14%
Organizational Services 11%
Public Works 9%
Community Development 6%
Leadership 3%
Use of Funds in the General Fund can also be broken down into the following spending categories for which further explanation and comparison of change from 2021 to 2022 is provided.
General Fund Expense by Category
Personnel 73%
Other Expenditures 24%
Transfers 2%
CVB - Lodging tax 1%
City of Burnsville 2022 Budget 38 Financial Plan - General Fund

Personnel CostsPersonnel costs are comprised of wages, health insurance costs, and other benefits such as employer taxes, employer pension contribution, workers compensation insurance, funding for accrued vacation and sick leave, and disability insurance. Expanded organizational development initiatives and investment in diversity and inclusion efforts are also included in the 2022 budget. Worker’s compensation insurance expense is projected to increase in 2022 due mainly to and increase in worker's compensation rates overall as well as a decline in overall experience ratings. The City is focusing efforts of the safety committee to review trends and identify injury avoidance strategies across all areas of the City. Budget neutral staffing movements are included as part of the budget. A one-year Elections position for 2022 is to be funded with use of fund balance consistent with elections related expenses. Cable TV has made a budget neutral move to increase the FTEs by 0.4 using part-time staffing expenses. Community Experience and Engagement has added a digital specialist in response to increasing demand for communication throughout the City, this position was repurposed and did not result in a net FTE change across departments.
Current Expenditures Supplies, legal fees, auditing fees, repairs, dues and subscriptions, training, telephone, software maintenance, etc. are accounted for as current expenditures. Fuel costs have been favorable for the past few years. The City budgets for fuel based on average prices and therefore several departments were able to recognize savings in fuel which offset other pressures in current expenses. Current expenditures include $1.2 million for the cost of payment to the Dakota Communications Center (DCC) for operations of the City's 911 response center. Travel expenses have been increased for 2022, this brings the travel budget to 2018 levels. Travel expenses were significantly reduced as a result of the pandemic, but travel is making a comeback with the national and regional management of the pandemic. The 2022 budget reflects expectations for increased expenditure in this area.
There are several large items this year, including the continuation of the update of a portion the City’s Code Title 10 and 11 for $85,000. In Information Technologies the City is continuing taking advantage of more hosted services rather than capital purchases of software and the associated hardware. The IT budget includes technology additions for several departments, which will provide efficiencies in those departments.
Future year current expenditures were projected out using a constant inflationary factor of 2 percent.
Capital Outlay Major capital expenses for facilities, fleet and other large capital items are accounted for in the Equipment & Vehicle Capital Fund and the Facilities Capital Fund.
DebtThe General Fund does not make any direct debt service payments, but the fund does transfer revenue to support the payment of debt as highlighted below under Transfers.
TransfersTransfers are made from the General Fund for the purpose of allocating general property taxes to other funds. The table below shows the 2022 transfers compared to the 2021 transfer. The Council's funding plans to provide increases to some of the funds remain as previously planned. Transfers now represent two percent of the General Fund expenditure projections at $0.9 million.
City of Burnsville 2022 Budget 39 Financial Plan - General Fund

Transfer to Fund Purpose2021
Transfer2022
Transfer
Special Revenue Funds:
Sustainability Transfer from fund balance reserved for landfill abatement to fund Burnsville sustainability and recycling activities.
$130,577 $104,058
Youth Center Annual subsidy to support the operation of the Youth Center. Funds are used for repairs and maintenance of the facility.
$0 $10,000
Debt Service Funds:
Ice Center Debt 2012 was the first year of use of General Fund Balance to fund debt service on the Ice Center renovation project. Transfers are planned for 10 years ending in 2021.
$140,000 $0
Capital Project Funds:
Vehicle & Equipment Replacement
Transfers to provide funding for police radios, community development vehicle replacements and a community engagement vehicle.
$96,000 $383,500
Street Revolving Transfer to fund sealcoating and other street maintenance projects. This remains a transfer to provide flexibility to annually address street operations maintenance and capital maintenance need.
$372,000 $372,000
Enterprise Funds:
Ames Center Enterprise To provide non-operating revenue for the Ames Center. $291,000 $0
Total $1,029,577 $869,558
FUND BALANCEIt is important for the financial stability of the City to maintain fund balance for unanticipated expenditures or unforeseen emergencies, as well as to provide adequate working capital for current operating needs so as to avoid short-term borrowing.
The City will maintain fund balances in the General Fund at a level which will avoid issuing short-term debt to meet the cash flow needs of the current operating budget. Generally, the goal would be to maintain a minimum total General Fund balance of 40 percent of the operating budget; however, this need could fluctuate with each year’s budget objectives and appropriations such as large capital expenditures, and variations in the collection of revenues.
City of Burnsville 2022 Budget 40 Financial Plan - General Fund

General FundFive-Year Financial Plan
Actuals 2021 2022 Projected
2019 2020 Original Amended Estimate Budget % Chg 2023 2024 2025 2026
SOURCE OF FUNDS:
Property Taxes
General Fund Tax Levy 27,025,000 28,708,967 29,973,845 29,973,845 29,973,845 30,979,156 3 % 32,778,778 34,954,668 37,287,772 39,855,752
Delinquent & Other 105,646 (92,419) (339,300) (339,300) (341,300) (289,300) (15) % (289,300) (289,300) (289,300) (289,300)
Net Collections 27,130,646 28,616,548 29,634,545 29,634,545 29,632,545 30,689,856 4 % 32,489,478 34,665,368 36,998,472 39,566,452
Other taxes (Lodging) 351,690 174,326 285,000 285,000 245,000 285,000 0 % 287,850 290,729 293,636 296,572
Licenses and permits 3,367,440 2,026,218 2,267,670 2,267,670 2,630,797 2,438,198 8 % 2,499,153 2,561,632 2,625,673 2,691,315
Fines and forfeits 320,101 201,204 298,170 298,170 193,070 195,170 (35) % 197,122 199,093 201,084 203,095
Investment income 532,834 274,781 317,500 317,500 291,000 325,880 (1) % 317,019 320,189 323,391 326,625
Rents 906,650 869,985 852,184 852,184 927,692 828,151 (3) % 836,433 844,797 853,245 861,777
Intergovernmental 2,501,534 4,642,164 1,948,697 1,956,300 1,906,026 1,938,176 (1) % 1,957,558 1,977,134 1,996,905 2,016,874
Charges for services 6,112,741 5,782,188 6,068,124 6,068,124 6,005,475 6,090,416 — % 6,225,704 6,381,347 6,540,881 6,704,403
Other 105,726 108,558 60,900 60,900 59,290 58,400 (4) % 58,984 59,574 60,170 60,772
Transfer from Other Funds 185,000 185,000 185,000 185,000 185,000 2,000,000 1,035 % 2,435,000 2,435,000 435,000 435,000
SOURCE OF FUNDS 41,514,362 42,880,972 41,917,790 41,925,393 42,075,895 44,849,247 7 % 47,304,301 49,734,863 50,328,457 53,162,885
USE OF FUNDS:
Personnel Services 28,212,378 29,905,275 32,260,619 32,275,989 32,298,751 33,774,461 5 % 35,669,040 37,095,802 38,579,634 40,122,819
Current Expense 8,752,407 9,097,488 10,259,770 10,300,960 10,067,593 11,143,343 9 % 11,578,374 11,809,941 12,046,140 12,287,063
Capital — — — — — — — % — — — —
Total Operating Uses 36,964,785 39,002,763 42,520,389 42,576,949 42,366,344 44,917,804 6 % 47,247,414 48,905,743 50,625,774 52,409,882
Non-Operating:
Burnsville CVB 334,106 165,610 270,750 270,750 232,750 270,750 0 % 273,458 276,193 278,955 281,745
Transfer to other funds 1,783,000 1,177,076 1,029,577 1,029,577 1,029,577 869,558 (14) % 686,299 716,709 647,291 918,050
Total Non-Operating 2,117,106 1,342,686 1,300,327 1,300,327 1,262,327 1,140,308 (12) % 959,757 992,902 926,246 1,199,795
TOTAL USE OF FUNDS 39,081,891 40,345,449 43,820,716 43,877,276 43,628,671 46,058,112 5 % 48,207,171 49,898,645 51,552,020 53,609,677
NET CHANGE IN FUND BALANCE 2,432,471 2,535,523 (1,902,926) (1,951,883) (1,552,776) (1,208,865) (902,870) (163,782) (1,223,563) (446,792)
OTHER CHANGES TO FUND BALANCE:
Net change in fair value of investments 794,585 485,653 — — — — — — — —
Beginning Fund Balance 22,608,694 25,835,750 28,856,926 28,856,926 28,856,926 27,304,150 26,095,285 25,192,415 25,028,633 23,805,070
Ending Fund Balance 25,835,750 28,856,926 26,954,000 26,905,043 27,304,150 26,095,285 25,192,415 25,028,633 23,805,070 23,358,278
City of Burnsville 2022 Budget 41 Financial Plan - General Fund

General FundDepartmental Use of Funds
2021 2022
2019 2020 Original Amended Estimate Budget % Chg
USE OF FUNDS
Police 14,233,651 14,709,263 15,738,192 15,745,795 15,762,856 16,483,822 5 %
Fire & EMS 7,685,208 8,134,082 8,497,421 8,497,421 8,497,421 9,042,313 6 %
Public Safety 21,918,859 22,843,345 24,235,613 24,243,216 24,260,277 25,526,135 5 %
Development and Redevelopment — 432,574 459,811 459,811 446,311 476,891 4 %
Planning 442,623 319,849 510,478 510,478 451,668 530,267 4 %
Comp Plan Update 40,721 7,819 60,000 60,000 60,000 40,000 (33) %
Protective Inspections 660,570 790,655 921,923 921,923 908,348 952,568 3 %
Licensing & Code Enforcement 564,921 486,934 723,415 723,415 620,457 744,013 3 %
Community Development 1,708,835 2,037,831 2,675,627 2,675,627 2,486,784 2,743,739 3 %
Engineering 918,839 1,015,181 1,088,843 1,101,543 1,119,331 1,161,245 7 %
Streets & Utilities 2,151,987 1,934,039 2,129,058 2,129,058 2,087,928 2,202,999 3 %
Fleet Maintenance 368,652 422,829 452,584 452,584 574,040 484,398 7 %
Public Works 3,439,479 3,372,049 3,670,485 3,683,185 3,781,299 3,848,642 5 %
Parks & Natural Resources 3,799,809 3,754,725 4,220,660 4,241,917 4,185,124 4,304,678 2 %
Recreation 1,183,922 989,817 1,153,736 1,153,736 1,126,832 1,178,428 2 %
Facilities 586,568 597,727 680,495 680,495 677,451 737,020 8 %
Parks, Natural Resources, Recreation & Facilities 5,570,299 5,342,270 6,054,891 6,076,148 5,989,407 6,220,126 3 %
City Council 146,501 106,179 155,578 170,578 164,918 161,100 4 %
Administration 211,878 289,196 338,753 338,753 334,984 510,346 51 %
Legal Services 595,042 535,093 607,470 607,470 692,206 611,694 1 %
Leadership & Leadership Development 953,421 930,468 1,101,801 1,116,801 1,192,108 1,283,140 16 %
Human resources 297,414 626,010 722,707 722,707 757,819 1,049,797 45 %
Communications, Public Experience and Engagement 54,044 177,639 331,919 331,919 351,919 281,281 (15) %
City Clerk 157,377 163,661 180,179 180,179 178,274 189,036 5 %
Elections 16,686 310,689 19,196 19,196 19,675 304,571 1,487 %
Finance 651,893 603,213 688,329 688,329 691,167 693,662 1 %
Insurance 705,626 626,285 558,256 558,256 548,103 561,580 1 %
Information Technologies 1,490,853 1,969,303 2,281,386 2,281,386 2,109,512 2,216,095 (3) %
Organizational Services 3,373,892 4,476,799 4,781,972 4,781,972 4,656,469 5,296,022 11 %
Total Operating Uses 36,964,784 39,002,763 42,520,389 42,576,949 42,366,344 44,917,804 6 %
Convention Visitors Bureau 334,106 165,610 270,750 270,750 232,750 270,750 — %
Transfer to other funds 1,783,000 1,177,076 1,029,577 1,029,577 1,029,577 869,558 (16) %
Total Non-Operating Uses 2,117,106 1,342,686 1,300,327 1,300,327 1,262,327 1,140,308 (12) %
TOTAL USE OF FUNDS 39,081,890 40,345,449 43,820,716 43,877,276 43,628,671 46,058,112 5 %
City of Burnsville 2022 Budget 42 Financial Plan - General Fund

General FundSource of Funds
2021 2022
2019 2020 Original Amended Estimate Budget % Chg
SOURCE OF FUNDS
Property Taxes & Fiscal Disparities 27,130,646 28,616,548 29,634,545 29,634,545 29,632,545 30,689,856 4 %
Other Taxes - lodging 351,690 174,326 285,000 285,000 245,000 285,000 — %
Building 2,605,621 1,350,590 1,550,500 1,550,500 1,989,000 1,642,500 6 %
Business 453,159 405,303 463,120 463,120 445,397 468,548 1 %
Alcohol 306,841 174,466 208,150 208,150 150,000 281,250 35 %
Other 1,819 95,859 45,900 45,900 46,400 45,900 — %
Licenses & Permits 3,367,440 2,026,218 2,267,670 2,267,670 2,630,797 2,438,198 8 %
Fines & Forfeits 320,101 201,204 298,170 298,170 193,070 195,170 (35) %
Investment Income 532,834 274,781 317,500 317,500 291,000 325,880 3 %
Rents 906,650 869,985 852,184 852,184 927,692 828,151 (3) %
Police & Fire Aid 1,050,939 1,032,732 1,050,000 1,050,000 1,010,292 1,031,000 (2) %
MSA Maintenance 693,749 755,962 640,000 640,000 687,558 688,000 8 %
Federal & State Grants 556,457 2,682,907 81,046 88,649 64,193 35,883 (56) %
Other Intergovernmental 200,389 170,563 177,651 177,651 143,983 183,293 3 %
Intergovernmental Revenue 2,501,534 4,642,164 1,948,697 1,956,300 1,906,026 1,938,176 (1) %
Recreation Fees 332,716 142,210 310,929 310,929 316,529 315,583 1 %
General Gov't Charges 134,376 102,502 115,079 115,079 98,510 105,079 (9) %
EMS Charges 3,195,823 3,269,503 3,152,480 3,152,480 3,216,490 3,205,158 2 %
Other Public Safety Charges 391,165 322,660 375,686 375,686 374,826 382,746 2 %
Engineering Project Fees 1,831,567 1,798,448 1,955,000 1,955,000 1,875,000 1,955,000 — %
Other Public Works & Engineering 227,093 146,864 158,950 158,950 124,120 126,850 (20) %
Host Fees — — — — — — — %
Charges for Services 6,112,741 5,782,188 6,068,124 6,068,124 6,005,475 6,090,416 — %
Other Miscellaneous Revenue 105,726 108,558 60,900 60,900 59,290 58,400 (4) %
Transfers From Other Funds 185,000 185,000 185,000 185,000 185,000 2,000,000 981 %
TOTAL SOURCE OF FUNDS 41,514,363 42,880,971 41,917,790 41,925,393 42,075,895 44,849,247 7 %
City of Burnsville 2022 Budget 43 Financial Plan - General Fund

City of Burnsville 2022 BudgetFive-Year Financial Plan
Special Revenue Funds
The Special Revenue Funds are governmental funds to account for services and expenditures where revenue is restricted for a designated purpose. The City maintains seven Special Revenue Funds and all are budgeted funds using the modified accrual basis for both financial statement and budgeting purposes.
None of the Special Revenue Funds are major funds.
• Cable Franchise Fee Fund - includes franchise fee revenue received from cable television restricted for City communications related use.
• Youth Center Fund - reflects operations of THE GARAGE, the City’s teen center. The majority of revenue comes from grants.
• Sustainability (Recycling) Fund - reflects Dakota County grant revenue for the operations of the Burnsville, Eagan, Apple Valley, and Lakeville partnership for recycling and sustainability efforts.
• Grant Fund - accounts for revenue and expenditures related to federal, state and other financial assistance programs.
• EDA Fund - is the general fund for the Burnsville Economic Development Authority (EDA). The main revenue is the EDA tax levy for the purpose of funding development needs. Other non-TIF EDA activity is also accounted for in this fund.
• Forestry Fund - includes revenues and expenditures associated with managing diseased and distressed trees and preparing for the next outbreak including an infestation of the Emerald Ash Borer (EAB). Revenue is from the tax levy.
• Forfeiture Fund - is revenue received from court fines and is legally restricted for the purchase of otherwise unbudgeted police equipment.
44

Cable Franchise Fee FundFinancial Plan Year 2022
FUND DESCRIPTIONThe Cable Franchise Fee Fund was established in 2002 as a Special Revenue Fund to account for the revenues from cable franchise fees; Public, Education and Government (PEG) fees and expenditures for City communications. The principal source of revenue is franchise and PEG fee payments received from Burnsville’s cable television providers, currently Comcast and Frontier.
BACKGROUNDThe City has franchise agreements with both Comcast and Frontier that provide franchise fees, which are used to fund the City’s communications program, and PEG fees, which are used to fund local television programming. Originally, the revenues and expenditures associated with City communications were recorded in the General Fund. In 2002, the Cable Franchise Fee Fund was established. The franchise agreement with Comcast was renewed in 2019 and is valid through May 2029. The agreement with Frontier was valid through September 2021, with an optional five-year renewal. Frontier has provided notice it will not be renewing the agreement. It should be noted that future legislation at the federal and/or state level could impact the City’s ability to collect franchise fees and/or PEG fees, which could be a factor for budgeting in future years.
In the past, the City partnered with the City of Eagan to provide community television through Burnsville Eagan Community Television (BECT). In 2008, the partnership with Eagan ended, and Burnsville began providing community television independently as Burnsville Community Television (BCTV). At that time, a new partnership with Independent School District 191 (ISD 191) was formed to house and operate the City’s television studio. The City’s community television operations moved to a newly remodeled space within Burnsville High School. This partnership has resulted in significantly lower operating costs for community television by eliminating building maintenance and rent expense and reducing the number of employees. Capital costs have also been reduced and some costs are shared with ISD 191. The City continues to partner with the City of Eagan on the ownership and operation of a mobile cable production truck and equipment.
SOURCE OF FUNDSThe primary source of funding for the Cable Franchise Fee Fund is cable franchise fees and PEG fees. The City receives five percent of gross television revenue from the cable companies (cable franchise fee) as compensation for use of City right of way. These fees are paid on cable television service in Burnsville and not telephone or cable modem/internet service. The PEG fee is a flat amount, currently $1.89 per subscriber. The plan assumes that franchise fee revenue will decrease in future years and does not make any assumptions for changes in revenue with the franchise agreements with Comcast and Frontier. Based on consumer trends, cable subscriptions are expected to decline with the increase in streaming and other internet-based services.
USE OF FUNDSThe City has used cable franchise fees to pay for costs associated with the City’s communications programs. A portion of the savings that accumulated has gone toward reducing the tax levy in the City’s General Fund. Beginning in 2023, the communications program will move to the General Fund along with a portion of the franchise fee revenue in the form of a transfer. Fund balance was used in 2015 for major replacement of communications equipment including a major upgrade to City Council Chambers television equipment. Fund balance was used in 2018 for a planned extensive upgrade to the shared mobile production truck. The truck is shared with the City of Eagan. The PEG fees are used for BCTV purposes.
City of Burnsville 2022 Budget 45 Financial Plan - Special Revenue Funds

DEBT AND TRANSFERSThis Fund has transferred revenue into the General Fund in the amount of $185,000 through 2021. The transfer to the General Fund has been eliminated in 2022 due to changes in personnel expenses in response to additional service pressures. The General Fund will begin taking on support for the City's communications programs and will be offset by a transfer from the Cable fund beginning in 2023.
FUND BALANCEThe Fund Balance policy in the City’s Financial Management Plan states that the City will maintain fund balances in the Special Revenue Funds at a level that will avoid issuing short-term debt to meet the cash flow needs of the current operating budget. The Cable Franchise Fee Fund financial plan maintains the fund balance at a higher level to fund future capital replacement of BCTV and communications equipment.
City of Burnsville 2022 Budget 46 Financial Plan - Special Revenue Funds

Cable Franchise Fee FundFive-Year Financial Plan
Actuals 2021 Budget 2022 Budget Projected
2019 2020 Original Amended Estimate % Chg 2023 2024 2025 2026
SOURCE OF FUNDS:
Cable Franchise Fees 694,486 673,464 700,000 700,000 672,000 672,000 (4) % 672,000 672,000 672,000 672,000
PEG Fees 299,776 302,437 308,000 308,000 302,000 300,000 (3) % 300,000 300,000 300,000 300,000
Investment Income 17,266 5,485 7,000 7,000 7,000 7,000 — % 5,000 5,000 5,000 5,000
Charges for Services 8,821 4,281 6,600 6,600 500 6,600 — % 6,500 6,500 6,500 6,500
Other — 1,505 — — — — — % — — — —
TOTAL SOURCE OF FUNDS 1,020,349 987,172 1,021,600 1,021,600 981,500 985,600 (4) % 983,500 983,500 983,500 983,500
USE OF FUNDS:
Personnel 601,199 574,349 721,335 729,335 729,335 912,146 26 % 395,909 407,786 420,020 432,621
Current Expenses 196,915 267,507 303,844 355,144 355,144 311,407 2 % 102,357 103,381 104,415 105,459
Capital Outlay 125,694 8,443 139,000 139,000 139,000 141,500 2 % 80,000 20,000 20,000 31,500
Transfer to General Fund 185,000 185,000 185,000 185,000 185,000 — (100) % 435,000 435,000 435,000 435,000
TOTAL USE OF FUNDS 1,108,808 1,035,299 1,349,179 1,408,479 1,408,479 1,365,053 1 % 1,013,266 966,167 979,435 1,004,580
NET DIFFERENCE (88,459) (48,127) (327,579) (386,879) (426,979) (379,453) 16 % (29,766) 17,333 4,065 (21,080)
Beginning Fund Balance 1,060,078 971,619 923,492 923,492 923,492 496,513 117,060 87,294 104,627 108,692
Ending Fund Balance 971,619 923,492 595,913 536,613 496,513 117,060 87,294 104,627 108,692 87,612
City of Burnsville 2022 Budget 47 Financial Plan - Special Revenue Funds

Youth Center FundFinancial Plan Year 2022
FUND DESCRIPTIONThe Youth Center Fund was established to account for the revenue from contributions, grants, user fees, and transfers from the General Fund used to operate THE GARAGE, the City’s youth center.
BACKGROUNDThe City opened THE GARAGE in July of 1999 with grants, donations and a loan from the General Fund. The City was successful in obtaining several grants to cover the majority of operating funds. In 2001, THE GARAGE transitioned from a traditional teen center to a popular youth hangout with a music theme. As THE GARAGE evolved, grant dollars initially paid a large share of the operating expenses but as the number of participants grew rapidly so did the demand for additional expense. There was also concern whether the grant funds would be available for future operations indefinitely. Beginning in 2001, the City began to contribute funding from the General Fund. When other grant funding began to decline in 2003, the City began to allocate some of its Community Development Block Grant (CDBG) federal funding to support operations.
In 2014, the City formed a partnership with the Burnsville-Eagan-Savage School District 191 (ISD 191), the non-profit music group Twin Cities Catalyst Music and the Burnsville YMCA to transition the programs at THE GARAGE to a new Burnsville Youth Collaborative (BYC). This transition plan moved after-school activities to Nicollet Middle School and turned over the weekend music program to the non-profit organization. THE GARAGE facility was renovated in 2015 to accommodate an expanded music lesson program and will be utilized by Burnsville Sr. High, ISD 191 Community Education, YMCA, the non-profit music group and other school district entities to expand music lesson and educational opportunities.
The plan assumes that grants will continue to fund a portion of the operations in the future; however, grant funding reductions or eliminations are always a possibility. The City had a two-year operating commitment to the BYC and transfers from the General Fund assisted funding operating expenses of the BYC in 2015 and 2016.
SOURCE OF FUNDSA principal source of revenue is grant proceeds. Proceeds have come from a variety of different federal, state, county, and private sources over the years. Currently, the major grant funding comes from a combination of CDBG funds, other government grants and private foundation funding. The CDBG allocation is anticipated to be remain steady for the 2021-22 and future years; however, the amount is unknown at this time.
USE OF FUNDSExpenses are shown by funding source in this fund and are for BYC operations. A small amount for building repairs and maintenance each year is identified to be funded from the remaining fund balance or a transfer from the General Fund.
TRANSFERSTHE GARAGE receives a transfer in from the General Fund to cover the City’s commitment to the BYC partnership. The City committed funds for operations for two years, 2015 and 2016. Beginning in 2016, a transfer from the General Fund covers building repairs and maintenance. Contributions from the General Fund in 2017-2018 were planned for roof replacement and were transferred to the Facilities Fund. The balance of the roof replacement
City of Burnsville 2022 Budget 48 Financial Plan - Special Revenue Funds

will be funded from the Facilities Fund. Returning in 2022, a transfer of $10,000 from the General Fund is planned to cover building repairs and maintenance.
FUND BALANCEThe Fund Balance policy in the City’s Financial Management Plan states that the City will maintain fund balances in the Special Revenue Funds at a level which will avoid issuing short-term debt to meet the cash flow needs of the current operating budget. It was the intention to use all of the fund balance on building maintenance and repairs. Now that the operating commitment to the BYC is complete, the current expense activity and any remaining fund balance may be absorbed into other existing funds.
City of Burnsville 2022 Budget 49 Financial Plan - Special Revenue Funds
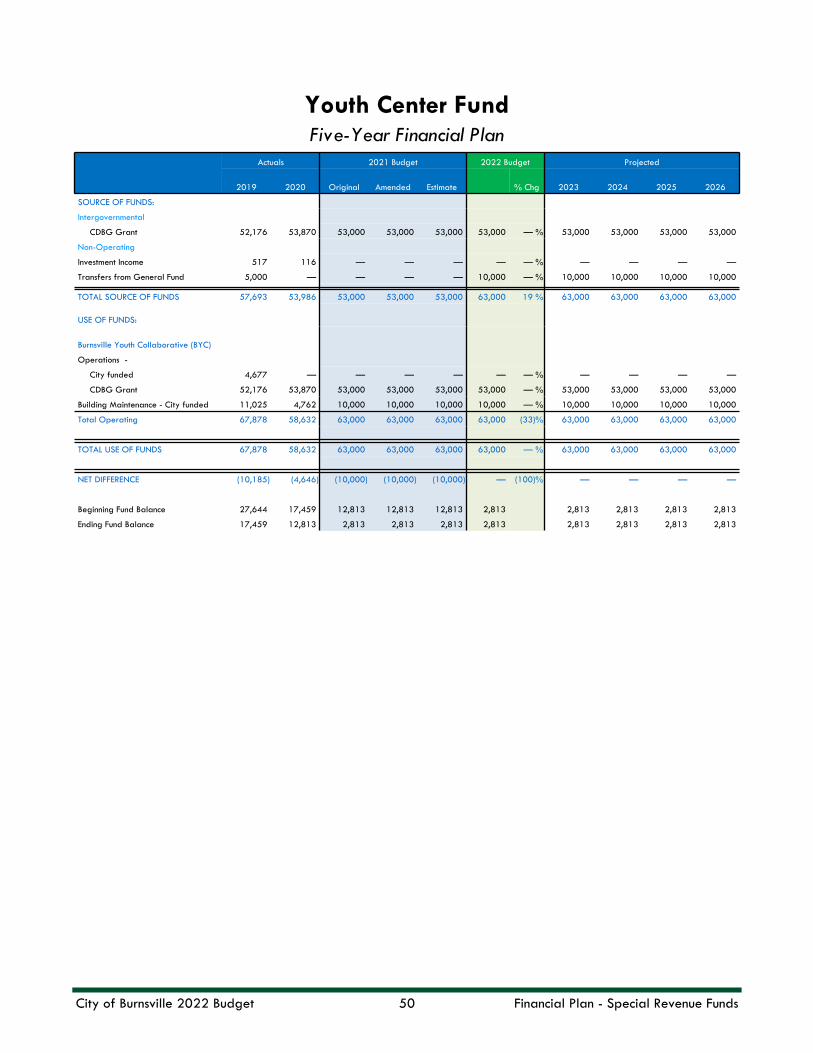
Youth Center Fund Five-Year Financial Plan
Actuals 2021 Budget 2022 Budget Projected
2019 2020 Original Amended Estimate % Chg 2023 2024 2025 2026
SOURCE OF FUNDS:
Intergovernmental
CDBG Grant 52,176 53,870 53,000 53,000 53,000 53,000 — % 53,000 53,000 53,000 53,000
Non-Operating
Investment Income 517 116 — — — — — % — — — —
Transfers from General Fund 5,000 — — — — 10,000 — % 10,000 10,000 10,000 10,000
TOTAL SOURCE OF FUNDS 57,693 53,986 53,000 53,000 53,000 63,000 19 % 63,000 63,000 63,000 63,000
USE OF FUNDS:
Burnsville Youth Collaborative (BYC)
Operations -
City funded 4,677 — — — — — — % — — — —
CDBG Grant 52,176 53,870 53,000 53,000 53,000 53,000 — % 53,000 53,000 53,000 53,000
Building Maintenance - City funded 11,025 4,762 10,000 10,000 10,000 10,000 — % 10,000 10,000 10,000 10,000
Total Operating 67,878 58,632 63,000 63,000 63,000 63,000 (33) % 63,000 63,000 63,000 63,000
TOTAL USE OF FUNDS 67,878 58,632 63,000 63,000 63,000 63,000 — % 63,000 63,000 63,000 63,000
NET DIFFERENCE (10,185) (4,646) (10,000) (10,000) (10,000) — (100) % — — — —
Beginning Fund Balance 27,644 17,459 12,813 12,813 12,813 2,813 2,813 2,813 2,813 2,813
Ending Fund Balance 17,459 12,813 2,813 2,813 2,813 2,813 2,813 2,813 2,813 2,813
City of Burnsville 2022 Budget 50 Financial Plan - Special Revenue Funds

Sustainability FundFinancial Plan Year 2022
FUND DESCRIPTIONThe Sustainability Fund is a Special Revenue Fund used to account for the revenues and expenditures associated with the City's sustainability and recycling programs.
BACKGROUNDThis fund was set up in 2004 to account for the recycling activities. The City has partnered with the cities of Eagan, Apple Valley and Lakeville to combine recycling programs under the Dakota Valley Recycling (DVR) umbrella. Activities that are related to all four cities are funded by a grant from Dakota County. The City also has certain activities that are specific to Burnsville, including hazardous waste collection days, Grow Burnsville, and implementation of the strategies identified in the City’s Sustainability Plan adopted by Council in 2020. These activities are funded by a transfer of reserved fund balance from solid waste fees collected in the General Fund.
SOURCE OF FUNDSThe major source of funds is a grant from Dakota County which are the combined allocations for Burnsville, Eagan, Apple Valley and Lakeville. The City also receives a state SCORE grant through Dakota County to support the organics drop-off site. The City has also occasionally obtained some small one-time grants for specific recycling activities.
USE OF FUNDSThe recycling activities consist mainly of public education and information efforts. Sustainability activities include an organics drop-off site in conjunction with Dakota County. Expenditures are for employee services and current expenditures. Capital expenses in 2018 were for a recycling truck and containers to start the recycling in the parks initiative.
TRANSFERSA transfer of $104,058 from the General Fund landfill abatement reserved fund balance is made to cover sustainability and recycling activities specific to the City of Burnsville. The majority of this expense is for the Burnsville hazardous waste collection days, Grow Burnsville and sustainability activities. The transfer changes each year to match the activity specific to Burnsville. A one-time transfer of $180,000 in 2020 from the General Fund landfill abatement reserved fund balance was made to provide cashflow for the fund as the Dakota County grant is changing to a reimbursement basis.
FUND BALANCEConsistent with adopted policy, the Plan maintains fund balances at a level to meet the cash flow needs of the current operating budget. In 2018, there was a planned use of fund balance for the capital expenses for the recycling in the parks truck and containers.
City of Burnsville 2022 Budget 51 Financial Plan - Special Revenue Funds

Sustainability FundFive-Year Financial Plan
Actuals 2021 Budget 2022 Budget Projected
2019 2020 Original Amended Estimate % Chg 2023 2024 2025 2026
SOURCE OF FUNDS:
Intergovernmental
Dakota County DVR 213,673 272,826 309,524 309,524 309,524 322,622 4 % 324,235 325,856 327,485 329,122
State Grants - Organics Drop Site — — — 5,980 5,980 16,000 — % 16,000 16,000 16,000 16,000
Transfers from other funds
General Fund 75,000 288,476 130,577 130,577 130,577 104,058 (20) % 111,299 118,709 126,291 134,050
(from reserved solid waste fees)
Investment Income 4,534 1,719 — — — — — % — — — —
TOTAL SOURCE OF FUNDS 293,207 563,021 440,101 446,081 446,081 442,680 1 % 451,534 460,565 469,776 479,172
USE OF FUNDS:
Dakota Valley Recycling
Personnel Services 173,634 240,888 239,773 239,773 239,773 218,038 (9) % 217,559 217,046 216,499 215,916
Current Expenses 40,039 31,938 69,751 69,751 69,751 104,584 50 % 106,676 108,810 110,986 113,206
213,673 272,826 309,524 309,524 309,524 322,622 4 % 324,235 325,856 327,485 329,122
Burnsville Sustainability
Personnel Services 87,448 56,284 100,677 100,677 100,677 74,158 (26) % 80,481 86,955 93,582 100,367
Current Expenses 20,184 8,281 29,900 29,900 29,900 45,900 54 % 46,818 47,754 48,709 49,683
Capital Outlay 3,750 — — — — — — % — — — —
111,382 64,565 130,577 130,577 130,577 120,058 (8) % 127,299 134,709 142,291 150,050
TOTAL USE OF FUNDS 325,055 337,391 440,101 440,101 440,101 442,680 1 % 451,534 460,565 469,776 479,172
NET DIFFERENCE (31,848) 225,630 — 5,980 5,980 — — % — — — —
Beginning Fund Balance 89,150 57,302 282,932 282,932 282,932 288,912 288,912 288,912 288,912 288,912
Ending Fund Balance 57,302 282,932 282,932 288,912 288,912 288,912 288,912 288,912 288,912 288,912
City of Burnsville 2022 Budget 52 Financial Plan - Special Revenue Funds
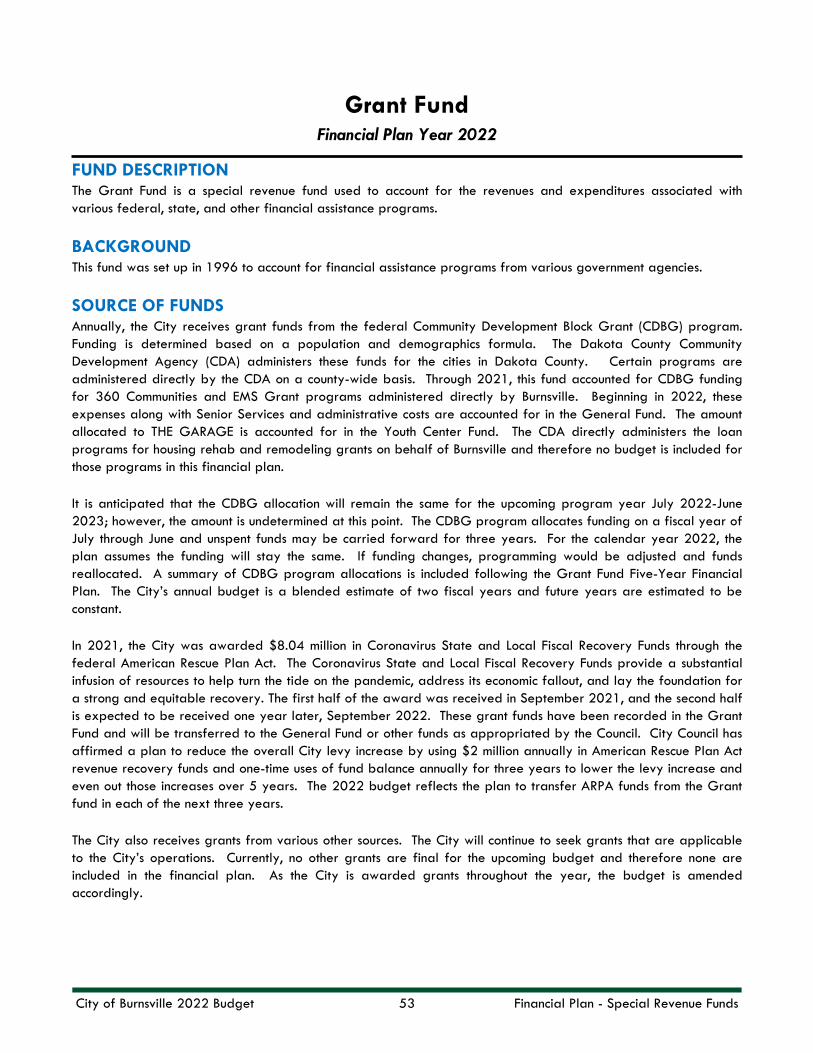
Grant FundFinancial Plan Year 2022
FUND DESCRIPTIONThe Grant Fund is a special revenue fund used to account for the revenues and expenditures associated with various federal, state, and other financial assistance programs.
BACKGROUNDThis fund was set up in 1996 to account for financial assistance programs from various government agencies.
SOURCE OF FUNDSAnnually, the City receives grant funds from the federal Community Development Block Grant (CDBG) program. Funding is determined based on a population and demographics formula. The Dakota County Community Development Agency (CDA) administers these funds for the cities in Dakota County. Certain programs are administered directly by the CDA on a county-wide basis. Through 2021, this fund accounted for CDBG funding for 360 Communities and EMS Grant programs administered directly by Burnsville. Beginning in 2022, these expenses along with Senior Services and administrative costs are accounted for in the General Fund. The amount allocated to THE GARAGE is accounted for in the Youth Center Fund. The CDA directly administers the loan programs for housing rehab and remodeling grants on behalf of Burnsville and therefore no budget is included for those programs in this financial plan.
It is anticipated that the CDBG allocation will remain the same for the upcoming program year July 2022-June 2023; however, the amount is undetermined at this point. The CDBG program allocates funding on a fiscal year of July through June and unspent funds may be carried forward for three years. For the calendar year 2022, the plan assumes the funding will stay the same. If funding changes, programming would be adjusted and funds reallocated. A summary of CDBG program allocations is included following the Grant Fund Five-Year Financial Plan. The City’s annual budget is a blended estimate of two fiscal years and future years are estimated to be constant.
In 2021, the City was awarded $8.04 million in Coronavirus State and Local Fiscal Recovery Funds through the federal American Rescue Plan Act. The Coronavirus State and Local Fiscal Recovery Funds provide a substantial infusion of resources to help turn the tide on the pandemic, address its economic fallout, and lay the foundation for a strong and equitable recovery. The first half of the award was received in September 2021, and the second half is expected to be received one year later, September 2022. These grant funds have been recorded in the Grant Fund and will be transferred to the General Fund or other funds as appropriated by the Council. City Council has affirmed a plan to reduce the overall City levy increase by using $2 million annually in American Rescue Plan Act revenue recovery funds and one-time uses of fund balance annually for three years to lower the levy increase and even out those increases over 5 years. The 2022 budget reflects the plan to transfer ARPA funds from the Grant fund in each of the next three years.
The City also receives grants from various other sources. The City will continue to seek grants that are applicable to the City’s operations. Currently, no other grants are final for the upcoming budget and therefore none are included in the financial plan. As the City is awarded grants throughout the year, the budget is amended accordingly.
City of Burnsville 2022 Budget 53 Financial Plan - Special Revenue Funds

USE OF FUNDSThe use of funds is consistent with the allowable expenditures under each of the financial assistance programs as determined by each grant award.
FUND BALANCEThe City will maintain fund balances in the Special Revenue Funds at a level which will avoid issuing short-term debt to meet the cash flow needs of the current operating budget. The Grant Fund financial plan maintains the fund balance near zero as grant expenditures equal grant revenues.
Community Development Block Grant (CDBG)Recommendations for Allocation
Application for Fiscal year July 1, 2022-June 30, 2023
The City receives federal CDBG funds administered through an agreement with the Dakota County CDA. The estimated allocation for the fiscal year July 1, 2021-June 30, 2022 time period is $209,707, which is a twenty-one percent decrease from FY 2020-2021. In Fiscal Year 2020-21, the City received an allocation of $263,812.
With some limitations and requirements, CDBG funds may be spent in three areas: to aid in the prevention or elimination of slums or blight; to meet an urgent community need, and to support programs and activities that benefit low & moderate income persons (including certain presumed benefit groups, such as Senior Citizens). CDA has set a maximum limit of 45% of Burnsville’s total allocation for Public Service Projects, and a 15% maximum for Administrative costs.
For the fiscal year July 1, 2021 - June 30, 2022 (Fiscal Year 2021-2022), the City focused available funding for the Burnsville Youth Collaborative and CDA Housing and Rehabilitation Projects. Support for Senior Services is through the General Fund tax levy. Support for 360 Communities and EMS Grants was funded halfway through 2021 by allocated but unspent funds carried forward from prior years. Beginning in 2022, these activities will be General fund supported. The CDBG allocation to the City for Fiscal Year 2022-2022 is unknown at this time.
PROJECT 2020-21 2021-22 Fund
Public Service Projects Recommended for Funding
Burnsville Youth CollaborativeFunding to provide staffing expenses to support the Burnsville Youth Collaborative after-school programming. 53,000 53,000
Youth Center
TOTAL PUBLIC SERVICE $53,000 $53,000
Housing and Rehabilitation Projects Recommended for Funding
CDA Rehab LoansLow interest loans for Burnsville residents meeting low to moderate income qualifications. 210,812 156,707
Pass-through
TOTAL HOUSING & REHABILITATION 210,812 156,707
TOTAL FUNDING $263,812 $209,707
City of Burnsville 2022 Budget 54 Financial Plan - Special Revenue Funds

Grant FundFive-Year Financial Plan
Actuals 2021 Budget 2022 Budget Projected
2019 2020 Original Amended Estimate % Chg 2023 2024 2025 2026
SOURCE OF FUNDS:
Intergovernmental
CDBG 22,200 33,779 9,500 9,500 16,307 — (100) % — — — —
American Rescue Plan - ARPA — — — 4,018,991 4,018,991 4,018,991 — % — — — —
Interest 239 79 — — 100 400 — % 400 200 200 200
TOTAL SOURCE OF FUNDS 22,439 33,858 9,500 4,028,491 4,035,398 4,019,391 100 % 400 200 200 200
USE OF FUNDS:
Programming 22,200 33,779 9,500 9,500 17,988 — (100) % — — — —
Transfers Out
General Fund - ARPA — — — — — 2,000,000 — % 2,000,000 2,000,000 — —
TOTAL USE OF FUNDS 22,200 33,779 9,500 9,500 17,988 2,000,000 100 % 2,000,000 2,000,000 — —
NET DIFFERENCE 239 79 — 4,018,991 4,017,410 2,019,391 100 % (1,999,600) (1,999,800) 200 200
Beginning Fund Balance 11,978 12,217 12,296 12,296 12,296 4,029,706 6,049,097 4,049,497 2,049,697 2,049,897
Ending Fund Balance 12,217 12,296 12,296 4,031,287 4,029,706 6,049,097 4,049,497 2,049,697 2,049,897 2,050,097
Reserved Fund Balance
Year-end ARPA Balance — — — 4,018,991 4,018,991 6,037,982 4,037,982 2,037,982 2,037,982 2,037,982
Available Fund Balance 12,217 12,296 12,296 12,296 10,715 11,115 11,515 11,715 11,915 12,115
The City's Grant Fund financial plan differs from the CDBG funding schedule due to the financial plan overlapping two CDGB grant fiscal years.
Also, the Grant Fund financial plan does not include projects related to THE GARAGE which are included in the Youth Center fund or the Home Remodeling and CDA Rehab loans which are administered directly by Dakota County.
City of Burnsville 2022 Budget 55 Financial Plan - Special Revenue Funds
EDA FundFinancial Plan Year 2022
FUND DESCRIPTIONThe Burnsville Economic Development Authority (EDA) Fund was created by the City Council in 1991. The EDA Fund accounts for the general activities of the EDA.
BACKGROUNDUnder Minnesota Statutes Chapter 469-Economic Development, cities may establish an EDA, including approval for the EDA to serve as a Housing and Redevelopment Authority (HRA). When the City of Burnsville created the EDA in 1991, it approved HRA authority for possible use in the future. The City Council appointed the members of the City Council to serve as the Board of Commissioners. The authorizing Statute permits the EDA to levy and collect a special benefit levy. Beginning in Fiscal Year 2002, and every year since, the EDA has adopted an EDA levy.
The maximum general operational levy of HRAs allowed for under State law is 0.0185 percent of the previous year’s taxable market value. Using this percent, the maximum allowable levy for the Burnsville EDA for Pay 2021 was estimated at $1.3 million. In September 2020, the EDA and City Council set the maximum at $2,500 for Tax Payable Year 2022, which is within the allowable amount.
In 2006, the City Council amended the City’s Financial Management Plan to create a new policy section addressing the EDA levy. The policy states that the EDA will annually appropriate money to the EDA Fund from a tax levy or other available sources. The appropriation will be equivalent to the “maximum” that could be provided by a tax levy for economic development purposes. The annual tax levy will be set based on the amount needed when combined with other available sources achieves the funding level set by this policy. To provide other non-tax sources of funding to the EDA, the City Council will annually review the fund balance in the General Fund to determine whether sufficient unrestricted fund balance is available for transfer from the General Fund to the EDA Fund. The decision on transfer of funds will be made at the time the annual EDA tax levy is established. If other sources of revenue are not available, the EDA may set the tax levy at the maximum allowed.
State law provides that expenditures may be made from the EDA Fund based on the following criteria: 1) the EDA appropriates the funds as part of the annual budget, and/or 2) the EDA authorizes an amendment to the EDA budget outside of the annual appropriation process.
SOURCE OF FUNDSThe principal sources of revenue for this fund have been property tax levy and interest earned on cash balances in the fund. Combined revenues will be less than the maximum allowable under City policy or allowable under the special levy law. For 2019, the City was awarded a Landfill Host Community Environmental Legacy Fund (ELF) Grant from Dakota County in the amount of $1,150,000 for land acquisition and building demolition for economic development. The City was awarded a second ELF grant in 2020 in the amount of $1,100,000. These funds will be recognized in the budget as specific projects are identified.
The finance plan shows an annual increase in the EDA levy for years 2020 through 2022. The long-term plan for the fund shows annual increases of $50,000 and $100,000 to build an annual levy to fund economic development operations which were moved to the EDA fund in 2010. Since that time the fund has been using fund balance to fund on-going expenses. This includes a position and related costs were funded out of the General Fund in 2009 and prior years. In 2020, the positions and related costs were moved back to the General Fund. The levy was moved from the EDA fund to the General Fund accordingly.
City of Burnsville 2022 Budget 56 Financial Plan - Special Revenue Funds

For 2022, the Council voted to increase the EDA levy max tax by $50,000 for the year 2022. This increase brought the EDA levy to a level sufficient to fund the annual on-going economic development activities and preserves the fund balance of the EDA fund to be available to be used on economic development initiatives to be identified in the future.
USE OF FUNDSAccording to State Statute, the proceeds from the EDA levy can be used for one or both of the following purposes: 1) for projects to remedy the shortage of housing for low and moderate-income residents, and/or 2) for public redevelopment costs in situations where private enterprise would not act without government participation.
Because the City has generally used the services of the Dakota County Community Development Agency (CDA) to address housing projects for low and moderate income residents, the City has not targeted the use of the EDA levy to remedy the shortage of housing for low and moderate income residents and has no future plans to do so. The City has used EDA Funds for redevelopment purposes.
Uses of funds for 2022 include Economic Development related marketing and department expenses, partnership activities of MCCD as well as EDA lobbyist efforts on special legislative initiatives such as the host fee and TIF 7. The 2020 budget moved funding for the Economic Development staff positions to the General Fund. The 2019 budget was expanded to provide for an additional staff position for project management and consulting fees for marketing to expand economic development efforts. The 2020 budget eliminates the use of funds for an annual transfer to the Ames Center Fund for payment of debt. In 2020, there was an effort to streamline debt payments and transfers between funds for more transparency. The levy amount was moved from the EDA fund to the debt fund accordingly. Debt payments by the Debt Fund are planned through 2027.
DEBTThe fund does not presently carry any debt.
TRANSFERSBeginning with the 2008 budget and ending in 2019, annual transfers were made to the Ames Center Fund for debt payments. The budget does not include a transfer in of cash from the General Fund.
FUND BALANCEThe City will maintain fund balances in the Special Revenue Funds at a level which will avoid issuing short-term debt to meet the cash flow needs of the current operating budget. The Plan maintains a fund balance within the EDA Fund to meet both anticipated and unanticipated future economic development needs. The City will annually evaluate the level of fund balance for its appropriateness. In 2022, planned use of fund balance is budgeted to have an impact of $(405,305) on fund balance.
OTHER FINANCIAL INFORMATIONIn 2011, the Council approved the creation of the Angel Fund which is a program to involve businesses and/or individuals to provide support to bring an additional series of performances to the Ames Center. The EDA has contributed matching funds to promote donations, up to $50,000. The EDA contributed matching funds of $20,000 in 2011, $17,000 in 2012, and $13,000 in 2013. The EDA funds are in the form of a loan to the Ames Center Fund and are therefore not included as expense. Repayment of the EDA loan by the Ames Center of $10,000 per year is now complete and is reflected in the five-year plan.
City of Burnsville 2022 Budget 57 Financial Plan - Special Revenue Funds

Economic Development AuthorityFive-Year Financial Plan
Actuals 2021 Budget 2022 Budget Projected
2019 2020 Original Amended Estimate % Chg 2023 2024 2025 2026
SOURCE OF FUNDS:
Property Taxes
EDA Tax Levy 742,500 197,500 247,500 247,500 247,500 297,500 20 % 397,500 497,500 547,500 597,500
Delinquent & Other 1,849 3,118 — — — — — % — — — —
Net Collections 744,349 200,618 247,500 247,500 247,500 297,500 20 % 397,500 497,500 547,500 597,500
Intergovernmental Revenue
CARES Business Loan Grants — 2,138,212 — — — — — % — — — —
Other intergovernmental grants — — — 15,000 15,000 — — % — — — —
Investment Income 9,570 9,684 1,000 1,000 1,000 5,300 430 % 1,300 500 700 1,300
Sale of Capital Assets 64,625 — — — — — — % — — — —
TOTAL SOURCE OF FUNDS 818,544 2,348,514 248,500 263,500 263,500 302,800 22 % 398,800 498,000 548,200 598,800
USE OF FUNDS:
Personnel Services 249,766 — — — — — — % — — — —
Current Expenses
Operations 223,454 172,521 703,405 728,405 497,225 708,105 1 % 476,343 480,870 485,487 490,197
CARES Business Loan Grants — 2,138,212 — — — — — % — — — —
Transfer to Ames Center for debt 410,000 — — — — — — % — — — —
TOTAL USE OF FUNDS 883,220 2,310,733 703,405 728,405 497,225 708,105 1 % 476,343 480,870 485,487 490,197
NET DIFFERENCE (64,676) 37,781 (454,905) (464,905) (233,725) (405,305) (11) % (77,543) 17,130 62,713 108,603
Beginning Fund Balance 794,457 729,781 767,562 767,562 767,562 533,837 128,532 50,989 68,119 130,832
Ending Fund Balance 729,781 767,562 312,657 302,657 533,837 128,532 50,989 68,119 130,832 239,435
Other Financial Information
Balance of Angel Fund loan 10,000 — — — — — — — — —
City of Burnsville 2022 Budget 58 Financial Plan - Special Revenue Funds

Forestry FundFinancial Plan Year 2022
FUND DESCRIPTIONThe Forestry Fund is a Special Revenue Fund used to account for the revenues and expenditures associated with managing diseased and distressed trees and preparing for the next outbreak including but not limited to an infestation of the Emerald Ash Borer (EAB).
BACKGROUNDThe City has a large number of ash trees on both public and private land. The City adopted an Emerald Ash Borer (EAB) Management Plan in September 2010 and this fund was added in 2011. The purpose of the plan is to set strategies and policies to mitigate the EAB’s effect on the City’s trees. In 2013, the City Council approved an updated plan that uses a combination of proactive treatment, removal and partial replacement of public ash trees. This approach, combined with lower treatment and removal costs, has allowed the City to minimize funding increases while still implementing the planned management strategy. While the plan leverages lower contract prices for treatment of private ash trees, it does not provide funding for removal, treatment or replacement of these trees impacted by EAB. Depending on the spread and impact of EAB on private trees, the City may need to consider options to provide additional assistance to private properties at that time. EAB has been found in several neighboring communities and was detected in Burnsville in 2018. In 2018, the purpose of the fund was broadened beyond the EAB to provide flexibility for the next outbreak and manage diseased and distressed trees.
SOURCE OF FUNDSThe primary source of funds is property tax revenue. The EAB Management Plan was revised in 2013 and a new funding plan was established that places greater emphasis on prevention of EAB via tree treatments. The plan is reviewed each year. With incremental increases to the levy over the past several years, the current annual levy is $250,000. The City also seeks grant funding as available. Unspent funds will be available in fund balance for future expenses as the need for treatment, removal, and replacement grows.
In 2017, the City received $187,708 in developer fees related to the removal of trees for redevelopment. These funds may be used throughout the City to target removal and replacement of other diseased and distressed trees.
USE OF FUNDSIn preparation for the infestation and future outbreaks, funds will be used for public education, monitoring and tree care activities. The funds will also be used for tree treatment, removal and replacement. Fund balance was used in 2017 and 2018 for capital purchases including a truck and wood chipper.
FUND BALANCEThe City will maintain fund balances in the Special Revenue Funds at a level which will avoid issuing short-term debt to meet the cash flow needs of the current operating budget. The financial plan maintains a minimum fund balance to fund the management of diseased and distressed trees with the flexibility to provide for the next outbreak.
City of Burnsville 2022 Budget 59 Financial Plan - Special Revenue Funds

Forestry FundFive-Year Financial Plan
Actuals 2021 Budget 2022 Budget Projected
2019 2020 Original Amended Estimate % Chg 2023 2024 2025 2026
SOURCE OF FUNDS:
Property Taxes
Forestry Fund Tax Levy 300,000 300,000 300,000 300,000 300,000 250,000 (17) % 250,000 250,000 250,000 250,000
Delinquent & Other 962 (2,555) — — — — — % — — — —
Net Collections 300,962 297,445 300,000 300,000 300,000 250,000 (17) % 250,000 250,000 250,000 250,000
Licenses 1,640 2,170 1,980 1,980 1,980 1,980 — % 2,000 2,000 2,000 2,000
Investment Income 12,126 5,349 — — — 7,200 — % 6,500 6,000 5,500 4,800
Developer Fees — 3,994 — — — — — % — — — —
TOTAL SOURCE OF FUNDS 314,728 308,958 301,980 301,980 301,980 259,180 (14) % 258,500 258,000 257,500 256,800
USE OF FUNDS:
Personnel Services 25,406 36,896 52,143 52,143 52,143 — (100) % — — — —
Current Expenses
Operations 218,905 122,508 309,242 309,242 244,242 240,000 (22) % 250,000 286,006 310,000 310,000
Developer Tree Replacement — — 55,758 55,758 55,758 60,000 8 % 60,000 23,994 — —
Capital — — 60,000 60,000 60,000 — (100) % — — 32,000 —
TOTAL USE OF FUNDS 244,311 159,404 477,143 477,143 412,143 300,000 (37) % 310,000 310,000 342,000 310,000
NET DIFFERENCE 70,417 149,554 (175,163) (175,163) (110,163) (40,820) (77) % (51,500) (52,000) (84,500) (53,200)
Beginning Fund Balance 559,522 629,939 779,493 779,493 779,493 669,330 (14) % 628,510 577,010 525,010 440,510
Ending Fund Balance 629,939 779,493 604,330 604,330 669,330 628,510 4 % 577,010 525,010 440,510 387,310
Reserved Fund Balance
Developer Tree Replacement Balance 195,758 199,752 143,994 143,994 143,994 83,994 23,994 — — —
Available Fund Balance 434,181 579,741 460,336 460,336 525,336 544,516 553,016 525,010 440,510 387,310
City of Burnsville 2022 Budget 60 Financial Plan - Special Revenue Funds

Forfeiture FundFinancial Plan Year 2022
FUND DESCRIPTIONThe Forfeiture Fund is a Special Revenue Fund used to account for money received from the court system with statutory spending restrictions for police expenditures.
BACKGROUNDThis fund was established in 1992. Certain offenses including some Driving Under the Influence (DUI) offenses and narcotics cases will result in forfeitures of property involved. Minnesota law and federal law provide that a certain amount of the forfeiture proceeds can go back to the law enforcement agency. After payment of associated expenses of the forfeiture, proceeds may be used for certain police expenditures. There are various restrictions on the agency’s use of forfeiture proceeds depending on the nature of the offense.
The City typically receives several forfeitures of vehicles from DUI charges each year. Vehicles are typically sold and proceeds are distributed according to State law. Most narcotics cases are handled by the Dakota County Drug Task Force; however, occasionally the City’s police department will be the sole agency in a narcotics case with forfeiture proceeds.
SOURCE OF FUNDSIn recent years, the main source of forfeiture proceeds has been from DUI-related offenses. Occasionally, the City also receives narcotics forfeitures and other miscellaneous forfeitures.
USE OF FUNDSAfter payment of associated expenses of the seizure such as towing and storage, proceeds may be used for certain police expenditures. DUI forfeitures must be spent on DUI enforcement activities, training and equipment. Narcotics forfeitures are limited to police capital items.
TRANSFERSThere are no transfers planned for future years.
FUND BALANCEThe City will maintain fund balances to fund future capital purchases.
City of Burnsville 2022 Budget 61 Financial Plan - Special Revenue Funds

Forfeiture FundFive-Year Financial Plan
Actuals 2021 Budget 2022 Budget Projected
2019 2020 Original Amended Estimate % Chg 2023 2024 2025 2026
SOURCE OF FUNDS:
DUI Forfeitures 38,316 3,885 25,000 25,000 25,000 25,000 — % 25,000 25,000 25,000 25,000
Investment Income 863 371 — — — — — % — — — —
TOTAL SOURCE OF FUNDS 39,179 4,256 25,000 25,000 25,000 25,000 — % 25,000 25,000 25,000 25,000
USE OF FUNDS:
Current Expenses
Forfeiture expense, DUI enforcement, police equipment 30,467 10,480 30,000 30,000 30,000 30,000 — % 25,000 25,000 25,000 25,000
TOTAL USE OF FUNDS 30,467 10,480 30,000 30,000 30,000 30,000 — % 25,000 25,000 25,000 25,000
NET DIFFERENCE 8,712 (6,224) (5,000) (5,000) (5,000) (5,000) — % — — — —
Beginning Fund Balance 27,656 36,368 30,144 30,144 30,144 25,144 (17) % 20,144 20,144 20,144 20,144
Ending Fund Balance 36,368 30,144 25,144 25,144 25,144 20,144 (20) % 20,144 20,144 20,144 20,144
Other financial information:
Year-end Cash Balance 36,368 30,144 25,144 25,144 25,144 20,144 20,144 20,144 20,144 20,144
City of Burnsville 2022 Budget 62 Financial Plan - Special Revenue Funds

City of Burnsville 2022 BudgetFive-Year Financial Plan
Capital Projects Funds
Capital Projects Funds account for the acquisition and construction of major capital facilities and equipment (except those financed by proprietary funds). This includes expenditures relating to capital projects and large capital outlay purchases. The City has seven budgeted funds in this category. The Capital Project Funds use the modified accrual basis for both financial statement and budgeting purposes.
• Parks Capital Fund - reflects development of new City parks and improvement of existing parks. Revenue is primarily from tax levy and park development fees.
• Equipment & Vehicle Fund - records capital purchases of equipment and vehicles. The resources are provided by issuance of Certificates of Indebtedness, sale of existing equipment, and transfers from other funds.
• Facilities Fund - records facilities replacements and improvements. The resources are provided by utility franchise fees, bond proceeds, and transfers from other funds. (major fund)
• Information Technology Capital Equipment Fund - includes capital purchases of Information Technology (IT) equipment and software development. The resources are provided by issuance of Certificates of Indebtedness and transfers from other funds.
• Infrastructure Trust Fund - includes property tax revenue for the purpose of replacing streets and park facilities. (major fund)
• Street Maintenance Construction Fund - reflects revenues and expenditures for street rehabilitation projects, major street maintenance projects, and small traffic control issues.
• Improvement Construction Fund - includes receipt and disbursement of bond proceeds or other sources obtained to finance improvements and additions to the City’s infrastructure.
63

Parks Capital FundFinancial Plan Year 2022
FUND DESCRIPTIONThe Parks Capital Fund accounts for capital improvement projects for the City’s park and trail system.
BACKGROUNDThe Parks Capital Fund was created in 1980 to fund renovation or additions to the City’s park system. More recently, the Parks Capital Fund has also provided funding support for development of the City’s parks and street trail system. As the City grew, developers either paid park dedication fees or donated land for the park system. The fee or land donations are based on the size of a particular development. The City developed its park system by adding general amenities, bituminous and concrete surfaces, fencing, hockey rinks, lighting systems, play equipment, shelters, buildings, tennis courts, etc. The City currently has 76 parks totaling approximately 1,750 acres.
In addition to parks dedication revenue, the City transfers property tax revenue from the General Fund into the Parks Capital Fund. Within the budget, Parks Capital Fund expenditures historically have been allocated to either renovation or improvements purposes. Renovation takes care of existing capital assets while improvements provide funding for new projects.
As the park system has matured and the fund became more stressed, the majority of the Fund’s budget is now committed to renovation - based on a long-term replacement and renovation schedule of existing park facilities. Routine maintenance of the park system is funded through the General Fund’s parks maintenance budget and is not accounted for within this Fund.
Budget challenges within the City’s General Fund have required a significant reduction in the commitment of general funding (transfer of revenue from the General Fund to the Parks Capital Fund) for parks capital improvements. Parks capital projects have been eliminated or deferred in response to this decline in available revenue. Incremental increases in the General Fund transfer are included in the plan over the next few years to restore this funding.
SOURCE OF FUNDSThe two major sources of revenue to this Fund are park dedication fees and property tax levy. Other sources of revenue to the Parks Capital Fund include interest earned and donations from local organizations for specific improvements.
Park dedication fees in recent years have been attributed mainly to one or two large developments annually. As the City reaches full development there are fewer parcels to develop that will be charged park dedication fees in the future. The plan anticipates an estimate for park dedication fees on certain properties currently in the planning stages for development. For the future years, the increase is based on recent average years, excluding the unusually high and low years. This revenue could fluctuate significantly if the City does or does not have any large developments in any particular year.
The property tax levy support for the Parks Capital Fund is provided through a levy in the Parks Capital Fund. Prior to 2020, there was a transfer from the Infrastructure Trust Fund (ITF). This was replaced with a direct property tax levy to the Parks Capital Fund in 2020.
City of Burnsville 2022 Budget 64 Financial Plan - Capital Projects Funds

The 2022 financial plan includes annual increases to the property tax levy consistent with prior year financial plans. This was part of a multi-year plan approved by the Council to increase funding over a series of years to allow the fund to reach stability. Future annual increases represent inflationary pressures and reduction in park development fee pressures.
USE OF FUNDSThe City prepares a detailed five-year capital improvement plan that outlines all planned renovations and improvements at City parks by park by project. The five-year plan anticipates an increase in General Fund support as previously directed by the Council.
The amount of property tax levy is based on the need to balance overall property tax supported spending citywide with the need for spending on capital improvements in parks. A reduction in the planned increase in tax levy would require postponement of additional projects in the Parks Capital Improvement Plan in order to maintain a positive fund balance in future years. Parks and public works staff are expanding asset management into the parks system to identify if the currently planned funding increases within the fund will support consistent sustainable renovation within the system in the future.
TRANSFERSPrior to 2020, the Infrastructure Trust Fund (ITF) transferred cash from the ITF property tax levy in to the Parks Capital Fund. There are no transfers budgeted or planned going forward.
FUND BALANCEThe City’s policies call for a pay-as-you-go strategy for supporting capital spending without use of debt whenever feasible. The City strives to pay cash for capital projects that can be anticipated and planned for in advance. Therefore, the City’s fund balance levels fluctuate, in part, based on capital project plans.
The City will maintain fund balance in the Capital Funds at a minimum level sufficient to provide adequate working capital for current expenditure needs and for future capital projects.
City of Burnsville 2022 Budget 65 Financial Plan - Capital Projects Funds

Parks Capital FundFive-Year Financial Plan
Actuals 2021 Budget 2022 Budget Projected
2019 2020 Original Amended Estimate % Chg 2023 2024 2025 2026
SOURCE OF FUNDS:
Property Taxes
Parks Capital Fund Levy 1,025,000 1,365,000 1,413,000 1,413,000 1,413,000 1,462,000 3 % 1,513,000 1,566,000 1,621,000 1,678,000
Delinquent & Other 5,272 (8,943) — — — — — % — — — —
Net Collections 1,030,272 1,356,057 1,413,000 1,413,000 1,413,000 1,462,000 3 % 1,513,000 1,566,000 1,621,000 1,678,000
Park Dedication Fees 1,934,984 641,598 79,294 79,294 2,982,582 844,000 964 % 620,880 100,000 100,000 100,000
Transfers from Other Funds:
Facilities Fund — 50,000 — — — — — % — — — —
Infrastructure Trust Fund 335,000 — — — — — — % — — — —
Intergovernmental Revenue 312,962 1,360,263 — 1,882,124 3,439,609 — — % — — — —
Donations — 165,800 — 2,215 1,800 — — % — — — —
Miscellaneous 840 — — — — — — % — — — —
Interest 93,164 42,272.36 40,000 40,000 30,000 48,000 20 % 37,000 30,000 23,000 20,000
TOTAL SOURCE OF FUNDS 3,707,222 3,615,990 1,532,294 3,416,633 7,866,991 2,354,000 54 % 2,170,880 1,696,000 1,744,000 1,798,000
USE OF FUNDS:
Renovations 793,451 2,092,105 1,740,102 2,618,460 2,618,460 1,182,991 (32) % 1,100,983 1,140,834 770,146 1,140,347
Bituminous Surfaces — — — — — 222,636 — % 967,262 519,926 1,169,377 82,261
Improvements* 98,375 — 179,540 694,540 694,540 2,042,669 1,038 % 120,000 272,625 120,000 120,000
Trail Development - City Funded* 181,809 367,785 400,000 777,215 777,215 100,000 (75) % 600,000 453,000 — —
Improvements Other Funded 1,475 45,664 50,000 82,017 82,017 — (100) % 52,625 — — —
Trail Development - Other Governmental Funding 312,964 2,917,748 — 1,867,124 1,867,124 — — % — — — —
TOTAL USE OF FUNDS 1,388,074 5,423,302 2,369,642 6,039,356 6,039,356 3,548,296 50 % 2,840,870 2,386,385 2,059,523 1,342,608
NET DIFFERENCE 2,319,148 (1,807,312) (837,348) (2,622,723) 1,827,635 (1,194,296) 43 % (669,990) (690,385) (315,523) 455,392
Beginning Fund Balance 2,559,635 4,878,783 3,071,471 3,071,471 3,071,471 4,899,106 3,704,810 3,034,820 2,344,435 2,028,912
Ending Fund Balance 4,878,783 3,071,471 2,234,123 448,748 4,899,106 3,704,810 3,034,820 2,344,435 2,028,912 2,484,304
Reserved Donations Balance
Skate Park Phase 3 5,800 — — — — — — — — —
Available Fund Balance 4,872,983 3,071,471 2,234,123 448,748 4,899,106 3,704,810 3,034,820 2,344,435 2,028,912 2,484,304
Park Dedication Fees 2,530,130 2,891,544 2,603,053 2,603,053 5,506,341 4,878,586 3,356,797 2,736,797 2,111,172 2,091,172
* Projects funded by Park Dedication Fees 280,184 367,785 579,540 1,471,755 1,471,755 2,142,669 720,000 725,625 120,000 120,000
Available for Future Improvements 2,249,946 2,523,759 2,023,513 1,131,298 4,034,586 2,735,917 2,636,797 2,011,172 1,991,172 1,971,172
Available for Park Renovations 2,623,037 547,712 210,610 (682,550) 864,520 968,893 398,023 333,263 37,740 513,132
City of Burnsville 2022 Budget 66 Financial Plan - Capital Projects Funds

Equipment & Vehicle FundFinancial Plan Year 2022
FUND DESCRIPTIONThe Equipment & Vehicle Fund is used to account for major capital purchases.
BACKGROUNDThis fund was established in 1986 to account for purchases of major capital purchases of equipment and vehicles. In 2002, facilities improvements were consolidated into this fund. In 2015 the City completed a facilities study and identified a need for significant facilities improvements over the next 20 years. As a result the 2016 budget moved facilities out of this fund and into a separate fund.
Use of the Equipment and Vehicle Fund assists in leveling annual capital outlay demands and funding using pay-as-you-go strategy when possible. The balance is maintained for the purpose of funding extraordinary equipment needs and for the move back to pay-as-you-go funding. While there are no current plans to issue equipment certificates for cash flow purposes, when equipment certificates are issued the debt service and property tax levy are accounted for in the debt service funds.
SOURCE OF FUNDSThe principal source of revenue in this fund has been property tax levy, sale of replaced equipment, and interest earned on cash balances in the fund. In certain years, the City has also used equipment certificate proceeds. Prior to 2018, the property tax was levied in the General Fund and transferred to the Equipment and Vehicle Capital Fund. Beginning in 2018, the property tax is levied directly in the Equipment and Vehicle Capital Fund.
Rather than incur debt and related interest expense for annual on-going vehicle and equipment purchases, the plan uses pay-as-you-go funding using property tax levy, transfers from the enterprise funds, and use of fund balance. The City may use bonding to fund extraordinary capital needs. The proposed five-year plan does not anticipate the issuance of bonds. Proceeds from the sale of replaced equipment and vehicles are also a revenue source for this fund.
USE OF FUNDSExpenditures are for major capital items related to the general operations of the City. The City’s fleet maintenance department maintains a vehicle replacement plan to manage the projected replacement needs of all City vehicles and major equipment. Useful lives and maintenance costs are considered in the timing of replacements. The plan is updated each year by the fleet maintenance department with the input of the appropriate City staff in each department using the vehicles. The City does not budget for unanticipated repairs but relies on judicious use of fund balance and other available resources to meet unexpected repairs at the time they occur. These plans can be found in the CIP in the capital section of this document. A detailed listing of capital equipment is included in the capital section of this document. The City also maintains a longer vehicle and equipment replacement plan to project the replacement needs over the next 10 to 20 years.
Enterprise fund equipment is included in the replacement planning process but is paid directly from the enterprise funds and is not included in this fund with the exception of those vehicles with multiple uses funded partially from the enterprise funds.
City of Burnsville 2022 Budget 67 Financial Plan - Capital Projects Funds

In 2021 a comprehensive fleet study is being conducted. Results of this study are expected to inform future planning for vehicle and equipment needs, ensure adequate size of the fleet is maintained and managed within the budget to support ongoing efforts.
TRANSFERSThe enterprise funds transfer in an amount for a proportional share of vehicles with multiple uses. Transfers are also made from the General Fund to fund community development vehicles from available permit fees in the General Fund.
FUND BALANCEThe City’s policies call for a pay-as-you-go strategy for supporting capital spending without use of debt whenever feasible. The City strives to pay cash for capital projects that can be anticipated and planned for in advance. Therefore, the City’s fund balance levels fluctuate, in part, based on capital project plans.
The goal of this plan is to maintain the fund balance at a level sufficient to provide adequate working capital as well as to provide for future capital needs as identified in the City’s five-year capital plan. Delayed fleet replacement and cost increases are challenging this fund. The City will need to address funding source options or other cost reduction options for fleet to address the projected reductions in fund balances in the future years of the plan.
City of Burnsville 2022 Budget 68 Financial Plan - Capital Projects Funds

Equipment & Vehicle FundFive-Year Financial Plan
Actuals 2021 Budget 2022 Budget Projected
2019 2020 Original Amended Estimate%
Chg 2023 2024 2025 2026
SOURCE OF FUNDS:
Property Taxes
Equipment & Vehicle Tax Levy 1,614,832 1,806,227 1,879,000 1,879,000 1,879,000 1,992,000 6 % 2,302,000 2,417,000 2,538,000 2,665,000
Delinquent & Other 7,917 6,408 — — — — — % — — — —
Net Collections 1,622,749 1,812,635 1,879,000 1,879,000 1,879,000 1,992,000 6 % 2,302,000 2,417,000 2,538,000 2,665,000
Investment Income 38,116 10,702 7,000 7,000 7,000 5,000 (29) % 5,000 — 6,000 1,000
Sale of property 132,349 54,401 100,000 100,000 — 100,000 — % 100,000 100,000 100,000 100,000
Intergovernmental
LGA dedicated to Capital 895 — — — — — — % — — — —
Transfers from other funds:
General fund
One-time transfers:
Community Development — 70,000 96,000 96,000 96,000 32,500 (66) % — — — —
Communications/Public Experience — — — — — 80,000 — % — — — —
Police Radios 400,000 — — — — 271,000 — % — — — —
TOTAL SOURCE OF FUNDS 2,194,109 1,947,738 2,082,000 2,082,000 1,982,000 2,480,500 19 % 2,407,000 2,517,000 2,644,000 2,766,000
USE OF FUNDS:
Vehicles & large equipmentAnnual Replacement Schedule 1,414,713 2,736,876 2,298,100 3,182,091 2,852,091 2,728,302 19 % 2,969,600 1,826,300 3,161,700 2,759,500
TOTAL USE OF FUNDS 1,414,713 2,736,876 2,298,100 3,182,091 2,852,091 2,728,302 19 % 2,969,600 1,826,300 3,161,700 2,759,500
NET DIFFERENCE 779,396 (789,138) (216,100) (1,100,091) (870,091) (247,802) 15 % (562,600) 690,700 (517,700) 6,500
Beginning Fund Balance 1,599,195 2,378,591 1,589,453 1,589,453 1,589,453 719,362 471,560 (91,040) 599,660 81,960
Ending Fund Balance 2,378,591 1,589,453 1,373,353 489,362 719,362 471,560 (91,040) 599,660 81,960 88,460
City of Burnsville 2022 Budget 69 Financial Plan - Capital Projects Funds

Facilities FundFinancial Plan Year 2022
FUND DESCRIPTIONThe Facilities Fund is used to account for major facility replacements and improvements.
BACKGROUNDThis fund was established in 2016 to account for the facilities replacement and improvement needs and bond proceeds. Prior to 2016, facilities replacements and improvements were in the Equipment, Vehicle & Facilities Replacement (EVFR) Fund. The creation of this fund allows for the centralization of facilities projects, funding and planning.
Use of this fund assists in leveling annual capital outlay demands and funding using pay-as-you-go strategy when possible. When bonds are issued the debt service and property tax levy are accounted for in the debt service funds.
SOURCE OF FUNDSThe principal revenue sources in this fund are utility franchise fees, bond proceeds, transfers from other funds and interest earned on cash balances in the fund.
The plan uses pay-as-you-go funding, when possible, through the use of utility franchise fees, enterprise fund transfers, and use of fund balance.
An increase in franchises fees was approved during the 2020 budget process for a long-term sustainable Facilities Fund. The increased fees were implemented during 2020, and the 2021 budget included the first year of increased franchise fee revenues. This provides for major capital replacement at all facilities while reducing debt and increasing pay-go funding.
Bonding is planned to fund extraordinary capital needs. The proposed five-year plan anticipates the issuance of bonds to fund large facilities improvements.
USE OF FUNDSExpenditures are for major capital items related to the City's facilities for the general operations of the City. The City does not budget for unanticipated repairs but relies on judicious use of fund balance and other available resources to meet unexpected repairs at the time they occur. The City prepares a multi-year facilities capital plan. These detailed plans can be found in the CIP in the capital section of this document. The City also maintains a longer facilities capital plan to project the replacement needs over the next 10 to 20 years. The Financial Management Plan includes a policy specifying the facilities covered by this fund.
This plan incorporates Phase 3 of major improvements planned for the Fire Station 2, City Hall, and the Maintenance Center in the amount of $26 million in 2023. The majority will be funded through bond issuance. Maintenance Facility improvements currently planned for 2025 will be assessed to determine if those projects will be rolled in to the phase 3 plan thus eliminating the large draw down in fund balance in 2025.
City of Burnsville 2022 Budget 70 Financial Plan - Capital Projects Funds

Enterprise fund facilities are included in the replacement planning process but improvements funded 100% by utility fees are paid directly from the utility funds and not included in this fund with the exception of those facilities with multiple uses funded partially from the utility funds.
TRANSFERSThe utility funds transfer in an amount for a proportional share of facilities with multiple uses.
FUND BALANCEThe City’s policies call for a pay-as-you-go strategy for supporting capital spending without use of debt whenever feasible. The City strives to pay cash for capital projects that can be anticipated and planned for in advance. The City has completed a facility study in 2015 and had budgeted for an updated facilities study in 2021.
The goal of this plan is to maintain the fund balance at a level sufficient to provide adequate working capital as well as to provide for future capital needs as identified in the City’s five-year capital plan.
City of Burnsville 2022 Budget 71 Financial Plan - Capital Projects Funds

Facilities Capital FundFive-Year Financial Plan
Actuals 2021 Budget 2022 Budget Projected
2019 2020 Original Amended Estimate % Chg 2023 2024 2025 2026
SOURCE OF FUNDS:
Property Taxes
Delinquent & Other 4,778 345 — — — — — % — — — —
Franchise Fees 1,251,210 2,571,639 4,880,000 4,880,000 5,100,000 5,100,000 5 % 5,100,000 5,100,000 5,100,000 5,100,000
Host Fee Revenue 777,632 — — — — — — % — — — —
Investment Income 56,608 8,695 10,000 10,000 10,000 28,000 180 % 25,000 17,000 18,000 2,000
Bond Proceeds — 17,606,547 — — — — — % 23,000,000 — — —
Transfers From Other Funds
Water & Sewer Utility 242,970 116,400 110,250 110,250 110,250 71,400 (35) % 90,390 110,790 546,300 148,500
Storm Water Utility 80,990 38,800 36,750 36,750 36,750 23,800 (35) % 30,130 36,930 182,100 49,500
TOTAL SOURCE OF FUNDS 2,414,188 20,463,359 5,037,000 5,037,000 5,257,000 5,223,200 4 % 28,245,520 5,264,720 5,846,400 5,300,000
USE OF FUNDS:
Improvements
Phase 2 (Fire Station 1) 55,387 4,980,790 — 15,663,823 15,663,823 — — % — — — —
Phase 3 (Fire Station 2/City hall/Mtnce Facilityl) — — — — — — — % 26,000,000 — — —
55,387 4,980,790 — 15,663,823 15,663,823 — — % 26,000,000 — — —
Maintenance & Replacement
City Hall / Police 86,790 277,422 124,000 195,367 195,367 110,000 (11) % 41,000 189,000 179,000 58,000
Civic Center City Garage 21,322 106,349 312,500 392,344 392,344 488,000 56 % 85,000 5,000 75,000 355,000
Fire Stations 6,362 2,644 96,000 187,355 187,355 547,000 470 % 50,000 106,000 123,000 69,500
HOC Parking Deck/Ramp 173,065 38,575 52,500 52,500 52,500 97,500 86 % 67,500 360,000 50,000 162,000
Parks Facility — — 300,000 300,000 300,000 633,000 111 % — 300,000 300,000 300,000
Maintenance Facility 50,083 150,745 55,000 113,255 113,255 225,000 309 % 216,300 364,300 1,746,000 140,000
Ames Center 4,200 5,389 — — — 484,500 — % 575,400 270,000 709,000 660,000
Golf Course — 180,932 20,000 27,068 27,068 20,000 — % 20,000 — 300,000 —
IT Technology — — — — — — — % — — 50,000 —
Ice Center 1,063,865 — — 15,000 15,000 1,125,000 — % 145,000 250,000 500,000 160,200
Annual Replacement 1,405,687 762,056 960,000 1,282,889 1,282,889 3,730,000 289 % 1,200,200 1,844,300 4,032,000 1,904,700
Total Capital Improvements 1,461,074 5,742,846 960,000 16,946,712 16,946,712 3,730,000 289 % 27,200,200 1,844,300 4,032,000 1,904,700
Bond Issuance Costs — 103,709 — — — — — % — — — —
Transfer to Other Funds
Debt Service (Phase 1) 809,790 859,340 808,140 808,140 808,140 808,840 — % 808,840 810,040 810,240 809,440
Phase 2 (Fire Station 1) — — 1,224,000 1,224,000 1,047,935 1,047,565 (14) % 1,049,365 1,050,165 1,049,965 1,048,765
Phase 3 (Fire Station 2/City Hall) — — — — — — — % — 1,475,400 1,475,400 1,475,400
TOTAL USE OF FUNDS 2,270,864 6,705,895 2,992,140 18,978,852 18,802,787 5,586,405 87 % 29,058,405 5,179,905 7,367,605 5,238,305
NET DIFFERENCE 143,324 13,757,464 2,044,860 (13,941,852) (13,545,787) (363,205) (118) % (812,885) 84,815 (1,521,205) 61,695
Beginning Fund Balance 2,493,815 2,637,139 16,394,603 16,394,603 16,394,603 2,848,816 2,485,611 1,672,726 1,757,541 236,336
Ending Fund Balance 2,637,139 16,394,603 18,439,463 2,452,751 2,848,816 2,485,611 1,672,726 1,757,541 236,336 298,031
City of Burnsville 2022 Budget 72 Financial Plan - Capital Projects Funds

Information Technology Capital FundFinancial Plan Year 2022
FUND DESCRIPTIONThe Information Technology (IT) Capital Fund is used to account for capital purchases of IT equipment and software development.
BACKGROUNDThis fund was established in 2007. Prior to 2007, IT capital purchases were in the General Fund, the Equipment, Vehicle, Facilities Replacement Fund, and the Enterprise Funds. The creation of this fund allowed for the centralization of all IT capital purchases and consolidation of IT capital planning. Since annual savings remain in the fund for future purchases, the fund provides flexibility in responding to the rapid pace of change in the IT industry. Decisions can be made to delay or reprioritize purchases to respond to changes in hardware and software availability and upcoming enhancements.
SOURCE OF FUNDSThe principal source of revenue in this fund is property tax levy and transfers from the enterprise funds. Property tax is levied directly in the IT Capital Fund. Transfers from the other enterprise funds are fund equipment used by the those funds.
USE OF FUNDSExpenditures are for major hardware and software capital purchases. The City prepares a five-year IT capital plan. Detailed plans are prepared for the first two years; the next three years look at major systems needs identified for each City department but at a less detailed level due to the rapid pace of change in available technology. In 2016 and 2017, major replacements of IT infrastructure were consolidated into one year and financed through a capital lease maturing in 2019. This allowed the City to implement equipment that is most effectively compatible throughout the system.
TRANSFERSThe Enterprise Fund transfers are proposed to be consistent with the historical level of funding in those areas. The Enterprise Fund transfer would fund the portion of IT capital used by those funds.
FUND BALANCEThe City’s policies call for a pay-as-you-go strategy for supporting capital spending without use of debt whenever feasible. The City strives to pay cash for capital projects that can be anticipated and planned for in advance of purchase. Therefore, the City’s fund balance levels fluctuate, in part, based on capital project plans.
The plan maintains fund balance in the fund at a level sufficient to provide adequate working capital for current expenditure needs and to provide for future capital needs.
City of Burnsville 2022 Budget 73 Financial Plan - Capital Projects Funds

Information Technology Capital Equipment FundFive-Year Financial Plan
Actuals 2021 Budget 2022 Budget Projected
2019 2020 Original Amended Estimate % Chg 2023 2024 2025 2026
SOURCE OF FUNDS:
Property Taxes
IT Capital Tax Levy 446,000 324,000 334,000 334,000 334,000 344,000 3 % 354,000 365,000 376,000 387,000
Delinquent & Other (1,424) 35,425 — — — — — % — — — —
Net Collections 444,576 359,425 334,000 334,000 334,000 344,000 3 % 354,000 365,000 376,000 387,000
Interest 22,553 8,967 4,000 4,000 4,000 6,000 50 % 4,000 4,000 3,000 2,000
Transfers from other funds:
Water & Sewer 217,423 94,808 131,538 131,538 131,538 191,890 46 % 175,180 136,300 291,830 286,500
TOTAL SOURCE OF FUNDS 684,552 463,200 469,538 469,538 469,538 541,890 15 % 533,180 505,300 670,830 675,500
USE OF FUNDS:
Public Safety
Police 11,151 70,962 20,900 147,285 122,200 70,800 239 % 52,300 49,200 45,800 49,200
Fire 21,578 — 22,200 79,373 71,355 44,300 100 % 24,900 27,300 36,900 32,300
Mobile Command 4,700 16,848 4,000 29,650 15,000 — (100) % 5,500 10,500 14,500 7,000
PC Computers 75,914 77,711 154,925 257,850 224,567 228,200 47 % 226,800 293,400 275,300 238,400
IT Infrastructure 78,109 247,197 162,000 312,476 301,408 178,100 10 % 231,100 129,600 387,100 379,100
Security systems 54,907 93,851 41,000 108,959 106,253 90,000 120 % 40,000 30,000 32,000 45,000
Document Imaging — — 2,200 43,367 25,000 — (100) % 12,700 — 12,700 —
Community Development 24,100 23,793 — 54,160 35,000 18,000 — % — — 15,000
Software Development 4,462 3,855 4,500 39,089 20,332 5,000 11 % 5,000 5,000 5,000 5,000
ERP System Developement 10,850 — 8,000 48,815 40,000 — (100) % 6,000 — 6,000 —
GIS 516 — 5,000 15,000 15,000 25,000 400 % — 5,000 — —
Recreation — 13,062 — — — 50,000 — % 2,000 21,000 4,000 —
Capital Lease 237,804 — — — — — — % — — — —
TOTAL USE OF FUNDS 524,091 547,279 424,725 1,136,024 976,115 709,400 67 % 606,300 571,000 819,300 771,000
NET DIFFERENCE 160,461 (84,079) 44,813 (666,486) (506,577) (167,510) (79) % (73,120) (65,700) (148,470) (95,500)
Beginning Fund Balance 1,035,898 1,196,359 1,112,280 1,112,280 1,112,280 605,703 438,193 365,073 299,373 150,903
Ending Fund Balance 1,196,359 1,112,280 1,157,093 445,794 605,703 438,193 365,073 299,373 150,903 55,403
City of Burnsville 2022 Budget 74 Financial Plan - Capital Projects Funds

Infrastructure Trust FundFinancial Plan Year 2022
FUND DESCRIPTIONThe Infrastructure Trust Fund (ITF) is a capital projects fund used to account for property tax revenues and expenditures associated with the infrastructure replacement costs for the City.
BACKGROUNDIn 1996, the City began to levy a property tax to fund future replacement of infrastructure. The goal was to achieve a pay-as-you-go strategy for the City contribution toward infrastructure projects, primarily streets and parks, with individual property owners also sharing in the cost through special assessments.
The ITF levy is supplemented by Municipal State Aid for Street (MSAS) revenue the City receives from the State of Minnesota from the State gas tax. The ITF budget combines the MSAS funds with the ITF levy to present a combined funding plan for infrastructure replacement costs.
The City has approximately 225 miles of streets to maintain. A Pavement Management Program (PMP) was initiated in about 1990 to provide an objective technical method of evaluating and cataloging the condition of streets. In 2017, the City automated this process using a contractor to provide a more consistent analysis. All City streets are rated every three years, with the most recent rating occurring in 2020. This rating value or Pavement Condition Index (PCI) is then used to assist staff in formulating the recommended approach to rebuilding or maintaining streets.
Each year, City staff works to determine its final recommendation for the scope of the next year’s projects. The staff then recommends what type of maintenance should be done to each street. Staff uses the PCI rating in conjunction with a number of other criteria (e.g., age of the street, traffic volume, water main conditions) to make this determination. Around 80 percent of the streets within Burnsville were constructed during the 1960s, 1970s and 1980s (about 180 miles out of the 225 total miles of streets). Bituminous streets have an expected life of 30 to 50 years depending on the soils, initial construction materials, and the maintenance that is done to them. A poorly constructed street will not last 30 years even with great maintenance. A well-constructed street can be made to last longer with the proper maintenance procedure at the correct time, which is the overarching goal of the PMP.
As noted above, the majority of the streets in the City were constructed in three decades. This means that the majority of streets will reach the end of their useful life in a similar time span. This is a problem that the PMP also attempts to address. The City has reconstructed approximately 118 miles of streets and has rehabilitated approximately 39 miles since the program began in 1990. At the present rate of reconstruction and rehabilitation, approximately five miles per year and 1 1/2 miles per year, respectively; the City has seen a general improvement of the overall pavement quality, which were less than desirable several years ago. The addition of the maintenance overlay program and end of season maintenance paving, in addition to completing street reclamation projects in place of more costly street reconstruction projects, have all played a role in overall improvement of pavement quality. Staff will continue to use the best approach possible to extend the life of existing streets and to reconstruct and rehabilitate as many miles as possible annually.
City of Burnsville 2022 Budget 75 Financial Plan - Capital Projects Funds

SOURCE OF FUNDSThe principal sources of revenue are ITF property tax levy, MSAS funds, and interest earned on cash balances in the fund. The annual levy for 2022 is set at $3.2 million. This fund also includes the City’s annual MSAS allotment, budgeted for $2.06 million in 2022, a increase of $135,000 from 2021.
USE OF FUNDSExpenditures are for infrastructure replacement for transportation and parks. The CIP includes the detail of projects which are scheduled to have funding from the ITF tax levy and MSAS.
Infrastructure Trust Fund Expenditures
Street Improvements Street Trail ImprovementsSignals/Intersection Improvements OtherCliff Road Interchange Maintenance Overlays
2022 2023 2024 2025 2026$0
$2,000,000
$4,000,000
$6,000,000
$8,000,000
TRANSFERSTransfers annually to the Street Maintenance Fund are planned to fund the additional crack sealing costs of the maintenance overlay program implemented in 2014. Debt service for bonds issued in 2010 to fund the City’s share of street projects are included as transfers from this fund to the Debt Service Fund.
FUND BALANCEThe fund balance will fluctuate as the timing of revenues and expenditures can vary on large projects and may cross fiscal years. Fund balance is used to even out the large swings in expenditures to most efficiently schedule projects that vary in size.
City of Burnsville 2022 Budget 76 Financial Plan - Capital Projects Funds

Infrastructure Trust FundFive-Year Financial Plan
Actuals 2021 Budget 2022 Budget Projected
2019 2020 Original Amended Estimate%
Chg 2023 2024 2025 2026
SOURCE OF FUNDS:
Property Taxes
ITF Property Tax Levy 3,329,865 3,028,387 3,151,800 3,151,800 3,151,800 3,246,354 3 % 3,343,745 3,444,057 3,547,379 3,653,800
Delinquent & Other 22,896 16,637 — — — — — % — — — —
Net Collections 3,352,761 3,045,024 3,151,800 3,151,800 3,151,800 3,246,354 3 % 3,343,745 3,444,057 3,547,379 3,653,800
MSAS Funding 1,960,507 1,799,424 1,927,704 1,927,704 2,062,673 2,062,673 7 % 2,062,673 2,062,673 2,062,673 2,062,673
Interest 101,416 29,607 13,884 13,884 20,741 33,639 142 % 36,820 22,783 27,669 28,359
TOTAL SOURCE OF FUNDS 5,414,684 4,874,055 5,093,388 5,093,388 5,235,214 5,342,666 5 % 5,443,238 5,529,513 5,637,721 5,744,832
USE OF FUNDS:
Capital Improvements 6,867,306 5,493,247 3,929,326 3,929,326 3,609,187 4,999,661 27 % 6,821,936 5,015,912 5,543,632 6,132,038
Transfers to Other Funds
Parks Capital Fund 335,000 — — — — — — % — — — —
Street Maintenance Fund 25,000 25,000 25,000 25,000 25,000 25,000 — % 25,000 25,000 25,000 25,000
Debt Service Funds 351,081 — 311,217 311,217 311,217 — (100) % — — — —
TOTAL USE OF FUNDS 7,578,387 5,518,247 4,265,543 4,265,543 3,945,404 5,024,661 18 % 6,846,936 5,040,912 5,568,632 6,157,038
NET DIFFERENCE (2,163,703) (644,192) 827,845 827,845 1,289,810 318,005 (62) % (1,403,698) 488,601 69,089 (412,206)
Beginning Fund Balance 4,882,032 2,718,329 2,074,137 2,074,137 2,074,137 3,363,947 3,681,952 2,278,254 2,766,855 2,835,944
Ending Fund Balance 2,718,329 2,074,137 2,901,982 2,901,982 3,363,947 3,681,952 2,278,254 2,766,855 2,835,944 2,423,738
City of Burnsville 2022 Budget 77 Financial Plan - Capital Projects Funds
Street Maintenance FundFinancial Plan Year 2022
FUND DESCRIPTIONThe Street Maintenance Fund is a capital projects fund used to account for the revenues and expenditures associated with street maintenance projects that extend the life of the existing street system for the City and smaller roadway, right-of-way and traffic control improvements.
BACKGROUNDThis fund was set up in 2004 to centralize the financing of major mid-life street maintenance. This provides greater flexibility in funding maintenance and smaller improvement activities for the most effective use of resources. The primary maintenance activities funded are pavement crack sealing, seal coating, and striping. More extensive projects, such as mill and overlay projects that further extend the life of existing streets are funded primarily by the Infrastructure Trust Fund (ITF).
In addition to street maintenance activities, small right-of-way replacements (i.e. sidewalks, small retaining walls, some curb and gutter replacement), and smaller traffic control studies, including any resulting projects are accounted for in this fund. The street rehabilitation projects remain in the Improvement Construction Capital Projects Fund.
SOURCE OF FUNDSThe principal sources of revenues are transfers from the General Fund and Enterprise Funds. The transfer from the General Fund is shown to remain flat from 2021budgeted amounts and continuing with increases of three and half percent over the next four years in order to account for the expanded use of preventative maintenance to extend the life of other City bituminous assets. Additionally, transfers from the General Fund totaling $100,000 to $190,000 annually, are planned from 2023 through 2025 to fund entrance monuments. The amount of transfers in from other funds is evaluated annually based on actual project costs that are incurred in the prior year.
The transfer in from the Enterprise Funds represents an allocation of a portion of the cost of street rehabilitation and major street maintenance work to the utility funds. The life of City streets and the need for maintenance is driven in part by the instability that the installation of utilities in the ground create underneath the street. Therefore, it is reasonable that the utilities contribute toward the cost of maintaining the street surface. When major capital projects are completed on a street, the utility funds pay for the cost of the utility work completed as part of the street project.
Annual transfers in from the ITF are scheduled to fund increased costs for crack sealing for the maintenance overlay program.
USE OF FUNDSExpenditures are for major street maintenance expenses such as seal coating and crack sealing, pavement marking, traffic studies and other work that extends the life of the existing street system.
Currently future years are based on an average year as estimated. The balance in the fund may be used to cover years that are above the average to even out the large swings in expenditures keeping the transfers from other funds even. Increases in crack sealing expenditures have been included to account for the increases due to the maintenance overlay program implemented in the Infrastructure Trust Fund.
City of Burnsville 2022 Budget 78 Financial Plan - Capital Projects Funds

FUND BALANCEThe City will maintain fund balance in the Capital Funds at a minimum level sufficient to provide adequate working capital for current expenditure needs. Generally, the City shall strive for a minimum of three months operating cash in these funds.
City of Burnsville 2022 Budget 79 Financial Plan - Capital Projects Funds

Street Maintenance FundFive-Year Financial Plan
Actuals 2021 Budget 2022 Budget Projected
2019 2020 Original Amended Estimate % Chg 2023 2024 2025 2026
SOURCE OF FUNDS:
Misc Refunds / Reimbursements 18,928 17,763 15,000 15,000 15,000 15,000 — % 15,000 15,000 15,000 15,000
Interest 18,939 6,836 5,000 5,000 5,000 5,000 — % 5,000 5,000 5,000 5,000
Transfers From Other Funds
General Fund 346,000 359,000 372,000 372,000 372,000 372,000 — % 385,000 398,000 411,000 424,000
General Fund - Monuments — — — — % 180,000 190,000 100,000 —
Infrastructure Trust Fund 25,000 25,000 25,000 25,000 25,000 25,000 — % 25,000 25,000 25,000 25,000
Water & Sewer Fund 200,625 200,625 200,625 200,625 200,625 200,625 — % 200,625 200,625 200,625 200,625
Storm Sewer 60,825 60,825 60,825 60,825 60,825 60,825 — % 60,825 60,825 60,825 60,825
Total Source of Funds 670,317 670,049 678,450 678,450 678,450 678,450 — % 871,450 894,450 817,450 730,450
USE OF FUNDS:
Roadway Preventative Maintenance 526,879 482,502 482,500 482,500 482,500 490,000 2 % 497,500 505,000 512,500 520,000
Pavement Marking 95,393 120,871 95,000 95,000 95,000 95,000 — % 95,000 95,000 95,000 95,000
Right of Way Maintenance 44,080 25,965 80,000 80,000 80,000 80,000 — % 80,000 80,000 80,000 80,000
Monuments — — — — — — — % 180,000 190,000 100,000 —
Other — — 15,000 15,000 15,000 15,000 — % 15,000 15,000 15,000 15,000
Total Use of Funds 666,352 629,338 672,500 672,500 672,500 680,000 1 % 867,500 885,000 802,500 710,000
NET DIFFERENCE 3,965 40,711 5,950 5,950 5,950 (1,550) (126) % 3,950 9,450 14,950 20,450
Beginning Fund Balance 527,343 531,308 572,019 572,019 572,019 577,969 576,419 580,369 589,819 604,769
Ending Fund Balance 531,308 572,019 577,969 577,969 577,969 576,419 580,369 589,819 604,769 625,219
City of Burnsville 2022 Budget 80 Financial Plan - Capital Projects Funds

Improvement Construction FundFinancial Plan Year 2022
FUND DESCRIPTIONThe Improvement Construction Fund is a capital projects fund used to account for the revenues and expenditures associated with improvement construction projects for the City.
BACKGROUNDThis fund accounts for the receipt and disbursement of bond proceeds or other sources obtained to finance construction of improvements to the City’s infrastructure. Projects that are assessed wholly or in part to the benefited property owners and/or have general tax levy funding are generally bonded.
SOURCE OF FUNDSMajor funding sources for improvement construction projects include special assessments, bond proceeds, and intergovernmental revenue. The bonds are then repaid in the Debt Service Funds using the special assessment and/or tax levy revenue. Intergovernmental revenue consists of County, State, and Federal funding for shared roads and various grants or other shared costs. Each improvement project may have numerous funding sources as identified in the Capital Improvements Plan (CIP).
USE OF FUNDS AND FUND BALANCEThe principal use of this fund is to support improvement construction projects related to the City’s infrastructure. The City prepares a five-year CIP to plan and prioritize these improvement projects. Each individual project also goes through Council approval prior to beginning the project.
The Improvement Construction Fund operates on a zero balance basis. Each project has revenues balancing expenditures. The fund may operate with short-term negative or positive fund balance due to timing of receipt of revenues and expenditures.
Detailed plans can be found in the CIP in the capital section of this document.
City of Burnsville 2022 Budget 81 Financial Plan - Capital Projects Funds

Improvement Construction FundFive-Year Financial Plan
Actuals 2021 Budget 2022 Projected
2019 2020 Original Amended Estimate % Chg 2023 2024 2025 2026
SOURCE OF FUNDS:
Special Assessments 778,421 336,500 776,294 776,294 200,000 1,493,201 92 % 1,311,489 1,652,070 988,970 1,270,427
Intergovernmental
Dakota County 244,666 1,236,340 2,225,000 2,225,000 2,225,000 600,000 (73) % — 1,000,000 — 1,600,000
Federal — — 670,000 670,000 670,000 2,632,000 293 % — — — 25,000,000
Other Intergovernmental 390,992 24,633 415,000 859,374 859,374 415,000 — % 415,000 415,000 415,000 415,000
Bond Proceeds:
Improvement Bonds 1,372,667 1,327,351 — — 576,294 — — % — — — —
Interest Income (32,711) (16,689) — — — — — % — — — —
Transfers From Other Funds
General Fund — — — — — — — % — — — 350,000
Total Source of Funds 2,759,035 3,127,436 4,086,294 4,530,668 4,530,668 5,140,201 26 % 1,726,489 6,567,070 1,403,970 28,635,427
USE OF FUNDS:
Capital Improvements 2,786,575 2,972,420 4,086,294 4,530,668 4,530,668 5,140,201 26 % 1,726,489 6,567,070 1,403,970 28,635,427
Other Expenses 13,535 9,832 — — — — — % — — — —
Total Use of Funds 2,800,110 2,982,252 4,086,294 4,530,668 4,530,668 5,140,201 26 % 1,726,489 6,567,070 1,403,970 28,635,427
NET DIFFERENCE (41,075) 145,184 — — — — — % — — — —
Beginning Fund Balance (172,561) (213,636) (68,452) (68,452) (68,452) — — — — —
Ending Fund Balance* (213,636) (68,452) (68,452) (68,452) (68,452) — — — — —
Note: The Improvement Construction Fund operates on a zero balance basis. Each project has revenues balancing expenditures.
The fund may operate with short term negative or positive fund balance due to timing of receipt of revenues and expenditures at year end.
* Negative Fund Balance at the end of 2021 will be offset by deferred special assessments collections in future years.
City of Burnsville 2022 Budget 82 Financial Plan - Capital Projects Funds

City of Burnsville 2022 BudgetFive-Year Financial Plan
G.O. Debt Funds
Debt service funds account for the accumulation of resources for the payment of general long-term debt principal and interest. The City maintains individual debt service funds for each bond issue. The City has established annual financial plans for all general obligation bond funds and certificate of indebtedness funds which is shown in total as the G.O. Debt Funds. The Debt Funds use the modified accrual basis for both financial statement and budgeting purposes.
City of Burnsville 2022 Budget 83 Financial Plan - G.O. Debt Funds

General Obligation Debt FundsFinancial Plan Year 2022
FUND DESCRIPTIONThe General Obligation Debt Funds account for the payment of general obligation bonds, certificates of indebtedness, lease revenue bonds, and improvement bonds. A separate debt service fund is established for each bond issue.
BACKGROUNDGeneral obligations bonds are secured by the full faith and credit of the City. The City has the authority to levy property taxes for repayment of these bonds.
For this plan, the amounts projected in the Capital Improvement Program (CIP) are assumed to be funded by General Obligation Improvement Bonds. The proposed debt structure is consistent with the City’s debt management policies. Interest rates are estimated conservatively.
SOURCE OF FUNDSThe principal sources of revenue are property taxes (i.e. debt service levies), special assessments, and interest earned on cash balances in the funds. Other sources of revenue include transfers from other funds, including franchise fees transferred from the Facilities to pay the Phase I and Phase II facilities plan improvements.
The following graph shows the amount of existing and projected debt service levies for the next five years. The increase in 2020 through 2022 is due to the consolidation of the debt service and tax abatement levies into the debt service funds. The existing debt levy on the graph represents the total levy that will be needed to fund the ad valorem bonding currently outstanding. Future bonding included in the CIP for facilities, assessment, and other improvement projects will not require a debt levy. Planned facility improvements included in the CIP will be funded through franchise fees collected in the Facilities Capital Projects Fund. Cash reserves and existing debt are reviewed annually for refunding opportunities that further reduces debt service requirements.
Years
Deb
t Se
rvic
e Le
vies
Estimated Debt Service Levies2021-2025 CIP
2019 2020 2021 2022 2023 2024 2025 20261,000,000
1,500,000
2,000,000
2,500,000
3,000,000
City of Burnsville 2022 Budget 84 Financial Plan - G.O. Debt Funds

The following chart shows the amount of existing debt service levies by individual bond issue for the next five years.
Existing Debt Levies by Bond Issue
YearBudget Projected
2019 2020 2021 2022 2023 2024 2025 2026
Bond Issue:
2010A EDA Lease Revenue (Ice Ctr) $ 278,666 $ — $ — $ — $ — $ — $ — $ —
2011D GO Improvement Crossover Refunding 122,633 — — — — — — —
2012A GO Tax Increment (CR 5 & TH 13) 320,460 315,000 314,790 314,475 314,055 308,280 307,755 202,125
2015B GO Tax Abatement Refunding (Ref 2008A) 201,784 200,944 200,104 199,264 664,524 1,778,949 1,740,034 1,674,274
2016A GO Tax Abatement Refunding (Ref 2008A) 203,131 1,125,950 1,125,436 1,615,945 1,135,260 — — —
2018A GO Tax Abatement (Ice Center Roof and Ref 2010A) — 364,813 366,377 509,061 508,925 512,594 511,705 515,437
Total 1,126,674 2,006,707 2,006,707 2,638,745 2,622,764 2,599,823 2,559,494 2,391,836
TRANSFERSTransfers are shown from the General Fund, the Infrastructure Trust Fund, and the Facilities Fund to pay debt service. Transfers from funds are dependent on project origination and planned funding in the CIP.
USE OF FUNDS AND FUND BALANCEAccording to State Statute, proceeds from the debt service levies and fund balance can only be used for redemption of debt. Additional information is available in the Existing and Projected Debt Analysis Schedule presented in the Capital and Debt Section.
City of Burnsville 2022 Budget 85 Financial Plan - G.O. Debt Funds

General Obligation Debt FundsFive-Year Financial Plan
Actuals 2021 Budget 2022 Budget Projected
2019 2020 Original Amended Estimate%
Chg 2023 2024 2025 2026
SOURCE OF FUNDS:
Operating:
Property Taxes
Tax Levy 1,126,674 2,006,707 2,006,707 2,006,707 2,006,707 2,638,745 31 % 2,622,764 2,599,823 2,559,494 2,391,835
Delinquent & Other 39,796 (15,408) — — — — — % — — — —
Property Taxes 1,166,470 1,991,299 2,006,707 2,006,707 2,006,707 2,638,745 31 % 2,622,764 2,599,823 2,559,494 2,391,835
Special Assessments 1,499,568 1,579,758 984,709 984,709 1,247,813 1,061,150 8 % 960,625 913,827 810,856 741,321
Intergovernmental 36,792 31,488 27,196 27,196 27,197 — (100) % — — — —
Investment Income 144,974 59,121 52,869 52,869 52,869 50,345 (5) % 46,959 42,347 51,389 62,848
Total Operating Sources 2,847,804 3,661,666 3,071,481 3,071,481 3,334,586 3,750,240 22 % 3,630,348 3,555,997 3,421,739 3,196,004
Non-Operating:
Bond Proceeds* 528,763 1,465,535 — — — — — % — — — —
Transfers From Other Funds
General Fund - Ames Center 342,000 — — — % — — — —
General Fund - Ice Center 230,000 140,000 140,000 140,000 140,000 — (100) % — — — —
Facilities Fund - Phase I (Police/City Hall) 809,790 809,340 808,140 808,140 808,140 808,840 — % 810,040 810,240 809,440 807,640
Facilities Fund - Phase II (Fire Station 1) — — 1,224,000 1,224,000 1,047,935 1,047,565 (14) % 1,049,365 1,050,165 1,049,965 1,048,765
Infrastructure Trust Fund 351,081 — 311,217 311,217 311,217 — (100) % — — — —
Ames Center Fund 585,900 — — — — — — % — — — —
Total Non-Operating Sources 2,847,534 2,414,875 2,483,357 2,483,357 2,307,292 1,856,405 (25) % 1,859,405 1,860,405 1,859,405 1,856,405
TOTAL SOURCE OF FUNDS 5,695,338 6,076,541 5,554,838 5,554,838 5,641,878 5,606,645 1 % 5,489,753 5,416,402 5,281,144 5,052,409
USE OF FUNDS:
Debt Service:
Bond Payment - Scheduled 3,197,358 5,875,000 4,787,500 4,787,500 4,560,000 4,700,000 (2) % 4,765,000 4,855,000 4,625,000 5,000,139
Bond Payment - Refunding* 525,000 — — — — — — % — — — —
Interest Expense 1,104,616 1,080,614 1,466,833 1,466,833 1,514,997 1,321,828 (10) % 1,177,678 1,028,278 881,190 1,009,393
Fiscal Agent Fees 37,903 18,795 15,000 15,000 15,000 8,014 (47) % 8,200 8,200 8,200 8,200
TOTAL USE OF FUNDS 4,864,877 6,974,409 6,269,333 6,269,333 6,089,997 6,029,842 (4) % 5,950,878 5,891,478 5,514,390 6,017,732
NET DIFFERENCE 830,461 (897,868) (714,495) (714,495) (448,119) (423,197) (41) % (461,125) (475,076) (233,246) (965,323)
Beginning Fund Balance 5,634,583 6,465,044 5,567,176 5,567,176 5,567,176 5,119,057 4,695,860 4,234,735 3,759,659 3,526,413
Ending Fund Balance 6,465,044 5,567,176 4,852,681 4,852,681 5,119,057 4,695,860 4,234,735 3,759,659 3,526,413 2,561,090
City of Burnsville 2022 Budget 86 Financial Plan - G.O. Debt Funds

City of Burnsville 2022 BudgetFive-Year Financial Plan
Enterprise Funds
Enterprise Funds account for business-type activities. These activities provide services where most of the costs are recovered through user fees and charges. The City has seven Enterprise Funds. The accrual basis of accounting is used by the Enterprise Funds for financial statement purposes. For budget purposes the funds use the accrual basis except for capital assets and debt payments which are budgeted on a modified accrual basis within each finance plan. Depreciation is noted at the bottom of the finance plans.
• Water and Sewer Fund - receives its revenues from charges to all property owners to provide water and sanitary sewer utilities, fund operations and maintenance and capital improvements. (major fund)
• Storm Water Fund - receives its revenues from charges to all property owners to fund water quality projects, operations and maintenance, and capital improvements. (major fund)
• Ice Center Fund -operates the City of Burnsville Ice Center which has two indoor sheets of ice.
• Golf Course Fund - accounts for the Birnamwood Golf Course, a nine-hole course operation supported by user fees.
• Street Lighting Fund - provides for the annual operations and maintenance of existing streetlights.
• Ames Center Fund - reflects the operation of the City’s performing arts center. (major fund)
87

Water and Sewer FundFinancial Plan Year 2022
FUND DESCRIPTIONThe Water and Sewer Fund was established for the accounting for costs of providing water and sewer services to residents and businesses.
BACKGROUNDThis fund was created in 1960 with the original development of the operation of a municipal water and sewer system. Services include water treatment and distribution, collection and transmission of wastewater, and the treatment of wastewater completed by the Metropolitan Council Environmental Services (MCES). The City operates a ground water treatment plant and added the operation of a surface water treatment facility in 2009. The source of the surface water is from an active private limestone quarry in Burnsville that was previously pumped into the Minnesota River by the owner of the quarry. The newer portion of the water treatment plant treats the surface water for potable water supply.
Billings to customers are based on actual water usage that is metered for each property. An annual review of rates is completed to ensure financial stability of the utility. Over the past several years, the City experienced changing capital improvement needs. To address ongoing changes in the utilities, a formal rate study took place in 2020 and the resulting new rates were implemented in 2021. The study analyzed the rate system structure to determine the appropriate base rate (fixed) and usage rate (variable due to usage fluctuations) to adequately provide resources for the continued sustainable operation of the utilities. Water utility revenue is a function of weather, consumer habits, and base charges.
A portion of the fees collected in this fund supports system infrastructure replacement. Significant capital improvements projected in this plan warrant borrowing for a share of the capital costs. Bonding for capital expenditures helps to maintain a stable rate structure by avoiding the significant spikes for large capital expenditures and supports sound cash management.
Utility bills are generated on a monthly basis to encourage water conservation. Monthly bills notify customers of their water usage each month, assisting with a better understanding of water usage and leak detection. Payments are received by check, electronic automatic withdrawal through bank drafting, bank transfer, or credit card payments, through an interactive voice response (IVR), or through an online credit card or bank transfer option. Unpaid bills are the responsibility of the property owner and are certified to the property taxes twice a year in the spring and fall of each year. Customers also have the option of opting out of a paper bill mailed each month to instead receive an e-mail indicating their bill is ready for viewing online. In early 2021, the City implemented a customer portal with a direct link to the online bill pay system. This online tool allow customers to monitor their usage and receive alerts if usage abnormalities are occurring as well as pay their bills online.
SOURCE OF FUNDSThe primary source of funding is user charges based on a property’s water usage. Minnesota Statutes require public water suppliers serving more than 1,000 to adopt a water rate structure that encourages water conservation. The City’s rate structure used for water billing includes a three-tiered rate system for all customers. The top tier is designed to affect high water users.
The study looked at the fixed and variable costs of the funds. Fixed costs are defined as those the City will incur regardless of water used. This includes utility billing, administrative overhead, and personnel expenses. These fixed
City of Burnsville 2022 Budget 88 Financial Plan - Enterprise Funds

costs should be paid for with the Base Fee/Meter Charge and the study recommended setting fixed charges for water and sewer to cover100% of the fixed costs of the system to provide revenue stability to the funds in the future. An adjusted monthly meter charge, based on meter size and actual replacement cost, was recommended to replace the prior base and meter fees fee for the water system fixed charges. Additionally, a single base charge was recommended for the sanitary sewer fixed charges.
The study also examined existing water usage charges to see if existing tier breaks were appropriate. Recommendations for new tier structures for both residential and commercial accounts were proposed to promote conservation. Tiers were eliminated from the irrigation accounts since that usage is not considered essential and a single snow making rate was proposed.
For residential users, the first tier rate is charged for the first 5,000 gallons used each month. A second tier surcharge of 25 percent is added for water used up to 15,000 gallons and a third tier surcharge of an additional 25 percent is added for usage over 15,000 per month. For commercial users, the base rate is charged for the first 15,000 gallons used each month. Again a 25 percent surcharge will be added for usage up to 105,000 gallons and another 25 percent surcharge for usage over 105,000 gallons each month.
The study also proposed the City combine previously charged city and metro sewer rates into a single sewer consumption rate.
Other sources of funds include connection charges, penalties, and interest. Charges collected directly offset the costs of providing services.
A rate increase for water and sewer service in 2022 has been adopted at 3.0 percent and 5.0 percent respectively. Updated rates are included in the 2022 fees and charges schedule. These rates cover inflation, infrastructure replacement, increased MCES costs, rising electric charges, growing cost for water treatment chemicals, and the implementation of a long-term meter replacement program. MCES costs are projected to increase by 11.0 percent in 2022, following a decrease of 2.7 percent in 2021. Increases of 5.0 percent are projected in the plan over the next several years.
Overall rate increases have remained constant at 4.5 percent over the last several years. Future rate increases for water and sewer rates are expected to remain stable from 3.0 to 5.0 percent. In the mid-2000’s, increases did not fund increased costs or inflation in most years. The Fund’s cash balance continue on a downward trend in future years. This is a planned draw down of fund balance and is based on the rate study conducted in 2020. Proposed rate increases over the next several years are related to increasing costs and funding a more aggressive capital replacement program, including utility replacement concurrent with road improvements, and significant technology upgrades. The updated financial plan for the Water and Sewer Fund assumes that the City will issue debt on costs related to the infrastructure replacement. This is to alleviate the consistent drain on cash balances, to assist with maintaining sound financial health to support the long-term needs of the fund, and to avoid what would otherwise need to be significantly greater annual rate increases. Estimated revenues for 2022 are based on an average year. Revenues for 2021 are expected to be greater than budgeted amounts.
USE OF FUNDSExpenses from this fund are used for operation and maintenance, debt service, capital improvements, and infrastructure replacement relating specifically to the operation of water and sewer services. This includes all direct and indirect overhead costs incurred from operating a water and sewer enterprise.
A five-year CIP is used by the City to project capital improvement and infrastructure replacement needs. The improvements scheduled include on-going programs of water main replacement, sewer rehabilitation, well
City of Burnsville 2022 Budget 89 Financial Plan - Enterprise Funds

rehabilitation, and other scheduled improvements. The detail on specific projects is included in the CIP. Many water and sewer system components (some of which are thirty to forty years old) have not had the major renovations necessary to keep them in long-term serviceable condition. These include the water storage facilities, major trunk water lines, major trunk sanitary sewer lines, and sanitary sewer lift stations.
Major Capital InitiativesThe CIP includes an aggressive approach to reconstruction and rehabilitation. Water and sewer infrastructure replacement or rehabilitation occurs as a street is replaced. In 2019, the City implemented a major technology improvement by upgrading its SCADA system, which is utilized to monitor sewer and water assets as well as providing alarms when something is not normal within the sewer and water system. This upgrade provides more redundancy and allows for the use of today's portable communication devices, making the system more effective.
As noted above stepped-up infrastructure needs will have financial planning impacts with the use of bonding as a financing tool, and ultimately may have rate impacts. Rate stability will be closely monitored as well as maintaining a strong long-term cash balance within the fund.
DEBTA portion of the rates charged pays for debt that has been incurred on capital portions of the utility systems.
TRANSFERSTransfers of funds from the water and sewer fund are currently limited to reimbursing other City funds for specific expenditure allocations, or capital project expenditures. The Water and Sewer Fund is not transferring any monies not related to its services.
NET ASSETSFor the Enterprise Funds, the City also strives to maintain working capital cash balances at a minimum equal to three months working capital plus an amount needed to fund future capital projects as identified in the CIP Bonding for large projects and judicious use of net assets within funds can be used to moderate fluctuations in capital projects and infrastructure maintenance expenses.
City of Burnsville 2022 Budget 90 Financial Plan - Enterprise Funds

Water & Sewer FundFive-Year Financial Plan
Actuals 2021 Budget 2022 Budget Projected
2019 2020 Original Amended Estimate % Chg 2023 2024 2025 2026
SOURCE OF FUNDS:
Operating:
Utility Fees - Water 6,346,286 7,031,088 5,247,886 5,247,886 5,970,212 5,408,381 3 % 5,764,794 6,024,210 6,295,299 6,578,587
Utility Fees - Sewer 6,269,941 6,568,630 6,238,184 6,238,184 6,302,827 6,545,439 5 % 6,872,711 7,181,983 7,505,172 7,842,905
Base Charges 1,940,470 1,961,110 1,939,267 1,939,267 1,949,971 2,036,231 5 % 2,127,861 2,223,615 2,323,678 2,428,244
Meter Charges 284,982 292,925 2,762,340 2,762,340 2,514,900 2,911,188 5 % 2,897,461 3,027,847 3,164,100 3,306,485
Sales to Other Cities 972,248 1,055,418 1,034,800 1,034,800 1,041,150 1,074,432 4 % 1,117,409 1,162,106 1,208,590 1,256,933
Total Operating Sources 15,813,927 16,909,171 17,222,477 17,222,477 17,779,060 17,975,671 4 % 18,780,236 19,619,761 20,496,839 21,413,154
Non-Operating:
Bond proceeds * 6,584,515 1,157,081 3,414,000 3,414,000 3,414,000 3,544,000 4 % 5,363,228 4,003,471 3,600,000 3,330,408
Investment Income 295,142 79,553 102,955 102,955 120,816 118,451 15 % 104,906 102,703 94,330 70,059
KMM Contract — — — — — 1,800,000 — % — — — —
Connection Charges 1,007,001 82,509 200,000 200,000 950,000 200,000 — % 200,000 175,000 175,000 110,000
Other 308,514 164,886 175,000 183,000 170,190 177,138 1 % 175,000 175,000 175,000 175,000
Total Non-Op Sources 8,195,172 1,484,029 3,891,955 3,899,955 4,655,006 5,839,589 50 % 5,843,134 4,456,174 4,044,330 3,685,467
TOTAL SOURCE OF FUNDS 24,009,099 18,393,200 21,114,432 21,122,432 22,434,066 23,815,260 13 % 24,623,370 24,075,935 24,541,169 25,098,621
USE OF FUNDS:
Personnel Services 3,948,551 4,162,088 4,661,275 4,661,275 4,670,475 4,753,168 2 % 4,895,763 5,042,636 5,193,915 5,349,732
Current Expenses 3,808,966 3,863,254 4,249,580 4,257,580 4,105,199 4,461,750 5 % 4,625,603 4,764,371 4,907,302 5,054,521
MCES 4,663,378 4,898,807 4,764,504 4,764,504 4,764,504 5,293,572 11 % 5,558,251 5,836,164 6,127,972 6,434,371
Total Operating Uses 12,420,895 12,924,149 13,675,359 13,683,359 13,540,178 14,508,490 6 % 15,079,617 15,643,171 16,229,189 16,838,624
Non-Operating:Water & Sewer System Mgmt — — 1,260,000 1,260,000 1,340,000 3,026,000 140 % 2,164,750 1,164,500 2,492,000 1,229,500
Street Projects & Rehab — — 2,204,000 2,204,000 2,204,000 1,592,500 (28) % 3,248,478 4,003,471 3,451,837 2,150,908
GWTP/SWTP — — 50,000 50,000 — 240,000 380 % — — 235,000 750,000
Projects from Prior Year(s) CIP — — — 3,206,745 3,206,745 — — % — — — —
W&S Capital Projects 4,404,928 4,307,404 359,000 393,465 385,802 112,500 (69) % 469,500 85,500 235,500 122,500
Subtotal capital improvements 4,404,928 4,307,404 3,873,000 7,114,210 7,136,547 4,971,000 28 % 5,882,728 5,253,471 6,414,337 4,252,908
Debt service pmts (existing) 5,838,704 2,793,577 2,947,516 2,947,516 2,947,516 3,098,598 5 % 2,947,700 2,938,936 2,688,482 2,414,585
Debt service pmts (new) — — 170,139 170,139 170,139 332,000 95 % 441,802 882,977 1,218,334 1,507,483
Subtotal debt 5,838,704 2,793,577 3,117,655 3,117,655 3,117,655 3,430,598 10 % 3,389,502 3,821,913 3,906,816 3,922,068
Transfers (non-debt) 661,018 411,833 442,413 442,413 442,413 463,915 5 % 558,263 319,252 457,503 889,163
Total Non-Operating Uses 10,904,650 7,512,814 7,433,068 10,674,278 10,696,615 8,865,513 19 % 9,830,493 9,394,636 10,778,656 9,064,139
TOTAL USE OF FUNDS 23,325,545 20,436,963 21,108,427 24,357,637 24,236,793 23,374,003 11 % 24,910,110 25,037,807 27,007,845 25,902,763
Net change in accruals (480,099) 678,502
NET DIFFERENCE 203,455 (1,365,261) 6,005 (3,235,205) (1,802,727) 441,257 7,248 % (286,740) (961,872) (2,466,676) (804,142)
Other financial information:
Year-end Cash Balance 15,013,100 13,647,839 13,653,844 10,412,634 11,845,112 12,286,369 11,999,629 11,037,757 8,571,081 7,766,939
Three months working capital 4,730,154 4,032,390 4,308,857 4,310,857 4,275,062 4,600,751 4,756,846 4,946,084 5,148,377 5,412,464
Capital replacement balance 10,282,946 9,615,449 9,344,987 6,101,777 7,570,050 7,685,618 7,242,783 6,091,673 3,422,704 2,354,475
* - Bond proceeds includes the PFA loan proceeds issued to fund the meter replacement project. This loan was authorized in 2016, and loan proceeds will be drawn down as project expenses are incurred.
City of Burnsville 2022 Budget 91 Financial Plan - Enterprise Funds

Storm Water FundFinancial Plan Year 2022
FUND DESCRIPTIONThe Storm Water Fund was established for the accounting of costs for providing storm drainage services to the community and for preserving and improving surface water quality in the City’s lakes and ponds.
BACKGROUNDThis fund was created in 1992 with the creation of a City ordinance establishing the storm drainage utility, which authorized a storm water charge for service. This user charge allocates costs based on the direct proportion of the amount of storm water run-off a property generates. Commercial/Industrial properties that have more impervious surface (pavement, rooftops, etc.) and are larger parcels than residential will pay more for the service.
The emphasis of this fund has drastically changed since its inception. The original concept focused on funding maintenance of the system and preserving water quality. In 1996, rates began to be increased to assist in funding the replacement of an aging system and the financing of major water quality improvement projects.
A comprehensive update of the Water Resources Management Plan (WRMP) was approved in 2002, with a major update in 2008, a minor update in 2014, and another major update in 2021. The WRMP addresses key issues related to water resources facing the City over a 10 to 20 year horizon. The plan is a combination of resource management, regulatory controls, public works management, and water quality goals. Though long-term in focus, the plan has numerous decision points related to recommending capital improvements, ongoing inspections, maintenance, and monitoring activities. All of these decisions have a direct impact on the rates charged for the storm water service. Improvements for water quality standards take many years to fully show results. The improvements need to be completed in the early years of the plan to achieve the desired goals in water quality in future years. The City has achieved success by having two lakes removed from the Minnesota Pollution Control Agency's (MPCA) impaired water body list and has addressed many past flooding issues.
SOURCE OF FUNDSThe rate charged for the user charge fees is based on a property’s land use and size. The land use is expressed in terms of a concept called Residential Equivalent Units (REU). A single family dwelling is charged for one REU. Other parcels such as commercial property and apartments are converted to a different number of REUs depending on the acreage of the property and how the land area is being used. Funding from other sources include connection charges and interest.
Based on implementation of the long-range plan a three and a half percent rate increase has been adopted for 2022 to adequately cover inflation and the continued support of the water resources management plan. Inflationary rate increases are projected at three and a half percent for the next few years. The adopted 2022 monthly storm water billing for a single family dwelling will be $7.45. A commercial user located on a one acre parcel will be at $98.37 per month.
City of Burnsville 2022 Budget 92 Financial Plan - Enterprise Funds

The following table is a summary of the annual rates:
Storm Water Rates
YearAdopted Budget Projected
2018 2019 2020 2021 2022 2023 2024 2025 2026
Annual Rate per REU $82.99 $83.88 $84.72 $86.40 $89.42 $92.55 $95.79 $99.15 $102.61
Annual % Increase 0.0% 1.1% 1.0% 2.0% 3.5 % 3.5% 3.5% 3.5% 3.5%
USE OF FUNDSThe storm water charges provide funding for storm drainage maintenance, street sweeping, pond clean-out, water quality work, tree management, and other storm water related functions. Expenditures from this fund are used for operation and maintenance, debt service, capital improvements and infrastructure replacement relating specifically to the storm water system. This includes direct and indirect overhead costs incurred related to the storm water utility. The WRMP assists in developing a projected five-year Capital Improvements Plan (CIP) for prioritizing the capital improvement needs and developing the budget. Spending requirements are requested and reviewed during the annual budget process. For 2022, the plan maintains an aggressive approach to street reconstruction and rehabilitation. Storm water infrastructure replacement, rehabilitation, or extension occurs as a street is replaced.
The Storm Water Fund may also incur additional funding pressure from other areas. The current finance plan does not show any future funding for unforeseen outside mandates or other improvements which may require funding from storm water funds. (e.g., standards imposed on water quality by federal or state agencies)
DEBTA portion of the rates charged pay for debt that has been incurred on capital portions of the utility systems. With a portion of the user fees dedicated toward funding the replacement of aging infrastructure, the use of debt has been eliminated. No new debt is being proposed through 2026.
TRANSFERSTransfers of funds from the storm water fund are currently limited to reimbursing other City funds for specific activities. The Storm Water Fund does not transfer any monies not related to its services.
NET ASSETSFor the Enterprise Funds, the City also strives to maintain working capital cash balances at a minimum equal to three months working capital plus an amount needed to fund future capital projects as identified in the CIP. Bonding for large projects and judicious use of net assets within funds can be used to moderate fluctuations in capital projects and infrastructure maintenance expenses.
City of Burnsville 2022 Budget 93 Financial Plan - Enterprise Funds

Storm Water FundFive-Year Financial Plan
Actuals 2021 Budget 2022 Budget Projected
2019 2020 Original Amended Estimate % Chg 2023 2024 2025 2026
SOURCE OF FUNDS:
Operating:
Storm Drainage Utility Fee 4,326,048 4,384,178 4,459,284 4,459,284 4,459,284 4,615,152 3 % 4,776,698 4,943,921 5,116,822 5,295,916
Total Operating Sources 4,326,048 4,384,178 4,459,284 4,459,284 4,459,284 4,615,152 3 % 4,776,698 4,943,921 5,116,822 5,295,916
Non-Operating:
Special Assessments 19,296 15,829 20,000 20,000 16,000 15,000 (25) % 20,000 20,000 15,000 15,000
Interest 146,582 44,566 42,086 42,086 45,000 45,000 7 % 34,811 39,295 37,867 40,201
Connection Charges 100,350 12,996 30,000 30,000 140,000 30,000 — % 30,000 30,000 30,000 30,000
Other 147,140 174,565 12,800 331,213 331,213 12,800 — % 21,259 23,088 25,000 25,000
Total Non-Operating Sources 413,368 247,956 104,886 423,299 532,213 102,800 (2) % 106,070 112,383 107,867 110,201
TOTAL SOURCE OF FUNDS 4,739,416 4,632,134 4,564,170 4,882,583 4,991,497 4,717,952 3 % 4,882,768 5,056,304 5,224,689 5,406,117
USE OF FUNDS:
Operating:
Personnel Services 1,014,524 1,026,668 1,090,307 1,108,957 1,108,957 1,298,636 19 % 1,337,595 1,377,723 1,419,055 1,461,627
Current Expenses 877,120 828,291 950,222 1,224,985 949,876 961,343 1 % 990,183 1,019,888 1,050,485 1,082,000
Total Operating Uses 1,891,644 1,854,959 2,040,529 2,333,942 2,058,833 2,259,979 11 % 2,327,778 2,397,611 2,469,540 2,543,627
Non-Operating:
Street Projects & Rehab — — 850,000 850,000 650,134 857,000 1 % 960,000 913,000 1,022,000 974,000
Storm Water Management — — 1,905,000 1,905,000 1,905,000 2,022,000 6 % 854,000 1,785,000 1,296,000 2,203,000 Storm Water Capital Equipment 2,335,623 2,998,914 350,000 350,000 350,000 46,000 (87) % 148,000 30,000 106,000 —
Projects from Prior Year(s) CIP — — — 801,452 962,917 — — % — — — —
Subtotal capital improvements 2,335,623 2,998,914 3,105,000 3,906,452 3,868,051 2,925,000 (6) % 1,962,000 2,728,000 2,424,000 3,177,000
Debt service payments (existing) 1,295,645 2,228 — — — — — % — — — —
Transfers (non-debt) 141,815 99,625 97,575 97,575 97,575 84,625 (13) % 144,625 73,455 97,755 235,925
Total Non-Operating Uses 3,773,083 3,100,767 3,202,575 4,004,027 3,965,626 3,009,625 (6) % 2,106,625 2,801,455 2,521,755 3,412,925
TOTAL USE OF FUNDS 5,664,727 4,955,726 5,243,104 6,337,969 6,024,459 5,269,604 1 % 4,434,403 5,199,066 4,991,295 5,956,552
Net change in accruals (49,978) (109,215)
NET DIFFERENCE (975,289) (432,807) (678,934) (1,455,386) (1,032,962) (551,652) (19) % 448,365 (142,762) 233,394 (550,435)
Other financial information:
Year-end Cash Balance 5,498,555 5,065,748 4,386,814 3,610,362 4,032,786 3,481,134 3,929,499 3,786,737 4,020,131 3,469,696
Three months working capital 832,276 489,203 534,526 607,879 539,102 586,151 618,101 617,767 641,824 694,888
Capital replacement cash balance 4,666,279 4,576,545 3,852,288 3,002,483 3,493,684 2,894,983 3,311,398 3,168,970 3,378,307 2,774,808
City of Burnsville 2022 Budget 94 Financial Plan - Enterprise Funds

Ice Center FundFinancial Plan Year 2022
FUND DESCRIPTIONThe Ice Center Fund is used to account for the operation, maintenance, and debt service for the City-owned ice arena.
BACKGROUNDThis fund was created in 1971 with construction of the first sheet of ice. A second sheet of ice was added in 1985. The debt incurred from building the second sheet of ice was paid off in 2005. The double rink facility operates year round and caters to hockey, figure skating, ice skating lessons, broomball, curling, and a variety of camps, clinics, and schools. Services include the promoting and scheduling of hockey, and figure and pleasure skating for youth and adults. The Ice Center relies on major users for a stable and significant share of ice time rental. Major users include the Burnsville Hockey Club, Minnesota Valley Figure Skating Club, and Burnsville High School. The Ice Center also has a large number of hours for ice rental from adult groups and one of the largest Learn to Skate programs in Minnesota.
Financial challenges for this fund include establishing an acceptable operating cash balance and identifying a source of funds to pay for capital improvements. The Center’s ice making plant was replaced in 2010, financed with the issuance of Economic Development Authority (EDA) Lease Revenue Bonds and federal grant funds. The debt does not appear within this fund because of the authority used to issue. As the facility continues to age, the need for additional equipment replacement and other improvements are required to maintain the current level of operations and for safety. The City has been planning for these major capital improvements. Plans for the next five years include a parking lot replacement and other significant improvements. Facility improvements at the Ice Center may be eligible for funding through the Facilities Capital Fund.
SOURCE OF FUNDSThe primary source of funding is user charges for ice rental. Other sources of funds include admissions, lessons, concessions, events, equipment rental, advertising, and interest. Charges collected directly offset the costs of providing services. A review of rates is completed annually to ensure the Ice Center’s rates are at or near the top of the market with similar double-rink facilities to ensure financial stability. Ice time is becoming more competitive due to the number of ice rinks in the south metro area. Revenues for the Ice Center have generally been consistent. The Ice Center financial plan will be sufficient for funding of the regular operations capital replacement; however, major capital facility improvements will need to be funded by bonding and GO debt service levy or the Facilities Fund.
USE OF FUNDSExpenses from this fund are used for operation, maintenance and capital improvements relating specifically to the operation of the Ice Center. The Ice Center is facing significant capital expenditures in the next 10-year period, including flooring, exterior door, bleacher, and ice resurfacer. The Ice Center financial plan calls for funding of the regular operations capital replacement; however, major capital facility improvements will need to be funded by bonding and GO debt service levy or the Facilities Fund.
City of Burnsville 2022 Budget 95 Financial Plan - Enterprise Funds

DEBTThe debt issued by the EDA in 2010 to finance major improvements at the Ice Center in 2010 does not appear in this fund. Payment on the debt will be made from the debt service levy. The General Fund plan includes a transfer to the Debt Service Fund of $140,000 annually to fund a portion of the debt service of the Ice Center. This approach was part of the 2012 budget strategy. These transfers were completed in 2021. Annual use of fund balance in the General Fund is the planned funding source.
The City issued bonds for the roof replacement in 2019.
TRANSFERSNo transfers are planned for 2022.
NET ASSETSFor the Enterprise Funds, the City strives to maintain working capital cash balances at a minimum equal to three months working capital plus an amount needed to fund future capital projects as identified in the City’s CIP. Bonding for large projects and judicious use of net assets within funds can be used to moderate fluctuations in capital projects and infrastructure maintenance expenses.
City of Burnsville 2022 Budget 96 Financial Plan - Enterprise Funds

Ice Center FundFive-Year Financial Plan
Actuals 2021 Budget 2022 Budget Projected
2019 2020 Original Amended Estimate % Chg 2023 2024 2025 2026
SOURCE OF FUNDS:
Operating:
Charges for Services 1,065,052 595,520 1,180,993 1,180,993 1,006,195 1,120,410 (5) % 1,142,818 1,165,674 1,188,987 1,212,767
Other 661 886 — — — — — % — — — —
Non-Operating:
Interest 20,615 6,904 1,000 1,000 100 100 (90) % 100 100 100 100
Total Non-Operating Sources 20,615 6,904 1,000 1,000 100 100 (90) % 100 100 100 100
TOTAL SOURCE OF FUNDS 1,086,328 603,310 1,181,993 1,181,993 1,006,295 1,120,510 (5) % 1,142,918 1,165,774 1,189,087 1,212,867
USE OF FUNDS:
Operating:
Personnel Services 658,238 646,433 737,911 737,911 695,994 691,174 (6) % 711,909 733,266 755,264 777,922
Current Expenses 353,016 291,629 397,240 397,240 326,916 379,382 (4) % 390,763 402,486 414,561 426,998
Total Operating Uses 1,011,254 938,062 1,135,151 1,135,151 1,022,910 1,070,556 (6) % 1,102,672 1,135,752 1,169,825 1,204,920
Non-Operating:
Purchase of Capital Assets — — 113,000 113,000 18,000 — (100) % 168,000 170,000 30,000 13,000
Transfers Out 90,000 — — — — — — % — — — —
Total Non-Operating Uses 90,000 — 113,000 113,000 18,000 — (100) % 168,000 170,000 30,000 13,000
TOTAL USE OF FUNDS 1,101,254 938,062 1,248,151 1,248,151 1,040,910 1,070,556 (14) % 1,270,672 1,305,752 1,199,825 1,217,920
NET DIFFERENCE (14,926) (334,752) (66,158) (66,158) (34,615) 49,954 (176) % (127,754) (139,978) (10,738) (5,053)
Other financial information:
Year-end Cash Balance 1,023,877 689,125 622,967 622,967 654,510 704,464 576,710 436,732 425,994 420,941
Three months operating cash estimate 275,314 234,516 312,038 312,038 260,228 267,639 317,668 326,438 299,956 304,480
Capital Replacement Cash Balance 748,563 454,609 310,929 310,929 394,282 436,825 259,042 110,294 126,038 116,461
Capital Outlay with Facilities Fund funding source — 15,000 — — — 1,125,000 145,000 250,000 500,000 160,200
Annual Depreciation 356,914 402,239 405,064 405,064 405,064 405,064 409,264 413,514 414,264 414,589
City of Burnsville 2022 Budget 97 Financial Plan - Enterprise Funds

Golf Course FundFinancial Plan Year 2022
FUND DESCRIPTIONThe Golf Course Fund is used to account for the operation and debt service of the municipal golf course.
BACKGROUNDThis fund was created in 1988 when the City purchased Birnamwood Golf Course. Birnamwood is a par 3, nine-hole golf operation that hosts leagues and tournaments for youth and adults, as well as open golf. Services include the promoting and scheduling of the leagues and tournaments, operation of the club house, and the maintenance of the facility and grounds.
The debt incurred from purchasing the course was paid off in 2003. The financial projection indicates a stable cash balance, including sufficient funds to pay for planned major equipment purchases and capital improvements.
SOURCE OF FUNDSThe primary source of funding is user charges consisting of green fees, passes and leagues. Other sources of funds include concessions, equipment rental, golf supplies, advertising, and interest. Charges collected directly offset the costs of providing services. A review of rates is completed annually to ensure they are in the upper quartile of the market with similar nine-hole operations. In 2020, pandemic conditions resulted in a significant increase in the number of rounds. Weather patterns impact the number of rounds golfed each season. Staff is cautiously expecting rounds for 2022 to be comparable to average years, or slightly higher. The following is a summary of the last six years of the operating revenues and rounds:
2016 2017 2018 2019 2020 2021 Est. 2022 Budget
Income $270,900 $257,031 $230,975 $238,221 $327,924 $364,351 $295,500
Rounds 23,059 20,725 17,107 18,676 26,213 29,500 24,500
USE OF FUNDSExpenses from this fund are used for operation, maintenance and capital improvements relating specifically to the operation of the golf course. Spending requirements are requested and reviewed during the annual budget process. This significant capital improvement expense is included in financial projections and will be paid from the Facilities Fund.
DEBT AND TRANSFERSThe golf course does not currently have any debt and no transfers are planned.
NET ASSETSFor the Enterprise Funds, the City strives to maintain working capital cash balances at a minimum equal to three months working capital plus an amount needed to fund future capital projects as identified in the City’s CIP. Bonding for large projects and judicious use of net assets within funds can be used to moderate fluctuations in capital projects and infrastructure maintenance expenses.
City of Burnsville 2022 Budget 98 Financial Plan - Enterprise Funds

Golf Course FundFive-Year Financial Plan
Actuals 2021 Budget 2022 Budget Projected
2019 2020 Original Amended Estimate % Chg 2023 2024 2025 2026
SOURCE OF FUNDS:
Operating:
Charges for Services 238,221 327,944 280,500 280,500 364,351 295,500 5 % 301,410 307,438 313,587 319,859
Non-Operating:
Investment Income 5,317 1,870 3,500 3,500 100 100 (97) % 100 100 100 100
Other Revenues 219 294 — — — — — % — — — —
TOTAL SOURCE OF FUNDS 243,757 330,108 284,000 284,000 364,451 295,600 — % 301,510 307,538 313,687 319,959
USE OF FUNDS:
Operating:
Personnel Services 201,420 174,689 227,140 227,140 227,140 233,099 3 % 240,092 247,295 254,714 262,355
Current Expenses 67,316 74,839 71,844 71,844 83,255 72,456 1 % 74,630 76,869 79,175 81,550
Total Operating Uses 268,736 249,528 298,984 298,984 310,395 305,555 2 % 314,722 324,164 333,889 343,905
Non-Operating:
Purchase of Capital Assets — 29,230 35,000 35,000 35,000 44,000 26 % 61,000 46,000 47,000 46,000
TOTAL USE OF FUNDS 268,736 278,758 333,984 333,984 345,395 349,555 5 % 375,722 370,164 380,889 389,905
NET DIFFERENCE (24,979) 51,350 (49,984) (49,984) 19,056 (53,955) 8 % (74,212) (62,626) (67,202) (69,946)
Other financial information:
Year-end Cash Balance 224,556 275,906 225,922 225,922 294,962 241,007 166,795 104,169 36,967 (32,979)
3 months operating cash estimate 67,184 69,690 83,496 83,496 86,349 87,389 93,931 92,541 95,222 97,476
Balance above operating estimate 157,372 206,216 142,426 142,426 208,613 153,618 72,864 11,628 (58,255) (130,455)
Capital Outlay with Facilities Fund funding source — 188,000 20,000 20,000 20,000 20,000 20,000 — 300,000 —
Annual Depreciation 13,230 13,354 20,000 20,000 20,000 20,000 20,000 22,300 24,650 26,950
City of Burnsville 2022 Budget 99 Financial Plan - Enterprise Funds

Street Lighting FundFinancial Plan Year 2022
FUND DESCRIPTIONThe Street Lighting Fund is used to account for the operation, maintenance, and replacement of the City’s street lighting system.
BACKGROUNDThis fund was created in 2002 with the establishment of a City ordinance establishing a street lighting utility. The main focus of this utility was to set a standard policy for continuous street lighting service throughout the community and to address future replacement needs for existing lights. In 2012, the City policy regarding the street lighting funding was changed. The change consolidated continuous street lighting and major roadway lighting into the Street Lighting Fund. Major roadway lighting includes major thoroughfare and intersection lights. The consolidation was a result of an aging lighting infrastructure. As the existing lighting infrastructure continues to age, the City will be faced with significant replacement expenses. Consolidating the different types of lighting will assist in dedicating a future funding mechanism for lighting improvements. A five-year Capital Improvements Plan (CIP) projects lighting replacement needs.
A standard fee structure is created for residential and commercial property for the different types of lighting. Continuous street lighting fees are only billed to properties that benefit from those lights and are used to fund the operation, maintenance and replacement of existing continuous street lights. Residential property is charged on a per unit basis and commercial property is charged on a front footage basis. New lights added into the system will be specially assessed to the benefiting properties for their original costs. Once new lights are installed, the street light utility fee will be utilized for the cost of operating, maintaining and replacing the lights.
For major roadway lighting a fee is charged to all properties in the City that have a utility account. The fee is a flat charge with the rate varying if the property is residential, high density residential, or commercial. Revenues from these fees are used to fund the operation, maintenance and replacement of existing major roadway lights and intersection lights.
The Street Lighting Fund’s cash balance shows a stable trend over the next several years with rate increases being tied to increases in electrical costs.
SOURCE OF FUNDSThe primary source of funding is user charges consisting of a unit charge for residential property and a front foot charge for commercial property for continuous street lighting. The major roadway light funding is a flat fee to all properties based on the type of property. Other sources of funds include interest and other reimbursements. Charges collected directly offset the costs of providing services.
City of Burnsville 2022 Budget 100 Financial Plan - Enterprise Funds

Based on adequate fund balance and the long range Street Lighting Plan, rates are not proposed to increase in 2022. The following is a summary of street lighting rates:
Residential Continuous Street Lighting
YearAdopted Budget Projected
2018 2019 2020 2021 2022 2023 2024 2025 2026
Annual Rate per Unit $34.32 $34.32 $34.32 $34.32 $34.32 $35.35 $36.41 $37.5 $38.63
Annual % Increase 0.0% 0.0% 0.0% 0.0% 0.0% 3.0% 3.0% 3.0% 3.0%
Commercial Continuous Street Lighting
YearAdopted Budget Projected
2018 2019 2020 2021 2022 2023 2024 2025 2026
Annual Rate Per Front Ft. $1.632 $1.632 $1.632 $1.632 $1.632 $1.681 $1.731 $1.783 $1.836
Annual % Increase 0.0% 0.0% 0.0% 0.0% 0.0% 3.0% 3.0% 3.0% 3.0%
Residential Major Roadway Lighting
YearAdopted Budget Projected
2018 2019 2020 2021 2022 2023 2024 2025 2026
Annual Rate Per Property $4.08 $4.08 $4.08 $4.08 $4.08 $4.20 $4.33 $4.46 $4.59
Annual % Increase 0.0% 0.0% 0.0% 0.0% 0.0% 3.0% 3.0% 3.0% 3.0%
High Density Major Roadway Lighting
YearAdopted Budget Projected
2018 2019 2020 2021 2022 2023 2024 2025 2026
Annual Rate Per Unit $2.46 $2.46 $2.46 $2.46 $2.46 $2.53 $2.61 $2.69 $2.77
Annual % Increase 0.0% 0.0% 0.0% 0.0% 0.0% 3.0% 3.0% 3.0% 3.0%
Commercial Major Roadway Lighting
YearAdopted Budget Projected
2018 2019 2020 2021 2022 2023 2024 2025 2026
Annual Rate Per Property $38.82 $38.82 $38.82 $38.82 $38.82 $39.98 $41.18 $42.42 $43.69
Annual % Increase 0.0% 0.0% 0.0% 0.0% 0.0% 3.0% 3.0% 3.0% 3.0%
USE OF FUNDSExpenditures from this fund are used for operation, maintenance, and replacement of existing street lights, primarily replacement of neighborhood High Pressure Sodium (HPS) lights with energy efficient Light Emitting Diode (LED) street lights. Spending requirements are requested and reviewed during the annual budget process. A five-year Capital Improvements Plan (CIP) is also utilized to project capital improvements and specific replacements.
TRANSFERSThere are no transfers proposed for this fund.
NET ASSETSFor the Enterprise funds, the City also strives to maintain working capital cash balances at a minimum equal to three months working capital plus an amount needed to fund future capital projects as identified in the City’s Capital Improvements Plan. Bonding for large projects and judicious use of net assets within funds can be used to moderate fluctuations in capital projects and infrastructure maintenance expenses.
City of Burnsville 2022 Budget 101 Financial Plan - Enterprise Funds

Street Lighting FundFive-Year Financial Plan
Actuals 2021 Budget 2022 Budget Projected
2019 2020 Original Amended Estimate % Chg 2023 2024 2025 2026
SOURCE OF FUNDS:
Operating:
Street Light Fees-Residential 269,542 269,535 271,128 271,128 271,128 271,128 — % 273,256 281,449 289,875 298,610
Street Light Fees-Commercial 184,427 183,458 177,888 177,888 177,888 177,888 — % 179,043 184,369 189,907 195,552
Major Roadway Lighting-Residential 61,384 61,457 61,200 61,200 61,200 61,200 — % 62,265 64,192 66,120 68,047
Major Roadway Lighting-High Density — — 26,224 26,224 26,224 26,224 — % 27,261 28,123 28,985 29,847
Major Roadway Lighting-Commercial 59,205 59,742 32,027 32,027 32,027 32,027 — % 31,984 32,944 33,936 34,952
Total Operating Sources 574,558 574,192 568,467 568,467 568,467 568,467 — % 573,809 591,077 608,823 627,008
Non-Operating:
Interest 13,427 5,555 5,000 5,000 5,000 5,000 — % 6,191 6,317 6,535 6,850
Other 8,300 8,667 10,000 10,000 10,000 10,000 — % 10,000 10,000 10,000 10,000
Total Non-Operating Sources 21,727 14,222 15,000 15,000 15,000 15,000 — % 16,191 16,317 16,535 16,850
TOTAL SOURCE OF FUNDS 596,285 588,414 583,467 583,467 583,467 583,467 — % 590,000 607,394 625,358 643,858
USE OF FUNDS:
Operating:
Current Expenses 442,312 336,958 397,120 397,120 397,363 399,432 1 % 407,421 415,569 423,880 432,358
Non-Operating:
Street Light Projects 127,037 78,952 170,000 347,706 347,706 170,000 — % 170,000 170,000 170,000 170,000
TOTAL USE OF FUNDS 569,349 415,910 567,120 744,826 745,069 569,432 — % 577,421 585,569 593,880 602,358
Net change in accruals 32,718 (90,914)
NET DIFFERENCE 59,654 81,590 16,347 (161,359) (161,602) 14,035 (14) % 12,579 21,825 31,478 41,500
Other financial information:
Year-end Cash Balance 685,103 766,693 783,040 605,334 605,091 619,126 631,705 653,530 685,008 726,508
Three months operating cash estimate 142,337 103,978 141,780 186,207 186,267 99,858 101,855 103,892 105,970 108,090
Capital Replacement cash balance 542,766 662,715 641,260 419,127 418,824 519,268 529,850 549,638 579,038 618,418
City of Burnsville 2022 Budget 102 Financial Plan - Enterprise Funds

Ames Center FundFinancial Plan Year 2022
FUND DESCRIPTIONThe Ames Center Fund was created by the City Council in 2007 to account for the operation of the Ames Center, formerly known as the Burnsville Performing Arts Center (PAC). The Ames Center is located at 12600 Nicollet Ave in the Heart of the City. This complex opened in January, 2009. The center has two theatres: a 1,000 seat Proscenium Stage and a 150 seat Black Box.
BACKGROUNDThe 1.5 acre land parcel, where the facility is located, was purchased by the City in 2001 for the express purpose of hosting such a center with grant money from the Metropolitan Council. In addition to the grant from the Metropolitan Council for land acquisition, cash reserves, bond proceeds, host fees from the Burnsville Sanitary Landfill (owned and operated by Waste Management, Inc.) and the economic development levy were used to finance the $20 million project.
In addition to the Ames Center Enterprise Fund, the City created two additional funds related to the performing arts center: the Ames Center Debt Service Fund and the PAC Construction Fund. The PAC Construction Fund was closed during 2010 with the completion of the building construction.
In planning for construction of the performing arts center, the City anticipated the Ames Center Fund would require non-operating revenue sources to cover net operating expense as well as debt on the bonds issued to finance the facility. The facility opened in January 2009, under distressed economic times. The first year of revenue performance fell short of original estimates, with total operating revenue reaching about 80 percent of the original budget. Operating revenue performance has improved over the last several years. The financial plan for the Ames Center shows negative ending cash balance in the initial years of operation. The negative balance is projected to be eliminated over time as total source of funds, which includes a transfer in from the General Fund, begins to exceed total use of funds. The negative cash balance is covered through an interfund loan, which will be repaid in full in 2020 and 2021. Use of funds for contribution toward debt service is covered in more detail under the Debt section.
SOURCE OF FUNDSThe primary source of funding for the operations of the Ames Center Fund is charges for services. The Ames Center Fund receives non-operating revenue from the receipt of a host fee collected from the landfill and revenue from the General Fund for capital outlay. Prior to 2020, the Ames Center received revenue from a transfer in of cash from the EDA Fund for debt service purposes. In 2020, an effort was made to streamline the debt payments and the related transfers were eliminated. The host fee revenue and the transfer in of cash from the EDA Fund provided additional needed revenue to cover debt service transfer expense. The facility has a naming rights agreement with Ames Construction that will bring in $100,000 each year for ten years, beginning in 2014. The naming rights revenue ends in 2023. In 2018, Masquerade Dance purchased the naming rights for the main theater for $50,000 per year for ten years. With this new agreement, future years are now closer to covering operating expenses annually.
Host fee revenue from the landfill fluctuates from year-to-year depending on volume at the Burnsville Sanitary Landfill. Over the life of the agreement with Waste Management which sets the host fee at $1.00 per ton of waste collected, the City anticipates collecting nearly $10 million in revenue. The timing of this cash flow will depend on the annual volume at the landfill. The total capacity at the landfill is a fixed amount and therefore the
City of Burnsville 2022 Budget 103 Financial Plan - Enterprise Funds

total projected host fee revenue amount will ultimately be collected and is a known amount, the timing of the cash flow will vary and may cause some short-term cash flow challenges that the City will need to manage. All City Host fee revenue was directed to the Ames Center in 2020 and 2021, for the purposes of repaying the General Fund advance. Host fee revenue will be directed elsewhere in the City for 2022 and beyond.
Facility capital needs at the Ames Center are eligible for funding by the Facilities Fund. Equipment needs will be funded by the Ames Center fund.
In 2021, the Ames Center was awarded a Shuttered Venue Operator Grant (SVOG) federal grant of $1,028,183 from the Small Business Administration. This grant was made available to performing arts organizations that were negatively impacted by the COVID-19 pandemic. The award amount was based on revenue losses, and will be used towards personnel expenses, utilities and operations expenses for 2020 and 2021.
Council approved the creation of the Angel Fund in 2011 which is a program to involve businesses and/or individuals to provide support to bring an additional series of performances to the Ames Center. The Angel Fund series is included in the financial plan. The Economic Development Authority (EDA) has contributed matching funds to promote donations. The EDA funds are in the form of a loan and are therefore not included as revenue. Repayment of the EDA loan began 2016 and is reflected in the five-year plan.
PrivateContributions EDA Match
Completed ShowResults
Available AngelFunds at end of
Season
2011-2012 Season 30,000 30,000 7,527 67,527
2012-2013 Season 7,000 7,000 14,571 96,098
2013-2014 Season 17,500 13,000 622 127,220
2014-2015 Season 10,000 — 5,386 142,606
2015-2016 Season 9,000 (10,000) 20,978 162,584
2016-2017 Season 9,000 (10,000) 21,500 183,084
2017-2018 Season 9,000 (10,000) 40,990 223,074
2018-2019 Season 9,000 (10,000) 18,666 240,740
2019-2020 Season 9,000 (10,000) (11,785) 227,955
2020-2021 Season 15,000 — 6,701 249,656
Total Season 124,500 — 125,156
USE OF FUNDSThis fund accounts for operating costs of the Ames Center. The City has a contract with an event facility managing company to manage the day-to-day operations of the facility including the booking of events. All employees at the facility are employees of the management company. Customary operating expenses for the facility are managed by the contractor with reimbursement from the City. The contractor is paid a management fee for these services. The current management contract is for the five-year period ending in 2023, with an option to renew.
As required by the contract, the management company has submitted an updated five-year budget plan. This plan is reflected in the financial plan the City has prepared for this fund. The business plan is submitted annually and reviewed by City staff as part of the budget process. The management company also submitted a five-year
City of Burnsville 2022 Budget 104 Financial Plan - Enterprise Funds

capital improvement plan for the facility at the request of the City. As the facility ages, an annual capital outlay is necessary in order to maintain the asset in good working condition.
DEBTIn 2008, the City issued a 20-year General Obligation Tax Abatement Bond for the construction of the performing arts center. The par amount of the Bonds less underwriter’s discount and cost of issuance was $16.5 million. The net bond proceeds along with dedicated cash on hand were used to support the $20 million construction budget. The construction expense and bond proceeds were accounted for in a separate PAC Construction Fund. The debt obligation is not reported as a liability of the Ames Center Fund as the debt is accounted for in a separate debt service fund into which funds were transferred from the General Fund and the Ames Center Fund to cover principal and interest payments. In 2020, the debt payments and transfers were streamlined to the debt fund and debt related transfers were eliminated from the Ames Center Fund.
In 2015 and 2016, the City issued crossover refunding bonds to refund a portion of the 2008 issuance. The proceeds of the new bonds were used to refund the 2008 bonds. The refunding was undertaken to reduce total debt service payments over thirteen years by $1,529,514 and resulted in an economic gain of $1,356,381.
The source of funds for payment on the bonds is abatement tax levy (transferred from the General Fund to the Debt Service Fund) and economic development levy and host fee revenue (transferred from the Ames Center Fund to the Debt Service Fund). Host fee revenue collected in the Ames Center Fund, which is in excess of the amount needed to support the debt service transfer, would be available to offset operating costs within the Fund. The debt related transfers were eliminated in 2020.
TRANSFERSThe Ames Center Fund has had both transfers in from other funds and transfers out to other funds. No transfers are planned for 2022.
Transfers In From Other FundsThe financial plan anticipates a transfer in from the General Fund to cover any revenue shortfall and capital needs. Prior to 2020, there was an annual transfer in of funds from the EDA Fund for the purpose of covering debt service.
Transfers Out To Other FundsPrior to 2020, the Ames Center Fund included an annual transfer out to the Ames Center Debt Service Fund. This was covered previously under the Debt section of this summary.
City of Burnsville 2022 Budget 105 Financial Plan - Enterprise Funds

Ames CenterFive-Year Financial Plan
Actuals 2021 Budget 2022 Budget Projected
2019 2020 Original Amended Estimate % Chg 2023 2024 2025 2026
OPERATIONS:
Operating Revenue:
Charges for Services 2,119,851 513,047 632,111 632,111 1,084,676 1,930,763 205 % 2,028,414 2,089,266 2,151,944 2,216,502
Sponsorships and donations 40,000 15,000 35,000 35,000 15,000 35,000 — % 50,000 50,000 55,000 55,000
Naming Rights 150,000 150,000 150,000 150,000 150,000 150,000 — % 150,000 50,000 50,000 50,000
Total Operating Revenue: 2,309,851 678,047 817,111 817,111 1,249,676 2,115,763 159 % 2,228,414 2,189,266 2,256,944 2,321,502
Operating Expense:
Contracted labor 1,187,447 493,221 624,417 624,417 838,534 1,401,729 124 % 1,459,775 1,503,567 1,548,675 1,595,134
Current expenditures 850,122 323,757 261,152 261,152 449,339 663,533 154 % 625,018 650,184 676,426 703,790
Management Fee 143,195 97,000 78,996 78,996 78,996 129,272 64 % 132,550 135,927 139,404 142,987
Total Operating Expense: 2,180,764 913,978 964,565 964,565 1,366,869 2,194,534 128 % 2,217,343 2,289,678 2,364,505 2,441,911
Total Operating Income (Loss) 129,087 (235,931) (147,454) (147,454) (117,193) (78,771) (47) % 11,071 (100,412) (107,561) (120,409)
NON-OPERATING SOURCES:
Host fees 264,652 887,158 515,000 515,000 515,000 — (100) % — — — —
Federal grant - SVOG — — — 1,028,183 1,028,183 — — % — — — —
Transfers from other funds
General Fund 475,000 291,000 291,000 291,000 291,000 — (100) % — — — —
EDA Fund 410,000 — — — — — — % — — — —
Total Non-Op Sources 1,149,652 1,178,158 806,000 1,834,183 1,834,183 — (100) % — — — —
NON-OPERATING USES:
Non-Operating Uses:
Capital outlay 195,163 143,377 384,892 566,482 566,482 147,000 (62) % 90,971 128,558 56,700 40,000
Repayment of EDA Angel Fund Loan 10,000 10,000 — — — — — % — — — —
Repayment of General Fund Advance — 745,000 446,544 446,544 446,544 — (100) % — — — —
Transfers to other funds:
Debt Service Fund 585,900 — — — — — — % — — — —
Total Non-Op Uses 791,063 898,377 831,436 1,013,026 1,013,026 147,000 (82) % 90,971 128,558 56,700 40,000
Total Non-Operating Income (Loss) 358,589 279,781 (25,436) 821,157 821,157 (147,000) 478 % (90,971) (128,558) (56,700) (40,000)
TOTAL INCOME (LOSS) 487,676 43,850 (172,890) 673,703 703,964 (225,771) 31 % (79,900) (228,970) (164,261) (160,409)
TOTAL SOURCE OF FUNDS 3,459,503 1,856,205 1,623,111 2,651,294 3,083,859 2,115,763 30 % 2,228,414 2,189,266 2,256,944 2,321,502
TOTAL USE OF FUNDS 2,971,827 1,812,355 1,796,001 1,977,591 2,379,895 2,341,534 30 % 2,308,314 2,418,236 2,421,205 2,481,911
NET DIFFERENCE 487,676 43,850 (172,890) 673,703 703,964 (225,771) 31 % (79,900) (228,970) (164,261) (160,409)
Other financial info:
Year End Net Current Assets 1,888,490 1,946,685 1,773,795 2,620,388 2,650,649 2,424,878 2,344,978 2,116,008 1,951,747 1,791,338
Financial Policy: Three months operating needs 742,957 453,089 449,000 494,398 594,974 585,384 577,079 604,559 605,301 620,478
Available for Capital Replacement (shortage) 1,145,533 1,493,596 1,324,795 2,125,990 2,055,675 1,839,494 1,767,899 1,511,449 1,346,446 1,170,860
Capital Outlay with Facilities Fund funding source — — — — — 484,500 575,400 270,000 709,000 660,000
Annual Depreciation 563,305 568,543 570,000 570,000 570,000 562,650 (1) % 558,101 551,673 548,838 546,838
Balance of Advance from General Fund 1,191,544 745,000 446,544 446,544 446,544 — — — — —
City of Burnsville 2022 Budget 106 Financial Plan - Enterprise Funds

City of Burnsville 2022 BudgetCapital & Debt
Capital Improvements Plan (CIP)
Debt Analysis
107

FUNDING SOURCE SUMMARY
Source 2022 2023 2024 2025 2026 Total
Dakota County 600,000 1,000,000 1,600,000 3,200,000
Federal 2,632,000 — 25,000,000 27,632,000
General Fund 180,000 190,000 100,000 350,000 820,000
Host Community Grant 415,000 415,000 415,000 415,000 415,000 2,075,000
Infrastructure Trust Funds 2,905,661 3,958,536 2,946,382 2,612,944 2,039,637 14,463,160
MnDOT 3,500,000 3,500,000
MSAS Funds 2,094,000 2,863,400 2,069,530 2,930,688 4,092,401 14,050,019
Special Assessments 1,493,201 1,311,489 1,652,070 988,970 1,270,427 6,716,157
Utility - St. Lighting 170,000 170,000 170,000 170,000 170,000 850,000
Utility - Storm Water 2,879,000 1,814,000 2,698,000 2,318,000 3,177,000 12,886,000
Utility - Water & Sewer - Sanitary Sewer 802,000 1,766,000 851,000 1,421,000 902,000 5,742,000
Utility - Water & Sewer - Water 4,056,500 3,647,228 4,316,971 4,757,837 3,228,408 20,006,944
GRAND TOTAL $ 18,047,362 $ 16,125,653 $ 19,808,953 $ 15,714,439 $ 42,244,873 $ 111,941,280
City of Burnsville, MinnesotaCapital Improvements Plan
2022 thru 2026
City of Burnsville 2022 Budget 108 Capital & Debt

Dakota County
Nicollet/Hwy 13 Mobility Improvements (RAISE) 1,600,000 1,600,000
I-35 SB Off-Ramp to Buck Hill Rd (TEDI Grant) 1,000,000 1,000,000
Cliff Road Interchange Freight Improvements 600,000 600,000
Dakota County Total 600,000 — 1,000,000 — 1,600,000 3,200,000
Federal
Cliff Road Interchange Freight Improvements 2,632,000 2,632,000
Nicollet/Hwy 13 Mobility Improvements (RAISE) 25,000,000 25,000,000
Federal Total 2,632,000 — — — 25,000,000 27,632,000
General Fund
I-35W/Burnsville Parkway Aesthetics Renovations 350,000 350,000
Monument Signs 180,000 190,000 100,000 470,000
General Fund Total — 180,000 190,000 100,000 350,000 820,000
Host Community Grant
Host Landfill Grant Projects 415,000 415,000 415,000 415,000 415,000 2,075,000
Host Community Grant Total 415,000 415,000 415,000 415,000 415,000 2,075,000
Infrastructure Trust Funds
Street Improvements (Recon., Reclaim., Rehab.) 2,535,661 1,541,081 2,641,382 1,397,494 1,529,637 9,645,255
Maintenance Overlays 1,917,455 85,000 975,450 2,977,905
Concrete Elements Improvements 150,000 120,000 270,000
Multi-Modal Transportation 80,000 400,000 80,000 400,000 960,000
Host Landfill Grant Projects 50,000 50,000 50,000 50,000 50,000 250,000
CSAH 42/Grand Right Turn Lane 15,000 15,000
Host Landfill Grant Projects 50,000 50,000 50,000 60,000 60,000 270,000
Connected/Automated Vehicles Readiness Study 25,000 25,000
ROW Retaining Walls 50,000 50,000
Infrastructure Trust Funds Total 2,905,661 3,958,536 2,946,382 2,612,944 2,039,637 14,463,160
MnDOT
Host Landfill Grant Projects 3,500,000 3,500,000
Host Community Grant Total — — 3,500,000 — — 3,500,000
MSAS Funds
City Signal Replacement 50,000 500,000 500,000 1,050,000
County Signals 162,000 230,000 240,000 240,000 240,000 1,112,000
Street Improvements (Recon, Reclaim, Rehab) 1,492,000 1,986,400 1,671,530 1,190,688 2,852,401 9,193,019
Cliff Road - Interchange Freight Improvements 300,000 300,000
Nicollet/Hwy 13 Mobility Improvements (RAISE) 1,000,000 1,000,000
CR 11/Burnsville Pkwy Intersection Improvement 90,000 147,000 158,000 395,000
I-35W SB Off-Ramp to Buck Hill Rd (TEDI Grant) 1,000,000 1,000,000
MSAS Funds Total 2,094,000 2,863,400 2,069,530 2,930,688 4,092,401 14,050,019
PROJECTS BY FUNDING SOURCE
Source 2022 2023 2024 2025 2026 Total
City of Burnsville, MinnesotaCapital Improvements Plan
2022 thru 2026
City of Burnsville 2022 Budget 109 Capital & Debt

Special Assessments
Street Improvements (Recon., Reclaim., Rehab.) 1,493,201 1,311,489 1,652,070 988,970 1,270,427 6,716,157
Special Assessments Total 1,493,201 1,311,489 1,652,070 988,970 1,270,427 6,716,157
Utility - St. Lighting Total
Street Light Replacement 170,000 170,000 170,000 170,000 170,000 850,000
Utility - St. Lighting Total 170,000 170,000 170,000 170,000 170,000 850,000
Utility - Storm Water
Street Improvements (Recon., Reclaim., Rehab.) 639,000 659,000 679,000 700,000 722,000 3,399,000
Minor Drainage Improvements 124,000 128,000 132,000 136,000 141,000 661,000
Pond Cleanout/Outfall Improvement Program 412,000 425,000 438,000 452,000 466,000 2,193,000
Maintenance Overlays 75,000 80,000 155,000
Host Landfill Grant Projects 31,000 32,000 33,000 34,000 36,000 166,000
County Overlays 62,000 64,000 66,000 68,000 71,000 331,000
Lift Station Rehabilitation SW 258,000 274,000 291,000 823,000
WRMP Update 25,000 100,000 125,000
Wood Pond StormFilter Maintenance 11,000 12,000 13,000 36,000
MRQ Stormwater and Floodplain Study 50,000 50,000
Ravine Restoration & Slope Stabilization 550,000 550,000
Street Project Storm Sewer Televising 52,000 54,000 56,000 58,000 60,000 280,000
Contract Patching 73,000 76,000 79,000 82,000 85,000 395,000
Maintenance Facility Treatment Structure 75,000 75,000
Resiliency and Water Quality Improvements 1,000,000 750,000 1,000,000 2,750,000
Trout Stream #4 Restoration Dev Cost Share 10,000 10,000
Alum Treatment 60,000 60,000
KMM Levee Inspection and Report 10,000 10,000
Park Drainage Improvements 133,000 133,000 142,000 408,000
Boulevard Tree Maintenance 42,000 44,000 46,000 48,000 50,000 230,000
Keller Lake Stormwater Quality Improvements 4,000 4,000
Deeg Pond Filter Replacement 45,000 45,000
Park Drainage Study 50,000 60,000 110,000
Private Pond Maintenance Options Study 20,000 20,000
Utility - Storm Water Total 2,879,000 1,814,000 2,698,000 2,318,000 3,177,000 12,886,000
Utility - Water & Sewer - Sanitary Sewer
Lift Station Rehabilitation - SS 900,000 500,000 1,400,000
Sanitary Sewer Rehabilitation 361,000 382,000 404,000 371,000 394,000 1,912,000
Street Improvements (Recon., Reclaim., Rehab.) 345,000 345,000 345,000 400,000 400,000 1,835,000
Maintenance Overlays 40,000 45,000 85,000
Host Landfill Grant Projects 31,000 32,000 33,000 34,000 35,000 165,000
County Overlays 65,000 67,000 69,000 71,000 73,000 345,000
Utility - Water & Sewer - Sanitary Sewer Total 802,000 1,766,000 851,000 1,421,000 902,000 5,742,000
PROJECTS BY FUNDING SOURCE
Source 2022 2023 2024 2025 2026 Total
City of Burnsville, MinnesotaCapital Improvements Plan
2022 thru 2026
City of Burnsville 2022 Budget 110 Capital & Debt

Utility - Water & Sewer - Water
Street Improvements (Recon., Reclaim., Rehab.) 958,000 1,183,926 3,351,971 428,000 1,425,908 7,347,805
Maintenance Overlays 1,381,552 2,263,837 3,645,389
Water Production Rehab 1,925,000 319,750 372,500 212,000 427,000 3,256,250
Host Landfill Grant Projects 20,500 21,000 21,500 22,000 23,000 108,000
Transmission and Storage Rehabilitation 690,000 513,000 338,000 1,359,000 358,500 3,258,500
County Overlays 25,000 26,000 27,000 28,000 29,000 135,000
Water Treatment Repairs and Rehabilitation 240,000 235,000 750,000 1,225,000
Watermain Breaks and Street Patching 148,000 152,000 156,000 160,000 165,000 781,000
Water Studies 50,000 50,000 50,000 50,000 50,000 250,000
Utility - Water & Sewer - Water Total 4,056,500 3,647,228 4,316,971 4,757,837 3,228,408 20,006,944
GRAND TOTAL 18,047,362 16,125,653 19,808,953 15,714,439 42,244,873 111,941,280
PROJECTS BY FUNDING SOURCE
Source 2022 2023 2024 2025 2026 Total
City of Burnsville, MinnesotaCapital Improvements Plan
2022 thru 2026
City of Burnsville 2022 Budget 111 Capital & Debt

Collector & Thoroughfare Improvements
CSAH 42/Grand Right Turn Lane 15,000 15,000
Infrastructure Trust Funds 15,000 15,000
County Road Overlays 152,000 157,000 162,000 167,000 173,000 811,000
Utility - Storm Water 62,000 64,000 66,000 68,000 71,000 331,000
Utility - Water & Sewer - Sanitary Sewer 65,000 67,000 69,000 71,000 73,000 345,000
Utility - Water & Sewer - Water 25,000 26,000 27,000 28,000 29,000 135,000
I-35W/Burnsville Parkway Aesthetics Renovation 350,000 350,000
General Fund 350,000 350,000
Monument Signs 180,000 190,000 100,000 470,000
General Fund 180,000 190,000 100,000 470,000
Cliff Road Interchange Freight Improvements 3,532,000 3,532,000
Dakota County 600,000 600,000
Federal 2,632,000 2,632,000
MSAS Funds 300,000 300,000
Nicollet/Hwy 13 Mobility Improvements (RAISE) 27,600,000 27,600,000
Dakota County 1,600,000 1,600,000
Federal 25,000,000 25,000,000
MSAS Funds 1,000,000 1,000,000
I-35W SB Off-Ramp to Buck Hill Road (TEDI Grant) 4,500,000 1,000,000 5,500,000
Dakota County 1,000,000 1,000,000
MnDOT 3,500,000 3,500,000
MSAS Funds 1,000,000 1,000,000
Connected/Automated Vehicle Readiness Study 25,000 25,000
Infrastructure Trust Funds 25,000 25,000
Collector & Thoroughfare Improvements Total 3,724,000 337,000 4,852,000 1,267,000 28,123,000 38,303,000
Intersection Improvement
City Signals Replacement 50000 500,000 500,000 1,050,000
MSAS Funds 50000 500,000 500,000 1,050,000
County Signals 162,000 230,000 240,000 240,000 240,000 1,112,000
MSAS Funds 162,000 230,000 240,000 240,000 240,000 1,112,000
CR 11/Burnsville Pkwy Intersection Improvement 90,000 147,000 158,000 395,000
MSAS Funds 90,000 147,000 158,000 395,000
Intersection Improvement Total 302,000 877,000 398,000 740,000 240,000 2,557,000
Sanitary Sewer System Mgmt
Lift Station Rehabilitation - SS 900,000 500,000 1,400,000
Utility - Water & Sewer - Sanitary Sewer 900,000 500,000 1,400,000
Sanitary Sewer Rehabilitation 361,000 382,000 404,000 371,000 394,000 1,912,000
Utility - Water & Sewer - Sanitary Sewer 361,000 382,000 404,000 371,000 394,000 1,912,000
Sanitary Sewer System Management Total 361,000 1,282,000 404,000 871,000 394,000 3,312,000
Storm Water Management
Minor Drainage Improvements 124,000 128,000 132,000 136,000 141,000 661,000
Utility - Storm Water 124,000 128,000 132,000 136,000 141,000 661,000
PROJECTS & FUNDING SOURCES BY DEPARTMENT
Department 2022 2023 2024 2025 2026 Total
City of Burnsville, MinnesotaCapital Improvements Plan
2022 thru 2026
City of Burnsville 2022 Budget 112 Capital & Debt

Pond Cleanout/Outfall Improvement Program 412,000 425,000 438,000 452,000 466,000 2,193,000
Utility - Storm Water 412,000 425,000 438,000 452,000 466,000 2,193,000
Lift Station Rehabilitation - SW 258,000 274,000 291,000 823,000
Utility - Storm Water 258,000 274,000 291,000 823,000
WRMP Update 25,000 100,000 125,000
Utility - Storm Water 25,000 100,000 125,000
Wood Pond StormFilter Maintenance 11,000 12,000 13,000 36,000
Utility - Storm Water 11,000 12,000 13,000 36,000
MRQ Stormwater and Floodplain Study 50,000 50,000
Utility - Storm Water 50,000 50,000
Ravine Restoration and Slope Stabilization 550,000 550,000
Utility - Storm Water 550,000 550,000
Street Project Storm Sewer Televising 52,000 54,000 56,000 58,000 60,000 280,000
Utility - Storm Water 52,000 54,000 56,000 58,000 60,000 280,000
Contract Patching 73,000 76,000 79,000 82,000 85,000 395,000
Utility - Storm Water 73,000 76,000 79,000 82,000 85,000 395,000
Maintenance Facility Treatment Structure 75,000 75,000
Utility - Storm Water 75,000 75,000
Resiliency and Water Quality Improvements 1,000,000 750,000 1,000,000 2,750,000
Utility - Storm Water 1,000,000 750,000 1,000,000 2,750,000
Trout Stream No. 4 Restoration Development Cost Share 10,000 10,000
Utility - Storm Water 10,000 10,000
Alum Treatment 60,000 60,000
Utility - Storm Water 60,000 60,000
KMM Levee Inspection and Report 10,000 10,000
Utility - Storm Water 10,000 10,000
Park Drainage Improvements 133,000 133,000 142,000 408,000
Utility - Storm Water 133,000 133,000 142,000 408,000
Boulevard Tree Maintenance 42,000 44,000 46,000 48,000 50,000 230,000
Utility - Storm Water 42,000 44,000 46,000 48,000 50,000 230,000
Keller Lake Stormwater Quality Improvements 4,000 4,000
Utility - Storm Water 4,000 4,000
Deeg Pond Filter Replacement 45,000 45,000
Utility - Storm Water 45,000 45,000
Park Drainage Study 50,000 60,000 110,000
Utility - Storm Water 50,000 60,000 110,000
Private Pond Maintenance Options Study/Report 20,000 20,000
Utility - Storm Water 20,000 20,000
Storm Water Management Total 2,147,000 984,000 1,920,000 1,436,000 2,348,000 8,835,000
Street Projects
Street Improvements (Recon., Reclaim., Rehab.) 7,462,862 7,026,896 10,340,953 5,105,152 8,200,373 38,136,236
Infrastructure Trust Funds 2,535,661 1,541,081 2,641,382 1,397,494 1,529,637 9,645,255
MSAS Funds 1,492,000 1,986,400 1,671,530 1,190,688 2,852,401 9,193,019
Special Assessments 1,493,201 1,311,489 1,652,070 988,970 1,270,427 6,716,157
Utility - Storm Water 639,000 659,000 679,000 700,000 722,000 3,399,000
Utility - Water & Sewer - Sanitary Sewer 345,000 345,000 345,000 400,000 400,000 1,835,000
Utility - Water & Sewer - Water 958,000 1,183,926 3,351,971 428,000 1,425,908 7,347,805
PROJECTS & FUNDING SOURCES BY DEPARTMENT
Department 2022 2023 2024 2025 2026 Total
City of Burnsville, MinnesotaCapital Improvements Plan
2022 thru 2026
City of Burnsville 2022 Budget 113 Capital & Debt

Street Light Replacement 170,000 170,000 170,000 170,000 170,000 850,000
Utility - St. Lighting 170,000 170,000 170,000 170,000 170,000 850,000
Maintenance Overlays 3,414,007 85,000 3,364,287 6,863,294
Infrastructure Trust Funds 1,917,455 85,000 975,450 2,977,905
Utility - Storm Water 75,000 80,000 155,000
Utility - Water & Sewer - Sanitary Sewer 40,000 45,000 85,000
Utility - Water & Sewer - Water 1,381,552 2,263,837 3,645,389
Concrete Elements Improvements 150,000 120,000 270,000
Infrastructure Trust Funds 150,000 120,000 270,000
Multi-Modal Transportation 80,000 400,000 80,000 400,000 960,000
Infrastructure Trust Funds 80,000 400,000 80,000 400,000 960,000
Host Landfill Grant Projects 547,500 550,000 552,500 555,000 559,000 2,764,000
Host Community Grant 415,000 415,000 415,000 415,000 415,000 2,075,000
Infrastructure Trust Funds 50,000 50,000 50,000 50,000 50,000 250,000
Utility - Storm Water 31,000 32,000 33,000 34,000 36,000 166,000
Utility - Water & Sewer - Sanitary Sewer 31,000 32,000 33,000 34,000 35,000 165,000
Utility - Water & Sewer - Water 20,500 21,000 21,500 22,000 23,000 108,000
ROW Retaining Walls 50,000 50,000
Infrastructure Trust Funds 50,000 50,000
Traffic Calming Improvements 50,000 50,000 50,000 60,000 60,000 270,000
Infrastructure Trust Funds 50,000 50,000 50,000 60,000 60,000 270,000
Street Projects Total 8,460,362 11,610,903 11,318,453 9,384,439 9,389,373 50,163,530
Water System
Water Production Rehab 1,925,000 319,750 372,500 212,000 427,000 3,256,250
Utility - Water & Sewer - Water 1,925,000 319,750 372,500 212,000 427,000 3,256,250
Transmission and Storage Rehabilitation 690,000 513,000 338,000 1,359,000 358,500 3,258,500
Utility - Water & Sewer - Water 690,000 513,000 338,000 1,359,000 358,500 3,258,500
Water Treatment Repairs and Rehabilitation 240,000 235,000 750,000 1,225,000
Utility - Water & Sewer - Water 240,000 235,000 750,000 1,225,000
Watermain Breaks and Street Patching 148,000 152,000 156,000 160,000 165,000 781,000
Utility - Water & Sewer - Water 148,000 152,000 156,000 160,000 165,000 781,000
Water Studies 50,000 50,000 50,000 50,000 50,000 250,000
Utility - Water & Sewer - Water 50,000 50,000 50,000 50,000 50,000 250,000
Water System Total 3,053,000 1,034,750 916,500 2,016,000 1,750,500 8,770,750
GRAND TOTAL 18,047,362 16,125,653 19,808,953 15,714,439 42,244,873 111,941,280
PROJECTS & FUNDING SOURCES BY DEPARTMENT
Department 2022 2023 2024 2025 2026 Total
City of Burnsville, MinnesotaCapital Improvements Plan
2022 thru 2026
City of Burnsville 2022 Budget 114 Capital & Debt

PROJECTS BY CATEGORY AND DEPARTMENT
DepartmentCategory 2022 2023 2024 2025 2026 Total
Special Revenue Fund
Cable Franchise Fee Fund
BCTV Equipment 60,000 60,000
Computer Equipment - PC 2,500 2,500 5,000
Studio/Mobile Truck Upgrades 20,000 50,000 20,000 20,000 20,000 130,000
Computer Equipment 9,000 9,000 18,000
Council Chambers Equipment Updates 50,000 50,000
Nicollet Avenue Readerboard 30,000 30,000
Cable Franchise Fee Fund Total 141,500 80,000 20,000 20,000 31,500 293,000
Forestry Fund
Grapple Bucket 32,000 32,000
Forestry Fund Total — — — 32,000 — 32,000
Special Revenue Funds Total: 141,500 80,000 20,000 52,000 31,500 325,000
GRAND TOTAL 141,500 80,000 20,000 52,000 31,500 325,000
City of Burnsville, MinnesotaCapital Improvements Plan
2022 thru 2026
City of Burnsville 2022 Budget 115 Capital & Debt

Parks Capital Fund
Park Renovation
General Park Renovation/Amenities 25,000 25,000 25,000 25,000 25,000 125,000
Borders 17,000 39,673 22,669 11,334 13,822 104,498
Fencing 101,129 245,886 207,037 199,041 753,093
Hockey Rinks 80,911 80,911 80,911 80,911 161,822 485,466
Irrigation System 121,000 129,458 86,305 336,763
Lighting Systems 67,069 111,594 72,208 180,313 124,722 555,906
Play Equipment 279,969 349,234 331,735 238,656 285,195 1,484,789
Structures & Buildings 150,000 162,321 50,000 88,943 197,076 648,340
Tennis Court Resurfacing 105,250 118,406 78,938 302,594
Bleacher Replacement - Annual 15,000 15,000 15,000 15,000 15,000 75,000
Frameworks - Parks Master Plan 98,679 71,364 88,410 21,050 32,364 311,867
Bleacher Replacement - Complex 30,000 30,000
Scoreboards 121,986 121,986
Park Renovation Total 1,182,993 1,100,983 1,140,834 770,145 1,140,347 5,335,302
Bituminous Surfaces
Bituminous/Concrete Surfaces 222,636 967,262 519,926 1,169,378 82,261 2,961,463
Park Improvements
Basic Park Amenities 30,000 30,000 30,000 30,000 30,000 150,000
Crystal Beach Play Equipment 300,000 300,000
Tennisioux - Sidewalk 22,668 22,668
Terrace Oaks West 52,625 52,625
Kelleher Trailhead Building 1,600,000 1,600,000
Fitness Park 100,000 100,000
Park Improvements Total 1,952,668 82,625 130,000 30,000 30,000 2,225,293
Technology & Security
Parks Fiber 60,000 60,000 60,000 60,000 60,000 300,000
Parks Technology End Points 30,000 30,000 30,000 30,000 30,000 150,000
Technology & Security Total 90,000 90,000 90,000 90,000 90,000 450,000
Trail System Development - Other Government Funded
Day Park - New Entrance 52,625 52,625
Regional Trail Expansion and Improvements 100,000 600,000 453,000 1,153,000
Trail System Development Total 100,000 600,000 505,625 — — 1,205,625
Parks Capital Fund Total 3,548,297 2,840,870 2,386,385 2,059,523 1,342,608 12,177,683
GRAND TOTAL 3,548,297 2,840,870 2,386,385 2,059,523 1,342,608 12,177,683
PROJECTS BY CATEGORY AND DEPARTMENT
DepartmentCategory 2022 2023 2024 2025 2026 Total
City of Burnsville, MinnesotaCapital Improvements Plan
2022 thru 2026
City of Burnsville 2022 Budget 116 Capital & Debt

Equipment
Fire
Body Armor 37,500 37,500
Cardiac Arrest Management (Lucas) 64,000 64,000 128,000
Cardiac Monitor 365,000 365,000
Extrication Equipment 38,000 40,000 40,000 118,000
Hose 15,000 15,000
Radio Replacement - 800 MHz 67,000 67,000 67,000 67,000 67,000 335,000
SCBA Washer 28,000 28,000
Stretchers 25,000 25,000 50,000
Thermal Imager 15,000 30,000 45,000
SCBA Compressor 120,000 120,000
Ventilation Fans 11,200 11,200
Stairmill Machine 20,000 20,000
Gear Wash Machine/Dryer 60,000 60,000
Fire Training Props 25,000 25,000
EMS Simulation Mannequins 20,000 20,000
Blitz Nozzles 10,000 10,000
Cable Weight Machine 18,000 18,000
Elliptical Machine 20,000 20,000
Fire Extinguisher Simulator 16,000 16,000
Gas Monitor Hazmat 18,000 18,000 36,000
Station Alerting Replacement 35,000 200,000 235,000
Stationary Bikes 10,000 10,000
Stretcher Lift 35,000 35,000
Med. Vaults 14,000 14,000
Fire Total 623,000 282,000 368,000 336,200 162,500 1,771,700
Police
Encrypted Police Mobile Radios 271,000 271,000
Fuming Hood 16,000 16,000
Radars 10,600 5,300 15,900
Evidence Drying Chamber 20,000 20,000
EAG Helmets 21,600 21,600
Throw Phone and Software Replacement 30,000 30,000
Glue Chamber 15,000 15,000
Alternative Light Source 12,000 12,000
Crime Scanner 3D 91,702 91,702
Warning Sirens 34,000 34,000 34,000 102,000
Police Total 407,302 82,600 75,300 — 30,000 595,202
Public Works
Radio Replacement 800 MHz 15,000 15,000 15,000 15,000 15,000 75,000
Public Works Total 15,000 15,000 15,000 15,000 15,000 75,000
PROJECTS BY CATEGORY AND DEPARTMENT
Department
Category 2022 2023 2024 2025 2026 Total
Equipment & Vehicle Fund
City of Burnsville, MinnesotaCapital Improvements Plan
2022 thru 2026
City of Burnsville 2022 Budget 117 Capital & Debt
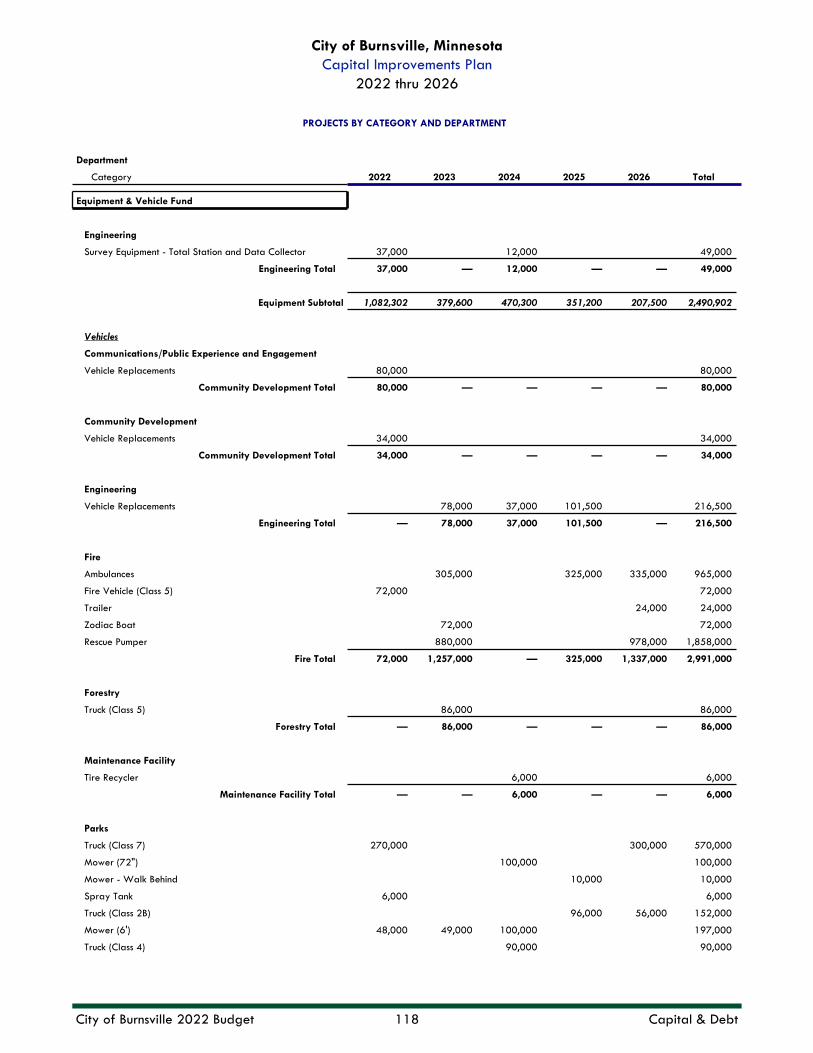
Engineering
Survey Equipment - Total Station and Data Collector 37,000 12,000 49,000
Engineering Total 37,000 — 12,000 — — 49,000
Equipment Subtotal 1,082,302 379,600 470,300 351,200 207,500 2,490,902
Vehicles
Communications/Public Experience and Engagement
Vehicle Replacements 80,000 80,000
Community Development Total 80,000 — — — — 80,000
Community Development
Vehicle Replacements 34,000 34,000
Community Development Total 34,000 — — — — 34,000
Engineering
Vehicle Replacements 78,000 37,000 101,500 216,500
Engineering Total — 78,000 37,000 101,500 — 216,500
Fire
Ambulances 305,000 325,000 335,000 965,000
Fire Vehicle (Class 5) 72,000 72,000
Trailer 24,000 24,000
Zodiac Boat 72,000 72,000
Rescue Pumper 880,000 978,000 1,858,000
Fire Total 72,000 1,257,000 — 325,000 1,337,000 2,991,000
Forestry
Truck (Class 5) 86,000 86,000
Forestry Total — 86,000 — — — 86,000
Maintenance Facility
Tire Recycler 6,000 6,000
Maintenance Facility Total — — 6,000 — — 6,000
Parks
Truck (Class 7) 270,000 300,000 570,000
Mower (72") 100,000 100,000
Mower - Walk Behind 10,000 10,000
Spray Tank 6,000 6,000
Truck (Class 2B) 96,000 56,000 152,000
Mower (6') 48,000 49,000 100,000 197,000
Truck (Class 4) 90,000 90,000
PROJECTS BY CATEGORY AND DEPARTMENT
Department
Category 2022 2023 2024 2025 2026 Total
Equipment & Vehicle Fund
City of Burnsville, MinnesotaCapital Improvements Plan
2022 thru 2026
City of Burnsville 2022 Budget 118 Capital & Debt

Mowers (16') 130,500 138,500 142,500 52,000 463,500
Lift Gate 8,500 8,500
Utility Carts 26,000 26,000
Modd Brushcat 14,000 14,000
Garbage Truck (Class 5) 136,000 136,000
Skid Loader and Attachments 104,500 104,500
Trailer 10,000 10,000 10,000 30,000
Parks Total 635,000 49,000 533,000 258,500 432,000 1,907,500
Police
Patrol Squad Vehicles 330,000 310,000 300,000 310,000 320,000 1,570,000
Admin. Vehicle Replacement 40,000 42,000 44,000 126,000
Armored Vehicle 150,000 150,000
Forensics Truck 100,000 100,000
Mobile Command Center 700,000 700,000
Drug Task Force Vehicle 40,000 40,000
Investigation Vehicles 40,000 42,000 43,000 44,000 169,000
EAG Deployment Vehicle 100,000 100,000
Patrol Transport Vehicle 39,000 39,000
Police Total 450,000 460,000 423,000 1,253,000 408,000 2,994,000
Recreation
Mini Van 30,000 30,000
Recreation Total 30,000 — — — — 30,000
Streets
Patch Box 32,000 45,000 77,000
Flat Bed 6,000 6,000
Anti-Ice System 24,000 24,000
Truck (Class 7) 305,000 315,000 325,000 700,000 375,000 2,020,000
Grader Attachment 30,000 30,000
Loader 97,500 97,500
Loader Forks 10,000 10,000
Truck (Class 8) 345,000 345,000
Streets Total 345,000 660,000 357,000 872,500 375,000 2,609,500
Vehicles Subtotal 1,646,000 2,590,000 1,356,000 2,810,500 2,552,000 10,954,500
Equipment & Vehicle Fund Total 2,728,302 2,969,600 1,826,300 3,161,700 2,759,500 13,445,402
GRAND TOTAL 2,728,302 2,969,600 1,826,300 3,161,700 2,759,500 13,445,402
PROJECTS BY CATEGORY AND DEPARTMENT
Department
Category 2022 2023 2024 2025 2026 Total
Equipment & Vehicle Fund
City of Burnsville, MinnesotaCapital Improvements Plan
2022 thru 2026
City of Burnsville 2022 Budget 119 Capital & Debt

Deferred Maintenance and Annual Replacement:
City Hall/Police
Acoustical Ceiling Replacement 10,000 10,000 10,000 30,000
VCT Tile and Countertop Replacement 32,000 32,000
Fire Panel Replacement 15,000 15,000
Chairs - Community Room 18,000 18,000
Wallpaper City Hall/Police 6,000 6,000 12,000
Transfer Fan and Controls 5,000 5,000
Energy Management System Upgrades 70,000 70,000
Exhaust Fans Roof Top 9,000 9,000
Amenities 30,000 30,000 30,000 30,000 30,000 150,000
City Hall Carpet Replacement 107,000 107,000
Seal Exterior Brick Work 100,000 100,000
Automatic Floor Scrubber 9,000 9,000
Boiler Room Transformer Replacement 10,000 10,000
VFD Replacement - Heat Pump 1 & 2 10,000 10,000
City Hall/Police Total 110,000 41,000 189,000 179,000 58,000 577,000
Civic Center City Garage
Acoustical Ceiling Tile Replacement 5,000 5,000 5,000 5,000 5,000 25,000
Roof Replacement 475,000 475,000
Recable Facility 80,000 80,000
Seal Exterior Brickwork 8,000 8,000
Parking Lot Replacement 350,000 350,000
Cabinet Heater Replacement 70,000 70,000
Civic Center City Garage Total 488,000 85,000 5,000 75,000 355,000 1,008,000
Fire Stations
Accoustical Ceiling Tile Replacement 21,500 21,500
Carpet Replacement - FS2 25,000 25,000
MAN Door Interior & Exterior 21,000 21,000
Seal Exterior Brickwork 15,000 15,000 30,000
Amenities 20,000 20,000 20,000 20,000 20,000 100,000
Plymovent Exhaust System 80,000 80,000
Paint/Wallpaper 6,000 6,000
Old Fire Station 1 Demolition 500,000 500,000
Apparatus Bay Lighting Replacement 12,000 12,000
HVAC Replacement 30,000 30,000
Office Furniture 15,000 15,000
Garage Door Opener Replacement 6,000 6,000 12,000 24,000
HVAC Bay Heater Replacement 15,000 16,000 31,000
Fire Stations Total 547,000 50,000 106,000 123,000 69,500 895,500
PROJECTS BY CATEGORY AND DEPARTMENT
DepartmentCategory 2022 2023 2024 2025 2026 Total
Facilities Fund
City of Burnsville, MinnesotaCapital Improvements Plan
2022 thru 2026
City of Burnsville 2022 Budget 120 Capital & Debt
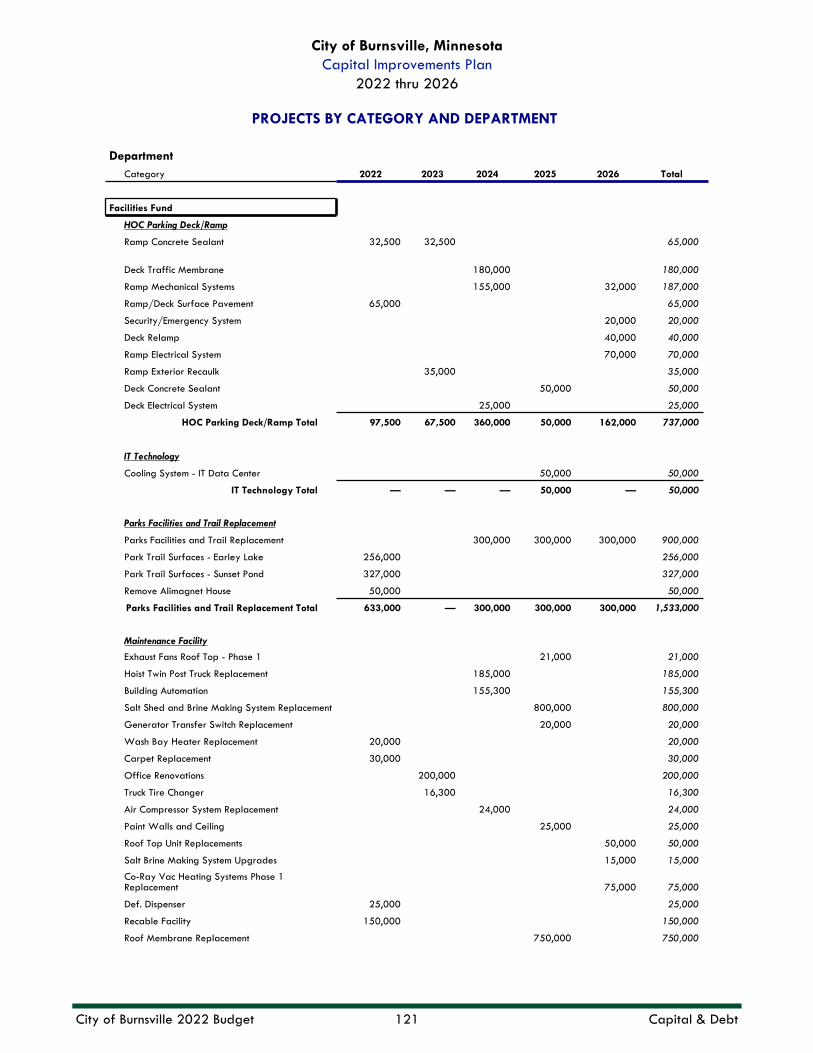
HOC Parking Deck/Ramp
Ramp Concrete Sealant 32,500 32,500 65,000
Deck Traffic Membrane 180,000 180,000
Ramp Mechanical Systems 155,000 32,000 187,000
Ramp/Deck Surface Pavement 65,000 65,000
Security/Emergency System 20,000 20,000
Deck Relamp 40,000 40,000
Ramp Electrical System 70,000 70,000
Ramp Exterior Recaulk 35,000 35,000
Deck Concrete Sealant 50,000 50,000
Deck Electrical System 25,000 25,000
HOC Parking Deck/Ramp Total 97,500 67,500 360,000 50,000 162,000 737,000
IT Technology
Cooling System - IT Data Center 50,000 50,000
IT Technology Total — — — 50,000 — 50,000
Parks Facilities and Trail Replacement
Parks Facilities and Trail Replacement 300,000 300,000 300,000 900,000
Park Trail Surfaces - Earley Lake 256,000 256,000
Park Trail Surfaces - Sunset Pond 327,000 327,000
Remove Alimagnet House 50,000 50,000
Parks Facilities and Trail Replacement Total 633,000 — 300,000 300,000 300,000 1,533,000
Maintenance Facility
Exhaust Fans Roof Top - Phase 1 21,000 21,000
Hoist Twin Post Truck Replacement 185,000 185,000
Building Automation 155,300 155,300
Salt Shed and Brine Making System Replacement 800,000 800,000
Generator Transfer Switch Replacement 20,000 20,000
Wash Bay Heater Replacement 20,000 20,000
Carpet Replacement 30,000 30,000
Office Renovations 200,000 200,000
Truck Tire Changer 16,300 16,300
Air Compressor System Replacement 24,000 24,000
Paint Walls and Ceiling 25,000 25,000
Roof Top Unit Replacements 50,000 50,000
Salt Brine Making System Upgrades 15,000 15,000
Co-Ray Vac Heating Systems Phase 1 Replacement 75,000 75,000
Def. Dispenser 25,000 25,000
Recable Facility 150,000 150,000
Roof Membrane Replacement 750,000 750,000
PROJECTS BY CATEGORY AND DEPARTMENT
DepartmentCategory 2022 2023 2024 2025 2026 Total
Facilities Fund
City of Burnsville, MinnesotaCapital Improvements Plan
2022 thru 2026
City of Burnsville 2022 Budget 121 Capital & Debt

Roof Membrane Replacement - Salt and Sand Sheds 30,000 30,000
Seal Vehicle Storage Bay Floors 50,000 50,000
Door, Frames, Hardware - Phase 1 50,000 50,000
Maintenance Facility Total 225,000 216,300 364,300 1,746,000 140,000 2,691,600
Ames Center
Plaza Concrete Replacement 425,000 425,000
Water Softener 14,500 14,500
Chiller Motor Pump 10,000 10,000
Overhead Roll-Up Door Replacements 165,400 165,400
Marquee Sign 100,000 100,000
Replace Stage Floors 40,000 40,000
Theatrical Lighting LED Conversion 110,000 270,000 660,000 1,040,000
Ceiling Tile Replacement 250,000 250,000
Office Renovation 50,000 50,000
Kitchen Build-Out and Equipment 300,000 300,000
Water Heater 20,000 20,000 40,000
Dance Floor 14,000 14,000
PA and Amplifiers 250,000 250,000
Ames Center Total 484,500 575,400 270,000 709,000 660,000 2,698,900
Golf Course
Clubhouse and Irrigation Improvements 300,000 300,000
Windows and Carpet Improvements 20,000 20,000 40,000
Golf Course Total 20,000 20,000 — 300,000 — 340,000
Ice Center
Cooling System 500,000 500,000
Evaporative condenser replacement 230,000 230,000
Parking Lot 575,000 575,000
Bleacher Replacement 125,000 125,000
LED Lighting Replacement - All Rink 140,000 140,000
Parking Lot - Poles and LED Lights 35,200 35,200
Rubber Flooring Replacement 180,000 180,000
Heating System for Rink 2 50,000 50,000
Desicant Dehumidification Wheels 120,000 120,000
Door Replacement - Rink 2 25,000 25,000
Locker Room Modifications 200,000 200,000
Ice Center Total 1,125,000 145,000 250,000 500,000 160,200 2,180,200
Total Deferred Maintenance and Annual Replacement 3,730,000 1,200,200 1,844,300 4,032,000 1,904,700 12,711,200
PROJECTS BY CATEGORY AND DEPARTMENT
DepartmentCategory 2022 2023 2024 2025 2026 Total
Facilities Fund
City of Burnsville, MinnesotaCapital Improvements Plan
2022 thru 2026
City of Burnsville 2022 Budget 122 Capital & Debt

Improvements:
Facilities Plan
Phase III (Fire Station 2/City Hall) 26,000,000 26,000,000
Facilities Plan Total — 26,000,000 — — — 26,000,000
Total Improvements — 26,000,000 — — — 26,000,000
Facilities Fund Total 3,730,000 27,200,200 1,844,300 4,032,000 1,904,700 38,711,200
GRAND TOTAL 3,730,000 27,200,200 1,844,300 4,032,000 1,904,700 38,711,200
PROJECTS BY CATEGORY AND DEPARTMENT
DepartmentCategory 2022 2023 2024 2025 2026 Total
Facilities Fund
City of Burnsville, MinnesotaCapital Improvements Plan
2022 thru 2026
City of Burnsville 2022 Budget 123 Capital & Debt

Community Development
Code Enforcement Tablets 18,000 15,000 33,000
Community Development Total 18,000 — — — 15,000 33,000
Document Imaging/Management
EDMS Scanner Additions 3,500 3,500 7,000
EDMS Scanner Replacements 7,000 7,000 14,000
EDMS Rio Named User License Additions 2,200 2,200 4,400
Document Imaging/Management Total — 12,700 — 12,700 — 25,400
ERMS System Development
ERMS Misc Modules for Adl Dev w/Finance System 6,000 6,000 12,000
ERMS System Development Total — 6,000 — 6,000 — 12,000
Fire Computer Equipment
MDC Replacements with Dell Rugged 24,000 24,000 24,000 24,000 24,000 120,000
Mounting Equipment Replacements 900 900 900 900 900 4,500
EMS Tablet Replacements 12,000 12,000 24,000
Broadband Mobile Modems 2,400 2,400 2,400 7,200
CAD/AVL Monitor Replacements 5,000 5,000
CAD Status Monitors 5,000 5,000
Fire Computer Equipment Total 44,300 24,900 27,300 36,900 32,300 165,700
GIS Equipment & Software:
GIS Equipment
Plotter Replacements 25,000 25,000
GIS Strategic Plan - GPS/Tablets 5,000 5,000
GIS Equipment & Software Total: 25,000 — 5,000 — — 30,000
IT Infrastructure
Switch Replacements 10,000 10,000 10,000 300,000 300,000 630,000
A/V Meeting Improvements Project 100,000 15,000 15,000 130,000
WLC Replacement 13,000 13,000 26,000
AV Video Encode/Decode Component Repl 50,000 50,000
APC 10KVM UPS Battery Replacement 5,000 5,000
Phone System Replacement 135,000 135,000
IP Clocks for City Facilities 2,100 2,100 2,100 2,100 2,100 10,500
Equipment for IT Van 4,000 4,000 8,000
APC Galaxy UPS Battery Replacement 7,000 7,000
IT Rack Replacements 3,000 3,000 3,000 3,000 3,000 15,000
SAN Node Additions - Tier 1 and 2 45,000 45,000 45,000 45,000 45,000 225,000
UPS Scheduled Replacements 5,000 5,000 5,000 5,000 5,000 25,000
APC 40KVM UPS Battery Replacement 7,000 7,000 14,000
PROJECTS BY CATEGORY AND DEPARTMENT
DepartmentCategory 2022 2023 2024 2025 2026 Total
IT Capital Fund
City of Burnsville, MinnesotaCapital Improvements Plan
2022 thru 2026
City of Burnsville 2022 Budget 124 Capital & Debt

VM Software Licensing 4,000 4,000 4,000 12,000
Wireless AP Replacements 5,000 5,000 2,500 12,500
IT Infrastructure Total 178,100 231,100 129,600 387,100 379,100 1,305,000
Mobile Command IT Equipment
Display Replacements 3,000 3,000
UPS Replacements 2,500 2,500 5,000
5G Modem Implementation 3,000 3,000
TV/Monitor replacements 4,000 4,000
Router/Firewall Replacement 3,000 3,000
Laptop Replacements 4,500 4,500 4,500 13,500
Server Replacement 6,000 6,000
Mobile Command IT Equipment Total — 5,500 10,500 14,500 7,000 37,500
PC Computers
Host Server Replacements 40,000 40,000 40,000 120,000
Server Additions 35,000 35,000
Printer Replacements 1,400 1,400 1,400 4,200
Tablet/Smartphones Replacements 5,000 5,000 5,000 5,000 5,000 25,000
Dell Replacement Project 175,000 175,000 225,000 225,000 225,000 1,025,000
Mounting Options 5,000 5,000 5,000 15,000
Monitor Replacements 3,300 3,300 3,300 9,900
City Council Tablets 15,000 15,000
PC Replacements - VDI Thin Clients 3,500 3,500 2,000 2,000 2,000 13,000
PC Computers Total 228,200 226,800 293,400 275,300 238,400 1,262,100
Police Computer
MDC Replacements 45,000 45,000 45,000 45,000 45,000 225,000
MDC Mounting Equipment Replacements 1,800 1,800 1,800 5,400
Broadband Mobile Modems 2,400 2,400 2,400 7,200
Mobile Printer Replacements 11,600 800 800 13,200
CAD/AVL AV Displays 10,000 10,000
Forensics Recovery of Evidence Device (FRED) 6,500 6,500
Police Computer Total 70,800 52,300 49,200 45,800 49,200 267,300
Recreation Software
POS Replacements/Additions 21,000 21,000
RMS Replacement Project 50,000 50,000
ID Badge Printers 2,000 4,000 6,000
Recreation Software Total 50,000 2,000 21,000 4,000 — 77,000
PROJECTS BY CATEGORY AND DEPARTMENT
DepartmentCategory 2022 2023 2024 2025 2026 Total
IT Capital Fund
City of Burnsville, MinnesotaCapital Improvements Plan
2022 thru 2026
City of Burnsville 2022 Budget 125 Capital & Debt

Security Systems
Camera Replacements 5,000 5,000 10,000
Camera Replacements - City Hall 35,000 35,000
Access Card ID Printer Additions 7,000 7,000
Camera Replacements - BCTV 15,000 15,000
Camera Replacements - FS2 20,000 20,000
Camera Replacements - Parks 20,000 20,000
Camera Replacements - ABLE Site 25,000 25,000
Mercury Boards 50,000 50,000
Camera Replacements - Maintenance Facility 45,000 45,000
Facilities Camera and Prox. Readers 5,000 5,000 10,000
Security Systems Total 90,000 40,000 30,000 32,000 45,000 237,000
Software
Servers Licenses and Miscellaneous Software 5,000 5,000 5,000 5,000 5,000 25,000
Software Total 5,000 5,000 5,000 5,000 5,000 25,000
IT Capital Fund Total 709,400 606,300 571,000 819,300 771,000 3,477,000
GRAND TOTAL 709,400 606,300 571,000 819,300 771,000 3,477,000
PROJECTS BY CATEGORY AND DEPARTMENT
DepartmentCategory 2022 2023 2024 2025 2026 Total
IT Capital Fund
City of Burnsville, MinnesotaCapital Improvements Plan
2022 thru 2026
City of Burnsville 2022 Budget 126 Capital & Debt

Enterprise Funds
Ames Center
Technology Replacement 30,000 30,000
Staging and Tables 10,000 10,000
Food and Beverage Equipment 15,000 15,000 15,000 45,000
Stage Curtains Fire Retardant Treatment 60,000 60,000
High Capacity Carpet Vacuum 17,000 17,000
Cooler and Freezer Replacement 15,000 15,000
Supplemental Audio 15,971 15,971
Wired Microphone Replacement 15,000 15,000
Truss Battens for House Electrics 20,000 20,000
Black Box PA and Console Replacement 40,000 40,000
Window Shades and Motors 24,000 24,000
Staging Pit and Fill 34,200 34,200 68,400
Radios 13,500 13,500
Commercial Washer/Dryer 4,029 4,029
Audio upgrades - Wireless Microphones 17,829 17,829
Rigging Equipment 20,000 20,000
Tables 7,500 7,500
Event Production Equipment 40,000 40,000
Ames Center Total 147,000 90,971 128,558 56,700 40,000 463,229
Golf Course
Golf Cart 12,000 12,000
Rotary Deck Mower 44,000 44,000
Utility Cart 26,000 10,000 35,000 71,000
Reel Mower 35,000 35,000
Blower 12,000 12,000
Greens Mower 47,000 47,000
Bunker Rake 11,000 11,000
Aerator/Spiker 12,000 12,000
Golf Course Total 44,000 61,000 46,000 47,000 46,000 244,000
Ice Center
Ice Surfacer 168,000 170,000 338,000
Floor Scrubbber 13,000 13,000
Water Heater 30,000 30,000
Ice Center Total — 168,000 170,000 30,000 13,000 381,000
Storm Water Management
Street Projects & Rehab 857,000 960,000 913,000 1,022,000 974,000 4,726,000
Storm Water Managment 2,022,000 854,000 1,785,000 1,296,000 2,203,000 8,160,000
Storm Water Capital Equipment 46,000 148,000 30,000 106,000 — 330,000
Storm Water Management Total 2,925,000 1,962,000 2,728,000 2,424,000 3,177,000 13,216,000
Street Lighting
Public Works Projects - Street Lighting 170,000 170,000 170,000 170,000 170,000 850,000
Street Lighting Total 170,000 170,000 170,000 170,000 170,000 850,000
PROJECTS BY CATEGORY AND DEPARTMENT
DepartmentCategory 2022 2023 2024 2025 2026 Total
City of Burnsville, MinnesotaCapital Improvements Plan
2022 thru 2026
City of Burnsville 2022 Budget 127 Capital & Debt

Water & Sewer
Water and Sewer System Management 3,026,000 2,164,750 1,164,500 2,492,000 1,229,500 10,076,750
Street Projects and Rehabilitation 1,592,500 3,248,478 4,003,471 3,451,837 2,150,908 14,447,194
GWTP/SWTP 240,000 — — 235,000 750,000 1,225,000
Water and Sewer Capital Equipment 112,500 469,500 85,500 235,500 122,500 1,025,500
Water & Sewer Total 4,971,000 5,882,728 5,253,471 6,414,337 4,252,908 26,774,444
Enterprise Funds Total 8,257,000 8,334,699 8,496,029 9,142,037 7,698,908 41,928,673
GRAND TOTAL 8,257,000 8,334,699 8,496,029 9,142,037 7,698,908 41,928,673
PROJECTS BY CATEGORY AND DEPARTMENT
DepartmentCategory 2022 2023 2024 2025 2026 Total
City of Burnsville, MinnesotaCapital Improvements Plan
2022 thru 2026
City of Burnsville 2022 Budget 128 Capital & Debt

City of Burnsville, Minnesota Capital Improvements Plan
2022 thru 2026 NARRATIVE
GENERAL FUND
I-35W/Burnsville Parkway Aesthetics Renovations - In the early 2000s, the City worked with the Minnesota Department of Transportation (MnDOT) to place aesthetic features on the Burnsville Parkway and Trunk Highway (TH)-13 bridges over I-35W. The City has completed repairs to the lighting system on the Burnsville Parkway bridge and removed the lighting from the TH-13 bridge. Items needing further renovation include the arches and the decorative elements, such as the bull horns and wrought iron elements. MnDOT is planning to replace the Burnsville Parkway bridge over I-35W in 2026. The City's aesthetic elements should be completed simultaneously to reduce the cost and impact to users. The City Council has discussed removing the elements from the TH-13 bridge instead of renovating them when they become too worn or a safety hazard.
City Entry Monument Signs - In the past, MnDOT had restrictions regarding the placement of City entrance monuments within their rights-of-way on interstate highways. Recently, those restrictions have loosened and the City will likely be permitted to place additional monument signs at City interstate entrances, similar to the one placed on either end of TH-13. Future locations include the City entrances at I-35E Northbound, I-35E Southbound, I-35W Southbound, and either end of County State Aid Highway (CSAH) 42. Two signs are planned for 2023, two in 2024, and one in 2025.
COLLECTOR AND THOROUGHFARECliff Road Interchange Freight Improvements - This project is for the realignment of the western loop of the interchange at Cliff Road and TH-13. The improvements include a roundabout and a new street connection running through the southern area of the old Knox Lumber site. This project is eligible for a 20 percent match under the Minnesota Highway Freight Program. The remainder of the project costs will be shared between the City, Dakota County, and State of Minnesota Host Community Landfill Grant program. Construction is planned for 2022.
I-35W Southbound Off-Ramp to Buck Hill Road - The City completed a Burnsville Center Village Vision in 2019 and subsequently completed a traffic study in 2020. By the end of 2021, Dakota County will have completed its CSAH 42 Visioning Study. In both the City's and County's traffic study, an improvement project has been analyzed that improves traffic flow on I-35W and CSAH 42. This project includes constructing a separate off-ramp from southbound I-35W, under CSAH 42, which allows vehicles to exit to eastbound CSAH 42 or continue on to Buck Hill Road or the Burnsville Center Redevelopment Area. The City applied for a State Transportation Economic Development (TED) grant in the summer of 2021. Dakota County is a funding partner on this project. Should the City be awarded the TED grant, construction is anticipated in 2024 and 2025.
TH-13 and Nicollet Mobility Improvements - In 2021, MnDOT completed a comprehensive visioning study of the TH-13 corridor between TH-169 in Savage to Nicollet Avenue in Burnsville. This vision included a mobility improvement at the intersection of TH-13 and Nicollet Avenue. Minnesota Valley Transit Authority (MVTA), Dakota County, and Metro Transit have all expressed interest in improving mobility across TH-13 and along Nicollet Avenue. The City applied for a Federal Rebuilding American Infrastructure with Sustainability and Equity (RAISE) grant in the summer of 2021. Should the RAISE grant be awarded to the City, construction is anticipated for 2026.
Connected and Automated Vehicles (CAV) Readiness Study - The City Council's strategic priorities pertaining to Transportation and Infrastructure include being committed to an effective, multi-modal transportation system that safely connects people and goods. One technology that the City needs to be ready for is CAV. This study will
City of Burnsville 2022 Budget 129 Capital & Debt

analyze current infrastructure and provide a plan for what improvements the City can make in the short-term, mid-term, and long-term pertaining to CAV readiness.
County Overlays - When Dakota County resurfaces its roadways, it is the best time for the City to improve its utility structures on and under those roadways. Therefore, the City budgets for repairing and improving its utility structures so it can react when Dakota County chooses to resurface a county road in Burnsville. In 2022, Dakota County has indicated they will complete the CSAH 42 Mill and Overlay Project from Burnsville's western border to CSAH 11, in which budget authority has been carried forward from 2019 to contribute to utility repairs and improvements. The City does not pay for any of the street improvements.
INTERSECTIONSCity Signal Replacement - This project budgets and plans for future traffic signal improvements throughout the City. Currently, the City has 21 traffic signal systems. In addition, there are 29 Dakota County-owned signal systems and 17 State-owned signal systems within the City. In 2022, the budget includes an update to a 10-year old review of City signals, which will help prioritize replacements in the future.
County Signal Replacement - This project is for signals owned by Dakota County that are proposed to be replaced. The City will pay for the number of legs, or portion of the signal, that are located on City roadways. In 2022, Dakota County will complete a signal optimization study on McAndrews Road (CSAH 38) from CSAH 5 east into Apple Valley. The construction of the signal optimization is anticipated in 2022. From 2023 and onward, the budget includes funding for a signal replacement, with those locations to be determined through collaboration with Dakota County.
County Road 11/Burnsville Parkway - Dakota County was awarded Federal grant funding to replace this signalized intersection with a roundabout. A roundabout will improve traffic flow and safety. This project will be designed in 2022, right-of-way obtained in 2023, and construction will occur in 2024. The City cost share for this project is based on the County's cost participation policy, which provides that the City contributes 45% of the costs after the grant has been allocated.
SANITARY SEWER SYSTEMLift Station Rehabilitation - This project will rehabilitate the 13 sanitary sewer lift stations (LS) and install emergency generators when necessary. The intent of this program is to reduce the number of emergency failures and backups within the sanitary sewer system. The project rehabilitates LS based on the Sanitary Sewer LS Condition Assessment.
Sanitary Sewer Rehabilitation - This project rehabilitates sanitary sewer lines in known trouble areas and areas in which root intrusion causes extensive maintenance and backups. Similar work is done within street project areas and this project funds work within areas not scheduled for a street project in the near future or more extensive work within the street project areas. The projects seeks to rehabilitate one percent of the gravity system per year.
STORM WATER MANAGEMENTMinor Drainage Improvements - Each year, the City works in various areas of the City to improve smaller local drainage issues, both in public rights-of-way and on City-owned property. The City also assists private property owners to improve private drainage nuisances or with the installation of drain tiles on private property by making public drainage systems accessible when reasonable. The City completes drainage improvements on private property when surface water runoff has entered a primary structure. The City owns a significant amount of corrugated metal pipe storm sewers. This type of pipe is subject to rusting which provides holes for sediment to get into the storm system. This results in downstream soil deposits and sink holes or other soil loss in the area of the hole. This project will allow for televising these pipes and then rehabilitating them as needed.
City of Burnsville 2022 Budget 130 Capital & Debt

Pond Clean Out/Outfall Improvement Program - This project is for removal of sediment that has accumulated in ponds and for maintenance of pond outfall structures. Funds are allocated annually and the City uses a storm asset management tools to prioritize projects.
Lift Station Rehabilitation - Routinely, the City schedules LS improvements as a preventative maintenance program. This includes repair or replacement of the LS and installation of an emergency generator when necessary. The City continues with this program based on Storm Sewer LS Condition Assessment.
Water Resources Management Plan (WRMP) Update -The WRMP guides water resources management activities within the City. The WRMP is required to be updated periodically and approved by the applicable watersheds and the Metropolitan Council. With changes in watershed district rules and an update to the State Municipal Separate Storm Sewer System (MS4) permit, the City will continue a major update into 2022.
Wood Pond Storm Filter Maintenance - This maintenance activity consists of replacing filter cartridges and cleaning out the structure at Wood Pond biennially.
Minnesota River Quadrant (MRQ) Storm Water and Floodplain Study and Report - This study will analyze the overall storm water management system needs for the MRQ to accommodate future development. The report will guide the review of future developments in the MRQ and optimize the location of future stormwater management facilities.
Ravine Restoration and Slope Stabilization - The City has several steep ravines that are in various states of erosion. This project will target those ravines in most need of maintenance and then fund their repair, preventing loss of soils, retaining property values, and reducing offsite deposit of these soils.
Street Project Storm Sewer Televising - The City televises its storm sewer pipes in next year’s street improvement areas to understand if these pipes are failing or if there are any obstructions in them. If issues are discovered, improvements are included in the street construction plans.
Contract Patching - Each year, there are several drainage structures in Burnsville that need repair that are not in the street reconstruction or rehabilitation project. These structures are repaired with this project.
Maintenance Facility Treatment Structure - This maintenance activity consists of replacing the filter for the Maintenance Facility stormwater treatment structure.
Resiliency and Water Quality Improvements - This project provides improvements for the highest risk systems identified through the resiliency assessment of major drainage systems. In addition, due to ongoing and ever- increasing regulations for stormwater quality, it is likely that improvements to ponds or other stormwater improvements will be necessary.
Trout Stream No. 4 Restoration Development Cost Sharing - The Minnesota Department of Natural Resources (MnDNR) and MN Trout Unlimited are considering rehabilitating a trout stream near the Cedarbridge area. The City may need to make storm sewer and drainage improvements in the existing system to help the stream become a viable trout habitat. This project is not being lead by the City but may include some cost sharing for the project.
Aluminum Sulfate (Alum) Treatment - The project involves the treatment of the bottom of ponds with Alum. The Alum ties up the phosphorous in the pond sediment and prevents it from releasing into the water column thereby reducing algae growth. It is anticipate this project will be completed every five years.
Kraemer Mining and Materials Levee Inspection and Report - This project includes inspecting the levee located at Kraemer Mining and Materials and summarizing the findings in a report. This report will help the City evaluate if any improvements are needed to the levee.
City of Burnsville 2022 Budget 131 Capital & Debt

Park Drainage Study and Improvements - This project is for drainage improvements within City parks. The scope of improvements will be determined by a Park Drainage Improvement Study to be completed the year before improvements are proposed.
Boulevard Tree Maintenance - Trees along City streets provide many benefits, including storm water management. Trees improve water quality by intercepting and holding rain on leaves, branches and bark, storing rainwater in their roots, and reducing soil erosion by slowing rainfall before it strikes the ground. However, when trees are not maintained properly, they are more susceptible to diseases and wind damage, which can leave tree branches and debris within the City streets and eventually lead to the storm sewer system. This annual project, which is funded 65% from the Forestry Operating Budget and 35% from the Storm Utility, will allow the City to trim approximately one-tenth of its boulevard trees annually, with the goal of getting to each tree every 10 years.
Keller Lake Stormwater Quality Improvements - This maintenance activity consists of inspecting the main vault of the structure at Keller Lake every five years and removing sediment and debris at least every ten years.
Deeg Pond Filter Media Replacement - This maintenance activity consists of replacing the filter at Deeg Pond every five years.
Private Pond Maintenance Options Study - Federal and State stormwater requirements are changing to include the City ensuring proper maintenance of private ponds. Often times, the owners of the private ponds are ill-equipped to analyze maintenance needs and complete these types of projects. This study will provide options to the City for implementing a private pond maintenance program, which may include prioritization, potential cost sharing mechanisms, and special assessment options.
LOCAL STREETS
Street Improvement Program - The annual street improvement program includes three construction techniques described below. A copy of the 2022-2026 Street Improvement Program map is included in the Maps section of the CIP. Selection of street segments is based upon the City's Pavement Management Program and staff recommendations. Funding for the annual program is based upon the Special Assessment Policy and assumes that up to 40% of the street costs will be assessed to benefiting properties. The remainder of the project costs are paid by other funds.
• Rehabilitation - This street improvement construction method consists of milling and overlaying selected streets. Spot replacement of curb and gutter and sidewalk is performed and minor utility repair/replacement is also completed with these projects. Streets typically rehabilitated are in excess of 20 years old and rehabilitating these streets helps avoid total reconstruction for another 15 years.
• Reclamation - This street improvement construction method consists of replacing the base and pavement of the roadway. Spot replacement of curb and gutter and sidewalk is performed and minor utility repair/replacement is also completed with these projects. Streets typically reclaimed are in excess of 30 years old and do not require full watermain replacement with the project.
• Reconstruction - This street improvement construction method consists of replacing the base and pavement of the roadway and full replacement of concrete curb and gutter. Spot replacement of sidewalk is performed. The watermain is typically replaced under the street and other minor utility repair/replacement is also completed with these projects. Streets typically reconstructed are in excess of 30 years old and generally require full watermain replacement with the project.
Street Light Replacement - This project will replace existing street lights. The lights to be replaced will be identified annually by the Engineering Division. Many of the lights replaced are located in the current year’s street
City of Burnsville 2022 Budget 132 Capital & Debt

reconstruction and rehabilitation program areas. When possible, streetlights will be replaced with energy-efficient Light Emitting Diode (LED) streetlights. The funding for street light replacements is from the Street Lighting Enterprise Fund.
Maintenance Overlays - This project includes a mill and overlay on residential streets that were reconstructed 20 to 30 years ago to extend the service life of the pavement to 40 years or more. The funding for this project is not expected to include special assessments.
Concrete Element Improvements and Retaining Walls - The City owns many assets in rights-of-way made out of concrete that are not addressed for maintenance in other ways. The primary needs are concrete intersections, sidewalk replacement and accessibility improvements, and retaining wall repairs and replacements. These projects are proposed every four to five years.
Multi-Modal Transportation - In 2021, a Multi-Modal and Complete Streets Study was be completed. This funding will provide for multi-modal improvements every three years. Funding is allocated in the year before the construction year for design.
Traffic Calming Improvements - In 2021, the City Council approved a new Traffic Calming Policy (Policy). This project will allow for permanent installations of traffic calming measures consistent with the Policy. Unspent funds may be carried-forward to accumulate sufficient budget authority for larger scale projects.
Host Landfill Grant Projects - The State of Minnesota, through the Department of Employment and Economic Development (DEED), has created a grant program specifically for metropolitan cities that host active landfills. There is no guarantee that this program will be continued each year, but the City will continue to apply for these grants as long as they are available. The City is eligible for approximately $415,000 annually if the specified project meets certain job creation goals. The City has identified projects that are good candidates for this grant.
WATER SYSTEM
Distribution System Rehabilitation and Replacement - As the street reconstruction program moves to streets with ductile iron water and watermains that test in sound structure condition, this project rehabilitates or replaces other watermains so that the City's annual replacement stays at or near one percent of the system annually. The 2021 allocation will support the street maintenance overlay program and fund watermain replacement in those areas passed over for watermain replacement when they were originally reconstructed in the 1990s.
Water Production Rehabilitation - This is a preventative maintenance project for the City’s water production infrastructure. This involves rotating evaluation and rehabilitation projects of the City’s 17 groundwater wells and two surface water pumps including the pumps, motors, well cavities, well piping and valves, well houses, and power systems. Annually, projects are bid in order to get to every well at least once every ten years. In 2022, $1.8 million is identified to start the project to replace the Raw Water Intake at Kraemer Mining and Materials (KMM) quarry. This project is planned to be fully funded by KMM.
Transmission and Storage Rehabilitation - This project identifies rehabilitation projects for the City’s water transmission and storage infrastructure, which includes projects for 10 High Service Pumps (HSP), the 7-mg clear well at the Water Treatment Plant (WTP), two underground reservoirs, three water towers, and the Pressure Reducing Valve (PRV) stations. The 2022 allocation is for rehabilitation of one HSP and effluent meters at the WTP, light rehabilitation of the Buck Hill Tank, and a PRV Project
Water Treatment Repairs and Rehabilitation - This project includes repairs and rehabilitation within the Ground Water Treatment Plant (GWTP) and Surface Water Treatment Plant (SWTP). The 2022 allocation is for rehabilitation of the Powder Activated Carbon building at the SWTP, replacement of the Granular Activated Carbon in two filters of the SWTP, and replacement of two cells for the disinfection system.
City of Burnsville 2022 Budget 133 Capital & Debt

Street Repairs of Water Main Breaks and Contract Patching - This project is to repair the streets sections that need to be removed due to a watermain segment that breaks. This project also is to improve street areas in disrepair because of a utility element that is located in the road such as gate valves and manholes.
PARKSPark Improvements - Park improvements include the significant upgrading or the addition of new facilities to the park system, such as adding a building, shelter, trails not associated with an existing amenity, new parking lots, lighting and periodically creating planning documents. Projects in this category for 2022 include:
• Adding general amenities, such as park benches, bleachers, and small recreational equipment to existing parks;
• Parking lot expansion at Red Oak to accommodate an increase in park visits related to recent park improvements (e.g., pickle ball courts, inclusive playground);
• Play equipment replacement at Crystal Beach Park;• Adding fiber and technology, such as end points, security, and fiber in community parks;• Remodel portion of Terrace Oaks West to better accommodate community rental needs;and• Park master planning for community parks, including trail head needs at Kelleher Park and the Lake
Marion Greenway.
Park Renovation - Park renovation includes the repair or replacement of existing elements and facilities within the park system, such as fencing, backstops, athletic field lighting, hockey rinks, play equipment, bituminous surfaces, tennis courts, and building renovations. The highest priority for park capital funding is maintaining the current park system. Projects in this category for 2022 include:
• General amenities replacement, such as benches, grills, picnic tables, and refuse receptacles;• Bituminous parking lot, basketball courts and internal park trails at various parks;• Tennis court crack repair at Neill and Terrace Oaks East park;• Bleacher replacement;• Hockey rink board replacement;• Automate lighting systems at Neill and Sue Fisher Parks; • Replace the parking lot lights at North River Hills;• Replacement of various concrete around park buildings and facilities;• Replace play equipment at Colonial Park;• Remove Alimagnet house; and• Framework plans with the community to remove or relocate existing, underused amenities to reduce long-
term capital needs and ongoing maintenance costs.
Trail System Development - These funds are for the development of new multi-modal trails outside the park system and trails that connect the park system to these regional trail systems. The priorities for this element are established by the Trail Master Plan and Multi-Modal Plan. Projects in this category are listed below.
• 126th Street and Dupont Avenue Trail connecting the trail on the east side of CSAH 5 and the new trails being constructed with the Cliff and I-35W Interchange improvements. This work will be designed in 2022 and constructed in 2023.
• Neighborhood connector trail between Pillsbury and Pleasant Avenues to connect development on the west side of Heart of the City to Nicollet Commons Park and other core Heart of the City amenities. This work may be constructed in 2024.
City of Burnsville 2022 Budget 134 Capital & Debt

FACILITIES Facilities Improvements - These funds are for the repair, replacement, or improvement of existing elements at City Hall/Police, Civic Center Garage, Fire Station No. 1, Fire Station No. 2, Maintenance Facility, as well as Parking Lots, Decks and Ramps. Projects in this category are listed below.
• Facilities Study - This study will be an update to the 2015 Facilities Study and will include City Hall, Fire Station No. 2, the Maintenance Facility, and the City Garage.
• City Hall/Police - Projects for this facility include the replacement of sections of acoustical ceiling tile, wall paper and staff work space remodel and relocations.
• City Garage - This facility will receive scheduled tuck point brick work on the 20,500 square foot building.• Fire Station No. 2 - Projects for this facility include the replacement of sections of acoustical ceiling tile,
wall paper, paint and general facility upkeep.• Maintenance Facility - This facility will receive a replacement of fuel tank sumps and pressure washers.• HOC Parking Deck and Ramps - This project will involve concrete sealant in the ramp and a renovation of
the security and emergency systems.• Ice Center - This project will include the replacement of the rubber flooring in portions of the arena.• Golf Course - This facility will receive window and carpet replacements.
INFORMATION TECHNOLOGYPersonal Computers (PCs), Laptops, and Servers Replacements - This annual project replaces desktops, laptops, and tablet equipment on a scheduled and staggered basis. Currently, there are several hundred devices that are replaced every four to five years. Staff are researching changes to this approach with the possibility of a one-time lease replacement program every four to five years to reduce staff time and to improve compatibility of products across all departments. Server hardware infrastructure is replaced every four to five years. Due to the COVID-19 pandemic, the mobile computer laptops for both training and the Emergency Operations Center lab was deferred until 2021.
Police Department Systems - These items represent projects that replace various Police specific equipment on a scheduled basis. New on officer-worn body cameras (BWC) and conducted electrical devices (CED) were deployed to Police staff in early 2020 and became an operating expense utilizing a five-year subscription plan. Due to the COVID-19 pandemic, some 2020 projects were deferred until 2021, including the replacement of secure mobile data communications equipment in all squad cars and in-vehicle camera systems. The next scheduled replacement for Mobile Data Computers for Police vehicles is 2023, but is currently being considered for early replacement as part of an comprehensive staff device replacement project in 2021.
Fire Department Systems - These projects represent new and replacement of various Fire systems and equipment on a scheduled basis. Implementation of new firefighter-worn cameras for inspections, investigations, and incident command occurred in 2020. Similar to Police, this item is now a five-year subscription service plan moved into the operating budget. Due to the COVID-19 pandemic, some 2020 projects were deferred until 2021, including the replacement of secure mobile data communications equipment in all Fire vehicles and the addition of in-vehicle camera systems. The next scheduled replacement for Mobile Data Computers for the Fire vehicles is 2022, but is currently being considered for early replacement as part of a comprehensive staff device replacement project in 2021. The new Fire Station No. 1 construction project also includes a significant amount of new technology, which is included in the facility construction budget, but the IT CIP also includes technology replacements for Fire Station No. 2 in 2021.
Document Imaging and Management – These projects continue to expand the Electronic Document Management System (EDMS) throughout the organization and replaces existing scanner workstations on a scheduled basis. Document imaging includes upgrades to functionality and the continued integration with multiple City systems. The
City of Burnsville 2022 Budget 135 Capital & Debt

City received a “Run Smarter” National award for an Elections Judge hiring workflow improvement project in 2019.
IT Infrastructure - This project addresses core network capacity and functions for 70 City facilities with rotating replacement over five to seven years, annual network storage additions and replacements, modifications and enhancements to the phone system as well as audio/visual replacements and enhancements for conference rooms. Projects in 2021 included the continued transition to hosted cloud storage for data backups, local data storage replacements, and audio/visual improvements for various conference rooms to accommodate remote work. Significant network infrastructure upgrades and replacements are expected in 2024.
Community Development Department - In 2020, staff began the process of reviewing new cloud-hosted Community Development software platforms for implementation in 2021. Funding of a hosted subscription model is identified in the 2022-2026 operating budget and has been moved out of the CIP. The new cloud-hosted solution include a integrated suite for Planning, Permitting, Inspections, Code Enforcement, and Licensing, as well as field-based mobile applications and a community engagement portal for applications, payments and data analytics.
Security Systems - This project addresses physical security systems for City assets, facilities, and public areas through the use of cameras, door access controls, and supporting systems. Continued improvements and additions in 2021 include: replacement of cameras at the HOC Deck; Birnamwood Golf Course buildings; and the GARAGE and Ice Center parking lot to address security, camera quality and reliability. New projects in 2021-2025 include continued security camera additions and scheduled replacements throughout other locations.
Software - This is an ongoing project for server licenses and license renewals. Projects in 2021 include migrating additional on-premise servers to a hosted Government Cloud environments and the renewal of a three-year Microsoft Enterprise Agreement for hosted Office 365. Microsoft software enterprise agreement contract review and renewal will take place in late 2021 for an additional three-year term for 2022-2025. This item was moved from Capital improvements to an operating expense.
Enterprise Resource Planning (ERP) System Development - This is an ongoing project to develop, enhance interfaces, and data exchanges among City systems. This includes document management access to payroll files, accounts payable, and utility reports as well as data integration with the Community Development system for account balances and payment history. In 2021, a continued focus on implementing an integrated HR employee on-boarding and off-boarding solution along with a new dash board of data analytics for easy access to department financial data.
Geographic Information System (GIS) Software – The COVID-19 pandemic delayed the process of updating the 2016 GIS Strategic Plan. The update will be completed for implementation in 2021-2026. The City continues to move forward with GIS strategic initiatives and integrations with existing GIS systems like: Public Safety, Community Development, Asset Management, and Utility Billing. A recent 2019 initiative called Datalink is 100% developed and being utilized by staff. The addition of a new GIS Coordinator position in 2018 enabled the City to design, implement, and leverage a new hybrid in-house and cloud-hosted GIS platform. No significant GIS CIP items are needed in 2021 with the new hybrid platform. The annual capital expenditures for licensing was moved to the operating budget.
GIS Equipment - This project provided tools for GIS field data collection in 2021. It will also provide for large format plotter replacements at both the City Hall and Maintenance Center in 2022.
Recreation Management System (RMS) - Staff continue to utilize the RMS system for Recreation programming, league scheduling, facility scheduling, and Point of Sale (POS) concessions at the Ice Center, Crystal Lake, Lac
City of Burnsville 2022 Budget 136 Capital & Debt

Lavon, and Birnamwood golf course. POS system replacements at Recreation sites were scheduled for 2020, but have been deferred due to the COVID-19 pandemic to late 2020 and early 2021.
Parks Capital Funds for IT Projects - The 2021 Parks Capital fund includes projects for the continued extension of City fiber optic Institutional Network (I-NET) and IT services in several parks including Nicollet Commons, Alimagnet Phase II, Neil, Red Oak, and Sue Fischer.
EQUIPMENT AND VEHICLESEquipment - This is an ongoing project to cover the acquisition and replacement of various capital equipment mostly for public safety. Each specific piece of capital equipment has a life cycle tracked by each department.
Vehicles - Vehicles are replaced according to the City Vehicle Acquisition and Replacement Policy.
City of Burnsville 2022 Budget 137 Capital & Debt

Debt Analysis
Measures for Debt Management
The City funds some of its capital projects by issuing debt. State statute and City policies govern how much debt the City may issue, as well as other standards for issuing debt. This section highlights those measures, explains the rationale for them, and shows how the City performs against those measures. City Council Policy No. 1.250 establishes the following measures:
Policy: The City will pay back debt within a period not to exceed the expected useful life of the projects, with at least 50% of the principal retired within 2/3 of the term of the bond issue.
• Current Year - All debt to be issued in 2021 will be structured within the parameters of this policy with a level annual payment schedule matched with projected revenue streams of taxes, special assessments and utility revenues.
• 2022 Budget Year - All debt proposed for 2022 issuance is planned to have a level annual payment schedule matched with projected revenue streams.
• Future Years - All future debt proposed is planned to be structured within the parameters of this policy • Best practices for debt management dictate that the funding for an asset is aligned with the life of that
issue. For example, a 20 year bond should not be issued for a piece of equipment that has a useful life of only 10 years. This policy ensures that the expense for an asset is evenly distributed throughout the terms of the bond. The City has always structured the term of bonds to be less than the useful life of the capital projects being financed. Generally, infrastructure improvement bonds have been 15 years or less.
Policy: Total general obligation debt shall not exceed 2% of the total market valuation of taxable property in the City.
2020 Actual 2021 Budget 2022 Budget
GO Debt as a percentage of Total Taxable Market Value 0.6% 0.6% 0.5%
The City policy is intended to be somewhat more restrictive than State statute, in order to keep the City’s debt burden at a manageable level. This measure differentiates between general obligation debt, which commits the full faith and credit of the City from other types of debt issued by the City, such as revenue bonds. This measurement is more relevant for a city like Burnsville that issues various types of debt, but the taxpayers are not committed to the repayment of all types of debt.
Policy: Direct net debt (gross debt less available debt service funds) shall not exceed 3% of the total market valuation of taxable property in the City.
2020 Actual 2021 Budget 2022 BudgetNet debt as a percentage of Total Taxable Market Value 0.4% 0.3% 0.5%
City of Burnsville 2022 Budget 138 Capital & Debt

Explanation: State statutes, limits the debt issued by a municipality to a net debt limit of no more than three percent of the market value of taxable property in the municipality. The statute outlines the type of debt that is subject to this limit, which is reported annually in the Annual Comprehensive Financial Report. This measure is intended to insure that cities do not issue more debt than the tax base is able to bear. In addition, the limit prevents municipalities from unduly burdening future generations with the costs of capital improvements.
Other types of measures that are used to measure government debt include: debt per capita, debt to personal income, and debt service payments as a percentage of general fund revenues or expenditures. These measures vary in their usefulness depending on the type of the debt issued by the municipality.
The City has levied a property tax for the Infrastructure Trust Fund to fund the City contribution toward replacement of infrastructure on a pay-as-you-go basis. Therefore, most issues since 2005 have been limited to funding the special assessment and utility portions of the improvements. The City also monitors its total debt as a percentage of the City’s total tax capacity and on a per capita basis:
2020 Actual 2021 Budget 2022 Budget
Total Debt as a percentage of Total Tax Capacity 85.1% 70.1% 65%
Debt per Capita $1,172 $1,014 $981
City of Burnsville 2022 Budget 139 Capital & Debt

Debt Analysis
Debt Summary - 2022 through 2026
2022 2023 2024 2025 2026
Debt Currently Existing at January 1
Balance, Beginning of Year $ 65,272,884 $ 58,060,884 $ 50,713,884 $ 43,445,884 $ 36,607,884
Principal Payments (7,212,000) (7,347,000) (7,268,000) (6,838,000) (6,294,000)
Balance, End of Year 58,060,884 50,713,884 43,445,884 36,607,884 30,313,884
Future Debt to be Issued
Proposed New Debt, Beginning of Year $ — $ 5,037,201 $ 34,441,085 $ 38,222,160 $ 40,576,351
Proposed New Issues
Special Assessments 1,493,201 1,311,489 1,652,070 988,970 1,270,427
Facilities Improvements Bonds — 23,000,000 — — —
Water and Sewer Utility Bonds 3,544,000 5,363,228 4,003,471 3,600,000 3,330,408
Total Proposed New Issues 5,037,201 29,674,717 5,655,541 4,588,970 4,600,835
Principal Payments - Proposed New Issues — (270,833) (1,874,466) (2,234,779) (2,548,556)
Proposed New Debt, End of Year 5,037,201 34,441,085 38,222,160 40,576,351 42,628,630
Total Existing and Proposed Debt, End of Year $ 63,098,085 $ 85,154,969 $ 81,668,044 $ 77,184,235 $ 72,942,514
City of Burnsville 2022 Budget 140 Capital & Debt

Debt AnalysisExisting and Projected Debt
Outstanding Debt (in millions) Debt Ratios
(4)
(1) (2) (3)To
Economic
as of Dec. 31 Existing Projected Total
To Tax Capacity
Market Value Per Capita
Actual
2012 62.6 $ $ 62.6 94.3 % 1.3 % $ 1,025
2013 60.4 60.4 95.2 1.1 985
2014 57.3 57.3 88.5 1.0 928
2015 54.6 54.6 78.5 0.9 882
2016 51.8 51.8 73.2 0.8 838
2017 64.6 64.6 89.5 1.0 1,044
2018 64.4 64.4 82.1 0.9 1,035
2019 61.1 61.1 73.7 0.9 975
2020 75.4 75.4 85.1 1.0 1,172
2021 65.2 65.2 70.1 0.8 1,014
Projected
2022 58.1 5.0 63.1 76.8 0.8 981
2023 50.7 34.4 85.1 73.7 1.1 1,323
2024 43.4 38.2 81.6 69.4 1.0 1,269
2025 36.6 40.6 77.2 73.9 1.0 1,200
2026 30.3 42.7 73.0 69.7 0.9 1,135
(1) This column lists outstanding amounts of existing debt each year. Note that 51% of the amount of outstanding debt at December 31, 2019 will be paid off in the next five years. All bonds net of refunding bond proceeds on hand, including tax increment and utility bonds are shown in the totals above.
(2) This column indicates the net amount of outstanding new debt being projected from the 2022-2026 Capital Improvements Program.
(3) Total tax capacity is the value, after adjustments for fiscal disparities, against which taxes are levied.
(4) Economic market value is the value determined by the County Assessor and approximately the value at which the property would be sold. The State Legislature sets the policy regarding the share of taxes each property will pay on its market value through a system of property classifications and mandated class rates for the different types of property; thus growth in total estimated market value may not equate to a corresponding growth in total tax capacity value.
City of Burnsville 2022 Budget 141 Capital & Debt

This page intentionally left blank.
City of Burnsville 2022 Budget 142

City of Burnsville 2022 BudgetFees & Charges Schedules
Administration 144
Advertising & Sponsorship 145
Ames Center 147
Antenna Site Rental 150
Birnamwood Golf Course 152
Burnsville Community Television 154
Facilities Room Rental 155
Fire / EMS 157
Ice Center 160
Business Permits, Licensing & Code Enforcement 162
Permits & Inspections 165
Planning 169
Police 171
Public Works 172
Recreation 176
Utility 179
143

ADMINISTRATIVE CHARGES
Notary Public $1 per stamp
Candidate Filing Fee for Mayor/City Council $20
Recover Rate for Staff Time (data requests, etc.)
Actual Rate Including benefits (unless otherwise specified in another area)
Copies - Photocopy or Scanned
Black & White Copies - per page $0.25
Black & White - Oversize (11x17) $0.50
Black & White - Larger than 11x17 $5
Color - Letter/Legal Copies -per page $1
Color - Oversize (11x17) -per page $2
Color - Larger than 11x17 $10
Election Map - Full Size Color $10
Fee for Returned Check or ACH $30
Collections/Revenue Recapture/Miscellaneous Billing Assessment Administrative Fee $30
Miscellaneous Billing Assessment and Certification Interest Charge 4% above the most recent interest rates received on the sales of construction
improvement bonds, rounded up to the nearest .5%
Aggregate Tax Rate determined by State Statute
Hotel Lodging Tax * 3% of Monthly Net Receipts
Administration Fees & ChargesCity of Burnsville 2022 Budget
ITEM - ACTIVITY 2022
*Use of Lodging Tax Proceeds - 95% of the proceeds obtained from the collection of taxes is used to fund Burnsville Convention & Visitors Bureau. The City retains 5%.
City of Burnsville 2022 Budget 144 Fees & Charges - Administration

Birnamwood Golf Course Advertising
Tunnel Signs: (Minimum three-year contract) $300/year
Tee Signs: (Minimum three-year contract) or one-time fee for six years $400/year
$2,000/six years
Sign Installation: (One-time fee for tunnel or tee signs) $50
Score Card Advertising $200
Ice Center Advertising
Ice Resurfacer $1,000-$5,000/year (Includes both sides)
Rink 1 Dasher Board $500-$1,000/year
Rink 2 Dasher Board $300-$500/year
In Ice Logo $1,000-$3,000/year
Rink 1 Scoreboard $1,000-$4,000/year (Includes all four sides)
Rink 2 Scoreboard $650-$1,250/year
Softball Advertising/Sponsorship
Softball Website Sponsor Varies Per Agreement
Softball Facility Fence (Lac Lavon) Varies Per Agreement
Softball Facility Fence (Alimagnet or Neill) Varies Per Agreement
Softball Tournament Sponsor Varies Per Agreement
Softball Special Event Sponsor Varies Per Agreement
Softball Manager Meeting Varies Per Agreement
Outdoor Reader Board Messages
Welcome/Event Announcements for private events at City Hall or at Civic Center Parkway $50
Event Announcement for public events outside City Facilities held by non-profit organization $25
Print Publication and Web Advertising (All ad prices are dependent on placement within the publication)
Recreation Times
Full Page Ad $1,000-$1,500
Half Page Ad $650-$750
Quarter Page Ad $450
Community Guide
Full Page Ad $800-$1,250
Half Page Ad $400-$625
Quarter Page Ad $200-$250
Website Advertising *Google Ad Rates
Recreation Event Sponsorship
Thursday Rockin’ Lunch Hour
Presenting (10 concerts) $2,000
Community (per concert) $250
Party on the Plaza
Booth Sponsor $100-$650
Community Sponsor $1,000 - $2,500
Presenting Sponsor $2,000 - $5,000
Advertising & Sponsorship Fees & ChargesCity of Burnsville 2022 Budget
ITEM - ACTIVITY 2022
City of Burnsville 2022 Budget 145 Fees & Charges - Advertising and Sponsorship

Flicks on the Bricks
Presenting (5 movies) $2,000
Community (per movie) $500
I Love Burnsville Friday Fest
Presenting $500
Community $250
I Love Burnsville 5K
Presenting $500
Community $250
Halloween Fest
Presenting $500
Community $250
Adult 62+ Events
Community (per event) $250
Advertising & Sponsorship Fees & ChargesCity of Burnsville 2022 Budget
ITEM - ACTIVITY 2022
City of Burnsville 2022 Budget 146 Fees & Charges - Advertising and Sponsorship

Main Hall
Rent $2,200 $1,900
Second Performance on same day $1,100 $950
Load In Day/Rehearsal Day $1,100 $950
Utilities (per day) Included Included
Custodial Services (per performance) $500 $500
Ticketing Services (per event) $150 $150
Credit Cards - percent of Box office sales 4% 4%
Facility Fee (per ticket) $3 $3
Staffing
Technical Director (as required) per hour $38 $38
Box Office (per performance) $175 $175
Event Coordinator (per day) $175 $175
House Manager (per performance) $325 $325
House Staff (per performance) $300 $300
Security (per hour) (2 person minimum) $25 $25
Building Engineer (per day) $150 $150
House Lights/Sound (per day) Included Included
Spotlights (per performance) (doesn’t include operator) $75 $75
Stage Labor (per hour) (3 technician minimum, plus Technical Director) 4 hour minimum per person
$35 $35
Projector & Screen Included Included
Piano (includes tuning)*Rates do not include Technical Labor*All rates subject to change and negotiation
$225 $225
Black Box Theater
Rent (per performance) $800 $550
Second Performance on same day $400 $275
Load In Day/Rehearsal Day $300 $200
Utilities (per day) Included Included
Custodial Services (per performance) $250 $250
Ticketing Services (per event) $150 $150
Credit Cards - percent of Box office sales 4 % 4 %
Facility fee (per ticket) $3 $3
Staffing:
Technical Director (per hour) $38 $38
Box Office (per performance) $150 $150
Event Coordinator (per day) $175 $175
House Manager (per performance) $175 $175
Security (per hour) $25 $25
Technical package (per day) Included Included
Stage Labor (per hour) (4 hour minimum)*Rates do not include Technical Labor*All rates subject to change and negotiation
$35 $35
Art Gallery
Rent, hourly $110 $100
Ames Center Fees & ChargesCity of Burnsville 2022 Budget
ITEM - ACTIVITY 2022 2022 Non-Profit
City of Burnsville 2022 Budget 147 Fees & Charges - Ames Center

Utilities (per day) Included Included
House Manager, hourly Included Included
Custodial Services, hourly Included Included
Rehearsal Room
Rent, hourly $110 $100
Utilities (per day) Included Included
House Manager, hourly Included Included
Custodial Services, hourly Included Included
Meeting Rooms
Rent, hourly $95 $85
Utilities (per day) Included Included
House Manager, hourly Included Included
Custodial Services, hourly Included Included
Green Room
Rent, hourly $95 $85
Utilities (per day) Included Included
House Manager, hourly Included Included
Custodial Services, hourly Included Included
VIP Suite
Rent, hourly $95 $85
Utilities (per day) Included Included
House Manager, hourly Included Included
Custodial Services, hourly Included Included
Second Floor Atrium
Rent, Hourly $100 $90
Utilities (per day) Included Included
House Manager, hourly $30 $30
Custodial Services (depending on event type & attendance) (4 hour minimum) $100-$400 $100-$400
Podium with Microphone Included Included
Second Floor Atrium Wedding Information
Wedding packages Includes:-8 Hours in space-Tables & Chairs-Set Up/Clean Up-Dance Floor-Event Staff & Security-On-site event coordinator-Bar & Bartender-General Liability Insurance Policy
Call for Pricing N/A
Additional Items, Equipment Rental, and Applicable Fees
Bar Set Up (per bar) $100 $100
Linens - Tablecloth (per piece) $5 $5
Linens - Napkins (per bundle of 100) $25 $25
Technical Package - per 4 hours,excludes Main Hall/Black Box,4 hour minimum
$300 $300
Additional Hours of Tech Package $35 $35
Ames Center Fees & ChargesCity of Burnsville 2022 Budget
ITEM - ACTIVITY 2022 2022 Non-Profit
City of Burnsville 2022 Budget 148 Fees & Charges - Ames Center

Wi-Fi Included Included
Staging/Platforming $150 $150
Dance Floor $300 $300
Coffee - per person (plus tax & service charge) $2 $2
Water Service - per person (plus tax & service charge) $1 $1
Coat Check (non-ticketed events) per hour $25 $25
Parking Included Included
Ames Center Fees & ChargesCity of Burnsville 2022 Budget
ITEM - ACTIVITY 2022 2022 Non-Profit
*All rates are subject to change without notice. Rates are based upon event needs. Additional charges may apply.
*All staffing levels and schedules are at the discretion of the Center.
*All rates subject to Executive Director approval. Some dates as identified as prime dates may have additional fees.
*All events over 75 patrons or any event serving alcohol must have general liability insurance. A policy can be purchased on your behalf for $200 - $500 depending upon the event.
*All in-house catering is subject to sales tax and a 20% service charge.
City of Burnsville 2022 Budget 149 Fees & Charges - Ames Center
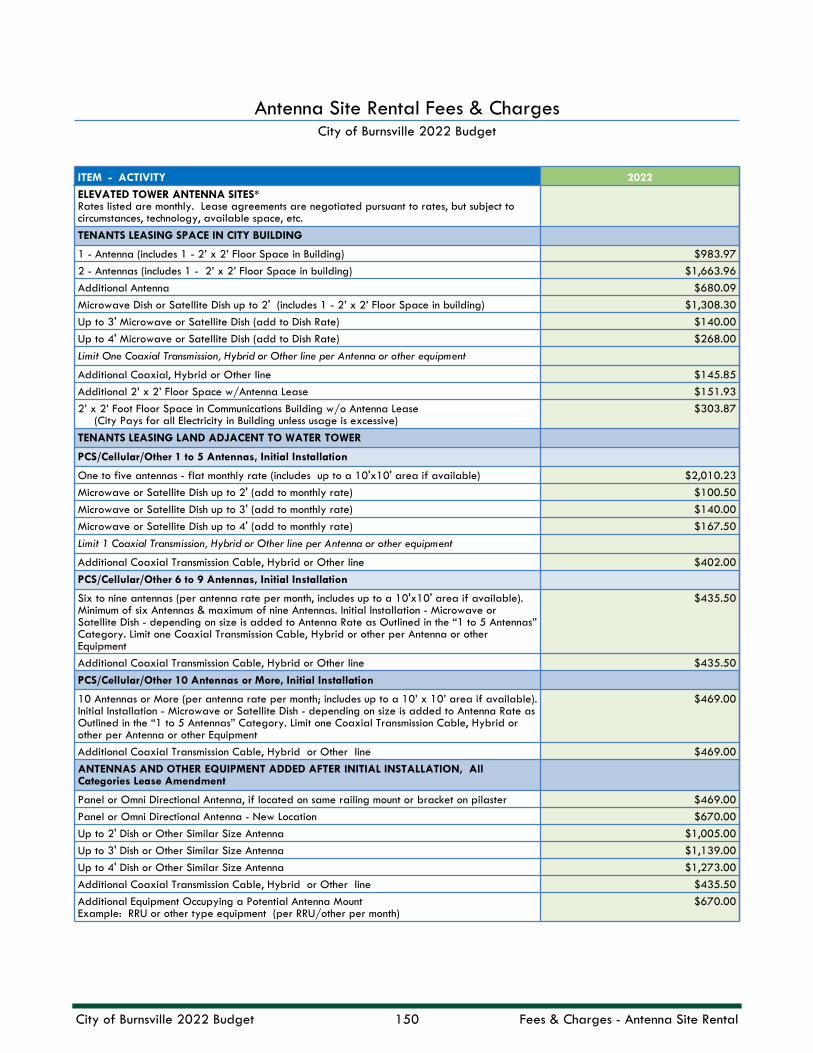
ELEVATED TOWER ANTENNA SITES*Rates listed are monthly. Lease agreements are negotiated pursuant to rates, but subject to circumstances, technology, available space, etc.
TENANTS LEASING SPACE IN CITY BUILDING
1 - Antenna (includes 1 - 2’ x 2’ Floor Space in Building) $983.97
2 - Antennas (includes 1 - 2’ x 2’ Floor Space in building) $1,663.96
Additional Antenna $680.09
Microwave Dish or Satellite Dish up to 2' (includes 1 - 2’ x 2’ Floor Space in building) $1,308.30
Up to 3' Microwave or Satellite Dish (add to Dish Rate) $140.00
Up to 4' Microwave or Satellite Dish (add to Dish Rate) $268.00
Limit One Coaxial Transmission, Hybrid or Other line per Antenna or other equipment
Additional Coaxial, Hybrid or Other line $145.85
Additional 2’ x 2’ Floor Space w/Antenna Lease $151.93
2’ x 2’ Foot Floor Space in Communications Building w/o Antenna Lease (City Pays for all Electricity in Building unless usage is excessive)
$303.87
TENANTS LEASING LAND ADJACENT TO WATER TOWER
PCS/Cellular/Other 1 to 5 Antennas, Initial Installation
One to five antennas - flat monthly rate (includes up to a 10'x10' area if available) $2,010.23
Microwave or Satellite Dish up to 2' (add to monthly rate) $100.50
Microwave or Satellite Dish up to 3' (add to monthly rate) $140.00
Microwave or Satellite Dish up to 4' (add to monthly rate) $167.50
Limit 1 Coaxial Transmission, Hybrid or Other line per Antenna or other equipment
Additional Coaxial Transmission Cable, Hybrid or Other line $402.00
PCS/Cellular/Other 6 to 9 Antennas, Initial Installation
Six to nine antennas (per antenna rate per month, includes up to a 10'x10' area if available). Minimum of six Antennas & maximum of nine Antennas. Initial Installation - Microwave or Satellite Dish - depending on size is added to Antenna Rate as Outlined in the “1 to 5 Antennas” Category. Limit one Coaxial Transmission Cable, Hybrid or other per Antenna or other Equipment
$435.50
Additional Coaxial Transmission Cable, Hybrid or Other line $435.50
PCS/Cellular/Other 10 Antennas or More, Initial Installation
10 Antennas or More (per antenna rate per month; includes up to a 10’ x 10’ area if available). Initial Installation - Microwave or Satellite Dish - depending on size is added to Antenna Rate as Outlined in the “1 to 5 Antennas” Category. Limit one Coaxial Transmission Cable, Hybrid or other per Antenna or other Equipment
$469.00
Additional Coaxial Transmission Cable, Hybrid or Other line $469.00
ANTENNAS AND OTHER EQUIPMENT ADDED AFTER INITIAL INSTALLATION, All Categories Lease Amendment
Panel or Omni Directional Antenna, if located on same railing mount or bracket on pilaster $469.00
Panel or Omni Directional Antenna - New Location $670.00
Up to 2' Dish or Other Similar Size Antenna $1,005.00
Up to 3' Dish or Other Similar Size Antenna $1,139.00
Up to 4' Dish or Other Similar Size Antenna $1,273.00
Additional Coaxial Transmission Cable, Hybrid or Other line $435.50
Additional Equipment Occupying a Potential Antenna MountExample: RRU or other type equipment (per RRU/other per month)
$670.00
Antenna Site Rental Fees & ChargesCity of Burnsville 2022 Budget
ITEM - ACTIVITY 2022
City of Burnsville 2022 Budget 150 Fees & Charges - Antenna Site Rental

Additional Equipment that does not occupy a Potential Antenna Mount but requires additional space on the tank or City monopoleExample: RRU or other type equipment (per RRU/Other per month)
$105.00
ADDITIONAL LEASE AREA - All Sites
Additional lease area for ground equipment up to 450 sq. ft. (if available and approved by the City). If footprint for proposed equipment is less than 450’, tenant will not be approved for 450’ even if space is for future equipment.
$1,215.50
…over 450 square feet (if available and approved by the City) $1.50/sq.ft.
MISCELLANEOUS FEES
Antenna Application - RF Study Rate set by consultant. See Antenna Application Form
ESCROW AGREEMENTS
Escrow Agreements will be utilized for out-of-pocket expenses related to new installations or site changes and modifications to existing Tenant facilities.Determined by the size of the project, i.e. if structural analysis is required, plan review, site survey, easements, attorney lease or amendment consent preparation
Varies
CITY LICENSE (DARK FIBER)
Subject to change due to Dakota Broadband Board rate adjustments
Public to Public per Pair $65.00 per mile/month
Public to Private per Strand $77.51 per mile/month
Antenna Site Rental Fees & ChargesCity of Burnsville 2022 Budget
ITEM - ACTIVITY 2022
City of Burnsville 2022 Budget 151 Fees & Charges - Antenna Site Rental

GREEN FEES
Weekdays (Monday-Thursday) $14.75
Weekends/Holidays (Friday, Saturday, and Sunday) $15.50
Second Nine 50% Off first round
Early Rate (before 7am on Mondays-Thursdays) $11.75
Senior Rate (62+, Mondays-Thursdays all day) $13.50
Junior Rate (15 & under, Mondays-Thursdays all day) $13.50
Large Group Rate/Outside League (Adult) $14.25
Large Group Rate/Outside League (Junior and Senior) $13.00
Large Group Rate/Outside League (Weekend) $15.00
Active Duty Military Discount $2 off regular round
Fall Discount Rate -October 1 to End of Season
$3 off regular round
PACKAGES (Usable all times)
10 Round $125
20 Round $235
ANNUAL PASSES (Usable all times)
1 Junior $375
1 Senior $375
1 Adult $400
FAMILY PASSES (Usable all times)
2 People $550
Additions (each) $118
LEAGUES
Adult $290
Senior $270
Junior $166
Annual Pass Holder $85
Junior League Annual Pass Holder $37
Sunday Fall $95
Sunday Fall Annual Pass Holder $16
Fall Adult $100
Fall Senior $89
Fall Annual Pass Holder $12
USGA Handicap fee-pass thru to USGA. Included in the 2022 league fee. $30
TOURNAMENTS
Fire Muster $16
Fall Scramble $28
RENTALS
Gas Cart $13
Senior Gas Cart $11
Gas Cart, 2nd Nine $6
Pull Cart $2
Clubs, Adult $5
Birnamwood Golf Course Fees & ChargesCity of Burnsville 2022 Budget
ITEM - ACTIVITY 2022
City of Burnsville 2022 Budget 152 Fees & Charges - Birnamwood Golf Course

Clubs, Junior $4
Locker Rental $35
15 Round Cart Rental $145
Birnamwood Golf Course Fees & ChargesCity of Burnsville 2022 Budget
ITEM - ACTIVITY 2022
City of Burnsville 2022 Budget 153 Fees & Charges - Birnamwood Golf Course

DUPLICATION SERVICES - DVD (Includes case & label)
1-19 Copies, per copy $30
20 Copies or more, per copy (Call for quote on larger orders) $15
Digital video file (download or transfer) $15
CLASS FEES
Individual Class $0
Group Class (2 or more) $0
PRODUCTION SERVICES (for other Government/Non-Profit)
Studio Rental with staff assistance (1/2 day) $250
Studio Rental with staff assistance (full day) $500
Production/Shoot/Edit/Script $55 hr/person
EQUIPMENT RENTAL (for other Government/Non-Profit)
Portable Cart $300/day-event
Camera/Tripod System $100/day-event
SPONSORSHIPS - Sports Cablecast
Pre- or Post-Game Show Sponsor $125/show
In-Game Sponsor $200/event
Play-of-the-Game Sponsor $75/event
Get to Know Package Sponsor $250/event
Total Package “Full Game” Sponsor $900/event
Burnsville Community TV Fees & ChargesCity of Burnsville 2022 Budget
ITEM - ACTIVITY 2022
City of Burnsville 2022 Budget 154 Fees & Charges - Community Television

Council Chambers
City Sponsored No charge
Local Non-Profit (3 hour min.)
Monday-Friday 7am-12am and Saturday 8am-4:30pm $21/hr
Saturday after 4:30pm and all day Sunday $44/hr
Local Resident/Business (3 hour min.) $64/hr$356/day
Non-Resident Individual/Business (3 hour min.) $73/hr$426/day
Community Room - Both Sides (Dakota and Nicollet)
City Sponsored No Charge
Local Non-Profit (3 hour min.)
Monday-Friday 7am-12am & Saturday 8am-4:30pm(3 hour min.)
$34/hr
Saturday after 4:30pm and all day Sunday(3 hour min.)
$88/hr
Local Resident/Business
(3 hour min. after 4:30pm Saturday, all day Sunday)
$156/hr$938/day
Non-Resident Individual/Business
(3 hour min. after 4:30pm Saturday, all day Sunday)
$175/hr$1041/day
Community Room - Large Side (Dakota A and B)
City Sponsored No Charge
Local Non-Profit (3 hour min.)
Monday-Friday 7am-12 midnight (3 hour min.)
$25/hr
Saturday after 4:30pm and all day Sunday (3 hour min.) $44/hr
Local Resident/Business
(3 hour min. after 4:30pm Sat., all day Sunday)
$131/hr$714/day
Non-Resident Individual/Business
(3 hour min. after 4:30pm Saturday, all day Sunday)
$131/hr$777/day
Community Room - Small Side (Dakota A, Dakota B, or Nicollet)
City Sponsored No Charge
Local Non-Profit (3 hour min.)
Monday-Friday 7am-12 midnight (3 hour min.)
$22/hr
Saturday after 4:30pm and all day Sunday (3 hour min.) $44/hr
Local Resident/Business
(3 hour min. after 4:30pm Saturday, all day Sunday)
$50/hr$316/day
Non-Resident Individual/Business
(3 hour min. after 4:30pm Saturday, all day Sunday)
$61/hr$392/day
Conference Rooms A, B, D
City Sponsored No Charge
Local Non-Profit (3 hour min.)
Monday-Friday 5pm-midnight (3 hour min.) $15/hr
Facilities Room Rental Fees & ChargesCity of Burnsville 2022 Budget
ITEM - ACTIVITY 2022
City of Burnsville 2022 Budget 155 Fees & Charges - Facilities Room Rental

Saturday after 4:30pm and all day Sunday (3 hour min.) $44/hr
Local Resident/Business (3 hour min.)
Monday-Friday 5pm-midnight (3 hour min.)
$26/hr
Saturday after 4:30pm and all day Sunday(3 hour min.)
$44/hr
Non-Resident Individual/Business(3 hour min.)
Monday-Friday 5pm-midnight (3 hour min.) $30/hr
Saturday after 4:30pm and all day Sunday (3 hour min.) $44/hr
Damage Deposit
Community Rooms $300
THE GARAGE
Rental fee for music non-profit organization use of site (per contract) $500 per month
Facility Reservation Cancellation Fee
Facility Reservation Cancellation Fee $25
Coffee with Rental
Per Cup $1
30 Cups $30
50 Cups $50
100 Cups $100
Equipment Rental and Applicable Fees
Wi-Fi Included with room rental fee
LCD Projector and Screen Included with room rental fee
TV/VCR/DVD on Cart Included with room rental fee
Overhead Projector Included with room rental fee
Whiteboard w/Markers, Easels, Pad Included with room rental fee
PA w/Speakers, 1 Hand-held Microphone Included with room rental fee
Required Technician Rate When Using Council Chambers Dias $50/hr per person; 4 hr minimum
Facilities Room Rental Fees & ChargesCity of Burnsville 2022 Budget
ITEM - ACTIVITY 2022
Other facility rental fees may be negotiated by contract.
City of Burnsville 2022 Budget 156 Fees & Charges - Facilities Room Rental

PARAMEDIC AMBULANCE FEES AND CHARGES
Basic Life Support $1,764
Advanced Life Support 1 $1,764
Advanced Life Support 2 $2,158
Treatment/No Transport $535
Treatment/No Transport - Cardiac Arrest $1,103
Mileage $25
SERVICES/STAND-BY
Chief Officer/Vehicle $105/hour
Firefighter $85/hour/person (2 hour min. per person)
Standby at non-City events or other instances that are not related to emergency response VEHICLES INCLUDE PERSONNEL: (1 hour minimum with additional ½ hour on each side of the event time for set up and clean up)
Ambulance $220/hour
Brush Truck $157.50/hour
Water Tender $210/hour
Fire Engine/Rescue Company $315/hour
Ladder Truck $525/hour
ADMINISTRATION FEES
Fire Report No charge until threshold of $2, then $.25/sheet
CD Copy with Pictures $20
Instructor Fee $55 - $100/hour
Ambulance Report No charge until threshold of $2.00, then $.25 per sheet
Sign-Off on Form Provided by Outside Entity $36
Interviews of Fire personnel regarding civil actions not involving the City or its employees (to be conducted during off-duty hours)
Minimum 2 ½ hours at time and ½ pay plus 20% PERA/Worker’s Comp.
Overhead charge.
PLAN REVIEW FEES
INTERNAL PLAN REVIEW - City Fire Personnel
First Plan (includes Hydraulic Calculations) Plan review fees are equal to 65% of the Fire permit fee
Subsequent Review of Rejected Plan Plan review fees are equal to 65% of the Fire permit fee
EXTERNAL PLAN REVIEW - Third Party Vendor, at City's discretion
First Plan (includes Hydraulic Calculations) - hourly rate set by outside contracted technical specialists
Plan review fees are equal to 65% of the Fire permit fee or the recovery cost of the third party vendor, whichever is greater. Estimated hourly rate ranges
from $106 to $160 per person per hour
Each Additional Plan for Same Project - hourly rate set by outside contracted technical specialists
Recovery cost of the third party vendor. Estimated hourly rate ranges from $106
to $160 per person per hour
Fire/EMS Fees & ChargesCity of Burnsville 2022 Budget
ITEM - ACTIVITY 2022
City of Burnsville 2022 Budget 157 Fees & Charges - Fire/EMS

Subsequent Review of Rejected Plan - hourly rate set by outside contracted technical specialists Plan review fees are equal to 65% of the Fire permit fee or the recovery cost of the third party vendor, whichever is greater. Estimated hourly rate ranges
from $106 to $160 per person per hour
SERVICE FEES
Vehicle Extrication Fee $500
Gas Line Encroachment Services/Standby Rate based on hours at scene (rounded up to next ½ hour)
Chief Officer/Vehicle $105/hour
Ambulance $220/hour
Brush Truck $157.50/hour
Water Tender $210/hour
Fire Engine/Rescue Company $315/hour
Ladder Truck $525/hour
Minimum 1 Hour Services/ Standby Rate per vehicle)
Department Response to Non-Compliant Fire Code, City Ordinance, and the Law Incidents Services/Standby Rate based on hours at scene (rounded up to next ½ hour)
Chief Officer/Vehicle $105/hour
Ambulance $220/hour
Brush Truck $157.50/hour
Water Tender $210/hour
Fire Engine/Rescue Company $315/hour
Ladder Truck $525/hour
Minimum 1 Hour Services/Standby Rate per vehicle)
Foam Use of More Than Three 5-Gallon Pails $115 per 5-gallon pail
PERMIT / INSPECTION FEESFire Alarm - Sprinkler - Cooking Hood Systems, Storage Tanks, & Fireworks require a final inspection from Staff.
Fire Suppression Permit Minimum $80 (includes $1 State surcharge)
1.5% of job value less than or equal to $10,000 and 1% of job value greater than $10,000 plus surcharge (.0005 x
job value)
Fire Alarm Permit (includes Low Voltage) Minimum $80 (includes $1 State surcharge)
1.5% of job value less than or equal to $10,000 and 1% of job value greater than $10,000 plus surcharge (.0005 x
job value)
Prescribed/Open/Controlled Burn Permit
(Must be performed by a licensed contractor and requires pre-burn and post-burn inspections)
$80
Prescribed/Open/Controlled Burn Extinguished by Fire Department(Failure to extinguish fire in compliance with permit issuance)
Services to Extinguish Rate based on hours at scene per vehicle (rounded up
to the next ½ hour)
Fire/EMS Fees & ChargesCity of Burnsville 2022 Budget
ITEM - ACTIVITY 2022
City of Burnsville 2022 Budget 158 Fees & Charges - Fire/EMS

Chief Officer/Vehicle $105/hour
Ambulance $220/hour
Brush Truck $157.50/hour
Water Tender $210/hour
Fire Engine/Rescue Company $315/hour
Ladder Truck $525/hour
Minimum 1 Hour Services/ Standby Rate per vehicle)
Permit Plan Review Permit Plan Reviews are subject to the same fees as Plan Review fees.
Commercial: Storage Tank Removal/Installation (per tank), Above Ground and Below Ground - All tanks except septic
$251
Residential: Storage Tank Removal/Installation (per tank), Above Ground and Below Ground - All tanks except septic
$65
Fire Department Special and Miscellaneous Inspections $130
Tent Permit: temporary indoor or outdoor assemblies and temporary use of tents in excess of 200 square feet or canopies in excess of 400 square feet. Tent shall include canopies, temporary membrane structures and air supported or air inflated structures
$50 per tent or canopy
Penalty for Failing to Obtain Permit - (Investigation Fee - intent is to double the permit fee (permit fee plus penalty)
Penalty for failing to obtain a permit prior to starting work required is up to the value of the permit fee established
herein.
Final Permit Inspection - First Attempt No Charge
Final Permit Inspection - 2nd and Subsequent Re-inspection $100
If the Contractor is not ready for the inspection or fails the inspection, the Contractor will be charged a fee for re-inspections.
FALSE FIRE ALARMS
First 3 Alarms No Charge
4th 4th $150
5th 5th $175
6th 6th $200
7th 7th $225
Increase for each additional alarm, no maximum (8th and more) $25 increase for each additional alarm, no maximum.
FIREWORKS PERMITS
Fireworks Only Retail Seller $350
Mixed Use Retail Seller $100
Fireworks Display Permit $150
APPLE VALLEY BURNSVILLE LAKEVILLE EAGAN TRAINING FACILITY RENTAL (ABLE)
Rental of Training Facility $250/hour(2 hour minimum)
ABLE Training Officer $80/hour
Cancellation Fee (less than 30 day notice) $75
DISASTER RESPONSE
Disaster Response (any vehicle) Current FEMA reimbursement rate for vehicle type and Direct Employee(s)
Cost
Fire/EMS Fees & ChargesCity of Burnsville 2022 Budget
ITEM - ACTIVITY 2022
City of Burnsville 2022 Budget 159 Fees & Charges - Fire/EMS

HOURLY ICE RENTAL
Spring/Summer Ice (Mar 15, 2022 - Sept 14, 2022)
$165-$210
Winter, Prime Time (Sept 15, 2022 - Mar 14, 2023) $240
Winter, Non-Prime Time (Sept 15, 2022 - Mar 14, 2023)
$165-$210
Winter, Non-Prime Weekday Morning (school year only - Sept 2022-May 2023)
$115
High School Games and Ice Center Ticket Sales Split 50% / 50%
BMVFSC and Ice Center Ticket Split for Annual Ice Show 50% / 50%
Manager has authority to negotiate within range per market demand
PUBLIC SKATING
Student and Adult (5-61 years)- Single Admission $7
Child and Senior Citizen- Single Admission (4 years and under/62 years and over) $5
Student and Adult 10-admission punch card $62
Student and Adult 20-admission punch card $119
Child and Senior 10-admission punch card $45
Child and Senior 20-admission punch card $85
BIRTHDAY PARTIES (based on number of participants)
1-5 people $45
6-10 people $60
11-15 people $90
16-20 people $125
21-25 people $155
Over 25 people add an additional fee per person $4
ADULT OPEN HOCKEY
League - Per Team $2,000 - $3,000
Weekday $10
Weekend $10
10-admission punch card $90
20-admission punch card $170
SKATING LESSONS
Private/Freestyle Lessons $120 - $210
General Group Lessons $55 - $130
SKATE RENTAL
Daily rental $5
10-Punch card $45
SKATE SHARPENING
Single Sharpening $7
10-Punch Card $62
SKATING SHOW
Participant, 1st Show Number $110
Participant, 2nd Show Number $90
Adult, 3-Show pass $30
Adult, single admission $12
Ice Center Fees & ChargesCity of Burnsville 2022 Budget
ITEM - ACTIVITY 2022
City of Burnsville 2022 Budget 160 Fees & Charges - Ice Center

Student/Senior, single admission $7
Child (4 years and under) Free
VENDING PERMIT
Daily Fee (Tournament Vendors, Other) $100
AAA TOURNAMENTS AND SUMMER CLINICS
Blaze Summer Clinics $1,000-$1,500
Ice Center Fees & ChargesCity of Burnsville 2022 Budget
ITEM - ACTIVITY 2022
City of Burnsville 2022 Budget 161 Fees & Charges - Ice Center

TOBACCO LICENSE July 1 - June 30
Tobacco License $380
LIQUOR, BEER AND WINE July 1 - June 30
On-Sale Liquor
License $8,100
Investigation Fee $1,500 + $250/individual
Investigation Renewal $75
Change in Operating Manager/Officer $250
Sunday On-Sale $200
Brewer Taproom License $400
Cocktail Room License $400
Brewpub License $380
Off-Sale
License (Non-participant of Best Practices) $380
License (Participant of Best Practices)*$100 reduction in fee for agreeing with Best Practices conditions as set forth by State Statute.
$280
Investigation Fee $1,500 + $250/Individual
Investigation Renewal $75
Change in Operating Manager/Officer $250
CLUB FEE
License $330-$700
Investigation Fee $265
Change in Operating Manager/Officer $250
WINE
License $1,730
Investigation Fee $500
Investigation Renewal $75
Change in Operating Manager/Officer $250
3.2 ON-SALE
License $590
Investigation Fee $500
Change in Operating Manager/Officer $250
3.2 Off-SALE
License $160
Investigation Fee $100
Change in Operating Manager/Officer $75
Temporary Liquor 1-4 days
Malt, Wine, On-Sale, and Community Festival $105/day
THERAPEUTIC MASSAGE July 1 - June 30
Annual Enterprise License (includes 1 individual license) $200
Annual Individual Therapist License $75
Investigation Fee-Enterprise (includes 1 owner) $300
Investigation Fee-Individual Massage Therapist $200
Business Permits, Licensing and Code Enforcement Fees & ChargesCity of Burnsville 2022 Budget
License Renewal
Period 2022
City of Burnsville 2022 Budget 162 Fees & Charges - Licensing and Code Enforcement

Reduction in investigation fee for providing current background report. (List of approved 3rd party background research companies and minimum report requirements will be provided by the Police Dept.)
($100)
Initial Inspection and 1st Reinspection (No charge if resolved at 1st reinspection)
No charge
Final Inspection (2nd reinspection) $185
RESELLER FEES July 1 - June 30
License $325
Investigation Fee/Change in Operating Manager/Officer Fee $500
Reseller Transaction Fee $1 per transaction
ADULT BUSINESS FEE Jan 1 - Dec 31
License $5,250
Investigation Fee $1,500
Change in Operating Manager/Officer $250
GAMBLING FEES 1-4 days
Gambling Occasion $100
Gambling Premises Permit Fee $250
LICENSING LATE FEE - percent of base fee 25% for 15-29 days late 50% for 30-45 days late 100% for over 45
days late
RENTAL LICENSING Annual
Apartment Complex per Building $160
Apartment Complex per Unit (in addition to per building charge) $15
Townhome Complex per Building $100
Townhome Complex per Unit (in addition to per building charge) $15
Manufactured Home Park (only if park owns and rents dwelling units ) $285
Manufactured Home Park per Unit (only for dwelling units owned and rented by the park)
$60
Individual Unit (Single Family, Condo, Townhouse, Manufactured Home, etc.)
$175
Individual Unit (condo, Townhouse, etc.) located within an association or within the same building
$175
Rental License Reinspection Fee (for any type of unit) $185
Rental License Reinstatement Fee (per unit or building) $200
Common Area Annual Fire Inspection (per building) $160
Common Area - Fire Reinspection Fee $185
Late Fee (as percent of base fee) 25% for 15-29 days late 50% for 30-45 days late 100% for over 45
days late
Administrative Appeal Fee
Residential $100
Commercial/Licensed Property $300
Rental Conversion Fee (new or over one year since expiration) $500
Short-Term Rental Permit Fee $55
PROPERTY MAINTENANCE n/a
Initial Inspection and 1st Re-inspection (no charge if resolved at 1st re-inspection)
No charge
Business Permits, Licensing and Code Enforcement Fees & ChargesCity of Burnsville 2022 Budget
License Renewal
Period 2022
City of Burnsville 2022 Budget 163 Fees & Charges - Licensing and Code Enforcement

Final Inspection (2nd re-inspection) and Citation $170
Final Inspection (2nd re-inspection) and Administrative Citation $120
Any Subsequent Inspections $120
Weed Control and Other Property Clean-Up Administration Fee (per service)
$50
PROPERTY REPAIR n/a
Property Repair Expense Assessment Request $420
Temporary Construction Noise Permit $175
CODE ENFORCEMENT FEES
Administrative Citations $120
Check Cashing Permit Public Hearing Fee $100
Missed Scheduled Inspection Fee (i.e. "No Show") $50
SPECIAL ASSESSMENT FEES
Administrative Fee (per code case) $50
Certification Interest Charge 4% above the most recent interest rates received on the sale of
construction improvement bonds,rounded up to the nearest 0.5%
SIGN PERMITS
Freestanding Temporary Sign $100
Temporary Banner Sign $200
SPECIAL EVENT PERMITS
Special Sales Event - Home Occupation $25
Special Events $150
Special Events (Outdoor one day event with same day on site advertising only)
$50
BUSINESS PERMITS
Special Event Right-of-Way Permit $121
Business Permits, Licensing and Code Enforcement Fees & ChargesCity of Burnsville 2022 Budget
License Renewal
Period 2022
City of Burnsville 2022 Budget 164 Fees & Charges - Licensing and Code Enforcement

Contractor's License - (Heating, Ventilation, Refrigeration and Air Conditioning) $140
Lead Certification Verification $5
Building Permits* (Includes Manufactured Home Setup)
Permit Range ($25-$5,957 for project value up to $1M) + $4/$1,000 of
project value >$1M
Building Permit Minimum Fee $74
Zoning Permit $78
Plan Review Fee 65% of permit fee
Foundation Inspection Fee $600
Final Grade and Stabilization $600
Residential Roofing $99
Residential Siding/Soffit/Fascia $99
Residential Windows/Doors $99
Building Permits - Residential
Investigation Fee (e.g., stop work, building without permit, visit of site of violation, and other similar according to code)
Minimum $99 up to the value of the permit fee cost or equal to the fixed
permit fee amount (fee must not exceed value of permit fee)
Reinspection Fee $25
Cancellation (without reasonable notification) $25
Building Permits - Commercial
Investigation Fee (e.g., stop work, building without permit, visit of site of violation, and other similar according to code)
Minimum $99 up to the value of the permit fee cost or equal to the fixed
permit fee amount (fee must not exceed value of permit fee)
Reinspection Fee $50 or not to exceed value of fixed permit fee
Cancellation (without reasonable notification) $25
MECHANICAL PERMITS - RESIDENTIAL*
Plumbing - New Single Family Residential $224
Plumbing Remodel $99
Plumbing Permits - Residential
Investigation Fee (e.g., stop work, building without permit, visit of site of violation, and other similar according to code)
Minimum $99 up to the value of the permit fee cost or equal to the fixed
permit fee amount (fee must not exceed value of permit fee)
Reinspection fee $25
Cancellation (without reasonable notification) $25
RPZ Permit -
Testing $30
New Installation $65
HVAC - New Single Family $224
HVAC Remodel $99
Heating Permits - Residential
Investigation Fee (e.g., stop work, building without permit, visit of site of violation, and other similar according to code)
Minimum $99 up to the value of the permit fee cost or equal to the fixed
permit fee amount (fee must not exceed value of permit fee)
Reinspection Fee $25
Permits & Inspections Fees & ChargesCity of Burnsville 2022 Budget
ITEM - ACTIVITY 2022
City of Burnsville 2022 Budget 165 Fees & Charges - Permits & Inspections

Cancellation (without reasonable notification) $25
Gas Piping (per opening) $30
Water and Sewer - Residential $174
Private Disposal System $600
Fireplace $74
Water Softener, Water Heater, Air Conditioner, Furnace, or Single Fixture Replacement Only $74
MECHANICAL PERMITS - COMMERCIAL
Plumbing - Non-Residential .0263 of Contr.
Heating - Non-Residential .0263 of Contr.
Heating Permits - Commercial
Commercial Mechanical Plan Review Fee (for all plans) 10% of the cost HVAC Permit Fee
Investigation Fee (e.g., stop work, building without permit, visit of site of violation, and other similar activity that requires a permits according to code)
Minimum $99 up to the value of the permit fee cost or equal to the fixed
permit fee amount (fee must not exceed value of permit fee)
Reinspection Fee $50 or not to exceed value of fixed permit fee
Cancellation without reasonable notification $25
Gas Piping (per opening) $30
Water and Sewer - Commercial $270
Commercial Fire Line $270
Utility .0263 of Contr.
Plumbing Permits - Commercial
Commercial Plumbing Plan Review Fee: Required to have plan review for 5 fixtures or more 10% of the cost Plumbing Permit Fee
Investigation Fee (e.g., stop work, building without permit, visit of site of violation, and other similar according to code)
Minimum $99 up to the value of the permit fee cost or equal to the fixed
permit fee amount (fee must not exceed value of permit fee)
Reinspection Fee $50 or not to exceed value of fixed permit fee
Cancellation (without reasonable notification) $25
ELECTRICAL PERMITS - RESIDENTIAL*
Complete wiring of new construction (includes service) $224
Upgraded electrical services and sub-panels $74
Wiring of additions/remodeling/rewiring $99
Minor work only (Installation, replacement, alteration, or repair limited to one inspection only)
$74
Saver switch (installation verification inspection) $45
Electrical Permits - Residential
Investigation Fee (e.g., stop work, building without permit, visit of site of violation, and other similar according to code)
Minimum $99 up to the value of the permit fee cost or equal to the fixed
permit fee amount (fee must not exceed value of permit fee)
Reinspection Fee $25
Cancellation (without reasonable notification) $25
ELECTRICAL PERMITS - COMMERCIAL
Permit Fee based on Job Cost
$0-$25,000 in valuation .0263 of Contr.
Permits & Inspections Fees & ChargesCity of Burnsville 2022 Budget
ITEM - ACTIVITY 2022
City of Burnsville 2022 Budget 166 Fees & Charges - Permits & Inspections

Balance remaining $25,001 & over 1% of Contr.
Electrical Permits - Commercial
Investigation Fee (e.g., stop work, building without permit, visit of site of violation, and other similar according to code)
Minimum $99 up to the value of the permit fee cost or equal to the fixed
permit fee amount (fee must not exceed value of permit fee)
Reinspection Fee $50 or not to exceed value of fixed permit fee
Cancellation (without reasonable notification) $25
MISCELLANEOUS
Quarterly Basis Facility Maintenance .0263 of Contr.
0 - 200 Amps temporary service during construction $74
Over 200 Amp temporary service during construction $135
Elevators and/or Moving Stairs $74
Carnival/Amusement Rides $225
Swimming Pools $138
Minimum fee for all permits $74
STATE SURCHARGE ON COMMERCIAL BUILDING, AND MECHANICAL PERMITS
Surcharge Minimum fee
$.0005 of value Minimum $1
SIGN PERMITS Temporary and Special Event Sign Permits located in Business Permits, Licensing and Code Enforcement Fee Schedule
Pylon Sign Permit $267
Monument Sign Permit $267
Freestanding Sign Permit $267
Wall Sign Permit $185
Sign Face Change Permit $185
Awning Signs (per building) and signs must all be the same $185
Temporary Decal Installation $267
Other Signs $78
GRADING PERMIT FEES
90 cu. yds. or less No charge
91 - 100 cu. yds. $48
101-1,000 cu. yds. $48/1st 100 yds. + $22/per additional 100 yds. or fraction
1,001-10,000 cu. yds. $246/1st 1,000 yds. + $18/ additional 1,000 yds. or fraction
10,001-100,000 cu. yds. $408/1st 10,000 yds. + $78/additional 10,000 yds. or fraction
100,001 cu. yds. or more $1,110/1st 100,000 yds. + $43/additional 10,000 yds. or fraction
GRADING PLAN REVIEW FEES
90 cu. yds. or less No charge
91 - 1,000 cu. yds. $48
1001-10,000 cu. yds. $62
10,001-100,000 cu. yds. $62/1st 10,000 yds. +$31/additional 10,000 yds. or fraction
Permits & Inspections Fees & ChargesCity of Burnsville 2022 Budget
ITEM - ACTIVITY 2022
City of Burnsville 2022 Budget 167 Fees & Charges - Permits & Inspections

100,001-200,000 cu. yds. $341/1st 100,000 yds. + $18/additional 10,000 yds. or fraction
200,001 cu. yds. or more $503/1st 200,000 yds. + $9/additional 10,000 yds. or fraction
BUILDING COMPLIANCE REQUESTS
Sign-Off on Form Provided by Outside Entity $36
Per Site Inspection - (Based on each trip required) / Compliance Letter $150 per inspection
Site Plan Review - (Code Analysis) $386
Permits & Inspections Fees & ChargesCity of Burnsville 2022 Budget
ITEM - ACTIVITY 2022
*A Fee for any residential building permit may be reduced by a credit with a receipt from a related Community Education Class.
City of Burnsville 2022 Budget 168 Fees & Charges - Permits & Inspections
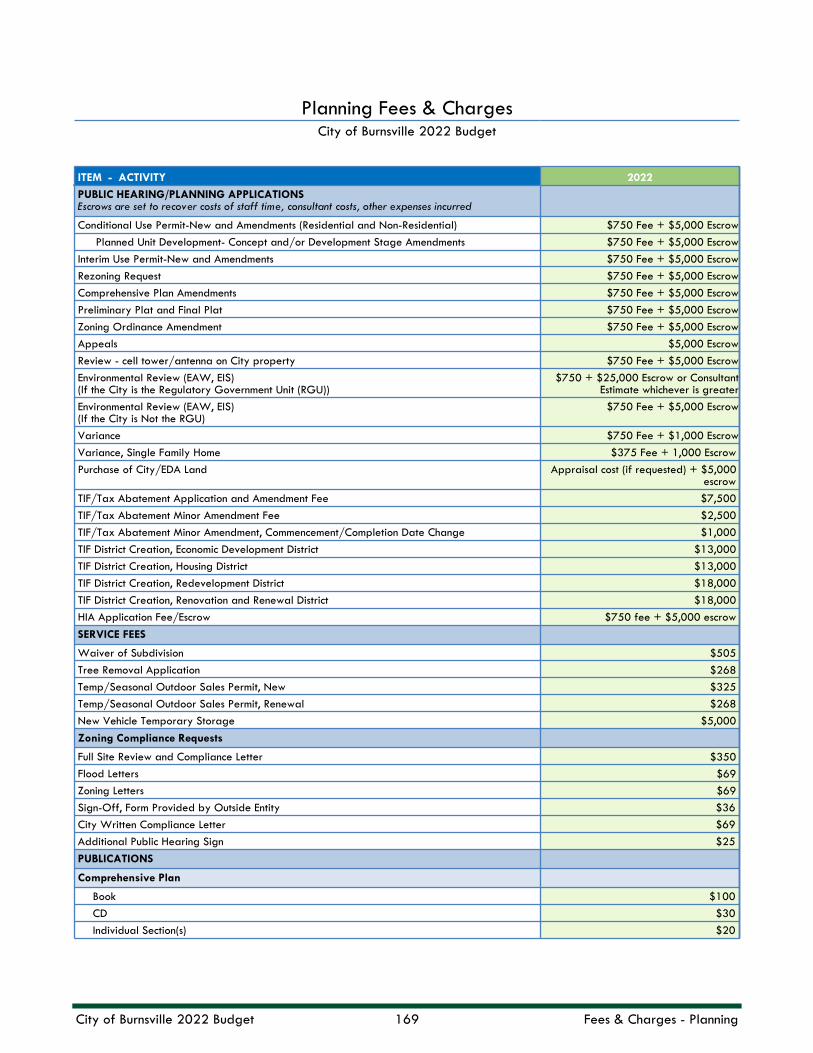
PUBLIC HEARING/PLANNING APPLICATIONSEscrows are set to recover costs of staff time, consultant costs, other expenses incurred
Conditional Use Permit-New and Amendments (Residential and Non-Residential) $750 Fee + $5,000 Escrow
Planned Unit Development- Concept and/or Development Stage Amendments $750 Fee + $5,000 Escrow
Interim Use Permit-New and Amendments $750 Fee + $5,000 Escrow
Rezoning Request $750 Fee + $5,000 Escrow
Comprehensive Plan Amendments $750 Fee + $5,000 Escrow
Preliminary Plat and Final Plat $750 Fee + $5,000 Escrow
Zoning Ordinance Amendment $750 Fee + $5,000 Escrow
Appeals $5,000 Escrow
Review - cell tower/antenna on City property $750 Fee + $5,000 Escrow
Environmental Review (EAW, EIS)(If the City is the Regulatory Government Unit (RGU))
$750 + $25,000 Escrow or Consultant Estimate whichever is greater
Environmental Review (EAW, EIS)(If the City is Not the RGU)
$750 Fee + $5,000 Escrow
Variance $750 Fee + $1,000 Escrow
Variance, Single Family Home $375 Fee + 1,000 Escrow
Purchase of City/EDA Land Appraisal cost (if requested) + $5,000 escrow
TIF/Tax Abatement Application and Amendment Fee $7,500
TIF/Tax Abatement Minor Amendment Fee $2,500
TIF/Tax Abatement Minor Amendment, Commencement/Completion Date Change $1,000
TIF District Creation, Economic Development District $13,000
TIF District Creation, Housing District $13,000
TIF District Creation, Redevelopment District $18,000
TIF District Creation, Renovation and Renewal District $18,000
HIA Application Fee/Escrow $750 fee + $5,000 escrow
SERVICE FEES
Waiver of Subdivision $505
Tree Removal Application $268
Temp/Seasonal Outdoor Sales Permit, New $325
Temp/Seasonal Outdoor Sales Permit, Renewal $268
New Vehicle Temporary Storage $5,000
Zoning Compliance Requests
Full Site Review and Compliance Letter $350
Flood Letters $69
Zoning Letters $69
Sign-Off, Form Provided by Outside Entity $36
City Written Compliance Letter $69
Additional Public Hearing Sign $25
PUBLICATIONS
Comprehensive Plan
Book $100
CD $30
Individual Section(s) $20
Planning Fees & ChargesCity of Burnsville 2022 Budget
ITEM - ACTIVITY 2022
City of Burnsville 2022 Budget 169 Fees & Charges - Planning

Zoning Ordinance and Map $65/$70
Zoning Map, Large/Small $40/$15
Planning Fees & ChargesCity of Burnsville 2022 Budget
ITEM - ACTIVITY 2022
City of Burnsville 2022 Budget 170 Fees & Charges - Planning

SERVICE FEES
Notary Public $1 per stamp
Recover Rate for Staff Time, Officer Interviews Minimum 2.5 hours at Overtime Rate + 20% admin fee (unless specified in
another area)
Clearance Letter $32
Fingerprinting $37
Report copy - accident/other:
B&W $.25 per page
Color - letter or legal $1 per page
Oversized (11x17) $2 per page
Records requested by subpoena $.25 per page
Computerized record search $.25 per page - or actual costs of searching/retrieving data based on
clerical salary
911 and Audio Statement Transcripts $29 per hour ($29 deposit)
Registration fee (peddlers, solicitors, transient merchants, and mobile vending) $110
Dangerous dog registration $250
Temporary animal event permit $125
NEWS RELEASES
Arrest and citation reports for commercial purposes $.25 per page
Accident reports for commercial purposes $.50 per accident
Audio/Video/Photo - CDs/DVDs/Blu-Rays $35
ANIMAL RECLAMATION/IMPOUND FEES*
Board per day $25
First pick-up within 12 month period $35
Second pick-up within 12 month period $55
Third pick-up within 12 month period $105 plus citation
Confinement of rabid animal $425
KENNEL LICENSE FEES - PER CALENDAR YEAR
Commercial $225
Residential $60
CONTRACTED OVERTIME
Contracted Overtime for Police Security $95/hour
CRIME SCENE CLASS
Crime Scene Class $700 - $800
FALSE POLICE ALARMS
First 3 Alarms $0/No Charge
4th and Successive Alarm(s) $160 per alarm
Police Fees & ChargesCity of Burnsville 2022 Budget
ITEM - ACTIVITY 2022
*Fees collected and retained by animal control contractor.
City of Burnsville 2022 Budget 171 Fees & Charges - Police

Street Reconstruction, Reclamation & Rehabilitation Assessment Policy40% of the 3-year average of recon/reclamation/rehab construction costs
LAND USE: Recon/Reclamation/Rehab
Single Family, Parks/Rec. & Open Space Land Uses*Single family (detached and attached) are assessed a per-unit assessment based on these established rates
$36.22/$21.85/$16.12 Per ft
Multi-Family Residential and Manufactured Housing Land Uses $50.32/$33.58/$21.88 Per ft
All Other Land Uses $67.92/$47.89/$26.81 Per ft
STORM SEWER AREA CHARGES
Single Family & Two Family (All R-1 & R-2 Zoning) $.25/Sq Ft
Multiple (All R-3 Zoning)(Mixed Use) $.34/Sq Ft
Commercial-Industrial (All B & I Zoning) $.37/Sq Ft
HOC 1 & 2 $.36/Sq Ft
City Sanitary Sewer Connection Charges (SAC)
Single Family, Duplex, Townhouse, Manufactured Home $603/SAC unit
Multiple (80% of Single Family), includes assisted living $603/SAC unit
Commercial $603/SAC unit
Industrial $603/SAC unit
Institutional: Churches, Schools, Hospitals, Nursing Homes $603/SAC unit
Mixed Use Total of the applicable mixed use fee
City Water Connection Charges (WAC)
Single Family, Duplex, Townhouse, Mobile Home $1,866/SAC unit
Multiple (80% of Single Family) includes assisted living $1,492/SAC unit
Commercial $1,866/SAC unit
Industrial $1,866/SAC unit
Institutional: Churches, Schools, Hospitals, Nursing Homes $1,866/SAC unit
Mixed Use Total of the applicable mixed use fees
CONSTRUCTION IN PUBLIC RIGHT-OF-WAY (ROW)
Curb Cuts $115
Excavation Permit $310 First 300 feet, $.20/each add'l ft
Obstruction Permit $121
BUS BENCHES
Bus Benches $40
Bus Benches License Renewal $175
Public Works Fees & ChargesCity of Burnsville 2022 Budget
ITEM - ACTIVITY 2022
City of Burnsville 2022 Budget 172 Fees & Charges - Public Works

MISC. DEVELOPMENT COSTS
Street Signs $385
Combined Street & Stop Sign $490
Regulatory/Warning Signs $300
Topo Mapping (Final Plat) $50/acre
Blue Prints $16/sheet
LICENSES & PERMITS
Solid Waste License Fee $345
Tree Contractor License Fee $45
Wetland Permit Fee $340
GIS Mapping $160/hour
PARK DEDICATION FEESThe Park Dedication formula is contained in the Subdivision Section of the City Code (Section 11-4-8). These fees establish the average cost per acre by zoning district and are utilized for purposes of calculating park dedication when City Council elects to take cash in lieu of land.
Based on a limited market value analysis conducted by a Real Estate Appraiser on an as-needed basis.
R1-A $60,000
R-1 $100,000
R-2 $125,000
R3-A $175,000
R3-B $240,000
Mixed Pro-rated based on actual use
Commercial $375,000
Industrial $185,000
Commercial Recreation District Determined by the County Assessor
OTHER
Encroachment Agreements, Processing Fee $552
Vacation of Easements $552
Online Bidding Downloads (Quest Fee, subject to change) $15/per download
Quest Online Bidding Fee Selection (Quest Fee, subject to change) $15/per download
Residential Hardship Boulevard Mowing Program (RHBMP) $130/lot
ELECTRIC VEHICLE CHARGING STATIONS
Charge Vehicles, per kilowatt hour $0.10 per kilowatt hour
Non-Charging Use of Station $2/hr after 1 hour grace period
EROSION CONTROL
Single Family (per lot) $78
Multi-Family (per acre) $102
Commercial (per acre) $114
MAILBOX DAMAGED DUE TO WINTER STREET MAINTENANCE
Mail Box Only $50
Post Only $53
Public Works Fees & ChargesCity of Burnsville 2022 Budget
ITEM - ACTIVITY 2022
City of Burnsville 2022 Budget 173 Fees & Charges - Public Works

SPECIAL ASSESSMENTS
Special Assessment Interest(Average Interest on Debt Issued = average interest costs on most recent G.O. Improvement Bonds issued - the cost of borrowing to fund special assessments)
Average Interest on Debt Issued, plus 2% (Rounded up to nearest .5%)
New Water Connection Meter or Replacement(With Encoder & Electronic Radio Transmitter) Fees are set by current pricing from vendor plus 10%. Price changes vary by meter due to using current actual pricing from the vendor. The fee includes the meter, electronic radio transmitter, and connection hardware.
Sensus Meters
3/4 inch Meter Only $154
3/4 inch $342
1 inch Meter Only $242
1 inch $439
1 ½ inch R2 $801
1 ½ Inch T2 $1,197
2 inch R2 $1,054
2 inch T2 $1,362
2 inch C2 $1,857
3 inch T2 $1,722
3 inch C2 $2,360
4 inch T2 $3,161
4 inch C2 $3,931
6 inch T2 $5,145
6 inch C2 $6,301
Other and Specialty Meters Actual + 10%
Tampered/Damaged/Frozen Meter Replacement Meter cost plus $70 service call fee
Meter Horn 3/4 inch with swivel $113
Meter Horn 3/4 inch $82
Meter Horn 1 inch with swivel $199
Meter Horn 1 inch $168
Pressure Reducing Valve (¾ Inch Wilkins) $147
HYDRANTS
Hydrant Meter Rental Usage Charge - per 1000 gallons
$4.33 per 1000 gallons - Minimum of $100
2" or 3" Meter Refundable Deposit (if available) $1,675 Deposit
1" Meter Refundable Deposit $675 Deposit
Private Hydrant Inspection (Fee relates to the year of inspection/costs incurred by the city. The property is billed in arrears spread over the following year’s utility bills.)
$59 per hydrant
Private Hydrant Electronic Reporting Fee $12
Hydrant Replacement - Materials, Equipment, and Labor Rate
Cost plus 20% Overhead
PUBLIC WORKS/UTILITIES LABOR/EQUIPMENT FEE
Labor - Operator Regular Time - Hourly Labor Rate Including 20% Overhead Fee
Public Works Fees & ChargesCity of Burnsville 2022 Budget
ITEM - ACTIVITY 2022
City of Burnsville 2022 Budget 174 Fees & Charges - Public Works

Labor - Operator Overtime (1 1/2 Regular rate) - Hourly Labor Rate Including 20% Overhead Fee
Heavy Equipment - Per Hour $164
Pickup - Per Hour $73
Weed Wrench-Buckthorn Removal $150 refundable deposit
WATER USE RESTRICTION FEES
1st Violation within a calendar year Warning Only
2nd Violation within a calendar year $25
3rd Violation within a calendar year $50
4th Violation within a calendar year $100
5th Violation within a calendar year $250
Public Works Fees & ChargesCity of Burnsville 2022 Budget
ITEM - ACTIVITY 2022
City of Burnsville 2022 Budget 175 Fees & Charges - Public Works

Recreation Buildings
Recreation Building Rental Damage Deposit for four park building rentals
Neill, Terrace Oaks West, Vista View $300 $300
Nicollet Commons Park $250 $250
Terrace Oaks / Neill / Vista View
5 Hours Mon -Thurs $85 $105
Per Day - Fri, Sat, Sun and Holidays $150 $170
Red Oak / NRH
5 Hours Mon - Thurs $65 $85
Per Day - Fri, Sat, Sun and Holidays $105 $130
Timberland/Knob Hill/Highland Forest/Terrace Oaks East/South River Hills
5 Hours Mon - Thurs $45 $55
Per Day - Fri, Sat, Sun and Holidays $75 $85
Picnic Shelters
Large - Per Day - Fri, Sat, Sun and Holidays $135 $165
Large - 5 hours Mon-Thurs only $80 $105
Large - hourly rate, minimum 2 hours, Mon-Thurs only $30 $35
Small - Per Day - Fri, Sat, Sun and Holidays $85 $105
Small - hourly rate, minimum 2 hours, Mon-Thurs only $30 $35
Park Rental (without Shelter) per day
Tyacke Park / Lake Park $130 $135
Amphitheater per day $85 $100
Bicentennial Garden - per hour $25 $30
Nicollet Commons Park - per 4 hours $220 $260
Lac Lavon Concession
Concession Stand Rent $150 $150
Field Rental (Non Leagues)
Camp/Non-Local Youth Tournament/per Day $54 $57
SB/BB/FB/Soccer - per Hour $21 $23
Youth Tournament Fees $40 per day per field $240 per day
max
N/A
Tournaments *
Lac Lavon
Saturday $385 $425
Sunday $290 $320
Other Sites - Sue Fischer, Neill, Alimagnet SB
Friday - per Field after 4pm $24 $27
Saturday - per Field $50 $63
Sunday - per Field (off at 4pm) $38 $46
Tournament Staff ReimbursementSeasonal employee per hour
$15 N/A
Tournament Cancellation Fee (inside 30 days) $100 $100
Recreation Fees & ChargesCity of Burnsville 2022 Budget
ITEM - ACTIVITY 2022 Resident2022 Non-Resident
City of Burnsville 2022 Budget 176 Fees & Charges - Recreation

Enhanced Service Fee - Ball Fields
Burnsville Athletic Club $11,238 N/A
Valley Athletic Association $487 N/A
League Play *
Adult Softball
(Public) - per Game $14 N/A
(Private) - per Game $16 N/A
(Public) - per field playoffs $50 N/A
Adult BB/High School - per Game $57 N/A
Adult Soccer - per Game $54 N/A
Volleyball - per Game $10 N/A
Adult Ice Sports - per Game $15 N/A
BA 191 - per Game $10 N/A
Red Oak Disc Golf Course
Tournament Rate- 6 Hr block of time $157 $167
League Rate - Per 12 week league $52 $63
Hockey Rinks
Per Hour During Open Hours $15 $17
Per hour during non-staffed hours[staff provided] $25 $30
Per day/per rink $82 $99
Park Rentals & Permits
Tennis Courts
per hour $8 $9
per day\per court $21 $26
per complex\per day $84 $94
Pickleball Courts
per hour $8 $9
per day\per court $21 $26
per complex\per day $84 $94
Volleyball Courts (No Ball)
per hour $10 $12
Canoe Rack Rental - per year $60 $75
Canoe Rental - per hour (Crystal Beach Concession)
$15 $18
Canoe Rental - add’l hour (Crystal Beach Concession)
$10 $10
Canoe Rental Deposit - (refundable upon return of canoe in acceptable condition) $25 $25
Paddleboard Rental - first hour (Crystal Beach Concession)
$15 $18
Paddleboard Rental - add’l hour (Crystal Beach Concession)
$10 $10
Paddleboard Rental Deposit - (refundable upon return of canoe in acceptable condition) $25 $25
Garden Plot - per year $45 N/A
Mandala Style Plots
20' x 10' Plot $50 N/A
Recreation Fees & ChargesCity of Burnsville 2022 Budget
ITEM - ACTIVITY 2022 Resident2022 Non-Resident
City of Burnsville 2022 Budget 177 Fees & Charges - Recreation

10' x 10' Plot $45 N/A
5' x 20' Plot $45 N/A
5' x 10' Plot $30 N/A
Garden Plot applicants may request scholarship assistance for up to 1/2 the fee of the plot
Vending Permits - Food Trucks, vendors in parks, etc.
per day $55 N/A
per year $500 N/A
per City Sponsored Event - flat fee $50 - $250 N/A
per City Sponsored Event - revenue share Varies per agreement
Dog Park Permit
per year $25 $25
Lac Lavon Boat Launch $10 $10
Event Bag - COUPON DISTRIBUTION $25 N/A
Memorial Bench Fee- Partnership with Burnsville Community Foundation
$1,800 $1,800
Civic Center Parking Lot - per day(Lots B & C Only)
$150 $210
Youth Programs & Individual Session Fees
KOS - Kids of Summer $140 per session or $250 for both
sessions
N/A
Individual Session $75-$100 N/A
KOS Field Trips $12-$100 N/A
Summer Day Camps $18-$155 N/A
Field Trips $18-$125 N/A
Non-School Day Activities $18-$125 N/A
Family programs and Special Events $5-$20 N/A
Preschool programs $40-$65 N/A
Adult Team Program Fees (All rates are per team)
Softball
Summer $500-$910 N/A
Fall $340-$760 N/A
Broomball $240-$380 N/A
Sand Volleyball $100-$160 N/A
Bean Bag League $40-$100 N/A
Indoor Volleyball League $120-$200 N/A
Cross Country Ski
Cross Country Ski Trails - per day $110 $113
Cross Country Ski Practice (High School Teams)
$110/$22 $120/$28
Recreation Fees & ChargesCity of Burnsville 2022 Budget
ITEM - ACTIVITY 2022 Resident2022 Non-Resident
* Any extracurricular activity (such as baseball, softball, football, tennis, soccer, chess, cheerleading, dance, etc) that has comparable facilities available within the School District 191 will be assessed 75% of the normal recreation fee.
City of Burnsville 2022 Budget 178 Fees & Charges - Recreation

WATER USAGE RATES-Monthly Charges
Residential, Apartments, & Manufactured Homes(Apartment & Manufactured Homes Base charge and consumption limits are multiplied by the # of units)
Tier 1 - up to 5,000 gallons per month $2.32/1,000 Gal
Tier 2 - Over 5,000 gallons per month up to 15,000 gallons per month $2.89/1,000 Gal
Tier 3 - Over 15,000 gallons per month $3.62/1,000 Gal
Commercial
Tier 1 - up to 15,000 gallons per month $2.32/1,000 Gal
Tier 2 - over 15,000 gallons per month up to 105,000 gallons per month $2.89/1,000 Gal
Tier 3 - Over 105,000 gallons per month $3.62/1,000 Gal
Irrigation (Includes Commercial, Apartment, Manufactured Home,& Association Sprinkler/Irrigation Meters)
All usage $3.62/1,000 Gal
Off-Peak Seasonal Snow Making
All usage $2.58/1,000 Gal
SEWER USAGE RATES-Monthly Charges
Residential, Apartments, & Manufactured Homes (Apartments & Manufactured Homes Base charges are per unit)
Base Charge - Sewer - per meter $6.25
Base Charge - Sewer Only - not metered $26.51
Usage - Sewer Based on 100% Metered Water for Winter Months
$4.05/1,000 Gal
Commercial/Industrial
Base Charge - Sewer - per meter $6.25
Base Charge - Sewer Only - not metered $26.51
Usage - Sewer Based on 100% Metered Water for Winter Months
$4.05/1,000 Gal
OTHER WATER UTILITY CHARGES
Water Meter Base Charges - Residential, Apartments, Manufactured Homes & Commercial
Base Charge based on Meter Size - per meter each month:
Meters:
5/8 inch x 3/4 inch $9.26
1 inch $23.15
1 ½ inch R2 $46.31
1 ½ inch T2 $55.57
1 ½ inch C2 $55.57
2 inch R2 $74.09
2 inch T2 $87.98
2 inch C2 $74.09
3 inch T2 $201.89
3 inch C2 $162.07
4 inch T2 $347.29
4 inch C2 $277.83
Utility Fees & ChargesCity of Burnsville 2022 Budget
(Utility rates billed on monthly utility bills go in effect for all billings processed after January 31, 2022)
ITEM - ACTIVITY 2022
City of Burnsville 2022 Budget 179 Fees & Charges - Utility

6 inch T2 $740.88
6 inch C2 $625.12
8 inch Buck Hill $1,296.54
Other & Specialty Meters Match formula for other base fees
Water Fill Station Charges
Water Usage Charge per 1000 gallons $4.33 per 1000 Gallons
Other
Water turn On / Off / Service Call $70.00
After Hours Call Out for Water Turn Off/On/Service Call Overtime Rate +20%
WATER & SEWER FEES
Annual certification administrative charge $50.00
Certification administrative charge for accounts requiring certification more frequently than annually
10% of unpaid balance
Certification interest charge 4% above the most recent interest rates received on the sales of
construction improvement bonds rounded to the nearest .5%
Late payment penalty charge - per month 1.5 %
Duplicate utility bill fee $1.00
Fee for Returned Check or ACH Amount of returned check or ACH added back on utility account balance.
External Manual Meter Reading $70 Per monthly read
STORM DRAINAGE UTILITY CHARGES
Per Residential Equivalent Unit (R.E.U.) - Monthly Charge $7.45 R.E.U
SIDEWALK SNOWPLOWING
Charged only to benefiting properties
Residential (R1 and R2 Zoning) Monthly Charge (per unit) $1.82
All Other Zoning Districts - Monthly Charge (per foot) $0.02
Public Property Sidewalks and Trails (Charged to all utility accounts within City)
Residential - Monthly Charge $0.19
High Density - Monthly Charge per Unit (60% of Residential Rate)
$0.10
Commercial/Industrial - Monthly Charge $1.77
STREET LIGHT UTILITY
Continuous Street Lighting (Charged only to benefiting properties)
Residential - Monthly Charge High density is based on 60% of residential rate (Only applies to Itokah Valley & Coppertop II)
$2.86
Commercial/Industrial - Monthly Charge- Per front foot
$0.136
Major Roadway Lighting (Charged to all utility accounts within City)
Residential - Monthly Charge $0.34
Utility Fees & ChargesCity of Burnsville 2022 Budget
(Utility rates billed on monthly utility bills go in effect for all billings processed after January 31, 2022)
ITEM - ACTIVITY 2022
City of Burnsville 2022 Budget 180 Fees & Charges - Utility

High Density - Monthly Charge per Unit (60% of Residential Rate)
$0.205
Commercial/Industrial - Monthly Charge $3.235
Utility Fees & ChargesCity of Burnsville 2022 Budget
(Utility rates billed on monthly utility bills go in effect for all billings processed after January 31, 2022)
ITEM - ACTIVITY 2022
City of Burnsville 2022 Budget 181 Fees & Charges - Utility

This page intentionally left blank.
City of Burnsville 2022 Budget 182

City of Burnsville 2022 BudgetFinancial Policies
Financial Management Plan
Glossary
183

FINANCIAL MANAGEMENT PLAN
This Financial Management Plan serves two main purposes: it draws together in single document the City’s major financial policies. Also, the plan establishes principles to guide both staff and Council members to make consistent and informed financial decisions.
This Financial Plan establishes City policy in the following areas:
1. Revenue Management
2. Cash and Investments
3. Fund Balance/Net Position
4. Operating Budget and Compensation Philosophy
5. Capital Improvements Plan
6. Infrastructure Trust Fund
7. Economic Development Authority Fund
8. Facilities Capital Fund
9. Debt Management
10. Accounting, Auditing and Financial Reporting
11. Risk Management
The objectives of this Financial Plan are:
• To provide both short-term and long-term future financial stability by ensuring adequate funding for providing services needed by the community;
• To protect the City Council’s policy-making ability by ensuring that important policy decisions are not controlled by financial problems or emergencies and prevent financial difficulties in the future;
• To provide sound principles to guide the decisions of the City Council and management;
• To employ revenue policies which prevent undue or unbalanced reliance on certain revenues, distribute the cost of municipal services fairly, and provide adequate funding to operate desired programs;
• To provide essential public facilities and prevent deterioration of the City’s public facilities and infrastructure;
• To protect and enhance the City’s credit rating and prevent default on any municipal debt;
• To create a document that staff and Councilmembers can refer to during financial planning, budget preparation and other financial management issues.
POLICY NO. 1.250
City of Burnsville 2022 Budget 184 Financial Management Plan

1. REVENUE MANAGEMENT
It is essential to responsibly manage the City’s revenue sources to provide maximum service value to the community. The most important revenue policy guidelines established by the City Council are for the two major sources of City revenue: property taxes and fees/charges.
PROPERTY TAXES
Property taxes will not be increased without exploring all other alternatives, including:
• Full range of policy options (debt management, fees and charges, cost allocation, use of reserves, and expenditure cuts).
• Options for a 0% tax levy dollar increase.
• Budget consideration will be given to staying within the amount of revenue generated by increased market value with no increase in the tax rate.
If, after exhausting these alternatives, an increase is required, the goal of the City will be to keep any property tax rate increase below the prevailing inflation rate. Basic City services, as annually defined and approved by the City Council, will be funded to the maximum extent possible by increases in market valuation, (i.e., new tax base growth and valuation increase).
Possible factors for considering an increase in property tax include:
• Long-term protection of the City’s infrastructure.
• Meeting legal mandates imposed by outside agencies.
• Maintaining adequate fund balance and reserve funds sufficient to maintain or improve the City’s bond rating.
• Funding City development and redevelopment projects that will clearly result in future tax base increases. The expenditures of development and redevelopment funds must be in accordance with a defined strategy as shown in the City’s Comprehensive Plan, Capital Improvement Program, and other Council documents.
Property tax increases to meet other purposes will be based on the following criteria:
• A clear expression of community need.
• The existence of community partnerships willing to share resources.
• Establishment of clearly defined objectives and measurements of success-including appropriate sunset provisions.
POLICY NO. 1.250
City of Burnsville 2022 Budget 185 Financial Management Plan

SERVICE FEES AND CHARGES
The City will establish service fees and charges wherever appropriate for the twin purposes of keeping the property tax rate at a minimum and to fairly allocate the full cost of services to the users of those services. Specifically, the City will:
• Establish utility rates sufficient to fund both the operating costs and the long-term depreciation and replacement of the utility systems.
• As part of the City’s enterprise effort, evaluate City services and aggressively pursue actions to accomplish the following:
◦ Find community based partners to share in service delivery.◦ Make services financially self supporting or, when possible, profitable.◦ Privatize services whenever appropriate
• Annually review City services and identify those for which charging user fees are appropriate. These services will be identified as enterprise services and a policy for establishing fees will be set for each. Included as part of this process will be a market analysis that compares our fees to at least four comparable market cities.
• Identify some enterprise services as entrepreneurial in nature. The intent of entrepreneurial services will be to maximize revenues to the extent the market allows.
• Waive or offer reduced fees to youth, seniors, community service groups, and other special population groups identified by the Council as requiring preferential consideration based on policy goals.
Selected criteria are used to determine the specific rate to charge for a fee for service. The approach for establishing the rate criteria is determined by the policy relating to the fee in the City Policies and Procedures Manual. The rate criteria can be one of five approaches:
1. Market Comparison - Attempt to set fees in the upper quartile of the market.
2. Maximum set by External Source - Fees set by legislation, International Building Code, etc.
3. Entrepreneurial Approach - Fees will be at the top of the market.
4. Recover the Cost of Service - Program will be self-supporting.
5. Utility Fees - A rate study will be completed each year.
UTILITY FRANCHISE FEES
Utility franchise fees collected on gas and electric utilities will be designated for the purpose of capital improvements to the City's facilities and will be accounted for in the Facilities Capital Fund.
NON-RECURRING REVENUES
POLICY NO. 1.250
City of Burnsville 2022 Budget 186 Financial Management Plan

Several revenue sources, such as intergovernmental transfers, one-time grants, court fines and other non-recurring revenues are outside of direct City control and must be relied upon conservatively. The City Manager shall insure that the budget preparation process includes an evaluation of all major non-recurring revenues, in order to minimize reliance on unpredictable revenues for on-going operating costs.
2. CASH AND INVESTMENTS
Effective cash management is essential to good fiscal management. Investment returns on funds not immediately required can provide a significant source of revenue for the City. Investment policies must be well founded and uncompromisingly applied in their legal and administrative aspects in order to protect the City funds being invested.
A. Purpose
The purpose of this policy is to establish the City’s investment objectives and establish specific guidelines that the City of Burnsville will use in the investment of city funds. It will be the responsibility of the Finance Director to invest city funds in order to attain a market rate of return while preserving and protecting the capital of the overall portfolio. Investments will be made, based on statutory constraints, in safe, low risk instruments.
B. Scope/Funds
This policy applies to the investment of all city funds available for investment and not needed for immediate expenditure. The City will consolidate cash balances from all funds to maximize investment earnings. Investment income will be allocated to the various funds based on their respective participation and in accordance with generally accepted accounting principles.
C. Delegation of Authority
Authority to manage the investment program is granted to the Finance Director who shall act in accordance with established written procedures and internal controls for the operation of the investment program consistent with this investment policy. Procedures should include references to: safekeeping, delivery vs. payment, investment accounting, repurchase agreements, wire transfer agreements, and collateral/depository agreements. No person may engage in an investment transaction except as provided under the terms of this policy and the procedures established by the treasurer.
The primary objectives, in priority order, of investment activities shall be safety, liquidity, and yield:
1. Safety: Safety of principal is the foremost objective of the investment program. Investments shall be undertaken in a manner that seeks to ensure the preservation of capital in the overall portfolio. The objective will be to mitigate credit risk and interest rate risk.
2. Liquidity: The investment portfolio must remain sufficiently liquid to meet all operating costs that may be reasonably anticipated. The portfolio must be structured so that securities mature concurrent with cash needs to meet anticipated demands. Cash needs will be determined based on cash flow forecasts.
3. Diversification of instruments: A variety of investment vehicles must be used so as to minimize the exposure to risk of loss. The investment portfolio must be diversified by individual financial institution,
POLICY NO. 1.250
City of Burnsville 2022 Budget 187 Financial Management Plan

government agency, or by corporation (in the case of commercial paper) to reduce the exposure to risk of loss.
4. Diversification of maturity dates: Investment maturity dates should vary in order to ensure that the city will have money available when it needs it.
5. Yield: The investment portfolio shall be designed with the objective of attaining a market rate of return throughout budgetary and economic cycles, taking into account the investment risk constraints and liquidity needs. Return on investment is of secondary importance compared to the safety and liquidity objectives described above.
D. Oversight
Under the direction of the City Manager, a staff level investment committee shall oversee the City’s investment program. The investment committee will maintain a more detailed and comprehensive investment policy based on the principles established by the City Council and consistent with the most current guidelines within the public sector. On at least an annual basis, the investment committee shall provide a status report to the City Council. Annually, the City Council shall designate depositories for investment purposes.
E. The City of Burnsville shall invest in the following instruments as allowed by Minnesota Statutes
United States Treasury Obligations, Federal Agency Issues, Repurchase Agreements, Certificates of Deposit, Commercial Paper - prime, Bankers Acceptance - prime, Money Market funds investing exclusively in U.S. government and agency issues.
F. Ethics and Conflicts of Interest
Officers and employees involved in the investment process shall refrain from personal business activity that could conflict with the proper execution and management of the investment program. Employees and investment officials shall disclose any material interests in financial institutions with which they conduct business or that could be related to the performance of the investment portfolio. Employees and officers shall refrain from undertaking personal investment transactions with the same individual with whom business is conducted on behalf of the City.
G. Internal Controls, Audits, External Controls
The Finance Director is responsible for establishing and maintaining an internal control structure designed to ensure that the assets of the City are protected from loss, theft, or misuse. Accordingly, the Finance Director shall establish a process for an annual independent review by the City’s Auditor to assure compliance with the policies and procedures.
POLICY NO. 1.250
City of Burnsville 2022 Budget 188 Financial Management Plan

3. FUND BALANCE/NET POSITION
It is important for the financial stability of the City to maintain fund balance/net position for unanticipated expenditures or unforeseen emergencies, as well as to provide adequate working capital for current operating needs so as to avoid short-term borrowing. The Fund Balance/Net Position Policy of the City is managed closely with the City’s Debt Management Policy. The City’s Debt Management Policy calls for a pay-as-you-go strategy for supporting capital spending without use of debt whenever feasible. The City strives to pay cash for capital projects that can be anticipated and planned for in advance. Therefore the City’s fund balance/net position levels fluctuate, in part, based on capital project plans.
This policy also outlines the classifications of fund balance as established in Governmental Accounting Standards Board (GASB) reporting guidelines.
CLASSIFICATION OF FUND BALANCE
Non-Spendable - balances that by nature cannot be spent by the government either because they are not in spendable form or legally or contractually required to be maintained intact (i.e. prepaids, inventories, long-term receivables, etc.).
Restricted – amounts with externally imposed constraints established by creditors, grantors or contributors, constitutional provisions, or enabling legislation.
Committed - amounts with internally imposed constraints for a specific purpose determined by formal action of the City Council, the highest level of decision making authority. The council action must be approved no later than the close of the reporting period.
Assigned – balances with constraints imposed for a specific purpose by the intent of the City Council or an official to which the City Council has delegated the authority to assign specific amounts. The City Council authorizes the City Manager and/or his/her designee to assign fund balance that reflects the City’s intended use of those funds.
Unassigned - balance that has not been reported in any other classification. The General fund is the only fund that can report a positive unassigned fund balance. Other governmental funds would report deficit fund balances as unassigned.
POLICY STATEMENT
Governmental Funds
1. General Fund
The City will maintain fund balances in the General Fund at a level which will avoid issuing short-term debt to meet the cash flow needs of the current operating budget. Since property taxes are a major source of funding for general operations, maintaining an adequate fund balance is essential to ensure adequate resources are available to fund basic City functions between property tax settlements.
POLICY NO. 1.250
City of Burnsville 2022 Budget 189 Financial Management Plan

The City strives to maintain a minimum total General Fund balance of 40-50% of the subsequent year’s budgeted expenditures; however, this need could fluctuate with each year’s budget objectives and appropriations such as large capital expenditures, and variations in the collection of revenues.
Fund balance up to 40% of next year’s budgeted expenditures will be retained to meet cash flow and working capital needs. When fund balance exceeds 45%, amounts can be considered for one-time purchases in the subsequent year’s operating or capital budget and other emergencies or contingencies. Fund balance appropriations should be used for one-time or transitional items only.
If fund balance falls below 40% of the following year’s expenditure budget and staff believes this will not self-correct, the city will develop and implement a plan to replenish the fund.
Special Revenue Funds
The special revenue funds are established to account for specific revenue sources that provide expenditure funding for a substantial portion of the fund’s resources on an on-going basis. The City will maintain fund balances in the Special Revenue Funds at a level to meet the cash flow needs of the current operating budget. Positive fund balances will be restricted or committed to expenditures for a specific purpose other than debt service or capital projects.
The City will strive to maintain a fund balance within the EDA Special Revenue Fund to meet both anticipated and unanticipated future economic development needs. The City will annually evaluate the level of fund balance for its appropriateness. The Financial Management Plan includes a policy for the collection of revenue for the EDA Fund.
The City Council commits the following special revenue fund balances for the purpose described:
Special Revenue Funds Committed* for
Cable franchise fee Cable television operations, maintenance and improvements
Forfeiture Public Safety
Grant Fund Community development activities
Youth Center Youth center operations, maintenance and improvements
EDA Economic development and redevelopment activities
Sustainability Promotion of sustainable activities
Forestry Preparing for and managing Emerald Ash Borer and related forestry activities
* Commitments apply to fund balances that are not otherwise nonspendable or restricted
Capital Project Funds
The Finance plan of each capital project fund will identify the appropriate fund balance to maintain a contingency for funding future capital needs as well as cashflow needs. The City will maintain fund balance in the Capital Funds at a minimum level sufficient to provide adequate working capital for current expenditure needs. Future capital projects must be identified in a written five-year capital improvement plan which shall be included in the City’s annual budget document. Project budgets should
POLICY NO. 1.250
City of Burnsville 2022 Budget 190 Financial Management Plan

include revenue sources to adequately match expected project expenses, including a contingency estimate as appropriate to each project.
Fund balances for TIF district capital projects funds are subject to State statutory restrictions and therefore constitute restricted fund balances. Fund balances for grant or bond funded capital projects also constitute restricted fund balances.
Infrastructure Trust Fund and Facilities Capital Project Fund balances are committed by the City Council for street construction projects and capital improvements to City facilities as specified in the Facilities Capital Fund Policy, respectively.
Fund balances for remaining capital project funds are considered assigned for the project or purpose for which the fund was established.
Debt Service FundsDebt service funds are used to account for and report financial resources that are restricted for principal and interest expenditures.
2. The City will annually review the adequacy of all fund balances.
3. Judicious use of fund balance within funds can be used to moderate fluctuations in capital projects and infrastructure maintenance expenses (i.e. parks capital).
4. When both restricted and unrestricted resources are available for use, the City will first use restricted resources, then use unrestricted resources as they are needed.
When any combination of committed, assigned, or unassigned resources are available for use, the City will use committed resources first, then assigned, then unassigned resources as they are needed.
Enterprise Funds
1. The City will maintain net position in the Enterprise Funds at a minimum level sufficient to provide adequate working capital for current expense needs. Generally the City shall strive to maintain cash on hand to cover the following:a. Minimum of three months operating cash in these funds. (This minimum shall be calculated
based on the approved operating budget multiplied by 25-percent).b. Subsequent year’s planned capital expenditures not financed with bonds or transfers.
2. The City will annually review the adequacy of all net position balances.
3. Judicious use of net position within funds can be used to moderate fluctuations in capital projects and infrastructure maintenance expenses.
POLICY NO. 1.250
City of Burnsville 2022 Budget 191 Financial Management Plan

4. OPERATING BUDGET AND COMPENSATION PHILOSOPHY
The Operating Budget is the annual financial plan for funding the costs of City services and programs. The General Operating Budget includes the General, Special Revenue, and Capital Funds. Enterprise operations are budgeted in separate Enterprise Funds.
1. The City Manager shall submit a balanced budget in which appropriations shall not exceed the total of the estimated revenues and available fund balance.
2. The City will provide for all current expenditures with current revenues. The City will avoid budgetary procedures that balance current expenditures at the expense of meeting future years’ budgets.
3. Historically, receipts of State Local Government Aid (LGA) have been significantly lower than State estimates resulting in budget shortfalls. Therefore, the City budget will not include LGA in the current year’s budget. Amounts received will be budgeted as use of fund balance for one-time expenditures in the following budget year.
4. The City Manager will coordinate the development of the capital improvement budget with the development of the operating budget. Operating costs associated with new capital improvements will be projected and included in future operating budget forecasts.
5. The budget will provide for adequate maintenance of the capital plant and equipment, and for their orderly replacement.
6. The impact on the operating budget from any new programs or activities being proposed should be minimized by providing funding with newly created revenues whenever possible.
7. The City Manager will insure that a budgetary control system is in place to adhere to the adopted budget.
8. The Finance Department will provide regular monthly reports comparing actual revenues and expenditures to the budgeted amounts.
9. The operating budget will describe the major goals to be achieved and the services and programs to be delivered for the level of funding provided.
10. In addition to operating expenses, Enterprise funds shall be budgeted to provide for capital replacement costs of property, plant, and equipment, if appropriate, when establishing rates and charges for services. Since capital replacement is budgeted, annual depreciation would be a duplication and therefore will not be budgeted. However, annual depreciation will be noted on the face of each finance plan as a reference.
POLICY NO. 1.250
City of Burnsville 2022 Budget 192 Financial Management Plan

Compensation Philosophy
As a matter of policy for productive labor relations, it is the Compensation Philosophy of the City of Burnsville to provide a total compensation package which places employees at the mid-range of the City’s identified public and private sector market.
The City’s compensation philosophy has developed in a manner which parallels the growth and complexity of the City itself. The expectations and requirements of those we serve requires a thoughtfully organized, carefully implemented, and continually well-managed City structure, staffed by competent, interested and motivated personnel who understand and are committed to meeting and even exceeding the expectations and requirements of our public.
The City’s compensation program is designed to achieve the following objectives:
• To maintain compensation and benefits at an appropriate level to attract and retain qualified, reliable and motivated personnel.
• To follow the principles of equal pay for equal work and comparable worth in establishing and maintaining pay relationships among positions based on problem solving, know-how, responsibility, and working conditions. To maintain the City’s pay equity compliance as determined by the State of Minnesota.
• To provide regular, ongoing opportunities for employee growth and development in a manner which helps each individual achieve and maintain service excellence and enhance the image of Burnsville as a well-managed, effective organization.
• To balance compensation and benefit needs with available resources.
POLICY NO. 1.250
City of Burnsville 2022 Budget 193 Financial Management Plan

5. CAPITAL IMPROVEMENTS PLAN (CIP)
The demand for services and the cost of building and maintaining the City’s infrastructure continues to increase. No City can afford to accomplish every project or meet every service demand. Therefore, a methodology must be employed that provides a realistic projection of community needs, the meeting of those needs, and a framework to support City Council prioritization of those needs. That is the broad purpose of the CIP.
The CIP includes the scheduling of public improvements for the community over a five-year period and takes into account the community’s financial capabilities as well as its goals and priorities. A “capital improvement” is defined as any major nonrecurring expenditure for physical facilities of government. Typical expenditures are the cost of land acquisition or interest in land, construction of roads, utilities, parks, vehicles, and equipment. The CIP is directly linked to goals and policies, land use, and community facility sections of the Comprehensive Plan since these sections indicate general policy of development, redevelopment, and the maintenance of the community.
CIP DEVELOPMENT PROCESS
• Compile and prioritize projects. Staff will consolidate and prioritize recommended projects into the proposed Capital Improvement Plan.
• Devise proposed funding sources for proposed projects. Recommended funding sources will be clearly stated for each project.
• Project and analyze total debt service related to the total debt of the City.• A debt study will be provided summarizing the combined impact of all the existing and proposed
debt.
As part of the annual budget process, the City Council will evaluate the proposed CIP and decide on the following:
• Project Prioritization• Funding Source Acceptability• Acceptable Financial Impact on Tax Levy, Total Debt, and Utility Rate Levels
POLICY NO. 1.250
City of Burnsville 2022 Budget 194 Financial Management Plan

6. INFRASTRUCTURE TRUST FUND
The Infrastructure Trust Fund (ITF) was created by Ordinance in 1996 to assist in paying for the cost of replacing streets infrastructure. The ITF essentially charges depreciation to existing taxpayers who are wearing out the system instead of leaving the replacement cost to the next generation of taxpayers. The annual Capital Improvements Plan (CIP) includes street projects based on the Pavement Management Plan.
FUNDING
The City Council shall annually appropriate money to the ITF from a tax levy or other available source. The annual tax levy proceeds committed to this fund will not exceed the annual replacement costs.
SPENDING LIMITATIONS As reflected in the ordinance, limitations on expenditures are as follows:
1. The fund may not be used for general maintenance or repairs;2. The project must have a minimum usable life of at least fifteen (15) years;3. Funds may only be used for street infrastructure replacement;4. The project must be included in the adopted CIP for at least two (2) years;5. The fund may not be used to displace traditional funding sources for specific projects; and 6. The fund may be used to supplement direct debt service in order to moderate annual debt
payments.
PROCEDURE FOR USING FUNDS
Expenditures may be made from the ITF based on the following criteria:
A. A public hearing with the appropriate legal notice must be held for any proposed project.B. The City Council must make the following findings which shall be incorporated into an adopted
resolution:a. The project has a community benefit.b. The project could not be reasonably funded by traditional sources of revenue.
POLICY NO. 1.250
City of Burnsville 2022 Budget 195 Financial Management Plan

7. ECONOMIC DEVELOPMENT AUTHORITY FUND
The Economic Development Authority (EDA) Fund was created by the City Council in year 1991. The City Council acted to appoint the members of the City Council to serve as the Board of Commissioners. Under Minnesota Statutes Chapter 469-Economic Development, cities are permitted to establish an EDA, including approval for the EDA to serve as a Housing & Redevelopment Authority (HRA). When the City of Burnsville created the EDA, it approved HRA authority for possible use in the future.
Among the HRA powers in Minnesota law is the authority to collect a “special benefits” tax up to 0.0185 percent of taxable market value in the City. The Burnsville EDA first began to collect a “special benefits” tax beginning in year 2002. Approval of the City Council is required before the EDA may levy the tax. The Revenue Management Policy of the City, as included in this Financial Management Plan, sets policy for when a tax levy may be considered.
This policy section sets policy for the “amount” of tax levy that will be considered for the EDA Fund.
FUNDING
The EDA, with approval by the City Council, shall annually appropriate money to the EDA Fund from a tax levy or other available source. The appropriation shall be equivalent to the “maximum” that could be provided by a tax levy for economic development purposes. The annual tax levy shall be set based on the amount needed when combined with other available sources achieves the funding level set by this policy.
To provide other sources (non-tax) of funding to the EDA, the City Council shall annually review the fund balance in the General Fund to determine whether sufficient unrestricted fund balance is available for transfer from the General Fund to the EDA Fund. The decision on transfer of funds shall be made at the time the annual EDA tax levy is established. If other sources of revenue are not available, the EDA may set the tax levy at the maximum allowed.
PROCEDURE FOR USING FUNDS
Expenditures may be made from the EDA Fund based on the following criteria:
A. The EDA appropriates the funds as part of the annual budget.B. The EDA authorizes an amendment to the EDA budget outside of the annual appropriation
process.
POLICY NO. 1.250
City of Burnsville 2022 Budget 196 Financial Management Plan

8. FACILITIES CAPITAL FUND
The Facilities Capital Fund was created in 2016 to account for the cost of replacing and maintaining the City's facilities. This fund allows for the centralization of facilities projects, funding and planning.
FUNDING
Revenue sources are proceeds from the City's utility franchise fee, bond proceeds, and transfers from utility funds. The Council implemented a utility franchise fee in July of 2016 which is dedicated to capital improvements for the City's facilities. SPENDING LIMITATIONS Facilities covered by this fund include:
• City Hall & Police Facility• Fire Stations• Fire Training Facility (Burnsville portion only – costs to be shared with other cities)• Maintenance Facility (excluding utility fund portion)• Civic Center Maintenance Building including THE GARAGE• Ice Center• Ames Center• Golf Course• Park facilities• Parking and trail surfaces
Excluded facilities:• Facilities funded 100% by water utility & stormwater utility fees• Utility portion of shared facilities
Allowable expenditures:• Capital improvements for additions and renovations• Capital expenditures for maintenance meeting the City's capitalization policy for useful life and
exceeds $5,000
Excluded expenditures:• Operating repairs and maintenance
PROCEDURE FOR USING FUNDS
Expenditures may be made from the Facilities Capital Fund based on the following criteria:
A. Funds are appropriated as part of the annual budget.B. Staff will included recommended projects in the five-year Capital Improvement Plan for
consideration with the annual budget.C. Enterprise Funds should generally fund related capital improvements; however, capital items
may be considered if the enterprise long-term financial plan indicates that the enterprise would not be able to fund the improvement without general government support.
D. Other funding sources such as grants will be considered when available.
POLICY NO. 1.250
City of Burnsville 2022 Budget 197 Financial Management Plan

9. DEBT MANAGEMENT
The use of borrowing and debt is an important and flexible revenue source available to the City. Debt is a mechanism which allows capital improvements to proceed when needed, in advance of when it would otherwise be possible. It can reduce long-term costs due to inflation, prevent lost opportunities, and equalize the costs of improvements to present and future constituencies.
Debt management is an integral part of the financial management of the City. Adequate resources must be provided for the repayment of debt, and the level of debt incurred by the City must be effectively controlled to amounts that are manageable and within levels that will maintain or enhance the City’s credit rating. A goal of debt management is to stabilize the overall debt burden and future tax levy requirements to ensure that issued debt can be repaid and prevent default on any municipal debt. A debt level which is too high places a financial burden on taxpayers and can create problems for the community’s economy as a whole.
POLICY STATEMENT
Wise and prudent use of debt provides fiscal and service advantages. Overuse of debt places a burden on the fiscal resources of the City and its taxpayers. The following guidelines provide a framework and limit on debt utilization:
1. The City will restrict long-term borrowing to planned capital improvements (see CIP Policy) and a limited use of short-term debt for capital outlay.
2. The City will not use long-term debt for current operations.3. The City will strive to maintain a “pay-as-you-go” capital funding policy, supporting capital spending
without use of debt whenever feasible. The City will strive to pay cash for capital projects that can be anticipated and planned for in advance.
4. The City will pay back debt within a period not to exceed the expected useful life of the projects, with at least 50% of the principal retired within 2/3 of the term of the bond issue.
5. Total general obligation debt shall not exceed 2% of the total market valuation of taxable property in the City.
6. Direct net debt (gross debt less available debt service funds) shall not exceed 3% of the total market valuation of taxable property in the City.
7. The City will maintain good communications with bond rating agencies regarding its financial condition. The City will follow a policy of full disclosure in every financial report and bond prospectus.
8. When feasible the City will use refunding mechanisms to reduce interest cost and evaluate the use of debt reserves to lower overall annual debt service where possible.
9. The City’s goal has been to maintain the level of annual debt service at or below the current debt levy.10. The City will annually review changes to continuing disclosure regulations to ensure compliance. The
City will work with the City’s Financial Advisor to prepare and file annual continuing disclosure reporting.
During the annual budget process, a debt study will be prepared in conjunction with the Capital Improvements Plan to provide information about the City’s debt structure.
POLICY NO. 1.250
City of Burnsville 2022 Budget 198 Financial Management Plan

10. ACCOUNTING, AUDITING, AND FINANCIAL REPORTING
The key to effective financial management is to provide accurate, current, and meaningful information about the City’s operations to guide decision making and enhance and protect the City’s financial position.
POLICY STATEMENT
1. The City’s accounting system will maintain records on a basis consistent with generally accepted accounting standards and principles for local government accounting as set forth by the Government Accounting Standards Board (GASB) and in conformance with the State Auditor’s requirements per State Statutes.
2. The City will establish and maintain a high standard of accounting practices.3. The City will follow a policy of full disclosure written in clear and understandable language in
all reports on its financial condition.4. The Finance Department will provide timely monthly and annual financial reports to users.5. An independent public accounting firm will perform an annual audit and issue an opinion on the
City’s financial statements.6. Annually the City Council Audit Committee and staff will meet with the Auditors to review the
audit report.7. Summary monthly financial reports on budget performance will be provided to the City Council
commencing with the close of the first quarter, through November.8. A report summarizing the City’s financial position will be provided annually to the Council at the
close of the calendar and fiscal year books.
POLICY NO. 1.250
City of Burnsville 2022 Budget 199 Financial Management Plan

11. RISK MANAGEMENT
A comprehensive risk management plan seeks to manage the risks of loss encountered in the everyday operations of an organization. Risk management involves such key components as risk avoidance, risk reduction, risk assumption, and risk transfers through the purchase of insurance. The purpose of establishing a risk management policy is to help maintain the integrity and financial stability of the city, protect its employees from injury, and reduce overall costs of operations.
POLICY STATEMENT
1. The City will maintain a risk management program that will minimize the impact of legal liabilities, natural disasters or other emergencies through the following activities:
a) Loss prevention - prevent losses where possible
b) Loss control - reduce or mitigate losses
c) Loss financing - provide a means to finance losses
d) Loss information management - collect and analyze data to make prudent prevention, control and
financing decisions
2. The City will review and analyze all areas of risk in order to, whenever possible, avoid and reduce risks or transfer risks to other entities. Of the risks that must be retained, it shall be the policy to fund the risks which the City can afford and transfer all other risks to insurers.
3. The City will maintain an active safety committee comprised of City employees.
4. The City will periodically conduct educational safety and risk avoidance programs within its various divisions.
5. The City will, on an ongoing basis, analyze the feasibility of self funding and other cooperative funding options in lieu of purchasing outside insurance in order to provide the best coverage at the most economical cost.
6. Staff will report to the Council, annually on the results of the City’s risk management program for the preceding year.
This policy dated January 8, 2019 replaces Policy No. 1.250 dated January 8, 2018.
POLICY NO. 1.250
City of Burnsville 2022 Budget 200 Financial Management Plan

GLOSSARY OF TERMSAccrual Accounting The basis of accounting which recognizes revenues as they are earned and expenses as
soon as a liability is incurred, regardless of related cash inflows and outflows.
Ad Valorem Tax A tax which is based on value, such as property taxes.
Ames Center The city-owned performing arts center.
Annual Comprehensive Financial Report (ACFR)
The official annual report of a government which includes combined financial statements, supporting schedules, supplementary information, extensive introductory information, and a statistical section.
Appropriation City Council authorization permitting the City to incur obligations and expend resources during the fiscal year.
Audit An annual third party review of financial operations and procedures required by State Statute.
Balanced Budget A budget in which the sources of funds (revenues) is equal to the uses of funds (expenditures).
Basis of Accounting The technical term that describes the criteria governing the timing of the recognition of transactions and events.
Bonds A written promise to pay a sum of money (called the principal or face value) at specified dates, including interest at a designated time. Bonds are typically long term debt.
General Obligation Bonds (GO Bonds) - Bonds that are backed by the full faith and credit of the City.Lease Revenue Bonds - Bonds that are funded by annual lease paymentsRevenue Bonds - Bonds that are funded by certain revenues such as utility revenues
Bond Proceeds The cash received from sale of bonds.
Bonded Debt The portion of City debt represented by outstanding bonds.
Budget A financial operations plan of proposed expenditures for a given period of time and the proposed revenues to finance them. Proposed expenditures must equal proposed revenues.
Budget - Adopted The financial plan of revenues and expenditures for the fiscal year as adopted by the City Council.
Budget Amendment A change to the budget approved by the City Council.
Budget Basis The basis of accounting used to estimate financing sources and uses in the budget. General Governmental fund are prepared on a modified accrual basis. Enterprise funds are prepared on a GAAP basis
Budget Message A general discussion of the budget presented in writing as a part of the budget document. The budget message explains principal budget issues and trends.
Burnsville Youth Collaborative (BYC)
A partnership with the City, Burnsville-Eagan-Savage School District 191 (ISD 191), a non-profit music group and the Burnsville YMCA to transition the programs at THE GARAGE and provide youth services.
Capital Assets Long-term tangible assets such as building, land, and equipment; sometimes referred to as fixed assets
Capital Improvement Expenditures related to the acquisition, expansion or rehabilitation of an element of the government’s physical plant; sometimes referred to as infrastructure.
Capital Improvement Plan (CIP) A plan for capital expenditures to be incurred each year for a fixed period of years and the estimated resources to finance the projected expenditures.
Capital Outlay Expenditures resulting from the acquisition of fixed assets. Capital is defined as assets with an initial cost of more than $10,000 and an estimated useful life of more than three years.
Carry Forward An unspent item that is was in the previous year’s budget which the City Council has approved to be spent in the current year.
City of Burnsville 2022 Budget 201 Glossary of Terms

City Council The elected officials of the City of Burnsville consisting of a mayor and four council members. All City of Burnsville elected officials serve the community at-large.
Component Unit A legally separate organization for which the elected officials of a primary government are financially accountable. The EDA is a component unit of the City of Burnsville.
Contingency An amount budgeted for possible unexpected expenses.
Current Expenses The portion of the budget relating to general operations (supplies, maintenance, utilities, etc) excluding employee salaries and benefits.
Current Service Level The services that are being provided by the City at the current quantity and quality.
Dakota Communications Center (DCC)
The DCC provides 911 communication and dispatch service for public safety police and fire for all cities in Dakota County.
Debt An obligation resulting from the borrowing of money or the purchase of goods or services.
Debt Service Payment of principal and interest on debt obligations which result from the issuance of bonds.
Delinquent Taxes Taxes which we not paid in the year in which they were due.
Economic Development Authority (EDA)
A legally separate government unit governed by a five-member council composed of the City Council. The Burnsville EDA is a component unit of the City of Burnsville. The EDA’s activity provides support to promote economic development within Burnsville.
Employee Benefits The costs incurred by the employer for employer payroll taxes, pension contributions, employee insurance, workers comp, etc.
Employee Services The portion of the budget pertaining to employee salaries and related fringe benefits.
Encumbrance The commitment of appropriated funds to purchase an item or service. To encumber funds means to set aside or commit funds for a specified future expenditure.
Strategic Priorities Adopted expectations of the Burnsville City Council.
Expenditures Disbursements for operating costs, debt service, capital outlay.
Fiscal Disparities A Minnesota law enacted in 1971 requiring all communities in the seven-county metropolitan area to contribute 40 percent of the growth in their commercial/ industrial tax base (from 1971) to a regional tax sharing pool which is then redistributed. Redistribution is bases on population and the value of all property relative to the metro average. Burnsville contributes more to the pool than it receives back in the redistribution.
Fiscal Year The twelve month period to which the annual budget applies and at the end of which the City determines its financial position. The City’s fiscal year is January 1 to December 31.
Five Year Financial Plan A five-year financial plan is prepared for each of the City’s funds. The plans consist of 2 years of historical information, the current year’s budget compared to estimated actual, the 2014 budget which is adopted by the City Council and projections of the next four years based on current service levels and estimated changes in revenues and expenditures.
Franchise Fee A fee charged by a governmental unit to a private business for the privileges of using a public right-of-way to generate revenue through its operations.
Full-time Equivalent (FTE) Represents the equivalent of one employee working full-time.
City of Burnsville 2022 Budget 202 Glossary of Terms

Fund An accounting entity with a self-balancing set of accounts in which assets, liabilities, and equity are recorded for a specific activity or objective.Governmental Funds A classification of funds that is typically used to account for tax-supported (governmental) activities. Included in this classification:
General Fund - Used to account for all general operations of the City which are necessary to provide basic governmental services.Special Revenue Funds Used to account for revenue which is restricted or committed for expenditures of a designated purpose.Capital Project Funds Used to account for financial resources to be used for the acquisition or construction of major capital facilities.Debt Service Funds Used to account for the payment of principal and interest on debt of the City.
Proprietary Funds A classification of funds that is used to account for a government’s business-type activities which are supported, at least in part, by fees or charges. Included in this classification:
Enterprise Funds Used to account for the financing of services to the general public where all or most of the costs involved are recovered primarily through user fees. (City enterprise funds are water and sewer, storm water, performing arts center, ice center, golf course, street lighting utility and sidewalk snow plowing). Internal Service Funds A fund established to report any activity that provides goods or services to other funds, departments, or agencies of the primary government and its component units, or to other governments, on a cost-reimbursement basis.
Fiduciary Funds Used to account for resources that are held by the government as a trustee or agent for parties outside the government and that cannot be used to support the government’s own programs.
Fund Balance The difference between fund assets and fund liabilities. The fund balance can be used as a revenue source by decreasing an existing positive balance.
General Operating Budget The part of the operating budget which includes the general, special revenue and capital funds (excludes the enterprise funds).
Generally Accepted Accounting Principles (GAAP)
Uniform minimum standards and guidelines for financial accounting and reporting. The primary authoritative body on the application of GAAP to state and local governments is the Governmental Accounting Standards Board (GASB).
Government Finance Officers Association (GFOA)
The national professional association of state and local finance officers dedicated to the professional management of governmental financial resources. The association provides financial policies, best practices, training, leadership, and reporting standards. The GFOA also administers award programs for excellence in financial reporting and distinguished budgeting.
Governmental Accounting Standards Board (GASB)
The highest source of accounting and financial reporting guidance to state and local governments.
Grant A contribution of cash or other asset from a government or other organization for a specified purpose, activity, or facility.
Infrastructure Immovable assets such as roads, bridges, curbs and gutters, streets and sidewalks, drainage systems, and lighting systems that are of value only to the City.
Infrastructure Trust Fund (ITF) A capital project fund created by Ordinance in 1996 to assist in paying for the cost of replacing streets and parks infrastructure.
Intergovernmental Revenue Revenues from other governments in the form of grants, entitlements, shared revenues, or payments in lieu of taxes.
Levy The total amount of taxes or special assessments imposed by the City.
Local Government Aid (LGA) Funds passed down to eligible cities by the State of Minnesota.
Market Value / Taxable Market Value
The value determined by the County Assessor for real estate or property used for levying taxes.
City of Burnsville 2022 Budget 203 Glossary of Terms

Market Value Homestead Exclusion (MVHE)
A tax reduction given to all homesteads valued below $413,800 by shifting a portion of the tax burden that would otherwise fall on the homestead to other types of property. The exclusion provides for a portion of each home’s market value to be excluded from its value for property tax calculations.
Max Tax State law requires the City Council in September of each year to adopt a maximum amount that the property tax levy will not exceed. Property owners will receive a proposed property tax statement in November using this max tax. The final tax levy is adopted in December.
Metropolitan Council Environmental Services (MCES)
The MCES is a division of the Metropolitan Council, a regional planning agency that serves the Twin Cities seven-county metropolitan area. The MCES provides the City with waste water treatment services.
Minnesota Valley Transit Authority (MVTA)
Established through a joint powers agreement with six other area cities to provide public transit.
Modified Accrual Basis of Accounting
The basis of accounting which recognizes increases and decreases in financial resources only to the extent that they reflect near-term inflows or outflows of cash. Revenues are recognized to the degree that they are available to finance expenditures of the fiscal period. Similarly, debt service payments and a number of specific accrued liabilities are only recognized as expenditures when payment is due because it is only at that time that they normally are liquidated with expendable available financial resources.
Net Assets The difference between assets and liabilities in the government-wide statement of net assets.
Operating Budget The annual financial plan for funding the costs of providing services and programs.
Proposed Budget The budget as submitted by the City Manager for the City Council’s consideration.
Program An activity or operation created to achieve a specific purpose or objective.
Reserves Funds set aside for unanticipated expenditures or unforeseen emergencies, as well as to have adequate working capital for current operating needs to avoid short-term borrowing.
Residential Equivalency Unit (REU) Standardized unit of measurement used in billing storm water utility fees to property owners.
Revenue Funds collected as income to offset operational expenses including property taxes, charges for service, licenses & permits, etc.
Risk Management The ways and means used to avoid accidental loss or to reduce its consequences if it does occur.
Special Assessment A levy made against a property to defray all or part of the cost of a capital improvement or service deemed to benefit that property.
Tax Capacity Value The taxable portion of the market value which is based on classification rates determined by the type of property tax.
Tax Increment Financing (TIF) A financing method in which bonds are secured by the anticipated incremental increase in tax revenue resulting from the development or redevelopment of an area.
Tax Levy The amount of property taxes levied to finance operations that are not funded by other sources.
Taxes Compulsory charges levied by a government to finance services performed for the common benefit.
The GARAGE The City’s Youth Center and music venue.
VEBA Voluntary Employees’ Beneficiary Association - an employee health reimbursement arrangement funded by the City for employees opting for a high-deductible health insurance option.
Yield The return on an investment in the form of interest or dividends.
City of Burnsville 2022 Budget 204 Glossary of Terms

City of Burnsville 2022 BudgetSupplemental Information
Supplemental Information Tables
Changes in Fund Balances of Governmental Funds- (Expenditures & Revenues)
General Government Tax Revenues by Source
Taxable Market Value and Estimated Actual Value of Taxable Property
Property Tax Rates
Property Tax Levies and Collections
Ratios of General Obligation Bonded Debt Outstanding
Legal Debt Margin
Operating Indicators by Function
Demographic and Economic Statistics
*Note: The above tables are extracted from the 2020 Comprehensive Annual Financial Report (CAFR). As of the date of the completion of this 2022 budget document, the 2021 CAFR has not been completed, therefore these tables do not include 2021 data.
Employee FTE Schedule
205

CITY OF BURNSVILLE, MINNESOTA
CHANGES IN FUND BALANCES OF GOVERNMENTAL FUNDSLAST TEN FISCAL YEARS(Modified Accrual Basis of Accounting)
Fiscal Year2011 2012 2013
Revenues:Taxes $ 30,567,623 $ 30,962,351 $ 31,436,569 Licenses and permits 1,911,453 1,584,388 2,445,580 Intergovernmental 3,696,469 5,381,672 3,818,161 Charges for services 4,905,971 5,269,516 5,889,564 Fines and forfeits 459,573 432,391 470,413 Investment income 1,338,841 463,782 (3,262,167) Special assessments 1,769,771 1,877,487 1,890,774 Miscellaneous 1,699,041 1,912,691 1,068,837
Total revenues 46,348,742 47,884,278 43,757,731
Expenditures:Current:
General government 6,058,728 5,423,448 5,508,509 Public safety 18,939,924 19,073,952 19,159,372 Public works and parks 6,627,057 6,263,265 6,530,255 Culture and recreation 1,269,730 1,254,987 1,231,581 Conservation of natural resources 861,604 898,444 1,022,316 Economic development 583,855 527,938 483,893
Capital outlay 7,940,344 13,050,371 9,805,507 Debt service:
Redemption of bonds 5,861,540 4,268,052 4,584,460 Interest on bonds 1,950,408 1,717,207 1,684,125 Fiscal agent fees 29,073 32,721 29,347 Bond issuance costs 42,330 53,246 31,009
Total expenditures 50,164,593 52,563,631 50,070,374
Excess of revenues over (under) expenditures (3,815,851) (4,679,353) (6,312,643)
Other financing sources (uses):Bonds issued 1,220,000 6,260,000 1,595,000 Refunding bonds issued 1,890,872 — 1,925,000 Premium (discount) on bonds issued 63,745 211,113 96,248 Payments to refunded bond escrow agent (1,250,000) — (949,748) Capital leases — — — Sales of capital assets 55,222 151,503 58,650 Transfers in 7,535,958 6,246,032 5,963,398 Transfers out (7,085,463) (5,625,476) (5,378,212)
Total other financing sources (uses) 2,430,334 7,243,172 3,310,336
Net change in fund balances $ (1,385,517) $ 2,563,819 $ (3,002,307)
Debt service as a percentage of noncapital expenditures 17.6% 14.8% 14.7%
City of Burnsville 2022 Budget 206 Supplemental Information

2014 2015 2016 2017 2018 2019 2020
$ 30,575,302 $ 31,867,814 $ 33,753,006 $ 35,989,886 $ 37,352,958 $ 39,090,762 $ 41,122,345 1,953,776 2,026,415 1,903,820 2,061,946 2,466,914 3,369,080 2,028,388 4,867,531 8,332,614 5,118,254 5,077,504 5,357,166 5,735,523 11,932,400 5,885,164 5,913,570 6,345,229 6,634,410 7,230,588 7,217,898 6,106,670 417,275 378,940 337,171 422,347 359,347 358,417 205,089 3,260,938 1,054,573 694,824 469,779 615,245 1,832,567 933,690 1,813,996 2,585,543 1,800,511 1,866,666 1,756,074 2,303,764 1,931,638 1,579,348 1,353,267 1,085,021 1,683,990 2,024,617 2,959,449 1,801,226 50,353,330 53,512,736 51,037,836 54,206,528 57,162,909 62,867,460 66,061,446
5,856,737 6,495,318 7,356,451 7,109,756 7,036,828 7,034,145 7,883,492 20,140,526 20,403,477 20,699,670 23,300,734 23,500,121 24,154,818 26,192,495 6,592,561 6,766,745 6,931,564 6,806,529 7,770,000 7,722,108 7,704,347 1,256,682 1,336,636 1,060,369 1,023,582 1,002,556 1,104,490 1,048,450 995,490 1,035,269 1,198,458 1,310,566 1,461,642 1,264,396 1,270,493 464,933 495,624 484,650 476,108 516,894 813,210 2,750,100 9,360,407 12,688,606 9,894,133 17,058,821 11,109,667 12,610,088 19,660,455
8,340,613 3,584,701 3,063,398 3,251,465 4,487,329 3,820,163 4,811,153 1,512,418 1,375,624 1,521,390 1,489,498 1,467,934 1,118,766 1,085,390 18,670 18,775 18,338 24,278 23,791 48,568 12,606 23,240 69,011 77,620 57,965 51,495 17,298 120,230 54,562,277 54,269,786 52,306,041 61,909,302 58,428,257 59,708,050 72,539,211
(4,208,947) (757,050) (1,268,205) (7,702,774) (1,265,348) 3,159,410 (6,477,765)
2,780,000 735,000 910,000 9,585,000 2,125,000 1,165,000 17,175,000 — 7,030,000 6,475,000 — 3,235,000 460,000 1,340,000 39,933 80,984 300,502 584,230 239,989 276,430 1,884,433 (952,430) (790,000) — — (16,784,136) (525,000) (1,458,847) — — 519,909 193,504 — — — 153,027 141,253 118,894 421,224 596,234 191,620 82,737 5,746,474 6,235,640 6,141,582 6,502,685 5,464,671 4,492,604 2,466,874 (5,206,408) (5,923,610) (5,913,846) (6,061,843) (4,875,871) (3,898,871) (2,246,416) 2,560,596 7,509,267 8,552,041 11,224,800 (9,999,113) 2,161,783 19,243,781
$ (1,648,351) $ 6,752,217 $ 7,283,836 $ 3,522,026 $ (11,264,461) $ 5,321,193 $ 12,766,016
21.0% 11.4% 10.5% 10.3% 12.5% 10.1% 9.9%
City of Burnsville 2022 Budget 207 Supplemental Information

This page intentionally left blank.
City of Burnsville 2022 Budget 208 Supplemental Information

CITY OF BURNSVILLE, MINNESOTA
GENERAL GOVERNMENT TAX REVENUES BY SOURCE
LAST TEN FISCAL YEARS
(Modified Accrual Basis of Accounting)
Tax Lodging Franchise
Fiscal Year Property Tax Increments Tax Tax Total
2011 $ 26,746,709 $ 2,917,347 $ 237,962 $ 665,605 $ 30,567,623
2012 26,970,365 3,034,447 259,879 697,660 30,962,351
2013 27,434,606 2,990,981 287,358 723,624 31,436,569
2014 28,765,443 791,450 289,198 729,211 30,575,302
2015 29,962,023 783,410 363,409 758,972 31,867,814
2016 31,292,321 819,707 366,918 1,274,060 33,753,006
2017 32,683,517 823,859 365,555 2,116,955 35,989,886
2018 34,062,564 929,157 389,019 1,972,218 37,352,958
2019 35,781,715 1,011,660 351,690 1,945,697 39,090,762
2020 37,635,629 67,287 174,326 3,245,103 41,122,345
City of Burnsville 2022 Budget 209 Supplemental Information

CITY OF BURNSVILLE, MINNESOTA
TAXABLE MARKET VALUE AND ESTIMATED ACTUAL VALUE OF TAXABLE PROPERTY
LAST TEN FISCAL YEARS
Real Property Less Less
Fiscal Residential Commercial Personal Fiscal Tax
Year Property Property Property Disparities Increment
2011 $ 41,564,948 $ 28,383,619 $ 792,954 $ (2,313,874) $ (3,231,981)
2012 37,598,236 28,018,520 794,954 (2,287,609) (3,025,708)
2013 34,997,156 27,649,303 828,786 (2,538,320) (2,867,371)
2014 36,175,049 27,747,684 816,729 (2,988,905) (850,866)
2015 39,954,586 28,740,490 824,450 (2,888,069) (901,387)
2016 41,440,693 28,490,235 860,668 (3,073,160) (896,845)
2017 43,601,698 27,701,119 907,851 (2,382,401) (926,409)
2018 48,949,347 28,530,496 945,133 (1,655,814) (929,157)
2019 52,425,000 29,503,800 943,031 (1,656,580) (1,158,569)
2020 55,924,956 31,657,917 1,002,211 (1,347,441) (225,215)
Source: Dakota County
City of Burnsville 2022 Budget 210 Supplemental Information

Tax Capacity
Value as a Taxable Value
Total Taxable Percentage of Estimated as a Percentage
Net Tax Taxable Total Direct Actual Taxable of Estimated
Capacity Market Value Tax Rate Market Value Market Value Actual Value
$ 65,195,666 1.18 % 42.598 $ 5,449,742,955 $ 5,525,473,700 101.4 %
61,098,393 1.20 43.213 4,997,862,158 5,111,878,744 102.3
58,069,554 1.20 47.021 5,019,680,534 4,835,520,311 96.3
60,899,691 1.23 46.670 5,258,005,375 4,953,041,063 94.2
65,730,070 1.22 44.790 5,625,420,202 5,373,401,377 95.5
66,821,591 1.21 46.525 5,915,258,394 5,506,514,039 93.1
68,901,858 1.22 46.557 6,138,533,666 5,670,777,401 92.4
75,840,005 1.22 43.552 6,670,619,761 6,204,343,440 93.0
80,056,682 1.21 43.595 7,026,455,810 6,590,112,904 93.8
87,012,428 1.24 43.148 7,350,427,230 7,034,358,859 95.7
City of Burnsville 2022 Budget 211 Supplemental Information

CITY OF BURNSVILLE, MINNESOTA
PROPERTY TAX RATES
DIRECT AND OVERLAPPING (1) GOVERNMENTS
LAST TEN FISCAL YEARS
Overlapping Rates:
City of Burnsville Dakota CountySchool District -
ISD #191
Operating Debt Service Total City Total County Total School
Fiscal Year Tax Rate Tax Rate Tax Rate Tax Rate (2) Tax Rate (2)
2011 40.763 1.835 42.598 29.149 21.854
2012 41.513 1.700 43.213 31.426 21.881
2013 45.215 1.806 47.021 33.421 26.168
2014 44.969 1.701 46.670 31.827 25.661
2015 43.020 1.770 44.790 29.633 24.554
2016 44.831 1.694 46.525 28.570 31.065
2017 44.922 1.635 46.557 28.004 27.529
2018 42.076 1.476 43.552 26.580 27.448
2019 42.187 1.408 43.595 25.386 24.409
2020 41.292 2.303 43.148 24.133 23.263
Source: Dakota County
Notes:(1) Overlapping rates are those of local and county governments that apply to property owners within the City of
Burnsville. Not all overlapping rates apply to all City of Burnsville property owners (e.g. the rates for special districts apply only to the proportion of the government’s property owners whose property is located within the geographic boundaries of the special district).
(2) The breakdown between operating and debt service tax rates were not available at the time of this report.
City of Burnsville 2022 Budget 212 Supplemental Information

School District - ISD #194
School District - ISD #196
Total School Total School Special Total Direct and Overlapping Rates
Tax Rate (2) Tax Rate (2) Districts ISD #191 ISD #194 ISD #196
32.138 26.959 5.366 98.967 109.251 104.072
32.061 28.440 5.827 102.347 112.527 108.906
33.535 27.956 6.247 112.857 120.224 114.645
33.048 27.606 5.882 110.040 117.427 111.985
31.459 23.271 5.427 104.404 111.309 103.121
35.319 24.317 5.505 111.665 115.919 104.917
32.914 23.336 5.355 107.445 112.830 103.252
26.835 26.715 4.833 102.413 101.800 101.680
26.992 26.162 4.748 98.138 100.721 99.891
31.225 34.367 3.767 94.311 102.273 105.415
City of Burnsville 2022 Budget 213 Supplemental Information

CITY OF BURNSVILLE, MINNESOTA
PROPERTY TAX LEVIES AND COLLECTIONS
LAST TEN FISCAL YEARS
Collected Within the Fiscal Year of the Levy Total Collections to Date
Fiscal Year Ended
December 31,
Total Tax Levy for Fiscal Year Amount
Percentage of Levy
Collections in
Subsequent Years Amount
Percentage of Levy
2011 $ 26,186,791 $ 25,741,822 98.30 % $ 108,562 $ 25,850,384 98.72 %
2012 26,348,820 26,006,410 98.70 32,579 26,038,989 98.82
2013 26,988,262 26,673,945 98.84 94,404 26,768,349 99.19
2014 28,448,573 28,171,331 99.03 112,366 28,283,697 99.42
2015 29,584,711 29,336,510 99.16 72,847 29,409,357 99.41
2016 30,951,674 30,715,364 99.24 114,433 30,829,797 99.61
2017 32,075,674 31,654,894 98.69 307,757 31,962,651 99.65
2018 33,242,674 32,996,925 99.26 34,191 33,031,116 99.36
2019 34,896,674 34,691,735 99.41 50,924 34,742,659 99.56
2020 37,588,674 37,199,804 98.97 — 37,199,804 98.97
City of Burnsville 2022 Budget 214 Supplemental Information

CITY OF BURNSVILLE, MINNESOTA
RATIOS OF GENERAL OBLIGATION BONDED DEBT OUTSTANDING
LAST TEN FISCAL YEARS
Fiscal Year
General Obligation Bonds (1)
Bond Issuance Premium/ (Discount)
Less Amounts Available in Debt Service
Funds Total
Percentage of Estimated
Actual Taxable Value of
Property (2) Per Capita (3)
2011 $ 42,513,643 $ 157,542 $ 10,400,855 $ 32,270,330 0.5840 % $ 532
2012 44,795,030 330,998 10,965,938 34,160,090 0.6682 559
2013 43,000,822 375,891 12,516,260 30,860,453 0.6382 503
2014 36,712,779 357,552 6,000,286 31,070,045 0.6273 503
2015 40,328,078 396,060 12,533,406 28,190,732 0.5246 455
2016 44,879,680 622,192 19,183,290 26,318,582 0.4780 426
2017 51,691,019 1,117,546 19,635,217 33,173,348 0.5850 533
2018 40,017,358 1,232,632 6,808,600 34,441,390 0.5551 550
2019 37,535,000 1,371,073 7,861,389 31,044,684 0.4711 494
2020 49,780,000 3,105,955 6,637,860 46,248,095 0.6575 737
Note: Details regarding the City’s outstanding debt can be found in the notes to basic financial statements.
Sources:(1) Excludes Taxable Tax Increment Revenue Notes and Lease Revenue Bonds reported in the Governmental Activities,
and General Obligation Revenue and Improvement Bonds reported in the Enterprise Funds.(2) See the Schedule of Taxable Market Value and Estimated Actual Value of Taxable Property for property value
data.(3) Population data can be found in the Schedule of Demographic and Economic Statistics.
City of Burnsville 2022 Budget 215 Supplemental Information

CITY OF BURNSVILLE, MINNESOTA
LEGAL DEBT MARGIN INFORMATION
LAST TEN FISCAL YEARS
Fiscal Year
2011 2012 2013 2014
Debt Limit $ 165,764,211 $ 153,356,362 $ 145,065,609 $ 148,591,232
Total net debt applicable to limit 1,374,951 1,000,595 612,797 213,115
Legal debt margin 164,389,260 152,355,767 144,452,812 148,378,117
Total net debt applicable to the limit as a percentage of debt limit 0.83 % 0.65 % 0.42 % 0.14 %
Note: Under Minnesota State Law, the City of Burnsville's net debt cannot exceed 3 percent of the estimated market value of taxable property. The legal debt limit applies to the City's general obligation tax levy bonds and excludes improvement and revenue-supported bonds.
City of Burnsville 2022 Budget 216 Supplemental Information

2015 2016 2017 2018 2019 2020
$ 161,202,041 $ 165,195,421 $ 170,123,322 $ 186,130,303 $ 197,703,387 $ 211,030,766
110,167 — 9,472,289 8,876,639 8,338,565 23,820,999
161,091,874 165,195,421 160,651,033 177,253,664 189,364,822 187,209,767
0.07 % — % 5.57 % 4.77 % 4.22 % 11.29 %
Legal Debt Margin Calculation for Fiscal Year 2020
Market Value $ 7,034,358,859
Debt limit (3% of market value) 211,030,766
Debt applicable to limit:
General obligation bonds 24,095,000
Less amount set aside for repayment of general obligation debt (274,001)
Total net debt applicable to limit 23,820,999
Legal debt margin $ 187,209,767
City of Burnsville 2022 Budget 217 Supplemental Information

CITY OF BURNSVILLE, MINNESOTA
Operating Indicators by Function
Last Ten Fiscal Years
Fiscal Year2011 2012 2013 2014
FunctionPolice
Total calls for service 40,771 46,632 47,906 46,209 Arrests - Adult 2,069 2,058 2,110 1,888 Arrests - Juvenile 490 410 370 367 Traffic citations 9,346 8,981 7,960 7,898
Fire and Emergency ServicesNumber of calls (excluding EMS) 1,305 1,248 1,388 1,353 Number of Emergency Medical Service (EMS) calls 3,650 3,732 4,023 4,303
EMS patients served 2,678 2,861 3,035 3,269 Protective inspections
Plan reviews 317 438 468 488 Building permits issued 2,097 6,415 6,161 7,252 Field inspections (Bldg, Plbg, Htg, Gas, S&W) 6,584 6,426 5,622 6,244 Code enforcement inspections 3,515 538 2,690 3,970
Public worksStreet rehabilitation/resurfacing (miles) 6.2 7.6 5.2 5.2 Sealcoating (miles) 12.9 23.3 7.5 18.5 Snow and ice control (miles) 221 222 222 222
RecreationYouth recreation activity participants 21,722 20,106 20,842 23,006 The Garage Attendance 31,992 16,267 25,044 22,500
WaterNew connections 21 20 15 27 Water main breaks 17 12 19 17 Average daily consumption (thousands of gallons) 8,940 9,830 9,215 9,008 Total daily pumping capacity (thousands of gallons) 29,000 29,000 29,000 29,000
SewerAverage daily flow (thousands of gallons) 5,352 5,031 5,125 5,346
Storm WaterStreet sweeping (miles) 221 222 222 222
Golf courseAnnual rounds sold 22,124 23,847 20,541 20,851
Ice CenterLearn to skate participants 687 602 580 513
Sources: Various City departments
Note: Indicators are not available for the general government functions.
* In 2014, the City transitioned the programs at THE GARAGE to the new Burnsville Youth Collaborative (BYC).
City of Burnsville 2022 Budget 218 Supplemental Information

2015 2016 2017 2018 2019 2020
49,924 48,859 48,575 49,482 47,653 47,196 1,922 1,846 1,758 1,691 1,572 1,482 351 323 409 238 192 111 6,613 5,452 6,426 5,547 4,286 2,642
1,355 1,536 1,507 1,571 1,594 1,455
4,665 5,037 5,116 5,427 5,685 5,863 3,400 3,765 4,009 4,372 4,910 5,216
546 530 610 491 596 588 6,888 6,871 7,044 7,359 8,853 9,781 6,869 6,765 6,824 7,351 8,673 10,606 3,904 4,716 4,238 4,806 3,350 605
8.8 9.1 10.7 4.9 11.8 9.14 6.1 5 4.7 6.4 6.8 5.25 222 222 222 222 222 222
27,195 23,200 22,917 27,662 49,432 3,913 *n/a *n/a *n/a *n/a *n/a *n/a
63 36 18 9 48 135 19 15 12 12 11 14
10,070 8,683 8,268 8,150 8,090 8,590
29,000 29,000 29,000 29,000 29,000 29,000
5,153 5,129 5,146 5,047 5,004 5,255
222 222 222 222 222 222
23,775 23,059 20,725 17,107 18,676 26,213
455 354 298 347 299 104
City of Burnsville 2022 Budget 219 Supplemental Information

CITY OF BURNSVILLE, MINNESOTA
DEMOGRAPHIC AND ECONOMIC STATISTICS
LAST TEN FISCAL YEARS
Fiscal Year
Population (1)
Number of Households
(1)
Estimated Personal Income
(2)
Per Capita Personal
Income (3)School
Enrollment (4)Unemployment
Rate (5)
2011 60,664 24,443 $ 2,709,982,208 $ 44,672 9,555 6.2 %
2012 61,061 24,609 2,865,287,425 46,925 9,478 5.2
2013 61,300 24,854 2,933,572,800 47,856 9,341 4.5
2014 61,747 24,960 3,007,758,117 48,711 9,213 3.7
2015 61,908 24,990 3,128,892,228 50,541 8,989 3.5
2016 61,849 25,132 3,223,384,333 52,117 8,914 3.5
2017 62,239 25,252 3,383,249,801 54,359 8,563 3.2
2018 62,657 25,339 3,800,209,707 60,651 8,874 2.5
2019 62,785 25,405 3,887,270,490 61,914 8,603 3.0
2020 62,785 25,405 3,887,270,490 61,914 8,010 6.8
Sources:(1) 2020 is an estimate of 0% growth from the 2019 actual figures provided by the Metropolitan Council. All years are
best available estimates provided by the Metropolitan Council.(2) Estimated personal income is calculated by multiplying the per capita personal income by the City population.(3) Per capita personal income provided by the U.S. Bureau of Economic Analysis is an estimate for the State of
Minnesota, the state in which the City is located. This is the smallest applicable region for which this data is available.
(4) School enrollment is enrollment in the largest district, ISD# 191 (Burnsville). Burnsville is also served by ISD# 194 (Lakeville) and ISD# 196 (Rosemount-Eagan-Apple Valley). Data is compiled by the Minnesota Department of Education
(5) Annual average unemployment rates compiled by the Minnesota Department of Employment and Economic Development.
City of Burnsville 2022 Budget 220 Supplemental Information

City of Burnsville
Employees By Division
Full-Time Equivalents (FTE)
(Full-time and regular part-time employee positions)
2020 Budget 2021 Budget 2022 Budget
GENERAL FUND
Organizational ServicesAdministration 2.0 2.0 2.0 Human Resources 4.0 4.0 4.0 Organizational Development 1.0 1.0 1.0 City Clerk / Elections 2.0 2.0 3.0 Finance 7.9 6.9 5.9 Information Technologies 9.0 9.0 9.0 Licensing 1.0 1.0 0.5 Public Experience — 3.0 3.5
26.9 28.9 28.9
Community DevelopmentDevelopment & Redevelopment 3.0 3.0 3.0 Planning 3.0 3.0 3.0 Protective Inspections 9.0 9.0 9.0 Licensing & Code Enforcement 5.0 5.0 5.0
20.0 20.0 20.0
Public SafetyPolice 91.1 91.1 91.1 Fire & Emergency Services 45.0 45.0 45.0
136.1 136.1 136.1
Recreation & FacilitiesRecreation & Community Services 8.0 6.0 6.0 Facilities 6.0 6.0 6.5
14.0 12.0 12.5
Public WorksEngineering 14.0 14.0 14.0 Streets & Utilities 14.5 14.0 14.0 Fleet Maintenance 9.0 9.0 9.0 Parks & Natural Resources 18.0 18.0 18.0
55.5 55.0 55.0
Total General Fund 252.5 252.0 252.5
SPECIAL REVENUE FUND
Cable Franchise Fee Fund
Public Affairs 3.0 3.0 4.0
BCTV 2.6 2.6 3.0
Cable Franchise Fee Fund 5.6 5.6 7.0
Forestry Fund 0.5 0.5 —
EDA Fund — — —
Sustainability Fund 3.0 3.0 2.5
Total Special Revenue Funds 9.1 9.1 9.5
ENTERPRISE FUNDS
Public Works Utilities 13.0 14.0 14.0
Finance 3.0 3.0 3.0
Water & Sewer Fund 16.0 17.0 17.0
Storm Water Fund 4.0 3.5 4.5 Ice Center Fund 6.5 6.5 6.0 Golf Course Fund 1.5 1.5 1.5
Total Enterprise Funds 28.0 28.5 29.0
Total All Fund Types 289.6 289.6 291.0
City of Burnsville 2022 Budget 221 Supplemental Information

GENERAL FUND
Organizational Services
Deputy City Clerk - Elections New - one-year appointment for 2022 — — 1.0
City Clerk - Licensing Specialist Moved to Public Experience — — (0.5)
Organizational Development Moved from Human Resources 1.0 — —
Human Resources Moved to Organizational Dev. (1.0) — —
Human Resources Moved to Public Experience — (1.0) —
Human Resources Moved from Finance — 1.0 —
Finance Moved to Human Resources — (1.0) —
Finance Vacancy reallocated to Cable — — (1.0)
Public Experience - Licensing Moved from City Clerk - Licensing — — 0.5
Licensing Specialist Moved from Community. Dev. 1.0 — —
Public Experience Moved from Recreation — 2.0 —
Public Experience Moved from Human Resources — 1.0 —
1.0 2.0 —
Community Development
Assistant Community Development Director Moved from EDA Fund 1.0 — —
Economic Development Coordinator Moved from EDA Fund 1.0 — —
Building Inspector New 1.0 — —
Inspections Assistant New 1.0 — —
Licensing Specialist Moved to Administration (1.0) — —
3.0 — —
Public Safety
Fire Inspector New 1.0 — —
1.0 — —
Recreation & Facilities
Facilities Maintenance Moved from Ice Center — — 0.5
Recreation Programmer Moved to Public Experience — (1.0) —
Administrative Assistant Moved to Public Experience — (1.0) —
— (2.0) 0.5
* 2019 Mid-year change
Public Works, Parks & Natural Resources
Maintenance Worker Trainees Full-time replacement of seasonal staff 3.0 — —
Maintenance Worker Trainee Moved to Utilities — (0.5) —
3.0 (0.5) —
Total General Fund 8.0 (0.5) 0.5
SPECIAL REVENUE FUNDS
Cable Franchise Fee Fund
Videographer - mid-year change Full-time replacement of seasonal staff* — — 0.4
Digital Communications Specialist New - reallocated from Org. Services — — 1.0
* 2021 Mid-year change — — 1.4
City of Burnsville
Changes in FTE Allocations from 2020 to 2022
Full-Time Equivalents (FTE)
(Full-time and regular part-time employee positions)
2020 Budget 2021 Budget 2022 Budget
City of Burnsville 2022 Budget 222 Supplemental Information

EDA Fund
Project Manager New/Moved to General Fund (1.0) — —
Economic Development Coordinator Moved to General Fund (1.0) — —
(2.0) — —
Forestry Fund
Nat. Resources and Forestry Technician Moved to Stormwater Fund — — (0.5)
Recycling Fund
Sustainability Coordinator Moved to Stormwater Fund — — (0.5)
Total Special Revenue Funds (2.0) — 0.4
ENTERPRISE FUNDS
Ice Center Maintenance Moved to General Fund — — (0.5)
Public Works Utilities Moved from General Fund — 0.5 —
Public Works Utilities Moved from Storm Water Fund — 0.5 —
Storm Water Fund Moved to Public Works Utilities — (0.5) —
Storm Water Fund - Forestry Moved from Forestry Fund — — 0.5
Storm Water Fund - Sustainability Coord. Moved from Recycling Fund — — 0.5
— 0.5 0.5
Total Enterprise Funds — 0.5 0.5
Total All Fund Types 6.0 — 1.4
City of Burnsville
Changes in FTE Allocations from 2020 to 2022
Full-Time Equivalents (FTE)
(Full-time and regular part-time employee positions)
2020 Budget 2021 Budget 2022 Budget
City of Burnsville 2022 Budget 223 Supplemental Information
This page intentionally left blank.
City of Burnsville 2022 Budget 224
City of Burnsville 2022 BudgetTIF Financial Plans
Tax Increment Financing Districts
The City is presenting financial plans for the following Active Tax Increment Financing (TIF) Districts:
• TIF District 7, Minnesota River Quandrant (MRQ) Project Area• TIF District 9
TIF Districts 1, 2, 2-1, 3, 4, and 6 have been decertified. TIF District 5 and 8 were never certified.
City of Burnsville 2022 Budget 225 TIF Financial Plans
City of BurnsvilleTax Increment Financing (TIF) District No. 7, Minnesota River Quadrant (MRQ)
Financial Plan Year 2022
Proposed Tax Increment Financing (TIF) District 7, Redevelopment Project 1, Minnesota River Quadrant (MRQ) Project Area
Tax Increment Financing (TIF) District DescriptionThis district was established in 2012 as a Soils Deficiency District, pursuant to a Special Law (2008 Minnesota Laws, Chapter 154, Article 9, Sections 21 and 25(b)). The primary purpose of the district is to enable redevelopment of certain property within the Minnesota River Quadrant (MRQ) Project Area. The maximum duration of this proposed district is 20 years after receipt of the first tax increment. The district began receiving increment in 2019, with approximately $76,000 in anticipated collections for the year.
BackgroundThe proposed use of tax increment within TIF District 7 includes reimbursement to the City and private developers for site improvements and preparation of costs related to the redevelopment of property. Site improvements and preparation costs include the cost of filling, grading, or other physical preparation of the land for use. Other qualifying improvements include public infrastructure improvements. Estimated tax increment revenues and projects costs are shown below:
Project Costs and Sources of Increments
Estimated Tax Increment Revenues (from tax increment generated by the district)
Tax increment revenues distributed from the County $ 13,860,000
Interest and investment earnings 30,000
Total Estimated Tax Increment Revenues $ 13,890,000
Estimated Tax Increment Revenues (from tax increment generated by the district)
Project Costs:
Site improvements/preparation costs 2,905,000
Other qualifying improvements 5,892,000
Administrative Costs 1,385,000
Estimated Tax Increment Project Costs 10,182,000
Estimated financing costs:
Interest expense 3,708,000
Total budgeted expenditures $ 13,890,000
The maximum original principal amount of TIF Bonds to be issued to finance project costs is $9 million.
No projects or contracts have been approved in this district to date.
City of Burnsville 2022 Budget 226 TIF Financial Plans
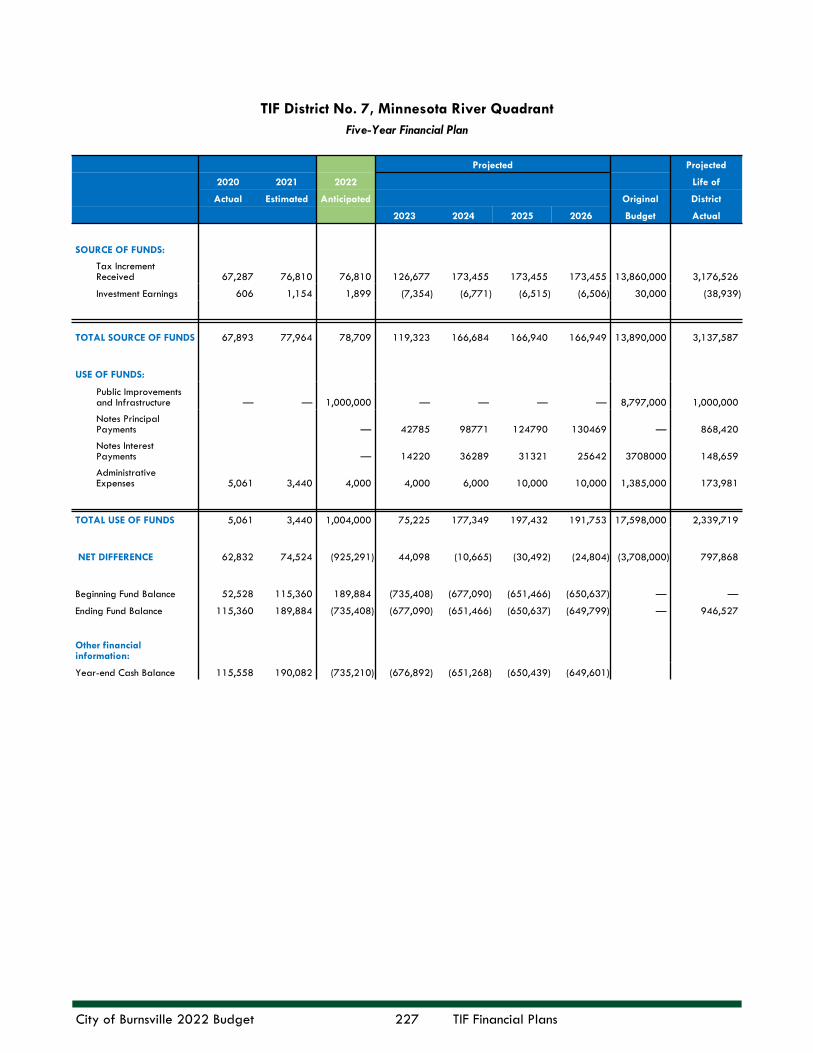
TIF District No. 7, Minnesota River QuadrantFive-Year Financial Plan
Projected Projected
2020 2021 2022 Life of
Actual Estimated Anticipated Original District
2023 2024 2025 2026 Budget Actual
SOURCE OF FUNDS:
Tax Increment Received 67,287 76,810 76,810 126,677 173,455 173,455 173,455 13,860,000 3,176,526
Investment Earnings 606 1,154 1,899 (7,354) (6,771) (6,515) (6,506) 30,000 (38,939)
TOTAL SOURCE OF FUNDS 67,893 77,964 78,709 119,323 166,684 166,940 166,949 13,890,000 3,137,587
USE OF FUNDS:
Public Improvements and Infrastructure — — 1,000,000 — — — — 8,797,000 1,000,000
Notes Principal Payments — 42785 98771 124790 130469 — 868,420
Notes Interest Payments — 14220 36289 31321 25642 3708000 148,659
Administrative Expenses 5,061 3,440 4,000 4,000 6,000 10,000 10,000 1,385,000 173,981
TOTAL USE OF FUNDS 5,061 3,440 1,004,000 75,225 177,349 197,432 191,753 17,598,000 2,339,719
NET DIFFERENCE 62,832 74,524 (925,291) 44,098 (10,665) (30,492) (24,804) (3,708,000) 797,868
Beginning Fund Balance 52,528 115,360 189,884 (735,408) (677,090) (651,466) (650,637) — —
Ending Fund Balance 115,360 189,884 (735,408) (677,090) (651,466) (650,637) (649,799) — 946,527
Other financial information:
Year-end Cash Balance 115,558 190,082 (735,210) (676,892) (651,268) (650,439) (649,601)
City of Burnsville 2022 Budget 227 TIF Financial Plans

City of BurnsvilleTax Increment Financing (TIF) District No. 9
Financial Plan Year 2022
TIF District DescriptionThe District was established in June 2019 as an Economic Development District, pursuant to M.S. 469.174 Subd. 12, to facilitate the development of an 81,000 square foot high-tech flex industrial facility in the City. The maximum duration of this district is 8 years after the first receipt of tax increment. First receipt is in 2021 and the District will decertify in 2029, or when all obligations are satisfied.
BackgroundThe District currently consists of one parcel of land. The City has executed a developer agreement with Timberstone, LLC to construct an 81,000 square foot warehouse facility, including office space. Budgeted costs for this District are estimated at $492,592, of which a TIF Note for a maximum of $247,000 is anticipated. Original budgeted expenditures are as follows:
Expenditures
Site Improvements $ 300,000
Installation of Public Utilities 40,000
Other qualifying improvements 15,386
Administrative expenses 44,781
Subtotal 400,167
Loan Interest Payments0 92,425
Total budgeted expenditures $ 492,592
This project, located at the interchange of Hwy 13 and I-35W, will allow Industrial Equities to expand their current footprint. However, the new building is being constructed on a site with steep slopes. To accommodate a building larger than the site would normally allow, it is necessary to build retaining walls up to sixteen feet and do additional extraordinary site work.
Timberstone, LLC has also agreed to increase its workforce by adding at least 20 new full-time jobs at an average wage of $20 per hour. This goal needs to be met within two years of the certificate of occupancy. These jobs must be maintained until the district is decertified in 2029.
Source of FundsThe main source of funding for this district will be a Pay-As-You-Go Note (or “TIF Note”) to the Developer. The TIF Note is expected to be executed in 2022, once the developer has provided proof of qualified costs. The TIF Note will have semi-annual payments on 2/1 and 8/1 each year. This type of obligation eliminates any risk to the City, since the TIF Note is special, limited obligation of the EDA and is paid solely from available tax increment. This district will need to be decertified once the obligation has been paid in full or it has reached its statutory maximum date of 12/31/2029, whichever comes first.
Use of FundsExpenditures from this district include land acquisition, public parking facilities, streets and sidewalks, developer pay-as-you-go payments, and debt service payments.
City of Burnsville 2022 Budget 228 TIF Financial Plans

TIF District No. 9Five-Year Financial Plan
Projected Projected
2021 2022 Life of
Estimated Anticipated Original District
2023 2024 2025 2026 Budget Actual
SOURCE OF FUNDS:
Tax Increment Received 18,022 44,194 45,914 47,716 49,570 51,482 447,811 423,392
Investment Earnings — 169 388 420 455 492 44,781 3,650
TOTAL SOURCE OF FUNDS 18,022 44,363 46,302 48,136 50,025 51,974 492,592 427,042
USE OF FUNDS:
Site Improvements / Preparation Costs — — — — — — 300,000 —
Public Improvements and Infrastructure — — — — — — 55,386 —
Loan/Notes Principal Payments — 4,402 28,245 31,275 34,605 38,162 — 247,000
Loan/Notes Interest Payments — 15,561 12,380 10,859 9,174 7,312 92,425 64,135
Administrative Expenses 1,135 2,500 2,500 2,500 2,500 2,500 44,781 21,135
TOTAL USE OF FUNDS 1,135 22,463 43,125 44,634 46,279 47,974 492,592 332,270
NET DIFFERENCE 16,887 21,900 3,177 3,502 3,746 4,000 — 94,772
Beginning Fund Balance — 16,887 38,787 41,964 45,466 49,212 — —
Ending Fund Balance 16,887 38,787 41,964 45,466 49,212 53,212 — 94,772
Other financial information:
Year-end Cash Balance 16,887 38,787 41,964 45,466 49,212 53,212
City of Burnsville 2022 Budget 229 TIF Financial Plans

This page intentionally left blank.
City of Burnsville 2022 Budget 230