Annual Budget Monitoring Report July 2009 - June 2010
464
1 THE REPUBLIC OF UGANDA Annual Budget Monitoring Report July 2009 - June 2010 September 2010 Ministry of Finance, Planning and Economic Development P.O.Box 8147 Kampala www.finance.go.ug
-
Upload
khangminh22 -
Category
Documents
-
view
4 -
download
0
Transcript of Annual Budget Monitoring Report July 2009 - June 2010

1
THE REPUBLIC OF UGANDA
Annual Budget Monitoring Report
July 2009 - June 2010
September 2010
Ministry of Finance, Planning and Economic Development
P.O.Box 8147
Kampala
www.finance.go.ug

2
TABLE OF CONTENTS ............................................................... Error! Bookmark not defined.
ABBREVIATIONS AND ACRONYMS ....................................................................................... 5
Foreword ....................................................................................................................................... 11
Executive Summary ...................................................................................................................... 12
CHAPTER 1: INTRODUCTION ................................................................................................. 30
1.1 Process ................................................................................................................................ 30
1.2 Limitation of the report ....................................................................................................... 30
1.3 Structure of the report ......................................................................................................... 30
CHAPTER 2: FINANCIAL PERFORMANCE ........................................................................... 31
2.1 Introduction. ............................................................................................................................ 31
2.1.2 Objectives ............................................................................................................... 31
2.1.3 Scope and methodology .......................................................................................... 31
2.2 Vote Analysis ...................................................................................................................... 31
2. 3 Financial Performance of Selected Districts for the Financial Year 2009/10 ................... 42
2.3.1 Introduction/Background ............................................................................................. 42
2.3.2 Objectives .................................................................................................................... 42
2.3.3 Scope and methodology .......................................................................................... 43
2.3.4 FINDINGS ............................................................................................................. 43
2.4 Conclusions ......................................................................................................................... 60
2.4.1 Financial performance ................................................................................................. 60
2.4.2 Recommendations ........................................................................................................ 63
CHAPTER 3: PHYSICAL PERFORMANCE ............................................................................. 64
3.1 AGRICULTURE ................................................................................................................ 64
3.1.1 Introduction .................................................................................................................. 64
3.1.2 Agriculture Marketing Support Project ....................................................................... 67
3.1.3 Integrated Pests and Disease Management .................................................................. 74
3.1.4 National Livestock Productivity Improvement Project (NLPIP)................................. 77
3.1.5 Support for Tea Cocoa Seedlings Project .................................................................. 100
3.1.6 Summary findings of other projects monitored in FY 2009/10 ............................ 111
3.2 EDUCATION ................................................................................................................... 118
3.2.1 Introduction: ............................................................................................................... 118

3
3.2.2. Utilization of the Euro 23m under the Royal Netherlands Embassy support FY
2008/09 ............................................................................................................................... 119
3.2.3 Pre-Primary and Primary ........................................................................................... 134
3.2.4. Secondary Education: ............................................................................................... 137
3.2.5 Development of TVET: ........................................................................................ 152
3.2.6 BTVET ....................................................................................................................... 154
3.2.7 Development of Teacher Education: ......................................................................... 157
3.2.8 Presidential Pledges for FY 2009/10: ........................................................................ 158
3.2.9. Inspection Grant: ................................................................................................... 172
3.3 ENERGY .......................................................................................................................... 174
3.3.1 Introduction ........................................................................................................... 174
3.3.2 Energy Planning, Management and Infrastructure Development ......................... 181
3.3.3 Large Hydropower Infrastructure ......................................................................... 219
3.3.4 Petroleum Exploration, Development and Production ......................................... 221
3.3.5 Key policy issues .................................................................................................. 225
3.4 HEALTH........................................................................................................................... 230
3.4.1 Introduction ................................................................................................................ 230
3.4.2 Rehabilitation of Regional Referral Hospitals Project............................................... 230
3.4.3 District Infrastructure Support Program .................................................................... 240
3.4.4 Support to the Health Sector Strategic Plan Project II ............................................. 245
3.4.5 Primary Health Care and PRDP Grants to Local Governments ........................... 249
3.5 INDUSTRIALIZATION .............................................................................................. 274
3.51: Introduction ................................................................................................................ 274
3.5.2 Ministry of Finance, Planning and Economic Development (MFPED) .................... 275
3.5.3 Uganda Industrial Research Institute ......................................................................... 280
3.5.4 Uganda National Bureau of Standards (UNBS) ........................................................ 283
3.5.5 Uganda Investment Authority (UIA) ......................................................................... 284
3.6 Information and Communication Technology ........................................................... 288
3.6.1 Introduction ........................................................................................................... 288
3.6.2 National Transmission Backbone and E-Government Infrastructure Project....... 289
3.7 ROADS ............................................................................................................................. 301
3.7.1 Introduction ................................................................................................................ 301
3.7.2 Reconstruction of Priority Sections of Kampala (Busega) - Masaka Road ............... 302

4
3.7.3 Upgrading of Masaka - Mbarara and Masaka – Kyotera Roads ................................ 307
3.7.4 Upgrading of Soroti – Dokolo – Lira Road ............................................................... 310
3.7.5 National Roads Maintenance Programme ................................................................. 317
3.7.6 District, Urban and Community Access Roads Maintenance Programmes .............. 328
3.7.7 Interconnectivity Improvement Project ..................................................................... 331
3.7.8 Project for Construction of Selected Bridges............................................................. 338
3.7.9 Key Policy Issues ....................................................................................................... 343
3.7.10 Conclusions .............................................................................................................. 345
3.7.11 Recommendations .................................................................................................... 346
3.8 WATER AND SANITATION ......................................................................................... 348
3.8.1 Introduction ................................................................................................................ 348
3.8.2. Rural Water Supply and Sanitation Vote Function................................................... 351
3.8.3. Urban Water Supply and Sanitation Vote Function ................................................. 379
3.8.4. Water for Production................................................................................................. 394
3.8.5 Meteorological Support to Plan for Modernisation of Agriculture ........................... 403
3.8.6. Key Policy Issues ...................................................................................................... 405
3.8.7. Conclusions ............................................................................................................... 406
3.8.8. Recommendations ..................................................................................................... 408
3.9 Micro Finance ................................................................................................................... 411
3.9.1 Introduction ................................................................................................................ 411
3.9.2 FINDINGS ................................................................................................................. 413
3.9.3 General challenges ................................................................................................ 452
3.9.4 Recommendations ...................................................................................................... 454
BIBLIOGRAPHY ....................................................................................................................... 455
ANNEX................................................................................................................................... 458

5
ABBREVIATIONS AND ACRONYMS
ACTs Artemisinin Combined Therapies
ADB African Development Bank
AIDS Acquired Immune Deficiency Syndrome
B.O.Qs Bills of Quantities
BBW Banana Bacterial Wilt
BC Broadcasting Council
BCP Brick laying and Concrete Practice
BECS Bundibugyo Energy Cooperative Society
BEL Bujagali Energy Limited
BIDRC Banana Industrial Research and Development Center
BMAU Budget Monitoring and Accountability Unit
BOQs Bills of Quantities
BTVET Business Technical Vocational Education and Training
CAIIP Community Agricultural Infrastructure Improvement Programme
CAO Chief Administrative Officer
CFO Chief administrative Officer
CJ Carpentry and Joinery
CMG Critical Mass Group
CMU Construction Management Unit
DBICs District Business Information Centers
DBST Double Bituminous Surface Treatment
DCO District Commercial Officer
DEO District Education Officer
DHO District Health Office/Officer
DIS District Inspector of School
DISO District Internal Security Officer
DLSP Districts Livelihood Support Programme
DRC Democratic Republic of Congo
DUCAR District, Urban and Community Access Roads
DVO District Veterinary Officer
DWD Directorate of Water Development

6
DWO District Water Office
DWSCG District Water and Sanitation Conditional Grant
ECOSAN Ecological Sanitation
EDF European Development Fund
EFT Electronic Funds Transfer
EPC Engineering, Procurement and Construction
ERA Energy Regulatory Authority
ERT Energy for Rural Transformation
EUR Euro
FFA Food for Assets
FFS farmer Field Schools
FGD Focus Group Discussion
FY Financial Year
GISO Gombolola Internal Security Officer
GoU Government of Uganda
GTZ German Development Corporation
H.E His Excellence
HC Health Center
HEP Hydro-electric plant
HIV Human Immunodeficiency Virus
HSD Health Sub District
IDA International Development Agency
IDA International Development Association
IDB Islamic Development Bank
IDP Internally Displaced Person
IFMS Integrated Financial Management System
IPC Interim Payment Certificate
IPF Indicative Planning Figure
IPPM/BBW Integrated Pests and Disease Management
ITP Industrial Technology Park
JBIC Japanese Bank for International Cooperation
JICA Japan International Cooperation Agency

7
JMS Joint Medical Stores
KCC Kampala City Council
KfW KfW Bankengruppe
KIIDP Kampala Institutional and Infrastructure Development Programme
Km Kilometre
LC Local Council
LG Local Government
LGDP Local Governments Development Programme
LGMSD Local Government Management and Service Development Programme
LRDP Luwero – Rwenzori Development Programme
MAAIF Ministry of Agriculture, Animal Industry and Fisheries
MDAs Ministries, departments and agencies
MEMD Ministry of Energy and Mineral Development
MFIs Microfinance financial institutions
MFPED Ministry of Finance, Planning and Economic Development
MoES Ministry of Education and Sports
MoH Ministry of Health
MoICT Ministry of Information and Commutations Technology
MOLG Ministry of Local Government
MoPS Ministry of Public Service
MoU Memorandum of Understanding
MoWT Ministry of Works and Transport
MSC Microfinance support centre ltd
MT Metric Tonne
MTEF Medium Term Expenditure Framework
MTTI Ministry of Tourism, Trade and Industry
MV Motor Vehicle
MWE Ministry of Water and Environment
NCDC National Curriculum Development Centre
NCR Northern Corridor Route
NEMA National Environmental Management Authority
NITA-U National Information Technology Authority-Uganda

8
NLPIP National Livestock Productivity Improvement Project
NMS National Medical Stores
NSADP North West smallholder agricultural development project
NTC National Teachers’ College
NUREP Northern Uganda Rehabilitation Programme
NWSC National Water and Sewerage Corporation
OHS Occupational Health and Safety
OPD Outpatient Department
OPM Office of the Prime Minister
PACMECS Pader-Abim Community Multi Purpose Electric Cooperative Society Limited
PAF Poverty Action Fund
PAT Provisional Acceptance Test
PCIC Per Capita Investment Cost
PDU Procurement and Disposal Unit
PER Public Expenditure Review
PHC Primary Health Care
PIBID Presidential Initiative on Banana Industrial Development
PO Private Operator
PPDA Public Procurement and Disposal of Public Assets Authority
PPP Public Private Partnership
PRDP Peace Recovery and Development Plan
PREEP Promotion of Renewable Energy and Energy Efficiency Programme
PRISEEE Participatory Rural Initiative to Save Environment and Energy
PS Primary School
PS/ST Permanent Secretary/ Secretary to Treasury
PTC Primary Teachers’ College
QEI Quality Enhancement Initiative
RAP Resettlement Action Plan
RC Roman Catholic
RCs Registrar of Co-operatives
RDC Resident District Commissioner
REA Rural Electrification Authority

9
RFSP Rural financial services programme
RGC Rural Growth Centre
RRP Rural Roads Programme
RSSP Road Sector Support Programme
S/C Sub County
SACCO Savings, Credit and Cooperative Organization
SEZ Special Economic Zones (SEZ)
SFG School Facilities Grant
SHSSP Support to the Health Sector Strategic Plan
SIDA Swedish International Development Cooperation Agency
SMEs Small and medium enterprise
T/C Town Council
TAF Technical Assistance Fund
TVET Technical Vocational Education and Training
UA Unit of Account
UCA Uganda Cooperative Alliance
UCC Uganda Communications Commission
UCSCU Uganda Co-operative Savings and Credit Union
UEDCL Uganda Electricity Distribution Company Limited
UETCL Uganda Electricity Transmission Company Limited
UIA Uganda Investment Authority
UIRI Uganda Industrial Research Institute
UNBS Uganda National Bureau of Standards
UNICEF United Nations International Children’s Emergency Fund
UNRA Uganda National Roads Authority
UNRA Uganda National Roads Authority
UPE Universal Primary Education
URF Uganda Road Fund
US$ United States Dollars
USE Universal Secondary Education
UShs Uganda Shillings
VAT Value Added Tax

10
VIP Ventilated Improved Pit
VoIP Voice over Internet Protocol
WFP World Food Programme
WSB Water and Sanitation Board
WSDF-E Water and Sanitation Development Facility – East
WSDF-N Water and Sanitation Development Facility – North
WUC Water User Committee

11
Foreword
Government is bent on enhancing effectiveness of implementation of public programmes. To this effect budget monitoring reports are produced on a regular basis to inform policy decisions. The focus continues to be on the priority areas of agriculture; education; energy; health; ICT, industrialization; roads; and water and sanitation.
This annual budget monitoring report gives an overview of financial and physical performance for selected programmes in the noted areas. Within the sectors, development expenditures are prioritized except in cases of education and health where some recurrent costs are tracked.
The report findings from field observations give actual performance on the ground of the various spending agencies. The key implementation challenges identified should inform policy decisions in the various institutions.
It is hoped that the relevant sectors and departments will use the findings therein to ensure enhanced effectiveness of implementation with a view to attaining value for money for public expenditures.
Keith Muhakanizi
For Permanent Secretary/ Secretary to the Treasury

12
Executive Summary
Background
Government stepped up its monitoring efforts geared towards enhanced effectiveness of public
expenditures. The focus is on agriculture; education; energy, health; industrialization; ICT;
roads; water and sanitation; and micro-finance.
This report is based on selected key programmes that have been followed throughout the FY
2009/10. Selection was based on significance of budget allocations to the votes within the sector
budgets; focus being on large expenditure programmes, preference has been given to
development expenditures except in the cases of education, road maintenance and health where
some recurrent costs are tracked.
Findings
Financial Performance
Financial performance
A) Central Government/Ministries
Releases.
There was no institution among those monitored whose receipts were 100% of the approved
domestic annual budget but it was in the range of 53%- 99%. UNRA had the least release
performance of 53%. This was attributed to the requirement of proof of absorption of the funds
and also tightened accountability measures for the MDA’s to access quarterly releases whereby
the sectors are required to timely submit the performance form A and the quarterly progress
reports.
Absorption of funds
Regarding the absorption of the funds received, there was generally good attempt to spend all the
funds received 998% - 100%) for the ministries, departments and agencies (MDAs) monitored as
per the IFMS. However, higher rates of expenditures were skewed during the fourth quarter as
compared to the first three quarters. This implies that most projects are implemented in the fourth
quarter
Reallocations
There were a number of reallocations within the vote functions and or projects. The votes
affected were Vote 019 Ministry of Water and environment and Vote 016 Ministry of works and
transport where a number of projects had their budgets decreased or increased. Reallocation of
funds between the projects implies that there was poor planning on the part of the sector at the
initial stages of budgeting whereby activities were not properly costed.
Budget trend analysis

13
On the budget trend analysis, most of the spending agencies registered an increment in the
approved budget amounts over the two financial years of 2008/2009 and 2009/2010. The sectors
which recorded an increment were: Ministry of agriculture, animal industry nad fisheries
(MAAIF) (31%); Ministry of water and environment (38%); Ministry of energy and mineral
development (MEMD) (58.2%); Ministry of education and sports (MOES) (25%); UNRA 17%
and Presidential initiative on banana (64.5%).There were declines in Ministry of health
(MOH)(0.5%) and the industrial parks was a decrease of 62%.
Supplementary releases
There was additional supplementary budget of UShs 2.2 billion to cater for taxes under Vote
014- Ministry of Health. This affected four projects 0216 District infrastructure support
programme; 0224 Imaging and theatre equipment; 1027 Institutional support to the Ministry of
Health and 1123- Health systems strengthening.
B) DISTRICTS
Lack of timely information on adjustments in the IPF figures.
Some districts still complained that changes in the IPFs are not timely communicated to enable
them effect changes in the budget and that final releases as indicated in the release schedules
were based on the revised budget of which they lacked the information. This therefore affected
efficient and effective implementation of the workplan. A case in point was Bundibugyo Local
Government where the final release schedules for NAADs and PHC development indicated
different figures from the IPF amounts.
Internal borrowings
The CAO and CFO of Bundibugyo LG had diverted LGMSD funds to cater for operational
expenses in total disregard of the financial regulations. The borrowing amounted to UShs
351million stretching far back in 2004. This matter raised an audit query but little was done to
pay off the funds.
Further, the district spent a total of UShs 75,007,000 being unspent balances as at end of the
financial year 2008/2009 which was spent without authority from the PS/ Secretary to the
Treasury.
Releases
There was evidence of timely releases (development grant) by the MFPED to the districts and
also the districts to the sector accounts. In some cases releases for rural roads were at 100% by
the second quarter. Some districts delayed to remit the funds received to the sectors for instance:
There was a delay of the remittance of LGMSD funds totaling to UShs 53,875,000 received by
Bududa local government on 30th
Jan 2010 but was remitted to the sector four months later on
6th
May 2010.
Absorption of funds

14
There was generally low absorption of development grant funds received for the period in all the
grants monitored in the districts of Bududa, Bundibugyo, Kabarole, Kapchorwa,Mayuge,
Sironko,and Tororo. The poor performance was largely attributed to late approval of the budgets
as most districts councils approved the budgets in the month of September to November 2009 ;
late initiation of the procurement processes by user departments which led to late
commencement of the procurement of the contractors.
The lowest absorption levels were registered with the PRDP funds. Some districts that receive
the PRDP funds raised the issue of conflicting instructions from the office of the Prime Minister
and the MFPED in respect to the management of the funds. OPM insisted that separate PRDP
accounts should be opened in which PRDP funds should be banked while the MFPED insisted
that sector PRDP funds should be banked on the sector program accounts.
Non –remittance of unspent conditional grants to the consolidated fund.
The case of non- remittance of un-spent conditional grants as at end of the financial year is still
prevalent in all the districts sampled. The districts claimed that the unspent balances were
committed funds and therefore sought authority from the Secretary to the Treasury to retain the
funds. The practice of permitting districts to retain the unspent balances at year end encourages
complacency and failure to implement the development budget work plans/ activities timely
since they know they will be given permission to spend the money.
The risk of the retained money being spent on unauthorized activities is high.
Budget trend analysis
There was generally no significant change in the annual approved budgets for the FY 2009/2010
as compared to FY 2008/2009. Some of the districts visited had a slight increment while others
experienced a downward trend.
Agriculture
Four projects were monitored namely National Livestock Productivity Improvement Project (NLPIP);
Agriculture and Marketing Support Project; Support for Tea Cocoa Seedlings Project; and Integrated
Pests and Disease Management.
The Agriculture and Marketing Support Project is a World Food Programme (WFP) supported
Government of Uganda project with two components: 1) Food for Assets (FFA) component and
2) Market Support Component. The market support component was reviewed. The activities for
FY 2009/10 included purchase by WFP of 6,536 metric tonnes of maize and 435 metric tonnes
of beans from small scale farmers. This totals to 6,971 metric tonnes of grains; as well as
providing grain storage facilities to farmer groups, one each in Masindi, Nakaseke and
Sembabule districts.Temporary structures for grain storage were up in Nakaseke and Masindi
districts but nothing in Sembabule.

15
The Integrated Pests and Disease Management project has reported provision of banana plantlets
in Hoima, Mayuge and Iganga. However the plantlets had been delivered only in Hoima.
The National Livestock Productivity Improvement Project aimed at increasing household
incomes in the cattle corridor through enhanced livestock productivity and marketing. During FY
2009/10 focus was on rehabilitation/construction of cattle dips and cattle crushes; completing of
livestock markets, slaughter sheds and water reservoirs. In Isingiro the slaughter shed was
completed but was underutilized, while the Busheka livestock market that was also completed
was not in use due to poor community participation. In Kamwenge progress had been made on
the Town Council Slaughter shed, but the livestock market had stalled. In Kamuli there were
delays in construction due to lack of land titles. Buyende district had completed livestock market,
and a valley dam (Imeri) which had small defects.In Kumi/Ngora districts, the livestock market
was completed, but Ajamaka dam had been handed over by the contractor before completion
(although MAAIF reported 100% completion). Kyenjojo/Kyegegwa had progress on Kyenjojo
Town Council slaughter shed and Ruyonza market. In Lira works at Abiting Livestock market
had been abandoned, while no work had been done at Okwangole Cattle crush, although MAAIF
had reported 25%. In Masindi, two out of the planned four infrastructures had been built - the
livestock market in Mitooma Parish, Bwijanga Sub-county and one cattle crush in Kijunjuba
Parish. The two infrastructures that were not constructed were due to land disputes and lack of
land titles. Good work had been done in Sembabule, while Nakaseke and had completed defects
at the Town Council slaughter shed. In Nakasongola, Kalongo Livestock market, Migyera
Slaughter shed and Bukabi Kyerindura cattle crush were 100% complete although with some
defects.
Support for Tea Cocoa Seedlings Project, planned to step up the number of cocoa seedlings
distributed to farmers from 300,000 in FY 2008/09 to 500,000 in FY 2009/10. The Support for
Tea Cocoa Seedlings Programme is performing fairly well in terms of distribution of cocoa
seedlings according to plan. More than 500,000 seedlings have been distributed to farmers
during FY 2009/10. However, the target of 1 million seedlings was not met as funds
disbursement from MAAIF has been rather slow.
Education
Off-budget support from Royal Netherlands Governments for FY 2008/09 – 2009/10, had its
four activities fairly well implemented. These included the supply of water tanks, procurement of
motorcycles, procurement and distribution of computers, printers and accessories for all
Inspectors of schools as well as support to the National Curriculum Development Centre
activities on P.4 curriculum reform. All the other activities on this project were not well
implemented; including the supply of P.4-P.7 text books P.1 and P.2 Thematic Curriculum
materials to primary schools in the Lango and Acholi sub-regions, and QEI intensity districts;
and supply of furniture to selected primary schools in the same region. While some publishers
supplied these materials, some did not while others made under deliveries. The government lost
money as it paid for goods (books, furniture) that were not supplied. Funds were not properly
accounted for under construction of latrines, classrooms and teachers’ houses.
16
Emergency Construction and Rehabilitation of primary schools
The primary schools visited were, Bukiyi in Sironko; Murago in Rukungiri; St Damascus in
Luwero and Ttaba in Wakiso districts. Except Bukiyi all schools had received funds for
construction of classrooms. Ttaba and St Damascus had not started construction and funds were
still on the school accounts by the time of monitoring.
Development of Secondary Education
The secondary schools of Kigezi College in Kabale; Masaba SS in Sironko, and Sir Samuel
Baker SS in Gulu were monitored and all had civil works going on. However in Masaba S.S
works were behind schedule.
Seed secondary schools
Five schools were visited. Bagezza Seed S.S and Mbarara Seed S.S. were new constructions and
civil works were going on well. Construction in Kidongole Seed S.S. had been completed.
However, there were incomplete civil works by the different contractors in the others. At
Bugunzu S.S, a staff house with 2 units sub contracted by Spencon was not completed. A latrine
and bathroom for the staff house were also not constructed. At Buweswa Seed another staff
house was abandoned at walling level by the contractor.
USE schools
Eleven USE schools (Bukooli SS in Bugiri; Kabale SS, Kakungube SS in Mubende, Kamod SS
in Soroti, Kyamate SS in Ntungamo, Mpanga SS in Fort Portal, Nkoma SS in Mbale, Pallisa SS ,
Rubaare SS in Ntungamo, Serere SS in Soroti, and Entebbe Comprehensive SS) visited received
the reported funds. Construction was at different stages of completion in the different schools.
However in Kabale S.S. the storied block has not been completed as reported in the Budget
speech. Good civil works was on-going in Mpanga S.S, Rubaare S.S and Pallisa S.S.
Development of TVET
In Ngugo Technical School in Mbarara, and St. Joseph Kyarubingo TS in Kamwenge civil were
almost complete. However in Lumino Community Polytechnic in Busia and Nakaseke
Polytechnic works had not started.
BTVET institutions
Kaliro Technical Institute, Madera TI inSoroti, Namisindwa TI in Manafwa and Rugando TI in
Mbarara were visited. All the institutions received their funds and works were either going-on or
had been completed.
Presidential pledges
17
MoES prioritized a number of primary schools, secondary schools and BTVET institutions to be
constructed during FY 2009/10. The monitoring team selected ten primary schools
(Bakulumpagi in Butambala, Bunaiga in Kabarole, Buwama in Mpigi, Kalasa and Kangavve in
Luwero, Kateebwa SDA in Kabarole, Kyamusisi in Mityana, Madera Boys in Soroti, Naluggi in
Mityana, Semuto in Nakaseke). In Kateebwa SDA (Kabarole district) construction had not
started while in Semuto P/S works had stalled due to a disagreement. Construction in the other 8
primary schools was going on according to schedule.
Eleven Senior Secondary schools (Aboke Girls in Apac, Bukinda St. Paul SS in Kabale,
Buremba SS in Kiruhura, Isingiro SS, Kamwenge SS, Katalekammese modern SS in Nakaseke,
Kibiito SS in Kabarole, Kinoni community high school in Kiruhura, Nyamirama SS in Kanungu,
and Rukoni SS in Ntungamo) constructed under the Presidential pledges were monitored.
However, in three districts of Ntungamo, Isingiro, and Kabarole, there were delays to transfer
funds to the respective schools which delayed the implementation. In one case in Kiruhura
district, construction of Buremba S.S. had not started. In the rest of the districts visited, civil
works were going on and were at different stages of completion.
Four BTVET institutions (Kasese Youth Community Polytechnic, Kitagwenda TS in
Kamwenge, Nakapiripirit TS, and Namutamba Demonstration in Mityana districts) were
monitored. The construction had not started for Kasese Youth Community Polytechnique while
for Kitagwenda Technical School and Namutamba works were moving on well. Nakapiripirit
works had been abandoned.
Inspection Grant
Uganda shs 2.5 billion was provided for the District Inspectorate Departments to supervise the
teaching and learning environments in all schools. The funds were disbursed during the FY. The
mode of disbursement of the Inspection Grant during FY 2009/10 jeopardized the Inspection
operations for most districts in the country. Almost all districts visited reported receiving the first
instalment of the Inspection Grant at the end of April (i.e. at the end of Q3).1 Funds for three
quarters were consequently released in one lump-sum to all districts.
Energy
Vote function 0301 (Energy Planning, Management and Infrastructure Development)
Project 0325 (Energy for Rural Transformation) exhibited poor financial performance
during FY 09/10: Although 50% of funds were released in Q3, only 5% of GoU approved
budget was expended. Absorption was low because activities under phase II were still in
planning stage. The gasifer installations from ERT were revisited and found that none of
the three gasifiers were functional.
Under project 0331 (Rural Electrification) thirteen grid extension schemes during FY
09/10 were monitored, eleven of which had been successfully commissioned. The value
for money analysis noted that although the grid extension schemes monitored displayed
adequate operational efficiency (generally unit costs were in line with MEMD
1 This was the case in Lira, Apac, Gulu, Nakapiripirit

18
guidelines), effectiveness was often poor. Several lines have only managed to connect
one or two customers and the planning and design processes were not sufficiently
transparent.
Also under 0331, progress was made in electricity generation, with the completion of
Bugoye (13 MW) and Kisiizi (0.3 MW) hydropower projects. It is however unlikely that
MEMD will meet its target of 18 MW of increased electricity generation, as works are
still ongoing at Buseruka, Mpanga, Ishasha and Nyagak hydropower developments.
The UEDCL mini electricity grids in Moroto, Moyo and Adjumani acquired new 750
KVA generators during FY 08/09 and continue to receive subsidy for fuel. Interviews
with beneficiaries found that local businesses are constrained by the lack of power during
daytime hours (subsidy is only provided for five hours of operation in the evenings).
Under project 0999 (Power Sector Development Operation) Mutundwe thermal plant was
was in operation. MEMD are currently undertaking discussions with the World Bank in
order to secure the additional funds needed to continue to subsidise Mutundwe until
Bujagali hydropower project comes online. Also within 0999, MEMD successfully
carried out 195 ‘Energy Audits’ at public and private institutions and is preparing to
implement the findings during FY 10/11.
Project 1023 (Promotion of Renewable Energy and Energy Efficiency Programme)
exhibited excellent financial performance and according to progress updates from GTZ,
activities are in line to meet annual work plan targets. The energy saving stoves were
popular with beneficiaries.
Works at Bujagali Interconnection Project (1024) are behind schedule because of ongoing
land acquisition and resettlement disputes along the Bujagali-Kawanda line. However,
the target commissioning date for Bujagali hydropower facility has been moved back to
April 2012 consequently the interconnection project could still be completed in time for
power generation to commence.
Feasibility studies are ongoing at Karuma Interconnection Project (project 1025) and
Mputa Interconnection Project (project 1026).
Vote function 0302 (Large Hydropower Infrastructure)
MEMD reported that there was no expenditure or activities undertaken under project
0985 (the Energy Fund) up to Q3 FY 09/10 in Performance Contract Form A. However,
the Integrated Financial Management System records expenditure of UShs 143 billion.
Elsewhere, MEMD officials reported progress on the feasibility study for Karuma
hydropower project – suggesting that activities took place but were not reported.
Vote function 0303 (Petroleum Exploration, Development and Production);
Five of the ten petroleum and gas ‘exploration areas’ are currently licensed to private
developers. The additional five areas will be licensed when the Parliament passes the
‘Petroleum Bill’. Drilling and hydrocarbon appraisal activities are ongoing in those areas
that are licensed. By June 2010, 40 wells had been drilled.

19
The Petroleum Exploration and Promotion Department (PEPD) is undertaking feasibility
studies that will assess the viability of: (i) commercial utilisation of the oil and gas that
will be produced as part of extended well testing; and (ii) establishment of an oil refinery.
Substantial funding has been allocated to building the capacity of PEPD to effectively
manage the petroleum sector. Considerable achievements have made and these efforts
need to continue to ensure that PEPD recruits and retains viable employees.
Health
1. Late Releases: Funds for Primary Health Care for the third quarter of FY 09/10 were
released at the end of the quarter (late March 2010). Local Governments reported delayed
releases as one of the main reasons for having awarded contracts late and delayed
payments to contractors. In addition to late releases, additional delays to transfer funds
within the district were also reported. Lack of operational funds was reported to have
significantly affected service delivery especially at lower level health facilities which
reported to have had no funds to buy, toiletries and consumables during the third quarter.
Equally significant, lack of operational funds affected community mobilisation including
immunisation outreaches—which are the mainstay of preventive health care. Several
Local Governments reported that over the same period, there was no official
communication on the actual causes of the delay.
2. Rehabilitation of General Hospitals: over the last two FYs, Government has allocated
UShs 33 billion to the renovation of Regional Referral Hospitals. The situation in general
hospitals has remained unabated with no funds allocated for capital development. It is
common characteristic to find general hospitals across the country with visible cracks in
walls, blocked plumbing systems and leaking roofs such as in Kayunga, Iganga and
Kiryandongo General Hospitals. Previous interventions like the District Infrastructure
Programme have been piece meal, protracted and with few tangible outputs.
3. Supervision of works: Both PHC capital development and PRDP grants do not have
funds for supervision of works. District Health Officials reported that due to lack of funds
for supervision, they were not able to supervise progress of works by contractors on a
regular basis. Without supervision, shoddy works and defects often go unnoticed.
4. Drug management. Whereas Local Governments appreciate the improvement in
performance of NMS, stock outs remain high in health facilities. It was reported by
several districts that the discrepancy between orders to and deliveries from NMS remain
high. Some of the facilities visited in Mityana, Mubende and Mayuge districts for
example, reported stock outs of drugs one week after drugs had been delivered by NMS.
Under deliveries partly explain a growing practice of community members claiming to be
sick—yet their intent is to secure and hoard drugs—to wait for the incident when they
20
ultimately fall sick. Malaria cases reported at health facilities (OPD) substantially
increase following drug deliveries by NMS. In the absence of adequate diagnostic
services, health workers presumptively treat and prescribe anti malarials to such
individuals leading to stock outs.
5. Kit System: NMS introduced a new push system where a standard set of drugs will be
distributed to HCII and HCIIIs countrywide. These facilities will no longer be required to
place any orders but merely await deliveries. Several health workers and district leaders
spoken to were concerned that that they were not consulted when drawing up the list of
essential drugs. It was reported that the kit might not be sensitive to unique disease
burdens in particular regions of the country yet health facilities have no alternative
sources of drug financing.
Industrialization
Good progress has been noted in the value addition industries, with the ongoing construction
of the Buhweju Tea factory, the Banana processing factory at Nyaruzinga in Bushenyi and
Uganda Industrial Research Institute.
Projects under industrial park development across the country are characterized by long
implementation delays ranging from land valuation delays, compensation of squatters,
securing contractors for major works, changes in project designs, inadequate staffing, and
inadequate procurement plans and work plans among others.
Consistent under utilization of development funds by UNBS for two financial years was
noted.
Information Communications Technology
Equipment for the establishment of a data center was installed at Statistics House which
houses NITA-Uganda. The center houses basic applications that were used to operationalize
phase I (which included connecting ministries to Video conferencing and VoIP). However
sensitization about the E-Government was not carried out leaving the entire project to work
on chance; “Users have not adopted the technology thus creating white elephants.
The national backbone and e-government infrastructure project, which was contracted to
M/s. Huawei Technologies of China, is characterized by inadequate supervision of the
contractor. The first phase, costing $30 million, was investigated by the Auditor General, at
the request of the Parliamentary committee on Information and Communication Technology
(ICT).
During the execution of the second phase, the parliamentary committee on ICT halted the
implementation of this project, however the contractor continued with project execution
without supervision as the Ministry of ICT could not supervise suspended work. By the time
the suspension of work was lifted, over 60% of the project was estimated to have been
completed. This presents a risk on quality of work conducted during the period without
supervision.
21
Roads
i). The three road development projects monitored were generally on course with targeted
outputs surpassed on Soroti – Dokolo – Lira road, and expected to be met on Busega –
Masaka and Masaka – Mbarara road projects, by the end of the FY. All the contracts had
reasonably matched financial/ physical performances, contractors were well mobilised on
site, and works convincingly in progress. However, the projects were experiencing generic
challenges ranging from issues of cost overruns, design changes, land acquisition issues, and
delays in obtaining key decisions.
ii). The National Roads Maintenance Programme was monitored at 13 UNRA stations with a
total road network of 6,489Km (59.5% coverage). It was observed that almost all the roads
under the stations received at least one maintenance cycle during the FY, which was a good
indication that the targeted outputs of routinely maintaining the entire old network manually
and 15,258Km with machines were most likely to be achieved. The targeted output of
gravelling of 1,500Km of unpaved roads was also likely to be achieved through the force
account operations and the periodic maintenance contracts that mainly spilled over from FY
2008/09. It was however evident that the programme did not achieve its targeted output on
rehabilitation of 100Km and resealing 220Km of paved roads. The programme’s absorption
was at 99.3% as at end of June 2010 (IFMS data, excluding funds released under URF).
Financial progresses of the contracts under the programme were generally less than the
physical progress of works and within less than 20% difference, indicating reasonably good
financial performance. The programme however had issues relating to under scoping of
routine maintenance contracts, insufficient equipment, old equipment with extensive
breakdowns and high maintenance costs, and delays in procurement of works planned for
contracting, leading to unplanned emergency interventions which were costly and time
consuming. The deteriorating work on Kiziranfumbi – Kabwoya – Kagadi Road road was an
issue for concern.
iii). District and urban roads maintenance programmes were monitored in 11 districts and four
urban councils, was observed that generally most planned activities were rolled out during
the third and fourth quarters. Several roads under the district networks did not receive any
maintenance intervention with some districts having up to 40% of their networks in a
condition beyond maintenance levels. Financial performance of the programmes was
generally poor having absorption levels less than 50% and some districts having only 4.6%
absorption at the end of the third quarter. It was therefore evident that the programme would
not achieve the targeted outputs of maintaining 22,000Km, resealing/ reconstruction of
75Km of urban roads and reconstruction of 7.5Km of KCC roads. The programme was
however likely to achieve the targeted out puts of rehabilitation of 150Km of district roads,
and maintenance of 42Km of KCC roads. The programme had generic challenges like
absence of funds for planned activities expected in the third and fourth quarters through URF
(by the close of the second quarter), understaffed works departments, lack of equipment, poor
condition of equipment, delays in the procurement process, and capacity weaknesses of local
contractors mostly affecting urban councils where shoddy works were observed.
iv). Interconnectivity Roads Improvement Programme: at the time of monitoring in May 2010,
some of the works were still under procurement, and average physical progress of the
22
contracted works was at 64.3% but with most of the ongoing contracts nearing completion.
Considering that during the FY, the programme had works on a group of roads totalling
836.7Km it was likely that the targeted output of rehabilitation/maintenance of 470Km of
roads with contracts that spilled over from FY 2008/09 and 51Km of roads with contracts
procured within the FY was achieved. The programme however had issues of inconsistent
data of expenditures on roads and bridges (IFMS Data) when compared to the total payments
to contractors.
Water and Sanitation
(i) Financial
The MWE made unrealistic budgets given the resources available. Outputs were included in the
work plan (which is signed by the Accounting Officer and approved by Parliament) for which
there were insufficient funds. In some cases works have been delayed, as contractors have not
been paid even though there is an unspent balance on the account. In other cases, lack of
payments resulted in accumulation of interest payments. These delays are allegedly due to the
MWE’s internal payments procedure which involves 22 steps.
Given the continued discrepancies between GoU financial data reported by the sector compared
to the IFMS there should be an investigation as to why this is a recurrent practice.
(ii) Rural water supply and sanitation vote function
There were varied unit costs provided by MWE with no clear explanations for deviations. For
example, emergency boreholes had a unit cost of UShs 18million compared with UShs 15million
in the BFP; and UShs 97.5million was budgeted for one social marketing campaign even though
sector officials estimate UShs 12million.
The funds for the District Water and Sanitation Conditional Grant were with works department
while the District Water Officer is the vote controller. This led to diversionary risks to other
priorities under ‘Works.’
In Arua, Iganga and Koboko districts, water points constructed by NGOs and development
partners, were accounted against GoU expenditure.
(iii)Sanitation
The Sanitation Conditional Grant was not in place. The funds for the Sanitation Conditional
Grant if established should be ring-fenced to prevent diversions. Furthermore, the MWE, MES
and MOH under the guidance of MOPS need to come to a conclusion as soon as possible on
which ministry will be responsible for the grant. This should be done before October 2010, in
time for the FY11/12 budget process.
(iv) Urban water supply and sanitation vote function
There were design changes and cost variations during implementation.
23
The deviations to the work plan due to “emergency requests,” raising expenditure against these
additional outputs were not accounted for in the quarterly progress reports (Performance Form
A’s). This would enhance the accuracy of reporting and accounting of funds.
(v) Water for Production vote function
Water for production was embarking on new constructions before completing ongoing facilities.
There needs to be greater coordination with MAAIF and local governments to ensure the correct
use of facilities once they have been complete. For example, Leye dam and Olelpec valley tank
in Apac district were completed in FY09/10 and are not being effectively utilised. There should
be greater efforts to train Water User Committees.
There should be an independent value for money study on unit costs for construction of water for
production facilities, with particular emphasis on procurement methods as a cost driver. This is
in light of public financial management reforms that have led to the establishment of PPDA and
the use of the force account provision, where the MWE claims the latter results in lower unit
costs.
(vi) Meteorological Support to Plan for the Modernisation of Agriculture
The Meteorology Agency had challenges of internal capacity and leadership constraints that need
to be addressed. The increased expenditure had not resulted in additional outputs; an audit of
FY09/10 expenditure is recommended.
Micro Finance The Microfinance Support Centre (MSC) Ltd has twelve zonal offices that facilitate outreach
to all registered entities such as the SACCOs, MFIs, SMEs and individuals. Each zonal office
covers not less than seven districts and has only five staff. The staffing levels are still low to
reach all the clients. SACCOs continue to be the biggest client among the beneficiaries.
These are spread all over the rural settings and there was evidence of some SACCOs
receiving funds from MSC which is lent out to members. However, there are still a few
SACCOs accessing the funds because most of them are in formation stages while others are
inactive and dormant. Some SACCOs mainly those that received the GOU loans of UShs
5,000,000 in 2006 closed operations after accessing the funds leading to high default rate.
MSC offers a number of products to its clients at an interest rate of 9%- 13% per annum but
the SACCOs and other benefiting entities are free to determine their own interest rate on the
loans disbursed. However most SACCOs interest rate are so exorbitant in the range of 2%-
6% per month (24%- 72% per annum) and this contributes to the high default rate by its
clients.
Challenges
All the SACCOs monitored had a recovery rate below the recommended MSC
recovery rate of 95%. The poor performance of the SACCOs affects the capacity to
borrow funds from the MSC. The loans recovery is a big challenge. Some borrowers
think that the money is free government offer which should not be paid back. The

24
problem of nonpayment of loans is aggravated by interference of politicians who
misled the community by advising them to get free money at the SACCOs. This has
also hindered the growth of the SACCOs.
A number of SACCOs had poor systems/ procedures and documentation of records.
In some instances the loan agreements are not kept in a single file or place while at
times the forms used for loan disbursements are not detailed enough to cover all the
relevant information.
A number of SACCO members were swindled of their hard earned savings by “fake
SACCO institutions” which closed operations after collecting funds from the savers.
According to some SACCO managers interviewed, it has become increasingly
difficult to mobilize members because some of them lost money through other
SACCOs which cheated people. It is now difficult to convince the community to join
new SACCOs because of the past experiences.
Many SACCOs lacked proper governance structures and the financial impropriety by
some managers led to lack of trust by the members. This affected membership
growth, leading to low/poor savings and share capital.
Many SACCOS/ MFIs were affected by conflict of interest by the board members and
politicians. These groups of borrowers get loans without going through the loans committee
and most of the loans are not secured which makes it difficult for recovery.
Poor loan appraisal by the SACCO managers and loan committee leading to high default and
poor servicing of MSC loans. This was common with SACCOs that had personnel of low
qualifications.
A number of SACCOs complained that getting the maximum liability from Ministry of Trade
was very tedious. There was a general complaint that the District Commercial officers always
complicate the process of getting the maximum liability and therefore SACCOs take a very
long time to obtain one.
Other salient issues included: lack of adequate transport at both the MSC zonal offices and
the SACCOs; lack of information and data management devices such computers, type
writers, printers, photocopiers to meet customer needs; competition from other money
lending institutions; non receipt of financial support from UCSCU in form of salaries that
stopped in Dec 2009 and also few instances of some SACCOs complaining of delayed
receipts of funds from the MSC.

25
RECOMMENDATIONS
Financial Performance District should comply with the provisions of the Public finance act and regulations
regarding unspent balances at end of the financial years and return the funds to the
consolidated fund. This will encourage the district officials to ensure that projects are
implemented on time.
Disciplinary action should be taken against district accounting officers (CAO and CFO of
Bundibugyo District in this instance) for utilizing the unspent balance for development
grants amounting to UShs 75,007,000 without authority from the Secretary to the
Treasury.
The CAO Sironko should take disciplinary action against the Senior Accounts assistants
of Education and that of Works for failing to keep uptodate books of accounts. The cash
books had been last posted in April 2010 and information could not easily be obtained.
The OPM and the MFPED should avail one manual to guide the districts on the
operations and management of the PRDP funds to avoid conflicting instructions.
Procurement process in local governments should be speeded up to avoid low absorption
of funds. Districts should also be advised to start on the procurement process in the initial
month of the financial year. The Public Procurement and Disposal unit should provide
more support to this effect.
Agriculture
MAAIF should step up monitoring and supervisory efforts to enhance delivery of
programmes and also reduce on wrong reporting. The involvement of district officials
may go along way in resolving this problem.
Contractors that have persistently performed poorly should be reported to PPDA for
blacklisting.
Education
The Ministry of Education should follow up on institutions and schools that have delayed
implementation of programmes.
The Inspectorate should be prioritized to ensure that school inspections are not
compromised because of delayed disbursement of funds.
Energy
Vote function 0301 (Energy Planning, Management and Infrastructure Development)
The gasifier installations at Kyambogo University, Kings College Buddo and at
Nyabyeya Forestry College need to be completed as soon as possible. They should be
made functional to the satisfaction of end users.

26
The renewed rural electrification strategy that will be developed during FY 10/11 should
include guidelines on ways in which the transparency of grid extension planning can be
improved. For example, clear selection criteria should be developed and analysis made
publically available. Provision should also be made for inclusion of local government and
existing local operators in the identification and design of new grid extension schemes.
MEMD and REA should consider the inclusion of a subsidy for connection fees
alongside all grid extension projects, as BMAU interviews with local operators and with
beneficiaries have found that rural households have limited ability and willingness to pay
for the high connection costs.
The hours of operation at the UEDCL mini electricity grids in Moyo, Moroto and
Adjumani are not sufficient to meet the needs of local businesses (no power is available
during the day). MEMD should consider extending the hours of operation (or at least
shifting some hours to the morning); and consider extension of the mini-grids in order to
make operations more profitable and access more people.
MEMD and UETCL need to work alongside the Chief Government Valuer to expedite
the resolution of ongoing land disputes at Bujagali Interconnection Project. Work needs
to be done to streamline the compensation and acquisition process for future construction
projects.
Vote function 0302 (Large Hydropower Infrastructure)
Transparency and accuracy in reporting of Energy Fund financial and physical
performance needs to improve as current procedures are inadequate. There is need to
institute an audit of funds so far released to this Vote function.
Vote function 0303 (Petroleum Exploration, Development and Production);
The number of skilled personnel within PEPD needs to continue to increase as the
industry grows. This will involve continued investment in capacity development as well
as recruitment of graduate staff.
MEMD should work with NEMA in order to develop its capacity to manage the growing
environmental management and legal challenges that the industry is presenting.
Health
1. Improve diagnostic services: Drugs like anti malarials are very expensive yet
presumptive treatment is the norm rather than the exception. It would be cost
effective to improve diagnostic services. Assuming that 1000 doses of coartem per
district per distribution cycle (every 2 months). It is estimated that Government would
spend UShs 6.9 billion per year. This is a conservative estimate because the abuse of
drugs is much higher than is illustrated above.
27
A study should be carried out on the cost effectiveness of improving diagnostic
services in lower level health facilities.
2. Release schedule: MoFPED should provide release schedules for funds disbursed to
Local Governments especially in instances where grants are supervised by different
ministries for example PRDP and PHC grants.
3. Undertake a value for money audit for major infrastructure undertaken under main
projects in the health sector including: Support to the Health Sector Strategic Plan
(HSSP), District Infrastructure Strategic Plan (DISP), primary health care conditional
grants (capital development) and Peace Recovery and Development Plan (PRDP).
4. Revise the wage bill to enable districts recruit and retain additional health workers.
5. Incentives should be provided for both hard to reach and hard to stay areas to improve
retention of health workers.
6. Development grants should have a component for supervision of activities.
Industrial Development
UIA should devise an elaborate strategy of improving performance of industrial parks
development if the stipulated targets are to be achieved.
UNBS is understaffed and therefore lacks the capacity to perform its objectives,
additional wage resources should be made available to ensure quality control and standards
of goods on Ugandan market. The agency should improve performance of development
programmes.
Information Communications Technology
Awareness campaigns and sensitizations should be carried out by NITA-Uganda/MoICT so
that beneficiaries appreciate the services offered under EGI/NBI and demystify the
allegations of espionage. NITA-U should urgently develop a change management strategy
and constitute a change management team to counter the negative publicity and achieve the
intended project benefits.
Implementation should address the immediate communication needs of the stakeholders such as
bandwidth, Internet services, Voice over Internet Protocol and email solutions. Implementers
should consider provision of shared services; negotiate concessionary rates for landline to mobile
and creation of closed user groups This will enable government agencies to separately and
collectively lift their performance.
The Ministry of ICT should review the existing ICT policy with a view of amending it to re-
align E-government in the policy.

28
Implementation of National Backbone Infrastructure should be properly supervised if the
accruing benefits are to be achieved. At the moment, the contractor and the sub contracted
firms execute project activities without any supervision.
There is no evidence of cost reduction/savings as a result of e-government infrastructure
interms of reduction in telephone costs and movements from one destination to another for
meetings. A study should be commissioned to evaluate the project performance and assess
the level at which it has achieved the set targets in order to benchmark benefits and improve
performance.
Roads
i). Generic challenges that cut across all development projects like cost overruns, design
changes, land acquisition issues, and delays in obtaining key decisions need to be
streamlined and proactively controlled in order to effectively manage the ever rising
construction unit rates and reduce the chronic delays in completion of the projects.
ii). Issues of under scoping of routine mechanised maintenance works, procurement ceilings
for micro-procurements and low equipment stock at the UNRA stations need to be
addressed so as to make the operations of the programme more efficient and cost effective.
iii). Supervision of the contract for maintenance of Kiziranfumbi – Kabwoya – Kagadi Road
needs to be strengthened in order to rectify the substandard works observed during
monitoring and to ensure value for money.
iv). There is need for a framework to improve the availability and maintenance of equipment at
district works departments in order to improve effectiveness of the district roads
maintenance programmes.
v). There is also need to improve information flow on projects centrally coordinated by MoWT
so as to improve transparency and accountability to people at the grass root.
vi). The data inconsistence between expenditures on roads and bridges (IFMS Data) and the
payments to contractors under the Interconnectivity Roads Improvement Programme needs
to be reconciled and explained.
Water and Sanitation
(i) The MWE should ensure that managers are availed with financial information to enhance
smooth implementation of works and reduce levels of misinformation on financial releases.
(ii) The internal payments procedure should be reviewed by the MWE to increase efficiency,
ensure contractors are paid for completed work on time, and avoid accumulation of interest
payments.
(iii) In nearly all cases, designs for new works were not shared with local government officials,
reducing their ability to monitor and supervise the works. As interventions are eventually
handed over to local governments, this information should be availed from the start to
enhance sustainability and ownership.

29
(iv) A separate account for the District Water and Sanitation Conditional Grant should be
established where District Water Officers are the vote controllers, to reduce on the practice of
diversion of funds from water and sanitation activities.
(v) The MWE’s leadership support for promoting environmental sanitation is recognised. In
order to kick-start operation of the sanitation conditional grant, the MWE should allocate
funds (possibly transfer funds from centralised sanitation services for sanitation campaigns),
which should be complimented by the MoES, MGLSD and MOH, as well as the MFPED.
(vi) Where there have been deviations from approved work plans due to “emergency requests”
this should be stated clearly in the work plan, in order to accurately account for expenditure.
(vii) There should be an independent study to inform the policy for water for production. This
should focus on unit costs for water for production facilities, with particular emphasis on
procurement methods as a cost driver.
(viii) Given the ambitious work plan for FY10/11 for water for production, efforts should first be
made to complete existing facilities that have been delayed, before embarking on new
constructions.
(ix) In order for the Meteorology Agency to be successfully established capacity constraints need
to be addressed urgently. There is need to ensure there is adequate leadership, managerial and
technical support to implement the initiative.
Micro Finance
MSC should in a long term strategy plan to increase the number of staff at the zonal
offices as the current number of five is too small to effectively handle the activities.
SACCOs should be guided on the range of interest rate charged to their customers that
range from 24%- 72% per annum. These rates are high and have lead to high default rate.
MSC should train the staff and board members of the SACCOs in developing the
guidelines of loan products and appropriate loan forms. The training program should be
intensified to sensitise the community stakeholders including religious, political, and
civic leaders; and SACCO leadership to improve on the awareness levels of MSC
services.
MSC should train the District Commercial officers to carry out competent and
satisfactory SACCO audits and expeditious processing of the maximum liability forms.
MSC should take legal action against defaulters to deter the culture of default that is
cropping up in SACCOs that have overdue loans of over 365 days and those that got
GOU loans but did not pay back
MSC should constantly offer the technical support and supervision of the activities of the
SACCOs to enable them enhance on their performance.
Continue to follow up the weak SACCOs in a bid to revive them in collaboration with
UCSCU and other Stakeholders.
There should be increased disbursements of financial services to qualifying SACCOs/
MFIs/ SMEs

30
CHAPTER 1: INTRODUCTION
Government stepped up its monitoring efforts for enhanced programme implementation. To this
effect, the Budget Monitoring and Accountability Unit (BMAU) prepare quarterly monitoring
reports, and this is the second financial year of these reports. Budget monitoring is concerned
with tracking implementation of selected government programs or projects with observing how
values of different indicators against stated goals and targets change over time. The
monitoring is confined to the levels of inputs- outputs in the following areas:
1. Agriculture
2. Infrastructure (Energy and Roads)
3. Industrialization and ICT
4. Social Services (Education, Health, and Water and sanitation)
5. Micro finance
1.1 Process
This report is based on a few selected programmes in the mentioned sectors. Selection was based
on a number of criteria:
The significance of the budget allocations to the votes within the sector budgets, with
focus being on large expenditure programmes. Preference was given to development
expenditure except in health, education and works sectors where some recurrent costs
were tracked.
The programmes that had submitted progress reports by the end of quarter three in FY
2009/10 were followed up for verification as they had specified outputs achievements for
the quarter.
Programmes that had been monitored during the first three quarters of 2009/10 especially
if they had major implementation issues were also revisited.
Programmes with planned activities in Q4 of FY 2009/10 were also sampled to assess
progress as the FY activities got on the way.
1.2 Limitation of the report
Information on donor releases was not readily available for all programmes and hence financial
performance may have been underestimated.
1.3 Structure of the report
The report has three chapters. The second chapter reviews the financial performance while
chapter three focuses on the physical performance of the selected programmes.
31
CHAPTER 2: FINANCIAL PERFORMANCE
2.1 Introduction.
The analysis consists of two components namely;
The general development grant funds performance for selected sectors.
A review of the flow of development grants funds to the selected seven (7) districts and
three Municipal councils.
2.1.1 Sector Financial performance
This section reports on GOU domestic development grant approved annual budget, releases and
absorptions for the FY 2009/2010 to selected MDA that include: Ministry of Agriculture, Animal
Industry and Fisheries; Ministry of Education and Sports; Ministry of Energy and Mineral
Development; Ministry of Health; Ministry of Works and Transport; Ministry of Water and
Environment ; Ministry of Finance, Planning and Economic development (development of
Industrial parks, Activities of Microfinance Support Centre Limited). It further makes a
comparison of the budget trend in the two financial years of 2008/09 and 2009/10.
2.1.2 Objectives
To provide analysis of the funds released to the sectors and absorbed against the
approved budget.
To establish the budget trends of the approved budget of FY 2008/09 and FY 2009/10
2.1.3 Scope and methodology
The period under review is the FY 2009/10 in respect to the GOU annual approved development
grant budget, releases and expenditures. For the trend analysis of the budget growth, the report
compares two financial years 2008/09 and 2009/10.
The analysis largely used the integrated financial management system (IFMS) data and the
legacy system.
2.2 Vote Analysis
1) Vote 010 Ministry of Agriculture, Animal Industries and Fisheries
A total of UShs 22.222 billion excluding taxes was the annual domestic development budget for
Vote 010 as compared to UShs 9.49 billion for FY 2008/09. This represents an increment of 31%
in the development GOU approved annual budget for FY 2009/10. For the period July 2009 –

32
June 2010, the MFPED released a total of UShs 19.944 billion representing 89.7% release
performance. The releases range from 66.2% to 100%. The release performance was not very
good for the period under review. Table 2.1 shows the various projects that received less than 90
% of the approved annual budget.
Table 2.1 : MAAIF, budget, releases and expenditures FY
2009/10
VOTE PROJ
ECT
PROJNAME GOU budget Releases July
09- June2010
Expenditures
July 09- June
2010
Release
perfor
mance
Absorptio
n rates
010 0074
AGRIC. SECTOR PRG.
SUPPORT PHASE II 221,640,000 180,157,953
180,157,953 81.2 100
010 0076
SUPPORT FOR
INSTITUTIONAL DEV-
MAAIF 700,000,000 563,700,000
563,400,116 80.5 100
010 0091
NATIONAL
LIVESTOCK PROD
IMPROVEMENT 2,100,000,000 1,738,600,000
1,738,351,276 82.8 100
010 0094
SUPERVISION,MONIT
ORING &
EVALUATION 377,000,000 249,500,400
249,500,400 66 100
010 0968
FARM INCOME
ENHANCEMENT
PROJECT 300,000,000 197,833,334
197,812,326 66 100
010 1009
SUSTAINABLE LAND
MANAGEMENT
PROJECT 100,000,000 88,700,000
88,700,000 88.7 100
010 1012
FAO/TCP
INTEGRATED
PEST&DISEASE MGT 300,000,000 243,225,000
242,948,669 81 99.8
10 1082
SUSTAINABLE RICE
PRODUCTION 200,000,000 163,700,000
163,349,268 81.85 99.8
10 1083
UGANDA MEAT
EXPORTS 500,000,000 436,903,667
435,228,066 87.4 99.6
10 1084
AVIAN AND HUMAN
INFLUENZA 138,000,000 106,130,000
106,129,999 76.9 100
10 1085
MAAIF
COORDINATION 347,000,000 230,030,666
224,340,187 66.2 97.5
10 1119
IMPROVED RICE
PRODUCTION 158,000,000 130,200,000
130,200,000 82.4 100
Source: IFMS data
The projects that registered very low releases (66%) included:
094 Supervision, monitoring and evaluation
0968 Farm income enhancement project
1085 MAAIF Coordination

33
Regarding absorption of the funds, MAAIF was able to absorb all the funds received at a rate of
100% as per the IFMS system during the fourth quarter as compared to an absorption rate of
88.7% during the end of the third quarter.
2). Vote 013-Ministry of Education and Sports
There was a 25% increase in the GOU development annual approved budget that moved from
UShs 39.74 billion in the FY 2008/09 to UShs 49 billion in FY 2009/10 excl .taxes. For the FY
2009/10, a total of UShs 45.688 billion was released representing a release performance of
93.2% of the total approved development grant budget. The projects receipts from the MFPED
were in a range of 88% to 95%. as shown in table 2.2
Table 2.2: Release performance of the projects under Vote 013
Vote Pro Project Name GOU Approved
Budget
Releases FY
2009/2010
Releases as %
of the budget
July 09 -June
2010
013 0176 CHILD FRIENDLY BASIC EDUCATION 172,000,000
163,244,000 95
013 0191
REH.NAT.HEALTH
SERV.&DEPT.TRAIN.INS 1,401,000,000
1,329,682,667 95
013 0210 WFP/KARAMOJA 599,960,000
528,850,700 88
013 0897
DEVELOPMENT OF SECONDARY
EDUCATION 13,063,000,000
11,863,470,000 90
013 0942 DEVELOPMENT OF BTVET 2,500,000,000
2,372,739,000 95
013 0943
EMERGENCY CONST.&
REH.PRIM.SCHOOLS 1,800,000,000
1,708,372,000 95
013 0944
DEVELOPMENT OF
PRIM.TEACHERS'COLL. 2,701,000,000
2,563,507,000 95
013 0949
ADB III POSTPRIMARY EDUC &
TRAINING 11,191,773,491
10,337,288,491 92
013 0971
DEVT TVET P7 GRAD. ENROLLING
INSTIT 3,100,000,000
3,081,974,300 99
013 0984
RELOCATION OF SHIMONI PTC &
PRI.SCH 4,998,000,000
4,743,579,000 95
13 1091 SUPPORT POST PRIMARY EDUCATION 1,200,000,000
1,069,703,333 89
13 1092 ADB IV SUPPORT TO SEC SCH 3,274,000,000
3,077,339,000 94
13 1093
NAKAWA VOCATIONAL TRAINING
INSTITUTE 3,000,000,000
2,847,287,000 95
TOTALS 49,000,733,491
45,687,036,491 93
Source; IFMS data

34
The overall absorption rate of the funds received was good at 100% for the period ending June
2010 as compared to 91 % for the period ending March 2010.
3) Vote 017 -Ministry of Energy and Mineral Development.
The total GOU domestic development budget for Vote 017 for FY 2009/10 was UShs 346.2
billion excluding taxes and arrears as compared to UShs 218.7 billion for FY 2008/2009. This
was an increase of 58.2% in the annual approved budget. The total releases for the period were
UShs 330.77 billion representing 95.5% of the approved annual budget.
Figure 2.1 Projects, amounts released and spent for the period July 2009- June 2010
Source: IFMS data
The following projects registered receipts of less than 100% of the annual approved budget from
the MFPED:
Project 0328 Sustainable management and mineral resources, release performance of
88.3%
Project 0940 support to thermal power generation, 95%
Project 1024 Bujagali interconnection project. The entire annual approved budget was
UShs 3 billion of which a total of UShs 2.1 billion (70%).
Project 1026 Mputa interconnection project. The entire annual approved budget was
UShs 32.06 billion of which a total of UShs 22.44 billion (70%).
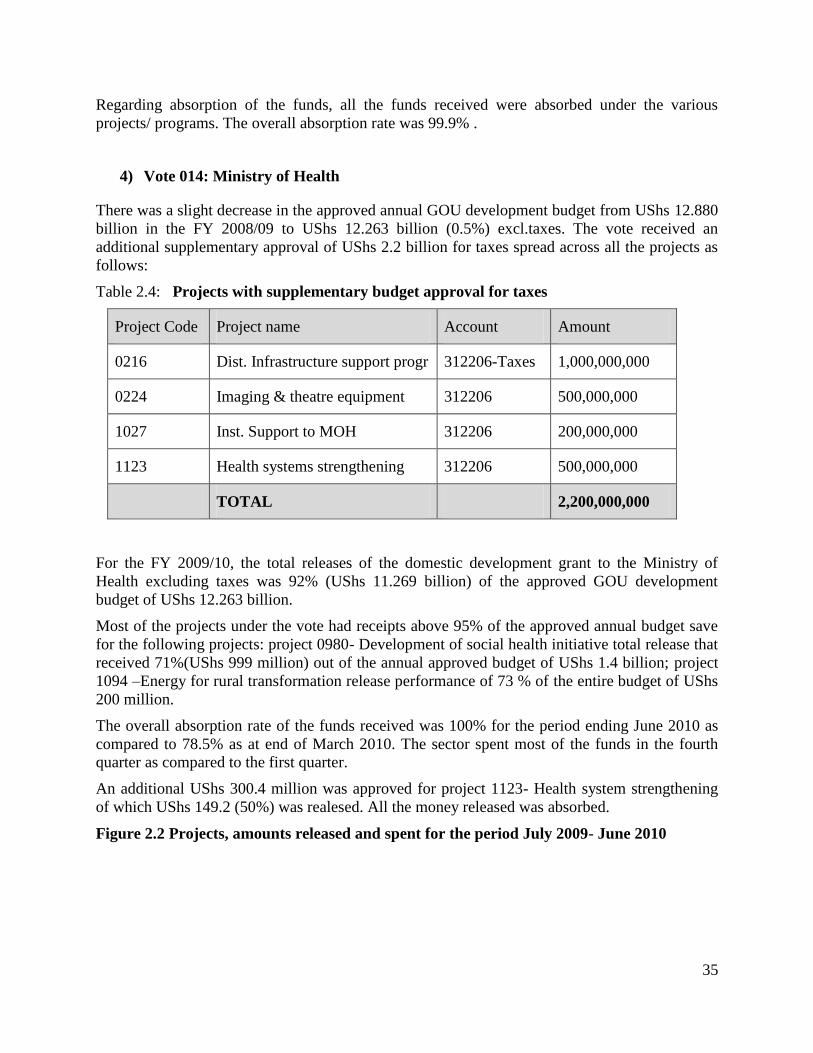
35
Regarding absorption of the funds, all the funds received were absorbed under the various
projects/ programs. The overall absorption rate was 99.9% .
4) Vote 014: Ministry of Health
There was a slight decrease in the approved annual GOU development budget from UShs 12.880
billion in the FY 2008/09 to UShs 12.263 billion (0.5%) excl.taxes. The vote received an
additional supplementary approval of UShs 2.2 billion for taxes spread across all the projects as
follows:
Table 2.4: Projects with supplementary budget approval for taxes
Project Code Project name Account Amount
0216 Dist. Infrastructure support progr 312206-Taxes 1,000,000,000
0224 Imaging & theatre equipment 312206 500,000,000
1027 Inst. Support to MOH 312206 200,000,000
1123 Health systems strengthening 312206 500,000,000
TOTAL 2,200,000,000
For the FY 2009/10, the total releases of the domestic development grant to the Ministry of
Health excluding taxes was 92% (UShs 11.269 billion) of the approved GOU development
budget of UShs 12.263 billion.
Most of the projects under the vote had receipts above 95% of the approved annual budget save
for the following projects: project 0980- Development of social health initiative total release that
received 71%(UShs 999 million) out of the annual approved budget of UShs 1.4 billion; project
1094 –Energy for rural transformation release performance of 73 % of the entire budget of UShs
200 million.
The overall absorption rate of the funds received was 100% for the period ending June 2010 as
compared to 78.5% as at end of March 2010. The sector spent most of the funds in the fourth
quarter as compared to the first quarter.
An additional UShs 300.4 million was approved for project 1123- Health system strengthening
of which UShs 149.2 (50%) was realesed. All the money released was absorbed.
Figure 2.2 Projects, amounts released and spent for the period July 2009- June 2010
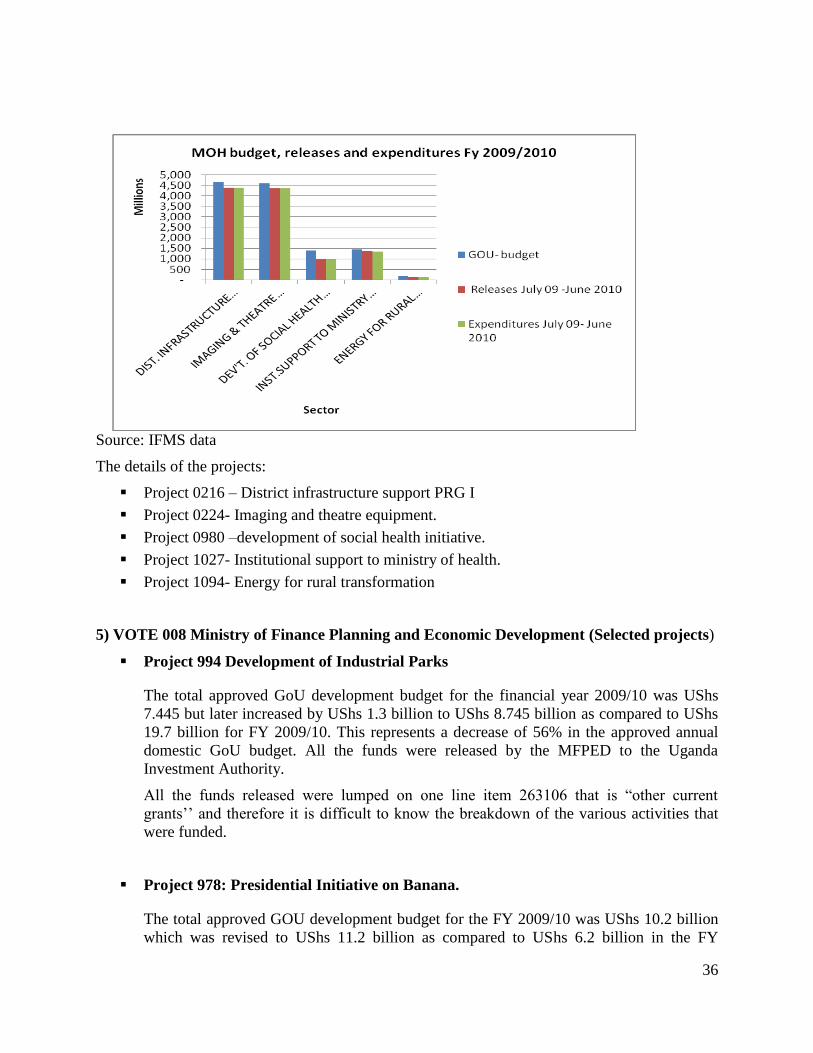
36
Source: IFMS data
The details of the projects:
Project 0216 – District infrastructure support PRG I
Project 0224- Imaging and theatre equipment.
Project 0980 –development of social health initiative.
Project 1027- Institutional support to ministry of health.
Project 1094- Energy for rural transformation
5) VOTE 008 Ministry of Finance Planning and Economic Development (Selected projects)
Project 994 Development of Industrial Parks
The total approved GoU development budget for the financial year 2009/10 was UShs
7.445 but later increased by UShs 1.3 billion to UShs 8.745 billion as compared to UShs
19.7 billion for FY 2009/10. This represents a decrease of 56% in the approved annual
domestic GoU budget. All the funds were released by the MFPED to the Uganda
Investment Authority.
All the funds released were lumped on one line item 263106 that is “other current
grants’’ and therefore it is difficult to know the breakdown of the various activities that
were funded.
Project 978: Presidential Initiative on Banana.
The total approved GOU development budget for the FY 2009/10 was UShs 10.2 billion
which was revised to UShs 11.2 billion as compared to UShs 6.2 billion in the FY

37
2008/09. There was an increase of 81% of the revised GOU annual approved budget. A
total of UShs 11.198 was released and according to the IFMS system, all the funds were
lumped on line item 312101- Non residential buildings without breaking down/ costing
the various activities being carried out. These funds were released by the third quarter of
the FY 2009/10.
Project 1111: Soroti Fruit Factory
All the releases totaling to UShs 3.062 billion under this project were released in the
fourth quarter. Late releases of funds leaves little room for the implementation of the
project. The annual approved budget for the FY2009/10 was UShs 5.0 billion but later
revised to UShs 3.462 billion of which a total of UShs 3.062 was released. The amount
released was 88 % of the revised budget. The funds were released under two line items.
Table 2.5 Details of funds received.
Project Account Budget Release.
1111 225001-Consultancy services
short term
250,000,000 250,000,000
1111 312101- Non residential
buildings
3,212,500,000 2,812,500,000
Totals 3,462,500,000 3,062,500,000
Source: IFMS data
There is need to verify whether the funds released for Non residential building was
actually utilized for the intended purpose.
5) Vote 019- Ministry of Water and Environment
The total domestic development budget for the financial year 2009/10 amounts to UShs 52.6
billion excluding arrears and taxes as compared to UShs 38 billion (Excl.taxes) for FY 2009/10.
This represents a 38% increase in the GOU development annual approved budget.
There were a number of reallocations between the vote functions/ projects as shown in table 2.6.
Table 2.6 Projects with reallocations.
Project
code
Project name GOU budget Revised budget
0140 Meteorological support for PMA 2,960,000,000 2,059,366,667
0151 Policy and management support 1,499,550,000 1,092,004,228

38
0158 School and community sanitation 1,600,000,000 3,700,000,000
0164 Support to small towns 5,219,946,480 5,021,950,814
01074 Water and sanitation devt for north 2,300,000,000 1706,174,771
13,579,496,480 13,579,496,480
Source: IFMS data
The reallocations affected five projects but on the whole did not affect the overall approved
budget amount. The reallocations imply that proper budgeting for activities at the initial stages
was not done creating insufficient or excess budget allocations.
There were arrears totaling to UShs 2.1 billion of which UShs 2 billion was released representing
a release performance of 95%.
The total releases for the period July 2009 – June 2010 including arrears were UShs 54.190
billion representing a release performance of 99%.
A total of Ushs 54.471 billion was spent representing an overall absorption rate of 100.5%. Most
of the funds released to the sector were consumed in the fourth quarter as the absorption rates for
the period ending March 2010 was 76.4%
The absorption range was 90% to 143% with project 0947-Farm income enhancement project
having absorption rate of 143% whereas there were no reallocations noted on the IFMS system.
This implies that there was an over expenditure for that project.
An over expenditure of UShs 381 Million was incurred on line item 312105 – taxes on buildings
and structures which had an approved budget of UShs 500 million but spent UShs 881 million.
The following table shows projects that received less than 100% of the entire approved budget.
Table 2.7: Projects that received less than 100% for the FY 2009/10
PROJE
CT PROJNAME GOU-Budget ARREARS
Releases July
09- June 2010
Expenditures
July 09- june
2010
Releas
e perf
Absorptio
n rates
0137
L.VICTORIA
ENVIRONMENT
MNGMT PROG. 1,810,000,000
1,748,426,675 1,745,312,399 97 99.8
0149
OPER.WATER
RESOURCE MGT -
NILE BASIN 400,000,000
379,638,000 377,372,772 95 99.4
0160
SOUTH/WEST TOWNS
WATER &
SANITATION 1,440,000,000
1,376,878,000 1,373,803,951 96 99.87
0163
SUPPORT TO RURAL
WATER SECTOR 3,009,000,532
400,000,000
3,383,815,537 3,373,975,218 99 99.7
0165
SUPPORT TO THE
WRMD 1,830,000,000
1,747,026,000 1,746,946,283 95 100
0168
URBAN WATER
REFORM 850,000,000
200,000,000
972,361,667 968,983,976 93 99.6
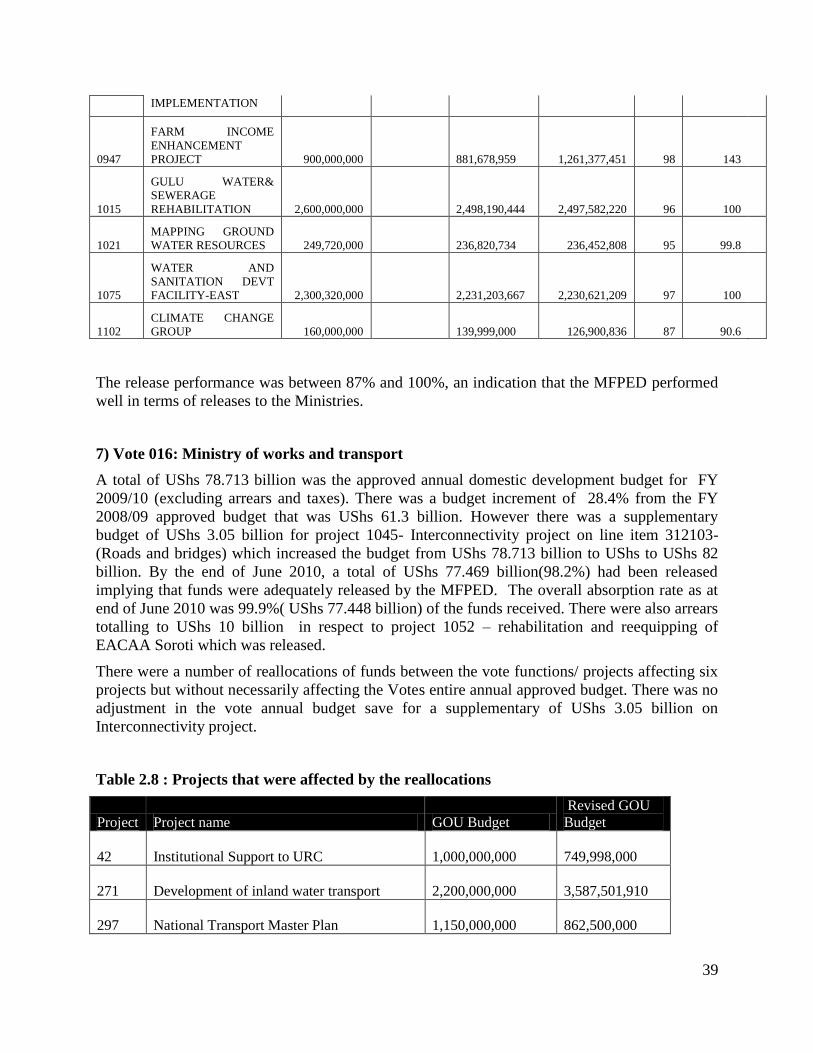
39
IMPLEMENTATION
0947
FARM INCOME
ENHANCEMENT
PROJECT 900,000,000
881,678,959 1,261,377,451 98 143
1015
GULU WATER&
SEWERAGE
REHABILITATION 2,600,000,000
2,498,190,444 2,497,582,220 96 100
1021
MAPPING GROUND
WATER RESOURCES 249,720,000
236,820,734 236,452,808 95 99.8
1075
WATER AND
SANITATION DEVT
FACILITY-EAST 2,300,320,000
2,231,203,667 2,230,621,209 97 100
1102
CLIMATE CHANGE
GROUP 160,000,000
139,999,000 126,900,836 87 90.6
The release performance was between 87% and 100%, an indication that the MFPED performed
well in terms of releases to the Ministries.
7) Vote 016: Ministry of works and transport
A total of UShs 78.713 billion was the approved annual domestic development budget for FY
2009/10 (excluding arrears and taxes). There was a budget increment of 28.4% from the FY
2008/09 approved budget that was UShs 61.3 billion. However there was a supplementary
budget of UShs 3.05 billion for project 1045- Interconnectivity project on line item 312103-
(Roads and bridges) which increased the budget from UShs 78.713 billion to UShs to UShs 82
billion. By the end of June 2010, a total of UShs 77.469 billion(98.2%) had been released
implying that funds were adequately released by the MFPED. The overall absorption rate as at
end of June 2010 was 99.9%( UShs 77.448 billion) of the funds received. There were also arrears
totalling to UShs 10 billion in respect to project 1052 – rehabilitation and reequipping of
EACAA Soroti which was released.
There were a number of reallocations of funds between the vote functions/ projects affecting six
projects but without necessarily affecting the Votes entire annual approved budget. There was no
adjustment in the vote annual budget save for a supplementary of UShs 3.05 billion on
Interconnectivity project.
Table 2.8 : Projects that were affected by the reallocations
Project Project name GOU Budget
Revised GOU
Budget
42 Institutional Support to URC
1,000,000,000
749,998,000
271 Development of inland water transport
2,200,000,000
3,587,501,910
297 National Transport Master Plan
1,150,000,000
862,500,000

40
902 Axle load control 600,000,000 450,000,000
1048 Motor Vehicle inspection service 900,000,0000
675,000,000
1049 Kampala-Kasese Railway feasibilty project
1,000,000,000
750,000,000
1096 Support for computerised driving permits 900,000,0000
675,000,000
7,750,000,000
7,749,999,910
Source: IFMS data
There were a number of projects whose receipts were less than 100 % of the annual approved
budget.
Table 2.9: Projects that received less than 100% of the approved budget.
Projec
t Project name GOU Budget Releases Payments
Release
performa
nce %
Absorptio
n %
261
District road network feeder
roads
400,000,000 379,638,000
379,594,000 95 99.9
262
District road network/Gravel
Roads
300,000,000 284,728,000
284,709,560 95 100
263
District Road
Network/labour based
1,800,000,000 1,708,372,000
1,708,372,000 95 100
264
AAMP Rehab.District
Roads/ADF
600,000,000 565,809,820
565,809,820 94.3 100
269
Construction of selected
Bridges
4,080,000,000 3,872,309,000
3,871,829,046 95 100
274
Feeder Roads
Rehab.Northern uganda
2,120,310,000 2,012,376,000
2,012,303,000 95 100
306 Urban roads resealing
4,200,000,000 3,986,201,000
3,985,781,188 95 100
307 Rehab.of District roads
5,000,000,000 4,745,477,000
4,745,477,000 95 100
995
Community Agriculture
Infrastructure improvement
1,040,000,000 987,059,000
987,059,000 95 100
996
Support to tourism
infrastructure development
1,000,000,000 949,096,000
948,266,600 95 100
1018
Rural roads programme-
support to MELTEC
2,200,000,000 2,088,010,000
2,088,010,000 95 100
1019
Rural roads programme-
support to MOWT
1,280,000,000 1,214,842,000
1,206,392,721 95 100
1062
Karamoja roads
development programme
200,000,000 189,819,000
189,725,000 95 100
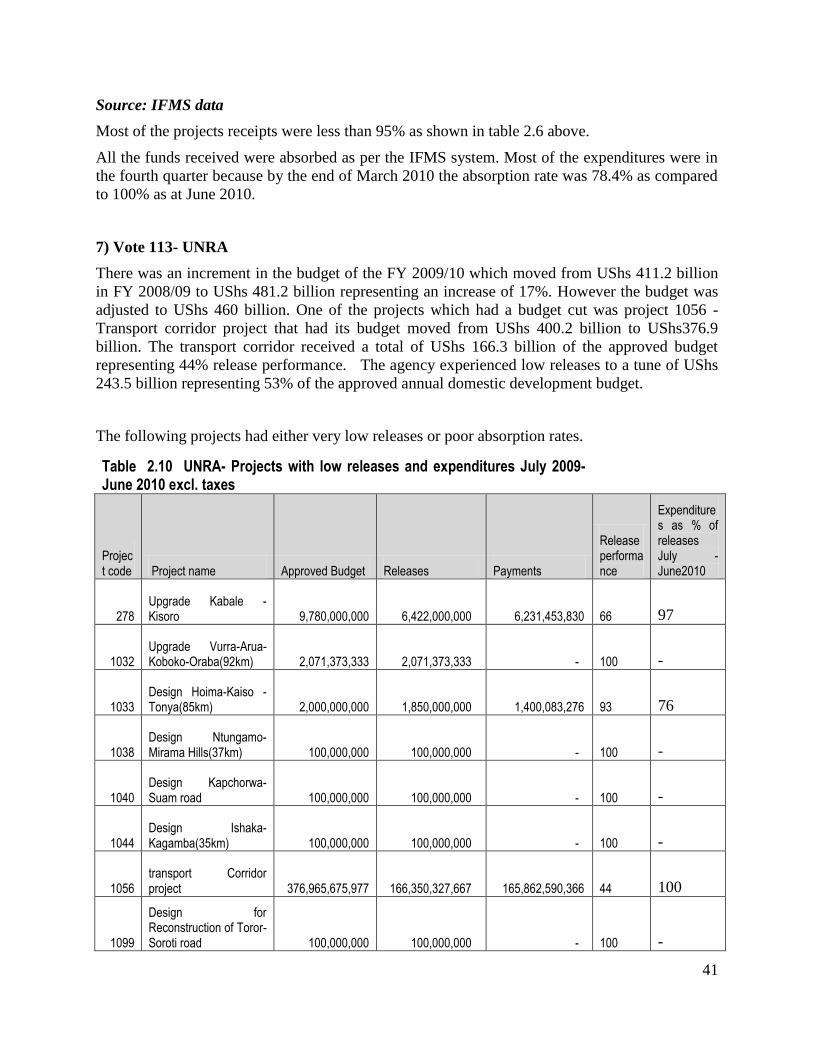
41
Source: IFMS data
Most of the projects receipts were less than 95% as shown in table 2.6 above.
All the funds received were absorbed as per the IFMS system. Most of the expenditures were in
the fourth quarter because by the end of March 2010 the absorption rate was 78.4% as compared
to 100% as at June 2010.
7) Vote 113- UNRA
There was an increment in the budget of the FY 2009/10 which moved from UShs 411.2 billion
in FY 2008/09 to UShs 481.2 billion representing an increase of 17%. However the budget was
adjusted to UShs 460 billion. One of the projects which had a budget cut was project 1056 -
Transport corridor project that had its budget moved from UShs 400.2 billion to UShs376.9
billion. The transport corridor received a total of UShs 166.3 billion of the approved budget
representing 44% release performance. The agency experienced low releases to a tune of UShs
243.5 billion representing 53% of the approved annual domestic development budget.
The following projects had either very low releases or poor absorption rates.
Table 2.10 UNRA- Projects with low releases and expenditures July 2009-June 2010 excl. taxes
Project code Project name Approved Budget Releases Payments
Release performance
Expenditures as % of releases July -June2010
278 Upgrade Kabale - Kisoro 9,780,000,000 6,422,000,000 6,231,453,830
66
97
1032 Upgrade Vurra-Arua-Koboko-Oraba(92km) 2,071,373,333 2,071,373,333 -
100
-
1033 Design Hoima-Kaiso -Tonya(85km) 2,000,000,000 1,850,000,000 1,400,083,276
93
76
1038 Design Ntungamo-Mirama Hills(37km) 100,000,000 100,000,000 -
100
-
1040 Design Kapchorwa-Suam road 100,000,000 100,000,000 -
100
-
1044 Design Ishaka-Kagamba(35km) 100,000,000 100,000,000 -
100
-
1056 transport Corridor project 376,965,675,977 166,350,327,667 165,862,590,366
44
100
1099
Design for Reconstruction of Toror-Soroti road 100,000,000 100,000,000 -
100
-

42
1100
Design for reconst of Lira -Kamudini -Gulu road 100,000,000 100,000,000 -
100
-
1103 Feasibility Study of Bus Rapid Transit 500,000,000 500,000,000 -
100
-
1104 Construct Selected Bridges (BADEA) 700,000,000 700,000,000 360,878,623
100
52
Source: IFMS data
Overall the absorption rates were 98% of the funds received according to the IFMS system.
However a number of projects did not spend any of the funds received as follows:
1032 Upgrade Vurra Arua- Koboko Oraba received UShs 2.071 billion
1038 design Ntugamo Mirama hills
1040 Design Kapchorwa Suam road
1044 Design Ishaka kagamba road
1099 Design for reconstruction of Tororo- Soroti road
1103- Feasibility Study of Bus Rapid Transit received UShs 500 million for the FY
2009/10
2. 3 Financial Performance of Selected Districts for the Financial Year 2009/10
2.3.1 Introduction/Background
This section provides financial performance analysis of selected districts that were monitored. A
total of seven districts2 were monitored and the purpose of the monitoring was to assess the
efficiency of the funds flow management at districts. The analysis was focused on the GOU
development grant for the sectors of: health (PHC development); education (SFG); agriculture
(NAADS), water and environment and works (rural water and rural roads) and Local
Government Management and Service Delivery (LGMSD).
2.3.2 Objectives
2 Bududa, Bundibugyo,Fortportal Municipal council,Jinja Municipal
council,Kabarole,Kapchorwa,Mayuge,Sironko,Tororo District and Tororo Municipal council

43
To establish the budget trends of the approved budget for the FY 2008/09 and FY
2009/10
Track the development grant funds released by the MFPED to the districts for FY
2009/10 and ascertain whether the funds were promptly remitted to the sectors of health,
education, agriculture, water and sanitation, works, NAADS and LGMSD for proper
execution of their programs.
Establish the absorption of the funds released by the MFPED
Ascertain whether there were any balances on the sector accounts as at close of the
financial year (end of June 2009), and if permission was sought to retain the balances if
any and whether the retained funds were appropriately utilised.
2.3.3 Scope and methodology
The period under review was the FY 2009/10 in respect to the funds released and the absorption
of those funds. For the trend analysis of the budget growth, the period under review was two
financial years 2008/09 and FY 2009/10.
The methodology used included; physical visits to the districts, reviewing of relevant official
documents and records (the general operational account cash books, sector cash books and the
bank statements); interviewing key personnel of the local governments including the CAOs ,
CFOs and some heads of departments.
2.3.4 FINDINGS
1) BUDUDA LOCAL GOVERNMENT
The local government received all the GoU development grants relating to the FY2009/10 for all
the sectors under review which were timely remitted to the spending units of PHC development,
SFG, Rural water, rural roads, LGMSD and NAADS.
The release performance of PHC development, SFG, Rural water, rural roads, LGMSD and
NAADS was 95%, 93%, 94%, 71%, 94%, and 100% respectively.
The release performance was commendable across all the sectors as shown by the performance
rates. The release performance to the rural roads was 71% because a total of UShs 99,251,755/=
that was received on the 22rd, June, 2010 had not yet been transferred to the sector account by
the time of monitoring (25th
June 2010).
The absorption rates were very low for PHC development, SFG, Rural water, Rural roads,
LGMSD and NAADS at; 36%, 53%, 40%, 38%, 73% and 76% respectively.
The poor absorption rates were attributed to the late start of procurement process that led to the
late start of the projects and the delay in receipt of some funds from the Ministry of Finance,
Planning and Economic Development. For example, UShs41, 549,000/= was received on the
22rd, June, 2010, eight days to the end of the financial year detailed as follows;
PHC development UShs18,479,000/=
SFG UShs13,748,000/=
Rural water UShs9,322,000/=

44
According to the district officials, those funds logically could not be absorbed before the end of
the FY2009/10 because of the short span of period in which to initiate the expenditure process.
At the time of the monitoring the funds had not been transferred to the sector accounts.
Figure 2.3: The approved budget FY2009/10, receipts and expenditures
SOURCE: BUDUDA DISTRICT GENERAL FUND ACCOUNT AND SECTOR CASH BOOKS
The absorption rates as shown in figure 2.3 are low with the exception of LGMSD and NAADS
of which mainly transfer the funds to lower spending units.
The local government is also a beneficiary of the PRDP component and duly received all the
grants which were transferred to the sector account. The expenditures of the PRDP funds was
poor with an absorption rate of 55.21% as shown in table 2.10
TABLE 2.10: PRDP BUDGET, RELEASES AND EXPENDITURES FY 2009/10
APPROVED
BUDGET
2009/10 (UShs)
AMOUNT
RECEIVED
(UShs)
AMOUNT
SPENT(UShs)
BAL C/F
AT JUNE
2010(UShs)
Release
perf. %
Absorptio
n rates %
1,025,914,950 1,039,578,920 573,969,923
435,608,997
101.33 55.21
SOURCE: BUDUDA DISTRICT SECTOR CASH BOOK
It was noted that sometimes the district delays to remit the funds to the sectors from the general
fund account. For example, UShs 53,875,000 received on 30th
Jan 2010 as LGMSD but
transferred to the sector account four month late on 6th
May 2010. The delays in remittance of
the funds affect timely execution of the projects.

45
The district also had substantial unspent balances as at end of the FY 2008/09 (end of June 2009)
for which they sought for permission to utilise from the Accountant General that was granted.
The balances were:
Sector Amount
LGMSD 24,096,202
SFG 9,261,539
PHC development 33,364,185
2) BUNDIBUGYO LOCAL GOVERNMENT
The district received funds for the FY 2009/10 for the sectors under review which were promptly
remitted to the respective sectors. All the funds received were remitted to the sectors. At the end
of the FY 2008/2009 the district had unspent balances totaling to UShs 75,007,000 which was
spent without authority from the PS/ Secretary to the Treasury. The monitoring team established
that the CAO on 30th
July 2009 wrote to the Secretary to the Treasury seeking for permission to
utilize the unspent balances but no authority was obtained and or efforts made to follow up.
Regarding releases, the MFPED performed at more than 95% for all the development grant
releases. However, there was a complaint that the approved IPF numbers for the NAADS and
PHC development were conflicting with the numbers on which the releases were based. For
instance the IPF budget for NAADs was UShs 1,708,409,000= which was later revised to
1,195,790,000 also being the amount released by the MFPED to the district. The IPF budget for
PHC development was UShs 550,000,000 but the third and fourth quarter release schedules
indicated the budget as UShs 167,540,000 which was different from the earlier IPF numbers
communicated to the district on which the workplan was based. According to the district staff the
changes were not earlier communicated to the district authority but they read the figures from the
release schedules. This meant that they had to adjust the work plan in the third quarter which
distorted the plan.
Figure 2.4: The amounts received and spent against the approved budget.

46
Source: Bundibugyo District fund account and sector accounts and reports
The programs/ sectors which registered poor absorption were the SFG, PHC development
and rural water whose absorption rates were 30%, 72% and 53% respectively. The poor
absorption for the SFG funds were attributed to late award of contracts for latrine
construction in seven schools coupled with the poor terrain. However, the works were on
going and the team was informed that efforts were made to complete the work. The
balances on the rural water account were to cater for procurement of a departmental car
and completion of the construction of the boreholes whose process was ongoing.
Figure 2.5: Budget trends analysis for FY 2008/09 and 2009/10 for Bundibugyo
district
Source: District accounts/ cash books
From figure 2.4, all the sectors registered an upward trend in the annual approved budget of the
FY 2009/10 compared to FY 2008/09. There was no budget for SFG and PHC development in
the FY 2008/09 but had a budget of UShs 77,000,000 and 167,540,000 respectively. The budget
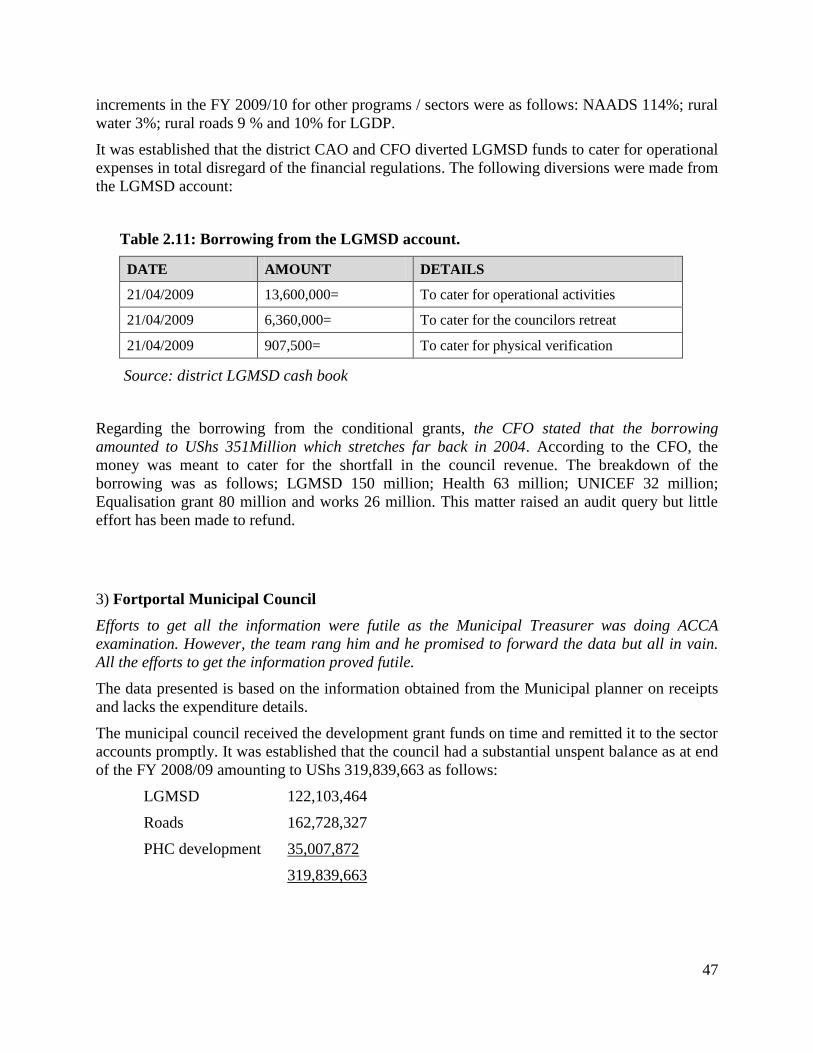
47
increments in the FY 2009/10 for other programs / sectors were as follows: NAADS 114%; rural
water 3%; rural roads 9 % and 10% for LGDP.
It was established that the district CAO and CFO diverted LGMSD funds to cater for operational
expenses in total disregard of the financial regulations. The following diversions were made from
the LGMSD account:
Table 2.11: Borrowing from the LGMSD account.
DATE AMOUNT DETAILS
21/04/2009 13,600,000= To cater for operational activities
21/04/2009 6,360,000= To cater for the councilors retreat
21/04/2009 907,500= To cater for physical verification
Source: district LGMSD cash book
Regarding the borrowing from the conditional grants, the CFO stated that the borrowing
amounted to UShs 351Million which stretches far back in 2004. According to the CFO, the
money was meant to cater for the shortfall in the council revenue. The breakdown of the
borrowing was as follows; LGMSD 150 million; Health 63 million; UNICEF 32 million;
Equalisation grant 80 million and works 26 million. This matter raised an audit query but little
effort has been made to refund.
3) Fortportal Municipal Council
Efforts to get all the information were futile as the Municipal Treasurer was doing ACCA
examination. However, the team rang him and he promised to forward the data but all in vain.
All the efforts to get the information proved futile.
The data presented is based on the information obtained from the Municipal planner on receipts
and lacks the expenditure details.
The municipal council received the development grant funds on time and remitted it to the sector
accounts promptly. It was established that the council had a substantial unspent balance as at end
of the FY 2008/09 amounting to UShs 319,839,663 as follows:
LGMSD 122,103,464
Roads 162,728,327
PHC development 35,007,872
319,839,663

48
The substantial unspent balances as at end of the FY were brought about as a result of the late
award of the contracts. According to the Municipal Planner, the funds were committed and
therefore the municipal council sought for permission to retain the funds for appropriations in the
current financial year. The authority to use the unspent money was granted by the Accountant
General in his letter dated 18th
August 2009.
Regarding releases, it was confirmed that the municipal council received funds for the following
grants: SFG, PHC development, urban roads and LGMSD. It had no budget provisions for the
water sector and NAADS. All the funds received were promptly remitted to the sector accounts.
Table 2.12: The amount received against the approved budget.
Item Annual approved
budget
Receipts Release
performance
%
SFG 46,000,000 44,127,000 96
PHC Dev’t 70,567,000 65,902,000 93
Urban roads 560,520,000 411,319,680 73
LGMSD 189,507,000 141,045,000 74
NAADS 0 0
Urban Water 0 0
Source: Municipal council accounts
The release performance for urban roads and LGMSD stood at 73% and 74 % respectively at the
time of monitoring on 16th
June 2010.
Figure 2.6: Budget trends for approved budget for FY 2008/09 and FY 2009/10

49
Source: Fortportal annual budget FY 2008/09 and FY 2009/10
There was improvement in the budget provision for the FY 2009/10 as compared to FY 2008/09
in all the grants that received funding as shown in figure 2.8. There was remarkable increase in
the urban roads fund by 249 % and 17 % for the PHC development while SFG received UShs 46
Million during the FY 2009/10 as compared to none in FY 2008/09.
4. JINJA MUNICIPAL COUNCIL
The Municipal council received funds for all the four quarters for the development grants. All the
funds received were promptly remitted to the sector accounts. The release performance was
generally good save for the road fund money that had an approved budget of UShs 392 million
but received a total of UShs 183 million (47 %).
Table 2.13: The annual approved budget, releases and payments
Item Approved
annual budget
Receipts Payments Release
performance
%
Absorption
%
SFG 46,500,000 44,120,000 24,700,000 95 64.8
PHC devt 74,160,000 70,430,000 70,660,000 95 100
Works-
LGMSD
301,030,000 284,990,000 248,000,000 95 96.4
Works- PAF 392,310,000 392,310,000 392,310,000 100 100
Road
Agency
392,310,000 183,030,000 133,000,000 47 67
Source: Municipal council cashbooks and cash releases schedules

50
There was low absorption of the SFG and the PHC development funds whose absorption rates
were 64.8% and 67% respectively. According to the district officials, the low absorption of the
funds was attributed to the small budget provision which was worsened by the little funds
received on quarterly basis. As a result, the implementation of the projects normally delays until
all the funds are received to make a substantial impact. According to the Municipal Senior
Accountant the project implementation started in the third quarter hence the low absorption rates.
Because of the little amount received for PHC development, the funds received were allocated
for implementation of only one project of the doctor’s house at Mpumudde Division.
The Municipal council had unspent funds at the end of the financial year 2008/2009 as follows:
Sector Unspent balances
SFG 8,400,000
PHC development 54,800,000
Works-LGMSD 5,200,000
Works- PAF 6,700,000
It was confirmed that permission to utilize the unspent funds was obtained from the Accountant
General’s office and by the time of the monitoring, all the funds had been utilized.
The trend in the approved budget for the two financial years 2008/09 and 2009/10, shows a
decline in the works budget both for the LGMSD and the PAF funds by 31% and 47.7 %
respectively.
Figure 2.7: The budget trends in the two successive financial years of 2008/09 and 2009/10
Source: District approved budget FY 2008/09 and FY 2009/10
5. KABAROLE LOCAL GOVERNMENT

51
The district received the GoU development grant for the FY 2009/10 for the programs/ sectors
under review. All the funds received were promptly remitted to the sector accounts and were
being absorbed save for the PHC development funds that had an absorption rate of 7.8 % . The
low absorption of the funds was as a result of the delayed procurement of the contractors. The
final batch of the award of the contracts for the various projects under health was done on 14th
June 2010.
Figure 2.8: The district annual approved budget, releases and expenditures for FY 2009/10
.
Source: District accounts / cash book
The implementation of the projects under rural roads was also lagging behind with an absorption
rate of 62%. The sector received a total of UShs 583.6 million which was over and above the
annual budget of UShs 520 million by UShs 60 million. All the contracts for the projects had not
been finalized by the time of the monitoring. The district had a total of Ushs 45.5 million as
unspent balances as at the end of the FY 2008/09 for which it obtained permission from the
Accountant General in his letter dated 7th
Sept 2009 to spend. The unspent balances were also on
Production account of UShs 3,597,501 and UShs 41,946,108 on Health account. All the retained
funds (unspent funds) had been utilized by the time of the monitoring exercise.
The approved budget for the FY 2009/10 as compared to the budget of FY2008/09, three grants
declined. PHC development grant fell by 9%: SFG 61% and LGMSD 13% while rural water,
roads and NAADS registered an increment in their annual budget of 49%’ 65% and 29%
respectively. The details are given in figure 2.9.
Figure 2.9: Budget trend analysis for the FY 2008/09 and FY 2009/10

52
Source: District Approved annual budgets.
6) KAPCHORWA LOCAL GOVERNMENT
The local government duly received all the grants for the FY2009/10 for the sectors of PHC
development, SFG, rural water, rural roads, LGMSD and NAADS which were timely remitted to
the spending units. The release performance for the sectors of PHC development, SFG, Rural
water, rural roads, LGMSD and NAADS was 94%, 94%, 94%, 97%, 94%, and 100%
respectively.
Funds absorption on the other hand was extremely low with the following absorption rates PHC
development 10%; SFG 9%, rural water 24%; rural roads 44%; LGMSD 67%and NAADS 98%.
The extremely low 10% absorption rate for the PHC development level was attributed to the
projects that were ongoing but had not yet reached a level for payments execution. The projects
included; construction of; an Out Patient Department at Benot, Kwanyiy Health Centre two
(HCII), Doctor’s house, Staff house at Cheplinya HCII, Chepsukunya HCIII Out Patient
Department and Equipment procurement. The fore mentioned projects amount to UShs 434,
099,991/= which was to be off set before the end of FY2009/10 according to the Chief Finance
Officer.
The poor absorption of the PHC development was also compounded by the unspent balance as at
close of F/Y2008/09 of UShs81, 060,284/= of which a total of UShs58, 000,000/= was still on
the account by the time of monitoring. These funds were meant for the construction of maternity
and children ward at Kaseremi Health Centre III and works were still ongoing. The District
disregarded the Accountant Generals letter that allowed them to utilise the unspent funds before
end of Dec 2009
Under the Education sector, the poor absorption rate of 9% was attributed to a series of projects
under way whose payments had not yet been made. The projects included: the two sites which
were for construction of two class rooms at Kaplegep primary school and Tumgoboi primary
school; the other projects were for completion of one class room at Kapsukununyo primary
school; six class rooms for construction at Cema primary school of which four had been

53
completed and two soon to be completed. Other schools where construction of class rooms was
under way included: Chemwania; Kapteret; Bujimoto; Kapmelko and Binyiny primary schools.
Other projects were construction of five stance latrines in six schools and a three stance latrine in
onother. It was noted that the construction had not yet started because the materials to be used in
the latrine substructure are supplied by Crest Tank Limited which delayed the supplies.
It was reported that the poor absorption rates were also due to the delay in the initiation of the
procurement process. The delay was attributed to the frequent changes in the senior staff for
instance the change of CAO and the absence of the CFO who had been interdicted since the first
quarter of FY2009/10. Award of contracts started in March 2010 and some of the contracts had
been awarded in May 2010 and therefore the project implementation started in June 2010.
NAADS had commendable absorption rate and this was because its receipts are primarily
transfers to sub-counties.
The details in figure 2.10 relate to the release and absorption performance of the funds released.
Figure 2.10: The approved budget FY2009/10, receipts and expenditures
SOURCE: KAPCHORWA DISTRICT GENERAL FUND ACCOUNT & SECTOR CASH BOOKS
It is clear from figure 2.10 that absorption was low as explained above while the releases on the
other hand performed well against the budget.
The district also received some grants from the Uganda Road fund but the absorption was still
poor.
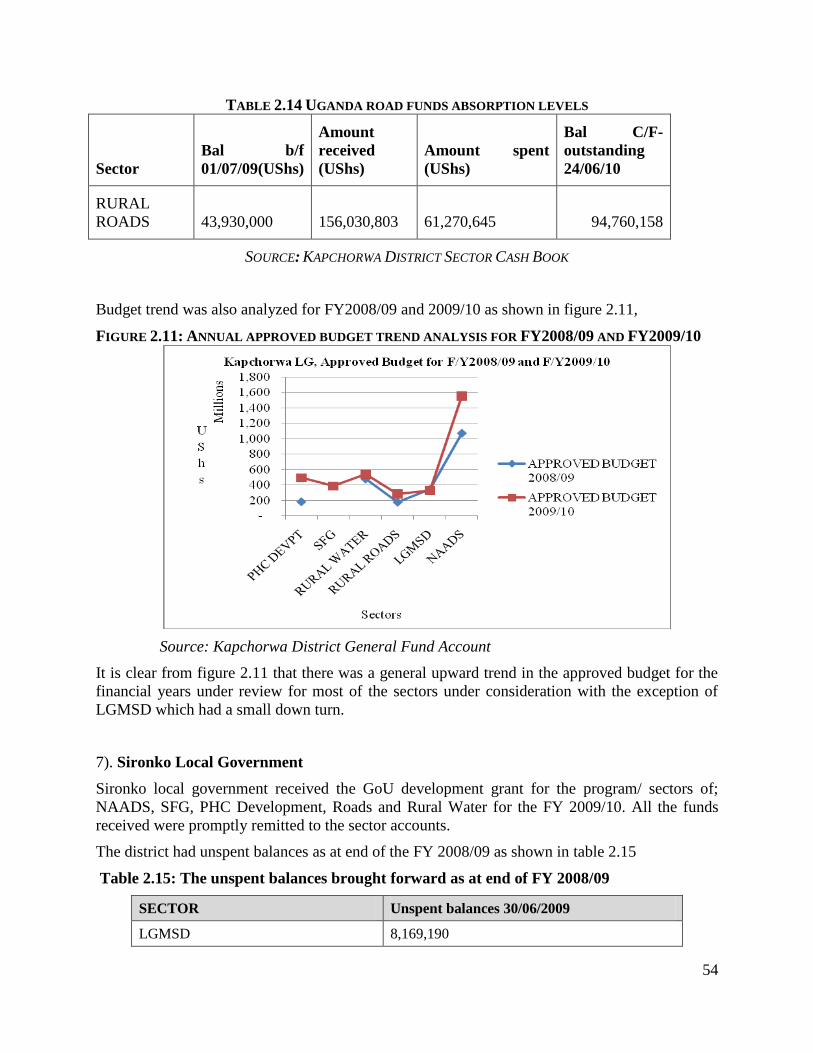
54
TABLE 2.14 UGANDA ROAD FUNDS ABSORPTION LEVELS
Sector
Bal b/f
01/07/09(UShs)
Amount
received
(UShs)
Amount spent
(UShs)
Bal C/F-
outstanding
24/06/10
RURAL
ROADS
43,930,000
156,030,803
61,270,645 94,760,158
SOURCE: KAPCHORWA DISTRICT SECTOR CASH BOOK
Budget trend was also analyzed for FY2008/09 and 2009/10 as shown in figure 2.11,
FIGURE 2.11: ANNUAL APPROVED BUDGET TREND ANALYSIS FOR FY2008/09 AND FY2009/10
Source: Kapchorwa District General Fund Account
It is clear from figure 2.11 that there was a general upward trend in the approved budget for the
financial years under review for most of the sectors under consideration with the exception of
LGMSD which had a small down turn.
7). Sironko Local Government
Sironko local government received the GoU development grant for the program/ sectors of;
NAADS, SFG, PHC Development, Roads and Rural Water for the FY 2009/10. All the funds
received were promptly remitted to the sector accounts.
The district had unspent balances as at end of the FY 2008/09 as shown in table 2.15
Table 2.15: The unspent balances brought forward as at end of FY 2008/09
SECTOR Unspent balances 30/06/2009
LGMSD 8,169,190
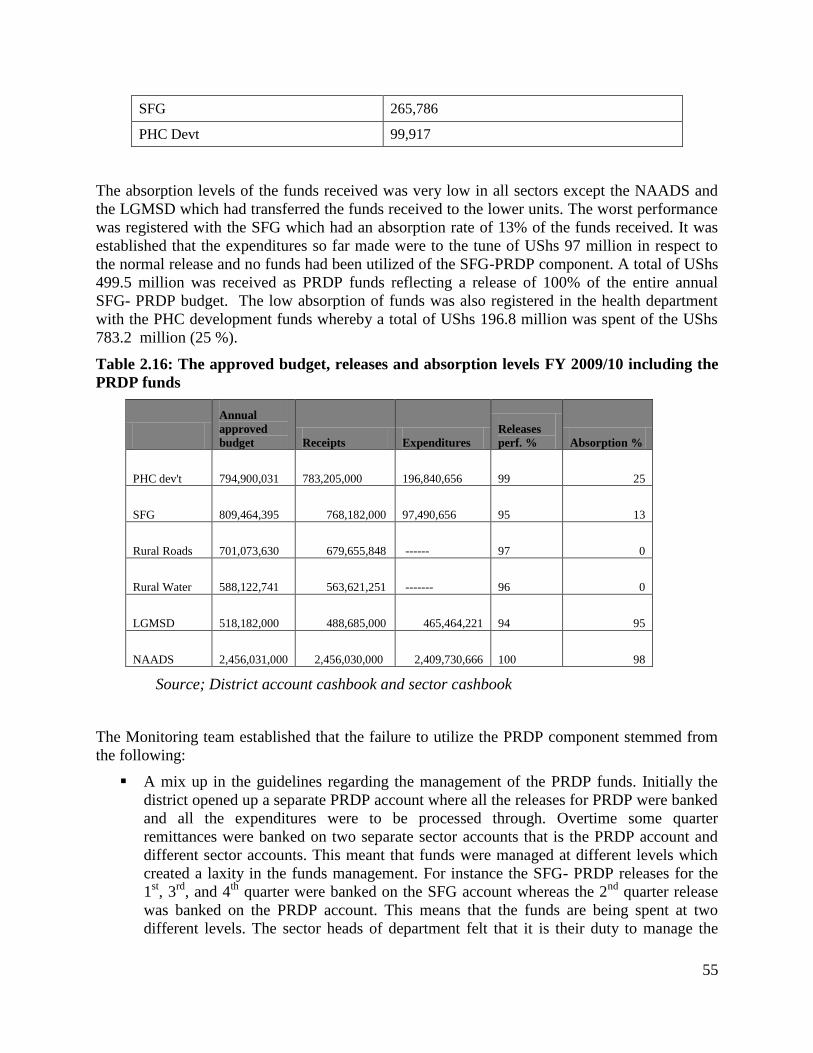
55
SFG 265,786
PHC Devt 99,917
The absorption levels of the funds received was very low in all sectors except the NAADS and
the LGMSD which had transferred the funds received to the lower units. The worst performance
was registered with the SFG which had an absorption rate of 13% of the funds received. It was
established that the expenditures so far made were to the tune of UShs 97 million in respect to
the normal release and no funds had been utilized of the SFG-PRDP component. A total of UShs
499.5 million was received as PRDP funds reflecting a release of 100% of the entire annual
SFG- PRDP budget. The low absorption of funds was also registered in the health department
with the PHC development funds whereby a total of UShs 196.8 million was spent of the UShs
783.2 million (25 %).
Table 2.16: The approved budget, releases and absorption levels FY 2009/10 including the
PRDP funds
Annual
approved
budget Receipts Expenditures
Releases
perf. % Absorption %
PHC dev't
794,900,031 783,205,000 196,840,656 99 25
SFG
809,464,395 768,182,000
97,490,656
95 13
Rural Roads
701,073,630 679,655,848 ------
97 0
Rural Water
588,122,741 563,621,251 -------
96 0
LGMSD
518,182,000 488,685,000 465,464,221
94 95
NAADS
2,456,031,000 2,456,030,000 2,409,730,666
100 98
Source; District account cashbook and sector cashbook
The Monitoring team established that the failure to utilize the PRDP component stemmed from
the following:
A mix up in the guidelines regarding the management of the PRDP funds. Initially the
district opened up a separate PRDP account where all the releases for PRDP were banked
and all the expenditures were to be processed through. Overtime some quarter
remittances were banked on two separate sector accounts that is the PRDP account and
different sector accounts. This meant that funds were managed at different levels which
created a laxity in the funds management. For instance the SFG- PRDP releases for the
1st, 3
rd, and 4
th quarter were banked on the SFG account whereas the 2
nd quarter release
was banked on the PRDP account. This means that the funds are being spent at two
different levels. The sector heads of department felt that it is their duty to manage the
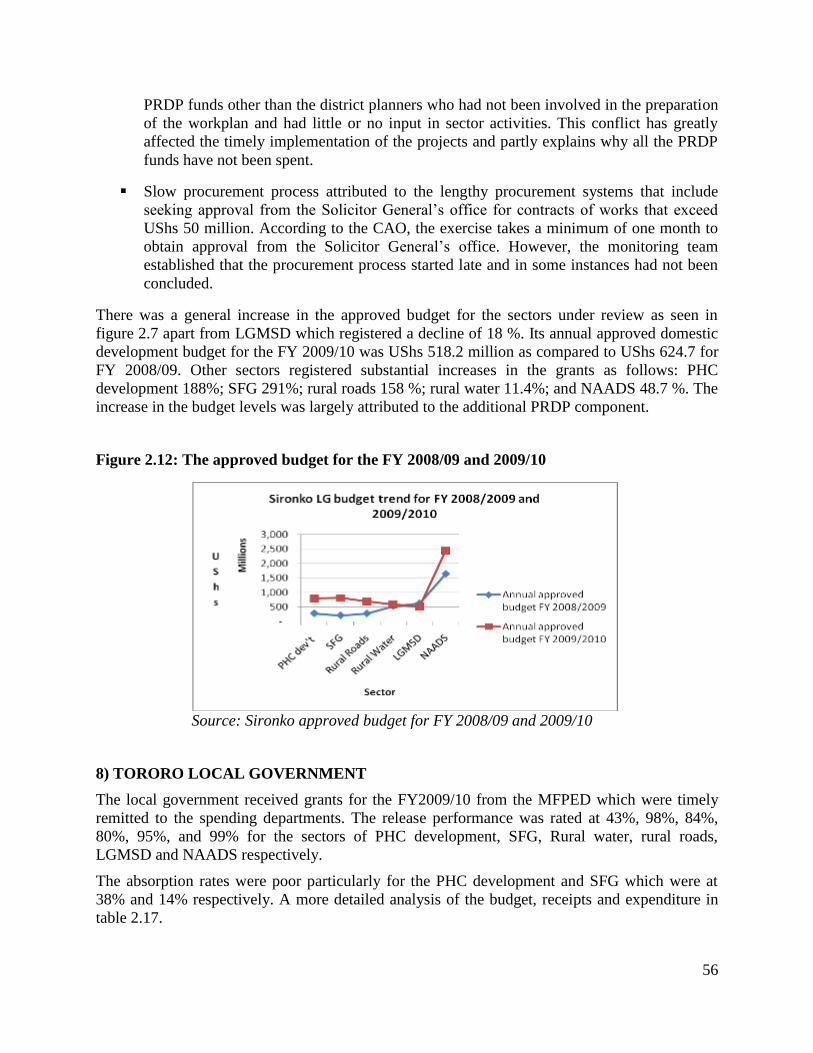
56
PRDP funds other than the district planners who had not been involved in the preparation
of the workplan and had little or no input in sector activities. This conflict has greatly
affected the timely implementation of the projects and partly explains why all the PRDP
funds have not been spent.
Slow procurement process attributed to the lengthy procurement systems that include
seeking approval from the Solicitor General’s office for contracts of works that exceed
UShs 50 million. According to the CAO, the exercise takes a minimum of one month to
obtain approval from the Solicitor General’s office. However, the monitoring team
established that the procurement process started late and in some instances had not been
concluded.
There was a general increase in the approved budget for the sectors under review as seen in
figure 2.7 apart from LGMSD which registered a decline of 18 %. Its annual approved domestic
development budget for the FY 2009/10 was UShs 518.2 million as compared to UShs 624.7 for
FY 2008/09. Other sectors registered substantial increases in the grants as follows: PHC
development 188%; SFG 291%; rural roads 158 %; rural water 11.4%; and NAADS 48.7 %. The
increase in the budget levels was largely attributed to the additional PRDP component.
Figure 2.12: The approved budget for the FY 2008/09 and 2009/10
Source: Sironko approved budget for FY 2008/09 and 2009/10
8) TORORO LOCAL GOVERNMENT
The local government received grants for the FY2009/10 from the MFPED which were timely
remitted to the spending departments. The release performance was rated at 43%, 98%, 84%,
80%, 95%, and 99% for the sectors of PHC development, SFG, Rural water, rural roads,
LGMSD and NAADS respectively.
The absorption rates were poor particularly for the PHC development and SFG which were at
38% and 14% respectively. A more detailed analysis of the budget, receipts and expenditure in
table 2.17.
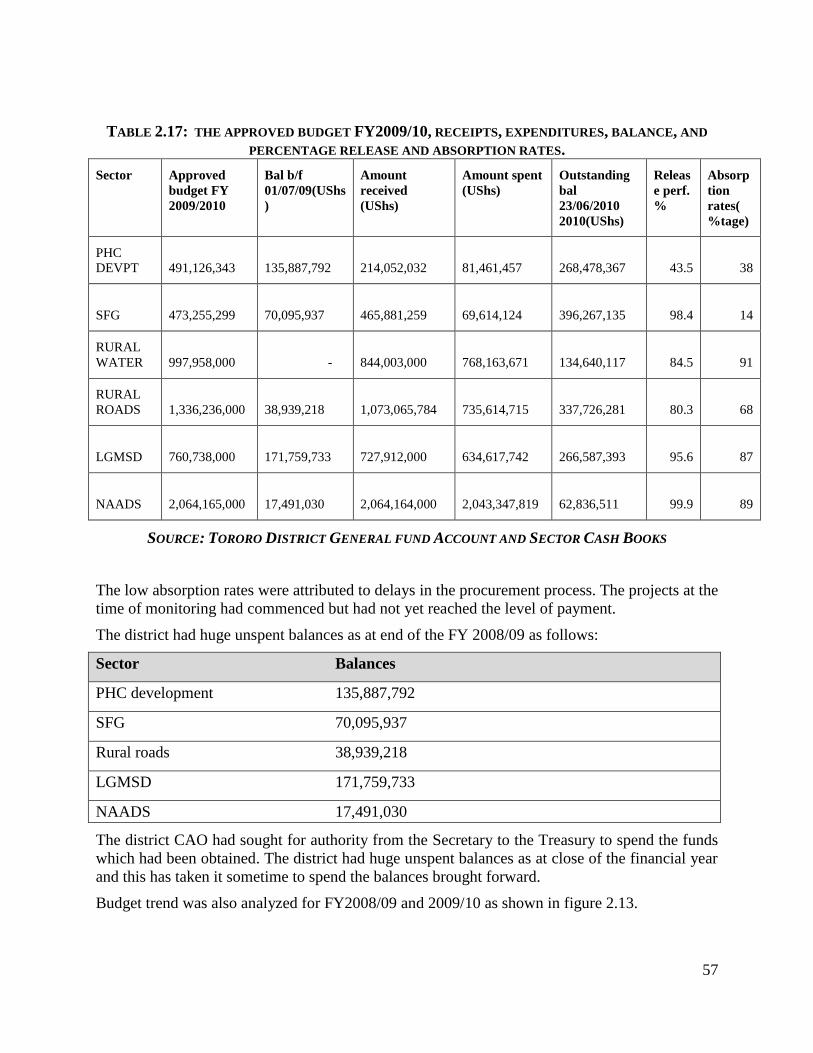
57
TABLE 2.17: THE APPROVED BUDGET FY2009/10, RECEIPTS, EXPENDITURES, BALANCE, AND
PERCENTAGE RELEASE AND ABSORPTION RATES.
Sector Approved
budget FY
2009/2010
Bal b/f
01/07/09(UShs
)
Amount
received
(UShs)
Amount spent
(UShs)
Outstanding
bal
23/06/2010
2010(UShs)
Releas
e perf.
%
Absorp
tion
rates(
%tage)
PHC
DEVPT
491,126,343
135,887,792
214,052,032
81,461,457
268,478,367 43.5 38
SFG
473,255,299
70,095,937
465,881,259
69,614,124
396,267,135 98.4 14
RURAL
WATER
997,958,000 -
844,003,000
768,163,671
134,640,117 84.5 91
RURAL
ROADS
1,336,236,000
38,939,218
1,073,065,784
735,614,715
337,726,281 80.3 68
LGMSD
760,738,000
171,759,733
727,912,000
634,617,742
266,587,393 95.6 87
NAADS
2,064,165,000 17,491,030
2,064,164,000 2,043,347,819 62,836,511 99.9 89
SOURCE: TORORO DISTRICT GENERAL FUND ACCOUNT AND SECTOR CASH BOOKS
The low absorption rates were attributed to delays in the procurement process. The projects at the
time of monitoring had commenced but had not yet reached the level of payment.
The district had huge unspent balances as at end of the FY 2008/09 as follows:
Sector Balances
PHC development 135,887,792
SFG 70,095,937
Rural roads 38,939,218
LGMSD 171,759,733
NAADS 17,491,030
The district CAO had sought for authority from the Secretary to the Treasury to spend the funds
which had been obtained. The district had huge unspent balances as at close of the financial year
and this has taken it sometime to spend the balances brought forward.
Budget trend was also analyzed for FY2008/09 and 2009/10 as shown in figure 2.13.
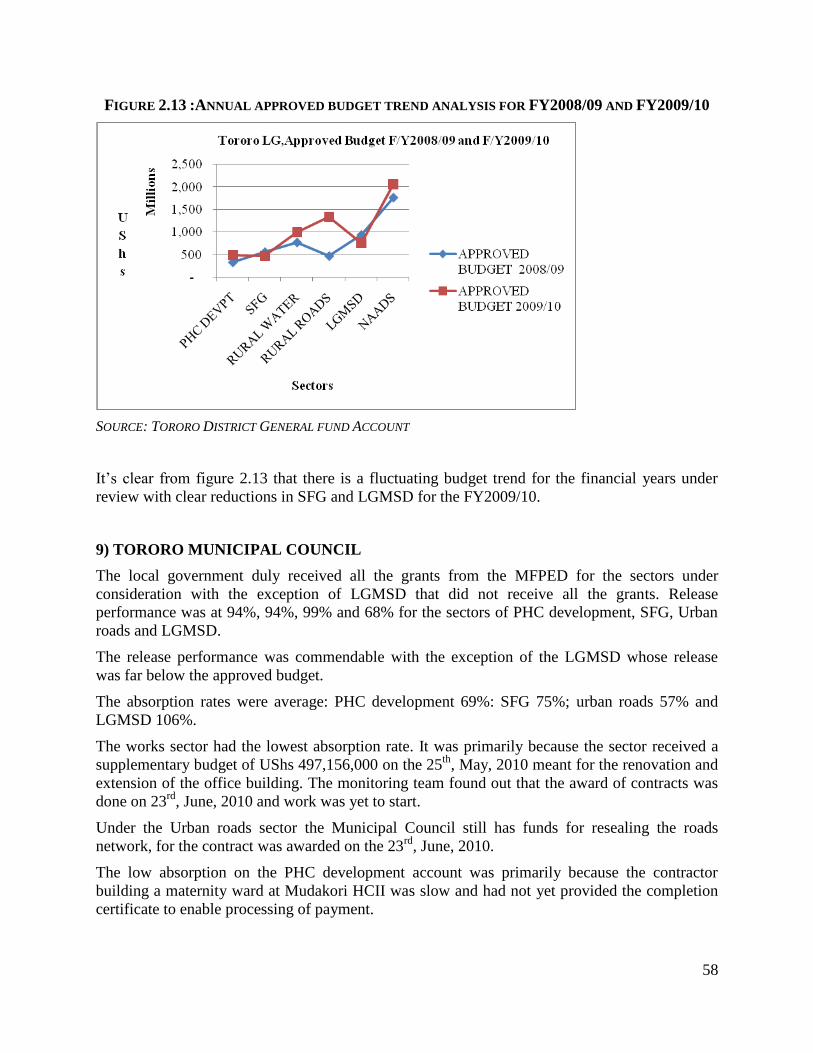
58
FIGURE 2.13 :ANNUAL APPROVED BUDGET TREND ANALYSIS FOR FY2008/09 AND FY2009/10
SOURCE: TORORO DISTRICT GENERAL FUND ACCOUNT
It’s clear from figure 2.13 that there is a fluctuating budget trend for the financial years under
review with clear reductions in SFG and LGMSD for the FY2009/10.
9) TORORO MUNICIPAL COUNCIL
The local government duly received all the grants from the MFPED for the sectors under
consideration with the exception of LGMSD that did not receive all the grants. Release
performance was at 94%, 94%, 99% and 68% for the sectors of PHC development, SFG, Urban
roads and LGMSD.
The release performance was commendable with the exception of the LGMSD whose release
was far below the approved budget.
The absorption rates were average: PHC development 69%: SFG 75%; urban roads 57% and
LGMSD 106%.
The works sector had the lowest absorption rate. It was primarily because the sector received a
supplementary budget of UShs 497,156,000 on the 25th
, May, 2010 meant for the renovation and
extension of the office building. The monitoring team found out that the award of contracts was
done on 23rd
, June, 2010 and work was yet to start.
Under the Urban roads sector the Municipal Council still has funds for resealing the roads
network, for the contract was awarded on the 23rd
, June, 2010.
The low absorption on the PHC development account was primarily because the contractor
building a maternity ward at Mudakori HCII was slow and had not yet provided the completion
certificate to enable processing of payment.

59
Works under LGMSD had been completed and awaiting certificate of completion and most of
the works were under health and works sectors.
The SFG absorption rate was 75% at the time of the monitoring and works were ongoing for
construction of five stance latrines at five schools in Tororo police primary school, St kizito
primary school, Elgon view primary School, Rock view primary and Ogutti primary school.
The Municipal Council also received a total of UShs358, 503,000/= as PRDP funds that were
allocated for works as resolved by the council officials. Most of the funds were absorbed as
shown in the table 2.18.
TABLE 2.18: APPROVED BUDGET, RELEASES AND ABSORPTION FOR PRDP FUNDS
Sector
Approved
budget
2009/10(UShs)
Bal B/F
01/07/09(UShs)
Amount
received
(UShs)
Amount spent
(UShs)
Outstanding
balance
23/06/10
WORKS
358,503,000 0 358,334,077 228,590,428
129,743,649
SOURCE: TORORO MUNICIPAL COUNCIL SECTOR CASH BOOK
The figure below details the release to the municipal council by the MFPED and absorption
performance by the local government.
Figure 2.14: The approved budget FY2009/10, receipts and expenditures
Source: Tororo Municipal Council General fund Account and Sector Cash Books
It’s clear from figure 2.14 that funds absorption is still average and the reflected excess of
expenditure over the receipts on the LGMSD account is attributed to cofunding by the district.

60
Budget trend was also analyzed for FY2008/09 and FY2009/10 as shown in graph 2.15,
Figure 2.15: Annual approved budget trend analysis for FY2008/09 and FY2009/10
SOURCE: TORORO MUNICIPAL COUNCIL GENERAL FUND ACCOUNT
It’s clear from figure 2.15 that there was a general upward trend in the approved budgets for the
financial years under review for the sectors under focus with the exception of LGMSD account.
2.4 Conclusions
2.4.1 Financial performance
C) Central Government/Ministries
Releases.
There was no ministry among those monitored whose receipts were 100% of the approved
domestic annual budget but it was in the range of 53%- 99%. UNRA had the least release
performance of 53%. This was attributed to the requirement of proof of absorption of the funds
and also tightened accountability measures for the MDA’s to access quarterly releases whereby
the sectors are required to timely submit the performance form A and the quarterly progress
reports.
Instead of remitting funds on quarterly basis, some projects received the entire funding in the
fourth quarter for instance project 1111- Soroti fruit factory received a total of UShs 3.062
billion in the fourth quarter.
Absorption of funds

61
The absorption of the funds received, was generally good in the range of 98% - 100% for the
MDA’s monitored as per the IFMS. However, higher rates of expenditures were skewed during
the fourth quarter as compared to the first three quarters. This implies that most projects are
implemented in the fourth quarter.
Reallocations
There were a number of reallocations within the vote functions and or projects. The votes that
were affected were Vote 019 Ministry of Water and Environment and Vote 016 Ministry of
Works and Transport. Reallocation of funds between the projects implies that there was poor
planning on the part of the sector at the initial stages of budgeting whereby activities were not
properly costed making the project appear as if it had more funds than required.
Budget trend analysis
Most of the sectors registered an increment in the approved budget amount over the two
financial years of 2008/09 and 2009/10. The sectors which recorded an increment were: MAAIF
(31%); Ministry of water and environment (38%); Ministry of Energy and Mineral resources
(58.2%); Ministry of Education and Sports (25%); UNRA 17%. Ministry of Health registered a
decline in the budget of 0.5%. Presidential initiative on banana (64.5%) while the development
of industrial parks was a decrease of 62%.
Supplementary releases
There was additional supplementary budget of UShs 2.2 billion meant to cater for taxes under
Vote 014- Ministry of Health. This affected four projects 0216 District infrastructure support
programme; 0224 Imaging and theatre equipment; 1027 Institutional support to the Ministry of
Health and 1123- Health systems strengthening.
D) DISTRICTS
Lack of timely information on adjustments in the IPF figures.
Some districts complained that changes in the IPF are not timely communicated to enable them
effect changes in the budget and that final releases as indicated in the release schedules were
based on the revised budget which they lacked information of. This therefore affected efficient
and effective implementation of the workplan.
Internal borrowing
The CAO and CFO of Bundibugyo LG had diverted LGMSD funds to cater for operational
expenses in total disregard of the financial regulations. The borrowing amounted to UShs
351Million which stretches far back in 2004. Further, the district spent a total of UShs
75,007,000 being unspent balances as at end of the financial year 2008/09 without authority
from the Secretary to the Treasury.
Releases
There was evidence of timely releases (development grant) by the MFPED to the districts and
also the districts to the sector accounts. In some cases releases for rural roads were at 100% by

62
the second quarter. Some districts delayed to remit the funds received to the sectors for instance:
There was a delay of the remittance of LGMSD funds totaling to UShs 53,875,000 received by
Bududa local government on 30th
Jan 2010 for the third quarter but was remitted to the sector
four month later on 6th
May 2010.
Absorption of funds
There was generally low absorption of development grant funds received for the period in all the
grants monitored. The low absorption was noted in all the districts visited and all of them had
huge unspent balances at year end. The sloppy performance was largely attributed to late
approval of the budgets as most districts councils approved the budgets in the month of
September to November 2009 ; late submission of procurement plans user departments to the
procurement officers.
The worst poor absorption levels were registered with the PRDP funds. Some districts that
receive the PRDP funds raised the following challenges as the reason for poor absorption of the
funds;
For the case of Sironko LG, all the funds received had not been spent because funds for
the 1st, 3
rd and 4
th quarter were sent to the sector accounts to be managed by the sector
heads while the 2nd
quarter funds were banked on the PRDP account under the control of
the district planner who was not involved with the sector activities but was managing the
expenditures. There was a feeling on the part of the sector heads that it was not the duty
of the district planner to offer an oversight role when he was not involved in the
formulation of the sector activities to be carried out.
Conflicting instructions from the office of the Prime Minister and the MFPED in respect
to the management of the funds. OPM insisted that separate PRDP accounts should be
opened in which PRDP funds should be banked while the MFPED insisted that sector
PRDP funds should be banked on the sector program accounts
Late award of contracts
It was noted that some districts awarded contracts late for instance some awards were done in
June. This definitely leads to failure to complete the projects in time.
Non –remittance of unspent conditional grants to the consolidated fund.
The case of non- remittance of un-spent conditional grants as at end of the financial year is still
prevalent in all the districts sampled. The districts always claim that the unspent balances are
committed. The act of allowing districts to retain the unspent balances at year end makes them
complacent and fails to implement the development budget work plans/ activities in time because
they know they will be given permission to spend the money.
Budget trend analysis
There was generally no significant upward change in the annual approved budgets for the FY
2009/10 as compared to FY 2008/09. Some of the districts visited had a slight increment while
others experienced a downward trend.

63
2.4.2 Recommendations
Financial performance
District should comply with the provisions of the Public Finance Act and regulations
regarding unspent balances at end of the financial years and return the unspent balances
to the consolidated fund. This will encourage the district officials to ensure that projects
are implemented on time.
Disciplinary action should be taken against district accounting officers (CAO and CFO of
Bundibugyo District in this instance) for utilizing the unspent balance for development
grants amounting to UShs 75,007,000 without authority from the Secretary to the
Treasury.
The CAO Sironko should take disciplinary action against the Senior Accounts assistants
of Education and that of Works for failing to keep uptodate books of accounts. The cash
books had been last posted in April 2010 and information could not easily be obtained.
The OPM and the MFPED should guide the districts on the operations and management
of the PRDP funds to avoid conflicting instructions.
Procurement process in local governments should be speeded up to avoid low absorption
of funds. Districts should also be advised to start on the procurement process in the initial
month of the financial year. The Public Procurement and Disposal unit should provide
more support to this effect

64
CHAPTER 3: PHYSICAL PERFORMANCE
3.1 AGRICULTURE
3.1.1 Introduction
The mission of the agricultural sector is to “Transform subsistence farming to commercial
agriculture”. The strategic objectives focus on enhancing crop and animal production and
productivity, value addition, food security, sustainable use of natural resources, increased
household incomes and efficient and effective use of public funds. To realize the mission and
strategic objectives, the Government in FY 2009/10 prioritized the following areas for financing
in agriculture3:
1) Provision of improved seeds, planting materials and animal breeding stock;
2) Strengthening Agricultural Advisory Services
3) Provision of physical agricultural infrastructure
4) Commodity development – coffee, cotton, cocoa, tea, vegetable oil, fish, livestock
5) Water for Agricultural Production
6) Epidemic diseases, parasites and pest control
7) Quality assurance and regulatory services
8) Primary and middle-level agricultural processing and marketing
9) Agricultural research and technology development
10) Tsetse Fly and Trypanosomiasis control, and
11) Institutional development for agricultural sector institutions and local governments.
Scope of monitoring work
In FY 2009/10, the BMAU tracked the budget and outputs in 10 programmes that are
implemented by MAAIF, its associated agencies and local governments (Table 3.1.1) to assess
the extent to which these budget priorities are being tackled. For the NAADS programme,
several districts were monitored in FY 2008/09 and many audits were being conducted in FY
2009/10 by various accountability arms of Government. Hence, it was not necessary or cost-
effective for BMAU to look at this programme again this year. However, Kiboga district was
specifically monitored to provide information on some audit queries and complaints from the
beneficiaries. The choice of programmes and districts to monitor was guided by the following
criteria:
i. The projects make a major contribution to the realization of the following sector budget
priorities:
3 MFPED, 2009a; MAAIF, 2009; MAAIF, 2009a.

65
Provision of improved seeds, planting materials and animal breeding stock;
Provision of physical agricultural infrastructure
Commodity development – coffee, cotton, cocoa, tea, vegetable oil, fish, livestock
Epidemic diseases, parasites and pest control
Quality assurance and regulatory services
Tsetse Fly and Trypanosomiasis control, and
Agricultural research and technology development.
Table 3.1.1: Programmes monitored in Agricultural Sector in FY 2009/10
Project
Code
Programmes monitored Sampled areas/institutions Period of
Monitoring
0091 National Livestock Productivity
Improvement Project (NLPIP)
Kamwenge, Lyantonde,
Bushenyi, Mpigi,
Nakasongola, Masindi,
Mubende, Isingiro,
Kiruhura, Kyenjojo, Kumi,
Lira, Kamuli, Kyegegwa,
Nakaseke, Buyende, Ngora
FY 2008/09 Q4,
FY 2009/10 Q4
National Agricultural Advisory
Services (NAADS)
Kiboga Q1
0077 Agriculture and Marketing Support
Project
Yumbe, Arua, Koboko,
Soroti, Amuria, Katakwi,
Masindi, Sembabule,
Nakaseke
Q1, Q4
0104 Support for Tea Cocoa Seedlings
Project
Bundibugyo, Mukono,
Luwero, Kibaale, Mayuge,
Hoima, Masindi, Mpigi,
Wakiso, Kamuli, Iganga,
Kiyunga
Q1, Q4
0968 Farm Income Enhancement and
Forest Conservation Project
(FIEFOC)
MAAIF, Kabarole,
Kamwenge, Kyenjojo,
Luwero, Bududa, Manafwa,
Kumi
Q2
500 Performance Contract Form B:
Implementation by District
Production Sector
Tororo, Mubende, Mityana,
Kayunga
Q2
0969 Creation of Sustainable Tsetse and
Trypanosomiasis Free Areas in East
and West Africa
MAAIF Q2, Q3
0083 Farming in Tsetse Controlled Areas
(FITCA)
MAAIF, Jinja, Mayuge,
Tororo, Kayunga, Iganga,
Mbale, Budaka, Manafwa,
Q3

66
Kamuli
0969 Creation of Sustainable Tsetse and
Trypanosomiasis Free Areas in East
and West Africa
Refurbishment of Insectary at
NaLIRRI
MAAIF, Kalangala
Tororo
Q3
1012 Integrated Pests and Disease
Management
Mayuge, Iganga, Hoima Q3, Q4
Source: Author
ii. Monitoring close to half or all the implementing districts for each programme. With the
exception of NAADS that is implemented countrywide, most of the other agricultural
development projects are mainly implemented in the western, central and eastern parts of
the country and less in Northern Uganda which thus influenced the sampling frame. Not
withstanding the fact that certain commodities are best suited to certain climatic
and soil conditions, it is vital that equity is achieved in the distribution of
agricultural projects geographically by ensuring that the Northern region too
benefits substantially since the negating factor of war has since ceased. Admittedly,
most of the ongoing agricultural development projects were conceived in the 1990s when
war was still raging in Northern Uganda, hence the region was not deemed suitable for
implementation.
iii. The programmes receive substantial GoU and Donor financing.
iv. The monitoring in the fourth quarter of FY 2009/10 focused on those projects that had
been monitored at the beginning of the year to review progress. Progress was more or less
the same by the end of the financial year for projects that were monitored in the third
quarter. Hence, these did not form part of the monitoring framework in Q4.
Methodology
Data collection methods included documentary reviews, key informant interviews both at the
central and local government level, focus group discussions, observations and photography.
Among the categories of officials met at the national and local government level were:
MAAIF Commissioners
National Project Coordinators
Chief Administrative Officers (CAO)
LCV and LCIII Chair persons

67
Principal Personnel Officers (PPO)
District Entomologists and Assistant Entomologists
District Veterinary Officers
District Production Coordinators
Other District Production Sector Staff
Programme/project beneficiaries
Contracted private firms/tenderers
Limitations
i. Redistricting has led to loss of records and institutional memory as staff are re-deployed
between districts.
ii. Accessing financial data for MAAIF projects remains a major challenge.
iii. Agricultural investments are remotely located in inaccessible areas which made
monitoring work difficult.
iv. The ongoing process of converting all extension staff to NAADS has brought low morale
and confusion such that institutional memory on various programmes is being lost.
3.1.2 Agriculture Marketing Support Project
Background
The Agriculture and Marketing Support Project is a World Food Programme (WFP) supported
Government of Uganda (GoU) project that commenced in 2002. Whereas the project was
intended to end in December 2005, it was extended to 2010 to complete unfinished tasks. The
primary beneficiaries of this project are displaced people and vulnerable groups. Its main
objective is to enable poor small-scale farmers to increase their incomes and food security so as
to make a shift to more sustainable livelihoods. The project has two components: 1) Food for
Assets (FFA) component and 2) Market Support Component.
The monitoring work during the first quarter of FY 2009/10 assessed the Food for Assets
Component that was using food incentives to facilitate the creation or rehabilitation of
community assets. MAAIF had reported that among its deliverables during FY 2008/09 were 200
fish ponds excavated and stocked with fish and over 10,000 acres of tree planted in the West Nile
Region. BMAU monitored the fish farming sub-component. The overall purpose of the fish
farming sub-component was to promote and enhance commercial farming in Arua, Yumbe and
Koboko. WFP entered into a partnership with NUSAF to extend the project in the Teso and

68
Lango regions with the establishment of a further 120 ponds. The detailed monitoring findings
were reported in the BMAU report of November 20094 and are summarized below.
During the fourth quarter of FY 2009/10, the BMAU team made follow up visits to this project
to assess the performance of the Market Support Component. The detailed findings on physical
performance of this component are reported below.
Progress Update
Disbursements
During FY 2008/09, donors injected US$ 1million in the Agriculture Marketing Support Project
while Government disbursed counterpart funding equivalent to Shs 60 million to MAAIF to
implement and monitor the project all totaling to Shs 1,661,000,000/=. In the previous year
2007/08, Government released Shs 200 million to MAAIF as counterpart funding5.
Physical performance of Food for Assets (FFA) Component
During Q1 of FY 2009/10, the BMAU team visited the 6 districts of Yumbe, Arua, Koboko,
Soroti, Amuria and Katakwi were the FFA Component was being implemented. The following
were the main findings from this visit:
1. The fish farming component in the West Nile and Eastern Region was found to have been
concluded/wound up in FY 2007/08 in the districts although the Agricultural Ministerial
Policy Statement of FY 2009/10 was reporting actual outputs of 200 fish ponds in FY
2008/09. In Yumbe for example, the project was concluded in FY 2006/07. This was mis-
reporting of outputs.
2. Over 120 ponds were excavated in the districts of Yumbe, Koboko and Arua during the
period 2004-2007, although a significant fraction was neither completed nor stocked with
fish. The monitoring team found that many of the ponds had dried up due to poor silting
resulting in interruption of the water sources, lack of maintenance and neglect due to lack
of fish seed. Sustainability of this intervention was generally low as the incentive of
providing food for assets and work had ceased which led to breakup of the community
groups.
3. There was nevertheless good performance and sustainability of this intervention in
Koboko district were further support was obtained from ADB Fisheries Development
Project and NAADS after the conclusion of the Agriculture Marketing Support Project.
Under the WFP support, 50 ponds were excavated, 26 stocked with fish while 24 were
not stocked and these were abandoned by farmers. The monitoring team found that all the
4 MFPED, 2009.
5 MFPED, 2009a.

69
ponds were now functional after farmers received fish feeds, fingerlings and assorted
equipment.
4. Several ponds were excavated in Soroti, Katakwi and Amuria district, although many
were not stocked with fish. Some ponds were found to be still operational while many
others had dried up. However there were serious challenges noted by the monitoring team
relating to poor service delivery by WFP, lack of transparency and proper accountability,
insufficient monitoring of the project by MAAIF and consequently low value for money
in the project. In Katakwi district, the beneficiary groups had petitioned WFP and
NUSAF for loss of funds and non-delivery of the fingerlings. In Soroti district, immature
fingerlings were reported by the beneficiaries to have been delivered by WFP resulting in
high mortality rates.
5. In conclusion, this project component helped communities to excavate ponds while
enhancing food security in its early stages of implementation. However, the primary goal
of self-reliance and sustainability of interventions at community level has not been
realized except in areas where successor projects have taken over. The integration of
MAAIF projects into district development plans was recommended for sustenance of
interventions once the projects wound up.
6. None of the districts visited acknowledged having seen MAAIF staff monitoring this
project in its entire life. It was recommended that MAAIF should strengthen its
supervisory role of central government projects that are implemented in districts to
improve service delivery and value for money.
Performance Contract Indicators for FY 2009/10
Most of the interventions under this project are of a recurrent nature including procurement of a
vehicle, undertaking grain training workshops and field visits and producing quarterly market
information bulletins. Under the development component, MAAIF planned during FY 2009/10
to achieve the following, through WFP support:
Promote community projects including 200 fish ponds in Teso and Lango regions,
opening 1,671 acres of agro-forestry (1.7 million seedlings planted) and seed
multiplication particularly cassava and sweet potatoes (1,300 acres of land).
Purchase by WFP of 6,536 metric tonnes of maize and 435 metric tonnes of beans from
small scale farmers. This totals to 6,971 metric tonnes of grains.
Provide grain storage facilities to farmer groups, one each in Masindi, Nakaseke and
Sembabule districts (this was not included in the performance contract although it was a
planned activity).
The first indicator on fish ponds was monitored in Q1 of FY 2009/10 and the summary findings
have been presented above. The monitoring work during Q4 focused on the last two indicators
(purchase of maize and storage facilities and the detailed findings are presented below.
Financial performance

70
The approved budget for the Agriculture Marketing Support Project in FY 2009/10, was UShs
370,000,0006. By the end of the first 3 quarters of the year (July 2009-March 2010), 299,777,779
or 81 percent of the budget had been released and payments worth UShs 239,776,667 were
made. This was Government counterpart funding. Information could not be easily accessed on
donor financing for this project by WFP in FY 2009/10.
Physical Performance for Market Support Component
Grain purchase
The monitoring team found that the mobilization for local procurement is jointly done by
MAAIF and WFP. During calendar years 2009 and part of 2010, a total of 7,066 metric tones of
grains was purchased from the farmer associations under this project (Table 3.1.2). This was
above the target of 6,971 metric tones of grain that was anticipated in the MAAIF Performance
Contract indicating excellent performance on this indicator. Disaggregated data for the tonnage
of each commodity procured was not readily available.
Table 3.1.2: Purchases from farmer associations 2007 – 2010
Year Procurement (MT) Value (US$)
2007 6,383 1,167,377.00
2009 6,314 2,440,823.00
2010 (by June) 2,752 652,283.00
TOTAL 15,449 4,260,483.00
Source: MAAIF data, June 2010.
Note: Procurement in MT include Maize Grain, Maize Meal, Beans, Unimix (CSB), &
Vegetable Oil
Grain storage facilities
The monitoring team visited the three districts where the grain storage facilities were to be built
– Masindi, Nakaseke, Sembabule – to access progress in construction/installation.
MASINDI DISTRICT
Performance
6 MFPED, 2009b.
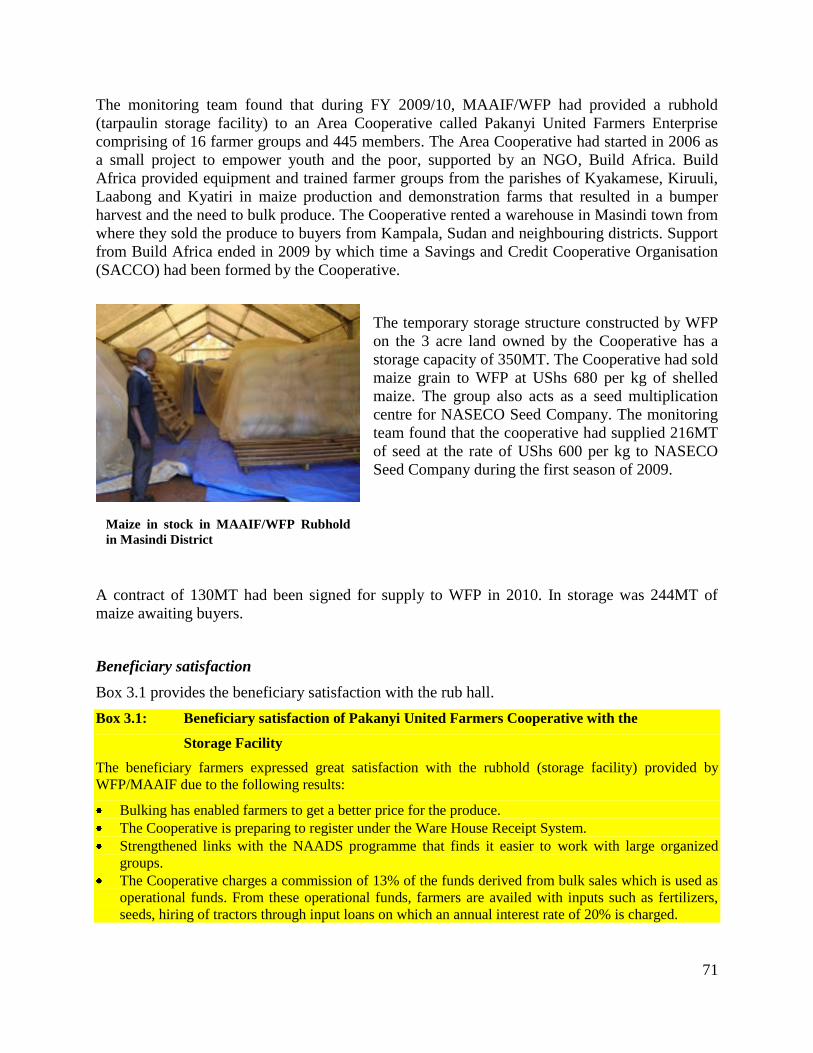
71
The monitoring team found that during FY 2009/10, MAAIF/WFP had provided a rubhold
(tarpaulin storage facility) to an Area Cooperative called Pakanyi United Farmers Enterprise
comprising of 16 farmer groups and 445 members. The Area Cooperative had started in 2006 as
a small project to empower youth and the poor, supported by an NGO, Build Africa. Build
Africa provided equipment and trained farmer groups from the parishes of Kyakamese, Kiruuli,
Laabong and Kyatiri in maize production and demonstration farms that resulted in a bumper
harvest and the need to bulk produce. The Cooperative rented a warehouse in Masindi town from
where they sold the produce to buyers from Kampala, Sudan and neighbouring districts. Support
from Build Africa ended in 2009 by which time a Savings and Credit Cooperative Organisation
(SACCO) had been formed by the Cooperative.
The temporary storage structure constructed by WFP
on the 3 acre land owned by the Cooperative has a
storage capacity of 350MT. The Cooperative had sold
maize grain to WFP at UShs 680 per kg of shelled
maize. The group also acts as a seed multiplication
centre for NASECO Seed Company. The monitoring
team found that the cooperative had supplied 216MT
of seed at the rate of UShs 600 per kg to NASECO
Seed Company during the first season of 2009.
A contract of 130MT had been signed for supply to WFP in 2010. In storage was 244MT of
maize awaiting buyers.
Beneficiary satisfaction
Box 3.1 provides the beneficiary satisfaction with the rub hall.
Box 3.1: Beneficiary satisfaction of Pakanyi United Farmers Cooperative with the
Storage Facility
The beneficiary farmers expressed great satisfaction with the rubhold (storage facility) provided by
WFP/MAAIF due to the following results:
Bulking has enabled farmers to get a better price for the produce.
The Cooperative is preparing to register under the Ware House Receipt System.
Strengthened links with the NAADS programme that finds it easier to work with large organized
groups.
The Cooperative charges a commission of 13% of the funds derived from bulk sales which is used as
operational funds. From these operational funds, farmers are availed with inputs such as fertilizers,
seeds, hiring of tractors through input loans on which an annual interest rate of 20% is charged.
Maize in stock in MAAIF/WFP Rubhold
in Masindi District
72
The Cooperative has also secured collaboration from other development partners such as USAID
under the Market Linkages Initiative for the construction of additional stores.
Previously the group used to hire the stores at a cost of UShs 9 million per annum but with the
construction of the stores these costs have been eliminated.
They also used to incur transport costs because they used to transport their produce to various districts
in search of the market. With the construction of the stores, the buyers have a collection centre where
they can collect maize produce in bulk thus reducing the transport costs.
The stores have also boosted the confidence of the farmers and as a result, farmers’ production has
increased due to the presence of a ready market.
A simple warehouse system has been instituted at the rub hall; the receipts given at the rubhall for
produce delivered are used as collateral at the SACCO. The SACCO provides agricultural loans
against the receipts.
The main challenge is that the current storage capacity of 350MT is too small as the Cooperative
produces up to 500-600MT of maize per season. Other challenges are that the floor of the storage facility
is murram exposing the grain to moisture and rodents; the structure is not secure as it is made of
tarpaulin; it is too costly to pay guards (UShs 140,000 per month); insufficient funds to facilitate
collective marketing and WFP may not buy from the cooperative as the tonnage remains small due to lack
of inputs like tractors and fertilizers.
Source: Key Informat Interview with Business/Secretarial Manager, Pakanyi United Farmers
Cooperative Ltd, Masindi District.
Recommendations
1) Provision of more storage facilities, particularly the more permanent types. Alternatively,
the Government should provide seed financing for enabling the Cooperative build more
permanent stores using share capital.
2) MAAIF/WFP should equip the rubhold with moisture meters, weighing scales and
stitching machines.
3) Government to provide crop finance to the Cooperative for expansion of production and
purchase more inputs (fertilizers, tractor hire).
NAKASEKE DISTRICT
Performance
The BMAU monitoring team found that two rubholds each of 350MT had been constructed in
Nakaseke district by MAAIF/WFP during FY 2009/10. The rubholds were given to Kapeke
Maize Growers Association that had launched into commercial maize production under the
stewardship of General Salim Saleh of Namunkekera Project. The association leased 500 acres
from Namunkekera project, of which 300 acres was planted with maize during 2009/2010. The
association partnered with NAADS to provide farm inputs to farmers including maize seeds,
fertilizers, herbicides, pesticides that resulted in high output requiring bulk marketing. The

73
district approached MAAIF that introduced the Agriculture Marketing Support project in
Nakaseke district during FY 2009/10.
The two stores of total capacity 700 MT were already in use. By the time of the monitoring visit
in June 2010, 500 tonnes of maize grain were in storage and another 600 tonnes were expected
from the current seasons. NAADS had provided tarpaulins for spreading on the murram floors
for the storage facilities. Namunkerera Project also provided maize seed. The association had
also created a link with maize millers in the district in order to add value to their produce by
producing flour.
Beneficiary satisfaction
The beneficiaries interviewed were grateful for this initiative because previously, farmers used to
experience up to 20% losses attributed to poor post handling methods which is no longer the case
with the produce bulking system. There is a ready market for the bulked produce at a good price.
The following challenges were noted however:
1) The temporary storage facilities require high investment costs before they can be used
effectively, For example, the association invested 50 trips of murram worth UShs 6.4
million on the floor and wooden stands worth UShs 8.2 million to raise the bags from the
ground. Constructing the floor with concrete would require UShs 60 million that the
association does not have.
2) The tarpaulin structure is not ideal for storage and does not meet the storage standards.
For example, rodents come through as the rubhold is not tight on the ground; moisture
seeps through gaps; high humidity due to the tarpaulins.
3) Lack of crop finance for hiring tractors and paying farmers promptly. The management of
the association tried to access loans from commercial banks and Microfinance Support
Centre Ltd without success due to stringent requirements.
4) Difficulty of expanding production using a hoe.
Left: One of the Rubholds in Nakaseke district Right: Farmers produce stored in the rub hall

74
Recommendations
The managers and farmers of Kapeke Maize Growers Association recommended the following:
1) The Association should be piloted for a concessional grant from the Government to
enhance their production and marketing which can later be rolled out to other areas if it
proves successful.
2) Government should build silos possibly at regional and district level.
3) Provision of tractor hire services for commercialization of agriculture.
SEMBABULE DISTRICT
Performance
The district officials in Sembabule reported that the Agriculture Marketing Support project was
introduced to them by MAAIF officials in April 2010. The district was asked to identify 2 sites
in areas that have high levels of maize production. The two sites – Lwebitakuli and Lwemiyaga –
were identified and appraised. The communities in the sites were briefed about the project and
requested to make a contribution of murram to the project. A Memorandum of Understanding
was signed between the district and MAAIF, although a copy was not left in the district. At the
time of the monitoring visit in June 2010, the labhold had not been constructed yet and the
district officials were still waiting for progress from MAAIF.
3.1.3 Integrated Pests and Disease Management
Background
The Integrated Pests and Disease Management (IPPM/BBW) is a successor project and scale up
of the best practices derived from an earlier project that was supported by the Food and
Agriculture Organisation (FAO) known as ‘Improved Integrated Production and Pest
Management to Control Banana Bacterial Wilt Project in Uganda’. The project was intended to
control the banana bacterial wilt (BBW) that was first reported in 2001 in 2 districts and was
confirmed to have spread to 33 districts by 2005. The FAO supported project was implemented
during September 2006 to September 2008 working with farmers to provide them with
knowledge and information needed to effectively control BBW. It was implemented in 5 districts
namely: Mbarara, Mukono, Kiboga, Kamuli and Lira.
Among the achievements of the FAO supported project were: between 2,500 and 3,000 farmers
were organized in groups and trained in banana improved production and pest management;
1,500 acres of old plantation were rehabilitated and 500 acres of new banana plantations were
established; farmer field schools (FFS) were established in 20 selected sub-counties and over 100
extension workers and NAADS Coordinators were trained in improved banana management. The
project demonstrated that Farmer Field Schools methodology was suitable for developing
75
sustainable farmer groups to contain the banana bacterial wilt disease. It was recommended this
approach should be scaled up and rolled out to other parts of the country.
As a follow up, MAAIF started in FY 2008/09 to implement the IPPM/BBW project in Hoima,
Iganga and Mayuge districts and plans to scale up to other districts in the coming years. This is a
100% financed government intervention. In a bid to enhance banana production and productivity,
MAAIF is promoting the use of improved integrated production and pest management (IPPM)
technologies through increased adoption of high yielding banana seed by farmers. The core
activities of this intervention include first the identification of production constraints in selected
project areas and agreed solutions and second, mobilization of communities for project activities
and third, capacity building through training and provision of banana suckers for demonstration
sites.
Performance Contract Indicators for FY 2009/10
The MAAIF Performance Contract for FY 2009/10 indicated that the following would key
indicators of performance for this project:
Disease free tissue cultured banana planting materials distributed to 5 more districts
100 banana mother gardens established
100 FFS established
12 technical back stopping visits to districts undertaken
40 farmer facilitators trained on nutritious meals preparation.
Supervision and monitoring at community level.
On the basis of these planned activities, MAAIF communicated to the implementing districts in
March 2010 indicating that MAAIF would provide clean banana planting materials for
establishment of four (4) improved banana mother gardens of 0.5 acres each. A total of UShs 3.3
million would be provided to each district for farmer mobilization and site selection (UShs
300,000) and farmer training and activity supervision (UShs 3,000,000)7.
Financial Performance
The approved budget for the IPPM/BBW Project in FY 2009/10 was UShs 300,000,000.
Releases to MAAIF in the first three quarters of the year July 2009 – March 2010 totaled UShs
199,800,000 or 67% of the approved budget. Almost all the releases (UShs 190,085,000) was
paid out by the end of Q3.
Physical performance
In its Q2 FY 2009/10 progress report, MAAIF reported the following progress:
Assessment of banana production status undertaken in Iganga, Mayuge, Luwero,
Nakaseke and Wakiso districts.
7 Letter to CAO Hoima District from MAAIF dated 3
rd March 2010.
76
Stakeholder consultative meetings in Rukungiri and Kibaale districts.
3,000 banana plantlets procured for Hoima, Mayuge and Iganga districts
2 mother gardens established in each of the districts Hoima, Mayuge and Iganga districts,
Field findings
The monitoring team accessed reports that indicated that the first two activities – assessment of
banana production and stakeholder consultations had been held as planned. The district officials
in Iganga, Mayuge and Hoima districts also confirmed having been consulted by MAAIF
officials on site identification for the banana demos. The MAAIF officials reported that banana
plantlets had been procured and that the distribution to the three districts was ongoing. The
findings on the last two indicators are presented below.
HOIMA
Performance
Hoima district officials confirmed having received 900 improved banana suckers from MAAIF
on 17th
May 2010. These were sufficient to establish 3 mother gardens each of ¾ acre. These
were delivered to three farmers – one in each of the sub-counties Kizirafumbi, Buhimba and
Kitoba. The monitoring team visited the farmers who confirmed receipt of the suckers one week
earlier from the date of the visit (24th
May 2010). The suckers were planted by the farmers.
The district officials acknowledged having received UShs 3.3 million from MAAIF in March
2010 that was used to mobilize farmers.
Challenges
The following challenges were identified by the farmers and district officials:
1) Delay in delivery of materials by MAAIF. They were delivered when the dry season had
started and hence the purpose of the project may not be realized as planting was done in
the drought season.
2) Suckers were very few resulting in very low coverage. The project is likely to have very
low potential impact.
3) Three instead of four sites were planted because one farmer opted out of the project due
to lack of initial investment costs associated with opening up land.
The monitoring team noted that the freshly planted gardens were in bush because the farmers
were complaining of lack of funds for labour and equipment such as pangas.
Recommendations
MAAIF should increase the number of suckers delivered to each district so that more
sites are established for increased impact.

77
IGANGA
Performance
Although the MAAIF progress reports indicated that 2 mother gardens had been planted in
Iganga, there was no evidence of this. The district officials indicated that they were still waiting
for delivery of suckers from MAAIF. They expressed ignorance on the name and overall
intention of this project as the information provided by MAAIF officials to the district was very
scanty.
MAYUGE
Performance
Similar to Iganga district, the district officials in Mayuge district were still waiting for the
delivery of planting materials from MAAIF. Sites had been identified but there had been no
further communication from MAAIF hence no work done.
Conclusion
Generally, the IPPM/BBW project is underperforming as many performance indicators have not
been met during FY 2009/10. Some of the outputs that were reported as completed have not been
implemented yet despite the disbursement of most funds as planned. The factors that might be
leading to slow implementation need to be identified for further action. At this rate of
implementation, the goals of the intervention are unlikely to be achieved.
3.1.4 National Livestock Productivity Improvement Project (NLPIP)
Background
The National Livestock Productivity Improvement Project (NLPIP) was launched in 2003 under
Ministry of Agriculture, Animal Industry and Fisheries (MAAIF) with the objective of
increasing household incomes in the cattle corridor through enhanced livestock productivity and
marketing. Total project cost is UA 33.60 million, jointly financed by an ADF loan of UA 23.74
million, Technical Assistance Fund (TAF) grant worth UA 2.79 million, GoU UA 3.17 million,
Local Governments UA 1.88 million and the balance by beneficiaries (UA 2.02 million). The
project which is being implemented in 42 districts has five components8:
Livestock Genetic Resources Development: oxen, indigenous breeding cows and goats
provided to poor rural households; support to Animal Genetic Resources Centre and Data
8 GoU, 2002.

78
Bank (NAGRIC&DB) and Makerere University Goat Farm to produce better quality
breeding sires including rehabilitation of Ruhengere and Kasolwe Ranches.
Animal Health: addressed major vector-borne and epidemic livestock diseases and
regulatory services to control animal movement.
Water Supply and Forage Resources Development: includes construction/rehabilitation of
livestock watering facilities, support to pasture seed production (managed by Uganda Seed
Ltd) and assistance to 300 farmers in 9 districts to establish demonstration plots for rangeland
improvement.
Livestock market infrastructure and information systems: rehabilitation of livestock
marketing facilities, construction of slaughter facilities, dissemination of marketing
information and capacity building for farmers and staff.
Project Management
Performance Contract Indicators for FY 2009/10
The key annual performance indicators of the NLPIP project as agreed in MAAIF Performance
Contract A for FY 2009/10 were as follows:
1) Rehabilitation/construction of 4 cattle dips and 3 cattle crushes
2) 16 livestock markets completed
3) 19 slaughter sheds completed
4) 10 water reservoirs completed
These targets were consolidating the work done in the previous FY 2008/09 where it was
planned that 12,000 goats and 1,200 cattle would be distributed, vaccines procured and
vaccination done for birds and cattle, 10 dips and crushes rehabilitated, 22 livestock markets and
17 slaughter shades constructed, 8 valley tanks rehabilitated, veterinary regulations enforced and
disease surveillance carried out, among many other activities.
It was reported by MAAIF9 at the end of FY 2008/09 that the cattle and goats were procured and
distributed and were being monitored, vaccines and animal drugs had been distributed and works
had commenced on 3 dips, 2 crushes, 8 valley dams and tanks, 13 livestock markets and 9
slaughter sheds. The NLPIP project was planned to end in 2009 but got an extension to finally
close by December 2010 to enable satisfactory completion of the various infrastructures.
Financial Performance
Table 3.1.3 summarizes the sources of finance for the NLPIP project and the actual fund
disbursement as of December 2009, the latest reporting period10
.
Table 3.1.3: Loan disbursement for NLPIP as of 31 December 2009
9 MAAIF, 2009.
10 MAAIF, 2010.
79
Sources of Finance Loan amount Disbursement Undisbursed balance
Amount % Amount % Amount %
ADB Loan (UA) 23,740,000 70.65 20,598,509 86.70 3,141,491 13.30
TAF Loan (UA) 2,790,000 8.30 2,790,000 100.00 0 0.00
GoU Contribution
(Shs)
7,328,496,000 21.05 3,594,253 47.78 3,734,243,000 52.22
Total 33,600,000 100
Source: GoU and ADB, 2009; MAAIF, 2010.
Substantial progress has been made in loan disbursement since March 2009 from 77.21% to
86.70% of the ADB loan by December 2009 and from 23.36% to 52.22% of GoU counterpart
funding in the same reporting period; 100% of the technical assistance fund had already been
disbursed by March 2009. Although the government had doubled its expenditure towards
counterpart funding, the releases were still minimal given the fact that the project is moving
towards completion. The expectation is that by now, 100% counterpart funding would have been
released. Government of Uganda is responsible for financing the recurrent costs and 26% of civil
works. Inadequate counterpart funding had slowed project implementation.
Earlier monitoring work done by BMAU in the fourth quarter of FY 2008/09, an evaluation by
GoU and ADB11
and an efficiency review of the project conducted by EPRC in 200812
concluded NLPIP as having a high leakage of funds transferred to districts. Examples were cited
- in 2006/07 Bushenyi district was taken to have received Shs 22,830,000 but records revealed
that no funds were transferred; Pallisa was taken to have received Shs. 23,990,000 in the same
period but only 7,440,000 was receipted reflecting a leakage of 69% of total funds. In FY
2007/08, a leakage of 4.1% was noted13
. The causes of fund leakage should be identified and
dealt with in the second phase of the project if it is granted. Funds disbursement to districts was
noted to be erratic, a problem that should also be minimized in future to aid proper planning.
Annex 2.1 summarizes the allocations and actual disbursements to the individual infrastructure
projects
Physical Performance
Overall performance
11
GoU and ADB, 2009
12 EPRC, 2008.
13 EPRC, 2008.
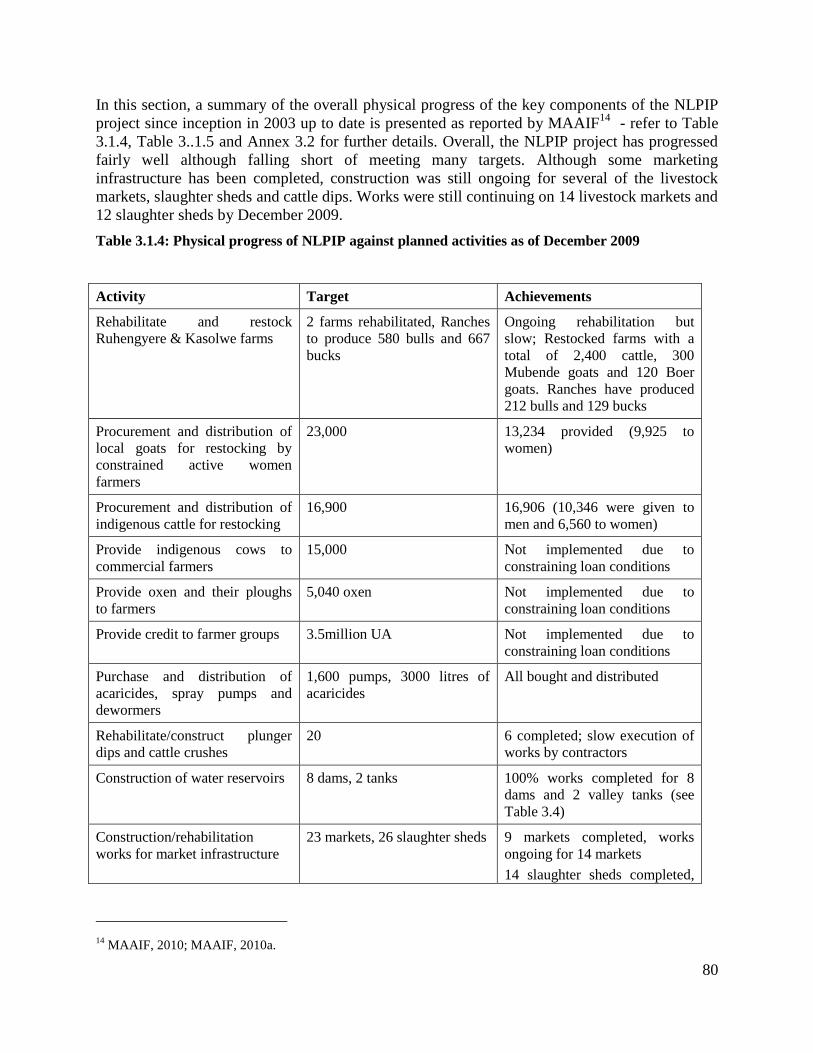
80
In this section, a summary of the overall physical progress of the key components of the NLPIP
project since inception in 2003 up to date is presented as reported by MAAIF14
- refer to Table
3.1.4, Table 3..1.5 and Annex 3.2 for further details. Overall, the NLPIP project has progressed
fairly well although falling short of meeting many targets. Although some marketing
infrastructure has been completed, construction was still ongoing for several of the livestock
markets, slaughter sheds and cattle dips. Works were still continuing on 14 livestock markets and
12 slaughter sheds by December 2009.
Table 3.1.4: Physical progress of NLPIP against planned activities as of December 2009
Activity Target Achievements
Rehabilitate and restock
Ruhengyere & Kasolwe farms
2 farms rehabilitated, Ranches
to produce 580 bulls and 667
bucks
Ongoing rehabilitation but
slow; Restocked farms with a
total of 2,400 cattle, 300
Mubende goats and 120 Boer
goats. Ranches have produced
212 bulls and 129 bucks
Procurement and distribution of
local goats for restocking by
constrained active women
farmers
23,000 13,234 provided (9,925 to
women)
Procurement and distribution of
indigenous cattle for restocking
16,900 16,906 (10,346 were given to
men and 6,560 to women)
Provide indigenous cows to
commercial farmers
15,000 Not implemented due to
constraining loan conditions
Provide oxen and their ploughs
to farmers
5,040 oxen Not implemented due to
constraining loan conditions
Provide credit to farmer groups 3.5million UA Not implemented due to
constraining loan conditions
Purchase and distribution of
acaricides, spray pumps and
dewormers
1,600 pumps, 3000 litres of
acaricides
All bought and distributed
Rehabilitate/construct plunger
dips and cattle crushes
20 6 completed; slow execution of
works by contractors
Construction of water reservoirs 8 dams, 2 tanks 100% works completed for 8
dams and 2 valley tanks (see
Table 3.4)
Construction/rehabilitation
works for market infrastructure
23 markets, 26 slaughter sheds 9 markets completed, works
ongoing for 14 markets
14 slaughter sheds completed,
14
MAAIF, 2010; MAAIF, 2010a.

81
works ongoing for 12 sheds
Disease surveillances and mass
vaccinations
400,000 animals, 6 million
birds
1,541,400 birds vaccinated
against NCD, 400 animals
vaccinated against FMD
Maintenance of rangeland
improvement demo sites
50 demo sites; 240 outgrowers
provided with pasture seed
grass and legumes
81 demo sites set; 240
outgrowers given pasture seed
Forage resources development Rehabilitate 1500 ha degraded
and 1000 ha oversown natural
pastures in 20 districts
Carried out in 10 districts
totaling 1000 ha and 500 ha
over sown.
Source: MAAIF, 2010; MAAIF, 2010a; MAAIF, 2010b.
Most of the planned cattle crushes for Kyenjojo, Nakasongola and Lira districts were not built
due to difficulties associated with securing land titles for the land where the facilities were to be
built. Performance was best in the construction of water reservoirs that were reported to have
been completed (Table 3.1.5).
Table 3.1.5: Water reservoir construction
District Reservoir Physical progress
Rakai Kibanda valley dam 100%
Isingiro Rwenjubu valley dam 100%
Lyantonde Makukulu valley dam 100%
Mubende Lyangoma valley dam 100%
Kiboga Kasejjere valley dam 100%
Kamuli Kasira valley dam 100%
Kumi Ajamaka valley dam 100%
Kitgum Wangkwo valley day 100%
Lira Atar valley dam 100%
Source: MAAIF, 2010; MAAIF, 2010a; MAAIF, 2010b.
Many targets under the NLPIP project, however, have been partially met or not met at all. The
MAAIF officials and progress reports identified the following as the main constraints that have
hindered achievement of the project targets:
1) The project was too large, amorphous and badly designed, targeting to solve too many
problems in the livestock sector at the same time. Project interventions focused on
disease control, pasture growing, nutrition, water reservoirs, marketing infrastructure,
market information, meat standards, training in hides and skins, national livestock census,

82
training district staff at Masters Level and farmer training. The project operated in 42
districts and involved several institutions15
that resulted in poor coordination. Over 150
contracts have been handled during the project duration.
2) The project was not fully manned at the beginning resulting in two dead years of non-
implementation. Initially, the project had a Coordinator who is also a fulltime employer
of MAAIF and a part time Accountant and M&E Officer. The Deputy Coordinator was
recruited in 2007. Although the project was signed off in 2003, it only became effective
in 2006 leading to a major lag in implementation.
3) The loan amount was too small such that the infrastructure had to be reduced by 70% at
mid-term review. Designs were changed for more appropriateness which increased the
cost of infrastructure. The disbursement procedures were lengthy resulting in delays in
procurement and implementation.
4) Escalating costs of construction materials beyond the original costs proposed by the
contractors at the time of bidding. This has been aggravated by the delays in project
implementation.
5) Low capacity of small contractors: The project used small contractors because of the
small size of the infrastructures being constructed. Payments were made after completion
of work implying that the contractors have to use their own funds for the works and get
refunded. Most of the contractors found it difficult to pre-finance the construction work,
leading to delays in implementation. Other associated problems included of small
contractors included poor financial planning and scheduling of works, inadequate
technical capacity, over-commitment in parallel projects and delayed processing of
interim certificate
6) Lack of land titles: Failure of local governments to acquire land titles for the
infrastructural projects, that was a prerequisite for financing under this project.
7) Lack of operational funds for local governments: The project was design required own
funding by the districts for supervision of the project in their localities and
process/purchase land for infrastructural projects. Due to limited resources, districts
found it difficult to co-fund this led to failure of the project in some areas.
Recommendations
1. Focusing the second phase of this project on fewer project components that can be
effectively implemented and deliver results.
2. To negotiate loans that fully finance the project including supervision and land
acquisition.
3. Lumping districts such that all the construction work is done by one large contractor who
has sufficient capacity for pre-financing, equipment and managerial skills. However, it
was observed that although this is a desirable approach as it would result in speedy
implementation of projects, it has a downside: only large domestic and or foreign
contractors would be attracted thus stifling the growth of small domestic contractors.
15
Uganda Bureau of Statistics, Uganda National Bureau of Standards, Ministry of Water and Environment
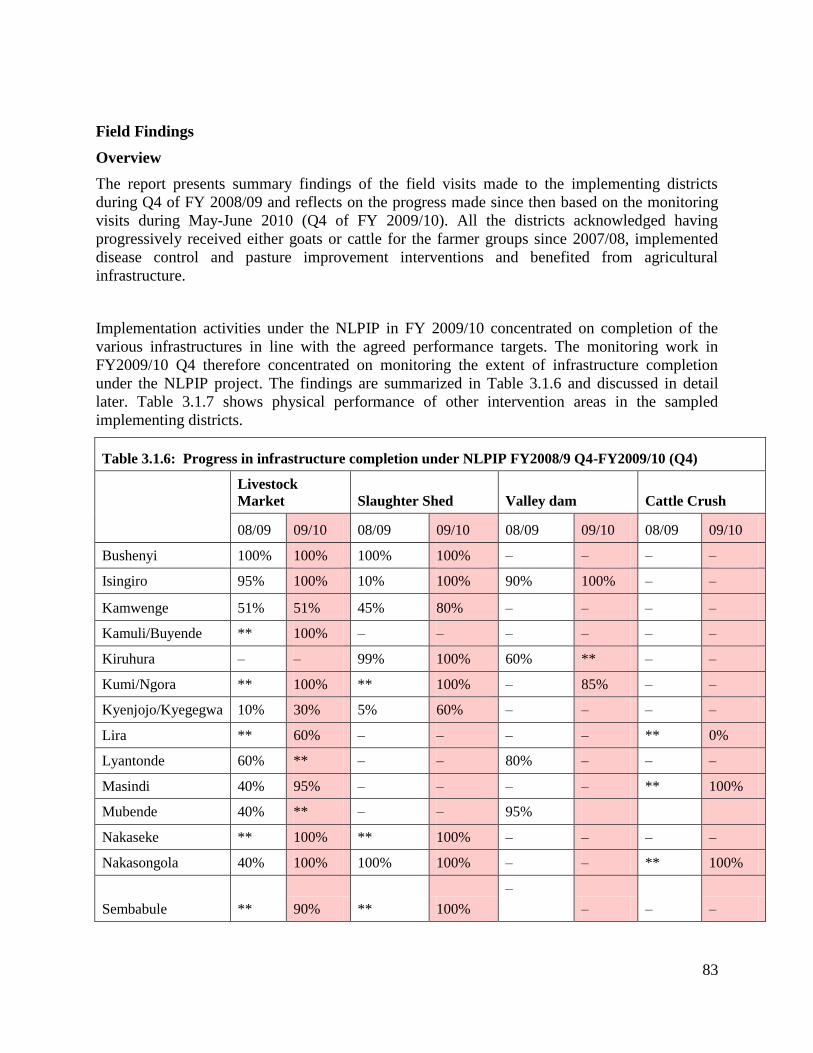
83
Field Findings
Overview
The report presents summary findings of the field visits made to the implementing districts
during Q4 of FY 2008/09 and reflects on the progress made since then based on the monitoring
visits during May-June 2010 (Q4 of FY 2009/10). All the districts acknowledged having
progressively received either goats or cattle for the farmer groups since 2007/08, implemented
disease control and pasture improvement interventions and benefited from agricultural
infrastructure.
Implementation activities under the NLPIP in FY 2009/10 concentrated on completion of the
various infrastructures in line with the agreed performance targets. The monitoring work in
FY2009/10 Q4 therefore concentrated on monitoring the extent of infrastructure completion
under the NLPIP project. The findings are summarized in Table 3.1.6 and discussed in detail
later. Table 3.1.7 shows physical performance of other intervention areas in the sampled
implementing districts.
Table 3.1.6: Progress in infrastructure completion under NLPIP FY2008/9 Q4-FY2009/10 (Q4)
Livestock
Market Slaughter Shed Valley dam Cattle Crush
08/09 09/10 08/09 09/10 08/09 09/10 08/09 09/10
Bushenyi 100% 100% 100% 100% – – – –
Isingiro 95% 100% 10% 100% 90% 100% – –
Kamwenge 51% 51% 45% 80% – – – –
Kamuli/Buyende ** 100% – – – – – –
Kiruhura – – 99% 100% 60% ** – –
Kumi/Ngora ** 100% ** 100% – 85% – –
Kyenjojo/Kyegegwa 10% 30% 5% 60% – – – –
Lira ** 60% – – – – ** 0%
Lyantonde 60% ** – – 80% – – –
Masindi 40% 95% – – – – ** 100%
Mubende 40% ** – – 95%
Nakaseke ** 100% ** 100% – – – –
Nakasongola 40% 100% 100% 100% – – ** 100%
Sembabule ** 90% ** 100%
–
– – –

84
Table 3.1.7: Status of implementation of other NLPIP activities and completion rates
Cattle Dip
Valley Tank
08/09 09/10 08/09 09/10
Goats
received
Cattle
received
Disease
control Pasture
Field
station
Bushenyi – – – – 400 – –
Isingiro – – – – 400 – –
Kamwenge – – – – 1200 – – –
Kamuli/Buyende – – ** 90% 198 – – –
Kiruhura – – – – 700 –
Kumi – – – – 278 1065 –
Kyenjojo – – – – 820 – –
Lira ** 50% – – – 1488 –
Lyantonde – – – – 616 – –
Masindi – – – – 400 – –
Mpigi – – – – 1003 – –
Mubende – – – – 719 – –
Nakaseke – – – – 858 – – –
Nakasongola – – – – 299 – –
Sembabule – – – – 1110 – –
Key
Activity implemented
– Activity not in district ** Not available
% Percentage completion of works
Source: Field Observations
ISINGIRO DISTRICT
Interventions in FY 2009/10 focused on completing Kabingo slaughter shed in Isingiro Town
Council, Busheka livestock market in Endizi sub-county and Rwejubu valley dam. At the last
monitoring visit during Q4 of FY 2008/09, the monitoring team found that the livestock market
was almost complete (95%), the valley dam was also near completion (90%) and the slaughter
shed was just started (10%). In the monitoring of Q4 FY 2009/10, the team was able to
physically monitor the livestock market and slaughter shed. All the facilities were commissioned
on 15th
January 2010.

85
Kabingo slaughter shed
The field visit showed that Kabingo slaughter shed had been completed. Its management had
been tendered out in May 2009 to Ms. Josephine Nkabiguluka. There was evidence of the facility
already in use.
The tenderer noted that the slaughter shed was extremely useful to the surrounding community as
it had improved on the hygiene in slaughtering the animals. However, the animals received for
slaughtering were still few as the community was yet to fully appreciate the need for using this
facility instead of slaughtering animals in the backyard under unhygienic conditions. This has
resulted in low revenue to the tendered compared to the fees charged by the Town Council. Box
3.2 gives a simple cost-benefit analysis of the slaughter shed when in use.
Box 3.2: Cost-Benefit Analysis of slaughter shed in Isingiro Town Council
These are the costs and revenues that are incurred on a monthly basis. Every animal that is slaughtered is
taxed: UShs 1000 for a goat and UShs 2000 for a cow. The facility design did not cater for poultry,
though it would be desirable for this to be taken into account in future. Water was installed so this is not a
cost.
Fees paid to Town Council per month = 172,000/=
Gross Revenue per month
8 goats slaughtered per day for 26 days x 1000/= per goat = 208,000/=
12 cows per month x 2000/= per cow = 24,000/=
Total income = 232,000/=
Expenses per month
Detergents = 10,000/=
Cleaning the slaughter shed and any labour requirements are met by tenderer.
Net revenue = UShs232,000 - UShs 172,000 – Ushs 10,000 = 26,000/=
Left: Skeleton slaughter shed at Isingiro TC in FY 2008/10 Right: Completed slaughter shed

86
Source: Ms. Josephine Nkabiguluka, Tenderer Isingiro T/C slaughter shed
The tenderer is still operating at the margin with very low net profit. In order to make this and
other facilities of this nature in the country profitable, she recommended that the Government
should pass a law that mandates all cattle dealers to slaughter and transport beef for sale to major
towns instead of transporting live animals. This would have many benefits of reducing transport
costs, improving hygiene, reducing on disease spread while increasing on the profitability of
slaughter sheds in the country.
Some complaints were registered on the design of the slaughter shed: lack of sieves in the
drainages that were already clogged with blood; small doors on the facility in which large bulls
could not pass through due to the long horns; the nets all around the facility allow in rain and
dust that reduces the hygiene of the meat and work stalls during the rainy period; steps to the
facility that cannot be easily negotiated by animals – it was preferred that a gentle sloping
surface should have been used; and soil erosion all around the facility as there was no stablising
of soil in the compound. This has led to poor hygiene as animals and humans come in the facility
with soiled feet. Stone pitching of the compound recommended. Many of these complaints were
common to all the slaughter sheds in the other districts and therefore should be addressed in
future designs.
Busheka livestock market
The monitoring team found that the Busheka livestock market was satisfactorily completed but
not in use. The livestock sold in this market were largely originating from Tanzania. No more
animals are emanating from Tanzania due to the sealing off of the border to control disease
spread. The remaining livestock farmers transact on phone and the animals are collected from
their farms. Other farmers have shifted from beef rearing to diary cattle. These challenges pose a
threat for the livestock market to become a white elephant unless cross order trade with Tanzania
is reinstated but with strict quality disease control measures.
Rwejubu valley dam
Physical monitoring done in Q4 FY 2008/09 by BMAU indicated that construction work of this
was near completion (90%). Poor road conditions made it difficult for the monitoring team to
visit this site during Q4 FY 2009/10 but the district officials confirmed that the valley dam had
been completed 100% and was handed over to the community for use.
KAMWENGE DISTRICT
During FY 2009/10, activities focused on completion of Kamwenge Town Council slaughter
shed and Katalyeba livestock market in Nkoma Parish, Nkoma Sub-county.
Kamwenge T/C slaughter shed
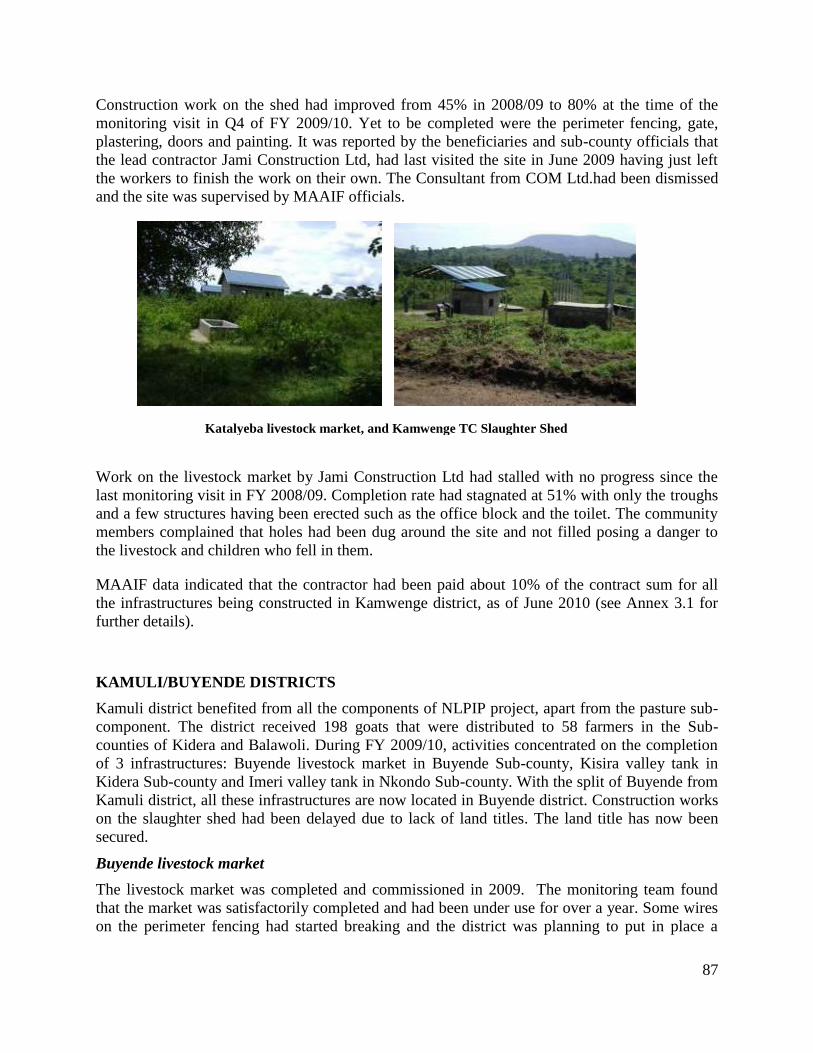
87
Construction work on the shed had improved from 45% in 2008/09 to 80% at the time of the
monitoring visit in Q4 of FY 2009/10. Yet to be completed were the perimeter fencing, gate,
plastering, doors and painting. It was reported by the beneficiaries and sub-county officials that
the lead contractor Jami Construction Ltd, had last visited the site in June 2009 having just left
the workers to finish the work on their own. The Consultant from COM Ltd.had been dismissed
and the site was supervised by MAAIF officials.
Work on the livestock market by Jami Construction Ltd had stalled with no progress since the
last monitoring visit in FY 2008/09. Completion rate had stagnated at 51% with only the troughs
and a few structures having been erected such as the office block and the toilet. The community
members complained that holes had been dug around the site and not filled posing a danger to
the livestock and children who fell in them.
MAAIF data indicated that the contractor had been paid about 10% of the contract sum for all
the infrastructures being constructed in Kamwenge district, as of June 2010 (see Annex 3.1 for
further details).
KAMULI/BUYENDE DISTRICTS
Kamuli district benefited from all the components of NLPIP project, apart from the pasture sub-
component. The district received 198 goats that were distributed to 58 farmers in the Sub-
counties of Kidera and Balawoli. During FY 2009/10, activities concentrated on the completion
of 3 infrastructures: Buyende livestock market in Buyende Sub-county, Kisira valley tank in
Kidera Sub-county and Imeri valley tank in Nkondo Sub-county. With the split of Buyende from
Kamuli district, all these infrastructures are now located in Buyende district. Construction works
on the slaughter shed had been delayed due to lack of land titles. The land title has now been
secured.
Buyende livestock market
The livestock market was completed and commissioned in 2009. The monitoring team found
that the market was satisfactorily completed and had been under use for over a year. Some wires
on the perimeter fencing had started breaking and the district was planning to put in place a
Katalyeba livestock market, and Kamwenge TC Slaughter Shed

88
maintenance budget for the facility. District officials recommended that MAAIF should in future
provide a maintenance tool kit to help in maintaining the facilities. This is because some of the
materials used to construct these facilities are not easily accessible.
Valley dams
The monitoring team confirmed the completion of Imeri valley dam and Kaseri valley dam,
though with a few defects. The two dams were commissioned in February 2010 but were used
for three weeks only and abandoned. The management committee of Imeri dam reported that the
treadle pumps used to pump water from the dam to the troughs were entrusted to one of the
community members who had gone missing. Efforts to establish where and who kept the treadle
pumps were futile.
Kaseri dam was also non-functional due to the breakdown of the treadle pumps and non-
installation of a hose pump for the goats trough.
The dams are supposed to use treadle pumps in order to pump water into the troughs for the
animals. The treadle pumps at Kaseri dam were noted to be very weak and broke down three
weeks after use. They have been kept in storage at a nearby office. The management teams of
both dams reported failure to collect user fees from the community for maintaining the dam
because the communities did not appreciated the value of dams. The committee also
acknowledged limited expertise and capacity to maintain the dams. The dams pose a serious
safety risk to the community because children and livestock might drown as water is drawn
directly from the dams.
The dam management committees and the district officials recommended the following as
measures to improve effectiveness in use of these dams:
1) Strengthening the capacity of dam management committees – training, equipping and
provision of maintenance tool kits.
Left: Imeri Valley Tank Middle: Hose pipes but with no treadle pumps on Imeri Valley Tank Right:
Treadle pumps that had broken down at Kaseri dam at store

89
2) Tendering the dams out
3) Encouraging income generating projects at the dams to raise funds for maintenance. Such
projects could include fish farming and citrus growing.
KUMI/NGORA DISTRICTS
Kumi district benefited from all the NLPIP components. Under restocking, the district received
278 goats and 1065 heads of cattle. In animal health, six motorcycles, 2 refrigerators, a deep
freezer, laboratory equipment and reagents and vaccination dozes were provided. The
refrigerators were however not functional. Fencing materials were provided to the district in
early 2009 and distributed in the sub-counties of Ngora, Kobwin and Kapir for pasture
demonstration sites.
During FY 2009/10, MAAIF targeted completion of Ngora livestock market in Ngora Sub-
county, Ajamaka valley dam in Mukuru Sub-county and Kumi Town Council Slaughter shed.
With the split of Kumi district into two, the dam is now located in Ngora District. The
monitoring team inspected all the three sites.
Slaughter shed
The slaughter shed was completed and commissioned in 2009. However at the time of
monitoring, cracks were seen in the floor of the shed. The district officials attributed this to the
use of heavily silted soil during construction. It was noted that the nets used on the sides of the
shed had started rusting resulting in poor hygiene, especially during the rainy season when the
rains pass through the nets onto the slaughtered beef. The district officials expressed concern
regarding the lack of water, electricity and cold storage facilities that would hinder the effective
utilization of the facility. It was reported that the Veterinary officers lack enough space at the
shed to isolate and observe all the animals during inspection. The tenderer Mr. Rashid Ogwang
provided a simple cost benefit analysis of the slaughter shed in Kumi district (Box 3.3).
Box 3.3: Cost-Benefit Analysis of slaughter shed in Kumi Town Council
The facility was leased from Kumi Town Council 2 months ago. Every animal slaughtered is charged as
follows: 3000/= for a cow; 1000/= for a goat and 100/= for poultry. The major constraint is the lack of
water and electricity.
Lease fee paid to Council each month = UShs 340,000
Gross Revenue per month
6 goats slaughtered per day for 26days x 1000/= per goat = 156,000/=
3 cows per day x 3000/= per cow x 26days = 234,000/=
Total income = 390,000/=
Expenses per month
Labour 2 workers x 20,000/= per month = 40,000/=

90
Water 2000/= per day x 26 days = 52,000
Detergents 3000/= per week x 4 weeks = 12,000/=
Net revenue = UShs390,000 - UShs 340,000 – Ushs 104,000 = -54,000/=
Source: Mr. Rashid Ogwang, Tenderer Kumi T/C slaughter shed
The simple analysis show that the slaughter shed in Kumi is operating at a loss, until such a time
when more animals are brought for slaughtering. It is important for the Government to
strengthen enforcement of hygiene in the beef sector and sensitize the farmers and traders to use
such facilities more regularly.
Ngora Livestock market
The monitoring team found that the livestock market in Ngora Sub County was satisfactorily
completed and is fully operational with bi-weekly market days. The only challenge encountered
was the standard design of the market that did not take into account the small nature of cows in
the region that makes it difficult for the cattle to feed in the trough because they are large and
high. The troughs are more suited to the long-horned cattle in Western Uganda. The district
officials recommended the following:
A weighbridge installed at the market in order to be able to measure the weight of the
animals.
A slaughter shed should also be installed at the market in order t provide facility for those
who would prefer to transport meat instead of the animal.
Provision of water should be considered in order to ensure smooth operations at the
market.
Ajamaka valley dam
This is an old dam built in the 1960s that broke its dyke in 2004. It has been rehabilitated under
the NLPIP project. Although the dam was reported by MAAIF to be 100% completed (Table
3.4) and commissioned in February 2010, the monitoring team found that the contractors had
handed over a facility which was incomplete with many defects. The BMAU rated the
completion work at 85%. There was a leakage on the retaining dam wall and the dyke had
broken. This leakage was reported to the contractors in April and repairs were done but these
were inadequate. The dam was not properly compacted and hence felt soggy when walked upon.
The life span and safety of this dam is therefore under question.
Works on the water troughs was also not complete. As a result, the troughs are already sinking in
Left: Water stretching to farmers’ gardens Middle: Incomplete dam Right: Water channeled
through community road.

91
mud.
There were a number of challenges that were highlighted by the community members who stay
next to the dam:
1) Land disputes: the reservoir extended past its stipulated demarcations and flooded the
neighbouring gardens of farmers resulting into land disputes. However the district
officials claim that the land is government owned and these farmers are encroachers and
issues of compensation do not arise.
2) Inaccessible community road: the community was previously using the dyke as a
community access road joining several villages and health centres. With the construction,
the contractor closed the road and provided an alternate road by the side of the dam. The
dam water was channeled into this alternate road without culverts which has made it
inaccessible. The contractor indicated that the alternate road was not in his contract and
therefore any constructions should be handed directly by the Government.
3) Maintenance: the dam is large with 47,000 cubic metres of water and already filling with
weeds. The district noted that they have no funds and equipment to maintain such a large
dam.
It is recommended that the Contractor addresses the defects so that the dam is satisfactorily
completed. The district should complete construction of the alternate community access road.
KYENJOJO/KYEGEGWA DISTRICTS
MAAIF planned to construct 5 infrastructures in Kyenjojo district: Ruyonza Livestock Market in
Mpara Sub-county, Kyenjojo T/C Slaughter shed and 3 cattle crushes. The 3 cattle crushes were
not built because G.O.U did not meet its counterpart funding requirement. Construction of the
market and slaughter shed is ongoing. However, with the creation of a new district out of
Kyenjojo, the livestock market is now located in Kyegegwa district.
During the previous monitoring visit in Q4 of FY 2008/09, little work had been done on the
infrastructures. The completion rate was 5% for the slaughter shed and 10% for Ruyonza
livestock market. Discussions with the district officials and end-users indicated that the
contractor for both sites B&T Ltd had abandoned the sites leaving behind debts for materials that
had been delivered. The company was noted to have low capacity for delivering parallel
contracts at the same time. BMAU recommended then that B&T Ltd should be terminated and
replaced by proven firms.
Kyenjojo T/C slaughter shed and Ruyonza market
The BMAU second monitoring visit to the two sites during Q4 of FY 2009/10, a year later from
the first monitoring visit, showed little progress made by B&T Uganda in constructing the
livestock market (30%) and substantial progress on the slaughter shed (60%), although both sites
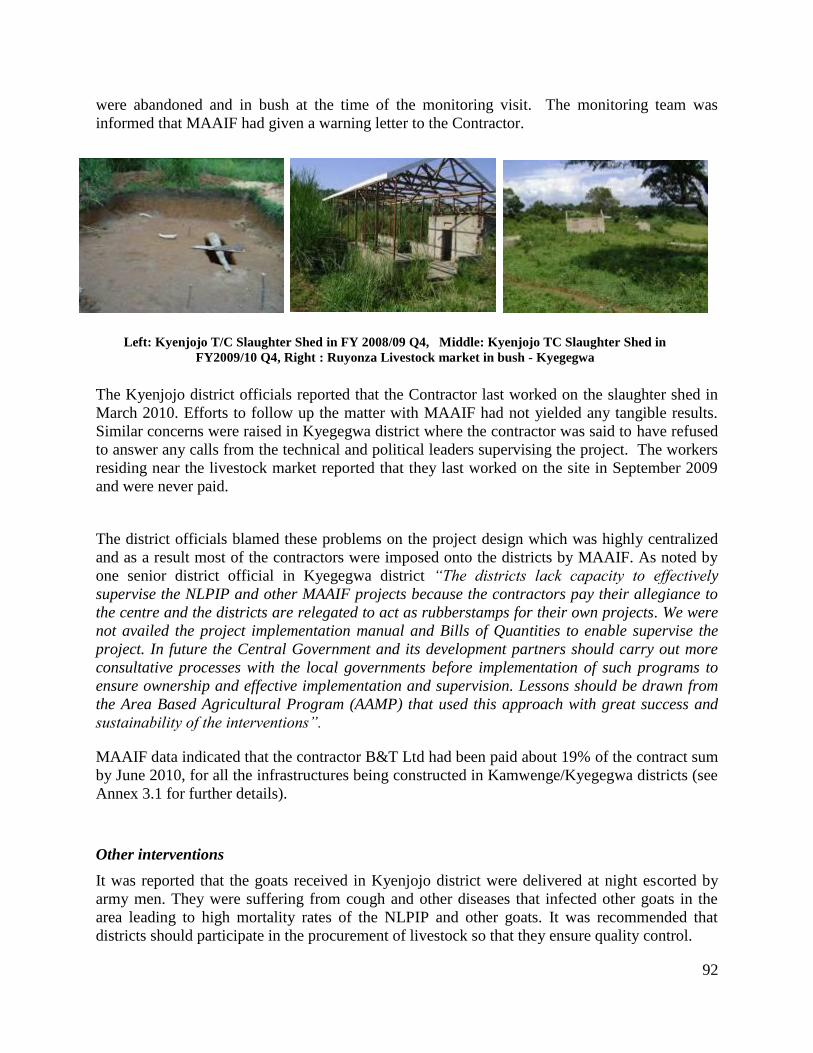
92
were abandoned and in bush at the time of the monitoring visit. The monitoring team was
informed that MAAIF had given a warning letter to the Contractor.
The Kyenjojo district officials reported that the Contractor last worked on the slaughter shed in
March 2010. Efforts to follow up the matter with MAAIF had not yielded any tangible results.
Similar concerns were raised in Kyegegwa district where the contractor was said to have refused
to answer any calls from the technical and political leaders supervising the project. The workers
residing near the livestock market reported that they last worked on the site in September 2009
and were never paid.
The district officials blamed these problems on the project design which was highly centralized
and as a result most of the contractors were imposed onto the districts by MAAIF. As noted by
one senior district official in Kyegegwa district “The districts lack capacity to effectively
supervise the NLPIP and other MAAIF projects because the contractors pay their allegiance to
the centre and the districts are relegated to act as rubberstamps for their own projects. We were
not availed the project implementation manual and Bills of Quantities to enable supervise the
project. In future the Central Government and its development partners should carry out more
consultative processes with the local governments before implementation of such programs to
ensure ownership and effective implementation and supervision. Lessons should be drawn from
the Area Based Agricultural Program (AAMP) that used this approach with great success and
sustainability of the interventions”.
MAAIF data indicated that the contractor B&T Ltd had been paid about 19% of the contract sum
by June 2010, for all the infrastructures being constructed in Kamwenge/Kyegegwa districts (see
Annex 3.1 for further details).
Other interventions
It was reported that the goats received in Kyenjojo district were delivered at night escorted by
army men. They were suffering from cough and other diseases that infected other goats in the
area leading to high mortality rates of the NLPIP and other goats. It was recommended that
districts should participate in the procurement of livestock so that they ensure quality control.
Left: Kyenjojo T/C Slaughter Shed in FY 2008/09 Q4, Middle: Kyenjojo TC Slaughter Shed in
FY2009/10 Q4, Right : Ruyonza Livestock market in bush - Kyegegwa
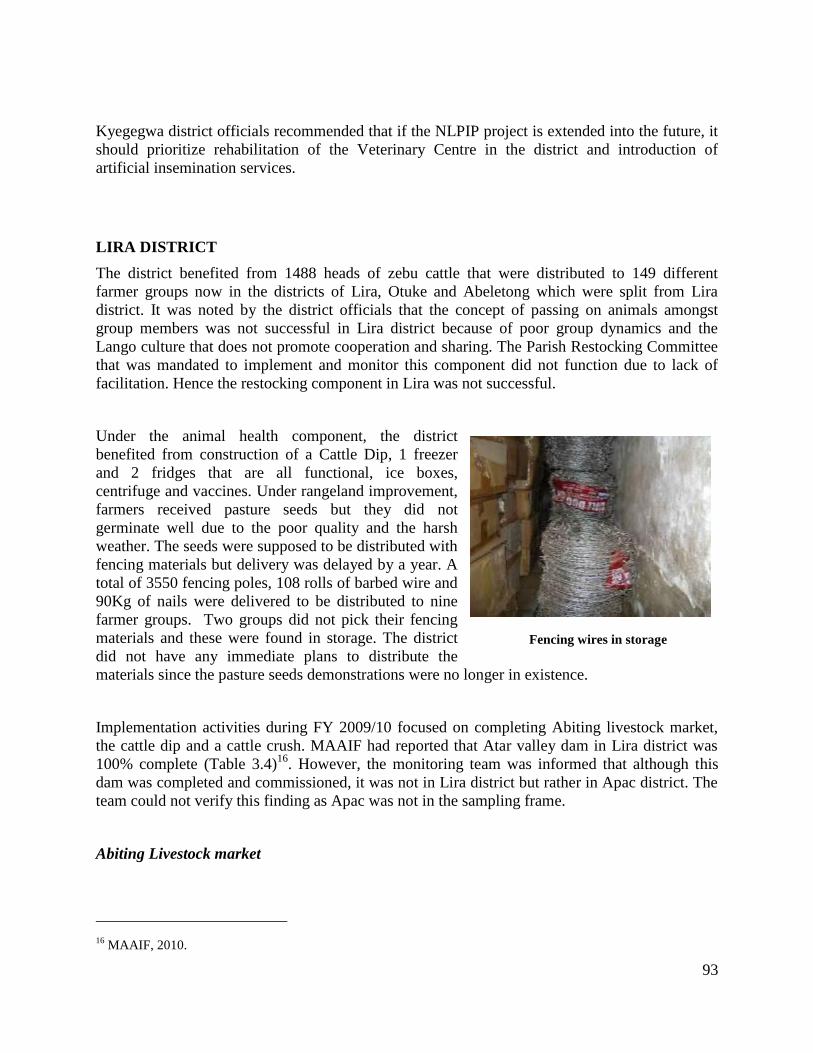
93
Kyegegwa district officials recommended that if the NLPIP project is extended into the future, it
should prioritize rehabilitation of the Veterinary Centre in the district and introduction of
artificial insemination services.
LIRA DISTRICT
The district benefited from 1488 heads of zebu cattle that were distributed to 149 different
farmer groups now in the districts of Lira, Otuke and Abeletong which were split from Lira
district. It was noted by the district officials that the concept of passing on animals amongst
group members was not successful in Lira district because of poor group dynamics and the
Lango culture that does not promote cooperation and sharing. The Parish Restocking Committee
that was mandated to implement and monitor this component did not function due to lack of
facilitation. Hence the restocking component in Lira was not successful.
Under the animal health component, the district
benefited from construction of a Cattle Dip, 1 freezer
and 2 fridges that are all functional, ice boxes,
centrifuge and vaccines. Under rangeland improvement,
farmers received pasture seeds but they did not
germinate well due to the poor quality and the harsh
weather. The seeds were supposed to be distributed with
fencing materials but delivery was delayed by a year. A
total of 3550 fencing poles, 108 rolls of barbed wire and
90Kg of nails were delivered to be distributed to nine
farmer groups. Two groups did not pick their fencing
materials and these were found in storage. The district
did not have any immediate plans to distribute the
materials since the pasture seeds demonstrations were no longer in existence.
Implementation activities during FY 2009/10 focused on completing Abiting livestock market,
the cattle dip and a cattle crush. MAAIF had reported that Atar valley dam in Lira district was
100% complete (Table 3.4)16
. However, the monitoring team was informed that although this
dam was completed and commissioned, it was not in Lira district but rather in Apac district. The
team could not verify this finding as Apac was not in the sampling frame.
Abiting Livestock market
16
MAAIF, 2010.
Fencing wires in storage

94
The monitoring team found that construction of Abiting livestock market in Apala Sub County
was not complete, estimated at 60% completion rate. All the structures as required by design
such as office block, toilets and troughs had been erected but not equipped. The fencing was yet
to be done. The site was abandoned at the time of the visit, with signs that no work had been
ongoing for some months.
Okwangole Cattle crush
In its progress report covering the period October to December 200917
, MAAIF reported that this
cattle crush was 25%. The BMAU monitoring team found that no construction had been done on
this site which was in a bush. The district officials claimed that the contractor had withdrawn
from the site due to land conflicts despite the land title had been secured by the district.
Alebtong cattle dip in Lira
Construction of the cattle dip located in Abeletong Sub
County started in 2008 but only about 50% of works
have been completed. Yet to be constructed are the
boma, foot bath, crush, walls and the roof. The already
completed construction exhibited poor workmanship as
there were cracks on the walls of the facility.
The site visitors book had information showing that
MAAIF staff had inspected the site in April 2010 and
had commented about the poor quality of works that
needed improvement. The district officials complained
that the Contractor Akia Ltd had too many running contracts but with little capacity and
resources. Hence the delayed and poor quality works. Financial data at MAAIF showed that the
contractor had received only 32% of the contract sum for all the infrastructures he was
constructing (Annex 3.1).
MASINDI DISTRICT
Masindi districts benefited from 4 components under the NLPIP project: restocking, rangeland
management, disease control and infrastructural development. Under restocking, the district
expected delivery of 4,000 goats but received 400. Under the infrastructure development
component, the district expected a livestock market, two cattle crushes and a slaughter shed. The
monitoring team found that two out of the planned four infrastructures had been built - the
livestock market in Mitooma Parish, Bwijanga Sub-county and one cattle crush in Kijunjuba
Parish, Kimengo Sub-county. The two infrastructures that were not constructed due to land
disputes and lack of land titles were the Town Council slaughter shed and one cattle crush.
17
MAAIF, 2010

95
The construction of the livestock market was near completion at the time of the monitoring visit
in May 2010 (95% complete) with the only pending works including straining of the perimeter
fencing wires, putting concrete and repainting on the fence poles and installing two tanks for rain
harvesting. The cattle crush was also 100% complete and the community was already using it
even if it was yet to be handed over.
The following were the main challenges faced by the contractor Minimax Enterprises Ltd:
1) Under-costing in the Bills of Quantities (BOQs), especially as there was a time lag in
overall project implementation resulting in a significant rise in unit costs of materials. For
example, at the time of submission of the BOQs, a galvanized pipe of 6 metres cost
180,000/=. Currently, the same pipe length costs 320,000/=. The type of wire and pipes
recommended by MAAIF were very expensive and scarce hence the contractor had to
import them into the country.
2) Delayed payment of interim certificates for completed works. Delays ranged from 3 to 6
months from the period of submission to MAAIF by the contractor.
3) Escalating fuel prices that increased the cost of transporting materials
4) The requirement of getting a performance bond from commercial banks at every stage of
construction completed was noted to be too tedious and costly, leading to delayed project
implementation. Banks charge 10% - 12% of the amount requested; having 3
performance bonds in the lifetime of the project leads to loss of a significant amount of
the contracted sum to the banks.
5) Unexplained deductions by MAAIF on the company’s operational funds as explained
below:
“There are deductions that are made from our certificates that are not explained to us.
We know that we are supposed to pay withholding tax. MAAIF deducts the withholding
tax from our certificates. But the Ministry officials also ask us to give them a post-dated
Completed Bwijanga livestock market – Masindi District

96
cheque of the same amount of the withholding tax before we can receive payment. We
thus pay this tax twice. Why? Our advance payment request was UShs 148,130,185 and
we were paid UShs 118,002,012 less UShs 30,128,173. When we submitted the first
Certificate of UShs 60,184,502, we received payment of UShs 54,350,194, with a
difference of UShs 5,834,308. We submitted a postdated cheque to MAAIF of withholding
tax of UShs 3,261,011. On our second Certificate of UShe 102,633,432, we were paid
UShs 86,952,484, which was less by UShs 15,680,948. We submitted to MAAIF a
postdated cheque for the withholding tax of UShs 5,217,149. Who is going to pay these
balances given that we have completed the construction?” Managing Director, Minimax
Enterprises Ltd.
NAKASEKE DISTRICT
Nakaseke district acknowledged having received 858 goats in FY 07/08 which were distributed
in six Sub-counties. In addition, 5000 doses of Newcastle Vaccines, 2500 doses of Lumpy Skin
disease 80,000 doses of Foot and Mouth Disease, 2000 doses of rabies, and 2500 doses of
brucellosis were delivered to the district. The district also received six motorcycles, one
refrigerator and one ice box and seven district staff benefited from short courses on animal
health. The district staff were trained in pasture improvement but pasture seeds were not given,
hence the component was not implemented. Implementation of NLPIP in Nakaseke district in FY
2009/10 concentrated on completion of the Town Council slaughter shed and the Ngoma
livestock market in Ngoma sub-county.
Ngoma livestock market and Nakaseke T/C Slaughter shed
Both facilities were satisfactorily completed and the contractors were at the stage of correcting
the defects. The wires used in the livestock market
perimeter fencing were graded as weak and of poor
quality by one of the visiting area Hon. Ministers and had
already started rusting. They were all being replaced by
strong wires at the time of the monitoring visit in June
2010. The monitoring team noted cracks on the water
troughs but the site foreman noted that this defect could
not be rectified as it would require construction of
troughs again. The main defect identified by the
monitoring team on Nakaseke T/C slaughter shed were
the cracking floors due to the apparent use of inadequate
cement.
NAKASONGOLA DISTRICT
During FY 2009/10, implementation of the NLPIP project in Nakasongola district focused on
completion of the infrastructures. The monitoring team visited Kalongo Livestock market in
Cracks in floor of slaughter shed

97
Kalongo Sub-county, Migyera Slaughter shed and Bukabi Kyerindura cattle crush in Kakooge
Sub-county. The three infrastructures were 100% complete although with some defects.
Construction of a valley tank, one cattle crush and another slaughter shed was not done due to
difficulties in acquiring land titles.
Kalongo livestock market
For Kalongo livestock market, the Kalong Sub-county Chief and beneficiaries complained of the
weak and elastic wires used in the perimeter fencing that cows could go through easily as well as
tax evaders; the poor quality of gate that was welded with gas instead of electricity and
insufficient concrete on the fencing poles. The monitoring team confirmed the existence of these
defects. The Sub-county officials expressed concern that they were not privy to the BOQs for the
livestock market and hence did not know whether the completed infrastructure was as planned.
They reported that the above defects were mainly due to limited supervision of the construction
works as the Consultant was terminated by MAAIF and not replaced. Lack of water in the
facility was a challenge. The Sub County receives UShs 14 million annually for all capital
development and hence does not have capacity to install the water system. It was recommended
that the Government should install the water system in the infrastructure.
However, despite these defects, the Sub-county officials and the beneficiaries were greatly
appreciative of the facility. Since the market is properly fenced, it would reduce on tax evasion
and hence result in higher income for the Sub-county.
Bukabi Kyerindura cattle crush
The community crush in Kakooge Sub-county was satisfactorily completed and there was
evidence of use by the community.
Left: Kalongo Livestock market Right: Bukabi Kyerindura cattle crush – Nakasongola
District

98
SEMBABULE DISTRICT
Over the past four years, Sembabule district benefited from all the components under the NLPIP
project. A total of 1110 female goats were distributed to 35 farmer groups in FY 08/09.
However, procurement of these goats was centralized resulting in sourcing of poor quality goats
(young and sick), mismanagement by contractors and high mortality immediately after they were
distributed to the farmers. The project provided 12 improved male goats to NAGRIC station for
breeding and multiplication and then distribution to the farmer groups that had received the
female goats. NAGRIC did not provide the beneficiaries with male goats. But the district
procured and provided some male goats to the communities using other resources. It was
recommended that districts and project beneficiaries should be involved in selection of livestock
breeds.
Under the pasture improvement component, 10 farmers were given fertilizers, poles and barbed
wire to fence off paddocks for demonstrating improved pasture management. Pasture seeds that
were promised were not delivered and hence the component became inactive until the district
provided seeds to five of the 10 farmers. The district plans to give pasture seeds to the remaining
5 beneficiary farmers in FY 2010/11.
During FY 2009/10, activities under NLPIP focused on completion of Sembabule T/C slaughter
shed and Ntusi livestock market in Ntusi Sub-county. The monitoring team found the slaughter
shed satisfactorily completed and awaiting commissioning. What was missing was an access
road, water and electricity which was to be provided by the district. Works on Ntusi livestock
market were near completion (90%). District officials appreciated these facilities and
recommended that more livestock markets, slaughter sheds and water for production facilities
should be constructed in all the other parts of the district. It was noted that the market has
potential to generate between UShs 600,000 and UShs 1 million per week as 150 cows would be
sold on each market day.
General Challenges
Implementation manual and BOQs: All districts expressed ignorance of these vital documents
that would have enabled them to supervise the contractors. They did not know what the
infrastructures should look like and what should be in them to be certified as completed.
Vandalisation: Most of the infrastructures are remotely located and were built without adequate
participation and sensitization of the communities for increased ownership. Vandalisation of the
installations was noted to be a major threat as some members of the communities do not fully
appreciate the facilities and there is limited community policing. At most risk are the coloured
ironsheets that are used by people to beautify their houses and fencing wires that are used in
welding.
Lack of sustainability and followup: NLPIP project investments have not been integrated in
district and sub-county workplans for sustainability. It was not clear to districts which funds
would be used for completing unfinished works upon the closure of the current phase of NLPIP.
Districts have not allocated funds for follow up of completed activities which has resulted in
limited impact of the interventions. For example, upon learning that the current phase of the

99
NLPIP project was coming to a closure and there is no possible follow up by the districts, many
beneficiaries of the restocking programme have started eating the goats instead of passing on off
springs. Similarly, those who benefited from rangeland management training and inputs have
since abandoned the intervention due to lack of supervision and followup.
Acquisition of land titles: Difficulty in acquiring land titles by the districts for the
infrastructures due to the high prevalence of land disputes and lack of funds to pay survey and
high compensation costs.
Lack of feedback mechanisms: User communities of the infrastructures complained of lack of
feedback mechanisms to Government regarding misuse of infrastructures. In Masindi for
example, it was reported that even when a complaint is channeled to the district officials, they
seem not to care since the infrastructures were constructed by Central Government. Often there
is no action taken by the district.
Inappropriateness of communal infrastructure: It was noted in several districts that
communal infrastructure such as communal crushes and dips are no longer viable or useful
because of changing land use patterns. Due to the emerging trends of private ownership of land,
communal facilities are not easily accessed especially if they are surrounded by private farms
and they lead to spread of diseases.
Poor performance of contractors Most contractors were noted to have low capacity and unable
to pre-finance the works as required in the agreements. This problem was exacerbated by the fact
that many of the contractors were constructing other facilities in other parts of the country that
overstretched their capacities. Examples of poor performers were B&T Ltd. working in Kyenjojo
district.
Recommendations
1) Performance bonds should be issued once in the lifetime of the project.
2) Need for building capacity of private contractors to submit realistic costing of proposed
infrastructures and BOQs.
3) MAAIF should improve timeliness in payment of interim certificates for completed
works. It was recommended by contractors that payment should be made at most 21 days
after the submission of the certificates.
4) The districts recommended that Government should extend the NLPIP project to provide
more interventions especially valley tanks, valley dams, livestock markets, slaughter
sheds and rangeland improvement.
5) Terminate all non-performing contracts and blacklist the contractors. Firms with proven
competence should be hired to complete the works.
6) Adequate information should be disseminated to the contractors regarding the various
taxes that have to be paid and all the conditionalities attached to them.
7) MAAIF should share the implementation manuals and BOQs with the relevant district
officials to ensure effective supervision of infrastructure projects.
8) Government should phase out construction of communal facilities and instead support
farmers to dig small ponds and dams on their farms. This could be through provision of
excavating equipment at regional level that could be used by farmers at a fee.

100
9) Need for districts, working closely with MAAIF to put in place operations and
maintenance plans for the various infrastructures to ensure sustainability.
3.1.5 Support for Tea Cocoa Seedlings Project
Background
Government commenced this project in 2001 under the strategic interventions initiative with the
purpose of revitalizing the cocoa industry through distribution of cocoa seedlings to farmers. The
Government contracts private nursery operators who produce quality cocoa seedlings that are
distributed free to farmers, after sensitization and mobilization with the help of district officials.
The private operators in turn are paid Shs 300/= per seedling in line with supply orders issued by
Government every season.
ATea Unit in MAAIF which was distributing tea seedlings was phased out and its activities
subsumed under the cocoa project in 2004. However, the Tea Unit had incurred a debt of 2.9bn
by 2003 and hence the activities of distributing seedlings were suspended at the time of merging
the projects. Up to date, the funds earmarked for the tea component under the Tea Cocoa Project
are paying off these debts. The Cocoa Component is the functional part of the project and is the
one that was monitored in this financial year, in the first and fourth quarter. The monitoring work
in the first quarter of FY 2009/10 focused on the investments made in FY 2008/09 while the
forth quarter monitoring focused on the investments made in FY 2009/10.
Progress update
During FY 2008/09 a total of Shs 888,893,000 was disbursed to the Support for Tea Cocoa
Seedlings project. Of this, Shs 619,000,000 was used to pay off arrears in the tea industry and the
balance Shs 269,000,000 was used to pay for cocoa seedlings, inspections and other activities
implemented by MAAIF in the cocoa industry. MAAIF reported that during FY 2008/09, the
ministry established 4 cocoa demonstration nurseries and 4 demonstration plots in Mukono,
Kibaale, Jinja and Mpigi and also issued out 300,000 cocoa seedlings to farmers from the private
nursery operators. The Ministry also reported having inspected the quality of cocoa beans for
export in warehouses in Bundibugyo and Kampala owned by Esco U Ltd, Olam U Ltd, Ugacof U
Ltd, Outspan U LTD and Multi-trade U Ltd18
.
During Q4 FY 2009/10, the BMAU verified this information in 519
out of the 10 implementing
districts and visited the cocoa warehouses in Bundibugyo. The summary findings were20
:
18
MAAIF, 2009b; MAAIF 2009.
19 Mukono, Bundibugyo, Luwero, Kibale and Mayuge districts.
20 Detailed findings in MFPED, 2009.

101
1) The project was found to be fully functional with private cocoa nurseries having
distributed cocoa to farmers during FY 2008/09 as per the Government orders. More
seedlings had been distributed (310.000 seedlings) by nursery operators in the five
districts that what was captured in MAAIF records (205,453 seedlings). Farmers
acknowledged having received seedlings for free except in Bundibugyo were the major
cocoa buyers Esco Uganda Ltd and Olam indicated that they had paid UShs 500 per
seedling in Busaru Nursery. The nursery operator denied the allegation. It was also noted
that the quality of cocoa seedlings issued by the nurseries was poor.
2) The nursery operators in all the sampled districts complained of the low price paid by
Government at UShs 300 per seedling yet the cost of inputs had risen dramatically. A
simple cost-benefit analysis using the data collected in that round showed that nursery
operators were still making a profit as long as Government did not make small supply
orders of less than 10,000 seedlings. Most nursery opertaors were producing in excess of
20,000 seedlings per season hence they made losses where Government ordered less than
10,000 seedlings.
3) Among the key challenges identified by the nursery operators and farmers were the
untimely and inconsistent supply orders from MAAIF resulting in under or over supply
of seedlings; lack of update knowledge about cocoa growing among the district extension
workers, rampant pests and diseases and lack of sufficient guidance to farmers from
MAAIF on cocoa husbandry and control of pests and diseases.
4) The direct disbursement of funds from the centre to nursery operators without any
information to the districts was making supervision of the programme difficult. Districts
are expected to validate the lists of farmers who have benefitted.
Financial Performance
The approved budget for FY 2009/10 for the Support for Tea Cocoa Seedlings Project was UShs
869,000,000. During the four quarters of FY 2009/10, a total of UShs 758,213,045 or 87% of the
approved budget was released to MAAIF for this project. However, by close of the financial
year, the Cocoa Coordination Unit had received UShs 587,789,726 or 77% of the released funds.
Of this amount, UShs 94,241,197 was for the Tea Unit activities. Information could not be
obtained to explain why MAAIF had not released 100% of the received funds as they were
available. The disbursement rate of funds from MAAIF to projects needs to improve so that
funds received are spent fully as planned. The Coordination Unit reported that all the funds
received had been spent 100% as shown in Table 3.1.8.
Table 3.1.8: Financial performance of Tea Cocoa Seedlings Project in FY 2009/10
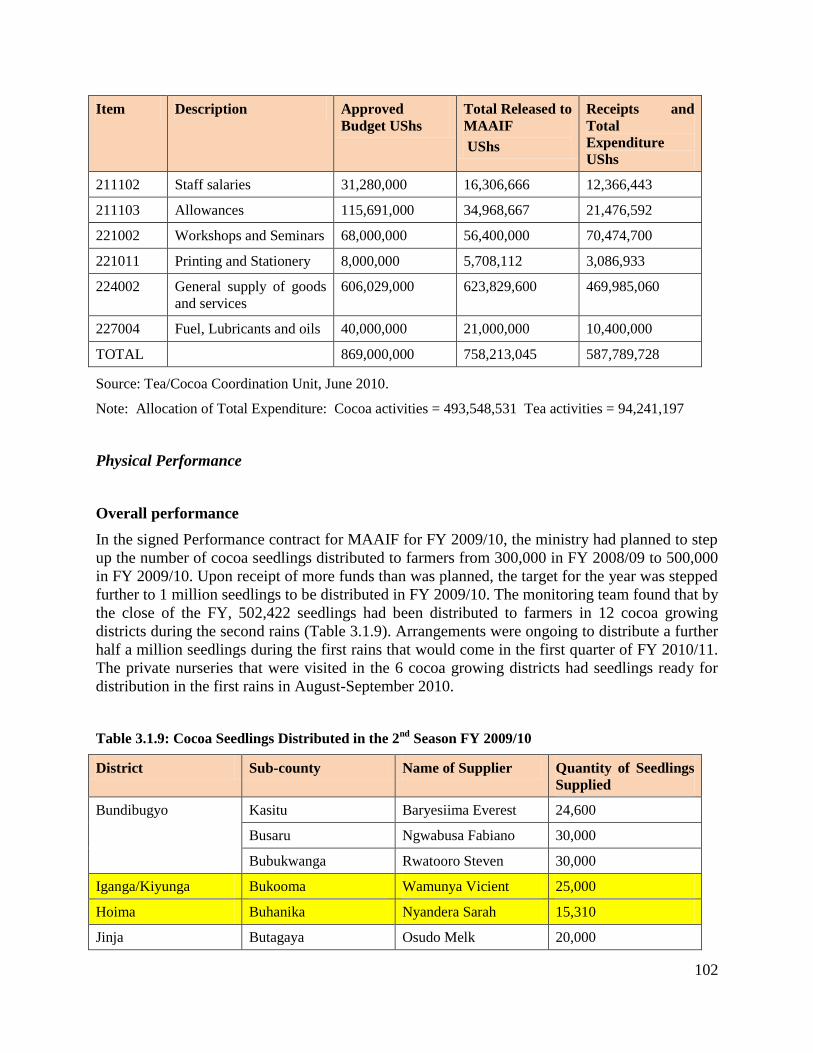
102
Item Description Approved
Budget UShs
Total Released to
MAAIF
UShs
Receipts and
Total
Expenditure
UShs
211102 Staff salaries 31,280,000 16,306,666 12,366,443
211103 Allowances 115,691,000 34,968,667 21,476,592
221002 Workshops and Seminars 68,000,000 56,400,000 70,474,700
221011 Printing and Stationery 8,000,000 5,708,112 3,086,933
224002 General supply of goods
and services
606,029,000 623,829,600 469,985,060
227004 Fuel, Lubricants and oils 40,000,000 21,000,000 10,400,000
TOTAL 869,000,000 758,213,045 587,789,728
Source: Tea/Cocoa Coordination Unit, June 2010.
Note: Allocation of Total Expenditure: Cocoa activities = 493,548,531 Tea activities = 94,241,197
Physical Performance
Overall performance
In the signed Performance contract for MAAIF for FY 2009/10, the ministry had planned to step
up the number of cocoa seedlings distributed to farmers from 300,000 in FY 2008/09 to 500,000
in FY 2009/10. Upon receipt of more funds than was planned, the target for the year was stepped
further to 1 million seedlings to be distributed in FY 2009/10. The monitoring team found that by
the close of the FY, 502,422 seedlings had been distributed to farmers in 12 cocoa growing
districts during the second rains (Table 3.1.9). Arrangements were ongoing to distribute a further
half a million seedlings during the first rains that would come in the first quarter of FY 2010/11.
The private nurseries that were visited in the 6 cocoa growing districts had seedlings ready for
distribution in the first rains in August-September 2010.
Table 3.1.9: Cocoa Seedlings Distributed in the 2nd
Season FY 2009/10
District Sub-county Name of Supplier Quantity of Seedlings
Supplied
Bundibugyo Kasitu Baryesiima Everest 24,600
Busaru Ngwabusa Fabiano 30,000
Bubukwanga Rwatooro Steven 30,000
Iganga/Kiyunga Bukooma Wamunya Vicient 25,000
Hoima Buhanika Nyandera Sarah 15,310
Jinja Butagaya Osudo Melk 20,000

103
Kamuli Nawanyago Innya Martin 20,000
Kibaale Kakindo Agro-care Services 20,420
Nalweyo Kiddawalime Bonifasi 20,000
Luwero Katikamu Kalibbala David 20,000
Masindi Bulima Isingoma Anthony 10,600
Mayuge Imanyiro Tibita Sam 35,000
Kityerera Mugogo Mike 30,000
Bayitambogwe Nakaziba Monica 10,040
Mpigi Mut I Lubega John 21,994
Mukono Namuganga Kasumba Andrew 20,100
Kasawo Lwanga Henry 20,050
Nkokonjeru Musisi Alex 20,800
Ntenjeru Musisi Alex 10,000
Wakiso Nsangi Kidde James 35,400
TOTAL 502,422
Source: Tea/Cocoa Coordination Unit, June 2010.
Note: In yellow colour are the nurseries that were sampled and visited in Q4 FY 2009/10.
Field findings
The monitoring team visited 6 out of the 12 cocoa growing districts that received supply orders
from Government to verify the level of supply of seedlings to farmers by the nursery operators.
The findings are presented below.
HOIMA DISTRICT
Performance
The nursery operator of Butema Cocoa Nursery located in Buhanika Sub County reported having
distributed 10,000 seedlings to farmers in the past year 2009 and an additional 500 in 2010
bringing the total to 10,500 seedlings. This figure was less that what was reported by MAAIF –
15,310 seedlings (Table 3.8). The monitoring team confirmed from the distribution list that
farmers had signed against receipt of 10,400 seedlings. At a cost of 300/= per seedling, the
farmer had anticipated being paid UShs 3million but actually received UShs 2.8 million with the
explanation that the balance of UShs 200,000 was deducted to pay taxes incurred. Evidence was
found in the field of several farmers who had received seedlings from Butema Cocoa Nursery
during FY 2009/10. The nursery had planted 5,000 seedlings that would be ready for distribution
in August 2010. However, the seedlings were seriously affected by drought; pests and diseases.
Challenges

104
The lack of a target from Government for the supply orders was cited as a major challenge to the
operator as there is over production of seedlings that are not bought leading to losses. Other
challenges faced by the operator as well as the farmers included:
1) Lack of transport to distribute the seedlings to the farmers.
2) Low supply orders by Government compared to the high demand by farmers for
seedlings.
3) Drought
4) Inadequate staff/extension assistants and equipment to man the cocoa sector. The regional
cocoa officer is in charge of Masindi, Hoima and Kibaale districts with no assistants or
vehicle for programme supervision.
5) High prevalence of pests and diseases. Farmers and the nursery operator expressed
unawareness of approaches to control the pests and diseases.
6) Farmers complained about the high cost of labour that was greatly reducing profits.
Recommendations
The farmers recommended that Government should increase the supply orders so that
more seedlings are distributed, make spray pumps accessible at subsidized prices and
provide a vehicle to the Regional Cocoa Officer to increase supervision of the cocoa
industry in Hoima district.
IGANGA/KIYUNGA DISTRICTS
Performance
The nursery operator of Bukooma Cocoa Nursery in Naigobya village, Bukooma Sub-county,
Kiyunga District (formerly part of Iganga district until 1st July 2010) reported having distributed
25,000 seedlings to farmers in FY 2009/10. This figure was in agreement with the MAAIF
reported figures. He confirmed having been paid UShs 7,050,000 for the seedlings. He had
expected UShs 7,500,000 for the seedlings at UShs 300 each but was informed that shs 450,000
was deducted as taxes. The monitoring team found 20,000 seedlings planted in the nursery for
the next rains.
Challenges
1) Increasing unit costs of inputs such as polythenes, labour, and water
2) Remoteness of areas where the seedlings are distributed makes transportation costs very
high.
3) Getting signatures for all the beneficiaries for accountability purpose is difficult as
seedlings are sent to LCs for further distribution to individual farmers. Sometimes 2-3
farmers are requested by LC officials to sign for the rest of the farmers.
4) Lack of extension services for cocoa farmers. The nursery operators do not have the
resources or skills to train the farmers that take the seedlings.
5) Labourers at the nursery complained of late payment of their wages as the main challenge
for them.
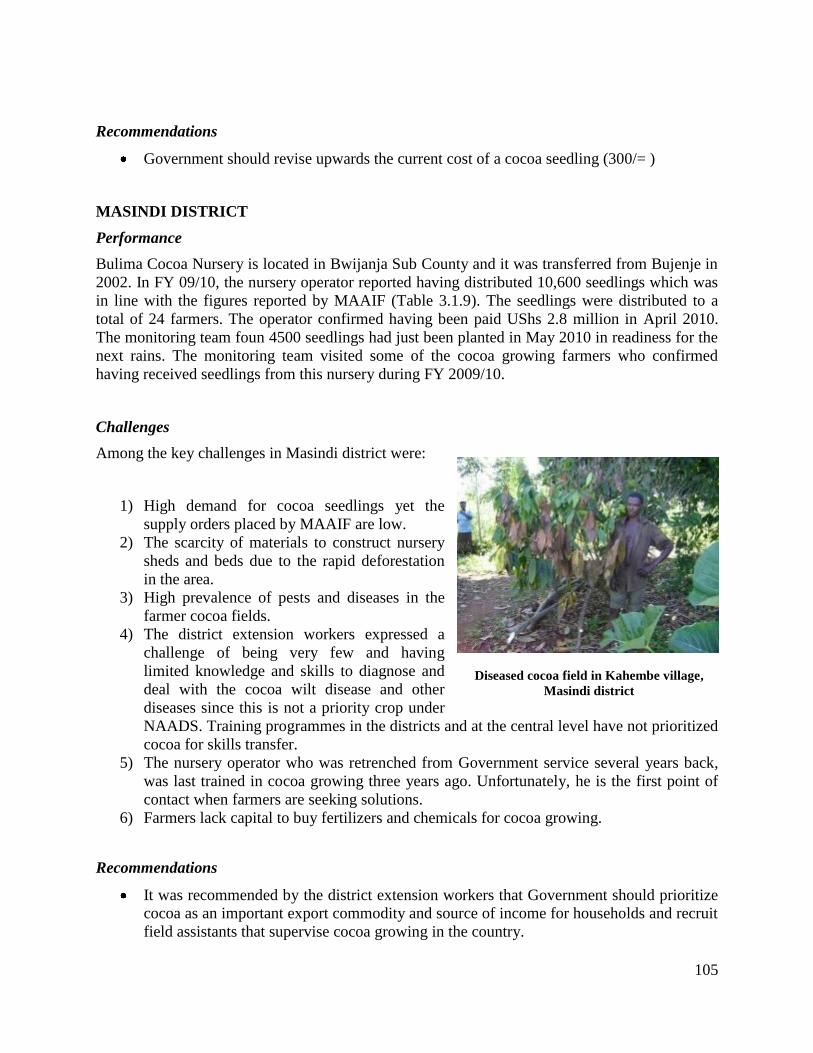
105
Recommendations
Government should revise upwards the current cost of a cocoa seedling (300/= )
MASINDI DISTRICT
Performance
Bulima Cocoa Nursery is located in Bwijanja Sub County and it was transferred from Bujenje in
2002. In FY 09/10, the nursery operator reported having distributed 10,600 seedlings which was
in line with the figures reported by MAAIF (Table 3.1.9). The seedlings were distributed to a
total of 24 farmers. The operator confirmed having been paid UShs 2.8 million in April 2010.
The monitoring team foun 4500 seedlings had just been planted in May 2010 in readiness for the
next rains. The monitoring team visited some of the cocoa growing farmers who confirmed
having received seedlings from this nursery during FY 2009/10.
Challenges
Among the key challenges in Masindi district were:
1) High demand for cocoa seedlings yet the
supply orders placed by MAAIF are low.
2) The scarcity of materials to construct nursery
sheds and beds due to the rapid deforestation
in the area.
3) High prevalence of pests and diseases in the
farmer cocoa fields.
4) The district extension workers expressed a
challenge of being very few and having
limited knowledge and skills to diagnose and
deal with the cocoa wilt disease and other
diseases since this is not a priority crop under
NAADS. Training programmes in the districts and at the central level have not prioritized
cocoa for skills transfer.
5) The nursery operator who was retrenched from Government service several years back,
was last trained in cocoa growing three years ago. Unfortunately, he is the first point of
contact when farmers are seeking solutions.
6) Farmers lack capital to buy fertilizers and chemicals for cocoa growing.
Recommendations
It was recommended by the district extension workers that Government should prioritize
cocoa as an important export commodity and source of income for households and recruit
field assistants that supervise cocoa growing in the country.
Diseased cocoa field in Kahembe village,
Masindi district

106
Cocoa nursery operators should be trained in modern practices of cocoa growing.
MAYUGE DISTRICT
Performance
The BMAU monitoring team visited two of the three cocoa nurseries in Mayuge district:
1) Ikulwe Cocoa Nursery in Manyiro Sub County: the nursery operator reported having
distributed 45,000 seedlings to the farmers in the 2nd
rains of FY 2009/10. The seedlings
that were distributed were more than what the MAAIF records indicated for this nursery
(35,000 seedlings). Payment had been received for 15,000 seedlings leaving 30,000
seedlings to be paid. The nursery was in a very good condition with 30,000 seedlings
ready for distribution in the coming season.
2) Bugingo Cocoa Nursery in Mayuge Town Council: the operator reported having
distributed 40,000 seedlings in the 2nd
rains of FY 2009/10, although the MAAIF report
had recorded only 10,040 seedlings as having been distributed by the nursery. The
nursery operator had not been paid yet for the seedlings delivered to the farmers. A total
of 18,000 seedlings were in the nursery awaiting distribution.
Best practice in the cocoa industry
The monitoring team found a best practice in efficient management of cocoa nurseries in
Mayuge district by a private company ESCO Mayuge. The company, among many other
businesses, deals in export of cocoa as well as planting cocoa nurseries. In order to further
increase the production of cocoa in Mayuge district for export, ESCO is implementing a
community based approach where the farmers are directly involved at all stages in the process of
cocoa production. Farmers through their LCs are mobilized to donate and open up land and the
company provides seeds at a subsidized rate of Shs.50/=. This approach has helped in creating
awareness about cocoa growing and its intended benefits resulting in more farmers embracing
the programme. The farmers currently earn Shs. 4400/= per kilogram of cocoa sold to ESCO.
In 2009 the company, through this approach planted a nursery bed in Malongo Sub County. Two
additional nurseries were established, one in Kityerera Sub County and another in Busakira Sub
County near the Government funded nursery. The company distributed a total of 55,434
seedlings to 136 farmers in April 2010. The company has planned to raise 180,000 seedlings in
the October 2010 season in Mayuge district. The number of seedlings to be produced in 3
nurseries in one district is almost a half of what is distributed by all the Government funded
nurseries in 12 districts showing a high level of efficiency in the private sector. ESCO has been
able to cut down on the costs of operation due to the contributions made by the community in
terms of land, construction of sheds and labour. At the time of the monitoring visit in June 2010,
a group of men and women (including the LC Chairman) was found clearing land that they had
offered for the ESCO Cocoa nursery.

107
The community members in a Focus Group Discussion (FGD) had this to say “We are
contributing labour and other inputs to ESCO nurseries because we are assured of getting free
good quality cocoa seedlings at the start of the rains. We have had problems with the
Government nurseries that provide stunted seedlings in drought seasons and give us very small
quantities. Government should support ESCO with funds to buy us farming equipment so that we
can increase production of cocoa seedlings”.
ESCO has recruited its own extension workers to supervise the farmers when they are planting
the crop and whenever they have problems of pests and diseases. The main challenges reported
by ESCO were
Problem of Government promoting low value crops like maize, beans and bananas that
occupy the land that could have been planted with high value and high income crops like
cocoa.
High cost of potting materials
ESCO recommended that Government should establish public private partnerships (PPP) so that
they can triple the production of cocoa seedlings. Among the suggested areas of cooperation
were:
1) Government supporting company to get black soils for potting for free. Currently, ESCO
buys the soils from National Forestry Authority.
2) Providing subsidies on the potting materials. In a season, the company uses more than 2
tonnes of polythene for potting,
3) Providing chain links for fencing the nurseries.
Conclusion on the Cocoa programme
The Support for Tea Cocoa Seedlings Programme is performing fairly well in terms of
distribution of cocoa seedlings according to plan. More than 500,000 seedlings have been
distributed to farmers during FY 2009/10. However, the target of 1 million seedlings was not met
as funds disbursement from MAAIF has been rather slow. By the close of FY 2009/2010, only
77% of the funds that had been released to MAAIF had been disbursed to the implementing unit.
It is recommended that Government considers expanding the PPPs in the cocoa industry by
involving more efficient firms such as ESCO and providing the appropriate incentives for scaling
up production.
MPIGI DISTRICT
Performance
Mpigi Cocoa Nursery is located in Mayembe Gambogo village Mpigi Town Council and serves
the Sub-counties of Mpigi Town Council and Kamengo Sub County. The nursery operator

108
reported that 40,000 seedlings were raised in FY 2009/10 out of which 21,944 seedlings were
distributed to 50 farmers in November 2009. The field report was consistent with the MAAIF
reported figures (Table 3.8). The seedlings were distributed to nearby farmers due to
transportation problems and also to avoid the cumbersome process of getting the LCIII Chairman
to verify distribution for widely scattered farmers. In the nursery at the time of the monitoring
visit in June 2010 were 10,000 seedlings ready for distribution in the following rains in August
2010.
The monitoring team interacted with a middleman who had come to buy cocoa at farm level and
he shared his experiences. Due to the small quantities of cocoa produced by the individual
farmers, it takes the middle man about 2 days to collect 2-3 bags of dry cocoa beans. He travels
not less than 30km per day to collect this small quantity, buying at UShs 3000- 3500/= per kg.
His market is the Olam cocoa factory in Nalukolongo and Esco branch in Nakawa.
Challenges
The middleman noted the following challenges:
1) The very high cost of doing business and small profits in cocoa buying due to the
remoteness of farms, low farm production and small volumes collected.
2) Poor quality of cocoa beans due to non-enforcement of quality assurance measures in the
cocoa industry. The post handling methods at farm level are very poor and the beans are
small due to poor agronomy yet the buyers prefer large, clean and well processed beans.
Farmers dry the beans on the ground and process them for less than the recommended 6
days.
3) Lack of capital to lend farmers so that they can expand acreage and volumes produced.
The middleman also lacked capital to expand purchases and pay farmers promptly. The
middleman had a low opinion regarding SACCOs viewing them as money/asset grabbing
institutions.
The farmers and nursery operator in Mpigi district highlighted the following as the key
challenges faced in cocoa growing:
Left: Seedlings ready in Mpigi Cocoa Nursery, Centre: Cocoa Buyer weighing cocoa to be bought at one
of the farms in Mpigi Right: Diseased pods on Mr. Edward Musisi’s farm

109
1) High prevalence of pests and diseases especially the wilt disease.
2) Costly materials for constructing cocoa nursery sheds and beds.
3) Lack of capital for major costly activities such as bush clearing.
4) Seedlings are often distributed when the fields are not ready and some farmers do not
water them consequently they dry.
5) Prices for cocoa beans are still low as there are very few buyers.
6) Inabilities by nursery operators to make seedling production a business to satisfy demand
as seedlings are currently given free. Nursery operators depend on Government to
purchase the seedlings. Even if they could expand production, they cannot do so as
farmers would not accept to buy the seedlings yet the operators would have made
investments.
7) Cocoa growing is not mainstreamed in district work plans and budgets which hinders
effective implementation as most district officials and farmers view it as an ad hoc
intervention like vanilla, moringa and Aloe Vera.
8) Low national level publicity on cocoa and mobilization of farmers by the leaders to grow
the crop.
Recommendations
Government to provide subsidized crop finance to farmers for major activities such as
bush clearing and traders for produce buying.
National level publicity/campaign to promote cocoa growing in the country. This would
also involve mainstreaming cocoa growing and trade activities in the district, sub-county
and NAADS Workplans.
WAKISO DISTRICT
Performance
Buwali Cocoa Nursery is located in Nsangi Parish, Nsangi Sub County and it distributes
seedlings to the Sub Counties of Nsangi, Sisa and Kasangi. The nursery operator confirmed
delivery of 35,400 seedlings to farmers during FY 2009/10 which was in agreement with the
MAAIF records. Due to capacity constraints at the nursery, the delivery was done in two batches,
in the second rains during November 2009 and in May 2010. Payments had not been effected but
the Nursery operator was confident“Government is
trustworthy; I will be paid in time”. The monitoring
team found the nursery with 50,000 seedlings that were
ready for distribution in the second rains of August and
September.
Buwali Cocoa Nursery

110
The BMAU team was shown by a number of farmers the young cocoa trees that had been
planted in FY 2009/10 obtained from Buwali Cocoa Nursery. One of the cocoa/coffee farmers in
Wakiso district who had received 700 seedlings in November 2009 arged
Government to promote cocoa in the country to gradually replace coffee as the major income
earner at household level since the former is more profitable with a quick market. He provided
evidence of what he had earned from both commodities in the previous season to support this
recommendation (Box 3.4):
Box 3.4: Case study of comparative returns to cocoa and coffee growing on a small holder farm in
Mpigi district
“Cocoa: I have 3 acres of mature cocoa and another 3 acres of mature coffee. Harvesting in cocoa is done
almost in every month once the crop is mature. In February, I sold the crop that I had harvested during
December 2009 to January 2010 from my cocoa field. I sold 290 kg of dry cocoa beans at 4,500/= each
kg earning me 1,305,000/. During the four month period February to May 2010, I harvested 210 kg of dry
beans from which I realised UShs 945,000. So since December 2009 to May 2010, I have earned a total of
UShs 2,250,000 from the 3 acres of cocoa.
Coffee: Coffee mainly yields around December. So during December 2009, I harvested 560kg of dry
coffee beans from the 3 acres of coffee. I sold each Kg at 1,000/= giving me UShs 560,000. My next
harvest was in the four months period February to May 2010 where I harvested 140 kg of dry coffee
beans. I sold each Kg of dried coffee beans at 1,000/= earning me UShs 140,000. So since December
2009 to May 2010, I have earned a total of UShs 700,000.
The returns to cocoa are three times those for coffee for the same acreage and period of harvesting. Cocoa
has been the main source of funds for paying school fees for my children and financing my home needs.
This is why I am gradually replacing coffee with cocoa as we no longer have land to open up fresh
gardens. The main challenge I face in cocoa growing is the high prevalence of pests and diseases. Market
is not a problem and the price is very competitive”.
Source: Key informant interview with Mr. George Kiryowa, Busembe Zone, Maya Parish, Nsangi
Sub-county, Wakiso district.
This case study suggests the need for Government to carefully study the viability of the cocoa
commodity as a potential export crop and income earner at the household level.
On whether any persons with disabilities are involved in cocoa growing in Wakiso district, the
nursery operator responded thus: “In the last nine years I have been in operation, I have never
distributed cocoa seedlings to a disabled person. None has approached us to get seedlings. But
how would such a person manage the crop? Disabled persons often do not have land where they
can grow cocoa except when they have inherited it from their parents”.
Challenges

111
1) Cocoa production was diminishing due to rapid urbanization as all farm lands are being
converted into townships.
2) Supply orders from Government are not synchronized with the planting seasons causing
disruptions in the distribution of the seedlings and high mortality. This is a result of
distributing seedlings during dry seasons.
3) Expensive input materials and costly transportation of seedlings to farmers.
4) Low awareness among farmers about the viability of the cocoa crop
5) Youth do not appreciate farming, especially perennial crops that take long to generate
income; cocoa grown mostly by people who are above 40 years of age.
6) High prevalence of cocoa wilt disease
7) Land disputes hindering long-term investments such as cocoa growing
8) Lack of extension workers to train farmers on cocoa growing. Nursery operators find it
difficult to distribute seedlings to farmers who have never been trained.
Recommendations
Timely placement of supply orders by Government to enable the nursery operators prepare
adequate seedlings.
Special programmes targeting youth to interest them in farming high value crops such as
cocoa for income generation.
Overall Recommendations
1) In the short run, Government should continue providing cocoa seedlings free. But in the
medium to long-term, the Government should focus on developing public private
partnerships where the seedlings are produced by private companies and distributed to
farmers at a cost as the case is in the coffee sector. Government should instead support
private companies through various incentives to produce the seedlings on a large scale.
2) Promote contract farming in the cocoa sector where buyers lend crop finance to farmers
who then produce in bulk and sell to the financiers. The buyers would provide private
extension service and promote quality assurance to meet the market standards.
3) The extension workers should, with support from the NAADS Secretariat, encourage
farmers to prioritize cocoa among their selected commodities so that it can receive
adequate extension support.
4) Wide scale publicity of cocoa growing and mobilizing farmers to grow the crop.
3.1.6 Summary findings of other projects monitored in FY 2009/10

112
Six other projects where monitored by BMAU during the first three quarters of FY 2009/10
(refer to Table 3.1). The summary findings on these projects are presented below. Details can be
found in the respective BMAU quarterly reports covering the period July 2009 – March 2010.
a) Creation of Sustainable Tsetse and Trypanosomiasis Free Areas in East and West
Africa
Background
Uganda is one of the six countries implementing the regional Creation of Tsetse &
Trypanosomiasis Free Areas (STATFA) project, other countries being Kenya, Ethiopia, Burkina
Faso, Mali and Ghana. At the African Continent level, the project is coordinated by the Pan
African Tsetse and Trypanosomiasis Eradication Campaign (PATTEC). Hence, the project is
also referred to as PATTEC-Uganda. The objective of the project is to eradicate Tsetse and
Trypanosomiasis from Uganda. The project is implemented by MAAIF with loan amount UA
6,550,000 and Grant Amount of UA 240,000 by ADF/GoU over the period 2006-2011.
Financial performance
By March 2010, only 13.57% of the ADF loan, 81% of the ADF grant and 6.28% of the GoU
contribution had been disbursed. Overall, only 15% of the total project funds had been disbursed
over the four year period. In terms of utilization, slightly over a half (54%) of the disbursed
funds had been utilized by the project over the four year period. This suggests a very slow rate of
funds absorption and project implementation. These are worrying trends given that the project is
supposed to be concluded in 2011 with the date of the last disbursement agreed as 31st December
2011. Among the key challenges that explain these financial trends:
1) Government took long to fulfill some of the loan conditions such as hiring the required
staff and putting in place a management committee.
2) Bureaucracies in procurements – using two procurement systems of ADB and GoU –
have led to excessive delays.
3) Low counterpart funding.
Physical performance
Among the key activities planned under this project for FY 2009/10 as indicated in the signed
MAAIF Performance Contract A were:
The reduction of tsetse, nagana and sleeping sickness incidence and prevalence by 45%
in Rakai, Lyantonde, Masaka, Sembabule, Mpigi, Wakiso, Kampala and Mukono.
Deployment of traps and screen and treat infected animals in Kalangala
Complete refurbishment and expansion of insectary in Tororo (findings on this indicator
are presented separately in section b).

113
Rearing flies at NaLIRRI
Creating awareness and advocacy on project activities.
Monitoring work indicated that the project had not reached any of the planned districts, apart
from Kalangala despite having been in existence since April 2006. Therefore the expected output
of reduction tsetse flies, nagana and sleeping sickness is yet to be achieved or even tackled. A
total of 2,840 traps were received and deployed in Kalangala district.
b) Refurbishment of Insectary at NALIRRI
Background
The MAAIF Insectary21
, hosted by National Livestock Research Institute (NALIRRI) in Tororo,
is a regional facility intended to breed tsetse flies that can guarantee total eradication of tsetse by
releasing males after sterilization that ensure that no- further tsetse fly offspring are produced.
The insectary is supposed to produce seed colony - 300,000 breeding females. The project is
directly implemented and supervised by MAAIF with support from ADB. NALIRRI offered a
building to be used as an insectary that required expansion and refurbishment. The contract for
refurbishment of the insectary was awarded by MAAIF to a private company M/s BUILTRUST
Construction company in July 2006. It was planned that the work would be done and completed
by December 2006.
Financial performance
The total contract sum signed between MAAIF and M/s BUILTRUST Construction company for
the refurbishment and extension works was UShs 618,336,59122
. The contractor was paid UShs
410,701,501/= or 66% of the contract sum despite having completed less than 50% of the works.
Physical performance
The construction work was never completed and it was reported by MAAIF that M/s
BUILTRUST Construction Company disappeared and hence could not be taken to Courts of
Law. The Solicitor General advised that the remaining work should be completed by the
Ministry of Works and Transport (MOWT). The MOWT has submitted fresh Bills of Quantities
and in FY 2010/11 funds have been budgeted by MAAIF to complete the insectary. Physical
monitoring by BMAU during Q3 FY 2009/10 found that the construction work had stalled
completely and what had been done was sub-standard.
c) Farm Income Enhancement and Forest Conservation Project
21
Building that housing equipment for breeding flies.
22 MAAIF, 2006.
114
Background
The Farm Income Enhancement and Forest Conservation Project (FIEFOC), that commenced in
2005 and is scheduled to end in 201023
, aims at improving incomes, rural livelihoods and food
security through sustainable natural resources management and agricultural enterprise
development. The project has two components: i) Agricultural Enterprise Development
Component coordinated by the Ministry of Agriculture, Animal Industry and Fisheries (MAAIF)
ii) Forestry Support Component coordinated by the Ministry of Water and Environment (MWE).
The total project cost for the five-year period is estimated at UA51.15m funded by ADB/ADF
and GoU24
. Monitoring work during Q2 of FY 2009/10 focused on the Agricultural Enterprise
Development Component.
Financial performance
MAAIF received the following disbursements from ADF/ADB for the FIEFOC Agricultural
Enterprise Development Component since inception in 2005:
US$263,000 disbursed on 25th
July 2006
US$1,038,000 disbursed on 2nd
July 2007
US$3,860,000 disbursed on 27th
October 2008
The development funds for this component in FY 2008/09 amounted to UShs 7.374 billion in FY
2008/09.
Physical performance
Three of the four sub-components of the Agricultural Enterprise Development Component were
suspended at mid-term review in April 2009 after large sums of money had been injected as start
up capital. This resulted in no value for money for the three sub-components (soil fertility,
agricultural marketing and small scale irrigation). The fourth sub-component on apiculture was
under implementation at the time of the monitoring visit.
Overall, the apiculture sub-component of the FIEFOC project is on course and has delivered the
intended outputs at district level. It was not possible to access performance of the centrally
implemented components of this project that are implemented by MAAIF as financial and
physical performance data was not availed by the ministry. The project however is likely to have
limited outreach due to the design that provides demonstration equipment and training to only
two groups per district.
23
The mid-term review in 2009 recommended an extension of 2 years.
24 GoU and ADF, 2004.

115
Implementation related challenges included: irregular funds flow, difficulties in changing bank
signatories, limited staff in production department, poor choice of participating areas; project
design related constraints related to limited potential impact of project as all activities revolve
around workshops and training and suspension of project sub-components. It was recommended
that the project should be redesigned to cater for a larger number of beneficiary groups per sub-
county for added impact.
d) Farming in Tsetse Controlled Areas
Background
The Farming in Tsetse Controlled Areas (FITCA) is a regional project implemented by MAAIF,
with support from the European Development Fund (EDF), in 14 districts in South Eastern
Uganda. The project objective is to increase farmers’ income through higher productivity in
order to enable them sustain tsetse and trypanosomiasis control (T&TC). The main outputs
include dissemination and adoption of appropriate agricultural practices (zero grazing, animal
traction and pasture development) and strengthening capacity for sustainable control of T&T.
The project has been implemented over the 2001-2010 period. This project was monitored in Q3
FY 2009/10.
Financial performance
Between FY 2005/06 and 2008, UShs 5,955,268,365 was released to the FITCA project.
Releases to the project for the period January to December 2009 was UShs 1,117,053,110.
Physical performance
All the implementing districts that were visited acknowledged having received the inputs as
planned by MAAIF, most of these having been received in the first phase of the project and a
few in FY 2009/10. The monitoring work indicated varying levels of physical performance of the
project components (Entomology, Veterinary, Land Use, and Medical), some performing better
than others in terms of output delivery. The most noticeable outputs related to the Land Use
Component that encompassed dissemination of appropriate agricultural practices (zero grazing
units, animal traction and pasture development). Farmers in all the sampled districts
acknowledged having been trained prior to being provided with the inputs and technologies.
Outputs under the Entomology and Veterinary components were almost non-existent as
interventions were gradually being phased out. The key project objective of ensuring
sustainability of the tsetse and trypanosomiasis interventions by farmers beyond the FITCA
project is unlikely to be met as some facilities that were installed under these components have
since been abandoned when inputs were no longer being provided by Government. In the early
phases of the project (2004-2008), the key objective of reducing the incidence of tsetse flies was
achieved. However, since then, the tsetse fly incidence has increased not only in the intervention
areas, but also in neighbouring areas and districts as the project gradually phases out. The

116
objective of sustaining tsetse fly interventions through farmer managed approach and eradicating
tsetse fly has not been achieved.
e) National Agricultural Advisory Services
The strategic objectives of NAADS are to increase the effectiveness and efficiency of
agricultural advisory/extension delivery to farmers for enhanced agricultural productivity, food
security and commercialization. The BMAU was requested, in Q1 of FY 2009/10, to investigate
specific complaints by beneficiaries in Kiboga district on misappropriation of funds/technologies
by district officials as shown in Table 3.1.10.
Table 3.1.10: Concerns raised by beneficiaries on NAADS in Kiboga District
Sub-county Concern
Kyankwanzi sub-county Concerns were raised that the LCIII Chairman and the Chairman
Farmer Fora had changed/ignored NAADS guidelines and
instead supplied different enterprises. Apiary was supplied
instead of diary cows.
Overpriced technologies – a cow costing Shs 1.8m.
Mulagi sub-county
Fake/sub-standard spray pumps had been distributed to farmers
Decampaigning of the NAADS programme by sub-county
officials
Bukomero sub-county There was undersupply of some technologies
Source: Kiboga district beneficiaries
Performance
The monitoring team found that farmers had accessed several technologies from the NAADS
programme. However, because the programme was in its infancy in Kiboga district, it was facing
challenges including poor alignment of procurement processes with PPDA guidelines, low
supply of hybrid seeds and negative publicity of the programme affecting implementation.
On the above concerns, the monitoring team found that in Kyankwanzi sub-county, the NAADS
guidelines had not been followed but for justifiable reasons. There was no evidence to support
the allegations in Mulagi sub-county. The reported undersupply of technologies was found to be
true but for justifiable reasons. The frequent change in the NAADS guidelines was a principle
cause of the problems. Insufficient funds for technology development could not allow for
technology supplies to cover all the farmer groups.

117
f) Performance Contract Form B: Implementation by District Production Sector
Background
In FY 2009/10, Government introduced the Performance Contract as a measure to link the output
performance to the expenditure in various Ministries, Agencies and Local Governments. Central
and Local Government Accounting Officers sign Performance Contract Form A and B
respectively with MFPED Permanent Secretary/Secretary to the Treasury. The performance
contracts clearly articulate the activities, inputs and outputs under each Vote for the resources
appropriated in the financial year. During Q2 of FY 2009/10, the BMAU sampled 4 districts –
Tororo, Mubende, Kayunga and Mityana - to assess progress in implementation of the
Performance Contract Form B and the challenges that were being faced in using this tool.
Financial performance
During Q2, the District Agricultural Extension Services Grant was scrapped and resources re-
allocated to other activities. The PMA Grant for districts was restructured such that 65% was for
development expenditure and 35% for recurrent expenditure. These changes greatly affected
programme implementation in the sampled districts. The districts had more funds that had been
planned for except that they were earmarked for the NAADS programme. More than half of the
other activities were not funded, due to the suspension of the 2 grants.
Physical performance
The four sampled districts had adapted the Performance Contract Form B. All the districts were
using other detailed workplans for implementation rather than the performance contracts. Other
than NAADS, all the other activities in the production sector were not implemented in the first
and second quarter of FY 2009/10 due to lack of funding. The scrapping of the agricultural
extension grants had a major negative impact in terms of realization of the national priorities in
the sector. This undermines the entrenchment of performance contracts when central government
breaches some parts of the contract – not providing funds as agreed. Other challenges included:
i) Delayed remittance of funds from the district accounts to the user departments
ii) Understaffing in District Accounts Department to manage the ever expanding NAADS
programme;
iii) Releases for centrally managed projects often do not come with guidelines for
expenditure which makes implementation difficult.
iv) Districts expressed concern regarding the inequitable distribution of MAAIF donor
financed projects regionally.
118
3.2 EDUCATION
3.2.1 Introduction:
The sector objectives which guide medium term outputs and resource allocations are: Increasing
and improving equitable access to quality education at all levels; improving the quality and
relevance of education at all levels; and improving effectiveness and efficiency in delivery of the
education services.
During the period January – March 2010, MoES implemented a number of development projects
under the approved work-plan/performance contract. A progress report on the status of these
projects was submitted to MFPED in April 2010. Based on this progress report, a team of
officers from the Budget Monitoring and Accountability Unit (BMAU) visited the reported
activities in order to verify the reported status and to establish the achievement of the second
quarter planned outputs targets.
Scope:
The monitoring team sampled activities reported in the January – March 2009/10 Progress
Report and visited development projects in 26 districts.25
These included:- Utilization of the Euro
23m under the Royal Netherlands Embassy support FY 2008/09, developmental projects
reported under Emergency Construction and Rehabilitation of Primary Schools, Development of
Secondary Education, Development of BTVET and Development of TVET P7 Graduate and
Development of PTCs and NTCs, and constructions under the Presidential Pledges for FY
2009/10 in several districts.
This report therefore gives the status and progress of implementation as at the time of the
monitoring visit during the months of May and June 2010.
Methodology:
The team undertook a desk review of a number of documents in preparation for the fieldwork
and during the process of compiling this report. From this, a check list of issues and activities for
the monitoring exercise was developed. Focus Group Discussions (FGD) and Key Informant
Interviews were held with various Government officials at central and district levels regarding
the physical status of reported activities in the Progress Report. Observations of events,
processes and activities regarding the reported outputs were made. In some cases call-backs were
done to triangulate information. The team also took photographs to show the status of the
monitored projects as at the time of the monitoring visits.
Challenges:
25
Kabale, Kanungu, Rukungiri, Ntungamo, Mbarara, Isingiro, Kiruhura, Kasese, Kabarole, Kamwenge, Mubende,
Mityana,Pallisa, Soroti, Bukedea, Mbale, Manafwa, Wakiso, Gulu, Apac, Luwero, Nakaseke, Mpigi, Busia, Bugiri,
and Kaliro
119
A number of beneficiaries had little information on scope of civil works, costs, contract periods
particularly on projects contracted and implemented by the centre. It was also found that some
heads of Institutions /head teachers do not share financial information with their staff/deputies.
This posed challenges in getting information from head-teachers who were not at schools at the
time of the monitoring. However, the team interacted with officers handling projects at the
centre and also made telephone contacts with the head teachers.
3.2.2. Utilization of the Euro 23m under the Royal Netherlands Embassy support FY
2008/09
Introduction:
Government of Uganda received a total of Euro 23m from the Royal Netherlands Government as
an off-budget support to MoES. The funds were for improvement of quality of primary
education in 12 districts in the Lango and Acholi sub regions26
under the Peace Recovery and
Development Programme (PRDP) and the 12 districts that fall under the Quality Enhancement
Initiative (QEI).27
The agreements for these funds were signed by the Netherlands Minister for
Development Cooperation and Minister of Finance, Planning and Economic Development of the
Republic of Uganda on 25th
September 2008 and 4th
December 2008 respectively. Thereafter the
funds were released in two instalments of Euro 17m and Euro 6m during the FY 2008/09. Under
the same arrangement Euro 0.5m was to be released during the FY 2009/10.
During May 2010, officers from BMAU conducted a monitoring exercise to track the progress of
implementation of activities and to verify the reported outputs. Fourteen districts were sampled
for the monitoring exercise (i.e. five districts from the Lango and Acholi sub-region28
and ten
from the QEI districts29
).
Methodology
The team reviewed the accountability report submitted by MoES. Key Informant interviews were
held with District Education Officers, District Inspectors of Schools, Inspectors of Schools and
selected head teachers in some schools that received the reported outputs in the sampled districts.
For districts in the Acholi and Lango regions, the team interacted with some suppliers. The team
also interacted with officers from National Curriculum Development Centre (NCDC).
Photographs were also taken as evidence of outputs found on the ground.
26
i.e. Adjumani, Amolatar, Amuru, Apac, Dokolo, Gulu, Kitgum, Lira (including Lira Municipality), Oyam, Pader
and Gulu (including Gulu Municipality)
27 Arua, Amuru, Bududa, Bukedea, Buliisa, Kaabong, Kyenjojo, Lyantonde, Mubende, Nakapiripirit, Nebbi and
Oyam.
28 Lira, Apac, Oyam, Gulu, Amuru including the two Municipalities of Lira and Gulu,
29 Arua, Amuru, Nakapiripirit, Bukedea, Bududa, Mubende, Lyantonde, Kyenjojo, Nebbi and Oyam

120
Findings:
a) Supply of P.4-P.7 textbooks in primary schools in the Lango and Acholi sub-regions
The Performance report on the utilization of the Euro 23m indicated that all Government aided
primary schools in the Lango and Acholi sub regions were supplied with P.4 –P.7 text books by
10 publishers for all subjects under various titles.30
The report further noted that Mathematics
and English were supplied at a ratio of 1:1 and other subjects in the ratio of 1:3.
Findings indicated that the bigger majority of Government Aided Primary schools in the Lango
and Acholi sub regions received the reported text books. The supply of these text books by
different publishers in various districts was reported to have taken place between October 2009
and January 2010.
Officials in the districts of Lango and Acholi sub regions visited reported that there were a few
schools that did not receive the reported text books from publishers. In Lira district five primary
schools did not receive the reported primary text books. These include Boke P/S, Teongora P/S,
Akwanilum P/S and Ongura P/S. In Apac District 2 schools missed, that is Apac P/S and
Ololango P/S. Twelve community schools that have UPE pupils in Apac also missed out on
these text books. The details of schools that did not receive the text books are summarized in
table 3.2.1.
Table 3.2.1: Distribution of textbooks to schools in lango and Acholu subregions.
District Number of
Schools that
received
Number of Schools that did not receive
Lira 207 5 schools
Apac 178 2 Govt Aided and 12 Community schools and one private
school all having UPE pupils did not receive text books
Oyam 102 1 (Alworopii P/S in Minakulu S/C)
Gulu 7 schools; (Karo abili P/S, Abwoc Koran P/S, Pageya omel
Apme P/S, Lukome P/S etc)
Source: District Education offices.
From the above, it is clear that overall many primary schools in the Lango and Acholi sub
regions that did not receive the reported text books of P4- P7. In monetary terms this translates
into a lot of money lost by Government.
30
18 titles by Longhorn, 8 titles by Fountain, 30 titles by Macmillan, 18 titles by Joibaso, 6 titles by MK General
School suppliers Ltd, 8 titles by MK Publishers Ltd, one title by Gustro Ltd, 7 titles by Mukono Bookshop, 4 titles
by Net Media and 20 titles Longman.

121
In a number of instances schools received less text books than the numbers indicated in the
delivery notes. Many schools in Apac and Lira for instance registered complaints to the DEOs
that many boxes contained less text books than what was indicated in the delivery notes. In Lira
District for instance Head-teachers of Bardago P/S and Alangi P/S expressed this complaint.
All District authorities reported that they did not know how many books each publisher was
supposed to supply under each of the titles to the various schools. This information was not
shared with them by MoES prior to the beginning of the exercise. This made monitoring the
numbers of books delivered by each of the publisher under the different titles to schools under
their jurisdiction rather difficult. District authorities depended on lists that the publishers availed
them. This concern was noted in the districts of Lira, Apac, Oyam and Gulu.
Private Schools that received text books:
It was reported that there were a few private schools that received text books. Bright Valley
Primary School in Gulu District for instance is one such school. It was not clear how these
schools came to be on the supply list of the publishers.
Modality of deliveries:
Three districts reported that the publishers delivered the text books directly to schools. MK
publishers, Mukono Bookshop and Joibaso were particularly reported to have delivered directly
to schools in Lira, Oyam and Gulu districts. Several districts complained however, that these
publishers distributed the text books directly to schools without involving the District Education
Officers.
While publishers were contracted to deliver books directly to schools, some of them did not do
so. In Apac for instance, publishers invited the headmasters together with the chair persons of
the school management committees to district headquarters through radio announcements and
facilitated them to transport the books back to their schools. A few publishers such as Macmillan
publishers delivered the text books at sub county level and facilitated the respective head
teachers to transport the books to their respective schools. This was the case in Apac District. In
Lira District, Monitor publications sub-contracted a local Book shop called Alpha Bookshop to
distribute the books on their behalf.
Recommendation:
For P.4-P7 there is need for government to undertake a systematic investigation into what each
of the 10 publishers actually supplied to each of the primary schools in the Lango and Acholi
sub-regions. This will help to establish the value of what was lost/not supplied to all the primary
schools in the sub regions. This data will therefore be useful in compelling those publishers to
supply what they did not supply so that government gets value for money.
b) Supply of P1 and P2 Thematic Curriculum materials to Primary Schools.

122
The Performance report for the utilization of the Euro 23m indicated that each Government
aided primary school in the Lango and Acholi sub-regions and all those in the QEI districts were
supplied with a set of Wall Charts, Math practice books, English practice book, Math work
cards, Readers in English and Readers in the area Local Language.
Findings indicated that primary schools in Districts in the Lango and Acholi sub regions visited
received the thematic curriculum materials for P1 and P2. Also all districts in the QEI region
visited reported that their schools received the thematic curriculum materials.
However, almost all district officials in the Lango and Acholi sub regions and those in the QEI
districts noted that they could not verify what was received because they did not have a
comprehensive list of thematic curriculum materials from MoES indicating what each publisher
was supposed to supply to each of the schools in the respective districts.
District officials in the Lango and Acholi sub regionsw reported that all schools that missed out
on the P.4 –P.7 text books also missed out on the P.1 and P2 thematic curriculum materials.
Findings further indicated that a number of primary schools in the 12 districts under QEI also
missed out on the P1 and P2 thematic curriculum materials. In Lyantonde district for instance; 5
primary schools were reported not to have received these materials (i.e. Kitazigolokwa RC P/S,
Buyanja P/S, Buyaga P/S, Kalyamenvu P/S and Kyemmamba P/S).
Several DEOs reported that they had also received complaints from their schools to the effect
that some schools received fewer thematic curriculum materials due to under- packing. This was
because the number of materials in some packages did not tally with the delivery notes.
The monitoring team randomly sampled out at least one school in five of the districts visited to
find out more about which publishers supplied thematic curriculum materials and what materials
were supplied. The findings are summarized in table 3.2.2.
Table 3.2.2: Publishers supplying themetic curriculum materials to smapled primary
schools
District School sampled Publishers that supplied
to this School
Publishers that did not supply
to this school
Lyantonde Kasambya P/S Fountain Publishers Joibaso Publishers
MK Publishers Pelican Publishers
Macmillan Publishers Baroque Publishers
Longhorn Publishers
Net Media Publishers
Pearson Publishers
Mubende Kibalinga P/S Pearson Publishers Joibaso Publishers
MK Publishers Net Media Publishers
Longhorn Publishers Macmillan Publishers

123
Baroque Publisher
Pelican Publisher
Fountain Publisher
Kyenjojo Kaihura P/S Pearson Publishers Joibaso Publishers
Net Media Publishers Macmillan
Mk Publishers
Longhorn Publishers
Pelican Publishers
Baroque Publishers
Fountain Publisher
Arua Jiako P/S Pearson Publishers Joibaso Publishers
Longhorn Publishers MK Publishers
Baroque Publishers Pelican
Fountain Publishers
Macmillan Publishers
Net Media Publishers
Nebbi Omyer P/S Fountain Publishers
Pearson Publishers
Longhorn Publishers
Net Media Publishers
MK Publishers
Joibaso Publishers
Pelican
Baroque
Source: Delivery Notes in schools visited.
From that sample of 5 primary schools in 5 districts, it is clear that some publishers did not
supply materials as per contract to a number of schools in various districts. From the above, it is
also clear that Joibaso Publishers did not supply thematic curriculum materials to four sampled
primary schools in four different districts. If the results of this sample are generalized, it may be
concluded that Joibaso Publishers did not supply thematic curriculum materials to many schools
in the Lango and Acholi sub regions and in districts under the QEI programme. This translates
into a lot of money lost by government.

124
Macmillan Publishers, that had a longer list of titles to supply to each of the schools in the
various districts, did not supply in 2 sampled primary schools in two different districts. Again if
the results of this small sample are generalized, Macmillan Publishers did not supply thematic
curriculum materials to many schools in the Lango and and Acholi sub regions and in districts
under the QEI programme. The same applies to the other publishers.
Officials in Nakapiripirit district in particular reported that some publishers did not supply the
reported materials to schools in the district. The monitoring team probed the officials using a list
of publishers in the report; they noted that at least three publishers (Joibaso, Mukono Bookshop
and Longman) did not supply any books to the district.
The monitoring team did a case study of thematic curriculum materials supplied by publishers to
Kibalinga Primary School in Mubende District. The findings are summarized in table 3.2.3.
Tbale 3.2.3: Case study of what was delivered to Kibalinga P/S in Mubende District.
Publisher Date
supplied
Book title P1 P2 Books not supplied to this
school by the publishers
Pearson 14/11/09 Readers in English 6 8 Wall charts for P1 & P 2,
English Practice Books for
P.1 Readers in Luganda 2 38
Maths Practice Book 13 15
Maths Work Cards 5 16
English Practice Book 0 11
Wall charts 0 0
MK Publishers 1/10/09 Readers in Luganda 5 30
Readers in English 0 10 Wall charts for P1 & P2,
Readers in English for P1, Math work cards 19 11
English Practice book 6 11
Maths Practice books 6 13
Dictionaries 3 0
Wall charts 0 0
Longhorn 3/8/09 Math Practice books 10 8 Wall charts for P1, Math
work cards for P.1 & P.2 English Practice books 16 6
Readers in English 13 0
Readers in Luganda 12 0
Baroque 28/7/09 Readers in English 30

125
Pelican 20/07/09 Math Practice books 10
Fountain 3/07/09 Math Practice books 16 12 Wall charts, Dictionaries
English Practice books 13 46
Maths works cards 10 21
Readers in English 16 24
Readers in Luganda 10 15
Wall Charts 0 02
Dictionaries 0 0
Joibaso All titles not supplied
Macmillan All titles not supplied
MK All titles not supplied
Source: Delivery Notes at Kibalinga P/S.
Table 3.2.3 shows that Pelican Publishers, MK Publishers, Long horn Publishers and Fountain
Publishers did not supply all the titles of thematic curriculum materials to Kibalinga primary
school. The same school missed out on all the titles from Net Media Publisher (2 titles), Joibaso
Publishers (Wall charts and English readers) and Macmillan (5 titles) for both classes. If this
case is generalised, probably the same publishers supplied the curriculum materials in the same
manner to other schools in the various districts.
Mode of deliveries:
While publishers were contracted to deliver thematic curriculum materials directly to schools,
some of them did not do so. A number of them invited head teachers to the district headquarters
and distributed the materials at the district level. In these cases head teachers were facilitated to
take the materials to their respective schools. In a few instances some publishers supplied these
materials directly to schools.
The head masters in the various districts complained about the poor facilitation given to them by
the publishers to transport the books to schools. In Nakapiripirit district for instance, head
teachers were given between Ushs 25,000/= to 30,000/= while in Bukedea they were given UShs
10,000/=
Recommendation:
There is need to carry out a systematic investigation in all the primary schools that were
supposed to receive thematic curriculum materials in the 24 districts in order to establish what
was not supplied by each of the 10 publishers. This will also give an indication of value of
money lost by government due to under deliveries by some of the publishers, and publishers.
This data will therefore be useful in compelling those publishers to supply what they did not
supply so that government gets value for money.

126
c) Mix up in the distribution of Thematic Curriculum Materials:
All districts in the Lango and Acholi sub regions further observed that there was a mix up in the
distribution of thematic curriculum materials to their schools. The Langi speaking districts
(Apac, Oyam and Lira) received Acholi versions while all the Acholi speaking districts (e.g
Gulu) received Langi versions of the thematic curriculum materials. This mix up in the
distribution process rendered the supplied materials to schools in the region un-usable. A district
official in Apac expressed his feelings about this mix up in the following words:
“Lango children cannot be taught in Acholi and Acholi children cannot be taught in
Lango. The two are different. We cannot use these materials because we do not speak
Acholi here. This has to be sorted out immediately in order for the materials to be
useful.” District Official Apac District.
The same problem was noted in the QEI districts of Nebbi, Arua and Lyantonde. All schools in
Nebbi districts were supplied with Lugbara thematic curriculum materials instead of Alur. A few
schools in Arua district neighbouring Nebbi district that speak Alur also suffered the same fate.
In Lyantonde Districts all schools were supplied with Luganda thematic materials yet a number
of schools use Lunyankole.
In Bukedea, it was reported that some of the thematic materials particularly those in Atesot
contained a number of spelling errors. It was recommended that teachers who know the
orthographies of the different languages be employed to clean them up before the final versions
are published and distributed.
Recommendations:
MoES should make arrangements to sort out the issue of thematic curriculum materials in
the districts of Lango and Acholi sub regions and QEI districts.
The materials distributed to districts where languages differed should be retrieved and
redistributed accordingly.
P.3 Thematic Curriculum materials:
The Performance report (Pg.2) indicates that Euro 1.1m of the first tranche of 17m was spent on
P3 thematic curriculum materials. The same reports in table (ii) Page 2 reports that Euro 3.5m of
the second tranche of Euro 0.6m, was spent to purchase thematic curriculum materials for P1- P3
in QEI districts.
However during the monitoring, no district in the Lango and Acholi sub regions or any district in
the QEI region had received thematic curriculum materials for P.3 with funding from the

127
Netherlands support during the period under review. The only thematic curriculum materials that
all districts reported to have received were for P1 – P.2.
Recommendation:
MoES should clarify on the reported accountabilities for thematic curriculum materials for P.3.
The clarifications should indicate full accountability for the Euro 4.5m; the titles of the
curriculum materials for P.3, the publishers involved and the districts where they were supplied.
(c)Use of the text books:
Officials in the districts visited reported that the books are generally in use in most of the
primary schools. However there were also reported cases where some head teachers were not
putting the texts books into the hands of the learners. In these schools text books are locked in
capboards or stores. In Lira District for instance the DEO noted that over 70% of the schools
were simply storing the books instead of giving them to pupils. The same was reported in Apac
district. District officials of Gulu District in their routine monitoring also found that in many
schools, these text books were still in boxes.
Recommendation:
District inspectors of schools in their routine monitoring should ensure that teachers utilise the
thematic curriculum materials and also distribute them to the learners. It is the effective use of
these materials by the learners that will partly bring out the desired learning outcomes.
Storage of text books:
Storage of text books is a big challenge in many schools in various districts. Several District
Education Officers reported that a bigger proportion of primary schools in districts do not have
libraries or book stores. Most of these books are either locked up in head teachers’ offices or in
one of the lockable classrooms. By the time of monitoring many schools in various districts had
not stamped the text books. The head teacher of Omyer Primary School in Nebbi District31
, for
instance, reported that a number of these books recently supplied were lost due to poor storage
by the previous head master. Before he was transferred to the school, there was no inventory of
the books at the school and books were kept in classes. However, these have been registered and
put in a store.
Recommendation:
31
Omyer Primary School is located in Owinyopyelo village, Kalowang Parish, Nebbi sub county, Padyere county,
Nebbi District.

128
During school inspections, inspectors should ensure that schools have Stock Registers and Stock
Issue Registers. These registers would help in holding teachers accountable for the thematic
curriculum materials that they pick from the stores for their use in classes.
d) Supply of furniture.
The Performance report for the utilization of the Euro 23m indicated that 8,771 eight infant sitter
tables, 70,175 pupils’ chairs, 19,737 three-seater desks, 2,848 teachers’ chairs and 2,192
teachers’ tables were in the process of being supplied. The report noted that 272 primary schools
selected by the various Local Governments were to benefit from the supply of furniture. It also
noted that contracts to supply this furniture were given out to 2 firms: HL Investments limited
and Eliana Agencies Limited.
Findings indicated HL Investments Limited was contracted to supply furniture in six districts of
Adjumani, Amuru, Pader, Lira, Amolatar and Dokolo. Eliana Agencies was consequently
contracted to supply furniture to the rest of the districts in the Lango and Acholi sub regions.
Each primary school in the various Districts was supposed to receive 32 eight-seater tables for
P1-P2, 256 pupil chairs for P1-P2, 72 three-seater pupil desks, 8 teachers’ chairs and teachers’
tables.
Findings further indicated that HL Investments started supplying furniture to schools during
February 2010 and by the time of monitoring in May 2010 this work was still going on. It was
also reported at the time of monitoring that, all the 43 primary schools in Pader District had
received their furniture while 16 out of 53 primary schools in Lira District had fully been
supplied with furniture. It was further reported that supply of furniture to the rest of the schools
in the districts of Adjumani, Amuru, Dokolo and Amolatar was yet to start.32
HL Investments
secured some space in the Mayoral gardens in Lira Municipality for assembling all the furniture
before delivery to the schools in the various districts. The beneficiaries were happy with the
quality of furniture so far received from the contractor.
On the other hand districts that were being supplied furniture by Eliana Agencies Limited had a
lot of reservations about the way the contractor was doing this work. As at the time of
monitoring, two districts reported that this contractor was simply dumping un-assembled boxes
of furniture to the schools.
This complaint was registered in Apac and Oyam districts. In Apac it was reported that some
primary schools only received frames, others received only tops.
While the supply of furniture started in December 2009, no school out of the 42 eligible primary
schools in Apac had received a complete set of furniture as at the time of the monitoring visit.33
32
Adjumani has 10 schools to receive furniture, while Amuru District has 15 schools, Dokolo District has 11 and
Amolatar District has 10 schools.
33 i.e. 32 eight-seater tables for P1-P2, 256 pupil chairs for P1-P2, 72 three-seater pupil desks, 8 teachers’ chairs and
teachers’ tables

129
Table 3.2.4: Examples of schools that did not receive full sets of furniture in Apac District:
Name of Primary
school
What was received and not fitted What the school didn’t
receive
Aboko P/S Tables and Desks
Inomo P/S Only frames Tops
Awir P/S Desks, tables chairs
Chegere P/S Desks, tables, chairs
Apolika P/S Tables, desks
Atudu P/S Frames for tables, chairs, desks Tops
Source: Apac District Education Officer.
In Apac District 23 primary schools did not receive any furniture. These include:- Abuli P/S,
Ogwil P/S, Awila P/S, Ayago P/S, Aninolal P/S, Olelpek P/S, Alworoceng P/S, Alenga P/S,
Arocha P/S among others.
This means that Government did not get value for money in all the schools and in all districts
where Eliana Agencies supplied the furniture. Unfortunately some head teachers in Apac signed
the delivery notes indicating that they had received the full delivery of furniture.
Oyam district officials also re-echoed the same complaint. While they reported that Eliana
Agencies had supplied some furniture to some primary schools, all the schools received partial
deliveries and all schools received boxes of furniture partially assembled. Out of the 27 primary
Some of the furniture being assembled by HL Investments in Lira Mayor’s gardens
Some of the furniture in boxes dumped without being assembled to Ikwera P/S, Apac District

130
school in Oyam District no school had received a complete set of assembled furniture as at 18th
of May 2010.
On the other hand, supply of furniture to primary schools in Gulu District had not started as of
20th
May 2010.
Schools not on the furniture list:
It was reported that a few schools that were not on the original list of beneficiary schools were
supplied with furniture. In Lira district for instance furniture for Ngeta Boys was instead
delivered to Ngeta Girls primary school. These are neighbouring schools. It was reported that
this issue even became political and district authorities failed to retrieve the furniture and deliver
it to the rightful recipient. A similar case was reported in Oyam district where Loro primary
school was supplied with furniture despite not being on the list.
Recommendation:
In order to get value for money, MoES should follow up on the supply of furniture by Eliana
Agencies to schools and in the districts where this firm was contracted to supply. The ministry
should compel Eliana Agencies to supply all furniture to schools in the selected districts as per
the contract. MoES should compel Eliana Agencies to assemble all the boxes of furniture that
they dumped un-assembled in the different schools in the districts of Apac and Oyam as well as
other districts where the monitoring team was not able to visit.
e) Supply of Water tanks to schools:
The Performance report for the utilization of the Euro 23 million indicated that Euro 2 million
was used to buy water tanks for distribution to schools. The report also indicates that 1041 water
tanks were supplied to 830 primary schools in the Lango and Acholi sub-regions.
Findings indicated that all districts in the Lango and Acholi sub regions reported that the selected
primary schools received at least one 10,000 litre water tanks. Findings about receipt of water
tanks in visited districts are summarized in table 3.2.5:
Table 3.2.5: Primary schools that received water tanks
District Number of schools that received water tanks
Lira 75 schools
Apac 194 tanks supplied (poly-tanks 91 tanks, crest tanks 103)
Oyam 57 schools
Gulu 69 schools
Source: DEOs and DIS in those Districts

131
In Apac, the DEO complained about the selection criteria for the schools that received water
tanks. He noted that some schools which have boreholes also received water tanks while some
needy schools did not receive. This means that some schools that have no water problems
received tanks and are not using them.
It was reported in 2 districts (Apac and Gulu) that some of these tanks were vandalised by
children and the communities. In a number of schools in the 2 districts children have removed
the tap. One district official was worried that a lot of funds spent on the water-tanks support
component may not produce the intended outcomes.
Recommendation:
District education officials in the education departments should undertake sensitization
campaigns in schools to ensure that the school property is not vandalized. Head teachers should
be held more accountable for the safety of school property under their care.
f) Supply of Motor cycles:
The Performance report for the utilization of the Euro 23m indicated that 108 motor cyles were
supplied to all Districts and Municipalities giving a priority to the Lango and Acholi sub-regions
and the QEI districts.
Findings indicated that all districts visited received the
reported motorcycles. All the motor cycles were all brand
new and bore red number plates of UG/---E series. The
motor cycles seen by the team were all Honda XL 125 cc. At
the time of the monitoring visit all the motor cycles were
being used by officers in the District Education Departments
particularly the District Inspectors of Schools. The details of
what was received by each District and Municipality are
summarized in table 3.2.6:
Table 3.2.6: Receipt of motorcycles by districts
District No. of Motor cycles received
Lira 1
Lira Municipality 1
Apac 2
Oyam 2
Gulu 2
Gulu Municipality 1
One of the Motorcycles that MoES
procured
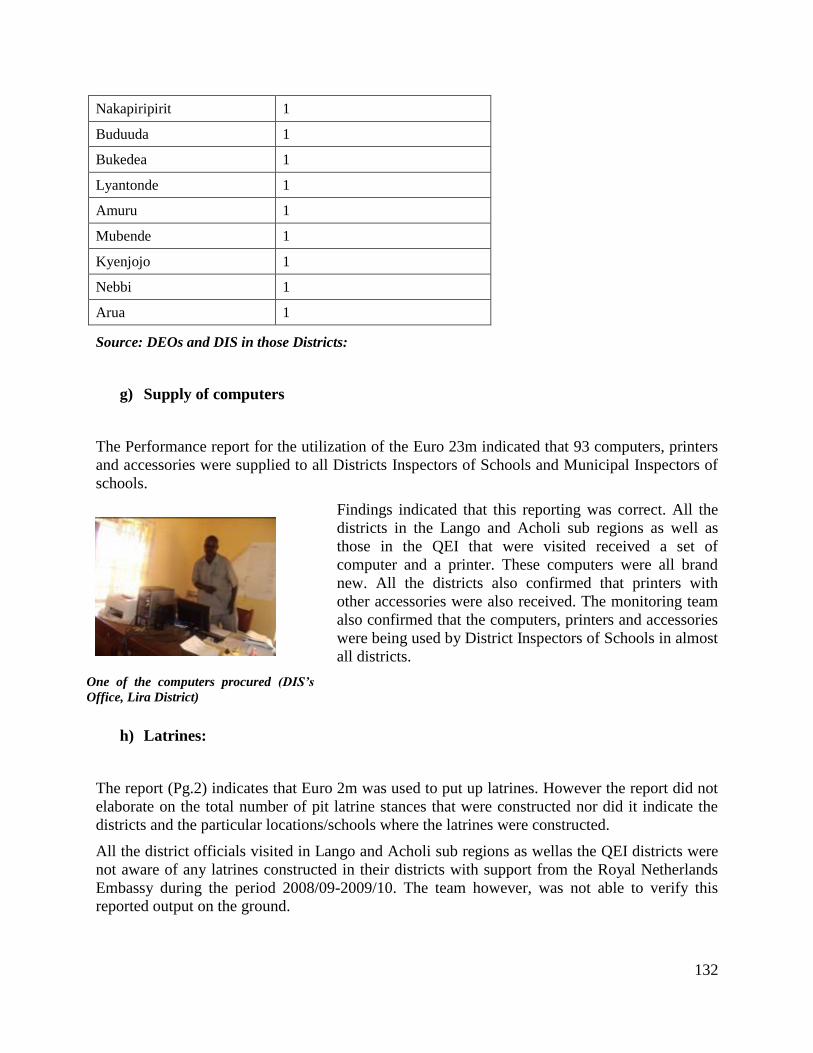
132
Nakapiripirit 1
Buduuda 1
Bukedea 1
Lyantonde 1
Amuru 1
Mubende 1
Kyenjojo 1
Nebbi 1
Arua 1
Source: DEOs and DIS in those Districts:
g) Supply of computers
The Performance report for the utilization of the Euro 23m indicated that 93 computers, printers
and accessories were supplied to all Districts Inspectors of Schools and Municipal Inspectors of
schools.
Findings indicated that this reporting was correct. All the
districts in the Lango and Acholi sub regions as well as
those in the QEI that were visited received a set of
computer and a printer. These computers were all brand
new. All the districts also confirmed that printers with
other accessories were also received. The monitoring team
also confirmed that the computers, printers and accessories
were being used by District Inspectors of Schools in almost
all districts.
h) Latrines:
The report (Pg.2) indicates that Euro 2m was used to put up latrines. However the report did not
elaborate on the total number of pit latrine stances that were constructed nor did it indicate the
districts and the particular locations/schools where the latrines were constructed.
All the district officials visited in Lango and Acholi sub regions as wellas the QEI districts were
not aware of any latrines constructed in their districts with support from the Royal Netherlands
Embassy during the period 2008/09-2009/10. The team however, was not able to verify this
reported output on the ground.
One of the computers procured (DIS’s
Office, Lira District)
133
Recommendation:
MoES should clarify on the number of pit latrines that were constructed during the FY 2008/09-
2009/10 with support from the Royal Netherlands Embassy. This clarification should give the
total number of pit latrines constructed with clear locations (i.e. names of schools, village,
parishes, sub counties and districts).
i) Construction of classrooms and teachers’ houses:
The report (Pg.2) further notes that Euro 1.5m was used for construction of classrooms and
teachers’ houses in hard to reach schools in the QEI districts. However, just like with the latrines,
the report did not elaborate on total number of classrooms and teachers’ houses that were
constructed nor did it indicate the districts and the particular locations/schools where they were
constructed.
All the district officials in the Lango and Acholi sub regions and those in the QEI disricts visited
did not know of any primary school where classrooms and teachers’ houses were constructed
with support from the Royal Netherlands Embassy during the period 2008/09-2009/10. The
monitoring team was therefore not able to verify this reported output on the ground.
Recommendation:
MoES should clarify on the number of classrooms and the number of teachers’ houses
constructed with support from the Royal Netherlands Embassy to hard to reach schools in QEI
district worth Euro 1.5m during the FY 2008/09-2009/10. This clarification should give clear
locations (names of schools, village, parishes, sub counties and districts).
j) Support to NCDC:
The report (Pg.2) indicates that Euro 0.12m was used to fund the National Curriculum
Development Centre (NCDC) to re-arrange the P4 curriculum from the proposed 10 subjects to 7
subjects.
Findings from our monitoring indicated that NCDC received UShs 300,000,000/= during the
period under review from MoES. According to the Director NCDC, this money was used to fund
activities for repackaging the P.4 curriculum. This activity involved working with ten panels of
subject curriculum development specialists to reduce the subjects from ten subjects to seven.34
The developed P.4 curriculum was completed and piloted in selected schools during 2009 and
has now been rolled out to all schools.
34
Some subjects were merged while others were dropped. For instance Physical education was merged with Art and
Technology, Music Dance and Dramma to come up with Creative Art and Physical Education as one learning area.
The subject content for Integrated Production Skills was dissolved into a number of subjects. Subjects that were
dropped included Kiswahili and ICT.

134
Conclusion:
Overall, 4 activities that included supply of water tanks, procurement of motorcycles,
procurement and distribution of computers, printers and accessories for all Inspectors of schools
as well as support to the NCDC activities on P.4 curriculum reform were well handled. No
complaints were received on these activities. However, a number of complaints were registered
on the supply of P.4-P.7 text books to primary schools in the Lango and Acholi sub-regions,
supply of P.1 and P.2 thematic curriculum materials to primary schools in the Lango and Acholi
sub regions and primary schools in the QEI intensity districts, and supply of furniture to selected
primary schools in the same region. While some Publishers supplied, a few did not supply while
others made under deliveries. A lot of money was not properly accounted for under construction
of latrines, classrooms and teachers’ houses. There was no evidence for construction of these
facilities in the Lango and Acholi sub regions or in the QEI districts with support from the
Netherlands support for the period 2008/2009-2009/10.
3.2.3 Pre-Primary and Primary
The approved budget for Development programmes for FY 2009/2010 was UShs
49,000,733,491/=. Out of that UShs 45,687,036,491/= was released. The IFMS system indicates
that at the end of the FY Ushs 45,656,705,401/= was spent on different development
programmes under the different vote functions.
Emergency Construction and Rehabilitation of Primary Schools:
The approved budget for Emergency Construction and Rehabilitation of Primary schools project
for FY 2009/10 (0943) was UShs 1,500,000,000/= . Out of that UShs 1,408,372,000/= (94%)
was released. The IFMS system indicates that at the end of the FY all this money had been spent.
Four primary schools under the emergency construction and rehabilitation of primary schools
project were monitored. Findings indicated that three of these schools received funds for
construction of classrooms. Two of them had not started construction and funds were still on the
school accounts by the time of monitoring. One of them (i.e. Bukiyi P/S) had not received funds
for construction as at the time of the construction. The details follow below:
Bukiyi Primary School:
Bukiyi Primary School is found in Katuulu LCI, Dahami parish, Bukiyi sub county, in Sironko
District. This is one of the schools that was earmarked to be rehabilitated under the Emergency
Construction and Rehabilitation of primary schools. A 4 classroom block was hit by a storm
destroying the entire roof in February 2008. The Progress Report for Q3 from MoES indicated
that MoES rehabilitate a 4 classroom block at Bukiyi P/S worth 20m.

135
Findings from the ground indicated that this reporting was incorrect. By the time of the
monitoring visit on 8th
June 2010 the school had not received any funds and the 4 classroom
block had not been rehabilitated as reported.
The deputy headmaster reported that the school received a letter from MoES notifying them
about the above mentioned funds and requesting them to acknowledge receipt. However, no
funds had been remitted to the school. He also noted that the head-teacher together with the
District Education Officer were following this issue with MoES.
Murago Primary School:
Murago Primary School is located in Kagorogoro cell, Murama parish, Nyakishenyi sub county,
Rubabo county in Rukungiri District. The Progress Report for Q3 indicated that MoES
rehabilitated a 7 classroom block, procured 126 desks for the classrooms, constructed 2 blocks of
pit latrines of 5 stances each at the school. This was reported to have cost UShs 40 under the
Emergency construction and Rehabilitation of Primary Schools project.
Findings from the monitoring visit on 22nd
June 2010 indicated that the school received UShs 40
million. The funds were credited to the school account35
on 22nd
March 2010. However, the
actual construction had not started.
While the Q3 Progress Report indicates that 7 classrooms were rehabilitated 126 desks
purchased and 2 blocks of 5 stance pit latrines built at this school, the guidelines from MoES as
well as the BoQs to the school and the contract which was signed with the contractor were for
construction of 2 classrooms with an office and a store, construction of 2 stances of pit latrine
and provision of furniture for 2 classes. Therefore there was a mix-up between what was in the
progress report and the guidelines.
The school management put in place a contracts committee. The contract for the civil works was
awarded to MMUFA Limited of Box 130 Rukungiri. The contractor also accepted the offer in a
letter dated 20th
May 2010. Findings further indicated that the head teacher on 7th
June 2010 paid
out UShs 20,000,000/= to the contractor in advance, allegedly for mobilisation, and by the time
of the monitoring visit on 22nd
June no works had started. This particular payment contravened
the payment guidelines in the contract agreement as there was no work done,36
and no certificate
produced.
There is need for MoES to investigate how the procurement process at this school was handled
that led to awarding a contract to a firm that did not have funds. Secondly there is need for
MoES to follow up construction at this school to ensure that the civil works are done and that no
funds are lost.
St. Damascus Primary School:
35
Account Number 0120706063301 Stanbic Bank, Rukungiri Branch
36 The agreement is clear that payments shall be made upon producing certificates for the slab level, Ring bim level,
Roofings and fittings level and final completion of the structure.

136
St Damascus Primary School is located in Katasule LCI, in Kireku parish, Kikyusa sub county in
Luwero district. According to the Q2 progress report, MoES constructed a 2 classroom block, 5
stances of Pit latrine and procured 36 desks for this school under the Emergency Rehabilitation
and Construction of Primary Schools project. All this school was reported to have cost UShs
37m.
Findings indicated that the school received the funds in mid
April 2010. The funds were used to construct a 2 classroom
block and a 5 stance pit latrine. Civil works started in May
2010. By the time of monitoring the classroom block was
completed. However, the desks had not been procured as at the
time of our monitoring.
Ttaba Primary Schools:
Ttaba Primary Schools is found in Ttaba village LCI, Mako parish, Kasanje sub county, Busiro
County in Wakiso District. The Q3 Consolidated Progress Report indicates that MoES
completed construction of a 3 classroom block at this school. The block is reported to have cost
Ushs 20,000,000/= under the Emergency Construction and Rehabilitation of Primary Schools
project.
Findings from the monitoring visit indicated that the school received the reported funds on 24th
April 2010. However, construction of the 3 classroom block has not been completed as reported.
In fact no civil works had started on the block as at the time of monitoring on 8th
July 2010.
Initially the funds were intended for completion of a 3 classroom block that the parents started
and stalled at window level. It was also reported that the school management wanted to divert the
funds and use them to put up teachers’ houses. However, MoES did not clear them to do so. By
the time of the monitoring visit the funds were still lying on the school account. Interestingly the
DEO had no official communication that MoES had disbursed the reported funds to the school.
Findings further indicated that while the FY 2009/10 had ended, there was no evidence of
commitment of these funds and also no evidence that the accounting officer (HM) had sought
permission from PS/ST or received a written authorization from the Accountant General to retain
the funds on the school account. This contravenes the Finance and accounting regulations.
Recommendation:
To ensure value for money under the Emergency Construction and Rehabilitation of Primary
Schools project, MoES should follow up on the following:
A 2-classroom block at St
Damascus P/S, FY 2009/2010

137
Share information with District authorities when they release funds for capital
development under the Emergency Construction and Rehabilitation of Primary schools
project. Districts as stakeholders in capital development under the sector need to play
their supervisory roles.
Ensure that the 36 desks for Damascus Mixed P/S are actually procured.
Ensure that UShs 20m for Bukiyi P/S for construction of a 3 classroom block is remitted
to the school.
Investigate how the procurement process at Murago primary school was handled that led
to awarding a contract to a firm that did not have funds. Secondly MoES to follow up
construction at this school to ensure that the civil works are done and that no funds are
lost.
3.2.4. Secondary Education:
The approved budget for Development of Secondary Education project (0897) for FY 2009/10
was UShs 13,063,000,000/=. Out of that UShs 11,863,470,000/= was released. The IFMS system
indicates that at the end of the FY Ushs 11,838,351,361/= had been spent. Ushs 25,118,436/ was
still committed.
Secondary Schools for rehabilitation:
Three secondary schools under this project were monitored. All these projects were centrally
procured. In all of them construction/rehabilitation was going on.
Kigezi College
Kigezi College is located in Butobere LC I, Butobere Ward, Central division, Kabale
Municipality in Kabale District. This is one of the traditional schools for expansion. By the time
of the monitoring visit civil works by Amongoli enterprises were going on at the school.
The structures under construction were at different levels:
1. A library block was at ring bim level.
2. A storied classroom block that will have 3 classrooms down and 3 classrooms upstairs
was at ground slab level.
3. A science block was at ring bim level.
4. A teachers’ house was at foundation level. At the time of the monitoring visit, the base
columns were being casted.
A library block and the 6 classroom storied block at Kigezi College

138
It was reported that the project is slightly behind schedule. This was largely due to the fact that
the long heavy rains coupled with the area being swampy reduced the speed at which the
contractor was working. However, the beneficiaries were satisfied with the quality of civil
works.
Masaba Senior Secondary:
Masaba Senior Secondary School is one of the traditional schools under rehabilitation during FY
2009/10. The school is located in Budadiri Town Council, in Budadiri East, in Sironko District.
Findings indicated that the school was handed over to SKMG Holdings Limited for rehabilitation
in December 2009 for a contract period of one year. However by the time of monitoring on 08th
June 2010, very little had been done and the civil works were moving on at a very slow pace.
The headmaster had reservations but reported that the firm was behind schedule. The team
observed that the firm had only 8 workers on site.
The only completed civil works were on the 7 classroom block. The old asbestos was removed
and replaced with new pre-painted iron sheets. All the electrical works in all the classes were
done. Internal re-plastering and outside rendering on the walls was done. The entire block was
repainted. Works on the veranda and all the splash aprons were completed.
A new block of science laboratories was constructed.
By the time of monitoring it was at finishes level.
All other works under rehabilitation on the rest of the
structures had either not started or had stalled at some
level as at the time of monitoring. A storied block of
two classrooms that started in mid-April had stalled at
plinth level. 2 blocks of ablution for boys were roofed
and works on the walls were not moving. Another
block of ablution had been de-roofed to remove the
asbestos and was awaiting to be re-roofed with new
pre painted iron sheets. Civil works on the
administration block, dining hall and on the library had
not started. The head teacher expressed his disappointment regarding the pace at which civil
works were moving as follows.
A storied classroom block that had stalled
at plinth level at Masaba S.S.

139
“These people need to be woken up. They are very slow, they bring materials in
instalments, for example 20 bags of cement to such a site, materials get finished and
they get redundant, there are only about 8 workers on site as we talk now, I do not
know whether they will beat the deadline.” HM Masaba S.S.
Sir Samuel Baker Secondary School:
Sir Samuel Baker Secondary School is found in Gulu District. This school is undergoing
rehabilitation and expansion with funding from the Uganda-Belgium cooperation. Belgium
contributed Euro 1.5million while Government of Uganda co-funded with Euro 0.5 million. The
rehabilitation and expansion works are being undertaken by Rohi Services and Global
Construction Company. On site 28 structures and a fence were being worked on. Civil works on
all these structures were moving on simultaneously. The contractor was commended for the good
quality of civil works and the pace up to that level.
Findings indicated that by the time of monitoring, six structures had been completed and handed
over to Government of Uganda in a ceremony that was presided over by Hon Geradine
Namirembe Bitamazire on 18th
May 2010. The structures that were handed over included a
dining hall, kitchen, technical drawing workshop, one new dormitory, a new 2 classroom block
and P’Btek house.
The following section details the status of rehabilitation of the remaining structures as at the time
of monitoring.
1. Main Hall: At the time of monitoring, demolition works on the old Main Hall were going
on. The suspended slab, the gable beams, a timber floor and some walls were being
demolished in order to replace them with new ones. The site supervisor reported that new
columns would be introduced and new steel translucent roof would be put. Electrical and
all plumbing works were to be re-done. The rehabilitation works on this structure would
take 3-4 months to complete.
2. Livingstone Hall ‘O’ level and Livingstone ‘A’ level dormitories: Rehabilitation of
these dormitories was almost complete. A new roof with new pre-painted iron sheets was
put. Internal plastering and rendering of the walls was done. New windows and doors were
put. New ceilings and electrical works had been completed. Works on the splash apron and
the verandahs were done. As at the time of monitoring, the remaining works included
working on the floors and internal painting.

140
3. Grant Hall ‘O’Level dormitory: This dormitory was rehabilitated. A new roof with new
pre-painted iron sheets was put. Internal plastering and rendering of the walls was done.
New windows and doors were put. New ceilings and electrical works had been completed.
Works on the splash apron and the verandah were done. As at the time of monitoring, the
remaining works included working on the floor and internal painting.
4. Grant Hall Annex: This dormitory was rehabilitated and works were being finalised. A
new roof with new pre-painted iron sheets was put. Internal and external plastering was
done. New windows and doors were put. New ceiling and electrical works had been
completed. Works on the splash apron and the verandah were done. Internal and external
painting had partially been done. As at the time of monitoring, the remaining works
included working on the floor.
5. Burton Hall ‘O’ Level dormitory: This dormitory was rehabilitated. A new roof with new
pre-painted iron sheets was put. Internal plastering and rendering of the walls was done.
New windows and doors were put. New ceilings and electrical works had been completed.
Some rooms for the head prefects were created. Works on the splash apron and the
verandah were going on at the time of monitoring. The external painting had partially been
done. The remaining works included working on the floor and internal painting.
6. Burton Hall ‘A’ Level dormitory: The same civil works as on Burton hall ‘O’ level had
been completed. A new water born toilet had been put but the water was not yet flowing.
7. Dining and Kitchen: The renovation works on the dining and kitchen included the
following; both the dining and the kitchen have a new roof. The timber perlins and iron
sheets were changed. The structure has 2 new windows and 3 new external doors. There is
also one new internal door connecting to the kitchen. All the internal and external
plastering was completed. Internal painting as well as electrical works and plumbing works
for both structures were also completed. All the windows for the kitchen are new and
glasses had been put. The floors for both the kitchen and dining were replaced.
8. Bulky Food Store: At the time of monitoring on 19th
May 2010, civil works on the food
store had not yet started.
9. Two new class room blocks each with 3 classrooms were completed. These were new
constructions all together.
10. Renovation works on a 4-classroom block was completed. This block has a new roof. All
the windows and doors are new. External and internal plastering was completed. Electrical
works in the 4 classes was done. The block has a new ceiling in all the classes. The splash
apron and the verandah were replaced. The floors for all the 4 classes had been replaced.

141
11. Senior and Junior Laboratories: By the time of monitoring only the replacement of the
roofs and the ceilings had been completed. However, the other civil works were on going.
12. Two blocks each with 5 classrooms: Civil works were on going on each of these two
blocks. By the time of monitoring the roofs and ceilings had been replaced. New windows
and new doors had been fixed on both structures. The external and internal plastering, the
splash aprons as well as the electrical works had been completed on both structures. It was
only the floors and internal and external painting that were yet to be done on both
structures.
13. Underground electrical works: Underground electrical works covering the entire school
had been completed. This involved installing security lights around the entire campus that
included the walk ways, classes, dormitories and the Dear Park.
14. The Administration block: By the time of monitoring, civil works on the administration
block had not yet started.
15. Technical Drawing workshop: By the time of monitoring, renovation works on the
technical drawing workshop had been completed. A new roof with new pre-painted iron
sheets was put. Internal and external plastering was completed. New windows and doors
were fixed. New ceilings and electrical works had been completed. Works on the splash
apron and the veranda were done. Works on the floor as well as internal and external
painting had been completed.
16. P’Btek House: This house has 3 units of dormitories. Renovation works for all of them
were completed A new roof with new pre-painted iron sheets was put. Internal and external
plastering was done. New windows and doors were fixed. New ceilings and electrical
works were completed. Works on the splash apron and the verandah were done. Works on
the floors as well as the internal and external painting had been completed.
17. Speke ‘O’ Level and Speke ‘A’ Level Houses: These dormitories were rehabilitated. A
new roof with new pre-painted iron sheets was put for each. Internal and external plastering
was complete. New windows and doors were put. New ceilings and electrical works had
been completed. Works on the splash apron and the verandahs were done. As at the time of
monitoring, the remaining works included working on the floors and internal painting.
18. Stanley ‘O’ level and Stanley ‘A’ level Dormitories: same works and on the same level
as in Speke.
19. New Dormitory: This is a new construction and by the time of monitoring all the civil
works was complete.

142
R-L Headteachers house and Deputy Headteachers House
20. Deputy Head
master’s house:
Renovation of the
house was fully complete. The renovation works included putting a new tiled roof.The old
ceiling was also replaced. The old windows and doors were removed and replaced with
new ones. The external and internal plastering was completed. The plumbing works, a new
sewage system, electrical works as well as works on the floor were completed.
21. Head master’s house: The same renovation works as on the Deputy HM’s house were
done on the HM’s house and were completed.
22. Fence: The firm had started on the activity of putting a fence around the school. The fence
was said to cover about 2.5 square kilometres. By the time of monitoring, 900 meters had
been covered. The firm was also making the pre-cast fence poles for this activity on-site.
Seed Schools:
Five seed schools were monitored. Two of them (Bagezza Seed S.S and Mbarara Seed S.S. were
new constructions and civil works were going on. The three others (Buweswa Seed S.S.,
Bugunzu Seed S.S. and Kidongole Seed S.S.) had been previously constructed. However, there
were incomplete civil works by the different contractors. The details are summarized below:
Bagezza Seed Secondary School:
Bagezza Seed Secondary School is found in Lusaalira LCI, Kibalinga parish, Bagezza sub
county, Buweekula county in Mubende District. This is one of the seed secondary schools for
expansion with funding from ADB III during the FY 209/10. The contract for this school was
awarded by MoES to Dott Services with Arch Design as the consultants for a contract period of
one year. Civil works were reported to have started on 1st December 2009. By the time of
monitoring on 28th
June 2010 civil works were going on.

143
1. A 2 unit science laboratory was at roofing level.
2. 3 blocks each with 2 classrooms were at roofing level.
3. Construction of a four stance aqua-privy latrines with a shower for girls and for another 4
stances for boys were at excavation level. Works on the latrine stances for staff had not
started.
4. An underground water tank that was at excavation level.
5. 2 housing units for staff were at plinth wall level. Each of the units has a sitting room, a
bedroom and a store.
6. A girls’ dormitory was at walling level.
7. Civil works on Pit latrines had not started.
8. A head master’s house was at foundation level. It will have 2 bedrooms, sitting rooms
and a cooking area.
The beneficiaries were satisfied with the quality of civil works.
Bugunzu Seed S.S.
Bugunzu Seed S.S. is located in Buwasa LCI, Bukimali parish, Buwasa Sub County in Sironko
District.
Construction of this school started in October 2008. Civil works were undertaken by Spencon
Construction Company. The school administration started using the new structures of the school
in term II of 2009. The structures included an administration block (HM’s office, Deputy HM’s
office, bursar’s office, waiting room, staff room, book store, document centre), a science
laboratory block for chemistry and biology, 2 blocks of 2 classes each, 3 stances of pit latrines
with a washroom for girls, 4 stances of pit latrines with a urinal for boys, 2 stances of pit latrines
with a wash room for staff. A gate man’s house was also done. A 100,000 litre underground
water tank and two 10,000 litre overhead water tanks for the laboratories were constructed.
The school was also supplied with a range of text books from MoES and ADB in various
subjects. Furniture for the classrooms, offices, staffroom and stools for the science laboratories
were all supplied.
A staff house with 2 units sub contracted by Spencon to another company is incomplete up to
now. Some of the incomplete works on the house include the electrical wiring, fittings and
connecting it to the grid, painting, working on the verandah and splash aprons, and putting
glasses. The latrine and bathroom for the staff house were also not constructed.
The school has recently been connected to the electricity grid. However, the school
administration complained that a single phase was installed instead of the 3-phase as per the
designs and plan. They noted that the school did not get a transformer and this resulted in the low
volgates, sometimes as low as 155.
The school administration also observed that works on the fence around the school were not
completed. They also reported that the foot ball pitch was not well graded making the pitch water
logged during the rainy seasons.
Buweswa Seed Secondary School:

144
Buweswa Seed Secondary School is located in Mufuufu village, in Buweswa parish,in Kaato
Sub county, Bubulo county, Bududa district. This school was constructed under ADB III. Civil
works, which were undertaken by SKMG Holdings Limited, started in 2007.
Construction of 2 classroom blocks each with two classes were all completed and are in use.
Construction of an administration block together with 2 science laboratories (chemistry/biology
and physics laboratories), were completed in term II of 2008. Twelve stances of pit latrines (i.e. 2
for staff, 4 for boys and 6 for girls) were also constructed and completed. These laboratories
were equipped with a variety of science equipment. Walk ways connecting the different
structures within campus were done. A football pitch was level and planted with grass. A
Kiapple fence was put around the school. The quality of these civil works was good.
Findings further indicated that the school received all the furniture for the classes, administration
block and for the science laboratories.37
This school received a variety of books for science,
mathematics and English from MoES.
A 100,000 litre underground water tank was also installed. However the manual water pump
cannot pump water up wards because of the steep gradient.
Three smaller tanks with capacity of 10,000 litres were provided
and installed at the gable end of 3 structures.
During May 2010, the school was connected to the power grid.
All school structures are now connected.
The only complaint at this school was that of the teachers’
house. The contractor started on the house and abandoned it at
walling level.
Kidongole Seed S.S.
Kidongole Seed S.S. is located in Kidongole village, Kidongole parish, Kidongole sub-county in
Bukedea District.
This school is one seed school undergoing construction under the expansion programme of seed
school funded by ADB III. Civil works were being undertaken by SKMG holdings limited and
works started on 29th
December 2009 for a contract period of one year. By the time of
monitoring visit on 2nd
June 2010 construction was going on.
37
Furniture for the science laboratories included stools and working tables
The H/M showing the team the
Teachers’ house that was left
incomplete by the contractor

145
Two blocks each with 2 classrooms had been roofed and were at finishes level. Shutters had been
fixed. The remaining works on these blocks included internal plastering, outside rendering,
flooring, works on the verandah, splash apron and painting.
A 2 unit science laboratory had been roofed. At the time of the monitoring visit, they were
compacting the floor of this block with murram. Shutters were yet to be fixed. The remaining
works on this block included internal and external plastering, flooring, works on the verandah,
splash apron and painting.
Construction of a girls’ dormitory was at plinth wall level. The dormitory is to accommodate 80
girls. There was an issue of positioning the latrine on the girls’ side. This pit latrine was
positioned 12 meters directly behind the dormitory. The DEO citing the health guidelines
directed that it should be shifted to at least 30 meters on the gable end of the dormitory block
instead of where it had been positioned. The site supervisor did not seem to agree with the
stakeholders on this issue.
Construction of a teachers’ semi-detached house and another house for the head teacher had not
started at the time of monitoring visit on 2nd
June 2010.
Another 3 classroom block at this school was left incomplete by NUSAF. The incomplete works
on this block include the floor, plastering, painting, no shutters, works on the verandah and
putting furniture for the classes. This structure is not in use.
Mbarara Seed Secondary School:
Mbarara Seed Secondary School is found in Kirembe Cell, Nyamityobora ward, Kakoba
Division, Mbarara Municipality in Mbarara District. It is one of the seed secondary schools
under expansion during the FY 2009/10. The expansion of this school was reported to be under
ADB III project.
Findings indicated that the civil works for expansion started in December 2009. The works were
being undertaken by Ambition Construction Company Limited of Kampala. The structures under
construction were under different levels of construction as shown below:
1. Construction of a 6 classroom storied block was on-
going. By the time of monitoring on 24th
June 2010, the
basic works for the ground floor were complete. A slab
for the upper floor was being casted.
2. A 2 unit science laboratory had been roofed. They were
beginning on fitting the shutters
3. A head teacher’s house was at ring bim level. The house
has 2 bed rooms with a sitting room.
4. A 2 unit teachers’ house was also at ring bim level.
Six classroom storied block
146
5. Pit latrines were at roofing level. (4 stances for boys, 4 stances for girls, 2 stances for
staff).
Recommendation:
MoES should ensure that:
The contractor for Buweswa Seed Secondary School, SKMG Holdings Limited,
completes the teachers’.
A staff house with 2 units that was sub contracted by Spencon to another company at
Bugunzu Seed Senior Secondary school is completed. All the incomplete civil works
should be completed. These include the electrical wiring and fittings, painting, working
on the veranda and splash aprons, putting glasses and connecting it to the grid. The
latrine and bathroom for the staff house which were not done should also be constructed.
MoES should also ensure that the installation and connection of the school to the
electricity grid is done as per the agreed contract. MoES should also ensure that the
contractor completes installing the entire fence around the school as agreed in the
contract. The contractor should also ensure that water drains from the pitch during the
rainy seasons.
MoES should provide resources for completion of a 3 classroom block that was left
incomplete at Kidongole Seed Senior Secondary School. This classroom block was
constructed with funding from NUSAF. Completion of this block will provide the school
with additional teaching and learning space.
Construction of USE schools:
Eleven USE schools were monitored during this monitoring activity. Findings indicated that all
the USE schools visited received the reported funds. Construction was also going on and was at
different stages of completion.
Bukooli Senior Secondary:
Bukooli Senior Secondary is located in Muyenga LC I, Ndifakulya parish, Bugiri Town Council,
Bugiri District. This is one of the USE schools that received funds for construction of additional
classes to accommodate the large number of USE students. The school received an initial release
of Ushs 75 for construction of 4 classrooms in 2007. The classrooms were constructed however
they were not completed due to inadequate funds. The Consolidated Progress Report for Q3
reported that MoES released an additional UShs 30m for completion of those structures.

147
Findings indicated that the reported funds were received on 27th
February in 2010. Wangi
General Enterprises (U) limited, the contractor who constructed the classroom block, was
recalled to complete the project. Civil works were reported to have commenced in April 2010.
By the time of monitoring the 4 classrooms were complete. A 10,000 litre water harvesting tank
was also installed. A seven stance lined pit latrine with a urinal was being completed.
Kabale Senior Secondary:
Kabale Senior Secondary is located on Nyerere avenue, Nyabikone ward, Central division,
Kabale municipality. This is one of the USE schools. This school has received UShs
135,000,000/= from Government of Uganda for construction of additional classrooms to
accommodate the large USE student population. The school received an initial Ushs 75 m for
construction of classrooms in 2008.
Due to shortage of space, the funds were used to start on foundation of a storied classroom block.
MoES committed itself to complete the ground level of the structure. The first batch of funds
was used to work on underground works, the plinth walls, the ground slab up to the walling.
However, the slab for the middle level was not done.
The Q3 consolidated progress report indicated that MoES had completed the ground floor for
Kabale S.S. The report notes that UShs 60m was released for this purpose. Findings from
monitoring confirmed that the school received UShs 60,000,000/= in mid March 2010.
However, findings showed that the ground floor is still incomplete. The head teacher reported
that the additional funds were used to pay off all the debtors who supplied materials to the school
during the initial phase of construction. He reported that the remaining part of the funds was used
to buy max pans. The ground floor is not complete yet and cannot be used.
Kakungube Senior Secondary School:
Kakungube Senior Secondary School is located in Kakungube LC I, Kyannamugera parish,
Nalutuntu sub county, Kassanda county in Mubende District. The Q3 Consolidated Progress
Report indicates that MoES carried out emergency repairs at this school at a cost Ushs
25,000,000/=.
Findings from the monitoring visit confirmed that the school received the reported funds. The
funds were used to complete a 3 classroom block that had been left at window level. Part of the
funds was used to do internal and external plastering on another 3 classroom block. Both blocks
have been affected by the storm of August 2008.

148
Kamod Senior Secondary:
Kamod Senior Secondary is a USE school found in Cental ward, Kamod parish, Bugondo Sub
county, Kasilo County in Soroti District. Beginning July 1st2010, this school is now located
within the new District of Serere. However all the implementation was done before Soroti
District was split.
In April 2010, one of the classroom blocks at the school was
hit by a storm that removed the whole roof. Following this
emergency, the school administration requested MoES as well
as all other stakeholders to assist in repairing the classroom
block.
The consolidated progress report for Q3 reported that MoES
carried out emergency repairs at Kamod S.S. at a cost of UShs
10m. Findings at the school indicated that reporting was
correct. The classroom block has been repaired. However, the funds were not enough. Findings
further indicated that parents and other well wishers that included the political leaders
particularly the 2 Members of Parliament, Hon Elija Okupa, Hon Alice Alaso, and the LC III
chairperson also mobilised funds that were used to complete the repair works.
Kyamate Senior Secondary:
Kyamate Senior Secondary is found in Kyamate cell, Kyamate ward, Ntungamo Town council,
Ntungamo District. The Q3 Consolidated Quarterly Progress Report indicates that MoES
released Ushs 44,404,000/= for completion of the administration block at this school.
Findings from the monitoring visit indicated that reported funds were received by the school.
The school administration reported that out of the Ushs 44,404,000/=, Ushs 11,000,000/= was
used to complete the administration block. The civil works included putting the floor, office
furniture, electrical fittings, putting glasses, working on the verandah and the splash apron. All
these were completed.
The head teacher reported that the balance on the school account was Ushs 33,000,000/=. He
also observed that they had received permission from MoES to use these balances to start on the
Main Hall for the school. The head teacher must be commended for the efficient use of the
resources and for the good quality of works for the structures.
Mpanga Senior Secondary:
Mpanga Senior Secondary is one of the traditional schools for rehabilitation and expansion. The
school is located in Fort Portal municipality. By the time of the monitoring visit, Dott services
Repaired Block at Kamod SS

149
Limited was undertaking the civil works. Civil works at this site started on 1st December 2009
and are expected to be completed within one year.
1. A multi purpose hall with a store and kitchen was
at ring bim level. The kitchen has two stores and
2 offices for cooks.
2. A 2 unit science laboratory was a ring bim level.
3. A storied classroom block that will have 3
classrooms down and 3 classrooms on the upper
floor was at casting the middle slab for first floor.
Nkoma Senior Secondary School:
Nkoma S.S. is located in Sebei cell, Nabuyonga parish,
Nothern Division, Mbale Municipality in Mbale District. This is a Universal Secondary
Education (USE) school which has received funds from government for construction of
additional classrooms to accommodate the large USE student population.
Findings indicated that the school has hitherto received UShs 135,000,000/= from Government
of Uganda. The first instalment was UShs 75m received in September 2008 while the second
instalment was UShs 60m received in March 2010. The funds were released directly into the
school account.
Findings showed that construction of a 2 storied classroom
block started on 16th
April 2009. The structure will
accommodate 9 classrooms (3 on the ground, 3 on the first
floor and 3 on the second floor) on completion. It was
reported that the MoES commitment is to complete the
ground floor.
Civil works on the ground floor were in advanced stages. At
the time of the monitoring visit, all works on the ground slab
and all the walling for the ground floor had been completed.
Works were going on the middle slab. The district
engineering assistant closely supervised the civil works. The quality of the works and is very
good.
Pallisa Senior Secondary:
Storied classroom block
Science laboratory

150
Pallisa S.S. which is located in Kawucho ‘A’ village, Hospital ward; Pallisa Town Council in
Pallisa District is a USE school that got funds for construction of additional classrooms from
Government.
Findings indicated that the above school received the initial
release of UShs 75m in 2008. This money was used to
construct a 2 classroom block. This block was completed
and is in use. In April 2010, this school received an
additional UShs 73m.
The additional funds have been used to construct another 2
classroom block and a pit latrine of 3 stances. The civil
works for both the classroom block and the pit latrine was
contracted out to Ripako Limited of P.O.Box 204 Pallisa at
a contract price of 72,500,000/=.
This figure also includes supplying furniture for the same classroom block. By the time of
monitoring, the classroom had been roofed and was at finishes level. The beneficiaries were
satisfied with the quality of civil works up to that level.
Rubaare Senior Secondary:
Rubaare Senior Secondary is a USE school found in Ntungamo District. According the Q3
Consolidated Progress Report, the school received UShs 72,395,720/= for completion of
classroom block, science laboratory and administration block.
Findings from the monitoring visit confirmed that the school received the reported funds. At the
time of the visit, civil works were going on mentioned structures as follows:
1. The 2 unit science laboratory was being plastered. Works on the ceiling, floor, work-tops
and fitting the shutters were going on. The remaining works included putting the glasses
and painting.
2. A 2 classroom block was almost complete. The remaining works included painting,
putting the glasses and furniture.
3. Part of the funds was to furnish the library.
The quality of works was very good and there is value for money.
Serere Secondary School:
Serere Secondary is a USE school located in Airiamet cell, Osuguro parish, Olio sub county,
Serere County, Soroti District. Beginning July 1st2010, this school is now located within the new
District of Serere. However all the implementation was done before Soroti District was split.
Two classroom block at Palisa

151
During the FY 2007/08 the school received UShs 75m for construction of additional classrooms.
The funds were credited to the school account on 12th
November 2007. The funds were used to
construct a 4 classroom block. The contractor used more money than available funds to complete
the classroom block and was not fully paid at that time. So the block was locked for almost 2
years pending payments.
This FY 2009/10, MoES released UShs 42m to the school for completion of the mentioned
block. Findings indicated the funds were credited to the school account on 11th
March 2010.
Following receipt of the funds, Attoti Contractors, was recalled and repaid his balances. By the
time of monitoring he had also completed the remaining civil works on the building. All the
furniture for the 4 classes was supplied. He also formally handed over the structure to the school
administration on 5th
July 2010. The school administration was awaiting an official handover
ceremony by MoES.
Compensation of land for Entebbe Comprehensive S.S
Entebbe Comprehensive S.S. is located in Lugonjo-Nakiwogo LC I, Division B, Entebbe
municipality, in Wakiso District. During FY 2009/10, MoES planned to pay compensation to
squatters on the land belonging to this school. The land occupied by this school formally
belonged to Entebbe Primary Teachers’ College which was phased out during the re-structuring
of 1999. The size of the land was estimated to be between 10-11 acres on plot 298-318 Kiwafu
road.
It was reported that during FY 2008/09 MoES paid UShs 9,000,000/= being costs for surveying
the land of the school. It was also reported that after surveying the land, Entebbe Comprehensive
S.S. was supposed to retain and receive a land title of 4-5 acres and the rest of the land be
allocated to Cavendish University. However, at the time of our monitoring on 18th
June 2010 the
school had no official communication from MoES regarding the size of the land retained.
Findings indicated that both the school administration and Board of Governors (BoGs) were not
involved in the process of compensating the squatters. It was reported that the assessment of
trees, crops and structures was based on Wakiso District compensation rates and the values of the
bibanja were based on the market value of land. There was also a disturbance allowance of 5%
calculated to arrive at the final compensation value for each squatter. The total value
compensation was estimated to be UShs 603,898,108/= as of 20th
February 2009.
The Q3 Consolidated Progress Report indicated that Ushs 303m as second tranche of land
compensation the school was paid. However, it was not clear how much money MoES actually
released as first tranche. It is also not clear how much was actually paid to each of the squatters.
The BoGs and the school administration did not have any information on these figures. They did
not know whether all the squatters had actually been paid.

152
3.2.5 Development of TVET:
The approved budget for Development of TVET (0971) for FY 2009/10 was UShs
4,500,000,000 Out of that UShs 4,481,974,300/= was released. The IFMS system indicates that
at the end of the FY Ushs 4,479,439,011 had been spent. Ushs 2,432,793 was committed and
UShs 102,496/= was unspent.
Four TVET institutions were monitored during this phase of monitoring. In 2 of the institutions
civil were almost complete while in the other 2 works had not started. The findings are detailed
in the following section.
Lumino Community Polytechnique:
Lumino Community Polytechique is situated along Majanji roard, in Bulagi village, Lumino
parish, Lumino Sub County, South Samia Bugwe, Busia District. The Q3 Progress Report from
MoES indicated that the Institute received UShs 135m for construction of 2 classrooms and 2
workshops.
Findings from monitoring indicated that the institution received the reported funds on 1st March
2010. The administration of the institution advertised for construction of the 2 classrooms and
the 2 workshops locally by placing posters at strategic notice boards and locations in the districts
of Busia, Mbale, Bigiri and Tororo. Only 3 bidders responded to the adverts. One of them came
after the expiry of the bid submission deadline and was therefore disqualified. The remaining
two (i.e. St Mugagga and Bagwe Builders) were subjected to the normal evaluation procedures.
In the end the committee recommended St. Mugagga Contractors as the best evaluated bidder to
take the contract. St Mugagga contractors were awarded this contract and therefore mobilised
materials and started construction.
In the meantime the loser, Bagwe Builders, was dissatisfied with the way the process was
conducted and appealed to PPDA to intervene. PPDA therefore wrote to the Institution’s
administration requesting them to stop the construction process pending finalisation of their own
investigations into this matter. By the time of the monitoring visit, all civil works had stopped.
Meanwhile before PPDA stopped the construction process, St. Muggaga Contractors produced a
bank bond worth UShs 25m (i.e. 20%) and was given an advance payment worth that amount.
The balances of the funds (i.e.110m) are all still on the institution’s account.
Given the intervention from PPDA, it was clear that the institution was not going to use the funds
before the end of the Financial Year. However, there was no evidence that the institution
received permission of PS/ST to retain the funds on their account after the FY closed.
153
Nakaseke Polytechnique:
Nakaseke Polytechnique is a new institution which will be located just near Nakaseke District
administration at Butalangu. It will be located within Butalangu village, in Butalangu parish.
According to the Q3 Consolidated Progress from MoES, UShs 135m was released to this
institution for construction of 2 classrooms and 2 workshops.
Findings from the field indicated that the above mentioned funds were received on the District
consolidated account in May 2010. However, by the time of the monitoring visit on 4th
June
2010, construction had not started. All the funds were still on the District consolidated account.
The team was also informed that even the procurement process for this project had not been
concluded. It was very clear that the district was not going to utilise the funds before the close of
this FY. It was not clear whether the district had made arrangements to seek permission of PS/ST
to retain the funds on the District consolidated account.
Ngugo Technical School:
Ngugo Technical School is found in Ngugo I LC I, in Ngugo parish, in Bugamba sub county,
Rwampara county in Mbarara District. The Q3 Consolidated Progress Report indicates that
MoES released UShs 28,775,400/= for procurement of assorted learning tools and equipment for
the Technical School.
Findings from the monitoring visit confirmed that the Technical school received the reported
funds. Findings further indicate that a number of tools and equipment for tropical agriculture
were procured worth UShs 5,498,000/= These tools included, Knap sack sprayers (2), watering
cans (30, pangas (20), secateurs (4), wire strainer (1), burdizzo (2), rubbering (2), elastrator (2),
hot iron dehorner (1), drenching gun for goats (1), drenching gun for cattle (1), hot iron brander
(1), milk can (1), milk bucket (1), trocca and cannular (2), adebeaker (1), ear tag applicator (1),
ear notcher (1), delivery water pipe PVC (200 meters), manual water pump (1), hoove
trimeer/hoove cutter (1), milk strainer (1), a strip cup (1) and an ox-plough (1). The monitoring
team verified that these items were bough; and a number of tools were in use.
A number of tools/equipment for Tailoring/Cutting /Garment department worth Ushs
23,277,400/= were procured. They included the following: designing machine (1), zigzag
sewing machine (1), charcoal flat iron (20), electrical flat iron (20), steam iron (3), tailors
dummy (2), tracing wheel (4), needle threader (5), button hole cutting (5), wooden curves (20),
seam opener/ripper (8), dressing mirro (4), dressing board (1), sleeve board (3), French curves
(7), straight edge (40), hand needles (15), sewing machine needles (20 heads), Used treading
straight sewing machine from Japan (20), hand used sewing machines from Japan (2), ward robe
(2), cutting table (10), sewing tools (10), over locking machine (1). The monitoring team verified
that these items were bought.

154
Findings further indicated that MoES transferred UShs 135,371,600/= to the Technical School
for construction of a 2 classroom block and a twin workshop for Carpentry and Joinery (CJ); and
Brick laying, Concrete and Practice (BCP)courses. These funds were received in October 2009.
The contract for this work was undertaken by Rwakuko Construction and services limited at a
contract sum of Ushs 135,213,600/=. By the time of the monitoring visit, both the 2 classroom
block and the twin workshop were at finishes level.
St Joseph Kyarubingo Technical School:
Kyarubingo Technical School is found in Kyarubingo Cell, Bujomero parish, Buhanda sub
county, Kitagwenda county in Kamwenge District. The Q3 Consolidated Progress Report
indicateD that MoES released UShs 135,000,000/= for construction of 2 classrooms and a twin
workshop.
Findings indicated that the Technical School received the reported funds. The contract for the
works were awarded to VISA Multiplex based in Ibanda for a contract price of Ushs
135,000,000/=. By the time of monitoring on 30th
June 2010, the 2-classroom block had been
roofed and was finishes level. Internal and external plastering was complete. The shutters were
being fixed. Remaining works included working on the verandahs, splash aprons and painting.
The CJ and BCP workshop was also at roofing level. They were going on to the finishes works.
The beneficiaries were satisfied with the quality of works done up to that level.
Recommendation:
MoES should follow up on the PPDA recommendations regarding the procurement at
Lumino Community Polytechnique. MoES should take the necessary actions on the
accounting officer if there is loss of funds to Government resulting from mishandling of
the initial procurement process at this institution.
3.2.6 BTVET
The approved budget for Development of BTVET for FY 2009/10 was UShs 2,700,000,000/=.
Out of that UShs 2,572,739,000/= was released. The IFMS system indicates that at the end of the
FY Ushs 2,572,583,444/= was spent. Ushs 141,600/= was still committed and UShs 13,965/=
was unspent.
Four BTVET institutions were monitored during this phase of monitoring. All the institutions
under this vote function received their funds and works were either going-on or had been
completed. The details are summarized below:
Kaliro Techincal Institute:
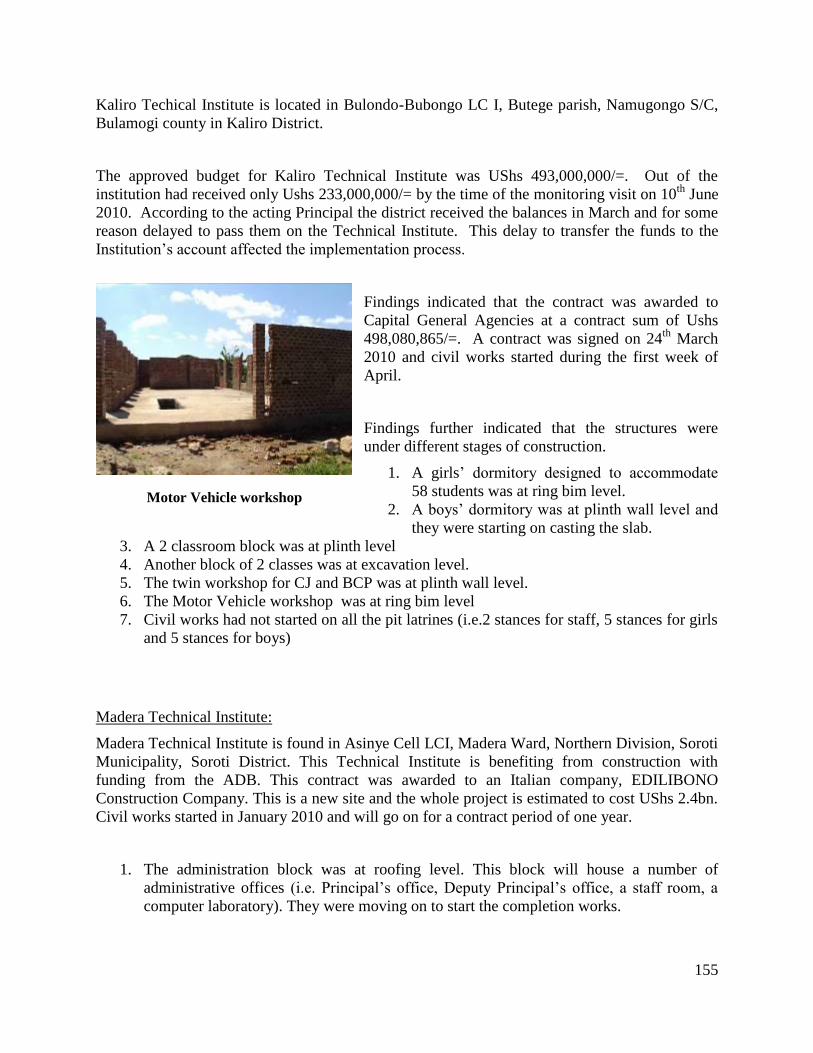
155
Kaliro Techical Institute is located in Bulondo-Bubongo LC I, Butege parish, Namugongo S/C,
Bulamogi county in Kaliro District.
The approved budget for Kaliro Technical Institute was UShs 493,000,000/=. Out of the
institution had received only Ushs 233,000,000/= by the time of the monitoring visit on 10th
June
2010. According to the acting Principal the district received the balances in March and for some
reason delayed to pass them on the Technical Institute. This delay to transfer the funds to the
Institution’s account affected the implementation process.
Findings indicated that the contract was awarded to
Capital General Agencies at a contract sum of Ushs
498,080,865/=. A contract was signed on 24th
March
2010 and civil works started during the first week of
April.
Findings further indicated that the structures were
under different stages of construction.
1. A girls’ dormitory designed to accommodate
58 students was at ring bim level.
2. A boys’ dormitory was at plinth wall level and
they were starting on casting the slab.
3. A 2 classroom block was at plinth level
4. Another block of 2 classes was at excavation level.
5. The twin workshop for CJ and BCP was at plinth wall level.
6. The Motor Vehicle workshop was at ring bim level
7. Civil works had not started on all the pit latrines (i.e.2 stances for staff, 5 stances for girls
and 5 stances for boys)
Madera Technical Institute:
Madera Technical Institute is found in Asinye Cell LCI, Madera Ward, Northern Division, Soroti
Municipality, Soroti District. This Technical Institute is benefiting from construction with
funding from the ADB. This contract was awarded to an Italian company, EDILIBONO
Construction Company. This is a new site and the whole project is estimated to cost UShs 2.4bn.
Civil works started in January 2010 and will go on for a contract period of one year.
1. The administration block was at roofing level. This block will house a number of
administrative offices (i.e. Principal’s office, Deputy Principal’s office, a staff room, a
computer laboratory). They were moving on to start the completion works.
Motor Vehicle workshop

156
2. Two dormitories, one for boys and another for girls, were also at roofing level. Each of
these dormitories will have a capacity of 80 students. The two dormitories will also be
equipped with beds.
3. A storied structure that will accommodate 7 workshops on the ground floor (i.e.
Mechanical works, Fabrication, Building, Carpentry and Joinery, Plumbing, Tailoring
and Electrical) and classrooms with offices on the first floor was at plinth wall level. It
was reported that all the workshops and classrooms will be equipped with the necessary
tools and furniture respectively. The books for the different technical courses will also be
supplied.
4. Construction of a multi-purpose hall with a kitchen attached was at excavation level.
Namisindwa Technical School:
Namisindwa Technical School is found in Bupoto Sub county, Manafwa District. The Q3
Consolidated Progress Report from MoES indicated that Namisindwa Technical School received
UShs 28,775,400/= for procurement of assorted learning tools and equipment. Findings from our
monitoring indicated that the Institute received the reported funds in March 2010.
Findings further indicated that the procurement committee of the Institution procured a number
of tools. The items procured are summarised in the table 3.2.7.
Table 3.2.7: Tools procured by Namisindwa TS
Item Procured Number Cost in UShs
Carpentry machine (wood working
machine/combined surface thicknesser)
1 5,800,000/=
Photo copier (Cannon) 1 3,300,000/=
Computer set (Compaq ) with an HP laser jet
Printer (P 1505)
1 2,250,000/=
Brick laying tools Many ??
Wood working machines (MQ4 42 M) 2 1,900,000/=
Brick laying machine (not yet delivered) 1 ??
Source: Namisindwa T/S:
MoES should follow up on the full accountability of UShs 28,775,400/= because the figures
above given to the monitoring team do not seem to add up to total sum of funds released.

157
Rugando Technical Insititute:
Rugando Technical Institute is found in Bushenyi LCI, Nyakabara parish, Rugando Sub county,
Rwampara county in Mbarara District. The Q3 Consolidated Progress Report indicates MoES
released Ushs 14,200,000/= to the institute for construction of a kitchen.
Findings from the monitoring visit indicated the reported funds were received by the institute.
The funds were credited to the institute’s bank account on 31st May 2010. The Principal reported
that the kitchen had earlier been built by the institute borrowing from other sources internally.
The kitchen also has an office for the caterer, a preparation room, a store and one room with a
bed for whoever is on duty preparing the meals. The received funds have therefore been used to
pay back the borrowed funds.
3.2.7 Development of Teacher Education:
The approved budget for Development of Teacher Education for FY 2009/10 was UShs
2,668,000,000/=. Out of that UShs 2,563,507,000/= was released. The IFMS system indicates
that at the end of the FY all these funds had been spent.
Two Primary Teacher Colleges were monitored. There were a number of defects in Christ the
King PTC in Gulu that have hitherto not been rectified. The details are summarized below:
Buhungiro PTC:
Buhungiro PTC is found in Buhungiro village, Burama LCI, Burama parish, Kashumba sub
county, Bukanga county in Isingiro District. The Q3 Consolidated Progress Report indicated that
MoES had released UShs 5,167,000/= to the PTC for completion of a library.
Findings from the monitoring visit indicated that the library was completed. The Principal
reported that all the defects that had been identified had been rectified.
Christ the King PTC Gulu:
Christ the King PTC is one of the Primary Teachers’ Colleges that received 2 classroom blocks
during the FY 2008/09. Findings indicated that construction of this block was completed in early
2009. Civil works were done by Spider Construction Company. The classroom block is already
being used.
The beneficiaries noted a number of defects that have hitherto not been rectified by the
contractor. It was reported that termites are moving inside the walls of the new classroom block
and had destroyed one of the notice boards inside the classrooms. This means that the contractors

158
did not adequately apply the pesticides in the foundations of the block. Secondly the floors inside
the classrooms are cracked and these cracks need to be fixed. The gutters for the 10,000 litre
tanks which was fixed on-to the block collapsed, the drainage around the water was not well
done as water stagnates, and the soak pit is blocked with mud.
Recommendation:
MoES should follow up on the Spider construction Company to rectify the identified defects on
the classroom block at Christ the King PTC Gulu.
3.2.8 Presidential Pledges for FY 2009/10:
During FY 2009/10 Government provided UShs 10 bn for the implementation of the Presidential
Pledges under the Education Sector. These pledges spread across the Primary, Secondary,
BTVET, TVET and tertiary vote functions. MoES drew out a priority list of the institutions to be
implemented during FY 2009/10. These funds were released to the respective districts accounts
as SFG. The monitoring team sampled out activities in 16 districts to assess the progress of
implementation of the Presidential Pledges for FY 2009/10.
Findings indicated all the districts ear-marked to receive funds for Presidential Pledges this FY
actually received these funds. The progress of implementation in the sampled districts was at
various stages. The details are summarized in the section below.
Primary Schools Constructed under the Presidential Pledges:
During financial year 2009/10 MoES prioritized a number of primary schools that were pledged
to be constructed under the Presidential Pledges. The monitoring team sample out ten primary
schools under this category. The details of each school are summarized below:
Bakulumpagi Primary School:
Bakulumpagi Primary School is found in Kasoso village, in Bulo sub county, Butambala County
in Mpigi District. H.E pledged pledged Ushs 131,000,000/= for construction of 7 classrooms.
MoES prioritized this school to be built during the FY 2009/10.
The district contracted Kimeze Technical Services limited. By the time of monitoring the
progress of construction of the different structures was as follows:
1. A 2 classroom block with an office was at completion level. The block was roofed. All
the internal and external plastering as well as installation of shutters had been completed.

159
2. A 3 classroom block was also at completion level. The block was roofed. Shutters were
fixed. Internal and external plastering as well as flooring was complete. It was only
painting remaining.
3. Another 2 classroom block was also at completion level.
The beneficiaries were happy with the quality of civil works done by the contractor.
Bunaiga Primary School:
Bunaiga Primary School is a UPE school found in Kaatumba zone LCI, Bunaiga parish,
Kateebwa sub county, Bunyangabo County in Kabarole District. H.E the President pledged UShs
10,000,000/= for procurement of iron sheets and cement.
The school administration put in place a procurement committee that managed the funds. By the
time of the monitoring visit on 29th
June 2010, 200 iron sheets and 200 bags of cement for
renovation of a 3 classroom block had been procured. The old 3 classroom block was also being
de-roofed.
Buwama Primary School:
Buwama Primary School is found in Lubugumu village LCI, Lubugumu parish, Buwama sub
county, Mawokota County in Mpigi District. The school was initially supposed to be constructed
around Buwama and was later shifted to Lubugumu. H.E the President pledged Ushs
131,000,000/= for construction of 7 classrooms. MoES prioritized this school to be built during
the FY 2009/10.
The district awarded the contract to Lusina Investments based in Mpigi. By the time of
monitoring the progress of construction for the structures were as follows:
1. A 2 classroom block was at finishes level. It had been roofed and shutters had been fixed.
Internal and external plastering was complete. They were working on the veranda and the
floor. The remaining works included painting.
2. A 3 classroom block was also at the same level as the 2 classroom block above.
3. A 2 classroom block with and office and store was also at finishes level. It had been
roofed and shutters were fixed. They were starting on the internal plastering. The
remaining works included external plastering, working on the floor, the veranda, the
splash apron and painting.
4. Works on the pit latrines were at excavation level. (i.e. 2 stances for staff and 4 stances
for students).
Kalasa Primary School:
Kalasa Primary School is found in Kalasa-Katiiti LC I, in Kalasa parish, Makulubita sub county,
Katikamu county, Luwero district. H.E the President pledged UShs 131,000,000/= for

160
construction of 7 classes at Kalasa primary school. MoES prioritized this school to be built
during FY 2009/10.
Civil works started in February 2010. By the time of the monitoring visit (4th
June 2010), one
classroom block of 2 classes was at ring beam level, another 2 classroom block with offices was
at walling level while the third classroom block of 3 classes was at foundation level. Two stances
of pit latrine for staff and another 5 stances of pit latrines for pupils were also constructed. The
contract for the civil works, awarded at the district level, was undertaken by Bakaseka
Contruction Company. The beneficiaries were satisfied with the quality of civil works up to that
level.
Kangavve Primary school:
This primary School is found in Kangave LC I, Kangave parish, Makulubita Sub county,
Katikamu county, Luwero District. H.E the President pledged 7 classes at Kangavve primary
school. MoES prioritized this school to be built during FY 2009/10 at a cost of UShs
131,000,000/=.
Findings indicated that civil works started in early December 2009. By the time of the
monitoring visit a 2 classroom block was at finishes level. It had been roofed and all the doors
and windows were fixed. Internal and external plastering was complete. Finishing works that
were yet to be done included the floor, the verandah and the splash apron.
Another 2 classroom block with an office and store was also at finishes level. It had been roofed
and windows were fixed. Internal and outside plastering was complete. Finishing works that
were yet to be done included the doors, the floor, the verandah and the splash apron.
A 3 classroom block was at finishes level. It had been roofed and all the doors and windows
were fixed. Internal plastering and outside rendering of the walls was complete. Finishing works
that were yet to be done as on 4th
June 2010 included fixing the doors, working on the floor and
the ramps, the verandah and the splash apron.
The contract for the civil works, awarded at the district level, was undertaken by Muganwa
contractors limited. The beneficiaries were satisfied with the quality of civil works up to that
level.
Kateebwa SDA Primary School:
Kateebwa SDA Primary School is a UPE school found in Kateebwa I LC I village, Kateebwa
parish, Kateebwa sub county, Bunyangabu county in Kabarole district. H.E the President pledged
Ushs 10,000,000/= for procurement of cement and iron sheets to this school. MoES prioritized
this school to be worked on during FY 2009/10.
Findings indicated that the Kabarore district received funds for Presidential Pledge which were
released to the district as SFG. However, there was a delay in transferring these funds to the
school. It was reported that the funds were transferred to the school account on 29th
June 2010,
one day to the end of the FY. Because of this delay the items had not been procured. All the
funds were still on the school account.

161
At the time the monitoring visit the parents were mobilising themselves to collect stones and
contribute bricks, timber and sand for the classroom block.
It is the view of the monitoring team that construction of this school should be taken up by
MoES. The place is remote and the people are poor. Their contribution of bricks, sands and
stones is a good gesture. But it is going to take them a very long time to put up this classroom
block. One resident/parent expressed their plight in their following words:
“It can only be God’s providence to have this project completed. Otherwise, for these
people to contribute enough bricks, enough stones, enough sand, it will be a miracle,
a real miracle....”
Kyamusisi Primary School:
Kyamusisi P/S is found in Kyamusisi LC 1, Kyamusisi/Kalama parish, in Bulera sub county of
Mityana District. H.E the President pledged 7 classes at Kyamusisi primary school. MoES
prioritized this school to be built during FY 2009/10 at a cost of UShs 131,000,000/=.
The District contracted the works to three different contractors (i.e Butamba General Traders,
Sebbu General Merchandise and Winco).
At the time of monitoring on 20th
Many 2010, a 2 classroom block with an office and store being
constructed by Butambala General Traders was at roofing level.
Another 2 classroom block constructed by Sebbu General Merchandise was at ring bim level. A
3 classroom block constructed by Winco contractors was at slab level.
A 2 stance pit latrine for staff was at finishing level while a 5 stance pit latrine for students was
at walling level. These two pit latrines were constructed by Sebbu General Merchandise.
All the contractors at this site were not using the batch box as per the guidelines from CMU-
MoES. They were all using a wheel barrow as a unit of measure for mixing the materials.
Madera Boys Primary School:
Madera Boys Primary School is located in Asinye Cell LC I, Madera Ward, Northern Division,
Soroti Municipality, Soroti District. H.E. pledged UShs 50m towards the completion of this
primary school. This school is one of the schools earmarked for construction under the
Presidential Pledges during FY 2009/10.
The district awarded the contract to Attoti contractors. By the time of monitoring on 7th
June
2010, works were going on and nearing completion. Some changes were made under the
renovations of the original 4 classroom block. One of the classrooms was partitioned to create a

162
new HM’s office, leaving 3 classrooms. Civil works on this block included putting a ring bim
around the entire block, removing the old roof and replacing it with a new one, putting a
provision for a verandah, re-plastering and rendering all the walls, working on the splash apron
as well as painting the entire block.
Naluggi Primary School:
Naluggi Primary School is found in Naluggi LC I in Mityana district. H.E the President pledged
UShs 131,000,000/= for construction of 7 classes at Naluggi primary school. MoES prioritized
this school to be built during FY 2009/10.
The District contracted the works to two different contractors (i.e MJK contractors and
Investment co ltd, Kiyinda C/W contractors). By the time of the monitoring visit, three
classroom blocks were being constructed at this school.
A 2 classroom block constructed by MJK constructors and Investment Company limited was at
ring beam level. Another 2 classroom block with a headmaster’s office and store constructed by
C/W contractors was at completion level. At the time of monitoring on 20th
May 2010, this block
was roofed, internal and external plastering was complete. The floors, verandah and splash
aprons had also been done. It was only the painting that was remaining. The water tank stand had
also been completed. This same contractor had completed construction of pit latrines (i.e. 2
stances for staff and 5 stances for pupils). Construction of the third block of 3 classrooms had not
started.
Semuto Primary School:
Semuto Primary School is found in Church zone LCI, Semuto Town Council, Nakaseke District.
H.E the President pledged 7 classes at Semuto primary school. MoES prioritized this school to
be built during FY 2009/10 at a cost of UShs 131,000,000/=.
The district awarded a contract to Lwotowone Investments Company to construct the 7 classes.
The contractor accepted the award and ferried materials to the site and started the classroom
constructions. However, after this contactor had started civil works for the classrooms, the
School Management Committee disagreed and instead wanted teachers’ houses to be
constructed. Due to this disagreement, construction was interrupted and works stalled. Findings
also indicated the contractor had used own funds up to the level where the structures stalled. In
addition there was no evidence that School Management Committee had received clearance from
MoES to divert the funds from construction of 7 classrooms to teachers’ houses.
Findings further indicated that a Senior Engineer from costruction management unit (CMU)-
MoES made the following technical observations on the structures: The aggregates used were
75mm against the 12-20 mm required, the plinth wall for the 2 classroom block was too high and
could easily fall and that the contractor did not level the ground well and that generally the works
were not to the right specifications.
It is unlikely that these funds will be utilised before the close of the Financial Year.

163
Recommendation:
The CAO of Nakaseke should follow the construction of the Presidential Pledge at
Semuto P/S to ensure that it is fulfilled. The CAO should also follow up on the clearance
from MoES to divert from the original objective of constructing 7 classes to teachers’
houses at the school. He should also get clearance of PS/ST for retention of those funds
on the district since the funds were for FY 2009/10.
Secondary Schools Constructed under the Presidential Pledges:
During financial year 2009/10 MoES prioritized a number of secondary schools that were to be
constructed under the Presidential Pledges. The monitoring team sample out eleven senior
secondary schools under this category to track the progress of implementation. Findings indicate
that the respective districts received the funds and construction was at different stages of
completion. However, findings also indicated that three districts (i.e Ntungamo, Isingiro, and
Kabarole), delayed to transfer funds to the respective schools which delayed the implementation.
In one case in Kiruhura district construction of Buremba S.S. had not started.
Since funds for construction of schools/institutions under Presidential Pledges in districts is
released as SFG, some districts tend to think that all the SFG remitted funds are for their SFG
projects. In many districts this has caused delays in transferring these funds to schools. MoES
should therefore send clear information in time to districts that have construction of
schools/institutions under Presidential Pledges. Districts should also transfer these funds to the
respective schools/institutions quickly in order for these institutions to implement in time.
The details of each school are summarized below:
Aboke Girls:
Aboke Girls Secondary School is found in Apac district. H.E pledged a science laboratory valued
at UShs 140,000,000/=. MoES prioritized this pledge to be implemented during the FY 2009/10.
At the time of monitoring (18th
May 2010), the district had transferred UShs 61,852,021/= to the
school. These funds were received in two instalments of UShs 28,039,006/= received in
November 2009 and UShs 33,813,015/=. As at the time of monitoring the balance of UShs
78,149,979/= had not been received.
Findings indicated that given the shortage of space, the school administration received
authorization from MoES to change the initial designs of the structure. New designs of a storied
structure were approved. In the new designs, the science laboratory block will occupy the ground
floor while the upper floor will have 3 classrooms for ‘A’ level science students. The new
designs of the structure were estimated to cost Ushs 267,965,800/=. Government will meet its
obligation of 140m while the school finds alternative sources to complete the structure.
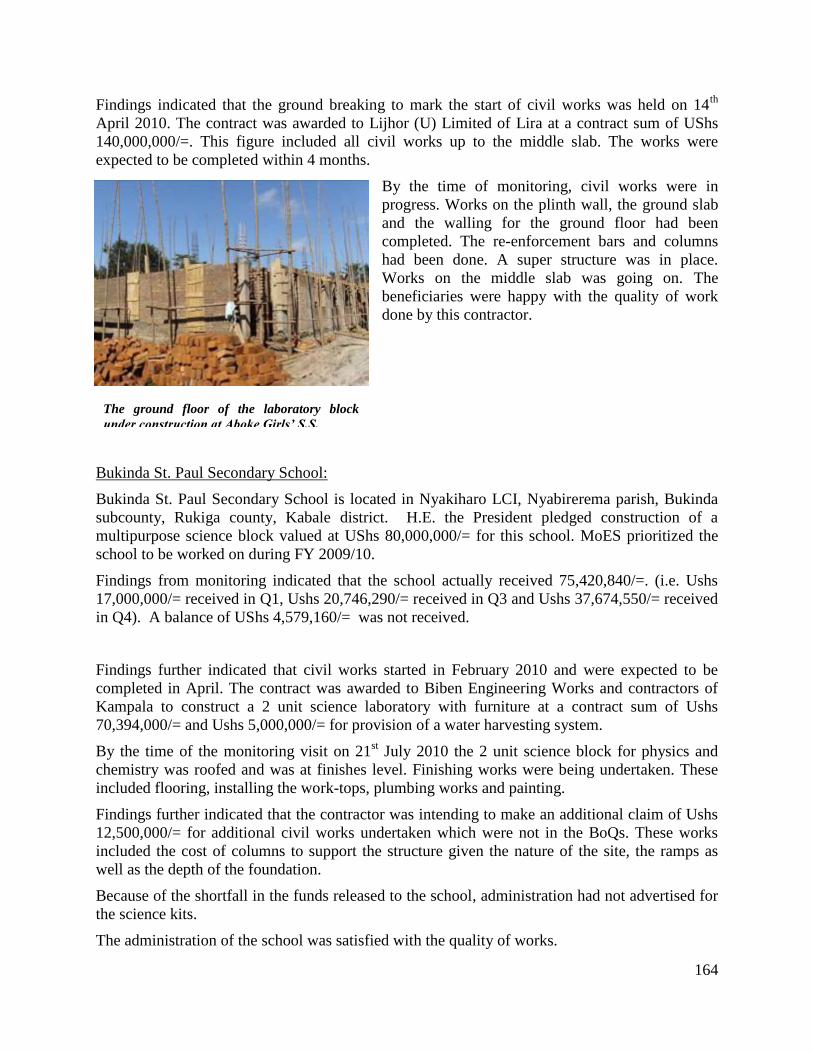
164
Findings indicated that the ground breaking to mark the start of civil works was held on 14th
April 2010. The contract was awarded to Lijhor (U) Limited of Lira at a contract sum of UShs
140,000,000/=. This figure included all civil works up to the middle slab. The works were
expected to be completed within 4 months.
By the time of monitoring, civil works were in
progress. Works on the plinth wall, the ground slab
and the walling for the ground floor had been
completed. The re-enforcement bars and columns
had been done. A super structure was in place.
Works on the middle slab was going on. The
beneficiaries were happy with the quality of work
done by this contractor.
Bukinda St. Paul Secondary School:
Bukinda St. Paul Secondary School is located in Nyakiharo LCI, Nyabirerema parish, Bukinda
subcounty, Rukiga county, Kabale district. H.E. the President pledged construction of a
multipurpose science block valued at UShs 80,000,000/= for this school. MoES prioritized the
school to be worked on during FY 2009/10.
Findings from monitoring indicated that the school actually received 75,420,840/=. (i.e. Ushs
17,000,000/= received in Q1, Ushs 20,746,290/= received in Q3 and Ushs 37,674,550/= received
in Q4). A balance of UShs 4,579,160/= was not received.
Findings further indicated that civil works started in February 2010 and were expected to be
completed in April. The contract was awarded to Biben Engineering Works and contractors of
Kampala to construct a 2 unit science laboratory with furniture at a contract sum of Ushs
70,394,000/= and Ushs 5,000,000/= for provision of a water harvesting system.
By the time of the monitoring visit on 21st July 2010 the 2 unit science block for physics and
chemistry was roofed and was at finishes level. Finishing works were being undertaken. These
included flooring, installing the work-tops, plumbing works and painting.
Findings further indicated that the contractor was intending to make an additional claim of Ushs
12,500,000/= for additional civil works undertaken which were not in the BoQs. These works
included the cost of columns to support the structure given the nature of the site, the ramps as
well as the depth of the foundation.
Because of the shortfall in the funds released to the school, administration had not advertised for
the science kits.
The administration of the school was satisfied with the quality of works.
The ground floor of the laboratory block
under construction at Aboke Girls’ S.S.

165
Buremba Senior Secondary School:
Buremba Senior Secondary School is located in Buremba LC I, Kijooha parish, Buremba sub
county, Kazo county in Kiruhura District. H.E. the President pledged Ushs 278,250,000/=. The
funds are for construction of a 2 unit science laboratory, two dormitories, 3 classroom with
furniture, 8 stances of pit latrines, a water harvesting tank and procurement of science kits.
It took about 4 months to transfer these funds from the consolidated account of Mbarara District
to Kiruhura District’s consolidated account.
Findings further indicated that the initial scope of civil works had changed. MoES has cleared
the school administration to use the funds initially intended for procurement of science kits and
construction of the 2 dormitories to put up 3 teachers’ quarters. On 18th
May 2010, Kiruhura
district administration instructed the school administration to open up a special account for the
funds. Kiruhura district transferred these funds to the school account during the first week of
June 2010.
It was also reported that the procurement process was handled by the District administration. By
the time of the monitoring visit on 25th
June 2010 the process had not been concluded. It was
also not clear whether the district and school authorities received permission from PS/ST to
retain the funds on the school account after the end of the financial year.
Isingiro Senior Secondary:
Isingiro Senior Secondary is found in Kabingo Central LCI, Kaharo parish, Kabingo Sub county,
in Isingiro District. H.E the President pledged UShs 308,800,000/= for construction of 8
classrooms, a library and completion of science laboratories. MoES prioritised this school to be
worked in during the FY 2009/10.
By the time of the monitoring visit on 23rd
June 2010, the District had transferred to the school
UShs 219,949,793/= . This money was transferred from the district consolidated account to the
school in two installments. The initial transfer was UShs 146,679,985/= and the second transfer
was UShs 73,269,808/= in early June. This means that there was a delay to transfer these funds
to the school account.
Findings further indicated that the contract was awarded to Alpha-Gama Engineering Enterprises
limited of Isingiro at a contract price 298,230,502/=. By the time of monitoring, civil works
were going on.
1. A 2 classroom block was at roofing level.
2. A 3 classroom block was also at roofing level.
3. Another 3 classroom block was also at roofing level.
4. The library block was at walling level.
5. Works on the science laboratory had not started by the time of our monitoring visit.

166
It was observed that workers at this site were using the batch box as per the guidelines from
CMU. The beneficiaries were satisfied with the quality of civil works.
Kamwenge Senior Secondary:
Kamwenge Senior Secondary is found in Kyabyoma cell, Kitunzi ward, Kamwenge Town
Council in Kamwenge district. H.E. the President pledged UShs 232,000,000/= for construction
of a 2-unit science labaratory, library, and 2-unit staff house at this school.
By the time of monitoring on 30th
June 2010, the district had transferred only Ushs
218,172,360/= to the school. Out of that UShs 54,542,880/= was credited to the school account
on 30th
June 201038
. UShs Ushs 13,827,640/= was not received.
The school administration received clearance from PPDA to use a force account modality. A
Ground breaking ceremony was held on 5th
June 2010 and civil works started thereafter. A
supervisor of works was recruited. By the time of monitoring visit the progress of civil works
was as follows:
1. A library block was at slab level.
2. A 2 unit science laboratory block was at slab level.
3. Works on the 2 classroom block were at ground slab level
4. Works on the 4 unit staff house had not started.
Katalekammese Modern Secondary School:
Katalekammese Modern Secondary School is found in Kivumu LCI, Kivumu parish, Kito sub
county, Nakaseke County, Nakaseke district. H.E the President pledged UShs 50m to this
school for procurement of construction materials.
Findings indicated that this is a new construction as there was no secondary school in the sub
county and there was nothing on ground at this site. Findings also indicated that the school had
received three instalments totalling to 35,292,500/=39
and was awaiting the final instalment from
the district by the time of the monitoring visit.
Findings showed that the first instalment of UShs 10,530,000/= was used to clear the bush where
the new school is being constructed. Part of it was used to construct pit latrines (4 stances for
staff and 5 stances for students). The community mobilised an additional 2 million shillings to
top up to complete this work. The second instalment of UShs 13,087,620/= was used to
complete a 3 classroom block with a small office that the community had earlier-on started and
which had stalled at window level. This structure was roofed and plastered but it was not fully
completed. However, this structure is under use. Part of this instalment was also used to procure
38
That means that UShs 54,542,880/= was credited to the school account on the last day of the Financial year.
39 UShs 10,530,000/= (received on 13
th October 2009), UShs 13,087,620/= (received on 5
th February 2010) and
UShs 11,774,880/= (received on 16th
May 2010).
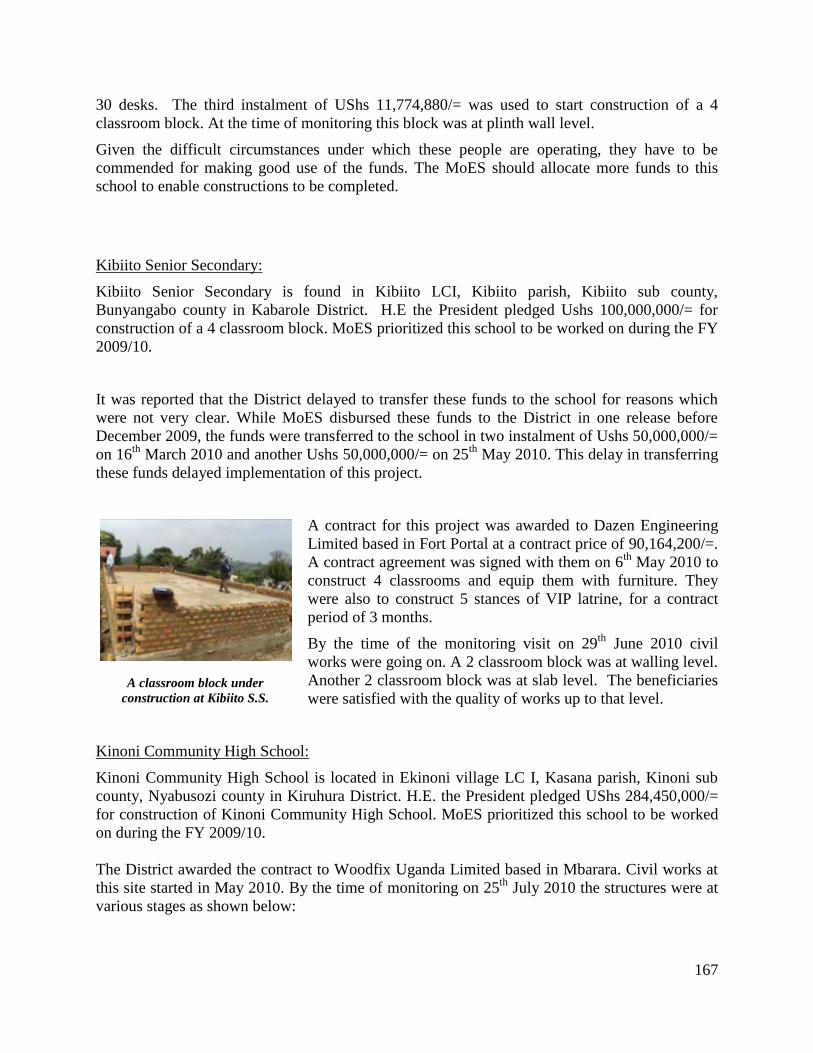
167
30 desks. The third instalment of UShs 11,774,880/= was used to start construction of a 4
classroom block. At the time of monitoring this block was at plinth wall level.
Given the difficult circumstances under which these people are operating, they have to be
commended for making good use of the funds. The MoES should allocate more funds to this
school to enable constructions to be completed.
Kibiito Senior Secondary:
Kibiito Senior Secondary is found in Kibiito LCI, Kibiito parish, Kibiito sub county,
Bunyangabo county in Kabarole District. H.E the President pledged Ushs 100,000,000/= for
construction of a 4 classroom block. MoES prioritized this school to be worked on during the FY
2009/10.
It was reported that the District delayed to transfer these funds to the school for reasons which
were not very clear. While MoES disbursed these funds to the District in one release before
December 2009, the funds were transferred to the school in two instalment of Ushs 50,000,000/=
on 16th
March 2010 and another Ushs 50,000,000/= on 25th
May 2010. This delay in transferring
these funds delayed implementation of this project.
A contract for this project was awarded to Dazen Engineering
Limited based in Fort Portal at a contract price of 90,164,200/=.
A contract agreement was signed with them on 6th
May 2010 to
construct 4 classrooms and equip them with furniture. They
were also to construct 5 stances of VIP latrine, for a contract
period of 3 months.
By the time of the monitoring visit on 29th
June 2010 civil
works were going on. A 2 classroom block was at walling level.
Another 2 classroom block was at slab level. The beneficiaries
were satisfied with the quality of works up to that level.
Kinoni Community High School:
Kinoni Community High School is located in Ekinoni village LC I, Kasana parish, Kinoni sub
county, Nyabusozi county in Kiruhura District. H.E. the President pledged UShs 284,450,000/=
for construction of Kinoni Community High School. MoES prioritized this school to be worked
on during the FY 2009/10.
The District awarded the contract to Woodfix Uganda Limited based in Mbarara. Civil works at
this site started in May 2010. By the time of monitoring on 25th
July 2010 the structures were at
various stages as shown below:
A classroom block under
construction at Kibiito S.S.

168
1. An administration block, that has offices for the head teacher, deputy head teacher, a
bursar and a staff room, was at ring bim level.
2. A 3 classroom block was at ring bim level.
3. A 3 classroom block was at walling level.
4. All the pit latrines were at excavation level (i.e. 2 stances for staff, 5 stances for boys and
5 stances for girls)
Nyamirama Seed S.S.
Nyamirama Seed S.S. is located in Mishenyi LCI, Ntungwa parish, Nyamirama sub county in
Kannungu District. This school started in February 2009 and currently has 2 classes. H.E. the
President pledged UShs 353,000,000/= for construction of a new secondary school in this place.
MoES prioritised this school to be constructed during financial year 2009/10.
Construction of the school, which started in January 2010, was
going on by the time of the monitoring visit. A number of
structures were at different levels of completion.
1. A 3 classroom and a 2 classroom block were at roofing
level
2. A 3 classroom block was ring bim level
3. A 2 unit science block , and an administration block with
offices for the head master, deputy head master, a
staffroom and a store was at roofing level
According to the chairman BoGs, the quality of civil works was commendable.
Rukoni Senior Secondary School:
Rukoni Senior Secondary School is found in Rukoni LCI village, Rukoni parish, Rukoni West
Sub County, Ruhaama county, Ntungamo district. H.E the President pledged UShs 68,000,000/=
for construction of a Multi Purpose Science laboratory. MoES prioritized this school to be
worked on during FY 2009/10.
The head teacher reported that an official from MoES
informed him that funds for his school were released to
the District consolidated account in October 2009.
However, whenever he contacted the District authorities
about the funds they always told him that they were not
aware. Therefore the District delayed to transfer these
funds to the school for reasons that are not very clear.
Classroom block at
Nyamirama SSS
Science Lab. at substructure
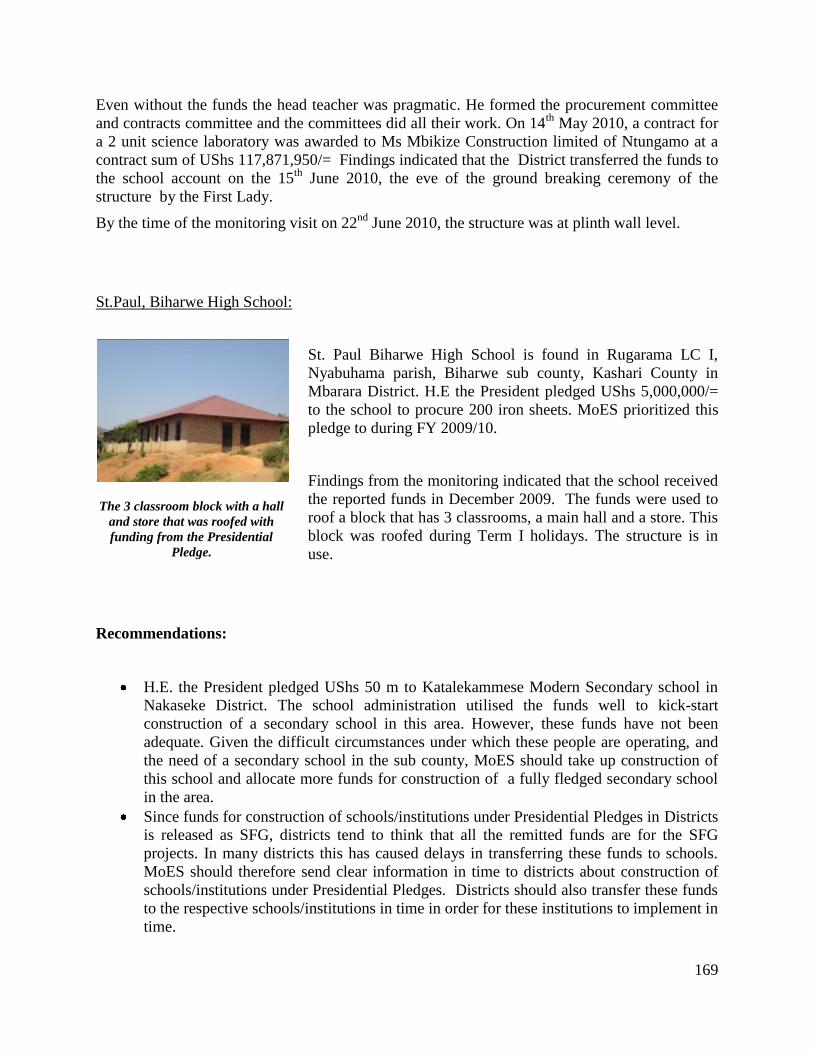
169
Even without the funds the head teacher was pragmatic. He formed the procurement committee
and contracts committee and the committees did all their work. On 14th
May 2010, a contract for
a 2 unit science laboratory was awarded to Ms Mbikize Construction limited of Ntungamo at a
contract sum of UShs 117,871,950/= Findings indicated that the District transferred the funds to
the school account on the 15th
June 2010, the eve of the ground breaking ceremony of the
structure by the First Lady.
By the time of the monitoring visit on 22nd
June 2010, the structure was at plinth wall level.
St.Paul, Biharwe High School:
St. Paul Biharwe High School is found in Rugarama LC I,
Nyabuhama parish, Biharwe sub county, Kashari County in
Mbarara District. H.E the President pledged UShs 5,000,000/=
to the school to procure 200 iron sheets. MoES prioritized this
pledge to during FY 2009/10.
Findings from the monitoring indicated that the school received
the reported funds in December 2009. The funds were used to
roof a block that has 3 classrooms, a main hall and a store. This
block was roofed during Term I holidays. The structure is in
use.
Recommendations:
H.E. the President pledged UShs 50 m to Katalekammese Modern Secondary school in
Nakaseke District. The school administration utilised the funds well to kick-start
construction of a secondary school in this area. However, these funds have not been
adequate. Given the difficult circumstances under which these people are operating, and
the need of a secondary school in the sub county, MoES should take up construction of
this school and allocate more funds for construction of a fully fledged secondary school
in the area.
Since funds for construction of schools/institutions under Presidential Pledges in Districts
is released as SFG, districts tend to think that all the remitted funds are for the SFG
projects. In many districts this has caused delays in transferring these funds to schools.
MoES should therefore send clear information in time to districts about construction of
schools/institutions under Presidential Pledges. Districts should also transfer these funds
to the respective schools/institutions in time in order for these institutions to implement in
time.
The 3 classroom block with a hall
and store that was roofed with
funding from the Presidential
Pledge.

170
BTVET Institutions Constructed under the Presidential Pledges:
During financial year 2009/10 MoES prioritized a number of BTVET that were pledged to be
constructed under the Presidential Pledges. The monitoring team sample out four under this
category to track the progress of implementation. Findings indicate that the respective Districts
received the funds and construction was at different stages of completion. The details of each
institution are summarized below:
Kasese Youth Community Polytechnic
Kasese Youth Community Polytechnic is located in Rukoki LC I , Rukoki parish, Rukoki sub
county, Busongora county, Kasese District. H.E. the President pledged UShs 384,000,000/= to
construct a new community polytechnic.
Findings indicated that Kasese District received the funds for construction of the Presidential
Pledge. By the time of our monitoring on 29th
June 2010, the contract for the works had been
awarded to Mariam and Brothers Trading Company based in Kasese. However, construction had
not started.
It was also not clear whether the district had received clearance from PS/ST to retain the funds
had not been spent and the FY was ending the following day.
Kitagwenda Technical School:
Kitagwenda Technical School is found in Kiryanga village LCI, Ntara parish, Ntara sub county,
Kitagwenda county in Kamwenge District. H.E the President pledged UShs 434,000,000/= for
construction of this new Technical Institute.
Findings indicated that Kamwenge District received these funds for construction of a Presidential
Pledge. The District awarded the contract to Kinombe-Nyaruzinga Construction Company. Civil
works started on 28th
April 2010. By the time of our monitoring visit works on a number of
structures was going on as follows:
1. A boys’ and a girls’ dormitory each to house 56 students was at roofing level. .
2. A 2 classroom block was at slab level. They were starting on the walling.
3. A 2 classroom block and an administration block at roofing level. The administration
block has offices for the principal, the deputy principal, the bursar, store, receptionists
and a staffroom.
4. A twin workshop for BCP and CJ was at foundation level.
5. The Motor Vehicle workshop was at foundation level. The foundation trenches had been
excavated but were not casted.
171
6. Works on the pit latrines had not yet started.
Findings indicated that there were items that were not included in the drawings but which were
included in the BoQs. These included the columns for both walls and foundations for all the
structures, the ground bims for all the structures, the concrete worktops in the dormitories and
the BRC on the floor slab for all the structures. It was also reported that the roof tuss in the
drawings was single. However, the supervisor of works instructed them to use double.
Recommendation
Construction Management Unit, in MOES should scrutinize the drawings before giving them to
contractors.
Nakapiripirit Technical School:
Nakapiripirit Technical School is one of the Institutions under the Presidential Pledges that were
constructed during last FY 2008/09. The Institution was allocated a total budget of UShs
334,500,000/=. The funds were intended for construction of 4 classrooms, 2 workshops and 2
dormitories.
Findings from monitoring indicated that construction at this institution was never complete. A 2
classroom block was left incomplete with no doors, windows, glasses; both internal and external
plastering, the floor, the verandah and splash aprons were not done. It was not painted.
A dormitory block was also left incomplete with no doors, windows and glasses. Both the
internal and external plastering, the floor, the verandah and splash aprons were not done. It was
not painted.
There was another block either a classroom or a workshop. However, this block was not roofed.
It was abandoned at roofing level.
Recommendation
MoES will have to follow up on the contractor who did not complete these civil works and take
the necessary corrective measures. It is also worth noting that the defects liability period for this
has expired.
Namutamba Demonstration:
Namutamba Demonstration School is found in Kiwanda LCI, Namutamba parish, Bulera sub
county, Mityana District. This is one of the schools planned to be constructed under the
Presidential Pledge during FY 2009/10.
Findings from the monitoring visit, showed that three classroom blocks were being constructed
at this school. The District contracted the works to three different contractors (i.e MK
contractors, Nakiduduma contractors and Naama Agro consultants). All the civil works at this
site started in April 2010.

172
As at the time of our monitoring on 20th
May 2010, a 3 classroom block constructed by MK
contractors was at ring bim. Another 2 classroom block constructed by Nakiduduma contractors
was at wall plate level. A third classroom block with 2 classes with an office and a store
constructed by Naama Agro consultants was at window level.
3.2.9. Inspection Grant:
During the FY 2009/10, a total of UShs 2.5 billion was provided as Inspection Grant. This
money was supposed to be used by the District Inspectorate Departments to supervise the
teaching and learning environments in all schools. Each of the respective 91 districts had their
respective approved IPFs.
During this monitoring officers from total of 26 districts were interviewed to find out their views
on this grant during the course of this FY.
Findings indicated that the way the Inspection Grant was disbursement to all districts during the
course of the FY 2009/10 had a lot of problems. Firstly all districts reported that while the
disbursement was supposed to be quarterly, this was not the case. Almost all districts visited
reported receiving the first instalment of the Inspection Grant at the end of April (i.e. at the end
of Q3).40
Funds for three quarters were released in one lump-sum to all districts. Many schools
were closing at that time and some districts were unable to utilize the grant. Secondly even this
instalment was only part of the total approved IPF. By the time of the monitoring visit, all the
balances of this grant had not reached the district education accounts for the districts visited.
Some districts such as Oyam, reported that they had not received any Inspection funds this FY as
on 18th
May 2010 the date of monitoring despite fully accounting for all earlier inspection
releases.
The disbursement of the Inspection Grant during FY 2009/2010 jeopardized the inspection
operations for most districts in the country. Education departments in all districts were unable to
carry out fully their planned inspection activities for terms II and III of 2009 as well as term I of
2010.
A few districts reported that some inspections were done by pegging the inspection activity to
other programmes that had funds. In some districts such as Apac, inspection was only done with
assistance of some development partners such as Save the Children who provided some fuel to
the education departments.
40
This was the case in Lira, Apac, Gulu, Nakapiripirit

173
Due to the poor disbursement of funds this FY, many districts reported that there only able to
monitor the beginning of term II of 2010 and activities of Term III. All districts visited noted that
even the balances of the Inspection Grant were going to delay yet the accountability for the same
will be demanded immediately. An example was given by Gulu district where the final release of
the grant for last FY 2008/09 was received on 23rd
June 2009 seven days to the end of the FY.

174
3.3 ENERGY
3.3.1 Introduction
Main aims and objectives of the energy sector:
The Ministerial Policy Statement for the Ministry of Energy and Mineral Development (MEMD)
(FY 09/10) identifies four key priorities for the energy sector over the medium term. These are:
to increase electricity generation capacity and expansion of the transmission line
network;
to increase access to modern energy through rural electrification and renewable energy
development;
promotion and monitoring of petroleum exploration and development in order to achieve
local production; and
mineral investment promotion through the acquisition of geo-scientific data and capacity
building41
.
The total approved budget for the Energy and Mineral Development sector (inclusive of donor
project funding and excluding taxes and arrears) is UShs 699 billion for FY 09/10. This is a 51%
increase in total budget on FY 08/0942
. Of this, GoU expenditure (excluding taxes and arrears)
totals UShs 350 billion.
Scope of the report:
The aim of this report is to assess whether expenditure in the energy sector achieves value for
money: i.e. whether it is efficient and effective. The report will consider whether financial
expenditure is commensurate with observed physical performance for development projects
under vote functions 0301 (Energy Planning, Management and Infrastructure Development),
0302 (Large Hydropower Infrastructure) and 0303 (Petroleum Exploration, Development and
Production); which together comprise 98% of GoU energy sector expenditure43
.
BMAU monitored progress in the energy sector during Q1, Q2 and Q3 of FY 09/10. This report
updates progress at Q4 FY 09/10 as well as providing an assessment of annual performance for
FY 09/10 (based on projects monitored by BMAU over the financial year). Table 3.1.1 gives an
overview of projects and outputs monitored during FY 09/10 as well as giving a broad
assessment of annual performance of outputs monitored.
Methodology:
41
MEMD Ministerial Policy Statement 2009/10 (Kampala 2009) 42
MoFPED Medium Term Economic Framework (Kampala 2009)
43 Defined as total GoU expenditure before tax and arrears deductions are made

175
Efficiency and effectiveness of expenditure is assessed though comparison of reported financial
and physical performance with that observed during field observations. In line with the output
based budget structure, outputs reported in MEMD Performance Contract Form A are verified.
Efficiency and effectiveness are defined here as follows:
Efficiency: comprises allocative efficiency (proportion of expenditure on high and low
priority areas) and operational efficiency (delivery at the lowest possible unit cost);
Effectiveness: is the extent to which the intended goals are achieved. This report will
consider the quality of: (i) project planning; (ii) service delivery; (iii) beneficiary
satisfaction; and (iv) management and operation.
Financial data is sourced from the Integrated Financial Management System (IFMS) for GoU
expenditure and from project profiles in the Public Investment Plan44
for donor components.
Prior to field visits potential outputs for monitoring are identified using the Ministerial Policy
Statement quarterly work plans45
, Rural Electrification Agency (REA) work plans, and reported
progress in Performance Contract Form A46
. Detailed project contracts and progress documents
are obtained from various sources including MEMD, REA, and Uganda Electricity Transmission
Company (UETCL) colleagues. During field visits information is collected through interviews
with officials on site; with local government officials; and with beneficiaries. Observations are
compared with that of previous monitoring visits.
Limitations:
Capital development activities undertaken within the energy sector tend to be financed by donors
or private sector investors. Many activities take the form of public-private partnerships (such as
hydropower development or oil exploration) or public-donor partnerships (such as rural
electrification projects implemented by REA).
The prevalence of public-private and public-donor partnerships in the energy sector has a
number of implications for project monitoring:
The majority of spending is not visible on the IFMS accounting system because it is
donor or privately funded. This makes analysis of planned versus actual expenditure,
absorptive capacity and operational efficiency problematic;
Donors and private firms may be unable or unwilling to provide detailed financial
information;
Where projects are not implemented by government there may be limited scope for action
when challenges and recommendations are identified.
In addition to the above, many of the activities implemented by REA and UETCL are not fully
captured in Performance Contract Form A reporting. This means that MEMD progress reports
do not fully capture the extent of ongoing works in the sector (despite their inclusion in the
44
MoFPED Public Investment Plan FY 2009/10-2011/12 (Kampala 2009) 45
MEMD Ministerial Policy Statement 2009/10 (Kampala 2009)
46 MEMD Central Government Performance Contract Form A (Kampala 2009

176
Ministerial Policy Statement). This issue will be discussed more fully as part of section 3.3.5
(key policy issues).

177
Table 3.3.1: Energy sector development projects: summary of annual performance based on BMAU monitoring activities FY
09/10
Financial information
Q3FY 09/10
Outputs monitored by BMAU
Locations monitored Time of monitoring
Planned achievements
(sector annual work plan)
Actual achievements
(observed by BMAU)
Realisation of targets
VF: 0301; Project 0325 Energy for Rural Transformation
GoU Budget: UShs 2.2 bn.
Release:
UShs 1.15 bn.
Expenditure: UShs 0.12 bn.
Energy Efficiency Promotion
Solar Panels in Schools monitored in (Kamuli, Bushenyi, Luwero)
Q2
Not reported in work plan 29 of 30 schools sampled had received solar panels.
Not possible to assess target – but BMAU found scheme was popular with beneficiaries.
Renewable Energy Promotion
Gasifier technology monitored in (Kampala, Masindi)
Q1, Q2, Q4
Promote gasifier technology
The three gasifiers installed at public institutions are not functional.
Behind target – gasifier promotion not successful.
VF: 0301; Project 0940 Support to Thermal Generation
GoU Budget: 174.5 bn.
Release:
UShs 105.6 bn.
Expenditure: UShs 64.4 bn.
Not monitored by BMAU.
n/a n/a Subsidise thermal power generation.
Not monitored by BMAU.
Performance Contract Form A reports that subsidies have been paid.
VF: 0301; Project 0331 Rural Electrification
GoU Budget: UShs 25.16 bn.
Release:
UShs 12.34 bn.
Expenditure: UShs 8.47 bn.
Increased Rural Electrification
Transmission/ distribution infrastructure monitored in (Pader, Bundibugyo, Kasese, Kyenjojo, Iganga, Bugiri, Kaberamaido,
Q2, Q3, Q4
Various transmission projects are reported in work plan but these do not fully reflect activities undertaken by REA.
Transmission infrastructure financed by Sida is complete; schemes under JICA and PRDP finance are ongoing.
Not possible to assess progress as targets were not accurately reported in sector work plans.

178
Tororo)
Small hydro-electric plants monitored in (Rukungiri, Kamwenge, Kanungu, Hoima, Paidha, Kasese)
Q1, Q2, Q3, Q4
Hydropower facilities are not recorded in work plans.
Bugoye and Kisiizi HEPs are complete. All others expect to complete by end of 2010.
UEDCL generators purchased in FY08/09 (Moyo, Adjumani, Moroto)
Q2, Q4 This scheme is from FY08/09.
UEDCL generators purchased and in operation.
VF: 0301; Project 0999 Power Sector Development Operation
GoU Budget: UShs 50.1 bn.
Release:
UShs 25 bn.
Expenditure: UShs 0.07 bn.
Thermal and Small Hydro Power Generation
Mutundwe thermal plant (Kampala)
Q4 50 MW Mutundwe plant operational
Plant is in operation. Target met.
Energy Efficiency Promotion
Energy audits verified (Kampala)
Q4 Energy audits conducted in 120 schools, 6 universities, NWSC, 10 industries, 20 public buildings.
Evidence of audits observed.
Targets met.
VF: 0301; Project 1023 Promotion of Renewable Energy and Energy Efficiency Programme
GoU Budget: UShs 0.21 bn.
Release:
UShs 0.16 bn.
Expenditure: UShs 0.15 bn.
Renewable Energy Promotion
Institutional stoves (Luzira and Kauga prisons)
Household stoves (Arua, Yumbe)
Q1, Q2 100000 improved household and 80 improved institutional stoves disseminated
BMAU sample size small but suggest target exceeded.
Targets met.

179
VF: 0301; Project 1024 Bujagali Interconnection Project
GoU Budget: UShs 5 bn.
Release:
UShs 2.46 bn.
Expenditure: UShs 0 bn.
Thermal and small hydro generation (UETCL)
Bujagali interconnection infrastructure (Jinja)
Bujagali hydropower project (Jinja)
Q1, Q3 Construction of transmission infrastructure.
Construction of transmission is ongoing but behind schedule.
Hydropower project now expected to complete April 2012.
Behind target - transmission infrastructure is behind schedule but should be complete in time for HEP commissioning.
VF 0301; Project 1025 Karuma Interconnection Project
GoU Budget: UShs 0
Release: n/a
Expenditure: n/a
Government Buildings and Service Delivery Infrastructure
Discussions with UETCL officials in Kampala as no works ongoing on site.
Q4 Feasibility study report on resettlement action plan (RAP) for Karuma Interconnection Project available.
Consultants awarded contract for feasibility study. Inception Report and Economic and Social Impact Assessment have been submitted.
Behind target – feasibility study is ongoing.
VF 0301; Project 1026 Mputa Interconnection Project
GoU Budget: UShs 32.07 bn.
Release:
UShs 14.43 bn.
Expenditure: 14.01 bn.
Thermal and small hydro generation (UETCL)
Discussions with UETCL officials in Kampala as no works ongoing on site.
Q4 Early Production Scheme activities;
RAP Nkenda–Mbarara.
Early Production Scheme is undergoing feasibility study.
RAP is ongoing; 57% of disclosures have been made.
Targets met.
VF 0302; Project 0985 Energy Fund
GoU Budget: UShs 191.28 bn.
Release:
UShs 143.4 bn.
Expenditure: UShs 143.4 bn.
Increased power generation – large scale hydro-electric
Discussions with UETCL officials in Kampala as no works ongoing on site.
Q4 Commence construction of Karuma power project;
Complete feasibility study for Karuma and Isimba power projects.
Feasibility study for Karuma HEP has commenced; feasibility study for Isimba has commenced but financed outside of Energy Fund.
Behind target – feasibility studies are not complete.

180
VF 0303; Project 0985 Petroleum Exploration Promotion
GoU Budget: UShs 8.6 bn.
Release:
UShs 5.9 bn.
Expenditure: UShs 3.7 bn.
Capacity Building for the Oil and Gas sector
PEPD offices (Entebbe); Albertine Graben.
Q3, Q4 National expertise for the oil and gas developed;
Creation of new institutions. Commencement of petroleum production, refining and utilisation.
Expertise developed; development of institutions awaiting approval of the Petroleum Bill; exploration and well testing is ongoing.
Capacity building targets met. Other targets dependent on approval of Petroleum Bill and progress of private sector developers.
Source: IFMS 2010; MEMD 2009; Fieldwork observations.

181
3.3.2 Energy Planning, Management and Infrastructure Development
Vote Function 0301:
Vote function 0301 receives 72% of the total energy sector budget (GoU plus donor). Its
strategic objectives are: (i) to review and put in place modern policies; (ii) to increase the energy
mix and to promote and co-invest in new generation and transmission; (iii) to facilitate private
sector participation and capital inflow; (iv) to promote rural electrification; (v) to carry out
training and capacity building; (vi) to carry out energy audits and consumer awareness; and (vii)
to promote and regulate atomic energy47
.
(a) Project (0325) Energy for Rural Transformation
Background:
Energy for Rural Transformation (ERT) is a two phase project designed to develop Uganda’s
rural energy and information/communication technology sector, so that they make a significant
contribution to bringing about rural transformation48
. Phase I of ERT took place from 2002 to
2009, with a total expenditure of approximately $200 million49
. Phase II of ERT was due to
begin implementation during FY 09/10 but activities are still in planning stage.
The Public Investment Plan states that planned expenditure for project 0325 over June 2009 to
June 2013 is US$100 million50
. GoU approved budget for project 0325 for FY 09/10 was UShs
2.2 billion, which represents approximately 0.75% of total GoU expenditure for the vote
function, and approximately 0.44% of total GoU expenditure in the energy sector as a whole.
BMAU has provided a full impact evaluation of ERT phase I elsewhere51
and so a value for
money assessment is not made here. However, during FY 09/10, BMAU provided in depth
analysis of following outputs under ERT phase I:
(i) Output 030102: Energy Efficiency Promotion: solar panel installation in schools
component (Q2)
(ii) Output 030103: Renewable Energy Promotion: gasifier technology component (Q1,
Q2, Q4)
Financial performance:
Planning activities of phase II of ERT commenced in December 2009. As shown in figures 3.3.1
and 3.3.2, release and expenditure for the project were low up to Q3 FY 09/10 because physical
implementation of activities has yet to commence. Approved GoU budget for FY 09/10 was
47
MEMD Ministerial Policy Statement 2009/10, (Kampala 2009) 43 48
MoFPED Public Investment Plan FY 2009/10-2011/12 (Kampala 2009) 298 49
MEMD Energy for Rural Transformation Phase I Implementation Completion Report (Kampala August 2009) 47
50MoFPED Public Investment Plan FY 2009/10-2011/12 (Kampala 2009) 298
51 Ibid.

182
approximately UShs 2.2 billion. By March 2010 (Q3), 52% of approved budget had been
released and 10% of released funds had been spent. In sum, only 5% of approved budget had
been spent by Q3.
Of expenditure to March 2010, 40% was on ‘Contract Staff Salaries’; 17% was on ‘Staff
Training’; 15% was on ‘Allowances’; 11% was on ‘Travel Inland’. The remaining 17% was on
other line items. The recurrent nature of the project expenditure reflects the fact that capital
expenditure on ERT will be largely sourced from donor funds.
Figure 3.3.1 Figure 3.3.2
Source: MoFPED 2010
Physical performance:
Phase I of ERT was implemented from July 2002 to February 2009, after receiving a two years
and eight months extension. According to the ERT phase I completion report, the major
achievements were: (i) increased access to rural electricity from 3% to about 6%; (ii) installation
of 371,975 watt peaks geared towards improved service delivery in water, health and education
sectors; (iii) supported installation of over 1,100,000 watt peaks through the private sector; (iv)
increased renewable generation capacity of over 15MW; and (v) a 30MW reduction in peak
demand from the National Grid52
.
BMAU has provided a full impact evaluation of ERT phase I elsewhere53
and so the above
achievements have not been verified within BMAU quarterly reporting. Quarterly monitoring
reports did however provide in-depth analysis of the solar installation in schools, and gasifier
technology components. Findings are detailed below.
52
MEMD Energy for Rural Transformation Phase I Implementation Completion Report (Kampala August 2009), ix
53 Ibid.
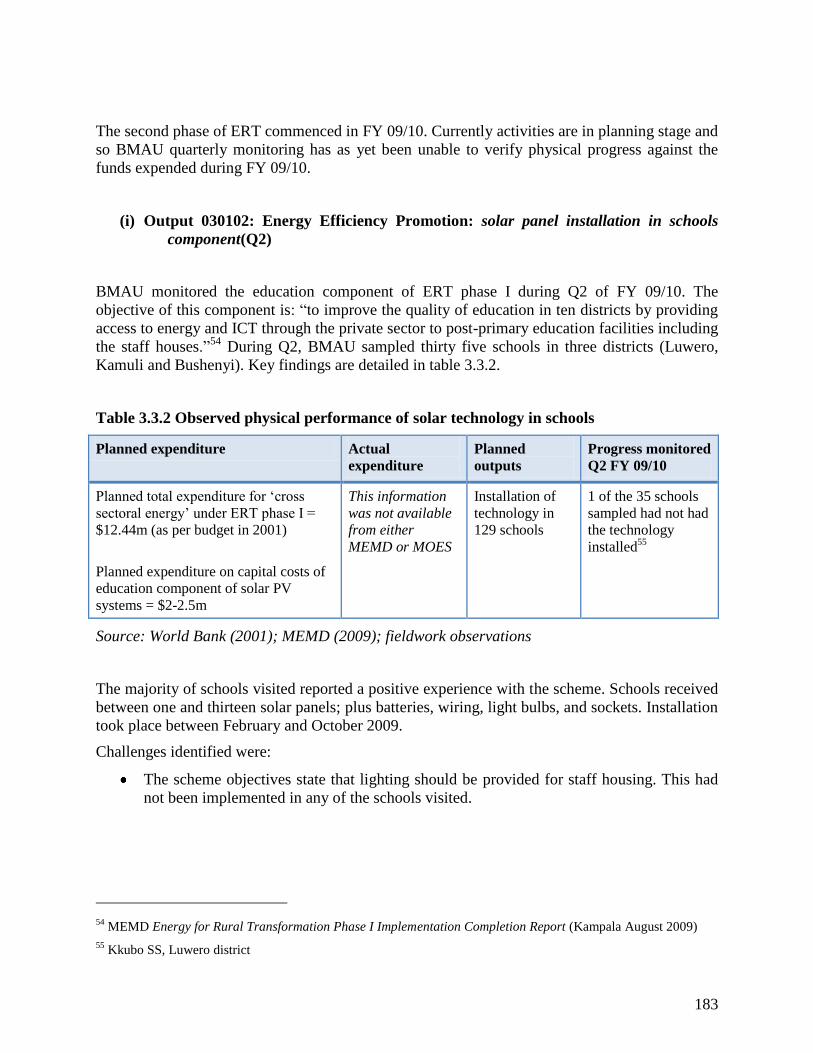
183
The second phase of ERT commenced in FY 09/10. Currently activities are in planning stage and
so BMAU quarterly monitoring has as yet been unable to verify physical progress against the
funds expended during FY 09/10.
(i) Output 030102: Energy Efficiency Promotion: solar panel installation in schools
component(Q2)
BMAU monitored the education component of ERT phase I during Q2 of FY 09/10. The
objective of this component is: “to improve the quality of education in ten districts by providing
access to energy and ICT through the private sector to post-primary education facilities including
the staff houses.”54
During Q2, BMAU sampled thirty five schools in three districts (Luwero,
Kamuli and Bushenyi). Key findings are detailed in table 3.3.2.
Table 3.3.2 Observed physical performance of solar technology in schools
Planned expenditure Actual
expenditure
Planned
outputs
Progress monitored
Q2 FY 09/10
Planned total expenditure for ‘cross
sectoral energy’ under ERT phase I =
$12.44m (as per budget in 2001)
Planned expenditure on capital costs of
education component of solar PV
systems = $2-2.5m
This information
was not available
from either
MEMD or MOES
Installation of
technology in
129 schools
1 of the 35 schools
sampled had not had
the technology
installed55
Source: World Bank (2001); MEMD (2009); fieldwork observations
The majority of schools visited reported a positive experience with the scheme. Schools received
between one and thirteen solar panels; plus batteries, wiring, light bulbs, and sockets. Installation
took place between February and October 2009.
Challenges identified were:
The scheme objectives state that lighting should be provided for staff housing. This had
not been implemented in any of the schools visited.
54
MEMD Energy for Rural Transformation Phase I Implementation Completion Report (Kampala August 2009)
55 Kkubo SS, Luwero district

184
The evaluation report for phase I of ERT states, “The institutions are willing to meet the
maintenance costs such as replacement of broken bulbs”56
. This was not consistent with
the BMAU interview findings: most schools find it difficult or impossible to cover
maintenance costs themselves. The schools sampled were remote and raised limited funds
from school fees.
(ii) Output 030302: Renewable Energy Promotion: gasifier technology component (Q1,
Q2, Q4)
Gasifier generators have been installed at three government institutions (Kyambogo University,
Kings College Buddo and Nyabyeya Forestry College). BMAU visited Kyambogo University
and Kings College Buddo in Q1, Q2 and Q4 and Nyabyeya College in Q4. Previous field visits
found that works were more than three years behind schedule and that gasifiers were not in use.
Table 3.3.3 gives findings from Q4 monitoring.
MEMD were unable to provide a detailed breakdown of the financial performance of this
scheme. Officials from MEMD reported that the total cost of electro-mechanical equipment and
the gasifiers themselves was $250,000 in total.
Table 3.3.3: Observed physical performance of gasifier installations
Cost of works Planned output Observed physical performance, Q4 FY
09/10
Kings College (Buddo, Kampala)
Not available.
Cost of civil works
estimated at UShs 45
million.
Gasifier installed in kitchen
area for cooking purposes.
The gasifier was not in operation and no
progress had been made since the
previous BMAU visit in Q2 FY 09/10.
The gasifier machine has been installed
but the electronic components have not
been connected.
The machine needs a three-phase
electricity connection in order to work,
which MEMD have asked the school to
fund. The school have not been provided
with evidence to show that an investment
in a three –phase will be cost effective.
The gasifier will require grid electricity
as well as wood for fuel, and so running
costs are likely to be high.
56
MEMD Energy for Rural Transformation Phase I Implementation Completion Report (Kampala August 2009)
XV
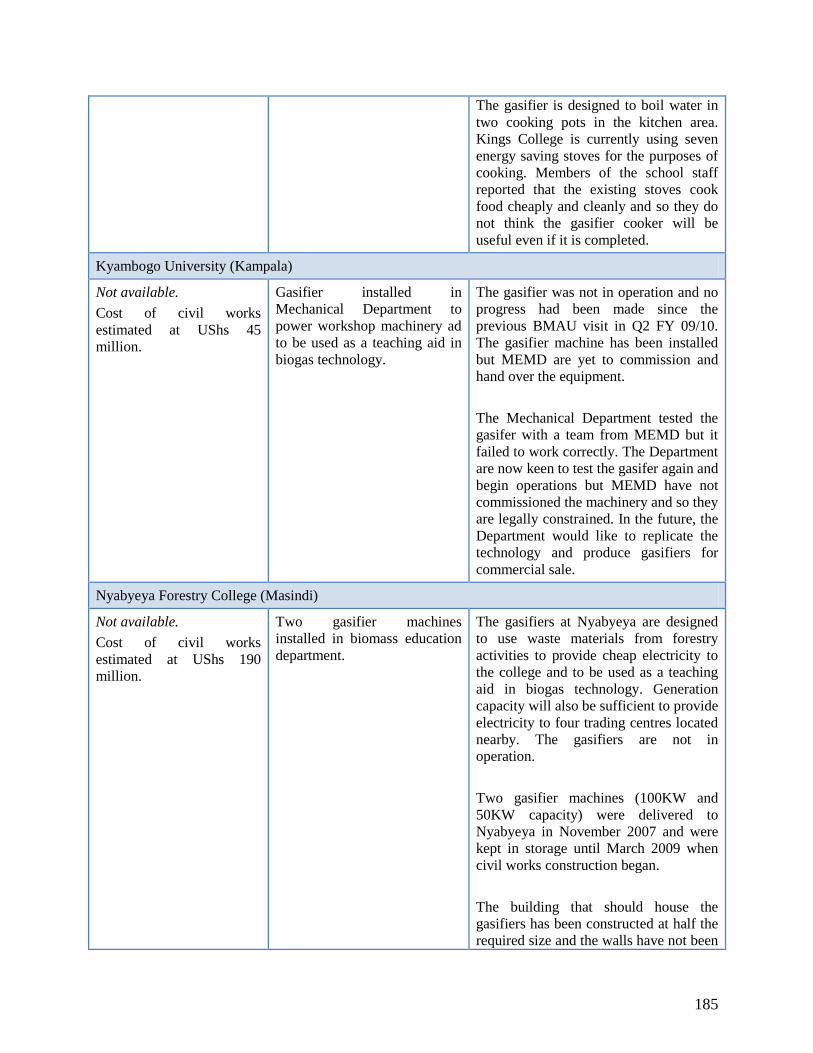
185
The gasifier is designed to boil water in
two cooking pots in the kitchen area.
Kings College is currently using seven
energy saving stoves for the purposes of
cooking. Members of the school staff
reported that the existing stoves cook
food cheaply and cleanly and so they do
not think the gasifier cooker will be
useful even if it is completed.
Kyambogo University (Kampala)
Not available.
Cost of civil works
estimated at UShs 45
million.
Gasifier installed in
Mechanical Department to
power workshop machinery ad
to be used as a teaching aid in
biogas technology.
The gasifier was not in operation and no
progress had been made since the
previous BMAU visit in Q2 FY 09/10.
The gasifier machine has been installed
but MEMD are yet to commission and
hand over the equipment.
The Mechanical Department tested the
gasifer with a team from MEMD but it
failed to work correctly. The Department
are now keen to test the gasifer again and
begin operations but MEMD have not
commissioned the machinery and so they
are legally constrained. In the future, the
Department would like to replicate the
technology and produce gasifiers for
commercial sale.
Nyabyeya Forestry College (Masindi)
Not available.
Cost of civil works
estimated at UShs 190
million.
Two gasifier machines
installed in biomass education
department.
The gasifiers at Nyabyeya are designed
to use waste materials from forestry
activities to provide cheap electricity to
the college and to be used as a teaching
aid in biogas technology. Generation
capacity will also be sufficient to provide
electricity to four trading centres located
nearby. The gasifiers are not in
operation.
Two gasifier machines (100KW and
50KW capacity) were delivered to
Nyabyeya in November 2007 and were
kept in storage until March 2009 when
civil works construction began.
The building that should house the
gasifiers has been constructed at half the
required size and the walls have not been
186
completed (see photographs below). The
works are also of poor quality. In order
to install the gasifiers, the existing
building needs to be extended to proper
size, walls need to be completed and
poor quality concrete works in the water
cooling area need to be improved.
In order for the gasifiers to function,
electrical installation needs to take place,
faulty turbines on the generators need to
be replaced and exhaust pipes need to be
installed.
To provide power for the college, a
power line is needed to connect the
gasifiers to the switch board room
(around 300 metres of cable). Additional
cables will need to be constructed to
provide power to the local communities.
Source: cost figures from MEMD officials; fieldwork observations.
BMAU has previously recommended that a value for money assessment of gasifier technology
take place (see Q2 monitoring report). Official communication from MEMD indicated that such
a review would take place before gasifiers are implemented as part of ERT phase II.
Challenges:
None of the gasifiers are currently functional and staff at all three institutions were
dissatisfied with the way in which MEMD have managed this scheme. The amount of
additional work needed to successfully complete the gasifer schemes is not large and
BMAU suggests that MEMD accelerate completion of works in order to improve its
reputation amongst the beneficiaries.

187
(b) Project (0331) Rural Electrification
Background:
The objective of this project is: “[to] improve the rural quality of life and facilitate significant
rural non- farm income by accelerating main grid extension based rural electrification with a
tentative target of contributing to increasing rural electricity access from about 1% in 2000 to
about 10% ten years later”57
.The project started in 2000 and is expected to complete in 2010.
Total budget over 2000-2010 is US$ 22 million58
. GoU approved budget for FY 09/10 was UShs
25.2 billion, which represents approximately 8.5% of total GoU expenditure for the vote
function, and approximately 5% of total GoU expenditure in the energy sector.
Much of the expenditure under 0331 is implemented by the Rural Electrification Agency (REA),
which receives funding for capital investments from donors including the World Bank, Japan
International Cooperation Agency (JICA), and Swedish International Development Agency
(Sida).
Outputs monitored during FY 09/10 under Rural Electrification were as follows:
(i) Output 030104: Increased Rural Electrification: rural electrification schemes under
Sida funding component (Q2, Q3, Q4)
(ii) Output 030104: Increased Rural Electrification: rural electrification schemes under
JICA funding component (Q4)
57
MoFPED Public Investment Plan FY 2009/10-2011/12 (Kampala 2009)
58 Ibid.
Nyabyeya Forestry College: incomplete walls and wood storage areas (left); building not wide enough for the
machines (middle); concrete works in water cooling area are not waterproof (right)

188
(iii) Output 030104: Increased Rural Electrification: rural electrification schemes under
PRDP funding component (Q4)
(iv) Output 030104: Increased Rural Electrification: grid extension at [Kasese-Lhubiriha]
component (Q2, Q4)
(v) Output 030104: Increased Rural Electrification: small and micro hydropower
developments component (Q1, Q2, Q3, Q4)
(vi) Output 030104: Increased Rural Electrification: generator purchase for UEDCL ‘off
grids’ component from FY08/09 (Q2, Q4)
Financial performance:
Figures 3.3.3 and 3.3.4 summarise the financial performance of Rural Electrification to Q3
FY09/10. For project 0331 for FY 09/10, 49% of approved funds were released from July 2009
to end March 2010. Of the released funds, 68%were absorbed during the period.
Output 030104 ‘Increased Rural Electrification’ received 98% of expenditure on project 0331
BY March 2010. Expenditure on output 030104 is used for GoU contribution to schemes
implemented by REA. Within project 0331, 88% of expenditure was on line item ‘General
Supply of Goods and Services’; 9% was on ‘Tax Refund’; 2% was on ‘Transport Equipment’
and 1% was on ‘Fuels, Lubricants and Oil’.
Figure 3.3.3 Figure 3.3.4
Source: MoFPED 2010
Physical performance:
(i) Output 030104: Increased Rural Electrification: rural electrification schemes under
Sida financing component(Q2, Q3, Q4)

189
GoU has received a grant of approximately UD$ 10.2 million59
from Sida to support various
rural electrification projects in the districts of Pader, Abim, Bundibugyo, Kyenjojo and Bugiri60
.
Responsibility for implementation of these projects lies with REA.
As part of this grant, Sida provided financial and practical support during infrastructure
construction and capacity building of local operators at the following grid extension projects:
[Fort-Portal- Bundibugyo-Nyahuka]; [Rugombe – Kyenjojo]; [Namayemba – Namuntere]; and
[Corner Kilak – Pader – Abim]. These projects involve: (i) the construction of high voltage (HV)
transmission lines and associated low voltage (LV) distribution networks; (ii) capacity building
and subsequent hand over of low voltage network to a local operator; and (iii) supply of pre-pay
electricity metres and subsidised connection fee for new customers.
Table 3.3.4 details observed physical performance of Sida financed rural electrification schemes,
based on monitoring activities during Q3 and Q4. Schemes were identified using the REA
2009/10 work plan as only the [Corner-Kilak – Pader – Abim] scheme was included in
Performance Contract Form A reporting.
Table 3.3.4: Physical performance Sida financed rural electrification projects
59
74 million Swedish Kroner
60 Rural Electrification Agency Cooperation between the energy sector and the Swedish International Development
Agency (Sida); Annual progress report (Kampala, January 2010)
Approved cost
of works
Planned output Observed physical performance – most recent visit
Corner Kilak –Pader – Abim(Pader/Abim) – Q3 FY 09/10
US$ 4.7 million
130 Km HV power line
40 Km LV power line
34 transformers
Capacity building of
‘PACMECS’ energy
cooperative; subsidised
connection of 1167
members.
Works were contracted to Ferdsult Engineering and
completed during 2009.
HV network is in place although the Board of Trustees
expressed concern that the line does not extend as far as
planned.
LV network is in place but in places design maps poorly to
distribution of population.
The contractor did not complete customer connections.
27 transformers installed; one is not functional.
Capacity building of PACMECS was completed.
1354 members, 119 customers connected (3rd
March 2010)
Fort-Portal- Bundibugyo-Nyahuka(Bundibugyo)– Q3 FY 09/10
US$ 3.8 million 98 Km HV power line Works contracted to Ferdsult Engineering during 2009.

190
31 Km LV power line
15 transformers at 8 load
centres
Capacity building of
‘BECS’ energy
cooperative; subsidised
connection of 730 one-
phase connections and 110
three-phase connections.
HV network is in place.
LV is in place but in places design maps poorly to
distribution of population.
Insufficient materials were supplied for customer
connections.
Transformers are in place and functional.
Capacity building of BECS completed.
1132 members, 553 connected customers (10th March
2010)
Rugombe – Kyenjojo (Kyenjojo) – Q4 FY 09/10
US$ 1.9 million 45 Km HV power line
13 Km LV power line
11 transformers at 6 load
centres.
Handover of operations to
Ferdsult Engineering (no
capacity building)
Subsidised connection of
500 one-phase customers.
Works were contracted to Ferdsult Engineering and took
place between December 2008 and April 2009.
Infrastructure has been constructed according to
specifications.
Operations are managed by Ferdsult Engineering who
began connecting customers in June 2009. Subsidy was
provided for initial 500 one-phase customers.
565 connected customers, 12 of which have three-phase
connections (18th May 2010)
Namayemba – Namuntere (Bugiri)- Q4FY 09/10
US$ 0.8 million 30 Km HV power line
13 Km LV power line
5 transformers at 4 load
centres.
Handover of operations to
Umeme Limited. No
provision for capacity
building or connection
subsidies.
Works were contracted to Ferdsult Engineering and took
place between September 2008 and March 2009.
Infrastructure has been constructed according to
specifications although the Umeme manager expressed
concern with the technical design. The insulators are
considered to be of inferior quality and have caused a
number of system failures. Umeme also noted that the HV
line is too long without an intervening sub-station,
meaning that when break downs occur the entire line is
affected. Interviews with beneficiaries at Namuntere,
Muwayo, Butema and Namayemba trading centres found
that customers were dissatisfied with the unreliable
service.
No provisions were made for connection subsidies.
Approximately 100 customers had been connected by 2nd
June 2010.

191
Source: fieldwork observations; Sida 2009.
Challenges:
Challenges faced by the cooperative organisations in Pader and Bundibugyo were
outlined in BMAU’s Q3 monitoring report. In summary, the Q3 report recommended that
REA consider the offer of additional support to the organisations – which were shown to
be doing good work in the face of capacity and funding constraints. In particular, REA
could consider donating a vehicle or additional vending machine to the cooperative
operators.
Q4 monitoring suggests that private operators also face difficulties in connecting people
to distribution networks. In Kyenjojo, 500 one-phase customers were connected in six
months (June to November 2009) when the subsidy was in place. During the six months
from November to May when the subsidy no longer applied, only 53 new one-phase
customers were connected. The Ferdsult area manager reported that the regional network
would not be profitable with the current number of connections if it were not for one
large three-phase consumer that was bringing in significant revenue.
Whilst community sensitisation was taking place at the Pader and Bundibugyo
cooperatives (both employ a community liaisons officer) similar activities were not
ongoing at the private operators - due to lack of funds for these activities. Poor
community sensitisation may be a contributory factor to the low levels of new
connections that have occurred amongst non-subsidised customers.
(ii) Output 030104: Increased Rural Electrification: rural electrification schemes under
JICA financing component (Q4)
Funds have been provided by JICA to support rural electrification infrastructure projects in
Iganga, Bugiri, Kibaale, and Masaka districts. Responsibility for implementation of these
projects lies with REA. Unlike the Sida schemes outlined above, no provision was made for
subsidy of the connection fee for new customers. Table 3.3.5 summarises findings from field
monitoring in Q4 FY/0910.
Schemes were identified using the REA 2009/10 work plan as they were not reported in
Performance Contract Form A.
Table 3.3.5: Physical performance JICA funded rural electrification projects
Contract
amount
Planned output Observed physical performance - Q4 FY 09/10
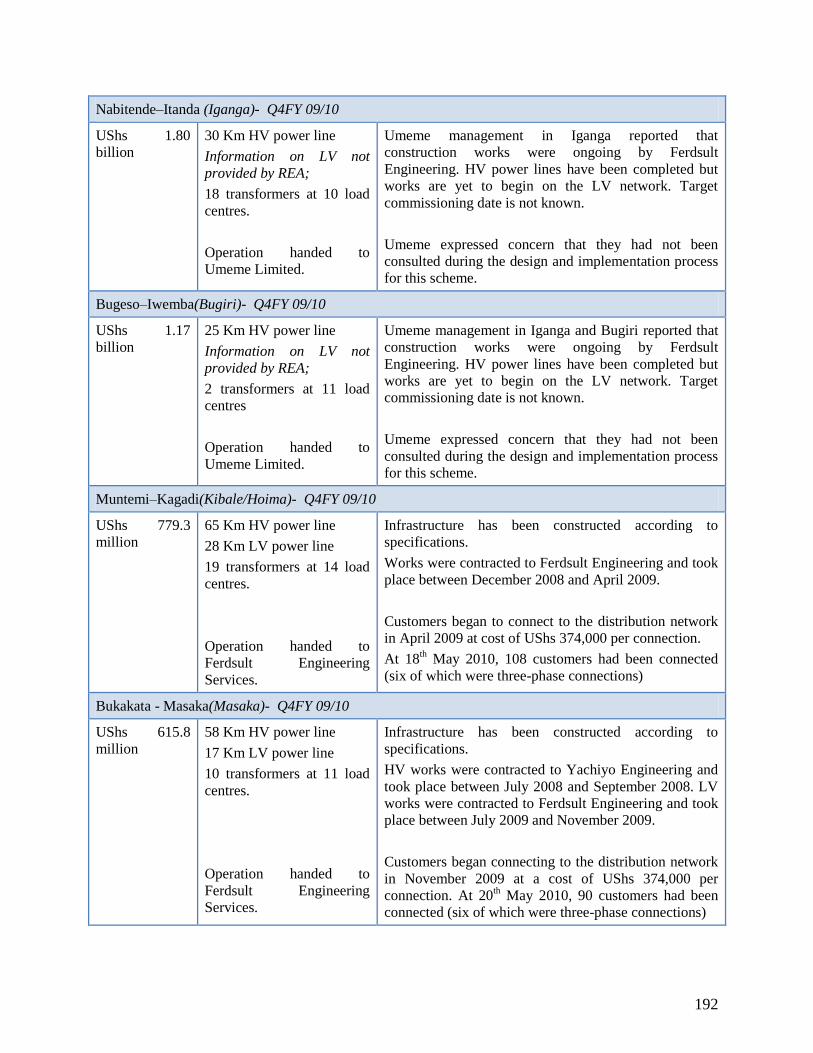
192
Nabitende–Itanda (Iganga)- Q4FY 09/10
UShs 1.80
billion
30 Km HV power line
Information on LV not
provided by REA;
18 transformers at 10 load
centres.
Operation handed to
Umeme Limited.
Umeme management in Iganga reported that
construction works were ongoing by Ferdsult
Engineering. HV power lines have been completed but
works are yet to begin on the LV network. Target
commissioning date is not known.
Umeme expressed concern that they had not been
consulted during the design and implementation process
for this scheme.
Bugeso–Iwemba(Bugiri)- Q4FY 09/10
UShs 1.17
billion
25 Km HV power line
Information on LV not
provided by REA;
2 transformers at 11 load
centres
Operation handed to
Umeme Limited.
Umeme management in Iganga and Bugiri reported that
construction works were ongoing by Ferdsult
Engineering. HV power lines have been completed but
works are yet to begin on the LV network. Target
commissioning date is not known.
Umeme expressed concern that they had not been
consulted during the design and implementation process
for this scheme.
Muntemi–Kagadi(Kibale/Hoima)- Q4FY 09/10
UShs 779.3
million
65 Km HV power line
28 Km LV power line
19 transformers at 14 load
centres.
Operation handed to
Ferdsult Engineering
Services.
Infrastructure has been constructed according to
specifications.
Works were contracted to Ferdsult Engineering and took
place between December 2008 and April 2009.
Customers began to connect to the distribution network
in April 2009 at cost of UShs 374,000 per connection.
At 18th May 2010, 108 customers had been connected
(six of which were three-phase connections)
Bukakata - Masaka(Masaka)- Q4FY 09/10
UShs 615.8
million
58 Km HV power line
17 Km LV power line
10 transformers at 11 load
centres.
Operation handed to
Ferdsult Engineering
Services.
Infrastructure has been constructed according to
specifications.
HV works were contracted to Yachiyo Engineering and
took place between July 2008 and September 2008. LV
works were contracted to Ferdsult Engineering and took
place between July 2009 and November 2009.
Customers began connecting to the distribution network
in November 2009 at a cost of UShs 374,000 per
connection. At 20th May 2010, 90 customers had been
connected (six of which were three-phase connections)

193
Source: REA work plan 2009/10; planned outputs provided by REA officials 2010; fieldwork
observations.
Challenges:
The JICA funded grid extension schemes included funds for infrastructure construction
but not for subsidy of connection fees. The rate of connection to the new distribution
networks in Kibaale and Bukakata has been low. For example, in Bukakata, only 90
customers have connected to a network covering almost 60Kms in the 6 months of
operation. Ferdsult offices in both Kibaale and Bukakata reported that their operations
were being subsidised by more profitable Ferdsult operations elsewhere.
Ferdsult Engineering reported that they do not currently employ a community liaisons
staff or were not undertaking any community sensitisation programmes. Poor
sensitisation could be a contributory factor to low connection rates.
Umeme have not been consulted on the designs for the new infrastructure and have not
been able to provide input into the location of the HV and LV networks.
(iii)Output 030104: Increased Rural Electrification: rural electrification schemes under
PRDP financing component (Q4)
The Peace Recovery and Development Plan (PRDP) is a cross sectoral programme managed by
Office of the Prime Minister designed to recover and stabilize Northern Uganda61
. The overall
goal of PRDP is “to consolidate peace and security, and lay foundation for recovery and
development”62
.
According to the 2009/10 REA work plan, REA has responsibility for implementation of four
PRDP funded schemes. These are: [Katine – Kakure – Kalaki – Lwala]; transmission lines and
low voltage networks in Gulu, Tororo and Masaka; transmission lines and low voltage network
in Oyam; and electrification of Iyolwa sub-county headquarters. These schemes were not
recorded in Performance Contract Form A reporting. Table 3.3.6 summarises findings from field
monitoring during Q4 FY/0910
Table 3.3.6: Physical performance PRDP funded rural electrification projects
Contract amount Planned output Observed physical performance - Q4 FY 09/10
Katine – Kakure – Kalaki – Lwala (Kaberamaido/Soroti)- Q4FY 09/10
UShs 2.56
billion
39 Km HV power line
10 Km LV power line
Infrastructure has been constructed according to
specifications.
61
See PRDP summary on OPM website, at: http://www.opm.go.ug/index.php?curpage=submenus&id=15 62
Ibid.

194
5 transformers at 4 load
centres.
Operation handed to Umeme
Limited.
Works were contracted to Spencon Services and took
place between June 2009 and November 2009.
By 1st June 2010 (six months after commissioning)
only one customer had been connected to the network.
Umeme reported that another seven customers were
awaiting connection.
The beneficiary (located at Lwala trading centre)
reported that the service was unreliable and that this
was deterring other people from connecting.
Transmission lines and low voltage networks in Gulu, Tororo and Masaka- Q4FY 09/10
Gulu:
UShs 234.1
million
Gulu:
12 Km HV power line
5 m LW power line
(underground)
1 transformer at 1 load
centre.
Operation handed to Umeme
Limited.
Infrastructure is has been constructed according to
specifications at Northern Uganda Youth
Development Centre in Gulu.
Works took place between July 2008 and March 2010.
According to the manager, the youth centre did not
previously have electricity. Now that they have
power, there are plans to extend the youth training
services provided – by purchasing agro-processing
equipment, building an ICT centre, purchasing
carpentry equipment and obtaining motor vehicle
repair machinery.
The power is sometimes unreliable and can be off for
as much as a week. The manager expressed concern
that the poles used were not of good quality.
Tororo: UShs
136.72 million
Tororo:
4 Km HV power line
5 Km LW power line
2 transformers at 2 load
centres.
Operation handed to Umeme
Limited.
Umeme were not able to verify the technical
specifications but reported that HV and LV
infrastructure had been constructed at Kirewa and
Kitanda.
The line was commissioned in May 2009 and by June
11th 2010 only two customers had been connected.
BMAU interviewed both beneficiaries (one
household, one saloon) who said that although they
are pleased to have access to electricity, the service is
very unreliable and often they do not have power for
two to three weeks.
Umeme expressed concern that they had not been
consulted during the design and implementation
process for this scheme.

195
Masaka:
n/a
Masaka:
This scheme has been
cancelled.
REA officials reported that this project has been
cancelled.
Transmission lines and low voltage network in Oyam- Q4FY 09/10
UShs 2.99
billion
30 Km HV power line
(Information on LV not
provided by REA);
10 transformers at 8 load
centres.
Operation handed to Umeme
Limited
Neither Umeme or Oyam local government were able
to verify the technical specifications but both reported
that HV and LV infrastructure had been constructed.
Commissioning took place in May 2010. By 7th June
2010, one customer had been connected to the
network. The local government offices plan to
connect early in the new financial year as they
currently use a generator for power.
Umeme expressed concern that they had not been
consulted during the design and implementation
process for this scheme.
Iyolwa sub-county headquarters (Tororo)- Q4FY 09/10
REA officials reported that this project has been cancelled.
Source: REA work plan 2009/10; planned outputs provided by REA officials 2010; fieldwork
observations.
Challenge:
The Katine – Kakure – Kalaki – Lwala grid extension has only managed to connect one
customer in the six months since commissioning. Similarly, the [Kirewa-Kitanda] line in
Tororo has only two customers a year after commissioning. BMAU has serious concerns
about the value for money of these grid extensions. The operators (Umeme) in Tororo
and Soroti were not consulted on the designs of the extensions. This raises questions as to
how the schemes were identified and if the funds could have been spent better elsewhere.
(iv) Output 030104: Increased Rural Electrification: grid extension at [Kasese-Lhubiriha]
component (Q2, Q4)
Kilembe Investments is a private organisation that mobilised community members in 1997 and
developed the business plan, environmental impact assessment, and infrastructure design for a
grid extension scheme. In 2003, Kilembe Investments applied to REA for funding for
infrastructure construction. REA agreed to fund the scheme and contracted the works to Spencon
Services Ltd. Table 3.3.7 gives a summary of the aspects of the scheme provided by REA and by
Kilembe Investments.

196
Table 3.3.7: Physical performance, grid extension at [Kasese-Lhubiriha]
Contract amount Planned output Observed physical performance - Q4 FY 09/10
REA component
UShs 4.7 billion
HV and LV
construction;
UShs 519 million
procurement of
pre-pay metering
system;
UShs 346 million
provision for
connections
68 Km HV line
54 Km LV line
26 transformers
Materials and pre-pay
billing equipment for
subsidised connection of
2000 customers (including
cables, poles, meters and
cards, meter boxes)
Infrastructure is complete to specifications and took
place between January 2008 and May 2009.
Materials provided for subsidised connection of 2000
customers.
Kilembe Investments Limited component
UShs 269 million Running costs whilst
scheme was being designed
and approved by REA.
Project designs, including
business plan for operations
and Environmental Impact
Assessment.
Supervision during the
construction work.
Purchase of IT
equipment/software for pre-
pay system.
Kilembe Investments designed and supervised the
construction works.
Agreement made with REA that the first 2000
customers would receive a 60% subsidy on their
connection fee (domestic customers to pay UShs
125,000 rather than UShs 312,500).
By June 2009, 2000 customers had paid their
connection fee (some in instalments that are not fully
paid). Customers were encouraged to join the scheme
by ‘electrical committees’ at trading centres.
By 19th May 2010, 900 of those customers had been
connected.
Source: REA Due diligence on Kilembe Investments Limited; fieldwork observations.
Challenges:
Kilembe Investments identified the following challenges to connecting the remaining
1100 customers: (i) not all customers had paid in full as yet; (ii) not all of the customers
have wired their houses; and (iii) not all of the customers are close to the low voltage
network.
The LV network was designed in 2004 but constructed in 2008, meaning that many of the
customers who have paid for connection are actually not close to the distribution
network. Kilembe have now submitted a proposal to REA for extension of the LV
network, as a second phase of the scheme. This would ensure that those that have paid
but do not have access to the LV network would be connected. According to ongoing
discussions, REA would undertake phase two as one of their ‘community schemes’.

197
Under this scheme, REA would provide 70% of the funds for the infrastructure and the
community would need to provide 30%.
Box 3.3.1 Value for money comparison of grid extension schemes– efficiency component
Allocative efficiency is not considered here as the proportion of budget spent on low and high priority
items was not available from contractors. Operational efficiency (delivery at the lowest possible unit cost)
is illustrated in figure 3.3.5, which provides a comparative analysis of the unit costs of various grid
extension schemes implemented by REA during FY 09/10.
Unit costs are obtained by dividing the total HV and LV line length by the contract amount. The MEMD
Budget Framework Paper for FY10/11 estimates the unit cost of 1 Km of distribution and transmission
line to be between US$25,000 and US$35,00063
.
In figure 3.3.5 schemes under PRDP funding are shown in green, those financed by JICA are in light blue
and Sida schemes are in dark blue. Most of the schemes display unit costs below the MEMD estimate.
The exception is Oyam district headquarters and environs project, which has a unit cost of approximately
US$50,000 per Km of power line.
Figure 3.3.5
63
MEMD Budget Framework Paper FY 2010/11 (Kampala 2010) 180
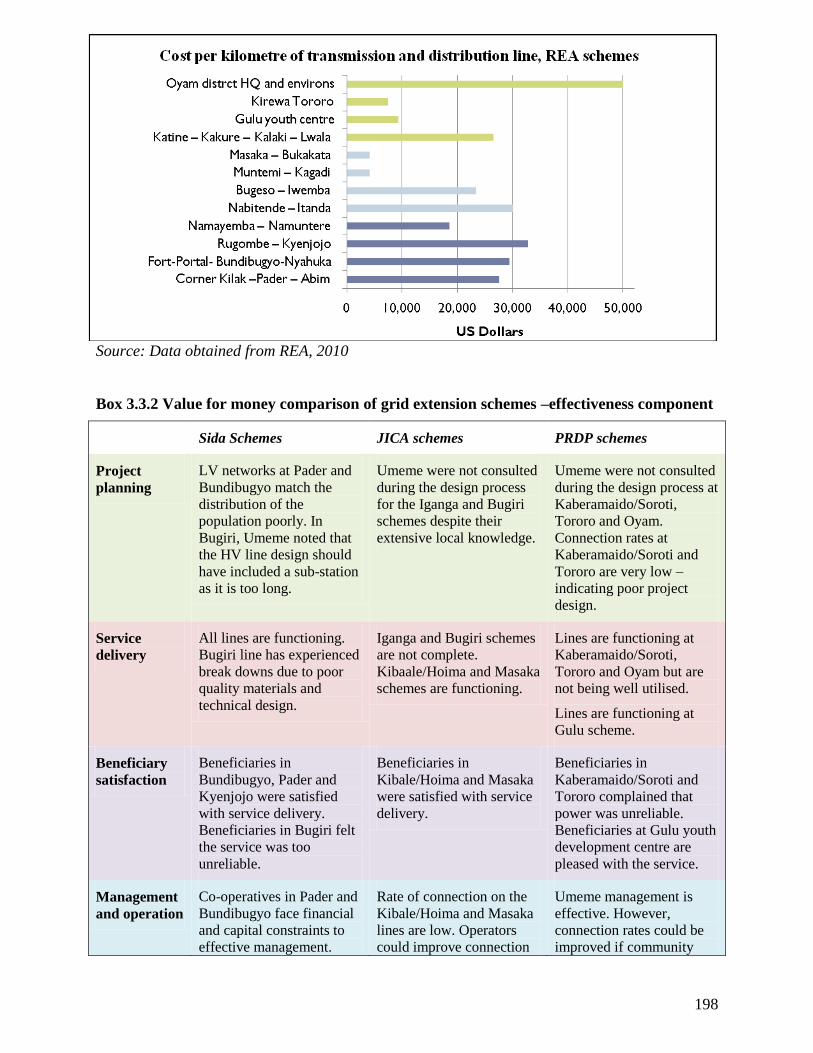
198
Source: Data obtained from REA, 2010
Box 3.3.2 Value for money comparison of grid extension schemes –effectiveness component
Sida Schemes JICA schemes PRDP schemes
Project
planning
LV networks at Pader and
Bundibugyo match the
distribution of the
population poorly. In
Bugiri, Umeme noted that
the HV line design should
have included a sub-station
as it is too long.
Umeme were not consulted
during the design process
for the Iganga and Bugiri
schemes despite their
extensive local knowledge.
Umeme were not consulted
during the design process at
Kaberamaido/Soroti,
Tororo and Oyam.
Connection rates at
Kaberamaido/Soroti and
Tororo are very low –
indicating poor project
design.
Service
delivery
All lines are functioning.
Bugiri line has experienced
break downs due to poor
quality materials and
technical design.
Iganga and Bugiri schemes
are not complete.
Kibaale/Hoima and Masaka
schemes are functioning.
Lines are functioning at
Kaberamaido/Soroti,
Tororo and Oyam but are
not being well utilised.
Lines are functioning at
Gulu scheme.
Beneficiary
satisfaction
Beneficiaries in
Bundibugyo, Pader and
Kyenjojo were satisfied
with service delivery.
Beneficiaries in Bugiri felt
the service was too
unreliable.
Beneficiaries in
Kibale/Hoima and Masaka
were satisfied with service
delivery.
Beneficiaries in
Kaberamaido/Soroti and
Tororo complained that
power was unreliable.
Beneficiaries at Gulu youth
development centre are
pleased with the service.
Management
and operation
Co-operatives in Pader and
Bundibugyo face financial
and capital constraints to
effective management.
Rate of connection on the
Kibale/Hoima and Masaka
lines are low. Operators
could improve connection
Umeme management is
effective. However,
connection rates could be
improved if community
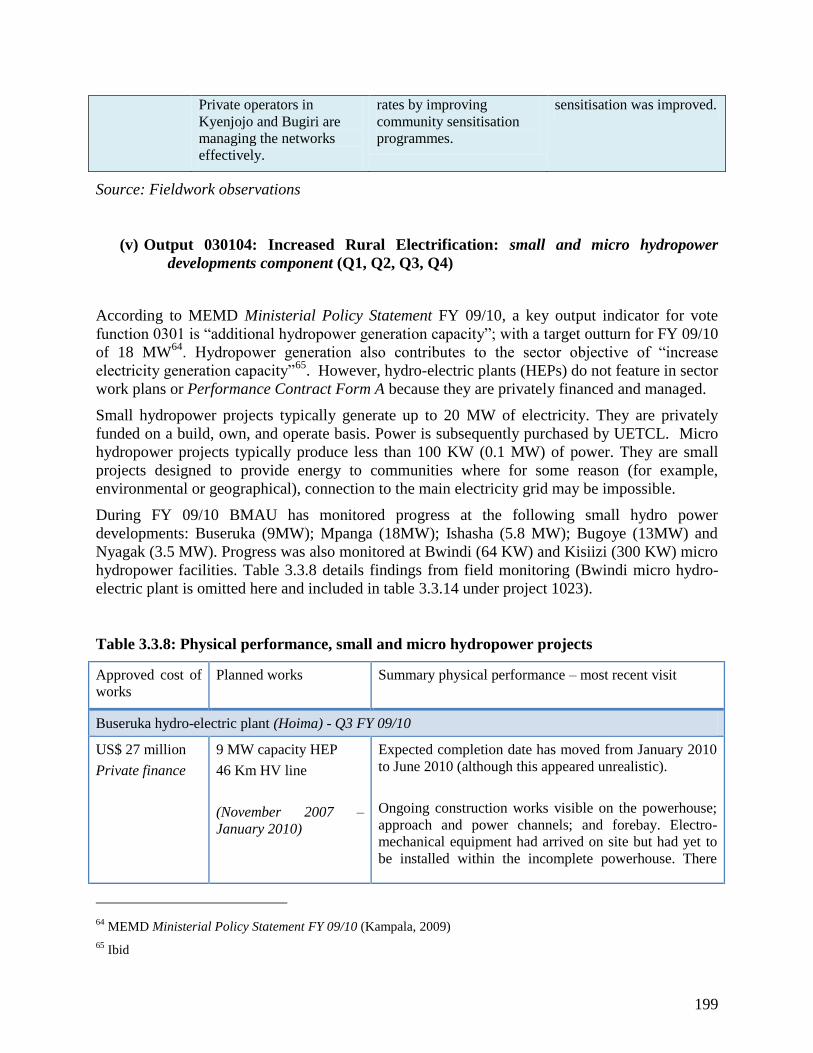
199
Private operators in
Kyenjojo and Bugiri are
managing the networks
effectively.
rates by improving
community sensitisation
programmes.
sensitisation was improved.
Source: Fieldwork observations
(v) Output 030104: Increased Rural Electrification: small and micro hydropower
developments component (Q1, Q2, Q3, Q4)
According to MEMD Ministerial Policy Statement FY 09/10, a key output indicator for vote
function 0301 is “additional hydropower generation capacity”; with a target outturn for FY 09/10
of 18 MW64
. Hydropower generation also contributes to the sector objective of “increase
electricity generation capacity”65
. However, hydro-electric plants (HEPs) do not feature in sector
work plans or Performance Contract Form A because they are privately financed and managed.
Small hydropower projects typically generate up to 20 MW of electricity. They are privately
funded on a build, own, and operate basis. Power is subsequently purchased by UETCL. Micro
hydropower projects typically produce less than 100 KW (0.1 MW) of power. They are small
projects designed to provide energy to communities where for some reason (for example,
environmental or geographical), connection to the main electricity grid may be impossible.
During FY 09/10 BMAU has monitored progress at the following small hydro power
developments: Buseruka (9MW); Mpanga (18MW); Ishasha (5.8 MW); Bugoye (13MW) and
Nyagak (3.5 MW). Progress was also monitored at Bwindi (64 KW) and Kisiizi (300 KW) micro
hydropower facilities. Table 3.3.8 details findings from field monitoring (Bwindi micro hydro-
electric plant is omitted here and included in table 3.3.14 under project 1023).
Table 3.3.8: Physical performance, small and micro hydropower projects
64
MEMD Ministerial Policy Statement FY 09/10 (Kampala, 2009)
65 Ibid
Approved cost of
works
Planned works
Summary physical performance – most recent visit
Buseruka hydro-electric plant (Hoima) - Q3 FY 09/10
US$ 27 million
Private finance
9 MW capacity HEP
46 Km HV line
(November 2007 –
January 2010)
Expected completion date has moved from January 2010
to June 2010 (although this appeared unrealistic).
Ongoing construction works visible on the powerhouse;
approach and power channels; and forebay. Electro-
mechanical equipment had arrived on site but had yet to
be installed within the incomplete powerhouse. There

200
Primary contractor:
HydroMax Limited
were no visible works ongoing on the dam, transmission
lines or penstock.
Progress as reported by contractor on site:
Resettlement and land compensation– 100%
Powerhouse– 40%
Penstock - 60%
Dam/weir– 30%
Approach and power channels (1.4km)-95%
Forebay – 90%
Turbines and generators – 0%
33 KV transmission line to existing Hoima sub-station –
unclear
Overall at Q3 monitoring visit- 42%
Mpanga hydro-electric plant (Kamwenge) - Q3 FY 09/10
US$ 27 million
Private finance
Cost of
transmission
lines is yet to be
determined.
18 MW capacity HEP
9 Km district roads
34 Km 33 KV line and
sub-station at Kahunge
(February 2008 – March
2010)
Primary contractor:
South Asia Energy
Management Systems
Completion date has moved forward to 31st of July 2010
(although this appeared unrealistic).
Transmission lines and sub-station to be constructed by
REA have not commenced.
Progress as reported by contractor on site:
Resettlement and land compensation – 100%
Powerhouse – 65%
Penstock – 50%
Dam/weir – 50%
Intake – 90%
Headrace – 65%
Turbines and generators – to have arrived April 2010
Transmission line and sub-station (REA component) –
0%
Overall at Q3 monitoring visit– 65-70%
Ishasha hydro-electric plant(Kanungu) - Q3 FY 09/10
US$10 million
(HEP)
US$ 0.4 million
(transmission
lines)
Private finance
5.8MW capacity HEP
7 Km HV line
(June 2008 – April
2010)
Primary contractor:
Ecopower Limited
Contractor estimates works will be complete on time but
BMAU monitoring found this unrealistic.
Works were ongoing on the powerhouse, penstock and
dam. Good examples of community involvement were
reported.
Progress as reported by contractor on site:
Resettlement and land compensation– 100%
Powerhouse – 90%
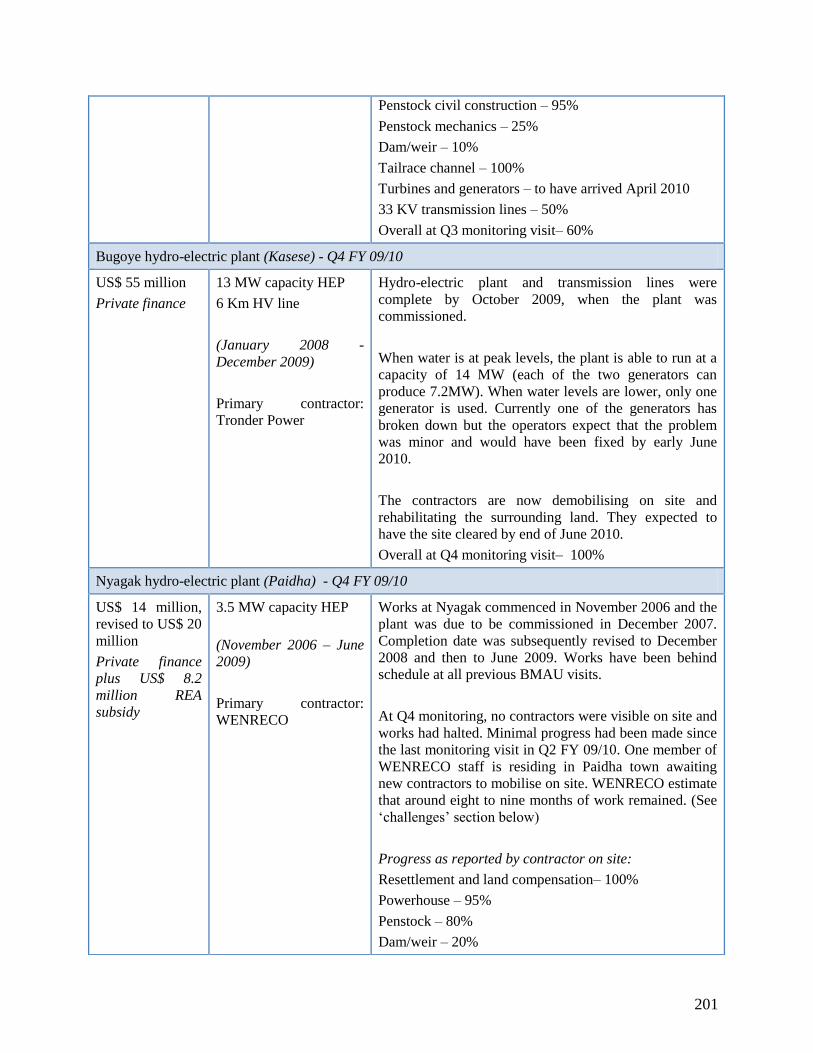
201
Penstock civil construction – 95%
Penstock mechanics – 25%
Dam/weir – 10%
Tailrace channel – 100%
Turbines and generators – to have arrived April 2010
33 KV transmission lines – 50%
Overall at Q3 monitoring visit– 60%
Bugoye hydro-electric plant (Kasese) - Q4 FY 09/10
US$ 55 million
Private finance
13 MW capacity HEP
6 Km HV line
(January 2008 -
December 2009)
Primary contractor:
Tronder Power
Hydro-electric plant and transmission lines were
complete by October 2009, when the plant was
commissioned.
When water is at peak levels, the plant is able to run at a
capacity of 14 MW (each of the two generators can
produce 7.2MW). When water levels are lower, only one
generator is used. Currently one of the generators has
broken down but the operators expect that the problem
was minor and would have been fixed by early June
2010.
The contractors are now demobilising on site and
rehabilitating the surrounding land. They expected to
have the site cleared by end of June 2010.
Overall at Q4 monitoring visit– 100%
Nyagak hydro-electric plant (Paidha) - Q4 FY 09/10
US$ 14 million,
revised to US$ 20
million
Private finance
plus US$ 8.2
million REA
subsidy
3.5 MW capacity HEP
(November 2006 – June
2009)
Primary contractor:
WENRECO
Works at Nyagak commenced in November 2006 and the
plant was due to be commissioned in December 2007.
Completion date was subsequently revised to December
2008 and then to June 2009. Works have been behind
schedule at all previous BMAU visits.
At Q4 monitoring, no contractors were visible on site and
works had halted. Minimal progress had been made since
the last monitoring visit in Q2 FY 09/10. One member of
WENRECO staff is residing in Paidha town awaiting
new contractors to mobilise on site. WENRECO estimate
that around eight to nine months of work remained. (See
‘challenges’ section below)
Progress as reported by contractor on site:
Resettlement and land compensation– 100%
Powerhouse – 95%
Penstock – 80%
Dam/weir – 20%

202
Source: Fieldwork observations, ERA 2010, discussions with REA officials March 2010.
Challenges:
No activities were taking place on site at Nyagak hydro-electric plant. BMAU monitoring has
identified the following information:
Earlier during the financial year WENRECO (the primary contractor) faced financial
difficulties resulting from its generation obligations in Arua town. WENRECO operates a
1.5 MW heavy fuel oil generator that was designed to provide electricity to the towns of
Paidha, Nebbi, Koboko and Arua for three years until Nyagak came online in December
2007. The generator uses approximately 150,000 litres of heavy fuel oil per month yet
revenue is just UShs 190 million per month on average. Delays in the completion of
Nyagak meant that WENRECO faced financial insolvency and subsequently no power
was supplied for four months from March 2009 and works at Nyagak ceased entirely.
REA subsidised operation of the generator over the period July to November 2009 in
order to restore power supply to the West Nile towns;
In September 2009 the Electricity Regulatory Authority (ERA) wrote to WENRECO
with intention to revoke the company’s license to build, own and operate Nyagak HEP.
Headrace channel – 50%
Turbines and generators – 0%
Overall at Q4 monitoring visit– 50-60%
Kisiizi micro hydro-electric plant (Rukungiri) - Q3 FY 09/10
Approximately
US$ 1 million
70% provided by
REA subsidy
through Energy
for Rural
Transformation;
30% from
charitable
donations from
the UK.
Expansion of existing
HEP at Kisiizi hospital
from 60KW to 300 KW
7 Km independent grid
network with pre-pay
meters.
(August 2004- January
2009)
Micro hydropower plant and distribution infrastructure
were completed September 2009 and are fully
functioning.
The local community are now being connected to the
distribution network. In March 2010, monthly revenue
from electricity sales and inspection fees was
approximately UShs 0.5 million. Kisiizi Electricity
general manager reported that the expected capacity of
the hydropower facility is 300 - 350 connections which
should create monthly revenue of around UShs 1 million.
Profits will be donated to Kisiizi hospital.
Overall at Q3 monitoring visit– 100%
Nyagak HEP: Incomplete works on dam (left); incomplete excavation works (middle); incomplete works on
tailrace channel (right)

203
Subsequently WENRECO provided evidence of renewed financial backing; justifications
for the company’s difficulties and agreement with new contractors to carry out the
consultation and construction work;
During Q2 FY09/10 monitoring, some work had resumed on site at Nyagak. By Q4,
limited additional progress had been made and no contractors were on site. The
WENRECO representative at Nyagak HEP reported that final negotiations are ongoing
between MEMD, WENRECO, and KfW to secure additional finance.
WENRECO expect financial agreements to be completed in June 2010 so that works
could resume.
Box 3.3.3 provides a comparison of the efficiency of small hydro power projects. Unfortunately
it is not possible to compare effectiveness as most of the projects are ongoing, but this will be
provided in future BMAU analysis.
Box 3.3.3: Value for money comparison of small hydro-electric plants – efficiency
component
Allocative efficiency is not considered here as the proportion of budget spent on low and high priority
items was not available from contractors. Operational efficiency (delivery at the lowest possible unit cost)
is illustrated in figure 3.3.6, which provides a comparative analysis of the unit costs of small hydropower
facilities constructed during FY 09/10.
Unit costs are calculated by dividing the total cost of construction by the number of megawatts generated.
According to MEMD’s Budget Framework Paper for FY10/11, unit cost per megawatt for FY 09/10
should be approximately US$1.15 million66
.
As shown in figure 3.3.6, none of the hydro-electric plants constructed during FY 09/10 exhibit unit costs
lower than the US$ 1.15 million estimated by MEMD. Mpanga hydroelectric plant had the best
performance with US$1.5 million per megawatt; by contrast Nyagak hydroelectric plant has the highest
unit costs, at US$5.7 million per megawatt.
Figure 3.3.6
66
MEMD Budget Framework Paper FY10/11 (Kampala, 2010) 180
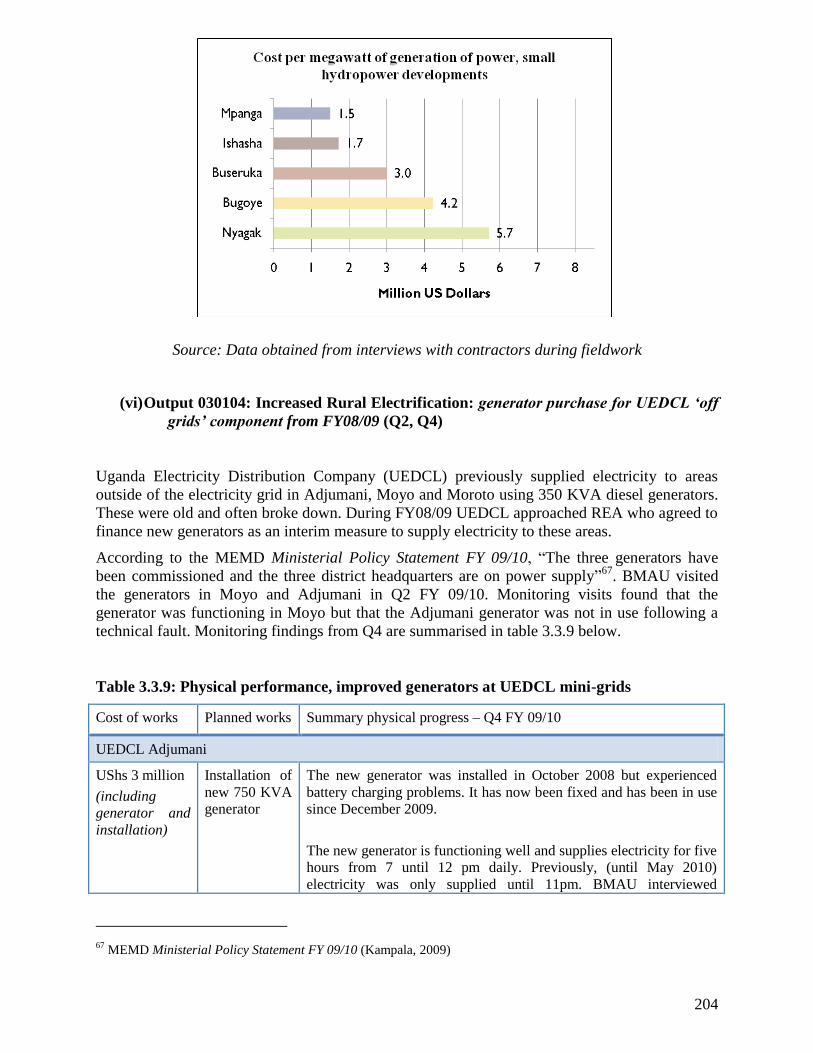
204
Source: Data obtained from interviews with contractors during fieldwork
(vi) Output 030104: Increased Rural Electrification: generator purchase for UEDCL ‘off
grids’ component from FY08/09 (Q2, Q4)
Uganda Electricity Distribution Company (UEDCL) previously supplied electricity to areas
outside of the electricity grid in Adjumani, Moyo and Moroto using 350 KVA diesel generators.
These were old and often broke down. During FY08/09 UEDCL approached REA who agreed to
finance new generators as an interim measure to supply electricity to these areas.
According to the MEMD Ministerial Policy Statement FY 09/10, “The three generators have
been commissioned and the three district headquarters are on power supply”67
. BMAU visited
the generators in Moyo and Adjumani in Q2 FY 09/10. Monitoring visits found that the
generator was functioning in Moyo but that the Adjumani generator was not in use following a
technical fault. Monitoring findings from Q4 are summarised in table 3.3.9 below.
Table 3.3.9: Physical performance, improved generators at UEDCL mini-grids
67
MEMD Ministerial Policy Statement FY 09/10 (Kampala, 2009)
Cost of works Planned works Summary physical progress – Q4 FY 09/10
UEDCL Adjumani
UShs 3 million
(including
generator and
installation)
Installation of
new 750 KVA
generator
The new generator was installed in October 2008 but experienced
battery charging problems. It has now been fixed and has been in use
since December 2009.
The new generator is functioning well and supplies electricity for five
hours from 7 until 12 pm daily. Previously, (until May 2010)
electricity was only supplied until 11pm. BMAU interviewed
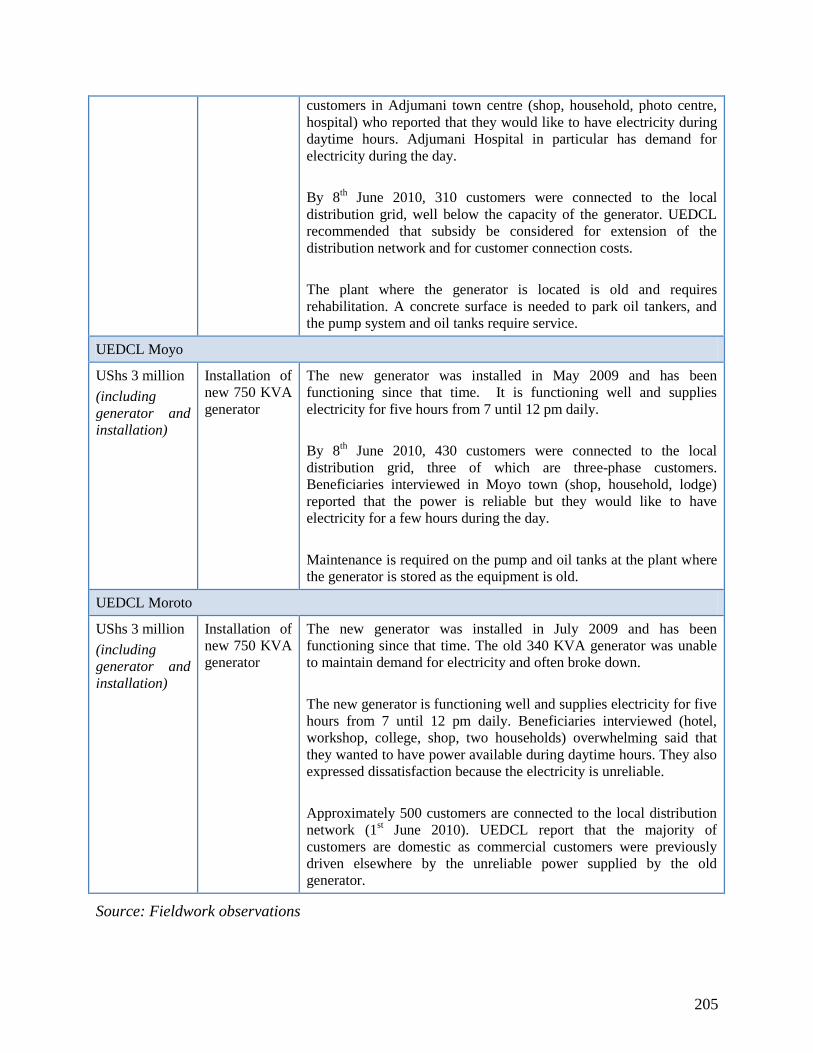
205
Source: Fieldwork observations
customers in Adjumani town centre (shop, household, photo centre,
hospital) who reported that they would like to have electricity during
daytime hours. Adjumani Hospital in particular has demand for
electricity during the day.
By 8th June 2010, 310 customers were connected to the local
distribution grid, well below the capacity of the generator. UEDCL
recommended that subsidy be considered for extension of the
distribution network and for customer connection costs.
The plant where the generator is located is old and requires
rehabilitation. A concrete surface is needed to park oil tankers, and
the pump system and oil tanks require service.
UEDCL Moyo
UShs 3 million
(including
generator and
installation)
Installation of
new 750 KVA
generator
The new generator was installed in May 2009 and has been
functioning since that time. It is functioning well and supplies
electricity for five hours from 7 until 12 pm daily.
By 8th June 2010, 430 customers were connected to the local
distribution grid, three of which are three-phase customers.
Beneficiaries interviewed in Moyo town (shop, household, lodge)
reported that the power is reliable but they would like to have
electricity for a few hours during the day.
Maintenance is required on the pump and oil tanks at the plant where
the generator is stored as the equipment is old.
UEDCL Moroto
UShs 3 million
(including
generator and
installation)
Installation of
new 750 KVA
generator
The new generator was installed in July 2009 and has been
functioning since that time. The old 340 KVA generator was unable
to maintain demand for electricity and often broke down.
The new generator is functioning well and supplies electricity for five
hours from 7 until 12 pm daily. Beneficiaries interviewed (hotel,
workshop, college, shop, two households) overwhelming said that
they wanted to have power available during daytime hours. They also
expressed dissatisfaction because the electricity is unreliable.
Approximately 500 customers are connected to the local distribution
network (1st June 2010). UEDCL report that the majority of
customers are domestic as commercial customers were previously
driven elsewhere by the unreliable power supplied by the old
generator.

206
UEDCL head office provided administrative data detailing changes in generation and efficiency
at the three mini-grids between calendar year 2008 and 2009. The total number of units of
electricity generated increased in Moyo and Moroto where the generators have been in use since
May 2009 and July 2009 by around 30%; but decreased in Adjumani (where the new generator
was not in use until December 2009). The number of units billed increased in all areas but most
significantly in Moyo where the increase was by 98%.
The number of litres of diesel consumed during 2009 compared to 2008 increased by 95% in
Moroto and 188% in Moyo, reflecting the larger fuel consumption of the new generators. Fuel
consumption increased by only by 1% in Adjumani where the old generator was still in use
during 2009. Efficiency (KWh generated per litre of fuel) decreased in all areas suggesting that
the new generators are not more fuel efficient (but this is likely to be because the machines are
under-loaded).
All three areas experienced an increase in electricity billed and revenue collected between 2008
and 2009. In Moyo and Moroto the increase in revenue collected was as more than 200%.
Revenue has increased despite the reduction in new customer connections (from 74 in 2008 to 13
in 2009 in Moyo, and from 45 in 2008 to 10 in 2009 in Moroto). The increase in revenue could
therefore reflect improved reliability of electricity as a result of the new generators.
Challenges:
In all of the mini grid areas, the cost of running the 750 KVA generators exceeds revenue
collected. For example, in Moroto UEDCL staff estimated that the cost of fuel
(approximately 10,000 litres) plus operation and maintenance costs is on average UShs
22 million per month. This generates around 26,000 KWh of electricity per month of
which revenue of around 60% of power generated, or UShs 6 – 7 million, is collected.
Similar financial data was reported at the other offices.
The new generators are being under-loaded, which implies low revenue collections and
could lead to technical problems in the future. For example, the Moyo office estimates
that the current load of 430 customers uses around one third of the generator’s capacity.
UEDCL could consider extending the distribution networks and/or subsidising customer
connections.
Interviews with beneficiaries found that customers are willing and able to pay for
electricity during the day. However, UEDCL only supply for five hours in the evening in
order to minimise financial losses from the operations. UEDCL could consider either
New generator at Adjumani (left); outdated manual pumping system at Adjumani (middle); outdated fuel calibration
system (right)

207
subsidising additional hours of operation or shifting some of the hours into the morning
(i.e. provide power from 9am - 11am and then 7pm-10pm). This would allow businesses
such as workshops and agro-processing to do some work during daylight hours.
(c) Project (0999) Power Sector Development Organisation
Background:
The Power Sector Development Operation aims to: “assist government to meet the short-term
mitigation measures to meet the power shortfall. In particular the funds secured from the World
Bank will be used to bring down the high cost of thermal generation”68
. Specifically, the project
aims to support short-term thermal generation until Bujagali hydropower project is able to
provide necessary generation capacity.
Project 0999 started in May 2007 and will finish in July 201169
. Total planned expenditure is
US$ 306 million. GoU approved budget for FY 09/10 was UShs 50.1 billion, which represents
approximately 17% of total GoU expenditure for the vote function, and approximately 10% of
total GoU expenditure in the energy sector. Almost the entire GoU budget for project 0999 is
allocated to payment of tax on fuel purchased to support thermal generation.
During FY 09/10 BMAU monitored the following outputs during Q4:
(i) Output 030152: Thermal and Small Hydro Power Generation (UETCL): Mutundwe
thermal plant component (Q4)
(ii) Output: 030102: Energy Efficiency Promotion: energy audits component (Q4)
Financial performance:
By March 2010, 50% of approved GoU budget for FY 09/10 had been released. Of released
funds, only 0.3% had been expended. As shown in figure 3.3.7, releases were minimal until Q3
FY 09/10, when UShs 25 billion was released under line item “gross tax”.
Indeed within project 0999, UShs 50 billion of the UShs 50.1 billion approved budget is
allocated to “gross tax”. No GoU budget is allocated to output 030152 (Thermal and Small
Hydro Power Generation (UETCL) as it is donor funded); Mutundwe power plant is financed
using donor funding. UShs 41 million was allocated to output 030102 (Energy Efficiency
Promotion), of which 73% had been released. 93% of release had been spent.
68
MoFPED Public Investment Plan FY 2009/10-2011/12 (Kampala 2009) 324
69 Ibid.

208
Figure 3.3.7 Figure 3.3.8
Source: MoFPED 2010
Physical performance:
(i) Output 030152: Thermal and Small Hydro Power Generation (UETCL): Mutundwe
thermal plan component (Q4)
Mutundwe 50MW thermal generation plant in Kampala was constructed under a ‘Build Own
Operate’ arrangement by private developer, Aggreko, in early 2008. Aggreko entered into a
Power Purchase Agreement and Implementation Agreement with UETCL in November 2007.
In order to reduce power shortages until Bujagali hydropower facility comes online, the World
Bank agreed to provide US$ 206.5 million70
in International Development Assistance (IDA) to
fund running costs of Mutundwe thermal plant. Under the agreement, IDA finances capital
charges (rent of the plant at capacity of 50MW), energy costs (fuel and fuel logistics) and some
contribution towards operation and maintenance. Payments began in April 2008 and were
intended to continue until June 2011. Table 3.3.10 summarises findings from Q4 monitoring.
Table 3.3.10 Observed physical performance, Mutundwe thermal plant
Budget
amount
Disbursed funds
(April 2010)
Planned outputs Progress monitored Q4 FY 09/10
US$ 209.7
million
US$ 145.3 million
(69.3% of budget)
50MW thermal electricity
generated per hour to
National Grid.
Plant is fully functioning and
operational on a 24 hour basis.
Approximately 300,000 litres of
fuel are consumed daily.
70
Exchange rate at time of agreement

209
Load shedding has been reduced.
Source: UETCL 2010; fieldwork observations.
Challenges:
Fluctuations in the price of oil and in the dollar exchange rate have meant that the costs
of producing the 50MW have been higher than anticipated. UETCL estimate that given a
conservative assumption about oil prices (US$ 85 per barrel), the financing gap of
running Mutundwe until June 2011 will be approximately US$ 65.2 million. If operations
are to continue until December 2011 (when the first unit of Bujagali hydropower facility
is now expected to be ready), the financing gap will be approximately US$ 117.6 million.
UETCL are currently under discussions with the World Bank about further assistance in
meeting this finance gap.
(ii) Output 030102: Energy Efficiency Promotion: energy audits component (Q4)
MEMD planned to carry out energy audits at a number of institutions during FY 09/10 in order
to identify energy saving potential. Findings from Q4 monitoring are presented in table 3.3.11.
Although BMAU was unable to physically visit the beneficiary institutions during the
monitoring visit, the 195 completed audit reports were obtained and reviewed. MEMD plan to
implement phase two of the scheme (implementing the audit findings) during FY 10/11. BMAU
will monitor progress of the scheme during phase two.
As table 3.3.11 highlights, GoU expenditure to Q3 according to the IFMS was UShs 28.2
million. However, Performance Contract Form A reported expenditure to Q3 of just UShs 9.8
million. MEMD should clarify this reporting anomaly.
Table 3.3.11: Observed physical performance, Energy Efficiency Promotion
Planned
expenditure to Q3
FY 09/10
Actual
expenditure to
Q3 FY 09/10
Planned outputs FY 09/10 Progress monitored Q4 FY 09/10
GoU: UShs 10
million
Donor: UShs 446
million
GoU: UShs 28.2
million
Donor
expenditure
information not
available.
Energy audits conducted in
100 schools and colleges;
NWSC facilities and 20 public
buildings.
Investments in energy
efficiency carried out.
MEMD officials produced
evidence of energy audits in 6
universities, 24 hospitals, 115
schools and colleges; 20
commercial and public buildings;
10 industries; 10 national water
facilities; 10 police barracks.
Procurement is now ongoing for
the second phase, which will
involve investments in energy
efficiency based on audit findings.
210
Source: Planned expenditure and outputs from Performance Contract Form A; actual
expenditure from IFMS; fieldwork findings.
(d) Project (1023) Promotion of Renewable Energy and Energy Efficiency Programme
Background:
The main objectives of Promotion of Renewable Energy and Energy Efficiency Programme
(PREEP) are: (i) to improve the supply of energy from renewable sources, thereby increasing the
total energy generation capacity in the country; and (ii) to increase the efficiency of the use of
energy71
. PREEP consists of two components: financial cooperation financed by KfW and
technical cooperation provided by the German Technical Corporation (GTZ).
Total planned expenditure is €12.1 million over the period July 2008 to June 201172
. GoU
approved budget for FY 09/10 was UShs 0.21 billion, which represents approximately 0.07% of
total GoU expenditure for the vote function, and approximately 0.04% of total GoU expenditure
in the energy sector.
During FY 09/10 BMAU monitored activities under the following output:
(i) Output 030103: Renewable Energy Promotion: improved household and institutional
stoves component (Q1, Q2)
(ii) Output 030103: Renewable Energy Promotion: Bwindi micro hydro-electric plant
component (Q3)
Financial performance:
Project 0999 exhibits excellent financial performance. By March 2010, 75% of GoU approved
budget for project 1023 had been released. Of released funds, 97% had been expended. Output
030103 (Renewable Energy Promotion) was allocated 43% of project budget. Within the output,
76% of budget was released by March of which 97% had been spent.
Within the project as a whole, 22% of expenditure to Q3 was on line item ‘allowances’; 18% was
on ‘fuel, lubricants and oils’; 17% was on ‘travel inland’; 12% was on ‘contract staff salaries’;
9% was on ‘workshops and seminars’; and the remaining 22% was on other (also recurrent) line
items. The recurrent nature of expenditure reflects the fact that capital expenditure in this project
is donor funded.
71
MoFPED Public Investment Plan FY 2009/10-2011/12 (Kampala 2009) 327
72 Ibid.

211
Figure 3.3.9 Figure 3.3.10
Source: MoFPED 2010
Physical performance:
Table 3.3.12 updates on progress to May 2010 on all planned outputs as reported in the sector
work plan under output 030301 (Renewable Energy Promotion). This data was provided by GTZ
project officials. As shown, the energy saving stoves, solar home systems and solar PV system
schemes are on target to complete by the close of the financial year. The hydropower plants at
Bwindi, Suam and Fofo will not be completed by the end of FY 09/10.
Table 3.3.12: Physical performance of output 030103, ‘Renewable Energy Promotion’
Output 030301:
Planned outputs FY09/10 (sector work plan)
Physical performance to May 2010
(provided by GTZ May 2010)
100,000 improved household stoves disseminated At least 82,675 households using improved stoves have
been disseminated (one household may have more than
one stove)
80 improved institutional stoves disseminated At least 65 social institutions are using improved stoves
1000 solar home systems disseminated 670 solar home systems and solar lanterns disseminated
40 institutions electrified with solar PV 23 social institutions electrified with solar PV systems
Bwindi mini hydropower plant operational Power plant completed, mini-grid being procured
Construction of mini hydropower plant in Suam Construction of civil works has started, turbine procured
Construction of mini hydropower plant in Fofo Under preparation
Feasibility study for Nyalit MHP finalised. Completed
Source: MEMD work plan FY09/10; GTZ May 2010.

212
(i) Output 030103: Renewable Energy Promotion: improved household and institutional
stoves component (Q1, Q2)
Table 3.3.13 summarises the findings from BMAU monitoring of the energy saving stoves
scheme during Q1 and Q2.
The improved stoves scheme is managed by GTZ and implemented by selected NGOs. Energy
saving stoves are made from locally available products such as mud and grasses. Households are
able to cook food using less fuel than they would use with traditional ‘three stones’ cooking
stoves which reduces deforestation in rural areas. The scheme provides funding for
implementing NGOs to: (i) train local people to make stoves for sale in the community; (ii)
subsidise the production of an initial batch of stoves; and (iii) raise awareness in the community
about the benefits of energy saving stoves. The scheme operates in 14 districts
Table 3.3.13: Physical performance of energy saving stoves project, Q1 monitoring
Institutional stoves in Mukono and Kampala district s–Q1 FY 09/10
The program disseminated three institutional energy saving stoves to Luzira prison and three to Kauga
prison. The recipient institutions were utilising the stoves and reported that they were useful and
efficient. They use 50% less firewood and cook very fast. They also create less smoke and they are clean
compared to the traditional ‘three stones’ stoves. The stoves constructed in Luzira and Kauga prisons
were part of the pilot for the overall scheme and were poorly constructed.
Household stoves in Yumbe and Arua districts – Q2 FY 09/10
In Yumbe district, ‘Yumbe Farmers Association’ piloted the stoves project in November 2008 in one
sub-county and rolled out the scheme across the district in January 2009. Over 20,000 household stoves
in use in Yumbe district. GTZ provided trainers who spent two weeks teaching local people to build
stoves; they also provided additional funds and bicycles to enable ‘mobilizers’ to disseminate
information throughout the district. People that were initially trained by GTZ are now paid by Yumbe
Farmers Association to pass on their skills to others.
In Arua district, ‘Participatory Rural Initiative to Save Environment and Energy’ (PRISEE) piloted the
GTZ scheme in Oluku Sub County in June 2006 and rolled out to two additional sub-counties in early
2007. Around 5,000 households are using energy saving stoves in Arua district. Support received from
GTZ included funds for eight days of training, bicycles, and t-shirts. The NGO funds training in the
beneficiary sub-counties, as well as selling the stoves themselves.
Interviews with beneficiaries in both districts found that stoves were very popular with users. Users
reported that they could cook food more quickly, use less fuel, and maintain a clean kitchen. People who
have trained to build the household stoves reported that they are able to supplement their income with
stove production. One challenge identified in Yumbe was that although demand for stoves was initially
high, it had now reduced significantly as many people now already own a stove.
Source: Fieldwork observations.

213
(ii) Output 030103: Renewable Energy Promotion: Bwindi micro hydro-electric plant
component (Q3)
Table 3.3.14: Physical performance, Bwindi micro hydropower project
Source: Fieldwork observations
Challenges:
Earlier BMAU monitoring during Q3 FY 08/09 found that there had been a number of
delays to the project implementation. These were largely attributed to environmental
constraints (the site is set within dense forest and the gorilla conservation area). During
Q3 FY 09/10 BMAU met with ‘Bwindi Community Micro Hydropower’ Board
Chairperson, who felt that the community had become disillusioned with the project
following the considerable delays in implementation.
GTZ officials note that a secondary but important objective of the scheme is the
development of capacity in Ugandan firms in hydropower construction73
. A Ugandan
based firm was awarded the contract for civil construction works. Since this was the first
hydropower project undertaken by the contractor, GTZ assigned a consultant to closely
supervise works. GTZ officials report that the contractor faced a number of capacity
related issues and despite provision of intensive supervision and assistance, they were
73
Discussion with GTZ officials March 2010, Kampala
Approved cost
of works
Planned works
Summary physical performance – Q3 FY 09/10
Bwindi micro hydro-electric plant
UShs 614.5
million (civil
works)
€60,000
(turbines)
GTZ funding
64 KW capacity hydro-
electric plant
(October 2007 – May
2008)
No contractor is visible on site. Works are incomplete.
Progress visible on site:
Resettlement and land compensation – 100%
Powerhouse – 100%
Penstock – 0%
Dam/weir – 100%
Channels – 100%
Turbines and generators – 100%
Transmission lines – 0%
Overall – civil works are 95% but transmission
infrastructure has yet to commence.

214
eventually forced to terminate the civil works contract. They are currently tendering for a
new contractor and estimate that the project will be completed within 201074
.
(e) Project (1024) Bujagali Interconnection Project (Q1, Q3)
Background:
Bujagali hydropower project is a 250 MW power generating facility located at Dumbbell Island
on the Victoria Nile, 8kms from Jinja town. Bujagali Energy Limited (BEL) was awarded the
concession to build, own and operate Bujagali hydropower project in 2007.75
. The total costs of
works (onshore plus off-shore) are estimated at US$ 861 million (this privately financed).
Bujagali interconnection project will connect Bujagali hydropower project to the national
electricity grid, and will be managed by UETCL. BEL is working closely with UETCL in
managing the development of the power transmission line as well as supervision of its
construction. Total cost is US$ 74 million76
(African Development Bank will finance US$
28.63m; Japanese Bank for International Cooperation US$ 28.63m and GoU US$ 17.45m)77
.
GoU expenditure is earmarked for the Resettlement Action Plan (RAP) aspect of the project.
Monitoring during FY 09/10 focussed on the following:
(i) Output 030252: Thermal and Small Hydro Power Generation (UETCL): Bujagali
hydropower project component (Q1, Q3)
(ii) Output 030152: Thermal and Small Hydro Power Generation (UETCL): Bujagali
interconnection project (Q1, Q3)
Financial performance:
Table 3.3.15 summarises the financial performance at Q3 FY 09/10 of Bujagali hydropower
project and Bujagali interconnection project against physical progress observed during Q3
monitoring.
Table 3.3.15: Summary of overall financial performance Bujagali hydropower project and
Bujagali interconnection project
74
Ibid
75 BEL is a joint venture between Industrial Promotion Services Kenya and SG Bujagali Holding Limited. Industrial
Promotion Services Kenya is part of the Agha Kahn Development Network; SG Bujagali Holding Limited part of
Sithe Global Power, United States
76 (at 2007 exchange rates)
77 MoFPED Public Investment Plan FY 2009/10-2011/12 (Kampala 2009)

215
Source: BEL, February 2010; UETCL March 2010.
GoU is funding the Resettlement Action Plan aspect of the interconnection project. In May 2008
GoU released US$ 17.46 million (approximately UShs 34 billion) to BEL in an escrow account
with Bank of Uganda for the purposes of funding the Resettlement Action Plan. Subsequently no
GoU funds were released during FY 08/09 to this project. As shown in table 3.3.15, so far 67%
of the US$ 17.46 million have been expended.
Figures 3.3.11 and 3.3.12 summarise GoU budget, expenditure and release for project 1024 for
FY 09/10. In addition to funds still available in the escrow account, GoU approved an additional
budget of UShs 5 billion for FY 09/10. Of this 40% (UShs 2 billion) had been released by Q3 but
expenditure had been zero.
According to discussions with UETCL officials, the additional UShs 5 billion GoU funds will
account for changes in the scope of works that require additional land compensation and
resettlement - for example, extension of works at Kawanda sub-station. UETCL have not yet
received the additional UShs 2 billion from MEMD and have requested that the funds be
deposited in an additional escrow account with Bank of Uganda. It is anticipated that these funds
will be called upon when land acquisition and compensation claims are finalised.
Figure 3.3.11 Figure 3.3.12
Financial progress Physical progress
Bujagali hydropower project (to February 2010)
Onshore works 73.2% of total contract invoiced 56%
Offshore works 88.8% of total contract invoiced 95%
Bujagali interconnection project (to March 2010)
Physical works ADB funds = 38% dispersed
JBIC funds = 34% dispersed
30%
Resettlement Action Plan (GoU) 67% of funds in Escrow account
had been spent by February 2010
92%

216
Source: MoFPED 2010
Physical performance:
(i) Output 030152: Thermal and Small Hydro Power Generation (UETCL): Bujagali
hydropower project component (Q1, Q3)
The completion date for Bujagali (250MW) hydropower project has been moved back 10
months, to April 2012. This follows a settlement agreement signed by Bujagali Energy Limited
and the contractors that packaged together a number of changes in works and allowed for an
increase in project costs of US$ 41.6 million. At the time of monitoring in Q3 FY 09/10 onshore
works were 56% complete.
(i) Output 030152: Thermal and Small Hydro Power Generation (UETCL): Bujagali
interconnection project component (Q1, Q3)
Bujagali interconnection project is projected to complete around 9 months behind schedule, by
March 2011. Works have been delayed by the ongoing land compensation and acquisition
disputes that have hindered construction works on the Bujagali-Kawanda transmission line. At
the time of monitoring in Q3 FY 09/10 works were 30% complete and resettlement activities
were 92% complete.
(f) Project (1025) Karuma Interconnection Project
Background:
The objective of this project is to provide adequate transmission capacity for evacuation of
electricity from the proposed Karuma hydropower station. The project will be managed by
UETCL. The proposed power lines are intended to evacuate power from Karuma hydropower
station to load centres in Kampala, Lira town and Olwiyo.

217
According to the Public Investment Plan, the project began in July 2008 but does not have an
end date. Total planned expenditure for the feasibility study is NOK 14 million (approximately
US$2.1 million78
) which will be fully donor funded by the Kingdom of Norway. Planned output
for FY 09/10 is “feasibility study report on RAP for Karuma Interconnection Project available”.
Financial performance:
No GoU development expenditure for this project was budgeted for FY 09/10.
Physical performance:
UETCL have provided a progress report for project 1025 dated April 2010. A procurement
process took place and SMEC International Limited engineering consultants, based in Australia
have been awarded the contract for the feasibility study. So far the following activities have been
carried out79
:
A brief survey of the proposed 400kV and 132kV line routes;
Gathering of information, reports and maps required to carry out the study;
Submission of Inception Report;
Submission of Economic and Social Impact Assessment Scoping Report.
(g) Project (1026) Mputa Interconnection Project
Background:
Project 1026 was designed to facilitate the evacuation of power from oil refining activities taking
place as part of the Early Production Scheme (EPS) at the Mputa oil fields in western Uganda.
According to the Public Investment Plan80
oil evacuated from the EPS would power a thermal
generation plant at Mputa. This project would transmit this power to the main grid. As detailed in
section 3.3.4 below, the specific design of the EPS is unclear and so it is possible that the scope
of the interconnection project may change significantly.
GoU planned outputs under project 1026 for FY 09/10 are: “Early Production Scheme
Activities” and “Resettlement Action Plan Mputa –Nkenda”. Planned activities are: “EPS
activities, land valuation, compensation to third parties”81
. Total planned expenditure for project
78
Exchange rate at June 14th
2010
79 UETCL Karuma Interconnection Project, Project Performance Brief, period ending April 30
th 2010 (Kampala
2010) 6
80 MoFPED Public Investment Plan FY 2009/10-2011/12 (Kampala 2009) 336
81 MEMD Ministerial Policy Statement FY 09/10 (Kampala 2009) 130

218
is US$74 million82
. GoU approved budget for FY 09/10 was UShs 32 billion, which represents
approximately 11% of total GoU expenditure for the vote function, and approximately 7% of
total GoU expenditure in the energy sector.
Financial performance:
As shown in figures 3.3.13 and 3.3.14, of the UShs 32 billion GoU budget, 45% had been
released by Q3, of which 97% had been expended.
Figure 3.3.13 Figure 3.3.14
Source: MoFPED 2010
Physical performance:
UETCL provided a progress update for project 1026 in May 2010. According to this
documentation, the Environmental Impact Assessment for the project has been completed and
submitted to the National Environmental Management Agency (NEMA) for approval. RAP
implementation has commenced and is summarised in table 3.3.16 below.
Table 3.3.16: Performance of Resettlement Action Plan, Mputa Interconnection Project
Number of project affected
persons
Percentage of total
transactions
Total number of transactions 1603 100%
Disclosures made 910 57%
Agreements completed 797 50%
82
MoFPED Public Investment Plan FY 2009/10-2011/12 (Kampala 2009) 336

219
Disputes raised 113 7%
Payments made 22 1%
Outstanding transactions 693 43%
Source: UETCL May 2010
3.3.3 Large Hydropower Infrastructure
Vote Function 0302:
Vote function 0302 will receive approximately 27% of total energy sector expenditure (GoU plus
donor) in FY 09/1083
. Its strategic objectives are: (i) to promote the development of large hydro
power stations; (ii) to carry out studies such as pre-feasibility studies, feasibility studies and
environmental impact assessments of large hydropower projects; (iii) to implement the
Resettlement Action Plans (RAPs) for hydro power projects; (iv) to implement the Resettlement
Action Plans (RAPs) for transmission lines evacuating power from large hydropower station; and
(iv) to invest and construct power plants on public/private sector partnership84
.
According to ‘planned outputs’ in the MEMD Ministerial Policy Statement, “for the FY 2009/10,
the proceeds of this fund are earmarked to kick-start the development of Karuma hydropower
project”85
.
(a) Project (0985) Energy Fund (Q4)
Background:
The Public Investment Plan states that,“[t]he project aims to provide GoU contributions towards
the financing of the large power projects in the country including the Bujagali, Karuma and
Ayago projects”86
. GoU approved budget for FY 09/10 was UShs 191.2 billion, which represents
100% of total GoU expenditure for the vote function, and approximately 38% of total GoU
expenditure in the energy sector.
Financial performance:
No funds were released during Q1 and Q2 to project 0985. As shown in figures 3.3.15 and
3.3.16, 74% of approved budget was released during Q3, of which 100% was expended.
83
Total energy sector approved budget excluding taxes, arrears and NTR; MoFPED Approved Budget Estimates
(Kampala 2009)
84 MEMD Ministerial Policy Statement FY 09/10 (Kampala 2009) 62
85 Ibid.
86 MoFPED Public Investment Plan FY 2009/10-2011/12 (Kampala 2009) 321

220
Conversely, Performance Contract Form A: Q3 progress report reports zero release and
expenditure by Q3 FY 09/10. MEMD should provide an explanation for this reporting anomaly.
Figure 3.3.15 Figure 3.3.16
Source: MoFPED 2010
Physical performance:
Planned outputs for FY 09/10 as reported in the MEMD Ministerial Policy Statement are:
“Commence construction of Karuma power project” and “Complete feasibility study for Karuma
and Isimba power projects”87
. Performance Contract Form A: Q3 progress report states that no
activities were undertaken up to Q3 because no funds were released for activities88
.
However - contrary to Performance Contract Form A reporting - MEMD have provided a
progress update for Karuma hydropower project which states that the following progress has
been made89
:
A contract was signed during September 2009 with Energy Infratech Limited of India to
undertake a detailed feasibility study, do preliminary designs, prepare tender documents
and assist in the tendering and procurement of the Engineering Procurement Construction
(EPC) contractor. Work commenced in October 2009 after payment of an advance
payment;
The consultant submitted an Inception Report in December 2009;
Terms of Reference for the Economic and Social Impact Assessment have been
submitted to NEMA for approval;
87
MEMD Ministerial Policy Statement FY 09/10 (Kampala 2009) 130
88 MEMD Performance Contract Form A: Quarter 3 Progress Report (Kampala 2010) 48
89 MEMD Karuma HP Feasibility Study Progress Report, 12
th May 2010 (Kampala, 2010)
221
Ongoing topographical surveys and geological mapping in the dam and powerhouse area
are in advanced stages, and studies are waiting to begin in game reserve area once access
roads are in place;
Works on access roads within the game reserve area have commenced and are expected
to be completed by May 2010.
MEMD officials also reported that a feasibility study for Isimba hydropower project had
commenced, using funding from the Government of Norway rather than the Energy Fund.
MEMD were unable to provide further information.
3.3.4 Petroleum Exploration, Development and Production
Vote Function 0303:
Vote function 0303 will receive approximately 2% of total energy sector expenditure (GoU plus
donor) in FY 09/1090
. Despite the relatively small proportion of GoU expenditure received,
petroleum exploration and development has the potential to be critically important to the future
of Uganda’s economic development. According to The National Development Plan (2010/11 –
2014/15): “[t]he oil and gas sector is relatively new but with large potential. It is estimated that
the oil reserves in the country is at 2 billion barrels. To exploit these resources, large
investments will be required for further exploration, development and extraction of oil91
”
(a) Project (0329) Petroleum Exploration and Promotion (Q3)
Petroleum Exploration Promotion is the only development project within vote function 0303. Its
objectives are to arrive at a policy and regulatory framework that maximizes value creation from
the petroleum resources in Uganda; to strengthen the Petroleum Exploration and Production
Department (PEPD) to efficiently carry out its duties; and to study key parameters that will
determine commercial viability of discoveries92
.
GoU approved budget for project 0329 for FY 09/10 was revised from UShs 5.5 billion to UShs
8.6 billion, which represents approximately 1.7% of GoU expenditure in the energy sector.
BMAU Q3 monitoring provides an update on:
(i) Output 030303: Capacity Building in the Oil and Gas Sector (Q3, Q4)
90
MoFPED Approved Budget Estimates (Kampala 2009)
91 The Government of Uganda National Development Plan 2010/11 – 2014/15 (Kampala, 2010)
92 MoFPED Public Investment Plan FY 2009/10-2011/12 (Kampala 2009) 308

222
Financial performance:
As shown in figure 3.3.18, 69% of GoU approved budget had been released by Q3, and of the
released funds 62% had been absorbed.
Within project 0329, 42% of approved budget is allocated to output 030303 ‘capacity building in
the oil and gas sector’; 15% is allocated to output 312204 ‘purchase of specialised machinery
and equipment’; 13% on 30372 ‘government buildings and service delivery infrastructure’; 13%
output 30376 ‘purchase of office and ICT equipment, including software’; (the remaining eight
outputs comprise the remaining 17% of approved budget).
Figure 3.3.17 Figure 3.3.18
Source: MFPED 2010
Figure 3.3.19 provides financial data for GoU budget, release and expenditure for output 030303,
‘capacity building in the oil and gas sector’. Approved budget for output 030303 was UShs 3.6
billion for FY 09/10, of this 81% had been released by March 2010; 96% of released funds were
absorbed. Within the output, 57% of expenditure to March 2010 was spent on allowances; 18%
was spent on short term consultancy services; and 15% was spent on staff training. (The
remaining 8% of expenditure comprises 18 other expenditure line items.)
Figure 3.3.19

223
Source: MoFPED 2010
Physical performance:
Table 3.3.17 updates physical performance in the oil and gas sector as observed during Q4
monitoring. The forthcoming Petroleum Bill will enshrine the principles of the National Oil and
Gas Policy (2008) into legislation. The Bill is currently awaiting approval from The Parliament
of Uganda and so some activities await approval before they can commence.
Table 3.3.17: Physical performance of output 030303, ‘Capacity Building in the Oil and
Gas Sector’
Output 030303:
Planned outputs
FY09/10 (sector work
plan)
Physical performance – Q4 FY09/10
National expertise for
the oil and gas
developed
So far more than 20 members of senior staff, engineers and geologists in PEPD
have attained Masters level training; during FY 09/10 three members of staff
were undertaking Masters.
Other types of staff training and development are ongoing: two staff are
attached to the feasibility study for an oil refinery; overseas travel, for example
to observe ‘extended well testing’ overseas; academic study in laboratory work
and environmental management at Kyambogo University; short courses in
Norway; in-house training on computer software; in-house workshops.
Members of PEPD staff regularly participate in regional meetings and activities.
Creation of new
institutions
The Petroleum Bill will create three institutions for petroleum management: a
policy arm; a regulatory authority; and a national oil and gas company.
Activities cannot commence until the Bill is passed by Parliament of Uganda.
Commencement of
petroleum production,
refining and utilisation
Five of the ten exploration areas are currently licensed. Within these, 40 oil
wells had been drilled by 22nd
June 2010. Hydrocarbons were found in EA1,
EA2 and EA3A. PEPD has granted a “period of appraisal” to the developers in
these areas – meaning that additional wells may be drilled in order to establish
the extent of resource deposits. Two unsuccessful wells were drilled in EA5 but
Neptune Petroleum plan to continue exploratory works. Companies will
commence bidding for the un-licensed exploration areas when the Petroleum
Bill has been passed by Parliament.
The Early Production Scheme (EPS): Originally developed in 2006, the EPS
was a plan to refine crude oil extracted from the Mputa wells in EA2 as part of
the ‘extended well testing’ period. The heavy fuel oil produced would
subsequently be used for thermal generation at a new generation facility.
However, plans were put on hold following the discovery of significantly higher
reserves of oil and commercially viable gas than were anticipated.
A feasibility study is ongoing for a revised version of the EPS, known as the
“Integrated Power Project”, which would primarily use the gas reserves
discovered at the Nzizi wells in EA2 for power generation. Early plans involve

224
the construction of 14 Km of gas pipeline to a new 50MW power generating
facility at Kabale trading centre. It is envisioned that Tullow Oil would fund the
pipelines and Jacobsen Uganda would construct the power generation facility.
In addition, crude oil extracted from extended well testing in EA2 would be
transported by road to existing thermal generation facilities in Namanve and
Hima.
Construction of oil refinery: A feasibility study commenced in August 2009
by Foster Wheeler UK, looking at the practical implications of constructing an
oil refinery in Uganda. Findings are anticipated in July 2010.
Capacity building in
the Petroleum
Exploration and
Production
Department.
Retention allowances are paid to PEPD staff in order to increase wages in line
with private sector;
27 new entry level staff recruited during FY 09/10.
Improved data management practices – including procurement of technical
equipment and software for data analysis, management and storage. Work is
ongoing with assistance from Norway to improve the data management
database.
Plans drawn by architects for new PEPD buildings in Entebbe, in particular
including a new data centre. Works on perimeter wall has commenced.
Development of communications strategy has commenced.
Source: MEMD work plan FY09/10; fieldwork observations.
Challenges:
Whilst significant progress has been made in human capacity development in PEPD, the
organisation still lacks sufficient staff and resources. PEDP staff note the challenge of
monitoring private developers in the field on a twenty-four hour basis during drilling
whilst maintaining sufficient staff in office.
Tullow Oil plan to increase staff levels by 50-80% as work expands in EA1 and EA2, and
express concern that PEPD will not do the same93
. Tullow Oil stressed that whilst the
relationship between the company and PEPD has improved over the past 3 years, more
work needs to be done to share analysis of large production projects.
As the industry develops, there will be pressure for oil companies to recruit increased
numbers of Ugandan staff. PEPD need to consider ways to ensure that staff are retained
(wages in the private sector are significantly higher).
During Q3 monitoring, both PEPD and Tullow Oil expressed concern about the capacity
of NEMA to regulate the environmental aspects of the industry. For example, many of
the well drill sites visited contained waste materials as NEMA has not provided guidance
on waste management.
93
Discussions with Tullow Oil, March 2010

225
3.3.5 Key policy issues
This section outlines the key issues that have arisen from monitoring in the energy sector during
FY 09/10.
(i) Some progress has been made towards achievement of sector outcomes but most
output indicator targets as outlined in Budget Framework Paper FY09/10 were
not met;
The MEMD Budget Framework Paper for FY 10/11 defines sector outcomes as “increased
power generation capacity and transmission” and “increased promotion of petroleum exploration
and monitoring of the supply chain”. Unfortunately, outcomes were not outlined in the Budget
Framework Paper for FY 09/10 and so instead table 3.3.18 summarises observations of progress
made towards sector output indicators as defined in the 09/10 Budget Framework Paper.
Overall, there has been progress in the sector towards the outcomes as defined in the Budget
Framework Paper for the coming year, but the output indicator targets set at the start of the
financial year have largely not been met.
Table 3.3.18: Performance observed by BMAU on sector output indicators (as outlined in
MEMD Budget Framework Paper FY09/10)
Output Indicators Target
FY09/10
Performance observed by BMAU FY 09/10
Vote Function:0301 Energy Planning, Management & Infrastructure Development
Number of renewable
energy systems
installed (biomass,
100,000 BMAU visited gasifier installations at three locations, none of
which were functional. In addition, household and institutional
energy saving stoves were monitored in Arua, Yumbe, Mokono
Software training in PEPD (left); new equipment used to read and manage geological data (right)

226
solar, gasification
technologies, household
stoves)
and Kampala districts, which were popular with beneficiaries.
GTZ report that at least 82,675 households are using improved
stoves and that 670 solar home systems had been disseminated by
May 2010.
Additional hydropower
generation capacity
18 MW Completed hydropower plants at Bugoye (13MW) and Kisiizi
(0.3 MW) were visited. Other hydropower developments were
not complete by time of Q4 monitoring.
Number of Km of
power lines extended
No target
specified
Twelve electricity grid extension schemes that took place during
the financial year were monitored. Of these, ten had been
commissioned (totalling approximately 670 Km of high and low
voltage lines). REA undertook numerous other projects during the
financial year but MEMD did not document these activities and
so assessment of progress is not possible.
Number of new
connections
20,000 Approximately 1,500 new connections had been made during the
financial year at the ten commissioned grid extension schemes
monitored. The low connection rate at many schemes suggests
that it is unlikely that the 20,000 target will be met overall.
However, REA undertook numerous other projects during the
financial year that MEMD did not document and so assessment of
progress is not possible.
Vote Function:0302 Large Hydropower Infrastructure (Energy Fund)
Number of studies done No target
specified
Feasibility studies are ongoing at Karuma and Ishasha
hydropower projects but documentation will not be completed by
the end of the financial year.
Vote Function:0303 Petroleum Exploration, Development & Production
New institutions created
to regulate oil and gas
activities in the country
3 The Petroleum Bill will create three institutions for petroleum
management: a policy arm; a regulatory authority; and a national
oil and gas company. Activities cannot commence until the Bill is
passed by Parliament of Uganda.
Number of national
expertise’s for oil & gas
developed
4 Unclear how this target should be measured. Monitoring found
that a significant number of training and development activities
were taking place in PEPD.
Source: National Budget Framework Paper FY10/11; fieldwork observations
Figure 3.3.20 provides a time series analysis of budget allocations (GoU plus donor) for vote
functions 0301, 0302 and 0303 for financial years 08/09, 09/10, 10/11 and projected budget
allocation for 11/12. As shown, vote function 0301 (Energy Planning, Management and
Infrastructure Development) retains the majority share of funding – reflecting sector emphasis on
outcome “increased power generation capacity and transmission”. Vote function 0303
(Petroleum Exploration, Development & Production) is projected to receive a steady increase in
funding – reflecting the increased importance of the petroleum sector in national development
priorities. Vote function 0302 (the Energy Fund) will be suspended during financial FY 10/11
but will resume in FY 11/12.
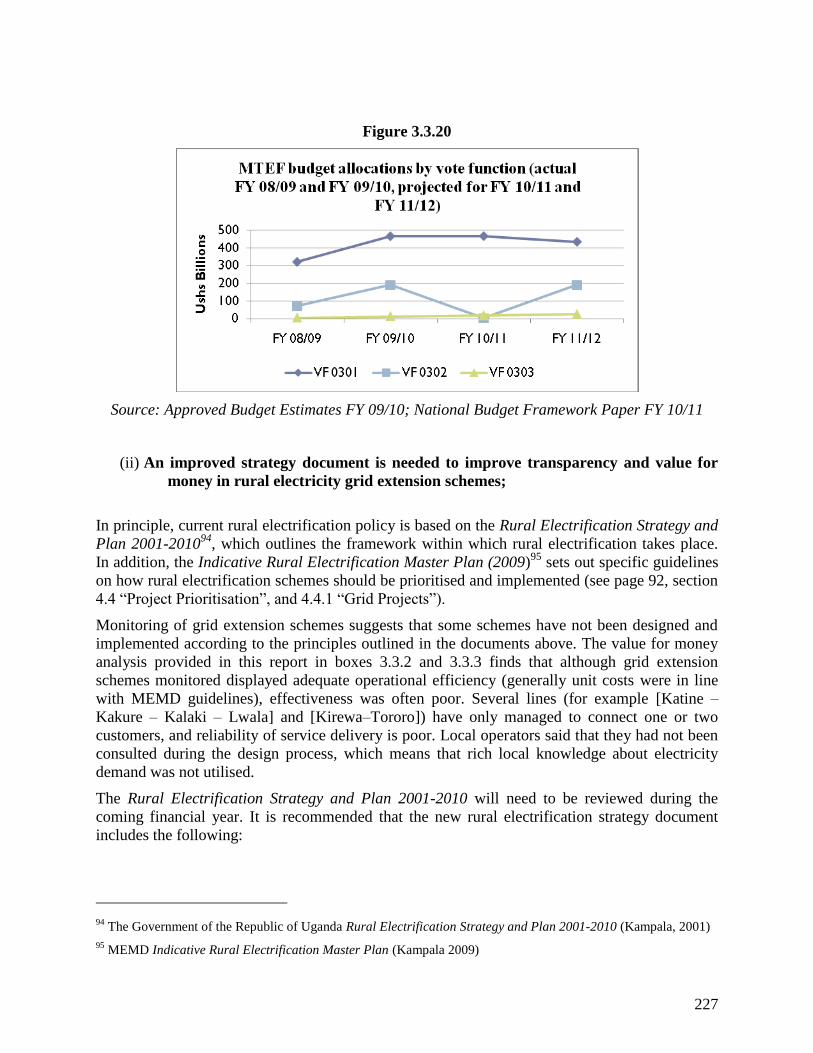
227
Figure 3.3.20
Source: Approved Budget Estimates FY 09/10; National Budget Framework Paper FY 10/11
(ii) An improved strategy document is needed to improve transparency and value for
money in rural electricity grid extension schemes;
In principle, current rural electrification policy is based on the Rural Electrification Strategy and
Plan 2001-201094
, which outlines the framework within which rural electrification takes place.
In addition, the Indicative Rural Electrification Master Plan (2009)95
sets out specific guidelines
on how rural electrification schemes should be prioritised and implemented (see page 92, section
4.4 “Project Prioritisation”, and 4.4.1 “Grid Projects”).
Monitoring of grid extension schemes suggests that some schemes have not been designed and
implemented according to the principles outlined in the documents above. The value for money
analysis provided in this report in boxes 3.3.2 and 3.3.3 finds that although grid extension
schemes monitored displayed adequate operational efficiency (generally unit costs were in line
with MEMD guidelines), effectiveness was often poor. Several lines (for example [Katine –
Kakure – Kalaki – Lwala] and [Kirewa–Tororo]) have only managed to connect one or two
customers, and reliability of service delivery is poor. Local operators said that they had not been
consulted during the design process, which means that rich local knowledge about electricity
demand was not utilised.
The Rural Electrification Strategy and Plan 2001-2010 will need to be reviewed during the
coming financial year. It is recommended that the new rural electrification strategy document
includes the following:
94
The Government of the Republic of Uganda Rural Electrification Strategy and Plan 2001-2010 (Kampala, 2001)
95 MEMD Indicative Rural Electrification Master Plan (Kampala 2009)

228
Guidelines on how to improve transparency in the identification and prioritisation of grid
extension schemes: for example by developing clear selection criteria and making
analysis publically available;
Provision for inclusion of local government and existing local operators in the
identification and design of new schemes.
(iii)Households in rural areas often have limited ability or willingness to pay for
connection to electricity grid extensions;
Monitoring of rural electrification schemes during FY 09/10 found that some grid extension
projects have failed to attract a significant number of new customers. Interviews with
beneficiaries (households and businesses) that have managed to connect to the new electricity
distribution networks noted that connection fees and wiring costs were difficult to afford.
Discussions with local operators (BECS, PACMECS, Ferdsult Limited, Kilembe Investments,
and Umeme) revealed similar conclusions. Where subsidies have been provided for an initial
batch of connection fees (for example at the Kasese and Kyenjojo extensions), the rate of new
connections was much higher during the subsidy period than it was after subsidies were stopped.
It is recommended that the following actions could improve effectiveness of future grid
extension schemes:
Local operators could be encouraged to employ community liaisons officers in order to
improve sensitisation of beneficiaries (Monitoring noted that officers were employed at
BECS and PACMECS cooperative organisations but not at the private operators);
All future grid extension projects could include a connection subsidy component;
BECS have designed and locally produce a product called a ‘ready-board’ which when
purchased by customers (for around UShs 150,000) removes the need to pay for wiring
and inspection costs. This significantly reduces the cost of connection to the distribution
network. Other operators could consider replication of the ready board product (see
picture below).

229
(iv) MEMD reporting systems could be improved to improve transparency;
Analysis of progress in the energy sector during FY 09/10 has been constrained by the
information provided by MEMD in work plans (outlined in the Ministerial Policy Statement FY
09/10) and Performance Contract Form A quarterly reporting. Specifically:
Only a small proportion of activities undertaken by REA were documented in
Performance Contract Form A. This means that numerous activities that should be
recorded under project 0331 (Rural Electrification) are not documented – and so
transparency is poor;
Activities taking place under the direction of UETCL are also not reported in
Performance Contract Form A, even though they feature in the Ministerial Policy
Statement. For example, four international electricity transmission projects outlined in the
Ministerial Policy Statement will connect Uganda with The Democratic Republic of
Congo, Tanzania, Kenya and Rwanda. Although work on land acquisition and
resettlement has already commenced, these activities no not feature anywhere in
Performance Contract Form A.
Official reporting on the use of the Energy Fund (project 0895) has been inadequate.
Whilst Performance Contract Form A states that no activities have taken place due to non
release of funds; MEMD officials confirmed that activities were in fact taking place on
the feasibility study for Karuma hydropower project (for which the funds are earmarked).
MEMD should improve transparency regarding the use of these funds.
Ready-boards contain the meter box, one socket and one light bulb. They can be purchased
inexpensively and remove inspection fee costs.
Female headed
household using
ready- board in
Bundibugyo town
(left);
Phone charging
shop in
Bundibugyo town
(right)

230
3.4 HEALTH
3.4.1 Introduction
The total approved allocation to the health sector in FY 09/10 was UShs 735.67 billion out of
which UShs 434.17 billion was GoU contribution and UShs 301.50 billion was donor funding.
This was an increase of UShs 107.21 billion from last (08/09) FY’s allocation of UShs 628.46
billion. It should be noted that substantial resources continue to flow to the sector through off the
budget support. The medium term health sector policy objective of the health sector is to reduce
morbidity and mortality from the major causes of ill health and premature death and reduce
disparities therein. The key policy implementation issues to be addressed in the medium term
include: inadequate essential medicines and health supplies in health facilities, underequipped
health facilities, poor functionality and low coverage of village health teams and low staffing
levels96
Methodology
During the fourth quarter of FY 2009/10 (April-June 2010), the health sector team of the Budget
Monitoring and Accountability Unit (BMAU) monitored the following projects. Rehabilitation
of Arua, Kabale and Masaka Regional Referral Hospitals; Support to the Health Sector Strategic
Plan II Project (SHSSP) where the team monitored construction and rehabilitation of health
facilities in three districts of South Western Uganda namely: Isingiro, Kabale, and Rukungiri;
Instittional Support to the Ministry of Health Project; and District Infrastructure Support Project
where the team visited three hospitals including: Nebbi, Tororo and Masafu.
Implementation of PHC and PRDP grants was monitored in the following districts: Bugiri, Busia
Hoima, Isingiro, Kabale, Kiboga, Koboko, Maracha-Terego, Mityana, Mubende, Namutumba,
Nebbi, Rakai, Rukungiri, Sembabule, and Tororo. The districts were purposively selected taking
into consideration regional representation and going back to areas that had been visited in earlier
quarters. The monitoring exercise focused on the inputs, processes and outputs of disbursements
to projects and programs within the health sector.
3.4.2 Rehabilitation of Regional Referral Hospitals Project.
Introduction
During FY 08/09 Government allocated UShs 16 billion (excluding taxes) for the Rehabilitation
of 11 Regional Referral Hospitals including: Arua, Buhinga, Gulu, Hoima, Jinja, Kabale,
Masaka, Mbale, Soroti, Lira and Mbarara. In FY 09/10 Government allocated UShs 17 billion
for the rehabilitation of the above listed RRHs. Releases to the Regional Referral Hospitals over
shown in the table below:
Table 3.4.1: Releases to Regional Referral Hospitals in FY 08/09
96
Republic of Uganda. MoH. 2009. Health sector budget framework paper.

231
Reg. Referral
Hospital Budget Release
Variance as at 30
June 2009 Percentage
Arua 1,681,420,000 1,631,110,000 50,310,000 97.0
Fortportal 900,000,000 871,128,000 28,872,000 96.8
Gulu 1,850,000,000 1,796,415,000 53,585,000 97.1
Hoima 1,243,000,000 1,109,913,000 133,087,000 89.3
Jinja 1,813,000,000 1,750,500,000 62,500,000 96.6
Kabale 1,849,320,000 1,849,320,000 0 100.0
Masaka 1,806,000,000 1,753,500,000 52,500,000 97.1
Mbale 1,551,886,000 1,464,936,000 86,950,000 94.4
Soroti 1,450,374,000 1,450,372,000 2,000 100.0
Lira 1,660,000,000 1,491,667,000 168,333,000 89.9
Mbarara 200,000,000 194,207,000 5,793,000 97.1
Source: MFPED Legacy system
Table 3.4.2: Releases to Regional Referral Hospitals in FY 09/10
Reg.
Referral
Hospital Revised Budget TOTALS Releases
Variance as at
30 June 2010 Percentage
Arua 1,481,000,000 1,481,000,000 100
Fort Portal 1,750,000,000 1,750,000,000 100
Gulu 1,750,000,000 1,750,000,000 - 100
Hoima 1,143,000,000 1,143,000,000 100
Jinja 1,808,000,000 1,708,424,000 99,576,000 94.5
Kabale 1,800,000,000 1,800,000,000 100
Masaka 1,806,000,000 1,806,000,000 100
Mbale 1,452,000,000 1,452,000,000 100
Soroti 1,350,000,000 1,260,959,000 89,041,000 93.4
Lira 1,460,000,000 1,460,000,000 - 100
Mbarara 1,200,000,000 1,200,000,000 100
Total 17,000,000,000 16,811,383,000 188,617,000
Source: MFPED Legacy system

232
As shown in the table 3.4.1, Government released over 97% of the proposed budget for 08/09.
For FY 09/10, UShs 16,811,383,000 (98.89%) out of the approved budget of UShs
17,000,000,000 was released as at the end of FY 2009/10 (30 June 2010). Only UGX
188,617,000 was not released accounting for only 1.1%. Although Moroto and Mubende
Hospitals were upgraded to Regional Referral Hospital status starting FY 09/10, no funds were
allocated during the FY. During the fourth quarter ended 30 June 2010, the budget monitoring
team visited 3 RRHs namely: Arua, Kabale and Masaka as described below.
A. ARUA REGIONAL REFERRAL HOSPITAL
In FY 2009/10 Arua Regional Referral Hospital was allocated and actually received its entire
allocation amounting to UShs 1,481,000,000 for capital development. During FY 09/10, the
district planned to undertake the following activities: complete construction of the medical ward,
the lagoon, complete the staff houses and procurement of furniture, office equipment,
photocopiers, computers, motorcycles, firefighting equipment and medical equipment. The
detail of all activities that were to be undertaken is as illustrated in the table 3.4.3.
Financial Performance
The table 3.4.3 is a summary of capital development activities undertaken during FY 08/09 and
FY 09/10. Information provided include: project undertaken, contractors, contract sums and
payments todate.
Table 3.4.3: Financial performance for FY 08/09 and FY 09/10 for Arua Regional Referral
Hospital
Output Description Contractor Contract sum Cumulative
payment to date
(Ug. Sh.)
Construction of the 3
storeyed medical ward
Excel Construction 3,212,114,188 1,753,968,168
Construction of
Residential houses
Ishaka Muhereza
Workshop
582,245,184 505,204,756
Procurement of motor
vehicle (station wagon
Motor care (U) Limited 154,974,762 154,974,762
Procurement of motor
cycles
Honda (U) Limited 23,917,500 10,630,000
Procurement of office
and IT Equipment
Wiz Technology Limited 37,400,000 37,400,000
Procurement of filling
cabinets and carpets
Footsteps 8,365,000 8,365,000
Procurement of medical
equipment
Joint Medical Stores
Limited
70,440,251 70,440,251

233
Procurement of
medical equipment
Crown Health Care 98,579,560 Funds committed
Procurement of fire
fighting equipment
Fire Masters Limited 8,378,000 Funds committed
Procurement of office
equipment
Olitec International 8,875,960 8,875,960
Procurement of office
furniture
Translog Distributors 36,870,000 36,870,000
Source: field findings
In regard to the construction of the medical ward, the Ministry of health (MoH) paid the initial
UShs 900,000,000 and it was consequently financed under the Rehabilitation of the Referral
Hospital.
Physical Performance
By the time of the monitoring visit on 2 June 2010, the construction of the 9 staff houses had
been completed and they were occupied by health workers. The medical ward had been roofed,
plastered and painting and other internal finishes was ongoing. The construction of the lagoon
stalled after business owners and households adjacent to the lagoon secured a court injunction
against further works on the lagoon. At the time of the monitoring visit, the Hospital
administration had commissioned an environmental impact assessment of the lagoon. Below are
pictures of some of the capital development activities undertaken at Arua RRH over the last two
FYs (08/09 and 09/10).
Part of the 6 housing units Inside the medical ward 3 storey medical ward
Station wagon Lagoon under construction

234
B. KABALE REGIONAL REFERRAL HOSPITAL
In the FY 2009/10 the hospital received its entire annual allocation for capital development
amounting to UShs 1,800,000,000.
Planned Activities FY 2009/10
During FY 09/10, the hospital planned to undertake the following activities: construction of the
private ward; a nurse’s hostel, renovation of TB ward and mini TASO, the mortuary, renovation
of staff houses, main store and X-ray unit, the gynaecology ward, the main theatre, renovation of
the maternal and child health/ family planning unit, the walk ways and theatre fence, the
maternity ward, orthopaedic and physiotherapy departments and other minor repairs.
Financial Performance
The table below gives a summary of capital development activities being undertaken at Kabale
Regional Referral Hospital from FY 2008/09 to FY 2009/10. The information includes; the
projects, contractors, contract sums and payments made.
Table 3.4.4: Financial performance for FY 08/09 and FY 09/10
Activities and Expenditure for FY
2008/09
Project Contractor
Contract sum
Payment to
date
Renovation of medical ward Kamutongo Contractors & Suppliers Limited 48,480,300 48,480,300
Renovation of surgical ward PEARL Combined Agents Limited 71,539,200 71,539,200
Renovation of Outpatient Department Kyomwaka Willy & Kamutongo Contractors 52,975,024 52,975,024
Renovation of staff houses Several 14,874,365 14,874,365
Renovation of administration block Multi-Purpose Technical Services Limited 15,329,830 15,329,830
Other miscellaneous minor repairs Several 19,544,512 19,544,512
Construction of a private wing PRIME I.K Limited 2,882,208,505 1,011,083,316
Construction of a nurses hostel Trandint Limited. 913,807,488 478,504,893
Construction of main gate & guard room
TAZIT Construction Co. Limited 11,763,910 11,763,910
Construction of two 6 stance Pit Latrines
DAFFMIR Construction & Gen. Agencies Limited 30,631,680 30,631,680
Activities and Expenditure for
FY 2009/10
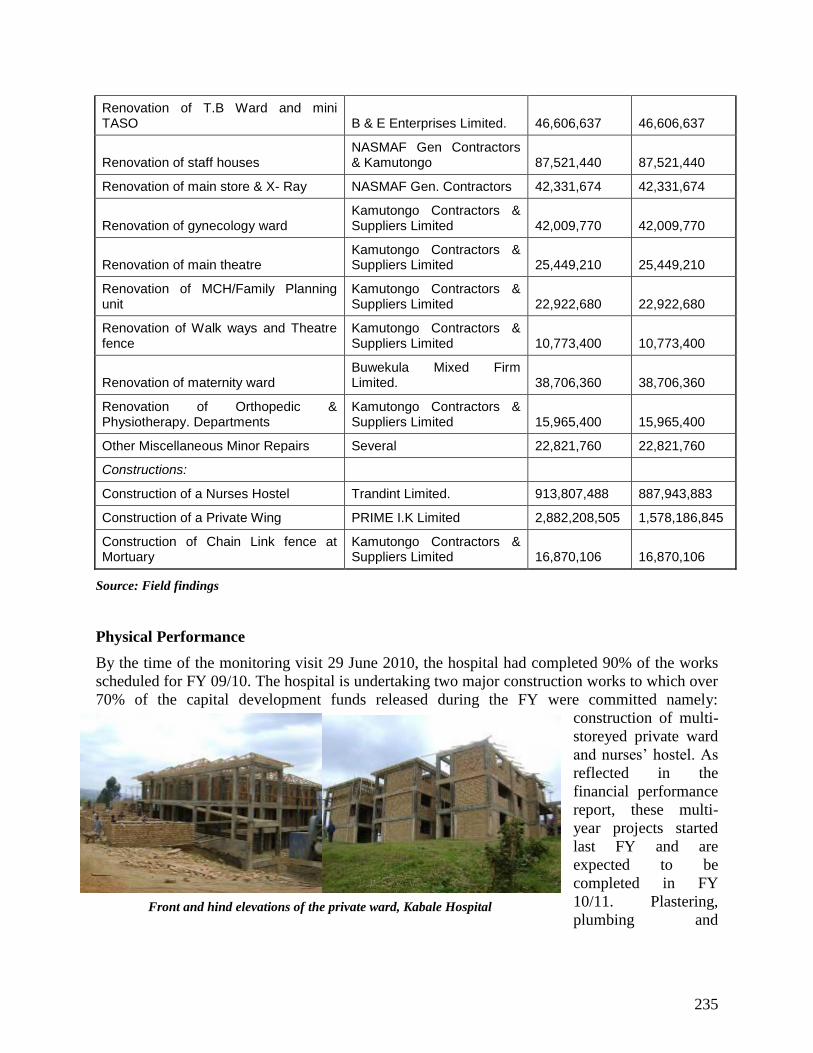
235
Renovation of T.B Ward and mini TASO B & E Enterprises Limited. 46,606,637 46,606,637
Renovation of staff houses NASMAF Gen Contractors & Kamutongo 87,521,440 87,521,440
Renovation of main store & X- Ray NASMAF Gen. Contractors 42,331,674 42,331,674
Renovation of gynecology ward Kamutongo Contractors & Suppliers Limited 42,009,770 42,009,770
Renovation of main theatre Kamutongo Contractors & Suppliers Limited 25,449,210 25,449,210
Renovation of MCH/Family Planning unit
Kamutongo Contractors & Suppliers Limited 22,922,680 22,922,680
Renovation of Walk ways and Theatre fence
Kamutongo Contractors & Suppliers Limited 10,773,400 10,773,400
Renovation of maternity ward Buwekula Mixed Firm Limited. 38,706,360 38,706,360
Renovation of Orthopedic & Physiotherapy. Departments
Kamutongo Contractors & Suppliers Limited 15,965,400 15,965,400
Other Miscellaneous Minor Repairs Several 22,821,760 22,821,760
Constructions:
Construction of a Nurses Hostel Trandint Limited. 913,807,488 887,943,883
Construction of a Private Wing PRIME I.K Limited 2,882,208,505 1,578,186,845
Construction of Chain Link fence at Mortuary
Kamutongo Contractors & Suppliers Limited 16,870,106 16,870,106
Source: Field findings
Physical Performance
By the time of the monitoring visit 29 June 2010, the hospital had completed 90% of the works
scheduled for FY 09/10. The hospital is undertaking two major construction works to which over
70% of the capital development funds released during the FY were committed namely:
construction of multi-
storeyed private ward
and nurses’ hostel. As
reflected in the
financial performance
report, these multi-
year projects started
last FY and are
expected to be
completed in FY
10/11. Plastering,
plumbing and Front and hind elevations of the private ward, Kabale Hospital

236
electrical installations was ongoing for the nurses hostel. The private wing had been roofed and
walling of some sections was ongoing. The quality of work is commendable.
Challenges to the Delivery of Health Care Services in the Hospital
1. Encroachment on hospital land: It was reported that substantial portions of the hospital
land has been encroached on over the years. Efforts by
the hospital to redeem the land have been rather futile.
The hospital administration has sought legal guidance
from the Solicitor General but have not received the
much needed legal advice. Some individuals have
occupied staff houses within the hospital land and are
not willing to vacate or even negotiate. Of the
encroachers leased hospital land to a telecom company
which elected a mast—that is an eye sore in the vicinity
of the hospital.
2. Late releases: The hospital administration was concerned about delays to release funds.
For instance funds for the fourth quarter of FY 09/10 were disbursed in May 2010. In
addition to these late releases, additional delays by Stanbic Bank to credit the accounts of
the hospital for an average of 2 weeks were also noted.
3. Lack of an accident and emergency unit: tThe hospital doesn’t have an accident and
emergency unit and currently uses the OPD for emergences which doesn’t have all the
facilities to handle emergency cases. The hospital is located along a high way and
receives a number of accident cases.
Nurses hostel at Kabale Hospital

237
4. Lack of contingency funds for medicines: Following the centralisation of procurement
and distribution of medicines under NMS, the Hospital does not have any funds to enable
it respond to emergencies. Similarly mental health and anaesthetic drugs are supplied in
few quantities by NMS. Lack of a contingency plan makes it difficult for the hospital to
act quickly in case of emergencies and stock outs of drugs.
C. MASAKA REGIONAL REFERRAL HOSPITAL
In FY 09/10, the hospital received its entire allocation for capital development amounting to
UShs 1,806,000,000.
Planned Activities FY 2009/10
During FY 09/10, the hospital planned to undertake the following activities: renovation of the
maternity wards, the female surgical ward, two male wards, the TB ward, the female medical
ward, the pediatric ward, the mortuary; and renovation and expansion of the male medical ward.
Other planned activities included: completion of construction of tarmacking the 0.96 km road
from the main gate into the hospital; refurbishing the drainage system, construction of walk ways
connecting to all wards, procurement of medical equipment including: an ultra sound machine,
pathology equipment, operating table, dental chairs and other assorted medical equipment. The
Hospital further planned to expand the administration block and renovate the interns’ mess. For
FY 10/11, the hospital intends to construct a staff hostel of 54 self contained housing units.
Financial Performance
The table below gives a summary of capital development activities being undertaken at Masaka
Regional Referral Hospital for the FY 2009/10.
Table 3.4.5: Financial performance for FY 08/09 and FY 09/10 for Masaka Regional
Referral Hospital
Project title Contractor Contract sum
Payments to
date
Expansion and Renovation of Male
Medical ward Block Technical Services Ltd 221,967,605 167,279,431
Renovation of female and Pediatric
ward Simeo Enterprises Ltd 153,441,890 94,024,996
Renovation and expansion of
administration block Litho Enterprises Ltd 108,462,001 90,127,896
Renovation of drug store Redline Investment Ltd 48,270,821 38,544,464
Renovation of private OPD
Triple Pride Building &
Contractors 16,505,000 15,679,750
Renovation of kitchen at private Sauda Nampeera 14,685,300 11,613,284

238
OPD
Construction and renovation of OPD
toilets Omega Jap 22,962,087 17,580,098
Construction of hedge and guard
rails
Triple Pride Building &
Contractors 12,762,360 12,124,242
Construction of walk ways from
Admin. Block to Uganda Cares,
Canteen & private OPD to
emergency ward Sauda Nampeera 28,652,860 2,370,400
Completion of paving private ward Block Technical Services Ltd 27,470,400 27,470,400
Completion of private ward Block Technical Services Ltd 27,412,473 27,412,473
Construction of a 3 storeyed staff
hostel Block Technical Services Ltd 2,674,824,035 504,227,394
Renovation of interns mess
Triple Pride Building&
Contractors 92,753,369 88,068,201
Procurement of consultancy services
for construction of staff hostel Ace Consult Ltd 65,796,520 17,731,728
Construction of a uniport hut at the
gate
Triple Pride Building&
Contractors 1,938,000 1,938,000
Construction of a generator house
St Jude Electricals & Medical
Equipment Ltd 1,837,500 1,837,500
Purchase of 1 station wagon Toyota Uganda Ltd 129,125,749 51,650,295
Procurement of assorted medical
Equipment Matrix U ltd 432,917,000 432,917,000
Procurement of assorted medical
Equipment Matrix U ltd 1,945,000 1,945,000
Procurement of assorted medical
Equipment Mulago hills Diagnostics Ltd 32,712,257 32,354,127
Procurement of assorted medical
Equipment Mednet Health Care (u) Ltd 64,371,200 45,586,345
Installation of Apbx machine in the
hospital
St Jude Electricals & Medical
Equipment Ltd 45,586,345 45,586,345
Procurement of generator
St Jude Electrical& Medical
Ltd 23,090,000 23,090,000
Procurement of five computers Real Tech Ltd 9,750,000 9,750,000
Procurement of television set
St Jude Electricals& Medical
Equipment Ltd 3,101,800 3,101,800
Procurement of an inverter
Overseas General Investors U
ltd 11,000,000
Procurement of office furniture Footstep Furniture Co. Ltd 28,168,016
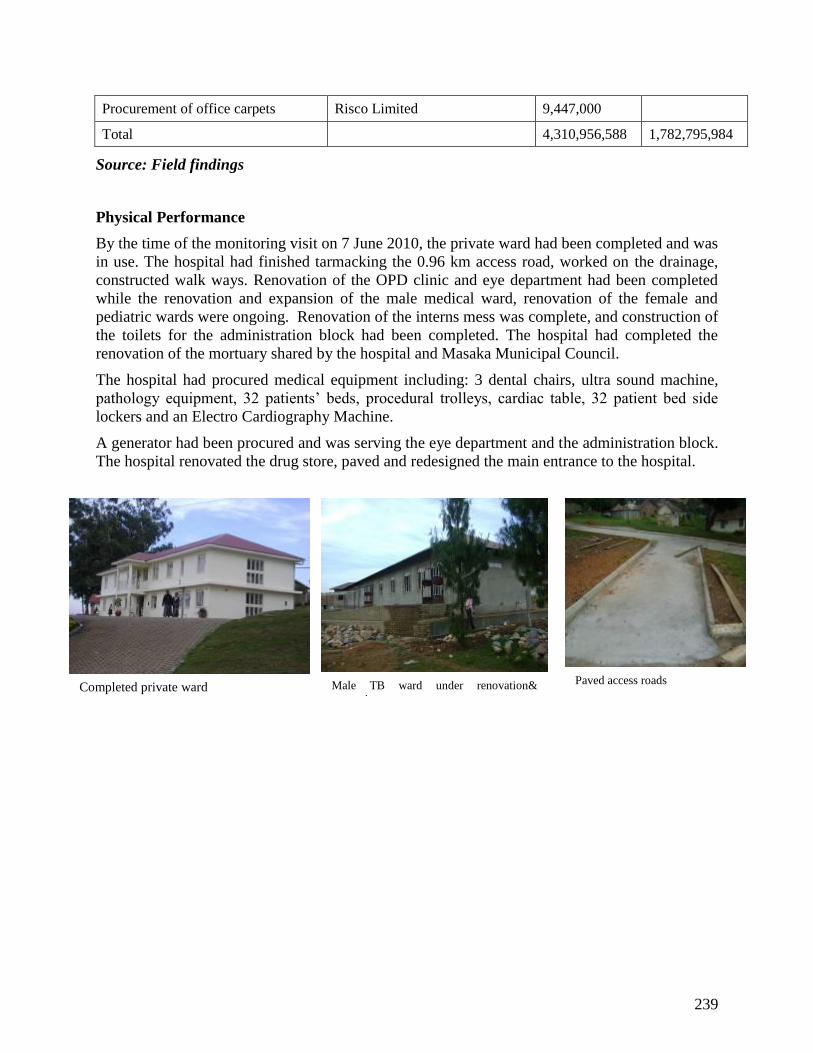
239
Procurement of office carpets Risco Limited 9,447,000
Total 4,310,956,588 1,782,795,984
Source: Field findings
Physical Performance
By the time of the monitoring visit on 7 June 2010, the private ward had been completed and was
in use. The hospital had finished tarmacking the 0.96 km access road, worked on the drainage,
constructed walk ways. Renovation of the OPD clinic and eye department had been completed
while the renovation and expansion of the male medical ward, renovation of the female and
pediatric wards were ongoing. Renovation of the interns mess was complete, and construction of
the toilets for the administration block had been completed. The hospital had completed the
renovation of the mortuary shared by the hospital and Masaka Municipal Council.
The hospital had procured medical equipment including: 3 dental chairs, ultra sound machine,
pathology equipment, 32 patients’ beds, procedural trolleys, cardiac table, 32 patient bed side
lockers and an Electro Cardiography Machine.
A generator had been procured and was serving the eye department and the administration block.
The hospital renovated the drug store, paved and redesigned the main entrance to the hospital.
Completed private ward Paved access roads Male TB ward under renovation&
expansion

240
3.4.3 District Infrastructure Support Program
The District Infrastructure Support Programme (DISP) is a Government of Uganda funded
infrastructure development programme which is implemented by the Ministry of Health (MoH).
The project focuses on rehabilitation, and provision of ambulances and medical equipment to
General Hospitals. Works have been undertaken at the following hospitals over the last 6 years:
Nakaseke, Abim, Nebbi, Moyo, Masafu, Kambuga, Itojo, Rushere, Bududa and Tororo. Works
at most of these facilities have been protracted usually spanning several FYs.
During the fourth quarter FY 2009/10, the health sector budget monitoring team visited three of
the general hospitals where works have been ongoing namely: Busia, Nebbi and Tororo. The
progress of the rehabilitation works are described below.
A. NEBBI GENERAL HOSPITAL
Spencon Services Limited was contracted by Ministry of Health to rehabilitate Nebbi Hospital at
a sum of UShs 1,183,558,928. The scope of works at Nebbi Hospital included: refurbishment of
windows and doors and patches in the hospital; rehabilitating the drainage and sewerage systems
Dental chair and ultra sound machine Generator for eye & admin Dep’ts
Rehabilitated drug store Drug store before rehabilitation Renovated and expanded admin
department

241
within the Hospital and replacing some of the drainage pipes within the hospital. Other works
included rehabilitating drainage systems within the medical staff quarters, drilling of a borehole,
installation of a solar pump on the borehole and rehabilitating the lagoon.
The contract was scheduled to run for a period of 18 months starting from April 2009 to
September 2010. The annual progress report for FY 09/10 indicated that 90% of the scheduled
works had been completed while the contractor reported payment over 90% of the contractual
sum. Actual payments by the MoH to the contractor had not been availed by the time this report
was finalized.
However the monitoring visit on 31 May 2010 revealed the contrary. Rehabilitation of the
sewage system had stalled. There was no significant progress of work done between September
2009 when the team last visited and the recent visit. On request of the contractor, the Hospital
Administration shifted patients into some of the wards to allow works on selected wards.
However since the wards were handed over in April 2009, none of the scheduled works had been
completed. Verification confirmed that none of the toilets in the hospital had been completed.
Broken cisterns had been removed but no replacements had been fixed. Old tiles had been
replaced with new ones. Door frames for most of the toilets had been replaced but doors had not
been fixed. Rehabilitation of the lagoon was nearing completion.
Spencon Services Limited –the contractor acknowledged the delays and reported that some of
the required materials and parts were yet to be imported into the country. For example, the solar
pump was ordered from Canada. No sewer pumps had been replaced within the hospital. Some
of the pipes were being repainted instead of being replaced. Some of the outright visible cracks
that have been a sore sight in the hospital have not been patched.
Rusty water pipes to be repainted. Partially rehabilitated toilets Lagoon
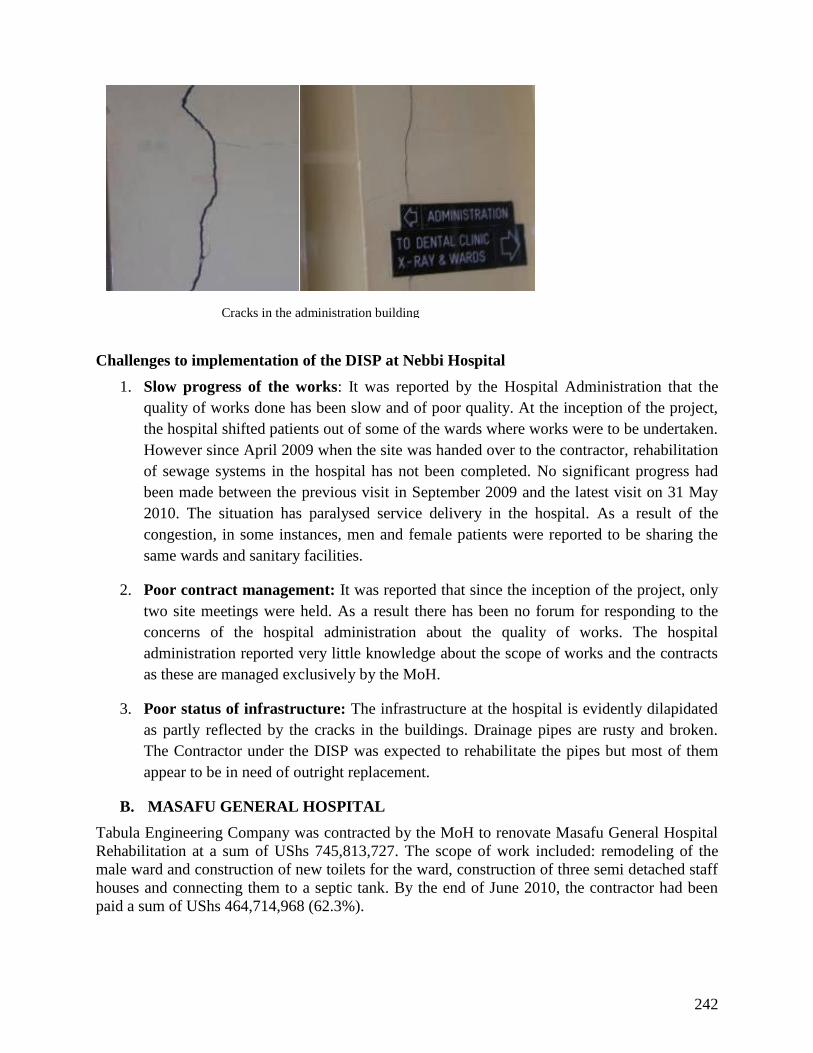
242
Challenges to implementation of the DISP at Nebbi Hospital
1. Slow progress of the works: It was reported by the Hospital Administration that the
quality of works done has been slow and of poor quality. At the inception of the project,
the hospital shifted patients out of some of the wards where works were to be undertaken.
However since April 2009 when the site was handed over to the contractor, rehabilitation
of sewage systems in the hospital has not been completed. No significant progress had
been made between the previous visit in September 2009 and the latest visit on 31 May
2010. The situation has paralysed service delivery in the hospital. As a result of the
congestion, in some instances, men and female patients were reported to be sharing the
same wards and sanitary facilities.
2. Poor contract management: It was reported that since the inception of the project, only
two site meetings were held. As a result there has been no forum for responding to the
concerns of the hospital administration about the quality of works. The hospital
administration reported very little knowledge about the scope of works and the contracts
as these are managed exclusively by the MoH.
3. Poor status of infrastructure: The infrastructure at the hospital is evidently dilapidated
as partly reflected by the cracks in the buildings. Drainage pipes are rusty and broken.
The Contractor under the DISP was expected to rehabilitate the pipes but most of them
appear to be in need of outright replacement.
B. MASAFU GENERAL HOSPITAL
Tabula Engineering Company was contracted by the MoH to renovate Masafu General Hospital
Rehabilitation at a sum of UShs 745,813,727. The scope of work included: remodeling of the
male ward and construction of new toilets for the ward, construction of three semi detached staff
houses and connecting them to a septic tank. By the end of June 2010, the contractor had been
paid a sum of UShs 464,714,968 (62.3%).
Cracks in the administration building
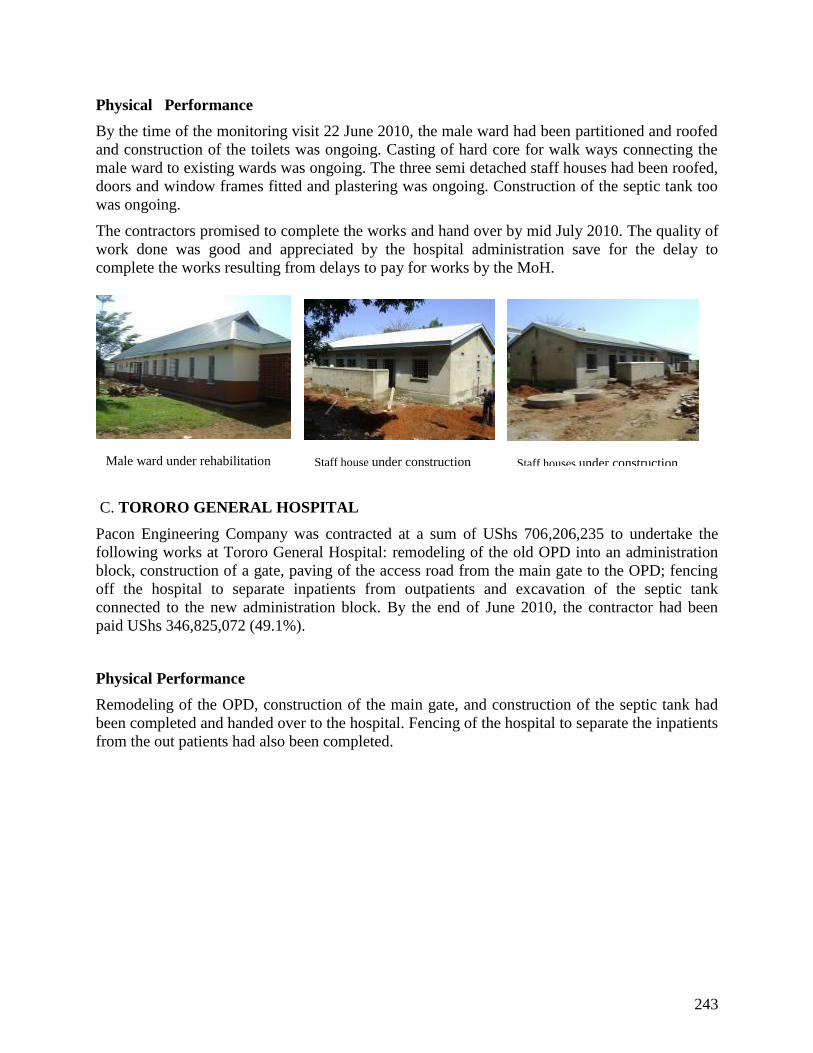
243
Physical Performance
By the time of the monitoring visit 22 June 2010, the male ward had been partitioned and roofed
and construction of the toilets was ongoing. Casting of hard core for walk ways connecting the
male ward to existing wards was ongoing. The three semi detached staff houses had been roofed,
doors and window frames fitted and plastering was ongoing. Construction of the septic tank too
was ongoing.
The contractors promised to complete the works and hand over by mid July 2010. The quality of
work done was good and appreciated by the hospital administration save for the delay to
complete the works resulting from delays to pay for works by the MoH.
C. TORORO GENERAL HOSPITAL
Pacon Engineering Company was contracted at a sum of UShs 706,206,235 to undertake the
following works at Tororo General Hospital: remodeling of the old OPD into an administration
block, construction of a gate, paving of the access road from the main gate to the OPD; fencing
off the hospital to separate inpatients from outpatients and excavation of the septic tank
connected to the new administration block. By the end of June 2010, the contractor had been
paid UShs 346,825,072 (49.1%).
Physical Performance
Remodeling of the OPD, construction of the main gate, and construction of the septic tank had
been completed and handed over to the hospital. Fencing of the hospital to separate the inpatients
from the out patients had also been completed.
Male ward under rehabilitation Staff house under construction Staff houses under construction

244
Challenges to service delivery in Tororo Hospital
Poor quality of works: There are several defects identified within the works undertaken
at the hospital including: doors which do not lock, leaking roofs, storm water entering the
offices and the road works which have not been completed. The contractor handed over a
road that had not been completed. The hospital administration identified defects which
the contractor was expected to complete within 6 months but was reluctant to do so.
Inadequate human resources: The hospital has only two medical doctors out of an
establishment of 7 doctors. There are no dispensers, no laboratory technicians, no
radiographer and no pharmacist. The hospital has an ultra modern x-ray which was
donated by JICA but is currently not used due to lack of a radiologist. The few health
workers at the hospital are overwhelmed by the amount of work.
Poor maintenance of equipment: The hospital has no engineer in its establishment who
would carry out routine maintenance of hi-tech medical equipment. The Hospital relies
on hiring the services of staff from Mbale Regional Referral Hospital.
Inadequate security: The Hospital employs only two Askaris who man the two gates to
the hospital. There are no security personnel to patrol the hospital premises. At night the
Hospital employees one policeman and are not able to recruit additional security
personnel due to inadequate funding.
Administration block New gate and security house Septic tank

245
3.4.4 Support to the Health Sector Strategic Plan Project II
A total of 39 health facilities are being rehabilitated and remodeled in 9 districts of South
Western Uganda including: Mbarara, Kiruhura, Isingiro, Ibanda, Ntungamo, Kabale, Rukungiri,
Kanungu and Bushenyi. The contracts for the rehabilitation of the 39 Health Centres were
awarded to Multiplex limited which was contracted to rehabilitate/remodel 9 HCIVs and 18
HCIIIs under Lot 2 and 3; and Creative Construction Company Ltd and Krish Developers and
Consultants(joint Venture) which was hired to remodel 4 HCIVs and 8 HCIIIs. Contracts for the
above works were signed on 15 August 2008. Each facility had varying dates of completion
ranging from 15 May 2009 and 15 June 2010. None of the sites was completed on schedule.
During the fourth quarter of FY 09/10, the health sector monitoring team sampled health
facilities in Isingiro, Kabale and Rukungiri districts. Below is the progress of the civil works in
the districts.
ISINGIRO DISTRICT
In Insingiro district, the following sites are undergoing construction: Nyarubungo HCIII, Endinzi
HCIII, Rwenkubo HCIV and Nyamuyanja HCIV. Works were expected to start on 15 August
2008 at Nyarubungo HCIII and end on 15 May 2009. The monitoring team visited Rwenkubo
HCIV and Nyamuyanja HCIVs.
a) Rwenkubo HCIV
At Rwenkubo HCIV, the following facilities were to be constructed under the contract: an
outpatient department, general ward, operating theatre, attendant shelter and staff houses. At the
time of the monitoring visit on 28 June 2010, the OPD was at ring beam, the operating theatre
had been roofed and the general ward was at ring beam. Construction of the staff houses was at
window level while the construction of the attendant shelter was also at ring beam. The physical
progress of the civil works is illustrated below.
General ward Outpatient department Operating theatre

246
b) Namuyanja HCIV
At Namuyanja HCIV, the following facilities were to be constructed: an outpatient department,
operating theatre, maternity ward, general ward, single staff house and double staff house. At the
time of the monitoring visit on 28 June 2010, the OPD was at roofing stage, the operating
theatre, maternity ward; general ward, the single and double staff houses had been roofed and
outside plastering completed. The physical progress of the civil works is shown below.
KABALE DISTRICT
In Kabale district, the following health centres were to be rehabilitated/upgraded: Bukinda
HCIV, Hamurwa HCIV, Kamuganguzi HCIII, Buhara HCIII, Bufundi HCIII and Butanda HCIII.
The contract for works at the above 6 health centres was awarded to Multiplex Limited. Works at
Bukinda HCIII, were expected to commence on 15 November 2008 and end on 15 August 2009.
Works at Hamurwa HCIV, Kamuganguzi HCIII and Buhara HCIII were expected to have
commenced on 15 June 2009 and end on 15 March 2010 while the remodeling of Bufundi HCIII
and Butanda HCIII was expected to start on 15 September 2009 and 15 June 2010.
The contract for the upgrading of the above health centres was also awarded to Multiplex
Limited and the Consultant is Infrastructure Design Forum. The monitoring team visited Buhara
HCIII and Kamuganguzi HCIII to establish the progress.
Double staff house Maternity ward Operating theatre
Outpatient department General ward Single staff house

247
a) Buhara HCIII
At Buhara HCIV, the following structures were to be constructed; single staff house, double staff
house, attendant shelter, general ward, single and double laundry, double VIP latrine, out patient
department, attendant shelter, maternity and general ward. By the time of the monitoring visit 29
June 2010, the single staff house, the double staff house, OPD, and general ward had been
roofed, plastered and window flames fitted. The construction of the attendant shelter was at
roofing stage while the construction of the double laundry was at ring beam. The physical
progress of the civil works is shown below.
b) Kamuganguzi HCIII
The following structures were planned to be constructed at Kamuganguzi HCIII: general ward,
staff houses, outpatient department, single and double VIP latrines, attendant shelter and laundry.
At the time of the monitoring visit 29 June 2010, the general ward had been roofed and plastered;
the outpatient department had been plastered and roofed. The attendant shelter, VIP latrines were
at foundation level. The single and double staff houses had been roofed and outside plastering
was ongoing. Below is the progress of the physical works at Kamuganguzi HCIV.
General ward Double and single staff houses
Outpatient department Operating theatre Operating theatre

248
RUKUNGIRI DISTRICT
In Rukungiri District, the following health facilities were to be constructed/ remodeled: Kebisoni
HCIV, Buhunga HCIV, Nyakisenyi HCIII, Nyakagyema HCIII, Rweshama HCIII, Bikurungu
HCIII. It was reported that works at Nyakagyeme HCIII had been completed while construction
of facilities at Rwensama HCIII had just commenced. The team visited Buhanga HCIV to
establish the progress of the construction. The progress is highlighted below.
a) Buhunga HCIV
At this site, the following structures were planned: construction of a single and double staff
house, an operating theater, a maternity ward, a general ward, a double and single laundry and an
outpatient department. Civil works at this site were contracted to Creative Construction and
Krisha Developers (Joint Venture). By the time of the monitoring visit on 30 June 2010,
shuttering and finishes were ongoing as shown below.
General ward Outpatient department Staff houses
Outpatient department Maternity ward Operating theatre

249
CHALLENGES IN IMPLEMENTING OF THE SHSSP PROJECT
Value Added Tax Compensation: VAT was included in the contracts signed in August
2008 and was to be paid by the Government of Uganda as counterpart funding. However
in the budget speech of FY 2008/09, donor funded projects in agriculture, health and
education sector were exempted from paying Value Added Tax (VAT) and had their
arrears written off—in order to ease the challenges associated with counterpart funding97
.
Creative Construction Company Limited was contracted to carry out works in Kanungu,
Rukungiri and Bushenyi at a sum of US$ $5, 315,579.35. By April 2010, the company
had been paid US$ 2,958,002.25 excluding VAT. It was reported that the VAT associated
with the certified works was US$ 900,000 out of which the contractor had only been paid
VAT compensation worth only US$ 51,840. Construction materials are supplied
inclusive of VAT which compensation has not been paid by Government. The contractor
claimed that the VAT compensation owed to Government had constrained works
resulting into abandoning several of the sites in the three districts of operation.
Over contracting: Only two companies were contracted to undertake works at 39 health
facilities. These were over stretched. By the completion date for the contract, some of the
scheduled works at selected facilities across the 9 Districts had not been embarked on.
3.4.5 Primary Health Care and PRDP Grants to Local Governments
Throughout the FY 09/10, BMAU monitored implementation of PHC grants in over 70 District
Local Governments. Some of the Districts visited during the first quarter of FY 09/10 were re-
visited to establish progress made throughout the FY using the first quarter as the benchmark.
Districts revisited include: Mityana, Mubende, Hoima, Kiboga, Sembabule, Rakai, Namutumba,
97
MFPED budget speech FY 2009/10 paragraph 95.
General ward Staff houses

250
Maracha, Nebbi, Arua, Busia, Bugiri, Isingiro, Kabale, and Rukungiri. Districts like Tororo and
Koboko were visited for the first time during the FY to take stock of progress made toward
implementing PHC grants as at the end of the FY.
BUGIRI DISTRICT LOCAL GOVERNMENT
The district health office received UShs 209,600,000 between July 2009 and June 2010 for PHC
capital development. The following activities were scheduled to be undertaken in FY 09/10:
expansion of an OPD at Buyinja HCIV, remodeling of the OPD at Nankoma HCIV, construction
of an OPD at Mutumba HCIII and procurement of medical equipment.
Financial Performance
3.4.6 Financial Performance Report for PHC Capital Development, Bugiri District
Name of the Project Contractor Contract sum Payments to date
Expansion of OPD at
Buyinja HCIV Dankik Enterprises 173,456,500 49,358,790
Construction of OPD at
Nankoma HCIV
Greenland Building
Contractors and Civil
Engineers Company
Limited 393,000,000 600,000
Procurement of Medical
equipments
Kagga Investments
Limited 9,941,000 9,941,000
Procurement of
architectural drawings Ikaaba 571,000
Construction of OPD at
Mutumba HCIII
Nkabi Investment
Limited 103,799,995 17,138,509
Retention on DHO's office
Ebikuumu Ebibiri
Contractors 67,434,140 3,371,707
Total 80,981,006
Source: Field findings
Physical Performance
By the time of the monitoring visit 21 June 2010, the OPD expansion at Buyinja HCIV was at
ring beam while the OPD at Mutumba HCIII had been roofed, and plastered, but remodeling of
the OPD at Nankoma HCIV had not started.
OPD at Buyinga HCIV Maternity ward at Mutimba HCIII

251
BUSIA DISTRICT LOCAL GOVERNMENT
The district received UShs 522,669,000 for both traditional PHC and PRDP from July 2009 to
June 2010. The following activities were planned for FY 09/10: construction of the district drug
store, completion of a laboratory at Busia HCIV, and procurement of beds and beddings under
PHC. Under PRDP, the following were scheduled: construction of staff houses at Amoni Kakinei
HCII, Buwamba HCII, Bumunji HCII and Hasyule HCII, fencing of Masafu General Hospital
and Buhehe HCIII. The district also planned to construct maternity wards at Habuleke HCII,
Buwembe HCII, Sikuda HCII, and Buttette HCII.
Financial Performance
Table 3.4.7: Financial Performance Report for PHC Capital Development, Busia District
Project Contractor contract sum Payments
Construction of staff houses at Hashule
& Bumunji HCII,
Pentagon Contractors
Limited 99,692,172 55,798,900
Construction of staff houses at
Buwumba HCII and Amonikakinei
HCII
Nafito Contractors
Limited 99,009,481 49,304,946
Fencing of Masafu Hospital
Time traders and
Transporters Limited 53,681,551 49,806,458
Construction of maternity wards at
Habuleke HCII, Buwembe HCII, &
Sikuda HCII One by One Limited 87,940,467 11,953,908
Construction of Laboratory at Busia
HCIV
M/S BBK General
Contractors Limited 253,981,694 73,511,782
Construction of District Drug Store
M/S BBK General
contractors Limited 70,003,347 33,617,925
Construction of OPD at Mawero HCII
Raph Construction
Company 49,956,777 11,434,677
Construction of OPD at Tira Ajuket
HCII
Pentagon Contractors
Limited 49,956,777 27,162,657
Source: Field findings
Physical Progress
By the time of the monitoring visit 22 June 2010, construction of the drug store was at ring beam
while the laboratory at Busia HCIV was almost complete. Construction of the maternity ward at
Buwembe HCII was still at foundation level while the maternity ward at Habuleke HCII was at
window plate level.

252
HOIMA DISTRICT LOCAL GOVERNMENT
The district had received UShs.129, 757,000 for capital development for FY 09/10. The
following capital development activities were scheduled for FY 09/10: completion of an
operating theatre at Kigorobya HCIII, construction of a doctor’s house at Kigorobya HCIII,
completion of Bukuku HCIV, construction of staff quarters at Kasetta HCIII and construction
of a water pump at Kikube HCIV.
Financial Performance
Table 3.4.8: Financial Performance Report for PHC Capital Development, Hoima District
Name of the Project Contractor Contract sum
Payments to
date
Construction of a theatre at
Kigorobya HCIII
Rujabu General
Enterprises 85,000,000 60,975,277
Construction of a doctor's
house at Kigorobya HCIII
Bakt trading
company 45,000,000 17,252,307
Completion of Bukuku
HCIV
Global Construction
Company Limited 29,000,000
Construction of the drug store Laboratory at Busia HCIV
Maternity ward at Habuleke HCII Staff house at Amoni Kakinei HCII

253
Construction of staff
quarters at Kasetta HCIII
Muda Construction
Company 36,000,000
Installation of a water pump
at Kikube HCIV
Water Mall
Contractors 15,000,000 14,657,500
Total 210,000,000 92,885,084
Source: Field findings
Physical Performance
Works on the operating theatre at Kigorobya HCIV were nearing completion. Construction of the
Doctor’s house had stalled. There was
hardly any progress made between
October 2009 the last monitoring visit
to the health unit and 29 May 2010 the
recent monitoring visit.
ISINGIRO DISTRICT LOCAL GOVERNMENT
The district received UShs 215,645,000 for PHC capital development from July 2009 to June
2010. The following activities were scheduled for FY 09/10: construction of a theatre and
doctor’s house at Rugaga HCIII, an Out Patient Department and staff house at Kyabahesi HCII
and a junior staff house at Ruborogota HCIII. Construction of a maternity ward at Ruborogota
HCIII was scheduled for FY 08/09 but was undertaken in FY 09/10.
Financial Performance
Table 3.4.9: Financial Performance Report for PHC Capital Development, Isingiro District
Project Contractor Contract sum
Payments to
date
Construction of a theatre and staff
house at Rugaga HCIII
Behumuka Mahiso
Construction & Building
Company Limited 206,193,200 0
Construction of an Outpatient
Department & staff house at
Kyabahesi HCII
Tesla Engineering and
Supplies Limited 45,734,924 0
Construction of a junior staff house
at Ruborogota HCIII
Ms Keen Contractors
Company Limited 21,654,180 0
Doctor’s house at Kigorobya HCIII Water tank, Kigorobya
HCIII

254
Construction of a maternity ward at
Ruborogota HCIII** 10,749,384
Source: Field findings
** Activity carried forward from FY 08/09.
The district had not spent the money received for capital development in the FY 2009/10 because
contracts for works at Rugagga HCIII and Ruborogota were awarded late on March 24, 2010.
Physical Performance
By the time of the monitoring visit on 28 June 2010, the theatre at Rugagga HCIII was nearing
completion. It had been roofed, plastered, with window and door frames fitted. Construction of
the staff house had not commenced but was expected to start soon after completion of the theatre
by the same contractor—MS Keen Contractors Company Limited. At Kabahesi HCII,
construction of OPD was at window level while the construction of the staff house was at ring
beam. Construction of the junior staff house at Ruborogota HCIII was near completion and the
contractor was carrying out internal finishes.
Challenges to Health Care Delivery in the District
Poor communication: There have been several policy changes in the recent past but
communication to Local Governments has often been late. Taking the example of drug
management, NMS was made a vote at the start of FY 09/10 but the communication about the
change of policy was only received in December 2010. NMS has also introduced a drug kit
system for distribution of drugs to health facilities where a standard set of drugs will be delivered
to health facilities at HCII and HCIII levels. The District Health Office noted that Local
Governments were not consulted. As a result essential drugs that are required are supplied in
minimal quantities and while drugs that are not essential are supplied in large quantities. The
district was in the process of providing feedback to NMS on the issue.
Theatre at Rugagga HCIII Staff house at Kabahesi HCII OPD at Kabahesi HCII
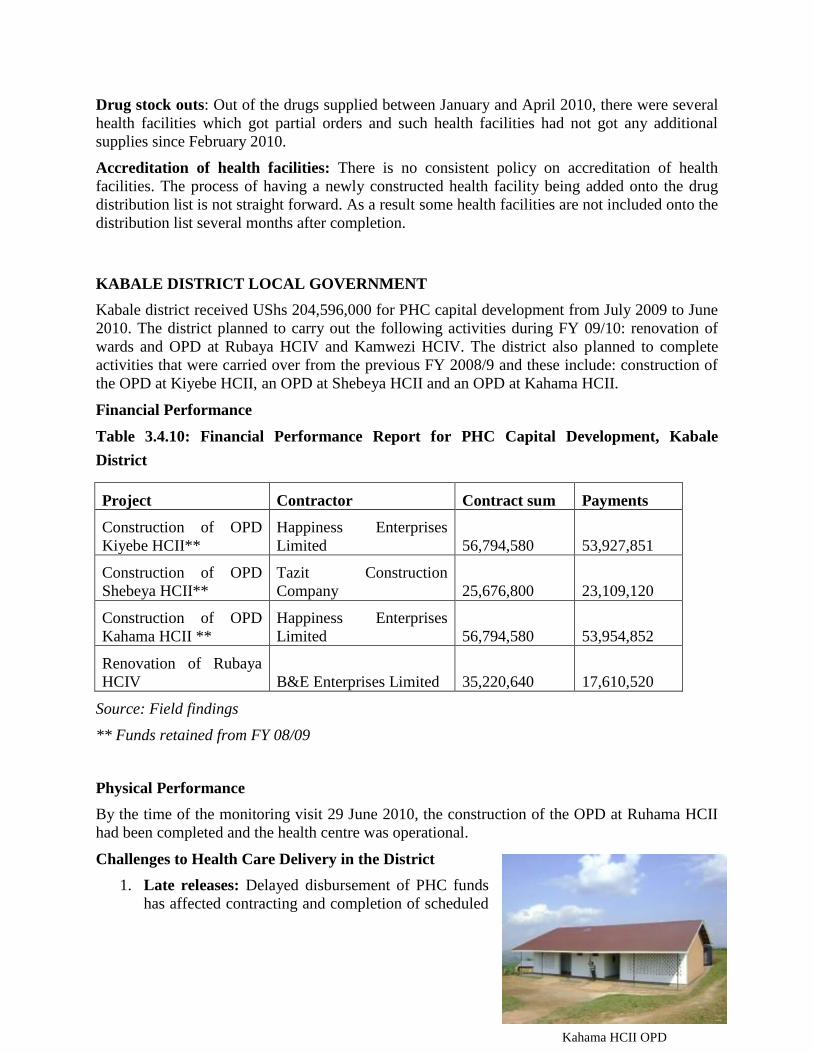
255
Drug stock outs: Out of the drugs supplied between January and April 2010, there were several
health facilities which got partial orders and such health facilities had not got any additional
supplies since February 2010.
Accreditation of health facilities: There is no consistent policy on accreditation of health
facilities. The process of having a newly constructed health facility being added onto the drug
distribution list is not straight forward. As a result some health facilities are not included onto the
distribution list several months after completion.
KABALE DISTRICT LOCAL GOVERNMENT
Kabale district received UShs 204,596,000 for PHC capital development from July 2009 to June
2010. The district planned to carry out the following activities during FY 09/10: renovation of
wards and OPD at Rubaya HCIV and Kamwezi HCIV. The district also planned to complete
activities that were carried over from the previous FY 2008/9 and these include: construction of
the OPD at Kiyebe HCII, an OPD at Shebeya HCII and an OPD at Kahama HCII.
Financial Performance
Table 3.4.10: Financial Performance Report for PHC Capital Development, Kabale
District
Project Contractor Contract sum Payments
Construction of OPD
Kiyebe HCII**
Happiness Enterprises
Limited 56,794,580 53,927,851
Construction of OPD
Shebeya HCII**
Tazit Construction
Company 25,676,800 23,109,120
Construction of OPD
Kahama HCII **
Happiness Enterprises
Limited 56,794,580 53,954,852
Renovation of Rubaya
HCIV B&E Enterprises Limited 35,220,640 17,610,520
Source: Field findings
** Funds retained from FY 08/09
Physical Performance
By the time of the monitoring visit 29 June 2010, the construction of the OPD at Ruhama HCII
had been completed and the health centre was operational.
Challenges to Health Care Delivery in the District
1. Late releases: Delayed disbursement of PHC funds
has affected contracting and completion of scheduled
Kahama HCII OPD

256
works. Contractors are reluctant to undertake works once there requests for payment are
not honored.
2. Limited involvement in central level projects: The District Administration reported to
be having very limited involvement in the implementation of central level funded
projects. They are not facilitated to undertake field supervisions on behalf of the Central
Government which limits accountability on the side of the contractor to the local
leadership and technical staff.
KIBOGA DISTRICT LOCAL GOVERNMENT
The district had received UShs 153,187,000 for PHC capital development during FY 09/10. The
following capital development activities were scheduled for FY 09/10: construction of
Bananywa HCII, a staff house at Kikolimbo HCII; a staff house at Katalama HCII and
completion of an OPD at Ntwetwe HCIV.
Financial Performance
Table 3.4.11: Financial Performance Report for PHC Capital Development, Kiboga
Project Contractor Contract sum Payments
Construction of a kitchen, bathrooms and
a five stance pit latrine at Kikolimbo HCII
Zion Group of
Companies
46,997,770 8,994,579
Construction of maternity ward at
Kikolimbo HCII (retention)
Zion Group of
Companies
55,950,900 2,797,545
Construction of Bananywa HCII MJK Investments
Limited
90,000,000 66,833,545
Construction of OPD at Ntwetwe HCIV Wava Investments
Limited
58,938,145 11,251,357
Construction of Katalama HCII Mplamb Construction
Services
90,000,000 27,000,000
Source: Field findings
Physical Performance
Construction of the OPD at Ntwetwe HCIV had been completed. The OPD at Bunanywa HCII
had been roofed and plastered while the staff house at Kikolimbo HCII had been completed.
OPD at Ntwetwe HCIV OPD at Bananywa HCII

257
Challenges to Health Care Delivery in the District
Late releases: For a period of over two quarters during the FY 09/10, the district did not receive
any PHC funds from MoFPED. The funds for the third quarter were only received at the
beginning of the fourth quarter. Delayed releases have affected service delivery including
immunization, outreaches, and collection of blood samples from health centres.
KOBOKO DISTRICT LOCAL GOVERNMENT
The District received UShs 546,897,000 for FY 09/10 for PHC capital development and PRDP.
The following activities were scheduled for FY 2009/10: construction of a staff house at
Chakulia (UShs 45,164,000); latrines at Dranya HCIII, Pamudo HCII and Ayipe HCIII (UShs
22,911,000); an OPD at Chakulia (UShs 67,395,000); a maternity ward at Ayipe HCIII (UShs
100,454,000); a maternity ward at Dranya HCIII (UShs 150,454,000); the district drug store
(UShs 55,214,000); and renovation of an OPD at Ombokof HCII (UShs 10,750,000).Under the
traditional primary health care, the district planned to construct a maternity ward at Dricile
HCIII .
Financial Performance
Table 3.4.12: Financial Performance Report for PHC Capital Development, Koboko
Name of the Project Contractor Contract sum Payments to date
Construction of 3 latrines at Dranya,
Pamodo and Ayipe Health centres Kurere Contractors 22,909,334 16,494,721
Construction of a staff house at
Chakulia
Alli and Sons
Contractors 46,186,334 0
Construction of a staff house at Dranya
HCIII Maways Limited 46,186,334 0
Construction of a staff house at Ayipe
HCIII Bomak 45,999,850 0
Construction of OPD at Chakulia
HCII AG Swaib 67,494,598 33,438,842
Construction of a maternity ward at
Ayipe Abiriga H 102,764,140 49,327,168
Construction of a maternity ward at
Dranya HCIII Honest MK 98,144,400 26,498,870
Construction of district drug stores Top care Limited 53,085,639 0

258
Construction of maternity ward at
Dricile HCIII Magtech Limited 120,899,988 20,167,599
Total 145,927,200
Source: Field findings
**PHC capital development projects
Physical Progress
By the time of the monitoring visit 1 June 2010, the construction of a maternity ward at Dricile
HCIII was at roofing stage. The construction of the maternity ward at Ayipe HCIII was at
roofing stage works having commenced on 21 February 2010. The staff house at Ayipe HCIII
was at walling stage, roofing and outside plastering had been completed and the contractor was
fitting windows and door flames. The construction of the district drug store was at window plate
level while the maternity ward at Dranya HCIII was at roofing stage.
MARACHA –TEREGO DISTRICT LOCAL GOVERNMENT
The District received UShs 462,023,000 for PHC capital development and PRDP for FY
2009/10. The district planned to undertake the following activities: construction of semi-
detached staff houses at: Chilio HCIII, Andelizo HCII, a maternity ward in Kamaka HCII
(80,000,000); and a staff house at Etie HCII (50,000,000). The district further planned to
Maternity ward at Dricile HCIII Maternity ward at Ayipe HCIII Drug store, District HQs

259
construct a staff house at Loinya HCII (50,000,000); and placenta pits at Tara HCII, Kijomoro
HCII, Nucu HCII, and Odupi HCII as well as a mortuary in Omugo HC IV (UShs 30,000,000).
Financial Performance
Table 3.4.13: Financial Performance Report for PHC Capital Development, Maracha
Terego District
Name of the Project Contractor Contract sum Payments to date
Construction of a semi detached staff
house at Chilio HCII Amazing Grace 52,500,000 0
Construction of a semi detached staff
house at Andelizo HCII Stratagem Limited 52,500,000 31,611,592
Construction of mortuary at Omugo
HCIV Magtech Construction 25,475,120 0
Construction of staff house at Odupi
HCII - 0
Construction of Staff house at Itia
HCII
Abiringa Hassan
enterprises 53,848,599 51,156,170
Construction of a staff house and
Kitchen at Loinya HCII Gibo Cheap stores 56,842,497 14,004,662
Construction of Nyadri HCII (finishes
work and retention) Ms Gibo Cheap stores 30,232,236
Completion of theatre at Omugo
HCIV ( finishes and Retention) HT Alli and Sons 11,764,607
Retention on construction of staff
house at Wandi/Oninia HCII AG.AHB Swaib and sons 45,000,000 2,250,000
Construction of Placenta Pits at Tara
HCII, Kijomoro HCII, Nucu HCII,
Odupi HCIIs
Maways Construction
company 13,200,000 12,540,000
Construction of semi detached staff
house at Chilio HCIII Amazing Grace 52,500,000 13,016,805
Construction of maternity ward at
Kamaka HCIII AG.AHB Swaib and Sons 77,250,300 13,401,935
10% monitoring of projects 23,123,200
Total 203,101,207
Source: Field findings
Physical Performance

260
Sites for physical verification of progress were randomly selected. By the time of the monitoring
visit on 2 June 2010, construction of the semi detached staff house and kitchen at Loinya HCII
was at excavation stage while a staff house at Etia HCII was at ring beam. At Ajikoro HCII
works had not commenced which was contrary to the report of the District Health Officer.
Challenges to Health Care Delivery in the District
Absense of a District Council: The district does not have a council to institute statutory bodies
like the contract committee and the District Service Commission. This delays the procurement of
contractors by the district. The district often relies on the district council of Arua which derails
implementation of Government programs in Maracha-Terego.
Late releases: Funds for the third quarter were released at the end of March 2010, the end of the
quarter. Such delays partly explain the low absorption capacity of the district.
MITYANA DISTRICT LOCAL GOVERNMENT
The district received a total of UShs 121,276,000 from July 2009 to March 2010 for PHC capital
development. The following capital development activities were scheduled for FY 09/10:
construction of a maternity ward at Bulera HC III (UShs 90,000,000), and completion of the
staff house at Namungo HC II (UShs 35,565, 320). Under the Local Government Managerial and
Service Delivery Program (LGMSD), the district planned construction of one staff house at
Kalangalo HCII (UShs 31,656,620) and completion of a staff house at Mwera HC III (UShs
53,965, 862).
Financial Performance
Table 3.4.14: Financial Performance Report for PHC Capital Development, Mityana
District
Staff house at Loinya HCII Staff house at Etie HCII

261
Name of the Project Contractor Contract Sum
(UShs)
Payments as at 24
May 2010 (UShs)
Construction of a maternity
ward Bulera HCIII-Phase I
Kiyinda Carpentry
Workshop 90,000,000 43,439,700
Completion of construction of
staff house at Namungo
HCIII**
MK Constructors and
Engineering company 35,565,320 29,177,466
Renovation of laboratory at
Mityana hospital***
Butambala General
Traders 7,786,537 7,357,510
Completion of a staff house at
Mwera HCIV Kakindu Contractors 53,965, 862 50,524,372
Construction of a staff house at
Kalangalo HCII
Kiyinda Carpentry
Workshop 31,656,620 0
Total 165,008,477 130,499,048
Source: Field findings
** Activity of FY 2008/09,
*** Activity funded by LGMSD, MoLG
Physical Performance
By the time of the monitoring visit on 24 May 2010, the construction of the maternity ward at
Bulera HCIII was had been roofed, plastered and painted. This maternity ward is to be
constructed in phases with the first phase involving the construction of the super structure. The
staff house at Namungo HCIII was near completion. The staff house at Kalangalo HCII had been
roofed.
Challenges to Health Care Delivery in Mityana District
Maternity ward at Bulera HCIII Staff house at Namungo HCIII Staff house at Kalangalo HCII

262
Low staffing levels: The district has low staffing levels. The two recent recruitment drives only
attracted 2 laboratory assistants, 13 enrolled midwives and 25 enrolled nurses. The district was
not able to attract a single medical doctor.
Drug stock outs: The district continues to experience persistent drug stock outs. These arise
partly due to late and under deliveries by the National Medical Stores. For instance Kagandalo
HCII on 18 May 2010 received 1 tin each of paracetamol, Aspirin, Amoxyl capsules, and
Septrin, 700 condoms and 30 tubes of Tetracycline eye ointment. The health centre did not
receive any anti-malarials. A week later on 24 May 2010 at the time of the monitoring visit, most
of the items delivered were out of stock. A subsequent delivery was expected two months later.
Poor health Infrastructure: Health facilities in the district are in dire need of repairs. Taking
the example of Mityana Hospital, the facilities are dilapidated and over congested by the ever
increasing population seeking services.
MUBENDE DISTRICT LOCAL GOVERNMENT
The district had received UShs 149,222,000 for PHC capital development for FY 2009/10. The
following activities were planned to be undertaken during FY 09/10: construction of a
maternity/general ward at Kiganda HCIV, a maternity ward at Kikandwa HCII, a maternity ward
at Mundadde HCII, and latrines at Kibalinga HCIII.
Financial Performance
Table 3.4.15: Financial Performance Report for PHC Capital Development, Mubende
District
NAME OF PROJECT CONTRACTOR CONTRACT SUM PAYMENTS
Construction of Maternity ward at Munsa Enterprises 49,897,000 -
Mundadde HC II
Construction of maternity ward at
Kikandwa HCII
Kitongo Farmers and
Construction Limited
49,587,000 12,472,550
Renovation of a maternity ward at
Kassanda HC IV
Chaka and Brothers
Carpentry Workshop
9,900,000 -
Procurement of medical equipment National Medical Stores 39,838,000 -
Total 12,472,550
Source: Field findings

263
Note that the only UShs 12,472,550 out of UShs 149,222,000 disbursed to the district during FY
09/10 had been spent by the time of the monitoring visit on 24 May 2010 (8.4%). The low
absorption is a result of contractors taking on several contracts coupled with delays to award
contracts.
Physical Performance
By the time of the monitoring visit 24 May 2010, construction of
the general ward at Kiganda HCIV had stalled. It was reported
that the contractor was undertaking several works simultaneously
and had been overstretched and consequently unable to carry out
scheduled works. The staff house at Kibalinga HCIII had been
completed while the contract for construction of maternity ward
at Mundadde HCII had just been awarded.
Challenges to Health Care Delivery in the District
Slow progress by the contractors: There are few contractors handling several contracts both
with and outside the district. As a result, the progress of works at all sites is very slow. This
situation has resulted into low absorption capacity on the side of the district.
Lack of supervision: The district officials reported they receive no funding for supervision of
capital development grants. The works department too does not have adequate funds for
supervision and often request for allowances from the health department. Often funds have to be
sourced from the PHC non wage releases which are often constrained. As a result works are
undertaken without supervision which usually explains the instances of shoddy works by
contractors.
Drug Stock-outs: Drug stock outs are rampant in the district due to late delivery of drugs. In
addition instances where NMS supplies drugs not requested for by the district were reported. In
May 2010, NMS supplied chloroquine tablets for treatment of malaria yet government policy
shifted from monotherapies to ACTs since 2005. Several other health facilities in the districts
received no drugs because they were not on the NMS distribution list. Some health facilities
reportedly do not receive any drugs even after orders are placed.
Inadequate staffing levels: The staffing levels at the district stood at 28% of the establishment.
The levels dropped from the previous 47% after upgrading Mubende hospital to regional referral
status. By the time of the monitoring visit in May 2010, MoPS and MoFPED had not yet
disaggregated payrolls for the hospital and the district which made it difficult for the hospital to
Stalled General ward, Kiganda HCIV
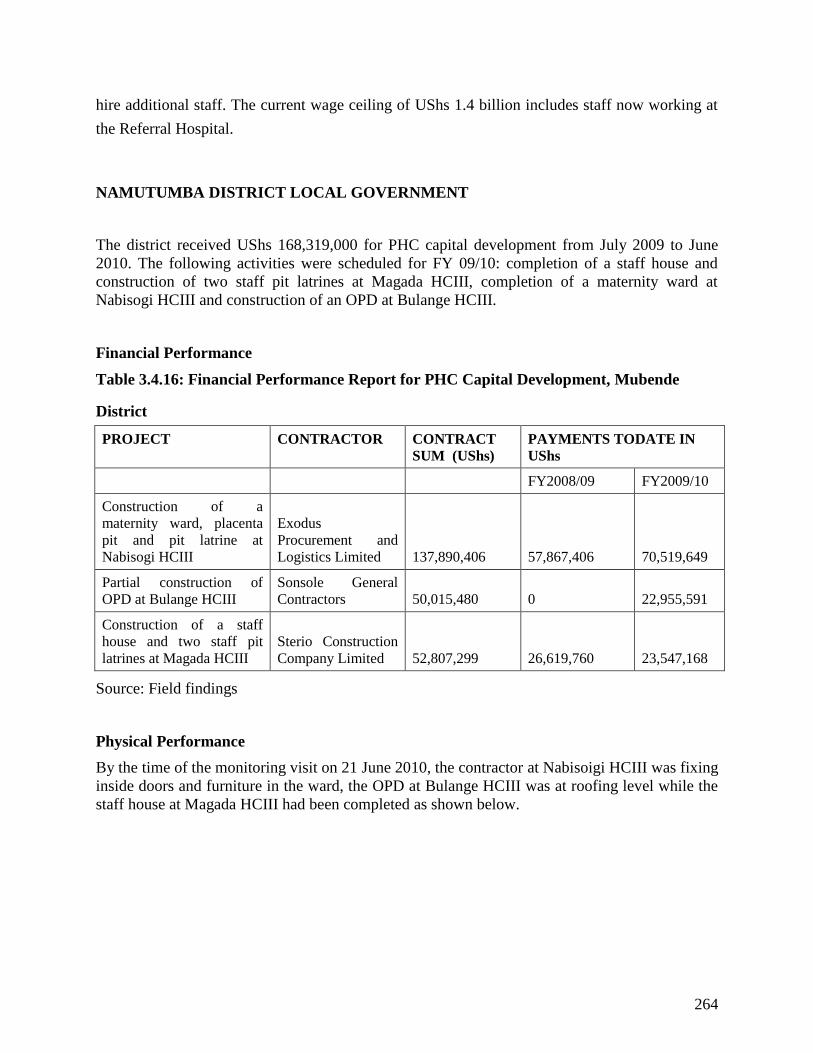
264
hire additional staff. The current wage ceiling of UShs 1.4 billion includes staff now working at
the Referral Hospital.
NAMUTUMBA DISTRICT LOCAL GOVERNMENT
The district received UShs 168,319,000 for PHC capital development from July 2009 to June
2010. The following activities were scheduled for FY 09/10: completion of a staff house and
construction of two staff pit latrines at Magada HCIII, completion of a maternity ward at
Nabisogi HCIII and construction of an OPD at Bulange HCIII.
Financial Performance
Table 3.4.16: Financial Performance Report for PHC Capital Development, Mubende
District
PROJECT CONTRACTOR CONTRACT
SUM (UShs)
PAYMENTS TODATE IN
UShs
FY2008/09 FY2009/10
Construction of a
maternity ward, placenta
pit and pit latrine at
Nabisogi HCIII
Exodus
Procurement and
Logistics Limited 137,890,406 57,867,406 70,519,649
Partial construction of
OPD at Bulange HCIII
Sonsole General
Contractors 50,015,480 0 22,955,591
Construction of a staff
house and two staff pit
latrines at Magada HCIII
Sterio Construction
Company Limited 52,807,299 26,619,760 23,547,168
Source: Field findings
Physical Performance
By the time of the monitoring visit on 21 June 2010, the contractor at Nabisoigi HCIII was fixing
inside doors and furniture in the ward, the OPD at Bulange HCIII was at roofing level while the
staff house at Magada HCIII had been completed as shown below.

265
Challenges to Health Care Delivery in the District
Lack of transport facility: The district health office (DHO) does not have an official vehicle to
enable it undertake both administrative and managerial work by the district. Lower health
facilities lack motorcycles and bicycles to enable health workers carry out outreaches.
Lack of office space: The DHO’s office does not have adequate office space and currently the
health staff are housed in other departments. In addition, the district does not have a drug store
which is a risk to safe storage of medicines.
Poor Health infrastructure: Due to the limited financing, the district has not been able to
rehabilitate health infrastructure in the district. The priority has been to rehabilitate HCIVs and
HCIIIs leaving HCIIs utterly dilapidated.
Inadequate Human resources: Staffing levels in the district are estimated at only 39% of the
establishment. The District has no Medical Doctors at Nsinze HCIV and no laboratory
technicians within the district. The District realized a slight increase in its wage bill for FY
2010/11 and will accordingly recruit additional staff.
Inadequate drugs: The drug supplies by NMS were reported to be far lower than the need.
Related to the low supplies is an emerging practice of the communities rushing to pick drugs
once delivered by NMS. Because of lack of disease diagnostics capacity, most are treated
presumptively. It was also reported that NMS delivers drugs without allowances for off-loading.
Where districts mobilize labour to off-load they have to incur drug management costs—yet they
do not have any funds for such costs—following the centralization of drug procurement under
NMS. The drug Kits by NMS for distribution of drugs (push system) to HCII and HCIIIs were
developed without due consideration of basic drugs required by the health facilities.
NEBBI DISTRICT LOCAL GOVERNMENT
The district received UShs 649,955,000 for PHC capital development and PRDP for FY 2009/10.
The district planned to undertake the following capital development activities during FY 09/10:
Under PHC the activities included: renovation of the theatre at Pakwach HCIV, construction of
new OPD at Mukhale HCII and a staff house at Mukhale HCII. Under PRDP, the following
activities were scheduled: construction of semi detached staff house in Parambo HCIII, an OPD
Maternity at Nabisoigi HCIII OPD at Bulange HCIII Staff house at Magada HCIII

266
and semi detached staff house at Pagwata HCII; staff house at Pachora HCII, construction of
staff house in Zombo HCIII, a kitchen and staff house at Paminya HCII. Other activities
included: construction of staff house at Kituna HCII and staff house and kitchen at Kikobe
HCIII, a semidetached staff house at Abongo HCII, a staff house at Anwoll HCII; and
asemidetached staff house at Pukwello HCII.
Financial Performance
Table 3.4.17: Financial Performance Report for PHC Capital Development, Nebbi District
Project contractor contract sum payments to
date
Construction of a semidetached
staff house at Paminya HCII
Hassan and Sons Business
LTD 53,913,919 14,655,617
Construction of a health care waste
pit at Pagwata HCII
E&B Construction
Company 3,500,000 3,150,000
Acquisition of land titles Terrain Consult
105,128,130 820,000
Rehabilitation of Paidha HCIII
KG Adubango Construction
and Engineering Works
Limited. 185,147,000 37,029,400
Construction of a semi detached
staff house at Pachora HCII
River Shore Trade Links
Construction Works 55,837,698 7,752,590
Construction of semi detached staff
house at Kikobe HCII
Jagon Construction
Company Limited 55,977,588 21,067,928
Construction of a semi detached
staff house at Kituna HCII
GL Yesu Nuti Construction
and Engineering Works
Limited 65,000,000 17,007,629
Construction of OPD at Pagwata
HCII
Hassan and Sons Business
Ltd 64,929,449 11,250,855
Construction of a semi detached
staff house at Abongo HCII**
God's will Construction and
Engineering Limited 63,763,550 60,575,373
Construction of a semidetached
staff house at Therur HCIII**
KG Adubango Construction
and Engineering Works
Limited. 63,763,550 60,575,371
Source: Field findings
** Paid using funds retained from FY 2008/09

267
Physical Performance
By the time of the monitoring visit 31 May 2010, the semi-detached staff house at Abongo HCIII
had been completed. However the structure had several defects for example all the doors and
windows could not lock. Several cases of thieves breaking into the staff houses were reported.
Construction of the OPD at Pagwata HCII was at ring beam level while the foundation was at
excavation level. The staff house at Kikobe HCII was at ring beam level while the renovation of
the OPD at Phaida HCIII had not commenced.
Challenges to Health Care Delivery in Nebbi District
Inadequate Drugs: The district health officer acknowledged the improvement in performance of
NMS over the last two FYs but decried the persistent delays to distribute drugs and under
deliveries. It was reported that in a recent delivery of May 2010 some health facilities did not
receive any drugs while others received a few doses of key items.
Procurement delays: The process of procuring contractors took long after protracted
discussions within the district, MoH and Office of the Prime Minister and delays to disburse
funds by MoFPED especially for the third quarter ended March 2010.
OPD at Pagwata HCII
OPD at Pagwata HCII Staff house at Kikobe HCII
Staff house at Pagwata HCII
Staff house at Abong HCII
Kitchen at Abong HCII

268
Lack of funds for monitoring and supervision: In the PRDP component there are no funds
for monitoring and supervision of the projects which makes routine monitoring difficult by
the Engineering department.
RAKAI DISTRICT LOCAL GOVERNMENT
The district received UShs 213,565,000 for PHC capital development for FY 09/10. The district
planned to undertake the following activities: construction of a maternity ward at Kalisizo
Hospital (UShs 64,000,000), completion of an OPD at Kasensero landing site (UShs 45,000,000)
construction of an OPD at Kyalurangira HCIII and procurement of medical equipment (UShs
59,562,000).
Financial Performance
Table 3.4.18: Financial Performance Report for PHC Capital Development, Rakai
District
Name of the Project Contractor Contract sum
Payments to
date
Construction of OPD at Kasensero
HIV/AIDS Care Services HCII Solumu Contractors 45,000,000 28,566,276
Construction of Maternity ward at
Kalisizo Hospital Solumu Contractors 64,000,000 43,702,016
Construction of staff house at
Kyalulangira HCII
Wanaik Construction
Company Limited 38,002,300 0
Procurement of medical equipment
Byansi Services Limited
and Joint Medical Stores 59,563,000 49,947,930
Total 122,216,222
Source: Field findings
Physical Performance
By the time of the monitoring visit 8 June 2010, the maternity ward at Kalisizo Hospital had
been roofed and plastering was ongoing. The team visited Kasensero HCII at Kansensero landing
site where Solumu Contractors was said to have been paid. The staff at the facility were new and
had no information about the contractors. Local residents who preferred anonymity reported that
the OPD was over 3 years old with no construction works in the recent past. It was further
reported that the facility had been constructed by an association of people living HIV/AIDS and
not the district.

269
Challenges to Health Care Delivery in the District
Shortage of medicines and supplies: the district continues to experience shortage of medicines
and supplies as a result of delays by NMS to supply drugs in addition to underfunding of the
credit line. Some of the health facilities had not received any drugs from NMS during the second
and third quarters of FY 09/10 including: Kirumba HCIII, Byerima HCII and Michungiro HCII.
This was reportedly due to the fact that these health facilities are not in the NMS database. The
District wrote to NMS in January 2010 requesting to have the 3 health centres included on the
list of public health facilities in the district but had received no response as of 8 June 2010.
Delayed release of funds: Funds for third quarter FY 2009/10 came late which affected service
delivery especially in hospital and other recurrent programs in the district. The funds were later
released in the beginning of the fourth quarter.
Inadequate funding: The budget allocation for the hospital has remained constant although the
utility bills for both water and electricity are ever increasing and this has constrained service
delivery in the district.
Lack of transport: The health department has only one running vehicle; there is no ambulance
in the district. Health facilities lack motorcycles and bicycles to carry out preventive health care
including immunization.
RUKUNGIRI DISTRICT LOCAL GOVERNMENT
The district received UShs 182,174,000 for PHC capital development from July 2009 to June
2010. The district planned to undertake the following activities: completion of OPD at Ngoma
HCII, construction of Bwanda HCII, completion of Katwekamwe HCII, and extension of OPD to
include a maternity at Rubanga HCII.
Financial Performance
Maternity ward at Kalisizo Hospital
OPD at Kasensero HCII

270
Table 3.4.19: Financial Performance Report for PHC Capital Development, Rukungiri
District
Project Contractor
Contract
sum
Payments
to date
Construction of OPD at Ngoma
HCII Tesla Engineering Company 16,676,135 15,969,047
Construction of OPD at Katonya
HCII
Tumukunde Dennis
Enterprises 46,255,085 32,043,789
Construction of Rubanga HCII Katungi John Contractors 38,243,800 9,560,950
Construction of Bwanda HCII Parkline Technical Services 42,400,166 37,872,869
Completion of Katwekamwe HCII
Kyebuka General
Enterprises 31,017,952 21,074,150
Source: Field findings
Physical Performance
By the time of the monitoring visit 30 June 2010, the
construction of the OPD at Katwekamwe HCII was in its
final stages. It had been roofed, plastered, windows fitted
and other finishing works were ongoing.
Contracts were awarded late for most of the projects and
not much had been done at the other specified sites.
Challenges to health care delivery in the district
Inadequate Human resources: The district is building health centers to improve equity and
access but there is a restriction on recruitment. They just re organize the available staff and send
them to the new health centers. The situation was worsened when the town council was elevated
to a municipal council and the available staff were divided among the municipal council and the
district on a 50% basis.
Drug stock outs: The district has been experiencing stock outs of drugs for about one and half
months. The allocated drugs normally take them for only three quarters of the expected time.
This was attributed to the high OPD attendance and absence of diagnostic services at HCIIs.
When the district used to have the rapid test kits the drug consumption level reduced from an
average of 20,000 per month to 4000 per month.
OPD at Katwekamwe HCII

271
Late priorities from MOH: Ministry of Health sends priorities to the district in the middle of
the year when the district has already began on the procurement process for the priorities that
were passed by the council. Many times there is a clash between district agreed priorities and
those that are sent by Ministry of Health.
SEMBABULE DISTRICT LOCAL GOVERNMENT
The district received UShs 140,514,000 for PHC capital development for FY 2009/10. The
district planned to undertake the following activities: construction of a staff house at Rwebitakuli
HCIII, completion of the DHO’s office, the OPD at Kabale HCII, a water tank and an
underground water tank in Rwemiyaga HCIII and AN underground water tank at Sembabule
HCIV.
Financial Performance
Table 3.4.20: Financial Performance Report for PHC Capital Development, Sembabule
District
Name of the Project Contractor Contract sum Payments to date
Construction of a staff house at
Rwebitakuli HCIII
Ever Trust Builders and
Contractors 49,900,000 35,135,437
Construction of a ground water
tank at Sembabule HCIV Taba Services 18,516,212 17,054,182
Construction of a water tank and
a ground water tank at
Lwemiyaga HCIV Cape Contractors Limited 19,891,700 0
Construction of OPD at Kabale
HCII Cape Contractors Limited 28,000,000 0
Source: Field findings
Physical Performance
By the time of the monitoring visit on 7 June 2010,
the underground water tank at Sembabule HCIV had
been completed while the staff house in Rwebitakuli
HCIII had been roofed and outside plastering was
ongoing.
Staff house at Lwebitakuri HCIII

272
Challenges to Health Care Delivery in the District
Understaffing: The staffing level in the district currently stands at 32% of the establishment.
Such low staffing levels stretch the existing staff too thin to provide any quality health care. At
the time of the monitoring visit on 7 August, the district had submitted its recruitment plans to
MoH and MoPS under which they anticipated to raise staffing levels to 65%.
Inadequate transport facilities: Most of the lower level health facilities in the district (HCII
and HCIII) do not have any functional transport facilities including motor cycles and bicycles.
As a result provision of outreach services by health centres is severely constrained.
Lack of accommodation facilities: Most of the health centers in the district do not have staff
houses. As a result, some staff reside in Outpatient departments for example at Rwebitakuli
HCIII.
Poor drug management: The District Health Officer decried the delays by NMS to deliver
drugs. It was also highlighted that the recently introduced push system of drug kits by NMS has
several shortcomings. Chief of these is the concern that health centres are getting drugs that they
do not require and few quantities of very essential drugs like anti-biotics and anti-malarial drugs.
TORORO DISTRICT LOCAL GOVERNMENT
The district received UShs 316, 498,000 for both PHC and PRDP capital development from July
2009 to June 2010. The following activities were to be undertaken: construction of an OPD at
Osia HCII, an OPD at Were HCII, an OPD at Chawolo HCII, completion of a maternity ward at
Panyangasi HCIII, construction of staff house at Namwaya HCII, a ward at Nagongera HCIV, a
staff house at Kayoro HCII, a staff house at Ligingi HCII, a maternity unit at Kirewa HC III and
construction of staff house at Mukuju HCIV (PRDP).
Financial Performance
Table 3.4.21: Financial Performance Report for PHC Capital Development, Tororo
District
Project contractor contract sum Payment to date
Construction of staff house and two
stance pit latrine at Namwaya HCII*
KATZ and Limi
International 57,536,992 20,370,222
Construction of OPD at Chawolo
HCII*
Helma Amalgamated
Ventures limited 95,467,192 5,573,376
Construction of staff house and two
stance pit latrine at Kayoro HCII*
Kanyoutu General
Enterprises limited 57,934,092 5,123,088
Construction of a maternity ward at
Kirewa HCIII
Mugweri and Sons
Limited 82,756,155 73,070,060
* Payments out of FY 2008/09 funds
Source: Field findings

273
Physical Performance
By the time of the monitoring visit 23 June 2010, the OPD at Chawolo HCII and the staff house
at Namwaya HCII were both at roofing stage; construction of a staff at Namwaya was at roofing
stage. The construction of a maternity unit at Kirewa HCIII was complete but not yet handed
over, while the construction of the staff house at Mukujju HCIV was at roofing stage. Contracts
were recently awarded for the construction of OPD at Osia HCII and an OPD at Were HCII.
Challenges to health care delivery in the district
Inadequate transport: It was reported that health facilities do not have adequate bicycles and
motor cycles to enable them carry out community outreaches.
High Utility Costs: Utility costs especially water and electricity are ever increasing in the
district hospital and at the three HCIVs in the district yet funds for recurrent expenditure have
not increased.
Inadequate human resources: There is an acute shortage of medical doctors in the district. It
was reported that there are only two medical doctors at Tororo hospital against an establishment
of 7 medical doctors. The staffing levels stand at 44.7% of the establishment.
OPD at Chawolo HCII Maternity ward at Kirewa HCIII

274
3.5 INDUSTRIALIZATION
3.51: Introduction
Industrial development is an integral and important part of the Government’s overall
development strategy. This development strategy is to be achieved by transforming Uganda into
a modern and industrial country through, among other things; adding value by processing to
reduce post-harvest losses and increasing exports of higher value products, especially from
agricultural and mineral resources.
Processing of primary commodities has long been considered one of the bridges from
dependence on primary commodities to industrialization and development.98
The activities
involved include rising up the chain from raw outputs to processed outputs such as instant coffee
from unprocessed coffee, tinned juices from fruits, leather from hides and skins, paper pulp or
furniture instead of logs among others.
Industrialization offers greater prospects for increased employment, more export earnings, wider
tax base, increased purchasing power, increased integration with agriculture, product
diversification, greater efficiency, and technical skills for modernization and higher productivity
throughout the whole economy.99
Scope
Physical and financial monitoring during the fourth quarter 2009/10 focused on activities
undertaken by Uganda Investment Authority (UIA) Uganda Industrial Research Institute,
Uganda National Bureau of Standards and Ministry of Finance, Planning and Economic
Development (MFPED).
Under the Ministry of Finance, Planning and Economic Development (MFPED), monitoring
covered the Value Addition Tea Industry (Buhweju Tea Factory) in Bushenyi district and the
Presidential Initiative on Banana Industrial Development; under UIA, progress on development
of Mbarara Gatsby Park was monitored while for Uganda Industrial Research Institute (UIRI),
establishment of the fruit processing plant in Mpigi, civil works at headquarters and procurement
and installation of equipment were monitored. Status of construction of UNBS headquarters at
Bweyogerere was monitored.
Methodology
Projects were selected on the basis of capital investment, planned outputs and funds released as
of fourth quarter of FY 2009/10.
Financial data for the projects visited was sourced from the Integrated Financial Management
System (IFMS) and the FY 2009/10 quarterly progress reports. Progress on implementation was
assessed by observation and interviews with the project officials while comparing with the
quarterly progress reports.
98
The Courier ACP-EU n° 196, January-February 2003
99 National Industrial Policy (Jan.2008)
275
3.5.2 Ministry of Finance, Planning and Economic Development (MFPED)
Value Addition Industries
(a) Buhweju Tea Factory
Igara Growers Tea Factory is the promoter of Buhweju tea factory, Igara tea factory limited was
established in 1969 by the government of Uganda as part of Small holder Tea Development
Programme, having earlier established Uganda Tea Growers Corporation (UTGC) in 1969 by an
Act of Parliament. It’s mandate was to promote tea production by the smaller holder farmers,
establish tea factories and ultimately hand them over to the smaller holder tea farmers’ group.100
Igara Growers Tea Factory was privatized in 1995 and is 100% owned by smallholder tea
farmers numbering over 2,900 as shareholders. The factory has a processing capacity of
56,000kg green leaf per day. In 2007, the average leaf delivered was 60,000kg, with some days
recording 120,000kg (on peak days), 45% of the leaf is from Buhweju, and therefore, supply of
green leaf is beyond the factory processing capacity.
The establishment of the new tea factory is premised on the enormous production potential from
Buhweju as a result of available land, new planting over the last six years, government’s
intervention in the sector and planting of high yielding colonal varieties of tea.101
The Buhweju Tea Factory is a four year project (July 2008 to July 2012) aimed at building a tea
factory at Burere, Buhweju County, Bushenyi District.
Government through the Ministry of Finance, committed funds to the building of the factory
complex and additional buildings to facilitate its operation. A memorandum of understanding to
this effect was signed between GOU and the promoter (Igara Growers Tea Factory).
Objectives of the project
Establish a tea factory for processing the green tea leaf produced by farmers from
Buhweju, To increase and sustain the benefits to farmers in the area from tea growing and reduce
poverty by improving household incomes.
Planned outputs
A new factory building built, new offices and staff houses built, processing machinery including
grading, packaging and storage procured and installed, power and water infrastructure
developed, high quality green leaf collected and processed.
Financial Performance
100
Public Investment Plan (PIP) FY 2009/10-2011/12
101 Progress report Igara growers Tea Factory(Sept. 09)

276
The total project cost is US$ 7.44million. The project is expected to be jointly financed as
follows; GoU Grant of US$3.2 million102
, Bank loan of US$2.805 million and residential
building and working capital by Igara Growers Tea Factory of US$ 1.43 million.
With effect from FY 2008/09, GoU undertook to disburse its grant to the project on an annual
basis amounting to UShs. 1,601,000,000/= per year. In FY2009/10 a total of UShs.
1,601,000,000/= were budgeted. It was reported that as of November 2009, all the funds
budgeted for by GoU for the two financial years had been disbursed and received, reflecting a
50% of GoU grant release to the project (UShs. 3,202,000,000) and 100% release of the annual
budget for FY 2009/10.
Financial Status at the time of monitoring
During the monitoring visit, (19th
May 2010), the contractor had raised three certificates of
which two had been cleared.
Quarter three planned expenditure was UShs.1,338 million and actual expenditure stood at Ushs.
730.9 million. This variance is reportedly a result of heavy rains leading to low productivity on
the part of the contractor during the months of March and April 2010.
Annual Planned Output Targets FY 2009/10
All the structural works leading to construction of factory building, boiler house, firewood shed,
generator house, administrative block, input store, motor vehicle garage, kitchen and dining
embarked on.
Physical Performance
Main processing plant
All column bases had been cast, hard core placed ready to receive concrete, shattering for the
entire structure had been completed. It was reported that fabrication of steel for the
superstructure was on going off the site and was near completion. Deliveries were expected by
the 30th
day of May 2010.
102
Public Investment Plan (PIP) FY 2009/10-2011/12
Main plant slab, administration block and kitchen house at Burere-Buhweju
277
Other works
Floor concrete had been cast and walls erected on office block. Floor concrete was cast on
garage, boiler house, inputs store, generator house and fuel wood shed.
The overall physical progress was estimated to be at 45%, with most of the ongoing works at the
administration block.
It was further reported that the board of management was progressing with the loan application
for procurement of the factory equipment.
Challenges
The state of roads from Bushenyi to Burere-Buhweju (40km) was raised in the second quarter
monitoring (2009/10) report as a major obstacle to smooth transportation of materials and
equipment to the site. This situation has been made worse by the rains making transportation of
materials to the site more expensive and almost impossible in some cases.
The existence of unstable soils on site called for extra time on the side of the contractor
Recommendation
The promoter and MFPED should liaise with Uganda National Roads Authority to urgently re-
gravel the Bushenyi – Buhweju road to ease transportation of materials and equipment.
(b) Presidential Initiative on Banana Industry
Background
Commissioned in 2005, the Presidential Initiative on Banana Industrial Development (PIBID) is
a pilot project premised on the theory that rural farmers with access to science-led-processing
and value addition enterprises will be able to rapidly access profitable market chains that supply
local, regional and international markets resulting into increased household incomes. The overall
goal of the initiative is to kick start a pilot industry in banana value addition.
Project objectives:
Establish benchmarks; build capacity for rural farmers in new production technologies and
agronomic practices;
Ascertain sustainable processing of quality market driven Matooke products;
Link rural farmers to favorable micro-financing mechanisms;
Establish reliable supply chain models linking farmers to profitable market outlets;
Assess project impact on environmental sustainability and overall economic wealth;
Transform the Bushenyi Technology Business Incubator (TBI) into a Banana Industrial
Research and Development Centre (BIRDC);
Promote entrepreneurship in private sector and training at public institutions through
establishment of an Industrial Technology Park (ITP).
278
The project expected outputs
A state of the art rural based banana processing industry at Nyaruzinga-Bushenyi and Sanga-
Kiruhura based on technology business incubator framework, a range of banana industrial –
based products on the market, capacity building for market competitive banana production and
value addition at all levels.
Financial Performance
PIBID is executing two major infrastructure contracts including; construction of the main
processing plant, renovation of office buildings and construction of a resource centre at
Nyaruzinga-Bushenyi. The contract was awarded to M/s Dott Services Limited at a contract
price of UShs. 23.3 billion and implementation of an irrigation scheme awarded to M/s Vambeco
Limited at a contract price of about UShs. 2.5 billion.
The annual approved development budget for this project FY 2009/10 is Ushs. 7,927,097,368 of
which,Ushs. 9,492,823,026 had been released by the end of March 2010 representing 120%
release of the annual development budget.
During the monitoring visit, it was noted that, four certificates from M/s Dott Services had been
raised of which two had been cleared.
Physical Performance
Processing Plant
At the time of the monitoring visit, May 19th
2010, physical progress of major works was at 70%
with activities of steel works and framing on going. Pending works included steel cladding,
finishing and installations.
In an interview with the contractor, it was noted that, time extension was requested as the
completion date (July 2010) for the first phase construction cannot be achieved and the client
was yet to accept this request.

279
Irrigation Plant
Progress of works was at 60%, with the completion of a sand filter, a main tank and eco san
toilet .The pump house is at finishing stage. According to the contractor, work is still on schedule
and the irrigation scheme will be fully operational in August 2010.
Water filter and pump house at the Irrigation plant
Ongoing Stell works at the main processing plant and administration block
Water filter, pump house and water tank at the Irrigation plant

280
3.5.3 Uganda Industrial Research Institute
The Uganda Industrial Research Institute (UIRI) was established by a 2002 Act of Parliament
under the auspices of the Ministry of Tourism, Trade and Industry (MTTI) as a government
parastatal mandated to engage in activities that will result in Uganda’s rapid industrialization.
In order to fulfill this mandate, UIRI’s core activities focus on identifying affordable
technologies and applied research, business incubation, analytical laboratory services, business
advisory, prototyping, industrial engineering design and development to result in the creation of
new products and value-addition.
The Institute (UIRI) operates under four main departments. Three of which are technical viz
Technology Development Center(TCD), Production and Industrial Processes Systems(PIPS) and
Product Development(PD).The departments operate towards achieving technology transfer and
adoption, rural industrialization through targeted value addition, research, development and new
innovations for new marketable products.
Efforts at supporting rural industrialization are undertaken by the department of Product
Development in order to establish model processing units country wide focusing on value
addition.
Expected outputs
Machines and pilot plants set-up
Rural agro-processing small scale unit
Skills and core competencies in industrial processing.
Financial Performance
Table: 3.5.1 UIRI Budget Performance as of 10th
June 2010
Program/
Project
Output
code
Item Total Release
(Q1-Q4)
Total
Expenditure
(Q1-Q4)
Balance
224002 065102 General Supply of
Goods and Services
2,087,220,289.00 1,713,299,652 373,920,637
224002 065103 General Supply of
Goods and Services
779,233,000.00 62,799,800 716,433,200
228001 065104 Maintenance-Civil
works
1,737,063,000.00 1,374,618,940 362,444,060
228003 065105 Maintenance-
Machinery,
Equipment and
Furniture
330,000,000.00 328,992,688 1,007,312
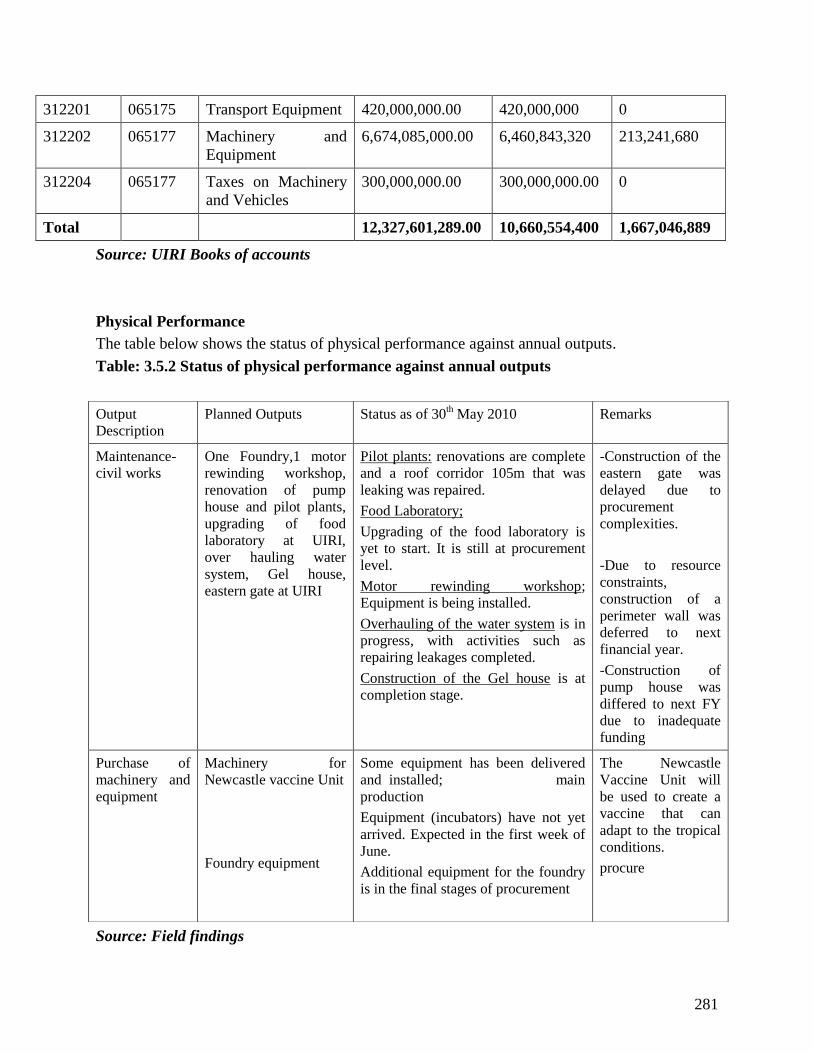
281
Source: UIRI Books of accounts
Physical Performance
The table below shows the status of physical performance against annual outputs.
Table: 3.5.2 Status of physical performance against annual outputs
Source: Field findings
312201 065175 Transport Equipment 420,000,000.00 420,000,000 0
312202 065177 Machinery and
Equipment
6,674,085,000.00 6,460,843,320 213,241,680
312204 065177 Taxes on Machinery
and Vehicles
300,000,000.00 300,000,000.00 0
Total 12,327,601,289.00 10,660,554,400 1,667,046,889
Output
Description
Planned Outputs Status as of 30th May 2010 Remarks
Maintenance-
civil works
One Foundry,1 motor
rewinding workshop,
renovation of pump
house and pilot plants,
upgrading of food
laboratory at UIRI,
over hauling water
system, Gel house,
eastern gate at UIRI
Pilot plants: renovations are complete
and a roof corridor 105m that was
leaking was repaired.
Food Laboratory;
Upgrading of the food laboratory is
yet to start. It is still at procurement
level.
Motor rewinding workshop;
Equipment is being installed.
Overhauling of the water system is in
progress, with activities such as
repairing leakages completed.
Construction of the Gel house is at
completion stage.
-Construction of the
eastern gate was
delayed due to
procurement
complexities.
-Due to resource
constraints,
construction of a
perimeter wall was
deferred to next
financial year.
-Construction of
pump house was
differed to next FY
due to inadequate
funding
Purchase of
machinery and
equipment
Machinery for
Newcastle vaccine Unit
Foundry equipment
Some equipment has been delivered
and installed; main
production
Equipment (incubators) have not yet
arrived. Expected in the first week of
June.
Additional equipment for the foundry
is in the final stages of procurement
The Newcastle
Vaccine Unit will
be used to create a
vaccine that can
adapt to the tropical
conditions.
procure

282
Rural Agro Processing small scale unit (Nabusanke Fruit Factory)
The initiation of this project was a result of the President’s pledge to support a group of women
in Mpigi district who were processing juice using basic methods in early 2006. The institute was
tasked to assist in setting up a modern facility with the requisite technologies and transfer of
skills appropriate for juice processing in partnership with Central Buganda Diocese Mothers
Union found in Kanoni Gomba on Mpigi- Masaka Highway. The Union’s core activities are
mainly to empower members through community development work such as undertaking income
generating activities, capacity building among others.103
Field Findings
Construction of factory was completed, with processing floor area, washrooms, administration
offices, gatehouse, fence and drainage. Borehole was drilled and constructions of submersible
water pump done.
Equipment has been installed and the factory is waiting commissioning. Ongoing activities
include paving and planting of grass around the facility compound.
103
UIRI Status Report Value addition 2009
New Gel House, repaired Roof corridor and Newcastle vaccine laboratory at UIRI
Front view of Nabusanke Fruit Factory plant, installed equipment and ongoing paving
works

283
Challenge
Procurement delays: Most of the industrial equipment procured by UIRI requires international
bidding which takes a lot of time over and above the financial year duration yet the resources are
made available for only one financial year.
Further delays were reportedly emanating from the office of Solicitor General which sometimes
delays to clear awarded contracts.
3.5.4 Uganda National Bureau of Standards (UNBS)
UNBS was established as a semi autonomous body by an Act of Parliament in 1983. UNBS
mandate is: develop and promote standardization; quality assurance; laboratory testing and
metrology to enhance the competitiveness of local industry to strengthen Uganda’s economy and
promote quality, safety and fair trade.
Expected Outputs
Construction of UNBS head quarters
Procure vehicles and other transport equipment
Financial Performance
At the time of the monitoring visit, the total annual release stood at Ushs 3,542,832,000/= of
which 780,413,484 had been expended.
Table 3.5.3: UNBS Development Expenditure Budget FY 2009/10
Item Cumulative Release
(Q1-Q4)
Expenditure Balance
Buildings 2,462,000,000 29,737,370 2,432,262,630
Vehicles 455,000,000 189,588,205 265,411,795
Machinery and Equipment 530,000,000 530,000,000 -
Furniture and fixture 95,832,000 60,825,279 35,006,721
Total 3,542,832,000 780,413,484 2,732,681,146
Source: UNBS Accounts Unit
Physical performance

284
Construction of UNBS Headquarters
The tender for construction of UNBS headquarters was re-advertised as a design and build
project.
The evaluation of technical bids had been concluded pending the decision of the contracts to
allow opening of financial bids.
Procurement of vehicles:
Evaluation of bids for procurement of four pickups, two SUVs and one car had been completed
awaiting contracts committee to award this contract.
Challenges
Under utilization of funds: It should be noted that, towards the close of FY 2008/09, UNBS
was cleared by the Accountant General to retain Ushs 2,585,177,229/= through letters of credit
with Bank of Uganda on assumption that the resources would be used this FY for construction of
the headquarter. At the close of two financial years UNBS had over five billion shillings unspent.
Delay in initiating procurements: Most of the procurements under UNBS were initiated in the
third quarter of the financial year leading to delays in implementation.
The agency is understaffed to achieve its objectives, additional wage resources should be made
available to ensure quality control and standards of goods on Ugandan market.
The agency has an outstanding bill (arrears) of Ushs. 1.2 billion for Pay as You Earn which
the. Arrangements should be made through budget provision to clear the arrears before the
accounts of the agency are frozen.
3.5.5 Uganda Investment Authority (UIA)
Industrial Parks Development
The government committed itself to a national industrial parks development program funded
from budgetary provisions starting FY2008/09. The project has a time frame of five years (2008-
2013) and the expected output is a minimum of twenty well serviced industrial parks in different
regions of Uganda.104
Starting with the set up of the Kampala based industrial parks at Namanve, Bweyogerere and
Luzira the process is spreading to up country towns. It is anticipated that the Kampala parks will
be fully operational by 2010/11.
Objective
104
Public Investment Plan FY 2009/10-2011/12

285
The importance of establishing the parks is to provide serviced areas (with roads and utilities) for
home manufacturing and value addition to locally manufactured goods. Industrial parks will
strengthen the Ugandan private sector to enable it play it’s expected role as the engine of the
country’s economic growth and development, as well as create employment.
Planned Outputs
This financial year 2009/10, UIA set to achieve the following outputs under industrial parks
development.
Purchase of industrial land in Kasese, Fortportal, Arua, Kabale, Bukwo and Masaka
Carry out Environmental Impact Assessment’s (EIA) and physical planning requirements
Procure contractors for the construction of park roads
Procure and coordinate the provision of electricity and water in the parks
Extend electricity from Kiwanga-Namanve to Luzira industrial estate.
Allocate land to deserving investors and market available plots
Financing
The government took up the initiative to kick start the park development process with World
Bank providing an initial US$ 26m for the Kampala Industrial and Business Park (KIBP) at
Namanve.
GoU has funded the infrastructure activities in the Luzira and Bweyogerere industrial parks as
well as purchased 619 acres of land in Mbale at shs.3.1bn and built up 12 acre park at Mbarara at
shs.2.6bn.
Field Findings
Physical Performance
Special Economic Zones (SEZ) have been setup in Kampala Industrial and Business Park
(KIBP) Namanve, Luzira, Mbarara and Bweyogere; land for two estates in Mbale and Soroti was
acquired and extra land was identified in Kasese, Masaka, Gulu, FortPortal, Jinja, Bukwo, Arua
and Nakasongola.
Mbarara SME Park (approx. 13 acres)
The park is located 2km from Mbarara town at Rwebishuri opposite Mbarara Army Barracks in
the outskirts of Mbarara Municipality. It was formerly owned by Gatsby (u) Ltd and later
transferred to Uganda Investment Authority in February 2009 which runs and manages it on
behalf of the government. The park comprises of 42 workspaces that are serviced with roads,
water and power and the entire land is fenced.
Planned out puts
Installation of individual Electricity Meters

286
Recruitment of a Park Manager
Field findings
Uganda Investment Authority hired a Park
manager who runs and manages the day today
activities of the park.
All work spaces were advertised in the National
press and bidders were evaluated. Accordingly,
eleven successful bidders were issued with bid
acceptance letters and tenancy agreements for
signing. Only one tenant signed the agreement
while the rest under their former umbrella
organization appealed to the President for a
review of the process.
Most of the work spaces are officially vacant but
still locked by former occupants pending a
response from the office of the president on this
appeal.
Challenges
1. The park still uses the bulk metering system which is characterized with problems of
apportioning and clearance of bills.
2. The service provider (M/s Umeme) was reportedly too slow in providing individual meters to
each unit.
3. Since the filing of an appeal to the Office of the President, the tenants continue to occupy and
use utilities at the park without any payments which is affecting the collection of Non Tax
Revenue to UIA on one hand and accumulation of utility bills on the other hand.
Bweyogerere Industrial Park
The 50 acre Bweyogerere Industrial Park for light and clean businesses is in advanced stages of
implementation with the major investor, Bweyogere Hospital planning to begin construction
soon105
.
Expected Outputs
The government allocated funds to Uganda Investment Authority to be used for construction of
access roads in Bweyogerere Industrial Estate, boundary opening and construction of the
105
Industrial Parks Update: Retrieved from: http://www.ugandainvest.com/admin/docs/kibp2.pdf
SME Park Mbarara

287
following roads; Bypass link (895m), Kyaliwajjala road (580m), First street (278m) and Second
street (172m).
Findings:
At the time of the monitoring visit, boundaries had been opened and all plots (8) allocated to
investors. There was no physical progress on road construction at the park as reported in the
progress report.
Conclusion
Good progress was noted in the value addition industries, with the ongoing construction of
the Buhweju Tea factory, the Banana processing factory at Nyaruzinga in Bushenyi and
Uganda Industrial Research Institute.
Projects under industrial park development across the country are characterized by long
implementation delays ranging from land valuation delays, compensation of squatters,
securing contractors for major works, changes in project designs, inadequate staffing, and
inadequate procurement and work plans among others.
Consistent under utilization of development funds by UNBS for two financial years was
noted. The agency should fast track the contract for construction of her headquarters urgently
to avoid any further under spending.
Recommendation
UIA should devise an elaborate strategy of improving performance of industrial parks
development if the stipulated targets are to be achieved.
UNBS is understaffed to achieve its objectives, additional wage resources should be made
available to ensure quality control and standards of goods on Ugandan market.

288
3.6 Information and Communication Technology
3.6.1 Introduction
The government recognized the important role played by Information and Communications
Technologies (ICT) as a tool for social and economic development.
The Ministry of ICT was established in 2006 to address ICT development in a well organized,
regulated and monitored way of operation through adopting the emerging new technologies in
the governance processes, a practice commonly known as e-governance. Current applications of
e-governance cover areas such as e-health, e-commerce, e-learning among others.
The Information and Communications Technology sector is divided into three levels namely;
Policy, Regulatory and Operational. The Ministry of Information and Communications
Technology (MoICT) leads the sector. The Regulatory level is composed of Uganda
Communications Commission (UCC), Broadcasting Council (BC) and National Information
Technology Authority-Uganda (NITA-U). The operational level is composed of
telecommunications companies, postal, Information Technology (IT) and broadcasting
operators.106
The Ministry’s mandate is to provide strategic and technical leadership, overall coordination,
support and advocacy on all matters of policy, laws, regulations and strategy; sustainable,
effective and efficient development, harnessing and utilization of Information and
Communications Technology in all spheres of life to enable the country achieve its national
development goals.
Strategic objectives of the ministry include:
To develop information technology services such that they can significantly contribute to
national development
To promote use of information technologies in all spheres of life to enhance efficiency
and effectiveness
To increase teledensity and geographical coverage of telecommunications services with a
high quality of service.
To promote affordable rural communications
To have in place a balanced and coordinated national and regional communications
infrastructure.107
Scope
The fourth quarter of FY 2009/10 monitoring covered the National Transmission Backbone and
E-Government Infrastructure Project which has been transferred to the National Information
Technology Authority-Uganda (NITA-U). Installation sites for the National Transmission
106
Briefing notes for the minister of Information and Communications Technology
107 Ministerial Policy Statement(MoICT 2009/10)

289
Backbone in the districts of Mbarara, Bushenyi, Kabarole, Mbale and Tororo were visited; In
addition, the Ministry of Foreign affairs, Ministry of Finance and the secondary data center at
Uganda Bureau of Statistics were also visited to assess the implementation of E-Government
Infrastructure.
3.6.2 National Transmission Backbone and E-Government Infrastructure Project
Background
One of Uganda's strategies is to utilize Information and Communication Technologies (ICTs) to
create an efficient government aimed at simplifying procedures, bringing transparency,
accountability and making timely information available to all citizens.
To achieve the above, the ministry of ICT, through a concessional loan provided by the
Government of the People’s Republic of China has indicated two enabling priority actions
namely: the establishment of the E-government Infrastructure (EGI) and the establishment of the
National Data Transmission Infrastructure (NDI).108
Subsequently, a Commercial Contract was signed between the Ministry of Information and
Communications Technology (ICT), Uganda and Huawei Technologies Co. Ltd of the Peoples
Republic of China. The value of contract works for the overall proposed project including all
contractors equipment, imported plant & materials, civil works and all services is USD
106,590,305 (one hundred and six million, five hundred ninety thousands, three hundred and five
US dollars only).109
Table 3.6.1: Project Phases of EGI/NBI Project
Phases Time Line Cost Component
1 NBI
Cost Component
2 EGI Total (US$)
Phase 1 6 Months 8,234,416 21,905,242 30,138,659
Phase 2 12 Months 42,484,125 8,575,000 61,059,125
Phase 3 9 Months 10,918,835 4,472,687 15,391,522
Total 27 Months 61,637,376 44,952,929 106,590,305
Source: MoICT
108
Public Investment Plan(FY 2009/10-2011/12)
109 http://www.ict.go.ug/index.php?option=com_content&view=article&id=69:national-data-t...(4/12/10)

290
Objectives110
Establish a National backbone infrastructure (high bandwidth data connection) in major
towns of Uganda.
Connect all Ministries in a single wide area network
Establish a Government Data Centre
Establish District Information Centers
Expected Outputs
All government ministries connected
E-government implemented
An optic fiber backbone transmission cable set up across the country
District Information Center established
Technical Description
This project has two components namely: The National Backbone Infrastructure (NBI) and the
E-Government Infrastructure (EGI).
NBI is intended to ensure that high bandwidth data connection is available in all major towns in
Uganda at affordable rate. EGI is designed to reduce cost of doing business in government,
improving communication between government agencies and thus reducing the need for officials
to commute for meetings-increasing efficiency in government.
The project is implemented in three phases which are similar but only differentiated by the
magnitude of the scope in term of geographical coverage.
Phase 1 (168.5 km)
This phase covers Kampala, Entebbe and Jinja where the headquarters of government ministries
and Agencies are located. It has both NBI and EGI components i.e. High bandwidth cable (NBI)
will be laid covering the districts and government institutions and agencies in the districts will be
linked. The net work for phase 1 will require approximately 168.5km while the whole network
will need about 2.118.64km of fiber cable.
Phase 11(1.542.33km)
This phase has two links. Link 1 covers the western districts starting from Masindi through
Hoima, Kyenjojo, Kabarole, Kasese, Bushenyi, Mbarara up to Katuna. Link 2 covers the districts
in the east and northern Uganda starting from Mbale, Kumi, Soroti through Lira up to Gulu. Its
total cost is estimated at $61.1m and the implementation was to last 12 months.
Phase 111(407.8km)
110
Briefing notes for the minister of Information and Communications Technology

291
This phase will cover the links; (1) Kampala to Mbarara, (2) Kampala to Masindi through
Luwero and Nakasongola (3) Jinja-Mbale. Its total cost is estimated at $ 15.4m and the
implementation is to last nine months.
Financing
This project is being co-financed by the loan from the Chinese government and the government
of Uganda. The loan Agreement for phase 1 for US$ 30m was signed by government of Uganda
and the Export-Import Bank (Exxim Bank- on behalf of Chinese government) in late July 2007
and the loan became operational in late August. The project started in July 2007 and completion
date for all phases is July 2012. 111
Field Findings
The MoICT completed the implementation of Phase 1 of the project which comprises of:
(i) Connecting of five towns of Kampala, Entebbe, Mukono, Jinja and Bombo with 183 km
of optical fiber cable.
(ii) Connecting of 27 ministries/government departments into a government network under
the E-Government subcomponent of the programme. The total number of users connected
is 347 across MDAs.
(iii) Deployment of Video Conferencing services to the headquarters of all ministries.
After the completion of phase 1, the MoICT together with the project contractor carried out
Provisional Acceptance Test (PAT) to ensure that the equipment supplied are of the right
specification and properly installed. Services expected after the completion of phase 1 are Voice
over Internet Protocol (VOIP), Video conferencing, internet services, office automation and
email services.
Table 3.6.2: Financial Performance EGI/NBI Project FY 2009/10
Annual Budget FY
2009/10 (Ush
millions)
Q1-Q3.Release
FY2009/2010
(million)
Cumulative
expenditure by March
2010 (million)
Unspent balance by
March 2010
(million)
12,900.00
2155.69
690.1
1465.59
Source: Performance contract, MoICT Q3 2009/10
Physical Performance
Data Center (Uganda Bureau of Statistics)
111
Public Investment Plan(FY 2009/10-2011/12)

292
Equipment for the establishment of a data center was installed at Statistics House which houses
NITA-Uganda. The center houses basic applications that were used to operationalize phase I
(which included connecting ministries to Video conferencing and VoIP).
Equipment installed include; universal switching routers, universal media gateway, soft switches,
universal media servers, firewalls (Eudemon 500 model), Ethernet switching system, Sun
Microsystems Servers, Video Conferencing System, IBM Servers, LAN switches (for Jinja,
Kampala and Entebbe), power system, a monitoring system and a battery bank. All the
equipment was tested and reported to be running properly.
NITA-U was reportedly testing the migration of e-government services such as Integrated
Financial Management System (IFMS) and Integrated Payroll and Pension System (IPPS) onto
the EGI infrastructure.
To assess the functionality of the e-government infrastructure (phase 1), the monitoring team
visited the Ministry of Foreign Affairs and Ministry of Finance, Planning and Economic
Development.
Ministry of Foreign Affairs (MoFA)
Equipment was installed at the Ministry of Foreign affairs server room to support the VoIP and
video conferencing applications. This included installation of; a universal switching router,
firewall, routing switch system, VoIP equipment, VoIP Main Distribution Frame, Video
conferencing Terminal, Broad band Videophone, Microphone, 9 circuits AC Power Distribution
Box(VAPEL), a Sony camera, a 42” LCD TV, a battery bank and 6KVA UPS.
The telephones were installed in offices of the heads of department, directors and ministers
however, they are hardly used. It was reported that officials are not comfortable with video
telephones as some relate them to espionage. Therefore most of these phones were switched off.
In an interview with one of the officials, it was noted that sensitization of the EGI was not
carried out leaving the entire project to work on chance; “Users have not accepted the technology
thus creating white elephants and no value for money”.
Servers, switches and battery bank installed at NITA-U secondary data centre
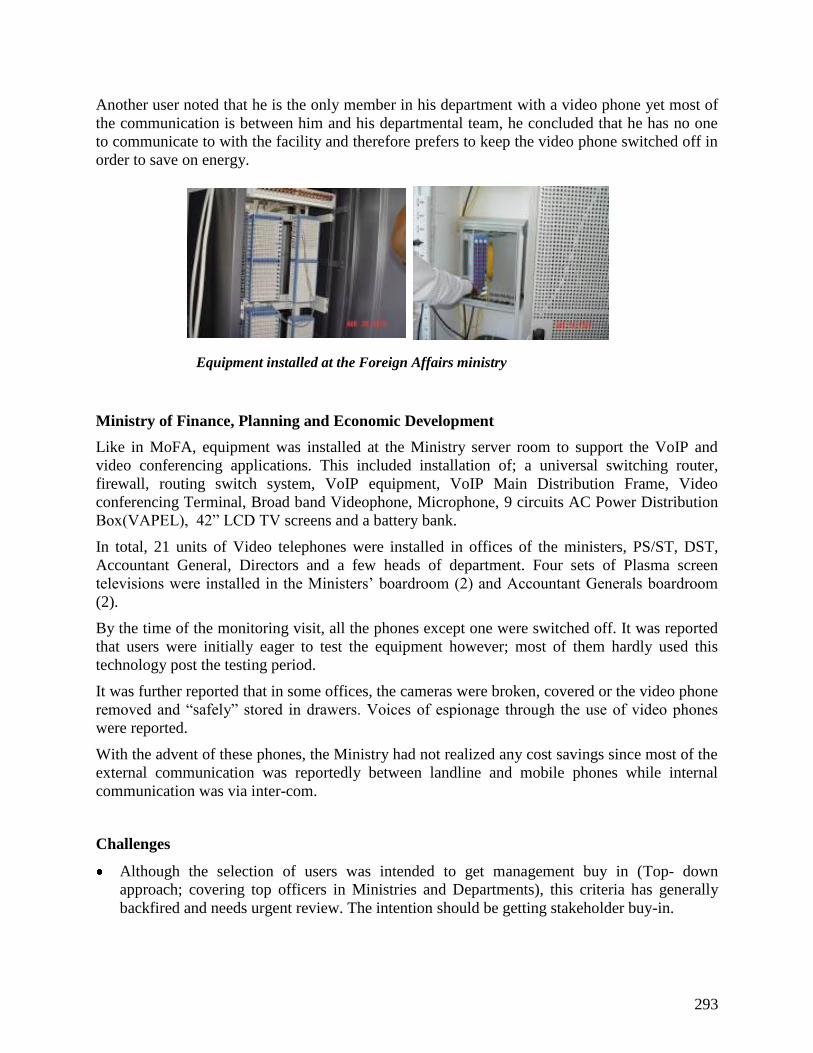
293
Another user noted that he is the only member in his department with a video phone yet most of
the communication is between him and his departmental team, he concluded that he has no one
to communicate to with the facility and therefore prefers to keep the video phone switched off in
order to save on energy.
Ministry of Finance, Planning and Economic Development
Like in MoFA, equipment was installed at the Ministry server room to support the VoIP and
video conferencing applications. This included installation of; a universal switching router,
firewall, routing switch system, VoIP equipment, VoIP Main Distribution Frame, Video
conferencing Terminal, Broad band Videophone, Microphone, 9 circuits AC Power Distribution
Box(VAPEL), 42” LCD TV screens and a battery bank.
In total, 21 units of Video telephones were installed in offices of the ministers, PS/ST, DST,
Accountant General, Directors and a few heads of department. Four sets of Plasma screen
televisions were installed in the Ministers’ boardroom (2) and Accountant Generals boardroom
(2).
By the time of the monitoring visit, all the phones except one were switched off. It was reported
that users were initially eager to test the equipment however; most of them hardly used this
technology post the testing period.
It was further reported that in some offices, the cameras were broken, covered or the video phone
removed and “safely” stored in drawers. Voices of espionage through the use of video phones
were reported.
With the advent of these phones, the Ministry had not realized any cost savings since most of the
external communication was reportedly between landline and mobile phones while internal
communication was via inter-com.
Challenges
Although the selection of users was intended to get management buy in (Top- down
approach; covering top officers in Ministries and Departments), this criteria has generally
backfired and needs urgent review. The intention should be getting stakeholder buy-in.
Equipment installed at the Foreign Affairs ministry

294
Change in inter-governmental communication from; landline to landline communication to
mobile to mobile and landline to mobile communication affects the use of the facility which
is tied to the former. The introduction of Voice over Internet Protocol (VoIP) facility should
be fast tracked in this respect.
The lack of change management strategy and up-to-date ICT policy to ensure that
beneficiaries are aware of the changes introduced in the business processes, identify critical
user needs and address them, consensus on the benefits of the project as well as policy
guidance in ensuring compliance with ICT standards generally affects implementation of this
project.
Video conferencing facilities are common platforms in geographically apart locations which
is not the case with the first phase of the EGI where the furthest point (Entebbe) is within a
radius of 40km. Because of the proximity between ministries and departments, users prefer
physical meetings to video conference meetings. Indeed video conferencing facilities in the
ministries visited were hardly used past the testing period. It should be noted that NITA-U
reported a cost reduction in video conferencing within government to zero.
The project scope covered a few users in the 27 Ministries, Departments and Agencies
(MDA), on the other hand, MDAs are expected to expand the network through regular
budget provisions. The ministries visited indicated that although the present benefits from the
EGI are good, they are not among their current priorities, furthermore, video phones are more
expensive as compared to other telephone sets.
There is no Service Level Agreement (SLA) to ensure maintenance support for all the
equipment deployed in MDAs under the EGI project. NITA-U reported that SLAs will be
finalized once the entire project is completed.
National Backbone Infrastructure (NBI)
The monitoring team visited sites on the western and eastern routes under phase two
implementation:
The diagram below shows the project routes of the NBI project.

295
NBI Transmission Routes
Source: NITA-U
Mbarara NBI site
A structure was set up at the Uganda National Roads
Authority Station in Mbarara. Equipment installed
includes a generator, a fuel tank, router, switch,
optical switching nods, and batteries. At the time of
the monitoring visit, the equipment was pending
wiring and powering the facility. A test operation of
the facility with other sites could not be carried out.
The equipment is situated in a secure location with
security guard in place.
Mbarara NBI facility
---Yellow: Phase1
--- Blue: Phase II
---Green: Phase III

296
Bushenyi NBI site
A structure was set up adjacent to the District Local Government main building and installation
of equipment was in progress. The equipment include: a fuel tank, router switch, optical
switching node, and a change over switch. It was reported that once the final equipment is
installed, system testing will be conducted.
Notwithstanding the presence of night guards at the district administration, the absence of a
fence behind the structure and existence of a foot path near this site renders the facility insecure.
Kabarole NBI site
A structure was set up at the post office, equipment delivered and installed. It includes a fuel
tank, router switch, optical switching nods, and a change over switch. Cabling of the equipment
is complete waiting powering and interconnections between racks. The facility is guarded during
the day and night.
Kabarole NBI facility and mounted racks with equipment
Server racks, Fuel tank and generator, and structure housing the NBI site in Bushenyi

297
Tororo NBI site
In an interview with the postal manager, it was
confirmed, that the proposed site for the NBI site was
at the post office and that cables had been laid up to the
proposed site.
However the facility had not yet been set up at the time
of the monitoring visit and equipment had not been
delivered.
Challenges
Funding gap for extension of services to all districts: The project covers a few districts yet
the entire country (central and Local governments) need e-government services.
Lack of harmonization of ongoing projects in other sectors such as road works, water
extensions among others has led to continuous damaging of laid optic fiber cables for
example along Kampala –Jinja road. In the case of Kigumba-Masindi-Hoima-Kyenjojo road
(238km) and Lira-Kamdini, work has stalled due to incomplete road designs and periodic
maintenance respectively.
Delayed implementation: The ICT committee of Parliament suspended works under phase
two of NBI to allow an audit of the first phase and correct the anomalies in implementation
of the second phase which affected the project schedule. Further still, during that period, the
contractor continued with work unsupervised which created verification backlog on the side
of NITA-U.
The project has received a lot of negative publicity arising out of implementation oversights
such as the lack of supervision on the side of the client; allegations of overpricing and
installation of inferior optic fiber cables.
Conclusion
The national backbone and e-government infrastructure project, which was contracted to
M/s. Huawei Technologies of China, is characterized by inadequate supervision of the
contractor. The first phase, costing $30 million, was investigated by the Auditor General, at
the request of the Parliamentary committee on Information and Communication Technology
(ICT).
The resulting report raised questions about the way in which the contractor, Huawei, was
selected to implement the project, including the pricing and laying of 2,100 kilometers of
NBI Cables at the Tororo Site

298
fiber-optic cable. The auditor general found there was inadequate supervision of the project
by both the Ministry of ICT and the main contractor. This was further aggravated by the fact
that most of the work was subcontracted by the main contractor without the input of the
client. The contractor also failed to supervise the sub-contractors. This left a big question on
the quality of work undertaken.
Recommendations
Awareness campaigns and sensitization should be carried out by NITA-Uganda/MoICT so
that beneficiaries appreciate the services offered under EGI/NBI and demystify the
allegations of espionage.
Implementation should address the immediate communication needs of the stakeholders such
as bandwidth, Internet services, VoIP and email solutions. Implementers should consider
provision of shared services; negotiate concessionary rates for landline to mobile and
creation of closed user groups This will enable government agencies to separately and
collectively lift their performance.
NITA-U should urgently develop a change management strategy and constitute a change
management team to counter the negative publicity and achieve the intended project benefits.
The Ministry of ICT should review the existing ICT policy with a view of amending it to re-
align E-government in the policy.
Implementation of NBI should be properly supervised if the accruing benefits are to be
achieved.
There is no evidence of cost reduction/savings as a result of e-government infrastructure
interns of reduction in telephone costs and movements from one destination to another for
meetings. A study should be commissioned to evaluate the project performance and assess
the level at which it has achieved the set targets in order to benchmark benefits and improve
performance.
Table: 3.6.3: Summary Sector Performance
Vote Function/Key
output
2009/10 Expected Achievements Output cost
Ushs.Bn
Remarks/observations
Output:
050305:Communicati
on Infrastructure
Network established
in Uganda
-Complete survey of phase 11
Optical fibre routes and
transmission sites.
-1100km of optical fibre under
phase11 installed
-Design for phase111 developed
-Back up equipment installed in 21
MDAs.
0.69 -Delayed implementation of
activities was noted in the
National Transmission
Backbone and E-Government
Infrastructure Project as the
ICT committee of parliament
stayed works to allow an
audit of the first phase and
correct the anomalies in

299
-Design of primary data center
implementation of the second
phase.
-Project should be properly
supervised.
Output: 050103
BPO industry
promoted
-Transition framework to NITA-U
development and submitted to
NITA-U
0.134
Output:050304:Techn
ical Support on e-
Government and e-
Commerce provided
-Training of 6 Trainers for DBICs.
-Review of operation status of the
existing DBICs in preparation for
the expansion of programme to
other areas.
-In some DBICs, inadequate
information shared among the
key stakeholders was a major
concern especially from the
recipients of the
equipment.(Lira,Rukungiri)
- In future, readiness
assessment for each proposed
DBIC/Tele-centre should be
undertaken given the unique
needs of each place.
Output:050102:
E-government
services provided
-Monitoring reports in place
-GoU website activated.
-Technical guidance given to
IRMIS(MoD)
-Transformation of Public
Servcie(MoPOS)
-Northern Uganda Data
centre(OPM)
-UNEB computerization Draft
0.193 -Government of Uganda web
portal was not activated
during the year.
-Other activities not
monitored during financial
year.
Output:050203:Logis
tical Support to ICT
infrastructure
-Technical support provided to
Uganda police on expansion of
TETRA network specifically TOR
and specifications.
-Nakaseke wireless monitored.
-National Postal code and
Addressing system pilot project
initiated
2.491 Implementation of wireless IP
should be re-aligned with the
initial objectives of achieving
tele-medicine, e-commerce,
e-training and overall e-
governance in rural areas so
that technology use makes a
real impact on socio-
economic development.
-Tetra and postal address
system were not monitored
Output: 050301: A
harmonized and
coordinated National
Information
Technology Systems
Recruitment of NITA-U
Leadership(ED and Directors)
-Recruitment of staff was
ongoing (an Interim
Executive Director and
technical officers currently
steering the organization).

300
developed

301
3.7 ROADS
3.7.1 Introduction
Roads is one of the three sub-sectors112
under the Ministry of Works and Transport (MoWT)
whose mandate is to plan, develop, and maintain an economic, efficient, and effective transport
infrastructure and transport services by road, rail, water and air; manage public works including
government structures; and promote standards in the construction industry.
Key institutions involved in the implementation of planned activities within the Roads sub-sector
include: MoWT; the Uganda National Roads Authority (UNRA); the Uganda Road Fund (URF);
district local governments, lower local governments (sub-counties) and urban councils. Other
institutions outside the works and transport sector that have projects with roads subcomponents
include the Office of the Prime Minister (OPM) and the Ministry of Local Government (MoLG).
a) Sector objectives
The sector strategic objectives include:
i) Develop policy, set standards, regulate and ensure compliance and monitor transport
infrastructure and buildings to meet the needs of users and promote social and economic
development;
ii) Plan, design and ensure construction and maintenance of well co-ordinated and efficient
transport infrastructure and buildings which meet the needs of users and promote social and
economic development;
iii) Develop the capacity of the local construction industry;
iv) Ensure safe and environmentally friendly transport and physical infrastructure;
v) Ensure the mainstreaming of cross-cutting issues namely: Environment, HIV/AIDS,
Gender and Occupational Health and Safety (OHS) into the policies, programmes and
activities of the Sector.
b) Scope of the report
The report covers input – output monitoring of selected road development projects and road
maintenance programmes that were planned for implementation in FY 2009/10. It highlights the
progress made on key planned activities as well as the financial performance of the Projects/
Programmes, and outlines implementation challenges identified, any arising policy issues, and
recommendations.
The report specifically covers Projects monitored for performance during the first and fourth
quarters and programmes monitored on a quarterly basis throughout the FY, as outlined in Table
112
The three sub-sectors under the Ministry of Works and Transport are: 1. Transport Services; 2. Roads; and 3. Construction Standards and
Quality Assurance
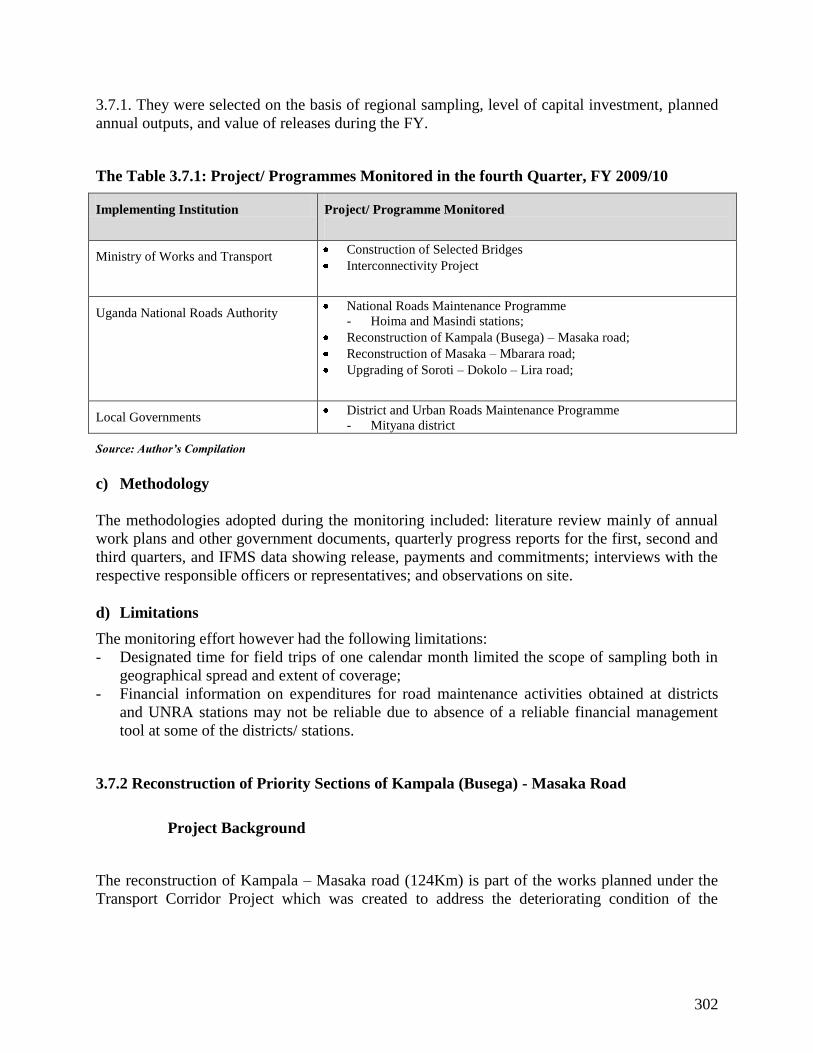
302
3.7.1. They were selected on the basis of regional sampling, level of capital investment, planned
annual outputs, and value of releases during the FY.
The Table 3.7.1: Project/ Programmes Monitored in the fourth Quarter, FY 2009/10
Implementing Institution Project/ Programme Monitored
Ministry of Works and Transport Construction of Selected Bridges
Interconnectivity Project
Uganda National Roads Authority National Roads Maintenance Programme
- Hoima and Masindi stations;
Reconstruction of Kampala (Busega) – Masaka road;
Reconstruction of Masaka – Mbarara road;
Upgrading of Soroti – Dokolo – Lira road;
Local Governments District and Urban Roads Maintenance Programme
- Mityana district
Source: Author’s Compilation
c) Methodology
The methodologies adopted during the monitoring included: literature review mainly of annual
work plans and other government documents, quarterly progress reports for the first, second and
third quarters, and IFMS data showing release, payments and commitments; interviews with the
respective responsible officers or representatives; and observations on site.
d) Limitations
The monitoring effort however had the following limitations:
- Designated time for field trips of one calendar month limited the scope of sampling both in
geographical spread and extent of coverage;
- Financial information on expenditures for road maintenance activities obtained at districts
and UNRA stations may not be reliable due to absence of a reliable financial management
tool at some of the districts/ stations.
3.7.2 Reconstruction of Priority Sections of Kampala (Busega) - Masaka Road
Project Background
The reconstruction of Kampala – Masaka road (124Km) is part of the works planned under the
Transport Corridor Project which was created to address the deteriorating condition of the

303
Northern Corridor Route (NCR)113
and other major export/ import highways and their spurs with
the objective of facilitating intra and international trade. The Transport Corridor Project was
planned to have a total cost US$ 1.0 billion starting in July 2008 and expected to complete in
June 2012. The project is funded by GoU to the tune of US$ 600 million with the short fall in
funding expected to be funded in due course by donor funding and public – private partnership
modalities.
Reconstruction of Kampala – Masaka road was however fragmented into four sections with the
on-going contract covering only two sections totalling 63.1 Km with one section starting at
Busega roundabout to Nsangi (11.5Km), and another starting at Kamengo to Lukaya (51.6Km).
The scope of works under the contract essentially comprises of the following activities:
Site clearance; earthworks including widening and realigning of the road from Class II to
Class I road specifications, reconstruction of 63.1Km of road pavement with a graded
crushed stone sub-base and base, construction of a dense bitumen macadam course, an
asphalt wearing course across the carriageway, and double bituminous surface treatment
across the shoulders.
Drainage works including: new culverts installation, extension of selected existing culverts,
replacement of damaged culverts; construction of headwalls, lined and unlined open drains,
and drainage at junctions consisting of pipes and gully systems;
Modification of one existing bridge to incorporate pedestrian walkways; and
Ancillary works including: retaining structures, traffic signs, guardrails, road markings and
reflectorised road studs, kerbing and footpaths, street lighting at junctions and interchanges,
landscaping and environmental mitigation works.
The Table 3.7.2 shows a summary of the contract data and progress of the construction works on
the road.
Table 3.7.2: Busega – Masaka Project Summary
Supervision Consultant AIC Progetti S.p.A in Association with
TECHNITAL & SABA Engineering Plc
Contractor Reynolds Construction Company (RCC)
Length 63.1 Km
Works Contract Price (Original) EUR 44,791,586.90
Works Contract Price (Revised) EUR 46,184,290.90
Supervision Contract Price (Original)
EUR 2,028,989
Supervision Contract Price (Revised)
EUR 2,101,457.28
Commencement Date 5th January 2009
Construction Period 24 Months
Original Completion Period 4th January 2011
Contract Time Elapsed 470 Days (64.5% Time Progress)
Works Payments Certified EUR 19,946,836.85 (43.2% of revised contract
price)
113
Malaba/ Busia – Kampala – Katuna road

304
Works Actual Payments EUR 19,788,336.69 (42.8% of revised contract
Price) Supervision Payments Certified EUR 932,693 (44.4% of revised contract price)
Supervision Actual Payments EUR 896,716.67 (42.7% of revised contract price)
Estimated Physical Progress 37.0%
Source: Supervising Consultants’ Resident Engineer.
The project had last been monitored in the first quarter of FY 2009/10, at which time progress of
works was estimated at 14.5% against a financial progress of 32.6% and a contract time progress
of 35.7%. In FY 2008/09, the project had budget allocations under the NCR Kampala – Mbarara
project and under the Transport Corridor Project; and achieved a total progress of works of 5.0%
thus failing to achieve the annual targeted output of 30%, and also falling behind the contract
time progress (24.1%). In FY 2009/10 the project was allocated a total of UShs 40.0 billion
under the Transport Corridor Project which had an approved budget of UShs 400.266 billion of
which UShs 176.4 billion had been released (44.1% of annual budget) and UShs 170.9 billion
expended (96.9% absorption). Targeted outputs included an annual progress of 35% with
quarterly progress of 8.5% for each of the four quarters. The section 3.7.2.2 gives the findings
from the field visit done on 24th
May 2010.
Findings
i) Financial Performance
Table 3.7.3: Financial Performance of the Project for Reconstruction of Kampala (Busega) –
Masaka road
Approved
Estimates
(UShs
Millions)
Releases
(UShs
Millions)
Expenditure
(UShs
Millions)
% of
Budget
Released
% of
Releases
Spent
Contracts
Contract
Sum
(EUR)
Cum %
Payment
to the
Contractor
Consultant’s
Contract
Sum (EUR)
Cum %
Payment
to the
Consultant
FY
2008/09
n/a* n/a* n/a* n/a* n/a* 44,791,587 31.3% 2,028,989 27.9%
FY
2009/10
40,000.00 (Under Transport
Corridor Project)
n/a* n/a* n/a* n/a* 46,184,291 42.8% 2,101,457 44.4%
n/a*: Information not available Source: MoWT MPS, 2009/10; Supervising Consultant’s Resident Engineer
The project being only a part of the Transport Corridor Project had no specific approved budget
estimates and therefore no specific releases. According to UNRA work plans however, the
project was allocated a total of UShs 40.0 billion.
The financial progress of the works contract was estimated at 42.8% of the revised contract
price, which is inclusive of 30% advance payment on works, materials and equipment. However
the contract price was expected to rise further mainly due to the variation of price due to increase
of prices of construction inputs; costs from a design review by the supervising consultants,
305
mainly from increased quantities especially on swamp fills and culverts, changes in design to
incorporate climbing lanes; and an addendum to the contract for the maintenance of sections not
yet handed over to the contractor from Busega to Masaka. The project was at the time of
monitoring projected to have a final cost overrun of 10.0% of the original contract price.
Cumulative payments to the supervising consultant were at 44.4% of the revised contract price,
inclusive of 30% advance payment. At the time of monitoring, the combined payments to the
contractor and the consultant during the FY amounted to EUR 5.649 million while the
cumulative payments amounted to EUR 20.685 million inclusive of 30% advance payments.
ii) Physical Performance
The following were the field findings on physical performance of the project:
Progress of works was estimated at 37%, representing a total progress of 32% against the
35% projected in the work plans with a month left to the end of the FY. Therefore the
targeted project output of 35% was likely to be achieved by the end of the FY. Physical
progress of works was however still lagging behind the contractor’s approved work
programme and behind the contract time progress, which was at 64.5% at the time of
monitoring.
Ongoing works included clearing, grabbing and removal of top soils; swamp widening and
filling using geo-textiles, rocks, and course crushed stone material; replacement of culvert
crossings; pothole patching in sections yet to be worked; earthworks for widening of the
existing road by 3.6m on one side; construction of the road pavement layers at subgrade,
subbase and base levels in the different sections; and rock blasting and stone production
works in the quarry.
The contractor had mobilized all necessary equipment and personnel and was fully
established on site.
The HIV awareness programme was still on-going with a treatment clinic established on site
and other activities like the outreach programme, distribution of condoms, radio programmes
on HIV and road safety/awareness campaigns, counselling and voluntary testing in progress.
The monitoring team was informed that although the general response of women towards
employment opportunities on the project had been low, the few successful female applicants
were mainly employed in less strenuous portfolios such as flagmen, controllers of deliveries,
fuel clerks, water operators, site offices and domestic roles. However one woman had been
employed as a wheel loader operator. In addition, the HIV awareness programme had mainly
targeted female workers and women in the surrounding communities.
The monitoring team was also informed that several environmental protection measures had
been mainstreamed in the works but with varying levels of satisfaction. In particular
measures undertaken included: control of dust and air pollution through routine watering of
dusty sections, operational health and safety issues like traffic and workers safety measures,
silt control, water pollution controls, noise pollution controls etc.

306
iii) Challenges and Setbacks Experienced by the Project
The project continued to be affected by land acquisition issues for example, while the section
from Kamengo to Lukaya had been handed over to the contractor, several affected
landowners had neither had negotiations nor been compensated leading to blockage of works
in some sections (like the Kobil fuel station in Buwama) and thus exposing the project to
contractor’s claims and delays in the completion of works. The section from Busega to
Nsangi was yet to be handed over to the contractor.
The project had also been affected by the high staff turnover of the contractor’s key
personnel leading to delays in submission of the contractor’s payment certificates, which
were two months behind at the time of monitoring. This was also affecting the contractor’s
capacity to accelerate works and bridge the lag in the approved work programme.
Conclusion and Recommendations
While the project was on course to achieve the targeted outputs (35% of works completed),
the progress of works was still lagging behind the project time progress and behind the
approved work programme. Therefore, there is need for the contractor to accelerate works
and bridge the lag in progress against the approved work plan.
Land acquisition issues relating to delays in negotiations and compensation of affected
landowners were clearly affecting progress of works, which exposes the project to
contractor’s claims and delays in the implementation of the project. These issues need to be
expeditiously resolved to enable the contractor acquire complete access to the site and as
such avoid further delays to the progress of works and to pre-empt any claims for cost and
time (which also represents increase in cost of the project due to the increasing cost of
construction inputs under the variation of price clause).
A final cost overrun of 10% was projected on the project due to increase of prices of
construction inputs; costs from a design review by the supervising consultants, mainly from
increased quantities especially on swamp fills and culverts, changes in design to incorporate
climbing lanes; and an addendum to the contract for the maintenance of sections not yet
handed over to the contractor from Busega to Masaka.
Busega – Masaka Road: Swamp widening (left) and Dust control by routine watering (right)

307
3.7.3 Upgrading of Masaka - Mbarara and Masaka – Kyotera Roads
Project Background
Masaka – Mbarara road (148.7Km) is part of the NCR which links Kampala to the major exit to
Rwanda at Katuna border. A significant portion of the traffic using the road is from Mombasa to
Western Uganda and the neighbouring countries of Rwanda, and the Democratic Republic of
Congo (DRC). It also forms part of the Trans-African highway from Mombasa in Kenya to
Lagos in Nigeria. The primary objective of the project is to provide an adequate and suitable
road link and to cater for the projected traffic demand and road safety requirements of the Trans-
African highway. The project is jointly funded by the European Development Fund (EDF) and
the Government of Uganda. It commenced on 7th
January 2008 and was expected to complete by
6th
January 2010 at a total cost of EUR 79.014 million.
Construction works were planned to cover a package of roads totalling 154.5Km comprising of a
road section that starts 2.4Km north of Masaka bypass junction and ends approximately 6.5Km
west of Mbarara town, and a separate 5.5Km section along Masaka – Kyotera road. The scope of
works essentially comprises of the following activities:
Site clearance; earthworks including widening and realigning of the road to Class I road
specifications, reconstruction of 154.5Km of road pavement with a cement stabilized sub-
base and a graded crushed stone base, construction of a dense bitumen macadam course, and
double bituminous surface treatment across the carriageway and shoulders.
Drainage works including: new culverts installation, extension of existing culverts,
construction of headwalls, lined and unlined ditches, and drainage at junctions consisting of
pipes and gully systems; and
Ancillary works including: retaining structures, traffic signs, guardrails, road markings and
reflectorised road studs, kerbing and footpaths, street lighting at junctions and interchanges,
landscaping and environmental mitigation works.
The Table 3.7.4 shows a summary of the contract data and progress of the construction works on
the road.
Table 3.7.4: Masaka – Mbarara Project Summary
Contract Number EU/HW/C004
Supervision Consultant AIC Progetti S.p.A in Association with
TECHNITAL & SABA Engineering Plc
Contractor Reynolds Construction Company (RCC)
Length 154.4 Km
Works Contract Price EUR 79,014,151.02
Supervision Contract Price
EUR 2,632,488
Commencement Date 7th January 2008
Construction Period 36 Months
Original Completion Period 6th January 2011
Contract Time Elapsed 844 Days (77.1% Time Progress)

308
Works Payments Certified EUR 48,926,132 (61.9% of Contract Price)
Supervision Payments Certified EUR 1,528,486 (60.3% of original price)
Weighted Physical Progress 43.86%
Source: Supervising Consultants’ Resident Engineer.
The project had last been monitored in the first quarter of FY 2009/10, at which time progress of
works was estimated at 20% against a financial progress of 40.5% and a contract time progress
of 67.7%. In FY 2008/09, the project had an annual budget of UShs 25.727 billion and achieved
a total progress of works of 13% thus failing to achieve the annual targeted output of 25%, and
also falling behind the contract time progress. In FY 2009/10 the project was allocated a total
annual budget of 48.183 billion all of which was donor funded and had an annual targeted output
of 35% physical progress of works. The project was monitored on 24th
May 2010 and the
findings were as follows in 3.7.32.
Findings
i) Financial Performance
As shown in Table 3.7.5, financial progress of the works contract was estimated at 61.9% of the
original contract price, which included 10% advance payment on works, materials and
equipment, of which 61% had been recovered. Contract price overruns were projected from
claims for price adjustment following increase in contract inputs like steel, cement, fuel,
bitumen, and expatriate labour; and an increase in some itemised quantities following a design
review by the supervising consultants. Other likely sources of cost overruns included items
related to land acquisition like extension of fences; and additional works like the introduction of
climbing lanes. The project was at the time of monitoring projected to have a final cost overrun
of approximately 26.6%.
Table 3.7.5: Financial Performance of the Project for Upgrading of Masaka – Mbarara road
Approved
Estimates
(UShs
Millions)
Releases
(UShs
Millions)
Expenditure
(UShs
Millions)
% of
Budget
Released
% of
Releases
Spent
Contracts
Contract
Sum
(EUR
Millions)
%
Payment
to the
Contractor
Consultant’s
Contract
Sum (EUR
Millions)
%
Payment
to the
Consultant
FY
2008/09
25,727 n/a* n/a* n/a* n/a* 79.014
39.0% 2.632
n/a*
FY
2009/10
48,183 n/a* n/a* n/a* n/a* 61.9% 60.3%
n/a*: Information not available Source: MoWT MPS, 2009/10; Supervising Consultant’s Resident Engineer
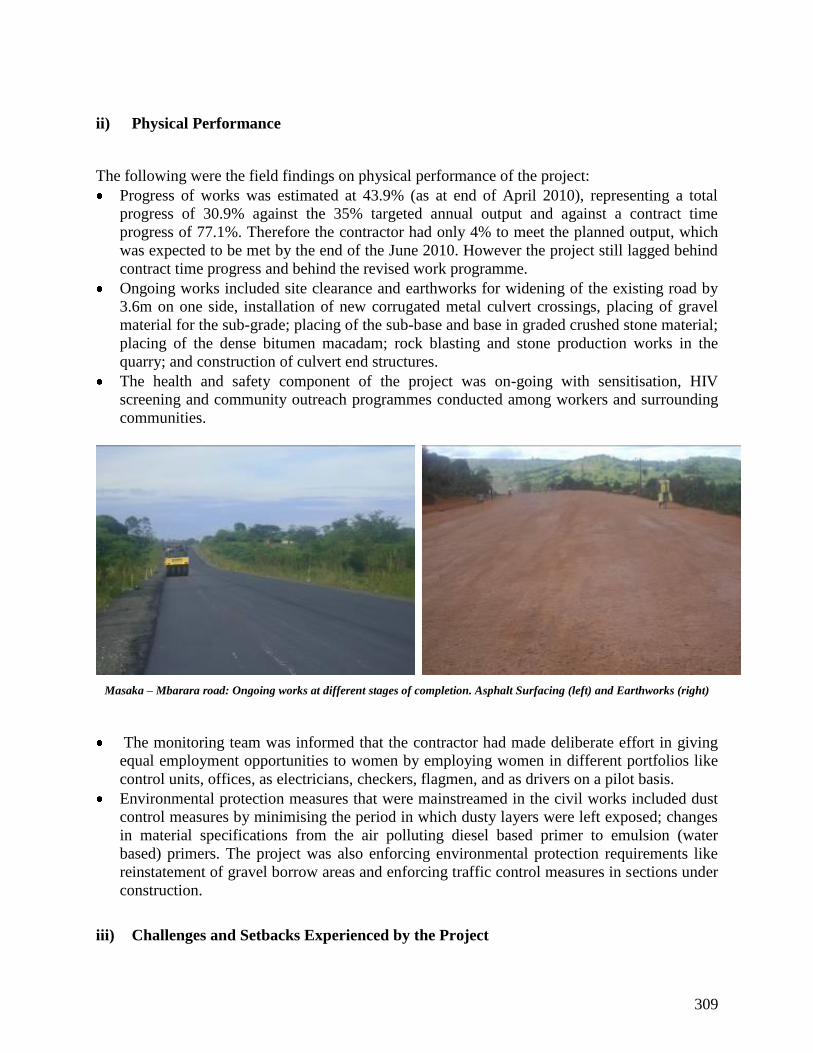
309
ii) Physical Performance
The following were the field findings on physical performance of the project:
Progress of works was estimated at 43.9% (as at end of April 2010), representing a total
progress of 30.9% against the 35% targeted annual output and against a contract time
progress of 77.1%. Therefore the contractor had only 4% to meet the planned output, which
was expected to be met by the end of the June 2010. However the project still lagged behind
contract time progress and behind the revised work programme.
Ongoing works included site clearance and earthworks for widening of the existing road by
3.6m on one side, installation of new corrugated metal culvert crossings, placing of gravel
material for the sub-grade; placing of the sub-base and base in graded crushed stone material;
placing of the dense bitumen macadam; rock blasting and stone production works in the
quarry; and construction of culvert end structures.
The health and safety component of the project was on-going with sensitisation, HIV
screening and community outreach programmes conducted among workers and surrounding
communities.
The monitoring team was informed that the contractor had made deliberate effort in giving
equal employment opportunities to women by employing women in different portfolios like
control units, offices, as electricians, checkers, flagmen, and as drivers on a pilot basis.
Environmental protection measures that were mainstreamed in the civil works included dust
control measures by minimising the period in which dusty layers were left exposed; changes
in material specifications from the air polluting diesel based primer to emulsion (water
based) primers. The project was also enforcing environmental protection requirements like
reinstatement of gravel borrow areas and enforcing traffic control measures in sections under
construction.
iii) Challenges and Setbacks Experienced by the Project
Masaka – Mbarara road: Ongoing works at different stages of completion. Asphalt Surfacing (left) and Earthworks (right)

310
The project continued to be affected by land acquisition issues forcing the contractor to keep
skipping sections not yet handed over and thus clearly affecting the contractor’s construction
efficiencies and progress of works. Although contractor had not indicated intention to claim
for costs, the project remained exposed to such claims.
Conclusion and Recommendations
While the project was on course to achieve the targeted outputs (35% of works completed),
the progress of works was still lagging behind the project time progress and behind the
approved work programme. Therefore, there was need for the contractor to accelerate works
and bridge the lag in progress against the approved work plan.
Land acquisition issues relating to delays in negotiations and compensation of affected
landowners were clearly affecting progress of works, which exposed the project to
contractor’s claims and delays in the implementation of the project. These issues need to be
expeditiously resolved to enable the contractor acquire complete access to the site and as
such avoid further delays to the progress of works and to pre-empt any claims for cost and
time (which also represents increase in cost of the project due to the increasing cost of
construction inputs under the variation of price clause).
A final cost overrun of 26.6% was projected due to increase of prices of construction inputs;
costs from a design review by the supervising consultants, and increased itemised quantities
especially on culverts.
3.7.4 Upgrading of Soroti – Dokolo – Lira Road
Project Background
Soroti – Dokolo – Lira road (123Km) which traverses the districts of Soroti, Kaberamaido,
Dokolo and Lira is a link with significant economic importance that is used by both internal and
international traffic plying through Northern and Eastern Uganda and providing interconnectivity
with the West Nile, international borders with DRC and Southern Sudan; the districts of
Northern Uganda, Eastern Uganda and the international borders with Kenya. Upgrading of the
road from a class B gravel road to a class II bitumen paved national roads standard is aimed at
improving the general condition of the road, lowering travel times, providing the structural
strength necessary for its ever increasing traffic loading, reducing vehicle operating costs,
adopting the more cost effective option of maintaining the road, lower transport costs, and to
stimulate trade, investment, economic growth and delivery of social services within the region.
The project was expected to cost UShs 70.6 billion jointly funded by the World Bank through the
International Development Association (IDA) and GoU. The implementing agency is UNRA and
the works were contracted out in two sections namely Soroti – Dokolo, which commenced in
November 2007, and Dokolo – Lira which commenced in June 2008.

311
The project entailed construction works for the upgrading of a total of 123Km of the road linking
the towns of Soroti, Dokolo and Lira from the existing Class B gravel road to class II paved road
standard with a 6.0m wide carriageway, surfaced with a Double Bitumen Surface Treatment
(DBST), and 1.5/ 2.0m wide shoulders surfaced with a Single Bitumen Surface Treatment
(SBST). The major works included earthworks, construction of a new cement stabilized sub-
base, graded crushed stone base, surface dressing of the carriageway and shoulders; construction
of new cross and longitudinal drainage systems, and ancillary works including installation of
traffic road signs, guardrails and road markings. The Table 3.7.6 shows summaries of contract
data for the two contracts and progress of the construction works on the road.
The Table 3.7.6: Soroti – Dokolo – Lira Project Summary
Soroti – Dokolo Road Contract Dokolo – Lira Road Contract
Contract Number RDP/HW/C010 RDP/HW/C011
Funding Agency World Bank and GoU World Bank and GoU
Supervision Consultant J Burrow Ltd COMPTRAN Engineering and Planning
Associates
Contractor China Road and Bridge Corporation China Road and Bridge Corporation
Length 62.6 Km 60.4Km
Works Contract Price
(UShs)
UShs 70,642,241,162 (Original Contract
Price)
UShs 75,715,581,155 (Revised Contract
Price)
UShs 87,794,405,526 (Final Contract
Price)
UShs 82,068,227,664 (Original Contract
Price)
UShs 115,311,053,349 (Projected Final
Cost) Supervision Contract
Price
US$ 1,235,264 (Inclusive of taxes) US$ 354,800 (Interim services, inclusive
of taxes)
US$ 844,285 (Inclusive of taxes) Commencement Date 1st November 2007 1st June 2008
Construction Period 30 Months 30 Months
Original Completion
Period
30th April 2010 30th November 2010
Contract Time Elapsed Completed on 18th March 2010 727 days (79.8% Time Progress)
Works Payments
Certified
UShs 87,131,429,637 (123.3% of Original
Contract Price)
UShs 98,443,666,807/- (120.0% of
Original contract price)
Payments to the
Contractor
UShs 83,794,405,526 (118.6% of Original
Contract)
UShs 98,443,666,807/- (120.0% of
Original contract price)
Payments to the
Consultants
US$ 1,054,122 (85.3% of original contract
sum)
US$ 354,800 (100% of Interim services
costs)
US$ 565,042 (66.9% of contract sum) Weighted Physical
Progress
100% (substantially completed) 90.6% (Based on projected final cost)
117.5% (Based on original contract)
Cumulative Financial
Progress
96.8% (Based on Revised Contract Price) 85.4% (Based on projected final cost)
120.0% (Based on Original contract sum)
Source: Respective Resident Engineers of Supervising Consultants.

312
The project had last been monitored in the first quarter of FY 2009/10, at which time progress of
works on Soroti – Dokolo road was estimated at 90.4% against a financial progress of 90.6% and
a contract time progress of 73.9%; while progress of works on Dokolo – Lira road was at 61.9%
against a financial progress of 64.8% and a time progress of 50.5%. In FY 2008/09, the project
had an annual budget of UShs 57.002 billion and achieved a total progress of works of 61%
completion on Soroti – Dokolo road against the 58% targeted; and 45% completion on Dokolo –
Lira road against the 30% targeted. The progress of works in both contracts thus exceeded the
targets for the FY, and the works were ahead of schedule on Dokolo – Lira road but slightly
behind schedule on Soroti – Dokolo road. In FY 2009/10 the project was allocated a total budget
of UShs 54.619 billion and had targeted outputs of 32% of physical progress of works on Soroti
– Dokolo road and 45% on Dokolo – Lira road.
At the time of monitoring done on 1st June 2010, the findings were as follows in 3.7.4.2:
Findings
i) Financial Performance
Table 3.7.7: Financial Performance of the Project for Upgrading of Soroti – Dokolo – Lira road
(123 Km)
FY Source
of
funding
Approve
d
Estimates
(UShs
Millions)
Releases
(UShs
Millions
)
Expendit
ure (UShs
Millions)
% of
Budget
Released
% of
Releases
Spent
Total of
Original
Works
Contract
Sums
(UShs
Billions)
%
Paymen
t to the
Contrac
tors
Total of
Consultant’s
Contract
Sums (US$ )
%
Payment
to the
Consulta
nts
FY
2008/09
GoU 1,000.0 611.774 223.558 61.2% 36.5% 152.710
65.9% 2,434,349 44.2%
Donor 56,001.7 n/a* n/a* n/a* n/a*
FY
2009/10
GoU 25,000.0 24,450 24,211.4 97.8% 99.0% 152.710
106.0% 2,434,349 81.1%
Donor 29,619.0 n/a* n/a* n/a* n/a*
n/a*: Information not available Source: MoWT MPS, 2009/10; Supervising Consultant’s Resident Engineer
As shown in Table 3.7.7, in FY 2009/10 the approved budget estimate for the project amounted
to UShs 54.619 billion of which UShs 29.619 billion was under the donor component and UShs
25.0 billion, the GoU component. At the time of monitoring, the project had received a total of
UShs 24.45 billion from the GoU component (97.8% of approved estimate) of which UShs 24.21
billion (99.0% of releases – IFMS Data) had been expended. Payments to the contractors during
the FY amounted to UShs 61.33 billion bringing the cumulative total payment to UShs 161.9
billion (106.0% of the sum of the works contract prices) while payments to the consultants
313
amounted to US$ 0.898 million bringing the cumulative total payment to US$ 1.974 million
(81.1% of sum of the supervision contract prices).
On Soroti – Dokolo road, financial progress was estimated at 118.6% of the original contract
price however the final value of works certified was at 123.3% of the original contract price.
Cost overruns arose from the following areas:
Price adjustments following increase in costs of construction inputs like fuel, bitumen, steel
reinforcement bars, cement, and local/expatriate labour. Payments in respect of this were five
times higher than the figure provided for in the contract.
Design changes requiring the change from single surface treatment to double surface
treatment of the shoulders along the entire road, and increase in number of access culverts.
Provision of road humps and rumble strips in townships and adjacent to schools
Provision of service roads in Nakatunya, Atirir and Otuboi townships; and
Claims for interest on delayed payments of IPC 5 & 6 totalling UShs 667,766,758 (US$
262,849.12 and UShs 187,473,075). This had however improved in the subsequent
certificates as there hadn’t been any more interest levied on delayed payments since the issue
was reported in the quarter 1 monitoring report of FY 2008/09.
On Dokolo – Lira road, financial progress of the project was estimated at 120.0% of the original
contract price. Cost overruns were arising from the following areas:
Price adjustments following increase in costs of construction inputs like fuel, bitumen, steel
reinforcement bars, cement, and local/expatriate labour. Payments in respect of this had
increased from UShs 3.8 billion provided for in the contract to UShs 20.3 billion at the end of
April 2010 and projected to increase to UShs 23.2 billion at completion.
Design changes requiring the following changes:
o Construction of 3 roundabouts in Lira and 1 in Dokolo towns;
o Construction of access road around Dokolo market;
o Construction of concrete protection kerbs along the road edges to protect the crushed
stone base from progressive erosion;
o Construction of 2nd
bituminous sealing along the shoulders to prolong design life
o Increasing the road width in Lira town to provide 3.0m wide on-street parking lane on
one side or on both sides where physical constraints allow; and
o Construction of road humps and rumble strips at pedestrian crossings.

314
Increase in quantities of culverts with total number of 600mm diameter increasing from
450m to 1400m and those of 900mm diameter increasing from 1400m to 2176m;
Increase in the total length of swamp crossings from 5.6Km to 9.3Km, which increased
earthworks quantities;
Increase in quantities for stone pitching of open drains, which increased from 6.7Km to
19Km; and
Claims for interest on delayed payments of IPCs 1 to 10 totalling UShs 163,062,426 (US$
57,385.83 and UShs 58,260,406). This had however stopped with effect from July 2009.
The final contract cost was projected at UShs 115.31 billion representing total cost overruns of
40.5% of the original contract price.
The final project cost for construction of Soroti – Dokolo –Lira road (123Km) was projected at
202.44 billion representing a total increase of 32.6% compared to the sum of the contractors’
original contract price.
ii) Physical Performance
The following were the field findings on physical performance of the project:
a) Soroti – Dokolo Section (62.6Km)
Civil works in the section had been substantially completed on 18th
March 2010, 1½ months
ahead of the original completion date. Progress of works was estimated at 100%,
representing a total progress of 39% against the 31% planned annual. Therefore the targeted
annual output for works in the section was surpassed. The road was under defects liability
period.
Dokolo – Lira road: Additional works in progress, Earthworks for the roundabouts in Lira town (left) and Construction of
concrete protection kerbs along the road edges (right)

315
Ongoing works at the time of the site visit included: construction of rumble strips and
reinstatement of gravel borrow pits in some sections of the road.
The following construction defects were observed during the site visit:
o Surface undulations probably from uneven settlement of the road embankment along the
entire road;
o Huge water ponds at several reinstated gravel borrow pits;
o Top soiling and grassing of the side slopes to the road embankment had uncovered
patches in some sections of the road;
o Several temporary roads used as diversion roads during construction had not been
obliterated as required by the contract; and
o Bleeding of the bituminous surface was also observed in some sections of the road.
b) Dokolo - Lira Section (60.4Km)
Soroti – Dokolo road: A completed section of the road (Left) and construction of ramble strips at Anyara trading centre (right)
Soroti – Dokolo Road: Water pond at a reinstated gravel borrow pit (left) and a section with defective side slope top soiling
and grassing

316
Progress of works was estimated at 90.6% (as at end of May 2010), representing a total
progress of 45.6% against the 45% targeted annual output and against a contract time
progress of 80.0%. Therefore the contractor had surpassed the targeted annual output with a
month to the end of the FY. The project was also ahead of the contract time progress and was
expected to complete before the completion date.
Completed works included all earthworks, base construction for the main stream works,
installation of cross culverts, 1st seal bituminous surface treatment, 50% of 2
nd seal
bituminous surface treatment, rock blasting and stone production works in the quarry.
Ongoing works included additional works on roundabouts in Lira town and the loops in
Dokolo and Agwata towns; drainage works that included stone lining of drains in Dokolo and
Lira town, installation of access culverts and construction of headwall structures;
reinstatement of gravel borrow pits, installation of culvert marker posts, obliteration of
diversion roads, and top soiling along the slopes of the road embankment; construction of
concrete protection kerbs along the road edges; and 2nd
seal bituminous surface treatment.
The health and safety component of the project was on-going with an HIV clinic for testing
and counselling established in Dokolo town and HIV screening and community outreach
programmes conducted among workers and surrounding communities.
Environmental protection measures that were mainstreamed in the civil works included
obliteration of unwanted diversion roads and reinstatement of gravel borrow pits, which were
ongoing; and routine conducting of compliance assessments by the consultant’s
environmentalist in collaboration with the UNRA environment officers. The monitoring team
was additionally informed that while minimum occupational safety measures like provision
of protective gear for the workers had been instituted, the contractor had not fully complied
with the requirements.
The project had however not mainstreamed issues of gender and people with disabilities. For
example there were no specific schemes to ensure equal employment opportunities for
women and people with disabilities on the project.
Dokolo – Lira road: Works in progress - 2nd layer of bituminous surface dressing (left) and stone lining of open drains in Dokolo
town (right)

317
iii) Challenges and Setbacks Experienced by the Project
The monitoring team was informed that the project implementation team saw no real
challenges ahead apart from the high and disproportionate quotations received from UMEME
and National Water and Sewerage Corporation for the relocation of utilities within the areas
earmarked for the roundabouts in Lira town.
Conclusions
Annual targeted outputs for FY 2009/10 of both contracts under the project were surpassed
and the project was on course for completion within the original contract period.
The final project cost for construction of Soroti – Dokolo –Lira road (123Km) was projected
at 202.44 billion representing a total increase of 32.6% of the contractors’ original contract
prices. Soroti – Dokolo road had a cost overrun of 23.3% while Dokolo – Lira road projected
a total cost overrun of 40.5%. The key factors responsible for the cost overruns included:
price adjustments using the Variation of Price (VOP) clause to cater for the increase in cost
of construction inputs like materials, labour, fuels and lubricants (which accounts for more
than 20% of the original contract prices and more than 60% of the projected cost overrun);
design changes including additional works; increase in quantities of contract items like
culverts and earthworks; and interest accruing from delays in payment of IPCs which were
expected to have a total cost of UShs 830.8 million (0.54% of the sum of the original contract
prices).
Recommendations
It is prudent that the positive lessons of best practices are drawn from this project for
replication in future projects to increase the prevalence of such roads development projects
that complete within the original contract periods.
Alternative options around the effects of the VOP clause need to be studied and explored.
The idea that contractors be given the freedom to import some of the construction inputs so
as to benchmark the costs to international indices rather than local indices may be worthwhile
exploring.
3.7.5 National Roads Maintenance Programme
Project Background
The programme involves several activities for maintenance of 10,970Km on the national roads
network, ferry services or inland water transport services and axle load control across the
network. The programme also includes emergency activities on some of the estimated 10,300Km
of roads that were upgraded from district and community access roads at the beginning of FY

318
2009/10. It is a recurrent programme which aims at improving and maintaining interconnectivity
across the country by reducing the rate of deterioration of the national roads network, lowering
vehicle operating costs and travel time as well as ensuring safety of road users and ferry services.
In FY 2009/10, the programme was allocated a total annual budget of UShs 161.721 billion
comprising of UShs 95.024 billion under the UNRA budget and UShs 67.697 million under the
URF budget. Planned activities under the programme included manual routine maintenance of
10,900 Km; mechanized routine maintenance of 15,258 Km; rehabilitation of 100Km of paved
roads; resealing of 220 Km of paved roads; gravelling of 1500 Km of unpaved roads;
rehabilitation of 8 bridges; maintenance of 239 bridges; ferry services and axle load control on
the national roads network.
During the FY, the programme was monitored at 13 UNRA stations with a combined road
network of 6,489 Km and making up 59.5% coverage of the national roads network. In the first
quarter, the programme was monitored at six UNRA stations with maintenance programmes
covering a total road network of 2,857.5Km and with interventions done by both force account
and contracts supervised by the stations. These included: Kabale, Luwero, Masaka, Mbale,
Soroti and Tororo. At the time of the first quarter monitoring, the programme had received a total
of UShs 24.513 billion, and had expended UShs 15.909 billion. In the second quarter, the
programme was monitored at two UNRA stations namely, Mubende and Fort Portal, with a
combined network of 964 Km. At the time of monitoring, the project had received a total of
UShs 78.158 billion (82.3% of annual budget), and had expended UShs 72.732 billion (93.1% of
received funds). In the third quarter, the programme was monitored at three UNRA stations
namely, Gulu, Lira and Mpigi with a combined network of 1,679.4Km. At the time of
monitoring, the project had received a total of UShs 115.229 billion (71.3% of annual budget)
composed of UShs 32.159 billion received through URF in the third quarter, and UShs 83.070
billion received directly through the consolidated fund. Expenditure of the funds received
directly through the consolidated fund was at UShs 78.93 billion. However expenditure of the
funds received through URF was not available.
In the fourth quarter, the programme was monitored at two UNRA stations namely, Masindi and
Hoima with a combined network of 987.7Km, and the findings were as follows in section
3.7.5.2.:

319
Findings
i) Financial Performance
Table 3.7.8: Financial Performance of the National Roads Maintenance Programme
Station Implementation by Force account Implementation by Contract
Receipts
(UShs
Million)
Expenditure as
at end of Nov
2009 (UShs
Million)
% of
Receipts
Spent
Contract Name Financial
Progress
(UShs
Million)
Remarks
Hoima 1,536.7 1,165.7 75.9% Kagadi – Kibaale (42.0Km) 100.0% Completed
Kiziranfumbi – Kabwoya – Kagadi
(69.0Km)
10.4% Physical progress was
estimated at 35%
Masindi 1,496.3 1,165.4 77.8% Biso – Bukumi – Butyaba – Bilisa –
Wanseko (68Km)
97.2% Completed, total saving of
2.7% inclusive of liquidated
damages totalling 1.8%
Bulisa – Park Junction (22Km) 99.7% Completed in Sept 2009
Masindi – Biso (51Km) 97.3% Completed, total saving of
2.7% inclusive of liquidated
damages totalling 2.1%
Approved Budget Estimates UShs 161.721 billion
Releases as at end of June 2010 UShs 159.411 billion (98.6% of annual budget)
Expenditure as at end of June 2010 (IFMS Data), UShs 87.263 billion (99.3% of releases) – figure excludes expenditures on funds
disbursed by URF, which was not on IFMS.
Source: UNRA Station Engineers; IFMS Data.
As shown in Table 3.7.8, during the FY, the programme received a total of UShs 159.411 billion
(98.6% of annual budget) comprised of UShs 87.873 billion through the regular transfers from
the consolidated fund and UShs 71.538 billion from the URF transfers. Of the funds received
from the consolidated fund, UShs 87.263 billion had been expended (99.3% of released funds –
IFMS Data). Information on absorption of funds received through the URF was however not
available as it had not been captured on the IFMS system. Financial management of the
programme was therefore operating on two separate and independent systems, which was
contrary to the intended objectives of rolling out the IFMS system to UNRA.
Table 3.7.8 also shows financial performance of selected maintenance works contracts, and
UNRA maintenance stations that implement some activities directly by force account. Compared
to the respective physical progress of works, the financial performance of all the contracts
monitored were in harmony. Financial performance of the force account activities was also
reasonably good considering that unspent balances were part of funds received within the fourth
quarter, which had not yet ended at the time of monitoring.

320
ii) Physical Performance
A) Masindi Station
The station has a total road network of 475Km, of which 134Km (28.2%) is paved and 341Km
(71.8%) are gravel roads. An additional 183Km of roads upgraded from district to national roads
in FY 2009/10 of which 102Km were planned to be maintained by force account operations, and
the rest of the network had no planned activities during the FY. The road network is comprised
of roads in 3 districts that include Masindi, Bulisa, and Kiryandongo districts. Planned
maintenance activities during the FY included: maintenance using contracts on 208Km (43.8%);
and maintenance using force account on 237Km (49.9%) of which 106Km were planned to be
maintained by both force account and contracted works at different times of the year.
a) Maintenance using contracts
All maintenance works planned to be done by contracts had not commenced but were still
expected to commence before the end of the FY. However the station had contracts that spilled
over from FY 2008/09 some of which had been planned to have more contracted works during
FY 2009/10. The following are performance reports on the contracted works that spilled over
from FY 2008/09:
1) Masindi – Biso road (51Km)
This project involving the routine mechanised maintenance of 51Km of the road from Masindi
town to Biso was awarded to M/s M & B Engineers Ltd and involved reshaping of the road by
heavy/ medium grading, drainage improvement, and spot re-gravelling of selected sections
totalling 5Km, at a total contract price of UShs 358.3 million. Civil works commenced on 22nd
June 2009 and were expected to be completed by 22nd
November 2009. The works were however
substantially completed on 28th
December 2009 and the contractor was charged liquidated
damages over the period of 36 days. The works were supervised by the UNRA Station Engineer,
Masindi.
During the site visit, the monitoring team observed that the works had been completed but the
first 15Km of the road had already considerably
deteriorated with several intermittent potholes,
blocked drains and a generally rough riding surface.
The rest of the road was generally still in fair
condition. It was also observed that sections of the
road was highly trafficked with sugar cane trucks to
Kinyara Sugar Works and was therefore predisposed
to littering with sugar cane droppings that block
drains, and to rapid deterioration. Physical progress
was at 100% and the final project cost was at 99.1%
of original cost inclusive of 1.8% liquidated
A section of Masindi – Biso road with potholes

321
damages and representing a total financial saving of 2.7%.
The monitoring team was informed that an additional periodic maintenance contract on this road
that had been planned to start within the FY had finally been awarded and was still expected to
start before the end of the FY.
2) Biso – Bukumi – Butyaba – Bulisa – Wanseko road (68Km)
This project involving the periodic mechanised maintenance of 68Km of the roads from Biso
through Bukumi, Bulisa to Wanseko and from Bukumi to Butyaba was awarded to M/s Sese
Construction Services Ltd and involved reshaping of the road by medium grading; drainage
improvement including installation of 120m of 600mm culverts; and re-gravelling of the entire
section with 150mm gravel wearing course, at a total contract price of UShs 1.557 billion. Civil
works commenced on 20th
July 2009 and were expected to be complete within 8 months (by 20th
March 2010). The works were supervised by Technology Consults in association with Trio
Consults Ltd. The works were however substantially completed on 30th
April 2010 and the
contractor was charged liquidated damages over the period of 40 days. The road was still under
defects liability period which was expiring on 30th
October 2010.
During the site visit, the monitoring team observed
that the works had been substantially completed and
the road was still generally in good condition. The
team however also observed that some more works
needed to be done to protect the side drains in
critical areas from erosion. Notably a section of
about 1Km along Bukumi – Butyaba that was
heavily eroded, posed a serious road safety threat to
the traffic and as such required urgent attention.
Several defects on the civil works, like humps on
newly installed culverts, sections with inferior gravel
material and defective headwalls also required
attention. Physical progress was at 100% and the
final project cost was at 97.2% of original cost
inclusive of 2.1% liquidated damages and
representing a total financial saving of 2.8%.
3) Bulisa – Park Junction road (22Km)
This project involving the routine mechanised maintenance of 22Km of the road from Bulisa to
the junction with Masindi – Para Lodge road crossing was awarded to M/s Malu Construction
Ltd and involved reshaping of the road by medium grading, drainage improvement, and spot
gravelling of selected sections totalling 3.1Km, with 100mm thick gravel wearing course. The
works were contracted out at a total cost of UShs 197.76 million, commencing on 10th
June 2009
and completing within 4 months (by 10th
October 2009). The works were supervised by the
UNRA Station Engineer Masindi and were substantially completed on time. The impact of the
Heavily eroded side drain along Bukumi – Butyaba
road

322
works was however short lived leading to an additional intervention by force account operations,
emphasizing the generic under scoping of routine mechanised maintenance contracts across the
entire programme with respect to the amount of gravel and culvert crossings required on the
roads. The works were however completed at a total cost of 99.8% of the contract price.
b) Maintenance using Force account
In FY 2009/10 force account interventions were planned to be done on 237Km (49.9%) of which
106Km were planned to be maintained by both force account and contracted works at different
times of the FY. The scope of works under force account included: slashing of grass and routine
de-silting of drains using labour based contractors; operation and maintenance of the Masindi
Port Ferry; construction of temporally public toilet facilities and shades at 3 landing sites;
grading, spot gravelling, and limited drainage improvement on gravel roads; patching (using
gravel/ Asphalt/surface dressing) on paved roads; major and minor repairs of road equipment;
and emergency repairs of roads and bridges. The roads maintained by force account interventions
were monitored on 7th
and 8th
June 2010.
At the time of the monitoring field visit, the station had received a total of UShs 1,497.3 million
of which UShs 1,165.4 million (77.8% of the funds received) had been expended on the
following activities: slashing of grass and routine de-silting of drains along the entire road
network using labour based contractors; operation and maintenance of the Masindi Port Ferry;
maintenance of 3 gravel ferry landings, construction of temporally public toilet facilities and
shades at Wanseko landing site in Bulisa district, Masindi port landing site and at Kungu landing
site in Apac district; major and minor repairs of road equipment; improvement of road safety
features on Kafu – Masindi road; grading, spot gravelling, and limited drainage improvement on
four gravel roads (149Km)114
; shoulder repairs and patching on Kafu – Karuma road (88Km);
and emergency repairs on Karuma bridge, Masindi – Hoima road (34Km) and on two roads from
the lot of former district roads (102Km)115
. At the time of the monitoring visit, on-going works
included grading, spot gravelling and culverts installation on the two former district roads; and
shoulder repair and pothole patching on Kafu – Karuma road.
The monitoring team visited Kafu – Karuma road and observed that pothole patching, edge
repair, grass cutting and de-silting of side drains had been done in some sections and was still on-
going in other sections. Premature failures on new pothole patches and gravel shoulders were
however observed in some sections. On Bulisa – Park Junction, the team observed that although
the road had been maintained by a routine mechanised contract and an additional force account
intervention, the first 17Km from Bulisa had already lost shape due to heavy traffic of trucks
working on the Oil project by Tullow and the predominant sandy clay soils, however the rest of
the road was still in goods condition. On Kasanja – Park Junction and Masindi – Rwenkunye
114
Bulisa – Park Junction road (22Km), Kisanja – Para road (84Km), Masindi – Rwenkunye road (36Km), and Rwenkunye – Masindi Port
(7Km)
115 Ihungu – Kijunjubwa road (42Km); and Ikoba – Ntoma road (60Km)

323
roads, the team observed that the roads had been graded and some selected sections gravelled,
however some failures like potholes, corrugations and eroded shoulders and side drains had
already developed in some sections. On Rwenkunye – Masindi port road, the team observed that
the road had been graded, gravelled in some sections, and was still generally in good condition.
On Ikoba – Ntoma and Ihungu – Kijunjubwa roads, the team observed that grading, culvert
installation and spot gravelling was in progress on both roads with 20Km of either roads graded.
Progress of works had however been affected by inclement whether from heavy rains in the
region. The team also visited Wanseko and Masindi ferry landing sites and observed that the
gravel ferry landings had been worked on and were still in good condition; and passenger shades,
public urinals and latrines had been constructed. The latrines constructed were of the ecosan
type, raised to about 1.5m above the ground level with a staircase provided. The team however
observed that the design needed to be improved with ramps to cater for concerns of people with
disabilities.
Implementation challenges at the station included: old road construction equipment which was
very unreliable with frequent breakdowns and high maintenance costs; over stretched equipment
base given the lot of new roads added to the station, leading to situations where the equipment is
deployed on a priority basis rather than the work plan; delays in procurement of works planned
to be contracted out, which led to unplanned emergency interventions on the roads and thus a
waste of time and money; capacity weaknesses of the contractors, which led to delays in
completion of contracted works; and the general under scoping of routine mechanised
maintenance contracts that makes them largely ineffective.
The monitoring team was informed that the station attempts to mainstream gender, occupational
health and safety measures, road safety measures and environmental issues in their maintenance
operations by favouring women labour based contractors during evaluation of bids; ensuring
enough road signs and presence of first aid boxes at construction sites; and by enforcing the
gravel borrow pit reinstatement requirements in all contracted works and force account
operations including a requirement for contractors to obtain an environmental compliance
certificate before final payment certificates are issued. HIV awareness had however not yet been
mainstreamed.
Works done by force account: a section of Rwenkunye – Masindi Port road, still in good condition (Left); Passenger shade and
latrine at Wanseko landing site (center and right)

324
B) Hoima Station
The station has a total road network of 512.7Km, of which 95Km (18.5%) is paved and 417.7Km
(81.5%) are gravel roads. The station additionally has 470Km of roads upgraded from district to
national roads in FY 2009/10. The road network is comprised of roads in 5 districts that include
Bulisa, Hoima, Kibale, Kiboga, and Kyankwanzi districts. During the FY maintenance works
planned on the entire network included: maintenance by force account operations alone on
154.5Km (30.1% of the old network); maintenance contracts alone on 62Km (12.1% of old the
network); and maintenance by both contracts and force account operations on 296.2Km (57.8%
of old the network). A total of 80Km of the additional road network was also planned to be
maintained during the FY. The station was in charge of implementing all the force account
activities and supervising some of the works contracted out.
a) Maintenance using contracts
The station had planned to have contracts on roads totalling 358.2Km (69.9% of old network)
however at the time of the monitoring field visit, only works on 111Km which spilled over from
FY 2008/09 had been implemented. No new contracts had commenced as yet but some contracts
were still expected to commence before the end of the FY. The following are the findings on
roads with contracts that spilled over from FY 2008/09 that were monitored on 11th
and 12th
June
2010:
1) Kagadi - Kibaale Road (42.0Km)
This project involving the routine mechanised maintenance of 42Km of the road from Kagadi
town to Kibaale town was awarded to M/s MM Construction Services Ltd, and involved
reshaping of the road by heavy/ medium grading, drainage works including installation of some
culverts, and spot gravelling in selected areas at a total contract price of UShs 290.462 million.
Civil works commenced on 8th
June 2009 and were completed on time on 7th
October 2009. The
works were supervised by the UNRA Station Engineer Hoima.
During the site visit, the monitoring team observed that the works had been completed but the
road had already deteriorated with galleys, spot failures, corrugations, loss of shape and potholes
along the most length of the road which had only been graded. The sections that received gravel
were however still in good condition. The monitoring team observed that the routine mechanised
maintenance contract had been greatly under scoped leading to the short lived impact on the
condition of the road. Labour based contractors were also observed manually maintaining some
sections of the road. A periodic maintenance contract of the road was however expected to
commence before the end of the FY. Physical progress was at 100% and the financial progress
was also estimated at 100%.
2) Kiziranfumbi – Kabwoya – Kagadi Road (69Km)
This project involving the periodic mechanised maintenance of 69Km of the road from
Kiziranfumbi through Kabwoya to Kagadi town was awarded to M/s BCR General Ltd and
involved reshaping of the road by medium grading, drainage improvement, and re-gravelling of

325
the entire section with 150mm gravel wearing course, at a total contract price of UShs 1.446
billion. Civil works commenced on 11th
August 2009 and had been expected to complete within
8 months (by 10th
April 2010). The works were supervised by Technology Consults in
association with Trio Consults.
During the site visit, the monitoring team was informed that the contractor had completed
grading of the entire road but abandoned site for over 2 months, in which time the road had
deteriorated. The team observed that bush clearing, reshaping of the road to cross section, and
gravelling were ongoing but in intermittent sections. The contractor had also installed 12 lines of
cross culverts but which had not been completed. In the sections where works were ongoing, the
team observed several construction defects that included: placement of the gravel on dusty
surface without watering; using untested gravel material which seemed too poor by visual
inspection; spacing of the gravel damps was 3 times wider than required to achieve the 150mm
thickness (actually less than 50mm in the compacted sections); in some sections, a lot of gravel
material had been pushed into the side drains thus wasting the material and blocking the drains;
back sloping had not been done in some gravelled sections; and one of the newly installed
culvert crossings had already collapsed. Generally, there were indications of poor quality control
on site, poor work methods and poor quality works. Physical progress was estimated at 35%
against a contract time progress of 125.6% and a financial progress of 10.4%. Physical progress
of works was therefore far behind the contract time progress, which had already expired, and the
contract was therefore expected to attract liquidated damages.
b) Maintenance using Force account
In FY 2009/10 force account interventions were planned to be done on 450.7Km (87.9% of old
network) under the station with a scope of works that included: grading, spot gravelling, patching
(using gravel/ Asphalt/surface dressing), emergency repairs of roads and bridges and limited
drainage improvement. The roads maintained by force account interventions were monitored on
11th
and 12th
June, 2010.
Kiziranfumbi – Kagadi road: a long stretch graveled with less than 50mm thickness as opposed to the 150mm instructed (left) and
the wide spacing of gravel heaps placed on a dusty road. Shoddy works evident.
326
At the time of the monitoring field visit, the station had received a total of UShs 1,536.7 million
(inclusive of annual receipts of UShs 1,248.4 and a balance of UShs 288.2 Million brought
forward from FY 2008/09) of which UShs 1,165.7 million (75.9% of the funds received) had
been expended on the following activities: maintenance of seven selected roads totalling
233.2Km116
; emergency repair works on Hoima – Masindi road and on Kiziranfumbi – Kabwoya
– Kagadi road; and emergency works on three roads totalling 80Km117
from the batch of
additional network upgraded to national roads. Other works funded under force account included
repair works on nine selected bridges118
; repairs and maintenance of the road construction
equipment; fuel and lubricants; staff allowances; and routine manual maintenance of the roads
using labour based contractors. Works that were ongoing at the time of monitoring included:
maintenance of Sebagolo Landing Access Link (8.3Km) and Hoima – Kiziranfumbi road
(24.8Km); emergency works on the three roads from the additional network upgraded to national
roads; and repair works on Nguse bridge and swamps along Kiziranfumbi – Kabwoya – Kagadi
road.
The monitoring team visited Parajwoki – Kaiso road (80.2Km) and observed that the station had
graded a total of 23Km of the road in two sections and installed two cross culverts. The graded
sections were still in good condition and the rest of the road in fair condition. The team also
visited the four bridges along the road where repair works had been undertaken and observed
that on Wambabya Bridge, 4no pads for Bailey bridge deck had been cast on existing piers, the
deck installed and side drains at the approaches to the bridge protected with gabions and stone
lining. On Rutoha Bridge, the team observed that an alternative bridge had been constructed at
the river crossing using 4 lines of corrugated metal culverts, including construction of 4m high
headwalls and approaches. On Hohwa I&II, the team noted that although river training was
reportedly done at the crossings, the inlets and outlet channels were already bushy again. On
Sebagolo link, the team observed that works were still underway with the entire road graded,
spot gravelling in progress and one line of culverts installed. The works had however stalled due
to equipment breakdown and it was observed that the road required more culverts than the 1 line
planned as storm water was seen forming small rivulets across the road at several sections of the
road.
116
Bukwiri – Kyankwanzi road (30Km), Buhimba – Mubende Bdr road (16Km), Kabwoya – Katuti road (42 Km), Hoima – Biso road (43Km),
Hoima – Kiziranfumbi road (24.8Km), Kiziranfumbi – Kabaale road (69Km), and Sebagolo Landing Access Link (8.3Km)
117 Katasiha – Bugambe Sub-county HQ – Mairirwe & Bugambe Sub-county HQ – Bugambe tea factory (24Km); Kidoma – Bugambe tea
factory – Buseruka (25Km); and Muhooro – Ndaiga – L. Albert (31 Km)
118 On Parajwoki – Kaiso road: Wambabya bridge, Rutoha bridge, Hohwa I bridge, and Hohwa II bridge; on Hoima – Lwamata road:
Nyakasanga swamp, Kiribanya swamp, and Kafu swamp; on Hoima – Biso road: Waki bridge; on Kiziranfumbi – Kagadi road: Nguse bridge.

327
The team visited the three swamp crossings with multiple box culverts along Hoima – Lwamata
road and observed that minimal river training and clearing of box culvert inlets and outlets had
been done at the swamp crossings and were still clear though the reeds had already grown back
on two of the swamps done in February and March 2010. On Hoima – Kiziranfumbi road, the
team observed that the road had been maintained in two equal phases each covering 12Km.
Works in the first phase had been completed and the section was still generally in fair condition.
Works in the second section were still underway with the grading works at around 40%
completion and 1Km gravelled. The team however observed that the grading was ongoing
without compaction reportedly due to breakdown of the roller, which was exposing the works to
accelerated damage from rains and traffic. The team also visited Katasiha - Bugambe sub-county
headquarter road and observed that about 16Km of the road had been graded and three culvert
lines installed. However the culverts had been poorly installed leading to premature collapse of
one of the lines. All the culverts required re-installation to appropriate depth/invert and to be
given sufficient gravel cover in order to have sufficient distribution of the traffic loads. Works on
this road had also stalled due to equipment breakdown.
Implementation challenges at the station included: delays in procurement of contractors for
works planned for contracting, thus creating backlogs; insufficient stock of equipment; old
equipment with extensive breakdowns and high maintenance costs; increased pressure on the
available resources (equipment, supervision personnel, transport etc.) due to the drastic increase
in the national roads network; and capacity weaknesses of the contractors and consultants,
leading to delays in completion of contracted works
The team was informed that the station mainstreams crosscutting issues through a number of
measures that include: affirmative action given to women, youth and people with disabilities
during the selection of manual routine maintenance contractors; enforcing minimum health and
safety standards on construction sites by ensuring UNRA workers have the appropriate safety
gear, and encouraging contractors not to leave gravel damps on the road over extended periods;
environmental protection measures like ensuring reinstatement of gravel borrow areas, including
a requirement for contractors to obtain a certificate of reinstatement of borrow pits before final
payments are made. The team was however informed that the station was having challenges of
Works done by force account: Wambabya Bridge and the newly alternative crossing at River Rutooha both along Parajwoki – Kaiso
road; and one of the water crossings along Sabagolo Landing access link where culverts were required.

328
reinstating gravel borrow pits opened during force account interventions due to lack of suitable
equipment for the activity.
3.7.6 District, Urban and Community Access Roads Maintenance Programmes
Programme Background
District, Urban and Community Access roads (DUCAR) make up 57,500Km which represents
73.2% of the entire road network in Uganda, broken down as 22,750Km of district roads,
4,800Km of Urban roads, and 30,000Km of Community Access roads. They are maintained by
the respective local governments using central government conditional grants for road
maintenance and to a limited extent using locally generated revenue. More than 40% of the
DUCAR network is however beyond maintenance level and necessitates rehabilitation, which is
carried out through a concerted effort of donor supported programmes like CAIIP, LRDP,
KIIDP, DLSP, PRDP, NUREP, RSSP and RRP119
; and GoU supported programmes coordinated
by the MoWT, MoLG, and OPM. The districts, to a limited extent, also utilise the non
conditional grants from the central government under the LGMSD Programme. MoWT provides
the collective technical support and supervision to the local governments under the DUCAR
department.
In FY 2009/10, planned activities on the DUCAR roads included maintenance of 22,000Km and
rehabilitation of 150Km of district roads; maintenance of 42Km and resealing/ reconstruction of
7.5Km of KCC roads; and resealing/ reconstruction of 75Km of other urban roads. The
programme was allocated an annual budget of UShs 123.16 billion including grants under the
URF, PRDP, RRP, and the conditional grant for road maintenance to the districts. As at the end
of the third quarter, UShs 74.71 billion (60.7% of total budget) including UShs 18.419 billion
released through URF, had been released to the districts. In the third quarter, the programme was
monitored in nine district local governments and two municipal councils namely: Amuru, Apac,
Bududa, Busia, Kabarole, Kasese, Kumi, Lira and Soroti; and Mbale and Tororo Municipal
Councils. In the fourth quarter, the programme was monitored in Mityana district and the
following were the findings:
Findings
i) Financial Performance
At the time of monitoring, done in May 2010, financial performance of Mityana district roads
maintenance programmes was as shown in Table 3.7.9, where it can be seen that the district had
119
CAIIP: Community Agricultural Infrastructure Improvement Programme; LRDP: Luwero Rwenzori Development Programme; KIIDP:
Kampala Institutional and Infrastructure Development Programme; DLSP: District Livelihood Support Programme; PRDP: Peace Recovery and
Development Programme; NUREP: Northern Uganda Rehabilitation Programme; RSSP: Road Sector Support Programme; RRP: Rural Roads Programme; LGMSDP: Local Government Management and Service Delivery Programme.

329
received all the funds expected under PAF, and absorbed up to 62.1% of the funds received, with
only a month to the end of the FY. However the department had not received any funds from
LGMSD and local revenue, indicating poor performance under the respective financial streams
though the works under LGMSD had been contracted out and the contractor was on site.
Table 3.7.9: Financial Performance of Mityana District Roads Maintenance Programme
District Funding Source Indicative
Planning
Figure (UShs
Millions)
Receipts
(UShs
Millions)
Expenditure
(UShs
Millions)
% of IPF
Received
% of
Receipts
Spent
Mityana PAF 437.434 437.434 302.988 100.0% 69.3%
Local Revenue 12.400 0.000 0.000 0.0% 0.0%
LGMSD 37.988 0.000 0.000 0.0% 0.0%
Totals 487.822 437.434 302.988 89.7% 62.1%
Source: District Engineer, Mityana n/a*: information not availed
ii) Physical Performance
a) Mityana District
The district had a total road network of 235Km though maintenance activities in FY 2009/10
were based on 335Km (including 100Km of roads upgraded to national roads) with a total annual
budget of UShs 487.822 million, expected to be fully funded by the conditional grant under PAF
of UShs 437.4 million, Local Revenue of UShs 12.4 million and unconditional grants under the
Local Government Management and Service Development Programme (LGMSD) of UShs
37.988 million. Maintenance activities that were planned for implementation during the FY
included periodic maintenance of 53 Km120
and manual routine maintenance of 335 Km (1 cycle
of intervention during the entire year). All the works were planned to be implemented by
contracts.
At the time of the monitoring field visit done on 27th
May 2010, the district had received a total
of UShs 437.434 million (89.7% of IPF) of which UShs 302.988 million (62.1% of releases) had
been spent. Under PAF, UShs 437.4 million (100.0% of expected funds) had been received,
representing the only funds received for maintenance of the roads and from which all expenses
had been made.
120
Naama – Buswa Bulongo (12Km); Nakwaya – Kabulamuliro – Matte (16Km); Wabiyinja – Kakindu – Nsozibiye (13Km); and Nsozibiye –
Kiwawu (13Km).

330
Physical progress of the works included: manual routine maintenance works on 25 roads out of
the 28 roads planned, and periodic maintenance works on all the four roads planned, which was
still on-going.
The monitoring team visited the three of the four roads with periodic maintenance works which
included: Wabiyinja – Kakindu – Nsozibiye road (13Km) where it was observed that grading of
the road had been completed, gravel had been placed in several spots along the road, and five
lines of culverts installed. The works had been substantially completed in accordance with the
scope of works, though some sections had either been damaged by rains or had not been
compacted. The contractor was still on site attending mainly to drainage works. Physical
progress of works was estimated at 90% and financial progress at 44.5%. The team also visited
Buswabulongo Nama – Miseebe (12Km), on which it was observed that the works comprised of
a package of 3 road links, all of which had been graded to completion, spot gravelled and had 5
lines of cross culverts installed. Works on the road had been substantially completed and the road
was under defects liability period. All the roads were still in good condition. On Nsozibiye –
Kiwawu road which was under LGMSD, the team observed that works had just commenced with
mainly bush clearing, tree removal and grabbing done on one half of the road. The works had
however stalled reportedly due to uncertainties surrounding poor release of the LGMSD funds to
the district.
The monitoring team examined contract documents of some of the on-going contracts in the
district, from which it was verified that the district mainstreams cross-cutting issues in the road
works through inclusion of items in the bills of quantities for HIV/AIDS awareness, occupational
health and safety, and environmental issues awareness. These were implemented through site
meetings targeting communities along the contract roads that were also attended by the district
community development officer, the gender officer, the environmental officer, and the district
engineer. The team was however informed that, the district had not yet mainstreamed gender
issues and issues of people with disabilities in the implementation of the works though a good
number of the routine maintenance contractors procured were female.
Implementation challenges in the district included: communication gaps on the planning figures
for PAF, especially with regard to the coming on board of URF, leading to gaps in planned
activities; Major breakdown of the district key equipment over a prolonged period, like the bull
A completed section of Buswabulongo – Nama road, still in good condition (left); a bush cleared section of Nsozibiye – Kiwawu
road under LGMSD (center); and a section of Wabiyinja – Nsozibiye road with a manually opened side drain (left).

331
dozer that had been at the regional workshop for mote than 2 years; slow release of the LGMSD
funds, leading to delays in commencement of some maintenance activities.
3.7.7 Interconnectivity Improvement Project
Project Background
The Interconnectivity Improvement Project was designed to allow for budgetary provisions to
the MoWT for the timely response in undertaking specific road works under the presidential
directives, emergency response to disaster, and for general improvement of interconnectivity in
areas with road links that are in critical condition across the country. The project commenced in
July 2008 and was expected to complete in June 2013, with a total planned expenditure of UShs
13.125 billion. The project was expected to improve, rehabilitate or upgrade a total of 700Km of
roads across the country.
In FY 2008/09, the project had an approved budget of UShs 8.74 billion, of which total releases
were UShs 5.257 billion representing 60.2% budget performance. The project had 100%
absorption of the released funds during FY 2008/09. In FY 2009/10, planned outputs under the
project included rehabilitation and maintenance of 470Km of roads with contracts that spilled
over from FY 2008/09 and 51Km of roads with contracts planned to be procured within the FY;
and procurement of 2 vehicles for monitoring and supervision of the projects. The project was
monitored in May 2010 and the findings were as follows in 3.7.7.2
Findings
i) Financial Performance
Table 3.7.10: Financial Performance of the Interconnectivity Improvement Project
FY Source of
funding
Approved
Budget
Estimates
(UShs Millions)
Releases (UShs
Millions)
Expenditure
(UShs Millions)
% of Budget
Released
% of Releases
Spent
2008/09 GoU 8,740.0 5,257.5 5,257.5 60.2% 100.0%
Donor 0.0 0.0 0.0 n/a* n/a*
2009/10 GoU 10,900.0 10,900.0 10,898 100.0% 100.0%
Donor 0.0 0.0 0.0 n/a* n/a*
Source: MoWT Ministerial Budget Policy Statement FY 2009/10; IFMS Data.

332
In FY 2009/10, the project had an approved budget of UShs 7.85 billion and obtained a
supplementary budget of UShs 3.05 billion121
thus making its revised total approved budget
UShs 10.9 billion. At the time of monitoring done in May 2010, releases to the project amounted
to UShs 10.9 billion (100% of revised approved budget), of which expenditures amounted to
UShs 10.898 billion (100.0% absorption of released funds). It was however observed that as at
the end of March 2010, the project had received a total of UShs 14.88 billion for ‘Roads and
Bridges’ (IFMS Data) and expended all the funds yet total payments to the contractors over the
2-year period was only UShs 6.8 billion thus representing imminent gross internal lending or
diversion of funds.
Total planned expenditure for the civil works under the project amounted to UShs 12.809 billion
however as at the end of June 2010 the project had received a total of UShs 16.157 billion and
expended 100% of the funds. As can be seen from the Table 3.7.11, several of the works were
still under procurement, some roads had been upgraded to national roads under UNRA and
average physical progress of the contracted works was at 64.3% yet all the funds were expended.
A summary of the financial performance of the project in FY 2008/09 and 2009/10 is as shown
in the Table 3.7.10. Financial progress of 38 packaged lots covering 30 contracts awarded under
the project was as shown the Table 3.7.11
ii) Physical Performance
In FY 2009/10, planned outputs under the project included rehabilitation and maintenance of
470Km of roads with contracts that spilled over from FY 2008/09 and 51Km of roads with
contracts planned for procurement within the FY; and procurement of 2 vehicles for monitoring
and supervision of the projects.
The works were packaged into 38 lots covering a total of 836.7Km in 31 districts122
across the
country. Implementation was through 28 maintenance contracts, force account operations by the
urban roads sealing unit on 1 road in Kyankwanzi, and one disbursement to Fort Portal
Municipal Council for works on access roads in Fort Portal Municipal Council. The works were
expected to cost UShs 12.809 billion.
Management of the contracted works was through MoWT staff appointed as project managers
and supervisors of works identified through the respective district works departments. Table
3.7.11 shows the performance of works under each of the 38 lots of the project as at end of
March 2010. The project was monitored in May 2010.
Table 3.7.11: Interconnectivity Roads Improvement Programme: Planned Activities and Status of
Implementation
121
Source: IFMS Data
122 The districts include: Bukwo, Butaleja, Iganga, Isingiro, Kabarole, Kalangala, Kampala, Kaliro, Kamuli, Kanungu, Katakwi, Kayunga,
Kibaale, Kiboga, Kisoro, Koboko, Kotido, Kumi, Luwero, Manafwa, Mayuge, Mbale, Mpigi, Mubende, Nakaseke, Namutumba, Ntungamo, Oyam, Sironko, Soroti, and Wakiso.

333
No. Road Name Length
(Km)
Cost Physical
progress
Expenditure
as at end of
March 2010
Remarks
A. PRESIDENTIAL PLEDGES
1.0 Bukomero-Kakinzi-Kayera-
Kyankwanzi Road
76.0 2,285,694,834 30% 457,138,967 Works in Progress
2.0 Kakiri-Masulita-Kangave-Mawale
Road
23.0 638,511,500 72% 418,518,253 Contract terminated;
Seeking force account
operation by Wakiso
district or UNRA take over
3.0 Gobero – Kyengeza – Sseganga –
Lugungudde - Kakonda, Kigyaguza –
Kakonda –Namuyamba and
Kikumbampanga – Lutabiyima –
seganga Roads
39.0 1,232,276,540 87% 967,857,808 Slow progress by
contractor. Completion
expected at end of FY
2009/10
4.0 Namayumba - Kitalya – Mityana
Road
19.0 929,146,000 60% 504,332,228 No progress because of
high water table. Bridge
works start in April 2010
5.0 Kitenga –Kannyogoga – Ikula –
Busoba Road
45.0 1,318,002,702 84% 1,103,343,433 Works expected to
complete within the fourth
quarter.
6.0 Bunga – Buziga & Munyonyo –
Buziga Access Roads,
6.0 322,371,062 100% 322,371,062 works completed and road
handed over to UNRA
7.0 Access roads for the Ntungamo Pearl
Flower Project Phase 1
4.5 141,000,800 100% 141,000,800 Works completed
8.0 Access roads for the Ntungamo Pearl
Flower Project Phase 2
10.0 300,000,000 Contract under procurement
9.0 Access road to Nsamizi radar site 1.6 878,081,626 60% 175,616,325 Works behind schedule,
contractor to be charged
liquidated damages.
10.0 Parade grounds and driveways at
NALI
1.6 366,370,875 Materials
like
chippings
and
bitumen
are being
procured
- Award for supply of
bitumen and chippings was
issued
B. INTER DISTRICT ROADS
REGION: CENTRAL
11.0 Kigavu – Balita (9.5Km), Kasala –
Kikunyu (6.8Km), Luwube –
Dhekabusa (9.3Km), Nakazi -
Presidents lodge (0.7Km).
26.3 377,663,000 100% 368,213,430 Works completed
12.0 Bishop Brown - St Regina – Ntenjeru
Parish (3Km), Kanjuki - Kyanya
(8Km) & Wampologoma – Kasana
(2.7Km)
16.0
13.0 Kansanga – Muyenga quarry
(2.5Km), Bunga -Kawuku (2.7Km)
& Muyenga – Namuwongo (2.8Km)
8.0

334
No. Road Name Length
(Km)
Cost Physical
progress
Expenditure
as at end of
March 2010
Remarks
14.0 Lwanabatya – Kibanga 22.0 452,780,000 75% 341,479,712 Works expected to be
completed in the 4th quarter
REGION: EASTERN
15.0 Kaluba – Wandawa – Bugoto 42.0 200,921,000 100% 192,529,838 Works completed
16.0 Kamod – Owii (8Km), Kidetok –
Agule (8Km), Kadungulu – Iruko
(8Km) & Abulabula – Ajuba
(3.8Km)
27.8 354,890,000 99% 275,120,000 Works completed
17.0 Atutur – Kojie (5Km), Ongino -
Akum school (4Km), Nyero -
Checkickec (4Km), Ariet-Kabwele
(4Km), Kumi – Kabata School
(4Km), Omusikiti – Onyakelo
(5Km) & Kumi hospital – Oseera
(4Km)
31.5
18.0 Miwu – Mabala (6Km), Kado –
Muyembe (4Km), Muyembe –
Makerere (8Km), Nandere –
Buwagama (4Km), Simu –Namwene
(3Km)
25.0 388,963,000 100% 371,492,757 Works completed
19.0 Kufu – Bukhaweka – Nambola –
Magale – Bumbo – Sikhana
25.0
20.0 Lwabola – Wokukiri – Nagarima
(4Km) & Wambewo – Khamoto
15.0
21.0 Njenjwe (4.6Km), Nkondo Pr.Sch –
Kiwala (2.7Km), Iringa – Katogwe
(5.3Km), Kidera T.C –Miseru
(7.0Km), Nkondo landing site
26.0 203,765,000 100% 198,670,875 Works completed
22.0 Kyabazinga 25.0
23.0 Mazuba –I vukula – Kaliro 25.0 267,738,000 100% 261,044,550 Works completed
24.0 Budambuyala – Naigobya (10Km) &
Namulanda – Busala (10.8Km)
20.8
25.0 Namukanga – Bukuwa (4.6Km) &
Nawandala – Busala
14.4
REGION: WESTERN
26.0 Nyanga – Kitanjojo swamp crossing
(14Km) & Ntantamukye – Kaweema
(16.0Km)
30.0 356,740,000 50% 168,824,500 Works behind schedule,
completion expected in 4th
quarter
27.0 Rwakimrimira – Kitoma (12Km) 12.0 85,821,218 70% 59,106,673 completion expected in 4th
quarter
28.0 Nyakisenyi – Nyamuganda (10Km) 10.0 92,184,000 30% - Works behind schedule,
completion expected in 4th
quarter
29.0 Bugarama – Kembeho (6Km),
Kembanda – Kiganda – Kambungu
(6Km)
12.0 87,876,000 70% - Works behind schedule,
completion expected in 4th
quarter

335
No. Road Name Length
(Km)
Cost Physical
progress
Expenditure
as at end of
March 2010
Remarks
30.0 Kaguhu – Buhozi 18.0 119,455,003 75% - Works behind schedule,
completion expected in 4th
quarter
31.0 Access roads in Fort Portal
Municipality
3.0 267,000,000 Nil 267,000,000 Funds disbursed to Fort
Portal Municipality
REGION: NORTHERN
32.0 Loro Corner (6km), Iyanya – Amido
(5km), Wewiawe – Barlongo (8km),
Te Opobo – Apece (6km) & Olam
(3km) Roads
25.0 291,672,308 100% - Works completed
33.0 Keri – Lima & Lurujo – Nyorcaku –
Lobule Roads
28.0 116,156,000 5% - Contractor abandoned site;
contract recommended for
termination.
REGION: EASTERN
34.0 Hasahya – Kaiti – Nahamya and
Wampologoma – Nuhulu – Mawanga
– Nabiganda
25.0
177,313,000
92% 45,961,000 Works in progress
35.0 Aminang – Chepkwasta – Kiretey 20.0 115,038,000 98% 75,743,500 Works in progress
36.0 Rengen – Nkwakwa via Lupuyo
Kacheri
25.0 122,747,000 98% 88,442,625 Works in progress
37.0 Katakwi – Aliakamer (7Km),
Ocorimongin – Orungo (14Km), &
Akoboi – Abwanget (7Km)
28.0 183,070,000 40% - Submitted certificate of
UShs 73,649,700, but funds
were not available in Q3.
38.0 Atiira – Asuret (8.7Km) & Asuret –
Gweri (16.5Km)
25.2 135,755,000 36% - Submitted certificate of
UShs 49,018,908, but funds
were not available in Q3.
Grand Total 836.7
KM
12,809,003,468 6,803,808,336
Source: Ministry of Works and Transport
The monitoring team visited roads in three of the contracts listed in Table 3.7.11 and the
following were the respective observations made:
1. Isingiro District
Road Names: Endiizi – Nyabyondo (11Km); Endiizi –
Mpikye (5Km); & Ntantamukye – Kaweema (14.0Km)
Contractor: M/s Pekassa Enterprises Ltd
Contract sum : 356,740,000/-
The contract was for the maintenance of 3 roads in Isingiro
district totalling 30Km, commencing on 2nd
November 2009 and
completing on 02 Jan 2010. The contract period had however
been extended by 3 months ending 2nd
April 2010. The scope of
works included grading, spot gravelling and limited culvert
installations.
The monitoring team visited Ntantamukye – Kaweema road and
observed that the entire road had been graded and gravelled and
10 lines of culverts installed. Almost all the works had been
completed with only headwalls construction outstanding. The
team however observed that storm water crossed the road at

336
several sections and as such required more culverts than provided
in the contract.
On Endiizi – Nyabyondo road, the team observed that the road
had been bush cleared and shaped to completion, with 2Km
gravelled and 7 lines of culverts installed but the road required
extra gravel and culverts than provided in the contract.
On Endiizi – Mpikye road, the team visited one link measuring
3.4Km, on which it was observed that grading had been done to
completion, 1.9Km had been gravelled and 10 lines of culverts
installed. The team however observed that one of the culverts
installed had already collapsed, and another had both misaligned
and cracked culverts. In addition, the road had been narrowed in
swamps and the placed fill material not compacted.
Physical progress was estimated at 90% against 135% time
progress, and 47.3% financial progress.
2. Kumi District
Road Names: Atutur – Kojie (5Km), Ongino - Akum school
(4Km), Nyero - Checkickec (5.7Km), Ariet-Kabwele (5.7Km),
Kumi – Kabata School (4Km), Omusikiti – Onyakelo (5Km)
& Kumi hospital – Oseera (4Km)
Contractor: M/s Allied Tec Engineers Ltd
Contract sum : 354,890,000/-
The contract was for the maintenance of 7 roads in Kumi district
and 4 roads in Soroti district altogether totalling 58.5Km,
commencing on 1st June 2009 and completing on 1
st December
2010. The contract period was however extended by 6 months
ending 30th
June 2010 owing to stoppages lasting over 3 months
while area political leaders addressed issues raised by the
communities. The scope of works included grading, spot
gravelling and installation of only 2 culvert lines.
The monitoring team visited all the 7 roads in Kumi district and
A completed section of Ntantamukye –
Kaweema road
Graded section of Endiizi – Nyabyondo
road with an eroded side drain A completed section of Endiizi – Mpikye
road

337
observed that all the roads had been graded to completion, and
the 2 lines of culverts installed, but spot gravelling was still
outstanding and the roads were already generally overgrown with
grass across the shoulders, and across the carriageway on some
roads. The roads generally required more culverts than provided
for in the contract. On Kumi – Kabata school road, the team
noted that works on the road had been rendered futile as the road
had been blocked by an apparent disgruntled landlord who was
constructing a building across the newly graded road. It was also
strange that the works were ongoing unabated.
The monitoring team was however informed that the contractor
had commenced gravelling starting with the roads in Soroti
district, where gravel had reportedly been damped but not yet
spread.
Physical progress was estimated at 80% against a 92.3% time
progress, and 77.5% financial progress.
3. Luwero District
Road Names: Kigavu – Balida (9.5Km), Kasala –
Kikunyu (6.8Km), Luwube – Ddekabusa (9.3Km),
Nakazi - Presidents lodge (0.7Km).
Contractor: M/s Nippon Parts (U) Ltd
Contract sum : 377,663,000/-
The contract was for the maintenance of 3 roads in Kampala
district, 3 roads in Kayunga district and 4 roads in Luwero
district altogether totalling 50.3Km, commencing in May 2009
and completing in November 2009. The scope of works included
grading, spot gravelling and installation of only 2 culvert lines.
The monitoring team visited all the 4 roads in Luwero district and
observed that all the roads had been graded to completion, and
the 2 lines of culverts installed, one on Kigavu – Balida road and
one on Nakazi – President’s lodge road. The team additionally
observed that the roads were already generally overgrown with
grass across the shoulders, and generally required more gravel
and culverts than provided for in the contract. Luwuube –
Ddekabusa was however short by 1.5Km.
Physical progress of works was estimated at 100% against 100%
time progress and 97.5% financial progress. The roads were still
under defects liability period.
Kumi – Kabata school road: unabated
building construction cutting across the road
and effectively blocking off the road
A section of Kasala – Kikunyu road with
overgrown shoulders and slippery surface
A completed section of Ddekabusa –
Luwuube road with overgrown shoulders

338
The monitoring team was informed that minimum environmental protection and road safety
aspects like the requirement for contractors to obtain environmental compliance certificates from
the respective District Environment Officers before payment of retention moneys, and the
inclusion of an item for road safety and traffic management in the bills of quantities, had been
mainstreamed in the implementation of the project. However, other crosscutting issues like HIV
awareness, gender issues, and issues concerning people with disabilities had not been
mainstreamed.
Implementation challenges identified included:
Capacity weaknesses of some of the contractors leading to slow progress and poor
performance of some of the contracts. There were cases of contractors abandoning works and
cases where contracts had been recommended for termination and possible completion by
force account operations by the respective district works departments;
Progress of works in some contracts was affected by delays in settlement of payment
certificates reportedly due to unavailability of funds.
3.7.8 Project for Construction of Selected Bridges
Project Background
The project for the construction of selected bridges was designed as a follow up of an earlier
project TR 23(A) which carried out a feasibility study and detailed engineering design of some
selected bridges. The project was aimed at constructing new selected bridges and rehabilitating
old bridges on the district, urban and community access roads, some of which had been
neglected since the 1970s. The project is funded jointly by GoU and the Islamic Development
Bank (IDB). It commenced in FY 2000/2001 and is expected to continue on a rolling term basis,
under the medium term expenditure framework.
A stone lined drain along Nakazi –
President’s lodge road A completed section of Kigavu – Balida road

339
In FY 2008/09, the project had an approved budget of UShs 2.47 billion with a GoU component
of UShs 1.19 billion of which total releases were UShs 727.1 million representing 60.9% budget
performance of the GoU component. The project had 100% absorption of the released funds
during FY 2008/09. In FY 2009/10, planned outputs under the project included: 18 selected
bridges in fourteen districts designed and constructed; 17 bridges funded by IDB in North
Eastern Uganda constructed; computers, photocopiers and consumables procured and; GPS
device and software procured. The project was monitored in May 2010 and the findings were as
follows in 3.7.8.2
Findings
i) Financial Performance
In FY 2009/10 the project was allocated a total budget of UShs 5.93 billion (composed of UShs
1.85 billion donor funding and UShs 4.08 billion GoU funding). At the time of monitoring, done
at the end of May 2010, the project had received a total UShs 3.87 billion (94.9% of the GoU
component). By the end of the financial year (IFMS data) almost all the funds released to the
project in the FY had been expended on payments to contractors, consultants, and
workshops/seminars. A summary of the financial performance of the project in FY 2008/09 and
2009/10 is as shown in the Table 3.7.12.
Financial progress of the works under the project was as shown the Table 3.7.13
Table 3.7.12: Financial Performance of the Project for Construction of Selected Bridges
FY Source of
funding
Approved
Budget
Estimates
(UShs Millions)
Releases (UShs
Millions)
Expenditure
(UShs Millions)
% of Budget
Released
% of Releases
Spent
2008/09 GoU 1,194.31 727.07 727.00 60.9% 100.0%
Donor 1,277.00 n/a* n/a* n/a* n/a*
2009/10 GoU 4,080.00 3,872.31 3,871.83 94.9% 100.0%
Donor 1,850.00 n/a* n/a* n/a* n/a*
Source: MoWT Ministerial Budget Policy Statement FY 2009/10; IFMS Data.
ii) Physical Performance
In FY 2009/10, planned activities under the project included: training of stakeholders on bridge
maintenance; designing and construction of 18 selected bridges in fourteen districts; the
construction of 17 bridges funded by IDB in North Eastern Uganda; procurement of computers,
photocopiers and consumables; and procurement of GPS device and software. Table 3.7.13
shows the progress made on bridges rehabilitated under the project.

340
Table 3.7.13: Summary of progress of works under the Selected Bridges Project as at end of March 2010.
No Bridge Name Scope Cost
(Millio
n UShs)
Physical
Progress
(%)
Financial
Progress
(%)
Comments
1.0 Construction of Selected Bridges
1.1 Nyamabare bridge,
Isingiro district
14m span reinforced
concrete bridge
499.158 100% 88.6% Works completed
1.2 Mpongo River Crossing,
Kibale district
600m embankment fill and
installation of a series of
culverts
689.214 10% 20.0% Works in Progress
1.3 Agwa bridge, Lira District Reconstruction of abutments
and installation of compact
panel bridges
150.000 50% 0.0% 1.Cost is for
installation of
panel bridge
provided by the
ministry
2. The US/UPDF
army pulled out,
MoWT is to
complete the
remaining works.
Funds to be
transferred to
UNRA for
construction of the
abutments.
1.4 Simu – Pondo bridge,
Sironko district
12m span reinforced
concrete bridge
546.546 0.0% 0.0% Works
commenced on 26
Mar 2010
1.5 Okor bridge, Kumi district Three cell box culvert 400.04 0.0% 0.0% Pending contract
signing
1.6 Kabundaire bridge,
Kabarole district
12m span reinforced
concrete bridge
414.86 0.0% 0.0% Pending contract
signing
1.7 Alla 2 bridge, Arua district 20m span reinforced
concrete bridge
890.00 0.0% 0.0% Pending contract
signing
1.8 Nyanga river crossing,
Isingiro district
800m embankment fill and
installation of a series of
culverts
960.00 0.0% 0.0% Under
procurement
2.0 Design of Selected Bridges
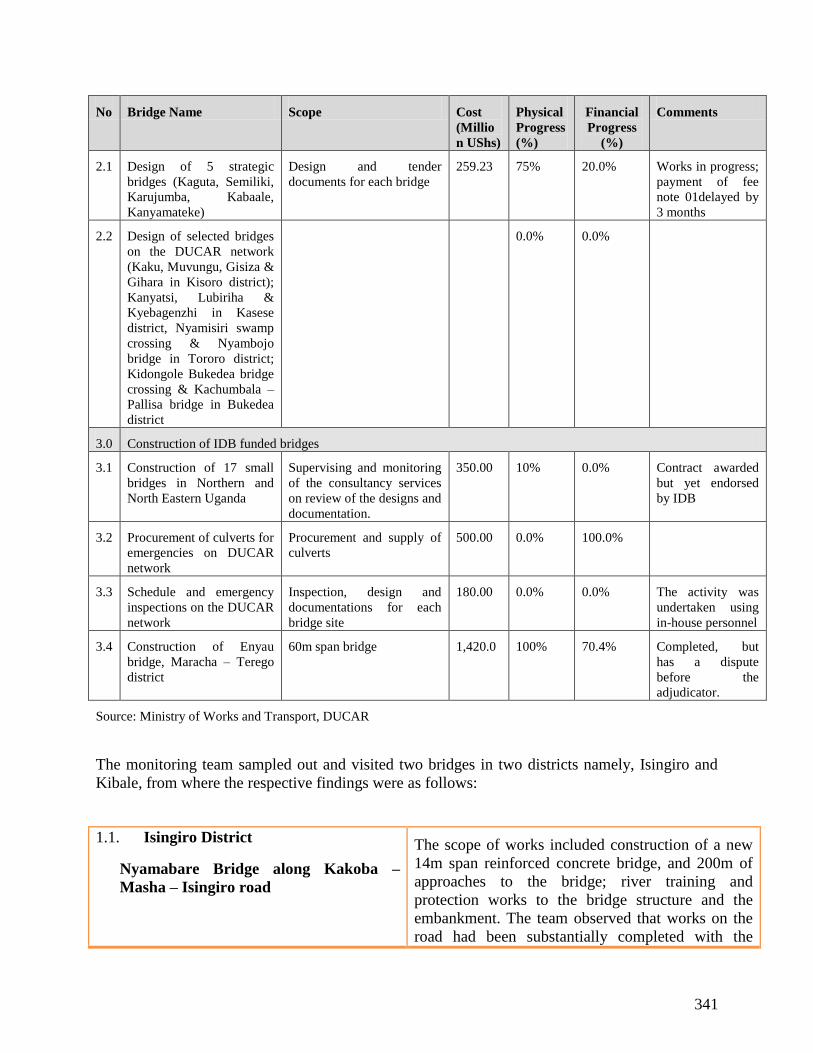
341
No Bridge Name Scope Cost
(Millio
n UShs)
Physical
Progress
(%)
Financial
Progress
(%)
Comments
2.1 Design of 5 strategic
bridges (Kaguta, Semiliki,
Karujumba, Kabaale,
Kanyamateke)
Design and tender
documents for each bridge
259.23 75% 20.0% Works in progress;
payment of fee
note 01delayed by
3 months
2.2 Design of selected bridges
on the DUCAR network
(Kaku, Muvungu, Gisiza &
Gihara in Kisoro district);
Kanyatsi, Lubiriha &
Kyebagenzhi in Kasese
district, Nyamisiri swamp
crossing & Nyambojo
bridge in Tororo district;
Kidongole Bukedea bridge
crossing & Kachumbala –
Pallisa bridge in Bukedea
district
0.0% 0.0%
3.0 Construction of IDB funded bridges
3.1 Construction of 17 small
bridges in Northern and
North Eastern Uganda
Supervising and monitoring
of the consultancy services
on review of the designs and
documentation.
350.00 10% 0.0% Contract awarded
but yet endorsed
by IDB
3.2 Procurement of culverts for
emergencies on DUCAR
network
Procurement and supply of
culverts
500.00 0.0% 100.0%
3.3 Schedule and emergency
inspections on the DUCAR
network
Inspection, design and
documentations for each
bridge site
180.00 0.0% 0.0% The activity was
undertaken using
in-house personnel
3.4 Construction of Enyau
bridge, Maracha – Terego
district
60m span bridge 1,420.0 100% 70.4% Completed, but
has a dispute
before the
adjudicator.
Source: Ministry of Works and Transport, DUCAR
The monitoring team sampled out and visited two bridges in two districts namely, Isingiro and
Kibale, from where the respective findings were as follows:
1.1. Isingiro District
Nyamabare Bridge along Kakoba –
Masha – Isingiro road
The scope of works included construction of a new
14m span reinforced concrete bridge, and 200m of
approaches to the bridge; river training and
protection works to the bridge structure and the
embankment. The team observed that works on the
road had been substantially completed with the

342
Contractor: M/s Pearl Shelter Promoters (U) Ltd
Contract Sum: UShs 499,158,000
concrete decking, installation and painting of steel
guardrails, and construction of abutments
completed. Works on the approaches that included
lining of side drains, installation of culverts and
gravelling were also complete. River training had
also been done to about 100m on either side of the
Bridge, however timber logs previously used for
pedestrian crossing had been left at the inlet to the
bridge causing an obstruction to the free flow across
the bridge. Progress of work was estimated at 100%
while financial progress was at 88.6%.
1.2. Kibale District
Mpongo Bridge along Katanabiri –
Buhonda road
Contractor: M & B Construction Ltd
Contract Sum: UShs 689,213,700
The works included construction of a new swamp
crossing, 600m long across River Mpanga bordering
Kibale and Kiboga road along Katanabiri – Buhonda
road. The scope of works specifically included
installation of a series of culverts and a gravel
embankment fill across the river. The team observed
that the contractor was on site, and had filled a
section of about 100m and stock piled gravel at one
side of the river bank. The contractor had spent more
than a month with no works on site due to cash flow
issues and equipment breakdown but had resumed
by the time of the monitoring visit. The contractor
was in the process of sourcing hardcore rocks for
use in the construction of a rock fill base in the
sections ahead. A suitable rock near the site had
been identified, exposed and prepared for blasting.
Progress of works was estimated at 40%, while
financial progress was at 20.3% and contract time
progress at 109.2%. Physical progress of works was
thus lagging behind contract time progress.
Timber logs clogging flow at the inlet of the Bridge Completed works on Nyamabare Bridge
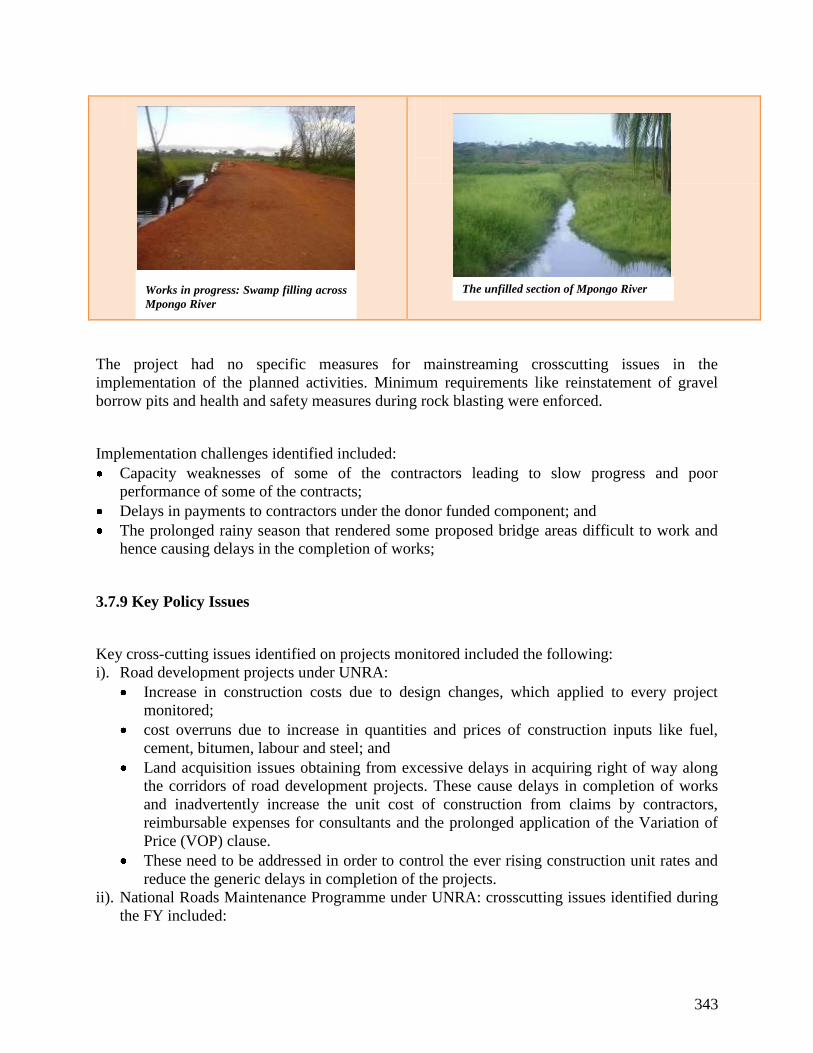
343
The project had no specific measures for mainstreaming crosscutting issues in the
implementation of the planned activities. Minimum requirements like reinstatement of gravel
borrow pits and health and safety measures during rock blasting were enforced.
Implementation challenges identified included:
Capacity weaknesses of some of the contractors leading to slow progress and poor
performance of some of the contracts;
Delays in payments to contractors under the donor funded component; and
The prolonged rainy season that rendered some proposed bridge areas difficult to work and
hence causing delays in the completion of works;
3.7.9 Key Policy Issues
Key cross-cutting issues identified on projects monitored included the following:
i). Road development projects under UNRA:
Increase in construction costs due to design changes, which applied to every project
monitored;
cost overruns due to increase in quantities and prices of construction inputs like fuel,
cement, bitumen, labour and steel; and
Land acquisition issues obtaining from excessive delays in acquiring right of way along
the corridors of road development projects. These cause delays in completion of works
and inadvertently increase the unit cost of construction from claims by contractors,
reimbursable expenses for consultants and the prolonged application of the Variation of
Price (VOP) clause.
These need to be addressed in order to control the ever rising construction unit rates and
reduce the generic delays in completion of the projects.
ii). National Roads Maintenance Programme under UNRA: crosscutting issues identified during
the FY included:
The unfilled section of Mpongo River Works in progress: Swamp filling across
Mpongo River

344
Unlike the funds released to the programme in quarters 1 & 2, the funds disbursed under
URF in quarter 3 and 4 were not on IFMS and thus financial management of the
programme was on two separate and independent systems, which obviates the intended
objectives of rolling out the IFMS system to UNRA.
Improper scoping of routine mechanised maintenance contracts, which renders them
ineffective and expensive due to the multiple interventions and recurrence of unplanned
emergency works which supplement the contracts by force account interventions.
Insufficient stock of equipment at some stations and old equipment at other stations with
extensive breakdowns, low effective availability and high maintenance costs;
Lengthy procurement processes leading to delayed commencement of planned activities
and costly unplanned emergency interventions;
Land acquisition issues especially along the roads recently upgraded to national roads. It
was noted that many of the roads upgraded were non-existent while others were too
narrow and required land acquisition through compensation of land owners.
It was noted that while the national roads network had been increased, resources at the
UNRA maintenance stations had remained unchanged in terms of personnel and
equipment, which was constraining their capacities to adequately maintain the roads.
There were cases of shoddy works like on the contract for maintenance of Kiziranfumbi –
Kabwoya – Kagadi Road, where supervision required to be strengthened in order to
ensure value for money.
iii). District Urban and Community Access Roads Maintenance: the issues identified on the
district and urban roads monitored during the FY included:
Lack of sufficient guidance on the official IPFs for conditional grants of FY 2009/10,
which led to gaps in the scope of planned activities, whereby funds expected from the
URF in the third and fourth quarters were not planned for in some districts monitored;
Understaffing of works departments partly due to failure of some local governments to
attract staff of specified qualifications. This was observed in several districts like
Lyantonde, which had only one staff in the roads sub-sector; and in Soroti and Kasese
districts which had no substantive district engineers, no assistant engineers and road
inspectors.
Lack of equipment in some districts, poor condition of the available equipment in other
districts, and lengthy repair times for equipment taken to regional mechanical workshops
were constraining to the maintenance programmes in districts;
Absence of procurement committees, procurement delays and lengthy procurement
processes that led to delays in commencement of planned road maintenance activities
were cross cutting in the districts monitored. Absence of procurement committees was
however only in Apac and Kasese districts;
Capacity weaknesses of local contractors with respect to financial base, equipment base
and personnel was a cross cutting challenge but which affected urban councils most.
Low unit rates for the manual routine maintenance works leading to failures in attracting
labourers.
Complications with the IFMS/EFT system that was leading to delayed payments to
contractors and thus affecting the contractors’ capacities to deliver works on time. This
was noted in Lira and Soroti districts where the IFMS had been rolled out.

345
In Kasese district, 36.4% of funds released for road maintenance were frozen by URA for
non-remittance of taxes. This should be investigated further to bring to book the
responsible officers.
Poor quality works in contracts for sealing of urban roads due to capacity weaknesses of
contractors was noted in both Mbale and Tororo municipal councils. In Mbale the
municipal council engineer reportedly signed payment certificates for the shoddy works
under duress from MoWT officials. This needs to be investigated further and the
responsible officers reprimanded for unethical conduct.
Funding constraints that limit the design of the structural strength of the urban roads to
low traffic volume roads was noted in both municipal councils monitored and therefore it
required to be taken up to ensure that the roads are built to the required standards.
(iv) Interconnectivity Roads Improvement Programme
The discrepancy between funds paid to the contractors and funds paid under the
programme (IFMS data) revealed continued diversion of funds under the project yet the
project received a supplementary budget which did not trickle down to project out puts.
This project needs to be investigated further to explain the expenditures outside the
project outputs.
The scope of works under the inter district component of the project was largely
insufficient and difficult to justify since many of the roads were new earth roads which
were quickly returning to bushes with no maintenance plan in place. The case of Kumi –
Kabata school road where a building was being constructed across the newly graded road
unabated clearly demonstrates a case of wasted investment in some of the roads.
3.7.10 Conclusions
v). The three road development projects monitored were generally on course with targeted
outputs for both projects surpassed on Soroti – Dokolo – Lira road, and expected to be met
on Busega – Masaka and Masaka – Mbarara road projects, by the end of the FY. All the
contracts had reasonably matched financial/ physical performances, contractors were well
mobilised on site, and works convincingly in progress. However, the projects were
experiencing generic challenges ranging from issues of cost overruns, design changes, land
acquisition issues, and delays in obtaining key decisions.
vi). The National Roads Maintenance Programme was monitored at 13 UNRA stations with a
total road network of 6,489Km (59.5% coverage). It was observed that almost all the roads
under the stations received at least one maintenance cycle during the FY, which was a good
indication that the targeted outputs of routinely maintaining the entire old network manually
and 15,258Km with machines were most likely to be achieved. The targeted output of
gravelling of 1,500Km of unpaved roads was also likely to be achieved through the force
account operations and the periodic maintenance contracts that mainly spilled over from FY
2008/09. It was however evident that the programme did not achieve its targeted output on
rehabilitation of 100Km and resealing 220Km of paved roads. The programme’s absorption
was at 99.3% as at end of June 2010 (IFMS data, excluding funds released under URF).
Financial progresses of the contracts under the programme were generally less than the
physical progress of works and within less than 20% difference, indicating reasonably good

346
financial performance. The programme however had issues relating to under scoping of
routine maintenance contracts, insufficient equipment, old equipment with extensive
breakdowns and high maintenance costs, and delays in procurement of works planned for
contracting, leading to unplanned emergency interventions which were costly and time
consuming.
(vii) District and urban roads maintenance programmes were monitored in 11 districts and
four urban councils, where it was observed that generally most planned activities were rolled
out during the third and fourth quarters. Several roads under the district networks did not
receive any maintenance intervention with some districts having up to 40% of their networks
in a condition beyond maintenance levels. Financial performance of the programmes was
generally poor with 8 out of 9 districts having absorption levels less than 50% and some
districts having only 4.6% absorption at the end of the third quarter. It was therefore evident
that the programme would not achieve the targeted outputs of maintaining 22,000Km,
resealing/ reconstruction of 75Km of urban roads and reconstruction of 7.5Km of KCC
roads. The programme was however likely to achieve the targeted out puts of rehabilitation
of 150Km of district roads, and maintenance of 42Km of KCC roads. The programme had
generic issues like absence of planned activities for funds expected in the third and fourth
quarters through URF (by the close of the second quarter), understaffed works departments,
lack of equipment, poor condition of equipment, delays in the procurement process, and
capacity weaknesses of local contractors mostly affecting urban councils where shoddy
works were observed.
(viii) Interconnectivity Roads Improvement Programme: at the time of monitoring in May
2010, some of the works were still under procurement, and average physical progress of the
contracted works was at 64.3% but with most of the ongoing contracts nearing completion.
Considering that during the FY, the programme had works on a group of roads totalling
836.7Km it was likely that the targeted output of rehabilitation/maintenance of 470Km of
roads with contracts that spilled over from FY 2008/09 and 51Km of roads with contracts
procured within the FY was achieved. The programme however had issues of inconsistent
data of expenditures on roads and bridges (IFMS Data) when compared to the total payments
to contractors.
3.7.11 Recommendations
ix). Generic challenges that cut across all development projects like cost overruns, design
changes, land acquisition issues, and delays in obtaining key decisions need to be
streamlined and proactively controlled in order to effectively manage the ever rising
construction unit rates and reduce the generic delays in completion of the projects.
x). Issues of under scoping of routine mechanised maintenance works, procurement ceilings
for micro-procurements and low equipment stock at the UNRA stations need to be
addressed so as to make the operations of the programme more efficient and cost effective.
xi). Supervision of the contract for maintenance of Kiziranfumbi – Kabwoya – Kagadi Road
needs to be strengthened in order to rectify the substandard works observed during
monitoring and to ensure value for money.

347
xii). There is need for a framework to improve the availability and maintenance of equipment at
district works departments in order to improve effectiveness of the district roads
maintenance programmes.
xiii). There is also need to improve information flow on projects centrally coordinated by MoWT
so as to improve transparency and accountability to people at the grass root.
xiv). The data inconsistence between expenditures on roads and bridges (IFMS Data) and the
payments to contractors under the Interconnectivity Roads Improvement Programme needs
to be reconciled and explained.
348
3.8 WATER AND SANITATION
3.8.1 Introduction
The vision statement for the water and environment sector is ‘Sound management and
sustainable utilisation of water and environment resources for the betterment of the population
of Uganda;’ and the mission statement is ‘To promote and ensure the rational and sustainable
utilisation, development and effective management of water and environment resources for
socio-economic development of the country.’ The policy objectives for the sector have been
developed in line with the Poverty Eradication Action Plan (2004). In brief this includes:
(i) To manage and develop the water resources of Uganda in an integrated and sustainable
manner;
(ii) To achieve sustainable provision of safe water within easy reach and hygienic sanitation
facilities;
(iii) To develop and efficiently use water supply for production123
.
The FY09/10 on-budget water and environment sector allocation is UShs 172.24bn. Over the
medium term there is a planned funding increase to the sector to UShs 219.23bn in FY10/11 and
UShs 263.58bn in FY11/12124
. This is due to an increase in both GoU and donor funding and has
resulted in proposed increased allocations to the following vote functions: centralised rural water
supply and sanitation services; water resources management; weather, climate and climate
change; and natural resources management125
.
Scope of the report:
This report provides an assessment of annual performance of the water and sanitation sub-sector,
by consolidating findings and recommendations presented throughout FY09/10. The findings
generated in Q4 will form the main basis of the report, with a summary section under each vote
function highlighting the performance of other projects monitored in FY09/10.
The water and sanitation sub-sector has been prioritised for monitoring as it accounts for 67% of
the FY09/10 on-budget sector funding,126
where the focus has been on Rural Water Supply and
Sanitation, Urban Water Supply and Sanitation and Water for Production vote functions. Whilst
the importance of Water Resources Management vote function is recognised for contributing to
the sector’s objectives, it has not been monitored as the majority of outputs reported cannot be
physically verified. In addition, Meteorological Support to Plan for Modernisation of
123
Adapted from ‘Strategic Investment Plan for the Water and Sanitation Sub-Sector,’ August 2009, Ministry of
Water and Environment, pg. i
124 Ministry of Finance, Planning and Economic Development, National Budget Framework Paper FY2010/11 –
FY2014-2015, pg. 276 and 291 (excluding taxes, arrears and non tax revenue)
125 Ibid
126 Ibid

349
Agriculture, under the Weather, Climate and Climate Change vote function was also monitored,
due to the increased funding to meteorology in FY09/10 and the recent approval by Parliament
for the creation of a Meteorology Agency.
The monitoring criteria include:
(i) Projects that contribute to the sector’s priority objectives;
(ii) Projects which have outputs that are physically verifiable;
(iii) Projects that have a significant level of expenditure, with financial data available;
(iv) Projects or issues that have budget policy implications, such as the sanitation grant.
The geographical scope of monitoring coverage includes Central Region, Eastern Region,
Northern Region and Western Region. The sampling frame for FY09/10 is as follows:
Table 3.8.1: Sampling frame for FY09/10127
Vote Function and Project
/ Grant
Outputs Monitored with Locations Time of
Monitoring
Rural Water Supply and
Sanitation vote function /
(0163) Support to Rural
Water Supply and Sanitation
(090172) Construction of Tororo gravity flow scheme in
Tororo, Manafwa districts; drilling emergency boreholes in
Amolotar, Bulisa, Lira, Masaka, Oyam, Pallisa,
Sembabule, Sironko and Wakiso districts; extension of Bunyaraguru piped water system
(090104) Pilot rainwater harvesting in Bushenyi, Isingiro and Rakai districts
(090103) Sanitation campaigns in Kamuli, Masaka and Mbarara districts
Q3, Q4
Q1, Q3
Q1, Q2, Q4
Rural Water Supply and
Sanitation vote function /
(0158) School and Community IDPs
(090172) Construction of piped water systems in 8 RGCs
in Apac, Gulu, Katakwi, Kitgum, Lira, Oyam and districts
(090103) Construction of sanitation facilities in Luzira,
Mukono and Rakai
Q1, Q2, Q4
Q4
Rural Water Supply and Sanitation vote function /
District Water and
Sanitation Conditional Grant
Construction of water points and sanitation facilities in
Amuru, Apac, Arua, Gulu, Iganga, Jinja, Kaberamaido,
Kamuli, Kasese, Katakwi, Kayunga, Kitgum, Koboko,
Maracha-Terego, Moyo, Nakaseke, Nakasongola, Oyam,
Pader, Palissa, Rakai, Wakiso and Yumbe districts
Sanitation campaigns in Kaliro, Mubende, Mukono, Rakai and Wakiso districts
Q1, Q2, Q3, Q4
Q4
Urban Water Supply vote
function / (0164)
(off-budget item) Construction of piped town water supply
in Magale, Masafu, Namutumba, Sipi; Expansion of 6
Q2
127
The codes used are consistent with the Ministry of Water and Environment’s output based budget structure
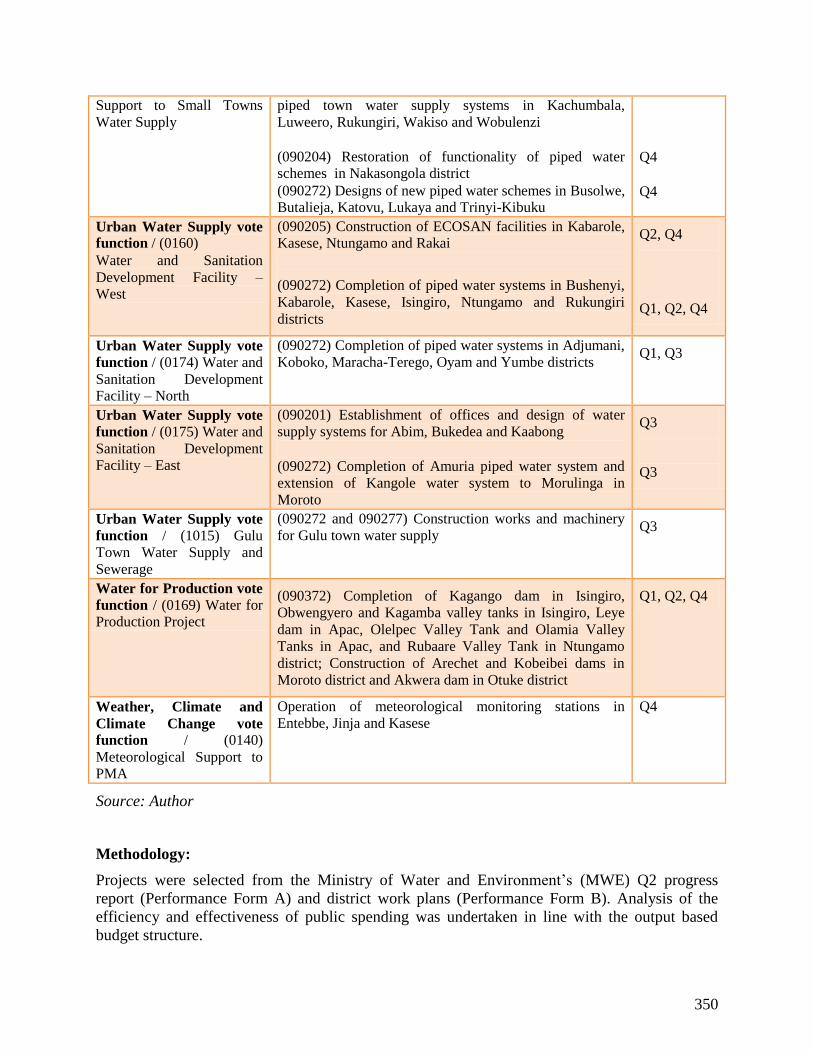
350
Support to Small Towns
Water Supply
piped town water supply systems in Kachumbala,
Luweero, Rukungiri, Wakiso and Wobulenzi
(090204) Restoration of functionality of piped water schemes in Nakasongola district
(090272) Designs of new piped water schemes in Busolwe, Butalieja, Katovu, Lukaya and Trinyi-Kibuku
Q4
Q4
Urban Water Supply vote function / (0160)
Water and Sanitation
Development Facility – West
(090205) Construction of ECOSAN facilities in Kabarole, Kasese, Ntungamo and Rakai
(090272) Completion of piped water systems in Bushenyi,
Kabarole, Kasese, Isingiro, Ntungamo and Rukungiri
districts
Q2, Q4
Q1, Q2, Q4
Urban Water Supply vote
function / (0174) Water and
Sanitation Development Facility – North
(090272) Completion of piped water systems in Adjumani,
Koboko, Maracha-Terego, Oyam and Yumbe districts Q1, Q3
Urban Water Supply vote
function / (0175) Water and
Sanitation Development Facility – East
(090201) Establishment of offices and design of water
supply systems for Abim, Bukedea and Kaabong
(090272) Completion of Amuria piped water system and
extension of Kangole water system to Morulinga in
Moroto
Q3
Q3
Urban Water Supply vote
function / (1015) Gulu
Town Water Supply and
Sewerage
(090272 and 090277) Construction works and machinery
for Gulu town water supply Q3
Water for Production vote
function / (0169) Water for Production Project
(090372) Completion of Kagango dam in Isingiro,
Obwengyero and Kagamba valley tanks in Isingiro, Leye
dam in Apac, Olelpec Valley Tank and Olamia Valley
Tanks in Apac, and Rubaare Valley Tank in Ntungamo
district; Construction of Arechet and Kobeibei dams in
Moroto district and Akwera dam in Otuke district
Q1, Q2, Q4
Weather, Climate and
Climate Change vote
function / (0140)
Meteorological Support to PMA
Operation of meteorological monitoring stations in
Entebbe, Jinja and Kasese
Q4
Source: Author
Methodology:
Projects were selected from the Ministry of Water and Environment’s (MWE) Q2 progress
report (Performance Form A) and district work plans (Performance Form B). Analysis of the
efficiency and effectiveness of public spending was undertaken in line with the output based
budget structure.

351
Efficiency was considered in terms of operational efficiency (whether reported expenditure is
commensurate with the output monitored, with a consideration of unit costs); and allocative
efficiency (proportion of expenditure on high priority areas, such as capital outputs compared
with low priority areas such as recurrent expenditures128
). Financial data was sourced from the
Integrated Financial Management System (IFMS) for GoU project data and MWE Q3 Progress
Report for donor development data. The expenditure data refers to the end of the Q3 FY09/10.0
Effectiveness of service provision was considered for interventions that are complete which
involved monitoring indicators in the following areas:
Planning and design (evidence of feasibility studies and environmental impact assessments,
beneficiary consultations);
Quality of service provision (functionality, water quality, reliability, timely
implementation);
Access to services by intended beneficiaries (affordability, gender and equity);
Management and administration (trained board or committee, private operator).
Data collection methods included site observations, interviews with officials from the Directorate
of Water Development (DWD), local government, private operators (PO); structured interviews
with beneficiaries; and site photographs. A range of beneficiaries were interviewed including
men, women and people with disabilities. Key literature sources included progress reports,
contract documents, the Ministerial Policy Statement, the Budget Framework Paper and the
Sector Performance Report (SPR) amongst others. Performance of the District Water and
Sanitation Conditional Grant (DWSCG) was monitored by BMAU in partnership with the
Resident District Commissioner’s offices (RDCs), including District Internal Security Officers
(DISOs) and Gombolola Internal Security Officers (GISOs). The field visits took place between
24th
May and 24th
June 2010.
Limitations:
Validity of donor financial data. Donor expenditure data by project and output submitted
by MWE cannot be verified by MFPED, as bank receipts are not readily available from the
donor accounts in the Bank of Uganda or other project accounts.
3.8.2. Rural Water Supply and Sanitation Vote Function
This vote function contributes to the sector objective of “The sustainable provision of safe water
within easy reach and hygienic facilities.” Under the vote Ministry of Water and Environment,
rural water supply and sanitation has been allocated UShs 10.45bn in FY09/10 which is 6% of
the sector budget129
. Under the vote Local Governments, rural water supply and sanitation has
128
Recurrent expenditures include allowances, workshops, seminars, travel inland, fuel and vehicle maintenance and
should not exceed more than 10% of the budget
129 Ministry of Finance, Planning and Economic Development, National Budget Framework Paper FY2010/11-
FY2014/15, May 2010, pp. 280-3

352
been allocated UShs 55.38bn in FY09/10, which is 32% of the sector budget130
. This is remitted
to districts directly by the Treasury through the District Water and Sanitation Conditional Grant.
Over the medium term there is a projected increase in funding to rural water supply and
sanitation, where the total sector allocation including centralised and decentralised services is
UShs 65.83bn in FY09/10 and UShs 78.39bn in FY10/11. This translates to 38% of the sector
budget in FY09/10 and 36% of the sector budget in FY10/11. Hence, the increase in funding
allocation has not resulted in a higher proportion of the budget being allocated to rural water.
Given that an estimated 85% of Ugandans live in rural areas131
and the rapid multiplication in the
number of districts it is of concern that the sector has not allocated a proportionate increase in
funding to decentralised rural water supply and sanitation services, which will remain unchanged
at UShs 55.38bn in FY10/11. The overall funding trends for rural water supply and sanitation are
presented below:
Figure 3.8.1
Source: MFPED
130
Ibid
131 National Planning Authority, The 2008 National Service Delivery Survey, May 2010, pg. 9

353
Figure 3.8.2
Source: MFPED
(a) School and Community IDPs Project (0158)
This project is fully funded by GoU and aims to improve water supply and sanitation facilities in
areas affected by the conflict in northern Uganda. The project started in FY04/05 and is expected
to be complete in FY16/17. Total planned expenditure is UShs 6.348bn132
. In FY08/09 the
planned output was the construction of eight motorised water supply schemes, but this was rolled
over to FY09/10 due to prolonged procurement procedures. In Q1 FY09/10 three piped water
systems were monitored: Northern Uganda Youth Development Centre and Lugore sub-county
in Gulu district, and Minakulu sub-county in Oyam district. During Q2 five piped water systems
were monitored: Adwari RGC in Otuke, Ayara RGC in Kole, Madi Opei RGC in Lamwo,
Magoro RGC in Katakwi, and Orum RGC in Lira where construction was ongoing. In Q4 follow
up visits were undertaken to all the sites, as well as construction of sanitation facilities in Luzira,
Rakai and Wakiso. These come under the Output 090172 Government Buildings and Service
Delivery Infrastructure.
Financial performance:
By the end of Q3 FY09/10, 69% of the budget was released, of which expenditure was at 93%.
Analysis of the expenditure composition showed that 14% was on low priority items and 50%
was on high priority items.
Figure 3.8.3
132
Ministry of Finance Planning and Economic Development Public Investment Plan FY2009/10 – 2011/12, pg. 965

354
Source: MFPED
Physical performance:
Table 3.8.2 FY09/10 Performance of Output 090172 Government Buildings and Service
Delivery Infrastructure, Schools and Community IDPs Project (0158)
Planned outputs
(quantity and
location)
Actual
achievements
monitored
Realisation
of target
Financial
performance
(UShs GoU
and donor)
Time of
monitoring
Explanation of
variance /
comments
(i) Continue
construction in 8
RGCs: (Adwari in
Otuke, Ayara in Kole,
Lugore and Gulu YC
in Gulu, Magoro in
Katakwi, Madiope in
Lamwo, Minakulu in
Oyam and Orum in
Lira)
(ii) Start new
constructions in 6
RGCs:
Bukholi, Iki-Iki,
Kanyampanga,
Karenga, Kyere and
Ongino
8
0 – designs
complete but
no works have
started
Off target
Off target
Annual
budget:
1.02bn
Q1 to Q3
release:
0.62bn
Q1 to Q3
expenditure:
0.55bn
Unspent
balance:
0.065bn
Q1, Q2, Q4
Completion of
schemes has
been delayed as
the contractors
have not
received
payments.
Insufficient
funds available
to start the
constructions.

355
(iii) 7 sanitation
facilities constructed
Construction
monitored in
Luzira,
Mukono and
Rakai. Other
facilities
planned include
Iganga, Pallisa,
Wakiso.
On target –
but not all
complete.
Q4
Source: MWE and Field Findings
Output 090172 Government Buildings and Service Delivery Infrastructure
A summary of operational efficiency is below:
Figure 3.8.4 Financial Performance of Output 090172 Government Buildings and Service
Delivery Infrastructure and link to Physical Performance
Source: MFPED, MWE and Field Findings
There are three planned components under this output:
(i) Continuation of construction of eight water supply schemes in RGCs;
(ii) Construction of seven sanitation facilities;
(iii)Construction of piped water supply systems in Bukholi, Iki-Iki, Kanyampanga, Karenga,
Kyere and Ongino.
(i) Continuation of construction of eight piped water supply schemes in RGCs:
The combined contract sums are UShs
4.27bn compared with an approved budget
of UShs 1.02bn, which implies unrealistic
budgeting and could result in arrears
accumulation. Physical works had stalled as
contractors were not paid even though there
is an unspent balance on the IFMS by the
end of Q3. This implies inefficiencies in
issuing payments, which currently involves
22 procedures.
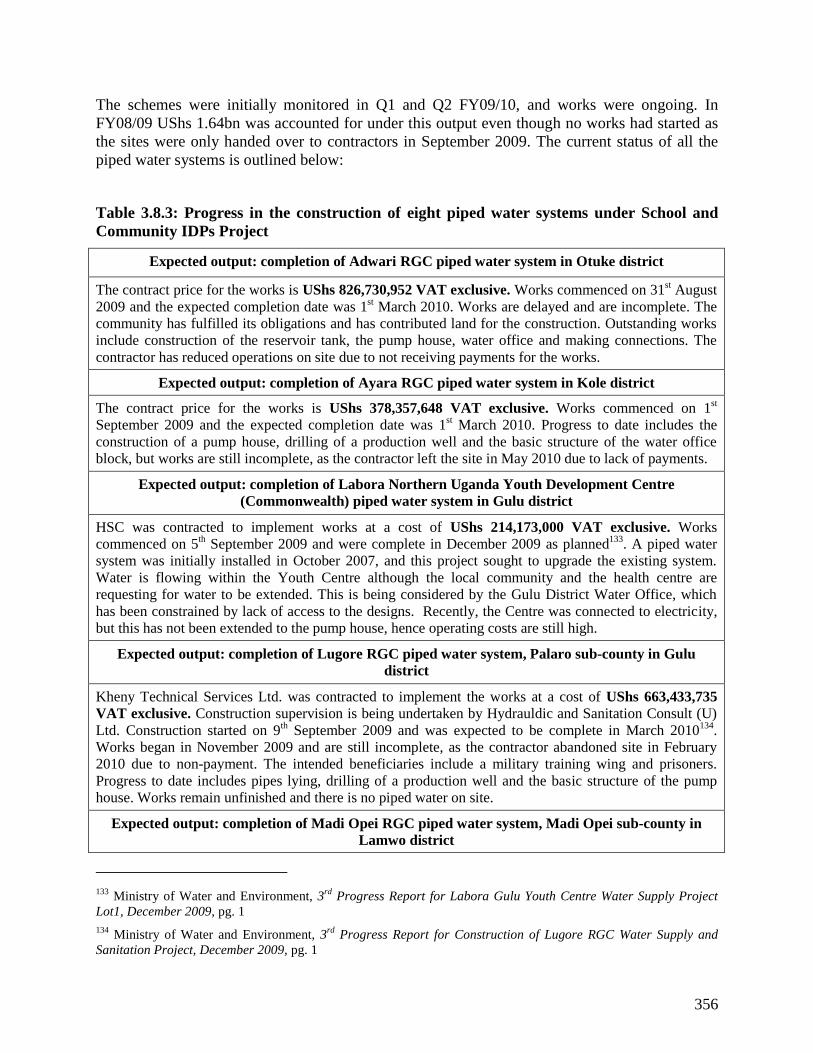
356
The schemes were initially monitored in Q1 and Q2 FY09/10, and works were ongoing. In
FY08/09 UShs 1.64bn was accounted for under this output even though no works had started as
the sites were only handed over to contractors in September 2009. The current status of all the
piped water systems is outlined below:
Table 3.8.3: Progress in the construction of eight piped water systems under School and
Community IDPs Project
Expected output: completion of Adwari RGC piped water system in Otuke district
The contract price for the works is UShs 826,730,952 VAT exclusive. Works commenced on 31st August
2009 and the expected completion date was 1st March 2010. Works are delayed and are incomplete. The
community has fulfilled its obligations and has contributed land for the construction. Outstanding works
include construction of the reservoir tank, the pump house, water office and making connections. The
contractor has reduced operations on site due to not receiving payments for the works.
Expected output: completion of Ayara RGC piped water system in Kole district
The contract price for the works is UShs 378,357,648 VAT exclusive. Works commenced on 1st
September 2009 and the expected completion date was 1st March 2010. Progress to date includes the
construction of a pump house, drilling of a production well and the basic structure of the water office
block, but works are still incomplete, as the contractor left the site in May 2010 due to lack of payments.
Expected output: completion of Labora Northern Uganda Youth Development Centre
(Commonwealth) piped water system in Gulu district
HSC was contracted to implement works at a cost of UShs 214,173,000 VAT exclusive. Works
commenced on 5th September 2009 and were complete in December 2009 as planned
133. A piped water
system was initially installed in October 2007, and this project sought to upgrade the existing system.
Water is flowing within the Youth Centre although the local community and the health centre are
requesting for water to be extended. This is being considered by the Gulu District Water Office, which
has been constrained by lack of access to the designs. Recently, the Centre was connected to electricity,
but this has not been extended to the pump house, hence operating costs are still high.
Expected output: completion of Lugore RGC piped water system, Palaro sub-county in Gulu
district
Kheny Technical Services Ltd. was contracted to implement the works at a cost of UShs 663,433,735
VAT exclusive. Construction supervision is being undertaken by Hydrauldic and Sanitation Consult (U)
Ltd. Construction started on 9th September 2009 and was expected to be complete in March 2010
134.
Works began in November 2009 and are still incomplete, as the contractor abandoned site in February
2010 due to non-payment. The intended beneficiaries include a military training wing and prisoners.
Progress to date includes pipes lying, drilling of a production well and the basic structure of the pump
house. Works remain unfinished and there is no piped water on site.
Expected output: completion of Madi Opei RGC piped water system, Madi Opei sub-county in
Lamwo district
133
Ministry of Water and Environment, 3rd
Progress Report for Labora Gulu Youth Centre Water Supply Project
Lot1, December 2009, pg. 1
134 Ministry of Water and Environment, 3
rd Progress Report for Construction of Lugore RGC Water Supply and
Sanitation Project, December 2009, pg. 1

357
Norrkorping was contracted to implement works at a cost of UShs 572,732,890 VAT exclusive.
Construction supervision is being undertaken by Hydrauldic and Sanitation Consult (U) Ltd. Construction
started on 10th September 2009
135. Progress has been very slow and works are still incomplete, with an
approximate 20% of works finished. The contractor abandoned the site in May 2010 due to non payment.
Outstanding works include laying pipes (the trenches have been dug and there is a risk of livestock
falling), completing the pump house and installing a reservoir tank. The sub-county has requested for
documentation of this project, including designs but this has not been forthcoming by the MWE. The sub-
county have also requested the contractor to involve local staff to promote sustainability of the system,
but this has not received a positive response.
Expected output: completion of Magoro RGC piped water system in Katakwi district
Karobwa Technical Services Ltd. was contracted to implement works at a cost of UShs 571,838,650
VAT exclusive. Construction supervision is being undertaken by Hydrauldic and Sanitation Consult (U)
Ltd. Construction works started on 11th September 2009
136 and were supposed to be complete in March
2010 but are still unfinished. The reservoir tank has not been constructed, the kiosks are still under
construction where shutters are being put in place, and the contractors have not been seen on site since
May 2010. The district was not involved in the process.
Expected output: completion of Minakulu RGC piped water system in Oyam district
The contract price for the works is UShs 525,423,109 VAT exclusive. Works commenced on 1st
September 2009 and the expected completion date was 1st March 2010. The works have been delayed,
although the contractor is on site. The remaining works include laying distribution lines, construction of
public tap stands and making connections to households. The distribution lines are uncovered and there is
a risk that livestock may fall through the trenches. A Water and Sanitation Board still has to be
appointed. The main challenge is over land compensation which is an ongoing process. The original land
owner sold the land to an institution, which is now demanding a higher level of compensation which is
unaffordable to the sub-county. The land is now being valued and compensation may be supported by the
MWE.
Expected output: completion of Orum RGC piped water system in Lira district
The contract price for the works is UShs 516,129,430 VAT exclusive. Works commenced on 31st August
2009 and the expected completion date was 1st March 2010. Construction is incomplete. There is no
reservoir tank, although the basic structure of the pump house is in place. The contractor was last seen on
site in March 2010. Again, late payments were said to be the reason the contractor left the site.
Source: Field Findings
Challenges
There are delays to all sites as the contractors have not been paid even though IFMS records
show that by the end of Q3 there was an unspent balance of UShs 65,606,310.
135
Ministry of Water and Environment, Progress Report for Construction of Madiopei RGC Water Supply and
Sanitation Project, December 2009, pg. 3
136 Ministry of Water and Environment, 3
rd Progress Report for Construction Supervision of Magoro RGC Water
Supply and Sanitation Project, Katakwi District, February 2010, pg. iii

358
In all cases the districts had limited involvement in the construction, where the site designs
and related documentation were not shared. This will have implications for the long term
sustainability of the systems once they have been handed over to the districts.
Construction of seven sanitation facilities:
Seven facilities were planned and three were monitored. The findings are presented below:
Table 3.8.4 Construction of Sanitation Facilities, School and Community IDPs Project
Expected output: construction of sanitation facility in Bukalango Prayer Palace, Kakiri Town
Council, Wakiso district
An ECOSAN is under construction by the MWE, although at the time of the monitoring visit in June
2010 the works were incomplete and there were no contractors on site. Kakiri Town Council has also
recently constructed a water borne toilet at the same site, which is of good quality and is being well
maintained. As there are two different types of facilities on the same site the implication is that it will be
harder to maintain the ECOSAN which has had limited success in public places. Furthermore, the district
and Town Council expressed concern over poor communication from the MWE.
Expected output: construction of sanitation facility in Kimuli Senior Secondary School, Rakai
district
Due to the inadequacy of existing facilities at the school, there was a ministerial intervention to construct
sanitation facilities at the school. Construction started around September 2009 and is nearly complete but
training still has to be provided. Based on past experiences, there have been challenges in using ECOSAN
facilities in public institutions, such as schools. As a result, a varied practice is being implemented which
follows a pilot in St. James Primary School in Luzira, where the treated faeces and urine is being stored
and utilised by parents and other individuals for agricultural use.
Expected output: construction of sanitation facility at MWE staff headquarters, Luzira, Kampala
The construction is almost complete and finishing touches are remaining, such as door painting. Once
New reservoir complete
as planned, Gulu Youth
Centre, Gulu district
Trenching done but left
uncovered posing a health
and safety risk, Madi Opei
RGC, Lamwo district
Incomplete construction of the pump
house, Ayara RGC, Kole district
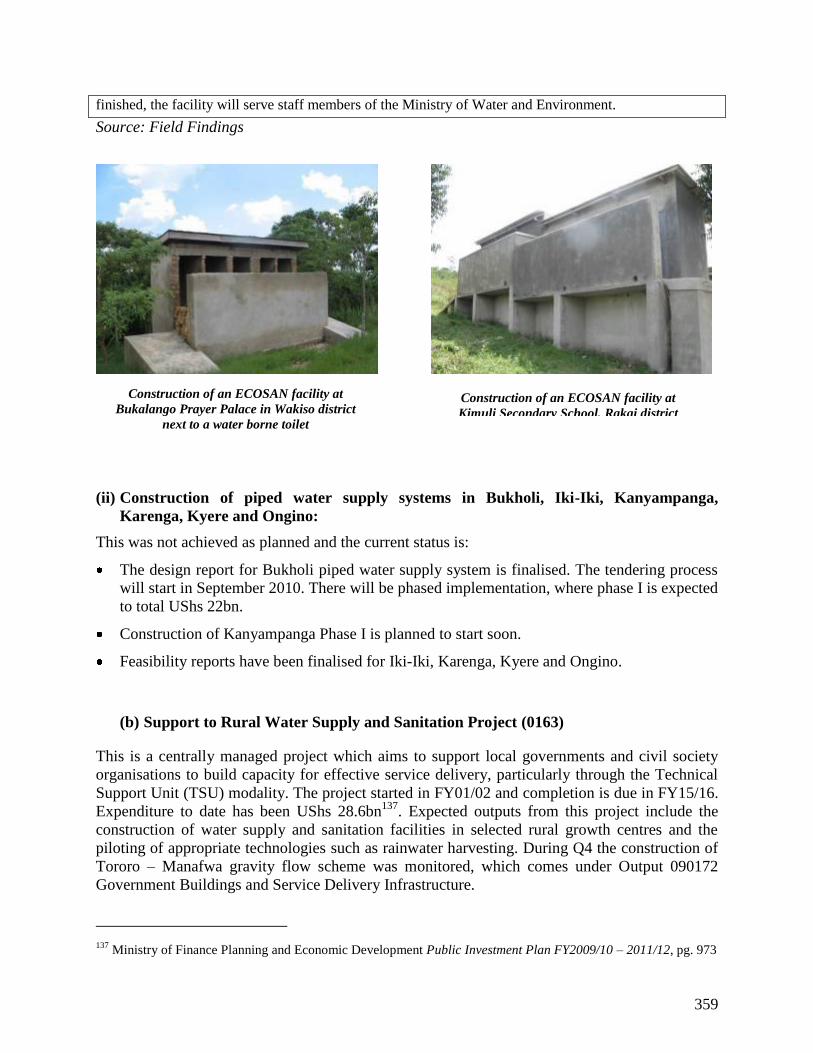
359
finished, the facility will serve staff members of the Ministry of Water and Environment.
Source: Field Findings
(ii) Construction of piped water supply systems in Bukholi, Iki-Iki, Kanyampanga,
Karenga, Kyere and Ongino:
This was not achieved as planned and the current status is:
The design report for Bukholi piped water supply system is finalised. The tendering process
will start in September 2010. There will be phased implementation, where phase I is expected
to total UShs 22bn.
Construction of Kanyampanga Phase I is planned to start soon.
Feasibility reports have been finalised for Iki-Iki, Karenga, Kyere and Ongino.
(b) Support to Rural Water Supply and Sanitation Project (0163)
This is a centrally managed project which aims to support local governments and civil society
organisations to build capacity for effective service delivery, particularly through the Technical
Support Unit (TSU) modality. The project started in FY01/02 and completion is due in FY15/16.
Expenditure to date has been UShs 28.6bn137
. Expected outputs from this project include the
construction of water supply and sanitation facilities in selected rural growth centres and the
piloting of appropriate technologies such as rainwater harvesting. During Q4 the construction of
Tororo – Manafwa gravity flow scheme was monitored, which comes under Output 090172
Government Buildings and Service Delivery Infrastructure.
137
Ministry of Finance Planning and Economic Development Public Investment Plan FY2009/10 – 2011/12, pg. 973
Construction of an ECOSAN facility at
Kimuli Secondary School, Rakai district
Construction of an ECOSAN facility at
Bukalango Prayer Palace in Wakiso district
next to a water borne toilet

360
Financial performance:
By the end of Q3 FY09/10, 105% of the total budget was released, of which expenditure was at
74%. Of the GoU expenditure, 35% was on low priority items (as 25% of total expenditure was
on allowances) and 47% was on high priority items. Overall financial performance of the project
from Q1 to Q3 FY09/10 is illustrated below:
Figure 3.8.5
Source: MFPED and MWE FY09/10
Physical performance:
A summary of performance of outputs monitored throughout FY09/10 under Support to Rural
Water Supply Project is outlined below:
Table 3.8.5 FY09/10 Performance of Support to Rural Water Supply Project (0163)
Planned
outputs
(quantity and
location)
Actual
achievements
monitored
Realisation
of target
Financial
performance
(UShs GoU
and donor)
Time of
monitoring
Explanation of
variance / comments
Output 090172 Government buildings and service delivery infrastructure
Construction of
Tororo -
Manafwa GFS
Drilling of
emergency
boreholes (No.
not specified)
Provide pipes
for Budama
Works in
progress
32 boreholes
completed in
Q3
Pipes not
On target
N/A as
target no.
not provided
Off target
Annual budget:
3.06bn
Q1 to Q3
release:
4.6bn
Q1 to Q3
expenditure:
3.45bn
Unspent
balance:
Q3, Q4 N/A
High unit costs at
18mil; not all
boreholes could be
located; WSCs
formed but not
trained.
N/A

361
Planned
outputs
(quantity and
location)
Actual
achievements
monitored
Realisation
of target
Financial
performance
(UShs GoU
and donor)
Time of
monitoring
Explanation of
variance / comments
West water
supply system
delivered
1.15bn
Output 090104 Research and development of appropriate water and sanitation technologies
400 rainwater
harvesting pilots
in Bushenyi and
Isingiro
Up-scaling iron
removal plants
324
constructed
Piloted in
Rakai, but not
up-scaled
Off target
Off target
Annual budget:
0.65bn
Q1 to Q3
release:
0.68bn
Q1 to Q3
expenditure:
0.63bn
Unspent
balance:
0.054bn
Q1, Q3
Increasing unit costs
so less achieved than
planned, but there is
still an unspent
balance.
Up-scaling strategy
being developed.
Output 090103 Promotion of sanitation and hygiene education
4 social
marketing
campaigns
undertaken in
Iganga, Kamuli,
Mbarara and
Mukono
Monitored in
Mbarara and
Kamuli
On target Annual budget:
0.39bn
Q1 to Q3
release:
0.44bn
Q1 to Q3
expenditure:
0.37bn
Unspent
balance:
0.07bn
Q1, Q3 Only 4 campaigns
planned against a
budget of 0.39bn,
yields a unit cost of
99.75mil. However,
sector officials say a
campaign costs
approx. 12mil,
implying 351mil was
over-budgeted.
Source: MFPED, MWE and Field Findings
Output 090172 Government Buildings and Service Delivery Infrastructure
A summary of operational efficiency for this output is below:
Figure 3.8.6 Financial Performance of Output 090172 Government Buildings and Service
Delivery Infrastructure and Link to Physical Performance:
The Q1 to Q3 release is higher than the
approved budget due to an increase in donor
funding. The outputs are progressing
according to plan, with the exception of
delivering pipes to Budama West. UShs
1.8bn has been paid for Tororo – Manafwa
GFS and UShs 983mil has been paid for
emergency boreholes, so the outputs are
broadly commensurate with expenditure.
DWD estimate that 90 emergency boreholes

362
Source: MFPED, MWE and Field Findings
Expected output: ongoing construction of Tororo – Manafwa gravity flow scheme
Background: Given the lack of piped water supply in Tororo and Manafwa districts this is a
long-awaited investment, which was initiated through a Presidential Pledge made in 2005. The
site was handed over to the contractor on 14th
January 2010 and the expected completion date is
28th
January 2012138
. The contract was awarded to M/S Vambeco Enterprises Ltd and
consultancy supervision of works was awarded to Alliance Consultants in association with Infra-
Consult Ltd. The contract sum is UShs 7,591,236,901 VAT exclusive, and by March 2010
UShs 1,837,670,100 had been certified. The estimated beneficiary population in 2009 is 31,804
and anon domestic population of 16,961. This yields an average per capita investment cost
(PCIC) of UShs 155,670 or US$77, which is well above the sector average of US$63.6139
. DWD
has indicated that the high PCIC is due to the use of surface water (which requires treatment) and
the bulk transfer of water across the districts of Manafwa and Tororo. The benefiting sub-
counties include Bumwoni and Bubutu in Manafwa district, and Kwapa, Mella and Molo in
Tororo district.
Field findings: Works are ongoing, where concentration of efforts is on the intake and treatment
works. In June 2010 less than 5% of the works were complete, where delays were due to
excessive rains. There is also a need to secure land for sanitation facilities and for water offices.
138
Ministry of Water and Environment, Construction of Gravity Flow Scheme in Tororo and Manafwa Districts,
Monthly Progress Report No.3, March 2010, pg. 4
139 Ministry of Water and Environment, Water and Environment Sector Performance Report 2009, October 2009,
pg. 114
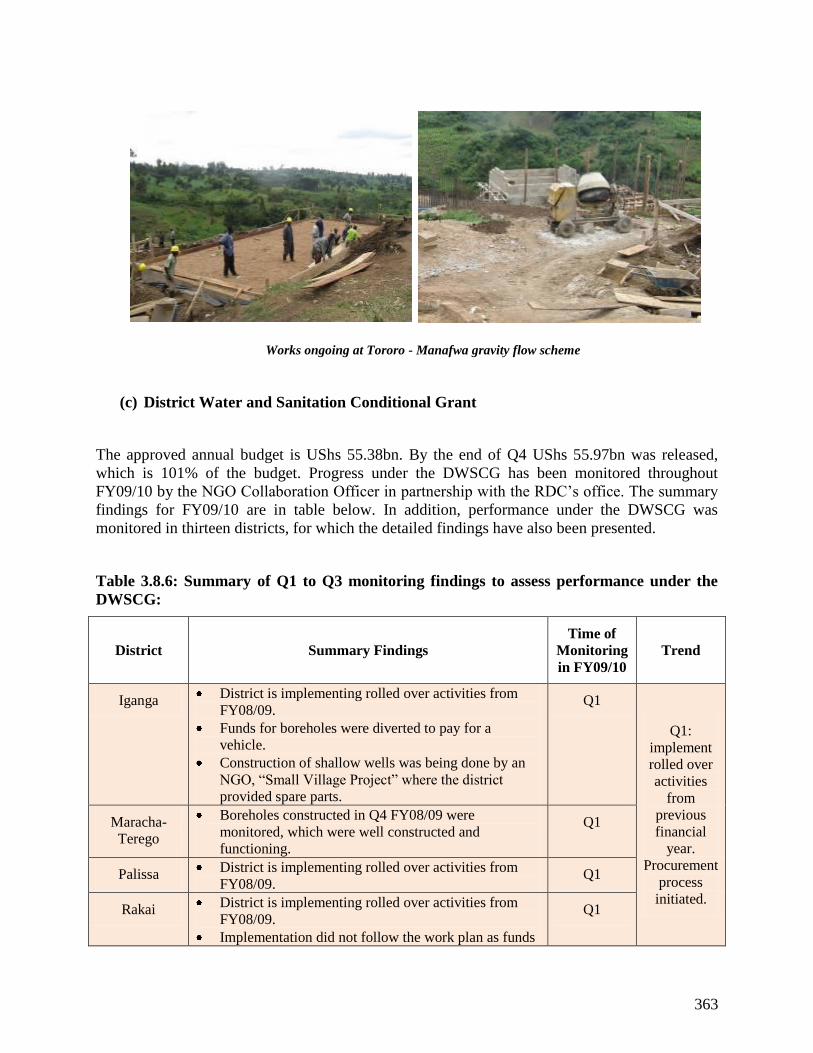
363
(c) District Water and Sanitation Conditional Grant
The approved annual budget is UShs 55.38bn. By the end of Q4 UShs 55.97bn was released,
which is 101% of the budget. Progress under the DWSCG has been monitored throughout
FY09/10 by the NGO Collaboration Officer in partnership with the RDC’s office. The summary
findings for FY09/10 are in table below. In addition, performance under the DWSCG was
monitored in thirteen districts, for which the detailed findings have also been presented.
Table 3.8.6: Summary of Q1 to Q3 monitoring findings to assess performance under the
DWSCG:
District Summary Findings
Time of
Monitoring
in FY09/10
Trend
Iganga District is implementing rolled over activities from
FY08/09.
Funds for boreholes were diverted to pay for a
vehicle.
Construction of shallow wells was being done by an
NGO, “Small Village Project” where the district
provided spare parts.
Q1
Q1:
implement
rolled over
activities
from
previous
financial
year.
Procurement
process
initiated.
Maracha-
Terego
Boreholes constructed in Q4 FY08/09 were
monitored, which were well constructed and
functioning.
Q1
Palissa District is implementing rolled over activities from
FY08/09. Q1
Rakai District is implementing rolled over activities from
FY08/09.
Implementation did not follow the work plan as funds
Q1
Works ongoing at Tororo - Manafwa gravity flow scheme
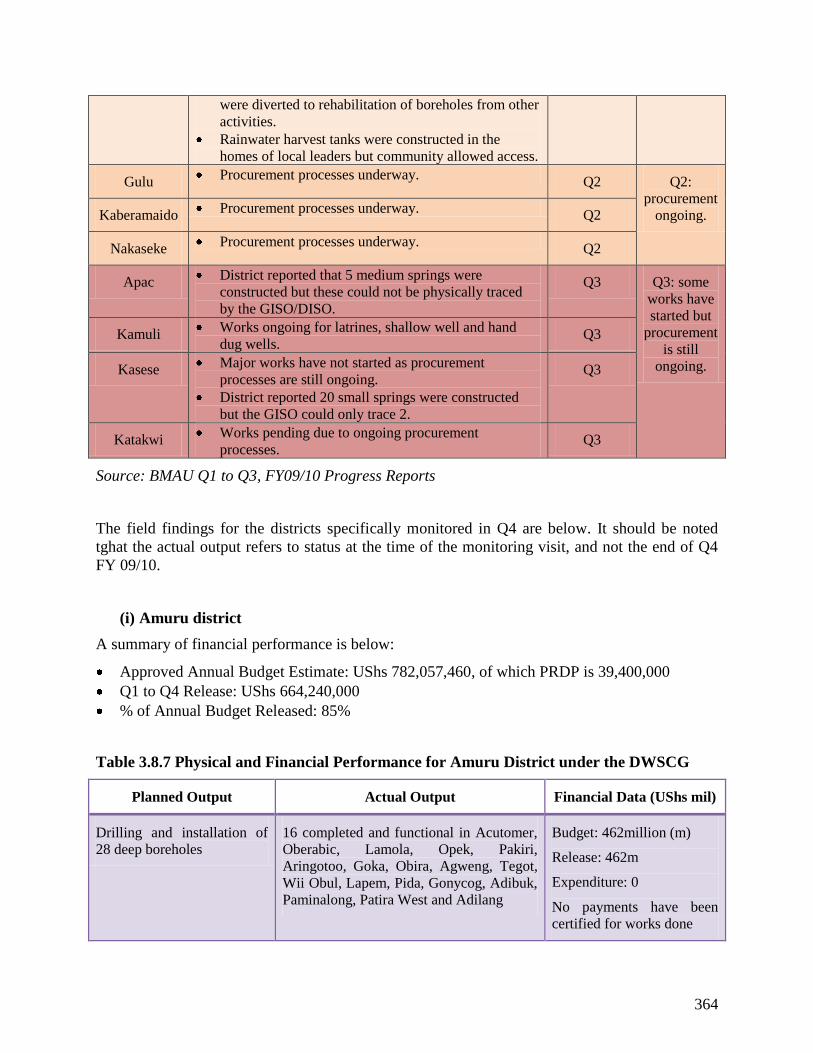
364
were diverted to rehabilitation of boreholes from other
activities.
Rainwater harvest tanks were constructed in the
homes of local leaders but community allowed access.
Gulu Procurement processes underway.
Q2 Q2:
procurement
ongoing. Kaberamaido Procurement processes underway.
Q2
Nakaseke Procurement processes underway.
Q2
Apac District reported that 5 medium springs were
constructed but these could not be physically traced
by the GISO/DISO.
Q3 Q3: some
works have
started but
procurement
is still
ongoing.
Kamuli Works ongoing for latrines, shallow well and hand
dug wells. Q3
Kasese Major works have not started as procurement
processes are still ongoing.
District reported 20 small springs were constructed
but the GISO could only trace 2.
Q3
Katakwi Works pending due to ongoing procurement
processes. Q3
Source: BMAU Q1 to Q3, FY09/10 Progress Reports
The field findings for the districts specifically monitored in Q4 are below. It should be noted
tghat the actual output refers to status at the time of the monitoring visit, and not the end of Q4
FY 09/10.
(i) Amuru district
A summary of financial performance is below:
Approved Annual Budget Estimate: UShs 782,057,460, of which PRDP is 39,400,000
Q1 to Q4 Release: UShs 664,240,000
% of Annual Budget Released: 85%
Table 3.8.7 Physical and Financial Performance for Amuru District under the DWSCG
Planned Output Actual Output Financial Data (UShs mil)
Drilling and installation of
28 deep boreholes
16 completed and functional in Acutomer,
Oberabic, Lamola, Opek, Pakiri,
Aringotoo, Goka, Obira, Agweng, Tegot,
Wii Obul, Lapem, Pida, Gonycog, Adibuk,
Paminalong, Patira West and Adilang
Budget: 462million (m)
Release: 462m
Expenditure: 0
No payments have been
certified for works done

365
Construction of 15 shallow
wells in AmuruT/C, Lamogi
SC, Pabbo SC, Alero SC,
Anaka SC, Goma SC and
Purongo SC
None has been done to date. But the money
has been committed
Budget: 104m
Release: 96m
Expenditure: 0
Construction of 4 latrines in
Amuru T/C (2 drainable
latrines); Atiak and
Abalokodi (2 ECOSAN)
Tenders had just been awarded and work
has started
Budget: 45.3m
Release: 44.5m
Expenditure: 0
Source: Field Findings and GISO / DISO Reports
(ii) Arua district
A summary of financial performance is below:
Approved Annual Budget Estimate: UShs 849,075,938, of which PRDP is 149,969,000
Q1 to Q4 Release: UShs 813,774,000
% of Annual Budget Released: 96%
Table 3.8.8 Physical and Financial Performance for Arua District under the DWSCG
Planned Output Actual Output Financial Data (UShs mil)
Construct 12 protected
springs
Work ongoing in Ayava, Ekalawa,Tiba,
Ombaranya, Ewuata, Alivu, Egaa, IdriAiia,
Ozukuva, Odruu and Arava
Budget: 66m
Release: 66m
Expenditure: 44.9m
Construction of 6 hand dug
wells
4 have been completed and 2 are ongoing
in the areas of Ayikoze and Oniva
Budget: 36m
Release: 36m
Expenditure: 34.7m
Drilling 6 motorised shallow
wells
All the 6 have been drilled and are
completed in Ewazoku. Ayivu, Otriku,
Okuozoku, Opebaku, Andifeku B
Budget: 49m
Release: 49m
Expenditure: 41.9m
Designing 1 GFS The GFS is on going in Ogoko RGC Budget: 30m
Release: 30m
Expenditure: 25m
Drilling 21 deep wells in
Arivu,Logiri, Pajuru, Oluko,
Adumu,Vurra, Dadamu,
Ajia, Manibe, Aroi
All work completed but the DWO did not
share all the information on the locations
and financial data. SNV is actively
constructing water points in Arua, and
have not been informed by the district if
counterpart funding is available.
Budget: 327m
Release: not provided
Expenditure: not provided
Source: Field Findings and GISO / DISO Reports

366
(iii) Iganga District
A summary of financial performance is below:
Approved Annual Budget Estimate: UShs 804,169,084
Q1 to Q4 Release: UShs 763,233,000
% of Annual Budget Released: 95%
Table 3.8.9 Physical and Financial Performance for Iganga District under the DWSCG
Planned Output Actual Output Financial Data (UShs
million)
Drilling and installation of
20 deep wells
10 were completed and are operational
Irongo SC, Nawandala SC, Bulongo SC,
Nawampiti SC, and in Ikumbya SC. 10
contracts signed in Nakigo SC, Igombe,
Namalenba SC, Namungalwe SC,
Nambale SC, Nabitende SC, Matumu SC,
Nakalama SC
Budget: 326m
Release: not provided
Expenditure: 206m
Construction of 16 motorised
shallow wells
Citing completed for all the 16, and 8 have
been drilled in the areas of Ikumbya,
Bukoona, Nakawa, Nawandhala,
Nakalama, Nakigo, Buynga and Kitikiiro
Budget: 166.4m
Release: not provided
Expenditure: 16.7m
Construction of 4 protection
springs
Locations have been cited and tenders
awarded in Igombe SC and Makutu SC
Budget: 10m
Release: not provided
Expenditure: 2m
Construction of 20 hand dug
wells
The district contributed towards spare
materials and the construction was done by
an NGO called Small Village Water
Project in Buwooya, Nakabugu, Nabugo,
Nawansinge, Nawansisi,
Buyanga, Nawampiti, Nakisiga
Budget: 30m
Release: not provided
Expenditure: 30m
Rehabilitation of 3 deep
wells in Buyanga SC,
Nambale SC and Waibuga
SC
No works have started Budget: 13.5m
Release: not provided
Expenditure: not provided
Construction of 3 RGC
latrines and 1 Ecosan
Bunyiro, Bulamagi and
Ibulanku
2 ongoing; no land has been secured for
the 3rd
site in Ibulanku
Budget: 24m
Release: not provided
Expenditure: 8.6m
Source: Field Findings and GISO / DISO Reports

367
(iv) Jinja district
A summary of financial performance is below:
Approved Annual Budget Estimate: UShs 804,169,084
Q1 to Q4 Release: UShs 763,233,000
% of Annual Budget Released: 95%
Table 3.8.10 Physical and Financial Performance for Jinja District under the DWSCG
Planned Output Actual Output Financial Data (UShs
million)
Drilling and installation of
24 deep boreholes
16 completed and functional in
Nabitambala, Kisizi, Namulondo,
Kinyonyi, Bulinda, Katalakabi, Kiyumba,
Mesulam, Namazala, Lukolo West,
Nakanyonyi, Buwenge Central, Kagera
Central, Lumuli, Kabowa, Iwololo. But not
all were done by the district
Budget: 384m
Release: 384m
Expenditure: 256m
Construction of 8 motorised
medium wells in Iwololoa,
Muguluka West, Magamaga
East, Bukyebambe B,
Bulinda, Lwanda, Kisasi,
Buwolero Igombe
8 constructed: 6 completed and 2 ongoing Budget:74m
Release: 74m
Expenditure: 60m
Construction of 9 hand dug
shallow wells
7 have been completed and 2 in Bukolwa
and Yuuka are being drilled.
Budget: 54m
Release: 54m
Expenditure: 42m
Construction of 5 spring
wells
5 achieved in Kivubuka B, Kigaya, Kigaya
Butiki-Mataala and Bugobya the suggested
areas (according to the GISOs, 2 of these
were constructed in FY08/09)
Budget: 17.5m
Release: 17.5m
Expenditure: 17.5m
Construction of 4 VIP
public latrines in Lukolo,
Nawampanda, Mawoito,
Budumbula RGCs
Nothing has been done so far due to the
slow procurement process
Budget: 30m
Release: 30m
Expenditure: 0
Construction of 1 ECOSAN
toilet in Lubani T/C
Work had just started due to the slow
procurement process
Budget: 15m
Release:15m
Expenditure: 10m
Source: Field Findings and GISO / DISO Reports

368
(v) Kayunga District
A summary of financial performance is below:
Approved Annual Budget Estimate: UShs 552,996,102
Q1 to Q4 Release: UShs 524,846,000
% of Annual Budget Released: 95%
Table 3.8.11 Physical and Financial Performance for Kayunga District under the DWSCG
Planned Output Actual Output Financial Data (UShs
million)
Construction of 13 deep
wells
12 successfully drilled and are functional
in the areas of Nabityanka, Kyamuletere,
Kasolokamponye, Kakyika, Nkokonjeru,
Nnongo, Kyaato III, Namabuga, Kyampisi,
Bisaka, Bumaalio and Jiira
Budget:188.5m
Release:172.3m
Expenditure: 88.4m
Construction of 7 hand dug
wells
Work still in Kangulumira SC, Nazigo SC,
Kayunga SC
Budget: 35m
Release: 29.8m
Expenditure: 10m
Rehabilitation of 14
boreholes
11 were rehabilitated and are functional in
Kigayaza, Kyampisi, Bisaka, Bumali,
Nnongoto, Kyato, Kitimbwa and
Namabuga
Budget: 41.3m
Release: 39.2m
Expenditure: 37m
Construction of GFS Phase 1 of the project has been completed Budget: 150m
Jinja district reported construction of this borehole
at Mpumwire Muslim P/S but it was actually drilled
by friends of the school from South Africa in 2007
Drilling complete at Nakasongola Prison but
pumps need to be installed

369
in Nazigo Release:
Expenditure: 141m
Hydro-geological citing,
design and supervision for 7
hand dug wells and 13 bore
holes
Activity was carried out in Kangulumira
SC, Nazigo SC, Galiraaya SC, Kayonza
SC, KitimbwaSC, Kangulumira SC,
Bbaale SC, Nazogo SC and Busaana SC
and Kayunga SC
Budget: not provided
Release: not provided
Expenditure: 23.3m– not all
payments are complete
Source: Field Findings and GISO / DISO Reports
(vi) Kitgum District
A summary of financial performance is below:
Approved Annual Budget Estimate: UShs 1,159,203,486 of which PRDP is UShs
376,519,000
Q1 to Q4 Release: UShs 1,100,195,000
% of Annual Budget Released: 95%
Table 3.8.12 Physical and Financial Performance for Kitgum District under the DWSCG
Planned Output Actual Output Financial Data (UShs
million)
Construction of 7 deep wells 6 bore holes constructed in Lokung, Padibe
East, Paloga, Agoro, Madi Opei
Budget: 156m
Release: not provided
Expenditure: 147m
Construction of 10 deep
wells
8 deep wells constructed in Oroma,
Namokoro, Omiya Anyima, Kitgum
Matidi, Lagoro, Layamo, Akwang and
Palabek Kal
Budget: 223m
Release: not provided
Expenditure: 210m
Construction of 5 bore holes 5 bore holes were constructed in Madi
Opei, Mucwini, Agoro, Paloga,
Padibe East
Budget: 111m
Release: not provided
Expenditure: 105m
Construction of 20 deep
wells
19 bore holes constructed in Palabek,
Orom NamakoraA Namakora B, Omayim,
Anyima, Kitgum, Matidi, LagoroA ,
Lagoro B, Agoro A and Agoro B, Palogo,
Ogiri, Omiya, Akwanga, Amidi, Mucwini,
Amida
Budget: 447m
Release: not provided
Expenditure: 420mil
Construction of 3 drainable
latrines in Atwoli Market in
Padibe, Ogili Market in
Palabec and Anyima Market
in Omiya
2 completed and 1 ongoing in the proposed
sites
Budget: 40.7m
Release: not provided
Expenditure: 39m
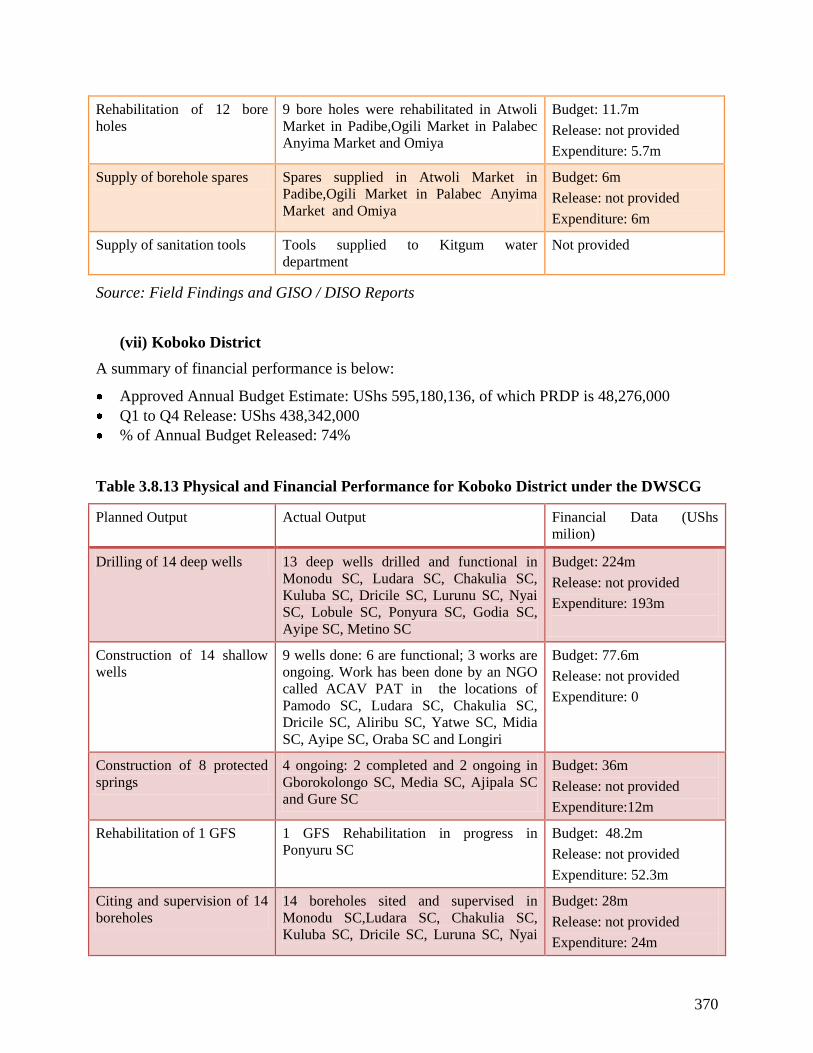
370
Rehabilitation of 12 bore
holes
9 bore holes were rehabilitated in Atwoli
Market in Padibe,Ogili Market in Palabec
Anyima Market and Omiya
Budget: 11.7m
Release: not provided
Expenditure: 5.7m
Supply of borehole spares Spares supplied in Atwoli Market in
Padibe,Ogili Market in Palabec Anyima
Market and Omiya
Budget: 6m
Release: not provided
Expenditure: 6m
Supply of sanitation tools Tools supplied to Kitgum water
department
Not provided
Source: Field Findings and GISO / DISO Reports
(vii) Koboko District
A summary of financial performance is below:
Approved Annual Budget Estimate: UShs 595,180,136, of which PRDP is 48,276,000
Q1 to Q4 Release: UShs 438,342,000
% of Annual Budget Released: 74%
Table 3.8.13 Physical and Financial Performance for Koboko District under the DWSCG
Planned Output Actual Output Financial Data (UShs
milion)
Drilling of 14 deep wells 13 deep wells drilled and functional in
Monodu SC, Ludara SC, Chakulia SC,
Kuluba SC, Dricile SC, Lurunu SC, Nyai
SC, Lobule SC, Ponyura SC, Godia SC,
Ayipe SC, Metino SC
Budget: 224m
Release: not provided
Expenditure: 193m
Construction of 14 shallow
wells
9 wells done: 6 are functional; 3 works are
ongoing. Work has been done by an NGO
called ACAV PAT in the locations of
Pamodo SC, Ludara SC, Chakulia SC,
Dricile SC, Aliribu SC, Yatwe SC, Midia
SC, Ayipe SC, Oraba SC and Longiri
Budget: 77.6m
Release: not provided
Expenditure: 0
Construction of 8 protected
springs
4 ongoing: 2 completed and 2 ongoing in
Gborokolongo SC, Media SC, Ajipala SC
and Gure SC
Budget: 36m
Release: not provided
Expenditure:12m
Rehabilitation of 1 GFS 1 GFS Rehabilitation in progress in
Ponyuru SC
Budget: 48.2m
Release: not provided
Expenditure: 52.3m
Citing and supervision of 14
boreholes
14 boreholes sited and supervised in
Monodu SC,Ludara SC, Chakulia SC,
Kuluba SC, Dricile SC, Luruna SC, Nyai
Budget: 28m
Release: not provided
Expenditure: 24m
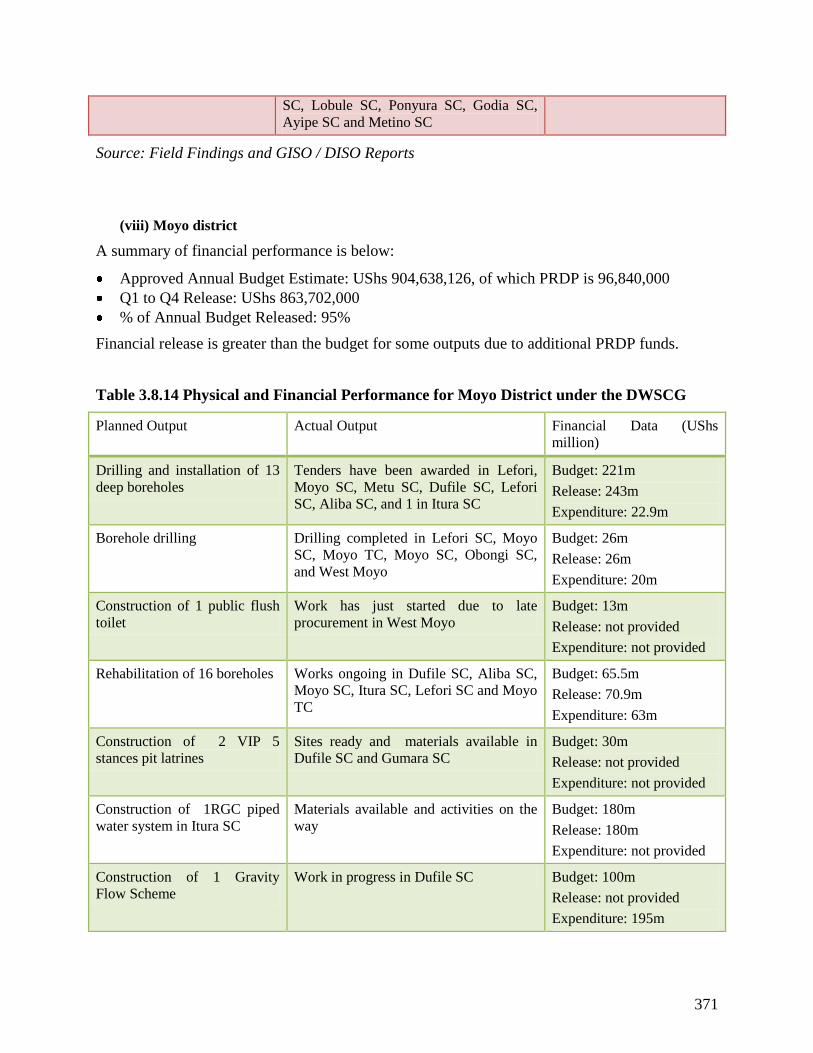
371
SC, Lobule SC, Ponyura SC, Godia SC,
Ayipe SC and Metino SC
Source: Field Findings and GISO / DISO Reports
(viii) Moyo district
A summary of financial performance is below:
Approved Annual Budget Estimate: UShs 904,638,126, of which PRDP is 96,840,000
Q1 to Q4 Release: UShs 863,702,000
% of Annual Budget Released: 95%
Financial release is greater than the budget for some outputs due to additional PRDP funds.
Table 3.8.14 Physical and Financial Performance for Moyo District under the DWSCG
Planned Output Actual Output Financial Data (UShs
million)
Drilling and installation of 13
deep boreholes
Tenders have been awarded in Lefori,
Moyo SC, Metu SC, Dufile SC, Lefori
SC, Aliba SC, and 1 in Itura SC
Budget: 221m
Release: 243m
Expenditure: 22.9m
Borehole drilling Drilling completed in Lefori SC, Moyo
SC, Moyo TC, Moyo SC, Obongi SC,
and West Moyo
Budget: 26m
Release: 26m
Expenditure: 20m
Construction of 1 public flush
toilet
Work has just started due to late
procurement in West Moyo
Budget: 13m
Release: not provided
Expenditure: not provided
Rehabilitation of 16 boreholes Works ongoing in Dufile SC, Aliba SC,
Moyo SC, Itura SC, Lefori SC and Moyo
TC
Budget: 65.5m
Release: 70.9m
Expenditure: 63m
Construction of 2 VIP 5
stances pit latrines
Sites ready and materials available in
Dufile SC and Gumara SC
Budget: 30m
Release: not provided
Expenditure: not provided
Construction of 1RGC piped
water system in Itura SC
Materials available and activities on the
way
Budget: 180m
Release: 180m
Expenditure: not provided
Construction of 1 Gravity
Flow Scheme
Work in progress in Dufile SC Budget: 100m
Release: not provided
Expenditure: 195m
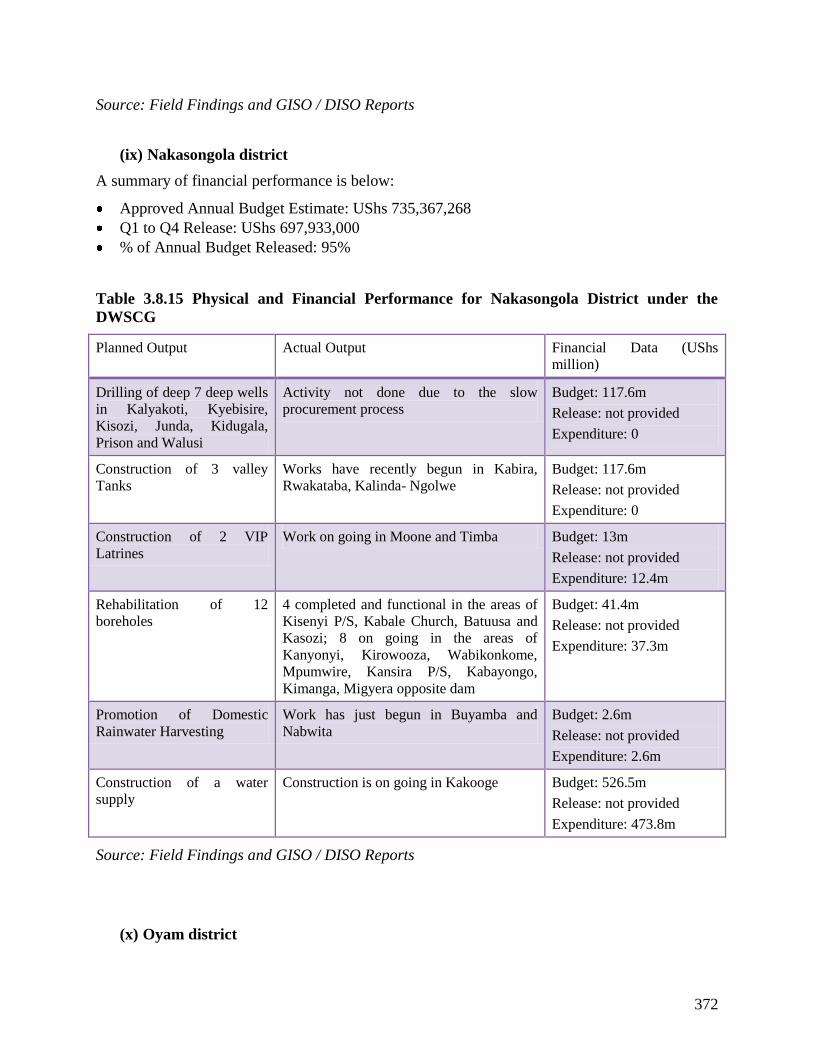
372
Source: Field Findings and GISO / DISO Reports
(ix) Nakasongola district
A summary of financial performance is below:
Approved Annual Budget Estimate: UShs 735,367,268
Q1 to Q4 Release: UShs 697,933,000
% of Annual Budget Released: 95%
Table 3.8.15 Physical and Financial Performance for Nakasongola District under the
DWSCG
Planned Output Actual Output Financial Data (UShs
million)
Drilling of deep 7 deep wells
in Kalyakoti, Kyebisire,
Kisozi, Junda, Kidugala,
Prison and Walusi
Activity not done due to the slow
procurement process
Budget: 117.6m
Release: not provided
Expenditure: 0
Construction of 3 valley
Tanks
Works have recently begun in Kabira,
Rwakataba, Kalinda- Ngolwe
Budget: 117.6m
Release: not provided
Expenditure: 0
Construction of 2 VIP
Latrines
Work on going in Moone and Timba Budget: 13m
Release: not provided
Expenditure: 12.4m
Rehabilitation of 12
boreholes
4 completed and functional in the areas of
Kisenyi P/S, Kabale Church, Batuusa and
Kasozi; 8 on going in the areas of
Kanyonyi, Kirowooza, Wabikonkome,
Mpumwire, Kansira P/S, Kabayongo,
Kimanga, Migyera opposite dam
Budget: 41.4m
Release: not provided
Expenditure: 37.3m
Promotion of Domestic
Rainwater Harvesting
Work has just begun in Buyamba and
Nabwita
Budget: 2.6m
Release: not provided
Expenditure: 2.6m
Construction of a water
supply
Construction is on going in Kakooge Budget: 526.5m
Release: not provided
Expenditure: 473.8m
Source: Field Findings and GISO / DISO Reports
(x) Oyam district

373
A summary of financial performance is below:
Approved Annual Budget Estimate: UShs 942,215,000, of which PRDP is 508,160,000
Q1 to Q4 Release: UShs 982,117,000
% of Annual Budget Released: 104%
Table 3.8.16 Physical and Financial Performance for Oyam District under the DWSCG
Planned Output Actual Output Financial Data (UShs
million)
Construction of 7 spring
wells
7 spring wells completed in Minakulu SC,
Ngai SC, Acaba SC, Iceme SC and Otwalo
SC
Budget: 24.5m
Release: not provided
Expenditure: 6.76m
Rehabilitation of 20
boreholes
10 boreholes rehabilitated in Otwalo SC,
Minakulu SC, Ngai SC, Loro SC and
Iceme SC
Budget: 34m
Release: 29.9m
Expenditure: 26.6m
Construction of 21
motorised shallow wells
10 are completed and functional in the
areas of Lero, Aceme SC, Aber SC and in
Acaba SC
Budget: 126m
Release: 60m
Expenditure: 55.8m
Construction of 4 production
wells
2 have been completed in Aber SC and
Otwal SC
Budget: 170m
Release: 8.5m
Expenditure: 7.5m
Construction of 4 deep wells None have been constructed Budget: 63.5m
Release: not provided
Expenditure: 0
Source: Field Findings and GISO / DISO Reports
(xi) Pader district
A summary of financial performance is below:
Approved Annual Budget Estimate: UShs 1,026,008,729, of which PRDP is UShs
463,167,000
Q1 to Q4 Release: UShs 998,241,000
% of Annual Budget Released: 97%
Table 3.8.17 Physical and Financial Performance for Pader District under the DWSCG
Planned Output Actual Output Financial Data (UShs
million)

374
Drilling of 42 deep wells 32 were attempted: 21 are complete, 1
failed,1 was not done and 9 are on going
Budget: 882m
Release: not provided
Expenditure: 798m
Rehabilitation of 15
boreholes
15 bore holes rehabilitated and completed
in Dure, Central Ward, Odwor, Adilang
T/C, Atut Arweny, Adongkena, Rachkoko
Trading Centre, Acholibur Centre, Ogong
Budget: 60m
Release: not provided
Expenditure: 46.8m
Construction of 11 shallow
wells
11 wells completed in lagile, Oret, Gem
Central, Latigi, Gojan, Ademi, Awondwee,
Polcani, Ogong, Ngekidi, Oryang
Budget: 77m
Release: not provided
Expenditure: 71.5m
Construction of 7 protected
springs
7 protected springs constructed in Awere,
Omot, Adilang, Pajule, Atanga, Puranga,
Patango
Budget: 35m
Release: not provided
Expenditure: 28m
Source: Field Findings and GISO / DISO Reports
(xii) Wakiso District
A summary of financial performance is below:
Approved Annual Budget Estimate: UShs 734,842,110
Q1 to Q4 Release: UShs 814,697,000
% of Annual Budget Released: 111%
Table 3.8.18 Physical and Financial Performance for Wakiso District under the DWSCG
Planned Output Actual Output Financial Data (UShs million)
Rehabilitation of 7 boreholes 6 bore holes rehabilitated all in
Busukuma SC
Budget: 24.5m
Release: not provided
Expenditure: 21m
(Committed )
Construction of 7 deep wells Activity ongoing. Citing is
complete for 3 locations and pipes
have to be installed in the other
locations
Budget: 122m
Release: 17m
Expenditure: not provided
Construction of 20 shallow
well
12 are ongoing in Ssisa, Gombe,
Busukuma, Nangabo, Nsangi,
Namayumba, Masulita, Wakiso
Budget: 100m
Release: not provided
Expenditure: 60m
Construction of 4 motorised
shallow wells Gombe,
Work still pending only 2 have been Budget: not provided

375
Kakiri, Masulita and Siisa cited Release: not provided
Expenditure: not provided
Source: Field Findings and GISO / DISO Reports
(xiii) Yumbe district
A summary of financial performance is below:
Approved Annual Budget Estimate: UShs 900,807,800, of which PRDP is UShs 121,074,000
Q1 to Q4 Release: UShs 677,763,000
% of Annual Budget Released: 75%
Table 3.8.19 Physical and Financial Performance for Yumbe District under the DWSCG
Planned Output Actual Output Financial Data (UShs
million)
Drilling of 24 deep boreholes 24 deep wells completed and in use in
Romogi SC, Kei SC, Kn. Apo SC,
Drajiuru SC, Odravu SC and Midigo SC
Budget: 408m
Release: 338m
Expenditure: 338m
Construction of 6 shallow
wells
6 shallow wells constructed in Drajin SC,
Kuru SC, Kei SC and Midigo SC
Budget: 39.6m
Release: 39.6m
Expenditure: 39.6m
Rehabilitation of 6 boreholes 6 bore holes rehabilitated in Kuru SC,
Kei SC, Romogi SC, and Odravu SC
Budget: 30m
Release: 23.2m
Expenditure: 23.2m
Construction of 1 public
latrine
Project ongoing excavation done in Lobe
SC
Budget: 11.7m
Release: 16.5m (additional
funds used from PRDP)
Expenditure:16.5
Construction of 1 GFS On going with 3 private connections in
Kuru SC, Odravu SC
Budget: 121m
Release: 121m
Expenditure: 121m
Borehole citing and
supervision of 24 sites
24 boreholes cited designed and
supervised in Romogi SC, Kei SC, Kn.
Apo SC, Drajiuru SC, Odravu SC and
Midigo SC
Budget: 48m
Release: 32.5m
Expenditure: 32.5m
Source: Field Findings and GISO / DISO Reports
Summary of challenges
376
Procurement: Completion of outputs stated in the work plan has been delayed in all districts
due to prolonged procurement procedures.
Implementation by NGOs and Development Partners: In the districts of Arua, Iganga and
Koboko it was observed that outputs in the work plan were completed by NGOs and
Development Partners, although the funding source was not indicated in reports submitted to
MWE and MFPED.
General works account: In certain districts such as Koboko funds were diverted away from
water activities to the general works, as the District Water Officer is not the vote controller.
(d) Promoting environmental sanitation and hygiene
Background: In FY08/09, access to improved sanitation was at 68% for rural households and
73% for urban households against targets of 69% and 77% respectively140
. There are far reaching
benefits of improved environmental sanitation and hygiene, such as lowering the risk of
waterborne diarrheal diseases. A recent study by the World Health Organisation provides
evidence that a US$1 investment in sanitation in Sub-Saharan Africa would result in a benefit of
US$6.6, calculated as the related health cost savings and productivity benefits141
. Despite this
impressive cost benefit ratio, sanitation is under-prioritised and implementation is fragmented.
To address this, MFPED established a sanitation conditional grant in March 2009, although no
funds have been allocated. Hence, the field visits sought to determine how funds available for
sanitation and hygiene are being utilised with recommendations for future funding. The districts
visited include Wakiso, Mukono, Mubende, Rakai and Kaliro, since with the exception of
Wakiso the rest have “model villages142
” which should offer lessons learnt on successful
implementation that can be shared with other districts.
Financing available for environmental sanitation and hygiene:
There are three main streams of on-budget financing:
The District Water and Sanitation Conditional Grant under the Ministry of Water and
Environment. In FY10/11 8% has been allocated to “software” which is a reduction from
11% in FY09/10. However, this guideline is not observed and there is under spending on
sanitation, where in FY08/09 only 3% was spent on the sanitation budget line143
.
140
Ministry of Water and Environment, Water and Environment Sector Progress Report, October 2009, pg. viii
141 World Health Organisation, Economic and Health Effects of Increasing Coverage of Low-Cost Household
Drinking-Water Supply and Sanitation Interventions to Countries Off-Track to Meet the MDG Target 10, Geneva
2007, pg. 20
142 Each of the eight TSU’s selects one model village which is the best performing in terms of sanitation and other
related human development indicators, including food security and health.
143 Ministry of Water and Environment, Water and Environment Sector Performance Report 2009, October 2009,
pg. 133

377
The Primary Health Care non-wage Conditional Grant (PHCCG) under the Ministry of
Health. It is estimated that only 2% is actually used to improve sanitation according to a 2006
DWD commissioned study on sanitation and hygiene144
.
School Facilities Grant (SFG) under the Ministry of Education and Sports. A significant
proportion of this grant is intended for school sanitation.
In addition, off-budget financing for environmental sanitation and hygiene can be sourced from
household/individual investment, non-governmental organisations and UN agencies, and
investments by the private sector.
Coordination in implementation
A Memorandum of Understanding exists between the three line ministries: MWE is responsible
for sewerage services and public facilities in towns and RGCs, MOH is responsible for
household sanitation and hygiene, and MES is responsible for school latrine construction and
hygiene education. However, these roles and responsibilities are not implemented in practice.
For example, sanitation campaigns which focus on household sanitation are primarily financed
from the DWSCG, but implemented by the District Health Inspector and health extension
workers who receive allowances from the DWSCG.
Under prioritisation of sanitation was also noted, where institutions focus on their core mandates
over sanitation, such as water development for the MWE, pupil-teacher ratio for the MES and
drugs supply for the MOH. Hence, in an emergency situation, funds for sanitation are the first in
line to be diverted. This was the case in Mubende and Wakiso district, where latrines were not
constructed even though they were in the work plan, and funds for sanitation software were used
for gathering data on mapping water points.
Box 3.8.1 Sanitation Campaigns and Model Villages
One of the main focuses of sanitation activities in districts is the implementation of household
sanitation campaigns, which usually focus on only one village in an entire district. The campaign
is coordinated by the water and health departments, with oversight from the Technical Support
Units (TSU), which come under the remit of the MWE. A campaign involves village level
sensitisation and household visits, which are led by sub-county health extension workers.
Household sanitation performance is assessed through a checklist, which includes indicators such
as latrine construction, evidence of agricultural productivity with a separate area for poultry,
hand washing facilities and general cleanliness of the compound. Households do not receive
monetary incentives and so emphasis is on the use of readily available local materials. The most
144
The World Bank, Environmental Sanitation in Uganda: Addressing Institutional and Financial Challenges, June
2008, pg.34

378
successful village in a TSU region is then known as the “model village” and households receive
prizes for their efforts. TSU’s are allocated approximately UShs 5mil for awarding prizes. Each
model village proceeds to compete at the national level. In determining what makes a model
village, there were some common themes of success highlighted by district officials and
beneficiaries, which contribute to behaviour change:
Strong local / political leadership. The most concrete example was through the enactment of
sanitation ordinances, where local leaders would “name and shame” and / or penalise
households without a latrine;
Beneficiaries were motivated by appreciation from others and recognised success, including
receipt of visitors and prizes;
Active sensitisation by health assistant workers, with emphasis on disease prevention.
A gender related observation is that it was mostly the women in households who took
responsibility for implementing changes;
Involvement of individuals and NGOs. For example in Rakai district the UNDP Millennium
Village Project supported 3 model villages in FY08/09, as well as World Vision and other
local NGOs.
Where the campaigns are successful there are clear benefits:
“The campaign gave us the motivation to improve our households. Before, the campaign our
children used to fall sick, especially with malaria and diarrhoea but now they no longer fall
sick.”Beneficiary, Kaliro district
“Since our house was recognised in the campaign my husband keeps on praising me and
encourages me to continue.” Beneficiary, Mukono district
Source: Field Findings
Recommendations:
Given the under-prioritisation of sanitation, and the risk of diverting funds to other priorities
(such as the recent reduction in funds to the sanitation budget line under the DWSCG in favour
of rehabilitating water sources), the line ministries need to show commitment by allocating
resources directly to the Sanitation Conditional Grant. It should be stressed that resources need
to be allocated by all the line ministries to promote joint responsibility and commitment. Some
commitments to date have been recognised: the MWE has demonstrable high level political
support for sanitation, and has established the output code “promotion of sanitation and hygiene
education” within its budget; and the MES had allocated a large portion of the SFG to school
latrine construction in FY09/10, although this was largely disputed by local government officials
and diverted to other priorities. Hence, the need to ring-fence funds for sanitation should be
stressed with clear guidelines on the operation of the conditional grant.
One immediate source of funding from the MWE could be from the vote function rural water
supply and sanitation centralised services from “output 090103 promotion of sanitation and
hygiene education.” One of the key components under this output is the implementation of

379
sanitation campaigns, which is already undertaken jointly with local health workers, as indicated
in the section on sanitation campaigns and model villages. Similarly, the other line ministries
should also make proposals on where resources can be allocated for sanitation within the existing
budgets. Once this level of commitment has been indicated by the line ministries, the MFPED
can consider allocating additional resources. When considering funding requirements, the cost
effectiveness of implementing sanitation activities should be stressed, where one sanitation
campaign costs approximately UShs 8-10mil. Furthermore, the line ministries, the MFPED and
Ministry of Public Service (MOPS) need to come to an agreement on which institution would be
responsible for the sanitation conditional grant, as soon as possible to initialise operation.
3.8.3. Urban Water Supply and Sanitation Vote Function
This vote function contributes to the sector objective of “Provision of viable urban water supply
and sewerage/sanitation systems for domestic, industrial and commercial uses.” Under the vote
Ministry of Water and Environment, urban water supply and sanitation was allocated UShs
Use of a “tippy tap” as a hand washing facility
to avoid wastage of water
Plot of agricultural land to promote food security Use of an energy saving stove in Kaliro district
Construction of a pit latrine

380
24.5bn in FY09/10 which is 13% of the sector budget145
. Under the vote Local Governments,
urban water supply and sanitation services (Operations and Maintenance Grant) was allocated
UShs 2.3bn in FY09/10, which is only 1% of the sector budget146
.
Allocations to urban water supply and sanitation services have declined since FY07/08, although
there is an increase planned in FY10/11, where the total sector allocation including centralised
and decentralised services is UShs 26.8bn in FY09/10 and UShs 33bn in FY10/11. This
translates to 16% of the sector budget in FY09/10 and 15% of the sector budget in FY10/11.
Thus the increase in funding allocation has not resulted in a higher proportion of the budget
being allocated to urban water services. Over the medium term, allocation to decentralised urban
water services is projected to remain at only 1% of the sector budget. This has implications for
the long-term functionality of piped water systems and indicates lack of prioritisation for
operations and maintenance. The overall funding trends for urban water supply and sanitation
services are presented below:
Figure 3.8.7
Source: MFPED
145
Ministry of Finance, Planning and Economic Development, National Budget Framework Paper FY2010/11-
FY2014/15, May 2010, pp. 280-3
146 Ibid

381
Figure 3.8.8
Source: MFPED
(a) Support to Small Towns Water Supply and Sanitation Project (0164)
This is a countrywide programme financed by GoU, DANIDA and GTZ under the Joint
Partnership Fund, which started in 1999 and is due to be complete in 2013. The project aims to
construct water supply and sanitation facilities, conduct community sensitisation and build the
capacity of water authorities and systems operators. This project incorporates the Output Based
Aid component, an off-budget item where the payment of aid is linked to the delivery of basic
services such as connections to piped water in poor households. Achievements have to be
independently verified before a payment is made. In Q4 restoration of the functionality of
Migyera piped water system in Nakasongola and completion of designs was monitored.
Financial performance
By the end of Q3 FY09/10, 81% of the budget was released, of which expenditure was at 71%.
Analysis of Q3 GoU FY09/10 expenditure showed that 8% was on low priority items and 56%
was on high priority items.

382
Figure 3.8.9
Source: MFPED and MWE FY09/10
Physical performance
Table 3.8.20 FY09/10 Performance of Support to Small Towns Water Supply and
Sanitation (0164)
Planned outputs
(quantity and
location)
Actual
achievements
monitored
Realisation
of target
Financial
performance
(UShs GoU
and donor)
Time of
monitoring
Explanation of
variance /
comments
(090204)
Functionality of
piped water systems
restored in
Kalangala, Migyera
(Nakasongola
district)
Migyera piped
water system
Off target
Annual budget:
0.8bn
Q1 to Q3
release:
0.78bn
Q1 to Q3
expenditure:
0.69bn
Unspent
balance:
0.088bn
Q4 DWD made
efforts to restore
functionality but
there was a
further
breakdown.

383
(090272)
Completion of 5
designs (Busolwe,
Butaleja, Katovu
Lukaya and Tiriniyi-
Kibuku);
Construction of
Butaleja, Kagadi,
Kisoko, Nakaseke,
Tirinyi and piped
water systems
(Off-budget –
Output Based Aid)
Completion of 4
water supply
schemes in Magale,
Masafu,
Namutumba, Sipi,
Expansion of 6
water supply
systems in
Kachumbala,
Kalisizo, Luweero,
Rukungiri, Wakiso,
and Wobulenzi
Designs
completed as
planned
Construction
of new
systems not
started
Construction
ongoing for
Namatumba,
Magale,
Masafu, Sipi
Expansion
ongoing but
there are
problems in
Rukungiri
Off target
Off target
Off target
Annual budget:
4.19bn
Q1 to Q3
release:
3.39bn
Q1 to Q3
expenditure:
2.53bn
Unspent
balance:
0.86bn
Q4
Q2
Q2
Construction not
started as DWD
was focusing on
activities outside
of the work plan.
Private
contractors have
lacked the
capacity to
implement
according to
Output Based Aid
guidelines.
Source: BMAU Q1 to Q3 Progress Reports and Field Findings
Output 090204 Back-up support for operations and maintenance
A summary of operational efficiency of restoring functionality of piped water systems in
Migeera, Nakasongola district is below:
Figure 3.8.10 Financial Performance of Output 090204 Back-up Support for Operations
and Maintenance and link to Physical Performance

384
Piped water system is not functioning due
to a mechanical fault with the wires
Source: MFPED, MWE and Field Findings
Expected output: restored functionality of Migyera piped water system, Nakasongola
district
The piped water system was initially constructed
in 2005. After a short period of operation the
system became non-functional, and in February
2010 the MWE restored functionality which lasted
a period of 3 months. However, in May 2010 the
new equipment installed developed a wiring
problem and is once again non-functional. The
Water and Sanitation Board are making efforts to
contact the supplier to resolve the problem and will
have to use locally raised funds this time.
Output 090272 Government Buildings and Service Delivery Infrastructure
A summary of operational efficiency of completing designs and constructing piped water
systems is below.
Figure 3.8.11 Financial Performance of Output 090272 Government Buildings and Service
Delivery Infrastructure and Link to Physical Performance
The budget of UShs 800mil has been
allocated to restoring functionality for only
two systems. Despite expenditure of UShs
693mil the Migyera piped water system is
still not functioning, as there were further
mechanical problems which will be resolved
by the Water and Sanitation Board using
locally generated funds.

385
Source: MFPED, MWE and Field Findings
A summary of the findings under this output is below:
Table 3.8.21 Physical Performance of Components under Output 090272 Government
Buildings and Service Delivery Infrastructure
Expected output: construction of new piped water systems
Butaleja – the design is complete but costs UShs 9bn and no funding source has been identified;
Kigadi – no progress to date;
Kisoko – water supply is being extended from Tororo. NWSC are implementing the works with pipes
procured by DWD;
Nakaseke – at evaluation stage;
Tirinyi – the procurement process finished late. Works should start in Q1 FY10/11.
Expected output: completion of new designs
Designs are complete as expected in Lukaya, Katovu, Butaleja, Busolwe and Tiriniyi-Kibuku.
Source: Field Findings
In addition, works have been ongoing on unplanned outputs, due to directives and emergencies
requests. This includes works in the following areas:
Pipes have been sent to Kabale town as part of the same contract with Kisoko at a cost of
UShs 0.18billion.Pipes have also been procured for Rukungiri (but not OBA related) and
Kisoko water supply at a cost of 1.2bn.
10,000 water metres have been supplied at a cost of around 0.5bn.
(b) Water and Sanitation Development Facility – South West (0160)
This project aims to improve the water and sanitation facilities in the south western region
through supplying clean, manageable and affordable water, and through promoting ECOSAN
The only on-budget outputs are the
completion of designs, which has been
accounted against expenditure of UShs
2.5bn, suggesting expenditure is not
commensurate with the outputs. However,
some of the expenditures is due to payment
certificates carried over from FY 08/09 for
works in Kibaale, Kapchorwa and
Kamwenge. No new construction has started
as planned, as implementation has been
outside of the work plan and is not officially
reported to the MFPED.

386
facilities. The project began in FY95/96 and is due for completion in FY13/14. Overall, the total
planned expenditure is 17.5m Euros and the funds secured are 15.75m Euros147
. The number of
planned outputs under this project is considerably greater than other projects under urban water
supply and sanitation and includes the construction of 14 piped water systems, design of 22
piped water systems and construction of 77 ECOSAN facilities. Due to the success of this
regionalised project approach, Water and Sanitation Development Facility branches have been
introduced to northern, eastern and central regions. One of the main reasons for the success of
the approach is that communities are expected to fulfil a number of obligations and so the
interventions are demand driven. This quarter the completion of piped water systems was
monitored in Rwenanura RGC in Ntungamo district; Bugoye RGC and Rugendabala RGC in
Kasese district; Rwimi RGC, Kibito Town Council, Nyakigumba RGC and Rubona RGC in
Kabarole district.
Financial performance:
By the end of Q3 FY09/10, 114% of the budget was released, of which expenditure was at 98%.
Analysis of Q3 GoU FY09/10 expenditure showed that 4% was on low priority items and 63%
was on high priority items.
Figure 3.8.12
Source: MFPED and MWE FY09/10
The table below summarises the FY09/10 performance of Water and Sanitation Development
Facility – West against planned outputs.
Table 3.8.22 FY09/10 Performance of Water and Sanitation Development Facility – West
(0160)
147
Ministry of Finance Planning and Economic Development Public Investment Plan FY2009/10 – 2011/12, pg. 969

387
Planned outputs (quantity
and location)
Actual
achievements
monitored
Realisation
of target
Financial
performance
(UShs GoU
and donor)
Time of
monitoring
Explanation of
variance /
comments
Output 090172 Government buildings and service delivery infrastructure
(i) Complete 14 schemes:
Kibiito, Rwimi,
Nyakiigumba,
Kasunganyanja, Rubona,
Hima, Omungyeni,
Rwenanura/ Kakukur,
Rugendabara,
Kabale/Kicuucu, Ibanda,
Bugoye, Kabira and
Mutara
(ii) Start construction
works in 22 town water
supply schemes for:
Kinuuka, Kasagama,
Buyamba, Lwebitakuri,
Kikagati, Nyarubungo,
Kabula, Kainja, Kyabi,
Kahunge, Lwemiyanga,
Rwene, Kyempene,
Nyeihanga, Nyakashaka,
Rwenkobwa,
Butare/Mashonga,
Mabona,Gasiza,
Kashenyi/Nyanama,
Kyeirumba and Kinoni
14 are complete
but not all are
functioning
Works ongoing
in Bwera,
Npondwe in
Kasese district;
Rubidi in
Mbarara
district; Rwene
in Kabale
district;
Kanungu in
Kanungu
district;
Kyeirumba and
Mabona in
Isingiro district
Off target
Off target
Annual
budget:
5.26bn
Q1 to Q3
release:
2.53bn
Q1 to Q3
expenditure:
1.84bn
Unspent
balance:
0.69bn
Q1, Q2
and Q4
Contractor not
paid (even
though there is
an unspent
balance) and
so works are
incomplete.
Output 090205 Improved sanitation services and hygiene
77 ECOSANS in:
Rwene (7), Kyempene
(7), Nyeihanga (7),
Nyakashaka (7),
Rwenkobwa (7), Butare/
Mashonga (7), Mabonna
(7), Gaiza (7), Kashenyi/
Nyanama (7), Kyeirumba
(7), Kinoni (7)
Q2 – 42
monitored in
Kakuto,
Kasensero in
Rakai district;
Kayanga/
Kirumba and
Buyamba in
Kyotera Town
Council.
Q4 locations
monitored are
Rwenanura,
Rugendabala,
Off target,
as locations
are
different to
those in the
plan.
Annual
budget:
0.9bn
Q1 to Q3
release:
1.32bn
Q1 to Q3
expenditure:
2.01bn
Unspent
balance:
Q2 and Q4 Construction
only takes
place once
communities
have fulfilled
obligations,
which is why
there is a
variation in
the locations.

388
Planned outputs (quantity
and location)
Actual
achievements
monitored
Realisation
of target
Financial
performance
(UShs GoU
and donor)
Time of
monitoring
Explanation of
variance /
comments
Kibito Town
Council and
Rubona
-0.69bn
Source: BMAU Q1 to Q3, FY09/10 Progress Reports
090272 Government Buildings and Service
Delivery Infrastructure
A summary of operational efficiency for the
construction of piped water systems is below:
Figure 3.8.13 Financial Performance of 090272 Government Buildings and Service Delivery
Infrastructure and link to Physical Performance
Source: MFPED, MWE and Field Findings
As this project has been monitored in Q3 FY08/09, Q1 and Q2 FY09/10 a summary of the
findings from previous monitoring visits is presented below:
Works are delayed for all of the sites
monitored, as the contractor has not been
paid, even though there is an unspent
balance on the account, due to MWE’s
lengthy process of clearing payments.
The schemes monitored in Q4 have a
combined contract sum of UShs 9.4bn.
Given the design population, the per capita
investment cost is $45, which is well within
the $75 target.
Steady flow of water in Rwenanura RGC,
Ntungamo district

389
Table 3.8.23 Summary of field findings for piped water systems monitored in Q3 FY08/09,
Q1 and Q2 FY09/10
Expected output Progress:
Q3 FY08/09
Progress:
Q1 FY09/10
Progress:
Q2 FY09/10
Progress:
Q4 FY09/10
Completion of Bikurungu
RGC piped water system,
Bwambere Sub County,
Rukungiri district in Q1
FY07/08
Incomplete and
delayed with no
works ongoing.
Works are 90%
complete and
materials procured.
Works progressing
according to
revised plan.
Not
monitored
Not
monitored
Completion of Kabira piped
water system, Bushenyi
district in Q1 FY09/10
Not monitored Works complete
and water is
flowing.
N/A N/A
Completion of Kagarama
RGC piped water system,
Ntungamo district in Q3
FY09/10
Works ongoing
according to
schedule.
Not monitored. Not
monitored.
Not
monitored.
Completion of Mutara/
Kyeibare piped water
system, Bushenyi district in
Q1 FY09/10
Not monitored Extension of the
Kabira scheme.
Works are
complete and water
is flowing.
N/A N/A
Completion of Omugyenyi
piped water scheme,
Ntungamo district in Q1
FY08/09
Works ongoing. Works complete
according to
schedule – water is
flowing.
N/A N/A
Completion of Rugaaga
piped water scheme,
Isingiro district in Q1
FY07/08
Incomplete and
delayed with no
works ongoing.
Works are 95%
complete and are
progressing
according to the
revised plan.
Previous defects
were rectified.
Not
monitored
Not
monitored
Completion of Rwenanura
RGC piped water system,
Ntungamo district in Q4
FY08/09
Works delayed due
to late completion of
designs, late supply
of materials and
contentions over the
water source.
Works ongoing. Not
monitored.
Works are
complete and
water is
flowing.
Source: BMAU FY08/09, FY09/10 Progress Reports and Q4 Field Findings
The progress of seven piped water systems was monitored in Q4. With the exception of
Rwenanura in Ntungamo district, the rest of the towns are served by the same gravity flow

390
scheme, which is why there are similar challenges of irregular flow of water and delayed works.
This is due to the contractor not being paid on time and so works are minimal or non-existent.
The progress of the piped water systems monitored in Q4 FY09/10 is presented below:
Table 3.8.24: Status of piped water systems monitored under Water and Sanitation
Development Facility – West
Expected output: completion of piped water system in Bugoye RGC, Ibanda, Kasese district
Works started in May 2009. The contract sum is 1,295,160,271. The basic structures are in place but
works are incomplete and there is no contractor on site due to non receipt of payments.
Expected output: completion of Kibito Town Council, Kabarole district
Construction started around July 2008 and should have been complete in March 2009. The contract sum
is UShs 1,333,068,820. Progress to date includes the construction of 4 public kiosks, 20 private
connections and 3 demonstration ECOSANS. The number of connections is relatively small as the
connection fees are very high – between UShs 50,000 and 1mil, as prospective customers are expected to
pay for pipes for extension if they are outside of the project supply area. Water has not reached the public
kiosks and delays are due to the works being sub-contracted and the payments not being cleared. A Water
and Sanitation Board is in place with 5 members of which 2 are women. No training has been received,
although a study tour was organised for the WSB members and local leaders in Ntungamo.
Expected output: completion of Nyakigumba piped water system, Kabarole district
Works started in May 2009 and the scheme was substantially complete in March 2010. The contract
sum is UShs 1,031,721,070. Works include the construction of 3 kiosks. The system has not been
commissioned and water flow is irregular. So far, beneficiaries are accessing water without paying a tariff
as there is no management structure in place.
Expected output: completion of Rubona piped water system, Kabarole district
Works started in May 2009 and construction was completed in January 2010, but has still not been
commissioned. The contract sum is UShs 869,140,026. The water flow is irregular. 3 public kiosks
have been constructed and 65 customers have paid for private connections, but not all have been
connected. A water office has been constructed but is not open. ECOSANS are under construction, and
training has already been carried out. A Water and Sanitation Board has been formed and trained which
consists of 3 women and 5 men.
Expected output: completion of piped water system in Rugendabala RGC, Kitswamba sub-county,
Kasese district
Construction began in March 2009 and was due to be complete six months later. The contract sum is
UShs 1,970,437,993 for Rugendabala, Kabale and Rwimi. The system was substantially complete in
February 2010. 2 kiosks and 60 private connections have been finalised. However, water is still not
flowing, as the line is being tested. The Water and Sanitation Board, which consists of 3 men and 2
women has not received any communication about when the works are expected to be complete. 3
ECOSANS have also been constructed and are in use.
Expected output: completion of Rwenanura RGC piped water system, Ntungamo district

391
Works started in December 2009 and the scheme was handed over in May 2010. The contract sum is
UShs 979,948,240. In total there are 5 public kiosks and 64 private connections. The system is
functioning and there is a steady flow of piped water. The system is being operated using solar power, and
so during cloudy periods there is no water. The scheme operator has recently requested for a hybrid solar-
electricity scheme. The water has been tested by the Umbrella organisation but the results have not been
shared with the scheme operators. A Water and Sanitation Board was formed in February 2010,
consisting of 3 men and 2 women, but has not received formal training. Seven ECOSANS have also been
constructed, and there has been sensitisation in the community.
Expected output: completion of Rwimi RGC piped water system, Rwimi sub-county, Kabarole
district
Works started in May 2009 and the scheme was handed over in December 2010. So far 5 public kiosks
have been constructed. The system has not been commissioned and the flow of water is irregular. A
water and sanitation board has been formed. There have been delays due to non-receipt of payments.
Field Findings
Challenges
Some of the sites under construction have not been paid for, and so the contractor is not
rectifying the defects. This is despite an unspent balance of UShs 690,654,799.
Lack of funds. 20 towns have met the community obligations, and are ready for construction
but this is not possible within the current budget.
In the case of Kagaasha in Rukungiri district there is a problem of procurement. There was
an issue over the legitimacy of contractor’s tax clearance certificate, but it was cleared by the
URA. Nevertheless, this was still disputed, and PPDA has become involved. The dispute has
now entered the legal process as the Contracts Committee and Evaluation Committee have
failed to come to an agreement.
Note: A GoU account was opened in February 2010. At the time of the monitoring visit on 7th
June 2010 no GoU funds had reached the account. However, during a subsequent visit carried
out by the Accountability Sector on 14th
June 2010 it was reported that UShs 290mil was
received on the account.
(c) Summary of findings for Projects Monitored in Q3 FY09/10: Support to Gulu Town
Water Supply and Sewerage, Water and Sanitation Development Facility – East and
Water and Sanitation Development Facility – North
Support to Gulu Water Supply started in 2002 and is being implemented by National Water and
Sewerage Corporation (NWSC). The objective is to provide adequate water supply to the
residents of Gulu municipality and the surrounding areas, given the high levels of population
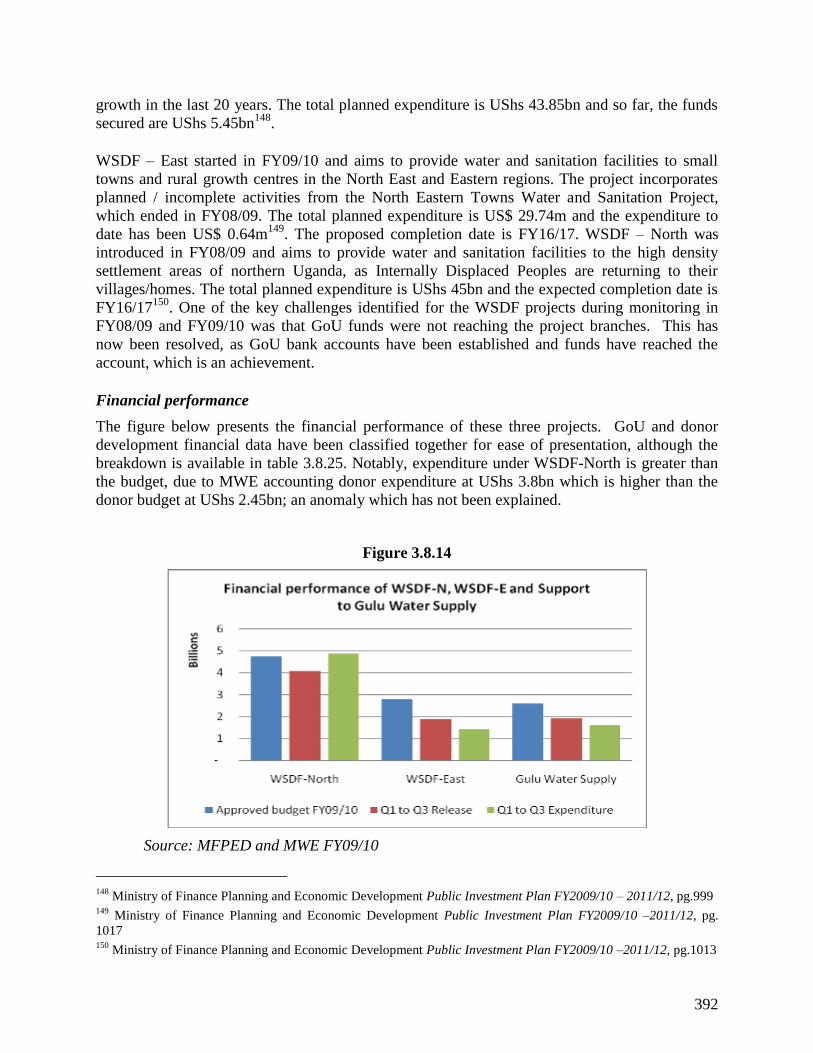
392
growth in the last 20 years. The total planned expenditure is UShs 43.85bn and so far, the funds
secured are UShs 5.45bn148
.
WSDF – East started in FY09/10 and aims to provide water and sanitation facilities to small
towns and rural growth centres in the North East and Eastern regions. The project incorporates
planned / incomplete activities from the North Eastern Towns Water and Sanitation Project,
which ended in FY08/09. The total planned expenditure is US$ 29.74m and the expenditure to
date has been US$ 0.64m149
. The proposed completion date is FY16/17. WSDF – North was
introduced in FY08/09 and aims to provide water and sanitation facilities to the high density
settlement areas of northern Uganda, as Internally Displaced Peoples are returning to their
villages/homes. The total planned expenditure is UShs 45bn and the expected completion date is
FY16/17150
. One of the key challenges identified for the WSDF projects during monitoring in
FY08/09 and FY09/10 was that GoU funds were not reaching the project branches. This has
now been resolved, as GoU bank accounts have been established and funds have reached the
account, which is an achievement.
Financial performance
The figure below presents the financial performance of these three projects. GoU and donor
development financial data have been classified together for ease of presentation, although the
breakdown is available in table 3.8.25. Notably, expenditure under WSDF-North is greater than
the budget, due to MWE accounting donor expenditure at UShs 3.8bn which is higher than the
donor budget at UShs 2.45bn; an anomaly which has not been explained.
Figure 3.8.14
Source: MFPED and MWE FY09/10
148
Ministry of Finance Planning and Economic Development Public Investment Plan FY2009/10 – 2011/12, pg.999 149
Ministry of Finance Planning and Economic Development Public Investment Plan FY2009/10 –2011/12, pg.
1017 150
Ministry of Finance Planning and Economic Development Public Investment Plan FY2009/10 –2011/12, pg.1013
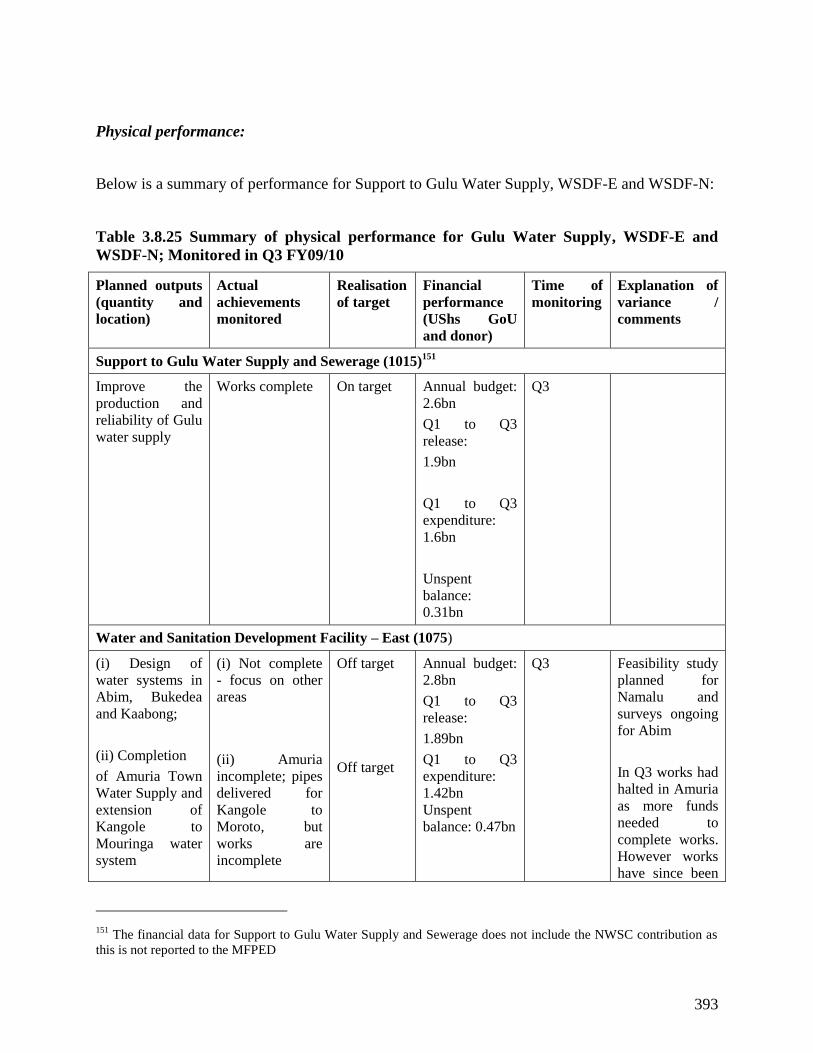
393
Physical performance:
Below is a summary of performance for Support to Gulu Water Supply, WSDF-E and WSDF-N:
Table 3.8.25 Summary of physical performance for Gulu Water Supply, WSDF-E and
WSDF-N; Monitored in Q3 FY09/10
Planned outputs
(quantity and
location)
Actual
achievements
monitored
Realisation
of target
Financial
performance
(UShs GoU
and donor)
Time of
monitoring
Explanation of
variance /
comments
Support to Gulu Water Supply and Sewerage (1015)151
Improve the
production and
reliability of Gulu
water supply
Works complete On target Annual budget:
2.6bn
Q1 to Q3
release:
1.9bn
Q1 to Q3
expenditure:
1.6bn
Unspent
balance:
0.31bn
Q3
Water and Sanitation Development Facility – East (1075)
(i) Design of
water systems in
Abim, Bukedea
and Kaabong;
(ii) Completion
of Amuria Town
Water Supply and
extension of
Kangole to
Mouringa water
system
(i) Not complete
- focus on other
areas
(ii) Amuria
incomplete; pipes
delivered for
Kangole to
Moroto, but
works are
incomplete
Off target
Off target
Annual budget:
2.8bn
Q1 to Q3
release:
1.89bn
Q1 to Q3
expenditure:
1.42bn
Unspent
balance: 0.47bn
Q3 Feasibility study
planned for
Namalu and
surveys ongoing
for Abim
In Q3 works had
halted in Amuria
as more funds
needed to
complete works.
However works
have since been
151
The financial data for Support to Gulu Water Supply and Sewerage does not include the NWSC contribution as
this is not reported to the MFPED

394
reported as
ongoing.
Water and Sanitation Development Facility – North (1074)
(i) Construction
of 5 piped water
supply systems in
Anaka, Kamdini,
Koboko, Kuru
and Wandi
(ii) New
construction in
Adjumani,
Amuru, Dokolo
and Paidha
(iii) Completion
of new designs in
Adjumani,
Amolatar,
Amuru, Dokolo,
Ibuje, Kalongo,
Lefori, Midigo,
Ogur, Okollo,
Omugo, Opit,
Ovujo, Oyam,
Padibe, Paidha,
Patongo and
Zombo
(i) 4 complete:
Kamdini,
Koboko, Kuru
and Wandi
(ii) New
construction has
started in Anaka
and Lefori
(iii) Designs
complete in
Amolatar,
Adjumani, Ibuje,
Lefori, Midigo,
Ogur, Okollo,
Omugo, Oyam,
Paidha, Patongo,
Purongo and
Singila
Off target
Off target
Off target
Annual budget:
4.75bn
Q1 to Q3
release:
4.097bn
Q1 to Q3
expenditure:
4.88bn
Unspent
balance:
-0.78bn
Q1 and Q3 Construction in
Anaka ongoing
but delayed due
to procurement
Some locations
have been
adjusted to
ensure there is
adequate water
production
capacity after
feasibility
studies. In
Dokolo the
designs will start
soon
Source: BMAU Q1 to Q3 Progress Reports
3.8.4. Water for Production
Water for Production is recognised as one of the “complementary sectors” in the National
Development Plan as it is a vital input for production processes and enhanced economic
activity152
. This prioritisation is reflected in the increased funding allocation from UShs 11.32bn
in FY08/09 to UShs 23.24bn in FY09/10, which is 13% of the sector allocation. The dams and
valley tanks monitored throughout FY09/10 is part of the strategy to meet Objective 2 of water
for production in the NDP: Increase supply of water in the cattle corridor from the current 36%
to 50% and those outside the cattle corridor from 21% to 30%153
. Over the medium term the
152
National Planning Authority, National Development Plan 2010/11 – 2014/15, May 2010 pg. 129 153
Ibid, pg. 131

395
allocation to water for production is projected to increase, although it will receive a declining
share of the sector budget in FY10/11. This is presented graphically below:
Figure 3.8.15
Source: MFPED
Figure 3.8.16
Source: MFPED

396
Financial Performance:
By the end of Q3 FY09/10, 96% of the budget was released, of which expenditure was at 77%.
Analysis of Q1 to Q3 GoU FY09/10 expenditure showed that 4% was on low priority items and
82% was on high priority items.
Figure 3.8.17
Source: MFPED and MWE FY09/10
Output 090372 Government Buildings Service Delivery Infrastructure
Summary of operational efficiency for the construction of water for production facilities:
Figure 3.8.18 Financial Performance of Output 090372 Government Buildings Service
Delivery Infrastructure and link to Physical Performance
80% of the budget has been spent and the
majority of the facilities are still incomplete,
including those that were rolled over from
FY08/09. In addition, construction has
commenced for several new sites,
particularly in the Karamoja region, for
which advance payments have been made.
Hence, even though the expenditure has not
resulted in the completion of planned
outputs stated in the work plan, works are
ongoing.

397
Source: MFPED, MWE and Field Findings
Physical Performance:
As most of the facilities monitored were follow up visits, the progress over time is presented
below. In summary, of the ten sites that should have been complete in FY08/09, only four sites
are complete and the remaining six sites are still facing further delays. In Q4 the sites monitored
included Kawomeeri dam in Abim district, Kagamba valley tank, Kagango dam and
Obwengyero valley tank in Isingiro district, Olamia valley tank and Olelpec valley tank in Apac
district, Akwera dam in Otuke district, and Arechet dam and Kobeibei dam in Moroto district.
Table 3.8.26 Summary of Findings for Water for Production Facilities Monitored from Q1
FY08/09 to Q4 FY09/10
Expected output Progress:
Q1 FY08/09
Progress:
Q3 FY08/09
Progress: Q4
FY08/09
Progress: Q2
FY09/10
Progress:
Q4 FY09/10
Akwera dam, Otuke
district Start date:
Q3 FY09/10
End date: Q3
FY10/11
Contract sum:
6,999,404,500
37% complete
and works
ongoing
according to
schedule. Land
compensation and
heavy rains have
affected progress.
Arechet dam,
Moroto district
Start date: Q4
FY09/10
End date: Q4
FY10/11
Contract sum:
6,681,682,150
23% complete
and works
ongoing
according to
schedule. Heavy
security presence
on site. Works
affected by heavy
rains.
Bwanalaki dam,
Sembabule district
Start date: Q2
FY07/08
End date: Q4
FY07/08
Contract sum:
798,000,000
Construction
ongoing.
Construction
ongoing and
delayed due to
poorly
performing
contractor.
Kagamba valley
tank, Isingiro
district
Start date: Q1
Works
ongoing but
delayed due to
land
1 year delayed.
Design changes
required and land
compensation is

398
Expected output Progress:
Q1 FY08/09
Progress:
Q3 FY08/09
Progress: Q4
FY08/09
Progress: Q2
FY09/10
Progress:
Q4 FY09/10
FY08/09
End date: Q1
FY09/10 Contract
sum for Kagamba
and Obwengyero
valley tanks:
4,234,908,480
acquisition –
55% complete.
still an issue.
Kagango dam,
Isingiro district
Start date: Q1
FY08/09
End date: Q1
FY09/10
Contract sum:
949,700,257
Minimal
works
ongoing.
Works
delayed –
85%
complete.
1 year delayed.
Contract
extension
awarded to 30th
June. 90%
complete. Delays
due to: abnormal
rains, design
changes because
of illegal
connection, and
waiting for dry
season to do
remedial changes.
Kakinga dam,
Sembabule district
End date: Q4
FY07/08
Contract sum:
1,224,425,500
Complete.
Kawomeeri dam,
Abim district
Start date: Q1
FY08/09
End date: Q2
FY09/10 Contract
sum: 3,531,705,100
Works
ongoing.
Works 25%
complete and
delayed due
to lack of
payments to
the
contractor.
Estimated
90%
complete.
Delays due
to late
payments,
heavy rains
and change
to the
designs.
0.5 years delayed.
90% complete.
Contractor
abandoned site
and contract has
been terminated.
MWE is in the
process of
engaging another
contractor.
Leye dam, Apac
district
Start date : Q1 fy
08/09
End date: Q1 FY
09/10
Site finished
ahead of
schedule.
Water User
Committee
trained in the
beginning
but is not

399
Expected output Progress:
Q1 FY08/09
Progress:
Q3 FY08/09
Progress: Q4
FY08/09
Progress: Q2
FY09/10
Progress:
Q4 FY09/10
Contract sum:
3,364,859,300
fully
operational.
O&M is an
issue.
Mayikalo dam,
Sembabule district
Start date: Q1
FY08/09
End date: Q1
FY09/10 Contract
sum: 1,162,466,180
Works
progressing
according to
schedule.
Nshenyi valley
tank, Ntungamo
district Phase II
works
End date: Q3
FY08/09
Contract sum:
547,459,604
Works delayed
– no contractor
on site due to
lack of
payments.
Obwengyero valley
tank, Isingiro
district
Start date: Q1
FY08/09
End date: Q1
FY09/10 Contract
sum for Kagamba
and Obwengyero
valley tanks:
4,234,908,480
Works
ongoing but
delayed due to
land
acquisition.
1 year delayed.
No cost contract
extension
awarded. Delays
due to land
acquisition and
design changes.
Olamia valley tank,
Apac district
Start date: Q1
FY08/09
End date: Q1
FY09/10
Contract sum for
Olamia and
Olelpec:
2,759,598,000
Delayed –
70%
complete.
Ongoing
land issues.
Delayed –
85%
complete and
no works
ongoing.
1 year delayed.
Site has a number
of snags including
potential silting
due to porous
rocks and bad soil
texture. “Site has
potential to be a
white
elephant154
.” The
geo-textile
154
Quote from Apac Local Government Official

400
Expected output Progress:
Q1 FY08/09
Progress:
Q3 FY08/09
Progress: Q4
FY08/09
Progress: Q2
FY09/10
Progress:
Q4 FY09/10
membrane to
arrest porosity of
the soils is under
procurement.
Indicates lack of
planning and
design.
Olelpec valley tank,
Apac district
Start date: Q1
FY08/09
End date: Q1
FY09/10
Contract sum for
Olamia and
Olelpec:
2,759,598,000
Delayed –
70%
complete.
Ongoing
land issues.
Delayed –
85%
complete and
no works
ongoing.
Commissioned
and handed over
in May 2010.
Water Committee
not functioning –
cattle troughs dry
as no water
available from the
valve.
Beneficiaries
observed to be
accessing water
directly from the
valley tank
instead of the
water points –a
public health
concern.
Kobeibei dam,
Moroto district
Start date: Q4
FY09/10
End date: Q4
FY10/11
Contract sum:
6,016,098,105
23% complete.
Likely to be a
cost variation due
to redesigns and
road construction
costs which were
not in the initial
contract.
Rubaare valley
tank, Ntungamo
district
End date: Q1
FY08/09
Contract sum:
828,608,000
50% complete
and delayed
due to lack of
payments to
the contractor,
rains and
equipment
breakdown.
No works
ongoing-
contractor
awaiting
additional
works to be
approved by
DWD.
Source: BMAU FY08/09 and FY09/10 Progress Reports and Q4 Field Findings

401
Challenges:
There main causes for delays in completion are listed below in order of frequency:
Design changes. Once a contract has been awarded there are changes to the design, either to
increase the scope of works, such as road construction to access the site, or if the terrain is
different to what was first anticipated and requires other materials. This indicates that
insufficient priority is given to the design and feasibility stage, as these changes could have
been incorporated in initial designs, limiting the need for cost variations.
Late payments to the contractor. Even though IFMS records indicate that there is an
unspent balance, there are cases where the contractor has abandoned site or reduced the
scope of works due to non-payment.
Land acquisition. Compensation for land, which is the responsibility of the local
government, is often delayed.
Heavy rains.
Incompetent contractors. This is most usually because the contractor is engaged in a
number of different works, and can therefore not keep to the contract schedule.
Box 3.8.2 Cost drivers of water for production facilities
Cost variations in the construction of new facilities have been of concern to decision makers and
implementers. The investment cost of facilities constructed in FY08/09 to FY09/10 can vary
from UShs 828mil for Rubaare valley tank in Ntungamo district to UShs 7bn for Akwera dam in
Otuke district. The main cost drivers are the following:
The level of storage capacity;
Type of technology. The unit cost of constructing a valley tank is higher than an earth
dam155
;
155
Ministry of Water and Environment, Water and Environment Sector Progress Report, October 2009, pg. 91
Works ongoing on Akwera dam, Otuke district Kawomeeri dam still incomplete, Abim district

402
Location. Proximity to where materials can be accessed and security provisions necessary in
the Karamoja region;
Access to the facility. In some instances contract prices include construction of access roads;
Additional features such as sanitation facilities and reservoir tanks for domestic use;
Cost variations once the contract has been awarded due to design changes.
Recently there has also been debate over the contribution procurement methods have as a cost
driver. As part of reforms in public financial management, the Public Procurement and Disposal
of Public Assets Act (PPDA) was introduced in 2003, and has been much hailed for the
progressive nature of the policies and values adopted. One of the objectives is to “ensure the
application of fair, competitive, transparent, non discriminatory and value for money public
procurement and disposal standards and practices156
.”
However, implementers of water for production facilities have argued that government led
implementation through the force account provision would reduce costs. For example, Katakwi
district received supplementary expenditure of UShs 185mil to construct eight valley tanks with
a storage capacity of 7,000m³ each, under the force account provision. This yields a unit cost of
Ushs 3,300 per m³. In comparison, valley tanks constructed by the MWE have an average unit
cost of UShs 40,000 per m³ using the competitive bidding process. In addition, the MWE
recently procured equipment for construction of valley tanks in Kiruhura district which can be
leased to farmers to do their own construction on-farm. Under this arrangement DWD estimate
an average unit cost of UShs 1,000 per m³ for the excavation of more basic valley tanks than
those completed in Katakwi district, although this will increase over time as equipment ages.
Hence, the MWE are implying that government led implementation of valley tanks has
efficiency gains compared to when the competitive bidding system promoted by PPDA is
utilised. Given the public financial management reforms which led to the introduction of PPDA,
as well as the interest in the force account provision, it is recommended that an independent
study is carried out to provide evidence and policy advice on this issue.
Source: Field Findings
156
http://www.ppda.go.ug/ viewed on 12th
July 2010
Olamia valley tank in Apac constructed at a unit cost
of UShs 34,000 per m³. Site is one year delayed and
still incomplete; a beneficiary is accessing water
directly – a public health risk
Valley tank constructed in Katakwi at a unit cost
of UShs 3,300 per m³

403
3.8.5 Meteorological Support to Plan for Modernisation of Agriculture
Weather, Climate and Climate Change Vote Function
This project aims to develop the capacity of the national meteorological services by improving
the observing station networks and development of human resources. The project started in July
2001. Planned outputs include procurement and installation of meteorological instruments,
training of staff required for manning the stations and upgrading meteorological stations in
Mbarara and Gulu. This project received a funding increase from UShs 500mil in FY08/09 to
UShs 2.5bn in FY09/10. Recently, Cabinet approved the formation of a Meteorology Agency
which will provide much more autonomy for meteorological activities, although this still needs
to be approved by Parliament. Hence, the additional funds were intended for the formation of the
Agency and purchasing equipment
Financial performance:
The differences in the funding levels in FY08/09 and FY09/10 are illustrated below. Even
though only 57% of the FY09/10 budget has been released, absorption has been low at 75%.
Figure 3.8.19 Figure 3.8.20
Source: MFPED Source: MFPED
Physical performance:
Three weather stations were monitored in Entebbe Control Tower, Jinja and Kasese. The finding
is that the weather stations are still lacking vital equipment, as the meteorology department has
not been able to utilise the additional funds to procure equipment. It is highly unlikely that the
funds will be spent before the end of FY09/10. However, despite Q1 to Q3 expenditure in

404
FY09/10 being UShs 1.08bn which is greater than FY08/09 expenditure at UShs 460mil, the
additional outputs planned for FY09/10 have not been achieved: equipment has not been
purchased and the Meteorology Agency has not been formed. However, the department has
realized some achievements such as the preparation of Meteorological Policy, Strategic Plan,
Business Plan and Meteorological Bill which is before Parliament awaiting Second Reading. In
addition, the department has been monitoring El Nino evolution which was not part of the
original work plan.
Table 3.8.27 Summary Findings of Weather Stations Monitored
Expected output: successful operation of Entebbe Control Tower
The weather station is lacking vital weather equipment as some of the existing equipment is non-
functioning. This includes: upper air weather station lacks hydrogen gas, the weather radar has aproblem
with display unit, the calibration chamber needs repair/replacement, lack of forecasting tools such as
weather charts, and lack of computers.
Expected output: successful operation of Jinja weather station
The weather station is in operation, although some of the equipment is very old or broken. This includes a
tipping bucket rain gauge which is broken but could be repaired, and equipment donated by Japanese
International Cooperation Agency which is not functioning including a rain gauge, a sunshine sensor and
an evaporation pan.
Expected Output: successful operation of Kasese weather station
The equipment for monitoring the weather station is limited, and certain items are broken, including the
wet bulb thermometer, rain gauge and sunshine recorder as the cards are unavailable. In addition an
automatic weather operator was installed in 2007, but staff members did not receive training on how to
use the equipment.
Source: Field Findings
Challenges:
In addition to the missing pieces of equipment in the weather stations, a message switching
system to obtain data from the field and a hydro generator to monitor disturbances is also
required. The lack of progress has been due to a number of challenges:
Procurement. The process was initiated in time but the bid was rejected by PPDA as the
specifications did not follow international standards. It has since been agreed that the US
Trade and Development Agency will fund the ‘Feasibility Study for Modernization of
Uganda Meteorological Services’ The study will recommend the minimum category of
personnel and equipment/ facilities needed to run modern Meteorologicl services.

405
Position of meteorology department within the current structure. Staff members
expressed concern that meteorological issues had been marginalised. This could be resolved
through the creation of the Meteorological Agency, which is still awaiting approval by
Parliament.
Lack of capacity. The department is under-staffed as senior staff members have recently
retired.
3.8.6. Key Policy Issues
(x) Given that decentralised rural water supply and sanitation services have been allocated a
declining share of the sector budget in FY10/11, the allocation should be revised upwards in
FY11/12, in order for the sector to realistically meet the target of increasing access to
improved water points.
(xi) The MWE should ensure that managers are availed with financial information to enhance
smooth implementation of works and reduce levels of misinformation on financial releases.
(xii) The internal payments procedure should be reviewed by the MWE to increase efficiency,
ensure contractors are paid for completed work on time, and avoid accumulation of interest
payments.
(xiii) In nearly all cases, designs for new works were not shared with local government officials,
reducing their ability to monitor and supervise the works. As interventions are eventually
handed over to local governments, this information should be availed from the start to
enhance sustainability and ownership.
(xiv) A separate account for the District Water and Sanitation Conditional Grant should be
established where District Water Officers are the vote controllers, to reduce diversionary
risks from water and sanitation activities.
Use of manual rain gauge in Jinja –
collecting drops of rain in a bottle – as
the automated one is broken
Automated weather station in Kasese

406
(xv) The MWE’s leadership support for promoting environmental sanitation is recognised. In
order to kick-start operation of the sanitation conditional grant, the MWE should allocate
funds (possibly transfer funds from centralised sanitation services for sanitation campaigns),
which should be complimented by the MES and MOH, as well as the MFPED.
(xvi) Where there have been deviations from approved work plans due to “emergency requests”
this should be stated clearly in the work plan, in order to accurately account for expenditure.
(xvii) There should be an independent study to inform the policy direction for water for
production. This should focus on unit costs for water for production facilities, with particular
emphasis on procurement methods as a cost driver.
(xviii) Given the ambitious work plan for FY10/11 for water for production, efforts should first
be made to complete existing facilities that have been delayed, before embarking on new
constructions.
(xix) In order for the Meteorology Agency to be successfully established capacity constraints
need to be addressed urgently, to ensure there is adequate leadership, managerial and
technical support to see through the initiative.
3.8.7. Conclusions
Snapshot of performance for FY09/10
Certain areas should be noted for good performance. Under rural water supply and sanitation
vote function this includes the implementation of rainwater harvesting (for which up-scaling has
been recommended) and social marketing campaigns. Under urban water supply and sanitation
vote function, good examples include the Water and Sanitation Development Facility western
and northern branches, which are delivering clear outputs that can be directly traced to budgetary
expenditure; as well as the recent completion of works on time for Gulu Town Water Supply.
Water for production has initiated new constructions as stated in the work plan, but there are
delays to incomplete facilities from FY08/09 that should be prioritised. In addition, high unit
costs for the construction of valley tanks are of concern. However, for all the vote functions
monitored, most of the planned targets set in the work plan were not met. This was mainly due to
setting unrealistic work plans given the resources available, delaying payments to contractors
when works are complete, and responding to “emergency requests” which lead to
implementation outside of the work plan.
(i) Financial
Proportion of sector allocation to decentralised rural water services to decline: Over the
medium term the water and environment on-budget sector allocation is set to increase. However,
this will not result in a proportionate increase in sector funding allocations to rural water supply
and urban water supply vote functions. In particular, the allocation to decentralised rural water
services (through the District Water and Sanitation Conditional Grant) will remain unchanged at
407
UShs 55.38bn in FY10/11. This is likely to compromise the attainment of increasing access to
improved water points, which is one of the sector’s key performance indicators.
Misinformation of financial releases: Where there was evidence of slow progress of works, the
most frequent explanation from DWD officials was that “The Ministry of Finance has not
released funds on time.” However, financial data availed in the IFMS showed this to be incorrect
as the same projects had funds released on time and unspent balances. This indicates that there
are high levels of misinformation within the MWE on project specific financial releases, which
can compromise managers’ ability to deliver results.
Inconsistency between financial data presented by the sector and the IFMS
The sector continues to present financial data which is different to the records kept in MPFED on
the IFMS, even though the MWE also utilises the IFMS. For example, in the Water and
Environment Sector Performance Report (October 2009) the GoU financial data for FY08/09 for
Support to Rural Supply Project, showed a release of UShs 2.8bn compared with UShs 3.5bn on
the IFMS – a difference of nearly UShs 0.7bn! Similarly, expenditure for FY08/09 for Gulu
Town Water Supply was reported as UShs 2.9bn compared with UShs 2.4bn in the IFMS.
(ii) Rural water supply and sanitation vote function
Under School and Community IDPs Project construction of piped water systems had stalled due
to contractors not being paid, even though there was an unspent balance on the account at the end
of Q3. Furthermore, the combined contractual sums for the new piped water systems in the north
are UShs 4.27bn compared with an approved budget of UShs 1.02bn. This suggests unrealistic
budgeting, which could result in arrears accumulation. Under Support to Rural Water Supply
Project construction of Tororo-Manafwa gravity flow scheme has commenced. Whilst social
marketing campaigns had positive results, implementation of only four campaigns was reported
against a budget of UShs 390million, which yields a unit cost of UShs 97.5million per campaign.
However, sector officials indicate a campaign costs approximately UShs 12million, implying
UShs 351million was over-budgeted.
Under the District Water and Sanitation Conditional Grant a general trend in implementation
has been observed: in Q1 districts complete rolled over activities from the previous financial
year; in Q2 procurement processes are ongoing; in Q3 only some districts start construction
works; and in Q4 works are rushed in an effort to complete before the end of the financial year.
This process results in the under-utilisation of funds for Q1 and Q2 and creates a risk of
diversion to other district priorities, particularly as the district water officer is not the vote
controller. In addition, in Arua, Iganga and Koboko districts, water points that the district
claimed expenditure against were actually constructed by NGOs, development partners and
individuals.
(iii)Sanitation

408
Despite the long-term and cost-effective benefits of promoting environmental sanitation and
hygiene, it remains under-prioritised and implementation is fragmented. Even where there is top
level support, such as strong leadership within the MWE to promote sanitation, and increased
allocation to school sanitation under the School Facilitation Grant, in practice funds are diverted
to other priorities. To address this, the MFPED established a conditional grant for sanitation but
no funds were allocated for implementation in FY10/11. In addition, the MWE, the MoES and
the MOH have requested assistance from the MoPS to agree on which line ministry should be
responsible for the grant, which needs to be resolved as soon as possible.
(iv) Urban water supply and sanitation vote function
Whilst implementation is underway, progress is off-track for all projects with the exception of
Support to Gulu Water Supply. Challenges in urban water projects include delayed payments to
contractors (leading to accrual of interest), design changes, unrealistic work plans, and
implementation outside of the work plan due to responses to “emergency requests.” This is of
particular concern for Small Towns Water Supply Project, where planned on-budget construction
as stated in the work plan did not commence in FY09/10, due to deviations from the work plan.
An achievement noted for WSDF branches is that regionalised project accounts have been
established for the receipt of GoU funds, and Q4 GoU funds had reached the project accounts.
This means that contractors can be paid directly from the WSDF branch, which should reduce
transaction costs and lead to efficiency gains.
(v) Water for Production vote function
Construction of new facilities in northern Uganda and Karamoja has started as planned.
However, sites such as Kawomeeri dam in Abim district, Olamia valley tank in Apac district, Kagamba
and Obwengyero valley tanks in Isingiro district, and Kagango dam in Isingiro district are still facing
delays of one year. Delays are due to design changes, late payments to contractors (when funds
are available), land acquisition, heavy rains and incompetency of contractors. In addition, high
unit costs for the construction of valley tanks are of concern, where the MWE has a unit cost of
UShs 40,000 per m³ compared to a unit cost of UShs 3,300 per m³ for the construction of valley
tanks by Katakwi district using the force account provision. This has contributed to the debate
that procurement methods have a cost driver, and should be supported by an independent study.
(vi) Meteorological Support to Plan for Modernisation of Agriculture
Additional funds were allocated to this project in FY09/10 for the purchase of much needed
equipment and to aid the formation of a Meteorology Agency which had been approved by
Cabinet. Despite the increase in expenditure there was no direct link to outputs as additional
equipment has not been purchased due to a failure to meet procurement regulations and steps
have not been taken to form the agency, since approval from Parliament was still needed.
3.8.8. Recommendations
409
(vii) Financial
The MWE should be encouraged to develop more realistic budgets given the resources available.
Outputs were included in the work plan (which is signed by the Accounting Officer and
approved by Parliament) for which there were insufficient funds, and can result in arrears
accumulation.
In some cases works have been delayed, as contractors have not been paid even though there was
an unspent balance on the account. In other cases, lack of payments resulted in accumulation of
interest payments. These delays are allegedly due to the MWE’s internal payments procedure
which involves 22 steps, and should be reviewed.
The water and environment sector should be encouraged to allocate a greater proportion of
resources to decentralised rural water supply and sanitation services. This would enhance the
likelihood of the sector attaining the target of increasing access to improved water points.
Given the continued discrepancies between GoU financial data reported by the sector compared
to the IFMS there should be an investigation as to why this is a recurrent practice.
(viii) Rural water supply and sanitation vote function
Accurate unit costs should be provided by the MWE with clear explanations for deviations. For
example, emergency boreholes had a unit cost of UShs 18mil compared with UShs 15million in
the BFP; and UShs 97.5million was budgeted for one social marketing campaign even though
sector officials estimate UShs 12million. This would enhance analysis of sector spending,
particularly where efficiency gains can be made.
Given the positive results so far, rainwater harvesting should be scaled-up in FY10/11.
A separate account should be established for receipt of funds under the District Water and
Sanitation Conditional Grant, where the district water officer is the vote controller, to reduce
diversionary risks to other priorities under ‘works.’
Audits are recommended in Arua, Iganga and Koboko districts, after water points constructed by
NGOs and development partners, were accounted against GoU expenditure.
(ix) Sanitation
Line ministries should allocate funding to initiate the Conditional Grant, which would enhance
the case for the MFPED to allocate additional resources. The funds for the Sanitation
Conditional Grant should be ring-fenced to prevent diversions. Furthermore, the MWE, MoES
and MOH under the guidance of MoPS need to come to a conclusion as soon as possible on
which ministry will be responsible for the grant. This should be done before October 2010, in
time for the FY11/12 budget process.
(x) Urban water supply and sanitation vote function

410
There should be further efforts to improve the planning and design processes through enhanced
investment in feasibility studies, to avoid design changes and cost variations once
implementation has started.
Where there are deviations to the work plan due to “emergency requests,” expenditure against
these additional outputs should be accounted for in the quarterly progress reports (Performance
Form A’s). This would enhance the accuracy of reporting and accounting of funds.
(xi) Water for Production vote function
Water for production should concentrate efforts on completing ongoing facilities before
embarking on new constructions.
There needs to be greater coordination with MAAIF and local governments to ensure the correct
use of facilities once they have been complete. For example, Leye dam and Olelpec valley tank
in Apac district were completed in FY09/10 and are not being effectively utilised. In particular
there should be greater efforts to train Water User Committees.
There should be an independent value for money study on unit costs for construction of water for
production facilities, with particular emphasis on procurement methods as a cost driver. This is
in light of public financial management reforms that have led to the establishment of PPDA and
the use of the force account provision, where the MWE claims the latter results in lower unit
costs.
(xii) Meteorological Support to Plan for the Modernisation of Agriculture
In order for the successful progression to a Meteorology Agency, internal capacity and
leadership constraints need to be addressed. Given the increased expenditure has not resulted in
additional outputs; an audit of FY09/10 expenditure is recommended.

411
3.9 Micro Finance
3.9.1 Introduction
In order to operationalise the rural financial service strategy; the government is closely working
with Micro finance support centre ltd (MSC) in the drive of extending financial services to rural
Uganda through micro finance institutions.
MSC is a company owned by the government of Uganda and was incorporated in 2001 as a
company limited by guarantee. It has been managing the credit component of the North West
Smallholder Agricultural Development Project (NSADP), and the government fund for support
to savings and credit cooperative societies (SACCOs). Arising out of past Government
experiences and lessons learnt, government found it appropriate to divest itself from direct
intervention by creating MSC with a sole purpose of making it a lynch pin in the delivery of
wholesale credit to the SACCOs country wide. It’s a lead agency for delivery of wholesale funds
to the SACCOs in the country.
In order to address the issue of easy accessibility and increased response rate, MSC has
reorganized its operations by creating Zonal /regional offices in a bid to decentralize its
activities. Appraisal and disbursement of loans have been devolved to regional offices. Regional
offices disburse loans up to UShs50, 000,000/= from a credit loan float of up to UShs500,
000,000/=. Formerly, loans that are more than UShs50, 000, 000/= were referred to head office
but now the zonal offices can disburse to a tune of UShs 100,000,000.=
The MFPED supports the MSC by giving them funds to loan out to various microfinance
institutions and SACCOs in Uganda. It is also mandated to monitor the performance of the
activities of the MSC. In view of the above, the Budget Monitoring and Accountability unit
(BMAU) monitored activities of five regional /zonal offices in Iganga; Kabarole; Masaka;Mbale:
and Soroti
Objectives
The objectives of MSC include but not limited to the following;
To enhance capacity of the MSC to deliver rural financial development services.
To maximize outreach and deliver demand driven credit.
To expand and deepen financial outreach through increased collaboration and synergy
between key players in rural development.
To enhance productivity and performance of rural enterprises
The budget monitoring and analysis unit (BMAU) therefore monitored the achievements and
successes; and also verified the extent of implementation of the MSC objectives in respect to
provision of wholesale credit to the SACCOs; development of appropriate financial products;
provision of SME finance and extent of use of the funds channeled by GOU for loan
disbursement.

412
Scope and Methodology
The period under review was the 4th quarter FY2009/2010 and the following
methodology was used:
Visited the MSC head offices and held discussions with the officials. The 3rd
quarter
report was obtained that formed a basis of the monitorable outputs. Verified the quarterly
progress report and the portfolio reports.
Visited MSC zonal offices of Mbale, Iganga, Soroti, Masaka, Kabarole and Hoima and
held discussions with the staff of the regional offices
Physical visits to the SACCO premises; interviewed key personnel and took photographs.
1) Activities of Microfinance Support Centre Limited
Currently MSC has regional/ zonal offices which are located in Arua, Gulu, Hoima, Iganga,
Kabale, Kabarole, Kampala, Masaka, Mbale, Mbarara, Moroto and Soroti. Each Regional office
serves a cluster of districts.
MSC offers a number of products administered through the zonal offices to the clients that
include:
Agricultural Development Fund; This targets institutions/enterprises supporting and or
are engaged in primary agricultural production, agro processing and marketing. The loan
period ranges between 2-4 years with a grace period of 6-12 months and an interest rate
of 9% per annum charged on reducing balance. The repayment frequency depends on the
activity funded.
Business development Fund; This fund enables SACCOs to enhance their growth,
performance and participation in providing financial services for example by extending it
to weak SACCOs to cover 50% of their audit expenses, upgrading their management
information systems to the level they are able to interface with that of MSC. They also
give out the Start –up loans to enable SACCOs increase their on-lending capital base.
The SACCOs that benefit pay back only the principal loan amount. The loan period is
two years with a grace period of 6 months; minimum loan size is 5 million whereas the
maximum is 10million.
Micro-Enterprise fund; this enables Microfinance institutions finance a wide range of
commercially viable activities of their customers. This has a loan period of two years
with a grace period of six months and at an interest rate of 13% per annum on declining
balance. Repayment frequency depends on the activity funded.
Small and Medium Enterprise (SME) Development Fund. This fund includes loans
and leasing options for SMEs with an annual return of 100 million. It has a maximum
loan period of four years with a 6-12months grace period. If the SME is in trade, there is
an interest rate of 17% per annum on declining balance and if it is in agriculture, the
interest is 9% per annum.
Guarantee fund. This enables MSC client’s access bigger loans of about one billion
from identified banks for investment. Loan terms are determined and agreed upon by
both MSC and commercial banks.

413
MSC has introduced new products that were to kick off during the FY 2010/11. The products
include:
Agricultural Development loan to be increased to minimum loan amount of UShs 20
million and targets mainly the unions, SACCOs and produce and marketing cooperatives.
Environmental loan which is supposed to support people to protect the environment such
as tree planting, soil management. The minimum loan amount is 20million.
Special interest loan; that has replaced the business development fund. It targets
SACCOs, producer cooperative enterprises plus weak SACCOs and offers a minimum
loan amount of 10 million and maximum amount of 50 million.
Commercial loan; this was formerly the micro enterprise fund and targets SACCOs,
MFIs and is offered at an interest rate of 13% with a maximum loan period of 2years.
MSC also offers non- financial services like capacity building services. These services
are offered to SACCOs and MFIs.
For any institution to access MSC loan products, it is required to fulfill the following:
Must be registered
Minimum of one year experience in running the activity for which the organization is
registered
Operates in a specific area with clearly defined target communities
Clear ownership, governance structure and management capacity
Adequate staffing with knowledge and skills in microfinance and or basic accounting
knowledge.
Physically identifiable and accessible offices
3.9.2 FINDINGS
A) IGANGA ZONAL OFFICE
Iganga zonal office covers seven districts of; Kamuli, Iganga, Jinja, Bugiri, Kaliro, Namutumba
and Mayuge.
The office has five staff members who include; Senior financial services officer, Financial
services officer, Accountant, Administrative assistant and Logistics assistant.
At the time of the monitoring exercise, Iganga zonal office had disbursed a total of UShs 1.3
billion to 61 SACCOs from different districts since the program started. The numbers of clients
per district were: Iganga 17; Kamuli 10; Jinja 15; Bugiri 7; Kaliro 2; Namutumba 1; and Mayuge
9.
The funds disbursed were mainly agricultural loans and business development loans. Details of
the products offered were as follows.
Agricultural Development Fund. This loan was given to SACCOs that were engaged in
primary agricultural production, agro processing and marketing.

414
Business development Fund. This fund enables SACCOs to enhance their growth,
performance and participation in providing financial services for example by extending it
to weak SACCOs to cover 50% of their audit expenses, upgrading their management
information systems to the level they are able to interface with that of MSC.
There was a total review of the products therefore some of them have completely changed while
new products have been introduced. The Iganga zonal office had not yet started offerings the
new products but was in the process of doing so.
Table 3.9.1 List of SACCOs funded per district under Iganga Zone.
District No of Sub
counties
SACCOs
operational
SACCOs
funded per
sub county
% coverage
by SACCOs
Iganga 21 30 17 57
Kamuli 18 10 10 100
Jinja 12 63 15 24
Bugiri 18 10 7 70
Kaliro 6 4 2 50
Namutumba 7 4 1 25
Mayuge 13 10 9 9
Source: Iganga zone office records
Table 3.9.1 shows there are many SACCOs that are not covered by the MSC, the worst hit
district being Jinja with a percentage coverage rate of 24. A total of 15 SACCOs are being
funded of the entire 63 SACCOs in Jinja District.
Challenges:
The staffing level at the zonal office is very small. There are only five staff members
comprising of three technical officers and two support staff who manage the seven (7)
districts.
Most of the staff members are field based but there is only one vehicle for the zonal
office. It’s therefore hard for them to move frequently and also to easily supervise the
SACCOs and other microfinance institutions being supported.

415
a) Ibulanku Sub County SACCO( Iganga District)
This is one of the SACCO which benefited from the MSC. The SACCO was registered on the
11th
of January 2008.
There are four staff members managing Iburanku SACCO, the manager, cashier, credit officer
and security officer. They are assisted by the seven board members who play an oversight role.
It has 307 fully registered members. To be fully registered one pays a total of UShs 25,000
which includes UShs 10,000 for subscription, UShs 10,000 for buying a share and UShs 5,000
for opening up an account.
The total savings portfolio at the time of the monitoring exercise was UShs 4,127,000, share
capital of UShs 3,420,000 while loan portfolio stood at 17,500,000. The breakdown of the loan
portfolio:
Loan product Amount
Bodaboda 2,500,000
Commercial 11,000,000
Agriculture 1,500,000
The SACCO lends out mainly commercial loans, at an interest rate of 3% per month for a period
of 4 to 12 months. The area was heavily hit by drought which affected agriculture and therefore
the loan amount for this product was only UShs 1,500,000.
The SACCO offers mainly four products that include commercial loans, school fees loans, boda
boda loans and Agricultural loans each at 3% per month. The boda boda loan was still a new
product and two clients had benefited from this product.
The overall loan recovery rate as at end of April was 84% which was below the zonal
recommended rate of 95%
Support from MSC
The manager, cashier and board
members have been trained by MSC
several times.
The SACCO has also received
financial support from MSC in terms
of loans. A Business enhancement loan
was received in November 2009 of
UShs 15,000,000/= at an interest rate
of 13% per annum with a six months
grace period. The SACCO was
servicing the loan on time.
The SACCO had also received support Office Premises of Ibulanku SACCO

416
from UCSCU in form of a safe and a filing cabinet.
b)Bugiri Agency for Youth Development SACCO ( Bugiri District)
Bugiri Youth SACCO started operations in 2003 and was registered in 2004. It had a
skeleton staff with two members of staff; the manager and cashier. There were 436 fully
registered members who pay a total of UShs 20,000/= to be registered. This includes UShs
10,000/= for membership and UShs 10,000/= as share capital.
Its savings portfolio was UShs 5,600,000/= and share capital UShs 7,600,000/= while the
loan portfolio was UShs 9,600,000/=. The SACCO was performing poorly.
Though the SACCO opened in 2004, it closed operations in 2009 after losing a total of UShs
23 miilion saved with TEAM (Together Everyone Achieves More). At the time the SACCO
was monitored, it had been in operation for only one week. TEAM had convinced the
SACCO into investing most of their funds in their organization with a hope to reap quick
profits. The office closed before paying any money back to the SACCO. This put the
SACCOs portfolio at risk at 96.4% as at 31st December 2009.
The SACCO offers commercial loans at a 4% interest per month for a period of six month
and emergency loans at 10% interest for only one month.
Support from MSC
The manager and board members had been trained by MSC.
Two loans from MSC, the first loan was a commercial loan of UShs 5,000,000 at a
13% interest rate on reducing balance received in 2006 for a loan period of two years.
The SACCO paid back part of the loan and had an outstanding balance of UShs
1,800,000. The second loan was UShs 10,000,000 commercial loan at a 13% interest
rate per annum and the outstanding balance was UShs 9,000,000.
Challenge
Small capital base of savings portfolio of UShs 5,600,000/=; share capital UShs
7,600,000/= and the loan portfolio of UShs 9,600,000/=. The SACCO is not able to
meet the clients demand.
c) Bunya SACCO (Mayuge District )
The SACCO was registered in September 2004 and is managed by three members of staff:
the manager, loans officer and a cashier.
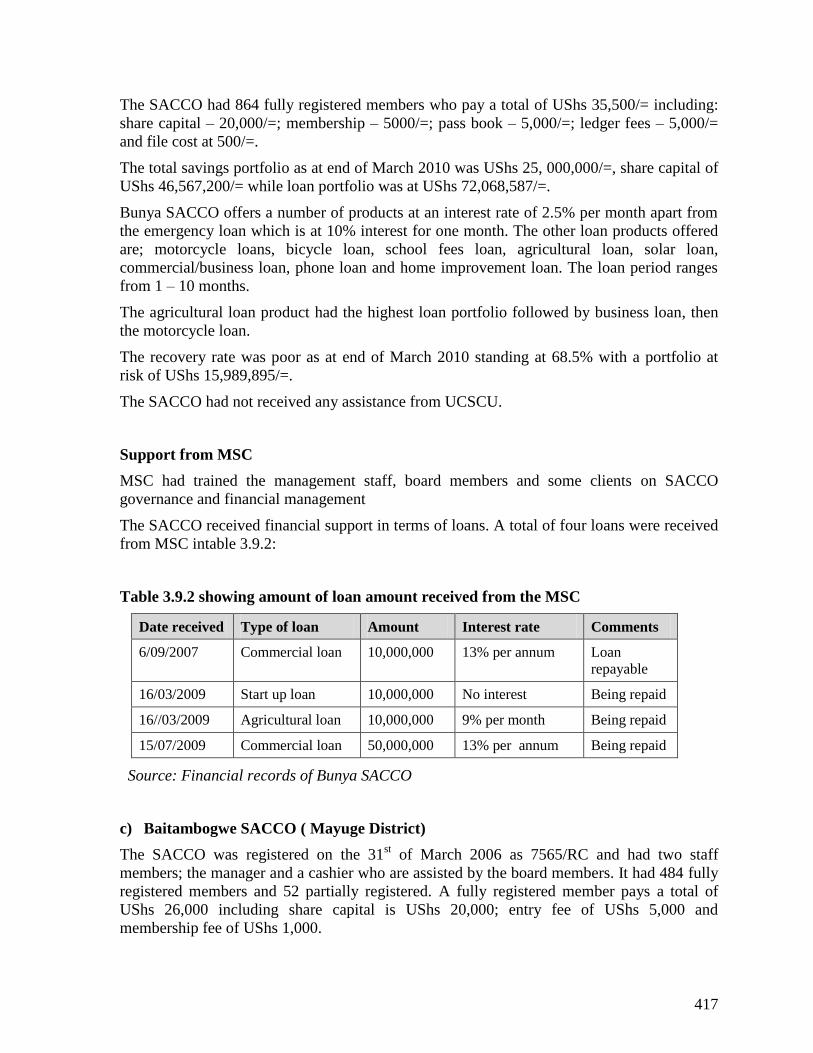
417
The SACCO had 864 fully registered members who pay a total of UShs 35,500/= including:
share capital – 20,000/=; membership – 5000/=; pass book – 5,000/=; ledger fees – 5,000/=
and file cost at 500/=.
The total savings portfolio as at end of March 2010 was UShs 25, 000,000/=, share capital of
UShs 46,567,200/= while loan portfolio was at UShs 72,068,587/=.
Bunya SACCO offers a number of products at an interest rate of 2.5% per month apart from
the emergency loan which is at 10% interest for one month. The other loan products offered
are; motorcycle loans, bicycle loan, school fees loan, agricultural loan, solar loan,
commercial/business loan, phone loan and home improvement loan. The loan period ranges
from 1 – 10 months.
The agricultural loan product had the highest loan portfolio followed by business loan, then
the motorcycle loan.
The recovery rate was poor as at end of March 2010 standing at 68.5% with a portfolio at
risk of UShs 15,989,895/=.
The SACCO had not received any assistance from UCSCU.
Support from MSC
MSC had trained the management staff, board members and some clients on SACCO
governance and financial management
The SACCO received financial support in terms of loans. A total of four loans were received
from MSC intable 3.9.2:
Table 3.9.2 showing amount of loan amount received from the MSC
Date received Type of loan Amount Interest rate Comments
6/09/2007 Commercial loan 10,000,000 13% per annum Loan
repayable
16/03/2009 Start up loan 10,000,000 No interest Being repaid
16//03/2009 Agricultural loan 10,000,000 9% per month Being repaid
15/07/2009 Commercial loan 50,000,000 13% per annum Being repaid
Source: Financial records of Bunya SACCO
c) Baitambogwe SACCO ( Mayuge District)
The SACCO was registered on the 31st of March 2006 as 7565/RC and had two staff
members; the manager and a cashier who are assisted by the board members. It had 484 fully
registered members and 52 partially registered. A fully registered member pays a total of
UShs 26,000 including share capital is UShs 20,000; entry fee of UShs 5,000 and
membership fee of UShs 1,000.

418
The loan portfolio was UShs 85,602,990/= while the portfolio at risk was UShs 4,189,640/=.
The SACCO offers three loan products; business loan/commercial loan at 3.5% interest rate
per month, agricultural loan at 3.5% interest rate per month and school fees loans. This
means that the interest rate per annum is 42% which is high for the rural based population
and a cause for escalating default rates.
Most of the loans are business loan and the recovery rate as at end of March 2010 was 64%
which is rather low. The recovery rate was too low
Assistance from MSC
Some management staff members and board members had been trained by MSC.
The SACCO got financial support from MSC in terms of loans. A total of UShs
45,000,000 was received.
The SACCO was also supported by UCSCU in terms of salaries for three staff members,
safe, filing cabinet and stationary.
Challenge
The Board members reported that it took over three months to access loans from MSC.
However the zonal manager stated that it only takes two weeks to get the loans if all the
requirements are met.
e) Bateesa SACCO (Iganga district)
The SACCO started operations in 2005 and it was registered on the 27th
of May 2005. It is
managed by five staff members: manager, two cashiers, a credit officer and a security guard.
It had 1,172 fully registered members who were required to pay a total of UShs 20,000/=
each for full membership comprising of a membership fee of UShs 10,000 and share capital
of 10,000=
As at 30thApril 2010 the loan portfolio was UShs 94,000,000/=, savings UShs 59,907,124/=
while the share capital was UShs 15,596,869/=. The portfolio at risk was UShs 4,844,000
while the recovery rate was at 87% .
The loan products offered by Bateesa SACCO were business loans, school fees loans, salary
loans, all at a 3% interest rate per month. Emergency loans are also offered at an interest rate
of 10% per month for a maximum period of one month. Business loans take up the largest
part of the loan portfolio.
Support from MSC

419
The manager, credit officers and three board members were trained in various fields by
MSC.
The SACCO also received financial support in terms of loans. At the time of monitoring
four loans totaling to UShs 56,000,000 had been received. The first loan of UShs 5
million was received in 2006 at an interest rate of 9% per annum. The second loan was a
commercial loan of UShs 6 million in 2007 at an interest rate of 10%. The third loan was
UShs 15m in 2008, being a commercial loan at an interest rate of 10% and the fourth
commercial loan of UShs 30m in October 2009. The first three loans were paid off and
the fourth loan was being serviced.
The SACCO had not received any support from UCSCU.
f) Buganga Agali Awamu SACCO
The SACCO was registered on the 21st of March 2007 and had four staff members that is the
manager, cashier, loan officer and accounts assistant. The SACCOs performance was good.
The SACCO had 1,300 fully registered members who pay a total of UShs 18,000/=
comprising of entry fee of UShs 5,000/=, share capital contribution of UShs 10, 000/=, pass
book 2,000/= and ledger card cost at 1,000/=.
The savings portfolio was UShs 96,380,635/=, share capital UShs 35,290,000/= while the
loans portfolio was UShs 135,051,217/=.
The SACCO offers a variety of loan products that include;
Agricultural loans offered at 2% and 3% interest rate per month depending on the
crop in question.
Commercial loan offered at a 4% interest for a period of 12 months.
Transport loans were also offered at a 4% interest for a period ranging from 6-8
months. This type of loan is given to individuals who are interested in dealing in the
“boda boda” business. For an individual to access this loan, they must have UShs
1,700,000 compulsory saving with the SACCO. At the time of monitoring about 40
motorcycles had been given out under this arrangement.
Housing loan; the maximum loan amount for this product was UShs 1,000,000 at a
4% interest. This type of loan is given to individuals who want to improve their
homes for instance finishing construction or buying home assets.
School fees loan; offered at a 4% interest per month for a maximum period of four
months. The maximum loan amount was UShs 500,000/=.
Emergency loan; offered at a 10% interest and it’s only for one month. The maximum
loan amount was UShs 100,000/=.
The biggest percentage of the loan portfolio was for Agricultural loans that had a balance of
UShs 41,052,250 followed by commercial loans (37,112,417). The recovery rate at the time
of monitoring was 83% while the PAR was UShs13, 000,000/=.

420
MSC support
MSC had trained members of staff and some board members in various fields.
The SACCO received three commercial loans totaling to Ushs 50,000,000 at a 9%
interest rate per annum. The SACCO was paying back the loans well, with the 1st one
cleared and yet to clear the 2nd
one in February 2011.
g) ROBUDA Luuka SACCO (Royal Busoga Dev’t Agency-Robuda)
The SACCO started operation in 2002 and it was registered on the 14th
of August 2002 and it
had three members of staff managing its daily activities; the manager, credit officer and cashier.
There were 1,052 fully registered members and each was required to pay a total of UShs
37,000/= which was broken down as; membership fee UShs 12,000/=, share capital contribution
UShs 20,000/= and stationary (pass book, file, membership form) UShs5, 000/=.
Robuda’s savings portfolio was at UShs 73,000,000/=, share capital at UShs 20,000,000/= while
the loan portfolio was at UShs 159,000,000/=
The SACCO offers mainly two loan products: the commercial loan at a 2% interest per month
and the motorcycle loan which is also offered at a 2% interest per month for a maximum period
of 10 months.
The minimum loan amount for a commercial loan is UShs 100,000/= and maximum is UShs
3,500,000/= for a period ranging from 4-10 months.
For the motorcycle loan, a client has to have savings ranging from UShs 700,000/= to UShs
1,000,000/= before accessing the loan. For the case of the motorcycle loan, the SACCO
maintains the log book card until the client clears the loan amount. It was stated that the
motorcycle loan is a popular product and it has given opportunity to many youths to earn a living
in the area. A total of fifteen (15) beneficiaries were able to get the motorcycle loans.
The portfolio at risk was 20% while the recovery rate was in the range of 70% to 80%.
The commercial loans take up majority of the loans portfolio with a total of UShs 123,000,000/=
while the motorcycle loan value was UShs 37,000,000/=.
Support from MSC
The SACCO had received financial support in terms of loans since 2005.At the time of
monitoring; it had received five loans from MSC as shown in table 3.9.3.
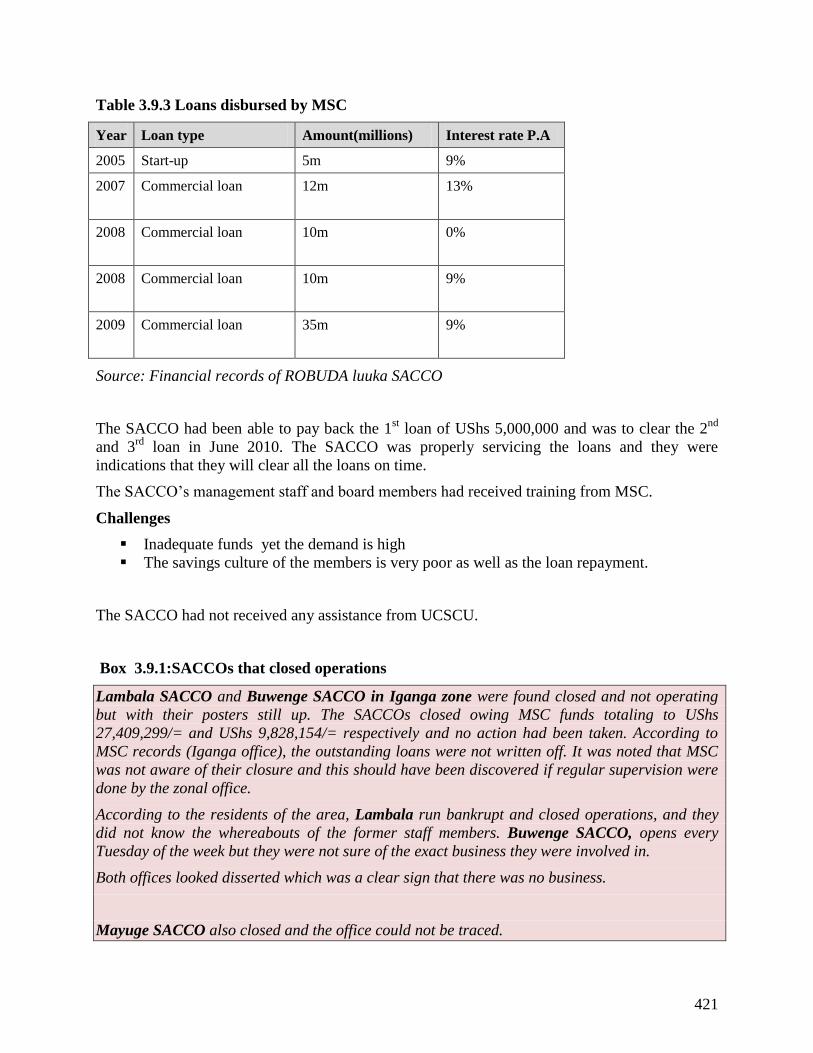
421
Table 3.9.3 Loans disbursed by MSC
Year Loan type Amount(millions) Interest rate P.A
2005 Start-up 5m 9%
2007 Commercial loan 12m 13%
2008 Commercial loan 10m 0%
2008 Commercial loan 10m 9%
2009 Commercial loan 35m 9%
Source: Financial records of ROBUDA luuka SACCO
The SACCO had been able to pay back the 1st loan of UShs 5,000,000 and was to clear the 2
nd
and 3rd
loan in June 2010. The SACCO was properly servicing the loans and they were
indications that they will clear all the loans on time.
The SACCO’s management staff and board members had received training from MSC.
Challenges
Inadequate funds yet the demand is high
The savings culture of the members is very poor as well as the loan repayment.
The SACCO had not received any assistance from UCSCU.
Box 3.9.1:SACCOs that closed operations
Lambala SACCO and Buwenge SACCO in Iganga zone were found closed and not operating
but with their posters still up. The SACCOs closed owing MSC funds totaling to UShs
27,409,299/= and UShs 9,828,154/= respectively and no action had been taken. According to
MSC records (Iganga office), the outstanding loans were not written off. It was noted that MSC
was not aware of their closure and this should have been discovered if regular supervision were
done by the zonal office.
According to the residents of the area, Lambala run bankrupt and closed operations, and they
did not know the whereabouts of the former staff members. Buwenge SACCO, opens every
Tuesday of the week but they were not sure of the exact business they were involved in.
Both offices looked disserted which was a clear sign that there was no business.
Mayuge SACCO also closed and the office could not be traced.

422
h) Joyford SACCO ( Jinja District)
Joyford SACCO is managed by five staff members, the manager, cashier, accounts assistant,
loans officer and a security guard.
It started operations in 2004.
The SACCO had 1135 fully registered members who pay a total of UShs 16,000/= to be
registered. This includes; a share of UShs 10,000/=, membership fee of UShs 5,000/=, and a pass
book at UShs 1,000/=.
As at end of March 2010, Joyford’s savings portfolio was UShs 20,954,000/= and share capital
at UShs 16,400,000/= while the loans portfolio was at UShs 22,390,500/=
The SACCO offers two loan products, the
commercial loan at 3% interest for a loan
period ranging from 6-8months and emergency
loans at 1.5% interest for a period of 2-3
months. The SACCO was in the process of
introducing an agricultural loan. At the end of
March 2010, the recovery rate was at 95%.
Support from MSC
Joyford had received two commercial loans from MSC of UShs 30m, received on the 24th
of
November 2009 and UShs 20m, received in April 2010 at an interest rate of 13% per annum.
The SACCO officials stated that it took two years to get their first loan, and this was due to the
many requirements which they were not well informed about. The SACCO has started servicing
both loans and it is on schedule.
The manager, loan officers and board members had been trained by MSC on loan management
and governance.
The SACCO received support from UCSCU of two computers, one motorcycle, a safe, filing
cabinet, four bicycles and a generator.
Challenges
Office Premises of JOYFORD SACCO

423
The team noted the following:
The clients have a poor savings culture
Staff members receive low salaries and therefore would wish government to come in and
support them with salaries.
The SACCO did not have enough furniture for clients.
B) K ABAROLE ZONAL OFFICE
The office handles seven districts of Kamwenge; Kabarol;e; Bundibugyo; Kasese; Kyenjojo;
Mubende and Kyegegwa covering ninety four (94) sub counties. The total number of clients was
sixty four (64) as follows; Kamwenge district (12); Kabarole (19); Bundibugyo (5); Kasese (16);
Kyenjojo (6); Mubende (4) and Kyegegwa (2)
The zonal office covers ninety four sub-counties with a total of sixty four clients; of which fifty
six are Savings and Credit Cooperatives (SACCOs) while the remaining eight accounts for the
Small and Medium Enterprises and the Microfinance Institutions.
The loan products offered by the zonal office as at March 2010 were; Small and medium
enterprises loans charged at 13% interest rate per annum; Agriculture loan charged at 9% interest
rate per annum; Business development loan which was subdivided into Start up loan charged at
0% interest rate per annum; and Business enhancement loan charged at 9% interest rate per
annum; Commercial/business loan charged at 13% per annum; Government loan which operated
once in 2006 and the Guarantee loan which was to be charged at 9% interest rate per annum but
was not implemented.
The loan types had however been slightly modified and others scraped for instance the start up
loan and guarantee loan.
Kabarole region had by March 2010 disbursed a total of UShs 7,699,500,000 to 64
SACCOs/MFIs from different districts. The coverage of SACCOs by sub-county is Kabarole
district 65%, Kyenjojo district 56%, Kamwenge district 76.2%, Bundibugyo district 36%,
Kyegegwa district 40%, and Mubende district 27%
Table 3.9.4 shows the loan products, amount of funds disbursed and the outstanding balances on
the disbursed loans for F/Y2009/10 for Kabarole zone
TABLE 3.9.4 THE LOAN DISBURSEMENT UNDER DIFFERENT LOAN PRODUCTS TO CLIENTS
Loan product Amount Disbursed (‘000)
UShs
Outstanding
balances(‘000) UShs
Commercial loan 1,435,000 1,109,657
Agriculture loan 5,539,000 5,278,961

424
Business Development 140,000 122,222
Small and Medium Enterprises 180,000 180,000
Government of Uganda 95,000 40,575
TOTALS 7,389,000 6,731,415
Source: Kabarole Zonal Office
The beneficiaries of the Small and Medium Enterprises loan were still in the grace period till
June 2010.
Of the outstanding UShs 40.575,000 on the GoU loan, a total of UShs 17,300,000/= accrues to
Kasambya SACCO while UShs 13,300,000/= accrues to Bageza SACCO and the balance of
UShs 9,975,000 is the GOU loan balance which was overdue. Most of the SACCOs that received
the GOU loan closed before paying back for example Bugoye women SACCO in Kasese district
had a balance of UShs 2,000,000/= and Kasulenge SACCO in Bundibugyo district closed with
UShs 1,666,710/=. The reason for the reluctance to pay and consequent closure of the SACCOs
was based on the belief that GoU loan was free money.
The Zonal recovery rate as at April 2010 was 89% with a Portfolio at risk standing at 11%.
It was ascertained thatMSC authorized a loan disbursement increase from UShs 50,000,000/= to
UShs100, 000,000/= commencing April 2010 and it took one month for a client to receive a loan
having fulfilled all the requirements.
The zonal office provides technical support to the clients through hands on training; workshops
among others to the management staff and board members. Two trainings were given in
F/Y2009/10 on good governance and management of SACCOs and basic accounting.
Challenges at Zonal level
Bundibugyo institutions have a low repayment rate because out of the five SACCOs; it’s
only Rwebisengo that is paying on schedule and the rest are defaulters.
The Bunyoro Tooro Cooperative Union also is a threat since most of the SACCO/ people
in the Kabalore region pay a lot of allegiance to their kingship and had been encouraged
to join the Bunyoro Tooro Cooperative Unions that offers similar services like those of
MSC.
Some managers of SACCOs misappropriate the savers funds making loan recovery
extremely difficult. The case in point was KALCADA SACCO where the manager
misappropriated UShs25, 000,000/= received as an agriculture loan.
a) Smile SACCO (Kabalore local government)
The SACCO was registered on 24th
July, 2008. It had 1600 fully registered members of whom
921 were female, 569 `male while 110 were students. The registered pupils/ students are either

425
sons or daughters of the adult members but registered independently in order to easily access the
school fees loan.
The requirements for full registration include:
Share purchase at UShs 10,000/= @
Stationary(pass book, ledger cards etc) at UShs10,000/=
Local council recommendation letter and three pass port size photographs.
The SACCO had a share capital of UShs16, 000,000/=, cumulative savings portfolio of UShs80,
048,500/= and a loan portfolio of UShs100, 931,000/= with a recovery rate of 100% as at April
2010.
The SACCO provides four types of loans that included;
School fees loan provided at 2% interest rate per month with maximum loan period of
three months and the loan amount between UShs20,000/= and UShs400,000/=
Business loan charged at 3% interest rate per month with the loan amount between
UShs100, 000/= and UShs2, 000,000/= without a grace period.
Emergency loan charged at 10% interest rate per month with a maximum loan amount of
Ushs1, 000,000/= and a loan period of one month respectively for only those saving with
the SACCO.
Home improvement loan provided at 1.5% interest rate per month with a grace period of
two months. The loan amount is between UShs100, 000/= and UShs 1,000,000/= and a
loan period of one month and eight months.
Motor cycle loan which are provided at UShs2, 100,000/= to members having a savings
of UShs1, 300,000/= for a maximum loan period of five months. The SACCO retains the
motorcycle logo book as collateral.
According to the Manager, it takes a month to obtain a loan from MSC and two to three weeks to
receive a loan from the SACCO having fulfilled all the requirements.
The SACCO had so far received two loans from MSC; UShs 10,000,000/= as start up loan at 0%
interest rate per annum in November, 2009 and UShs30, 000,000/= as a commercial loan at 13%
interest rate per annum in May, 2010 for a maximum period of two years with a grace period of
six months.
The SACCO is on schedule with the loan amortization. The SACCO manager and cashier
received training in accounting and management and technical support from MSC.
Challenge
Lack of soft ware for loan tracking, making it is extremely difficult to monitor loans and
accurately truck their performance and repayment. The SACCO applied to MSC for the

426
soft ware and a memorandum of understanding was signed to that effect but no further
progress had been registered.
b)Agahakine Sacco (Kasese local government)
It was fully registered on 5th
, September, 2003. It had 847 fully registered members.
The necessary information could not be obtained due to the absence of the manager and efforts
to get in touch with him were futile.
c) Maliba Sacco (Kasese District)
The SACCO was in the hands of the office attendant so information could not readily be
obtained. The manager and cashier were said to have travelled to Kasese town by the time of the
monitoring.
d) Kahunge Rural SACCO (Kamwenge local government)
The Sacco was fully registered in 2003. It had 1,300 fully registered members as at end of May
2010 of whom thirty were disabled persons. It had four staff members that include; manager,
loans officer, cashier and office attendant.
The requirements for full registration include:
Membership fee of UShs10, 000/=
Share purchase at UShs 10,000/= @
Minimum savings of UShs10,000/=
Stationary(pass book, ledger cards etc) at UShs5,000/=
The SACCO had a loan portfolio of UShs 185,000,000/= and a recovery rate of 90% with a
Portfolio at risk approximately 4.5%. Its share capital was UShs39, 000,000/= and a cumulative
savings portfolio of UShs 61,000,000/=.
The loan products offered by the SACCO include;
Business loan provided at 3% interest rate on declining balance per month
School fees loan at 3% interest rate flat rate for a maximum loan period of four months
and the loan fund is between UShs 100,000/= and UShs 2,000,000/=
Asset acquisition loan at 4% interest rate for a maximum loan period of twelve months;
with the loan amount of UShs 100,000/= to UShs3,000,000/=. The assets under question
are usually; land, motorcycle, house hold items like sofa sets among others.
Agriculture loan which is further subdivided into;

427
Horticulture loan at 2% interest rate on flat rate per month for a maximum period
of five months
Perennial crop loan at 1.5% interest rate on flat rate per month for a maximum
period of one year.
Live stock loan at 1.8% rate on flat rate per month for a maximum period of one
year.
Emergency loan at 10% per month with the loan amount of UShs100, 000/= to
UShs 500,000/= and loan period of 1-2 months.
According to the Manager, it takes a fortnight to acquire a loan from the SACCO incase a client
fulfills all the requirements. It was noted that the management can approve loans below UShs
400,000/= while all those above are approved by the loans committee.
It was established that 70% of the SACCO members received loans including four members of
disabled persons.
The collateral obtained from the clients include logo books for motor cycles, Kibanja agreements
and receipts of assets being used.
The SACCO obtained a total of UShs 150,000,000 from the MSC as stated here below:
UShs10,000,000/= obtained in February, 2006 as a commercial loan charged at 13% per
annum
UShs10,000,000/= obtained in July,2006 as a commercial loan charged at 13% per
annum
UShs15,000,000/= in September,2007 as a commercial loan charged at 13% per annum
UShs15,000,000/= in June,2008 as a commercial loan charged at 13% per annum
UShs 100,000,000/=obtained in August, 2009 as agriculture loan charged at 9% per
annum with a six month grace period.
The first three loans were fully paid off while the fourth and fifth loans were yet to be completed.
The SACCO staff and the board members were trained by MSC on ownership, governance, and
micro loan appraisal in the year 2009.
There had been technical support and supervision by the MSC. The management complained that
the MSC staff takes long to visit them for supervision.
Challenges
Lack of soft ware for loan tracking is making it extremely difficult to monitor loans and
accurately track performance and repayment. The SACCO applied to MSC for the soft
ware and a memorandum of understanding was signed to that effect but no further
progress has been registered.
Loan appraisal and monitoring of the client is also difficult due to absence of transport
and absence of equipment to execute such activities like computers.

428
The UCSCU also promised strengthening support of Motor cycle, regenerator and or
solar equipment and a memorandum of understanding was signed to that effect but had
delivered.
e) Businge SACCO (Kamwenge District)
The SACCO was duly registered on 15th
February 2005 and had 947 fully registered members as
at April 2010. The SACCO had 611 males, 204 females, 128 groups and 4 institutions.
The requirements for full registration include:
Subscription fee of UShs5,000/=
Entry fee of UShs5,000/=
Two share purchase at UShs20,000/=
Stationary(pass book, ledger cards ) at UShs2,000/=
The SACCO had a share capital UShs32, 325,000/=, cumulative savings portfolio of UShs29,
224,994/= and loan portfolio of UShs105, 966,389/=. It had a recovery rate of 83% with a
portfolio at risk of 0.7% translating into bad debts of UShs9, 000,000/=.
The loan products offered by the SACCO include:
School fees loan at 3% interest rate per month on declining balance for a maximum loan
period of three months and the loan is between UShs 100,000/= and UShs500,000/=
Commercial loan at 3% interest rate per month on declining balance for a maximum loan
period of six months and the loan is between UShs 100,000/= and UShs2,000,000/=
Agriculture loan at 2.5% interest rate per month on declining balance for a maximum
loan period of nine months with a grace period of one year.
According to the manager it takes two to three weeks for the clients to receive loans from the
SACCO. The loans are processed by the loans committee and the funds are directly deposited
into the client’s savings account. This is aimed at controlling the big numbers of clients who
would otherwise congest the SACCO premises waiting for cash payment. For one to get a loan,
one has to present the collateral security usually in form of land (bibanja) agreement, car/
motorcycle logo books, cows, and livestock.
Funding from the MSC
The SACCO had so far received one loan of UShs40, 000,000/= as an agriculture loan in June,
2008 at 13% interest rate per annum with a grace period of one year for a maximum loan period
of three years.

429
According to the manager, it took the SACCO four months to receive a loan from MSC and had
applied for another loan of UShs100, 000,000/= which the SACCO had not yet received.
f) Bugaaki SACCO (Kyenjojo local government)
The team was unable to obtain all the
necessary information because the manager
was absent and the only staff present was the
security guard who was able to avail the
following little information.
The SACCO was duly registered in June, 2008
The SACCO had 294 fully registered members
with two staff members; the manager and the
security guard who are assisted by the board of
governors who play an oversight role.
The requirements for full registration of members include:
Share contribution at UShs 20,000/=
Registration fee at UShs 5,000/=
Stationary(pass book, ledger cards etc) at UShs1,000/=
g) Miranga SACCO in Kyenjojo
The SACCO was duly registered on 25th
, May, 2006. The SACCO had four staff members; the
manager, cashier, loans officer and security guard.
It had 518 fully registered members as at end of May 2010 including fifteen social groups of
women, youth and entrepreneurs. The SACCO had four disabled members of whom three were
male and a female.
The SACCO had a share capital of UShs 10,425,000/=; cumulative savings portfolio of UShs14,
611,050/= and loan portfolio of UShs34, 606,900/=. The agriculture loan takes the biggest
percentage of the loan portfolio. The recovery rate stood at 84% with portfolio at risk of 16%.
The SACCO offers the following loan products to its clients:
Agriculture loan offered at 3% per month with the loan period between one to six
months and amount between 50,000/= and UShs2, 000,000/=.
The office premises of Bugaaki SACCO. The
Middle door shows the office

430
Business loan offered at 3% per month with the loan period between one to six
months and amount of UShs50,000/= to UShs2,000,000/= .
School fees loan offered at 3% per month with the loan amount between UShs300,
000/= and UShs1, 000,000/=.
The requirements for one to receive a loan from the SACCO include:
Having 15% savings of the loan amount required.
Having collateral which include but not limited to; land, commercial house, tea
chambers; and two guarantors.
Assistance from MSC
The SACCO had received one loan from MSC of UShs 10,000,000/= in September, 2009 as start
up loan at 0% interest rate for a period of two years. The SACCO also applied for an agricultural
loan of UShs30, 000,000/= in March 2010 but had not yet received the funds.
Apart from the loans, the SACCO staff and board members were trained in loan appraisal and
governance.
The SACCO received the start up kit from UCSCU which included the safe, filing cabinet, two
bicycles, two calculators and salary for the staff up to December 2009.
Challenge
The SACCO had not received any operation grant from UCSCU to cater for the salaries of the
staff members since December 2009 and was struggling to pay from the internally generated
funds.
h) Banyakyaka SACCO (Kyegegwa local government)
The SACCO was fully registered on the 1st, March, 2002. It had five staff members that include;
the manager, cashier, loans officer, records assistant and security guard. The SACCO had 771
fully registered members as at 2nd,
June, 2010 comprising of 549 men; 131 female; 20 groups and
33 institutions. Of the 20 groups; two are for the disabled.
Requirements for full registration are:
Four share purchase at UShs40,000/=
Savings account opening at UShs10,000/=
Registration at UShs5,000/=
Stationary(pass book, ledger cards etc) at UShs10,000/=
.

431
The SACCO had share capital of UShs23, 566,500/=, savings portfolio of UShs48, 652,849/=
and a loan portfolio of UShs103, 249,050/=. The agriculture loan takes the biggest share of the
loan portfolio. The recovery rate was 66%.
The loan products offered by the SACCO include:
Agriculture loan offered at 3% interest rate per month with a three month grace period and a
maximum loan amount of UShs3,000,000/= for six months.
Commercial loan offered at 3% per month with a maximum loan amount of UShs3,
000,000/= for eight months.
Emergency loan provided at 5% per month for a maximum loan period of three months and
maximum loan amount of UShs 1,000,000/=
School fees loan provided at 4% per month with maximum loan amount UShs1, 000,000/=
and a period of four months.
The SACCO set up some requirements for one to access the loan that includes collateral in form
of: land; logo book: savings of at least 10% of the loan applied for and two guarantors
Support from the MSC.
The SACCO received two loans from MSC: one of UShs10, 000,000/= as start up at 0% interest
for a maximum loan period of two years and UShs UShs20,000,000/= as agriculture loan at 9%
interest rate for two years. According to the manager, the SACCO had not obtained more
funding because they had to first change the board members as the current one had overstayed.
However, the SACCO members had confidence in the board and were against disbanding it.
MSC offered technical support and training to the staff and the board members.
Challenges
Failure by MSC to give the SACCO more funds that is premised on the fact that the
board members had overstayed in office.
i) Kasambya SACCO ( Mubende District)
The SACCO was duly registered in 2005.. It had four staff members; manager, cashier,
accountant and loans officer. The SACCO had 1,138 fully registered members who pay a total of
UShs 55,000 including:
Share contribution of UShs30,000

432
Savings account opening at UShs25,000/=
The groups’ registration requirements however vary as theu pay Ushs 115.000 including:
Three share purchase at UShs 90,000/= and
savings account opening at UShs25, 000/=
The agriculture loan accounts for the largest
portion of the loan portfolio. The SACCO had a
share capital of UShs53, 149,000/=, cumulative
savings portfolio of UShs189, 412,951/= and a
loan portfolio of UShs251, 165,400/= with a
recovery rate of 70% and portfolio at risk of
20%.
The SACCO was performing well and had been
able to mobilize a reasonable number of
members totaling to 1138.
Of the 1,138 members, 519 have received loans
among those are the disabled and people with HIV/AIDS.
The SACCO offers the following loan products:
Agriculture loan offered at interest rate of 2% for a period of one to twelve months and
loan amount UShs50, 000/= to UShs5, 000,000/= while for groups it was UShs50,000/=
to UShs10,000,000/=
School fees loan offered at an interest rate 1% per month with loan period between one
month to six months for tertiary education loans and one month to three months for
secondary and primary school loans. The amount offered is UShs 400,000 to 1,500,000.
Trade and commerce loan is charged at 2% per month for a maximum loan period of
twelve months; maximum loan amount lies between UShs100,000/= to UShs5,000,000/=
for an individual while for the group, the loan amount is between UShs100,000/= and
UShs10,000,000/=
Transport loan which is further subdivided into;
o Boda boda loan charged at 2% interest rate per month and the loan amount is
UShs 100,000 to Ushs5,000,000
o Commercial vehicles charged at 2% per month for a maximum loan period of
twelve months. The loans range between UShs100, 000/= and UShs5, 000,000/=.
For the client to receive a loan one is required to have 30% of the required value of the motor
vehicle/motor bike.
Housing loan charged at 2% per month for a maximum loan period of twelve months
with loan amount between UShs100, 000/= and UShs5, 000,000/=
Office premises of Kasambya SACCO in
Mubende District

433
Emergency/health loan charged at 2% per month for a maximum period of twelve
months. This loan is strictly offered on health related cases.
Assistance from the MSC
The SACCO received a total of UShs 61,500,000 from the MSC in three installments. The
SACCO received UShs5, 000,000/= in 2005 as start up loan at 0% interest; an agriculture loan of
UShs40, 000,000/= in 2008 charged at 9% per annum for a maximum period of three years and
UShs16, 500,000/= in 2009 as commercial loan charged at 13% per annum for a maximum loan
period of four years with a grace period of six months. The SACCO was on schedule with the
amortization of the loans.
Apart from the loans the SACCO benefited from training and technical support from MSC.
C) MASAKA ZONAL OFFICE
The Masaka zonal office controls five districts with 47 clients as shown in table 3.9.5
Table 3.9.5: Clients covered under Masaka Zonal office
District Number of clients
Masaka district 23
Lyatonde 04
Rakai 11
Ssembabule 06
Kalangala 03
TOTAL 46
Source: Zonal office performance report
There are five staff members at the Zonal office who include; Senior financial services officer,
Financial services officer, Accountant, Administrative assistant and Logistics assistant.
The clients include SACCOs, SME’s and individuals.
The Zonal office gives the following loan products to its clients;
Micro enterprise loan which is currently the commercial loan issued at a 13% interest rate
per annum for a two year loan period.
Agriculture loan offered at a 9% interest per annum. It has a loan period of two years
with six month grace period. The repayment frequency depends on the activity funded.
Small Medium Enterprise (SME) loans offered at a 17% interest rate but this was
negotiable, however, if it is for agricultural purposes it is given at a 9% interest.
434
Business enhancement loan offered at a 9% interest per annum on reducing balance. The
maximum loan amount is UShs 10 million payable in two years.
Start-up loan; The SACCOs pay back only the principal loan amount therefore it is
interest free. The maximum loan amount is UShs 10million payable in two years.
The monitoring team was informed that processing of the loan takes two to three weeks for a
SACCO after submitting in all the requirements .Originally the zonal office could approve loans
to a tune of UShs 50,000,000 but this was increased to 100,000,000 since May 2010. The
SACCO has to produce the following documents to access the loans:
SACCO Requirements
Certificate of registration
Audited accounts for at least one year.
Latest final accounts after audited accounts.
Maximum liability from the registrar of companies.
Annual returns
Application form.
Resolution to borrow by the board and management of the SACCO.
The zonal office identified some of the obstacles of the SACCOs to obtain the loans;
Inability to prepare final accounts for submission to the MSC.
Requirement of the maximum liability from the ministry of trade which according to the
SACCO takes time to be obtained.
Lack of skilled manpower to manage SACCO activities.
The Masaka zonal office was able to extend capacity building services in form of training and
workshops to its clients during the period under review. However funds for training were
inadequate and therefore the zonal office had not carried out a number of capacity building
training.
The Zonal office had given out a loan portfolio of UShs 1.9 billion of which the SME loan
product had the highest loan portfolio of UShs 882million, Agriculture was at UShs 836 million
while the start-up loan was at UShs 193million.
The zonal office was performing well with the recovery rate of 97%.
i) Rakai Local Government
In Rakai local government, Victoria Basin SACCO and Kyotera Tusimbude SACCO were
monitored.
a) Victoria Basin SACCO.
Victoria Basin was registered as a SACCO on the 6th
of November 2000.The SACCO had 28
members of staff with five branches in three districts.

435
There were 6378 fully registered members who pay a total of UShs 30,000/= each comprising of
UShs 20,000/= for opening an account and a share capital contribution of UShs 10,000.
The SACCO’s savings portfolio as at 31st march 2010 was UShs 206,000,000/=, share capital of
UShs 198,254,000/= while the loan portfolio was UShs 984,000,000/=.
The recovery rate by end of March was 87% while the portfolio at risk was 10.3%.
Victoria basin was supported by UCSCU who gave a generator and conducted trainings.
The SACCO offers a number of products to its clients which include:
Commercial loans which are offered at an interest rate of 38% per annum and 3.2% per
month. The loan period ranges from 6 -12 months and the minimum loan amount is UShs
200,000/= while the maximum loan amount is UShs 5,000,000/=
The Agricultural loan is offered at an interest rate of 38% per annum and at 3.2% per
month. This product takes the biggest percentage of the loan portfolio of 68% of the loan
funds disbursed.
Salary loans are offered at a 10% interest rate per month for a period of two months.
School fees loans are offered at 38% per annum and 3.2% per month.
Solar loans are offered at a minimum loan amount of UShs 300,000/= and the maximum
loan amount of UShs 4,000,000/=.The loan period is 6 months.
Assistance from MSC
The SACCO received training for staff members and board members in the year 2009
They also received financial support in terms of loans. At the time of monitoring the SACCO
had received 6 loans from MSC totaling to UShs 620 million as shown in table 3.9.6.
Table 3.9.6: Loans received from MSC
Year Loan type Amount(millions) Interest rate
P.A
Sept 2001 commercial 20,000,000 13 %
Oct 2002 Commercial loan 50,000,000 14%
June 2004 Commercial loan 75,000,000 13%
Aug 2006 Commercial loan 75,000,000 13%
Aug 2006 Commercial loan 200,000,000 13%
July 2007 Commercial loan 200,000,000 13%
Source ; The SACCO financial records

436
The SACCO has been paying back the loans very well but declined in the year 2009 because of
drought that hit the area. It had an outstanding amount of UShs 101million on the 5th
and 6th
loan
obtained from the MSC.
Specific challenges
There was multiple borrowing by clients from different institutions and this affects their
ability to pay back the loans.
The clients have a very poor saving culture, most of them just come for loans and are not
interested in saving
The SACCO is also faced with high staff turn over.
b) Kyotera Tusimbude SACCO Ltd (Rakai District)
Kyotera Tusimbude was formed in 2003 and it was later registered on the 16th
November 2004.
The SACCO is managed by 5 staff members who include the manager, loans officer, credit
officer, cashier and a security guard. They are assisted by the board members whom play an
oversight role.
It had 661 fully registered members as at April 2010.Atotal of UShs 23,000/= is paid by a client
to be a registered member, where UShs 10,000/= is for buying one share, UShs 10,000/= for
opening an account and UShs 3,000/= for a pass book. For a client to obtain a loan, he/she is
required to buy three shares i.e. UShs 30,000/=.
By the end of April 2010, the SACCO’s share capital was UShs21,770,000/= and savings
portfolio was UShs 24,056,013/= while the loan portfolio was UShs 60,838,250/=.The recovery
rate as at April 2010 was 27.2% after declining from 37.9% at the end of March 2010. The
portfolio at risk was UShs 23,740,350/ being 39%
The SACCO had a number of products it offers to its clients;
School fees loans are offered at 6% interest per month on reducing balance. The loan
period ranges from one month to eight months with a minimum amount of UShs100,
000/= and maximum of UShs 500,000/=.
Agricultural loans offered at a 6% interest per month on a reducing balance. The loan
period ranges between 1 – 8 months and the minimum loan amount is UShs100, 000/=
while maximum amount is UShs 700,000/=.
Commercial loans offered at 6% interest rate as school fees loans with a minimum loan
amount of UShs 100,000/= and maximum of UShs2,000,000/=.This product covers the
biggest percentage of the loans portfolio.
Emergency loans are offered at a 6%- 10% interest rate for only one month, the minimum
loan amount is UShs 100,000/= while the maximum loan amount is UShs 200,000/=.

437
Box 3.9.2: Interest rates charged by Kyotera Tusimbude SACCO
It was noted that Kyotera Tusimbude SACCO charges a very high interest rate of 6% per month
translating into 72 % per annum which is high for the borrowers to service the loan. This has led
to high default rate among the borrowers. The loans obtained from the MSC is charged at 9% to
13% per annum only but charged at 72% per annum to the client.
Support from MSC
The SACCO received technical advice in form of training in the year 2009.
It also received financial support in terms of loans. At the time of monitoring, the SACCO had
received two loans from MSC. The first loan was received in April 2006 as a business
enhancement loan of UShs 5,000,000 at a 9% interest rate per annum. This loan was already paid
off. The second loan of UShs 10,000,000 was a business enhancement loan received in March
2010 at a 9% interest per annum.
Specific challenges
Inadequate funds for loans. It was noted that because of the high interest rates charged,
there are few people interested in becoming members of the SACCO.
Multiple borrowing by clients yet the SACCO cannot easily tell whether a client has
other loans with different institutions. This constrains the repayment abilities of the
borrowers.
MASAKA LOCAL GOVERNMENT
In Masaka district, two SACCOs were monitored, that is Kyazanga Kwegata SACCO and
Kitooro SACCO.
c) Kyazanga Kwegata Microfinance SACCO Ltd.
The SACCO was registered in 2005 and is managed by five staff members; the manager, one
accounts assistant, one banking assistant and two loans officers.
There are 1,751 fully registered members that have fully paid a total amount of UShs
25,000/=each comprising of membership of UShs 5, 000/=, a share capital contribution of UShs
10,000/= and initial savings deposit of UShs 10,000/=.One is also required to bring three
passport photos, and a letter of introduction from the LC or a recommendation from a member of
the SACCO.
The SACCO’s share capital was UShs 147,510,000/=, savings portfolio at UShs 193,332,109/=
while the loans portfolio was UShs 586,957,906/=.The recovery rate was 85% while the portfolio
at risk was 20% which amounts to UShs 144,000,000 as at April 2010.
The SACCO was performing well and offers various products to its clients that include:

438
Commercial loans which are offered at a 2% interest per month. The loan period ranges
from 1-12 months with the minimum loan amount of UShs 300,000/= while the
maximum was UShs 20,000,000.
Agricultural loans offered at 2% interest per month on reducing balance. The loan period
ranges from 1 -12 months with a 2 months grace period. The minimum amount was UShs
300,000/= while the maximum loan amount was UShs 2,000,000. The maximum loan
amount could go up to UShs 20,000,000 depending on the agricultural activity a client is
involved in. This product forms the highest loan portfolio.
Education loans have a loan period ranging from 1 – 4 months at a 2% interest per month.
The minimum loan amount is UShs 300,000/= while the maximum loan amount is UShs
1,000,000
Development loans are usually offered for land acquisition, building and buying home
assets. It is offered at a 2% interest per month with a minimum loan amount of UShs
300,000/= while the maximum loan amount is UShs 5,000,000. Under this loan product,
solar loans are also offered but with a longer loan period of 1 – 12 months.
Emergency loans are for only one month at a 10% interest rate. The loan amount ranges
from UShs 10,000 to UShs 200,000/=.
Special loans are usually given to business people bringing in imports. The loan period is
one month at a 10% interest rate with a minimum loan amount of UShs 300,000/= while
the maximum loan amount is UShs 5,000,000.
Support from MSC.
The SACCO obtained loans from the Microfinance support center.
The first loan was a commercial loan of UShs 140,000,000 at an interest rate of 13% per annum.
This was received on the 21st of February 2009. At the time of monitoring, the SACCO had
unpaid balance of UShs 62,000,000 being serviced, to be completed by 12th
December 2011.
The second loan was UShs 50,000,000 an agricultural loan at a 9% interest rate per annum. It
was received on the 20th
of December 2009 for a loan period of 3 years with a one year grace
period.
d) Kitooro SACCO Ltd.
The SACCO is found in Kyazanga Sub-county in Masaka district. The SACCO was registered
on the 13th
November 2004 and has two staff members; the manager and the cashier.
There are 745 fully registered members who pay a total of UShs 25,000/= each comprising of
four shares at UShs 5000/=each, a pass book at UShs 3,000/= stationery at UShs 2,000/=.Three
passport photos, an LC letter or any other identification is also required.
Kitooro SACCO offers a number of products;
School fees loans are offered at a 4% interest per month. The loan period ranges from 1 -
6 months and the minimum amount is UShs 100,000/= while the maximum loan amount
is UShs 400,000/=.
439
Agriculture loan is offered at a 3.5% interest per month translating into 42% per annum.
The loan period is 12 months with a 3 months grace period. This loan product forms the
highest loan portfolio.
The emergency loan is offered at a 5% interest per month. The loan period ranges from
one week to one month and offers a minimum amount of UShs 100,000/= while the
maximum amount is UShs 500,000/=.
The loan portfolio as at 15th
May was UShs 72,334,650/= and savings portfolio at UShs
2,245,881/= while the share capital was at UShs 11,775,000/=.
The recovery rate as at May was 75% while the portfolio at risk was UShs 5,000,000/=.
It was noted that the savings portfolio was low at Ushs 2,245,881 implying that the SACCO had
not done enough to mobilize the members.
Support from MSC
The SACCO had received four loans from MSC by the time of monitoring.
The first loan was UShs 5,000,000 for business enhancement loan received in 2006 at a 0.75%
per month on reducing balance and the loan period was three years.The second loan was UShs
5,000,000; a commercial loan at a 13% interest per annum for two years and it was received in
July 2007. The third loan received in 2009was UShs 15,000,000; an agricultural loan of a 9%
interest per annum. Its loan period was three years with a grace period of 6 months. The fourth
loan was UShs 25,000,000, an agricultural loan at a 9% interest per annum. This was received in
2009 and it had a grace period of 6 months for a period of three years.
The SACCO was up-to-date with servicing the loans. It had paid off the first three loans and was
servicing the forth.
Kitooro SACCO members of staff and board members were also trained by MSC.
Challenges
Difficulty in getting audited books /accounts because it is expensive for the SACCO that
is still at the formation stage.
Those who borrow agricultural loans usually face problems with repayments especially
when they are faced with natural hazards that affect their products.
SEMBABULE LOCAL GOVERNMENT
One SACCO was monitored in the district and this was Mateete microfinance cooperative trust.
e) Mateete microfinance co-operative trust
It was registered on the 29th
of October 2002.
The SACCO had eleven members of staff and these include; a manager, accountant, supervisor,
three accounts assistants, four loan officers and one office assistant.
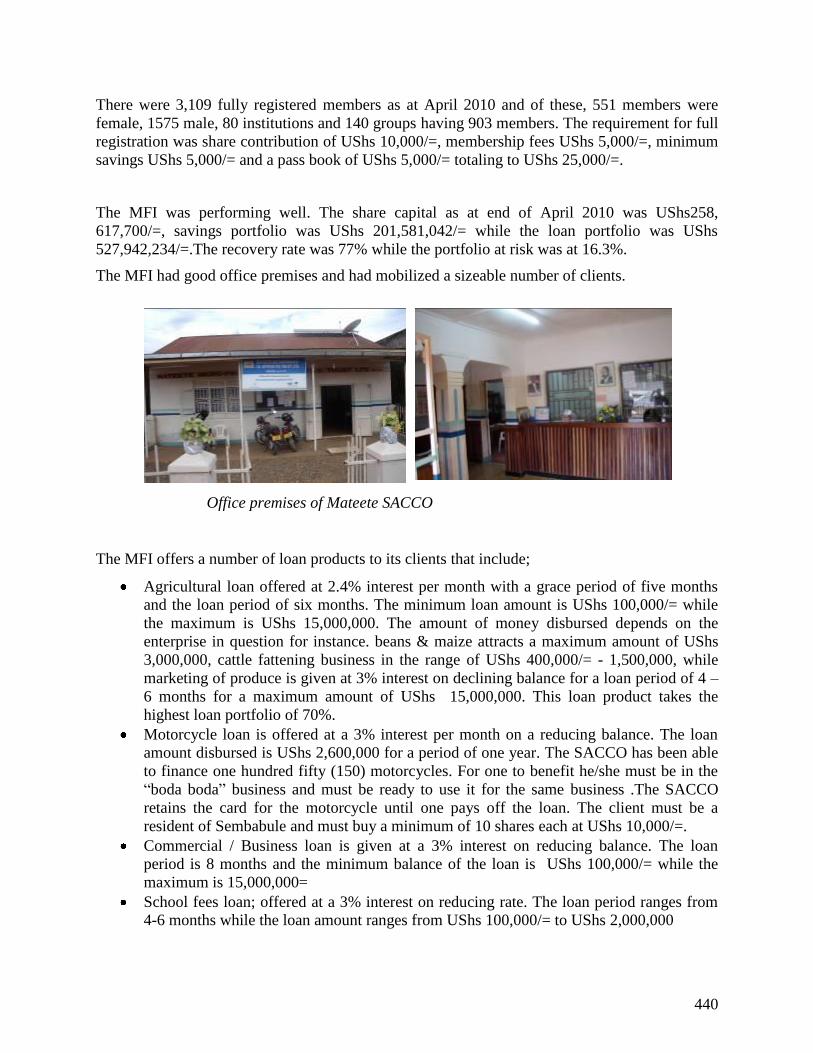
440
There were 3,109 fully registered members as at April 2010 and of these, 551 members were
female, 1575 male, 80 institutions and 140 groups having 903 members. The requirement for full
registration was share contribution of UShs 10,000/=, membership fees UShs 5,000/=, minimum
savings UShs 5,000/= and a pass book of UShs 5,000/= totaling to UShs 25,000/=.
The MFI was performing well. The share capital as at end of April 2010 was UShs258,
617,700/=, savings portfolio was UShs 201,581,042/= while the loan portfolio was UShs
527,942,234/=.The recovery rate was 77% while the portfolio at risk was at 16.3%.
The MFI had good office premises and had mobilized a sizeable number of clients.
The MFI offers a number of loan products to its clients that include;
Agricultural loan offered at 2.4% interest per month with a grace period of five months
and the loan period of six months. The minimum loan amount is UShs 100,000/= while
the maximum is UShs 15,000,000. The amount of money disbursed depends on the
enterprise in question for instance. beans & maize attracts a maximum amount of UShs
3,000,000, cattle fattening business in the range of UShs 400,000/= - 1,500,000, while
marketing of produce is given at 3% interest on declining balance for a loan period of 4 –
6 months for a maximum amount of UShs 15,000,000. This loan product takes the
highest loan portfolio of 70%.
Motorcycle loan is offered at a 3% interest per month on a reducing balance. The loan
amount disbursed is UShs 2,600,000 for a period of one year. The SACCO has been able
to finance one hundred fifty (150) motorcycles. For one to benefit he/she must be in the
“boda boda” business and must be ready to use it for the same business .The SACCO
retains the card for the motorcycle until one pays off the loan. The client must be a
resident of Sembabule and must buy a minimum of 10 shares each at UShs 10,000/=.
Commercial / Business loan is given at a 3% interest on reducing balance. The loan
period is 8 months and the minimum balance of the loan is UShs 100,000/= while the
maximum is 15,000,000=
School fees loan; offered at a 3% interest on reducing rate. The loan period ranges from
4-6 months while the loan amount ranges from UShs 100,000/= to UShs 2,000,000
Office premises of Mateete SACCO
441
Solar loan is given at a 3% interest on reducing balance. The loan amount ranges from
UShs 100,000/= to UShs 10,000,000 depending on the type of panel required. The solar
panels are procured in bulk from the service provider and given out to the borrowers.
Housing loan is given to clients who are constructing houses, buying a plot or buying
household assets. It is given at a 3% interest rate on reducing balance for a maximum
period of one year.
Emergency loans are given out at a 6% interest for a maximum period of one month and
the loan amount ranges from UShs 50,000/= to UShs 100,000/=.
Special loans are for three months period with two months of grace period. The loan
amount ranges from UShs 500,000/= to UShs 10,000,000.
It was noted that it takes seven days for the SACCO to process a loan apart from the emergency
and special loans which take one day and two days respectively. This is so because the loans
committee sits weekly.
Support from MSC
The SACCO staff and the board members were trained on governance and accounting.
The SACCO received financial support in terms of loans. MSC had given the SACCO
three loans totaling to UShs 175,000,000 at the time of monitoring. The first loan of UShs
5,000,000 was received in March 2006 at a 9% interest with a grace period of six months.
The second loan of UShs 120,000,000; an agricultural loan was received in March 2009
at an interest rate of 9% and a loan period of three years. The third loan was UShs
50,000,000; a commercial loan received in November 2009 at a 13% interest rate for two
years with a grace period of six months. The loan repayment was on schedule.
Challenge
The SACCO needs computers as the number of clients has grown instead of the manual
system currently being used. The manual system is slow and tedious.
D) MBALE REGIONAL/ZONAL OFFICE
The office is responsible for fourteen (14) districts: Mbale, Bududa, Manafwa, Sironko, Budaka,
Pallisa, Bukedea, Busia, Tororo, Butaleja, Bukwo, Kapchorwa and soon Kibuku and Bulambuli
effective from F/Y 2010/11.
The districts had the following clients/SACCOs: Tororo has seven clients; Sironko had seven;
Pallisa with twenty seven; Mbale with sixteen; Bududa with seven; Manafwa with seven; Busia
with ten; Bukedea with one; Kapchorwa with nine and Budaka with two making the total
clients/SACCO under MSC support ninety three .
The Zone office has disbursed a total of UShs 1,095,000,000 to the SACCOs and at the time
of monitoring, the outstanding loan amount was UShs 866,961,249. The bad loans amounted
to UShs 21,417,914 outstanding for over 365 days in respect to Bukedi teachers SACCO (

442
UShs 6,973,469) and Aminanara SACCO ( 14,097,220). Both the SACCOs have closed
offices and there was little chance of the MSC recovering the funds.
Box3.9.3: SACCOs that closed offices in Mbale zone
It was established that twenty three SACCOs received the UShs5, 000,000/= as GoU loan
in 2006 of which eight SACCOs failed to pay the loans leaving an outstanding balance of
UShs13, 619,967. The eight SACCOs are: NARU SACCO; Butiru SACCO; Budadiri
SACCO; Morukokume growers SACCO; Syanyonja multipurpose SACCO; Burumico
SACCO; Tororo poverty alleviation SACCO and Sebei teachers SACCO
The office provides the following loan products:
Capacity development loans/start up loans of UShs 5,000,000- 10,000,000 at 0% interest
rate per annum with grace period of six months.
Business enhancement loan provided at 9% interest rate per annum of UShs 5,000,000-
10,000,000.
Agricultural loan of UShs 5,000,000- 40,000,000 at an interest rate of 9% for a period of
six month to one year.
Commercial/Micro enterprise loan offered at 13% per annum for a maximum loan period
of three years.
Small and Medium enterprise loans provided at 17% for the processing SME and at 9%
for the agriculture SME.
The startup loan and business enhancement forms the biggest percentage of the loan
portfolio.
The zonal office also provides training and technical support to the SACCOs management
staff and the board.
Challenges
Most of the SACCOs under the zone are start up with few members, low loan portfolio,
savings and share capital.
Some SACCOs are set up and managed as family SACCOs in anticipation of receiving
‘’government free money’’.
Poor record keeping systems which makes it difficult for the SACCOs to make rational
economic decisions or credit decisions.
Some SACCOs have low repayment rates because the board members borrow from the
SACCOs and are usually reluctant to pay back. The cases in point are; Bungokho Mutoto
SACCO, Busiu SACCO and Bahugu SACCOs in Mbale and Sironko districts
respectively. It was also noted that some politicians borrowed funds from Bungokho
Mutoto refused to pay back and when arrested, the chairperson instructed for their

443
acquittal. MSC therefore should sensitize the people that the loans from MSC is not
government free money but must be paid back.
MBALE District
a)Nkwatirako SACCO
Nkwatirako SACCO is managed by two members of staff and nine board members. The staff
members are the manager and a cashier. It was registered on 26th
May 1992. It started way back
in 1988 as kasale group but later became a SACCO and that’s when it registered as Nkwantirako
SACCO.
There are 360 fully registered members where 152 members are male and 208 are female. One is
considered to be a fully registered member after paying a sum of UShs 45,000/= where UShs
30,000/= is for share contribution and UShs 15,000/= as entrance fee.
The share capital as at April 2010 was UShs 11,797,281/=, and savings portfolio was UShs
17,587,674/= while the loan portfolio was UShs 38,413,604/=.
The recovery rate as at April 2010 was 87% while the portfolio at risk was 13% of UShs
2,014,500. In the FY 2009/10 a total of 109 members of which 40 are male and 69 female
received loans.
Loan products
The SACCO gives out two loan products that are the commercial and agricultural loans that are
offered at 3% interest for a loan period of 6 – 12 months on declining balance. The loan amount
for commercial loans ranges from UShs 100,000/= to UShs 1,000,000 while agricultural loans
ranges between UShs 100,000/= to UShs 500,000/=.The agricultural loan forms the highest loan
portfolio.
Support from MSC
The SACCO had received six commercial loans from MSC totaling to UShs 56,000,000. The
first three loans totaling to UShs 15,000,000 was paid off on time and the SACCOwas servicing
the fourth loan of UShs 8,000,000. The outstanding loan is the fifth and sixth loan of UShs
10,000,000 and 23,000,000 received in Dec 2009 and February 2010 respectively.
Challenges
Non members of the SACCO use the clients of the SACCO to obtain money and
eventually refuse to service the loans because they know that it will be difficult to follow
them up.

444
b) Namatsyo SACCO
The SACCO was registered on 14th
May 2009. There are three staff members; the manager,
cashier and loans officer.
It had 650 fully registered members of which 204 are female while 446 are male. One is
considered a fully registered member after paying UShs45, 000/=, where UShs 5,000/= is for
membership, UShs 20,000/= for share contribution and UShs 20,000/= for opening a savings
account.
The share capital was UShs 49,950,000/= and loan portfolio was UShs 77,984,700/= while the
savings portfolio was UShs 34,335,500/=.The SACCOs recovery rate was 69% while the
portfolio at risk was 31%.
The SACCO offers two loan products that include commercial and agricultural loans.
Commercial loans are offered at a 20% interest in six months in the range of UShs 300,000/= to
UShs 2,000,000=. Agricultural loans are also offered at 20% interest for six months while the
loan amount ranges from UShs 300,000/= to UShs 2,000,000. Commercial loans take the highest
percentage of the loan portfolio. A total of 480 members had accessed the loans from the
SACCO that had greatly contributed to the growth in the number of members.
Support from MSC
The SACCO received three loans since April 2009. The first loan was UShs 5,000,000
received in April 2009 as a startup loan, with a grace period of six months. The second
loan was also a startup one of UShs 5,000,000 received in July 2009. In September 2009,
a total of UShs 20,000,000 was received at 13% interest rate for two years without a
grace period.
The SACCO manager and loans officer were trained in sound practices of Microfinance.
c) Budaka rural enterprise SACCO (Budaka District)
The SACCO was registered in December 2006. It has four staff members; the manager, cashier,
customer care officer and security guard.
As at April, there were 561 fully registered members and of these, 162 were female, 392 male
and 7 groups. Ten of the members were disabled and only one of them had applied for a loan.
An individual is required to pay a total of UShs 38,000/= to be considered fully registered. This
comprises of UShs 5,000/= as registration fees; UShs 20,000/= for share contribution; UShs
10,000/= for a savings account and UShs 3,000/= for a pass book. The share capital as at end of
April was UShs 14,640,000/= and loan portfolio was UShs 38,427,818/= while the cumulative
savings portfolio was UShs 29,368,238/=.
The recovery rate was 94% as at April 2010 while the portfolio at risk was 7% amounting to
UShs 2,772,283
The SACCO gives out four loan products: the agricultural loan; education/ school fees loans;
business loan and service industry loans.

445
The agricultural loan is given at a 2.75% per month for 10 months and the loan amount ranges
from UShs 300,000/= to UShs 2,000,000
School fees loans, business loans and service industrial loans are all offered at a 2.75% interest
rate per month for a period of six months. The loan amount ranges from UShs 300,000/= to UShs
2,000,000
For a member to access the loan one must meet the following requirements.
Be fully registered with at least a share.
Be trained by a SACCO in loan management
Have at least 15% savings of the amount needed.
Have collateral security such as cows, goats, land, and log book for a car or a motorcycle.
MSC support
The SACCO received loans from MSC since early 2009.The first loan was a startup loan
of UShs 10,000,000 received in March 2009 for a period of two years. Then a business
enhancement loan of UShs 10,000,000 was received in August 2009 at a 9% interest rate
per annum. The loan period was two years with a grace period of six months. In May
2010, an agricultural loan of UShs 25,000,000 was received for a period of two years at
an interest rate of 9% per annum. The SACCO also received some grants from Uganda
Rural enterprise cooperative union of UShs 1,500,000 to assist HIV/orphans.
There was a complaint of the delay to access the loan for instance they applied for an
agricultural loan of 25,000,000 in Oct 2009 but had not received the money eight month later
and no plausible reason had been offered for the failure.
UCSCU supported the SACCO by giving them a filing cabinet, safe, bicycle, motorcycle and
salaries. They had also promised to refurbish the building in 2007 but did not do it.
Challenge
Reluctance by the people to save having lost money through Ms Access microfinance
which misused people’s savings to a tune of UShs 38,000,000.
d) Kirika SACCO (Pallisa district)
The SACCO was registered in February 2007. It had 304 fully registered members of whom 199
were male, 89 female, 16 groups/institutions and 2 disabled.
An individual/group is required to pay a total of UShs 37,000/= to become fully registered which
includes, UShs 20,000/= for two shares, UShs 5,000/= for membership, UShs 2,000 for ledger
card cost and UShs 10,000/= as savings.
The share capital was UShs 14,290,000/= and loan portfolio was UShs 67,210,600/= while the
cumulative savings portfolio was UShs 34,385,550/=.
The recovery rate was 60% while the portfolio at risk was 10% of UShs 3,178,500.

446
The SACCO offers a number of loan products at a 3% interest and a loan period of one to three
months. This applies for all loan products including agricultural loans, business loans, school
fees loans and emergency loans. The minimum loan amount for both the business loan and the
school fees loan is UShs 100,000/= while the maximum amount is UShs 1,000,000.For the
agricultural loan, the minimum amount is UShs 100,000 /= while the maximum amount is
UShs1, 000,000. The emergency loan depends on the kind of emergency in question. The
business loan takes the highest percentage of the loan portfolio.
Support from MSC
The SACCO received two loans from MSC totaling to UShs 25,000,000. The first loan was a
startup loan of UShs 5,000,000 for a period of two years at free interest rate. It was received in
March 2009.
E) SOROTI ZONAL OFFICE
Soroti zonal office is located in Soroti town and controls five districts of Soroti, Kaberamaido,
Amuria, Katakwi and Kumi which is the greater Teso region.
The office has five employees as follows;
Senior financial services officer
Financial services officer
Accounts finance officer
Administrative assistant
Logistics assistant
The zonal office covers a large geographical area and therefore five staff members are
inadequate to cover the districts covered.
The office has 29 SACCO clients and 1 MFI as shown in table 3.9.7.
Table 3.9.7: SACCOs in Soroti zone
District
Soroti
Kaberamaido
Amuria
Katakwi
Kumi
Number of SACCO
6
8
5
3
8
Total 30
Source: Field findings

447
The Zonal office had a cumulative disbursement of UShs 2.093 billion in the region with
outstanding loan balance of UShs 1.232billion as at March 31st 2010. The highest loan value was
in Microenterprise of 1.268 billion while other products had the following: agriculture loans
UShs 530 million; Start up loans UShs 120 million; business enhancement loans UShs 70 million
and GOU loans UShs 105 million.
The 29 SACCOs that have ever accessed MSC services are in 30 sub-counties out of 53 sub-
counties in the region representing 55% coverage.
The office offers a number of loan products to the SACCOs and the MFI;
Micro enterprise loan/ commercial loan at an interest rate of 13%
Agricultural loan at an interest rate of 9% per annum
Start up loan at zero interest rate. However, MSC no longer gives out the start up loans.
Business enhancement loan at interest rate of 9%, and
GoU loan
The recovery rate was low at 52% and this was attributed to Teso Rural Development Trust ltd
(TERUDET) a microfinance institution which failed to pay off the funds borrowed. TERUDET
borrowed six loans totaling to UShs 720 million and mismanaged the funds. At the time of
monitoring, UShs 320 million had been paid off leaving a balance of 400 million unpaid. The
institution had closed business and little efforts had been taken to recover the funds.
The MSC has offered the following services to the clients: carried out two trainings for the
SACCO during the FY 2009/10; routine supervision offering technical and support service.
A number of SACCOs that received the GOU loans closed business before paying off the loans.
Those that closed include;
Amuria district
Kapelebyong SACCO
Morungatony SACCO
Amuria mutual SACCO
Katakwi District
Katakwi SACCO
Akwara
Kidde Farmers
Kumi District
Nyero farmers SACCO
Soroti District.
Kadungulu

448
Challenges;
Poor performing SACCOs. Some SACCOs that have ever managed to access MSC
services have collapsed and closed business instead of growing stronger to access more
services e.g. Kadungulu (soroti District), Koka (Kaberamaido District), Amuria Mutual
(Amuria District) and Kide Farmers (Katakwi District). This is a big loss to the
community in which they were located. Even those operating, some are weak in terms of
governance and management issues and have failed to fulfill MSC requirements to access
more funds.
The attitude of the community towards accessing MSC loans: Folowing the many
clamities that have befallen Teso many communities prefer handouts or grants rather than
the kind of services offered by MSC. This is even evident in SACCOs that are considered
to be active in the area whose loan repayments are quite low.
Lack of legally registered entities to partner with MSC. There are no strong SACCOS
that are able to access MSC services in most of the parts of the region and Katakwi and
Amuria districts are the worst hit. The only three SACCOs in Katakwi that have ever
accessed MSC services have all defaulted and closed business. On the other hand, in
Amuria district only Asamuk and Wera SACCOs are active with MSC loans.
The level of formation of SACCOs in the region is quite low with some districts almost
having no active SACCO as mentioned above.
They have had destructive political statements from political leaders in the past towards
MSC activities in the region that its money from government and hence no need to be
paid back. The SACCOs that believed such statements eventually closed business but did
not only did they lose on accessing MSC services but also lost members’ savings and
membership eventually especially Murungatuny and Amuria Mutual SACCOs which are
both in Amuria District.
During monitoring, a number of beneficiary SACCOs were sampled and visited asdetailed
below.
a) OTUBOI SACCO( Kaberamaido district)
The SACCO started in 2005.
There are four members of staff comprising of the manager, cashier, loans officer and a security
guard. There are 724 fully registered members of which 261 members are male and 463 are
female.
To be considered a fully registered member, a total of UShs 30,000/= must be paid comprising
of: entrance fee, UShs 5,000/=; stationary-2000/=; one share – 10,000/=; account opening –
10,000/=; bank charge – 2,500/= and a file – 500/=.
The SACCO’s savings portfolio as at end of April was UShs 11,406,100/=, and loan portfolio,
UShs 25,600,000/= while the share capital was at UShs 14,210,000/=.
Commercial loans are the majorly issued loans at an interest rate of 3% per month. The loan
amount is in two categories that is UShs 100,000/= – 400,000/=, that is given for a period of four
months and UShs 400,000/= – 1,000,000 for a maximum period of ten months.

449
The recovery rate was 79% as at 31st March 2010.
Support from MSC
The SACCO received a commercial loan of 5,000,000 in 2005 at 9% interest rate which
was paid off and a second loan of 10,000,000 as start up loan at no interest rate for a
period of eighteen months.
The SACCO staff and board members were trained in short courses on governance and
financial management.
Challenges with regard to MSC
Lack of funds for transport and allowances to enable the staff and board members attend
the workshops/ trainings.
Unwillingness by the borrowers to pay back the loans on assumption that the funds are
meant for “prosperity for all’’ and therefore it is free money.
Otuboi SACCO is one of the SACCOs where disabled persons benefited. One disabled person
received a commercial loan of UShs 600,000. The loan was being effectively serviced.
b) ODONGAI SACCO (Kaberamaido district)
Odongai SACCO found in Kaberamaido district is managed by six members of staff comprising
of; the manager, cashier, three credit officers and an internal auditor.
It was registered on the 1st of March 2006
under reg no 7557/RCs. There were 903 fully
registered members as at end of March 2010 of
which 508 were male, 288 female and 2
disabled persons. To be considered a fully
registered member, a total of UShs 29,500/= is
paid together with two passport photographs.
The payment includes membership fee of UShs
-10,000/=, a share of Ushs 10,000/=, savings
opening account – Ushs 5,000/=, stationary
UShs 3500/= and a file of 1000/=
The savings portfolio as at end of April was at UShs 99,690,133/=, loans portfolio was also at
244,852,800/= while the share capital was at UShs 55,370,000/=. The portfolio at risk was high
standing at 67%. This means that the SACCO is not performing well in terms of loan recovery.
The SACCO offers two loan products to the clients; the commercial loan at 4% interest rate per
month with a loan period ranging from 4 – 12 months. The loan amounts given range from UShs
500,000-2,000,000.
Office premises of Odongai SACCO

450
School fees loan at a 4% interest rate per month with a loan period of 4 – 12 months. The
minimum loan amount is UShs 500,000 and maximum amount was Ushs 2,000,000. The 4%
interest per month means that the interest rate per annum is 48%.
Support from MSC
Odongai received a total of UShs 50,000,000 million in March 2009 broken into three loans of
UShs 10.000,000 as start-up loan at no interest; UShs 10,000,000 for a business enhancement
loan at a 13% interest per annum and UShs 30,000,000 for the agriculture loan at 9% interest.
The loan period was for two years. The loan repayment was on schedule.
c) Ejok Edeke SACCO
Ejok Edok SACCO is found in Soroti district and is managed by five staff members; the
manager, accountant, secretary, credit officer and a guard.
It was registered on the 10th
of May 2006. The SACCO had 358 registered members of which
222 are male, 114 female and 22 groups. To be fully registered, one has to pay a total of UShs
42,000/= of which UShs10, 000/= is for account opening, UShs10, 000/= for registration, UShs
20,000/= for one share and a pass book at UShs 2,000/=.
Ejok Edeke SACCO’s share capital was UShs 17,475,000/= and savings portfolio of UShs
12,968,922/=while the loan portfolio was UShs 54,791,550/=.
The SACCO offers a number of loan products;
Business loan offered at a 3% interest per month for a period of 4 – 8 months with a
minimum loan amount of UShs 200,000/= while the maximum loan amount is UShs2,
000,000.
The agricultural loan is given at a 3% interest per month with a loan period of 4- 8
months and the minimum loan amount being UShs 300,000/= while the maximum is
UShs 600,000/=.
The school fees loan offered at a 3% interest per month for a period of 4 – 8 months and a
minimum loan amount of UShs 200,000/= while the maximum is UShs 1,000,000.
The recovery rate was 25% and the portfolio at risk was 68%. The recovery rate of the funds
disbursed was poor.
Support from MSC
The SACCO received a loan amount of UShs 30,000,000 as startup loan, business loan and
agriculture loan in equal installments of UShs 10,000,000. According to the manager of the
SACCO, processing the loan took two months.
The staff and board members were trained in 2009.

451
Support from UCSCU
The SACCO received two bicycles, two calculators, a filing cabinet and a safe. They have been
receiving salaries from UCSCU till September 2009 when the payment stopped.
d) Soroti teachers SACCO (Soroti district)
The SACCO is found in Soroti district and started operations in 2003. It was registered on 20th
September 2004. There are 961 fully registered members of whom 457 are female and 504 male
and a teacher’s association. To be fully registered, a total of UShs 57,000/= is paid comprising of
membership UShs 5,000/=, pass book UShs 2,000/= and a share contribution of UShs 50,000/=.
Other requirements include; a valid identity card, three passport photos and one has to be a
teacher by profession.
The share capital as at 30th
march 2010 was UShs 120,193,000/= and cumulative savings
portfolio of UShs 44,527,296/= while the loan portfolio was UShs236, 615,112/=. The recovery
rate was 10% which was a sharp fall from 95% in August 2008. According to the manager, this
was caused by the change in salary payments whereby teachers now receive salaries directly into
their bank accounts via EFT. This makes it difficult for the SACCO to recover the loan
installments from the borrowers. As a result, the SACCO wrote to Ministry of Public Service
requesting them to make deductions from individual teachers’ salaries but it did not work out.
The strategy is now to convince the borrowers to pay cash on receipt of their salaries though
most teachers are reluctant to service the loans. This raised the portfolio at risk to 80%.
The SACCO offers a number of loan products
which include; solar loan, asset acquisition
loan, school fees loan, commercial loan and
agricultural loan that are offered at a 2.5%
interest rate per month. This translates into an
interest rate of 30% per annum.
Solar loans have a minimum amount UShs
200,000/= while the maximum amount is UShs
2,000,000. Asset acquisition loans are offered
for a period of two years, the minimum loan
amount being UShs 2,500,000 while the
maximum loan amount is UShs 5,000,000.
School fees loans are for a period ranging from
3 – 12 months at a minimum amount of UShs 200,000/= and maximum of UShs2, 000,000.
Commercial loans have a minimum amount of UShs 200,000/= and maximum amount of UShs2,
000,000. Agricultural loans are for a period of two years with a minimum amount of UShs
200,000/= and maximum amount of UShs 2,000,000
It was noted that commercial and school fees loans have equally the biggest share of the loan
portfolio.
Office premises of Sorioti teachers SACCO

452
Support from MSC
The SACCO received six commercial loans totaling to UShs 198,000,000 from MSC since 2005
as listed in table 3.9.8. The entire loan portfolio was UShs 236, 615,112.
Table 3.9.8: The loans obtained from MSC by Soroto Teachers SACCO
Year Loan type Amount(millio
ns)
Interest
rate P.A
comments
Sept 2005 commercial 10,000,000 13 %
Two years loan with a grace
period of six months
Feb 2006 GOU loan 5,000,000 9%
Three years loan grace period of
six months.
April 2006 Commercial loan 10,000,000 13% Two years loan with grace
period of six months
Dec 2006 Commercial loan 50,000,000 13% Two years loan
Nov 2007 Commercial loan 60,000,000 13% Two years loan
Sept 2008 Commercial loan 63,000,000 13% Two years loan with grace
period of six months
TOTAL 198,000,000
Source: SACCO records
Of the loans granted, the school fees and commercial loans form the highest loan portfolio.
The SACCO managers and the board members were trained in financial management and
governance in the year 2009.
Challenge
Failure to recover the money from the teachers (borrowers) since the EFT system was
introduced, whereby the salaries go straight on the client’s accounts which makes it hard
for the SACCO to make their deductions.
3.9.3 General challenges
The following challenges cut across most of the Zonal offices and SACCOs monitored.
All the SACCOs monitored had a recovery rate below the recommended MSC recovery rate
of 95% that shows that the performance of the SACCOs is not good and this also affects their
capacity to borrow funds from the MSC.

453
It was noted that the interest rate charged by most SACCOs for most loan products were in
the range of 2%- 6% per month ( 24%- 72% per annum) yet MSC offers the loans at a rate
of 9%-13% per annum depending on the loan product. Some SACCO’s interest rate of 72%
per annum is unrealistic and contributes to the high default rate by its clients.
Most of the SACCOs are in formation stage while others are inactive and dormant to
efficiently manage the funds disbursed to them. Some SACCOs mainly those that received
the GOU loans of UShs 5,000,000 in 2006 closed operations after accessing the funds
leading to high default rate.
Some SACCOs have poor systems/ procedures and documentation of records. In some
instances the loan agreements are not kept in a single file or place while at times the forms
lack adequate information to capture all the necessary details of the clients.
Recovery rate of the loans is a big challenge by those who borrow and fail to repay the loans
in time or at all. Some borrowers believe that the money is free money. Some members are
multiple borrowers who borrow from different financial institutions presenting the same
security. In the long run, when it’s time to pay back, it becomes very hard to do so because
they are unable to raise the money at the same time. There are also incidences of deaths of
the members.
Interference by some politicians who have misled the community by telling them to go for
free money at the SACCOs and therefore some people join the SACCOs to get the free
money from government. This has also hindered the growth of the SACCOs.
Many SACCOs collude with their Accountants/ Auditors to submit falsified financial
statements to access loans from the MSC.
The community has also been conned of their hard earned savings by “fake institutions”
which closed operations after collecting funds from the savers. According to a number of the
SACCO Managers interviewed, it has become increasingly difficult to mobilize members
because some of them lost money through other SACCOs which cheated people. It is now
difficult to convince people to join the SACCOs because of their past experiences.
Lack of proper governance structures and financial impropriety by some managers in a
number of the SACCOs leading to lack of trust by the members thereby affecting
membership growth, low/poor savings and share capital.
Conflict of interest by the board members who borrow money and fail to pay back. The same
applies to politicians who borrow money and fail to pay back. Loans are at times given to the
board members without going through the loans committee and most of the loans are not
secured which makes it difficult to recover them. It has also become increasingly difficult for
the staff members to recover the money from the board members and politicians for fear of
loss of their jobs.
A number of SACCOs lack adequate means of transport which they can use to reach out to
the community. Those who have received the bicycles are slow and therefore it takes them
long time to move from one place to another and hence there is need for motor cycles for
those SACCCOs that have proven good performance.
Some SACCOs do not receive salary top up from UCSCU and the amount they afford to pay
to the staff is meager. This in a way has affected the morale of the staff. Further most
454
SACCOs stopped receiving financial support from UCSCU in Dec 2009 and no plausible
reason was given.
Lack of information and data management devices like computers, type writers, printers,
photocopiers to meet customer needs. This was a case for most of the SACCOs.
A number of SACCOs complained that getting the maximum liability from ministry of trade
is very tedious. There was a general complaint that the District commercial officers always
complicate the process of getting the maximum liability.
Poor loan appraisal by the SACCO managers and loan committee leading to high default and
poor servicing of MSC loans.
Competition from other Micro finance institutions that have more funds than the SACCOs.
They also have a variety of products to offer to the customers and therefore have captured a
large market share as compared to the SACCOs. Some of them give out instant loans at a
lower interest rate and therefore are able to out-compete the SACCOs.
Delayed receipts of funds from the MSC for instance Budaka rural enterprise SACCO
complained that it had taken them over nine months without receiving a loan of UShs
25,000,000 applied for in October 2009
3.9.4 Recommendations
MSC should plan to increase the number of staff at the zonal offices as the current
number of five is too small to effectively handle the activities.
SACCOs should be guided on the range of interest rate charged to their customers which
range from 2% -6% per month (4%- 72% per annum) that is high and has lead to high
default rate. The interest rate charged by SACCOs is too high compared to the interest
rate charged by MSC which is zero to 13% per annum.
MSC should train the staff and board members of the SACCOs in developing the
guidelines of loan products and appropriate loan forms. The training program should be
intensified to sensitise the community stakeholders including religious leaders, political
leaders, civic leaders and the SACCO leadership to improve on the awareness levels of
MSC services.
MSC should train the District commercial officers to carry out competent and satisfactory
SACCO audits and expeditious processing of the maximum liability forms.
MSC should take legal action against defaulters to deter the culture of defaulting that is
cropping up especially in SACCO that have overdue loans of over 365 days and SACCOs
that got GoU loans but did not pay back
MSC should constantly offer the technical support and constant supervision of the
activities of the SACCOs to enable them enhance on their performance.
Continue to follow up the weak SACCOs in a bid to revive them in collaboration with
UCSCU and other Stakeholders.
There should be increased disbursements of financial services to qualifying SACCOs/
MFIs/ SMEs

455
BIBLIOGRAPHY
1. Bujagali Energy Limited Bujagali Hydroelectric Power Project, Monthly Report February 2010,
(BEL 2010)
2. Bujagali Energy Limited Bujagali Hydroelectric Power Project, Monthly Report December 2009,
(BEL 2010)
3. Bujagali Energy Limited Bujagali Hydropower Project Social and Environmental Assessment
Report (Burnside International Limited 2008)
4. Bundibugyo Energy Cooperative Society Business Plan for BECS (BECS 2009)
5. CDO, 2009. Cotton Development Organization Performance Form A: Part II. Report for
Development) FY 2008/09.
6. Effectiveness of Agricultural Expenditures. Report submitted to Ministry of Agriculture,
Animal Industry and Fisheries, Economic Policy Research Centre, Kampala.
7. EPRC, 2008. Agriculture Sector Public Expenditure Review Phase Three: Efficiency and
8. GoU and ADB, 2009. Report of the Assessment of Two ADB-Funded Livestock Projects
in
9. GoU, 2002. Appraisal Report. National Livestock Productivity Improvement Project.
10. Igara Growers Tea Factory: Performance form A, 30th
March 2010.
11. Industrial Parks Update: Retrieved from:
http://www.ugandainvest.com/admin/docs/kibp2.pdf
12. Karekaho and Baker The Global Partnership on Output Based Aid; Uganda Enhanced Electricity
Access Report; Inception Report (Kampala, December 2009)
13. Kisiizi Electricity Commissioning Report on the Kisiizi Electricity Project 2005 to 2009 (Kisiizi
Electricity 2009)
14. MAAIF, 2009. MAAIF Performance Forms for the Period January – March 2009.
15. MAAIF, 2009. Policy Statement for MAAIF for the FY 2009/10.
16. MAAIF, 2010. NLPIP Progress Report October to December 2009. Ministry of
Agriculture, Animal Industry and Fisheries, Entebbe. January 14th
2010.
17. MAAIF, 2010a. NLPIP Progress Report July to September 2009. Ministry of Agriculture,
Animal Industry and Fisheries, Entebbe. October 12th
2010.
18. MFPED, 2008. Approved estimates of Revenue and Expenditure (Recurrent and
19. MFPED, 2009. Budget Monitoring Report July-September 2009. Ministry of Finance,
Planning and Economic Development, Kampala. November 2009.
20. Ministry of Energy and Mineral Development Energy for Rural Transformation Phase I
Implementation Completion Report (Kampala August 2009)
21. Ministry of Energy and Mineral Development Indicative Rural Electrification Master Plan
(Kampala 2009)

456
22. Ministry of Energy and Mineral Development Karuma HP Feasibility Study Progress Report,
12th May 2010 (Kampala, 2010)
23. Ministry of Energy and Mineral Development Performance Form A: Quarter 3 Progress Report
(Kampala 2009)
24. Ministry of Energy and Mineral Development The National Oil and Gas Policy (Kampala 2008)
25. Ministry of Finance, Planning and Economic Development Approved Budget Estimates (Kampala
2009)
26. Ministry of Finance, Planning and Economic Development Medium Term Economic Framework
(Kampala 2009)
27. Ministry of Finance, Planning and Economic Development Public Investment Plan FY 09/10-
11/12 (Kampala 2009)
28. Ministry of Finance, Planning and Economic Development, (2009). Approved
Estimates of Revenues and Expenditures FY 2009/10. Kampala
29. Ministry of Finance, Planning and Economic Development, (2009). Public
Investment Plan FY 2009/10 – 2011/12. Kampala
30. Ministry of Finance, Planning and Economic Development: Ministerial Policy Statement
FY 2009/10.
31. Ministry of Finance, Planning and Economic Development: Public Investment Plan FY
2009/10-2011/12; 2009
32. Ministry of Trade Tourism and Industry: National Industrial Policy, January 2008.
33. Ministry of Works and Transport, (2008). Performance Form A: Quarter 4
Progress Report FY 2008/09. Unpublished
34. Ministry of Works and Transport, (2009). Ministerial Budget Policy Statement FY
2009/10. Kampala
35. Ministry of Works and Transport, (2009). Performance Form A: Quarter 3
Progress Report FY 2009/10. Unpublished
36. Oneck, H. Ministry of Energy and Mineral Development, FY 09/10 Ministerial Policy Statement
(Ministry of Energy and Mineral Development Kampala)
37. Presidential Initiative on Banana Industrial Development: Performance Form A, 13th
,
May 2010. Quarter 3 FY 2008/09.Republic of Uganda and African Development Fund.
38. Rural Electrification Agency Cooperation between the energy sector and the Swedish
International Development Agency (Sida); Annual progress report (Kampala, January 2010)
39. Rural Electrification Agency Due diligence on Kilembe Investments Limited (Kampala,
2007)
40. Rural Electrification Board Budget 2009/10, Donor Funded Projects 08/09 (Kampala 2009)
41. The Government of the Republic of Uganda National Development Plan 2010/11 – 2014/15
(Kampala, 2010)

457
42. The Government of the Republic of Uganda Rural Electrification Strategy and Plan 2001-2010
(Kampala, 2001)
43. Uganda Electricity Transmission Company Limited Bujagali Interconnection Project, Executive
Summary (Burnside International Limited 2008)
44. Uganda Electricity Transmission Company Limited Bujagali Interconnection Project, Progress
Report March 2010 (Kampala 2010)
45. Uganda Electricity Transmission Company Limited Karuma Interconnection Project, Project
Performance Brief, period ending April 30th 2010 (Kampala 2010)
46. Uganda Industrial Research Institute; Performance Form A, 20th
April 2010
47. Uganda Industrial Research Institute; Status Report Value addition 2009
48. Uganda National Bureau of Standards: Performance Form A, 23rd
April 2010
49. Uganda National Roads Authority, (2008). Performance Form A: Quarter 4
Progress Report FY 2008/09. Unpublished
50. Uganda National Roads Authority, (2009). Performance Form A: Quarter 3
Progress Report FY 2009/10. Unpublished
51. Uganda: National Livestock Productivity Improvement Project and Creation of
Sustainable Tsetse and Trypanosomiasis Free Areas in East and West Africa – Uganda
Component. Agricultural Sector Portfolio Improvement Plan (SPIP) Mission 14th
April –
1st May 2009 Kampala.
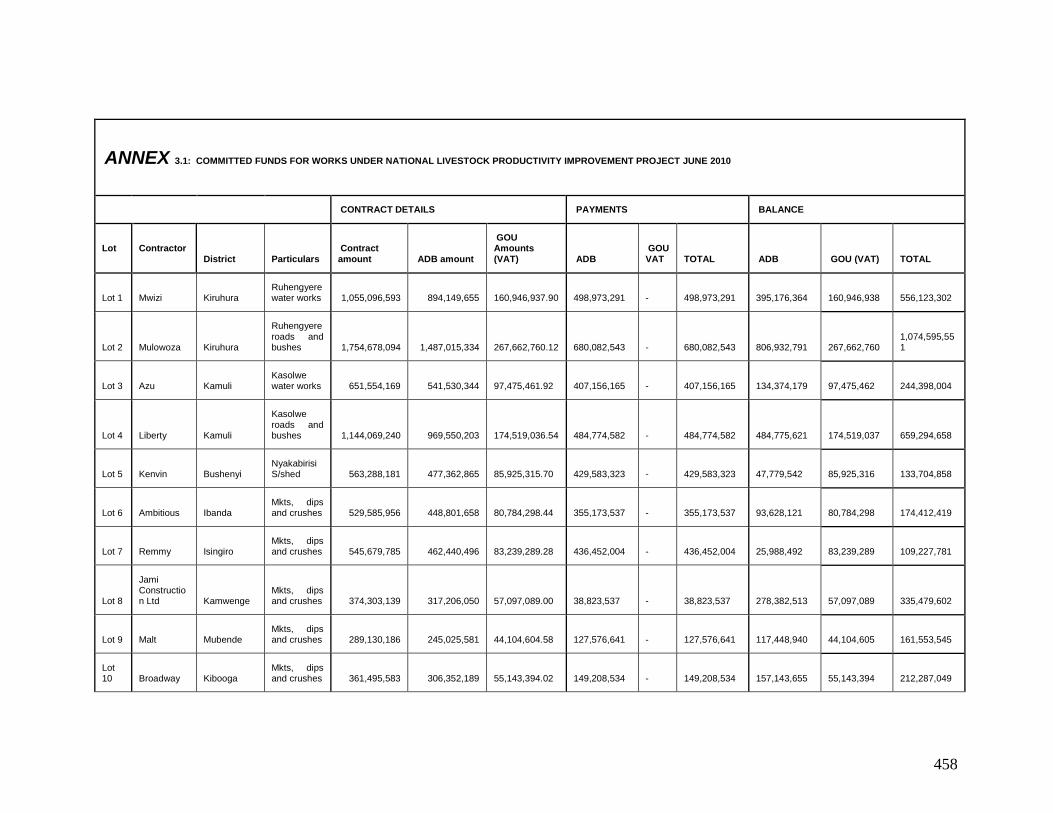
458
ANNEX 3.1: COMMITTED FUNDS FOR WORKS UNDER NATIONAL LIVESTOCK PRODUCTIVITY IMPROVEMENT PROJECT JUNE 2010
CONTRACT DETAILS PAYMENTS BALANCE
Lot Contractor District Particulars
Contract amount ADB amount
GOU Amounts (VAT) ADB
GOU VAT TOTAL ADB GOU (VAT) TOTAL
Lot 1 Mwizi Kiruhura Ruhengyere water works
1,055,096,593
894,149,655
160,946,937.90
498,973,291
-
498,973,291
395,176,364
160,946,938
556,123,302
Lot 2 Mulowoza Kiruhura
Ruhengyere roads and bushes
1,754,678,094
1,487,015,334
267,662,760.12
680,082,543
-
680,082,543
806,932,791
267,662,760
1,074,595,551
Lot 3 Azu Kamuli Kasolwe water works
651,554,169
541,530,344
97,475,461.92
407,156,165
-
407,156,165
134,374,179
97,475,462
244,398,004
Lot 4 Liberty Kamuli
Kasolwe roads and bushes
1,144,069,240
969,550,203
174,519,036.54
484,774,582
-
484,774,582
484,775,621
174,519,037
659,294,658
Lot 5 Kenvin Bushenyi Nyakabirisi S/shed
563,288,181
477,362,865
85,925,315.70
429,583,323
-
429,583,323
47,779,542
85,925,316
133,704,858
Lot 6 Ambitious Ibanda Mkts, dips and crushes
529,585,956
448,801,658
80,784,298.44
355,173,537
-
355,173,537
93,628,121
80,784,298
174,412,419
Lot 7 Remmy Isingiro Mkts, dips and crushes
545,679,785
462,440,496
83,239,289.28
436,452,004
-
436,452,004
25,988,492
83,239,289
109,227,781
Lot 8
Jami Construction Ltd Kamwenge
Mkts, dips and crushes
374,303,139
317,206,050
57,097,089.00
38,823,537
-
38,823,537
278,382,513
57,097,089
335,479,602
Lot 9 Malt Mubende Mkts, dips and crushes
289,130,186
245,025,581
44,104,604.58
127,576,641
-
127,576,641
117,448,940
44,104,605
161,553,545
Lot 10 Broadway Kibooga
Mkts, dips and crushes
361,495,583
306,352,189
55,143,394.02
149,208,534
-
149,208,534
157,143,655
55,143,394
212,287,049

459
Lot 11 B & T Kyenjojo
Mkts, dips and crushes
695,964,140
589,800,119
106,164,021.42
128,922,402
-
128,922,402
460,877,717
106,164,021
567,041,738
Lot 12 Mini Max Masindi
Mkts, dips and crushes
413,007,567
350,006,413
63,001,154.34
259,329,690
-
259,329,690
90,676,723
63,001,154
153,677,877
Lot 13 Ishaka Ntungamo
Mkts, dips and crushes
600,846,236
509,191,725
91,654,510.50
466,036,844
-
466,036,844
43,154,881
91,654,511
134,809,392
Lot 14 RESCO Kayunga
Mkts, dips and crushes
114,563,516
97,087,725
17,475,790.58
91,188,962
-
91,188,962
5,898,763
17,475,791
23,374,554
Lot 15 Tabula Luweero
Mkts, dips and crushes
348,301,869
295,171,075
53,130,793.50
213,731,612
-
213,731,612
81,439,463
53,130,794
134,570,257
Lot 16 Ndora Nakaseke
Mkts, dips and crushes
612,297,445
518,896,140
93,401,305.20
344,348,307
-
344,348,307
174,547,833
93,401,305
267,949,138
Lot 17 Mubiko
Nakasongola
Mkts, dips and crushes
635,144,431
538,257,992
96,886,438.56
232,004,096
-
232,004,096
306,253,896
96,886,439
403,140,335
Lot 18 Rohi
Kamuli and Kaliro
Mkts, dips and crushes
562,206,472
476,446,163
85,760,309.34
390,423,568
-
390,423,568
86,022,595
85,760,309
171,782,904
Lot 19 Wako Sembabule
Mkts, dips and crushes
655,518,164
555,523,868
99,994,296.24
400,097,344
-
400,097,344
155,426,524
99,994,296
255,420,820
Lot 24 Mukal
Kaberamaido and Kaabong
Mkts, dips and crushes
1,198,774,811
1,015,910,857
182,863,954.26
72,630,200
-
72,630,200
943,280,657
182,863,954
1,126,144,611
Lot 25 Mogen
Katakwi and Amuria
Mkts, dips and crushes
256,982,440
217,781,729
39,200,711.22
190,727,915
-
190,727,915
27,053,814
39,200,711
66,254,526
Lot 26 TK Amuria
Mkts, dips and crushes
586,900,052
497,372,925
89,527,126.50
384,492,420
-
384,492,420
112,880,505
89,527,127
202,407,632
Lot 29 Coil
Bukedea and Kumi
Mkts, dips and crushes
905,720,151
767,559,450
138,160,701.00
570,233,230
-
570,233,230
197,326,220
138,160,701
335,486,921
Lot 30
Kanyangarang
Nakapiripirit and Moroto
Mkts, dips and crushes
857,810,685
726,958,208
130,852,477.44
267,222,667
-
267,222,667
459,735,541
130,852,477
590,588,018
Lot 31 Alliance
Budaaka, Sironhko
Mkts, dips and crushes
682,918,005
578,744,072
104,173,932.96
326,642,035
-
326,642,035
252,102,037
104,173,933
356,275,970
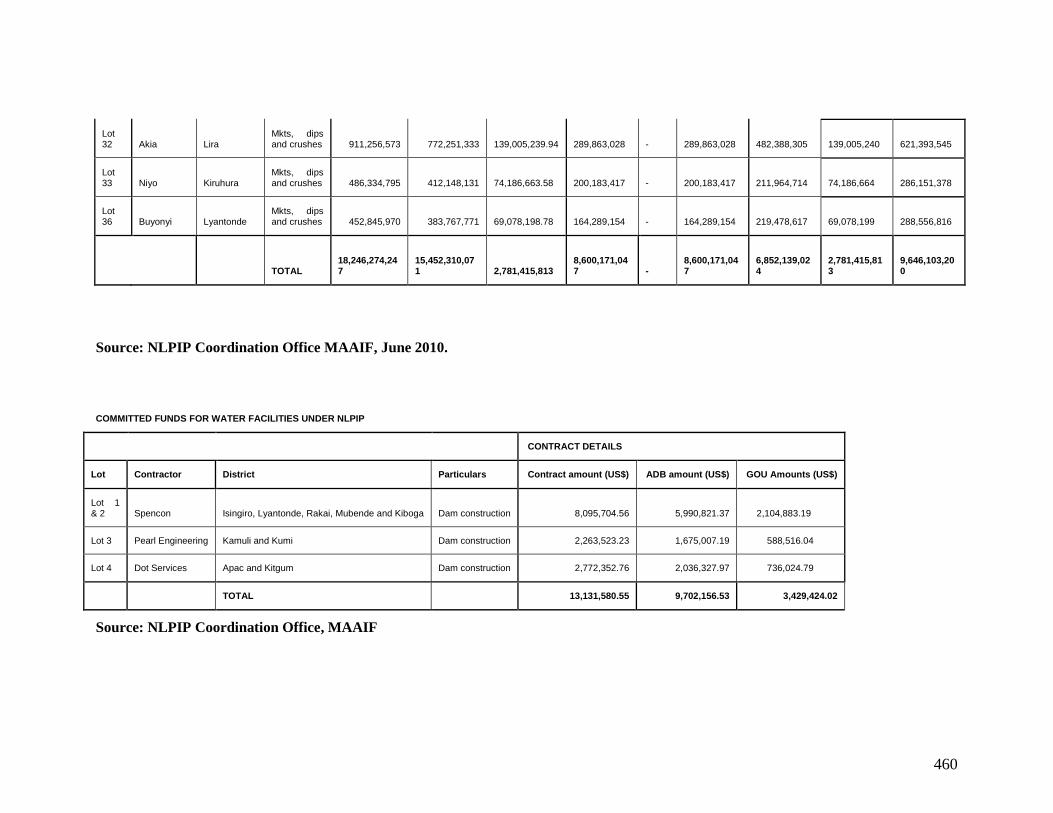
460
Lot 32 Akia Lira
Mkts, dips and crushes
911,256,573
772,251,333
139,005,239.94
289,863,028
-
289,863,028
482,388,305
139,005,240
621,393,545
Lot 33 Niyo Kiruhura
Mkts, dips and crushes
486,334,795
412,148,131
74,186,663.58
200,183,417
-
200,183,417
211,964,714
74,186,664
286,151,378
Lot 36 Buyonyi Lyantonde
Mkts, dips and crushes
452,845,970
383,767,771
69,078,198.78
164,289,154
-
164,289,154
219,478,617
69,078,199
288,556,816
TOTAL
18,246,274,247
15,452,310,071
2,781,415,813
8,600,171,047
-
8,600,171,047
6,852,139,024
2,781,415,813
9,646,103,200
Source: NLPIP Coordination Office MAAIF, June 2010.
COMMITTED FUNDS FOR WATER FACILITIES UNDER NLPIP
CONTRACT DETAILS
Lot Contractor District Particulars Contract amount (US$) ADB amount (US$) GOU Amounts (US$)
Lot 1 & 2 Spencon Isingiro, Lyantonde, Rakai, Mubende and Kiboga Dam construction 8,095,704.56 5,990,821.37 2,104,883.19
Lot 3 Pearl Engineering Kamuli and Kumi Dam construction 2,263,523.23 1,675,007.19 588,516.04
Lot 4 Dot Services Apac and Kitgum Dam construction 2,772,352.76 2,036,327.97 736,024.79
TOTAL 13,131,580.55 9,702,156.53 3,429,424.02
Source: NLPIP Coordination Office, MAAIF

461
Annex 3.2: Status of physical implementation livestock marketing infrastructure –
September 2009
Contract District Facility %Progress of
work
Overall %
Progress
/06-07/01 Kiruhura 1. construction of a water dam (Ruhengyere
AGRC)
90 67.46
2. Rehabilitation of water supply
(Ruhengyere AGRC)
44.92
/06-07/02 Kiruhura 1. Rehabilitation of Firebreaks (Ruhengyere
AGRC)
86.4 68.3
2. Fencing (Ruhengyere AGRC) 12
3. Pasture development (Ruhengyere
AGRC)
80.00
4. Construction of the tyre wash
(Ruhengyere AGRC)
59.50
/06-07/03 Kamuli 1. Contruction of a water dam (Kasolwe
AGRC)
49.12 56.04
2. Rehabilitation of water supply 70.09
3. Rehabilitation of dip tank (Kasolwe
AGRC)
30.19
/06-07/04 Kamuli 1. Rehabilitation of firebreakers (Kasolwe
AGRC)
60.79 32.91
2. Fencing (Kasolwe AGRC) 0
3. Pasture development (Kasolwe AGRC) 0
Construction of the tyre wash (Kasolwe
AGRC)
0
06-07/05 Bushenyi 1. Construction of Nyakabirizi slaughter
shed
100 100
2. Construction of Kirambi livestock
market
100
06-07/06 Mbarara 1. Construction of Mbarara M/C Slaughter
shed
100 78.8
2.Construction of Kyeshama livestock
market
77
Ibanda 1. Construction of Ibanda T/C Slaughter
shed
100
06-07/07 Isingiro 1. Construction of Busheka livestock
market
100 100

462
2. Construction of kabingo T/C Slaughter
shed
100
06-07/08 Kamwenge 1. Construction of Kamwenge T/C
slaughter shed
52.34 55.60
2. Construction of Katalyeba livestock
market
57.78
Contract District Facility %Progress of
work
Overall %
Progress
06-07/09 Mubende 1. Construction of Kiganda livestock
market
75 75
/06-07/10 Kiboga 1. Construction of Kiboga T/C slaughter
shed
88 55.3
2. Construction of Kitegwa cattle dip 0.00
3. Construction of Mpiita Cattle dip 0.00
4. Construction of Lwenkonge cattle crush 90.00
/06-07/11 Kyenjojo 1. Construction of Ruyonza livestock
market
60.57 26.20
2. Construction of Kyenjojo T/C Slaughter
shed
43.74
3. Construction of Rwemirondo cattle crush 0
4. Construction of Karuhuura cattel crush 0
5. Construction of Mukyeeya cattle crush 0
6. Construction of Barahija cattle crush 0
/06-07/12 Masindi 1. Construction of Bwijanga market 85.00 89.3
2. Construction of Kijunjumbwa cattle
crush
100
06-07/13 Ntungamo 1. Construction of Rwashamaire slaughter
shed
100 100
2. Construction of Rubaare market 100
06-07/14 Kayunga 1. Construction of Kayunga slaughter shed 100 100
/06-07/15 Luwero 1. Construction of Luwero T/C Slaughter
shed
100 95.69
2. Construction of Kamira Market 90.85
/06-07/16 Nakaseke 1. Contruction of Ngoma Livestock market 100 100
2. Contruction of Nakaseke T/C Slaughter
shed
100
/06-07/17 Nakasongola 1. Construction of Kalongo market 87.89 74.15

463
2. Construction of Migyera slaughter shed 100
3. Construction of Bukabi Kyerindura cattle
crush
0.00
4.Construction of Kyambogo cattle crush 0.00
5. Construction of Nangyere cattle crush 80.00
Contract District Facility %Progress of
work
Overall %
Progress
/06-07/18 Kaliro 1. Construction of Kaliro Town Council
Slaughter shed
100 100
Kamuli 2. Construction of Buyende market 100
/06-07/19 Sembabule 1. Construction of Sembabule T/C slaughter
shed
100 92.2
2. Construction of Ntusi Livestock market 88.0
/06-07/24 Kaberamaido 1. Rehabilitation of Otuboi livestock market 60.00 45.27
Kaboong 2. Rehabilitation of Rumumitai livestock
market
39.59
3. Construction of Kaboong T/C slaughter
shed
34.70
/06-07/25 Katakwi 1. Construction of Usuk slaughter shed 80.04 72.54
2. Construction of Alikamer cattle dip 79.00
/06-07/26 Amuria 1. Rehabilitation of Obalanga livestock
market
59.00 58.2
2. Construction of Alirasite slaughter shed 57.00
/06-07/29 Kumi 1. Construction of Ngora livestock market 100 100
2. Rehabilitation of Kumi T/C slaughter
shed
100
/06-07/30 Nakapiripiti
Moroto
1. Construction of Lolochat livestock
market
45.00 44.10
2. Construction of Nakapiripit slaughter
shed
41.00
3. Construction of Matany livestock market
48.50
/06-07/31 Budaka 1. Construction of Iki-Iki livestock market 58.00 58.3
Pallisa 2. Rehabilitation of Pallisa T/C slaughter
shed
60.00
Sironko 3. Construction of Sironko T/C slaughter
shed
57.00

464
/06-07/32 Lira 1. Construction of Abiting livestock market 46.00 36.09
2. Construction of Alebtong cattle dip 53.00
3. Construction of Okwangole cattle crush 25.00
4. Construction of Alwango cattle crush 0
Contract District Facility %Progress of
work
Overall %
Progress
/06-07/33 Kiruhura 1. construction of Kazo livestock market 20 51.2
2. Construction of Sanga slaughter shed 100
/06-07/36 Lyantonde 1. Construction of Kasagama market 72.0 51.2
2. Construction of Lyantonde slaughter
shed
15
All sites have started work but some have been rated zero because the works have just began
and works have not been measured and approved yet.