Anisotropic interactions of a single spin and dark-spin spectroscopy in diamond
17
1 Anisotropic interactions of a single spin and dark-spin spectroscopy in diamond R. J. Epstein, F. M. Mendoza, Y. K. Kato & D. D. Awschalom * Center for Spintronics and Quantum Computation, University of California, Santa Barbara, California 93106, USA * e-mail: [email protected] The nitrogen-vacancy (N-V) center in diamond is a promising atomic-scale system for solid-state quantum information processing. Its spin-dependent photoluminescence has enabled sensitive measurements on single N-V centers, such as: electron spin resonance 1 , Rabi oscillations 2 , single-shot spin readout 3 and two- qubit operations with a nearby 13 C nuclear spin 4 . Furthermore, room temperature spin coherence times as long as 58 µs have been reported for N-V center ensembles 5 . Here, we have developed an angle-resolved magneto-photoluminescence microscopy apparatus to investigate the anisotropic electron spin interactions of single N-V centers at room temperature. We observe negative peaks in the photoluminescence as a function of both magnetic field magnitude and angle that are explained by coherent spin precession and anisotropic relaxation at spin level anti-crossings. In addition, precise field alignment unmasks the resonant coupling to neighboring “dark” nitrogen spins that are not otherwise detected by photoluminescence. The latter results demonstrate a means of investigating small numbers of dark spins via a single bright spin under ambient conditions.
-
Upload
independent -
Category
Documents
-
view
1 -
download
0
Transcript of Anisotropic interactions of a single spin and dark-spin spectroscopy in diamond

1
Anisotropic interactions of a single spin and dark-spin spectroscopy in diamond R. J. Epstein, F. M. Mendoza, Y. K. Kato & D. D. Awschalom* Center for Spintronics and Quantum Computation, University of California, Santa Barbara, California 93106, USA *e-mail: [email protected]
The nitrogen-vacancy (N-V) center in diamond is a promising atomic-scale system
for solid-state quantum information processing. Its spin-dependent
photoluminescence has enabled sensitive measurements on single N-V centers, such
as: electron spin resonance1, Rabi oscillations2, single-shot spin readout3 and two-
qubit operations with a nearby 13C nuclear spin4. Furthermore, room temperature
spin coherence times as long as 58 µs have been reported for N-V center ensembles5.
Here, we have developed an angle-resolved magneto-photoluminescence microscopy
apparatus to investigate the anisotropic electron spin interactions of single N-V
centers at room temperature. We observe negative peaks in the photoluminescence
as a function of both magnetic field magnitude and angle that are explained by
coherent spin precession and anisotropic relaxation at spin level anti-crossings. In
addition, precise field alignment unmasks the resonant coupling to neighboring
“dark” nitrogen spins that are not otherwise detected by photoluminescence. The
latter results demonstrate a means of investigating small numbers of dark spins via
a single bright spin under ambient conditions.

2
The nitrogen-vacancy defect pair has an anisotropic electron spin Hamiltonian
due to its trigonal symmetry6 and spin-orbit coupling7. Consequently, the degree of spin
level mixing and coupling to nearby impurity spins is very sensitive to the orientation of
an applied magnetic field, which has not been controlled in previous experiments on
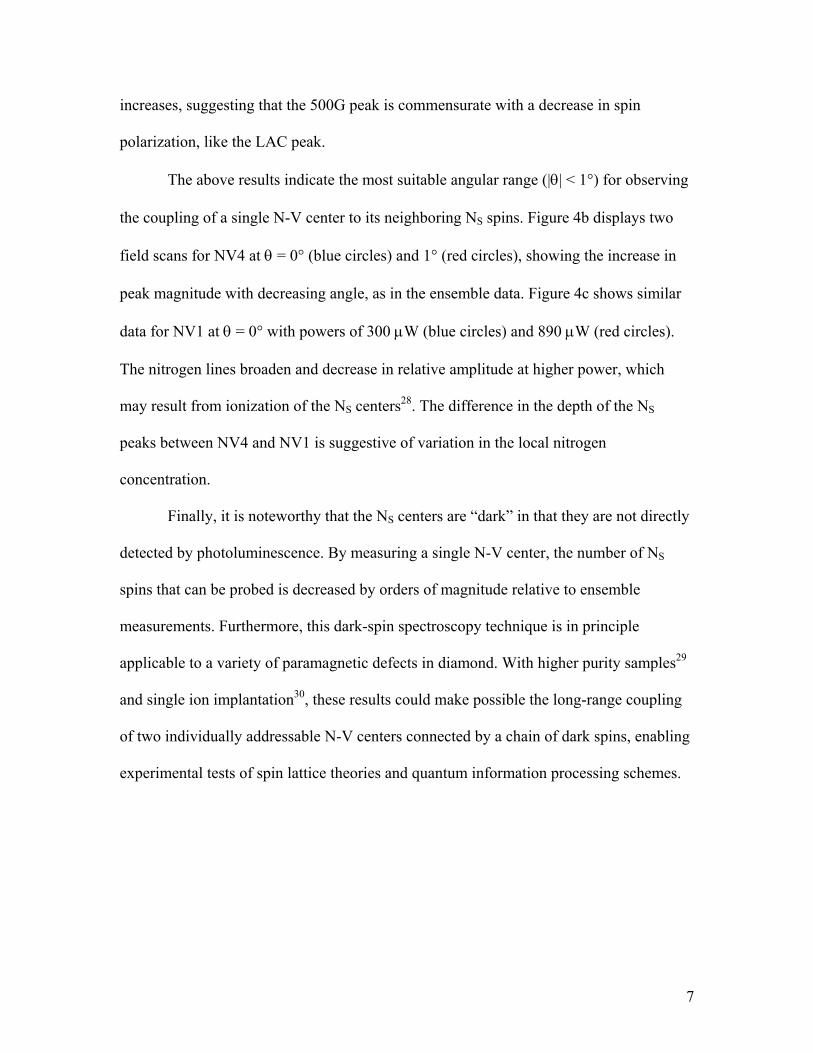
single N-V centers. Figure 1a depicts the atomic structure and relevant energy levels of
the (negatively charged) N-V center. The triplet (3A) ground state8,9,10 has a zero-field
splitting between the 0=Sm and 1±=Sm sublevels quantized along the N-V
symmetry axis, a 111 crystal axis11. Zero-field spin splittings have also been measured
in the triplet (3E) excited state but there is no consensus on the arrangement of
sublevels12,13,14,15. Linearly polarized optical excitation of the 3A → 3E transition
preferentially pumps the spin system into the 0 ground state sublevel16. In addition, the
average photon emission rate is substantially smaller for transitions involving the 1±
levels than for the 0 level3, which enables the spin state to be determined by the
photoluminescence (PL) intensity. Both of the latter two effects have been attributed to
spin-dependent intersystem crossing to the singlet (1A) level17.
Here, the phonon-broadened transition between the 3E and 3A states is detected
via non-resonant PL (see Methods). For example, Fig. 1b is a spatial image of the
spectrally-integrated PL from a diamond sample with the laser focused roughly 1 µm
below the surface. Multiple resolution-limited features are observed within the 20×20 µm
field. In order to determine that a given feature is due to a single emitter, a histogram is
plotted of the time τ between consecutive photon detection events using a Hanbury
Brown and Twiss detection geometry18, yielding the experimental intensity correlation

3
function g(2)(τ). Figure 1c shows data from a color center labeled NV1. The value of
g(2)(0) is below 0.5, proving that NV1 is a single color center19. In addition, the rise of
g(2)(τ) above unity with increasing |τ| is indicative of intersystem crossing to the 1A meta-
stable state19,20.
These single photon emitters are further characterized by optically detected
electron spin resonance (ESR) (see Methods). Figure 1d contains data from NV1 with
zero applied magnetic field. In this case, the 1± ground state levels are degenerate so
that only one resonance (mS = 0 → ±1) is observed at 2.87 GHz, the characteristic zero-
field splitting of N-V centers11. The data is fit with a Lorentzian of 11 MHz FWHM
(solid line), which is comparable to previous measurements on similar diamond samples1.
Previous strain-dependent optical measurements on ensembles of N-V centers
indicated that electric dipole transitions are allowed for dipoles in the plane perpendicular
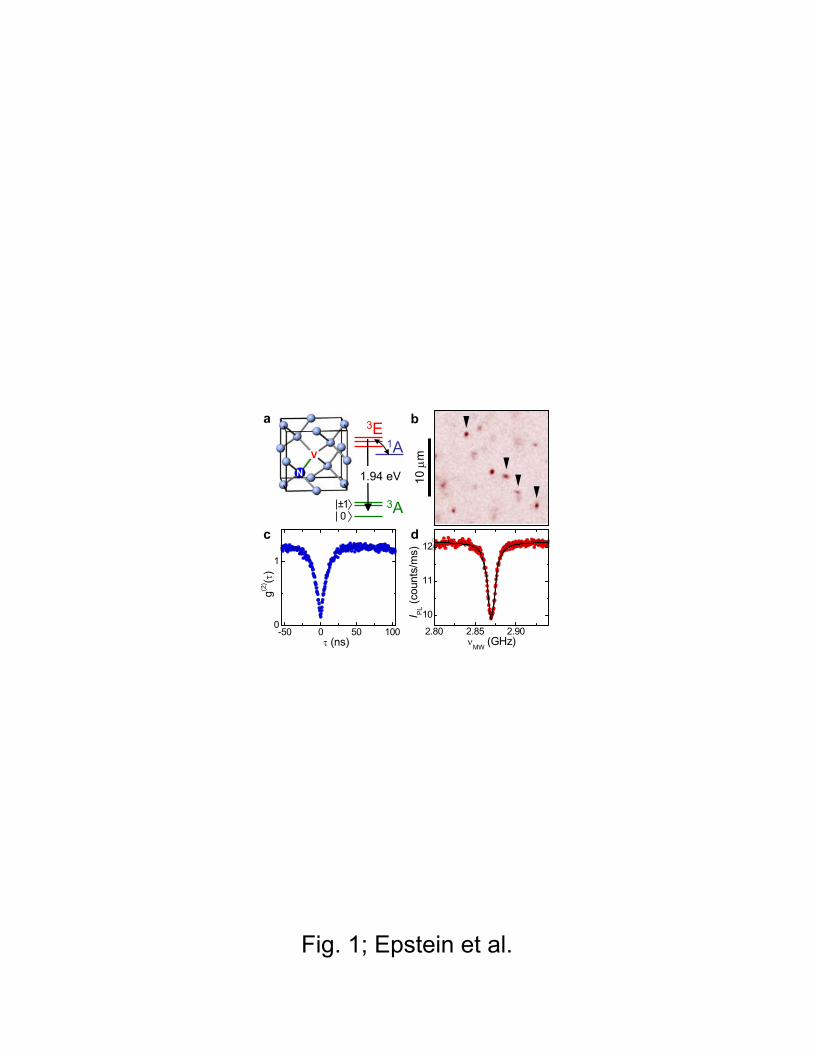
to the symmetry axis6. Figure 2a depicts an N-V center with transition dipoles X|| [ ]211
and Y|| [ ]011 in a (111) plane. The excitation is along [001] for all measurements,
therefore, IPL depends on the laser polarization angle φ due to unequal excitation of the
two dipoles. The dependence of IPL on φ is measured for twenty N-V centers and exhibits
either vertical or horizontal lobes, as exemplified for three N-V centers in Fig. 2b. The
measured anisotropies, defined as the ratio IPL(φ = 0°)/IPL(φ = 90°), are roughly 2:1 and
1:2 on average; a simple anisotropy calculation gives 3:1, 3:1, 1:3, and 1:3 for the N-V
symmetry axis along [111], [ ]111 , [ ]111 and [ ]111 , respectively (see Methods). The
measured data are modified by the presence of polarized background PL (subtracted from
the data) and a small dip, most visible for NV2 at φ = 0°, which varies in depth from

4
center to center. Nevertheless, comparison of the measured and calculated anisotropies
enables the number of possible orientations of a given center to be reduced from four to
two.
The double degeneracy of the polarization anisotropy is lifted by application of a
magnetic field B. The upper panel of Fig. 2c shows the ground state spin levels as a
function of |B| calculated using the Hamiltonian7 H = gµBB·S + D(Sz2 – S(S+1)/3), where
µB is the Bohr magneton, g = 2.0, S = 1 and D = 2.88 GHz. A level anti-crossing (LAC)
near 1000 G is predicted for an N-V center with symmetry axis at a small angle to B (6°;
solid lines), but not for a large angle (55°; dashed lines). The middle panel is a plot of
|α|2, the coefficient of z
0 , calculated for both angles and for each spin level,
zzzSm 110 ++−+= γβα , where the z subscript denotes the [111] basis; the plot
shows how the spin states mix with |B| and will be used to model the data below. The
lower panel is a plot of IPL as a function of |B|, with a ~1° angle between B and [111], for
the same three N-V centers as in Fig. 2b. Whereas NV1 and NV2 have similar
polarization dependences, their field dependences reveal that the symmetry axis of NV1
(NV2) is (non-)parallel to B. For NV1, the negative peak at ~1000 G coincides with the
calculated LAC. Additionally, NV1 exhibits a peak at ~500 G, the origin of which is less
clear.
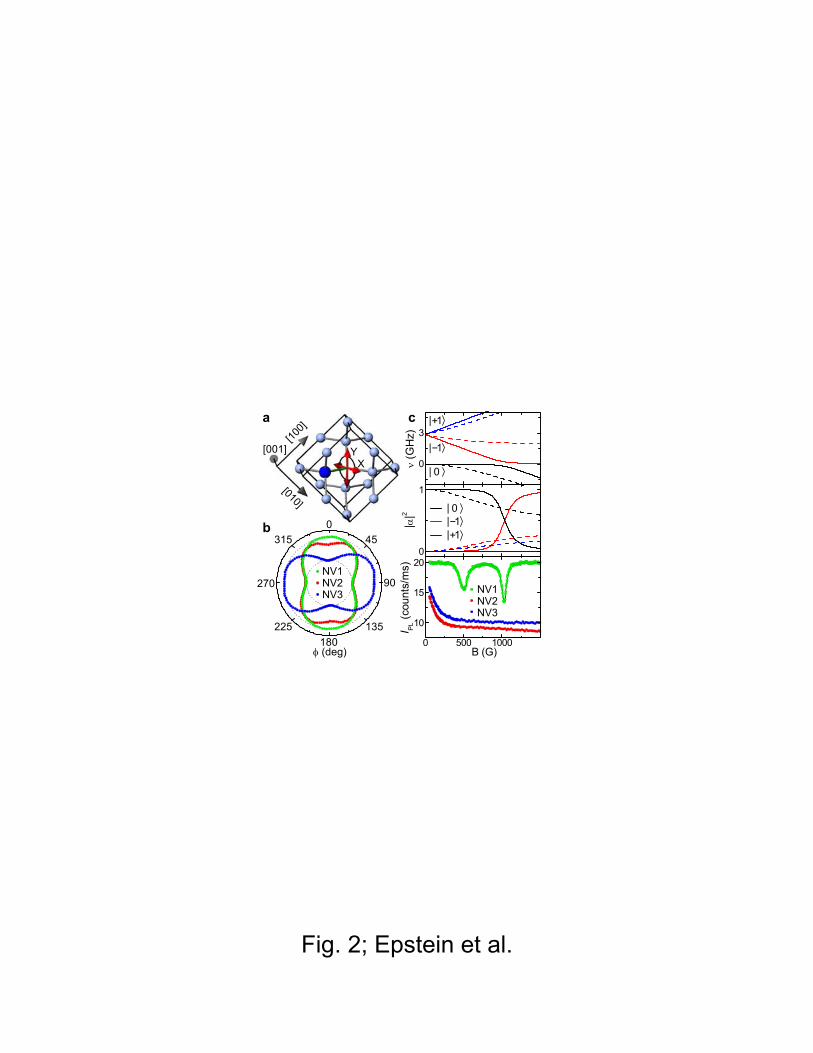
In order to investigate these peaks further, IPL is measured as a function of |B|
with B at a series of angles θ in the ( )011 plane; a selection of such data from NV1 is
displayed in Fig. 3a. As B approaches the [111] direction (θ → 0°), the LAC peak gets
narrower, as expected from previous ensemble measurements21,22. At sufficiently small
angles, however, the LAC peak amplitude decreases for NV1 (Fig. 3b) or even vanishes
5
for some centers, such as NV4 (Fig. 3c). This is in contrast to the ensemble
measurements21,22 that showed a maximum in the LAC peak amplitude at θ = 0°.
According to the Hamiltonian above, however, spin mixing should vanish at θ = 0°. The
presence of residual spin mixing at θ = 0° has been attributed to strain and nuclear
interactions23, which vary from center to center.
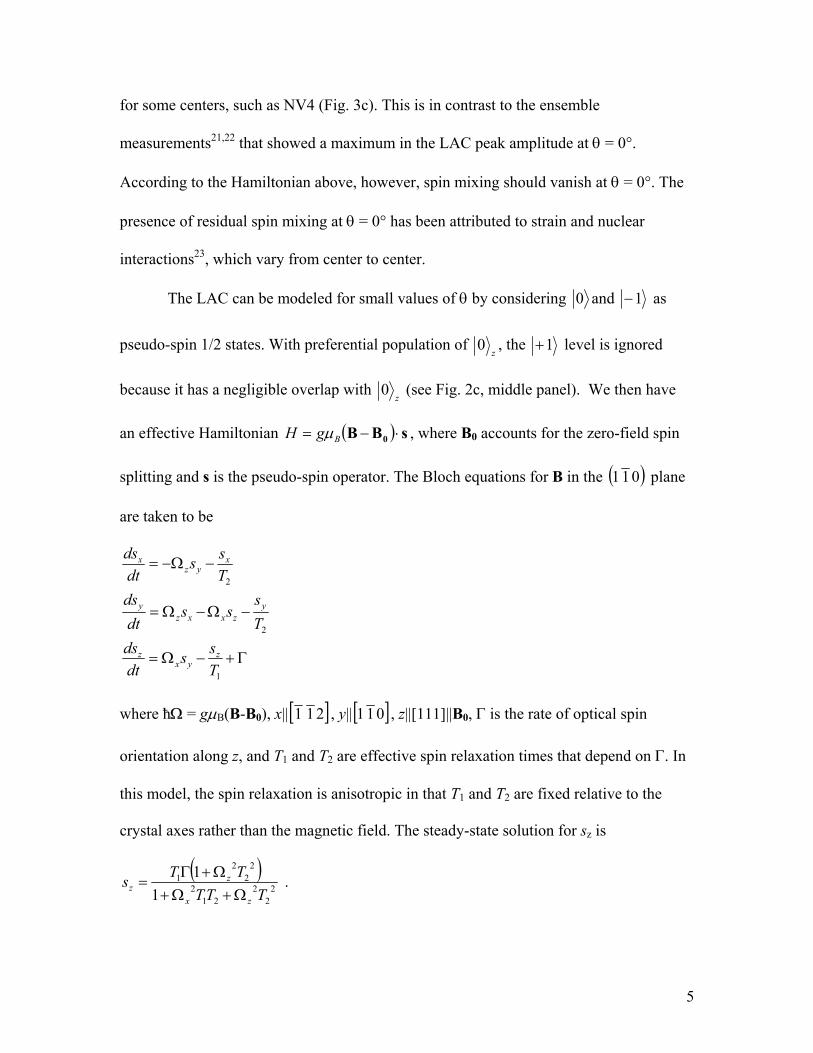
The LAC can be modeled for small values of θ by considering 0 and 1− as
pseudo-spin 1/2 states. With preferential population of z
0 , the 1+ level is ignored
because it has a negligible overlap with z
0 (see Fig. 2c, middle panel). We then have
an effective Hamiltonian ( ) sBB 0 ⋅−= BgH µ , where B0 accounts for the zero-field spin
splitting and s is the pseudo-spin operator. The Bloch equations for B in the ( )011 plane
are taken to be
Γ+−Ω=
−Ω−Ω=
−Ω−=
1
2
2
Tss
dtds
Ts
ssdtds
Tss
dtds
zyx
z
yzxxz
y
xyz
x
where ħΩ = gµB(B-B0), x|| [ ]211 , y|| [ ]011 , z||[111]||B0, Γ is the rate of optical spin
orientation along z, and T1 and T2 are effective spin relaxation times that depend on Γ. In
this model, the spin relaxation is anisotropic in that T1 and T2 are fixed relative to the
crystal axes rather than the magnetic field. The steady-state solution for sz is
( )2
22
212
22
21
11
TTTTTs
zx
zz Ω+Ω+
Ω+Γ= .

6
We then take IPL = An0+Bn-1 = A(1/2+sz)+B(1/2-sz), where A and B (n0 and n-1) are the PL
rates (occupation probabilities) for the z
0 and z
1− levels, respectively. This simple
model describes the experimental data for a wide range of angles and magnetic fields,
where the same fit parameters are used for all angles (Fig. 3b and c lines). The fits yield
T1 = 64 ns and T2 = 11 ns for NV4 using a laser power of 2.9 mW (Fig. 3c) and T1 = 130
ns and T2 = 23 ns for a power of 890 µW (not shown). The results indicate that the laser
introduces substantial anisotropic spin relaxation via excitation out of the ground state
manifold.
The 500G peak evolves similarly to the LAC peak but over a broader angular
range. It has nearly the same amplitude and width at a given field angle for all N-V
centers investigated with suitable orientation. In addition, the peak has been observed in
all four samples measured. The evolution of the 500G peak with θ and B can be
reasonably accounted for in the model by postulating an LAC in the excited state, as is
expected to occur at some field due to the presence of zero-field spin splittings12,13,14.
Figure 3d shows the normalized amplitudes A of the 500G and LAC (1000 G) peaks as a
function of θ. Fits of the model to this data (red lines) and to the field scans (not shown)
yield T1 = 36 ns and T2 = 1.8 ns for an excited state LAC at ~500 G.
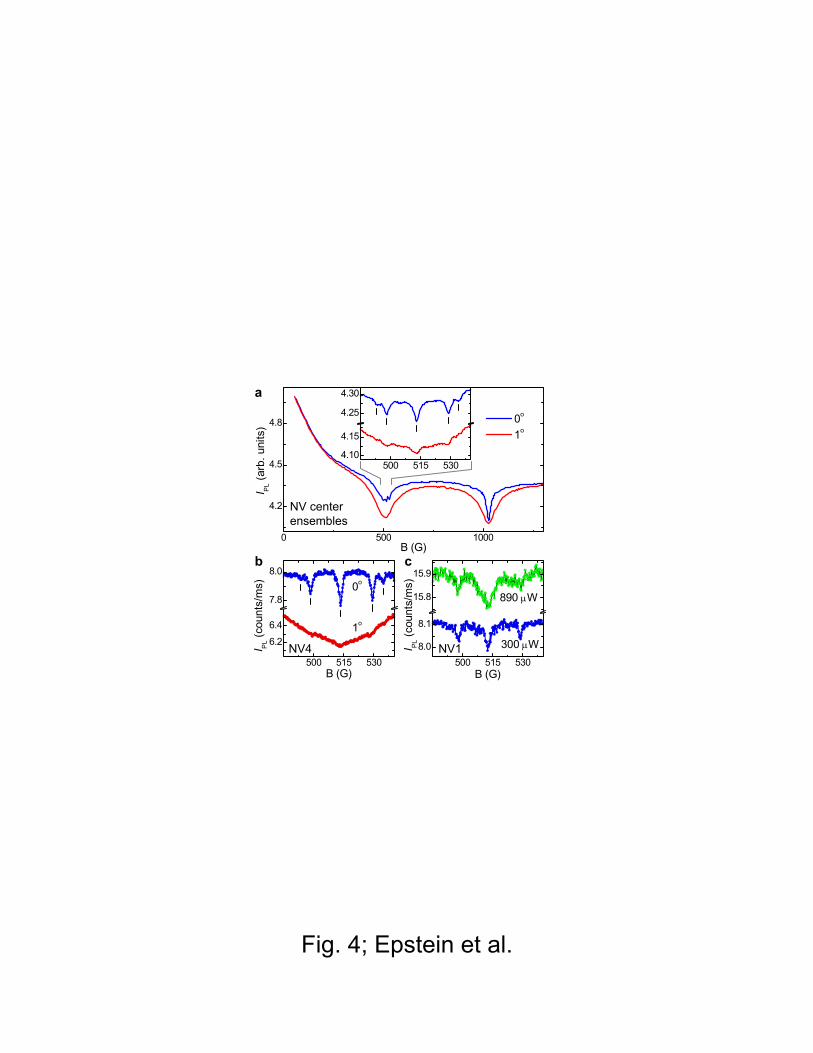
Similar data is taken on ensembles of N-V centers in Fig. 4a, where the 500G
peak is found to reduce in amplitude by ~50% at θ = 0°. Additionally, higher resolution
field scans around 500 G (Fig. 4a, inset) reveal the characteristic hyperfine quintuplet of
substitutional nitrogen (NS) centers24. These peaks appear when the electron spin
splittings of NS and N-V centers are equal, resulting in enhanced cross relaxation via the
magnetic dipole interaction25,26,27. Notably, the NS peak amplitudes diminish as |θ|
7
increases, suggesting that the 500G peak is commensurate with a decrease in spin
polarization, like the LAC peak.
The above results indicate the most suitable angular range (|θ| < 1°) for observing
the coupling of a single N-V center to its neighboring NS spins. Figure 4b displays two
field scans for NV4 at θ = 0° (blue circles) and 1° (red circles), showing the increase in
peak magnitude with decreasing angle, as in the ensemble data. Figure 4c shows similar
data for NV1 at θ = 0° with powers of 300 µW (blue circles) and 890 µW (red circles).
The nitrogen lines broaden and decrease in relative amplitude at higher power, which
may result from ionization of the NS centers28. The difference in the depth of the NS
peaks between NV4 and NV1 is suggestive of variation in the local nitrogen
concentration.
Finally, it is noteworthy that the NS centers are “dark” in that they are not directly
detected by photoluminescence. By measuring a single N-V center, the number of NS
spins that can be probed is decreased by orders of magnitude relative to ensemble
measurements. Furthermore, this dark-spin spectroscopy technique is in principle
applicable to a variety of paramagnetic defects in diamond. With higher purity samples29
and single ion implantation30, these results could make possible the long-range coupling
of two individually addressable N-V centers connected by a chain of dark spins, enabling
experimental tests of spin lattice theories and quantum information processing schemes.

8
Acknowledgements
We thank O. Gywat for valuable discussions and G. C. Farlow for high energy electron
irradiation of several samples. This work was supported by AFOSR, DARPA/MARCO,
and ARO.
Methods
Sample preparation and characterization
The samples are commercially available high-temperature high-pressure diamond
(Sumitomo) with nominal dimensions of 1.4×1.4×1.0 mm and nitrogen concentrations of
100-1000 ppm, measured by UV absorption31. N-V centers naturally exist in these
samples with estimated densities ranging from 1010 to 1013 cm-3. Two parallel sample
faces are polished and have (100) orientation. For ensemble measurements, samples are
irradiated with 1.7 MeV electrons with a dose of 5×1017 cm-3 and subsequently annealed
at 900oC for 2 hours to increase the N-V center concentration6.
Experimental techniques
The measurement apparatus is based around a confocal microscope with a
Hanbury Brown and Twiss detection scheme18. A diode-pumped solid state laser emitting
at 532 nm is linearly polarized and focused onto the sample with a microscope objective
of numerical aperture 0.73 and working distance 4.7 mm. The linear polarization is set to
any desired angle by changing the retardance of a variable wave plate (fast axis at 45o to
the initially vertical polarization) in front of a quarter-wave plate (fast axis vertical). The
laser spot is positioned on the sample in both lateral dimensions with a fast steering

9
mirror. The PL from the sample is collected by the same microscope objective, passed
through a dichroic mirror and a 640 nm long-pass filter and sent via a 50/50 beam-splitter
to two fiber-coupled silicon avalanche photodiode modules. For antibunching
measurements, the outputs of the detectors are connected to a time-correlated single
photon counting module. For measurements of N-V center ensembles, PL is detected
with a photodiode and lock-in amplifier. In general, the PL is used as a feedback signal to
compensate for thermal drift, enabling a single N-V center to be tracked for several days.
The samples are at room temperature for all measurements discussed in this Letter.
The static magnetic field B is applied to the sample with a permanent magnet
mounted on a multi-axis stage that allows the distance between the magnet and the
sample to be adjusted by a stepper motor, thereby setting |B| at the sample. In addition,
the polar and azimuthal angles of B are manually adjustable with micrometers while
keeping |B| constant at the sample to better than 1%. For ESR measurements, a 25 µm
diameter gold wire is connected to a microwave signal generator (with 16 dBm power
output) and placed in close proximity (~50 µm) to the laser spot.
Polarization anisotropy calculation
According to Fermi’s golden rule in the electric dipole approximation, the
absorption rate is proportional to |D·E|2, where D is the dipole matrix element and E is
the excitation electric field vector. The absorption anisotropy is estimated as
|Y·V|2/|X·H|2, where X and Y are the dipoles (see Fig. 2a) and V|| [ ]011 and H||[110] are
polarization vectors. A more accurate calculation would account for the dipole radiation
pattern, the large numerical aperture of the microscope objective and refractive effects

10
due to the diamond air boundary. However, the simple equation above is sufficient to
account for both the anisotropy orientations and degeneracies that are measured.

11
References
1 Gruber, A. et al. Scanning confocal optical microscopy and magnetic resonance on single defect centers. Science 276, 2012 (1997). 2 Jelezko, F., Gaebel, T., Popa, I., Gruber, A. & Wrachtrup, J. Observation of coherent oscillations in a single electron spin. Phys. Rev. Lett. 92, 076401 (2004). 3 Jelezko, F. et al. Single spin states in a defect center resolved by optical spectroscopy. Appl. Phys. Lett. 81, 2160 (2002). 4 Jelezko, F. et al. Observation of coherent oscillation of a single nuclear spin and realization of a two-qubit conditional quantum gate. Phys. Rev. Lett. 93, 130501 (2004). 5 Kennedy, T. A., Colton, J. S., Butler, J. E., Linares, R. C. & Doering, P. J. Long coherence times at 300 K for nitrogen-vacancy center spins in diamond grown by chemical vapor deposition. Appl. Phys. Lett. 83, 4190 (2003). 6 Davies, G. & Hamer, M. F. Optical studies of the 1.945 eV vibronic band in diamond. Proc. Roy. Soc. A 348, 285 (1976). 7 Pryce, M. H. L. A modified perturbation procedure for a problem in paramagnetism. Proc. Phys. Soc. A 63, 25 (1950). 8 Reddy, N. R. S., Manson, N. B., & Krausz, E. R. Two-laser spectral hole burning in a colour centre in diamond. J. Lumin. 38, 46 (1987). 9 van Oort, E., Manson, N. B. & Glasbeek, M. Optically detected spin coherence of the diamond N-V centre in its triplet ground state. J. Phys. C 21, 4385 (1988). 10 Redman, D. A., Brown, S., Sands, R. H. & Rand, S. C. Spin dynamics and electronic states of N-V centers in diamond by EPR and four-wave-mixing spectroscopy. Phys. Rev. Lett. 67, 3420 (1991). 11 Loubser, J. H. N. & van Wyk, J. A. Electron spin resonance in the study of diamond. Rep. Prog. Phys. 41, 1201 (1978). 12 Redman, D., Brown, S. & Rand, S. C. Origin of persistent hole burning of N-V centers in diamond. J. Opt. Soc. Am. B 9, 786 (1992). 13 Manson, N. B. & Wei, C. Transient hole-burning in N-V centre in diamond. J. Lumin. 58, 158 (1994). 14 Lenef, A. et al. Electronic structure of the N-V center in diamond: experiments. Phys. Rev. B 53, 13427 (1996). 15 Martin, J. P. D. Fine structure of excited 3E state in nitrogen-vacancy centre of diamond. J. Lumin. 81 237 (1999). 16 Harrison, J., Sellars, M. J. & Manson, N. B. Optical spin polarization of the N-V centre in diamond. J. Lumin. 107, 245 (2004). 17 Nizovtsev, A. P. et al. NV centers in diamond: spin-selective photokinetics, optical ground state spin alignment and hole burning. Physica B 340-342, 106 (2003).

12
18 Hanbury Brown, R. & Twiss, R. Q. Correlation between photons in two coherent beams of light. Nature 177, 27 (1956). 19 Kurtsiefer, C., Mayer, S., Zarda, P. & Weinfurter, H. Stable solid-state source of single photons. Phys. Rev. Lett. 85, 290 (2000). 20 Beveratos, A., Brouri, R., Poizat, J.-P. & Grangier, P. Bunching and antibunching from single NV color centers in diamond. quant-ph\0010044 (2000). 21 van Oort, E. & Glasbeek, M. Fluorescence detected level-anticrossing and spin coherence of a localized triplet state in diamond. Chem. Phys. 152, 365 (1991). 22 Martin, J. P. D. et al. Spectral hole burning and Raman heterodyne signals associated with an avoided crossing in the NV centre in diamond. J. Lumin. 86, 355 (2000). 23 He, X.-F., Manson, N. B. & Fisk, P. T. H. Paramagnetic resonance of photoexcited N-V defects in diamond. I. Level anticrossing in the 3A ground state. Phys. Rev. B 47, 8809 (1993). 24 Smith, W. V., Sorokin, P. P., Gelles, I. L., & Lasher, G. J. Electron spin resonance of nitrogen donors in diamond. Phys. Rev. 115, 1546 (1959). 25 Holliday, K., Manson, N. B., Glasbeek, M. & van Oort, E. Optical hole-bleaching by level anti-crossing and cross relaxation in the N-V centre in diamond. J. Phys. C 1, 7093 (1989). 26 van Oort, E. & Glasbeek, M. Cross-relaxation dynamics of optically excited N-V centers in diamond. Phys. Rev. B 40, 6509 (1989). 27 van Oort, E., Stroomer, P., & Glasbeek, M. Low-field optically detected magnetic resonance of a coupled triplet-doublet defect pair in diamond. Phys. Rev. B 42, 8605 (1990). 28 Farrer, R. G. On the substitutional nitrogen donor in diamond. Solid State Comm. 7, 685 (1969). 29 Butler, J. E. et al. Exceptionally high voltage Schottky diamond diodes and low boron doping. Semicond. Sci. Technol. 18, S76 (2003). 30 Meijer, J. et al. Generation of single colour centers by focussed nitrogen implantation. cond-mat/0505063. 31 Kaiser, W. & Bond, W. L. Nitrogen, a major impurity in common type I diamond. Phys. Rev. 115, 857 (1959).

13
Figure Legends Figure 1. Characterization of single N-V centers. a, Atomic structure and relevant energy levels of the N-V center. The green “bond” depicts the symmetry axis. b, Spatial PL image (20×20 µm) showing emission from multiple N-V centers; NV1 through NV4 (left to right) are marked. The data is taken by raster-scanning the laser across the sample while measuring the average photon count rate IPL at each position. Darker red corresponds to higher IPL. c, Intensity correlation function g(2)(τ) versus τ for NV1, indicating photon emission from a single N-V center. The data is normalized by the detector count rates, the time bin width and total integration time and has not been corrected for background PL. d, Optically-detected ESR for NV1: IPL versus microwave frequency νMW (circles) with Lorentzian fit (solid line). The laser power is 1 mW for b, and 370 µW for c and d. The samples are at room temperature for all data in this Letter. Figure 2. Polarization and magnetic field anisotropy of single N-V centers. a, Measurement geometry indicating crystal and transition dipole orientations. b, Normalized IPL (radial axis) versus laser polarization angle φ for NV1, NV2 and NV3. Polarization along [ ]011 corresponds to φ = 0. A background is subtracted from each curve and data is taken from -90° to 90° and reproduced from 90° to 270°. The dotted lines are guides to the eye. c, Upper panel: calculated ground-state spin splitting ν as a function of B for θ = 6o (solid lines) and 54.7o (dashed lines). Middle panel: probability amplitude |α|2 of
z0 for each spin level at the same two angles. Lower panel: IPL versus
B for NV1, NV2, and NV3, with ~ 1o angle between B and [111]. The laser power is 370 µW for b, and 1 mW for c. Figure 3. Control of spin level mixing via magnetic field alignment. a, IPL versus B for NV1 at specified magnetic field angles. b, Zoom of data in a (points), focusing on the LAC peak with fits (lines) to the model described in the text. Data taken with smaller field steps at θ = 0o are included and an angle of 0.2o is used to fit this data to account for residual spin mixing (see text). c, IPL versus B for NV4 (points) and fits (lines) at specified field angles. d, Normalized amplitude A of the LAC and 500G peaks versus field angle θ for NV4 and NV1, respectively. The laser power is 1 mW for NV1 and 2.9 mW for NV4. Figure 4. Resonant coupling of a single spin to its neighboring spins. a, IPL versus B for an ensemble of N-V centers at two field angles. Inset: higher resolution field scans around 500 G showing the nitrogen hyperfine structure. b, Field scans showing nitrogen coupling to a single N-V center (NV4) at two indicated field angles with 300 µW laser power. c, Field scans at two indicated laser powers for NV1 showing broadening of nitrogen peaks with increased power. For a (inset), b and c, a small linear background is subtracted from the data.
0
3
6
9
12
1515
2.80 2.85 2.90
10
11
12
I PL (c
ount
s/m
s)
νMW
(GHz)-50 0 50 100
0
1
g(2
) (τ)
τ (ns)
b
c d
V
N
a
3A
3E1A
1.94 eV
|±1
10 µ
m
| 0
Fig. 1; Epstein et al.
0 500 1000
10
15
20
B (G)
I PL (c
ount
s/m
s)
0
3
ν (G
Hz)
0
1
|α|2
[010]
[100]
[001] YX
a
NV2NV1
NV3
b
NV2NV1
NV3
0
270
180
90
315
225 135
45
φ (deg)
c
| 0
| 1+
| 1−
| 0
| 1+| 1−
Fig. 2; Epstein et al.

250 500 750 1000 125012
16
20
NV4NV1
0.0°0.6°1.0°2.0°4.0°6.2°
I PL (c
ount
s/m
s)
B (G)
NV1
-4 -2 0 2 40
1
NV4 LACNV1 500G
A (a
rb. u
n.)
θ (deg)
1000 1030 1060
16
20
0.2°0.4°
0.0°0.1°
B (G)
I PL (c
ount
s/m
s)
900 1000 1100
15
18
I PL (c
ount
s/m
s)
B (G)
0.0°0.6°
1.0°2.0°
a
cb
d
Fig. 3; Epstein et al.
0 500 1000
4.2
4.5
4.8 0o
1o
I PL (a
rb. u
nits
)
B (G)
500 515 5304.10
4.15
4.25
4.30
500 515 530
6.2
6.4
7.8
8.0
1o
I PL (c
ount
s/m
s)
B (G)
0o
500 515 5308.0
8.1
15.8
15.9
300 µW
I PL (c
ount
s/m
s)
B (G)
890 µW
a
b c
NV centerensembles
NV4 NV1
Fig. 4; Epstein et al.