
and marine propulsion units equipped with combustion piston ...
226
GDANSK UNIVERSITY OF TECHNOLOGY FACULTY OF OCEAN ENGINEERING AND SHIP TECHNOLOGY SECTION OF TRANSPORT TECHNICAL MEANS OF TRANSPORT COMMITEE OF POLISH ACADEMY OF SCIENCES UTILITY FOUNDATIONS SECTION OF MECHANICAL ENGINEERING COMMITTEE OF POLISH ACADEMY OF SCIENCE ISSN 1231 – 3998 ISBN 83 – 900666 – 2 – 9 Journal of POLISH CIMAC ENERGETIC ASPECTS Vol. 5 No. 1 Gdansk, 2010 Science publication of Editorial Advisory Board of POLISH CIMAC
-
Upload
khangminh22 -
Category
Documents
-
view
1 -
download
0
Transcript of and marine propulsion units equipped with combustion piston ...

GDANSK UNIVERSITY OF TECHNOLOGY FACULTY OF OCEAN ENGINEERING AND SHIP TECHNOLOGY
SECTION OF TRANSPORT TECHNICAL MEANS OF TRANSPORT COMMITEE OF POLISH ACADEMY OF SCIENCES
UTILITY FOUNDATIONS SECTION OF MECHANICAL ENGINEERING COMMITTEE OF POLISH ACADEMY OF SCIENCE
ISSN 1231 – 3998
ISBN 83 – 900666 – 2 – 9
Journal of
POLISH CIMAC
ENERGETIC ASPECTS
Vol. 5 No. 1
Gdansk, 2010
Science publication of Editorial Advisory Board of POLISH CIMAC


Editor in Chief: Jerzy Girtler Editorial Office Secretary: Jacek Rudnicki
Editorial Advisory Board
J. Girtler (President) - Gdansk University of Technology L. Piaseczny (Vice President) - Naval Academy of Gdynia A. Adamkiewicz - Maritime Academy of Szczecin J. Adamczyk - University of Mining and Metallurgy of KrakowJ. B�achnio - Air Force Institute of Technology L. B�dkowski - WAT Military University of Technology C. Behrendt - Maritime Academy of Szczecin P. Bielawski - Maritime Academy of Szczecin J. Borgo� - Warsaw University of Technology T. Chmielniak - Silesian Technical University R. Cwilewicz - Maritime Academy of Gdynia T. D�browski - WAT Military University of Technology Z. Domachowski - Gdansk University of Technology C. Dymarski - Gdansk University of Technology M. Dzida - Gdansk University of Technology J. Gronowicz - Maritime University of Szczecin V. Hlavna - University of Žilina, Slovak Republic M. Idzior – Poznan University of Technology A. Iskra - Poznan University of TechnologyA. Jankowski – President of KONES J. Ja�wi�ski - Air Force Institute of Technology R. Jedli�ski - Bydgoszcz University of Technology and AgricultureJ. Kici�ski - President of SEF MEC PAS, member of MEC O. Klyus - Maritime Academy of Szczecin Z. Korczewski - Naval Academy of Gdynia K. Kosowski - Gdansk University of Technology L. Ignatiewicz Kowalczuk - Baltic State Maritime Academy in Kaliningrad J. Lewitowicz - Air Force Institute of Technology K. Lejda - Rzeszow University of Technology
J. Macek - Czech Technical University in Prague Z. Matuszak - Maritime Academy of Szczecin J. Merkisz – Poznan Unversity of Technology R. Michalski - Olsztyn Warmia-Mazurian University A. Niewczas - Lublin University of Technology Y. Ohta - Nagoya Institute of Technology M. Orkisz - Rzeszow University of Technology S. Radkowski - President of the Board of PTDTY. Sato - National Traffic Safety and Environment Laboratory, Japan M. Sobieszcza�ski - Bielsko-Biala Technology-Humanistic AcademyA. Soudarev - Russian Academy of Engineering Sciences Z. Stelmasiak - Bielsko-Biala Technology-Humanistic Academy M. �l�zak - Ministry of Scientific Research and Information Technology W. Tare�ko - Maritime Academy of Gdynia W. Wasilewicz Szczagin - Kaliningrad State Technology Institute F. Tomaszewski - Poznan University of Technology J. Wajand – Lodz University of Technology W. Wawrzy�ski - Warsaw University of Technology E. Wiederuh - Fachhochschule Giessen Friedberg M. Wyszy�ski - The University of Birmingham, United Kingdom M. Zab�ocki – V-ce President of KONES S. �mudzki - West Pomeranian University of Technology in Szczecin B. �ó�towski - Bydgoszcz University of Technology and Life Sciences J. �urek - Air Force Institute of Technology
Editorial Office:
GDANSK UNIVERSITY OF TECHNOLOGY Faculty of Ocean Engineering and Ship Technology
Department of Ship Power Plants G. Narutowicza 11/12 80-233 GDANSK POLAND
tel. +48 58 347 29 73, e – mail: [email protected]
www.polishcimac.pl
This journal is devoted to designing of diesel engines, gas turbines and ships’ power transmission systems containing these engines and also machines and other appliances necessary to keep these engines in movement with special regard to their energetic and pro-ecological properties and also their durability, reliability, diagnostics and safety of their work and operation of diesel engines, gas turbines and also machines and other appliances necessary to keep these engines in movement with special regard to their energetic and pro-ecological properties, their durability, reliability, diagnostics and safety of their work, and, above all, rational (and optimal) control of the processes of their operation and specially rational service works (including control and diagnosing systems), analysing of properties and treatment of liquid fuels and lubricating oils, etc.
All papers have been reviewed @Copyright by Faculty of Ocean Engineering and Ship Technology Gdansk University of Technology
All rights reserved ISSN 1231 – 3998
ISBN 83 – 900666 – 2 – 9
Printed in Poland


CONTENTS
W. Balicki, Z. Korczewski, S. Szczeci�ski: POSSIBILITIES OF THE PERFORMANCE IMPROVEMENT OF THE AERO- AND MARINE PROPULSION UNITS EQUIPPED WITH COMBUSTION PISTON ENGINES …………………………... 7
D. Boche�ski: ANALYSIS OF POSSIBILITY AND PURPOSEFULNESS OF APPLICATION OF WASTE-HEAT BOILERS TO TRAILING SUCTION HOPPER DREDGERS 23
M. Giernalczyk, Z. Górski, B. Kowalczyk: ESTIMATION METHOD OF SHIP MAIN PROPULSION POWER, ONBOARD POWER STATION ELECTRIC POWER AND BOILERS CAPACITY BY MEANS OF STATISTICS ……………………… 33
J. Girtler: METHOD OF EVALUATION OF LUBRICATING ABILITY OF LUBE OILS AND FUELS IN TERMS OF ENERGY …………………………....................................... 43
Z. Górski, M. Giernalczyk: ANALYSIS OF TRENDS IN ENERGY DEMAND FOR MAIN PROPULSION, ELECTRIC POWER AND AUXILIARY BOILERS CAPACITY OF TANKERS …………………………............................................... 51
A. Janicka, Z. J. Sroka, W. Walkowiak: THE EFFECT OF INNER CATALYST APPLICATION ON DIESEL ENGINE PERFORMANCE …………………………........................... 59
A. Ka�mierczak, K. Krakowian, A. Górniak, P. Kawali�o: ANALYSYS AND SYMULATION OF INTERNAL COMBUSTION ENGINE PERFORMANCE CHARACTERISTICS USING ELECTRONIC INTERFACE WITH “EEC IV” CAR COMPUTER ……… 69
C. Kolanek, M. Reksa, W. Walkowiak, A. Janicka: THE FUTURE OF ALTERNATIVE FUELS FOR INTERNAL COMBUSTION ENGINES APPLICATIONS ………………… 77
Z. Korczewski, M. Zacharewicz: EVALUATION OF WORKING SPACES’ TECHNICAL CONDITION OF MARINE DIESEL ENGINE ON THE BASIS OF OPERATION RESEARCH ………………………….......................................................................... 85
J. Kowalski: THE ANN APPROXIMATION OF THE CH4 COMBUSTION MODEL ………… 95
J. Kowalski: THE CH4 COMBUSTION MODEL …………………………..................................... 103
P. Krasowski: CHANGE CAPACITY AND FRICTION FORCE IN SLIDE JOURNAL BEARING BY TORSIONAL SHAFT VIBRATION ……………………………….. 111
P. Krasowski: PRESSURE AND VELOCITY DISTRIBUTION IN SLIDE JOURNAL BEARING LUBRICATED MICROPOLAR OIL ………………………….................................. 119
R. Michalski: THE ENERGETIC AND EXERGETIC EVALUATION OF THE EXHAUST GASES ON THE EXAMPLE OF THE SELECTED MARINE DIESEL ENGINES 127
L. Piaseczny: ANALYSIS OF MAIN PROPULSION ENGINE SEATINGS IN SHIP POWER PLANTS …………………………............................................................................... 135
L. Piaseczny, R. Zadr�g: THE OPTIMALISATION OF CHOOSING THE COMPOSITION OF FUEL-WATER EMULSION APPLIED FOR FEEDING MARINE COMBUSTION ENGINES …………………………............................................................................. 143
J. Ros�anowski: INFORMATION BANKS OF ENERGETIC DEVICES OPERATION FORMED BY MEANS OF DIMENSIONAL ANALYSIS ………………………….................. 151
J. Ros�anowski: AUXILIARY BOILER OPERATION OF VX TYPE INSTALLED IN SHIP COMBUSTION ENGINE ROOM …………………………....................................... 161

W. Serdecki: DETERMINATION OF COMPRESSION RING WALL PRESSURE DISTRIBUTION ………………………….................................................................. 171
M. Styp-Rekowski, J. Musia� ROLLING BEARINGS’ OPERATING FEATURES AS A FUNCTION OF THEIR ELEMENTS HARDNESS …………………………........... 179
W. Tare�ko: POWER TAKE-OFF SYSTEMS OF OFFSHORE RIG POWER PLANTS ………… 187
T. Tu�ski: NEW WORKING CONDITIONS OF A MARINE DIESEL ENGINE-WASTE-HEAT BOILER SYSTEM …………………………............................................................... 199
W. Ze�czak: THE CONCEPT OF SHIP’S POWER PLANT ARRANGEMENT INVOLVING BIOMASS FIRED BOILER …………………………................................................. 205
B. �ó�towski, M. Kastelik: APPLICATION OF SPECTROSCOPIC RESEARCH METHODS FOR MOTOR OIL CONDITION AND QUALITY EVALUATION ……………… 213
B. �ó�towski, M. Kastelik: FT-IR METHOD USED FOR EVALUATION OF MOTOR OIL CONDITION AND QUALITY …………………………............................................ 221

POSSIBILITIES OF THE PERFORMANCE IMPROVEMENT OF THE AERO- AND MARINE PROPULSION UNITS EQUIPPED WITH
COMBUSTION PISTON ENGINES
W�odzimierz Balicki1), Zbigniew Korczewski2), Stefan Szczeci�ski1)
1)Institute of Aviation 110/114 KrakowskaAv. 02-256 Warsaw, Poland
Ph.: +4822 346 00 11 w.337 e-mail: [email protected]
2)Gda�sk University of Technology 11/12 Gabriela Narutowicza Str. 80-233 Gda�sk, Poland
Ph.: +4858 347 21 81 e-mail: [email protected]
Abstract
Within the paper there have been presented the authors’ opinions concerning possibilities and needs of the
performance optimization of the aero- and marine units powered by piston engines both of "classic" and contemporary construction. There have been also discussed the reserves contained within combustion piston engines which enable its performance improvement (the power and specific fuel consumption) as well as the fulfillment of the ecological requirements. Keywords: transportation, powered unites, aero- and marine combustion piston engines.
1. Introduction
The common application of combustion piston engines as a propulsion of motorcars (there were about half a billion cars in Europe, USA and Japan on 2000), truck, lorries, working machines, stationary industrial aggregates as well as the vessels, airplanes, helicopters etc. requires undertaking optimization tasks of their cooperation with the power receivers. It goes without saying that the most important task concerns the minimization of the specific fuel consumption as well as the emission of noise and toxic components in the exhaust.
The contemporarily applied constructional solutions of engines, used materials and production technologies as well as operation strategies enable multiplying the engines' durability in comparison to one achieved in fifties of the previous century. Thanks to the application of electronic systems a classic idea of the low-pressure fuel injection has become more popular assuring, among the others, the constant mixture composition, close to stechiometric one (controlled by a signal of the "lambda” probe) as well as the selection of the ignition advance angle which depends on the current engine's load [8, 16]. The progress in construction of the electromagnetic micro valves made it possible to introduce the complex, digitally controlled, fuel dosage directly to the engine's cylinders by means of high pressure injectors. The next
7

achievements within the range of enlarging the combustion process efficiency, spreading the engines turbocharging systems and also, the progress in the scope of computational methods concerning the endurance of constructions which subject to changeable loads, including thermal loads - permit obtaining larger powers of engines from the unit of cylinder displacement.
Development of control systems represents the next, significant step in the domain of above mentioned propulsions. Such systems permit taking into account the more and more large number of parameters influencing on the efficiency of thermodynamical processes worked out in combustion engines. Introducing hybrid drives in vehicles permits the engine users to limit a range of the combustion engine performance to such, near which, the specific fuel consumption is the smallest. Today there can be imagined a similar solution of the helicopter propulsion aided with of a solar energy from the batteries.
The adaptation of combustion engines to renewable bio-original fuels (alcohols and oils) represents the separate problem in the further engines' development (also turbine engines).
2. Profiles of contemporary engines
Constructions of cylinder heads and timing gear as well as an application of the
turbocharged compressor represent the most essential constructional solutions shaping the profiles of contemporary engines. At present, the engine constructions with four valves in the cylinder head (two inlet and two outlet valves) have been almost exclusively applied within the group of unsupercharged engines for many years. Such a solution of the timing gear was introduced in aviation just before II World War [11]. By this way a good cylinder filling-up and high power of the engine at the maximum rotational speed could be achieved. It represents the most required feature in terms of the airscrew propulsion. But on the other hand, the engine’s filling-up within the range of low and medium rotational speed is much worse than one in the engines equipped with a singular inlet valve. It results from feedback flows appearing in the initial phase of unlocking the valves as well as in the final phase of their closing. This was explained on figure 1.
A „four-valve” construction of the cylinder head aims to increase the inlet valve opening area – it is usually bigger by 50% than one in the classic construction.
a) b)
Fig.1. Flow relation between the inlet valves’ slot and the angle location of a crankshaft �:
a) valve lift h and volumetric air flow rate through the valve V; b) instantaneous cylinder filling-up coefficient �V for different rotational speed of the engine’s crankshaft n; (1, 2 – feedback flows).
8

In figure 2 there is presented the relationship between a torque (proportional to the measure of filling-up the cylinders) and the engine's rotational speed while the engine has got the heads equipped with singular inlet valve and two inlet valve in every cylinder.
As the result of enlarged feedback flows through two inlet valves the reduction of torque value within the range of low and medium rotational speed can occur. However within the range of high rotational speed the positive effect of such an arrangement appears, making possible to utilize the smaller flow resistances more efficiently (the larger slots) as well as the inertia of speeding-up stream of inlet air in the final phase of closing the valves. In the consequence of such
Fig. 2. Dependence between the engine’s torque Mo and crankshaft rotational speed n:
1 – singular inlet valve in the cylinder head; 2 – two inlet valves. a phenomenon the maximum power of engines equipped with "for-valve" heads is larger in comparison to engines with "two-valve" heads of the same cubic capacity [12].
3. Optimal ranges of the engines work The strong requirements (from the ecologic and economic point of view) relating to a
minimization of the fuel consumption could be fulfilled by means of precise knowledge of the general engine profile (also called the universal profile) [5]. The example of such a profile is demonstrated in figure 3. The profile's course is typical for all combustion piston engines. The differences concern only the numerical values of rotational speed, specific fuel consumption and torque. It is worth pointing out on the well-known fact that minimum values of the specific fuel consumption exist while the torque achieves the maximum values (the engine is the most efficient). When the users of vehicles, ships and airplanes possess the knowledge of this engine's feature and try to implement this theory into practical utilization, by keeping-on the rotational speed within the range �nopt, the fuel consumption and quantity of exhaust expelled to atmosphere could be significantly reduced.
9
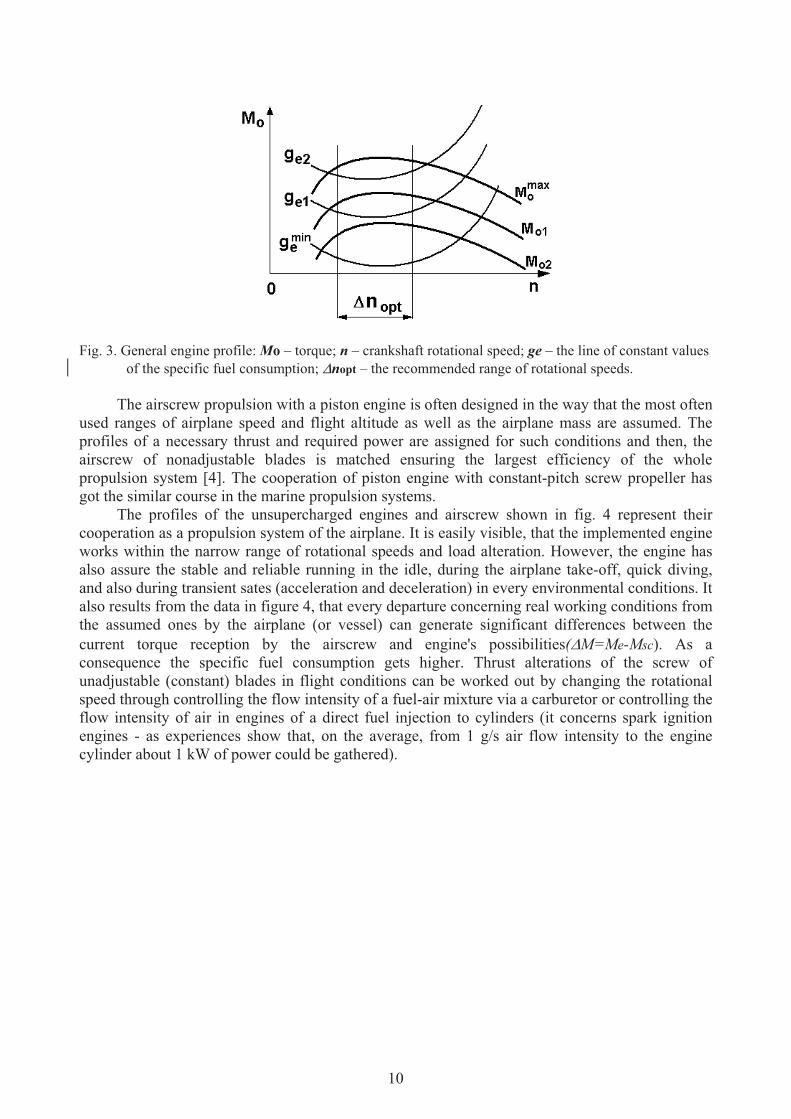
Fig. 3. General engine profile: Mo – torque; n – crankshaft rotational speed; ge – the line of constant values
of the specific fuel consumption; �nopt – the recommended range of rotational speeds.
The airscrew propulsion with a piston engine is often designed in the way that the most often used ranges of airplane speed and flight altitude as well as the airplane mass are assumed. The profiles of a necessary thrust and required power are assigned for such conditions and then, the airscrew of nonadjustable blades is matched ensuring the largest efficiency of the whole propulsion system [4]. The cooperation of piston engine with constant-pitch screw propeller has got the similar course in the marine propulsion systems.
The profiles of the unsupercharged engines and airscrew shown in fig. 4 represent their cooperation as a propulsion system of the airplane. It is easily visible, that the implemented engine works within the narrow range of rotational speeds and load alteration. However, the engine has also assure the stable and reliable running in the idle, during the airplane take-off, quick diving, and also during transient sates (acceleration and deceleration) in every environmental conditions. It also results from the data in figure 4, that every departure concerning real working conditions from the assumed ones by the airplane (or vessel) can generate significant differences between the current torque reception by the airscrew and engine's possibilities(�M=Me-Msc). As a consequence the specific fuel consumption gets higher. Thrust alterations of the screw of unadjustable (constant) blades in flight conditions can be worked out by changing the rotational speed through controlling the flow intensity of a fuel-air mixture via a carburetor or controlling the flow intensity of air in engines of a direct fuel injection to cylinders (it concerns spark ignition engines - as experiences show that, on the average, from 1 g/s air flow intensity to the engine cylinder about 1 kW of power could be gathered).
10

Fig. 4. Dependence of the engine’s torque Me and the constant pitch screw’s anti-torque Msc
on the rotational speed n (H – flight altitude; Po – cooperation point between the screw and engine in ground conditions; PH>0 – cooperation point between the screw and engine
in flight condition).
An application of the control pitch airscrew enables wider possibilities of the efficiency enlargement in the propulsion system. It makes the engine possible to run in the range relating to the smallest specific fuel consumption and the well-chosen pitch of an airscrew responds to its maximum efficiency. This principle is explained on fig. 5. However, an operation practice of the contemporary propulsion units of small airplanes applied in aviation servicing for the sanitary, police, firefighting needs as well as in disposable aviation makes such a way optimization of the cooperation between a piston engine and airscrew impossible. Such the operational practice results from the fact that the carburetor engines are still mostly used and the control system is hand operated. As a consequence, practical activities come down to the selection necessity - by the pilot in given flight condition - of the appropriate power (the rotational speed) of the engine, airscrew pitch, composition of mixture (with regard to discrepancy between quick, significant changes of the air density and small, little changes of the fuel density in terms of flight altitude), and also the intensity of cooling the lube oil and heating-up the inlet air in the favorable condition of icing the carburetor throat [2]. In the effect, a control system of the propulsion system consists from many levers (at least four or five), and the "hand" optimization of such a system is practically impossible even for a high qualified engine-expert (a pilot absorbed with the realized task and safety assurance of the flight is able to alter the position of individual levers only step by step).
11

Fig.5. Dependence of the engine’s torque and the control pitch screw’s torque on the rotational speed n (DSS – a position of the control lever of the engine power; � – an angle of screw
blades setting; �n – the range of rotational speed alteration during flight
Several years ago in the Institute of Aviation this system was improved [1], making possible the controlling process with only one lever. The modernisation was carried out by means of contemporary electronic systems - measuring and executive. An idea of this control system is presented in figure 6. It was checked on "Franklin 4A-235" engine and then it was adapted to the propulsion system consisting of Avco Lycoming 0-360 A1A engine and the control pitch screw.
The usage, in a common aviation (General Aviation), of the automated control systems of the propulsion systems "piston combustion engine along with control pitch screw” type will be probably continued with an adaptation of technical achievements which have been operated in automotive propulsion for years: engines' fuel feed systems equipped with the low pressure fuel injection and the electronically controlled ignition. The slowness of an implementation of the modern technique, based on electronic elements, in so called "piston aviation" (the "conservatism”- despite that nowadays the turbine engines are commonly controlled with the microprocessor systems FADEC type) results from the necessity of obeying recipes and procedures to assure the flight safety in difficult to controlling the area of civil aviation in small companies operating the individual agricultural, touristic or sport airplanes.
12

Fig. 6. Schematic diagram of automated controlling the airplane propulsion system: 1 – piston engine; 2 – control pitch screw; 3 – a lever of controlling the power; 4 – electronic
control unit; n – rotational speed; TH – ambient temperature; Ts – exhaust temperature; DSS – a position of the control lever of the engine power.
4. Reserves existing in air piston engines’ performance
The top of air piston engines' development was practically reached in half of last century. It that times a prototype of the "Nomad" engine was designed and built by the British company Napier. It was 12-cylindrical, self-ignition engine at a push-pull arrangement of cylinders ("boxer”). The maximum power equaled 3050 kW (achieving 73,5 kW of power from 1 dm3 of the engine cubic capacity), specific fuel consumption - 230 g/kWh and unitary mass - 0,53 kg/kW. The engine was supercharged by means of a multistage axial compressor driven by the engine's crankshaft. Such the engine construction contained also an axial turbine, powered with escaping exhaust, which gave back the power on the crankshaft across the toothed gear and hydraulic coupling. This way of driving the compressor (assuring "keeping up” a compression against a rotational speed of the engine crankshaft) and using the turbine's power made it possible to shorten the time of acceleration process and assure the stable engine running during the deceleration process. This solution outdistanced the contemporary productive practice by almost half a century. In spite of so good performances in comparison to constructions of aviation leading companies of II World War times: USA, USSR and Germany (the unit power usually did not exceeded 37 kW from 1 dm3 of the engine cubic capacity) the "Nomad" engine lost the competition with the violently developing turbine engines: airscrew and helicopter, which achieved the similar power at the smaller personal mass, overall dimensions and the simpler construction. The project was finished in April 1955.
Piston engines contemporarily used in aviation dispose powers that are many times smaller than the Napier "Nomad” engine. The majority of them are unsupercharged engines, construction bearing elements of which are not very high loaded. However, almost an absolute working
13

reliability and large durability are required from them, and additionally the newly projected engines have to fulfill the more and more sharper norms concerning exhaust toxicity. The reduction of a noisiness level during take-off and flight on small altitude level has aimed recently. The reserves exist in each of them. They can be used by modernizing the construction on the basis of a present knowledge about the aerodynamics, combustion theory, gases filtration in cleaners, load exchange in cylinders, theory of fluid-flow machines (compressors and turbines), and at last about dynamics, construction endurance and the new materials. For several years these disciplines have represented scientific penetration fields in both of the aspects - theoretical and experimental. The common accessibility of contemporary computational and measurement tools permits their further development.
As far as the issues relating to the engine's fuel feed systems are concerned the closest future of such engines will deal with exchanging the carburetor supply for direct fuel injection into cylinders with doses controlled by an electronic system (sometimes an opening the electromagnetic injectors), or for the low-pressure injection with a catalytic afterburner and the control system making use of a signal from oxygen sensor in exhaust (the "lambda" probe). However, it will be possible after introduction of the leadless aviation gasoline into operation (maybe the wider usage of "biofuels" containing ethanol), because neither the catalytic afterburners nor the "lambda" probes can not work properly (they “poison” themselves) in engines feed with gasoline containing the lead tetraethyl - and just such a petrol (the Avgas) is universally applied in aviation.
Independently from above mentioned issues, every one of the engine has got a reserve in the range of unification possibilities of the flow resistance in all the cylinders' inlet passages aiming the obtaining an equal filling-up and equal power - the engine smoothness. It is possible through the suitable selection (e.g. experimental) of inlet pipes' shape and dimensions [12]. The analogous proceeding with outlet passages channels will permit receiving the equal content of exhaust remainders in the engine's cylinders - which also influences on a degree and equability of the filling-up. Moreover, it has got also impact on the combustion process and the content of toxic components in exhaust. The positive results obtained in these ways could be very simple in case of radial engines and a little bit more difficult as for the in-line engines.
There has been also observed a significant, positive influence of the strong rotating load on the process of inflaming the mixture in engines' cylinders of the spark ignition - it is explained on figure 7 presenting the simplified case of one sparking plug (the ignition systems with two sparking plugs for every one of engine are applied in aviation) [6]. An extension of the discharge time on sparking plug's electrodes from several microseconds (at the inconnector initiation) to a few hundred microseconds at the usage of an electronic ignition system is in favour with the fuller utilization of the axial-symmetric whirl in the engine’s cylinder. A peripheral speed of the whirling load in relation to sparking plugs should be greater than the speed of moving the flame's forehead in a mixture.
A noise emission of the engine might be considerably limited by means of an application of dust extractors of inlet air, e.g. multicycloned (at the effectiveness level of 95%) which is sufficiently remote from the engine. This way is more and more often used in large trucks (TIR). The introduction of a catalytic afterburner not only limits a content of nonburnt hydrocarbons, but reduces the noisiness of expelled exhaust. The similar result is gained in SI engines (self ignition) of trucks in which the exhaust filters stopping the soot have been applied.
A noise could be limited in every engine by introducing an ejector in exhaust passages (compare fig. 8). The silencers with two exhaust pipes at the large diameter installed in "tuned” automobiles have only a slight impact on decreasing the dirt of load with exhaust remaining from the previous cycle (a coefficient of the exhaust's rest). Such pipes influence on the power enlargement in a small degree. Only the lowering a frequency of the emitted noise represents the most essential effect resulting from this engine's modification.
14

Fig.7. The load whirl in the engine’s cylinder:
1 – inlet channel; 2 – screw whirler; 3 – inlet valve; 4 – sparking plug; 5 – piston; 6 – whirl in the cylinder; P – inflaming area.
Rys.8. Ejector of the exhaust passages
(c1, c2, c3 – exhaust flow velocity and flow velocity of exhaust mixed with ejected air)
An application of the supercharged compressor represents the radical way of a power increase of the combustion piston engine. It is usually a radial compressor driven by the turbine (turbocompressor), in which the energy of escaping exhaust is utilized [10]. The application of a turbocompressor instead of the compressor driven by the engine's crankshaft improves the general efficiency and configuration of a whole propulsion system, because enables a location of the turbocompressor not necessarily in direct closeness of engine' heads. Nevertheless, these fluid-flow machines fine tuning is difficult, particularly for piston engines at the number of cylinders smaller than 5. It results from their gasdynamical originality. From one's nature the piston engine are characterized by the strong flow pulsations in inlet passages (receipt from the compressor) and exhaust passages (powering the turbine) and the compressor sa well as turbine are machines of the
15

Fig. 9. Courses of the fluid flow intensity in inlet passages of the piston engine:
a) 2-cylinder; b) 3-cylinder; c) 4-cylinder; d) 5-cylinder; e) 6-cylinder.
16

continuous flow. The courses of a temporary flow intensity of air in inlet passages of piston engines of different numbers of cylinders in dependence of position of crankshaft's angular position and resulting from here the flow pulsations in a inlet collector are shown in figure 9. These phenomena, i.e. the affected pulsations of stream and periodical flow throttling are in favour with appearing the compressor's unsteady work (the local stream tearing-off phenomenon on the blades' profiles). Additionally, they also cause also lowering the efficiency of filling-up process in cylinders. It is well-known that the smaller is the existing pressure in front of an inlet valve during its opening the smaller is a working medium density and mass of the fresh load (the filling-up efficiency gets smaller �v). Hence, there should be aimed to "tune-up” the pressure pulsations of air in the inlet channel of a multi-cylinder engine to the position of inlet valves of individual cylindrical sets in order to assure approaching the overpressure waves during maximal valve lift. It is worked out through grouping cylinder connection into common inlet channel as well as the suitable selection of its length. From the data presented in figure 9 result that only in the case of engines at the number cylinders equals 6 (and more) the good conditions of co-operation between the engine and turbocompressor can be expected. In order to evaluate the conditions of co-operation between the engine and compressor of the supercharging system (the most often radial) there should be associated the compressor's universal profile i.e. a dependence of the compression ratio �S on the fluid flow intensity of air sprm� , within
the background of contour lines of the constant efficiencies �eS� , with a profile of the network
cooperating with the compressor S. This profile represents a flow resistant curve, as a resultant of the engine capacity curve, flow channels along with a filter and radiator of the charging-up air and also the compressor's diffuser (compare fig. 10). A well-chosen compressor should be characterised with the steady work at all the possible engine's loads and the possibly highest efficiency.
How it results with cooperation line courses, drawn on figure 10, the fulfillment of such a condition is only possible when the inclination of the network profile is similar to the inclination of the compressor's profile. Moreover, the network profile has to run in an appropriate distance from the border of instable work (the surging line). The higher is a flow resistance the more ornate becomes the network profile favouring with the getting the maximum compressor efficiencies. Nevertheless, because of worked out transient processes and diverse accumulation features of the turbocompressor’s rotor mechanical and thermal-flow system, the margin of the compressor steady work should not be exceeded by more than 10% of the minimum value.
In case of the force growth of load (the quick acceleration) the four-stroke engine is especially threatened with the phenomenon of unsteady compressor's and in case of sudden changing the load on the small one (the deceleration) - the two-stroke engine. It results from a nature of the flow resistances courses for the network with the four-stroke and two-stroke engine - the dashed lines 1' and 2" on figure 10.
Furthermore, the exhaust pressure wave, which the amplitude depends on a pressure in the cylinder and a speed of opening the outlet valve or a speed of exposing the escape slot, is generated during unlocking the outlet valve or the slot of the engine cylinder. In the supercharged engines the exhaust escape channel is closed with the turbine guide of precise determined active section of flow, guaranteeing a possibility of an obtainment of the maximum pressure fall and delivery of a turbine. The maximum efficiency and performance of the turbine are limited with the occurrence of the sound velocity in the guide or in the rotor (so called "clogging the nozzle”). It finds one's reflection in a convergence of the izodrom bunch on the turbine flow profile. Additionally, because of the lock of exhaust escape channel with the turbine guide, either the inreflexive flow is gained (very seldom) or a reflection in the pressure impulse in a form of the return wave improving the cylinder scavenging and consequently enlarging the engine power in a well-chosen range of the crankshaft rotational speed.
17

Fig. 10. A cooperation profile of the compressor and the engine flow network:
1 – network profile of the four-stroke engine in steady states;
1’ – network profile of the four-stroke engine in a process of the forced load increasing;
2 – network profile of the two-stroke engine in steady states;
2” – network profile of the two-stroke engine in a process of sudden load drop; ��
minmax , eSeS �� - lines of the same values of the compressor efficiency;
maxmin , SS nn - lines of the compression ratio profiles at constant values of the turbocompressor rotor rotational speed (izodroms).
The pulsating course of a flow intensity in the exhaust escape channel as well as the fact, that
a capacity of the turbine guide vanes is chosen by the constructor to averaging flow intensity affect (similarly to the compressor) the lowering the turbine efficiency and the extortion of vibration of the exhaust stream which are shifted in relation to air stream vibration in the compressor, in the whole range of the engine work, by the value resulting from timing angles. In this place, the conditions of the engine's cooperation with a turbine of the turbocompressor could be also significantly improve by the grouping connection of the engine's cylinders to separate exhaust channels circuitaly feeding the turbine. It gives the additional advantage in a form of the considerable lowering of the turbine ventilating losses. The cylinder grouping should exclude a possibility of joining these cylinders in which occurs the mutual, significant agreeing the phases of the exhaust outlet, and by then, the interference of the pressure waves in the channel. There should be also excluded a possibility of the return exhaust pumping. Such a possibility significantly grows up during increasing a counter-pressure in the channel. Therefore, the correct designing the dimensions and the form of exhaust escape as well as the flow section of the turbine guide vanes gather a key meaning (fig. 11).
18

Fig. 11. Changeability course of exhaust pressure in a control intersection of the channel powering a turbocompressor in 6-cylinder engine Sulzer 6AL20/24 type, as a function of the angle the crankshaft rotation: 1,2,3 - the cylinder numbers(the courses for 3 cylinders are shown in the
figure); the continuous, red line - the course of exhaust pressure changeability in the channel at a full flow patency; blue line - the course of exhaust pressure changeability in the channel at 50%
decrease in a flow active section's field. It known from the analysis of exhaust flow conditions through the turbine working in a constant-pressure supercharging system, that the flow intensity and the turbine power diminishes together with decreasing a section field of the turbine nozzle. However, within pulsating systems (Büchi) the smaller is this field the higher is an amplitude of exhaust pressure waves. On the basis of the curves course presented in figure 11 there could be observed a considerable enlargement of the maximum values of the amplitudes of pressure waves while reducing the active flow section of the channel in front of turbine. At the same time, their angular positions in reference to opening moment of the outlet valves of individual cylinders stay almost unchanged. The energy enlargement of exhaust escape impulses leads to the growth of the turbine power, rotational speed turbocompressor rotor as well as supercharging pressure. However, from the other hand, the growth of the exhaust average pressure in front of turbine worsens the conditions of cylinders scavenging - a counter-pressure reacting on pistons grows, which extorts the growth of energy losses on removing exhaust from cylinders. It seems, that the theory of a cooperation of a piston engine with turbocompressor (and also with a compressor driven by the engine crankshaft and with a turbine giving back a power on the crankshaft) still expects finishing-up a scientific polishing and experimental verification. There is already known, using an engineer intuition, supported with experimental investigations of fluid-flow systems of unsupercharged automotive engines and there could be foreseen, that the optimum turbocompressor location should be sought through the appropriate selection of volumes of inlet and outlet collectors, taking into account the number of engine's cylinders.
5. Conclusion
An observation of rapidly and effectively realized modernizing the mass produced combustion engines for automobiles, trucks, working machines and military heavy caterpillar vehicles as well as an observation of a "development” state of aviation piston engines leads to conclusion that generally speaking there is still very much to do in aviation. It does not seem
19

possible direct transfer of the existing, already verified solutions from traction engines to aviation. It results from the aviation specific which permits implementation of such devices (only), which assure the reliability of working and flight safety in all working ranges and environmental conditions.
In aircrafts there should be taking into account quickly existed changes of the air pressure and temperature in surroundings (particularly during the take-off - with the growth of a flight altitude or during the altitude lowering - approach to landing) in distinction to the ground transport and marine propulsions. Within the altitude scope of usage of piston engines driven airplanes and helicopters a density of air changes within the range from about 1,2 kg/m3 - on the ground, to about 0,6 kg/m3 - on the ceiling and a temperature alteration (in the same flight) can reach even 70 degrees. It is worth pointing out that these changes can arise within several minutes only.
We can not require from the pilot burdened a duty of safe leading the airplane, navigation etc. to optimize a cooperation of the engine and airscrew, interfering in regulators' settings and choosing the suitable range of the engine. Such activities should be taken over by the already available automatics (successively implemented for turbine engines and applied on ships powered by control pitch propellers) which makes use of optimization algorithms of the propulsion system working ranges and diagnostic algorithms worked out by the experienced expert of aviation engines. Contemporary electronic systems enable the safe usage the propulsion system thanks to the sufficient reliability during flight (enlarged by the possibility of "doubling” connections and control components - construction redundancy) at the retaining the smaller mass and overal dimensions than the classic hydromechanical systems have. This "electronization” of control systems of the piston propulsion systems should be applied in newly arising constructions as well as in "classic” carburetor constructions in frames of modification (carried out e.g. at the opportunity of periodical repairs).
The problem of the appropriate selection of volumes of inlet and outlet channels in dependence on the cylinder number and displacement stays still underestimated. There can not be also omitted the fact that the modern control systems enable conducting a current registration of the propulsion system's working parameters and its diagnosing, which enlarges safety and reduces the overall operation costs.
Bibliography:� 1. Balicki W., Szczeci�ski S. Systemy sterowania lotniczym zespo�em nap�dowym silnik t�okowy -
�mig�o. Tendencje rozwojowe. Prace Instytutu Lotnictwa, nr 158 /1999 r. 2. Bodner W.A. Automatyka silników lotniczych. Wyd. MON. Warszawa 1958r. 3. Bohne C.: Der Flügmotor Wyd. Berlin 1943r. 4. Bukowski J., ucjanek W.: Nap�d �mig�owy. Teoria i konstrukcja.
Wyd. MON. Warszawa 1986r. 5. Dzieranowski P. i in.: Silniki t�okowe (seria „Nap�dy lotnicze”)
Wyd. Komunikacji i �czn. Warszawa 1981r. 6. Gryglewski W: Wp�yw zawirowania �adunku na proces spalania w silniku t�okowym o zap�onie
iskrowym Rozprawa doktorska, Politechnika ódzka 1995r. 7. Janu�a J. i in.: Poprawa ekonomiczno�ci i dynamiki samochodów osobowych
Wyd. Komunikacji i �czno�ci, Warszawa 1989r. 8. Kasedorf J. Zasilanie wtryskowe benzyn�. Wyd. Komunikacji i �czn. Warszawa 1989r. 9. Kordzi�ski Cz., �rodulski T.: Uk�ady dolotowe silników spalinowych.
Wyd. Komunikacji i �czn. Warszawa 1968r. 10. Mys�owski J.: Do�adowanie silników. Wyd. Kom. i �czno�ci, Warszawa 2006r. 11. Oderfeld J.: Silniki lotnicze-rozrz�d. Wyd. PZL Warszawa 1938r.
20

12. Orkisz M.: Wymiana �adunku w czterosuwowych silnikach t�okowych. Wyd. Komunikacji i �czn. Warszawa 1991r.
13. Pi�tak A. : Ocena wp�ywu parametrów przep�ywowych na sprawno�� i moc silnika samochodowego. Rozprawa doktorska, Wojskowa Akademia Techniczna 1984r.
14. Strzeszewski W.: Silniki lotnicze - spr�arki i ich nap�d. Wyd. PZL Warszawa 1938r. 15. Szczeci�ski S.: Lotnicze silniki t�okowe. Wyd. MON. Warszawa 1969r. 16. Wendeker M.: Adaptacyjna regulacja wtrysku benzyny w silniku o zap�onie iskrowym.
Wyd. Uczeln. Politechn. Lubelskiej. Lublin 1998 r. 17. Wola�ski P. i in.: Problemy spalania w silnikach spalinowych. Ekspertyza.
Wyd. PAN Wydz. IV Nauk Techn. Warszawa 2000 r. 18. Instrukcja uytkowania silników lotniczych firmy TEXTRON LYCOMING serii 0-320,
IO-320, AO-320, LIO-320. Wydanie marzec 1973 r. 19. RSA-5 and RSA-10 Fuel Injection Systems Operation and Service Manual. Bendix Energy
Controls Division, January 1985 r. 20. Three German Engine Fuel Systems. Wyd. „Aircraft Engineering”, September 1943 r.
21

22

ANALYSIS OF POSSIBILITY AND PURPOSEFULNESS OF APPLICATION OF WASTE-HEAT BOILERS TO TRAILING SUCTION HOPPER DREDGERS
Damian Boche�ski
Gda�sk University of Technology
Ul. Narutowicza 11/12, 80-952 Gda�sk, Poland Tel.: +48 58 3472773, fax: +48 58 3472430
e-mail: [email protected]
Abstract
This paper presents an analysis of possibility and purposefulness of application of waste-heat boilers to trailing suction hopper dredgers. Using results of own operational research on dredgers this author determined thermal power demand for six hypothetical trailing suction hopper dredgers of various size, at accounting for a type of power system and kind of fuel combusted by dredger’s power plant. By means of basic indices of economical analysis it was determined under which conditions the application of waste-heat boilers to suction hopper dredgers is economically justified. Key words: Trailing suction hopper dredgers, ship power plants, waste-heat boilers 1. Introduction
Waste-heat boilers (exhaust boilers) are commonly used on transport ships. Practically, they can be found on all types of transport ships of both small and large size. It results from general use of heavy oil and a greater thermal power demand connected with it. On most types of transport ships is used a system of auxiliary boilers consisted of a waste-heat boiler covering thermal power demand during ship voyage and an oil combusting boiler which operates during manoeuvres, port stopovers and anchoring. On ships of a large thermal power demand (e.g. tankers) the oil combusting boiler operates also during voyage supporting this way the waste-heat unit.
However there are types of ships on which the application of waste-heat boilers is not so common as compared with transport ships. It obviously results from not so common use of heavy oil as well as from their operational characteristics. Among them, dredgers can be numbered for instance. The most characteristic type of dredgers is suction hopper one. Not yet long ago the waste-heat boilers have been rarely applied to such dredgers, only to large ones. In present, the trend has been changing for a dozen or so years. The waste-heat boilers are used on smaller and smaller dredgers. This paper is an attempt to show in which situation the application of waste-heat boilers to such dredgers would be economically justified.
2. Characteristics of trailing suction hopper dredgers and their power systems
The suction hopper dredgers are characterized by hydraulical loosening the soil which is transferred to soil hopper by using special pumps, dredge ones capable of forcing through a
23

soil-water mixture. The suction hopper dredgers are as a rule fitted with their own propulsion systems which ensure moving the dredger during operation. The demanded high maneuverability is usually provided by a two-propeller propulsion system and bow thrusters as well. The propulsion system makes transporting the spoil to a given dump place, possible. Emptying the hopper is realized by the so - called silting up (pumping the spoil through a pipeline to land) or gravitationally (by opening hopper bottom flaps or valves).
Such dredgers are built in a wide size range. The basic parameter which characterizes dredger’s size is soil hopper capacity contained within the range of 300÷33 000 m3. The total power of installed diesel engines reaches 1000÷38000 kW.
The power systems of suction hopper dredgers can be very different. Their basic type is a system in which two (usually) main engines provide propulsion to the dredger and drive to all mechanical and electrical power consumers. The electric generating sets (usually two in number) operate sporadically and cover electric power demand practically only during main engine standstill. The type of power system has several variants differing to each other by a way of driving the main mechanical power consumers [4].
There are also power systems characterized by a much greater number of diesel engines. The most extreme example can be systems in which every main mechanical power consumer is driven by a separate diesel engine and the electric power demand from the side of auxiliary consumers is covered by electric generating sets only. In this case the number of diesel engines reaches even ten. As showed below, the application of waste-heat boilers is affected by a type of power system installed on suction hopper dredgers. 3. Determination of thermal power demand
In order to calculate thermal power demand which takes place on suction hopper dredgers the use was made of the results of the author’s operational investigations on dredgers [2,7,8] as well as a design method based on them [9].
The method for determining the distribution parameters of the operational loading of auxiliary thermal power consumers deals with determining the total thermal power of each of the three thermal power groups , values of nominal power usage coefficients of
thermal power consumers in each of the three groups of consumers , and then the distribution parameters of thermal power demand from the side of all consumers. The above mentioned groups of thermal power consumers are the following:
jnomCEN )(
�rjCE )(ε
� auxiliary power plant devices ( e.g. heaters of fuel oil, lubricating oil and water, heating coils of fuel oil return tanks );
� shipboard devices (e.g. heaters of air conditioning units, accommodation heating ) ;
� heating units of hull tanks (e.g. coils in heavy oil storage, settling and daily tanks).
The total nominal power of j-th group of thermal power consumers, , was determined under assumption on their linear dependence on a given design parameter ( or function of parameters ), , of dredgers , which characterizes a given group of consumers or is logically associated with it :
jnomCEN )(
jA
(1) jjjjnomCE AbaN ⋅+=)(
where: - constans jj ba ,
24

In Tab.1 the correlation formulae (1) for three groups of thermal power consumers on trailing suction hopper dredgers, are presented.
The operational nominal power usage coefficients for particular groups of thermal power consumers, jCE )(ε , were determined as ratio of the operational demand on thermal power from
the side of j-th group of consumers in a considered operational state, , and the
nominal power of j-th group of consumers, : j
eksplCEN )(
jnomCEN )(
j
nomCE
jeksplCE
jCE NN
)()(
)( =ε (2)
In Tab. 2 are presented the averaged (mean) values of the coefficients and their
standard deviations , determined on the basis of thermal balances of eight dredgers. The values were determined for winter conditions.
avjCE )(ε
)( jCEσ
Tab. 1 The linear regression equations which determine the total power of groups of particular thermal power consumers
Thermal power consumers groups
Relations Statistical evaluation
][kWσ R F krF m
Auxiliary power plant equipment 81,670763,0)( 1 +⋅= DE
nomCE NN 188,5 0,814 11,78 5,99 8
Shipboard devices 55,106647,17)( 2 +⋅= ZN nomCE 188,9 0,754 7,91 5,99 8
Heating units of hull tanks 58,7549,0)( 3 +⋅= STnomCE VN 102,7 0,918 32,29 5,99 8
where: DEN - total installed diesel engine power, kW
STV - storage tank volume, m3
Z - crew, persons
Tab. 2 The averaged (mean) values of the coefficients and their standard deviations av
jCE )(ε jCE )(σ
Thermal power consumers groups avjCE )(ε jCE )(σ
Auxiliary power plant equipment 0,42 0,11 Shipboard devices 0,53 0,12
Heating units of hull tanks 0,57 0,19
The distribution parameters of thermal power demand during realization of dredging work are determined by the relations:
25

��
�
��
�
�
⋅=
⋅=
�
�
=
=
n
jj
nomCEjCECE
n
j
avjCEj
nomCE
avCE
N
NN
1
22
1
)()(
)()(
σσ
ε
(3)
For calculations of thermal power demand six hypothetical dredgers of various size, whose parameters are given in Tab. 3, were selected. The parameters were determined by using technical parameters of dredgers, contained in the data base DRAGA [3].
Tab. 3 Selected technical parameters of six analyzed suction hopper dredgers
Size of dredger HPV STV MEN AEN Z
3m 3m kW kW . os
Dredger 1500 1500 350 23001) 18002) 2401) 20002) 12
Dredger 2500 2500 440 37001) 24002) 7001) 32002) 14
Dredger 4000 4000 600 55001) 30002) 7501) 38002) 18
Dredger 6500 6500 750 90001) 50002) 14001) 66002) 20
Dredger 9000 9000 850 110001) 90002) 18001) 76002) 24
Dredger 12000 12000 950 120001) 100002) 23001) 100002) 32
where: HPV - hopper volume, m3
MEN - total main engine power, kW
AEN - total auxiliary engine power, kW
1) – the solution of the power system in which main engines cover whole power demand from the side of main and auxiliary consumers , but auxiliary engines cover the demand only during standstill of main engines;
2) – the solution of the power system in which main engines cover power demand from the side of main screw propellers, but the remaining demand is covered by various auxiliary engines.
The calculated thermal power demand for six hypothetical dredgers (in winter conditions) is presented in Tab. 4 and Fig. 1. For the analysis the two above described extremely different types of power system as well as two kinds of fuel: MDF DMC light oil, and HFO180 heavy oil, were selected. In Fig. 1 the mean demand values and their standard deviations are presented (distinguished by whiskers).
While comparing the data given in Tab.4 and Fig.1, can be observed a very great difference in thermal power demand depending on a kind of used fuel oil. When heavy oil is used the thermal power demand is threefold higher on average. While comparing the suction hopper dredgers with other ships of a similar power plant output the smaller thermal power demand can be observed (at the same kind of fuel oil).This is probably caused by a smaller capacity of spare fuel tanks. The capacity results from an assumed ship operation autonomy. The transport ships are characterized by the autonomy of about 60÷90 days, deep-sea fishing trawlers –of even 100÷110 days, whereas the suction hopper dredgers - of about 20÷30 days only.
26

In the case of the application of light oil, thermal power demand is so low that the use of steam boilers or oil heaters is often unjustified. Then the solutions are applied in which the entire thermal power demand covered by means of electric devices or electric heaters is supported by water boilers (one combustion boiler as a rule ) which serve for accommodation heating.
The use of heavy oil requires to choose another heating medium (water vapour or heating oil) as well as to think a system of auxiliary boilers (number and type of boilers) over.
When analyzing calculation results of thermal power demand on suction hopper dredgers it is necessary to observe the following facts : 10 - the calculations were conducted for winter conditions , 20 – the values of the coefficients jCE )(ε determined on the basis of available thermal balances are probably a little too high. Like in the case of electrical power balances a correction factor (called in various ways, e.g. general coincidence factor) should be introduced. For electrical power balances its values are usually assumed to be within the range of 0,7 ÷ 0,8 , [5,6].
Tab. 4 Calculation results of distribution parameters of thermal power demand on six analyzed
trailing suction hopper dredgers
Size of dredger Heavy fuel Diesel oil
Type power system-1 Type power system-2 Type power system-1 and 2�rCEN CEσ �r
CEN CEσ �rCEN CEσ
Dredger 1500 419,3 67,0 459,7 72,1 168,7 38,2
Dredger 2500 522,7 82,6 561,1 88,4 187,4 42,4
Dredger 4000 664,1 105,4 681,6 108,1 224,8 50,9
Dredger 6500 857,4 138,1 895,8 145,2 243,6 55,1
Dredger 9000 999,6 161,1 1121,2 185,1 280,9 63,6
Dredger 12000 1150,4 182,4 1332,8 218,4 355,8 80,6
0
200
400
600
800
1000
1200
1400
1600
1800
0 2000 4000 6000 8000 10000 12000 14000
Size of dredger
HFO, type power system - 1 MDF, type power system - 1 and 2HFO, type power system - 2
Fig.1. Thermal power demand taking place on six analyzed suction hopper dredgers
27

4. Possibility of thermal power production by waste-heat boilers during dredging
The thermal power of waste-heat boiler, , is determined by the relation: EBN
EBssssEB ttcmN η⋅−⋅⋅= )( 21 (4)
where: sm - mass flow of exhaust gases from the engine,
sc - specific heat of exhaust gas,
EBη - waste-heat boiler efficiency,
21, ss tt - exhaust gas temperature (at the inlet and outlet of the exhaust boiler).
A random character of main engine loading makes that the real effectiveness characteristics of waste-heat boilers interacting with the engines, are of similar character. In calculating a thermal power amount which can be produced by waste-heat boiler the method given in [1] may be useful. In this case to know the characteristics of waste-heat boiler in function of main engine loading, )( MEEB NfQ = , is necessary. The characteristics can be determined by means of Eq. (4) at simultaneous knowledge of the relation between operational parameters of the engine and its loading. In general case the characteristics can be approximated by the relation as follows:
2210 MEMEEB NaNaaQ ⋅+⋅+= (5)
where:
210 ,, aaa - constans,
If the main engine loading distribution is described by the density function )( SGNf then the mean (average) thermal power of waste-heat boiler can be determined by using the following relation:
22210 )([ ME
avME
avME
nomEB
avEB NaNaaNN σ++⋅+= (6)
and standard deviation:
avEBav
ME
SGEB N
N⋅= σσ (7)
In Tab.5 are presented the calculation results dealing with the thermal power distribution parameters of the waste-heat boilers on six analyzed dredgers under dredging work. Operation of suction hopper dredger is characterized by a working cycle consisted of: loading the spoil, transporting it, discharging it , and sailing back free of the load. The operations greatly differ to each other as far as the operational loading of main engines is concerned. The operations are appropriately distinguished in Tab. 5.
For the calculations, Wartsila medium-speed engines (and the mean values of the constants: as well), were selected. The distribution parameters of the operational engine loading during conducting the operations included in the scope of dredging work, were determined on the basis of the author’s operational investigations [2,7,8].
0,77,0,23,0 210 === aaa
For all the kinds and size of the dredgers fitted with the 1st type power system the predicted values of mean thermal power of waste-heat boilers are greater than the thermal
28

power demand calculated for them (Tab.4). In the case of the 2nd type power system the mean thermal power values of waste-heat boilers exceed the thermal power demand only during sailing. The application of waste-heat boilers to suction hopper dredgers is justified only when the boilers are capable of covering thermal power demand for the entire duration time of the state of dredging. The conclusion drawn from the analysis of the data given in Tab. 4 and 5 is unambiguous:
- in the case of the dredgers fitted with the 2nd type power system, application of waste-heat boilers is not justified because during loading and discharging operations amount of thermal power produced by them is too small. This results from a low value of main engines loading which occurs during loading and discharging the soil.
Tab. 5 The thermal power distribution parameters of the waste-heat boilers installed on six analyzed trailing suction hopper dredgers
Size of dredger Type of
power system
Sailing Loading the spoil
Discharging the spoil
avMEN MEσ av
MEN MEσ avMEN MEσ
kW kW kW kW kW kW
Dredger 1500 1 457,3 114,3 555,4 83,4 450,1 81,1
2 405,9 81,2 228,0 27,4 207,7 29,1
Dredger 2500 1 785,5 196,3 947,2 142,1 752,3 135,6
2 561,6 112,3 310,8 37,3 283,7 39,7
Dredger 4000 1 1291,5 284,2 1453,2 188,7 1176,3 188,5
2 735,8 147,2 405,5 48,7 363,1 50,8
Dredger 6500 1 2202,9 444,5 2405,1 288,6 1960,1 274,4
2 1280,2 256,0 710,4 85,3 610,7 85,5
Dredger 9000 1 2940,1 588,2 3100,4 372,6 2548,3 356,8
2 2410,6 482,1 1267,1 152,1 1088,1 152,5
Dredger 12000 1 3148,6 629,7 3323,7 398,8 2798,2 391,7
2 2845,4 569,1 1420,7 170,5 1221,3 171,0
5. Economical assessment
For economical analyses, economical effectiveness indices are commonly used to measure quality of analyzed variants of a given design solution. The following indices are usually applied: the Average Annual Costs AAC, the Net Present Value NPV and the Recoupment Period Time RPT. In this paper only the RPT index was used. It is defined as follows [10]:
���
�
���
�
=ΔΔ
≠ΔΔ⋅−+
=
1
1log
)11log(
,
,
qdlaKC
qdlaq
KC
RPT
OP
UE
OP
UE
(8)
29

rsq
++=
11
(9) where:
UECΔ - difference between price of a considered boiler system variant and that of the cheapest variant assumed basic, [ € ];
PKΔ - difference between yearly fuel cost for the power system variant assumed basic and that for a considered power system variant, [ €/year] ;
r - yearly rate of discount, [%/100]; s - rate of inflation (yearly increase of fuel and lubricating oil price),[ %/100].
In Tab.6 are collected differences in investment cost between the solutions composed of two-waste-heat boilers and one combustion boiler and the solution of only one combustion boiler. In Tab. 7 are presented differences in operational cost, limited to those in combusted fuel cost, as well as the calculated index RPT. Three fractions of dredging operation time related to calendar year time were assumed: 30%, 50% and 60%. To simplify, the values
were assumed. %5== srTab. 6
Differences in investment cost of two considered variants of waste-heat boiler systems on suction hopper dredgers
Size of dredger UECΔ euro
Dredger 1500 160.000
Dredger 2500 180.000
Dredger 4000 220.000
Dredger 6500 250.000
Dredger 9000 280.000
Dredger 12000 300.000
The fraction of duration time of the dredging mode in one calendar year can be very different. For the dredgers of Polish and foreign owners, on which comprehensive operational investigations were carried out in the years 2000÷2006 the dredging duration time values related to calendar year time are contained within the interval of 0,16 ÷ 0,68, with the mean value equal to 0,4 (the data were determined on the basis of records in ship’s log-books) And, the smaller values concerned smaller dredgers and the greater ones – larger dredgers.
In economical analyses of design solutions of ships the RPT index value equal to 2 ÷ 3 year is usually deemed satisfactory [10,11].
Taking into account the above given information and analyzing the data contained in Tab. 7 one can conclude that the application of waste-heat boilers to suction hopper dredgers may be economically justified for the dredgers having hopper capacity of about 6500 m3 and larger. In certain cases the application of waste-heat boilers may be considered also to smaller dredgers.
30
Tab. 7 Differences in operational cost of two considered variants of waste-heat boiler systems, as well as calculated values of the RPT index for six analyzed suction hopper dredgers
Size of dredger
The fraction of duration time of the dredging mode in one calendar year
30% 50% 60%
PKΔ RPT PKΔ RPT PKΔ RPT
euro/rok lata euro/rok lata euro/rok lata
Dredger 1500 21.800 7,3 36.300 4,4 43.600 3,7
Dredger 2500 27.500 6,5 45.800 3,9 55.000 3,3
Dredger 4000 34.700 6,3 57.900 3,8 69.500 3,1
Dredger 6500 44.600 5,6 74.400 3,4 89.300 2,8
Dredger 9000 52.000 5,4 86.500 3,2 104.000 2,7
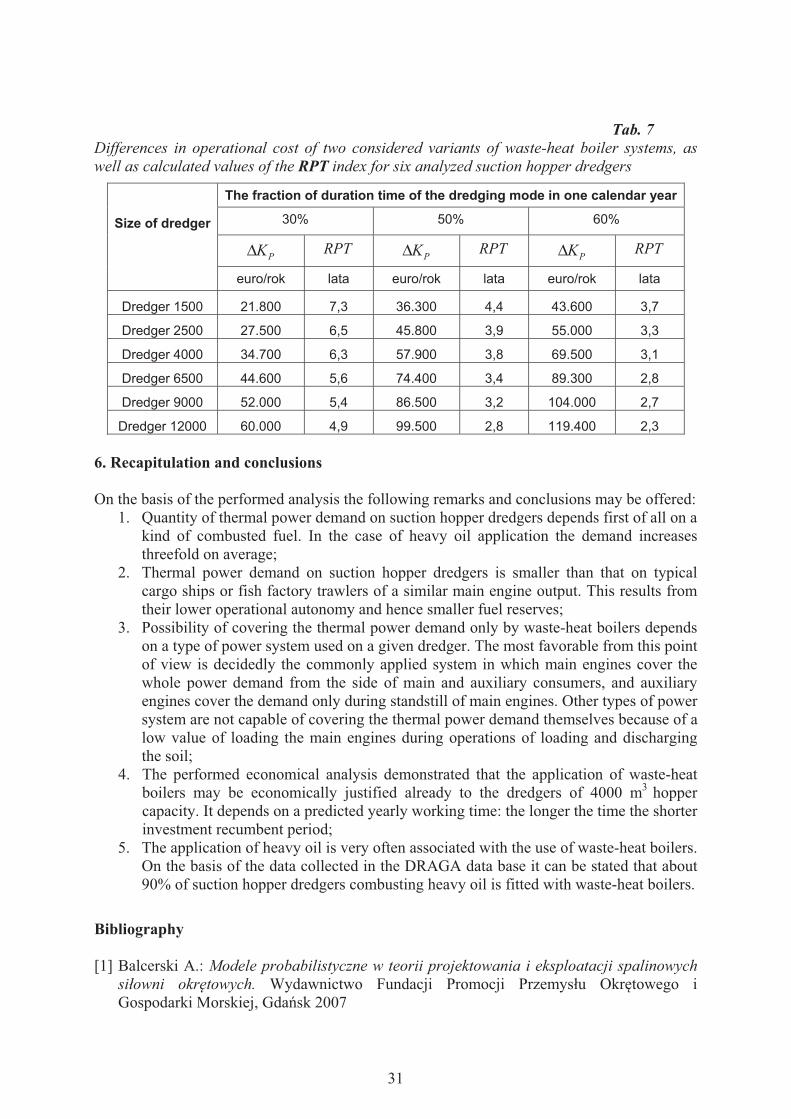
Dredger 12000 60.000 4,9 99.500 2,8 119.400 2,3 6. Recapitulation and conclusions On the basis of the performed analysis the following remarks and conclusions may be offered:
1. Quantity of thermal power demand on suction hopper dredgers depends first of all on a kind of combusted fuel. In the case of heavy oil application the demand increases threefold on average;
2. Thermal power demand on suction hopper dredgers is smaller than that on typical cargo ships or fish factory trawlers of a similar main engine output. This results from their lower operational autonomy and hence smaller fuel reserves;
3. Possibility of covering the thermal power demand only by waste-heat boilers depends on a type of power system used on a given dredger. The most favorable from this point of view is decidedly the commonly applied system in which main engines cover the whole power demand from the side of main and auxiliary consumers, and auxiliary engines cover the demand only during standstill of main engines. Other types of power system are not capable of covering the thermal power demand themselves because of a low value of loading the main engines during operations of loading and discharging the soil;
4. The performed economical analysis demonstrated that the application of waste-heat boilers may be economically justified already to the dredgers of 4000 m3 hopper capacity. It depends on a predicted yearly working time: the longer the time the shorter investment recumbent period;
5. The application of heavy oil is very often associated with the use of waste-heat boilers. On the basis of the data collected in the DRAGA data base it can be stated that about 90% of suction hopper dredgers combusting heavy oil is fitted with waste-heat boilers.
Bibliography [1] Balcerski A.: Modele probabilistyczne w teorii projektowania i eksploatacji spalinowych
si�owni okr�towych. Wydawnictwo Fundacji Promocji Przemys�u Okr�towego i Gospodarki Morskiej, Gda�sk 2007
31

[2] Boche�ski D. (kierownik projektu) i in.: Badania identyfikacyjne energoch�onno�ci i parametrów urabiania oraz transportu urobku na wybranych pog��biarek i refulerów. Raport ko�cowy projektu badawczego KBN nr 9T12C01718. Prace badawcze WOiO PG nr 8/2002/PB, Gda�sk 2002.
[3] Boche�ski D.: Baza danych DRAGA i mo�liwo�ci jej wykorzystania w projektowaniu uk�adów energetycznych pog��biarek. W:[Mat] XXIII Sympozjum Si�owni Okr�towych SymSO 2002. Akademia Morska, Gdynia 2002
[4] Boche�ski D.: Analiza rozwi�za� konstrukcyjnych i zale�no�ci okre�laj�cych parametry uk�adów energetycznych pog��biarek ss�cych nasi�biernych. Zeszyty Naukowe Akademii Morskiej w Szczecinie, nr 73. XXIV Sympozjum Si�owni Okr�towych SymSO2003, Szczecin 2003
[5] Boche�ski D.: Demand determination for electrical energy for trailing suction hopper dredgers. W:[Mat] IV International Scientific-Technical Conference EXPLO DIESEL & GAS TURBINE ’05, Gda�sk-Mi�dzyzdroje-Kopenhaga 2005
[6] Boche�ski D.: Okre�lanie zapotrzebowania energii przez odbiorniki pomocnicze na pog��biarkach wieloczerpakowych. W: [Mat] XXVIII Sympozjum Si�owni Okr�towych 2007. Akademia Morska, Gdynia 2007
[7] Boche�ski D.: Operational loads of diesel engines on trailing suction hopper dredgers in their main service states. Journal of Polish CIMAC, Energetic Aspects vol. 3, nr 1, Gda�sk 2008
[8] Boche�ski D.: Okre�lanie parametrów rozk�adów eksploatacyjnych obci��e� nap�du w�asnego pog��biarek ss�cych nasi�biernych podczas robót pog��biarskich. Zeszyty Naukowe Akademii Marynarki Wojennej w Gdyni nr 178/A, XXX Sympozjum Si�owni Okr�towych SymSO 2009, Gdynia 2009
[9] Boche�ski D.: Metoda okre�lania zapotrzebowania energii cieplnej na pog��biarkach z nap�dem w�asnym. W: [Mat] XXXI Sympozjum Si�owni Okr�towych 2010. Politechnika Gda�ska, Gda�sk 2010
[10] Jamro� J., Swolkie� T., Wieszczeczy�ski T.: Projektowanie si�owni okr�towych. Wydawnictwo Politechniki Gda�skiej, Gda�sk 1992
[11] Kubiak A.: Zastosowanie pr�dnic wa�owych na statkach towarowych w �wietle aktualnych uwarunkowa�. W[Mat] XII Sympozjum Si�owni Okr�towych, WSM Szczecin 1992
32

ESTIMATION METHOD OF SHIP MAIN PROPULSION POWER, ONBOARD POWER STATION ELECTRIC POWER AND BOILERS
CAPACITY BY MEANS OF STATISTICS
Mariusz Giernalczyk, Zygmunt Górski, Bart�omiej Kowalczyk
Marine Power Plants Department Gdynia Maritime University, 83 Morska Street, 81-225 Gdynia, Poland
Tel.:+48 58 6901307, e-mail: [email protected]
Abstract
This paper describes an estimation method of ship propulsion power, onboard power station electric power and
boilers capacity for the number of ship types by means of statistics. A wide population of being in operation and new built container ships, ferries, ro-ro vessels, passenger cruisers, tankers, LNG carriers and bulk carriers was taken into consideration on the base of similar ships list. The list of similar ships was prepared mainly on data given in works of THE ROYAL INSTITUTION OF NAVAL ARCHITECTS published in famous year’s issue the SIGNIFICANT SHIPS OF YEAR. As a result of analysis formulas for calculations of ship propulsion power, onboard power station electric power and boilers capacity for considered types of ships were obtained. Formulas elaborated by means of described method are characterised by good representation of described values as they have high coefficients of correlation and regression determination. Keywords: ship main propulsion power, onboard power station electric power, ship boilers capacity
1. Introduction
There are number of methods making possible the estimation of propulsion energy, electric power and heating energy for seagoing ship. For example the main propulsion power may be determined by means of Papmiel, Guldhammer-Harvald, Hansen, Holtrop or Series 60 methods. These methods are based on arduous calculations and on determination of big number of coefficients which should be farther corrected and finally results of calculations are not satisfied in accuracy. Thus a necessity to elaborate such a method or ready made formulas which can make possible to determine energy needed for new designed ship in simple and quick manner.
The paper introduces ready made formulas making possible estimation of ship main propulsion
power, onboard power station electric power and steam boilers capacity for different types of seagoing ships by means of statistic methods.
To apply statistic methods a “reference list of similar ships” was elaborated. The reference list
includes basic technical particulars of ships built in recent years and being under construction. Technical particulars logically and functionally connected with main propulsion energy, electric power and boilers capacity were analysed.
33

Ships placed in reference list come mainly from The Royal Institution of Naval Architects publications, where the most outstanding representatives of marine industry and management present their works in year’s issue SIGNIFICANT SHIPS OF YEAR. It guarantees rational and objective selection of reference list ships and ensures that this list includes representative selection of ships.
2. Determination of ship main propulsion power
A following was considered as a main propulsion power Nw:
Nw = Ne - Npw [kW], (1)
where: Ne [kW] – main engine shaft power, Npw [kW] – shaft generator power.
To analyse ship main propulsion power of the ship Nw The Admiralty Formula was used where
the propulsion power depends on ship deadweight or displacement D, ship speed v and Admiralty Coefficient cx regarding a hull geometric similarity:
xcvD
wN 332
�� . (2) Using formula (2) the coefficient cx was calculated for each ship from reference list. Next it was used for calculation of main propulsion power Nwi for a number of ship speed v=v1� vn for each ship from reference list. Calculations were executed for a number of ships from reference list. For each given ship speed a cumulative diagram of dependency Nw=f(D) for all population was elaborated. The linear dependency between main propulsion power in given ship speed Nwv and ship deadweight or displacement was affirmed: Nwv = ao + a1 D . (3) Calculations of aoi and a1i coefficients for each chosen ship speed were based on linear regression by means of least squares method. Coefficients aoi and a1i in formula (3) depend on ship speed: ao = f(v), a1 = f (v), (4)
To determine ao and a1 coefficients value in dependence on ship speed the approximation by power function was used: y = b x d , (5)
In this case the following was assumed:
ao = bo v do and a1 = b1 v d1.
Coefficients bi and di were calculated by means of least square method an it was assumed that formula (5) is third power function of ship speed: ao = f (v) = bo
. v3, a1 = f (v) = b1
. v3. (6)
34

The dependency (5) was applied to formula (3) and as a result a final formula for ship main propulsion power was obtained: Nw = (ao + a1
.D) v 3 [kW], (7) where: D [tons] – ship deadweight or displacement, v [knots] – ship speed, ao , a1 – coefficients depending on ship type. Example of calculation of tankers main propulsion power [4]
A number i=63 ships was analyzed. Using formula (1) coefficient cx was calculated for each ship from reference list and next it was used for calculation of each tanker main propulsion power Nwi for seven chosen speeds v: 12, 13,14, 15,16, 17 i 18 knots. For each speed the cumulative diagram of dependency Nw=f(D) for whole population was elaborated. An example of linear regression for v=15 knots is shown on figure 1.
Calculation of formula (2) ao and a1 coefficients was executed by means of least square method for each ship speed. The following dependencies were obtained:
for: v = 18 w Nw18 = 12955 + 0,10030 D v = 17 w Nw17 = 10914 + 0,08449 D v = 16 w Nw16 = 9099 + 0,07044 D v = 15 w Nw15 = 7497 + 0,05804 D r 2 = 0,8066, r = 0,8981 (8) v = 14 w Nw14 = 6096 + 0,04719 D v = 13 w Nw13 = 4881 + 0,03778 D v = 12 w Nw12 = 3839 + 0,02972 D Nw15 = 7497 + 0,05804*D r2 = 0,8066
0
5000
10000
15000
20000
25000
30000
35000
0 50000 100000 150000 200000 250000 300000 350000DWT [ton]
Nw [kW]
Fig. 1. An example of linear regression describing dependence Nw=f(D) for ship speed v=15 knots
As coefficients ao and a1 of dependencies (7) are power functions of ship speed type y=axb in this case was assumed:
ao = bo vdo, a1 = b1 vd1 , (9)
35

After regression coefficients bi and di are calculated by means of least square methods formulas (9) are as follows:
ao = f(v) = 2,2215 * v3, a1 = f(v) = 0,0000172 * v3, (10)
Applying (9) to formula (2) the final form of formula for main propulsion power is: Nw = (2,2215 + 0,0000172 * D) * v3 [kW] , (11) where: D[tons] - DWT ship deadweight v[knots] - ship speed. For formula (11) the coefficient of regression determination is r2 = 0,8420 and correlation coefficient is r = 0,9176. It proves high compatibility of calculation results obtained from formula (11) with real parameters and confirms the correctness of previous assumptions. The correlation between power calculated according to formula (10) and power appointed in reference list is shown on figure 2.
Nw = (2,2215 + 0,0000172 * D) * v3
r2 = 0,8420 r = 0,9176
0
5000
10000
15000
20000
25000
30000
35000
40000
0 5000 10000 15000 20000 25000 30000 35000 40000
Nw = Ne - Npw [kW]
Nw [kW]
Fig. 2. Correlation between shaft power calculated according to formula (10) and shaft power of ship main propulsion from similar ship list
3. Determination of total electric power
At preliminary estimation of ship engine room working parameters it is not possible to determine exactly total electric power of onboard power station is the electric power balance of ship is not yet elaborated. Thus, to obtain forecast of total electric power it is necessary to use reference list or empirical formulas. However existing formulas concern ships of older
36

construction and do not regard many aspects concerning new ships construction. The necessity to elaborate new formulas is obvious at the moment. A number of ship types was statistically analysed with assumption that the total electric power of onboard power station depends on main propulsion power. The statistic analysis showed that with satisfactory accuracy the linear regression could be used giving the following formula:
Nel = a + b . Nw , (12)
where: Nel – total electric power of ship power station, Nw – main propulsion shaft power. Example of calculation of tankers total electric power [4]
Thirty three tankers (26 crude oil carriers and 7 product carriers) were taken into statistic analysis. Only tankers with steam turbine driven cargo pumps were taken into consideration because tankers with hydraulically or electrically driven cargo pumps are characterized by higher electric power consumption due to higher energy demand of such driven pumps.
To estimate total electric power of onboard power station the linear regression with least square method was used. Concerning tankers, the formula (12) is as follows: Nel = 1225 + 0,07443 * Nw [kW], (13) where: Nel [kW] – total electric power, Nw [kW] – main propulsion shaft power. Coefficient of regression determination is r2=0,6311, correlation coefficient r = 0,7944.
The dependence between total electric power obtained from formula (12) and main propulsion shaft power from similar ships reference list is shown in figure 3.
Fig. 3. Dependence between total electric power obtained from formula (12) and shaft power of main ship
Nel = 1225 + 0,07443 * Nw r2 = 0,6311
0
500
1000
1500
20002500
3000
3500
4000
4500
0 5000 10000 15000 20000 25000 30000 35000Nw [kW]
Nel [kW]
propulsion from similar ships list
4. Determination of total boilers capacity
To estimate total boilers capacity without exact steam consumption balance the problem is
37

similar to the estimation of total electric power. It is impossible to determine exactly boilers capacity during preliminary estimations.
Similarly to electric power estimation the linear dependency between total boilers capacity and main propulsion shaft power was assumed. To estimate total boilers capacity as a function of main propulsion shaft power the linear regression with least square method was used. As a result of calculations the following formula was obtained: Dkmax = c + d . NW [kg/h] , (14)
where: Dkmax [kg/h] – total boilers capacity, Nw [kW] – main propulsion shaft power. Example of calculation of tankers total boilers capacity [4]
Comparing other types of ships steam systems and boilers configuration are much developed.
Usually there are two main fuel fired boilers of high capacity and one auxiliary boiler heated by main engine exhaust gases. The steam from main boilers is among other proposes used for steam turbine driven cargo pumps. That is why it is necessary to analyze steam production of such ships. The population of 39 tankers was analyzed (32 crude oil carriers and 7 product carriers). Only tankers with steam turbine driven cargo pumps were on the list because tankers equipped with hydraulically driven cargo pumps have much lower steam consumption.
Similarly to electric power case it was assumed that total steam boilers capacity is linear function of main propulsion power. To determine total boilers capacity the linear regression pattern with least square method. As a result of calculations the following formula for total boilers capacity was obtained:
Dkmax = 24981 + 2,4289 .NW [kg/h], (15)
where: Dkmax [kg/h] – total boilers capacity, Nw [kW] – main propulsion shaft power.
Coefficient of regression determination r2=0,6819, correlation coefficient r = 0,8258. The dependence between total boilers capacity obtained from formula (14) and main propulsion
shaft power from similar ships reference list is shown in figure 4.
Dkmax = 24981 + 2,4289 * Nw r2 = 0,6819
0
20000
40000
60000
80000
100000
120000
0 5000 10000 15000 20000 25000 30000 35000 40000Nw [kW]
Dkmax [kg/h]
Fig. 4. Dependence between total capacity of boilers obtained from formula (14) and shaft power of main ship propulsion from similar ships list
38

5. Ready made formulas for calculations of main propulsion shaft power, total electric power and boilers capacity for different types of seagoing ships 5.1. Container ships
Nw = (0,9179 + 0,00003412 .D) . v3 [kW], (16) where: D[tons] - ship displacement, v[knots] - ship speed.
Nel = 1077 + 0,1580 .Nw [kW], (17)
where: Nw [kW] - main propulsion shaft power,
Dkmax = 2537 + 0,0657 .Nw [kg/h], (18)
where: Nw [kW] - main propulsion shaft power. 5.2. Ferries and ro-ro ships
Nw = (1,49042 + 0,00003888 .Dn). v3 [kW], (19)
where: Dn [tons] - DWT ship deadweight, v[knots] - ship speed,
Nel = 2432 + 0,14944 .Nw [kW], (20) where: Nw [kW] - main propulsion shaft power,
Dkmax = 1382 + 0,15265 .Nw [kg/h], (21)
where: Nw [kW] - main propulsion shaft power, 5.3. Passenger cruisers Nw = (1,1896 + 0,00002051 .D) . v3 [kW], (22) where:
39

D[tons] - ship displacement, v[knots] - ship speed, Nel = 3044 + 0,24048 .D [kW], (23) where: D[tons] - ship displacement,
Dkmax = - 4763 + 1,15191 .Nw [kg/h], (24) where: for Nw>5000 [kW] - main propulsion shaft power, 5.4. Tankers
Nw = (2,2215 + 0,0000172 .Dn) . v3 [kW], (25)
where: Dn [tons] - DWT ship deadweight, v[knots] - ship speed,
Nel = 1225 + 0,07443 .Nw [kW], (26)
where: Nw [kW] - main propulsion shaft power,
Dkmax = 24981 + 2,4289 .Nw [kg/h], (27)
where: Nw [kW] - main propulsion shaft power, 5.5. LNG carriers
Nw = (1,34571 + 0,00003091 .Dn) . v3 [kW], (28) where: Dn [tons] - DWT ship deadweight, v[knots] - ship speed,
Nel = -1126 + 0,4401 .Nw [kW], (29)
where: for Nw>5000 [kW] - main propulsion shaft power,
40

Dkmax = -1010 +0,4761 .Nw [kg/h], (30) where: for Nw>5000 [kW] - main propulsion shaft power, 5.6. Bulk carriers
Nw = (1,535 + 0,0000197 .Dn) . v3 [kW], (31) where: Dn [tons] - DWT ship deadweight, v[knots] - ship speed,
Nel = 812,7 + 0,08912 .Nw [kW], (321)
where: Nw [kW] - main propulsion shaft power,
Dkmax = 656,6 + 0,09145 .Nw [kg/h], (33) where: Nw [kW] - main propulsion shaft power. 6. Conclusions
Ready made formulas presented in the paper make possible quick and simple calculations of energy demand for ships being on preliminary state of design [2, 3, 4, 5, 6, 8]. Formulas may be useful for designers or students in project calculations especially in preliminary estimations while modeling simulations of hull resistance, electric energy balance and steam consumption balance are not yet executed.
During statistic analysis high correlation coefficients were obtained in formulas for ship main
propulsion power, total electric power and total boilers capacity (in the most cases r>0,9). It shows a strong relation between analyzed parameters. High correlation coefficients make possible to apply the method with high expectation that obtained preliminary results will be in high approximation of precise real results obtained in exact technical project of the ship.
It can be stated that the farther statistic analysis are necessary to improve presented formulas
regarding new built ships and trends in ship industry. The paper does not deal with some types of ships for example having dynamic positioning, characterized by high electric energy consumption and usually propelled by diesel-electric systems. References [1] Draper, N.R., Smith, H., Analiza regresji stosowana, Warszawa 1973. [2] Giernalczyk, M., Górski, Z., Method for determination of energy demand for main propulsion,
electric power production and heating purposes for modern container vessels by means of statistic,. XXI Sesja Naukowa Okr�towców, European Marine Shipbuilding 2004, Polski Przemys� Okr�towy w Unii Europejskiej, Gda�sk, 27-28 September 2004.
41

[3] Giernalczyk, M., Górski, Z., Improvement in preliminary determination of energy demands for main propulsion, electric power and auxiliary boiler capacity by means of statistics: an example based on modern bulk carrier, 9th Baltic Region Seminar on Engineering Education, Gdynia, 17 – 20 June 2005.
[4] Giernalczyk, M., Górski, Z., Metoda okre�lania zapotrzebowania energii do nap�du statku, energii elektrycznej i wydajno�ci kot�ów dla nowoczesnych zbiornikowców do przewozu ropy naftowej i jej produktów przy wykorzystaniu metod statystycznyc,. IV Mi�dzynarodowa Konferencja Naukowo-Techniczna Explo-Ship 2006, �winouj�cie – Kopenhaga, 18 – 21 maja 2006.
[5] Giernalczyk, M., Górski, Z., Improvement in preliminary determination of energy demand for main propulsion, electric power and auxiliary boiler capacity by means of statistics as an example of modern ro-ro vessel, V International Scientific Technical Conference, Explo Diesel & Gas Turbine’07,Gda�sk – Stockholm – Tumba, 11 – 15 of May 2007.
[6] Giernalczyk, M., Górski, Z., Metoda okre�lania zapotrzebowania energii do nap�du statku, energii elektrycznej i wydajno�ci kot�ów dla nowoczesnych statków pasa�erskich przy wykorzystaniu metod statystycznych, V Mi�dzynarodowa Konferencja Naukowo-Techniczna EXPLO-SHIP 2008, Problemy eksploatacji obiektów p�ywaj�cych i urz�dze� portowych, Ko�obrzeg – Bornholm (Dania) 28-30.05.2008 r.
[7] Hewlett Packard, HP-65 Stat Pac 1, Cupertino, California, March 1976. [8] Kowalczyk, B., Analiza rozwi�zania nap�du g�ównego dla zbiornikowca do przewozu
skroplonego gazu naturalnego LNG o �adowno�ci 300000 m3, Praca dyplomowa magisterska wykonana pod kierunkiem Z. Górskiego, Wydzia� Mechaniczny Akademii Morskiej w Gdyni, Gdynia 2009.
[9] Michalski, R., SIOWNIE OKRTOWE, Obliczenia wst�pne oraz ogólne zasady doboru mechanizmów i urz�dze� pomocniczych instalacji si�owni motorowych, Politechnika Szczeci�ska, Szczecin 1997.
[10] Opracowanie CTO, Ujednolicone metody oblicze� instalacji si�owni spalinowych, Gda�sk 1974.
[11] Opracowanie CTO, Unifikacja si�owni, Cz��� V, Elektrownia, Gda�sk 1978. [12] Zieli�ski, R., Tablice statystyczne, WNT, Warszawa 1978.
42

METHOD OF EVALUATION OF LUBRICATING ABILITY OF LUBE OILS, DIESEL OILS AND HEAVY FUEL OILS
IN ENERGETISTIC FORMULATION
Jerzy Girtler Gdansk University of Technology
Faculty of Ocean Engineering & Ship Technology Department of Ship Power Plants
tel. (+48 58) 347-24-30 fax (+48 58) 347-19-81 e-mail:[email protected]
Abstract
The paper presents an interpretation of operation of a boundary layer of a lubricating medium. A model of the homogeneous Poisson process has been proposed to assess the deterioration process of the layer’s operation. The assessment considers the original interpretation of operation of a boundary layer, as a lubricity measure of a boundary layer of any lubricant. In the submitted proposal the operation of a boundary layer is understood as a transfer of energy Ep, resulting from tribological system load at a given time t, in the form of work Lp which may lead to a breakdown of this layer. The operation is equated to a physical quantity with the unit of measure which is joule-second. Hereby, it has been shown that for this interpretation the operation may be determined not only by a number with the unit of measure [Js], but also in the form of an area of operation presented in a graph made on the "Lp-t" system, where: Lp(t) � work needed to break a boundary layer of a lubricating medium at time t, t � time of operation of the lubricant boundary layer. The paper also demonstrates usefulness of such understood operation of a lubricant boundary layer for assessment of the lubricity of this layer. The usefulness consists in that the layer operation can be defined as the required operation and possible operation. If the possible operation of a lubricant boundary layer is larger than the required, this medium can be used for lubrication of tribological systems. Otherwise, each tribological system undergoes wear.
Keywords: operation, lubricating oil, fuel, stochastic process, lubricity
1. Introduction
Lubricity, like viscosity, is one of the most important properties of lubricating mediums. In shipbuilding such substances include lubricating oils and fuels. Lubricating oils are used, among others, for lubrication of tribological systems like main bearings and crank bearings, pistons with rings mating with the cylinder liners, and in case of crosshead engines – crossheads mating with the crosshead bearings. Whereas, fuels enable lubrication of precision pairs like pistons and cylinder liners in fuel injection pumps, and injector needles and guides. Therefore, the systematic study of lubricity of marine lubricants should not only refer to lubricating oils, but also fuels. Lubrication is required by all tribological systems, not only just these that have been mentioned. It is essential since it allows to reduce both the wear of tribological systems and the energy losses due to friction.
As the lubricity of oils and the lubricity of fuels applied in shipbuilding are equally important in further considerations the terms lubricating oil and fuel are replaced by the term lubricating
43

medium which can be both a lubricating oil or fuel. In tribology there are different types of friction [6, 19]. The most important in engineering is
the division of friction into: dry (or more precisely technically dry) friction, boundary friction and fluid friction. Lubricity is especially important for boundary friction. For this friction, lubrication of the mating surfaces of any tribological system is provided by a boundary layer (boundary film). The boundary layer is thin (about 0.5 �m) and is preserved in consequence of the interaction between the lubricating medium and the mating surfaces lubricated by the medium. Such a thin layer of the lubricating medium is formed as a result of high unit tensions between the mating surfaces in the tribological system and the too low speed of their relative motion. Formation of such a layer and prevention against its breakdown and thus against occurrence of dry friction, is possible when adequate lubricity is provided. For this reason, lubricity is interpreted the most often as the ability of the lubricant particles to adhere to the lubricated surfaces, by which production of a stable layer on these areas, enabling their separation, is possible. 2. Interpretation of lubricity and possibilities for its determination
Contemporary views on lubricity of lubricating mediums (oils, fuels) are significantly different [1, 2, 6, 7, 8, 10, 11].
An extensive analysis of the views of different authors on the lubricity, which shows a considerable variety, is presented in the paper [15]. The results of this analysis and of lubricity tests of lubricating mediums led to formulation of the following definition of lubricity: lubricity is a property of a lubricating medium that characterizes its behavior under conditions of boundary friction. It determines the ability to produce on solid surfaces (substrates) a stable boundary layer as a result of adsorption (surface sorption) and more precisely: physisorption (physical adsorption) and chemisorption (chemical adsorption) [8]. This means that the lubricity depends not only on the structure of a lubricating medium, but also on the properties of the lubricated mating surfaces of the given tribological system. However, it is the property of a lubricant prepared to interact with the rubbing surfaces through interaction resulting from the existence of cohesive forces (different types of intermolecular bonds and intermolecular attractions) in the tribological system.
Taking into account considerations concerning the operation of machines, eg. diesel engines [5, 6, 7], lubricity can be defined as a property of a lubricating medium (and thus of the tribological system) ensuring its correct operation (D) under conditions of boundary friction. Lubricity characterizes preparation of the substance to form a stable boundary layer as a result of adsorption (physisorption and chemisorption) on solid surfaces. It is obvious that chemisorption increases the lubricity of a lubricating medium. This follows from the fact that the adsorption (surface sorption) is the process of forming surface bonds between the lubricant particles and the particles of the lubricated solid surfaces, while physisorption is caused by the action of intermolecular attractive forces, and chemisorption is a result of forming chemical bonds between the lubricant particles and the particles of the lubricated solid surface [8, 20]. For the applied substances the coefficient of friction may be different, i.e. smaller in case of occurrence of physisorption on the lubricated surfaces, or higher � in case of chemisorption on these surfaces.
The measurement of lubricity is durability of the boundary layer, understood as durability of the existing connection (bond) of a lubricating medium with the substrate (solid surface). The durability can be determined [8]:
at time of forming the boundary layer, as a result of investigation of the accompanying effects, eg. by measurement of the thermal energy (heat) of sorption; or
at time of destroying the layer, eg. by measurement of the quantity of energy needed to break the layer.
Durability of the boundary layer can also be determined indirectly through studying the phenomena associated with lubricity such as wear, scuffing (eg. susceptibility to scuffing, what is
44

important in diagnostic tests), or adsorption, thus physisorption and chemisorption (eg. substance susceptibility to adsorption), etc. Lubricity assessed as the lubricant susceptibility to adsorption can be investigated in static as well as dynamic conditions [8].
From the presented definitions and considerations follows that the energy consumption to overcome the friction resistance (forces) in tribological systems of machines depends not only on the lubricant viscosity but also on its lubricity. Therefore, for operation of the machines, not only of marine application, such as internal combustion engines, reciprocating compressors, etc. the tendency should also be to determine the lubricity of the substances. One of the possibilities might be testing the boundary layer operation. This requires to demonstrate the operation in such a form of mathematical dependence that determines measurement of lubricity of the mentioned lubricating mediums which are lube oils and fuels. 3. Operation of the boundary layer as a measurement of lubricity
Operation of a lubricant boundary layer will be correct only when it is not broken. Due to the fact that the lubricant ages in the course of time, the endeavor to ensure the durability of the substance and its boundary layer as high as possible is evident. The more bounded the lubricant boundary layer particles to the substrate (lubricated surface), the higher the durability of the layer. When the bond strengths between the lubricating medium and the substrate increase, the quantity of energy emitted during formation of this bond rises [8, 15]. This means that measurement of durability of the mentioned boundary layer can be based on measurements of effects accompanying formation of the layer. Thus, the duration of a forming boundary layer can be determined through measurements of the thermal effects accompanying adsorption.
The measurement of durability of a lubricant boundary layer may also be based on measurements of the effects accompanying destruction of the layer. In this case, there can be distinguished as follows [8]:
� wear interpretation of measurements of the boundary layer durability, � energy interpretation of measurements of the boundary layer durability. Therefore, resistance of the boundary layer to destructive effects can also be a measure of
lubricity. To determine durability of the boundary layer it is needed to estimate such a critical value of destructive effects that causes breakdown of this layer. These effects can be expressed in the form of energy or work per unit of area (unit energy or work) [8]. For this approach, the destructive effect is expressed by a product of the load (p) and the relative sliding speed (v) of rubbing surfaces. This product defines the work performed in time due to existing external load and a lubricating film (between rubbing surfaces) per unit of area, thus the unit power (power per unit of the friction area) in accordance with the formula [8]:
N(1) = pv (1) where:
p � pressure in the boundary layer, v � relative sliding speed of rubbing surfaces. It is therefore necessary to determine the value of the mentioned work which causes the destruction of the lubricant boundary layer in a tribological system having larger or smaller predispositions to produce this layer. This approach can also be used to determine the power destroying the boundary layer with regard to the friction area (F), so N = N (1)F.
Effects destroying a lubricant boundary layer should be considered at a determined time t [6, 7]. Therefore, the work Lp can be considered instead of the power N and its value can be calculated from the formula:
Lp(t) = p(t)F(t)v(t)t (2) where p � pressure in the boundary layer, F � friction area, v � relative sliding speed of rubbing
45

surfaces, t � duration of the boundary layer load. By using the formula (2) the operation of a lubricant boundary layer can be determined as a measurement of lubricity from the formula [6, 7]:
�� ���������2
1
2
1
)()()()()(t
t
t
tp dvFpdLtD (3)
where: D(t) � operation of a lubricant boundary layer at time t; Lp(t) � work needed to break a
lubricant boundary layer at time t; p(t) � pressure in the boundary layer at time t; F(t) � friction area at time t; v(t) � relative sliding speed of rubbing surfaces at time t; t � operational time of the lubricant boundary layer; t1, t2 � moments of the interval [t1, t2] in which the lubricant boundary layer operates. In the course of the operational time of a tribological system, due to its wear, operation of a lubricant boundary layer deteriorates in the aspect that the resistance of this layer decreases. This means that the work causing destruction of this layer gets smaller. Reduction of the work can be recorded only when it reaches at least an elementary quantity (portion) �Lp, which can be called a quantum, just like in physics for the energy of electromagnetic radiation [6]. As a result of this reduction after determined time, the mentioned work Lp takes such a low value that further use of the lubricant under boundary friction becomes impossible. In this case the lubricant should be replaced with another. Otherwise, the boundary layer gets broken what results in occurring dry friction (technically dry) causing damage (destruction) of the tribological system.
Such understood operation of a tribological system (eg. a bearing) can be presented in compliance with the formulas (2) and (3), in a coordinate system of "Lp-t ", so in the form of a graph, which can be called an operation graph. Such a graph in the coordinates of "Lp-t " is shown in Fig. 1.
Durability (Tr) of the boundary layer of a lubricating medium is a random variable. Realization of this variable (tr) for the given substance may be the time interval [0, tmax], so the maximum time of correct operation of the boundary layer, after which this layer gets broken.
In the presented approach, the operation of a lubricant boundary layer can be considered as: a) demanded operation (DW), so that one which is necessary to perform a given task by a
machine having tribological systems in which the boundary layer exists; b) possible operation (DM), so that one which can be done by the boundary layer existing in a
given tribological system at the particular technical condition.
Fig.1. Exemplary graph of boundary layer operation: Lp - work needed to break the boundary layer of a lubricating medium (oil, fuel), t - time of operation (action) of a lubricating medium; t0, tn - initial moment and the next
moment between which the operation of a lubricant boundary layer is analyzed.
tn
t
t0
L p
Lpn operation area
Lp0
46

It can be assumed that any operation of a lubricant boundary layer is possible (DM) when the energy (EpM) generated inside as a result of the load p and the related work (LpM) which might lead to a breakdown of this layer, or heat (QpM) being an equivalent to the work, will reach at most the boundary value after the time t. The demanded operation (DW) of a boundary layer is when the energy (EpW) generated inside as a result of the load p, and thus also the work (LpW) needed to destroy this layer or the heat (QpW) being an equivalent to the work will achieve the demanded (adequate to the operating conditions) values at time (tW) required to perform the given task. Consequently, it can be accepted that each boundary layer is in ability state (is able to perform the task) when:
MW DD � (4)
The maximum possible operation which characterizes a breakdown of the boundary layer and occurrence of dry friction in particular micro areas of contacting surfaces, is in this case a boundary operation. Thus, the possible boundary operation can be expressed by the formula:
tLD pGpG � (5) where: DpG - maximum possible operation, LpG – boundary operation, so that one by which the beginning of scuffing of rubbing surfaces in the tribological system (eg. sliding bearing) is possible to occur.
The boundary layer can operate (work) properly in accordance with the formula (4) if:
tM � tW, when simultaneously LpM � LpW.
This means that for practical reasons, this general case must be considered in the following variants:
1) tM = tW, when simultaneously LpM = LpW 2) tM = tW, when simultaneously LpM > LpW 3) tM > tW, when simultaneously LpM = LpW 4) tM > tW, when simultaneously LpM > LpW.
In case when: DW > DM (6)
the boundary layer should be recognized as destroyed and the tribological systems damaged, and the machine in which they are located is not able to perform a task appropriately to the need.
For modeling the changes of energy or work causing a breakdown of a lubricant boundary layer, a homogeneous Poisson process can be applied [6, 7]. By applying this process a physical interpretation can be formulated for the process of reducing by a constant elementary value ep the work required to break the boundary layer Lp, which is as follows: from the beginning of operation of this layer (this may be the time t0 = 0) till the time of recording by a measuring device the event A for the first time, consisting in work Lp reduction by the value Lp = ep, each task can be performed by the tribological system. Further operation of the boundary layer (during task performance by the mentioned system) causes in the course of time successive decreases in values of the work Lp, by the equal values ep, recorded by the measuring device. Therefore, in case of having recorded till the time t a cumulative number Bt of the occurred events A, described with a homogeneous Poisson process, the reduction of work Lp by the value Lp = ep till the time t can
47

be presented by the formula [3]:
�Lpt = epBt (7)
here the random variable Bt has (as it is known) the distribution [6, 7]: w
nktktkBP
k
t ,,2,1;)(exp!)()( ����
��� , (8)
where: � - constant (� = idem) interpreted as intensity of work Lp reduction by equal values
ep, reco
The expected value and the variance of the process of increasing the number of events A, thus red
Taking the fact into considerations that the greatest energy Ep, thus also the work Lp, is needed to
rded during tests; � > 0.
ucing the work Lp by the successively recorded values ep, can be demonstrated as follows: tBtB tt �� �� )(D;)(E 2 (9)
break the lubricant boundary layer (when t = 0) the mathematical relationship describing the work reduction over the time t can be expressed by the formula:
��
�
��
�
� �tdlaL
�����
�
0
0
)(tdlateteL
tL
pppmax
pmax
p (10)
graphic interpretation of the relation (10) is shown in Fig. 2.
Fig. 2. Graphic interpretation of an exemplary realization of the process of reducing the work needed to break
the
A
� �tteLtL ppmaxp �����)(
Lp(t)
Lpmax
Lp1
Lp2
Lp3
Lpmin
ep
ep
ep
t1 t2 t3 t4
t
� �t-teLtL ppmaxp ����)(
teLtL ppmaxp ���)(
boundary layer: Lp � work that causes breakdown of the boundary layer, ep � quantum by which the work Lp changes, t � time
48

From the formula (10), results that for any tim t it is possible to determine the work Lp which can be performed by a tribological system (eg. piston with rings - cylinder liner, bearing, etc.) and fro
d proposal, is understood as transferring by it e energy Ep, resulting from the tribological system load at determined time t, in the form of work
Lp,
f:
Ref
: Od ropy naftowej do tworzyw sztucznych. WNT, Warszawa 1967. . D�bicki M.: Materia�y na zebranie naukowe Sekcji Podstaw Eksploatacji Komitetu Budowy
NOSTYKA 2000, Warszawa 2000,
EL & GAS TURBINE”01.
SIMP wydawany
�dzy powierzchniowymi a przeciwzuyciowymi 44.
e
m the formula (8) - that it is possible to estimate the probability of occurring such decrease of work Lp. Thus, the probability P(Bt = k; k = 1,2, ..., n) defined by the formula (8), can be recognized as an indicator of the operational reliability of the boundary layer. 4. FINAL REMARKS AND CONCLUSIONS
Operation of the boundary layer in the submitteth
which may lead to breakdown of this layer. Therefore, it has been compared to a physical quantity that can be expressed with a numeric value and a unit of measure [joule � second].The direct results of such interpreted operation of the boundary layer is the energy transferred by it and the time at which that energy can be transferred. This energy (thus also the work Lp or its equivalent – heat Qp) and the time are the quantities which unequivocally characterize the operation of the boundary layer. Such understood operation can be considered as a quantity directly characterizing durability of the layer, thus a symptom of its ability. With the increased wear of opposing surfaces in a tribological system and / or deterioration of physicochemical properties of a lubricant (lubricating oil, fuel) under determined conditions and at a defined time, the value of such understood work decreases as a result of deteriorating lubricity and in consequence, increasing the friction work thus the heat of friction. To determine the range of deterioration of operation of the boundary layer it has been applied a stochastic model of reducing work Lp needed to break this layer, in the form of a random process with equal (constant) intervals, homogeneous and independent increments, which is a homogeneous Poisson process.
Operation of the layer in the presented version also has also this advantage that can be analyzed by performing precise measurements, and then can be expressed in the form o
� number with the unit of measure (Formula 3); � graph, as a field of area (Fig. 1 and 2).
erences
1. Balada A.2
Maszyn PAN. Informator WITPIS, Warszawa 1972, s. 224. 3. Girtler J.: Dzia�anie urz�dze� jako symptom zmiany ich stanu technicznego. II
Mi�dzynarodowy Kongres Diagnostyki Technicznej DIAGdysk SD, s. [1-8], streszczenie referatu Volume 2, s. 123 i 124.
4. Girtler J.: Work of a compression-ignition engine as the index of its reliability and safety. II International Scientifically-Technical Conference EXPLO-DIESConference Procedings. Gdansk-Miedzyzdroje-Copenhagen, 2001, pp.79-86.
5. Girtler J.: Metoda energetyczno-czasowa oceny dzia�ania poprzecznych �oysk �lizgowych. Tribologia. Teoria i praktyka 1/2002. Dwumiesi�cznik Naukowo-Techniczny we wspó�pracy z Polskim Towarzystwem Tribologicznym I Instytutem Technologi Eksploatacji w Radomiu. ITE, Radom, 2002, s.215-226.
6. Hebda M., Wachal A.: Trybologia. WNT, Warszawa 1980. 7. Kolczy�ski J., Wachal A.: Zwi�zek mi
w�asno�ciami oleju. Technika Smarownicza nr 2/1976, s.41-8. Wachal A.: Pewne zagadnienia poj�cia smarno�ci. Technika Smarownicza nr 5/1973, s. 129-
139..
49

9. Wierzcholski K.: Kinetyczny opis zjawisk tarcia. Materia�y XIII Sympozjum Trybologicznego. Sekcja Podstaw Eksploatacji Komitetu Budowy Maszyn PAN. Cestochowa-Poraj, 1984, s.253-260.
10. Zwierzycki W.: Oleje i smary przemys�owe. Wyd. ITE, Radom 1999. 11. Leksykon naukowo-techniczny z suplementem. Praca zbiorowa. Wyd. IV poprawione. WNT,
Warszawa 1989.
50

ANALYSIS OF TRENDS IN ENERGY DEMAND FOR MAIN PROPULSION, ELECTRIC POWER AND AUXILIARY
BOILERS CAPACITY OF TANKERS
Zygmunt Górski, Mariusz Giernalczyk
Gdynia Maritime University 83 Morska Street, 81-225 Gdynia, Poland
tel.: +48 58 6901307, +48 58 6901324 e-mail: [email protected], [email protected]
Abstract
The paper deals with problem of energy demand for main propulsion as a function of deadweight and speed for tanker ships built in 60-ties, 70-ties, 8--ties as well as recently built. Changes in power of main propulsion and trends observed in the matter are appointed. In the same way analysis of electric power and boilers capacity are carried out. In summary conclusions and prognosis concerning energetic plants of tanker ships are expressed. Keywords: Tanker, main propulsion power, electrical power, auxiliary steam delivery, statistics 1. Introduction
Tankers the largest merchant ships are used for transport of liquid cargo. Their deadweight excess even 500000 tons. Such a transport capability have crude oil carriers belonging to ULCC class (Ultra Large Crude Carrier). A view of ULCC class tanker is shown on figure 1.
Fig. 1. ULCC class tanker Knock Nevis: length 458,45 m, 564763 DWT
51

Tankers are mostly used for transport of crude oil and crude oil products (product tankers), liquefied sulphur (sulphur carriers), liquefied chemicals (chemical carriers) and liquefied gases (gas carriers LNG and LPG). Combined bulk cargo ships for example OBO (oil-bulk-ore) or COB (container-oil-bulk) are also classified as tankers.
Recently built tankers are constructed as double-hull (double skin) to protect sea environment
against cargo leaks in case of hull defects (due to collision, grounding etc.). The subject of this analysis are crude oil tankers and product tankers. Depending on cargo
properties (density, viscosity) there are some differences in propulsion plants construction of these ships mainly in boilers capacity and onboard electric power station size. It depends on different configuration of cargo pumps. In case of crude oil carriers and large product carriers three or four big cargo pumps with capacity 3000 ÷ 5000 m3/h steam turbine driven are used. It results in high steam demand and high boilers capacity. Turbine driven cargo pumps are shown on figure 2. a)
b)
Fig. 2. View of crude oil tanker’s cargo pumps: a) driving turbine b) cargo pump
Separate cargo pumps for each cargo tank are used on smaller products tankers, sulphur
carriers, chemical carriers and liquefied gas carriers LNG and LPG. These pumps are driven by electric motors or hydraulic motors thus the electric power demand increases. According to these circumstances described ships were divided to two groups in statistic analysis of boilers capacity and electric power demand.
The preliminary analysis of energetic plants configuration considered ships gives the following
conclusions: - slow speed diesel engines are mostly used for main propulsion, - steam turbine propulsion dominates on VLCC (Very Large Crude Carriers) and ULCC class
tankers, - the speed of tankers is about 14�16 knots, - onboard electric power station consists of three diesel alternators of moderate power as these
ships do not have large electric power consumers e.g. bow thrusters; only some number of product carriers equipped with separate electrically driven cargo pumps for each cargo tank have higher electric power demand,
52

- tankers are distinguished in comparison to other types of ships by larger steam systems particularly on crude oil carriers where boilers steam capacity achieves 50000÷100000 kg/h at pressure 1,8�3,0 MPa. The target of this work is analysis of development of main propulsion plants, onboard electric
power station and boilers capacity on crude oil tankers and large product tankers on the base of statistic methods. 2. Analysis of main propulsion plants development
To determinate main propulsion power of tankers built 60-ties technical data of 637 ships were used [4]. As a results of statistics calculations and after determination of regression coefficients formula (1) was obtained [4]. Tanker propulsion power is described in dependence on ship deadweight and ship speed:
Nn = 0,0566 * D 0,476 * v 2,564 [kW], (1) where: Nn [kW] - shaft power of main engine, D [tons] - ship deadweight (DWT), v [knots] - ship speed.
Statistic calculations carried out in Marine Power Plants Department of Gdynia Maritime University made possible to determine formula (2) for recently built tankers [2]:
Nn = (2,2215 + 0,0000172 * D) * v3 [kW], (2) where: D [tons] - ship deadweight (DWT), v [knots] - ship speed.
0
10000
20000
30000
40000
50000
60000
10000 30000 50000 70000 90000 110000 130000 150000 170000 190000 210000 DWT [tons]
Nn[kW] Tankers Nn = 0,0566 * D0,476 * v2,564 [kW]
22 kn
20 kn
18 kn
16 kn
14 kn
12 kn
10 kn
Fig. 3. Dependency Nn =f(D) at different ship speed for tankers built in 60-ties according to formula (1)
53

The dependence of ship main propulsion power on ship deadweight for different ship speeds according to formulas (1) and (2) is shown on figures 3 and 4. Dependency between main propulsion shaft power and ship deadweight at different ship speed for tankers built in 60-ties according to formula (1) is shown on figure 3.
The same dependences for recently built tankers according to formula (2) are shown on figure
4. Aby móc porówna� i oceni� rozwój mocy nap�dów tych statków w ostatnich 50-ciu latach dla wybranej pr�dko�ci p�ywania v=14 w�z�ów przedstawiono na rys. 5 wykresy zbiorcze, celem dokonania analizy porównawczej zmian mocy tej kategorii statków.
0
20000
40000
60000
80000
100000
120000
0 100000 200000 300000 400000 500000
22 kn
20 kn
18 kn
16 kn
14 kn
12 kn10 kn
DWT [tons]
Nn[kW] Tankers (2,2215+0,0000172 * D) * v3 [kW]
Fig. 4. Dependency Nn =f(D) at different ship speed for recently built tankers according to formula (2) To compare and evaluate the development of tankers main propulsion power in recent years a
cumulative diagrams were executed. An example of cumulative diagram for ship speed 14 knots is shown on figure 5.
5000
10000
15000
20000
25000
30000
35000
0 100000 200000 300000 400000 500000 DWT [tons]
Nn[kW] Camparison of tankers main propulsion power for v = 14 knots
formula (1)
formula (2)
Fig. 5. Comparison of main propulsion power at v=14knots for tankers built in 60-ties and nowadays
54

As the deadweight of tankers built in 60-ties achieved maximum 200000 tons to make possible comparing analysis especially for VLCC and ULCC class tankers the extrapolation of dependencies was executed for main propulsion power of tankers built in 60-ties. Results of comparative analysis (fig. 5) show that for tankers of deadweight up to 300000 tons main propulsion power demand did not change during last 50 years. It results from small modification of tankers hull construction and still used ship operational speed about 14�16 knots. Considering larger ships i.e. ULCC class (above 300000 DWT) main propulsion power demand is moderate higher. It is probably the result of slightly higher operational speed and minor changes in hull construction. 3. Analysis of onboard electric power station development
Total electric power of older tankers onboard power station can be approximately estimated using formula (3) elaborated by Ship Design and Research Center in Gda�sk [5]:
Nel = 663 + 0,0748 * Nn [kW], (3)
where: Nn [kW] - main engine shaft power.
In turn total electric power of recently built tankers onboard power station is described by
formula (4) elaborated in Marine Power Plants Department of Gdynia Maritime University [2]:
Nel = 1225 + 0,07443 * Nn [kW], (4)
where: Nn [kW] - main engine shaft power.
Dependencies of total electric power on main engine shaft power elaborated according to
formulas (3) and (4) are shown on figure 5. It makes possible to compare total electric power of older and recently built tankers.
0
1000
2000
3000
4000
5000
6000
0 10000 20000 30000 40000 50000 60000
Nel [kW]
Nn [kW]
acc. to formula (3)
acc. to formula (4)
Comparison of tankers total electric power
Fig. 5. Comparison of total electric power for older and recently built tankers
55

Comparing total electric power (fig. 5) it is found that total electric power of recently built
tankers is higher than for older construction in whole range of main engine shaft power. It results from tendency to fit out ships with higher number of electrically driven plants and equipment. A typical example are modern navigation equipment, automatically controlled modern machinery equipment, modern air condition equipment etc.
4. Analysis of steam boilers capacity development
To estimate total boilers capacity mounted onboard of tankers propelled by diesel engines built
in 70-ties and 80-ties the formula (5) given in [3] was used:
Dk = 1,2507�10-8�(Nn)3 – 3,7444�10-4�(Nn)2
+5,60705�Nn–7960 [kg/h], (5)
where: Nn [kW] - main engine shaft power.
Whereas total boilers capacity mounted onboard of recently built tankers propelled by diesel engines the formula (5) from [2] was used: Dk = 24981 + 2,4289 * Nn [kg/h], (6) where: Nn [kW] - main engine shaft power.
Dependencies of tankers total boilers capacity on main engine shaft power according to formulas (5) and (6) is matched on figure 6.
0
50000
100000
150000
200000
250000
0 10000 20000 30000 40000 50000 60000
Dk [kg/h]
Nn [kW]
Comparison of tankers total boilers capacity
acc. to formula (6)
acc. to formula (5)
Fig. 6. Comparison of total boiler capacity for older and recently built tankers
56

As shown on figure 6 the formula (5) comes true only for smaller tankers having main engine shaft power up to 15000 kW built in 70-ties of last century. Presently built much bigger VLCC and ULCC class tankers have considerably higher propulsion shaft power. Statistic analysis [2] affirms that total boilers capacity on recently built tankers is strongly linearly depended on main propulsion shaft power. Total boilers capacity on such tankers estimated according to formula [6] have very good correlation (above 0,8) with reference to main propulsion shaft power. Thus to use formula (6) for recently built tankers is entirely justified. 5. Conclusion
Nowadays tankers are the largest operated merchant ships. The population of these ships is distinguished by increasing cargo capacity and increasing operational speed. As a result the main propulsion shaft power also increases. Some limitation in tankers size is the possibility in passing through Suez Channel and Panama Channel.
Increase of total installed electric generators power is a result of fitting recent ships with large
number of electrically driven equipment (for example bow thrusters), increasing tendency in automation and increasing comfort in ships crew working and living conditions (air condition of accommodation, air condition of working rooms etc.).
In turn high demand for steam on diesel engine propelled tankers is a result of using steam
turbine driven cargo pumps and ballast pumps. The power necessary for cargo pumps propulsion is a result of high cargo unloading rate imposed by charter contracts.
References: [1] Górski, Z., Giernalczyk, M., Analysis of trends in energy demand for main propulsion,
electric power and auxiliary boilers capacity of general cargo and container ships, Journal of POLISH CIMAC – ENERGETIC ASPECTS, Vol.4. Gda�sk 2009.
[2] Giernalczyk, M. , Górski, Z., A Statistics-based Method for the Determination of energy demands for main propulsion, electric power and auxiliary boiler capacity for modern crude oil and products tankers, Explo-ship 2006, Szczecin pp 183-192. [3] Michalski, R., Ship propulsion plants, Preliminary calculations, Szczecin Technical
University, Szczecin (1997). [4] Nowakowski, L., Wyznaczenie przybli�onej mocy nap�du zbiornikowców w zale�no�ci od
no�no�ci i pr�dko�ci (Calculation of approximate propulsion power of tankers relation of deadweight capacity and speed), Budownictwo Okr�towe I/1970.
[5] Unification of ship engine room, Part V, Ship power plant, Study of Ship Techniques Centre (CTO), Gda�sk 1978.
[6] Urba�ski, P., Gospodarka energetyczna na statkach, Wydawnictwo Morskie, Gda�sk 1978.
57

58

THE EFFECT OF INNER CATALYST APPLICATION ON DIESEL ENGINE PERFORMANCE
Anna Janicka, Zbigniew J. Sroka, Wojciech Walkowiak
Wroc�aw University of Technology
wyb. Wyspia�skiego 27 50-370 Wroclaw
tel./fax. +48 71 3477918 e-mail: [email protected]
Abstract
This paper presents the results of the initial researches on platinum-rhodium inner catalyst application in one-
cylinder compression-ignition engine (SB 3.1 type). According to recent researches [2-6] the active factor in an engine combustion space impacts on a combustion process. It is suspected that a catalyst i.e. a precious metal, affects the fuel combustion process by catalyzing the fuel-air combustion reaction (prior-combustion reactions what is correlated with shortening of combustion delay period).The researches was carried out in Division of Motor Vehicles and Internal Combustion Engines at Wroclaw University of Technology. The catalyst was put onto the engine valves surface. As a catalyst support a plasma-sprayed zirconium ceramic was used. The researches proved that the platinum-rhodium active factor on zirconium thermal barrier coating (TBC) placed into combustion chamber (inner catalyst) effects on the diesel engine performance. The impact of the inner catalyst seems to be advantageous for ignition delay. The active ceramic on the engine valve surface caused increase of in-cylinder maximum pressure and temperature values.
Keywords: internal combustion engine, active coating, catalytic fuel ignition, pressure diagram
1. Introduction Nowadays, research on improvement of engine fuel combustion process has been increasing
due to an increase in the price of diesel oil and increase in the environmental concerns. A great deal of research has been conducted on modification of the engine construction, using biobased-fuels and fuel addition including catalytic elements [1].
Williams and Schmidt [2] during their research on catalytic oxidation of liquid hydrocarbon fuel using rhodium as active agent, have analyzed the parameters of fuel-air mixture autoignition. The authors have observed that even minimal addition of rhodium to a reactor simulating internal combustion engine conditions (with some restrictions referring to real engine because the reactor worked in adiabatic conditions) causes improvement in chosen parameters of the combustion process. One of Williams and Schmidt suggestions is that the active agent put into combustion space causes start of complex chain reactions and the phenomena is related with shortening of time of chemical autoignition delay.
Mello, Bezaire and Sriramulu [3], in their researches have investigated influence of catalytic coating inside of a compression-ignition engine fueled with natural gas (DI-NG) on autoignition
59

delay. The authors have proved that the catalyst coating in combustion space may improve the engine efficiency.
Based on references [2 – 6] it is possible to conclude that modification of combustion space by catalytic active agent implementation may, with significant probability, causes shortening of fuel-air mixture autoignition delay time in the internal combustion engine.
It is suspected that the active agent i.e. a precious metal affects the fuel combustion process by catalyzing the fuel-air combustion reaction, especially prior-combustion reactions what is correlated with shortening of combustion delay period.
The researches on an active ceramic application inside the combustion chamber of the internal combustion engines have been provide in Division of Motor Vehicles and Internal Combustion Engines at Wroclaw University of Technology for last few years. The inner catalyst is a solution based on implementation of active factor on chosen engine elements (glow plugs, piston and engine valves) to improve the combustion process [5,6].
Thick plasma sprayed thermal barrier coatings (TBC) is used as a catalyst support. zirconium, yttrium-stabilized ceramic, because of its special properties, is well known, suitable for thermal and hot corrosion protection material which is often use for diesel engines applications. In addition, they represent potential solutions to increase the engine efficiency, in terms of higher combustion temperature and reduced cooling air flow, and to reduce the fuel consumption [7].
The aim of this research was analysis of the effect of the platinum-rhodium inner catalyst on diesel engine performance.
2. Experiment
The researches was carried out in the Division of Motor Vehicles and Internal Combustion
Engines laboratory of Wroclaw University of Technology. A one-cylinder SB 3.1.type diesel engine was employed as the research engine. The lay-out of the engine test bed is presented on figure 1.
Fig. 1. The lay-out of the research test bed
60

The test bed was equipped with in-cylinder pressure and temperature measurement system. The system for data register and acquisition based on measurement channel with piezoelectric sensor, impulses amplifier, oscilloscope and software for signal processing software. Each pressure diagram has been averaging of 600 to 800 diesel engine cycles.
The engine modification was platinum-rhodium application on the engine valves surface. Plasma-sprayed, zirconium ceramic coating was used as a catalyst support. The ceramic coating acted simultaneously as a thermal barrier caused a local temperature increase.
The direct signals was put into several mathematical transformations connected with signal filtering and measurement channel calibration to eliminate potential disturbances. In the signal filtering process the signal aggregating method and average values weighting method were used.
The methods error was estimated as 0,01 MPa for range 0 to 5 MPa and 0,03 MPa for range 0 to 10 MPa. The difference in error level is an effect of signal transformations on values of pressure for various signal amplifications in the amplifier and the oscilloscope.
The tests were done for chosen engine speeds: 1200 rpm, 1400 rpm and 1600 rpm and crank angle degrees of fuel injection advance: 20 deg, 23 deg and 27 deg in crank angle. Two states of engine work were studied and compared: without and with inner catalyst. Average real operational engine load, 47,7 Nm, was chosen for pressure diagram analysis for each engine speed. 3. Results and discussion
Some results of the researches are presented on diagrams (fig. 2 - fig. 12) and in the tables (tab. 1 – tab. 3).
When engine run without the modification the combustion pressures measurements indicate typical performance for the engine type, comparable to producer data, what is shown on the figure 2 and 3.
Fig 2.The pressure diagram for various fuel injection advances, engine without catalyst; engine speed: 1200 rpm
61

Fig 3. The pressure diagram for various fuel injection advances, engine without catalyst;
engine speed: 1600 rpm
Higher values of maximum pressure was measured for higher angle for different fuel injection advances (higher for 27 deg of crank angle than 20 deg). Higher values of crank angle causes faster combustion ignition. After catalyst application insignificant changes was observed (fig. 4 and 5) but the tendency of engine pressure performance is comparable to basic state: the higher crank angle degree the higher maximum pressure values are observed (the higher crank angle degree the faster combustion ignition and higher pressure to crank angle ratio dp/d�).
Fig 4. The pressure diagram for various fuel injection advances, engine with catalyst; engine speed: 1200 rpm
62

Fig 5. The pressure diagram for various fuel injection advances, engine with catalyst; engine speed: 1600 rpm
The comparison of the results shown on the figures 2 and 3 (engine without catalyst) with
figures 4 and 5 (engine with active ceramic coating on the engine valves surface) shows that inner catalyst application caused higher maximum pressures in combustion chamber and faster combustion ignition was observed. Ratio dp/d� of the fuel combustion process were comparable for both states of engine work. Maximum pressure values was decreasing while engine speed was increasing.
The maximum in-cylinder pressures for both engine states on each analyzed engine speed are presented in table 1.
Tab. 1. The maximum in-cylinder pressure, MPa, for various engine speeds and both states of engine work
Crank angle fuel injection advance, deg
Maximum in-cylinder pressure, MPa 1200 rpm 1400 rpm 1600 rpm
Without catalyst
With catalyst Without catalyst
With catalyst Without catalyst
With catalyst
- 20 4,59 4,97 4,48 4,76 4,27 4,59 - 23 5,06 5,03 4,85 4,91 4,73 4,65 - 27 5,03 5,57 4,76 5,30 5,30 5,30
The values of crank angle fuel injection advance, presented in table 2, indicate on phenomena
of inner catalyst impact on ignition delay. Combustion ignition is also function of engine speed: the higher engine speed the closer to TDC fuel combustion process starts.
Tab. 2. The ignition of the combustion process, crank angle before TDC, deg, MPa, for various engine speeds and
both states of engine work
Crank angle fuel injection advance, deg
Start of the combustion process, crank angle fuel injection advance, deg 1200 rpm 1400 rpm 1600 rpm
Without catalyst
With catalyst Without catalyst
With catalyst Without catalyst
With catalyst
- 20 - 1,10 - 4,70 - 3,40 - 4,20 - 2,30 - 5,60 - 23 - 3,24 - 4,96 - 4,19 - 4,58 - 2,86 - 3,82 - 27 - 11,00 - 11,80 - 11,20 - 11,20 - 9,50 - 11,00
63

The changes in pressure to crank angle ratio (dp/d�), presented in table 3, show that for 20 and 23 degrees of crank angle before TDC, the ratio values are higher when engine worked with platinum/rhodium catalyst on the engine valves surface in comparison to state without the engine modification. Only for 27 deg of crank angle and the lower engine speed the relation was opposite. The phenomena needs to be explained in future researches.
Tab. 3. The ratio of dp to d�, MPa/deg, for various engine speeds and both states of engine work
Crank angle before TDC,
deg
dp/d�, MPa/deg 1200 rpm 1400 rpm 1600 rpm
Without catalyst
With catalyst Without catalyst
With catalyst Without catalyst
With catalyst
- 20 0,43 0,43 0,33 0,33 0,25 0,32 - 23 0,29 0,47 0,20 0,47 0,31 0,35 - 27 0,64 0,36 0,84 0,75 0,57 0,64
The thermodynamic state of the medium in combustion chamber is determine by Three
parameters: pressure, temperature and volume. Two of them: pressure and volume as direct parameters are known as parameters indicates direct on engine performance. The third parameter, temperature, in engine measurements is define by mathematical rules because pressure and volume changes are easier and more precise tool for temperature measurement than using direct sensor of this parameter. By using data of pressure value, state of engine work, engine speed and specific fuel consumption etc,. it is possible to get knowledge about the temperature behavior in the combustion chamber. The example of that estimation is presented on figure 6.
Fig 6.The in-cylinder pressures and temperatures versus crank angle (example)
In following figures (7 to 10) the in-cylinder temperatures values are presented versus
various crank angle degrees. In case of 20 deg of crank angle (fig. 7 and 8), for both engine speeds, the higher values of
temperature was observed for engine equipped with inner catalyst. Also ignition of the combustion process started faster. Simultaneously with engine speed increase the temperature of medium in the combustion chamber was increasing.
64
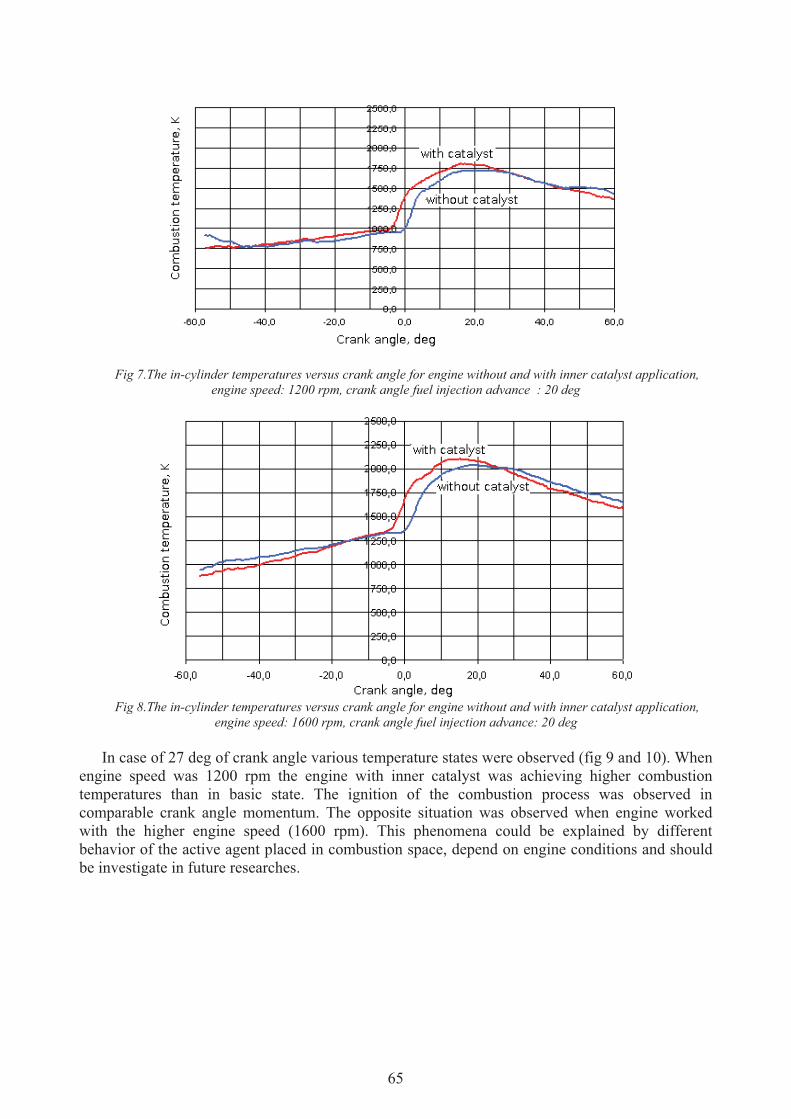
Fig 7.The in-cylinder temperatures versus crank angle for engine without and with inner catalyst application, engine speed: 1200 rpm, crank angle fuel injection advance : 20 deg
Fig 8.The in-cylinder temperatures versus crank angle for engine without and with inner catalyst application,
engine speed: 1600 rpm, crank angle fuel injection advance: 20 deg
In case of 27 deg of crank angle various temperature states were observed (fig 9 and 10). When engine speed was 1200 rpm the engine with inner catalyst was achieving higher combustion temperatures than in basic state. The ignition of the combustion process was observed in comparable crank angle momentum. The opposite situation was observed when engine worked with the higher engine speed (1600 rpm). This phenomena could be explained by different behavior of the active agent placed in combustion space, depend on engine conditions and should be investigate in future researches.
65

Fig 9. The in-cylinder temperatures versus crank angle for engine without and with inner catalyst application,
engine speed: 1200 rpm, crank angle fuel injection advance: 27 deg
Fig 10. The in-cylinder temperatures versus crank angle for engine without and with inner catalyst application,
engine speed: 1600 rpm, crank angle fuel injection advance: 27 deg The maximum in-cylinder temperatures variation is shown on figures 11 and 12.
Fig 11.The in-cylinder temperatures versus crank angle and engine speed, without ((left) and with (right) inner
catalyst application
66

Fig 12.The in-cylinder temperatures versus engine speed, for both engine states (with and without catalyst) and
various crank angle degrees The results of in-cylinder temperature analysis indicates on effect of inner catalyst application
on engine performance but trends of the engine parameters variations and their explanation should be investigate in the future research.
4. Conclusions:
1. The platinum/rhodium active factor on zirconium thermal barrier coating placed into
combustion chamber (inner catalyst) effects on the diesel engine performance. 2. The impact of the inner catalyst seems to be advantageous for ignition delay. 3. The active ceramic on the engine valve surface caused increase of in-cylinder maximum
pressure and temperature values. 4. To determine and explain trends of pressure and temperature values changes versus engine
parameters the researches on inner catalyst application should be continue and developed. References:
[1] Keskin A., Guru M., Alt�parmak D.: Influence of tall oil biodiesel with Mg and Mo based on diesel engine performance and emission, Bioresource Technology 99 (2008) 6434–6438
[2] Williams K. A., Schmidt L.D.: Catalytic autoignition of higher alkane partial oxidation on Rh-coated foams, Applied Catalysis A: General 299 (2006), pp. 30-45
[3] Mello J.P., Bezaire D., Sriramulu S.: Performance and Economics of Catalytic Glow Plugs and Shields in Direct Injection Natural Gas Engines for the Next Generation Natural Gas Vehicle Program; Final Raport, National Renewable Energy Laboratory, Cambridge, Massachusetts, August 2003, NREL/SR-540-34286
[4] Peucheret S., Feaviour M., Golunski S.: Exhaust-gas reforming using precious metal catalysts; Applied Catalysis B: Environmental 65 (2006) 201-206
[5] Walkowiak W., Szynalski K. :The effectiveness of starting heater plug with active ceramic coating; Journal ok Kones; Powertrain and Transport, vol.13, No 3, Warsaw 2006
67

[6] Walkowiak W. Janicka A. Sroka J.Z.: Obnianie toksyczno�ci spalin silnika o zap�onie samoczynnym przez zastosowanie wewn�trznego katalizatora spalania. Raport Politechniki Wroc�awskiej Seria:Spr.47/2007
[7] Girolamo G.D., Blasi C., Schioppa M., Tapfer L.: Structure and thermal properties of heat treated plasma sprayed ceria–yttria co-stabilized zirconia coatings, Ceramics International 36 (2010) 961–968
68

ANALYSYS AND SYMULATION OF INTERNAL COMBUSTION ENGINE PERFORMANCE CHARACTERISTICS USING ELECTRONIC
INTERFACE WITH “EEC IV” CAR COMPUTER
Andrzej Ka�mierczak, Konrad Krakowian, Aleksander Górniak, Pawe� Kawali�o
Wroclaw University of Technology Department of Mechanical Engineering, Institute of Machine Design and Operation
ukasiewicza St. 5, 50-371 Wroc�aw, Poland Tel. +48 603 486 614
e-mail: [email protected] [email protected] [email protected]
Abstract Currently all modern car combustion engines are equipped with an electronic control device, sometimes called on-board computer. It is responsible for driving the engine depending on driver behavior, engine working conditions and engine load. Main loads an Electronic Engine Control (EEC) unit is empowered to control are injectors (to doze certain amount of fuel) and ignition system (to ensure ignition timing). The control decision is estimated on the basis of readings from various sensors like MAP (Manifold Air Pressure) Sensor, CKP (Crankshaft Position) Sensor, air temperature sensor, throttle position and many others. Treating the EEC unit as a black box with specific inputs and outputs, an engine simulator was be constructed. Its principle is to substitute real sensors with compatible artificial electrical signals, arrange them in patterns similar to typical engine working conditions, expose EEC to them and eventually measure how EEC changes output signals values in real-time. The purpose behind was to create a fixture for educational purposes. Its operator can easily manipulate with virtual throttle pedal, set temperatures, load, even simulate sensor disconnection, having the ability of monitoring and registering the resulting EEC control decision. Those activities are realized by an electronic circuit involving 8-bit microcontroller and signals level match elements usage. Currently chosen target to interface with is Ford EEC IV unit, originally designed for Ford Sierra 2.0DOHC EFI engine. A series of successful measurements of ignition angle and cylinder filling characteristics have been done. Achieved results were verified with empirical data collected from a real engine.
Keywords: Electronic Engine Control, educational, sensors, real-time visualization, interface
1. Introduction Technology of electronic engine control is a modern and extensively developed branch of motorization industry. Main reasons for it are: introducing rigorous norms concerning toxic fumes emission, minimization of fuel consumption, attempt to gain as much power as possible from a
69

certain cubic capacity. In addition to above, trends to simplify car maintenance and automatic failures diagnosing systems should be mentioned. Currently all cars equipped with direct fuel injection engine have a dedicated type of Electronic Engine Control (EEC) unit as an integral element of whole driving system[1]. Major difficulty while electronically controlling a combustion engine is a possible sensor defect. The common way to deal with this problem is to use some default reading value or attempt to estimate the value on the basis of other sensors. The sensors can be differentiated on those which malfunction is resulting with improper engine behavior (diminished power, irregular work) and on those, like Crankshaft Position Sensor, which failure immobilizes the engine completely. Other problem is that sensor readings could be affected by random or systematic noise. Presence of such condition, in state of dynamic adaptation functioning, can disturb control characteristics. In worst case they have to be manually reset. This paper presents a device that is enabling to observe EEC internal characteristics. The main idea behind is to replace all of the real sensors attached to EEC unit with artificially generated signals. Their time and frequency characteristics should resemble the specifics of each physical sensor. Additionally, the simulator is attached to EEC outputs for parallel monitoring EEC response (control decision) in real-time. The device can be used in real engine diagnostic (by serving a "fake signal" instead of a temporarily disconnected sensor) or for educational purposes. 2. Inputs of an EEC unit The target chosen to interface with is Ford EEC-IV unit, originally designed for Ford Sierra 2.0DOHC EFI engine. There is a number of sensors that this control unit requires to monitor in order to discover engine working conditions. Below an absolute minimum set is listed. This set is sufficient enough to make EEC "think" it is mounted and working in a real car. Other inputs can be left connected to signal ground or supply voltage.
Tab. 1. Summary of major sensors present in direct fuel injection engine control systems
EEC-IV Input name
Functional description Signal shape expected by EEC-IV
Signal properties description
Crankshaft Position (CKP) Sensor
Used to record the rate at which the crankshaft is spinning. The sensor system consists of a rotating part, typically a disc, as well as a static part, the actual sensor. Typically a Hall Effect sensor is used as the static part requiring a magnet to be mounted somewhere in the periphery of the rotating disc[2,3,4].
Fig. 1. Typical CKP signal curve
Sinusoid changing its amplitude and period depending on engine RPM. For 800RPM the absolute values were in range of -10V/+10V, but for 6000RPM between –50V and +50V.
70

Mainfold Absolute Pressure (MAP) Sensor
Indicated data is used to calculate air density and determine the engine's air mass flow rate, which in turn determines the required fuel metering for optimum combustion[2,4].
Fig. 2. Typical MAP signal curve
Square wave of 5V amplitude. Modulated by frequency, from 160Hz (which corresponds to maximal engine load) to 100Hz (engine idling).
Engine Coolant Temp. (ECT) and Intake Air Temp. (IAT) Sensor
Temperature indicators of an engine and it's environment. Used for determining cold engine start, operating temperature reach as well as overheating [2,3].
Fig.3. Typical ECT resistance and corresponding output
voltage depending on the sensor temperature
Almost linear voltage from 0.2V to 4.5V. The sensor is connected in series to a fixed value resistor. The ECM supplies 5V to the circuit and measures the change in voltage between the fixed value resistor and the temperature sensor.
Throttle Position (TP) Sensor
Usually a potentiometer located on the butterfly spindle so that it can directly monitor the position of the throttle valve butterfly. In fuel injected engines, in order to avoid stalling, extra fuel may be injected if the throttle is opened rapidly (mimicking the accelerator pump of carburetor systems) [2,4].
Fig. 4.Typical curve for Vtp / Vref relationship
Almost linear voltage from 0.5V to 4.5V.
Heated Oxygen Sensor (HO2S)
Used to regulate the fuel mixture in a "closed loop" operation. The result is a constant flip-flop back and forth from rich to lean which allows the catalytic converter to operate at peak efficiency while keeping the average overall fuel mixture in proper balance to minimize emissions [2,4].
Fig. 5. Typical HO2S signal curve
Constantly changing signal between two levels: 0,2V and 0,8V.
71

3. Simulator circuit Core of the simulator is an 8-bit Atmel ATmega88 RISC microcontroller. Because most of the generated/measured signals have simple digital nature, there was no reason to introduce a microprocessor of a greater complexity. Due to the fact that EEC consumes about 500mA of current (at 12V) in a normal state and a need for two operational voltage levels (+5V for the micro and +12V for operational amplifiers) to power up the system, an external ATX computer power supply was used. Main sub-circuits that can be identified in the device are: user interface (potentiometer, buttons) and a context numerical display MAX517 8-bit and TDA8444P 6-bit D/A converters, instructed trough I2C bus by the micro, serving an analog signal for TP, IAT and ECT LM324N configured as differential amplifier, powered by symmetrical -12V/+12V voltage taken from ICL7660CPA voltage inverter. Used for adjusting the micro PWM signal levels in CKP sensor module. What is worth mentioning is that the CKP signal was reconstructed as a square wave, but this occurred sufficient enough for EEC and allowed to keep maximal circuit simplicity. simple voltage divider associated with transistor, for HO2S signal. The resistors have been chosen is such a way that output voltage shall be equal 200mV or 800mV, depending on the transistor state.
Fig. 6. Simulator functional block diagram Software necessary for the simulator was created in ANSI C language, in AVR Studio 4 environment. A great focus on modularity and future extensions has been made. Implemented software architecture is time-slotted, with no autonomous OS. Two working modes are foreseen for the device. One can be called real-time emulation, in which the user can set a quantized value for a certain sensor (from its valid range). Second mode is an automatic data acquisition mode, in which the user interface is disabled, UART and monitor circuits activated and previously uploaded (into micro Flash memory) test vector is executed. The structure of test vector is described in detail in the simulator manual. It enables to define simulated sensor values, sampling time, idle time needed to cover EEC lag when executing control decision and samples number for one measurement.
72

4. Measured signals and data acquisition method It was decided that two events will illustrate EEC unit control decision: injection duration and ignition timing. Both of those events were time synchronized to TDC (Top Dead Centre) of the crankshaft. For injection in Ford Sierra 2.0DOHC EFI engine four electromagnetic valves are used. They are grouped in two pairs (1-3 and 2-4). Valves can be considered as bi-state elements driven by current. Their circuit is energized once each full crankshaft rotation. Energizing time shall be proportional to amount of fuel to be supplied to the cylinder. To measure this signal a simple circuit transferring current amount to voltage level is needed.
Fig. 7. Oscilloscope curve representing voltage applied to injector
The ignition angle is measured in crankshaft rotation degrees. They represent crankshaft position (relatively to TDC occurrence) in which the ignition spark should appear. The proper ignition plug is selected mechanically by an ignition distributor. A following circuit was developed to measure the ignition moment.
Fig. 8. Circuit used for measuring ignition moment
The high voltage (about 7kV) present on ignition cable results in voltage induction in the test coil. The D1 and R1 elements are only for adopting inducted voltage level. To measure the ignition signal the system must react on signal edge. For the data being gathered a following scheme was accepted. After system power-up, an EEC unit is stimulated with conditions resembling a cold engine start and idle work for 15 minutes. Then the required sensor values are set. To ensure that EEC will have the time to react properly, a three second pause is made. Assuming that after that time the control decision is stable and unchangeable, 1000 samples is gathered. This is done by resetting the internal timers each time TDC occurs and continuously debouncing the EEC output signal in anticipation of a certain slope appearance. The trigger for each single measurement is the nearest TDC occurrence. The final registered value is an arithmetical average of previously collected in a whole step. After that the
73

emulator is switching to next set of emulated sensor output values or finishes the activity. Gathered data and procedure status are being outputted to UART in parallel with measurements progression. The reason behind taking an average for estimating the real value is an assumption that the signal is time stable and is not affected by hysteresis effect. Reason for having 1000 samples is that the earlier oscilloscope observation had shown that the control signals have the tendency to fluctuate 30-60us relatively to TDC moment. While sample taking time equals roughly 2us, having 1000 samples is aimed to eliminate this effect. Increasing samples number beyond that count would theoretically improve the precision, but make the overall process unrealistic in terms of time. 5. Example characteristics and final summary The simulator outcome data was eventually stored and reworked on a PC. Data selection, filtration and visualization were done using Microsoft Excel and MathWorks Matlab. Obtained values were compared and contrasted with data gathered empirically. This was done using an isolated oscilloscope interfaced in parallel with EEC-IV signals controlling 2.0DOHC EFI engine, mounted in an engine test bed. Final results weren't mismatching the reference measurements (in the comparison scope, that is the filling and timing characteristics presented below) more than 6%, what can be perceived as a satisfying result.
Fig. 9. Example of obtained ignition angle characteristics, TP = 5º, ECT = 0ºC, IAT = 0ºC
74

Fig. 10. Example of obtained ignition angle characteristics for different temperatures, MAP = 140Hz
Fig. 11. Example of obtained filling characteristics, TP = 90º, ECT = 0ºC, IAT = 0ºC
75

Fig. 12. Example of obtained filling characteristics for different temperatures, MAP = 140Hz
Main conclusion from other test series (not presented in this paper) is that the reverse engineering attempts, aimed to uncloak EEC internal control algorithms, are very hard to succeed. The vast number of factors that are influencing the momentary control decision, dynamic adaptation mechanism presence and the fact that some of the constant parameters are estimated empirically by manufacturer during engine development, makes the obtained results valid only for an qualitative rather than quantitative analysis. References [1] Jürgen Kasedorf, Zasilanie wtryskowe benzyn�, Wydawnictwo Komunikacji i �czno�ci, Warszawa, 1989 [2] Andrzej Gajek, Zdzis�aw Juda, Czujniki. Mechatronika samochodowa, Wydawnictwo Komunikacji i �czno�ci, Warszawa, 2008 [3] Anton Herner, Hans-Jürgen Riehl, Elektrotechnika i elektronika w pojazdach samochodowych, Wydawnictwo Komunikacji i �czno�ci, Warszawa, 2009 [4] Praca zbiorowa, Sterowanie silników o zap�onie iskrowym. Uk�ady Motronic., Wydawnictwo Komunikacji i �czno�ci, Warszawa, 2008
76

THE FUTURE OF ALTERNATIVE FUELS FOR INTERNAL COMBUSTION ENGINES APPLICATIONS
Anna Janicka, Czes�aw Kolanek, Marek Reksa, Wojciech Walkowiak
Wroc�aw University of Technology
wyb. Wyspia�skiego 27 50-370 Wroclaw
tel./fax. +48 71 3477918 e-mail: [email protected]
Abstract
The European Union 2009/28WE directive treating promotion and using of energy from alternative sources
assumes that bio-components addition to conventional fuel should account for 7 % for diesel oil and 10 % for petroleum. The aim of this study is finding answer for a question if that numbers are reasonable in aspect of contemporary internal combustion engines operation and development.
The problem of alternative fuels application in combustion engines should be discussed in two aspects: adjusting new fuel parameters for engine properties and adjusting an engine to be fuelled with new fuel. Taking into consideration the possible ways of renewable fuels applications it is important to consider costs of the researches of the engines adjustment. The expenditures are reasonable if the alternative fuels supplies will be at the same level as crude oil exploitation these days. The fuel of the future seems to be the hydrogen, fuel for temporary period – natural gas and partly, methane from biomass and dimethylether (DME) as a fuels which can be used in contemporary engine after insignificant modifications.
Keywords: renewable energy sources, engine fuel, DME, SynFuel, hydrogen, Biodiesel
1. Introduction The worldwide energy consumption in 2005 accounted for over 10,5 Gtoe (ton of oil
equivalent). The 88% of that value came from fossil fuels: crude oil (36,5%), coal (28%) and natural gas (23,5%). If in next few years velocity of increase in fuel consumption will be higher than new sources discovering, the supplies of crude oil will be exhausted after 40 years of exploitation, natural gas after 60 years of exploitation and coal after 200 years of exploitation [1].
The coal is used directly for electric and heat energy production, natural gas for mainly in industry sector for energy production and as a fuel in automotive industry. Crude oil is used almost only as an engine fuel: petroleum, diesel oil, turbine fuels and shipping fuels.
During the fuel combustion processes the exhaust gases are produced. The exhausts consist environment harmless compounds: CO, CO2, SO2, NOx, particle matter (PM) and unburned hydrocarbons. Some of that chemical invidious have mutagenic and carcinogenic properties (mainly hydrocarbons like aromatic and polyaromatic compounds). Some of them (especially carbon dioxide and some hydrocarbons) are responsible for Green House effect.
According the recent researches 25 mld Mg of CO2 is emitted every year and in each year the emission increase about 3 ppm. The CO2 concentration in atmosphere in 2008 accounds for 385
77
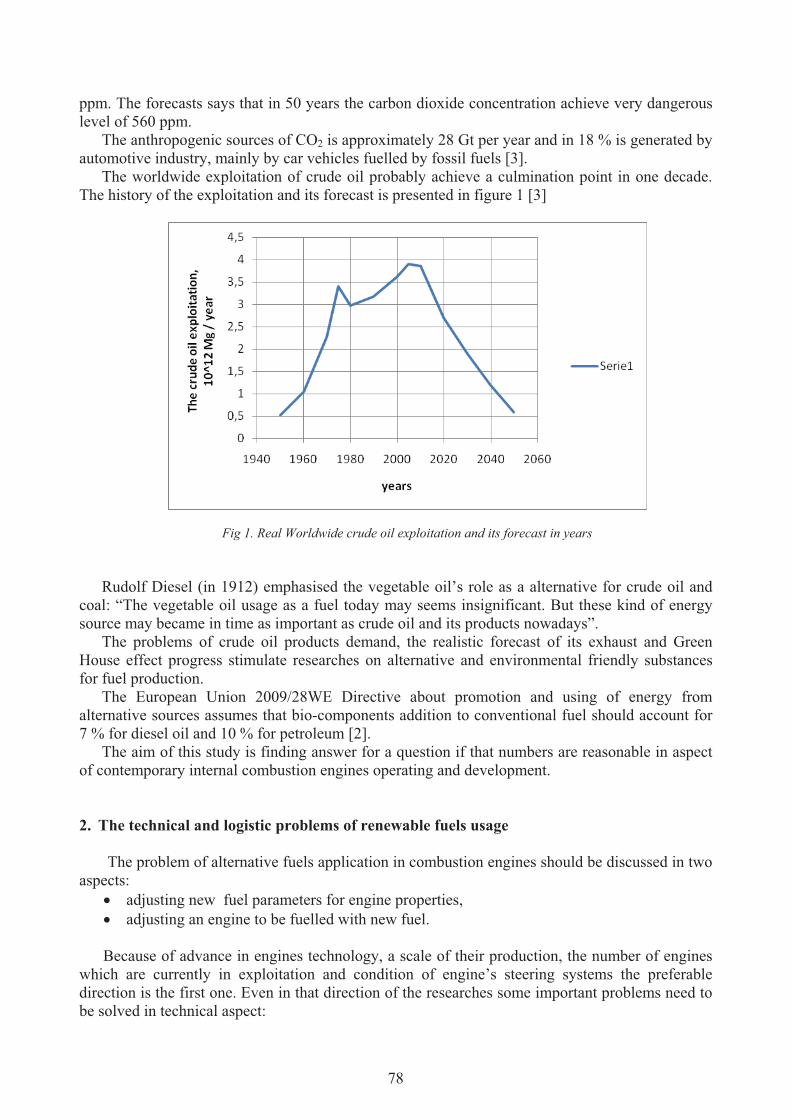
ppm. The forecasts says that in 50 years the carbon dioxide concentration achieve very dangerous level of 560 ppm.
The anthropogenic sources of CO2 is approximately 28 Gt per year and in 18 % is generated by automotive industry, mainly by car vehicles fuelled by fossil fuels [3].
The worldwide exploitation of crude oil probably achieve a culmination point in one decade. The history of the exploitation and its forecast is presented in figure 1 [3]
Fig 1. Real Worldwide crude oil exploitation and its forecast in years Rudolf Diesel (in 1912) emphasised the vegetable oil’s role as a alternative for crude oil and
coal: “The vegetable oil usage as a fuel today may seems insignificant. But these kind of energy source may became in time as important as crude oil and its products nowadays”.
The problems of crude oil products demand, the realistic forecast of its exhaust and Green House effect progress stimulate researches on alternative and environmental friendly substances for fuel production.
The European Union 2009/28WE Directive about promotion and using of energy from alternative sources assumes that bio-components addition to conventional fuel should account for 7 % for diesel oil and 10 % for petroleum [2].
The aim of this study is finding answer for a question if that numbers are reasonable in aspect of contemporary internal combustion engines operating and development.
2. The technical and logistic problems of renewable fuels usage
The problem of alternative fuels application in combustion engines should be discussed in two aspects:
adjusting new fuel parameters for engine properties, adjusting an engine to be fuelled with new fuel. Because of advance in engines technology, a scale of their production, the number of engines
which are currently in exploitation and condition of engine’s steering systems the preferable direction is the first one. Even in that direction of the researches some important problems need to be solved in technical aspect:
78

decrease in engine effectiveness in comparison to conventional fuel, disadvantageous impact of fuel on engine fuelling system and its components, problems with fuel-air mixture formation because of difference in viscosity, density and
surface tension of bio-based fuels and the problems with combustion process caused by that facts,
need of engine’s control systems modification because of previous facts, nitric oxides emission increase, discursive scale of other exhaust toxic compounds decrease, problems with current exhausts toxicity standards abiding, a scale of fuel available compare to crude oil products, no compatible, with alternative fuel demand, engine development
logistic aspect:
oil plants harvesting one time per year, dependence of fuel quantity on environment condition (climate, soil, pollution), unstable fuel parameters (quantity), demand on infrastructure for bio-based fuel production, fuel stability and its ageing, necessity of using areas assigned for food production for biomass production, increase in food prices, organisation of fuel distributing net,
ecologic aspect:
change in culture structures (so called: monoculture), demand on chemical substances for disease prevention, soil demineralisation.
Taking into consideration the direction of alternative fuels application also engine adaptation
to new fuel parameters is needed. The main engine parameters should be investigated to achieve the engine effectiveness comparable to the effectiveness with engine fuelled with conventional fuel.
That is why the question about alternative fuels should be answered only in context of the engine assigned for concrete fuel usage (in aspect of thermodynamic machine). Typically, for that kind of situations, the arguments are divided according to the author’s background.
3. The VOLVO AB strategy
The VOLVO AB Company, as a producer of heavy-vehicles and buses, consistently believes diesel engines as a drive unit for next 20 years [3]. The main advantageous of compression-ignition engine usage is high effectiveness – even at maximum 45 % level. The others diesel engine advantageous are:
Low toxic compounds emission – contemporary compression-ignition engine equipped with exhaust gases purification system is very profitable for environment in toxic emission aspect especially particle matter (PM) and NOx; According to the forecast in next few years the emission will be 100 times lower than in 1980.
The fuel flexibility – the compression-ignition engine can be fuelled with various alternative fuels like synthetic diesel oil, dimethylethers (DME), alcohols and gas fuel.
79
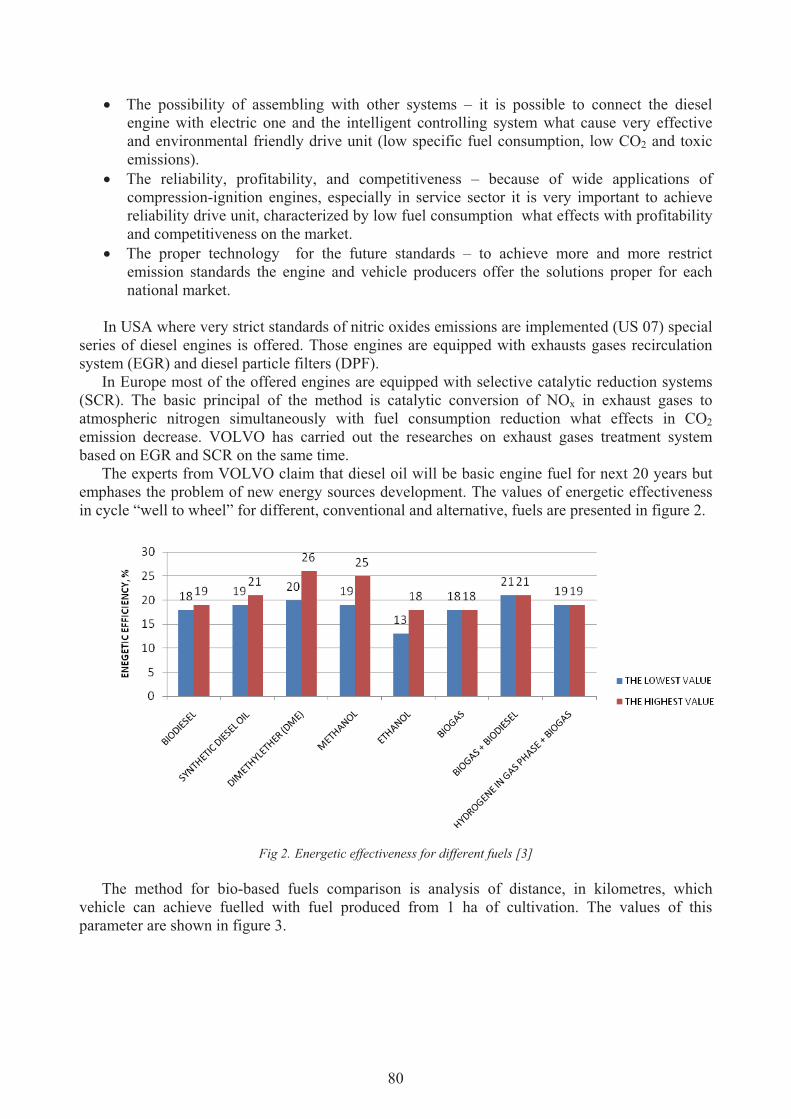
The possibility of assembling with other systems – it is possible to connect the diesel engine with electric one and the intelligent controlling system what cause very effective and environmental friendly drive unit (low specific fuel consumption, low CO2 and toxic emissions).
The reliability, profitability, and competitiveness – because of wide applications of compression-ignition engines, especially in service sector it is very important to achieve reliability drive unit, characterized by low fuel consumption what effects with profitability and competitiveness on the market.
The proper technology for the future standards – to achieve more and more restrict emission standards the engine and vehicle producers offer the solutions proper for each national market.
In USA where very strict standards of nitric oxides emissions are implemented (US 07) special
series of diesel engines is offered. Those engines are equipped with exhausts gases recirculation system (EGR) and diesel particle filters (DPF).
In Europe most of the offered engines are equipped with selective catalytic reduction systems (SCR). The basic principal of the method is catalytic conversion of NOx in exhaust gases to atmospheric nitrogen simultaneously with fuel consumption reduction what effects in CO2 emission decrease. VOLVO has carried out the researches on exhaust gases treatment system based on EGR and SCR on the same time.
The experts from VOLVO claim that diesel oil will be basic engine fuel for next 20 years but emphases the problem of new energy sources development. The values of energetic effectiveness in cycle “well to wheel” for different, conventional and alternative, fuels are presented in figure 2.
Fig 2. Energetic effectiveness for different fuels [3]
The method for bio-based fuels comparison is analysis of distance, in kilometres, which
vehicle can achieve fuelled with fuel produced from 1 ha of cultivation. The values of this parameter are shown in figure 3.
80

Fig 3. The distance, in kilometers, which vehicle can achieve fuelled with fuel produced from 1 ha of cultivation
The energy source which is the most perspective seems to be syngas (dimethylether, DME).
DME may be produced from biomass but also from coal and natural gas. The most profitable is the production from biomass sources. 4. The strategy of VOLKSVAGEN AG
The VW company as a worldwide producer of internal combustion engines (gasoline and
diesel), discuss the possibility of alternative fuels applications, especially on synthetic fuels(SynFuels) field and biofuels (SunFuel: SunDiesel and SunEthanol). Hydrogen and its usage in fuel cells is an electrotraction stage [4]. The VW fuel and powertrain strategy is presented in figure 4.
Fig 4. The Volkswagen fuel and powertrain strategy: SynFuel – Synthetic fuel, SunFuel – fuel derived from
biomass, CCS – Combined Combustion System [4] Implementation of alternative fuels for engine applications causes series of consequences. The
basic problem is change in caloric value and its changing in time. The phenomena is presented in figure 5.
81

Fig. 5. The change in caloric value of alternative fuel in time [4]: f1 – diesel oil, f2 – biodiesel, f3 – diesel with
commercial additions, f4 – diesel oil with 5% of bio-component and commercial additions, f5 – diesel with special additions
The changes in combustion process on example of indicator diagram of engine fueled with
diesel oil and rape oil methyl ester (RME) is presented in figure 6.
Fig 6. The indicator diagram for diesel fuel and biodiesel [4]
The change in fuel-air mixture combustion process in compression-ignition engine has
significant impact on exhaust quality (toxic compounds concentration). The impact of fuel change from diesel fuel to biodiesel on emission of HC, CO, NOx and smoke matter is shown in figure 7.
82

Fig. 6. The change in emission of chosen exhausts compounds from diesel engine fueled with biodiesel in comparison
to conventional fuel [4] The “zero emission” of toxic compounds and high heat efficiency ensure hydrogen usage as an
engine fuel. The disadvantageous of hydrogen fuel is insufficient caloric value and high energy-consuming factor of its production process.
4. Conclusions:
Nowadays the trends of alternative fuels production are very difficult to estimate. The wide international cooperation is needed for finding alternative for diesel oil for engines
application. Taking into consideration the possible ways of renewable fuels application it is important to
consider costs of the researches on engines adjustment. The expenditures are reasonable if an alternative fuel supplies will be at the same level like crude oil exploitation these days.
The fuel of the future seems to be the hydrogen fuel for temporary period – natural gas and partly methane from biomass sources and dimethylether (DME) as a fuel which can be used in contemporary engines after insignificant modifications.
References:
[1] Suryga�a J.: Wodór jako paliwo. WNT Warszawa 2008 [2] Dyrektywa UE 2009/28/ WE w sprawie promowania stosowania energii ze �róde�
odnawialnych [3] Volvo trucks i �rodowisko. RSP 20100070017.0710 [4] SunFuel® – The Way to Sustainable Mobility. Materia�y informacyjne Volkswagen AG [5] UNEP Report on the Automotive Industry as a Partner for Sustainable Development; 2002 [6] ACEA Communication – vehicles and biofuels towards 2020 [7] Girolamo G.D., Blasi C.,
Schioppa M., Tapfer L.: Structure and thermal properties of heat treated plasma sprayed ceria–yttria co-stabilized zirconia coatings, Ceramics International 36 (2010) 961–968
83

84

EVALUATION OF WORKING SPACES’ TECHNICAL CONDITION OF MARINE DIESEL ENGINE ON THE BASIS OF OPERATION RESEARCH
Zbigniew Korczewski1)
Marcin Zacharewicz2)
1) Gdansk University of Technology
Faculty of Ocean Engineering & Ship Technology Department of Ship Power Plants
11/12 Gabriela Narutowicza Str. 80-233 Gda�sk tel.: +4858 347 21 81
e-mail: [email protected] 2) Polish Naval Academy
Mechanic-Electric Faculty 69 midowicza Str. 81-103 Gdynia
tel.: +4858 626 23 82 e-mail: [email protected]
Nomenclature Parameters Abbreviations and indexes D – diagnostic measure BL, BP – left and high cylinder block
*H� - exhaust enthalpy flux CH – cooler
n – crankshaft speed k1, k2, k3, k4 – specific control sections p – pressure R – Roots’ compressor V - volume OWK – crankshaft revolutions � – rotation angle S – compressor � – time T – turbine
Abstract
The paper presents the method of evaluation of the technical state of working spaces of a marine diesel engine at the reduced control susceptibility. The method foresees making diagnosis on the basis of the measurements of exhaust gas pressure in the channels connecting engine cylinders with turbocharger’s turbine. In the beginning of the article the research objects are characterized i.e. ZVIEZDA main engine of M401 type and the auxiliary engine DETROIT DIESEL of DDA149TI type. Then, there has been defined a diagnostic measure used to identify the condition of the considered engines. Moreover, there have been presented the selected results of diagnostic tests carried out on the engines being in current operation on warships in the Polish Navy Keywords: marine diesel engines, working spaces, operation, diagnostics
85

1. Introduction
How to develop methods for assessing a technical condition of the working spaces of marine diesel engines which are not equipped with indicator valves by the manufacturer this is one of the research priorities of the Mechanic-Electric Faculty of the Polish Naval Academy. It will allow users to apply the operation strategies according to the engine technical state. These types of engines, characterized with reduced control susceptibility are widely used in Polish Navy ships. So far they have been operated according to the utility potential utility expressed by the fixed working hours adjusted by the producer, so called the engine’s service life (engine’s installation time).
The essence of the research was to find diagnostic relations between the technical state of working spaces of the marine engine (cylinders, air and exhaust flow channels and inter-blades’ spaces of a turbine and compressor of the turbocharger unit) and the waveforms of pressure alterations in the channels connecting engine’s cylinder with a turbine of the turbocharger unit.
The issue of diagnostic research of workspaces of marine diesel engines on the basis of an analysis of thy pressure waveforms in the channels of exhaust gases as a function of time is innovative. To this date, the studies within the gas-dynamic processes of flow channels of combustion engines have been mainly conducted for design development purposes. The results of these works were presented in publications of scientific teams directed by: W. Mitianiec and A. Jaroszewski [3] T. Rychter and A. Teodorczyk [4] and M. Sobieszcza�ski [5].
2. Research problem formulation
The following research problem has been formulated on the basis of an analysis of available
specialist literature, results of the article authors' own research and results of diagnostic tests conducted by the leading centers in the country and abroad, dealing with broadly understood diagnostics of piston engines:
How to conduct diagnostic tests aimed to assess a technical condition of the working spaces of marine diesel engines which are not fitted with indicator valves in standard, during current operation?
Because a direct quantitative and qualitative evaluation processes inside the cylinders of marine diesel engines which are not equipped with indicator valves is not possible, the problem of diagnostic tests of their workspaces has become a significant operational problem. It results from the introducing warships into service in the Polish Navy equipped with such engines. As the result of conducted simulation studies there has been demonstrated that changes in the technical state of the engine’s working spaces cause deformation of the exhaust pressure waveform in the channel powering turbocharger’s turbine, thus determining the stream of energy from the turbine’s exhaust, and thus the turbine’s power, delivery of the charged compressor and thus the engine’s performance and efficiency. As the result of experimental studies carried out on real objects there has been confirmed that it is possible to extract the adequate diagnostic parameters that uniquely identify these changes from the set of gasdynamic parameters characterizing pulsating flow of exhaust gases leaving the engine’s cylinders. In the case of considered engines the following parameters have been distinguished:
• speed of a movement of the peak amplitude of the pressure wave, • dispose enthalpy flux of the exhaust in control sections of the outlet channel, • ratio of harmonic amplitudes of the pressure pulsation in the exhaust duct: the primary
amplitude to the amplitude relating to the number of cylinders powering the examined supply channel.
86

3. Characteristics of the research objects During carrying out the experimental research on the Polish Navy vessels the article authors
focused on two the most popular types of marine diesel engines at the reduced control susceptibility. The first engine group consisted of 15 ZVIEZDA marine diesel engine of M401 type - main propulsion engines. The second engine group consisted of 8 DETROIT DIESEL marine diesel engine of DDA149TI type - auxiliary engines.
Fig.1. Division of engines into sub-sets as testing objects M4010 type, b) DDA149TI type
As the result, 23 engines have been tested. They are in the current use on the Polish Navy warships, i.e. 46 cylinder blocks, which give a total number of 308 examined cylinders.
The ZVIEZDA engine of M401 type is a four-stroke, V-type, twelve-cylinder engine applied to power small boats (minesweepers of 207 type). The engine is turbocharged by two turbochargers in the pulsation system. A general view of the fluid-flow system of the ZVIEZDA engine of M401 type is shown in figure 2.
Fig. 2. Schematic diagram of the fluid-flow system of the ZVIEZDA engine of M401 type
87

The exhaust outlet channels in this engine (powering turbocharger’s turbine) are made in the form of two coaxial tubes. The internal one is fed with exhaust from cylinders 4, 5 and 6, while the external one - with cylinders 1, 2 and 3. In addition, the gas flow channel is cooled by means of the external (sea) water by the so-called "water jacket". Such a design of the channel makes difficult the access to the gas space. Technology openings provided by the engine’s manufacturer represent only one place where it is possible to install a pressure transducer (fig. 3).
Fig. 3. Exhaust channel of M401 engine with marked places of mounting the pressure transducers
The auxiliary DETROIT DIESEL engine of DDA149TI type, operated on frigates the Oliver
Hazard Perry class represents another object of the conducted research. This is a two-stroke, V-type, sixteen-cylinder engine, supercharged in two stages. The first stage of supercharging system consists of four turbochargers - two ones for each cylinder block. The second stage of supercharging system consists of two Roots' supercharging compressors driven directly from the engine’s crankshaft. A general view of the fluid-flow system of the DETROIT DIESEL engine of DDA149TI type is shown in figure 4.
Fig. 4. Schematic diagram of the fluid-flow system of the DETROIT DIESEL engine of DDA149TI type
Similarly to the M401 engines DDA149TI type engines’ exhaust channels are cooled through the so called "water jacket". Such a solution makes it difficult to install pressure sensors in any sections of the exhaust channel connecting the engine’s cylinders to the turbocharger’s turbine. The channel’s ends closed with the special sealing covers represent the only one structural component of the channel, which are not cooled with "water jacket", where the sensors measuring the exhaust pressure could be mounted (k1 and k2 in figure 4).
88

4. Diagnostic measures
Investigations of marine diesel engines necessitate the need to define the diagnostic measurements enabling the univocal identification and location of the occurring engine’s technical unfitness states. The analysis of the measurement and usage possibility of the exhaust pressure and temperature in flow channels has been within the conducted research. At the preliminary stage of analysis it was decided to reject the exhaust temperature as a parameter being difficult to measure with an assumed sampling frequency (20kHz), due to the thermal inertia of available thermocouples. Within the further studies, three diagnostic measures were applied, which are based on the pressure measurement in selected specific sections of the exhaust outlet channels.
The velocity of the peak amplitude of the pressure wave in the exhaust outlet channel represents the first one defined diagnostic measure. A value determination of this diagnostic measure requires two pressure sensors placed in the exhaust outlet channel, distanced each other by at least 50 cm. The measure equals the relation of the road (understood as the distance between the sensors) to the time of running the peak amplitude of the exhaust pressure wave between the sensors. The principle of determining the speed of movement of the peak amplitude of the pressure wave is shown in figure 5. A real application possibility of the so-defined diagnostic parameter to assess the engine working spaces’ technical state have been tested on the AL type SULZER engines, where its diagnostic informativeness was confirmed [1,2]. But, there is no possibility to install simultaneously two pressure sensors in the exhaust outlet channel of the considered ZVEZDA and DETROIT DIESEL engines. Hence, it was not possible to apply this diagnostic measure for these engines.
Fig. 5. The principle of determining the peak velocity amplitude of the wave pressure in the exhaust outlet duct
A disposed enthalpy flux of exhaust stream in characteristic test cross-sections of the outlet
channel stands for another diagnostic measure used in experimental research. It is defined as an integral of the pressure waveform’s course in terms of an angle of the engine’s crankshaft revolution with reference to the time (relation 1, 2 and 3). An exemplifying course of the exhaust pressure waveform in the control section of the outlet channel, recorded during the experimental tests of the engine M401 is shown in figure 6.
89

Fig. 6. Waveform course of exhaust pressure in the outlet channel of ZVIEZDA M401 marine diesel engine as a
function of an angle of the crankshaft revolution
The course of exhaust pressure as a function of an angle of the crankshaft revolution was integrated within the value’s limits of an angle of the crankshaft revolution corresponding to the engine’s cycle:
for four-stroke engines the following relation was used:
� ��0
0
720
0
*)( )( �dpVH OWK
� (1)
whereas for two-stroke engines:
� ��0
0
360
0
*)( )( �dpVH OWK
� (2)
There could be proved for the considered engines that the mean volume of all the cylinders
feeding the cumulative channel is constant over the time [1], therefore, the value of the integral described by equation 2 and 3 is dependent on the course alterations of pressure values.
In to determine disposed enthalpy flux the value obtained from integration must be multiplied by a coefficient which converts angle degrees of the engine’s crankshaft revolution to the corresponding time expressed in seconds. The appropriate calculation formula can be written as follows:
*)(
*
36060 OWKHnH �� ��
� (3)
In addition, the limits of integration could be determined in such a way to determine the
enthalpy flux of the exhaust streams generated by individual engine’s cylinders by analyzing the pressure waveform shown in figure 6 and the working sequence of the engine’s individual cylinder sections. It restricts the area of searching the unfitness state to the concrete cylinder section.
The ratio of harmonics’ amplitudes D of the registered exhaust pressure represents the last measure used in operation investigations of marine diesel engines, defined as: the basic harmonic to the harmonic corresponding to the number of cylinders powering the examined flow channel (expression 4).
nAAD 1� (4)
The examples of frequency characteristics for two different states of technical fitness are shown in figure 7
90

a)
b)
Fig. 7. An amplitude spectrum of the pressure pulsation in the exhaust channel of SULZER 6AL20/24 type engine for
the crankshaft rotational speed equals 492 min-1 a) in a state of the full-service fitness, b) in the partial operation suitability - No.1 cylinder leaks.
5. Representative research results
The engines ZVIEZDA M401 type and DETROIT DIESEL DDA149TI type have been
covered by a passive experiment. Pressure waveforms for characteristic control cross sections of the exhaust outlet channel as a function of the sample’s number were recorded as the result of the worked out studies. By knowing the sampling frequency these waveforms can be treated as a function of time. An exemplifying course of the exhaust pressure for the test engine is shown in figure 8.
a)
b)
Fig. 8. Pressure waveforms in the selected control cross-sections of the exhaust channel as a function of the sample’s number
a) ZVIEZDA engine M401 type, b) DETROIT DIESEL engine DDA149TItype.
A transormation to the pressure courses as a function of an angle of the crankshaft rotation has been worked out on the basis of the recorded pressure courses, as a function of the sample’s number (fig. 9)
91

a)
Pk2 Pk1
b) Pk3
Pk4 Pk1Pk2
Fig. 9. Waveform of the gas pressure in the monitoring cross channel exhaust gases as a function of the angle of
rotation of the crankshaft: a) engine type M401 ZVIEZDA, b) DETROIT DIESEL engine type DDA149TI.
As the result of integrating the exhaust pressure courses recorded in the characteristic control cross-sections of the exhaust outlet channel as a function of the rotation angle a disposed enthalpy flux flowing from the individual engine cylinders were obtained. A bar graph presenting the computed values of this diagnostic parameter for each of the cylinder sections of ZVEZDA engine M401 type is shown in figure 10
b) a)
c) d)
Fig. 10. Disposed enthalpy flux flowing from the individual cylinder sections of ZVEZDA engine M401 type
a) 1, 2 and 3 cylinder of the right block, b) 4, 5 and 6 cylinder of the right block, b) 1, 2 and 3 cylinder of the left block, d) 4, 5 and 6 cylinder of the left block.
A received frequency characteristics representing the result of a spectral analysis of the
exhaust pressure time courses recorded for the selected control cross-sections are shown in figure 11.
92

a) D=7,570
b) D=1,600
D=11,400 c)
d) D=11,200
Fig. 11. Frequency characteristics of the time course of the exhaust pressure pulsation in control cross-sections for
M401 engine along with the marked values of the diagnostic measure assigned by "D" c) 1, 2 and 3 cylinder of the right block, b) 4, 5 and 6 cylinder of the right block,
d) 1, 2 and 3 cylinder of the left block, d) 4, 5 and 6 cylindre of the left block. It can be concluded from the data presented in figures 10 and 11 that the combustion process worked out in 4, 5 and 6 cylinders group of the right cylinder block is incorrect. This is proved by the values of the diagnostic measures D (amplitude relation of the primary harmonic of pressure in the exhaust outlet channel to the third harmonic) and by the values of disposed enthalpy flux *H� . It can be also concluded from the analysis of quantity data shown in figure 11b) that the abnormal combustion process takes place in the cylinder number 5 of the right cylinder block. In order to confirm the formulated diagnosis the injectors of 4, 5 and 6 cylinder of the right cylinder block were dismantled and checked. Well visible corrosion traces have been observed on the injector of cylinder 5. This is evidence that disturbances within the fuel combustion process in this cylinder had been taken place (fig. 12b).
a) b)
Fig.12. Injectors screwed out from the right engine block of M401 engine
a) injector of cylinder No. 4, b) injector of cylinder No. 5.
The injectors’ checking on the test bed was the next step of diagnostic investigation. There was confirmed that the injector opening pressure is compatible with the value incorporated in the engine’s technical documentation. Moreover, the fuel spray picture did not also deviate from the
93

norm. After exclusion of the injector’s the tests on a proper performance of the injection pump were carried out as failure the next step of diagnostic activities. For this purpose, high pressure pipes of 4, 5 and 6 cylinder of the engine’s right cylinder block were dismantled. Paper flakes were laid in places of the dismantled pipes and the engine crankshaft was rotated. The fuel doses were observed on the flakes covering sections 4 and 6 of the injection pump, while the fuel was not observed on the flake covering section 5 (fig. 13). A lack of the fuel dose on the flake covering the connector of section 5 of the fuel pump testifies its damage.
Section 6
Section 5
Section 4
Fig. 13. A view of the fuel pump during its testing
6. Conclusion
The method, presented in the paper, is foreseen for assessing the technical condition of the
working spaces of marine diesel engines which are not equipped with indicator valves. The method represents the main achievement of the worked out research project No 0T00B02129 and Ph.D. dissertation defended by Marcin Zacharewicz in 2010. Its implementation to the marine engines operated in the Polish Navy will permit a passage from the less effective strategy of an operation according to the hourly service life to the operation according to the engine’s technical shape.
The practical usefulness of the proposed method for assessing the engine’s technical condition was confirmed during the research on real objects. It is worth mentioning that the conducted research resulted in early detection of the unfitness of the engine’s injection pump, which before did not generate the observable alteration of other diagnostic symptoms. Bibliography [1] Zacharewicz M., Metoda diagnozowania przestrzeni roboczych silnika okr�towego
na podstawie parametrów procesów gazodynamicznych w kanale zasilaj�cym turbospr�ark�. Rozprawa doktorska, AMW, Gdynia 2010.
[2] Korczewski Z, Zacharewicz M. i inni, Metoda diagnozowania silników okr�tów wojennych o ograniczonej moliwo�ci pomiaru ci�nie� wewn�trzcylindrowych na podstawie wyników badania procesów gazodynamicznych w uk�adzie turbodo�adowania,. Opracowanie w ramach projektu badawczego nr: 0T00B02129.
[3] Mitianiec W., Adam Jaroszewski., Modele matematyczne procesów fizycznych w silnikach spalinowych ma�ej mocy. Wydawnictwo im. Ossoli�skich. Wroc�aw 1993.
[4] Rychter T., Teodorczyk A. Modelowanie matematyczne roboczego cyklu silnika t�okowego. PWN, Warszawa 1990.
[5] Sobieszcza�ski, M., Modelowanie procesów zasilania w silnikach spalinowych. WK, Warszawa 2000.
94

THE CH4 COMBUSTION MODEL
Jerzy Kowalski
Gdynia Maritime University, Department of Engineering Sciences Morska Street 81-87, 81-225 Gdynia, Poland
tel.+48 58 6901484, fax: +48 58 6901399 e-mail: [email protected]
Abstract
This paper presents the research effect of the modeling of the CH4 combustion process in different conditions. Presented model was prepared with using the GriMech 3 chemical kinetic mechanism of methane combustion. Its mechanism developed by research unit from University of Berkley and verified by more than 140 science publications. Mechanism GriMech 3 consist of description of reactions between 52 assumed chemical species and thermodynamic data of these reactions and chemical species. The paper presents algorithm of calculations the summarize heat release from combustion process and changing of chemical species mole fractions. Calculations was prepared for different temperature from 1100K to 3600K, different pressure from 2MPa to 5MPa and different combusted mixture composition (changing the humidity of air from 4,5 to 30gH2O/kg of air and air-fuel excess ratio from 0.8 to 2.5). Obtained results of calculations show dependences between mentioned parameters and time of combustion process. Increase temperature and/or pressure of combustion accelerate the combustion process and same process stay sudden. Increasing the quantity of air in fuel mixture causes a significant drop of the maximum heat release but accelerates the combustion process. The changing of quantity of water in combusted mixture not give the significant effect in heat release but changes mole fractions of a few chemical species.
Keywords: combustion process, model, combustion engines, methane, kinetic calculation, GriMech 3 1. Introduction
Most popular source of energy in the world transportation is a combustion process of many
kinds’ hydrocarbon fuels in different constructions of internal combustion engines [1]. Energy machines, uses this kind of process, are still no effective constructions, emitted into the atmosphere a lot of kinds of toxic gaseous compounds. [2]. For this reason, the intensive research on improving the efficiency of combustion and conversion energy processes carried out. Mathematical models are commonly used to designing and testing the processes of combustion of hydrocarbon fuels [3]. Most popular and effective methods of combustion processes calculation are methods based on finite element methods. They rely on dividing the combustion chamber on smaller elements, in which the phenomenon of mixing and the fuel combustion and the mass and energy exchange with the environment are mathematical described [4]. Finite element methods, however, require substantial computing power due to the complexity of phenomena occurring in the combustion chambers of energy machines. The example of this situation is work of the diesel engine [5]. During the compression process of air in the combustion chamber of the engine, the liquid fuel injection process occurs. During compression of air and fuel injection simultaneously take place the following phenomena: the atomization and the vaporization of liquid hydrocarbon fuel, its turbulent mixing in air, the self-ignition and the combustion process according to complex
95

chemical reactions of fuel oxidation. Parameters of mentioned phenomena depend on local concentrations of chemical components of the combusted mixture and local thermodynamic parameters [6]. Due to the motion of the piston, the fuel injection into the combustion chamber and the course of various phenomena of the combustion process takes place in dynamic and heterogeneous conditions in different areas of the engine cylinder. For these reasons, the accuracy of the combustion process modeling also depends on the chosen quantity and the size for finite elements and the accuracy of the description of phenomena occurring in elements. Constantly increasing computational power of computers, however, is still too small for a comprehensive modeling of combustion in the combustion chamber with the use of methods based on Reynolds equations [7]. Therefore, used mathematical models are largely simplified, depending on the purpose of modeling [8]. In the case of models aimed at increasing the efficiency of the combustion processes commonly used simplification is the limitations of the mathematical description of the kinetic combustion process. Such a description is often introduced to a few chemical reactions in each finite element. For modeling the combustion process to reduce emissions of harmful and toxic substances in exhaust gases often used simplification is reduction of the finite elements number or simplified mathematical description of phenomena of heat transfer, mixing of fuel, etc. Each simplification, however, is a compromise between quality and cost modeling.
As a result of the kinetic modeling of the combustion process achieved a continuous function of energy from the fuel dose combustion, depending on mole concentrations of individual chemical species of the combustible mixture, temperature, pressure and time of the combustion. The values of such functions in the combustion process modeling should be carried out for a considered time to determine the energy balances of individual finite elements [9]. The resulting energy function can then be used to model the instantaneous energy states of individual finite elements in various types of combustion chambers of engines.
The paper presents the kinetic model of hydrocarbon fuel combustion in air on the example of methane under conditions of variable pressure and variable temperature. The calculation results are presented for different molar concentrations of fuel and oxidizer and variable humidity of air.
2. The combustion process model
Commonly used hydrocarbon fuels are usually delivered to customers in liquid form, as a
mixture of many, often complex, hydrocarbon compounds. The variety compositions of various hydrocarbon fuels make the designation of the composition strictly impossible in practice. It should also be noted that the fuel processing, the storage and transportation conditions contribute to changes in the chemical composition of delivered fuel. On the other hand, fuel supplied to the energy machine before combustion is usually prepared. In the case of internal combustion engines, fuel supplied to the combustion chamber is atomized and evaporated (in the case of liquid fuels) and in the next stage combusted. The reason of this situation is necessity of the neighborhood of fuel and oxidizer particle, capable of initiating the ignition process. In parallel with these phenomena is the mixing of fuel with the oxidant (usually air) and the process of the thermal dissociation, causing the breaking of complex hydrocarbon chains of the simpler compounds. [10]. And so the combustion process is hydrocarbon fuel in gaseous form and the fuel composition is significantly different from the delivered to the engine.
In the modeling of combustion processes, therefore, the replacement composition of fuel are assumed, selected on the basis of the different criteria. Usually it’s a molar ratio of carbon and hydrogen, similar to the average value of the unprepared fuel or the similar molar mass, the flash point, the heat release, etc. After the assumption of the replacement fuel composition the next stage of modeling is building a kinetic model of the combustion process. This model is built from partial chemical reactions based on their properties such as the required activation energy, molar
96

concentrations of substrates and products and the heat released or collected from the environment. These parameters change with the prevailing thermodynamic conditions and the presence of catalysts, and therefore the process of selecting the model of chemical reactions is usually tedious and proceeded by the theoretical and the experimental research. For that reason, we know only a few reliable and validated kinetic models of the hydrocarbon fuel combustion process [11].
The GriMech 3 kinetic mechanism was assumed to modeling the combustion process [12]. Assumed mechanism was developed by the research unit from University of Berkley and was optimized for natural gas combustion process. GriMech 3 mechanism was chose for reason of its simplicity and verifies at least 143 scientific publications [13]. The chosen model includes a description of the chemical reactions between 52 chemical species, the coefficients needed to determine the course of each reaction and thermodynamic data of considered chemical species. These data allow determining the molar concentrations of substrates, products, and heat release in various chemical reactions for selected thermodynamic parameters (temperature, pressure, composition of the mixture).
The first step of the calculation is defining the constant rate for all considered chemical reactions in the combustion process according to GriMech 3 mechanism. It was calculated with using Arrhenius equation:
� �RT-ETAki exp' ��� � , (1)
where:
A and � - constant coefficients, E - the activation energy, R – the universal gas constant, T – temperature.
and constant rate for reverse reaction:
ci
ii K
kk'
" � , (2)
where:
Kci – the equilibrium constant for the i-th reaction, determined by the following equation [14]:
� � � � ���
!
�" ��" �
"�#�
$!
��
��
��#�
$! �
TRH
RS
TRpK k
K
kkiki
kK
kkiki
K
kkiki
ci
0
1
"'0
1
"'1
"'
exp %%%%&&
#$, (3)
where:
p - pressure, Sk
0 – the standard state molar entropy of the k-th species, Hk
0 – the standard state molar enthalpy of the k-th species, �’ki – the stoichiometric coefficient of k-th reactant species in the i-th reaction, �”ki – the stoichiometric coefficients of k-th product species in the i-th reaction.
97

Obtained results allowed calculating rates of molar concentration change of chemical species by the following equation:
� � ' (� � ' ( ' ( ��#
� $
!���
#
� $
!�� ))"
���
K
kkri
K
kkfi
K
kkkii
kiki XkXkXaq111
"' %% , (4)
where:
aki – the enhanced third-body efficiency of the k-th species in the i-th reaction, Xk – the molar concentration of the k-th species.
Determination of the rate of change of the molar concentration for each chemical reaction highlighted the sum of molar concentrations of all chemical species for a given moment of time.
Based on Hess's law it‘s possible to designate the heat release from the chemical reaction mechanism. Assuming isothermal-isobaric combustion we can write for all considered reactions:
, (5) ' ( '" ""� ��
*+,
-./ ��������
I
i
K
kfkk
Tkki
K
kfkk
Tkki HHHHHHQ
1 1
'0'
1
"0" %% (
where:
Q – the heat release from all considered reactions, Hk
T – the molar enthalpy of the k-th species at temperature T, �Hfk – the enthalpy of formation k-th species.
The calculations are made using a spreadsheet for the data presented in Table 1.
Tab. 1. Parameters used to kinetic calculations according to GriMech 3 mechanism
Parameter Value Unit Pressure p 2, 3, 4, 5 MPa Temperature T 1100, 1600, 2100, 2600, 3100, 3600 K Air humidity X 4,5; 10; 20; 30 gH2O/kg of air Air-fuel excess ratio � 0,8; 1; 2,5 – Time interval t 1,5�10-5 s
Combustion process parameters presented in Table 1 correspond to temperature and pressure in
the combustion chamber of the marine diesel engine. Chosen air humidity correspond the engine charge air humidity from 20% at 200C to 95% at 300C and time interval corresponds to the rotation of the engine crankshaft by 0.1 degree at the engine working with 100 rpm. The calculations were made for the excess and deficiency of air to burn the fuel dose in the cylinder and quantity of charge enough (air-fuel excess ratio equal 1). Such conditions may arise in different areas of the engine combustion chamber.
The sequence of calculations was as follows: for selected parameters from Table 1, initial molar concentrations and mole fractions of chemical species were calculated. For selected temperature and pressure the forward and reverse constant rates of all reactions were calculated. Using these parameters the molar concentrations of chemical species after the time equal 1,5�10-5 second were calculated by summation of molar concentrations of all reaction products. The total heat release from the combustion process was the sum of energy of each reaction [10], [14]. Obtained results were the input to the next stage of the calculation after an identical period of time, so that calculation results for different initial concentrations of combustion mixture were obtained.
98

Moreover, such an approach allows for the automation of calculations. In one series of calculations 1500 successive calculations were performed. The calculations are made for all possible configuration parameters set out in Table 1 (288 series of calculations for 1500 in one series).
Using the presented algorithm 432 thousands data sets were collected. All obtained data sets consists of 52 input mole fractions of chemical species, temperature and pressure, 52 output mole fractions of chemical species and the heat release from all considered reactions.
3. Results of calculation
Figure 1 shows example calculation results for chosen chemical species and thermodynamic
parameters equal 1100K i 4MPa, 10gH2O/kg humidity of air and air-fuel excess ratio equal 2,5. The quantity of chemical species is represented in mole fractions in the combustion mixture.
0
0,05
0,1
0,15
0,2
0,25
0 0,005 0,01 0,015 0,02 0,0250
0,05
0,1
0,15
0,2
0,25
0 0,00002 0,00004 0,00006 0,00008 0,0001
16002100260031003600
t[s]
[–] O2
t[s]
[–]
O2
H2O
CH4
NO2
CO2
Fig. 2. Mole fractions of O2 for p=4MPa, X=10gH2O/kg of air, �=2,5 and changed
temperature
Fig. 1. Calculation results of mole fractions of chosen chemical species for T=1100K, p=4MPa,
X=10gH2O/kg of air and �=2,5
According to presented results fastest reactions, responsible for mole fractions of O2, H2O and
CH4 for chosen thermodynamic parameters obtained after the 6ms. Further chemical reactions result only minor changes in the mole fractions. After about 17ms, the combustion process of CH4 is complete. The relatively low temperature of the combustion process is not conducive to the formation of compounds from the group of nitric oxides, that is why the maximum mole fraction of NO2 in the mixture is 2�10-11 and graph for this chemical species coincides with x-axis of the coordinate system.
0
0,00001
0,00002
0,00003
0,00004
0,00005
0,00006
0,00007
0,00008
0,00009
0 0,0001 0,0002 0,0003 0,0004 0,0005
16002100260031003600
0
0,05
0,1
0 0,00005 0,0001 0,00015 0,0002
p=2MPap=3MPap=4MPap=5MPa
NO2 [–] CH4 [–]
t[s] t[s]
Fig. 3. Mole fractions of NO2 for p=4MPa, X=10gH2O/kg of air, �=2,5 and changed temperature
Fig. 4. Mole fractions of CH4 for T=1600K, �=1,0, X=10gH2O/kg of air and changed pressure
99

Figure 2 shows the loss of O2 from the initial mole fraction value. With the increase in
temperature of the process followed to faster obtain the equilibrium fraction of O2. The relation between forward and reverse constant rate of reactions influence on the value of equilibrium fractions of chemical species, which in turn is influenced the prevailing temperature of the combustion process. According to Figure 3 increase in temperature of the combustion process favors the formation of compounds from the group of nitric oxides. Our results are qualitatively consistent with the data in available literature [5].
Figure 4 shows the effect of pressure on the combustion process on the example of the mole fractions of CH4. During the course of the combustion process the mole fraction of this species decrease. The mole fraction equal zero comes at a time that is shorter the higher is pressure of the combustion process. According to the results the speed of the CH4 combustion is proportional to the prevailing pressure. Effect of pressure on the rate of chemical transformation is associated with the reactions that cause changes the quantity of substances (synthesis reactions and reactions of breaking chemical species) [10].
Figure 5 presents the effect of humidity of air on the water content in the combustion mixture. The figure shows that increase of humidity in air results the increase of water content in the mixture. It should be noted that, during the combustion process hydrogen-containing components of fuel combust, inter alia, to water form, thus the amount of water in the combustible mixture during the combustion process increases. The effect of humidity of air on water content in the combustion mixture is visible especially at high values of excess air-fuel ratio.
0
0,05
0,1
0,15
0 0,00005 0,0001 0,00015 0,0002
X=4,5X=10X=20X=30
0
0,05
0,1
0,15
0,2
0,25
0 0,00005 0,0001 0,00015 0,0002
2,51,00,8
The content of the air in combustion mixture has a significant influence on the process of
combustion. According to the data in figure 6 the combustion process is fastest in the case of a large excess of oxygen, while running slowest in the case of oxygen deficiency. It should also be noted that the value of air-fuel excess ratio is determined by the participation of oxygen mole fraction at the end of the combustion process.
Figure 7 shows examples results of the total heat release, derived from the CH4 combustion. According to presented dependencies increasing pressure causes the acceleration of the combustion process and generates larger maximum heat release. The maximum heat release followed after 4ms from start of the combustion at 5MPa pressure and more than 11ms for the combustion at 2MPa pressure at the same temperature. Completion of the combustion process takes place after a 9ms and 20ms, respectively. A similar relationship was obtained in the case of temperature changes and constant other thermodynamic parameters.
t[s] t[s]
[–] [–] H2O O2
Fig. 5. Mole fractions of H2O for p=5MPa, T=1600K, �=2,5 and changed humidity of air
Fig.6. Mole fractions of O2 for p=2MPa, T=1600K, X=10gH2O/kg of air and changed air-fuel excess
100

Figure 8 shows the effect of water content in air at the speed of the combustion process. Due to imperceptible differences between individual results graph has been enlarged at the area of the maximum energy. The reference area is lowest graph from the Figure 7, which corresponds to the graph of the Figure 8 for relative humidity equal 10gH2O/kg. According to results, increasing humidity of air decreases the maximum energy but accelerates the combustion process.
0
5
10
15
20
25
0 0,005 0,01 0,015 0,02
4
4,1
4,2
4,3
4,4
4,5
4,6
0,01 0,0102 0,0104 0,0106 0,0108 0,011
4,5102030
[G
J/m
2 ·s]
[s]
[GJ/
m2 ·s
]
[s]
5MPa
4MPa
3MPa
2MPa
Fig. 7. The heat release from combustion process for T=1100K, X=10gH2O/kg and �=0,8 and changes
ressure
Fig. 8. The heat release from combustion process for T=1100K, p=2MPa and �=0,8 and changes
humiditp
0
0,5
1
1,5
2
2,5
3
3,5
4
4,5
5
0 0,005 0,01 0,015 0,02
Fig. 9. The heat release from combustion process in T=1100K, p=2MPa, X=10gH2O/kg and changes air-fuel excess
ratio
Figure 9 shows the effect of the amount of air on the heat release. Increasing of air content in
the mixture causes a significant drop of the maximum heat release but accelerates the combustion process.
4. Conclusions
As a result of calculations of methane combustion process it is possible to formulate the
following conclusions: � results of the kinetic calculation of mole fractions of chemical species considered in the
GriMech 3 combustion process mechanism are qualitatively consistent with the data available in literature;
� increase in temperature of the combustion process favors the formation of compounds from the group of nitric oxides;
� the speed of the combustion is proportional to the prevailing pressure;
y of air
[GJ/
m2 ·s
[s]
0,8
1,0
2,5
101

� increase of humidity of air results increase of water content in the mixture; � increasing pressure and temperature of combustion process causes the acceleration of the
combustion process and generates larger maximum heat release; � increasing humidity of air and it’s content in combustion mixture decrease the maximum
heat release and accelerate the combustion process. References
[1] Demirbas, A., Biodiesel – a realistic fuel alternative for diesel engines, Springer-Verlag, 2008.
[2] Hester, R. E., Harrison, R. M., Air pollution and health. Royal Society of chemistry, 1998. [3] Winterbone, D. E., Advanced Thermodynamics for Engineers, Wiley & Sons, 1997. [4] Zienkiewicz, O. C., Taylor, R. L., Zhu, J. Z., The Finite element method, 6-th edition,
McGraw-Hill, 2005. [5] Heywood, J. B., Internal Combustion Engine Fundamentals, McGraw-Hill, 1988. [6] Chopey, N. P., Handbook of chemical engineering calculations 3-rd edition, McGraw-
Hill, 2004. [7] Pozrikidis, C., Fluid dynamics – theory, computation and numerical simulation, Kluwer
academic publishers, 2001. [8] Woodward, J. L, Estimating the flammable mass of a vapor cloud, American Institute of
Chemical Engineers, 1998. [9] Kowalski, J., Tare�ko, W., NOx emission from a two-stroke ship engine. Part 1: Modeling
aspect, Applied Thermal Engineering, Vol. 29 No 11-12, pp. 2153 – 2159, Elsevier Science Inc, 2009.
[10] Kuo, K. K., Principles of combustion, Wiley & Sons, 2005. [11] Bradley, A., Williams, A., Pasternack, L., The effect of nitric oxide premixed flames of
CH4, C2H6, C2H4 and C2H2, Combustion and flame, Vol 111, pp. 87 – 110, Elsevier Science Inc, 1997.
[12] Bowman, C. T, i in, http://www.me.berkeley.edu/gri_mech/ [13] http://www.me.berkeley.edu/gri_mech/version30/text30.html#targets [14] Reynolds, J. P., Jeris, J., Theodore, L., Handbook of chemical and environmental
engineering calculations, Wiley & Sons, 2007. [15] Kowalewicz, A., Podstawy procesów spalania, WNT, 2000.
102

THE ANN APPROXIMATION OF THE CH4 COMBUSTION MODEL
Jerzy Kowalski
Gdynia Maritime University, Department of Engineering Sciences Morska Street 81-87, 81-225 Gdynia, Poland
tel.+48 58 6901484, fax: +48 58 6901399 e-mail: [email protected]
Abstract
The paper presents results of research on the possibility of approximation of the results of calculations using the GriMech 3 kinetic mechanism by an artificial neural network (ANN). Application of kinetic mechanisms for modeling of combustion process in the finite element method requires considerable computing power which is associated with high costs of modeling. It is therefore necessary to seek alternative solutions in this area. The paper focuses on the possibility of application of ANN to approximate the total heat release from the combustion of methane. We built and trained ANN allows the approximation of the total heat release from the combustion process with a mean square error not exceeding 0.04% and the individual error for one result equal to 1.9%. Inputs for this model are the temperature and pressure of the combustion process and 52 mole fractions of chemical species in combusted mixture taken into account in the GriMech 3 kinetic model. For this reason, we tried to build and train the ANN approximating the mentioned mole fractions of chemical species. During the study we tested different configurations of ANN’s, containing different numbers of hidden layers and different numbers of neurons in the output and the hidden layer. The best results were obtained for the approximation of the ANN with one hidden layer containing 38 neurons. It was built and trained 52 ANN’s, one for each chemical species. Unfortunately, even for obtained small values of mean square errors of approximation, errors of individual results often exceed 100% of the results obtained from the kinetic calculations. For this reason, the application of ANN in the presented form to approximate mole fractions of chemical species is impossible.
Keywords: combustion process, model, combustion engines, methane, kinetic calculation, GriMech 3
1. Introduction
The development of alternative energy sources is not as yet resulted in a significant reduction of hydrocarbon fuels consumption. Still, hydrocarbon fuels are the most widely used in power machinery of the world [2]. In energy machines the energy generation from hydrocarbon fuels is obtained by changing the chemical energy into heat release during the combustion process and then into mechanical energy. Therefore, studies on the improving efficiency of the combustion process and accompanying energy changes reducing the amount of emitted to the atmosphere toxic compounds are a necessity. The high cost of experimental research makes that to the study of combustion processes and design of combustion chamber components of energy machines are also commonly used mathematical models [11]. The steady increase the computing power of computers makes models based on finite element method popular. The basis of these methods is dividing the combustion phenomena in the smaller elements (it’s possible the division according to the geometry of the combustion chamber or other physical parameters such as velocity or temperature) [12]. This division is made in such a way that the mathematical description of physical phenomena in these finite elements were as simple as possible. Elements are “connected” each other by
103

boundary equations. This procedure simplifies the analysis and computation of complex phenomena as the combustion process, however, requires considerable high computing power because of the multiplicity of finite elements used (often exceeding hundreds of thousands elements), and the number and complexity of the phenomena taking place simultaneously during the combustion process.
The use of hydrocarbon fuel required to provide it to the energy machine in the liquid or gas form. This process requires a preparatory treatment before combustion the fuel. Preparation is often done directly in the combustion chamber, which is caused by economic considerations and increasing the efficiency of the machine. That is why in the combustion chamber often take place parallel a variety of physical and chemical phenomena. In the case of diesel engine working [4], during the process of air compressing in the cylinder with a piston simultaneously take place injection of liquid hydrocarbon fuel into the combustion chamber, its atomization and evaporation, turbulent mixing with air, self-ignition and combustion of the mixture by chemical reactions of oxidation in air. The rate of chemical transformations and their progress depends largely on local concentrations of substrates involved in the combustion process and the local thermodynamic conditions [5]. Due to the movement of the piston, the process of delivering fuel and progress of considered individual phenomena takes place in a dynamic and heterogeneous conditions in different areas of the combustion chamber. For these reasons, the accuracy of the model of the combustion process depends on number and size of finite elements established to calculations, but also on the accuracy of the description of phenomena occurring in the same elements. In the case of modeling the phenomena associated with turbulent combustion in the combustion chamber of the diesel engine the complexity of the phenomena enforces of the high cost of modeling. So often it is reasonable simplification to the model, depending on the intended purpose and accuracy of modeling.
In work [7] author has attempted to model of combustion process of methane based on the GriMech 3 kinetic mechanism [1], developed by scientific unit from University of Berkley. Our results appear to be qualitatively consistent with available results of similar studies and the general knowledge about the phenomena occurring in combustion processes. The results of modeling are continuous functions of heat release derived from the fuel combustion, depending on the concentrations of individual chemical species of the combustible mixture, temperature, pressure and time of combustion and mole fractions of established chemical kinetic model. The obtained values of mole fractions, together with the heat release function should be in the next stage used to determine individual energy balances in all finite elements of the combustion phenomena to modeling the instantaneous energy states of different areas of the engine cylinder or other combustion chamber [6]. The complexity of the calculations carried out, however, difficult to use even such a simple model for finite element calculations. For this reason, author tried made approximations of obtained results using the artificial neural network (ANN). During the preparation of approximation author made assumption that properly trained ANN able to provide correct results for other, similar thermodynamic parameters and calculation of individual weights of the network requires significantly less computing power than the algorithm based on the kinetic model of combustion.
The paper presents the results of approximation of the GriMech 3 modeling results of the methane combustion process using the ANN. The calculation results are presented for different mole fractions of fuel and oxidizer in the combusted mixture, different humidity of air and different pressure and temperature of combustion.
2. The selection of ANN parameters
The data used to approximate the relationship between the mole fractions of chemical species
and the heat release from the combustion process of methane in humidity air have been determined
104

on the basis of calculations based on the GriMech 3 kinetic mechanism. Calculations were performed for selected values of temperature and pressure of the combustion process and selected mole fractions of methane and air. The calculations are made for all possible configurations of parameters given in Table 1.
Tab. 1. Parameters used to kinetic calculations according to GriMech 3 mechanism
Parameter Value Unit Pressure p 2, 3, 4, 5 MPa Temperature T 1100, 1600, 2100, 2600, 3100, 3600 K Air humidity X 4,5; 10; 20; 30 gH2O/kg of air Air-fuel excess ratio � 0,8; 1; 2,5 – Time interval �t 1,5�10-5 s
The obtained calculation results include a total of 432,000 data sets. Each data set contains the
input data in the form of 52 mole fractions of chemical species adopted in the GriMech 3 kinetic mechanism and temperature and pressure of combustion process as well as output in the form of 52 mole fractions of combustion products and the total heat release from the CH4 combustion after �t time. The course and results of calculations are presented in the work [7].
Obtained results of calculations have been modified in such a way that removed all of data sets, which are duplicate. The reason for this approach is the need to avoid false ANN training in case of repeated administration to train the same data sets [9]. After presented modification process data sets received 232,222 cases, which were used to ANN’s training. The training process allow approximate of the results obtained by calculation based on GriMech 3 kinetic mechanism of combustion.
Approximation of functions, describing the amount of total heat release from combustion processes and functions of changes of mole fractions of chemical species depending on the conditions of the combustion process is classified as regression problem [9]. To address these issues are usually used perceptron neural networks or radial basis neural networks. The use of both of networks has been tested by the author at [8] work. Results of work permitted to formulate conclusions that would allow to select the perceptron neural network for further research. Perceptron neural network, which structure is presented in Figure 1, consists of input layer, hidden layer or layers and output layer.
x1
x2
y
x3
xn
input layer
hidden layer
output layer
Fig. 1. The scheme of ANN
105

The input and output layer consists of neurons, one for each input and output parameter of the approximated model. Hidden layers can include any number of neurons. Each of the neurons in the network converts input signals by summing them using the weight factors according to the following dependency:
�#
� $
!� "
�
n
iii xwfy
1, (1)
were:
f – the nonlinear function, named activation function, x – the input signal, w – the weight of the input signal, n – the number of the input signal, y – the output signal.
The ANN training rely on matching weights of input signals so as to achieve the intended
output signal or signals. The study used data from the GriMech 3 kinetic calculations, standardized to the values in the range from -1 to 1. To ANN training process 60% of randomly selected data sets were used as training data, 20% as a validation data and the remaining 20% as test data. The present study included the building, training and testing of ANN’s to allow for the designation of 52 mole fractions of chemical species and the total heat release derived from CH4 combustion process after �t time. All trained ANN’s consists of 54 neurons in the input layer, corresponding to 52 initial mole fractions of chemical species and temperature and pressure of the combustion process, neurons in the output layer corresponding to the output signals and from 15 to 60 neurons in the hidden layer. During the study the following configurations of ANN’s were tested:
– a neural network with one output for the total heat release from CH4 combustion process; – a neural network with 52 outputs for each mole fractions of combustion products and one
hidden layer; – a neural network with 52 outputs for each mole fractions of combustion products and two
hidden layers; – 52 neural networks with one output for each mole fraction of combustion product and 38
neurons in one hidden layer. To ANN training the Broyden-Fletcher-Goldfarb-Shanno (BFGS) method of back propagation
weights setting was used, as one of the fastest quasi-Newton methods of ANN training [3], [10]. As the activation function we applied the logistic function for all hidden layers of ANN’s and a linear function for the output layers to all ANN’s approximating the mole fractions of chemical products of combustion and hyperbolic tangent function for the output layer network approximating the total heat release from the CH4 combustion process. The calculations are made using the Matlab software with Neural Network Toolbox on the Galera server in The Academic Computer Centre in Gda�sk.
3. Results of approximation
During the training all configurations of ANN’s, after a random distribution of data sets on
training, testing and validation sets, input data were made available to input neurons. Random adopted weights of neurons allow to calculate the summarize heat release from all considered in the GriMech 3 kinetic mechanism chemical reactions or mole fractions of chemical species. Values of mentioned parameters were compared with the appropriate output values of heat an
106

mole fractions, obtained from the kinetic calculations. After administration of all training data errors of approximation was calculated. Errors were input data to algorithm of modifying weights of all neurons in ANN in accordance with the BFGS back propagation method of training. All presented steps of training named one epoch. After this we start the next epoch of ANN’s training by random redistribution of data set, and re-modification of neurons’ weights until a satisfactory accuracy with the validation data. In all cases the number of training epochs not exceeded 200.
3.1 Sum of heat release from combustion process As mentioned earlier, the approximation of sum of heat release from fuel combustion was used
perceptron network with 54 neurons in the input layer, corresponding to 52 values of mole fractions of al considered in GriMech 3 kinetic mechanism chemical species, temperature and pressure of the combustion process, and one neuron in output layer corresponding to the total heat release from all chemical reactions. During the training process we considered ANN’s containing from 15 to 60 neurons in one hidden layer.
Figure 2 shows a comparison of the results of calculations of total heat release from the combustion process using nine ANN’s with the smallest mean square error as a function of total heat release calculated by kinetic calculations (x-axis) for the test data. The names of the ANN’s derived from the number of neurons of sequentially the input layer, the hidden and the output layer.
-6E14 -5E14 -4E14 -3E14 -2E14 -1E14 0 1E14
Heat release from kinetic calculation
-6E14
-5E14
-4E14
-3E14
-2E14
-1E14
0
1E14
Heat for 54-16-1 Heat for 54-21-1 Heat for 54-17-1 Heat for 54-15-1 Heat for 54-19-1 Heat for 54-28-1 Heat for 54-27-1 Heat for 54-18-1 Heat for 54-44-1
[J/m
2 ·s]
Fig. 2. The best ANN approximations of the kinetic calculations of the total heat release for all considered parameters of the combustion process
According to the results presented on figure 2, the biggest differences between the results
obtained from each ANN’s and results from kinetic calculations were obtained for the negative heat release. The negative heat release from the combustion process means, that the fuel oxidation process is endothermic. That process is possible for low thermodynamic data of fuel dissociation.
[J/m2·s]
107

It should be noted that the results of the negative values of heat release do not exceed 35% of all test results. With the increase in temperature the combustion process became exothermic and the differences in results between different networks was minimal. Smallest mean square error was obtained for networks with 19 neurons in hidden layer (named 54-19-1). It not exceed of 0.04% for test data and 0.02% for the validation data. Such low values of errors were made possible because of the large amount of data available and low number of training epochs. The maximum error for a single result was 1.9% ant it was in endothermic area of the combustion process.
3.2 Mole fractions of chemical species Using ANN approximation of heat release from one finite element is only possible when we
know changes of mole fractions of all considered in established kinetic mechanism chemical species during the combustion process. During the initial phase of the ANN training for approximation of mole fraction we tried to properly train a single network with 52 output neurons, one for each chemical species. In the course of the calculations, however, failed to obtain satisfactory results for both the application; ANN with one and two hidden layers. For this reason it was decided to training separate 52 ANN’s, having in each case, one neuron output for each chemical compound. The best results with minimum approximation error we obtained for ANN’s with 38 neurons in hidden layer.
According to mentioned situation we obtained 52 networks, trained for all considered mole fractions of chemical species after �t time of the combustion process. All trained networks consist of 54 neurons in the input layer, 38 neurons in the hidden layer and one neuron in the output layer. Figure 3 shows sample results of calculations of the mole fractions of nitric oxide as a function of mole fraction of this chemical species approximated by obtained ANN. According to the presented relation there is a linear relationship between the obtained results. The mean square error for the network was 3·10-4 % for both test and validation data. The maximum error for a single result was 1.6%.
0,000 0,002 0,004 0,006 0,008 0,010 0,012 0,014 0,016 0,018 0,020
NO - GriMech 3
0,000
0,002
0,004
0,006
0,008
0,010
0,012
0,014
0,016
0,018
0,020
NO
- 54
-38-
1
Fig. 3. Mole fractions of nitric oxide calculated by GriMech 3 mechanism and approximated by 54–38–1 ANN
108

Similar results we were also obtain for the remaining 51 considered chemical species. In any case, the mean square error of approximated by trained ANN mole fractions did not exceed a value of 1·10-2 %, but the maximum error for a single value of the mole fractions of 43 chemical species excess even more than 100% of the value of mole fractions calculated by the GriMech 3 kinetic mechanism of the combustion process. Please note that the calculated mole fractions of chemical species are products of the combustion process in a finite element. For modeling the combustion process in engine cylinder, which the dynamic changes in pressure and temperature, it is necessary to use the calculated mole fractions, as input for modeling the subsequent phases of the combustion process until the end of the work cycle of diesel engine. Such a model creates the possibility of a geometric rise of the calculation error of mole fractions. Due to the fact that these mole fractions are also input data to the model of heat release from the combustion process in one finite element, these errors also affect the value of the output from this model. For this reason it is necessary to adopt a conclusion that the obtained approximation errors of mole fraction values of chemical species in relation to the calculated values taken from the kinetic mechanism calculation, despite the small mean square errors, have individual values errors too large. Obtained individual error results for mole fractions of 43 chemical species are too large and disqualify the application of ANN in their current form for modeling the combustion process.
4. Conclusions
The presented work was to apply the ANN to approximate functions of the total heat release
from the combustion process and mole fractions of CH4 combustion products, calculated using the GriMech 3 kinetic mechanism. During the research work we were built and train several ANN’s configurations, differing in the number of neurons in the hidden and the output layer and the number of hidden layers. The result of this study was to obtain an ANN, allowing approximation of total heat release obtained from the combustion process with a mean square error not exceeding 0.04%, and with a maximum error 1.9%. The inputs to this model are temperature and pressure of the combustion process and 52 mole fractions of chemical species, considered in mentioned GriMech 3 kinetic mechanism. For this reason, we tried to set up and train an ANN, which allows approximation of mole fractions of these chemical species. As work progresses, however, failed to obtain a satisfactory ANN, allowing to obtain reliable results, enabling the use of ANN’s in prace of modeling. Despite the small value of the mean square error, the errors of individual results often exceed 100% of the value obtained from the kinetic calculations. For this reason, it is necessary to conduct further investigations in order to seek an alternative methods of calculating of mole fractions of chemical species, enabling the reduction the cost of modeling in relation to the kinetic calculations.
Acknowledgements: Calculations performed on computers in The Academic Computer Centre in Gda�sk.
References
[1] Bowman, C. T, at all., http://www.me.berkeley.edu/gri_mech/ [2] Demirbas, A., Biodiesel – a realistic fuel alternative for diesel engines, Springer-Verlag,
2008. [3] Ghobadian, B., Rahimi, H., Nikbakht, A. M., Najafi, G., Yusaf, T. F., Diesel engine
performance and exhaust emission analysis using waste cooking biodiesel fuel with an artificial neural network, Renewable Energy, Vol. 34, Elsevier Science Inc, 2009.
[4] Heywood, J. B., Internal Combustion Engine Fundamentals, McGraw-Hill, 1988.
109

[5] Chopey, N. P., Handbook of chemical engineering calculations, 3-rd edition, McGraw-Hill, 2004.
[6] Kowalski, J., Tare�ko, W., NOx emission from a two-stroke ship engine. Part 1: Modeling aspect, Applied Thermal Engineering, Vol. 29, No 11-12, pp. 2153 – 2159, Elsevier Science Inc, 2009.
[7] Kowalski, J., The CH4 combustion model, Journal of Polish CIMAC, Vol. 4, Gda�sk 2010. [8] Kowalski, J., The NOx emission estimation by artificial neural network: the analyze,
Journal of KONES, Vol. 15, No 2, 2008, pp. 225 – 232. [9] Masters, T., Practical neural network recipes in C++, Academic Press Inc, 1993. [10] Svozil, D., Kvasnicka, V., Pospichal, J., Introduction to multi-layer feed-forward neural
networks, Chemometrics and intelligent laboratory systems, Vol. 39, Elsevier Science Inc, 1997.
[11] Winterbone, D. E., Advanced Thermodynamics for Engineers, Wiley & Sons, 1997. [12] Zienkiewicz, O. C., Taylor, R. L., Zhu, J. Z., The Finite element method, 6-th edition,
McGraw-Hill, 2005.
110

PRESSURE AND VELOCITY DISTRIBUTION IN SLIDE JOURNAL BEARING LUBRICATED MICROPOLAR OIL
Pawe� Krasowski
Gdynia Maritime University ul. Morska 81-87,81-225 Gdynia, Poland tel.:+48 58 6901331, fax:+48 58 6901399
e-mail:[email protected]
Abstract Present paper shows the results of numerical solution Reynolds equation for laminar, steady oil flow in slide bearing gap. Lubrication oil is fluid with micropolar structure. Materials engineering and tribology development helps to introduce oils with the compound structure (together with micropolar structure) as a lubricating factors. Properties of oil lubrication as of liquid with micropolar structure in comparison with Newtonian liquid, characterized are in respect of dynamic viscosity additionally dynamic couple viscosity and three dynamic rotation viscosity. Under regard of build structural element of liquid characterized is additionally microinertia coefficient. In modeling properties and structures of micropolar liquid one introduced dimensionless parameter with in terminal chance conversion micropolar liquid to Newtonian liquid. The results shown on diagrams of hydrodynamic pressure, velocity and velocity of microrotation distribution in dimensionless form in dependence on coupling number N2 and characteristic dimensionless length of micropolar fluid �1. Differences were showed on graphs in the schedule of the circumferential velocity oils after the height of the gap in the flow of the micropolar and Newtonian liquid. In presented flow, the influence of lubricating fluid inertia force and the external elementary body force field were omit. Presented calculations are limited to isothermal models of bearing with infinite length. Keywords: micropolar lubrication, journal bearing, hydrodynamic pressure, velocity, velocity of microrotation 1. Introduction Presented article take into consideration the laminar, steady flow in the crosswise cylindrical slide bearing gap. Non-Newtonian fluid with the micropolar structure is a lubricating factor. Exploitation requirements incline designers to use special oil refining additives, to change viscosity properties. As a experimental studies shows, most of the refining lubricating fluids, can be included as fluids of non-Newtonian properties with microstructure [3],[4],[6]. They belong to a class of fluids with symmetric stress tensor that we shall call polar fluids, and include, as a special case, the well known Navier-Stokes model. Presented work dynamic viscosity of isotropic micropolar fluid is characterized by five viscosities: shearing viscosity � ( known at the Newtonian fluids ), micropolar coupling viscosity � and by three rotational viscosities. This kind of micropolar fluid viscosity characteristic is a result of essential compounds discussed in works [3],[4]. Regarding of limited article capacity please read above works. In presented flow, the influence of lubricating fluid inertia force and the external elementary body force field were omit [4],[5],[9].
111

2. Reynolds equations, hydrodynamic pressure
Basic equation set defining isotropic micropolar fluid flow are describe following equations [2],[4],[5]: momentum equation, moment of momentum equation, energy equation, equation of flow continuity. Incompressible fluid flow is taken into consideration with constant density skipping the body force. Further equation analysis were taken in rolling co-ordinate system, where the wrapping coordinate � describes the wrapping angle of the bearing, the coordinate r describes radial direction from the journal to the bearing, the coordinate z describes longitudinal direction of crosswise bearing. In order to make the analysis of basic equations in dimensionless form [7], we input dimensionless quantities characterizing individual physical quantities. Oil velocity vector components are:
VLUV UVV UVV 3
1z2r1 ��� 12 (1)
Reference pressure po caused by journal rotation with the angular velocity � was assumed in (7) taking into consideration dynamic viscosity of shearing � and the lubricating gap height h1 at the wrapping angle � was taken in relative eccentricity function � :
� � 2��213� cos1,h;p 120 ��� (2)
The constant viscosity of micropolar oil, independent from thermal and pressure condition in the bearing. Quantity of viscosity coefficient depend on shearing dynamic viscosity �, which is decisive viscosity in case of Newtonian fluids. Reference pressure p0 is also described with this viscosity, in order to compare micropolar oils results with Newtonian oil results. In micropolar oils decisive impact has quantity of dynamic coupling viscosity � [1],[4]. In some works concerning bearing lubrication with micropolar oil, it’s possible to find the sum of the viscosities as a micropolar dynamic viscosity efficiency. In presented article coupling viscosity was characterized with coupling number N2, which is equal to zero for Newtonian oil:
4�
4�
�N 1N0 5� (3)
Quantity N2 in case of micropolar fluid, define a dynamic viscosity of coupling share in the oil dynamic viscosity efficiency. From the dynamic rotational viscosities at the laminar lubrication, individual viscosities are compared to viscosity �, which is known as the most important and it ratio to shearing viscosity � is bounded to characteristic flow length �, which in case of Newtonian flow assume the zero quantity. Dimensionless quantity of micropolar length �1 and micropolar length � are defined:
�67 � ; 877 �1 (4)
Dimensionless micropolar length �1 in case of Newtonian oil approach infinity. Reynolds equation for stationary flow of laminar micropolar fluid in the crosswise cylindrical slide bearing gap can be present [1],[2],[3],[8] in dimensionless form:
112

ddh6
zp)h,N,(
zL1p)h,N,( 1
1
1111
121
1111 2
792
792
���#
� $
!::
::
���#
� $
!::
:: (5)
for 1z1- ;hr0 ;0 111k ������ 22
where: �#�
$!���
2NhcothNh6h12h 11
1
21
21
1311
777
9 (6)
Below solutions (5) for infinity length bearing is presented. In this solution the Reynolds boundary conditions, applying to zeroing of pressure at the beginning (�=0) and at the end (�=�k) of the oil film and zeroing of the pressure derivative on the wrapping angle at the end of the film where fulfill. The pressure distribution function in case of the micropolar lubrication has a form:
� � 279
22
dh,N,
hh6)(p0 111
k111 �
�� ; 22
2d
hhh6)(p
031
k11N1 �
�� (7)
where: h1k= h1(�k) lubricating gap height at the end of the oil film. In the boundary case of lubricating Newtonian fluid, pressure distribution function is a pressure p1N(�). Example numerical calculation were made for the infinity length bearing with the relative eccentricity �=0,6.
0
1
2
3
4
5
6
7
8
9
10
0 45 90 135 180 225
7 = 201
p1
N =0,92
N =0,7
N =0,5 N =0,3
N =0,1
N =0
2
2 2
2
2
;'(o
Fig.1 The dimensionless pressure distributions p1 in direction 2 in dependence on coupling number N2 by micropolar (N2>0) and Newtonian (N2=0) lubrication for dimensionless eccentricity ratio
�=0,6 and characteristic dimensionless length of micropolar fluid �1=20 Analyzing the influence of coupling number N2 and the influence of dimensionless micropolar length �1 on hydrodynamic pressure distribution in the bearing liner circuital direction. At the Fig.1 pressure distribution for individual coupling numbers at constant micropolar length �1 =20. The pressure increase effect is caused by oil dynamic viscosity efficiency increase as a result of coupling viscosity �. At N2= 0,5, coupling viscosity is equal to shearing viscosity. Pressure graph in the Fig.1 for micropolar oil lubrication (N2>0) find themselves above the pressure graph at the Newtonian oil lubrication (N2=0). Pressure distribution is higher for higher coupling number. It is caused by oil viscosity dynamic efficiency. In the Fig.2 the course of dimensionless pressure p1for few micropolar length quantity �1 is shown: Decrease of this parameter determine the increase of
113

micropolar oil rotational dynamic viscosity. Pressure distribution are presented at the constant coupling number N2=0,4. Newtonian oil pressure in the course 1. Rotational viscosity increase determine the pressure distribution increase and is caused, because both the oil flow and velocities of microratation are coupled. Quantities of coupling number N2 and dimensionless micropolar
0
1
2
3
4
5
6
7
8
9
0 45 90 135 180 225
N = 0,42
p1
1
2
3
4 5
;'(o
Fig.2 The dimensionless pressure distributions p1 in direction 2 in dependence on characteristic dimensionless length of micropolar fluid �1: 1) Newtonian oil, 2) �1=40, 3) �1=30, 4) �1=20,
5) �1=10, for dimensionless eccentricity ratio �=0,6 and coupling number N2=0,4 length where taken from works [1],[2]. Based on given hydrodynamic pressure distribution p1 on wrapping angle of the bearing �, the numerical quantities of maximal pressure p1m and the angular
146,5
147
147,5
148
148,5
149
149,5
150
150,5
151
151,5
152
152,5
0 0,1 0,2 0,3 0,4 0,5 0,6 0,7 0,8 0,9
1
2
3
4
;m [ ]o
N 2
Fig.6 Angle �m situated maximal pressure p1m in dependence on coupling number N2 for characteristic dimensionless length of micropolar fluid �1: 1) �1=10, 2) �1=20, 3) �1=30, 4) �1=40 coordinate �m (at the maximal position) were obtain. Quantities p1m are presented in the Fig.3 in the coupling Number N2 function for chosen micropolar length �1. All lines are coming out from the maximal pressure point in case of Newtonian fluid flow. We observe maximal pressure increase when the coupling number N2 increases.
114

3. Velocity and velocity of microrotation distribution The field equation of micropolar fuid with general lubrication theory assumptions is simplified into two systems of coupled ordinary differential equation. He interests us in the case of the bearing of the infinite breadth the arrangement the coupling the velocity V2 and the microroation velocity <z according [8] and introduced in dimensionless form:
� �1
322
1
12
12
rN
rVpN1
::
�::
�::
�<
2 (8)
02rV
rNN1
31
12
1
32
21
2
2
��::
�::� <<
7
Dimensionless velocity of microrotation <3 are in formula:
8
<< U3z � (9)
The profiles of the schedule of velocity and microrotation velocity after the height of the gap (co-ordinate r) comply following boundary conditions V1(s1) and <3(s1) [8] on the surface of the bearing s1 = 0 and on the slide s1 = 1:
; � �� ��
��
��
01V10V
1
1 � �� ��
��
��
0100
3
3
<<
; 1
11 h
rs � (10)
Thus, the expressions for velocity V2 as a results of the solutions of the abowe equations with boundary conditions (10) are [8] in dimensionless form V1:
� � 1AAN2hNscosh1AhNssinh
hNhsphs
21V
2
3
11111111
1111
121
211 �����
#
� $
!��
::
�7
7772
(11)
where:
� � 2
77
7
7::
�
*+
,-.
/��
�� 1
21
1111
11
111
p2h
1hNcoshhN2hNsinh
hNsinhA
� *+
,-.
/��� 1hNcosh
hN2hNsinhhA 11
111112 7
77 � (12)
� � � � *+
,-.
/���
::
��� 1111
111
21
113 hNsinhhN211hNcosh
21p
2h1hNcosh
21A 7
77
27
The profile velocity V1 was introduced on Fig.4 along the height of the gap in the point where maximum hydrodynamc pressure steps out for three parameters of the micropolar oil. Nonlinearity visible is insignificant in the relation to the linear graph in the case of lubrication from newtonian oil. Differences among the schedule of the velocity of micropolar and newtonian oil it was introduced on Fig. 5. in points of the maximum pressure. The difference of the speed was marked from dependence: N1p11 VVV ��� (13)
115

where: V1p - dimensionless velocity for micropolar oil flow marked from (12), V1N - dimensionless velocity for newtonian oil flow marked from (14)
� �2:
:���� 1
121
11N1
pss2hs1V (14)
Change velocities �V1 in point of the maximal pressure is asymmetric in relation to the centre of the height of the gap. For 0 < s1 < 0,5 the velocity of the micropolar flow is larger from the
0
0,1
0,2
0,3
0,4
0,5
0,6
0,7
0,8
0,9
1
0 0,1 0,2 0,3 0,4 0,5 0,6 0,7 0,8 0,9 1
7�=>1V1
s
1
5
4
3
2
Fig.4 Velocities V1 in points of the maximal pressure of micropolar
fluid �1=20 : 1) N2=0,1; 2) N2=0,3;3) N2=0,5; 4) N2=0,7; 5) N2=0,9 velocity of the flow of the Newtonian oil and is for 0,5 < s1 < 1 smaller. The growth of the coupling viscosity (coupling number N) causes the growth of the nonlinearity of velocity V1.
-0,06
-0,05
-0,04
-0,03
-0,02
-0,01
0
0,01
0,02
0,03
0,04
0,05
0,06
0 0,1 0,2 0,3 0,4 0,5 0,6 0,7 0,8 0,9 1
V1�
s 1
1
4
32
5
Fig.5. Change velocities �V1 in points of the maximal pressure of micropolar
fluid �1=20 :1) N2=0,1; 2) N2=0,3 ; 3) N2=0,5 ; 4) N2=0,7 ;5) N2=0,9
116

The expressions for velocity of microrotation <z as a results of the solutions of the abowe equations with boundary conditions (10) are [8] in dimensionless form <3 :
� � 1112
3
1
1111
1113 hNssinh
AA
h2A1hNscoshp
2hs 77
2< ���
::
�� (
15)
In the Fig.6 are presented profile velocity of microrotation <3 in points of the maximum pressure in the coupling Number N2 function for chosen micropolar length �1 = 20.
0
0,2
0,4
0,6
0,8
1
1,2
1,4
1,6
0 0,1 0,2 0,3 0,4 0,5 0,6 0,7 0,8 0,9 1
7�=>1
s
< 3N =0,9 N =0,7
N =0,5
N =0,3
N =0,12
2
2
22
Fig.6. Velocities of microrotation <3 in points of the maximal pressure of micropolar
The profile of the velocity of microrotation <3is symmetrical in relation to the centre of gap. He is
Conclusions
resented example of the Reynolds equation solutions for steady laminar non-Newtonian
cylindrical slide bearings.
fluid �1=20 :1) N2=0,1 ;2) N2=0,3 ; 3) N2=0,5 ; 4) N2=0,7 ;5) N2=0,9
more even (flat) after the height of the gap in the case of the growth of the coupling number N. 4.
Plubricating oil flow with micropolar structure, enable the hydrodynamic pressure distribution introductory estimation as a basic exploitation parameter of slide bearing. Comparing Newtonian oil to oils with micropolar structure, can be used in order to increase hydrodynamic pressure and also to increase capacity load of bearing friction centre. Micropolar fluid usage has two sources of pressure increase in view of viscosity properties: increase of fluid efficient viscosity (coupling viscosity increase) and the rotational viscosity increase (characteristic length parameter �). Author realize that he made few simplified assumptions in the above bearing centre model and in the constant parameter characterizing oil viscosity properties. Despite this calculation example apply to bearing with infinity length, received results can be usable in estimation of pressure distribution and of capacity force at laminar, steady lubrication of cylindrical slide bearing with infinity length. Presented results can be usable as a comparison quantities in case of numerical model laminar, unsteady flow Non-Newtonian fluids in the lubricating gaps of crosswise
117

References [1] Das S., Guha S.K., Chattopadhyay A.K.- Linear stability analysis of hydrodynamic journal
nder micropolar lubrication - Tribology International 38 (2005), pp.500-507 ] Krasowski P. – Stacjonarny, laminarny przep�yw mikropolarnego czynnika smaruj�cego
heory and Aplications – Birkhäuser, Boston 1999
,
cal
in Zhu – Numerical analysis of journal bearings lubricated with ),
ss bearing length L1=b/R ng number of the journal (m)
�, r, z (m/s) ponents of oil velocity in co-ordinate �, r, z
)
dinate �, r, z
ssure (Pa) ure p1 = p/p0 l (m)
m) al z1 = z/b te �, r, z (Pa s m2)
l clearance ( � = �/R (1/s)
bearings u[2 w szczelinie smarnej poprzecznego �o�yska �lizgowego - Zeszyty Naukowe nr 49, pp. 72- 90 , Akademia Morska, Gdynia 2003 [3] Krasowski P. – Capacity forces in slide journal bearing lubricated oil with micropolar structure - Journal of POLISH CIMAC, Vol. 4, No. 2, pp.137-144, Gda�sk 2009 [3] ukaszewicz G.– Micropolar Fluids. T[4] Walicka A.– Reodynamika pzep�ywu p�ynów nienewtonowskich w kana�ach prostych i zakrzywionych – Uniwersytet Zielonogórski, Zielona Góra 2002 [5] Walicka A. - Inertia effects in the flow of a micropolar fluid in a slot between rotating sufrages of revolution – International Journal of Mechanics and Engineering, 2001,vol.6 No. 3, pp. 731-790 [6] Wierzcholski K.- Mathematical methods in hydrodynamic theory of lubrication- Techni University Press, Szczecin 1993. [7] Xiao-Li Wang, Ke-Q micropolar fluids including thermal and cavitating effects – Tribology International 39 (2006 pp.227-237 Notation L1 dimensionleN coupliR radiusU peripheral journal velocity (m/s) U = �R
velocity in co-ordinate i =Vi components of oil Vi i=1,2,3 dimensionless com� characteristic length of micropolar fluid (m�1 dimensionless characteristic length of micropolar fluid �i components of oil microrotation velocity in co-ordinate i =�, r, z (1/s)
rorotation velocity in co-or�i i=1,2,3 dimensionless components of oil micb length of the journal (m) h gap height (m) h1 dimensionless gap height h = �h1
a) p hydrodynamic pressure (Pue of prepo characteristic val
p1 dimensionless hydrodynamic pressrnar co-ordinate in radial of the jou
z co-ordinate in length of the journal (z1 dimensionless co-ordinate in length of the journ
-ordina�, �, � micropolar rotational viscosities in co� radial clearance (m) � dynamic oil viscosity (Pa s) � micropolar coupling viscosity (Pa s)
icity ratio � dimensionless eccentr� oil density (kg/m3) � the angular co-ordinate
m end �e the angular co-ordinate for the fil34 1010 �� �1� ) � dimensionless radia
� angular journal velocity
118

CHANGE CAPACITY AND FRICTION FORCE IN SLIDE JOURNAL BEARING BY TORSIONAL SHAFT VIBRATION
Pawe� Krasowski
Gdynia Maritime University
ul. Morska 81-87,81-225 Gdynia, Poland tel.:+48 58 6901331, fax:+48 58 6901399
e-mail: [email protected]
Abstract
This paper shows results of numerical solutions an modified Reynolds equations for laminar unsteady oil flow in slide journal bearing gap. Laminar unsteady oil flow is performed during periodic and unperiodic perturbations of bearing load or is caused by the changes of gap height in time. During modelling crossbar bearing operations in combustion engines, bearing movement perturbations from engine vertical vibrations causes velocity flow perturbations of lubricating oil on the shaft in the circumferential direction. This solution example apply to isothermal bearing model with infinity length. Lubricating oil used in this model has Newtonian properties and constant dynamic viscosity. Results are presented in the dimensionless hydrodynamic pressure and tangential tension distribution diagrams. Diagrams also presents capacity and friction force change during the time of velocity perturbations. Received solutions were compared with the solution received by the stationary lubrication flow in the slide journal bearing, which were made with the same parameter assumption by constant dynamic oil viscosity. Isothermal bearing model is similar to friction node model by steady-state heat load conditions. Described effect can be used as on example of modeling the bearing friction node operations in reciprocating movement during exploitation of engines and machines. Keywords: laminar unsteady lubrication, journal bearing, pressure, capacity and friction forces 1. Introduction
This article refer to the unsteady, laminar flows issue, in which modified Reynolds number Re* is [5],[6] smaller or equal to 2. Laminar, unsteady oil flow is performed during periodic and unperiodic perturbations of bearing load or is caused by the changes of gap height in the time. Above perturbations occur mostly during the starting and stopping of machine. Lubricated oil disturbance velocity the pin and on the bearing shell was also consider in the article. Reynolds equation system describing Newtonian oil flow in the gap of transversal slide bearing was discussed in the articles [4],[5]. Velocity perturbations of oil lubricated flow on the journal can be caused by torsion journal vibrations during the rotary movement of the shaft. Perturbations are proportional to torsion vibration amplitude, frequent constraint and to journal radius of the shaft. Oil velocity perturbations on the shell surface can be caused by rotary vibration of the shell together with bearing casing. This movement can be consider as kinematical constraint for whole bearing friction node. Isothermal bearing model can be approximate to bearing operation in friction node under steady thermal load conditions for example bearing in generating set on ship.
119

2. Hydrodynamic pressure and capacity forces The unsteady, laminar and isotherm flow Newtonian oil in journal bearing gap is described for modified Reynolds equation [1],[2] from Newtonian oil with constant and variable dynamic viscosity depended for pressure. In considered model we assume small unsteady disturbances and in order to maintain the laminar flow, oil velocity Vi
* and pressure p1* are total of dependent
quantities iV~ ; 1~p and independent quantities from time [4], [6] according to equation (1). 1; pVi
1,2,3i ,p~pp ,V~VV 111iii ����� �� (1)
Unsteady components of dimensionless oil velocity and pressure are [4] in following form of infinite series :
)ttjkexp()z,r,(V)t,z,r,(V~ 100111k
)k(i111i 322 "�
?
� i=1,2,3
(2) )ttjkexp()z,r,(p)t,z,r,(p~ 100111k
)k(11111 322 "�
?
�
where: �0 – angular velocity perturbations in unsteady flow, j - imaginary unit j= 1� . Components of oil velocity V2 ,Vr ,Vz in cylindrical co-ordinates r,�,z have presented as V1,V2 ,V3 in dimensionless [1] form:
VLUV UVV UVV 3
1z2r1 ��� 12 (3)
where: U – peripheral journal velocity U=�R, � – angular journal velocity, R – radius of the journal, �– dimensionless radial clearance ( ), 34 1010 �� �1�2b – length of bearing, L1 – dimensionless bearing length, � – radial clearance :
RbL ;
R 1 ��81 (4)
Putting following quantities [1],[5]: dimensionless values density �1, hydrodynamic pressure
time t1, longitudinal gap height h1, radial co-ordinate r1 and co-ordinate z1. p1 ,�
(5) � � hh ,r1Rr ,zbz
ttt ,ppp ,
111
101010
81@@@
�������
Rule of putting dimensionless velocity and pressure quantities in unsteady and steady part of the flow stays similar. Following symbols with bottom zero index signify density @0, dynamic viscosity �0 , pressure p0 and time t0 describe characteristic dimension values assigned to adequate quantities. Reynolds number Re , modified Reynolds number Re* are in form [1]:
120

; ReRe ; RURe ; R
Up *
0
02
00 1
�1@
1�
��� (6)
The equation solution Reynolds equation [2],[3] with disturbances of peripheral velocity V10 on the journal for bearing with infinity length determine unsteady dimensionless hydrodynamic pressure function in following form: 1
~p
"�"��#
� $
!���
?
�
?
�
�
1k)k(1010V
1k)k(
031
3e110V11 BVpA
hdhVnRe
21p~ 6226@
2 (7)
where: h1 - height of gap, h1e - height of gap by film ended 2 = 2e , �- eccentricity ratio.
2�2 cos1)(h1 �� ; h1e = h1(�e) (8) Quantity �V are factor of scale for velocity perturbations, dependent for acceptant of term series (2). Pressure p10 is located in the oil gap by steady flow and by constant oil dynamic viscosity.
Sum for series and in right side of Reynolds solution equation (7) are results from
conservation of the momentum solutions and were define in work [1],[2].
"?
�1kkA "
?
�1kkB
� � 1t0 3
tt41
k)ttkcos(B
1;0t 0
1t0 2
tt
k)ttksin(A
1
22
1001k
2100
1k)k(
1
1100
1k
100
1k)k(
��*+
,-.
/���"" �
��
���
�
55�
�"" �
?
�
?
�
?
�
?
�
A3A3
3A3
(9)
In presented calculation way an expression value is assumed n�1Re* = 12, what is approximately equivalent to force over first frequency torsion vibrations force of six cylinder engine shaft. Examples apply to bearing with constant dependent eccentricity �=0,6. In case where oil velocity perturbations are caused by forced vibrations of engine then the number n in equation (7) define multiplication of perturbation frequency �0 to angular velocity of engine crankshaft �. Multiplication factor n is equal to number of cylinder c in two-stroke engine (s=2) or in four-stroke engine (s=4) to number of cylinders c/2 :
��
���
�
��� 4s
2c
2scn 0
33 (10)
We analyst cylindrical bearing infinite length with circumferential velocity perturbations on the journal V10. Circumferential velocity perturbations are caused by torsional vibrations shaft (on the journal). In the further numerical analysis relation time t0 was taken into account as a propagation period of axial velocity perturbation of lubricating oil. Four velocities perturbations will analysed in this article. Pressure perturbation 1p~ course in point �=160° presented Fig.1 by following circumferential velocity perturbations on the journal V10=
121

0,01; 0,025; 0,05; 0,075. Changes of pressure 1p~ are asymmetrical in relation to the time. The growth of the pressure is smaller than his fall. Sizes these grow when the size of the perturbations of the velocity grows up.
-1
-0,9
-0,8
-0,7
-0,6
-0,5
-0,4
-0,3
-0,2
-0,1
0
0,1
0,2
0,3
0,4
0 0,1 0,2 0,3 0,4 0,5 0,6 0,7 0,8 0,9 1
t 1
p~1
2
43
1
;�BC> o
Fig.1. Pressure distributions 1
~p in place 2=1600 in the time t1 by velocity perturbations: 1) V10=0,01; V1h=0; 2) V10=0,025; V1h=0; 3) V10=0,05; V1h=0; 4) V10=0,075; V1h=0
Capacity force W for cylindrical slide journal bearing has following components Wx and Wy to be determined [2],[6] in the local co-ordinate systems in Fig. 2. Capacity force W is resultant force from concurrent pressure forces configuration.
Fig. 2. Capacity force W and components Wx and Wy in the local co-ordinate system Thus dimensionless components W1x and W1y of capacity forces W1 are as follows [2]:
122

��������kk
01
0
yy1
01
0
xx1 dsinp
WW
W ;dcospWWW
222222 (11)
W1 0
2y1
2x1 W
WWW ���
where: W0 - characteristic value of capacity force W0 D 2Rbp0 Hydrodynamic capacity force change caused by the pressure perturbation is calculate from:
1*
11~ WWW �� (12)
where: � �*
11*
1 pWW � ; � �111 pWW �
Pressure in the bearing during the perturbation is a total of stationary flow pressure and perturbation pressure according to (1) According to mentioned equation [2] if we provide stationary flow pressure p1 we will obtain capacity force W1. Figure 3 also presents change capacity calculation results by four oil viscosity perturbations. Hydrodynamic capacity force 1W~ changes periodically with a period equal to perturbation velocity. In case of velocity perturbation in the bearing pin, increase of capacity force above the stationary condition value last no longer than half of the perturbation period and the increase of capacity force is bigger than the decrease in the remaining time.
-0,75
-0,5
-0,25
0
0,25
0,5
0,75
1
1,25
1,5
1,75
0 0,1 0,2 0,3 0,4 0,5 0,6 0,7 0,8 0,9 1
2
4
3
1
W~ 1
t 1
Fig.3. Change the dimensionless capacity forces in the time t1 by velocity 1W~
perturbations: 1) V10=0,01; 2) V10=0,025; 3) V10=0,05; 4) V10=0,075;
increase of capacity force than decrease. It is opposite in case of oil peripheral velocity perturbation on the shell surface, but his diagrams are not presented in his article. Capacity force
123

course in time is not symmetrical for different perturbation of velocity quantities on the pin. The fall of change the capacity force is smaller than his growth. Sizes these grow when the size of the perturbations of the velocity grows up.
3. Elementary friction force and friction force in bearing gap Elementary friction forces � and this change �~ for dimension an dimensionless form 1
~� , we calcullated as tangential stress (pressure) by newtonian oil in formula:
hrr
V
�::
� 2�� ; 11 hr1
111 r
V
�::
��� ; 11 hr1
111 r
V~~�
::
��� ; (13)
1010p ��1�� �� ; 00 p1� �
Velocity circumferential perturbation (7) [3] are in formula:
)tk2sin(
k)k(P
hhhV
2
)tk2cos(k
)k(AV)tk2cos(k
)k(Ph
hhVnRe
6V~
11k
231
3e1
31
10V
11k
210V11k
331
e1110V*
1
11
A6
A6A6@
�
"�
�
�"�"�
�
?
�
?
�
?
� (14)
Components of series P(k), A(k) i B(k) from formula (14) are in following forms [3]:
)Xshcos()Xshcosh(
)Xshsinh(]Xh)s1sin[(]Xh)s1sinh[()Xshsin()k(Pk1k1
k1k1k1k1
����
�
)Xh2cos()Xh2cosh(
)Xshcos(]Xh)s2cosh[(]Xh)s2cos[()Xshcosh()k(Ak1k1
k1k1k1k1
�����
� (15)
1
1
hrs � ; 2V
6A
6 � ; nRe2
kX1
1k
���@ k=1,2,3……
Additional symbol s marking dimensionless parameter height of gap ( ). In numerical calculation example oil with constant density was assume, what is equivalent to quantity �1.
1s0 ��
)tk2sin(
k)k(P
hhhV
2
)tk2cos(k
)k(AV)tk2cos(k
)k(Ph
hhVnRe
6rV~
11k
231
3e1
31
10V
11k
210V11k
331
e1110V*
1
1hr
1
111
A6
A6A6@
�
"E�
�
�"E
�"E�
�::
?
�
?
�
?
��
(16)
where:
� � � � � � � �� � � �k1k1
k1k1k
hr1 XhcosXhcoshXhsinhXhsinX
drkdPkP
11�
����E
�
124

� �)Xh2cos()Xh2cosh(
)Xhsin()Xrhcosh()Xhcos()Xhsinh(X2dr
)k(dAkAk1k1
k1k1k1k1khr
111 �
����E � (17)
-0,1
-0,08
-0,06
-0,04
-0,02
0
0,02
0,04
0,06
0,08
0 0,1 0,2 0,3 0,4 0,5 0,6 0,7 0,8 0,9 1
2
1
43�~ 1
t1
;�BC> O
Fig.4. Tangential pressure distributions 1
~� in place 2=1600 in the time t1 by velocity perturbations:1) V10=0,01; 2) V10=0,025; 3) V10=0,05; 4) V10=0,075
The results change tangential pressure 1
~� distribution in the time t1 show Fig. 4. in place of coordinate �=160°. Change elementary friction forces (tangential pressure) 1
~� perturbation are values different sign from initial perturbations V10 and absolutely lesser.
-0,4
-0,3
-0,2
-0,1
0
0,1
0,2
0,3
0,4
0 0,1 0,2 0,3 0,4 0,5 0,6 0,7 0,8 0,9 1
1 2
3 4T~1
t 1
Fig.5. Change the dimensionless friction forces in the time t1 by velocity 1T~
125

perturbations:1) V10=0,01; 2) V10=0,025; 3) V10=0,05; 4) V10=0,075 Friction forces T and this change T~ for dimension an dimensionless form 1T~ , we calcullated as sum tangential stress (pressure) in circumference co-ordinate bearing by formula:
10hr0
T~Tdr
V~RbT~
e
�::
�� � 2� 22
(18)
� � 22�2
d~T~e
011 ��
where: T0 - characteristic value of friction force 100 WT �
In Fig. 5 presented change the dimensionless friction forces in the time t1 by four of velocity perturbation.
1T~
4. Conclusions Presented Reynolds equation solution for unsteady laminar Newtonian flow of lubricated oil to enable initial opinion to hydrodynamic pressure, elementary friction pressure distribution and capacity, friction forces as a basic slide bearing operating parameter. Unsteady velocity perturbation on the journal and sleeve effect on capacity and friction forces in lubricated gap. Capacity and friction forces variation in bearing have periodical character equal to periodical velocity perturbation time and this variations value and character depend on type of perturbation. Author is aware of simplifications that were assumed in presented model which apply to Newtonian oil and to isothermal bearing model. Despite that presented calculation example apply to bearing with infinity length, obtained conclusions can be useful to elementary friction pressure and friction forces distribution by laminar, unsteady lubrication of cylindrical slide bearing with finite length.
References [1] Krasowski P.: Modelling of laminar unsteady and unsymetrical oil flow in slide journal bearing gap. Tribologia 5/2002, s. 1425-1436. [2] Krasowski P.: Pressure and capacity forces in slide journal plane bearing by laminar unsteady lubrication. Journal of POLISH CIMAC , DIAGNOSIS, RELIABILITY AND SAFETY, Gdansk 2008, Vol.3 No. 2, pp. 91 – 98. [3] Krasowski P.: Pressure and velocity distribution in slide journal bearing by laminar unsteady lubrication. Journal of KONES, POWERTRAIN AND TRANSPORT, Warsaw 2009, Vol.16 No. 2, pp. 239 – 246. [4] Teipel I., Waterstraat A.: The Reynolds equation for lubrication under unsteady conditions. Proceedings The IX Canadian Congress of Applied Mechanics, University of Saskatchewan 1983, 497-502. [5] Wierzcholski K.: Mathematical methods in hydrodynamic theory of lubrication, Technical University Press, Szczecin 1995. [6] Wierzcholski K.: Teoria niekonwencjonalnego smarowania �oysk �lizgowych, Technical University Press, Szczecin 1995.
126

THE ENERGETIC AND EXERGETIC EVALUATION OF THE EXHAUST GASES
ON THE EXAMPLE OF THE SELECTED MARINE DIESEL ENGINES
Ryszard Michalski
West Pomeranian University of Technology 41 Piastów Av, 71-065 Szczecin, Poland
tel: +48 91 4494941 e-mail: [email protected]
Abstract
The tendency to improve the efficiency of the utilisation of the primary energy on board the ships, as well as the
anticipated necessity of the obtainment of the Energy Efficiency Design Index (EEDI) in accordance with the requirements of the International Maritime Organisation (IMO) induce to apply the power system solutions which are among others characterised by low CO2 emission.
The way to improve the ship’s power plant energetic efficiency, thus lowering CO2 emission on motor ships, is to apply continuously more developed recovery systems of the waste energy whose basic sources are the piston Diesel engines consisting the ship’s main propulsion. The most significant component of the waste energy is the energy of the exhaust gases. In order to efficiently utilise this energy not only its quantity, but also its quality should be evaluated.
The article presents the examples of the energetic evaluation of the energy of the flue gases of the selected ship’s main propulsion Diesel engines and the examples of the exergetic evaluation of this energy. The commonly applied in design practice energetic analysis in principle allows to determine the fundamental possibilities of the utilisation of the exhaust gas energy in the systems with waste-heat boilers. The exergetic evaluation which includes the temperature and pressure parts of the physical exergy offers a possibility to analyse more complex systems where so called exhaust gas reverse turbine or waste-heat Diesel turbogenerator are used. The latter solutions including the part where the energy carrier is steam are becoming nowadays the object of interest of the Diesel engine manufacturers and ship owners, as well as the subjects of research works and study projects concerning the efficient and low-emission ship’s power plants. Key words: ship’s power plants, utilisation of waste energy, exhaust gas, exergetic analysis 1. Introduction
The tendency to improve the efficiency of the utilisation of the primary energy on ships,
as well as the anticipated necessity to obtain the Energy Efficiency Design Index (EEDI) in compliance with the requirements of the International Maritime Organisation (IMO) ) induce to apply power system solutions of high general efficiency which owing to this are also among others characterised by a relatively low CO2 emission [2]. Other IMO documents concerning the necessity of reduction of CO2 emission are Energy Efficiency Operational Indicator (EEOI) [3] and Ship Energy Efficiency Management Plan (SEEMP) [1]. The analysis of each of the aforesaid documents indicates that a method to improve the ship’s power plant energy efficiency, thus limiting CO2 emission on motor ships is the application of the continuously developed recovery systems of waste energy whose basic sources are the Diesel piston engines consisting ship’s main propulsion.
127

The development of the ship’s main and auxiliary propulsion system engine construction makes their efficiency visibly increase. However, it becomes more difficult to recover the waste energy due to its lowering quality. Thus is becomes very important to utilise this energy which ensures the improvement of the general ship’s operation cost balance. The appropriate evaluation of the waste energy sources consists the basis for the choice of the manner of its utilisation, and then subsequently elaborating the ship’s power system design. This evaluation should cover not only the parameters of the waste energy carriers corresponding to the nominal engine load, but also should include their change resulting from the change in engine load during ship’s service.
2. Balance of the Energy Flux of the Ship’s Diesel Piston Engines
The modern ship’s Diesel engines effectively utilise approximately 50 % of the energy
contained within the combusted fuel. Despite the high efficiency of these engines there still remains a significant part of unused fuel energy as so called “waste” energy. Thus apart from the mechanical energy there is also discharged to the environment the energy contained in: exhaust gas, cylinder cooling water, charging air cooling water, piston coolants, lubricating oil, fuel valve coolants as well as in the convection processes and heat transfer to the engine ambient air. A part of the waste energy, owing to its relatively high quality factor, can be further utilised in economically viable manner [5, 10].
There are distinguished the physical waste energy and the chemical waste energy related to the operation of ship’s Diesel piston engines. The physical waste energy appears in the temperature part, the form which results from the deviation of the temperature of the energy waste carrier from the ambient temperature and the pressure part resulting from the increased pressure in relation to the ambient prevailing pressure. The chemical waste energy is the result of the difference in the chemical composition of the waste substance which is exhaust gas in relation to the commonly present components of the environment [8, 9, 10]. This part of the waste energy is, however, generally utilised.
In order to assess the waste energy resources so called engine heat balance is done. A supplementary information for this energy form is the knowledge of the temperature, pressure and properties of its carriers. The analysis of heat balance of the commonly used as the ship’s main propulsion slow speed piston Diesel engines of MAN Diesel and Wärtsilä make indicates that the heat utilised efficiently consists (chiefly subject to the engine rating or power output) 47.1 ÷ 50.9 % of the energy contained in the combusted fuel. The heat transferred in the exhaust gas consists respectively 21.5 ÷ 25.5 %, in charging air cooling water – 15.6 ÷ 19.5 %, in cylinder cooling water 6.5 ÷ 10.5 % whereas the heat contained in luboil – 3.8 ÷ 6.3 %. The exhaust gas temperature in ISO Standard conditions and at the maximum continuous rating (MCR) varies within 508 ÷ 548 K, charging air cooling water temperature 318 ÷ 331 K, cylinder cooling water outlet temperature 353 ÷ 363 K, oil temperature at the engine outlet 323 ÷ 348 K [6]. It should be noted that the relatively high value of heat amount does not always correspond to the high temperature of the heat carriers. This is for instance the case of the heat contained in charging air cooling temperature. The precise analysis of the parameters referred to above frequently causes leaving aside the sources advantageous in terms of the amount of heat carried and paying more attention to others, characterised for instance by a bigger capacity to perform a work.
Considering the fact that the waste energy source of the biggest energetic potential in motor power plants (and also turbo-Diesel power plants) are the engine exhaust gases, the further part of this article shall be devoted chiefly to the example of the evaluation of the energy contained therein.
128

3. Exhaust Gas Energy and Exergy The basis for the evaluation of engine exhaust gas energy amount is the knowledge
of the exhaust gas temperature and the specific exhaust gas amount. The exhaust gas temperature after the turbochargers in the design conditions, similarly as the specific exhaust gas amount, is a function of many variables. In order to determine it, one should determine its value corresponding to the maximum continuous rating (MCR) of a given engine in the ISO Standard conditions for a given turbocharger type and pressure value after the turbocharger corresponding to MCR. The calculated exhaust gas temperature is then revised subject to: location in the field of the contractual parameters, so called Contract Maximum Continuous Rating (CMCR), also referred to as Specified Maximum Continuous Rating (SMCR) and the location of the optimised engine operation point. Attention should also paid to the ambient conditions (air temperature at compressor inlet, ambient pressure, water temperature at the charging air inlet), exhaust gas pressure after turbocharger corresponding to the location of the optimised engine operation point in relation to the parameters corresponding to MCR and chiefly engine load resulting from its assumed power output and crankshaft rpm. It also depends on whether the fixed pitch propeller (FPP) or controllable pitch propeller (CPP) is applied as the ship’s main propulsion. The exhaust gas temperature will be the lower the lower rpm and power output is determined by CMCR point in relation to the parameters corresponding to MCR point and engine load will be lower in the result of the reduced power rating. The decrease in exhaust gas temperature is also caused by the increase in the barometric pressure. The increase of the air temperature at the turbocharger inlet and the increase of the water temperature before charging air cooler and increase of pressure at the engine turbocharger turbine outlet cause the exhaust gas temperature to grow. The illustration of the discussed changes are the data in table 1 specific for MAN Diesel low-speed engines [4].
Tab. 1. Correction of exhaust gas data to the ambient conditions and exhaust gas back pressure [4]
Parameter
Change
Change of exhaust gas temperature
Change of exhaust gasamount
Blower inlet temperature + 10oC +16.0oC -4.1 % Blower inlet pressure (barometric pressure) + 10 mbar -0.1oC +0.3 % Change in air coolant temperature (seawater temperature) + 10oC +1.0oC +1.9 % Exhaust gas back pressure at the specified MCR point + 100 mm WC +5.0oC -1.1 %
The examples of the correction of the temperature value DTs and specific gas amount Dms resulting
from the change of the MAN L70 MC-C power output are demonstrated in figures 1 and 2 [4].
-5-4-3-2-101234
50 60 70 80 90 100 110
Optimised power Ps %
DTs
, K FPPCPP
-202468
101214161820
50 60 70 80 90 100 110
Optimised power Ps %
Dm
s, % FPP
CPP
Fig.1. Change of exhaust gas temperature, DTs, at part load [4]
Fig.2. Change of specific exhaust gas amount, Dms, in % at part load [4]
129

The courses of the changes in the temperatures of exhaust gas before and after turbocharger in the function of the loads of the selected low-speed and medium-speed engines are shown in figures 3. These have been elaborated thanks to Messrs Cegielski in Pozna� having made available the tests and trials results on their factory test bed. As an example there have been quoted the values of exhaust gas parameters of 6L70 MC-C engine of MAN Diesel make of 17,200 kW power at 108 rpm, provided with the 1xMAN B&W NA 70/T09 turbocharger, running on ISO-F-DMB fuel; 6RTA72U Wärtsilä make, of 17,940 kW power and 97 rpm, provided with 2xABB TPL77-B11 turbochargers, running on ISO-F-DMB fuel and 8L32/40 engine of Man Diesel make of 3,840 kW and 750 rpm provided with 1xMAN NR34/SO30 turbocharger, running on MDF-D.O. LII fuel. a) b)
6L70MC
400
500
600
700
800
20 30 40 50 60 70 80 90 100 110 120Load, %
Tem
pera
ture
, K
before TC after TC
6RTA72U
400
500
600
700
800
20 30 40 50 60 70 80 90 100 110 120
Load, %
Tem
pera
ture
, K
before TC after TC
c)
Fig 3. The course of the exhaust gas temperature changes before and after turbochargers 8L32/40
500
600
700
800
900
20 30 40 50 60 70 80 90 100 110 120Load, %
Tem
pera
ture
, K
beforeTCafter TC
a) 6L70MC-C engine; b) 6RTA52U engine; c) 8L32/40 engine
The data shown in figure 1 indicate a strong
coincidence with the results obtained during the tests of the engine on the factory test bed (figure 3a), in particular as far as the quality of the exhaust gas temperature changes after turbocharger is concerned. It should be noted
that within the area of the maximum engine efficiencies the temperature of exhaust gas reaches the lowest values for the obvious reasons. It is also worth emphasising that the exhaust gas temperatures before turbochargers are higher than the average temperature of the exhaust gas leaving the cylinders due to the phenomenon of the swelling occurring during the exhaust gas flow from the cylinders to the big volume outlet [7].
In cases of the recovery systems where steam is generated or special oils are heated,
it is important to know mainly the course of the temperature changes of the exhaust gas leaving the turbocharger. Whereas, if one considers the variant with the internal combustion waste heat turbine running in the system Power Take In (PTI) or Power Take Off (PTO), it is important to know not only the temperature but also the pressure of exhaust gas before turbine (in exhaust gas tank).
The inclusion of this parameter is of particular significance while evaluating the exhaust gas capacity for performing a work in the internal combustion waste heat turbine. The exhaust gas pressure before the turbine allows to determine the possible expansion in the turbine. The courses of the exhaust gas pressure changes before and after turbochargers are demonstrated on figures 4.
130

As shown by the data quoted in figures 4, this expansion at the nominal load of the engines in question, both low-speed as the medium-speed, slightly exceeds the value 3. a) b)
6L70MC
0500
1000150020002500300035004000
20 30 40 50 60 70 80 90 100 110 120Load, %
Pres
sure
abs
., hP
a
before TC after TC
6RTA72U
0500
1000150020002500300035004000
20 30 40 50 60 70 80 90 100 110 120Load, %
Pres
sure
abs
., hP
a
before TC after TC
c)
Fig 4. The course of the changes of the absolute pressure of exhaust gas before and after turbochargers 8L32/40
0500
1000150020002500300035004000
20 30 40 50 60 70 80 90 100 110 120Load, %
Pres
sure
abs
, hPa
before TC after TC
a) 6L70MC-C engine; b) 6RTA72U engine c) 8L32/40 engine
While analysing the complex systems
of the recovery of the waste energy, particularly those using IC turbines, it is useful to consider the exergy concept for the evaluation of the waste energy quality. The knowledge of exergy of the carriers under consideration allows to evaluate more closely the quality [8, 9, 10].
And while designing the ship’s systems of waste energy recovery it is sufficient to know the physical exergy. The specific physical exergy of the exhaust gas “b”, comprising the temperature and pressure parts can be determined according to the method presented in [6].
The data presented in figures 3 and 4 allowed to determine the value of the specific exergy
of the exhaust gas before and after engine turbochargers. The results of the calculations have been presented in the graphic form in the figures 5 and 6, narrowing the area of the example to the low-speed engines. For the comparative purposes there have been demonstrated also the courses in changes of the specific enthalpy “i” of exhaust gas in the function of engine load. a) b)
6L70MC
0100200300400500600
20 30 40 50 60 70 80 90 100 110 120Load, %i (T) before TC, kJ/kg
b (T+p) before TC, kJ/kgb (T) before TC, kJ/kg
6RTA72U
0100200300400500600
20 30 40 50 60 70 80 90 100 110 120
Load, %i (T) before TC, kJ/kgb (T+p) before TC, kJ/kgb (T) before TC, kJ/kg
Fig 5. The course of the changes in the specific enthalpy and (T), specific exergy including the temperature and the pressure b (T+p) part and the specific exergy including the temperature part b (T)
of the exhaust gas before turbochargers a) 6L70MC-C engine; b) 6RTA72U engine
131

a) b)
6L70MC
0
100
200
300
400
20 30 40 50 60 70 80 90 100 110 120Load, %i (T) after TC, kJ/kg
b (T+p) after TC, kJ/kgb (T) after TC, kJ/kg
6RTA72U
0
100
200
300
400
20 30 40 50 60 70 80 90 100 110 120
Load, %i (T) after TC, kJ/kgb (T+p) after TC, kJ/kgb (T) after TC, kJ/kg
Fig 6. The course of the changes in the specific enthalpy and (T), specific exergy including the temperature and the pressure b (T+p) part and the specific exergy including the temperature part b (T)
of the exhaust gas after turbochargers a) 6L70MC-C engine; b) 6RTA72U engine
With the engine loads in order of 90% the exhaust gas specific exergies in case of 6RTA72U
are slightly higher in comparison with the specific exergies of the exhaust gas leaving 6L70MC-C engine. This practically offers in this manner the similar possibilities of the utilisation of this form of energy.
The usability of the resources of the low temperature waste energy can also be evaluated by means of so called energy quality index [10]. This index means the maximum share of the work possible to attain for the assumed ambient conditions, in relation to the heat amount contained in the waste energy carrier.
m
om
TTT �
�1 (1)
where Tm – average thermodynamic temperature of the waste energy carrier, K, To – ambient temperature, K. The temperature part of exergy bT can be expressed by means of Carnote’s factor:
m
ompT T
TTib ��� (2)
where �ip – isobaric enthalpy increase of a substance under pressure p within the ambient temperature and the temperature of substance in question.
Thus the energy quality index can be determined as:
p
T
ib�
�1 (3)
Using the model presented above there have been calculated energy quality indices including only temperature part and those including both temperature and pressure parts of the exhaust gas both before and after turbochargers.
The figures 7 and 8, by way of example, present the quality indices of the exhaust gas of 6L70MC-C and 6RTA72U engines calculated according to equation 3, both before and after turbochargers. Under 90% load index including the temperature part � (T) of exhaust gas of MAN Diesel engine amounts to 32.9 %, after turbocharger 19.6 %. If one considers the pressure part these indices � (T+p), shall amount respectively over 56.2 % and 26.2 %. In case of Wärtsilä engine, before turbochargers � (T) = 35.6 %, � (T+p) = 55.0 %, whereas after the turbochargers � (T) = 26.1 %, and � (T+p) = 33.0 % respectively.
132

a) b)
6L70MC
10
20
30
40
50
60
20 30 40 50 60 70 80 90 100 110 120Load, %
Was
te h
eat q
ualit
y in
dexi
, %
� (T+p) before TC � (T) before TC
6RTA72U
10
20
30
40
50
60
20 30 40 50 60 70 80 90 100 110 120Load, %
Was
te h
eat q
ualit
y in
dexi
, %
� (T+p) before TC � (T) before TC
Fig 7. The course of the changes of the heat energy quality index including both the temperature and pressure parts � (T+p) as well as same including only temperature part � (T) of the exhaust gas before turbochargers
a) 6L70MC-C engine; b) 6RTA52U engine a) b)
6L70MC
10
20
30
40
20 30 40 50 60 70 80 90 100 110 120Load, %
Was
te h
eat q
ualit
y in
dexi
, %
� (T+p) after TC � (T) after TC
6RTA72U
10
20
30
40
20 30 40 50 60 70 80 90 100 110 120Load, %
Was
te h
eat
qual
ity in
dexi
, %
� (T+p) after TC � (T) after TC
Fig 8. The course of the changes of the heat energy quality index including both the temperature and pressure parts � (T+p) as well as same including only temperature part � (T) of the exhaust gas after turbochargers of
a) 6L70MC-C engine; b) 6RTA52U engine
4. Conclusions
In the design practice, in the ship’s recovery systems chiefly the energy/heat contained in exhaust gas and cylinder cooling water is utilised, less frequently that in the engine charging air and only occasionally that contained in the lubricating oil. The biggest part of waste energy/heat is contained in the engine exhaust gas.
The knowledge of the exhaust gas parameters allows to take a reasonable decision concerning the choice of one of many possible variants of the recovery system solutions. While designing such systems one should consider not only the exhaust gas parameters corresponding to the calculated continuous service rating at which the engine rating is usually 85 to 90 (92) % of the nominal continuous rating (CMCR), and the rpm consist respectively 95 to 97 % of the nominal rpm value, but also the exhaust gas parameters corresponding to other partial ratings. The available amount of waste energy/heat contained in exhaust gas is decreasing on account of their decreasing specific amount despite the increase of their specific exergy within certain engine loads, At that time the total ship’s need of heat decreases but slightly.
The evaluation of the sources of waste energy made on the basis of the engine heat balance, even in connection with the information on the temperature of the heat carriers fails to provide the explicit and clear information on its usability. An important component of the exhaust gas exergy is its pressure part. Information on this exergy part is significantly meaningful when designing the recovery systems with internal combustion turbines.
133
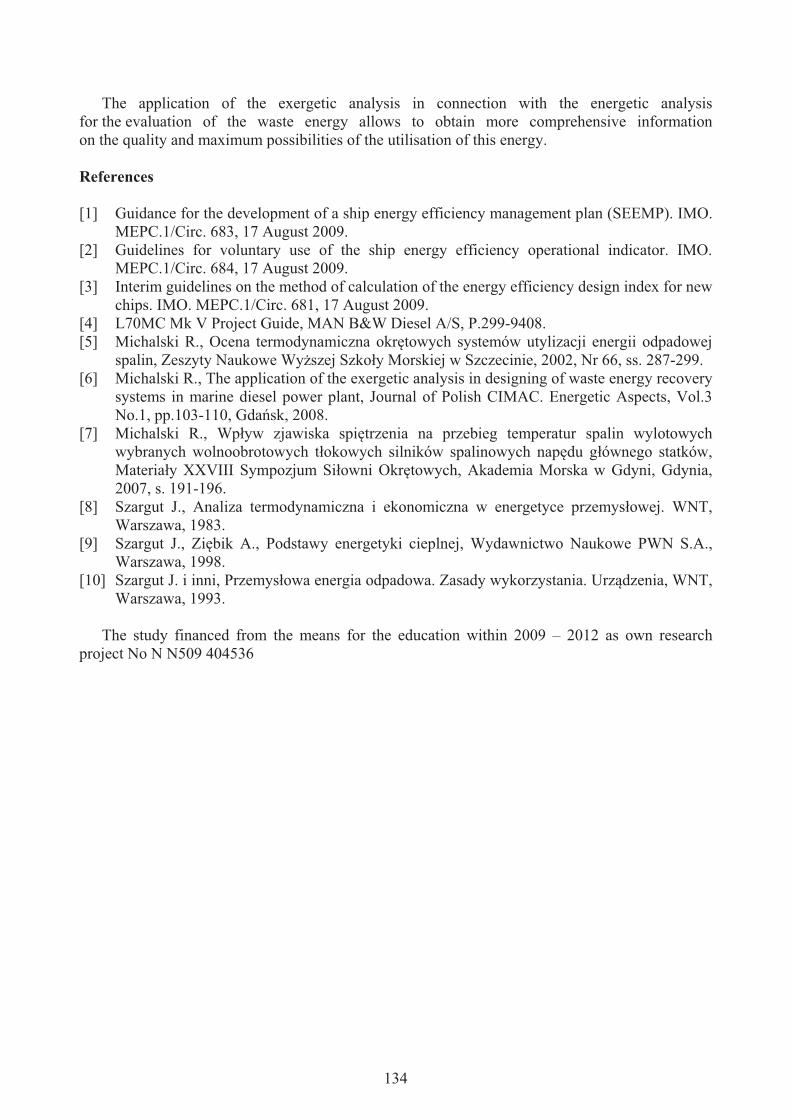
The application of the exergetic analysis in connection with the energetic analysis for the evaluation of the waste energy allows to obtain more comprehensive information on the quality and maximum possibilities of the utilisation of this energy.
References [1] Guidance for the development of a ship energy efficiency management plan (SEEMP). IMO.
MEPC.1/Circ. 683, 17 August 2009. [2] Guidelines for voluntary use of the ship energy efficiency operational indicator. IMO.
MEPC.1/Circ. 684, 17 August 2009. [3] Interim guidelines on the method of calculation of the energy efficiency design index for new
chips. IMO. MEPC.1/Circ. 681, 17 August 2009. [4] L70MC Mk V Project Guide, MAN B&W Diesel A/S, P.299-9408. [5] Michalski R., Ocena termodynamiczna okr�towych systemów utylizacji energii odpadowej
spalin, Zeszyty Naukowe Wyszej Szko�y Morskiej w Szczecinie, 2002, Nr 66, ss. 287-299. [6] Michalski R., The application of the exergetic analysis in designing of waste energy recovery
systems in marine diesel power plant, Journal of Polish CIMAC. Energetic Aspects, Vol.3 No.1, pp.103-110, Gda�sk, 2008.
[7] Michalski R., Wp�yw zjawiska spi�trzenia na przebieg temperatur spalin wylotowych wybranych wolnoobrotowych t�okowych silników spalinowych nap�du g�ównego statków, Materia�y XXVIII Sympozjum Si�owni Okr�towych, Akademia Morska w Gdyni, Gdynia, 2007, s. 191-196.
[8] Szargut J., Analiza termodynamiczna i ekonomiczna w energetyce przemys�owej. WNT, Warszawa, 1983.
[9] Szargut J., Zi�bik A., Podstawy energetyki cieplnej, Wydawnictwo Naukowe PWN S.A., Warszawa, 1998.
[10] Szargut J. i inni, Przemys�owa energia odpadowa. Zasady wykorzystania. Urz�dzenia, WNT, Warszawa, 1993.
The study financed from the means for the education within 2009 – 2012 as own research
project No N N509 404536
134

ANALYSIS OF MAIN PROPULSION ENGINE SEATINGS IN SHIP POWER PLANTS
Leszek Piaseczny
Gdansk University of Technology
ul. Narutowicza 11/12, 80-950 Gda�sk, Poland Tel. +48 58 3472673, fax +48 58 3472430
e-mail: [email protected]
Abstract In the circumstances of information gap from the manufacturer of engines mounted in ship power plants about the
tension of foundation bolts resulting from normal engine work in ship operation, the author resolved to check on ships constructed in Poland how the applied pre-tensions of foundation bolts relate to different parameters of engines. On the basis of research and control calculations of the seating of main propulsion engine series MAN B&W type L35MC on foundations it was shown that the number and tension of foundation bolts are directly proportional to the weight of seated engine.
Keywords: marine engines, seating, foundation plates, pre-tension
1. Introduction
Main propulsion diesel engines are seated on foundation plates in ship power plants by metal
or polymer chocks [1]. According to regulations [2] two bolts should pass through each chock, with which the engine is mounted on the foundation plate. The bolts are pre-tightened, usually with a hydraulic jack, to a particular force value (usually 60-70% of ductility limit of the bolt ma-terial, frequently 42CrMo4), with controlled elongation, of usually elongated and reduced bolt shank. The larger the elongation when pre-tightening the bolts, the larger the security before loos-ening the bolt nuts during engine's work. This elongation is controlled during the engine's opera-tion to make sure if there is no relaxation in the bolts' pre-tension.
The number of foundation bolts, their materials and dimensions and the pre-tension values are determined by the engine manufacturer. He also usually provides a hydraulic jack for pre-tightening of bolts with established piston surface in the cylinder and adjustable oil pressure. With proper selection of oil pressure the required tension of foundation bolts is obtained.
Regulations [1] require that the pre-tension of foundation bolts applied when seating the engine foundation in the ship power plant should be larger (without specifying how much larger) than the tension resulting from normal engine work at full load. What this last-mentioned is for a particular engine, is not given by the engine manufacturer and it has to be presumed that it is smaller than the pre-tightening of foundation bolts required by the manufacturer.
In literature [5] suggestions are made that when seating the engine on the foundation plate with metal chocks (usually made of steel) the tension sum of all foundation bolts should be ten times larger than the engine weight, due to the relatively small (0.1) coefficient of static friction of the
135

metal chock against the foundation plate. When applying polymer chocks, due to the relatively large (0.7) coefficient of static friction of the polymer against the foundation plate it is suggested that for a certain position of the engine on the foundation it is sufficient for the tension sum of all foundation bolts to be five times larger than the engine weight.
Firm ITW Polymer Technologies [2] is of the opinion that for a certain seating of the engine on the foundation with polymer chocks in the ship power plant it is sufficient for the tension sum of all foundation bolts to be two and a half times larger than the engine weight. 2. Own research
The object of analysis is the seating in ship power plants of eight engines MAN B&W type
L35MC differing as to the number of cylinders (5, 6, 7, 8, 9, 10, 11 or 12), power and weight. The engines were seated on foundation plates with cast polymer chocks. The distribution and dimen-sions of chocks are shown in Figs 1 and 2.
Fig.1. Scheme of seating engines MAN B&W type L35MC on foundation plates in ship power plants
Fig. 2. Chock cross sections: a) section B-B showing position and dimensions of the chock hole for the foundation
bolt, b) section C-C showing the position of bolt aligning between chocks When aligning with the shaft line the engine is vertically removed from the foundation plate by
means of 10-24 M30x2 aligning bolts (Fig. 2b). Depending on the number of cylinders the engine is mounted on the foundation plate of the
ship power plant by means of 26-54 M30x2 foundation bolts (Fig. 3) with reduced bolt shanks (∅ 26 mm), facilitating to obtain the required elongation of pre-tightened bolts. The obtaining of clear elongation is also enhanced by increasing the length of bolts combined with mounting a spacing sleeve (4).
136

Fig.3. Foundation bolt and side stopper of engine MAN B&W type L35MC: 1 - protective shield, 2 - spherical nut, 3 -
spherical chock, 4 - spacing sleeve, 5 – circular nut, 6 – foundation bolt The certitude of the engine's position on the foundation plate is also ensured by four side stop-
pers and two head stoppers (Figs 1 and 2). This is important as there are forces trying to push off the engine from the foundation plate with the vessel's rolling and pitching.
For measuring seating parameters the weights of four engines type L35MC series were taken from MAN B&W products catalogue [3]. The number of foundation bolts for particular engines in the series were reckoned from Fig.1.
In control calculations of seatings of engine series MAN B&W type L35MC from dimensions given in Figs 1 and 2 there was calculated the effective surface of Ae polymer chocks for each en-gine. The engines were assumed to be seated on polymer chocks admitted by classification socie-ties for load up to 3.5 N/mm2 [1] (currently polymers are applied accepting load up to 5 N/mm2).
Seating parameters of particular engines in the series were calculated from formulae given in regulations [1]. Changes of seating parameters with the change engine weights have been pre-sented in Fig. 4.
137

Fig. 4. Change of seating parameters in the weight function of engine MAN B&W type
L35MC Data system shown in Fig. 4 proves that all seating parameters of engine series MAN B&W
type L35MC are directly or inversely proportional to the engine weight. The proportion of pre-tensions sum of foundation bolts Fpc to the engine weight decreases with the increase of engine weight from 7.11 to 5.08. This proportion can be considered as safety coefficient of a certain measure before tearing off the engine from the foundation plate, that is, the larger the engine weight the more certain its seating on the foundation in the ship power plant.
The dynamics of ship diesel engines [4] indicates that the forces tearing out the engine from the foundation plate can be the impacts of diesel gases on the head at ignition moment in the cylinder and vertical vibrations caused by unbalanced moments of inertial forces and centrifugal forces active on each crank. For engines of up to 300 rev/min, stiffly seated on foundations, vibrations in the frequency range 1-10 Hz with amplitude max 0.16 mm are considered admissible [3]. The op-eration of 6L35MC engine on a ship showed that engine vibrations were smaller than admissible ones, hence the impacts of gases against the head can be considered as the main force attempting to tear out the engine from the foundation plate.
It was established during research on a ship that with full load and 210 rev/min of 6L35MC engine the largest pressure of gases at ignition moment in the cylinder is equal to 14.5 N/mm2. The wave of gases with this pressure strikes simultaneously against the piston crown, i.e. 96162.5 mm2. The force of gases impact against the engine head is thus equal to Fg=1394356 N. In the 5L35MC engine currently analysed there are 26 foundation bolts, each of them being loaded with force Fgj=46479 N.
In the work of L35MC type engines, foundation bolts are also loaded with forces emerging from unbalanced external moments of first and second order (Fig. 5) and forces from transverse
138

moment of type H bending the engine, arising from the pressure of the crosshead against the guide (Fig. 6a). The simultaneously arising moment of type X (Fig. 6b) does not result in loading of the foundation bolts.
Fig. 5. Unbalanced external moments and force moments of the crosshead pressure on the guide: A – combustion
pressure, B – crosshead pressure on the guide, C – bolt tension, D – forces on journal bearings, E – external vertical longitudinal moments of the first and second order, F – H type moment of pressure force of crosshead on the guide, G
– X type moments of crosshead pressure force on the guide
Fig. 6. H type (a) and X type (b) moments of crosshead pressure on the guide: 1 – engine top level, 2 – mean position
of crosshead, 3 – level of crankshaft axis 4 – engine feet level
Unbalanced external moments arise from the engine's unbalanced elements masses performing rotary motion or reciprocating motion. External moments of the first order (one cycle per revolu-
139

tion) are considered first of all for engines with a small cylinder number (up to six cylinders). Iner-tial forces in engines with more than six cylinders get more or less self-neutralised.
The remedies (reducers of unbalanced external moments, Fig.7) are applied when the reso-nance of ship's hull vibrations occurs in the range of operational speed of the engine's revolutions and if the level of vibrations leads to accelerations and/or speeds higher than those established in international standards. The natural frequency of vessel's hull vibrations depends on the hull's stiffness and distribution of mass, whereas vibrations level at resonance depends mainly on the values of unbalanced external moments and the engine's position in relation to the vessel hull's vibration nodes.
In practice, the application of reducers of unbalanced external moments concerns engines with cylinder bores of 460 mm and more [5].
Fig. 7. Reducers of external moments of the first and second order mounted on MAN B&W engines: a) reduce
mounted on the stern wall of the engine, b) reducer mounted on the bow wall of the engine
For the assessment of risk if external moments of the first and second order will disturb the vessel hull's vibrations, the PRU value (Power Related Unbalance) is applied as index, the value being the proportion of the external moment T to the engine's power P:
��
�� ⋅=
kWmN
PTPRU (1)
140

according to manufacturer's data [3] the PRU values for the analysed engine series type L35MC have been given in Table 1. The Table also gives the values of the engine's unbalanced external moments reckoned at 650 kW/cylinder power obtained from those engines with 210 rev/min and full load.
Tab. 1. Values of PRU and unbalanced external moments of engines type L35MC with power 650 kW/cyl at 210
rev/min
Feature Unit 5 cyl. 6 cyl. 7 cyl. 8 cyl. 9 cyl. 10 cyl. 11 cyl. 12 cyl. PRU1 N·m/kW 9.1 0.0 3.9 5.7 10.3 2.3 1.4 0.6 PRU2 N·m/kW 88.0 51.0 12.6 0.0 11.2 0.5 1.8 0.3
T1 kN·m 29.575 0.0 17.745 29.640 60.255 14.950 10.01 4.680 T2 kN·m 286.00 198.90 57.33 0.0 65.52 3.25 12.87 2.34
PRU1 – first order moment index, PRU2 – second order moment index, T1 – first order moment, T2 – second order moment.
In the analysed engine 5L35MC five unbalanced external moments of the first and second or-
der are active, attempting to turn the engine on the foot edge of the engine's head wall on the stern side of the ship. The arms of these moments are distances of axes of particular cylinders from the foot edge of the engine's head wall. According to Fig.1, for the engine 5L35MC the moment arms are equal to: for cylinder 5 – 816 mm, for cylinder 4 – 1416 mm, for cylinder 3 – 2016 mm, for cylinder 2 – 2616 mm and for cylinder 1 3216 mm. This permits the writing down of the engine's external moments sum in the equations:
][)216.3016.2416.1816.0()2(1 mNFLFTT bb ⋅+++=⋅= (2)
After substituting in these equations the values M1 and M2 from Table 2 there are obtained the
sums of forces acting on the engine's foundation bolts: Fb1=2934 N and Fb2=28373 N. As the 5L35MC engine has 26 foundation bolts, the forces loading a single bolt are equal to: Fb1j=112.8 N and Fb2j=10912.7 N.
In engine type L35MC the largest MH moment appears when the crank R=525 mm sets perpen-dicularly to the cylinder axis, and crankshaft K=1260 mm is deflected from the cylinder axis by angle α emerged after the piston has performed half a stroke (Fig. 6). In this system, sinα=K/R=0.4167, and angle α≈24o40’.
Engines of type L35MC, with piston travel s = 1050 mm have cylinder displacement volume Vs = 100970620 mm3. With compression degree � = 15, the volume of compression chamber is equal to Vk = Vs/(� – 1) = 7212187 mm3. Maximum gas pressure in the compression chamber after fuel ignition with work at full load is equal to pks = 14.5 N/mm2. It has been determined from Ber-noulli equation that:
( ) psskksk pVVpV 5,0+=⋅ (3)
halfway of the piston stroke the gas pressure is equal to pps = 1.8125 N/mm2. The gas force at
this place is Aps = 174294.5 N, hence B = Aps·tg � = 80036 N. This force is active on arm L = K·cos � = 1145 mm and creates moment MH = B·L = 91641220 N·mm. To find the force loading the row of the engine's foundation bolts, the distance of both bolt rows was accepted, i.e. 1830 mm, as the moment's arm (Fig. 1). Hence, the row of foundation bolts is loaded with force F = 50077.169 N. As the 5-cylinder engine produces five MH moments, the row of foundation bolts is loaded with force FH = s·F = 250385.84 N. In a row of a 5-cylinder engine there are 13 foundation bolts, hence the load of a single bolt is equal to FHj = 19260 N.
141

Cumulatively, the operational load of a single bolt of engine 5L35MC is equal to:
Fa = Fg + Fb1 + Fb2 + FH = 46479 + 2934 + 28373 + 2572 = 80358 N. According to regulations [1] the operational load of foundation bolts has to be smaller than
their pre-tension. As the pre-tension of a single foundation bolt is equal to 1581 N (Table 1), this condition is fulfilled for engines MAN B&W 5L35MC. 3. Conclusions
The conducted research and control calculations of seatings on foundations in ship power
plants of engines series MAN B&W type L35MC permit the statement that: 1. The sum of foundation bolts tension is directly proportional to the engine weight. 2. With the increase of engine weight there increases the certitude of engine seating on the foun-
dation in the ship power plant measured by the relation Fpc/W. References
[1] Germanischer Lloyd. Regulation for the Seating of Propulsion Plant. Hamburg, April 1995. [2] ITW Polymer Technologies. General Guidelines for Marine Chock Designers. Montgomery-ville PA 18936 USA. Technical Bulletin No 6920. 2005. [3] MAN B&W, Diesel A/S. L35MC Engine Seating Epoxy Chock Arrangement. 2009. [4] Piaseczny, L., Technologia polimerów w remontach okr�tów. Gda�skie Towarzystwo Nauko-we. Gda�sk 2002. [5] Wilson, J. M., Marine Epoxy Resin Chocks. Marine Technology, Vol.21, No 1, pp.10-18, Januar 1984.
142

THE OPTIMALISATION OF CHOOSING THE COMPOSITION OF FUEL-WATER EMULSION APPLIED FOR FEEDING
MARINE COMBUSTION ENGINES
Leszek Piaseczny Ryszard Zadr�g
Naval University of Gdynia
Ul. midowicza 69, 81-103 Gdynia, Poland tel.: +48 58 6262665
e-mail: [email protected], [email protected]
Abstract
Delivery of water to cylinders is one of the basic ways of limitation of nitrogen oxides concentration in exhausts gases from the diesel engine and is justified in many published results of researches. In effect of engine’s supply by fuel-water emulsion, simultaneously with decrease of nitrogen oxides, the changes of concentration of hydrocarbons, carbon oxides, solid particles, and changes of basic engine’s working coefficients determining its performance and load of crank and cylinder-piston set. In article, the results of researches of water delivery, in form of fuel-water emulsion to cylinders on changes of exhausts blackening; so on the changes in emission of toxic compounds in exhausts were introduced. In addition, the problem of choosing composition of fuel-water emulsion and way of its preparation were taken into consideration. Keywords: Marine Diesel Engine, toxic exhausts emission, fuel-water emulsion.
1. Introduction
More and more frequently applied manner of active affecting on the combustion process to decrease the emission of nitrogen oxides is delivery of water to the cylinders. One way of water delivery to the cylinder is an injection of the fuel-water emulsion by standard but more efficient injector [3,9].
In the authors’ opinion, applying fuel-water emulsion assures effect of the greatest reduction of NOx concentration, simultaneously with full control of influence on the combustion process. Among all things it occurs because injected water (which is a component of fuel) is delivered directly to the flaming zone in cylinder, which is the area where nitrogen oxides directly form [1,9].
The essential issue is selection of the composition and manners of obtaining the fuel-water emulsion. In case of selecting composition of the fuel-water emulsion for concrete engine (with specific features of exploitation process) it is a significant problem of such a selection of emulsion, that the effect on the exploitation parameters of engine was possibly low at desirable level of ZT emission [4,5,6,7,].
143
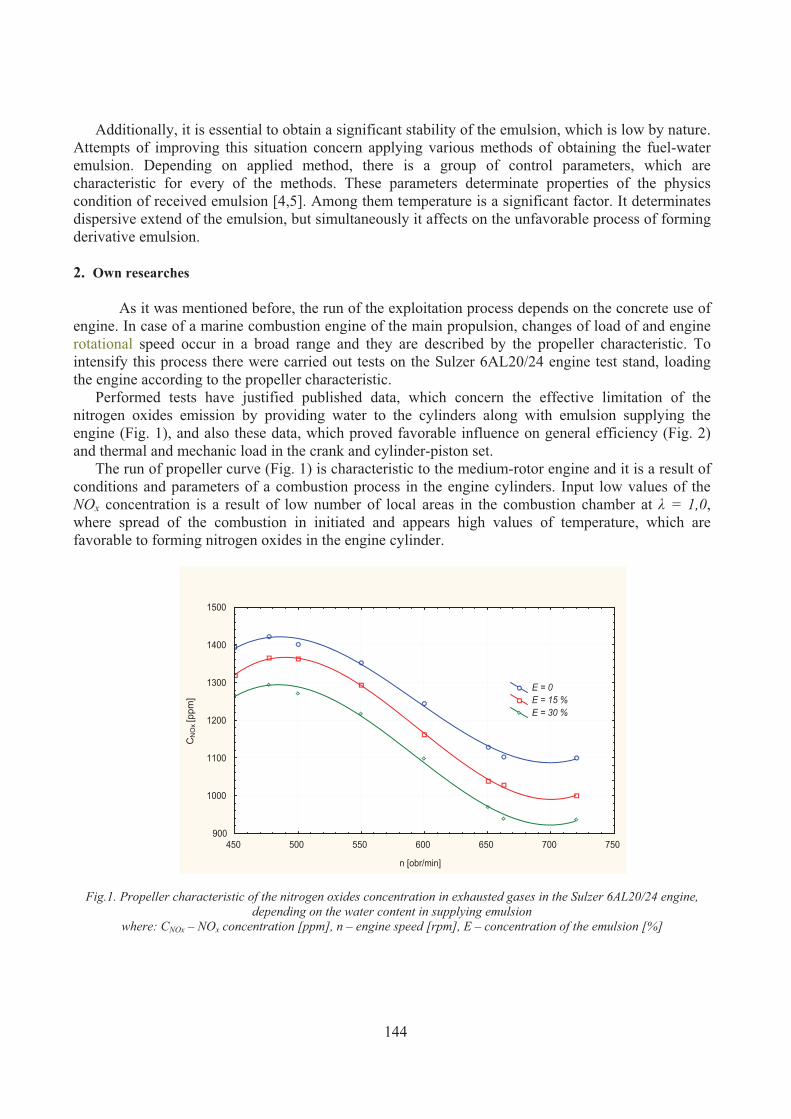
Additionally, it is essential to obtain a significant stability of the emulsion, which is low by nature. Attempts of improving this situation concern applying various methods of obtaining the fuel-water emulsion. Depending on applied method, there is a group of control parameters, which are characteristic for every of the methods. These parameters determinate properties of the physics condition of received emulsion [4,5]. Among them temperature is a significant factor. It determinates dispersive extend of the emulsion, but simultaneously it affects on the unfavorable process of forming derivative emulsion. 2. Own researches
As it was mentioned before, the run of the exploitation process depends on the concrete use of engine. In case of a marine combustion engine of the main propulsion, changes of load of and engine rotational speed occur in a broad range and they are described by the propeller characteristic. To intensify this process there were carried out tests on the Sulzer 6AL20/24 engine test stand, loading the engine according to the propeller characteristic.
Performed tests have justified published data, which concern the effective limitation of the nitrogen oxides emission by providing water to the cylinders along with emulsion supplying the engine (Fig. 1), and also these data, which proved favorable influence on general efficiency (Fig. 2) and thermal and mechanic load in the crank and cylinder-piston set.
The run of propeller curve (Fig. 1) is characteristic to the medium-rotor engine and it is a result of conditions and parameters of a combustion process in the engine cylinders. Input low values of the NOx concentration is a result of low number of local areas in the combustion chamber at � = 1,0, where spread of the combustion in initiated and appears high values of temperature, which are favorable to forming nitrogen oxides in the engine cylinder.
450 500 550 600 650 700 750
n [obr/min]
900
1000
1100
1200
1300
1400
1500
CN
Ox [
ppm
]
E = 0 E = 15 % E = 30 %
Fig.1. Propeller characteristic of the nitrogen oxides concentration in exhausted gases in the Sulzer 6AL20/24 engine, depending on the water content in supplying emulsion
where: CNOx – NOx concentration [ppm], n – engine speed [rpm], E – concentration of the emulsion [%]
144

A low load accompanies high value of air-excess coefficient. Increase of the nitrogen oxides concentration to the maximal value is a result of the increasing number of local zones in the combustion chamber at high temperature value.
Along with the further increase of load, engine rotation speed increases and affects on the improvement of homogeneous mixture in the cylinder, which is provoked by a movement of the piston, more even and placid combustion of he mixture at lowering number of high temperature zones. Despite the increasing load values and mean temperature of exhausts, nitrogen oxides concentration decreases even to 30% in proportion to the maximal value, which occur at relatively low load of the engine.
450 500 550 600 650 700 750
n [obr/min]
180
200
220
240
260
280
300
320
b e [g
/kW
h]
E = 0 E = 15 % E = 18 % E = 30 %
Fig. 2. Propeller characteristic of the unit fuel consumption in exhausted gases in the Sulzer 6AL20/24 engine, depending on water content in the supplying emulsion
where: be – unit fuel consumption [g/kW·h], n – engine rotation speed [rpm], E – concentration of emulsion [%]
The issue of selecting composition of the fuel-water emulsion is a broad issue and it could be taken under consideration depending on the amount of accepted standards. Analyzing changes of the nitrogen oxides concentration, presented in Fig. 1, it is noticeable, that decrease of the NOx concentration (the main purpose of applying the fuel-water emulsion) it takes place in the whole considerate area of the engine’s work. In relation to this, the selection of water content in the fuel-water emulsion could take place on the basis of one standard, what certainly would be the greatest decrease of the concentration or emission of NOx.
This standard could be described by the dynamic signal change index dp defined as [5]:
o
omp X
XXd ���1 (1)
where: Xo – initial value of signal (NOx concentration at supplying by pure fuel), Xm – current value of signal (NOx concentration at supplying by emulsion). As a result, quantities described as maximal values of dynamic signal change index had to be regarded as optimal.
145

Presented solution is certainly imperfect, because during the supplying engine by the fuel-water emulsion energy parameters of engine have changed, and among them also unit fuel consumption. Because of this, greater amount of the simulation standards should be accepted to analyze the problem.
Finally it was assumed that participation of water in the fuel-water emulsion gw defined as:
wf
ww dd
dg
�� (2)
where: dw –dose of water injected at engine cycle, df – dose of fuel injected at engine cycle will be optimal, if the unit fuel consumption bi minimizes as well as nitrogen oxides eNOx. at unlimited point of the propeller characteristic. Basis on what is above presented, the purpose function was accepted (function of working quality index) in the form of [5]:
2
0
2
0
),(
��#
� $
!��
�#
� $
!�
i
i
NO
NO
w
bb
ee
CngF
x
x
(3)
where: C – constant, n – engine speed [rpm] bi0, eNOx0 – values for given n and gw = 0. The injection of water gw,opt would be optimal, when:
F(gw, n) = F(gw, n)max for n = idem (4)
Presented solution also seems to be not fully satisfying, because it omits such significant elements as physical properties of the fuel-water emulsion, which, as it was proved in the authors’ papers [3,4,6,7,10], change in broad range and have influence in certainly significant way on the combustion process and NOx concentration as well.
These quantities: dynamic viscosity, dispersion extend and stability - for the fuel-water emulsion at change of temperature and pressure changes significantly for quality of pulverization and influenced on energy effort, which is connected with blending and delivery of the emulgated fuel.
Streams of pulverized fuel is characterized by the extend of dispersion, an angle of the obtuse stream, diameter and the range of drops. Along with an increase of temperature of the fuel-water emulsion, these quantities increase, what shows that conditions are more favorable to blending in cylinder filled by the fuel with load. It shows also possibility of fast evaporation and then combustion of fuel included in the fuel-water emulsion. As it is known, intensity of the evaporation increases in proportion to the surface of drops.
Viscosity of emulsion mainly depends on the content of water, the extend of dispersion, temperature and properties of emulgator. Changes are significant in comparison to viscosity of diesel fuel. Rapid increase of viscosity till the stage of gel occurs only at water content above 40% [8].
For the sake of stability, but first of all combustion very important is an extend of dispersion and a homogenous of the emulsion. There are various methods of obtaining a high extend of the dispersion and generally they result from the same way of forming the fuel-water emulsion. However, the basic condition is that the diameter of water particles can not be greater than the diameter of drops of
146

pulverized emulsion. Therefore, the extend of dispersion depends on quality of pulverized emulsion in cylinder of engine. On this condition, drops of the pulverized emulsion contains water, coated by hydrocarbons and emulgator. It is assumed, that diameter of water drops should not exceed 10 �m, and its main part should fit in the range of 2 - 3 �m .If emulsion contains water drops greater than diameter of drops appeared as a result of pulverization by the injector, in engine cylinder comes to the direct contact of water and walls of the combustion chamber, which effects in the deterioration of conditions of the combustion process.
One of the features of emulsion stability is its resistance to influence at low and high temperatures. Particularly sensitive are these emulsions with high content of water. Exceeding limitation values of temperature leads to the inversion of stages or the decline of emulsion into the separate components of fuel and water [7,10].
As it was mentioned before, the formation of emulsion does not occur spontaneously, but it requires supplies of energy from the external souce. The most effective method to emulgate water in fuel feeding the self-ignition engine is to insert diesel fuel under the surface of fuel. To production the emulsion are applied rotation devices: disc disperser, agitator, ultrasonic, cavitation and injection device, helicoidal mixer.
In case of helicoidal mixer the properties of obtained fuel-water emulsion depend on the setting parameters of mixer [2], which are: rotation speed, height of slot in the mixer and efficiency, understood as total mass of fuel and water, which flow through the helicoidal mixer. Also important is temperature of the emulsion formation, a parameter, which could be easily controlled as well as the rotation speed. First of all, dispersion of the emulsion and its stability are determined by these parameters.
Thus, purpose function, defined by the equation (3), should contain the term, which describe value of dispersion of emulsion. In relation to this, the new form of purpose function is following:
22
0
2
0 2
1),(
��#
� $
!���
#
� $
!��
�#
� $
!�
OHi
i
NO
NO
w
ibb
ee
CngF
x
x
(5)
where: iH2O –number of water drops on the control survey of the fuel-water emulsion [7,10]. Suggested solution is also imperfect, it does not consider particular terms of the equation. In fact, influence of the particular terms is not equal. To take under consideration these differences, it is necessary to convert vector coordinates of the purpose function F(gw, n) into a singular function H(gw, n):
),(),( ngwFngH ww � , (6)
where:
, (7) mm Rwwww F� ],...,,[ 21
is such a normalized verse form vector of significances, that the coordinates are:
]1,0[Fiw , i = 1, 2,..., m, (8)
and:
147

. (9) 11
�"�
m
iiw
At this stage values of significances are intuitively accepted and in relation to this, the purpose function would be following:
22
0
2
0 2
12,04,04,0
),(
��#
� $
!����
#
� $
!���
�#
� $
!�
�
OHi
i
NO
NO
w
ibb
ee
CngH
x
x
(10)
Considering the fact, that low amount of samples were analyzed, in this paper was not carried out
the complete analysis of function eNOx = h(gw, n) i bi = h(gw, n). The analysis was limited to description of extreme values of the function established n for gw, treating received results as values of working quality index– h. Standard of optimum would be fulfilled, analogous to (4), when values of work quality index h were accepted as maximal values.
The results of analysis of selecting the water content in emulsion, accepting the above mentioned standards are presented in Fig.3.
E = 15 % E = 30 %
Fig. 3. Relation of working quality index h to nitrogen oxides concentration and engine speed in engine Sulzer 6AL20/24
type powered by fuel-water emulsion ��
Analyzing Fig. 3 it should be remarked that working quality index h had the highest values for both types of emulsion: 15% and 30% of water content. The extreme value has occurred at n = 650 rpm and load T = 3,18 kNm. The influence on such condition undoubtedly has a very favorable run of the unit fuel consumption in this area of engine’s work (Fig. 2).
148

Aside from just mentioned decrease of the nitrogen oxides concentration, it is a result of the fact, that applying the fuel-water emulsion causes a number of effects on a run of the combustion process in the cylinder. Among other things, presence of water in the combustion area is a reason of decreasing temperature of the combustion products, but simultaneously specific volume of exhausted gas increases. In comparison to exhausted gas, the low molecule mass of the vapour causes considerable increase of pressure, as well as effective power of the engine.
In performed tests with application of 30% fuel-water emulsion a low increase of mean indicated pressure was remarked at the practically invariable maximal pressure of the combustion. It results in the increase of indicated power [1,6]. Dose of fuel per circuit of emulsion increased due to the decrease of energy, referred to a volume unit injected to the cylinder in comparison to analogues dose of pure fuel. However, after subtracting a mass of water included in the emulsion, consequently to the change of mean indicated pressure, consumption of fuel was reduced.
This resulted in increase of general efficiency of engine for about 2%. �3. Conclusions In conclusions should be remarked, that presented above material does not completely solve problem of selection components of fuel-water emulsion for various conditions of using the engine. This is only an attempt at formalizing a problem in the essential scope to prepare input data for the principal tests, which authors plan to carry out for statistically significant population, using the multiply regression. Such obtained results will be purposely used to devise supply system of marine combustion engine by the fuel-water emulsion, which composition would be dynamically formed depending on a current load, what come out of the exploitation conditions. The minimal nitrogen oxides emission at the possibly greatest general efficiency of engine obviously remains a standard of selecting composition of the fuel-water emulsion. References [1] Chomiak J.: Performance analysis of a Steam injected Diesel (STID) Engine. Marine Science
and Technology for Sustainability – ENSUS 2000, CQD Journal, Newcastle 2000. [2] D�uska E., Hubacz R., Wro�ski S.: Simple and multiple water fuel emulsions preparation
inhelicalflow. Conference Proceedings of the Fourth Mediterranean Combustion Symposium, Lisbon 2005.
[3] Piaseczny L., Zadr�g R.: Wp�yw zasilania emulsj� paliwo-wodn� na dymienie okr�towego silnika spalinowego. Journal of KONES Internal Combustion Engines, Warszawa – Bielsko-Bia�a 2003.
[4] Piaseczny L., Zadr�g R.: Wp�yw zasilania emulsj� paliwowo-wodn� na toksyczno�� okr�towego silnika spalinowego. Zeszyty Naukowe Politechniki Gda�skiej 598 BUDOWNICTWO OKR�TOWE Nr 65, Gda�sk 2004.
[5] Piaseczny L., Zadr�g R.: Dobór zawarto�ci wody w emulsji paliwowo-wodnej dla ró�nych procesów u�ytkowania silnika. Mi�dzynarodowa Konferencja, Silniki w zastosowaniach wojskowych, SILWOJ’05, WAT – AMW. Rynia 2005.
[6] Piaseczny L., Zadr�g R.: Researches of influence of water delivery to cylinder on parameters of combustion process and toxicity of CI Engine. SILNIKI SPALINOWE, No 2/2005 (121).
[7] Piaseczny L., Zadr�g R.: Effect of selected fuel-water emulsion parameters on NOx emission of an SI engine. SILNIKI SPALINOWE, No 2007-SC2.
[8] Scherman F.: Emulsji. Izd. Chimija, Moskwa 1972. [9] Velji A., Remmels W., Schmidt R. M.: Water to reduce NOx emissions in diesel engines a basic
study. CIMAC, Interlaken 1995.
149

[10] Zadr�g R. The effect of temperature on the properties of fuel-water emulsion applied for feeding marine combustion engines. Journal of POLISH CIMAC, EXPLO-DIESEL & GAS TURBINE’07, V INTERNATIONAL SCIENTIFIC-TECHNICAL CONFERENCE. Gda�sk – Stockholm – Tumba. 2007.
150

INFORMATION BANKS OF ENERGETIC DEVICES OPERATION FORMED BY MEANS OF DIMENSIONAL ANALYSIS
Jan Roslanowski Ph.D.Ch. (Eng.)
Gdynia Marit ime Academy
Facul ty of Marine Engineering 81-87 Morska s tr .
81-225 Gdynia Poland e-mail: [email protected]
Abstract
The following article explains how information banks of energetic devices can be created by means of
dimensional functions complex. Operation of energetic devices have been assessed, according to J. Girtler proposal, by means of physical quantity called Joule multiplied by second [Js]. Interpreted in this way operation is nothing else but energy transfer in the form of work or heat to the neighbourhood and expressed by Joule multiplied second product. Diagnostics of energetic devices, according to J. Girtler in his works [2, 3], can be carried out by means of their operation. As has been indicated there is also a possibility to describe working processes, taking place in energetic devices with the help of parametric dimensional functions, giving reasons for their creation. There are formal rules, presented in this paper, concerning working processes that take place in energetic devices with the help of dimensional analysis. We have also been shown an exemplary diagram of diagnostic activities, making use of information bank of energetic devices operation, and at the same time, being confronted by diagnosis of technical condition of such devices. Exemplary dimensional functions of working processes taking place in piston combustion engine and in ship auxiliary boiler have been presented in information bank of energetic processes.
Key words: information banks of energetic devices operation, dimensional analysis 1. Introduction
Technical means that serve to transform information enable us to collect numerous research results of working processes, taking place in energetic devices and their handling in computer informing banks of operation [4].
Energetic devices in thermodynamic formulation, constitutes an object that influences the surroundings. The most of ten reactions between an object and the surroundings or between two objects is represented by energetic influence. It consists in energy exchange. There are two forms of this influence: work and heat in the objects that do not exchange substances between each other. Heat is the form of energy transformation different than work. Energy transformation by energetic devices both in the form of heat and work as well, is subject to a change with the passage of time. Such change does not depend only on performed tasks by energetic devices and conditions in which they proceed, but it also depends on their technical condition.
According to the above, it makes sense to consider the operation of energetic devices, defined at the same time, by the energy brought to them and carried away, while being transmitted. Estimation of energetic devices operation, according to J. Girtler in his works [2, 3], can be compared with dimensional physical quantity with measurement unit called Joule multiplied by second. Such operation can be interpreted as conversion of energy alt a definite time.
151

Operation of energetic devices in which the exchange of energy takes place, can be a carrier of information about their technical condition.
The basic problem of working process analysis in energetic devices, for operation needs, is building of mathematical models describing their operation. Forming of similar specifications becomes indispensable in undertaking optimal operation decisions in the range of energetic devices repair.
Necessity of such descriptions in other words, mathematical models, results from the need of knowledge about the regularities taking place between the parameters of a device performance and its technical condition. To find mathematical dependence for such complicated realities as working processes in energetic devices in an analytic way is not an easy task [4].
Experimental methods are most often used for this purpose. They consist in collecting and describing scientifically, statistic data which characterize particular parameters of energetic devices performance.
Dimensional analysis enables us to pass from quality descriptions to quantity ones. It also leads the experiment in the right direction or even simplifies it. For this reason it is suitable for creating of mathematical specifications concerning working processes that take place in energetic devices. One function can not be useful as a description of all working processes, and thus it does not reflect all conditions of its mechanisms [4, 5, 6, 7]. For this reason it is necessary to process a great amount of information previously collected in computer banks. 2. Creation rules of dimensional functions, concerning operation of energetic devices
Research is carried out in a defined direction of energetic devices operation. The results of the accomplished experiments are presented in dimensional function quantities or functions of these quantities. Most important in preparing measurements and elaboration of its results is to examine what limitations should be imposed on the functions of device operation, as dimensional quantities are their arguments and not the numerical ones. After fulfilment of the above conditions one can start to determine functional dependence, if such dependence can be determined at all [4, 6].
Dimensional analysis does not determine the number and the kind of quantities. It depends entirely on the knowledge of the working process taking place in the device under examination. One can not use a device working process description without quality recognition, as it would be difficult to achieve any sensible information. Dimensional analysis does not produce any information about the forms of numerical functions. According to Kasprzak and Lysik in paper [4] dimensional analysis ensures only dimensional regularity of the description, not entering however the physical description of the world. By means of the above mentioned analysis, we can achieve dimensional functions of working machines determined exact to a parameter, if only the arguments of a dimensional function are dimensionally independent [1, 4, 6, 7]. The parameter can be determined only by means of the measurements performed on working energetic devices [7].
The conception of dimensional function is of great importance in applications of dimensional analysis. Dimensional function of energetic devices operation is just a function defined in dimensional space �, arguments of which are parameters of working devices, being elements of the same dimensional space [1, 4, 6, 7].
It is necessary for dimensional function, created on the basis of energetic device work, to fulfil consistently interpretation rules together with the notions that suit its description. Working process description that takes place during the device performance and all information we have to obtain about its work is expressed in the language of some discipline with the help of defined notions which are dimensional quantities. They imitate real technical conditions of the device and all resulting operation features that are included in working processes [4, 7]. Parameters of working process under examination are physical quantities marked by dimensions. Therefore exponent matrix of dimensional arguments concerning operation functions of energetic device forms (1) in
152

the basic unit set of measure SI, is of the third order. It means that in case of dimensional function of the form (1a), three quantities form among five arguments are dimensionally independent, and two arguments are dimensionally dependent on the three, mentioned above. For this reason one can choose arguments dimensionally independent form the dimensional function (1a) and separate them from the remaining ones, that is, to accept a dimensional base of this function in ten ways. Not all accidentally accepted dimensional bases will be appropriate which results from dimensional independence of the unit set. Making use of Buckingham theorem [1,4,6,7] in the function (1), after previous acceptance of dimensional bases, one can obtain different forms of these functions [1,5,6].
Exemplary forms of such functions are represented by the following formulas:
(1) ) () () ( mtpBDc
tGnNDbtpGnMDa
KKK
S
S
,,,,,,
,,,,
Φ=⋅⋅⋅Φ=⋅⋅⋅Φ=⋅⋅⋅ )
))
where: � – symbol of dimensional function, DS – propulsion engine operation in [Js], DK – auxiliary boiler operation in [Js],
M – the engine torque in �
� �
� ⋅2
2
smkg ,
n – revolution speed of the engine in ��
��
s1 ,
G – volumetric fuel consumption by the engine in �
� �
�s
m3
,
N – effective power of ship propulsion engine in �
� �
� ⋅3
2
smkg ,
p – supercharging air pressure in ��
��
⋅ 2smkg ,
t – time of engine operation in [s],
B – firing oil consumption by the boiler in ��
��
skg ,
PK – steam pressure generated by the boiler in ��
��
⋅ 2smkg ,
m – boiler efficiency in ��
��
skg ,
tK – time of boiler operation in [s].
In table 1 there is a notation concerning dimensional functions of energetic device operation in a quality form.
3. Creation of dimensional banks concerning energetic device operation
Chosen dimensional quantities must interfere in a description of a device operation in a radical
way and restrict considerably the possibility of its description. Selection of these quantities must be preceded by their detailed analysis.
153

According to formal principles of dimensional function creation, concerning energetic device operation, presented in point 2 of the paper, their work is defined by a composed function of the form (1). Their different parametric forms, while using Buckingham theorem, are presented in table 1.
Table 1. Notations of dimensional function operation of energetic devices in a quality form. Schedule
of measure
units
Dimensional parameters describing the signals of the
above energetic device
Dimensional quantities describing
energetic device operation
Non normalized information about energetic device
operation Process
class entrance exit Features
Description of working process taking place in a piston combustion engine of the ship
kg; m; s;
pnMG G
⋅⋅= ϕ
nGpM M
⋅⋅= ϕ nMfDS ⋅= 1
GnMp p ⋅
⋅= ϕ t
n n1⋅= ϕ 23 n
pGfDS⋅⋅=
pG
MfDS ⋅=
2
5
24 tpGfDS ⋅⋅⋅=
tMfDS ⋅⋅= 6
28 nNfDS ⋅=
29 tNfDS ⋅⋅=
Description of working process taking place in ship auxiliary boiler of VX type
kg; m; s;
mB B ⋅= ϕ
Bm m ⋅= ϕ 22
3
10KK
K tpmfD
⋅⋅=
22
3
11KK
K tpBfD
⋅⋅=
Parameters measurements of a device work in the form of dimensional functions concerning
operation, and defined on the basis of working processes that take place in different technical conditions of the device, can be collected in so called computer dimensional bank of energetic device operation. Such operation bank should have at is disposal an analytic notation of dimensional function described qualitatively, the form of which, is presented in table 2. Such table enables one to select work parameters of a device or to record them in the bank according to the code included in it.
Parameters that are measured and calculated by means of numerical functions should be comparable with the parameters used in respective theories. Interpretation principles presenting connections between the calculated parameters and the observed quantities during energetic device operation make such comparisons possible.
154

Numerical function that can be found there, are called similarity invariants. If similarity invariants define the points of dimensional space, then the quantities determined on their basis, suit working processes that place in energetic devices [4, 5, 6, 7].
Table 2. Notation of measured parameters during working process of energetic device and calculated operation functions in a computer dimensional bank of their operation
Information of experimentally examined realizations taking place in a propulsion combustion engine of the ship,
described qualitatively in table 1. 1 2 3 4 5 6
G p t
M n
( )tGf ϕϕ ,1 ( )tMf ϕϕ ,3 ( )nMf ϕϕ ,4 ( )tnf ϕ ϕ,5 ( )Gnf ϕ ϕ,6
N n t G
( )f tϕ8 ( )nf ϕ9
Information about experimentally examined realizations of the working process taking place in a ship auxiliary boiler of VX type,
described qualitatively in table 1. B
Kp
Kt m
( )f Bϕ10 m ( )f ϕ11
Table 3 presents exemplary numerical function adjustment of propulsion engine operation and
its auxiliary boiler VX by the method of least square estimator at linear regression of its non dimensional arguments in the accepted dimensional bases. Table 3. Function adjustment of energetic device operation by the way of least square estimator, at linear regression
of its non dimensional arguments and accepted dimensional base Dimensional function of ship propulsion engine operation ( )tpGnMDS ,,,,Φ=
Dimensional base Numerical form of operation function in a piston propulsion engine of the ship
( ) tMfDMtp GnS ⋅⋅=� φφ ,,, 6 tMMtntGpDS ⋅−⋅⋅+⋅⋅= −− 92212 1027,610
( )nMfDpnM tGS ⋅=� φφ ,,, 1 2
2 5,103,03,602,0n
pGtMtnMnMDS
⋅+⋅−−⋅⋅+−=
Dimensional function of auxiliary boiler operation ( )mtpBD KKK ,,,Φ=
Dimensional base Numerical function from of auxiliary boiler operation VX type
( ) 22
3
11,,KK
mK tpBfDBtp
⋅⋅=� φ �
��
��� ⋅⋅
⋅⋅=
Bm
tpBD
KKK 72,0exp02,0 22
3
Diagrams of a variable dependent on dependent variables, being dimensional function
arguments of propulsion engine and its auxiliary boiler operation, have been presented in Fig. 1.
155

Non dimensional arguments of dimensional function operation of ship propulsion engine and its auxiliary boiler in the accepted bases have been calculated on the basis of measurements performed on the ship.
Dimensional base B, tK ,M
610⋅⋅
=tM
DC - operation indicator of the engine,
- similarity invariant of engine revolution
Speed,
610⋅⋅= tnA
MGpB ⋅⋅= t - volumetric similarity invariant of fuel
consumption by the engine
Dimensional base M , n , pK
MnDZ ⋅= - indicator of engine operation, -
similarity invariant of engine revolution speed,
tnX ⋅=
nMGY
⋅⋅= p
- volumetric similarity invariant of fuel consumption by the engine
Dimensional base p, tK, B
313
22
10⋅⋅⋅=B
ptDY KK - operation indicator of the boiler, BmX = - boiler load indicator
Fig. 1. Non dimensional arguments of a dimensional function of operation, in the accepted bases obtained on the basis of measurements, carried out during steady work of the ship propulsion engine and its auxiliary boiler
Fig. 2 shows the block diagram which presents research planning towards functioning of energetic devices, taking advantage of computer dimensional bank of their operation.
156

I Description of working process taking place in an energetic device:-
a) selection of dimensional quantities, b) determination of measurement range towards work parameters.
II Descriptions of working process parameters, in an accepted set of measure units.
III Dimensional base selection of quantities dimensionally independent, taking into consideration all
variants.
IV Separation of quantities dimensionally dependent from the independent ones, which are arguments of dimensional function.
V Dimensional function notation of the numerical form in all dimensional bases.
VI Information concerning the realization process on the basis of measurement data
included in the computer bank of energetic device operation. �bank
operation Information present in the bank Shortage of information in the bank
VII Interval determination of parameters variability Xi
VIIInterval determination of work parameters
variability with establishing of measurement range towards energetic
device operation
VIII
Comparison of variability intervals with the bank data Xi’ i.e. Xi/Xi’
X Possibility testing towards carrying out device measurement during operation
Partial interference
φ≠∩ 'ii XX ' ii XX ∈ separable
IX Take advantage of bank data XI
Methods and measurement techniques concerning work parameters of energetic
devices and their definition
IX Receive of variability
intervals parameters fulfils condition φ≠∩ 'ii XX
XIICarrying out of work parameters of
devices with calculation of numerical function arguments
XIII Notation of parameter measurement and
calculated invariants of probability
Operation of energetic devices � XIV Form determination of numerical function
Fig.2 Block diagram presenting research planning of energetic devices functioning, making use of computer
dimensional bank of their operation Temporary operation functions of ship propulsion engine, during steady work and of auxiliary
boiler VX as well, have been presented in Fig. 3
a)
157
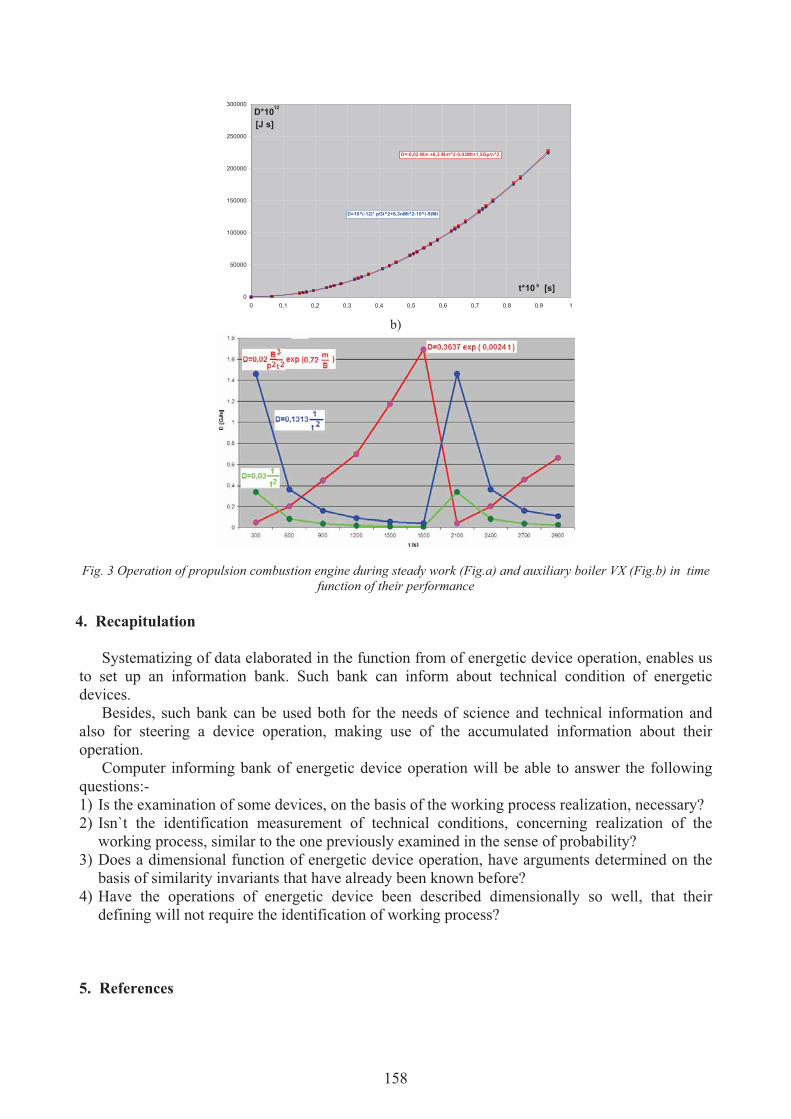
b)
0
50000
100000
150000
200000
250000
300000
0 0,1 0,2 0,3 0,4 0,5 0,6 0,7 0,8 0,9 1
D=-0,02 M/n +6,3 Mnt^2-0,03Mt+1,5Gp/n^2
D=10^(-12)* pGt^2+6,3nMt^2-10^(-9)Mt
t*10 6
D*1012
[J s]
[s]
Fig. 3 Operation of propulsion combustion engine during steady work (Fig.a) and auxiliary boiler VX (Fig.b) in time
function of their performance 4. Recapitulation
Systematizing of data elaborated in the function from of energetic device operation, enables us to set up an information bank. Such bank can inform about technical condition of energetic devices.
Besides, such bank can be used both for the needs of science and technical information and also for steering a device operation, making use of the accumulated information about their operation.
Computer informing bank of energetic device operation will be able to answer the following questions:- 1) Is the examination of some devices, on the basis of the working process realization, necessary? 2) Isn`t the identification measurement of technical conditions, concerning realization of the
working process, similar to the one previously examined in the sense of probability? 3) Does a dimensional function of energetic device operation, have arguments determined on the
basis of similarity invariants that have already been known before? 4) Have the operations of energetic device been described dimensionally so well, that their
defining will not require the identification of working process? 5. References
158

[1] Drobot S., On the foundation of dimensional analysis, Dissertation Mathematic, vol. XI, 1954. [2] Girtler J., Energy-based aspect of machine diagnostic, pp. 149-155, Diagnostica 1 (45)/2008. [3] Girtler J., Identification method of technical state of the objects on the Ground of estimation of
their work, pp. 126-132, Diagnostic 2 (46), 2008. [4] Kasprzak W., Lysik B., Dimensional analysis, algorithmic procedures of experiment service,
WNT Warszawa 1988. [5] Roslanowski J., Identification of ships propulsion engine operation by means of dimensional
analysis, Journal of polish CIMAC Energetic Aspects, Vol. 4 No. 1, pp. 137-144, Gdansk 2009. [6] Roslanowski J., Methodology of model building, concerning energetic processes, taking place
in ship propulsion units, by means of dimensional analysis defining their dynamic features, Scientific brochure no. 8 , pp. 41-64, WSM Gdynia 1982.
[7] Szucs E., Mathematical modeling in physics and technique, WNT Warszawa 1977.
159

160

AUXILIARY BOILER OPERATION OF VX TYPE INSTALLED IN SHIP COMBUSTION ENGINE ROOM
Jan Roslanowski Ph.D.Ch. (Eng.)
Gdynia Marit ime Academy
Facul ty of Marine Engineering 81-87 Morska s tr .
81-225 Gdynia Poland e-mail: [email protected]
Abstract
The following paper presents determination method of auxiliary boiler operation of VX type installed in ship combustion engine room basing on parameters of its work by means of dimensional analysis. Auxiliary boiler
operation, as energetic device has been treated, according to J. Girtler, as new physical quality of dimension Joul multiplied by second [Js]. It expresses transformation of chemical energy bring about with fuel to a boilers burner on
the outside, in the form of heat through steam enthalpy. Quantity of this kind can be determined on algebraic basis diagram of dimensional analysis constructed by S. Drobot. This diagram allows us to control principles correctness of
conclusion in respect of mathematics, used in numerical functions of auxiliary boiler operation, installed in combustion engine department of ship propulsion engine.
Key words: auxiliary boiler operation installed in ship combustion engine, algebraic diagram of dimensional analysis, physical quantity of Joule second dimension 1. Introduction
Steam boiler being an energetic device according to boiler regulations is a closed vessel. This vessel is supplied with energy in the from of heat causing the water in the vessel turn into a wet steam with compression higher than atmospheric, used on the outside. Boilers generating such steam in ship combustion engine room are called auxiliary ones and are liquid fuel fired. It means that boiler operation is determined by energy transmission in the enthalpy from on the outside through wet steam.
The basic parameter of such operation is a momentary steam efficiency generated by the boiler witch steady, in advance determined definite pressure. Momentary steam efficiency which determines boiler loading must be equal to steam demand by devices cooperating with it. It causes necessity of cyclic supply of the boiler with adequately definite amount of fuel, air and water according to its load. It forces keeping on steady level such parameters of boiler performance as:
- steam pressure, - level of water in the boiler, - excess of air. In such situation boiler performance is of oscillating character. Parameters describing boiler
performance are changeable in time and with permanent demand of steam by the ship and stabilized temperature of supply water, change in identically similar oscillations.
161

Auxiliary boiler performance as transformation of chemical energy into thermal one, transmitted to the outside through steam enthalpy, during its operation, can be estimated by a physical quantity of dimension Joul multiplied by second [2,3].
2. Dimensional function forms of auxiliary steam boiler performance
Boiler operation is determined by changes of its work parameters during typical, full oscillation. Oscillatory performance of auxiliary boiler, type VX, presented in Fig.1, in dimensional space can be specified by means of the following dimensional function: (1) ( mtpBD ,,,Φ= )where: D – operation of auxiliary boiler in [ J�s] , – symbol of dimensional function, B – consumption of combustible oil by the boiler in [ kg/s ], p – steam pressure generated by the boiler in [ kg/ms2 ], t – time of boiler operation in [s], m – boiler efficiency in [ kg/s].
Auxiliary boiler operation is a quantity determined by formula (1) belonging to the elements of dimensional space. Characteristics of such spaces allow to describe boiler operation by means of positive real numbers [1]. Dimensional function (1) belongs to three-dimensional space which
Fig.1. Auxiliary boiler operation of VX type in ship combustion engine room; Explanations: D –boiler operation in [Js], t – time of boiler operation in [s]
allows to choose in two ways, three quantities dimensionally independent of the remaining ones. They fulfil the condition of homogeneity and invariance as well. Such quantities are called space dimensional base [1, 5, 6, 7].
Such bases together with corresponding to them numerical functions have been presented in table 1. Dimensional base created by quantities dimensionally independent like steam pressure from the boile, operation time and efficiency, have been rejected: pressure of outlet steam from the
162
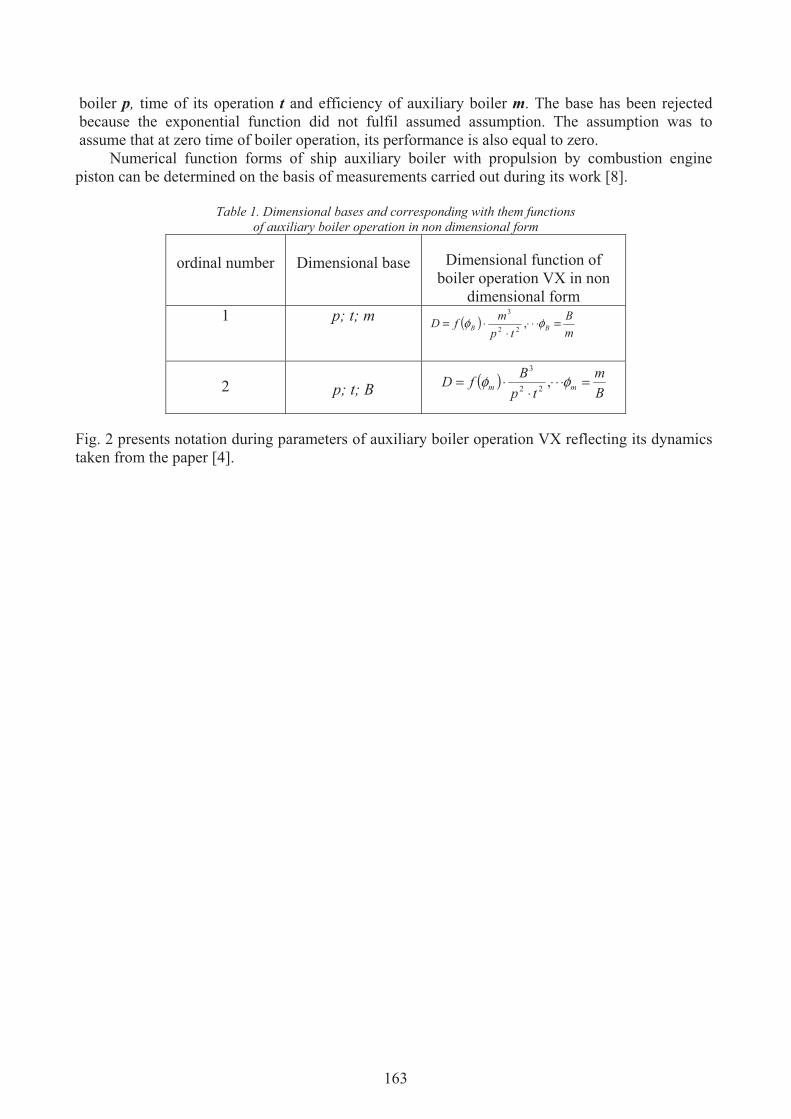
boiler p, time of its operation t and efficiency of auxiliary boiler m. The base has been rejected because the exponential function did not fulfil assumed assumption. The assumption was to assume that at zero time of boiler operation, its performance is also equal to zero.
Numerical function forms of ship auxiliary boiler with propulsion by combustion engine piston can be determined on the basis of measurements carried out during its work [8].
Table 1. Dimensional bases and corresponding with them functions
of auxiliary boiler operation in non dimensional form
ordinal number
Dimensional base
Dimensional function of
boiler operation VX in non dimensional form
1
p; t; m ( )mB
tpmfD BB =⋅⋅⋅
⋅⋅= φφ ,22
3
2
p; t; B ( )
Bm
tpBfD mm =⋅⋅⋅
⋅⋅= φφ ,22
3
Fig. 2 presents notation during parameters of auxiliary boiler operation VX reflecting its dynamics taken from the paper [4].
163

Fig. 2. Notation during boiler operation parameters VX reflecting its dynamics [4];
Explanations: t – time of boiler operation in [s]; B-fuel consumptions; B1 – work of first nozzle; B2 – work of two nozzles; m- boiler efficiency; p – overpressure of steam in the boiler
3. Way of determination and measurements of dimensional function arguments of auxiliary
boiler VX operation
To measure dimensional function arguments of auxiliary boiler operation, specially for this purpose, standard control – measurement apparatus was used. Measurements were carried out during heating process of propulsion combustion engine before the voyage of the ship. Under these conditions steam demand in combustion engine room is constant and heavy. This ensures stability of dimensional parameters modification in oscillatory operation of the boiler [8].
Fuel consumption by the boiler depends on working time of each nozzle. Boiler operation with heavy demand of steam takes place during continuous work of one nozzle and the other periodically.
Working time measurement of nozzle burner was carried out by means of spring stopper (in the range of 0-30 minutes, exact to 0,2 [s]) basing on light signal observation of oil burner.
Fuel consumption by the boiler during work of one and two nozzles was determined with the help of measuring tank of 0,0071 [m3] volume and linear dependence of heating oil density on temperature such dependence was determined basing on the knowledge of heating oil density in two different temperatures specified on the bunkering receipt.
164

Measurement of heating oil temperature was carried out with the help of mercurial thermometer exact to 1 [0C], placed on the oil burner heater.
Efficiency measurement of the boiler i.e. steam demand produced by the boiler in time unit, can be treated as density measurement of steam flow in the outlet pipe from the boiler. Measurement of this density was carried out with the help of steam bellows meter in the range from (0-800) [kg/h] and exactitude class 1,5% in the indication range (30-100)%. The meter measured the difference of steam pressure in front of and behind the measuring reducer built in the outlet pipe from the boiler. Basing on manometer readings of steam overpressure in the boiler and barometric pressure of generated steam could be calculated.
Despite the fact that the auxiliary boiler of VX type, possessed steam separator, the degree of its steam dryness was slighter than unity and changed depending on pressure and boiler efficiency. Steam dryness degree of outlet steam from the boiler was defined by choking it is enthalpy way in the calorimeter nozzle.
Temperature of steam overheated in the calorimeter was measured by hydrostatic tube gauge. On the basis of absolute knowledge of pressure and steam temperature behind calorimeter nozzle, it is possible to read in steam diagram enthalpy-entropy, the coefficient value of steam X dryness. Calculated on the basis of the above measurements, pressure value and a degree of steam dryness allow to determine specific enthalpy of steam, produced by the boiler.
Auxiliary boiler VX is periodically supplied with water and fired in an abrupt change way. In this situation the boiler performance is periodically variable in time. We calculate it as intensity product of steam flow with defined specific enthalpy and time square of boiler performance [8].
The above mentioned parameters of boiler performance necessary to determine arguments of its performance were carried out simultaneously every 300 [s] from turning on the second nozzle of the oil burner until it was turned on again. This period of time allowed us to measure work parameters during complete period of boiler performance (Fig. 2).
Results of parameter measurements concerning boiler performance and the following calculations are presented in table 2. Taking advantage of measurements and calculations from table 2 and also from dimensional function base of boiler operation, presented in table 1, we can achieve its non dimensional function of auxiliary boiler operation in ship combustion engine room are presented in Fig. 3
Non dimensional arguments presented in Fig. 3 express numerical indicators of boiler operation in particular conditions of its work. It means that non dimensional indicator of operation is a numerical function of auxiliary boiler load indicator VX (Fig. 3).
Table 2. Results of work parameters measurement concerning ship auxiliary boiler VX, being arguments of dimensional function of its operation
Ord. numb.
Time of operation
t 103
Fuel consumption by the boiler
B
Boiler efficiency
m
Overpressure of outlet steamfrom the boiler
p 105
Specific enthalpy of outlet steam
from the boiler
h
Boiler Operation
D 109 (D= m h t 2 )
- [s] [kg/s] [kg/s] [Pa] [J/kg] [J s] 1 0,3 0,0206 0,2133 3,54 2624 50,37 2 0,6 0,0206 0,2153 4,46 2637 204,39 3 0,9 0,0111 0,2108 4,46 2637 450,26 4 1,2 0,0111 0,1856 3,46 2624 701,30 5 1,5 0,0111 0,1978 3,38 2642 1175,82 6 1,8 0,0111 0,1976 3,29 2642 1691,47
second period of boiler operation 7 2,1 (0,3) 0,0194 0,1667 3,00 2681 40,22
165

8 2,4 (0,6) 0,0194 0,2153 4,00 2631 203,92 9 2,7 (0,9) 0,0111 0,2150 4,63 2637 459,23
10 2,9 (1,1) 0,0111 0,2078 4,34 2634 662,29
Fig. 3. Non dimensional indicator of auxiliary boiler operation Y in the function of its load X determined on the basis
of work parameters, Explanations: 313
22
10⋅⋅⋅
=B
ptDY - indicator of boiler operation; BmX = - indicator boiler load;
D – boiler operation in [s]; p – overpressure of outlet steam from the boiler in [Pa]; B – fuel consumption by the boiler in [kg/s]; m – boiler efficiency in [kg/s]; t – time of boiler operation in [s]
Such numerical function in domain of real numbers can be determined with the help of least
squares estimator by linearizing nonlinear regression. Such regression of defined from of numerical function allows to define its constant coefficients.
Fig. 3 presents measuring coordinates of boiler work parameters during one period of work expressed by means of non dimensional function arguments of its operation. With the help of least square estimator linearizing nonlinear regression, exponential function was fitted to coordinates, obtaining the equation of the fallowing form:
���
��� ⋅⋅=⋅⋅
Bm
BtpD 72,0exp02,03
22
, (2)
where: - symbols as in formula (1).
Fitting non dimensional arguments (Fig.3) to the form of exponential function i.e. defining its constant coefficients was carried out with the help of STATISTICA programme.
Such dependence fitting (2) among non dimensional arguments of boiler operation is justified by the determination coefficients of correlation relation and correlation itself amounting to 0,59.
However (Fisher) F statistic by the assumed level of substance � =0,05 and degrees number of freedom f1 =1 and f2 = 8 indicates that correlation ratio � = 0,93 among numerical function arguments of boiler operation is essential ( F = 13,48 > Fkr = 5,32 ). It indicates that dependence of non dimensional arguments dependent Y in relation to independent X is defined by curvilinear function of auxiliary boiler operation VX.
Fig. 4 presents auxiliary boiler operation VX at different parameters of its work in defined time moments of one period. Exponential function is also marked in Fig. 4 which describes such
166

Fig. 4. Operation of auxiliary boiler VX during one period in time function at different parameters of work,
Explanations: D – operation of auxiliary boiler VX in [GJs]; t – time of operation in [s]
operation loading of the boiler. This function has the following numerical form:
(3) ( tD ⋅⋅= 0024,0exp37,36 )where: D – Auxiliary boiler during one period VX at different loading in [GJs], t – auxiliary boiler operation time in [s].
Curvilinear degree of auxiliary boiler operation VX in relation to its time of work, was estimated on the basis of absolute value difference of determination coefficients in aspect of correlation ratio and correlation itself which amounts to:
Md|t = | �2- r2 | = | 0,95672 – 0,9582 | = 0,0025 (4) where: � – value of correlation ratio, r – coefficient of linear correlation.
The difference defined by formula (4) gives evidence of linear correlation between boiler
operation and the time of its work. However the value of correlation ratio close to unity (� = 0,9567) indicates strong correlation dependence of auxiliary boiler operation on the time of its work. Correlation dependence is of linear character as correlation coefficient is also close to unity (r = 0,958).
Presented numerical function form (3) of boiler operation, obtained with the help of least square estimator is of simple form and easy physical interpretation. Therefore it is recommended to carry out analysis of auxiliary boiler operation VX during its work.
Fig. 5 presents auxiliary boiler operation of VX type, at two different constant loads and a changeable one as well.
167

Fig.5. Auxiliary boiler operation of VX type at two different loads and changeable one as well, Explanations:
0
0,2
0,4
0,6
0,8
1
1,2
1,4
1,6
1,8
0 500 1000 1500 2000 2500 3000
time t [s]
oper
atio
n D
[GJs
]���
���=
Bm72,0exp
tpB02,0D 22
3
( )t0024,0exp3637,0D =
2t11313,0D =
2t103,0D =
-----boiler operation changeable load conditions; ------ boiler operation during constant work parameters with fuel consumption B = 0,0206 [kg/s], efficiency m = 0,2153 [kg/s]and waste steam overpressure from the boiler p = 4,46 [Pa];-------- boiler operation during constant work parameters: fuel consumption B = 0,0111 [kg/s],
efficiency m = 0,1978 [kg/s] and waste steam from the boiler p = 3,38 [Pa] 4. Summary
Dimensional function of auxiliary boiler VX (1) operation has different numerical structures presented in table 1 obtained by means of algebraic diagram of dimensional analysis presented by S. Drobot. These structures allow us to define numerical dependence by means of least squares estimator, linearizing nonlinear regression among dimensional quantities describing boiler operation. Obtained on their basis numerical estimates of boiler operation are defined exact to constant non dimensional coefficients, determined on the basis of its work parameters.
Formula (3) defining auxiliary boiler operation VX in one period of work, can be treated as a correct proposal in dimensional respect.
Dimensional quantities were used while determining numerical function forms. Those quantities characterize boiler operation and are isomorphism with vectors according to S. Drobot and his work in which he proves the above mentioned fact [1]. Treating dimensional quantities as scalars is equally wrong as replacing vectors with scalars.
Numerical function of auxiliary boiler operation is characterized by the fact that it takes into account essential work parameters depending on one period of time. It is dynamic character and in connection with this, can be used for diagnostic and prognostic purpose.
It allows to examine the influence of its particular work parameters on auxiliary boiler operation VX during one period as it presents in a clear way its numerical structure.
On the other hand calculated value dependence of boiler operation VX on the basis of work parameter measurement in time function of one period by method of least squares estimator, does not possess this property. In this case boiler work parameters are hidden in constant numerical coefficients defining its operation during one period of time, being then only time function.
Numerical function from of boiler operation VX can be defined on the basis of calculations carried out by means of measured work parameters during one period.
Operation function of auxiliary boiler VX is correct only for the boiler on which the measurement was carried out.
168

Possibility of dimensional analysis application depends on measuring of all quantities characterizing auxiliary boiler operation VX in an accepted set of units.
Application of this set of units in problems connected with defining of auxiliary boiler operation VX is indispensable for a complete description of its work with the help of dimensional function.
Dimensional analysis requires also work parameters measurement of auxiliary boiler VX in time of one period in order to obtain exact numerical function of its operation on the basis of an accepted dimensional function. 5. References [1] Drobot, S., On the foundation of dimensional analysis. Dissertation Mathematic, vol. XIV,
1954. [2] Girtler, J., Energy-based aspect of machine diagnostic, pp. 149-155, Diagnostica 1 (45)/2008. [3] Girtler, J., Identification method of technical state of the objects on the Grodnu of estimation of
their work, pp. 126-132, Diagnostic 2 (46), 2008. [4] Mazurkiewicz, J., Examination of ship auxiliary boiler type VX, Research Works of Marine
Power Plant Institute Merchant Marine College in Gdynia, Gdynia 1976. [5] Roslanowski, J., Modelling of ship movement by means of dimensional function, Radom
University of Technology, pp.443-448, Transport No 3(23) 2005. [6] Roslanowski, J., The methodology of energetically process model construction in ship
propulsion systems by means of dimensional analysis defining their dynamical features. International Conference Technical, economic and environmental aspects of combined cycle power plants, pp. 59-66, Gdansk University of Technology 2004.
[7] Roslanowski, J., Identification of ships propulsion engine operation by means of dimensional analysis, Journal of polish CIMAC Energetic Aspects Vol. 4 No. 1, pp. 137-144, Gdansk 2009.
[8] Roslanowski, J., Diagnosis possibilities of technical condition of propulsion engine during ships voyage on the basis of engine operation value, Research work no. 07/09/PB Faculty of Ocean Engineering and Ship Technology, Gdansk University of Technology.
169

170

DETERMINATION OF COMPRESSION RING WALL PRESSURE DISTRIBUTION
Wojciech Serdecki Institute of Combustion Engines and Transport
Pozna� University of Technology 3, Piotrowo St., 60-965 Pozna�
tel.+48 665 2243, fax: +48 e-mail: [email protected]
Abstract On a correctly designed engine piston-cylinder assembly the contact of ring and bore should take place through a
layer of oil, called oil film. In order to obtain a continuous oil film a proper lubricating oil should be introduced into the region of node elements collaboration, sliding surfaces should have adequate geometry and parameters of collaboration should be chosen suitably. The ring pressure against the liner is one of important quantities that affect formation of oil film. Selection of ring pressure circumferential distribution is pretty complex and depends on a number of factors and changes along the engine life.
Presented paper discuss the methods of ring pressure distribution along its circumference and indicate problems connected with measurements. Moreover, basic assumptions used for construction of compression ring mathematical model as well as results obtained using that model were presented for full and partial loads. A need for the construction of computational program that could take into consideration evenly worn and distorted bore surface have been validated as well. Keywords: marine combustion engine, piston ring, oil film, ring pressure
1. Introduction
A required distribution of ring pressure against the bore is being established already at design stage. This pressure should be enough high that ring would precisely contact the bore (without so called light slits where blow-by could occur). Only minor deviations from circular form could occur assuming that possible slits will be filled with lubricating oil. In the case of large diameter engines (marine ones) clearance could reach up to 30 �m, but only along 10% of ring circumference.
For less precise calculations a tangential force Ft is taken for a measure of ring pressure, i.e. force that put to the ring free ends makes them meet to achieve a required clearance lz (see Fig. 1).
Another requirement that should be met by compression rings is ability to form a continuous oil film. According to the hydrodynamic theory of lubrication such film can occur only when between two moving surfaces there is a gap filled with oil.
171

Definition of ring momentary position relative to bore requires a knowledge of radial forces loading the ring [7]. The force pressing the ring on bore Fs (resulting from outside pressure pa and pb, and ring own elasticity p(�)) and Ff force radial component moving ring away (resulting from hydraulic pressure pf acting in oil film – see Fig. 2) belong to the most important ones.
a) b)
c)
Fig. 1. Sketch of compression ring with marked principal dimensions and
points of tangential force Ft
application
Definition of ring momentary position relative to bore requires a knowledge of radial forces
loading the ring [7]. The force pressing the ring on bore Fs (resulting from outside pressure pa and pb, and ring own elasticity p(�)) and Ff force radial component moving ring away (resulting from hydraulic pressure pf acting in oil film – see Fig. 2) belong to the most important ones.
Depending on momentary values of such quantities as ring moving speed u, oil viscosity �,
Fig. 2. Sketch of ring moving over bore surface: pa, pb – external
pressure, Fs – pressing on force, Ff – oil layer reaction force, Tf –
ring on oil friction force, u – speed of ring run [6]
172

ring total pressure against the bore pc, ring axial width bf and ring face shape described by the Wu parame er, the minimum oil film thickness hm changes according to formula (1).
t
uc
m pDespite the relatively low radial speed u and high total pressure pc on marine engines, the oil
film of thickness securing complete separation of collaborating surfaces emerges during ring travel along the bore. This results above all from big size of these rings in comparison to the rings of other categories of engines. On contemporary high power engines the compression rings have a barrel profile (of curvature radius R up to 1 m) at axial width hp up to 0.02 m and radial thickness gp to 0.03 m [2, 8]. As a result, the specific pressure p is not high (f
f Wbu
h��
��
. (1)
or bore larger than 0.5 m it does not exceed 0.1 MPa) in spite of high value of tangential force Ft.
2. Methods of ring to bore pressure measurement
ightening of the band. The deflection of elas eans the measure of tangential force Ft.
ow to determine the ring elasticity numerically qual to the ring average pressure against bore ps.
The measurement of tangential force Ft value is performed by special, simple devices
(e.g. like that shown in Fig.3). During measurement the tested ring is surrounded by steel band (of 0.08 to 0.1 mm thickness) and tightened till reach an operational clearance lz. In order to eliminate friction between ring and band the collaborating surfaces are covered with lubricating oil while the reduction in static friction is obtained by the multiple t
tic beam 2 m
Fi
rotating drum tightening drum [3]
g. 3. Schematic of device purposed forring tangential force measurement:
1 – beam hold, 2 – elastic beam, 3 – sensor hold, 4 – micrometer, 5 – steel band, 6 – lever handle, 7 – limit screw, 8 – screw, 9 – band hold, 10 –
, 11 –
Knowledge of the tangential force Ft value all
e
phdtF
sp��
�2
. (2)
ted to the bore would not be perfectly ylindrical despite the correct clearance between ring ends.
The described method allows only for an estimation of ps pressure mean value which
corresponds to actual pressure p(�)only when this pressure in evenly distributed (Fig. 4). For a ring of uneven pressure distribution, the form of ring mounc
173

Fig. 4. Uniform (p = ps) and irregular (p = p(�)) distribution of ring circumferential pressure [4]
The device presented in Fig. 5 is used for a pr
distribution.
ecise measurement of circumferential pressure
3.
(Fig. 6a),
Fig. 5. Construction of device for the measurement of ring contact pressure distribution: 1 – model of cylinder liner, 2 – piston ring tested, 3 – pressing
on mandril, 4 – measuring tip of displacement sensor, 5 – dial gauge, 6 – load adjustment screw,
lic cylinder, 9 – manometer, lease screw [1]
7 – nut, 8 – hydrau10 – re
Along the circumference of cylinder liner 1 which encompasses the tested ring 2 there are
holes through which mandrels 3 loads radially the ring. A hydraulic arrangement 8 equipped with measuring manometer 9 is used for generation of radial force. When ring loses its contact with a cylinder model (this moment is detected by the dial gauge 5) a value of radial force is being read. Repetition of measurement for consecutive ring positions enables to estimate the distribution of circumferential pressure.
Calculations of ring circumferential wall pressure distribution Author has developed a computer program for analysis of piston rings collaborating with
cylinder liner, especially dependences that occur between ring material, its geometry and elasticity. This program contains subroutines that enable to:
determine the ring free form for a known distribution of pressure against the bore–
174

– (Fig. 6b),
determine the distribution of pressure and form of ring for a known geometry of bore (case of radial wear - Fig. 6b),
of ring for a known geometry of bore (case of
ptions given and explained in [1].The putational model, consisting of a
e to another by joints. It is assumed that bending al rigidity should correspond to the real
B gap pm ar n of this distribution at an arbitrary point of ring circumference (given by � angle):
determine the distribution of pressure against the bore for a known ring free form
–
– determine the distribution of pressure and form deformation - Fig. 6b).
The program has been developed according to assumessence of the method lies in substitution of real ring with its comnumber of rigid rectilinear sections connected onof substitute ring is possible only in joints and substitutionrigidity dispersed along the ring entire circumference (see Fig. 7).
a) b)
Fig. 6. Flow chart of computer program: a – definition of ring free shape, b – definition of pressure form and distribution in deformed bore
Fig. 7. Schematic diagram of piston ring substitutional model [1]
eside ring geometry also the value of ring mean pressure ps and pressure at the vicinity of e used as program input data. Following formula has been used for mathematic descriptio
175

� � ))cos((...2coscos 210 2222 ��������� lhppppp n , (3)
here lh is a number of harmonics taken into consideration. Taking into account conditions of ring balance in bore one can define the formulas enabling
omputations of elastic wall pressure at any angle �. In particular, the value of pressure at ring gap .e. at point 1, for � = 0) should be equal to preliminarily assumed pressure pm (maximum pmax or inimum pmin, depending on circumferential distribution assumed at the beginning). Due to the mited volume of this study the method of pressure distribution definition will not be presented ere (it might be found in [1]).
The number of harmonics lh taken into consideration for calculations of wall pressure affects its istribution along the circumference (for given ps and pm). Larger their number taken into account
as driving away from ring gap. Fig. 8 (in Cartesian coordinates) and Fig. 9 (in polar coordinates) show changes in the ring elastic pressure wall distribution depending on number of harmonics (computations were carried out for marine engine compression ring of 0.48 m in diameter, where the mean pressure is 0.063 MPa) and pressure in the vicinity of gap higher or lower from the mean value by 20%. The course of curves shows that lower number of harmonics gives higher deviation from the mean value not only at the gap vicinity but also along the entire circumference. It seems that distribution obtained for a greater number of harmonics is more advantageous for a correct ring operation (however, a ring section of higher of lower pressure becomes shorter). Because of that 10 harmonics have been taken into account in further studies presented in the paper. a) b)
Pa, pmax = 0,076 MPa, pmin = 0,050 MPa
w
c(imlih
din computations of loads, the quicker fall (or rise) in pressure
Fig. 8. Changes in circumferential pressure distribution relative to the number of harmonics taken into account for a
ring of increased (a) and decreased (b) load in ring gap vicinity and for 5 harmonics (1), 10 harmonics (2), 15 harmonics (3); the pressure mean value ps = 0,063 M
176

a) b)
Fig. 9. Changes in circumferential pressure distribution relative to the number of harmonics taken into account for a
ring of increased (a) and decreased (b) load in ring gap vicinity and for 5 harmonics (1), 10 harmonics (2), 15 harmonics (3); ring data as in Fig. 8
As mentioned above the ring of not uniform contact pressure around the bore adopts the form different from the ideal circle after being surrounded by the steel belt (as in Fig. 5) and tightened. Computations carried out using the earlier presented program revealed that for the ring presented in Figs. 8 and 9 deviations are about 150 ly to r es itse
sented in Fig. 5
e measurement of ring loaded this way as a base for determination of
assembly elements wear is a significant task connected with the operation of this set. Along the engine mileage the cylinder radius grows and the ring face
�m close to the gap, which means less than 1% relativeing radius. Moreover, the precise calculations show that the value of tangential force changlf as well. For example, for a ring presented in Fig. 10a the tangential force rises from 216 to
220 N, while for a ring in Fig. 10b – from 216 to 227 N. a) b)
Fig. 10. Ring shape after its encircling by the steel band of device pre
It seems possible to use thring pressure distribution and its change with ring life.
The evaluation of piston-cylinder
177
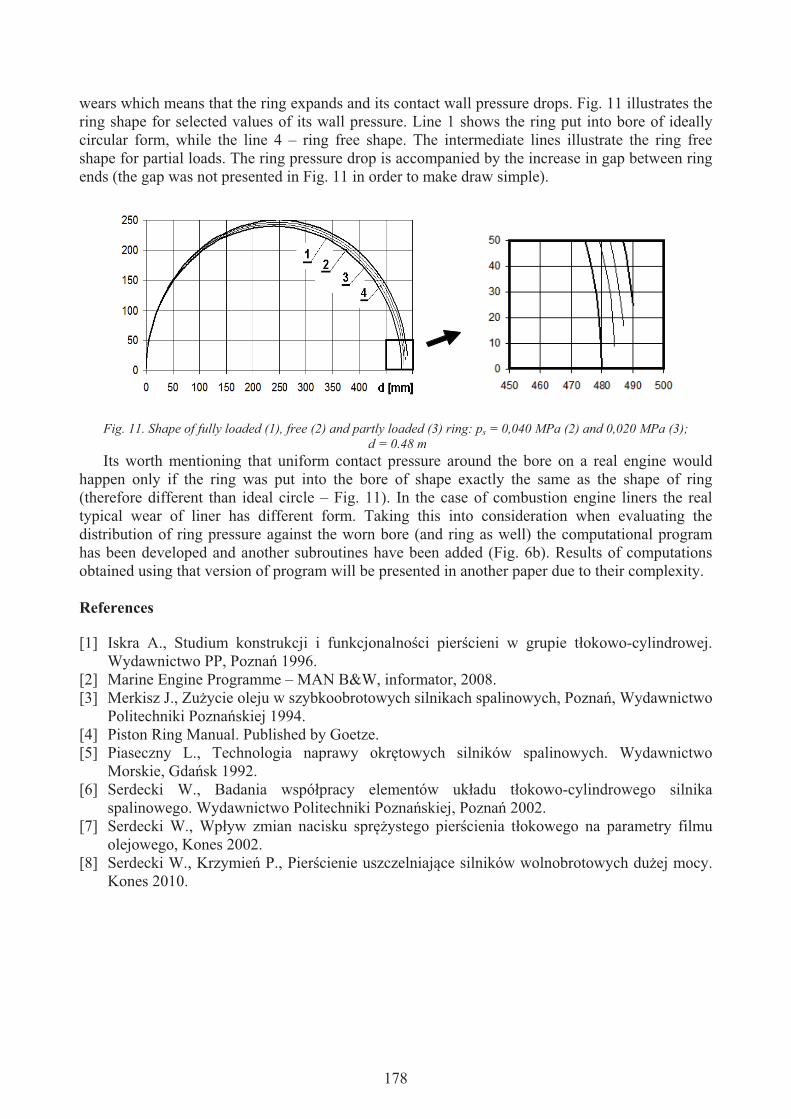
wears which means that the ring expands and its contact wall pressure drops. Fig. 11 illustrates the ring shape for selected values of its wall pressure. Line 1 shows the ring put into bore of ideally circular form, while the line 4 – ring free shape. The intermediate lines illustrate the ring free shape for partial loads. The ring pressure drop is accompanied by the increase in gap between ring ends (the gap was not presented in Fig. 11 in order to make draw simple).
Fig. 11. Shape of fully loaded (1), free (2) and partly loaded (3) ring: ps = 0,040 MPa (2) and 0,020 MPa (3); d = 0.48 m
Its worth mentioning that uniform contact pressure around the bore on a real engine would happen only if the ring was put into the bore of shape exactly the same as the shape of ring (therefore different than ideal circle – Fig. 11). In the case of combustion engine liners the real typical wear of liner has different form. Taking this into consideration when evaluating the distribution of ring pressure against the worn bore (and ring as well) the computational program has been developed and another subroutines have been added (Fig. 6b). Results of computations obtained using that version of program will be presented in another paper due to their complexity. References
[1] Iskra A., Studium konstrukcji i funkcjonalno�ci pier�cieni w grupie t�okowo-cylindrowej.
Wydawnictwo PP, Pozna� 1996. [2] Marine Engine Programme – MAN B&W, informator, 2008. [3] Merkisz J., Zuycie oleju w szybkoobrotowych silnikach spalinowych, Pozna�, Wydawnictwo
Politechniki Pozna�skiej 1994. [4] Piston Ring Manual. Published by Goetze. [5] Piaseczny L., Technologia naprawy okr�towych silników spalinowych. Wydawnictwo
Morskie, Gda�sk 1992. [6] Serdecki W., Badania wspó�pracy elementów uk�adu t�okowo-cylindrowego silnika
spalinowego. Wydawnictwo Politechniki Pozna�skiej, Pozna� 2002. [7] Serdecki W., Wp�yw zmian nacisku spr�ystego pier�cienia t�okowego na parametry filmu
olejowego, Kones 2002. [8] Serdecki W., Krzymie� P., Pier�cienie uszczelniaj�ce silników wolnobrotowych duej mocy.
Kones 2010.
178

ROLLING BEARINGS’ OPERATING FEATURES AS A FUNCTION OF THEIR ELEMENTS HARDNESS
Micha� Styp-Rekowski, Janusz Musia�
University of Technology and Life Sciences
Faculty of Mechanical Engineering ul. Prof. S.Kaliskiego 7, 85-789 Bydgoszcz tel.:+48 52 3408239, fax: +48 52 3408245
e-mail: [email protected]
Abstract
In this paper investigations concern relations between constructional and operational features of rolling elements have been presented. In described experiments bearing raceways hardness was accepted as a variable constructional feature, and tested operating features were: motion resistance inside the bearings and their fatigue life. Described investigations were carried out on example of bearings used in popular transport means – bicycles.
Keywords: rolling bearing, bicycle, bearing’s element hardness, motion resistance, fatigue life
1. Introduction
The task of rolling bearings in all kinds of machines and mechanical devices, including
different means of transport, involves transmission of load with rotational or linear motion of the elements undergoing bearing. Rolling and slide bearings can be used for this purpose. To make decision as to which kind of bearing to use, the below listed factors are to be taken into consideration:
- load: kind (static or dynamic) value, direction and sense, - desirable life, - rotational speed, - stiffness.
When one decides about rolling bearing application, the next step should be a choice of the bearing kind concern first of all:
- type of bearing: transverse, longitudinal, thurst, - shape of rolling elements: balls, cylinder, cones, barrels or needles, - geometric dimensions of bearings.
To make a choice one can use catalogues of bearings which include specific data on the above presented factors concerning bearings of a given producer. Some of the rolling bearing features are standardized at the national (PN), European (EN) or global (ISO) levels which makes the choice of a bearing much easier in case it needs to be changed.
In standard applications, a set of bearings contained in catalogues available on the market is absolutely sufficient and then there is no need to analyze factors determining particular functional qualities. However, the demand for applications of rolling bearings in which standard ones do not
179

accomplish the assigned tasks or accomplish them insufficiently, is constantly growing. Thus, it is necessary to use special bearings and in such applications relations between structural features (mainly material and geometric) of bearings elements and their functional qualities are of importance.
In this paper, a fragment of a study of such relations has been presented, and the bearing track hardness was accepted as a variable constructional feature and operating features were: motion resistance in the bearings and their fatigue life. The tests were carried out on the example of bearings used for transport means as popular as the bicycle.
The purpose of this work was to verify the hypothesis that hardness of elements of rolling bearings could be accepted as a controllable factor for choosing functional features of a special type of rolling bearings.
2. Design features of bearings
Rolling bearings, like all other products, are identified by three constructional features: - material, - geometric, - dynamic.
Identification of each of them involves matching its constructional form II with system of dimensions W. In a symbolic denotation it can be presented in the form of equation:
Ck = � G W (1)
The first of the above mentioned design feature components – constructional form II defines
features in terms of quality, whereas, system of dimensions W - identifies properties of the design feature in terms of quantity and can be recorded as a logical sum:
W = (Ni G �Ti�) (2) "�
n
1i
where: Ni – the i-th nominal dimension,
Ti – value of the i-th dimension tolerance and its field location. An analysis of the influence of all the three design features on the bearings functional quality
makes it possible to say that a feature of special importance is the material characteristics. This finding provides better possibilities for production of special bearings which can be operated in conditions in which operation of typical bearings could be impossible. Thanks to advances observed in the field of material engineering the offer of constructional materials used for production of rolling bearings elements has been significantly extended.
3. Features of special rolling bearings
A special bearing or more often an unconventional bearing system (single bearing is rarely
used as a kinematical pair) is understood as such a structural solutions in which each of the above mentioned features differs from a typical one. The differences can be of qualitative character in terms of constructional form II, or quantitative ones – concerning a single dimension or their group, from dimension system W.
Research in the field of Machinery design and operation, aims mainly at improving the machine performance parameters. In case of rolling bearings, it covers improving: bearing capacity, boundary rotational speed, operating temperature.
180

There also occur situations in which bearing nodes do not carry high loads and the working environment is not an additional threat to correct operation of bearings. Such cases occur e.g. in medicine and industries using micro and nanotechnologies.
The widespread opinion that hardness of working surfaces of bearing elements should be possibly great is only partially true. There are many theories which account for the phenomena of initiation and growth of rolling bearing elements fatigue strength, e.g. [5]. All of them have one feature in common – they make the course of the surface wear processes dependent on the bearing pair external load value, thereby on values of contact stresses. Thus, hardness which is to be required from bearings made of different constructional materials should be treated as the function of load.
Searching of new constructional materials used for production of elements of rolling bearings has two goals. One of them covers searching for materials of bigger hardness, the second one covers searching for materials whose hardness is lower, though sufficient in given conditions. A good example of sudden progress in the first field of the research is application of ceramics – chemical compounds, e.g. nitrates, borides, oxides and carbides of such elements as: zircon, aluminum, cobalt, silicon, wolfram in construction of machines including the process of rolling bearings manufacture.
Hardness of ceramics is not always the most important factor for the choice of material for production of rolling bearings elements. The factor of more importance is often the material resistance to high temperatures – creep-resistance. Moreover, this group is characterized by significantly lower density as compared to steel, which is of special importance for bearings operating at high rotational speeds n (that is for great values of high-speedness coefficients d·n >2 ·106 mm/min.).
Steel whose hardness is definitely lower (30�35 HRC) than typical (60�63 HRC) can also be considered as unconventional constructional material in a traditional approach to rolling bearings. There are known examples of kinematical pairs with rolling friction whose steel elements hardness was 30÷35HRC and in specified conditions they performed their functions properly. Elements of rolling bearings (rings, balls, baskets) are also manufactured from high-molecular plastics, e.g.: polyacetal, (POM), polyamide (PA), polyetheretherketone (PEEK), polyphenylene-sulfide (PPS) and others whose hardness was in the range from 76÷98 HRM. These bearings performed their functions for 1,5·106 revolutions with small external load equal to 49N which can be found to be of sufficient durability for special applications [4].
In literature, there are given ways of defining the value change caused by hardness decrease. One of them [5] contains experimentally obtained dependence in the form:
(3) )(1,012
12 HRCHRCeLL ���where: Ln(10) – fatigue life of bearings with elements hardness, respectively, HRC1 and HRC2,
where HRC1<HRC2. It was also found that due to fatigue life it is advantageous when the balls of the bearing are
harder than the track. Maximum life was reached for a bearing whose balls were harder by 2 degrees HRC than the ring with raceway. This dependence has been presented in Fig.1.
181

Fig.1. Life as a function of difference between toughness of balls and bearing (�H = Hball – Hraceway) [2]
Although there is no remark like that in the paper, it should be supposed that the results of this research can be used only to a certain limited degree, concerning both the type of constructional material and its hardness value. This statement was one of the main circumstances to take up the research described below. 4. Conditions of experimental tests
Tests were carried out on a test object in which there was a possibility of control of the force
loading a system of two oblique bearings [1, 2]. The objects of research were bearings whose constructional forms corresponded to bearings used in such a popular transport means as bicycles. Due to some factors, including conditions in which bicycles are used, special bearings, both in range of geometry and the constructional material properties, were applied.
Axial force Px was being changed (the bearing initial tension) within the range H50;100I, whereas transverse load Py was constant and equal to 250 N. The value of constant load was defined on the basis of statistic anatomic features of potential bicycle users, taking into consideration geometric design features of the selected bicycle type. In these conditions the resultant load of a pair of bearings was also variable.
Measurements were taken at bearings rotational speeds n=23s-1. Such a value was accepted in order to reduce the time of testing. This procedure was possible because the frequency of load changes at the areas of balls contact with tracks has no practical importance in range of the bearings fatigue life, for the accepted scope of this research.
Life of bearings was measured by the number of performed work cycles (revolutions) and it was determined on the basis of motion resistances Mf in bearings. As the real time of bearings life L* one accepted time over which resistances in bearings reached the same values as initial resistances – Fig. 2. Since rotational speed n was constant during tests, function Ln(10)=f(t) was the same as function Ln(10)=f(n), similarly to the relations of Mf motion resistances with these input quantities.
182

Fig. 2. The graphic interpretation of way of the bearing real life L* determination on the basis of its motion resistance changes [3]
In order to make an assessment of the influence of hardness on the above mentioned functional
qualities, tests for three values and hardness were performed. External rings used as samples, were made of steel C45 and after thermal machining they were characterized by nominal hardness 150, 300 and 450 HV. Acceptance of such hardness values resulted from the fact that it was possible to machine the rings after thermal machining which provided better conditions for comparison of the tests results.
5. Tests results
In result of the carried out tests, relations between two functional qualities of bearings, that is,
resistance of Mf motion and life Ln(10) have been recognized, with coefficient $, defining conditions of fitting of balls with diameter db to the track with profile curvature radius rb, defined from formula:
b
b
dr2
�J (4)
equal to 1.05 These relations for three different values of axial force Px have been presented in Figs: 3 and
4. In both cases the influence of hardness on the bearings functional features is visible.
Fig.3. Dependences of resistances to motion Mf on the hardness H of tested bearing internal ring for:
1) Px=100, b) Px=75N, c) Px=50N
183

Fig.4. Dependence of fatigue life Ln(10) on the hardness H of tested bearing internal ring H for: 1)Px=100N, b)Px=75N, c) Px=50N
In any of the recorded relations occurrence of local extremes was found. The observed
functions are of monotonic character but with a decreasing gradient. The same relations have been presented in the form of spatial graphs – Figs. 5 and 6.
Fig.5 Resistances to motion Mf in the function of the hardness H of bearing internal ring and of axial load Px
Fig. 6. Life of bearings Ln(10) in the function of the hardness H of bearing internal ring and of axial loads Px
184

The obtained results were elaborated statistically and the recorded changes were described by
equations of regression in the form of a second degree polynominal. Their forms are, respectively: - for motion resistances:
Mf = 43,594 + 0,271Px – 0,063H – 0,003Px
2 – 2,467·10-4PxH + 9,259·10-5H2 (5)
- for fatigue life:
Ln(10) = 0,111 + 0,086Px + 0,014H – 4,133·10-4Px2 – 1,481·10-5H2 (6)
Also, coefficients of multiple correlation R have been calculated for accepted regression
models, with normally accepted value of significance level �=0,05. Coefficient values: 0,9325 (for Mf) and 0,8965 (for Ln(10)) prove good fitting of models with results of measurements obtained from experimental tests.
6. Conclusions
In result of carried out tests, the relations between functional qualities of special bearings and
factors such as: constructional – hardness H and operational – axial load Px have been discovered. This allows to control functional qualities by means of the studied factors. Thus, the set goal has been reached.
Also, thanks to development of mathematical models, two-factor optimization of rolling bearings basic features such as, undoubtedly, motion resistance and fatigue life, will be possible.
Satisfactory values of quantities describing the bearing functional qualities obtained in specific conditions confirm the possibility and purposefulness of using special types of rolling bearings and, with more and more often applied flexible manufacturing systems in the range of technology and organization, their use is also possible and economically justified.
References
[1] Styp-Rekowski, M., Sposób pomiaru momentu tarcia w sko�nych �o�yskach tocznych. Patent
nr 205198 z dnia 7.10.2009. [2] Styp-Rekowski, M., Urz�dzenie do pomiaru oporów ruchu. Patent nr 205199 z dnia 7.10.2009. [3] Styp-Rekowski, M., Znaczenie cech konstrukcyjnych dla trwa�o�ci sko�nych �o�ysk kulkowych.
Wydawnictwa ATR Bydgoszcz, 2001. [4] Tsukamoto, N., Kimura, Y., Frictional Properties of Various Kinds of Plastics as Rolling
Bearings Material. Proc. of Ist World Tribology Congress. Mechanical Engineering Publications Ltd., pp. 812÷816, London 1997.
[5] Zwirlein, O., Schlicht, H., Rolling Contact Fatigue Mechanisms – Accelerated Testing versus Field Performance. in: Rolling Contact Fatigue Testing of Bearing Steels. ASTM STP 771, , pp. 358÷379 Philadelphia (USA), 1982.
185

186

POWER TAKE-OFF SYSTEMS OF OFFSHORE RIG POWER PLANTS
Wieslaw Tarelko
Gdynia Maritime University ul. Morska 81-87, 81-225 Gdynia, Poland
tel.: +48 58 6901331 e-mail: [email protected]
Abstract
The growing demand for subsea energy resources forces developing the various structural designs of offshore units destined for oil and gas exploration. Their more and more complicated power plants have to produce energy necessary for power supply of all drilling and production systems. This paper presents offshore structures for oil and gas exploration as one of tendencies in design of large technical systems. They are compared with the biggest structures whenever have been developed by mankind. Moreover, classification and application of the considered types of oil rigs, types of machinery supplied by their power plants, and key problems appearing during their operation are presented. Keywords: oil rigs, power plant, power take-off systems 1. Introduction
The key challenge for designers of the contemporary technical objects is to gain their greatest achievements (quicker, larger, stronger, etc.). In some degree, this is in accordance with the human nature, which was expressed in the Olympic maxim in Latin: citius, altius, fortius – what means quicker, higher and stronger. And tendencies in the present day design are similarly. They could be expressed, inter alia, in precise steering of the machine movements, in precise processing of the machine element surfaces, reaching high reliability of technical systems, developing machines operated in severe conditions, developing machines with miniature or immense sizes.
Today, we are able to produce robots, for example surgical ones, with the steering accuracy of their movements nearly 10 microns; manufacture optical mirrors and lens with roughness of their surfaces nearly Ra= 5nm; make miniature air bearings with rotation speed nearly 300000rpm. We are also able to construct safe machines with a high level of their reliability, for example means of air transportation. High expenses for operational use of some of technical systems causes to their high reliability. For example, cost of operational use of continuous casting and rolling lines and continuous car body painting lines are 10000 €/h and 100000 €/h, respectively. Current nanotechnology allows to develop microscopic machines 1000 times less than thickness of human hair, for instance steam engine which pistons have 5 �m diameter.
Regarding the structures with immense sizes, the highest building standing on shore is a skyscraper Burj Dubai in United Arab Emirates. Unquestionably, the tallest free-standing structure in the world, until surpassed by the Burj Dubai in January 2008, was offshore oil rig Petronius named after Petronius, the Roman writer. This is very complex and expensive
187

construction 609,9 meters high, two times higher than Eiffel Tower and almost three times higher than Palace of Culture and Science in Warsaw (Figure 1).
Petronius Platform
Empire State Building
EiffelTower
Palace of Culture and Science, Warsaw
Fig. 1. The comparison of the Petronius Platform with well-known buildings
Except Petronius platform, the tallest off-shore oil rigs in the world (Figure 2) are Baldpate Platform, 579,1 m; Bullwinkle Platform, 529,1 m; Troll A Platform, 472 m; and Gullfaks C, 380 m, respectively.
Petronius Platform
Baldpate Platform
Bullwinkle Platform
Troll A Platform
Gullfaks C Platform
Fig. 2. The tallest offshore oil rigs
Power plants of offshore rigs should assure energy for different purposes, for example propulsion for mobile rigs, bit rotation for drilling rigs, oil and gas transportation for production rigs. This paper deals with issues concerned types of drilling and production systems supplied in
188

energy produced by offshore rig plants, various structures of offshore rigs and key problems appearing during their operation. 2. Structures of offshore oil and production units
Discovery of oil and natural gas fields under the sea bottom has forces the development of the special technologies for their operation and transportation. Offshore structures are large units used to house workers and machinery needed to drill and then produce oil and natural gas in the ocean. Their various structural design placed on these fields are intended to many purposes [3], such as for search and operation of oil-wells, for getting out oil and gas, for preliminary processing (for example for separation of water and gases from oil), for storage of the extracted oil and gas. The general classification of offshore structures according to the selected aspects is presented in Figure 3.
TYPES OF OFFSHORE STRUCTURES
APPLICATION
TYPE OF SUPPORTING
MOBILITY FIXED UNIT
MOBILE UNIT
DRILLING UNIT
PRODUCTION UNIT
STATIONARY UNIT
FLOATING UNIT
Fig. 3. General classification of offshore structures
According to application, the offshore structures may be used for drilling or for production of oil and/or natural gas, they can be fixed that cannot be moved from one place to another or mobile allowing for their dislocation.
Depending on the circumstances (Figure 4), these units may be attached to the ocean floor, consist of an artificial island (stationary units), or be floating (floating units).
semi-submersible rigs
SPAR rigs
tension leg rigs
drillships and FPSO
fixed platforms
jack-up platforms
gravity based platforms
compliant towers
OFFSHORE OIL AND PRODUCTION STRUCTURES
STATIONARY FLOATING
Fig. 4. Types of offshore units
189

In shallow waters, it is physically possible to fix an offshore structure to the sea floor. This is
what is called stationary units. The advantages of stationary units are their good stability, as they are permanently fixed to the sea floor and there is no movement due to wind and water forces.
a) b)
c) d)
� �
Fig. 5. Stationary offshore structures: a) fixed platform; b) jack-up platform; c) gravity based platform; d) compliant tower
A fixed platform (Figure 5a) is built on concrete and/or steel legs anchored directly onto the
seabed, supporting a deck with space for drilling rigs, production facilities and crew quarters. Such platforms are designed for very long term use. Steel jackets are vertical sections made of tubular steel members, and are usually piled into the seabed.
A jack-up platform (Figure 5b), as the name suggests, is a platform that can be jacked up above the sea, thanks to legs which can be lowered like jacks. Its steel body is designed to float. These platforms, used in relatively low depths, are designed to move from place to place, and then anchor themselves by deploying the jack-like legs.
Another type of bottom-supported structure is a gravity based platform (Figure 5d), where its stability ensures its own weight. The substructure is usually built from concrete in deep, protected water near shore. Deck is usually built in one piece, brought on a barge or barges over to and then mated with almost completely submerged substructure. The completely assembled
190

platform is then towed to the installation site and ballasted down to seafloor. Because of this unique way of construction, geographical locations to which this type is applicable are limited. This type is inevitably massive and suitable for self-contained drilling and production role. Storage capability can be easily incorporated, making this type suitable for situations where pipeline transportation is not readily available.
An alternative of gravity based platform is a sub-mersible rig (Figure 6) consists of upper and lower hulls connected by a network of posts or beams. The equipment and living quarters are installed on the upper hull deck. The lower hull has the buoyancy capacity to float and support the upper hull and equipment. When water is pumped into the lower hull, the rig submerges and rests on the seabed to provide a working place for the drilling. Movement and drilling operations proceed as that of the jack-up rig.
Fig. 6. Submersible rig
A compliant tower (Figure 5d) is constructed similar as a fixed platform. It consists of a
narrow tower, mounted to a foundation on the seabed extended up to the platform. The offshore compliant tower is flexible, as opposed to the relatively rigid legs of a fixed platform. This structural flexibility allows it to operate in much deeper water, as the construction can take much of the loads exerted on it by the wind and waves. The compliant tower design is more flexible than conventional land structures to cope better with sea forces. It can deflect (sway) in excess of 2% of height. Most buildings are kept to within 0,5% of height in order to have occupants not feel uneasy during periods of movement. Despite its flexibility, the compliant tower is strong enough to withstand even hurricane conditions. In some cases, several guy wires and clumps weights can support the fixed and compliant towers.
Floating offshore units for oil and gas exploration float on pontoons or other buoyant chambers and can be moved to the exploration site. They can be towed by boats, and sometimes can have self-propelled capacity.
A semi-submersible rig has submerged pontoons (lower hulls) that are interconnected to the deck by vertical columns as shown in Figure 7. The lower hulls provide improved stability for the vessel. Also, the open area between the vertical columns of the semi-submersible rig provides a reduced area on which the environment can act. In drilling operations, the lower hulls are submerged in the water about half-length of the column, but do not rest on the seabed. When a semi-submersible rig moves to a new location, the lower hulls float on the sea surface.
191

Fig. 7. Semi-submersible rig
A SPAR rig is among the largest offshore structures in use. These huge rigs consist of a
large cylinder supporting a typical fixed rig platform (Figure 8a). The cylinder however does not extend all the way to the seafloor, but instead is tethered to the bottom by a series of cables and lines. The large cylinder serves to stabilize the platform in the water, and allows for movement to absorb the force of potential hurricanes.
a) b)
Fig. 8. Floating offshore structures: a) SPAR rig; b) Tension Leg Platform (TLP)
192

One of the floating structures specifically developed for deepwater application is the Tension Leg Platform (TLP). It is essentially a semi-submersible rig attached to the seabed by vertical members called tendons, which are usually made of steel tubular and tensioned by excess buoyancy of the platform hull as shown in Figure 8b. Tendons are pinned to the seabed directly or indirectly by piles. Motion characteristics of the TLP allows wells to be completed on its deck, a big advantage because wells are one of the most important and expensive components of a petroleum production system and ease of access to them is a matter of prime concern in field development planning.
An alternative of the tension leg platforms are SEASTAR platforms. They are basically smaller tension leg platforms and consist of a floating rig, as for the semisubmersible drilling rigs. A lower hull is ballasted with water when drilling, which increases the stability of the platform movement from environmental loads. In addition to this semisubmersible rig type of features, SEASTAR platforms also incorporate the tension leg system found in larger platforms. SEASTAR platforms are typically used for smaller deepwater reservoirs, were it is not economical or practical to develop a larger platform.
A drillship (Figure 9) is the most mobile, self-sufficient and durable kind of the mobile exploratory rig, designed to drill in very deep water. Drillships contain all of the equipment and material needed to drill and complete the well. An opening called a moon pool is equipped in the center of the ship from the main deck to the water. Drilling assembly, a riser pipe, wellhead equipment, and so forth are lowered through the moon pool to the sea floor. They are easily moved by wind and waves, which puts excessive fatigue on the drilling equipment. The DPS is the most common technique used to combat excessive movement but is expensive to install and operate.
Fig. 9. Drillship
Floating Production Storage and Offloading (FPSO) units are essentially semi-submersible
drilling rigs, except that they contain petroleum production equipment, as well as drilling equipment (Figure 10). Ships can also be used as floating production systems. The platforms can be kept in place through large, heavy anchors, or through the DPS used by drillships. With a
193

floating production system, once the drilling has been completed, the wellhead is actually attached to the seafloor, instead of up on the platform. The extracted petroleum is transported via risers from this wellhead to the production facilities on the semi-submersible platform.
Drilling Platform FPSO
Existing Well Centers
Injection lines
Tanker-Offloading buoy
Fig. 10. Floating Production Storage and Offloading (FPSO) unit
To keep the position of semi-submersible rigs and drillships, DPS (acronym of Dynamic
Positioning System) is used (Figure 11). In simple terms, a DP system consists of a central processor linked to a number of position reference and environment reference systems.
Fig. 11. Dynamic Positioning System
The semi-submersible rigs and drillships are provided with sufficient power and
maneuverability by means of a variety of thrusters and propellers. The measured position of the vessel is compared to the desired or set point position, the computers then generate appropriate thruster commands to maintain or restore vessel position. Effects of wind forces and other environmental forces are taken into account. A bridge control console allows the operator to communicate with the system and vice versa, and vessel control to be effected. Often the only alternative positioning technique is the use of an anchor spread, but this is limited by depth of water. If this exceeds around 500m then cost, time and space considerations may preclude it.
194

Often the amount of hardware on the seabed renders it impossible to run anchors safely, if at all. The presence of anchor cables may prevent the vessel from positioning close to platform structures, and may also provide obstructions to other vessels.
3. Power take-off systems
Power plants of offshore drilling units can provide energy for various purposes, for example
power supply of navigational devices, operation of rescue appliances, working of cranes and lifts, operation of mooring and anchoring, power supply for crew facilities. In some structural design of mobile units, their power plants supply of energy necessary for propulsion and steering.
Diesel engines compose the majority of power sources on offshore drilling units. Diesel engines drive large electric generators. The generators, in turn, produce electricity that is sent through cables to electric switch and control gear.
The following essential systems are supplied in energy produced by power plants of offshore drilling units:
� a hoisting system, � a rotating system, � a circulation system. The hoisting system is used to raise and lower pipe in and out of the hole and to support the
drill string to control the weight on the drill bit during drilling. The hoisting system consists of derrick, traveling and crown blocks, a drilling line, and drawworks. The derrick is a steel tower that is used to support the traveling and crown blocks and the drill string. The drawworks consists of a revolving drum around which the wire rope called drilling line is spooled or wrapped. The crown and traveling blocks are a set of pulleys that raise and lower the drill string.
The rotary system includes all the equipment used to achieve bit rotation. The main parts of the rotary system are: a swivel, a kelly, a rotary drive, a rotary table, a drill pipe, and drill collars.
The swivel supports the weight of the drill string and permits rotation. The swivel is attached to the bottom of the traveling block and permits the drill string to rotate. The kelly is the first section of pipe below the swivel. The outside cross section of the kelly is square or hexagonal to permit it to be gripped easily for turning. Torque is transmitted to the kelly through kelly bushings, which fit inside the master bushing of the rotary table (Figure 12). A kelly saver sub is used between the kelly and the first joint of drill pipe. As the rotary table turns the kelly is also turned. The movement of the kelly rotates the drill string and the drill bit. The major portion of the drill string is composed of drill pipe. Drill pipe is round steel tubes. The lower section of the rotary drill string is composed of drill collars. The drill collars are thick-walled heavy steel tubulars used to apply weight to the bit and prevent buckling of the drillpipes. The process of drilling a hole in the ground requires the use of drilling bits. Drill bits set up the drill end that actually cuts up the rock. They come in many shapes and materials (tungsten carbide steel, diamond) that are specialized for various drilling tasks and rock formations. Rotary drilling bits usually are classified according to their design as:
� drag bits: fixed cutter blades, rotate as a unit with the drill string. � rolling cutter bits: usually three cones that are free to turn as bit rotates.
195

a) b)
Fig. 12. Kelly and kelly bushings of rotating head: a) with-out torque transmission; b) with torque transmission
The circulating system replaces drilling fluid. The drilling fluid is most commonly a
suspension of clay and other materials in water and is called drilling mud. Drilling mud removes cuttings from the hole and cools and lubricates the drilling bit. The principal components of the circulating system include:
� mud pumps and mud pits, � mud-mixing equipment, � contaminant-removal equipment. The drilling mud travels through the following elements: steel tanks, a mud pump, a drill
string, a bit, annular space between the drill string and hole to the surface, contaminant-removal equipment, and back to the suction tank.
Wellhead and Blow Out Preventer
Return Line
Drillpipe
Rotating Diverter
Bottom Hole Assembly Drill String Valve
Mud Returnand Pump
Seawater-Driven MudLift Pump
Seawater Filled Marine Riser
Seawater Power Line,Control Umbilicals
Seawater Pumps(Existing Mud Pumps)
Fig. 13. Subsea mudlift configuration
Subsea mudlift configuration is presented in Figure 13. The mud pump takes in mud from
the mud pits and sends it out a discharge line to a standpipe. The standpipe is a steel pipe mounted vertically on one leg of the mast or derrick. The mud is pumped up the standpipe and into a flexible, very strong, reinforced rubber hose called the rotary hose or kelly hose. The rotary hose is connected to the swivel. The mud enters the swivel, goes down the kelly, drill
196

pipe and drill collars and the bit. It then does a sharp U-turn and heads back up the hole in the annulus. Finally the mud leaves the hole through a steel pipe called the mud return line and falls over a vibrating, screen like device called the shale shaker. Agitators installed on the mud pits help maintain a uniform mixture of liquids and solids in the mud. If any fine silt or sand is being drilled, then devices called desilters or desanders may be added. If there are small amounts of gas in the formation, a device called degasser is also added.
For example, main problems of 3 000 meters deep drilling are the following: � the typical riser with 533 mm diameter has an internal capacity about 650 m3, � weight of the riser itself is about 900 ton, � weight of mud inside the riser is about 1 200 ton, � away from tectonic plate boundaries, the geothermal gradient is 25-30°C per km of
depth. According to the technical specification description of the semisubmersible rig LEIV
EIRIKSSON (Figure 14), its machinery guarantees the following operating parameters [1]: � water depth of drilling - 2300 meters, � transit speed - 7 knots. The rig machinery consists of: � 6 x Wartsila Vasa 18V32 diesel engines, rated 7500 kW each, � 6 x ABB ASG 900 XUB generators, rated 7300 kW each, � 6 x KaMeWa Aquamaster UUC 7001 fixed pitch variable speed thrusters, rated 5 500
kW each, 157 rpm, 4,09 m diameter.
Fig. 14. Semisubmersible rig LEIV EIRIKSSON [1]
Moreover, this rig is equipped in the following drilling equipment: � derrick: Hydralift 51,8 x 12,2 x 12,2 m; 680 tons, � motion compensators: Hydralift Crown rating 680 tons, compensating: 362,9 tons; 7,62
m stroke, � drawworks: Continental Emsco Electrohoist III, 2206,2 kW, � rotary: Varco BJ RSTT, 984,2 tons, � top drive: Hydralift HPS 750 2E ac electric drive, 680 tons; speed: 0 - 280 rpm, � riser tensioners: 6 x Hydralift double, 90,7 tons each; � mud pumps: 3 x Continental Emsco FC-2200, 1617,9 kW, 51,7 MPa. The ultra-deep water drillship (Figure 15) new developed by OCEAN RIG should ensure the
following operating parameters [2]: � water depth of drilling - 3048 meters,
197

� transit speed - 12 knots. The drillship machinery consists of: � 6 x STX_B&W 16V32 diesel engines, rated 8000 kW each, � 6 x ABB AMG 900 XU10 LSE generators, rated 7000 kW each, � 6 x Rolls Royse AQM UUC455 fixed pitch variable speed under water demountable
azimuth thrusters, rated 5 500 kW each.
Fig. 15. Ultra-deep water drillship [2]
The ultra-deep water drillship is equipped in the following drilling equipment: � derrick: NOV 61 x 18,3 x 24, 4 m; 1200 tons, � motion compensators: NOV AHC, rating 907 tons, compensating: 454 tons; 7,62 m
stroke, � drawworks: NOV SSGD, 4228,5 kW, � rotary: NOV VBJ RTS hydraulic operated, static 6,4 tons, � top drive: NOV HPS, 6,4 tons; speed: 0 - 300 rpm, � riser tensioners: 6 x NOV DWRT, 544,3 tons each, � mud pumps: 5 x NOV 14 P-220, 1617,9 kW, 51,7 MPa.
4. Conclusion The growing demand for subsea energy resources forces developing the various structural
designs of offshore units destined for oil and gas exploration. Their more and more complicated power plants have to produce energy necessary for power supply of all drilling and production systems. References [1] Ocean Rig. The Effective Answer for Ultra-Deep Waters and Harsh Environments.
www.ocean-rig.com. 2008. [2] Ocean Rig. Ultra-deep Water Drill Ships. www.ocean-rig.com. 2009. [3] Sadeghi K. An Overview of Design, Analysis, Construction and Installation of Offshore
Petroleum Platforms Suitable for Cyprus Oil/Gas Fields. GAU J. Soc. & Appl. Sci., 2(4), 1-16, 2007.
198

NEW WORKING CONDITIONS OF A MARINE DIESEL ENGINE-WASTE-HEAT BOILER SYSTEM
dr in. Tomasz Tu�ski
Instytut Technicznej Eksploatacji Si�owni Okr�towych Akademia Morska
ul. Wa�y Chrobrego 1 / 2, Szczecin +48 91 4809479
Abstract
In the paper, there have been described typical working conditions for a waste-heat boiler fed by exhaust gases of
a high power slow speed marine diesel engine. New ways of correcting economic calculation of a ship operation depending on „unloading” engines of newly constructed units’ main propulsion system, as well as, the attempts of adapting the methods in question to already operated vessels have been dealt with. Moreover, the trends in changes of selected work parameters of the diesel engine waste-heat boiler system based on real operational conditions of a ship propelled by unloaded engine have been characterized. Dangers and possible discomforts affecting the waste-heat boiler working in „Super Slow Steaming” system have been emphasized.
Key words: unloaded engine, real operational conditions of a ship, steam deficiency
1. Typical working conditions for a marine engine- waste-heat boiler system
Waste-heat boilers are installed on vessels as elements of waste gas energy recovery. A usual
period of time for full use of potentials of a marine engine - waste-heat boiler system waste gas energy recovery appears a “sea journey”. It is the time of vessel operation when the engine load is maintained on almost constant level. Such a long lasting engine load during a voyage ranges between 85÷95 % of its rated load. The level of the engine load results from the construction basics determined while designing elements and parameters of an engine working process. Within the load range, the engine produces exhaust gases of such parameters (the amount and temperature), that a sufficient amount of heating energy for safe and effective ship operation is provided. Any changes of the engine working parameters caused by exhaust gas changes shall affect waste-heat boiler working parameters.
Possible changes of the engine load at a set sailing speed may be the result of the following: - sea rolling; - change of wind direction;
199
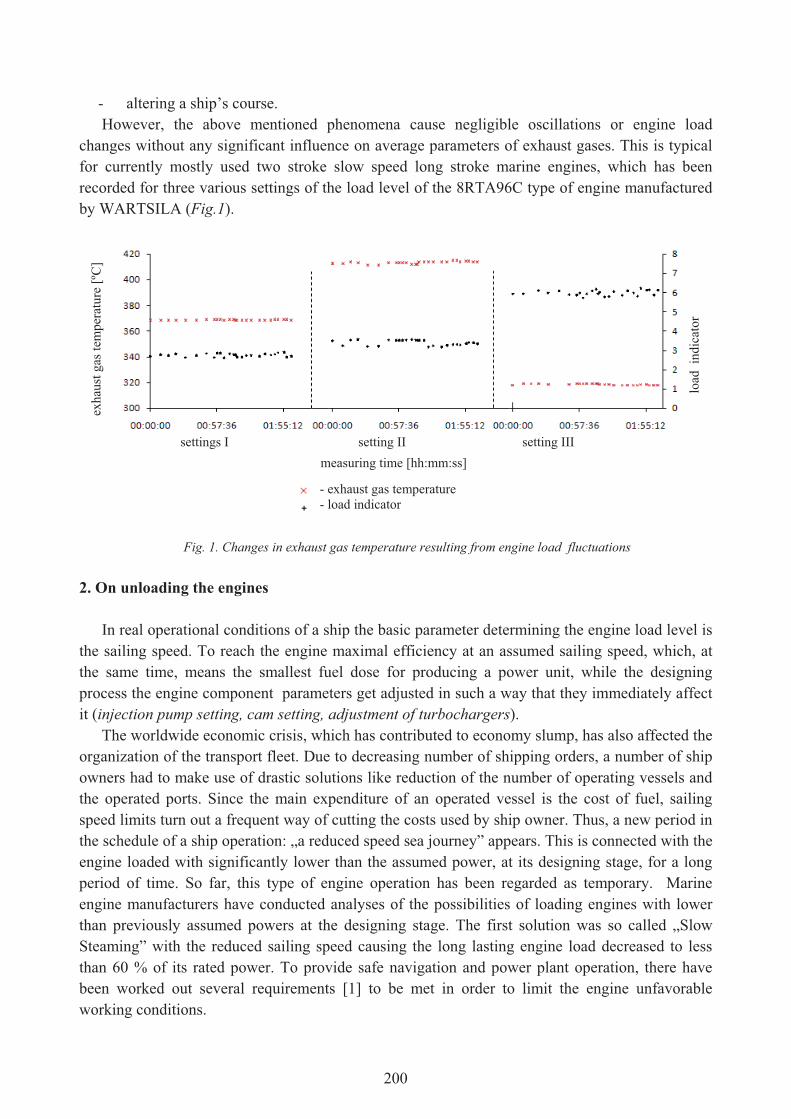
- altering a ship’s course. However, the above mentioned phenomena cause negligible oscillations or engine load
changes without any significant influence on average parameters of exhaust gases. This is typical for currently mostly used two stroke slow speed long stroke marine engines, which has been recorded for three various settings of the load level of the 8RTA96C type of engine manufactured by WARTSILA (Fig.1).
load
ind
icat
or�
exha
ust g
as te
mpe
ratu
re [º
C]�
- exhaust gas temperature - load indicator
measuring time [hh:mm:ss] settings I setting II setting III�
Fig. 1. Changes in exhaust gas temperature resulting from engine load fluctuations
2. On unloading the engines
In real operational conditions of a ship the basic parameter determining the engine load level is
the sailing speed. To reach the engine maximal efficiency at an assumed sailing speed, which, at the same time, means the smallest fuel dose for producing a power unit, while the designing process the engine component parameters get adjusted in such a way that they immediately affect it (injection pump setting, cam setting, adjustment of turbochargers).
The worldwide economic crisis, which has contributed to economy slump, has also affected the organization of the transport fleet. Due to decreasing number of shipping orders, a number of ship owners had to make use of drastic solutions like reduction of the number of operating vessels and the operated ports. Since the main expenditure of an operated vessel is the cost of fuel, sailing speed limits turn out a frequent way of cutting the costs used by ship owner. Thus, a new period in the schedule of a ship operation: „a reduced speed sea journey” appears. This is connected with the engine loaded with significantly lower than the assumed power, at its designing stage, for a long period of time. So far, this type of engine operation has been regarded as temporary. Marine engine manufacturers have conducted analyses of the possibilities of loading engines with lower than previously assumed powers at the designing stage. The first solution was so called „Slow Steaming” with the reduced sailing speed causing the long lasting engine load decreased to less than 60 % of its rated power. To provide safe navigation and power plant operation, there have been worked out several requirements [1] to be met in order to limit the engine unfavorable working conditions.
200

The basic requirements are:
- the regime of maintaining fuel parameters (viscosity, temperature) within the range defined by the manufacturer (in regard of the fuel type);
- the regime of maintaining water temperatures of low and high temperature engine cooling system;
- strict control of the injection valve operation aiming at detection of any malfunctioning leading to shortened periods between the scheduled overhauls;
- frequent checks of easily polluted components (charge air receiver, charge air non-return valves, under piston spaces, exhaust manifold, waste-heat boiler).
Engine manufacturers have developed systems of engine conversion by applying additional
equipment components [1]. The systems allow for engine steady operation at their low load without the need of supporting charge air system by auxiliary blowers. Another advantage of their application is the reduced pollution of the charge air system and the exhaust gas outlet at the reduced specific fuel consumption. Because of extra costs of the equipment and its installation, the systems are hardly ever installed on vessels already in service.
The idea was developed by defining vessel’s new operational conditions called „Super Slow Steaming”, where the reduced sailing speed resulted in the decrease of engine potential power to 30 % of its rated power, providing the recipients accepted the prolonged delivery time of the shipped cargo.
3. Changes in selected parameters of a marine engine - waste-heat boiler system
At winter time, (ambient temperature tO=2 ºC), in real ambient conditions of a ship operation,
a direct recording of selected working parameters (Fig.2) of a marine engine - waste-heat boiler system when reducing the engine load to less than 30 %, corresponding to „Super Slow Steaming” working conditions, was carried out. The measurements were taken on a ship equipped with the AQ2 smoke tube boiler of 482 m2 heat exchange space, manufactured by AALBORG, fed by exhaust gases of a slow speed, long stroke 8RTA96C type of engine, manufactured by WARTSILA.
The engine, by no means, was prepared to long lasting work at very low load. In the presented diagram three characteristic areas can be outlined:
- I area-within 60 % range of the engine rated load with the engine prepared for steady economic work during standard sea journeys;
- II area-temporary period of decreasing engine load, which typically appears while ship maneuvering at a reduced speed (mooring, anchoring, drifting);
- III area-engine working at along lasting load below 30 %.
201

�TA
A
�TIII
�TI
I II III
- engine load - exhaust gas outlet waste-heat boiler temperature - exhaust gas temperature before waste-heat boiler
Fig. 2. Changes in the selected parameters of the Main Engine – waste-heat boiler system
The III area presented in the diagram corresponds with the engine working conditions
according to „Super Slow Steaming”. In the area it is essential that, after the time of stabilizing, the exhaust gas outlet temperature of the waste-heat boiler is maintained on the exhaust gas temperature level adequate to the engine load in the I area, in spite of the increase (30 ºC) of the inlet exhaust gas temperature. Using simplified methods of determining the amount of outlet exhaust gases produced by the marine engine [2,3], it has been stated that within the engine load range their amount drops to the level of 31 % of production in the rated load conditions. Such changes in exhaust gas parameters do not turn out indifferent to the amount of steam production, which can be determined from the dependence (1). Limiting the amount of the produced steam may lead to disturbances of power plant heating systems. Especially, nowadays when residual high viscosity fuels (500÷700 cSt at 50 ºC), which demand higher transport temperatures between the tanks (minimum 50 ºC), and the injection temperature into the engine cylinders (minimum 145÷150 ºC).
, (1)
202
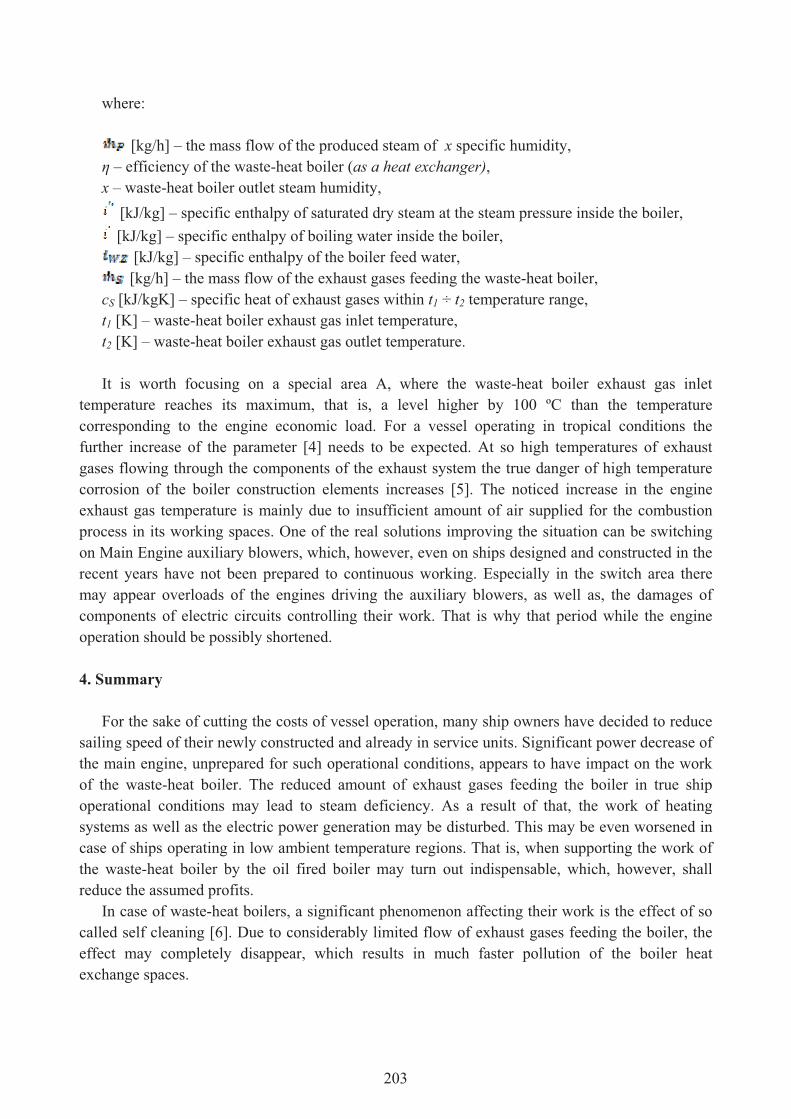
where:
[kg/h] – the mass flow of the produced steam of x specific humidity, � – efficiency of the waste-heat boiler (as a heat exchanger), x – waste-heat boiler outlet steam humidity,
[kJ/kg] – specific enthalpy of saturated dry steam at the steam pressure inside the boiler, [kJ/kg] – specific enthalpy of boiling water inside the boiler,
[kJ/kg] – specific enthalpy of the boiler feed water, [kg/h] – the mass flow of the exhaust gases feeding the waste-heat boiler,
cS [kJ/kgK] – specific heat of exhaust gases within t1 ÷ t2 temperature range, t1 [K] – waste-heat boiler exhaust gas inlet temperature, t2 [K] – waste-heat boiler exhaust gas outlet temperature. It is worth focusing on a special area A, where the waste-heat boiler exhaust gas inlet
temperature reaches its maximum, that is, a level higher by 100 ºC than the temperature corresponding to the engine economic load. For a vessel operating in tropical conditions the further increase of the parameter [4] needs to be expected. At so high temperatures of exhaust gases flowing through the components of the exhaust system the true danger of high temperature corrosion of the boiler construction elements increases [5]. The noticed increase in the engine exhaust gas temperature is mainly due to insufficient amount of air supplied for the combustion process in its working spaces. One of the real solutions improving the situation can be switching on Main Engine auxiliary blowers, which, however, even on ships designed and constructed in the recent years have not been prepared to continuous working. Especially in the switch area there may appear overloads of the engines driving the auxiliary blowers, as well as, the damages of components of electric circuits controlling their work. That is why that period while the engine operation should be possibly shortened.
4. Summary
For the sake of cutting the costs of vessel operation, many ship owners have decided to reduce
sailing speed of their newly constructed and already in service units. Significant power decrease of the main engine, unprepared for such operational conditions, appears to have impact on the work of the waste-heat boiler. The reduced amount of exhaust gases feeding the boiler in true ship operational conditions may lead to steam deficiency. As a result of that, the work of heating systems as well as the electric power generation may be disturbed. This may be even worsened in case of ships operating in low ambient temperature regions. That is, when supporting the work of the waste-heat boiler by the oil fired boiler may turn out indispensable, which, however, shall reduce the assumed profits.
In case of waste-heat boilers, a significant phenomenon affecting their work is the effect of so called self cleaning [6]. Due to considerably limited flow of exhaust gases feeding the boiler, the effect may completely disappear, which results in much faster pollution of the boiler heat exchange spaces.
203

During a ship operation this means constant limitation of the boiler heat exchange process, as well as, the growing danger of fire due to the accumulated flammable pollution. It is of special importance when referred to water pipe boilers equipped with elements intensifying heat exchange (plates, bands, pins…). The real danger of fire may be prevented only by more frequent cleaning of the boilers. However, the operation may be conducted only during a ship’s lay time.
References
[1] Wartsila, Continuous Low Load Operation – RTA-79.2 / RT-flex-08.2, Wintertuhr, 2009. [2] Tu�ski, T., Symulacja pracy kot�a utylizacyjnego z wykorzystaniem jego statycznego modelu,
III Mi�dzynarodowa Konferencja Naukowo-Techniczna EXPLO–SHIP’2004, Szczecin, 2003. [3] Tu�ski, T., Zwi�kszenie efektywno�ci wykorzystania energii odpadowej w uk�adzie silnik-kocio�
utylizacyjny w rzeczywistych warunkach otoczenia i eksploatacji statku, Rozprawa doktorska, Akademia Morska, Szczecin, 2005.
[4] MAN DIESEL (MAN B&W), Influence of ambient temperature conditions on main engine operation, Copenhagen, 2006.
[5] Adamkiewicz, A., Ko�wzan, K., Wp�yw produktów spalania na uszkodzenia okr�towych kot�ów pomocniczych, XXVIII Sympozjum Si�owni Okr�towych SYMSO’2007, Gdynia, 2007.
[6] MAN DIESEL, Soot deposits and fires in Exhaust gas boilers, Copenhagen, 2009.
204

THE CONCEPT OF SHIP’S POWER PLANT ARRANGEMENT INVOLVING BIOMASS FIRED BOILER
Wojciech Ze�czak
West Pomeranian University of Technology in Szczecin 41 Piastów Ave, PL 71-065 Szczecin, Poland tel.: +48 91 4494431, fax: +48 91 449 4737
e-mail: [email protected]
Abstract
The article presents the results of the analysis of the possibilities of the application of the solid biomass in the form of pellets as the fuel for ships in consideration of the environment protection as well as due to increase of the liquid fuel prices and decreasing resources of the crude oil. As the object of investigation a ship of minor cruising range of river – sea type has been assumed, chiefly intended for the service on the Baltic Sea. The ship’s power system solution has been discussed. A simplified comparative analysis of the fuel costs for a ship with power plant including biomass fired boilers and a ship with the conventional solution of the motor power plant supplied by Diesel oil has been demonstrated. The advantage of the application of the fluidised bed biomass fired boiler has been indicated and the research trends have been presented.
Key words: ship’s power plant, environment protection, alternative fuels, biomass, fluidised bed boiler 1. Introduction
The modern ship’s power systems generating mechanical energy for the main propulsion needs, electrical energy and heat are dominated by Diesel engines and boilers. The basic kind of fuel applied are still the liquid fuels originating from crude oil – mainly heavy fuel oil. The exhausting resources of crude oil and growing prices of the fuels cause to search for the new solutions of power plants, eg such where unconventional energy sources might be utilised including the renewable energy sources.
Another argument for the abstaining from the liquid fuels originating from crude oil is the marine environment protection. It is estimated that the share of the ships in the worldwide emission of sulphur oxides (SOx) resulting from the combustion of the mineral fuels amounts to approximately 7%, and the share of the nitrogen oxides (NOx), subject to the source, amounts to ca 13-17% [1, 4, 9]. The worldwide shipping trade is also responsible for the emission to the atmosphere of the significant quantities of carbon dioxide (CO2), constituting 3.3% of the global emission of this gas causing in the largest degree the occurrence of the greenhouse effect. Amongst all the transport means the participation of the ships in the CO2 emission is however 7% [13].
Such situation causes that there are going to be imposed more and more strict regulations concerning the permissible emission of toxic compounds contained within exhaust gas from the ships. The basic document regulating the emission of toxic compounds are the regulations of the International Maritime Organisation (IMO) formulated in Annex VI to MARPOL 73/78
205

Convention. The permissible limits of NOx emission applicable by the end of 2010 (Tier I standard) shall be replaced on 1.01.2011 by the new ones (Tier II standard). In 2016, however, there will be introduced very stringent limits concerning the NOx emission control areas (Tier III). Beyond the emission control areas still Tier II regulations will continue to apply. The permissible NOx emission limits – Tier II and Tier III standards are stated in table 1.
Tab. 1. The permissible NOx emission limits acc to MARPOL convention Annex VI [10]
Engine speed (rpm) [min-1] NOx emission limit [g/kWh]
Tier II Tier III
n<130 14,4 3,4 130 ?n<2000 44·n (-0,23) 9·n (-0,2)
n\2000 7,7 1,96
On the other hand with regard to the sulphur oxides the permissible emission has been limited by introducing in Annex VI the Rule 14 that regulates the permitted sulphur content in the fuel. The permissible sulphur limits in the fuel, in the global terms and in SOx control areas (SECA-SOx Emissions Control Areas) and the dates of their applicability are shown in table 2. It is permitted to apply, both in the control areas and globally, the scrubbers to clean the exhaust gas of the sulphur oxides. For example, the alternative for the fuel of sulphur content up to 1.5% must be the equipment cleaning down to the level ? 6g/kWh (SO2). It is worth reminding that one of the SECA areas is Baltic Sea.
Tab. 2. The permissible sulphur content in fuel acc to MARPOL convention Annex VI [10]
Date of limit application Sulphur limits in fuel (%) SECA Global
by June 2010 1,5 4,5 by July 2010 1,0 2012 3,5 2015 0,1 2020 or 2025 0,5
The current IMO standards do not comprise the carbon dioxide (CO2) emission. Nevertheless
there are works carried out to implement the regulations aiming to limit its emission. It is anticipated that the Carbon Dioxide Transport Efficiency Index will be applied, defined as the ratio of the mass of the emitted CO2 to the unit of the carried cargo within 1 mile. As a cargo unit, depending on the ship’s type, it is proposed to use eg m3 (tankers and bulk carriers), a passenger (passenger ships), a vehicle or a unit of the length of the lane occupied (vehicle carriers and ferries), a container (container ships) etc. The application of CO2 indexing is at first voluntary [7].
The CO2 emission level depends mostly on the fuel consumption. In case of the heat boilers and engines, in particular slow-speed engines, there is but a small margin to reduce the emission, if it is assumed to reduce the fuel consumption only by the improvement in the thermal efficiency of the simple cycle and the utilisation of the waste energy.
A significant reduction of CO2 emission can be achieved by the application on the ships of the renewable energy sources such as eg wind or solar radiation. Their disadvantage is however small density in comparison to the energy from the conventional source, which with the restricted ship’s surface makes it difficult to utilise them, and besides they are temporarily inaccessible. Thus the utilisation of the wind or solar radiation is for these reasons restricted to the sport and recreational watercraft or to the role of just auxiliary energy source on bigger merchant ships. On the other hand, it is worth analysing to utilise on the ships the renewable energy in the form of biomass.
206

2. Biomass General Characteristics
In the most general terms the biomass is the organic matter contained in animal and floral
organisms, originating as the product of the photosynthesis. This is a complex process covering various stages of photochemical and biochemical conversion of the electromagnetic (solar) radiation resulting in the formation of the biomass chemical energy. Under the influence of the solar radiation water is decomposed and in the reaction with carbon dioxide the carbohydrates are generated
CO2+2H2O+h� � O2+H2O+(CH2O) +E, (1) where: h – Planck constant v – electromagnetic radiation frequency [8].
The energy E synthesised from one mole of CO2 equals to 470 kJ. Biomass can be therefore regarded as the solar energy storage. The transformation of the biomass chemical energy into heat in the combustion reaction is related with the emission of CO2. However, this is treated as environment-friendly, not causing the greenhouse effect because it is subsequently absorbed by the next generations of plants in the photosynthesis, thus circulating within closed cycle. The length of such cycle depends on the kind of plant and varies within several months and several dozens of years.
The detailed classification of biomass is hard in view of numerous possible technological processes of biomass production and conversion and the generation processes of secondary biomass in these processes. The concept of biomass comprises many energy carriers of various properties. According to [5] the basis for the floral biomass classification can be the method of its transformation by conversion or the application of the products obtained. The conversion of biomass may take place by direct combustion, gasification or conversion into liquid or gaseous fuels in various processes. The forms of biomass utilised for the energy generating purposes are shown in the diagram in fig 1.
Biomass
Waste timber
Straw Organic waste
Liquid biofuels
Biogas
Fig. 1. The forms of biomass used for the energy generating purposes
The table 3 shows the calorific value and densities of various forms of biomass and for the sake
of comparison same data for heavy fuel oil, diesel oil and coal. These two parameters determine the volume of the fuel stock for the assumed ship’s cruising range.
Tab. 3. The calorific values and densities of various forms of biomass and fuel oil, diesel oil and coal
Biomass form Calorific value [MJ/kg] Density [kg/m3] Grey straw 15,2 90 -165 Timber debarked 18,5 380 - 640 Rapeseed oil 35,8 886 ( at temp. 20 oC) Ethyl alcohol 26,9 790 ( at temp. 20 oC) Briquetted timber 17,5 470 1) Timber pallets 19,5 630- 750 1)
207

Diesel oil DMA 40 890 (at temp. 15 oC) Heavy fuel oil (RMK 700) 39,4 1010 (at temp. 15 oC) Hard coal 16 - 29 800 - 1000
1) dump density
3. Biomass as Fuel for Ships In the shipbuilding relatively the most simple would be to substitute the liquid fuels generated
from crude oil by the biofuels on account of the minor differences in the calorific values and densities, similar fuel installations as well as existing experience in engine operation by use of this fuel in shore conditions [9]. The marine engines, both the slow-speed and the medium-speed, manufactured by the major makers in the world, suitable to fire fuel oil are also capable of combusting biofuels (bio-oils). The problems can only be expected in the engines designed for combusting only the Diesel oil on account of the cavitation appearing in the fuel injection pumps [11]. So far the application of the liquid biofuels takes place in a very restricted degree and is related either with research projects or limited to the utilisation of biofuels as only several percent addition to conventional fuel originating from crude oil [2]. One of the barriers for the wider application of biofuels at the current legal status within the permissible CO2 emission is the high price in calculation onto a unit of energy in comparison with the conventional fuels [11].
In the shore power engineering there are presently many technologies available to use the solid biomass for energy generating; the technologies being more or less complex, referred to inter alia in [5]. The selected technologies which are worth considering in terms of the application in ship’s power plant are shown in figure 2.
Solid biomass
Combustion
Steam turbine
Gassification
Piston engine
Gas Turbine
Fuell Cell ORC Turbine 1)
Gas Turbine 2)
Stirling Engine 2)
1with the application of heating oil as the intermediate medium 2 combustion in outer chamber
Fig. 2. The selected technologies of the solid biomass application in ship’s power plants
The synthesis gas (syngas) obtained within the biomass gasification process can be very successfully used as the fuel for heat engines or boilers as well as for the supply of the fuel cells. However, its production is related with the necessity of installing of the gas generator on board the ship; the generator occupying additional space in engine room; as well as the additional energy consumption for the process implementation. The synthesis gas is characterised by relatively low
208

calorific value, i e 4 – 7 MJ/kg. This can be increased by the gasification with pure oxygen or adding the steam within the process which however leads to the enlargement of the installation. On account of its low calorific value it is not economic either to produce this gas on shore in order to compress it and supply subsequently to the ship.
Among the technologies utilising directly combustion of biomass the most simple and at the same time well-proven in a sense in marine conditions, at the time when coal was commonly used as fuel, is the technology of firing biomass in the boiler and the application of steam circulation. The dump density of biomass is however much lower than coal dump density which makes the storage facilities for biomass larger than for coal. For this reason the most adequate fuel from amongst various biomass forms pellets should be considered as characterising by the biggest dump density. An additional argument for the choice of this kind of ecological fuel is also significantly lower price than bio-oil in terms of the unit of the obtained energy. The pellets are also easily transported from the receiver to the boiler, eg by pneumatic method.
Pellets contain not more than 0.08% sulphur and not more than 0.3% nitrogen [5]. Therefore the problem of sulphur oxide emissions practically does not exist. The generation of NOx from nitrogen contained in fuel is of minor importance as well. With the typical for pellet combustion surplus of air (�=1.1-1.3) the generation of NOx shall mainly take place in the thermal manner from the nitrogen contained in air. The formation of NOx strongly increases in the temperatures exceeding approximately 1300°C. The reduction of NOx emission can be obtained in this situation by gradually supplying the air for combustion or the application of the fluidised bed boiler allowing the firing in lower temperatures.
4. The Choice of the Ship and the Concept of Power Plant Arrangement
From the comparison of the dump densities and their calorific values (table 3) it ensues that for
the same cruising range of a ship the volume of the fuel stock in the pellet form would have been only slightly bigger that the coal stock. The comparison with fuel oil or Diesel oil looks much worse as their stock needs several times smaller volume than that in case of pellets. The large volume of fuel stock limits the cargo space. In this situation naturally the preferable type of a ship where pellets would act as fuel should be a ship of small design cruising range.
In order to verify these relations there has been selected as an example of the design object – the power plant of the river – sea type ship of 2,900 DWT and 12 knots contract speed which would operate in the Baltic area and the inland waters connected [6]. The Baltic Sea is the area covered by the strict regulations concerning the emissions of toxic compounds, which in particular justifies the choice of the ship of such type, and where biomass would be utilised as fuel. An important argument is also an excellent availability of pellets within Baltic Sea area [12].
The power of the ship’s main propulsion of 1,500 kW is divided between the two azimuth propellers with AC electric motors, each of 750 kW. Considering other electric energy consumers on the ship, including bow thruster of 280 kW and the heating needs satisfied by the application of the electrical power, there has been assumed the required power plant rating of 2,320 kW. It has been assumed that the total electric energy is generated by turbogenerator supplied with steam generated in the pellet fired boiler. The proposed power plant arrangement is an alternative solution for the design of Diesel electric power plant with the high-speed engines presented in [6]. The cruising range for the ship has been assumed as for the model ship, ie 4,000 nautical miles.
One of the key questions arising from the application of the pellets as the fuel is to determine the volume of its stock for the assumed ship’s cruising range. To determine the stock it has been assumed that in the engine room a simple steam cycle is assumed. The assumed parameters of the cycle and the results of calculations are presented in table 4.
The calculations of the required stock of Diesel oil conducted on the basis of the same assumptions regarding the components of the time of voyage duration for the model vessel with
209

the Diesel electric power plant have rendered the result determining its needs as 250 Mg. The capacity of the Diesel oil storage tanks equals for that purpose 309 m3. Evidently these are the values more than three times less than for the pellets.
Tab. 4. The assumed parameters of the cycle and the results of calculations of fuel stock
Parameter Value Unit Steam temperature at the turbine inlet 530 °C Steam pressure at the turbine inlet 9 MPa Pressure in the condenser 0.006 MPa Turbine internal efficiency 0.9 - Turbine mechanical efficiency 0.97 - Boiler efficiency 0.85 - Turbogenerator power 2,320 kW Steam flux directed to turbine 2.49 kg/s Hourly pellet consumption 1,789 kg/h Stock weight 795 Mg Volume of the pellet stock for the 4,000 nautical miles range 1,060 m3
On account of the very good availability of the pellets within Baltic Sea region and the
meridional stretch of Baltic as 1,300 km and the parallel stretch being ca 600 km in its widest place, the ship’s cruising range could be shortened by half and thus reduce the pellet stock volume down to ca 530 m3. These are already acceptable figures.
Definitely more advantageous for the power plant with biomass fired boiler on the other hand is the comparison of the fuel prices. The table 5 shows the specification of the fuel costs for the assumed cruising range of 4,000 sea miles for both solutions of power plant with the average prices applicable in June 2010 [14, 15].
Tab. 5. Fuel costs for biomass power plant and motor power plant
Parameter Fuel type Pellets Diesel oil
Unit price [zlotys/Mg] 700 4,686 Fuel stock [Mg] 795 250 Fuel cost [zlotys] 556,500 1,217,000
The comparison of the costs shows that the fuel costs for the ship with biomass fired boiler are
twice as low. The comparison would have been even more advantageous, if straw pellets are applied instead of the timber pellets which are characterised by similar properties and half the price. 5. Ship’s Biomass Fired Fluidised Bed Boiler
CO2 emission limits applicable in the European Union states as well as the obligations to
increase the participation of the renewable energy sources in the generation of electric energy cause that in the shore power engineering industry in Poland there is applied combination of coal with biomass combustion or new biomass fired boilers are built. In many cases these are fluidised bed boilers ensuring the environment friendly combustion. In the proposed power plant arrangement it would be also advisable to apply also the fluidised bed boiler as more environment
210

friendly and also characterised by the smaller dimensions in relation to the classic boiler of the same rating. In view of the shortage of experience in the operation of the boilers of this type in marine conditions, there have been commenced the investigations of the physical model of the fluidised bed boiler, with a part of results presented among others in [16]. These investigations concern the behaviour of the fluidised bed and the conditions of heat exchange during the disturbances originated by the ship’s motion on the waves. In the course of further works there has been designed a new construction of fluidising column that will allow inter alia to conduct the examination of the average heat transfer coefficient in the circulating bed subject to the height of the probe location over the grid during the cyclical pendulous motion of the column. The column diagram is presented in figure 3.
air outlet
Fig. 3. The diagram of the fluidising column with the fluidised bed material return system 6. Summary
By the example of river-sea type ship intended for the operation within Baltic Sea waters
where the strict regulations are applicable concerning the permissible emissions of the toxic compounds it has been demonstrated that it may be justified to utilise turbo-steam power plant with pellets fired boiler. The simplified analysis of the operational costs of the power plant indicates also a possibility of their significant reduction, if instead of motor power plant the proposed arrangement is applied. Although the low emissions level is achievable by use of the classic biomass fired boilers, it would be recommendable to apply the fluidised bed boilers which are characterised by even smaller emissions. This however requires the implementation of the experimental research of such boilers in the actual or simulated marine conditions.
cyclone
a
b
c
d
A
a, b, d – blanking caps for the openings in column for the alternative positioning of the cap c/w probe c – cap c/w probe
A A-A
fluidising air inlet
probe
auxiliary air
distributor
211

Other positive aspects of biomass application as fuel on ships in the country scale may be the partial getting independent of the imported fuels originating from crude oil as well as the improvement of the environment by the farming of energy generating plants.
However, in consideration of biomass application for the energy generating purposes, some ethical aspects should be duly taken into account. The farming of energy generating plants should not enter into direct competition with the foodstuff production. References [1] Bazari Z., Reynolds G., Sustainable Energy in Marine Transportation, IMarEST
Conference, Sustainable Shipping, February 2005. [2] BC Ferries introduces biodiesel to its fleet, www.motorship.com. [3] Bio – Plant in Fritzens , www.mandiesel-greentechnology.com. [4] Brabeck S., Turn wind in to profit, Fuel and Environmental Seminar, BV Hamburg 2008. [5] Chmielniak T., Technologie energetyczne, WNT, Warszawa 2008. [6] Eureka Project –E!2772, Baltekologicalschip, Outline Specification SINE 205, River –Sea
Vessel 2900 DWT, March 2003. [7] Interim Guidelines for Voluntary Ship CO2 Emission Indexing for use in trials,
MEPC/Circ.471, 29 July 2005. [8] Lewandowski W.M., Proekologiczne odnawialne �ród�a energii, WNT, Warszawa 2006. [9] MAN B&W, Further reductions seen in maritime NOx emissions, Dieselfacts, Autumn
2003. [10] MEPC.176(58) Amendments to the Annex of the Protocol of 1997 to amend the
International Convention for the Prevention of Pollution from Ships, 1973, as modified by the Protocol of 1978 relating thereto (Revised MARPOL Annex VI).
[11] Opdal A.A., Hojem J.F., Biofuels in ships, A project report and feasibility study into the use of biofuels in the Norwegian domestic fleet, Zero Emission Resource Organization 2007.
[12] The Bioenergy international, 6/2009. [13] Vahs M., „Green Ship” als Zukunftsaufgabe , Schiff und Hafen, Januar 2010. [14] www.eg.com. [15] www.pelet.zalubski.pl. [16] Ze�czak, W., Investigation of fluidized bed of the physical model of the marine fluidized bed
boiler, Journal of POLISH CIMAC, Vol.3, No.1,pp 183-190, Gda�sk , 2008. The study financed from the means for the education within 2009 – 2012 as own research project No N N509 404536
212

APPLICATION OF SPECTROSCOPIC RESEARCH METHODS FOR MOTOR OIL CONDITION AND QUALITY EVALUATION
Ma�gorzata Kastelik, Bogdan �ó�towski
University of Technology and Life Science ul. S. Kaliskiego 7, 85-789 Bydgoszcz, Poland
e-mail: [email protected], [email protected]
Abstract
The study presents an application of spectroscopic methods to diagnose motor oil condition and quality basing on FT-IR and ICP methods.
Keywords: FT-IR spectral analysis in infrared radiation, FT-IR spectrometry, ICP plasma emission atomic spectrometry 1. Introduction
In order to determine motor oil condition there are used different research methods. Research
laboratories run effective projects of oil analysis which include motor oil condition monitoring in order to determine efficiency and remaining period of oil lifetime basing on its degradation and pollution. Tests of physical properties performed in typical analysis laboratory of used oils (frequently used are modified procedures of ASTM (American Standard Test Method) containing analysis of: viscosity, TBN (alkalinity), TAN (acidity), water content (Karl Fisher), solution with fuel and insoluble compounds analysis [2,4,6,7,9]. The parameters mentioned are essential information about oil condition itself but also about the technical condition of the motor in which it was used.
Spectroscopic methods [5,6]are increasingly frequently used in research laboratories for motor oil condition monitoring.
Spectroscopy is a science dealing with theoretical and practical relations between matter and electromagnetic radiation. Such methods include: spectral analysis in infrared radiation (FT-IR) and ICP element para - plasme analysis. The first one is used mostly to monitor the motor oil condition via its physical and chemical feature evaluation. The latter one belongs to methods of motor oil evaluation via observation of trace amounts of particles created from motor or other device element wearing transported by oil. Basing on performed examination results one can conclude about motor technical condition and about necessity of oil change.
The article introduces application of selected spectroscopic methods in recently performed researches [5] led in order to analyze and evaluate of motor oil condition. Methods presented in this publication refer to research of selected motor oils used in lorry cars. The oils in discussion were also examined by traditional methods, but their deeper discussion was not included in this
213

article. The examined motor oil samples of particular mileage were taken and changes occurring in them were analyzed.
2. Spectral analysis in infrared radiation (FT-IR)
IR spectrophotometer is a method based on infrared radiation absorption by oscillation particles [5,8,10,11]. New measurement possibility was created by introducing IR spectrometry with Fourier transformation. Infrared radiation covers electromagnetic spectrum range between visual and microwave radiation. The biggest practical value has a wave band of 4000 cm-1 - 400 cm-1[8,10,11]. IR spectrum of the examined oil sample is presented as a diagram picturing relative radiation intensity coming through the researched oil (transmittance) in relation to recorded spectral band (E ? % [cm-1]) and it is characteristic feature of particular chemical compound, thus it is used to identification of compounds.
Oscillating spectra of particles are examined with classical infrared spectrometers as well as spectrophotometers with Fourier transformations [5,8].
An example of application of FT-IR transmission technology are results presented in research work [5] performed within wave range of 4000- 450 cm-1. The spectra of examined oil during exploitation were compared with the reference spectrum of fresh oil. During interpretation of selected spectra there were observed quality changes which mostly picture the lack of absorption bands of additives and increase of bands characteristic for oxidation products (Fig.1).
Fig.1. Example of spectrum for fresh and overworked oil TITAN CARGO MC [5] MC (wiskozator - viscosator; stopie� utleniania - oxidation rate; w. aromatyczne - aromatic hydrocarbons; w. parafinowe - paraffin hydrocarbons;
dodatek -additive; �wie�y olej - fresh oil; olej przepracowany - overworked oil)
Essential in this case for interpretation are bands: 3640 cm-1,1600 cm-1. In relation to these bands we can read from the spectrum that decrease (flattening) indicates the following data about quality content of oil – antioxidant additive is decreasing (peak 3640 cm-1), amount of aromatic
214

hydrocarbons is decreasing (peak 1600 cm-1). The distinct widening and more circular shape of peak 1600 cm-1 gives signal that oxidation and nintriding processes go on.
Information about quality composition changes in motor oil is not the only information possible to conclude from spectra. Beside oil content evaluation we can also read certain properties of motor oil. For instance decrease in two previously discussed absorption bands shows increase in oil viscosity (Fig.2.). Knowing that you can omit kinematic viscosity analysis. High depletion of D-D additive (peak 1230 cm-1) and drastic drop of EP and AW (anti-wear) additives (peak 970 cm-
1) can suggest already without additional TBN analysis, that TBN drops. This example shows the reading out of TBN and kinematic viscosity increase without
performing costly and time consuming traditional analyses. Disappearance of peaks 1000-1100 cm-1 suggests the presence of glycol in motor oil.
Fig.2. Example of spectrum for fresh and overworked oil TITAN CARGO MC [5] MC (wiskozator - viscosator; stopie� utleniania - oxidation rate; w. aromatyczne - aromatic hydrocarbons; w. parafinowe - paraffin hydrocarbons;
dodatek -additive; �wie�y olej - fresh oil; olej przepracowany - overworked oil)
Fig.1 and 2 presented above indicate clearly changes occurring in oil during exploitation. There are three areas which can be defined in which clear differences happen when comparing to fresh oil. Besides sooner mentioned possible interpretations of spectra, IR spectroscopic technology is a complementary analysis allowing also:
- base oil identification (mineral, PAO, ester oil) - definition of oil compatibility, choice of complements, - definition of enrichment additives and their share in fresh oil - detection of processes (i.e. oxidation, nitridation, sulfating) - detection of additives and pollutions (water, fuel, mineral substance etc.)
215

3. Element anlysis by ICP (Inductively Coupled Plasma)
ICP method is used for automatic marking of oil chemical content in argon plasma [5]. It is used for analysis of particles 5 μm.
Inductively excited plasma consists of atoms and ions of argon and proper amount of electrons and it is visible as intensively shining discharge of characteristic shape. A sample in form of solution or suspension is transformed into spray by atomizer. Elements excited in plasma emit radiation of different wave lengths – it is polychromatic emission. Polychromatic radiation is then dispersed according to wave length so it is possible to identify particular excited atoms or ions and to measure radiation intensity. An example of application of this spectroscopic method for motor oil condition is research work [5], in which research was done according to research standard: ASTM D 4951 – 92 (fresh oil), ASTM D 5185 – 93 (overworked oil).
The ASTM D4951-92 method determines a way of content marking for elements coming from enrichment additives in motor oils while the second standard determines a way of marking of element content from metals coming from wearing of cooperating parts and impurities in overworked oils.
ICP spectral element analysis – enables marking of the following element groups: - elements originating from oil (additives): Zn, P, B, Ca, Ba, Mg, Na, - elements originating from friction wear of motor parts: Fe, Cr, Ni, Mn, Cu, Pb, Al, Mo, - elements originating from impurities and additives: (Si : Al = 1,5:1), Ca, Na, B. Equipped with such technique we can quickly determine with high precision whole standard
set of elements. The full range of element analysis by ICP method for monitoring purpose should cover the following elements:
Fe, Pb, Cu, Sn, Si, Al, Sn, Ag, Na, B, Li, Cr, Ni, Mo, Mn, V, Sb, W, Ti, Cd – usually measured within range 0 – 100 mg/kg (ppm),
Zn, Ca, Mg, P, Ba – measured within range 0 – 900 mg/kg (ppm), S – measured within range 0 -10000 mg/kg (ppm).
Essential feature of ICP-AES is possibility of simultaneous marking of element group and it is most often used to marking of metal content in fresh and overworked lubricating oils.
Using research results from [5] the below presented examples (Table 1,2) show element analysis of motor oil performed by ICP method.
Tab 1. Example of element analysis of TITAN CARGO MC motor oil [5] 1 Sample number
Acceptable values L 0617
2 External look yellow
3 Sampling date ASTM
D 5185-93
---------
4 Mileage 52000 km
216

5 Element content; [ppm]
B
Ca
P
Zn
Pb
Fe
Mg
Mo
Cr
Sn
Si
Al
Cu
Ni
Na
15-25 ppm
-----
additive
-----
10-20 ppm
100-150 ppm
10-30 ppm
6-10 ppm
5-10 ppm
10-20 ppm
30-45 ppm
15-30 ppm
25-40 ppm
4-8 ppm
5-10 ppm
21.3
221.5
1112.0
328.0
56.2
22.0
79.2
71.7
31.9
48.9
1.1
3.2
7.9
3.9
0.5
Tab 2. Results of oil element analysis with ICP method [5]
No Examined parameter Marking value
1 Sample number Fresh oil L0730 L1062 L1285
2 Sample origin Fresh oil Opel
Omega
Opel
Omega
Opel
Omega
3 Mileage ----- 13500 km 27000 km 47000 km
4
Element content [ppm]
B
Ca
P
Zn
Pb
Fe
Mg
Mo
Cr
Sn
Si
Al
Cu
Ni
Na
ASTM D5185-93
<0.1
3680
480
1
3
2
8
<0,1
<0,1
<0,1
3
3
<0.1
<0.1
<0.1
10
3472
339
106
13
24
47
7
1
3
6
5
4
4
<0.1
28
3650
252
98
18
43
45
6
1
2
6
8
6
2
<1
<0.1
3600
275
82
18
56
40
9
2
<1
9
7
9
4
<0.1
The results of oil element analysis, i.e. such elements as lead, magnesium, tin, as well as chromium and molybdenum testify for excessive wear of such motor parts as bearings, sleeves and piston rings. Excessive wear of these parts can result from overheating as a result of overloading and also incorrect motor exploitation within full range of rotational speed (driving habits). Excessive wear of motor parts has direct influence on increased consumption of motor oil.
217

4. Basic analytic instruments used in spectroscopic analyses
In order to perform analysis with spectroscopic technique we use number of analytic instruments provided by tribology laboratories. FT-IR spectrometers (for example SPECTRO FT-IR OIL ANALYZER) are designed to used oil analysis [6]. They have dedicated software which detects degradation and pollution parameters from spectrum of a used oil sample. This technique is quick, analysis lasts less than a minute and provides data about oxidation, nitration, sulfating, dustiness, fuel dilution, water and glycol content, and in some cases depletion of additives in used lubrication oils. Because of its speed and trend setting, it became a standard technique in laboratories analyzing large number of used oil tests. ICP spectrometers with inductive coupled plasma (for example SPECTRO ARCOS and SPECTRO GENESIS) are recommended when there is need for high analysis accuracy, e.g. additive analysis in oil enrichment factories. These basic instruments can be complemented with other analytical instruments. Ferrography enables magnetic separation of particles in oil sample arising from motor wear and ordering them in relation to their size on microscope base.
More and more frequently automatic particle analysis technique is used. LASERNET FINES particie analyzer enables measurement of particle quantity contained in oil, determining their shape, origin, size, recording data and determining a trend. It simultaneously counts particles (particle counter) and determines dust pollution rate of oil. It is a tool simple in usage and can be also equipped with sample feeder what makes it an ideal instrument for laboratories analyzing large number of samples [6].
However, for objective determination of oil condition it is necessary to examine parallels such features as: acidity (Total Acid Number), alkalinity (Total Base Number), marking of water with Karl Fisher method. They are most often performed tests ASTM (American Standard Test Method) for determination of oil degradation and pollution. If more detailed information is needed than obtained from FT-IR spectrometer, then often in comprehensive system of oil analyses there is also provided an automatic titrates. ITL Industrial Tribology Laboratory by SPECTRO company fulfils the above requirements for equipment adjustment and compatibility having a comprehensive system for monitoring of machine and motor condition on basis of oil analysis.
5. Final conclusions
The analysis of data from scientific literature and authors’ experiments lets formulate the
following conclusions: 1. Spectroscopic methods enable quick and efficient analysis and evaluation of motor oil. 2. They are modern methods enabling motor oil examination during motor exploitation. 3.FT-IR spectroscopy enables a comprehensive analysis of composition and change recording which enables differentiation of oil conditions being the basis for usage of this applied methodology of motor oil research. 4.ICP spectroscopy delivers quality and quantity analysis of particles in lubricant oil arisen from wearing of parts. This technique is very effective in detecting defects which are characterized with incorrect increase of metal particles coming from wearing and polluting. 5.At present stage of science and technology it is extremely difficult to precise one universal parameter characterizing in objective way motor oil in any exploitation phase. References [1] Baczewski, K., Hebda, M., Jaroszczyk, T., Filtracja oleju, paliwa i powietrza w t�okowych
silnikach spalinowych. (Oil, Fuel and Air Filtration in Piston Combustion Motors). Wydawnictwa Komunikacji i �czno�ci. Warszawa 1977.
218
[2] Zwierzycki, W., Oleje, paliwa i smary dla motoryzacji i przemys�u. (Oils, Fuels and Lubricants for Motorization and Industry). Rafineria Nafty Glimar. Gorlice 2001.
[3] Kajdas, Cz., Podstawy zasilania paliwem i smarowania samochodów. (Foundations of Fuel Feeding and Lubrication of Cars). Wydawnictwa Komunikacji i �czno�ci. Warszawa 1983.
[4] Zwierzycki, W., Oleje smarowe. Dobór i u�ytkowanie. (Lubricating Oils. Choice and Usage). Rafineria Nafty Glimar 1996.
[5] Wojciechowski, D., Analiza i ocena stanu oleju silnikowego metodami spektroskopii. Rozprawa doktorska. (Analysis and Evaluation of Motor Oil by Spectroscopic Methods. Ph.D. Thesis). Szczecin 2007.
[6] http://www.spectro.com.pl. [7] Barcewicz, K., �wiczenia laboratoryjne z chemii wody, paliw i smarów. (Laboratory Exercises
in Chemistry of Water, Fuels and Lubricants). Wydawnictwo Akademii Morskiej w Gdyni. Gdynia 2006.
[8] Silverstein, R. M., Webster, F. X., Kiemle, D. J., Spektroskopowe metody identyfikacji zwi�zków organicznych. (Spectroscopic Methods of Organic Compounds Identification). PWN. Warszawa 2007.
[9] Micha�owska, J., Paliwa, oleje, smary. (Fuels, Oils and Lubricants). WKi. Warszawa 1977. [10] Woli�ski, J., Chemia organiczna. (Organic Chemistry). PZWL. Warszawa 1985. [11] Mastalerz, P., Chemia organiczna (Organic Chemistry) Wydanie I. Wydawnictwo
Chemiczne, Wroc�aw 2000.
This paper is a part of investigative project WND-POIG.01.03.01-00-212/09.
219

220

FT-IR METHOD USED FOR EVALUATION OF MOTOR OIL CONDITION AND QUALITY
Ma�gorzata Kastelik, Bogdan �ó�towski
University of Technology and Life Science
ul. S. Kaliskiego 7, 85-789 Bydgoszcz, Poland e-mail: [email protected], [email protected]
Abstract
In this study there is an introduction to a concept of using FT-IR spectroscopic method for evaluation of motor oil
condition and quality. The way of preparation of oil samples to laboratory analyses as well as methodology of research was presented.
Keywords: spectroscopic methods, FT-IR method, FT-IR spectrophotometer, FT-IR spectrometry
1. Introduction
The problem of motor oil quality diagnosing concerns the choice of strictly adjusted proper research methods. During recent years spectroscopic methods have grown in meaning in motor oil condition and quality. Because of growing interest in the above mentioned methods there is a need to develop motor oils and approach them in rational and optimal way in question of motor oil condition and operational properties evaluation.
Motor oils constitute a very complex medium both structurally as well as functionally, thus difficult to quality evaluation. As a result of thermo-chemical and physical and chemical transformations, during exploitation, changes of their chemical constitution occur. In practice it is not possible to characterize the detailed chemical composition of such a complicated mixture [4]. One of techniques applied to evaluate the above mentioned oil features is infrared spectral analysis (FT-IR), based on infrared radiation absorption by oscillating particles [2,3,4]. The equipment used in this type of marking are IR spectrometers with Fourier transformation (Fourier Transfer Infrared – FT-IR).
FT-IR spectrometers (Fig.1) are devices richly equipped with electronics and computers, which control the measurement process and help spectrum processing and analyzing. In this type of devices all optical parts as prisms and measurement corvettes must be transparent for IR radiation. The negative feature of these materials is low resistance to humidity and scratching so optical parts of the device need to be placed in special air-conditioned chambers with temperature slightly higher than ambient temperature. Liquid samples are examined in form of solutions in special corvettes which consist of two IR transparent windows, separated by pads of certain thickness. The thickness of solution absorption layer ranges from 0.01 mm to 2.0 mm. Properly adjusted solvent should dissolve the examined sample well and posses low absorptive within the sample absorption range. Frequently used solvents are carbon tetrachloride (within the range of 4000 – 1000 cm-1)
221

and carbon disulfide (within the range of 1300 – 600 cm-1). This study presents the usage of FT-IR method for motor oil condition evaluation basing on experiments of other authors.
Fig.1.Schematic operation of Fourier spectrometer with Michelson interferometer [1,2]
2. Research methodology
In these article consideration are based on scientific material gathered in scientific work [1]. The results published refer to only one type of motor oil examined – synthetic oil TITAN CARGO 1040 MC. An important element for running such type of analyses is preparation of research station and control of performed marking. In this case the spectrometer used, was FT-IR Spectrum One by Perkin Elmer company (Fig.2). Before starting this type of instrumental apparatus, there are certain environmental conditions to be fulfilled, which among other are:
- in-door operation - ambient air temperature of 5 0C to 40 0C, - maximum relative humidity of 80% for temperature up to 31 0C, - dust-free air, - working desk free from shocks and vibrations, - avoiding sunlit places, - eliminating of strong magnetic fields in computer location.
Fig.2. Spectrum One FT-IR spectrometer [1]
Spectrum software is used for Spectrum One operation which enables control and processing of spectra which were collected. It is important that a KBr measuring chamber window placed at front of Spectrum One, must display humidity level not exceeding 75%. Oil samples have to be collected from central part of a tank, always from the same depth in normal working conditions of the device (constant circulation, usual warmth). They should be collected by a hand pump or syringes to disposable tight-proof 500 ml containers made from plastic. The frequency of sample
222

collection should be adjusted to device work and should be increased when analysis results are worrying.
Samples for examinations were collected periodically, paying attention to well differentiated mileage, taking into account changes in motor oil condition. Examinations were performed in the range. Spectra of oil condition during exploitation were compared with spectra of fresh oil.
3. Interpretation of research results
In research result interpretation it is essential to analyze group composition, and consequently the quality analysis of motor oil composition. To achieve this goal we must know theoretical location of particular chemical compounds characterized in FT-IR spectrum, which indicates assignment of responsive functional groups to particular strictly defined areas [2], in which there are absorption bands, characteristic for fresh oils. Once we know locations of peaks which describe characteristic groups of chemical compounds in the spectrum, we can get information referring the most important physical and chemical features of the examined oil. On their basis we can evaluate oil condition and whether it is fit to further exploitation. For example peaks of bands of wave number about 3000 cm-1 and 1460, 1377 cm-1 are hydrocarbon bands and let determine the quality of base oil i.e. determine paraffin, naphthenic or aromatic hydrocarbons. In turn, by periodic recording of motor oil spectrum during motor exploitation we can watch changes occurring in oil i.e. oxidation, nitrating, sulfating, soot and water accumulation, exhausting of additives, fuel or coolant (glycol) pollution. This information can be used to motor oil quality control and to inform an operator about combustion conditions, wearing rate and pollutant penetration.
4. Research results and their analysis In this part of the study there are presented examples of chosen spectra of motor oils [1]. Fig.3
shows a small decrease of peak 3640 cm-1, testifying for antioxidant addition and peaks 1600 cm-1 for aromatic hydrocarbon quantity decrease. The ongoing processes of oxidation and nitrating can be detected when this narrow peak becomes wider and more circular. From decreasing of these peaks we read that viscosity of oil will grow. High depletion of D-D additive (peak 1230 cm-1) and drastic drop of EP and AW (anti-wearing) additives point (peak 970 cm-1) can suggest that basic number (TBN) is decreasing. This example shows a TBN drop readout a as well as kinematic viscosity rise without performing time-consuming and costly traditional analyses. Pollution, soot, dark color of base oil and water content cause vertical movement of a spectrum. The FT-IR spectrum of examined oil (Fig.4) shows a lack of peak 3640 cm-1 (antioxidant additive) and very low peaks 1500-1774 cm-1 – rate of oxidation, D-D, viscosator, lowering of aromatic hydrocarbons – these usually narrow peaks are widening and become more circular, which is result of oxidation and nitrating. Decrease of these peaks can, already without costly and time-consuming analyses of kinematic viscosity and viscosity indicator, suggest that these features will grow drastically. Lack of peaks 1000-1100 cm-1 suggests presence of glycol in motor oil. Figure 5 clearly indicates changes occurring in oil during exploitation, there are three different areas in which clear deviations from fresh oil are present.
The selected changes in motor oil during exploitation shown by the author in research study [1] cause disappearance of additive’s absorption bands and increase of bands characteristic for oxidation products. It is also observed decreasing intensity of bands which are characteristic for dispersant and viscosator. Degradation of additives and increasing of content of oxidation products cause worsening of motor oil exploitation features
223

.
Fig.3. Example of fresh and overworked oil TITAN CARGO MC (wiskozator - viscosator; stopie� utleniania - oxidation rate; w. aromatyczne - aromatic hydrocarbons; w. parafinowe - paraffin
hydrocarbons; dodatek - additive; �wie�y olej - fresh oil; olej przepracowany - overworked oil)
Fig.4. Example of fresh and overworked oil TITAN CARGO MC(wiskozator - viscosator; stopie� utleniania - oxidation rate; w. aromatyczne - aromatic hydrocarbons; w. parafinowe - paraffin
hydrocarbons; dodatek -additive; �wiey olej - fresh oil; olej przepracowany - overworked oil)
224

Fig.5. Example of fresh and overworked oil TITAN CARGO 10W40 MC (wiskozator - viscosator; stopie� utleniania - oxidation rate; w. aromatyczne - aromatic hydrocarbons; w. parafinowe -
paraffin hydrocarbons; dodatek - additive; �wie�y olej - fresh oil; olej przepracowany - overworked oil)
5. Final conclusions In summary of this article considerations the following conclusions can be indicated:
1. The proposed way of implementation of spectroscopic methods for analysis and evaluation of motor oil condition during exploitation can successfully complement and finally replace traditional methods of motor oil monitoring, limit marking time and result interpretation, which can effectively protect against many defects of combustion engines. 2. FT-IR spectrum lets analyze oil composition and record changes which in turn makes it possible to differentiate oil conditions being basis for using this motor oil examination methodology. 3. Taking into account researches intending to more detailed analysis of typical groups of chemical compounds contained in motor oils depending on exploitation changes happening inside them – the FT-IR method can constitute an alternative direction for later development of scientific research. References [1] Wojciechowski, D., Analiza i ocena stanu oleju silnikowego metodami spektroskopii. Rozprawa
doktorska, (The Analysis and Evaluation of Motor Oil Condition with Spectroscopic Methods. Ph.D. Thesis) Szczecin 2007.
[2] Silverstein, R. M., Webster, F. X., Kiemle, D. J., Spektroskopowe metody identyfikacji zwi�zków organicznych, (Spectroscopic Mehods of Organic Compound Identification) PWN, Warszawa 2007
[3] Woli�ski, J., Chemia organiczna, (Organic Chemistry) PZWL, Warszawa 1985. [4] Gr�dkowski, M., Problemy Eksploatacji,(Exploitation Problems) 1, s. 93-5-125, 1995
225

[5] Mastalerz P., Chemia organiczna, (Organic Chemistry) Wydanie I, Wydawnictwo Chemiczne, Wroc�aw 2000.
This paper is a part of investigative project WND-POIG.01.03.01-00-212/09.
226