Analyzing the influence of marketing mix strategies on export
71
Analyzing the influence of marketing mix strategies on export performance in the garment industry of Ethiopia: The case of garment exporters in Addis Ababa By Yodit Gizaw A thesis submitted to Addis Ababa University School of Commerce, Department of Marketing Management in partial fulfillment of the requirements for the Master of Arts in Marketing Management Advisor: Tewodros Mesfin (PhD.) May, 2018 Addis Ababa Ethiopia
-
Upload
khangminh22 -
Category
Documents
-
view
0 -
download
0
Transcript of Analyzing the influence of marketing mix strategies on export
Analyzing the influence of marketing mix strategies on export
performance in the garment industry of Ethiopia: The case of
garment exporters in Addis Ababa
By Yodit Gizaw
A thesis submitted to Addis Ababa University School of
Commerce, Department of Marketing Management in partial
fulfillment of the requirements for the Master of Arts in
Marketing Management
Advisor: Tewodros Mesfin (PhD.)
May, 2018
Addis Ababa Ethiopia
Analyzing the influence of marketing mix strategies on export
performance in the garment industry of Ethiopia: The case of
garment exporters in Addis Ababa
By Yodit Gizaw
A thesis submitted to Addis Ababa University School of Commerce, Department of Marketing Management in partial fulfillment of the requirements for the Master of Arts in Marketing Management
Advisor: Tewodros Mesfin (PhD.)
May, 2018
Addis Ababa Ethiopia

Declaration
I, Yodit Gizaw, hereby declare that this research paper entitled “Analyzing the influence of
marketing mix strategies on export performance in the garment industry of Ethiopia: The case of
garment exporters in Addis Ababa” is my original work and has not been presented for any
degree in any university and all sources used for the study have been duly acknowledged.
_______________________ ____________________ ____________________ Name Signature Date

Approval Sheet
Addis Ababa University, School of Commerce, Graduate Studies Program, Department of Marketing Management
Analyzing the influence of marketing mix strategies on export performance in the garment industry of Ethiopia: The case of garment exporters in Addis Ababa
By Yodit Gizaw
Approved by Board of Examiners
_______________________ ____________________ ____________________ Advisor Signature Date
_______________________ ____________________ ____________________ Internal examiner Signature Date
_______________________ ____________________ ____________________ External examiner Signature Date
Letter of Certification
This research has been submitted to Addis Ababa University, School of Commerce,
Graduate Studies Program, Department of Marketing Management for examination with
my approval as an advisor.
Tewodros Mesfin (Ph.D) ______________________________ Advisor Signature
Addis Ababa University
May, 2018 G.C.

i
Table of contents Contents Page
Acknowledgment .................................................................................................................................. v
List of Acronyms ................................................................................................................................. vi
List of Tables ..................................................................................................................................... vii
Abstract ............................................................................................................................................. viii
Chapter One: Introduction.................................................................................................................... 1
1.1. Background of the study ....................................................................................................... 1
1.2. Statement of the problem ...................................................................................................... 3
1.3. Research questions ................................................................................................................ 4
1.4. Objectives of the study .......................................................................................................... 4
1.4.1. General objective of the study ...................................................................................... 4
1.4.2. Specific objectives of the study .................................................................................... 5
1.5. Significance of the study ....................................................................................................... 5
1.6. Scope of the study ................................................................................................................. 5
1.7. Definition of terms ................................................................................................................ 6
1.8. Organization of the paper ...................................................................................................... 6
Chapter Two: Review of related literatures ........................................................................................ 7
2.1. Introduction ............................................................................................................................ 7
2.2. Background of the study area ............................................................................................... 7
2.2.1. Export performance trend of garment industry ............................................................ 9
2.2.1.1. Global trend of garment industry export performance ............................................ 9
2.2.1.2. Ethiopia trend of garment industry export performance ......................................... 9
2.3. Theoretical literature review ............................................................................................... 10
2.3.1. Product marketing mix ................................................................................................ 11
ii
2.3.2. Price marketing mix ..................................................................................................... 11
2.3.3. Distribution marketing mix ......................................................................................... 12
2.3.4. Promotion marketing mix............................................................................................ 12
2.4. Determinants of export performance.................................................................................. 12
2.4.1. Internal factors ............................................................................................................. 13
2.4.2. External factors ............................................................................................................ 14
2.5. Marketing mix strategy influence on export performance ................................................ 14
2.5.1. Product marketing strategy impact on export performance ...................................... 15
2.5.2. Price marketing strategy impact on export performance........................................... 16
2.5.3. Place marketing strategy impact on export performance .......................................... 17
2.5.4. Promotion marketing strategy impact on export performance.................................. 18
2.6. Measures of export performance ........................................................................................ 19
2.6.1. Objective measures ...................................................................................................... 21
2.6.2. Subjective measures .................................................................................................... 22
2.7. Conceptual framework ........................................................................................................ 22
Chapter Three: Research Methodology ............................................................................................. 24
3.1. Research approach ............................................................................................................... 24
3.2. Research methods ................................................................................................................ 24
3.3. Research design ................................................................................................................... 25
3.4. Sampling design .................................................................................................................. 25
3.4.1. Target population and sampling frame ....................................................................... 25
3.4.2. Sampling technique ..................................................................................................... 25
3.4.3. Sample size and sampling procedure.......................................................................... 26
3.5. Data collection sources ....................................................................................................... 26
3.5.1. Primary source ............................................................................................................. 26

iii
3.5.2. Secondary source ......................................................................................................... 26
3.6. Data collection instruments ................................................................................................ 26
3.7. Data analysis ........................................................................................................................ 27
3.8. Reliability and Validity ....................................................................................................... 27
3.8.1. Reliability ..................................................................................................................... 27
3.8.2. Validity ......................................................................................................................... 27
3.9. Ethical considerations ......................................................................................................... 27
Chapter four: Data presentation, Analysis and Interpretation ......................................................... 28
4.1. Introduction .......................................................................................................................... 28
4.2. Data screening and cleaning ............................................................................................... 28
4.3. Reliability test ...................................................................................................................... 28
4.4. General company information ............................................................................................ 29
4.4.1. Year of establishment .................................................................................................. 29
4.4.2. Years of export experience .......................................................................................... 30
4.4.3. Company information .................................................................................................. 30
4.4.4. Origin of exporter ........................................................................................................ 31
4.4.5. Respondents position in the company ........................................................................ 31
4.5. Objective data ...................................................................................................................... 32
4.6. Descriptive data ................................................................................................................... 33
4.6.1. Product marketing strategies ....................................................................................... 33
4.6.2. Price marketing strategies ........................................................................................... 34
4.6.3. Distribution marketing strategy .................................................................................. 35
4.6.4. Promotion marketing strategy ..................................................................................... 36
4.6.5. Export performance ..................................................................................................... 37
4.7. Normal distribution ............................................................................................................. 38
iv
4.8. Correlation analysis ............................................................................................................. 39
4.9. Analysis of inferential statistics .......................................................................................... 40
4.9.1. Test for multicollinearity ............................................................................................. 40
4.9.2. Regression analysis ...................................................................................................... 41
4.10. Validation of hypotheses ................................................................................................. 42
Chapter Five: Summary, Conclusion and Recommendation ........................................................... 45
5.1. Summary and Conclusion ................................................................................................... 45
5.2. Recommendation ................................................................................................................. 46
5.3. Limitation and direction for future study ........................................................................... 47
References ........................................................................................................................................... 48
Appendix I: Questionnaire ................................................................................................................LII
Appendix II: Statistical Outputs ...................................................................................................... LV

v
Acknowledgment
Above all, I am greatly indebted to my family who has been there for me and supporting me
throughout my life. I cannot thank you enough!
I would also like to express my deepest gratitude to my Advisor Dr. Tewodros Mesfin for his
relentless guidance through the accomplishment of this study. His valuable comments throughout
the study were most treasured.
I am thankful for all the respondents in the exporting companies who gave their precious time to
fill out the questionnaire.
vi
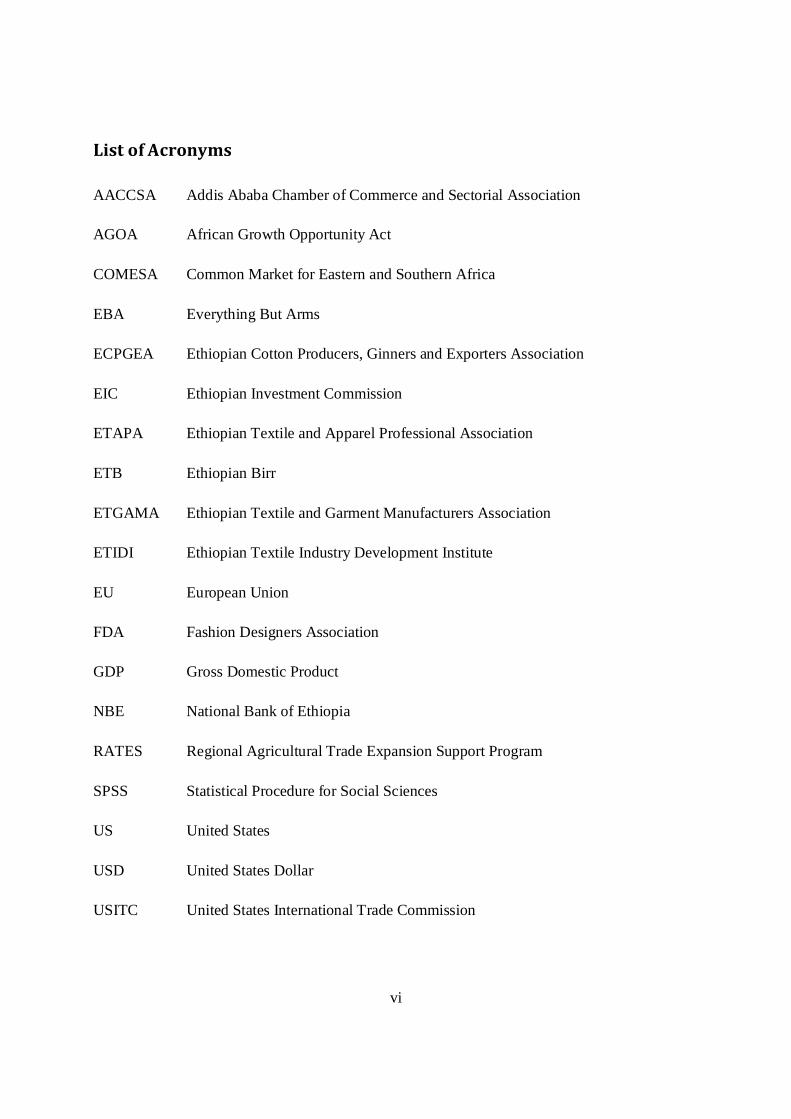
List of Acronyms
AACCSA Addis Ababa Chamber of Commerce and Sectorial Association
AGOA African Growth Opportunity Act
COMESA Common Market for Eastern and Southern Africa
EBA Everything But Arms
ECPGEA Ethiopian Cotton Producers, Ginners and Exporters Association
EIC Ethiopian Investment Commission
ETAPA Ethiopian Textile and Apparel Professional Association
ETB Ethiopian Birr
ETGAMA Ethiopian Textile and Garment Manufacturers Association
ETIDI Ethiopian Textile Industry Development Institute
EU European Union
FDA Fashion Designers Association
GDP Gross Domestic Product
NBE National Bank of Ethiopia
RATES Regional Agricultural Trade Expansion Support Program
SPSS Statistical Procedure for Social Sciences
US United States
USD United States Dollar
USITC United States International Trade Commission

vii
List of Tables
Table 4.3.1: Reliability test ................................................................................................................ 29
Table 4.4.1.1: Year of establishment ................................................................................................. 29
Table 4.4.2.1: Year of export experience .......................................................................................... 30
Table 4.4.3.1: Company information ................................................................................................ 31
Table 4.4.4.1: Involved investors in garment exporting business ................................................... 31
Table 4.4.5.1: Respondents position in the company ....................................................................... 32
Table 4.5.1: Garment industry foreign currency earning in million USD in Ethiopia ................... 32
Table 4.5.2: Garment industry foreign currency earning in million USD in Addis Ababa ........... 33
Table 4.6.1.1: Descriptive data on product marketing mix strategies ............................................. 34
Table 4.6.2.1: Descriptive statistics on price marketing strategy .................................................... 35
Table 4.6.3.1: Descriptive data on distribution marketing mix strategies ...................................... 36
Table 4.6.4.1: Descriptive statistics on promotion marketing mix strategy ................................... 37
Table 4.6.5.1: Descriptive statistics on export performance ............................................................ 38
Table 4.7.1: Normal distribution........................................................................................................ 39
Table 4.8.1: Correlation analysis ....................................................................................................... 39
Table 4.8.1.1: Test of multicollinearity ............................................................................................. 40
Table 4.8.2.1: Model summary of R Square ..................................................................................... 41
Table 4.8.2.2: ANOVA ...................................................................................................................... 41
Table 4.8.2.3: Coefficients ................................................................................................................. 42
viii
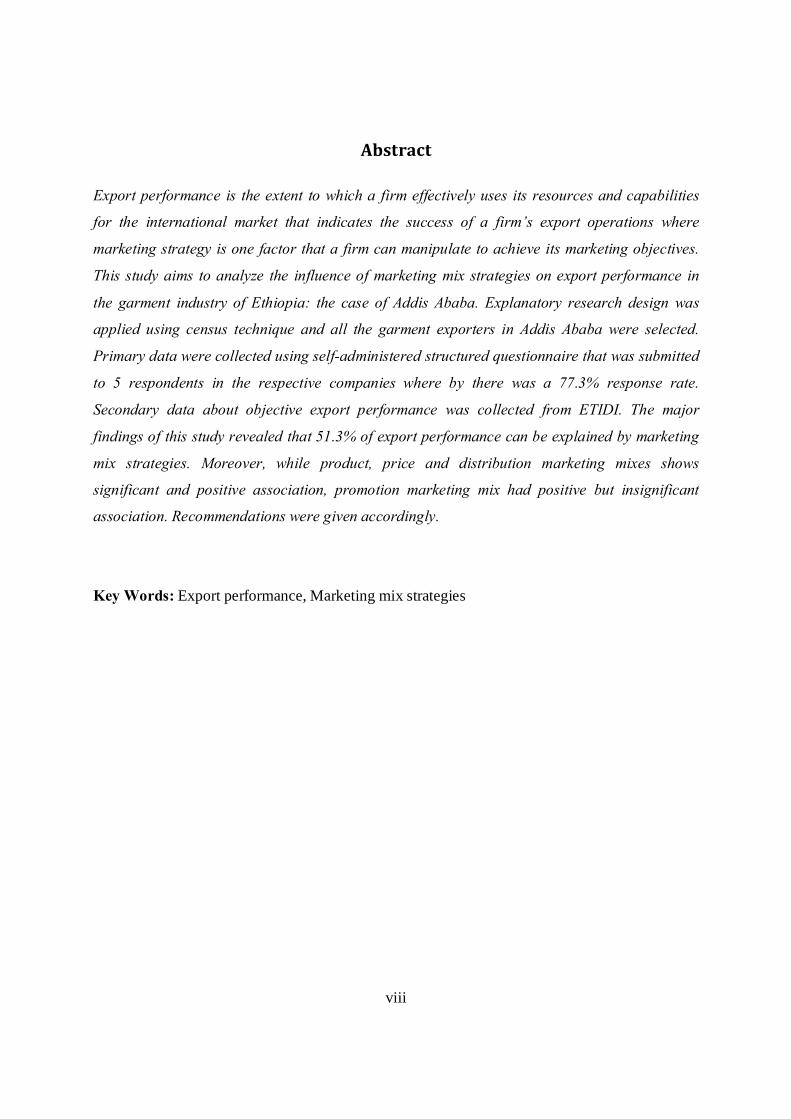
Abstract
Export performance is the extent to which a firm effectively uses its resources and capabilities
for the international market that indicates the success of a firm’s export operations where
marketing strategy is one factor that a firm can manipulate to achieve its marketing objectives.
This study aims to analyze the influence of marketing mix strategies on export performance in
the garment industry of Ethiopia: the case of Addis Ababa. Explanatory research design was
applied using census technique and all the garment exporters in Addis Ababa were selected.
Primary data were collected using self-administered structured questionnaire that was submitted
to 5 respondents in the respective companies where by there was a 77.3% response rate.
Secondary data about objective export performance was collected from ETIDI. The major
findings of this study revealed that 51.3% of export performance can be explained by marketing
mix strategies. Moreover, while product, price and distribution marketing mixes shows
significant and positive association, promotion marketing mix had positive but insignificant
association. Recommendations were given accordingly.
Key Words: Export performance, Marketing mix strategies
1
Chapter One: Introduction
1.1. Background of the study
International business is the process of commercial transaction across national borders.
Customers found in different countries of the world are heterogeneous hence have diverse needs,
values, perceptions, and requirements. Moreover, they have different competencies and there
may be a need to specialize in a sector in which they have abundant resource to produce
offerings for which they will have competitive advantage in the world market hence creating the
need for international business (Vijayasri, 2013). While international marketing is a marketing
activity between different countries of the world dealing with both imports and exports, export
marketing is an integral part of international business that is involved with only exporting
products across countries. The role of exporting for countries economic development is vital.
Bringing foreign exchange, creating balance of payment and economic development, efficient
resource utilization, increasing employment and standard of living, are among the list. It also
provides utmost benefits for firms exporting their offerings as it gives increased profits, develops
reputation and increased competitive advantage in the domestic market, aids in spreading risk
between the domestic and export market (VandeMataram, 2006).
Export marketing is very crucial for better economic success in developing countries (European
commission, 2012). Hence Ethiopia has been involved with exporting of various goods including
coffee, oil seeds and spices, fruits and vegetables, flowers, footwear and leather, meat and live
animals etc. to the international market. According to the business opportunity report as
commissioned by the Netherlands Embassy in Addis Ababa, of the various offerings from the
Ethiopian market being exported, the garment industry is one of them that is showing a
promising development over the past years (Polls, 2015).Garment manufacturing companies in
the country are involved with range of activities including knitting, spinning, weaving,sewing,
embroidery, printing, finishing and other depending on the available machines of the company.
Several industries in Ethiopia have been increasing year to year with different capacity and
product categories. This can be accredited to the government’s effort to improve the

2
manufacturing sector in the country by providing several financial and non-financial incentives
for native and foreign investors (Mulu, 2016). By the same token, the number of garment
producing companies has been increasing over time. According to ETIDI (2017), this can be
explained by the country’s comparative advantages including availability of industrial parks,
abundant and cheap human resources, availability of large area and suitable climate that is
required for cotton plantation, accessibility to global market programs such as AGOA (African
Growth and Opportunity Act), EBA (Everything But Arms), and COMESA (Common Market
for Eastern and Southern Africa) which allow export opportunities for developing countries free
of duty excluding quota restriction for all export products. In addition, there are governmental
organizations and non-governmental associations that aid in the development of the sector
including Ethiopian Textile Industry Development Institute (ETIDI), Ethiopian Cotton
Producers, Ginners and Exporters Association (ECPGEA), Ethiopian Textile and Apparel
Professional Association (ETAPA), Ethiopian Textile and Garment Manufacturers Association
(ETGAMA) and Ethiopian Fashion Designers Association (EFDA) (Ethiopian textile portal,
2017).
As stated by ETIDI there are currently more than a 100 large scale textile and garment
manufacturing companies (including traditional and hand-woven producers) and 18 cotton
ginning factories located in the different states of the country. Of them 115 companies include
garment manufacturing in their business and 68 are involved in exporting their products. From
the exporters 30 are found in the state of Addis Ababa that are actively exporting (ETIDI, 2017).
Export performance of a company can be seen as how much of the firm’s objectives, which
could be either financial or non-financial, are fulfilled. Beleska-Spasova (2014) states that a
reliable export performance measure has to be “composite and multidimensional”, with a frame
of reference, is measurable over a certain time period and should reflect firms strategic goals.
Taking this under consideration, export performance measurement is classified into two as
financial and non-financial.
Export performance can be influenced by several factors. As indicated by Daniel (2016), factors
including insufficient human and capital resources, managerial capability, unavailability of raw
materials, marketing elements are observed as influential factors of export performance of the
garment industry in Ethiopia. Leonidas (2014) also stressed that marketing mix elements have a
3
significant effect on export performance of companies. Similarly, in their study of MAA garment
and textile factory in Mekelle,Ataklty, Girma and Zemen(2015) stated that while the
manipulation of product, place and price have significant effect on export performance
promotion on the other hand have lower significance.
The purpose of this study is to analyze the performance of garment exporters with relation to the
4Ps of marketing mix namely product, price, place and promotion, and how these marketing mix
strategies impact their export performance. The focus of the study are garment exporters located
in the state of Addis Ababa.
1.2. Statement of the problem
Ethiopian textile and garment production have a long history starting from 1939 with the
establishment of Dire Dawa Textile mills. From then on, several manufacturing sectors of similar
industry have been launched in the various states of the country facilitating increment in export
value for the country. As stated by Ethiopian Investment Commission (EIC), Textile and
garment factories in Ethiopia export performance has shown an average growth of 51% during
the period of 2010-2016 (EICa, 2016).
Marketing mix strategies have paramount effect on export performance in the textile and
garment sector. A study in Pakistani textile sector stress that adaptation of marketing mix
strategies is essential for increasing export performance in the international market with pricing
strategy being the most common one and most important followed by product adaptation
(Batavia and Kolachi, 2012). Then again, another study on a textile and garment factory showed
that when price, product and place marketing strategy significantly influence the factory’s export
performance by increasing the export sales volume by 24%, promotion marketing strategy shows
insignificant relationship (Ataklty, Girma and Zemen, 2015).
Textile and garment industry supports economic and social performances of developing
countriesby balancing trade, providing incomes, encouraging women employment and in the
long-run by creating opportunity for sustained economic development (Keane and Velde,
2008).Hence, Ethiopia can benefit a lot from investing and working effectively and efficiently in
the industry. Increasing the country’s manufacturing sector, such as promising industries like this
4
one, and hence export performance is the goal of Ethiopia as stated in the industry development
roadmap of 2013-2025 (MOI, 2013). According to the report of Keane and Velde (2008) the role
of textile and garment export practice is significant for developing countries as it aids in export
diversification and creating incentives for investing in low-income countries so as to benefit
from low labor cost.
Marketing strategy is internal factor that influence market performance of a company and hence
is controllable by the firm. Understanding the performance manufacturing firms regarding
marketing mix elements and their relationships with export performance is vital to recognize
ways of improvement as necessary. As mentioned earlier, there is a difference in outcomes when
the influence of marketing mix strategy on export performance is measured in different settings.
Thus far, according to the author, there are no researches that give strong emphasis on the topic
at hand regarding the garment industry in Ethiopia. The research helps the garment industry and
the country in general as it stresses on the marketing mix elements, show the country’s
performance and give recommendation as necessary to improve the export market.
1.3. Research questions
1. What is the effect of product marketing mix strategy on export performance in the
garment industry?
2. What is the effect of price marketing mix strategy on export performance in the garment
industry?
3. What is the effect of distribution marketing mix strategy on export performance in the
garment industry?
4. What is the effect of promotion marketing mix strategy on export performance in the
garment industry?
1.4. Objectives of the study
1.4.1. General objective of the study
The general objective of this study is to analyze marketing mix strategies relating with the
practice and the emphasis a company puts on product, price, place and promotion for export

5
purpose and its influence on export performance specifically in the garment industry in Addis
Ababa, Ethiopia.
1.4.2. Specific objectives of the study
• To analyze the effect of product marketing strategy on garment export performance
• To analyze the effect of price marketing strategy on garment export performance
• To analyze the effect of place marketing strategy on garment export performance
• To analyze the effect of promotion marketing strategy on garment export
performance
1.5. Significance of the study
The garment industry is one of investment opportunities which is observed to be on the fast track
of development in Ethiopia (ETIDI, 2017). The study aids in enlightening how marketing mix
strategies focusing on the international market are affecting the export performance of the
garment industry in Ethiopia so that exporters can take necessary measures to increase their
respective export performance. This study benefits the existing garment exporters in Ethiopia
also new investors in the same area including those giving attention to the local market desiring
to explore the international market. Moreover, the higher export performance, the more dollar
income, the better the economic status of the country.
1.6. Scope of the study
The study focuses on companies which are currently involved with garment export and are found
in Addis Ababa only. All those garment exporters that are outside Addis Ababa and also those
within Addis Ababa not involved in export practice were not included.
For the purpose of undertaking this study, export performance was taken as the dependent
variable. It was stated using satisfaction level of the respondents in the respective companies and
the export sales growth of the country. The marketing mix strategies expressed as Product, Price,
Place and Promotion are the independent variables. This studyonly used marketing mix elements
as independent variables, accordingly other internal factors and external factors were not be
6
considered. Explanatory research design was used as the studentresearcher is attempting to see
the relationship between the dependent (export performance) and independent variable
(marketing mix elements). Data was collected using structured questionnaire.
1.7. Definition of terms
Garment exporters: manufacturers of that are engaged in preparation of finished apparelsuch as
adults and kids wear, pajamas, scarfs, shawls, bags, socks, sports-wears, uniforms and traditional
cloths for international market.
Export performance: is the extent to which a firm effectively uses its resources and capabilities
for the international market that indicates the success of a firm’s export operations.
Export marketing strategy: is a way by which a firm manipulates internal and external forces so
that the target export performance will be met.
1.8. Organization of the paper
This paper is organized into fivechapters. Chapter one contains background of the study,
research questions, general and specific objectives of the study, its significance and the
scope/delimitation. Chapter two is the literature review section and it includes the background,
theoretical literature review, export performance trend of the world and Ethiopia, internal and
external determinant factors of export performance, marketing mix elements (product, price,
place and promotion) influence on export performance, measures of export performance
(subjective vs. objective) and finally presents the conceptual framework of the study. Chapter
three discusses the research methodology and includes research approach, research methods,
research design, sampling design, data collection methods and instruments, data analysis, and
finally reliability and validity. Chapter four covers the data analysis and interpretation section
while chapter five deals with summary, conclusion and recommendation of the study.

7
Chapter Two: Review of related literatures
2.1. Introduction
This section of the proposal contains background of the study, theoretical literature review,
global export trend and export trends of Africa as well as Ethiopia. In addition it encompasses
empirical literature review about internal and external factors influencing export performance,
the impact of marketing mix elements on export performance, measures of export performance
and finally concluding with conceptual framework of the study.
2.2. Background of the study area
International trade has the ability to make economic performance better on condition that there
are suitable policy measures and economic environment that is adequate to deal with the changes
of social and financial situation (Vijayasri, 2013). According to the European commission report
(2016), it is especially important for developing countries as it helps to improve quality and other
standards by increasing competition, encouraging innovation through investment in research and
development, aiding in creating strong relationship between countries, ensuring better
livelihoods by increasing employment, enhancing development, reducing poverty and allowing
lowering of prices with better choices for consumers by means of widening sources of supply.
For a successful international marketing to occur there are certain criteria that need to be
fulfilled. Of them, interdependency between countries, the desire of a firm to participate in
export practice, excess of demand over supply, availability of national monetary systems,
developed market infrastructure, improved living standard can be pointed out (Kozak and
Smyczek, 2015).
In accordance with the annual report of National Bank of Ethiopia (NBE) (2015), the service
sector comprises the highest value of GDP having 46.6% while the agriculture and industry
sector were 38.8% and 15.2%, respectively.Ethiopia has been introducing her numerous products
ranging from coffee, seeds, to animal products, leather products, textile and garment products
and others to the international community. While the import to GDP ratio is 26.5%, export to
GDP was 4.6% which was low according to the report. Export led investment positively and
8
significantly affects the economic growth of Ethiopia as argued by Senait (2014). By the same
token, a Hailegiorgis (2012) state that export led growth strategy is highly imperative for the
advancement of the country.
The history of Ethiopian modern textile and garment industry first started with the establishment
of Dire Dawa textile mills in 1939 (Chemonics International, 1996).Several textile, garment and
cotton ginning factories have been seen all over the country since then. Export performances
have been seen in some firms in the industry which grew over the years especially after launch of
quota and duty free access to the US and EU under the agreement AGOA and EBA which
created a favorable export condition for the country (EICb, 2016; USITC 2014).
The African Growth and Opportunity Act (AGOA) was signed by President Clinton in 2000 with
the purpose of encouraging trade and investment, and minimizing possible barriers between Sub
Saharan African countries and the United States (USITC, 2014). Rahel (2007) reported that
AGOA has impacted the export performance of the Ethiopian textile and garment factories
positively. Under this act US imports from 2001-2013 increased by about 10% per year from
$7.6 Billion to $24.8 Billion and the Ethiopian textile industry alone has gotten more than $300
Million foreign direct investment in 2012 and 2013 largely from Europe, Turkey and India
mainly focusing on export to Europe (USITC, 2014). Endalkachew (2010) as well implied that
economic agreements like AGOA add to the national economy by creating a chain of effects. For
instance, increase in export in textile and garment industry will create better employment
opportunity, improved investment in the sector, in addition to increasing value on agricultural
products such as cotton.
Similarly, EBA has helped Ethiopia in encouraging exports to Europe in quota free and duty free
access. In 2014, according to the report of NBE (2014/15), about 33.6% of the country’s exports
went to EU. COMESA is a program that pursued for Ethiopia to be included in these sorts of
quota free and duty free access to the foreign market regarding export (RATES, 2005).
Labor intensive manufacturing industries are more encouraged by the Ethiopian government
taking its benefits into account. These sorts of industries allow for increased employment status
in the country and are relatively cheaper (EICa, 2016). Soderbom and Teal (2003) support this

9
argument as they indicate in their study that countries in Africa has a better potential cost
advantage in a more labor intensive technology than the opposite.
It is reported that (USITC, 2014) even though Ethiopian government provide support to attract
private investors in textile and apparel sector, there are factors that influence its competitiveness
including insufficient and erratic electricity supply, underutilized mill capacity, problems
regarding credit and tiring customs procedures. Rahel (2007) added that there is shortage of raw
materials causing firms not to process orders in time. Besides, the foreign currency that is earned
will be lost to some extent in this process as well.
2.2.1. Export performance trend of garment industry
2.2.1.1. Global trend of garment industry export performance
Top 10 exporters of apparel in the world are China, EU, Bangladesh, Vietnam, Hong Kong,
India, Turkey, Indonesia, Cambodia and finally the United States. Totally they account for 87%
of the world export in 2015. On the other hand the top 10 importers are EU, US, Japan, Hong
Kong, Canada, Republic of Korea, Australia, China, Switzerland, Russia Federation (WTO,
2016). Total textile and apparel export value, according to International Trade Center (ITC) was
$377 million for Kenya, $248 million for the United Republic of Tanzania, $21,534 million for
Vietnam, $40,192 million for India and the top exporter China accounted for $273,959 million
(ITC, 2016).
2.2.1.2. Ethiopia trend of garment industry export performance
The Ethiopian government has been providing incentives for the manufacturing sector including
textile and garment manufacturers. According to investment proclamation 768/2012 there is duty
draw-back voucher, bonded export factory, manufacturing warehouse and bonded input supply
schemes provided as incentives for investors. In addition, they are allowed for duty free
importation of raw materials, machinery and equipment for the use of the production purpose
(AACCSA, 2014).
The gross value of production for the textile and garment industry was around 9.1 billion ETB in
2013 while 8.2 billion ETB were accounted by privately owned firms. In the same year, the total
value added of the sector was 515 million ETB (AACCSA, 2014). Textile and garment exports
10
in Ethiopia have been $94 million in 2013 showing an increment form $26 million in 2009. On
the same year, key textile and apparel export markets were Germany, Turkey, China, Italy and
USA accounting for 86% of the total export (EICb, 2016).
2.3. Theoretical literature review
When a company wants to enter into a foreign market, it could either use exporting, joint
venturing or direct investment as a mode of entry exporting being the simplest one
(Kotler,Wong, Saunders, Armstrong, 2005). In international business, as per Kotler (2003),
companies are assumed to evolve through five stages which are passive exporting, active
exporting using distributors, opening sales offices in the international market, setting up factories
in a foreign country and finally establishing regional headquarters in a foreign country. Hence,
exporting is the baby step that companies take to go up the hierarchy of the international business
to get the utmost benefit. In order for exporting to go accordingly with company objectives,
understanding marketing mix elements is very essential.
Exporting can be either direct or indirect. In direct exporting can done through the use of
domestic export department, overseas sales branch, sales branch, sending sales personnel abroad
to find more order and the like. Direct exporting requires the use of high investment by the
involved firm, hence high risk, for better sales activity. Unlike direct exporting, indirect
exporting does not require high investment and is less risky. For this case, seller companies are
working through the use of interdependent international marketing intermediaries such as export
agents, export management companies and government export agencies (Kotleret al, 2005).
The marketing mix elements for products are simply referred as the 4Ps. They are product in
compliancewith customer solution, price corresponding to customer cost, place referring to
convenience and promotion for communication (Kotleret al, 2005). There is the addition of
people, physical evidence and process for services making it 7Ps.
Before going abroad, a company must choose to either standardize or adapt its offering.
Standardization refers toapplying the same sort of marketing mix elements that is used for the
home country when going across borders. On the other hand, adaptation is the process when the
marketing mix elements are somehow manipulated to make them favorable for the foreign
11
country (Kotler, 2003). While designing international market channels, the cultural, economic
and social development of the country should be noted as they are not uniform and affect the
choice of channels (Moore and Pareek, 2006).
The variables to be included in this study are product, price place (distribution) and promotion
marketing mixes. They are discussed in the following subsections.
2.3.1. Product marketing mix
Product is an offering provided for purchase to a customer by an organization to satisfy a specific
wants or needs. These offerings can either be tangible or intangible (Moore and Pareek, 2006)
Product has three levels namely the core product, the actual product and the augmented product.
The core product, the first level of a product, is the one which offers the basic benefit of the
offering provided. It is the value of a product for a consumer rather than the tangible product
itself. Actual product on the other hand is the physical product that is made use of to get the core
benefit. It is the second level of a product. It includes the quality, features, packaging, styling and
brand name of the product. The third level of a product is the augmented product. It is the
additional value offered to augment the core and the actual product. It is where competition
within different organizations providing the same product exists (Kotleret al, 2005). When
considering about launching a product, an organization must first answer questions regarding
what they want their product to offer, its brand, quality, design, and value that they want to add
(Kermally, 2003).
2.3.2. Price marketing mix
Price is, as per Kotler et al (2005, p. 665), “the amount of money charged for a product or
service, or the sum of the values that consumers exchange for the benefits of having or using the
product or service.”It is the element of marketing mix that generates income. When determining
a pricing strategy, one has to consider internal factors of the organization including the
marketing objectives, the marketing mix strategy, its costs, and the external factors including the
nature of the market and demand,and competition.

12
2.3.3. Distribution marketing mix
This marketing mix creates a way for a consumer to get a handle of the offering provided by an
organization. Organizations could reach their consumers directly or look for an intermediate
channel, also known as a distribution channel, to sell their product. When determining
distribution channel, an organization has to first analyze customer needs considering their
offering as to whether their need will be satisfied more with direct delivery or using a
distribution channel. The price, service, delivery time period may be different given the number
of stops it takes for a product to reach its consumer, depending on the type of the product.
Secondly, it has to separate segments, choose which segment/s it wants to serve and pick the
channel/s for the selected segment/s which serves the highest purpose. Third, it has to identify
channel alternatives regarding the number of intermediaries, their types, and what each channel
member should do and finally evaluate those alternatives that meets the organization’s objectives
and satisfies customer’s needs (Kotleret al, 2005). Choosing the right distribution channel to
reach the target customers is imperative for achieving organization objectives (Moore and
Pareek, 2006).
2.3.4. Promotion marketing mix
Promotion is creates a way for communication with the customer. Promotion aims to achieve the
AIDA principle which is Awareness, Interest, Desire and Action (Kermally, 2003). Promotion
encompasses five elements including advertising, sales promotion, public relations, personal
selling and direct marketing (Moore and Pareek, 2006). Cultural, political, legal, and other
differences have to be considered when trading across national borders. All or some form of the
promotional methods can be used in the international market. Trade fairs are also useful media
for international communications (Kotleret al, 2005).
2.4. Determinants of export performance
There have been several studies done in this context coming up with numerous variables that are
found to have an influence on export performance (Zou and Stan, 1998; Beleska-Spasova, 2014;
Carneiro, Rocha and Silva, 2011; O’Cass and Julian, 2003, Roper and Love, 2002). These factors
13
are broadly classified into internal and external determinants and further subcategorized to
controllable and uncontrollable (Zou and Stan, 1998; Beleska-Spasova, 2012).
Internal determinant factors are guided by resource-based-theory which conceives a firm as a
unique bundle of tangible and intangible resources that are controlled by the firm. On the other
hand, external determinant factors impact firm’s strategies which consequently influence
economic performance (Zou and Stan, 1998).
2.4.1. Internal factors
Internal determinant factors are those factors which are within the control of the firm. They could
be categorized as controllable and uncontrollable unlike the external determinant factors which
are always uncontrollable (Zou and Stan, 1998). Beleska-Spasova (2014) and Zou and Stan
(1998) generally recognized several internal variables including management characteristics and
perceptions (i.e. commitment and support, international experience, motivation, education,),
organizational capabilities regarding appropriate export strategy, marketing mix elements,and
use of advanced technology and quality of product, and firm characteristics (i.e. size, experience,
culture, financial resources, degree of internationalization).
In his study assessing factors influencing export performance of the garment industry in
Ethiopia, Daniel (2016) identified issues revolving around labor skill and cost, capital of firms,
the choice of marketing mix elements, technology, and managerial capability as internal factors.
Yared (2010) also implied that there is a low labor cost in the sector which is believed to
contribute for the improvement of export performance while Wang (2013) showed that low labor
cost give competitive advantage for exporters of garment and textile products in Asian
developing countries. However, the influence of employing highly skilled workforces has a
tendency to create more successful export market performance (Roper and Love, 2002).
The extent of resource commitment in the export market, degree of exposure of product in the
export market, and product characteristics (i.e. degree of culture specificity, uniqueness and
patent) were found as internal determinants of export performance in (Julian, 2003; Julian and
Ahmed, 2005). On the other hand, O’Cass and Julian (2003) argue that adaptation of marketing
strategy does not significantly influence export performance in Australian exporters and that both
standardization and adaptation are appropriate.

14
2.4.2. External factors
External factors are those variables which are beyond a firm’s area of control but still influence
export performance (Zou and Stan, 1998). Export market characteristics including competitive
intensity in the foreign market, environmental hostility, export marketing structure, distribution
channel accessibility, culture and government intervention (Beleska-Spasova, 2014; O’Cass and
Julian, 2003; Julian, 2003). Domestic market characteristics such as domestic market conditions,
export assistance and environmental hostility are also mentioned as external determinants of
export performance.
A study in the Ethiopian garment and textile industry export performance identified issues
related with raw materials (limited and high cost local supply, dependency on imported raw
materials), and infrastructure related factors (easy and efficient access electricity, water,
communication and transportation) and customs processes for raw material import and export of
product as influential external factors. Yared (2010) also denoted that export of the best quality
raw cotton forced the use of inferior quality cotton in the textile and apparel industry creating a
significant negative impact on their overall export performance.
2.5. Marketing mix strategy influence on export performance
Several literatures have discussed about the impact of marketing mix elements on export
performance of a company (Ataklty, Girma and Zemen, 2015; Beleska-Spasova, 2014;
Leonidou, Katsikeas, Samiee, 2002; Zou & Stan, 1998). Moghaddam et al (2011, p.27) defined
export marketing strategy as “the roadmap of how a firm responds to internal and external forces
by the use of marketing mix elements that include product, price, promotion, place in order to
supply and achieve firm’s objective.”
It has been implied (Julian, 2003) that managers of firms that are involved in export should
recognize the dimensions of export marketing strategy that can have an impact on the success of
the company’s export performance. On the same note, Edril and Ozdemir (2016) showed that
there is a statistically significant relationship between firm’s marketing mix strategy and export
performance. Then again it was argued that the choice of marketing strategy of firms should be
dependent upon the level of export involvement whether it is high or low (Al-Aali et al, 2013).
15
Whereas Nguyen (2012) in his study about impact of relationship marketing on export
performance argues that garment enterprises should set up “professional export marketing
section” (p. 140) to deal with challenges in the export market environment.
Jamshidi and Moazemi (2016) stated that adaptation of marketing mix elements with foreign
customers’ needs creates a better exporting performance than standardized marketing strategies
and hence strategic managers should aim at adapting marketing mix elements according to
foreign customer needs when dealing with export. On similar note, Breiet al (2011) confirmed
that both marketing mix standardization and adaptations shows a positive impact on export
performance however it is suggested that more emphasis should be given towards adaptation.
Breiet al (2011) also suggested adapting price followed by promotion, then product and finally
distribution when prioritizing the marketing mix elements.
The following sections will overview empirical literatures regarding the influence of marketing
mix strategies namely product, price, place and promotion on companies export performance.
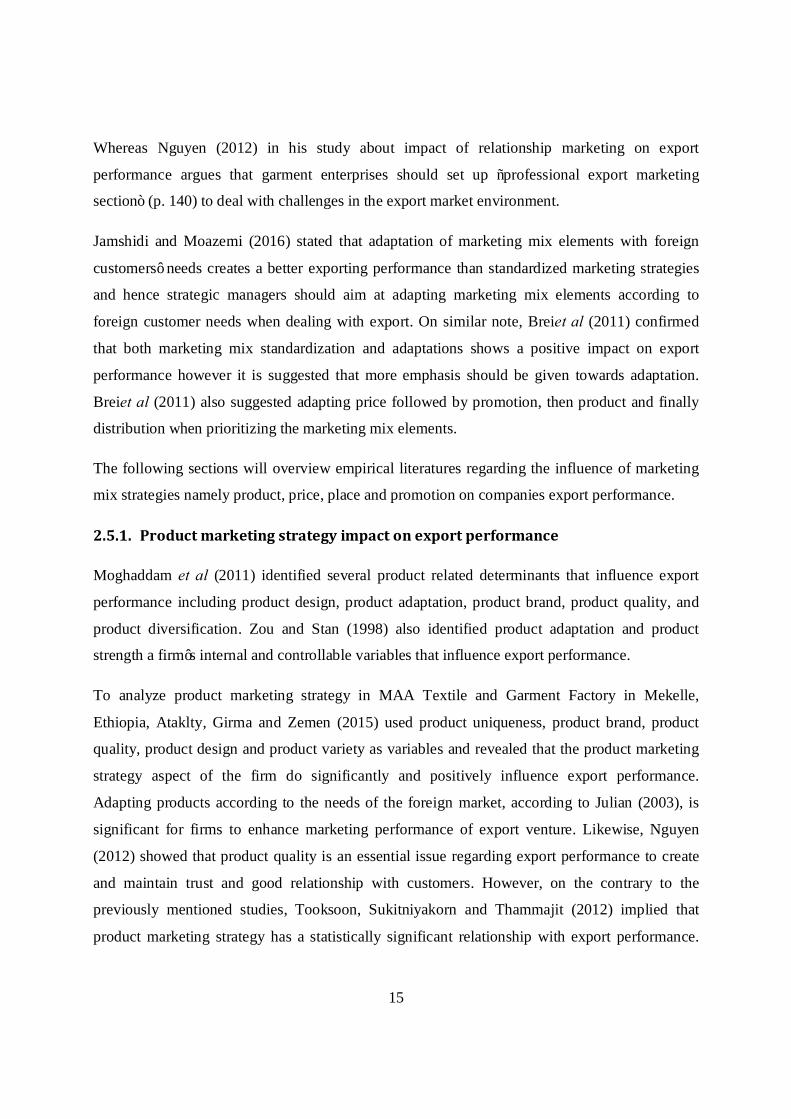
2.5.1. Product marketing strategy impact on export performance
Moghaddam et al (2011) identified several product related determinants that influence export
performance including product design, product adaptation, product brand, product quality, and
product diversification. Zou and Stan (1998) also identified product adaptation and product
strength a firm’s internal and controllable variables that influence export performance.
To analyze product marketing strategy in MAA Textile and Garment Factory in Mekelle,
Ethiopia, Ataklty, Girma and Zemen (2015) used product uniqueness, product brand, product
quality, product design and product variety as variables and revealed that the product marketing
strategy aspect of the firm do significantly and positively influence export performance.
Adapting products according to the needs of the foreign market, according to Julian (2003), is
significant for firms to enhance marketing performance of export venture. Likewise, Nguyen
(2012) showed that product quality is an essential issue regarding export performance to create
and maintain trust and good relationship with customers. However, on the contrary to the
previously mentioned studies, Tooksoon, Sukitniyakorn and Thammajit (2012) implied that
product marketing strategy has a statistically significant relationship with export performance.
16
However, the relationship was found to be negative and the reason was clarified by the fact that
product adaption is costly.
On product related aspects an interview with responsible managers (Ataklty, Girma and Zemen,
2015) confirmed that product quality, of all the others, highly influences export performance. In
similar study, when assessing the level of importance of the marketing mix strategies using a 5
point likert scale (very important to not important at all), product marketing strategy was found
to be very important. Leonidou et al (2002) also confirmed that product quality variables
specifically product design, quality, branding, and majorly product adaptation positively
influence export marketing performance. From the above argument the following hypothesis was
drawn.
H1: Product marketing mix strategy has significant effect on export performance.
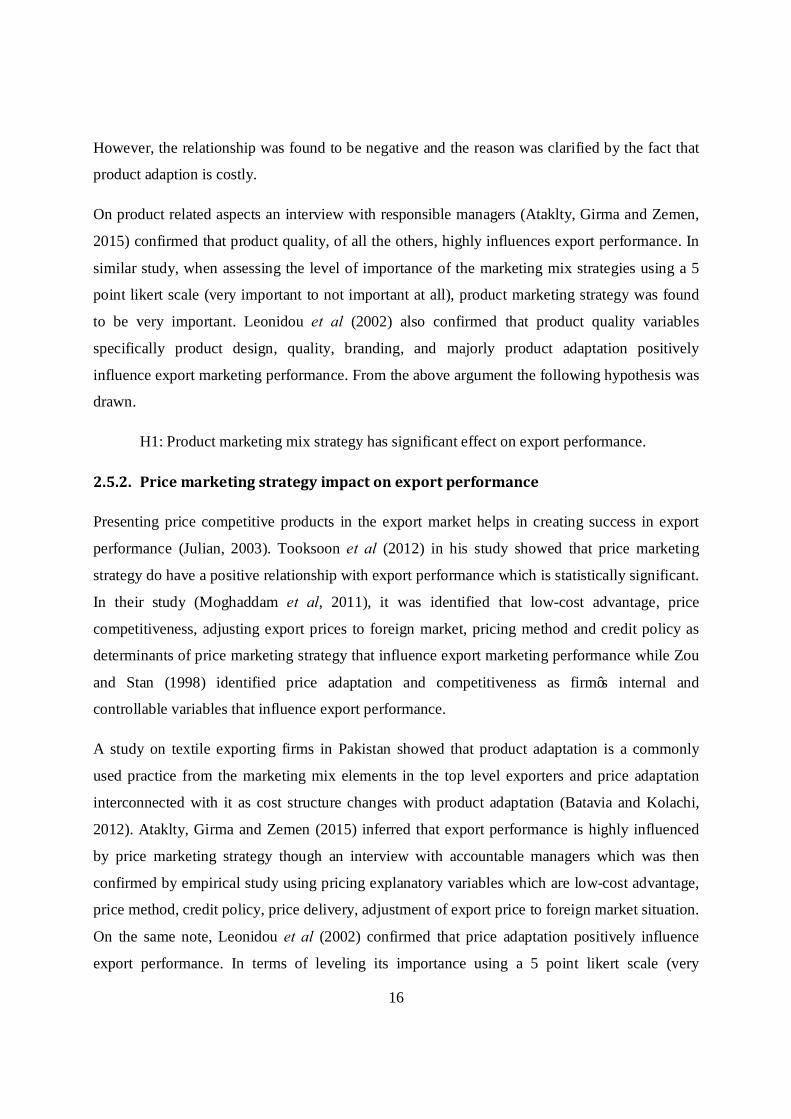
2.5.2. Price marketing strategy impact on export performance
Presenting price competitive products in the export market helps in creating success in export
performance (Julian, 2003). Tooksoon et al (2012) in his study showed that price marketing
strategy do have a positive relationship with export performance which is statistically significant.
In their study (Moghaddam et al, 2011), it was identified that low-cost advantage, price
competitiveness, adjusting export prices to foreign market, pricing method and credit policy as
determinants of price marketing strategy that influence export marketing performance while Zou
and Stan (1998) identified price adaptation and competitiveness as firm’s internal and
controllable variables that influence export performance.
A study on textile exporting firms in Pakistan showed that product adaptation is a commonly
used practice from the marketing mix elements in the top level exporters and price adaptation
interconnected with it as cost structure changes with product adaptation (Batavia and Kolachi,
2012). Ataklty, Girma and Zemen (2015) inferred that export performance is highly influenced
by price marketing strategy though an interview with accountable managers which was then
confirmed by empirical study using pricing explanatory variables which are low-cost advantage,
price method, credit policy, price delivery, adjustment of export price to foreign market situation.
On the same note, Leonidou et al (2002) confirmed that price adaptation positively influence
export performance. In terms of leveling its importance using a 5 point likert scale (very
17
important to not important at all) pricing marketing strategy was found to be important (Ataklty,
Girma and Zemen, 2015). Hence, from the above argument the following hypothesis was drawn.
H2: Price marketing strategy has significant effect on export performance.
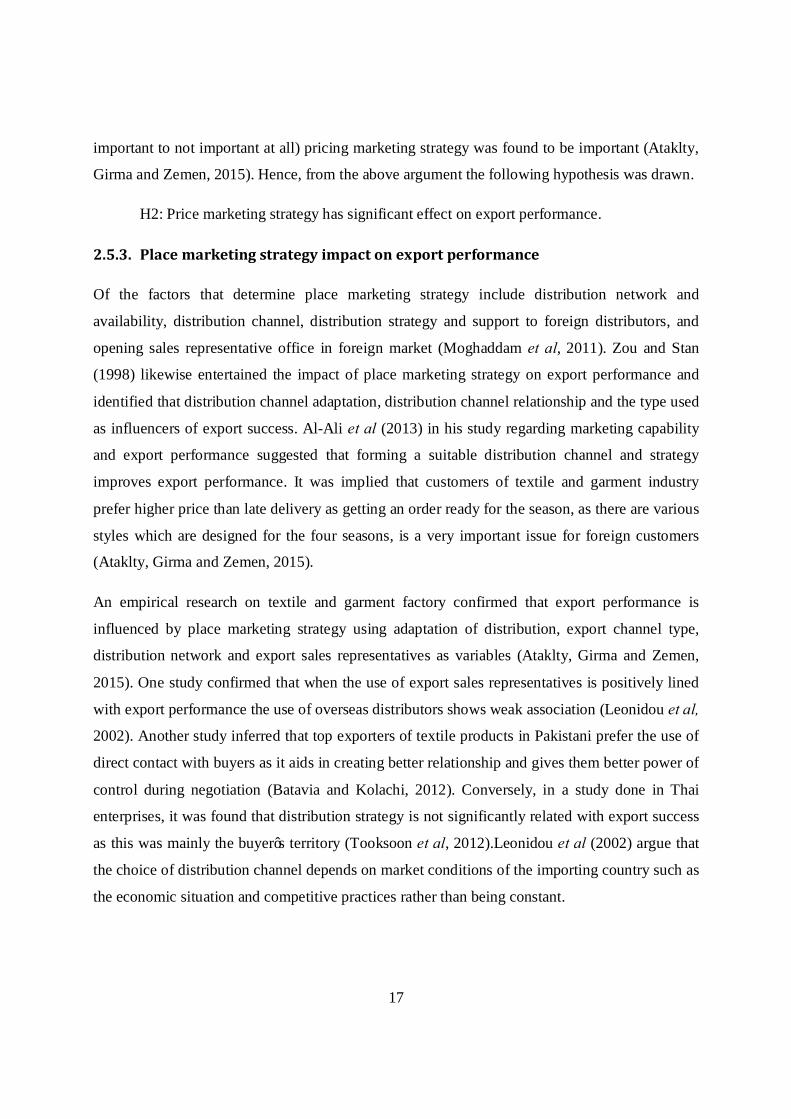
2.5.3. Place marketing strategy impact on export performance
Of the factors that determine place marketing strategy include distribution network and
availability, distribution channel, distribution strategy and support to foreign distributors, and
opening sales representative office in foreign market (Moghaddam et al, 2011). Zou and Stan
(1998) likewise entertained the impact of place marketing strategy on export performance and
identified that distribution channel adaptation, distribution channel relationship and the type used
as influencers of export success. Al-Ali et al (2013) in his study regarding marketing capability
and export performance suggested that forming a suitable distribution channel and strategy
improves export performance. It was implied that customers of textile and garment industry
prefer higher price than late delivery as getting an order ready for the season, as there are various
styles which are designed for the four seasons, is a very important issue for foreign customers
(Ataklty, Girma and Zemen, 2015).
An empirical research on textile and garment factory confirmed that export performance is
influenced by place marketing strategy using adaptation of distribution, export channel type,
distribution network and export sales representatives as variables (Ataklty, Girma and Zemen,
2015). One study confirmed that when the use of export sales representatives is positively lined
with export performance the use of overseas distributors shows weak association (Leonidou et al,
2002). Another study inferred that top exporters of textile products in Pakistani prefer the use of
direct contact with buyers as it aids in creating better relationship and gives them better power of
control during negotiation (Batavia and Kolachi, 2012). Conversely, in a study done in Thai
enterprises, it was found that distribution strategy is not significantly related with export success
as this was mainly the buyer’s territory (Tooksoon et al, 2012).Leonidou et al (2002) argue that
the choice of distribution channel depends on market conditions of the importing country such as
the economic situation and competitive practices rather than being constant.
18
While assessing the level of importance using a 5 point likert scale (very important to not
important at all) Ataklty, Girma and Zemen (2015) found that place marketing strategy was of
average importance. From the above argument the following hypothesis was drawn.
H3: Place marketing strategy has significant effect on export performance.
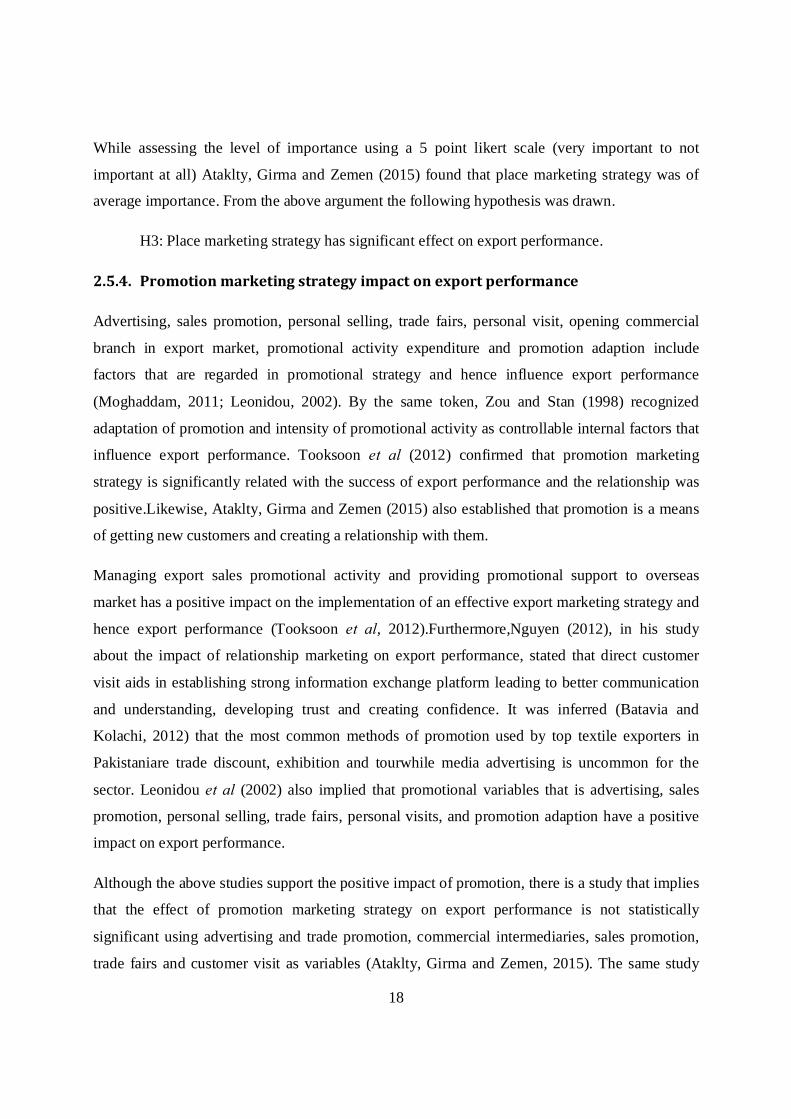
2.5.4. Promotion marketing strategy impact on export performance
Advertising, sales promotion, personal selling, trade fairs, personal visit, opening commercial
branch in export market, promotional activity expenditure and promotion adaption include
factors that are regarded in promotional strategy and hence influence export performance
(Moghaddam, 2011; Leonidou, 2002). By the same token, Zou and Stan (1998) recognized
adaptation of promotion and intensity of promotional activity as controllable internal factors that
influence export performance. Tooksoon et al (2012) confirmed that promotion marketing
strategy is significantly related with the success of export performance and the relationship was
positive.Likewise, Ataklty, Girma and Zemen (2015) also established that promotion is a means
of getting new customers and creating a relationship with them.
Managing export sales promotional activity and providing promotional support to overseas
market has a positive impact on the implementation of an effective export marketing strategy and
hence export performance (Tooksoon et al, 2012).Furthermore,Nguyen (2012), in his study
about the impact of relationship marketing on export performance, stated that direct customer
visit aids in establishing strong information exchange platform leading to better communication
and understanding, developing trust and creating confidence. It was inferred (Batavia and
Kolachi, 2012) that the most common methods of promotion used by top textile exporters in
Pakistaniare trade discount, exhibition and tourwhile media advertising is uncommon for the
sector. Leonidou et al (2002) also implied that promotional variables that is advertising, sales
promotion, personal selling, trade fairs, personal visits, and promotion adaption have a positive
impact on export performance.
Although the above studies support the positive impact of promotion, there is a study that implies
that the effect of promotion marketing strategy on export performance is not statistically
significant using advertising and trade promotion, commercial intermediaries, sales promotion,
trade fairs and customer visit as variables (Ataklty, Girma and Zemen, 2015). The same study
19
regarded the marketing mix element as important in leveling its importance using a 5 point likert
scale (very important to not important at all).
Taking the all the above literatures into consideration, the following hypothesis was drawn.
H4: Promotion marketing strategy has significant effect on export performance.
2.6. Measures of export performance
There have been several studies done on the topic of measuring export performance for decades
indicating that it is an important notion among researchers (Carneiro, Rocha and Silva, 2017;
Beleska-Spasova, 2014; Sousa, 2004; Zou and Stan, 1998). However there is a lack of clear
understanding among those studies mainly owing to lack of synthesis and diverse data from
various sources that are distinct (Zou and Stan, 1998). By the same token, Carneiro, Rocha and
Silva (2017) mentioned that inconsistency among researches regarding export performance is
attributed to differences in conceptualization, operationalization and measurement of export
performance concept.
As stated by Sousa (2004) when explaining about export performance measurement, “a firm is
successful if the targets are met or exceeded.” (p. 14) Achievement of successful export
performance shows to what extent a firm’s international trade related objectives (which may vary
between different companies even for similar products) are met over a given point of time.
Moreover, it shows appropriateness of the export marketing strategy used for the achievement of
those objectives (Beleska-Spasova, 2014) hence indicating the necessity of measuring
performance regarding the international business.
For an export performance measure to be considered reliable, there are some criteria that should
be fulfilled. For one it has to be multidimensional and include both objective and subjective
measures to gain a better view of performance from the actual sales perspective and the
managerial perception perspective. And more, it is required to have a frame of reference against
which it will be compared such as prior market performance, competitor and/or domestic market
performance. In addition, it should be measurable over time in both absolute and relative terms
and finally it better assess objectives of the firm over a period of time which could be either
20
short-term or long-term (Diamantopoulos and Kakkos, 2007; as cited byBeleska-Spasova, 2014).
Likewise, Carneiro, Rocha and Silva (2007) fashioned analytical framework for export
performance characterization having two dimensions namely conceptual dimension and
methodological dimension. Taking the conceptual dimension consideration, it include different
classes of measures (i.e. economic, market, behavioral/situational measure, strategic measure,
overall evaluation), having a frame of reference which could be absolute or relative, with
temporal orientation which may well be static or dynamic. On the other hand, methodological
dimensions comprises unit of analysis, mode of assessment which could either be objective or
subjective having its own property of indicator structure (i.e. single indicator vs. multiple
indicators, reflective vs. formative indicators or composite indicators).
Sousa (2004) in his study identified roughly 50 performance indicators with export intensity,
export sales growth, export profitability, export market share, satisfaction with overall export
performance and perceived export success taking high percentage. He majorly divided measures
of export performance as objective and subjective measures (both measures including sales
related measures, profit related measures and market related measures). Objective measures of
export performance are based on absolute values such as export sales volume, export profit
margin, market share and the like while subjective indicators are based on perceptual values like
manager’s perception of success and satisfaction with export sales. On the other hand, Beleska-
Spasova (2014) covered several literatures and found 34 performance indicators and majorly
divided them as economical (10 sales related measures, 8 market related measures) and non-
economical (16 measures). Zou and Stan (1998) also reviewed export performance and grouped
them into seven categories, representing financial (sales, profit and growth measures), non-
financial (perceived success, satisfaction and goal achievement) and composite scales. Carneiro,
Rocha and Silva (2007) on the other hand modeled an export performance measurement tool
comprising three economic indicators (satisfaction with export venture revenues, growth of
revenues of the focal export venture vs. other export ventures of the firm, expected export
venture profitability), three market indicators (firm’s volume of export venture vs. competitors,
expected volume of focal export venture vs. other export ventures of the firm and export venture
growth) and two overall indicators (overall export venture results and expected overall export
venture results) considering three year time-frame.
21
There are various factors that could affect the choice of measures of export performance. Of
them availability and accessibility of data, size and export experience of the firm, the chosen
time frame (short-term vs. long-term), unit of assessment, strategic objectives and position of the
evaluator in the firm (export manager, financial manager, export manager) can be mentioned
(Beleska-Spasova, 2014).
For the sake of this study, objective and subjective measures of export performance are
considered.
2.6.1. Objective measures
Objective measures are those export performance indicators that are grounded upon absolute
values (Beleska-Spasova, 2014). These measures could be self-reported by managers or may be
secondary sources. They give the same outcome whatever the source is or whoever reports it
(Carneiro, Rocha and Silva, 2007). Objective measures are mainly related with
financial/economic information rather that non-financial/non-economic information (Zou and
Stan, 1998).
Of the objective measures, the sales-related ones have shown to be the most extensively used
indicator for measure of export performance and it includes export intensity (the most common),
export intensity growth, export sales growth (the second most common), export sales volume and
export sales efficiency. Profit-related measures on the other hand include export profitability,
export profit margin and export profit margin growth whereas market related measures include
export market share, export market share growth and market diversification (Sousa, 2004).
Woodcock et al (1994) as cited in Sousa (2004) inferred that employing objective measures to
assess export performance could be challenging in cases where the data required is not available
or finding accurate information is not possible, where managers are unwilling to give financial
information as they may label them as confidential, or when there is difficulty in analyzing data
as a consequence of exchange rate deviations or variances in financial reportingbetween
countries.
22
2.6.2. Subjective measures
On the contrary to objective measures, the subjective ones employ perceptual values to measure
export performance rather than absolute values (Beleska-Spasova, 2014). Likewise, Sousa
(2004) defined subjective measures as comprising of those indicators that measure attitudinal or
perceptual data regarding export performance, which actually involves the majority of the
literatures he reviewed (78%). The data collected may be based upon primary sources such as
self-evaluation by the respondent, competitor evaluation, or assessment by external experts, or
from secondary sources like case materials. Since they are reports from personal opinion or
perception of the respondent, they may differ based on the source of information (Carneiro,
Rocha and Silva, 2007).
Managers are better persuaded to respond for subjective indicators as they are not expected to
give confidential financial information. Similar to objective measures, subjective measures also
subdivided as sales, profit and market related measures of export performance differing from the
former by being more of perceptual/attitudinal response than actual response. Moreover, unlike
objective measures, there are indicators doing perceptual comparison with competitors (Sousa,
2004).
Subjective measures are also subdivided as general and miscellaneous. General measures include
overall export performance, overall export performance compared to competitors, export
success, meting expectation, how firm’s export performance is rated by competitors and strategic
export performance. All of these are filled by a responsible managers as per his/her intuition
(Beleska-Spasova, 2014 and Sousa, 2004).
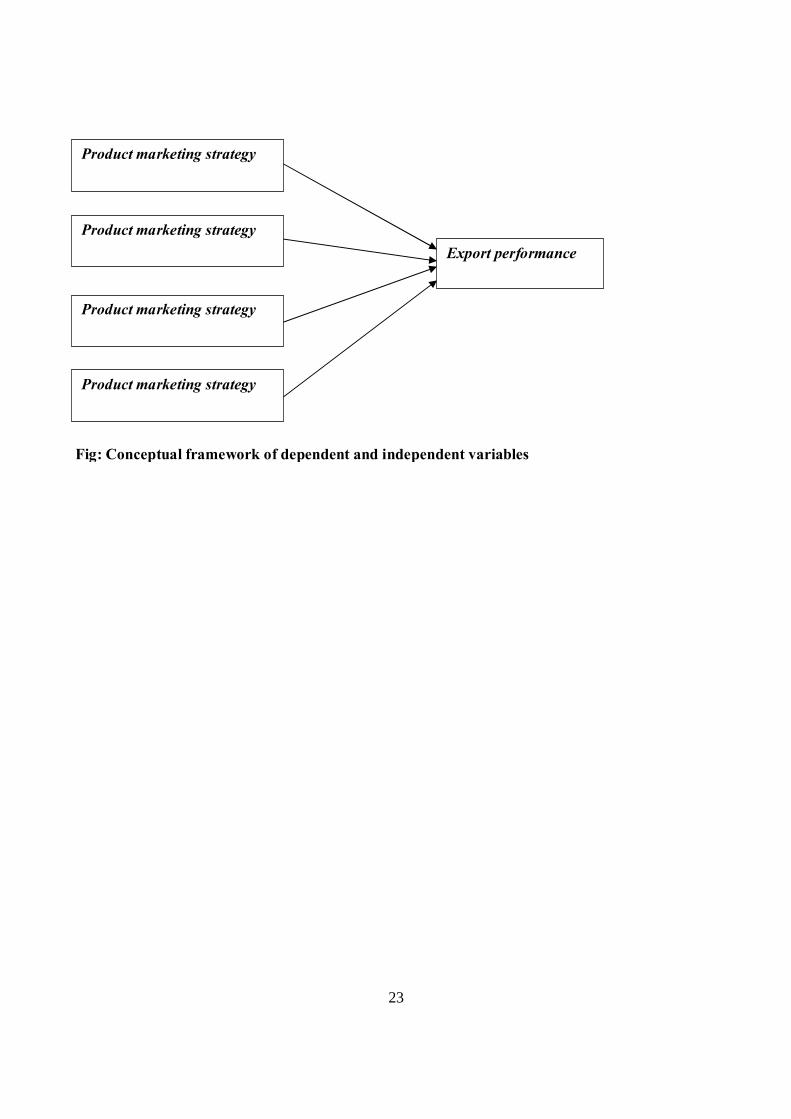
2.7. Conceptual framework
Taking into account the aforementioned literature reviews, the following conceptual framework
was established having export performance as dependent variable and the 4Ps which are product,
price, place and promotion as independent variables. The variables for the independent variables,
which are the marketing mix strategies are adopted from Moghaddam et al (2011) and for the
export performance measurement is adopted from Sousa (2004).
23
Product marketing strategy
Export performance
Fig: Conceptual framework of dependent and independent variables
Product marketing strategy
Product marketing strategy
Product marketing strategy

24
Chapter Three: Research Methodology
This chapter discusses about the research methodology that the author believed is most
appropriate and went about when doing the study. It encompasses research approach, methods,
research and sampling design, data collection and its instruments, data analysis and validation.
3.1. Research approach
Research approaches can either be inductive approach of deductive approach. In inductive
approach, a researcher observes a phenomenon, collects data about that phenomenon and finally
develops a theory. Hence the research goes from one specific phenomenon to general. On the
other hand there is deductive approach where a researcher begins with development of
hypotheses from an already established theory and tests that theory with in different
circumstances. So it goes from general to specific. This study applies deductive research
approach since it uses already established theories with regard to marketing mix strategies and
export performance, to do empirical research.
3.2. Research methods
Research methods are classified as qualitative, quantitative or mixed. In qualitative research
method, a description of different behavioral aspects of a target population is seen. For this
research method data are collected mainly through observations, in-depth interviews, and group
discussions and are put in the form of descriptions not numbers. On the other hand, quantitative
research methods are described in the form of numbers rather than mere descriptions. It involved
the use of systematic and scientific investigation by the use of theories and hypotheses to
describe, or check a relationship between different variables. It usually uses of surveys and
experiments to gather data. In mixed research approach, the researcher applies both the
qualitative and quantitative research method.
For the purpose of obtaining the research objective in analyzing the effect of marketing mix
strategies on export performance, the student researcher used quantitative research method as an
25
established theory was used to generate hypotheses and test those hypotheses in the target groups
which are garment exporters which then was analyzed to generate quantitative data.
3.3. Research design
Research design can be descriptive, causal, explanatory or exploratory. Descriptive research
design describes a phenomenon as it is through a form of frequency, mean, standard deviation
about the subjects at hand. Causal research design sees the cause and effect relationship between
variables. Exploratory research design is more qualitative as it observes and explores a
phenomenon and presents it whereas explanatory describes a relationship between variables.
The objective of the study was to analyze the effect of marketing mix strategies on export
performance in the garment industry and to study the relationship between the dependent (export
performance) and independent variables (product, price, place and promotion). For this
mentioning description of several phenomenon about the belief of the respondents was necessary
hence descriptive design was used. The research mainly focuses on understanding the
relationship between the dependent and independent variable hence explanatory research design
was employed.
3.4. Sampling design
3.4.1. Target population and sampling frame
The target population for this study is all garment producers that are involved in export business
found in Ethiopia which are 68 in total. The study considers only those which are found in the
state of Addis Ababa that are currently exporting which are30 in total to be taken as the sampling
frame.
3.4.2. Sampling technique
With the intention of achieving the research objective, all garment producers that are involved
with exporting which are operational in the state of Addis Ababa were used. The author
employed census method and used all the population in the sample frame. The student researcher
believes that census method is most appropriate technique for this research considering the target
26
population and sampling frame is small and taking a sample from it would give insufficient
response to generalize.
3.4.3. Sample size and sampling procedure
The sample size for this study was 30 garment exporters which are the total of factories that are
involved in garment export found in Addis Ababa. Considering the census method to be
employed, sampling procedure is not required.
3.5. Data collection sources
3.5.1. Primary source
For the purpose of collecting primary data the study used self-administered structured
questionnaire that was be submitted to 5 respondents of the respective factories. The respondents
were those which are well-informed and authorized to reply which could be CEO, assistant
manager, marketing manager, merchandizer, administrator or other cognizant body of the
company. Primary data is imperative for the study as it is the way to find out about the company
practice and performance from the company responsible personnel without which there will be
insufficient data for conclusion.
3.5.2. Secondary source
The secondary source of information is noteworthy to have adequate data to compare and
contrast the required relationship between the export marketing strategies with performances of
garment industries. In addition, it aids for triangulation purpose by considering the management
perspective and government data regarding performance. Secondary data was collected from the
responsible governmental organization which is ETIDI.
3.6. Data collection instruments
The data collection instrument employed to study the influence of marketing mix strategies on
export performance of garment industries was structured self-administered questionnaire. The
questionnaire is adopted from Moghaddam et al (2011) for measuring the influence of marketing

27
mix elements on export performance while export measurement modes are adopted from Sousa
(2004).
3.7. Data analysis
The collected data was screened for any missing values that could cause a problem in analysis of
the research. Then descriptive statistical analysis was presented in a form of frequency,
percentage, mean and standard deviation. To analyze relationships between the dependent and
independent variables, correlation, ANOVA and multiple regression was used. To see the value
of relationship among the dependent variable and each independent variables, value of
coefficient was analyzed. Statistical Package for Social Science (SPSS) was used for analyzing
data.
3.8. Reliability and Validity
3.8.1. Reliability
This study employs the use of Cronbach’s alpha to check the reliability of the instrument.
Reliability measurement helps to see if the measurement s used are free from errors and ensures
internal consistency.
3.8.2. Validity
Validity of the instrument was checked through pilot study. The pretest was done using
professionals in marketing, administration and managers from other garment manufacturing
companies that are not included in the main research.
3.9. Ethical considerations
The research was first approved by the School of Commerce, department of marketing
management. The management bodies of garment manufacturers included in the study were
informed about the research objective and that their names and company information will be
anonymous. Informed consent from the responding individuals was obtained.
28
Chapter four: Data presentation, Analysis and Interpretation
4.1. Introduction
In this chapter description and analysis of the data collected from the respondents in the garment
factories. From the submitted 150 questionnaire a 119 were collected giving a response rate of
79.3%.
This section of the paper encompasses data screening and cleaning, reliability test, the general
company information, objective data on export performance, descriptive data of the study,
measurement of model validity and validation of hypotheses.
4.2. Data screening and cleaning
Data were screened and cleaned prior to analysis. Cases with over 50% of missing data were
removed (Hair et al, 2010). This was the case for credit policy from pricing strategies, the use of
export sales representatives from distribution strategies and regular field visits from promotional
strategies because they have 36.7 %, 23.3 % and 23.3 % missing data respectively. This is
because they are not applicable and not applied in the responding companies and analyzing them
would affect the reliability of the study results. After screening and cleaning, 116 (77.3 %
response rate) responses were found valid and used for further analysis for the study.Hence, from
the 150 questionnaires given the response rate was 77.3% after excluding questionnaires with
missing values.
4.3. Reliability test
Reliability test is done to check for the internal consistency or correlation of items with in a
variable. It is determined by the use of Cronbach alpha. Internal consistency is assured when
Cronbach’s alpha is closer to 1 (Gliem and Gliem, 2003). The acceptable internal consistency is
when Cronbach’s alpha is greater than 0.7 (George and Mallery, 2003). If it is below 0.7, an item
may need to be removed from the instrument as there will be questionable internal consistency
and reliability will not be assured for the instrument.

29
Table 4.3.1: Reliability test
Model Cronbach’s alpha Cronbach’s alpha based on standardized items
Place 0.769 0.811
Price 0.740 0.731
Distribution 0.951 0.952
Promotion 0.805 0.792
Export performance 0.972 0.973
Source: Survey result, SPSS (2018)
As it can be seen form the above table, the Cronbach alpha for all the variables is above 0.7. This
confirms internal consistency of the research instrument. Hence, no item deletion was found
necessary.
4.4. General company information
In this section the general company information of the exporters included in the study is
described. This includes the year of establishment, years of export experience, company
information, origin of exporter, and the respondent’s position in the company.
4.4.1. Year of establishment
Of the garment exporters, the furthest one included in this study was established 39 years ago in
1971 while 2 years of experience was the lowest one. The majority are established in 2013, 2014
and 2015.
Table 4.4.1.1: Year of establishment
Years of establishment (in G C.)
No. of firms
1971 1 2001 1 2002 1 2004 2 2005 2 2006 3 2007 1 2008 1
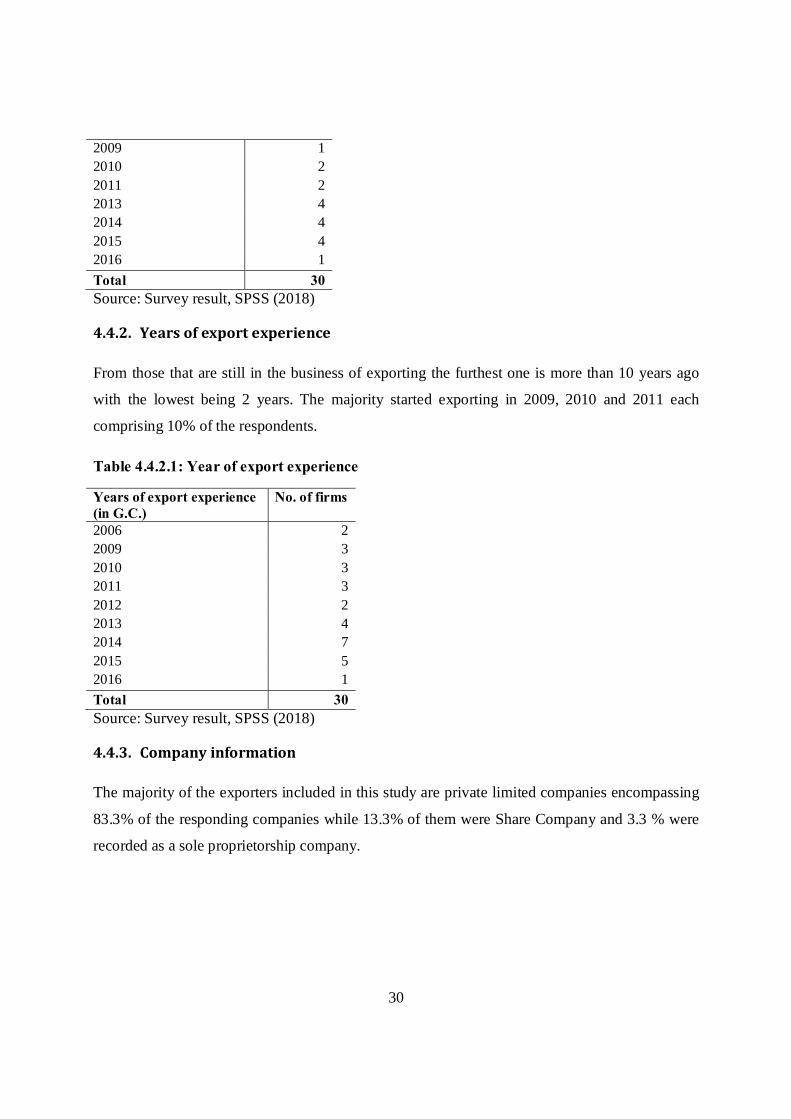
30
2009 1 2010 2 2011 2 2013 4 2014 4 2015 4 2016 1 Total 30 Source: Survey result, SPSS (2018)
4.4.2. Years of export experience
From those that are still in the business of exporting the furthest one is more than 10 years ago
with the lowest being 2 years. The majority started exporting in 2009, 2010 and 2011 each
comprising 10% of the respondents.
Table 4.4.2.1: Year of export experience
Years of export experience (in G.C.)
No. of firms
2006 2 2009 3 2010 3 2011 3 2012 2 2013 4 2014 7 2015 5 2016 1 Total 30 Source: Survey result, SPSS (2018)
4.4.3. Company information
The majority of the exporters included in this study are private limited companies encompassing
83.3% of the responding companies while 13.3% of them were Share Company and 3.3 % were
recorded as a sole proprietorship company.

31
Table 4.4.3.1: Company information
Company information No. of firms Percentage Pvt.Ltd.Co 25 83.3 Sole proprietorship 1 3.3 Share company 4 13.3
Total 30 100.0 Source: Survey result, SPSS (2018)
4.4.4. Origin of exporter
Native owned companies holds the majority position of the exporting companies with 53.3% of
the respondents while the rest is foreign owned companies. From them India and South Korea
holds the majority position with 13.3% each while China follows with 6.7% of the responding
companies, with Turkey, Italy, U.S.A. and Taiwan being 3.3%.
Table 4.4.4.1: Involved investors in garment exporting business
Owner No. of firms Percentage Native 16 53.3 India 4 13.3 South Korea 4 13.3 China 2 6.7 Turkey 1 3.3 Italy 1 3.3 U.S.A 1 3.3 Taiwan 1 3.3
Total 30 100.0 Source: Survey result, SPSS (2018)
4.4.5. Respondents position in the company
The student researcher used key informants in the selected companies no matter their position is.
Hence the majority which is 23.3% were marketing manager followed by 19.8% of assistant
manager, and 19.0% of finance manager. The rest contains general manager, merchandiser,
designer, administrator and export marketing head.
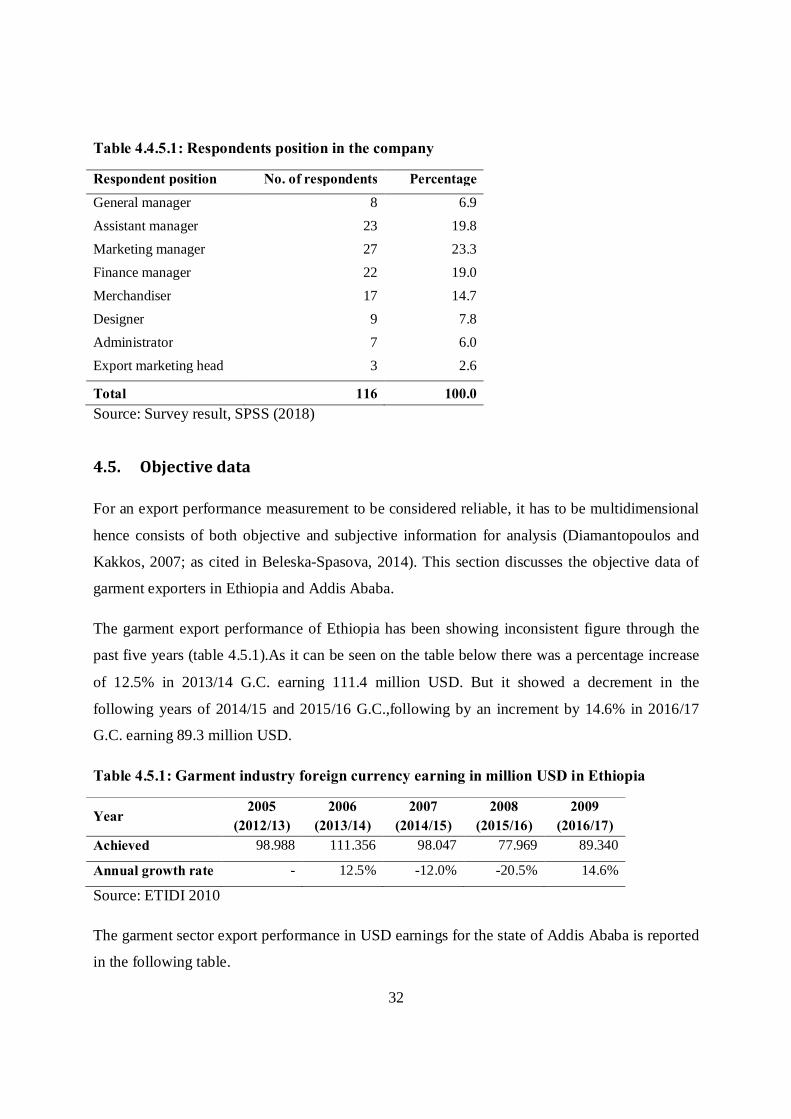
32
Table 4.4.5.1: Respondents position in the company
Respondent position No. of respondents Percentage General manager 8 6.9 Assistant manager 23 19.8 Marketing manager 27 23.3 Finance manager 22 19.0 Merchandiser 17 14.7 Designer 9 7.8 Administrator 7 6.0 Export marketing head 3 2.6
Total 116 100.0 Source: Survey result, SPSS (2018)
4.5. Objective data
For an export performance measurement to be considered reliable, it has to be multidimensional
hence consists of both objective and subjective information for analysis (Diamantopoulos and
Kakkos, 2007; as cited in Beleska-Spasova, 2014). This section discusses the objective data of
garment exporters in Ethiopia and Addis Ababa.
The garment export performance of Ethiopia has been showing inconsistent figure through the
past five years (table 4.5.1).As it can be seen on the table below there was a percentage increase
of 12.5% in 2013/14 G.C. earning 111.4 million USD. But it showed a decrement in the
following years of 2014/15 and 2015/16 G.C.,following by an increment by 14.6% in 2016/17
G.C. earning 89.3 million USD.
Table 4.5.1: Garment industry foreign currency earning in million USD in Ethiopia
Year 2005
(2012/13) 2006
(2013/14) 2007
(2014/15) 2008
(2015/16) 2009
(2016/17) Achieved 98.988 111.356 98.047 77.969 89.340
Annual growth rate - 12.5% -12.0% -20.5% 14.6%
Source: ETIDI 2010
The garment sector export performance in USD earnings for the state of Addis Ababa is reported
in the following table.

33
Table 4.5.2: Garment industry foreign currency earning in million USD in Addis Ababa
Year 2005
(2012/13) 2006
(2013/14) 2007
(2014/15) 2008
(2015/16) 2009
(2016/17) USD 62.538 69.474 66.312 50.224 54.213
Annual growth rate - 11.1% -4.5% -24.3% 7.9%
Source: ETIDI 2010
The table above (table 4.5.2) shows that the export performance of garment exporters in Addis
Ababa has been going erratic as there was 11.1% increase in the 2013/14 G.C. earning 69.5
million USD. Then it drops down for the next two consecutive years with 66.3 million USD and
50.2 million USD for 2014/15 and 2015/16 G.C., respectively. However, in the 2016/17 G.C. it
shows a 7.9% increase earning 54.2 million USD.
4.6. Descriptive data
In this section descriptive analysis of the study on the perceptions of the respondents with regard
to the dependent variable (export performance) and independent variables (product, price,
distribution and promotion) is conferred. The mean and standard deviation for all was computed.
The mean is the average value and the standard deviation shows how much deviated the values
are from the mean. A mean score of 3.80 and higher are considered to show high level of
agreement, those between 3.40 and 3.79 moderate agreement and a mean of 3.39 and below to
show low level of agreement (Akmaliah, 2014; as cited by Muhumed and Ssekajugo, 2015).
4.6.1. Product marketing strategies
For the analysis of product marketing strategies, five questions were asked on the product
quality, the uniqueness of their product design, the variety of products being exported, the brand
awareness and their overall belief about the effect that the aforementioned aspect of their
garment products has on export performance. A five point likert scale was used with strongly
disagree, disagree, neutral, agree and strongly agree being equal to 1, 2, 3, 4, and 5, respectively.

34
Table 4.6.1.1: Descriptive data on product marketing mix strategies
Product marketing mix strategies Mean Std. deviation
Our products are of high quality and suitable for foreign market
4.43 0.760
Our product/s design is unique for foreign market 3.62 1.139
Our products brand is highly recognized in foreign market
3.16 1.060
We have several product (garments) variety at our company for the export market 4.19 0.874
I believe the product aspect of our company highly influence export performance 4.33 0.766
Overall mean 3.94 0.557
Source: Survey result, SPSS (2018)
Considering the quality of their product for the foreign market, the respondents show high level
of agreement with a mean of 4.43 and a standard deviation of 0.76. For the product uniqueness of
product design, it showed moderate level of agreement with a mean of 3.62 whereas a low
agreement is seen in brand recognition having a mean of 3.16. Regarding the variety of garments
presented for the export market and the overall belief about the influence of the product
marketing mix influence on the export performance, there was a high level of agreement with a
mean of 4.19 and 4.33, respectively.
The overall mean for the product marketing mix was found to be 3.94 which indicate that there is
a high level of agreement with the respondents with regard to its influence on export
performance.
4.6.2. Price marketing strategies
For the analysis of this variable, a five point likert scale was used similar to the product variable
from strongly disagree to strongly agree having a level from 1 unto 5. This variable contains
price adjustment according to foreign market, low-cost advantage, pricing strategy, payment
method, and their perception regarding the pricing strategy effect on export performance.
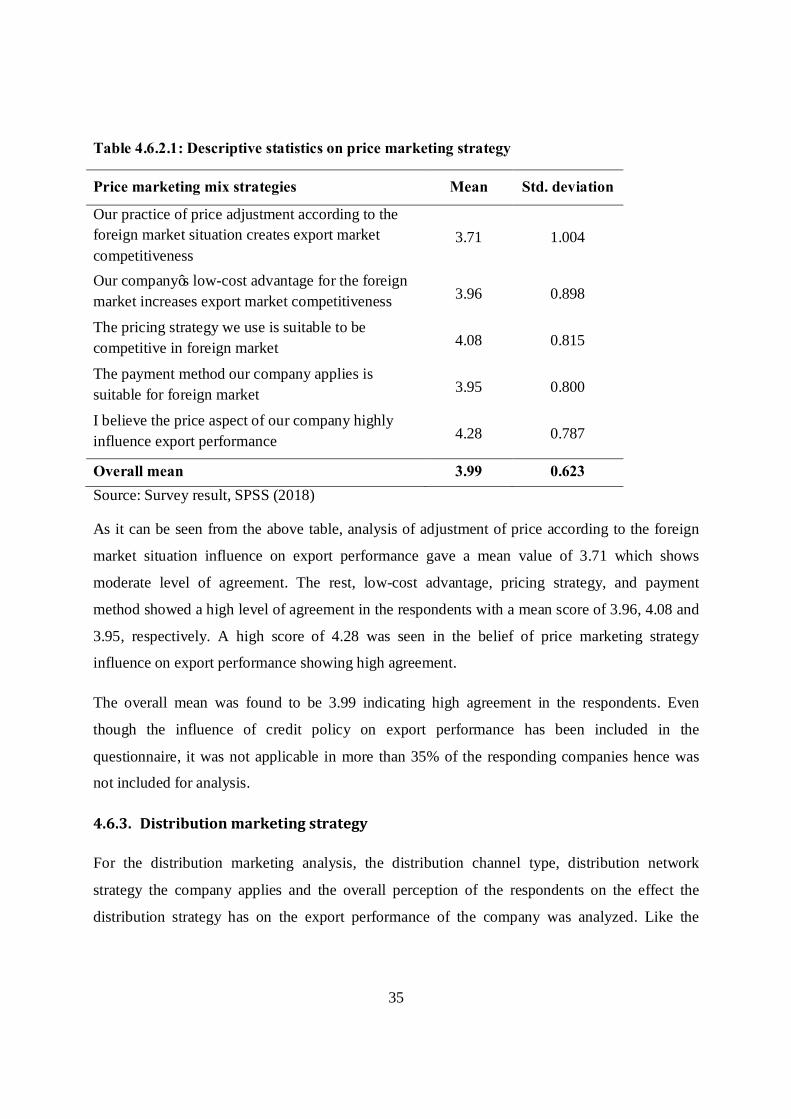
35
Table 4.6.2.1: Descriptive statistics on price marketing strategy
Price marketing mix strategies Mean Std. deviation
Our practice of price adjustment according to the foreign market situation creates export market competitiveness
3.71 1.004
Our company’s low-cost advantage for the foreign market increases export market competitiveness 3.96 0.898
The pricing strategy we use is suitable to be competitive in foreign market 4.08 0.815
The payment method our company applies is suitable for foreign market 3.95 0.800
I believe the price aspect of our company highly influence export performance 4.28 0.787
Overall mean 3.99 0.623 Source: Survey result, SPSS (2018)
As it can be seen from the above table, analysis of adjustment of price according to the foreign
market situation influence on export performance gave a mean value of 3.71 which shows
moderate level of agreement. The rest, low-cost advantage, pricing strategy, and payment
method showed a high level of agreement in the respondents with a mean score of 3.96, 4.08 and
3.95, respectively. A high score of 4.28 was seen in the belief of price marketing strategy
influence on export performance showing high agreement.
The overall mean was found to be 3.99 indicating high agreement in the respondents. Even
though the influence of credit policy on export performance has been included in the
questionnaire, it was not applicable in more than 35% of the responding companies hence was
not included for analysis.
4.6.3. Distribution marketing strategy
For the distribution marketing analysis, the distribution channel type, distribution network
strategy the company applies and the overall perception of the respondents on the effect the
distribution strategy has on the export performance of the company was analyzed. Like the
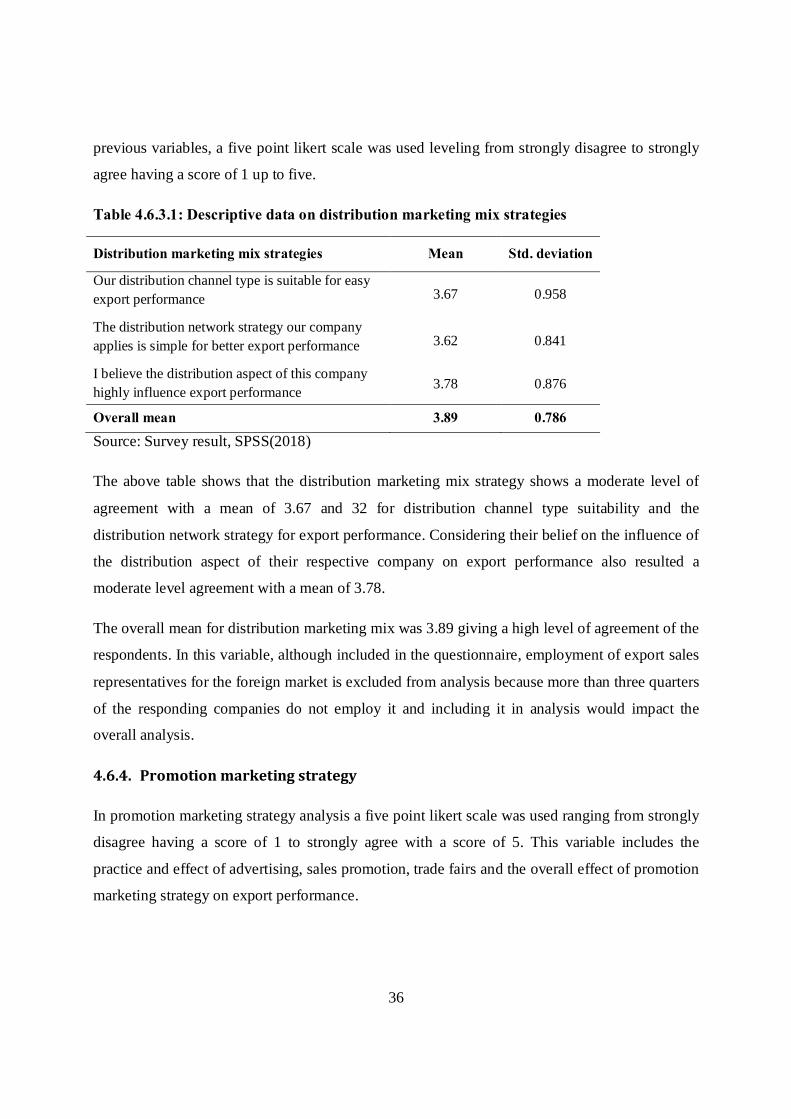
36
previous variables, a five point likert scale was used leveling from strongly disagree to strongly
agree having a score of 1 up to five.
Table 4.6.3.1: Descriptive data on distribution marketing mix strategies
Distribution marketing mix strategies Mean Std. deviation
Our distribution channel type is suitable for easy export performance 3.67 0.958
The distribution network strategy our company applies is simple for better export performance 3.62 0.841
I believe the distribution aspect of this company highly influence export performance 3.78 0.876
Overall mean 3.89 0.786 Source: Survey result, SPSS(2018)
The above table shows that the distribution marketing mix strategy shows a moderate level of
agreement with a mean of 3.67 and 32 for distribution channel type suitability and the
distribution network strategy for export performance. Considering their belief on the influence of
the distribution aspect of their respective company on export performance also resulted a
moderate level agreement with a mean of 3.78.
The overall mean for distribution marketing mix was 3.89 giving a high level of agreement of the
respondents. In this variable, although included in the questionnaire, employment of export sales
representatives for the foreign market is excluded from analysis because more than three quarters
of the responding companies do not employ it and including it in analysis would impact the
overall analysis.
4.6.4. Promotion marketing strategy
In promotion marketing strategy analysis a five point likert scale was used ranging from strongly
disagree having a score of 1 to strongly agree with a score of 5. This variable includes the
practice and effect of advertising, sales promotion, trade fairs and the overall effect of promotion
marketing strategy on export performance.

37
Table 4.6.4.1: Descriptive statistics on promotion marketing mix strategy
Promotion marketing mix strategy Mean Std. deviation
Our company performance of advertising activities for foreign market aids in export market competitiveness
3.40 0.893
Our company provision of sales promotion activities for foreign market increases export competitiveness 3.28 0.822
Our company participation in trade fairs increases export competitiveness 4.06 0.858
I believe the promotion aspect of this company highly influence export performance 3.25 0.986
Overall mean 3.49 0.706 Source: Survey result, SPSS (2018)
As the above table shows, the mean for advertising and sales promotion shows a low level of
agreement with a mean score of 3.40 and 3.28, respectively whereas for the influence of
participation in trade fairs on export performance gave a high level of agreement with a mean
score of 4.06. Respondents showed a low level of agreement on their general belief regarding the
influence of promotion marketing mix on export performance of garment products as it resulted
in a mean of 3.25.
The overall mean on the influence of promotion marketing mix strategy on export performance
was 349 giving a moderate level of agreement from the respondents. The questionnaire included
about the effect that regular field visits to foreign customers has on export performance.
However since it is not applicable in more than third quarter of the responding companies, it was
excluded from analysis.
4.6.5. Export performance
Export performance was analyzed using export intensity, export sales growth, market share in
foreign markets, export profitability, meeting export targets and overall export performance. A
five point likert scale was used from strongly disagree to strongly agree with a score of 1 to 5.

38
Table 4.6.5.1: Descriptive statistics on export performance
Export performance Mean Std. deviation
The export intensity of my company has been growing over the past 5 years 3.68 0.830
The export sales growth of my company has been increasing over the past 5 years 3.75 0.893
The market share of garment products from my company in foreign market has been increasing over the past 5 years
3.36 0.908
Export profitability of my company has been increasing over the past 5 years 3.84 0.978
The overall export performance of my company has been meeting the company’s target performance over the past 5 years
3.67 0.921
The overall export performance of my company has been increasing over the past 5 years 3.83 0.935
Overall mean 3.69 0.781 Source: Survey result, SPSS (2018)
To measure their export performance as adopted from Sousa (2004) export intensity, export sales
growth, export market share, export profitability, meeting export targets and overall export
performance was analyzed considering the past five years. Export intensity (mean=3.68), export
sales growth (mean=3.75) and meeting target export performance (mean=3.67) gave a moderate
level of agreement while export market share had a low level of agreement with a mean of 3.36.
Higher mean values are seen in export profitability and overall export performance increment
over the past five years with a mean of 3.84 and 3.83 giving high level of agreement.
The results seen in the above table (table 4.6.5.1) regarding the export performance giving a
moderate level of agreement are comparable with the inconsistent value gained measured as
dollar earned in USD in Addis Ababa in table 4.5.2.
4.7. Normal distribution
Skewness and Kurtosis are used to check for normal distribution. Skewness measures the tilt of
distribution which can either incline to the right or to the left. The normal range is with in +2 and

39
-2. Kurtosis on the other hand measures the peakdness or the flatness and it can be considered
normal when it is between the range of +3 and -3 (Garson, 2012). Taking the normal distribution
under consideration, the figures show that both skewness and kurtosis is not an issue in this study
as they are all within the given range.
Table 4.7.1: Normal distribution
Items N
Skewness Kurtosis Statistic Std. error Statistic Std. error
Product 116 -0.406 0.225 0.247 0.446 Price 116 -1.123 0.225 2.836 0.446 Distribution 116 -1.153 0.225 2.514 0.446 Promotion 116 -0.526 0.225 -0.183 0.446 Export performance 116 -0.969 0.225 1.466 0.446 Source: Survey result, SPSS (2018)
4.8. Correlation analysis
The correlation analysis done between the dependent variable (export performance) and the
independent variables (product, price, distribution and promotion) was computed. The
correlation coefficient for each of the variables is shown in the table below.
Table 4.8.1: Correlation analysis
Independent variables Product Price Distribution Promotion Export
performance
Product 1 0.380 0.275 0.269 0.442
Price 0.380 1 0.553 0.470 0.564
Distribution 0.275 0.553 1 0.552 0.622
Promotion 0.269 0.470 0.552 1 0.472
Export performance (Pearson Correlation)
0.442 0.564 0.622 0.472 1
Source: Survey result, SPSS (2018)
Correlation coefficients that lie on 0.70 and higher are said to have strong association whereas
those between 0.50-0.69 have substantial association, those between 0.30-0.49 have moderate
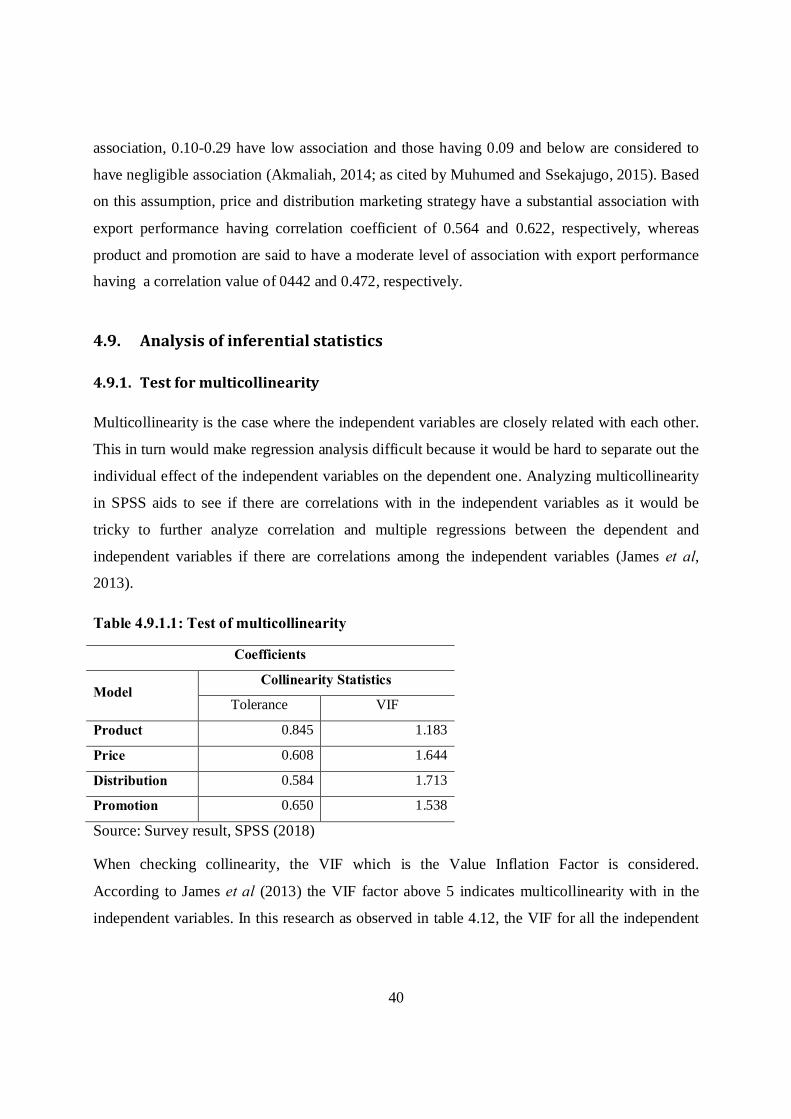
40
association, 0.10-0.29 have low association and those having 0.09 and below are considered to
have negligible association (Akmaliah, 2014; as cited by Muhumed and Ssekajugo, 2015). Based
on this assumption, price and distribution marketing strategy have a substantial association with
export performance having correlation coefficient of 0.564 and 0.622, respectively, whereas
product and promotion are said to have a moderate level of association with export performance
having a correlation value of 0442 and 0.472, respectively.
4.9. Analysis of inferential statistics
4.9.1. Test for multicollinearity
Multicollinearity is the case where the independent variables are closely related with each other.
This in turn would make regression analysis difficult because it would be hard to separate out the
individual effect of the independent variables on the dependent one. Analyzing multicollinearity
in SPSS aids to see if there are correlations with in the independent variables as it would be
tricky to further analyze correlation and multiple regressions between the dependent and
independent variables if there are correlations among the independent variables (James et al,
2013).
Table 4.9.1.1: Test of multicollinearity
Coefficients
Model Collinearity Statistics
Tolerance VIF
Product 0.845 1.183
Price 0.608 1.644
Distribution 0.584 1.713
Promotion 0.650 1.538
Source: Survey result, SPSS (2018)
When checking collinearity, the VIF which is the Value Inflation Factor is considered.
According to James et al (2013) the VIF factor above 5 indicates multicollinearity with in the
independent variables. In this research as observed in table 4.12, the VIF for all the independent
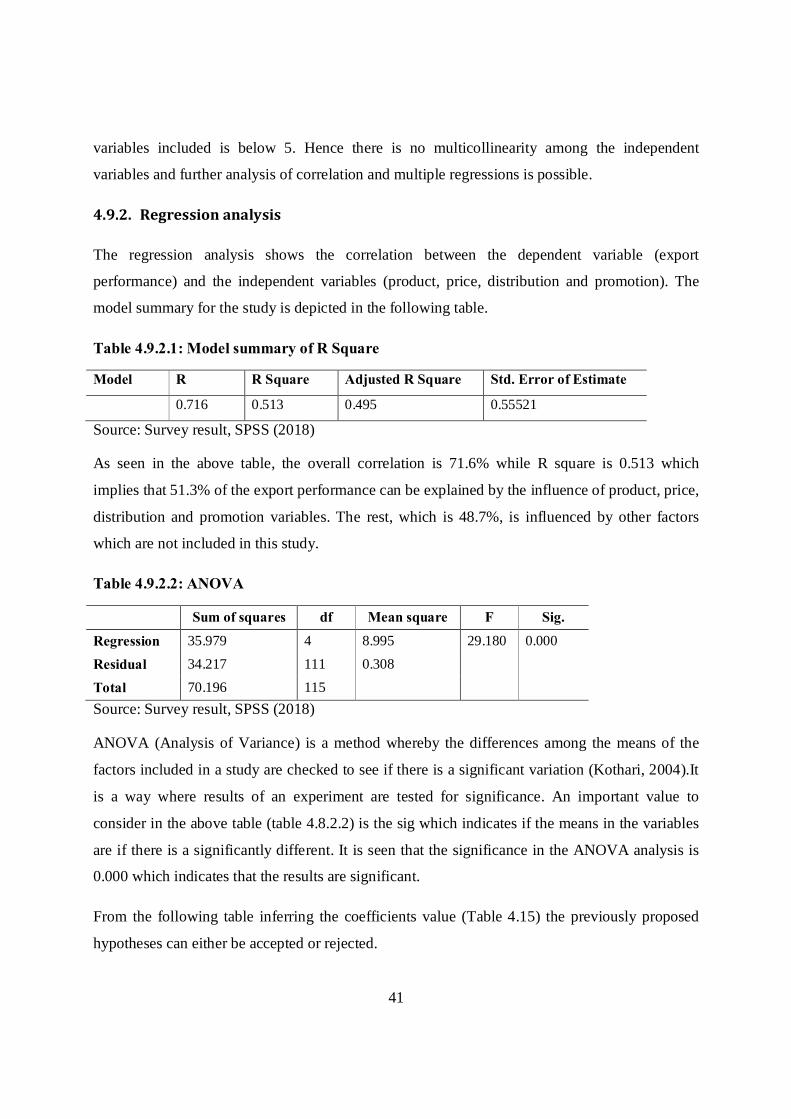
41
variables included is below 5. Hence there is no multicollinearity among the independent
variables and further analysis of correlation and multiple regressions is possible.
4.9.2. Regression analysis
The regression analysis shows the correlation between the dependent variable (export
performance) and the independent variables (product, price, distribution and promotion). The
model summary for the study is depicted in the following table.
Table 4.9.2.1: Model summary of R Square
Model R R Square Adjusted R Square Std. Error of Estimate
0.716 0.513 0.495 0.55521
Source: Survey result, SPSS (2018)
As seen in the above table, the overall correlation is 71.6% while R square is 0.513 which
implies that 51.3% of the export performance can be explained by the influence of product, price,
distribution and promotion variables. The rest, which is 48.7%, is influenced by other factors
which are not included in this study.
Table 4.9.2.2: ANOVA
Sum of squares df Mean square F Sig.
Regression 35.979 4 8.995 29.180 0.000
Residual 34.217 111 0.308
Total 70.196 115 Source: Survey result, SPSS (2018)
ANOVA (Analysis of Variance) is a method whereby the differences among the means of the
factors included in a study are checked to see if there is a significant variation (Kothari, 2004).It
is a way where results of an experiment are tested for significance. An important value to
consider in the above table (table 4.8.2.2) is the sig which indicates if the means in the variables
are if there is a significantly different. It is seen that the significance in the ANOVA analysis is
0.000 which indicates that the results are significant.
From the following table inferring the coefficients value (Table 4.15) the previously proposed
hypotheses can either be accepted or rejected.
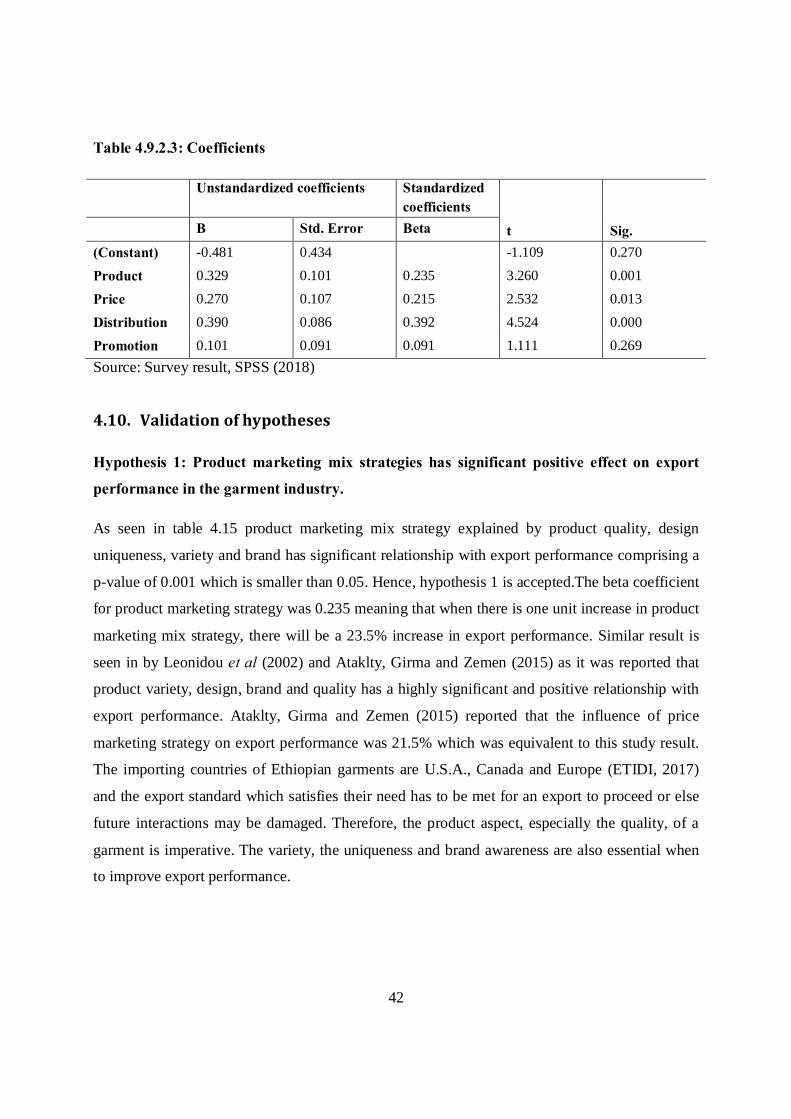
42
Table 4.9.2.3: Coefficients
Unstandardized coefficients Standardized coefficients
t Sig. B Std. Error Beta
(Constant) -0.481 0.434 -1.109 0.270
Product 0.329 0.101 0.235 3.260 0.001
Price 0.270 0.107 0.215 2.532 0.013
Distribution 0.390 0.086 0.392 4.524 0.000
Promotion 0.101 0.091 0.091 1.111 0.269 Source: Survey result, SPSS (2018)
4.10. Validation of hypotheses
Hypothesis 1: Product marketing mix strategies has significant positive effect on export
performance in the garment industry.
As seen in table 4.15 product marketing mix strategy explained by product quality, design
uniqueness, variety and brand has significant relationship with export performance comprising a
p-value of 0.001 which is smaller than 0.05. Hence, hypothesis 1 is accepted.The beta coefficient
for product marketing strategy was 0.235 meaning that when there is one unit increase in product
marketing mix strategy, there will be a 23.5% increase in export performance. Similar result is
seen in by Leonidou et al (2002) and Ataklty, Girma and Zemen (2015) as it was reported that
product variety, design, brand and quality has a highly significant and positive relationship with
export performance. Ataklty, Girma and Zemen (2015) reported that the influence of price
marketing strategy on export performance was 21.5% which was equivalent to this study result.
The importing countries of Ethiopian garments are U.S.A., Canada and Europe (ETIDI, 2017)
and the export standard which satisfies their need has to be met for an export to proceed or else
future interactions may be damaged. Therefore, the product aspect, especially the quality, of a
garment is imperative. The variety, the uniqueness and brand awareness are also essential when
to improve export performance.
43
Hypothesis 2: Price marketing mix strategies has significant positive effect on export
performance in the garment industry
The value of coefficient for the price marketing strategies was found to be 0.215 with a p-value
of 0.013 (p-value < 0.05) showing significant and positive relationship with export performance.
From this it can be said that whenever there is a one unit increase in price marketing strategy,
there will be a 21.5% increase in export performance. This indicates that devoting oneself with
regard to adjustment of price according to foreign market, low-cost advantage, pricing strategy
and payment method will increase export performance. Hence hypothesis 2 was accepted. The
2015 study by Ataklty, Girma and Zemen also confirmed similar result as the price marketing
strategy explained as price adjustment according to the foreign market situation, low-cost
advantage, pricing methods and payment methods do affect the export performance of garment
manufacturing companies. Leonidou et al (2002) in his study also concluded that the price
marketing strategy do have positive and significant relationship with export performance. Price
marketing strategy influence in Ethiopia market could be explained with the incentives given for
exporters including duty draw back scheme, voucher scheme, industry park scheme and others
which minimize the cost of production (EICb, 2016).
Hypothesis 3: Distribution marketing mix strategies has significant positive effect on export
performance in the garment industry
This study found that there is a statistically significant relationship between distribution
marketing strategy and export performance with a p-value of 0.001 (p-value less than 0.05). Not
only there was a significant relationship, but also the relationship is positive. The value of
coefficient was found to be 0.392 meaning that the independent variable (distribution marketing
strategy) positively and significantly influence export performance by 39.2%. Convenience and
timely delivery are very important concerns with regard to distribution especially timely delivery
since they have different types of styles for the four seasons (Ataklty, Girma and Zemen, 2015).
Hence, the third hypothesis stating that distribution marketing strategy positively and
significantly affects export performance is accepted. According to Ataklty, Girma and Zemen
44
(2015) distribution marketing strategy was found to be very important among responders and it
had a positive and significant relationship with export performance.
Hypothesis 4: Promotion marketing mix strategies has significant positive effect on export performance in the garment industry
When assessing the effect of promotion marketing strategy on export performance in garment
industries in Addis Ababa, the value of coefficient was found to be 0.091 with a p-value of 0.269
which is higher than 0.05. Therefore, taking the p-value in consideration, promotion marketing
strategy of garment exporters does not have statistically significant effect on export performance.
However, the relationship is positive bearing the value of coefficient in mind. According to the
value of coefficient, it can be inferred than whenever there is a one unit increase in promotion
marketing strategy, there will be a 9.1% increase in export performance. Similar result was
observed by a study (Ataklty, Girma and Zemen, 2015) where promotion marketing strategy
does not provide significant relationship with export performance. Promotion increases the
overall cost of a product. This explains why less work is seen by garment industries in this area.
Foreign countries purchase garments and textiles from manufacturers in developing countries
mainly for the low-cost advantage with high quality they require (EICb, 2016).
45
Chapter Five: Summary, Conclusion and Recommendation
5.1. Summary and Conclusion
This study examined the influence of marketing mix elements namely product, price, distribution
and promotion, on export performance. A total of 30 garment exporters were taken whereby five
well-informed respondents were sampled from each were included in the study.
After checking the validity and reliability of the study instrument a 150 questionnaires were
distributed, Following data collection, screening and cleaning 116 were found fit for analysis
with a response rate of 77.3%. The mean and standard variation for all the dependent and
independent variables were computed. The overall mean for product, price and distribution
showed high level of agreement among respondents with a mean of 3.94, 3.99 and 3.89,
respectively. On the other hand, promotion and export performance overall mean showed
moderate agreement with a mean score of 3.49 and 3.69, respectively.
Correlation analysis was done for the study variables where price and distribution showed
substantial association with a value of 0.564 and 0.622, respectively while product and
promotion showed moderate association with a value of 0.442 and 0.472, respectively. Normal
distribution was checked using skewness and kurtosis which was with in the normal range.There
was no collinearity between the independent variables as proved by VIF below 5 indicating that
the independent variables are not closely related with each other and regression analysis can be
done.
Succeeding this the value of R square was 0.513 indicating as marketing mix strategies increase
by one step, garment exporting performance will increase by 51.3%. the correlation coefficients
for the independent variables were 0.235, 0.215, 0.392, 0.091 for the product, price, distribution
and promotion, respectively signifying there is a positive and significant association with export
performance and product, price and distribution marketing mix strategies while the association is
insignificant for promotion however positive. Hence, H1, H2 and H3 stating that there is
significant and positive association with export performance and product (H1), price (H2) and
distribution (H3)were accepted whereas the significance of promotion marketing influence in
export performance (H4) was rejected.
46
5.2. Recommendation
Based on the major findings of this study, the following recommendations are proposed.
§ Garment exporters should give attention to marketing mix elements and allocate
investment for them as they are imperative for a success of export performance.
§ Garment exporters should give due emphasis to the quality of their product as poor
quality of products will damage future relationship with the foreign company. Creating a
brand and making sure that brand is well communicated is also suggested for garment
exporters. They also should increase the variety of their garments so that more targets can
be reached.
§ Ethiopia is promoting export by providing several incentives for the different industries
they are interested at. Garment exporters should exploit the low-cost advantage that exists
in the country. They should also amend their pricing strategy and payment method to
gain more competitive advantage in the foreign market.
§ Regarding the distribution marketing mix strategy, garment exporters should change their
exporting type to gain more competitive edge in foreign markets. If they are applying
passive exporting, they should change their long term objective towards more active
export and go along the hierarchy of exporting. They should take advantage of export
sales representatives so that a focused attention can be given for the export market
separately.
§ Garment exporters should not ignore promotion marketing mix. Even though significant
relationship is not observed in this study, the benefit of promotion is not to be
disregarded. They should allocate resources and promote their best features of their
products through advertising, sales promotion, national or international trade fairs, and
exploit export sales representatives for customer visits as it will create increased
awareness and recognition.
47
5.3. Limitation and direction for future study
This study utilized structured questionnaire to collect data about the influence of marketing mix
strategies on export performance in garment industries from the exporter’s perspective. Future
studies can focus on the same objective regarding the customer perspective.
This study uses garment exporters found in the state of Addis Ababa only for analysis and others
operating in similar business that are out of the state were not included. A research regarding
export performance in the whole country taking all garment exporters in consideration is
recommended for future study.
For the independent variable, only marketing mix strategies were employed to analyze their
influence on export performance. Future researchers can also give strong emphasis on the other
factors that influence export performance giving due consideration for each variables in both
internal and external influencing factors.
48
References
Al-Aali, A, Lim, J-S, Khan, T, Khurshid, M. (2013) ‘Marketing capability and export performance: The moderating effect of export performance’ South African Journal of Business Management. 44(3) pp. 59-69.
Akmaliah, Z. (2014) ‘Choice of self-employment intentions among secondary school students’
Ataklty, A.A, Girma T.D, Zemen M.A. (2015) 'Assessment of export marketing strategy on the export performance of Ethiopian garment and textile industry (the case of MAA garment and textile factory)', International Journal of Current Research ,7(01), pp. 12218-12228.
Batavia, A.R. and Kolachi, N.A. (2012) 'Impact of export marketing strategies on organizational performance: evidences from Pakistani textile sector', Interdisciplinary Journal of Contemporary Research in Business, 4(2), pp. 72-80.
Beri, V.A, D’Avila, L, Camargo, L.F, Engels, J. (2011) ‘The influence of adaptation and standardization of the marketing mix on performance: a meta-analysis’ Brazilian Administration Review. 8(3), pp. 266-287.
Carneiro. J, Rocha. A, Silva. J.F. (2011) ‘Determinants of export performance: a study of large Brazilian Manufacturing firms’. Brazilian Administration Review, 8(2), pp. 107-132.
Chemonics international. (1996) Ethiopian textile sector study: final report. Addis Ababa.
Daniel T. (2016) Assessment of factors affecting the performance of garment exporting industry in Ethiopia: The case of Addis Ababa. Unpublished MBA Thesis. Addis Ababa. Addis Ababa University.
EICa.(2016) Investment Opportunities & Policies in Ethiopia.Addis Ababa.
EICb. (2016) Ethiopian cotton, textile and apparel sector investment profile. Addis Ababa.
Endalkachew, S. (2010) The impact of AGOA on textile and apparel industries in Ethiopia. African Cotton and Textile Industries Federation.
Ethiopian textile & fashion protal (2017) Ethiotextile portal, Available at: https://ethiotextile.com/about/# (Accessed: 3rd November 2017).
ETIDI. (2017) Ethiopian textile and apparel profile. Addis Ababa. Sivanet Printing.
Erdil, T.S. and Ozdemir, O. (2016) ‘The determinants of relationship between marketing mix strategy and drivers of export performance in foreign markets: an application on Turkish clothing industry’. Social and Behavioral Sciences. 235(2016), pp. 546-556.
European Commission (2012) 10 benefits of trade for developing countries ,Available at: http://trade.ec.europa.eu/doclib/docs/2012/january/tradoc_148991.pdf (Accessed: 6th November 2017).

49
Garosn, D.G. (2012) Testing statistical assumptions.1st edn.North Carolina, USA. David Garson and Statistical Associates Publishing.
Gliem, J.A. and Gliem R.R. (2003) Calculating, interpreting, and reporting Cronbach’s alpha reliability coefficient for likert-type scale.pp.82-88
Kothari C.R. (2004) Research methodology methods and techniques. New Delhi. New Age International Limited Publishers.
Hailegiorgis, B.A (2012) 'The Effect of export - led growth strategy on the Ethiopian economy', American Journal of Economy, 2(3), pp. 50-56.
Hair, J.F., Black, W.C, Babin, B.J, Anderson, R.E. Multivariate data analysis.7th edn. England. Pearson Prentice Hall.
ITC. (2016) Kenya textile and clothing value chain roadmap 2016-2020. Switzerland: International Trade Center.
James, G., Witten, D., Hastie, T., Tibshirani, R. (2013)An introduction to statistical learning.1st edn. New York. Springer Science and Business Media
Jamshidi, H. and Moazemi, M. (2016) ‘ The impact of external environment on export performance’ Journal of Business and Financial Affairs. 5(4) doi: 10.4172/2167-0234.1000214
Julian, C.C. (2003) ‘Export marketing performance: a study of Thailand firms’. Journal of Small Business Management. 41(2), pp. 213-221.
Julian, C.C. and Ahmed Z.U. (2005) ‘The impact of barriers to export on export marketing performance’.Journal of Global Marketing. 19(1), pp. 71-94.
Keane, J. and Velde, D.W. (2008) The role of textile and clothing industries in growth and development strategies. Investment and Growth Programme.Overseas Development Institute.
Kermally, S. (2013) Gurus on Marketing. 1st edn. London.Thorogood.
Kotler, P. (2003) Marketing insights form A to Z, 1st edn., U.S.A: John Wiley & Sons, Inc..
Kotler, P, Wong, V, Saunders, J, Armstrong, G. (2005)Principles of Marketing. 4thedn. England. Pearson Education Limited.
Kozak, Y. and Smyczek, S. (2015) International Marketing. Odessa National Economic University.
Leonidou, L.C. (2014) Strategic perspectives of export marketing, Available at: https://www.ama.org/publications/E-publications/Pages/ama-journal-reader-august-14-export-performance.aspx (Accessed: 07 November 2017).
Leonidou, L.C, Katsikeas, C.S, Samiee, S. (2002) ‘Marketing strategy determinants of export performance: a meta-analysis’. Journal of Business research. 55(2002), pp. 51-67.
MOI.(2013) Industry development roadmap. Addis Ababa: Ministry of Industry.
50
Moghaddam, F.M, Abdul Hamid, A., Abdul Rasid, S.Z, Darestani, H. (2011) ‘The influence of export marketing strategy determinants on firm export performance: A review of empirical literatures between 1993-2010’. International Journal of Fundamental Psychology and Social Sciences. 1(2), pp. 26-34.
Moore, K. and Pareek, N. (2006) Marketing the basics. London. Taylor & Francis Group.
Muhumed, F.O. and Ssekajugo, D. (2015) ‘Social media management and marketing strategies in selected telecommunication companies in Hargeisa in Somaliland’. The international journal of business and management. 3(8), pp. 122-126.
Mulu, G. (2013) Industrial Policy and Development in Ethiopia: Evolution and Present Experimentation , Helsinki
NBE.(2015) Annual Report. National Bank of Ethiopia
Nguyen, H. (2012) ‘Impact of relationship marketing on export performance: empirical study in Vietnamese garment enterprises’ International Business Research. 5(12), pp. 133-142
O’Cass, A and Julian. C.C, (2003)‘Examining firm and environmental influences on export marketing mix strategy and export performance of Australian exporters’. European Journal of Marketing, 37(3-4), pp. 336-384.
Polls, D. (2015) Business opportunity report of Ethiopia: Textile and apparel industry.Nash international.Netherlands Embassy.
Rahel, A. (2007) ‘Opportunities and challenges of development for Africa in the global arena, AGOA: the case of Ethiopian Textile sub-sector’. African Economic Conference.
RATES.(2005) Cotton and textile regional trade policy paper.
Roper, S. and Love, J.H. (2002) The determinants of export performance: panel data evidence for Irish manufacturing plants. Unpublished paper. Aston Business School Research Institute: Aston University.
Senait G. (2014) ‘The contribution of export earnings to economic growth of Ethiopia: A trend analysis’. Journal of African Development, 4(1), pp, 1-29.
Soderbom, M. and Teal, F. (2002) ‘Are manufacturing exports the key to economic success in Africa’. Centre for the Study of African Economics. University of Oxford.
Sousa, C.M.P. (2004) ‘Export performance measurement: an evaluation of the empirical research in the literature’. Academy of Marketing Science Review. 2004(9), pp. 1-22.
Tooksoon, P, Sukitniyakorn, S, Thammajit, J. (2012) ‘The exploratory study of marketing capabilities and export success: an investigation of Thai’s SMEs’. International Conference on Economics Marketing and Management. 28(2012), pp. 106-110.
USITC. (2014) AGOA: trade and investment performance overview. Washington, 4461.
VandeMataram (2006) Introduction to export marketing.VandeMataram College.
51
Vijayasri, G.V. (2013) 'The importance of international trade in the world', International Journal of Marketing, 2(9), pp. 111-119.
Wang, X. (2013) The determinants of textile and apparel export performance in Asian countries.Unpublished thesis.IOWA State University.
WTO (2016) World Trade Statistical Review.
Yared, M. (2010) Economic impact and determinants of export: the case of Ethiopian textile and apparel industry. Unpublished thesis. Addis Ababa. Addis Ababa University.
Zou, S. and Stan, S. (1998) ‘The determinants of export performance: a review of empirical literature between 1987 and 1997’. International Marketing Review, 15(5), pp. 333-356.
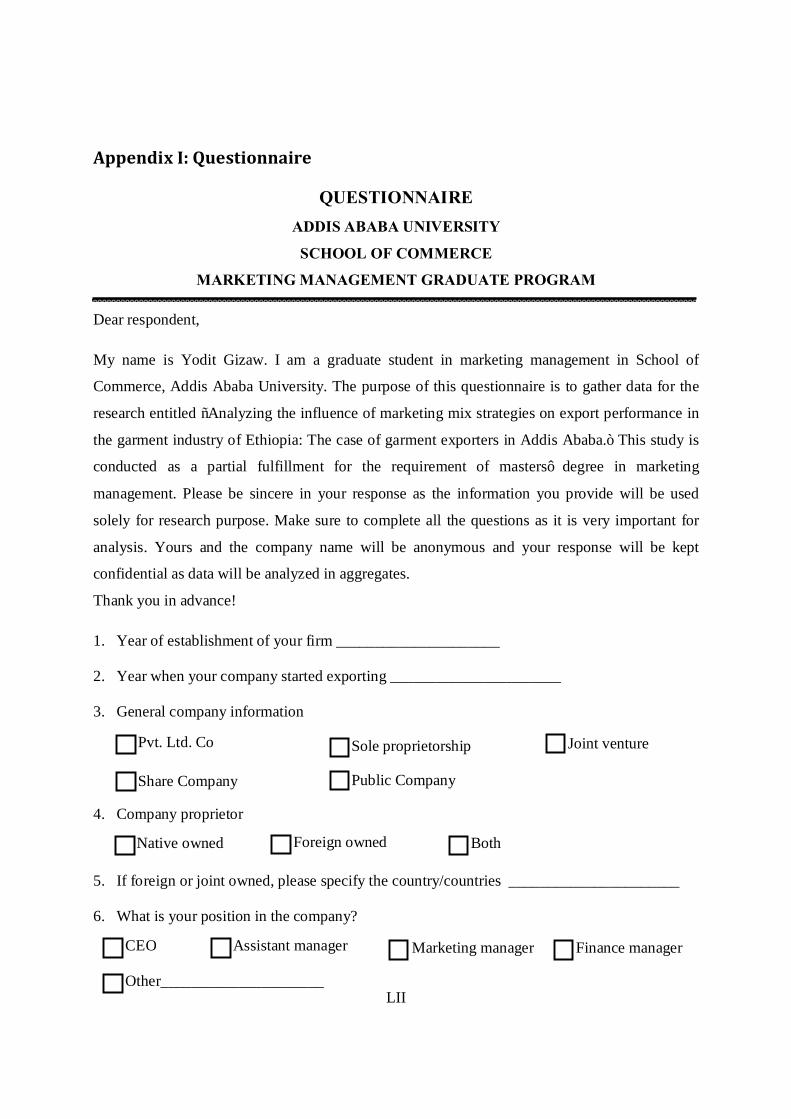
LII
Appendix I: Questionnaire
QUESTIONNAIRE ADDIS ABABA UNIVERSITY
SCHOOL OF COMMERCE
MARKETING MANAGEMENT GRADUATE PROGRAM
Dear respondent,
My name is Yodit Gizaw. I am a graduate student in marketing management in School of
Commerce, Addis Ababa University. The purpose of this questionnaire is to gather data for the
research entitled “Analyzing the influence of marketing mix strategies on export performance in
the garment industry of Ethiopia: The case of garment exporters in Addis Ababa.” This study is
conducted as a partial fulfillment for the requirement of masters’ degree in marketing
management. Please be sincere in your response as the information you provide will be used
solely for research purpose. Make sure to complete all the questions as it is very important for
analysis. Yours and the company name will be anonymous and your response will be kept
confidential as data will be analyzed in aggregates.
Thank you in advance!
1. Year of establishment of your firm _____________________
2. Year when your company started exporting ______________________
3. General company information
4. Company proprietor
5. If foreign or joint owned, please specify the country/countries ______________________
6. What is your position in the company?
Pvt. Ltd. Co Sole proprietorship Joint venture
Share Company Public Company
CEO
Foreign owned Both
Assistant manager Marketing manager Finance manager
Native owned
Other_____________________
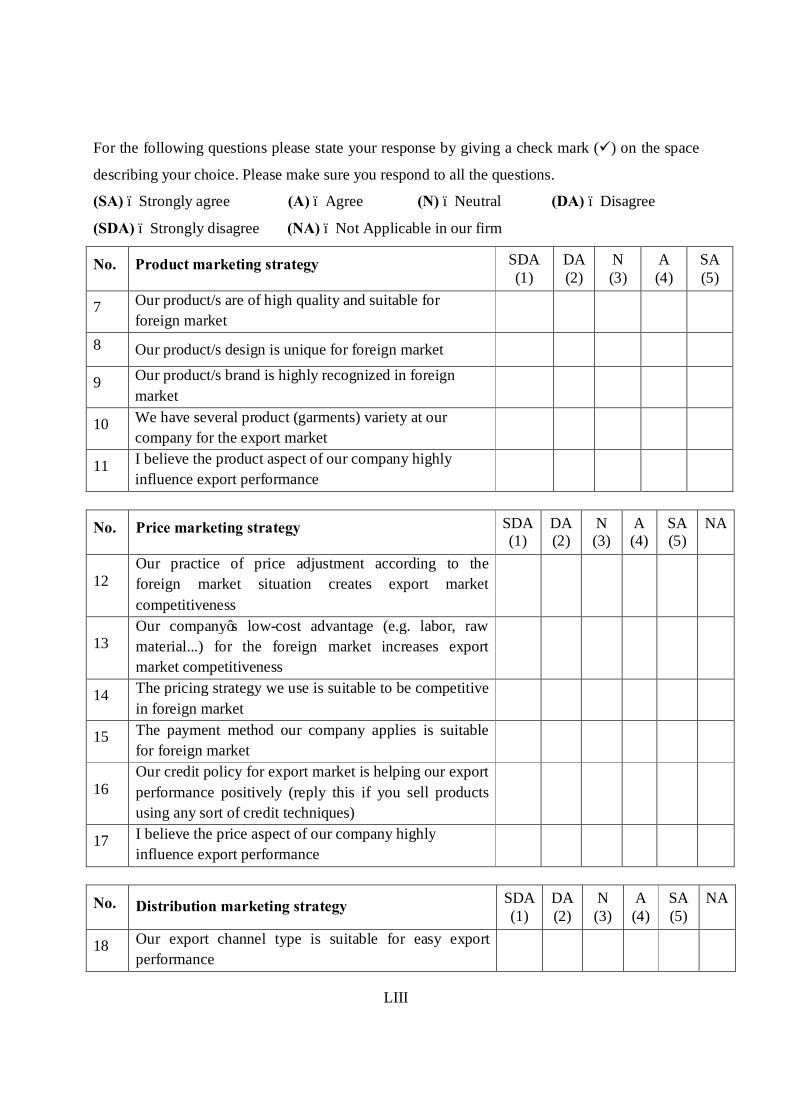
LIII
For the following questions please state your response by giving a check mark (ü) on the space
describing your choice. Please make sure you respond to all the questions.
(SA) – Strongly agree (A) – Agree (N) – Neutral (DA) – Disagree
(SDA) – Strongly disagree (NA) – Not Applicable in our firm
No. Product marketing strategy SDA (1)
DA (2)
N (3)
A (4)
SA (5)
7 Our product/s are of high quality and suitable for foreign market
8 Our product/s design is unique for foreign market
9 Our product/s brand is highly recognized in foreign market
10 We have several product (garments) variety at our company for the export market
11 I believe the product aspect of our company highly influence export performance
No. Price marketing strategy SDA (1)
DA (2)
N (3)
A (4)
SA (5)
NA
12 Our practice of price adjustment according to the foreign market situation creates export market competitiveness
13 Our company’s low-cost advantage (e.g. labor, raw material...) for the foreign market increases export market competitiveness
14 The pricing strategy we use is suitable to be competitive in foreign market
15 The payment method our company applies is suitable for foreign market
16 Our credit policy for export market is helping our export performance positively (reply this if you sell products using any sort of credit techniques)
17 I believe the price aspect of our company highly influence export performance
No. Distribution marketing strategy SDA (1)
DA (2)
N (3)
A (4)
SA (5)
NA
18 Our export channel type is suitable for easy export performance
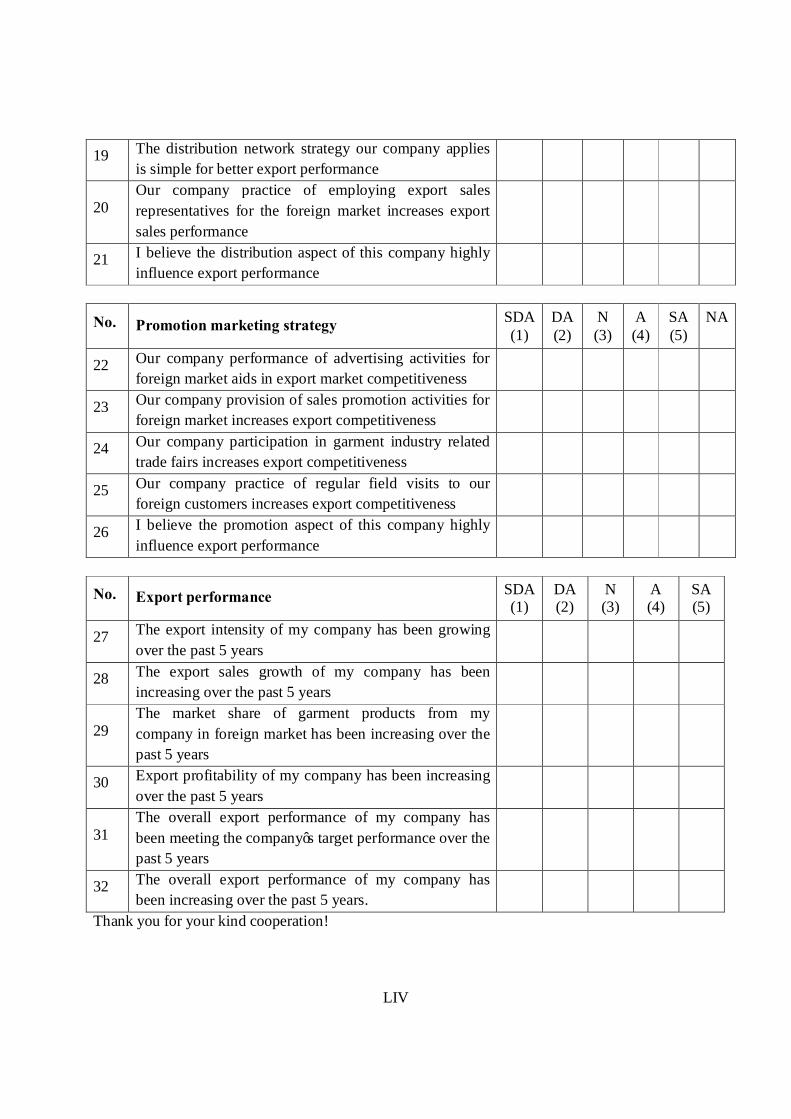
LIV
19 The distribution network strategy our company applies is simple for better export performance
20 Our company practice of employing export sales representatives for the foreign market increases export sales performance
21 I believe the distribution aspect of this company highly influence export performance
No. Promotion marketing strategy SDA (1)
DA (2)
N (3)
A (4)
SA (5)
NA
22 Our company performance of advertising activities for foreign market aids in export market competitiveness
23 Our company provision of sales promotion activities for foreign market increases export competitiveness
24 Our company participation in garment industry related trade fairs increases export competitiveness
25 Our company practice of regular field visits to our foreign customers increases export competitiveness
26 I believe the promotion aspect of this company highly influence export performance
No. Export performance SDA (1)
DA (2)
N (3)
A (4)
SA (5)
27 The export intensity of my company has been growing over the past 5 years
28 The export sales growth of my company has been increasing over the past 5 years
29 The market share of garment products from my company in foreign market has been increasing over the past 5 years
30 Export profitability of my company has been increasing over the past 5 years
31 The overall export performance of my company has been meeting the company’s target performance over the past 5 years
32 The overall export performance of my company has been increasing over the past 5 years.
Thank you for your kind cooperation!
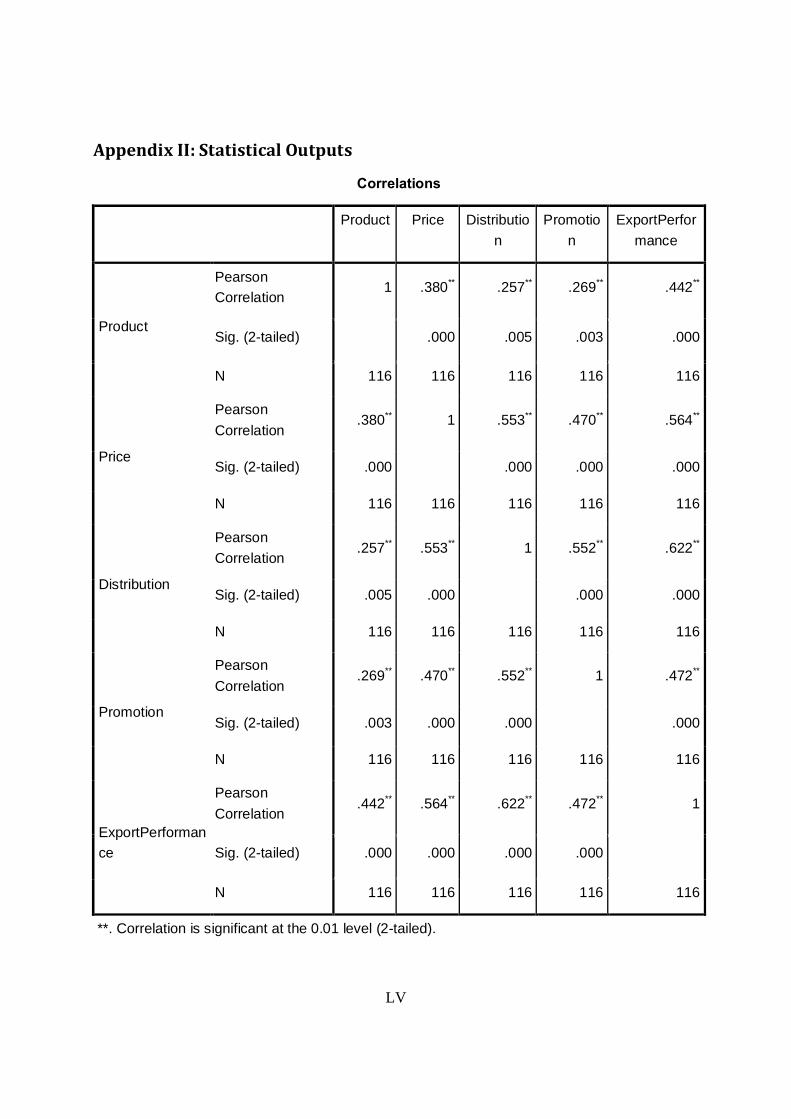
LV
Appendix II: Statistical Outputs
Correlations
Product Price Distribution
Promotion
ExportPerformance
Product
Pearson Correlation 1 .380** .257** .269** .442**
Sig. (2-tailed) .000 .005 .003 .000
N 116 116 116 116 116
Price
Pearson Correlation
.380** 1 .553** .470** .564**
Sig. (2-tailed) .000 .000 .000 .000
N 116 116 116 116 116
Distribution
Pearson Correlation .257** .553** 1 .552** .622**
Sig. (2-tailed) .005 .000 .000 .000
N 116 116 116 116 116
Promotion
Pearson Correlation
.269** .470** .552** 1 .472**
Sig. (2-tailed) .003 .000 .000 .000
N 116 116 116 116 116
ExportPerformance
Pearson Correlation .442** .564** .622** .472** 1
Sig. (2-tailed) .000 .000 .000 .000
N 116 116 116 116 116
**. Correlation is significant at the 0.01 level (2-tailed).
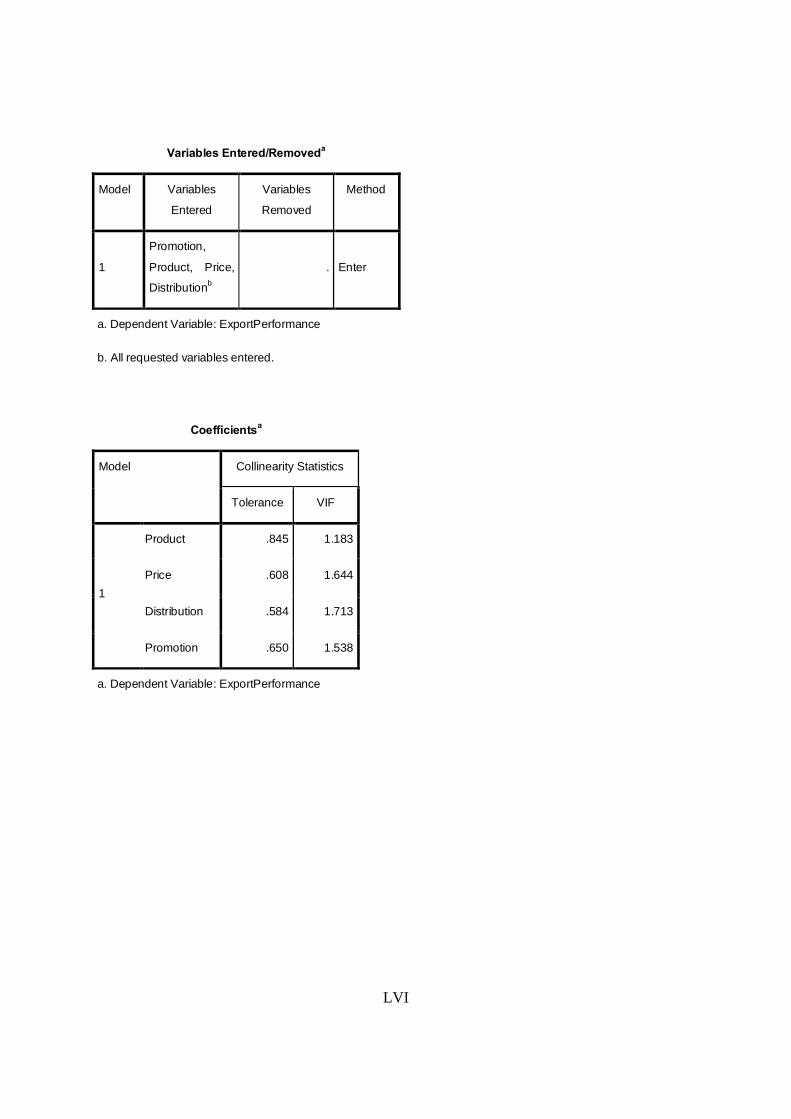
LVI
Variables Entered/Removeda
Model Variables
Entered
Variables
Removed
Method
1
Promotion,
Product, Price,
Distributionb
. Enter
a. Dependent Variable: ExportPerformance
b. All requested variables entered.
Coefficientsa
Model Collinearity Statistics
Tolerance VIF
1
Product .845 1.183
Price .608 1.644
Distribution .584 1.713
Promotion .650 1.538
a. Dependent Variable: ExportPerformance
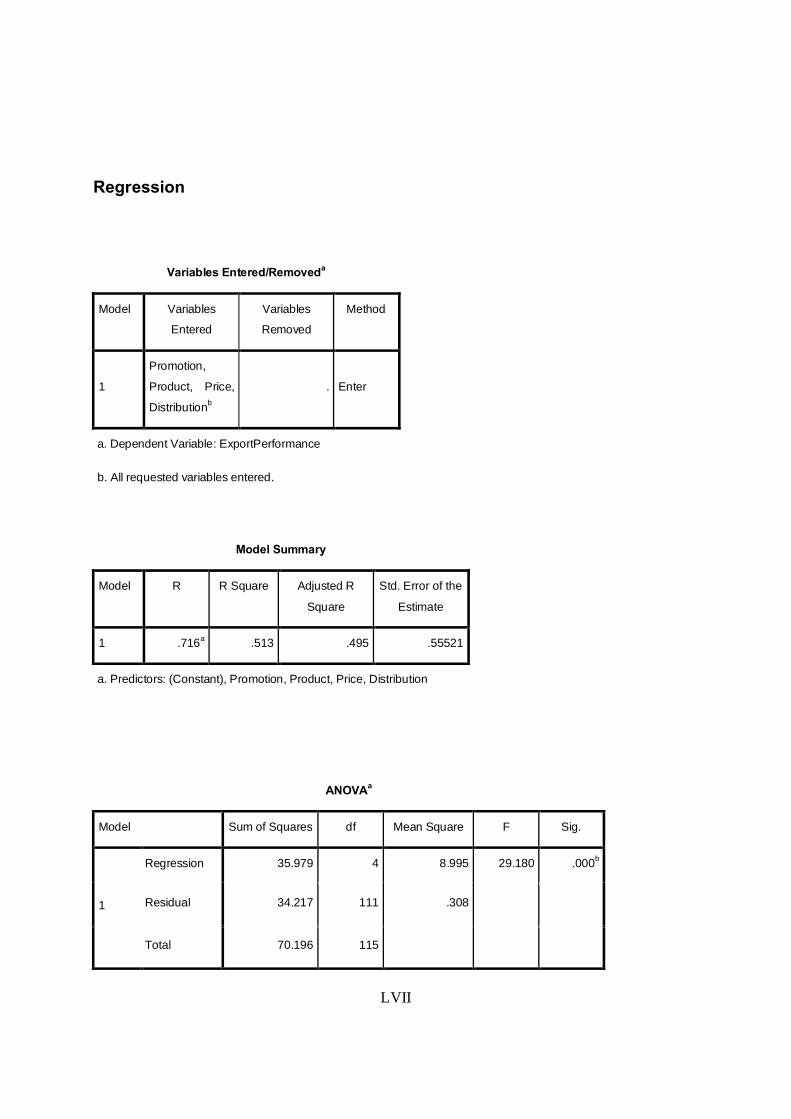
LVII
Regression
Variables Entered/Removeda
Model Variables
Entered
Variables
Removed
Method
1
Promotion,
Product, Price,
Distributionb
. Enter
a. Dependent Variable: ExportPerformance
b. All requested variables entered.
Model Summary
Model R R Square Adjusted R
Square
Std. Error of the
Estimate
1 .716a .513 .495 .55521
a. Predictors: (Constant), Promotion, Product, Price, Distribution
ANOVAa
Model Sum of Squares df Mean Square F Sig.
1
Regression 35.979 4 8.995 29.180 .000b
Residual 34.217 111 .308
Total 70.196 115
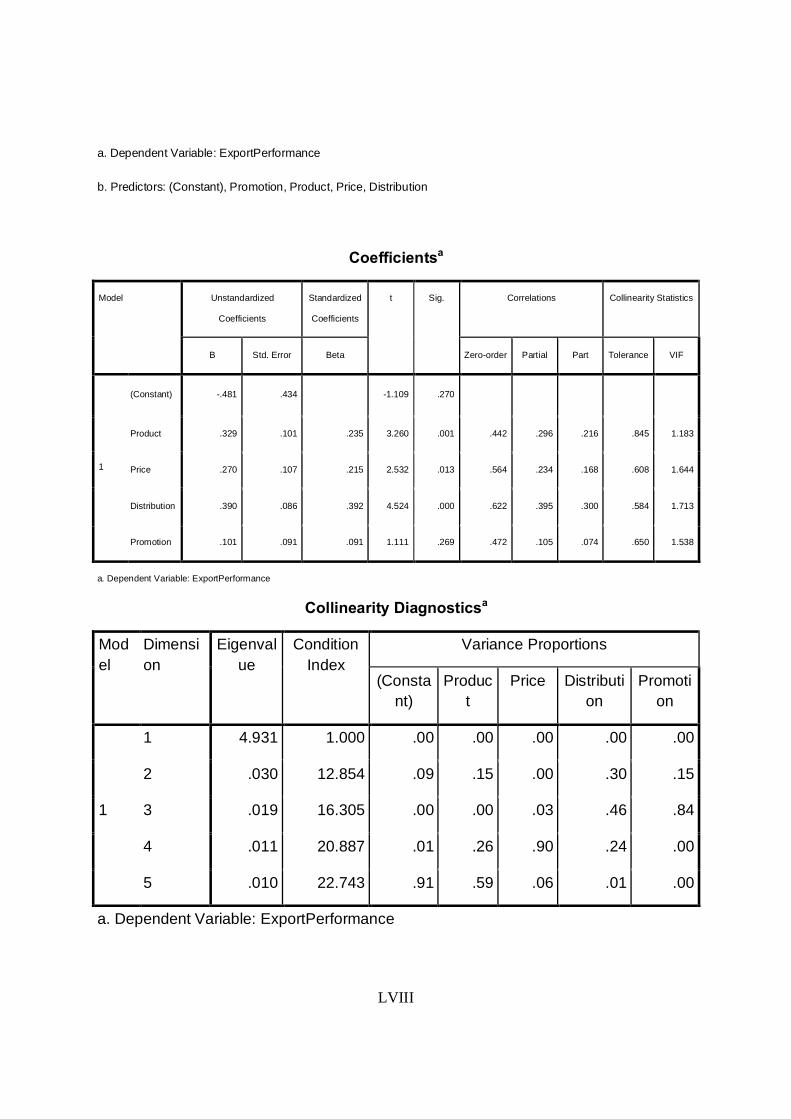
LVIII
a. Dependent Variable: ExportPerformance
b. Predictors: (Constant), Promotion, Product, Price, Distribution
Coefficientsa
Model Unstandardized
Coefficients
Standardized
Coefficients
t Sig. Correlations Collinearity Statistics
B Std. Error Beta Zero-order Partial Part Tolerance VIF
1
(Constant) -.481 .434
-1.109 .270
Product .329 .101 .235 3.260 .001 .442 .296 .216 .845 1.183
Price .270 .107 .215 2.532 .013 .564 .234 .168 .608 1.644
Distribution .390 .086 .392 4.524 .000 .622 .395 .300 .584 1.713
Promotion .101 .091 .091 1.111 .269 .472 .105 .074 .650 1.538
a. Dependent Variable: ExportPerformance
Collinearity Diagnosticsa
Model
Dimension
Eigenvalue
Condition Index
Variance Proportions
(Constant)
Product
Price Distribution
Promotion
1
1 4.931 1.000 .00 .00 .00 .00 .00
2 .030 12.854 .09 .15 .00 .30 .15
3 .019 16.305 .00 .00 .03 .46 .84
4 .011 20.887 .01 .26 .90 .24 .00
5 .010 22.743 .91 .59 .06 .01 .00
a. Dependent Variable: ExportPerformance