
Analyzing the Impact of Rooftop Renewable Energy on Distribution System with Monte Carlo Simulation
10
International Journal of Electrical and Electronics Engineering Research (IJEEER) ISSN (P): 2250-155X; ISSN (E): 2278-943X Vol. 3, Issue 5, Dec 2013, 29-38 © TJPRC Pvt. Ltd. ANALYZING THE IMPACT OF ROOFTOP RENEWABLE ENERGY ON DISTRIBUTION SYSTEM WITH MONTE CARLO SIMULATION A. SRINIVASA RAO 1 , S. V. L. NARASIMHAM 2 , R. GOWRISANKARA RAO 3 , & R. SRINIVASA RAO 4 1 Department of Electrical and Electronics Engineering, GITAM University, Visakhapatnam, India 2 Department of Information Technology, JNT University, Hyderabad, India 3 Department of Electrical and Electronics Engineering, MVGR College of Engineering, Vizayanagaram, India 4 Department of Electrical and Electronics Engineering, JNT University, Kakinada, India ABSTRACT In developing countries energy demand is steadily increasing at a pace which is not met by the conventional sources alone. This is particularly noticeable in developing countries like India. Non conventional energy or renewable energy which is a clean, environment friendly sustainable source of energy freely obtainable from nature, should play a vital role in meeting the energy needs of the country. India is witnessing a rapid growth in solar and wind energy sector. Recently MNRE (Ministry of New and Renewable Energy sources) stressed on the roof top power generation in their policy document. Estimating the actual power generated by a roof top energy system with wind and solar power needs attention. Though several methods are available in literature they need large number of samples. In this paper an attempt has been made to estimate potential of wind and solar simultaneously using Monte Carlo simulation technique. Effective load is also computed and load flow analysis is performed for a typical residential feeder. KEYWORDS: Renewable Energy, Monte Carlo, Roof Top Energy INTRODUCTION Energy plays a critical role in the growth of economy and. in improving the quality of life. World energy outlook summary states that a whooping 80% of the total energy generated in the world is from fossil fuels like coal, gas and oil. Use of Fossil fuels causes green house gas emissions particularly carbon dioxide which leads to global warming. In the Indian context, it is estimated that the energy demand will raise to about 3 times the present demand by2020 In India 50% of commercial energy production is done by coal Inspite of low per capita consumption when compared with other developed countries the contribution of carbon dioxide emission is about 4% of total world as on now. The climatic change not only effects human habitat but also eco systems. The need of the hour is to increase generation which is environment friendly and affordable [1]. N.K. Sharma et al [2] estimated that 1GW of additional power generation by renewable energy sources reduce emission of carbon content by 3.3 million tons a year. To fill up the supply demand gap the country is looking towards alternate sources of energy. These sources augment the energy supply as well as help in mitigating the climatic change. Solar and wind are most popular among the renewable energy sources and are playing an important role in bridging the supply demand gap. The Ministry of New and Renewable Energy Sources (MNRES) is taking several measures to promote these resources. SOLAR ENERGY This is an alternate energy source with zero emission and has minimum maintenance cost. In India, with its vast open lands, the solar energy potential is estimated to be about 5 Peta Watt hours per year (5 trillion kWh) which is huge in terms of the present energy consumption.
-
Upload
independent -
Category
Documents
-
view
0 -
download
0
Transcript of Analyzing the Impact of Rooftop Renewable Energy on Distribution System with Monte Carlo Simulation
International Journal of Electrical and Electronics
Engineering Research (IJEEER)
ISSN (P): 2250-155X; ISSN (E): 2278-943X
Vol. 3, Issue 5, Dec 2013, 29-38
© TJPRC Pvt. Ltd.
ANALYZING THE IMPACT OF ROOFTOP RENEWABLE ENERGY ON DISTRIBUTION
SYSTEM WITH MONTE CARLO SIMULATION
A. SRINIVASA RAO1, S. V. L. NARASIMHAM
2, R. GOWRISANKARA RAO
3, & R. SRINIVASA RAO
4
1Department of Electrical and Electronics Engineering, GITAM University, Visakhapatnam, India
2Department of Information Technology, JNT University, Hyderabad, India
3Department of Electrical and Electronics Engineering, MVGR College of Engineering, Vizayanagaram, India
4Department of Electrical and Electronics Engineering, JNT University, Kakinada, India
ABSTRACT
In developing countries energy demand is steadily increasing at a pace which is not met by the conventional
sources alone. This is particularly noticeable in developing countries like India. Non conventional energy or renewable
energy which is a clean, environment friendly sustainable source of energy freely obtainable from nature, should play a
vital role in meeting the energy needs of the country. India is witnessing a rapid growth in solar and wind energy sector.
Recently MNRE (Ministry of New and Renewable Energy sources) stressed on the roof top power generation in their
policy document. Estimating the actual power generated by a roof top energy system with wind and solar power needs
attention. Though several methods are available in literature they need large number of samples. In this paper an attempt
has been made to estimate potential of wind and solar simultaneously using Monte Carlo simulation technique. Effective
load is also computed and load flow analysis is performed for a typical residential feeder.
KEYWORDS: Renewable Energy, Monte Carlo, Roof Top Energy
INTRODUCTION
Energy plays a critical role in the growth of economy and. in improving the quality of life. World energy outlook
summary states that a whooping 80% of the total energy generated in the world is from fossil fuels like coal, gas and oil.
Use of Fossil fuels causes green house gas emissions particularly carbon dioxide which leads to global warming. In the
Indian context, it is estimated that the energy demand will raise to about 3 times the present demand by2020 In India 50%
of commercial energy production is done by coal Inspite of low per capita consumption when compared with other
developed countries the contribution of carbon dioxide emission is about 4% of total world as on now. The climatic change
not only effects human habitat but also eco systems. The need of the hour is to increase generation which is environment
friendly and affordable [1]. N.K. Sharma et al [2] estimated that 1GW of additional power generation by renewable energy
sources reduce emission of carbon content by 3.3 million tons a year. To fill up the supply demand gap the country is
looking towards alternate sources of energy. These sources augment the energy supply as well as help in mitigating the
climatic change. Solar and wind are most popular among the renewable energy sources and are playing an important role in
bridging the supply demand gap. The Ministry of New and Renewable Energy Sources (MNRES) is taking several
measures to promote these resources.
SOLAR ENERGY
This is an alternate energy source with zero emission and has minimum maintenance cost. In India, with its vast
open lands, the solar energy potential is estimated to be about 5 Peta Watt hours per year (5 trillion kWh) which is huge in
terms of the present energy consumption.

30 A. Srinivasa Rao, S. V. L. Narasimham, R. Gowrisankara Rao, & R. Srinivasa Rao
WIND ENERGY
Wind farms have become very popular due to the tremendous development in related technologies. The very low
gestation periods, high reliability and excellent performance made wind a viable alternative for energy capacity addition in
India. Wind energy is viable in many parts of the country and at present only a faction of potential is being tapped.
ROOF TOP ENERGY GENERATION
To install large grid connected generation large areas are required for alternate energy sources. Centre for study of
science, technology and policy mentions that for example a 50 MW renewable energy generating station may require about
100 hectares of land where as a gas base station require only 1to 2 hectares Instead of constructing large generation farms it
is convenient to install small energy centers particularly on roof tops which can produce small amounts of energy needed
for a house. Small scale roof top systems have several advantages.
No additional useful land is needed
Minimized of transmission and distribution losses
Fossil fuel consumption which leads to pollution is reduced
Reliance on the grid is reduced
Estimating the roof top energy potential is very cumbersome and time consuming. M. Arshad Javaid et. al [3]
conducted experiments on solar power modules throughout the day in PCSIR laboratory, Lahore, Pakistan and found that
the results are useful for implementation of smart grid technology in Pakistan. M. Bindi et al [4] estimated daily global
radiation using the data of maximum and minimum temperatures and the total rain fall. Dimas Firmanda Al Riza et al [5]
predicted hourly solar radiation data using two methods. In the first method a decision matrix is used from the measured
values of relative humidity and temperature data. The second method is done by taking into account the relative humidity
clearness index, relative humidity correlation etc. Iranna Korachgaon et al [6] estimated global solar radiation for different
places in Brazil using parameters like ambient temperature, humidity, wind speed, moisture etc with the Iranna- Bapat’s
model proposed by them. A ten parameter model and a two parameter models were developed and results they got are
about 90% accurate. A. M. Muzathik et al [7] collected different empirical models that are available to estimate average
daily global radiation in Terengganu in Malasia.T hey compared the models that were collected taking into account the
statistical error tests like mean bias error, root mean square error etc and modified Angstrom model is recommended for
predicting average daily global radiation. V. K. Marwal et al [8] employed six empirical relations and predicted daily solar
radiation for jaipur India.
They found that cubic correlation is the best. Rizwan M et al [9] Proposed Generalized Neural Network technique
[GNN] to estimate solar energy accurately. Tamer Khatib et al. [10] predicted global solar energy estimation using feed
forward multilayer perception model in Malasia taking latitude, longitude, day number and sunshine ratio and found that
error is around 7.96%. Ibeh G.F et al [11] compared Multi layer Perceptron ANN model and Angstrom – Prescott using
four parameters maximum temperature, relative humidity, cloudiness and sunshine duration for Warri- Nigeria for
prediction of solar radiation and concluded that ANN model is better. Emad A. Ahmed et al [12] Used ANN technique to
predict solar radiation and compared with the available empirical regression models and found it to be more suitable.
N. Premalatha et al[13] used Gradient descent back propagation with adoptive learning rate ANN for predetermining
global solar radiation. However it can be used for locations where data of ambient temperature is available.

Analyzing the Impact of Rooftop Renewable Energy on Distribution System with Monte Carlo Simulation 31
The literature survey also has been done for estimation of wind energy. J. V. Seguro et al [14] presented and
compared three methods for finding Weibul parameters for distribution of wind speed to estimate wind energy. The
methods include maximum likelihood method, general graphical method and modified MLH method. They observed that
maximum likelihood method is suitable for usage with time series wind data and modified likelihood method for wind data
in format of frequency distribution Nabiha Brahmi et al [15] developed a method Using ANN called optimized maximum
Likelihood method. This algorithm is used to find out wind energy potential of SFax city, Tunisia. S. Vijaya Venkataraman
et al. [16] analyzed the data of wind speed for 15 stations in India randomly for the year 2009 and identified in which
months maximum energy can be harnessed. Tian Pau Chang [17] proposed two probability functions namely Mixture
Gamma–Weibull function and mixture truncated normal function and compared with methods that are already available.
Three wind farms under different weather conditions in Taiwan are considered and concluded that the proposed GW
method is superior to other methods. Kobayashi. Y et al [18] estimated the total potential of wind energy in the world by
beginning of 22 century. They considered world population to be 13billion and predicted that 7.75 of world energy demand
will be met by wind. Abbes D et al [19] estimated wind energy for different sites using Weibull distribution and direct
integrated methodology. Results indicated that the latter method was accurate.
For assessing wind power, wind power distribution (WPD) curve is necessary. Mark L. Morrissey et al. [20]
proposed a new method for directly estimating the curve using Gauss–Hermite expansion which provides a reliable WPD
curve
Above literature survey indicates that this requires data of previous years with the required time interval and the
accuracy of the method depends on the number of samples (years). In many cases the data at this granularity may not be
available, but hourly average data should be available easily, which is not sufficient for Weibull method. In this paper,
Monte Carlo Simulation is used to estimate the wind and solar energy simultaneously at a given time. This energy is
considered while computing the profile of a distribution system. The proposed method can be extended to any number and
type of source of energy.
MONTE CARLO METHOD
Broadly Monte Carlo principle states that random events with equal probability produce similar results when the
number of trials tends to infinity. Monte Carlo Simulation refers to a typical simulation which depends on repeated random
samplings and statistical analysis to find results. A literature survey has been carried out taking renewable energy
applications using Monte Carlo approach into account
Samik Ray Chaudhuri [21] described in detail about Monte Carlo simulation and discussed about mathematical
techniques that are involved and presented examples from various Engineering disciplines where MCS is used which
includes electronic engineering, mechanical engineering etc. Halamay D A [22] used the WSCC/WECC 179 bus system to
find out feasibility of combining solar, wind and ocean wave generation with existing base generation using Monte Carlo
analysis and discussed about the importance of alternate energy sources. Hopkins. M. D et al [23] developed a method for
predicting energy production by solar and wind using Monte Carlo based method. Billinton. R [24] proposed a sequential
Monte Carlo Simulation method for generation of capacity adequacy simulation of small stand alone wind energy
conversion system applicable to rural areas using battery storage. Amir Saf darian et al[25] proposed a novel formulation
for optimal sizing of wind and solar resources in hybrid generation system. The decision variables include number of wind
turbines, solar modules to be introduced and also uncertainties associated with load, wind speed, solar irradiation. Monte
Carlo simulation is used to generate different scenarios. Grigorios Marmidic et al [26] introduced a novel procedure for

32 A. Srinivasa Rao, S. V. L. Narasimham, R. Gowrisankara Rao, & R. Srinivasa Rao
optimal placement of wind turbines using Monte Carlo simulation method. The optimization took into account maximum
energy production and minimum cost criteria. Su Youli et al [27] proposed a reliability evaluation of laboratory base micro
grid consisting of wind, solar, diesel generator with storage batteries using Monte Carlo simulation for system well being
analysis
PROBLEM FORMULATION
In this paper, an attempt is made to use Monte Carlo (MC) method to simulate the available power.
Pm = Pa × (1 + ∆p)
Where
Pm is the power estimated with Monte Carlo Method
Pa is the average power obtained from known data
∆p is a random variable that represents the variation from average (as a percentage) for which value is obtained
using MC simulation
Pt = sum for day = 1 to 365 (sum for hour = 0 to 23 (Pm))
Where Pt is total estimated harvested energy
Le = La – Lg
Where Le is the effective load, La is actual load and Lg is generated (rooftop) load.
|V(i + 1)| = [(P(i+1) R(i) + Q(i+ 1) X(i) − 0.5|v(i)|2)2 - ( R(i)
2 + X(i)
2) (P(i+1)
2 + (Q(i+1)
2)- (P(i+1) R(i) + Q(i+ 1) X(i) − 0.5|v(i)|2)]
1/2
LP(i) = R(i) (P(i + 1)2 + Q(i + 1)
2) / (|V (i + 1)|)
2
LQ(i) = X(i) (P(i + 1)2 + Q(i + 1)
2)/ (|V (i + 1)|)
2
The data of a typical residential feeder is obtained from the Utility Company for which the data is as follows:
Feeder length is approximately 1 km with laterals at various places. For simplicity, the feeder is assumed to have
uniformly distributed load and the laterals are reduced to 10 with a length of one km each. Considering each house with a
width of 10 to 15 meters, it can be fairly assumed that there are about 1000 houses per feeder. The feeder has (R +JX)
ohms/km. The following is the line diagram of the feeder with above assumptions:
Weasel conductor has been used for calculations. We have considered 10 Bus with the given types of loads
(Monte Carlo load data and Average load data) with equal load sharing by each bus with a span of 60 meters between
buses. Resistance and Reactance per Km are taken to be 0.908Ω and 0.314Ω respectively for Weasel conductor. Figure 1
Represents a 10 bus system
Figure 1: Bus Distribution Network
Since load varies with season, effective load for each hour of each month is considered.
Analyzing the Impact of Rooftop Renewable Energy on Distribution System with Monte Carlo Simulation 33
MONTE CARLO METHOD
Broadly Monte Carlo principle states that random events with equal probability produce similar results when the
number of trials tends to infinity. In this paper, the bell shape probability distribution of variation from median is
approximated to discrete ranges as follows:
Variation can be up to 25% (-12 to +13%) from the average value
For 50% of times, variation is 10% (+/- 5%)
For 30% of times, variation is 15% (-7 to +8%)
For 10% of times, variation is 20% (-10 to +10)
For 10% of times, variation is 25% (-12 to 13%)
These ranges are taken considering the weather will not change considerably with respect to the average
(taken over about 30 years). As the proposed method is a framework, the values, the deviations etc can be changed
according to the conditions under consideration.
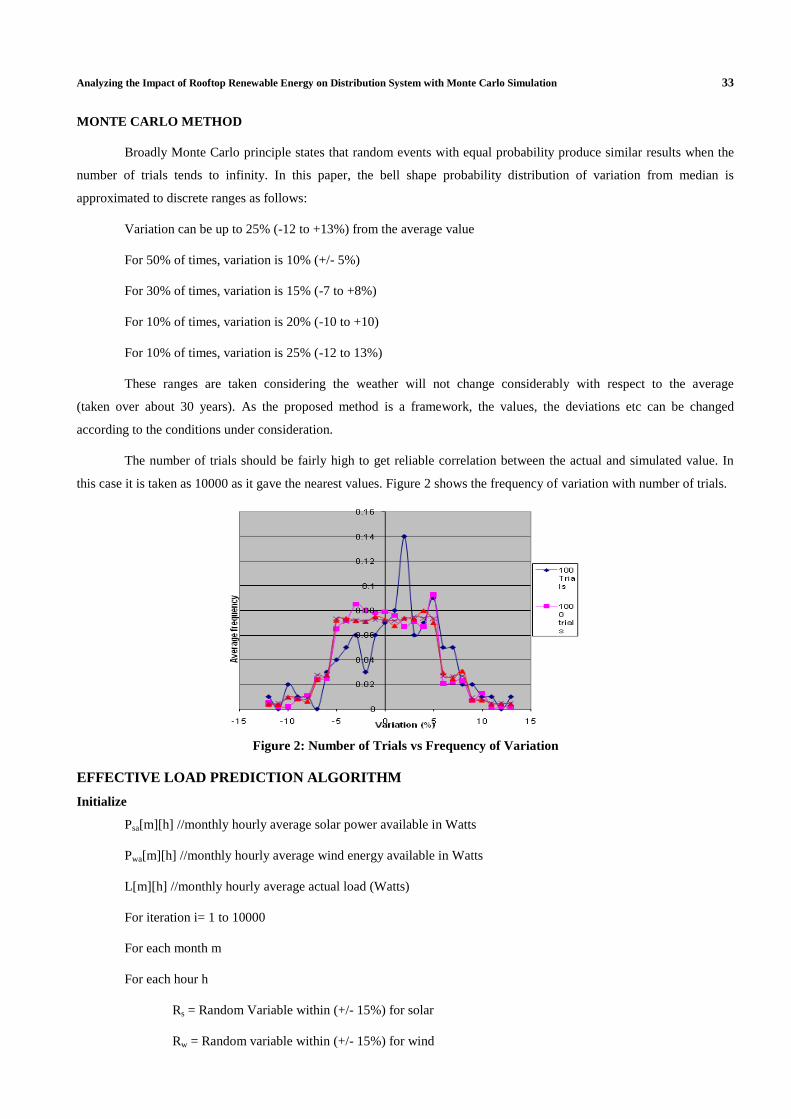
The number of trials should be fairly high to get reliable correlation between the actual and simulated value. In
this case it is taken as 10000 as it gave the nearest values. Figure 2 shows the frequency of variation with number of trials.
Figure 2: Number of Trials vs Frequency of Variation
EFFECTIVE LOAD PREDICTION ALGORITHM
Initialize
Psa[m][h] //monthly hourly average solar power available in Watts
Pwa[m][h] //monthly hourly average wind energy available in Watts
L[m][h] //monthly hourly average actual load (Watts)
For iteration i= 1 to 10000
For each month m
For each hour h
Rs = Random Variable within (+/- 15%) for solar
Rw = Random variable within (+/- 15%) for wind
34 A. Srinivasa Rao, S. V. L. Narasimham, R. Gowrisankara Rao, & R. Srinivasa Rao
Ps = psa[m][h]*(1+Rs) //estimated solar power available in that month and hour
Pw= pwa[m][h]*(1+Rw) //estimated wind power available in that month and hour
Le = L[m][h]-(Ps+Pw) //effective load at that month and hour
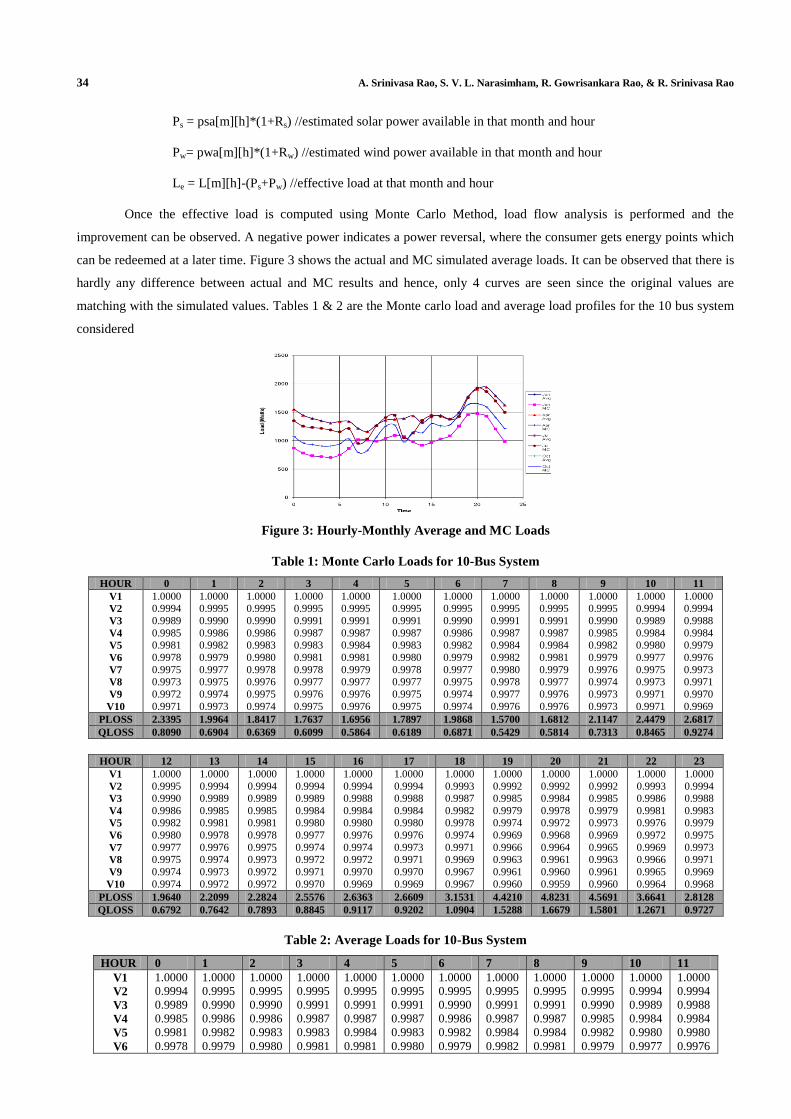
Once the effective load is computed using Monte Carlo Method, load flow analysis is performed and the
improvement can be observed. A negative power indicates a power reversal, where the consumer gets energy points which
can be redeemed at a later time. Figure 3 shows the actual and MC simulated average loads. It can be observed that there is
hardly any difference between actual and MC results and hence, only 4 curves are seen since the original values are
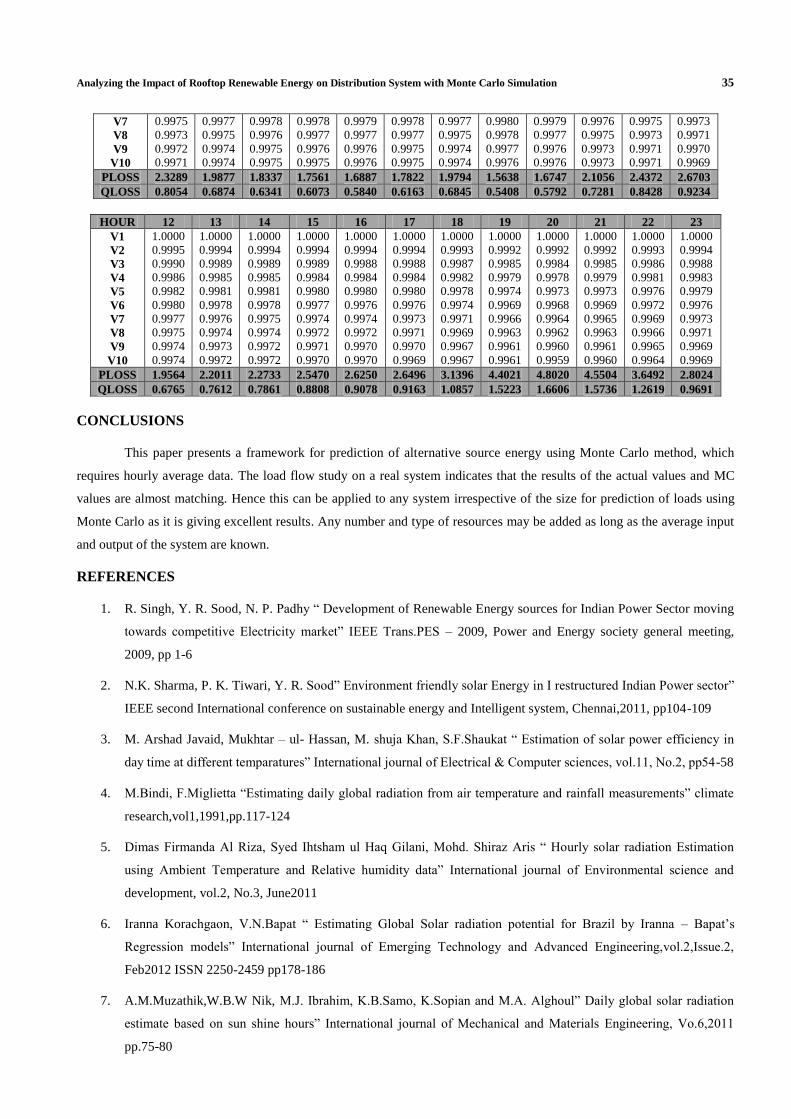
matching with the simulated values. Tables 1 & 2 are the Monte carlo load and average load profiles for the 10 bus system
considered
Figure 3: Hourly-Monthly Average and MC Loads
Table 1: Monte Carlo Loads for 10-Bus System
HOUR 0 1 2 3 4 5 6 7 8 9 10 11
V1
V2
V3
V4
V5
V6
V7
V8
V9
V10
1.0000 0.9994
0.9989
0.9985 0.9981
0.9978
0.9975 0.9973
0.9972
0.9971
1.0000 0.9995
0.9990
0.9986 0.9982
0.9979
0.9977 0.9975
0.9974
0.9973
1.0000 0.9995
0.9990
0.9986 0.9983
0.9980
0.9978 0.9976
0.9975
0.9974
1.0000 0.9995
0.9991
0.9987 0.9983
0.9981
0.9978 0.9977
0.9976
0.9975
1.0000 0.9995
0.9991
0.9987 0.9984
0.9981
0.9979 0.9977
0.9976
0.9976
1.0000 0.9995
0.9991
0.9987 0.9983
0.9980
0.9978 0.9977
0.9975
0.9975
1.0000 0.9995
0.9990
0.9986 0.9982
0.9979
0.9977 0.9975
0.9974
0.9974
1.0000 0.9995
0.9991
0.9987 0.9984
0.9982
0.9980 0.9978
0.9977
0.9976
1.0000 0.9995
0.9991
0.9987 0.9984
0.9981
0.9979 0.9977
0.9976
0.9976
1.0000 0.9995
0.9990
0.9985 0.9982
0.9979
0.9976 0.9974
0.9973
0.9973
1.0000 0.9994
0.9989
0.9984 0.9980
0.9977
0.9975 0.9973
0.9971
0.9971
1.0000 0.9994
0.9988
0.9984 0.9979
0.9976
0.9973 0.9971
0.9970
0.9969
PLOSS 2.3395 1.9964 1.8417 1.7637 1.6956 1.7897 1.9868 1.5700 1.6812 2.1147 2.4479 2.6817
QLOSS 0.8090 0.6904 0.6369 0.6099 0.5864 0.6189 0.6871 0.5429 0.5814 0.7313 0.8465 0.9274
HOUR 12 13 14 15 16 17 18 19 20 21 22 23
V1
V2
V3
V4
V5
V6
V7
V8
V9
V10
1.0000
0.9995 0.9990
0.9986 0.9982
0.9980
0.9977 0.9975
0.9974
0.9974
1.0000
0.9994 0.9989
0.9985 0.9981
0.9978
0.9976 0.9974
0.9973
0.9972
1.0000
0.9994 0.9989
0.9985 0.9981
0.9978
0.9975 0.9973
0.9972
0.9972
1.0000
0.9994 0.9989
0.9984 0.9980
0.9977
0.9974 0.9972
0.9971
0.9970
1.0000
0.9994 0.9988
0.9984 0.9980
0.9976
0.9974 0.9972
0.9970
0.9969
1.0000
0.9994 0.9988
0.9984 0.9980
0.9976
0.9973 0.9971
0.9970
0.9969
1.0000
0.9993 0.9987
0.9982 0.9978
0.9974
0.9971 0.9969
0.9967
0.9967
1.0000
0.9992 0.9985
0.9979 0.9974
0.9969
0.9966 0.9963
0.9961
0.9960
1.0000
0.9992 0.9984
0.9978 0.9972
0.9968
0.9964 0.9961
0.9960
0.9959
1.0000
0.9992 0.9985
0.9979 0.9973
0.9969
0.9965 0.9963
0.9961
0.9960
1.0000
0.9993 0.9986
0.9981 0.9976
0.9972
0.9969 0.9966
0.9965
0.9964
1.0000
0.9994 0.9988
0.9983 0.9979
0.9975
0.9973 0.9971
0.9969
0.9968
PLOSS 1.9640 2.2099 2.2824 2.5576 2.6363 2.6609 3.1531 4.4210 4.8231 4.5691 3.6641 2.8128
QLOSS 0.6792 0.7642 0.7893 0.8845 0.9117 0.9202 1.0904 1.5288 1.6679 1.5801 1.2671 0.9727
Table 2: Average Loads for 10-Bus System
HOUR 0 1 2 3 4 5 6 7 8 9 10 11
V1
V2
V3
V4
V5
V6
1.0000
0.9994
0.9989
0.9985
0.9981
0.9978
1.0000
0.9995
0.9990
0.9986
0.9982
0.9979
1.0000
0.9995
0.9990
0.9986
0.9983
0.9980
1.0000
0.9995
0.9991
0.9987
0.9983
0.9981
1.0000
0.9995
0.9991
0.9987
0.9984
0.9981
1.0000
0.9995
0.9991
0.9987
0.9983
0.9980
1.0000
0.9995
0.9990
0.9986
0.9982
0.9979
1.0000
0.9995
0.9991
0.9987
0.9984
0.9982
1.0000
0.9995
0.9991
0.9987
0.9984
0.9981
1.0000
0.9995
0.9990
0.9985
0.9982
0.9979
1.0000
0.9994
0.9989
0.9984
0.9980
0.9977
1.0000
0.9994
0.9988
0.9984
0.9980
0.9976
Analyzing the Impact of Rooftop Renewable Energy on Distribution System with Monte Carlo Simulation 35
V7
V8
V9
V10
0.9975
0.9973
0.9972
0.9971
0.9977
0.9975
0.9974
0.9974
0.9978
0.9976
0.9975
0.9975
0.9978
0.9977
0.9976
0.9975
0.9979
0.9977
0.9976
0.9976
0.9978
0.9977
0.9975
0.9975
0.9977
0.9975
0.9974
0.9974
0.9980
0.9978
0.9977
0.9976
0.9979
0.9977
0.9976
0.9976
0.9976
0.9975
0.9973
0.9973
0.9975
0.9973
0.9971
0.9971
0.9973
0.9971
0.9970
0.9969
PLOSS 2.3289 1.9877 1.8337 1.7561 1.6887 1.7822 1.9794 1.5638 1.6747 2.1056 2.4372 2.6703
QLOSS 0.8054 0.6874 0.6341 0.6073 0.5840 0.6163 0.6845 0.5408 0.5792 0.7281 0.8428 0.9234
HOUR 12 13 14 15 16 17 18 19 20 21 22 23
V1
V2
V3
V4
V5
V6
V7
V8
V9
V10
1.0000
0.9995
0.9990
0.9986
0.9982
0.9980
0.9977
0.9975
0.9974
0.9974
1.0000
0.9994
0.9989
0.9985
0.9981
0.9978
0.9976
0.9974
0.9973
0.9972
1.0000
0.9994
0.9989
0.9985
0.9981
0.9978
0.9975
0.9974
0.9972
0.9972
1.0000
0.9994
0.9989
0.9984
0.9980
0.9977
0.9974
0.9972
0.9971
0.9970
1.0000
0.9994
0.9988
0.9984
0.9980
0.9976
0.9974
0.9972
0.9970
0.9970
1.0000
0.9994
0.9988
0.9984
0.9980
0.9976
0.9973
0.9971
0.9970
0.9969
1.0000
0.9993
0.9987
0.9982
0.9978
0.9974
0.9971
0.9969
0.9967
0.9967
1.0000
0.9992
0.9985
0.9979
0.9974
0.9969
0.9966
0.9963
0.9961
0.9961
1.0000
0.9992
0.9984
0.9978
0.9973
0.9968
0.9964
0.9962
0.9960
0.9959
1.0000
0.9992
0.9985
0.9979
0.9973
0.9969
0.9965
0.9963
0.9961
0.9960
1.0000
0.9993
0.9986
0.9981
0.9976
0.9972
0.9969
0.9966
0.9965
0.9964
1.0000
0.9994
0.9988
0.9983
0.9979
0.9976
0.9973
0.9971
0.9969
0.9969
PLOSS 1.9564 2.2011 2.2733 2.5470 2.6250 2.6496 3.1396 4.4021 4.8020 4.5504 3.6492 2.8024
QLOSS 0.6765 0.7612 0.7861 0.8808 0.9078 0.9163 1.0857 1.5223 1.6606 1.5736 1.2619 0.9691
CONCLUSIONS
This paper presents a framework for prediction of alternative source energy using Monte Carlo method, which
requires hourly average data. The load flow study on a real system indicates that the results of the actual values and MC
values are almost matching. Hence this can be applied to any system irrespective of the size for prediction of loads using
Monte Carlo as it is giving excellent results. Any number and type of resources may be added as long as the average input
and output of the system are known.
REFERENCES
1. R. Singh, Y. R. Sood, N. P. Padhy “ Development of Renewable Energy sources for Indian Power Sector moving
towards competitive Electricity market” IEEE Trans.PES – 2009, Power and Energy society general meeting,
2009, pp 1-6
2. N.K. Sharma, P. K. Tiwari, Y. R. Sood” Environment friendly solar Energy in I restructured Indian Power sector”
IEEE second International conference on sustainable energy and Intelligent system, Chennai,2011, pp104-109
3. M. Arshad Javaid, Mukhtar – ul- Hassan, M. shuja Khan, S.F.Shaukat “ Estimation of solar power efficiency in
day time at different temparatures” International journal of Electrical & Computer sciences, vol.11, No.2, pp54-58
4. M.Bindi, F.Miglietta “Estimating daily global radiation from air temperature and rainfall measurements” climate
research,vol1,1991,pp.117-124
5. Dimas Firmanda Al Riza, Syed Ihtsham ul Haq Gilani, Mohd. Shiraz Aris “ Hourly solar radiation Estimation
using Ambient Temperature and Relative humidity data” International journal of Environmental science and
development, vol.2, No.3, June2011
6. Iranna Korachgaon, V.N.Bapat “ Estimating Global Solar radiation potential for Brazil by Iranna – Bapat’s
Regression models” International journal of Emerging Technology and Advanced Engineering,vol.2,Issue.2,
Feb2012 ISSN 2250-2459 pp178-186
7. A.M.Muzathik,W.B.W Nik, M.J. Ibrahim, K.B.Samo, K.Sopian and M.A. Alghoul” Daily global solar radiation
estimate based on sun shine hours” International journal of Mechanical and Materials Engineering, Vo.6,2011
pp.75-80

36 A. Srinivasa Rao, S. V. L. Narasimham, R. Gowrisankara Rao, & R. Srinivasa Rao
8. V.K.Marwal, R.C.Punia, N.Sengar, S.Mahawar and P.Dashora “ A comparative study of correlation functions for
estimation of monthly mean daily global solar radiation for jaipur, Rajasthan, India” Indian journal of science and
Technology, vol.5,no.5, pp.2729 -2732, may 2012
9. Rizwan.M, Jamil.M, Kothari.D.P “Generalized Neural Network Approach for Global Solar Energy Estimation in
India” IEEE trans. On Sustainable Energy vol3, Issue3, July2012, pp.576-584
10. Tamer Khatib, Azah Mohamed, M.mahmoud, K.Sopian “ Estimating Global Solar Energy Using Multi layer
Perception Artificial Neural Network” International journal of energy, Vol.6, Issue 1,2012,pp.25-33
11. Ibeh G.F and Agbo G.A” Estimation of mean monthly global solar radiation for Warri- Nigeria(using angstrom
and MLP ANN model)” Advances in applied science research, 2012, Pelagia research Library,pp.12-18
12. Emad A.Ahmed and M.EI – Nouby Adam “ Estimate of Global Solar radiation by using Artificial Neural
Network in Qena, Upper Egypt” Journal of clean energy technologies vol.1, no.2 April2013, pp.148-150
13. N.Premalatha, A.ValanArasu “ Estimation of Global Solar Radiation in India using Artificial Neural Network”
International journal of Engineering science and advanced technology, vol.2, issue.6 nov-dec 2012,pp. 1715-1721
14. J.V.Seguro and T.W.Lambert “ Modern estimation of the parameters of the Weibull wind speed distribution for
wind energy analysis” Journal of wind Engineering and Industrial Aerodynamics, vol.85, issue.1 pp.75-84
15. Nabiha Brahmi, Souhir Sallem, Maher Chaabene “ ANN based parameters estimation of Weibull: Application to
wind energy potential assessment of Sfax, Tunisia” Internationa Renewable Energy Congress, Nov 5 – 7,2010,
PP.203-207
16. S.Vijaya Venkataraman, S.Iniyan, L.Suganthi and R.Goic “ Wind Energy potential estimation in India” Clean
Technology 2010, pp.179 – 182
17. Tian Pau Chang “ Estimation of wind energy potential using different probability density functions” journal of
applied energy Vol. 88, Issue 5, May 2011, pp. 1848-1856
18. Kobayashi. Y and Hirata. M “ Estimation of wind resources through out the world” journal of heat transfer- Asian
research vol.34, issue 5, July 2005, pp. 279-292
19. Abbes.D, la Rochelle, Martinez.A, Champenois.G and Gaubert.J.P ‘ Estimation of wind turbine and solar
photovoltaic energy using variant sampling intervals” 14 th IEEE International Power Electronics and Motion
Control conference, 6-8 sep 2010, T12-28 – T12-34.
20. Mark L.Morrissey, Werner E.Cook and J.Scott Greene “ An improved method for Estimating the wind power
density distribution function “ Journal of atmospheric and Oceanic technology, vol.27, Issue 7,July 2010pp. 1153-
1164
21. Samik Ray Chaudhuri “Introduction to Monte Carlo Simulation” Proceedings of 2008 IEEE winter simulation
conference
22. Halamay. D.A “Monte Carlo analysis of impacts of high renewable power penetration” Energy conversion
congress and Exposition(ECCE), IEEE 2011, 17-22 Sep 2011,pp 3059-3066
23. Hopkins.M.D, Pahwa. A” Monte Carlo Simulation of energy production by a small wind generator” 40 th North
American power symposium, 28 – 30 september 2008, pp 1-6

Analyzing the Impact of Rooftop Renewable Energy on Distribution System with Monte Carlo Simulation 37
24. Billinton.R “ A sequential simulation method for the generating capacity adequacy of small stand alone wind
energy conversion systems” IEEE CCECE 2002, Canadian conference on Electrical and computer Engineering,
Vol1,pp 72-77
25. Amir Saf darian, Mahmud Fotuhi- Firuzabad, Farrokh Aminifar “Compromising wind and solar energies from the
power system adequacy view point” IEEE transactions on power systems vol 27, No 4, November 12, pp 2368 –
2376
26. Grigorious Marmidic, Stavros Lazarou, Eleftheria pyrgioti “ Optimal placement of wind turbines in a wind park
using Monte Carlo Simulation “ Science direct Renewable energy 33[2008] pp 1455-1460
27. Su Youli, Ken Nagasaka “Monte Carlo Simulation method used in reliability evaluation of a laboratory based
micro grid “ Proceedings of International conference on engineering and computer sciences, 2010, Vol 2, March
17 – 19, Hongkong