Analyzing E-Learning Adoption via Recursive Partitioning
41
Philipp Köllinger and Christian Schade Analyzing E-Learning Adoption via Recursive Partitioning Discussion Papers 34 6 Berlin, May 2003
Transcript of Analyzing E-Learning Adoption via Recursive Partitioning

Philipp Köllinger and Christian Schade
Analyzing E-Learning Adoption via Recursive Partitioning
Discussion Papers
346
Berlin, May 2003

Opinions expressed in this paper are those of the author and do not necessarily reflect views of the Institute.
DIW Berlin German Institute for Economic Research Königin-Luise-Str. 5 14195 Berlin, Germany Phone +49-30-897 89-0 Fax +49-30-897 89-200 www.diw.de ISSN 1619-4535

- 1 -
Analyzing E-Learning Adoption via Recursive Partitioning
Philipp Köllinger(1) and Christian Schade(2)
Working paper
May 9, 2003
(1) Deutsches Institut für Wirtschaftsforschung (DIW Berlin), Königin-
Luise-Str. 5, 14195 Berlin, Germany
(2) Humboldt-Universität zu Berlin, Institut für Entrepreneurship /
Innovationsmanagement, Ziegelstr. 13a, 10117 Berlin, Germany

PHILIPP KOELLINGER AND CHRISTIAN SCHADE
Analyzing E-Learning Adoption via Recursive Partitioning
Abstract.
The paper analyzes factors that influence the adoption of e-learning and
gives an example of how to forecast technology adoption based on a post-hoc
predictive segmentation using a classification and regression tree (CART). We
find strong evidence for the existence of technological interdependencies and
organizational learning effects. Furthermore, we find different paths to e-
learning adoption. The results of the analysis suggest a growing “digital
divide” among firms.
We use cross-sectional data from a European survey about e-business in
June 2002, covering almost 6,000 enterprises in 15 industry sectors and 4
countries. Comparing the predictive quality of CART, we find that CART
outperforms a traditional logistic regression. The results are more parsimo-
nious, i. e. CARTs use less explanatory variables, better interpretable since
different paths of adoption are detected, and from a statistical standpoint,
because interactions between the covariates are taken into account.
Keywords
TECHNOLOGY ADOPTION, PATH DEPENDENCE, INTERACTION BETWEEN
DIFFERENT TECHNOLOGIES, REGRESSION TREES, PREDICTIVE
SEGMENTATION, LOGISTIC REGRESSION, E-LEARNING, E-BUSINESS
JEL Classifications
O30 – Economic Development, Technological Change and Growth /
Technological Change / General; C14 – Econometric and Statistical Methods
/ General / Semiparametric and Nonparametric Methods; L29 – Industrial
Organization / Firm Objectives, Organization, and Behavior / Other
- 2 –

PHILIPP KOELLINGER AND CHRISTIAN SCHADE
Introduction
The diffusion of Internet-based technological innovations in firms has
recently received much attention both from researchers and from policy
makers. Innovations such as online sales, e-procurement, or supply chain
management are supposed to reduce variable costs and thus improve
productivity and eventually social rents. Adopters of these innovations are
frequently believed to gain competitive advantage over their rivals, which in
turn can result in changes in market structures and profit levels (see, for
example, OECD [2000] and Brynjolfsson [2000]). In addition, there is
evidence that investments into information and communication technologies
spur economic productivity and long term growth (Jorgenson [2001], Oliner
and Sichel [2000], Nordhaus [2002]).
Technological change is often associated with research and development.
However, only those innovations that are finally used lead to the realization
of economic benefits. To better understand the process by which innovative
new technologies may generate competitive advantage, higher productivity or
greater economic welfare, it is essential to explore and understand the
process of technology adoption (see Stoneman, [1995]).
A number of theories have been suggested to explain the adoption of
innovations by firms. The most prevailing are rank, stock, order, and epide-
mic effects. Also, uncertainty and technological interdependencies have
recently been discussed in the literature.
With rank effects one refers to the impact of size, R&D intensity, or market
power etc. on the adoption of new technology. The basic idea is that firms
are heterogeneous and differ from each other in at least one important
dimension such that the gross-return of a technological innovation is higher
for some firms than for others. This allows to rank firms in terms of the
benefit to be obtained from the use of the new technology. Firms that rank
higher are expected to adopt more rapidly. It is assumed that the gross-
returns from adoption are independent from the number of other users of
- 3 –

PHILIPP KOELLINGER AND CHRISTIAN SCHADE
the new technology (see, for example, David [1969], [1991], Davies [1979],
Götz [1999]).1
In models with stock effects diffusion occurs even if an industry exhibits a
priori identical firms. Stock effects imply that the timing of adoption and the
number of rival firms already using the new technology have consequences
for the adoption payoff of each firm in the market. It is argued that the
operating profit of a firm decreases as the number of firms producing with
the new technology increases. Also, the profit increase of each individual
firm induced by the adoption of the new technology diminishes as the share
of firms that have already adopted grows (see, for example, Reinganum
[1981). However, it can also be shown that under monopolistic competition
stock effects lead to diffusion rather than uniform adoption dates even when
payoffs equalize and firms in a market are both a priori and ex post identical
(Götz [1999]).
Order effects result from the assumption that the adoption payoff of a firm
depends upon its position in the order of adoption, with the existence of
first-mover advantages making early adoption more attractive (see
Fudenberg and Tirole [1985]). This could happen due to a restricted supply
of qualified labor or other inputs (such as prime geographic locations), on
the grounds of pre-emption, or reputation effects that result in greater
costumer loyalty etc.
Epidemic effects relate to endogenous learning as a process of self-
propagation of information about a new technology that grows with the
spread of that technology. Models of this kind have their origin in the
analysis of the spread of diseases (see, for example, Bass [1969]). In the most
simple form it is assumed that the use of a new technology is restricted by
1 A part of this line of reasoning is already reflected in Schumpeter’s early analysis of the
impact of monopoly power and firm size on innovativeness. Schumpeter primarily focused
on different investments in R & D. However, the basic idea also applies to process
innovations within firms that require the adoption of a new technology (see, for example,
Kamien and Schwartz [1982]).
- 4 –

PHILIPP KOELLINGER AND CHRISTIAN SCHADE
the number who know of the existence. As time proceeds, the experience of
pioneer users is transmitted through the population by human contact. Non-
users are “infected” by the information, and successively turn into users as
well. The behavioral theory behind this is that a part of the population is
being influenced by pressures of social emulation and competition.
Uncertainty as to the dynamics of price, technical change, or profitability of
an innovation existing in the early period of diffusion may also have
considerable influence on the diffusion process (see, for example, Jensen
[1982]). These uncertainties deter risk averse firms from adoption. However,
as time proceeds, uncertainty reduces as a result of learning from
experience, and thus the number of adopters increases. Uncertainty can be
seen as an extension to the epidemic theory because it places the availability
of information at the center of the analysis.
Also, the absolute capital requirements of installing the new technology are
frequently considered (see, for example, Mansfield [1968]). Capital
requirements may decrease over time due to falling prices of the technology
or more efficient ways of implementing it, which leads to higher adoption
rates.
Recently, research has started to analyze the influence of interactions
between different technologies on the diffusion process as an additional
dimension that contributes towards rank effects between firms (see, for
example, Stoneman and Kwon [1994] and Colombo and Mosconi [1995]).
Interaction effects can occur due to indirect network externalities arising
because of complementarities between goods (e.g. software and hardware
systems, see Church and Gandal [1993]), or due to firm’s experience with
previously available, related technologies.
Dosi [1982] points out that interdependencies have to be taken into account
when a cluster of technological innovations stems from a unique
technological paradigm. The idea is that most new technologies require
learning efforts, reorganization of processes, and cumulating experience on
the side of the user. If a firm has already done so for one particular
- 5 –

PHILIPP KOELLINGER AND CHRISTIAN SCHADE
technology, it will have greater benefits or lower costs from the adoption of a
related technology.
E-business technologies constitute such a cluster of technological
innovations with a unique paradigm (i.e. the Internet), owing to significant
complementarities which extend to IT-infrastructure, organization,
processes, know-how of employees and firm strategy. Thus, it can be
expected that the adoption of one particular e-business technology (such as
online sales) provides positive externalities to the adoption of another e-
business technology (such as supply chain management). This can be due to
the efficient supply of complementary inputs (for example in-house IT
specialists), availability of technological and organizational infrastructures
(for example an Intranet), or the transmission of information and know how
(organizational learning). Colombo and Mosconi [1995] refer to this as
cumulative learning-by-using effects, which reflect the stock of knowledge,
capabilities, technical and managerial skills that a firm has been developing
through the use of previous technologies related to the new technology under
scrutiny. The existence of such effects should have an impact on the
adoption pattern of firms: As far as complementarities prevail, the marginal
benefits from adoption of a technology are greater for firms which have
previously adopted other related technologies. This should result in a more
rapid diffusion of technologies in firms that are already experienced users of
related technologies.
In other terms, the “progress” of a firm upon the technological trajectory of e-
business is likely to retain some cumulative features: the probability of
advances is related to the position of a firm vis-à-vis the existing
technological frontier, i.e. the highest level upon a technological path with
respect to relevant technological and economic dimensions. The closer a firm
is to the technological frontier, the more likely it will make future advances
upon the technological trajectory. That is, the higher the Internet
competence of a firm, the more likely it will be to adopt additional e-business
innovations.
- 6 –

PHILIPP KOELLINGER AND CHRISTIAN SCHADE
In this paper we want to empirically explore factors that influence the
adoption of one particular Internet-based technological innovation, e-
learning. By e-learning we mean the use of online technologies to support
training activities in firms. We give an example of how to forecast the
probability of becoming an e-learning adopter based on a post-hoc predictive
segmentation analysis using classification and regression trees (CART). The
analysis is predictive because it allows to forecast the probability of adoption
based on the group membership of a particular firm, and it is post-hoc
because the groups are determined based on the results of the data analysis,
rather than on a-priori defined segments.
The CART method allows us to discover the factors that have the most
influence on becoming an adopter and to identify different paths to adoption.
In addition, the method allows to forecast the probability of a firm to become
an e-learning adopter at one particular point in time based on the
parameter-values of the key adoption factors. We show that the adoption
factors we find are highly significant and provide strong support for the
existence of technological interdependencies and organizational learning
effects. Furthermore, we provide evidence that CARTs can outperform
standard Logit models in parsimony and predictive quality. CARTs are easy
to interpret and provide more accurate estimation results than Logit models
when interdependencies between the covariates exist.
The Data
The data used for this analysis originates from the first enterprise survey of
the e-business market w@tch function, a research project sponsored by the
European Commission, DG Enterprise. The first survey round was
conducted in summer 2002 among almost 10,000 firms, covering 15
industry sectors across 15 member states of the European Union2. The
- 7 –
2 The precise definition of the sectors included in the survey can be found on the website of the project at http://www.ebusiness-watch.org. If you are interested in obtaining the original data set, contact Philipp Koellinger for further information.

PHILIPP KOELLINGER AND CHRISTIAN SCHADE
purpose of the questionnaire was to measure the uptake and impact of e-
business technologies.
A number of particularities had to be taken into account when using this
data set for our purposes. First, the survey was conducted in all 15 sectors
only in the four largest European member states (France, Germany, Italy,
and the UK). In the smaller countries only five to six sectors where included
in the survey. We therefore decided to limit our analysis to the EU4 that
exhibits a homogeneous sector coverage to eliminate sample selection bias.
This reduced the number of relevant observations to 5,917.
Second, the survey was conducted as a stratified sample to include a
sufficient number of larger companies. Each country-sector-cell includes
approximately 100 observations, stratified into three enterprise size classes
(1-49, 50-249, and more than 250 employees). This approach allowed to
display survey results in different weighting schemes at the aggregate level to
arrive at approximately representative figures. However, for multivariate
analysis weighting would have artificially blown up the database by factors
larger than four for most sectors due to the prevalence of small companies.
This would result in heavily biased significance tests and other
methodological problems, which is why we abstained from weighting. Thus,
our results are not representative for the entire population of firms, but only
for those included in this sample.
Third, the survey involved a number of filter questions that enabled the
interviewer to terminate the interview when a firm did not have computers or
Internet access, and therefore did not have the minimum necessary
infrastructure to conduct any kind of e-business. These firms are still part of
the database, and had to be filtered out. This reduced the number of
observations to 5,399.
A number of further considerations had to be made concerning the adoption
of e-learning to eliminate bad noise in the data. For the purpose of the
survey and for this paper, e-learning is defined as the usage of online,
Internet-based technologies to support employee training. Thus, firms that
did not have the necessary basic infrastructure and ability to use the WWW
- 8 –

PHILIPP KOELLINGER AND CHRISTIAN SCHADE
and Email could also be filtered out. At last, firms that do not offer any kind
of computer training support to their employees were also excluded. Firms
that do not care about the basic computer skills of their work force do
obviously not qualify for the rather advanced application of e-learning. This
way we arrived at our working sample for the analysis, which still includes
4,098 firm observations, 801 of which are e-learning users (19.5%).3 All of
these firms fulfill the necessary technological and organizational
requirements to eventually become e-learning adopters4.
The data we used consisted of qualitative, binary variables only. It does,
unfortunately, have no time dimension. It only measures the degree of e-
business uptake in summer 2002. However, for the purpose of identifying
factors and patterns that influence adoption at that point in time, the data
proves useful. Furthermore, empirical tests have shown that adoption
factors with significant influence at one point in time usually also remain
significant in a dynamic analysis (see Litfin [2000]).
The survey was very extensive with respect to collecting e-business
indicators and includes more than 100 questions for each observation. For
the purpose of brevity we only shortly discuss some of the variables here
that are theoretically of interest. The complete list of modules and indicators
of the survey can be found in the annex.
Most of the indicators in the data relate to rank effects as they capture the
heterogeneity of firms, for example with respect to their sector membership,
country of origin, size class, IT infrastructure, turnover development, and
employee training activities. Uncertainty of firms about the potential benefits
and risks of e-business are captured in a number of “soft” indicators that
ask firms about e-commerce barriers, their general attitude towards e-
business, and potential winners and losers of the new technology. Stock,
3 Of the 1,819 firms that we excluded from the analysis, 85 stated to be e-learning users
(4.7%). We believe these firms did not understand the question correctly and confused e-learning with the usage of CD-Roms or similar applications that were not of interest for our analysis.
- 9 –
4 That is, they all have computers and Internet access, use the WWW and Email, and offer some kind of computer training support to their employees.

PHILIPP KOELLINGER AND CHRISTIAN SCHADE
order, and epidemic effects are not covered in the survey because of the
lacking time dimension.
However, because of the extensive coverage of e-business technology
parameters in the survey, the data is pre-destined to test for the existence of
interactions between different technologies on the adoption of e-learning.
This is particularly noteworthy because of the joint technological paradigm of
all Internet-based process innovations. Thus, we would expect a positive
influence of other e-business technologies on the adoption of e-learning.
Methodology: Classification and Regression Trees
The objective of our analysis is to identify factors and patterns that are most
predictive for whether a firm is an e-learning adopter or not. Once this is
done, it is possible to calculate the probability of being an e-learning adopter
for each individual firm.
- 10 –
We are using a classification and regression tree (CART) for this purpose.
CART is a nonparametric regression and classification method. There are
different versions of CART that can be used to analyze either continuous or
nominal dependent variables. In our case, the dependent variable is nominal
(E-Learning: Yes=1; No=0). The corresponding parametric alternatives to
CART for qualitative dependent variables are the logistic regression or probit
models. CART has a number of advantages over traditional parametric
regression methods. Parametric regression models may not lead to faithful
data descriptions when the underlying assumptions are not satisfied, for
example if the covariates are not strictly independent and some kind of
higher-order interactions exist among potent predictors (multicollinearity).
CART relaxes some of these assumptions, reveals interactions of covariates,
and uses them to improve the quality of the model. Another advantage of
CART is that independent variables can be a mixture of binary, ordinal and
metric scales. Tree-based models are usually more accurate and easier to
use for classification and simulation than the parametric ones. Results and
decision rules are easy to interpret. In addition, CART is robust to outliers
and, unlike parametric models, invariante to monotone transformations of
predictors (see Gatnar [2002]).

PHILIPP KOELLINGER AND CHRISTIAN SCHADE
We will discuss further methodological issues later on. Also, we will compare
the results and the predictive power of CART versus a logistic regression for
our data .
CARTs were first introduced by Breiman et. al. (1984). The following section
gives a brief introduction to CART, closely referring to the excellent
presentation of Zhang and Singer [1999]. The basic idea of CART is to
systematically segment cases into homogeneous groups based on a set of
measurements on each case in the sample. CART uses these measurements
to predict what class a subject is in. In our case, we are interested in
identifying classes of firms that exhibit significantly different probabilities of
being e-learning adopters and we want to understand which factors account
for the differences.
The root node of a tree contains the sample of subjects from which the tree
is grown. Then, based on the parameter value which is most predictive for
the outcome, the root node is split into two daughter nodes that now form a
second layer of the tree. All nodes in the same layer constitute a partition of
the root node. The process of splitting nodes is continued and the partition
becomes finer and finer as the layer gets deeper and deeper. This process is
called recursive partitioning. Each case x of the sample is being sorted into
one of the daughter nodes at each layer of the tree, according to the splitting
rule that was used. Those subsets which are not split are called terminal
nodes. When x finally moves into a terminal subset, its predicted class is
given by the class label attached to that terminal subset (e.g. “adopter {Y=1}”
or “non-adopter {Y=0}” for node t).
The essence of recursive partitioning is that it tries to find terminal nodes
that are homogeneous in the sense that they contain only cases that are
either {Y=1} or {Y=0}. On the other hand, the internal nodes are
heterogeneous because they contain both {Y=1} and {Y=0}, in our case e-
learning adopters and non-adopters. Complete homogeneity of terminal
nodes is an ideal that is rarely realized. Thus, the numerical objective of
partitioning is to make the contents of the nodes as homogeneous as
- 11 –

PHILIPP KOELLINGER AND CHRISTIAN SCHADE
possible. A quantitative measure of the extent of node homogeneity is the
fraction of positive outcomes {Y=1} in a node:
(1) n
YnYh }1{)1( === ,
which is also called “node impurity”. The closer the fraction is to 0 or 1, the
more homogeneous the node. To understand the construction of the tree, is
it necessary to define why and how a parent node is split into two daughter
nodes; and when to declare a terminal node.
Splitting the nodes: CART considers all possible predictor variables in the
data set for each parent node and chooses the one that allows the best split.
Note that because of that a predictor variable may appear more than once in
a tree. A number of methods have been proposed to define the best split (see,
for example, Breiman [1984] chapter 4). We have decided to use entropy
impurity for the construction of the tree. The entropy criterion is related to
the likelihood function. It tends to look for splits where as many levels as
possible are divided perfectly or near perfectly. As a result, entropy puts
more emphasis on getting rare levels right to common levels than e.g. Gini or
Twoing. This is desirable in our case because e-learning adopters are
relatively rare. In addition, using entropy allows to compare the performance
of CART with a logistic regression on “fair grounds” because both methods
use a likelihood function approach.
Consider the following split, where a, b, c, and d are the number of subjects
in the two daughter nodes:
- 12 –

PHILIPP KOELLINGER AND CHRISTIAN SCHADE
Predictor Adopter Non-Adopter
Left node )( Lt 1=is a b a+b
Right node ( )Rt 0=is c d c+d
a+c b+d n =a+b+c+d
Then, the entropy impurity in the left daughter node is
(2)
++−
++−=
bab
bab
baa
baatL loglog)(i .
Likewise, the entropy impurity in the right daughter node is
(3)
++−
++−=
dcd
dcd
dcc
dcctR loglog)(i .
The impurity of the parent node consequently is
(4)
++
−
++
−=n
dbn
dbn
can
cati loglog)( .
The goodness of a split, s, is then measured by
(5) }{}{)(}{)(),( RRLL titPtitPtitsI −−=∆
The goodness of a split is calculated for all possible predictor variables, and
the best split, which is the one with the highest ),( tsI∆ , is selected.
This recursive partitioning process continues until the tree is saturated in
the sense that the offspring nodes subject to further division cannot be split
any further (e.g. when there is only one subject in a node). The saturated
tree is usually too large to be useful, because the terminal nodes are so
small that they cannot make statistical inference. Also, this level of detail is
not interpretable or trivial.
Determining terminal nodes: We use the pruning algorithm proposed by
Breiman et. al. (1984) to solve this problem. Beginning with the generally
large tree, we “prune” it from the bottom up to find a subtree of the
- 13 –

PHILIPP KOELLINGER AND CHRISTIAN SCHADE
saturated tree that is most predictive of the outcome and least vulnerable to
the noise in the data. For this purpose, we define the cost complexity of the
entire tree as
(6) Τ+Τ=Τ ~)()( αα RR ,
where )0(≥α is a complexity parameter that can be calculated for every
subtree (see Zhang and Singer [1999], section 4.2.2 and 4.2.3), Τ~ is the
number of terminal nodes, and )(ΤR the misclassification cost of all terminal
nodes T, which we will explain later. This cost function allows to optimize the
classification quality of the tree with respect to its complexity (tree size). The
CART algorithm constructs a sequence of nested “essential subtrees” of the
original saturated tree, examines the properties of these subtrees, and
chooses the subtree with the smallest value for )(ΤαR .
The only open question now is how to measure the predictive quality of the
tree. Recall that CART predicts the outcome (adoption or non-adoption)
based on the group membership of a subject. In the tree, each subject falls
into exactly one terminal node. Thus, the quality of the entire tree is merely
the quality of its terminal nodes
(7) , ∑∈
=ΤTt
trtPR )()()(
where is the quality of the tree, T the set of terminal nodes in the tree,
the probability of a subject to fall into the terminal node t, and the
quality measure of the node, similar to the sum of squared residuals in the
linear regression. Because we predict the outcome based on the group
membership of a subject, false positive and false negative errors can occur. It
is possible to weigh these errors and to assign specific misclassification
costs.
)(ΤR
)(tP )(tr
Let )( ijc be a unit misclassification cost that a class j subject is classified as
a class i subject. When i=j, the classification is correct and the cost should
be zero. Since i and j take only values of 0 or 1, we can set 1)01( =c . In other
words, one false positive error counts as one. The cost of a false negative
- 14 –

PHILIPP KOELLINGER AND CHRISTIAN SCHADE
error could be specified differently, e.g. 10)10( =c , that is one false negative
counts as much as 10 false positive ones. Note that only the ratio of the
costs of both classes matters, not the absolute numbers.
In some cases, a cost ratio that is smaller or greater than one could be
necessary because the consequences of assigning a subject false negative
could be more severe than a false positive misclassification, or vice versa.
For example, this is relevant in the medical science when ordering patients
into risk groups (see Zhang and Bracken [1995]). However, in our case we
did not see a specific reason to punish one error more heavily than the other.
Instead, we are interested in predicting the aggregate number of adopters as
good as possible. For this reason, the misclassification costs for both errors
are set to one.
Formally, the expected cost resulting from any subject within a node, also
called the “conditional misclassification cost” within a node, is given by
(8) ( ) { }[ ]∑ ==i
tiYPjictr )( .
This is the weighted sum of errors resulting from assigning node t either to
group i or group j, respectively. Formally, node t is assigned to class j if
(9) { }[ ] { }[ ]∑ ∑ =−≤=i i
tiYPijctiYPijc )1()(
For our special case, where 1)01( =c and 1)10( =c , node t is assigned to class i
if { } 5.0≥= tiYP
)(tP
and vice versa. Multiplying from (8) by the probability of
the node yields the “unconditional misclassification cost” , also
called the resubstitution estimate of the misclassification cost for nodet:
)(tr
)(tR s
(10) . )()()( trtPtR s =
This is the specification used to determine the quality of the terminal nodes,
, in the pruning cost function (6). )(ΤR
We used the freeware RTREE developed by Heping Zhang of Yale University
for the analysis of our data set. As pointed out above, the misclassification
- 15 –

PHILIPP KOELLINGER AND CHRISTIAN SCHADE
cost for both types of errors is equally set to 1. In addition, the pruning was
stopped when the following two conditions were satisfied simultaneously:
(11) 5.0)1( ≥=it
tYP for a terminal node t and
(12) 5.0)1( <= itYP for the parent node t of the terminal node t. i
This allows to identify the segments with the highest probability of becoming
e-learning adopters, overriding the pruning algorithm when pruning
suggested to merge a high probability group with a low probability group
(daughter nodes) to form a non e-learning group (parent node with
5.0)1( <= itYP ) for the sake of a smaller tree. Thus, we deliberately accepted
to increase the number of terminal nodes and the number of false positive
misclassifications slightly for the purpose of finding the most e-learning
affine segments in the data set. This seemed plausible as we defined from
the beginning that we were not as much interested in minimizing one
particular kind of error, but rather in predicting the aggregate number of
adopters correctly. For this purpose it was essential to identify the segments
with the highest probability of becoming e-learning adopters, even if they are
small compared to the entire population and thus would have been neglected
according to the cost complexity function (6).
Empirical Results: Different Paths to E-Learning Adoption
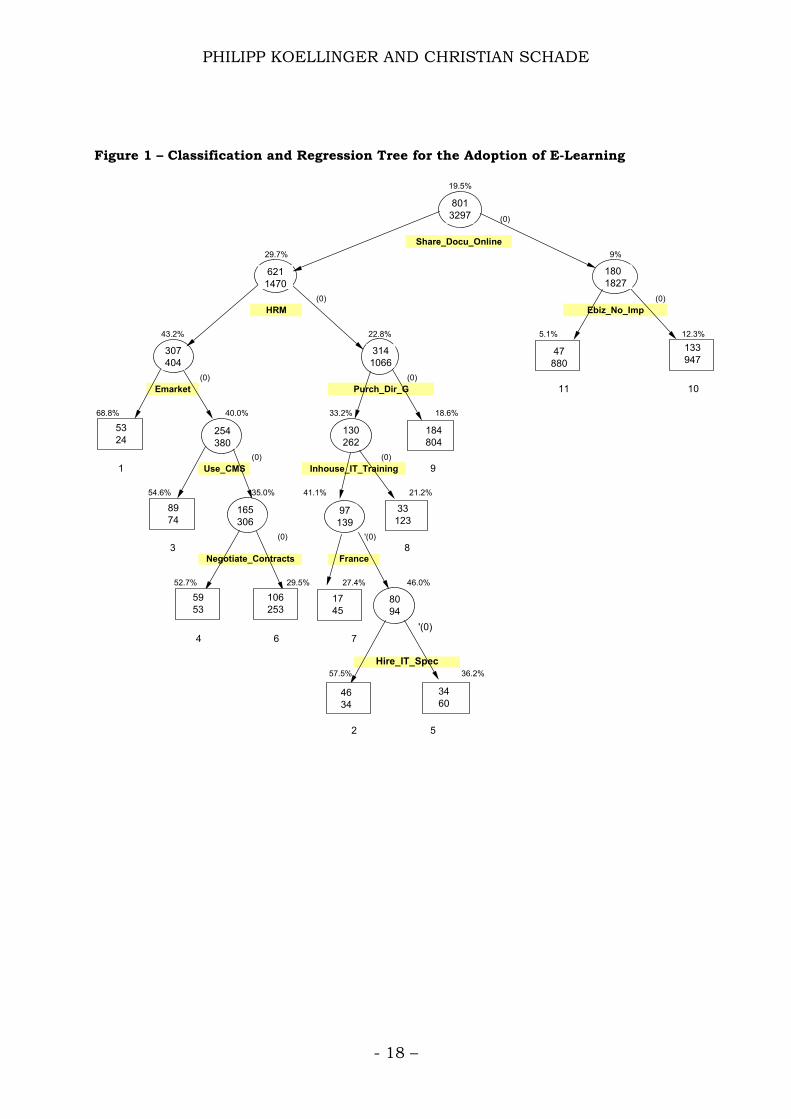
The results of our analysis are displayed in figure 1, a detailed description of
the relevant predictor variables is given in table 1. Note that all available
variables in the dataset were included in the CART analysis. In each tree
node the number of e-learning adopters (top) and non-adopters (bottom) is
given, as well as the ratio of adopters (percentage figure above the node). The
variable names below the nodes are the predictors that provided the best
split for the node according to the entropy impurity criterion of equation (5).
Because all variables in the data set were of binary format (with 0=No and
1=Yes), the split of each node was according to whether the predictor
occurred or not. Negative replies are always sorted to the right in figure 1.
- 16 –

PHILIPP KOELLINGER AND CHRISTIAN SCHADE
The terminal nodes can be ordered according to the ratio of e-learning
adopters they contain. The numbers below the terminal nodes indicate this
order, with 1 being the most and 11 being the least e-learning affine segment
in the data. We will refer to these order number of the segments to describe
and interpret them.
- 17 –
PHILIPP KOELLINGER AND CHRISTIAN SCHADE
Figure 1 – Classification and Regression Tree for the Adoption of E-Learning
(0)
(0) (0)
(0) (0)
(0) (0)
35.0% 21.2%
(0) '(0)
52.7% 29.5% 46.0%
'(0)
57.5% 36.2%Hire_IT_Spec
Purch_Dir_G
Ebiz_No_Imp
8France
Inhouse_IT_Training
Share_Docu_Online
3
6 7
27.4%
Negotiate_Contracts
19.5%
29.7%
43.2%
9%
HRM
10
12.3%
Use_CMS
11
33.2% 18.6%
22.8% 5.1%
1
68.8% 40.0%
2 5
Emarket
41.1%54.6%
4
9
8013297
3141066
8094
1745
97139
33123
130262
184804
5324
254380
307404
6211470
1801827
47880
133947
8974
165306
5953
106253
4634
3460
- 18 –

PHILIPP KOELLINGER AND CHRISTIAN SCHADE
Table 1 – Description of relevant predictor variables
Predictors in Tree
Variable description
Share_Docu_ Online
Company uses online technologies to share documents with colleagues or to perform collaborative work in an online environment
HRM Company uses online technologies to support human resources management Ebiz_No_Imp Company says that e-business does not constitute a significant part of the way how it
operates today. Emarket Company trades goods or services through a B2B e-marketplace. Purch_Dir_G Company uses the Internet to purchase goods that go directly into the products or services
the company offers (direct goods). Use_CMS Company uses a content management system for its webpage. Inhouse_IT_ Training
Company provides in-house computer or IT training for its employees.
Negotiate_ Contracts
Company uses online technologies other than email to negotiate contracts.
France Company’s main domicile is in France. Hire_IT_Spec Company tried to recruit IT specialists within the last 12 months (before June 2002). Additional Predictors in Logit Model
Variable description
Z01B_MON Sector dummy for monetary institutions (banks and credit institutions) SZ50_249 Dummy for enterprises with 50-249 employees NONE_BEN Companies says that no one will benefit from e-business ACC_WWW Majority of office workers has access to the WWW ET_WTLEA Employees can use working time for learning purposes ET_THP_C Company offers computer training by third parties to employees USE_EXTR Company uses an extranet REIMBUR Company uses Internet technologies to reimburse travel costs DOC_SUPP Company uses online technologies other than email to exchange documents with suppliers MAN_CAP Company uses online technologies to manage capacities PMORE2Y Company purchases online for more than 2 years SLESSTH5 Company sells less than 5 per cent of its total sales online IT_SP_IN Company will increase IT spending in the coming 12 months
The final tree consists of eleven terminal nodes. CART used 10 different
predictor variables to construct the tree. Each of the terminal nodes exhibits
different fractions of e-learning users. The most e-learning affine segment
(number 1) contains almost 70% of adopters, whereas in the least e-learning
affine segment (number 11) a fraction of only 5% uses e-learning.5 The
terminal nodes each contain a different number of firms. Some of the nodes
are rather small and describe rare, but statistically relevant sub-groups (like
- 19 –
5 Note that the fraction of e-learning adopters in segment 11 is still significantly higher than the fraction of the excluded cases that stated to use e-learning.

PHILIPP KOELLINGER AND CHRISTIAN SCHADE
number 1, which contains only 77 firms), whereas others are very large (like
number 10, which contains 1,080 firms). The firms in each terminal node
share the common characteristics of all relevant predictor variable
parameters that lead to the node. For example, firms in node 11 all have in
common that they do not use online technologies to share documents
(Share_Docu_Online=0), and they stated that e-business does not play a
significant role in the way the company operates in June 2002
(Ebiz_No_Imp=1). Note that the impact of each predictor variable on the ratio
of e-learning users can be followed along the tree branches. For example, the
fraction of e-learning users decreases from 19.5% (root node) to 9% for firms
that do not share documents online. It again drops sharply to 5.1%, if firms
also said that e-business currently plays no role for them.
Table 2 summarizes inference statistics for the micro level of the tree, that is
for each individual split. The performance of the entire tree (macro level) will
be evaluated in the next section (see table 4). In table 2, the impurity of the
best split according to (5) is given. In addition, the relative resubstitution
risk and the according 95% confidence interval are reported. The relative
resubstitution risk is the probability of being an e-learning adopter if a
subject is a member of one node divided by the probability of being an e-
learning adopter if the subject is a member of the other node. For example,
the two daughter nodes of the first split (Share_Docu_Online) have a
resubstitution risk of 3.31. This means that the probability of being an e-
learning adopter is 3.31 times higher for those subjects that share
documents online than for those that do not.
The corresponding confidence intervals for the true resubstitution risk can
also be computed (see Sheskin [2000], section 16.6). The distribution in the
two daughter nodes can be described in a two-way contingency table, where
a, b, c, and d are the number of subjects:
E-Learning = YES E-Learning = NO Left daughter node a b Right daughter node c d
- 20 –

PHILIPP KOELLINGER AND CHRISTIAN SCHADE
The calculation of the confidence interval requires to compute the standard
error of the two daughter nodes, which is given by
(13) dcba
SE 1111+++= .
Since the sampling distribution of the resubstitution risk is positively
skewed, a logarithmic scale transformation is employed in computing the
confidence interval (see Christensen [1990] and Pagano and Gauvreau
[1993]). The α -confidence level is obtained by
(14) ( )[ ] ( )[ ]{ }αα zSErzSEr ee •+•− lnln ; ,
where r is the resubstitution risk and is the tabled two-tailed z value for
the
αz
( )α−1
.z
confidence level. For the 95% confidence level, the relevant .05
value is . 96.105 =
A split is significant, if we can be sure that the probability of being an e-
learning adopter is not equal in both daughter nodes. Thus, we should be
able to reject the null-hypothesis that the resubstitution risk equals 1. In
other words, the α -confidence level should not include 1.
According to this criterion, all splits in the tree are significant at the 95%
confidence level, except “France” and “Hire_IT_Spec”. “France” is significant
at 90%, “Hire_IT_Spec” at 85% confidence. These two weak splits were
deliberately not “pruned away” because of the interesting and e-learning
affine cluster 2. In the evaluation of the performance of the entire model in
the next section, we will see that cluster 2 is a highly significant predictor for
e-learning (see table 4). The related clusters 5 and 7 remain insignificant in
the marco evaluation. Their existence, however, had to be tolerated in order
to identify the highly relevant cluster 2.
- 21 –

PHILIPP KOELLINGER AND CHRISTIAN SCHADE
Table 2: Inference statistical measures for the tree
Split Impurity of split Resubstitution relative risk
95% confidence interval
Share_Docu_Online .46 3.31 2.77 ; 3.96 HRM .59 1.90 1.56 ; 2.31 Ebiz_No_Imp .29 2.43 1.72 ; 3.43 Emarket .67 1.72 1.03 ; 2.85 Purch_Dir_G .52 1.78 1.37 ; 2.32 Use_CMS .66 1.56 1.09 ; 2.24 Inhouse_IT_Training .61 1.94 1.22 ; 3.09 Negotiate_Contracts .63 1.78 1.16 ; 2.76 France .66 1.68 .89 ; 3.16 Hire_IT_Spec .67 1.59 .86 ; 2.93
Table 3 shows how the tree segments correspond to the a-priori classes
defined in the survey (sector membership, size class, country of origin). It
can be seen that some significant correlations between a-priori and post-hoc
segments prevail, however, they are by no means equivalent or trivial.
We find that the most e-learning affine clusters contain over-proportionately
many firms from the UK and Germany. The e-learning ratio in France
remains below the EU4 average. Also, the adoption pattern of French firms
seems to exhibit some national particularities that lead to a sorting out of
French firms in cluster 7.
As expected, large companies are over-proportionately represented in the
highly e-learning affine clusters 1 and 3, while small firms dominate the
least e-learning affine segments 10 and 11.
- 22 –

PHILIPP KOELLINGER AND CHRISTIAN SCHADE
Table 3– Significant Correlations of Tree Segments with Sectors, Countries, and Size
Classes
Tree 1 2 3 4 5 6 7 8 9 10 11 Food + Publishing + Chemicals + Metal + Machinery - Electronics + - Transport Eq. + Retail - Tourism + Banks + + - - Insurances - - + Real Estate - - + Telcos & IT + + + + + + - - Business Services - Health - France - - - - - ++ - + -- ++ Germany + - + - - + - ++ -- Italy - + UK + + + + - - 1-49 empl - -- - -- + - ++ + 50-249 + + + - >250 empl + ++ ++ - - - All entries significant at 95% ++: phi> 0.1; +: 0 <phi< 0.1; -: 0 >phi> -0.1; --: phi< -0.1
The results of the tree provide very strong evidence for the existence of
technological interdependencies and organizational learning effects. In fact,
seven of the ten relevant predictor variables in the tree directly relate to the
usage of other e-business technologies. Other indicators in the dataset that
reflected firm heterogeneity, such as size class, sector membership, or
turnover development, did not turn out to be relevant. Also, none of the
variables that served as proxies for the uncertainty of e-business
investments are relevant. The five variables with the highest predictor power
with respect to e-learning (the variables in layers one to three) exclusively
indicate the usage of some other e-business technology.
- 23 –

PHILIPP KOELLINGER AND CHRISTIAN SCHADE
It has to be kept in mind that the usage of other e-business technologies as
explanatory variables in the model does not imply a simple causal
relationship. From this cross-sectional dataset we cannot tell in which order
a company has adopted various e-business technologies. E.g., we do not
know whether firms in cluster 1 have first adopted e-marketplaces or e-
learning. Because of this we cannot say that e-marketplaces explain e-
learning or vice versa. Thus, all variables in the model that relate to the
usage of some other e-business technology have to be interpreted as a proxy
for the sunk investments into the technological trajectory of Internet-enabled
processes that a company has already undertaken and the degree of
organizational learning that results as a consequence of these investments.
In other words, the technology variables in the tree are proxies for the
Internet competence of a firm.
The existence of other e-business technologies implies a functioning IT
infrastructure, know-how of managers and employees to implement and use
Internet technologies, and an organizational structure and firm strategy that
is compatible with e-business innovations. All of these conditions are costly
to obtain but necessary to realize the full benefits that e-learning promises to
its users (e.g. learning on demand, cost savings, shorter learning times, and
higher consistency of training contents). Consequently, firms that are
already advanced users of some e-business technologies rank higher in the
benefits they expect from any other innovation from the same technological
paradigm (including e-learning), and thus are more likely to adopt.
Moreover, we see that there are different paths to e-learning adoption and
that significant differences still prevail between the adopter segments. For
example, the two segments with the highest rate of e-learning users are
found in two very different arms of the tree.
Segment 1, which exhibits almost 70 per cent of e-learning users, can be
referred to as fully Internet-enabled enterprises. This segment is sufficiently
characterized by just three predictor variables: It includes firms that share
documents online, use Internet technologies to support human resource
management functions (such as tracking working time, vacations, employee
- 24 –

PHILIPP KOELLINGER AND CHRISTIAN SCHADE
evaluations etc.), and use B2B online market places to sell or purchase
goods and services. At least HRM and B2B market places can be seen as
rather advanced e-business applications that are not yet used by many
companies. In other words, firms in this segment are already very advanced
in the usage of Internet technologies. In fact, the complementarities between
the technologies and the collected experience with these technologies seem
to imply that these firms can indeed expect lower implementation costs and
higher benefits of e-learning. Large British firms from the
telecommunications and computer services sector are over-proportionately
represented in this cluster.
The situation of companies in segment 2, which still exhibits almost 60 per
cent of e-learning users, is very different. This segment also contains firms
that are familiar with basic Internet applications, but they are not as
advanced in usage as segment 1. For example, they do not use HRM tools or
B2B online market places. They partially compensate for that by using the
Internet to purchase goods that go directly into the goods or services they
produce. However, something else is characteristic: Firms in this segment
tried to recruit IT specialists within the last year, and they offer in-house
computer training to their employees. Obviously, these firms are highly
interested to invest into their human capital, and they are interested to
increase their IT competence. Thus, these firms do not primarily choose to
adopt e-learning because it easily fits into their way of doing business, but
rather because they made the decision to invest into their human resources
and to catch up in terms of IT competence. Firms from the German telco and
computer services sector are heavily represented in this group.
Interestingly, CART filters out firms from France in this arm of the tree.
French firms exhibit a much lower degree of e-business usage across a wide
range of applications. This might be due to the Minitel history of France, or
could also have to do with cultural preferences about how to do business. In
any case, the adoption pattern of French firms is different from that of other
countries.
- 25 –

PHILIPP KOELLINGER AND CHRISTIAN SCHADE
Firms in segments 3 and 4, which still exhibit more than 50% of e-learning
users each, are comparable to segment 1. They are also characterized by an
advanced degree of e-business technology usage, which makes e-learning
attractive to them. These clusters includes over-proportionately many
medium sized and large companies.
The two segments with the lowest rate of e-learning users (number 10 and
11) capture a major part of the sample population. Together, 2,007 firms fall
into these two classes, which is almost half of the sample. These companies
have in common that they do not share documents online. This appears to
be a very powerful proxy for the basic “e-readiness” of a company. Firms that
do not use this rather simple form of Internet technology are obviously not
ready yet to adopt more complex solutions, such as e-learning. Cluster 11,
containing the smallest ratio of e-learning adopters of all segments, is
furthermore characterized by the company’s statement that e-business does
currently not play any role in the way business is conducted. This cluster is
very typical for small firms from France and Italy, whereas small firms from
Germany seem to be slightly more advanced and are heavily represented in
cluster 10. Compared to segments 1, 3, and 4, companies in segments 10
and 11 would have to bear much higher costs to adjust their organization, IT
infrastructure, and to acquire the necessary skills in order to benefit from e-
learning. Thus, the adoption of e-learning is much less attractive to firms in
these segments. Consequently, they are more likely to adopt e-learning
either later or never. This suggests a growing “digital divide” between firms
that have already made progress on the path towards e-business, and those
who have not. Keeping in mind that IT and e-business applications are
usually associated with lower variable costs and thus higher productivity,
this growing “digital divide” could have important consequences for market
structures and the economy in general.
The remaining classes share a mixture of attributes from the characteristics
of the more noticeable segments described above. Firms in these remaining
classes exhibit e-learning adoption rates that are more comparable to the
average of the entire population. One could speculate that companies in
- 26 –

PHILIPP KOELLINGER AND CHRISTIAN SCHADE
these segments are in a transitional phase, adopting some Internet
technologies for parts of their operations.
Comparing CART with a Logit-Model
We complete the evaluation of the tree by analyzing its overall performance
in terms of loglikelihood, significance of terminal nodes, and predictive
performance. We compare CART with a logistic regression and finish the
model comparison with a methodological note. To measure the overall
quality of the CART model, we define dummy variables for all terminal nodes
of the tree. For example, the dummy for segment 1 is set to 1 for the 77
firms in this segment, and zero otherwise. Then, we can run a logistic
regression using only the tree dummies as predictors. This is model 1. For
comparison, we also run an ordinary logistic regression, including all
available variables of the data set as potential predictors. This is model 2. We
are using a stepwise forward method for both models that includes only
significant variables (<0.05) according to the Wald test.6
- 27 –
6 The Wald test is applied to confirm that a predictor is not redundant to other predictors and significantly improves the model. The test follows a chi-squared distribution with r degrees of freedom, which equals the number of included predictors in the model.

PHILIPP KOELLINGER AND CHRISTIAN SCHADE
Table 4 – Model 1: CART
Variables in the equation Variable Odds Ratio Coefficient Significance Tree1 5.04 1.617 .000 Tree2 3.09 1.127 .000 Tree3 2.74 1.009 .000 Tree4 2.54 .932 .000 Tree8 .61 -.491 .024 Tree9 .52 -.650 .000 Tree10 .32 -1.139 .000 Tree11 .12 -2.104 .000 Constant -.824 .000 Model Diagnostics Classification Table Predicted Observed E-Learning = NO E-Learning = YES % correct E-Learning 0 3112 185 94.4 E-Learning 1 554 247 30.8 Overall 3666 432 82.0 Nagelkerke R2 .198 -2 Loglikelihood 3506.3
- 28 –

PHILIPP KOELLINGER AND CHRISTIAN SCHADE
Table 5– Model 2: Logistic Regression
Variables in the equation Variable Odds Ratio Coefficient Significance Z01B-MON 1.53 .425 .004 P01_FRAN .54 -.623 .000 SZ50_249 .66 -.411 .000 EIMP_NO .75 -.285 .006 NONE_BEN .47 -.764 .050 ACC_WWW 1.35 .301 .022 ET_WTLEA 1.37 .321 .013 ET_THP_C 1.37 .310 .002 ET_IH_CO 1.70 .525 .000 USE_EXTR 1.29 .257 .014 HRM 2.08 .731 .000 REIMBUR 1.44 .307 .015 SHARE_DO 1.33 .900 .000 DOC_SUPP 1.43 .366 .000 MAN_CAP 1.85 .289 .016 PMORE2Y 1.43 .359 .000 EMARKET 1.85 .617 .000 SLESSTH5 1.62 .484 .001 IT_SP_IN 1.31 .273 .002 Constant -3,580 .000 Model Diagnostics Classification Table Predicted Observed E-Learning = NO E-Learning = YES % correct E-Learning 0 3171 126 96.2 E-Learning 1 601 200 25.0 Overall 3772 326 82.3 Nagelkerke R2 .258 -2 Loglikelihood 3324.7
Model 1, based on the regression tree, is specified with eight of the eleven
dummies and a constant. The clusters that exhibit either a very high or a
very low ratio of e-learning adopters turn out to be excellent and highly
significant predictors. For example, the odds of a segment 1 member to be
an e-learning adopter is 5 times higher than on average. On the other
extreme, the odds of a segment 11 member to be an e-learning user is 88%
lower than on average. Segments 5, 6, and 7 were eliminated because they
did not increase the quality of model 1.
Model 2, the traditional logistic regression, includes 19 variables and a
constant. Interestingly, three of the variables that were used by CART to split
a node do not turn up in the logit model as significant predictors (Dir_pgoo, - 29 –

PHILIPP KOELLINGER AND CHRISTIAN SCHADE
Use_CMS, Spec_IT). On the other hand, 12 new variables appear in the
model that are not relevant in the tree (description of variables in table 1).
This occurs because CART does not necessarily use all significant predictors
to construct the tree, but only those that provide the best split at each stage.
In addition, distinctions in predictor selection can occur due to the different
assumptions that are made in both models. CART is a path-dependent
regression procedure that takes interactions between predictors into
account, whereas the logistic regression assumes all covariates to be
independent, which is not the case for this data set. As pointed out above,
this might lead to an untruthful representation of the data by the logistic
regression and contributes to the different predictor selection in both
models.
Nevertheless, some results of the logistic regression are noteworthy. The
majority of significant predictors with a positive coefficient comes from other
e-business technologies and training activities offered by firms, which
confirms the view that technological dependencies and organizational
learning effects exist and that they have a significant influence on the
diffusion process (ACC_WWW, USE_EXTR, HRM, REIMBUR, SHARE_DO,
DOC_SUPP, MAN_CAP, EMARKET).
Interestingly, IT_SP_IN (company will increase IT-spending in the 12 months)
is also included as a positive predictor for e-learning. This means that plans
to increase IT-spending in the future occur jointly with current e-learning
adoption. This also confirms our finding that positive externalities of e-
business technologies exist, and that a “growing digital divide” of firms
appears plausible.
The logistic regression includes further variables that do not reveal much
additional insight (Z01B_MON, SZ50_249,PMORE2Y, andSLESSTH5).
Comparing the statistical diagnostics of the models we find that both CART
and the logistic regression perform satisfactory. Both models predict more
than 80 per cent of the subjects correctly. However, CART clearly
outperforms the logistic regression in identifying e-learning adopters (CART
correctly classifies 247 e-learning adopters, the logit model only 200). Also,
- 30 –

PHILIPP KOELLINGER AND CHRISTIAN SCHADE
both models exhibit satisfactory loglikelihoods. The logistic regression is
marginally better than CART in this respect, but at the price of including
more than twice as many variables.
The most visible difference between both models lies in the predictive quality
of each single variable, as measured by the odds ratio. The consideration of
path dependencies and interactions between the variables in the original
data set leads to significantly better predictors in the CART model than in
the logistic regression. This confirms the presumption that the logistic
regression does not appropriately measure all effects present in the data
because it neglects interactions between the covariates.
In addition, CART reveals 11 significantly different clusters in the data, and
clearly distinguishes how these clusters are different from each other. This
allowed us to gain additional insight into typical characteristics of adopters
an non-adopters. We conclude that CART is therefore the more appropriate
model for forecasting and classification purposes and for identifying the most
relevant covariates and their interactions. Combining CART with a logistic
regression is an appropriate tool to evaluate model performance.
Methodological note on CART and the logistic regression
Two caveats have to be made with respect to CART and the logistic
regression. First, the misclassification estimates of both models (reported in
table 5 and 6) are too optimistic because both models tend to over-fit the
sample. This is not specific to our analysis, but rather a general
methodological problem of the two procedures. Over-fitting means that the
models appear to explain the sample quite well, but classification
performance decreases when the model is tested on another sample from the
same population. Second, the stability of the models to variations in the
sample is problematic. For example, the chances of getting identical model
configurations are not so great when we exchange a part of the sample with
replacements drawn from the same population.
Statisticians have recently developed robust and powerful advancements for
CART to deal with these two problems (see Gatnar [2002]). Cross-validation
- 31 –

PHILIPP KOELLINGER AND CHRISTIAN SCHADE
procedures are suggested (Breiman [1984, chapter 11]), and most of the
newer models build a “committee” of trees. Bagging (Breiman [1996]),
boosting (Freund and Shapire [1997]) and random forests (Breiman [2001])
have been proposed to significantly improve prediction accuracy and model
stability of tree-based methods. A disadvantage of these new methods is that
they do not return a single best tree anymore. Rather, a classification
prediction is made according to a majority votum of the “committee” of trees.
Unfortunately, the underlying mechanism disappears in a “black box”.
Therefore, these models are currently not suitable for theory building
purposes, although they are very powerful classification procedures.
Surprisingly, despite the popularity of the logistic regression, there are not a
lot of papers that deal with over-fitting and stability issues of this method,
although the logistic regression suffers from these problems just as well (see
e.g. Zhang and Singer [1999], section 4.9).
We conducted numerous repetitions of our analysis, each time randomly
changing a part of the sample. Comfortingly, the main findings presented in
this paper could comprehensively be supported in these tests, although we
experienced minor model instabilities and a decrease in classification
performance when the models were applied to a randomly chosen sub-
sample. However, having pointed out these two caveats, we believe that
CART is currently the best methodological approach to analyze and forecast
technology adoption using cross-section data.
Conclusion and Outlook
- 32 –
In this paper, we found strong empirical evidence for the existence of
technological interdependencies and organizational learning effects that
influence the adoption of e-learning in firms. E-learning refers to the usage
of Internet technologies to support business processes, in this case employee
training. Thus, e-learning is related to other e-business technologies which
all stem from one common technological paradigm (the Internet) with
significant complementarities which extend to IT-infrastructure,
organization, processes, strategy, and know-how of employees and

PHILIPP KOELLINGER AND CHRISTIAN SCHADE
managers. Firms that already use some sort of e-business technologies can
expect lower implementation costs and higher benefits of adopting additional
e-business technologies (e.g. e-learning). Consequently, they rank higher in
their expected benefits from the new technology and thus exhibit a higher
probability of adoption. Models that do not take such complementarities into
account might not be specified correctly.
Our empirical results suggest that the positive externalities of related
technologies on another retain some cumulative features: The probability of
adopting one particular kind of e-business technology generally increases
with the number of e-business technologies that a company has already
implemented in the past. I.e., if a company is relatively close to the
technological frontier, its probability of adoption increases and vice versa.
This suggests a growing “digital divide” between firms. This growing gap
could have important consequences for market structures and the economy
in general, because the introduction of e-business applications usually leads
to lower variable costs and higher productivity.
In addition, the regression tree identifies different paths to adoption, taking
interactions between covariates into account. Furthermore, it outperforms
an ordinary logistic regression in predictive quality.
As an extension of this research, it would be desirable to analyze time series
data with similar properties as the cross section data used here to capture
dynamic effects and to enable a forecast of the adoption potential of different
e-business technologies over time. Furthermore, the base of predictor
variables could be extended once industry statistics become available to
further enhance the predictive quality of the model and to gain additional
insights into the factors that influence the adoption decision of firms. Our
modeling approach could also be applied to other technological innovations.
- 33 –

PHILIPP KOELLINGER AND CHRISTIAN SCHADE
References
Bass, F. (1969) “A New Product Growth Model for Consumer Durables”,
Management Science 15, pp. 215-227.
Breiman, L. et. al. (1982) “Classification and Regression Trees”, Wadsworth
International Group, Statistics/Probability Series, Belmont (CA-USA).
Breiman, L. (1996) “Bagging Predictors”, Journal of Machine Learning, vol.
24, pp. 123-140.
Breiman, L. (2001) “Random Forests”, Journal of Machine Learning, vol. 45,
pp. 5-32.
Brynjolfsson, E. and Hitt, L.M. (2000) “Computing Productivity: Firm-Level
Evidence”, MIT Sloan School of Management, Center for
eBusiness@MIT, Paper 139.
Christensen, R. (1990) “Log-linear models”, Springer-Verlag, New York et. al.
Church, J. and Gandal, N. (1993) “Complementary Network Externalities
and Technological Adoption” International Journal of Industrial
Organization, Vol. 11, pp. 239-260.
Colombo, M.G. and Mosconi, R. (1995) “Complementarity and Cumulative
Learning Effects in the Early Diffusion of Multiple Technologies”,
Journal of Industrial Economics, Vol. 43, pp. 13-48.
David, P. (1969) “A Contribution to the Theory of Diffusion”, Center for
Research in Economic Growth Research Memorandum, no. 71,
Stanford University.
David, P. (1991) “Behind the Diffusion Curve”, Westview Press , Oxford..
Dosi, G. (1982) “Technological Paradigms and Technological Trajectories: A
Suggested Interpretation of the Determinants and Directions of
Technical Change”, Research Policy, Vol. 11, pp. 147-162.
Freund, Y. and Schapire, R.E. (1997) “A Decision-Theoretic Generalization of
On-Line Learning and an Application to Boosting”, Journal of
Computer and System Sciences, 55, pp. 119-139.
- 34 –

PHILIPP KOELLINGER AND CHRISTIAN SCHADE
Fudenberg, D. and Tirole, J. (1985) “Preemption and Rent Equalization in
the Adoption of New Technology”, Review of Economic Studies, Vol. 52,
pp. 383-401.
Gatnar, E. (2002) “Tree-based Models in Statistics: Three Decades of
Research”, in: Jajuga et. al. (Eds.) Classification, clustering and data
analysis: recent advances and applications, Springer-Verlag, Berlin et.
al., p. 399-408.
Götz, G. (1999) “Monopolistic competition and the diffusion of new
technology”, RAND Journal of Economics, Vol. 30, No. 4, pp. 679-693.
Jensen, R. (1982) “Adoption and Diffusion of an Innovation of Uncertain
Profitability”, Journal of Economic Theory, Vol. 27, pp. 182-193.
Jorgenson, D.W. (2001) “Information Technology and the U.S. Economy”,
The American Economic Review, Vol. 91 No. 1, pp. 1-32.
Kamien, M.I. and Schwartz, N.L. (1982) “Market Structure and Innovation”,
Cambridge University Press, Cambridge.
Litfin, T. (2000) “Adoptionsfaktoren” Deutscher Universitäts Verlag, Kiel.
Mansfield, E. (1968) “Industrial Research and Technological Innovation”,
Norton , New York.
Nordhaus, W. D. (2002) “Productivity Growth and the New Economy”,
Brooking Papers on Economic Activity, No. 2 2002, pp. 211-245.
OECD (2000) “Information Technology Outlook – ICT’s, E-Commerce and the
Information Economy”, OECD Publications Service, Paris.
Oliner, S.D. and Sichel, D.E. “The Resurgence of Growth in the Late 1990’s:
Is Information Technology the Story?”, Journal of Economic
Perspectives, Fall 2000, Vol. 14 No. 4, pp. 3-22.
Pagano, M. and Gauvreau, K. (1993) “Principles of biostatistics”, Duxbury
Press, Belmont (CA).
Reinganum, J.F. (1981) “On the Diffusion of New Technology: A Game
Theoretic Approach”, Review of Economic Studies, Vol. 48, pp. 395-
405.
Sheskin, D. J. (2000) “Handbook of Parametric and Nonparametric
Statistical Procedures”, 2nd edition, Chapman & Hall, Boca Raton et.
al.
- 35 –

PHILIPP KOELLINGER AND CHRISTIAN SCHADE
Stoneman, P. et. al. (1995) „Handbook of the Economics of Innovation and
Technological Change", Blackwell Publishers, Oxford and Cambridge.
Stoneman, P. and Kwon, M.J. (1994) „The Diffusion of Multiple Process
Technologies“, The Economic Journal, 104, pp. 420-431.
Zhang, H. and Bracken, M. (1995) „Tree-based risk factor analysis of
preterm delivery and small-for-gestational-age birth“, American
Journal of Epidemiology, Vol. 141, pp. 70-78.
Zhang, H. and Singer, B. (1999) „Recursive Partitioning in the Health
Sciences“, Springer, New York et. al.
- 36 –

PHILIPP KOELLINGER AND CHRISTIAN SCHADE
ANNEX
List of Modules and Indicators in the E-Business Market Watch survey 1 from June 2002
Module Indicators X Basic characteristics 1 Average number of employees 2 Size of enterprises 3 Enterprises with >1 establishment 4 Turnover development 5 Primary customers A ICT usage 1 Computer usage 2 Internet access 3 Type of internet access 4 Bandwidth 5 E-mail usage 6 WWW usage 7 Intranet usage 8 Extranet usage 9 LAN usage 10 WAN usage 11 EDI usage 12 Size of IT department 13 Computer and IT training 14 Importance of various types of training 15 Recruitement of IT skills 16 Employees working with computers 17 Remote access to computer system 18 Employees' access to ICT B E-commerce and e-business 1 Web site 2 Web hosting and maintenance 3 Size of web department 4 Usage of Content Management Systems 5 Language(s) of web site 6 Information about products on the web site 7 Selling online 8 Starting point for selling online 9 E-commerce channels used 10 Online customers 11 Share of online sales 12 Target market for online sales 13 Processing of online orders 14 Online orders triggering business processes 15 Usage of an online sales system with SSL 16 Enabling online payment 17 After-Sales-Service provided online 18 Online procurement 19 Types of goods procured online 20 Starting point for procuring online 21 Share of online procurement
- 37 –

PHILIPP KOELLINGER AND CHRISTIAN SCHADE
22 Usage of e-business for various processes 23 Access to an extranet of partners 24 Participation in e-marketplaces 25 Types of activities on e-marketplaces 26 E-marketplace operators 27 SCM usage 28 CRM usage 29 Usage of a Knowledge Management Solution 30 Usage of an ASP 31 Usage of an ERP system 32 Share documents / collaborative work 33 Automation of travel reimbursements 34 Tracking working hours 35 E-Business to support HR management 36 E-learning 37 Posting job vacancies on internet boards 38 Online banking C Barriers to selling / procuring online 1 Barriers to selling online: Few customers online 2 Barriers to selling online: Customers hesitant to buy
online 3 Barriers to selling online: Goods / services do not lend
themselves to selling online 4 Barriers to selling online: Processing of payments for
online orders is a problem 5 Barriers to selling online: Technology too expensive 6 Barriers to selling online: Revenue of online sales is still
low 7 Barriers to selling online: Delivery process causes
problems 8 Barriers to selling online: Adapting corporate culture to
e-commerce is difficult 9 Barriers to procuring online: requires face-to-face
interaction 10 Barriers to procuring online: suppliers do not sell online
11 Barriers to procuring online: concerns about data protection and security issues
12 Barriers to procuring online: technology is expensive 13 Barriers to procuring online: Suppliers' technical systems
are not compatible 14 Barriers to procuring online: Cost advantage is
insignificant D Impact of selling / procuring online 1 Impact of selling online: volume of sales 2 Impact of selling online: number of customers 3 Impact of selling online: Sales area 4 Impact of selling online: qualtity of customer service 5 Impact of selling online: efficiency of internal business
processes 6 Impact of selling online: costs of logistics and inventory
7 Impact of procuring online: procurement costs 8 Impact of procuring online: Relations to suppliers 9 Impact of procuring online: Internal business processes
- 38 –

PHILIPP KOELLINGER AND CHRISTIAN SCHADE
- 39 –
10 Impact of procuring online: Costs of logistics and inventory
11 Impact of procuring online: Number of suppliers E Impact of and satisfaction with e-business 1 General importance of e-business for company 2 E-business impact: Organisational structure 3 E-business impact: Internal work processes 4 E-business impact: Customer relationship 5 E-business impact: Relationship to suppliers 6 E-business impact: Offers of products / services 7 Changed way of conducting business 8 Future impact of e-business 9 Beneficiaries of e-business 10 Satisfaction with e-business 11 Expenditure on e-business technologies