A recursive model for static empty container allocation
10
RESEARCH ARTICLE A recursive model for static empty container allocation Zijian GUO 1 , Wenyuan WANG 1 , Guolei TANG (✉) 1 , Jun HUANG 2 1 Faculty of Infrastructure Engineering, Dalian University of Technology, Dalian 116023, China 2 Transport Planning and Research Institute, Ministry of Communications, Beijing 100028, China © Higher Education Press and Springer-Verlag Berlin Heidelberg 2011 Abstract Backlogged empty containers have gradually turned into a serious burden to shipping networks. Empty container allocation has become an urgent settlement issue for the container shipping industry on a global scale. Therefore, this paper proposes an improved immune algorithm based recursive model for optimizing static empty container allocation which integrates with the global maritime container shipping network. This model minimizes the operating and capital costs during container shipping considering 0-1 mixed-integer programming. So an immune algorithm procedure based on a special two- dimensional chromosome encoding is proposed. Finally, computational experiments are performed to optimize a 10-port static empty container shipping system. The results indicate that the proposed recursive model for static empty container allocation is effective in making an optimal strategy for empty container allocation. Keywords immune algorithm, shipping network, empty container allocation 1 Introduction In recent years, backlogged empty containers have become a bottleneck to the development of carriers. Idle empty containers are a waste of shipping resources, which increase the logistics cost on the global level. In the fierce competition of the international container shipping market, optimization of empty container allocation is of great importance to improve resource utilization and increase benefits. Empty container allocation is a widely investigated problem in combinatorial optimization. Shen and Khoong present a decision support system to solve the multi- period distribution of empty containers on the shipping company level [1]. Choong et al. present a computational analysis of the intermodal transportation network of empty container management [2]. Li et al. formulate the empty container allocation between multi-ports and design a heuristic method to solve them [3]. Crainic et al. introduce two dynamic deterministic formulations for the single and multi-commodity cases to offer a general modeling framework for the allocation of empty contain- ers [4]. Cheung and Chen formulate the problem as a two- stage stochastic network [5]. Jula et al. present a dynamic empty container reuse model to study empty container movements between the Los Angeles and Long Beach port [6]. Lam et al. apply approximate dynamic program- ming to relocate the empty containers for a simple two- ports two-voyages (TPTV) system [7]. Researchers have previously paid more attention to route optimization and empty container repositioning for a single ship route on the shipping company level. However, little effort has been applied to empty container allocation optimization from the comprehensive perspec- tive of the container shipping network design problem. Therefore, we establish a recursive optimization model considering the mixed traffic of empty and loaded containers to minimize the total transport cost of the network on global level. The strategy of empty container repositioning in the network as well as optimal container shipping routes between port of departure and destination can also be obtained in the model. Since the proposed combinatorial optimization model is computationally Received February 15, 2011; accepted May 27, 2011 E-mail: [email protected] Front. Comput. Sci. China 2011, 5(4): 486–495 DOI 10.1007/s11704-011-1013-y
Transcript of A recursive model for static empty container allocation

RESEARCH ARTICLE
A recursive model for static empty container allocation
Zijian GUO1, Wenyuan WANG1, Guolei TANG (✉)1, Jun HUANG2
1 Faculty of Infrastructure Engineering, Dalian University of Technology, Dalian 116023, China2 Transport Planning and Research Institute, Ministry of Communications, Beijing 100028, China
© Higher Education Press and Springer-Verlag Berlin Heidelberg 2011
Abstract Backlogged empty containers have graduallyturned into a serious burden to shipping networks. Emptycontainer allocation has become an urgent settlement issuefor the container shipping industry on a global scale.Therefore, this paper proposes an improved immunealgorithm based recursive model for optimizing staticempty container allocation which integrates with theglobal maritime container shipping network. This modelminimizes the operating and capital costs during containershipping considering 0-1 mixed-integer programming. Soan immune algorithm procedure based on a special two-dimensional chromosome encoding is proposed. Finally,computational experiments are performed to optimize a10-port static empty container shipping system. Theresults indicate that the proposed recursive model forstatic empty container allocation is effective in making anoptimal strategy for empty container allocation.
Keywords immune algorithm, shipping network, emptycontainer allocation
1 Introduction
In recent years, backlogged empty containers havebecome a bottleneck to the development of carriers. Idleempty containers are a waste of shipping resources, whichincrease the logistics cost on the global level. In the fiercecompetition of the international container shippingmarket, optimization of empty container allocation is ofgreat importance to improve resource utilization and
increase benefits.Empty container allocation is a widely investigated
problem in combinatorial optimization. Shen and Khoongpresent a decision support system to solve the multi-period distribution of empty containers on the shippingcompany level [1]. Choong et al. present a computationalanalysis of the intermodal transportation network ofempty container management [2]. Li et al. formulate theempty container allocation between multi-ports anddesign a heuristic method to solve them [3]. Crainic etal. introduce two dynamic deterministic formulations forthe single and multi-commodity cases to offer a generalmodeling framework for the allocation of empty contain-ers [4]. Cheung and Chen formulate the problem as a two-stage stochastic network [5]. Jula et al. present a dynamicempty container reuse model to study empty containermovements between the Los Angeles and Long Beachport [6]. Lam et al. apply approximate dynamic program-ming to relocate the empty containers for a simple two-ports two-voyages (TPTV) system [7].Researchers have previously paid more attention to
route optimization and empty container repositioning for asingle ship route on the shipping company level.However, little effort has been applied to empty containerallocation optimization from the comprehensive perspec-tive of the container shipping network design problem.Therefore, we establish a recursive optimization modelconsidering the mixed traffic of empty and loadedcontainers to minimize the total transport cost of thenetwork on global level. The strategy of empty containerrepositioning in the network as well as optimal containershipping routes between port of departure and destinationcan also be obtained in the model. Since the proposedcombinatorial optimization model is computationally
Received February 15, 2011; accepted May 27, 2011
E-mail: [email protected]
Front. Comput. Sci. China 2011, 5(4): 486–495DOI 10.1007/s11704-011-1013-y

complex, an immune algorithm based on two-dimensionalchromosome encoding is proposed to solve it efficiently.Finally, computational experiments are performed todemonstrate the effectiveness of the proposed recursivemodel for static empty container allocation.
2 Model formulation
2.1 Description, assumptions, and notations of the model
With the enlargement of containerships, a hub-and-spokenetwork has been developed due to the economicconsideration of containership routes, as illustrated inFig. 1. Based on such a transportation mode, we propose arecursive model for optimizing static empty allocation onthe global level. This model minimizes the total costsduring container transportation in the container shippingnetwork, which is based on the cargo volume, flowdirection, carrying ship, and transshipment of empty andloaded containers.
Empty container allocation is a complicated processwhich involves many integrated elements: fleet size, shipfrequency, and cargo routing. To simplify the modelingprocedure, four reasonable conditions are assumed asfollows:1) Empty container demand for a port is satisfied by
importing from other supply ports, instead of leasing.2) The shipping system is stable without emergency.3) All cargo is carried by 20-foot containers; we do not
consider other container sizes.4) A port-to-port path uses a one-sized ship.And the definitions of notations used in the model are
given in Table 1.
2.2 Static empty container allocation model
2.2.1 Shipping cost per ship
The shipping cost of a ship with capacity Qm TEU fromport i to j, includes operating costs and capital costs [8]. Inour study, the shipping cost per ship is divided into twoparts: ship-related costs (CS) and port-related costs (CP),according to the interests of both port and shippingenterprises. So the shipping cost per ship Cm
ij is written as
Fig. 1 Hub-and-spoke network for container transportation
Table 1 Notation table
Notations Definitions
N The number of ports in shipping network
i & j The sequence number of each port
k The sequence number of the port of origin
t The sequence number of the destination port
M The number of ship types, indexed by m
Xkt Origin-Destination (O-D) distribution matrices of loadedcontainer in twenty-foot equivalent unit (TEU)
Ek The excess containers at port k (TEU)
St The demanded containers at port t (TEU)
Qm Container capacity for a ship of type m (TEU)
Dij Shipping distance between port i and j (nautical miles)
vm Average service speed for a ship of type m (knots)
Cmij Shipping cost for a ship of type m from port i to j
CSmij Ship-related costs for a ship of type m from port i to j
CPmij Port-related costs for a ship of type m from port i to j
CCDm Time charter cost for a ship of type m
ei (ej) Handling time (loading or unloading) per container at port i (j)
fi (fj) Standby time for departure and arrival at port i (j)
RFuel Fuel consumption (g/hp/h)
CFuel Fuel cost (US$/metric ton)
RLub Lubricant consumption (g/hp/h)
CLub Lubricant cost (US$/metric ton)
HPm Average engine horsepower for a ship of type m
A & B The constant, AQm + B means port entry cost for a ship of typem (US$)
Ci (Cj) Handling cost per container at port i (j)
Xíij Annual cargo volume of loaded container from port i to jinvolving transshipped amount (TEU)
Wíij Annual cargo volume of empty container from port i to j
involving transshipped amount (TEU)
xij Average cargo volume of loaded container including trans-shipped one to a specified ship
wij Average cargo volume of empty container including trans-shipped one to a specified ship
qij Service frequency of containership from port i to j (vessel/month)
Wkt O-D (Origin-Destination) distribution matrix of empty con-tainer
Pijkt
The decision variable, showing the relationship of containertransshipment process
Zijian GUO et al. A recursive model for static empty container allocation 487
Cmij ¼ CSmij þ CPm
ij , (1)
where
CSmij ¼ CCDm
Dij
24vmþ ðei þ ejÞðxij þ wijÞ þ fi þ fj
24
� �
þ ðCFuelRFuel þ CLubRLubÞ$HPm$Dij
vm,
CPmij ¼ AQm þ Bþ ðCi þ CjÞðxij þ wijÞ:
Thus
Cmij ¼ CCD
mDij
24vmþ ðei þ ejÞðxij þ wijÞ þ fi þ fj
24
� �
þ ðCFuelRFuel þ CLubRLubÞ$HPm$Dij
vmþ AQm
þ Bþ ðCi þ CjÞðxij þ wijÞ: (2)
Define
am ¼ CCDm
24þ ðCRuelRRuel þ CLubRLubÞHPm
� �1
vm,
bmij ¼CCDm ðei þ ejÞ
24þ ðCi þ CjÞ
" #,
cmij ¼CCDm ðfi þ fjÞ
24þ AQm þ B:
Then, Cmij is simplified as follows:
Cmij ¼ amDij þ bmij ðxij þ wijÞ þ cmij : (3)
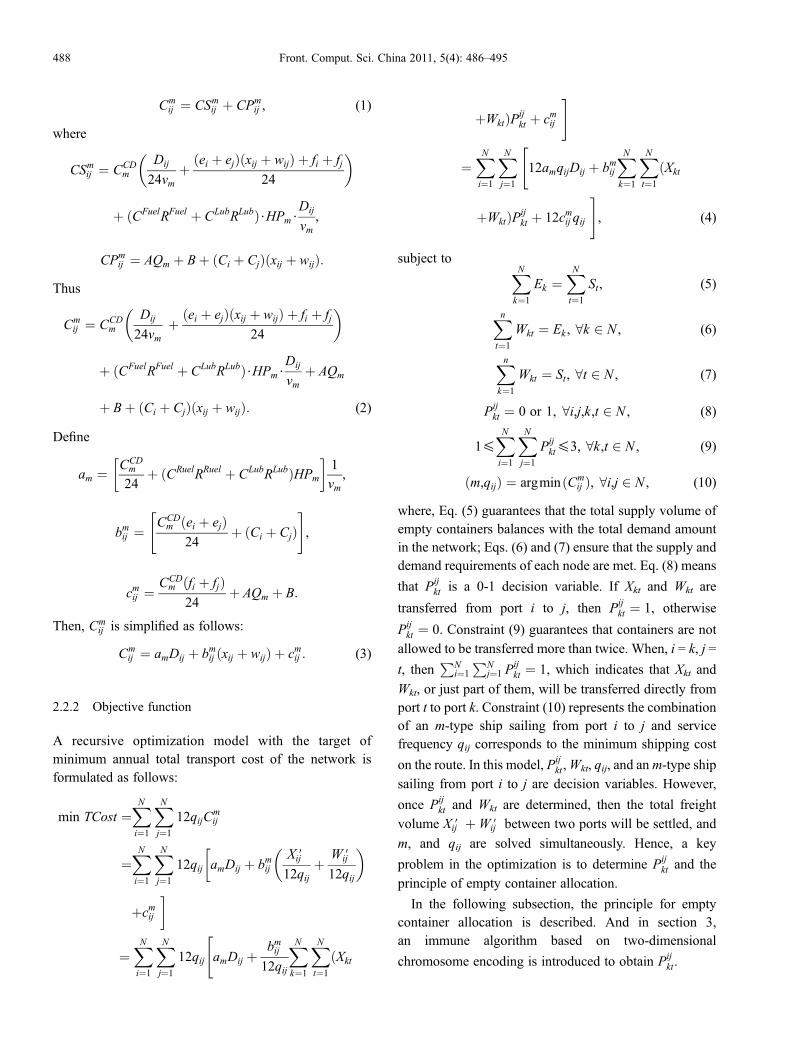
2.2.2 Objective function
A recursive optimization model with the target ofminimum annual total transport cost of the network isformulated as follows:
min TCost ¼XNi¼1
XNj¼1
12qijCmij
¼XNi¼1
XNj¼1
12qij amDij þ bmijXíij12qij
þ Wíij
12qij
� ��
þcmij �¼
XNi¼1
XNj¼1
12qij amDij þbmij12qij
XNk¼1
XNt¼1
ðXkt
"
þWktÞPijkt þ cmij #
¼XNi¼1
XNj¼1
12amqijDij þ bmijXNk¼1
XNt¼1
ðXkt
"
þWktÞPijkt þ 12cmij qij #, (4)
subject to XNk¼1
Ek ¼XNt¼1
St, (5)
Xnt¼1
Wkt ¼ Ek , 8k 2 N , (6)
Xnk¼1
Wkt ¼ St, 8t 2 N , (7)
Pijkt ¼ 0 or 1, 8i,j,k,t 2 N , (8)
1£XNi¼1
XNj¼1
Pijkt£3, 8k,t 2 N , (9)
ðm,qijÞ ¼ argminðCmij Þ, 8i,j 2 N , (10)
where, Eq. (5) guarantees that the total supply volume ofempty containers balances with the total demand amountin the network; Eqs. (6) and (7) ensure that the supply anddemand requirements of each node are met. Eq. (8) means
that Pijkt is a 0-1 decision variable. If Xkt and Wkt are
transferred from port i to j, then Pijkt ¼ 1, otherwise
Pijkt ¼ 0. Constraint (9) guarantees that containers are not
allowed to be transferred more than twice. When, i = k, j =
t, thenPN
i¼1
PNj¼1 P
ijkt ¼ 1, which indicates that Xkt and
Wkt, or just part of them, will be transferred directly fromport t to port k. Constraint (10) represents the combinationof an m-type ship sailing from port i to j and servicefrequency qij corresponds to the minimum shipping cost
on the route. In this model, Pijkt,Wkt, qij, and anm-type ship
sailing from port i to j are decision variables. However,
once Pijkt and Wkt are determined, then the total freight
volume Xíij þWíij between two ports will be settled, and
m, and qij are solved simultaneously. Hence, a key
problem in the optimization is to determine Pijkt and the
principle of empty container allocation.
In the following subsection, the principle for emptycontainer allocation is described. And in section 3,an immune algorithm based on two-dimensional
chromosome encoding is introduced to obtain Pijkt.
488 Front. Comput. Sci. China 2011, 5(4): 486–495

2.3 Principles for empty container allocation
Two principles for empty container allocation areproposed including allocation by minimum cost (AMC)and allocation by shortest distance (ASD).Principle AMC allocates empty containers by minimum
cost when containers are transferred from a port withempty containers to one lacking them. However, eventhough every single route can achieve a minimum costregardless of other transshipped cargo volumes, a simplecombination of every single optimum route does notnecessarily achieve a general optimization of a containershipping network. Because when several cargo volumesaccumulate in a given port, they may be transshipped by alarger liner on account of its more economical cost [9].Principle ASD is the initial distribution scheme for the
proposed recursive model to initialize the empty containerOrigin-Destination matrices (OD). The empty containersare transferred by the shortest distance from the portwhich has a surplus to one which lacks them. So thisprinciple conforms to the general transportation modelbased on linear programming. Because ASD onlyconcentrates on the sea route distance, it cannot usuallyachieve a lower shipping cost, and therefore AMC is amuch better choice.
3 Proposed immune algorithmmethodology
3.1 Hardness of the problem
The human immune system is an efficient paralleloperation system, and possesses many excellent char-acteristics, such as immune memory, pattern recognition,learning mechanism, etc. [10]. It can produce finiteantibodies to attack almost infinite antigens. So theimmune algorithm can achieve a relative optimal solutionfrom a considerable number of feasible solutions.For the container shipping network optimization
problem, there are ½C1N – 2ðC1
N – 3 þ 1Þ þ 1�U antibodies,in the state space of feasible solutions, namely thecombination of the M � 4 matrix. The scale will expandexponentially along with the increase of port number, N,and the quantity of nonzero cargo volume, U. If there areN = 10 ports, and U = 9�10 = 90, then the number offeasible antibodies is 6590. A traditional optimizationalgorithm can hardly support such high time complexity.Considering the high computational complexity of a
recursive model for static empty containers, therefore, animproved immune algorithm based on two-dimensionalchromosome encoding is proposed to efficiently achievethe optimum solution within the range of acceptableexpenditure of operation time and computer memory.
3.2 Two-dimensional chromosome encoding
In an immune algorithm, a one-dimensional chromosomeis the commonly used standard encoding of the antibody.However, in view of the two-dimensional structuralcharacteristics of the container shipping network, usingone-dimensional coding is neither intuitive, nor conve-nient, especially for crossover operation. Therefore, two-dimensional chromosome encoding is adopted in thispaper [11].Each antibody represents a container shipping network,
namely the container transshipping schedule. Therefore,the two-dimensional chromosome encoding is a strategysimplifying the representation of the antibody. It canproperly depict the structural characteristics of thisdirected network with multiple nodes, thereby simplifyingthe modeling process and adapting the immune algorithmto static empty container allocation.According to two-dimensional chromosome encoding,
an antibody is represented by a matrix with dimensionsU�N. The elements in each row represent a given searoute for Xkt, and each dimension of this row, matrix, orvector represents the ports through which the containersare transported. Therefore, a matrix with dimensionsU�Nshows the U routes for XN�N.However, the containers are usually transshipped at
least twice despite the N ports in existence. So every searoute for Xkt is depicted by a four-dimensional vectorwhich contains a departure port (Depart.), two transship-ment ports (Trans.) and an arrival port (Arrival) as shownin Table 2. So the two-dimensional chromosome encodingevolves into a U�4 matrix that has smaller state space andlower computational complexity.In Table 2, X14 represents a container departing from
port 1, then transshipped via port 5, and arriving at port 4.
Table 2 Sample of the two-dimensional chromosome encoding
No. Antibody Depart. Trans. 1 Trans. 2 Arrival
1 X14 1 5 0 4
2 X16 1 2 3 6
3 X25 2 0 0 5
⋮ ⋮ ⋮
U X6N 6 1 0 N
Zijian GUO et al. A recursive model for static empty container allocation 489
This is the same for X16, X25 and X6N. It is worth notingthat the code “0” represents there being no port oftransshipment. However, the adoption of “0” canefficiently enhance the diversity of antibodies, and avoidthe algorithm falling into local optimization, which plays agreat role in the encoding.The application of “0” results in two kinds of encoding
for the same Xkt with the same meaning. Examine Table 3,vector A, B, and C have the same meaning, that thecontainer will be transferred from port k to t via port i.That’s to say, vectors A and B are redundant schemes foreach other, and only one is needed to describe the searoute Xkt. So, the inner elements that the second dimensionis “0” and the third dimension is “i” are exchanged tomake sure the nonzero element lies ahead in the process ofantibody evolving, as illustrated in Fig. 2.
3.3 Algorithm parameters
The scale of the antibody pool (PN) is the number ofantibodies in the pool. The greater the scale, the moreobvious the diversity of the antibodies, and feasiblesolutions will cover a larger state space. So the immunealgorithm can find an optimal solution with greaterprobability. However, a larger scale will result in a longersearching time, which may not be desirable. Moreover, thestrategy of maintaining antibody diversity also needsefficient mechanisms of clone selection and somatichyper-mutation. Simply expanding the scale of antibodypool is not an effective method.To maintain the diversity of antibodies, genetic
operations, mutation in particular, are included in theimmune algorithm. If the mutation rate (PM) is too small,the antibody pool may fall into a local optimal solution.However, a too large value may result in an unstableantibody pool because of a fluctuating search process.
Furthermore, the immune algorithm needs an effectivetermination criterion to stop the recursive process. Sincethe optimum solution of the container shipping network isunknown, this paper designates a given iteration numberTEM to terminate the algorithm.In short, the algorithm parameter includes the scale of
the antibody pool, PN, number of the memory cell, MCN,mutation rate of the antibody, PM, and the affinitythreshold between antibody and antigen, Th, all play animportant role in this proposed recursive model.
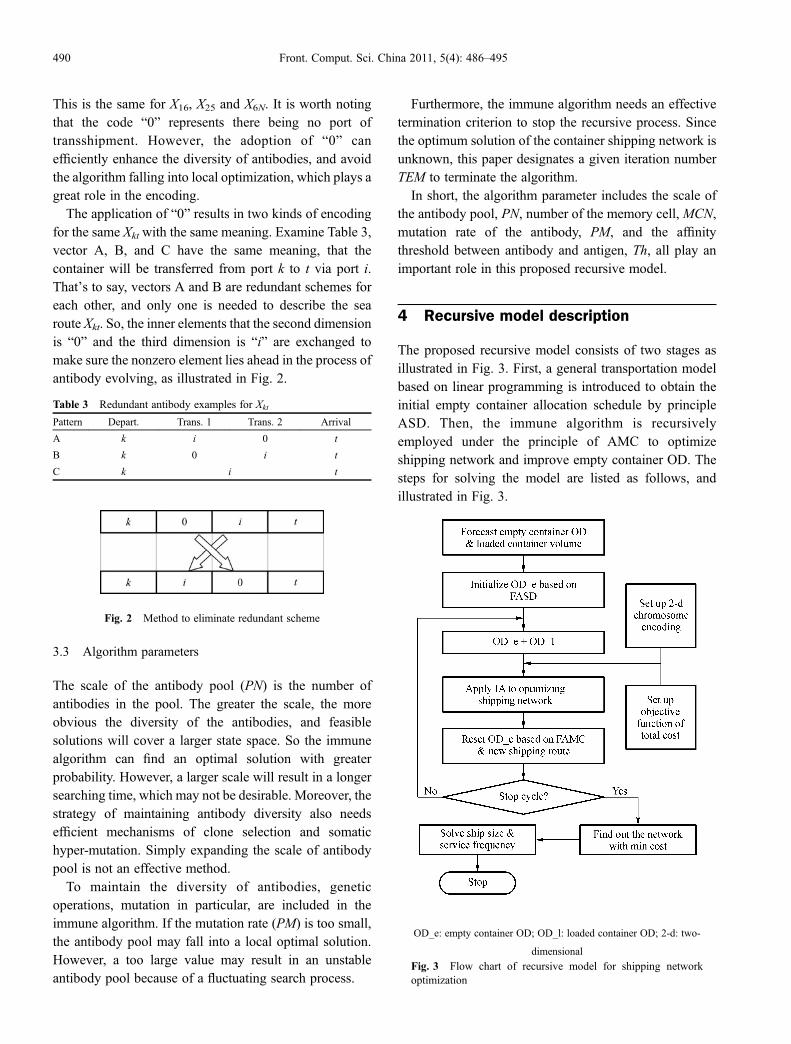
4 Recursive model description
The proposed recursive model consists of two stages asillustrated in Fig. 3. First, a general transportation modelbased on linear programming is introduced to obtain theinitial empty container allocation schedule by principleASD. Then, the immune algorithm is recursivelyemployed under the principle of AMC to optimizeshipping network and improve empty container OD. Thesteps for solving the model are listed as follows, andillustrated in Fig. 3.
Table 3 Redundant antibody examples for Xkt
Pattern Depart. Trans. 1 Trans. 2 Arrival
A k i 0 t
B k 0 i t
C k i t
Fig. 2 Method to eliminate redundant scheme
OD_e: empty container OD; OD_l: loaded container OD; 2-d: two-
dimensional
Fig. 3 Flow chart of recursive model for shipping networkoptimization
490 Front. Comput. Sci. China 2011, 5(4): 486–495
Step 1 To determine the scale of container shippingnetwork, and to forecast loaded container OD, demandand supply amount of empty container;Step 2 To initialize empty container OD under ASD
principle;Step 3 To sum loaded container OD and empty
container OD to obtain the total OD of the network;Step 4 To initialize antigen and antibody by two-
dimensional chromosome encoding and then optimize thecontainer shipping network using immune algorithm. Ifpopulation evolution reaches the ultimate evolutionarygenerations, to output the current optimal network matrixand go to the next step;Step 5 To reset empty container OD according to the
AMC principle, and record this OD matrix;Step 6 If the termination criterion is satisfied, to end the
process, or return to step 3 cyclically until the terminationcriterion is satisfied.
5 Computational experiments
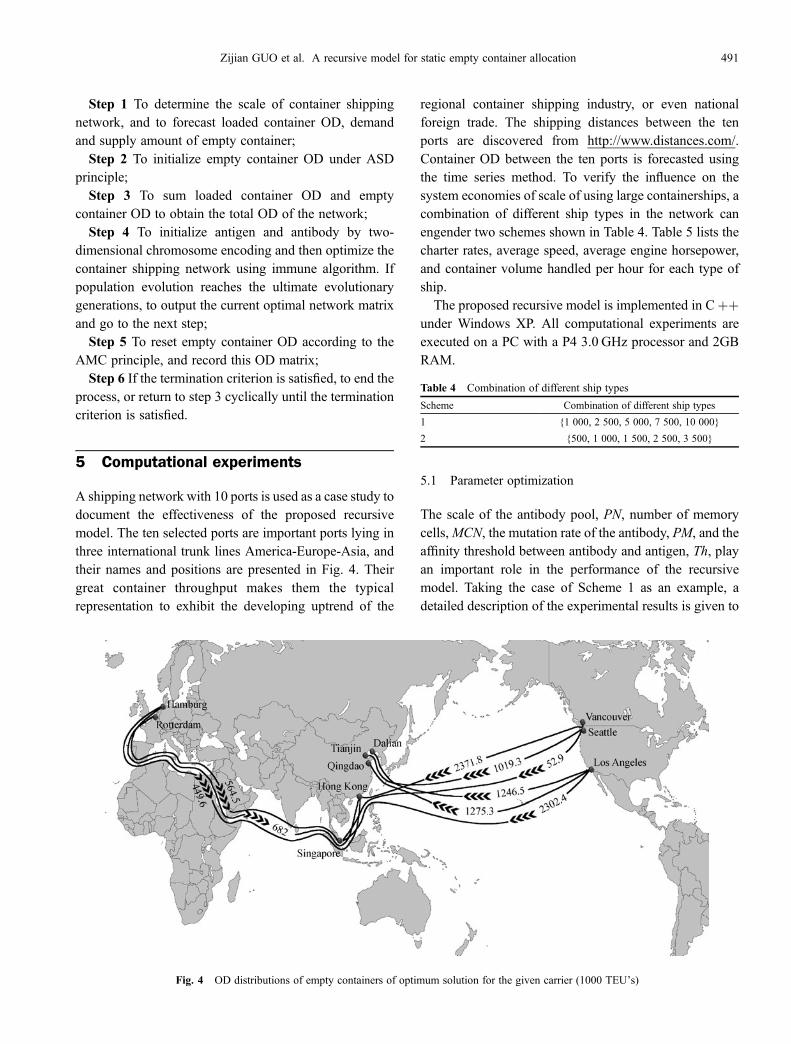
A shipping network with 10 ports is used as a case study todocument the effectiveness of the proposed recursivemodel. The ten selected ports are important ports lying inthree international trunk lines America-Europe-Asia, andtheir names and positions are presented in Fig. 4. Theirgreat container throughput makes them the typicalrepresentation to exhibit the developing uptrend of the
regional container shipping industry, or even nationalforeign trade. The shipping distances between the tenports are discovered from http://www.distances.com/.Container OD between the ten ports is forecasted usingthe time series method. To verify the influence on thesystem economies of scale of using large containerships, acombination of different ship types in the network canengender two schemes shown in Table 4. Table 5 lists thecharter rates, average speed, average engine horsepower,and container volume handled per hour for each type ofship.The proposed recursive model is implemented in C++
under Windows XP. All computational experiments areexecuted on a PC with a P4 3.0 GHz processor and 2GBRAM.
5.1 Parameter optimization
The scale of the antibody pool, PN, number of memorycells,MCN, the mutation rate of the antibody, PM, and theaffinity threshold between antibody and antigen, Th, playan important role in the performance of the recursivemodel. Taking the case of Scheme 1 as an example, adetailed description of the experimental results is given to
Table 4 Combination of different ship types
Scheme Combination of different ship types
1 {1 000, 2 500, 5 000, 7 500, 10 000}
2 {500, 1 000, 1 500, 2 500, 3 500}
Fig. 4 OD distributions of empty containers of optimum solution for the given carrier (1000 TEU’s)
Zijian GUO et al. A recursive model for static empty container allocation 491
determine the parameters.First, to ascertain the value of PN, the experimental
parameters are set as follows: Th = 0.85,MCN = 20, TEM= 300, PM = 0.03. When PN = {400, 500, 600, 700}, thetrend line of total cost is shown in Fig. 5 as calculated bythe proposed optimization process. It can be seen whenPN = 500, the total cost of the container shipping networkachieves a minimum. Compared to the other three values,when PN = 700, the corresponding total cost of thesearched feasible solutions are significantly lower at theearlier stage of algorithm. This is reflected in the differentlocation of trend lines. However, when PN = 700 theminimum total cost when the program running is notachieved. Thus, the scale of antibody pool does not equateto, the larger the better. So the scale of antibody pool is setto PN = 500.
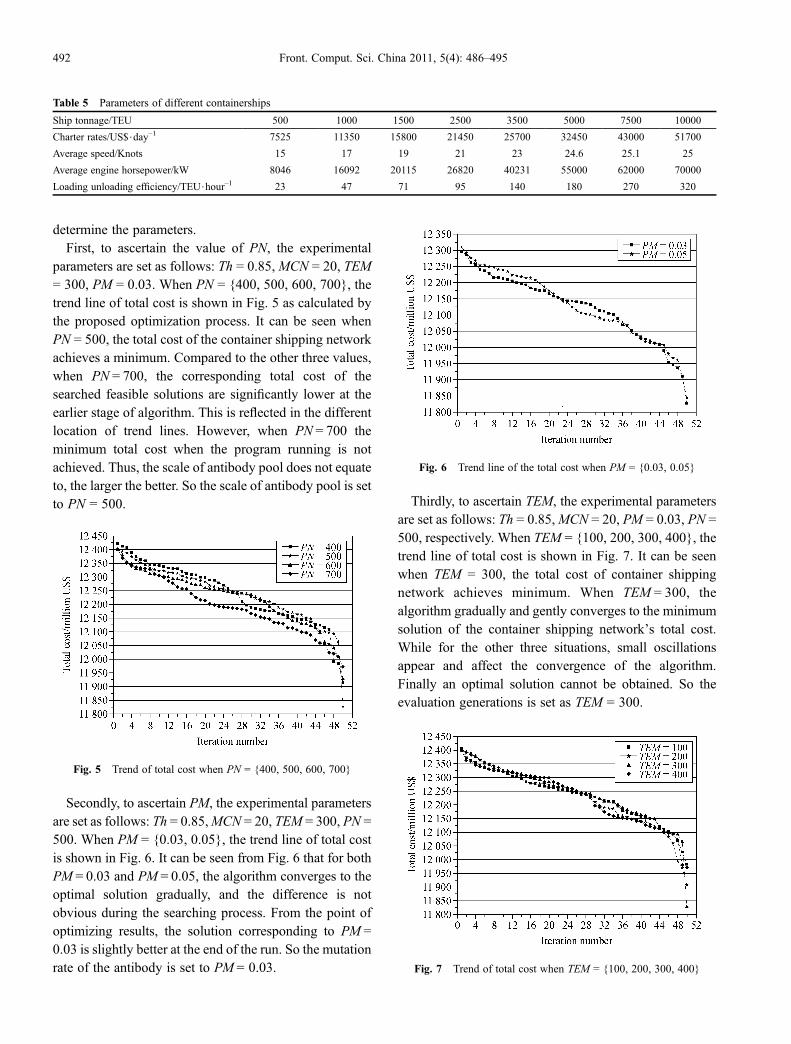
Secondly, to ascertain PM, the experimental parametersare set as follows: Th = 0.85,MCN = 20, TEM = 300, PN =500. When PM = {0.03, 0.05}, the trend line of total costis shown in Fig. 6. It can be seen from Fig. 6 that for bothPM = 0.03 and PM = 0.05, the algorithm converges to theoptimal solution gradually, and the difference is notobvious during the searching process. From the point ofoptimizing results, the solution corresponding to PM =0.03 is slightly better at the end of the run. So the mutationrate of the antibody is set to PM = 0.03.
Thirdly, to ascertain TEM, the experimental parametersare set as follows: Th = 0.85,MCN = 20, PM = 0.03, PN =500, respectively. When TEM = {100, 200, 300, 400}, thetrend line of total cost is shown in Fig. 7. It can be seenwhen TEM = 300, the total cost of container shippingnetwork achieves minimum. When TEM = 300, thealgorithm gradually and gently converges to the minimumsolution of the container shipping network’s total cost.While for the other three situations, small oscillationsappear and affect the convergence of the algorithm.Finally an optimal solution cannot be obtained. So theevaluation generations is set as TEM = 300.
Table 5 Parameters of different containerships
Ship tonnage/TEU 500 1000 1500 2500 3500 5000 7500 10000
Charter rates/US$$day–1 7525 11350 15800 21450 25700 32450 43000 51700
Average speed/Knots 15 17 19 21 23 24.6 25.1 25
Average engine horsepower/kW 8046 16092 20115 26820 40231 55000 62000 70000
Loading unloading efficiency/TEU$hour–1 23 47 71 95 140 180 270 320
Fig. 5 Trend of total cost when PN = {400, 500, 600, 700}
Fig. 6 Trend line of the total cost when PM = {0.03, 0.05}
Fig. 7 Trend of total cost when TEM = {100, 200, 300, 400}
492 Front. Comput. Sci. China 2011, 5(4): 486–495

5.2 Empty container distribution experiment
After carrying out the execution of the parameterexperiment, the immune algorithm with two-dimensionalchromosome encoding is performed to optimize the emptycontainer shipping network. The optimized results areshown in Fig. 8.
It can be seen that the total transport cost of the networkis lower when choosing larger ship types (i.e., Scheme 1).Hence, large containerships can reflect the economies ofscale and benefit effectively in long-distance containertransportation.The minimum cost under AMC is reduced by 4.9% and
2.6% compared to the ASD method, for Schemes 1 and 2,respectively. In other words, guided by the AMCprinciple, we can obtain the global optimal cost ofempty container allocation, namely the optimum solutionfor the container shipping network. This indicates that theoptimized effect is more notable when larger container-ships are deployed. Therefore, blindly transferring theempty containers from a port to the nearest port lackingempty containers is not a desirable policy, and may result
in an increase of shipping cost. This part of cost can besaved by perfect empty container allocation.In this experiment, empty container throughput uses
31.2% of the total container volume. For the optimizedresults of Scheme 1, the transport cost of empty containersaccounts for 24.7% of the total shipping cost. The averagecost of empty container allocation is about 390 US$/TEU.Here, a comparison of two schemes is conducted. Forintuitive purpose, we refer the reader to the optimumscheme for empty container allocation which is describedearlier in Fig. 4. Table 6 shows the optimal ship typesbetween the ports corresponding to the optimum solutionin Scheme 1.The optimum assignment of containerships with
different carrying capacities to every route is listed inTable 6. Of the 79 sea routes, 12 routes adopt contain-erships with 10 000 TEU carrying capacity, and contain-erships of 7 500 TEU capacity are employed in 14 routes.Therefore, the routes using the above two types of biggerships account for 33% of the whole network. According toTable 6, the 10 000 TEU containerships are used in ocean-going main lines, which indicate that the mega-contain-ership is much more economical than small one; therefore,carriers will dedicate themselves to figuring for theeconomies of scale of container transportation.
6 Conclusions
In real container shipping networks, empty containersare unavoidable because of the imbalance betweentransportation demand and supply of shipping. Decreasingempty container throughput and planning empty containerallocation are of great importance to reduce shipping costsand increase profits for carriers.In this paper a new recursive model has been presented
for the optimization of empty container allocation inmaritime container shipping networks. The proposed
Fig. 8 Comparison of the optimized effects
Table 6 Allocation of different sized containerships for optimum solution (TEU)
Capacity QD TJ DL HK SP SA LA VC RD HB
QD - 2 500 2 500 2 500 2 500 10 000 3 500 0 5 000 5 000
TJ 2 500 - 2 500 2 500 10 000 10 000 2 500 5 000 0 7 500
DL 2 500 2 500 - 2 500 2 500 10 000 3 500 5 000 5 000 0
HK 0 2 500 2 500 - 2 500 5 000 3 500 10 000 7 500 7 500
SP 7 500 2 500 7 500 2 500 - 1 000 3 500 10 000 10 000 10 000
SA 2 500 2 500 0 10 000 2 500 - 5 000 7 500 5 000 2 500
LA 5 000 5 000 2 500 10 000 7 500 2 500 - 2 500 0 75 00
VC 0 1 000 1 000 7 500 0 7 500 2 500 - 2 500 0
RD 1 000 0 1 000 5 000 7 500 5 000 7 500 7 500 - 2 500
HB 2 500 2 500 0 1 000 7 500 5 000 10 000 10 000 2 500 -
Zijian GUO et al. A recursive model for static empty container allocation 493

model constructs two strategies for empty containerallocation, ACM and ASD. To solve the foundedobjective function of minimum shipping cost, animproved heuristic immune algorithm has been appliedfor this combinational optimization problem. In view ofthe complexity of container shipping networks, a two-dimensional chromosome encoding has been proposed todescribe the route structure of container transportation.The proper use of this encoding exactly combines theshipping network with an immune algorithm, and there-fore the immune algorithm is of favorable adaptability tothe optimization of static empty container allocation.The computational experiments have been given to
demonstrate the effectiveness of the proposed recursivemodel. From the results by computational experiments, itcan be seen that 24.7% of the total shipping cost isattributable to empty container allocation, which affectsthe whole container shipping industry including thedecision of ship size and frequency. Therefore, it isindispensable to adopt efficient measures to lessen theallocation volume of empty container, and thereby controlshipping cost. The results show that the empty containerallocation strategy AMC is much more economical thanASD.Furthermore, mega-containerships have a notable
advantage of economies of scale, which will bringconsiderable benefits to carriers. However, the operationcost of mega-containerships gets higher and higherespecially with the rising price of crude oil. To achievemore profit, several preconditions should be satisfied forfurther development, that is, sufficient containerized cargoin correlative sea routes, and logically planned ship routes,and enhanced efficiency of container transportation,especially empty container allocation.
Acknowledgements The authors express thanks to the National NaturalScience Foundation of China (Grant No. 51079022) for its financial support.
References
1. Shen W S, Khoong C M A. DSS for empty container distribution
planning. Decision Support Systems, 1995, 15(1): 75–82
2. Choong S T, Cole M H, Kutanoglu E. Empty container manage-
ment for intermodal transportation networks. Transportation
Research Part E, Logistics and Transportation Review, 2002, 38
(6): 423–438
3. Li J A, Leung S C H, Wu Y, Liu K. Allocation of empty containers
between multi-port. European Journal of Operational Research,
2007, 182(1): 400–412
4. Crainic T G, Gendreau M, Dejax P. Dynamic and stochastic-
models for the allocation of empty containers. Operations
Research, 1993, 41(1): 102–126
5. Cheung R K, Chen C Y. A two-stage stochastic network model and
solution methods for the dynamic empty container allocation
problem. Transportation Science, 1998, 32(2): 142–162
6. Jula H, Chassiakos A, Ioannou P. Port dynamic empty container
reuse. Transportation Research Part E, Logistics and Transportation
Review, 2006, 42(1): 43–60
7. Lam S W, Lee L H, Tang L C. An approximate dynamic
programming approach for the empty container allocation problem.
Transportation Research Part C, Emerging Technologies, 2007, 15
(4): 265–277
8. Shintani K, Imai A, Nishimura E, Papadimitriou S. The container
shipping network design problem with empty container reposition-
ing. Transportation Research Part E, Logistics and Transportation
Review, 2007, 43(1): 39–59
9. Cullinane K, Khanna M. Economies of scale in large container-
ships: optimal size and geographical implications. Journal of
Transport Geography, 2000, 8(3): 181–195
10. Farmer J D, Packard N H, Perelson A S. The immune system,
adaptation, and machine learning. Physica D: Nonlinear Phenom-
ena, 1986, 2(1–3): 187–204
11. Yang J G, Luo Z H. Coalition formation mechanism in multi-agent
systems based on genetic algorithms. Applied Soft Computing,
2007, 7(2): 561–568
Zijian Guo received his PhD from NihonUniversity, Japan, in 1995. From 1999 to2001, he was a Post-Doctoral Fellow of theDepartment of Civil Engineering, Univer-sity of Tokyo, Japan. In 2002, he worked asa Post-Doctoral Fellow in the UPS Centerfor Worldwide Supply Chain Management,University of Louisville, USA. Currently,he is a Professor and doctoral advisor in the
Faculty of Infrastructure Engineering, Dalian University ofTechnology, China. His research interests cover optimization ofintegrated transport systems, and port system and logistics. He isalso editor-in-chief of Port Planning and Layout (third edition).
Wenyuan Wang obtained her bachelordegree in port, waterway, and coastalengineering in 2006, and her master degreein harbor, coastal and offshore engineeringin 2009, both from Dalian University ofTechnology. Currently, she is a PhD studentin the Faculty of Infrastructure Engineeringin the same university. She maintains activeresearch interests in the optimization of
container transportation networks, simulation and optimization ofport system.
494 Front. Comput. Sci. China 2011, 5(4): 486–495

Guolei Tang received his PhD from DalianUniversity of Technology in 2009. From2009 till now, he has worked as aPostdoctoral Fellow and then a lecturer inFaculty of Infrastructure Engineering,Dalian University of Technology. He hascompleted series of academic research andconsultancy projects in the areas of simula-tion and optimization of port systems, port
logistics, and network optimization.
Jun Huang received his bachelor degree inPort, Waterway, and Coastal Engineeringfrom Dalian University of Technology in2005, and master degree in Harbor, Coastaland Offshore Engineering in 2008 bothfrom Dalian University of Technology.Now, he is an engineer in transport planningand research institute ministry of commu-nications. His research interest is port
Planning.
Zijian GUO et al. A recursive model for static empty container allocation 495