A Rapid Spectrophotometric Assay for Quantifying Seed Coat ...
Upload
khangminh22Category
view
3download
0
ADVERTIMENT. Lʼaccés als continguts dʼaquesta tesi queda condicionat a lʼacceptació de les condicions dʼúsestablertes per la següent llicència Creative Commons: http://cat.creativecommons.org/?page_id=184
ADVERTENCIA. El acceso a los contenidos de esta tesis queda condicionado a la aceptación de las condiciones de usoestablecidas por la siguiente licencia Creative Commons: http://es.creativecommons.org/blog/licencias/
WARNING. The access to the contents of this doctoral thesis it is limited to the acceptance of the use conditions setby the following Creative Commons license: https://creativecommons.org/licenses/?lang=en

UNIVERSITAT AUTÒNOMA DE BARCELONA
Departament de Ciència Animal i dels Aliments, Facultat de Veterinària
CENTRE DE RECERCA EN AGRIGENÒMICA
Departament de Genètica Animal
Analysis of the genetic basis of porcine meat quality and coat color by using
genomic and transcriptomic tools
Tainã Figueiredo Cardoso
Doctoral thesis to obtain the Ph.D degree in Animal Production of the Universitat
Autònoma de Barcelona, April 2018
Supervisors
Dr. Marcel Amills Eras Dra. Angela Canovas Tienda


El Dr Marcel Amills Eras, professor agregat del Departament de Ciència Animal i dels
Aliments de la Universitat Autònoma de Barcelona, i la Dra. Angela Canovas Tienda,
professora assistent de la Universitat de Guelph,
fan constar
que el treball de recerca i la redacció de la memòria de la tesi doctoral titulada
“Analysis of the genetic basis of porcine meat and color phenotypes by using
genomic and transcriptomic tools” han estat realitzats sota la seva direcció per
Tainã Figueiredo Cardoso
I certifiquen
que aquest treball s’ha dut a terme al Departament de Ciència Animal i del Aliments de
la Facultat de Veterinària de la Universitat Autònoma de Barcelona i al Departament de
Genètica Animal del Centre de Recerca en Agrigenòmica,
considerant
que la memòria resultant es apta per optar al grau de Doctor en Producció Animal per
la Universitat Autònoma de Barcelona.
I perqué quedi constància, signen aquest document al març del 2018.
Dr. Marcel Amills Eras Dra. Angela Canovas Tienda Tainã Figueiredo Cardoso


Cover design by Renata Benites, 2018
This work was funded by the Spanish Ministry of Economy and Competitiveness
(grant numbers: AGL2010-22208-C02-02 and AGL2013-48742-C2-1-R). We
acknowledge the support of the Spanish Ministry of Economy and Competitiveness
for the Centre of Excellence Severo Ochoa 2016–2019 (SEV-2015-0533) grant
awarded to the Centre for Research in Agricultural Genomics.
Tainã Figueiredo Cardoso was funded by the program “Science without Borders”
fellowship provided by the “Coordenação de Aperfeiçoamento de Pessoal de Nível
Superior (CAPES)” from Brazilian Federal Government (2014-2018).


Aos meus pais, Jorge Tomás e Denize,
e a minha irmã Thaís.
Porque não importa a distância que nos separa,
se há um céu que nos une.


Content
Summary .......................................................................................................................... 11
Resumen ........................................................................................................................... 13
Resumo ............................................................................................................................. 15
List of Tables .................................................................................................................... 17
List of Figures .................................................................................................................. 19
List of annexes .................................................................................................................. 21
List of publications .......................................................................................................... 23
Other publications from the author ............................................................................... 25
Chaper 1: General introduction .................................................................................... 27
1.1 A brief history of pig breeds .............................................................................. 29
1.2 The search for causal mutations in pigs associated with economical traits ...... 30
1.3 The generation of biological information is essential to identify potencial
causal mutations ......................................................................................................... 35
1.4 The landscape of mammalian transcriptomes .................................................... 39
1.4 Methods to characterize the transcriptome ........................................................ 44
1.5 Transcriptomic studies in pigs ........................................................................... 55
Chapter 2: Objectives.................................................................................................... 63
Chapter 3: Papers and Studies ..................................................................................... 67
Paper I: RNA-Seq based detection of differentially expressed genes in the
skeletal muscle of Duroc pigs with distinct lipid profiles ............................................ 69
Paper II: Differential expression of mRNA isoforms in the skeletal muscle of
pigs with distinct growth and fatness profiles. ........................................................... 93
Paper III: Nutrient supply affects the mRNA expression profile of the porcine
skeletal muscle. ........................................................................................................ 119
Paper IV: The ingestion of food promotes changes in the expression of genes
regulating circadian rhythms in four porcine tissues containing peripheral
clocks ........................................................................................................................ 145
Paper IV: The red and blond pigmentation of Mangalitza pigs is strongly
associated with the variability of the Solute Carrier Family 45 Member 2
(SLC45A2) gene ....................................................................................................... 167
Chaper 4: General Discussion ..................................................................................... 193
4.1 Differential expression of metabolic genes in the skeletal muscle of
Duroc pigs with different fatness profiles ................................................................ 195
4.2 Limited contribution of the non-coding RNA transcriptome to differential
expression between HIGH and LOW pigs. .............................................................. 199
4.3 Differential expression of mRNA isoforms in the skeletal muscle of
Duroc pigs with different fatness profiles ................................................................ 201
4.4 The ingestion of food influences the expression of multiple transcription
factors in the skeletal muscle .................................................................................... 203
4.5 Food intake promotes changes in the expression of genes related to
oxidative stress and angiogenesis ............................................................................. 207

4.6 Existence of a close relationship between nutritional status and the
expression of genes regulating circadian rhythms. .................................................. 208
4.7 The polymorphism of the SLC45A2 gene is associated with the red and
blond pigmentation of Mangalitza pigs.................................................................... 211
Chapter 5: General conclusions .................................................................................. 215
Chapter 6: References .................................................................................................. 221
Chapter 7: Annexes ....................................................................................................... 239
Chapter 8: Acknowledgements .................................................................................... 279

11
Summary
The main objectives of this Thesis were to investigate the genetic basis of fatness in
pigs and to identify the genetic factors involved in the establishment of blond vs red
pigmentation patterns in Mangalitza pigs by using genomic and transcriptomic tools. In the
first study of the Thesis (Chapter 3), we compare the skeletal muscle expression patterns of
two groups of Duroc pigs with different growth and fatness profiles (HIGH: high backfat
thickness, intramuscular fat, saturated and unsaturated fatty acid content and serum lipids
vs LOW: opposite phenotypes). By using a RNA-Seq technology, we identified 96 genes
differentially expressed. Several of these genes are related to lipid metabolism (e.g.
SLC27A4, SFRP5 and CES1) and the transcription factor PPARG appears to be a key
regulator of porcine fatness. We have also observed that very few non-coding RNAs are
differentially expressed in these two groups of pigs, suggesting that the non-coding
transcriptome has a limited effect on the establishment of the HIGH and LOW phenotypes.
In the second study of the Thesis, we demonstrate the differential expression of specific
mRNA isoforms of four genes with a known role in obesity (ITGA5, LITAF, TIMP1 and
ANXA2) in HIGH vs LOW pigs. The differential expression of these isoforms may have
effects on transcript structure as well as on the protein sequence. In the third study, we
aimed to investigate the differential expression of mRNA encoding genes in response to
food ingestion. This goal has been achieved by comparing the muscle mRNA expression
patterns of Duroc sows before feeding (T0) and 5 h. (T1) and 7 h. (T2) after feeding.
Besides genes with a well-known role in energy homeostasis (e.g. PFKFB3 and G0S2), we
have identified several genes with a plausible but poorly characterized role in metabolism
(e.g. MIGA2, SDC4, and CSRNP1). We have also observed that the set of genes
differentially expressed before and after feeding is enriched in transcription factors and
pathways related to oxidative stress, angiogenesis, and circadian rhythms. Considering
these results, in the fourth study we use quantitative RT-qPCR technique to find out how
the expression of 8 circadian genes (ARNTL, BHLHE40, CRY2, NPAS2, NR1D1, PER1,
PER2 and SIK1) changes in response to food ingestion in five porcine tissues i.e. skeletal
muscle, hypothalamus, liver, intestine and dorsal fat. Our results indicate that the
expression of the Clock genes does not change in the hypothalamus, the tissue containing
the central clock entrained by light, but in contrast, it is strongly modified in the other four
tissues. This finding demonstrates that nutrition changes the expression of circadian genes
integrated in peripheral clocks. Finally, in the fifth study, we have analysed, in

12
collaboration with researchers of the Research Institute for Animal Breeding and Nutrition
(Hungary) and the University of Cluj-Napoca (Romania), the genetic basis of coat color
(red vs blond) of Mangalitza pigs. By combining a selection scan and a genome-wide
association study, we have found that the SLC45A2 gene is probably involved in the
genetic determination of pigmentation in Mangalitza pigs, a result that agrees well with
previous studies demonstrating the implication of this locus on the color patterns of
multiple mammalian species including humans. More specifically, two missense SNPs
c.806G>A (p.Gly269Glu) and c.956G>A (p.Arg319His) in the SLC45A2 locus appear to
be strongly but not fully associated with the red and blond coat colors of Mangalitza pigs.
This finding suggests the existence of addiitonal genetic factors regulating the
pigmentation of Mangalitza pigs.

13
Resumen
Los principales objetivos de esta Tesis fueron investigar la base genética de la
composición y deposito de la grasa en cerdos, e identificar los factores genéticos
involucrados en el establecimiento de los patrones de pigmentación rubia vs roja en cerdos
Mangalitza, mediante el uso de herramientas genómicas y transcriptómicas. En el primer
estudio comparamos los patrones de expresión del músculo esquelético en dos grupos de
cerdos Duroc, con diferentes perfiles de crecimiento y engrasamiento (HIGH: elevado
espesor del tocino dorsal, grasa intramuscular, contenido de ácidos grasos saturados e
insaturados y lípidos séricos vs LOW: fenotipos opuestos). Mediante el uso de la técnica
RNA-Seq, hemos encontrado que 96 genes se expresan diferencialmente en el músculo
gluteus medius de cerdos HIGH y LOW. Varios de estos genes están relacionados con el
metabolismo lipídico (p.ej, SLC27A4, SFRP5, y CES1) y el factor de transcripción PPARG
parece ser un regulador clave del engrasamiento en porcino. También hemos observado
que muy pocos RNAs no codificantes se expresan diferencialmente en estos dos grupos de
cerdos, lo que sugiere que el transcriptoma no codificante tiene un efecto limitado sobre el
establecimiento de los fenotipos HIGH y LOW. En el segundo estudio, analizamos la
expresión de isoformas de mRNA en cerdos HIGH y LOW y demostramos la expresión
diferencial de isoformas específicas de cuatro genes muy relacionados con la obesidad
(ITGA5, LITAF, TIMP1 y ANXA2). La expresión diferencial de estas isoformas podría
tener efectos sobre la estructura del transcrito, así como sobre la secuencia de la proteína.
En el tercer estudio, hemos analizado la expresión diferencial de genes que codifican
mRNA en respuesta a la ingestión de alimentos. Este objetivo se ha logrado al comparar los
patrones de expresión muscular de cerdas Duroc antes de comer (T0), 5 h. (T1) y 7 h. (T2)
después de comer. Además de los genes con un papel bien conocido en la homeostasis
energética (p.ej, PFKFB3 y G0S2), hemos identificado varios genes con un rol plausible
pero mal caracterizado en el metabolismo (p.ej, MIGA2, SDC4 y CSRNP1). También
hemos observado un enriquecimiento de un conjunto de genes expresados diferencialmente
antes y después de comer que engloba diversos factores de transcripción así como genes
implicados en el estrés oxidativo, la angiogénesis y los ritmos circadianos. Teniendo en
cuenta estos resultados, en el cuarto estudio hemos desarrollado un experimento basado en
RT-qPCR para descubrir cómo la expresión de 8 genes circadianos (ARNTL, BHLHE40,
CRY2, NPAS2, NR1D1, PER1, PER2 y SIK1) se modifica en respuesta a la ingestión de
alimentos en cinco tejidos porcinos (músculo esquelético, hipotálamo, hígado, intestino y

14
grasa dorsal). Nuestros resultados indican que la expresión de los genes circadianos no
cambia en el hipotálamo, el tejido que contiene el reloj central influenciado por la luz. Por
el contrario, dicha expresión sí que presenta fuertes variaciones en los otros cuatro tejidos.
Este hallazgo demuestra que la nutrición cambia la expresión de los genes circadianos
integrados en los relojes periféricos. Finalmente, en el quinto estudio, hemos analizado, en
colaboración con investigadores del Research Institute for Animal Breeding and Nutrition
(Hungría) y la Universidad de Cluj-Napoca (Rumanía), la base genética del color de la
capa (rojo vs rubio) en cerdos Mangalitza. Combinando un barrido de selección y un
estudio de asociación del genoma completo, hemos encontrado que el gen SLC45A2
probablemente esté involucrado en la determinación genética de la pigmentación roja y
rubia de los cerdos Mangalitza, un resultado que concuerda bien con estudios previos que
demuestran la implicación de este locus en los patrones de color de múltiples especies de
mamíferos, incluyendo la especie humana. Más específicamente, dos SNP con efecto no-
sinónimo, c.806G>A (p.Gly269Glu) y c.956G>A (p.Arg319His), situados en el gen
SLC45A2, están fuertemente asociados con los colores rojo y rubio, no obstante dicha
asociación no es completa por lo que cabe deducir la existencia de factores genéticos
adicionales en la pigmentación de los cerdos Mangalitza.

15
Resumo
Os principais objetivos desta tese foram investigar a base genética do depósito de
gordura em suínos e identificar os fatores genéticos envolvidos no estabelecimento de
padrões de pigmentação loiro vs vermelho em suínos Mangalitza utilizando ferramentas
genômicas e transcriptômicas. No primeiro estudo, comparamos os padrões de expressão
em músculo esquelético de dois grupos de suínos Duroc (HIGH: alta espessura de gordura,
gordura intramuscular, conteúdo de ácidos graxos saturados e insaturados e lipídios séricos
vs LOW: fenótipos opostos) com diferentes perfis de crescimento e gordura. Usando uma
abordagem de RNA-Seq, mostramos que 96 genes são diferencialmente expressos. Vários
destes genes estão relacionados com o metabolismo lipídico (p. ex. SLC27A4, SFRP5 e
CES1) e o fator de transcrição PPARG parece ser um regulador chave da gordura suína.
Também observamos que poucos RNA não-codificantes são diferencialmente expressos
nesses dois grupos de suínos, sugerindo que o transcriptoma não-codificante tem um efeito
limitado sobre o estabelecimento dos fenótipos HIGH e LOW. No segundo estudo,
analisamos a expressão de isoformas de mRNA comparando os mesmos animais HIGH e
LOW, e demonstramos uma expressão diferencial de isoformas específicas de quatro genes
com papel conhecido na obesidade (ITGA5, LITAF, TIMP1 e ANXA2). A expressão
diferencial destas isoformas pode ter efeitos na estrutura do transcrito, bem como na
sequência da proteína. No terceiro estudo, analisamos a expressão diferencial de mRNA
codificando genes em resposta à ingestão de alimentos, através da comparação dos padrões
de expressão de mRNA musculares de suínos Duroc antes da alimentação (T0) e 5 h (T1) e
7 h (T2) após a alimentação. Identificamos genes diferencialmente expressos entre os
grupos com um papel bem conhecido na homeostase energética (p. ex., PFKFB3 e G0S2),
além de vários genes com um papel plausível, mas pouco caracterizado no metabolismo (p.
ex., MIGA2, SDC4 e CSRNP1). Também observamos um enriquecimento de genes
relacionados a fatores de transcrição e vias metabólicas relacionadas ao estresse oxidativo,
angiogênese e ritmos circadianos diferencialmente expressados antes e após a alimentação.
Considerando estes resultados, no quarto estudo usamos uma técnica quantitativa de RT-
qPCR para descobrir como a expressão de oito genes circadianos (ARNTL, BHLHE40,
CRY2, NPAS2, NR1D1, PER1, PER2 e SIK1) muda em resposta à ingestão de alimentos
em cinco tecidos suínos (músculo esquelético, hipotálamo, fígado, intestino e gordura
dorsal). Nossos resultados indicam que a expressão dos genes Clock não se altera no
hipotálamo (tecido contendo o relógio central e estimulado pela luz), mas em contraste, é

16
fortemente modificado nos outros quatro tecidos. Estes resultados demonstram que a
nutrição altera a expressão de genes circadianos de forma integrada nos relógios
periféricos. Finalmente, no quinto estudo, analisamos, em colaboração com pesquisadores
do Research Institute for Animal Breeding and Nutrition (Hungria) e da Universidade de
Cluj-Napoca (Romênia), a base genética da cor da pelagem (vermelho vs loiro) de suínos
Mangalitza. Ao combinar uma varredura de seleção e um estudo de associação genômica,
encontramos que o gene SLC45A2 está provavelmente envolvido na determinação genética
da pigmentação, um resultado em concordância com estudos prévios que demonstram a
participação desse locus nos padrões de cor de múltiplas espécies de mamíferos, incluindo
em seres humanos. Mais especificamente, dois Single Nucleotide Polimorfism (SNP) com
efeitos não sinônimos, c.806G> A (p.Gly269Glu) e c.956G> A (p.Arg319His) no gene
SLC45A2 parecem estar fortemente, mas não totalmente, associados às cores vermelho e
louro da pelagem dos suínos Mangalitza.

17
List of Tables
General introduction
Table 1.1 - Regulatory non-coding RNA types. ................................................................. 41
Table 1.2 - miRNAs and lncRNAs implicated in the development of skeletal muscle. ..... 41
Table 1.3 - Advantages of RNA-Seq technology compared with other
transcriptomics methods. ................................................................................................... 47
Table 1.4 - Summary of next generation sequencing (NGS) technologies ......................... 48
Table 1.5 - Summary of selected bioinformatics tools for NGS data processing. .............. 54
Table 1.6 - Published RNA-Seq experiments interrogating pig muscle phenotypes or
subject to different experimental conditions. .................................................................... 56
Paper I
Table 1 - List of the most significant differentially expressed genes in HIGH and
LOW pigs after correcting for multiple testing (q-value ≤ 0.05 and fold-
change ≥ 1.5) ...................................................................................................................... 73
Table 2 - IPA-based pathway analysis of the list of differentially expressed genes in
HIGH and LOW pigs (P-value ≤ 0.01 and fold-change ≥ 1.5) ......................................... 74
Table 3 - Evolutionary conservation of non-coding RNAs transcribed in the porcine
gluteus medius muscle.. ..................................................................................................... 80
Table 4 - List of non-coding RNAs that are differentially expressed (at the nominal
level, P-value ≤ 0.05) in the gluteus medius muscle of HIGH and LOW pigs.. ................ 81
Table 5 - Protein-encoding genes that map near (30 kb) to the subset of 12
differentially expressed ncRNAs (HIGH vs LOW pigs).. ................................................. 82
Paper II
Table 1 - Mean values ± standard deviation (SD) for 13 phenotypes recorded in
HIGH and LOW Duroc pigs............................................................................................ 100
Table 2 - Splicing variants that are differentially expressed (P-value < 0.01 and ±0.6
log2Fold-Change) in the gluteus medius muscle of HIGH (N = 26) vs LOW pigs (N
= 26) ................................................................................................................................ 108
Table 3 - Relative expression of the set of isoforms of four loci (TIMP1, ITGA5,
ANXA2 and LITAF) in HIGH (N=26) vs LOW (N=26) pigs. ......................................... 109

18
Paper III
Table 1 - Results of the Advaita Bio’s iPathwayGuide pathway analysis based on the
list of genes that are differentially expressed (q-value <0.05 and |fold-change| > 1.5)
in the porcine gluteus medius muscle before (T0) vs 5 h (T1) and 7 h (T2) after
eating................................................................................................................................ 132
Paper IV
Table 1 - Differential clock gene expression at fasting (T0) and 7 h after eating (T2)
in five porcine tissues. ..................................................................................................... 158
Table 2 - Differential clock gene expression in different tissues at fasting (T0) and 7
h after eating (T2) in comparison to hypothalamus. ........................................................ 159
Paper V
Table 1 - Summary statistics calculated over the whole set of pig populations. ............... 176
Table 2 - Putative selective sweeps identified in the hapFLK-based analysis. ................. 180
Table 3 - Markers associated with the coat pigmentation of Red vs Blond Mangalitza
pigs. .................................................................................................................................. 181
Table 4 - The genotype and allele frequency of SLC45A2 polymorphisms in 209 pigs
from different populations. .............................................................................................. 185
General discussion
Table 4.1 - Comparison between isoform annotation for the ITGA5, TIMP1, ANXA2
and LITAF genes available in the Sus scrofa genome (release 10.2 and 11.1), and
the Homo sapiens genome. .............................................................................................. 204
Table 4.2 - Differentially expressed genes (q-value < 0.05 and |fold-change| > 1.5) in
the pig gluteus medius muscle at fasting (T0) vs 5 h (T1) and 7 h (T2) after eating. ...... 208
Table 4.3 - List of candidate genes with known associations with coat colour in pigs. ... 213

19
List of Figures
General introduction
Figure 1.1 - World production of cattle, chicken goat, pig and sheep meat ....................... 30
Figure 1.2 - Schematic representation of the main factors that affect relevant meat
traits in pigs. ...................................................................................................................... 32
Figure 1.3 - Biological systems multi-omics from the genome, epigenome,
transcriptome, proteome, and metabolome to the phenome .............................................. 36
Figure 1.4 - Schematic representation of alternative splicing. ............................................ 43
Figure 1.5 - Workflow summary of printed microarrays. ................................................... 45
Figure 1.6 - Evolution of high-throughput sequencing platforms ...................................... 49
Figure 1.7 - Schematic presentation of the library contruction and sequencing
processes associated with the Illumina Sequencing Platform ........................................... 50
Figure 1.8 - Typical workflow for RNA-Sequencing (RNA-Seq) data analysis. ............... 53
Paper I
Figure 1 - The top-scoring regulatory network identified with the IPA software
corresponded to Cardiovascular Disease, Cardiovascular System Development and
Function, Organismal Injury and Abnormalities .............................................................. 77
Figure 2 - The Regulator Effects tool of the IPA package was employed to identify
two major upstream regulators (PPARG and PDGFB) of the networks of
differentially expressed genes.. ......................................................................................... 79
Paper II
Figure 1 - Functional classification of genes with differentially expressed (P-value <
0.05) mRNA isoforms identified with the CLC Genomics Workbench and
STAR/RSEM/DESeq2 pipelines in the gluteus medius muscle of HIGH vs LOW
pigs. ............................................................................................................................... 110
Paper III
Figure 1 - Kinetics of the average concentrations of plasma glucose, cholesterol,
triglycerides and non-esterified fatty acids (FA) in 8 Duroc pigs at four time points:
before eating and 2, 4 and 6 h post-ingestion (p.i). ......................................................... 127
Figure 2 - Reactome functional interaction network corresponding to 148 genes that
show differential expression in the T0 (fasting) vs T1 (5 h after eating) comparison. .... 134

20
Figure 3 - Reactome functional interaction network corresponding to 520 genes
showing differential expression in the T0 (fasting) vs T2 (7 h after eating)
comparisons. .................................................................................................................... 135
Figure 4 - Reactome functional interaction network corresponding to 135 genes
showing differential expression in the T1 (5 h after eating) vs T2 (7 h after eating)
comparison.. ..................................................................................................................... 136
Paper IV
Figure 1 - Principal component analysis of the ΔCT values of clock genes in five
tissues (hypothalamus, liver, duodenum, muscle and dorsal fat) and two time-points
(T0 = fasting sows, T2 = fed sows).. ............................................................................... 157
Paper V
Figure 1 - Multidimensional scaling plot (MDS) depicting the relationships between
Mangalitza pigs and other wild boar and pig populations. .............................................. 175
Figure 2 - Admixture analysis of Mangalitza pigs and additional wild boar and pig
populations for the K-value with the lowest cross-validation error (K = 12).. ................ 177
Figure 3 - Classification of the runs of homozygosity identified in Mangalitza pigs
and additional wild boar and pig populations based on their size. .................................. 178
Figure 4 - Number and total length of runs of homozygosity (ROH) in Mangalitza
pigs and additional wild boar and pig populations .......................................................... 178
Figure 5 - Genome scan for selection in Red and Blond Mangalitza pigs using the
hapFLK test.. ................................................................................................................... 179
General discussion
Figure 4.1 - Graphical plot of the first and second principal components
summarising phenotypic variation in the Duroc population............................................ 196
Figure 4.2 - Mechanism by which PPARG activation regulates metabolism and
inflammation. ................................................................................................................... 199
Figure 4.3 - Kinetics of the average concentrations of triglycerides and non-
esterified fatty acids (FA) in 36 Duroc pigs at three-time points: before eating and 5
and 7 h post-ingestion. ..................................................................................................... 206
Figure 4.4 - Implication of transcription factors modulated by nutrition, mediating
processes via PPAR pathways. ........................................................................................ 206
Figure 4.5 - The circadian Clock system is regulated by a self-oscillating
transcriptional loop. ......................................................................................................... 209

21
List of annexes
Annexes Paper 1
Annex 1 - Table S1 - Differentially expressed genes in the gluteus medius muscle of
HIGH and LOW pigs (P-value ≤ 0.05). (The complete table is included in the CD-
Rom). ............................................................................................................................... 241
Annex 2 - Table S2 - List of DE genes (P-value ≤ 0.05) detected simultaneously
with RNA-Seq (current work) and microarrays (Cánovas et al. 2010. BMC
Genomics 11, 372)........................................................................................................... 243
Annex 3 - Table S3 - Differentially expressed genes in the gluteus medius muscle of
HIGH and LOW pigs (P-value ≤ 0.01 and fold-change ≥ 1.5). ...................................... 244
Annexe 4 - Table S4 - Enriched pathways identified by IPA when using the data set
of 96 differentially expressed genes (P-value ≤ 0.01 and fold-change ≥ 1.5).. ............... 247
Annex 5 - Table S5 - Pathways identified by Reactome as enriched in differentially
expressed genes (P-value ≤ 0.01 and fold-change ≥ 1.5) ................................................ 248
Annex 6 - Table S6: Regulatory networks of genes that are differentially expressed
(P-value ≤ 0.01 and fold-change ≥ 1.5) in HIGH and LOW pigs .................................. 250
Annex 7 - Table S7 - Non-coding transcripts expressed in the gluteus medius muscle
of HIGH and LOW pigs. (The complete table is included in the CD-Rom). .................. 251
Annex 8 - Table S8: HIGH and LOW group mean values ± standard deviation (SD)
for 13 lipid-related traits .................................................................................................. 253
Annex 9 - Supplementary Figure S1. Venn diagram indicating the overlap between
the set of differentially expressed genes (P-value ≤ 0.05) detected in the current
work (RNA-Seq) and those identified by Cánovas et al (2010). ..................................... 254
Annexes Paper 2
Annex 10 - Table S1: Distribution of the 56 animals sequenced by RNA-Seq in the 5
half-sib families reported by Gallardo et al. (2008). ....................................................... 255
Annex 11 - Table S2. Primers employed in the validation of four differentially
expressed mRNA isoforms by RT-qPCR. ....................................................................... 255
Annex 12 - Table S3: Alternatively spliced mRNA isoforms identified in the porcine
gluteus medius muscle of Duroc pigs by CLC Bio and/or STAR/RSEM/DESEq2.
(The complete table is included in the CD-Rom). ........................................................... 256
Annex 13 - Table S4. Classification of alternative splicing (AS) events detected in
the porcine gluteus medius muscle with the SUPPA and Splicing Express softwares. .. 259
Annex 14 - Table S5: Differentially expressed (P-value < 0.05) mRNA isoforms
(HIGH vs LOW pigs) found with CLC Bio and STAR/RSEM/DESeq2 softwares
(those identified by both pipelines are shown in bold). (The complete table is
included in the CD-Rom). ............................................................................................... 260
Annex 15 - Table S6: Relative transcript levels of a set of isoforms corresponding to
five genes expressed in the gluteus medius muscle of HIGH and LOW pigs
identified with the CLC Bio and STAR/RSEM/DESeq2 pipelines (those showing

22
differential expression are indicated in bold, q-value < 0.05,|log2(fold-change)| >
0.6). .................................................................................................................................. 261
Annex 16 - Figure S1. Validation by RT-qPCR of the differential expression of
mRNA isoforms corresponding to the RXRG, SCD, MAFF and ITGA5 genes in
HIGH vs LOW pigs. ........................................................................................................ 263
Annexes Paper 3
Annex 17 - Additional file 1: Figure 1 - Kinetics of the average concentrations of
triglycerides and non-esterified fatty acids (FA) in 36 Duroc pigs at three time-
points: before eating and 5 and 7 hours post-ingestion. .................................................. 264
Annex 18 - Table S1. Differentially expressed genes (q-value < 0.05 and |fold-
change| > 1.5) in the pig gluteus medius muscle at fasting (T0) vs 5 h (T1) and 7 h
(T2) after eating, and 5 h (T1) vs 7 h (T2) after eating . (The complete table is
included in the CD-Rom)................................................................................................. 265
Annex 19 - Table S2 - Pathways identified by ReactomeFIViz as enriched in
differentially expressed genes (q -value < 0.05 and |fold-change| > 1 .5) between at
fasting (T0) vs 5 h (T1) and 7 h (T2) after eating, and 5 h (T1) vs 7 h (T2) after
eating................................................................................................................................ 267
Annex 20 - Table S3: Gene regulatory networks with the ReactomeFIViz app,
considering GO biological process, molecular function and cellular component (q -
value < 0.05). (The complete table is included in the CD-Rom). .................................... 269
Annexes Paper 4
Annex 21 - Supplementary file 1. Description of primers used in the RT-qPCR
analysis of gene expression. ............................................................................................ 272
Annex 22 - Supplementary file 2. Reference genes used as a reference in distinct
RT-qPCR assays .............................................................................................................. 272
Annexes Paper 5
Annex 23 - Additional file 1. Admixture analysis of Mangalitza pigs and additional
wild boar and pig populations for a range of K-values (K = 2-10). ................................ 273
Annex 24 - Additional file 2. Manhattan plot corresponding to the genome-wide
association analysis performed for coat color in Red and Blond Mangalitza pigs.. ........ 276
Annex 25 - Additional file 3. List of SLC45A2 SNPs identified through the
comparison of whole-genome sequences corresponding to Red, Blond and Swallow
Belly Mangalitza pigs and reported by Molnar et al. (2014). (The complete table is
included in the CD-Rom)................................................................................................. 277

23
List of publications
The present thesis is based on the work contained in the list of articles below:
Paper I: Cardoso TF, Cánovas A, Canela-Xandri O, González-Prendes R, Amills M,
Quintanilla R. RNA-Seq based detection of differentially expressed genes in the
skeletal muscle of Duroc pigs with distinct lipid profiles. Scientific Reports. 2017 Feb
14;7:40005. doi: 10.1038/srep40005.
Paper II: Cardoso TF, Quintanilla R, Castelló A, González-Prendes R, Amills M,
Cánovas Á. Differential expression of mRNA isoforms in the skeletal muscle of pigs
with distinct growth and fatness profiles. BMC Genomics. 2018 Feb 14;19(1):145. doi:
10.1186/s12864-018-4515-2.
Paper III: Cardoso TF, Quintanilla R, Tibau J, Gil M, Mármol-Sánchez E, González-
Rodríguez O, González-Prendes R, Amills M. Nutrient supply affects the mRNA
expression profile of the porcine skeletal muscle. BMC Genomics. 2017 Aug
10;18(1):603. doi: 10.1186/s12864-017-3986-x.
Paper IV: Cardoso TF, Quintanilla R, Castelló A, Mármol-Sánchez E, Ballester M,
Jordana J, Amills, M. The ingestion of food promotes changes in the expression of
genes regulating circadian rhythms in four porcine tissues containing peripheral clocks
(Submitted to Frontiers in Genetics).
Paper V: Balteanu VA, Cardoso TF, Amills M, Egerszegi I, Anton I, Beja-Pereira A,
Zsolnai A. The red and blond pigmentation of Mangalitza pigs is strongly associated
with the polymorphism of the Solute Carrier Family 45 Member 2 (SLC45A2) gene
(Manuscript in preparation).

24

25
Other publications from the author
(Not included in the thesis)
Mentzel CMJ, Cardoso TF, Pipper CB, Jacobsen MJ, Jørgensen CB, Cirera S,
Fredholm M. Deregulation of obesity-relevant genes is associated with progression in
BMI and the amount of adipose tissue in pigs. Molecular Genetics and Genomics. 2018
Feb;293(1):129-136. doi: 10.1007/s00438-017-1369-2.
Mentzel CMJ, Cardoso TF, Lex AMJ, Sørensen DB, Fredholm M, Cirera S. Fat and
carbohydrate content in the diet induces drastic changes in gene expression in young
Göttingen minipigs. Mammalian Genome. 2017 Jun;28(5-6):166-175. doi:
10.1007/s00335-017-9690-y.
Eusebi PG, González-Prendes R, Quintanilla R, Tibau J, Cardoso TF, Clop A, Amills
M. A genome-wide association analysis for carcass traits in a commercial Duroc pig
population. Animal Genetics. 2017 Aug;48(4):466-469. doi: 10.1111/age.12545.
Gonzalez-Prendes R, Quintanilla R, Canovas A, Manunza A, Cardoso TF, Jordana J,
Noguera JL, Pena RN, Amills M. Joint QTL mapping and gene expression analysis
identify positional candidate genes influencing pork quality traits. Scientific Reports, v.
7, p. 39830, 2017. doi:10.1038/srep39830.
Manunza A, Cardoso TF, Noce A, Martínez A, Pons A, Bermejo LA, Landi V,
Sànchez A, Jordana J, Delgado JV, Adán S, Capote J, Vidal O, Ugarte E, Arranz JJ,
Calvo JH, Casellas J, Amills M. Population structure of eleven Spanish ovine breeds
and detection of selective sweeps with BayeScan and hapFLK. Scientific Reports, v. 6,
27296. 10.1038/srep27296
Cardoso TF, Amills M, Bertolini F, Rothschild M, Marras G, Boink G, Jordana J,
Capote J, Carolan S, Hallsson JH, Kantanen J, Pons A, Lenstra JA, ADAPTmap
Consortium. Patterns of homozygosity in insular and continental goat breeds.
(Submitted to Genetics Selection Evolution)

26

27
1. Chaper 1 General introduction
Chapter 1

28

General introduction
29
1.1 A brief history of pig breeds
Pigs were independently domesticated in the Near East and China approximately
10,000 years ago (Larson et al., 2007; Larson et al., 2005). From these two primary
domestication sites, pigs spread across Europe, North Africa, and Asia (revised in Amills
et al., 2010). The concept of breed is relatively recent because they were created around
150-200 years ago in the United Kingdom. However, local types with specific
morphological and productive features were developed in much more ancient times, being
Europe and China the two main pig breeding centers in the Old World (Larson et al. 2005).
The first herd book of the Large White breed was published in the United Kingdom in the
end of the 19th
century and the first association of Duroc pig breeders (Duroc or Jersey Red
Swine Club) was founded in the United States also in the end of the 19th
century (Jones,
1998). It is difficult to estimate the current number of pig breeds might, but it might range
between 200–300 (Jones, 1998; Porter, 1993).
Many studies have aimed to reconstruct the history of pig breeds by using
microsatellite and mitochondrial markers. By using such approaches, it has been
established the existence of a strong genetic divergence between Western and Asian pigs,
giving support to the existence of two primary domestication sites in the Near East and
China (Giuffra et al., 2000; Larson et al., 2005). It was also revealed that certain European
breeds, that now have a cosmopolite distribution (e.g. Large White, Landrace, and
Piétrain), carry Asian alleles at significant frequencies due to an introgression event that
took place in the United Kingdom during the 18th
-19th
centuries (Fang & Andersson,
2006). Moreover, it has been shown that gene flow between domestic and wild pigs has
been relatively frequent (Scandura et al., 2008). Ancient DNA studies also provided proof
of the entry of Near Eastern pigs into Europe (Larson et al., 2007). In 2017, it was
published a comprehensive study reporting the diversity of pig breeds around the world
(Yang et al., 2017). Genome-wide single nucleotide polymorphism (SNP) data from more
than 3,400 pigs were analyzed confirming that many breeds have mixed Western and
Asian ancestries and that breeds from Southern Europe are genetically distinct from those
of Middle and North Europe. Evidence was also provided that breeds from Africa and
America have basically a European ancestry, a finding that is consistent with the process of
colonization of these two continents. Moreover, Yang et al. (2017) studied the abundance
and frequency of runs of homozygosity (ROH) (i.e. genomic regions displaying a series of
consecutive homozygous genotypes) in pig breeds. Their results showed that 40 native pig

General introduction m
30
breeds have a large fraction of the genome (> 200 Mb) covered by ROH, indicating that
they have undergone a history of intensive inbreeding. Such pattern was especially evident
in Mangalitza and Romagnola pigs, implying that appropriate genetic conservation
measures should be implemented in order to prevent a further loss of diversity.
1.2 The search for causal mutations in pigs associated with economical
traits
Porcine meat production
Pork is the most widely consumed meat around the world, representing 36.4% of total
meat intake (Food and Agriculture Organization of the United Nations - FAO, 2013 -
http://faostat3.fao.org/). In recent decades, improvement of the pig breeding technologies
(modern production systems and genetic upgrading) made possible to raise worldwide 1
billion pigs by 2014, more than 2-fold the number in the mid-1960s (FAO, 2013 -
http://faostat3.fao.org/). Pig breeding is one of the fastest growing livestock subsectors
(Figure 1.1) and the main producers are China, United States of America, Germany, Spain
and Brazil (FAO, 2016 - http://faostat3.fao.org/).
Figure 1.1 - World production of cattle, chicken goat, pig and sheep meat. Production of meat
in the world from 2004 to 2016 (FAO, 2016 - http://faostat3.fao.org/).

General introduction
31
However, the FAO predicts that the rate of meat consumption in the world will
decelerate in the years to come, principally due to a slower population growth
(Alexandratos & Bruinsma, 2012). Furthermore, environmental and health concerns may
affect the consumption of meat. In recent years, an increased evidence for a positive
association between red meat consumption and several chronic diseases, e.g. colorectal
cancer, coronary heart disease and type 2 diabetes, has been reported in the media (De
Smet & Vossen, 2016). Nevertheless, meat and its processed products contribute
significantly to the intake of energy, protein and important micronutrients that support
human growth and development (Leroy & Praet, 2015). Dickenson & Bailey (2002) and
Lyford et al. (2010) reported that consumers are willing to pay more for high-quality meat.
Thus, the pork industry should make an effort towards fulfilling consumer expectations in
terms of healthier nutritional value with better eating quality.
Relevant traits in the porcine industry
Meat production and quality traits are complex phenotypes of considerable importance
to the producers, consumers, and processing industry because they strongly influence meat
acceptance and commercial safety (Listrat et al., 2016). The main determinants of meat
quality, such as intramuscular fat (IMF), marbling, loin eye area, water-holding capacity,
pH, glycolytic potential, color, tenderness, juiciness, and flavor (Davoli & Braglia, 2008),
are influenced by a large number of interacting factors, e.g. environmental conditions,
animal genetics and tissue characteristics (Figure 1.2). Importantly, these traits can be
improved by traditional selection, management practices, and also by genomic selection.
In the pork industry, ultimate pH and meat color are the most important indices of meat
quality and they are significantly affected by pre and post-slaughter factors. Stress and
excessive energy expenditure in the pre-slaughter period cause the depletion of muscle
glycogen stores and, the acidification of the pH, resulting in adverse changes of color,
structure, taste, and tenderness of meat (Adzitey & Nurul, 2011). Pale Soft Exudative
(PSE) and Dark Firm Dry (DFD) meats are two of the major meat quality defects and they
have a strong impact on the pig industry. The PSE condition is characterized by a pale, soft
and exudative meat, while DFD is the opposite condition, being characterized by a dark,
firm and dry meat (Adzitey & Nurul, 2011). These two types of defective meat are
produced by an excessively low (PSE) or high (DFD) ultimate pH after slaughter (Adzitey
& Nurul, 2011). Acute or short-term stress just before slaughtering leads to PSE,

General introduction m
32
Figure 1. 2 - Schematic representation of the main factors that affect relevant meat traits
in pigs.
stimulated by a rate of acidification faster than normal and lower ultimate pH values (< 6 at
45 minutes after slaughter). This acidification combined with a raised carcass temperature
(Przybylski & Hopkins, 2015) provokes protein denaturation and an increase in the
extracellular space, thus causing a poor water holding capacity and a lighter color
(Przybylski & Hopkins, 2015; Warriss, 2000). With regard to DFD meat, it occurs when
animals are exposed to chronic or long-term stress before slaughtering, leading to the
depletion of stored glycogen and an increase in the postmortem pH (measured 12 – 48
hours after slaughter), which reaches values higher than 6 (Adzitey & Nurul, 2011). High
pH results in a relatively little denaturation of proteins, as indicated by low solubility of
sarcoplasmic and myofibrillar proteins, retaining more water during storage and darkening
the color of meat (Warriss, 2000).
Furthermore, IMF content and composition also affect the technological and nutritional
properties of meat. It is generally accepted that IMF positively influences the overall
consumer acceptability of meat by increasing flavor, juiciness, and tenderness (Hocquette
et al., 2010). Fernandez et al. (1999) reported that flavor and juiciness were significantly
enhanced when IMF levels increased above 2.5% in pig meat. However, during many
years the pig industry devoted its efforts to improve leanness, which has an unfavorable
correlated effect on IMF by decreasing it (Ciobanu et al., 2011). This unfavorable
correlated response has led to the development of genetic lines with an IMF content that
does not match the requirements of specialized markets (Hocquette et al., 2010; Wood et
al., 2008). Another important aspect determining meat quality is IMF composition (Wood

General introduction
33
et al., 2008) i.e. polyunsaturated fatty acids (FAs) are prone to become oxidized, worsening
fat firmness and oiliness and leading to the development of rancidity as shelf-time
increases. Moreover, FA composition affects meat flavor due to the production of volatile
and odorous compounds during cooking (Hausman et al., 2009; Wood et al., 2008).
Heritability values for IMF content and composition are moderate (from 0.27 to 0.47,
Casellas et al., 2010; Torres-Vázquez & Spangler, 2016), while, meat quality traits, such as
pH, cooking loss and color display a broad range of heritabilities going from 0.19 to 0.79
(Cabling et al., 2015). This important genetic determinism demonstrates that these traits
can be successfully modified by selection (Casellas et al., 2010; Hernandez-Sanchez et al.,
2013). The development of molecular markers and genome maps, together with advances
in molecular genetics and computational biology, enhanced by the recent availability of the
swine genome sequence, has paved the way to increase the rate of genetic gain by
identifying the genetic factors that modulate the variation of traits of economic interest.
Performance of Genome-Wide Association Studies and Selection Scans in pigs
The quest to identify genes and quantitative trait locus (QTLs) associated with traits of
economic importance in pigs began several decades ago. Up to the first decade of the 21th
century, the search of QTL involved the genotyping of microsatellite markers in resource
populations with available phenotypic records (Dekkers, 2004). The advent of whole-
genome sequencing technologies and the availability of affordable genome-wide SNPs
panels made possible to explore the genetic architecture of complex traits with a much
higher resolution. In humans, the first successful genome-wide association study (GWAS)
was published in 2005 by Klein et al., (2005). These authors made a genome-wide scan of
polymorphisms associated with the age-related macular degeneration and found two SNPs
which displayed altered allele frequencies when patients were compared with healthy
controls. In pigs, the first GWAS for meat traits was published by Duijvesteijn et al.
(2010), who identified 37 SNPs on pig chromosomes SSC1 and SSC6 related to
androstenone levels in a commercial Duroc-based sire line. Since then, many GWAS have
been carried out to identify causal mutations in pigs (see Sharma et al. 2015 for a thorough
review). Moreover, Ma et al. (2014) demonstrated that a point mutation in a splice site
modifies the expression of the PHKG1 gene, thus producing an increase of 43% of the
glycolytic potential and a negative effect on a broad array of pig meat quality traits. The

General introduction m
34
GWAS approach has also been used to elucidate the genetic basis of simple phenotypes
such as coat color. For instance, Ren et al. (2011) performed a GWAS and identified a
single locus variant (c.1484_1489del) in the TYRP1 gene as the causative mutation for the
brown coloration in Chinese indigenous pigs. This information complements previous data
indicating that the polymorphism of the KIT (Giuffra et al., 2002) and MC1R (Fang et al.,
2009) genes has a crucial role in the determination of pig pigmentation.
On the other hand, the combination of gene expression data obtained with microarrays
with high throughput SNP genotypic information has provided valuable options for
identifying causal mutations. Expression QTL (eQTL) are polymorphisms associated with
the transcript levels of one or more genes. Obviously, eQTL can have perceptible
consequences on complex phenotypes, so their detection can be crucial in elucidating the
genetic basis of complex traits. Ponsuksili et al. (2010) investigated the genome-wide
transcriptional profiles of the longissimus dorsi muscle and detected 653 putative cis-
eQTL. Moreover, the mRNA levels of 262 transcripts encoded by the cis-regulated genes
showed significant correlations with at least one meat quality trait. In this study, it was also
observed that cis-eQTL were more consistently detected than trans-eQTL, possibly
because they have larger effects and the correction for multiple testing is less stringent.
These findings demonstrate that global microarray eQTL analysis can be used for
exploring functional and regulatory gene networks and scanning cis-eQTL. Further studies
have reported several candidate genes for muscle traits based on GWAS supported by
eQTL-analysis (Cinar et al., 2012; Ponsuksili et al., 2014; González-Prendes et al., 2017).
Genome-wide SNP data have also been used to detect the footprint of selection in the
porcine genome (Vitti et al., 2013). Here, the basic assumption is that such footprint can be
detected because positive selection sweeps beneficial alleles towards high frequencies or
fixation. This causes a reduction in diversity around the selected locus and an increase in
the magnitude of linkage disequilibrium because the frequencies of the variants near the
selected allele are modified due to a hitchhiking effect (Vitti et al., 2013). Many studies
have been carried out to detect the footprint of selective processes related to domestication
(Rubin et al., 2012; Zhu et al., 2017), litter size (Trenhaile et al., 2016), and adaptation to
high altitudes (Burgos-Paz et al., 2013), to mention a few. Recently, a selection scan
investigating the genetic basis of the six-white-point pigmentation pattern of Diannan
small-ear pigs showed that this color coat is strongly determined by three loci i.e. EDNRB,
CNTLN, and PINK1 (Lü et al., 2016).

General introduction
35
1.3 The generation of biological information is essential to identify
potencial causal mutations
One of the main drawbacks of GWAS studies is that genomic regions displaying
significant associations with phenotypes may contain hundreds of genes and thousands of
polymorphisms. In the absence of biological information, it is very difficult to distinguish
the causal mutation from the set of “innocent bystander” polymorphisms linked with it.
Indeed, the vast majority of genetic variants (> 80%) detected by GWAS lie in intronic or
intergenic regions of unknown function, and it is unclear how these non-coding variants
affect traits and diseases (Hindorff et al., 2009) This is why it is so important to
characterize with enough detail and resolution the functional elements of the whole porcine
genome or, at least, of regions displaying significant associations with quantitative traits.
In human and mouse, a coordinated genome-wide effort towards the identification of
functional elements has enabled to gain new insights into the molecular basis of gene
expression and its potential phenotypic consequences (The ENCODE Project Consortium,
2012; The GTEx Consortium, 2015). Compared to human and mouse, the functional
complexity of the transcriptomes in domesticated animals has been poorly characterized so
far. Whilst approximately 70% to 90% of the coding elements can be readily identified,
little information about non-coding genes and regulatory sequences underlying complex
traits is available (Andersson et al., 2015). Recently, a Functional Annotation of ANimal
Genomes (FAANG) international project began to be developed in order to produce
comprehensive maps of functional elements in the genomes of domesticated animal
species (Andersson et al., 2015). The results of this project should start to be published in
the next few years, yielding valuable biological data about the genomic architecture of
gene expression and production phenotypes, domestication, and evolution. Such
information will be essential to interpret the results of GWAS and selection scans, making
possible to identify which functional elements are present in genomic regions involved in
the variation of phenotypic traits (Figure 1.3). Currently, many methodological approaches
are being developed to identify functional elements (e.g. transcription factor binding sites
and chromatin modifications) as well as the three-dimensional organization of the genome
and other aspects that are essential to improve our understanding of the genomic
architecture of complex traits - Figure 1.3 (Ritchie et al., 2015).

General introduction m
36
Figure 1.3 - Biological systems multi-omics from the genome, epigenome, transcriptome,
proteome, and metabolome to the phenome (Ritchie et al., 2015).
Transcriptomics analysis
In eukaryotes, cell-cell differences are determined by the expression of different sets of
genes. It is now clear that processing of primary transcripts as well as translational control
opens a myriad of opportunities for regulating gene expression (Day & Tuite, 1998).
Transcriptomic studies attempt to catalog and quantify the RNA content of a cell, tissue or
an organism. In some cases, the goal is to target all transcripts, regardless of their
complexity. Many transcripts can be generated from a single gene by alternative splicing
(AS) and by the use of alternative promoters or polyadenylation sites. The GTEx
Consortium (2015) described the landscape of gene expression across tissue in humans,
demonstrating a similar number of expressed mRNA genes for most tissues (average of
20,940). Moreover, they showed that tissue-specific transcription is typically dominated by
a few highly expressed genes which vary from tissue to tissue e.g. casein genes in the
mammary gland, loci encoding myofibrillar proteins in the skeletal muscle and heart etc.
(Mele et al., 2015). Ferraz et al. (2008) and Freeman et al. (2012) made pioneering studies

General introduction
37
about the pig transcriptome. In this way, Ferraz et al. (2008) conducted a microarray
expression profiling of 16 different tissues from two males and two females from two pig
breeds, Large White and Iberian, with highly divergent growth and fatness profiles. They
found that tissue type accounted for ~11 times more variability than sex or breed. On the
other hand, Freeman et al. (2012) built a gene expression atlas of the domestic pig and
identified multiple large clusters of genes showing a tissue-restricted pattern of expression.
Moreover, the analysis of genes expressed in the gastrointestinal tract showed marked
regional differences. For instance, the SLC40A1 gene, which is involved in the export of
iron, was only expressed in the duodenum, while SLC26A3 expression was restricted to the
large bowel (Freeman et al. 2012). Many tissues were analyzed looking for candidate
genes and metabolic routes related to complex characters, thus providing new clues about
the molecular mechanisms that determine distinct phenotypes. In liver, genes associated
with cholesterol metabolism, oxidation and reduction processes (e.g. CYP2E1, CYP2C9,
and HPGD) were differentially expressed between animals displaying divergent fatness
profiles (Ramayo-Caldas et al., 2012; Sodhi et al., 2014). In the porcine adipose tissue and
skeletal muscle, individuals with higher polyunsaturated fatty acids (PUFAs) content
showed a lower expression of lipogenic genes (Cánovas et al., 2010; Corominas et al.,
2013; Puig-Oliveras et al., 2014). Indeed, a higher PUFA content may enhance fatty acid
oxidation, thus decreasing the intracellular accumulation of triglycerides.
Transcriptome analysis has also revealed that genes producing non-coding RNAs can
be involved in skeletal muscle growth and development in pigs. Zou et al. (2017) identified
323 large intergenic non-coding RNAs (lincRNAs) that are expressed in the porcine leg
muscle and they found that lincRNA gene expression is correlated with the methylation
status of the respective promoters. In addition, lincRNA genes produced shorter transcripts
with lower levels of expression than protein-coding genes. In another study, Jing et al.
(2015) detected 15 differentially expressed microRNAs (miRNAs) when studying pigs
with different residual feed intakes. Through a miRNA-targeted pathway analysis, 55
KEGG pathways comprised genes potentially targeted by up or down-regulated miRNAs
e.g. the TGF-beta signaling pathway, PI3K-Akt signaling pathway, mTOR signaling
pathway and GnRH signaling pathway (Jing et al., 2015).

General introduction m
38
Epigenetics
Initially, the term “epigenetics” defined changes in the phenotype without changes in
the genotype (Triantaphyllopoulos et al., 2016) but the molecular basis of such
phenomenon was poorly understood. Currently, we know that epigenetic mechanisms
transduce the inheritance of gene expression patterns without altering the underlying DNA
sequence but by modifying chromatin (Allis & Jenuwein, 2016). These chromatin changes
are achieved through a broad variety of chemical modifications including DNA
methylation as well as histone acetylation, methylation, sumoylation, phosphorylation, and
ubiquitination. Technologies for epigenetics research such as ChIP–seq, MNase-seq,
FAIRE–seq, DNase-seq, Hi-C, ChIA-PET and ATAC-seq (Meyer & Liu, 2014) can reveal
different aspects of chromatin structure and are vital for deciphering interactions between
specific proteins and DNA as well as for mapping transcription-factor binding sites and
histone/chromatin modifications (Farnham, 2009). Recent studies suggest that the interplay
between chromatin and transcriptional activity is dynamic, very complex and species-
specific (Schmidt et al., 2010). Indeed, a variety of phenotypic changes important for the
normal development as well as for the progression of diseases are temporally and spatially
controlled by chromatin-coordinated gene expression programs (Robertson et al., 2007;
Zhao et al., 2016).
Epigenetic studies in pigs are scarce. Fan et al. (2012) investigated the epigenetic
effects of sulforaphane, a histone deacetylase inhibitor, in myostatin satellite cells. They
demonstrated that the supplementation of sulforaphane not only acts as a histone
deacetylase inhibitor but also as a DNA methyltransferase inhibitor in porcine satellite
cells. Braunschweig et al. (2012) examined the transgenerational epigenetic effects of
dietary methylating micronutrients on gene expression and DNA methylation in three
generations of Large White pigs offspring. The boars which received a hypermethylating
diet had a higher percentage of shoulder and were leaner compared to the offspring of the
control group fed with a standard diet.
DNA methylation is a common heritable epigenetic mark that cells use to lock genes in
the "off" position, thus regulating gene expression (Jin et al., 2011). DNA methylation is
essential for normal development, and it plays a very important role in numerous cellular
processes, including embryonic development, genomic imprinting, X-chromosome
inactivation, and preservation of chromosome stability. Differential methylation profiles
can be associated with diseases (Toyota et al., 1999) and distinct phenotypes (Yoon et al.,

General introduction
39
2017; Zhang et al., 2016). Li et al. (2012) generated a landscape of the DNA methylome
of adipose and muscle tissues in three pig breeds differing in their fatness levels. They
found that differentially methylated regions in promoters are highly associated with
obesity development via expression-repression of known obesity-related genes and novel
genes. Zhang et al. (2016) performed a DNA methylation analysis of adipose tissue and
showed evidence of functionally relevant methylation differences in the backfat tissue of
obese vs lean pigs. A total of 483 differentially methylated regions were located in
promoter regions for genes involved in lipid transport and localization (e.g. PLIN1,
BDKRB2, NSDHL, APOL1, and APOL4).
1.4 The landscape of mammalian transcriptomes
Understanding the biological significance of the genome sequence involves the
functional characterization of its RNA products. The Encyclopedia of the DNA element
(ENCODE) pilot project (The ENCODE Project Consortium, 2012) demonstrated that up
to 80% of the human genome has some type of biological function, with just 2.9% of the
genome covered by protein-coding genes. In the mouse, at least 46% of the genome is
capable of producing polyadenylated messenger RNAs (mRNA) and the vast majority (87–
93%) of exonic nucleotides are transcribed (Yue et al., 2014). These studies provide
evidence that the genome is largely transcribed, but a relevant fraction of the produced
RNAs do not encode proteins (Carninci et al., 2005; Derrien et al., 2012; The ENCODE
Project Consortium, 2012; Yue et al., 2014).
The mammalian transcriptome mainly comprises ribosomal RNA (∼80-90%, rRNA),
transfer RNA (∼10-15%, tRNA), mRNA (~3–7%) and a small proportion of non-coding
RNA (< 0.2%, ncRNA) with regulatory functions (Palazzo & Lee, 2015). In recent years,
the analysis of expression data sets from tissues and primary cells made possible to gather
a huge amount of information about the nature and function of coding and non-coding
transcripts and their isoforms. Such effort has been particularly fruitful in humans
(Lappalainen et al., 2013; Mele et al., 2015; The GTEx Consortium, 2015, Iyer et al.,
2015) and mice (Barak et al., 2013; Russ et al., 2013; Li et al., 2016). In this way, the
Genotype-Tissue Expression (GTEx) project (The GTEx Consortium, 2015) has collected
and analyzed samples from 175 postmortem human donors, retrieving an average of 43
tissue samples per donor, in order to examine the patterns of expression of transcribed

General introduction m
40
genes across tissues. An average of 20,940 genes are expressed in the majority of analyzed
tissues (The GTEx Consortium, 2015). Moreover, between 919 (heart) and 2,244 (thyroid
gland) were regulated by cis-eQTL, and more than 50% of all QTL were shared across the
nine tissues under analysis. Mele et al. (2015) showed that tissue-specific transcription is
typically dominated by a small number of genes that vary from tissue to tissue. In the case
of skeletal muscle, genes related to actin and other myofibrillar proteins were the main
contributors to the overall transcriptome. Though there are thousands of genes that are
differentially expressed across tissues, a few hundreds are exclusively expressed in a single
tissue (Mele et al., 2015). The majority of such genes are expressed in the testis and
encoded by lncRNAs. Moreover, variation of gene expression is much higher amongst
tissues than amongst individuals, and a number of genes show sex-, population- or age-
biased patterns of expression (Mele et al., 2015).
Transcripts from ncRNA genes are not translated into proteins and they are loosely
grouped into classes based on transcript size and/or characteristics (Table 1.1). There are
strong evidences that ncRNAs are key elements of cellular homeostasis by interacting with
chromatin complexes, working as RNA enhancers, recruiting or assembling certain
proteins and interacting with other RNAs at the post-transcriptional level (Beltrami et al.,
2014; Huarte & Marín-Béjar, 2015). Moreover, there are several ncRNAs with key roles in
the maintenance of muscle function (Table 1.2).
Due to their poor evolutionary conservation, it is unclear how many ncRNA genes are
present in a typical mammalian genome (Palazzo & Lee, 2015). Currently, 22,521 and
15,074 ncRNA genes have been annotated in the human (assembly GRCh38.p7) and mice
(assembly GRCh38.p5) genomes. Mirbase (http://www.mirbase.org) encompasses a total
of 1,881 miRNA precursor genes that are processed into 2,588 mature miRNA sequences
in human, and 1,193 precursors and 1,915 mature miRNA sequences in mouse. Recently,
Iyer et al. (2015) curated 7,256 RNA-Seq libraries from normal tissues, cell lines and
different types of tumors, identifying 58,648 lncRNA-encoding loci, of which 79% were
previously unannotated. They observed that only 1% (597) of the lncRNAs harbored
ultraconserved elements, whilst miRNAs are evolutionarily conserved from plants to
mammals (Nie et al., 2015). However, the majority of these ncRNAs have yet to be
biochemically characterized for clarifying their biological functions (Palazzo & Lee,
2015).

General introduction
41
Table 1.1 -Regulatory non-coding RNA types (adapted from Byron et al., 2016).
RNA types Associated name Length (nt) Description
miRNA Micro RNA ~ 18–24 Represent the most extensively characterized group of small ncRNAs and they are
mainly involved in gene repression.
piRNA PIWI-interacting RNA ~ 26–32 Functions in transposon repression and maintenance of germline genome integrity.
snRNA Small nuclear RNA ~ 100–300 Localized to the nucleus, with functions in RNA processing and splicing.
snoRNA Small nucleolar RNAs ~ 60–140 snoRNAs play a key role in ribosome biogenesis and rRNA modifications.
lncRNA Long ncRNA > 200 Regulating gene expression through a broad variety of mechanisms.
circRNA Circular RNA ~ 100–500
Contain a covalent bond between the 5’ and 3’ ends, resulting in a continuous circular
loop. CircRNAs can act as miRNA sponges and regulators of splicing and
transcription.
tRNA Transfer RNA ~ 75–90 Help with translation of mRNA to protein. tRNAs are highly structured and have many
modifications to bases, making them difficult to sequence through.
Nt = nucleotide.
Table 1.2 - miRNAs and lncRNAs implicated in the development of skeletal muscle (revised by Neguembor et al., 2014; Nie et al., 2015).
*miRNA= microRNA; lnRNA = long non-coding RNA.
Function Effector molecule References
miRNA
miR-1 Promotes differentiation HDAC4 Chen et al. (2006)
Inhibits proliferation PAX7 Chen et al. (2010)
miR-199a-3p Inhibits differentiation IGF-1, MTOR, and RPS6KA6 Jia et al. (2013)
miR-31 Maintenance of quiescence/stemness MYF5 Crist et al. (2012)
lncRNA
Malat1 Epigenetic repression, pre-mRNA splicing CBX4 and SR family of splicing factors Watts et al. (2013)
Neat1 Structural integrity of nuclear paraspeckles Various RNA-binding proteins Sunwoo et al. (2009)
l2/Meg3 Epigenetic repression PRC2 Zhou et al. (2015)

General introduction m
42
Alternative mRNA splicing takes place when a primary transcript is processed in
different ways, during the mRNA maturation process, thus yielding multiple mRNA
isoforms. A global survey of mRNA splicing events showed that a total of 62.1% of the
human genome is covered by processed transcripts (Djebali et al., 2012). The relative
location of strong and weak splice sites may result, depending on the cellular context, in
different AS events, as shown in Figure 1.4. Deep sequencing of 15 human tissues and cell
lines was consistent with these findings, thus demonstrating that exon skipping was the
most frequent AS event, followed by alternative 3’ splice site, alternative 5’ splice site and
alternative first exon (Wang et al., 2008). Exon skipping accounts for nearly 40% of AS
events in higher eukaryotes, while intron retention, in which an intron remains in the
mature mRNA transcript, is the rarest AS event in vertebrates and invertebrates,
accounting for less than 5% of known events (Alekseyenko et al., 2007).
The GTEx Pilot project has revealed the existence of splicing QTL for 1,900 human
genes and only 7-21% of them happened to be tissue-specific (The GTEx Consortium,
2015). Moreover, a large fraction of splicing QTLs (20 - 48%) associated with changes in
gene transcript isoforms was identified as eQTL. In mice, Giudice et al. (2016) suggested
that AS in trafficking and membrane dynamics genes (SNAP23, TRIP10, CLTC, and
TMED2) is involved in T-tubule maturation and possibly in mitochondria positioning
during the postnatal phase of striated muscle development. Interestingly, a MICU1.1 splice
variant confers high sensitivity to the mitochondrial Ca2+
uptake, a process required to
increase ATP supply for skeletal muscle contraction (Reane et al., 2016). Another
important source of transcript variation involves the alternative usage of promoters and
polyadenylation sites. In a recent study, Reyes & Huber et al. (2017) investigated the cell
type-dependent differences in exon usage of over 18,000 protein-coding genes in 23 cell
types and found that alternative transcription start and termination sites, instead of AS,
accounted for most of tissue-dependent exon usage. Their results also indicated that AS
mostly affects untranslated exons and thus it has a limited impact on proteome complexity.
In the light of this, alternative transcription start and termination sites would be the main
drivers of transcript isoform diversity across tissues. Natural variation in gene expression is
extensive in humans and other organisms, and variation in the baseline expression level of
many genes has a heritable component (Cheung et al., 2003a; Cheung et al., 2003b). The
tissue-specificity of eQTLs across different tissues and cell types is relevant to identify
putative regulatory variants and linking them with phenotypes or diseases.

General introduction
43
Figure 1.4 -Schematic representation of different types of alternative splicing events
(Cartegni et al., 2002). The figure illustrates different types of alternative splicing events: exon
inclusion or skipping, alternative splice-site selection, mutually exclusive exons, and intron
retention for an individual pre-mRNA.
Nica et al. (2011) explored in-depth the role of cis-regulatory variation in three human
tissues: lymphoblastoid cell lines, skin, and fat. In doing so, they discovered that 4.7% of
genes in each tissue are regulated by cis-eQTLs, whilst 29% of eQTLs happen to be tissue-
specific. Grundberg et al. (2012) showed that at least 40% of the total heritable cis effect
on expression cannot be accounted for by common cis variants in twins, highlighting the
importance of characterizing low frequency/rare regulatory variants which may have large
effects. The GTEx project (The GTEx Consortium, 2013) investigated the patterns of
eQTLs sharing across tissues by using a data set of 22,286 genes expressed in nine tissues.
They observed that 50% of all detected eQTL were common to all nine tissues. The
majority of the significant cis-eQTL clustered around the transcription start site of target
genes. As a complementary approach, the GTEx project (The GTEx Consortium, 2015)
investigated the allele-specific expression of genes in order to estimate the overall effect of
cis-regulatory variants on the expression of nearby genes. Allele-specific expression ratios

General introduction m
44
and gene expression levels were highly correlated (r = 0.77), indicating that tissues with
similar gene expression profiles share similar regulatory mechanisms.
1.4 Methods to characterize the transcriptome
The generation of global gene expression profiles is a common approach in basic and
translational research. Different methods to comprehensively and systematically
interrogate gene expression have been developed. The choice of the technology depends on
the number of genes to be analyzed. Quantitative PCR is best suited for the analysis of
limited numbers of genes; while microarrays and RNA-Seq make possible to characterize
the transcript levels of thousands of genes in a single experiment. The microarray
technology (Figure 1.5) has been extensively used in porcine transcriptomic studies but in
the last five years, it has been progressively replaced by next-generation sequencing
methods.
While microarrays have been incredibly useful in a wide variety of applications, they
have a number of limitations. First, arrays provide an indirect measure of relative transcript
concentrations and the intensity of fluorescence is not linearly proportional to the
concentration of the species hybridizing to the array. For example, the signal may become
saturated in the case of highly expressed transcripts and, the sensitivity threshold is
probably lower for cell types with a more-limited concentration range of transcripts
(Bumgarner, 2013). Second, there is a cross-hybridization of sequences with high identity,
a feature that is specially relevant for complex mammalian transcriptomes and can be
particularly problematic for gene families and for genes with multiple splice variants
(Koltai & Weingarten-Baror, 2008). Third, a DNA array can only detect probed transcripts.
Finally, many problems related to chip to chip variation (e.g. unequal dye incorporation,
sample preparation, hybridization conditions) and analysis and interpretation of data
(image capture and processing) may influence the accuracy, sensitivity, and reproducibility
of results (Daly et al., 2005; Koltai & Weingarten-Baror, 2008).

General introduction
45
Figure 1.5 -Workflow summary of printed microarrays (Miller & Tang, 2009). Probes are
usually oligonucleotides that are spotted onto a solid surface. In this example, RNA from two
samples representing different conditions is used as template to synthesize cDNA which is
differentially labeled. This cDNA is hybridized to the arrayed probes and fluorescent signals are
recorded by confocal microscopy, providing information about which genes are expressed in each
sample as well as their levels of expression.
RNA-Seq, a sequencing technology to investigate gene expression
RNA-Seq involves the sequencing of the whole transcriptome of a sample, thus making
possible to characterize not only transcript abundance but also RNA splice events and
edited RNAs (Piskol et al., 2013; Wolf, 2013; Korir & Seoighe, 2014). This technological
development eliminated many challenges posed by microarrays (hybridization-based) and
Sanger (sequencing-based) approaches that were previously used for measuring gene
expression (Table 1.3). A typical RNA-Seq experiment implies purification of RNA,
synthesis of cDNA, preparation of the library and its sequencing in a next-generation
sequencing (NGS) platform. However, many experimental issues should be carefully
considered before performing an RNA-Seq experiment (Kukurba & Montgomery, 2015).
For example, the RNA extraction protocol needs to be adjusted having in mind the targeted
RNA-species i.e. all RNAs, small or large RNAs etc. (Wolf, 2013). Another key
consideration, concerning library construction, is whether or not to prepare strand-specific
libraries. Strand-specific information about the orientation of transcripts is valuable for
transcriptome annotation, especially for regions with overlapping transcription from

General introduction m
46
opposite directions (Borodina et al., 2011). Moreover, the amplified fragments can be
sequenced either from one end (single-end) or from both ends (paired-end). Paired reads
allow more accurate alignment to a reference genome, facilitating the discovery of novel
transcripts, splice isoforms and the de novo assembly of the transcriptome (Berglund et al.,
2011).
Several NGS platforms are commercially available and many more are under active
development (Table 1.4). Each commercially available platform has similarities and
differences relative to the others depending on the chemistries and detection methods used.
Sequencing platforms can be generally classified on the basis of three features (Berglund et
al., 2011; van Dijk et al., 2014; Levy & Myers, 2016). First, they may detect single
molecules (Pacific Biosciences and Oxford Nanopore) or clonally amplified DNAs
(Illumina, Ion Torrent, and Roche 454). Second, detection can be optical, e.g. fluorescence
(Illumina and Pacific Biosciences) or light (Roche 454), or non-optical, e.g. IonTorrent
(detection of the release of H+ during a polymerization reaction via a solid-state sensor)
and Oxford Nanopore (measurement of the translocation of DNA through a nanopore
sensor) platforms. Finally, the majority of sequencing technologies are based on
sequencing-by-synthesis reactions, as performed by Illumina, Ion Torrent, Pacific
Biosciences, and Roche 454 platforms, whereas the Applied Biosystems SOLiD and the
Polonator platforms use a ligation-mediated synthesis approach. Direct analysis of DNA
sequences is performed by the Oxford Nanopore platform (Berglund et al., 2011; Levy &
Myers, 2016; van Dijk et al., 2014). A comparison of the different sequencing platforms in
terms of read length, output and runtime can be found in Figure 1.6. The majority of
platforms can generate reads of one or few hundreds of bp (Figure 1.6A). PacBio (Pacific
Biosciences) can produce long reads, with maximum read lengths over 20 kb, making this
technology an ideal tool to finish genome assemblies. Illumina currently offers the highest
throughput per run and the lowest per-base cost (Figure 1.6B). These improvements have
resulted in a substantial decrease in the costs of sequencing genomes (Figure 1.6C). Ion
Torrent PGM and PACBio are the fastest bench-top NGS platforms (Figure 1.6D).
Nowadays, Illumina produces the most widely used family of sequencing platforms
(GA/HiSeq/MiSeq/NextSeq) (Hodkinson & Grice, 2015) and, by this reason, a schematic
presentation of the library preparation and sequencing processes is provided in Figure 1.7.

General introduction
47
Table 1.3 - Advantages of RNA-Seq techonology compared with other transcriptomics
methods (Wang et al., 2009).
Technology Microarray cDNA or EST
sequencing RNA-Seq
Technology specifications
Principle Hybridization Sanger sequencing High-throughput
sequencing
Resolution From several to
100 bp Single base Single base
Throughput High Low High
Reliance on genomic
sequence Yes No In some cases
Background noise High Low Low
Application
Simultaneously map
transcribed regions and
gene expression
Yes Limited for gene
expression Yes
Dynamic range to quantify
gene expression level
Up to a few-
hundredfold Not practical > 8,000-fold
Ability to distinguish
different isoforms Limited Yes Yes
Ability to distinguish allelic
expression Limited Yes Yes
Practical issues
Required amount of RNA High High Low
Cost for mapping
transcriptomes of large
genomes
High High Relatively low

General introduction m
48
Table 1.4 - Summary of next generation sequencing (NGS) technologies (adapted from Levy & Myers, 2016).
Manufacturer Amplification Detection Chemistry URL
Commercial
Illumina Clonal Optical Sequencing by synthesis http://www.illumina.com
Oxford Nanopore Single molecule Nanopore Nanopore http://www.nanoporetech.com
Pacific Biosciences Single molecule Optical Sequencing by synthesis http://www.pacb.com
ThermoFisher Ion Torrent Clonal Solid state Sequencing by synthesis http://www.thermofisher.com/us/
en/home/brands/ion-torrent.html
QIAGEN (GeneReader) Clonal Optical Sequencing by synthesis http://www.qiagen.com
Pre-commercial
Quantum Biosystems Single molecule Nanogate Nanogate http://www.quantumbiosystems.com
Base4 Single molecule Optical Pyrophosphorolysis http://base4.co.uk
GenapSys (GENIUS) Clonal Solid state Sequencing by synthesis http://www.genapsys.com
Roche Genia Single molecule Solid state Nanopore http://geniachip.com
Post-commercial
Roche 454 (GS FLX) Clonal Optical Sequencing by synthesis http://www.454.com
Helicos BioSciences
(Heliscope) Single molecule Optical Sequencing by synthesis —
Dover (Polonator) Clonal Optical Sequencing by ligation —
ThermoFisher Applied
Biosystems (SOLiD) Clonal Optical Sequencing by ligation
http://www.thermofisher.com/us/en/
home/brands/applied-biosystems. html
Complete Genomics Clonal Optical Sequencing by ligation http://www.completegenomics.com
*Dashes indicate that no URL or reference is available. Platforms listed as precommercial have been announced but at the time of writing have not
been formally launched; platforms listed as post-commercial are no longer commercially available as new instrument sales.

General introduction
49
Figure 1.6 -Evolution of high-throughput sequencing platforms (van Dijk et al., 2014) (A) Blue
bars: maximum read length of the first commercially available sequencing instruments. Orange
bars: maximum read length obtained today on the bench-top versions; brown bars: maximum read
length obtained today for the large instruments. (B) Blue bars Maximum throughput of the first
commercially available sequencing instruments. Brown bars: current maximum throughput. (C)
Evolution of the cost of sequencing a human genome from 2001-2015. (D) Run times to complete a
bacterial genome sequence using the sequencing platforms of various manufacturers. Brown: large
instruments. Orange: bench-top machines

General introduction m
50
Figure 1.7 - Schematic presentation of the library preparation and sequencing processes
associated with the Illumina Sequencing Platform.
(http://www.3402bioinformaticsgroup.com/service/; accessed in October 2017). Outline of
Illumina genome analyzer sequencing process. (1) Adaptors are annealed to the ends of sequence
fragments. (2) Fragments bind to primer-loaded flow cells and bridge PCR reactions amplify each
bound fragment to produce clusters of fragments. (3) During each sequencing cycle, one
fluorescent nucleotide is added to the growing strands. Laser excites the fluorophores in all the
fragments that are being sequenced and an optic scanner collects the signals from each fragment
cluster. Then the sequencing terminator is removed and the next sequencing cycle starts.
Bioinformatic data processing
A single run of any sequencing platform generates an appreciable amount of
sequencing data, quickly reaching hundreds of gigabytes. Like other high-throughput
sequencing technologies, RNA-Seq faces several informatics challenges. Different tools
have been developed by bioinformaticians, using different algorithms and models, to
analyze the data flood in order to make biological inferences. Routine RNA-Seq data
analysis is shown in Figure 1.8, and consists of the following five steps: 1 - raw data
quality control and processing; 2 - alignment of the reads and visualization of data; 3-

General introduction
51
transcriptome reconstruction; 4 - expression quantification, and 5 - differential expression
analysis. Some bioinformatic tools for NGS data processing are shown in Table 1.5.
As an initial step, RNA-Seq data should be subjected to the quality control of the raw
data, and an additional quality control procedure can be performed to evaluate the quality
of the aligned reads after read alignment (Conesa et al., 2016). Depending on the RNA-Seq
library construction strategy, it is recommended some form of read trimming prior to
aligning the RNA-Seq data. Adapter and quality trimming aim to remove adapter
sequences used during library construction and to eliminate poor quality bases (Conesa et
al., 2016). When a reference sequence is available, two strategies can be used to align
reads i.e. mapping to the genome or mapping to the annotated transcriptome (Yang & Kim,
2015). If a transcriptome is used as a reference, only known exons and junctions are
mapped. However, when the reference is the genome, spliced aligners should be employed
because they allow a spliced-read placement and make possible the filling of a wide
range of gaps. This approach facilitates the identification of novel transcripts generated by
AS (Yang & Kim, 2015). Transcriptome reconstruction is based on two strategies e.g. the
reference-guided approach and the reference-independent approach. Reference-guided
approach is advantageous when reference annotation information is complete and
thorough. However, when a reference genome is not available or its annotation is deficient,
RNA-Seq reads can be assembled de novo by building consensus transcripts from short
reads with bioinformatic packages such as Trinity (Haas et al., 2013).
The most common application of RNA-Seq is to estimate gene and transcript
expression levels. This application is primarily based on inferring the number of reads that
map to each transcript sequence. The simplest approach to quantification is to aggregate
raw counts of mapped gene reads by using programs such as HTSeq-count (Anders et al.,
2014) or FeatureCounts (Liao et al., 2014). Algorithms that quantify expression from
transcriptome mappings include RSEM (Li & Dewey, 2011), Cufflinks (Trapnell et al.,
2012), Sailfish (Patro et al., 2014) and Kallisto (Bray et al., 2016). Sequencing depths
and/or library sizes may diverge across samples (implying that the observed counts are not
directly comparable between samples). Complex normalization schemes have been
proposed and are used by different softwares for quantification of transcripts, such as total
counts (Vêncio et al., 2004); trimmed mean of M-values - TMM (Robinson et al., 2010),
counts normalization (Anders & Huber, 2010) and quantile normalization - Reads Per
Kilobase Million (RPKM) (Mortazavi et al., 2008). Differential expression analysis takes

General introduction m
52
as input normalized read count data and performs statistical analysis to detect differences
in the expression of loci across different treatments or conditions (Conesa et al., 2016). An
extensive number of software packages and pipelines have been developed with such
purpose (Table 1.5). In the methods explicitly developed for the analysis of differential
expression based on count data, the Poisson [employed by DEGseq2 - Love et al. (2014)]
and the Negative Binomial [adopted by edgeR - Robinson et al. (2010) and DESeq -
Anders & Huber (2010)] distributions are the two most commonly used approaches to
model RNA-Seq data. Alternatively, user-friendly tools such as CLC Bio
(http://www.clcbio.com; CLC inc, Aarhus, Denmark), Galaxy (Blankenberg et al., 2010;
http://g2.bx.psu.edu), GeneSpring (http://genespring-support.com/; Silicon Genetics,
Redwood, CA), BaseSpace Apps (https:// basespace.illumina.com/home/index; Illumina
Inc., CA, USA) and Partek (http://www.partek.com; Partek Inc, St Louis, MO, USA) can
be employed to carry out all the analysis detailed above in a single dedicated platform.
There is not a broad consensus on how to approach an optimal study design in order to
ensure the validity of the results in terms of reproducibility, accuracy, and robustness.
Zhang et al. (2014) and Schurch et al. (2016) affirmed that each method has its own
particular strengths and pitfalls making them suitable for specific RNA-Seq datasets.
Therefore, a crucial prerequisite for a successful RNA-Seq study is a good experimental
design and the selection of an appropriate bioinformatic pipeline. Other important
decisions are the choice of library sizes, sequencing depth and the number of replicates
under study. Moreover, it is also very important to take into account the heterogeneity of
the samples in order to eliminate potential biases.
The last step in a standard transcriptomics study is the characterization of the molecular
functions or metabolic pathways in which differentially expressed (DE) genes are
involved. A commonly used approach includes Gene Ontology (GO) and pathways
enrichment analysis with the aim of determining if DE genes are associated with a certain
biological process or molecular function. Popular softwares for gene set enrichment and
metabolic pathway analysis are Panther, DAVID, STRING, Cytoscape and Reactome
among others (Table 1.5). However, very little functional information is available for
ncRNAs such as lncRNAs or miRNAs (Conesa et al., 2016). In some cases, functional
annotation of predicted unknown genes and transcripts can be done by assessing their
sequence similarity across orthologs, e.g. using approaches based on BLAST, with a
success rate of 50-80% (Conesa et al., 2016).

General introduction
53
Figure 1.8 - Typical workflow for RNA sequencing (RNA-Seq) data analysis (Conesa et al., 2016).

General introduction m
54
Table 1.5 - Summary of selected bioinformatics tools for NGS data processing.
Workflow Package Reference
Quality control and read processing FastQC, Qualimap 2, HTSeq Andrews (2010), García-Alcalde et al. (2012),
Anders et al. (2014)
Read alignment Bowtie, BWA, SOAP, Tophat2, STAR Down et al. (2008), Li et al. (2008), Li & Durbin (2009), Kim
et al. (2013), Dobin et al. (2013)
Transcriptome reconstruction Cufflinks, Trinity Trapnell et al. (2010), Grabherr et al. (2011)
Expression quantification
ALEXA-seq, Cufflinks, RSEM,
FeatureCounts, HTSeq-count, Sailfish,
Kallisto.
Griffith et al. (2010), Trapnell et al. (2010), Li & Dewey
(2011), Liao et al. (2014), Anders et al. (2014), Patro et al.
(2015), Bray et al. (2016)
Differential expression Limma, EdgeR, RSEM, Cuffdiff, DESeq2,
Sailfish, NOIseq
Smyth (2004), Robinson et al. (2010), Li & Dewey (2011),
Trapnell et al. (2012), Love et al. (2014), Patro et al. (2014),
Tarazona et al. (2015)
Genomic variants Samtools mpileup, SOAPsnp, Comrad,
FusionHunter, GATK
Li et al. (2009b), Li et al. (2009a), DePristo et al. (2011), Li et
al., 2011), McPherson et al. (2011)
Gene function and interaction Cytoscape, KEGG, DAVID, GOSeq, STRING Shannon et al. (2003), Kanehisa & Goto (2000), Huang et al.
(2007), Young et al. (2010), Szklarczyk et al. (2015)

General introduction
55
1.5 Transcriptomic studies in pigs
The characterization of the pig transcriptome is an essential step towards identifying
the functional elements of the porcine genome and understanding the genetic architecture
of complex traits such as fat deposition, metabolism, and growth. So far, the functional
annotation of the pig genome is quite poor, particularly for lncRNAs displaying a limited
evolutionary conservation. High-throughput techniques, such as cDNA, oligo-based arrays
or RNA-Seq approaches, represent valuable tools to study the transcriptome and its
regulatory mechanisms. Numerous cDNA-microarray (revised by Pena et al., 2014) and
RNA-Seq studies aiming to characterize the expression of key tissues (e.g. liver, fat and
skeletal muscle) in pigs with divergent phenotypes or subject to different experimental
conditions have been reported. Published RNA-Seq experiments investigating gene
expression in the porcine skeletal muscle are shown in Table 1.6.
Differences in gene expression across different muscles
Ayuso et al. (2016) investigated the differences in gene expression in two distinct
skeletal muscles (longissimus dorsi and biceps femoris). Biceps femoris has a higher PUFA
content than the longissimus dorsi muscle, and the set of DE genes showed an enrichment
of pathways related with adipocyte differentiation and lipid metabolism (LXR/RXR
activation, FXR/RXR activation, and biosynthesis of retinoids). These results suggest a
more active lipid metabolism in biceps femoris than in longissimus dorsi. In contrast,
growth and proliferative processes were more prevalent in genes overexpressed in
longissimus dorsi, with an enrichment of biological functions related to cell proliferation
and body size. Zhu et al. (2016) compared differences in the transcriptome between
extensor digitorum longus (white fiber) and soleus (red fiber) muscles of Large White pigs
and identified a large number of DE genes and pathways implicated in muscle fiber type
determination. Myofibril was the most significant gene ontology term in the muscle fiber
type determination process. Moreover, several collagen encoding genes (COL12A1,
COL11A2, COL11A1, and COL13A1) display a higher expression in the soleus muscle
suggesting differences in collagen composition between different types of myofibers.

General introduction m
56
Table 1.6 - Published RNA-Seq experiments interrogating pig muscle phenotypes or subject to different experimental conditions.
Breed/phenotype of comparison Replicates Thresholds of significance Number of DEGs* Reference
Differences in gene expression across tissues
Longissimus dorsi and Biceps femoris 24 p < 0.01 and FC > 1.5 135 Ayuso et al. (2016)
Extensor digitorum longus and soleus 3 FDR < 0.001 and FC > 2 561 Zhu et al. (2016)
Differences in gene expression amongst porcine breeds
Indigenous Chinese pig and introduced pig breeds 8 p < 0.05 and FC > 2 315 Wang et al. (2015)
Purebred and Duroc-crossbred Iberian pigs 9-10 p < 0.01 and FC > 1. 5 149 Ayuso et al. (2015)
Jeju native pig and Berkshire piglets 5 FDR < 0.001 and FC > 2 56 Ghosh et al. (2015)
Differences in gene expression amongst pigs with highly divergent phenotypes
Intramuscular fat content and composition 6 p < 0.01 and FC > 1.2 131 Puig-Oliveras et al. (2014)
Postweaning growth rates 9 p < 0.01 768 Pilcher et al. (2015)
Drip loss 2 (pool) FDR < 0.005 and FC > 2 150 Li et al. (2016a)
Developmental stage
Eleven developmental stages in Tongcheng and
Yorkshire pigs. ~35 FC > 2 and prob >0.7 8,289 Zhao et al. (2015)
Birth and growth 5-6 p < 0.01 and FC > 1.5 5.812 Ayuso et al. (2016)
Four developmental stages in Laiwu pigs 3 FDR < 0.01 and FC > 4 - Wang et al. (2017)
Diet induced differences in gene expression
Fed with a supplemented diet 2 (pool) FDR < 0.001 and FC > 2 749 Ogłuszka et al. (2017)
Expression of mRNA isoforms
Global view of porcine transcriptome 2 - - Chen et al. (2011)
Biceps femoris and Soleus. 3 - - Li et al. (2016b)
Expression of non-coding RNA
Domesticated pigs and wild boars 93 FDR < 0,01 30 Zhou et al. (2014)
Global view of porcine transcriptome 2 - - Chen et al. (2011)
Indigenous Chinese pig and introduced pig breeds 8 p < 0.05 and FC > 2 30 Wang et al. (2015b)
Four developmental stages 6 p < 0.01 and FC > 1.2 8 Wang et al. (2017a)
*DEGs = differentially expressed genes; FDR = false discovery rate; FC = fold-change

General introduction
57
Differences in gene expression amongst porcine breeds
When comparing the muscle expression profiles of Chinese pigs vs introduced
(European) swine, Wang et al. (2015b) identified 315 DE genes. The ryanodine receptor 3
(RYR3) and mannose receptor C type 2 (MRC2) genes were 30-fold overexpressed in
Chinese breeds when compared with the European ones, a finding that is relevant because
these two genes have important roles in muscle growth. Moreover, several genes related to
lipid deposition (e.g. ESR1, SCD, FASN, and LDLR) were overexpressed in Chinese pigs
explaining their increased fatness. In another study, Ayuso et al. (2015) investigated gene
expression differences between Iberian purebred and Duroc x Iberian crossbred pigs. They
detected 149 DE genes and demonstrated an enrichment of genes involved in cellular and
muscle growth in lean Duroc x Iberian crossbred pigs in contrast with Iberian purebred
pigs. Genes overexpressed in Iberian purebred pigs showed an enrichment of functions and
pathways related to lipid and glucose metabolism in accordance with the greater adipose
accretion of this breed. Ghosh et al. (2015) carried out a study to investigate DE genes
between Jeju native pigs (better taste, tenderness and marbling quality than from Western
breeds) and Berkshire swine (better growth rate and meat palatability traits than do Jeju
pigs). In doing so, they observed that 65% of genes in muscle had a higher expression in
Jeju than in Berkshire pigs. However, an upregulation of DE genes related with body
growth and skeletal system development (COL21A1, COL2A1, and POSTN) and immunity
(IL7R, CRP, and CD) was detected in the Berkshire breed.
Differences in gene expression amongst pigs with divergent phenotypes
Puig-Oliveras et al. (2014) compared the muscle expression profile of sows from an
Iberian x Landrace backcross displaying extreme phenotypes for fatty acid composition
and found 131 DE genes, and an enrichment of genes related with lipid metabolism. Puig-
Oliveras et al. (2014) proposed that a high intramuscular PUFA content may influence FA
metabolism and glucose uptake resulting in an inhibition of the lipogenesis and in the
increase of the rate of FA oxidation. This interpretation agrees well with previous
microarray studies (Cánovas et al., 2010; Corominas et al., 2013; Pena et al., 2013)
suggesting that a higher PUFA content would enhance fatty acid oxidation and decrease
the intracellular accumulation of triglycerides through the establishment of a cycle where
triacylglycerols are synthesized and degraded continuously. In another study, Pilcher et al.

General introduction m
58
(2015) characterized gene expression in the skeletal muscle to investigate the metabolic
basis of poor weaned-pig transition. The group of DE genes with decreased expression in
the longissimus dorsi muscle of pigs with a poor transition was enriched in loci with
functions related to muscle contraction, glucose metabolism, cytoskeleton organization,
muscle development, and response to hormone stimulus, while genes related with protein
catabolism displayed an increased expression. Li et al. (2016a) used a commercial pig
population to perform a transcriptional study contrasting animals with high and low drip
loss values. Drip loss is defined as weight loss (mainly consisting of water and proteins) of
a fresh meat under gravity at 0–4 °C for 24 h and it has a low heritability (van Wijk et al.,
2005). This comparative analysis of gene expression levels made possible to detect 150 DE
genes in the High group relative to the Low group. The authors also reported that the
TRDN gene, which is involved in muscle contraction and fat deposition, and the MSTN
gene, which has a role in muscle growth, can be critical candidate genes responsible for
drip loss.
Developmental stage
Zhao et al. (2015a) analyzed the muscle transcriptome profiles across 11 developmental
stages for Yorkshire and Tongcheng pigs. Yorkshire pigs are characterized by fast growth,
low backfat and a high lean meat percentage. Several genes with a key position in the
muscle regulatory networks were overexpressed in the Yorkshire pigs, e.g. SGCD, ENG,
THBD, AQP, and BTG2, whereas CXCL10, EIF2B5, PSMA6, FBXO32, and
LOC100622249 were overexpressed in the Tongcheng breed. These genes showed breed-
specific and development-dependent differential expression patterns. Ayuso et al. (2016),
analyzed ten litters at birth and 12 at growing stage and observed more than 5,800 DE
genes between the two ages under comparison. Several genes overexpressed in newborn
piglets were involved in the synthesis of cholesterol, triglycerides and other metabolites
(e.g. ELOVL1, LSS and NSDHL). In growing pigs, an overexpression of genes associated
with the immune response and related to catabolic processes (e.g. PGK1, GAPDH, PFKM,
and ME1) was reported. Wang et al. (2017a) analyzed the evolution of IMF content in four
developmental stages in the porcine longissimus dorsi muscle. They found three temporal
expression profiles correlated with IMF variation, i.e. 15 DE genes with known functions
in lipid metabolism (e.g. ACACA, SCD, ACLY, ELOVL1 and FAS), 4 DE genes encoding

General introduction
59
desaturases (SCD, FADS1, FADS2, and FADS3) and 6 DE genes involved in the steroid
biosynthesis pathway (CYP51, DHCR24, EBP, HSD17B7, SOAT1, and SQLE) .
Diet induced differences in gene expression
Next-generation sequencing was used by Ogłuszka et al. (2017) to compare animals
subjected to either a control diet or a diet supplemented with linseed and rapeseed oil to
increase polyunsaturated fatty acid content. In the group of pigs supplemented with omega-
3 and omega-6 fatty acids, the expression of 219 and 530 genes was upregulated and
downregulated, respectively. In the light of these results, the authors proposed a role of
fatty acids in the regulation of the expression of genes which are essential for muscle tissue
development and functioning. Interestingly, the identified genes were important for diverse
biological processes related to the inflammatory response, signaling, lipid metabolism, and
homeostasis.
Expression of mRNA isoforms
Chen et al. (2011) used RNA-Seq to generate a high-resolution map of the porcine
mRNA and miRNA transcriptome in liver, longissimus dorsi and abdominal fat from
White Duroc × Erhualian pigs with divergent phenotypes for growth and fat deposition.
They found that about 18.8% of the annotated genes showed AS isoforms, and alternative
3' splicing was the most common type of AS events in pigs. In addition, they demonstrated
that the majority of AS events showed a clear pattern of tissue specificity. These results
highlighted the importance of AS in tissue-specific programs of gene expression and its
major role in expanding functional complexity. Interestingly, the RYR1 gene presented the
largest number of longissimus dorsi-specific AS events. According to Li et al., (2016b),
exon skipping was the most common AS event and, accounted for more than 85% of all
AS events in biceps femoris and soleus muscle. These results suggest that the frequencies
of AS type events may vary across and even within tissues.
Reyer et al. (2013) explored the structural diversity of the NR3C1 gene in pigs. This
gene encodes the glucocorticoid receptor, and showed the highest proportion of transcripts
containing the predominant exon 1C variant and only minor variability in the usage of
other alternative first exons in tissues related to metabolism (skeletal muscle and fat),
suggesting a major role of the promoter region of exon 1C in driving constitutive

General introduction m
60
expression and, at the same time, limited plasticity in the regulation of NR3C1 in metabolic
tissues. In another study, five different isoforms of the glycogen synthase kinase 3
(GSK3β) gene were identified in different porcine tissues (Wang et al., 2012).
Interestingly, the GSK3β isoforms have different effects on glycogen synthase activity. In
this way, an overexpression of GSK3b1, GSK3b2, and GSK3b3 isoforms, but not GSK3b5,
decreased significantly glycogen synthase enzyme activity in PK-15 cells (Wang et al.,
2012). These results suggest that different GSK3β isoforms may have different roles in the
insulin signaling pathway in pigs. Ma et al. (2014) described a mutation in a splice
acceptor site of intron 9 (g.8283C>A) of the porcine phosphorylase kinase catalytic subunit
gamma 1 (PHKG1) gene that drives the synthesis of an aberrant transcript subjected to
nonsense-mediated decay. This polymorphism has causal effects on glycogen content and
meat quality.
Expression of non-coding RNAs
Currently, there are 3,250 annotated porcine ncRNAs in the Ensembl database
(http://www.ensembl.org/Sus_scrofa/Info/Annotation; Sscrofa v.11.1). The MiRBase
database (http://www.mirbase.org) contains 382 miRNA precursor genes that are
processed into 411 mature miRNA sequences. Very likely, the catalog of non-coding
RNAs in pigs is much larger. Anthon et al. (2014) annotated 3,183 high confidence
ncRNAs mapping to the pig genome. Zhou et al. (2014) identified 6,621 lincRNA
transcripts from 4,515 genes loci using RNA-Seq data from 93 samples. The domestic-
animal lncRNA database (ALDB - Li et al., 2015) currently comprises 12,103 pig
lincRNAs. In contrast, the NONCODE database recently made available the information of
17,811 lncRNA genes encoding 29,585 lncRNA transcripts compiled from many different
sources (Noncode database; http://www.bioinfo.org/NONCODE2016). Despite these
advances, there is a pressing need to improve the genomic annotation of non-coding
RNAs. Indeed, in human and mouse 90,062 and 79,940 ncRNAs have been annotated so
far, respectively.
Non-coding RNAs carry out a broad variety of biological functions, regulating gene
expression at the levels of transcription, RNA processing, and translation (Cech & Steitz,
2014). In consequence, they may play a fundamental role in the metabolism of the porcine
skeletal muscle. However, only a few studies have catalogued and investigated muscle

General introduction
61
ncRNAs in pigs. Zhou et al. (2014) compared the expression profile of lincRNAs in
domesticated pigs and wild boars and found 30 lincRNAs that showed a differential
expression between groups. Linc-sscg2561 displayed 1.4-fold higher expression in
domesticated pigs compared with wild boars. Adjacent to this lincRNA, there is the
DNMT3A gene which displayed a 1.4-fold higher expression in the domesticated pig. The
DNMT3A gene is a DNA methyltransferase which regulates behavioral plasticity to
emotional stimuli (LaPlant et al., 2010). Thus, together DNMT3A and Linc-sscg2561 could
contribute to changes in behavior during the domestication of the pig (Zhou et al. 2014).
With regard to miRNAs, Chen et al. (2011) detected increased levels of miR-1/206 in
the porcine muscle vs liver. Myostatin gene is a target-gene to miR-1/206 and can present a
mutation that creates an illegitimate binding site for this miRNA leading to efficient
translational inhibition of the myostatin gene and an increase in muscularity in Texel sheep
(Clop et al., 2006). Wang et al. (2015b) also compared miRNA sequences from
longissimus dorsi muscle of the two indigenous Chinese pig breeds and two introduced pig
breeds. They found 20 upregulated (e.g. ssc-miR-145-5p, -339 and 133a-5p) and 10
downregulated (e.g. ssc-let-7c, ssc-miR-122 and -4332) miRNAs in the fat Chinese pig
breeds. Through a miRNA target gene prediction and functional analysis, these authors
anticipated that these miRNAs might target 2,393 genes, which are mainly involved in
pathways associated with lipogenesis, metabolism, and adipocyte lineage commitment
(e.g. insulin- signaling, mitogen-activated protein kinase 1 signaling and GnRH signaling
pathways). Recently, Wang et al., (2017a) explored the relationship between the miRNA
profile and the development of porcine muscle and adipose tissue. They found 17 core
miRNAs that were differentially expressed in adipose tissue vs skeletal muscle at three
development stages (30, 90, 240 days-old pigs). Amongst them, ssc-miR-128 and -133a-5p
and -489 are muscle-related miRNAs differentially expressed at all four stages and they
may have a major role in regulating the muscle differentiation and development of pigs.
Epigenetic differences
Schachtschneider et al. (2015) produced DNA methylome maps and gene transcription
profiles of eight tissues, including muscle tissue, from one adult Duroc female. Analysis of
over 500,000 CpG sites demonstrated patterns similar to those observed in humans,
including a reduction of CpG and an increase of TpG density at transcription start sites of

General introduction m
62
lowly expressed genes, suggesting that DNA methylation can play a significant role in
adaptive evolution by modulating gene expression. CpG methylation levels (defined as the
ratio of methylated reads/total reads at a given site) were similar across tissues, with an
average of 41.39% (Schachtschneider et al., 2015). Skeletal muscle presents a lower
methylation level than other tissues (39.52 %, Schachtschneider et al., 2015). Choi et al.
(2015) performed a correlation analysis between the levels of gene expression and tissue-
specific differentially methylated CpG sites in diverse pig tissues. In the muscle, 18 tissue-
specific differentially methylated CpG sites were associated with 11 genes which promote
muscle development. As expected, a negative correlation between gene expression and
methylation was observed. Li et al. (2012) analyzed the genome-wide DNA methylation
levels of three porcine breeds (Landrace, Rongchang, and Tibetan) which display different
obesity and muscle-related phenotypes and two different muscles were analyzed
(longissimus dorsi and red psoas major muscles). A total of 2,510 and 218,623 regions in
the genome showed changes in their methylation rate across muscle types and breeds,
respectively. Several of these differentially methylated regions (223) comprised genes
orthologous to known human obesity-related loci, thus suggesting that changes in the
methylation rates can be associated with fatness phenotypes in pigs. Zhou et al. (2015b)
analyzed the same dataset used by Li et al. (2012) with the aim of characterizing the DNA
methylation patterns of lincRNA genes in adipose and muscle tissues in pigs. They showed
that 13.2% and 6.8% of differentially methylated regions overlap with lincRNA genes
when comparing muscle types and breeds, respectively.

63
2. Chapter 2 Objectives
Chapter 2

64

Objectives
65
This Ph.D. thesis was done under the framework of the project Study of traits related to
pigs lipid metabolism and pork quality by means of integral analyses of high density
genotyping and gene expression data (grant number: AGL2010-22208-C02-02) and
Genomic physiology of intramuscular fat storage in pigs (grant number: AGL2013-48742-
C2-1-R) awarded by the Spanish Ministry of Economy, Industry and Competitiveness. The
main goal of these projects is to analyze the genetic basis of fatness in pigs by using next-
generation sequencing and high throughput genotyping approaches. More specifically, the
objectives of the Thesis are:
To identify differentially expressed mRNA genes (and their isoforms) and non-
coding RNA genes in the skeletal muscle of pigs with distinct fatness profiles and to
ascertain their potential roles on fat deposition (Chapters 1 and 2).
To investigate the effects of food ingestion on the mRNA expression patterns of the
porcine muscle (Chapter 3) and to evaluate how food intake modulates the expression of
eight circadian genes in five porcine tissues (Chapter 4).
In the framework of a collaborative study with the Research Institute for Animal
Breeding and Nutrition (Hungary) and the University of Cluj-Napoca (Romania), the
following objective was undertaken in the Thesis:
To identify the genetic factors involved in the segregation of blond vs red
pigmentation patterns in Mangalitza pigs (Chapter 5).

66

67
3. Chapter Papers and Studies
Chapter 3

68

69
RNA-Seq based detection of differentially expressed genes in the
skeletal muscle of Duroc pigs with distinct lipid profiles
T. F. Cardoso,1,2
A. Cánovas,1 O. Canela-Xandri,
3 R. González-Prendes,
1 M. Amills,
a,1,4
and R. Quintanillaa,3
1Department of Animal Genetics, Center for Research in Agricultural Genomics
(CSIC-IRTA-UAB-UB), Universitat Autònoma de Barcelona, Bellaterra, 08193, Spain
2CAPES Foundation, Ministry of Education of Brazil, Brasilia D. F., Zip Code 70.040-020,
Brazil. 3Animal Breeding and Genetics Program, Institute for Research and Technology in
Food and Agriculture (IRTA), Torre Marimon, Caldes de Montbui 08140, Spain
4Departament de Ciència Animal i dels Aliments, Universitat Autònoma de Barcelona,
Bellaterra, 08193, Spain
aCorresponding authors: R. Quintanilla and M. Amills
Sci Rep. 2017; 7: 40005.
Published 2017 Feb 14. doi: 10.1038/srep40005

Papers and Studies s
70

Papers and Studies
71
Abstract
We have used a RNA-Seq approach to investigate differential expression in the skeletal
muscle of swine (N = 52) with divergent lipid profiles i.e. HIGH (increased intramuscular
fat and muscle saturated and monounsaturated fatty acid contents, higher serum lipid
concentrations and fatness) and LOW pigs (leaner and with an increased muscle
polyunsaturated fatty acid content). The number of mRNAs and non-coding RNAs
(ncRNAs) expressed in the porcine gluteus medius muscle were 18,104 and 1,558,
respectively. At the nominal level of significance (P-value ≤ 0.05), we detected 1,430
mRNA and 12 non-coding RNA (ncRNA) transcripts as differentially expressed (DE) in
the gluteus medius muscle of HIGH vs LOW pigs. This smaller contribution of ncRNAs to
differential expression may have biological and technical reasons. We performed a second
analysis, that was more stringent (P-value ≤ 0.01and fold-change ≥ 1.5), and only 96 and 0
mRNA-and ncRNA-encoding genes happened to be DE, respectively. The subset of DE
mRNA genes was enriched in pathways related with lipid (lipogenesis and triacylglycerol
degradation) and glucose metabolism. Moreover, HIGH pigs showed a more lipogenic
profile than their LOW counterparts.
Introduction
Several RNA-Seq studies have been carried out on different pig breeds in order to
identify genes involved in fat deposition and meat quality1,2
. Besides analysing gene
expression differences, these studies aimed to dissect the complex networks of pathways
and genes that determine porcine phenotypes of economic interest. In this way, the
expression patterns of porcine liver, longissimus dorsi and abdominal fat were examined in
two full-sib hybrid pigs with extreme phenotypes for growth and fatness traits3. The
proportion of tissue-specific mRNA transcripts happened to be quite modest (<10%) and
several microRNAs (miRNAs) were differentially expressed (DE) across tissues. Other
studies analysing differential gene expression in muscle, fat and liver tissues of Iberian x
Landrace pigs with extreme phenotypes for muscle fatty acid (FA) composition revealed
that DE loci are inte-grated in common pathways related with LXR/RXR activation,
peroxisome proliferator-activated receptors (PPARs) and β-oxidation1,4,5
. A recent analysis
comparing Iberian and Iberian x Duroc pigs also identified LXR/ RXR activation and

Papers and Studies s
72
cholesterol synthesis as enriched pathways in the set of DE genes2. In contrast, the
potential role of ncRNAs in muscle fat deposition has been scarcely studied in pigs4,6
.
In a previous experiment, we demonstrated that genes involved in FA uptake,
lipogenesis, triacylglycerol syn-thesis, lipolysis and insulin signalling are DE in the
skeletal muscle of Duroc pigs with divergent lipid phenotypes7. One drawback of this
study was that gene expression was measured with microarrays, which have a limited
dynamic range, sensitivity (specially for low-abundance transcripts) and specificity.
Moreover, the expression of non-coding RNAs could not be measured with Affymetrix
porcine microarrays. In the current work, we aimed to circumvent all these limitations by
analysing, through a RNA-Seq approach, the muscle transcriptome of a subset of these
Duroc pigs. Our goal was to determine the relative contributions of protein-coding and
non-coding RNAs to differential expression in the skeletal muscle of pigs with distinct
lipid profiles.
Results
The RNA-Seq experiment allowed us generating an average of 133 million paired-end
reads per sample and 72.8% of them were successfully mapped to the pig Sscrofa10.2
genome assembly. The percentages of exonic and intronic reads were 91.4% and 8.6%,
respectively. After quality control analysis, four samples were discarded. Thereby, we used
a final dataset of 26 animals per group (HIGH and LOW) to identify DE genes.
Differential expression of mRNA encoding genes.
A total of 1,430 mRNA genes happened to be DE when considering exclusively a
significance threshold of P-value ≤ 0.05 (Supplementary Table S1). Only 76 of these 1,430
mRNA-encoding genes were identified as DE by Cánovas et al.7 when they compared the
gene expression of HIGH and LOW pigs retrieved from the same population employed by
us (Supplementary Figure 1, Supplementary Table S2). When we performed a more
stringent analysis (P-value ≤0.01 and fold-change ≥1.5), 96 genes were DE
(Supplementary Table S3). Moreover, twenty-one genes remained significant after
correction for multiple testing (q-value ≤0.05 and fold-change ≥1.5) as shown in Table 1.

Papers and Studies
73
Table 1 - List of the most significant differentially expressed genes in HIGH and LOW pigs
after correcting for multiple testing (q-value ≤ 0.05 and fold-change ≥ 1.5). A negative FC
means that the affected gene is overexpressed in LOW pigs.
We used the IPA package (QIAGEN Redwood City, www.qiagen.com/ingenuity) to
identify pathways to which DE genes belong to as well as to explore the existence of
signalling networks connecting DE genes. Forty four pathways were significantly enriched
in the dataset of 96 DE genes (Supplementary Table S4). This information should be
interpreted with caution because, in general, pathways were represented by a small number
of genes and statistical significance was not very high. Amongst the enriched pathways, it
is worth to mention TR/RXR activation, synthesis of palmitate and stearate, FA
biosynthesis, triacylglycerol degradation, and the conversion of acetate into acetyl-CoA
(Table 2, Supplementary Table S4). A complementary analysis with the ReactomeFIViz
app8 revealed 50 significant pathways (Supplementary Table S5). Differentially expressed
mRNA genes were also grouped in gene regulatory networks with the IPA software. As
shown in Supplementary Table S6, we found eleven regulatory networks related with a
variety of functions, and the top-scoring one was that of Cardiovascular Disease,
Cardiovascular System Development and Function, Organismal Injury and Abnormalities
(Fig. 1 and Supplementary Table S6).
Ensembl ID Gene name Fold-change P-value q-value
ENSSSCG00000005648 SLC27A4 1.66 1.32E-06 4.28E-03
ENSSSCG00000027946 MVP 1.78 2.63E-06 5.97E-03
ENSSSCG00000017232 SLC9A3R1 1.72 1.26E-05 1.36E-02
ENSSSCG00000005935 AGO2 1.59 1.77E-05 1.43E-02
ENSSSCG00000003379 KLHL21 1.79 1.61E-05 1.43E-02
ENSSSCG00000011740 SERPINI1 −1.81 2.48E-05 1.72E-02
ENSSSCG00000001931 GRAMD2 −1.58 2.74E-05 1.76E-02
ENSSSCG00000011444 NT5DC2 1.54 3.26E-05 1.76E-02
ENSSSCG00000007574 SDK1 1.58 2.97E-05 1.76E-02
ENSSSCG00000007745 SUMF2 −1.54 4.21E-05 1.95E-02
ENSSSCG00000000293 ITGA5 1.72 4.46E-05 1.96E-02
ENSSSCG00000007133 ACSS1 1.51 5.18E-05 2.09E-02
ENSSSCG00000028814 SOD3 1.97 5.37E-05 2.09E-02
ENSSSCG00000006277 SPIDR 2.04 5.90E-05 2.19E-02
ENSSSCG00000007554 ZFAND2A 2.54 1.01E-04 2.88E-02
ENSSSCG00000003105 SLC1A5 1.67 1.17E-04 3.07E-02
ENSSSCG00000010529 SFRP5 2.03 1.31E-04 3.11E-02
ENSSSCG00000006245 SDR16C5 3.02 1.36E-04 3.15E-02
ENSSSCG00000013579 CD209 1.95 1.50E-04 3.31E-02
ENSSSCG00000008232 RNF181 −2.09 2.05E-04 3.57E-02
ENSSSCG00000030165 MAFF 1.67 2.22E-04 3.72E-02

Papers and Studies s
74
The Regulator Effects tool of the IPA package was employed to identify potential
transcriptional regulators that may explain the differential patterns of expression observed
between HIGH and LOW pigs (Fig. 2). By doing so, two main transcriptional regulators
were identified i.e. peroxisome proliferator-activated receptor γ (PPARG) and platelet-
derived growth factor BB (PDGFB). In the network shown in Fig. 2, these genes appear to
be involved in an heterogeneous array of biological functions related with the quantity of
carbohydrate, insulin sensitivity, necrosis of prostate cancer cell lines and apoptosis of
lymphocytes. Indeed, the PPARG gene (P-value = 0.02 and FC = 1.36) is depicted as a key
regulator of genes related with carbohydrate metabolism (CEBPA, CES1, CIDEC) and the
inhibition of insulin sensitivity (CES1, CIDEC, FASN).
Table 2 - IPA-based pathway analysis of the list of genes that are differentially expressed in
HIGH and LOW pigs (P-value ≤ 0.01 and fold-change ≥ 1.5). Ratio: number of DE genes in a
pathway divided by the number of genes comprised in the same pathway.
Differential expression of non-coding RNAs.
We identified 1,558 ncRNA transcripts expressed in the pig gluteus medius muscle,
with sizes between 53 and 9,032 bp (Supplementary Table S7). Amongst these, 1,354 and
204 transcripts were classified as small (sncRNA) and long (lncRNA) non-coding RNAs,
respectively. It is important to emphasize that the annotation of porcine ncRNAs is still
very preliminar and it should be taken with caution. In general, sncRNA had orthologous
sequences in other mammalian species, while lncRNAs were much less conserved (Table
3). We only detected 12 ncRNAs (11 lncRNAs and 1 sncRNA) that were DE at the
Ingenuity Canonical Pathways −log(p-
value) Ratio Nodes
Acute Myeloid Leukemia Signaling 3.22 4/91 CEBPA, FLT3, RUNX1,
STAT3
Hematopoiesis from Pluripotent Stem Cells 2.98 3/47 CD3E, CD8E, CSF1
Primary Immunodeficiency Signaling 2.96 3/48 CD3E, CD8E, ZAP70
Hepatic Fibrosis/Hepatic Stellate Cell
Activation 2.12 4/183 CCR5, CSF1, IGFBP4, TIMP1
TR/RXR Activation 2.08 3/98 BCL3, FASN, SYT2
Palmitate Biosynthesis I (Animals) 2.07 1/2 FASN
Fatty Acid Biosynthesis Initiation II 2.07 1/2 FASN
CTLA4 Signaling in Cytotoxic T
Lymphocytes 2.07 3/99 CD3E, CD8A, ZAP70
Retinoate Biosynthesis I 2.04 2/34 RDH5, SDR16C5
Stearate Biosynthesis I (Animals) 2.02 2/35 FASN, SLC27A4

Papers and Studies
75
nominal level (P- value ≤ 0.05), while none of these ncRNAs remained significant after
correction for multiple testing (in all cases the q-value was non-significant, Table 4).
In addition, we identified 25 mRNA-encoding genes that mapped near (30 kb or less) to
the subset of DE ncRNA loci (Table 5). This observation may have biological implications
because ncRNAs often cis-regulate the expression of genes located in their vicinity. Within
this list of neighbouring genes (Table 5), CU468594.8 (P-value =0.003 and FC =1.26) and
MT-ND6 (P-value =0.038 and FC =−1.21) mRNAs are DE in HIGH vs LOW pigs (P-value
< 0.05 and 1.2-fold change in expression).
Discussion
Divergent muscle mRNA expression profiles in pigs with extreme phenotypes for
fatness traits.
After correcting for multiple testing, twenty-one genes, displaying a wide array of
functional roles, showed a significant DE between HIGH and LOW pigs (Table 1). For
instance, SLC27A4 is involved in the translocation of long-chain fatty acids across the
plasma membrane9 while SFRP5 plays a role in anti-inflammatory and insulin-sensitizing
processes10
and AGO2 and MVP contribute to RNA interference11
and signal transduction
and transport12
, respectively. Two of the genes listed in Table 1 might be related with meat
quality i.e. RNF181, which encodes a E3 ubiquitin-protein ligase that participates in the
degradation of muscle proteins through the ubiquitin-proteasome system13
, and SDK1,
which has been associated with intramuscular fat (IMF) content in Large White pigs14
.
The Spearman correlation between the microarray data reported by Canovas et al.7 in
68 HIGH and LOW pigs and RNA-seq data generated in the current study (N = 52) was
0.54. This value is comparable to what has been published in previous studies analysing
gene expression in human brain cells (r = 0.61–0.67)15
and proliferating vs quiescent
fibroblasts (r =0.18–0.42)16
. We also compared our dataset of DE genes with those detected
by Canovas et al.7. As shown in Suppl Figure 1 the level of concordance was quite low
(only 76 genes were simultaneously identified by both platforms). A modest overlap
between microarray and RNA-Seq data has been reported in previous studies. For instance,
Trost et al.16
analysed the concordance between both types of data in fibroblasts cultured at
two different developmental stages, and they just found an overlap of around 25% in the

Papers and Studies s
76
two lists of DE genes. This value is higher than the one reported by us, but it is important
to highlight that the analysis of Trost et al. 16
was based on a set of probes common to both
platforms. Moreover, the microarray analysis performed by Canovas et al.7 was based on a
dataset of around 68 pigs, while we used a subset of 52 individuals in our RNA-Seq
analysis. Trost et al.16
used quantitative real-time PCR as a third approach to validate
microarray and RNA-Seq data and they found that RNA-Seq outperforms the microarray
technology. However, differences between both methods are not dramatic i.e. the
Spearman correlations between microarray and RNA-Seq data vs qPCR validation results
were 0.44 and 0.56, respectively. This means that both technologies detect different sets of
DE expressed genes and, in consequence, they are complementary17
. According to Wang et
al. 18
, the magnitude of the treatment effect has a strong impact on the level of concordance
between microarray and RNA-Seq platforms i.e. large discrepancies can be anticipated
when two similar biological conditions are compared. Low-abundance transcripts are
another source of discrepancy between both methodological approaches18
.
We found some evidence that pathways related with lipid synthesis (stearate, palmitate
and FA synthesis) and catabolism (triacylglycerol degradation), glucose metabolism
(glucose synthesis and degradation) and hormonal response (growth hormone signalling)
were enriched in the set of DE genes (Table 2 and Supplementary Table S4). Similar
results were obtained by Cánovas et al.7 i.e. they detected an overexpression of pathways
related with the synthesis of FA and insulin signaling in HIGH pigs. Puig-Oliveras et al.1
compared the muscle mRNA expression of pigs with high saturated (SFA) and
monounsaturated (MUFA) FA muscle contents against those with a high polyunsaturated
FA (PUFA) content and also observed an enrichment of pathways related with fat
deposition (PPAR and insulin signalling) in the set of DE genes. Insulin stimulates the
absorption of glucose, which is a lipogenic substrate, and PPARG enhances triglyceride
storage19
. By using the same animal material employed by Puig-Oliveras et al.1,
Corominas et al.5 observed an overexpression of genes belonging to the LXR/RXR
activation pathway in the adipose tissue of pigs with high muscle SFA and MUFA
contents. These results, which agree well with ours (Supplementary Table S4), make sense
because liver X receptors are sterol-activated transcription factors that enhance
lipogenesis20
.

Papers and Studies
77
Figure 1 - The top-scoring regulatory network identified with the IPA software corresponded
to Cardiovascular Disease, Cardiovascular System Development and Function, Organismal
Injury and Abnormalities. Genes that are upregulated and downregulated in HIGH pigs (when
compared with the LOW ones) are displayed within red and green nodes, respectively. Solid and
dashed lines between genes represent known direct and indirect gene interactions, respectively. The
shapes of the nodes reflect the functional class of each gene product: transcriptional regulator
(horizontal ellipse), transmembrane receptor (vertical ellipse), enzyme (vertical rhombus),
cytokine/ growth factor (square), kinase (inverted triangle) and complex/group/other (circle).
Though not all studies comparing pigs with divergent lipid phenotypes identify the
same sets of pathways, an outcome that partly depends on the software and databases used
as well as on the targeted tissue and phenotype variability, the general trend that emerges is
that biochemical routes that promote lipid deposition are overexpressed in the skeletal
muscle of fat pigs with high muscle SFA and MUFA contents. In close concordance with a
previous study7, we have also found that one gene that promotes the catabolism of

Papers and Studies s
78
triglycerides, carboxylesterase 1 (CES1), is strongly upregulated in HIGH pigs (P -value =
0.0006, FC = 2.4). The CES1 protein has hydrolase activity and its inactivation leads to
hyperlipidemia and increased fat deposition in peripheral tissues, obesity, fatty liver,
hyperinsulinemia and insulin insensitivity and a decreased energy expenditure21
.
According to Cánovas and coworkers7, the upregulation of lipolytic genes in HIGH pigs
suggests the existence of a cycle where triacylglycerols are continuously synthesized and
degraded. However, we have also detected the downregulation of lipolytic genes such as
lipase C, hepatic type (LIPC, P-value =0.002, FC =−1.5)22
, a feature that suggests that the
mechanisms that promote an adequate balance between anabolic and catabolic lipid
metabolism routes are highly complex.
Analysis of the data with the IPA software (QIAGEN) showed that the top-scoring
regulatory network was Cardiovascular Disease, Cardiovascular System Development and
Function, Organismal Injury and Abnormalities, a result that it is not surprising given the
tight relationship between lipoprotein metabolism and cardiovascular risk23
. In the network
shown in Fig. 1, the V-Akt murine thymoma viral oncogene homolog molecule (AKT)
occupies a central position, having connections with several DE lipid-related genes (e.g.,
TRIB3, TIMP1 and ITGA5). Interestingly, AKT is one of the main regulators of glucose
homeostasis24
, a feature that is consistent with the existence of tight links between lipid
and carbohydrate metabolism.
When we used the Regulator Effects tool of IPA, the PPARG and PDGFB genes were
predicted to be major transcriptional regulators of the set of 96 DE loci (Fig. 2). The
PPARG transcription factor is critically required for adipogenesis, being a powerful
modulator of whole-body lipid homeostasis and insulin sensitivity25
. Polymorphism in the
PPARG gene is associated with individual susceptibility to type 2 diabetes, obesity and
body mass index26
. In our study, PPARG is upregulated (P-value = 0.02 and FC = 1.36) in
HIGH pigs and appears to regulate several genes, such as CEBPA (P-value = 0.009 and
FC = 1.64), CES1 (P-value = 0.0004 and FC = 2.03), CIDEC (P-value = 0.0005 and
FC = 2.46) and FASN (P-value = 0.0009 and FC = 2), that play distinct roles in lipid
metabolism (http://www.genome.jp/kegg/pathway.html).
www.nature.com/scientificreports/

Papers and Studies
79
Figure 2 - The Regulator Effects tool of the IPA package was employed to identify two major
upstream regulators (PPARG and PDGFB) of the networks of differentially expressed genes.
This tool integrates Upstream Regulator results with Downstream Effects results to build causal
hypotheses that help to interpret what may be occurring upstream to cause particular phenotypic or
functional outcomes downstream (http://www. ingenuity.com/products/ipa/ipa-spring-release-
2014). In the upper tier, there are two upstream regulators (PPARG and PDGFB) predicted to be
activated (orange color). In the middle tier, we can see the genes whose expression changes in
response to the activation of upstream regulators (red = upregulation). The shapes of the nodes
reflect the functional class of each gene product: enzyme (vertical rhombus), transcription regulator
(vertical ellipse), cytokine/growth factor (square), ligand-dependent nuclear receptor (horizontal
rectangle) and complex/group/ other (circle). In the lower tier, the expected phenotypic
consequences of changes in gene expression are shown by considering the Ingenuity Knowledge
Base (absolute z-score > 2 and P-value < 0.05). The octagonal symbol defines Function, while
solid and dashed lines between genes represent known direct and indirect gene interactions,
respectively. Orange leads to activation, while blue leads to inhibition predicted relationships.
Orange (predicted to be activated) and blue (predicted to be inhibited) lines represent relationships
with causal consistency.

Papers and Studies s
80
Table 3 - Evolutionary conservation of non-coding RNAs transcribed in the porcine gluteus
medius muscle. miRNA =microRNAs; misc_RNA=miscellaneous other RNA; Mt-
rRNA =Mitochondrial ribosomal RNA; Mt-tRNA =transfer RNA located in the mitochondrial
genome; rRNA =ribosomal RNA; snoRNA =small nucleolar RNA; snRNA =small nuclear RNA;
lincRNA =Long intergenic non-coding RNAs.
Limited contribution of the non-coding RNA transcriptome to differential
expression between HIGH and LOW pigs.
Non-coding RNAs have been shown to regulate gene expression by interacting with
chromatin complexes, working as RNA enhancers, recruiting or assembling certain
proteins and interacting with other RNAs at the post-transcriptional level27
. In consequence
they may play a fundamental role in the metabolism of the porcine skeletal muscle. In our
study, we have identified 1,558 muscle-expressed ncRNA transcripts (Supplementary
Table S7). The total number of ncRNAs in the pig genome is currently unknown, but Zhou
et al.28
highlighted the existence of at least 6,621 long intergenic non-coding RNAs
(lincRNA) transcripts encoded by 4,515 gene loci. In humans, 58,648 lncRNA encoding
loci have been identified so far29
. In our dataset (Table 3), the degree of evolutionary
conservation of ncRNAs happened to be much higher than that of lncRNAS. Zhou et al.28
characterized the porcine lincRNA transcriptome and found that only 40% of the
transcripts had a detectable human lincRNA ortholog. This scarcity of orthologous
sequences can be due, in part, to the poor annotation of ncRNAs in all investigated species.
Transcript Transcript Type Number Conserved ncRNA
Small ncRNA
miRNA 433 137
misc_RNA 95 82
Mt-rRNA 2 0
Mt-tRNA 22 0
rRNA 57 52
snoRNA 417 395
snRNA 328 273
Long ncRNA
Non coding 4 0
Processed transcript 143 0
Antisense 15 0
lincRNA 42 0

Papers and Studies
81
Table 4 - List of non-coding RNAs that are differentially expressed (at the nominal level, P-value ≤ 0.05) in the gluteus medius muscle of HIGH and
LOW pigs. A negative FC means that the affected gene is overexpressed in LOW pigs; lincRNA = Long intergenic non-coding RNAs, Mt-tRNA = transfer
RNA located in the mitochondrial genome.
www.nature.com/
Ensembl ID Gene ID Size (bp) Fold Change P-value Type of ncRNA
ENSSSCG00000031004 CH242-227G20.3 1833 −1.44 0.002 lincRNA
ENSSSCG00000031028 CH242-15C8.2 1495 −1.34 0.014 lincRNA
ENSSSCG00000015579 PTGS2 3601 −1.47 0.016 Processed transcript
ENSSSCG00000030904 CU468594.10 1083 −1.49 0.025 Non coding
ENSSSCG00000001227 TMP-SLA-3 1767 −1.31 0.026 Processed transcript
ENSSSCG00000030767 TMP-SLA-5 1147 −1.29 0.027 Processed transcript
ENSSSCG00000015549 RNASEL 2716 −1.87 0.028 Processed transcript
ENSSSCG00000018090 Unavailable 70 −2.05 0.036 Mt-tRNA
ENSSSCG00000001397 TMP-CH242-74M17.4 1726 −1.27 0.038 Processed transcript
ENSSSCG00000001227 TMP-SLA-3 1700 −1.30 0.043 Processed transcript
ENSSSCG00000004334 MAP3K7-001 2818 −1.72 0.044 Processed transcript
ENSSSCG00000015897 IFIH1 3720 −1.60 0.046 Processed transcript

Papers and Studies s
82
Table 5 - Protein-encoding genes that map near (30 kb) to the subset of 12 differentially expressed ncRNAs (HIGH vs LOW pigs). Differentially
expressed ncRNAs and mRNAs (HIGH vs LOW pigs) P-value ≤ 0.05, Fold Change ≥ 1.2) are shown in bold. A negative Fold Change means that the
affected gene is overexpressed in LOW pigs.
Non-coding RNA Neighboring mRNA gene Fold Change P-value RPKM-means LOW RPKM-means HIGH
CH242-15C8.2 USP9X −1.02 0.500 10.70 10.50
CH242-227G20.3 PDK3 −1.03 0.435 8.97 8.69
PCYT1B −1.07 0.461 0.35 0.33
CU468594.10
CU468594.8 1.26 0.003 1.40 1.77
CPSF1 1.10 0.020 12.60 13.90
SLC39A4 1.24 0.316 0.09 0.11
FBXL6 −1.03 0.777 1.88 1.84
ADCK5 −1.04 0.865 2.82 2.72
TMEM249 1.07 0.587 0.08 0.08
ENSSSCG00000018090
MT-ND2 −1.15 0.024 5019.58 4372.26
MT-ATP6 −1.13 0.033 25335.60 22504.43
MT-ND6 −1.21 0.038 5199.05 4287.84
MT-COX2 −1.12 0.051 20299.35 18062.05
MT-ND5 −1.16 0.051 3264.12 2809.24
MT-COX1 −1.13 0.064 24826.52 21886.25
MT-ND3 −1.10 0.086 4413.22 4010.71
MT-CYTB −1.10 0.123 10033.49 9149.34
MT-ATP8 −1.07 0.162 6421.54 5974.98
MT-COX3 −1.08 0.164 31328.03 28896.14
MT-ND1 −1.06 0.197 8412.34 7957.73
MT-ND4 −1.04 0.243 5784.35 5564.63
MT-ND4L −1.03 0.289 2042.94 1980.50
IFIH1 FAP −1.10 0.665 2.56 2.33
RNASEL RGS8 2.22 0.300 0.11 0.24
TMP-SLA-5 and TMP-CH242-74M17.4 SLA-1 −1.17 0.123 79.31 67.50

Papers and Studies
83
There is growing evidence that there might be a positive correlation between the
expression of ncRNAs and nearby mRNA encoding genes, suggesting that the former may
regulate the expression of the latter 30
. We investigated this issue by analysing if there are
DE protein-coding genes in the vicinity of any of the 12 DE ncRNAs identified in our
work (P-value ≤ 0.05, Tables 4 and 5). Two protein-coding genes, i.e. mitochondrially
encoded NADH:ubiquinone oxidoreductase core subunit 6 (MT-ND6) and CU468594.8,
fulfilled this condition (P-value ≤ 0.05 and FC ≥ 1.2, Table 5). The MT-ND6 gene encodes
a NADH dehydrogenase that catalyses the oxidation of NADH by ubiquinone, an essential
step in the mitochondrial electron transport chain31
. The CU468594.8 locus is orthologous
to human solute carrier family 52-riboflavin transporter, member 2 (SLC52A2). Riboflavin
is the precursor of flavin adenine dinucleotide (FAD) and flavin mononucleotide (FMN),
two essential cofactors that participate in a wide range of redox reactions32,33
.
We aimed to ascertain if differences amongst HIGH and LOW pigs, in terms of IMF
content and composition, are mainly due to the DE of either mRNA or ncRNA encoding
genes. When considering a nominal P-value of 0.05 as a threshold of significance, the
number of DE ncRNAs (12 loci) was much smaller than that of DE mRNAs (1,430 loci),
even if we take into account that the number of expressed mRNAs (18,104) was also
higher than that of ncRNAs (1,558). Moreover, none of the DE ncRNAs remained
significant after correction for multiple testing. In a recent experiment, the transcriptome of
pig endometrial samples collected at different pregnancy stages was characterized, and
2,376 transcripts were identified as DE in pairwise comparisons34
. Only 12% of these
transcripts corresponded to lncRNAs indicating that changes in the endometrial
transcriptome associated with pregnancy mainly affect the expression of protein-coding
genes. However, studies performed in humans indicate a much more balanced contribution
of mRNAs and ncRNAs to differential expression. For instance, Wang et al.35
investigated
the expression patterns of peripheral leukocytes of healthy and autistic individuals and
identified 3,929 and 2,591 DE lncRNAs and mRNAs, respectively. Similarly, Zhou et al.36
identified 891 and 576 DE mRNAs and lncRNAS, respectively, when comparing the
expression patterns of ectopic and eutopic endometrial tissue. These differences between
humans and pigs are probably the consequence of technical rather than biological causes,

Papers and Studies s
84
evidencing the pressing need of improving the genomic and functional annotation of
porcine ncRNAs.
Conclusions
By comparing the mRNA expression of HIGH and LOW pigs by RNA-Seq, we have
identified 96 loci displaying differential expression (P- value ≤ 0.01 and FC ≥ 1.5). Many
of these loci were not detected in a previous microarray-based experiment, suggesting that
distinct platforms detect different sets of DE genes. Lipid biosynthetic pathways were
enriched in DE genes and upregulated in HIGH pigs, a result that is consistent with
previous reports. We have also undertaken the analysis of non-coding RNAs, a feature that
has been neglected in previous studies investigating the differential expression of porcine
genes. Our results indicate that the number of DE non-coding RNAs is much lower than
that of mRNAs, an outcome that might be partly explained by the poor annotation of
porcine ncRNAs.
Material and Methods
Ethics statement.
All experiments were performed in accordance with the ARRIVE guidelines (https://
www.nc3rs.org.uk/arrive-guidelines). Animal care and management procedures were
approved by the Ethical Committee of the Institut de Recerca i Tecnologia
Agroalimentàries, IRTA.
Animal Material.
One population of 350 Duroc barrows belonging to 5 half-sib families, and distributed
in 4 fattening batches was generated in 2003. All animals were kept under the same
feeding and man-agement conditions37
. A wide array of growth, fatness, feed efficiency
and carcass and meat quality traits were recorded in these animals, including weight, daily

Papers and Studies
85
food intake, fat deposition, and IMF content and composition (C:12-C:22 interval) of the
gluteus medius muscle7. By using a principal component analysis based on 13 lipid-related
traits, we selected two groups of pigs, i.e. HIGH and LOW, displaying distinct phenotypic
profiles7 (Supplementary Table S8). Compared with their LOW counterparts, HIGH pigs
were fatter and they had a higher IMF, SFA and MUFA muscle contents as well as
elevated serum lipid concentrations7. LOW pigs, in contrast, had a higher muscle PUFA
content7.
RNA isolation and library construction and sequencing.
Total RNA was isolated from 56 porcine gluteus medius muscle samples (28 HIGH and
28 LOW) by using the acid phenol method implemented in the RiboPure kit (Ambion,
Austin, TX). Total RNA was quantified in a Nanodrop ND -1000 spectrophotometer,
checked for purity and integrity in a Bioanalyzer-2100 device (Agilent Technologies, Inc.,
Santa Clara, CA) and submitted to the Centre Nacional d’Anàlisi Genòmica (CNAG,
http://www.cnag.cat) for sequencing. Libraries were prepared using the TruSeq RNA
Sample Preparation Kit (Illumina Inc) according to the protocols recommended by the
manufacturer. Each library was paired-end sequenced (2 × 75 bp) by using the TruSeq SBS
Kit v3-HS, in a HiSeq2000 platform.
Bioinformatic analyses.
All bioinformatic analyses were performed with the CLC Bio Workbench software
(CLC Bio, Aarhus, Denmark). Quality control was carried out with the NGS Core Tools,
considering several parameters based on the FastQC-project
(http://www.bioinformatics.babraham.ac.uk/projects/fastqc/). We carried out per-sequence
and per-base analyses to filter reads according to the following criteria: sequence-read
distribution =75 bp, 100% coverage in all bases, GC -content ~50%, ~25% of A, T, G and
C nucleotide contribu-tions, ambiguous base-content <0.1% and a Phred score higher than
30 (i.e. base-calling accuracy larger than 99.9%). Short sequence reads were assembled,
mapped and annotated by using as template the pig reference genome version 10.2

Papers and Studies s
86
(Sscrofa10.2-http://www.ensembl.org/info/data/ ftp/index.html). For mapping purposes,
we just considered alignments with a length fraction of 0.7 and a similarity fraction of 0.8.
Besides, two mismatches and three insertions and deletions per read were allowed.
Gene expression data were normalized by calculating the reads per kilobase per million
mapped reads (RPKM)38
. Using scales of abundance estimates by exon length and millions
of mapped reads, original expression values were transformed and normalized. More
specifically, data were transformed on a decimal logarithmic scale and a scaling algorithm
was utilized for the normalization of average scores39
. For the statistical analysis of differ-
ential expression, we used a two- tailed t-test that assumes a Gaussian distribution and
homogeneous variances. This statistical test compares the mean expression levels in the
two experimental groups (HIGH vs LOW) and evaluates the significance of the difference
relative to the variance of the data within the groups. Multiple testing correction was
performed by using a false-discovery rate approach (cut-off =0.05) implemented in the
QVALUE R package40
. Fold-Change was computed as the ratio of HIGH vs LOW gene
expressions (a negative FC means that the affected gene is upregulated in LOW pigs).
Ingenuity Pathway Analysis (IPA, QIAGEN Redwood City,
www.qiagen.com/ingenuity) was used to identify gene ontologies, pathways, and
regulatory networks to which DE genes belong to, as well as upstream regulators.
Ingenuity Pathway Analysis can transform a set of genes into a number of relevant
networks based on comprehensive records maintained in the Ingenuity Pathways
Knowledge Base. Networks are presented as graphs depicting the biological relationships
between genes/gene products. Genes are shown as nodes, and the molecular relationship
between two nodes is represented with either a solid (direct interactions) or a dashed
(indirect interactions) line. The analysis of upstream regulators considers every possible
transcription factor and upstream regulator contained in the Ingenuity Knowledge Base
repository as well as their predicted effects on gene expression (inferred from the scientific
literature). Then, this tool analyses if the patterns of expression observed in the DE genes
can be explained by the activation/inhibition of any of these regulators through the
calculation of a z-score i.e. a statistical measure of the match between expected
relationship direction between the regulator and its targets and observed gene expression41
.

Papers and Studies
87
A parallel analysis was performed with the Cytoscape software42
by using the
ReactomeFIViz app8. IPA and Cytoscape analyses were performed on a subset of DE
genes, with P-value ≤0.01 and a FC ≥1.5. Transcript classification and the search of
homologs of porcine ncRNAs in other mammalian species were carried out with tools
implemented in the BioMart web interface (http://www.ensembl. org/biomart/martview).
References
1. Puig-Oliveras, A. et al. Differences in muscle transcriptome among pigs
phenotypically extreme for fatty acid composition. Plos One 9, e99720 (2014).
2. Ayuso, M. et al. Comparative analysis of muscle transcriptome between pig genotypes
identifies genes and regulatory mechanisms associated to growth, fatness and
metabolism. Plos One 10, e0145162 (2015).
3. Chen, C. et al. A global view of porcine transcriptome in three tissues from a full-sib
pair with extreme phenotypes in growth and fat deposition by paired-end RNA
sequencing. BMC Genomics 12, 448 (2011).
4. Ramayo-Caldas, Y. et al. Liver transcriptome profile in pigs with extreme phenotypes
of intramuscular fatty acid composition. BMC Genomics 13, 547 (2012).
5. Corominas, J. et al. Analysis of porcine adipose tissue transcriptome reveals
differences in de novo fatty acid synthesis in pigs with divergent muscle fatty acid
composition. BMC Genomics 14, 843 (2013).
6. Ye, R.-S. et al. Comparative anterior pituitary miRNA and mRNA expression profiles
of Bama minipigs and Landrace pigs reveal potential molecular network involved in
animal postnatal growth. Plos One 10, e0131987 (2015).
7. Cánovas, A., Quintanilla, R., Amills, M. & Pena, R. N. Muscle transcriptomic profiles
in pigs with divergent phenotypes for fatness traits. BMC Genomics 11, 372 (2010).
8. Wu, G., Dawson, E., Duong, A., Haw, R. & Stein, L. ReactomeFIViz: a Cytoscape
app for pathway and network-based data analysis. F1000Res 3, 146 (2014).
9. Jia, Z., Moulson, C. L., Pie, Z., Miner, J. H. & Watkins, P. A. Fatty acid transport
protein 4 is the principal very long chain fatty acyl-CoA synthetase in skin fibroblasts.
J. Biol. Chem. 282, 20573–83 (2007).
10. Carstensen, M. et al. Effect of Sfrp5 on cytokine release and insulin action in primary
human adipocytes and skeletal muscle cells. Plos One 9, e85906 (2014).
11. Kalantari, R., Chiang, C. M. & Corey, D. R. Regulation of mammalian transcription
and splicing by nuclear RNAi. Nucl. Acids Res. 44, 524–37 (2016).

Papers and Studies s
88
12. Berger, W., Steiner, E., Grusch, M., Elbling, L. & Micksche, M. Vaults and the major
vault protein: novel roles in signal pathway regulation and immunity. Cell. Mol. Life
Sci. 66, 43–61 (2009).
13. Cao, P. R., Kim, H. J. & Lecker, S. H. Ubiquitin-protein ligases in muscle wasting.
Int. J. Biochem. Cell Biol. 37, 2088–97 (2005).
14. Davoli, R. et al. Genome-wide study on intramuscular fat in Italian Large White pig
breed using the PorcineSNP60 BeadChip. J. Anim. Breed. Genet. 133, 277–82 (2014).
15. Fu, X. et al. Estimating accuracy of RNA-Seq and microarrays with proteomics. BMC
Genomics 10, 161 (2009).
16. Trost, B. et al. Concordance between RNA-Sequencing data and DNA microarray data
in transcriptome analysis of proliferative and quiescent fibroblasts. R. Soc. Open Sci. 2
(2015).
17. Kogenaru, S., Qing, Y., Guo, Y. & Wang, N. RNA-Seq and microarray complement
each other in transcriptome profiling. BMC Genomics 13, 629 (2012).
18. Wang, C. et al. The concordance between RNA-Seq and microarray data depends on
chemical treatment and transcript abundance. Nat. Biotechnol. 32, 926–32 (2014).
19. Ferré, P. The biology of peroxisome proliferator-activated receptors: relationship with
lipid metabolism and insulin sensitivity. Diabetes 53 Suppl 1, S43–50 (2004).
20. Hong, C. & Tontonoz, P. Liver X receptors in lipid metabolism: opportunities for drug
discovery. Nat. Rev. Drug Discov. 13, 433–44 (2014).
21. Quiroga, A. D. et al. Deficiency of carboxylesterase 1/esterase-x results in obesity,
hepatic steatosis, and hyperlipidemia. Hepatology 56, 2188–98 (2012).
22. Perret, B. et al. Hepatic lipase: structure/function relationship, synthesis, and
regulation. J. Lipid Res. 43, 1163–9 (2002).
23. Millán, J. et al. Lipoprotein ratios: Physiological significance and clinical usefulness
in cardiovascular prevention. Vasc. Health Risk Manag. 5, 757–65 (2009).
24. Hay, N. Akt isoforms and glucose homeostasis - the leptin connection. Trends
Endocrinol. Metab. 22, 66–73 (2011).
25. Ahmadian, M. et al. PPARγ signaling and metabolism: the good, the bad and the
future. Nat. Med. 99, 557–66 (2013).
26. Masud, S. & Ye, S. Effect of the peroxisome proliferator activated receptor-c gene
Pro12Ala variant on body mass index: a meta-analysis. J. Med. Genet 40, 773–80
(2003).t
27. Huarte, M. & Marín-Béjar, O. Long noncoding RNAs: from identification to functions
and mechanisms. Adv. Genomics Genet. 5, 257 (2015).
28. Zhou, Z.-Y. et al. Genome-wide identification of long intergenic noncoding RNA
genes and their potential association with domestication in pigs. Genome Biol. Evol. 6,
1387–92 (2014).

Papers and Studies
89
29. Iyer, M. K. et al. The landscape of long noncoding RNAs in the human transcriptome.
Nat. Genet. 47, 199–208 (2015).
30. Guil, S. & Esteller, M. Cis-acting noncoding RNAs: friends and foes. Nat. Struct. Mol.
Biol. 19, 1068–75 (2012).
31. Vartak, R., Deng, J., Fang, H. & Bai, Y. Redefining the roles of mitochondrial DNA-
encoded subunits in respiratory Complex I assembly. Biochim. Biophys. Acta. 1852,
1531–9 (2015).
32. Powers, H. J. Riboflavin (vitamin B-2) and health. Am. J. Clin. Nutr. 77, 1352–60
(2003).
33. Ghisla, S. & Massey, V. Mechanisms of flavoprotein-catalyzed reactions. Eur. J.
Biochem. 181, 1–17 (1989).
34. Wang, Y. et al. Analyses of long non-coding RNA and mRNA profiling using RNA
sequencing during the pre-implantation phases in pig endometrium. Sci. Rep. 6, 20238
(2016).
35. Wang, Y. et al. Genome-wide differential expression of synaptic long noncoding
RNAs in autism spectrum disorder. Transl. Psychiatry. 5, e660 (2015).
36. Zhou, C. et al. The differential expression of mRNAs and long noncoding RNAs
between ectopic and eutopic endometria provides new insights into adenomyosis. Mol.
Biosyst. 12, 362–70 (2016).
37. Gallardo, D. et al. Mapping of quantitative trait loci for cholesterol, LDL, HDL, and
triglyceride serum concentrations in pigs. Physiol. Genomics 35, 199–209 (2008).
38. Mortazavi, A., Williams, B. A., McCue, K., Schaeffer, L. & Wold, B. Mapping and
quantifying mammalian transcriptomes by RNA-Seq. Nat. Methods 5, 621–8 (2008).
39. Bolstad, B. M., Irizarry, R. A., Astrand, M. & Speed, T. P. A comparison of
normalization methods for high density oligonucleotide array data based on variance
and bias. Bioinformatics 19, 185–93 (2003).
40. J. D. Storey, A. J. Bass, A. Dabney & D. R. Q-value estimation for false discovery rate
control. R package version 2.1.1-http://github. com/jdstor at
http://www.bioconductor.org/packages/release/bioc/vignettes/qvalue/inst/doc/qvalue.p
df (2015).
41. Krämer, A., Green, J., Pollard, J. & Tugendreich, S. Causal analysis approaches in
Ingenuity Pathway Analysis. Bioinformatics 30, 523–30 (2014).
42. Shannon, P. et al. Cytoscape: a software environment for integrated models of
biomolecular interaction networks. Genome Res. 13, 2498–504 (2003).

Papers and Studies s
90
Acknowledgements
Part of the research presented in this publication was funded by grants AGL2013-
48742-C2-1-R and AGL2013-48742-C2-2-R awarded by the Spanish Ministry of
Economy and Competitivity. We also acknowledge the support of the Spanish Ministry of
Economy and Competitivity for the Center of Excellence Severo Ochoa 2016–2019 (SEV-
2015-0533) grant awarded to the Center for Research in Agricultural Genomics. The
authors are indebted to Selección Batallé S.A. for providing the animal material. We
gratefully acknowledge to J. Reixach (Selección Batallé) and J. Soler (IRTA) for their
collaboration in the experimental protocols. Tainã F Cardoso was funded with a fellowship
from the CAPES Foundation-Coordination of Improvement of Higher Education, Ministry
of Education (MEC) of the Federal Government of Brazil.
Author Contributions
R.Q. and M.A. conceived the study and designed the experiment; R.Q. was responsible
for producing the animal material, phenotypic records and RNA-Seq data; T.F.C., A.C. and
O.C. did the bioinformatic analyses; R.G.P. helped in the statistical analyses; M.A. and
T.F.C. wrote the manuscript. All authors helped to draft the manuscript and read and
approved its final version.
Additional Information
Table S1 - Differentially expressed genes in the gluteus medius muscle of HIGH and
LOW pigs (P-value ≤ 0.05)
Table S2 - List of DE genes (P-value ≤ 0.05) detected simultaneously with RNA-Seq
(current work) and microarrays (Cánovas et al. 2010. BMC Genomics 11, 372).
Table S3 - Differentially expressed genes in the gluteus medius muscle of HIGH and
LOW pigs (P-value ≤ 0.01 and fold-change ≥ 1.5)
Table S4 - Enriched pathways identified by IPA when using the data set of 96
differentially expressed genes (P-value ≤ 0.01 and fold-change ≥ 1.5).

Papers and Studies
91
Table S5 - Pathways identified by Reactome as enriched in differentially expressed genes
(P-value ≤ 0.01 and fold-change ≥ 1.5)
Table S6 - Regulatory networks of genes that are differentially expressed (P-value ≤ 0.01
and fold-change ≥ 1.5) in HIGH and LOW pigs
Table S7 - Non-coding transcripts expressed in the gluteus medius muscle of HIGH and
LOW pigs.
Table S8 - HIGH and LOW group mean values ± standard deviation (SD) for 13 lipid-
related traits

Papers and Studies s
92

Papers and Studies
93
Differential expression of mRNA isoforms in the skeletal muscle of
pigs with distinct growth and fatness profiles.
Cardoso TF1,2
, Quintanilla R3, Castelló A
1,4, González-Prendes R
1, Amills M
5,6,a,
Cánovas A7,a
.
1Department of Animal Genetics, Centre for Research in Agricultural Genomics
(CRAG), CSIC-IRTA-UAB-UB, Campus de la Universitat Autònoma de Barcelona,
Bellaterra, 08193, Barcelona, Spain. 2CAPES Foundation, Ministry of Education of Brazil,
Brasilia D.F, 70.040-020, Brazil. 3Animal Breeding and Genetics Programme, Institute for
Research and Technology in Food and Agriculture (IRTA), Torre Marimon, 08140, Caldes
de Montbui, Spain. 4Departament de Ciència Animal i dels Aliments, Universitat
Autònoma de Barcelona, Bellaterra, 08193, Barcelona, Spain. 5Department of Animal
Genetics, Centre for Research in Agricultural Genomics (CRAG), CSIC-IRTA-UAB-UB,
Campus de la Universitat Autònoma de Barcelona, Bellaterra, 08193, Barcelona, Spain.
[email protected]. 6Departament de Ciència Animal i dels Aliments, Universitat
Autònoma de Barcelona, Bellaterra, 08193, Barcelona, Spain. 7Centre for Genetic
Improvement of Livestock, Department of Animal Biosciences, University of Guelph,
Guelph, ON, Canada.
aCorresponding authors: A. Cánovas and M. Amills
BMC Genomics. 2018 Feb 14;19(1):145.
doi: 10.1186/s12864-018-4515-2.

Papers and Studies s
94

Papers and Studies
95
Abstract
The identification of genes differentially expressed in the skeletal muscle of pigs
displaying distinct growth and fatness profiles might contribute to identify the genetic
factors that influence the phenotypic variation of such traits. So far, the majority of
porcine transcriptomic studies have investigated differences in gene expression at a
global scale rather than at the mRNA isoform level. In the current work, we have
investigated the differential expression of mRNA isoforms in the gluteus medius (GM)
muscle of 52 Duroc HIGH (increased backfat thickness, intramuscular fat and saturated
and monounsaturated fatty acids contents) and LOW pigs (opposite phenotype, with an
increased polyunsaturated fatty acids content). Our analysis revealed that 10.9% of genes
expressed in the GM muscle generate alternative mRNA isoforms, with an average of 2.9
transcripts per gene. By using two different pipelines, one based on the CLC Genomics
Workbench and another one on the STAR, RSEM and DESeq2 softwares, we have
identified 10 mRNA isoforms that both pipelines categorize as differentially expressed in
HIGH vs LOW pigs (P-value < 0.01 and ±0.6 log2fold-change). Only five mRNA
isoforms, produced by the ITGA5, SEMA4D, LITAF, TIMP1 and ANXA2 genes, remain
significant after correction for multiple testing (q-value < 0.05 and ±0.6 log2fold-change),
being upregulated in HIGH pigs. The increased levels of specific ITGA5, LITAF, TIMP1
and ANXA2 mRNA isoforms in HIGH pigs is consistent with reports indicating that the
overexpression of these four genes is associated with obesity and metabolic disorders in
humans. A broader knowledge about the functional attributes of these mRNA variants
would be fundamental to elucidate the consequences of transcript diversity on the
determinism of porcine phenotypes of economic interest.
Keywords: Alternative splicing, mRNA isoform, Swine, Differential expression

Papers and Studies s
96
Background
Recent estimates indicate that in mammals, at least 70% of genes have multiple
polyadenylation sites, > 50% of genes have alternative transcription start sites and nearly
95% of genes undergo alternative splicing (AS) yielding multiple messenger ribonucleic
acid (mRNA) isoforms [1, 2]. The use of alternative transcriptional initiation and/or
termination sites can produce diverse pre-mRNAs, which can further be subjected to AS
yielding a broad array of mRNA isoforms that are derived from a single gene. A recent
study indicated that alternative transcription start and termination sites, rather than AS,
encompasses most of tissue-dependent exon usage [1]. Transcripts produced by any of the
mechanisms mentioned above might contribute to differences between tissues or cells by
modifying protein structure and expression [3–5]. Indeed, the differential expression of
mRNA isoforms has been associated with a broad array of physiological and pathological
conditions in humans [3, 4] and domestic species [5, 6].
The important consequences of transcript diversity on porcine phenotypes of economic
interest have been recently evidenced in a couple of studies. In White Duroc × Erhualian
F2 intercross pigs, a mutation in a splice acceptor site of intron 9 (g.8283C > A) of the
porcine phosphorylase kinase catalytic subunit gamma 1 (PHKG1) gene has been shown to
drive the synthesis of an aberrant transcript subjected to nonsense-mediated decay [7].
This results in the inactivation of this enzyme, which plays a key role in the degradation of
glycogen, and in the production of a low quality meat with a poor water-holding capacity
[7]. Moreover, Koltes et al. [8], identified a mutation located in the pig guanylate binding
protein 5 (GBP5) gene that introduces a new splice acceptor site that results in the
insertion of five additional nucleotides, thus altering the open reading frame and
introducing a premature stop-codon. This mutation has a major effect on the host response
to the porcine respiratory and reproductive syndrome virus [8].
Transcript diversity of the porcine muscle has been poorly characterized so far and the
majority of studies comparing the transcriptomes of pigs with distinct phenotypic attributes
have just focused on global differences in gene expression, rather than identifying the
specific transcripts that are differentially expressed (DE) [9–12]. The goals of the current

Papers and Studies
97
experiment were to provide a first picture of transcript diversity in the gluteus medius
(GM) muscle of pigs as well as to identify mRNA isoforms that are DE in the GM muscle
of Duroc swine with distinct growth and fatness profiles.
Methods
Animal material
The muscle transcriptomes of 56 Duroc pigs, retrieved from a population of 350
individuals distributed in 5 half-sib families, were analyzed using RNA-Sequencing (RNA-
Seq) (Additional file 1: Table S1). As previously reported by Gallardo et al. [13], barrows
were transferred to the IRTA-CCP experimental test station after weaning (3–4 weeks of
age) and bred under normal intensive conditions. In the first stage of fattening (up to 90 kg
of live weight, around 150 days of age) barrows were fed ad libitum a standard diet with
18% protein, 3.8% fiber, 7.0% fat, 1.0% lysine, and 0.3% methionine (net energy
concentration: 2450 kcal/kg). In the last period of fattening (i.e. 30–40 days before
slaughter) animals were fed ad libitum a standard diet with 15.9% protein, 4.5% fiber,
5.2% fat, 0.7% lysine, and 0.2% methionine (net energy concentration: 2375 kcal/kg). Pigs
were slaughtered when they reached ≈ 122 kg live weight (i.e. at an age of 180–200 days
approximately). Backfat and ham fat thickness were measured with a ruler in the cutting
room 24 h after slaughtering. Lean meat content was estimated on the basis of fat and
muscle thickness data measured with an Autofom ultrasound device. Samples of the GM
muscle were retrieved, snap frozen in liquid nitrogen and stored at − 80 °C. A near infrared
transmittance device (NIT, Infratec 1625, Tecator Hoganas, Sweden) was employed to
determine intramuscular fat content. The determination of fatty acid composition was
achieved with a technique based on the gas chromatography of methyl esters [14]. As
reported by Gallardo and coworkers [13], blood samples were obtained at 190 days and a
variety of enzymatic methods were used to determine cholesterol (cholesterol oxidase-
based method), high-density lipoprotein (immunoinhibition method) and triglyceride
concentrations (glycerol kinase reaction). Low density lipoprotein concentration was
calculated according to the equation of Friedewald et al. [15].

Papers and Studies s
98
Principal component analysis based on the 13 traits listed in Table 1 was performed in
order to select pigs with distinct growth and fatness phenotypes (HIGH and LOW pigs)
[10]. When compared with LOW pigs, the HIGH (n = 28) ones showed a higher live
weight, backfat thickness and intramuscular fat content and also displayed increased serum
lipid concentrations and muscle saturated (SFA) and monounsaturated (MUFA) fatty acids
contents (Table 1). On the other hand, LOW pigs (n = 28), were lighter, leaner and had a
higher muscle polyunsaturated fatty acids (PUFA) content than HIGH pigs.
RNA isolation, library construction and sequencing
Each muscle sample (N = 56, 28 HIGH and 28 LOW) was individually submerged in
liquid nitrogen and grinded with a mortar and a pestle to produce a homogenous powder.
This powder was submerged in TRIzol reagent (Thermo Fisher Scientific, Barcelona,
Spain) and homogenized with a Polytron device (IKA, Staufen, Germany). Total RNA was
purified with the Ambion RiboPure kit (Thermo Fisher Scientific, Barcelona, Spain) by
following the instructions of the manufacturer. RNA samples were resuspended in a buffer
solution provided in the kit and kept at − 80 °C until use. RNA quantification and purity
were assessed with a Nanodrop ND-1000 spectrophotometer (Thermo Fisher Scientific,
Barcelona, Spain), while integrity was checked with a Bioanalyzer-2100 equipment
(Agilent Technologies, Santa Clara, CA). All samples showed an RNA integrity number
above 7.5. Sequencing libraries were prepared with the TruSeq RNA Sample Preparation
Kit (Illumina, San Diego, CA) and sequenced in a paired-end mode (2 × 75 bp),
multiplexing two samples in each sequencing lane, on a HiSeq2000 Sequencing System
(Illumina, San Diego, CA). Library preparation and sequencing were developed according
to the protocols recommended by the manufacturer.
Differential expression analyses of mRNA isoforms between HIGH and LOW pigs
Adaptors and low quality bases were trimmed from sequences by using Trimmomatic
[16] with default parameters. Quality control of sequences in FASTQ and BAM format
was assessed with the FASTQC software (Babraham Bioinfomatics,

Papers and Studies
99
http://www.bioinformatics.-babraham.ac.uk/projects/fastqc/). Sequence quality was
measured by taking into account sequence-read lengths and base-coverage (distribution =
75 bp, 100% coverage in all bases), nucleotide contributions and base ambiguities (GC-
content ~ 50%, ~ 25% of A, T, G and C nucleotide contributions and an ambiguous base-
content < 0.1%) and a Phred score higher than (i.e. base-calling accuracy larger than
99.9%). All samples, except four, passed the quality control parameters, so our final data
set consisted of 52 animals. With the aim of minimizing the rate of false positives, we used
two different pipelines in the analysis of differential expression. In the first pipeline, read
mapping and counting were carried out with CLC Genomics Workbench 8.5 (CLC Bio,
Aarhus, Denmark, https://www.qiagenbioinformatics.com/). In the second pipeline, reads
were mapped with Spliced Transcripts Alignment to a Reference (STAR) v. 2.4 [17],
counted with the RNA-Seq by Expectation Maximization (RSEM) software v. 1.3 [18] and
differential expression was analysed with DESeq2 [19]. We considered as DE mRNA
isoforms those simultaneously identified with the two pipelines.
Pipeline 1 (CLC genomics workbench)
The Large Gap Mapper (LGM) tool of CLC Genomics Workbench 8.5 was used to
map the reads. This tool can map sequence reads that span introns without requiring prior
transcript annotations. In this way, the LGM tool finds the best match for a given read. If
there is an unaligned end which is long enough for the mapper to handle (17 bp for
standard mapping) this segment of the read is re-mapped with the standard read mapper of
the CLC Genomics Workbench. This process is repeated until no reads have unaligned
ends that are longer than 17/18 bp. In our study, short sequence reads were mapped and
annotated by using as template the pig reference genome version 10.2 (Sscrofa 10.2 -
http:// www.ensembl.org/info/data/ftp/index.html). Additional details can be found in
http://resources.qiagenbioinformatics./com/manuals/transcriptdiscovery/208/index.php?ma
nual=-Large_gap_mapper.html. For mapping purposes, we considered alignments with a
length fraction of 0.7 and a similarity fraction of 0.8. Two mismatches and three insertions
and deletions per read were allowed. The quantification of mRNA isoform levels by the
CLC Genomics Workbench follows a count-based model, where reads are counted on

Papers and Studies s
100
small counting units (exons), instead of the whole transcript unit, and the two possible
splicing out-comes (inclusion and/or exclusion) are tested for each counting unit.
Normalized count values are transformed on a decimal logarithmic scale. Statistical
analysis of differential expression of splicing variants is based on an empirical analysis of
digital gene expression [20] that implements an ‘Exact Test’ for two-group comparisons,
assuming a negative binomial distribution and an overdispersion caused by biological
variability estimated at 5%.
Table 1 - Mean values ± standard deviation (SD) for 13 phenotypes recorded in HIGH and
LOW Duroc pigs
Phenotypes
HIGH group
(N=28)
Mean ± SD
LOW group
(N=28)
Mean ± SD
Carcass traits
LW - Live weight (kg) 130.90 ± 9.46 a 110.75 ± 16.62
b
BFTiv - Backfat thickness in vivo (mm) 28.74 ± 3.47 a 18.76 ± 3.90
b
BFT - Backfat thickness 3rd
-4th
ribs (mm) 47.07 ± 11.94 a 33.89 ± 10.03
b
HFT - Ham fat thickness (mm) 28.02 ± 2.70 a 20.97 ± 3.56
b
LEAN - Lean content (%) 39.17 ± 5.15 a 45.48 ± 4.21
b
Meat quality traits (gluteus medius)
IMF - Intramuscular fat content (%) 7.27 ± 1.70 a 3.69 ± 0.93
b
SFA - Saturated fatty acids content (%) 38.70 ± 1.41 a 34.76 ± 1.30
b
PUFA - Polyunsaturated fatty acids content (%) 14.71 ± 3.08 a 27.82 ± 4.40
b
MUFA - Monounsaturated fatty acids content (%) 46.58 ± 2.67 a 37.4 ± 4.30
b
Serum lipid levels - 190 days
CHOL - Total cholesterol (mg/dL) 161.11 ± 30.32 a 104.17 ± 16.40
b
HDL - HDL-cholesterol (mg/dL) 61.12 ± 8.58 a 42.92 ± 9.19
b
LDL - LDL-cholesterol (mg/dL) 86.34 ± 29.32 a 50.57 ± 15.12
b
TG - Triacylglycerides (mg/dL) 68.07 ± 26.28 a 50.71 ± 29.7
b
Means with different letters are significantly different (P-value < 0.05), t-test for: LW, IMF,
MUFA, CHOL and LDL; Wilcoxon test for: BFTiv, BFT, LEAN, SFA, PUFA, HDL and TG

Papers and Studies
101
Pipeline 2 (STAR/RSEM/DESeq2)
The STAR software v. 2.4 [17] was employed to map the reads generated in the RNA-
Seq experiment. The STAR algorithm comprises two main steps. First, a sequential
maximum mappable seed search is carried out. For instance, if a read contains a single
splice junction, a first seed is mapped to a donor splice site and the unmapped portion of
the read is mapped again (in this case to an acceptor splice site). Subsequently, STAR
builds alignments of the entire read sequence by stitching together all the seeds that were
aligned to the genome in the first step [17]. In our study, the parameters employed in
STAR mapping were those reported by Zhang et al. [21] and the pig reference genome v.
10.2 (Sscrofa 10.2) was used as template.
Once reads were mapped, they were counted with the RSEM v. 1.3 [18] software by
using default parameters with the option “–paired-end” and considering the porcine gene
annotation file and the pig Sscrofa 10.2 genome sequence. RSEM generates a set of
reference transcript sequences and subsequently a set of RNA-Seq reads are aligned to
these reference transcripts [18]. Alignments generated with this procedure are used to infer
transcript abundances by computing maximum likelihood abundance estimates with the
Expectation-Maximization algorithm [18]. Credibility intervals at 95% are built with a
Bayesian approach implemented in RSEM. Additional details can be found in Li et al.
[18]. Read counts associated with each specific mRNA isoform were employed to carry
out analysis of differential expression with DESeq2 [19]. DESeq2 assumes that read counts
follow a negative binomial distribution, for each gene i and for each sample j, with a mean
μij and a dispersion value αi. Means are proportional to the amounts of complementary
deoxyribonucleic acid (cDNA) fragments corresponding to each gene scaled by a
normalization factor. Gene-wise dispersion values are calculated with a maximum
likelihood approach and subsequently they are shrunk towards a set of predicted dispersion
values with an empirical Bayes approach. Subsequently, DESeq2 shrinks log2 fold-change
(FC) estimates, with an empirical Bayes procedure [19], to reduce variance due to
noisiness issues of genes that are poorly expressed. Finally, a Wald test is used to infer if
shrunk log2FC estimates (and their standard errors) are significantly different from zero. In

Papers and Studies s
102
the Wald test, the shrunken estimate of the log2FC is divided by its standard error,
generating a z-statistic that can be compared to a standard normal distribution [19].
Transcript annotation
To classify splicing events with the SUPPA [22] and Splicing Express [23] softwares,
genome BAM files were generated with the STAR software [17], by using the same
parameters described above. These BAM files were employed to assemble transcripts with
Cufflinks [24], taking as a reference the Sscrofa 10.2 genome, and a master transcriptome
was generated with Cuffmerge. The SUPPA software annotates AS events from a general
input annotation file generated with Cuffmerge. The AS event types considered by SUPPA
are: exon skipping, alternative 5′ and 3′ splice sites, and intron retention. For each event,
SUPPA calculates the inclusion parameter Ψ, which is defined as the ratio of the
abundance of transcripts that include one form of the event over the abundance of the
transcripts that contain either form of the event. On the other hand, the Splicing Express
software uses a well-annotated set of reference sequences to detect different AS events
from a transcriptome data (GTF file) input file i.e. exon skipping, intron retention and
alternative 5′ and 3′ splicing borders. Splicing Express clusters expressed transcripts to
identify their gene of origin and identifies AS events by using an algorithm based on the
pairwise comparison. Besides, expressed sequences are represented as binary sequences
(exons = 1, introns = 0) that are pairwisely compared thus generating numerical patterns
which reflect their splicing differences. Finally, a graphic representation of the expression
level is created for each gene and for each identified AS event [23].
Transcript type annotation of porcine GM mRNA isoforms was retrieved from the
BioMart database, available in the Ensembl database (http://www.ensembl.org/bio-
mart/martview/). Gene Ontology (GO) Enrichment Analysis was performed by using the
Panther database v. 12.0 (http://www.pantherdb.org/) with the data set of 87 genes
simultaneously detected by both pipelines (P-value < 0.05) as producing mRNA isoforms
DE in HIGH vs LOW pigs.

Papers and Studies
103
Validation of differentially expressed mRNA isoforms by RT-qPCR
Differential expression of mRNA isoforms was validated for the MAF BZIP
transcription factor F (MAFF), stearoyl-CoA desaturase (SCD), retinoic acid receptor γ
(RXRG) and integrin α5 (ITGA5) genes by reverse transcription-quantitative polymerase
chain reaction (RT-qPCR). Primers spanning exon-exon boundaries, or alternatively
binding at different exons (in order to avoid the amplification of residual contaminating
genomic DNA), and complementary to exonic regions that define specific isoforms were
designed with the Primer Express software (Applied Biosystems) (Additional file 2: Table
S2). One μg of total RNA from 14 pigs (7 from each group - HIGH and LOW), selected at
random from the global population of 52 pigs, was used as template for cDNA synthesis.
The reverse transcription reaction was carried out with the High-Capacity cDNA Reverse
Transcription Kit (Applied Biosystems, Foster City, CA) in a final volume of 20 μl.
Quantitative PCR reactions included 7.5 μl of SYBR Select Master Mix, 300 nM of each
primer and 3.75 μl of a 1:25 dilution of the cDNA in a final volume reaction of 15 μl.
Three genes e.g. β-actin (ACTB), TATA-Box binding protein (TBP) and hypoxanthine
phosphoribosyltransferase 1 (HPRT1) were used as endogenous controls. The PCR thermal
cycle involved one denaturing step at 95 °C for 10 min plus 40 cycles of 15 s at 95 °C and
1 min at 60 °C. Reactions were run in a QuantStudio 12 K Flex Real-Time PCR System
(Applied Biosystems, Foster City, CA). A melting curve analysis i.e. 95 °C for 15 s, 60 °C
for 15 s and a gradual increase in temperature, with a ramp rate of 1% up to 95 °C,
followed by a final step of 95 °C for 15 s, was performed after the thermal cycling protocol
to ensure the specificity of the amplification. We made sure that housekeeping and target
genes had comparable amplification efficiencies (90–110%) by performing standard curve
assays with serial 1:5 dilutions. Gene expression levels were quantified relative to the
expression of endogenous controls by employing an optimized com-parative Ct (2- Ct
method) value approach [25] implemented in the Thermo Fisher Cloud (Thermo Fisher
Scientific, Barcelona, Spain). Each sample was analysed in triplicate. All results were
evaluated using RT-qPCR data analysis software (Thermo Fisher Cloud, Thermo Fisher
Scientific, Barcelona, Spain). The sample displaying the lowest expression was used as
calibrator. Differential expression was assessed with a Student’s t-test.

Papers and Studies s
104
Results
After quality control analysis, we used a final dataset of 52 GM muscle samples
equally distributed between the HIGH (N = 26) and LOW (N = 26) groups. RNA-
Sequencing of these samples generated an average of 66 million paired-end reads per
sample. The majority of reads (72.8%, CLC Bio; 89% STAR software) were successfully
mapped to the pig Sscrofa 10.2 genome assembly. The mean mapping proportions
obtained with CLC Bio were 91.4% and 8.6% for reads corresponding to exonic and
intronic regions, respectively. When using STAR, 79.3% of the mapped reads were located
in exons and 6.5% in introns. The remaining (14.2%) reads mapped to intergenic regions.
In the CLC Bio analysis, we found evidence of the existence of alternative transcripts
in 2066 genes (11.7% of protein-coding genes expressed in the GM muscle of HIGH and
LOW swine) which produced 5835 mRNA isoforms (2.8 transcripts per gene). In contrast,
the STAR software detected 1430 genes (10.2% of expressed protein-coding genes)
yielding 4391 different transcripts (3.0 transcripts per gene). Only 5.0% of alternative
transcript variants were potentially subject to nonsense-mediated decay (Additional file 3:
Table S3). Interestingly, 93% of the genes identified by STAR/ RSEM/DESeq2 as
displaying alternative transcripts were also detected with CLC Bio. Analysis of
transcriptomic data with the SUPPA software [22] evidenced that exon skipping is the
most prevalent AS event, while intron retention is the rarest one, i.e. they comprise 36.7%
and 12.2% of all GM AS events, respectively (Additional file 4: Table S4). Similar results
were obtained with the Splicing Express software [23] (Additional file 4: Table S4), i.e.
exon skipping was the most prevalent AS event (41.1%) and intron retention the least
favoured one (12.7%).
We used two different pipelines (CLC Bio and STAR/RSEM/DESeq2) to detect DE
mRNA isoforms in HIGH vs LOW pigs. Combination of such data sets made possible to
identify 104 alternative transcripts and 87 genes that were simultaneously detected by both
pipelines (P-value < 0.05) (Additional file 5: Table S5). A more stringent analysis (P-value
< 0.01 and ±0.6 log2FC) ascertained 10 DE transcripts (corresponding to 10 genes)
concurrently discovered by both pipelines (Table 2). Five of these transcripts remained

Papers and Studies
105
significant after correction for multiple testing (q-value < 0.05 and ±0.6 log2FC; Table 2).
In general, differential expression only affected one isoform and, more particularly, that
showing a predominant pattern of expression (Tables 2, 3 and Additional file 6: Table S6).
In order to validate the accuracy of our RNA-Seq approach, we measured the expression of
four DE mRNA isoforms (ITGA5, SCD, RXRG and MAFF) by RT-qPCR analysis
(Additional file 7: Figure S1). A significant differential expression was confirmed for two
splicing variants e.g. ITGA5 (4445 bp) and SCD (5585 bp) genes (P-value < 0.04).
Besides, a strong statistical tendency was observed for the RXRG (544 bp) gene (P-value =
0.06). In contrast, the MAFF (2145 bp, P-value = 0.23) did not show a statistically
significant differential expression, though RT-qPCR data reflected the same trends (FC
and raw abundance estimates) detected by RNA-Seq. We carried out a GO analysis of the
data set of 87 genes producing alternative transcripts (P-value < 0.05). We did not analyse
the two other data sets (10 genes, P-value < 0.01 and ±0.6 log2FC; 5 genes, q-value < 0.05
and ±0.6 log2FC) because they are too small. The main molecular functions identified in
the data set of 87 genes were Binding and Catalytic activity (Fig. 1a). These results are
consistent with those of Lindholm et al. [26], who found that the main functions of mRNA
encoding genes expressed in the human skeletal muscle are also related with binding and
catalytic activity. The top GO terms of the cellular component GO category were
Membrane and Cell part (Fig. 1b), while Metabolism and Cellular process were the most
common biological processes amongst genes producing alternative transcripts (Fig. 1c).
These results agree well with previous data obtained in humans, mouse and cow [23].
These functional processes are remarkably unspecific, thus probably reflecting the
heterogeneous biological roles of genes expressing alternative transcripts.
Discussion
About 10.9% (average of CLC Bio and STAR results) of pig genes expressed in the
GM muscle produced alternative transcripts, as opposed to 95% of genes detected in a
broad array of human tissues [2]. Besides, the average number of mRNA isoforms per
gene in the porcine skeletal muscle was 2.9 (average of CLC Bio and STAR results). The

Papers and Studies s
106
analysis of transcript diversity in the human skeletal muscle revealed a similar pattern,
with an average of 2 isoforms per gene [26], a figure that is clearly below the average
transcript diversity (5.4 isoforms/gene) found in other human tissues [27]. Such feature
might be due to the fact that in the skeletal muscle there is a reduced number of transcripts
(e.g. myofibrillar proteins) that encompass a disproportionate fraction of the total
transcriptome [26]. Besides that, Taneri et al. [28] predicted a lower quantity of transcripts
per gene in primary tissues e.g. skeletal muscle. In cattle, Chacko et al. [29] observed that
21% of genes are alternatively spliced, and similar percentages were observed by Kim et
al. [30] in cows (26%) and dogs (14%).
The types of splicing events detected in the porcine muscle have been compiled in
Additional file 4: Table S4. Exon skipping was the most frequent AS event predicted by
SUPPA and Splicing Express softwares, followed by the use of alternative 5′ splice
(SUPPA) and 3′ splice (Splicing Express) sites. Deep sequencing of 15 human tissues and
cell lines was consistent with these findings, thus demonstrating that exon skipping was the
most frequent AS event, followed by the use of alternative 3′ splice and 5′ splice sites [31].
In accordance with results obtained in humans [31], the less frequent event was intron
retention (Additional file 4: Table S4). Besides, only 5.0% of produced transcripts were
predicted to undergo nonsense-mediated decay. In humans, nonsense-mediated decay and
nuclear sequestration and turnover of intron-retention transcripts have been involved in the
downregulation of genes in tissues where they do not have a relevant physiological role
[32].
Though SUPPA and Splicing Express yielded consistent results about the relative
importance of distinct AS event categories in the porcine skeletal muscle, the sets of genes
identified by these two softwares as yielding alternative transcripts were quite different.
The proportions of genes overlapping the SUPPA and Splicing Express data sets classified
according to the type of AS event were: exon skipping = 27%, alternative 5′ =24%, 3′
splice sites = 20% and intron retention = 14%. Though we do not have a straightforward
explanation for these discrepancies, we hypothesize that they might be due to the existence
of relevant differences in the assumptions and algorithms on which these two softwares are
based.

Papers and Studies
107
Estimating isoform mRNA abundance is a challenging task and results may vary
depending on the bioinformatics approach employed in differential expression analysis
[33]. One of the main factors influencing the outcome of differential mRNA isoform
expression is the quality and completeness of the transcript assembly [33]. The mRNA
isoform annotation of the pig genome is still incomplete and obviously this might affect
the results of our analysis, but we have not attempted to re-construct transcripts because
bioinformatic and statistical approaches to do so are not very robust and they may lead to
inaccurate transcript quantitations [34].
In order to obtain results as much precise as possible, we have used two different
pipelines to identify DE mRNA isoforms and we have considered as genuine differential
expression events those identified by both approaches. This combined analysis highlighted
the existence of five genes with DE mRNA isoforms that remained significant after
correction for multiple testing (q-value < 0.05, ± 0.6 log2FC). It is worth to highlight that
the DE isoform (487 bp) of the pig semaphorin 4D (SEMA4D) gene is annotated, in the
Ensembl database (Sscrofa 10.2 assembly; https://www.ensembl.org), as truncated in its
3’end. In the human SEMA4D gene, there are 13 protein-encoding mRNA isoforms and
five of them are also truncated in their 3’ends (GRCh38.p10 assembly;
https://www.ensembl.org). The existence of truncated transcripts is due to the inability of
conventional RNA-Seq experiments to define the ends of genes with high precision [35].
Moreover, automated gene prediction is a difficult task and, in consequence, first-pass
annotations can be quite inaccurate [35]. Obviously, the analysis of the differential
expression of mRNA isoforms strongly depends on the accuracy of transcript annotation,
so the results presented in the current work need to be interpreted with this caveat in mind.

Papers and Studies s
108
Table 2 - Splicing variants that are differentially expressed (P-value < 0.01 and ±0.6 log2Fold-Change) in the gluteus medius muscle of
HIGH (N = 26) vs LOW pigs (N = 26)1
Feature ID Feature transcript ID Transcript ID
Lengt
h
(bp)
Relative
expression
mean (%)
CLC Bio STAR/RSEM/DESeq2
Log2
(FC) P-value q-value
Log2
(FC) P-value q-value
2
ENSSSCG00000000293 ENSSSCT00000000314 ITGA5-201 4445 99.00 0.85 2.64E-05 2.56E-02 0.85 2.54E-06 1.21E-03
ENSSSCG00000001252 ENSSSCT00000001367 UBD-201 1281 75.81 -0.72 1.37E-03 2.29E-01 -0.83 7.73E-04 NA
ENSSSCG00000003079 ENSSSCT00000003416 PVR-202 1167 48.41 0.77 7.76E-03 5.94E-01 0.66 9.27E-03 1.27E-01
ENSSSCG00000004578 ENSSSCT00000005057 ANXA2-202 1455 99.36 0.70 3.32E-06 6.56E-03 0.69 4.56E-06 1.58E-03
ENSSSCG00000012277 ENSSSCT00000013426 TIMP1-001 931 97.85 2.57 4.61E-07 1.68E-03 0.79 2.01E-04 1.32E-02
ENSSSCG00000012653 ENSSSCT00000013834 ZDHHC9-209 2967 17.79 0.77 3.29E-03 3.75E-01 0.77 2.56E-03 6.11E-02
ENSSSCG00000013579 ENSSSCT00000014831 CD209-001 1042 95.10 1.04 7.84E-05 4.18E-02 1.01 2.09E-05 NA
ENSSSCG00000006328 ENSSSCT00000033501 RXRG-202 544 17.68 -0.70 4.09E-04 1.18E-01 -0.76 9.31E-05 8.98E-03
ENSSSCG00000009584 ENSSSCT00000034286 SEMA4D-208 487 8.57 1.40 2.75E-06 6.53E-03 1.09 5.87E-05 6.59E-03
ENSSSCG00000024982 ENSSSCT00000036552 LITAF-201 2190 88.44 1.01 1.02E-04 4.38E-02 0.79 1.21E-04 1.04E-02
1Differentially expressed mRNA isoforms that remained significant after correction for multiple testing (q-value < 0.05 and ±0.6 log2Fold-
Change) are shown in bold. A positive log2FC means that the gene is upregulated in HIGH pigs.
2For multiple testing correction, DESeq2 carries out a filtering step based on the average expression strength of each gene across all samples
with the aim of discarding genes which are likely to loose significance after correcting for multiple testing. The purpose of this filtering
step is to increase statistical power by reducing the list of candidate genes to be tested. The q-values of the genes which do not pass the
filtering step are set to NA.

Papers and Studies
109
Table 3 - Relative expression of the set of isoforms of four loci (TIMP1, ITGA5, ANXA2 and LITAF) in HIGH (N=26) vs LOW (N=26)
pigs1.
Feature ID Feature transcript ID Transcript
ID
Length
(bp) Type2
Relative
expression
mean (%)
CLC Bio STAR/RSEM/DESeq2
Log2
(FC) P-value q-value
Log2
(FC) P-value q-value3
ENSSSCG00000004578 ENSSSCT00000034155 ANXA2-201 1609 Protein coding 0.64 0.21 6.77E-01 1.00E+00 0.07 9.20E-01 NA
ENSSSCG00000004578 ENSSSCT00000005057 ANXA2-202 1455 Protein coding 99.36 0.70 3.32E-06 7.23E-03 0.69 4.56E-06 1.58E-03
ENSSSCG00000000293 ENSSSCT00000000314 ITGA5-201 4445 Protein coding 99.00 0.85 2.64E-05 2.82E-02 0.85 2.54E-06 1.21E-03
ENSSSCG00000000293 ENSSSCT00000035821 ITGA5-203 1255 NMD 0.34 -0.03 9.18E-01 1.00E+00 - - -
ENSSSCG00000000293 ENSSSCT00000034427 ITGA5-204 1013 NMD 0.71 -0.08 1.00E+00 1.00E+00 - - -
ENSSSCG00000000293 ENSSSCT00000033141 ITGA5-205 766 NMD 0.48 -0.29 1.00E+00 1.00E+00 -0.01 9.97E-01 NA
ENSSSCG00000012277 ENSSSCT00000013426 TIMP1-001 931 Protein coding 97.86 2.57 4.61E-07 1.85E-03 0.79 2.01E-04 1.32E-02
ENSSSCG00000012277 ENSSSCT00000033796 TIMP1-002 598 Protein coding 0.38 1.12 5.56E-01 1.00E+00 0.38 8.98E-01 NA
ENSSSCG00000012277 ENSSSCT00000034602 TIMP1-003 641 Protein coding 1.57 1.19 8.47E-01 1.00E+00 -0.19 7.39E-01 NA
ENSSSCG00000012277 ENSSSCT00000036308 TIMP1-004 173 Protein coding 0.19 3.05 4.21E-01 1.00E+00 0.18 9.52E-01 NA
ENSSSCG00000024982 ENSSSCT00000036552 LITAF-201 2190 Protein coding 88,45 1,01 1,02E-04 4,82E-02 0,79 1,21E-04 1,04E-02
ENSSSCG00000024982 ENSSSCT00000025103 LITAF-202 2370 Protein coding 11,55 -0,04 1,00E+00 1,00E+00 0,49 7,52E-01 NA
1 Differentially expressed mRNA isoforms that remained significant after correction for multiple testing (q-value < 0.05 and ± 0.6 log2Fold-Change) are
shown in bold. A positive log2FC means that the gene is upregulated in HIGH pigs.
2 NMD= Nonsense-mediated mRNA decay.
3 For multiple testing correction, DESeq2 carries out a filtering step based on the average expression strength of each gene across all samples with the aim of
discarding genes which are likely to loose significance after correcting for multiple testing. The purpose of this filtering step is to increase statistical power
by reducing the list of candidate genes to be tested. The q-values of the genes which do not pass the filtering step are set to NA.

Papers and Studies s
110
2
Figure 1 - Functional classification of genes with differentially expressed (P-value < 0.05)
mRNA isoforms identified with the CLC Genomics Workbench and STAR/RSEM/DESeq2
pipelines in the gluteus medius muscle of HIGH vs LOW pigs. a) molecular function, b)
cellular components and c) biological processes. Categorizations were based on information
provided by the online resource PANTHER classification system (http://www.pantherdb.org).
By examining Tables 2 and 3, we have noticed that the differential expression of
mRNA isoforms might have different functional consequences depending on the gene
under consideration. For instance, in the case of the ITGA5 and TIMP metallopeptidase
inhibitor 1 (TIMP1) genes the DE mRNA isoform encodes a protein that is longer than the
proteins encoded by the remaining mRNA isoforms recorded in the Ensembl database
(Sscrofa 10.2 assembly; https://www.ensembl.org). With regard to ITGA5, the DE isoform
(4445 bp) encodes a full length protein of 1057 amino acids (aa) and it has a predominant
pattern of expression (99%), while the remaining porcine ITGA5 isoforms reported in the
Ensembl database correspond to processed transcripts or transcripts subject to nonsense-
mediated decay. Similarly, in humans there is one major ITGA5 isoform (4444 bp), another
one that might encode a protein but it is truncated in its 5’end, and eleven isoforms that
correspond to processed transcripts, retained introns and transcripts subject to nonsense-

Papers and Studies
111
mediated decay (https:// www.ensembl.org). Concerning the TIMP1 gene, the DE isoform
(931 bp) encodes a full length protein of 207 aa that is longer than the proteins encoded by
other isoforms (Sscrofa 10.2 assembly; https://www.ensembl.org): 195 aa (but incomplete
5’end), 123 aa and 38 aa (but incomplete 3’end). If we compare the 207 aa (931 bp
transcript) and the 123 aa (598 bp transcript) TIMP1 isoforms, the latter lacks a central part
of the protein (from aa site 68 to 151), a feature that involves the loss of four of the six
disulfide bridges which stabilize the fold of the molecule and of two aa residues (sites 68
and 69) which bind to the catalytic zinc [36, 37]. These observations imply that the two
207 aa and 123 aa porcine protein isoforms are expected to be very different at the
functional level.
A different case is represented by the annexin A2 (ANXA2) and lipopolysaccharide-
induced TNF-alpha factor (LITAF) genes in which the DE mRNA isoform (ANXA2: 1455
bp, LITAF: 2190 bp) is shorter than the longest annotated transcript (ANXA2: 1609 bp,
LITAF: 2370 bp, Table 3) but both encode proteins of identical length (ANXA2: 339 aa,
LITAF: 161 aa, Sscrofa 10.2 assembly; https://www.ensembl.org). This situation is
comparable to what has been reported in humans for the ANXA2 (1676 bp, 1444 bp and
1435 bp isoforms encoding a protein of 339 aa) and LITAF (six different isoforms e.g.
2632 bp, 2467 bp, 2356 bp, 1118 bp, 717 bp and 603 bp mRNAs encoding a protein of 161
aa) genes (GRCh38.p10 assembly; http://www.ensembl.org). Though proteins with an
identical length and sequence composition should be functionally equivalent, differences in
transcript length might affect mRNA translatability (e.g. presence of short upstream open
reading frames in the 5’UTR), stability (e.g. formation of stable stem-loops, presence of
microRNA binding sites and of AU-rich elements) and cell localization [38].
The upregulation of certain mRNA isoforms of the ITGA5, TIMP1, ANXA2 and LITAF
genes in HIGH pigs is relevant because these four genes have been implicated in human
obesity and diabetes. For instance, high glucose concentrations induce the overexpression
of the fibronectin receptor, an heterodimer whose α-chain is encoded by the ITGA5 gene
[39]. Moreover, TIMP1 expression is increased in the serum and adipose tissue of obese
mouse models [40]. There is also evidence that the knockout of the ANXA2 gene in mice
involves an hypotrophy of the white adipose tissue due to reduced fatty acid uptake [41],

Papers and Studies s
112
and LITAF mRNA is overexpressed in overweight and obese humans [42]. In summary,
the upregulation of these four genes in HIGH swine is consistent with the increased fatness
and live weight of these pigs and suggests that the differential expression of specific
mRNA isoforms might contribute to the phenotypic differences observed in HIGH vs
LOW pigs.
Finally, we would like to discuss a third case in which DE mRNA isoforms encode
proteins that are shorter than the canonical full-length protein. We have observed that a
3155 bp transcript corresponding to the porcine ubiquitin specific peptidase 2 (USP2) gene
and encoding a 396 aa protein is upregulated in HIGH pigs (Additional file 5: Table S5). In
the Ensembl database (http://www.ensembl.org, Sscrofa 10.2), a second mRNA isoform
that encodes a 606 aa protein has been annotated. In humans, two USP2 protein isoforms
of 605 aa (USP2–69) and 396 aa (USP2–45) have been reported and that there are
evidences that both are able to prevent the degradation of the low density lipoprotein
(LDL) receptor. The upregulation of the 396 aa USP2 isoform in HIGH swine might
constitute a mechanism to cope with the elevated serum LDL concentrations observed in
this group of pigs (Table 1). It is also worth to highlight that the USP2–69 and USP2–45
isoforms might not be functionally equivalent. In Xenopus, for instance, USP2–45 can
deubiquitylate epithelial Na+ channels in oocytes, while USP2–69 cannot perform such
function due to differences in their N-terminal domains. In humans, functional differences
have been also observed with regard to the implication of USP2 isoforms in cell cycle
progression and antiviral response [43], but unfortunately no such data are currently
available for pigs.
Conclusions
We have demonstrated that around 10.9% of genes expressed in the porcine skeletal
muscle produce alternative transcripts, thus generating an average of 2.9 different mRNA
isoforms per gene. Exon skipping is the most frequent splicing event, followed by the use
of alternative 5′ splice sites (SUPPA) and 3′ splice sites (Splicing Express). By analysing
the differential expression of mRNA isoforms in HIGH vs LOW pigs, we have
demonstrated that in the GM muscle of HIGH pigs, which display an increased fatness,

Papers and Studies
113
specific ITGA5, ANXA2, LITAF and TIMP1 mRNA isoforms are upregulated. This finding
is biologically meaningful because these four genes have been implicated in human obesity
and metabolism [39–42]. A deeper functional characterization of these mRNA isoforms,
through initiatives such as the Functional Annotation of Farm Animal Genomes project
[44], will be essential to infer the consequences of their differential expression on porcine
growth and fatness.
Additional files
Additional file 1: Table S1. Distribution of the 56 animals sequenced by RNA-Seq in the
5 half-sib families reported by Gallardo et al. [13].
Additional file 2: Table S2. Primers employed in the validation of four differentially
expressed isoforms by RT-qPCR.
Additional file 3: Table S3. Alternatively spliced mRNA isoforms identified in the
porcine gluteus medius muscle of Duroc pigs by CLC Bio and/or STAR/ RSEM/
DESEq2.
Additional file 4: Table S4. Classification of alternative splicing (AS) events detected in
the porcine gluteus medius muscle with the SUPPA and Splicing Express softwares.
Additional file 5: Table S5. Differentially expressed (P-value < 0.05) mRNA isoforms
(HIGH vs LOW pigs) found with CLC Bio and STAR/RSEM/ DESeq2 softwares.
Additional file 6: Table S6. Relative transcript levels of a set of isoforms corresponding
to five genes expressed in the gluteus medius muscle of HIGH and LOW pigs identified
with the CLC Bio and STAR/RSEM/DESeq2 pipelines.
Additional file 7: Figure S1. Validation by RT-qPCR of the differential expression of
mRNA isoforms corresponding to the RXRG, SCD, MAFF and ITGA5 genes in HIGH vs
LOW pigs.

Papers and Studies s
114
Acknowledgements
The authors are indebted to Selección Batallé S.A. for providing the animal material.
We gratefully acknowledge to J. Reixach (Selecció Batallé), J. Soler (IRTA), C. Millan
(IRTA), A. Quintana (IRTA) and A. Rossell (IRTA) for their collaboration in the
experimental protocols and pig management.
Funding
Part of the research presented in this publication was funded by grants AGL2013–
48742-C2–1-R and AGL2013–48742-C2–2-R awarded by the Spanish Ministry of
Economy and Competitivity and grant 2014 SGR 1528 from the Agency for Management
of University and Research Grants of the Generalitat de Catalunya. We also acknowledge
the support of the Spanish Ministry of Economy and Competitivity for the Center of
Excellence Severo Ochoa 2016–2019 (SEV-2015-0533) grant awarded to the Centre for
Research in Agricultural Genomics (CRAG). Tainã Figueiredo Cardoso was funded with a
fellowship from the CAPES Foundation-Coordination of Improvement of Higher
Education, Ministry of Education of the Federal Government of Brazil. Rayner Gonzalez-
Prendes was funded with a FPU Ph.D. grant from the Spanish Ministry of Education
(FPU12/00860). Thanks also to the CERCA Programme of the Generalitat de Catalunya.
The funders had no role in study design, data collection and analysis, decision to publish or
preparation of the manuscript.
Availability of data and materials
Data have been deposited in the Figshare database (https://doi.org/10.6084/
m9.figshare.5831235.v1).

Papers and Studies
115
Authors’ contributions
MA, ACan and RQ designed the experiment; RQ was responsible for the experimental
protocols and generation of animal material; all authors contributed to the obtaining of
biological samples; TFC and RGP performed RNA extractions; TFC analysed the RNA-
Sequencing data; ACas designed the RT-qPCR experiments; TFC carried out the RT-
qPCR validation experiments; TFC and ACas analysed the RT-qPCR data; MA, ACan and
TFC wrote the paper. All authors read and approved the manuscript.
Ethics approval and consent to participate
Animal care, management procedures and blood sampling were performed following
national guidelines for the Good Experimental Practices and they were approved by the
Ethical Committee of the Institut de Recerca i Tecnologia Agroalimentàries (IRTA).
Consent for publication
Not applicable.
Competing interests
The authors declare no competing interests.
References
1. Reyes A, Huber W. Alternative start and termination sites of transcription drive most
transcript isoform differences across human tissues. Nucleic Acids Res. 2017;46:582–
92.
2. Barash Y, Calarco JA, Gao W, Pan Q, Wang X, Shai O, et al. Deciphering the splicing
code. Nature. 2010;465:53–9.
3. Eswaran J, Horvath A, Godbole S, Reddy SD, Mudvari P, Ohshiro K, et al. RNA
sequencing of cancer reveals novel splicing alterations. Sci Rep. 2013;3:93–7.

Papers and Studies s
116
4. Yao Y, Shang J, Song W, Deng Q, Liu H, Zhou Y. Global profiling of the gene
expression and alternative splicing events during hypoxia-regulated chondrogenic
differentiation in human cartilage endplate-derived stem cells. Genomics.
2016;107:170–7.
5. Zhang S, Cai H, Yang Q, Shi T, Pan C, Lei C, et al. Identification of novel alternative
splicing transcript and expression analysis of bovine TMEM95 gene. Gene.
2016;575:531–6.
6. Xie Y, Yang S, Cui X, Jiang L, Zhang S, Zhang Q, et al. Identification and expression
pattern of two novel alternative splicing variants of EEF1D gene of dairy cattle. Gene.
2014;534:189–96.
7. Ma J, Yang J, Zhou L, Ren J, Liu X, Zhang H, et al. A splice mutation in the PHKG1
gene causes high glycogen content and low meat quality in pig skeletal muscle. PLoS
Genet. 2014;10:e1004710.
8. Koltes JE, Fritz-Waters E, Eisley CJ, Choi I, Bao H, Kommadath A, et al.
Identification of a putative quantitative trait nucleotide in guanylate binding protein 5
for host response to PRRS virus infection. BMC Genomics. 2015;16:4
9. Cánovas A, Quintanilla R, Amills M, Pena RN. Muscle transcriptomic profiles in pigs
with divergent phenotypes for fatness traits. BMC Genomics. 2010; 11:372.
10. Ayuso M, Óvilo C, Rodríguez-Bertos A, Rey AI, Daza A, Fenández A, et al. Dietary
vitamin A restriction affects adipocyte differentiation and fatty acid composition of
intramuscular fat in Iberian pigs. Meat Sci. 2015;108:9–16.
11. Cánovas A, Pena RN, Gallardo D, Ramírez O, Amills M, Quintanilla R, et al.
Segregation of regulatory polymorphisms with effects on the gluteus medius
transcriptome in a purebred pig population. PLoS One. 2012;7: e35583.
12. Puig-Oliveras A, Ramayo-Caldas Y, Corominas J, Estellé J, Pérez-Montarelo D,
Hudson NJ, et al. Differences in muscle transcriptome among pigs phenotypically
extreme for fatty acid composition. PLoS One. 2014;9:e99720.
13. Gallardo D, Pena RN, Amills M, Varona L, Ramírez O, Reixach J, et al. Mapping of
quantitative trait loci for cholesterol, LDL, HDL, and triglyceride serum
concentrations in pigs. Physiol Genomics. 2008;35:199–209.
14. Mach N, Devant M, Díaz I, Font-Furnols M, Oliver MA, García JA, et al. Increasing
the amount of n-3 fatty acid in meat from young Holstein bulls through nutrition. J
Anim Sci. 2006;84:3039–48.
15. Friedewald WT, Levy RI, Fredrickson DS. Estimation of the concentration of low-
density lipoprotein cholesterol in plasma, without use of the preparative
ultracentrifuge. Clin Chem. 1972;18:499–502.
16. Bolger AM, Lohse M, Usadel B. Trimmomatic: a flexible trimmer for Illumina
sequence data. Bioinformatics. 2014;30:2114–20.
17. Dobin A, Davis CA, Schlesinger F, Drenkow J, Zaleski C, Jha S, et al. STAR:
ultrafast universal RNA-Seq aligner. Bioinformatics. 2013;29:15–21.

Papers and Studies
117
18. Li B, Dewey CN. RSEM: accurate transcript quantification from RNA-Seq data with
or without a reference genome. BMC Bioinformatics. 2011;12:323.
19. Love MI, Huber W, Anders S. Moderated estimation of fold change and dispersion for
RNA-Seq data with DESeq2. Genome Biol. 2014;15:550.
20. Robinson MD, Smyth GK. Small-sample estimation of negative binomial dispersion,
with applications to SAGE data. Biostatistics. 2008;9:321–32.
21. Zhang C, Zhang B, Lin LL, Zhao S. Evaluation and comparison of computational
tools for RNA-Seq isoform quantification. BMC Genomics. 2017;18:583.
22. Alamancos GP, Pagès A, Trincado JL, Bellora N, Eyras E. Leveraging transcript
quantification for fast computation of alternative splicing profiles. RNA.
2015;21:1521–31.
23. Kroll JE, Kim J, Ohno-Machado L, de Souza SJ. Splicing Express: a software suite for
alternative splicing analysis using next-generation sequencing data. PeerJ.
2015;3:e1419.
24. Trapnell C, Williams BA, Pertea G, Mortazavi A, Kwan G, van Baren MJ, et al.
Transcript assembly and quantification by RNA-Seq reveals unannotated transcripts
and isoform switching during cell differentiation. Nat Biotechnol. 2010;28:511–5.
25. Livak KJ, Schmittgen TD. Analysis of relative gene expression data using real-time
quantitative PCR and the 2−CT
method. Methods. 2001;25:402–8.
26. Lindholm ME, Huss M, Solnestam BW, Kjellqvist S, Lundeberg J, Sundberg CJ. The
human skeletal muscle transcriptome: sex differences, alternative splicing, and tissue
homogeneity assessed with RNA sequencing. FASEB J. 2014;28:4571–81.
27. Birney E, Stamatoyannopoulos JA, Dutta A, Guigo R, Gingeras TR, Margulies EH, et
al. Identification and analysis of functional elements in 1% of the human genome by
the ENCODE pilot project. Nature. 2007;447:799–816.
28. Taneri B, Snyder B, Novoradovsky A, Gaasterland T. Alternative splicing of mouse
transcription factors affects their DNA-binding domain architecture and is tissue
specific. Genome Biol. 2004;5:R75.
29. Chacko E, Ranganathan S. Genome-wide analysis of alternative splicing in cow:
implications in bovine as a model for human diseases. BMC Genomics. 2009;10:S3–
S11.
30. Kim N, Alekseyenko AV, Roy M, Lee C. The ASAP II database: analysis and
comparative genomics of alternative splicing in 15 animal species. Nucleic Acids Res.
2007;35:D93–8.
31. Wang ET, Sandberg R, Luo S, Khrebtukova I, Zhang L, Mayr C, et al. Alternative
isoform regulation in human tissue transcriptomes. Nature. 2008; 456:470–6.
32. Braunschweig U, Barbosa-Morais NL, Pan Q, Nachman EN, Alipanahi B,
Gonatopoulos-Pournatzis T, et al. Widespread intron retention in mammals
functionally tunes transcriptomes. Genome Res. 2014;24:1774–86.

Papers and Studies s
118
33. Hartley SW, Mullikin JC. Detection and visualization of differential splicing in RNA-
Seq data with JunctionSeq. Nucleic Acids Res. 2016;44:e127.
34. Shenker S, Miura P, Sanfilippo P, Lai EC. IsoSCM: improved and alternative 3’ UTR annotation using multiple change-point inference. RNA. 2015;21:14–27.
35. Schurch NJ, Cole C, Sherstnev A, Song J, Duc C, Storey KG, et al. Improved
annotation of 3′ untranslated regions and complex loci by combination of strand-
specific direct RNA sequencing, RNA-Seq and ESTs. PLoS One. 2014;9: e94270.
36. Batra J, Robinson J, Soares AS, Fields AP, Radisky DC, Radisky ES. Matrix
metalloproteinase-10 (MMP-10) interaction with tissue inhibitors of
metalloproteinases TIMP-1 and TIMP-2: binding studies and crystal structure. J Biol
Chem. 2012;287:15935–46.
37. Gomis-Rüth F-X, Maskos K, Betz M, Bergner A, Huber R, et al. Mechanism of
inhibition of the human matrix metalloproteinase stromelysin-1 by TIMP-1. Nature.
1997;389:77–81.
38. Mockenhaupt S, Makeyev EV. Non-coding functions of alternative pre-mRNA
splicing in development. Semin Cell Dev Biol. 2015;47–48:32–9.
39. Roth T, Podestá F, Stepp MA, Boeri D, Lorenzi M. Integrin overexpression induced
by high glucose and by human diabetes: potential pathway to cell dysfunction in
diabetic microangiopathy. Proc Natl Acad Sci USA. 1993;90:9640–4.
40. Meissburger B, Stachorski L, Röder E, Rudofsky G, Wolfrum C. Tissue inhibitor of
matrix metalloproteinase 1 (TIMP1) controls adipogenesis in obesity in mice and in
humans. Diabetologia. 2011;54:1468–79.
41. Salameh A, Daquinag AC, Staquicini DI, An Z, Hajjar KA, Pasqualini R, et al.
Prohibitin/annexin 2 interaction regulates fatty acid transport in adipose tissue. JCI
Insight. 2016;1:e86351.
42. Ji ZZ, Dai Z, Xu YC. A new tumor necrosis factor (TNF)-α regulator,
lipopolysaccharides-induced TNF-α factor, is associated with obesity and insulin
resistance. Chin Med J. 2011;124:177–82.
43. Zhu H-Q, Gao F-H. The molecular mechanisms of regulation on USP2’s alternative
splicing and the significance of its products. Int J Biol Sci. 2017; 13:1489–96.
44. Andersson L, Archibald AL, Bottema CD, Brauning R, Burgess SC, Burt DW, et al.
Coordinated international action to accelerate genome-to-phenome with FAANG, the
functional annotation of animal genomes project. Genome Biol. 2015;16:57.

Papers and Studies
119
Nutrient supply affects the mRNA expression profile of the porcine
skeletal muscle.
Cardoso TF1,2
, Quintanilla R3, Tibau J
4, Gil M
4, Mármol-Sánchez E
1, González-
Rodríguez O2, González-Prendes R
1, Amills M
5,6,a.
1Department of Animal Genetics, Center for Research in Agricultural Genomics (CSIC-IRTA-
UAB-UB), Universitat Autònoma de Barcelona, 08193, Bellaterra, Spain. 2CAPES Foundation,
Ministry of Education of Brazil, Brasilia D. F., Zip Code 70.040-020, Brazil.3Animal Breeding and
Genetics Program, Institute for Research and Technology in Food and Agriculture (IRTA), Torre
Marimon, 08140, Caldes de Montbui, Spain.4IRTA-Monells, Finca Camps i Armet s/n 17121,
Monells, Spain. 5Department of Animal Genetics, Center for Research in Agricultural Genomics
(CSIC-IRTA-UAB-UB), Universitat Autònoma de Barcelona, 08193, Bellaterra, Spain.
[email protected] de Ciència Animal i dels Aliments, Facultat de Veterinària,
Universitat Autònoma de Barcelona, 08193, Bellaterra, Spain. [email protected].
aCorresponding author: M. Amills
BMC Genomics. 2017 Aug 10;18(1):603.
doi: 10.1186/s12864-017-3986-x.

Papers and Studies s
120

Papers and Studies
121
Abstract
The genetic basis of muscle fat deposition in pigs is not well known. So far, we have
only identified a limited number of genes involved in the absorption, transport, storage
and catabolism of lipids. Such information is crucial to interpret, from a biological
perspective, the results of genome-wide association analyses for intramuscular fat content
and composition traits. Herewith, we have investigated how the ingestion of food changes
gene expression in the gluteus medius muscle of Duroc pigs. By comparing the muscle
mRNA expression of fasted pigs (T0) with that of pigs sampled 5 h (T1) and 7 h (T2)
after food intake, we have detected differential expression (DE) for 148 (T0-T1), 520
(T0-T2) and 135 (T1-T2) genes (q-value <0.05 and a |FC| > of 1.5). Many of these DE
genes were transcription factors, suggesting that we have detected the coordinated
response of the skeletal muscle to nutrient supply. We also found DE genes with a dual
role in oxidative stress and angiogenesis (THBS1, THBS2 and TXNIP), two biological
processes that are probably activated in the post-prandial state. Finally, we have
identified several loci playing a key role in the modulation of circadian rhythms (ARNTL,
PER1, PER2, BHLHE40, NR1D1, SIK1, CIART and CRY2), a result that indicates that the
porcine muscle circadian clock is modulated by nutrition. We have shown that hundreds
of genes change their expression in the porcine skeletal muscle in response to nutrient
intake. Many of these loci do not have a known metabolic role, a result that suggests that
our knowledge about the genetic basis of muscle energy homeostasis is still incomplete.
Keywords: Pig, RNA-Seq, Oxidative stress, Transcription factor, Circadian rhythm,
Angiogenesis
Background
Physiological genomics aims to understand the molecular basis of highly complex
biological processes by applying high-throughput technologies to the large-scale analysis
of genomes, transcriptomes and proteomes [1]. We have a very limited understanding of
the physiological genomics of intramuscular fat (IMF) content and composition traits in

Papers and Studies s
122
pigs. Several RNA-Seq studies comparing the muscle transcriptomes of pigs with
divergent lipid profiles have been performed, demonstrating the differential expression of a
number of genes related with carbohydrate and lipid metabolism [2–4]. Noteworthy,
genome-wide association studies (GWAS) of blood lipid traits in humans have uncovered
the existence of a large number of genes strongly associated with plasma lipid
concentrations whose involvement in lipoprotein metabolism had never been reported
before [5]. For instance, Teslovich et al. [6] performed a GWAS for lipid traits in 100,000
individuals and identified several associated loci (e.g. GALNT2, PPP1R3B, and TTC39B)
whose participation in lipid metabolism had not been described previously. Similarly, the
Global Lipids Genetics Consortium reported 62 novel loci displaying significant
associations with blood lipid levels, and 30 of them had never been previously connected
to lipid metabolism [7]. In the light of these results, we can infer that many genes
contributing to muscle fat deposition remain to be identified.
The skeletal muscle compartment encompasses a substantial fraction of the body
weight and accounts for ≈75% of total insulin-stimulated glucose uptake [8]. Moreover,
adipose and muscle tissues absorb most of the chylomicrons generated after a meal
consumption [9]. Fat deposition in the porcine muscle may depend, at least in part, on the
activation of genes that regulate the uptake, transport, storage, synthesis and degradation of
fatty acids (FA) and carbohydrates. As a first step to identify such genes, we have
investigated how the profile of pig muscle mRNA expression changes in response to
nutrient supply.
Methods
Animal material and metabolic profile
A group of 36 female piglets belonging to a commercial Duroc line were brought, after
weaning (age = 3–4 weeks), to the IRTA-Pig Experimental Farm at Monells (Girona,
Spain). They were fed with a transition feed for 40 days, and, at an approximate age of 2
months, they entered the fattening period. Gilts were housed individually and fed ad
libitum with a commercial feeding diet (13% and 5.5% of crude protein and crude fat

Papers and Studies
123
respectively) until they reached an average live weight of 73 ± 1.2 kg (161 ± 1.1 days). The
post-prandial time-points at which muscle gene expression should be analysed were chosen
on the basis of the following experiment (experiment 1): we selected at random eight
Duroc gilts (out of the 36), with an approximate age of 100 days, and blood samples were
taken with citrate Vacutainer tubes before feeding and 2, 4, 6 h. after feeding. These 32
samples were submitted to the Veterinary Clinical Biochemistry Service of the Universitat
Autònoma de Barcelona (http://sct.uab.cat/sbcv). The following metabolites were
measured using standard protocols: plasma glucose, triglycerides, cholesterol and non-
esterified fatty acids.
In experiment 2, we analysed the transcriptomic changes associated with food intake by
sequencing the muscle transcriptomes of the 36 Duroc gilts mentioned in the previous
paragraph. These gilts were slaughtered at the IRTA-Experimental slaughterhouse in
Monells (Girona, Spain) in controlled conditions and complying all national welfare
regulations. These 36 sows fasted 12 h prior slaughtering and then 12 of them were
stunned, with high concentrations of CO2 to minimize pain, and bled (T0, fasting). The
remaining 24 gilts were supplied with a standard feed ad libitum, and slaughtered 5 h (T1,
N = 12) and 7 h (T2, N = 12) after T0, following the same procedure reported above.
Before slaughter, we took blood samples from these sows and triglyceride and plasma free
FA were measured at the Veterinary Clinical Biochemistry Service of the Universitat
Autònoma de Barcelona (http://sct.uab.cat/sbcv). After slaughtering, samples of the gluteus
medius muscle were collected and submerged in RNAlater (Ambion), being stored at −80
°C until use.
RNA isolation and library construction and sequencing
Each muscle sample was individually submerged in liquid nitrogen and pulverized with
a mortar and a pestle. This powder was homogenized with a polytron device in 1 mL of
TRI Reagent (Thermo Fisher Scientific, Barcelona, Spain). Total RNA was extracted from
gluteus medius muscle samples by using the acid phenol method implemented in the
RiboPure kit (Ambion, Austin, TX). Total RNA concentration and purity were assessed
with a Nanodrop ND-1000 spectrophotometer (Thermo Fisher Scientific, Barcelona,

Papers and Studies s
124
Spain), while integrity was checked with a Bioanalyzer-2100 equipment (Agilent
Technologies, Inc., Santa Clara, CA). Total RNA samples were submitted to the Centre
Nacional d’Anàlisi Genòmica (CNAG, http://www.cnag.cat) for sequencing. Individual
libraries for each one of the analysed pigs (N = 36) were prepared using the TruSeq
Stranded mRNA Library Preparation Kit (Illumina Inc., CA) according to the protocols
recommended by the manufacturer. This level of replication is 4-fold higher than the
minimum required (3 individuals/group) in standard RNA-Seq studies. Each library was
paired-end sequenced (2 × 75 bp) in a HiSeq 2000 platform (Illumina Inc., CA) by using
the TruSeq SBS Kit v3-HS (Illumina Inc., CA).
Bioinformatic analyses
Quality control of sequence reads was carried out with the FASTQC software
(Babraham Bioinformatics, http://www.bioinformatics.babraham.ac.uk/projects/fastqc/).
We made per-sequence and per-base analyses to filter reads according to the following
criteria: sequence-read distribution = 75 bp, 100% coverage in all bases, GC-content
~50%, ~25% of A, T, G and C nucleotide contributions, ambiguous base-content <0.1%
and a Phred score higher than 30 (i.e. base-calling accuracy larger than 99.9%).
Subsequently, sequences were trimmed for any remaining sequencing adapter by using
Trimmomatic v.0.22 [10]. Raw reads were mapped to the pig reference genome (version
10.2) with the STAR Alignment v.2.5. software [11] by using default parameters and
STAR 2-pass alignment steps. The FeatureCounts tool [12] was used to summarize counts
of unambiguously mapped reads. The expression of each mRNA was estimated with
DESeq2 [13]. This software builds a count matrix Kij (with one row for each gene i and
one column for each sample j) encompassing the number of sequencing reads that have
been unambiguously mapped to a gene in a sample [13]. The main assumption of this
method is that read counts follow a negative binomial distribution with mean μij and
dispersion αi [13]. A second important assumption is that genes of similar average
expression levels are expected to have a similar dispersion αi value. DESeq2 calculates
final dispersion values by using an empirical Bayes approach that shrinks dispersion
estimates towards a set of predicted αi values. When dealing with genes that are poorly

Papers and Studies
125
expressed, log2 fold-change (FC) estimates can have a high variance due to noisiness
issues. To avoid this potential problem, DESeq2 shrinks log2FC estimates, with an
empirical Bayes procedure [13]. Finally, a Wald test is used to infer if shrunken log2FC
estimates (and their standard errors) are significantly different from zero. In the Wald test,
the shrunken estimate of the log2FC is divided by its standard error, generating a z-statistic
that can be compared to a standard normal distribution [13]. Correction for multiple testing
is achieved by using a false discovery rate approach [14]. We considered as differentially
expressed (DE) those mRNAs displaying a |FC| > 1.5 and a q-value <0.05.
Advaita Bio’s iPathwayGuide (http://www.advaitabio.com/ipathwayguide) and the
Cytoscape software [15] combined with the ReactomeFIViz app [16] were used to infer if
certain gene ontology terms and pathways are enriched across the sets of DE genes as well
as to build biological networks. In order to detect the GO categories that are over- or
under-represented in the condition under study, Advaita Bio’s iPathwayGuide uses an
impact analysis method that relies on classical statistics but also takes into account other
key factors such as the magnitude of each gene’s expression change, their type and
position in the given pathways, their interactions, etc. [17]. The ReactomeFIViz
application can access the Reactome pathways database in order to do pathway enrichment
analysis for a set of genes and visualize hit pathways with the aid of Cytoscape [16]. This
application can also access the Reactome Functional Interaction (FI) network to construct a
FI sub-network based on a set of genes [16]. In our study, the standard ReactomeFIViz
“Gene Set/Mutation Analysis” application was employed to build gene functional
interaction networks on the basis of a list of DE genes (q-value <0.05 and a |FC| > of 1.5)
and curated pathway information contained in the Reactome database. The functional
enrichment analyses for pathways and GO annotations were based on a binomial test [16].
Results
In Experiment 1, measurement of the concentrations of plasma glucose, cholesterol,
triglycerides and non-esterified fatty acids revealed that glycaemia and lipidemia peaks
took place 2 and 4 h after the 8 Duroc gilts began to eat, a result that was very consistent
across individuals (Fig. 1). Eating was also accompanied by a marked decrease of plasma

Papers and Studies s
126
free FA (Fig. 1), a finding that agrees well with the role of these metabolites as a source of
energy during fasting. We chose 5 and 7 h post-ingestion as time-points to carry out the
analysis of differential expression. Our expectation was that T1 would reflect the process
of lipid absorption, while T2 would correspond to a posterior phase in which lipids are
stored as triglycerides or catabolized in the β-oxidation pathway to generate ATP.
Nevertheless, when we measured the concentrations of triglycerides and plasma free fatty
acids in the slaughtered sows forming part of Experiment 2 (Additional file 1: Figure S1),
we observed that feeding is associated with an increase in the concentration of triglycerides
and a decrease of circulating free FA levels, a result that matches the metabolic profile
observed in Experiment 1. However, the kinetics of these two metabolites were not
identical to those observed in Experiment 1 because 7 h after feeding triglyceride levels
were still peaking. Despite this circumstance, our main comparison (fasting vs fed pigs)
remains completely valid.
The RNA-Seq experiment generated an average of 45 million paired-end reads per
sample and 69.8% of them were unambiguously mapped to the pig Sscrofa10.2 genome
assembly. Analysis of the data with DESeq2 highlighted 148 (T0 vs T1), 520 (T0 vs T2)
and 135 (T1 vs T2) differentially expressed mRNA-encoding genes (Additional file 2:
Table S1). Moreover, 85 genes showed DE both in the T0-T1 and T0-T2 comparisons, a
result that evidences the high consistency of our results. The analyses of pathways and
signalling networks enriched in DE genes with Advaita iPathwayGuide
(http://www.advaitabio.com/ ipathwayguide) revealed 18 (T0-T1), 18 (T0-T2) and 14 (T1-
T2) enriched pathways (Table 1). Similarly, the ReactomeFIViz app identified 34 (T0-T1),
18 (T0-T2) and 15 (T1-T2) pathways (Additional file 3: Table S2). In both analyses, we
identified pathways related with (1) T0-T1: circadian clock system, muscle contraction and
signaling in cardiomyocytes; (2) T0-T2: circadian rhythm and ribosome pathway; and (3)
T1-T2: oxidative phosphorylation, metabolic process and ribosome pathways.
Differentially expressed mRNA-encoding genes were also grouped in gene regulatory
networks with the ReactomeFIViz app. We found 6 (T0-T1), 20 (T0-T2) and 4 (T1-T2)
functional interaction networks which are displayed in Figs. 2, 3 and 4. Several enriched
pathways (q-value <0.05) such as Wnt signaling pathway (T0-T2), TNF signalling (T0-
T1), ATF-2 transcription factor network (T0-T2) and oxidative phosphorylation (T0-T2,

Papers and Studies
127
T1-T2) are tightly linked to metabolism and energy homeostasis. We also found pathways
related with striated muscle contraction (T0-T1) and myogenesis (T0-T2), a result that
could be anticipated given the predominance of myofibrilar proteins in the muscle
proteome. Other pathways of interest were circadian clock and rhythm (T0-T1, T0-T2),
oxidative stress induced gene expression via Nrf2 (T0-T2) and SRP-dependent
cotranslational protein targeting to membrane (T1-T2) and eukaryotic translation
termination (T1-T2).
Figure 1 - Kinetics of the average concentrations of plasma glucose, cholesterol, triglycerides
and non-esterified fatty acids (FA) in 8 Duroc pigs at four time points: before eating and 2, 4
and 6 h post-ingestion (p.i).
Considering gene ontology (GO) cellular component, biological process and molecular
function related to network functions, the top-scoring networks were (1) T0-T1:
transcription factor complex, circadian regulation of gene expression and E-box binding;
(2) T0-T2: nucleo-plasm, negative regulation of transcription from RNA polymerase II
promoter and structural constituent of ribosome and (3) T1-T2: cytosolic small ribosomal

Papers and Studies s
128
subunit, translation and structural constituent of ribosome (Additional file 4: Table S3).
We have an established role in metabolism, while for others evidence reported in the
literature is more tenuous or even absent. For instance, the 6-phosphofructo-2-
kinase/fructose-2,6-biphosphatase 3 (PFKFB3, T0-T1: FC = −3.01, q-value = 1.91E-07)
gene can modulate glucose homeostasis by regulating the levels of fructose-2,6-
biphosphate [18], and there are substantial evidences that the G0/G1 switch 2 (G0S2, T0-
T1: FC = 1.84, q-value = 4.03E-02; T0-T2: FC = 2.06, q-value = 9.35E-04) protein is
involved in the regulation of the rate-limiting lipolytic enzyme adipose triglyceride lipase
[19].
Discussion
Post-prandial activation of genes with and without known roles in muscle energy
homeostasis
Several of the genes that show the most significant DE between fasted and fed animals
(Additional file 2: Table S1), have an established role in metabolism, while for others
evidence reported in the literature is more tenuous or even absent. For instance, the 6-
phosphofructo-2-kinase/fructose-2,6-biphosphatase 3 (PFKFB3, T0-T1: FC = −3.01, q-
value = 1.91E-07) gene can modulate glucose homeostasis by regulating the levels of
fructose-2,6-biphosphate [18], and there are substantial evidences that the G0/G1 switch 2
(G0S2, T0-T1: FC = 1.84, q-value = 4.03E-02; T0-T2: FC = 2.06, q-value = 9.35E-04)
protein is involved in the regulation of the rate-limiting lipolytic enzyme adipose
triglyceride lipase [19].
The analysis of Additional file 2: Table S1 also evidences the existence of DE for
several genes with a plausible but poorly characterized role in metabolism. A good
example is the mitoguardin 2 (MIGA2, T0-T1: FC = 1.62, q-value = 1.86E-02; T0-T2: FC
= 2.22, q-value = 2.10E-05) gene, which shows a dramatic increase in its expression after
food intake i.e. MIGA2 is 1.62 and 2.22 times more expressed at 5 and 7 h post-ingestion,
respectively. This gene encodes a protein that regulates mitochondrial [20]. Noteworthy,
mitochondrial dynamics is highly inter-connected with the energy status of the cell, and it

Papers and Studies
129
has been demonstrated that starvation promotes an acute inhibition of mitochondrial
fission [21]. Another gene of interest is syndecan 4 (SDC4, T0-T1: FC = −1.80, q-value =
3.88E-04; T0-T2: FC = −1.82, q-value = 9.59E-04), whose expression levels decreased at
5 h and 7 h after ingestion. In mammals, this gene has been mostly related with cell-matrix
adhesion, migration, neuronal development, and inflammation, but studies performed in
Drosophila have revealed that it may also have broad effects on the regulation of energy
homeostasis [22]. A third example would be the cysteine- serine-rich nuclear protein 1
(CSRNP1, T0-T1: FC = −1.67, q-value = 5.37E-03; T0-T2: FC = −1.75, q-value = 1.07E-
02), a molecule that has been mostly related with T-cell immunity and cephalic neural
progenitor proliferation [24]. Interestingly, the expression of this molecule is induced by
axin, which appears to promote glucose uptake by enhancing the translocation of GLUT4
[25].
Finally, there is a third category of genes, exemplified by the family with sequence
similarity 212, member B (FAM212B, T0-T1: FC = 2.04, q-value = 3.36E-02; T0-T2: FC =
2.68, q-value = 1.13E-06), transmembrane protein 169 (TMEM169, T0-T2: FC = 2.83, q-
value = 6.81E-07) and matrix metallopeptidase 25 (MMP25, T0-T2: FC = −2.41, q-value =
7.97E-04) loci, that, to the best of our knowledge, have never been reported to participate
in the regulation of energy homeostasis.
The ingestion of food involves changes in the muscle expression of many
transcription factors
As shown in Additional file 2: Table S1, we did not detect significant changes in the
expression of several genes with a well-established role in lipid uptake (e.g. CD36,
lipoprotein lipase), synthesis (e.g. acetyl-CoA carboxylase, fatty acid synthase,
diacylglycerol O-acyl-transferase 1), transportation (e.g. FA binding proteins) and
catabolism (e.g. genes of the β-oxidation pathway). One of the few exceptions to this
general trend was the lipase G locus (LIPG, T0-T1: FC = −1.80, q-value = 4.10E-02),
which encodes and endothelial lipase modulating lipoprotein metabolism [26]. This gene
shows an important drop in its expression levels (1.8 times) 5 h after food intake, a feature
that would result in an inhibition of high-density lipoprotein catabolism [26].

Papers and Studies s
130
We observed DE for many genes encoding transcription factors (Figs. 2 and 3,
Additional file 2: Table S1) e.g. the AT-rich interactive domain 5B (ARID5B, T0-T2: FC =
−2.31, q-value = 5.98E-04) gene, which influences adipogenesis and also the accumulation
of postnatal lipid storage [27]; Kruppel-like factor 5 (KLF5, T0-T2: FC = −1.96, q-value =
1.25E-02), that regulates the expression of genes involved in the β-oxidation of FA [28];
NR4A2, (T0-T1: FC = −2.16, q-value = 8.93E-04), a nuclear orphan receptor that controls
the expression of genes related with glucose metabolism [29]; CCAAT/Enhancer Binding
Protein δ (CEBPD, T0-T1: FC = −2.33, q-value = 6.37E-05; T0-T2: FC = −1.84, q-value =
1.71E-02) that plays an essential role in adipogenesis [30]; and forkhead box O1 (FOXO1,
T0-T1: FC = −1.55, q-value = 2.12E-02; T0-T2: FC = −1.66, q-value = 2.7E-02), which
integrates glucose utilization and lipogenesis [31]. In the T0-T2 comparison we found a
similar pattern, with DE of genes encoding the nuclear receptor NR4A3 (FC = −2.28, q-
value = 1.99E-03), SRY-box 9 (SOX9, FC = −2.28, q-value = 6.84E-05) and BTB and
CNC Homology 1, Basic Leucine Zipper (BACH2, FC = −2.45, q-value = 4.61E-05)
transcription factors, to mention a few (Figs. 2 and 3, Additional file 2: Table S1). In the
T0-T2 comparison (Fig. 3, Additional file 2: Table S1), we also detected an increase in the
expression levels of the meteorin (METRNL, FC = 1.77, q-value = 7.33E-03) mRNA that
encodes an hormone that promotes energy expenditure and glucose tolerance [32].
Feeding elicits strong changes in the expression of ribosomal protein genes
Mammalian ribosomes contain 79 different proteins, all of them being encoded by
single-copy genes expressed in all tissues [33]. Interestingly, we have detected significant
changes in the expression of several ribosomal protein genes (Additional file 2: Table S1).
Ribosomal protein genes formed part of the Reactome functional networks shown in Figs.
3 and 4. Moreover, pathways related with ribosomal biogenesis appeared as significant in
Table 1 and Additional file 3: Table S2. When nutrients are available, cells tend to activate
energy-consuming anabolic pathways whilst under stress or starvation catabolic processes
are predominant [33]. Ribosomal biogenesis consumes 60% of cellular energy and this is
the key reason why this process is tightly coupled with nutrient supply [34]. The
rapamycin (TOR) signalling pathway is deeply involved in coupling ribosome biogenesis

Papers and Studies
131
with the energy status of the cell by regulating the expression of ribosomal proteins and
RNAs [35]. The fundamental role of ribosomal proteins in skeletal muscle metabolism has
been illustrated by generating mice where the ribosomal protein S6 cannot be
phosphorylated i.e. these mice are viable and fertile but they show muscle weakness and
energy deficit [36]. According to our data, these strong changes in the expression of
ribosomal protein genes are observed in the T0-T2 and T1-T2 comparisons, but not in T0-
T1. Another intriguing observation of our study is that several of these DE ribosomal
protein genes are consistently downregulated (e.g. RPS6KA1,RPL35A, RPS23, RPS21,
RPL9 and RPL39), a result that is counterintuitive and hard to explain.
Differential expression of genes related with angiogenesis and oxidative stress.
The thrombospondin 1 (THBS1, T0-T1: FC = −1.99, q-value = 8.00E-03) and 2
(THBS2, T0-T2: FC = 2.45, q-value = 5.18E-04) and thioredoxin interacting protein
(TXNIP, T0-T1: FC = −1.78, q-value = 1.34E-02; T0-T2: FC = −1.79, q-value = 1.13E-02)
genes showed significant DE before and after eating (Additional file 2: Table S1).
Moreover, they were integrated in the Reactome functional networks depicted in Figs. 2
and 3. These loci have a dual biological role, regulating both angiogenesis and response to
oxidative stress. For instance, THBS1 and THBS2 are negative regulators of angiogenesis
[37, 38] and their expression is down- and upregulated by oxidative stress, respectively
[39, 40]. This feature agrees well with our study, since we found a post-prandial (both at
T1 and T2) decreased and increased expression of THBS1 and THBS2, respectively. The
TXNIP protein is one of the main regulators of redox homeostasis [41] and also an
angiogenic factor [42]. We have observed a diminished expression of this gene after food
ingestion, a finding that agrees well with its function as a promoter of oxidative stress and
apoptosis [41].

Papers and Studies s
132
Table 1 - Results of the Advaita Bio’s iPathwayGuide pathway analysis based on the list of genes that are differentially expressed (q-
value <0.05 and |fold-change| > 1.5) in the porcine gluteus medius muscle before (T0) vs 5 h (T1) and 7 h (T2) after eating. athe P-value
corresponding to the pathway was computed using only over-representation analysis.
T0 vs T1 T0 vs T2 T1 vs T2
Pathway P-value Pathway P-value Pathway P-value
Circadian rhythm 1.00E-03 Ribosome * 4.97E-06 Ribosome * 2.84E-13
Circadian entrainment 4.00E-03 Circadian rhythm 8.48E-04 Huntington's disease 2.84E-04
Cholinergic synapse 4.00E-03 Huntington's disease 1.00E-03 Parkinson's disease 7.33E-04
Adrenergic signaling in
cardiomyocytes 4.00E-03 Legionellosis 5.00E-03 Oxidative phosphorylation * 8.74E-04
Transcriptional misregulation in
cancer 7.00E-03 Parkinson's disease 6.00E-03 Alzheimer's disease 1.00E-03
TGF-beta signaling pathway 1.30E-02 Viral myocarditis 7.00E-03 Tight junction 1.30E-02
GABAergic synapse 1.50E-02 Malaria 7.00E-03 Metabolic pathways * 1.80E-02
Malaria 1.60E-02 p53 signaling pathway 1.00E-02 Herpes simplex infection 1.80E-02
Cardiac muscle contraction * 2.40E-02 Alzheimer's disease 1.10E-02 p53 signaling pathway 2.50E-02
Herpes simplex infection 2.70E-02 Mineral absorption 1.30E-02 Viral myocarditis 2.90E-02
Fructose and mannose metabolism * 3.20E-02 Toxoplasmosis 1.50E-02 Legionellosis 3.20E-02
Neuroactive ligand-receptor
interaction 3.20E-02 PPAR signaling pathway 1.90E-02
Amyotrophic lateral sclerosis
(ALS)
3.20E-02
Dopaminergic synapse 3.30E-02 Amyotrophic lateral sclerosis
(ALS)
2.20E-02 Sulfur metabolism * 3.60E-02
Alanine, aspartate and glutamate
metabolism * 3.50E-02 Sulfur metabolism * 2.40E-02
Arrhythmogenic right
ventricular cardiomyopathy
(ARVC)
5.00E-02
Glutamatergic synapse 3.60E-02 African trypanosomiasis 2.50E-02
Estrogen signaling pathway 3.70E-02 Transcriptional misregulation in
cancer
2.90E-02
Bladder cancer 4.10E-02 Cardiac muscle contraction * 3.30E-02
Dilated cardiomyopathy 4.90E-02 Tight junction 4.90E-02

Papers and Studies
133
In the mitochondria, oxidative phosphorylation, by which ATP is synthesized as a
source of energy, involves the generation of reactive oxygen species (e.g. superoxide,
hydrogen peroxide, hydroxyl radical) as a byproduct [43]. This may promote a state of
oxidative stress, i.e. an imbalance between oxidants and antioxidants, resulting in cell and
tissue damage. Indeed, a single high-fat meal can temporarily impair endothelial function
in healthy individuals and this effect is inhibited by antioxidants [44]. Moreover, lipid
peroxidation by reactive oxygen species has been suggested as one of the main
mechanisms leading to the development of mitochondrial dysfunction and insulin
resistance [45]. On the other hand, it is well known that insulin, which is secreted by the
pancreas in response to food ingestion, promotes vasodilation and capillary recruitment in
the skeletal muscle, an effect mediated by nitric oxide [46]. These actions on the muscle
vasculature are fundamental for the maintenance of glucose homeostasis [47]. As a matter
of fact, oxidative stress and neovascularization are two tightly linked biological processes
i.e. there are evidences that end products of lipid oxidation can bind the Toll-like receptor
2 promoting an angiogenic response [48]. As a whole, DE of THBS1, THBS2 and TXNIP
between pre- and post-prandial states probably reflects the combined redox and vascular
response of the porcine skeletal muscle to nutrient availability.

Papers and Studies s
134
Figure 2 - Reactome functional interaction network corresponding to 148 genes that show
differential expression in the T0 (fasting) vs T1 (5 h after eating) comparison. Nodes in
different network modules are displayed in different colors. Letters in parentheses represent the
source database as follows: R – Reactome, K – KEGG, and B – BioCarta. Enriched pathways (q-
value <0.05) in each one of the individual network modules are: 1: Proteoglycans in cancer (K); 2:
TNF signaling (R); 3: Circadian clock (R); 4: Bone remodeling (B); 5: Striated muscle contraction
(R) and 6: Transcriptional regulation of pluripotent stem cells (R)

Papers and Studies
135
Figure 3 - Reactome functional interaction network corresponding to 520 genes showing
differential expression in the T0 (fasting) vs T2 (7 h after eating) comparisons. Nodes in
different network modules are displayed in different colors. Letters in parentheses represent the
source database as follows: R – Reactome, K – KEGG, N – NCI PID, P - Panther, and B –
BioCarta. Enriched pathways (q-value <0.05) in each one of the individual network modules are: 1:
Mitotic G1-G1/S phases (R); 2: Nicotinic acetylcholine receptor signaling pathway (P); 3: SRP-
dependent co-translational protein targeting to membrane (R); 4: Senescence-associated secretory
phenotype (SASP) (R); 5: Signaling events mediated by HDAC Class II (N); 6: Circadian rhythm
pathway (N), 7: Oxidative stress induced gene expression via Nrf2 (B); 8: ABC-family proteins
mediated transport (R); 9: Toll-like receptors cascades (R); 11: Proximal tubule bicarbonate
reclamation (K); 12: Wnt signaling pathway (K); 13: Nucleotide-binding domain, leucine rich
repeat containing receptor (NLR) signaling pathways (R); 14: ATF-2 transcription factor network
(N); 15: ECM-receptor interaction (K); 16: GPCR ligand binding (R); 17: Oxidative
phosphorylation (K); 18: Integrin signalling pathway (P); 19: Myogenesis (R); 20: Transcriptional
regulation of white adipocyte differentiation (R)

Papers and Studies s
136
Figure 4 - Reactome functional interaction network corresponding to 135 genes showing
differential expression in the T1 (5 h after eating) vs T2 (7 h after eating) comparison. Nodes
in different network modules are displayed in different colors. Letters in parentheses represent the
source database as follows: R – Reactome and K – KEGG. Enriched pathways (q-value <0.05) in
each one of the individual network modules are: 1: SRP-dependent cotranslational protein targeting
to membrane (R); 2: Eukaryotic Translation Termination (R); 3: Oxidative phosphorylation (K) and
4: Parkinson’s disease (K).
A close relationship between nutritional status and the expression of genes
integrated in the muscle circadian clock.
One of the main results of our experiment was the detection of DE for a set of genes
that form part of the peripheral clock that determines the maintenance of circadian rhythms
in the skeletal muscle (Figs. 2 and 3, and Additional file 2: Tables S1, Additional file 3:
Tables S2 and Additional file 4: Tables S3). Patterns of DE in the two available
comparisons (T0-T1 and T0-T2) were consistent i.e. there was an upregulation of ARNTL
(T0-T1: FC = 1.87, q-value = 193E-0.4; T0-T2: FC = 2.43, q-value = 2.99E-13) and
NR1D1 (T0-T1: FC = 1.61, q-value = 8.30E-03; T0-T2: FC = 1.87, q-value = 9.52E-04),
and a downregulation of PER1 (T0-T1: FC = −2.85, q-value = 3.95E-11; T0-T2: FC =
−1.83, q-value = 1.12E-0.2), PER2 (T0-T1: FC = −1.67, q-value = 4.33E-04, T0-T2: FC =
−2.48, q-value = 7.03E-14), BHLHE40 (T0-T2: FC = −1.77, q-value = 7.87E-0.5), SIK1
(T0-T1: FC = −2.62, q-value = 1.91E-07), CIART (T0-T1: FC = −2.16, q-value = 5.79E-

Papers and Studies
137
05; T0-T2: FC = −2.35, q- value = 4.52E-06) and CRY2 (T0-T2: FC = −1.60, q-value =
1.28E-0.2). In mammals, the circadian clock is regulated by either the CLOCK-ARNTL or
the NPAS2-ARNTL heterodimers depending on the tissue under consideration [49]. These
heterodimers activate the transcription of the Period (PER1 and PER2) and Cryptochrome
(CRY1 and CRY2) genes [49]. In diurnal species, the PER and CRY complexes accumulate
in the cytoplasm during daytime and they are translocated to the nucleus in the evening,
thus repressing their own expression through the interaction with CLOCK/ARNTL [49].
The BHLHE40 molecule is a negative regulator of the ARNTL-CLOCK complex [50].
Other clock genes of interest are SIK1, that regulates the entrainment of the circadian clock
[51], CIART, whose inactivation increases the circadian period of locomotor activity in
mice [52] and NR1D1, a critical regulator of the circadian clock with strong effects on lipid
homeostasis [53]. Our data indicate that food ingestion modulates the expression of
circadian genes in the porcine skeletal muscle. It might be argued that this DE is just the
obvious consequence of slaughtering pigs at different time-points (T0 = 0 h., T1 = + 5 h.
and T2 = + 7 h.). However, studies performed in model species have revealed that the
feeding/fasting cycle is one of the main zeitgebers (time cues) synchronizing the skeletal
muscle clock [54]. Noteworthy, this clock plays a key role in muscle physiology by
regulating the expression of more than one thousand genes mainly involved in metabolic
processes [55]. Muscle lipid deposition in pigs could be affected by the expression of these
genes because their inactivation in mouse has evidenced numerous metabolic abnormalities
including ectopic fat in the muscle, reduced circulating levels of triglycerides and free fatty
acids, obesity, hyperlipidemia and severe hepatic steatosis [49]. Besides, SNPs in the
human clock genes have been related with abdominal obesity, increase in carbohydrate
intake, higher body mass index and metabolic syndrome [56].
Conclusions
Our results indicate that the ingestion of food affects the expression of many
transcription factors that are essential for coordinating the metabolic response triggered by
the availability of nutrients. Amongst these, clock genes could be particularly important
due to their key role in the adequate synchronization of this response as well as because of
their broad effects on muscle metabolism. We have also shown that several genes without
an evident link with muscle metabolism change their expression in response to nutrient

Papers and Studies s
138
inflow, an observation that suggests that our knowledge about the genetic basis of energy
homeostasis in the porcine muscle is still quite limited. Given the close physiological
similarity between pigs and humans, data presented in the current study could be also of
interest to understand the consequences of food intake on gene expression in this latter
species.
Additional files
Additional file 1: Figure S1. Kinetics of triglyceride and non-esterified fatty acids (FA)
concentrations in 36 Duroc pigs at three time points: before eating and 5 and 7 h post-
ingestion.
Additional file 2: Table S1. Differentially expressed genes (q-value <0.05 and |fold-
change| > 1.5) in the pig gluteus medius muscle at fasting (T0) vs 5 h (T1) vs 7 h (T2)
after eating.
Additional file 3: Table S2. Pathways identified by ReactomeFIViz as enriched in
differentially expressed genes (q-value <0.05 and |fold-change| > 1 .5). Three conditions
were compared: fasting (T0), 5 h after eating (T1) and 7 h after eating (T2).
Additional file 4: Table S3 Gene regulatory networks identified with the ReactomeFIViz
app, considering GO biological process, molecular function and cellular component (q-
value<0.05).
Acknowledgements
The authors are indebted to Selección Batallé S.A. for providing the animal material.
We gratefully acknowledge to J. Reixach (Selecció Batallé), J. Soler (IRTA), C. Millan
(IRTA), A. Quintana (IRTA) and A. Rossell (IRTA) for their collaboration in the
experimental protocols and pig management. Thanks also to the CERCA Programme of
the Generalitat de Catalunya.

Papers and Studies
139
Funding
Part of the research presented in this publication was funded by grants AGL2013-
48742-C2-1-R and AGL2013-48742-C2-2-R awarded by the Spanish Ministry of
Economy and Competitivity. We also acknowledge the support of the Spanish Ministry of
Economy and Competitivity for the Center of Excellence Severo Ochoa 2016-2019 (SEV-
2015-0533) grant awarded to the Center for Research in Agricultural Genomics. We also
acknowledge grant 2014 SGR 1528 from the Agency for Management of University and
Research Grants of the Generalitat de Catalunya. Tainã F Cardoso was funded with a
fellowship from the CAPES Foundation-Coordination of Improvement of Higher
Education, Ministry of Education (MEC) of the Federal Government of Brazil. Emilio
Mármol-Sánchez was funded with a PhD fellowship FPU15/01733 awarded by the Spanish
Ministry of Education and Culture (MECD).
Availability of data and materials
Data have been submitted to the Sequence Read Archive (SRA) database (submission
number: SUB2676631).
Authors’ contributions
MA and RQ designed the experiment; RQ, JT and MG were responsible for the
experimental protocols and generation of animal material; RGP and OG performed the
kinetic study; all authors contributed to the obtaining of biological samples; TFC and EM
performed RNA extractions; TFC analysed the data; MA and TFC wrote the paper; all
authors read and approved the manuscript.
Ethics approval
Animal care, management procedures and blood sampling were performed following
national guidelines for the Good Experimental Practices and they were approved by the
Ethical Committee of the Institut de Recerca i Tecnologia Agroalimentàries (IRTA).

Papers and Studies s
140
Consent for publication
Not applicable.
Competing interests
The authors declare that they have no competing interests.
References
1. Cowley AW. Physiological genomics: tools and concepts. J Physiol. 2004;554:3.
2. Puig-Oliveras A, Ramayo-Caldas Y, Corominas J, Estellé J, Pérez-Montarelo D, Hudson
NJ, et al. Differences in muscle transcriptome among pigs phenotypically extreme for
fatty acid composition. PLoS One. 2014;9:e99720.
3. Ayuso M, Fernández A, Núñez Y, Benítez R, Isabel B, Barragán C, et al. Comparative
analysis of muscle transcriptome between pig genotypes identifies genes and regulatory
mechanisms associated to growth, fatness and metabolism. PLoS One.
2015;10:e0145162.
4. Wang Z, Li Q, Chamba Y, Zhang B, Shang P, Zhang H, et al. Identification of genes
related to growth and lipid deposition from transcriptome profiles of pig muscle tissue.
PLoS One. 2015;10:e0141138.
5. Khetarpal SA, Rader DJ. Genetics of lipid traits: genome-wide approaches yield new
biology and clues to causality in coronary artery disease. Biochim Biophys Acta.
2014;1842:2010–20.
6. Teslovich TM, Musunuru K, Smith AV, Edmondson AC, Stylianou IM, Koseki M, et al.
Biological, clinical and population relevance of 95 loci for blood lipids. Nature.
2010;466:707–13.
7. Willer CJ, Schmidt EM, Sengupta S, Peloso GM, Gustafsson S, Kanoni S, et al.
Discovery and refinement of loci associated with lipid levels. Nat Genet. 2013;45:1274–
83.
8. Shulman GI, Rothman DL, Jue T, Stein P, DeFronzo RA, Shulman RG. Quantitation of
muscle glycogen synthesis in normal subjects and subjects with non-insulin-Dependent
diabetes by 13C nuclear magnetic resonance spectroscopy. N Engl J Med.
1990;322:223–8.
9. Frayn KN. Metabolic regulation: A Human Perspective. 3rd Edition. Wiley-Blackwell;
2010.
10. Bolger AM, Lohse M, Usadel B. Trimmomatic: a flexible trimmer for Illumina
sequence data. Bioinformatics. 2014;30:2114–20.
11. Dobin A, Davis CA, Schlesinger F, Drenkow J, Zaleski C, Jha S, et al. STAR: ultrafast
universal RNA-Seq aligner. Bioinformatics. 2013;29:15–21.

Papers and Studies
141
12. Liao Y, Smyth GK, Shi W. FeatureCounts: an efficient general purpose program for
assigning sequence reads to genomic features. Bioinformatics. 2014;30:923–30.
13. Love MI, Huber W, Anders S. Moderated estimation of fold change and dispersion for
RNA-Seq data with DESeq2. Genome Biol. 2014;15:550.
14. Benjamini Y, Hochberg Y. Controlling the false discovery rate: a practical and
powerful approach to multiple testing. J R Stat Soc. 1995;57:289–300.
15. Shannon P, Markiel A, Ozier O, Baliga NS, Wang JT, Ramage D, et al. Cytoscape: a
software environment for integrated models of biomolecular interaction networks.
Genome Res. 2003;13:2498–504.
16. Wu G, Dawson E, Duong A, Haw R, Stein L. ReactomeFIViz: a Cytoscape app for
pathway and network-based data analysis. F1000Res. 2014;3:146.
17. Draghici S, Khatri P, Tarca AL, Amin K, Done A, Voichita C, et al. A systems biology
approach for pathway level analysis. Genome Res. 2007;17:1537–45.
18. Hue L, Rider MH. Role of fructose 2,6-bisphosphate in the control of glycolysis in
mammalian tissues. Biochem J. 1987;245:313–24.
19. Heckmann BL, Zhang X, Xie X, Liu J. The G0/G1 switch gene 2 (G0S2): regulating
metabolism and beyond. Biochim Biophys Acta. 2013;1831:276–81.
20. Zhang Y, Liu X, Bai J, Tian X, Zhao X, Liu W, et al. Mitoguardin regulates
mitochondrial fusion through MitoPLD and is required for neuronal homeostasis. Mol
Cell. 2016;61:111–24.
21. Liesa M, Shirihai OS. Mitochondrial dynamics in the regulation of nutrient utilization
and energy expenditure. Cell Metab. 2013;17:491–506.
22. De Luca M, Klimentidis YC, Casazza K, Chambers MM, Cho R, Harbison ST, et al. A
conserved role for syndecan family members in the regulation of whole-body energy
metabolism. PLoS One. 2010;5:e11286.
23. Gingras RM, Warren ME, Nagengast AA, DiAngelo JR. The control of lipid
metabolism by mRNA splicing in Drosophila. Biochem Biophys Res Commun.
2014;10:672–6.
24. Feijóo CG, Sarrazin AF, Allende ML, Glavic A. Cystein-serine-rich nuclear protein 1,
Axud1/Csrnp1, is essential for cephalic neural progenitor proliferation and survival in
zebrafish. Dev Dynam. 2009;238:2034–43.
25. Guo H-L, Zhang C, Liu Q, Li Q, Lian G, Wu D, et al. The Axin/TNKS complex
interacts with KIF3A and is required for insulin-stimulated GLUT4 translocation. Cell.
2012;22:1246–57.
26. Ma K, Cilingiroglu M, Otvos JD, Ballantyne CM, Marian AJ, Chan L. Endothelial
lipase is a major genetic determinant for high-density lipoprotein concentration,
structure, and metabolism. Proc Natl Acad Sci U S A. 2003;100:2748–53.
27. Whitson RH, Tsark W, Huang TH, Itakura K. Neonatal mortality and leanness in mice
lacking the ARID transcription factor Mrf-2. Biochem Biophys Res Commun.
2003;312:997–1004.

Papers and Studies s
142
28. Oishi Y, Manabe I, Tobe K, Ohsugi M, Kubota T, Fujiu K, et al. SUMOylation of
Krüppel-like transcription factor 5 acts as a molecular switch in transcriptional
programs of lipid metabolism involving PPAR-δ. Nat Med. 2008;14:656–66.
29. Pérez-Sieira S, López M, Nogueiras R, Tovar S, Ahima RS, Flier JS, et al. Regulation
of NR4A by nutritional status, gender, postnatal development and hormonal deficiency.
Sci Rep. 2014;4:327–32.
30. Hishida T, Nishizuka M, Osada S, Imagawa M. The role of C/EBPδ in the early stages
of adipogenesis. Biochimie. 2009;91:654–7.
31. Ido-Kitamura Y, Sasaki T, Kobayashi M, Kim HJ, Lee YS, Kikuchi O, et al. Hepatic
FoxO1 integrates glucose utilization and lipid synthesis through regulation of Chrebp
O-glycosylation. PLoS One. 2012;7:e47231.
32. Rao RR, Long JZ, White JP, Svensson KJ, Lou J, Lokurkar I, et al. Meteorin-like is a
hormone that regulates immune-adipose interactions to increase beige fat
thermogenesis. Cell. 2014;157:1279–91.
33. Mayer C, Grummt I. Ribosome biogenesis and cell growth: mTOR coordinates
transcription by all three classes of nuclear RNA polymerases. Oncogene.
2006;25:6384–91.
34. Jewell JL, Guan KL. Nutrient signaling to mTOR and cell growth. Trends Biochem
Sci. 2013;38:233–42.
35. Zhou X, Liao WJ, Liao JM, Liao P, Lu H. Ribosomal proteins: functions beyond the
ribosome. J Mol Cell Biol. 2015;7:92–104.
36. Ruvinsky I, Katz M, Dreazen A, Gielchinsky Y, Saada A, Freedman N, et al. Mice
deficient in ribosomal protein S6 phosphorylation suffer from muscle weakness that
reflects a growth defect and energy deficit. PLoS One. 2009;4:e5618.
37. Bornstein P, Kyriakides TR, Yang Z, Armstrong LC, Birk DE. Thrombospondin 2
modulates collagen fibrillogenesis and angiogenesis. J Investig Dermatol Symp Proc.
2000;5:61–6.
38. Lawler J. Thrombospondin-1 as an endogenous inhibitor of angiogenesis and tumor
growth. J Cell Mol Med. 2002;6:1–12.
39. Chen JK, Zhan YJ, Yang C-S, Tzeng SF. Oxidative stress-induced attenuation of
thrombospondin-1 expression in primary rat astrocytes. J Cell Biochem. 2011;112:59–
70.
40. Bae ON, Wang JM, Baek SH, Wang Q, Yuan H, Chen AF. Oxidative stress-mediated
thrombospondin-2 upregulation impairs bone marrow-derived angiogenic cell function
in diabetes mellitus. Arterioscler Thromb Vasc Biol. 2013;33:1920–7.
41. Zhou J, Chng WJ. Roles of thioredoxin binding protein (TXNIP) in oxidative stress,
apoptosis and cancer. Mitochondrion. 2013;13:163–9.
42. Park SY, Shi X, Pang J, Yan C, Berk BC. Thioredoxin-interacting protein mediates
sustained VEGFR2 signaling in endothelial cells required for angiogenesis. Arterioscler
Thromb Vasc Biol. 2013;33:737–43.
43. Lacroix S, Rosiers CD, Tardif JC, Nigam A. The role of oxidative stress in
postprandial endothelial dysfunction. Nutr Res Rev. 2012;25:288–301.

Papers and Studies
143
44. Sies H, Stahl W, Sevanian A. Nutritional, dietary and postprandial oxidative stress. J
Nutr. 2005;135:969–72.
45. Schrauwen P, Hesselink MKC. Oxidative capacity, lipotoxicity, and mitochondrial
damage in type 2 diabetes. Diabetes. 2004;53:1412–7.
46. Muniyappa R, Montagnani M, Koh KK, Quon MJ. Cardiovascular actions of insulin.
Endocr Rev. 2007;28:463–91.
47. Manrique C, Sowers JR. Insulin resistance and skeletal muscle vasculature:
significance, assessment and therapeutic modulators. Cardiorenal Med. 2014;4:244–56.
48. West XZ, Malinin NL, Merkulova AA, Tischenko M, Kerr BA, Borden EC, et al.
Oxidative stress induces angiogenesis by activating TLR2 with novel endogenous
ligands. Nature. 2010;467:972–6.
49. Gooley JJ, Chua ECP. Diurnal regulation of lipid metabolism and applications of
circadian lipidomics. J Genet Genomics. 2014;41:231–50.
50. Nakashima A, Kawamoto T, Honda KK, Ueshima T, Noshiro M, Iwata T, et al. DEC1
modulates the circadian phase of clock gene expression. Mol Cell Biol. 2008;28:4080–
92.
51. Jagannath A, Butler R, Godinho SIH, Couch Y, Brown LA, Vasudevan SR, et al. The
CRTC1-SIK1 pathway regulates entrainment of the circadian clock. Cell.
2013;154:1100–11.
52. Goriki A, Hatanaka F, Myung J, Kim JK, Yoritaka T, Tanoue S, et al. A novel protein,
CHRONO, functions as a core component of the mammalian circadian clock. PLoS
Biol. 2014;12:e1001839.
53. Solt LA, Kojetin DJ, Burris TP. The REV-ERBs and RORs: molecular links between
circadian rhythms and lipid homeostasis. Future Med Chem. 2011; 3:623–38.
54. Dudek M, Meng QJ. Running on time: the role of circadian clocks in the
musculoskeletal system. Biochem J. 2014;463:1–8.
55. Hodge BA, Wen Y, Riley LA, Zhang X, England JH, Harfmann BD, et al. The
endogenous molecular clock orchestrates the temporal separation of substrate
metabolism in skeletal muscle. Skelet Muscle. 2015;5:17.
56. Ribas-Latre A, Eckel-Mahan K. Interdependence of nutrient metabolism and the
circadian clock system: importance for metabolic health. Mol Metab. 2016;5:133–52.

Papers and Studies s
144

Papers and Studies
145
The ingestion of food promotes changes in the expression of genes
regulating circadian rhythms in four porcine tissues containing
peripheral clocks
Cardoso T.F.1,2
, Quintanilla R.3, Castelló A.
1,4, Mármol-Sánchez E.
1, Ballester M.
3,
Jordana J.4, Amills, M.
1,4,a
1Department of Animal Genetics, Center for Research in Agricultural Genomics (CSIC-IRTA-
UAB-UB), Campus de la Universitat Autònoma de Barcelona, Bellaterra, Spain. 2CAPES
Foundation, Ministry of Education of Brazil, Brasilia, D. F., Brazil. 3Animal Breeding and Genetics
Programme, Institute for Research and Technology in Food and Agriculture (IRTA), Torre
Marimon, Caldes de Montbui, Spain. 4Departament de Ciència Animal i dels Aliments, Universitat
Autònoma de Barcelona, Bellaterra, Spain.
aCorresponding author: M. Amills
Submitted to Frontiers in Genetics, February 2018

Papers and Studies s
146

Papers and Studies
147
Abstract
In a previous study, we demonstrated that the expression of circadian clock genes in the
porcine skeletal muscle changes in response to nutrient supply. The goal of the current
work was to investigate if such changes also take place in tissues containing peripheral
(duodenum, dorsal fat, muscle, and liver) and central (hypothalamus) clocks. As animal
material, we used 12 sows that fasted 12 h before slaughtering (T0) and 12 sows that were
fed ad libitum 7 h. prior slaughtering (T2). Tissue samples were collected immediately
after slaughter and total RNA was subsequently extracted. The expression of the ARNTL,
BHLHE40, CRY2, NPAS2, NR1D1, PER1, PER2 and SIK1 genes was measured by
quantitative reverse transcription PCR. Our results show that four (dorsal fat and
duodenum), six (skeletal muscle) and seven (liver) genes integrated into or modulating
peripheral clocks are differentially expressed before and after feeding. In contrast, none of
the eight analysed genes shows a significant differential expression in hypothalamus, the
tissue where the central clock resides. This result indicates that the differential expression
of clock genes in the four tissues mentioned before is induced by nutrition and not by the
central clock entrained by light. Moreover, we have observed that the NPAS2 and ARNTL
genes display positive log2(Rq) values in the five tissues under analysis, whilst the CRY2,
PER1 (except dorsal fat) and PER2 (except hypothalamus) genes generally show negative
log2(Rq) values. Such result might be explained by the existence of a negative feedback
loop between the ARNTL/NPAS2 and CRY/PER genes. Collectively, these results indicate
that porcine peripheral circadian clocks are modulated by nutrition and that such regulation
could be essential for coordinating the subsequent metabolic response.
Introduction
Circadian clocks are highly conserved endogenous oscillators controlling a wide
repertoire of physiological events, including metabolism and behavior (Bellet & Sassone-
Corsi, 2010). At the molecular level, the rhythmicity of circadian clocks is modulated by
several transcriptional feedback loops composed by positive and negative regulators
(Eckel-Mahan & Sassone-Corsi, 2013; Partch, Green, & Takahashi, 2014). The aryl
hydrocarbon receptor nuclear translocator-like (ARNTL) transcription factor
heterodimerizes with either the clock circadian regulator (CLOCK) or its paralogue, the

Papers and Studies s
148
neuronal PAS domain protein 2 (NPAS2), thus activating the expression of the period
(PER) and cryptochrome (CRY) genes. Upon reaching a critical concentration threshold,
PER and CRY translocate to the nucleus where they inhibit the activity of the
(CLOCK/NPAS2):ARNTL heterodimer, thus establishing a negative feedback loop
(Menet et al., 2014; Peek et al., 2012). Cyclical oscillations in the expression of
(CLOCK/NPAS2):ARNTL and PER:CRY genes modulated by this and other feedback
loops promote the establishment of circadian patterns modulating the transcriptional
activity of thousands of genes (Partch et al., 2014; Takahashi, 2017). This core mechanism
is further refined by the action of additional genes, such as nuclear receptor subfamily 1
group D member 1 (NR1D1), basic helix-loop-helix family member E40 (BHLHE40), and
salt-inducible kinase 1 (SIK1) which cooperate to finely tune the rhythmicity of
mammalian circadian clocks (Bugge et al., 2012; Honma et al., 2002; Oike et al., 2014).
In mammals, the central circadian clock is located in the hypothalamus, and more
specifically in the suprachiasmatic nucleus (Partch et al., 2014). This central clock is
fundamentally entrained by the light/dark cycle (Partch et al., 2014). Circadian clocks are
also present in peripheral tissues, but they are mainly entrained by feeding/fasting cycles,
glucose metabolism, insulin secretion and temperature (Hastings et al., 2008; Oike et al.,
2014; Richards & Gumz, 2012). Circadian clocks have a profound effect on metabolism
and gene expression. For instance, a third of the genes in the mouse genome show
circadian patterns of expression (Gooley & Chua, 2014). The knockout of specific
circadian genes in mice is associated with a broad variety of abnormal metabolic
phenotypes including obesity, hyperglycemia, hepatic steatosis, hypertriglyceridemia,
hypotriglyceridemia, glucose intolerance, hypoinsulinemia and cholesterolemia (Gooley &
Chua, 2014). The analysis of the murine skeletal muscle transcriptome has shown that
genes related with fatty acid uptake and ß-oxidation peak in the inactive phase, whilst
genes related with carbohydrate catabolism, carbohydrate storage and lipogenesis peak in
the early, middle and late active phases, respectively (Hodge et al., 2015).
Whereas circadian clocks have been intensively studied in humans and mouse, little is
known about the mechanisms by which these clocks respond to food intake in domestic
species. Zhou et al. (2017) showed that long-chain polyunsaturated fatty acid levels in
plasma and liver as well as the hepatic mRNA levels of lipid genes (i.e. FADS1, FADS2,
ELOVL2, and ELOVL5) exhibit diurnal rhythms in pigs. Recently, we compared the

Papers and Studies
149
patterns of skeletal muscle expression of sows that fasted 12 h before slaughtering (T0) vs
sows that were fed 5 h (T1) and 7 h (T2) before slaughtering (Cardoso et al., 2017). Our
results demonstrated that nutrient supply affects the mRNA expression of circadian clock
genes in the pig skeletal muscle, and such differences were particularly significant in the
T0 vs T2 comparison (Cardoso et al., 2017). The main goal of the current work was to
extend this analysis of differential expression (DE) to a broader array of tissues containing
central (hypothalamus) and peripheral clocks (liver, duodenum, muscle, and dorsal fat).
Our working hypothesis is that food intake promotes changes in the mRNA expression of
porcine clock genes not only in the skeletal muscle but also in other tissues of metabolic
importance.
Materials and Methods
RNA isolation
Sample tissues were retrieved from 12 sows that fasted 12 h before slaughtering (T0)
and 12 sows that were fed ad libitum 7 h prior slaughtering (T2). The weight and age of the
sows at slaughtering were 73 ± 1.2 kg and 161 ± 1.1 days, respectively. Additional details
about how these sows were bred and fed can be found in Cardoso et al. (2017). Tissue
samples (liver, dorsal fat, gluteus medius muscle, duodenum, and hypothalamus) were
collected immediately after slaughter, submerged in RNAlater (Ambion, Austin, TX,
USA), and stored at −80 °C until RNA extraction. Muscle tissue samples were individually
pulverized using a pre-chilled mortar and a pestle. Powdered samples were homogenized
in 1 ml TRIzol Reagent (Invitrogen Corp., Carlsbad, CA). Liver, dorsal fat, duodenum, and
hypothalamus tissues were directly homogenized in TRIzol Reagent (1 ml). All samples
(n = 120) were homogenized with a polytron device (IKA, Denmark). Total RNA was
extracted according to the protocol recommended by Chomzynski and Sacchi (1987). In
brief, homogenates were centrifuged and visible fat and cell debris were removed.
Chloroform (200 μl) was added and samples were centrifuged to separate the nucleic acid
and protein phases. Total RNA was precipitated using 500 μl isopropanol and washed with
ethanol (75%). Finally, RNA was resuspended with RNase-free water and stored at
−80 °C. RNA concentration and purity were measured using a NanoDrop ND-1000
spectrophotometer (NanoDrop Technologies, Wilmington, USA).

Papers and Studies s
150
Synthesis of complementary DNA
Complementary DNA synthesis was carried out with the High-Capacity cDNA Reverse
Transcription Kit (Applied Biosystems, Foster City, CA, USA) by using 10 μl (100 ng/μl)
of total RNA as template in a final reaction volume of 20 μl. One μl of MultiScribe
Reverse Transcriptase (50 U/µl), 2 μl of 10x random primers, 2 μl of 10x buffer, 0.8 μl of
25x dNTP Mix (100 mM) and 4.2 μl of water were added to the reaction. Tubes were
incubated for 10 min at 25 °C, 2 h at 37 °C and 5 min at 85 °C to inactivate the reverse
transcriptase according to the manufacturer instructions (Applied Biosystems, Foster City,
CA, USA). A negative control was made for each tissue with no reverse transcriptase
added (−RT control). Complementary DNAs were stored at −80 °C until use.
Primer design
The eight genes included in this study were selected based on previous results obtained
by Cardoso et al. (2017) as well as by performing a literature search (Gnocchi et al., 2015;
Tahara & Shibata, 2013). Primers spanning exon-exon boundaries, or alternatively binding
at different exons (in order to avoid the amplification of residual contaminating genomic
DNA) were designed with the Primer 3 software (Untergasser et al., 2012). Primers
employed in the amplification of the β-actin (ACTB), TATA-Box Binding Protein (TBP),
and hypoxanthine phosphoribosyltransferase 1 (HPRT1) were reported by Ballester et al.
(2017). Primer sequences and gene names are available in Supplementary file 1.
RT-qPCR
The quantification of mRNA expression by quantitative reverse transcription PCR (RT-
qPCR) was performed by using the QuantStudio 12K Flex Real-Time PCR System
(Applied Biosystems, Foster City, CA, USA). Four genes i.e. ACTB, TBP, HPRT1, and ß2-
microglobulin (B2M) were used as endogenous controls (Supplementary file 2). Standard
curves with serial dilutions from a pool of cDNA from each tissue were made to evaluate
the performance of our RT-qPCR assays. Efficiencies from 90 to 110 were obtained. In
short, 3.75 µl of cDNA (1/25 diluted for samples, or 1/5-1/15,625 diluted for standard
points), 7.5 µl of SYBR Select Master Mix (Applied Biosystems, Foster City, CA, USA),
and 300 nM of each primer were mixed in a final volume of 15 μl. All reactions were done

Papers and Studies
151
in triplicate Thermal profile was 10 min at 95 °C and 40 cycles of 15 sec at 95 °C and 1
min at 60 °C. A melting curve step (95 ºC for 15 sec, 60 ºC for 1 min and a gradual
increase in temperature with a ramp rate of 0.05ºC/s up to 95 ºC and a final step of 95 ºC
for 15 sec) was carried out to confirm the specificity of the assays.
Data analysis
Clock gene expression data were normalized taking as a reference the mRNA levels of
four reference genes (ACTB, TBP, HPRT1, and B2M), according to the stability of the gene
expression for each assay. Genes selected as reference controls can be found in
Supplementary file 2. Relative quantification of gene expression differences between T0
and T2 for each tissue was calculated with the 2−ΔΔCT
method (Livak & Schmittgen, 2001)
by using the following formulae:
ΔΔCT = ΔCT(T2) – ΔCT(T0) (calibrator)
ΔCT(T2) = (CT target gene T2 – CT reference gene T2) averaged across all T2 samples in each tissue
ΔCT(T0) = (CT target gene T0 – CT reference gene T0) averaged across all T0 samples in each tissue
Relative quantification of gene expression differences across tissues was also
calculated with the 2−ΔΔCT
method. Hypothalamus samples were used as calibrator. For
instance, in the case of liver samples at T0:
ΔΔCT(liver T0) = ΔCT (liver T0) – ΔCT(hypothalamus T0) (calibrator)
ΔCT(liver T0) = [CT(target gene liver T0) – CT(reference genes liver T0)] averaged across all T0 liver
samples.
ΔCT(hypothalamus) = [CT(target gene hypothalamus T0) – CT(reference genes hypothalamus T0)] averaged across all
T0 hypothalamus samples.
In T2, the procedure would be the same but T0 should be replaced by T2 in the above
formulae.

Papers and Studies s
152
Data were evaluated with the RT-qPCR data analysis software available in the Thermo
Fisher Cloud (Thermo Fisher Scientific, Barcelona, Spain). The statistical significance of
the mRNA expression differences between T0 and T2 was assessed with a Student t-test
and relative quantification (Rq) was expressed in a logarithmic scale (Log2). We
considered that gene expression between T0 and T2 was significantly different when two
conditions were met i.e. |log2Rq| > 0.58 and q-value < 0.05. A principal component
analysis (PCA) of the 120 tissue samples was carried out based on the measured ΔCT
values without correcting for any calibrator. All figures were made with the R software
(https://www.r-project.org/).
Results
We have examined how the expression of eight clock genes changes in response to
food ingestion across five tissues. In this study, we did not analyse the CLOCK gene
because it was not annotated in the Sus scrofa genome v.10.2 (Sscrofa 10.2 assembly;
https://www.ensembl.org). In Figure 1, we have plotted a PCA of the ΔCT values for eight
genes and two timepoints (T0 and T2) of all samples from five tissues. It can be seen that
in general samples cluster according to their tissue of origin (Figure 1A) rather than to the
T0/T2 timepoints under consideration (Figure 1B), evidencing that tissue is the main factor
that defines the patterns of clock gene expression. Moreover, the analysis of Figure 1A
shows that hypothalamus and duodenum samples cluster apart from those of dorsal fat,
liver, and muscle samples.
The comparison of the patterns of expression before and after feeding (T0 vs T2
comparison) indicates that the expression of four (dorsal fat and duodenum), six (skeletal
muscle) and seven (liver) genes integrated into or modulating peripheral clocks changes in
response to food ingestion (Table 1). In contrast, none of the eight analysed genes shows
significant variations of expression in hypothalamus, the tissue where the central clock
resides (Table 1). Another interesting observation is that in the four tissues containing
peripheral clocks, the sets of genes showing a significant DE are not the same. For
instance, in duodenum and muscle, there are four and six genes displaying DE between T0
and T2, but only two of them (NPAS2 and SIK1) are shared by both tissues (Table 1). In
contrast, the comparison of genes displaying DE in muscle (6 genes) and liver (7 genes)
demonstrates the existence of a much higher level of overlap i.e. five genes (BHLHE40,

Papers and Studies
153
NPAS2, PER1, PER2, and SIK1) are shared by both tissues (Table 1). The Rq values
(Table 1) do not allow comparing the magnitude of the changes in gene expression across
tissues because a different calibrator sample has been used in each tissue (e.g. average of
T0 liver samples for the liver and so on). In order to facilitate the comparison across
tissues, we have made a second analysis in which the Rq of four tissues (muscle, liver,
duodenum, and dorsal fat) and two timepoints (T0 and T2) are referred to a calibrator
based on the average of T0 or T2 hypothalamus samples (Table 2). This analysis evidences
that the mRNA levels of the eight clock genes are substantially different across tissues.
Such result explains why in Figure 1 samples are clustered according to their tissue of
origin whilst the timepoint (T0/T2) would have a much lower effect on sample clustering.
About the direction (positive = increased mRNA levels in T2, or negative = decreased
mRNA levels in T2) of the change in expression before and after feeding, there are genes
that show consistent patterns across tissues whilst others do not. For instance, the NPAS2
and ARNTL genes display positive log2(Rq) values in the five tissues under analysis (Table
1), whilst CRY2, PER1 (except dorsal fat) and PER2 (except hypothalamus) generally
show negative log2(Rq) values (Table 1). In contrast, the direction of the expression
changes for the BHLHE40 and SIK1 genes is quite variable depending on the tissue under
consideration. For instance, mRNA levels of the BHLHE40 gene are decreased in liver and
muscle (log2Rq = -0.94, q-value = 0.01 and log2Rq = -1.11, q-value = 0.00, respectively;
Table 1), but they are increased in dorsal fat (log2Rq = 1.18, q-value = 0.02, Table 1). The
expression of the Sik1 gene also presents some degree of tissue specificity, decreasing its
mRNA levels in liver and muscle (log2Rq = -1.84, q-value = 0.00, and log2Rq = -2.60, q-
value = 0.00, respectively; Table 1), but increasing in duodenum (log2Rq = 1.57, q-value =
0.04; Table 1).
Discussion
Clock genes play an essential role in the regulation of metabolic genes in order to
coordinate their expression across tissues and organs (Jagannath et al, 2017; Patel et al.,
2016; Ribas-Latre & Eckel-Mahan, 2016). We have measured the mRNA expression of
eight genes that modulate circadian rhythms. The analysis of Figures 1A and 1B evidences
that tissue, rather than the nutritional status, is the main factor explaining the clustering of
samples. We observed that hypothalamus and duodenum samples clustered apart from

Papers and Studies s
154
liver, muscle, and dorsal fat samples. Such groupment did not have a clear relationship
with the embryonic origin of each tissue (hypothalamus: ectoderm, muscle and fat:
mesoderm, liver and duodenum: endoderm) despite the fact that Ferraz et al. (2008)
demonstrated, through the analysis of porcine microarray data, that tissues with similar
developmental origin tend to cluster together indicating that embryonic development
leaves an enduring footprint on the transcriptome. However, the importance of tissue origin
in determining the mRNA levels of clock genes is also evidenced by data showing large
differences in the magnitude of gene expression across tissues (Table 2).
After feeding, the expression of four (duodenum and dorsal fat) to seven (liver) clock
genes changed in tissues regulated by peripheral clocks. In strong contrast, the
hypothalamus, which contains the suprachiasmatic nucleus where the central clock resides,
did not show any significant change in the mRNA levels of the eight analysed genes (Table
1). It is well known that food is the main entraining cue (zeitgeber) of peripheral clocks.
Many studies suggest that feeding conditions can modify the phase of circadian gene
expression in peripheral tissues while leaving the phase of cyclic gene expression in the
suprachiasmatic nucleus unaffected (Damiola et al., 2000; Hirota & Fukada, 2004).
Indeed, the central clock in the suprachiasmatic nucleus is entrained by the 24 h light-
dark cycle and not by feeding. Importantly, the lack of mRNA expression changes in the
hypothalamus that we have observed when comparing T0 and T2 sows indicates that the
expression changes that we have observed in the four remaining tissues are not induced by
the central clock i.e. they are not due to variations in the amount of light between the T0
and T2 timepoints but to nutrient supply. In order to reach a definitive conclusion,
however, it would be necessary to specifically characterize the mRNA expression pattern
of the suprachiasmatic nucleus because the hypothalamus is a very complex tissue
containing different anatomical areas with specialized functions. In summary, our results
are consistent with the notion that food intake acts as a dominant “timer” to peripheral
clocks by delivering nutrients and hormonal signals, and that it does so in a
suprachiasmatic nucleus-independent manner (Hirota and Fukada, 2004).
We have observed that the effects of food intake on mRNA expression patterns show
marked differences across tissues i.e. different sets of genes display changes in their
mRNA levels, and sometimes the direction of these changes varies across tissues (Table 1).
These observations might be due to the fact that the timing of nutrient absorption varies

Papers and Studies
155
from tissue to tissue. After food ingestion, the majority of nutrients are absorbed in the
intestine and the first organ that glucose and amino acids reach, through the portal system
which drains blood from the gastrointestinal tract and other organs, is the liver (Frayn,
2010). Afterwards, glucose and amino acids reach the general circulation and they are
absorbed in the skeletal muscle and adipose tissue (Frayn, 2010). On the other hand, the
absorption and distribution of lipids are delayed, if compared with that of soluble nutrients,
because they are packaged as chylomicrons in the intestine (Frayn, 2010). Thus, the
expression of clock genes in distinct tissues may reflect to some extent the specific timing
of nutrient absorption in each organ. Paradoxically, and despite the sequence of events
outlined above, the overlap between the sets of DE genes is much higher in the liver vs
muscle comparison than in the dorsal fat vs muscle comparison. This apparent
contradiction might be explained by additional factors related to tissue function and
environmental cues operating at a tissue-specific level. For instance, one fundamental
difference between skeletal muscle and adipose depots is that the latter not only absorbs
nutrients but also releases non-esterified fatty acids that are used as a source of energy
during fasting (Frayn, 2010). The rhythmic release of free fatty acids and glycerol from
adipocytes is locally regulated by clock genes (Shostak et al , 2013; Yoshino & Klein,
2013). In the case of the intestine, an additional key regulatory factor that modulates
circadian rhythms is the microbiome. In this regard, Mukherji et al. (2013) have shown that
the absence of intestinal microbiota alters drastically circadian gene expression and the
cyclic production of corticosterone by the ileum, causing hyperglycemia,
hypertrigliceridemia and insulin resistance (Henao-Mejia et al., 2013; Mukherji et al.,
2013). Additionally, specific microbial metabolites, as short-chain fatty acids, may directly
modulate circadian clock gene promoting diet-induced obesity by modification of the
central and hepatic circadian rhythm (Leone et al., 2015). Another distinctive feature of the
gastrointestinal tract is the secretion of large amounts of extrapineal melatonin, an
hormone that can contribute to the synchronization of the peripheral clocks (Liu et al.,
1997). Finally, the timing and phasing of clock gene expression differ across tissues
because they are subject to distinct regulatory cues and, moreover, they serve distinct
metabolic roles. Such organ-specific differences were recently reported in a study
analysing the expression of clock genes in mouse liver and stomach and demonstrating that
the acrophase of several clock genes was delayed in the stomach (Mazzoccoli et al., 2012).
Storch et al. (2002) also showed that the distributions of circadian phases in the liver and

Papers and Studies s
156
heart are substantially different and that a reduced number of genes show circadian
regulation in both tissues. Importantly, Storch et al. (2002), highlighted that this specificity
of circadian regulation is not explained by the tissue-specific patterns of gene expression.
When comparing the mRNA expression patterns of T0 and T2 sows, we have observed
that the NPAS2 and ARNTL genes display positive log2(Rq) values in the five tissues under
analysis (Table 1), whilst CRY2, PER1 (except dorsal fat) and PER2 (except
hypothalamus) generally show negative log2(Rq) values (Table 1). These observations
could be explained by the existence of a negative feedback loop regulating the expression
of the NPAS2/ARNTL and CRY and PER genes. In this way, the NPAS2/ARNTL
heterodimers stimulate the transcription of PER and CRY genes. When PER and CRY
reach a certain concentration threshold in the cytosol, they translocate to the nucleus and
repress the expression of the NPAS2/ARNTL genes (Partch et al., 2014). In consequence, a
certain degree of antagonism in the expression of NPAS2/ARNTL and PER/CRY genes
could be anticipated. With regard to NR1D1 (also known as REV-ERBα), it is known that
this nuclear receptor binds ROR-specific response elements in the promoter of the ARNTL
gene, thus hindering the binding of the positive transcription regulator RORα (Mazzoccoli
et al., 2012; Nakashima et al., 2008). This inhibitory role of NR1D1 on ARNTL mRNA
expression agrees well with the fact that most of log2(Rq) values of this gene are negative
(except in the skeletal muscle).

Papers and Studies
157
Figure 1 - Principal component analysis of the ΔCT values of clock genes in five tissues (hypothalamus, liver, duodenum, muscle and dorsal fat)
and two timepoints (T0 = fasting sows, T2 = fed sows). A) comparison between time-points; B) comparison between tissues. The ΔCT values
are defined as: CT(targeted gene) – CT(reference gene).

Papers and Studies s
158
Table 1 - Differential clock gene expression at fasting (T0) and 7 h after eating (T2) in five porcine tissues1.
Dorsal Fat Duodenum Hypothalamus Liver Muscle
q-value log2(Rq) q-value log2(Rq) q-value log2(Rq) q-value log2(Rq) q-value log2(Rq)
ARNTL 0.00 2.12 0.02 1.16 0.41 0.36 0.00 1.40 0.27 0.56
BHLHE40 0.02 1.18 1.00 0.55 0.75 -0.17 0.01 -0.94 0.00 -1.11
CRY2 0.74 -0.24 1.00 -0.41 0.72 -0.19 0.17 -0.47 0.01 -1.32
NPAS2 0.02 0.68 0.02 1.05 0.12 0.71 0.00 2.07 0.00 1.02
NR1D1 0.02 -1.08 0.03 -1.48 1.00 -0.15 0.00 -1.93 1.00 0.29
PER1 1.00 0.16 1.00 -0.05 0.50 -0.48 0.01 -1.05 0.00 -1.22
PER2 1.00 -0.14 1.00 -0.48 1.00 0.10 0.03 -1.06 0.00 -1.46
SIK1 1.00 0.00 0.04 1.57 1.00 0.10 0.00 -1.84 0.00 -2.60
1 Genes showing a significant DE are indicated in bold. A positive log2(Rq) indicates up-regulation in the T2 timepoint and a negative log2(Rq)
indicates down-regulation in the T2 timepoint.

Papers and Studies
159
Table 2 - Differential clock gene expression in different tissues at fasting (T0) and 7 h after eating (T2) in comparison to hypothalamus 1.
1Differentially expressed genes are shown in bold. A positive log2(Rq) indicates up-regulation in the targeted tissue when compared with the
hypothalamus and a negative log2(Rq) indicates down-regulation in the analysed tissue in comparison to hypothalamus.
T0 timepoint
Dorsal Fat Duodenum Liver Muscle
q-value log2(Rq) q-value log2(Rq) q-value log2(Rq) q-value log2(Rq)
ARNTL 0.03 -1.02 0.00 -1.93 0.98 0.12 0.82 0.23
BHLHE40 0.00 1.51 0.08 -0.93 0.00 1.50 0.00 3.58
CRY2 0.71 0.22 0.46 0.45 0.00 -1.53 0.00 2.38
NPAS2 0.00 -2.53 0.00 -1.67 0.00 -4.88 0.00 -3.66
NR1D1 0.14 0.54 0.12 0.75 0.03 -0.92 0.56 -0.34
PER1 0.00 2.37 0.00 -2.57 0.02 1.01 0.00 1.36
PER2 0.00 1.08 0.00 -2.36 0.00 1.84 0.00 2.01
SIK1 0.00 3.18 0.01 1.21 0.00 2.35 0.00 2.27
T2 Timepoint
Dorsal Fat Duodenum Liver Muscle
q-value log2(Rq) q-value log2(Rq) q-value log2(Rq) q-value log2(Rq)
ARNTL 0.00 1.38 0.93 0.18 0.00 1.34 0.00 1.09
BHLHE40 0.00 3.50 0.36 0.51 0.00 1.32 0.00 3.27
CRY2 0.01 0.75 0.02 0.90 0.00 -1.51 0.00 1.90
NPAS2 0.00 -2.04 0.06 -0.71 0.00 -3.38 0.00 -2.81
NR1D1 0.54 0.31 0.88 -0.16 0.00 -2.56 0.10 0.89
PER1 0.00 3.64 0.00 -1.43 0.11 0.75 0.01 1.27
PER2 0.00 1.49 0.00 -2.34 0.03 0.91 0.00 1.08
SIK1 0.00 3.63 0.00 2.88 0.14 0.63 0.99 0.12

Papers and Studies s
160
The BHLHE40 gene displays positive log2(Rq) values in dorsal fat and duodenum, and
negative values in hypothalamus, liver, and muscle (Table 1). On the other hand, the SIK1
gene displays positive log2(Rq) values in duodenum and negative values in liver and
muscle (Table 1), a pattern of expression that resembles that of BHLHE40. Interestingly,
the functional analysis of the SIK1 gene has shown that it is expressed in the
suprachiasmatic nucleus and that it modulates the entrainment of the central circadian
clock by light (Jagannath et al., 2013). Our results indicate that SIK1 mRNA levels in
liver, muscle and duodenum are also influenced by nutrition, thus suggesting that SIK1
could also play a role in the fine tuning of peripheral clocks. The general picture that
emerges from our results is that the sign of the log2(Rq) values of BHLHE40 and SIK1 can
be positive or negative depending on the tissue under consideration (Table 1). Indeed,
these genes are not only involved in the maintenance of circadian rhythms but also in many
other biological processes, so their mRNA levels are determined by a multiplicity of
factors and complex interactions. For instance, BHLHE40 proteins repress the
NPAS2/ARNTL transactivation of the PER1 gene promoter by competing for E-box
binding and interacting with ARNTL (Honma et al. 2002). In addition, this transcription
factor regulates cell proliferation and differentiation (Shen et al., 1997), adipogenesis
(Ozaki et al., 2012), cytokine production by T cells (Lin et al., 2014), apoptosis (Qian et al,
2012) and cellular senescence (Yingjuan et al, 2008). Similarly, the SIK1 gene performs a
broad variety of functions related with inflammation (Lombardi et al, 2016),
steroidogenesis (Hu et al, 2015), renal function (Taub et al., 2015), vascular remodeling
(Bertorello et al., 2015) and glucose metabolism (Patel et al., 2014), to mention a few, so
its biological role goes far beyond the modulation of circadian rhythms and this is reflected
in its variable pattern of expression across porcine tissues.
In a previous work, we demonstrated, by using an RNA-Seq approach, that the
expression of clock genes in the porcine skeletal muscle changes in response to food
ingestion (Cardoso et al., 2017). Here, we have confirmed this result by using a RT-qPCR
approach and we have also provided evidence that the expression of clock genes is affected
by nutrient supply in three additional tissues regulated by peripheral clocks (duodenum,
liver, and dorsal fat), but not in the hypothalamus, which contains the central master clock
entrained by light. We also show that the pattern of expression of these clock genes differs
across tissues, suggesting a differential modulation of circadian rhythms not only in time
but also in space.

Papers and Studies
161
Conflict of Interest
The authors declare no conflict of interest
Author Contributions
MA, RQ, and JJ designed the experiment; RQ was responsible for the experimental
protocols and generation of animal material; all authors contributed to the obtaining of
biological samples; TFC and EMS performed RNA extractions; ACas designed the RT-
qPCR experiments; TFC carried out the RT-qPCR experiments; TFC and ACas analysed
the RT-qPCR data; MB contributed to the biological interpretation of the expression data;
MA and TFC wrote the paper. All authors read and approved the manuscript.
Funding
Part of the research presented in this publication was funded by grants AGL2013-
48742-C2-1-R and AGL2013-48742-C2-2-R awarded by the Spanish Ministry of
Economy and Competitivity and grant 2014 SGR 1528 from the Agency for Management
of University and Research Grants of the Generalitat de Catalunya. We also acknowledge
the support of the Spanish Ministry of Economy and Competitivity for the Center of
Excellence Severo Ochoa 2016-2019 (SEV-2015-0533) grant awarded to the Centre for
Research in Agricultural Genomics (CRAG). Tainã Figueiredo Cardoso was funded with a
fellowship from the CAPES Foundation-Coordination of Improvement of Higher
Education, Ministry of Education of the Federal Government of Brazil. Emilio Mármol-
Sánchez was funded with an FPU Ph.D. grant from the Spanish Ministry of Education
(FPU15/01733). Thanks also to the CERCA Programme of the Generalitat de Catalunya.
The funders had no role in study design, data collection, and analysis, decision to publish
or preparation of the manuscript.
Acknowledgments
The authors are indebted to Selección Batallé S.A. for providing the animal material.
We gratefully acknowledge to J. Reixach (Selecció Batallé), J. Soler (IRTA), C. Millan

Papers and Studies s
162
(IRTA), A. Quintana (IRTA), O. González (IRTA) and A. Rossell (IRTA) for their
collaboration in the experimental protocols and pig management.
References
Ballester, M., Ramayo-Caldas, Y., Revilla, M., Corominas, J., Castelló, A., Estellé, J., et
al. (2017). Integration of liver gene co-expression networks and eGWAs analyses
highlighted candidate regulators implicated in lipid metabolism in pigs. Sci Rep. 7,
46539. doi: 10.1038/srep46539
Bellet, M.M., and Sassone-Corsi, P. (2010). Mammalian circadian clock and metabolism -
the epigenetic link. J. Cell Sci. 123, 3837–48. doi: 10.1242/jcs.051649
Bertorello, A.M., Pires, N., Igreja, B., Pinho, M.J., Vorkapic, E., Wagsater, D. (2015).
Increased arterial blood pressure and vascular remodeling in mice lacking salt-inducible
kinase 1 (SIK1). Circ. Res. 116, 642–652. doi: 10.1161/CIRCRESAHA.116.304529
Bugge, A., Feng, D., Everett, L.J., Briggs, E.R., Mullican, S.E., Wang, F. (2012). Rev-erbα
and Rev-erbβ coordinately protect the circadian clock and normal metabolic function.
Genes Dev. 26, 657–67. doi: 10.1101/gad.186858.112
Cardoso, T.F., Quintanilla, R., Tibau, J., Gil, M., Mármol-Sánchez, E., González-
Rodríguez, O. (2017). Nutrient supply affects the mRNA expression profile of the
porcine skeletal muscle. BMC Genomics. 18, 603. doi: 10.1186/s12864-017-3986-x
Chomczynski, P., and Sacchi, N. (1987). Single step method of RNA isolation by acid
guanidinium thiocyanate-phenol-chloroform extraction. Anal Biochem. 162, 156-159.
doi: 10.1006/abio.1987.9999
Damiola, F., Le Minh, N., Preitner, N., Kornmann, B., Fleury-Olela, F., Schibler, U.
(2000). Restricted feeding uncouples circadian oscillators in peripheral tissues from the
central pacemaker in the suprachiasmatic nucleus. Genes Dev. 14, 2950–61. doi:
10.1101/GAD.183500
Eckel-Mahan, K., and Sassone-Corsi, P. (2013). Metabolism and the circadian clock
converge. Physiol. Rev. 93, 107–35. doi: 10.1152/physrev.00016.2012
Ferraz, A.L.J., Ojeda, A., López-Béjar, M., Fernandes, L.T., Castelló, A. (2008).
Transcriptome architecture across tissues in the pig. BMC Genomics. 9, 173. doi:
10.1186/1471-2164-9-173
Frayn, K.N. (2010). Metabolic regulation: A Human Perspective. Chichester, U.K.;
Malden, MA: Wiley-Blackwell Pub.
Gnocchi, D., Pedrelli, M., Hurt-Camejo, E., Parini, P. (2015). Lipids around the Clock:
focus on circadian rhythms and lipid metabolism. Biology. 4, 104–32. doi:
10.3390/biology4010104
Gooley, J.J., and Chua, E.C.P. (2014). Diurnal regulation of lipid metabolism and
applications of circadian lipidomics. J. Genet. Genomics. doi:
10.1016/j.jgg.2014.04.001
Hastings, M.H., Maywood, E.S., Reddy, A.B. (2008). Two decades of circadian time. J.
Neuroendocrinol. 20, 812–819. doi: 10.1111/j.1365-2826.2008.01715.x

Papers and Studies
163
Henao-Mejia, J., Strowig, T., Flavell, R.A. (2013). Microbiota keep the intestinal clock
ticking. Cell. 153, 741–743. doi: 10.1016/j.cell.2013.04.043
Hirota, T., and Fukada, . (2004). Resetting mechanism of central and peripheral circadian
clocks in mammals. Zool. Sci. 21, 359–368. doi: 10.2108/zsj.21.359
Hodge, B.A., Wen, Y., Riley, L.A., Zhang, X., England, J.H. (2015). The endogenous
molecular clock orchestrates the temporal separation of substrate metabolism in skeletal
muscle. Skelet. Muscle 5, 17. doi: 10.1186/s13395-015-0039-5
Honma, S., Kawamoto, T., Takagi, Y., Fujimoto, K., Sato, F., Noshiro, M. (2002). Dec1
and Dec2 are regulators of the mammalian molecular clock. Nature. 419, 841–844. doi:
10.1038/nature01123
Hu, Z., Hu, J., Shen, W.J., Kraemer, F.B., Azhar, S. (2015). A novel role of salt-inducible
kinase 1 (SIK1) in the post-translational regulation of scavenger receptor class b type 1
activity. Biochem. 54, 6917–6930. doi: 10.1021/acs.biochem.5b00147
Jagannath, A., Butler, R., Godinho, S.I.H., Couch, Y., Brown, L.A., Vasudevan, S.R.
(2013). The CRTC1-SIK1 pathway regulates entrainment of the circadian clock. Cell.
154, 1100–1111. doi: 10.1016/j.cell.2013.08.004
Jagannath, A., Taylor, L., Wakaf, Z., Vasudevan, S.R., Foster, R.G. (2017). The genetics
of circadian rhythms, sleep and health. Hum. Mol. Genet. 26, R128–R138. doi:
0.1093/hmg/ddx240
Leone, V., Gibbons, S.M., Martinez, K., Hutchison, A.L., Huang, E.Y., Cham, C.M.
(2015). Effects of diurnal variation of gut microbes and high-fat feeding on host
circadian clock function and metabolism. Cell Host Microbe. 17, 681–689. doi:
10.1016/J.CHOM.2015.03.006
Lin, C.C., Bradstreet, T.R., Schwarzkopf, E.A., Sim, J., Carrero, J.A., Chou, C. (2014).
Bhlhe40 controls cytokine production by T cells and is essential for pathogenicity in
autoimmune neuroinflammation. Nat. Commun. 5, 3551. doi: 10.1038/ncomms4551
Liu, C., Weaver, D.R., Jin, X., Shearman, L.P., Pieschl, R.L., Gribkoff, V.K., Reppert,
S.M. (1997). Molecular dissection of two distinct actions of melatonin on the
suprachiasmatic circadian clock. Neuron 19, 91–102. doi: 10.1016/S0896-
6273(00)80350-5
Livak, K.J., and Schmittgen, T.D. (2001). Analysis of relative gene expression data using
Real-Time Quantitative PCR and the 2−ΔΔCT
Method. Methods. 25, 402–408. doi:
10.1006/meth.2001.1262
Lombardi, M.S., Gilliéron, C., Dietrich, D., Gabay, C. (2016). SIK inhibition in human
myeloid cells modulates TLR and IL-1R signaling and induces an anti-inflammatory
phenotype. J. Leukoc. Biol. 99, 711–721. doi: 10.1189/jlb.2A0715-307R
Mazzoccoli, G., Francavilla, M., Pazienza, V., Benegiamo, G., Piepoli, A., Vinciguerra, M.
(2012). Differential patterns in the periodicity and dynamics of clock gene expression in
mouse liver and stomach. Chronobiol. Int. 29, 1300–1311. doi:
10.3109/07420528.2012.728662
Menet, J.S., Pescatore, S., Rosbash, M. (2014). CLOCK:BMAL1 is a pioneer-like
transcription factor. Genes Dev. 28, 8–13. doi: 10.1101/gad.228536.113

Papers and Studies s
164
Mukherji, A., Kobiita, A., Ye, T., Chambon, P. (2013). Homeostasis in intestinal
epithelium is orchestrated by the circadian clock and microbiota cues transduced by
TLRs. Cell. 153, 812–827. doi: 10.1016/j.cell.2013.04.020
Nakashima, A., Kawamoto, T., Honda, K.K., Ueshima, T., Noshiro, M., Iwata, T. (2008).
DEC1 modulates the circadian phase of clock gene expression. Mol. Cell. Biol. 28,
4080–4092. doi: 10.1128/MCB.02168-07
Oike, H., Oishi, K., Kobori, M. (2014). Nutrients, clock genes, and chrononutrition. Curr.
Nutr. Rep. 3, 204–212. doi: 10.1007/s13668-014-0082-6
Ozaki, N., Noshiro, M., Kawamoto, T., Nakashima, A., Honda, K., Fukuzaki-Dohi, U.
(2012). Regulation of basic helix-loop-helix transcription factors Dec1 and Dec2 by
RORα and their roles in adipogenesis. Genes Cells 17, 109–121. doi: 10.1111/j.1365-
2443.2011.01574.x
Partch, C.L., Green, C.B., Takahashi, J.S. (2014). Molecular architecture of the
mammalian circadian clock. Trends Cell. Biol. 24, 90–99. doi:
10.1016/j.tcb.2013.07.002
Patel, K., Foretz, M., Marion, A., Campbell, D.G., Gourlay, R., Boudaba, N. (2014). The
LKB1-salt-inducible kinase pathway functions as a key gluconeogenic suppressor in the
liver. Nat. Commun. 5, 4535. doi: 10.1038/ncomms5535
Patel, S.A., Velingkaar, N., Makwana, K., Chaudhari, A., Kondratov, R. (2016). Calorie
restriction regulates circadian clock gene expression through BMAL1 dependent and
independent mechanisms. Sci. Rep. 6, 25970. doi: 10.1038/srep25970
Peek, C.B., Ramsey, K.M., Marcheva, B., Bass, J. (2012). Nutrient sensing and the
circadian clock. Trends Endocrinol. Metab. 23, 312–8. doi: 10.1016/j.tem.2012.02.003
Qian, Y., Jung, Y.-S., Chen, X. (2012). Differentiated embryo-chondrocyte expressed gene
1 regulates p53-dependent cell survival versus cell death through macrophage inhibitory
cytokine-1. Proc. Natl. Acad. Sci. U.S.A. 109, 11300–11305. doi:
10.1073/pnas.1203185109
Qian, Y., Zhang, J., Yan, B., Chen, X. (2008). DEC1, a basic helix-loop-helix transcription
factor and a novel target gene of the p53 family, mediates p53-dependent premature
senescence. J. Biol. Chem. 283, 2896–2905. doi.org/10.1074/jbc.M708624200
Ribas-Latre, A., and Eckel-Mahan, K. (2016). Interdependence of nutrient metabolism and
the circadian clock system: Importance for metabolic health. Mol. Metab. 5, 133–152.
doi: 10.1016/j.molmet.2015.12.006
Richards, J., and Gumz, M.L. (2012). Advances in understanding the peripheral circadian
clocks. FASEB J. 26, 3602–13. doi: 10.1096/fj.12-203554
Shen, M., Kawamoto, T., Yan, W., Nakamasu, K., Tamagami, M., Koyano, Y. (1997).
Molecular characterization of the novel basic helix–loop–helix protein DEC1 expressed
in differentiated human embryo chondrocytes. Biochem. Biophys. Res. Commun. 236,
294–298. doi: 10.1006/BBRC.1997.6960
Shostak, A., Meyer-Kovac, J., Oster, H. (2013). Circadian regulation of lipid mobilization
in white adipose tissues. Diabetes. 62, 2195–2203. doi: 10.2337/db12-1449
Storch, K.-F., Lipan, O., Leykin, I., Viswanathan, N., Davis, F.C., Wong, W.H. (2002).
Extensive and divergent circadian gene expression in liver and heart. Nature. 417, 78–
83. doi: 10.1038/nature744

Papers and Studies
165
Tahara, Y., and Shibata, S. (2013). Chronobiology and nutrition. Neuroscience. 253, 78–
88. doi: 10.1016/J.NEUROSCIENCE.2013.08.049
Takahashi, J.S. (2017). Transcriptional architecture of the mammalian circadian clock. Nat.
Rev. Genet. 18, 164–179. doi: 10.1038/nrg.2016.150
Taub, M., Garimella, S., Kim, D., Rajkhowa, T., Cutuli, F. (2015). Renal proximal tubule
Na,K-ATPase is controlled by CREB-regulated transcriptional coactivators as well as
salt-inducible kinase 1. Cell. Signal. 27, 2568–2578. doi: 10.1016/j.cellsig.2015.09.015
Untergasser, A., Cutcutache, I., Koressaar, T., Ye, J., Faircloth, B.C., Remm, M. (2012).
Primer3-- new capabilities and interfaces. Nucleic Acids Res. 40, e115. doi:
10.1093/nar/gks596
Yoshino, J., and Klein, S. (2013). A novel link between circadian clocks and adipose tissue
energy metabolism. Diabetes. 62, 2175–2177. doi: 10.2337/db13-0457
Zhou, X., Wan, D., Zhang, Y., Zhang, Y., Long, C., Chen, S. (2017). Diurnal variations in
polyunsaturated fatty acid contents and expression of genes involved in their de novo
synthesis in pigs. Biochem. Biophys. Res. Commun. 483, 430–434. doi:
10.1016/J.BBRC.2016.12.126

Papers and Studies s
166

Papers and Studies
167
The red and blond pigmentation of Mangalitza pigs is strongly
associated with the variability of the Solute Carrier Family 45 Member 2
(Slc45a2) gene
Valentin A. Balteanu1*, Tainã F. Cardoso
2,3*, Marcel Amills
2,4,a, István Egerszegi
5,
István Anton6, Albano Beja-Pereira
7, Attila Zsolnai
6,a
1Institute of Life Sciences, Faculty of Animal Science and Biotechnologies, University
of Agricultural Sciences and Veterinary Medicine, Cluj-Napoca, Romania. 2Department of
Animal Genetics, Centre for Research in Agricultural Genomics (CSIC-IRTA-UAB-UB),
Campus de la Universitat Autònoma de Barcelona, Bellaterra, Spain. 3CAPES Foundation,
Ministry of Education of Brazil, Brasilia D. F., Brazil. 4Departament de Ciència Animal i
dels Aliments, Universitat Autònoma de Barcelona, Bellaterra, Spain. 5
Szent István
University, Gödöllő, Hungary 6NAIK-Research Institute for Animal Breeding, Nutrition
and Food Science, Herceghalom, Hungary. 7
Centro de Investigacao em Biodiversidade e
Recursos Geneticos, Universidade do Porto (CIBIO-UP), Vairao, Portugal
*V. A. Balteanu and T. F. Cardoso share the first authorship
aCorresponding authors: A. Zsolnai and M. Amills
Manuscript in preparation

Papers and Studies s
168

Papers and Studies
169
Abstract
The Mangalitza pig breed has suffered strong demographic reductions due to
competition with more productive cosmopolitan breeds. Four main varieties were created
one century ago by artificial selection and admixture i.e. Red Mangalitza, Black
Mangalitza (extinct), Blond Mangalitza and Swallow Belly Mangalitza, which has a black
coat combined with yellow blond throat and underbelly. In the current work, we aimed to
test two hypotheses: (1) that population recession has resulted in the contraction of the
genetic diversity of Mangalitza pigs, and (2) that the red and blond colorations of
Mangalitza pigs are genetically determined by one or a few loci. The analysis of BeadChip
SNP60 genotypes of 45 Red (N = 20 from Hungary and N = 25 from Romania) and 37
Blond Mangalitza pigs and 191 pigs from the Hampshire, Duroc, Landrace, Large White,
Piétrain breeds plus 46 wild boars from Romania and Hungary revealed that Hungarian
and Romanian Red Mangalitza pigs and Romanian wild boars display an increased
frequency of very long ROH (> 30 Mb), evidencing the occurrence of a recent and strong
inbreeding. We also observed that Blond Mangalitza, Red Mangalitza from Hungary, wild
boar from Hungary and Romania and Hampshire pigs display lower levels of
heterozygosity than cosmopolitan breeds such as Landrace, Large White and Piétrain.
Performance of a selection scan with hapFLK and of a GWAS for coat color in Red and
Blond Mangalitza pigs highlighted the existence of one region on SSC16 (20 Mb) with
potential effects on pigmentation. The analysis of the gene content of this region allowed
us to detect the solute carrier family 45 member 2 (SLC45A2) gene, whose polymorphism
has been associated with reduced levels or absence of melanin in many mammalian species.
The genotyping of three missense polymorphisms in the porcine SLC45A2 gene evidenced
that c.806G>A (p.Gly269Glu) and c.956G>A (p.Arg319His) SNPs are strongly but not
fully associated with the red and blond coat colors of Mangalitza pigs. Alternative
genotypes were nearly fixed in Red and Mangalitza pigs illustrating the consequences of
divergent directional selection for coat color in a domestic species.
Keywords: SNPs, Mangalitza, color coat, population

Papers and Studies s
170
Introduction
Many European local pig breeds have experienced a sustained demographic recession
due to indiscriminate crossbreeding, competition with more productive breeds, decline of
traditional production systems, progressive abandonment of rural activities and loss of
grazing land (FAO, 2015). In Europe and the Caucasus, at least 90 breeds have
disappeared and many others are endangered or face extinction (FAO, 2015). One
appropriate model to investigate the genetic consequences of such strong demographic
contractions is the Mangalitza breed, which is distributed in Hungary and, with a much
lower population census, in Romania, Germany, Austria and Switzerland (Egerszegi,
Rátky, Solti, & Brüssow, 2003). In 1927-1930, there were 1,000-1,920 Mangalitza pigs in
Hungary, and this number peaked to 17,691 individuals in 1955. However, this breed
experienced a very serious demographic decline during the two subsequent decades,
mainly due to competition with more productive breeds. Noteworthy, only 34 breeding
sows were registered in the herd-book in 1975 (Egerszegi et al., 2003). Fortunately, the
establishment of conservation genetic plans allowed the demographic recovery of this
breed (Egerszegi et al., 2003). In Romania, the Mangalitza breed accounted for 500
individuals in 1983, but only 34 pigs remained in 1996 and nowadays this population faces
extinction (Egerszegi et al., 2003) and it has a low diversity (Manunza et al., 2016). In
principle, this sustained demographic decline is expected to reduce genetic variation and to
increase the levels of inbreeding of Mangalitza pigs, two features that might threaten the
genetic conservation of this ancient traditional breed.
The Mangalitza breed also constitutes an appropriate genetic model for investigating
the inheritance of color in European pigs because several varieties with distinct
pigmentation patterns have been created through artificial selection (Egerszegi et al.,
2003). The Blond variety was probably obtained in the 19th
century by crossing small
ancient Alföldi pigs with Serbian Sumadia swine, and one of its main features is a dense
and curly hair with a coloration that might go from grey-yellow to ruddy (Egerszegi et al.,
2003). The Black variety, which became extinct in the 20th
century, was crossed with the
Blond one to yield Swallow Belly Mangalitza. These pigs have a black coat combined with
yellow blond throat and underbelly (Egerszegi et al., 2003). Finally, the Red variety is the
result of crossing Blond Mangalitza with Szalontai pigs and arose during the second half of
the 19th
century (Egerszegi et al., 2003). The hypothesis that we wanted to test in the
current work were: (1) that the strong population reduction that the Mangalitza breed has

Papers and Studies
171
experienced during the second half of the 20th
century has severely constrained the genetic
diversity of this breed, and (2) that the blond vs red pigmentation patterns that were
established in the Mangalitza breed by artificial selection one century ago are genetically
determined by one or few loci.
Materials and Methods
Sample collection, DNA extraction and genotyping
Blood from Blond Mangalitza (N = 37) and Red Mangalitza from Hungary (N = 20)
and Red Mangalitza from Romania (N = 25) was collected in EDTA coated vacutainer
tubes. For comparative purposes, several reference populations were included in this study:
Blond Mangalitza x Duroc crossed pigs (N = 48), Bazna (N = 5), Duroc (N = 56),
Hampshire (N = 11), Landrace (N = 29), Large White (N = 27), Piétrain (N = 20) and wild
boar from Hungary (N = 28) and Romania (N = 25). DNA was isolated from the samples
using a simple protocol (Zsolnai et al., 2003). In case of samples genotyped with the
Illumina Infinium HD Porcine SNP60 BeadChip (Illumina, San Diego, CA) or GGP
50K Porcine SNP chip (Neogen, Scotland, UK), the service provider performed the DNA
preparation from blood. A series of quality control procedures were conducted on the raw
data using SVS SNP & Variation Suite 8.8.1. software (Golden Helix, Bozeman, MT,
USA). Linkage disequilibrium (LD; r2 > 0.5) pruning was applied to the whole dataset.
Linkage disequilibrium between adjacent SNPs was calculated with the genotype
correlation coefficient (r2). In addition, monomorphic markers and unmapped SNPs, as
well as those with a call rate < 95%, were eliminated from the dataset. In addition, we
removed SNPs with a minor allele frequency (MAF) lower than 0.05. Duplicated samples
(IBD > 0.95) and individuals with a genotype call rate < 95% were removed. After filtering
steps, the final dataset included 324 animals and 30,121 SNPs (Table 1).
Population genetics analyses
The proportion of mixed ancestry and population structure were evaluated with the
ADMIXTURE software v.1.3 (Alexander et al., 2009) by using default parameters.
ADMIXTURE calculates maximum likelihood estimates of individual ancestries based on
data provided by multiple loci. We evaluated different numbers of clusters (K-value, from

Papers and Studies s
172
2 to 12) by considering the mixed ancestry model. The optimal K-value was determined by
taking into account the estimates of the cross-validation errors (Alexander & Lange, 2011).
PLINK software v1.7 (Purcell et al., 2007) was used to calculate observed (Ho) and
expected (He) heterozygosities. This software was also used to build a multidimensional
scaling (MDS) plot by using a genome-wide identity-by-state pairwise distances matrix (--
mds-plot 2 and --cluster options). The analysis of runs of homozygosity (ROH) was also
carried out with PLINK v1.7 (Purcell et al., 2007). We defined ROH as homozygous
genomic stretches with a length of at least 1 Mb containing a minimum number of 15 SNP
markers with adjusted parameters (--homozyg-density 1000, --homozyg-window-threshold
0.001, --homozyg-window-missing 5 and --homozyg-window-het 1). The inbreeding
coefficient derived from ROHs (FROH) was calculated by dividing total ROH length per
individual by total genome length across all 18 autosomes (2,502 Mb).
Selection scan and genome-wide association analysis
In order to investigate the genetic basis of red vs blond pigmentation in Mangalitza
pigs, we carried out a selection scan and a genome-wide association analysis (GWAS).
Selection signatures were detected with the hapFLK statistic (Fariello et al., 2013). In the
hapFLK analysis, the number of haplotype clusters was set to 20 and the hapFLK statistic
was calculated as the average of 30 expectation maximization iterations. Multiple testing
correction was done by using a false discovery rate approach (Storey & Tibshirani, 2003).
The GWAS was performed by employing a multivariate likelihood ratio test
implemented in the GEMMA software (Zhou & Stephens, 2014). Briefly, a single-SNP
association analysis was performed under an additive genetic model that included the
genomic kinship matrix to account for relatedness. We used the following statistical model
to analyze coat color traits:
y = Wα + xβ + u + ε,
where y is the vector of phenotypes (red or blond in this case) for all individuals; W is a
matrix of covariates, i.e. country of origin (Hungary or Romania); α is a vector of the
corresponding coefficients including the intercept; x is a vector of genotypes of a marker; β

Papers and Studies
173
is the effect size of the marker; u is a vector of random individual effects with an n-
dimensional multivariate normal distribution MVNn (0, λ τ−1
K), where τ−1
is the variance
of the residual errors, λ is the ratio between the two variance components and K is a known
relatedness matrix derived from SNPs; Z is an n × m loading matrix and ε is a vector of
errors with an n-dimensional multivariate normal distribution MVNn (0, τ−1
In), where In
is an n × n identity matrix. Correction for multiple testing was implemented with a false
discovery rate approach (Benjamini & Hochberg, 1995), and SNPs with a q-value < 0.05
were considered as significantly associated with pigmentation.
Genotyping of the SLC45A2 gene.
The selection of SLC45A2 polymorphisms to be typed in our animal material was based
on a set of whole-genome sequences (SRA access: SRP039012) from Mangalitza Blond
and Red pigs reported by Molnár et al. (2014). Variant discovery procedures followed the
GATK Best Practices workflow for SNP calling on DNA-seq data
(https://gatkforums.broadinstitute.org /gatk/discussion/3238/best-practices-for-variant-
discovery-in-dnaseq). Briefly, sequence reads were mapped to the porcine reference
genome (Sscrofa 10.2, https://www.ensembl.org/) and duplicate reads were removed.
Variant calling was carried out by running the HaplotypeCaller for the BAM files
corresponding to each sample. The potential effects and impact of SNPs were predicted
with the SnpEff software v4.3s (Cingolani et al., 2012). We used SIFT (Sorting Intolerant
from Tolerant; Kumar et al., 2009) and PANTHER (Protein ANalysis THrough
Evolutionary Relationships; Thomas et al., 2003) as in silico tools to identify the functional
impact of missense mutations. SIFT prediction is based on the sequence homology and the
physico-chemical properties of amino acids which are dictated by the substituted amino
acid (Kumar et al., 2009). PANTHER program is a protein family and subfamily database
which predicts the frequency of the occurrence of certain amino acid at a particular
position in evolutionarily related protein sequences (Thomas et al., 2003). On the basis of
such analyses, we selected three missense SNPs that had a differential distribution in Red
and Blond Mangalitza pigs i.e. rs341599992 (c.806G>A, p.Gly269Glu), rs327001340
(c.829A>G, p.Ser277Gly) and rs693695020 (c.956G>A, p.Arg319His). These SNPs were
typed in an independent sample of 209 pigs from the Blond Mangalitza (N = 55), Red
Mangalitza (N = 65), Swallow Belly Mangalitza (N = 30), Piétrain (N = 15), Large white

Papers and Studies s
174
(N = 15), Landrace (N = 15) and Duroc (N = 14) breeds. Genotyping tasks were carried out
by the Molecular Genetics Veterinary Service from the Universitat Autonoma de
Barcelona (http://sct.uab.cat/svgm/en) by using a QuantStudio 12K Flex Real-Time PCR
System (ThermoFisher Scientific, Waltham, Massachusetts, USA). The association
analysis between SLC45A2 SNPs and coat color in Red and Blond Mangalitza pigs was
based on a chi-square test, and the effect of SLC45A2 gene variants was calculated as odds
ratios by using the R software (https://www.r-project.org/).
Results
Autosomal diversity and population structure
To investigate the genetic relationships between Red and Blond Mangalitza and other
pig and wild boar populations, we built an MDS plot based on genome-wide identity-by-
state pairwise distances calculated with PLINK (Figure 1). The first principal component
separated Duroc pigs from the remaining breeds (Figure 1). As expected, Blonde
Mangalitza x Duroc crossed pigs occupied an intermediate position between both parental
populations. In the second component, the cosmopolitan breeds Landrace, Large White and
Piétrain clustered independently from Mangalitza pigs and Romanian and Hungarian wild
boars. The Hampshire and Bazna pigs occupied an intermediate position between these
two clusters. We also observed that Blond, Hungarian Red, and Romanian Red Mangalitza
formed three different subclusters, highlighting that these populations are genetically
differentiated. Moreover, we detected a close relationship between Mangalitza pigs and
Romanian and Hungarian wild boars. Descriptive statistics of genetic diversity are shown
in Table 1. Expected and observed heterozygosities were higher in Landrace, Large White
and Piétrain pigs (Ho = 0.35-0.36, He = 0.35) than in Blond Mangalitza, Red Mangalitza
from Hungary, wild boar from Hungary and Romania and Hampshire pigs (Ho = 0.27-0.29,
He = 0.24-0.31). Surprisingly, the diversity of Red Mangalitza pigs from Romania (Ho = He
= 0.35) was more similar to that of cosmopolitan breeds than to the Romanian and
Hungarian domestic and wild pig populations. Finally, Blond Mangalitza x Duroc swine
showed high levels of heterozygosity because of their hybrid origin (Ho = 0.40, He = 0.32)
The results of the Admixture analysis at K = 12 (Figure 2), the K-value with the lowest
cross-validation error, provided evidence of genetic admixture for Blond Mangalitza x
Duroc crossbreds, a result that was clearly expectable due to their hybrid origin, and also

Papers and Studies
175
for Bazna pigs. We observed that Romanian Red, Hungarian Red, and Blond Mangalitza
pigs have distinct genetic backgrounds and that Hungarian wild boars share part of their
genetic background with Red Mangalitza from Hungary and Blond Mangalitza (also from
Hungary), but not with the four cosmopolitan breeds (Duroc, Large White, Landrace, and
Piétrain). In contrast, and as previously published by Manunza et al. (2016), two Romanian
wild boars had been clearly introgressed with cosmopolitan breeds (probably Large
White). At K = 3, Duroc, the three remaining cosmopolitan breeds (Large White,
Landrace, Piétrain) and Romanian and Hungarian populations formed three distinct groups
(Additional file 1), and at K >= 4 we observed that Red Mangalitza from Hungary and
Romania shared the same background which was different from the one displayed by
Blond Mangalitza pigs (Additional file 1). From K=8 the common background of Reds of
Hungary and Romania splits. Giving hints for looking at descendants of Romanian Red
Mangalitza line(s) which are not present today in Hungary.
Figure 1 - Multidimensional scaling plot (MDS) depicting the relationships between
Mangalitza pigs and other wild boar and pig populations. Abbreviations are defined in Table 1.

Papers and Studies s
176
Table 1 - Summary statistics calculated over the whole set of pig populations.
Code Breed (place of collection) Number of
animals FROH
Observed (Ho)
heterozygosities
Expected (He)
heterozygosities
BAZNA Bazna (Hungary) 5 - - -
BLODU Blond Mangalitza x Duroc
(Hungary) 48 0.01 0.40 0.32
BLOMA Blond Mangalitza (Hungary) 37 0.13 0.28 0.28
DUROC Duroc (Hungary) 56 0.20 0.30 0.30
HAMPS Hampshire (Hungary) 11 0.18 0.28 0.24
HUNWB Wild boar (Hungary) 28 0.15 0.27 0.29
LANDR Landrace (Hungary) 29 0.11 0.35 0.35
LWHITE Large White (Hungary) 27 0.10 0.36 0.35
PIÉTRAIN Piétrain (Hungary) 20 0.13 0.36 0.35
REDMAH Red Mangalitza (Hungary) 20 0.18 0.29 0.28
REDMAR Red Mangalitza (Romania) 25 0.11 0.35 0.35
ROMWB Wild boar (Romania) 18 0.12 0.27 0.31

Papers and Studies
177
Figure 2- Admixture analysis of Mangalitza pigs and additional wild boar and pig
populations for the K-value with the lowest cross-validation error (K = 12). Each individual is
represented by a single column divided into K colored segments, where K is the number of
assumed clusters. Populations are separated by black lines. Abbreviations are defined in Table 1.
Analysis of runs of homozygosity
We have characterized the length, distribution, and frequency of ROH in the 12
populations under analysis. In general, short and medium ROH (5-15 Mb) were much
more frequent than long (15-30 Mb) or very long (> 30 Mb) ROH (Figure 3). The
relatively low frequency of very short ROH (1-5 Mb) might have technical reasons i.e.
with low-resolution SNP chips short ROH are more difficult to detect than the long ones. A
comparative analysis of ROH classes revealed that Bazna, Red Mangalitza from Romania
and Hungary and Romanian wild boars had the highest frequencies of very long ROH (>
30 Mb), while the levels of homozygosity in Blond Mangalitza x Duroc crossbred pigs
were negligible. The number of ROH (but not the ROH coverage) was particularly high in
Duroc pigs (Figure 4), while the individuals displaying the highest total ROH length (>
600 Mb) belonged to the Hungarian and Romanian wild boar, Duroc and Red Mangalitza
populations (Figure 4). The FROH coefficients (Table 1) were higher in Blond Mangalitza,
Red Mangalitza from Hungary, wild boar from Hungary and Romania and Hampshire pigs
(FROH = 0.12-0.18) than in the Landrace, Large White and Piétrain breeds (FROH = 0.11-
0.13).

Papers and Studies s
178
Figure 3 - Classification of the runs of homozygosity identified in Mangalitza pigs and
additional wild boar and pig populations based on their size. Abbreviations are defined in Table
1.
Figure 4 - Number and total length of runs of homozygosity (ROH) in Mangalitza pigs
and additional wild boar and pig populations. The number of ROH estimated in each individual
genome (y-axis) is plotted against total ROH total size (i.e. the number of Mb covered by ROH in
each genome, x-axis). Abbreviations are defined in Table 1.

Papers and Studies
179
Selection scan and genome-wide association study for coat coloration in
Mangalitza pigs
To identify the genes responsible for the coat coloration in Mangalitza pigs, we
performed a selection scan by using the hapFLK software (Fariello et al., 2013). We only
detected three putative selective sweeps on SSC7 (65.9-65.9 and 68.0-68.4 Mb), SSC13
(24.5-67.0 Mb) and SSC15 (129.5-133.9 Mb) that remained significant after correction for
multiple testing (Figure 5 and Table 2). At the nominal level of significance (Table 2),
twelve additional putative selective sweeps were detected on SSC2 (152.1-152.2 Mb),
SSC3 (4.9-5.4 Mb), SSC6 (27.9-28.1 Mb), SSC7 (50.9-51.7 Mb), SSC11 (22.3-25.6 Mb),
SSC12 (2.4-8.6 Mb), SSC15 (35.7-53.1 Mb), SSC16 (19.3-28.4, 35.0-52.4, 60.5-60.7 and
70.6-71.7 Mb) and SSC17 (60.5-65.8 Mb). As a complementary approach, we carried out a
GWAS for red vs blond coloration by using the GEMMA (Xiang Zhou & Stephens, 2014)
software (Additional file 2 and Table 3). This analysis indicated that the SSC16 (20 Mb)
region is the one displaying the most significant associations with coat color. In addition,
we found five regions on SSC11, SSC13, SSC15, and SSC16 that were associated with
coat color in the GEMMA analysis and that showed evidence of containing selective
sweeps in the hapFLK study (Tables 2 and 3). A detailed analysis of the gene content of
regions identified by both the GWAS and the hapFLK analysis made possible to identify
the SLC45A2 gene as potential candidate locus for pigmentation. Importantly, this gene
maps to the region identified in the GWAS as showing the strongest evidence of being
involved in the coloration of Mangalitza pigs.
Figure 5 - Genome scan for selection in Red and Blond Mangalitza pigs using the hapFLK
test. Genomic coordinates and statistical significance (−log10 P-values) are plotted in the x- and y-
axis, respectively. Blue and red lines indicate the thresholds of significance set at 0.05 before
(nominal P-value) and after (q-value) correction for multiple testing, respectively.

Papers and Studies s
180
Table 2 - Putative selective sweeps identified in the hapFLK-based analysis.
CHR Regions (Mb) Flanking SNPs Number of SNPs Raw P-value q-value
2 152.1-152.2 ASGA0012708 - ASGA0103431 2 0.041 0.285
3 4.9-5.4 ALGA0107454 - M1GA0003719 15 0.041 0.284
6 27.9-28.1 ASGA0082257 - ASGA0085552 4 0.047 0.324
7
50.9-51.7 ASGA0033485 - H3GA0021430 13 0.041 0.284
65.9-65.9 H3GA0021970 - ALGA0042379 2 0.005 0.049
68.0 - 68.4 INRA0026293 - ALGA0042379 1 0.005 0.048
11 22.3-25.6 ALGA0116830 - ALGA0061566 69 0.023 0.172
12 2.4-8.6 MARC0063986 - ALGA0064723 138 0.013 0.112
13 24.5-67.7 MARC0001222 -ALGA0070577 475 0.000 0.001
15 35.7-53.1 ALGA0112215 - ALGA0085228 192 0.006 0.052
129.5-133.9 ALGA0112215 - ALGA0085228 68 0.002 0.013
16
19.3-28.4 H3GA0053033 - ASGA0096846 141 0.008 0.069
35.0-52.4 ASGA0099845 - ASGA0073361 180 0.009 0.080
60.5-60.7 ASGA0073624 - ASGA0073630 4 0.046 0.313
70.6-71.7 ALGA0091290 - ALGA0091354 17 0.041 0.284
17 60.5 - 65.8 ALGA0095912 - INRA0054882 97 0.006 0.051
Those sweeps consistently found with GWAS analysis are shown in bold. CHR = chromosome, Mb = Megabase.

Papers and Studies
181
Table 3 - Markers associated with the coat pigmentation of Red vs Blond Mangalitza pigs.
Chr SNP Region (Mb) A1 MAF δ ± SE P-value q-value
1 H3GA0004085 268.57 T 0.201 1.59E-01 ± 3.81E-02 5.51E-05 4.95E-02
3 MARC0076501 13.16 T 0.463 -1.87E-01 ± 4.16E-02 1.58E-05 2.20E-02
4 ALGA0023180 11.95 C 0.305 1.77E-01 ± 3.66E-02 4.07E-06 8.10E-03
6 ALGA0104612 10.07 C 0.287 1.65E-01 ± 3.90E-02 4.18E-05 4.02E-02
ASGA0084188 84.01 G 0.012 4.81E-01 ± 1.09E-01 2.09E-05 2.49E-02
8 ALGA0049975 141.98 A 0.378 -1.42E-01 ± 3.11E-02 1.19E-05 1.84E-02
9 ALGA0106913 152.71 C 0.259 2.04E-01 ± 4.63E-02 2.14E-05 2.49E-02
11 ALGA0061440 24.06 T 0.195 2.28E-01 ± 4.50E-02 1.52E-06 4.06E-03
12
ASGA0100764 13.47 A 0.36 -1.57E-01 ± 3.35E-02 7.73E-06 1.33E-02
ALGA0065183 14.21 T 0.329 1.93E-01 ± 3.82E-02 1.60E-06 4.06E-03
ASGA0083985 15.00 A 0.396 1.36E-01 ± 3.18E-02 3.70E-05 3.68E-02
MARC0040976 15.89 G 0.037 3.58E-01 ± 7.26E-02 2.67E-06 6.21E-03
H3GA0053469 46.59 G 0.238 2.51E-01 ± 4.86E-02 1.08E-06 4.06E-03
13
ALGA0123031 25.91 T 0.439 -1.52E-01 ± 3.51E-02 3.02E-05 3.23E-02
ALGA0069677 40.63 G 0.061 2.23E-01 ± 5.28E-02 4.33E-05 4.02E-02
ALGA0073466 199.92 T 0.47 -1.78E-01 ± 3.47E-02 1.27E-06 4.06E-03
14 ALGA0081626 133.51 T 0.396 -1.92E-01 ± 3.38E-02 1.17E-07 1.09E-03
15
MARC0003646 38.89 C 0.329 1.51E-01 ± 3.41E-02 1.88E-05 2.49E-02
MARC0084849 52.27 T 0.25 1.68E-01 ± 3.28E-02 1.24E-06 4.06E-03
ASGA0070586 133.16 T 0.366 1.35E-01 ± 3.06E-02 2.14E-05 2.49E-02
16
H3GA0053033 19.38 A 0.488 1.81E-01 ± 3.56E-02 1.44E-06 4.06E-03
ASGA0097489 19.77 A 0.494 1.96E-01 ± 3.37E-02 6.44E-08 8.97E-04
MARC0032767 20.30 G 0.427 -2.42E-01 ± 3.67E-02 2.00E-09 5.58E-05
MARC0010290 20.67 A 0.494 -1.64E-01 ± 3.53E-02 8.12E-06 1.33E-02
H3GA0046337 26.74 C 0.39 1.46E-01 ± 3.21E-02 1.33E-05 1.95E-02
ALGA0090377 39.05 A 0.482 -1.34E-01 ± 3.09E-02 2.94E-05 3.23E-02
ALGA0090577 48.09 T 0.439 1.65E-01 ± 3.51E-02 7.27E-06 1.33E-02
ASGA0073624 60.52 G 0.378 1.71E-01 ± 3.53E-02 3.76E-06 8.06E-03
17 ALGA0093727 24.01 G 0.494 1.42E-01 ± 3.31E-02 3.30E-05 3.41E-02
18 ALGA0118541 0.12 G 0.262 2.62E-01 ± 5.01E-02 8.09E-07 4.06E-03
SSC: porcine chromosome, SNP: SNP displaying the significant association with the trait under study, Region (Mb): region containing SNPs significantly associated
with the trait under study in megabase, A1: minority allele, MAF: frequency of the minority allele, δ: allelic effect and its standard error (SE), P-value: nominal P-value,
q-value: q-value calculated with a false discovery rate approach.

Papers and Studies s
s
182
Analysis of the segregation of three SLC45A2 missense polymorphisms in
Mangalitza pigs with distinct coat coloration.
The analysis of the gene content of the SSC16 (20 Mb) region, which was based on the
annotation of the Ensembl database (https://www.ensembl.org), highlighted the solute
carrier family 45 member 2 (SLC45A2) locus as a potential candidate gene to explain the
segregation of coat color. The comparison of whole-genome sequences from one Red, one
Swallow Belly and two Blond Mangalitza pigs (SRA access: SRP039012) reported by
Molnar et al. (2014) made possible to detect 394 SNPs mapping to the SLC45A2 gene
(Additional file 3). Amongst this set of polymorphisms, we identified three missense
SNPs, i.e. rs341599992 (c.806G>A, p.Gly269Glu, in exon 3), rs327001340 (c.829A>G,
p.Ser277Gly, in exon 3) and rs693695020 (c.956G>A, p.Arg319His, in exon 4), that were
genotyped in an independent sample of 209 pigs including Red, Blond and Swallow Belly
Mangalitza as well as other breeds (i.e. these pigs were different than the ones typed with
the SNP chip). We also used the Mangalitza whole genome sequences reported by Molnar
et al. (2014) to examine the non-synonymous variability of the melanocortin receptor 1
gene (MC1R), which plays a key role in porcine coat color (Fang et al., 2009b). We
identified two missense SNPs, i.e. rs45435032 (c.491T>C, Val164Ala) and rs321432333
(c.727A>G, Thr243Ala), segregating in Mangalitza pigs. This analysis showed that both
Blond and Red Mangalitza pigs were homozygous for the MC1R-0401 allele which confers
a red pigmentation, i.e. their genotypes were TT and AA for the two above mutations.
The results of the SLC45A2 genotyping experiment are shown in Table 4. We observed
the existence of strong differences in the genotype and allele frequencies of the c.806G>A
and the c.956G>A SNPs between Red and Blond Mangalitza pigs. The majority of Blond
Mangalitza pigs were AA (c.806G>A) and GG (c.956G>A), while most of Red Mangalitza
pigs displayed the alternative genotypes i.e. GG or GA (c.806G>A) and AA or GA
(c.956G>A). The association between c.806G>A and c.956G>A genotypes and red and
blond coloration was very high (p = 0.001E10-23
) but not complete. The Swallow Belly
Mangalitza pigs, which have a black coat combined with yellow blond throat and
underbelly (Egerszegi et al., 2003), had a high frequency of the A-allele of the c.806G>A
SNP. This allele is relatively rare in Red Mangalitza as well as in the remaining breeds.
The A-allele of the c.956G>A SNP only segregated at significant frequencies in Red
Mangalitza, being very rare (Swallow Belly) or absent in the remaining populations. The

Papers and Studies
183
SIFT software (Kumar et al., 2009) predicted that the c.806G>A SNP is deleterious (SIFT
score: 0.05), while the Panther software (Thomas et al., 2003) predicted that both
c.806G>A and c.956G>A SNPs have pathogenic effects on protein function. The
c.829A>G SNP was classified by both softwares as a non-deleterious mutation and it did
not show any obvious association with coat color. Associations were much stronger for the
c.806G>A (χ 2
= 88.6, p-value < 2.2E-16) and the c.956G>A SNPs (χ 2
= 78.2, p-value <
2.2E-16 ) than for the c.829A>G SNP (χ 2
= 5.27, P-value = 0.021). Our results indicate
that the A-allele of the c.806G>A SNP significantly increases the chances of having a
blond coat colour (OR = 14.08), while the G-allele of the c.956G>A SNP would decrease
such chance (OR = 0.10). The c.829A>G SNP had an OR of 1.18, evidencing that this
polymorphism is not involved in Mangalitza pigmentation.
Discussion
One of the main goals of our study was to investigate if the strong population recession
experienced by Mangalitza pigs has resulted in a severe contraction of their genetic
diversity. The observed and expected heterozygosities of Hungarian Red and Blond
Mangalitza were lower than those estimated in cosmopolitan breeds as Large White,
Landrace and Piétrain. However, this result is expectable because cosmopolitan breeds,
and especially Large White swine, carry Asian alleles at high frequencies due to their
introgression with Chinese sows during the 18th
-19th
centuries. In contrast, the origin of
Mangalitza pigs is exclusively European (Manunza et al., 2016). Moreover, the observed
and expected heterozygosities were quite high in Romanian Red Mangalitza pigs and
relatively low in Hungarian and Romanian wild boars. As reported by Manunza et al.
(2016), the low variation of East European wild boars might be due to a process of
demographic reduction caused by excessive hunting, epidemic diseases, and habitat
destruction. The analysis of ROH also evidenced that Bazna, Red Mangalitza from
Romania and Hungary and Romanian wild boars have the highest frequencies of very long
ROH (> 30 Mb), reflecting a history of strong and recent inbreeding. Similar patterns of
homozygosity have been reported in Hungarian Mangalitza pigs (Yang et al., 2017). The
strong reduction in population size combined with matings between related individuals
might be the main cause of the high frequency of very long ROH in Hungarian Red
Mangalitza. In contrast, such pattern was not obvious in Blond or Romanian Red

Papers and Studies s
s
184
Mangalitza, evidencing that the three Mangalitza populations analysed in the current work
underwent different demographic histories. Indeed, the MDS plot (Figure 1) and the
Admixture results (Figure 2) indicated the existence of genetic differentiation between
Blond and Red Mangalitza. As previously explained, Red Mangalitza was produced by
crossing, approximately one century ago, Blond Mangalitza with Szalontai pigs, a high,
bulky, robust and red-coated Hungarian aboriginal race devoted to produce meat (Hankó,
1940).
One of the sources of genetic variability in Mangalitza pigs could be their introgression
with wild boars. Indeed, the genome-wide analysis of the diversity of Mangalitza pigs
indicated the existence of a close genetic affinity between this breed and wild boars
(HUNWB and ROMWB, Figure 1). In the Admixture analysis (Figure 2), Hungarian Red
and Blond Mangalitza shared a common genetic background with Hungarian wild boars.
Similar results have been obtained when comparing Iberian pigs and Spanish wild boars
(Manunza et al., 2016), a finding that might be explained by the occurrence of ancient and
recent genetic exchanges between wild and domestic pigs. Indeed, it is well known that
Szalontai sows, which intervened in the formation of the Red Mangalitza variety, produce
stripped piglets, a strong indication of their ancient and extensive introgression with local
wild boars (Egerszegi et al., 2003). Moreover, as many as 25% pigs of the commune of
Bârzava (Arad County, Romania) have been introgressed with wild boars (Matiuti et al.,
2010). This high level of introgression could be due to the extensive regime of pastoral
management that has been traditionally performed in certain areas of Romania, where pigs
are allowed to roam free providing a window of opportunity for the occurrence of
unintentional matings with wild boars (Matiuti et al., 2010). We also detected that in the
MDS plot the five Bazna pigs lie at an intermediate position between Mangalitza pigs and
cosmopolitan breeds and close to Hampshire pigs (Figure 1). Moreover, in the Admixture
analysis (Figure 2) the Bazna pigs showed evidence of introgression with cosmopolitan
breeds. This finding is consistent with the composite origin of this breed i.e. it was created
in 1872 by crossing Mangalitza and Berkshire pigs, being subsequently introgressed with
blood from Sattelschwein, Large White and Berkshire pigs (Ciobanu et al., 2001).

Papers and Studies
185
Table 4 - The genotype and allele frequency of SLC45A2 polymorphisms in 209 pigs from different populations.
Breed Number of animals
SLC45A2:c.829A>G SLC45A2:c.806G>A SLC45A2:c.956G>A
Genotype
Frequencies
Allele
Frequencies
Genotype
Frequencies
Allele
frequencies
Genotype
frequencies
Allele
frequencies
AA GA GG A G GG GA AA G A GG GA AA G A
Blond Mangalitza 55 0.96 0.04 0.00 0.98 0.02 0.00 0.04 0.96 0.02 0.98 1.00 0.00 0.00 1.00 0.00
Swallow Belly Mangalitza 30 0.63 0.30 0.07 0.78 0.22 0.13 0.23 0.63 0.25 0.75 0.93 0.07 0.00 0.97 0.03
Red Mangalitza 65 0.79 0.20 0.02 0.89 0.11 0.84 0.10 0.05 0.90 0.10 0.15 0.17 0.68 0.24 0.76
Piétrain 15 0.40 0.50 0.10 0.65 0.35 0.22 0.56 0.22 0.50 0.50 1.00 0.00 0.00 1.00 0.00
Large White 15 0.20 0.60 0.20 0.50 0.50 0.22 0.67 0.11 0.56 0.44 1.00 0.00 0.00 1.00 0.00
Landrace 15 0.00 0.07 0.93 0.03 0.97 0.88 0.13 0.00 0.94 0.06 1.00 0.00 0.00 1.00 0.00
Duroc 14 0.00 0.07 0.93 0.03 0.96 0.93 0.07 0.00 0.96 0.04 1.00 0.00 0.00 1.00 0.00

Papers and Studies s
s
186
Several pigmentation loci have been identified in pigs, but the genetic basis of coat
color remains to be fully elucidated. It is well known that the increase in the number of
copies of the KIT proto-oncogene receptor tyrosine kinase (KIT) gene, which is essential
for the survival, proliferation and migration of melanocytes, is the main causal factor of the
white coat characteristic of certain cosmopolitan breeds such as Large White and Landrace
(Giuffra et al., 2002). The polymorphism of the melanocortin receptor 1 (MC1R) gene is
another main determinant of pig pigmentation, being associated with red, black and black
spotted coat colors (Fang et al., 2009). More recently, several potential pigmentation loci,
such as TYRP1, MITF, EDNRB, CNTLN, and PINK1 have been reported in Chinese
porcine breeds (Lü et al., 2016; Ren et al., 2011; Chao Wang et al., 2015; Wu et al., 2016).
In the current work, we aimed to elucidate the genetic basis of the blond vs red color in
Mangalitza pigs by using a combination of selection scan and GWAS approaches. One of
the main advantages of our experimental design is that the two populations under analysis
are closely related, thus minimizing the presence of regions that are highly differentiated as
a consequence of drift (instead of artificial selection). The selection scan with the hapFLK
software in Red vs Blond Mangalitza pigs revealed a very strong selective sweep on
SSC13 SSC13 (24.5-67.7.0 Mb) which attained its maximum significance in the 27.1-47.2
Mb interval (q-value < 5.5E-04). Other significant selective sweeps were located on SSC2
(152.1-152.2 Mb), SSC3 (4.9-5.4 Mb), SSC6 (27.9-28.1 Mb), SSC7 (65.9-65.9, 50.9-51.7,
and 68.0-68.4 Mb), SSC11 (22.3-25.6 Mb), SSC12 (2.4-8.6 Mb), SSC15 (35.7-53.1 and
129.5-133.9 Mb), SSC16 (19.3-28.4, 35.0-52.4, 60.5-60.7, and 70.6-71.7 Mb) and SSC17
(60.5-65.8 Mb). As a complementary approach, we carried out a GWAS by using the
GEMMA software which confirmed that the SSC16 (20Mb) region is the one displaying
the most significant association with coat color (Additional file 2 and Table 3).
We examined the gene content of this SSC16 region and we detected the presence of
the SLC45A2 gene, also known as membrane-associated transporter protein (MATP).
Interestingly this protein is a key regulator of the melanosomal pH and tyrosinase activity
(Bin et al., 2015). In humans, mutations in the SLC45A2 gene have causal effects on
oculocutaneous albinism type 4 (Tóth et al., 2017) and the variability of this gene has been
associated with olive skin (Graf et al., 2005; Graf et al., 2007), blond/red hair, pale skin
and freckles (Fracasso et al., 2017) and black hair (Branicki et al., 2008). The cream color
of horses has also been linked to a missense substitution in the SLC45A2 gene (Mariat et
al., 2003). Moreover, there is compelling evidence that certain SLC45A2 polymorphisms

Papers and Studies
187
lead to reduced levels or absence of melanin in tigers, mice, medaka fish, chicken,
Japanese quails, gorillas, dogs and cattle (Rothammer et al., 2017). These evidences
resulted in the selection of the SLC45A2 locus as the most probable causal factor of the red
vs blond pigmentation in Mangalitza pigs.
The genotyping of three missense mutations in the porcine SLC45A2 locus evidenced
the existence of strong associations between c.806G>A and c.956G>A SNPs and coat
color (P-value < 2.2E-16). In contrast, the c.829A>G SNP showed a weak association with
pigmentation. The A-allele of c.806G>A was almost fixed in Blond Mangalitza and nearly
absent from Red Mangalitza. The A-allele was also present in Large White and Landrace
pigs, two breeds that are white due to the epistatic effect of the KIT duplication, which
suppresses any pigmentation. The A-allele of the c.956G>A SNP has a high frequency in
Red Mangalitza pigs being absent from the remaining breeds. The most probable cause for
the near-fixation of alternative SLC45A2 genotypes in Blond and Red Mangalitza pigs is
divergent directional selection for color. These two missense substitutions are predicted to
be deleterious by Panther and they are located in a cytoplasmic domain (Uniprot:
Q4LE88). According to Loganathan et al. (2016), the cytoplasmic domain plays a
fundamental role in the transport function of the integral membrane transport protein
SLC4A11. Although the associations between SLC45A2 genotypes and coat color are very
strong, they are not complete suggesting the existence of additional factors regulating
pigmentation in Mangalitza pigs. This conclusion is supported by the simultaneous
identification, with GEMMA and hapFLK, of several regions on SSC11, SSC13, SSC15
and SSC16 as associated with color and containing selective sweeps.
The knowledge about the genetic basis of pigmentation in pigs is still poorly
understood. Our study adds a new gene, the SLC45A2 locus, to the catalogue of loci with a
well established or probable role in the genetic determination of porcine coat color. Further
studies will be needed to finely map the causal mutation as well as to elucidate the
existence of genetic interactions between SLC45A2 and other genes. Our study also
illustrates the power of dissecting the genomic basis of simple phenotypes by employing
sets of closely related lines or populations and combining different statistical approaches.
Conflict of Interest
The authors declare no conflict of interest

Papers and Studies s
s
188
Author Contributions
AZ, VAB and MA designed the experiments; AZ, IA and VAB were responsible for
the experimental protocols and generation of animal material; ABJ, AZ, IA, IE and VAB
contributed to the obtaining of biological samples; AZ performed DNA extractions; AZ
and TFC carried out the diversity analyses, TFC carried out the selection scan and the
GWAS; MA and TFC analysed the gene content of selected regions, TFC contributed to
the genotyping of the SLC45A2 gene; MA, TFC, AZ and VAB wrote the paper. All authors
read and approved the manuscript.
Funding
Part of the research presented in this publication was funded by grant AGL2013–
48742-C2–1-R awarded by the Spanish Ministry of Economy, and by projects TKISSE and
TGENRE supported by the Hungarian Ministry of Agriculture. We also acknowledge the
support of the Spanish Ministry of Economy and Competitivity for the Center of
Excellence Severo Ochoa 2016-2019 (SEV-2015-0533) grant awarded to the Centre for
Research in Agricultural Genomics (CRAG). Tainã Figueiredo Cardoso was funded with a
fellowship from the CAPES Foundation-Coordination of Improvement of Higher
Education, Ministry of Education of the Federal Government of Brazil. Thanks also to the
CERCA Programme of the Generalitat de CatalunyaThe funders had no role in study
design, data collection, and analysis, decision to publish or preparation of the manuscript.
References
Alexander DH, Lange K (2011). Enhancements to the ADMIXTURE algorithm for
individual ancestry estimation. BMC Bioinformatics 12: 246.
Alexander DH, Novembre J, Lange K (2009). Fast model-based estimation of ancestry in
unrelated individuals. Genome Research 19: 1655–64.
Benjamini Y, Hochberg Y (1995). Controlling the false discovery rate: a practical and
powerful approach to multiple testing. Journal of the Royal Statistical Society 57: 289–
300.
Bin B-H, Bhin J, Yang SH, Shin M, Nam Y-J, Choi D-H, et al. (2015). Membrane-
associated transporter protein (MATP) regulates melanosomal ph and influences
tyrosinase activity. PLoS One 10: e0129273.

Papers and Studies
189
Branicki W, Brudnik U, Draus-Barini J, Kupiec T, Wojas-Pelc A (2008). Association of the
SLC45A2 gene with physiological human hair colour variation. Journal of Human
Genetics 53: 966–971.
Cingolani P, Platts A, Wang LL, Coon M, Nguyen T, Wang L, et al. (2012). A program for
annotating and predicting the effects of single nucleotide polymorphisms, SnpEff. Fly 6:
80–92.
Ciobanu DC, Day AE, Nagy A, Wales R, Rothschild MF, Plastow GS (2001). Genetic
variation in two conserved local Romanian pig breeds using type 1 DNA markers.
Genetics, Selection, Evolution : GSE 33: 417–32.
Egerszegi I, Rátky J, Solti L, Brüssow K-P (2003). Mangalica: an indigenous swine breed
from Hungary (Review). Archives Animal Breeding 46: 245–256.
Fang M, Larson G, Soares Ribeiro H, Li N, Andersson L (2009). Contrasting mode of
evolution at a coat color locus in wild and domestic pigs. PLoS Genetics 5: e1000341.
FAO (2015). The Second Report on the State of the World’s Animal Genetic Resources for
Food and Agriculture. AO Commission on Genetic Resources for Food and Agriculture
Assessments: Rome.
Fariello MI, Boitard S, Naya H, SanCristobal M, Servin B (2013). Detecting signatures of
selection through haplotype differentiation among hierarchically structured populations.
Genetics 193: 929–941.
Fracasso NC de A, de Andrade ES, Wiezel CEV, Andrade CCF, Zanão LR, da Silva MS, et
al. (2017). Haplotypes from the SLC45A2 gene are associated with the presence of
freckles and eye, hair and skin pigmentation in Brazil. Legal Medicine 25: 43–51.
Giuffra E, Törnsten A, Marklund S, Bongcam-Rudloff E, Chardon P, Kijas JMH, et al.
(2002). A large duplication associated with dominant white color in pigs originated by
homologous recombination between LINE elements flanking KIT. Mammalian Genome
13: 569–577.
Graf J, Hodgson R, van Daal A (2005). Single nucleotide polymorphisms in the MATP
gene are associated with normal human pigmentation variation. Human Mutation 25:
278–284.
Graf J, Voisey J, Hughes I, van Daal A (2007). Promoter polymorphisms in the MATP
( SLC45A2 ) gene are associated with normal human skin color variation. Human
Mutation 28: 710–717.
Hankó B (1940). Ancient domestic animals of Hungary. (Ősi magyar háziállataink)
Debrecen Tiszántúli Mg-i Kamara.
Kumar P, Henikoff S, Ng PC (2009). Predicting the effects of coding non-synonymous
variants on protein function using the SIFT algorithm. Nature Protocols 4: 1073–1081.
Loganathan SK, Lukowski CM, Casey JR (2016). The cytoplasmic domain is essential for
transport function of the integral membrane transport protein SLC4A11. American
Journal of Physiology-Cell Physiology 310: C161–C174.
Lü M-D, Han X-M, Ma Y-F, Irwin DM, Gao Y, Deng J-K, et al. (2016). Genetic variations
associated with six-white-point coat pigmentation in Diannan small-ear pigs. Scientific
Reports 6: 27534.

Papers and Studies s
s
190
Manunza A, Amills M, Noce A, Cabrera B, Zidi A, Eghbalsaied S, et al. (2016). Romanian
wild boars and Mangalitza pigs have a European ancestry and harbour genetic signatures
compatible with past population bottlenecks. Scientific Reports 6: 29913.
Mariat D, Taourit S, Guérin G (2003). A mutation in the MATP gene causes the cream coat
colour in the horse. Genetics, Selection, Evolution : GSE 35: 119–33.
Matiuti M, Bogdan AT, Crainiceanu E, Matiuti C (2010). Research Regarding the Hybrids
Resulted from the Domestic Pig and the Wild Boar. 43: 188–191.
Molnár J, Nagy T, Stéger V, Tóth G, Marincs F, Barta E (2014). Genome sequencing and
analysis of Mangalica, a fatty local pig of Hungary. BMC Genomics 15: 761.
Purcell S, Neale B, Todd-Brown K, Thomas L, Ferreira MAR, Bender D, et al. (2007).
PLINK: a tool set for whole-genome association and population-based linkage analyses.
American journal of human genetics 81: 559–75.
Ren J, Mao H, Zhang Z, Xiao S, Ding N, Huang L (2011). A 6-bp deletion in the TYRP1
gene causes the brown colouration phenotype in Chinese indigenous pigs. Heredity 106:
862–8.
Rothammer S, Kunz E, Seichter D, Krebs S, Wassertheurer M, Fries R, et al. (2017).
Detection of two non-synonymous SNPs in SLC45A2 on BTA20 as candidate causal
mutations for oculocutaneous albinism in Braunvieh cattle. Genetics, Selection,
Evolution : GSE 49: 73.
Storey JD, Tibshirani R (2003). Statistical significance for genomewide studies.
Proceedings of the National Academy of Sciences of the United States of America 100:
9440–5.
Thomas PD, Campbell MJ, Kejariwal A, Mi H, Karlak B, Daverman R, et al. (2003).
PANTHER: A Library of Protein Families and Subfamilies Indexed by Function. Genome
Research 13: 2129–2141.
Tóth L, Fábos B, Farkas K, Sulák A, Tripolszki K, Széll M, et al. (2017). Identification of
two novel mutations in the SLC45A2 gene in a Hungarian pedigree affected by unusual
OCA type 4. BMC Medical Genetics 18: 27.
Wang C, Wang H, Zhang Y, Tang Z, Li K, Liu B (2015). Genome-wide analysis reveals
artificial selection on coat colour and reproductive traits in Chinese domestic pigs.
Molecular Ecology Resources 15: 414–424.
Wu X, Zhang Y, Shen L, Du J, Luo J, Liu C, et al. (2016). A 6-bp deletion in exon 8 and
two mutations in introns of TYRP1 are associated with blond coat color in Liangshan
pigs. Gene 578: 132–136.
Yang B, Cui L, Perez-Enciso M, Traspov A, Crooijmans RPMA, Zinovieva N, et al. (2017).
Genome-wide SNP data unveils the globalization of domesticated pigs. Genetics
Selection Evolution: GSE 49: 71.
Zhou X, Stephens M (2014). Efficient multivariate linear mixed model algorithms for
genome-wide association studies. Nature Methods 11: 407–409.
Zsolnai A, Anton I, Kuhn C, Fesus L (2003). Detection of single-nucleotide
polymorphisms coding for three ovine prion protein variants by primer extension assay
and capillary electrophoresis. Electrophoresis 24:634–638.

Papers and Studies
191
Zsolnai A, Szántó-Egész R, Anton I, Tóth P, Micsinai A, Rátky J (2013a). Mangalica fajták
genetikai távolsága, elkülönítésük nukleotid polimorfizmust mutató DNS markerekkel
[Genetic distance of Mangalica breeds, distinction by DNA markers showing nucleotide
polymorphism]. Hungarian Veterinary Journal 135: 303–307.
Zsolnai A, Tóth G, Molnár J, Stéger V, Marincs F, Jánosi A, et al., (2013b). Looking for
breed differentiating SNP loci and for a SNP set for parentage testing in Mangalica.
Archives of Animal Breeding 56: 200–207.
LEGENDS TO ADDITIONAL FILES
Additional file 1. Admixture analysis of Mangalitza pigs and additional wild boar and pig
populations for a range of K-values (K = 2-11). Each individual is represented by a
single column divided into K colored segments, where K is the number of assumed
clusters. Populations are separated by black lines.
Additional file 2. Manhattan plot corresponding to the genome-wide association analysis
performed for coat color in Red and Blond Mangalitza pigs. In the y-axis, statistical
significance is expressed as a –log10 (q-value) whilst genomic coordinates are displayed
in the x-axis. The red and blue lines indicate the thresholds of genome-wide significance
corresponding to q-values of 0.01 and 0.05.
Additional file 3. List of SLC45A2 SNPs identified through the comparison of whole-
genome sequences corresponding to Red, Blond and Swallow Belly Mangalitza pigs
and reported by Molnar et al. (2014).

Papers and Studies s
s
192

193
4. Chaper 4: General Discussion
Chapter 4

Papers and Studies s
s
194

General discussion
195
One of the main goals of this Thesis was to investigate the molecular basis of fat
deposition in pigs. Such biological knowledge is necessary for understanding the functions
of genes and their interactions as well as to interpret correctly the results of genome-wide
association analyses. In this regard, studies performed in humans have demonstrated that
many genes involved in carbohydrate and lipid metabolism remain to be identified
(Khetarpal & Rader, 2014; Teslovich et al., 2010; Willer et al., 2013). For instance, 48% of
novel loci displaying significant associations with blood lipid levels described by Willer et
al. (2013) had never been previously connected to lipid metabolism.
To gain new insights into the genetic basis of meat quality and muscle metabolism, we
have analysed skeletal muscle mRNA expression in two different biological models: (1)
Two groups of pigs with distinct fatness profiles, and (2) Three groups of pigs with
different nutritional status (i.e. fasting, and 5 h. and 7 h. after feeding). In the next sections,
we will discuss the main results obtained through transcriptomics analysis of these two
different models using RNA-Seq technology
4.1 Differential expression of metabolic genes in the skeletal muscle of
Duroc pigs with different fatness profiles
The biological model employed in the first chapter of the Thesis consisted of 52 Duroc
pigs retrieved from an experimental population denominated as Lipgen (Gallardo et al.
2008). These 52 pigs represented two different metabolic patterns defined by a subset of 13
fatness and growth-related traits (Figure 4.1). HIGH pigs were fatter and they had a higher
IMF, SFA and MUFA contents as well as elevated serum lipid concentrations when
compared to LOW pigs. In contrast, LOW pigs had a higher muscle PUFA content and
were leaner than HIGH pigs.
Even though the initial analysis of RNA-Seq data made possible to identify 1,430 DE
mRNAs genes when considering a significance threshold of P-value < 0.05, this list of DE
genes suffered a strong reduction (96 genes) when we applied a more stringent threshold
(P-value < 0.01 and FC > 1.5). Moreover, only 21 genes showed a significant DE after
correcting for multiple testing (q-value < 0.05). The level of concordance between our
analysis and a previous study carried out by Cánovas et al (2010) using microarray
techlogy was quite modest, although the Spearman correlation between RNA-Seq and
microarray expression values was 0.54. A modest overlap between microarray and RNA-

Papers and Studies s
s
196
Seq data has been reported in previous studies (Trost et al., 2015; Wang et al., 2014).
Moreover, the study of Cánovas et al (2010) was based on 104 individuals and the
estimation of highly and lowly expressed genes with microarrays is difficult (Black et al.,
2014). In addition, the gene annotation of the porcine microarray is considerably poor
(Tsai et al., 2006). Seyednasrollah and coworkers (2015) performed a systematic
comparison of different pipelines for detecting differential expression by using RNA-Seq
data. They demonstrated that there are large differences across pipelines, and this can lead
to considerable variability in the reported results.
Figure 4.1 - Graphical plot of the first and second principal components summarising
phenotypic variation in the Duroc population. Summary of phenotypic variation of serum lipid,
growth and fatness parameters in the Duroc pig resource population. The distribution of the
individuals selected as HIGh and LOW is shown in the graph. PUFA = % Polyunsaturated fatty
acids; LEAN = %Lean; TG = Triacylglycerides (mg/dl); LDL = LDL-cholesterol (mg/dl); HDL =
HDL-cholesterol (mg/dl); CHOL = Total cholesterol (mg/dl); LW = Live weight (Kg); BFTiv =
Backfat thickness (in vivo) (mm); BFT = Backfat thickness 3rd
-4th ribs (mm); HFT = Ham fat
thickness (mm); IMF = % Intramuscular fat; SFA = % Saturated fatty acids; MUFA = %
Monounsaturated fatty acids (Cánovas et al., 2010).
The functions of the most significant DE loci between HIGH and LOW pigs are quite
heterogeneous. We have detected genes that have a well-known role in the development of
obesity and lipid metabolism. For instance, the long-chain fatty acid transport protein 4

General discussion
197
(SLC27A4) is the principal fatty acid transporter in small intestinal enterocytes and its
expression is correlated with adipose differentiation and the development of insulin
resistance (Yu et al., 2018). The acyl-CoA synthetase short-chain family member 1
(ACSS1) gene has also a key role in lipid metabolism because it converts acetate to acetyl-
CoA, a lipogenic substrate (Schwer et al., 2006). Moreover, overexpression of the SOD3
gene blocks high-fat diet-induced obesity, fatty liver, and insulin resistance (Cui et al.,
2014). In an experiment of differential gene expression, it is difficult to evaluate if
differential expression is the cause or the consequence of obesity. The altered expression of
several genes might contribute to establishing a phenotype of increased fatness, and such
phenotype might have downstream effects on the expression of other genes with
heterogeneous and unrelated functions. For instance, in obesity, to avert systemic
lipotoxicity from chronic overfeeding, adipocytes promote the activation of several
inflammatory pathways. This activation of macrophages/immune system genes culminates
in the development of insulin-resistant adipocytes that release excessive amounts of free
fatty acids and cause insulin resistance and lipoapoptosis in other tissues, e.g. liver and
muscle (Cusi, 2012)
To facilitate the interpretation of the data generated in the RNA-Seq experiment, we
explored the biological pathways enriched in the set of DE genes (96 genes, P-value < 0.01
and a FC > 1.5) and we also built networks connecting DE genes. In this way, we
identified pathways related with lipid synthesis (stearate, palmitate and γ-linolenate
synthesis, FA activation, CDP-diacylglycerol biosynthesis), catabolism (triacylglycerol
degradation), glucose metabolism (glucose synthesis and degradation) and hormonal
response (insulin-like growth factor-1, growth hormone, and hepatocyte growth factor).
Similar results were obtained by Cánovas et al. (2010), when analyzing the same
population with microarrays, as well as by other authors. For instance, a higher muscle
PUFA content in pigs has been related with the enrichment of pathways involved in
adipocyte differentiation and lipid metabolism (LXR/RXR activation, FXR/RXR
activation, and biosynthesis of retinoids) (Ayuso et al., 2016 and Puig-Oliveras et al.,
2014). The overexpression of carbohydrate (e.g. insulin) and lipogenic-related pathways
(e.g. PPAR signaling) in HIGH pigs has been also observed by Puig-Oliveras et al. (2014)
when comparing the muscle mRNA expression of pigs with high muscle SFA and MUFA
contents against those with a high PUFA content. In the case of HIGH and LOW pigs, we
have detected pathways involved in acute myeloid leukemia signaling and CTLA4

Papers and Studies s
s
198
signaling in cytotoxic T lymphocytes. One of the potential interpretations of this finding is
that the metabolic stress, caused by lipotoxicity causes an activation of the immune system
(Andersen et al., 2016). However, it is also necessary to take into account the intrinsic
limitations of over-representation analyses (Simillion et al, 2017). For instance, the same
gene can be present in multiple pathways confusing the biological interpretation of the
results and complicating the correction for multiple testing (the assumption of
independence is violated when there are overlapped genes amongst pathways). Converting
long lists of genes into long lists of pathways does not contribute much to solve the
original biological problem (Simillion et al., 2017) and enrichment analyses are prone to
yield false positive results (Pavlidis et al, 2012). This means that over-representation
analyses should be considered as an exploratory tool rather than as a conclusive analysis
upon which biological inferences are made. Recently, bioinformatic tools as SetRank have
been implemented to deal with the problems highlighted above (Simillion et al., 2017).
One of the genes that has often emerged in differential expression studies analysing
different pig fatness conditions is PPARG (Puig-Oliveras et al., 2014; Ramayo-Caldas et
al., 2014; Wei et al., 2017). In the experiment outlined in the first chapter of the thesis, we
detected that the PPARG gene, one of the major players in PPAR signaling, is upregulated
in HIGH pigs (P-value = 0.02 and FC = 1.36). In addition, PPARG was predicted to be a
major transcriptional regulator (together with PDGFB) of several DE genes related with
carbohydrate metabolism (CEBPA, CES1, and CIDEC) and the inhibition of insulin
sensitivity (CES1, CIDEC, and FASN). This finding suggests that the DE of PPARG has
consequences on carbohydrate metabolism since CES1 is one of the main regulators of
glucose homeostasis (Xu et al., 2014). Insulin stimulates the absorption of glucose, which
is a lipogenic substrate, and PPARG also enhances triglyceride storage (Ferré 2004). The
identification of PPARG as a key transcriptional regulator is relevant because genome-
wide association analysis revealed a close association between SNPs mapping close to the
PPARG locus and insulin sensitivity and obesity in pigs (Puig-Oliveras et al., 2016; Qiao et
al., 2015).
In summary, our results in concordance with previues studies performed in pigs point
to PPARG gene as a key factor determining porcine fatness. Activation of PPARG is
directly linked to improving glucose tolerance by enhancing insulin sensitivity and
restoring the function of β-cells in diabetic subjects (Sharma & Staels, 2007). Upregulation
of PPARG increases the expression of genes involved in fatty acid metabolism and

General discussion
199
triglyceride storage in adipose tissue (Sharma & Staels, 2007) and secondary effects can be
seen in liver and muscle lipid metabolism pathways (Figure 4.2). The effects of PPARG
also extend to macrophages (Figure 4.2), where this transcription factor suppresses the
production of inflammatory mediators, improving the relationship between the macrophage
and adipocyte that is distorted in obesity (Fuentes et al., 2013; Sharma and Staels, 2007).
Figure 4.2- Mechanism by which PPARG activation regulates the metabolism and
inflammation.
4.2 Limited contribution of the non-coding RNA transcriptome to
differential expression between HIGH and LOW pigs.
In general, the majority of differential gene expression analyses in pigs have been
focused on protein-encoding genes and only recently the analysis of microRNAs and
lncRNAs has been undertaken (Ayuso et al., 2016; Wang et al., 2017a; Wang et al., 2015b;
Zhou et al., 2014c). The general picture that emerges from the study reported in chapter 1
is that the DE of non-coding RNAs plays a minor role in the establishment of the HIGH
and LOW phenotypes. In this way, we have identified a total of 1,558 muscle-expressed
ncRNA transcripts, largely represented by small ncRNA. We only detected 12 ncRNAs (11
lncRNAs and 1 sncRNA) that were DE at the nominal level (P-value ≤ 0.05), while none
of these ncRNAs remained significant after correction for multiple testing. Recent studies

Papers and Studies s
s
200
in cattle with different IMF profiles indicate a small participation of miRNAs in the
determination of this trait (Oliveira et al., 2018; Zhang et al., 2017). Cesar et al. (2015)
compared the muscle expression profiles of Nellore steers displaying extreme genomic
estimated breeding values for IMF and found 42 DE mRNA genes (FDR < 0.05), while
Oliveira et al. (2018) using the same population found only one DE miRNA. Similarly, the
gene expression analysis of the subcutaneous adipose tissue of Laiwu and Large White
pigs made possible to identify 482 and 54 DE mRNAs and lncRNAs, respectively.
This apparent minor contribution of non-coding RNAs to phenotypes of economic
interest in livestock may be attributed to several factors. In general, ncRNAs are expressed
at lower levels than protein-coding transcripts (Palazzo & Lee, 2015). In addition, in the
skeletal muscle is difficult to measure ncRNA expression accurately because myofibrillar
and mitochondrial mRNA genes are highly expressed thus “masking” the expression of
other genes (Mele et al., 2015). In addition, the ncRNA sequences of the porcine genome
are poorly annotated. Iyer et al. (2015) performed a genome-wide lncRNA expression
analysis in humans and found that 79% of genes (43,331 loci) classified as lncRNAs had
not been previously annotated. This poor annotation of porcine ncRNAs becomes obvious
if the current porcine Ensembl release (Sscrofa11.1, 3,250 ncRNAs) is compared with the
22,521 and 15,074 ncRNAs annotated in the human and mice genomes, respectively.
Finally, another complicating factor is that the functions of the majority of ncRNAs are
unknown (Palazzo & Lee, 2015).
There is growing evidence that lncRNAs may play a key role in the recruitment of
regulatory complexes through RNA–protein interactions to influence the expression of
nearby genes, and, in this way, they may act as local regulators. Engreitz et al. (2016)
analysed 12 lncRNA loci in mouse embryonic stem cells and found that 5 of these loci
influenced the expression of neighbouring mRNA genes in cis. In chapter 1, we have
detected 25 mRNA-encoding genes that map near (30 kb or less) to the subset of DE
ncRNA loci. Amongst these, 2 mRNAs are DE in HIGH vs LOW pigs (P-value < 0.05 and
FC > 1.2) i.e. (1) CU468594.8 (P-value = 0.003 and FC = 1.26), which is orthologous to
human solute carrier family 52-riboflavin transporter, member 2 (SLC52A2), a
transmembrane protein that mediates the cellular uptake of riboflavin, a cofactor of certain
redox reactions (Ghisla & Massey 1989; Powers 2003); and (2) MT-ND6 (P-value = 0.038
and FC = −1.21) which encodes a NADH dehydrogenase that catalyzes the oxidation of
NADH by ubiquinone, an essential step in the mitochondrial electron transport chain

General discussion
201
(Vartak et al. 2015). However, the co-localization of DE mRNA and ncRNA genes should
not be considered as sufficient evidence of the latter regulating the former or vice versa.
Further molecular studies would be needed to establish such relationship.
4.3 Differential expression of mRNA isoforms in the skeletal muscle of
Duroc pigs with different fatness profiles
We aimed to take a further step in the analysis of gene expression differences in the
skeletal muscle of HIGH and LOW pigs by studying the differential expression of mRNA
isoforms generated by alternative splicing and other mechanisms. It is well established that
genes undergo alternative splicing (Eswaran et al., 2013; Yao et al., 2016), and that
changes in the abundance of mRNA isoforms affect metabolism regulation. For instance,
Beneit et al. (2018) observed a significant relationship between insulin receptor isoforms
ratios and plaque growth in early stages of atherosclerosis. Moreover, Montori-Grau et al.
(2018) showed that the glycogenin-interacting protein (GNIP) isoform 1 is the most
abundant isoform in human skeletal muscle, having a markedly glycogenic effect. An
overexpression of GNIP1 isoform decreased blood glucose levels, lactate levels and body
weight (Montori-Grau et al., 2018).
In chapter 2, we describe one of the first characterizations of the mRNA isoform
landscape in the skeletal muscle of pigs. The splicing landscape analysis of the porcine
gluteus medius muscle revealed that 10.9% of the expressed protein-encoding genes
generate alternative mRNA isoforms, with an average of 2.9 transcripts per gene. Exon
skipping was the most prevalent AS event (41.1%) and intron retention the least favored
one (12.7%). These results agree well with other studies performed in livestock species
(Chacko & Ranganathan, 2009; Kim et al., 2007; Reyes & Huber, 2017). However, in
humans 95% of genes can generate multiple isoforms (Barash et al., 2010). Differences in
the abundance of spliced genes between humans and pigs highlights the shortcomings of
pig genomic annotation, a limitation that may have a strong impact on the results of our
analysis.
As the accurate quantitation of isoform mRNA abundance may vary depending on the
bioinformatics pipeline employed in the analysis of the data (Hartley & Mullikin, 2016),
we have used two different pipelines with the aim of minimizing the rate of false positives
i.e. (1) STAR/RSEM/DESeq2 pipeline and (2) CLC Bio pipeline. The two differential

Papers and Studies s
s
202
expression analyses made possible to identify 104 alternative transcripts and 87 genes
simultaneously detected by both pipelines (P-value < 0.05). Moreover, 10 mRNA isoforms
were categorized as differentially expressed in HIGH vs LOW pigs with a P-value < 0.01
and ± 0.6 log2FC and only five of these transcripts remained significant after correcting for
multiple testing (q-value < 0.05 and ± 0.6 log2FC). Interestingly, if we consider the set of
10 mRNA DE isoforms (P-value < 0.01 and ± 0.6 log2FC) only four of these genes were
identified in the global analysis of DE detailed in Chapter 1.
Upregulation of specific ITGA5, TIMP1, ANXA2, and LITAF mRNA isoforms in the
skeletal muscle of HIGH group is consistent with their increased fatness and live weight
and suggests that differential expression of specific mRNA isoforms might be important in
the determination of lipid phenotypes. It is important to emphasize the existence of
substantial differences in the isoform annotation of the Sscrofa genome 10.2 and 11.1
versions (Table 4.1). The ITGA5 and TIMP1 genes in the Sscrofa v. 10.2 have 4 and 5
mRNA isoforms, respectively. However, in the new updated version, only 1 isoform is
described for each gene. In humans, 13 and 38 isoforms are reported for the ITGA5 and
ANXA2 genes, respectively. While, isoform number increased on ANXA2 gene from two
mRNA isoforms (Sscrofa v. 10.2) to 5 mRNA isoforms using the Sscrofa v. 11.1. If we
compare the principal isoforms discussed in this Thesis between porcine genome versions
(e.g. ITGA5 = 4445 bp, ANXA2= 1455 bp, version 10.2; and ITGA5 = 9021 bp, ANXA2 =
1618/1380 pb, version 11.1), we can see differences in length and sequence composition
but they encode the same full length protein (e.g. ITGA5 = 1057 aa, ANXA2 = 339 aa)
(Table 4.1). As shown in Table 4.1, the annotation of the pig ITGA5, LITAF, ANXA 2 and
TIMP1 mRNA isoforms reported in Sscrofa v. 10.2 is more similar to that described in
humans than the annotation found in Sscrofa v. 11.1.
Complete understanding of the functional implications of alternative splicing is still a
long way off. However, Tress et al. (2007) analyzed alternatively spliced gene products
annotated in the ENCODE pilot project and they found marked structural and functional
differences between isoforms generated by the same gene. Importantly, they described
substantial changes in relation to protein folding and activity sites.
Our results highlight the convenience of combining global and mRNA isoform analyses
of gene expression (31% of genes with DE isoforms were not identified in the DE gene
analysis, P-value < 0.05). Recently, Dapas et al. (2016) performed transcript abundance
estimation on raw RNA-Seq and exon-array expression glioblastoma cancer samples using

General discussion
203
different analysis pipelines and compared both the isoform- and gene-level expression
estimates. They found that a third of genes with at least one DE isoform in the RNA-Seq or
exon-array results were not likewise classified as DE in global analyses of gene expression.
4.4 The ingestion of food influences the expression of multiple
transcription factors in the skeletal muscle
The second biological model that we have explored in this Thesis focuses on the effects
of food ingestion on the mRNA expression patterns of the skeletal muscle. Our hypothesis
was that genes that play a role in nutrient absorption and metabolism might influence the
phenotypic variation of fatness and meat quality traits. The reason for choosing skeletal
muscle as a target tissue is that the majority of glucose and lipid absorption after a meal
consumption is featured by this tissue (Shulman et al., 1990). The postprandial kinetics of
blood glucose and lipid levels in the pig had not been well characterized, so we made a
pilot experiment in which we measured plasma glucose, triglycerides, cholesterol and non-
esterified fatty acids in eight Duroc gilts before feeding and 2, 4, 6 h. after feeding. These
results revealed that glycaemia and lipidemia peaks are reached at 2 and 4 h. after eating.
We also observed a marked decrease of plasma free FA at 2 h. after feed, since nutrition
abolishes the release of fatty acids by the adipose tissue.
Based on such results, the differential expression analysis comprised three different
time-points: T0 (fasting), T1 (5h after eating) and T2 (7h after eating). We assumed that at
5 h after eating, lipid absorption would be at its maximum, allowing us to detect genes
involved in such process, and that 7 h. after eating (i.e. 2 h. after absorption) the processes
of triglyceride synthesis (lipid storage) and ß-oxidation of FA (lipid burning) would be also
at their maxima. However, when we have analyzed triglycerides and plasma free fatty
acids concentrations in T0, T1 and T2 slaughtered sows, the kinetics of these two
metabolites were not identical to those observed in the pilot experiment. We found an
increase in the concentration of triglycerides and a decrease of circulating free FA levels,
but 7 hours after feeding triglyceride levels were still peaking. Nevertheless, our
comparison between fasting and fed state remains valid (Figure 4.3).

Papers and Studies s
s
204
Table 4.1 - Comparison between isoform annotation for the Itga5, Timp1, Anxa2 and Litaf genes available in the Sus scrofa genome version 10.2
and 11.1, and the Homo sapiens genome.
Isoforms differentially expressed found in this Thesis are shown in bold.
*Additional isoforms have been described, but they do not encode proteins.
Aa = Amino acids; Bp = Base pairs
Sus scrofa 10.2 Sus scrofa 11.1 Homo sapiens GRCh38.p10
Gene
Number
isoforms Bp Protein (aa)
Number
isoforms Bp
Protein
(aa)
Number
isoforms Bp Protein (aa)
ITGA5 5
1013,766,
4445,1255*
109,162,
1 9021 1057 13 4444,757,1240,1013 * 1,049,119,137,120 1057,93
TIMP1 4
931,641, 207,195,
1 1061 207 5 8,921,095,626,595,340 207,136,143,165,95 598,173 123,38
ANXA2 2 14,551,609 339,339 5
2702,1618, 322,339,
38
1676,1444,1444,1435, 339,357,339,399,
1380,1245, 339,414, 878,812,802,780, 256,176,146,142,
938 179 777,755,744,733, 227,119,248,4,
718,669,665,663, 176,149,139,110,
594,580,564,561, 176,175,59,45,
560,558 * 133,119
LITAF 2 2370, 2190 161,161 2 5396, 512 161,161 21
2632,2467,2356,2292, 161,161,161,152,
1118,717,692,603, 161,161,152,161,
1527,677,593,587, 228,75,137,39,
579,556,554,553, 153,33,88,136,
548,516,486,773,582 126,68,105,81,10

General discussion
205
The analysis of the expression data obtained by RNA-Seq highlighted 148 (T0 vs T1),
520 (T0 vs T2) and 135 (T1 vs T2) DE mRNA genes. Moreover, 85 genes showed DE both
in the T0-T1 and T0-T2 comparisons, a result that evidences the high consistency of our
results. Our data demonstrated a post-prandial activation of genes with a well-known role
in energy homeostasis (e.g. PFKFB3 and G0S2). Interestingly, we also detected the DE of
several genes with a plausible but poorly characterized role in metabolism (e.g. MIGA2,
SDC4, and CSRNP1). One of the main results of our study is that nutrition modulates the
expression multiple transcription factors e.g. ARID5B, KLF5, CEBPD, and FOXO1,
possibly mediating the integration of metabolic processes via PPAR (Figure 4.4). PPARA
mRNA is induced during fasting and plays a pivotal role in the management of energy
stores by enhancing hepatic fatty acid oxidation to supply substrates that can be
metabolized by other tissues (Kersten et al., 1999). Recently, Liu et al. (2017)
demonstrated that the knockdown of the ARID5B gene resulted in a reduced expression of
genes involved in atherosclerosis-related inflammatory and lipid metabolism pathways.
Overexpression of CCAAT/enhancer-binding protein delta (CEBPD) gene enhances lipid
accumulation and specifically activates PPARG transcription in HepG2 cells (Lai et al.,
2008). Armoni et al. (2006) suggested that the Forkhead box protein O1 (FOXO1) gene
represses PPARG in primary rat adipocytes. In a different experiment, we have evaluated
the DE of microRNAs in T0, T1, and T2 (Emilio Mármol, personal communication).
Differences in the expression of microRNAs were very slight and we were unable to
confirm them by quantitative PCR. The general picture that emerges from these results is
that the regulation of gene expression in response to food intake is mainly featured by
transcription factors.

Papers and Studies s
s
206
Figure 4.3 - Kinetics of the average concentrations of triglycerides and non-esterified fatty
acids (FA) in 36 Duroc pigs at three-time points: before eating and 5 and 7 hours post-
ingestion.
Figure 4.4 - Interaction of transcription factors modulated by nutrition with PPAR-mediated
pathways.

General discussion
207
4.5 Food intake promotes changes in the expression of genes related to
oxidative stress and angiogenesis
The thrombospondin 1 (THBS1, T0-T1: FC = -1.99, q-value = 8.00E-03) and 2
(THBS2, T0-T2: FC = 2.45, q-value = 5.18E-04) and thioredoxin interacting protein
(TXNIP, T0-T1: FC = -1.78, q-value = 1.34E-04; T0-T2: FC = -1.79, q-value = 1.13E-02)
genes showed significant DE at T0-T1 and T0-T2 reflecting the combined redox and
vascular response of the porcine skeletal muscle to nutrient availability. In a fed status,
mitochondria produce a huge amount of free oxygen radicals as a byproduct of oxidative
phosphorylation. Increased oxidative stress appears to be a determinant factor leading to
insulin resistance, β-cell dysfunction, and impaired glucose tolerance, so an adequate
balance between free oxygen radicals and antioxidants is necessary (Lobo et al, 2010).
THBS1 and THBS2 are down- and upregulated by oxidative stress, respectively (Bae et al.,
2013; Chen et al. 2011) and they are involved in the production of adaptive stress response
factors regulating NO, H2S, and superoxide production (Roberts et al., 2017). An
upregulation of TXNIP has been implicated in hyperglycemia-induced β-cell dysfunction
and apoptosis (Shah et al., 2013) and the thioredoxin/TXNIP system plays a major role in
the regulation of redox homeostasis ( Zhou & Chng, 2013). In addition, these genes have a
dual biological role, also being involved in angiogenesis. Insulin, secreted by the pancreas
in response to food ingestion, promotes vasodilatation and capillary recruitment in the
skeletal muscle to ensure the maintenance of glucose homeostasis (Manrique & Sowers,
2014). Dunn et al. (2014) reported that overexpression of TXNIP mediated by high glucose
levels may play a role in the pathogenesis of diabetes by impairing angiogenesis.
Moreover, THBS1 and THBS2 has been shown to be powerful inhibitors of angiogenesis
(Lawler & Lawler, 2012). This dual role complicates the physiological interpretation of
changes in the expression of thrombospondin-related genes, To make things even more
complicated, the THBS1 and THBS2 genes have been reported to be endogenous diet-
induced weight gain and adipocyte hypertrophy repressors (Inoue et al., 2013; Shitaye et
al., 2010; Soto-Pantoja et al., 2016). Inoue et al. (2013) demonstrated that THBS1-null
mice have an insulin-sensitive phenotype. Moreover, these knockout mice display a well-
controlled circadian rhythm in their energy expenditure, with higher amplitude of O2
consumption.
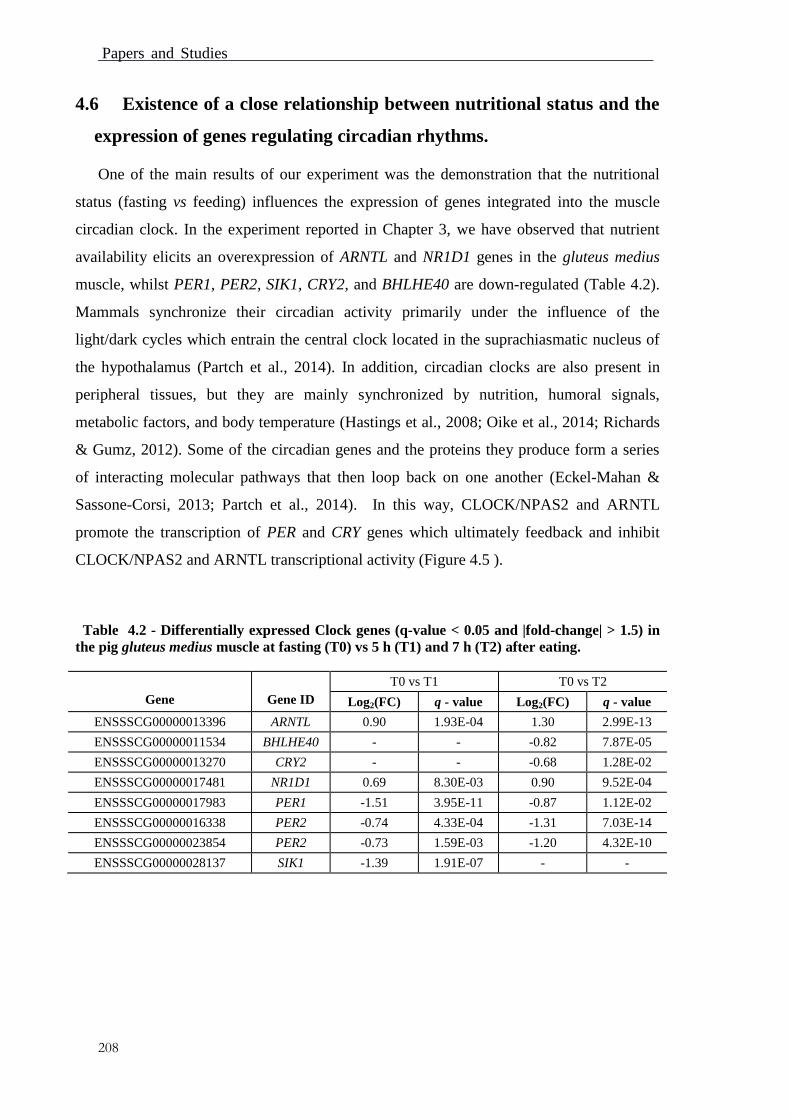
Papers and Studies s
s
208
4.6 Existence of a close relationship between nutritional status and the
expression of genes regulating circadian rhythms.
One of the main results of our experiment was the demonstration that the nutritional
status (fasting vs feeding) influences the expression of genes integrated into the muscle
circadian clock. In the experiment reported in Chapter 3, we have observed that nutrient
availability elicits an overexpression of ARNTL and NR1D1 genes in the gluteus medius
muscle, whilst PER1, PER2, SIK1, CRY2, and BHLHE40 are down-regulated (Table 4.2).
Mammals synchronize their circadian activity primarily under the influence of the
light/dark cycles which entrain the central clock located in the suprachiasmatic nucleus of
the hypothalamus (Partch et al., 2014). In addition, circadian clocks are also present in
peripheral tissues, but they are mainly synchronized by nutrition, humoral signals,
metabolic factors, and body temperature (Hastings et al., 2008; Oike et al., 2014; Richards
& Gumz, 2012). Some of the circadian genes and the proteins they produce form a series
of interacting molecular pathways that then loop back on one another (Eckel-Mahan &
Sassone-Corsi, 2013; Partch et al., 2014). In this way, CLOCK/NPAS2 and ARNTL
promote the transcription of PER and CRY genes which ultimately feedback and inhibit
CLOCK/NPAS2 and ARNTL transcriptional activity (Figure 4.5 ).
Table 4.2 - Differentially expressed Clock genes (q-value < 0.05 and |fold-change| > 1.5) in
the pig gluteus medius muscle at fasting (T0) vs 5 h (T1) and 7 h (T2) after eating.
Gene
Gene ID
T0 vs T1 T0 vs T2
Log2(FC) q - value Log2(FC) q - value
ENSSSCG00000013396 ARNTL 0.90 1.93E-04 1.30 2.99E-13
ENSSSCG00000011534 BHLHE40 - - -0.82 7.87E-05
ENSSSCG00000013270 CRY2 - - -0.68 1.28E-02
ENSSSCG00000017481 NR1D1 0.69 8.30E-03 0.90 9.52E-04
ENSSSCG00000017983 PER1 -1.51 3.95E-11 -0.87 1.12E-02
ENSSSCG00000016338 PER2 -0.74 4.33E-04 -1.31 7.03E-14
ENSSSCG00000023854 PER2 -0.73 1.59E-03 -1.20 4.32E-10
ENSSSCG00000028137 SIK1 -1.39 1.91E-07 - -

General discussion
209
Figure 4.5 - The circadian Clock system is regulated by a self-oscillating transcriptional loop.
The demonstration that the expression of Clock genes in the porcine skeletal muscle is
affected by nutrition has important metabolic implications Clock genes play a key role in
muscle physiology by regulating the expression of more than one thousand genes mainly
involved in metabolic processes (Hodge et al., 2015). In mice, Rudic et al. (2004) found
that the absence of ARNTL impaired glucose metabolism and was associated with insulin
hypersensitivity. PER1 and PER2 -deficient mice showed impaired glucose tolerance and
enhanced hypoglycemia (Lamia et al., 2008) and an increased adipogenesis was also
described in PER2−/−
mice (Grimaldi et al., 2010). In addition, natural genetic variations in
Clock genes can result in profound differences in the functioning of circadian clocks. In
humans, three variants of the CLOCK gene have been associated with energy intake
(Valladares et al., 2015). Moreover, PER2 polymorphism has been associated with
abdominal obesity (Garaulet et al., 2010). These results suggest that the altered expression
of Clock genes may cause the development of metabolic disorders, such as obesity and
diabetes, and influence traits related to lipid metabolism.
Given the biological relevance of the results reported in Chapter 3, we decided to
extend our analysis to four additional tissues: hypothalamus (which contains the central
biological clock modulated by light), liver, intestine and dorsal fat. We selected eight

Papers and Studies s
s
210
Clock genes based on our previous results (Cardoso et al. 2017) as well a by performing a
literature search (Gnocchi et al., 2015; Tahara & Shibata, 2013). Our goal was to analyze
the effect of food intake on the mRNA expression of Clock genes in tissues with distinct
metabolic roles. The results obtained in the experiment reported in Chapter 3 indicated
that differences in the expression of Clock genes were particularly significant in the T0 vs
T2 comparison (Cardoso et al., 2017). In the multissue study described in Chapter 4, we
have used these two-time points to carry out the analysis of differential expression by using
an RT-qPCR approach.
One of the main observations of the multissue study is that the expression of Clock
genes changes in four tissues containing peripheral clocks (liver, muscle, duodenum, and
dorsal fat) but not in the hypothalamus, which contains the central clock entrained by light.
This observation supports the idea that the changes of expression that we observe in the
four tissues mentioned before are not due to the passing of time (T0 and T2 are separated
by 7 hours) but to nutrient availability. Other studies suggest that feeding conditions can
modify, in a short time, the phase of circadian gene expression in peripheral tissues
possibly by delivering nutrients and hormonal signals, in an SCN-independent manner
(Damiola et al., 2000; Hirota & Fukada, 2004). The expression of Clock genes can have
important consequences on fat deposition and composition. For instance, Paschos et al.
(2012) suppressed the expression of the ARNTL gene in the adipose tissue of mice and
observed changes in the abundance of hypothalamic peptides that regulate appetite as well
as a decreased PUFA concentration in adipocytes and in the hypothalamic neurons
regulating food intake.
In addition, we have observed that the patterns of differential expression of Clock
genes differ across tissues i.e. we identified DE for four (dorsal fat and duodenum), six
(skeletal muscle) and seven (liver) genes. Of the four and six genes displaying DE between
T0 and T2 in duodenum and the muscle, respectively, only two of them (NPAS2 and SIK1)
were shared by both tissues. In contrast, muscle (6 genes) and liver (7 genes) have a higher
level of overlap i.e. five genes (BHLHE40, NPAS2, PER1, PER2, and SIK1) are shared by
both tissues. Moreover, not only the sets of DE genes vary across tissues but also there are
differences in the magnitude and direction of changes in gene expression i.e. the mRNA
levels of the BHLHE40 gene decreased in the liver and muscle (log2Rq = -0.94, q-value =
0.01 and log2Rq = -1.11, q-value = 0.00, respectively), but they increased in dorsal fat
(log2Rq = 1.18, q = 0.02). Another example would be featured by the Sik1 gene, whose

General discussion
211
expression decreased in the liver and muscle (log2Rq = -1.84, q-value = 0.00, and log2Rq =
-2.60, q-value = 0.00, respectively), but increased in the duodenum (log2Rq = 1.57, q-value
= 0.04). These results indicate the existence of important tisular differences in the
modulation of peripheral clocks by nutrition. Activation of distinct metabolic pathways
within a cell/tissue type is largely dependent on the cycling availability, sensitivity, and
transport of specific substrates, as well as of released hormones such as melatonin or
glucocorticoids (Gerber et al., 2013; Mühlbauer et al., 2009). In addition, differences in the
circadian timing of each tissue may also be controlled by the autonomic nervous system
and perhaps by other tissue clocks (Oster et al., 2006), and it could also be influenced by
the function of the tissue, environmental cues (e.g. the microbiome in the case of the
intestine) and the specific timing of nutrient availability.
4.7 The polymorphism of the SLC45A2 gene is associated with the red
and blond pigmentation of Mangalitza pigs
In Chapter 5, we have analyzed the genetic diversity of Mangalitza pigs and other
breeds and we have also investigated the genetic factors involved in the establishment of
blond vs red pigmentation patterns in this breed. In general, we have found results
consistent with occurrence of past population bottlenecks and recent inbreeding in
Mangalitza pigs breeds and Romanian and Hungarian wild boars. Observed and expected
heterozygosities were moderately high in Romanian Red Mangalitza (Ho = 0.35, He =
0.35) pigs and relatively low in Hungarian (Ho = 0.27, He = 0.29) and Romanian wild
boars (Ho = 0.27, He = 0.31 ), while Hungarian Red (Ho = 0.29, He = 0.28 ) and Blond
Mangalitza (Ho = 0.28, He = 0.28) displayed lower heterozygosities than those estimated
in cosmopolitan breeds such as Large White, Landrace, and Piétrain (mean Ho = 0.34, He
= 0.34). Admixture analysis demonstrated the existence of genetic differences between
Blond Mangalitza, Hungarian Red Mangalitza, and Romanian Red Mangalitza pigs, thus
evidencing that these populations underwent different demographic and/or selective
histories.
Coat colour is an important phenotype in the establishment of breed standards and it
was subjected to artificial selection in ancient times, dating back to about 5,000 years ago
(Fang et al., 2009). Despite the broad range of coat pigmentation patterns in pigs and that
several pigmentation loci have been identified (Table 4.3), the genetic basis of coat colour

Papers and Studies s
s
212
remains to be fully elucidated. Red and Blond Mangalitza are closely related populations
that diverged a short time ago (100-150 years), a feature that diminishes the presence of
regions that are highly differentiated as a consequence of genetic drift and other neutral
processes (Gregory, 2009).
We have investigated the genetic basis of the blond vs red coat in Mangalitza by using
two approaches i.e. a selection scan and a GWAS. The selection scan with the hapFLK
software revealed a very strong selective sweep on SSC13 (24.5-67.7.0 Mb, q-value <
5.5E-04). Other significant selective sweeps (P-value < 0.05) were located on SSC2
(152.1-152.2 Mb), SSC3 (4.9-5.4 Mb), SSC6 (27.9-28.1 Mb), SSC7 (65.9-65.9, 50.9-51.7,
and 68.0-68.4 Mb), SSC11 (22.3-25.6 Mb), SSC12 (2.4-8.6 Mb), SSC15 (35.7-53.1 and
129.5-133.9 Mb), SSC16 (19.3-28.4, 35.0-52.4, 60.5-60.7, and 70.6-71.7 Mb) and SSC17
(60.5-65.8 Mb). These putative selective sweeps might be due to factors unrelated to
pigmentation, so we carried out a GWAS with the GEMMA software. In this way, 6
regions identified in the selection scan were also identified as associated with coat color in
the GWAS. We investigated the gene content of the overlapping regions identified by
HapFLK and GEMMA. In doing so, we detected that the position of the SLC45A2 gene
(SSC16, 20 Mb) coincides with one of the regions (SSC16, 19-20 Mb) simultaneously
identified in the selection scan and the GWAS. The SLC45A2 gene is a key regulator of the
melanosomal pH and tyrosinase activity, and mutations in SLC45A2 are associated with
changes of melanin synthesis (implying a dilution of the pigmentation) in different species,
e.g in humans (Tóth et al., 2017), horses (Mariat et al., 2003) and cattle (Rothammer et al.,
2017).
By using whole-genome sequences from one Red, one Swallow Belly and two Blond
Mangalitza pigs (SRA access: SRP039012) reported by Molnar et al. (2014) we identified
three missense SNPs with a differential segregation in Red and Blond Mangalitzas, i.e.
rs341599992 (c.806G>A, p.Gly269Glu), rs327001340 (c.829A>G, p.Ser277Gly) and
rs693695020 (c.956G>A, p.Arg319His) The genotyping of these three missense
polymorphisms in the porcine SLC45A2 gene in Red, Blond and Swallow Belly
Mangalitza and other breeds evidenced that the c.806G>A (p.Gly269Glu) and c.956G>A
(p.Arg319His) SNPs are strongly but not fully associated with the red and blond coat
colours of Mangalitza pigs. Although the inheritance of pigmentation phenotypes is usually
simpler than that of complex traits, such as growth and fatness, it is rarely monogenic.
Recently, Crawford et al. (2017) performed a GWAS study and identified a list of genes,

General discussion
213
which clustered in four genomic regions that together accounted for almost 30% of the
phenotypic variation of pigmentation. The most significantly associated SNP were located
in the SLC24A gene that represents a 12.8% of the variability of human skin colour. These
results suggest that the genetic architecture of skin pigmentation in humans is a complex
trait determined by a set of few genes of strong effect (Crawford et al., 2017). In this way,
further studies will be needed to finely map the causal mutations of coat color in
Mangalitza pigs as well as to elucidate the existence of genetic interactions between
SLC45A2 and other color genes.
Table 4.3 - List of genes with known associations with coat colour in pigs.
Gene SSC Pigmentation Reference
KIT 8 White Giuffra et al. (2002)
MITF 13 Two‐end black Wang et al. (2015a)
TYRP1 1 Blond and Brown Wu et al. (2016) Ren et al. (2011)
MC1R 6 Black and red Fang et al. (2009)
PINK1, and CNTLN 1 and 6 Two-end-black Lü et al. (2016)
EDNRB 1 Black Wang et al. (2015a)
Lü et al. (2016)

s
214

215
5. Chaper 5: General conclusions
Chapter 5

s
216

General Conclusions
217
1. By using an RNA-Seq technology we identified a total of 18,104 mRNAs expressed in
the porcine gluteus medius muscle of 52 Duroc pigs. The differential expression
analysis of pigs with distinct growth and fatness profiles (HIGH: high backfat
thickness, intramuscular fat, saturated and unsaturated fatty acid content and serum
lipids vs LOW: opposite phenotypes), made possible to identify 1,430 mRNA
transcripts that are differentially expressed at the nominal level of significance (P-value
< 0.05). Ninety-six mRNAs were differentially expressed using more stringent
parameters (P-value < 0.01 and fold-change > 1.5). We conclude that the differential
expression of genes involved in lipid biosynthesis may explain the higher fat deposition
of HIGH pigs. Moreover, in our and previus studies PPARG appears to be a key
regulator of the genes differentially expressed in the skeletal muscle of pigs with
distinct lipid profiles
2. We have identified a total of 1,558 non-coding RNAs (ncRNAs) expressed in the
porcine gluteus medius muscle of HIGH and LOW pigs, however only 12 ncRNA
transcripts show differential expression when considering a P-value < 0.05, and none
when a more stringent threshold is used (P-value < 0.01 and fold-change > 1.5). These
results indicate that the different fatness profiles of HIGH and LOW pigs might be
mostly explained by the differential expression of protein-encoding genes.
3. We have found that 10.9% of genes expressed in the gluteus medius muscle generate
alternative mRNA isoforms, with an average of 2.9 transcripts per gene. This is
probably an underestimate caused by the poor annotation of the porcine mRNA
isoforms. The analysis of transcriptomic data with two prediction software (SUPPA and
Splicing Express) evidenced that exon skipping is the most prevalent splicing event,
while intron retention is the rarest one. These results are consistent with what has been
found in humans, where exon skipping has a predominant role in the generation of
splicing mRNA isoforms. A total of 10 mRNA isoforms were identified by CLC Bio
and DESeq2 software as differentially expressed when comparing HIGH vs LOW pigs
(P-value < 0.01 and ± 0.6 log2fold-change). Five mRNA isoforms, produced by the
ITGA5, SEMA4D, LITAF, TIMP1 and ANXA2 genes, remained significant after
correction for multiple testing (q-value < 0.05 and ± 0.6 log2fold-change), being
upregulated in HIGH pigs. An overexpression of ITGA5, LITAF, TIMP1 and ANXA2
mRNA is associated with obesity and metabolic disorders in humans. These findings
indicate that fat deposition in pigs could be affected not only by global differences of

General Conclusions s
s
218
gene expression but also by the abundance of specific mRNA isoforms.
4. By comparing the muscle expression of fasted pigs (T0) vs pigs sampled 5 h (T1) and 7
h (T2) after feeding, we have detected the differential expression of 148 (T0 vs T1), 520
(T0 vs T2) and 135 (T1 vs T2) mRNA-encoding genes. We can conclude that food
intake elicits changes in the expression of genes encoding transcription factors (e.g.
ARID5B, KLF5, CEBPD, and SOX9) as well as of loci regulating oxidative stress and
angiogenesis (THBS1, THBS2, and TXNIP) and circadian rhythms (i.e. ARNTL, PER1,
PER2, BHLHE40, NR1D1, SIK1, CIART, and CRY2).
5. The analysis of the expression of eight porcine Clock genes in five tissues has shown
that four (dorsal fat and duodenum), six (skeletal muscle) and seven (liver) genes
integrated into or modulating peripheral clocks are differentially expressed before and
after feeding. In contrast, none of the eight analysed genes shows a significant
differential expression in hypothalamus, the tissue where the central clock resides. From
these data, we infer that the differential expression of Clock genes in muscle,
duodenum, dorsal fat and liver tissue is induced by nutrition and not by the central clock
entrained by light. In addition, we have observed that the magnitude and direction of the
differential expression of Clock genes differ across tissues, thus indicating that the
ticking of peripheral clocks is modulated by tissue-specific factors.
6. Population analysis revealed that Blond Mangalitza, Red Mangalitza from Hungary,
wild boar from Hungary and Romania and Hampshire pigs display a lower diversity
than cosmopolitan breeds such as Landrace, Large White and Piétrain. In addition,
Hungarian and Romanian Red Mangalitza pigs and Romanian wild boars display an
increased frequency of very long ROH ( > 30 Mb), evidencing the occurrence of a
recent and strong inbreeding.
7. Performance of a selection scan with hapFLK and of a genome-wide association study
for coat color in Red and Blond Mangalitza pigs highlighted the existence of one region
on SSC16 (20 Mb) with potential effects on pigmentation. The analysis of the gene
content of this region allowed us to detect the solute carrier family 45 member 2
(SLC45A2) gene, which has a known role in color dilution. Genotyping of three
missense polymorphisms in the porcine SLC45A2 gene evidenced that c.806G>A
(p.Gly269Glu) and c.956G>A (p.Arg319His) SNPs are strongly but not fully associated
with the red and blond coat colors of Mangalitza pigs. Alternative SLC45A2 genotypes

General Conclusions
219
are almost fixed in Red and Blond Mangalitza pigs, a result that is probably explained
by the performance of artificial selection for coat color.

General Conclusions s
s
220

221
6. Chapter 6 References
Chapter 6

References s
222

References
223
Adzitey, F. & Nurul, H. Pale soft exudative (PSE) and dark firm dry (DFD) meats: Causes
and measures to reduce these incidences - a mini review. International Food Research
Journal 18, 11–20 (2011).
Alekseyenko, A. V, Kim, N. & Lee, C. J. Global analysis of exon creation versus loss and
the role of alternative splicing in 17 vertebrate genomes. RNA 13, 661–70 (2007).
Alexandratos, N. & Bruinsma, J. The 2012 Revision World agriculture towards 2030/2050:
the 2012 revision. (2012).
Allis, C. D. & Jenuwein, T. The molecular hallmarks of epigenetic control. Nature Reviews
Genetics 17, 487–500 (2016).
Amills, M. et al. in Encyclopedia of Life Sciences. John Wiley & Sons, Ltd (2010).
doi:10.1002/9780470015902.a0022884
Anders, S. & Huber, W. Differential expression analysis for sequence count data. Genome
Biology 11, R106 (2010).
Anders, S., Pyl, P. T. & Huber, W. HTSeq – A Python framework to work with high-
throughput sequencing data. Bioinformatics 15, 166-9 (2014).
Andersen, C. J., Murphy, K. E. & Fernandez, M. L. Impact of Obesity and Metabolic
Syndrome on Immunity. Advances in Nutrition 7, 66–75 (2016).
Andersson, L. et al. Coordinated international action to accelerate genome-to-phenome
with FAANG, the Functional Annotation of Animal Genomes project. Genome Biology
16, 57 (2015).
Andrews S. FastQC A Quality Control tool for High Throughput Sequence Data. at
<http://www.bioinformatics.babraham.ac.uk/projects/fastqc/> (2010).
Anthon, C. et al. Structured RNAs and synteny regions in the pig genome. BMC Genomics
15, 459 (2014).
Armoni, M. et al. FOXO1 represses peroxisome proliferator-activated receptor-γ1 and -γ2
gene promoters in primary adipocytes. Journal of Biological Chemistry 281, 19881–
19891 (2006).
Ayuso, M. et al. Comparative analysis of muscle transcriptome between pig genotypes
identifies genes and regulatory mechanisms associated to growth, fatness and
metabolism. PloS One 10, e0145162 (2015).
Ayuso, M. et al. Developmental stage, muscle and genetic type modify muscle
transcriptome in pigs: effects on gene expression and regulatory factors involved in
growth and metabolism. PloS One 11, e0167858 (2016).
Bae, O.-N. et al. Oxidative stress-mediated thrombospondin-2 upregulation impairs bone
marrow-derived angiogenic cell function in diabetes mellitus. Arteriosclerosis,
Thrombosis, and Vascular Biology 33, 1920–7 (2013).
Barak, B. et al. Opposing actions of environmental enrichment and Alzheimer’s disease on
the expression of hippocampal microRNAs in mouse models. Translational psychiatry 3,
e304 (2013).
Barash, Y. et al. Deciphering the splicing code. Nature 465, 53–59 (2010).
Beltrami, C., Angelini, T. G. & Emanueli, C. Noncoding RNAs in diabetes vascular
complications. Journal of Molecular and Cellular Cardiology 89: 42-50. (2014).

References s
224
Beneit, N. et al. Potential role of insulin receptor isoforms and IGF receptors in plaque
instability of human and experimental atherosclerosis. Cardiovascular Diabetology 17,
31 (2018).
Berglund, E. C., Kiialainen, A. & Syvänen, A.-C. Next-generation sequencing
technologies and applications for human genetic history and forensics. Investigative
Genetics 2, 23 (2011).
Black, M. B. et al. Comparison of Microarrays and RNA-Seq for gene expression analyses
of dose-response experiments. Toxicological Sciences 137, 385–403 (2014).
Blankenberg, D. et al. Galaxy: a web-based genome analysis tool for experimentalists.
Current Protocols in Molecular Biology 19: 1-21 (2010).
Borodina, T., Adjaye, J. & Sultan, M. A strand-specific library preparation protocol for
RNA sequencing. Methods in Enzymology 500: 79-98 (2011).
Braunschweig, M., Jagannathan, V., Gutzwiller, A. & Bee, G. Investigations on
transgenerational epigenetic response down the male line in F2 pigs. PloS One 7, e30583
(2012).
Bray, N. L., Pimentel, H., Melsted, P. & Pachter, L. Near-optimal probabilistic RNA-Seq
quantification. Nature Biotechnology 34, 525–527 (2016).
Bumgarner, R. Overview of DNA microarrays: types, applications, and their future.
Current Protocols in Molecular Biology 22, 22.1. (2013).
Burgos-Paz, W. et al. Porcine colonization of the Americas: a 60k SNP story. Heredity
110, 321–30 (2013).
Byron, S. A., Van Keuren-Jensen, K. R., Engelthaler, D. M., Carpten, J. D. & Craig, D. W.
Translating RNA sequencing into clinical diagnostics: opportunities and challenges.
Nature Reviews Genetics 17, 257–271 (2016).
Cabling, M. M. et al. Estimation of Genetic Associations between Production and Meat
Quality Traits in Duroc Pigs. Asian-Australasian Journal of Animal Sciences 28, 1061–5
(2015).
Cánovas, A., Quintanilla, R., Amills, M. & Pena, R. N. Muscle transcriptomic profiles in
pigs with divergent phenotypes for fatness traits. BMC Genomics 11, 372 (2010).
Cardoso, T. F. et al. Nutrient supply affects the mRNA expression profile of the porcine
skeletal muscle. BMC Genomics 18, 603 (2017).
Carninci, P. et al. The transcriptional landscape of the mammalian genome. Science 309,
1559–1563 (2005).
Cartegni, L., Chew, S. L. & Krainer, A. R. Listening to silence and understanding
nonsense: exonic mutations that affect splicing. Nature Reviews Genetics 3, 285–298
(2002).
Casellas, J. et al. Bayes factor analyses of heritability for serum and muscle lipid traits in
Duroc pigs. Journal of Animal Science 88, 2246–2254 (2010).
Cech, T. R. & Steitz, J. A. The noncoding RNA revolution-trashing old rules to forge new
ones. Cell 157, 77–94 (2014).
Cesar, A. S. M. et al. Putative Regulatory factors associated with intramuscular fat content.
PloS One 10, e0128350 (2015).

References
225
Chacko, E. & Ranganathan, S. Genome-wide analysis of alternative splicing in cow:
implications in bovine as a model for human diseases. BMC Genomics 10 : S11 (2009).
Chen, C. et al. A global view of porcine transcriptome in three tissues from a full-sib pair
with extreme phenotypes in growth and fat deposition by paired-end RNA sequencing.
BMC Genomics 12, 448 (2011).
Chen, J.-F. et al. microRNA-1 and microRNA-206 regulate skeletal muscle satellite cell
proliferation and differentiation by repressing Pax7. The Journal of Cell Biology 190,
867–879 (2010).
Chen, J.-F. et al. The role of microRNA-1 and microRNA-133 in skeletal muscle
proliferation and differentiation. Nature Genetics 38, 228–233 (2006).
Chen, J.-K., Zhan, Y.-J., Yang, C.-S. & Tzeng, S.-F. Oxidative stress-induced attenuation
of thrombospondin-1 expression in primary rat astrocytes. Journal of Cellular
Biochemistry 112, 59–70 (2011).
Cheung, V. G. et al. Genetics of quantitative variation in human gene expression. Cold
Spring Harbor Symposia On Quantitative Biology 68, 403–7 (2003a).
Cheung, V. G. et al. Natural variation in human gene expression assessed in
lymphoblastoid cells. Nature Genetics 33, 422–425 (2003b).
Choi, M. et al. Genome-wide analysis of DNA methylation in pigs using reduced
representation bisulfite sequencing. DNA Research 22, 343–355 (2015).
Cinar, M. U. et al. Association and expression quantitative trait loci (eQTL) analysis of
porcine AMBP, GC and PPP1R3B genes with meat quality traits. Molecular Biology
Reports 39, 4809–4821 (2012).
Ciobanu, D. C., Lonergan, S. M. & Huff-Lonergan, E. J. Genetics of meat quality and
carcass traits. In The Genetics of the Pig. 2nd edn. (ed. Rothschild, M. F. & Ruvinsky,
A.) 356 (CABI, 2011).
Clop, A. et al. A mutation creating a potential illegitimate microRNA target site in the
myostatin gene affects muscularity in sheep. Nature Genetics 38, 813–818 (2006).
Conesa, A. et al. A survey of best practices for RNA-Seq data analysis. Genome Biology
17, 13 (2016).
Corominas, J. et al. Analysis of porcine adipose tissue transcriptome reveals differences in
de novo fatty acid synthesis in pigs with divergent muscle fatty acid composition. BMC
Genomics 14, 843 (2013).
Crawford, N. G. et al. Loci associated with skin pigmentation identified in African
populations. Science 358, eaan8433 (2017).
Crist, C. G., Montarras, D. & Buckingham, M. Muscle Satellite Cells Are Primed for
Myogenesis but Maintain Quiescence with Sequestration of Myf5 mRNA Targeted by
microRNA-31 in mRNP Granules. Cell Stem Cell 11, 118–126 (2012).
Cui, R., Gao, M., Qu, S. & Liu, D. Overexpression of superoxide dismutase 3 gene blocks
high-fat diet-induced obesity, fatty liver and insulin resistance. Gene Therapy 21, 840–8
(2014).
Cusi, K. Role of Obesity and Lipotoxicity in the Development of Nonalcoholic
Steatohepatitis: Pathophysiology and Clinical Implications. Gastroenterology 142, 711–
725.e6 (2012).

References s
226
Daly, T. M. et al. Precision profiling and components of variability analysis for Affymetrix
microarray assays run in a clinical context. The Journal of Molecular Diagnostics : JMD
7, 404–12 (2005).
Damiola, F. et al. Restricted feeding uncouples circadian oscillators in peripheral tissues
from the central pacemaker in the suprachiasmatic nucleus. Genes & Development 14,
2950–61. (2000).
Dapas, M., Kandpal, M., Bi, Y. & Davuluri, R. V. Comparative evaluation of isoform-level
gene expression estimation algorithms for RNA-Seq and exon-array platforms. Briefings
in Bioinformatics 18, bbw016 (2016).
Davoli, R. & Braglia, S. Molecular approaches in pig breeding to improve meat quality.
Briefings in Functional Genomics and Proteomics 6, 313–321 (2008).
Day, D. A. & Tuite, M. F. Post-transcriptional gene regulatory mechanisms in eukaryotes:
an overview. The Journal of Endocrinology 157, 361–71 (1998).
De Smet, S. & Vossen, E. Meat: The balance between nutrition and health. A review. Meat
Science 120, 145–156 (2016).
Dekkers, J. C. M. Commercial application of marker-and gene-assisted selection in
livestock: Strategies and lessons 1,2. Journal Animal Science 82, 313–328 (2004).
DePristo, M. A. et al. A framework for variation discovery and genotyping using next-
generation DNA sequencing data. Nature Genetics 43, 491–8 (2011).
Derrien, T. et al. The GENCODE v7 catalog of human long noncoding RNAs: analysis of
their gene structure, evolution, and expression. Genome Research 22, 1775–89 (2012).
Dickenson, D. L. & Bailey, D. Meat Traceability: Are U.S. consumers willing to pay for
it? Journal of Agricultural and Resource Economics 27: 348-364
Djebali, S. et al. Landscape of transcription in human cells. Nature 489, 101–108 (2012).
Dobin, A. et al. STAR: ultrafast universal RNA-Seq aligner. Bioinformatics 29, 15–21
(2013).
Down, T. A. et al. A Bayesian deconvolution strategy for immunoprecipitation-based DNA
methylome analysis. Nature Biotechnology 26, 779–785 (2008).
Duijvesteijn, N. et al. A genome-wide association study on androstenone levels in pigs
reveals a cluster of candidate genes on chromosome 6. BMC Genetics 11, 42 (2010).
Dunn, L. L. et al. A critical role for thioredoxin-interacting protein in diabetes-related
impairment of angiogenesis. Diabetes 63, 675–687 (2014).
Eckel-Mahan, K. & Sassone-Corsi, P. Metabolism and the circadian clock converge.
Physiological Reviews 93, 107–35 (2013).
Engreitz, J. M. et al. Local regulation of gene expression by lncRNA promoters,
transcription and splicing. Nature 539, 452–455 (2016).
Eswaran, J. et al. RNA sequencing of cancer reveals novel splicing alterations. Scientific
Reports 3, 93–97 (2013).
Fan, H. et al. Sulforaphane causes a major epigenetic repression of myostatin in porcine
satellite cells. Epigenetics 7, 1379–1390 (2012).
Fang, M. & Andersson, L. Mitochondrial diversity in European and Chinese pigs is
consistent with population expansions that occurred prior to domestication. Proceedings

References
227
of the Royal Society B: Biological Sciences 273, 1803–1810 (2006).
Fang, M., Larson, G., Soares Ribeiro, H., Li, N. & Andersson, L. Contrasting Mode of
Evolution at a Coat Color Locus in Wild and Domestic Pigs. PLoS Genetics 5, e1000341
(2009).
Farnham, P. J. Insights from genomic profiling of transcription factors. Nature Reviews
Genetics 10, 605–616 (2009).
Fernandez, X., Monin, G., Talmant, A., Mourot, J. & Lebret, B. Influence of intramuscular
fat content on the quality of pig meat — 2. Consumer acceptability of m. longissimus
lumborum. Meat Science 53, 67–72 (1999).
Ferraz, A. L. J. et al. Transcriptome architecture across tissues in the pig. BMC Genomics
9, 173 (2008).
Ferré, P. The biology of peroxisome proliferator-activated receptors: relationship with lipid
metabolism and insulin sensitivity. Diabetes 53, S43–50 (2004).
Freeman, T. C. et al. A gene expression atlas of the domestic pig. BMC Biology 10, 90
(2012).
Fuentes, E., Guzmán-Jofre, L., Moore-Carrasco, R. & Palomo, I. Role of PPARs in
inflammatory processes associated with metabolic syndrome (Review). Molecular
Medicine Reports 8, 1611–1616 (2013).
Gallardo, D. et al. Mapping of quantitative trait loci for cholesterol, LDL, HDL, and
triglyceride serum concentrations in pigs. Physiological Genomics 35, 199–209 (2008).
Garaulet, M. et al. PERIOD2 variants are associated with abdominal obesity, psycho-
behavioral factors, and attrition in the dietary treatment of obesity. Journal of the
American Dietetic Association 110, 917–921 (2010).
García-Alcalde, F. et al. Qualimap: evaluating next-generation sequencing alignment data.
Bioinformatics 28, 2678–9 (2012).
Gerber, A. et al. Blood-borne circadian signal stimulates daily oscillations in actin
dynamics and SRF activity. Cell 152, 492–503 (2013).
Ghosh, M. et al. Evaluation of body growth and immunity-related differentially expressed
genes through deep RNA sequencing in the piglets of Jeju native pig and Berkshire.
Animal Genetics 46, 255–264 (2015).
Ghisla, S. & Massey, V. Mechanisms of flavoprotein-catalyzed reactions. European
Journal of Biochemistry 181, 1–17 (1989).
Giudice, J., Loehr, J. A., Rodney, G. G. & Cooper, T. A. Alternative splicing of four
trafficking genes regulates myofiber structure and skeletal muscle physiology. Cell
Reports 17, 1923-1933 (2016).
Giuffra, E. et al. A large duplication associated with dominant white color in pigs
originated by homologous recombination between LINE elements flanking KIT.
Mammalian Genome 13, 569–577 (2002).
Giuffra, E. et al. The origin of the domestic pig: independent domestication and subsequent
introgression. Genetics 154, 1785–91 (2000).
Gnocchi, D., Pedrelli, M., Hurt-Camejo, E. & Parini, P. Lipids around the Clock: focus on
circadian rhythms and lipid metabolism. Biology 4, 104–32 (2015).

References s
228
González-Prendes, R. et al. Joint QTL mapping and gene expression analysis identify
positional candidate genes influencing pork quality traits. Scientific Reports 7, 39830
(2017).
Grabherr, M. G. et al. Full-length transcriptome assembly from RNA-Seq data without a
reference genome. Nature Biotechnology 29, 644–652 (2011).
Gregory, T. R. Artificial selection and domestication: modern lessons from Darwin’s
enduring analogy. Evolution: Education and Outreach 2, 5–27 (2009).
Griffith, M. et al. Alternative expression analysis by RNA sequencing. Nature Methods 7,
843–847 (2010).
Grimaldi, B. et al. PER2 Controls lipid metabolism by direct regulation of PPARγ. Cell
Metabolism 12, 509–520 (2010).
Grundberg, E. et al. Mapping cis- and trans-regulatory effects across multiple tissues in
twins. Nature Genetics 44, 1084–9 (2012).
Haas, B. J. et al. De novo transcript sequence reconstruction from RNA-Seq using the
Trinity platform for reference generation and analysis. Nature Protocols 8, 1494–512
(2013).
Hartley, S. W. & Mullikin, J. C. Detection and visualization of differential splicing in
RNA-Seq data with JunctionSeq. Nucleic Acids Research 44, e127 (2016).
Hastings, M. H., Maywood, E. S. & Reddy, A. B. Two decades of circadian time. Journal
of Neuroendocrinology 20, 812–819 (2008).
Hausman, G. J. et al. Board-invited review: the biology and regulation of preadipocytes
and adipocytes in meat animals. Journal of Animal Science 87, 1218–46 (2009).
Hernandez-Sanchez, J. et al. Genomic architecture of heritability and genetic correlations
for intramuscular and back fat contents in Duroc pigs. Journal of Animal Science 91,
623–632 (2013).
Hindorff, L. A. et al. Potential etiologic and functional implications of genome-wide
association loci for human diseases and traits. Proceedings of the National Academy of
Sciences 106, 9362–9367 (2009).
Hirota, T. & Fukada, Y. Resetting mechanism of central and peripheral circadian clocks in
mammals. Zoological Science 21, 359–368 (2004).
Hocquette, J. F. et al. Intramuscular fat content in meat-producing animals: development,
genetic and nutritional control, and identification of putative markers. Animal 4, 303–319
(2010).
Hodge, B. A. et al. The endogenous molecular clock orchestrates the temporal separation
of substrate metabolism in skeletal muscle. Skeletal Muscle 5, 17 (2015).
Hodkinson, B. P. & Grice, E. A. Next-Generation Sequencing: a review of technologies
and tools for wound microbiome research. Advances in Wound Care 4, 50–58 (2015).
Huang, D. W. et al. The DAVID Gene Functional Classification Tool: a novel biological
module-centric algorithm to functionally analyze large gene lists. Genome Biology 8,
R183 (2007).
Huarte, M. & Marín-Béjar, O. Long noncoding RNAs: from identification to functions and
mechanisms. Advances in Genomics and Genetics 5, 257 (2015).

References
229
Inoue, M. et al. Thrombospondin 1 mediates high-fat diet-induced muscle fibrosis and
insulin resistance in male mice. Endocrinology 154, 4548–59 (2013).
Iyer, M. K. et al. The landscape of long noncoding RNAs in the human transcriptome.
Nature Genetics 47, 199–208 (2015).
Jia, L. et al. MiRNA-199a-3p regulates C2C12 myoblast differentiation through IGF-
1/AKT/mTOR signal pathway. International Journal of Molecular Sciences 15, 296–308
(2013).
Jin, B., Li, Y. & Robertson, K. D. DNA methylation: superior or subordinate in the
epigenetic hierarchy? Genes & Cancer 2, 607–17 (2011).
Jing, L. et al. Transcriptome analysis of mRNA and miRNA in skeletal muscle indicates an
important network for differential Residual Feed Intake in pigs. Scientific Reports 5,
11953 (2015).
Jones, G. F. Genetic aspects of domestication, common breeds and their origin. The
genetics of the pig. In: Rothschild MF and Ruvinsky A (eds) The Genetic (1998).
Kanehisa, M. & Goto, S. KEGG: kyoto encyclopedia of genes and genomes. Nucleic Acids
Research 28, 27–30 (2000).
Kersten, S. et al. Peroxisome proliferator–activated receptor α mediates the adaptive
response to fasting. Journal of Clinical Investigation 103, 1489–1498 (1999).
Khetarpal, S. A. & Rader, D. J. Genetics of lipid traits: Genome-wide approaches yield
new biology and clues to causality in coronary artery disease. Biochimica et Biophysica
Acta 1842, 2010–2020 (2014).
Kim, D. et al. TopHat2: accurate alignment of transcriptomes in the presence of insertions,
deletions and gene fusions. Genome Biology 14, R36 (2013).
Kim, N., Alekseyenko, A. V, Roy, M. & Lee, C. The ASAP II database: analysis and
comparative genomics of alternative splicing in 15 animal species. Nucleic Acids
Research 35, D93-8 (2007).
Klein, R. J. et al. Complement factor H polymorphism in age-related macular
degeneration. Science 308, 385–9 (2005).
Koltai, H. & Weingarten-Baror, C. Specificity of DNA microarray hybridization:
characterization, effectors and approaches for data correction. Nucleic Acids Research 36,
2395–2405 (2008).
Korir, P. K. & Seoighe, C. Inference of Allele-Specific Expression from RNA-Seq Data.
Methods in Molecular Biology 1112, 49–69 (2014).
Kukurba, K. R. & Montgomery, S. B. RNA Sequencing and Analysis. Cold Spring Harbor
protocols 2015, 951–69 (2015).
Lai, P.-H. et al. HDAC1/HDAC3 modulates PPARG2 transcription through the sumoylated
CEBPD in hepatic lipogenesis. Biochimica et Biophysica Acta (BBA) - Molecular Cell
Research 1783, 1803–1814 (2008).
Lamia, K. A., Storch, K.-F. & Weitz, C. J. Physiological significance of a peripheral tissue
circadian clock. Proceedings of the National Academy of Sciences of the United States of
America 105, 15172–7 (2008).
LaPlant, Q. et al. Dnmt3a regulates emotional behavior and spine plasticity in the nucleus
accumbens. Nature Neuroscience 13, 1137–1143 (2010).

References s
230
Lappalainen, T. et al. Transcriptome and genome sequencing uncovers functional variation
in humans. Nature 501, 506–11 (2013).
Larson, G. et al. Ancient DNA, pig domestication, and the spread of the Neolithic into
Europe. Proceedings of the National Academy of Sciences 104, 15276–15281 (2007).
Larson, G. et al. Worldwide phylogeography of wild boar reveals multiple centers of pig
domestication. Science 307, 1618–21 (2005).
Lawler, P. R. & Lawler, J. Molecular basis for the regulation of angiogenesis by
thrombospondin-1 and -2. Cold Spring Harbor Perspectives in Medicine 2, a006627–
a006627 (2012).
Leroy, F. & Praet, I. Meat traditions. The co-evolution of humans and meat. Appetite 90,
200–11 (2015).
Levy, S. E. & Myers, R. M. Advancements in Next-Generation Sequencing. Annual
Review of Genomics and Human Genetics 17, 95–115 (2016).
Li, A. et al. ALDB: A Domestic-Animal Long Noncoding RNA Database. PLoS One 10,
e0124003 (2015).
Li, B. & Dewey, C. N. RSEM: accurate transcript quantification from RNA-Seq data with
or without a reference genome. BMC Bioinformatics 12, 323 (2011a).
Li, B. et al. RNA-Seq analysis reveals new candidate genes for drip loss in a Piétrain ×
Duroc × Landrace × Yorkshire population. Animal Genetics 47, 192–199 (2016a).
Li, B. et al. Identification of candidate genes associated with porcine meat color traits by
genome-wide transcriptome analysis. Scientific Reports 6, 35224 (2016b).
Li, H. & Durbin, R. Fast and accurate short read alignment with Burrows-Wheeler
transform. Bioinformatics 25, 1754–1760 (2009a).
Li, H. et al. The Sequence Alignment/Map format and SAMtools. Bioinformatics 25,
2078–2079 (2009).
Li, M. et al. An atlas of DNA methylomes in porcine adipose and muscle tissues. Nature
Communications 3, 850 (2012).
Li, R. et al. Misregulation of alternative splicing in a mouse model of Rett Syndrome.
PLoS Genetics 12, e1006129 (2016).
Li, R., Li, Y., Kristiansen, K. & Wang, J. SOAP: short oligonucleotide alignment program.
Bioinformatics 24, 713–4 (2008).
Li, Y., Chien, J., Smith, D. I. & Ma, J. FusionHunter: identifying fusion transcripts in
cancer using paired-end RNA-Seq. Bioinformatics 27, 1708–1710 (2011b).
Liao, Y., Smyth, G. K. & Shi, W. featureCounts: an efficient general purpose program for
assigning sequence reads to genomic features. Bioinformatics 30, 923–930 (2014).
Listrat, A. et al. How Muscle Structure and composition influence meat and flesh quality.
The Scientific World Journal 2016, 3182746 (2016).
Liu, Y. et al. Blood monocyte transcriptome and epigenome analyses reveal loci associated
with human atherosclerosis. Nature Communications 8, 393 (2017).
Lobo, V., Patil, A., Phatak, A. & Chandra, N. Free radicals, antioxidants and functional
foods: Impact on human health. Pharmacognosy Reviews 4, 118–26 (2010).
Love, M. I., Huber, W. & Anders, S. Moderated estimation of fold change and dispersion

References
231
for RNA-Seq data with DESeq2. Genome Biology 15, 550 (2014).
Lü, M.-D. et al. Genetic variations associated with six-white-point coat pigmentation in
Diannan small-ear pigs. Scientific Reports 6, 27534 (2016).
Lyford, C. et al. Is willingness to pay (WTP) for beef quality grades affected by consumer
demographics and meat consumption preferences? Australasian Agribusiness Review -
Australasian Agribusiness Review 18 (2010).
Ma, J. et al. A splice mutation in the PHKG1 gene causes high glycogen content and low
meat quality in pig skeletal muscle. Plos Genetics 10, e1004710 (2014).
Manrique, C. & Sowers, J. R. Insulin resistance and skeletal muscle vasculature:
significance, assessment and therapeutic modulators. Cardiorenal Medicine 4, 244–56
(2014).
Mariat, D., Taourit, S. & Guérin, G. A mutation in the MATP gene causes the cream coat
colour in the horse. Genetics, Selection, Evolution : GSE 35, 119–33 (2003).
McPherson, A. et al. Comrad: detection of expressed rearrangements by integrated analysis
of RNA-Seq and low coverage genome sequence data. Bioinformatics 27, 1481–1488
(2011).
Mele, M. et al. The human transcriptome across tissues and individuals. Science 348, 660–
665 (2015).
Meyer, C. A. & Liu, X. S. Identifying and mitigating bias in next-generation sequencing
methods for chromatin biology. Nature Reviews Genetics 15, 709–721 (2014).
Miller, M. B. & Tang, Y.-W. Basic concepts of microarrays and potential applications in
clinical microbiology. Clinical Microbiology Reviews 22, 611–33 (2009).
Molnár J, Nagy T, Stéger V, Tóth G, Marincs F, Barta E. Genome sequencing and analysis
of Mangalica, a fatty local pig of Hungary. BMC Genomics 15: 761 (2014).
Montori-Grau, M. et al. GNIP1 E3 ubiquitin ligase is a novel player in regulating glycogen
metabolism in skeletal muscle. Metabolism 18, pii: S0026-0495(18)30044-1 (2018).
Mortazavi, A. et al. Mapping and quantifying mammalian transcriptomes by RNA-Seq.
Nature Methods 5, 621–628 (2008).
Mühlbauer, E., Gross, E., Labucay, K., Wolgast, S. & Peschke, E. Loss of melatonin
signalling and its impact on circadian rhythms in mouse organs regulating blood glucose.
European Journal of Pharmacology 606, 61–71 (2009).
Neguembor, M. V., Jothi, M. & Gabellini, D. Long noncoding RNAs, emerging players in
muscle differentiation and disease. Skeletal Muscle 4, 8 (2014).
Nica, A. C. et al. The architecture of gene regulatory variation across multiple human
tissues: the MuTHER study. Plos Genetics 7, e1002003 (2011).
Nie, M., Deng, Z.-L., Liu, J. & Wang, D.-Z. Noncoding RNAs, emerging regulators of
skeletal muscle development and diseases. Biomed Research International 2015, 676575
(2015).
Ogłuszka, M. et al. A porcine gluteus medius muscle genome-wide transcriptome analysis:
dietary effects of omega-6 and omega-3 fatty acids on biological mechanisms. Genes &
Nutrition 12, 4 (2017).
Oike, H., Oishi, K. & Kobori, M. Nutrients, clock genes, and chrononutrition. Current

References s
232
Nutrition Reports 3, 204–212 (2014).
Oliveira, G. B. et al. Integrative analysis of microRNAs and mRNAs revealed regulation of
composition and metabolism in Nelore cattle. BMC Genomics 19, 126 (2018).
Oster, H. et al. The circadian rhythm of glucocorticoids is regulated by a gating mechanism
residing in the adrenal cortical clock. Cell Metabolism 4, 163–173 (2006).
Palazzo, A. F. & Lee, E. S. Non-coding RNA: what is functional and what is junk?
Frontiers in Genetics 6, 2 (2015).
Partch, C. L., Green, C. B. & Takahashi, J. S. Molecular architecture of the mammalian
circadian clock. Trends in Cell Biology 24, 90–99 (2014).
Paschos, G. K. et al. Obesity in mice with adipocyte-specific deletion of clock component
Arntl. Nature medicine 18, 1768–77 (2012).
Patro, R., Duggal, G. & Kingsford, C. Salmon: accurate, versatile and ultrafast
quantification from RNA-Seq data using lightweight-alignment. bioRxiv 21592 (2015).
Patro, R., Mount, S. M. & Kingsford, C. Sailfish enables alignment-free isoform
quantification from RNA-Seq reads using lightweight algorithms. Nature Biotechnology
32, 462–4 (2014).
Pavlidis, P., Jensen, J. D., Stephan, W. & Stamatakis, A. A critical assessment of
storytelling: gene ontology categories and the importance of validating genomic scans.
Molecular Biology and Evolution 29, 3237–48 (2012).
Peek, C. B., Ramsey, K. M., Marcheva, B. & Bass, J. Nutrient sensing and the circadian
clock. Trends in endocrinology and metabolism: TEM 23, 312–8 (2012).
Pena, R. N. et al. Application of the microarray technology to the transcriptional analysis
of muscle phenotypes in pigs. Animal Genetics 45, 311–321 (2014).
Pena, R. N. et al. Transcriptional analysis of intramuscular fatty acid composition in the
longissimus thoracis muscle of Iberian × Landrace back-crossed pigs. Animal Genetics
44, 648–60 (2013).
Pilcher, C. M. et al. Transcript profiles in longissimus dorsi muscle and subcutaneous
adipose tissue: a comparison of pigs with different postweaning growth rates. Journal of
Animal Science 93, 2134–2143 (2015).
Piskol, R., Ramaswami, G. & Li, J. B. Reliable identification of genomic variants from
RNA-Seq data. The American Journal of Human Genetics 93, 641–651 (2013).
Ponsuksili, S., Murani, E., Schwerin, M., Schellander, K. & Wimmers, K. Identification of
expression QTL (eQTL) of genes expressed in porcine M. longissimus dorsi and
associated with meat quality traits. BMC Genomics 11, 572 (2010).
Ponsuksili, S., Murani, E., Trakooljul, N., Schwerin, M. & Wimmers, K. Discovery of
candidate genes for muscle traits based on GWAS supported by eQTL-analysis.
International Journal of Biological Sciences 10, 327–37 (2014).
Porter, V. Pigs: A Handbook to the Breeds of the World. Mountfield: Helm Information
Ltd. (1993).
Powers, H. J. Riboflavin (vitamin B-2) and health. The American Journal of Clinical
Nutrition. 77, 1352–60 (2003).
Przybylski, W. & Hopkins, D. Meat quality : genetic and environmental factors. CRC Press

References
233
(2015).
Puig-Oliveras, A. et al. Differences in muscle transcriptome among pigs phenotypically
extreme for fatty acid composition. PloS One 9, e99720 (2014).
Qiao, R. et al. Genome-wide association analyses reveal significant loci and strong
candidate genes for growth and fatness traits in two pig populations. Genetics Selection
Evolution 47, 17 (2015).
Ramayo-Caldas, Y. et al. From SNP co-association to RNA co-expression: novel insights
into gene networks for intramuscular fatty acid composition in porcine. BMC Genomics
15, 232 (2014).
Ramayo-Caldas, Y. et al. Liver transcriptome profile in pigs with extreme phenotypes of
intramuscular fatty acid composition. BMC Genomics 13, 547 (2012).
Reane, D. et al. A MICU1 splice variant confers high sensitivity to the mitochondrial CA2+
uptake machinery of skeletal muscle. Molecular Cell 64, 760–773 (2016).
Ren, J. et al. A 6-bp deletion in the TYRP1 gene causes the brown colouration phenotype in
Chinese indigenous pigs. Heredity 106, 862–868 (2011).
Reyer, H., Ponsuksili, S., Wimmers, K. & Murani, E. Transcript variants of the porcine
glucocorticoid receptor gene (NR3C1). General and Comparative Endocrinology 189,
127–133 (2013).
Reyes, A. & Huber, W. Alternative start and termination sites of transcription drive most
transcript isoform differences across human tissues. Nucleic Acids Research 25, 582-592
(2017).
Richards, J. & Gumz, M. L. Advances in understanding the peripheral circadian clocks.
FASEB Journal : Official Publication of the Federation of American Societies for
Experimental Biology 26, 3602–13 (2012).
Ritchie, M. D., Holzinger, E. R., Li, R., Pendergrass, S. A. & Kim, D. Methods of
integrating data to uncover genotype–phenotype interactions. Nature Reviews Genetics
16, 85–97 (2015).
Roberts, D. D., Kaur, S. & Isenberg, J. S. Regulation of cellular redox signaling by
matricellular proteins in vascular biology, immunology, and cancer. Antioxidants &
Redox Signaling 27, 874–911 (2017).
Robertson, G. et al. Genome-wide profiles of STAT1 DNA association using chromatin
immunoprecipitation and massively parallel sequencing. Nature Methods 4, 651–657
(2007).
Robinson, M. D. & Oshlack, A. A scaling normalization method for differential expression
analysis of RNA-Seq data. Genome Biology 11, R25 (2010).
Robinson, M. D., McCarthy, D. J. & Smyth, G. K. edgeR: a Bioconductor package for
differential expression analysis of digital gene expression data. Bioinformatics 26, 139–
140 (2010).
Rothammer, S. et al. Detection of two non-synonymous SNPs in SLC45A2 on BTA20 as
candidate causal mutations for oculocutaneous albinism in Braunvieh cattle. Genetics,
Selection, Evolution : GSE 49, 73 (2017).
Rubin, C.-J. et al. Strong signatures of selection in the domestic pig genome. Proceedings
of the National Academy of Sciences of the United States of America 109, 19529–36

References s
234
(2012).
Rudic, R. D. et al. BMAL1 and CLOCK, two essential components of the circadian clock,
are involved in glucose homeostasis. Plos Biology 2, e377 (2004).
Russ, A. E. et al. Gene expression changes in the colon epithelium are similar to those of
intact colon during late inflammation in interleukin-10 gene deficient mice. Plos One 8,
e63251 (2013).
Scandura, M. et al. Ancient vs. recent processes as factors shaping the genetic variation of
the European wild boar: are the effects of the last glaciation still detectable? Molecular
Ecology 17, 1745–1762 (2008).
Schachtschneider, K. M. et al. Adult porcine genome-wide DNA methylation patterns
support pigs as a biomedical model. BMC Genomics 16, 743 (2015).
Schmidt, D. et al. Five-vertebrate chip-seq reveals the evolutionary dynamics of
transcription factor binding. Science 328, 1036-40 (2010).
Schurch, N. J. et al. How many biological replicates are needed in an RNA-Seq experiment
and which differential expression tool should you use? RNA 22, 839–51 (2016).
Schwer, B., Bunkenborg, J., Verdin, R. O., Andersen, J. S. & Verdin, E. Reversible lysine
acetylation controls the activity of the mitochondrial enzyme acetyl-CoA synthetase 2.
Proceedings of the National Academy of Sciences 103, 10224–10229 (2006).
Seyednasrollah, F., Laiho, A. & Elo, L. L. Comparison of software packages for detecting
differential expression in RNA-Seq studies. Briefings in Bioinformatics 16, 59–70
(2015).
Shah, A. et al. Thioredoxin-interacting protein mediates high glucose-induced reactive
oxygen species generation by mitochondria and the NADPH oxidase, Nox4, in mesangial
cells. The Journal of Biological Chemistry 288, 6835–48 (2013).
Shannon, P. et al. Cytoscape: a software environment for integrated models of
biomolecular interaction networks. Genome Research 13, 2498–504 (2003).
Sharma, A. M. & Staels, B. Peroxisome proliferator-activated receptor γ and adipose
tissue—understanding obesity-related changes in regulation of lipid and glucose
metabolism. The Journal of Clinical Endocrinology & Metabolism 92, 386–395 (2007).
Sharma, A., Seop, J., Dang, C. G., Sudrajad, P. & Kim, H. C. Stories and challenges of
genome wide association studies in livestock — A Review. Asian-Australasian Journal
of Animal Sciences 28, 1371–1379 (2015).
Shitaye, H. S., Terkhorn, S. P., Combs, J. A. & Hankenson, K. D. Thrombospondin-2 is an
endogenous adipocyte inhibitor. Matrix Biology : Journal of the International Society for
Matrix Biology 29, 549–56 (2010).
Shulman, G. I. et al. Quantitation of muscle glycogen synthesis in normal subjects and
subjects with non-insulin-dependent diabetes by 13C nuclear magnetic resonance
spectroscopy. The New England Journal Of Medicine 322, 223–8 (1990).
Simillion, C., Liechti, R., Lischer, H. E. L., Ioannidis, V. & Bruggmann, R. Avoiding the
pitfalls of gene set enrichment analysis with SetRank. BMC Bioinformatics 18, 151
(2017).
Smyth, G. K. Linear models and empirical bayes methods for assessing differential
expression in microarray experiments. Statistical Applications in Genetics and Molecular

References
235
Biology 3, 1–25 (2004).
Sodhi, S. S. et al. Comparative transcriptomic analysis by RNA-Seq to discern differential
expression of genes in liver and muscle tissues of adult Berkshire and Jeju Native Pig.
Gene 546, 233–242 (2014).
Soto-Pantoja, D. R. et al. Dietary fat overcomes the protective activity of thrombospondin-
1 signaling in the Apc Min/+ model of colon cancer. Oncogenesis 5, e230–e230 (2016).
Sunwoo, H. et al. MEN epsilon/beta nuclear-retained non-coding RNAs are up-regulated
upon muscle differentiation and are essential components of paraspeckles. Genome
Research 19, 347–59 (2009).
Szklarczyk, D. et al. STRING v10: protein-protein interaction networks, integrated over
the tree of life. Nucleic Acids Research 43, D447–D452 (2015).
Tahara, Y. & Shibata, S. Chronobiology and nutrition. Neuroscience 253, 78–88 (2013).
Tarazona, S. et al. Data quality aware analysis of differential expression in RNA-Seq with
NOISeq R/Bioc package. Nucleic Acids Research 43, e140 (2015).
Teslovich, T. M. et al. Biological, clinical and population relevance of 95 loci for blood
lipids. Nature 466, 707–13 (2010).
The ENCODE Project Consortium. An integrated encyclopedia of DNA elements in the
human genome. Nature 489, 57–74 (2012).
The GTEx Consortium. The Genotype-Tissue Expression (GTEx) pilot analysis:
Multitissue gene regulation in humans. Science. 348, 648-60 (2015).
The GTEx Consortium. The Genotype-Tissue Expression (GTEx) project. Nature Genetics
45, 580–5 (2013).
Torres-Vázquez, J. A. & Spangler, M. L. Genetic parameters for docility, weaning weight,
yearling weight, and intramuscular fat percentage in Hereford cattle. Journal of Animal
Science 94, 21 (2016).
Tóth, L. et al. Identification of two novel mutations in the SLC45A2 gene in a Hungarian
pedigree affected by unusual OCA type 4. BMC Medical Genetics 18, 27 (2017).
Toyota, M. et al. CpG island methylator phenotype in colorectal cancer. Proceedings of the
National Academy of Sciences of the United States of America 96, 8681–6 (1999).
Trapnell, C. et al. Differential gene and transcript expression analysis of RNA-Seq
experiments with TopHat and Cufflinks. Nature Protocols 7, 562–578 (2012).
Trapnell, C. et al. Transcript assembly and quantification by RNA-Seq reveals unannotated
transcripts and isoform switching during cell differentiation. Nature Biotechnology 28,
511–5 (2010).
Trenhaile, M. D., Petersen, J. L., Kachman, S. D., Johnson, R. K. & Ciobanu, D. C. Long-
term selection for litter size in swine results in shifts in allelic frequency in regions
involved in reproductive processes. Animal Genetics 47, 534–542 (2016).
Tress, M. L. et al. The implications of alternative splicing in the ENCODE protein
complement. Proceedings of the National Academy of Sciences of the United States of
America 104, 5495–500 (2007).
Triantaphyllopoulos, K. A., Ikonomopoulos, I. & Bannister, A. J. Epigenetics and
inheritance of phenotype variation in livestock. Epigenetics & Chromatin 9, 31 (2016).

References s
236
Trost, B. et al. Concordance between RNA-Sequencing data and DNA microarray data in
transcriptome analysis of proliferative and quiescent fibroblasts. Royal Society Open
Science 2, 150402 (2015).
Tsai, S. et al. Annotation of the Affymetrix1 porcine genome microarray. Animal Genetics
37, 423–424 (2006).
Vartak, R., Deng, J., Fang, H. & Bai, Y. Redefining the roles of mitochondrial DNA-
encoded subunits in respiratory Complex I assembly. Biochimica et Biophysica Acta
1852, 1531–9 (2015).
Valladares, M., Obregón, A. M. & Chaput, J.-P. Association between genetic variants of
the clock gene and obesity and sleep duration. Journal of Physiology and Biochemistry
71, 855–860 (2015).
van Dijk, E. L., Auger, H., Jaszczyszyn, Y. & Thermes, C. Ten years of next-generation
sequencing technology. Trends in Genetics 30, 418–426 (2014).
van Wijk, H. J. et al. Genetic parameters for carcass composition and pork quality
estimated in a commercial production chain. Journal of Animal Science 83, 324 (2005).
Vêncio, R. Z., Brentani, H., Patrão, D. F. & Pereira, C. A. Bayesian model accounting for
within-class biological variability in Serial Analysis of Gene Expression (SAGE). BMC
Bioinformatics 5, 119 (2004).
Vitti, J. J., Grossman, S. R. & Sabeti, P. C. Detecting natural selection in genomic data.
Annual Review of Genetics 47, 97–120 (2013).
Wang, C. et al. Genome-wide analysis reveals artificial selection on coat colour and
reproductive traits in Chinese domestic pigs. Molecular Ecology Resources 15, 414–424
(2015a).
Wang, C. et al. The concordance between RNA-Seq and microarray data depends on
chemical treatment and transcript abundance. Nature Biotechnology 32, 926–32 (2014).
Wang, E. T. et al. Alternative isoform regulation in human tissue transcriptomes. Nature
456, 470–6 (2008).
Wang, L. et al. Alternative splicing of the porcine glycogen synthase kinase 3β (GSK-3β)
gene with differential expression patterns and regulatory functions. Plos One 7, e40250
(2012).
Wang, Q. et al. Differential expression profile of miRNAs in porcine muscle and adipose
tissue during development. Gene 618, 49–56 (2017a).
Wang, Y. et al. Dynamic transcriptome and DNA methylome analyses on longissimus
dorsi to identify genes underlying intramuscular fat content in pigs. BMC Genomics 18,
780 (2017b).
Wang, Z. et al. Identification of Genes Related to Growth and Lipid Deposition from
Transcriptome Profiles of Pig Muscle Tissue. Plos One 10, e0141138 (2015b).
Wang, Z. et al. RNA-Seq: a revolutionary tool for transcriptomics. Nature Reviews
Genetics 10, 57–63 (2009).
Warriss, P. D. Meat Science: An introductory text; CABI: Oxford, U.K., 2000
Watts, R., Johnsen, V. L., Shearer, J. & Hittel, D. S. Myostatin-induced inhibition of the
long noncoding RNA Malat1 is associated with decreased myogenesis. Cell Physiology
304, C995–C1001 (2013).

References
237
Wei, W. et al. miR-130a regulates differential lipid accumulation between intramuscular
and subcutaneous adipose tissues of pigs via suppressing PPARG expression. Gene 636,
23–29 (2017).
Willer, C. J. et al. Discovery and refinement of loci associated with lipid levels. Nature
Genetics 45, 1274–1283 (2013).
Wolf, J. B. W. Principles of transcriptome analysis and gene expression quantification: An
RNA-Seq tutorial. Molecular Ecology Resources 13, 559–572 (2013).
Wood, J. D. et al. Fat deposition, fatty acid composition and meat quality: A review. Meat
Science 78, 343–358 (2008).
Wu, X. et al. A 6-bp deletion in exon 8 and two mutations in introns of TYRP1 are
associated with blond coat color in Liangshan pigs. Gene 578, 132–136 (2016).
Xu, J. et al. Hepatic carboxylesterase 1 is induced by glucose and regulates postprandial
glucose levels. Plos One 9, e109663 (2014).
Yang, B. et al. Genome-wide SNP data unveils the globalization of domesticated pigs.
Genetics Selection Evolution 49, 71 (2017).
Yang, I. S. & Kim, S. Analysis of Whole Transcriptome Sequencing Data: Workflow and
Software. Genomics & Informatics 13, 119–25 (2015).
Yao, Y. et al. Global profiling of the gene expression and alternative splicing events during
hypoxia-regulated chondrogenic differentiation in human cartilage endplate-derived stem
cells. Genomics 107, 170–177 (2016).
Yoon, A., Tammen, S. A., Park, S., Han, S. N. & Choi, S.-W. Genome-wide hepatic DNA
methylation changes in high-fat diet-induced obese mice. Nutrition Research and
Practice 11, 105–113 (2017).
Young, M. D., Wakefield, M. J., Smyth, G. K. & Oshlack, A. Gene ontology analysis for
RNA-Seq: accounting for selection bias. Genome Biology 11, R14 (2010).
Yu, H., Li, R., Huang, H., Yao, R. & Shen, S. Short-chain fatty acids enhance the lipid
accumulation of 3t3-l1 cells by modulating the expression of enzymes of fatty acid
metabolism. Lipids 53, 77–84 (2018).
Yue, F. et al. A comparative encyclopedia of DNA elements in the mouse genome. Nature
515, 355–364 (2014).
Zhang, S. et al. DNA methylation landscape of fat deposits and fatty acid composition in
obese and lean pigs. Scientific Reports 6, 35063 (2016).
Zhang, Y.-Y. et al. Transcriptome analysis of mRNA and microRNAs in intramuscular fat
tissues of castrated and intact male Chinese Qinchuan cattle. Plos One 12, e0185961
(2017).
Zhang, Z. H. et al. A Comparative Study of Techniques for Differential Expression
Analysis on RNA-Seq Data. PLoS One 9, e103207 (2014).
Zhao, Q.-Y. et al. Global histone modification profiling reveals the epigenomic dynamics
during malignant transformation in a four-stage breast cancer model. Clinical Epigenetics
8, 34 (2016).
Zhao, Y. et al. Dynamic transcriptome profiles of skeletal muscle tissue across 11
developmental stages for both Tongcheng and Yorkshire pigs. BMC Genomics 16, 377
(2015a).

References s
238
Zhou, J. & Chng, W.-J. Roles of thioredoxin binding protein (TXNIP) in oxidative stress,
apoptosis and cancer. Mitochondrion 13, 163–9 (2013).
Zhou, Y. et al. Integrative analysis reveals enhanced regulatory effects of human long
intergenic non-coding RNAs in lung adenocarcinoma. Journal of Genetics and Genomics
42, 423–36 (2015c).
Zhou, Z.-Y. et al. DNA methylation signatures of long intergenic noncoding RNAs in
porcine adipose and muscle tissues. Scientific Reports 5, 15435 (2015b).
Zhou, Z.-Y. et al. Genome-wide identification of long intergenic noncoding RNA genes
and their potential association with domestication in pigs. Genome Biology and Evolution
6, 1387–92 (2014).
Zhu, J. et al. RNA-Seq transcriptome analysis of extensor digitorum longus and soleus
muscles in large white pigs. Molecular Genetics and Genomics 291, 687–701 (2016).
Zhu, Y. et al. Signatures of selection and interspecies introgression in the genome of
chinese domestic pigs. Genome Biology and Evolution 9, 2592–2603 (2017).
Zou, C. et al. Transcriptome analysis reveals long intergenic non-coding RNAs involved in
skeletal muscle growth and development in pig. Scientific Reports 7, 8704 (2017).

References
239
7. Chapte 7: Annexes
Chapter 7

Annexes s
240

Annexes
241
Supplemental material Paper I: "RNA-Seq based detection of differentially
expressed genes in the skeletal muscle of Duroc pigs with distinct lipid profiles"
Annex 1 - Table S1 - Differentially expressed genes in the gluteus medius muscle of HIGH and
LOW pigs (P-value ≤ 0.05). (The complete table is included in the CD-Rom).
Feature ID Gene ID Fold Change q- value P-value LOW - Means HIGH - Means
ENSSSCG00000002041 SLC7A7 -1.20 1.36E-03 1.36E-07 6.02 5.03
ENSSSCG00000007705 1.26 4.28E-03 9.78E-07 2.00 2.52
ENSSSCG00000005648 SLC27A4 1.66 4.28E-03 1.32E-06 1.03 1.71
ENSSSCG00000027946 MVP 1.78 5.97E-03 2.63E-06 14.75 26.30
ENSSSCG00000010514 RRP12 1.25 5.97E-03 3.07E-06 9.14 11.45
ENSSSCG00000002042 OXA1L -1.18 1.36E-02 1.20E-05 62.43 52.69
ENSSSCG00000001435 AGPAT1 1.28 1.36E-02 1.23E-05 7.15 9.19
ENSSSCG00000012914 RAD9A 1.35 1.36E-02 1.24E-05 0.65 0.88
ENSSSCG00000017232 SLC9A3R1 1.72 1.36E-02 1.26E-05 4.84 8.33
ENSSSCG00000003379 KLHL21 1.79 1.43E-02 1.61E-05 6.11 10.93
ENSSSCG00000024814 MAGEB5 -1.41 1.43E-02 1.74E-05 3.81 2.71
ENSSSCG00000005935 AGO2 1.59 1.43E-02 1.77E-05 3.34 5.32
ENSSSCG00000020963 EPDR1 -1.30 1.48E-02 1.98E-05 25.34 19.42
ENSSSCG00000011740 SERPINI1 -1.81 1.72E-02 2.48E-05 0.34
ENSSSCG00000001931 GRAMD2 -1.58 1.76E-02 2.74E-05 2.75 1.74
ENSSSCG00000007574 SDK1 1.58 1.76E-02 2.97E-05 0.24
ENSSSCG00000022373 JMJD6 1.38 1.76E-02 3.18E-05 12.98 17.96
ENSSSCG00000011444 NT5DC2 1.54 1.76E-02 3.26E-05 3.12 4.81
ENSSSCG00000011398 SEMA3F 1.41 1.82E-02 3.56E-05 2.66 3.76
ENSSSCG00000001679 1.41 1.84E-02 3.77E-05 6.25 8.80
ENSSSCG00000007745 SUMF2 -1.54 1.95E-02 4.21E-05 7.38 4.80
ENSSSCG00000000293 ITGA5 1.72 1.96E-02 4.46E-05 4.56 7.82
ENSSSCG00000023043 BCL2L13 1.16 1.96E-02 4.65E-05 19.45 22.58
ENSSSCG00000007133 ACSS1 1.51 2.09E-02 5.18E-05 7.25 10.96
ENSSSCG00000028814 SOD3 1.97 2.09E-02 5.37E-05 0.89 1.75
ENSSSCG00000006277 SPIDR 2.04 2.19E-02 5.90E-05 6.94 14.18
ENSSSCG00000003000 ITPKC 1.49 2.19E-02 6.07E-05 1.41 2.10
ENSSSCG00000003267 MBOAT7 1.27 2.23E-02 6.44E-05 3.35 4.25
ENSSSCG00000024295 SIAH2 1.43 2.46E-02 7.35E-05 3.57 5.12
ENSSSCG00000026817 ZNF646 1.26 2.55E-02 7.91E-05 1.29 1.62
ENSSSCG00000010986 1.26 2.55E-02 8.13E-05 8.39 10.61
ENSSSCG00000003134 GRWD1 1.26 2.88E-02 9.84E-05 10.53 13.26
ENSSSCG00000028197 PFKL 1.42 2.88E-02 1.01E-04 2.96 4.22
ENSSSCG00000007554 ZFAND2A 2.54 2.88E-02 1.01E-04 11.81 29.98
ENSSSCG00000000431 1.24 2.91E-02 1.06E-04 2.49 3.08
ENSSSCG00000010070 SMARCB1 1.19 2.91E-02 1.08E-04 9.58 11.39
ENSSSCG00000003105 SLC1A5 1.67 3.07E-02 1.17E-04 3.21 5.37
ENSSSCG00000006635 SEMA6C -1.38 3.10E-02 1.21E-04 28.68 20.80
ENSSSCG00000012655 BCORL1 1.44 3.11E-02 1.26E-04 0.54 0.78

Annexes s
242
ENSSSCG00000012886 1.18 3.11E-02 1.28E-04 2.65 3.12
ENSSSCG00000010529 SFRP5 2.03 3.11E-02 1.31E-04 1.98 4.02
ENSSSCG00000006245 SDR16C5 3.02 3.15E-02 1.36E-04 0.58 1.77
ENSSSCG00000001701 HSP90AB1 1.35 3.31E-02 1.47E-04 83.96 113.70
ENSSSCG00000013579 CD209 1.95 3.31E-02 1.50E-04 1.32 2.57
ENSSSCG00000004388 ARMC2 -1.43 3.35E-02 1.55E-04 0.30 0.21
ENSSSCG00000024235 NPLOC4 1.19 3.40E-02 1.63E-04 45.12 53.82
ENSSSCG00000010107 MED15 1.24 3.40E-02 1.65E-04 11.94 14.82
ENSSSCG00000022227 BRD4 1.22 3.40E-02 1.71E-04 8.56 10.45
ENSSSCG00000017882 MYBBP1A 1.21 3.40E-02 1.72E-04 16.87 20.36
ENSSSCG00000016207 FAM134A 1.16 3.46E-02 1.79E-04 18.18 21.05
ENSSSCG00000017479 WIPF2 1.22 3.46E-02 1.82E-04 1.97 2.40
ENSSSCG00000027689 SRM 1.36 3.46E-02 1.85E-04 3.33 4.52
ENSSSCG00000017774 FAM222B 1.20 3.46E-02 1.89E-04 2.07 2.49
ENSSSCG00000016775 ZNF777 1.16 3.46E-02 1.94E-04 7.80 9.04
ENSSSCG00000017835 CLUH 1.34 3.46E-02 1.96E-04 18.74 25.07
ENSSSCG00000008232 RNF181 -2.09 3.57E-02 2.05E-04 20.92 9.99
ENSSSCG00000030165 MAFF 1.67 3.72E-02 2.22E-04 12.50 20.89
ENSSSCG00000027779 TMEM259 1.17 3.72E-02 2.22E-04 28.80 33.63
ENSSSCG00000005943 ST3GAL1 1.42 3.75E-02 2.27E-04 2.58 3.67
ENSSSCG00000006496 LMNA 1.28 3.87E-02 2.39E-04 47.69 60.85
ENSSSCG00000001004 SLC22A23 1.42 4.30E-02 2.70E-04 4.34 6.15
ENSSSCG00000014084 POC5 -1.39 4.33E-02 2.76E-04 2.34 1.69
ENSSSCG00000013475 NCLN 1.16 4.47E-02 2.90E-04 8.75 10.19
ENSSSCG00000022528 DAZAP1 1.21 4.57E-02 3.03E-04 20.96 25.42
ENSSSCG00000008550 SLC5A6 1.47 4.57E-02 3.05E-04 7.49 11.02
ENSSSCG00000024437 AP2M1 1.25 4.92E-02 3.34E-04 70.29 87.59
ENSSSCG00000024577 1.23 5.05E-02 3.48E-04 427.48 523.91
ENSSSCG00000013303 ABTB2 1.95 5.05E-02 3.53E-04 0.38 0.74
ENSSSCG00000003138 HSD17B14 1.24 5.08E-02 3.62E-04 2.94 3.65
ENSSSCG00000016648 -1.45 5.08E-02 3.67E-04 1.27 0.88
ENSSSCG00000008040 TSC2 1.13 5.08E-02 3.71E-04 5.86 6.65
ENSSSCG00000002824 1.93 5.21E-02 3.88E-04 1.10 2.12
ENSSSCG00000023044 FASN 2.06 5.21E-02 3.91E-04 11.85 24.45
ENSSSCG00000005664 LRRC8A 1.26 5.56E-02 4.36E-04 2.87 3.61
ENSSSCG00000001398 SLA-6 -1.40 5.56E-02 4.46E-04 4.00 2.85
ENSSSCG00000006518 HCN3 1.26 5.56E-02 4.53E-04 0.75 0.94
ENSSSCG00000014859 SERPINH1 1.48 5.56E-02 4.53E-04 30.63 45.18
ENSSSCG00000001700 SLC29A1 1.21 5.56E-02 4.62E-04 10.07 12.18
ENSSSCG00000004367 POPDC3 1.20 5.56E-02 4.67E-04 49.18 58.92
ENSSSCG00000002826 CES1* 2.03 5.56E-02 4.68E-04 1.14 2.31
ENSSSCG00000030182 DEDD2 1.42 5.56E-02 4.69E-04 3.90 5.54
ENSSSCG00000005315 CA9 -1.25 5.56E-02 4.71E-04 3.21 2.57
ENSSSCG00000016191 1.29 5.56E-02 4.79E-04 2.05 2.65
ENSSSCG00000009545 COL4A2 1.31 5.56E-02 4.81E-04 21.20 27.73
ENSSSCG00000013745 FARSA 1.24 5.63E-02 4.93E-04 8.33 10.33

Annexes
243
Annex 2 - Table S2 - List of DE genes (P-value ≤ 0.05) detected simultaneously with RNA-Seq
(current work) and microarrays (Cánovas et al. 2010. BMC Genomics 11, 372).
List of Microarray RNA-Seq
common genes Fold-change P-value Fold-change P-value
MVP -1.54 1.00E-07 -1.25 8.15E-04
ZFAND2A -1.62 1.00E-06 -1.23 1.30E-03
MAFF 2.49 1.80E-06 1.90 1.49E-03
SLC5A6 3.09 2.30E-06 1.55 2.14E-02
PRKRA 2.22 2.90E-06 1.67 1.09E-02
TKT 1.92 3.00E-06 1.35 2.99E-03
PBX3 2.12 5.00E-06 1.86 1.89E-02
COL4A1 -2.54 7.30E-06 -1.42 1.68E-02
PGM3 -1.88 8.40E-06 -1.26 3.95E-03
PTX3 -1.53 1.01E-05 -1.20 1.24E-02
PPARD 2.57 3.22E-05 7.92 9.17E-04
TXNRD1 1.55 3.84E-05 1.59 2.16E-02
BAG3 1.70 5.14E-05 1.42 3.21E-02
ORAI1 1.40 5.63E-05 1.34 5.08E-03
ITIH3 1.37 5.88E-05 -1.29 3.76E-02
SNTB1 1.59 1.31E-04 1.41 1.14E-03
PPP1R3B 1.39 1.43E-04 1.25 3.26E-02
NPC2 2.33 1.47E-04 3.27 5.33E-03
SLC25A17 1.72 1.77E-04 2.54 1.01E-04
AQP3 1.69 1.86E-04 1.51 2.76E-02
SHISA2 1.43 2.15E-04 1.34 5.07E-03
CABLES2 -1.56 2.45E-04 -1.30 4.37E-02
MLF1 -1.37 3.09E-04 -1.11 3.98E-02
AVL9 1.33 3.18E-04 1.38 5.24E-03
NPC1 1.56 3.29E-04 1.46 1.27E-03
SQRDL 1.65 3.56E-04 1.42 6.32E-04
AMPD3 1.34 3.69E-04 1.45 2.60E-03
CHCHD4 1.60 3.70E-04 1.44 1.39E-02
HSPB1 2.30 4.02E-04 1.20 4.39E-03
RXRG 1.32 5.18E-04 -1.24 1.95E-02
TLR1 1.47 5.25E-04 1.66 1.04E-02
CIDEA -1.41 5.32E-04 -1.36 6.38E-04
ANXA2 1.33 5.43E-04 1.54 1.04E-02
SFRP1 1.56 6.20E-04 1.35 5.82E-03
NQO1 1.42 6.60E-04 1.33 3.96E-02
B4GALT5 -1.49 6.76E-04 -1.34 1.90E-02
TMEM38A -1.39 7.58E-04 -1.12 1.40E-02
SCD 1.28 7.88E-04 1.25 3.48E-02
SH3GL1 1.33 1.32E-03 1.42 4.21E-02
MS4A2 1.49 1.35E-03 1.33 1.67E-02
PPP1R15A -1.51 1.36E-03 -1.10 2.45E-02
GMPR -1.29 1.51E-03 -1.28 4.30E-03
AQP4 -1.30 1.59E-03 -1.14 2.91E-02
SEC31A -1.39 1.64E-03 -1.27 8.72E-03
CHORDC1 1.64 1.68E-03 1.45 3.38E-02
HSPH1 1.67 1.73E-03 -1.45 9.34E-03
IGFBP5 -1.29 1.74E-03 1.17 3.55E-02
FAM35A -1.50 1.74E-03 -1.26 6.03E-04
PPARG -1.30 1.82E-03 -1.24 4.84E-02

Annexes s
244
LIPE -1.31 2.30E-03 -1.69 1.62E-02
ACACA 1.25 2.61E-03 1.22 2.69E-02
BMP1 -1.38 2.71E-03 -1.15 4.23E-02
TBC1D20 1.27 2.73E-03 1.78 2.63E-06
YWHAH 1.38 2.76E-03 1.42 1.51E-02
GPD1 1.26 2.90E-03 1.47 3.05E-04
IGF1R 1.56 3.14E-03 1.32 2.15E-02
CCDC86 1.48 3.20E-03 1.68 3.38E-02
HSPA2 1.39 3.42E-03 1.12 1.80E-02
HOXB6 1.25 3.44E-03 1.25 2.29E-02
LRP11 -1.30 3.56E-03 -1.27 4.80E-03
RETSAT 3.17 3.88E-03 1.96 1.50E-02
TTC9 1.28 4.01E-03 1.27 7.28E-04
ICMT -1.44 4.06E-03 1.22 4.19E-02
FAM73B 1.26 4.41E-03 1.16 2.23E-02
ADAMTS1 1.39 4.84E-03 1.29 2.61E-02
SH3PXD2A 1.37 5.24E-03 1.67 2.22E-04
UHRF1BP1 1.31 5.25E-03 1.36 2.00E-02
BMP5 -1.57 5.78E-03 -1.56 2.01E-03
GPM6B -1.36 6.06E-03 -1.23 1.68E-02
RAMP2 -1.44 6.32E-03 -1.29 4.06E-02
ITGB3 -1.30 6.38E-03 -1.27 1.93E-03
FOXN3 1.55 8.06E-03 1.45 1.80E-02
METRNL 1.26 8.10E-03 1.61 5.95E-03
PDGFRL -1.36 8.15E-03 -1.29 2.91E-02
MAN2A1 1.23 8.48E-03 1.30 9.21E-04
TES 1.24 9.84E-03 1.18 3.34E-02
Annex 3 - Table S3 - Differentially expressed genes in the gluteus medius muscle of HIGH
and LOW pigs (P-value ≤ 0.01 and fold-change ≥ 1.5).
Feature ID Gene ID Fold Change q- value P-value LOW - Means HIGH - Means
ENSSSCG00000005648 SLC27A4 1.66 4.28E-03 1.32E-06 1.03 1.71
ENSSSCG00000027946 MVP 1.78 5.97E-03 2.63E-06 14.75 26.30
ENSSSCG00000017232 SLC9A3R1 1.72 1.36E-02 1.26E-05 4.84 8.33
ENSSSCG00000003379 KLHL21 1.79 1.43E-02 1.61E-05 6.11 10.93
ENSSSCG00000005935 AGO2 1.59 1.43E-02 1.77E-05 3.34 5.32
ENSSSCG00000011740 SERPINI1 -1.81 1.72E-02 2.48E-05 0.34
ENSSSCG00000001931 GRAMD2 -1.58 1.76E-02 2.74E-05 2.75 1.74
ENSSSCG00000007574 SDK1 1.58 1.76E-02 2.97E-05 0.24
ENSSSCG00000011444 NT5DC2 1.54 1.76E-02 3.26E-05 3.12 4.81
ENSSSCG00000007745 SUMF2 -1.54 1.95E-02 4.21E-05 7.38 4.80
ENSSSCG00000000293 ITGA5 1.72 1.96E-02 4.46E-05 4.56 7.82
ENSSSCG00000007133 ACSS1 1.51 2.09E-02 5.18E-05 7.25 10.96
ENSSSCG00000028814 SOD3 1.97 2.09E-02 5.37E-05 0.89 1.75
ENSSSCG00000006277 SPIDR 2.04 2.19E-02 5.90E-05 6.94 14.18
ENSSSCG00000007554 ZFAND2A 2.54 2.88E-02 1.01E-04 11.81 29.98
ENSSSCG00000003105 SLC1A5 1.67 3.07E-02 1.17E-04 3.21 5.37

Annexes
245
ENSSSCG00000010529 SFRP5 2.03 3.11E-02 1.31E-04 1.98 4.02
ENSSSCG00000006245 SDR16C5 3.02 3.15E-02 1.36E-04 0.58 1.77
ENSSSCG00000013579 CD209 1.95 3.31E-02 1.50E-04 1.32 2.57
ENSSSCG00000008232 RNF181 -2.09 3.57E-02 2.05E-04 20.92 9.99
ENSSSCG00000030165 MAFF 1.67 3.72E-02 2.22E-04 12.50 20.89
ENSSSCG00000013303 ABTB2 1.95 5.05E-02 3.53E-04 0.38 0.74
ENSSSCG00000002824 1.93 5.21E-02 3.88E-04 1.10 2.12
ENSSSCG00000023044 FASN 2.06 5.21E-02 3.91E-04 11.85 24.45
ENSSSCG00000002826 CES1 2.03 5.56E-02 4.68E-04 1.14 2.31
ENSSSCG00000012051 RUNX1 1.99 5.63E-02 5.01E-04 4.16 8.27
ENSSSCG00000027426 BCL3 1.74 5.63E-02 5.17E-04 1.82 3.16
ENSSSCG00000030995 PRAF2 1.84 5.64E-02 5.34E-04 0.93 1.71
ENSSSCG00000011557 CIDEC 2.46 5.77E-02 5.64E-04 3.90 9.58
ENSSSCG00000010046 GNAZ 1.56 5.94E-02 6.05E-04 0.22 0.35
ENSSSCG00000010253 HK1 1.55 5.94E-02 6.37E-04 3.07 4.75
ENSSSCG00000013637 QTRT1 1.53 5.94E-02 6.37E-04 1.63 2.50
ENSSSCG00000003951 C1orf210 -1.66 5.94E-02 6.42E-04 0.27
ENSSSCG00000029533 SEMA4G 1.52 6.12E-02 6.86E-04 0.44 0.67
ENSSSCG00000002825 CES1 2.41 6.17E-02 6.98E-04 1.24 2.98
ENSSSCG00000017403 STAT3 1.62 6.25E-02 7.20E-04 21.42 34.61
ENSSSCG00000017168 SEPT9 1.82 6.50E-02 7.99E-04 6.10 11.08
ENSSSCG00000027969 AHNAK 1.61 6.50E-02 8.03E-04 30.56 49.19
ENSSSCG00000012970 CTSW -1.88 6.50E-02 8.13E-04 0.88 0.47
ENSSSCG00000007208 TRIB3 2.86 6.71E-02 8.69E-04 0.41 1.16
ENSSSCG00000011727 PTX3 7.92 6.79E-02 9.17E-04 1.74 13.76
ENSSSCG00000029944 FASN 2.00 6.79E-02 9.21E-04 5.04 10.07
ENSSSCG00000017767 TLCD1 1.71 7.21E-02 1.09E-03 0.62 1.07
ENSSSCG00000013292 PRR5L 1.69 7.68E-02 1.27E-03 0.43 0.72
ENSSSCG00000003458 EFHD2 1.57 7.68E-02 1.30E-03 6.73 10.58
ENSSSCG00000008121 GPAT2 -1.58 7.83E-02 1.34E-03 0.22
ENSSSCG00000011451 ITIH3 1.90 8.39E-02 1.49E-03 1.48 2.82
ENSSSCG00000010974 CNTFR 1.57 8.39E-02 1.49E-03 10.27 16.08
ENSSSCG00000001844 PLIN1 2.23 8.78E-02 1.61E-03 4.15 9.24
ENSSSCG00000005465 SUSD1 -1.76 9.27E-02 1.88E-03 1.51 0.86
ENSSSCG00000022797 PPP1R3B -1.56 9.60E-02 2.01E-03 14.82 9.48
ENSSSCG00000030018 ZNF396 -1.54 9.89E-02 2.10E-03
ENSSSCG00000010926 SYT2 1.84 1.01E-01 2.16E-03 0.29
ENSSSCG00000016381 SNED1 1.75 1.02E-01 2.20E-03 0.64 1.12
ENSSSCG00000000362 RDH5 1.83 1.03E-01 2.28E-03 0.35 0.64
ENSSSCG00000013432 MIDN 1.52 1.07E-01 2.40E-03 13.43 20.36
ENSSSCG00000021143 LIPC -1.52 1.10E-01 2.54E-03 0.57 0.37
ENSSSCG00000024982 LITAF 1.61 1.10E-01 2.57E-03 3.38 5.46
ENSSSCG00000024108 SLC43A2 1.51 1.12E-01 2.62E-03 40.71 61.60
ENSSSCG00000014012 GFPT2 1.75 1.14E-01 2.74E-03 1.39 2.43
ENSSSCG00000008985 SOWAHB 2.01 1.15E-01 2.88E-03 0.65 1.30
ENSSSCG00000022004 SH3BP2 1.62 1.16E-01 2.94E-03 0.77 1.25

Annexes s
246
ENSSSCG00000015089 JAML -1.52 1.16E-01 2.96E-03 0.43 0.28
ENSSSCG00000008193 ZAP70 -1.89 1.20E-01 3.12E-03
ENSSSCG00000023038 -3.22 1.23E-01 3.25E-03 1.49 0.46
ENSSSCG00000026832 CSF1 1.61 1.25E-01 3.34E-03 0.92 1.48
ENSSSCG00000015092 CD3E -1.70 1.26E-01 3.46E-03 0.53 0.31
ENSSSCG00000000672 CLSTN3 1.58 1.26E-01 3.53E-03
ENSSSCG00000028056 ZFP36 1.81 1.26E-01 3.59E-03 44.78 80.95
ENSSSCG00000017472 IGFBP4 1.65 1.27E-01 3.68E-03 4.81 7.91
ENSSSCG00000003699 GREB1L -1.52 1.30E-01 3.78E-03 1.28 0.84
ENSSSCG00000027684 TRIM63 1.61 1.42E-01 4.57E-03 454.79 730.90
ENSSSCG00000015522 ANGPTL1 -1.83 1.46E-01 5.07E-03 0.88 0.48
ENSSSCG00000022492 AMPD3 3.27 1.50E-01 5.33E-03 8.24 26.95
ENSSSCG00000028568 HSPB1 1.61 1.54E-01 5.65E-03 470.31 757.67
ENSSSCG00000013263 CREB3L1 1.50 1.56E-01 5.91E-03 1.55 2.34
ENSSSCG00000024482 HSPB1 1.61 1.56E-01 5.95E-03 470.75 757.42
ENSSSCG00000011286 KLHL40 1.86 1.58E-01 6.10E-03 154.69 288.09
ENSSSCG00000018047 FAM83G 1.79 1.59E-01 6.19E-03 0.79 1.41
ENSSSCG00000008217 CD8A -2.03 1.61E-01 6.42E-03 0.28
ENSSSCG00000023176 TROAP -1.56 1.62E-01 6.54E-03
ENSSSCG00000013669 PIN1 -1.68 1.67E-01 6.92E-03 4.52 2.68
ENSSSCG00000011934 PLCXD2 1.76 1.69E-01 7.13E-03 1.01 1.77
ENSSSCG00000009314 FLT3 -1.79 1.72E-01 7.36E-03
ENSSSCG00000012277 TIMP1 5.35 1.74E-01 7.64E-03 6.29 33.63
ENSSSCG00000000641 KLRK1 -2.07 1.74E-01 7.65E-03 0.63 0.31
ENSSSCG00000006416 ACKR1 1.59 1.75E-01 7.69E-03 5.11 8.13
ENSSSCG00000012844 SLC25A22 1.51 1.75E-01 7.91E-03 1.58 2.38
ENSSSCG00000013735 JUNB 1.72 1.80E-01 8.32E-03 22.87 39.30
ENSSSCG00000013144 MPEG1 -1.54 1.81E-01 8.47E-03 0.95 0.61
ENSSSCG00000021651 SCN2B -1.95 1.83E-01 8.67E-03
ENSSSCG00000030369 KIAA1522 1.55 1.84E-01 8.87E-03 0.31 0.48
ENSSSCG00000024344 CCR5 -1.82 1.86E-01 9.19E-03 0.40 0.22
ENSSSCG00000004092 1.58 1.86E-01 9.19E-03 0.30 0.48
ENSSSCG00000002866 CEBPA 1.64 1.86E-01 9.30E-03 0.71 1.17
ENSSSCG00000010479 RBP4 1.69 1.86E-01 9.42E-03 0.86 1.45

Annexes
247
Annex 4 - Table S4 - Enriched pathways identified by IPA when using the data set of 96
differentially expressed genes (P-value ≤ 0.01 and fold-change ≥ 1.5). Ratio: number of DE
genes in a pathway divided by the number of genes comprised in the same pathway.
Ingenuity Canonical Pathways -log(P-value) Ratio Nodes
Acute Myeloid Leukemia Signaling 3.22 4/91 CEBPA, FLT3, RUNX1,
STAT3
Hematopoiesis from Pluripotent Stem Cells 2.98 3/47 CD3E, CD8E, CSF1
Primary Immunodeficiency Signaling 2.96 3/48 CD3E, CD8E, ZAP70
Hepatic Fibrosis / Hepatic Stellate Cell Activation 2.12 4/183 CCR5, CSF1, IGFBP4,
TIMP1
TR/RXR Activation 2.08 3/98 BCL3, FASN, SYT2
Palmitate Biosynthesis I (Animals) 2.07 1/2 FASN
Fatty Acid Biosynthesis Initiation II 2.07 1/2 FASN
CTLA4 Signaling in Cytotoxic T Lymphocytes 2.07 3/99 CD3E, CD8A, ZAP70
Retinoate Biosynthesis I 2.04 2/34 RDH5, SDR16C5
Stearate Biosynthesis I (Animals) 2.02 2/35 FASN, SLC27A4
T Cell Receptor Signaling 1.95 1/109 CD3E, CD8A, ZAP70
Retinol Biosynthesis 1.9 2/40 CES1, LIPC
Natural Killer Cell Signaling 1.82 2/122 KLRK1, SH3BP2,
ZAP70
IL-9 Signaling 1.81 2/45 BCL3, STAT3
Triacylglycerol Degradation 1.81 2/45 CES1, LIPC
FXR/RXR Activation 1.78 3/126 FASN, LIPC, RBP4
Acetate Conversion to Acetyl-CoA 1.77 1/4 ACSS1
Phospholipase C Signaling 1.74 4/237 AHNAK, CD3E, ITGA5,
ZAP70
Trehalose Degradation II (Trehalase) 1.68 1/5 HK1
UDP-N-acetyl-D-glucosamine Biosynthesis II 1.6 1/6 GFPT2
CNTF Signaling 1.53 2/63 CNTFR, STAT3
PCP pathway 1.53 2/63 HSPB1, JUNB
Calcium-induced T Lymphocyte Apoptosis 1.5 2/66 CD3E, ZAP70
Superoxide Radicals Degradation 1.47 1/8 SOD8
IL-10 Signaling 1.47 2/68 CCR5, STAT3
CCR5 Signaling in Macrophages 1.46 2/69 CCR5, CD3E
Acute Phase Response Signaling 1.46 3/169 ITIH3, RBP4, STAT3
Tec Kinase Signaling 1.45 3/170 GNAZ, ITGA5, STAT3
Pathogenesis of Multiple Sclerosis 1.43 1/9 CCR5
GDP-glucose Biosynthesis 1.42 1/9 HK1
Ephrin Receptor Signaling 1.42 3/174 GNAZ, ITGA5, STAT3
GM-CSF Signaling 1.42 2/73 RUNX1, STAT3

Annexes s
248
TREM1 Signaling 1.39 2/75 ITGA5, STAT3
Glucose and Glucose-1-phosphate Degradation 1.38 1/10 HK1
Role of Macrophages, Fibroblasts and Endothelial Cells in
Rheumatoid Arthritis 1.37 4/309
CEBPA, CSFA1, SFRP5,
STAT3
Role of NFAT in Regulation of the Immune Response 1.36 3/185 CD3E, GNAZ, ZAP70
Regulation of IL-2 Expression in Activated and Anergic T
Lymphocytes 1.35 2/79 CD3E, ZAP70
UDP-N-acetyl-D-galactosamine Biosynthesis II 1.34 1/11 HK1
Growth Hormone Signaling 1.33 2/81 CEBPA, STAT3
Macropinocytosis Signaling 1.33 2/81 CSF1, ITGA5
RAR Activation 1.33 3/190 RBP4, RDH5, SDR16C5
NRF2-mediated Oxidative Stress Response 1.31 3/193 JUNB, MAFF, SOD3
Hematopoiesis from Multipotente Stem Cells 1.3 1/12 CSF1, ITGA5
FLT3 Signaling in Hematopoietic Progenitor Cells 1.3 2/85 FLT3, STAT3
Annex 5 - Table S5 - Pathways identified by Reactome as enriched in differentially expressed
genes (P-value ≤ 0.01 and fold-change ≥ 1.5)
GeneSet Ratio P-value Q-value Nodes
Hematopoietic cell lineage(K) 5/87 3.50E-07 5.99E-05 CD8A, FLT3, CD3E, CSF1,
ITGA5
Acute myeloid leukemia(K) 4/57 2.79E-06 2.37E-04 CEBPA, FLT3, STAT3,
RUNX1
Primary immunodeficiency(K) 3/36 3.43E-05 1.96E-03 CD8A, CD3E, ZAP70
IL6-mediated signaling events(N) 3/47 7.55E-05 3.17E-03 JUNB, STAT3, TIMP1
TCR signaling in naive CD8+ T cells(N) 3/54 1.14E-04 3.86E-03 CD8A, CD3E, ZAP70
IL12-mediated signaling events(N) 3/61 1.63E-04 4.49E-03 CD8A, CD3E, STAT3
Downstream signaling in naive CD8+ T
cells(N) 3/64 1.87E-04 4.49E-03 CD8A, CD3E, JUNB
TCR signaling in naive CD4+ T cells(N) 3/67 2.14E-04 4.49E-03 CD3E, ZAP70, SH3BP2
CXCR4-mediated signaling events(N) 3/80 3.59E-04 6.82E-03 GNAZ, CD3E, STAT3
T cell receptor signaling pathway(K) 3/104 7.68E-04 0.0131 CD8A, CD3E, ZAP70
TNF signaling pathway(K) 3/110 9.03E-04 0.0135 CSF1, JUNB, BCL3
IL12 signaling mediated by STAT4(N) 2/31 1.36E-03 0.0191 CD3E, STAT3
Signaling events mediated by TCPTP(N) 2/35 1.73E-03 0.022 CSF1, STAT3
IL23-mediated signaling events(N) 2/36 1.83E-03 0.022 CD3E, STAT3
Transcriptional misregulation in cancer(K) 3/179 3.61E-03 0.0376 CEBPA, FLT3, RUNX1
Signaling events mediated by PTP1B(N) 2/52 3.76E-03 0.0376 CSF1, STAT3
Pathways in cancer(K) 4/397 4.51E-03 0.0451 CEBPA, FLT3, STAT3,
RUNX1
Costimulation by the CD28 family(R) 2/63 5.45E-03 0.0491 CD3E, TRIB3

Annexes
249
AP-1 transcription factor network(N) 2/70 6.68E-03 0.0601 JUNB, TIMP1
T cell activation(P) 2/81 8.85E-03 0.0708 CD3E, ZAP70
HIF-1 signaling pathway(K) 2/103 0.014 0.0974 STAT3, TIMP1
S1P5 pathway(N) 1/8 0.014 0.0974 GNAZ
Insulin resistance(K) 2/109 0.0156 0.0974 TRIB3, STAT3
TCR signaling(R) 2/120 0.0186 0.0974 CD3E, ZAP70
lck and fyn tyrosine kinases in initiation of
tcr activation(B) 1/11 0.0192 0.0974 CD3E
Osteoclast differentiation(K) 2/131 0.022 0.0974 CSF1, JUNB
Measles(K) 2/134 0.0229 0.0974 CD3E, STAT3
Natural killer cell mediated cytotoxicity(K) 2/134 0.0229 0.0974 ZAP70, SH3BP2
Atypical NF-kappaB pathway(N) 1/14 0.0244 0.0974 BCL3
Stress induction of hsp regulation(B) 1/14 0.0244 0.0974 HSPB1
Oxidative stress induced gene expression via
nrf2(B) 1/14 0.0244 0.0974 MAFF
S1P4 pathway(N) 1/14 0.0244 0.0974 GNAZ
Downregulated of mta-3 in er-negative
breast tumors(B) 1/18 0.0313 0.0974 HSPB1
Mets affect on macrophage
differentiation(B) 1/18 0.0313 0.0974 CSF1
Gata3 participate in activating the th2
cytokine genes expression(B) 1/18 0.0313 0.0974 JUNB
S1P1 pathway(N) 1/19 0.033 0.0974 GNAZ
The co-stimulatory signal during t-cell
activation(B) 1/20 0.0347 0.0974 CD3E
Sphingosine 1-phosphate (S1P) pathway(N) 1/21 0.0364 0.0974 GNAZ
p38 signaling mediated by MAPKAP
kinases(N) 1/21 0.0364 0.0974 HSPB1
Growth hormone receptor signaling(R) 1/24 0.0415 0.0974 STAT3
Role of mef2d in t-cell apoptosis(B) 1/25 0.0432 0.0974 CD3E
S1P3 pathway(N) 1/25 0.0432 0.0974 GNAZ
Nongenotropic Androgen signaling(N) 1/25 0.0432 0.0974 GNAZ
VEGFR3 signaling in lymphatic
endothelium(N) 1/25 0.0432 0.0974 ITGA5
S1P2 pathway(N) 1/26 0.0448 0.0974 GNAZ
IL27-mediated signaling events(N) 1/26 0.0448 0.0974 STAT3
Calcium signaling in the CD4+ TCR
pathway(N) 1/27 0.0465 0.0974 JUNB
Epstein-Barr virus infection(K) 2/200 0.0477 0.0974 STAT3, HSPB1
Proteoglycans in cancer(K) 2/203 0.049 0.0974 STAT3, ITGA5
EGF receptor (ErbB1) signaling pathway(N) 1/29 0.0499 0.0974 STAT3

Annexes s
250
Annex 6 - Table S6: Regulatory networks of genes that are differentially expressed (P-value ≤
0.01 and fold-change ≥ 1.5) in HIGH and LOW pigs
Top Diseases and Functions Molecules DE in the Network Score Focus
Molecules
Cardiovascular Disease, Cardiovascular System
Development and Function, Organismal Injury and
Abnormalities
ANGTL1, BLC3, CD209, CREB3L1,
CSF1, GFPT2, HK1, ITGA5, JUNB,
KLHL21, MAFF, MPEG1, MVP,
PIN1, SEPT9, SL9A3R1, TIMP1,
TRIB3
36 18
Hereditary Disorder, Immunological Disease,
Organismal Injury and Abnormalities
CD3E, CD8A, CES1, CIDEC,
EFHD2, FASN, GNAZ, IGFBP4,
KLRC4-KLRK1/KLRK1, LIPC,
LITAF, PTX3, RBP4, SH3BP2,
ZAP70
31 15
Cell-To-Cell Signaling and Interaction, Small
Molecule Biochemistry, Cell Death and Survival
ABTB2, AMPD3, CLSTN3, FAM83G,
GREB1L, QTRT1, RNF181, SDK1,
SEMA4G, SLC43A2, SNED1, SYT2,
ZNF396
24 13
Cellular Development, Cellular Growth and
Proliferation, Hematological System Development and
Function
CCR5, CNTFR, CTSW, FLT3,
HSPB1, PRAF2, PRR5L, RUNX1,
SOD3, STAT3, ZFAND2A, ZFP36
22 12
Cell Cycle, Cell-To-Cell Signaling and Interation,
Cellular Growth and Proliferation
ACKR1, ACSS1, AHNAK, ITIH3,
JAML, KIAA1522, KLHL40, PP1R3B,
PTX3, SCN2B, SLC25A22, SPIDR
22 12
Tissue Development, Hematological System
Development and Function, Hematopoiesis
AGO2, CEBPA, MIDN, RDH5,
SERPINI1, SFRP5, SLC27A4,
TRIMP63
13 8
Cellular Function nd Maintenance, Inflammatory
Responder, Organismal Injury and Abnormalities
NT5DC2, SLC1A5, SUMF2, SUSD1,
TROAP 7 5
Behavior, Cancer, Cardiovascular Disease PLCXD2 2 1
Lipids Metabolism, Small Molecule Biochemistry,
Cancer GPAT2 2 1
Developmental Disorder, Hereditary Disorder,
Neurogical Disease TLCD1 2 1
Connective Tissue Development and Function,
Lymphoid Tissue Structure and Development, Skeletal
and Muscular System Development and Function
SDR16C5 2 1

Annexes
251
Annex 7 - Table S7 - Non-coding transcripts expressed in the gluteus medius muscle of HIGH
and LOW pigs. (The complete table is included in the CD-Rom).
Feature ID Gene ID Size FC P-value LOW -
Means
HIGH -
Means
Transcript
type
ENSSSCG00000031004 CH242-
227G20.3 1833 -1.44
2.46E-
03 1879.03 1302.25 lincRNA
ENSSSCG00000031028 CH242-
15C8.2 1495 -1.34 0.01 1987.17 1484.83 lincRNA
ENSSSCG00000015579 PTGS2 3601 -1.47 0.02 36.29 24.67 processed_
transcript
ENSSSCG00000030904 CU468594.10 1083 -1.49 0.03 1058.89 711.39 non_coding
ENSSSCG00000001227 TMP-SLA-3 1767 -1.31 0.03 32900.06 25085.39 processed_
transcript
ENSSSCG00000030767 TMP-SLA-5 1147 -1.29 0.03 10275.63 7958.96 processed_
transcript
ENSSSCG00000015549 RNASEL 2716 -1.87 0.03 21.05 11.24 processed_
transcript
ENSSSCG00000018090 70 -2.05 0.04 1850.59 900.54 Mt_tRNA
ENSSSCG00000001397 TMP-CH242-
74M17.4 1726 -1.27 0.04 11706.02 9186.74
processed_
transcript
ENSSSCG00000001227 TMP-SLA-3 1700 -1.30 0.04 3777.12 2906.70 processed_
anscript
ENSSSCG00000004334 MAP3K7 2818 -1.72 0.04 326.60 189.72 processed_
transcript
ENSSSCG00000015897 IFIH1 3720 -1.60 0.05 168.63 105.27 processed_
transcript
ENSSSCG00000030790 TMP-CH242-
74M17.6 309 -1.25 0.05 25040.66 20022.19
processed_
transcript
ENSSSCG00000030936 CH242-
154K8.2 392 -1.48 0.05 531.81 360.18
processed_
transcript
ENSSSCG00000031041 CU466547.1 347 1.34 0.06 403.45 539.30 processed_
transcript
ENSSSCG00000031015 CH242-
33O21.2 2138 -1.27 0.06 1071.44 845.32 lincRNA
ENSSSCG00000030846 CH242-
358M12.6 474 -1.17 0.06 6460.16 5501.10 antisense
ENSSSCG00000030923 SBAB-
554F3.8 585 -1.26 0.07 321.55 254.22
processed_
transcript
ENSSSCG00000030892 CU302278.1 431 -1.23 0.07 1228.62 1000.86 lincRNA
ENSSSCG00000031025 CH242-
236E18.2 541 -1.44 0.09 100.90 70.23 lincRNA
ENSSSCG00000008841 PDGFRA 2859 -1.31 0.10 115.17 87.69 processed_
transcript
ENSSSCG00000030844 CH242-
100L3.3 766 -1.25 0.10 7239.06 5775.51
processed_
transcript
ENSSSCG00000030916 CH242-
136A20.1 1238 -1.26 0.10 588.78 467.07 lincRNA
ENSSSCG00000001727 TNFRSF21 3489 -1.36 0.10 638.39 469.72 processed_
transcript
ENSSSCG00000001228 TMP-CH242-
74M17.5 1303 -1.24 0.10 3941.47 3168.52
processed_
transcript
ENSSSCG00000010709 PLEKHG2 3630 -1.63 0.11 22.40 13.73 processed_
transcript
ENSSSCG00000024809 CLCN4 4337 -1.87 0.11 203.81 109.18 processed_
transcript
ENSSSCG00000018079 67 -1.24 0.13 70343.42 56715.47 Mt_tRNA
ENSSSCG00000030758 DEFB-104L 564 -1.34 0.14 314.00 233.63 processed_
transcript
ENSSSCG00000001227 TMP-SLA-3 1733 -1.79 0.15 256.54 143.69 processed_
transcript
ENSSSCG00000030773 CH242-
77E21.3 631 -1.29 0.17 941.24 728.98 non_coding

Annexes s
252
ENSSSCG00000026838 IFN-ALPHA-8 901 -1.47 0.18 173.66 117.95 processed_
transcript
ENSSSCG00000030935 CU302278.4 778 -1.13 0.18 25168.39 22345.07 lincRNA
ENSSSCG00000004334 MAP3K7 1740 -1.23 0.20 1302.05 1060.49 processed_
transcript
ENSSSCG00000030939 CH242-
124P4.2 453 -1.13 0.20 13371.03 11795.44
processed_
transcript
ENSSSCG00000007280 ITCH 3517 -1.32 0.21 1707.52 1290.22 processed_
transcript
ENSSSCG00000004600 CH242-
58J12.2 997 -1.41 0.21 54.20 38.55
processed_
transcript
ENSSSCG00000004943 MAP2K1 1423 -1.16 0.21 8488.64 7340.93 processed_
transcript
ENSSSCG00000001396 SLA-8 1305 -1.30 0.21 1614.73 1237.39 processed_
transcript
ENSSSCG00000018096 64 -1.65 0.22 5814.49 3514.84 Mt_tRNA
ENSSSCG00000020977 SH3BGRL 627 -1.17 0.24 1747.69 1498.53 processed_
transcript
ENSSSCG00000001241 ZFP57 1830 -1.58 0.25 138.01 87.60 processed_
transcript
ENSSSCG00000020977 SH3BGRL 352 -1.74 0.26 464.66 266.61 processed_
transcript
ENSSSCG00000020462 SCARNA13 276 -1.36 0.28 248.38 182.28 snoRNA
ENSSSCG00000030436 96 -1.12 0.29 26464.63 23683.55 miRNA
ENSSSCG00000030729 CU468856.1 208 -1.04 0.30 2320.51 2230.78 lincRNA
ENSSSCG00000004600 CH242-
58J12.2 5982 -1.15 0.31 1436.90 1246.19
processed_
transcript
ENSSSCG00000004334 MAP3K7 2737 -1.23 0.32 451.30 367.78 processed_
transcript
ENSSSCG00000010709 PLEKHG2 4268 -1.25 0.32 186.19 148.76 processed_
transcript
ENSSSCG00000026919 snoU89 255 1.19 0.34 351.63 418.10 snoRNA
ENSSSCG00000004334 MAP3K7 1821 -1.53 0.34 140.72 91.91 processed_
transcript
ENSSSCG00000003617 TXLNA 1367 1.45 0.34 437.52 634.85 processed_
transcript
ENSSSCG00000012298 CACNA1F 6038 -1.13 0.35 2486.42 2205.10 processed_
transcript
ENSSSCG00000010709 PLEKHG2 4062 -1.39 0.35 18.64 13.38 processed_
transcript
ENSSSCG00000030871 CU582909.1 1382 -1.04 0.36 91730.05 88401.20 processed_
transcript

Annexes
253
Annex 8 - Table S8: HIGH and LOW group mean values ± standard deviation (SD) for 13
lipid-related traits
HIGH group (N=28) LOW group (N=28)
Mean SD Mean SD
Carcass traits
LW - Live weight (Kg) 131.21 9.45 115.5 16.63
BFTiv - Backfat thickness (in vivo) (mm) 27.05 2.41 21.07 2.98
BFT - Backfat thickness 3rd-4th ribs (mm) 46.18 12.14 35.15 10.7
HFT - Ham fat thickness (mm) 29.09 3.37 20.02 3.67
LEAN - Lean % 39.56 5.35 45.5 3.83
Meat quality traits (gluteus medius)
IMF - % Intramuscular fat 7.21 1.71 3.76 0.95
SFA - % Saturated fatty acids 38.72 1.31 34.65 1.13
PUFA - % Polyunsaturated fatty acids 14.61 2.98 27.75 4.06
MUFA - % Monounsaturated fatty acids 46.67 2.66 37.61 3.97
Serum lipid levels - 190 days
CHOL - Total cholesterol (mg/dl) 167.25 37.23 103.18 16.68
HDL - HDL-cholesterol (mg/dl) 60.43 8.55 44.12 9.12
LDL - LDL-cholesterol (mg/dl) 92.69 36.82 48.95 15.03
TG - Triacylglycerides (mg/dl 70.54 26.06 48.3 27.74

Annexes s
254
Annex 9 - Supplementary Figure S1. Venn diagram indicating the overlap between the set of
differentially expressed genes (P-value ≤ 0.05) detected in the current work (RNA-Seq) and
those identified by Cánovas et al.

Annexes
255
Supplemental material Paper II: "Differential expression of mRNA isoforms in
the skeletal muscle of pigs with distinct growth and fatness profiles "
Annex 10 - Table S1: Distribution of the 56 animals sequenced by RNA-Seq in the 5 half-sib
families reported by Gallardo et al. (2008).
Sire Sequenced offspring - HIGH group Sequenced offspring - LOW group
BL12441 5 8
BL12445 2 7
BR112290 14 6
BR18035 6 6
BR22311 1 1
Annex 11 - Table S2. Primers employed in the validation of four differentially expressed
mRNA isoforms by RT-qPCR.
Primer Sequence 5' to 3'
PIG_ITGA5-001_F_E22 AGTGGCCTTCGGTTCACAGT
PIG_ITGA5-001_R_E22/E23 GAGATTCTTGCTGAGGATTTGGA
PIG_MAFF-001_F_E2 CGGGAGGGCACCTTTTG
PIG_MAFF-001_R_E2/E3 GCTCGCGCTTGATCTTCAG
PIG_RXRG-002_F_E1 TGGGAAACATGCTCCTTCTGT
PIG_RXRG-002_R_E1/E2 GGTTTGATGTCCTCTGAAATGCT
PIG_SCD-001_F_E5 GCCCTTATGACAAGACTATTAGCCC
PIG_SCD-001_R_E6 AAGGTGTGGTGGTAGTTGTGGAA
PIG_TBP_F CAGAATGATCAAACCGAGAATTGT
PIG_TBP_RV CTGCTCTGACTTTAGCACCTGTTAA
PIG_HPRT1_F TCATTATGCCGAGGATTTGGA
PIG_HPRT1_RV CTCTTTCATCACATCTCGAGCAA
PIG_ACTB_F CAAGGACCTCTACGCCAACAC
PIG_ACTB_RV TGGAGGCGCGATGATCTT

Annexes s
256
Annex 12 - Table S3: Alternatively spliced mRNA isoforms identified in the porcine gluteus medius muscle of Duroc pigs by CLC Bio and/or
STAR/RSEM/DESEq2. (The complete table is included in the CD-Rom).
Feature ID Feature transcript ID Gene ID Transcript
ID
Length
(bp)
Relative expression
CLC Bio(%)
Relative expression
STAR/RSEM/DESeq2
(%)
Type
ENSSSCG00000000031 ENSSSCT00000034350 MCAT MCAT-202 1119 2.84 0.56 Protein Coding
ENSSSCG00000000031 ENSSSCT00000035501 MCAT MCAT-203 850 12.73 8.40 Nonsense mediated
decay
ENSSSCG00000000031 ENSSSCT00000000033 MCAT MCAT-201 1396 84.42 90.75 Protein Coding
ENSSSCG00000000031 ENSSSCT00000033405 MCAT MCAT-205 679 - 0.29 Retained intron
ENSSSCG00000000058 ENSSSCT00000023171 SNU13 SNU13-202 1476 13.12 11.60 Protein Coding
ENSSSCG00000000058 ENSSSCT00000000064 SNU13 SNU13-201 1460 86.88 88.40 Protein Coding
ENSSSCG00000000068 ENSSSCT00000000074 EP300 EP300-202 8181 0.67 - Protein Coding
ENSSSCG00000000068 ENSSSCT00000026332 EP300 EP300-201 8364 99.33 100.00 Protein Coding
ENSSSCG00000000076 ENSSSCT00000031184 SGSM3 SGSM3-201 2568 6.44 0.17 Protein Coding
ENSSSCG00000000076 ENSSSCT00000000082 SGSM3 SGSM3-202 2562 93.56 99.83 Protein Coding
ENSSSCG00000000087 ENSSSCT00000000093 TAB1 TAB1-201 2006 0.58 0.18 Protein Coding
ENSSSCG00000000087 ENSSSCT00000035948 TAB1 TAB1-001 2433 99.42 87.23 Protein Coding
ENSSSCG00000000087 ENSSSCT00000033099 TAB1 TAB1-002 591 - 12.59 Retained intron
ENSSSCG00000000095 ENSSSCT00000029543 GTPBP1 GTPBP1-201 3510 3.22 - Protein Coding
ENSSSCG00000000095 ENSSSCT00000000101 GTPBP1 GTPBP1-202 3486 96.78 100.00 Protein Coding
ENSSSCG00000000107 ENSSSCT00000022980 CSNK1E - 1595 7.78 12.70 Protein Coding
ENSSSCG00000000107 ENSSSCT00000000113 CSNK1E - 2686 92.22 87.30 Protein Coding
ENSSSCG00000000110 ENSSSCT00000000116 PLA2G6 PLA2G6-201 2695 8.09 - Protein Coding
ENSSSCG00000000110 ENSSSCT00000022302 PLA2G6 PLA2G6-202 2524 91.91 100.00 Protein Coding
ENSSSCG00000000137 ENSSSCT00000034941 NCF4 NCF4-202 1429 23.69 94.31 Protein Coding
ENSSSCG00000000137 ENSSSCT00000036476 NCF4 NCF4-201 1569 29.56 5.69 Protein Coding
ENSSSCG00000000137 ENSSSCT00000000143 NCF4 NCF4-203 5020 46.75 - Protein Coding
ENSSSCG00000000138 ENSSSCT00000000144 PVALB PVALB-203 558 0.57 5.43 Protein Coding
ENSSSCG00000000138 ENSSSCT00000032626 PVALB PVALB-202 599 0.58 0.44 Protein Coding

Annexes
257
ENSSSCG00000000138 ENSSSCT00000035876 PVALB PVALB-201 585 98.85 94.13 Protein Coding
ENSSSCG00000000157 ENSSSCT00000000165 BPIFC BPIFC-202 2004 46.45 - Protein Coding
ENSSSCG00000000157 ENSSSCT00000036153 BPIFC BPIFC-201 2168 53.55 - Protein Coding
ENSSSCG00000000191 ENSSSCT00000000204 KMT2D KMT2D-202 18097 9.44 - Protein Coding
ENSSSCG00000000191 ENSSSCT00000031953 KMT2D KMT2D-201 18199 90.56 100.00 Protein Coding
ENSSSCG00000000232 ENSSSCT00000000251 ACVRL1 ACVRL1-203 3787 26.21 59.75 Protein Coding
ENSSSCG00000000232 ENSSSCT00000033395 ACVRL1 ACVRL1-201 4044 73.79 19.96 Protein Coding
ENSSSCG00000000232 ENSSSCT00000036596 ACVRL1 ACVRL1-202 764 - 20.29 Processed transcript
ENSSSCG00000000242 ENSSSCT00000000261 CH242-
185F9.2
CH242-
185F9.2-201 346 5.77 14.19 Protein Coding
ENSSSCG00000000242 ENSSSCT00000033904 CH242-
185F9.2
CH242-
185F9.2-001 944 94.23 85.81 Protein Coding
ENSSSCG00000000275 ENSSSCT00000000295 MAP3K12 MAP3K12-
202 2580 30.21 67.39 Protein Coding
ENSSSCG00000000275 ENSSSCT00000024918 MAP3K12 MAP3K12-
201 2983 69.79 32.61 Protein Coding
ENSSSCG00000000278 ENSSSCT00000023450 ATF7 ATF7-201 1652 4.34 0.40 Protein Coding
ENSSSCG00000000278 ENSSSCT00000000299 ATF7 ATF7-202 1619 95.66 99.60 Protein Coding
ENSSSCG00000000293 ENSSSCT00000035821 ITGA5 ITGA5-203 1255 0.34 - Nonsense mediated
decay
ENSSSCG00000000293 ENSSSCT00000033141 ITGA5 ITGA5-205 766 0.59 0.36 Nonsense mediated
decay
ENSSSCG00000000293 ENSSSCT00000034427 ITGA5 ITGA5-204 1013 0.71 - Nonsense mediated
decay
ENSSSCG00000000293 ENSSSCT00000000314 ITGA5 ITGA5-201 4445 98.36 99.64 Protein Coding
ENSSSCG00000000361 ENSSSCT00000032827 CD63 CD63-204 679 0.40 - Protein Coding
ENSSSCG00000000361 ENSSSCT00000032682 CD63 CD63-207 597 0.74 21.91 Protein Coding
ENSSSCG00000000361 ENSSSCT00000035463 CD63 CD63-209 461 0.91 1.94 Protein Coding
ENSSSCG00000000361 ENSSSCT00000000383 CD63 CD63-201 901 5.36 49.05 Protein Coding
ENSSSCG00000000361 ENSSSCT00000033233 CD63 CD63-202 1370 92.60 1.61 Protein Coding
ENSSSCG00000000361 ENSSSCT00000036432 CD63 CD63-211 437 - 0.19 Retained intron
ENSSSCG00000000361 ENSSSCT00000034338 CD63 CD63-203 390 - 0.23 Retained intron
ENSSSCG00000000361 ENSSSCT00000036425 CD63 CD63-205 544 - 0.29 Retained intron

Annexes s
258
ENSSSCG00000000361 ENSSSCT00000036614 CD63 CD63-206 310 - 0.37 Retained intron
ENSSSCG00000000361 ENSSSCT00000035947 CD63 CD63-208 691 - 0.73 Retained intron
ENSSSCG00000000361 ENSSSCT00000034881 CD63 CD63-210 394 - 23.67 Processed transcript
ENSSSCG00000000403 ENSSSCT00000032195 BAZ2A BAZ2A-202 8208 6.08 7.57 Protein Coding
ENSSSCG00000000403 ENSSSCT00000000436 BAZ2A BAZ2A-201 8727 93.92 92.43 Protein Coding
ENSSSCG00000000405 ENSSSCT00000033906 ATP5B ATP5B-201 1565 0.62 1.88 Protein Coding
ENSSSCG00000000405 ENSSSCT00000000438 ATP5B ATP5B-202 1767 99.38 98.12 Protein Coding
ENSSSCG00000000444 ENSSSCT00000000464 DCTN2 - 1411 0.68 - Protein Coding
ENSSSCG00000000444 ENSSSCT00000000479 DCTN2 - 1384 99.32 100.00 Protein Coding
ENSSSCG00000000462 ENSSSCT00000034992 TMEM5 TMEM5-201 450 2.18 6.12 Protein Coding
ENSSSCG00000000462 ENSSSCT00000000500 TMEM5 TMEM5-202 1632 97.82 93.88 Protein Coding
ENSSSCG00000000464 ENSSSCT00000000502 C12orf56 C12orf56-202 1638 44.40 - Protein Coding
ENSSSCG00000000464 ENSSSCT00000030713 C12orf56 C12orf56-201 1644 55.60 - Protein Coding
ENSSSCG00000000472 ENSSSCT00000000510 LLPH LLPH-202 581 0.88 43.38 Protein Coding
ENSSSCG00000000472 ENSSSCT00000025545 LLPH LLPH-201 1621 99.12 56.62 Protein Coding
ENSSSCG00000000475 ENSSSCT00000032082 IRAK3 IRAK3-202 490 11.10 - Protein Coding
ENSSSCG00000000475 ENSSSCT00000031580 IRAK3 IRAK3-203 256 13.93 86.13 Protein Coding
ENSSSCG00000000475 ENSSSCT00000000513 IRAK3 IRAK3-204 948 33.53 13.87 Protein Coding
ENSSSCG00000000475 ENSSSCT00000035165 IRAK3 IRAK3-201 2155 41.45 - Protein Coding
ENSSSCG00000000478 ENSSSCT00000033391 GRIP1 GRIP1-201 2174 44.04 - Protein Coding
ENSSSCG00000000478 ENSSSCT00000000516 GRIP1 GRIP1-202 3408 55.96 - Protein Coding
ENSSSCG00000000492 ENSSSCT00000033585 LYZ LYZ-003 762 3.52 1.63 Protein Coding
ENSSSCG00000000492 ENSSSCT00000034939 LYZ LYZ-002 858 5.33 3.16 Protein Coding
ENSSSCG00000000492 ENSSSCT00000000530 LYZ LYZ-001 1287 91.15 95.21 Protein Coding

Annexes
259
Annex 13 - Table S4. Classification of alternative splicing (AS) events detected in the porcine
gluteus medius muscle with the SUPPA and Splicing Express softwares.
SUPPA software
Event type Genes Total Events Events / Gene % total
Exon Skipping 3907 7651 1.96 36.75
Alternative 3' Splice Site 2692 4344 1.61 20.86
Alternative 5' Splice Site 3284 6279 1.91 30.16
Intron Retention 1490 2547 1.71 12.23
Splicing Express software
Event type Genes Total Events Events / Gene % total
Exon Skipping 2624 14543 5.54 41.02
Alternative 3' Splice Site 2386 8656 3.63 24.41
Alternative 5' Splice Site 2286 7756 3.36 21.87
Intron Retention 1745 4502 2.58 12.70

Annexes s
260
Annex 14 - Table S5: Differentially expressed (P-value < 0.05) mRNA isoforms (HIGH vs LOW pigs) found with CLC Bio and
STAR/RSEM/DESeq2 softwares (those identified by both pipelines are shown in bold). (The complete table is included in the CD-Rom).
Feature ID Feature transcript ID Gene ID Transcript
ID
Length
(bp) Type
CLC Bio STAR/RSEM/DESeq2
log2(FC) P-value q-value
Relative
expres-
sion (%)
log2
(FC) P-value q-value*
Relative
expres-
sion (%)
ENSSSCG00000016893 ENSSSCT00000018398 NDUFS4 - 567 Protein
Coding -0.22 1.55E-05 2.07E-02 99.85 -0.29 9.49E-08 1.25E-04 99.51
ENSSSCG00000010313 ENSSSCT00000011289 VCL VCL-201 5378 Protein
Coding -0.49 2.33E-07 1.25E-03 52.73 -0.63 1.18E-07 1.25E-04 37.61
ENSSSCG00000000293 ENSSSCT00000000314 ITGA5 ITGA5-201 4445 Protein Coding
0.85 2.64E-05 2.56E-02 98.36 0.85 2.54E-06 1.21E-03 99.64
ENSSSCG00000004578 ENSSSCT00000005057 ANXA2 ANXA2-202 1455 Protein
Coding 0.70 3.32E-06 6.56E-03 98.90 0.69 4.56E-06 1.58E-03 99.82
ENSSSCG00000012440 ENSSSCT00000032952 PGK1 PGK1-005 401 Protein Coding
-0.24 5.55E-04 1.33E-01 12.77 -0.51 4.61E-06 1.58E-03 3.82
ENSSSCG00000006549 ENSSSCT00000036394 IL6R IL6R-001 460 Protein
Coding 1.25 1.89E-02 9.33E-01 71.98 1.41 6.89E-06 NA 83.85
ENSSSCG00000012440 ENSSSCT00000034653 PGK1 PGK1-001 1561 Protein Coding
-0.26 8.53E-03 6.29E-01 3.39 -0.30 1.78E-05 2.75E-03 89.72
ENSSSCG00000013579 ENSSSCT00000014831 CD209 CD209-001 1042 Protein
Coding 1.03 7.84E-05 4.18E-02 93.21 1.01 2.09E-05 NA 97.00
ENSSSCG00000012448 ENSSSCT00000033853 ITM2A ITM2A-201 1626 Protein
Coding -0.45 2.43E-04 8.65E-02 76.96 -0.55 3.16E-05 4.24E-03 68.73
ENSSSCG00000009584 ENSSSCT00000034286 SEMA4D SEMA4D-
208 487
Protein Coding
1.40 2.75E-06 6.53E-03 7.90 1.09 5.87E-05 6.59E-03 9.25
ENSSSCG00000006328 ENSSSCT00000033501 RXRG RXRG-202 544 Protein
Coding -0.70 4.09E-04 1.18E-01 14.61 -0.76 9.31E-05 8.98E-03 20.75
ENSSSCG00000030970 ENSSSCT00000035366 COX7B COX7B-001 439 Protein Coding
-0.23 5.46E-04 1.33E-01 87.12 -0.29 1.07E-04 9.61E-03 96.53
ENSSSCG00000024982 ENSSSCT00000036552 LITAF LITAF-201 2190 Protein
Coding 1.01 1.02E-04 4.38E-02 78.56 0.79 1.21E-04 1.04E-02 98.33
ENSSSCG00000010184 ENSSSCT00000011150 AGT - 2242 Protein
Coding 0.57 3.74E-04 1.09E-01 98.48 0.65 1.32E-04 1.08E-02 25.49
ENSSSCG00000013242 ENSSSCT00000014462 ACP2 ACP2-001 2107 Protein
Coding 0.52 1.69E-03 2.56E-01 79.46 0.46 1.62E-04 1.28E-02 88.07
ENSSSCG00000012277 ENSSSCT00000013426 TIMP1 TIMP1-001 931 Protein
Coding 2.57 4.61E-07 1.68E-03 98.97 0.79 2.01E-04 1.32E-02 96.74
ENSSSCG00000006610 ENSSSCT00000035044 S100A11 S100A11-001 546 Protein Coding
0.55 1.46E-03 2.36E-01 70.33 0.63 2.04E-04 1.33E-02 85.52
ENSSSCG00000015310 ENSSSCT00000023446 AKAP9 AKAP9-202 13006 Protein
Coding -0.34 1.77E-02 9.09E-01 55.41 -0.55 2.15E-04 1.36E-02 63.58
ENSSSCG00000026914 ENSSSCT00000035582 PLA2G16 PLA2G16-
201 800
Protein Coding
0.36 4.57E-02 1.00E+0
0 63.04 0.32 3.67E-04 1.89E-02 78.13

Annexes
261
ENSSSCG00000017983 ENSSSCT00000032848 PER1 PER1-201 4590 Protein
Coding 0.43 2.76E-03 3.57E-01 76.76 0.42 5.13E-04 2.40E-02 77.16
ENSSSCG00000001252 ENSSSCT00000001367 UBD UBD-201 1281 Protein Coding
-0.72 1.37E-03 2.29E-01 96.35 -0.83 7.73E-04 NA 55.28
ENSSSCG00000006612 ENSSSCT00000007246 S100A10 S100A10-201 1512 Protein
Coding 0.57 1.22E-03 2.23E-01 88.28 0.51 8.47E-04 3.31E-02 26.43
ENSSSCG00000010107 ENSSSCT00000011068 MED15 MED15-201 2913 Protein Coding
0.37 5.83E-03 4.97E-01 98.60 0.30 1.19E-03 3.92E-02 99.89
ENSSSCG00000000657 ENSSSCT00000034328 CLEC2D CLEC2D-
002 1688
Protein
Coding -0.48 3.28E-02
1.00E+0
0 43.46 -0.70 1.24E-03 NA 51.21
ENSSSCG00000012345 ENSSSCT00000033201 PFKFB1 PFKFB1-203 471 Protein
Coding -0.33 3.11E-03 3.75E-01 25.63 -0.37 1.49E-03 4.47E-02 25.98
ENSSSCG00000000657 ENSSSCT00000033596 CLEC2D CLEC2D-
001 1673
Protein Coding
-0.57 7.04E-03 5.52E-01 56.30 -0.70 1.54E-03 NA 47.76
ENSSSCG00000014013 ENSSSCT00000034792 RNF130 - 650 Protein
Coding -0.16 2.96E-02
1.00E+0
0 14.03 -0.28 1.65E-03 4.79E-02 11.31
ENSSSCG00000012133 ENSSSCT00000032369 ASB11 ASB11-001 1464 Protein Coding
-0.14 3.98E-02 1.00E+0
0 81.39 -0.24 1.67E-03 4.81E-02 67.35
ENSSSCG00000011848 ENSSSCT00000012960 TFRC TFRC-201 5030 Protein
Coding -0.55 1.29E-03 2.24E-01 50.32 -0.79 1.83E-03 5.02E-02 49.80
ENSSSCG00000012411 ENSSSCT00000025272 PHKA1 - 5491 Protein Coding
-0.21 2.21E-03 3.05E-01 89.03 -0.27 1.98E-03 5.28E-02 98.63
ENSSSCG00000001398 ENSSSCT00000001327 SLA-6 SLA-6-201 1153 Protein
Coding -0.53 1.29E-02 7.67E-01 59.78 -0.85 2.19E-03 NA 36.38
ENSSSCG00000001468 ENSSSCT00000032605 PSMB9 PSMB9-001 959 Protein
Coding -0.63 4.04E-02
1.00E+0
0 74.08 -0.91 2.25E-03 NA 86.41
ENSSSCG00000029471 ENSSSCT00000032244 STAC3 STAC3-202 1629 Protein
Coding -0.12 3.93E-02
1.00E+0
0 99.94 -0.21 2.28E-03 5.69E-02 99.94
ENSSSCG00000014920 ENSSSCT00000033976 FZD4 FZD4-201 6963 Protein
Coding 0.38 2.98E-02
1.00E+0
0 99.58 0.41 2.54E-03 6.09E-02 99.68
ENSSSCG00000012653 ENSSSCT00000013834 ZDHHC9 ZDHHC9-
209 2967
Protein Coding
0.78 3.29E-03 3.75E-01 17.33 0.77 2.56E-03 6.11E-02 18.26
ENSSSCG00000004687 ENSSSCT00000005176 B2M - 1197 Protein
Coding -0.32 1.13E-03 2.11E-01 49.95 -0.35 2.92E-03 6.61E-02 49.59
ENSSSCG00000016186 ENSSSCT00000026123 TMBIM1 - 2030 Protein Coding
0.44 4.91E-04 1.25E-01 73.00 0.38 2.97E-03 6.65E-02 56.74
ENSSSCG00000012591 ENSSSCT00000033097 AMOT AMOT-201 6928 Protein
Coding -0.15 2.38E-02
1.00E+0
0 73.57 -0.38 3.23E-03 7.00E-02 15.48

Annexes s
262
Annex 15 - Table S6: Relative transcript levels of a set of isoforms corresponding to five genes expressed in the gluteus medius muscle of HIGH
and LOW pigs identified with the CLC Bio and STAR/RSEM/DESeq2 pipelines (those showing differential expression are indicated in bold, q-
value < 0.05,|log2(fold-change)| > 0.6).
Feature transcript ID
Gene ID
Transcript ID
Length
(bp)
Type
CLC Bio STAR/RSEM/DESeq2
log2
(FC) P-value q-value
Relative
expres-
sion (%)
log2
(FC) P-value q-value*
Relative
expres-sion
(%)
ENSSSCT00000034155 ANXA2 ANXA2-201 1609 Protein coding 0.22 6.77E-01 1.00E+00 1.1 0.07 9.20E-01 NA 0.18
ENSSSCT00000005057 ANXA2 ANXA2-202 1455 Protein coding 0.7 3.32E-06 7.23E-03 98.9 0.69 4.56E-06 1.58E-03 99.82
ENSSSCT00000000314 ITGA5 ITGA5-201 4445 Protein coding 0.85 2.64E-05 2.82E-02 98.36 0.85 2.54E-06 1.21E-03 99.64
ENSSSCT00000035821 ITGA5 ITGA5-203 1255 Nonsense
mediated decay -0.03 9.18E-01 1.00E+00 0.34 - - - 0.34
ENSSSCT00000034427 ITGA5 ITGA5-204 1013 Nonsense
mediated decay -0.08 1.00E+00 1.00E+00 0.71 - - - 0.71
ENSSSCT00000033141 ITGA5 ITGA5-205 766 Nonsense
mediated decay -0.29 1.00E+00 1.00E+00 0.59 -0.01 9.97E-01 NA 0.36
ENSSSCT00000036552 LITAF LITAF-201 2190 Protein coding 1.01 1.02E-04 4.82E-02 78.56 0.79 1.21E-04 1.04E-02 98.33
ENSSSCT00000025103 LITAF LITAF-202 2370 Protein coding -0.04 1.00E+00 1.00E+00 21.44 0.49 7.52E-01 NA 1.67
ENSSSCT00000033039 SEMA4D SEMA4D-201 3625 Protein coding 0.33 3.22E-02 1.00E+00 67.7 0.24 3.94E-02 2.75E-01 58.28
ENSSSCT00000033344 SEMA4D SEMA4D-202 2108 Protein coding -0.29 1.00E+00 1.00E+00 0.06 - - - 0.06
ENSSSCT00000033105 SEMA4D SEMA4D-203 4704 Protein coding 0.86 1.72E-02 9.86E-01 3.28 -0.21 8.34E-01 NA 0.29
ENSSSCT00000034118 SEMA4D SEMA4D-204 594 Protein coding 0.71 1.53E-01 1.00E+00 1.7 - - - 1.7
ENSSSCT00000034311 SEMA4D SEMA4D-205 823 Protein coding 0.21 2.40E-01 1.00E+00 16.3 0.24 9.34E-02 4.14E-01 23.88
ENSSSCT00000033153 SEMA4D SEMA4D-206 794 Protein coding 0.42 8.00E-01 1.00E+00 0.3 0.77 6.15E-01 NA 0.15
ENSSSCT00000036138 SEMA4D SEMA4D-207 1178 Protein coding 0.27 1.00E+00 1.00E+00 0.17 -0.11 9.70E-01 NA 0.02
ENSSSCT00000034286 SEMA4D SEMA4D-208 487 Protein coding 1.4 2.75E-06 7.19E-03 7.9 1.09 5.87E-05 6.59E-03 9.25
ENSSSCT00000010505 SEMA4D SEMA4D-209 4409 Protein coding 0.64 1.29E-01 1.00E+00 2.59 0.65 1.94E-03 5.25E-02 8.13
ENSSSCT00000013426 TIMP1 TIMP1-001 931 Protein coding 2.57 4.61E-07 1.85E-03 98.97 0.79 2.01E-04 1.32E-02 96.74
ENSSSCT00000033796 TIMP1 TIMP1-002 598 Protein coding 1.12 5.56E-01 1.00E+00 0.48 0.38 8.98E-01 NA 0.27
ENSSSCT00000034602 TIMP1 TIMP1-003 641 Protein coding 1.19 8.47E-01 1.00E+00 0.34 -0.19 7.39E-01 NA 2.81
ENSSSCT00000036308 TIMP1 TIMP1-004 173 Protein coding 3.05 4.21E-01 1.00E+00 0.21 0.18 9.52E-01 NA 0.18

Annexes
263
Annex 16 - Figure S1. Validation by RT-qPCR of the differential expression of mRNA
isoforms corresponding to the RXRG, SCD, MAFF and ITGA5 genes in HIGH vs LOW pigs.

Annexes s
264
Supplemental material Paper III: "Nutrient supply affects the mRNA
expression profile of the porcine skeletal muscle "
Annex 17 - Additional file 1: Figure 1 - Kinetics of the average concentrations of triglycerides
and non-esterified fatty acids (FA) in 36 Duroc pigs at three time points: before eating and 5
and 7 hours post-ingestion.

Annexes
265
Annex 18 - Table S1. Differentially expressed genes (q-value < 0.05 and |fold-change| > 1.5) in the pig gluteus medius muscle at fasting (T0) vs 5 h
(T1) and 7 h (T2) after eating, and 5 h (T1) vs 7 h (T2) after eating . (The complete table is included in the CD-Rom).
T0T1 T0T2 T1T2
Gene Gene ID FC Log2
(FC) P -value
q -
value FC
Log2
(FC) P -value q - value FC
Log2
(FC) P -value q - value
ENSSSCG00000016386
- - - - 60.97 5.93 2.12E-234 5.94E-231 46.85 5.55 7.57E-300 1.09E-295
ENSSSCG00000008767 RPS18 - - - - 28.84 4.85 1.84E-78 8.88E-76 45.89 5.52 8.18E-261 5.91E-257
ENSSSCG00000005274
- - - - 56.49 5.82 3.52E-167 4.93E-164 46.53 5.54 6.61E-248 3.18E-244
ENSSSCG00000002045
- - - - 60.13 5.91 0.00E+00 0.00E+00 34.78 5.12 1.90E-244 6.85E-241
ENSSSCG00000002261
- - - - 81.57 6.35 1.87E-243 6.57E-240 48.50 5.60 1.26E-240 3.64E-237
ENSSSCG00000016735
- - - - 38.05 5.25 7.19E-147 9.17E-144 32.67 5.03 2.25E-216 5.41E-213
ENSSSCG00000016538
- - - - 46.53 5.54 2.38E-198 5.57E-195 32.67 5.03 1.71E-210 3.54E-207
ENSSSCG00000030628 CH242-203F13.1 - - - - 31.34 4.97 5.28E-186 1.06E-182 25.63 4.68 1.89E-202 3.41E-199
ENSSSCG00000016571 RPS20 - - - - 19.84 4.31 4.95E-90 2.67E-87 24.93 4.64 8.34E-197 1.34E-193
ENSSSCG00000005172
- - - - 54.95 5.78 1.72E-173 3.02E-170 32.90 5.04 3.04E-181 4.39E-178
ENSSSCG00000029003 RPL14 - - - - 42.22 5.40 4.88E-267 3.42E-263 24.93 4.64 7.84E-180 1.03E-176
ENSSSCG00000014910 RPL35A - - - - 30.06 4.91 2.38E-255 1.11E-251 19.84 4.31 1.51E-176 1.82E-173
ENSSSCG00000024660
- - - - 30.91 4.95 5.68E-112 4.69E-109 26.72 4.74 3.47E-167 3.85E-164
ENSSSCG00000025403 RPS19 - - - - 11.63 3.54 1.09E-37 2.84E-35 28.25 4.82 4.88E-162 5.04E-159
ENSSSCG00000011910
- - - - 23.26 4.54 8.54E-112 6.65E-109 20.82 4.38 6.18E-144 5.95E-141
ENSSSCG00000007500 CH242-266P8.1 - - - - 8.94 3.16 1.83E-125 1.83E-122 8.88 3.15 3.61E-140 3.26E-137
ENSSSCG00000012578 COPE - - - - 58.49 5.87 2.28E-173 3.56E-170 21.86 4.45 1.04E-116 8.82E-114
ENSSSCG00000004575
- - - - 9.78 3.29 5.92E-105 3.77E-102 8.82 3.14 5.45E-113 4.37E-110
ENSSSCG00000021825 RPS21 - - - - -14.52 -3.86 3.33E-107 2.22E-104 -12.21 -3.61 5.96E-112 4.53E-109
ENSSSCG00000011667
- - - - 32.90 5.04 5.80E-129 6.78E-126 17.51 4.13 2.00E-105 1.44E-102

Annexes s
266
ENSSSCG00000030093
- - - - 22.32 4.48 5.30E-100 3.10E-97 14.62 3.87 6.64E-100 4.57E-97
ENSSSCG00000016791
- - - - 51.63 5.69 3.48E-120 3.26E-117 18.25 4.19 4.95E-98 3.25E-95
ENSSSCG00000002529
- - - - 16.00 4.00 1.31E-52 4.36E-50 15.78 3.98 5.35E-97 3.36E-94
ENSSSCG00000000744
- - - - 18.00 4.17 1.27E-79 6.36E-77 13.64 3.77 1.18E-92 7.11E-90
ENSSSCG00000027329
- - - - 27.67 4.79 3.78E-91 2.12E-88 15.24 3.93 3.06E-91 1.77E-88
ENSSSCG00000009133
- - - - 15.56 3.96 2.11E-126 2.28E-123 10.56 3.40 4.75E-85 2.64E-82
ENSSSCG00000016886
- - - - 9.25 3.21 5.32E-33 1.26E-30 11.39 3.51 9.63E-80 5.15E-77
ENSSSCG00000009848
- - - - 15.78 3.98 1.39E-71 6.07E-69 11.55 3.53 1.99E-79 1.03E-76
ENSSSCG00000026049 CYCS - - - - 44.32 5.47 3.87E-114 3.39E-111 13.64 3.77 8.30E-78 4.14E-75
ENSSSCG00000009677
- - - - 15.56 3.96 6.10E-71 2.59E-68 11.08 3.47 1.54E-71 7.42E-69
ENSSSCG00000014974 ENY2 - - - - 13.00 3.70 8.84E-109 6.20E-106 8.46 3.08 4.58E-68 2.13E-65
ENSSSCG00000028670
- - - - 11.71 3.55 2.97E-46 8.87E-44 10.41 3.38 8.28E-66 3.74E-63
ENSSSCG00000017077
- - - - 18.64 4.22 1.07E-79 5.53E-77 10.48 3.39 7.81E-65 3.42E-62
ENSSSCG00000009126
- - - - 19.56 4.29 1.26E-61 4.79E-59 10.93 3.45 2.96E-63 1.26E-60
ENSSSCG00000015620 TIAL1 - - - - 21.26 4.41 2.04E-64 8.19E-62 9.65 3.27 8.75E-59 3.61E-56
ENSSSCG00000011945
- - - - 5.54 2.47 4.91E-31 1.13E-28 6.23 2.64 2.38E-56 9.54E-54
ENSSSCG00000024384 DCAF12 - - - - 6.54 2.71 2.61E-44 7.18E-42 5.28 2.40 6.76E-54 2.64E-51
ENSSSCG00000004527
- - - - 16.56 4.05 7.07E-53 2.42E-50 9.25 3.21 1.63E-53 6.21E-51
ENSSSCG00000027246 NDUFA2 - - - - 12.04 3.59 6.11E-48 1.90E-45 8.00 3.00 3.47E-49 1.29E-46
ENSSSCG00000002850 RPLP2 - - - - 18.51 4.21 9.38E-59 3.37E-56 8.69 3.12 5.40E-49 1.95E-46
ENSSSCG00000010221
- - - - 3.61 1.85 3.27E-59 1.21E-56 3.78 1.92 6.07E-49 2.14E-46
ENSSSCG00000029019
- - - - 12.64 3.66 2.01E-52 6.54E-50 7.94 2.99 1.05E-48 3.60E-46

Annexes
267
Annex 19 - Table S2 - Pathways identified by ReactomeFIViz as enriched in differentially
expressed genes (q -value < 0.05 and |fold-change| > 1 .5) between at fasting (T0) vs 5 h (T1)
and 7 h (T2) after eating, and 5 h (T1)
T0 vs T1
GeneSet P-value q-value Nodes
Circadian Clock(R) 1.53E-08 4.52E-06 NR1D1, PER2, PER1, SIK1, ARNTL, UBB
Circadian rhythm pathway(N) 1.20E-07 1.77E-05 NR1D1, PER2, PER1, ARNTL
Circadian clock system(P) 1.55E-06 1.21E-04 PER2, PER1, ARNTL
Circadian rhythm(K) 1.64E-06 1.21E-04 NR1D1, PER2, PER1, ARNTL
AP-1 transcription factor network(N) 3.96E-05 2.34E-03 FOSL2, FOS, MYC, BCL2L11
Regulation of nuclear SMAD2/3
signaling(N) 5.72E-05 2.80E-03 FOXO1, FOS, GATA3, MYC
Striated Muscle Contraction(R) 8.66E-05 3.54E-03 MYL4, ACTN3, TNNT2
MAPK6/MAPK4 signaling(R) 9.57E-05 3.54E-03 FOXO1, TNRC6B, MYC, UBB
Glucagon signaling pathway(K) 1.62E-04 5.18E-03 PGAM1, FOXO1, SIK1, CREB5
Calcineurin-regulated NFAT-dependent
transcription in lymphocytes(N) 2.75E-04 7.62E-03 FOS, GATA3, EGR2
IL6-mediated signaling events(N) 2.93E-04 7.62E-03 FOXO1, FOS, MYC
Hepatitis B(K) 6.50E-04 1.50E-02 FOS, MYC, EGR2, CREB5
Adrenergic signaling in
cardiomyocytes(K) 6.84E-04 1.50E-02 MYL4, ACTC1, CREB5, TNNT2
Oxidative Stress Induced Senescence(R) 7.17E-04 1.51E-02 FOS, TNRC6B, UBB
cadmium induces dna synthesis and
proliferation in macrophages(B) 7.95E-04 1.51E-02 FOS, MYC
bone remodeling(B) 9.03E-04 1.63E-02 FOSL2, FOS
Cardiac muscle contraction(K) 1.27E-03 1.93E-02 MYL4, ACTC1, TNNT2
Glucocorticoid receptor regulatory
network(N) 1.27E-03 1.93E-02 FOS, GATA3, PBX1
Regulation of nuclear beta catenin
signaling and target gene transcription(N) 1.36E-03 1.93E-02 MYOG, MYC, KLF4
Transcriptional misregulation in
cancer(K) 1.38E-03 1.93E-02 FOXO1, PER2, MYC, PBX1
Herpes simplex infection(K) 1.53E-03 2.14E-02 FOS, PER2, PER1, ARNTL
inhibition of cellular proliferation by
gleevec(B) 2.00E-03 2.61E-02 FOS, MYC
Circadian entrainment(K) 2.22E-03 2.66E-02 FOS, PER2, PER1
CD40/CD40L signaling(N) 2.90E-03 3.35E-02 MYC, TNFAIP3
Oncogene Induced Senescence(R) 3.10E-03 3.35E-02 TNRC6B, UBB
role of egf receptor transactivation by
gpcrs in cardiac hypertrophy(B) 3.30E-03 3.35E-02 FOS, MYC
TNF signaling pathway(K) 3.35E-03 3.35E-02 FOS, CREB5, TNFAIP3
Syndecan-4-mediated signaling
events(N) 3.52E-03 3.52E-02 SDC4, THBS1
Transcriptional regulation of pluripotent
stem cells(R) 4.18E-03 3.98E-02 PBX1, KLF4
TNF signaling(R) 4.42E-03 3.98E-02 UBB, TNFAIP3
Dopaminergic synapse(K) 5.21E-03 4.55E-02 FOS, CREB5, ARNTL
Bladder cancer(K) 5.68E-03 4.55E-02 THBS1, MYC
FOXM1 transcription factor network(N) 5.68E-03 4.55E-02 FOS, MYC
LKB1 signaling events(N) 6.23E-03 4.98E-02 SIK1, MYC

Annexes s
268
T0 vs T2
GeneSet P-value q-value Nodes
Eukaryotic Translation Termination(R) 4.63E-11 1.08E-08
RPL14, RPLP2, RPL35A, RPS18, RPS19,
RPS16, RPL9, RPS20, RPS21, RPS23, RPS24,
RPL39, RPL22
Nonsense-Mediated Decay (NMD)(R) 6.29E-11 1.08E-08
RPL14, RPLP2, RPL35A, RPS18, RPS19,
RPS16, RPL9, RPS20, RPS21, RPS23, RPS24,
CASC3, RPL39, RPL22
Eukaryotic Translation Elongation(R) 7.08E-11 1.08E-08
RPL14, RPLP2, RPL35A, RPS18, RPS19,
RPS16, RPL9, RPS20, RPS21, RPS23, RPS24,
RPL39, RPL22
SRP-dependent cotranslational protein
targeting to membrane(R) 6.80E-10 6.93E-08
RPL14, RPLP2, RPL35A, RPS18, RPS19,
RPS16, RPL9, RPS20, RPS21, RPS23, RPS24,
RPL39, RPL22
Selenoamino acid metabolism(R) 7.62E-10 6.93E-08
RPL14, RPLP2, RPL35A, RPS18, RPS19,
RPS16, RPL9, RPS20, RPS21, RPS23, RPS24,
RPL39, RPL22
Ribosome(K) 1.67E-09 1.18E-07
RPL14, RPLP2, RPL35A, RPS18, RPS19,
RPS16, RPL9, RPS20, RPS21, RPS23, RPS24,
MRPS21, RPL39, RPL22
Eukaryotic Translation Initiation(R) 1.81E-09 1.18E-07
RPL14, RPLP2, RPL35A, RPS18, RPS19,
RPS16, RPL9, RPS20, RPS21, RPS23, RPS24,
RPL39, RPL22
Circadian rhythm pathway(N) 5.64E-08 3.21E-06 CRY2, ARNTL, BHLHE40, NR1D1, PER2,
PER1
Circadian Clock(R) 9.64E-07 4.82E-05 CRY2, ARNTL, BHLHE40, UBB, NR1D1,
PER2, PER1, DBP
Circadian rhythm(K) 2.57E-06 1.16E-04 CRY2, ARNTL, BHLHE40, NR1D1, PER2,
PER1
Circadian clock system(P) 3.28E-06 1.34E-04 CRY2, ARNTL, PER2, PER1
Signaling by NOTCH1(R) 9.27E-05 3.52E-03 HDAC10, HDAC5, HDAC9, MYC, TLE4, UBB
Myogenesis(R) 2.29E-04 8.00E-03 MYOD1, BOC, NEO1, MYOG
Regulation of nuclear SMAD2/3
signaling(N) 3.84E-04 1.23E-02
MYOD1, FOXO1, GATA3, RUNX1, MYC,
KAT2A
Senescence-Associated Secretory
Phenotype (SASP)(R) 4.66E-04 1.40E-02 ANAPC5, H3F3A, UBE2E1, UBB, RPS6KA1
p38 mapk signaling pathway(B) 5.96E-04 1.67E-02 HMGN1, HSPB1, H3F3A, MYC
MAPK6/MAPK4 signaling(R) 7.68E-04 2.00E-02 FOXO1, MAPK4, HSPB1, PAK1, MYC, UBB
Signaling events mediated by HDAC
Class II(N) 1.26E-03 3.15E-02 HDAC10, BCOR, HDAC5, HDAC9
T1 vs T2
GeneSet P-value q-value Nodes
Eukaryotic Translation Termination(R) 1.11E-16 1.11E-15
RPL35A, RPL14, RPLP2, RPL39, RPS18,
RPS19, RPS16, RPL9, RPS20, RPS21, RPS23,
RPS24
Eukaryotic Translation Initiation(R) 1.11E-16 1.11E-15
RPL35A, RPL14, RPLP2, RPL39, RPS18,
RPS19, RPS16, RPL9, RPS20, RPS21, RPS23,
RPS24
SRP-dependent cotranslational protein
targeting to membrane(R) 1.11E-16 1.11E-15
RPL35A, RPL14, RPLP2, RPL39, RPS18,
RPS19, RPS16, RPL9, RPS20, RPS21, RPS23,
RPS24
Ribosome(K) 1.11E-16 1.11E-15
RPL35A, RPL14, RPLP2, RPL39, RPS18,
RPS19, RPS16, RPL9, RPS20, RPS21, RPS23,
RPS24
Nonsense-Mediated Decay (NMD)(R) 1.11E-16 1.11E-15 RPL35A, RPL14, RPLP2, RPL39, RPS18,
RPS19, RPS16, RPL9, RPS20, RPS21, RPS23,

Annexes
269
RPS24
Eukaryotic Translation Elongation(R) 1.11E-16 1.11E-15
RPL35A, RPL14, RPLP2, RPL39, RPS18,
RPS19, RPS16, RPL9, RPS20, RPS21, RPS23,
RPS24
Selenoamino acid metabolism(R) 1.11E-16 1.11E-15
RPL35A, RPL14, RPLP2, RPL39, RPS18,
RPS19, RPS16, RPL9, RPS20, RPS21, RPS23,
RPS24
The citric acid (TCA) cycle and
respiratory electron transport(R) 1.89E-04 1.70E-03 CYCS, ATP5G2, COX6B1, ATP5I
p38 mapk signaling pathway(B) 1.52E-03 1.22E-02 H3F3A, HSPB1
Oxidative phosphorylation(K) 1.83E-03 1.28E-02 ATP5G2, COX6B1, ATP5I
Parkinson's disease(K) 2.20E-03 1.32E-02 CYCS, ATP5G2, COX6B1
Alzheimer's disease(K) 3.54E-03 2.12E-02 CYCS, ATP5G2, COX6B1
Huntington's disease(K) 5.21E-03 2.61E-02 CYCS, ATP5G2, COX6B1
Aurora C signaling(N) 7.42E-03 3.71E-02 H3F3A
the prc2 complex sets long-term gene
silencing through modification of histone
tails(B)
1.11E-02 4.44E-02 H3F3A
Annex 20 - Table S3: Gene regulatory networks with the ReactomeFIViz app, considering
GO biological process, molecular function and cellular component (q -value < 0.05). (The
complete table is included in the CD-Rom).
T0 vs T1
GeneSet P-value q-value Nodes
Cellular
component
transcription
factor complex 1.32E-03 4.14E-02 FOS, GATA3, MYOG, ARNTL
BIM-BCL-2
complex 2.86E-03 4.14E-02 BCL2L11
BIM-BCL-xl
complex 2.86E-03 4.14E-02 BCL2L11
Biological
Process
circadian
regulation of gene
expression
1.89E-07 1.10E-04 CIART, NR1D1, PER2, PER1, ARNTL
negative
regulation of
transcription.
DNA-dependent
1.59E-06 4.65E-04 CIART, FOXO1, NR1D1, GATA3, PER2, PER1,
ARNTL, ZNF217, KLF4
circadian rhythm 2.43E-06 4.72E-04 NR1D1, PER2, PER1, ARNTL, UBB
Molecular
function
E-box binding 5.45E-10 5.72E-08 CIART, GATA3, PER1, MYOG, MYC, ARNTL
sequence-specific
DNA binding
transcription
factor activity
1.00E-06 5.20E-05 FOSL2, FOS, GATA3, MYOG, MYC, EGR2, CREB5,
ZNF217, CSRNP1, HOXB6, PBX1, KLF4
transcription
factor binding
transcription
factor activity
8.13E-06 2.85E-04 FOXO1, PER2, PER1
T0 vs T2
GeneSet P-value q-value Nodes

Annexes s
270
Cellular
component
nucleoplasm 9.50E-06 1.08E-03
HMGN1, MYOD1, HIRA, TIRAP, FOXO1, GATA3,
EED, ORC1, RBFOX2, ANAPC5, HNRNPA2B1,
HDAC10, SKP2, ARNTL, KEAP1, SOX9, RUNX1,
KLF5, MAFF, NR4A3, HDAC5, PPIE, ATF3, RNF4,
IRF2BPL, H3F3A, FBXO32, HDAC9, UBE2E1, FGF1,
MYC, CDC7, TLE4, SMN1, ZFPM2, UBB, NEO1,
NR1D1, PER2, MYOG, SCO2, NFATC1, KAT2A,
CDC25A
cytosol 1.37E-05 1.08E-03
RPL14, TIRAP, PGAM1, FOXO1, RPLP2, ORC1,
RPL35A, C5AR1, ANAPC5, NCF2, CHAC1, MYH2,
SOCS1, SKP2, ACTN3, TANK, BCL2L11, RPS18,
RPS19, RND1, HSPB1, TNFAIP3, MYL5, AMER1,
PPP1R3C, RPS20, RPS21, RPS24, CASC3, HDAC5,
PPIA, FABP3, UBE2E1, HECW1, SYNJ2, FGF1, MYC,
PIK3C2B, CYCS, NLRP3, SMN1, ARHGAP26, UBB,
CCR1, RPL39, NFATC1, TXNIP, ACTC1, CDC25A,
RPL22
cytosolic small
ribosomal subunit 2.07E-05 1.08E-03 RPS18, RPS19, RPS20, RPS21, RPS24
Biological
Process
negative
regulation of
transcription from
RNA polymerase
II promoter
1.11E-10 1.22E-07
FOXO1, CRY2, GATA3, EED, TWIST2, HNRNPA2B1,
HDAC10, NFE2L3, SOX9, BHLHE40, BCOR, KLF5,
NR4A3, HDAC5, ATF3, IRF2BPL, HDAC9, BACH2,
BARX2, MYC, HIST1H1D, TLE4, ZFPM2, UBB,
NR1D1, PER2, PER1, TXNIP
translational
termination 4.01E-09 2.22E-06
RPL14, RPLP2, RPL35A, RPS18, RPS19, RPS20,
RPS21, RPS24, RPL39, RPL22
nuclear-
transcribed
mRNA catabolic
process.
nonsense-
mediated decay
1.19E-08 3.80E-06 RPL14, RPLP2, RPL35A, RPS18, RPS19, RPS20,
RPS21, RPS24, CASC3, RPL39, RPL22
Molecular
function
structural
constituent of
ribosome
2.73E-09 5.25E-07
RPL14, RPLP2, RPL35A, RPS18, RPS19, RPS16, RPL9,
RPS20, RPS21, RPS23, RPS24, MRPS21, RPL39,
RPL22
E-box binding 4.45E-09 5.25E-07 MYOD1, GATA3, ARNTL, CIART, BHLHE40, MYC,
PER1, MYOG
transcription
factor binding 5.52E-07 4.36E-05
MYOD1, FOXO1, GATA3, RBFOX2, KEAP1, BCOR,
HDAC5, RNF4, HDAC9, MYC, NLRP3, ZFPM2, PER1,
KAT2A
T1 vs T2
GeneSet P-value q-value Nodes
Cellular
component
cytosolic small
ribosomal subunit 9.80E-10 3.72E-08 RPS18, RPS19, RPS20, RPS21, RPS24
ribosome 1.95E-08 3.71E-07 RPS18, RPS19, RPS16, RPL9, RPS23
cytosolic large
ribosomal subunit 7.62E-07 9.15E-06 RPL35A, RPL14, RPLP2, RPL39
Biological
Process
translation 1.11E-16 9.99E-15 RPL35A, RPL14, RPLP2, RPL39, RPS18, RPS19,
RPS16, RPL9, RPS20, RPS21, RPS23, RPS24
translational
termination 3.33E-16 1.50E-14
RPL35A, RPL14, RPLP2, RPL39, RPS18, RPS19,
RPS20, RPS21, RPS24
translational
elongation 1.78E-15 5.33E-14
RPL35A, RPL14, RPLP2, RPL39, RPS18, RPS19,
RPS20, RPS21, RPS24
Molecular
function
structural
constituent of
ribosome
1.11E-16 3.44E-15 RPL35A, RPL14, RPLP2, RPL39, RPS18, RPS19,
RPS16, RPL9, RPS20, RPS21, RPS23, RPS24
hydrogen ion
transmembrane
transporter
3.18E-04 3.18E-03 ATP5G2, ATP5I

Annexes
271
activity
rRNA binding 6.53E-04 4.57E-03 RPS18, RPL9

Annexes s
272
Supplemental material Paper IV: "The ingestion of food promotes changes in the
expression of genes regulating circadian rhythms in four porcine tissues
containing peripheral clocks"
Annex 21 - Supplementary file 1. Description of primers used in the RT-qPCR analysis of
gene expression.
Gene Type Primer sequence
Forward (5'> 3') Reverse (5'> 3')
ARNT Target AGAGGCGTCGGGATAAGATG GTGGCACCTCGTAACGTTTT
PER1 Target ATCCACAGGTGACCTTCCAG AGTCTTGGCCTTGAATGTGC
PER2 Target GTCTCCCTGCCACCATTACT TTCCAAGATGAGTCCACCCC
BHLHE40 Target CAAGTGTACAAGTCGAGGCG GCACTCGTTAATCCGGTCAC
NR1D1 Target GGCCTCGGGTTTCCACTAT GGTTACGATTGATGCGGACG
SIK1 Target CTCCCTGCTCAGCTACAACT AGGAGGTAATAGATGGCCGC
CRY2 Target TGACGTGTTCCCAAGGCTAT ATGCGAGTTCTCAGTCACCA
NPAS2 Target CTCAGCTTCCAGGCCAAATG TGTTCCCCTGCATCATCTGT
B2M Reference CCGAGCTCTCATTCCACCG GGCGTGAGTAAACCTGAACC
TBP Reference CAGAATGATCAAACCGAGAATTGT CTGCTCTGACTTTAGCACCTGTTAA
HPRT1 Reference TCATTATGCCGAGGATTTGGA CTCTTTCATCACATCTCGAGCAA
ACTB Reference CAAGGACCTCTACGCCAACAC TGGAGGCGCGATGATCTT
Annex 22 - Supplementary file 2. Reference genes used as a reference in distinct RT-qPCR
assays
Reference gene
Assay B2M TBP HPRT1 ACTB
Liver (T0/T2) X X X
Duodenum (T0/T2) X X X
Dorsal fat (T0/T2) X X X
Muscle (T0/T2) X X X
Hypothalamus (T0/T2) X X X
Different tissues in comparison to hypothalamus X X
1The selection of the reference genes in each assay was based on the stability of their expression in
each specific tissue

Annexes
273
Supplemental material Paper V: " The red and blond pigmentation of Mangalitza
pigs is strongly associated with the variability of the Solute Carrier Family 45
Member 2 (Slc45a2) gene"
Annex 23 - Additional file 1. Admixture analysis of Mangalitza pigs and additional wild boar
and pig populations for a range of K-values (K = 2-11). Each individual is represented by a
single column divided into K colored segments, where K is the number of assumed clusters.
Populations are separated by black lines.

Annexes s
274

Annexes
275

Annexes s
276
Annex 24 - Additional file 2. Manhattan plot corresponding to the genome-wide association
analysis performed for coat color in Red and Blond Mangalitza pigs. In the y-axis, statistical
significance is expressed as a –log10 (q-value) whilst genomic coordinates are displayed in the x-
axis. The red and blue lines indicate the thresholds of genome-wide significance corresponding to
q-values of 0.01 and 0.05.

Annexes
277
Annex 25 - Additional file 3. List of SLC45A2 SNPs identified through the comparison of whole-genome sequences corresponding to Red, Blond
and Swallow Belly Mangalitza pigs and reported by Molnar et al. (2014). (The complete table is included in the CD-Rom).
CHR BP SNP REF ALT Swallown Belly Blond Blond Red Variant Impact
16 20758558 . C G - - - 0/1 synonymous_variant LOW
16 20727710 . A G - - - 1/1 synonymous_variant LOW
16 20758657 . C T - - - 0/1 synonymous_variant LOW
16 20731696 . C T 1/1 1/1 1/1 - missense_variant MODERATE
16 20731673 . T C - - - 0/1 missense_variant MODERATE
16 20727744 . C T - - - 0/1 missense_variant MODERATE
16 20745602 . C A 1/1 1/1 1/1 1/1 intron_variant MODIFIER
16 20749109 . C A - 1/1 0/1 - intron_variant MODIFIER
16 20719572 . G A - 1/1 - - intron_variant MODIFIER
16 20744979 . T C - 1/1 - - intron_variant MODIFIER
16 20726872 . T C 1/1 1/1 1/1 1/1 intron_variant MODIFIER
16 20719576 . G C - 1/1 - - intron_variant MODIFIER
16 20762353 . T C 0/1 1/1 1/1 - upstream_gene_variant MODIFIER
16 20745635 . C G 1/1 1/1 1/1 1/1 intron_variant MODIFIER
16 20726773 . C G 1/1 1/1 1/1 1/1 intron_variant MODIFIER
16 20744338 . G T 1/1 1/1 1/1 1/1 intron_variant MODIFIER
16 20734564 . G T 1/1 1/1 1/1 - intron_variant MODIFIER
16 20741102 . G T 1/1 1/1 1/1 - intron_variant MODIFIER
16 20741104 . C T 1/1 1/1 1/1 1/1 intron_variant MODIFIER
CHR = chromosome; BP = base pairs; SNP = Single Nucleotide Polymorphism; REF = reference; ALT = alternative

Annexes s
278

279
8. Chapter 8: Acknowledgements
Chapter 8

Acknowledgements
280

Acknowledgements
281
“Rendam graças ao Senhor, pois ele é bom; o seu amor dura para sempre.”
1 Crônicas 16:34
Después de cuatro años, quizá este sea unos de los momentos más difíciles, no por
algún pesar más por recordar de todo crecimiento personal y profesional, y de cómo la
vida cambia en tan poco tiempo. Muchas personas actuaran directa o indirectamente
para esto momento, y mismo que no estén citadas aquí o que mi gracias no sean tan
bonitas o en un idioma indescifrable que sepan que seguramente las levare en mi
corazón y que los quiero mucho.
En primer lugar, me gustaría agradecer a mi director de Tesis Dr. Marcel Amills, por
ter contestado tan prontamente mi correo dando su confianza a una desconocida,
además de su paciencia, amistad, ejemplo y enseñanzas durante estos años. Del mismo
modo me gustaría agradecer mi directora de Tesis Dra Angela Canovas por toda ayuda
y palabras de ánimos!
A mis compañeros de jornada pre-doctoral por recibirme tan cariñosamente y por
acoger una brasileña (no muy típica) de una forma tan especial. Sin duda alguna una
grande parte de esto trabajo y de todo que he aprovechado por aquí es debido a
vosotros. A las Dra Antonia Noce, Dra Arianna Manunza, Dr Rayner Gonzales-Prendes
(confeso que es un poco raro tal formalidad), Paulina Garcia, Emilio Marmól, Maria
Luigi y Dailu Guan con los cuales he compartido reuniones, proyectos, ensayos y
discusiones científicas (algunas ni tanto) en nuestro grupo de investigación. Gracias por
todo que hemos construido juntos!!
A los otros pré-doctores del grupo de genética animal, Jordi Leno, Marta Gòdia,
Lourdes Criado, Daniel Crespo, Laura Zingaretti, Lino Ramirez, Elies Ramon y a los ya
doctores.. Dr Manuel Revilla y Dra Erika Bianco. Además, pero no menos importante a
Dra Fabiana Quoos, Dra Ediane Paludo, Dra Sara Guiao y a Joan Rène, mi más
emocionado agradecimiento. No caben palabras para describirlos. Es increíble mirar
hacia atrás y ver lo cuanto hemos crecido juntos, en medio a cafés, tés, doces y ciencia!
A todos investigadores del grupo de genética animal de CRAG, Dr. Josep Maria
Folch, Dr. Miguel Pérez-Enciso, Dr. Sebastián Ramos-Onsins, Dr. Alex Clop y Dr
Amand Sanchez. Y todo suporte de investigación de Dra Anna Castelló, Dra Anna
Mércade y Betlem Cabrera.

Acknowledgements
282
Así como de todo personal de la Universitat Autònoma de Barcelona (UAB), en
especial a Julia Lacuesta, y todos del Centre de Recerca de Agrogènomica (CRAG), en
especial a Tania Guil.
A los del programa de Genética y Mejora Animal del Institute of Agrifood Research
and Technology, en especial a la Dra Raquel Quintanilla, Dra Maria Bellester y Olga
González.
A todos del grupo de Animal Genetics, Bioinformatics and Breeding de la
Universidad de Copenhagen por su hospitalidad durante mi estancia. En especial a Dra.
Merete Fredholm, Dra Caroline Mentzel y Dra Susanna Cirera por su amizade durante
los tres meses que hemos pasado juntas y por su ejemplo como persona e investigadora.
A minha família em Barcelona, com os quais tive o prazer imenso de dividir minha
casa, meus dias e meu coração. Dra Nubia Caramello, Dra Francyne Elias-Piera, Dr
Jackson Itikawa, Luís Fernando Gouveia, Julia Roberts, Gabriella Breda, Dra Anna
Paula Machado. Além de Dr Robson Trevizan e Otavio Marçal por os momentos
compartilhados.
Aos meus irmãos em Cristo: Lídia Maria, Bruna, Gustavo, Viviane, Sérgio, Roberta,
Daniel, Eva, Sheila e Arthur. Por todo carinho, amizade, palavras de apoio e essa
miscigenação de amor! Que Deus os abençoem!!
Em especial, a um dos maiores presentes de Barcelona e para vida. Leonardo
obrigada por me ensinar o caminho, me guiar, ser meu companheiro e amigo. Te quero!
Aos meus amigos de outras décadas, com os quais já passamos tantas coisas e agora
superamos a distância: Silvana; Danien, Christopher, Renata, Eduarda, e a Dra Estela.
Os tenho sempre comigo.
E finalmente, aos meus pais, Jorge e Denize, que sempre colocaram meus sonhos e
desejos à frente aos seus. Sei o quanto todo esse tempo longe foi difícil, mas com
certeza sem o apoio de vocês essa caminhada nunca iria se realizar. A minha irmã
Thais, por toda amizade, amor e por cuidar dos velhos na minha ausência. Vocês são o
meu porto seguro. Os amo!!
Copyright © 2022 FDOKUMEN