Analysis of the functional activity of the 1.4-kb 5′-region of the rice actin 1 gene in stable...
12
Plant Science 116 (1996) 73-84 Analysis of the functional activity of the 1.4-kb Y-region of the rice actin 1 gene in stable transgenic plants of maize (Zea mays L.) Heng Zhonga, Shibo Zhang”, Donal Warkentina, Baolin Suna, Tiyun Wub, Ray Wub, Mariam B. Sticklen*” ‘Department of Crop and Soil Sciences, Department of Entomology, 202 Pesticide Research Center, Michigan State University, East Lansing, MI 48824-1311, USA bSection of Biochemistry, Molecular and Cell Biology, Cornell University, Ithaca. NY 14853, USA Received 24 May 1995; revision received 24 January 1996; accepted 25 January 1996 The activity of the S/-region of the rice actin 1 gene (Act]), covering a region 1.4 kb upstream of the Act1 translation initiation codon, was extensively analyzed in transgenic maize plants. The 5’-region of Act1 fused to the @- glucuronidase (GUS) gene (gus) coding region was co-transformed to maize with the phosphinothricin acetyltransfer- ase gene (bar) and the potato proteinase inhibitor II gene @in2). One and 29 independent transformation events with expression of both bar and gas were recovered from bombardment of immature embryo-derived embryogenic callus of Hi-II derivative and bombardment of shoot tips of Honey N Pearl and Illinois Golden Extra Sweet, respectively. Expression of gas in tissues of transgenic plants was examined by histochemical assay, immunoblot analysis, and fluorometric GUS specific activity assay. A constitutive expression of the introduced gus was observed throughout the developmental stages of the vegetative and reproductive organs in transgenic maize plants. Quantitative analysis of GUS in transgenic plants showed that GUS, as percent of total soluble protein, was as much as 3.1% in leaves and 2.8% in roots. The functional activity of the 5 ‘-region of Act1 was inherited to transgenic progeny. The results indicate that the 1.4kb 5’-region of Act1 is an efficient and strong promoter for gene expression in stable transgenic maize plants. Keywords: Gene expression; fi-Glucuronidase (GUS); Rice actin 1 gene (Acrl); Transgenic maize; Shoot meristem 1. Iotroduetion The regulatory activity of the 5’ region of the rice actin 1 gene (Act]), when fused to the bacterial Abbreviafions: BA, N’benzyladenine; 2,4-D, 24dichIoro- phenoxyacetic acid; G, glufosinate ammonium; GUS, fl- glucuronidase; Hi-II, type II embryogenic callus line of A188 x B73; HNP, Honey N Pearl; IBA, indole-3-butyric acid; IGES, Illinois Golden Extra Sweet; MS, Murashige and Skoog (1962) basal medium; N6, Chu et al. (1975) rice anther culture medium; SDS, sodium dodecyl sulfate. l Corresponding author. 8-glucuronidase (GUS) gene (gus), has been exten- sively analyzed in transgenic rice plants [l]. This Act1 5’ region covers a region 2.1 kb upstream of the translation initiation codon of the Act2 gene, including a 1.64 kb nontranscribed 5 ’ flanking sequence and several Act1 transcribed sequences. The Actl-Gus gene fusion was constitutively expressed throughout the sporophytic and gametophytic tissues in transgenic rice. The tissue of transgenic rice plants had as much as 3% of total soluble protein as 8-glucuronidase. Although this fusion construct has also been introduced into 0168~9452/96/$15.00 0 1996 Elsevier Science Ireland Ltd. All rights reserved PII SO168-9452(96)04369-S
-
Upload
michiganstate -
Category
Documents
-
view
1 -
download
0
Transcript of Analysis of the functional activity of the 1.4-kb 5′-region of the rice actin 1 gene in stable...

Plant Science 116 (1996) 73-84
Analysis of the functional activity of the 1.4-kb Y-region of the rice actin 1 gene in stable transgenic plants of maize (Zea mays L.)
Heng Zhonga, Shibo Zhang”, Donal Warkentina, Baolin Suna, Tiyun Wub, Ray Wub, Mariam B. Sticklen*”
‘Department of Crop and Soil Sciences, Department of Entomology, 202 Pesticide Research Center, Michigan State University, East Lansing, MI 48824-1311, USA
bSection of Biochemistry, Molecular and Cell Biology, Cornell University, Ithaca. NY 14853, USA
Received 24 May 1995; revision received 24 January 1996; accepted 25 January 1996
The activity of the S/-region of the rice actin 1 gene (Act]), covering a region 1.4 kb upstream of the Act1 translation initiation codon, was extensively analyzed in transgenic maize plants. The 5’-region of Act1 fused to the @- glucuronidase (GUS) gene (gus) coding region was co-transformed to maize with the phosphinothricin acetyltransfer- ase gene (bar) and the potato proteinase inhibitor II gene @in2). One and 29 independent transformation events with expression of both bar and gas were recovered from bombardment of immature embryo-derived embryogenic callus of Hi-II derivative and bombardment of shoot tips of Honey N Pearl and Illinois Golden Extra Sweet, respectively. Expression of gas in tissues of transgenic plants was examined by histochemical assay, immunoblot analysis, and fluorometric GUS specific activity assay. A constitutive expression of the introduced gus was observed throughout the developmental stages of the vegetative and reproductive organs in transgenic maize plants. Quantitative analysis of GUS in transgenic plants showed that GUS, as percent of total soluble protein, was as much as 3.1% in leaves and 2.8% in roots. The functional activity of the 5 ‘-region of Act1 was inherited to transgenic progeny. The results indicate that the 1.4kb 5’-region of Act1 is an efficient and strong promoter for gene expression in stable transgenic maize plants.
Keywords: Gene expression; fi-Glucuronidase (GUS); Rice actin 1 gene (Acrl); Transgenic maize; Shoot meristem
1. Iotroduetion
The regulatory activity of the 5’ region of the rice actin 1 gene (Act]), when fused to the bacterial
Abbreviafions: BA, N’benzyladenine; 2,4-D, 24dichIoro- phenoxyacetic acid; G, glufosinate ammonium; GUS, fl- glucuronidase; Hi-II, type II embryogenic callus line of A188 x B73; HNP, Honey N Pearl; IBA, indole-3-butyric acid; IGES, Illinois Golden Extra Sweet; MS, Murashige and Skoog (1962) basal medium; N6, Chu et al. (1975) rice anther culture medium; SDS, sodium dodecyl sulfate. l Corresponding author.
8-glucuronidase (GUS) gene (gus), has been exten- sively analyzed in transgenic rice plants [l]. This Act1 5’ region covers a region 2.1 kb upstream of the translation initiation codon of the Act2 gene, including a 1.64 kb nontranscribed 5 ’ flanking sequence and several Act1 transcribed sequences. The Actl-Gus gene fusion was constitutively expressed throughout the sporophytic and gametophytic tissues in transgenic rice. The tissue of transgenic rice plants had as much as 3% of total soluble protein as 8-glucuronidase. Although this fusion construct has also been introduced into
0168~9452/96/$15.00 0 1996 Elsevier Science Ireland Ltd. All rights reserved PII SO168-9452(96)04369-S

74 H. Zhong et al. /Plant Science 116 (19%) 73-84
barley 121, wheat [3,4], and tritordeum [5], the expression of the GUS gene under the Actl 5’- region in these transgenic plants was not analyzed in as much detail as in transgenic rice [l].
The characterization of the rice Act1 5 ’ region revealed that the minimum amount of Actl se- quence required for maximal GUS expression is a 0.83 kb nontranscribed 5 ’ flanking sequence and the several Actl transcribed sequences, covering a region 1.4 kb upstream of the Actl translation ini- tiation codon, in transient assays of transformed rice protoplast [6]. Similar analysis of the activity of this ActZ-Gus gene fusion has been reported in rice, barley and maize cells at the transient gene expression level, and it was shown to be much higher than that of the CaMV 35s promoter [7,8]. Previously, we have transformed turfgrass with this 1.4-kb 5 ’ region uf rice ActZ and demon- strated the high level of constitutive expression of ActZ-Gus gene fusion in the vegetative parts of transgenic turfgrass plants [9].
Here we report the extensive analysis of the functional activity of the 1.4kb 5’-region of the rice ActZ in stable transgenic plants of maize. In our work, the level of expression of the introduced gus driven by the 1.4-kb rice ActZ 5’-region was analyzed in shoot and floral meristems, young leaves and leaf bases of mature leaves, roots, pol- len grains, and zygotic embryos. Our study in- dicated that the region 1.4 kb upstream of the ActZ translation initiation codon is a strong regulator in stable transgenic maize plants.
2. Materials and methods
2.1. Production of transgenic plants with ActZ-Gus fusion
Two transformation systems including the bom- bardment of shoot tips and the bombardment of immature embryo-derived callus were performed.
We have reported the development of a system for transformation of maize via bombardment of shoot tips [lo]. In summary, multiple shoot-tip cultures of two sweet cone genotypes, Honey N Pearl (HNP) and Illinois Golden Extra Sweet (IGES), were initiated on MS basal medium [l l] containing 2 mg/l N&enzyladenine (BA) and 0.5
mg/l 2,4-dichlorophenoxyacetic acid (2,4-D) from the mature kernels as described previously [12]. Shoot tips or shoot-tip clumps were positioned in an area of about 1.5 cm at the center of a Petri dish containing phytagel-solidified culture medium and bombarded 4 times with 1.0 pm tungsten particles at a density of 75 &hot and an acceleration pres- sure of 1550 psi.
For transformation via bombardment of em- bryogenic callus, the type II embryogenic callus was initiated from immature embryos of field plants germinated from seeds. The seeds were from self-pollinated greenhouse plants that were regenerated from embryogenic callus line Hi-II [13]. Samples of fresh embryogenic callus, a thin layer -3 cm in diameter, were arranged at the center of Petri dishes and were bombarded as previously reported [ 14,151.
The plasmid pActZ-F (Fig. la) [6] was delivered into cells of embryogenic callus and shoot tips in co-transformation with plasmid pTW-a (Fig. lb) in a 1: 1 ratio. The pActZ-F contains ActZ-Gus gene fusion. The pTW-a contains two linked genes, the potato proteinase inhibitor II gene (pin2) [16] driven by pin2 promoter with ActZ 5’ intron [6] and the Streptomyces hygroscopicus bar gene [ 171 driven by the Cauliflower Mosaic Virus (CaMV) 35s promoter.
The bombarded shoot-tips were multiplied on MS basal medium plus 2 mgZl BA and 0.5 mgZl2,4- D for 4 weeks, and then were selected on the same medium with 3 mgZl glufosinate ammonium (G) for 4 weeks and with 5 mg/I G at 4-week intervals for another 4 months. Plantlets were subsequently regenerated from G-resistant shoot-tip clumps on MS medium containing 0.5 mg/l BA, 0.5 mgZl indole3-butyric acid (IBA) and 5-10 mg/I G and MS medium containing 1 rngfl IBA and 10 mg/l G.
The bombarded callus samples were grown for 1 week on N6 medium [18] supplemented with 3.0 mgiI L-proline and 2.0 mg/l 2,4-D (Sigma). They were then selected on the same medium sup- plemented with 3 mg/l G for -2 weeks, followed by another 4-week selection on the medium con- taining 5 mg/l G. The selected G-resistant colony was transferred to embryogenesis medium [ 191 for 2 weeks. The somatic embryos were germinated on MS basal medium plus 2% sucrose. The regener-

H. Zhong et al. /Plant Science 116 (19%) 73-84 75
x* I!* SB B s Xb*; N* (a> v vv v
, Act! 5’ FS i 1 Act1 5’1 ]I
0.38 0.51 0.20 0.35 1.87 0.26 2.90
B B B; H EV*;E B E
pin2 5’ UC 19
1.0 0.5 0.6 0.9 0.8 0.6 0.3 2.7
Fig. 1. Restriction maps of constructs pActl-F and pTW-a. (a) pTW-a contains two linked genes: (I) the pin2 coding sequence (pin2) under the pin2 promoter (pin2 5’) with Act1 intron (Actf I), plus pin2 terminator (pin2 3 ‘); (2) bar is bar coding sequence (bar) under CaMV 35s promoter (35 S), plus the nos terminator (Nos). (b) pActI-F contains the Act1 5’4anking sequence (Act 1 FS), 5’- noncoding exons of Act1 (open boxes), Act1 5’4ntron (Act1 I), thegur coding sequence (pus), and the nos terminator (nos). Abbrevia- tions: B, BamHI; E, EcoRI; EV, EcoRV; H, HindIII, N, NotI; S, SacI; X, XhoI; and Xb, XbaI. *Unique site.
ated plantlets were selected again in Magenta boxes containing the above regeneration medium with 5 rng/l of G.
All of G-resistant plantlets with 2-3 leaves were transferred to pots containing soil in the greenhouse.
A 1% solution of Ignite@ non-selective herbicide (AKA BASTA, HOE-39866, Hoecht-Roussel Agri-Vet Company, Somerville, NJ) containing 2 g/l of G, the active ingredient, was sprayed on transgenic plants following an earlier report [14].
Ten pg of genomic DNA isolated from leaves of greenhouse-grown plants were digested overnight, electrophoresed on 0.8% agarose gels, and transferred to nylon membranes [20]. The blots were hybridized with probes of bar (0.6 kb bar coding sequence), pin2 (1.5 kb containing pin2 coding region and pin2 terminator), and gus (1.87 kb gus coding sequence) (Fig. la and b) for analy- sis of the presence of the bar, pin2, and gus in transgenic plants.
2.2. Histochemical GUS staining
Roots, shoot tips and leaves of in vitro-grown transgenic plants at the 4-6 leaf stage were col- lected and stained in GUS staining buffer with X- glucuronide (X-glut) at 37OC for the histochemical assay [21]. Male and female floral meristems were isolated from greenhouse-grown transgenic plants.
Pollen grains were isolated from mature and im- mature anthers of greenhouse-grown transgenic plants. All of these tissues and organs were stained with X-glut. Thin cross-sections of roots, leaves, and male and female flowers were made by hand. The immature embryos were isolated - 15-20 days after pollination and stained with X-glut. The immature embryos were also germinated in vitro to produce Tl plants for histochemical GUS staining.
2.3. Immunoblot analysis
Transgenic plants were assayed for gene expres- sion by immunoblot analysis [22]. Approximately 20 mg fresh weight of each tissue of a transgenic plant was ground in 200 ~1 2 x SDS gel-loading buffer (100 mM Tris-HCI, 200 mM dithiothreitol, 4% SDS, 0.2% bromophenol blue, 20% glycerol, pH 6.8) containing 14 mM /3-mercaptoethanol and 100 mM phenylmethylsulfonyl fluoride, then cen- trifuged at 14 000 rev./mm for 10 min at 4OC. An extract from an untransformed plant was used as the negative control. Purified fi-glucuronidase (1 .O pg and 0.1 pg) was used as the positive control. Rainbow pre-stained protein molecular weight markers (Amersham International Inc.) were used. A 20 pl aliquot of each sample extract was boiled at 100°C for 5 min, loaded onto a 10% running, 6% stacking SDS-polyacrylamide gel [23], electro-

16 H. Zhong et al. /Plant Science I I6 (19%) 73-84
phoresed at 30 mA for - 1 h, and electroblotted overnight onto a 0.45 pm nitrocellulose membrane (241. The membrane was incubated in rabbit anti- &glucuronidase antiserum (Clontech) diluted 1:800, followed by alkaline phosphatase con- jugated goat anti-rabbit IgG antiserum at 1:7500 dilution. The membrane was incubated with the substrates nitro blue tetrazolium and 5-bromo-4- chloro-3-indolyl phosphate [9].
2.4. Densitometer scanning of Coomassie stained gels
Coomassie-stained SDS gels were used to quan- tify the @-glucuronidase as percent of total soluble protein extracted from each tissue. The SDS gels were loaded with samples, electrophoresed, and stained in Coomassie brilliant blue staining solu- tion for 4 h. The gels were destained for -24 h. The 68 kD &glucuronidase band present in the putative transgenic extracts had similar mobility to the purified &glucuronidase positive control. The same size band was not visible in the untransform- ed plant sample. Quantification of the @-glucur- onidase as percent of total soluble protein was made by using the AMBIS densitometer computer program.
2.5. Fluorometric assay
GUS specific activity was measured by fluorometric assay [21]. Total soluble protein from each tissue was extracted in 200 ~1 GUS extraction buffer. Protein concentration of the samples was determined by the dye-binding method of Brad- ford [25] with a Bio-Rad kit. All of the samples were adjusted to the same concentration of total soluble protein before assay. A 50 ~1 aliquot of each sample extract was added to 500 ~1 of methylumbelliferyl-&Dglucuronide (MUG) buf- fer (1 mM MUG in GUS extraction buffer), and then incubated at 37°C for 0, 1, 2, 4 and 17 h. A standard curve was established with methyl umbelliferone (MU). Fluorescence was measured and analyzed with the AMBIS densitometer com- puter program, and the concentrations of methyl umbelliferone were determined by regression anal- ysis versus the standard curve.
3. Results
3.1. Production of transgenic plants with the Actl- Gus gene fusion
The Actl-Gus gene fusion was co-transformed with bar and pin2 into maize plants by bombard- ment of shoot tips and embryogenic callus. We have reported 29 independent transformed shoot- tip clumps of both HNP and IGES with intensive GUS-staining which were isolated on the selection of 3-5 mg/l G 3 months after bombardment [lo]. Southern blot analysis of uncut genomic DNA from each of these independent transformation events showed the presence of all transgenes, bar, pinZZ and gus [lo]. An intensely GUS-stained callus colony was also recovered 3 months after the bombardment of embryogenic callus line Hi-II under the selection of 3-5 m@I G. All of regenerated plantlets were resistant to 5 mg/l G in vitro, a level which killed 100% of untransformed plantlets. More than 1500 plantlets regenerated from 10 independent transgenic shoot-tip clumps of both HNP and IGES were transferred to the greenhouse. A total of 197 putative transgenic plantlets regenerated from the callus colony of Hi- II (MTl-MT197) were also transferred to the greenhouse. Untransformed plants and the putative transgenic plants were sprayed with 1% herbicide Ignite’s’ solution. All of the sprayed putative transgenic plants survived and displayed no necrotic symptoms, while all untransformed plants were killed within 7 days.
Preliminary southern blot analysis of genomic DNA of five plants from each of the independent transformed events revealed that the five plants from the same event were regenerated from the same transformed cell (data not shown). The inser- tion site of the transgenes, bar and gus, in the leaf genomic DNA of greenhouse-grown transgenic plants from five independent transformation events of all three genotypes was compared (e.g. see Fig. 2). The results showed that the transgenes were integrated into the genomes of the transgenic plants. A 3.3 kb gus-hybridized band, containing a portion of Act1 promoter, the gus and nos 3’ ter- minator in pActl-F, and a 0.9 kb bar-hybridized band, containing the bar and nos 3 ’ terminator in

H. Zhong et al. /Plant Science 116 (19%) 73-84 17
pTW-a, were observed in all transgenic plants after digestion with EcoRIINotI (Fig. 2A) or EcoRI (Fig. 2B), respectively. The band pattern of genomic DNA digested with EcoRI (Fig. 2A, a unique site in pActl-F) or EcoRV (Fig. 2B, a uni- que site in pTW-a) indicated that both gus and bar were integrated into different sites of genomic DNA with various copy numbers in different transformation events.
3.2. Histochemical GUS staining of tissues and organs of transgenic To and Tl plants
The roots of more than 200 in vitro-grown con- trol and independently transformed plants from all three genotypes were assayed by incubation in X-
glut GUS staining solution for 30 min to 4 h at 37°C. Intense GUS staining was observed in the root tip and elongation zone of all of the primary roots and adventitious roots in more than 93% of transgenic plants examined but not in control plants (Fig. 3a and b). Root hairs, which were the tissue that responded to GUS staining most rapid- ly, turned blue lo-30 min after staining. Less than 6% of transgenic plants showed higher GUS activ- ity only in the vascular tissues at the elongation zones (Fig. 3a and c). It was apparent that the GUS staining was much more intense in the cells of root hairs, epidermal layers, endodermis, and vascular areas, but was much lower in cortex cells (Fig. 3d).
When leaves and shoot tips of in vitro-grown
pAc/l-F co TA-5 TA-13 TA-42 TA-43 MT
7.2
3.6
1.9
1.2 0.9
PTW-a
33Slg__________ TA-5 TA-13 TA-42 TA-43 MT
Fig. 2. Southern blot analysis of transgenic TO plants harboring tlte transgenes gus (A) and bar (B). The amount of plasmid DNA represented 1, 3 and 5 copies in plant genomic DNA. Each lane contains IO cg of genomic DNA from control plant (CO, HNP) or transgenic maim plants of maim (TO: TA-5 and TA-13 of HNP, TA-42 and TA-43 of IGES, and MT of Hi-II). Lane a, undigested DNA; lane b, EcoRV-digested DNA; lane c, EcoRI-digested DNA; lane d, HindHI-digested DNA, and lane e, EcoRIINotI-digested DNA. Filters were hybridized with s-32P-labeled gu.r or bar coding region probe, respectively.

Fig. 3. Histochemical assay of gu.s expression in tissues of transgenic maize with pAcrl-F. (a) Roots from control (CR) and transgenic plants; PR, primary roots; AR, adventitious roots; SR, secondary roots; V, expression only in the vascular tissue. (b) gas expression in the root tips (RT). (c) Cross-section of a root with the expression only in the vascular tissues but not in cortex cells; M, metaxylem;
PH, phloem. (d) Cross-section of a primary root; C, cortex cells; E, epidermis cells; EN, endodermis cells; M, metaxylem; PH, phloem;
PX, protoxylem; RH, root hairs. (e) A shoot tip. (f) Cross-section of leaf sheathes; LV, lateral vein; IV, intermediate vein. (g) An
enlarged cross-section of a leaf blade. (h) Cross-section of a stem proximal to the leaf base in the node; AX, axillary bud; LS, leaf
sheath; VB, vascular bundle. (i) Cross-section of a stem-axillary bud junction. (i) A tassel primordium. (k) Cross-section of an imma- ture tassel; SP, spikelet primordium. (I) A developing tassel; GO, out glume. (m) Different development stages of ear; SP, spikelet
primordium; SL, silk. (n) Cross-section of a developing ear; SL, silk. (0) Immature pollen grains. (p) Immature embryos.

H. Zhong et al. /Plant Science 116 (19%) 73-84 19
Fig. 3. (continued)

80 H. Zhong et al. /Plant Science 116 (19%) 73-84
and greenhouse-grown transgenic and control plants were assayed with X-glut, the entire shoot tips (Fig. 3e) and the youngest leaves (Fig. 3f) showed most intense GUS staining in all plants tested. The older leaves of the most in vitro- and greenhouse-grown plants had high GUS activity at the leaf bases and several expressing sectors within the center of leaves or at the leaf tips. Thin cross- sections of GUS-stained leaf bases showed that high-level GUS expression was located in epider- ma1 cells and vascular tissue, while the expression was lower in mesophyll cells (Fig. 3g). The axillary buds and the vascular tissues in the internodes presented a high intensity of GUS staining (Fig. 3h and i). The vascular tissues proximal to leaf base in the node showed the intense blue color.
Young male and female florescences of trans- genie plants stained with X-glut showed high GUS activity in spikelet primordia (Fig. 3j, k and 1). Most of the more-developed florets showed a higher level of GUS activity in inner and outer glumes and anthers. In an exception observed, the high level of GUS activity displayed only in the developing anther primordia but not in the inner and outer glumes (Fig. 3m). The developing silks of transgenic plants showed high GUS activity (Fig. 3m and n), while the activity was very low or not visible in the highly developed silks and floral tissues (Fig. 31). Pollen grains collected from most transgenic plants of all three genotypes showed an approximate 1: 1 positive:negative GUS staining ratio with a variable GUS activity (Fig. 30).
The intensity of GUS staining in the immature embryos of transformants depended on their developmental stage (Fig. 3~). The younger the immature embryos, the more intense the blue. The statistic analysis of results from GUS assay of immature embryo, young leaf section, root and pollen grain of Tl and T2 plants revealed that the segregation of GUS expression followed Mendelian inheritance in the T2 progeny tested but not in all of the Tl progeny tested (3: 1 for self- pollination and 1: 1 for cross-pollination with a single gene in a single locus) (data not shown). Southern blot analysis of the leaf genomic DNA of selected GUS-positive Tl and T2 plants confirmed the presence of gus in the Tl and T2 progeny (data not shown).
3.3. Immunoblot analysis of transgenic plant tissues
Protein samples extracted from leaves (first, fourth, sixth) and three individual roots of a single transgenic plant of independent transformation events derived from HNP, IGES and callus line Hi-II were analyzed by immunoblot. The 68 kD band of &glucuronidase was present in samples from transgenic leaves and roots (e.g. see Fig. 4, lanes l-6), but not in the sample from an un- transformed plant (Fig. 4, lane 7). In another experiment, equal amounts of three root segments that showed three levels of GUS staining in a sin- gle stained root (dark blue, light blue and no visi- ble blue) were tested by immunoblot. The result showed that the lane loaded with a sample from a dark blue segment had a more intense p- glucuronidase band than that from a light blue segment, and there was no visible band from a seg- ment with no visible blue color (data not shown). This indicated that histochemical GUS staining was consistent with immunoblot for analysis of /3- glucuronidase.
3.4. Quantitative analysis of GUS protein by den- sitometer scanning of Coomassie-stained SDS gels
Densitometer scanning of Coomassie-stained SDS gels containing the same protein samples ex- tracted for immunoblot analysis as above was done to quantify /3-glucuronidase as percent of total soluble protein. The level of /3-glucuronidase in total soluble protein of the transgenic leaves and roots can be as much as 2.2% and 2.6% for Hi-II, 3.1% and 2.8% for HNP, or 2.9% and 2.5% for IGES, respectively (Fig. 5). The Actl-Gus expres- sion level in roots was more consistent than that in leaves among different genotypes. The younger the leaf, the higher the level of GUS.
3.5. Fiuorometric assay
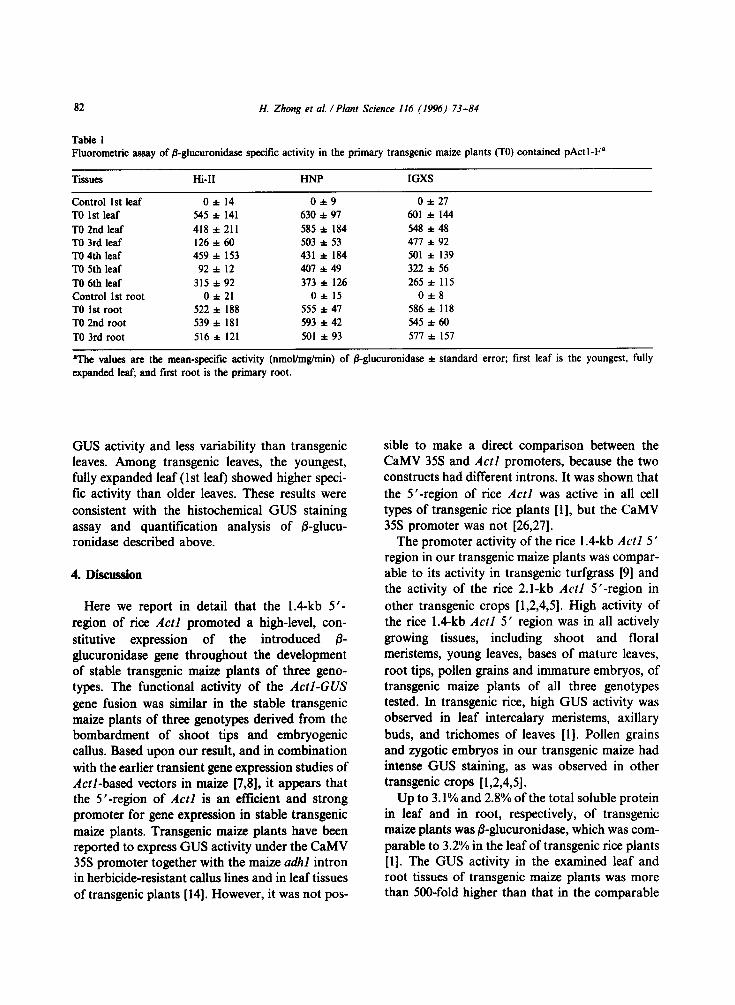
As compared to GUS specific activity measured by fluorometric assay in control plants of compar- able age, the activity in the leaves and roots of the transgenic plants derived from HNP, IGES and Hi-II was more than 500-fold higher (Table 1). Transgenic roots had relatively higher specific

H. Zhong et al. /Plant Science 116 (19%) 73-84
1 2 3 4 5 678 9 KD
Fig. 4. Immunoblot analysis of roots and leaves of maize transgenic TO plants with pActf-F. Lanes 1-3, first, second and third root samples from a transgenic plant MT 228; lanes 4-6, sixth, fourth and first leaf samples of the transgenic plant MT 228; lane 7, leaf sample of an untransformed plant; lanes 8-9, 0.1 and I .O pg of purified fi-glucuronidase. The arrow indicates the size of 68 kD 8- glucuronidase..
H HI-II
n
61 HNP
Cl IGES
4thLT0 6thLT0 lstRC0 lstRT0 2ndRTO 3rdRT0
Ti\SW\
Fig. 5. Quantification of GUS in the tissues of transgenic maize plants contained pActl-F; CO, control plants; TO, primary transform- ants; 1st L, the youngest, fully expanded leaf; 1st R, primary root.
82
Table 1
H. Zhong et al. /Plant Science 116 (19%) 73-84
Fluorometric assay of &glucuronidase specific activity in the primary transgenic maize plants (TO) contained pActI-Fa
Tissues Hi-II HNP IGXS
Control 1st leaf 0 l 14 0*9 0 f 21 TO 1st leaf 545 f 141 630 zt 91 601 l 144 TO 2nd leaf 418 zt 211 585 zt 184 548 zt 48 TO 3rd leaf 126 f 60 503 t 53 417 zt 92 TO 4th leaf 459 l 153 431 f 184 501 l 139 TO 5th leaf 92 zt 12 407*49 322 f 56 TO 6th leaf 315 f 92 313 zt 126 265 zt 115 Control 1st root 0 f 21 o* 15 O&8 TO 1st root 522 f 188 555 l 41 586 f 118 TO 2nd root 539 f 181 593 f 42 545 l 60 TO 3rd root 516 zk 121 501 f 93 511 * 151
pThe values are the mean-specific activity (nmol/mg/min) of &glucuronidase * standard error; first leaf is the youngest, fully expanded leaf; and first root is the primary root.
GUS activity and less variability than transgenic leaves. Among transgenic leaves, the youngest, fully expanded leaf (1 st leaf) showed higher speci- fic activity than older leaves. These results were consistent with the histochemical GUS staining assay and quantification analysis of &glucu- ronidase described above.
4. Discussion
Here we report in detail that the 1.4-kb 5 ‘- region of rice Actl promoted a high-level, con- stitutive expression of the introduced /3- glucuronidase gene throughout the development of stable transgenic maize plants of three geno- types. The functional activity of the Actl-GUS gene fusion was similar in the stable transgenic maize plants of three genotypes derived from the bombardment of shoot tips and embryogenic callus. Based upon our result, and in combination with the earlier transient gene expression studies of Actl-based vectors in maize [7,8], it appears that the 5’-region of Act1 is an efficient and strong promoter for gene expression in stable transgenic maize plants. Transgenic maize plants have been reported to express GUS activity under the CaMV 35s promoter together with the maize adhl intron in herbicide-resistant callus lines and in leaf tissues of transgenic plants [ 141. However, it was not pos-
sible to make a direct comparison between the CaMV 35s and Act1 promoters, because the two constructs had different introns. It was shown that the 5’-region of rice Act1 was active in all cell types of transgenic rice plants [1], but the CaMV 35s promoter was not [26,27].
The promoter activity of the rice 1.4-kb Actl 5 ’ region in our transgenic maize plants was compar- able to its activity in transgenic turfgrass [9] and the activity of the rice 2.1-kb Actl 5’-region in other transgenic crops [ 1,2,4,5]. High activity of the rice 1.4-kb Act1 5 ’ region was in all actively growing tissues, including shoot and floral meristems, young leaves, bases of mature leaves, root tips, pollen grains and immature embryos, of transgenic maize plants of all three genotypes tested. In transgenic rice, high GUS activity was observed in leaf intercalary meristems, axillary buds, and trichomes of leaves [l]. Pollen grains and zygotic embryos in our transgenic maize had intense GUS staining, as was observed in other transgenic crops [ 1,2,4,5].
Up to 3.1% and 2.8% of the total soluble protein in leaf and in root, respectively, of transgenic maize plants was &glucuronidase, which was com- parable to 3.2% in the leaf of transgenic rice plants [l]. The GUS activity in the examined leaf and root tissues of transgenic maize plants was more than 500-fold higher than that in the comparable

H. Zhong et al. /Plant Science 116 (19%) 73-84 83
tissues of control maize plants. We also observed that the level of gus expression varied in different tissues and in the same tissues at different developmental stages. Of all tissues tested, vegetative shoot tips and floral meristems showed the highest level of GUS expression. Actively cell- dividing and -growing regions showed a much higher level of expression compared to differen- tiated tissues. These results were not surprising, because the Act1 promoter exhibited a similar pat- tern of expression in rice [28].
Some primary transgenic maize plants presented a gus expression pattern different from most trans- formants in the same transformation events, such as higher GUS activity only in the vascular tissues of roots (Fig. 3c) and in the developing anther primordia (Fig. 31). The direct cause of those vari- ations is unknown. One possible explanation is the tissue culture-derived abnormalities [ 14) or greenhouse conditions.
Acknowledgements
We are grateful to Dr. Charles L. Armstrong (Monsanto Agriculture Company, St. Louis, MO) for providing the Hi-II embryogenic callus. The construction of plasmids was performed at Cornell University. The development of transformation system, the transformation and the analysis of transformants were performed at Michigan State University.
References
Ill
121
131
141
PI
W. Zhang, D. McElroy and R. Wu, Analysis of rice Acrl 5’ region activity in transgenic rice plants. Plant Cell, 3 (1991) 1155-1165. A. Jahne, D. Becker, R. Brettschneider and H. Lorz, Regeneration of transgenic, microspore-derived, fertile barley. Theor. Appl. Genet., 89 (1994) 525-533. D. Becker, R. Brettschneider and H. Lorz, Fertile trans- genie wheat from microprojectile bombardment of scutellar tissue. Plant J., 5 (1994) 299-307. N.S. Nehra, R.N. Chibbar, N. Leung, K. Caswell, C. Mallard, L. Steinhauer, M. Baga and K.K. Kartha, Self- fertile transgenic wheat plants regenerated from isolated scutellar tissues following microprojectile bombardment with two distinct gene constructs. Plant J., 5 (1994) 285-297. P. Barcelo, C. Hagel, D. Becker, A. Martin and H. Lorz, Transgenic cereal (tritordeum) plants obtained at high
161
171
PI
PI
IlO1
1111
WI
1131
1141
I151
1161
iI71
WI
efftciency by microprojectile bombardment of inllores- cence tissue. Plant J., 5 (1994) 583-592. D. McElroy, W. Zhang, J. Cao and R. Wu, Isolation of an efficient actin promoter for use in rice transformation. Plant Cell, 2 (1990) 163-171. D. McElroy, A.D. Blowers, B. Jenes and R. Wu, Con- struction of expression vectors based on the rice actin I (Ad) 5’ region for use in monocot transformation. Mol. Gen. Genet., 231 (1991) 150-160. K. Schledzewski and R.R. Mendel, Quantitative trans- ient gene expression: comparison of the promoters for maize polyubiquitin I, rice actin I, maizederived Emu and CaMV 3% in cells of barley, maize and tobacco. Transgen. Res., 3 (1994) 249-255. H. Zhong, M.G. Bolyard, C. Srinivasan and M.B. Sticklen, Transgenic plants of turfgrass (Agrostis palustris Huds.) from microprojectile bombardment of embryogenic callus. Plant Cell Rep., I3 (1993) l-6. H. Zhong, B. Sun, D. Warkentin, S. Zhang, R. Wu, T. Wu and M.B. Sticklen, The competence of maize shoot meristems for integrative transformation and inherited expression of transgenes. plahf Physiol., 110 (1996) In press.
T. Murashige and F. Skoog, A revised medium for rapid growth and bioassays with tobacco tissue cultures. Physiol. Plant., I5 (1962) 473-497. H. Zhong, C. Srinivasan and M.B. Sticklen, In-vitro morphogenesis of corn (Zea mays L.) I. Differentiation of multiple shoot clumps and somatic embryos from shoot tips. Planta, 187 (1992) 483-489. CL. Armstrong, C.E. Green and R.L. Phillips, Develop- ment and availability of germplasm with high type II cul- ture formation response. Maize Genet. Coop. Newslett., 65 (1991) 92-93. W.J. Gordon-Kamm, T.M. Spencer, M.L. Mangano, T.R. Adams, R.J. Daines, W.G. Start, J.V. O’Brien, S.A. Chambers, W.R. Adams, N.G. Willetts, T.B. Rice, C.J. Mackey, R.W. Krueger, A.P. Kausch and PG. Lemaux, Transformation of maize cells and regeneration of fertile transgenic plants. Plant Cell, 2 (1990) 603-618. D.A. Walters, C.S. Vetsch, D.E. Potts and R.C. Lund- quist, Transformation and inheritance of a hygromycin phosphotransferase gene in maize plants. Plant Mol. Biol., I8 (1992) 189-200. R.W. Thornburg, G. An, T. Cleveland, R. Johnson and CA. Ryan, Wound-inducible expression of a potato in- hibitor II-chloramphenicol acetyl transferase gene fusion in transgenic tobacco plants. Proc. Natl. Acad. Sci. USA, 84 (1987) 744-748. C.J. Thompson, N.R. Mowa, R. Tizard, R. Crameri, J.E. Davies, M. Lauwereys and J. Botterman, Character- ization of the herbicide-resistance gene bar from Strep- romyces hygroscopicw. EMBO J., 6 (1987) 2519-2523. C.C. Chu, C.C. Wang, C.S. Sun, C. Hsu, K.C. Yin, C.Y. Chy and F.Y. Bi, Establishment of an efficient medium for anther culture of rice through comparative experi- ments on the nitrogen source. Sci. Sin. (Peking), 18 (1975) 659-668.

R4 H. Zhong et al. /Plant Science 116 (19%) 73-84
1191 S. Zhang, Z.S. Guo, Y.Q. Qian, Q.G. Cai and Y.L. Zhou, Factors influencing isolation, division and plant regeneration in maim (Zea map L.) protoplast culture. Chin. J. Bot., 2 (1990) 18-25.
(201 EM. Southern, Detection of specific sequences among DNA fragments separation by gel electrophoresis. J. Mol. Biol., 98 (1975) 503-517.
[21] R.A. Jefferson, Assaying chime& genes in plants: the GUS gene fusion system. Plant Mol. Biol. Rep., 5 (1987) 387-405.
[24] H. Towbin, T. Staehelin and I. Gordon, Electrophoretic transfer of proteins from polyacrylamide gels to nitroccl- lulose sheets: procedure and some application. Proc. Nat]. Acad. Sci. USA, 76 (1979) 4350.
[25] MM. Bradford, A rapid and sensitive method for the quantitation of microgram quantities of protein utilizing the principle of protein-dye binding. Anal. B&hem., 72 (1976) 248-254.
[22] W.N. Bumette, ‘Western blot’: electrophoretic transfer of proteins from sodium dodecyl sulfate-polyacrylamide gels to unmodified nitrocellulose and radiographic detec- tion with antibody and radioiodinated protein A. Anal. Biochem., II2 (1981) 195.
(261 M.J. Battraw and T.C. Hall, Histochemical analysis of CaMV 35s promoter-&ghtcuronidase gene expression in transgenic rice plants. Plant Mol. Biol., 15 (1990) 527-538.
[27] R. Tereda and K. Shimamto, Expression of CaMV 35% GUS gene in transgenic rice plants. Mol. Gen. Genet., 220 (1990) 389-392.
[23] U.K. Laemmh, Cleavage of structural proteins during (281 D. McElroy, M. Rothenberg, K.S. Reece and R. Wu, the assembly of the head of the bacteriophage T4. Characterization of the rice (Oryza sativa) actin gene Nature, 227 (1970) 680-685. family. Plant Mol. Biol., I5 (1990) 257-268.