Analysis of the Effects of Adaptive Cruise Control on Driver ...
146
Analysis of the Effects of Adaptive Cruise Control (ACC) on Driver Behavior and Awareness Using a Driving Simulator By © 2017 Vishal C. Kummetha B.Sc. Civil Engineering, University of Cape Town, 2014 Submitted to the graduate degree program in Civil, Environmental, and Architectural Engineering and the Graduate Faculty of the University of Kansas in partial fulfillment of the requirements for the degree of Master of Science in Civil Engineering. Chair: Dr. Alexandra Kondyli Dr. Steven D. Schrock Dr. Thomas E. Mulinazzi Date Defended: 12 October, 2017
-
Upload
khangminh22 -
Category
Documents
-
view
1 -
download
0
Transcript of Analysis of the Effects of Adaptive Cruise Control on Driver ...

Analysis of the Effects of Adaptive Cruise Control (ACC) on Driver
Behavior and Awareness Using a Driving Simulator
By
© 2017
Vishal C. Kummetha
B.Sc. Civil Engineering, University of Cape Town, 2014
Submitted to the graduate degree program in Civil, Environmental, and Architectural
Engineering and the Graduate Faculty of the University of Kansas in partial fulfillment of the
requirements
for the degree of Master of Science in Civil Engineering.
Chair: Dr. Alexandra Kondyli
Dr. Steven D. Schrock
Dr. Thomas E. Mulinazzi
Date Defended: 12 October, 2017

ii
The thesis committee for Vishal C. Kummetha certifies that this is
the approved version of the following thesis:
Analysis of the Effects of Adaptive Cruise Control (ACC) on Driver
Behavior and Awareness Using a Driving Simulator
Chair: Dr. Alexandra Kondyli
Date Approved: 17 October, 2017

iii
ABSTRACT
The thesis was aimed at determining the effects of adaptive cruise control (ACC) on driver
behavior and awareness using a fixed-base driving simulator. ACC provides enhanced assistance
by automatically adjusting vehicle speed according to the headway preference selected by the
driver. The first step was to define the qualitative and quantitative measures of driver behavior and
awareness.
A review of existing literature was carried out to determine similar studies. The literature
revealed information on modeling the ACC in driving simulators and the effects of the ACC on
driver behavior. Based on this, a methodology was developed consisting of six main tasks. First,
participants were recruited and screened using a questionnaire. The questionnaire provided a quick
way to select participants from a particular demographic and screen them for any medical
conditions. The simulator was then prepared for the study by configuring the ACC, setting up the
detection response task (DRT) device, configuring the distraction application, and designing
events targeted to capture changes in driver behavior and awareness with and without the ACC.
After configuring events, data were collected during the drive of the participants. Data were then
reduced and prepared for a statistical analysis consisting of hypothesis testing and analysis of
variance (ANOVA).
The statistical analysis resulted in a few significant differences between the variables
collected. Participants were observed to maintain longer headways, reach lower peak velocities,
and react slower in some critical events when driving with the ACC. The data from the DRT
showed a significantly lower cognitive load when participants were engaged in a secondary task
and driving with the ACC when compared to driving without the ACC.

iv
ACKNOWLEDGEMENTS
I would like to thank the following people for their role in the successful completion of my
Master’s thesis.
First, Dr. Alexandra Kondyli and Dr. Steven Schrock, for providing continuous guidance
not only during my thesis but also throughout the course of my Master’s degree. Dr. Thomas
Mulinazzi for agreeing to be a part of my thesis committee and providing invaluable insights from
his vast experience in the transportation engineering industry.
Also, staff at the National Advanced Driving Simulator (NADS), specifically Andrew Viet,
Vincent Horosewski, and Shawn Allen, for sharing their expertise on driving simulators and ACC
systems. Their valuable input made understanding the functionality of the various software and
hardware simpler.
Finally, my parents, for providing me with everything I required to achieve my goals. Their
selflessness and immense love got me through the most challenging moments.

v
ACRONYMS
ACC Adaptive Cruise Control
ADAS Advanced Driver Assistance Systems
ADO Autonomous Dynamic Objects
CAN Controller Area Network
CC Cruise Control
CI Confidence Interval
DDO Deterministic Dynamic Objects
DOF Degree of Freedom
DRT Detection Response Task
ECG Electrocardiogram
EEG Electroencephalogram
FB Fixed-Base
FHWA Federal Highway Administration
FOV Field of View
GPS Global Positioning System
HD High Definition
HR Hit Rate
ISAT Interactive Scenario Authoring Tool
ITS Intelligent Transportation Systems
KU University of Kansas
LED Light Emitting Diode
MR Miss Rate
NADS National Advanced Driving Simulator
NHTSA National Highway Traffic Safety Administration
RSME Rating Scale Mental Effort
RT Response Time
TLX Task Load Index
TMT Tile Mosaic Tool
VDS Vehicle Dynamics
VR Virtual Reality

vi
TABLE OF CONTENTS
ABSTRACT ...................................................................................................................... iii
ACKNOWLEDGEMENTS .................................................................................................. iv
ACRONYMS ..................................................................................................................... v
LIST OF FIGURES ............................................................................................................. ix
LIST OF TABLES .............................................................................................................. xii
1. INTRODUCTION............................................................................................................... 1
1.1. Problem Statement ................................................................................................... 1
1.2. Objectives ................................................................................................................ 2
1.3. Thesis Outline .......................................................................................................... 2
2. LITERATURE REVIEW ....................................................................................................... 4
2.1. Introduction .............................................................................................................. 4
2.2. History of Adaptive Cruise Control .......................................................................... 4
2.3. ACC in Real Life ..................................................................................................... 5
2.4. Mechanics of Driving Simulators ............................................................................. 8
2.5. Modeling ACC in Simulators ................................................................................. 11
2.6. Influence of ACC on Driver Behavior .................................................................... 18
2.7. Measuring Cognitive Workload .............................................................................. 20
2.8. Summary ................................................................................................................ 25
3. METHODOLOGY ............................................................................................................ 27
3.1. Task 1: Participant Recruitment .............................................................................. 28
3.2. Task 2: Setting up the Simulator ............................................................................. 29
3.2.1. Configuring the ACC ................................................................................... 29
3.2.2. Designing the Roadway Geometry ............................................................... 31
3.2.3. Designing the Test Scenarios ....................................................................... 31
3.2.4. Pilot Testing ................................................................................................. 33
3.3. Task 3: Creating Distraction and Measuring Workload ........................................... 33
3.4. Task 4: Data Collection .......................................................................................... 35
3.5. Task 5: Data Reduction and Statistical Analysis ..................................................... 35
vii
3.6. Limitations ............................................................................................................. 36
4. DATA COLLECTION ........................................................................................................ 37
4.1. Sample Population ................................................................................................. 38
4.1.1. Information from Screening Questionnaires ................................................. 39
4.1.2. Assigning Participants to Scenarios .............................................................. 42
4.2. The KU driving simulator....................................................................................... 43
4.3. Designing an Application to Simulate Distraction .................................................. 45
4.4. Configuring Events in the Driving Simulator .......................................................... 46
4.4.1. Car Following .............................................................................................. 49
4.4.2. Deer Crossing .............................................................................................. 49
4.4.3. Desk Drop .................................................................................................... 51
4.4.4. Work Zone ................................................................................................... 52
4.4.5. Sudden Merging Vehicle .............................................................................. 53
4.4.6. Move Over Law ........................................................................................... 54
4.4.7. Distraction in the Vehicle ............................................................................. 55
4.5. After the Drive ....................................................................................................... 56
4.6. Data Extraction and Sorting .................................................................................... 57
4.7. Data Collection Summary ...................................................................................... 58
5. RESULTS ........................................................................................................................ 60
5.1. Whole Drive ........................................................................................................... 60
5.2. Major Events .......................................................................................................... 62
5.2.1. Car Following .............................................................................................. 62
5.2.2. Crossing Animal (Deer) ............................................................................... 68
5.2.3. Desk Drop .................................................................................................... 72
5.2.4. Work Zone ................................................................................................... 75
5.3. Minor Events.......................................................................................................... 76
5.3.1. Sudden Merging Vehicle .............................................................................. 76
5.3.2. Move Over or Slow Down Law .................................................................... 79
5.3.3. Distraction in Vehicle................................................................................... 80
5.4. Cognitive Workload ............................................................................................... 82
5.4.1. Quality of DRT data ..................................................................................... 82
viii
5.4.2. Without Events ............................................................................................ 82
5.4.3. Car Following Event .................................................................................... 84
5.4.4. Distraction while Driving ............................................................................. 86
5.4.5. Work Zone ................................................................................................... 88
5.5. Summary of the Results.......................................................................................... 89
6. SUMMARY AND CONCLUSIONS .................................................................................... 93
6.1. Summary ................................................................................................................ 93
6.2. Conclusions ............................................................................................................ 94
6.3. Recommendations and Future Research ................................................................. 97
7. REFERENCES .................................................................................................................. 98
APPENDIX A – ACC Study Flyer ................................................................................... 106
APPENDIX B – Screening Survey ................................................................................. 107
APPENDIX C – Wellness Questionnaire ....................................................................... 110
APPENDIX D – Consent Form and Approval Letter ..................................................... 113
APPENDIX E – Simulator Realism Questionnaire ........................................................ 117
APPENDIX F – Participant Database and Categorization ............................................. 119
APPENDIX G – Sorted Raw Data from MiniSim ........................................................... 121
APPENDIX H – Sorted DRT Data .................................................................................. 131

ix
LIST OF FIGURES
Figure 2-1: ACC vehicle detecting target vehicle (3) ...................................................................6
Figure 2-2: Internal layout of ACC vehicle (3) ............................................................................6
Figure 2-3: Types of simulators [Image modified from (5)] .........................................................9
Figure 2-4: Kinematics of NADS-1 (5)...................................................................................... 10
Figure 2-5: Forces acting on a vehicle (14) ................................................................................ 12
Figure 2-6: ACC scenarios (13) ................................................................................................. 13
Figure 2-7: NADS ACC distributed model (15) ......................................................................... 15
Figure 2-8: Maximum deceleration methods (15) ...................................................................... 17
Figure 2-9: Head-mount LED (a) and micro-switch (b) (35) ...................................................... 23
Figure 3-1: Major tasks while developing the study ................................................................... 27
Figure 3-2: Steering wheel configuration ................................................................................... 29
Figure 3-3: ACC activated instrument panel .............................................................................. 30
Figure 3-4: Possible time gap settings - 3 sec (a), 2 sec (b), and 1.2 sec (c) ................................ 30
Figure 3-5: Participant wearing a head-mount during the drive .................................................. 34
Figure 3-6: Areas of focus during video data collection ............................................................. 34
Figure 4-1: Age and gender of selected participants ................................................................... 38
Figure 4-2: Configuration and layout of the KU driving simulator ............................................. 44
Figure 4-3: KU driving simulator in action ................................................................................ 44
Figure 4-4: Interface of the application to simulate distraction ................................................... 45
Figure 4-5: Layout of scenarios showing varying event locations .............................................. 47
Figure 4-6: Car following event - design view (a) and driver view (b) ....................................... 49
Figure 4-7: Deer crossing event - design view (a) and driver view (b) ....................................... 50
Figure 4-8: Path followed by the deer ........................................................................................ 50
Figure 4-9: Desk drop event - design view (a) and driver view (b) ............................................. 51
Figure 4-10: Work zone event - design view (a) and driver view (b) .......................................... 53
x
Figure 4-11: Sudden merging vehicle event - design view (a) and driver view (b) ..................... 53
Figure 4-12: Move over event - design view (a) and driver view (b) .......................................... 55
Figure 4-13: Simulated distraction while driving ....................................................................... 55
Figure 4-14: Participants responses on the realism of the driving simulator ............................... 57
Figure 5-1: Collision counts for the entire drive......................................................................... 60
Figure 5-2: Maximum speed recorded during the drive .............................................................. 61
Figure 5-3: Average headway during the car following event .................................................... 63
Figure 5-4: Maximum speed recorded during the car following event ........................................ 64
Figure 5-5: Average speed during the car following event ......................................................... 65
Figure 5-6: Standard deviation of speed during the car following event ..................................... 66
Figure 5-7: Combined average speeds and standard deviations .................................................. 67
Figure 5-8: Lane deviation from centerline during the car following event ................................ 68
Figure 5-9: Average headway during the crossing animal event ................................................ 69
Figure 5-10: Time to collision to the deer .................................................................................. 71
Figure 5-11: Maximum speed recorded during the crossing animal event .................................. 71
Figure 5-12: Deviation of lane position during the crossing animal event .................................. 72
Figure 5-13: Average headway during the desk drop event ........................................................ 73
Figure 5-14: Time to collision to the desk ................................................................................. 74
Figure 5-15: Deviation of lane position during the desk drop event ........................................... 74
Figure 5-16: Average speed with standard deviations during the work zone event ..................... 75
Figure 5-17: Time to collision to the merging vehicle ................................................................ 76
Figure 5-18: Amount of brake force applied to avoid collision .................................................. 77
Figure 5-19: Maximum deceleration experienced during the event ............................................ 78
Figure 5-20: Total number of move over events observed.......................................................... 79
Figure 5-21: Total number of hit attempts during the distraction event ...................................... 80
Figure 5-22: DRT data quality – No ACC (a) and ACC (b) ....................................................... 82
Figure 5-23: Response time when no incidents occurred............................................................ 84
Figure 5-24: Hit rate when no incidents occurred ...................................................................... 84
Figure 5-25: Response time during the car following event ....................................................... 85

xi
Figure 5-26: Hit rate during the car following event .................................................................. 85
Figure 5-27: Average response time during the distraction events.............................................. 87
Figure 5-28: Average hit rate during the distraction events ........................................................ 87
Figure 5-29: Response time during the work zone event ............................................................ 88
Figure 5-30: Average hit rate during the work zone event.......................................................... 88

xii
LIST OF TABLES
Table 2-1: ACC parameters used in the NADS model (15) ........................................................ 17
Table 4-1: Responses from the screening questionnaire ............................................................. 40
Table 4-2: Participant distribution in scenarios without the ACC ............................................... 42
Table 4-3: Assigning participants to respective scenarios with the ACC .................................... 43
Table 5-1: Paired sample t-statistic for collisions during the drive ............................................. 61
Table 5-2: Paired sample t-statistic for maximum speed during the drive ................................... 62
Table 5-3: Paired sample t-statistic for headway during the car following event ........................ 64
Table 5-4: Paired sample t-statistic for maximum speed during the car following event ............. 65
Table 5-5: Paired sample t-statistic for average speed during the car following event ................ 66
Table 5-6: Paired sample t-statistic for speed deviation during the car following event .............. 67
Table 5-7: Paired sample t-statistic for lane deviation during the car following event ................ 68
Table 5-8: Paired sample t-statistics for the crossing animal event ............................................. 70
Table 5-9: Paired sample t-statistics for the desk drop event ...................................................... 73
Table 5-10: Paired sample t-statistics for the sudden merging event .......................................... 77
Table 5-11: Paired sample t-statistic for the move over law ....................................................... 79
Table 5-12: Paired sample t-statistic and multiple dependency comparisons .............................. 81
Table 5-13: Paired sample t-statistic for RT and HR during the drive without incidents ............. 83
Table 5-14: Paired sample t-statistic for RT and HR during the car following event .................. 86
Table 5-15: Paired sample t-statistic for RT and HR during the distraction events ..................... 87
Table 5-16: Paired sample t-statistic for RT and HR during the work zone event ....................... 89
Table 5-17: Summary of results collected in MiniSim ............................................................... 90
Table 5-18: Summary of results collected using the DRT device ............................................... 91

1
1. INTRODUCTION
1.1. Problem Statement
Adaptive cruise control (ACC) systems are an increasingly common guidance feature in new
vehicle models. These systems are similar to the conventional cruise control systems in terms of
engaging and disengaging. However, unlike cruise control, ACC provides enhanced assistance by
automatically adjusting vehicle speed according to the headway preference selected by the driver.
This is done by either accelerating or decelerating based on the in-lane traffic flow detected by
sensors, without constant input from the driver.
ACC systems are intended to increase roadway safety especially on highways and freeways
by minimizing driver errors caused due to fatigue, poor judgement, distractions inside and outside
the vehicle, lighting conditions, and weather. Although, the ACC is theoretically known to increase
roadway safety, the effects of this system on actual driver behavior and awareness are unclear.
This thesis aims at determining the effects of ACC systems on driver behavior and
awareness. Driver behavior and awareness includes, but is not limited to, aspects such as driver
reaction times in case of sudden lane changes or crossing animals, distractions caused by cell
phones or other electronic devices, adhering to speed limits, perceiving vehicles violating traffic
regulations, mental workload during various aspects of driving, and overall situational awareness.

2
1.2. Objectives
The objectives of the thesis are as follows:
• Conduct a literature review on existing ACC systems and how they are modeled in actual
vehicles versus driving simulators;
• Configure a working ACC system on the newly acquired University of Kansas (KU)
driving simulator;
• Design a questionnaire to establish and screen possible test subjects;
• Design custom highway scenarios using compatible software, to test approved subjects on
the effects of the ACC on driver behavior and awareness;
• Determine driver behavior and awareness based on individual reaction time, headway,
cognitive workload, time to collision, acceleration, lateral position, brake pedal force, and
speed in custom designed highway scenarios; and
• Perform a statistical analysis on the collected data to establish conclusions.
1.3. Thesis Outline
First, the thesis starts by briefly introducing the concept of ACC systems. It then discusses the aim
and objectives. Second, a review of the literature related to the thesis is presented. This consists of
the applications of ACC systems and their incorporation into driving simulators. It also consists of
data collection equipment and strategies that have been previously used in similar studies.

3
Third, the methodology followed in the thesis is presented involving the tasks carried out.
The methodology is grouped into six main tasks and they include: participant recruitment, setting
up the simulator, creating distraction and measuring workload, data collection, data reduction and
statistical analysis, and establishing conclusions. The methodology section also discusses possible
limitations to the methodology.
After the methodology, the process of data collection is explained in detail. The process of
participant recruitment, functionality of the KU driving simulator, scenario design, configuring
events, measuring cognitive workload, and creating an application to simulate distraction is
explained.
The results obtained from data collection are discussed in detail. Statistical significance of
the variables is determined with respect to the events and variables collected. Finally, the findings
of the research are stated with recommendations and scope for future research.

4
2. LITERATURE REVIEW
2.1. Introduction
A literature review is conducted to determine existing research related to this research topic and
their findings. Several publications, theses, and books were obtained using online library databases
and the University of Kansas Library resources. Online library databases such as Google Scholar,
Transportation Research International Documentation (TRID), ScienceDirect, DBPIA, JSTOR,
IEEE Xplore Digital Library, WorldCat, and KU Library WebRetrieve, were used.
First, a history of the ACC systems is presented. Second, a discussion of the configuration
of adaptive cruise control and its mechanism is presented. Third, a detailed review of existing
driving simulators is offered, including their mechanics, operation, and possible limitations.
Fourth, previous algorithms used to configure ACC on driving simulators are discussed. Fifth, a
series of previously conducted studies to determine the influence of ACC on driver behavior and
response times are presented. Finally, a summary of all the literature reviewed is provided,
highlighting the critical points discussed.
2.2. History of Adaptive Cruise Control
ACC systems were first available in high-end commercial vehicles around 1995 (1). Although
ACC has been available for the last 20 years, it is still being actively tested and refined in order to
improve safety and efficiency.
The first car equipped with a laser-based ACC system was the Mitsubishi Diamante (1).
However, this system did not apply brakes but instead it adjusted speed by downshifting the gears

5
(1). ACC systems were then further refined by Toyota in 2000, by providing braking and
low-speed tracking (1).
Around the same period, Mercedes-Benz also introduced their own ACC system known as
“Distronic” in the S-class Sedan. The refined “Distronic Plus” is able to bring a car to a complete
stop in order to prevent a collision. Similar guidance systems are currently available with most car
manufactures around the world (1).
2.3. ACC in Real Life
ACC is an Advanced Driver Assistance System (ADAS) that enables vehicles to maintain
appropriate speed and headway in a longitudinal trajectory (2). ACC systems were developed to
provide additional assistance to the driver by reducing the mental and physical workload. Users
select appropriate headway based on their comfort preference while maintaining control of the
steering (4).
The ACC system is engaged and disengaged just like a conventional cruise control system.
Figure 2-1 shows an illustration of the ACC equipped vehicle detecting a target. Although the
forward vehicle is closer to the ACC equipped vehicle, it is not selected as the target vehicle
because it is traveling in a different lane. However, if the forward vehicle decides to merge into
the left lane, sensors detect this movement and designate it as the new target vehicle.

6
Figure 2-1: ACC vehicle detecting target vehicle (3)
ACC equipped vehicles consist of a network of several components and modules known
as the Controller Area Network (CAN). Just as Local Area Network (LAN) enables data
transmission between multiple computers, CAN enables transmission of messages between
multiple modules present in the vehicle based on their priority. Three main modules are responsible
for the proper functioning of the ACC system in any vehicle (3). They are the ACC module, the
engine control module, and the brake control module. The three modules and the instrument cluster
are connected via the CAN. The layout of these modules in shown in Figure 2-2.
Figure 2-2: Internal layout of ACC vehicle (3)

7
The ACC interface is similar to that of the conventional cruise control system except for
two additional switches that control the time gap settings (3). When the cruise switches are
activated, the instrument cluster processes and sends the information to the ACC and engine
control module. The ACC module consists of a radar sensor that detects the presence of a forward
vehicle and its speed. The main function of the ACC module is to determine if a forward vehicle
exists, send information to the engine and brake control modules (3).
The engine control module receives information from the ACC module and instrument
cluster. Based on the information received, it regulates vehicle speed by controlling the engine’s
throttle (3). The brake control module also receives information from the ACC module. The
primary function of the brake control module is to monitor vehicle speed and apply brakes when
requested by the ACC module.
ACC systems usually have two operation modes when active. They are the speed control
and time gap control. The speed control mode is essentially the same as conventional cruise control
and applies when no forward vehicle is detected (3). The time gap control is activated if a forward
vehicle is detected. The ACC system chooses to either decelerate, accelerate, or stop depending
on the forward vehicle’s speed and clearance.
Canceling the ACC operation selected by the user is done either manually by the driver or
automatically by the system. Manual cancelation involves stepping on the brake pedal or pressing
the off button. An ACC operation can also be canceled automatically if a fault is detected within
the system or if the vehicle speed drops below 25 mph. In the event of ACC cancelation, a warning
message is displayed on the instrument panel to alert the driver.

8
2.4. Mechanics of Driving Simulators
Capustiac, in 2011, defined driving simulators as a virtual representation of the dynamics of a
vehicle and the surrounding environment without physically jeopardizing test subjects (5). The
goal of the driving simulator is to immerse drivers into a virtual environment generated by
computer rendering (5). While driving in a particular scenario, the virtually generated environment
moves with respect to the vehicle creating a perception of motion (6).
Several vehicle manufacturers and educational institutions use driving simulators to carry
out research on driver behavior, body position, human-vehicle interactions, roadway geometrics,
and driver assistance systems. As there is no physical threat to individuals, simulators act as an
efficient platform to determine risks associated with driving.
Driving simulators are generally categorized in terms of cost and number of degrees of
freedom (DOF) present. Degree of freedom (DOF) is defined as the direction in which motion is
free to occur. For example, a simulator with 3 DOFs would be capable of motion in three planes
(x-axis, y-axis, and z-axis). As the number of DOFs increases, the driving experience becomes
more realistic but the cost also increases as seen in Figure 2-3. The three main categories of
simulators are low level, mid-level, and high-level simulators (5). Low-level simulators are usually
fixed-based (FB) simulators (7).

9
Figure 2-3: Types of simulators [Image modified from (5)]
Driving simulators have existed since the early 1950s. Vehicle manufacturers started
designing their own simulators to test designs. In early 1970s, Volkswagen built their first driving
simulator with a 3 DOF (yaw, roll, and pitch) motion system (7). Mazda was the next vehicle
manufacturer to develop a 4 DOF (yaw, roll, pitch, and serge) system in 1985 (5). Around the same
period, Daimler-Benz introduced a 6 DOF system with a 180-degree view in a hydraulic hexapod
(7).
Ford Motors also introduced their 6 DOF simulator called Virttex in 1994 (7). Apart from
yaw, roll, and pitch, the simulator was also capable of sway, heave, and surge. Renault
implemented a similar system in 2004 (7). Kookmin University in South Korea started the
development of a 6 DOF system in a single seat simulator (8). In 2001, the system was replaced
with a full car chassis and a 2 DOF motion platform. The Kookmin University Simulator is capable
of generating effects such as rumble strips and speed bumps (8).
Bus and truck simulators are installed in driver training institutions to help improve driver
skill (7). TUTOR is a simulator that was commissioned in Spain around 2004 to assist in
10
commercial driver training. The benefit of such simulators is that drivers are able to perfect various
skill-demanding scenarios, allowing them to overcome similar situations when encountered in the
real world.
Highly sophisticated simulators (high-level simulators) such as the Toyota Driving
Simulator located at Higashifuji Technical Center in Susono City, Japan and the National
Advanced Driving Simulator (NADS) located at the University of Iowa in the United States, allow
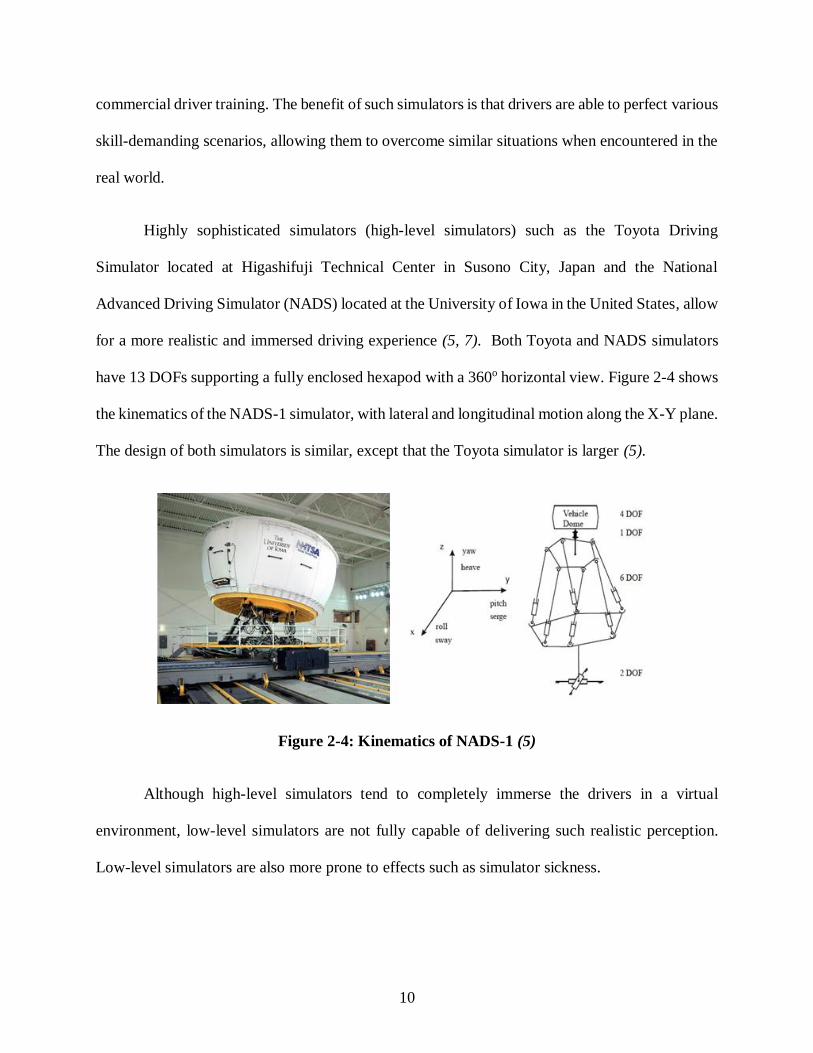
for a more realistic and immersed driving experience (5, 7). Both Toyota and NADS simulators
have 13 DOFs supporting a fully enclosed hexapod with a 360o horizontal view. Figure 2-4 shows
the kinematics of the NADS-1 simulator, with lateral and longitudinal motion along the X-Y plane.
The design of both simulators is similar, except that the Toyota simulator is larger (5).
Figure 2-4: Kinematics of NADS-1 (5)
Although high-level simulators tend to completely immerse the drivers in a virtual
environment, low-level simulators are not fully capable of delivering such realistic perception.
Low-level simulators are also more prone to effects such as simulator sickness.

11
Simulator sickness is usually experienced because of lacking motion cues. Humans
perceive motion through skin pressure and balance organs present in the ear (5). When the human
body is subject to a FB simulator, the eyes register visual cues but the ears and skin do not register
any movement (motion cues) leading to a lack of “perception of motion.” Perception of motion
can be defined as the interpretation of visual and motion cues by sensory organs to register
direction of movement and velocity (5, 10).
Most common symptoms experienced due to simulator sickness are nausea, headaches,
vomiting, sweating, and stomach awareness. Jamson in 2000 recommended a minimum horizontal
field of view (FOV) of 120o in order for drivers to accurately perceive speed with respect to moving
images in a driving simulator (12). In 2003, Kemey and Panerai suggested a similar concept,
implying that the effects of simulator sickness could be minimized on a FB simulator by increasing
the FOV as the drivers can more readily perceive speed and depth (10).
2.5. Modeling ACC in Simulators
Several transportation-related studies have incorporated ACC systems to driving simulators. Each
study is unique in modeling ACC.
In 2006, Guvenc and Kural proposed a nonlinear single-track model for ACC simulations
(13). This model was developed for cornering and straight-line cruising only. The nonlinear single-
track model, also known as the bicycle model, only controls the lateral dynamics of the vehicle
such as the wheel and suspension forces (13, 14). However, to incorporate longitudinal dynamics
such as braking, throttle, acceleration, aerodynamic drag, tire, engine, and driveline, Guvenc and
Kural proposed other models (13). Figure 2-5 shows a simple representation of the forces acting
on a vehicle with respect to its axis.

12
Figure 2-5: Forces acting on a vehicle (14)
Guvenc and Kural proposed the addition of the power-train model that consisted of the
inverse engine, driveline, and Dugoff tire models to the bicycle model. This allowed the modeling
of both the lateral and longitudinal components. However, the vertical components were ignored,
as they were assumed insignificant.
Based on the models set to control the various lateral and longitudinal dynamics, an ACC
control scheme was devised. When the ACC is engaged in an active scenario, the configured model
detects the target vehicle and determines its speed and longitudinal distance. The sensors will not
recognize a vehicle at a distance greater than the preset distance of 150 feet. The ACC control
computer then runs the inverse engine and driveline model to maintain the desired headway
between the ACC installed vehicle and target vehicle.
The configured ACC model determines the type of scenario with respect to the seven
possible cases shown in Figure 2-6.

13
Figure 2-6: ACC scenarios (13)
The first scenario is based on a situation where no lead vehicle is present. The ACC system
switches to conventional cruise control and proceeds with the preset driver speed. In the second
and third scenario, when a target vehicle is detected, the ACC system determines its speed and
position. The ACC control computer then runs the model and determines to either brake or
accelerate. If the target vehicle slows down such as in scenario four, the host vehicle’s speed
decreases to that of the target vehicle. The fifth scenario represents a situation where a merging
vehicle appears between the host and target vehicle. The ACC installed vehicle selects the merging
vehicle as the new target vehicle. The sixth scenario involves the target vehicle changing lanes. If
no vehicle is detected in front of the target vehicle after lane change, the ACC system switches to
conventional cruise control. The most difficult maneuver for the ACC system is cornering. The

14
seventh scenario occurs when approaching a horizontal curve, the ACC system is programmed to
determine if the target vehicle is cornering or changing lanes. The model assumes a different
azimuth for lane changing and cornering. This allows the two situations to be distinguished.
Moeckli et al. in 2015 modeled ACC using the NADS 1 simulator (15). The ACC structure
developed has two modes of operation as shown in Figure 2-7. The off-line mode and the run-time
mode. The run-time mode involves processes such as running the scenario, vehicle dynamics, ACC
model, sensor model, and data acquisition. The ACC model works hand in hand with the vehicle
dynamics software, NADSDyna. NADSDyna only simulates the vehicle dynamics and has no
knowledge of surrounding traffic in the rendered environment. The sensor model works
independently, and controls lane change warning and forward collision warning systems. When
ACC is activated in the cab, NADSDyna registers the input and sends information to the scenario
controller. The scenario controller runs the sensor model that determines the forward vehicle speed
and position. The data acquisition controller records all the necessary variables such as ACC
engaging time, disengaging time, speed, and others.
The off-line mode is mainly used to analyze the recorded data. The recorded data can be
analyzed by looking at a 2D representation of the simulated drive in the Interactive Scenario
Authoring Tool (ISAT).

15
Figure 2-7: NADS ACC distributed model (15)
The NADS ACC algorithm can operate in either free-driving or vehicle-following mode.
The conditions tested by the ACC model are as follows:
𝐴𝐶𝐶 𝑀𝑜𝑑𝑒 = {𝐹𝑟𝑒𝑒 𝑑𝑟𝑖𝑣𝑖𝑛𝑔,
𝐹𝑜𝑙𝑙𝑜𝑤𝑖𝑛𝑔,
𝑟 > 𝑟𝑚𝑎𝑥 𝑜𝑟 𝑣 + �̇� > 𝑣𝑑
𝑜𝑡ℎ𝑒𝑟
Where,
r is the distance between host and target vehicle;
v is the speed of the ACC equipped vehicle;
�̇� is the range rate; and
r max is the maximum allowable distance between vehicles.

16
In this test condition, if the range between the vehicles exceeds the maximum range set in
the algorithm, the ACC equipped vehicle switches to free driving mode. If the first condition is
not met, the vehicle switches to following mode. The maximum acceleration of the vehicle also
depends on the operation state. A maximum global acceleration of 0.2 g is assigned for free driving
and a minimum global acceleration of 0.1 g for following.
𝑎𝑚𝑎𝑥 = {𝐴𝑚𝑎𝑥,
𝐴𝑚𝑖𝑛,
𝑓𝑟𝑒𝑒 𝑑𝑟𝑖𝑣𝑖𝑛𝑔
𝑓𝑜𝑙𝑙𝑜𝑤𝑖𝑛𝑔
Where,
a max is the maximum allowed acceleration;
A max is the global maximum acceleration; and
A min is the global minimum acceleration.
The maximum deceleration to be applied can be calculated using three different methods
(15). The first method calculates using the time-to-collision (ttc) value. The second method
calculates maximum deceleration using the distance to lead vehicle based on the range selected by
the user. The third method uses both range rate (�̇�) and ttc. Based on the three methods shown in
Figure 2-8, the worst maximum deceleration is selected.

17
Figure 2-8: Maximum deceleration methods (15)
In the situation where the host vehicle is following, the desired range is determined by
multiplying the headway by the velocity. Table 2-1 shows some of the parameters used to develop
the ACC algorithm.
Table 2-1: ACC parameters used in the NADS model (15)
Parameter Value
ACC Velocity increments 5 mph
ttc threshold 3 s
A max 0.2 g
A min 0.1 g
D max 0.3 g
D min 0.05 g
r max 400 feet
r min 16.4 feet

18
2.6. Influence of ACC on Driver Behavior
There have been several studies to evaluate the influence of ACC on driver behavior. Most studies
involve experimentation using driving simulators.
Ohno in 2001 carried out a study on the adaptation process of driving behaviors using ACC
(16). The study compared behavior of drivers in manual mode versus ACC activated mode. It was
determined that drivers in ACC mode kept a longer headway when compared to manual mode.
The study also showed that lateral deviation was smaller for drivers in ACC mode.
Rudin-Brown and Parker, in 2004, studied the behavioral adaptation to the ACC. The study
did not involve driving simulators. The participants were asked to drive a luxury sedan in a closed
6.9 km test track (20). The lead vehicle used was a 1999 Toyota corolla with a polyurethane trailer
attached to avoid injury to the participant in case of a crash. The collected data included braking
times, lane keeping, sleepiness, trust, and subjective workload. The study concluded that ACC
systems induce changes to driver behavior. It was noted that drivers reacted slowly when braking
in critical situations. The study also showed reduced lane keeping ability when using ACC
systems.
In 2005, Ma, and Kaber carried out a series of workload experiments using a low-cost
virtual reality (VR) simulator. Eighteen participants, evenly distributed between male and female,
were subject to driving with and without the ACC system. The study also collected data on changes
to mental demand due to cell phone usage while driving with and without the ACC system. This
study measured workload using a subjective scale, with questionnaires requesting feedback about
the intensity of the task performed. The results of the study showed a reduction in overall mental
19
demand when the ACC was active (22). A reduction in following speed and headway standard
deviation was also observed among participants.
Cho, Nam, and Lee, in 2006, carried out a study of driver behavior with adaptive cruise
control at the Kookmin University in Korea. The study consisted of forty participants with a
50-50 split of male and female subjects (17). The researchers recorded the headway and lateral
position of participants with and without ACC. The study concluded that the preferred headway
of participants with the ACC activated was 1.5 seconds. The study also showed that when using
the ACC, drivers had reduced lane keeping ability. This implied that drivers were less attentive to
the roadway and surroundings.
In 2011, Vollrath et al. carried out a similar study to determine the influence of cruise
control (CC) and adaptive cruise control on driving behavior using a driving simulator. The study
required participants to safely engage in as many secondary tasks as possible while driving a
simulated scenario (2). The analysis revealed that drivers using the ACC and CC did not
demonstrate delayed reaction times because of increased engagement in secondary tasks when
intervening in critical situations. The study also found that drivers using ACC drove faster in the
fog. Vollrath et al. suggested that this could be because of drivers relying on the ACC system.
Based on the findings of this section, it is noted that ACC systems lead to changes in driver
behavior and awareness. Past studies showed mixed results on the effectiveness of ACC systems.
Some studies demonstrated delay in braking time, reduction in mental demand, reduction in lane
keeping ability, and decrease in attention towards the surrounding while others showed no
significant impact on reaction times and alertness. The mixed results create an ambiguity thus

20
justifying the need for the proposed research, aimed at establishing a more descriptive
understanding of the effects of ACC on driver behavior and awareness.
2.7. Measuring Cognitive Workload
Driving is a complex task that requires utilizing several physical and mental resources. As stated
in ISO 17488: 2016, resources can be categorized into three levels: sensory-actuator resources,
perceptual-motor resources, and cognitive resources (30). The sensory-actuator resources include
physical elements used by the driver to interact with the environment such as eyes, feet, hands,
ears, skin, and mouth. Perceptual-motor resources refer to brain functions that control specific
activities such as hand-eye coordination, and visual perception. Cognitive resources refer to higher
level brain tasks such as planning, decision making, dealing with emergency situations, and error
detection.
The primary task of drivers is to safely navigate from point A to point B. However, while
driving, drivers tend to engage in secondary tasks such as using their cellphones, operating the
media controller, adjusting the air conditioning, and using the global positioning system (GPS).
These secondary tasks can often lead to varying allocation of resources depending on the task
being performed, thus competing with the primary task (30).
There are several methods devised specifically to measure the cognitive resources being
used during a specific task. These methods can be categorized into four main groups, namely:
principal measures, subjective measures, psychological measures, and detection response tasks
(DRTs). A brief description of each of these categorizes is provided below.

21
Principal measures of the cognitive workload involve quantifying driving abilities with
respect to a secondary task assigned during the drive. The primary task of any driver is to drive
safely from the origin to the destination. Secondary tasks may include phone calls, using GPS
devices, texting, and using driver guidance systems. Principal measures such as lane deviations,
steering position, throttle, and brake force are compared in both drives, one with primary task only
and the other with both primary and secondary task. The difference in these principal measures
during the two drives gives an indication of the workload experienced by the driver (33). This
method requires no extra equipment when used in driving simulators, as the output variables
include the principal measures. The limitation to this method from previous studies is that the
outputs mostly show subtle differences with contradictory results. A suggested improvement to
the principal measure method is to record the reaction time to emergency events during both the
drives (33). However, implementing emergency events in real-life situations may lead to physical
harm of the driver.
Subjective measures are usually determined by analyzing the questions answered by the
participants after the completion of task/drive. The questions are aimed at establishing the
difficulty of the task from the perspective of the driver. The NASA-Task Load Index (TLX) and
the Rating Scale Mental Effort (RSME) are the two most commonly used subjective workload
measuring questionnaires. The NASA-TLX questionnaire reports workload experienced by
participants on a 21-point scale, ranging from “very low” to “very high” (35). Participants respond
to six questions consisting of mental demand, physical demand, temporal demand, performance,
effort, and frustration experienced during the task, each on a 21-point scale. The RSME works on
a similar principal, however, it consists of a nine-point scale ranging from “absolutely no effort”
to “extreme effort.” The main limitation of these subjective measures is that the results depend on
22
how much the participant can remember from the event after the completion of the drive. It is also
hard to judge the difficulty of a task without knowing what constitutes as extreme effort or very
high workload. The advantage with the subjective measures is that they can be easily administered
and require no additional equipment apart from printed questionnaires.
Psychological measures involve determining workload by recording any changes in
activity in the cardiovascular system, central nervous system, and sensory nervous system. There
are several equipment that can be used to psychologically determine cognitive workload. Some of
the most commonly used instruments include: electroencephalographic (EEG), electrocardiogram
(ECG), and pupilometer (35). EEG is commonly used in health care centers to detect abnormal
electrical activity in the brain. However, it can also be used to detect changes in brain activity
during driving tasks that require varying amounts of problem solving and critical reasoning. The
ECG is also used in health care centers to determine abnormalities in the heart and diagnose critical
heart conditions such as attacks, irregular beating, and poor blood flow. The ECG can be used to
determine heart rate of participants during various events in the drive. It provides continuous data
throughout the drive, accounting for any slight changes in heart rate. Another way to determine
the psychological measure is by using the pupilometer, also known as the eye-tracking device. The
device tracks eye movement of the driver without disrupting the primary task of driving safely
(33). Some advanced devices are also capable of tracking pupil dilation. The phenomenon causing
changes to the pupil diameter due to varying levels of cognitive workload is known as the task-
evoked pupillary response (TEPR). This can be used to assess cognitive workload at different
points of a drive. The advantage of using psychological measures is that they provide continuous
data without interruption during the drive. However, the equipment is very expensive and can be
considered intrusive as some require electrodes to be attached to the head of the participant (35).

23
Although the data collected is continuous, it requires extensive cleaning and sorting due to the
large quantity available.
The detection response task method was mainly devised to determine the effect of a
secondary task on cognitive load. The DRT equipment presents frequent artificial stimuli during a
task and records participant performance in the form of response time (RT), hit rate (HR), and miss
rate (MR) (30). There are three types of DRT stimuli commonly used in studies. The first type is
the head-mounted visual stimulus, which presents a single light-emitting diode (LED) to the
participant in intervals of three to five seconds. The LED can either be red or green depending on
the chosen configuration and task. The second type is the remote visual stimulus. The stimulus can
be presented as an LED somewhere attached to the inside of the vehicle or as a graphic at a fixed
location in a simulator scenario. The third type is a tactile stimulus, which consists of a tactor
(small electrical vibrator) attached to the driver’s shoulder (30). The driver senses the vibration
and responds accordingly. For all the different types of DRT stimuli, participants respond via a
micro-switch attached to their preferred finger as shown in Figure 2-9.
(a) (b)
Figure 2-9: Head-mount LED (a) and micro-switch (b) (35)
The DRT method has been used in several studies to study the effects of secondary tasks
during driving. However, there are not a lot of studies involving the use of the DRT method to
24
measure workload while using the ACC and performing a secondary task simultaneously. In
studies where participants drove with and without the ACC system while carrying out the same
secondary task in both situations, significant changes in cognitive workload were observed.
In 2014, Winter et al. provided a summary of results obtained from various studies on
reaction time to visual stimuli when driving with and without the ACC system. In the summarized
studies, a visual stimulus was presented in the form of a red square or blue LED lamp. Participants
were required to respond by either pressing the horn or steering wheel buttons. It was observed
that participants had fewer misses of stimuli when driving with the ACC engaged (11.2%) than
without the ACC (25.6%) (42). Reaction time to the visual stimuli was also observed to be quicker,
by up to 15%, for participants driving with ACC engaged. Determining the effect of the ACC on
workload, based on RT, HR, and MR, will be very crucial in understanding the driver behavior
and situational awareness.
The DRT method is relatively cheap and simple to implement as it only requires a visual
stimulus (LED bulb or on-screen image) and a micro-switch. The data collected are easily
manageable and records continuously throughout the drive. Participants also do not have to wait
after every event to provide their feedback on the experienced workload. The DRT method is also
less intrusive than the psychological measures previously described. The DRT method is also
preferred in driving simulators as it does not significantly alter the driving experience with
excessive cables or large equipment. Although the DRT method is straightforward to implement,
it can easily be manipulated by participants trying to guess the intervals of the stimuli. To avoid
manipulation, video data can be used to monitor and eliminate bad data. Participants should be
provided with clear instructions on how to naturally respond to the stimuli.

25
2.8. Summary
The reviewed literature showed several important concepts with respect to ACC systems.
• ACC systems operate just like conventional cruise control systems. However, vehicles
equipped with the ACC can automatically adjust speed based on a driver selected headway.
• ACC equipped vehicles contain three modules. ACC module, engine module, and brake
module. The ACC module consists of sensors that allow tracking of lead vehicle speed and
position.
• Several types of driving simulators exist. The number of DOFs present in a simulator is
directly proportional to the realism experienced by drivers. In addition, the cost of the
simulator increases significantly as the number of DOFs increase.
• Modeling an ACC system is a complicated process. It requires modeling of both
longitudinal and lateral vehicle dynamics by simultaneously using several algorithms.
• Past studies showed mixed results on the effectiveness of ACC systems. Especially towards
braking time, lane keeping ability, and awareness of the surroundings. Studies also showed
an increase in HR and a decrease in RT for DRT tasks when the ACC was active. Some
studies demonstrate negative impacts of the ACC on driver behavior and situation
awareness while others show no significant impact.
• Methods to measure cognitive workload while driving can be categorized in four main
groups and they include: principal measures, subjective measures, psychological measures,
and DRTs. Several studies have been carried out to validate each of the measures.
However, selecting the appropriate method for a study depends on several factors such as

26
cost, timeline, accuracy, mobility and availability of the equipment. The DRT device is
determined to be the least intrusive to participants while providing a continuous stream of
data. Although the DRT device can be subject to manipulation by participants, following
the ISO 17488: 2016, protocols while collecting video data to identify and correct
manipulation, can significantly improve the quality of data obtained.

27
3. METHODOLOGY
This chapter presents an overview of the procedures followed during the development of the study.
The first and second task were carried out simultaneously to efficiently manage time. The first task
was to recruit participants. Potential participants were provided with a screening questionnaire
which gathered general information pertaining to the study. The second task was to configure the
simulator. The task involved setting up the ACC, designing the scenarios, and pilot testing. The
process of configuring events was iterative due to visual differences between the design view and
what is observed by the driver. Figure 3-1 highlights the main tasks performed in this study.
Figure 3-1: Major tasks while developing the study
Task 1: Participant Recruitment
a. Advertise the study
b. Design of screening and wellness
questionnaires
c. Screen potential participants
d. Assign participants to test scenarios
Task 2: Setting up the Simulator
a. Configure a working ACC system
b. Design scenarios
• Roadway geometry
• Configure events
c. Pilot testing and debugging
Task 3: Creating Distraction and
Measuring Workload
a. Configure distraction application
b. Setting up DRT device
Task 4: Data Collection
Task 5: Data Reduction and
Statistical Analysis
a. 2-tailed paired sample t-test
b. Analysis of variance (ANOVA)
Task 6: Establishing Conclusions

28
After the completion of a satisfactory scenario, pilot testing was carried out to detect any
discrepancies missed by the designer. Four individuals were requested to drive the scenario,
providing feedback used for further debugging and a glimpse of the data output. After final
debugging, participants were assigned to their respective scenarios.
The third task occurred after the first two tasks were complete. It involved programming
an application to simulate distraction and to set up the DRT device. After the completion of the
first three tasks, the simulator was equipped for data collection.
The fourth task was to collect data and organize them by participant ID. After data
collection came data reduction and analysis. The fifth task required MATLAB (37) to extract the
data variables of interest. The data were analyzed using the statistical package for social sciences
(SPSS) software (36). It involved the paired t-test and the analysis of variance (ANOVA). A full
description of the tasks carried out are provided in the sections that follow.
3.1. Task 1: Participant Recruitment
The study was advertised on notice boards in the University of Kansas, Lawrence public library,
Department of Motor Vehicles (DMV) in Lawrence, churches, retail centers like Hy-Vee, and
social media platforms. A copy of the poster is shown in Appendix A.
The survey is an important part of this thesis. It allows determining participants familiarity
with ACC systems versus those who have minimal experience. The survey also provides
information about the test participant such as name, contact information, age, valid driving
credentials, existing health conditions, susceptibility to motion sickness, current vehicle model,
and level of exposure to ACC systems.

29
A total of 44 participants showed interest in participating in the study. From this initial
response, the selected sample size consisted of 30 participants equally split between males and
females. The participants selected were equally distributed between three age groups 18-24,
5-49, and 50-65, to ensure a broader sample size and accommodate for bias caused due to age of
drivers. A copy of the screening questionnaire is presented in Appendix B.
Screening was also carried out for simulator sickness, once after the completion of the first
scenario and then after the completion of the second scenario. Participants with severe effects were
excluded from the study. A copy of the wellness questionnaire is attached in Appendix C.
3.2. Task 2: Setting up the Simulator
3.2.1. Configuring the ACC
The system uses the NADS ACC algorithm (described in Section 2.5) and is activated using
repurposed buttons present on the steering wheel. Figure 3-2 shows the modified steering wheel
capable of activating the ACC system with user input. The software component had to be modified
on site with the help of the NADS troubleshooting team. The process of hardware and software
debugging of the ACC system required approximately three months to complete.
Figure 3-2: Steering wheel configuration
Time gap increase
Time gap decrease
Cruise on/off
Set
Resume
Cancel

30
Buttons that were originally configured to increase and decrease volume were repurposed to act as
the time gap increase and decrease buttons. This allowed participants to select a preferred time
headway between the cab and the lead vehicle. Figure 3-3 shows a few key icons on the instrument
panel such as the cruise control status, ACC time gap options, and vehicle speed, that are required
by the participants when engaging the ACC.
Figure 3-3: ACC activated instrument panel
For this study, three time gap settings were made available for the participants. They
include 3 seconds, 2 seconds, and 1.2 seconds. These settings were modeled by NADS, based on
the Toyota ACC system and were not modified for the study. Figure 3-4 shows the time gap icons
on the instrument panel and how they change based on the selected gap settings. Participants were
free to change the time gap to the lead vehicle at any point during the drive.
(a) (b) (c)
Figure 3-4: Possible time gap settings - 3 sec (a), 2 sec (b), and 1.2 sec (c)
Cruise control
ACC time gap
Speed
Time gap settings
31
The ACC system is also capable of warning drivers in instances where the system could
not brake in time. The warning alert is a loud three-tone beep, that will sound only when two
criteria are met simultaneously. The time to collision to the lead vehicle should to be less than
three seconds and the ACC system should be braking with a maximum force of 0.3g. The beep
acts as an alert to drivers, notifying them that the ACC system will not be able to brake in time to
avoid the collision without external assistance.
3.2.2. Designing the Roadway Geometry
Just like conventional cruise control, ACC is also most frequently used on highways and freeways.
This is because unlike smaller roadways, highways and freeways have relatively high free flow
speeds with full access control. This enables drivers to use ACC without constant interaction from
merging, diverging, and weaving vehicles.
The tile mosaic tool (TMT) (39) is used to generate the roadway alignments and render the
virtual environment. The program uses square tiles in multiples of 660 feet by 660 feet, consisting
of the virtual environment features such as the pavement, shoulder, vegetation, markings, and
geometry. The square tiles can be combined to form a continuous roadway layout. A four-lane
divided highway with a grass median is created for the study. The highway contains three clover
leaf interchanges that are used exclusively for the entry or exit of interacting traffic. This allows
for a smooth transition of traffic between events without visual glitches.
3.2.3. Designing the Test Scenarios
In this thesis, four major events were incorporated in the highway scenario to determine effects of
ACC on driver behavior and awareness. They include:
• Car following: This event requires the participants to maintain a preferred headway to the
lead vehicle with and without the ACC system. The lead vehicle is programmed to maintain

32
a constant velocity of 70 mph while the drivers are expected to maintain a safe following
distance;
• Crossing animal (deer): In this event, the participant is required to perform an evasive
maneuver to avoid hitting two deer running across the roadway. The deer are programmed
in such a way that the collision is unavoidable. This is done to ensure that most participants
only use their brakes to avoid the deer;
• Desk drop: This event comprises of two sequential sub events. The participant is required
to respond to a distraction, during which a desk is dropped from the lead vehicle.
Participant reaction times are measured based on their ability to perform an evasive
maneuver such as applying the brakes, adjusting the steering wheel angle, and
speeding-up; and
• Work zone: In this event, the awareness of the participants is measured based on their
ability to read and process traffic signs. The speed limit in the work zone is set at 55 mph
while a lead vehicle is programmed to violate the set speed limit by travelling at 70 mph.
Participant’s ability to navigate the roadway based on the speed regulations versus lead
vehicle influence is measured.
The scenario also included a few minor events such as an induced distraction in the vehicle,
sudden merging vehicle, and pulled over vehicles. During these minor events, specific driver
actions were monitored. For example, during the induced distraction event, the DRT response time
and hit rate were recorded as well as the hit rate on the application. During sudden lane change,
the driver’s time to collision was recorded with respect to the braking maneuver. And, during the

33
event involving a pulled over vehicle on the road shoulder, data on driver’s ability to observe the
“move over law” were collected.
3.2.4. Pilot Testing
After initial scenario design, four test participants with no prior exposure to the scenario or events
were invited to drive the scenario. Based on their feedback, a few modifications were made to the
events within the scenario such as changing traffic speed, adjusting distances between triggers,
and fixing unnoticed graphics bugs in the simulated environment. This phase provided key insights
on how actual participants would react to the study and the quality of the data to be collected.
3.3. Task 3: Creating Distraction and Measuring Workload
To simulate distractions in the vehicle, a Microsoft Windows based application was designed using
VB.NET. The application was modeled to simulate in-vehicle distractions caused when using
devices such as the media controller, climate controller, GPS device, and cell phone. The
application was installed on a 10-inch Windows touch screen tablet. The layout of the application
is shown in section 4.5.
For this study, a head-mount DRT device with a micro switch was used. The equipment
was borrowed from the Department of Psychology at KU. The DRT stimuli were presented in
accordance with the ISO 17488: 2016. A red LED was presented in intervals ranging between
three to five seconds with a duration of one second. The response time (RT) was collected in micro
seconds and only responses that occurred between 100ms to 2500ms were considered as hits.
Anything earlier than 100ms was regarded as a premature hit while anything greater than 2500ms
was regarded as a miss. Any responses that never occurred were also recorded as misses. Figure
3-5 shows a participant driving the simulator during the study.

34
Figure 3-5: Participant wearing a head-mount during the drive
The drive of each participant was recorded as a means of correcting ambiguities in the
collected data and synchronizing the DRT output. The video cameras in the simulator were
adjusted to focus on the areas of interest such as the left hand with the micro switch, application
to simulate distraction (also known as the GPS device), accelerator pedal, brake pedal, and an
overview of the virtual driving environment. Figure 3-6 shows a screenshot of the video output
with the areas of focus highlighted in red.
Figure 3-6: Areas of focus during video data collection
35
The frame rate of the video data is synchronized with the data acquisition tool, making
discovery of ambiguities in the quantitative data less complicated.
3.4. Task 4: Data Collection
The scenarios are run using the NADS MiniSim software (38). The software directly links to the
hardware inputs such as steering wheel, accelerator pedal, brake pedal, and gear selector. When a
participant drives the scenario, all the data outputs are stored in a data acquisition file, accessible
through MATLAB.
The filtered and sorted data included variables such as vehicle speed, lateral position,
distance to lead vehicle, driver selected time-gap, ACC disengaging time, braking force, ACC
warnings, steering wheel position, deceleration rate, and video data. Video data are mainly used
for DRT equipment calibration and identification of ambiguities during data reduction. Section 4
discusses the data collection task in grave detail.
3.5. Task 5: Data Reduction and Statistical Analysis
The thesis was aimed at determining changes in situational awareness of drivers, when exposed to
ACC systems. The proposed null hypothesis is that there is no significant difference between driver
behavior and awareness of individuals driving with the ACC and without the ACC. This is tested
by carrying out the 2-tailed paired sample t-test at a confidence level of 95%. An ANOVA is also
carried out where a significant difference in data variables between the age groups or genders is
observed.

36
H0: µ1 - µ2 = 0
Ha: µ1 - µ2 ≠ 0
Where,
µ1 represents the mean of the data variable collected during the scenario without the ACC; and
µ2 represents the mean of the data variable collected during the scenario with the ACC active.
SPSS was used to perform the statistical analysis on the sorted data. The obtained
significance tables and charts are shown in the Chapter 5.
3.6. Limitations
Driving simulators are not fully capable of reproducing real world details and motion cues.
However, it is necessary to immerse drivers into the task of driving in order to obtain significant
data. Although it is necessary to immerse drivers, some limitations exist.
Simulator sickness is a possibility and necessary precautions were taken to warn
participants in advance. Participants were required to drive a tutorial scenario for 5 to 20 minutes
depending on how comfortable they were with the ACC system and to eliminate severe cases of
simulator sickness. During this study, two participants reported severe simulator sickness during
the tutorial phase and could not continue. However, because it was detected early, other
participants were recruited to complete the study.
Attracting older age group participants was another significant challenge faced during this
study. Most businesses considered advertising in their premises soliciting and therefore declined
to assist with the study. However, with the assistance from Mr. Len Andyshak and the International
Students Services (ISS) at KU, willing older age group participants were recruited.

37
4. DATA COLLECTION
The process of data collection took approximately 50 days to complete. It required careful planning
and coordination especially with the participants in the older age group. The routine followed
during data collection is described below.
First, participants were given a brief tour of the equipment and what was expected during
the drive. Then they were given a few minutes to read and sign the consent form which elaborated
on the recorded data and how it would be used in the thesis. A copy of the consent form is attached
in Appendix D.
Second, participants were given a tutorial scenario to complete. This tutorial scenario
allows participants to get familiar with the ACC system, DRT device, touch screen GPS device,
feel of driving, voice commands, ACC warning sounds, and time headway to lead vehicle. More
detailed information on the tutorial scenario is given in Section 4.4.
After the tutorial scenario was completed and participants demonstrated a good command
of using the ACC system, the actual scenario was started. Participants first drove the cab without
using the ACC. Then, the participants drove the cab with the ACC system. This allowed for the
comparison of the various parameters in both drives as the only difference was the use of the ACC
system. The following sections provide more details on the procedure followed during data
collection.
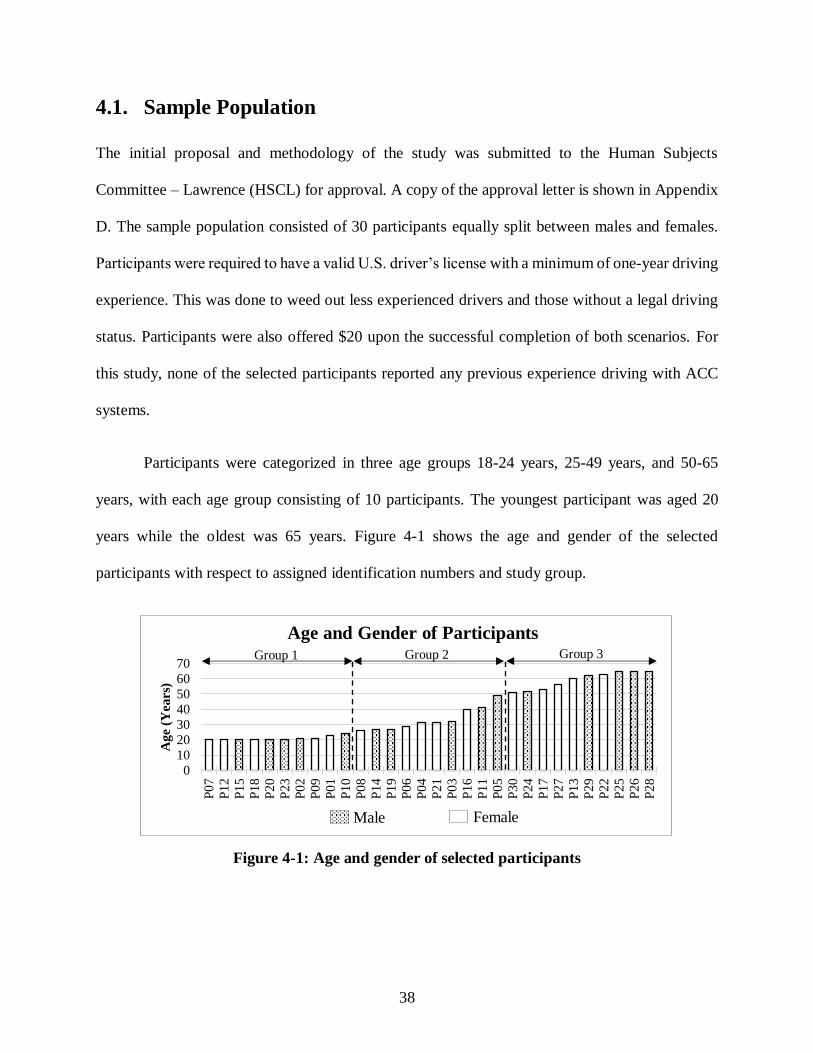
38
4.1. Sample Population
The initial proposal and methodology of the study was submitted to the Human Subjects
Committee – Lawrence (HSCL) for approval. A copy of the approval letter is shown in Appendix
D. The sample population consisted of 30 participants equally split between males and females.
Participants were required to have a valid U.S. driver’s license with a minimum of one-year driving
experience. This was done to weed out less experienced drivers and those without a legal driving
status. Participants were also offered $20 upon the successful completion of both scenarios. For
this study, none of the selected participants reported any previous experience driving with ACC
systems.
Participants were categorized in three age groups 18-24 years, 25-49 years, and 50-65
years, with each age group consisting of 10 participants. The youngest participant was aged 20
years while the oldest was 65 years. Figure 4-1 shows the age and gender of the selected
participants with respect to assigned identification numbers and study group.
Figure 4-1: Age and gender of selected participants
0
10
20
30
4050
60
70
P07
P12
P15
P18
P20
P23
P02
P09
P01
P10
P08
P1
4P
19
P06
P04
P21
P03
P16
P11
P05
P30
P24
P17
P27
P13
P29
P22
P2
5P
26
P28
Age (
Yea
rs)
Age and Gender of Participants
FemaleMale
Group 1 Group 2 Group 3

39
4.1.1. Information from Screening Questionnaires
The screening questionnaire provided key insights into the participant’s experience as a driver,
medical condition, and willingness to participate in the study. Participants fill out the questionnaire
with information pertaining to contact information, age, gender, possession of a valid U.S. driver’s
license, model/year of current vehicle, experience with ACC systems, estimate of a safe car
following distance, existing medical conditions, willingness to use ACC systems, willingness to
participate in a simulator based study, and history of motion sickness. A copy of the screening
questionnaire is shown in Appendix B of this thesis.
For participants to be approved for the study, some criteria had to be met such as no heart
conditions, no history of severe motion sickness (greater than 3 on a scale of 1 to 5), and no history
of seizures. Participants were also required to have responded with a safe following distance
between 2 seconds and 5 seconds, to be qualified for the study. This is because applicants who
preferred any shorter or longer distances than those mentioned were not considered as average
drivers. They might also affect the performance of other vehicles in the simulated scenarios, thus
resulting in data collection errors. Table 4-1 shows the responses received from participants during
the screening phase.

40
Table 4-1: Responses from the screening questionnaire
ID Question Number
1 2 3 4 5 6 7 8
P01 Yes Very Willing F 23 Kia 2007 No 4 Seconds No
P02 Yes Very Willing M 21 2000 Honda CR-V No 2 Seconds No
P03 Yes Very Willing M 32 Toyota Corolla No 3 Seconds No
P04 Yes Very Willing F 31 Toyota Corolla No 4 Seconds No
P05 Yes Very Willing M 49 Volvo S80-2001 No 5 Seconds No
P06 Yes Very Willing F 29 Volkswagen Golf 2002 No 3 Seconds No
P07 Yes Very Willing F 20 Toyota 2001 No 2 Seconds No
P08 Yes Very Willing F 26 Honda Accord 2010 No 2 or more No
P09 Yes Very Willing F 21 2007 Toyota Camry No 2-3 Seconds No
P10 Yes Very Willing M 24 Toyota Matrix '06 No 2 Seconds No
P11 Yes Very Willing M 41 Plymouth Voyager 1996 No 3 Seconds No
P12 Yes Very Willing F 20 Toyota Camry 2016 No 4 Seconds No
P13 Yes Willing F 60 Chevy Trax 2015 No 3 Seconds No
P14 Yes Very Willing M 27 Volvo S60R 2004 No 3 Seconds No
P15 Yes Very Willing M 20 2015 Toyota Tundra No 3 Seconds No
P16 Yes Very Willing F 40 Toyota Matrix 2005 No 2 Seconds No
P17 Yes Very Willing F 53 2009 Mazda Touring No 1 car length Not Sure
P18 Yes Willing F 20 Ford Taurus 2003 Yes 5 Seconds No
P19 Yes Very Willing M 27 Hyundai Sonata 2015 No 3 Seconds No
P20 Yes Very Willing M 20 Mazda 3 2012 No 2 or more No
P21 Yes Willing F 31 2003 Chevy Tracker No 2 Seconds No
P22 Yes Willing F 63 2010 Lexus No 3-4 Seconds No
P23 Yes Very Willing M 20 2004 Highlander No 2 Seconds No
P24 Yes Willing M 52 2008 Ford F150 No 2 Seconds No
P25 Yes Very Willing M 65 Honda Pilot 2013 No 1 car length No
P26 Yes Willing M 65 2011 Subaru Forester No 5 Seconds Not Sure
P27 Yes Very Willing F 56 2014 Toyota Rav 4 No 3 Seconds No
P28 Yes Very Willing M 65 2014 Toyota Rav 4 No 3 Seconds No
P29 Yes Very Willing M 62 2014 Toyota Camry No 2-3 Seconds No
P30 Yes Blank F 51 Toyota Camry 2008 No 3 Seconds Not Sure
Legend-Questions 1 to 8
1 Do you have a valid United States driver's
license? 5 What vehicle do you own/drive (make & year)?
2 How willing are you to participate in a driving
simulator study? 6 Have you ever used ACC in any vehicle?
3 What is your gender? 7 What is a safe car following distance in
seconds?
4 What is your age? 8 Is your current vehicle equipped with ACC?
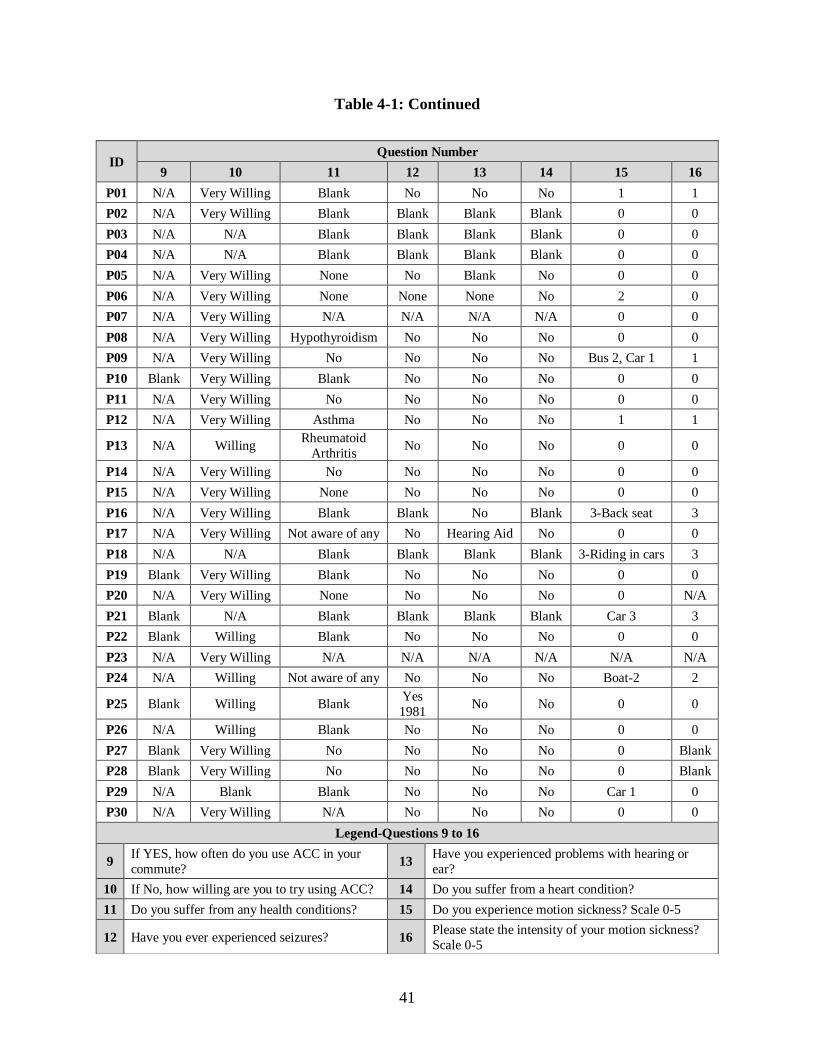
41
Table 4-1: Continued
ID Question Number
9 10 11 12 13 14 15 16
P01 N/A Very Willing Blank No No No 1 1
P02 N/A Very Willing Blank Blank Blank Blank 0 0
P03 N/A N/A Blank Blank Blank Blank 0 0
P04 N/A N/A Blank Blank Blank Blank 0 0
P05 N/A Very Willing None No Blank No 0 0
P06 N/A Very Willing None None None No 2 0
P07 N/A Very Willing N/A N/A N/A N/A 0 0
P08 N/A Very Willing Hypothyroidism No No No 0 0
P09 N/A Very Willing No No No No Bus 2, Car 1 1
P10 Blank Very Willing Blank No No No 0 0
P11 N/A Very Willing No No No No 0 0
P12 N/A Very Willing Asthma No No No 1 1
P13 N/A Willing Rheumatoid
Arthritis No No No 0 0
P14 N/A Very Willing No No No No 0 0
P15 N/A Very Willing None No No No 0 0
P16 N/A Very Willing Blank Blank No Blank 3-Back seat 3
P17 N/A Very Willing Not aware of any No Hearing Aid No 0 0
P18 N/A N/A Blank Blank Blank Blank 3-Riding in cars 3
P19 Blank Very Willing Blank No No No 0 0
P20 N/A Very Willing None No No No 0 N/A
P21 Blank N/A Blank Blank Blank Blank Car 3 3
P22 Blank Willing Blank No No No 0 0
P23 N/A Very Willing N/A N/A N/A N/A N/A N/A
P24 N/A Willing Not aware of any No No No Boat-2 2
P25 Blank Willing Blank Yes
1981 No No 0 0
P26 N/A Willing Blank No No No 0 0
P27 Blank Very Willing No No No No 0 Blank
P28 Blank Very Willing No No No No 0 Blank
P29 N/A Blank Blank No No No Car 1 0
P30 N/A Very Willing N/A No No No 0 0
Legend-Questions 9 to 16
9 If YES, how often do you use ACC in your
commute? 13
Have you experienced problems with hearing or
ear?
10 If No, how willing are you to try using ACC? 14 Do you suffer from a heart condition?
11 Do you suffer from any health conditions? 15 Do you experience motion sickness? Scale 0-5
12 Have you ever experienced seizures? 16 Please state the intensity of your motion sickness?
Scale 0-5

42
4.1.2. Assigning Participants to Scenarios
After the participants for the study were finalized, a distribution chart was developed to assign
participants to the different versions of the scenarios. This was done to prevent errors resulting
from all participants being exposed to the same sequence of events. Table 4-2 shows the
distribution of participants in the three versions of the scenario without ACC. Each age group sums
up to ten participants of which five are male and five are female.
Table 4-2: Participant distribution in scenarios without the ACC
Age Scenario 1 Scenario 2 Scenario 3 Total
18-24 1M 2F 2M 1F 2M 2F 5M 5F 10
25-49 1F 2M 2M 2F 2F 1M 5M 5F 10
50-65 2M 2F 1M 2F 1F 2M 5M 5F 10
Total 5M 5F 5M 5F 5M 5F
30 10 10 10
After distributing to the scenarios without ACC, participants in each age group and
scenario were further distributed into two scenarios with ACC. For example, the age group
between 18-24 years in scenario 1 without ACC contained one male and two female participants.
During the ACC scenario, the one male and one female participant were assigned to scenario 2
while the one female participant was assigned to scenario 3, to ensure that male and female
participants in the same age group were exposed to different sequence of events. However, not all
scenarios were able to fill both the male and female slots due to a small sample size. Table 4-3
shows how participants were assigned to their respective ACC scenarios.

43
Table 4-3: Assigning participants to respective scenarios with the ACC
NO ACC Scenario 1 Scenario 2 Scenario 3 Total
ACC Scenario 2 Scenario 3 Scenario 1 Scenario 3 Scenario 1 Scenario 2
18-24 1M 1F 1F 1M 1M 1F 1M 1F 1M 1F 5M 5F 10
25-49 1M 1M 1F 1M 1F 1M 1F 1M 1F 1F 5M 5F 10
50-65 1M 1F 1M 1F 1M 1F 1F 1M 1M 1F 5M 5F 10
Total 3M 2F 2M 3F 3M 2F 2M 3F 3M 2F 2M 3F
30 5 5 5 5 5 5
4.2. The KU driving simulator
The KU driving simulator is a FB simulator with both the Acura MDX vehicle chassis and the
display screens mounted to the ground. Because the vehicle is mounted to the ground, the
simulator does not provide any motion cues.
The scenarios are displayed onto the screens using overhead projectors. The three front
screens provide a 120o horizontal field of view (FOV) as seen in Figure 4-2 and Figure 4-3. A rear
screen (Screen 4) is also available to further increase realism by rendering display in the rear-view
mirror and side mirrors. This allows the simulator to deliver an all-round display, providing a more
immersed driving experience. As shown in Figure 4-2, the cab also contains a digital instrument
panel that is activated when a scenario starts. This panel displays the speed, turn signals, cruise
control notifications, gear selector display, and other vehicle related messages.

44
Figure 4-2: Configuration and layout of the KU driving simulator
The MiniSim PC controls the scenario simulation while the Video Capture PC is
responsible for video data collection. The cab is mounted with four high definition (HD) cameras
that record braking activity, facial cues, scenario position, and steering wheel activity. During this
thesis, the MiniSim PC was also used to run the DRT software and record the output data.
Figure 4-3: KU driving simulator in action

45
4.3. Designing an Application to Simulate Distraction
The application layout consists of nine tiles with numbers varying between zero and eight as seen
in Figure 4-4. The numbers are coded to rearrange randomly to prevent drivers from easily
remembering the layout and not actually taking their eyes off the road.
Participants were required to match the number in the yellow box to the number on the
square tiles. The application records the number of correct responses and the total number of
attempts carried out by each person. However, in this study we are only interested in the total
number of attempts during a given task as they were also required to respond to the DRT stimuli
during the task. Participants were asked to simultaneously drive and use the application during the
in-vehicle distraction task.
Figure 4-4: Interface of the application to simulate distraction
Participants practiced and got accustomed to the touch screen interface during the tutorial
scenario. Participants were also familiarized with the voice commands that trigger the use of the
application. The interface including the touch screen tablet was referred to as the GPS for this
study. Although it did not function as the GPS, participants were trained to respond to voice

46
commands that contained the word “GPS.” When the “start using the GPS now” phrase was heard,
participants were required to hit the application as accurately as possible, until the phrase “stop
using the GPS” was heard.
4.4. Configuring Events in the Driving Simulator
The Interactive Scenario Authoring Tool (ISAT) (40) is used to add roadway traffic and safety
infrastructure to the scenario. Roadway traffic includes objects such as the autonomous dynamic
object (ADO), deterministic dynamic object (DDO), stationary objects, and dependent DDO. The
paths of the roadway traffic can be altered using the different triggers. Triggers can be activated
by pads on the road (when any vehicle drives over the road pad), global time in the scenario, and
other traversing vehicles. These triggers control visual aspects such as indicators, lane changes,
vehicle dynamics, and vehicle condition.
The ADO can be visually represented as any type of vehicle (passenger car, bike, truck)
available in the ISAT database. The ADO follows a defined path and adheres by all the traffic
regulations just like a human driver. Although ADOs have a certain level of independent driving
capabilities, their path can be altered using triggers. For example, a lane change at a desired point
can be triggered when the desired vehicle drives over a road pad.
The DDO can also be represented as any type of vehicle. However, it can also be
represented as an animal or object. Unlike the ADO, the DDO does not adhere to any traffic
regulations, it blindly follows the path set in the scenario. The dependent DDO is almost the same
as the DDO but with a capability of arriving at a point based on another vehicle/object in the
scenario. The dependent DDO is used in the deer scenario as the deer was intended to reach the
center of the road when the external driver is 40 feet away. In this way, the deer is always at the

47
exact same location and distance for every participant in the study. The events are discussed at
length in Section 4.5.
Six highway scenarios were created, three intended for driving without the ACC and three
with the ACC system. The total length of the highway was 12 miles and took approximately 13 to
16 minutes depending on driver actions. The three variations of the highway scenario were created
to prevent participants from predicting the sequence of events thus causing a bias in the data.
Figure 4-5 shows the arrangement of events in the designed scenario.
Event car following Event deer crossing Event desk drop Event work zone
Figure 4-5: Layout of scenarios showing varying event locations
Voice commands set up within the scenarios, using a female computer-generated voice
with a United States accent, were used to guide participants. The voice instructions were short and
precise to avoid confusion or delays during the drive.
Participants were only allowed to proceed to the actual scenario if they showed proper
understanding of the use of ACC system, especially with respect to warning alerts, engaging,
BEGIN
1 2 3
END
BEGIN
END
BEGIN
END

48
disengaging, and time-gap adjustment. This Process of familiarizing participants with the ACC
system took anywhere between 5 to 20 minutes. During the tutorial scenario, participants were
also familiarized with the DRT equipment, GPS device, and in-vehicle systems such as air
conditioning, instrument panel, ignition, indicators, side mirror adjustment buttons, and seat
adjustment buttons.
The tutorial scenario was designed as a two-lane undivided highway. The goal of the
scenario was to get participants accustomed to the following distances in the driving simulator, as
they would differ slightly from real driving. Participants were asked to follow a lead vehicle
(ambulance) while trying to maintain a safe following distance. Within the scenario, participants
were also instructed to reach a velocity of 65 mph and activate the ACC system. However, the lead
ambulance was designed to travel at a speed of 55 mph, allowing participants to adjust the time
gap settings while observing the braking and acceleration capabilities of the ACC system. While
driving the tutorial scenario, participants were monitored for simulator sickness. In cases where
simulator sickness was detected, depending on how they felt, participants were given the option to
continue or quit the study.
The actual scenario has two phases. The first phase where the participants drive without
the ACC system and the second phase where they drive while engaging the ACC system at their
discretion. Each phase has the same number of major and minor events occurring in a different
sequence based on the participant allocation chart, shown in Table 4-3.The scenarios were
designed as a grass median divided four-lane highway. The total length of the highway was 12
miles and consisted of four major events and three minor events. To keep participants engaged,
simulated traffic was present in both directions of the highway. The design of each event with
respect to the resulting data variables are described in detail below.

49
4.4.1. Car Following
This event was the first to occur in all scenarios. The posted speed limit for this section of the drive
was 70 mph. It consisted of two lead vehicles, one in the left lane and the other in the right lane as
seen in Figure 4-6. The driver is expected to follow either vehicles at a headway that he/she is
comfortable maintaining. This event did not require the drivers to perform an emergency maneuver
as it designed to establish their normal driving preferences of headway, lane position, and speed
on a divided highway.
(a) (b)
Figure 4-6: Car following event - design view (a) and driver view (b)
The two lead vehicles are designed to travel at a constant velocity of 70 mph. The drivers
have the opportunity to maintain a safe headway while keeping close to the speed limit.
4.4.2. Deer Crossing
During this event, participants were required to perform some sort of evasive maneuver such as
applying the brakes, accelerating, and rotating the steering wheel. Based on these actions, time to
collision with the deer at the instance when the evasive maneuver was performed can be
determined. Time to collision will be used as a measure of the driver’s reaction time. Figure 4-7
shows the design and driver view of the deer scenario.
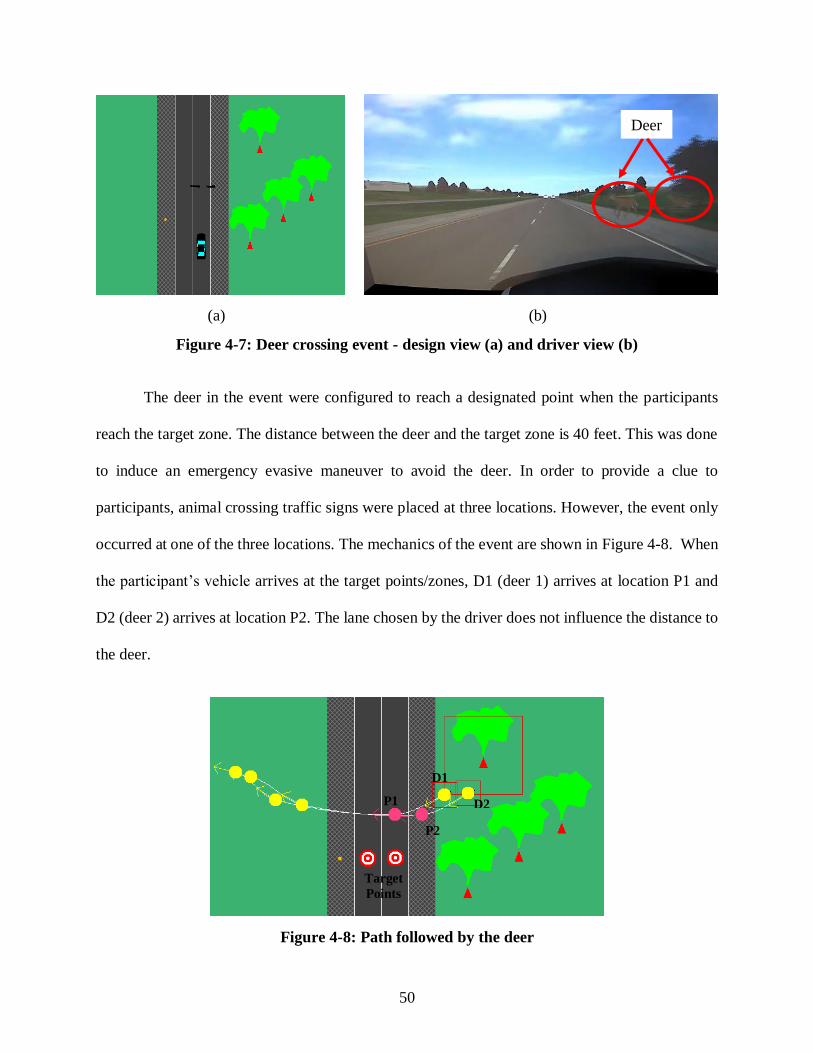
50
(a) (b)
Figure 4-7: Deer crossing event - design view (a) and driver view (b)
The deer in the event were configured to reach a designated point when the participants
reach the target zone. The distance between the deer and the target zone is 40 feet. This was done
to induce an emergency evasive maneuver to avoid the deer. In order to provide a clue to
participants, animal crossing traffic signs were placed at three locations. However, the event only
occurred at one of the three locations. The mechanics of the event are shown in Figure 4-8. When
the participant’s vehicle arrives at the target points/zones, D1 (deer 1) arrives at location P1 and
D2 (deer 2) arrives at location P2. The lane chosen by the driver does not influence the distance to
the deer.
Figure 4-8: Path followed by the deer
Deer
D1
D2 P1
P2
Target
Points

51
4.4.3. Desk Drop
The desk drop event was the most challenging to design and execute. This is because it consisted
of an overlapping path between an object (desk) and the transport vehicle (van). The van
transporting the desk is only activated when the driver is within 800 feet of the creation point. The
800 feet does not provide any significance to the event as it is the distance required by the van,
from the creation point, to get ahead of the driver with a 70 mph velocity. The desk is designed to
slide out of the transporting van with a velocity of 15 mph, towards the direction of the participant’s
vehicle. At the time of the desk drop, participants were instructed to use the GPS device through
voice commands. This induced distraction by forcing participants to take their eyes off the
roadway, thus creating an event that required an emergency evasive action.
The location of the desk drop during the event, in any scenario, is the same. However,
participant’s distance relative to the location of the desk drop depends on the traveling speed, and
chosen time gap setting. Also, to make sure that the participants do not easily recognize the van
that drops the desk, the same vehicle was used as roadway traffic during other events in the
scenario. Figure 4-9 shows the desk drop event from the perspective of the designer and the
participant in the study.
(a) (b)
Figure 4-9: Desk drop event - design view (a) and driver view (b)

52
The desk is represented as a red rectangle in the design view. However, during the simulated event,
it is represented as a wooden desk as shown in Figure 4-9 (b). During this event, three variables
were collected. They include: distance headway to the lead vehicle, vehicle speed, and time to
collision with the desk at the instance of evasive maneuver.
4.4.4. Work Zone
The work zone event was located on a straight one-and-one-half mile section of highway. During
the event, the left lane on the roadway was closed with traffic channelizers and road work
machinery. Warning signs were placed at intervals of 500 feet for one-half mile, ahead of the work
zone. This permitted sufficient time for participants to observe and process information on the
warning signs such as left lane closed ahead, speed limit 55 mph, and road work ahead.
In this event, each participant’s ability to follow traffic regulations based on the roadway
signs and surrounding environment was measured. The lead vehicles in the event were configured
to travel at 70 mph, violating the 55 mph speed limit. Participant’s ability not to blindly follow the
lead vehicle violating the traffic speed regulations is monitored. An average speed above 65 mph
in the work zone event is considered as a violation. This is because drivers usually take time to
slow down from the previous speed limit of 70 mph and speed up towards the end of the work
zone.

53
(a) (b)
Figure 4-10: Work zone event - design view (a) and driver view (b)
4.4.5. Sudden Merging Vehicle
As the name suggests, this event involves a vehicle merging suddenly into the left lane with a
lower speed (60 mph) than the posted speed limit of 70 mph. Participants were required to react to
the sudden merging by applying brakes. This event captures variables such as brake pedal force,
deceleration rate, and time to collision at the instance of braking. Figure 4-11 shows the instance
when the lead vehicle suddenly merges into the left lane.
(a) (b)
Figure 4-11: Sudden merging vehicle event - design view (a) and driver view (b)

54
Participants were forced to only apply their brakes as there was another vehicle configured
to merge into the right lane from the on-ramp at that instance, shown in Figure 4-11 (a). This
narrowed down the choices of evasive maneuvers to one, applying brakes. As a result, data
variables that were not available during other events were recorded and analyzed.
4.4.6. Move Over Law
The “move over or slow down” law applies to most roadways in the United States. As the name
suggests, it requires drivers to move over to the left lane or slow down when vehicles are seen
stationary alongside the shoulders or curbs. This is done mostly to avoid pedestrian fatalities
especially during entry and exit into the stationary vehicle or during roadway construction works.
During this event, participants ability to successfully move over during a stationary vehicle
scenario was analyzed. Every variation of the scenario was incorporated with three move over
events. They include: stationary passenger car, stationary construction truck, and passenger car
pulled over by the police. When a participant successfully obeyed the move over law by switching
lanes or slowing down, a value of one was recorded in the data sheet. However, if the participant
did not observe the law, a value of zero was recorded for that event. Figure 4-12 shows an example
of the move over event where a passenger car has been pulled over by the police. The police vehicle
is configured to have its warning lights active during the event. A maximum total of three can be
recorded in each scenario, if participant observed the law. Driver’s ability to demonstrate
situational awareness was determined by comparing the total number of successfully observed
move over law events, with and without using the ACC system.

55
(a) (b)
Figure 4-12: Move over event - design view (a) and driver view (b)
4.4.7. Distraction in the Vehicle
During this event, participants were required to drive the vehicle while using the GPS device
designed to simulate in-vehicle distractions as shown in Figure 4-13. The GPS device was a
10-inch touch screen tablet with a custom application, capable of shuffling numbers between 0 to
8 randomly as described in Section 4.3. Three distraction events were present in every scenario of
the drive, each lasting between 10 and 15 seconds depending on the speed of the driver. All
distraction events occurred on straight segments of the roadway with no traffic interference.
Figure 4-13: Simulated distraction while driving

56
The main variable recorded during the event was the number of hit attempts on the touch
screen interface. Hit attempts were analyzed together with the DRT data collected during the event,
to determine whether the reduction of mental workload as a result of using the ACC system
significantly altered the number of hit attempts recorded on the application.
4.5. After the Drive
After successful completion of both phases of the drive, participants were requested to fill a realism
questionnaire about their driving experience in the simulator. A copy of the realism questionnaire
is attached in Appendix E.
Figure 4-14 shows the average data obtained from the responses of the participants
regarding the comparison of the driving simulator to actual driving. Based on the data, it can be
determined that the overall experience was similar to driving. However, some aspects such as the
feel of brakes, response of brake pedal, and sensation of acceleration received less positive
feedback. The less positive feedback was anticipated as the simulator has a fixed-base and does
not provide any significant motion cues to the drivers. Overall, the driving experience and the ease
of engaging the ACC received positive feedback.
Participants were kept engaged after the drive, between 5-10 minutes, by asking a few
questions about their personal life such as work, education, and sports interest, to ensure full
physical and mental presence before leaving the test site. After, participants were issued a $20 gift
card for their contribution to the study.
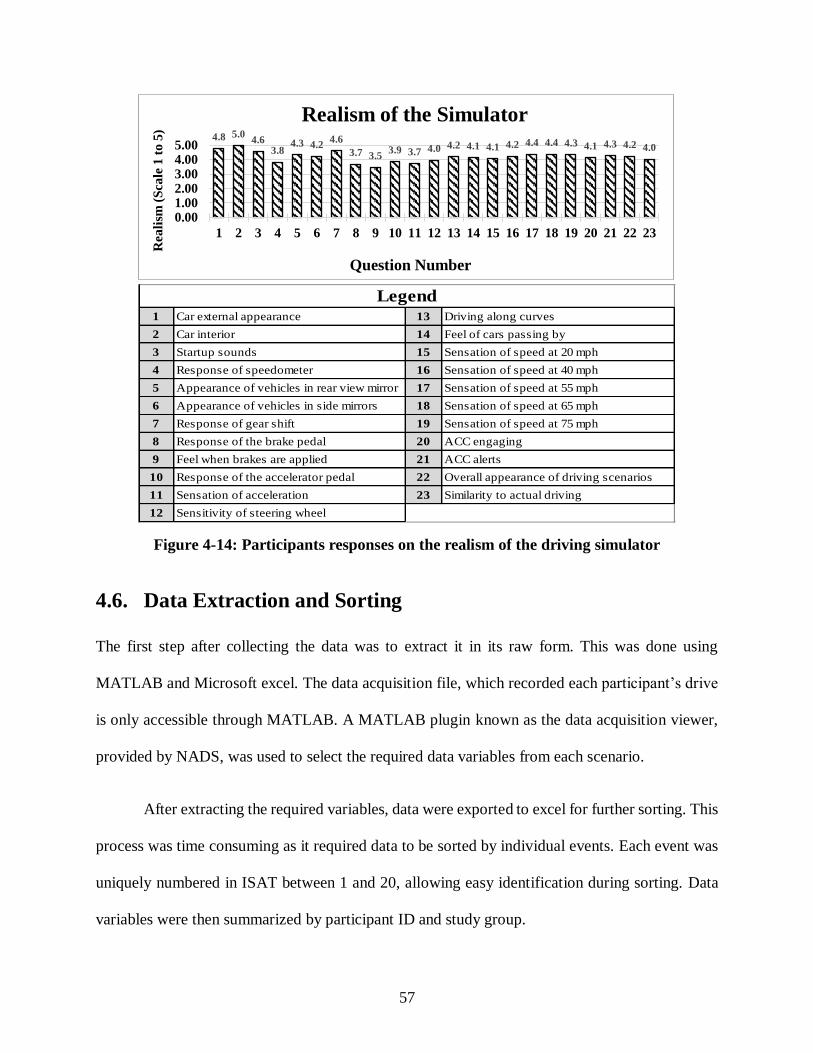
57
Figure 4-14: Participants responses on the realism of the driving simulator
4.6. Data Extraction and Sorting
The first step after collecting the data was to extract it in its raw form. This was done using
MATLAB and Microsoft excel. The data acquisition file, which recorded each participant’s drive
is only accessible through MATLAB. A MATLAB plugin known as the data acquisition viewer,
provided by NADS, was used to select the required data variables from each scenario.
After extracting the required variables, data were exported to excel for further sorting. This
process was time consuming as it required data to be sorted by individual events. Each event was
uniquely numbered in ISAT between 1 and 20, allowing easy identification during sorting. Data
variables were then summarized by participant ID and study group.
4.8 5.04.6
3.84.3 4.2
4.6
3.7 3.53.9 3.7 4.0 4.2 4.1 4.1 4.2 4.4 4.4 4.3 4.1 4.3 4.2 4.0
0.001.002.003.004.005.00
1 2 3 4 5 6 7 8 9 10 11 12 13 14 15 16 17 18 19 20 21 22 23
Reali
sm (
Scale
1 t
o 5
)
Question Number
Realism of the Simulator
1 Car external appearance 13 Driving along curves
2 Car interior 14 Feel of cars passing by
3 Startup sounds 15 Sensation of speed at 20 mph
4 Response of speedometer 16 Sensation of speed at 40 mph
5 Appearance of vehicles in rear view mirror 17 Sensation of speed at 55 mph
6 Appearance of vehicles in side mirrors 18 Sensation of speed at 65 mph
7 Response of gear shift 19 Sensation of speed at 75 mph
8 Response of the brake pedal 20 ACC engaging
9 Feel when brakes are applied 21 ACC alerts
10 Response of the accelerator pedal 22 Overall appearance of driving scenarios
11 Sensation of acceleration 23 Similarity to actual driving
12 Sensitivity of steering wheel
Legend

58
DRT data also required extensive filtering. This is because the data collected first needed
to be synchronized with the MiniSim frame rate. The DRT device used for this study was not
provided by NADS and hence required manual synchronization using video recordings. However,
both the DRT device and MiniSim data acquisition had a frame rate of 60Hz, making the
synchronization process easier. After synchronization, RT data had to be cleaned to weed out
misses and guess work. Non-responses to stimuli were recorded as misses. Only responses between
100ms and 2500ms were considered as hits. Any responses less than 100ms were considered as
premature responses, while responses that took longer than 2500ms were considered as
unrequested responses. Both premature hits and unrequested responses were excluded from the
analysis, as recommended in the ISO 17488: 2016.
4.7. Data Collection Summary
This section of the thesis elaborated on the process followed during data collection. Details such
as the process of participant recruitment, scenario assignment, configuration of events, recorded
data variables, and data sorting were discussed in length.
Participants were first assigned a unique identification number to avoid disclosing personal
information. Then, they were distributed to specific scenarios with the ACC and without the ACC.
This allowed each participant to be exposed to a different sequence of events in both phases of the
drive.
Participants were then familiarized with the simulator using the help of a tutorial scenario.
This exposed participants to the ACC system and its various time gap settings. After demonstrating
proper understanding of the ACC system, thr DRT process, and the use of the simulator functions,
successful participants proceeded to drive the actual scenario in two phases, without the ACC

59
system and with the ACC system. Each scenario consisted of four major events and three minor
events, each aimed at collecting a particular set of data variables. After collection, the data needed
to be sorted and summarized using MATLAB and Microsoft excel. The results obtained are
discussed in the next section of this thesis.

60
5. RESULTS
This section presents the results obtained from the data collection phase. The SPSS software was
used for the statistical analysis that involved the 2-tailed paired t-test and the analysis of variance
(ANOVA). The data used for the statistical analysis are shown in Appendix G and Appendix H.
5.1. Whole Drive
Every instance involving a contact between the driver and another vehicle or object was recorded
as a collision during the drive. A minimum of one collision was possible during the drive. This is
because the event involving the crossing deer was designed to be unavoidable. However, the event
involving a desk drop could be avoided by performing an evasive maneuver. Determining
differences in collision count between the two drives can be crucial in establishing whether
participants showed a significant change when exposed to the ACC system. Figure 5-1 shows the
number of collisions with respect to each participant.
Figure 5-1: Collision counts for the entire drive
Just by looking at Figure 5-1, there does not seem to be an increase or decrease in the total
number of collisions in the drive without ACC and with the ACC. A paired t-test was carried out
and the results are shown in Table 5-1. The paired t-test resulted in a p-value of 0.264 which is
0
1
2
P01
P02
P03
P04
P05
P06
P07
P08
P09
P10
P11
P12
P13
P14
P15
P16
P1
7
P18
P1
9
P20
P2
1
P22
P2
3
P24
P2
5
P26
P27
P28
P29
P30Tota
l C
oll
isio
ns
Collision Counts
No ACC ACC
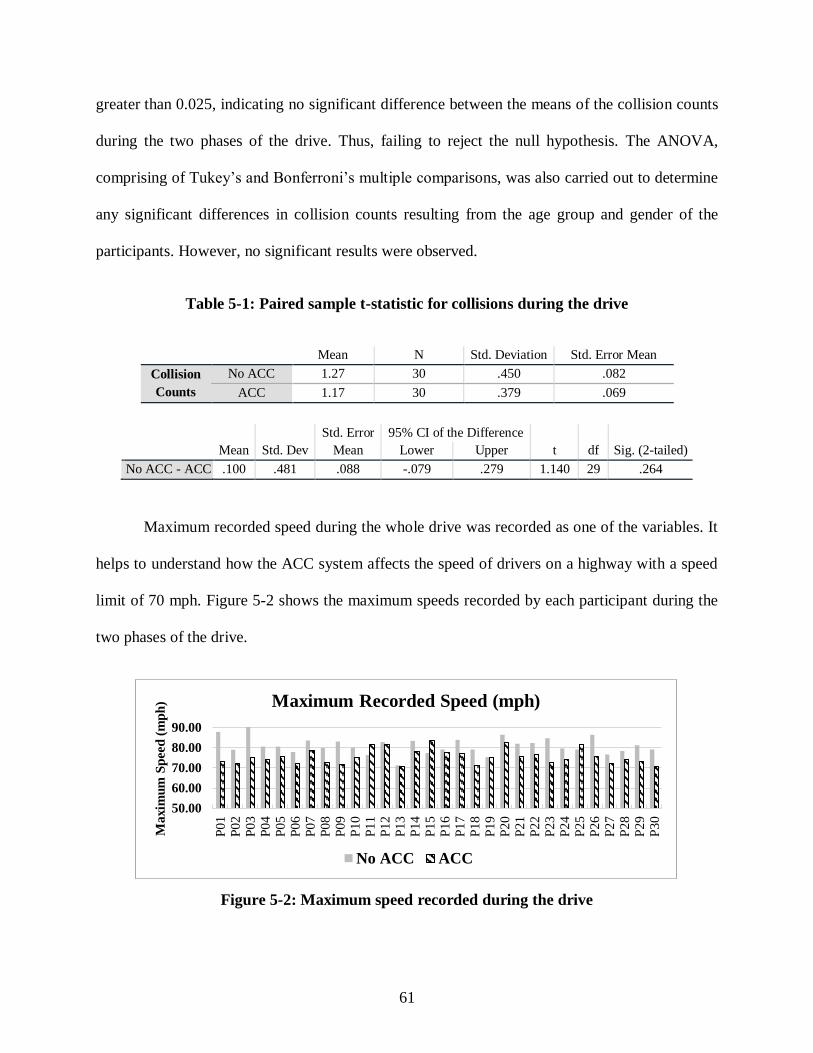
61
greater than 0.025, indicating no significant difference between the means of the collision counts
during the two phases of the drive. Thus, failing to reject the null hypothesis. The ANOVA,
comprising of Tukey’s and Bonferroni’s multiple comparisons, was also carried out to determine
any significant differences in collision counts resulting from the age group and gender of the
participants. However, no significant results were observed.
Table 5-1: Paired sample t-statistic for collisions during the drive
Mean N Std. Deviation Std. Error Mean
Collision
Counts
No ACC 1.27 30 .450 .082
ACC 1.17 30 .379 .069
Mean Std. Dev
Std. Error
Mean
95% CI of the Difference
Lower Upper t df Sig. (2-tailed)
No ACC - ACC .100 .481 .088 -.079 .279 1.140 29 .264
Maximum recorded speed during the whole drive was recorded as one of the variables. It
helps to understand how the ACC system affects the speed of drivers on a highway with a speed
limit of 70 mph. Figure 5-2 shows the maximum speeds recorded by each participant during the
two phases of the drive.
Figure 5-2: Maximum speed recorded during the drive
50.00
60.00
70.00
80.00
90.00
P0
1P
02
P0
3P
04
P05
P06
P07
P08
P09
P10
P11
P12
P13
P14
P15
P16
P17
P18
P19
P20
P21
P22
P23
P24
P25
P26
P27
P28
P29
P30
Maxim
um
Sp
eed
(m
ph
) Maximum Recorded Speed (mph)
No ACC ACC
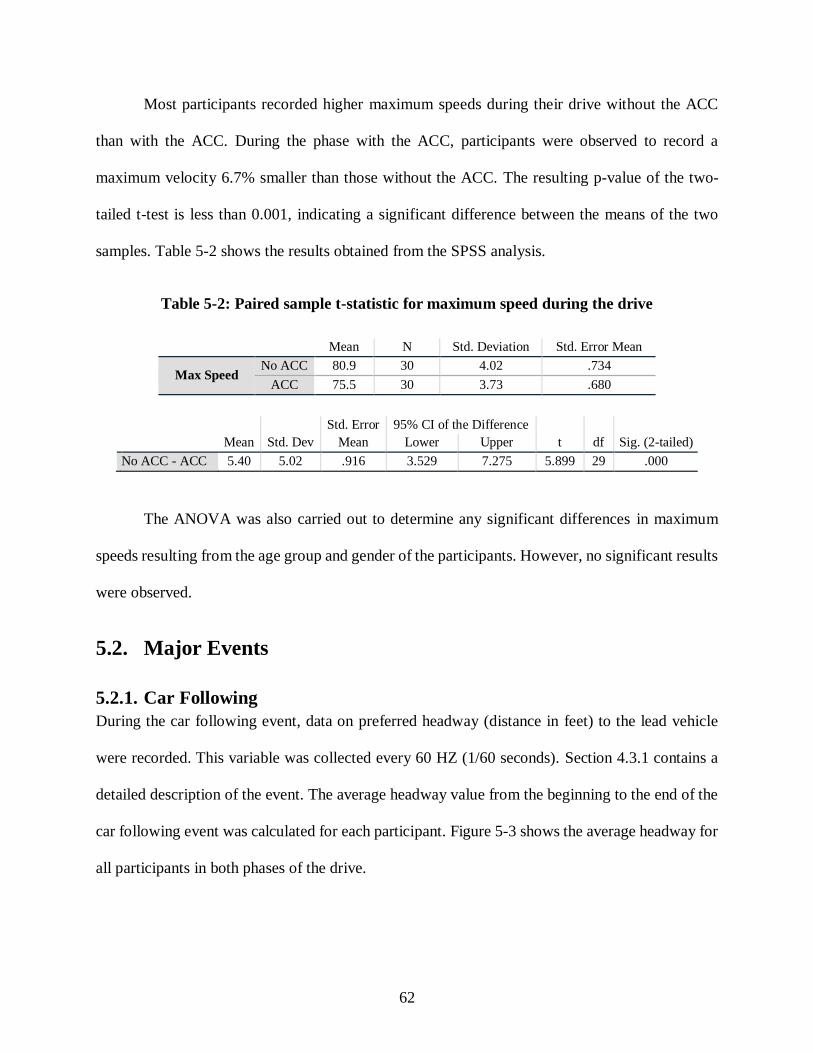
62
Most participants recorded higher maximum speeds during their drive without the ACC
than with the ACC. During the phase with the ACC, participants were observed to record a
maximum velocity 6.7% smaller than those without the ACC. The resulting p-value of the two-
tailed t-test is less than 0.001, indicating a significant difference between the means of the two
samples. Table 5-2 shows the results obtained from the SPSS analysis.
Table 5-2: Paired sample t-statistic for maximum speed during the drive
Mean N Std. Deviation Std. Error Mean
Max Speed No ACC 80.9 30 4.02 .734
ACC 75.5 30 3.73 .680
Mean Std. Dev
Std. Error
Mean
95% CI of the Difference
Lower Upper t df Sig. (2-tailed)
No ACC - ACC 5.40 5.02 .916 3.529 7.275 5.899 29 .000
The ANOVA was also carried out to determine any significant differences in maximum
speeds resulting from the age group and gender of the participants. However, no significant results
were observed.
5.2. Major Events
5.2.1. Car Following
During the car following event, data on preferred headway (distance in feet) to the lead vehicle
were recorded. This variable was collected every 60 HZ (1/60 seconds). Section 4.3.1 contains a
detailed description of the event. The average headway value from the beginning to the end of the
car following event was calculated for each participant. Figure 5-3 shows the average headway for
all participants in both phases of the drive.
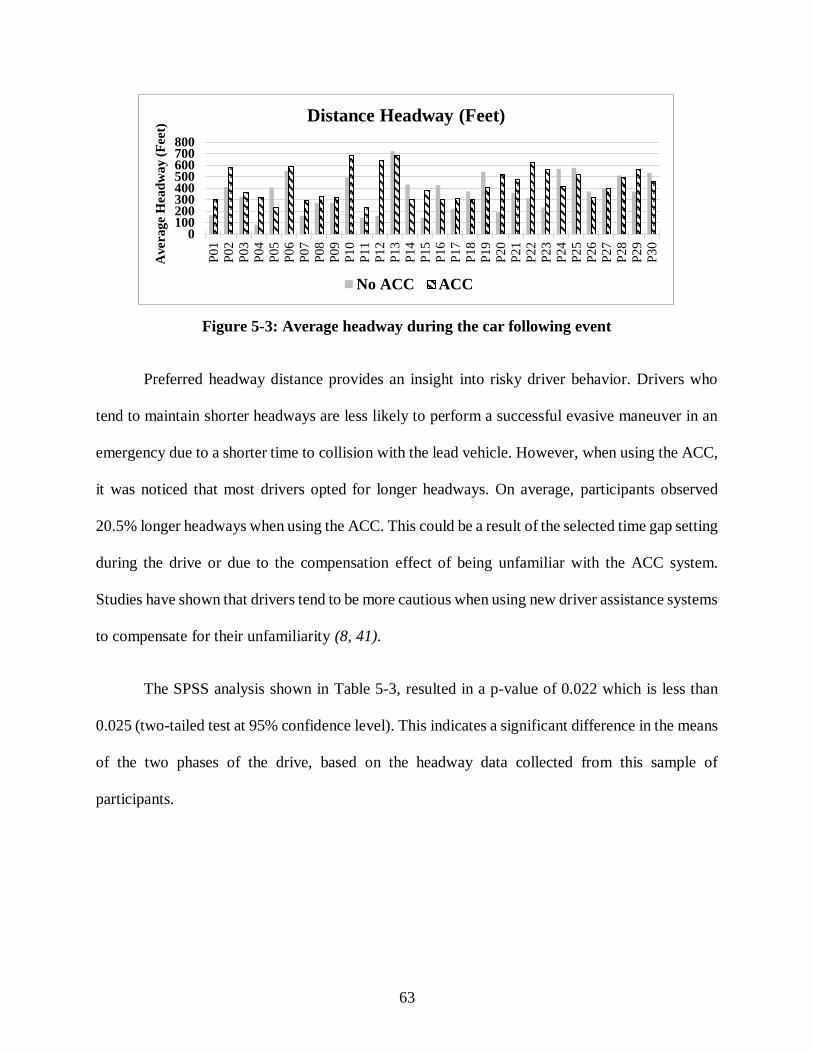
63
Figure 5-3: Average headway during the car following event
Preferred headway distance provides an insight into risky driver behavior. Drivers who
tend to maintain shorter headways are less likely to perform a successful evasive maneuver in an
emergency due to a shorter time to collision with the lead vehicle. However, when using the ACC,
it was noticed that most drivers opted for longer headways. On average, participants observed
20.5% longer headways when using the ACC. This could be a result of the selected time gap setting
during the drive or due to the compensation effect of being unfamiliar with the ACC system.
Studies have shown that drivers tend to be more cautious when using new driver assistance systems
to compensate for their unfamiliarity (8, 41).
The SPSS analysis shown in Table 5-3, resulted in a p-value of 0.022 which is less than
0.025 (two-tailed test at 95% confidence level). This indicates a significant difference in the means
of the two phases of the drive, based on the headway data collected from this sample of
participants.
0100200300400500600700800
P01
P0
2P
03
P04
P05
P06
P07
P08
P0
9P
10
P11
P12
P13
P14
P15
P16
P17
P18
P19
P20
P2
1P
22
P23
P24
P25
P26
P27
P2
8P
29
P30
Averag
e H
ead
way
(F
eet)
Distance Headway (Feet)
No ACC ACC

64
Table 5-3: Paired sample t-statistic for headway during the car following event
Mean N Std. Deviation Std. Error Mean
Headway No ACC 357.3 30 160.6 29.3
ACC 430.6 30 138.1 25.2
Mean Std. Dev
Std. Error
Mean
95% CI of the Difference
Lower Upper t df Sig. (2-tailed)
No ACC - ACC -73.2 165.4 30.198 -135.0 -11.48 -2.425 29 .022
Data on Maximum speed were also recorded during the event. Similar data, as seen during
the whole drive, were observed. Maximum speeds were higher during the no ACC phase with a
mean velocity of 77.3 mph, than those recorded in the ACC phase with a mean velocity of 73.3
mph (on average 5.2% reduction in maximum speed with the ACC active). Figure 5-4 and Table
5-4 show the resulting values of the statistical analysis. The observed p-value was less than 0.001,
indicating a significant difference between the two means. This also indicated that when using the
ACC, participants were closer to the posted speed limit than when not using the ACC.
Figure 5-4: Maximum speed recorded during the car following event
50
60
70
80
90
P01
P02
P03
P04
P05
P06
P07
P0
8
P09
P10
P11
P12
P13
P14
P15
P16
P17
P18
P19
P2
0
P2
1
P22
P23
P24
P25
P26
P27
P28
P29
P30
Maxim
um
Sp
eed
(m
ph
) Maximum Recorded Speed (mph)
No ACC ACC

65
Table 5-4: Paired sample t-statistic for maximum speed during the car following event
Mean N Std. Deviation Std. Error Mean
Max Speed No ACC 77.3 30 3.789 .692
ACC 73.3 30 2.831 .517
Mean Std. Dev
Std. Error
Mean
95% CI of the Difference
Lower Upper t df Sig. (2-tailed)
No ACC - ACC 3.990 4.76 .869 2.215 5.772 4.593 29 .000
The average speed variable is similar to the maximum speed variable. However, it is
calculated by averaging the point speed, recorded at a frequency of 60 HZ. Figure 5-5 shows the
average speeds during the car following event. The average speeds of both phases of the drive are
similar. This could be because the high and low values are averaged out over the span of the event.
Figure 5-5: Average speed during the car following event
The comparison of the means in the paired t-test resulted in a p-value of 0.128 (Table 5-5),
indicating no significant difference. The t-test failed to successfully reject the null hypothesis.
50
60
70
80
90
P0
1
P0
2
P0
3
P0
4
P0
5
P0
6
P0
7
P0
8
P0
9
P1
0
P1
1
P1
2
P1
3
P1
4
P1
5
P1
6
P1
7
P1
8
P1
9
P2
0
P2
1
P2
2
P2
3
P2
4
P2
5
P2
6
P2
7
P2
8
P2
9
P3
0
Avera
ge S
peed
(m
ph
)
Average Speed (mph)
No ACC ACC
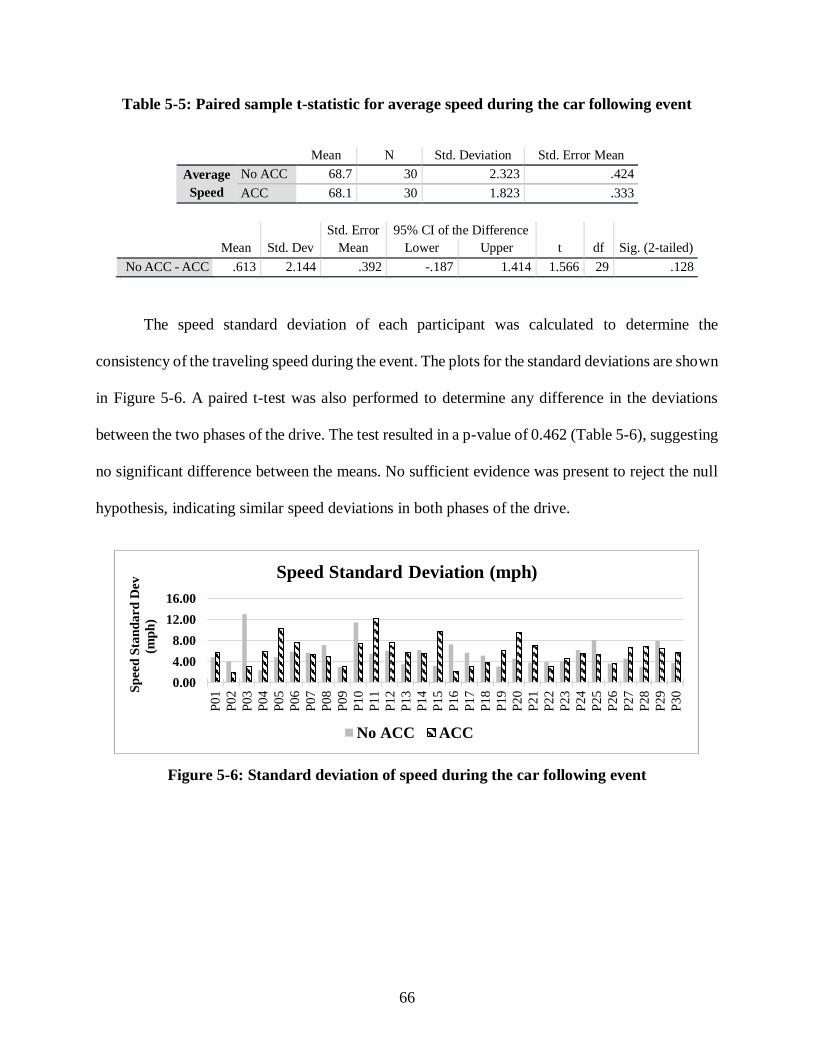
66
Table 5-5: Paired sample t-statistic for average speed during the car following event
Mean N Std. Deviation Std. Error Mean
Average
Speed
No ACC 68.7 30 2.323 .424
ACC 68.1 30 1.823 .333
Mean Std. Dev
Std. Error
Mean
95% CI of the Difference
Lower Upper t df Sig. (2-tailed)
No ACC - ACC .613 2.144 .392 -.187 1.414 1.566 29 .128
The speed standard deviation of each participant was calculated to determine the
consistency of the traveling speed during the event. The plots for the standard deviations are shown
in Figure 5-6. A paired t-test was also performed to determine any difference in the deviations
between the two phases of the drive. The test resulted in a p-value of 0.462 (Table 5-6), suggesting
no significant difference between the means. No sufficient evidence was present to reject the null
hypothesis, indicating similar speed deviations in both phases of the drive.
Figure 5-6: Standard deviation of speed during the car following event
0.00
4.00
8.00
12.00
16.00
P0
1
P0
2
P0
3
P0
4
P0
5
P0
6
P0
7
P0
8
P0
9
P1
0
P1
1
P1
2
P1
3
P1
4
P1
5
P1
6
P1
7
P1
8
P1
9
P2
0
P2
1
P2
2
P2
3
P2
4
P2
5
P2
6
P2
7
P2
8
P2
9
P3
0Sp
eed
Sta
nd
ard
Dev
(mp
h)
Speed Standard Deviation (mph)
No ACC ACC
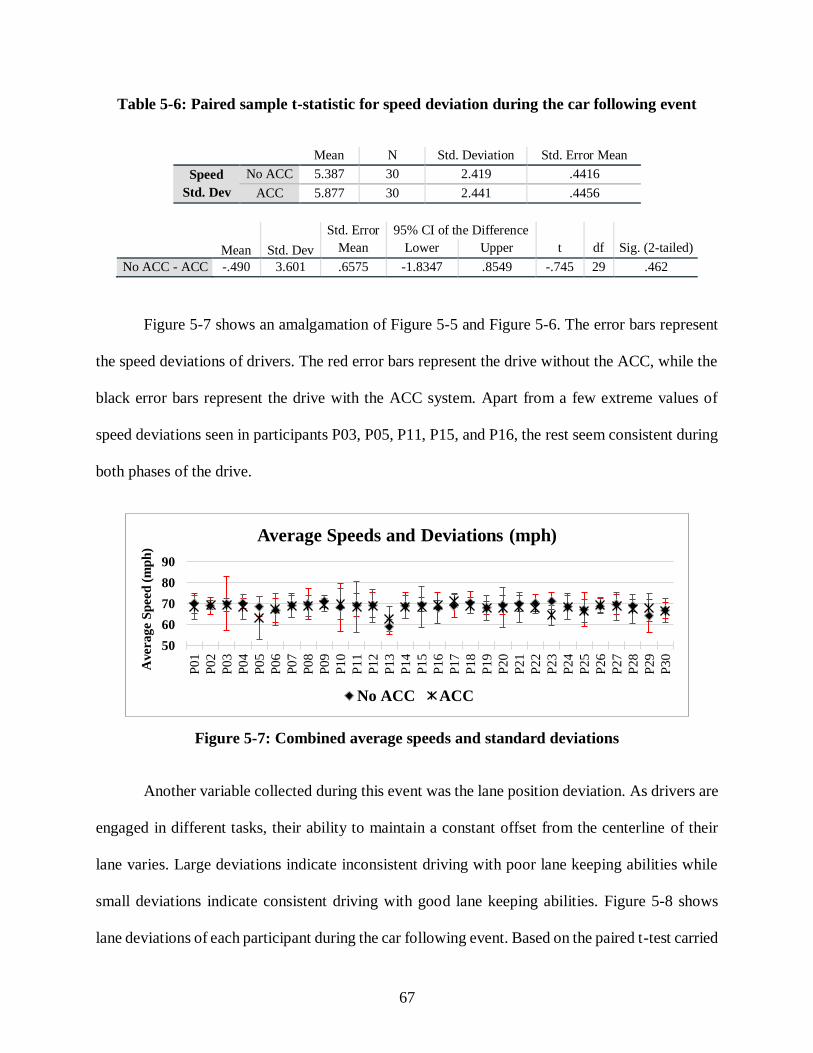
67
Table 5-6: Paired sample t-statistic for speed deviation during the car following event
Mean N Std. Deviation Std. Error Mean
Speed
Std. Dev
No ACC 5.387 30 2.419 .4416
ACC 5.877 30 2.441 .4456
Mean Std. Dev
Std. Error
Mean
95% CI of the Difference
Lower Upper t df Sig. (2-tailed)
No ACC - ACC -.490 3.601 .6575 -1.8347 .8549 -.745 29 .462
Figure 5-7 shows an amalgamation of Figure 5-5 and Figure 5-6. The error bars represent
the speed deviations of drivers. The red error bars represent the drive without the ACC, while the
black error bars represent the drive with the ACC system. Apart from a few extreme values of
speed deviations seen in participants P03, P05, P11, P15, and P16, the rest seem consistent during
both phases of the drive.
Figure 5-7: Combined average speeds and standard deviations
Another variable collected during this event was the lane position deviation. As drivers are
engaged in different tasks, their ability to maintain a constant offset from the centerline of their
lane varies. Large deviations indicate inconsistent driving with poor lane keeping abilities while
small deviations indicate consistent driving with good lane keeping abilities. Figure 5-8 shows
lane deviations of each participant during the car following event. Based on the paired t-test carried
50
60
70
80
90
P0
1
P0
2
P0
3
P0
4
P0
5
P0
6
P0
7
P0
8
P0
9
P1
0
P1
1
P1
2
P1
3
P1
4
P1
5
P1
6
P1
7
P1
8
P1
9
P2
0
P2
1
P2
2
P2
3
P2
4
P2
5
P2
6
P2
7
P2
8
P2
9
P3
0
Avera
ge S
peed
(m
ph
)
Average Speeds and Deviations (mph)
No ACC ACC
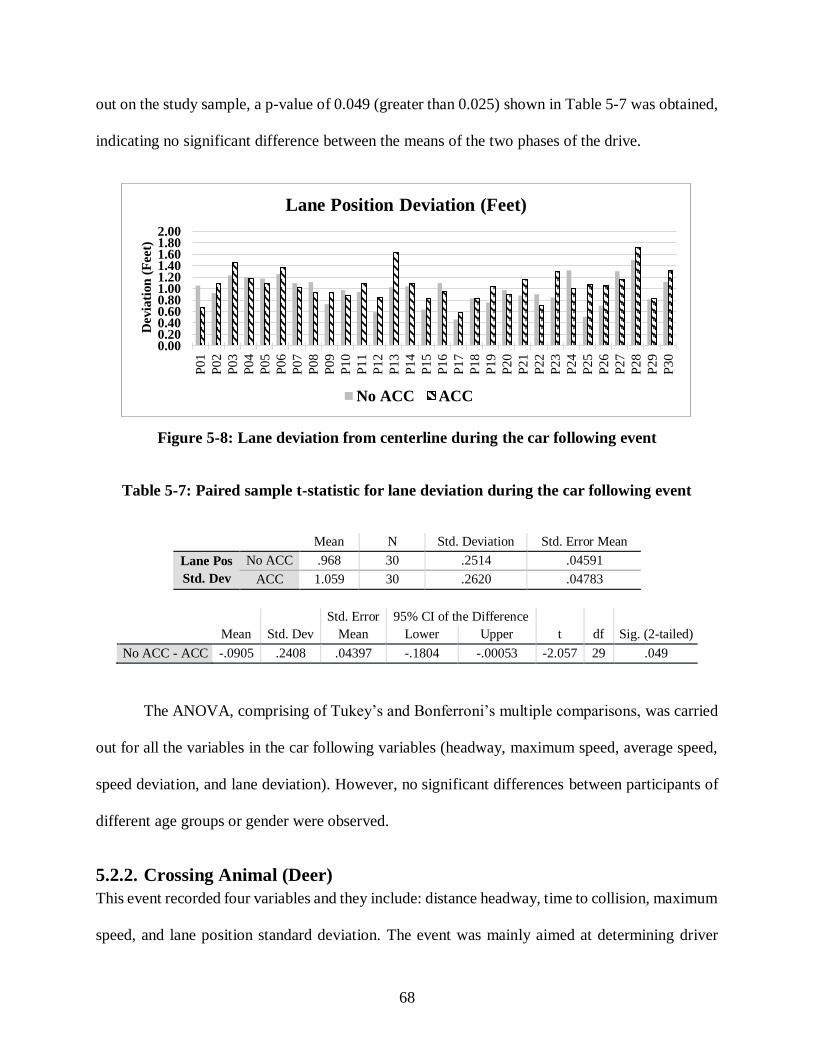
68
out on the study sample, a p-value of 0.049 (greater than 0.025) shown in Table 5-7 was obtained,
indicating no significant difference between the means of the two phases of the drive.
Figure 5-8: Lane deviation from centerline during the car following event
Table 5-7: Paired sample t-statistic for lane deviation during the car following event
Mean N Std. Deviation Std. Error Mean
Lane Pos
Std. Dev
No ACC .968 30 .2514 .04591
ACC 1.059 30 .2620 .04783
Mean Std. Dev
Std. Error
Mean
95% CI of the Difference
Lower Upper t df Sig. (2-tailed)
No ACC - ACC -.0905 .2408 .04397 -.1804 -.00053 -2.057 29 .049
The ANOVA, comprising of Tukey’s and Bonferroni’s multiple comparisons, was carried
out for all the variables in the car following variables (headway, maximum speed, average speed,
speed deviation, and lane deviation). However, no significant differences between participants of
different age groups or gender were observed.
5.2.2. Crossing Animal (Deer)
This event recorded four variables and they include: distance headway, time to collision, maximum
speed, and lane position standard deviation. The event was mainly aimed at determining driver
0.000.200.400.600.801.001.201.401.601.802.00
P01
P02
P03
P04
P05
P06
P07
P08
P09
P1
0
P11
P1
2
P13
P14
P15
P16
P17
P18
P19
P20
P21
P22
P23
P24
P25
P26
P2
7
P28
P29
P30
Devia
tion
(F
eet)
Lane Position Deviation (Feet)
No ACC ACC

69
reaction time to the crossing deer. Time to collision was selected as a suitable variable to describe
reaction time, as it considers both the speed of the driver and the distance to the deer. The time to
collision variable recorded the instance at which an evasive maneuver was performed by the
participant to avoid crashing into the deer in seconds. A large time to collision indicated that the
participant perceived and reacted to the deer faster. However, a small time to collision indicated a
slower perception and reaction to the event.
As described in section 4.3.2, the event design consists of two lead vehicles in both the left
and right lanes of the roadway. It is designed to let participants maintain a safe headway to either
lead vehicles, without anticipating a crossing deer. Figure 5-9 shows the recorded headways in feet
of the 27 participants. Headway data for three participants were not included as the results for this
variable were unavailable due to errors resulting from not maintaining the posted highway speed
limit. The SPSS analysis on the headway data resulted in a p-value of 0.217, indicating no
significant difference in between the means of the drive without the ACC and with the ACC.
Participants tended to maintain 11% larger headways while using the ACC system than without
the ACC.
Figure 5-9: Average headway during the crossing animal event
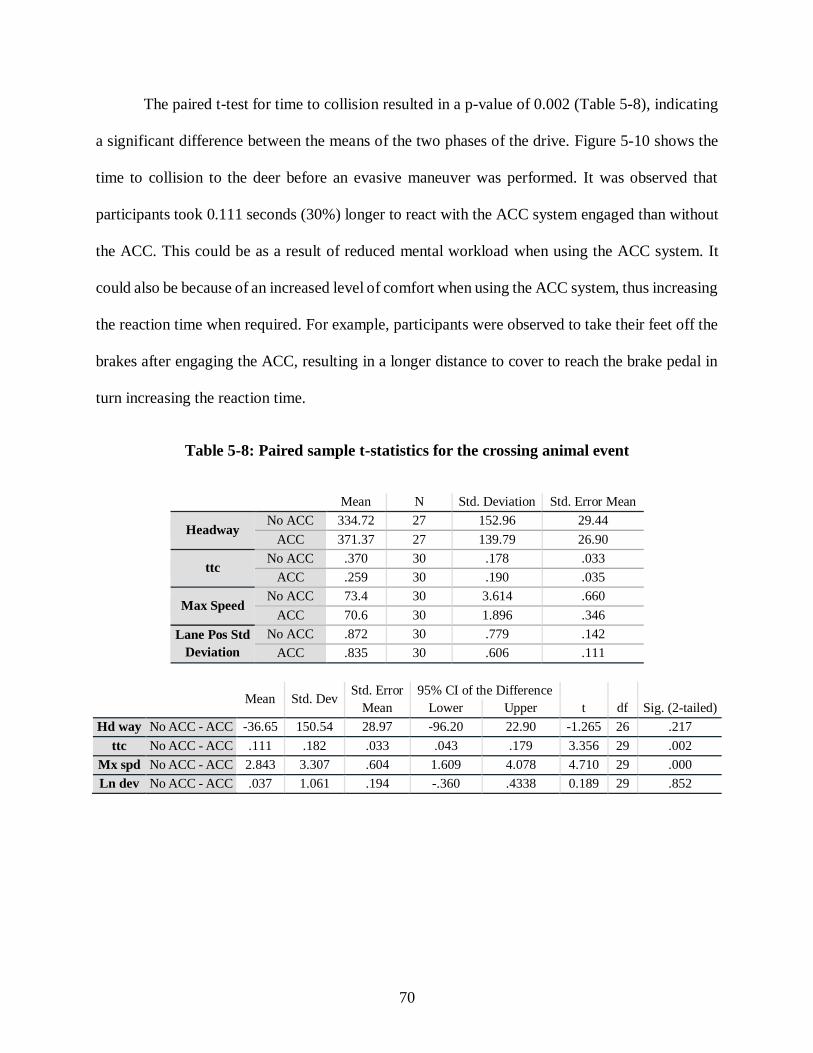
70
The paired t-test for time to collision resulted in a p-value of 0.002 (Table 5-8), indicating
a significant difference between the means of the two phases of the drive. Figure 5-10 shows the
time to collision to the deer before an evasive maneuver was performed. It was observed that
participants took 0.111 seconds (30%) longer to react with the ACC system engaged than without
the ACC. This could be as a result of reduced mental workload when using the ACC system. It
could also be because of an increased level of comfort when using the ACC system, thus increasing
the reaction time when required. For example, participants were observed to take their feet off the
brakes after engaging the ACC, resulting in a longer distance to cover to reach the brake pedal in
turn increasing the reaction time.
Table 5-8: Paired sample t-statistics for the crossing animal event
Mean N Std. Deviation Std. Error Mean
Headway No ACC 334.72 27 152.96 29.44
ACC 371.37 27 139.79 26.90
ttc No ACC .370 30 .178 .033
ACC .259 30 .190 .035
Max Speed No ACC 73.4 30 3.614 .660
ACC 70.6 30 1.896 .346
Lane Pos Std
Deviation
No ACC .872 30 .779 .142
ACC .835 30 .606 .111
Mean Std. Dev Std. Error
Mean
95% CI of the Difference
Lower Upper t df Sig. (2-tailed)
Hd way No ACC - ACC -36.65 150.54 28.97 -96.20 22.90 -1.265 26 .217
ttc No ACC - ACC .111 .182 .033 .043 .179 3.356 29 .002
Mx spd No ACC - ACC 2.843 3.307 .604 1.609 4.078 4.710 29 .000
Ln dev No ACC - ACC .037 1.061 .194 -.360 .4338 0.189 29 .852

71
Figure 5-10: Time to collision to the deer
The maximum speed is also recorded during the event. A p-value of less than 0.001 was
obtained from the SPSS analysis shown in Table 5-8. As seen from previous events, similar results
were recorded with participants achieving a higher overall speed without the ACC than with the
ACC. The obtained p-value indicated a significant difference between the means of the two phases
of the drive. Figure 5-11 shows the maximum speed recorded per test subject during the crossing
animal event.
Figure 5-11: Maximum speed recorded during the crossing animal event
The SPSS analysis of the lane position deviation resulted in a p-value of 0.852, showing
no significant difference between the means of the drive without the ACC and the drive with the
0.00
0.20
0.40
0.60
0.80
1.00
P01
P02
P0
3
P04
P05
P06
P07
P0
8
P09
P10
P11
P12
P1
3
P14
P15
P16
P17
P1
8
P19
P20
P21
P22
P2
3
P24
P25
P26
P27
P2
8
P29
P30
ttc (
Secon
ds)
Time to Collision (Seconds)
No ACC ACC
50
60
70
80
90
P01
P02
P03
P04
P05
P0
6
P07
P08
P09
P10
P11
P12
P13
P14
P15
P16
P17
P18
P19
P20
P21
P22
P23
P24
P25
P26
P27
P28
P29
P30
Maxim
um
Sp
eed
(m
ph
) Maximum Recorded Speed (mph)
No ACC ACC
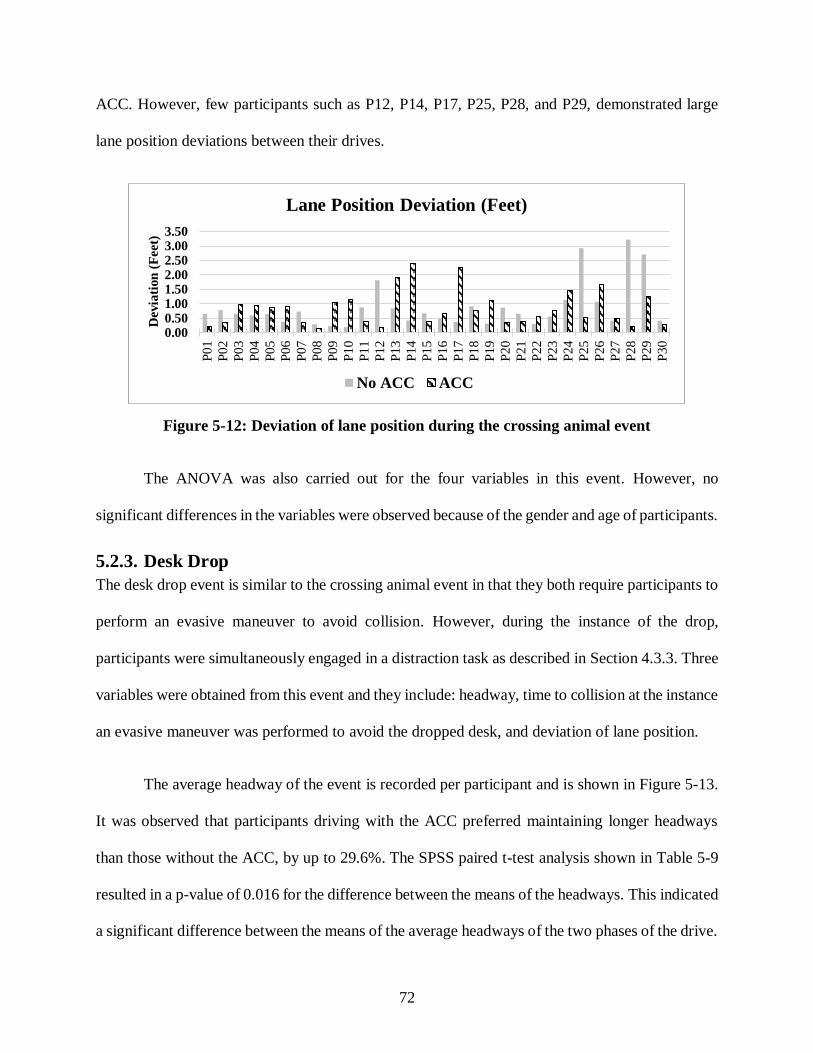
72
ACC. However, few participants such as P12, P14, P17, P25, P28, and P29, demonstrated large
lane position deviations between their drives.
Figure 5-12: Deviation of lane position during the crossing animal event
The ANOVA was also carried out for the four variables in this event. However, no
significant differences in the variables were observed because of the gender and age of participants.
5.2.3. Desk Drop
The desk drop event is similar to the crossing animal event in that they both require participants to
perform an evasive maneuver to avoid collision. However, during the instance of the drop,
participants were simultaneously engaged in a distraction task as described in Section 4.3.3. Three
variables were obtained from this event and they include: headway, time to collision at the instance
an evasive maneuver was performed to avoid the dropped desk, and deviation of lane position.
The average headway of the event is recorded per participant and is shown in Figure 5-13.
It was observed that participants driving with the ACC preferred maintaining longer headways
than those without the ACC, by up to 29.6%. The SPSS paired t-test analysis shown in Table 5-9
resulted in a p-value of 0.016 for the difference between the means of the headways. This indicated
a significant difference between the means of the average headways of the two phases of the drive.
0.000.501.001.502.002.503.003.50
P0
1
P02
P03
P04
P05
P06
P07
P0
8
P09
P10
P11
P12
P13
P14
P1
5
P16
P17
P18
P19
P20
P21
P2
2
P23
P24
P25
P26
P27
P28
P29
P30
Devia
tion
(F
eet)
Lane Position Deviation (Feet)
No ACC ACC

73
Figure 5-13: Average headway during the desk drop event
Time to collision is recorded in a similar manner to that of the crossing animal event. Only
data collected from 24 drivers were used for the SPSS analysis of this variable, as some participants
failed to react to the desk due to the distraction task. A p-value of 0.404 resulted from the SPSS
paired t-test analysis as shown in Table 5-9. This indicated no significance difference between the
means of the drives without the ACC and with the ACC. The obtained data failed to reject the null
hypothesis for this variable.
Table 5-9: Paired sample t-statistics for the desk drop event
Mean N Std. Deviation Std. Error Mean
Headway No ACC 310.47 26 223.536 43.840
ACC 402.25 26 165.582 32.473
ttc No ACC 2.089 24 1.401 .286
ACC 2.371 24 1.243 .254
Lane Pos Std.
Dev
No ACC 1.228 29 .665 .123
ACC 1.342 29 .731 .136
Mean Std. Dev
Std. Error
Mean
95% CI of the Difference
Lower Upper t df Sig. (2-tailed)
Hd way No ACC - ACC -91.78 181.55 35.611 -165.11 -18.449 -2.578 25 .016
ttc No ACC - ACC -.281 1.620 .331 -.966 .403 -.851 23 .404
Ln dev No ACC - ACC -.113 .609 .113 -.345 .118 -1.003 28 .324

74
Figure 5-14: Time to collision to the desk
Figure 5-15 shows the recorded deviation of lane position during this event. Two
participants, P07 and P25, experienced large deviations of lane position between the two phases
of their drive. However, a paired t-test resulted in a p-value of 0.324, indicating no significant
difference between the means of the two phases (without the ACC and with the ACC).
Figure 5-15: Deviation of lane position during the desk drop event
The ANOVA was carried out for the three variables (headway, ttc, and lane deviation). The
results showed no significant difference in the variables resulting from age and gender.

75
5.2.4. Work Zone
The work zone event was designed to determine situational awareness of participants. The event
consisted of two lead vehicles, travelling at 70 mph, while violating the posted work zone speed
limit of 55 mph. Driver’s ability to pay attention to the traffic signs and adjust the speed
accordingly, without instinctively following the lead vehicles especially while using the ACC was
monitored.
The average speed during the event is analyzed to determine any posted speed limit
violations. A violation is recorded if the average speed of the participant is greater than 10 mph of
the posted speed limit of 55 mph. A total of seven violations were observed during the drive
without the ACC and seven violations were also observed during the drive with the ACC. Figure
5-16 shows the average speeds recording during both phases of the drive.
Figure 5-16: Average speed with standard deviations during the work zone event
A SPSS analysis was not carried out for this variable as the total number of violations in
both phases of the drive among the participants were the same. There was no difference between
the means of the two drives. The ANOVA also resulted in no significant difference in the average
speeds of participants with respect to age or gender.
40
50
60
70
80
P0
1
P0
2
P0
3
P0
4
P0
5
P0
6
P0
7
P0
8
P0
9
P1
0
P1
1
P1
2
P1
3
P1
4
P1
5
P1
6
P1
7
P1
8
P1
9
P2
0
P2
1
P2
2
P2
3
P2
4
P2
5
P2
6
P2
7
P2
8
P2
9
P3
0
Avera
ge S
peed
(m
ph
)
Average Speed (mph)
No ACC ACC
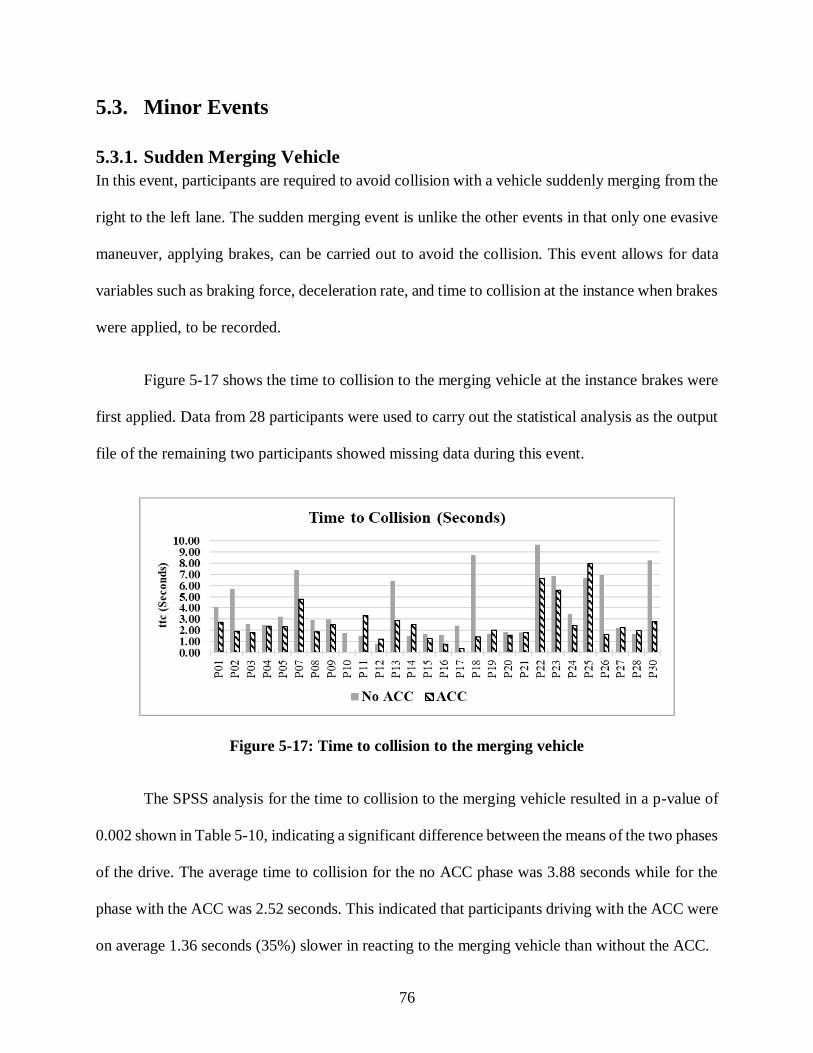
76
5.3. Minor Events
5.3.1. Sudden Merging Vehicle
In this event, participants are required to avoid collision with a vehicle suddenly merging from the
right to the left lane. The sudden merging event is unlike the other events in that only one evasive
maneuver, applying brakes, can be carried out to avoid the collision. This event allows for data
variables such as braking force, deceleration rate, and time to collision at the instance when brakes
were applied, to be recorded.
Figure 5-17 shows the time to collision to the merging vehicle at the instance brakes were
first applied. Data from 28 participants were used to carry out the statistical analysis as the output
file of the remaining two participants showed missing data during this event.
Figure 5-17: Time to collision to the merging vehicle
The SPSS analysis for the time to collision to the merging vehicle resulted in a p-value of
0.002 shown in Table 5-10, indicating a significant difference between the means of the two phases
of the drive. The average time to collision for the no ACC phase was 3.88 seconds while for the
phase with the ACC was 2.52 seconds. This indicated that participants driving with the ACC were
on average 1.36 seconds (35%) slower in reacting to the merging vehicle than without the ACC.

77
Table 5-10: Paired sample t-statistics for the sudden merging event
Mean N Std. Deviation Std. Error Mean
ttc No ACC 3.882 28 2.645 .499
ACC 2.515 28 1.772 .335
Braking Force No ACC 28.702 25 15.758 3.152
ACC 36.860 25 20.698 4.140
Deceleration No ACC -12.982 25 5.644 1.129
ACC -16.032 25 6.974 1.395
Mean Std. Dev
Std. Error
Mean
95% CI of the Difference
Lower Upper t df Sig. (2-tailed)
ttc No ACC - ACC 1.367 2.145 .405 .536 2.199 3.373 27 .002
Brk F No ACC - ACC -8.157 13.864 2.773 -13.880 -2.435 -2.942 24 .007
Decel No ACC - ACC 3.050 5.036 1.007 .972 5.129 3.029 24 .006
The maximum force applied on the brake pedal during the event was recorded. The braking
force variable assists in deducing the level of urgency experienced by the driver. For example, in
Figure 5-18, participant P10 exerted a large amount of braking force during the event. The time to
collision value for this participant was very low during the no ACC drive and included a collision
during the drive with the ACC system. The variable is used to determine whether participants
brake more aggressively or suddenly during any of the two phases of the drive.
Figure 5-18: Amount of brake force applied to avoid collision
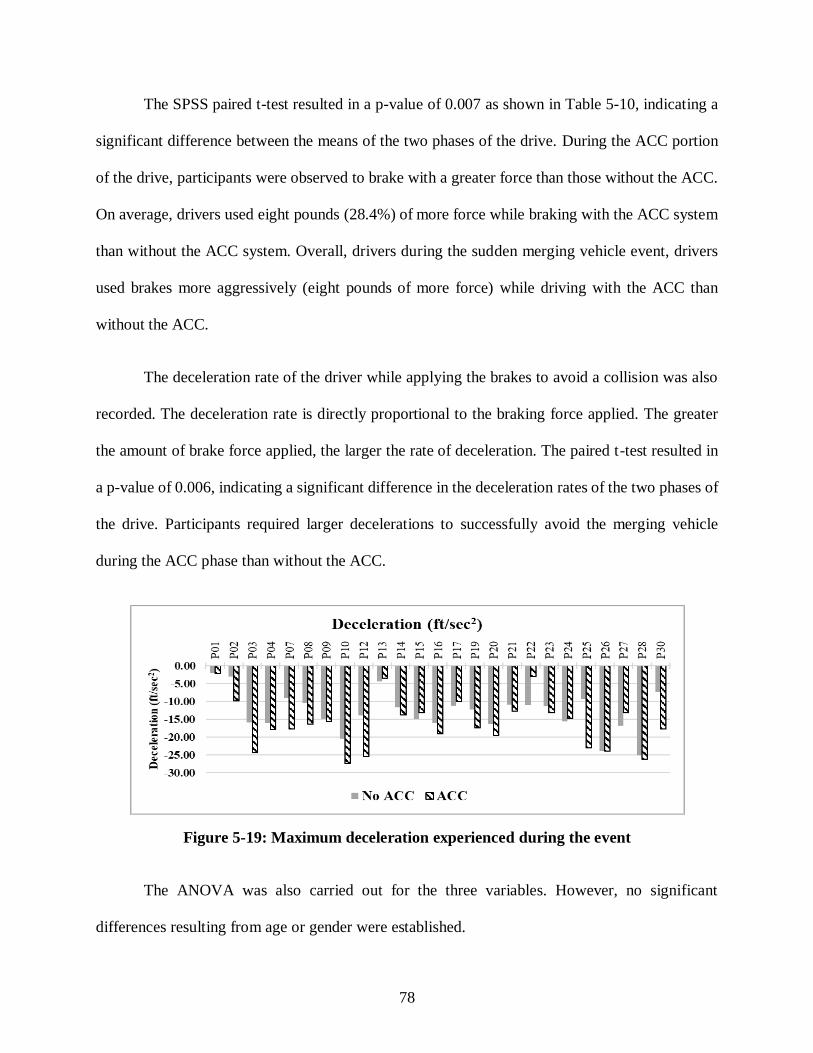
78
The SPSS paired t-test resulted in a p-value of 0.007 as shown in Table 5-10, indicating a
significant difference between the means of the two phases of the drive. During the ACC portion
of the drive, participants were observed to brake with a greater force than those without the ACC.
On average, drivers used eight pounds (28.4%) of more force while braking with the ACC system
than without the ACC system. Overall, drivers during the sudden merging vehicle event, drivers
used brakes more aggressively (eight pounds of more force) while driving with the ACC than
without the ACC.
The deceleration rate of the driver while applying the brakes to avoid a collision was also
recorded. The deceleration rate is directly proportional to the braking force applied. The greater
the amount of brake force applied, the larger the rate of deceleration. The paired t-test resulted in
a p-value of 0.006, indicating a significant difference in the deceleration rates of the two phases of
the drive. Participants required larger decelerations to successfully avoid the merging vehicle
during the ACC phase than without the ACC.
Figure 5-19: Maximum deceleration experienced during the event
The ANOVA was also carried out for the three variables. However, no significant
differences resulting from age or gender were established.

79
5.3.2. Move Over or Slow Down Law
Each designed scenario contained three locations where the move over law could be observed. A
value of one was assigned to every location where the law was observed during the drive. Each
participant could achieve a maximum number of three observed locations per scenario. If the law
was not observed at any location, a value of zero is be recorded.
Figure 5-20: Total number of move over events observed
Table 5-11: Paired sample t-statistic for the move over law
Mean N Std. Deviation Std. Error Mean
Move Law No ACC 1.67 30 .758 .138
ACC 1.57 30 .817 .149
Mean Std. Dev
Std. Error
Mean
95% CI of the Difference
Lower Upper t df Sig. (2-tailed)
No ACC - ACC .100 .548 .100 -.105 .305 1.000 29 .326
The paired t-test resulted in a p-value of 0.326, which is much greater than 0.05. This
indicated that the data obtained from the sample population failed to reject the null hypothesis,
thus showing no significant difference in driving behavior when obeying the move over law. The
ANOVA resulted in no significant differences in the move over law resulting from age or gender.
0
1
2
3
P0
1
P0
2
P0
3
P0
4
P0
5
P0
6
P0
7
P0
8
P0
9
P1
0
P1
1
P1
2
P1
3
P1
4
P1
5
P1
6
P1
7
P1
8
P1
9
P2
0
P2
1
P2
2
P2
3
P2
4
P2
5
P2
6
P2
7
P2
8
P2
9
P3
0
Tota
l O
bse
rved
Move Over Law
No ACC ACC

80
5.3.3. Distraction in Vehicle
The distraction in the vehicle was induced through an application and complementary voice
commands as described in section 4.3.7. Figure 5-21 shows the total number of hits attempted by
the participants during the two phases of their drive.
Figure 5-21: Total number of hit attempts during the distraction event
Participants driving with the ACC recorded much higher average hit attempts (15.6 hits)
than those driving without the ACC (12.8 hits). The SPSS paired t-test resulted in a p-value of less
than 0.001, indicating a significant difference between the means of the hit attempts of the two
phases of the drive. Table 5-12 shows the obtained paired t-test results and multiple dependency
comparisons.
Older participants were observed to have lower hit attempts than the other age groups in
the study. The ANOVA, comprising of Tukey’s and Bonferroni’s multiple comparison tests,
resulted in a significant difference in the hit attempts between age groups 1 and 2 and age group
3. This could be attributed to the exposure to touchscreen devices
0
5
10
15
20
25
30
P0
1
P0
2
P0
3
P0
4
P0
5
P0
6
P0
7
P0
8
P0
9
P1
0
P1
1
P1
2
P1
3
P1
4
P1
5
P1
6
P1
7
P1
8
P1
9
P2
0
P2
1
P2
2
P2
3
P2
4
P2
5
P2
6
P2
7
P2
8
P2
9
P3
0
Nu
mb
er o
f A
ttem
pts
App Hit Attempts
No ACC ACC
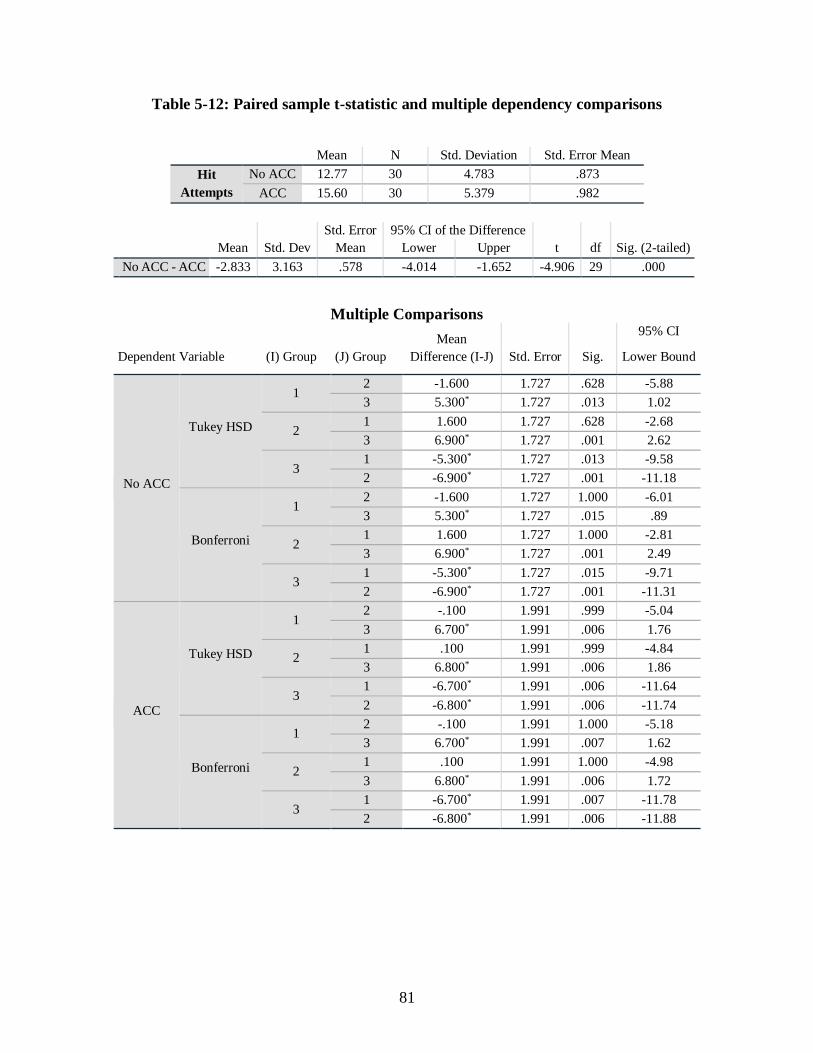
81
Table 5-12: Paired sample t-statistic and multiple dependency comparisons
Mean N Std. Deviation Std. Error Mean
Hit
Attempts
No ACC 12.77 30 4.783 .873
ACC 15.60 30 5.379 .982
Mean Std. Dev
Std. Error
Mean
95% CI of the Difference
Lower Upper t df Sig. (2-tailed)
No ACC - ACC -2.833 3.163 .578 -4.014 -1.652 -4.906 29 .000
Multiple Comparisons
Dependent Variable (I) Group (J) Group
Mean
Difference (I-J) Std. Error Sig.
95% CI
Lower Bound
No ACC
Tukey HSD
1 2 -1.600 1.727 .628 -5.88
3 5.300* 1.727 .013 1.02
2 1 1.600 1.727 .628 -2.68
3 6.900* 1.727 .001 2.62
3 1 -5.300* 1.727 .013 -9.58
2 -6.900* 1.727 .001 -11.18
Bonferroni
1 2 -1.600 1.727 1.000 -6.01
3 5.300* 1.727 .015 .89
2 1 1.600 1.727 1.000 -2.81
3 6.900* 1.727 .001 2.49
3 1 -5.300* 1.727 .015 -9.71
2 -6.900* 1.727 .001 -11.31
ACC
Tukey HSD
1 2 -.100 1.991 .999 -5.04
3 6.700* 1.991 .006 1.76
2 1 .100 1.991 .999 -4.84
3 6.800* 1.991 .006 1.86
3 1 -6.700* 1.991 .006 -11.64
2 -6.800* 1.991 .006 -11.74
Bonferroni
1 2 -.100 1.991 1.000 -5.18
3 6.700* 1.991 .007 1.62
2 1 .100 1.991 1.000 -4.98
3 6.800* 1.991 .006 1.72
3 1 -6.700* 1.991 .007 -11.78
2 -6.800* 1.991 .006 -11.88

82
5.4. Cognitive Workload
5.4.1. Quality of DRT data
In order to check the quality of data obtained from the DRT device, a frequency plot of the response
time for the test population is recommended in ISO 17488: 2016. Figure 5-22 shows frequency
plots of the response times of all participants in the study during the two scenarios.
(a) (b)
Figure 5-22: DRT data quality – No ACC (a) and ACC (b)
The frequency plots of the RT are seen to be positively skewed as specified in the ISO
17488: 2016. This indicates that the study yielded data of sufficient quality for analysis.
Participants were also monitored for cheating/guessing strategies through video data. No
participant during this study was excluded due to significantly higher responses than the presented
number of stimuli.
5.4.2. Without Events
The RT and HR for both phases of the drive without any incidents were recorded for each
participant. Data from two participants, P03 and P06, were excluded from the study due to
corrupted output files. The drive with the ACC recorded a 1.5% greater HR than that without the
0
20
40
60
80
100
120
140
0.00 0.50 1.00 1.50 2.00 2.50
Freq
uen
cy
Response Time (S)
No ACC
0
20
40
60
80
100
120
140
0.00 0.50 1.00 1.50 2.00 2.50
Freq
uen
cy
Response Time (S)
ACC

83
ACC. However, this did not present a significant difference to reject the null hypothesis. Table 5-
13 shows the obtained means and p-values from the SPSS analysis. The RT and HR data also
showed no significant difference between the two phases of the drive. The average value for RT
during the no ACC phase was 0.611 seconds and during the ACC phase was 0.608 seconds. The
ANOVA was also carried out to determine any significant differences in the RTs and HRs resulting
from age and gender of participants. However, no significant results were observed.
This can be interpreted as a compensation mechanism exhibited by the participants due to
their lack of experience and trust in the capabilities of the ACC system, therefore using the same
cognitive resources as the drive without ACC. Figure 5-23 and Figure 5-24 show the observed RTs
and HRs during both phases of the drive, for 28 participants.
Table 5-13: Paired sample t-statistic for RT and HR during the drive without incidents
Mean N Std. Deviation Std. Error Mean
Response
Time
No ACC .611 28 .142 .027
ACC .608 28 .125 .024
Hit Rate No ACC 84.6 28 12.22 2.309
ACC 86.1 28 13.16 2.488
Mean Std. Dev
Std. Error
Mean
95% CI of the Difference
Lower Upper t df Sig. (2-tailed)
RT No ACC - ACC .003 .101 .0191 -.037 .042 .137 27 .892
HR No ACC - ACC -1.517 8.587 1.623 -4.847 1.813 -.935 27 .358

84
Figure 5-23: Response time when no incidents occurred
Figure 5-24: Hit rate when no incidents occurred
5.4.3. Car Following Event
Figure 5-25 and Figure 5-26 show the RTs and HRs for the participants during the car following
event. The mean RTs for the participants were 0.528 and 0.560 for the phase without the ACC and
with the ACC, respectively. The HRs during the car following event were 93.3% (without the
ACC) and 88.5% (with the ACC).
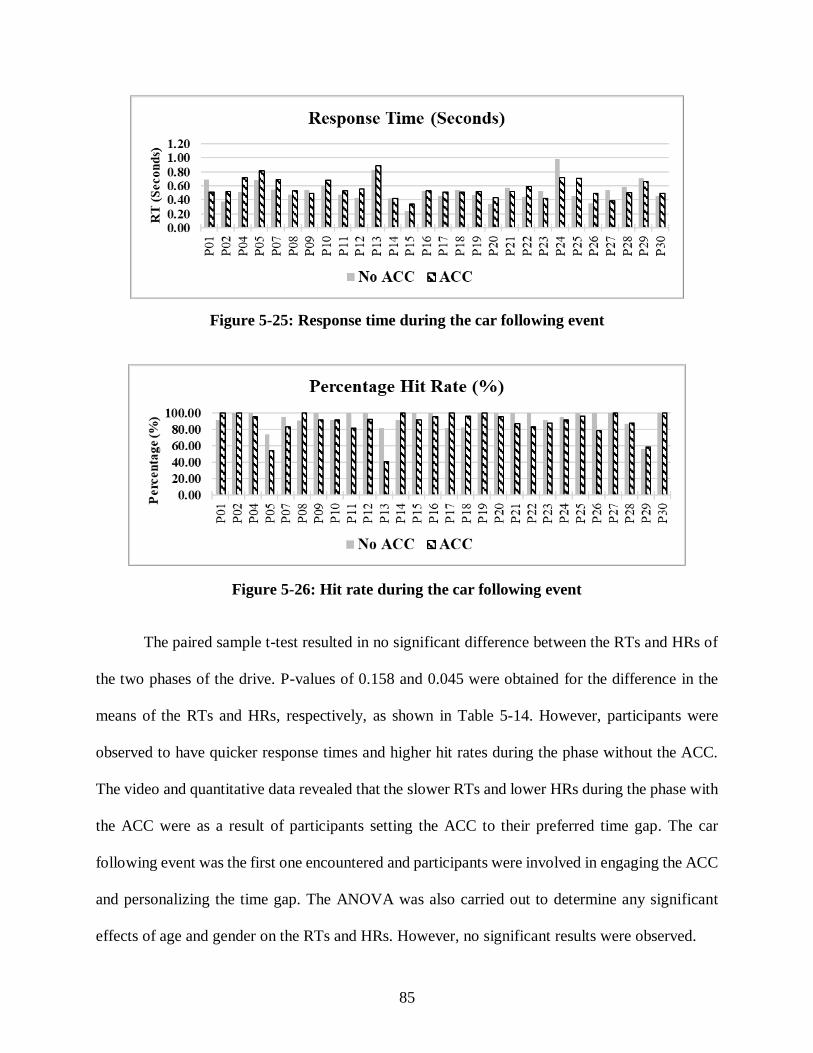
85
Figure 5-25: Response time during the car following event
Figure 5-26: Hit rate during the car following event
The paired sample t-test resulted in no significant difference between the RTs and HRs of
the two phases of the drive. P-values of 0.158 and 0.045 were obtained for the difference in the
means of the RTs and HRs, respectively, as shown in Table 5-14. However, participants were
observed to have quicker response times and higher hit rates during the phase without the ACC.
The video and quantitative data revealed that the slower RTs and lower HRs during the phase with
the ACC were as a result of participants setting the ACC to their preferred time gap. The car
following event was the first one encountered and participants were involved in engaging the ACC
and personalizing the time gap. The ANOVA was also carried out to determine any significant
effects of age and gender on the RTs and HRs. However, no significant results were observed.
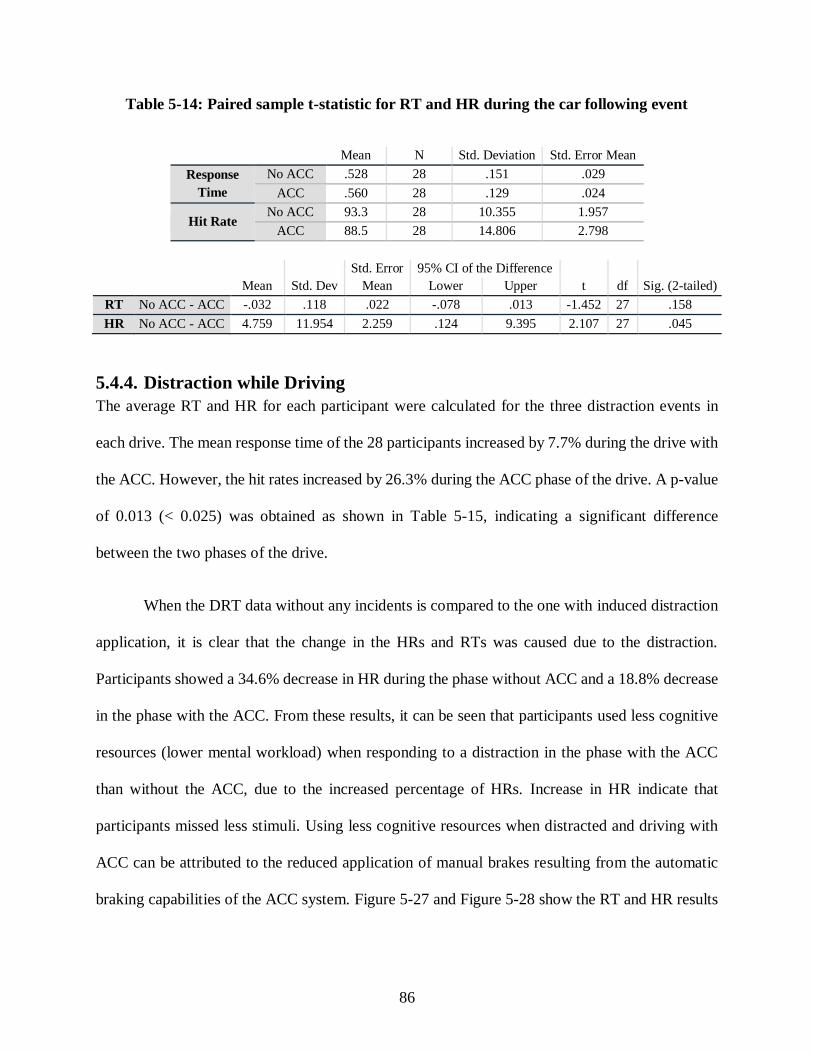
86
Table 5-14: Paired sample t-statistic for RT and HR during the car following event
Mean N Std. Deviation Std. Error Mean
Response
Time
No ACC .528 28 .151 .029
ACC .560 28 .129 .024
Hit Rate No ACC 93.3 28 10.355 1.957
ACC 88.5 28 14.806 2.798
Mean Std. Dev
Std. Error
Mean
95% CI of the Difference
Lower Upper t df Sig. (2-tailed)
RT No ACC - ACC -.032 .118 .022 -.078 .013 -1.452 27 .158
HR No ACC - ACC 4.759 11.954 2.259 .124 9.395 2.107 27 .045
5.4.4. Distraction while Driving
The average RT and HR for each participant were calculated for the three distraction events in
each drive. The mean response time of the 28 participants increased by 7.7% during the drive with
the ACC. However, the hit rates increased by 26.3% during the ACC phase of the drive. A p-value
of 0.013 (< 0.025) was obtained as shown in Table 5-15, indicating a significant difference
between the two phases of the drive.
When the DRT data without any incidents is compared to the one with induced distraction
application, it is clear that the change in the HRs and RTs was caused due to the distraction.
Participants showed a 34.6% decrease in HR during the phase without ACC and a 18.8% decrease
in the phase with the ACC. From these results, it can be seen that participants used less cognitive
resources (lower mental workload) when responding to a distraction in the phase with the ACC
than without the ACC, due to the increased percentage of HRs. Increase in HR indicate that
participants missed less stimuli. Using less cognitive resources when distracted and driving with
ACC can be attributed to the reduced application of manual brakes resulting from the automatic
braking capabilities of the ACC system. Figure 5-27 and Figure 5-28 show the RT and HR results

87
recorded for each participant. The ANOVA did not result in any significant differences resulting
from age and gender of participants.
Table 5-15: Paired sample t-statistic for RT and HR during the distraction events
Mean N Std. Deviation Std. Error Mean
Response
Time
No ACC .775 28 .306 .058
ACC .835 28 .270 .051
Hit Rate No ACC 55.3 28 27.779 5.250
ACC 69.9 28 25.079 4.739
Mean Std. Dev
Std. Error
Mean
95% CI of the Difference
Lower Upper t df Sig. (2-tailed)
RT No ACC - ACC -.060 .373 .071 -.204 .085 -.845 27 .406
HR No ACC - ACC -14.579 28.997 5.480 -25.823 -3.335 -2.660 27 .013
Figure 5-27: Average response time during the distraction events
Figure 5-28: Average hit rate during the distraction events

88
5.4.5. Work Zone
The work zone event was considered as a busy visual environment due to the presence of traffic
channelizers, safety signs, and construction vehicles. Intuitively, drivers approach work zones with
more caution due to increased traffic fines and unpredictability of the surroundings. For the 28
participants, the work zone event with the ACC showed no significant difference in RTs and HRs
than the work zone event without the ACC. When compared to the drive without any incidents,
the work zone event observed 5% higher mean RTs in both phases, with and without the ACC.
Figure 5-29 and Figure 5-30 show the RT and HR per participant during the two phases.
No significant difference between the means of the RTs or HRs was observed (Table 5-16).
Figure 5-29: Response time during the work zone event
Figure 5-30: Average hit rate during the work zone event

89
Table 5-16: Paired sample t-statistic for RT and HR during the work zone event
Mean N Std. Deviation Std. Error Mean
Response
Time
No ACC .641 28 .184 .0347
ACC .643 28 .213 .0403
Hit Rate No ACC 83.6 28 19.10 3.609
ACC 86.8 28 19.71 3.726
Mean Std. Dev
Std. Error
Mean
95% CI of the Difference
Lower Upper t df Sig. (2-tailed)
RT No ACC - ACC -.003 .161 .030 -.065 .060 -.092 27 .927
HR No ACC - ACC -3.217 12.235 2.312 -7.961 1.527 -1.391 27 .176
5.5. Summary of the Results
A summary of all the results obtained from the study are shown in Table 5-17 and Table 5-18. A
total of ten significant variables, grouped by events, were obtained from the statistical analysis.
All participants preferred the 3-second time gap setting to the other two settings during their entire
drive with the ACC. The Maximum speed was found to be significantly different, higher without
the ACC than with the ACC, in the three events that collected the variable. The distance headway
was found to be significant in two out of the three events that were designed to record it. The mean
headway values showed participants maintaining larger headways when driving with the ACC, by
up to 20.5% during the car following event and 29.6% during the desk drop event.
The statistical analysis resulted in two significant time to collision variables for the crossing
animal and sudden merging events. The results showed a decrease in time to collision when driving
with the ACC. A reduction in time to collision indicates an increase in reaction time as the
participants reacted when the object/vehicle was closer. Participants showed a 30% average
reduction in time to collision in the crossing animal event and a 35% average reduction in the

90
sudden merging vehicle event. However, the desk drop event did not show a significant difference
in the time to collision values for the drive without the ACC and with the ACC.
Table 5-17: Summary of results collected in MiniSim
Data Variable Phase Mean Significance
(2-tailed)
Rejected null
hypothesis
Whole
Drive
Collision Count No ACC 1.27
0.264 ACC 1.17
Maximum Recorded
Speed (mph)
No ACC 80.9 0.000 ✓ACC 75.5
Car
Following
Distance Headway
(feet)
No ACC 357.3 0.022 ✓ACC 430.6
Maximum Recorded Speed (mph)
No ACC 77.3 0.000 ✓ACC 73.3
Average Speed (mph) No ACC 68.7
0.128 ACC 68.1
Speed Standard
Deviation (mph)
No ACC 5.39 0.462
ACC 5.88
Lane Position
Deviation (feet)
No ACC 0.97 0.049
ACC 1.06
Crossing
Animal
Distance Headway
(feet)
No ACC 334.7 0.217
ACC 371.4
Time to Collision (s) No ACC 0.37
0.002 ✓ACC 0.26
Maximum Recorded
Speed (mph)
No ACC 73.4 0.000 ✓ACC 70.6
Lane Position
Deviation (feet)
No ACC 0.87 0.852
ACC 0.84
Desk Drop
Distance Headway
(feet)
No ACC 310.5 0.016 ✓ACC 402.2
Time to Collision (s) No ACC 2.09
0.404 ACC 2.37
Lane Position
Deviation (feet)
No ACC 1.23 0.324
ACC 1.34
Sudden
Merging
Vehicle
Time to Collision (s) No ACC 3.88
0.002 ✓ACC 2.52
Braking Force (Lbs) No ACC 28.70
0.007 ✓ACC 36.86
Deceleration (ft/sec2) No ACC -12.98
0.006 ✓ACC -16.03
Move Over
Law Total Observed
No ACC 1.67 0.326
ACC 1.57
App Hit
Attempts Attempts
No ACC 12.77 0.000 ✓ACC 15.60

91
During the sudden merging event, two other variables apart from time to collision were
found to be significant, the braking force and deceleration rate. Participants were observed to brake
using greater force (28.4%) and decelerate much quicker when using the ACC than without the
ACC. This could be because drivers tend to keep their feet further away from the pedals when
engaged in CC or ACC, increasing the distance to the brake pedal thus decreasing the time to
collision and increasing the amount of brake force applied.
Participants were also observed to have a greater number of hit attempts when driving with
the ACC, during the distraction event. This event also revealed that participants from the older age
category (group 3) showed significantly lower application hit attempts than those from the other
two age groups (groups 1 and 2).
Table 5-18: Summary of results collected using the DRT device
Data Variable Phase Mean Significance
(2-tailed)
Rejected null
hypothesis
Without
Events
RT (s) No ACC 0.611
0.892 ACC 0.608
HR (%) No ACC 84.6
0.358 ACC 86.1
Car
Following
RT (s) No ACC 0.528
0.158 ACC 0.560
HR (%) No ACC 93.3
0.045 ACC 88.5
Distraction
While
Driving
RT (s) No ACC 0.775
0.406 ACC 0.835
HR (%) No ACC 55.3
0.013 ✓ACC 69.9
Work Zone
RT (s) No ACC 0.641
0.927 ACC 0.643
HR (%) No ACC 83.6
0.176 ACC 86.8

92
The data from the DRT device only resulted in one significant variable from the three
categories shown in Table 5-18. The average HR while driving distracted showed a significant
increase when driving with the ACC, by up to 26.3%. This meant that participants were less likely
to miss a stimulus when driving distracted with the ACC than without the ACC. The findings based
on the obtained results are stated in the next section.
93
6. SUMMARY AND CONCLUSIONS
This section presents the summary, conclusions, and recommendations. The summary will consist
of an overview of the literature, methodology, and results. The findings will provide a comparison
of the findings from the literature review with the results obtained from the analysis. Then, possible
improvements and future research potential will be briefly discussed.
6.1. Summary
The thesis was aimed at determining the effects of adaptive cruise control on driver behavior and
awareness using a FB driving simulator. The first step was to define the qualitative and quantitative
measures of driver behavior and awareness. Driver behavior and awareness includes, but is not
limited to, aspects such as driver reaction times in case of sudden lane changes or crossing animals,
distractions caused by cell phones or other electronic devices, adhering to speed limits, perceiving
vehicles violating traffic regulations, mental workload during various aspects of driving, and
overall situational awareness.
A review of existing literature was carried out to determine similar studies. The literature
revealed information on modeling the ACC in driving simulators and the effects of the ACC on
driver behavior. Based on this, a methodology was developed consisting of six main tasks. First,
participants were recruited and screened using a questionnaire. The questionnaire provided a quick
way to select participants from a particular demographic and screen for any medical conditions.
The simulator was then prepared for the study by configuring the ACC, setting up the DRT device,
configuring the distraction application, and designing events targeted to capture changes in driver
behavior and awareness with and without the ACC. Pilot testing was carried out to determine bugs

94
in the scenario missed during the design. After configuring events, data were collected during the
drive of the participants.
The next step was to reduce and analyze the data. Two tailed paired t-test and ANOVA
were carried out to determine significant between the variables collected during the drive without
the ACC and with the ACC.
6.2. Conclusions
The following conclusions were obtained from the analysis:
• The study found significant differences between some of the variables collected.
Participants were observed to reach lower maximum speeds when driving with the ACC,
in all the three events configured to capture this variable. The average from the three
scenarios resulted in a 5.2% decrease in the highest speed achieved during the drive. This
was consistent with the findings of Ma and Kaber in 2005, who determined a decrease in
following speed when using the ACC.
• The distance headway was found to be significantly different in two out of the three
scenarios. The drive with the ACC showed that participants maintained longer headways.
The average of the two significant scenarios resulted in a 25% increase in the following
distance (headway). This finding was consistent with the study carried out by Ohno in
2001, where participants were observed maintain longer headways when using the ACC.
• The study found that the preferred ACC time gap setting used by the participants was 3
seconds. This was not consistent with the results from the study carried out by Cho, Nam,
and Lee, in 2006. They found that participants preferred a 1.5 second time-gap. This could

95
be because the lead vehicle in the Cho, Nam, and Lee, study was configured to travel at 90
km/h (56 mph). However, as many highways in the United States have a speed limit of
113km/h (70 mph), a longer headway might be preferred by the participants due to the
higher travelling speeds.
• Time to collision (ttc) at the instance of an evasive maneuver was determined during the
study. The statistical analysis found the variable to be significant in two out of the three
events. The average of the two significant events resulted in a 32.5% decrease in ttc during
the ACC phase. This can also be interpreted as a 32.5% increase in reaction time to an
event as participants performed an evasive maneuver later than the no ACC phase. The
increase in reaction time was consistent with the study carried out in 2004 by Rudin-Brown
and Parker. However, it is not clear whether the delay in reaction time is because of using
the ACC or as a result of an increase in distance/time to reach the brake pedal from a
relaxed foot position.
• There was no significant difference observed in the lane position deviations of the
participants between the two phases of the drive. This was inconsistent with the findings
from Cho, Nam, and Lee, 2006 and Rudin-Brown and Parker, 2004. In these studies
participants driving with the ACC were observed to have reduced lane keeping abilities.
However, the decrease in lane keeping could be attributed to the complexity of engaging
the ACC and not fully familiarizing the participants with the process of engaging the ACC.
• The results also showed a significant difference in the brake force and deceleration rates of
participants when reacting to a sudden merging vehicle. During the ACC phase,
participants were observed to brake with a greater force and have more rapid decelerations.

96
• Participants did not demonstrate a lack of situational awareness with respect to the work
zone event. No participant was observed to blindly follow the lead vehicle, configured to
violate the speed limit of the work zone.
• The hit attempts recorded by the application that was used to simulate distraction showed
a significant difference between the two phases of the drive. Participants were observed to
have a better attempt score when using the ACC, implying that the secondary task was
performed better when engaged in ACC. This could be as a result of a decrease in cognitive
resources required to drive the vehicle.
• The results from the DRT device did not show significant differences in mental workload
when driving without the ACC and with the ACC. The response times in both phases
without any incidents were consistent, not showing any changes in workload between the
two drives.
• In the instance of the distraction, RTs increased during the ACC phase. However, as
described by Xiong in 2013, this could be a result of the compensation effect experienced
by participants to account for not being fully comfortable with the capabilities of the ACC
system.
• The HRs during the distraction events were significantly higher during the ACC phase,
suggesting that participants were able to perform a secondary task better with the ACC.
• From the results, it can be established that vehicles equipped with the ACC, additionally
require an active collision avoidance system in order to compensate for the delayed reaction
times, especially in unforeseen situations.

97
6.3. Recommendations and Future Research
This section provides recommendations and scope for future research. They include:
• Recruiting participants with experience using the ACC systems. This will provide a better
understanding of the trust between the drivers and the ACC system, thus reducing the
compensation effects raised from unfamiliarity with the system. However, since the
technology is relatively new, it will be difficult to find willing participants for the study.
• Assessing the effects of the ACC on tired/fatigued participants can provide key insights
into the role played by the ACC in reducing physical and mental effort on the driver.
• Comparing the drives with conventional cruise control and adaptive cruise control can
provide more insights on the difference in reaction times as both systems allow drivers to
relax their foot positions from the brake/accelerator pedal, thus increasing the distance/time
when responding to a critical event.
• Using eye-tracking devices to accurately measure perception-reaction time of participants
when subject to critical situations that require evasive action.
• Also, introducing more complex visual environments such as fog and rain during the study
can provide information on the role played by the ACC in guiding/assisting driver to safely
navigate to their destination. The cognitive workload can also be assessed to monitor any
changes.
98
7. REFERENCES
1) Chester, K. Gizmos & Gadgets: Adaptive Cruise Control. EveryCarListed.com. LLC,
December 2014. http://www.everycarlisted.com/drivingzone/on-the-road/gizmos-gadgets
-adaptive-cruise-control. Accessed Dec. 20, 2016.
2) Vollrath, M., S. Schleicher, and C. Gelau. The Influence of Cruise Control and Adaptive
Cruise Control on Driving Behavior-A Driving Simulator Study. Accident Analysis and
Prevention, Vol. 43, No. 3, 2011, pp. 1134-1139.
3) Adaptive Cruise Control System Overview. Fifth Meeting of the U.S. Software System
Safety Working Group, April 12-14, 2005, Anaheim, CA.
4) Pauwelussen, J., and P. J. Feenstra. Driver Behavior Analysis during ACC Activation and
Deactivation in a Real Traffic Environment. IEEE Transactions on Intelligent
Transportation Systems, Vol. 11, No. 2, 2010, pp. 329-338.
5) Capustiac, N.A., and C. Napoca. Development and Application of Smart Actuation
Methods for Vehicle Simulators. University of Duisburg-Essen, Duisburg, Germany, 2011.
6) Lewis, C., and M. Griffin. Human Factors Consideration in Clinical Applications of Virtual
Reality. Virtual Reality in Neuro-Psycho-Physiology, 1997.
7) Slob, J. J. State-of-the-Art Driving Simulators, a Literature Survey. DCT report,
Eindhoven, 2008.

99
8) Lee, W.S., D.H. Sung, J. Y. Lee, Y. S. Kim, and J. H. Cho. Driving Simulation for
Evaluation of Driver Assistance Systems and Driving Management Systems. DSC North
America, 2007.
9) Larsen, C. D. Comparison of Three Degree of Freedom and Six Degree of Freedom Motion
Bases Utilizing Classical Washout Algorithms. Iowa State University, 2011.
10) Kemeny, A., and F. Panerai. Evaluating Perception in Driving Simulation Experiments.
TRENDS in Cognitive Sciences, Vol. 7, No. 1, 2003, pp. 31-37.
11) Picot, E. Motion Sickness: “Boarding Ring” Glasses a Visible Inner Ear for the Eyes.
SciTech Connect, May 2016. http://scitechconnect.elsevier.com/motion-sickness-boarding
-ring-glasses/. Accessed Dec. 31, 2016.
12) Jamson, H. Driving Simulation Validity: Issues of Field of View and Resolution.
Proceedings of Driving Simulators Conference, Paris, France, 2000, pp. 57-64.
13) Guvenc, B. A., and E. Kural. Adaptive Cruise Control Simulator: A Low-Cost, Multiple-
Driver-In-The-Loop Simulator. IEEE Control Systems Magazine, 2006, pp. 42-55.
14) Tautkus, A. Longitudinal and Lateral Dynamics, Kaunas University of Technology,
Erasmus LLP Intensive Program, 2011.
15) Moeckli, F., T. Brown, B. Dow, L. N. Boyle, C. Schwarz, and H. Xiong. Evaluation of
Adaptive Cruise Control Interface Requirements on the National Advanced Driving
Simulator. National Highway Traffic Safety Administration, Washington, DC, 2015.

100
16) Ohno, H. Analysis and Modeling of Human Driving Behaviors using Adaptive Cruise
Control. Applied Soft Computing, Vol. 1, Toyota Central R&D., Inc., Nagakute Aichi,
Japan, 2001, pp. 237-243.
17) Cho, J. H., H. K. Nam, and W. S. Lee. Driver Behavior with Adaptive Cruise Control.
International Journal of Automotive Technology, Vol. 7, No. 5, 2006, pp. 603-608
18) Bifulco, G. N., L. Pariota, M. Brackstone, and M. McDonald. Driving Behavior Models
Enabling the Simulation of Advanced Driving Assistance Systems: Revisiting the Action
Point Paradigm. Transportation Research Part C, Vol. 36, 2013, pp. 352-366.
19) Piccinini, G. F., C. M. Rodrigues, M. Leitao, and A. Simoes. Driver’s Behavioral
Adaptation to Adaptive Cruise Control (ACC): The Case of Speed and Time Headway.
Journal of Safety Research, Vol. 49, 2014, pp. 77-84.
20) Rudin-Brown, C. M., and H. A. Parker. Behavioral Adaptation to Adaptive Cruise Control
(ACC): Implications for Preventive Strategies. Transportation Research Part F, Vol. 7,
No. 2, 2004, pp. 59-76.
21) Hoedemaeker, M., and K. A. Brookhuis. Behavioral Adaptation to Driving with an
Adaptive Cruise Control (ACC). Transportation Research Part F, Vol. 1, 1998, pp.
95-106.
22) Ma, R., and D. B. Kaber. Situation Awareness and Workload in Driving While Using
Adaptive Cruise Control and a Cell Phone. International Journal of Industrial Ergonomics,
2005, pp. 939-953.
101
23) Marsden, G., M. McDonald, and M. Brackstone. Towards an Understanding of Adaptive
Cruise Control. Transportation Research Part C, Vol. 9, 2001, pp. 33-51.
24) Xiong, H., and L. N. Boyle. Drivers’ Selected Settings for Adaptive Cruise Control (ACC):
Implications for Long-Term Use. Human Factors and Ergonomics Society, Inc., 57th
Annual Meeting, 2013, pp. 1928-1932.
25) Hwang, S., W. Lin, and P. A. Green. Effects of Time-Gap Settings of Adaptive Cruise
Control (ACC) on Driving Performance and Subjective Acceptance in a Bus Driving
Simulator. Safety Science, Vol. 47, 2008, pp. 620-625.
26) Zhai, Y., L. Li, G. R. Widmann, and Y. Chen. Design of Switching Strategy for Adaptive
Cruise Control under String Stability Constraints. American Control Conference, O’Farrell
Street, San Francisco, CA, 2011, pp. 3344-3349.
27) Bifulco, G. N., L. Pariota, F. Simonelli, and R. D. Pace. Development and testing of a fully
Adaptive Cruise Control System. Transportation Research Part C, Vol. 29, 2013,
pp. 156-170.
28) Guvenc, L. Preventive and Active Safety Applications. Automotive Controls Research
Group, Istanbul Technical University, Istanbul, Turkey, 2004.
29) Jianqiang, W., L. Shengbo, H. Xiaoyu, and L. Keqiang. Driving Simulation Platform
Applied to Develop Driving Assistance Systems. IET Intelligent Transport Systems, Vol.
4, No. 2, 2010, pp. 121-127.

102
30) ISO 17488: Road Vehicles – Transport Information and Control Systems – Detection
Response Task (DRT) for Assessing Attentional Effects of Cognitive Load in Driving.
International Organization for Standardization, Switzerland, 2016.
31) Lee, J. D., D. V. McGehee, T. L. Brown, and D. C. Marshall. Rear-End Crash Avoidance
System (RECAS) Algorithms and Alerting Strategies: Effects of Adaptive Cruise Control
and Alert Modality on Driver Performance. National Highway Traffic Safety
Administration, Washington, DC, 2008.
32) Harbluk, J. L., P. C. Burns, S. Hernandez, J. Tam, and V. Glazduri. Detection Response
Task: Using Remote, Headmounted and Tactile Signals to Assess Cognitive Demand while
Driving. Seventh International Driving Symposium on Human Factors in Driver
Assessment, Training, and Vehicle Design. Transport Canada, Canada, 2013.
33) Strayer, D. L., J. M. Cooper, J. Turrill, J. Coleman, N. Medeiros-Ward, and F. Biondi.
Measuring Cognitive Distraction in the Automobile. AAA Foundation for Traffic Safety,
Washington, DC, 2013.
34) Strayer, D. L., J. M. Cooper, J. Turrill, J. Coleman, and E. V. Ortiz. Measuring Cognitive
Distraction in the Automobile II: Assessing In-Vehicle Voice-Based Interactive
Technologies. AAA Foundation for Traffic Safety, Washington, DC, 2014.
35) Chang, C. Assessing Cognitive Workload of In-Vehicle Voice Control Systems. University
of Washington, 2016.
36) IBM SPSS Statistics 20 Core System User’s Guide. IBM Corporation 1989, 2011.

103
37) MATLAB Language Reference Manual-Version 5. The MathWorks, Inc., MA, 1996.
38) MiniSim User’s Guide. The National Advanced Driving Simulator, Document version 19,
The University of Iowa, Iowa City, IA, 2015.
39) TMT User’s Guide. The National Advanced Driving Simulator, The University of Iowa,
Iowa City, IA, 2016.
40) ISAT User’s Guide. The National Advanced Driving Simulator, Document version 61, The
University of Iowa, Iowa City, IA, 2015.
41) Xiong, H. Quantifying Drivers’ Use of In-Vehicle Systems: Implications for Long-term
Behavior. University of Washington, 2013.
42) Winter, J. C., R. Happee, M. H. Martens, and N. A. Stanton. Effects of Adaptive Cruise
Control and Highly Automated Driving on Workload and Situation Awareness: A Review
of Empirical Evidence. Transportation Research Part F, Vol. 27, 2014, pp. 196-217.
43) Strayer, D. L., J. M. Cooper, J. Turrill, J. R. Coleman, and R. J. Hopman. The Smartphone
and the Driver’s Cognitive Workload: A Comparison of Apple, Google, and Microsoft’s
Intelligent Personal Assistants. AAA Foundation for Traffic Safety, Washington, DC, 2015.
44) Nordtomme, M. E., G. D. Jenssen., L. Lervag, O. Hjelkrem, and A. Kummeneje. Adaptive
Cruise Control in Norway. SINTEF Technology and Society, 2014.
45) Lee, S. H., and D. R. Ahn. Design and Verification of Driver Interfaces for Adaptive Cruise
Control Systems. Journal of Mechanical Science and Technology, 2015, pp. 2451-2460.
104
46) Rajamani, R., and C. Zhu. Semi-Autonomous Adaptive Cruise Control Systems. IEEE
Transactions on Vehicular Technology, Vol. 51, No. 5, 2002, pp. 1186-1192.
47) Zheng, P., and M. McDonald. Manual vs. Adaptive Cruise Control - Can Driver’s
Expectation be Matched? Transportation research Part C, Vol. 13, 2005, pp. 421-431.
48) Seppelt, B. D., and J. D. Lee. Making Adaptive Cruise Control (ACC) Limits Visible.
International Journal of Human-Computer Studies, Vol. 65, 2007, pp. 192-205.
49) Hajek, W., I. Gaponova, K. H. Fleischer, and J. Krems. Workload-Adaptive Cruise
Control - A New Generation of Advanced Driver Assistance Systems. Transportation
Research Part F, Vol. 20, 2013, pp. 108-120.
50) Siebert, F. W., M. Oehl, and H. Pfister. The Influence of Time Headway on Subjective
Driver States in Adaptive Cruise Control. Transportation Research Part F, Vol. 25, 2014,
pp. 65-73.
51) Larsson, A. F. L., K. Kircher, and J. A. Hultgren. Learning from Experience: Familiarity
with ACC and Responding to a Cut-In Situation in Automated Driving. Transportation
Research Part F, Vol. 27, 2014, pp. 229-237.
52) Merat, N., A. H. Jamson, F. C. H. Lai, M. Daly, and O. M. J. Carsten. Transition to Manual:
Driver Behavior when Resuming Control from a Highly Automated Vehicle.
Transportation Research Part F, Vol. 27, 2014, pp. 274-282.
53) Jones, S. Cooperative Adaptive Cruise Control: Human factors Analysis. Publication
FHWA-HRT-13-045. FHWA, U.S. Department of Transportation, 2013.

105
54) Bareket, Z., P. S. Fancher, H. Peng, K. Lee, and C. A. Assaf. Methodology for Assessing
Adaptive Cruise Control Behavior. IEEE Transactions on Intelligent Transportation
Systems, Vol. 4, No. 3, 2003, pp. 123-131.
55) Tricot, N., B. Rajaonah, J. C. Popieul, and P. Millot. Design and Evaluation of an Advanced
Driver Assistance System: The Case of Auto-Adaptive Cruise Control. Le Travail Humain,
Vol. 69, No. 2, 2006, pp. 129-152.
56) Nam, H. K., J. Y. Lee, J. S. Kim, and W. S. Lee. An Adaptive Cruise Control Study Using
a Driving Simulator. International Conference on Control, Automation and Systems,
October 16-19, 2002, Muju Resort, Jeonbuk, Korea, pp. 1539-1544.
57) Han, D. H., K. S. Yi, J. K. Lee, B. S. Kim, and S. Yi. Design and Evaluation of Intelligent
Vehicle Cruise Control Systems Using a Vehicle Simulator. International Journal of
Automotive Technology, Vol. 7, No. 3, 2006, pp. 377-383.
58) Kim, D., S. Moon, J. Park, H. J. Kim, and K. Yi. Design of an Adaptive Cruise Control/
Collision Avoidance with Lane Change Support for Vehicle Autonomous Driving. ICROS-
SICE International Joint Conference, August 18-21, 2009, Fukuoka International Congress
Center, Japan, pp. 2938-2943.

106
APPENDIX A – ACC Study Flyer

107
APPENDIX B – Screening Survey
Driving Simulator
What is Adaptive Cruise Control (ACC)?
ACC systems are similar to the conventional Cruise Control
systems in terms of engaging and disengaging. However,
unlike Cruise Control, ACC provides enhanced assistance by
automatically adjusting vehicle speed according to the
headway preference selected by the driver. This is done by
either accelerating or decelerating based on the in-lane traffic
flow detected by sensors, without constant input from the
driver.
A Transportation Engineering graduate student is studying the
“Effects of Adaptive Cruise Control (ACC) on Drivers”.
This survey’s objectives are:
• To determine users’ familiar with ACC systems; and
• To establish suitable candidates to participate in the
driving simulator study.
Characterization of You
1. Do you have a valid United States driver’s
license?
Yes
No
2. How willing are you to participate in a
driving simulator study?
Very willing
Willing
Less willing
Not willing
3. What is your gender? Male
Female
4. What is your age?
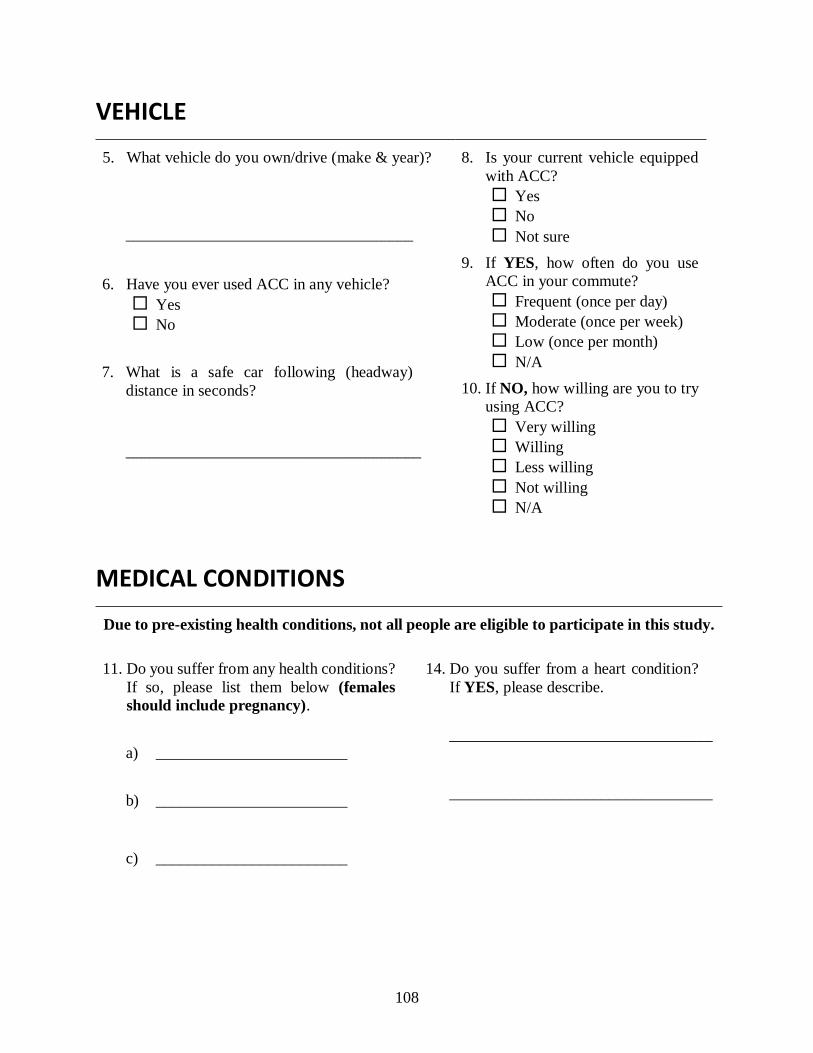
108
VEHICLE
5. What vehicle do you own/drive (make & year)?
____________________________________
6. Have you ever used ACC in any vehicle?
Yes
No
7. What is a safe car following (headway)
distance in seconds?
_____________________________________
8. Is your current vehicle equipped
with ACC?
Yes
No
Not sure
9. If YES, how often do you use
ACC in your commute?
Frequent (once per day)
Moderate (once per week)
Low (once per month)
N/A
10. If NO, how willing are you to try
using ACC?
Very willing
Willing
Less willing
Not willing
N/A
MEDICAL CONDITIONS
Due to pre-existing health conditions, not all people are eligible to participate in this study.
11. Do you suffer from any health conditions?
If so, please list them below (females
should include pregnancy).
a) ________________________
b) ________________________
c) ________________________
14. Do you suffer from a heart condition?
If YES, please describe.
_________________________________
_________________________________

109
12. Have you ever experienced seizures? If
YES, please state when it occurred
(MM/YY).
______________________________
13. Have you ever experienced problems with
hearing or inner ear? Please state if you
use any hearing aid devices.
______________________________
15. Do you experience motion sickness?
Please state the mode of transport
(train, bus, car, and plane) and the
frequency of your motion sickness.
Scale 0 to 5, where 0 = Never and 5 =
Always
_________________________________
16. Please state the intensity of your
motion sickness symptoms.
Scale 0 to 5, where 0 = Low and 5 =
Incapacitated
_________________________________
CONTACT INFORMATION
Please note that any personal information provided will not be distributed, but will solely
be used for purposes relating to this research.
a) Full Name
_____________________________________
b) Email
_____________________________________
c) Contact number
_______________________________

110
APPENDIX C – Wellness Questionnaire
WELLNESS QUESTIONNAIRE
PLEASE INDICATE IF YOU EXPERIENCED ANY OF THESE SYMPTOMS
1. Eye Strain?
Severe
Moderate
Slight
None
2. Headache?
Severe
Moderate
Slight
None
3. Nausea?
Severe
Moderate
Slight
None
4. Vomiting?
Severe
Moderate
Slight
None
5. Dizziness?
Severe
Moderate
Slight
None
6. Sweating?
Severe
Moderate
Slight
None
7. Fatigue?
Severe
Moderate
Slight
None
8. *Vertigo?
Severe
Moderate
Slight
None
9. **Stomach
awareness?
Severe
Moderate
Slight
None
10. General
discomfort?
Severe
Moderate
Slight
None
*Vertigo: is a feeling of disorientation
**Stomach awareness: uneasy feeling in the stomach
CONTACT INFORMATION
Please note that any personal information provided will not be distributed, but will solely
be used for purposes relating to this research.
11. Name
______________________________
12. Contact number
_____________________________

111
Table C-1: Participant wellness responses after the no ACC drive
ID Question Number
1 2 3 4 5 6 7 8 9 10
P01 Slight None None None None Severe None None None None
P02 None None None None None None None None None None
P03 None Slight None None Slight None None None None Slight
P04 Slight Slight Mod None None None Slight Mod None Slight
P05 None None Slight None Slight Slight Slight None Mod Slight
P06 None None None None None None None None None None
P07 None None None None None None None None None None
P08 None None None None None None None None None None
P09 None None None None Slight Slight Slight Slight Slight Slight
P10 None None Slight None Mod None Slight None Slight Slight
P11 None None None None None None None None None None
P12 Slight Mod Mod None Mod Mod None Slight Mod Mod
P13 Slight Slight None None None None Slight None None Slight
P14 None None None None None None Slight None None Slight
P15 None None None None None None None Slight None None
P16 Slight None Slight None Mod Slight Slight Slight None Mod
P17 Slight None None None Slight None None None None None
P18 None Mod Slight None None None None None Mod Mod
P19 Slight None None None Slight None None None None Slight
P20 None None None None None None None None None None
P21 None Slight Mod Mod Mod Mod Mod None None Slight
P22 Mod Mod Slight None Slight Slight None Slight Mod Slight
P23 None None Slight None None None None None None None
P24 Slight None None None None None None Slight None None
P25 Slight None None None Slight Slight Mod Slight None Slight
P26 None None None None Slight None None None None None
P27 Slight Slight None None Slight None None None None None
P28 Slight None None None None None Slight None Slight Slight
P29 Slight None Slight None None None Slight None Slight Slight
P30 None None None None None None None None None None
Legend-Questions
1 Eye Strain 6 Sweating
2 Headache 7 Fatigue
3 Nausea 8 Vertigo
4 Vomiting 9 Stomach awareness
5 Dizziness 10 General Discomfort

112
Table C-2: Participant wellness responses after the ACC drive
ID Question Number
1 2 3 4 5 6 7 8 9 10
P01 Slight None None None None Mod None None None None
P02 None None None None None None None None None None
P03 Slight Slight None None Slight None Slight None None None
P04 None None Slight None None None Slight Slight None None
P05 Slight None Slight None None None Slight None Slight Slight
P06 None None None None None None None None None None
P07 None None None None None None None None None None
P08 None None None None None None None None None None
P09 Slight None None None Slight None Slight Slight Slight Slight
P10 None Slight Slight None None None None None None Slight
P11 None None None None None None None Slight None None
P12 Slight Slight Slight None Slight Slight None Slight Slight Slight
P13 Slight Slight None None None None Slight None None Slight
P14 None None None None None None Slight None None None
P15 None None None None None None None None None None
P16 Slight None Slight None None None None Slight Slight Slight
P17 Slight None None None Slight None None None None None
P18 Slight Mod Mod None None None None None Slight Mod
P19 Slight Slight None None Slight None None None None Slight
P20 None None None None None None None None None None
P21 None None Slight None None None Slight None None Slight
P22 Mod Mod Slight None Slight Slight None Slight Mod Slight
P23 None None Slight None None None None None None None
P24 None None None None None None None Slight None None
P25 Slight None Slight None Slight Mod Slight Slight None Slight
P26 None None None None Slight None None None None None
P27 None Slight Slight None Slight None None None None None
P28 Slight Slight None None None None Slight None Slight None
P29 None None None None None None Slight None Slight None
P30 None None None None None None None None None None
Legend-Questions
1 Eye Strain 6 Sweating
2 Headache 7 Fatigue
3 Nausea 8 Vertigo
4 Vomiting 9 Stomach awareness
5 Dizziness 10 General Discomfort

113
APPENDIX D – Consent Form and Approval Letter
INFORMED CONSENT DOCUMENT
Analysis of the Effects of Adaptive Cruise Control (ACC) on Driver Behavior and Awareness Using a Driving Simulator
INTRODUCTION The Department of Civil, Environmental, and Architectural Engineering at the University of Kansas supports the practice of protection for human subjects participating in research. The following information is provided for you to decide whether you wish to participate in the present study. You may refuse to sign this form and not participate in this study. You should be aware that even if you agree to participate, you are free to withdraw at any time. If you do withdraw from this study, it will not affect your relationship with this unit, the services it may provide to you, or the University of Kansas. PURPOSE OF THE STUDY The research is part of a Master’s thesis and will analyze the effects of Adaptive Cruise Control (ACC) on Driver Behavior and Awareness using a Driving Simulator. The findings of this research will help us better understand Information on braking, lateral position, speed, time gap, acceleration, ACC engaging, and disengaging times of drivers under various situations. We are asking you to participate in a research study. PROCEDURES This study is part of a Master’s thesis. The study will recruit 30 drivers to participate in the experiments, from 18 to 65 years old. During the experiment, you will be asked to drive the driving simulator for approximately 30 minutes. The first 5 minutes will be for you to familiarize with the vehicle/simulator and also to see if you have any signs of motion sickness. After that, and provided you do not have motion sickness, we will start collecting data related to your driving along the simulated scenarios. We will be recording you during the entire duration of the experiment. You will be having intermediate breaks every 5-15 minutes. The principle investigator (PI) will be analyzing your drive and video recordings after the experiment is finished. Only people that are related to this research (Vishal Kummetha - PI, and Dr. Alexandra Kondyli) will have access to these recordings, which will be securely stored in hard drives and kept in the Driving Simulator Lab. The research team is committed to confidentiality. Your identity will not be revealed in the final report for this project, nor in any of the manuscripts produced. Instead, you will be assigned a participant ID number. RISKS The risks for this experiment are primarily related to motion sickness that you might experience as you are driving in the simulator. Motion sickness does not happen to everyone, but typical motion sickness symptoms include: general discomfort, fatigue, headache, eye strain, difficulty focusing, increased

114
salivation, sweating, nausea, difficulty concentrating, fullness of head, blurred vision, dizzy eyes, vertigo, stomach awareness, and burping. We will be monitoring you during the entire duration of the experiment for signs of motion sickness. During the frequent breaks, we will also ask you several questions on how you feel, so we determine whether you start to experience motion sickness or not. Additionally, you might experience mild stress during decision-making during the driving portion of the study, but this stressor is no more than most people experience on a daily basis. You might also experience mild anxiety about being video recorded while you are driving. BENEFITS There are no direct personal benefits from participating in this research. PAYMENT TO PARTICIPANTS You will be given $20 compensation (in the form of a gift card) for participating in this driving simulator data collection experiment. You will be receiving cash at the end of the experiment. Investigators may ask for your social security number in order to comply with federal and state tax and accounting regulations. PARTICIPANT CONFIDENTIALITY Your name will not be associated in any publication or presentation with the information collected about you or with the research findings from this study. Instead, the researchers will use a study number or a pseudonym rather than your name. Your identifiable information will not be shared unless (a) it is required by law or university policy, or (b) you give written permission. Permission granted on this date to use and disclose your information remains in effect indefinitely. By signing this form, you give permission for the use and disclosure of your information for purposes of this study at any time in the future. INSTITUTIONAL DISCLAIMER STATEMENT In the event of injury, the Kansas Tort Claims Act provides for compensation if it can be demonstrated that the injury was caused by the negligent or wrongful act or omission of a state employee acting within the scope of his/her employment. REFUSAL TO SIGN CONSENT AND AUTHORIZATION You are not required to sign this Consent and Authorization form and you may refuse to do so without affecting your right to any services you are receiving or may receive from the University of Kansas or to participate in any programs or events of the University of Kansas. However, if you refuse to sign, you cannot participate in this study. CANCELLING THIS CONSENT AND AUTHORIZATION

115
You may withdraw your consent to participate in this study at any time, without consequence, and receive part of the compensation of $10 in gift card. If participants do not show up at appointment time or withdraw before the start of the study, no compensation will be provided. QUESTIONS ABOUT PARTICIPATION If you have any questions or concerns about the research study, please contact Vishal Kummetha or Dr. Kondyli. They will be glad to answer any of your concerns (Contact information is provided below). PARTICIPANT CERTIFICATION I have read this Consent and Authorization form. I have had the opportunity to ask, and I have received answers to, any questions I had regarding the study. I understand that if I have any additional questions about my rights as a research participant, I may call (785) 864-7429 or (785) 864-7385, write the Human Subjects Committee Lawrence Campus (HSCL), University of Kansas, 2385 Irving Hill Road, Lawrence, Kansas 66045-7568, or email [email protected]. I agree to take part in this study as a research participant. By my signature I affirm that I am at least 18 years old and that I have received a copy of this Consent and Authorization form. _______________________________ _____________________ Type/Print Participant's Name Date _______________________________ Participant's Signature RESEARCHER CONTACT INFORMATION Vishal Kummetha, Graduate Research Assistant Principal Investigator Department of Civil, Environmental, and Architectural Engineering 1530 W. 15th Street 2160 Learned Hall University of Kansas Lawrence, KS 66045 (785) 312-0845 Dr. Alexandra Kondyli, PhD Faculty Supervisor Department of Civil, Environmental, and Architectural Engineering 1530 W. 15th Street 2159A Learned Hall University of Kansas Lawrence, KS 66045 (785) 864-6521

116
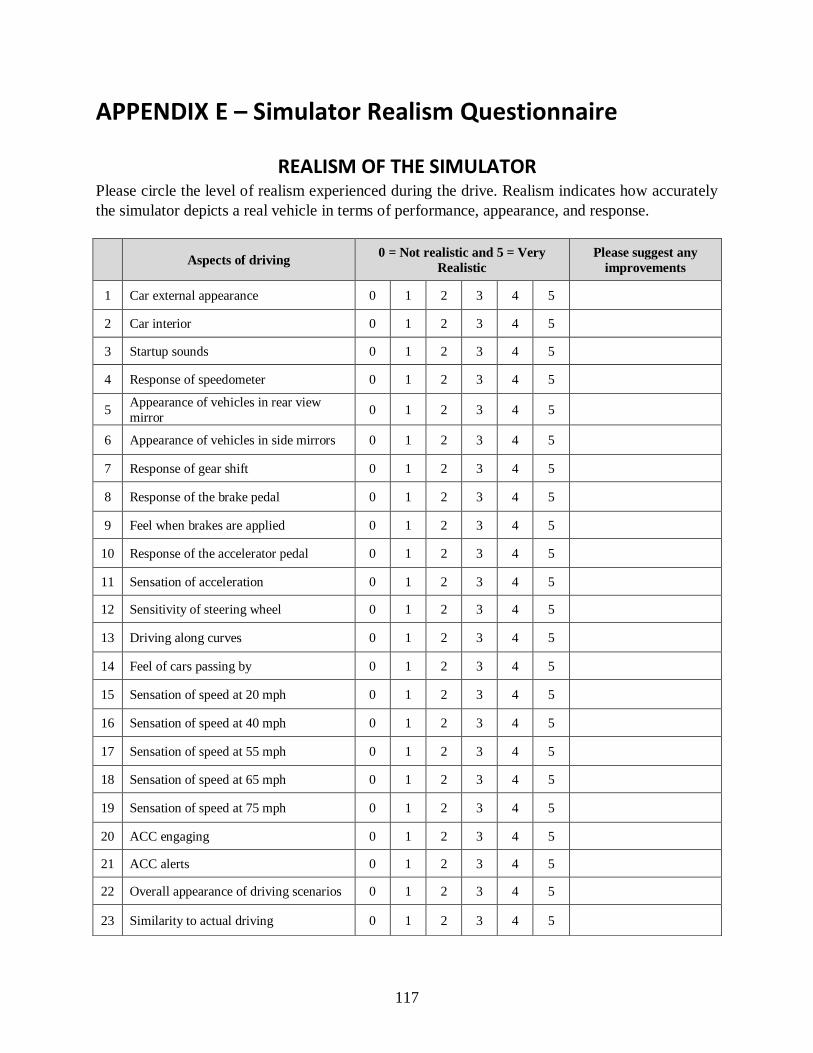
117
APPENDIX E – Simulator Realism Questionnaire
REALISM OF THE SIMULATOR Please circle the level of realism experienced during the drive. Realism indicates how accurately
the simulator depicts a real vehicle in terms of performance, appearance, and response.
Aspects of driving 0 = Not realistic and 5 = Very
Realistic
Please suggest any
improvements
1 Car external appearance 0 1 2 3 4 5
2 Car interior 0 1 2 3 4 5
3 Startup sounds 0 1 2 3 4 5
4 Response of speedometer 0 1 2 3 4 5
5 Appearance of vehicles in rear view
mirror 0 1 2 3 4 5
6 Appearance of vehicles in side mirrors 0 1 2 3 4 5
7 Response of gear shift 0 1 2 3 4 5
8 Response of the brake pedal 0 1 2 3 4 5
9 Feel when brakes are applied 0 1 2 3 4 5
10 Response of the accelerator pedal 0 1 2 3 4 5
11 Sensation of acceleration 0 1 2 3 4 5
12 Sensitivity of steering wheel 0 1 2 3 4 5
13 Driving along curves 0 1 2 3 4 5
14 Feel of cars passing by 0 1 2 3 4 5
15 Sensation of speed at 20 mph 0 1 2 3 4 5
16 Sensation of speed at 40 mph 0 1 2 3 4 5
17 Sensation of speed at 55 mph 0 1 2 3 4 5
18 Sensation of speed at 65 mph 0 1 2 3 4 5
19 Sensation of speed at 75 mph 0 1 2 3 4 5
20 ACC engaging 0 1 2 3 4 5
21 ACC alerts 0 1 2 3 4 5
22 Overall appearance of driving scenarios 0 1 2 3 4 5
23 Similarity to actual driving 0 1 2 3 4 5

118
Table E-1: Participant responses on the realism of the simulator
ID Question Number
1 2 3 4 5 6 7 8 9 10 11 12 13 14 15 16 17 18 19 20 21 22 23
P01 5 5 5 3 4 4 3 4 3 5 3 4 5 3 3 3 3 3 4 4 3 4 4
P02 3 5 4 4 5 5 5 3 3 4 4 5 3 5 5 5 4 4 4 3 5 4 4
P03 5 5 5 2 4 4 5 4 4 4 3 0 3 4 5 5 5 5 5 4 4 4 4
P04 5 5 4 4 4 5 5 5 4 4 4 5 4 3 4 4 4 3 3 5 5 5 4
P05 5 5 5 4 5 5 5 5 4 4 4 5 5 4 4 4 4 4 4 5 5 5 4
P06 5 5 5 5 5 5 5 4 5 5 4 4 3 3 5 5 5 5 5 5 5 4 4
P07 5 5 5 4 4 4 5 5 5 3 5 5 5 5 5 5 5 5 5 5 5 5 5
P08 5 5 4 4 3 3 5 3 3 3 4 3 3 4 4 4 4 4 4 5 - 4 4
P09 5 5 4 3 3 4 5 3 0 3 1 5 4 4 2 3 4 4 4 4 4 4 3
P10 4 5 4 3 3 3 3 3 3 2 2 4 4 3 2 2 2 2 2 3 3 3 3
P11 5 5 4 4 5 4 3 4 4 4 5 5 5 4 4 4 5 5 4 3 4 4 4
P12 4 5 4 4 4 3 4 3 5 5 4 4 4 4 4 5 5 5 4 4 4 4 4
P13 5 5 5 3 3 3 - 2 1 2 2 3 4 3 4 4 4 4 4 2 - 3 4
P14 5 4 5 5 5 4 5 5 3 3 3 5 3 5 5 5 5 5 5 5 - 5 3
P15 5 5 5 5 5 5 5 5 2 5 4 5 5 5 3 5 5 5 5 5 5 5 5
P16 3 5 5 3 5 5 5 2 3 3 2 5 4 4 4 3 4 4 3 3 - 4 3
P17 5 5 5 5 5 5 5 5 5 5 5 5 5 5 5 5 5 5 5 5 - 5 5
P18 5 5 4 3 3 2 4 3 2 5 5 4 5 4 4 5 5 5 4 4 5 3 4
P19 5 5 5 5 5 5 5 4 4 4 4 5 5 4 2 2 3 3 4 4 3 4 2
P20 5 5 4 5 5 5 5 3 3 4 4 5 5 5 3 3 3 4 5 5 5 5 5
P21 5 5 5 4 5 5 5 4 5 5 4 5 5 5 5 5 5 5 5 5 - 5 5
P22 5 5 5 3 5 5 5 3 3 3 4 1 5 5 - - - - - - - 5 4
P23 5 5 5 5 5 5 5 3 5 5 5 5 5 5 5 5 5 5 5 5 5 5 5
P24 5 5 4 4 4 4 4 3 3 3 3 2 4 4 4 4 4 4 4 3 4 4 4
P25 4 5 5 5 5 5 - - 4 5 5 3 4 - 5 5 5 5 5 4 4 4 5
P26 5 5 5 3 3 2 4 3 2 4 5 2 4 3 5 5 5 5 5 3 4 3 3
P27 5 5 5 3 5 5 5 4 4 3 4 5 5 5 5 5 5 5 5 5 - 4 5
P28 5 5 3 3 4 4 4 3 3 3 3 3 3 3 4 4 4 4 4 4 4 4 4
P29 5 5 4 3 4 4 5 5 4 4 3 2 2 4 3 4 5 5 5 4 4 4 3
P30 5 5 5 4 5 5 5 4 5 4 4 5 5 5 5 5 5 5 5 4 4 5 5
Qn 1 2 3 4 5 6 7 8 9 10 11 12
Avg 4.8 5.0 4.6 3.8 4.3 4.2 4.6 3.7 3.5 3.9 3.7 4.0
Qn 13 14 15 16 17 18 19 20 21 22 23
Avg 4.2 4.1 4.1 4.2 4.4 4.4 4.3 4.1 4.3 4.2 4.0
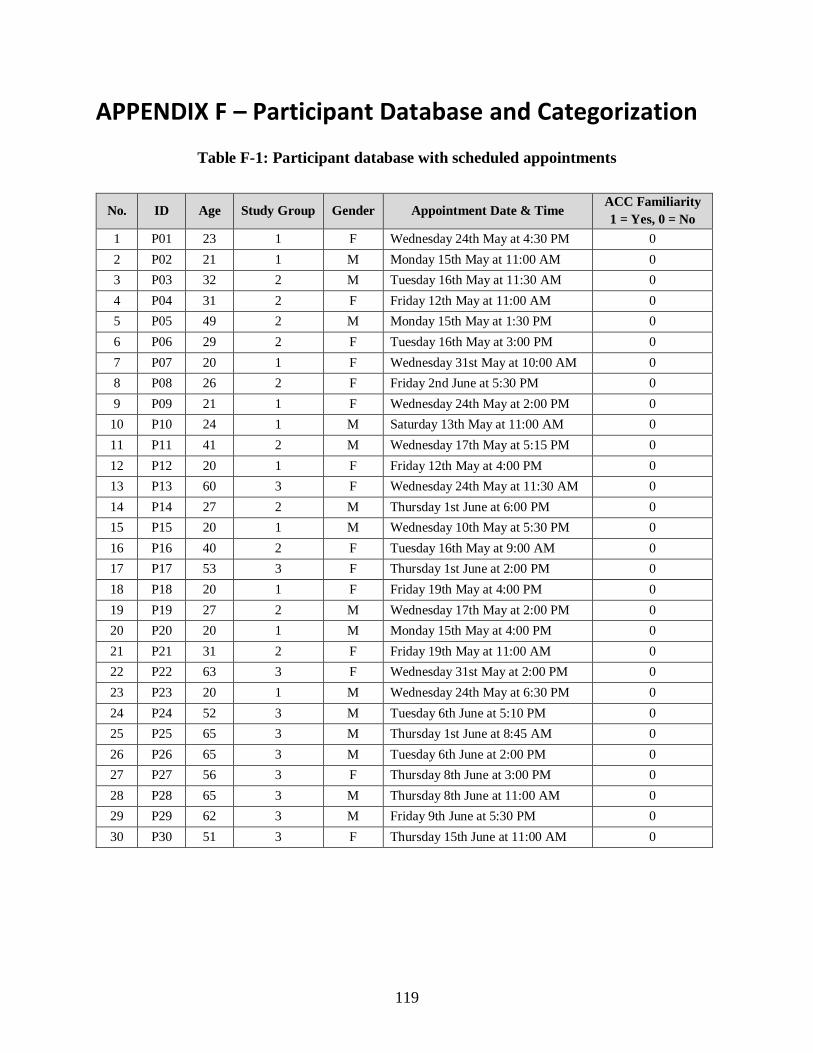
119
APPENDIX F – Participant Database and Categorization
Table F-1: Participant database with scheduled appointments
No. ID Age Study Group Gender Appointment Date & Time ACC Familiarity
1 = Yes, 0 = No
1 P01 23 1 F Wednesday 24th May at 4:30 PM 0
2 P02 21 1 M Monday 15th May at 11:00 AM 0
3 P03 32 2 M Tuesday 16th May at 11:30 AM 0
4 P04 31 2 F Friday 12th May at 11:00 AM 0
5 P05 49 2 M Monday 15th May at 1:30 PM 0
6 P06 29 2 F Tuesday 16th May at 3:00 PM 0
7 P07 20 1 F Wednesday 31st May at 10:00 AM 0
8 P08 26 2 F Friday 2nd June at 5:30 PM 0
9 P09 21 1 F Wednesday 24th May at 2:00 PM 0
10 P10 24 1 M Saturday 13th May at 11:00 AM 0
11 P11 41 2 M Wednesday 17th May at 5:15 PM 0
12 P12 20 1 F Friday 12th May at 4:00 PM 0
13 P13 60 3 F Wednesday 24th May at 11:30 AM 0
14 P14 27 2 M Thursday 1st June at 6:00 PM 0
15 P15 20 1 M Wednesday 10th May at 5:30 PM 0
16 P16 40 2 F Tuesday 16th May at 9:00 AM 0
17 P17 53 3 F Thursday 1st June at 2:00 PM 0
18 P18 20 1 F Friday 19th May at 4:00 PM 0
19 P19 27 2 M Wednesday 17th May at 2:00 PM 0
20 P20 20 1 M Monday 15th May at 4:00 PM 0
21 P21 31 2 F Friday 19th May at 11:00 AM 0
22 P22 63 3 F Wednesday 31st May at 2:00 PM 0
23 P23 20 1 M Wednesday 24th May at 6:30 PM 0
24 P24 52 3 M Tuesday 6th June at 5:10 PM 0
25 P25 65 3 M Thursday 1st June at 8:45 AM 0
26 P26 65 3 M Tuesday 6th June at 2:00 PM 0
27 P27 56 3 F Thursday 8th June at 3:00 PM 0
28 P28 65 3 M Thursday 8th June at 11:00 AM 0
29 P29 62 3 M Friday 9th June at 5:30 PM 0
30 P30 51 3 F Thursday 15th June at 11:00 AM 0
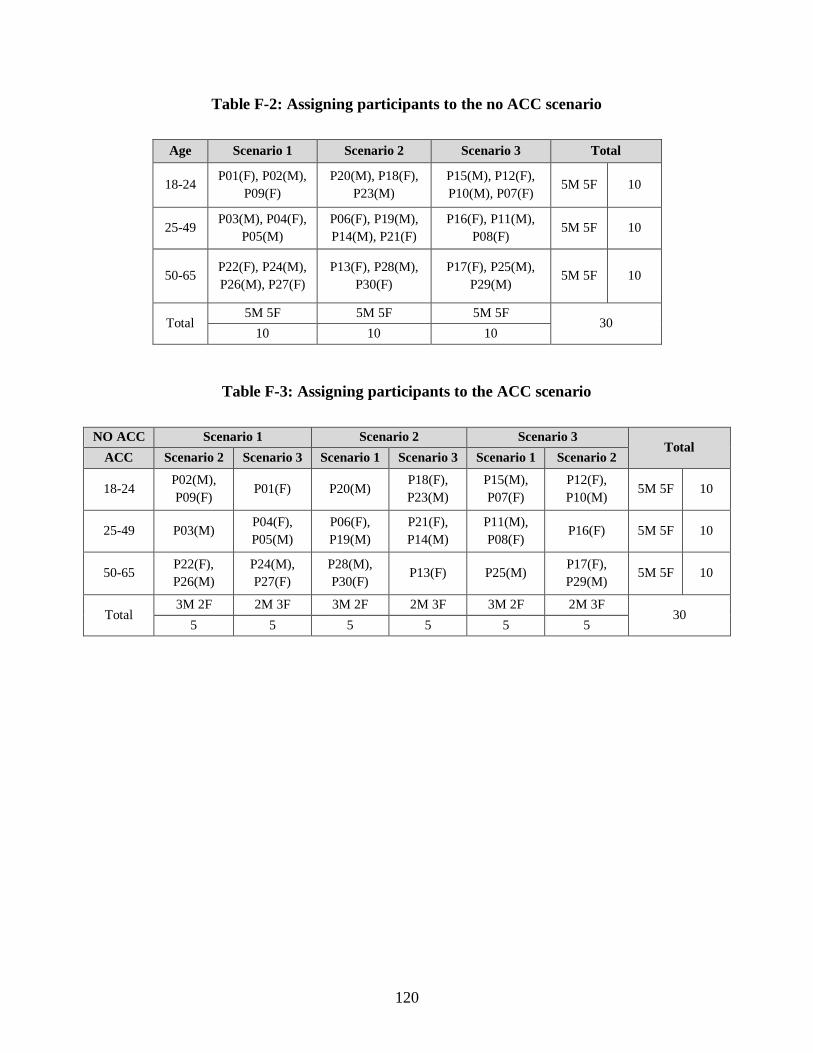
120
Table F-2: Assigning participants to the no ACC scenario
Age Scenario 1 Scenario 2 Scenario 3 Total
18-24 P01(F), P02(M),
P09(F)
P20(M), P18(F),
P23(M)
P15(M), P12(F),
P10(M), P07(F) 5M 5F 10
25-49 P03(M), P04(F),
P05(M)
P06(F), P19(M),
P14(M), P21(F)
P16(F), P11(M),
P08(F) 5M 5F 10
50-65 P22(F), P24(M),
P26(M), P27(F)
P13(F), P28(M),
P30(F)
P17(F), P25(M),
P29(M) 5M 5F 10
Total 5M 5F 5M 5F 5M 5F
30 10 10 10
Table F-3: Assigning participants to the ACC scenario
NO ACC Scenario 1 Scenario 2 Scenario 3 Total
ACC Scenario 2 Scenario 3 Scenario 1 Scenario 3 Scenario 1 Scenario 2
18-24 P02(M),
P09(F) P01(F) P20(M)
P18(F),
P23(M)
P15(M),
P07(F)
P12(F),
P10(M) 5M 5F 10
25-49 P03(M) P04(F),
P05(M)
P06(F),
P19(M)
P21(F),
P14(M)
P11(M),
P08(F) P16(F) 5M 5F 10
50-65 P22(F),
P26(M)
P24(M),
P27(F)
P28(M),
P30(F) P13(F) P25(M)
P17(F),
P29(M) 5M 5F 10
Total 3M 2F 2M 3F 3M 2F 2M 3F 3M 2F 2M 3F
30 5 5 5 5 5 5
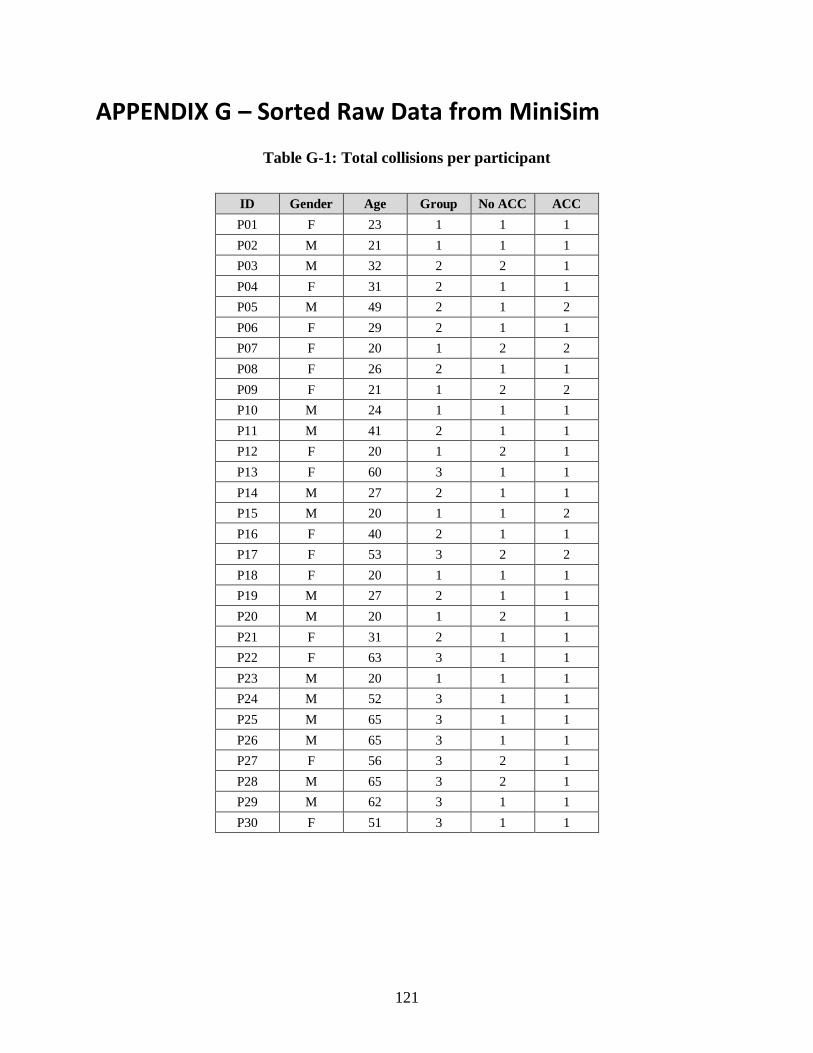
121
APPENDIX G – Sorted Raw Data from MiniSim
Table G-1: Total collisions per participant
ID Gender Age Group No ACC ACC
P01 F 23 1 1 1
P02 M 21 1 1 1
P03 M 32 2 2 1
P04 F 31 2 1 1
P05 M 49 2 1 2
P06 F 29 2 1 1
P07 F 20 1 2 2
P08 F 26 2 1 1
P09 F 21 1 2 2
P10 M 24 1 1 1
P11 M 41 2 1 1
P12 F 20 1 2 1
P13 F 60 3 1 1
P14 M 27 2 1 1
P15 M 20 1 1 2
P16 F 40 2 1 1
P17 F 53 3 2 2
P18 F 20 1 1 1
P19 M 27 2 1 1
P20 M 20 1 2 1
P21 F 31 2 1 1
P22 F 63 3 1 1
P23 M 20 1 1 1
P24 M 52 3 1 1
P25 M 65 3 1 1
P26 M 65 3 1 1
P27 F 56 3 2 1
P28 M 65 3 2 1
P29 M 62 3 1 1
P30 F 51 3 1 1
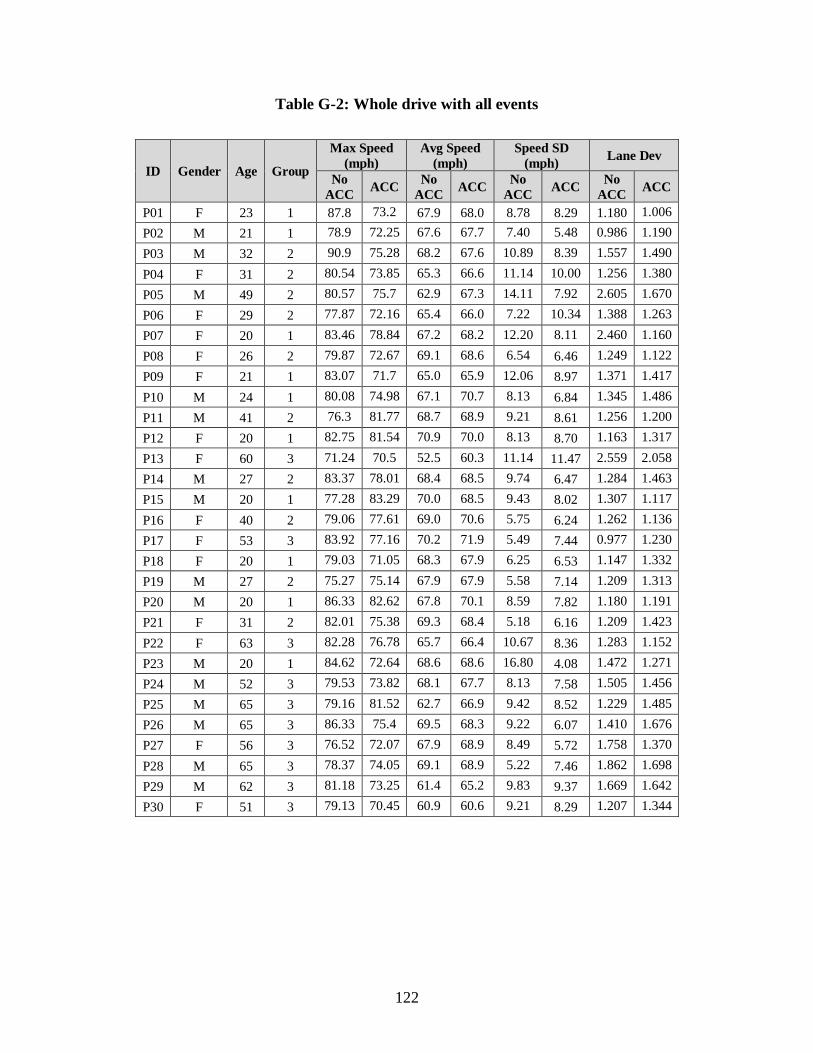
122
Table G-2: Whole drive with all events
ID Gender Age Group
Max Speed
(mph)
Avg Speed
(mph)
Speed SD
(mph) Lane Dev
No
ACC ACC
No
ACC ACC
No
ACC ACC
No
ACC ACC
P01 F 23 1 87.8 73.2 67.9 68.0 8.78 8.29 1.180 1.006
P02 M 21 1 78.9 72.25 67.6 67.7 7.40 5.48 0.986 1.190
P03 M 32 2 90.9 75.28 68.2 67.6 10.89 8.39 1.557 1.490
P04 F 31 2 80.54 73.85 65.3 66.6 11.14 10.00 1.256 1.380
P05 M 49 2 80.57 75.7 62.9 67.3 14.11 7.92 2.605 1.670
P06 F 29 2 77.87 72.16 65.4 66.0 7.22 10.34 1.388 1.263
P07 F 20 1 83.46 78.84 67.2 68.2 12.20 8.11 2.460 1.160
P08 F 26 2 79.87 72.67 69.1 68.6 6.54 6.46 1.249 1.122
P09 F 21 1 83.07 71.7 65.0 65.9 12.06 8.97 1.371 1.417
P10 M 24 1 80.08 74.98 67.1 70.7 8.13 6.84 1.345 1.486
P11 M 41 2 76.3 81.77 68.7 68.9 9.21 8.61 1.256 1.200
P12 F 20 1 82.75 81.54 70.9 70.0 8.13 8.70 1.163 1.317
P13 F 60 3 71.24 70.5 52.5 60.3 11.14 11.47 2.559 2.058
P14 M 27 2 83.37 78.01 68.4 68.5 9.74 6.47 1.284 1.463
P15 M 20 1 77.28 83.29 70.0 68.5 9.43 8.02 1.307 1.117
P16 F 40 2 79.06 77.61 69.0 70.6 5.75 6.24 1.262 1.136
P17 F 53 3 83.92 77.16 70.2 71.9 5.49 7.44 0.977 1.230
P18 F 20 1 79.03 71.05 68.3 67.9 6.25 6.53 1.147 1.332
P19 M 27 2 75.27 75.14 67.9 67.9 5.58 7.14 1.209 1.313
P20 M 20 1 86.33 82.62 67.8 70.1 8.59 7.82 1.180 1.191
P21 F 31 2 82.01 75.38 69.3 68.4 5.18 6.16 1.209 1.423
P22 F 63 3 82.28 76.78 65.7 66.4 10.67 8.36 1.283 1.152
P23 M 20 1 84.62 72.64 68.6 68.6 16.80 4.08 1.472 1.271
P24 M 52 3 79.53 73.82 68.1 67.7 8.13 7.58 1.505 1.456
P25 M 65 3 79.16 81.52 62.7 66.9 9.42 8.52 1.229 1.485
P26 M 65 3 86.33 75.4 69.5 68.3 9.22 6.07 1.410 1.676
P27 F 56 3 76.52 72.07 67.9 68.9 8.49 5.72 1.758 1.370
P28 M 65 3 78.37 74.05 69.1 68.9 5.22 7.46 1.862 1.698
P29 M 62 3 81.18 73.25 61.4 65.2 9.83 9.37 1.669 1.642
P30 F 51 3 79.13 70.45 60.9 60.6 9.21 8.29 1.207 1.344

123
Table G-3: Car following event
ID Gender Age Group
Avg Headway
(ft)
Max Speed
(mph)
Avg Speed
(mph)
Speed SD
(mph) Lane Dev
No
ACC ACC
No
ACC ACC
No
ACC ACC
No
ACC ACC
No
ACC ACC
P01 F 23 1 165.78 297.55 83.2 71.2 70.2 68.4 4.85 5.68 1.055 0.665
P02 M 21 1 408.80 583.04 73.7 70.4 68.9 69.4 4.07 1.96 0.927 1.089
P03 M 32 2 327.15 366.64 88.6 71.0 70.1 69.3 13.08 3.13 1.233 1.464
P04 F 31 2 82.97 316.57 74.7 71.8 70.2 68.4 2.34 5.92 1.206 1.173
P05 M 49 2 404.82 234.98 77.1 75.7 68.7 63.3 4.84 10.28 1.176 1.097
P06 F 29 2 548.94 589.26 73.4 72.2 66.8 67.3 5.85 7.64 1.255 1.379
P07 F 20 1 161.36 295.12 77.1 76.7 69.3 68.7 5.72 5.30 1.098 1.026
P08 F 26 2 271.58 329.02 79.9 72.5 69.9 69.1 7.18 4.98 1.114 0.935
P09 F 21 1 274.51 318.70 79.0 71.4 71.2 69.3 2.99 3.17 0.734 0.928
P10 M 24 1 493.71 688.42 78.5 75.0 68.4 70.0 11.49 7.39 0.976 0.889
P11 M 41 2 143.69 233.48 76.3 80.0 69.4 68.5 5.50 12.20 0.941 1.088
P12 F 20 1 156.04 641.87 79.1 78.0 69.4 69.0 6.07 7.69 0.589 0.843
P13 F 60 3 720.34 688.03 71.2 70.5 59.0 62.8 3.51 5.84 1.028 1.638
P14 M 27 2 432.80 303.59 80.5 73.1 69.2 68.6 6.18 5.51 1.042 1.096
P15 M 20 1 143.10 376.78 74.2 80.9 69.6 68.4 3.20 9.68 0.634 0.834
P16 F 40 2 426.72 304.04 75.8 75.0 68.0 69.6 7.28 2.06 1.098 0.957
P17 F 53 3 222.30 306.38 75.1 75.1 69.2 71.3 5.70 3.11 0.461 0.592
P18 F 20 1 371.16 303.77 78.5 71.0 70.5 69.0 5.17 3.80 0.831 0.826
P19 M 27 2 544.36 404.24 72.4 70.2 68.1 67.9 3.09 6.06 0.762 1.038
P20 M 20 1 189.47 519.93 78.9 75.8 69.4 68.1 4.52 9.52 0.979 0.892
P21 F 31 2 358.76 469.88 77.4 72.6 70.0 68.4 3.84 7.16 0.881 1.160
P22 F 63 3 314.78 624.57 76.2 72.2 70.4 68.2 3.95 3.06 0.906 0.705
P23 M 20 1 233.21 559.40 83.0 72.6 71.2 64.4 3.98 4.66 0.850 1.296
P24 M 52 3 569.06 415.89 78.0 71.0 68.6 68.3 6.17 5.58 1.325 1.007
P25 M 65 3 577.44 517.98 79.2 73.7 67.2 66.6 8.15 5.38 0.507 1.077
P26 M 65 3 370.06 317.36 73.5 71.9 68.8 69.4 3.65 3.58 0.703 1.054
P27 F 56 3 398.83 396.87 74.8 72.1 69.7 68.9 4.59 6.72 1.306 1.163
P28 M 65 3 510.10 496.84 71.2 72.0 69.2 67.7 2.98 6.92 1.498 1.711
P29 M 62 3 366.97 559.22 81.2 73.3 64.3 68.2 7.92 6.49 0.817 0.834
P30 F 51 3 531.12 457.77 76.6 69.6 66.8 66.8 3.77 5.85 1.123 1.312

124
Table G-4: Crossing animal event
ID Gender Age Group
Avg Headway
(ft)
Max Speed
(mph)
Avg Speed
(mph)
Speed SD
(mph) Lane Dev
No
ACC ACC
No
ACC ACC
No
ACC ACC
No
ACC ACC
No
ACC ACC
P01 F 23 1 431.5 409.6 76.1 70.0 70.7 70.0 2.42 0.00 0.661 0.226
P02 M 21 1 523.9 491.1 75.9 70.8 71.6 68.1 4.13 1.56 0.774 0.369
P03 M 32 2 162.2 333.9 70.3 72.9 65.9 64.5 2.79 9.62 0.663 0.970
P04 F 31 2 302.5 305.3 80.2 73.2 72.3 71.0 6.04 0.91 0.603 0.960
P05 M 49 2 503.2 251.9 68.8 70.0 64.2 65.3 3.34 6.12 0.651 0.863
P06 F 29 2 514.3 304.8 72.2 70.1 67.9 67.6 2.99 3.77 0.385 0.918
P07 F 20 1 158.3 283.6 70.8 69.4 64.8 62.5 5.91 4.15 0.738 0.352
P08 F 26 2 244.0 302.1 71.7 70.8 67.1 68.6 3.03 2.86 0.293 0.156
P09 F 21 1 309.6 776.6 73.9 70.5 53.5 68.2 16.14 2.35 0.226 1.036
P10 M 24 1 332.5 248.7 77.2 73.0 73.4 73.0 4.35 0.00 0.197 1.169
P11 M 41 2 406.4 459.1 74.0 71.9 60.9 67.9 17.75 5.16 0.877 0.383
P12 F 20 1 146.3 - 74.9 74.0 70.6 74.0 2.58 0.05 1.822 0.194
P13 F 60 3 - 686.4 66.5 68.6 55.4 37.9 11.23 28.46 0.840 1.917
P14 M 27 2 314.3 302.3 76.8 70.9 46.6 68.2 21.14 3.04 0.422 2.382
P15 M 20 1 265.2 396.9 72.0 69.0 67.3 63.2 5.21 8.22 0.666 0.381
P16 F 40 2 178.2 298.0 73.8 70.0 71.0 69.5 1.84 0.61 0.484 0.655
P17 F 53 3 115.9 11.4 75.0 75.0 69.5 75.0 2.75 0.01 0.375 2.254
P18 F 20 1 321.4 383.3 71.8 71.0 68.0 69.0 4.33 3.12 0.907 0.781
P19 M 27 2 350.8 350.2 72.5 70.9 66.2 67.7 7.76 4.44 0.319 1.122
P20 M 20 1 238.7 316.1 72.1 70.4 66.4 64.2 4.67 6.60 0.865 0.336
P21 F 31 2 158.1 481.9 75.9 69.5 70.7 69.5 5.21 0.02 0.656 0.407
P22 F 63 3 692.0 657.9 74.9 68.1 64.0 61.2 9.49 8.51 0.300 0.549
P23 M 20 1 241.2 360.6 76.8 70.0 72.0 70.0 2.43 0.00 0.559 0.782
P24 M 52 3 365.1 377.3 75.5 66.3 69.1 63.4 5.25 3.78 1.132 1.455
P25 M 65 3 631.9 473.5 68.5 67.9 65.8 64.7 2.33 1.27 2.918 0.523
P26 M 65 3 285.5 335.2 81.4 72.2 68.5 72.0 13.00 0.53 1.061 1.665
P27 F 56 3 305.0 301.4 73.2 70.1 68.7 68.2 4.36 3.01 0.413 0.499
P28 M 65 3 144.0 334.0 70.1 71.1 69.1 71.1 0.71 0.05 3.218 0.217
P29 M 62 3 - 556.6 73.8 71.0 64.9 60.5 9.30 13.80 2.708 1.252
P30 F 51 3 541.7 480.2 65.2 67.9 56.4 55.3 7.03 14.60 0.418 0.284

125
Table G-5: Desk drop event
ID Gender Age Group
Avg Headway
(ft)
Max Speed
(mph)
Avg Speed
(mph)
Speed SD
(mph) Lane Dev
No
ACC ACC
No
ACC ACC
No
ACC ACC
No
ACC ACC
No
ACC ACC
P01 F 23 1 200.3 527.4 74.0 73.0 66.9 73.0 5.95 0.00 1.155 0.724
P02 M 21 1 322.8 399.6 72.9 65.0 68.6 65.0 2.61 0.00 2.053 1.635
P03 M 32 2 243.9 350.5 72.2 66.5 51.9 66.5 17.16 0.00 0.733 0.500
P04 F 31 2 677.0 484.5 66.0 71.9 61.0 71.9 2.91 0.02 2.135 2.568
P05 M 49 2 212.3 126.2 72.7 71.0 64.1 70.9 3.70 0.16 1.292 1.102
P06 F 29 2 580.7 850.6 71.1 70.7 62.9 70.7 3.94 0.00 1.070 0.718
P07 F 20 1 110.4 97.5 75.2 75.7 68.5 67.4 4.49 4.86 0.583 2.007
P08 F 26 2 107.9 424.0 71.6 72.2 68.6 72.0 1.13 0.18 0.933 0.675
P09 F 21 1 283.6 460.3 71.8 70.0 38.7 47.0 26.16 22.40 0.532 0.841
P10 M 24 1 265.4 433.0 71.7 73.0 70.7 73.0 1.05 0.00 1.382 0.591
P11 M 41 2 164.3 394.0 73.1 66.7 72.5 61.0 0.30 5.23 0.489 0.759
P12 F 20 1 128.7 545.7 71.9 64.1 68.5 64.1 2.81 0.00 0.524 0.820
P13 F 60 3 1010.0 707.5 61.2 65.7 44.2 60.1 11.39 3.79 3.030 2.919
P14 M 27 2 127.2 220.3 69.9 72.2 65.1 67.8 3.38 1.20 2.243 2.494
P15 M 20 1 - 137.6 72.0 70.1 70.3 65.7 1.02 6.33 0.666 0.657
P16 F 40 2 172.5 348.2 76.2 74.5 66.4 74.3 6.69 0.29 1.504 1.722
P17 F 53 3 106.7 - 72.5 76.4 66.4 76.3 3.75 0.07 0.575 0.808
P18 F 20 1 190.6 334.1 70.1 70.5 66.2 70.4 3.50 0.13 1.822 0.918
P19 M 27 2 165.4 364.4 73.0 75.1 66.8 69.5 5.37 3.53 1.368 1.896
P20 M 20 1 183.1 - 73.1 72.0 60.5 71.8 10.27 0.31 0.780 0.885
P21 F 31 2 153.2 299.8 73.1 71.0 68.3 65.7 3.68 6.03 1.459 1.348
P22 F 63 3 400.0 356.4 69.6 71.0 55.7 52.3 10.91 14.98 1.686 1.962
P23 M 20 1 - 216.3 - 70.0 - 64.4 - 4.66 - 1.296
P24 M 52 3 214.6 324.6 72.9 72.0 69.6 71.8 2.13 0.28 1.180 1.790
P25 M 65 3 453.4 310.0 65.0 71.1 46.9 57.3 11.26 12.63 0.473 2.712
P26 M 65 3 131.9 233.3 73.3 70.4 70.2 70.1 2.39 0.10 1.748 1.774
P27 F 56 3 159.0 382.3 72.1 71.5 66.3 69.7 5.94 1.76 1.128 1.368
P28 M 65 3 438.6 659.0 69.2 70.2 68.5 66.9 0.41 2.04 0.342 0.520
P29 M 62 3 474.8 352.2 69.1 71.2 44.8 56.4 17.14 13.95 2.050 1.669
P30 F 51 3 683.6 473.0 63.9 65.2 58.4 47.1 2.82 11.23 0.683 0.525

126
Table G-6: Work zone event
ID Gender Age Group Max Speed (mph)
Avg Speed
(mph)
Speed SD
(mph) Lane Dev
No ACC ACC No ACC ACC No ACC ACC No ACC ACC
P01 F 23 1 62.3 70.0 57.6 64.0 2.66 5.20 0.634 1.122
P02 M 21 1 67.6 70.0 62.8 62.6 2.67 5.11 1.268 0.420
P03 M 32 2 68.3 67.0 56.2 55.9 4.25 2.75 0.647 1.148
P04 F 31 2 68.4 59.2 56.6 54.0 4.00 2.23 1.342 1.576
P05 M 49 2 61.7 70.3 53.0 61.0 2.32 7.85 1.022 1.616
P06 F 29 2 72.5 70.3 56.2 56.9 4.56 3.64 1.951 1.518
P07 F 20 1 74.3 73.9 61.1 63.4 4.16 3.51 0.660 1.150
P08 F 26 2 73.4 66.1 62.6 60.1 2.99 1.40 1.275 1.225
P09 F 21 1 69.9 68.4 55.5 60.1 1.77 1.46 1.334 0.899
P10 M 24 1 76.0 73.5 67.3 70.8 5.61 2.09 1.689 1.374
P11 M 41 2 73.3 74.5 62.2 64.9 8.91 6.15 1.136 1.104
P12 F 20 1 81.5 66.0 70.2 61.5 5.95 1.37 1.064 1.151
P13 F 60 3 60.6 66.4 49.6 58.3 3.87 5.03 1.372 2.006
P14 M 27 2 70.1 67.1 57.0 59.8 4.01 2.56 0.605 1.576
P15 M 20 1 76.8 70.8 66.8 64.7 3.76 1.89 1.225 0.465
P16 F 40 2 73.0 71.3 66.0 62.6 5.84 2.79 1.575 1.518
P17 F 53 3 74.3 72.4 64.1 56.7 4.64 3.61 1.155 1.216
P18 F 20 1 73.6 70.5 58.3 53.5 5.01 7.18 1.081 1.532
P19 M 27 2 65.2 68.5 55.3 58.5 3.18 4.64 1.377 0.847
P20 M 20 1 63.5 67.7 55.9 60.4 2.06 2.60 0.871 1.182
P21 F 31 2 73.0 71.0 65.8 65.7 4.55 6.03 0.938 1.348
P22 F 63 3 69.8 71.3 58.7 68.2 4.00 3.06 1.252 0.705
P23 M 20 1 71.5 70.0 59.7 70.0 3.52 0.01 1.293 1.988
P24 M 52 3 75.6 69.7 60.8 57.7 6.70 3.50 1.510 1.931
P25 M 65 3 68.6 70.1 59.0 56.4 3.39 4.44 0.900 1.489
P26 M 65 3 67.0 66.8 60.8 57.2 2.08 1.69 0.938 1.359
P27 F 56 3 68.6 71.0 61.3 62.2 2.48 3.88 1.680 1.903
P28 M 65 3 69.2 64.0 68.5 58.7 0.41 2.78 0.342 1.643
P29 M 62 3 59.9 67.9 50.6 53.2 4.97 3.92 1.295 1.407
P30 F 51 3 60.9 60.0 51.4 52.5 7.44 2.57 0.936 0.868

127
Table G-7: Time to collision for the desk drop and crossing animal event
ID Group
Desk drop event Crossing animal event
No ACC ACC No ACC ACC
Dist
(ft)
Speed
(mph)
TTC
(s)
Dist
(ft)
Speed
(mph)
TTC
(s)
Dist
(ft)
Speed
(mph)
TTC
(s)
Dist
(ft)
Speed
(mph)
TTC
(s)
P01 1 113.9 66.1 1.7 284.5 72.8 3.91 6.4 72.6 0.09 3.1 70.0 0.04
P02 1 182.2 66.0 2.8 289.6 65.0 4.46 39.4 71.6 0.55 25.1 66.7 0.38
P03 2 77.8 62.9 1.2 164.0 66.5 2.47 20.7 69.7 0.30 14.6 70.7 0.21
P04 2 201.2 58.8 3.4 120.4 71.9 1.67 15.4 69.8 0.22 12.2 70.4 0.17
P05 2 234.7 60.7 3.9 0.0 71.0 0.00 35.2 68.7 0.51 53.0 70.0 0.76
P06 2 - - - - - - 13.8 74.6 0.19 22.0 70.1 0.31
P07 1 53.4 75.0 0.7 108.1 68.2 1.59 46.2 70.7 0.65 28.1 69.3 0.41
P08 2 120.8 68.2 1.8 125.2 72.1 1.74 26.9 69.6 0.39 6.8 70.1 0.10
P09 1 133.9 71.7 1.9 127.9 70.0 1.83 19.5 61.6 0.32 14.4 70.5 0.20
P10 1 187.7 71.7 2.6 364.4 73.0 4.99 14.7 77.2 0.19 0.0 73.0 0.00
P11 2 170.0 73.0 2.3 68.4 66.7 1.03 35.4 74.0 0.48 10.6 71.9 0.15
P12 1 37.9 71.8 0.5 150.0 64.1 2.34 24.5 67.2 0.36 7.8 74.0 0.11
P13 3 - - - 422.2 52.4 8.06 36.1 60.8 0.59 24.5 68.2 0.36
P14 2 68.6 69.2 1.0 166.7 67.1 2.48 24.3 65.6 0.37 25.9 69.9 0.37
P15 1 - - - 20.9 70.0 0.30 22.8 69.8 0.33 6.7 69.0 0.10
P16 2 96.5 64.7 1.5 138.8 74.5 1.86 14.2 71.8 0.20 7.1 69.9 0.10
P17 3 12.2 68.0 0.2 - - - 15.9 70.2 0.23 12.3 75.0 0.16
P18 1 157.4 69.7 2.3 250.0 70.5 3.55 32.9 70.6 0.47 17.5 71.0 0.25
P19 2 130.2 69.0 1.9 165.5 71.4 2.32 23.6 71.9 0.33 37.8 70.9 0.53
P20 1 66.6 69.3 1.0 - 72.0 - 29.2 72.0 0.41 5.2 70.4 0.07
P21 2 106.6 69.0 1.5 161.7 71.0 2.28 16.7 68.7 0.24 8.8 69.5 0.13
P22 3 306.6 61.4 5.0 266.7 65.4 4.08 13.4 69.1 0.19 40.8 68.0 0.60
P23 1 30.0 77.9 0.4 25.0 70.0 0.36 16.2 71.4 0.23 13.6 70.0 0.19
P24 3 100.9 71.9 1.4 127.6 72.0 1.77 22.1 67.9 0.33 19.4 66.3 0.29
P25 3 182.6 63.8 2.9 135.3 65.5 2.07 20.9 68.5 0.31 14.4 67.8 0.21
P26 3 94.3 71.9 1.3 72.0 70.0 1.03 50.2 79.0 0.64 14.2 72.2 0.20
P27 3 0.0 65.6 0.0 230.3 70.1 3.29 36.9 72.9 0.51 16.5 70.1 0.23
P28 3 155.0 68.8 2.3 154.5 63.6 2.43 23.2 69.1 0.34 20.7 71.1 0.29
P29 3 365.6 61.7 5.9 239.2 70.8 3.38 17.8 73.7 0.24 8.5 71.0 0.12
P30 3 505.4 56.7 8.9 - - - 56.1 60.8 0.92 48.6 67.9 0.72
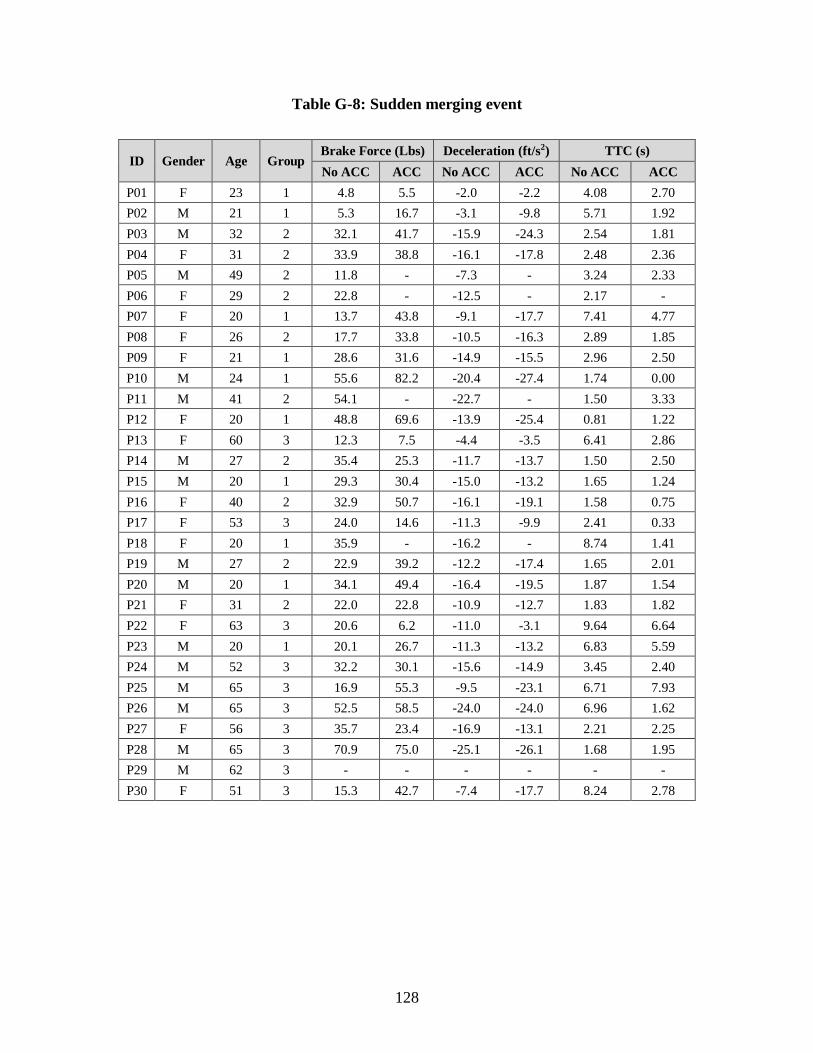
128
Table G-8: Sudden merging event
ID Gender Age Group Brake Force (Lbs) Deceleration (ft/s2) TTC (s)
No ACC ACC No ACC ACC No ACC ACC
P01 F 23 1 4.8 5.5 -2.0 -2.2 4.08 2.70
P02 M 21 1 5.3 16.7 -3.1 -9.8 5.71 1.92
P03 M 32 2 32.1 41.7 -15.9 -24.3 2.54 1.81
P04 F 31 2 33.9 38.8 -16.1 -17.8 2.48 2.36
P05 M 49 2 11.8 - -7.3 - 3.24 2.33
P06 F 29 2 22.8 - -12.5 - 2.17 -
P07 F 20 1 13.7 43.8 -9.1 -17.7 7.41 4.77
P08 F 26 2 17.7 33.8 -10.5 -16.3 2.89 1.85
P09 F 21 1 28.6 31.6 -14.9 -15.5 2.96 2.50
P10 M 24 1 55.6 82.2 -20.4 -27.4 1.74 0.00
P11 M 41 2 54.1 - -22.7 - 1.50 3.33
P12 F 20 1 48.8 69.6 -13.9 -25.4 0.81 1.22
P13 F 60 3 12.3 7.5 -4.4 -3.5 6.41 2.86
P14 M 27 2 35.4 25.3 -11.7 -13.7 1.50 2.50
P15 M 20 1 29.3 30.4 -15.0 -13.2 1.65 1.24
P16 F 40 2 32.9 50.7 -16.1 -19.1 1.58 0.75
P17 F 53 3 24.0 14.6 -11.3 -9.9 2.41 0.33
P18 F 20 1 35.9 - -16.2 - 8.74 1.41
P19 M 27 2 22.9 39.2 -12.2 -17.4 1.65 2.01
P20 M 20 1 34.1 49.4 -16.4 -19.5 1.87 1.54
P21 F 31 2 22.0 22.8 -10.9 -12.7 1.83 1.82
P22 F 63 3 20.6 6.2 -11.0 -3.1 9.64 6.64
P23 M 20 1 20.1 26.7 -11.3 -13.2 6.83 5.59
P24 M 52 3 32.2 30.1 -15.6 -14.9 3.45 2.40
P25 M 65 3 16.9 55.3 -9.5 -23.1 6.71 7.93
P26 M 65 3 52.5 58.5 -24.0 -24.0 6.96 1.62
P27 F 56 3 35.7 23.4 -16.9 -13.1 2.21 2.25
P28 M 65 3 70.9 75.0 -25.1 -26.1 1.68 1.95
P29 M 62 3 - - - - - -
P30 F 51 3 15.3 42.7 -7.4 -17.7 8.24 2.78
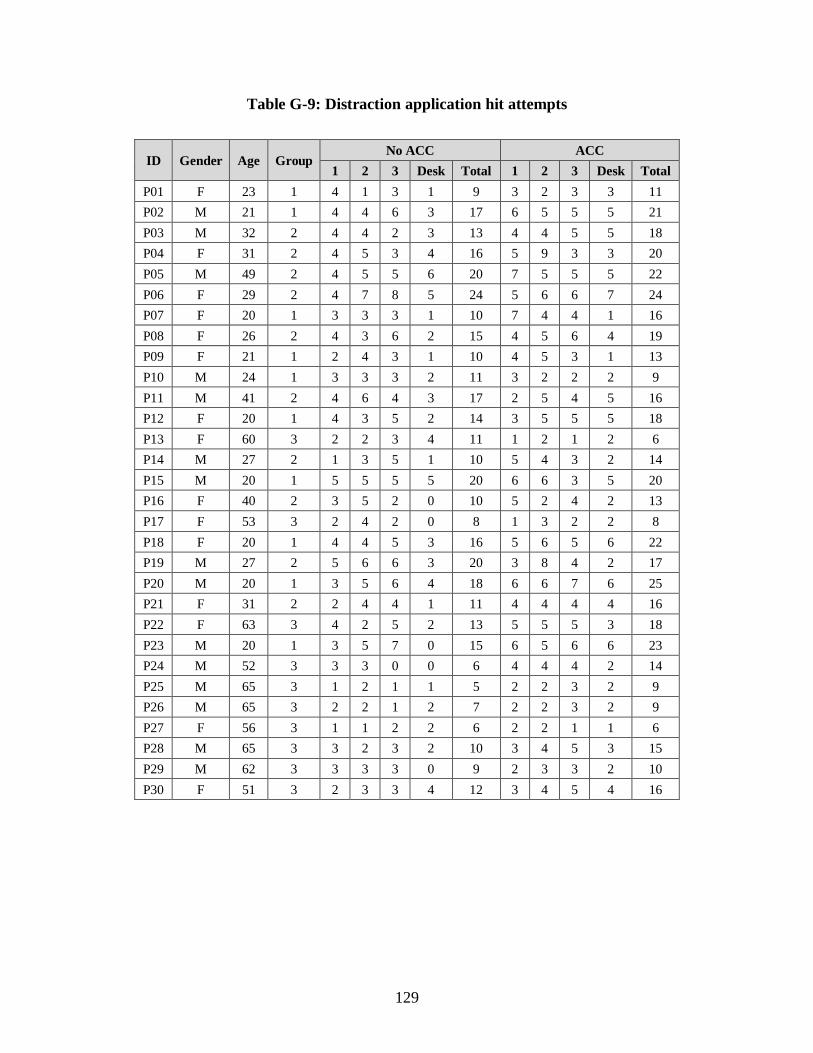
129
Table G-9: Distraction application hit attempts
ID Gender Age Group No ACC ACC
1 2 3 Desk Total 1 2 3 Desk Total
P01 F 23 1 4 1 3 1 9 3 2 3 3 11
P02 M 21 1 4 4 6 3 17 6 5 5 5 21
P03 M 32 2 4 4 2 3 13 4 4 5 5 18
P04 F 31 2 4 5 3 4 16 5 9 3 3 20
P05 M 49 2 4 5 5 6 20 7 5 5 5 22
P06 F 29 2 4 7 8 5 24 5 6 6 7 24
P07 F 20 1 3 3 3 1 10 7 4 4 1 16
P08 F 26 2 4 3 6 2 15 4 5 6 4 19
P09 F 21 1 2 4 3 1 10 4 5 3 1 13
P10 M 24 1 3 3 3 2 11 3 2 2 2 9
P11 M 41 2 4 6 4 3 17 2 5 4 5 16
P12 F 20 1 4 3 5 2 14 3 5 5 5 18
P13 F 60 3 2 2 3 4 11 1 2 1 2 6
P14 M 27 2 1 3 5 1 10 5 4 3 2 14
P15 M 20 1 5 5 5 5 20 6 6 3 5 20
P16 F 40 2 3 5 2 0 10 5 2 4 2 13
P17 F 53 3 2 4 2 0 8 1 3 2 2 8
P18 F 20 1 4 4 5 3 16 5 6 5 6 22
P19 M 27 2 5 6 6 3 20 3 8 4 2 17
P20 M 20 1 3 5 6 4 18 6 6 7 6 25
P21 F 31 2 2 4 4 1 11 4 4 4 4 16
P22 F 63 3 4 2 5 2 13 5 5 5 3 18
P23 M 20 1 3 5 7 0 15 6 5 6 6 23
P24 M 52 3 3 3 0 0 6 4 4 4 2 14
P25 M 65 3 1 2 1 1 5 2 2 3 2 9
P26 M 65 3 2 2 1 2 7 2 2 3 2 9
P27 F 56 3 1 1 2 2 6 2 2 1 1 6
P28 M 65 3 3 2 3 2 10 3 4 5 3 15
P29 M 62 3 3 3 3 0 9 2 3 3 2 10
P30 F 51 3 2 3 3 4 12 3 4 5 4 16

130
Table G-10: Move over or slow down law
ID Gender Age Group
Observed the Move Over Law: 1 = Yes, 0 = No, NA = Not
Applicable
No ACC ACC
Car Truck Police Total Car Truck Police Total
P01 F 23 1 0 1 1 2 0 0 1 1
P02 M 21 1 0 1 1 2 0 1 1 2
P03 M 32 2 NA 0 1 1 NA 0 1 1
P04 F 31 2 0 NA 1 1 0 NA 1 1
P05 M 49 2 0 1 1 2 0 1 1 2
P06 F 29 2 0 NA 1 1 0 NA 1 1
P07 F 20 1 1 0 1 2 1 0 0 1
P08 F 26 2 1 NA 1 2 1 NA 1 2
P09 F 21 1 1 1 1 3 1 1 1 3
P10 M 24 1 0 NA 1 1 0 NA 1 1
P11 M 41 2 0 0 1 1 0 0 1 1
P12 F 20 1 1 0 NA 1 0 0 NA 0
P13 F 60 3 0 0 0 0 0 0 0 0
P14 M 27 2 1 1 1 3 1 1 1 3
P15 M 20 1 0 0 1 1 0 0 1 1
P16 F 40 2 1 NA 1 2 0 NA 1 1
P17 F 53 3 0 0 1 1 1 0 1 2
P18 F 20 1 0 NA 1 1 0 NA 1 1
P19 M 27 2 1 NA 1 2 0 NA 1 1
P20 M 20 1 1 1 1 3 1 1 1 3
P21 F 31 2 0 0 1 1 0 0 1 1
P22 F 63 3 0 0 1 1 0 1 1 2
P23 M 20 1 0 1 1 2 0 1 1 2
P24 M 52 3 1 1 1 3 0 1 1 2
P25 M 65 3 0 1 1 2 0 1 1 2
P26 M 65 3 1 0 1 2 1 1 1 3
P27 F 56 3 0 0 1 1 0 0 1 1
P28 M 65 3 NA 1 1 2 NA 1 1 2
P29 M 62 3 1 NA 1 2 1 NA 1 2
P30 F 51 3 1 NA 1 2 1 NA 1 2

131
APPENDIX H – Sorted DRT Data
Table H-1: DRT data collected from the drive without any incidents
ID Gender Age Group No ACC ACC
RT (s) HR (%) RT (s) HR (%)
P01 F 23 1 0.857 72.03 0.610 98.20
P02 M 21 1 0.468 97.48 0.532 97.46
P03 M 32 2 - - 0.533 91.15
P04 F 31 2 0.602 98.36 0.608 96.55
P05 M 49 2 0.834 60.80 0.820 66.67
P06 F 29 2 - - 0.535 95.83
P07 F 20 1 0.546 88.18 0.601 81.42
P08 F 26 2 0.603 83.93 0.596 86.96
P09 F 21 1 0.637 90.98 0.746 80.18
P10 M 24 1 0.722 68.14 0.718 70.37
P11 M 41 2 0.499 95.58 0.637 86.49
P12 F 20 1 0.595 85.19 0.590 83.78
P13 F 60 3 0.702 54.93 0.918 50.39
P14 M 27 2 0.538 73.45 0.518 90.57
P15 M 20 1 0.332 94.55 0.329 96.52
P16 F 40 2 0.641 89.19 0.569 84.82
P17 F 53 3 0.612 95.33 0.551 97.22
P18 F 20 1 0.559 81.58 0.565 80.00
P19 M 27 2 0.549 98.23 0.553 99.15
P20 M 20 1 0.426 87.61 0.423 96.43
P21 F 31 2 0.536 89.09 0.561 94.59
P22 F 63 3 0.526 90.00 0.485 93.16
P23 M 20 1 0.870 74.77 0.592 94.55
P24 M 52 3 0.945 87.61 0.826 81.82
P25 M 65 3 0.572 93.22 0.703 87.29
P26 M 65 3 0.562 74.78 0.640 77.68
P27 F 56 3 0.530 93.04 0.504 93.75
P28 M 65 3 0.656 89.47 0.628 92.86
P29 M 62 3 0.740 62.90 0.718 51.72
P30 F 51 3 0.445 97.69 0.488 100.00
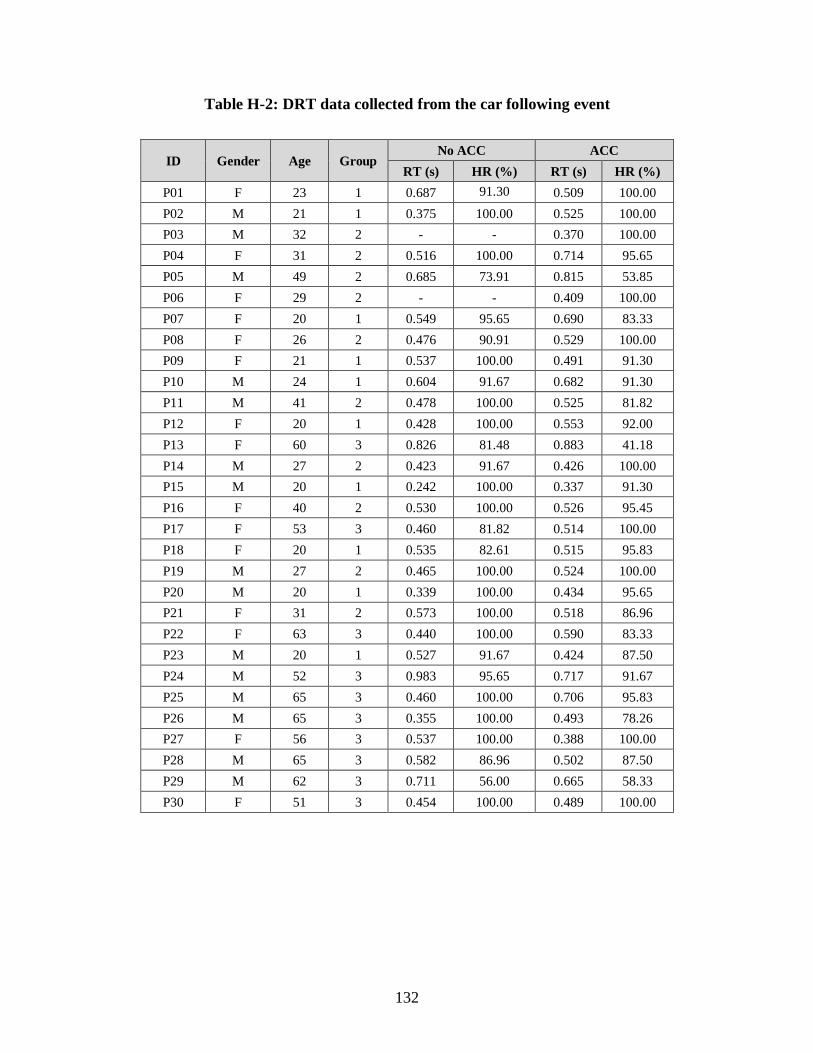
132
Table H-2: DRT data collected from the car following event
ID Gender Age Group No ACC ACC
RT (s) HR (%) RT (s) HR (%)
P01 F 23 1 0.687 91.30 0.509 100.00
P02 M 21 1 0.375 100.00 0.525 100.00
P03 M 32 2 - - 0.370 100.00
P04 F 31 2 0.516 100.00 0.714 95.65
P05 M 49 2 0.685 73.91 0.815 53.85
P06 F 29 2 - - 0.409 100.00
P07 F 20 1 0.549 95.65 0.690 83.33
P08 F 26 2 0.476 90.91 0.529 100.00
P09 F 21 1 0.537 100.00 0.491 91.30
P10 M 24 1 0.604 91.67 0.682 91.30
P11 M 41 2 0.478 100.00 0.525 81.82
P12 F 20 1 0.428 100.00 0.553 92.00
P13 F 60 3 0.826 81.48 0.883 41.18
P14 M 27 2 0.423 91.67 0.426 100.00
P15 M 20 1 0.242 100.00 0.337 91.30
P16 F 40 2 0.530 100.00 0.526 95.45
P17 F 53 3 0.460 81.82 0.514 100.00
P18 F 20 1 0.535 82.61 0.515 95.83
P19 M 27 2 0.465 100.00 0.524 100.00
P20 M 20 1 0.339 100.00 0.434 95.65
P21 F 31 2 0.573 100.00 0.518 86.96
P22 F 63 3 0.440 100.00 0.590 83.33
P23 M 20 1 0.527 91.67 0.424 87.50
P24 M 52 3 0.983 95.65 0.717 91.67
P25 M 65 3 0.460 100.00 0.706 95.83
P26 M 65 3 0.355 100.00 0.493 78.26
P27 F 56 3 0.537 100.00 0.388 100.00
P28 M 65 3 0.582 86.96 0.502 87.50
P29 M 62 3 0.711 56.00 0.665 58.33
P30 F 51 3 0.454 100.00 0.489 100.00

133
Table H-3: DRT data collected from the three distraction events
ID Gender Age Group No ACC ACC
RT (s) HR (%) RT (s) HR (%)
P01 F 23 1 0.594 50.00 0.669 71.43
P02 M 21 1 0.651 85.71 0.559 100.00
P03 M 32 2 - - 0.451 42.86
P04 F 31 2 0.801 71.43 0.639 100.00
P05 M 49 2 0.597 28.57 0.834 55.56
P06 F 29 2 - - 0.510 85.71
P07 F 20 1 0.657 85.71 0.772 100.00
P08 F 26 2 0.509 50.00 0.604 62.50
P09 F 21 1 1.217 33.33 1.017 37.50
P10 M 24 1 0.991 37.50 0.658 25.00
P11 M 41 2 0.504 100.00 0.721 50.00
P12 F 20 1 0.486 66.67 0.751 50.00
P13 F 60 3 0.711 9.09 0.996 100.00
P14 M 27 2 0.790 42.86 0.665 83.33
P15 M 20 1 0.441 100.00 0.390 87.50
P16 F 40 2 0.629 16.67 1.154 66.67
P17 F 53 3 0.732 100.00 0.424 100.00
P18 F 20 1 0.571 37.50 0.799 100.00
P19 M 27 2 0.557 100.00 0.642 100.00
P20 M 20 1 0.493 50.00 0.759 100.00
P21 F 31 2 0.539 57.14 1.080 71.43
P22 F 63 3 1.090 37.50 1.375 50.00
P23 M 20 1 0.999 50.00 0.894 75.00
P24 M 52 3 1.203 71.43 1.126 50.00
P25 M 65 3 0.814 55.56 0.934 33.33
P26 M 65 3 0.844 20.00 1.498 50.00
P27 F 56 3 0.649 42.86 0.805 71.43
P28 M 65 3 0.873 50.00 1.036 62.50
P29 M 62 3 1.879 12.50 0.484 14.29
P30 F 51 3 0.887 87.50 1.091 77.78

134
Table H-4: DRT data collected from the work zone event
ID Gender Age Group No ACC ACC
RT (s) HR (%) RT (s) HR (%)
P01 F 23 1 0.626 100.00 0.545 90.00
P02 M 21 1 0.564 100.00 0.570 100.00
P03 M 32 2 - - 0.482 90.91
P04 F 31 2 0.525 83.33 0.663 100.00
P05 M 49 2 0.742 33.33 0.770 27.27
P06 F 29 2 - - 0.442 100.00
P07 F 20 1 0.473 100.00 0.571 90.00
P08 F 26 2 0.764 90.00 0.600 100.00
P09 F 21 1 0.485 91.67 0.558 100.00
P10 M 24 1 0.900 77.78 0.702 100.00
P11 M 41 2 0.450 90.00 0.524 80.00
P12 F 20 1 0.655 70.00 0.581 90.00
P13 F 60 3 1.128 38.46 1.309 40.00
P14 M 27 2 0.548 75.00 0.557 100.00
P15 M 20 1 0.457 70.00 0.345 90.00
P16 F 40 2 0.585 88.89 0.837 72.73
P17 F 53 3 0.634 81.82 0.699 100.00
P18 F 20 1 0.487 81.82 0.703 72.73
P19 M 27 2 0.571 100.00 0.650 100.00
P20 M 20 1 0.320 100.00 0.429 100.00
P21 F 31 2 0.542 100.00 0.391 77.78
P22 F 63 3 0.547 100.00 0.391 100.00
P23 M 20 1 0.930 100.00 0.483 100.00
P24 M 52 3 0.959 81.82 1.190 100.00
P25 M 65 3 0.581 81.82 0.753 81.82
P26 M 65 3 0.665 72.73 0.569 83.33
P27 F 56 3 0.610 100.00 0.630 100.00
P28 M 65 3 0.705 90.91 0.814 90.00
P29 M 62 3 0.920 41.67 0.706 45.45
P30 F 51 3 0.563 100.00 0.475 100.00