analysis of the development of youth football throwing ...
101
ANALYSIS OF THE DEVELOPMENT OF YOUTH FOOTBALL THROWING MECHANICS A Thesis by BRANDON ANDREW KEYS Submitted to the Office of Graduate and Professional Studies of Texas A&M University in partial fulfillment of the requirements for the degree of MASTER OF SCIENCE Chair of Committee, Michael R. Moreno Committee Members, Pilwon Hur Bradley S. Lambert Head of Department, Andreas A. Polycarpou December 2018 Major Subject: Mechanical Engineering Copyright 2018 Brandon A. Keys
-
Upload
khangminh22 -
Category
Documents
-
view
3 -
download
0
Transcript of analysis of the development of youth football throwing ...
ANALYSIS OF THE DEVELOPMENT OF YOUTH FOOTBALL THROWING MECHANICS
A Thesis
by
BRANDON ANDREW KEYS
Submitted to the Office of Graduate and Professional Studies of Texas A&M University
in partial fulfillment of the requirements for the degree of
MASTER OF SCIENCE
Chair of Committee, Michael R. Moreno Committee Members, Pilwon Hur Bradley S. Lambert Head of Department, Andreas A. Polycarpou
December 2018
Major Subject: Mechanical Engineering
Copyright 2018 Brandon A. Keys
ii
ABSTRACT
Football coaches currently use qualitative measures to describe how a quarterback should
throw and can only describe the optimal throw verbally through what the naked eye can observe.
The goal of this research was to analyze the development of middle school and high school
quarterback (QB) throwing mechanics over consecutive seasons using motion capture technology.
To analyze the development of these subjects, interviews were conducted with middle school and
high school coaches to determine the most common pass types for the respective levels and
common aspects of the throwing motion that coaches use to teach what they believe to be the
optimal throwing motion as references for the analysis. Two separate years of analysis were used
in this research to analyze the development of subject sets. Two time points from a total of eight
subjects were analyzed to track the development of mechanics with physical development.
Improvements of the throwing mechanics of the subjects with multiple time points were observed.
The improvements were based on what was described by coaches as optimal throwing mechanics.
In conclusion the training techniques used by the coaches were effective in improving the
coaching points deemed as common from interviews with middle school and high school coaches.

iii
ACKNOWLEDGEMENTS
To my parents, thank you for your continuous support no matter where life takes me.
Thank you for always pushing me to be the best that I can be! I would not be where I am today
without both of you! Thank you and I love you!
To my advisor Dr. Michael Moreno, thank your for your continuous guidance over the
years and for allowing me to grow throughout my time at Texas A&M. The experience I had in
the Biomechanical Environments Laboratory was second to none and I am forever thankful for
the opportunity to work on so many interesting projects.
To my labmates in the BMEL, thank you for accepting me into the group and for being so
helpful throughout my time at Texas A&M. A special thank you to Lise for always helping me
with the long hours of the motion captures, the long trips to Houston, and for always assisting me
with anything I needed! This all would not have been possible without you! To all of the
undergrads I have had the pleasure of mentoring over my time at Texas A&M, thank you for
helping me on the long study days and for helping me throughout each week you were in the lab.
To my siblings, thank you for always encouraging me throughout my entire life and
especially during my time in grad school! You all never doubted me and for that I am forever
grateful. To my friends, from high school, to the University of Memphis, and to Texas A&M
thank you all for being a distraction from the stress of graduate school and always being there to
cheer me up.
Thank you to the Physical Education and Activities Program at Texas A&M for allowing
us to use their facilities to run the football studies. And to Texas A&M University, thank you for
allowing me to continue my academic pursuit at this great University and for giving students like
me the chance to follow their dreams!
iv
CONTRIBUTORS AND FUNDING SOURCES
Contributors
This work was supervised by a thesis committee consisting of Professor Michael Moreno
of the Mechanical Engineering Department, Professor Pilwon Hur of the Mechanical Engineering
Department, and Dr. Bradley Lambert of the Department of Health and Kinesiology. All work for
this thesis was completed by the student in collaboration with Hunter Storaci and Andrew
Robbins, previously of the Department of Biomedical Engineering at Texas A&M University.
Funding Sources
There are no outside funding contributions to acknowledge related to the research and
compilation of this document.
v
TABLE OF CONTENTS
Page
ABSTRACT ............................................................................................................................. ii
ACKNOWLEDGEMENTS ..................................................................................................... iii
CONTRIBUTORS AND FUNDING SOURCES .................................................................... iv
TABLE OF CONTENTS ......................................................................................................... v
LIST OF FIGURES .................................................................................................................. viii
LIST OF TABLES ................................................................................................................... xi
CHAPTER I INTRODUCTION ......................................................................................... 1
1.1 Background and Motivation ………………………………………………………… 1 1.2 Problem ……………………………………………………………………………… 2 1.3 Specific Aims………………………………………………………………………… 4
1.3.1 Specific Aim I.…………………………………………………………………. 4 1.3.2 Specific Aim II…………………………………………………………………. 4 1.3.3 Specific Aim III………………………………………………………………… 5
1.4 Significance…………………………………………………………………………… 5 1.5 Delimitations………………………………………………………………………….. 6 1.6 Limitations……………………………………………………………………………. 6 CHAPTER II LITERATURE REVIEW .............................................................................. 8
2.1 Introduction .................................................................................................................. 8 2.2 Quarterback Throwing Mechanics ............................................................................... 8 2.2.1 Kinematic and Kinetic Analysis…………………………………….…………. 8 2.2.2 Electromyography (EMG) Analysis…………………………………………… 18 2.2.3 Additional Sources…………………………………………………………….. 20 2.3 Motion Analysis Software…………………………………………………………… 22
2.3.1 Vicon Nexus Software......................................................................................... 22 2.3.2 C3d File Format……………………………………………………….……… 22
2.3.3 Pickled File Format ............................................................................................. 22 2.4 Discussion ..................................................................................................................... 23 CHAPTER III HUMAN SUBJECTS RESEARCH STUDY DESIGN…………………….. 24
3.1 Introduction ............................................................................................................ 24
vi
3.2 Interview Results .................................................................................................... 24 3.3 Marker Set Design .................................................................................................. 26 3.4 Study Design .......................................................................................................... 28 3.4.1 Participants ........................................................................................... 28 3.4.2 Testing Equipment ................................................................................ 30 3.4.3 Marker Attachment ............................................................................... 31 3.4.4 Throwing Data Capture ........................................................................ 32 3.4.5 Camera & Target Location ................................................................... 33 3.5 Discussion ............................................................................................................... 35 CHAPTER IV DESCRIPTION OF ANALYSIS ..................................................................... 37 4.1 Introduction .................................................................................................................. 37 4.2 Common Coaching Points ............................................................................................ 37 4.2.1 Hip Leading Angle .............................................................................................. 38 4.2.2 Elbow Leading Hand ........................................................................................... 39 4.2.3 Release Time ....................................................................................................... 40 4.2.4 Orientation at Ball Release .................................................................................. 41 4.2.5 Consistency of Throwing Motion ........................................................................ 44 4.2.6 Off Hand Motion ................................................................................................. 44 4.2.7 Accuracy .............................................................................................................. 45 4.2.8 Stride Length and Direction ................................................................................ 46 4.3 Discussion ..................................................................................................................... 47 CHAPTER V RESULTS .......................................................................................................... 48 5.1 First Year Testing Results ............................................................................................ 48 5.1.1 Overall First Year Results ................................................................................... 48 5.1.2 Consistency of Throwing Motion ........................................................................ 50 5.1.3 Statistically Significant Differences Between the Groups .................................. 51 5.2 Second Year of Testing Results ................................................................................... 55 5.2.1 Overall Second Year Results ............................................................................... 55 5.2.2 Consistency of Second Year of Testing .............................................................. 57 5.2.3 Statistically Significant Differences Between the Groups .................................. 58 5.3 Analysis of Development ............................................................................................. 66 5.3.1 Group 1 ................................................................................................................ 66 5.3.2 Group 2 ................................................................................................................ 74 CHAPTER VI CONCLUSIONS .............................................................................................. 82 6.1 Limitations of the Study ............................................................................................... 82 6.2 Future Developments of the Study ............................................................................... 82 6.2.1 Additional Analysis ............................................................................................. 82 6.2.2 Continue Longitudinal Analysis .......................................................................... 83 6.2.3 Analysis of QBs at Higher Levels ....................................................................... 84 6.3 Conclusions .................................................................................................................. 84

vii
REFERENCES ......................................................................................................................... 86
viii
LIST OF FIGURES
FIGURE Page
1 Reference values and signs for the angles of (a) shoulder abduction, (b) horizontal adduction, (c) external rotation, and (d) elbow extension defined by Rash & Shapiro (1995)[1]. Figure reprinted with permission from Human Kinetics, Inc………………………………………………………………………………….. 9
2 The six phases of the throwing motion of the baseball pitch applied to the football
throw defined by Fleisig et al. (1996) [2]. Figure reprinted with permission from Human Kinetics, Inc……………………………………………………………….. 10
3 The definition of the kinematic variables used by Fleisig et al. (1996): (a) shoulder
abduction, (b) horizontal adduction, (c) external rotation, (d) elbow flexion, (e) lead knee flexion and trunk tilt, and (f) pelvis angular velocity and upper torso angular velocity [2]. Figure reprinted with permission from Human Kinetics, Inc… 11
4 Definition of kinetic variables by Fleisig et al. (1996): (a) shoulder forces, (b)
shoulder torques, (c) elbow forces, and (d) elbow torques. Figure reprinted with permission from Human Kinetics, Inc……………………………………………… 12
5 Phases of the football throw defined by Kelly et al. (2002)[3]. As defined from left
to right: Early cocking, late early cocking, late cocking, acceleration, and follow through………………………………………………………………………………. 19
6 Quarterback marker set template developed by Storaci (2017) [16]………………. 27 7 Subject with reflective markers attached…………………………………………… 28 8 Camera, force plate, and target locations for the throwing trials…………………… 33 9 Camera set-up at the Texas A&M PEAP facility…………………………………… 34 10 Depicting vectors used to calculate hip leading angle in transverse plane. Adapted from Shutterstock [25]…………………………………………………………….. 39
11 Description of the elbow leading the hand used in the current research Rash &
Shapiro (1995)[1] Figure reprinted with permission from Human Kinetics, Inc.………………………………………………………………………………. 40
12 Representation of the beginning of the throwing motion………………………….. 41
ix
13 Representation of the timing of ball release of the throwing motion……………… 41 14 Area of the QB coaches focus on at time of release of the football……………….. 42 15 Target used for the 25-yard corner throws………………………………………… 45 16 Target used for the 5-yard hitch and the 12-yard comeback route………………… 46 17 Velocity comparison between the two groups during a hitch throw to the right side and a 25-yard corner to the left side out of a 3 step drop.………………………….. 52 18 The comparison of the two groups of the elbow leading the hand through the
throwing motion during the 25-yard corner throw to the right side out of 3 step drop………………………………………………………………………………. 53 19 The difference of the maximum distance from the body of the non-throwing arm between the two groups………………………………………………………....... 54 20 The release orientation comparison of the groups during the hitch throw to the right side in the second year of testing.……………………………………........... 59 21 Comparison of the release times for the two groups for three of the throws in the second year of study …………………………………………………………...... 60 22 Elbow leading angle comparison between the two groups during the hitch throw to the left side……………………………………………………………………. 61 23 Stride length and direction comparison between the two groups for the hitch throw to the left side in the second year of testing……………….………………. 62 24 Stride direction and length comparison between the two groups for the 25 yard corner out of a 3 step drop to the right side………….............................................. 63 25 Velocity comparison between the two groups during the hitch throw to the right
side in the second year of study…………………………………………………… 64
26 Non-throwing arm motion comparison between the two groups in the second year of testing during a hitch throw to the right side…………………….………... 65 27 Elbow leading the hand comparison between middle school and high school QBs during a 25-yard corner to the right throw out of a 3-step drop foot pattern……... 66 28 Development of the hip leading angle for group 1 during the 25 yard corner throw to the left side out of a 3 step drop…………………………………..……………... 68

x
29 Hip orientation for both years of testing for group 1 during the hitch throw to the right side…………………………………………………………………….............. 69 30 Hip orientation for both years of testing for group 1 during the hitch throw to the left side…………………………………………………………….……………….. 70 31 Hip orientation for both years of testing for group 1 during the 25 yard corner
throw to the right side out of a 3 step drop………………………………………….. 70 32 Development of the stride length for group 1 during the hitch throw to the left side. 71 33 Development of the non-throwing arm motion for group 1 during the hitch throw to the right side…………………………………………………………………….... 72 34 Development of the non-throwing arm motion for group 1 during the hitch throw to the left side…………………………………………………………………………… 73 35 Hip leading angle development for group 2 during the hitch throw to the left side…. 75 36 Hip orientation at the moment of ball release for group 2 during the hitch throw to the left for both years of testing…………………….................................................... 76 37 Orientation of the shoulders at ball release for group 2 during the hitch throw to the
left side during both years of testing.………………………………………………… 77 38 The release time comparison for both 25 yard corner throws for group 2 in both
years of study………………………………………………………………………… 78 39 Shoulder internal/external rotation throughout the hitch throw to the left for group 2
in both years of testing………………………………………………….……………. 79 40 Stride length and direction comparison of group 2 from each year of study during the
25 yard corner throw to the right side out of a 3 step drop…………………………… 80 41 Differences in velocities of group 2 during the hitch throw to the right side…………. 81

xi

xii
LIST OF TABLES
TABLE Page 1 The kinematics variables analyzed by Rash & Shapiro (1995)[1] and Fleisig et al. (1996)[2]……………………………………………………………………………. 14 2 The kinetic variables analyzed by Rash & Shapiro (1995)[1] and Fleisig et al. (1996)[2]…….............................................................................................................. 15 3 Grade and age distribution of the eight subjects that were tested in both year 1
and year 2…………………………………………………………………………… 29 4 Means and standard deviations of the analysis based on the first year of testing
for group 1………………………………………………………………………….. 48 5 Means and standard deviations of the analysis based on the first year of testing
for group 2………………………………………………………………………….. 49 6 The p-values from the independent t-test comparing the results of the two groups
from the first year of testing………………………………………………………... 51 7 Means and standard deviations of the analysis based on the second year of testing for group 1…………………………………………………………………………. 55 8 Means and standard deviations of the analysis based on the second year of testing
for group 2…………………………………………………………………………. 56 9 The p-values from the independent t-test comparing the results of the two groups
from the second year of testing…………………………………………………… 58 10 The p-values from the paired t-test comparing the results of group 1 from both
years of testing……………………………………………………………………... 67

xiii
11 The p-values from the paired t-test comparing the results of group 2 from both years of testing…………………………………………………………………….. 74
1
CHAPTER I
INTRODUCTION
1.1 Background and Motivation
Although football is one of the most popular sports in the country, there is little peer-
reviewed research done on the quarterback (QB) throwing motion. This lack of documentation
leads to an absence of consensus on coaching strategies to develop QB throwing mechanics. All
of the information currently used by coaches to instruct players is strictly qualitative; some
examples are shoulder alignment, release point, posture, and footwork. Coaches can describe
how a QB should throw a pass based on qualitative measures and describe the optimal throw
verbally through what the naked eye can observe. To improve those mechanics certain drills,
without proof of the efficacy, have been used to try optimize the athletes throwing mechanics.
An optimal throw has not been defined through research, therefore there is a need to obtain
highly quantitative biomechanical data of the football throwing mechanics of developing QBs in
order to help coaches optimize throwing techniques and develop common coaching points. This
data could increase interest for more research in QB throwing mechanics and can change the way
coaches teach the optimal throwing motion based on the level of play of the athlete.
From an early age a child is taught what their youth coaches believe to be the proper football
throwing technique. In order for an athlete to properly progress during their formative years,
coaches will instruct the athlete through certain drills in order to assist the QB’s muscle memory
to replicate the coach’s description of an optimal throw. Along with the throwing motion, as a
child progresses the vast amount of situations and foot patterns a QB might run into. A QB may
use up to six or more foot patterns during a game scenario, such as from the shotgun position,
2
which is when the QB is about 5 yards behind the center, or a 1, 3, 5, or 7 step drop, or a
designed “roll out” where the QB must throw the ball while running to avoid defenders. The vast
amount of foot patterns along with the different distances, ball slope, and velocities require a
highly technical coordination of body motion in order for the QB to successfully pass the
football to the receiver. As offensive schemes in football have evolved over time and the recent
shift towards passing, it is essential for QBs to learn the proper throwing technique at the
youngest age possible.
1.2 Problem
With over five million children participating in football at the youth level, the development
of an athlete’s mechanics relies on the coaching techniques employed at a young age. Although
football is a popular sport, there is no consensus on the “proper” coaching techniques for the
quarterback positions. The QB position is widely considered the most important position on a
football team because it involves throwing a football accurately to their receivers and can affect
the scoring of a team, which in turn can help win games. There have been only four articles
published on the throwing mechanics of a QB. The first study published on the QB throwing
motion analyzed the mechanics of 12 collegiate quarterbacks over a period of three years during
the collegiate Senior Bowl [1]. The purpose of this study was to analyze the kinetics and
kinematics of the shoulder and elbow at the moment of foot contact with the use of video
cameras [1]. The second study compares the throwing motion of a baseball pitcher to the
throwing motion of a quarterback [2]. High-speed motion cameras were used to compare the
kinetics and kinematics of the two throwing motions of 26 high school and collegiate QBs and
baseball pitchers [2]. The third study specifically analyzing the QB throwing mechanics used
3
electromyography (EMG) to define the different phases of the football throw, but did not analyze
the kinematics or kinetics [3]. The fourth and final study found, compares the most effective
joint movements, segment velocities, and body positions to perform the fastest and most accurate
pass [24].
Each study had different limitations, some of which include a non-representative subject set,
few types of throws analyzed, and an ineffective method of capturing the throwing kinematics
and kinetics. Due to the little research on QB throwing mechanics and the limitations in the
research conducted, there have been no publications to date investigating the throwing
mechanics of a youth quarterbacks or the longitudinal development of these mechanics. The
previous studies also had each subject throw the football, but did not mention an attempt to
replicate a game-like scenario. The research published is based on previous research of overhead
sport motions such as baseball and is aimed towards a scientific audience. Although research is
generally geared towards a scientific audience, football coaches and athletes would benefit the
most from the popularization of research findings which could help with coaching techniques
and allow the athlete to adjust mechanics to work towards optimizing their throwing motion. Due
to the limitations of previous research, there is a lack of standardization of the coaching
techniques used to improve the development of a QB.
Improper throwing technique can hinder the development of a child and can cause injury due
to repeated motion of potentially hindering form [3-5]. The development of a youth’s body and
bone structure is occurring and improper throwing technique can cause injuries that differ from
older, more developed athletes [6]. Due to the high variability of the football throwing motion,
research of overhead throwing revolves around baseball. There are multiple studies that present
the effects of baseball throwing such as how fatigue due to the number of throws effects the
4
shoulder and elbow, the technique due to different pitch types, and the overall throwing motion
[4, 6, 7], yet there are none on the effects of the repeated motion of throwing a football. There is
a study based on the development of the throwing mechanics of baseball pitchers based on the
specific developmental periods of the athletes [2]. This data can be used to help optimize the
throwing motion of a QB based on the level and development of the player and start the
standardization of coaching techniques for specific age groups and/or skill levels, as well as
analyze the period in the athlete’s specific development. Therefore there is a need to obtain
longitudinal high quality quantitative biomechanical data for the football throw of developing
QBs.
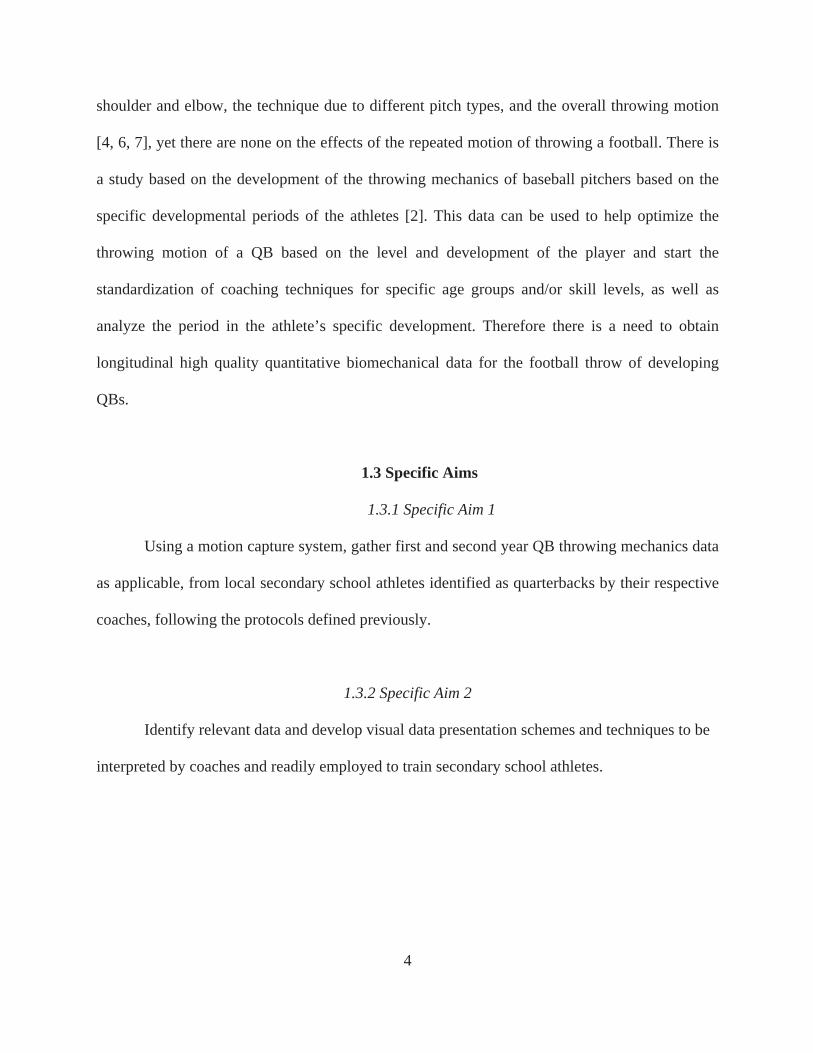
1.3 Specific Aims
1.3.1 Specific Aim 1
Using a motion capture system, gather first and second year QB throwing mechanics data
as applicable, from local secondary school athletes identified as quarterbacks by their respective
coaches, following the protocols defined previously.
1.3.2 Specific Aim 2
Identify relevant data and develop visual data presentation schemes and techniques to be
interpreted by coaches and readily employed to train secondary school athletes.
5
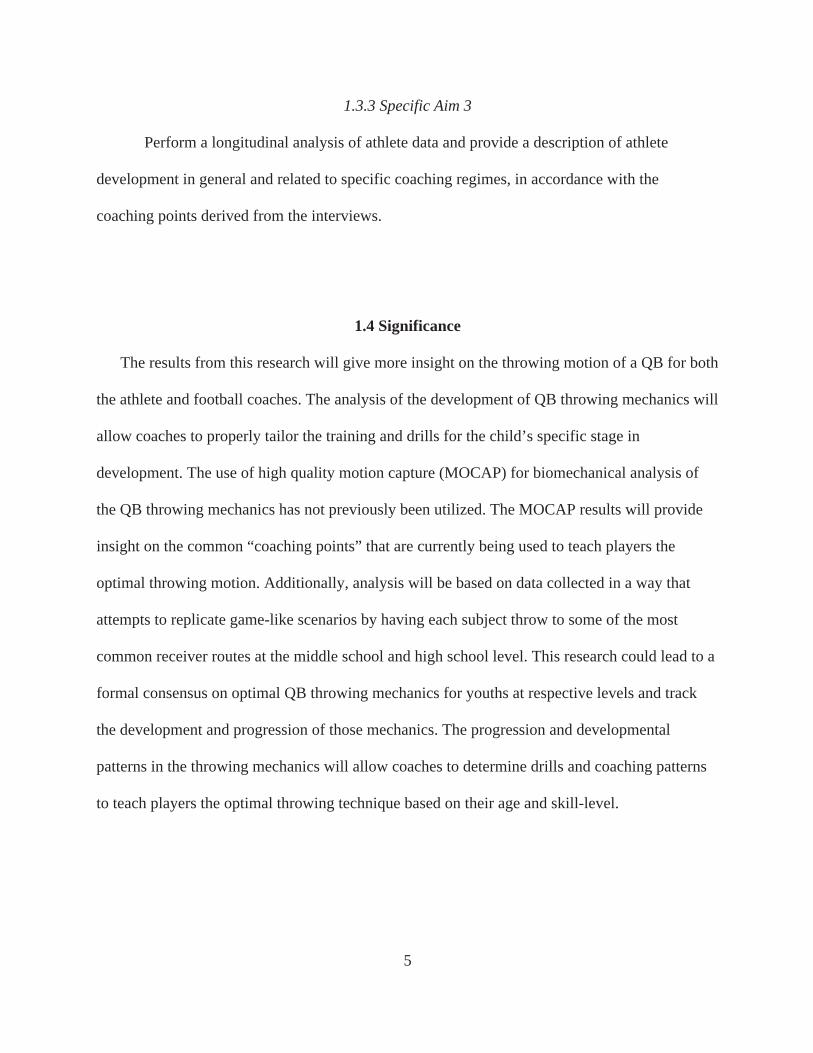
1.3.3 Specific Aim 3
Perform a longitudinal analysis of athlete data and provide a description of athlete
development in general and related to specific coaching regimes, in accordance with the
coaching points derived from the interviews.
1.4 Significance
The results from this research will give more insight on the throwing motion of a QB for both
the athlete and football coaches. The analysis of the development of QB throwing mechanics will
allow coaches to properly tailor the training and drills for the child’s specific stage in
development. The use of high quality motion capture (MOCAP) for biomechanical analysis of
the QB throwing mechanics has not previously been utilized. The MOCAP results will provide
insight on the common “coaching points” that are currently being used to teach players the
optimal throwing motion. Additionally, analysis will be based on data collected in a way that
attempts to replicate game-like scenarios by having each subject throw to some of the most
common receiver routes at the middle school and high school level. This research could lead to a
formal consensus on optimal QB throwing mechanics for youths at respective levels and track
the development and progression of those mechanics. The progression and developmental
patterns in the throwing mechanics will allow coaches to determine drills and coaching patterns
to teach players the optimal throwing technique based on their age and skill-level.
6
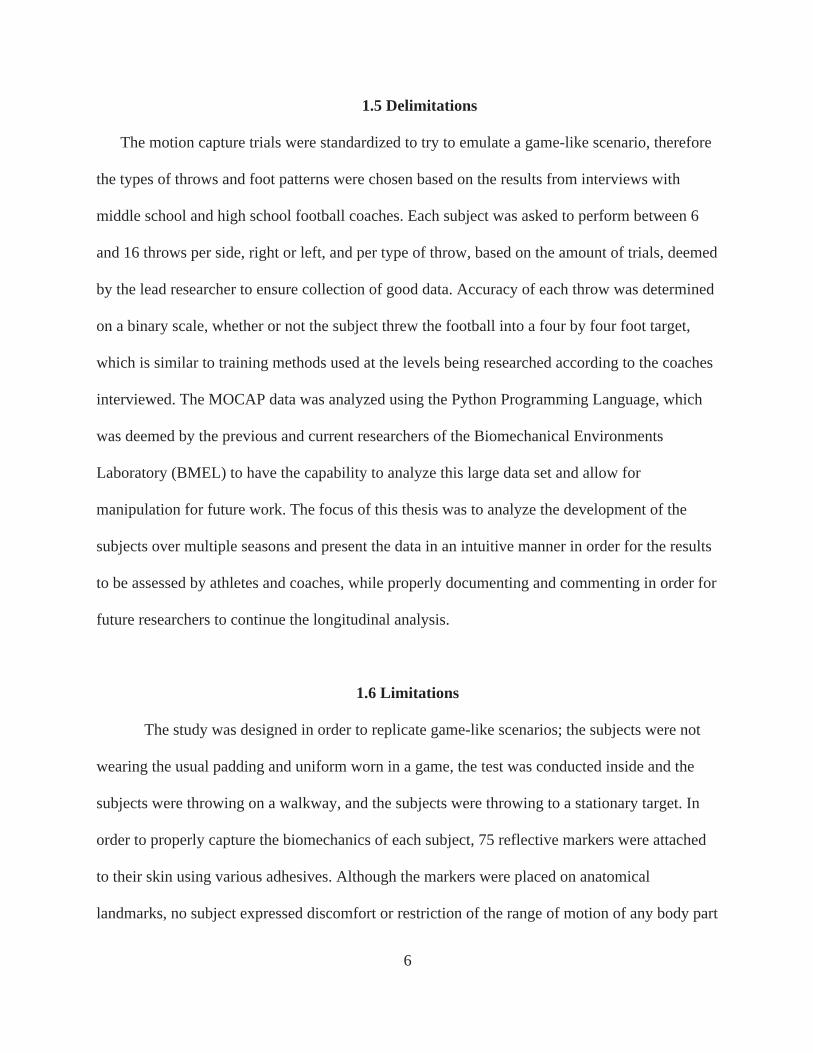
1.5 Delimitations
The motion capture trials were standardized to try to emulate a game-like scenario, therefore
the types of throws and foot patterns were chosen based on the results from interviews with
middle school and high school football coaches. Each subject was asked to perform between 6
and 16 throws per side, right or left, and per type of throw, based on the amount of trials, deemed
by the lead researcher to ensure collection of good data. Accuracy of each throw was determined
on a binary scale, whether or not the subject threw the football into a four by four foot target,
which is similar to training methods used at the levels being researched according to the coaches
interviewed. The MOCAP data was analyzed using the Python Programming Language, which
was deemed by the previous and current researchers of the Biomechanical Environments
Laboratory (BMEL) to have the capability to analyze this large data set and allow for
manipulation for future work. The focus of this thesis was to analyze the development of the
subjects over multiple seasons and present the data in an intuitive manner in order for the results
to be assessed by athletes and coaches, while properly documenting and commenting in order for
future researchers to continue the longitudinal analysis.
1.6 Limitations
The study was designed in order to replicate game-like scenarios; the subjects were not
wearing the usual padding and uniform worn in a game, the test was conducted inside and the
subjects were throwing on a walkway, and the subjects were throwing to a stationary target. In
order to properly capture the biomechanics of each subject, 75 reflective markers were attached
to their skin using various adhesives. Although the markers were placed on anatomical
landmarks, no subject expressed discomfort or restriction of the range of motion of any body part

7
during the throwing motion. The connection of the markers could have caused some effect on
their natural throwing motion, however no subject expressed motion being limited due to marker
placement. Each subject was asked to throw a minimum 36 throws during the test, which
generally lasted approximately an hour and a half to two hours. No subject complained of
fatigue, but it could have potentially affected the biomechanics during some of the throws. The
throws were not randomized and were standardized for each subject.
Each data capture had the same set up with the exception of Subjects 01-04 in the first
year of capture (2016). The initial force plate arrangement did not allow the subject to fully
strike a force plate with each foot, which did not allow for the full analysis of each subject. The
force plate arrangement was later changed after the first four subjects were tested to ensure the
force plates would allow for full force data during the tests.

8
CHAPTER II
LITERATURE REVIEW
2.1 Introduction
The purpose of this research is to analyze the understudied motion of QB throwing
mechanics using motion capture technology, as well as analyzing the development of youth
football throwing mechanics. The data from this study will be displayed in a way that illustrates
common coaching points in an intuitive way to be understood by coaches and players to apply to
specific coaching strategies. Thus, this section will review literature of relevant topics pertaining
to youth quarterback throwing mechanics using motion capture technology.
2.2 Quarterback Throwing Mechanics
2.2.1 Kinetic and Kinematic Analysis
The previous research conducted on QB throwing mechanics is limited, with only four
published articles on the topic to the researcher’s knowledge. Three of these articles analyze the
kinetics and kinematics of the throwing motion, while the other defines the football throwing
motion into phases using electromyography (EMG). The previous studies were limited in term of
the type of throws, the technology used to analyze the throw, the subject skill level, and the lack
of simulation of game-like situations.
The first research study published on QB throwing mechanics was by Rash and Shapiro
(1995) [1]. Rash and Shapiro analyzed 12 collegiate level QBs by investigating the kinetics and
kinematics at foot contact during a 30 yard straight pass. These QBs were analyzed using a video
images and a Peak Performance system with a three-dimensional coordinate data based on the
coordinate system and reference frames described in Figure 1.
9
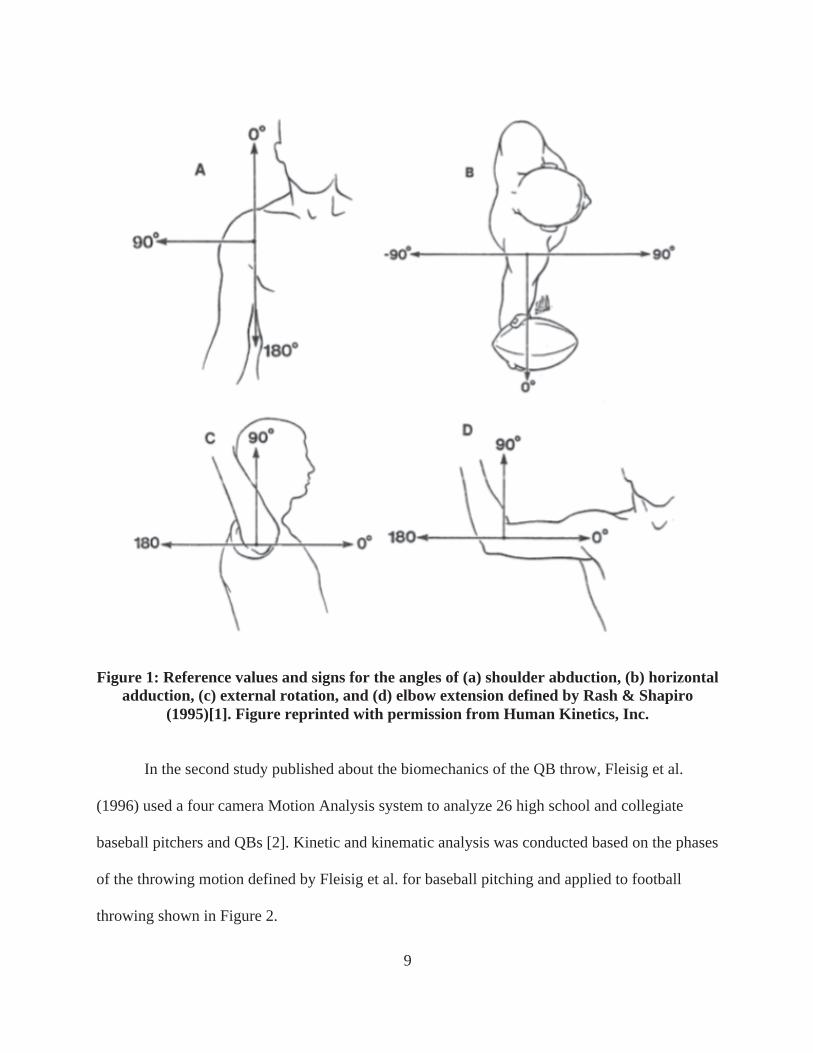
Figure 1: Reference values and signs for the angles of (a) shoulder abduction, (b) horizontal adduction, (c) external rotation, and (d) elbow extension defined by Rash & Shapiro
(1995)[1]. Figure reprinted with permission from Human Kinetics, Inc.
In the second study published about the biomechanics of the QB throw, Fleisig et al.
(1996) used a four camera Motion Analysis system to analyze 26 high school and collegiate
baseball pitchers and QBs [2]. Kinetic and kinematic analysis was conducted based on the phases
of the throwing motion defined by Fleisig et al. for baseball pitching and applied to football
throwing shown in Figure 2.
10
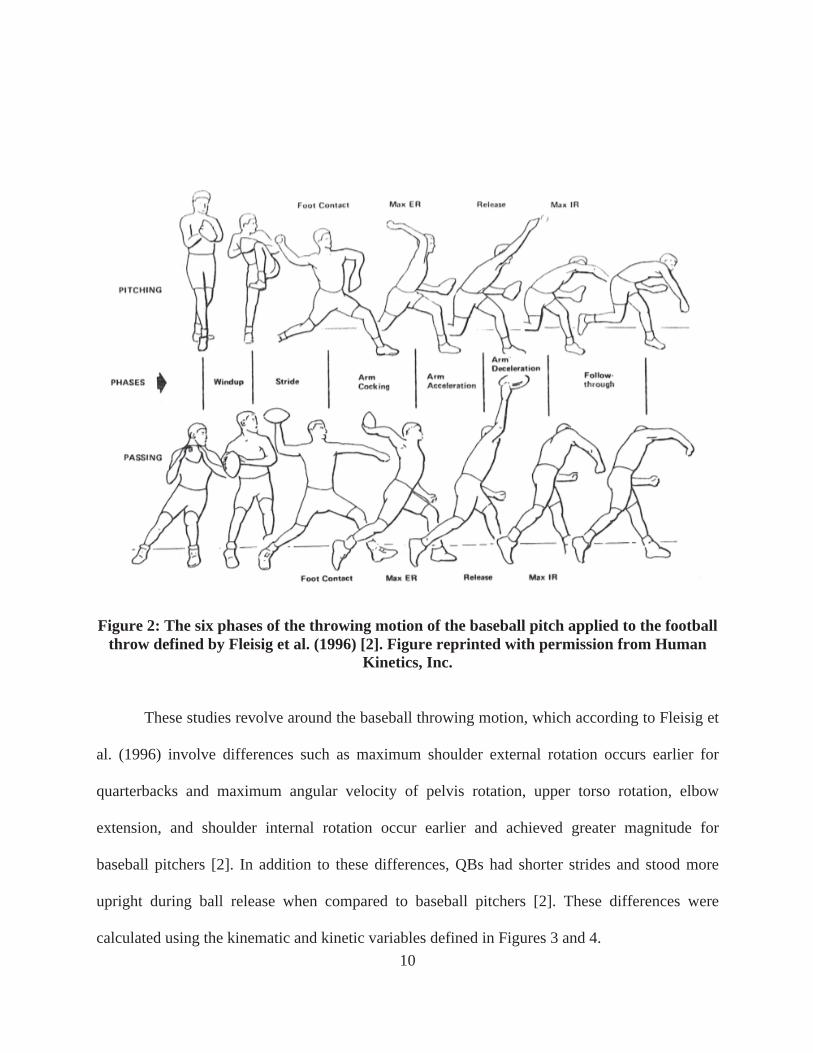
Figure 2: The six phases of the throwing motion of the baseball pitch applied to the football throw defined by Fleisig et al. (1996) [2]. Figure reprinted with permission from Human
Kinetics, Inc.
These studies revolve around the baseball throwing motion, which according to Fleisig et
al. (1996) involve differences such as maximum shoulder external rotation occurs earlier for
quarterbacks and maximum angular velocity of pelvis rotation, upper torso rotation, elbow
extension, and shoulder internal rotation occur earlier and achieved greater magnitude for
baseball pitchers [2]. In addition to these differences, QBs had shorter strides and stood more
upright during ball release when compared to baseball pitchers [2]. These differences were
calculated using the kinematic and kinetic variables defined in Figures 3 and 4.
11
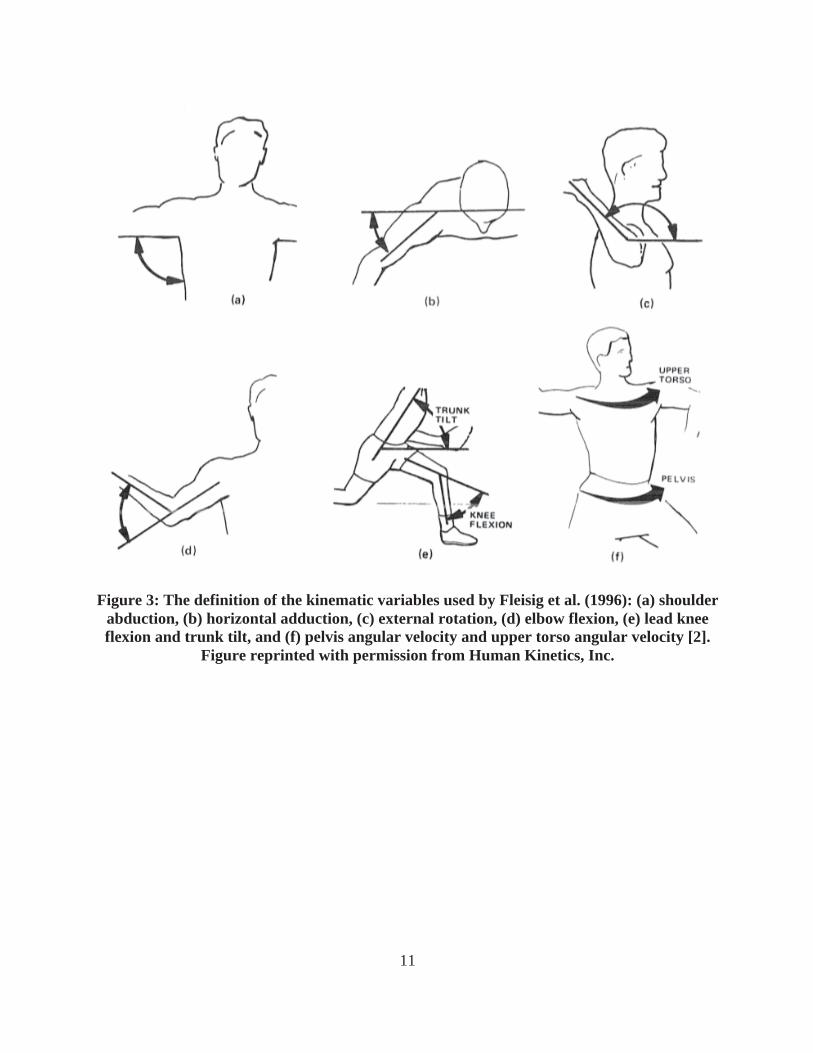
Figure 3: The definition of the kinematic variables used by Fleisig et al. (1996): (a) shoulder abduction, (b) horizontal adduction, (c) external rotation, (d) elbow flexion, (e) lead knee flexion and trunk tilt, and (f) pelvis angular velocity and upper torso angular velocity [2].
Figure reprinted with permission from Human Kinetics, Inc.

12
Figure 4: Definition of kinetic variables by Fleisig et al. (1996): (a) shoulder forces, (b) shoulder torques, (c) elbow forces, and (d) elbow torques. Figure reprinted with permission
from Human Kinetics, Inc.
The main difference between the study conducted Rash & Shapiro and Fleisig et al. is the
timing of the analysis. Rash & Shapiro analyzed the throwing motion at foot contact, while
Fleisig et al. conducted analysis throughout the entire throw and broke the throw into phases.
Although there are differences in the timing of the analysis, similar kinematic and kinetic
variables were studied.
13
To properly compare these studies, the differences in the methodology must be stated.
Rash & Shapiro analyzed 12 collegiate quarterbacks using two 60 Hz video cameras and the
Peak Performance Video Analysis System to digitize the video records of a three 30 yard passes
[1]. The subjects were not required to remove their clothing, therefore proper anatomical
landmarks were not visible, especially on the upper extremities, but was deemed insignificant by
the researchers [1]. Due to the space constraints of the capture, all four QBs were out of the
capture area for the first throw and half were out of the capture area for the second throw during
the first capture session in 1990, but the following capture sessions in 1991 and 1992 the
researchers were able to analyze five throws for each subject [1]. Therefore the data for four of
the subjects do not have the same amount of analyzed trials as the other subjects.
Fleisig et al. analyzed 26 quarterbacks, 13 high school and 13 collegiate, by attaching
reflective markers to anatomical landmarks while throwing dropback passes at a stationary target
located approximately 20 yards from the subject’s location at the time of ball release [2]. To
analyze the biomechanics of each subject, the Motion Analysis Corporation’s three-dimensional
automatic digitizing system was used to quantify each athlete’s motion with four cameras
synchronized at 200 Hz. Although there are some differences in the methodology, some kinetic
and kinematic parameters measured are similar. A comparison of those parameters broken into
the throwing phases is shown in Table 1 and 2.

14
Table 1: The kinematics variables analyzed by Rash & Shapiro (1995)[1] and Fleisig et al. (1996)[2].
Rash & Shapiro (1995) Fleisig et al. (1996) Instant of Foot Contact
Stride Length from Ankle to Ankle (% height)
- 61
Shoulder abduction (°) 97 (83*) 96 Shoulder Horizontal Adduction (°) 7 -1 Elbow Flexion (°) 77 75 (105*) Lead Knee Flexion - 37
Arm Cocking Phase Max Pelvis Angular Velocity (°/sec) - 500 Max Shoulder Horizontal Adduction (°) - 32 Max Upper Torso Angular Velocity (°/sec) - 950 Max Elbow Flexion (°) - 113
Instant of Maximum Shoulder External Rotation
Maximum Shoulder External Rotation Velocity (°/sec)
2987 -
Elbow Flexion (°) 85 (95*) - Elbow Flexion Velocity (°/sec) 1276 - Shoulder Horizontal Adduction (°) 7 - Shoulder Horizontal Adduction Velocity (°/sec)
851 -
Shoulder Abduction (°) 84 (96*) - Shoulder Abduction Velocity (°/sec) 1725 -
Arm Acceleration Phase Maximum Elbow Extension Velocity (°/sec)
- 1760
Average Shoulder Abduction During Acceleration (°)
96 108
Instant of Ball Release Ball Velocity (m/sec) 18 21 Shoulder External Rotation (°) 136 - Shoulder External Rotation Velocity (°/sec) 1063 Shoulder Abduction (°) 84 (96*) Shoulder Abduction Velocity (°/sec) 4 Shoulder Horizontal Adduction (°) 12 26 Shoulder Horizontal Adduction velocity (°/sec)
154 -
Elbow Flexion (°) 121 (59*) 36 Elbow Flexion Velocity (°/sec) 1225 - Trunk Tilt Forward (°) - 65

15
Table 1 Continued Rash & Shapiro (1995) Fleisig et al. (1996) Trunk Tilt Sideways (°) - 116 Lead Knee Flexion (°) - 28
Arm Deceleration Phase Maximum Shoulder Internal Rotation Velocity (°/sec)
- 4950
Maximum Elbow Flexion (°) - 24 Average Upper Torso Angular Velocity (°/sec)
- 310
*Variable as defined in terms of the reference plane defined by Fleisig et al.
Table 2: The kinetic variables analyzed by Rash & Shapiro (1995)[1] and Fleisig et al. (1996)[2].
Rash & Shapiro (1995) Fleisig et al. (1996) Arm Cocking Phase
Maximum Shoulder Anterior Force (N) - 350 Maximum Shoulder Horizontal Adduction Torque (N*M)
- 78
Maximum Shoulder Internal Rotational Torque (N*M)
- 54
Maximum Elbow Medial Force (N) - 280 Maximum Elbow Varus Torque (N*M) - 54
Instant of Maximum Shoulder External Rotation Shoulder Distraction Force (N) -435 - Shoulder Anterior Force (N) 233 - Shoulder Superior Force (N) -66 - External Rotation Torque (N*M) -60 - Adduction Torque (N*M) -889 - Horizontal Adduction Torque (N*M) -345 - Elbow Distraction Force (N) 236 - Elbow Medial Force (N) 162 - Elbow Anterior Force (N) -47 - Medial Deviation Torque (N*M) 69 -
Arm Acceleration Phase Maximum Elbow Flexion Torque (N*M) - 41
Instant of Ball Release Shoulder Distraction Force (N) -320 - Shoulder Anterior Force (N) 20 - Shoulder Superior Force (N) -150 - External Rotation Torque (N*M) -19 - Adduction Torque (N*M) 18 - Horizontal Adduction Torque (N*M) 23 -
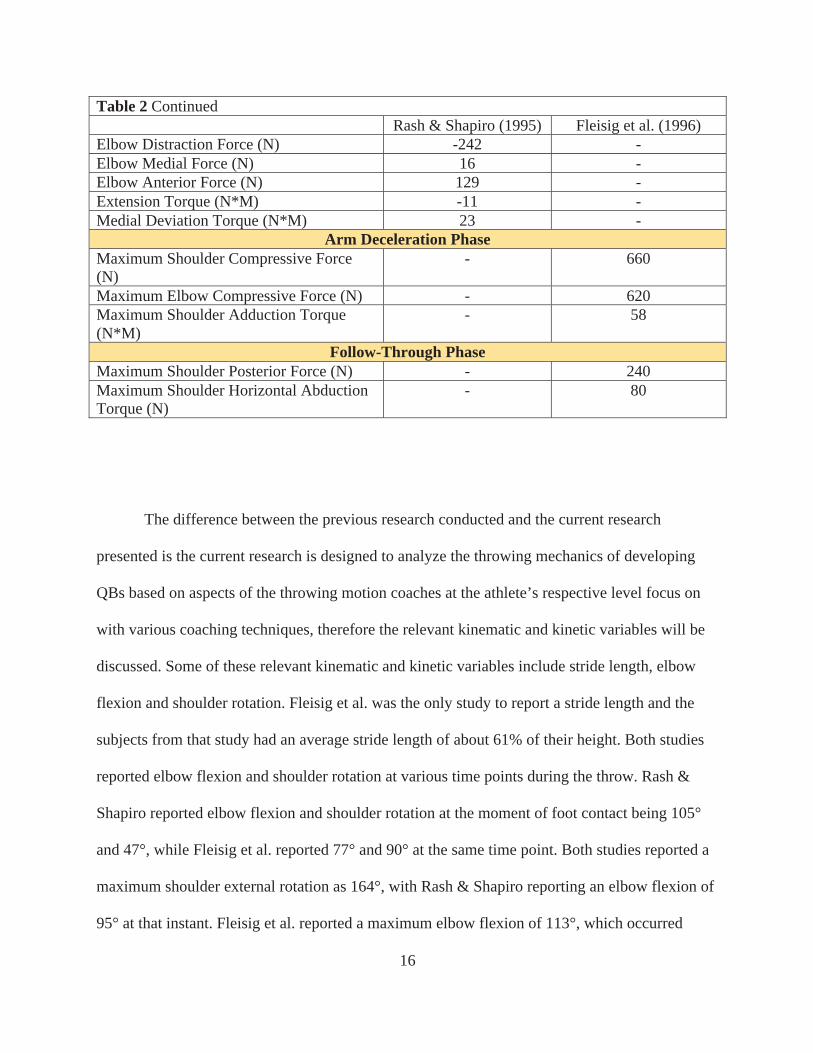
16
Table 2 Continued Rash & Shapiro (1995) Fleisig et al. (1996) Elbow Distraction Force (N) -242 - Elbow Medial Force (N) 16 - Elbow Anterior Force (N) 129 - Extension Torque (N*M) -11 - Medial Deviation Torque (N*M) 23 -
Arm Deceleration Phase Maximum Shoulder Compressive Force (N)
- 660
Maximum Elbow Compressive Force (N) - 620 Maximum Shoulder Adduction Torque (N*M)
- 58
Follow-Through Phase Maximum Shoulder Posterior Force (N) - 240 Maximum Shoulder Horizontal Abduction Torque (N)
- 80
The difference between the previous research conducted and the current research
presented is the current research is designed to analyze the throwing mechanics of developing
QBs based on aspects of the throwing motion coaches at the athlete’s respective level focus on
with various coaching techniques, therefore the relevant kinematic and kinetic variables will be
discussed. Some of these relevant kinematic and kinetic variables include stride length, elbow
flexion and shoulder rotation. Fleisig et al. was the only study to report a stride length and the
subjects from that study had an average stride length of about 61% of their height. Both studies
reported elbow flexion and shoulder rotation at various time points during the throw. Rash &
Shapiro reported elbow flexion and shoulder rotation at the moment of foot contact being 105°
and 47°, while Fleisig et al. reported 77° and 90° at the same time point. Both studies reported a
maximum shoulder external rotation as 164°, with Rash & Shapiro reporting an elbow flexion of
95° at that instant. Fleisig et al. reported a maximum elbow flexion of 113°, which occurred
17
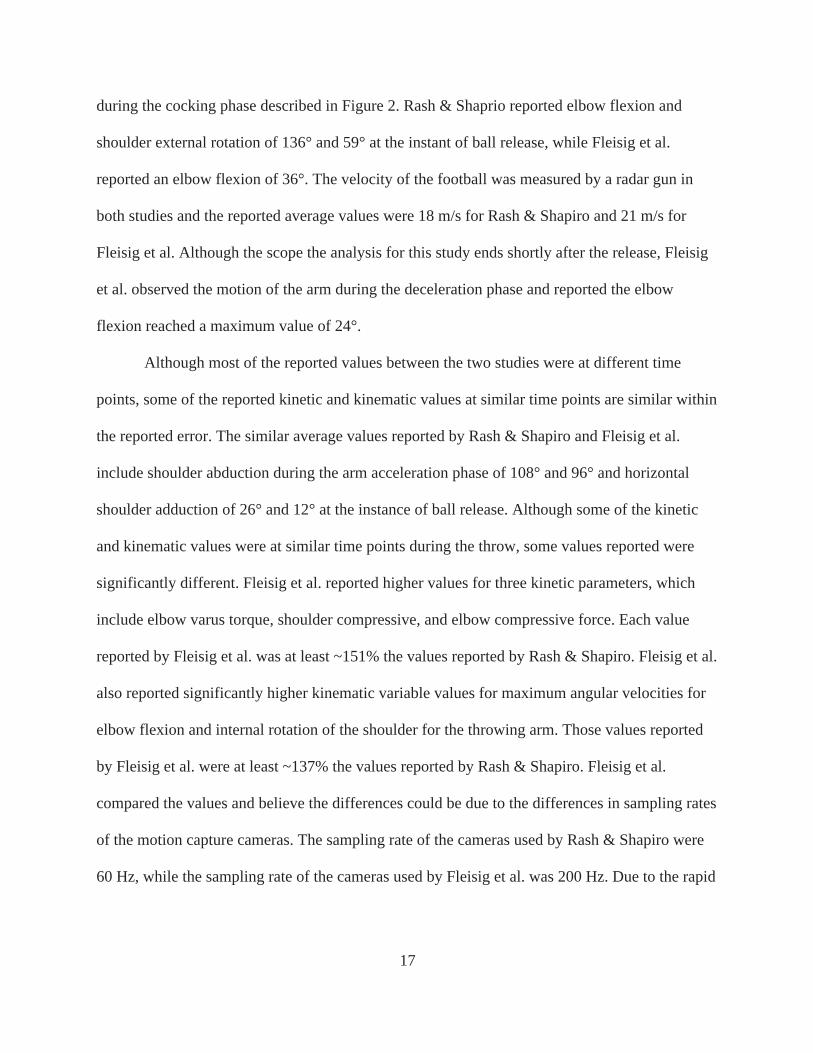
during the cocking phase described in Figure 2. Rash & Shaprio reported elbow flexion and
shoulder external rotation of 136° and 59° at the instant of ball release, while Fleisig et al.
reported an elbow flexion of 36°. The velocity of the football was measured by a radar gun in
both studies and the reported average values were 18 m/s for Rash & Shapiro and 21 m/s for
Fleisig et al. Although the scope the analysis for this study ends shortly after the release, Fleisig
et al. observed the motion of the arm during the deceleration phase and reported the elbow
flexion reached a maximum value of 24°.
Although most of the reported values between the two studies were at different time
points, some of the reported kinetic and kinematic values at similar time points are similar within
the reported error. The similar average values reported by Rash & Shapiro and Fleisig et al.
include shoulder abduction during the arm acceleration phase of 108° and 96° and horizontal
shoulder adduction of 26° and 12° at the instance of ball release. Although some of the kinetic
and kinematic values were at similar time points during the throw, some values reported were
significantly different. Fleisig et al. reported higher values for three kinetic parameters, which
include elbow varus torque, shoulder compressive, and elbow compressive force. Each value
reported by Fleisig et al. was at least ~151% the values reported by Rash & Shapiro. Fleisig et al.
also reported significantly higher kinematic variable values for maximum angular velocities for
elbow flexion and internal rotation of the shoulder for the throwing arm. Those values reported
by Fleisig et al. were at least ~137% the values reported by Rash & Shapiro. Fleisig et al.
compared the values and believe the differences could be due to the differences in sampling rates
of the motion capture cameras. The sampling rate of the cameras used by Rash & Shapiro were
60 Hz, while the sampling rate of the cameras used by Fleisig et al. was 200 Hz. Due to the rapid

18
motion of the throwing arm of a QB, the 60 Hz sampling rate may not have been sufficient for
the QB throwing analysis.
Toffan et al. analyzed the throwing technique of high school and university level QBs by
comparing the most effective joint movements, segment velocities, and body positions to
perform the fastest and most accurate passes [24]. This study analyzed the throwing motion by
using the Dartfish Team Pro 4.5.2 video analysis system in conjunction with high-speed video
cameras to analyze the kinematics of the throwing motion such as shoulder rotation and stride
length [24]. The significant differences found between the throwing motion of university and
high school level athletes was the body position at release, with high school athletes lacking
proper weight transfer, while university athletes did not externally rotate their throwing shoulder
as far as high school athletes [24]. University athletes also did not rotate their trunk as far as high
school athletes did during the test [24]. These analysis could be improved and track with greater
accuracy with high speed motion capture cameras because high speed video cameras and the
software used to analyze the subjects tracks anatomical landmarks via video and the anatomical
landmarks can be misconstrued during the throwing motion due to clothing.
2.2.2 Electromyography (EMG) Analysis
By using EMG techniques, Kelly et al. defined the football throw by analyzing the
muscle activation patterns [3]. The aim was to define the throw’s phases based on muscle
activation, thus no kinematic and kinetic data was collected. The phases of the throw were
defined as the early cocking, late cocking, acceleration, and the follow through shown in Figure
5.
19
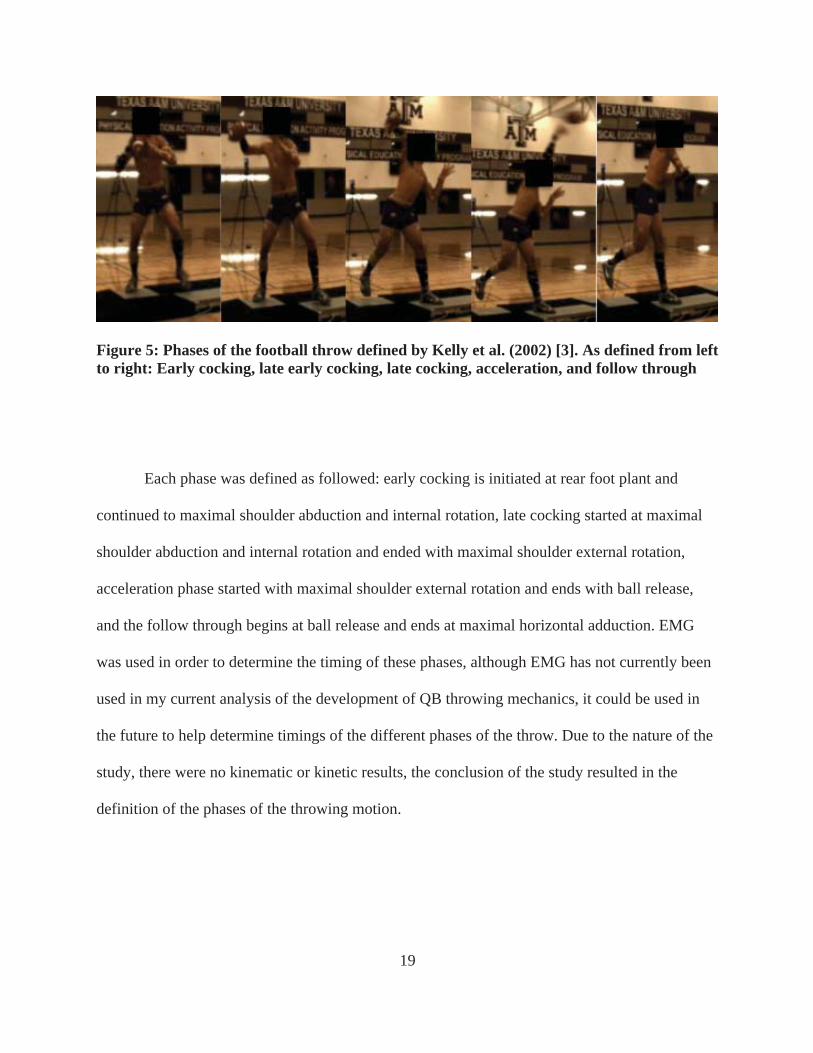
Figure 5: Phases of the football throw defined by Kelly et al. (2002) [3]. As defined from left to right: Early cocking, late early cocking, late cocking, acceleration, and follow through Each phase was defined as followed: early cocking is initiated at rear foot plant and
continued to maximal shoulder abduction and internal rotation, late cocking started at maximal
shoulder abduction and internal rotation and ended with maximal shoulder external rotation,
acceleration phase started with maximal shoulder external rotation and ends with ball release,
and the follow through begins at ball release and ends at maximal horizontal adduction. EMG
was used in order to determine the timing of these phases, although EMG has not currently been
used in my current analysis of the development of QB throwing mechanics, it could be used in
the future to help determine timings of the different phases of the throw. Due to the nature of the
study, there were no kinematic or kinetic results, the conclusion of the study resulted in the
definition of the phases of the throwing motion.

20
2.2.3 Additional Sources
Currently, to the researcher’s knowledge, the three studies previously mentioned are the
only peer-reviewed literature available. Although there is limited peer-reviewed literature, six
theses from graduate/undergraduate students have been published on an aspect of the QB
throwing motion. Due to the nature of a thesis, these analyses have not been peer-reviewed
therefore a brief summary of each is provided.
Robert A. Heppe in 1992 [11] reported kinematic variables associated with throwing a
football, such as hip and shoulder motion and lateral stride foot placement. Heppe used the Peak
Performance 3-D Motion Analysis System and video cameras to analyze four division 1-A QBs
during a straight throw out of a 5-step drop. The purpose of this research was to provide insight
into creating a more comprehensive model for QBs, as well as assist QBs in throwing from a
standing position, rolling out of the pocket and throwing on the move, or throwing while evading
a defender. In effort to provide this insight, Heppe analyzed the relationship between foot
placement and accuracy of the throw, but found no correlation between the two.
Next, Jeremy Wood in 2000 [12] analyzed the relationship between accuracy and
velocity with selected footwork patterns using a Peak 5 2D Motion system and a Tekscan
measurement system. After analyzing high school QBs, Wood concluded that a right-handed QB
should step to the left of the target, within approximately 10 degrees of the line to achieve
maximum accuracy and velocity based on the subjects tested and analyzed.
Brian Platt in 2012 [13] analyzed the kinematics of the football throwing motion and the
baseball pitching motion using electromagnetic sensors at the four different phases of the
throwing motion, described similarly to Fleisig et al. [2]. The kinematics of the throwing motion
based on foot position of high school QBs and baseball pitchers were compared and significant
21
differences were found in the degree of elbow flexion and velocity of hip rotation at the moment
of foot contact. A difference in elbow flexion at the instant of maximal external rotation was
found as well, but was not statistically significant.
Anthony Beeman in 2015 [14] created a Finite Element Model (FEM) of the throwing
arm using Abaqus to perform kinematic analysis based upon the Denavit-Hartenberg Method
combined with a planar two bar mechanism to model the overhead throwing motion. The
purpose of this research was to utilize previous research conducted to better understand the
kinematics of the football throwing motion and create a kinematic model via Abaqus to better
understand the internal forces in the shoulder and elbow. The goal of this model was to help
determine the optimum kinematics for the football throwing motion.
Kyle Bohnert in 2016 [15] used the Cortex software from Motion Analysis Corp. with 11
motion capture cameras, two force platforms (Bertec Corp), and electromyography (Delsys) to
analyze the kinematic and kinetic parameters of the football throw. These parameters were
analyzed on three collegiate QBs to determine the optimal football throwing mechanics.
Hunter Storaci in 2017 [16] used a 12-camera Vicon Motion Capture system to analyze 4
middle school and 11 high school quarterbacks. The kinematic and kinetic variables that were
analyzed were determined through interviews with local middle school and high school coaches
to determine common “coaching points” at the respective levels. Also through the interviews, the
three most common foot patterns with associated receiver routes were determined for the middle
school and high school levels. This study was used to validate the use of a custom Python
software to analyze motion capture data. This study developed the framework for the following
research and to analyze the longitudinal data to occur in the following years.
22
2.3 Motion Analysis Software
2.3.1 Vicon Nexus Software
The Vicon Motion Capture System uses the Nexus software program in order to label
reflective markers three-dimensional trajectories captured by near-infrared cameras in the
capture volume.
2.3.2 c3d File Format
The Nexus software outputs the three-dimensional data in a c3d file. The c3d file allows
the 3D data to be stored in a standardized form, which allows users to analyze the data similar to
analyzing a point or vector in 3D space because of the file format’s standard properties [17]. The
c3d file format stores 3D data, analog data, physical design of the laboratory such as the analog
channels and force plate orientation, trial information such as date and sample rates, patient
information, and any calculated results from the used models [17]. The wide use of this c3d file
format in the biomechanics field is due to format which allows for accessing data without any
specific hardware.
2.3.3 Pickled File Format
A pickled module implements binary protocols for serializing the input data by
converting the Python object hierarchy into a byte stream [18]. This allows for multiple results of
an analyzed c3d to be stored in a pickled file in the order analyzed. The grouping of analyzed
c3d results would allow for batch processing of data and grouping of data in any form necessary
for the respective data processing. The pickled data can be easily imported into a programming
language, and that data can be manipulated and analyzed.
23
2.4 Discussion
This literature review explored the relatively little amount of peer-reviewed literature on
QB throwing mechanics. These peer-reviewed articles analyzed the kinetics and kinematics of
the throwing motion in a limited fashion, describing the results in a scientific manner limiting the
audience. The aforementioned literature used a single type of throw to generalize the football
throwing motion, although different types of ball slopes, velocities, and foot patterns are
generally used in a game situation. The sample size and the type of subjects for the previous
studies were limited to a single group, which leaves information about other subjects and sample
groups untold. Due to these limitations, there is a need to analyze the development of youth
throwing mechanics and analyze and present the results in a way that benefits both coaches and
players in order to improve their throwing and coaching techniques.
The types of software tools available to analyze the motion capture data was discussed,
and the continuation of this project from a previous researcher [17], selected the types of
software needed to analyze the longitudinal results of this study. The previous software was used
and slightly upgraded in order to fit the needs of this study and to analyze the longitudinal data.
24
CHAPTER III
HUMAN SUBJECTS RESEARCH STUDY DESIGN
3.1 Introduction
This study was previously designed by Hunter Storaci (2017) in attempt to allow for the
most robust and useful analysis of the QB throwing motion [17]. The targeted audience of this
research is the coaches and quarterbacks. In order to reach this audience, interviews were
conducted with four middle school and four high school football coaches in order to determine
common “coaching points”, as well as determine three of the most common routes and foot
patterns used by QBs at the middle school and high school level in order to simulate a “game-
like” situations. The intention of this data is to be presented in a way to be intuitive to football
players and coaches to analyze throwing mechanics of specific players and determine aspects of
the throw to focus on to improve technique. This study is designed to follow subjects for up to 5
years in a longitudinal study to analyze the development from middle school through of their
high school playing career, possibly to further levels if a subject tested competes at higher levels.
Currently, there have been two time points in the longitudinal study, which is aimed to quantify
an understudied motion with a group of subjects that has seemingly been neglected. This data
will show the progression of throwing mechanics as the physical development of an adolescent
occurs.
3.2 Interview Results
Coaches’ experience varied from about 1 year to 31 years of coaching, but the goal of the
interviews was to determine common “coaching points” of the coaches at the middle school and
high school level, as well as the three most common foot patterns and receiver routes. These
25
coaches were interviewed under IRB approval (IRB2016-0211D) from the Texas A&M
Institutional Review Board prior to the initiation of the interviews. The results of the most
common “coaching points”, which was defined by being mentioned by the coaches in at least
half of the interviews, were the following eight aspects of throwing mechanics:
• Hip leading the shoulders throughout the throwing motion
• Elbow leading the hand during the through motion
• The time from the start of the throwing motion to the release of the ball (release time)
• Orientation of the hips, shoulders, and front foot at ball release
• Consistency of the throwing motion
• The motion of the non-throwing arm (or off-arm)
• Accuracy
• The length and direction of the stride
In order to analyze these coaching points during “game-like” scenarios, three common foot
patterns utilized by QBs in the schemes of the coaches interviewed were:
• No drop back (i.e., throwing from the shotgun position)
• 3-step drop
• 7-step rollout
These foot patterns commonly threw to the following three receiver routes:
• Quick game (i.e., screen, slant)
• Post/flag route
• Curl/dig/hitch route

26
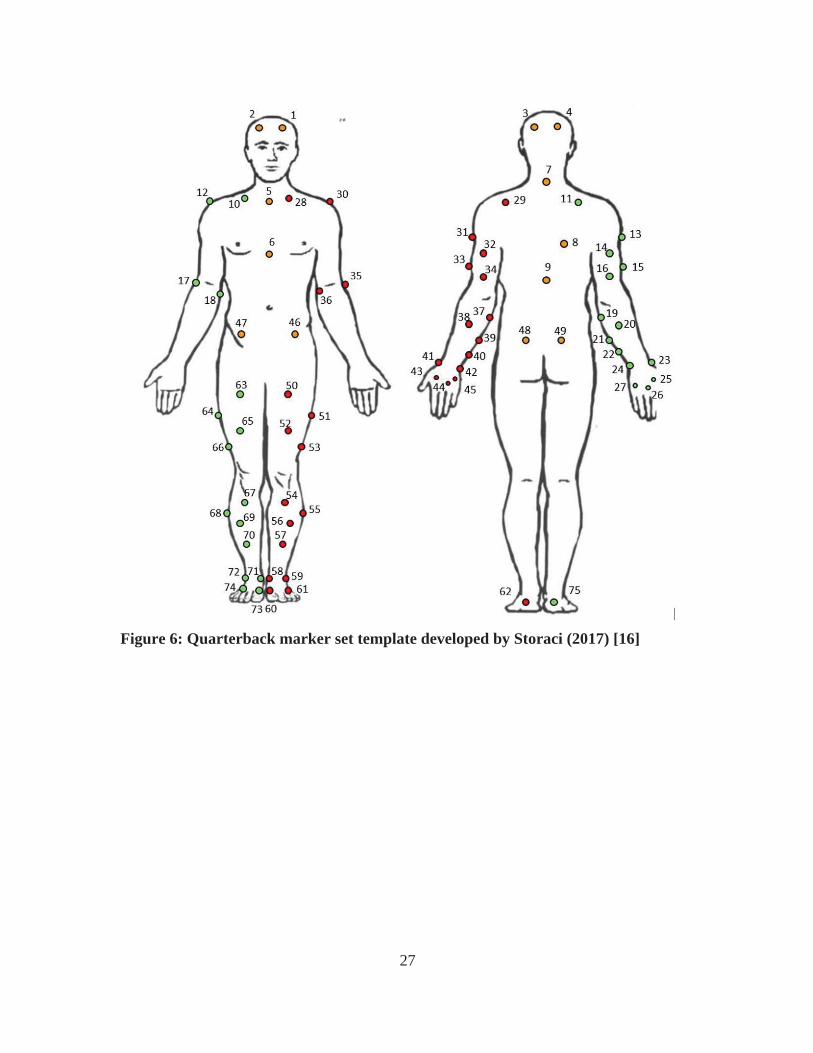
3.3 Marker Set Design
In order to fully analyze the throwing motion of a QB while not impeding the throwing
motion, a custom marker set was designed, which is compatible with the Nexus SCoRE and
SARA algorithms. The marker set was based on the cluster designs described by Cappozo et al.
(1997) [19] and from the documentation provided for Visual 3D [20]. The requirements for the
SCoRE and SARA algorithms are at least three markers per segment, so in this custom marker
set four markers were per segment were used to ensure three markers are present even in case of
an occlusion. The markers were placed in areas of the body where soft tissue artifact is minimum
with the long axis of the cluster along the long axis of the segment and the clusters were non-
collinear and widely distributed throughout each segment.
Due to the surface area of some segments, it was deemed infeasible to place four markers on
the hands, feet, and shoulders without obstructing the throwing motion, therefore these segments
contained three markets. Some subjects wore shoes during the tests; therefore it was difficult to
place markers on anatomical landmarks. Both the shoulders and hands presented no obvious
place for a fourth marker with minimal motion artifact without obstructing the throwing motion.
The marker set is shown in Figure 6 and the marker set on a subject is shown in Figure 7.
27
Figure 6: Quarterback marker set template developed by Storaci (2017) [16]
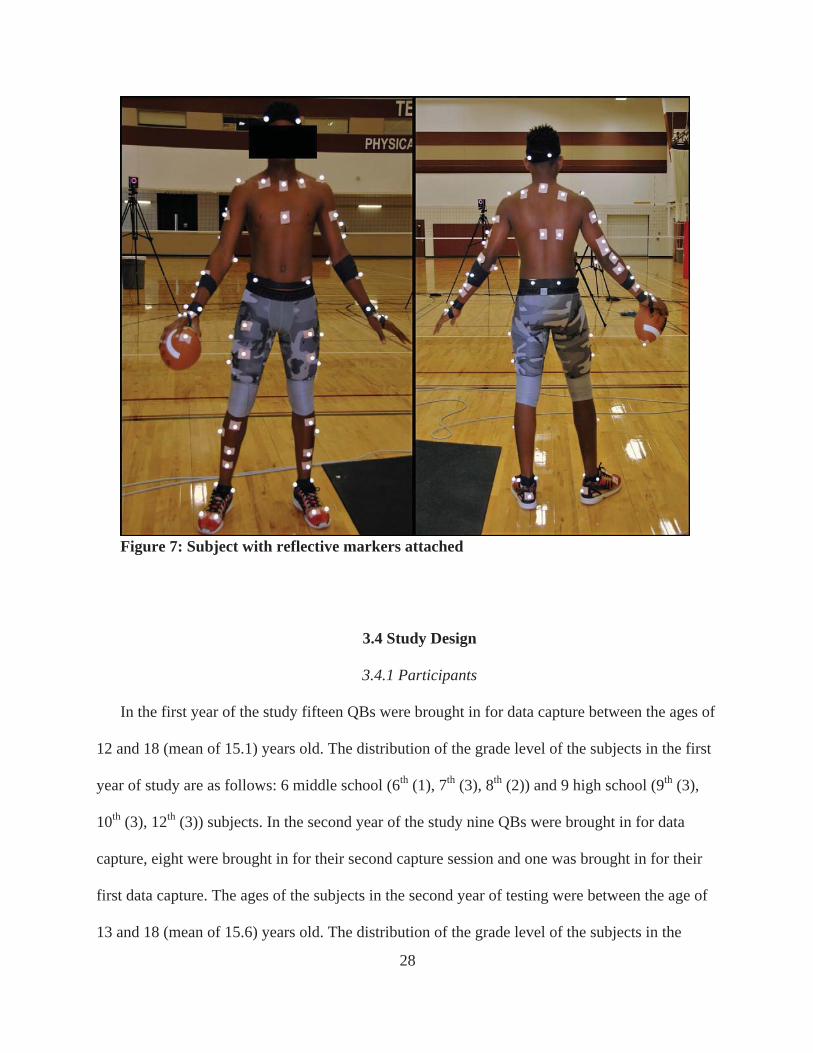
28
Figure 7: Subject with reflective markers attached
3.4 Study Design
3.4.1 Participants
In the first year of the study fifteen QBs were brought in for data capture between the ages of
12 and 18 (mean of 15.1) years old. The distribution of the grade level of the subjects in the first
year of study are as follows: 6 middle school (6th (1), 7th (3), 8th (2)) and 9 high school (9th (3),
10th (3), 12th (3)) subjects. In the second year of the study nine QBs were brought in for data
capture, eight were brought in for their second capture session and one was brought in for their
first data capture. The ages of the subjects in the second year of testing were between the age of
13 and 18 (mean of 15.6) years old. The distribution of the grade level of the subjects in the

29
second year of testing are as follows: 1 middle school (8th (1)) and 8 high school (9th (2), 10th (2),
11th (2), 12th (2)) subjects. The classification of subjects was based on the highest level of
completion, meaning an incoming freshman was considered a middle school age subject. The
subjects that were tested in two years with their grade and age distributions are shown below in
Table 3.
Table 3: Grade and age distribution of the eight subjects that were tested in both year 1 and year 2
Subject # 1st Year Grade 2nd Year Grade Age Year 1 Age Year 2
01 8 9 13 14
02 9 10 14 15
03 8 9 13 14
04 7 8 12 13
05 11 12 17 18
06 10 11 15 16
07 11 12 16 17
08 10 11 15 16
30
The QBs in this study were referred as a QB by their football coach and were football players
at the time of the data capture. These subjects were tested under IRB approval (IRB2016-
0290D), which was obtained from the Texas A&M Institutional Review Board, prior to the start
of the study.
Prior to the start of testing for each subject, written consent was obtained from all subjects,
which includes parental consent and minor assent for all subjects under the age of 18. To ensure
that there were no major health restrictions that could hinder the subject’s ability to participate in
the study, each subject was asked to fill out a brief health questionnaire to describe any possible
health issues. After each form was completed, the data capture was conducted at the Texas A&M
Physical Education Activities Program (PEAP) facility gymnasium. This space allowed for a
large enough space to perform game-like throws to targets placed similar distances from the QB
on a football field.
3.4.2 Testing Equipment
For the data capture, a twelve-camera Vicon Motion Capture System (Vantage V16),
with six wide angle and six narrow angle lens cameras, with three Vicon Bonita video cameras,
was used to obtain 3D marker data and 3D video overlay data for each throwing trial. Four
AMTI Force Plates (OR6-6-2000) were used to analyze force data while the subjects were on the
platforms. The near-infrared Vantage 16MP cameras were arranged as shown in Figure 8, while
one video camera was placed in front of the subject, one placed to the right side of the subject,
and one behind the target to record the accuracy of the throws. The gaps left in the front right and
31
front left of the capture were to clear an area for the target as well as give the subjects space to
make the throw. The calibration of the camera was determined to be adequate after the Nexus
software system reported a calibration error of less than or equal to 0.2 for each camera.
3.4.3 Marker Attachment
Each subject had 75 reflective markers attached to anatomical landmarks according to
Figure 6, developed previously. This Quarterback Template of markers required the subjects to
only wear compression shorts or leggings during trials, so the markers can be placed directly on
skin and a minimal amount of markers on clothing to avoid excess movement from clothing
artifact. Originally the reflective markers were attached with moleskin in the first round of study,
but with the nature of the test and the adhesive ability of moleskin, many markers would fall off
or move during the test due to perspiration. In order to combat this issue, electrode tape were
used to attach the markers to the skin of the subjects and moleskin was used to connect markers
on clothing. Self stick tape and safety pins were used if necessary. The most common area self
stick tape was the subjects’ hands, while safety pins were used to secure moleskin patches to
shoes and clothing to ensure the patches and markers do not move during the test. Each subject
was asked to express any discomfort or restriction during the throwing motion due to marker
placement or connection.
The marker placement was reviewed by the lead researcher prior to the start of each test
to ensure the marker placement followed the Quarterback Template described in Figures 6 & 7.
The technicians followed the same protocol set forth by Storaci (2017) [16] which included the
guidelines of marker placement set by Cappozo et al. [19] and C-Motion [20] in order to keep

32
consistency throughout the trials to avoid any differences in the data during the longitudinal
study.
3.4.4. Throwing Data Capture
In order to limit possible factors that could alter throwing mechanics, similar protocol to
Storaci (2017) [16] was used. Each subject was given ample time to warm up by conducting a
similar warm-up routine for a practice or a game before the start of the trials. After the warm-up
was completed calibration trials were conducted to determine segment length and range of
motion of each of the joints. The route order was not changed from Storaci (2017) [16] and that
order is as follows:
• 5 yard hitch to the right side, out of the shotgun
• 25 yard corner to the right out of a 3-step drop back
• 5 yard hitch out to the left side, out of the shotgun
• 25 yard corner to the left side out of a 3-step drop back
• 12 yard curl to the right side out of a designed rollout
• 12 yard curl to the left side out of a designed rollout
In order to analyze the forces distributed throughout the throwing motion, subjects threw off
of an elevated surface with four embedded force plates for the hitch routes out of the shotgun and
the 25-yard corners out of a 3-step drop. Due to the variability of the designed rollout throwing
motion and where the subject would begin the throwing motion, it was deemed infeasible to have
the subjects throw off of the force plates with the camera and force plate positioning. The
arrangement of the force plates was created in an attempt to ensure optimal data collection for
both the front foot strike and the back foot strike. Each subject threw between 6-16 throws to
33
each of the patterns in order to receive adequate foot strike force plate data. For the throws out of
a designed rollout the subjects were asked to throw between 6-10 throws.
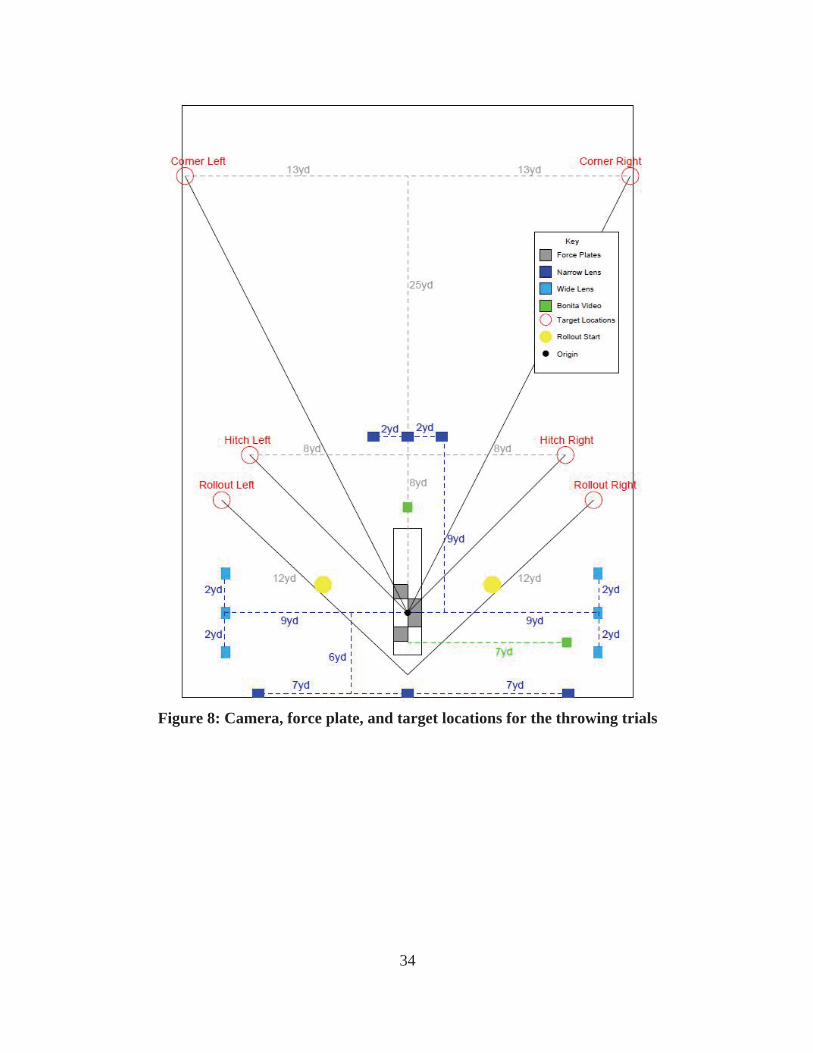
3.4.5 Camera and Target Locations
The stationary target was placed at the respective distances for each receiver route. A 4x4
foot vertical target was used for the hitch and comeback routes, while a horizontal target with the
same dimensions was used for the 25-yard corner to anticipate a higher release angle than the
hitch and comeback routes. A diagram of the camera, force plate, and target locations used is
shown in Figure 8 and 9.
34
Figure 8: Camera, force plate, and target locations for the throwing trials

35
Figure 9: Camera set-up at the Texas A&M PEAP facility
3.5 Discussion
This chapter focuses on the methods used to capture the throwing and force data during
the trials. The steps to develop a custom marker set and camera set-up to properly analyze the
parameters set forth by the interviews with football coaches. By using these parameters as a
framework, the longitudinal development can be analyzed primarily by what the coaches
qualitatively and give quantitative backing to the coaching points. To properly analyze the
mechanics, the researchers developed a protocol to simulate a “game-like” situation to avoid any
as many differences that could occur while throwing in a laboratory setting as possible.
Previously, interviews with middle school and high school coaches were conducted by Storaci
(2017) [16] to determine the most common receiver routes and foot patterns of the respective

36
levels and develop a protocol to simulate “game-like” scenarios during the data capture. This
protocol was emulated in order to limit the factors that could affect the results from year to year
to the development of the subject and the coaching techniques used throughout the year to
optimize throwing mechanics.
The set-up and location allowed for the subjects to have space to throw the football in an
ample capture volume. The arrangement in Figure 8 depicts the wide angle lenses cameras on
the sides of the volume, which are located closer to the subject, and the narrow angle lenses
cameras on the front, back, and corners to confine the capture volume. By maintaining similar
protocol, the data capture from each year remained a similar experience to the subjects.
37
CHAPTER IV
DESCRIPTION OF ANALYSES
4.1 Introduction
The nature of coaching QB throwing mechanics involves phrases and descriptions of
movements that are not in scientific language. In order to properly analyze the data via the
common “coaching points”, the description of these coaching points must be put into scientific
language to create an intuitive analysis. Once the coaching points were determined, analysis was
created based on previous overhead throwing mechanics literature and used those techniques to
analyze football throwing mechanics.
4.2 Common Coaching Points
Previously, Storaci (2017) [16] interviewed middle school and high school football
coaches to determine common “coaching points” for the middle school and high school level.
These common coaching points are as follows:
• Hip leading the shoulders throughout the throwing motion
• Elbow leading the hand during the through motion
• The time from the start of the throwing motion to the release of the ball (release time)
• Orientation of the hips, shoulders, and front foot at ball release
• Consistency of the throwing motion
• The motion of the non-throwing arm (or off-arm)
• Accuracy
• The length and direction of the stride
38
These descriptions by coaches were not in scientific language, thus the common coaching points
can be shown in multiple ways to show what coaches are looking for.
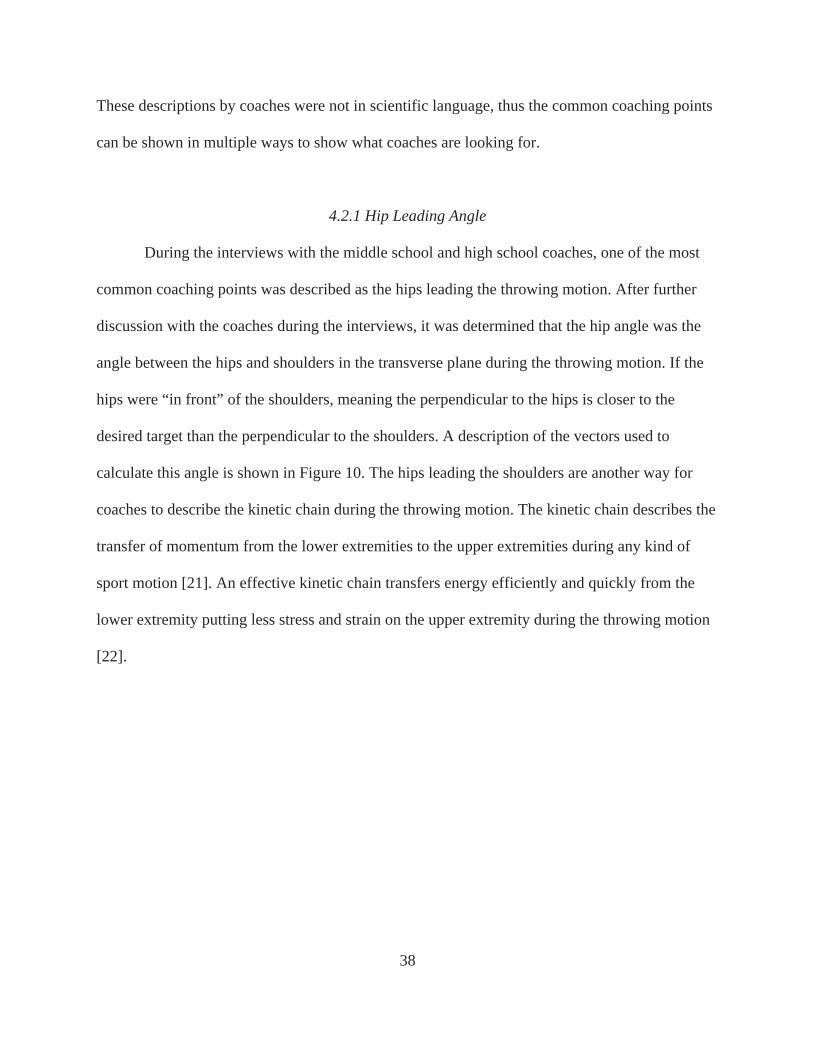
4.2.1 Hip Leading Angle
During the interviews with the middle school and high school coaches, one of the most
common coaching points was described as the hips leading the throwing motion. After further
discussion with the coaches during the interviews, it was determined that the hip angle was the
angle between the hips and shoulders in the transverse plane during the throwing motion. If the
hips were “in front” of the shoulders, meaning the perpendicular to the hips is closer to the
desired target than the perpendicular to the shoulders. A description of the vectors used to
calculate this angle is shown in Figure 10. The hips leading the shoulders are another way for
coaches to describe the kinetic chain during the throwing motion. The kinetic chain describes the
transfer of momentum from the lower extremities to the upper extremities during any kind of
sport motion [21]. An effective kinetic chain transfers energy efficiently and quickly from the
lower extremity putting less stress and strain on the upper extremity during the throwing motion
[22].
39
Figure 10: Depicting vectors used to calculate hip leading angle in transverse plane.
Adapted from Shutterstock[25]
4.2.2 Elbow Leading the Hand
For the elbow leading the hand angle, the coaches would like to see their QBs to have
their elbow towards the target with hand following until close to release. This description is
similar to shoulder internal and external rotation, but not all coaches are familiar with scientific
language so this is not the vernacular used to exclaim the coaching point. To calculate shoulder
internal/external rotation in the sagittal plane by using a vector created between the middle of the
hips and the middle of the shoulders and the vector created from the wrist and the elbow. The
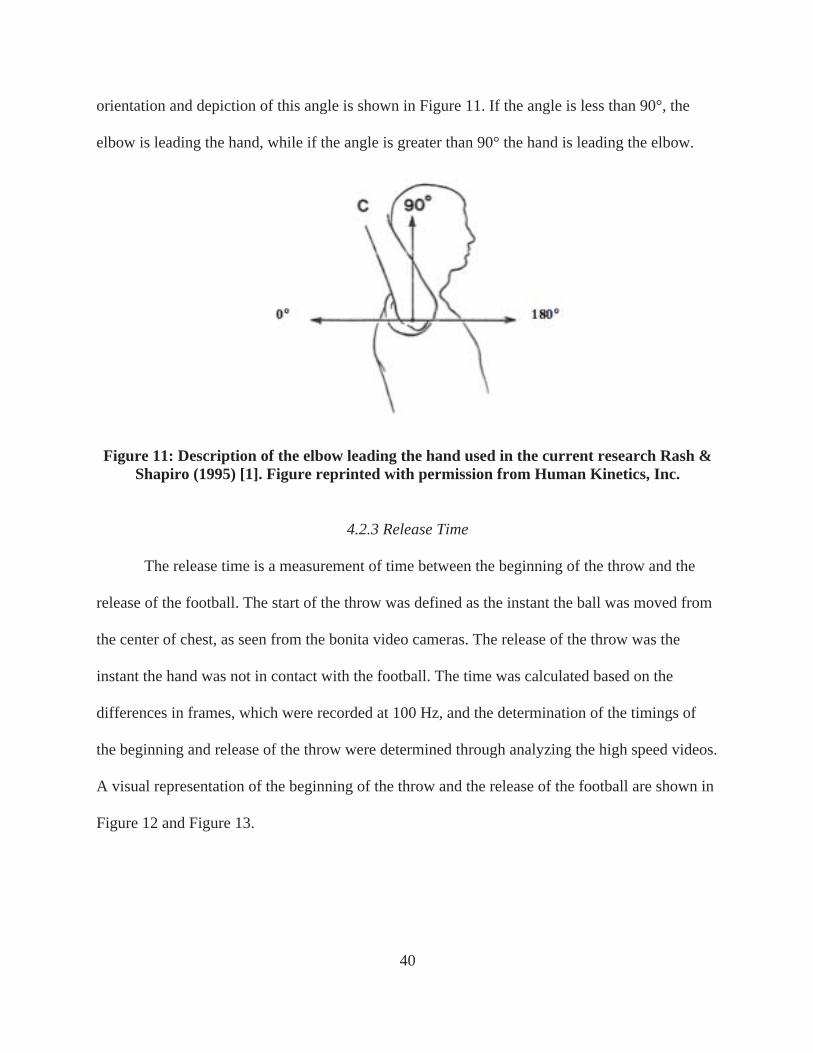
40
orientation and depiction of this angle is shown in Figure 11. If the angle is less than 90°, the
elbow is leading the hand, while if the angle is greater than 90° the hand is leading the elbow.
Figure 11: Description of the elbow leading the hand used in the current research Rash &
Shapiro (1995) [1]. Figure reprinted with permission from Human Kinetics, Inc.
4.2.3 Release Time
The release time is a measurement of time between the beginning of the throw and the
release of the football. The start of the throw was defined as the instant the ball was moved from
the center of chest, as seen from the bonita video cameras. The release of the throw was the
instant the hand was not in contact with the football. The time was calculated based on the
differences in frames, which were recorded at 100 Hz, and the determination of the timings of
the beginning and release of the throw were determined through analyzing the high speed videos.
A visual representation of the beginning of the throw and the release of the football are shown in
Figure 12 and Figure 13.

41
Figure 12: Representation of the beginning of the throwing motion
Figure 13: Representation of the timing of ball release of the throwing motion
4.2.4 Orientation at Ball Release
The orientation coaches expect at ball release involves the “7-eyes downfield”. The 7-
eyes described by the coaches include the direction of big toe of non-throwing side foot, the
direction of the inside of the non-throwing side knee, the perpendicular direction of the hips
42
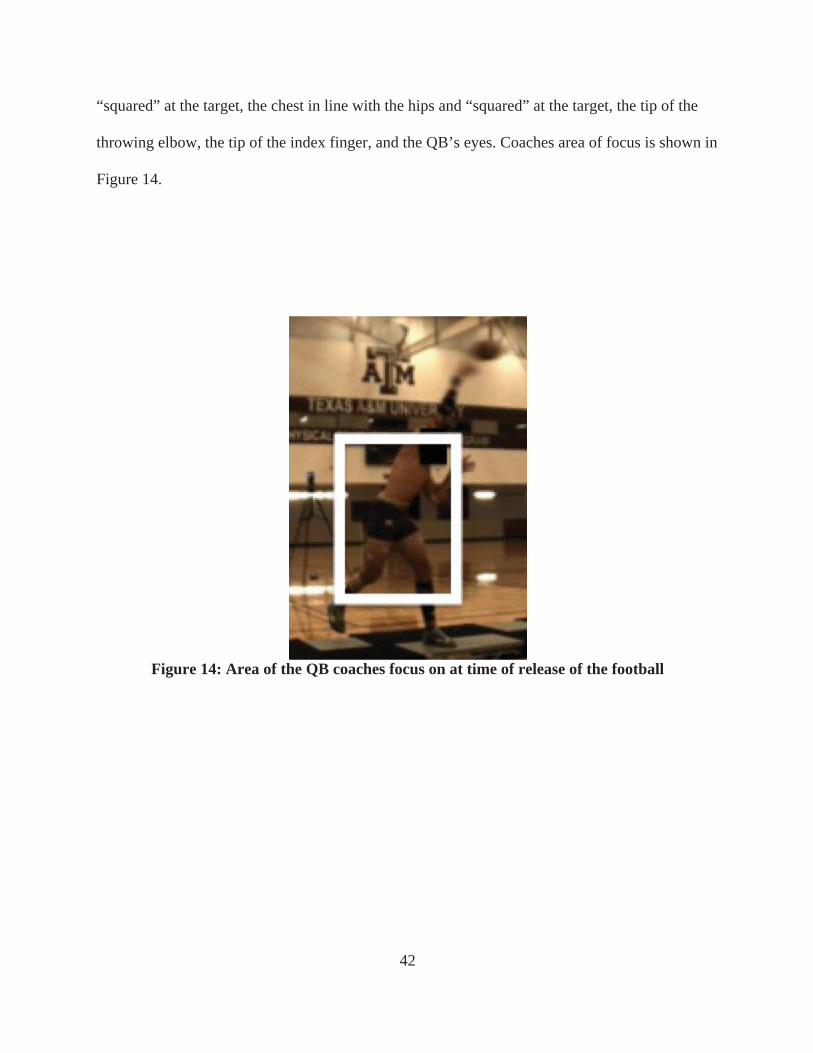
“squared” at the target, the chest in line with the hips and “squared” at the target, the tip of the
throwing elbow, the tip of the index finger, and the QB’s eyes. Coaches area of focus is shown in
Figure 14.
Figure 14: Area of the QB coaches focus on at time of release of the football
43
According to Van Tassel [23] each “eye” increases the efficiency, accuracy, and
precision of the throwing motion and holds a different purpose to assist in optimizing mechanics.
The direction of the big toe of the non-throwing side foot forces the QB to step slightly left of the
target to open the hips during the throw and helps place the QB’s body in a proper position to
make a horizontally accurate throw. The direction of the foot can also determine if the QB is
over-striding which may cause the ball to sail over the desired target or under-striding causing
the ball to drop short of the target. The second eye, the inside of the non-throwing side knee,
helps reinforce that the transfer of energy from the lower extremities through the arm. This
optimizes mechanics allowing the kinetic chain, the transfer of energy from the lower extremities
to the upper extremities during a sports related motion, to help with the efficiency of the
mechanics. The third eye, the belt buckle as described by various football coaches, allows the
body to be squared towards the target for the full transfer of momentum from the lower
extremities to the upper extremities. The fourth eye, the chest, allows for the momentum to be
fully transferred from the hips and ensures the upper and lower body is in line during the throw.
The tip of the elbow, or the fifth eye, aimed at the target is essential for vertical accuracy. The
fifth eye forces the QB to keep the throwing shoulder above the non-throwing shoulder, ensures
the elbow is leading the hand during the throwing motion, and forces the throwing elbow to be
above the throwing shoulder. The sixth eye, the tip of the index finger, ensures a tight spiral of
rotation for the football that helps with the accuracy of the throw. The seventh eye of the QB is
their actual eyes. Coaches want their QBs to focus on the target while the threat of the defense is
coming to ensure the throw is where a receiver is located.
44
4.2.5 Consistency of the Throwing Motion
The consistency of the throwing motion allows for an accurate and precise throw of the
football. If the player can consistently throw using the same mechanics, the result of the throw
will likely be the same. In order to measure the consistency of the results, standard deviation of
each of the other coaching points, with the exception of accuracy, was calculated to ensure the
motion did not drastically change for each trial. The standard deviation of accuracy was not
calculated because accuracy was measured on a binary scale, either the throw was accurate or
inaccurate and how close the ball was to the center of the target was neglected.
4.2.6 Non-Throwing Arm Motion
Coaches describe the optimal throwing motion as the QB keeping their off-hand or the
non-throwing hand close to their center of their body to minimize the amount of space needed to
make a throw. Keeping their non-throwing arm close to their body helps prevent defenders from
hitting the off-hand of the QB and disrupting the throwing motion. In baseball however, athletes
are taught to point their non-throwing hand at their target and extend their non-throwing arm and
use this arm to balance during the throwing motion. Football coaches work to differentiate the
two throwing motions because adolescent athletes might be taught to throw in different manners
for the two sports.
The off-hand motion was calculated by finding the distance of the elbow and hand from
the center of the body throughout the throw. The off-hand motion was reported as the maximum
distance of the non-throwing elbow and the non-throwing hand from the center of the body.
45
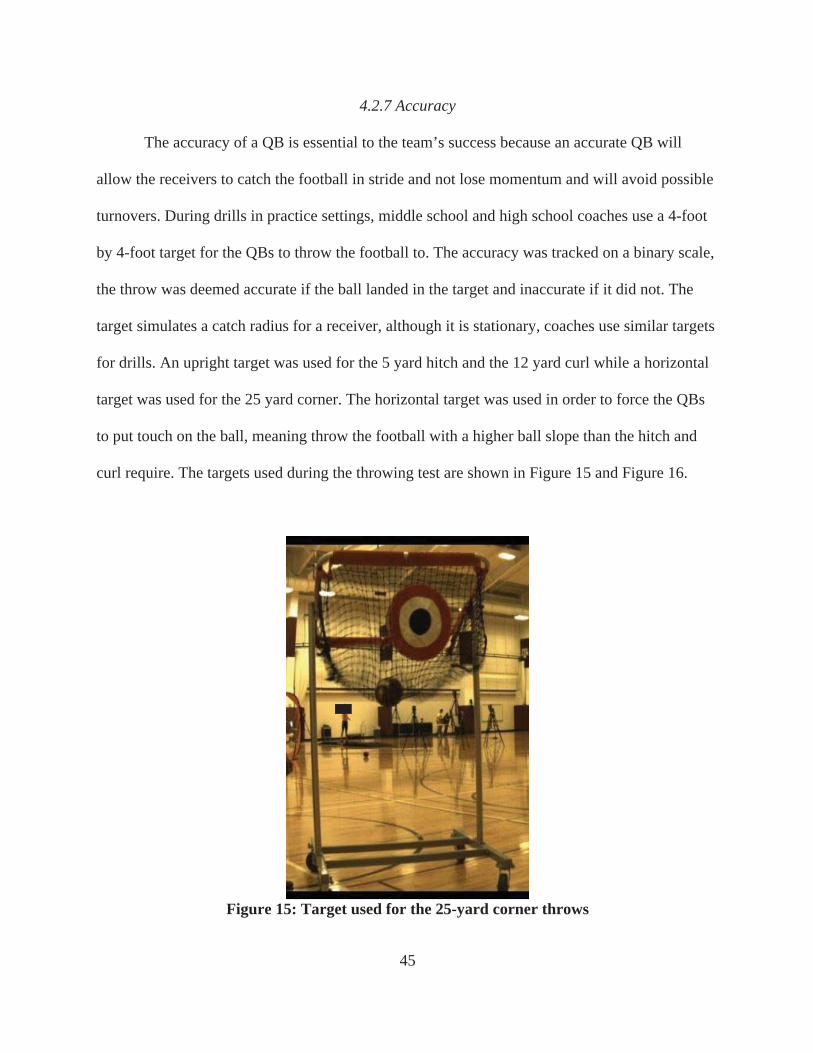
4.2.7 Accuracy
The accuracy of a QB is essential to the team’s success because an accurate QB will
allow the receivers to catch the football in stride and not lose momentum and will avoid possible
turnovers. During drills in practice settings, middle school and high school coaches use a 4-foot
by 4-foot target for the QBs to throw the football to. The accuracy was tracked on a binary scale,
the throw was deemed accurate if the ball landed in the target and inaccurate if it did not. The
target simulates a catch radius for a receiver, although it is stationary, coaches use similar targets
for drills. An upright target was used for the 5 yard hitch and the 12 yard curl while a horizontal
target was used for the 25 yard corner. The horizontal target was used in order to force the QBs
to put touch on the ball, meaning throw the football with a higher ball slope than the hitch and
curl require. The targets used during the throwing test are shown in Figure 15 and Figure 16.
Figure 15: Target used for the 25-yard corner throws

46
Figure 16: Target used for the 5-yard hitch and the 12-yard comeback route
4.2.8 Stride Length and Direction
The stride length will determine how effectively the QB transfers the momentum from
the lower extremities to the throw [23]. Rash and Shapiro (1996) [1] reported stride length
average of 61% of the subject’s height. Coaches believe over-striding while throwing will cause
the ball to sail over the desired target, while under striding will cause the throw to be shorter than
the desired target [23]. Thus finding the optimal stride length will help the QB throw to the
desired target. The stride length was calculated from the fifth metatarsal marker for each foot and
the instance of the foot strike.
Although there has not been any peer-reviewed literature on the direction of the stride for
optimal football throwing mechanics, Jeremy Wood (2000) [12] reported that approximately a
47
10-degree difference from the stride direction and the desired target was considered efficient.
The stride direction was calculated based on the direction of the stride to the direction of the ball
trajectory.
4.3 Discussion
By using the common coaching points from the interviews conducted with middle school
and high school coaches, the analysis is tailored towards what is currently being taught to the
QBs at the middle school and high school levels. By interviewing coaches, it was deemed that
the analysis was determined by experts in the field because there is little peer-reviewed research
on the subject therefore the ones that have analyzed the throwing motion are coaches.
These eight coaching points were analyzed and compared for the different subject groups
and allowed for the researcher to determine the optimal throwing mechanics based on what
players are being taught. Using these coaching points limited the analysis to what half of the
coaches exclaimed as an important aspect of the throwing motion, other points that may be
useful and are being used to teach the throwing motion may not have been mentioned in the
interviews and could be deemed as useful to the coaches and players. Due to the nature of motion
capture data, further analysis may be conducted in order to analyze all aspects of the football
throwing motion.
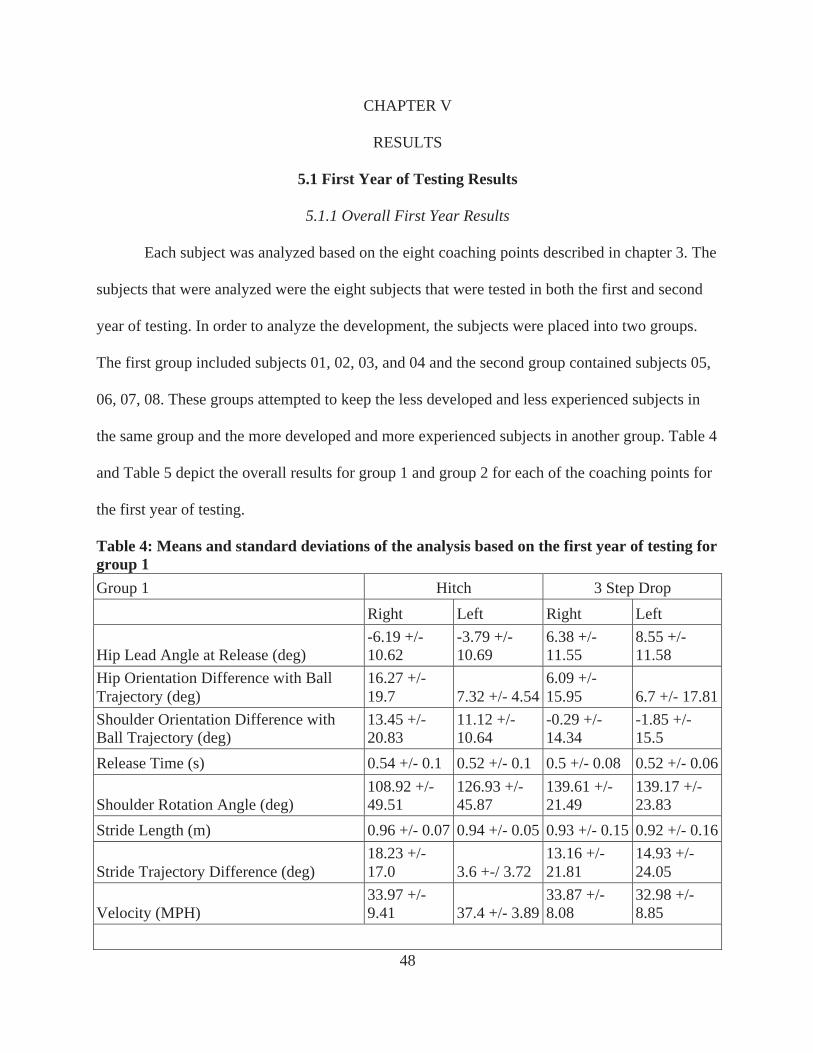
48
CHAPTER V
RESULTS
5.1 First Year of Testing Results
5.1.1 Overall First Year Results
Each subject was analyzed based on the eight coaching points described in chapter 3. The
subjects that were analyzed were the eight subjects that were tested in both the first and second
year of testing. In order to analyze the development, the subjects were placed into two groups.
The first group included subjects 01, 02, 03, and 04 and the second group contained subjects 05,
06, 07, 08. These groups attempted to keep the less developed and less experienced subjects in
the same group and the more developed and more experienced subjects in another group. Table 4
and Table 5 depict the overall results for group 1 and group 2 for each of the coaching points for
the first year of testing.
Table 4: Means and standard deviations of the analysis based on the first year of testing for group 1 Group 1 Hitch 3 Step Drop
Right Left Right Left
Hip Lead Angle at Release (deg) -6.19 +/- 10.62
-3.79 +/- 10.69
6.38 +/- 11.55
8.55 +/- 11.58
Hip Orientation Difference with Ball Trajectory (deg)
16.27 +/- 19.7 7.32 +/- 4.54
6.09 +/- 15.95 6.7 +/- 17.81
Shoulder Orientation Difference with Ball Trajectory (deg)
13.45 +/- 20.83
11.12 +/- 10.64
-0.29 +/- 14.34
-1.85 +/- 15.5
Release Time (s) 0.54 +/- 0.1 0.52 +/- 0.1 0.5 +/- 0.08 0.52 +/- 0.06
Shoulder Rotation Angle (deg) 108.92 +/- 49.51
126.93 +/- 45.87
139.61 +/- 21.49
139.17 +/- 23.83
Stride Length (m) 0.96 +/- 0.07 0.94 +/- 0.05 0.93 +/- 0.15 0.92 +/- 0.16
Stride Trajectory Difference (deg) 18.23 +/- 17.0 3.6 +-/ 3.72
13.16 +/- 21.81
14.93 +/- 24.05
Velocity (MPH) 33.97 +/- 9.41 37.4 +/- 3.89
33.87 +/- 8.08
32.98 +/- 8.85
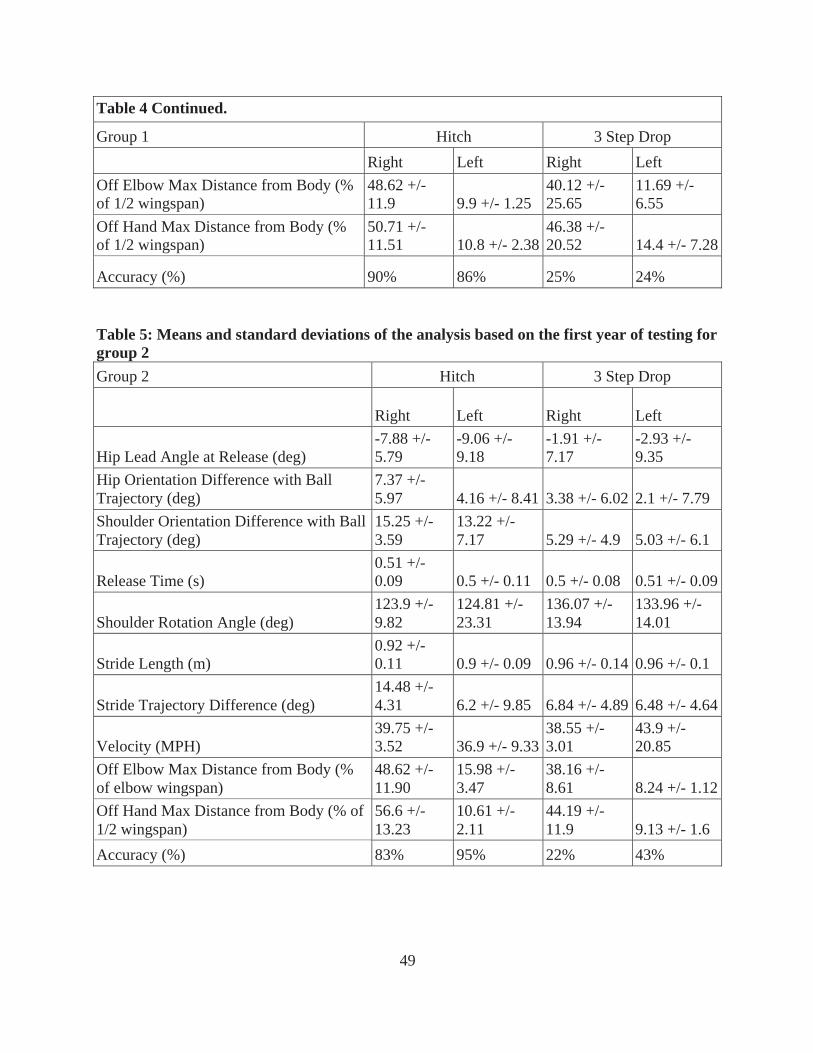
49
Table 4 Continued.
Group 1 Hitch 3 Step Drop Right Left Right Left Off Elbow Max Distance from Body (% of 1/2 wingspan)
48.62 +/- 11.9 9.9 +/- 1.25
40.12 +/- 25.65
11.69 +/- 6.55
Off Hand Max Distance from Body (% of 1/2 wingspan)
50.71 +/- 11.51 10.8 +/- 2.38
46.38 +/- 20.52 14.4 +/- 7.28
Accuracy (%) 90% 86% 25% 24%
Table 5: Means and standard deviations of the analysis based on the first year of testing for group 2 Group 2 Hitch 3 Step Drop
Right Left Right Left
Hip Lead Angle at Release (deg) -7.88 +/- 5.79
-9.06 +/- 9.18
-1.91 +/- 7.17
-2.93 +/- 9.35
Hip Orientation Difference with Ball Trajectory (deg)
7.37 +/- 5.97 4.16 +/- 8.41 3.38 +/- 6.02 2.1 +/- 7.79
Shoulder Orientation Difference with Ball Trajectory (deg)
15.25 +/- 3.59
13.22 +/- 7.17 5.29 +/- 4.9 5.03 +/- 6.1
Release Time (s) 0.51 +/- 0.09 0.5 +/- 0.11 0.5 +/- 0.08 0.51 +/- 0.09
Shoulder Rotation Angle (deg) 123.9 +/- 9.82
124.81 +/- 23.31
136.07 +/- 13.94
133.96 +/- 14.01
Stride Length (m) 0.92 +/- 0.11 0.9 +/- 0.09 0.96 +/- 0.14 0.96 +/- 0.1
Stride Trajectory Difference (deg) 14.48 +/- 4.31 6.2 +/- 9.85 6.84 +/- 4.89 6.48 +/- 4.64
Velocity (MPH) 39.75 +/- 3.52 36.9 +/- 9.33
38.55 +/- 3.01
43.9 +/- 20.85
Off Elbow Max Distance from Body (% of elbow wingspan)
48.62 +/- 11.90
15.98 +/- 3.47
38.16 +/- 8.61 8.24 +/- 1.12
Off Hand Max Distance from Body (% of 1/2 wingspan)
56.6 +/- 13.23
10.61 +/- 2.11
44.19 +/- 11.9 9.13 +/- 1.6
Accuracy (%) 83% 95% 22% 43%
50
5.1.2 Consistency of Throwing Motion
In order to track the consistency of the throwing motion for each of the throwing points,
standard deviations of each of the coaching points was calculated. The standard deviation values
show that during the hitch throws to the right and left side, the subjects in group 1 showed were
not consistent in the shoulder rotation angle at release, which shows more of a sporadic release
for a short throw. This result some athletes over extend the shoulder at release, which coaches
describe as “pushing” the football rather than throwing the football.
The stride trajectory for the hitch throw to the left side was consistent compared to the
other three throws. The consistency of the direction of the stride to the hitch throw to the left
shows that the limited movement of throwing to their non-throwing side out of the shotgun
allows for the subject to limit the variability of the stride direction.
The motion of the non-throwing hand during the throws to the right side was inconsistent
when compared to the throws of to the left. This shows that when the subject steps towards their
dominate throwing side, the movement of the non-throwing arm has more variability and extends
further from the body than the throws to the left side. Coaches would like to see the non-
throwing hand tucked close to the QB’s body to limit the amount of space needed to conduct the
throwing motion.
Group 2 generally had lower standard deviation values than group 1, with the exception
of the non-throwing arm motion during the hitch throw to the right side. This was also
inconsistent for group 1, which shows that there are similar trends in the throwing motions of the
less experienced and more experienced athletes but the more experienced athletes show more
consistency across all coaching points.
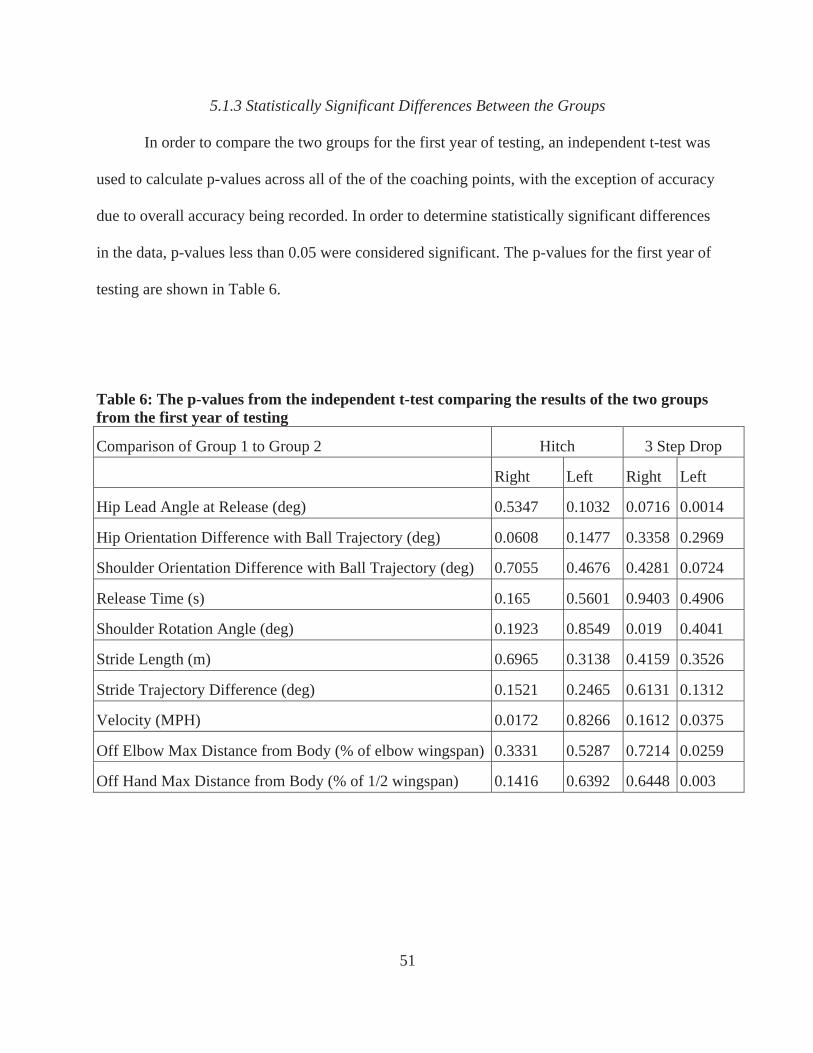
51
5.1.3 Statistically Significant Differences Between the Groups
In order to compare the two groups for the first year of testing, an independent t-test was
used to calculate p-values across all of the of the coaching points, with the exception of accuracy
due to overall accuracy being recorded. In order to determine statistically significant differences
in the data, p-values less than 0.05 were considered significant. The p-values for the first year of
testing are shown in Table 6.
Table 6: The p-values from the independent t-test comparing the results of the two groups from the first year of testing
Comparison of Group 1 to Group 2 Hitch 3 Step Drop
Right Left Right Left
Hip Lead Angle at Release (deg) 0.5347 0.1032 0.0716 0.0014
Hip Orientation Difference with Ball Trajectory (deg) 0.0608 0.1477 0.3358 0.2969
Shoulder Orientation Difference with Ball Trajectory (deg) 0.7055 0.4676 0.4281 0.0724
Release Time (s) 0.165 0.5601 0.9403 0.4906
Shoulder Rotation Angle (deg) 0.1923 0.8549 0.019 0.4041
Stride Length (m) 0.6965 0.3138 0.4159 0.3526
Stride Trajectory Difference (deg) 0.1521 0.2465 0.6131 0.1312
Velocity (MPH) 0.0172 0.8266 0.1612 0.0375
Off Elbow Max Distance from Body (% of elbow wingspan) 0.3331 0.5287 0.7214 0.0259
Off Hand Max Distance from Body (% of 1/2 wingspan) 0.1416 0.6392 0.6448 0.003
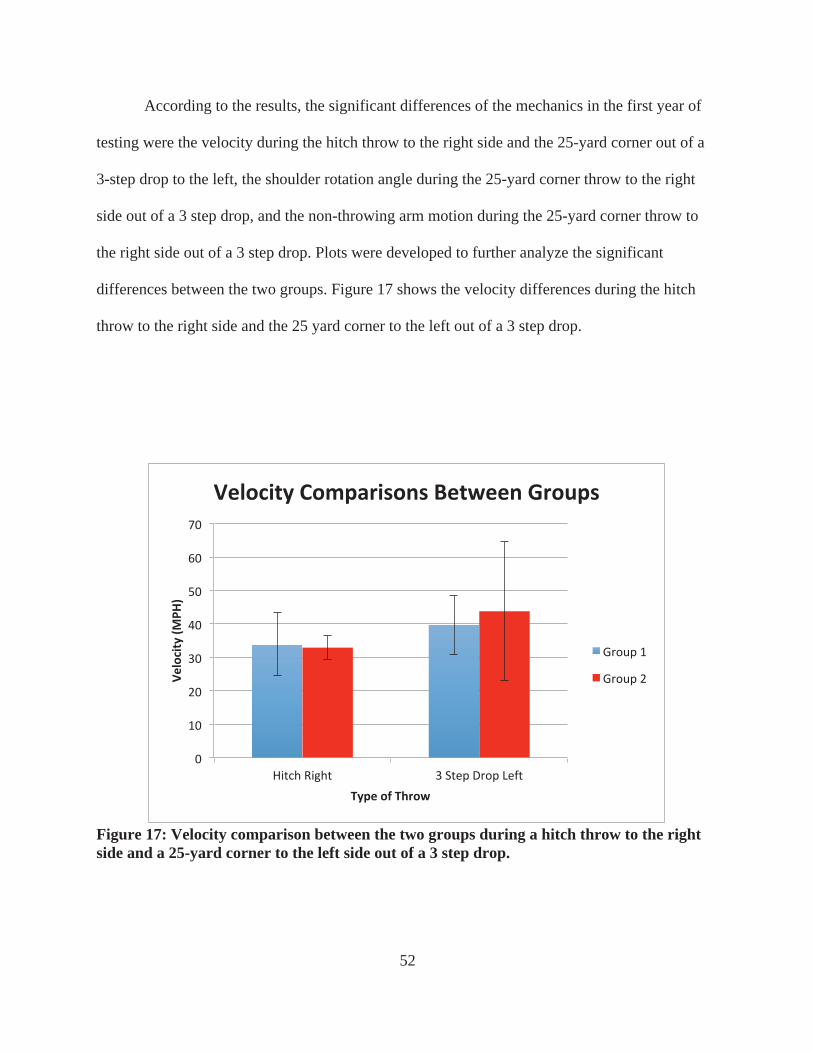
52
According to the results, the significant differences of the mechanics in the first year of
testing were the velocity during the hitch throw to the right side and the 25-yard corner out of a
3-step drop to the left, the shoulder rotation angle during the 25-yard corner throw to the right
side out of a 3 step drop, and the non-throwing arm motion during the 25-yard corner throw to
the right side out of a 3 step drop. Plots were developed to further analyze the significant
differences between the two groups. Figure 17 shows the velocity differences during the hitch
throw to the right side and the 25 yard corner to the left out of a 3 step drop.
Figure 17: Velocity comparison between the two groups during a hitch throw to the right side and a 25-yard corner to the left side out of a 3 step drop.
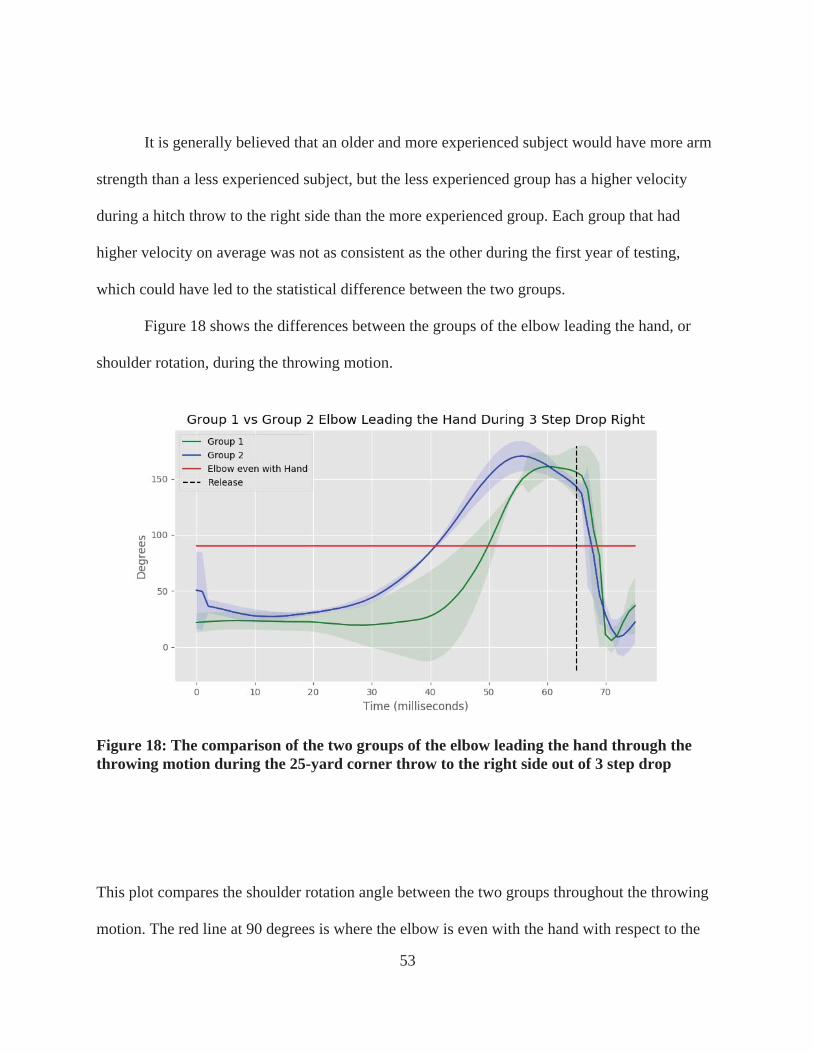
53
It is generally believed that an older and more experienced subject would have more arm
strength than a less experienced subject, but the less experienced group has a higher velocity
during a hitch throw to the right side than the more experienced group. Each group that had
higher velocity on average was not as consistent as the other during the first year of testing,
which could have led to the statistical difference between the two groups.
Figure 18 shows the differences between the groups of the elbow leading the hand, or
shoulder rotation, during the throwing motion.
Figure 18: The comparison of the two groups of the elbow leading the hand through the throwing motion during the 25-yard corner throw to the right side out of 3 step drop
This plot compares the shoulder rotation angle between the two groups throughout the throwing
motion. The red line at 90 degrees is where the elbow is even with the hand with respect to the
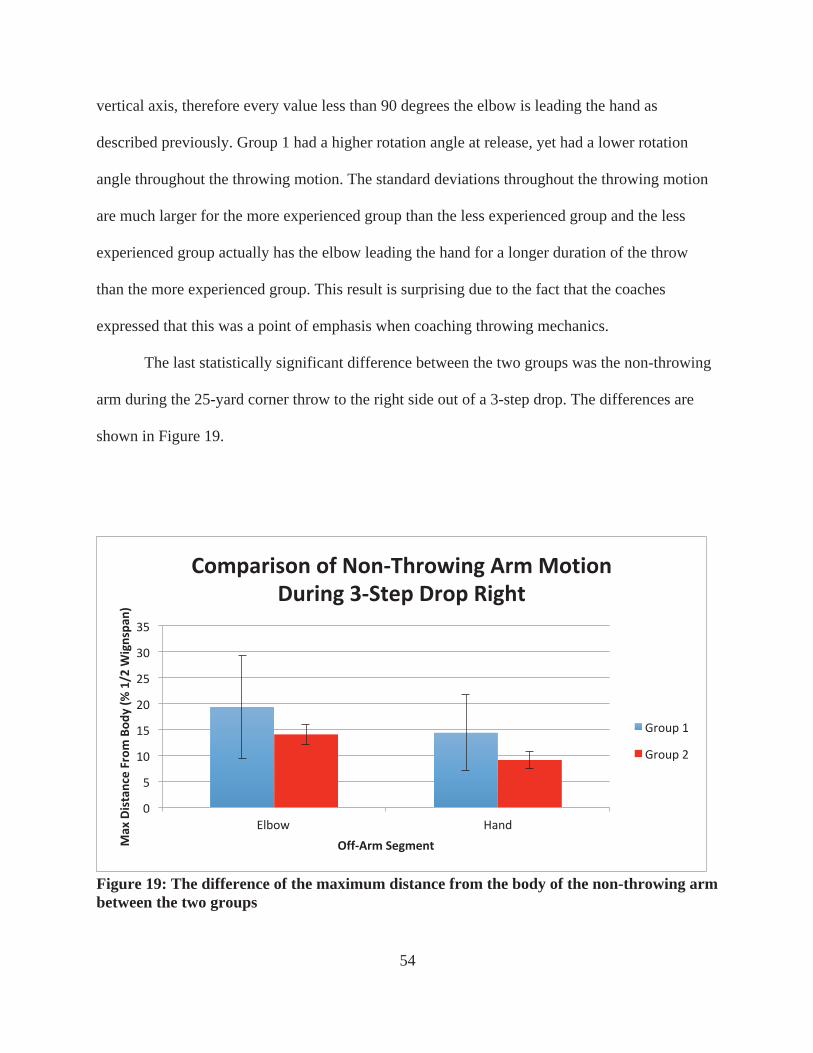
54
vertical axis, therefore every value less than 90 degrees the elbow is leading the hand as
described previously. Group 1 had a higher rotation angle at release, yet had a lower rotation
angle throughout the throwing motion. The standard deviations throughout the throwing motion
are much larger for the more experienced group than the less experienced group and the less
experienced group actually has the elbow leading the hand for a longer duration of the throw
than the more experienced group. This result is surprising due to the fact that the coaches
expressed that this was a point of emphasis when coaching throwing mechanics.
The last statistically significant difference between the two groups was the non-throwing
arm during the 25-yard corner throw to the right side out of a 3-step drop. The differences are
shown in Figure 19.
Figure 19: The difference of the maximum distance from the body of the non-throwing arm between the two groups
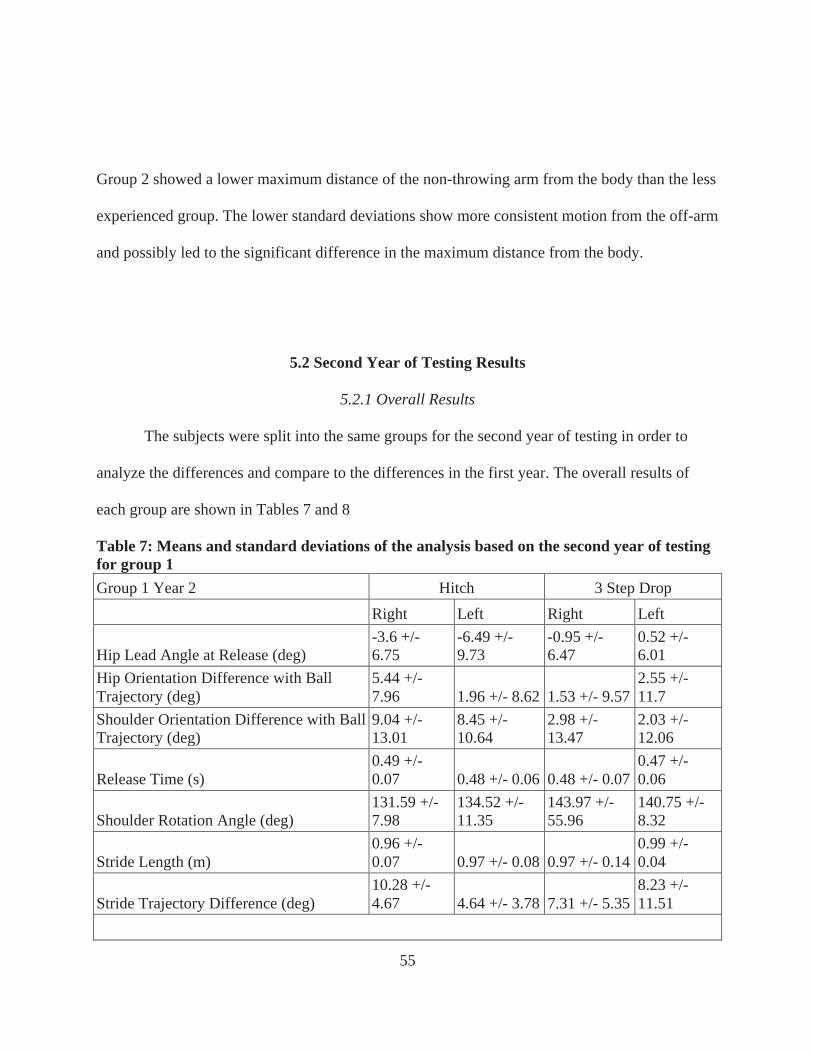
55
Group 2 showed a lower maximum distance of the non-throwing arm from the body than the less
experienced group. The lower standard deviations show more consistent motion from the off-arm
and possibly led to the significant difference in the maximum distance from the body.
5.2 Second Year of Testing Results
5.2.1 Overall Results
The subjects were split into the same groups for the second year of testing in order to
analyze the differences and compare to the differences in the first year. The overall results of
each group are shown in Tables 7 and 8
Table 7: Means and standard deviations of the analysis based on the second year of testing for group 1 Group 1 Year 2 Hitch 3 Step Drop
Right Left Right Left
Hip Lead Angle at Release (deg) -3.6 +/- 6.75
-6.49 +/- 9.73
-0.95 +/- 6.47
0.52 +/- 6.01
Hip Orientation Difference with Ball Trajectory (deg)
5.44 +/- 7.96 1.96 +/- 8.62 1.53 +/- 9.57
2.55 +/- 11.7
Shoulder Orientation Difference with Ball Trajectory (deg)
9.04 +/- 13.01
8.45 +/- 10.64
2.98 +/- 13.47
2.03 +/- 12.06
Release Time (s) 0.49 +/- 0.07 0.48 +/- 0.06 0.48 +/- 0.07
0.47 +/- 0.06
Shoulder Rotation Angle (deg) 131.59 +/- 7.98
134.52 +/- 11.35
143.97 +/- 55.96
140.75 +/- 8.32
Stride Length (m) 0.96 +/- 0.07 0.97 +/- 0.08 0.97 +/- 0.14
0.99 +/- 0.04
Stride Trajectory Difference (deg) 10.28 +/- 4.67 4.64 +/- 3.78 7.31 +/- 5.35
8.23 +/- 11.51
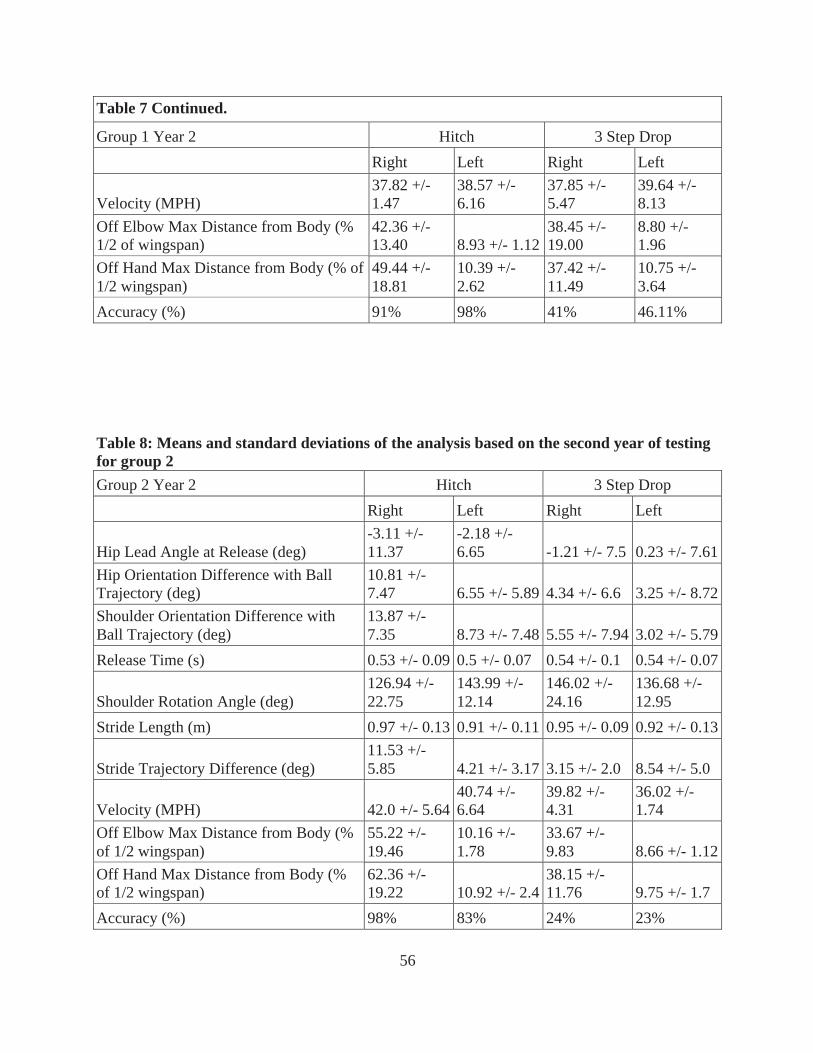
56
Table 7 Continued.
Group 1 Year 2 Hitch 3 Step Drop Right Left Right Left
Velocity (MPH) 37.82 +/- 1.47
38.57 +/- 6.16
37.85 +/- 5.47
39.64 +/- 8.13
Off Elbow Max Distance from Body (% 1/2 of wingspan)
42.36 +/- 13.40 8.93 +/- 1.12
38.45 +/- 19.00
8.80 +/- 1.96
Off Hand Max Distance from Body (% of 1/2 wingspan)
49.44 +/- 18.81
10.39 +/- 2.62
37.42 +/- 11.49
10.75 +/- 3.64
Accuracy (%) 91% 98% 41% 46.11%
Table 8: Means and standard deviations of the analysis based on the second year of testing for group 2 Group 2 Year 2 Hitch 3 Step Drop
Right Left Right Left
Hip Lead Angle at Release (deg) -3.11 +/- 11.37
-2.18 +/- 6.65 -1.21 +/- 7.5 0.23 +/- 7.61
Hip Orientation Difference with Ball Trajectory (deg)
10.81 +/- 7.47 6.55 +/- 5.89 4.34 +/- 6.6 3.25 +/- 8.72
Shoulder Orientation Difference with Ball Trajectory (deg)
13.87 +/- 7.35 8.73 +/- 7.48 5.55 +/- 7.94 3.02 +/- 5.79
Release Time (s) 0.53 +/- 0.09 0.5 +/- 0.07 0.54 +/- 0.1 0.54 +/- 0.07
Shoulder Rotation Angle (deg) 126.94 +/- 22.75
143.99 +/- 12.14
146.02 +/- 24.16
136.68 +/- 12.95
Stride Length (m) 0.97 +/- 0.13 0.91 +/- 0.11 0.95 +/- 0.09 0.92 +/- 0.13
Stride Trajectory Difference (deg) 11.53 +/- 5.85 4.21 +/- 3.17 3.15 +/- 2.0 8.54 +/- 5.0
Velocity (MPH) 42.0 +/- 5.64 40.74 +/- 6.64
39.82 +/- 4.31
36.02 +/- 1.74
Off Elbow Max Distance from Body (% of 1/2 wingspan)
55.22 +/- 19.46
10.16 +/- 1.78
33.67 +/- 9.83 8.66 +/- 1.12
Off Hand Max Distance from Body (% of 1/2 wingspan)
62.36 +/- 19.22 10.92 +/- 2.4
38.15 +/- 11.76 9.75 +/- 1.7
Accuracy (%) 98% 83% 24% 23%
57
5.2.2. Consistency of Second Year of Testing
In order to further analyze the groups in the second year of testing, the starndard
deviation of each of the coaching points, with the exception of accuracy due to the binary nature
of the measurement were analyzed. The large standard deviation values found when compared to
the values of each of the throws were the hip leading angle at release during the hitch throw to
the left side, the hip orientation difference during the 25 yard corner throw to the left side, the
shoulder rotation angle at release when throwing the 25 yard corner to the right side, the stride
trajectory difference when throwing the 25 yard corner to the left side, the velocity during both
the 25 yard corner throws, and the non-throwing arm motion during the throws to the right side.
Although some of these standard deviation values are much larger than the standard deviation
values for the different throws, the standard deviation for the hip leading angle at release, the hip
orientation difference at release, the stride trajectory difference, and velocities were all smaller in
the second year of testing than in the first. This shows that although these coaching points are not
as consistent during specific throws that the consistency of the throwing motion is improving.
The area of the throw that became more inconsistent in the second year of testing was the
shoulder rotation angle at release and the non-throwing hand motion during the throws to the
right side. These two coaching points might not have been stressed as heavily as the other points,
therefore the inconsistency shows the athlete’s in this group were not focusing on the point as
heavily in the second year of testing.
The large standard deviation values when compared to other standard deviation values for
each throw were the shoulder rotation angle at release for the throws to the right side, the stride
trajectory difference for the hitch to the right side and the 25 yard corner to the left, and the non-
throwing arm motion for the throws to the right. Each of these standard deviation values was
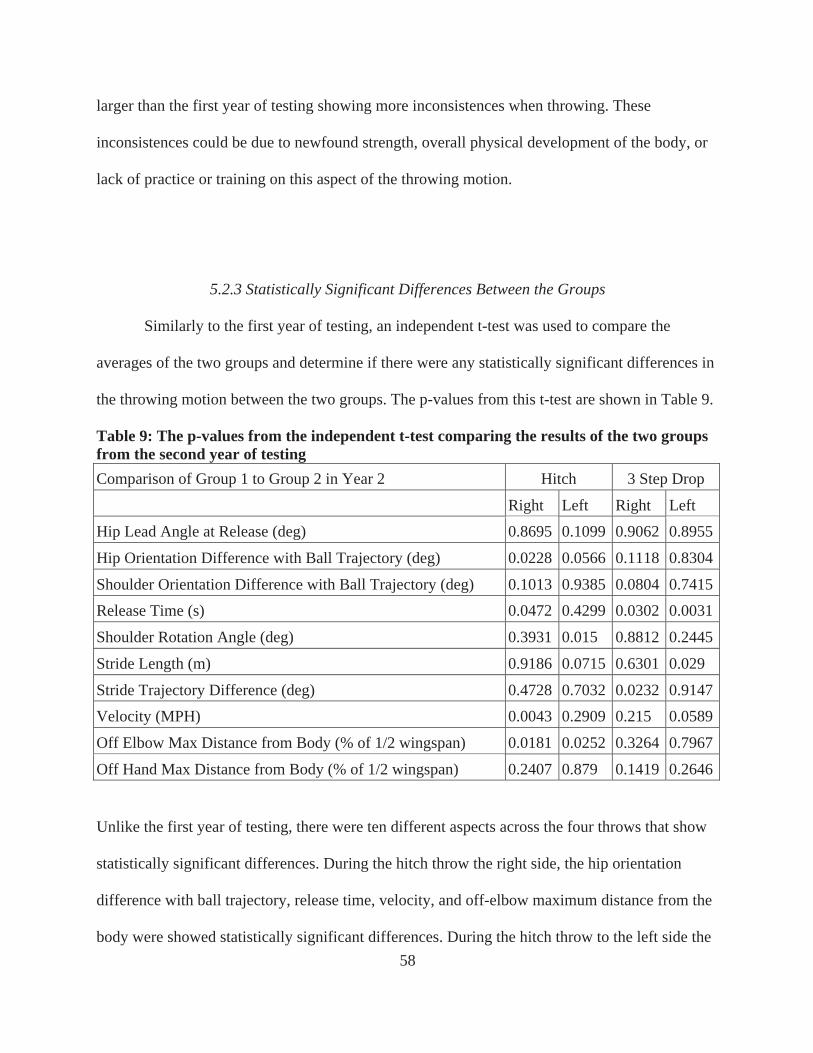
58
larger than the first year of testing showing more inconsistences when throwing. These
inconsistences could be due to newfound strength, overall physical development of the body, or
lack of practice or training on this aspect of the throwing motion.
5.2.3 Statistically Significant Differences Between the Groups
Similarly to the first year of testing, an independent t-test was used to compare the
averages of the two groups and determine if there were any statistically significant differences in
the throwing motion between the two groups. The p-values from this t-test are shown in Table 9.
Table 9: The p-values from the independent t-test comparing the results of the two groups from the second year of testing Comparison of Group 1 to Group 2 in Year 2 Hitch 3 Step Drop
Right Left Right Left Hip Lead Angle at Release (deg) 0.8695 0.1099 0.9062 0.8955
Hip Orientation Difference with Ball Trajectory (deg) 0.0228 0.0566 0.1118 0.8304
Shoulder Orientation Difference with Ball Trajectory (deg) 0.1013 0.9385 0.0804 0.7415 Release Time (s) 0.0472 0.4299 0.0302 0.0031
Shoulder Rotation Angle (deg) 0.3931 0.015 0.8812 0.2445
Stride Length (m) 0.9186 0.0715 0.6301 0.029
Stride Trajectory Difference (deg) 0.4728 0.7032 0.0232 0.9147 Velocity (MPH) 0.0043 0.2909 0.215 0.0589
Off Elbow Max Distance from Body (% of 1/2 wingspan) 0.0181 0.0252 0.3264 0.7967
Off Hand Max Distance from Body (% of 1/2 wingspan) 0.2407 0.879 0.1419 0.2646
Unlike the first year of testing, there were ten different aspects across the four throws that show
statistically significant differences. During the hitch throw the right side, the hip orientation
difference with ball trajectory, release time, velocity, and off-elbow maximum distance from the
body were showed statistically significant differences. During the hitch throw to the left side the
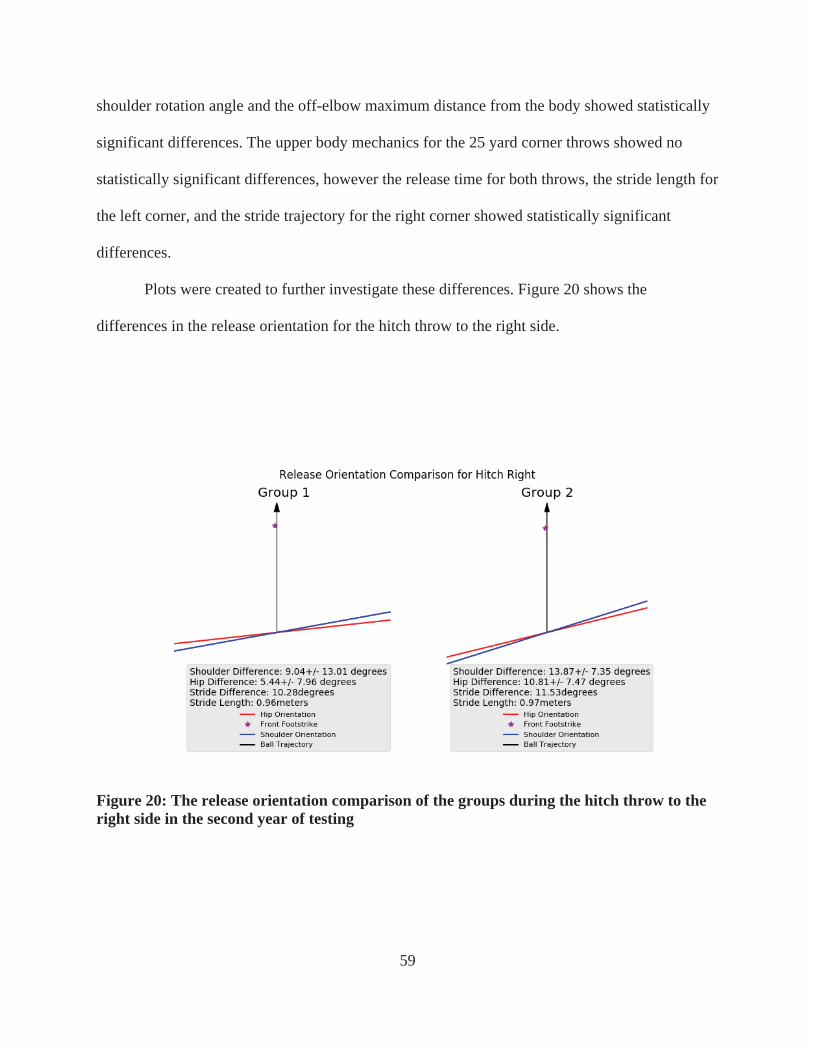
59
shoulder rotation angle and the off-elbow maximum distance from the body showed statistically
significant differences. The upper body mechanics for the 25 yard corner throws showed no
statistically significant differences, however the release time for both throws, the stride length for
the left corner, and the stride trajectory for the right corner showed statistically significant
differences.
Plots were created to further investigate these differences. Figure 20 shows the
differences in the release orientation for the hitch throw to the right side.
Figure 20: The release orientation comparison of the groups during the hitch throw to the right side in the second year of testing
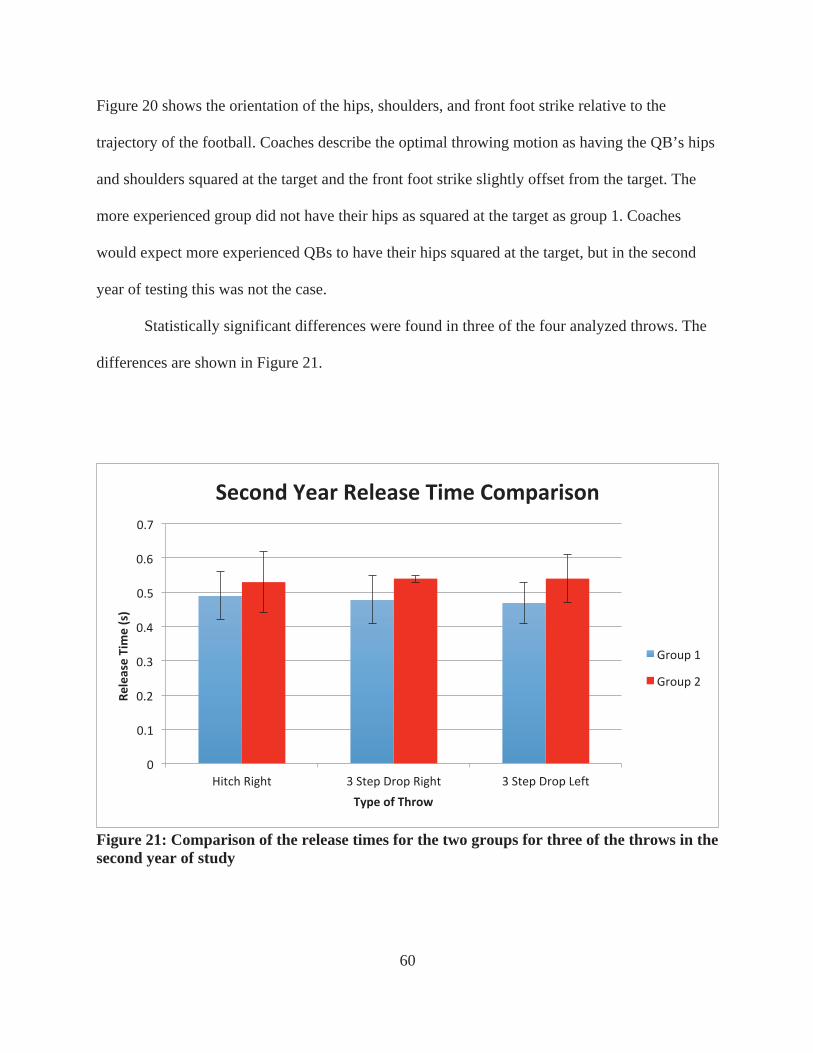
60
Figure 20 shows the orientation of the hips, shoulders, and front foot strike relative to the
trajectory of the football. Coaches describe the optimal throwing motion as having the QB’s hips
and shoulders squared at the target and the front foot strike slightly offset from the target. The
more experienced group did not have their hips as squared at the target as group 1. Coaches
would expect more experienced QBs to have their hips squared at the target, but in the second
year of testing this was not the case.
Statistically significant differences were found in three of the four analyzed throws. The
differences are shown in Figure 21.
Figure 21: Comparison of the release times for the two groups for three of the throws in the second year of study
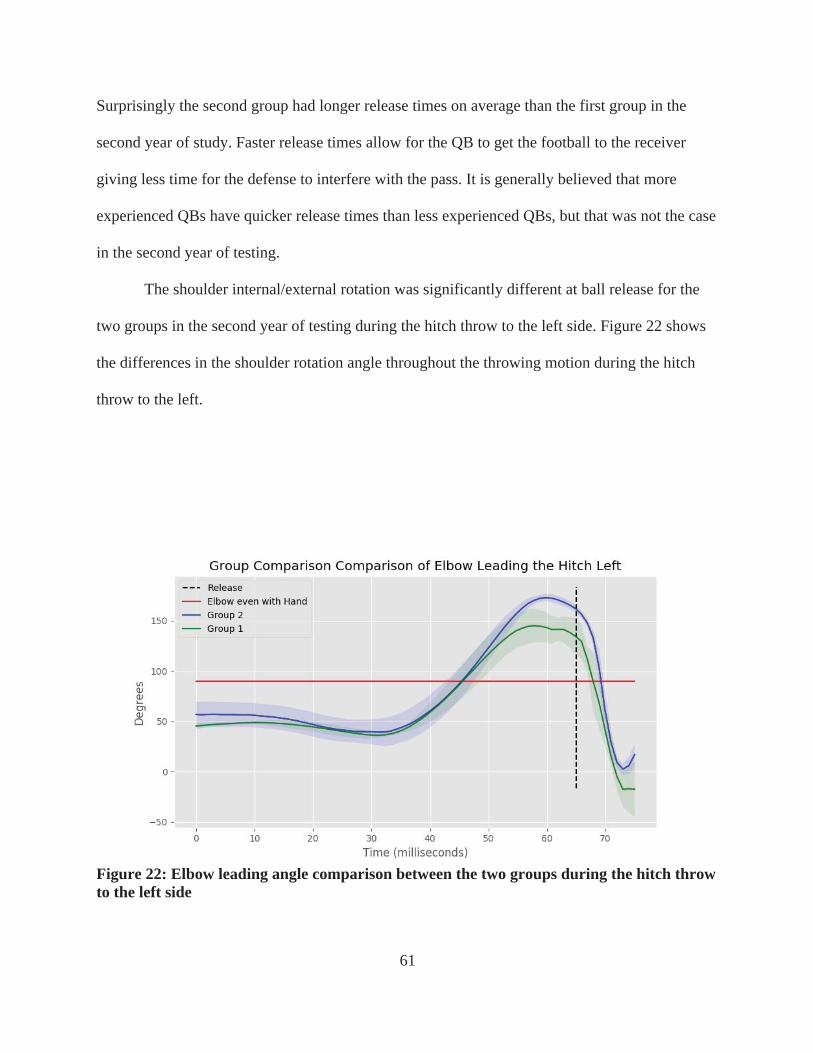
61
Surprisingly the second group had longer release times on average than the first group in the
second year of study. Faster release times allow for the QB to get the football to the receiver
giving less time for the defense to interfere with the pass. It is generally believed that more
experienced QBs have quicker release times than less experienced QBs, but that was not the case
in the second year of testing.
The shoulder internal/external rotation was significantly different at ball release for the
two groups in the second year of testing during the hitch throw to the left side. Figure 22 shows
the differences in the shoulder rotation angle throughout the throwing motion during the hitch
throw to the left.
Figure 22: Elbow leading angle comparison between the two groups during the hitch throw to the left side
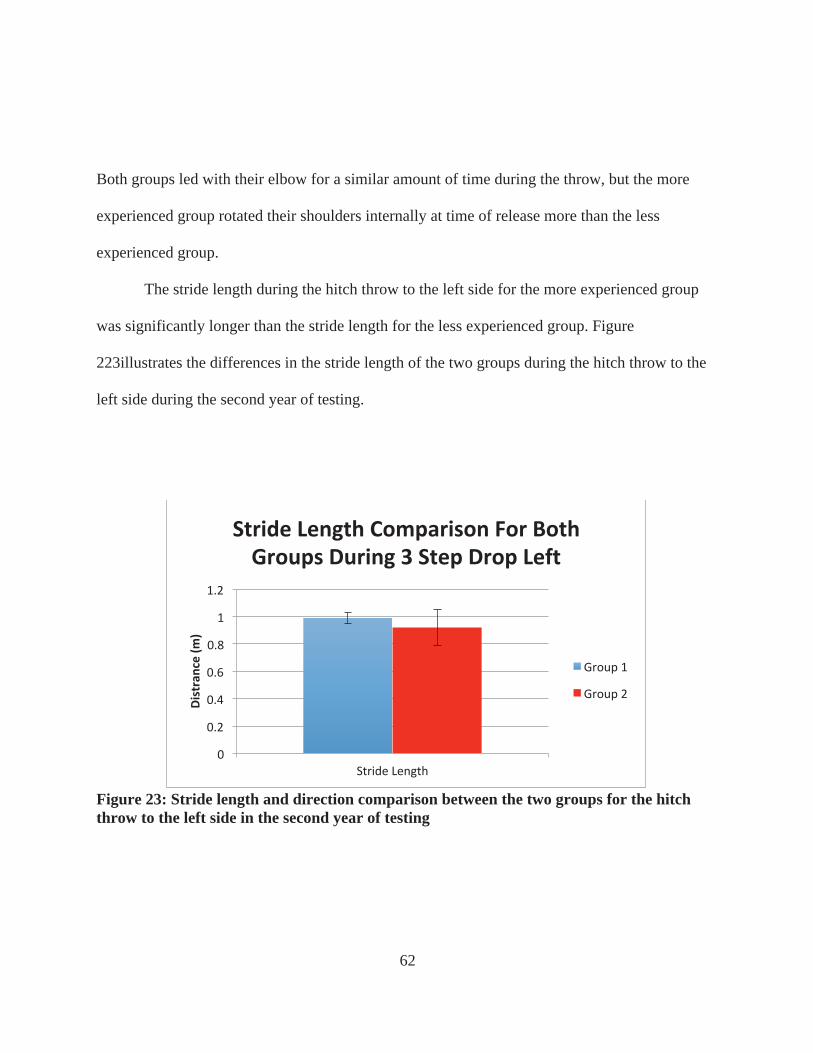
62
Both groups led with their elbow for a similar amount of time during the throw, but the more
experienced group rotated their shoulders internally at time of release more than the less
experienced group.
The stride length during the hitch throw to the left side for the more experienced group
was significantly longer than the stride length for the less experienced group. Figure
223illustrates the differences in the stride length of the two groups during the hitch throw to the
left side during the second year of testing.
Figure 23: Stride length and direction comparison between the two groups for the hitch throw to the left side in the second year of testing
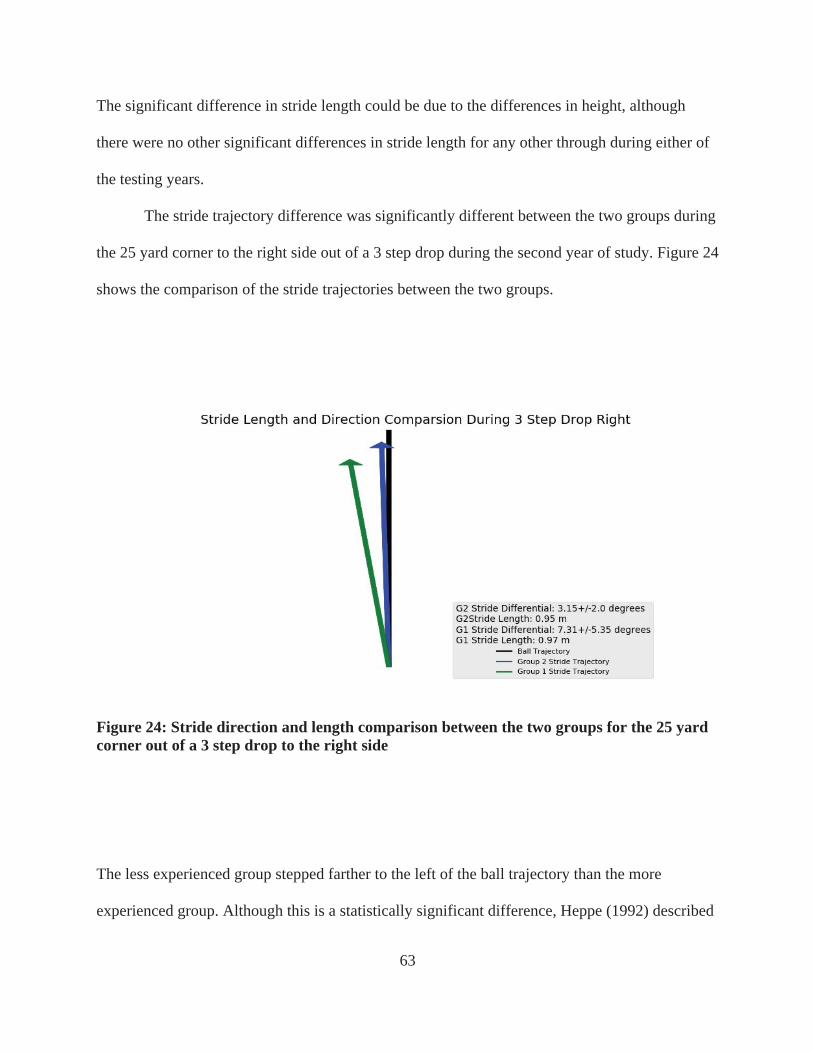
63
The significant difference in stride length could be due to the differences in height, although
there were no other significant differences in stride length for any other through during either of
the testing years.
The stride trajectory difference was significantly different between the two groups during
the 25 yard corner to the right side out of a 3 step drop during the second year of study. Figure 24
shows the comparison of the stride trajectories between the two groups.
Figure 24: Stride direction and length comparison between the two groups for the 25 yard corner out of a 3 step drop to the right side
The less experienced group stepped farther to the left of the ball trajectory than the more
experienced group. Although this is a statistically significant difference, Heppe (1992) described
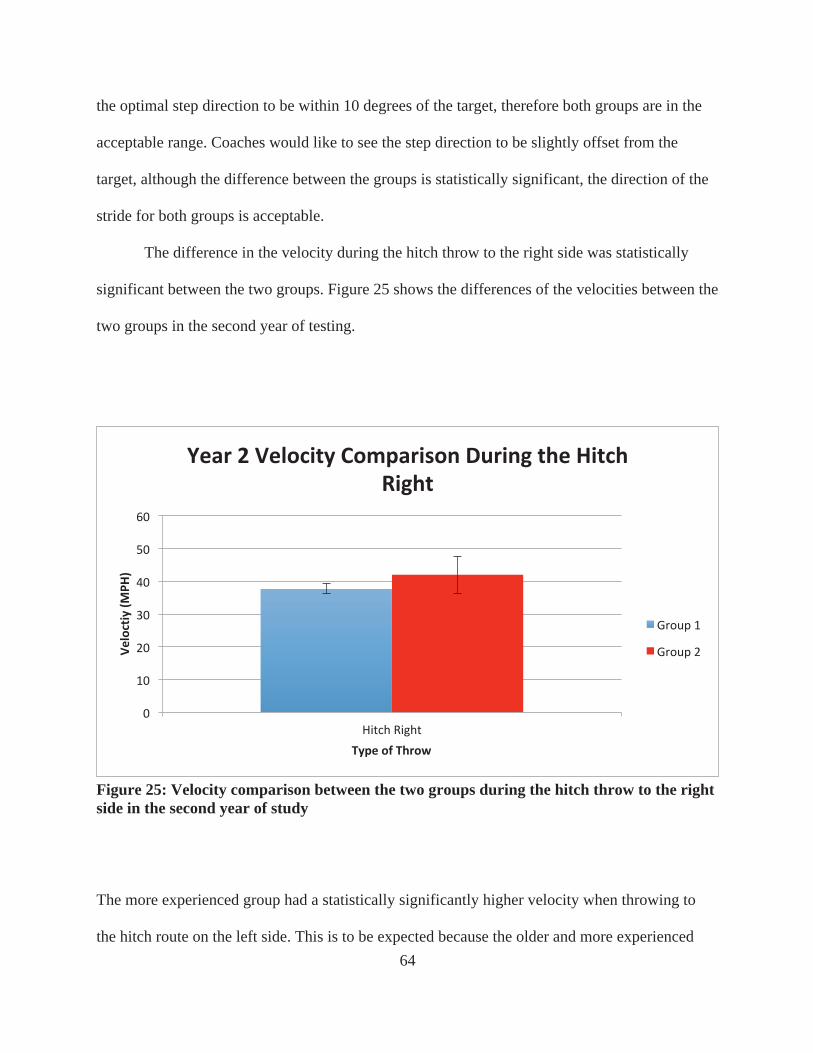
64
the optimal step direction to be within 10 degrees of the target, therefore both groups are in the
acceptable range. Coaches would like to see the step direction to be slightly offset from the
target, although the difference between the groups is statistically significant, the direction of the
stride for both groups is acceptable.
The difference in the velocity during the hitch throw to the right side was statistically
significant between the two groups. Figure 25 shows the differences of the velocities between the
two groups in the second year of testing.
Figure 25: Velocity comparison between the two groups during the hitch throw to the right side in the second year of study
The more experienced group had a statistically significantly higher velocity when throwing to
the hitch route on the left side. This is to be expected because the older and more experienced
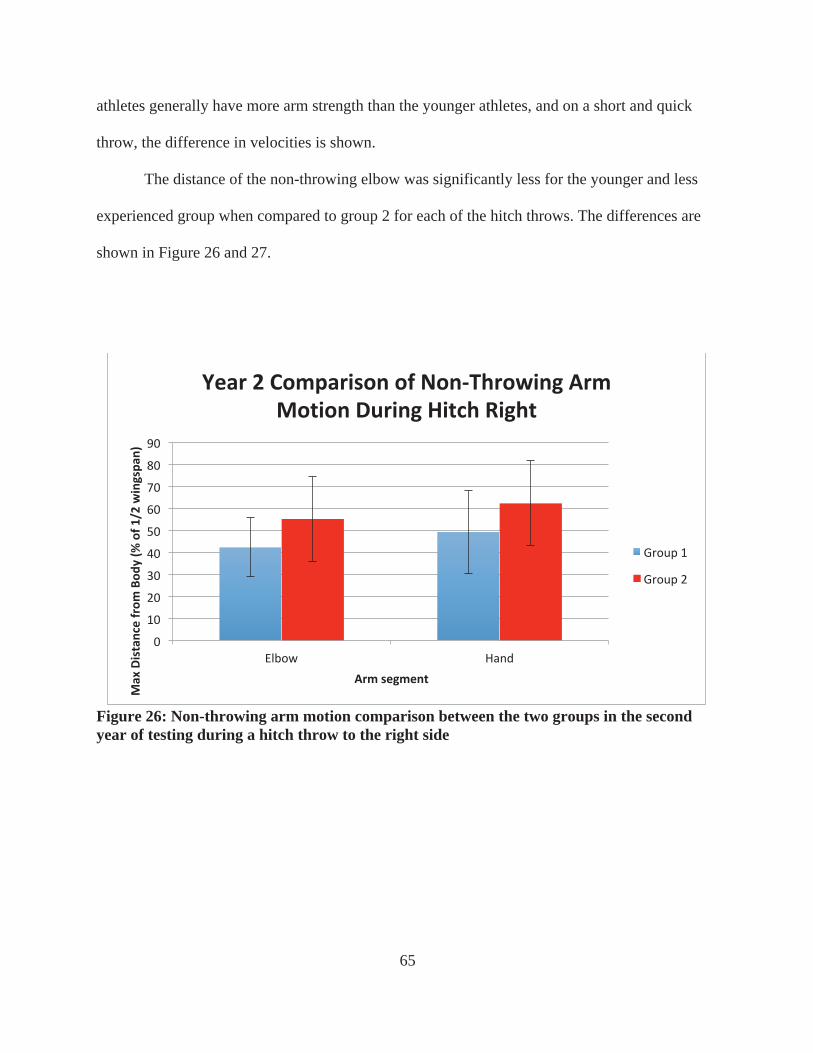
65
athletes generally have more arm strength than the younger athletes, and on a short and quick
throw, the difference in velocities is shown.
The distance of the non-throwing elbow was significantly less for the younger and less
experienced group when compared to group 2 for each of the hitch throws. The differences are
shown in Figure 26 and 27.
Figure 26: Non-throwing arm motion comparison between the two groups in the second year of testing during a hitch throw to the right side
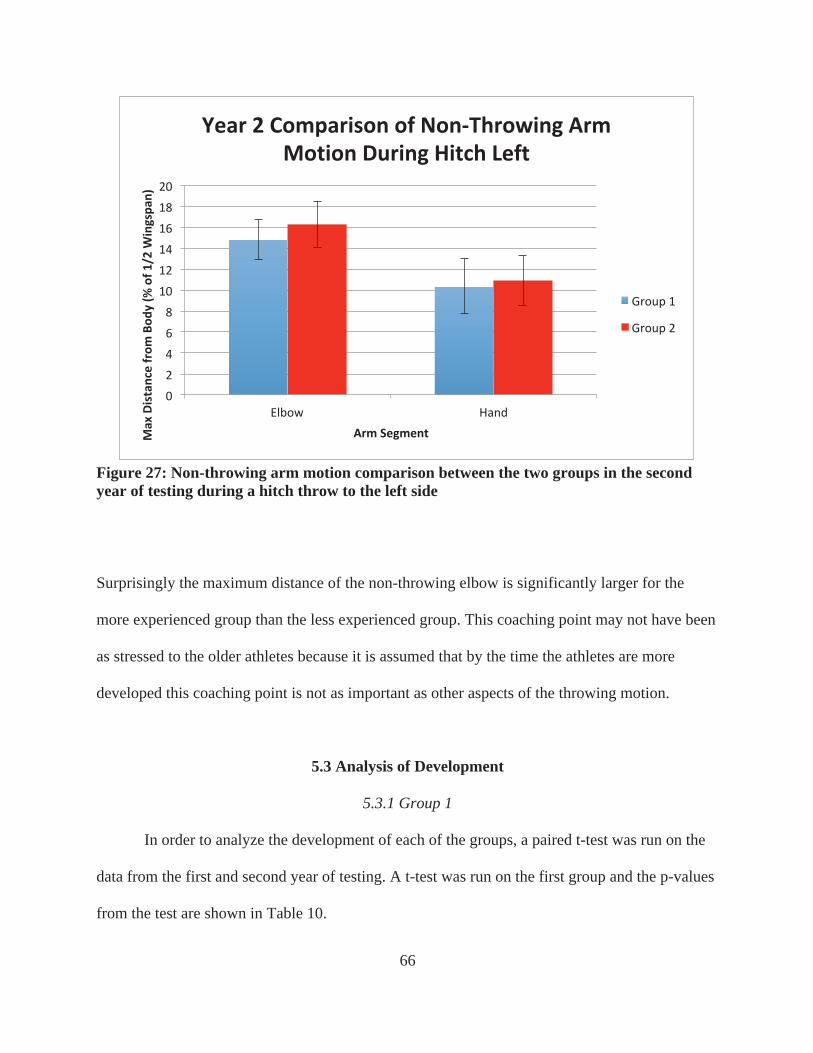
66
Figure 27: Non-throwing arm motion comparison between the two groups in the second year of testing during a hitch throw to the left side
Surprisingly the maximum distance of the non-throwing elbow is significantly larger for the
more experienced group than the less experienced group. This coaching point may not have been
as stressed to the older athletes because it is assumed that by the time the athletes are more
developed this coaching point is not as important as other aspects of the throwing motion.
5.3 Analysis of Development
5.3.1 Group 1
In order to analyze the development of each of the groups, a paired t-test was run on the
data from the first and second year of testing. A t-test was run on the first group and the p-values
from the test are shown in Table 10.
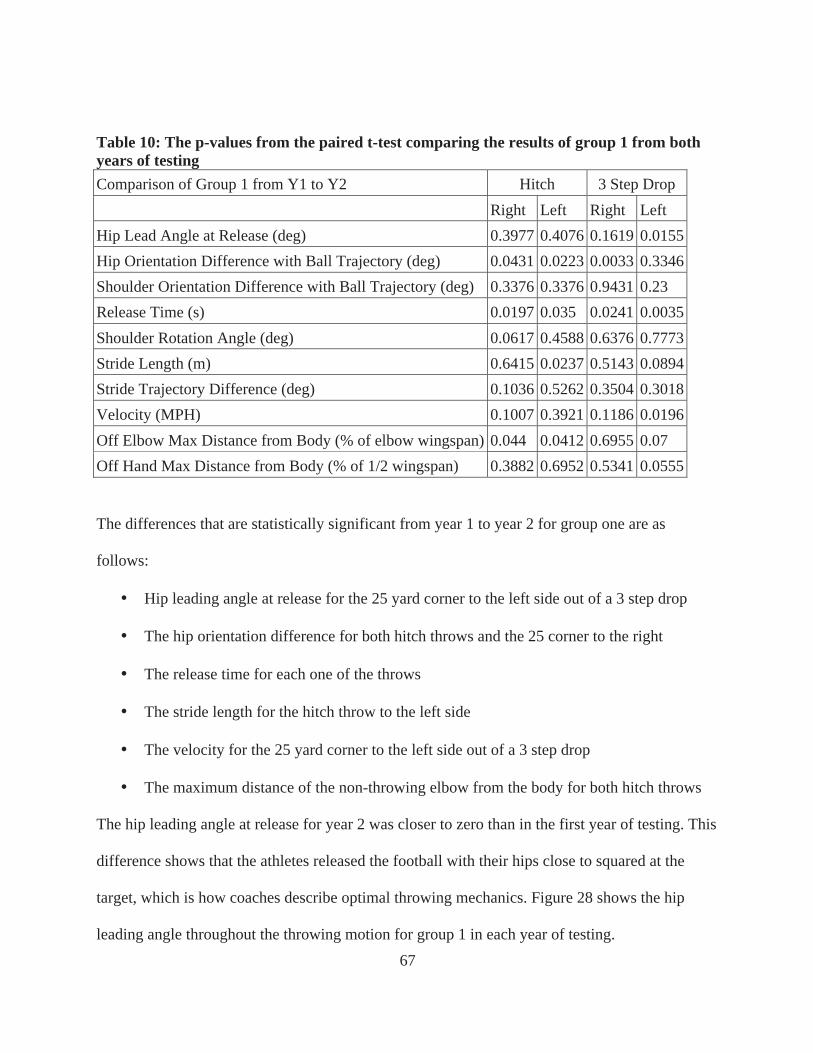
67
Table 10: The p-values from the paired t-test comparing the results of group 1 from both years of testing Comparison of Group 1 from Y1 to Y2 Hitch 3 Step Drop
Right Left Right Left Hip Lead Angle at Release (deg) 0.3977 0.4076 0.1619 0.0155 Hip Orientation Difference with Ball Trajectory (deg) 0.0431 0.0223 0.0033 0.3346 Shoulder Orientation Difference with Ball Trajectory (deg) 0.3376 0.3376 0.9431 0.23 Release Time (s) 0.0197 0.035 0.0241 0.0035 Shoulder Rotation Angle (deg) 0.0617 0.4588 0.6376 0.7773 Stride Length (m) 0.6415 0.0237 0.5143 0.0894 Stride Trajectory Difference (deg) 0.1036 0.5262 0.3504 0.3018 Velocity (MPH) 0.1007 0.3921 0.1186 0.0196 Off Elbow Max Distance from Body (% of elbow wingspan) 0.044 0.0412 0.6955 0.07 Off Hand Max Distance from Body (% of 1/2 wingspan) 0.3882 0.6952 0.5341 0.0555
The differences that are statistically significant from year 1 to year 2 for group one are as
follows:
• Hip leading angle at release for the 25 yard corner to the left side out of a 3 step drop
• The hip orientation difference for both hitch throws and the 25 corner to the right
• The release time for each one of the throws
• The stride length for the hitch throw to the left side
• The velocity for the 25 yard corner to the left side out of a 3 step drop
• The maximum distance of the non-throwing elbow from the body for both hitch throws
The hip leading angle at release for year 2 was closer to zero than in the first year of testing. This
difference shows that the athletes released the football with their hips close to squared at the
target, which is how coaches describe optimal throwing mechanics. Figure 28 shows the hip
leading angle throughout the throwing motion for group 1 in each year of testing.
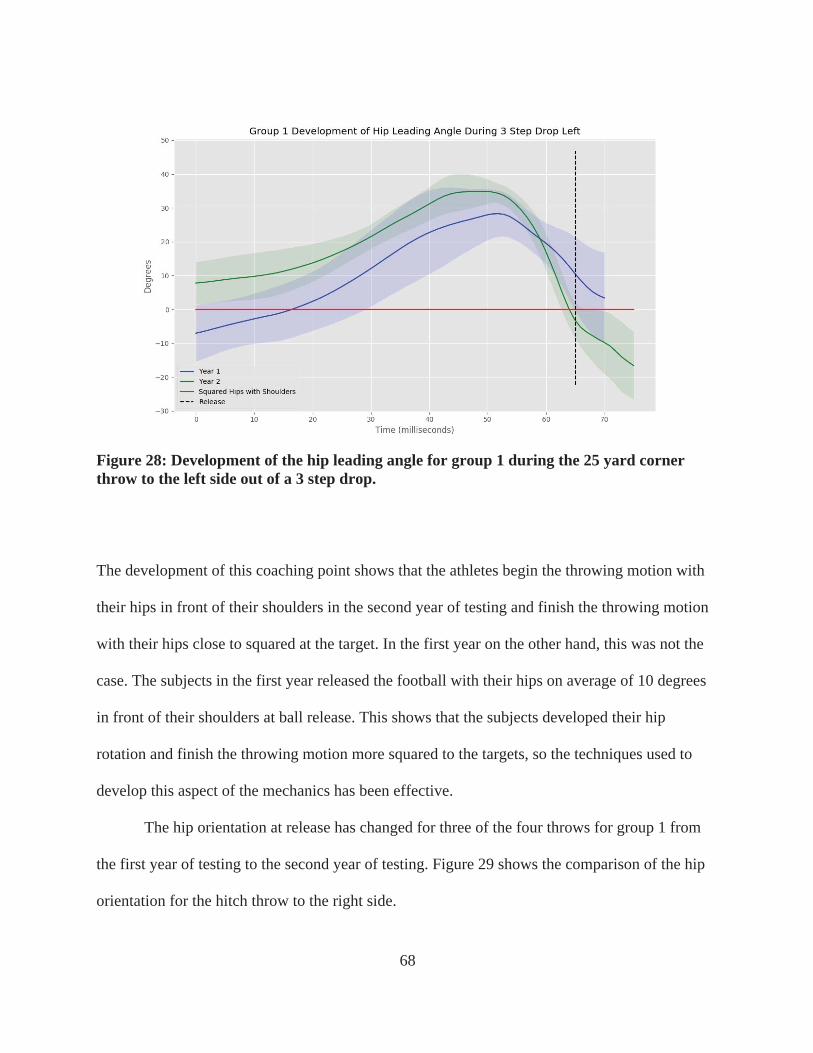
68
Figure 28: Development of the hip leading angle for group 1 during the 25 yard corner throw to the left side out of a 3 step drop.
The development of this coaching point shows that the athletes begin the throwing motion with
their hips in front of their shoulders in the second year of testing and finish the throwing motion
with their hips close to squared at the target. In the first year on the other hand, this was not the
case. The subjects in the first year released the football with their hips on average of 10 degrees
in front of their shoulders at ball release. This shows that the subjects developed their hip
rotation and finish the throwing motion more squared to the targets, so the techniques used to
develop this aspect of the mechanics has been effective.
The hip orientation at release has changed for three of the four throws for group 1 from
the first year of testing to the second year of testing. Figure 29 shows the comparison of the hip
orientation for the hitch throw to the right side.

69
Figure 29: Hip orientation for both years of testing for group 1 during the hitch throw to the right side
The hip orientation during the hitch the right side significantly improved according to what the
coaches describe as optimal throwing mechanics. Group 1 in the second year of testing released
the football with their hips more square to the target, which is optimal according to coaches.
Similar improvements were made with the hitch throw to the left side and the 25 yard corner to
the right side. The improvements for the hitch to the left and 25 yard corner to the right are
shown in Figures 30 and 31.
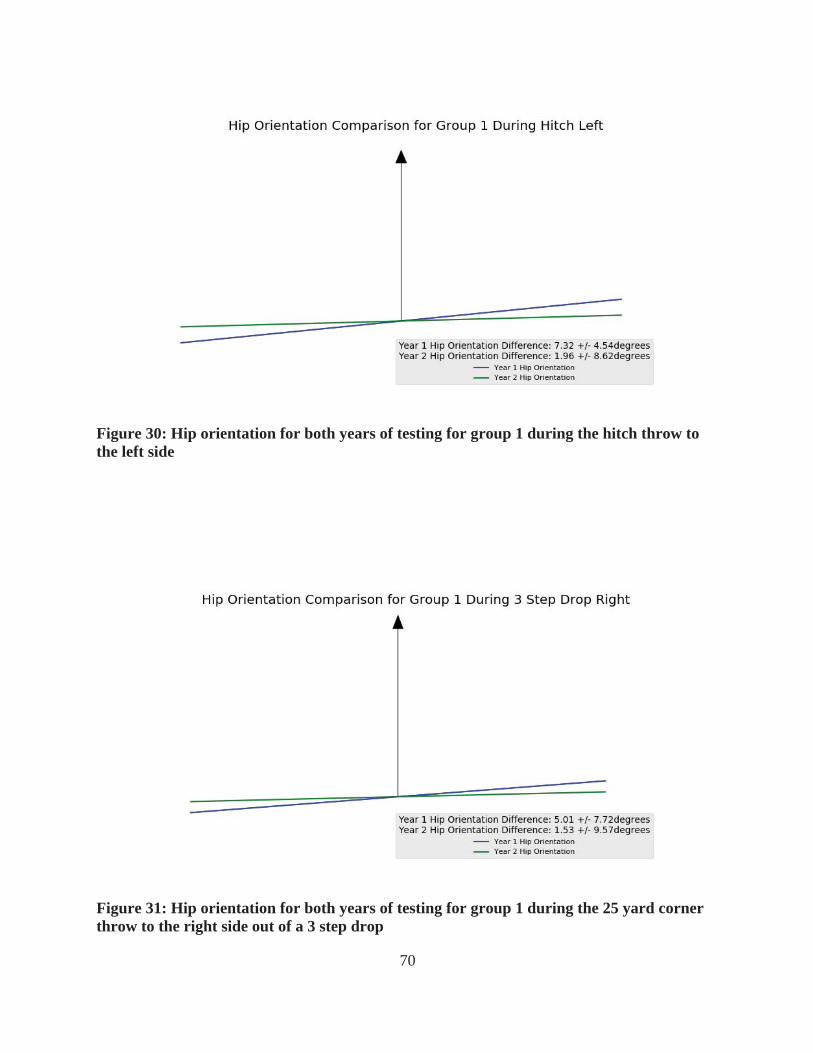
70
Figure 30: Hip orientation for both years of testing for group 1 during the hitch throw to the left side
Figure 31: Hip orientation for both years of testing for group 1 during the 25 yard corner throw to the right side out of a 3 step drop
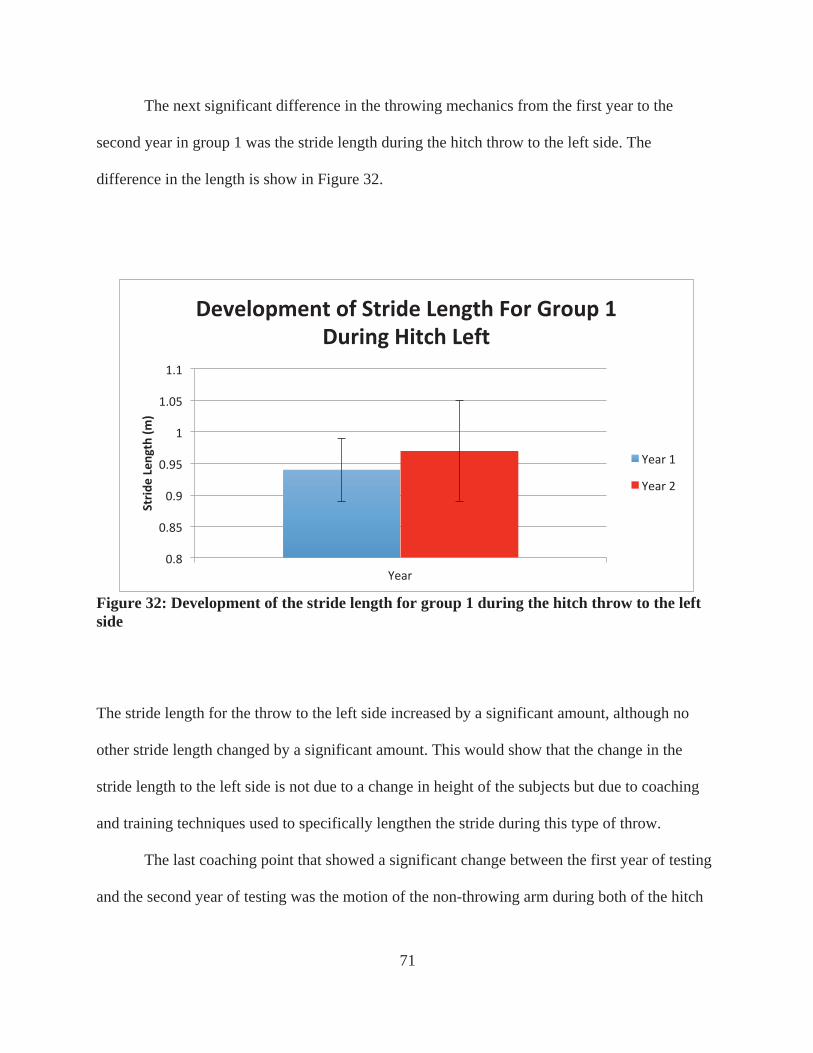
71
The next significant difference in the throwing mechanics from the first year to the
second year in group 1 was the stride length during the hitch throw to the left side. The
difference in the length is show in Figure 32.
Figure 32: Development of the stride length for group 1 during the hitch throw to the left side
The stride length for the throw to the left side increased by a significant amount, although no
other stride length changed by a significant amount. This would show that the change in the
stride length to the left side is not due to a change in height of the subjects but due to coaching
and training techniques used to specifically lengthen the stride during this type of throw.
The last coaching point that showed a significant change between the first year of testing
and the second year of testing was the motion of the non-throwing arm during both of the hitch
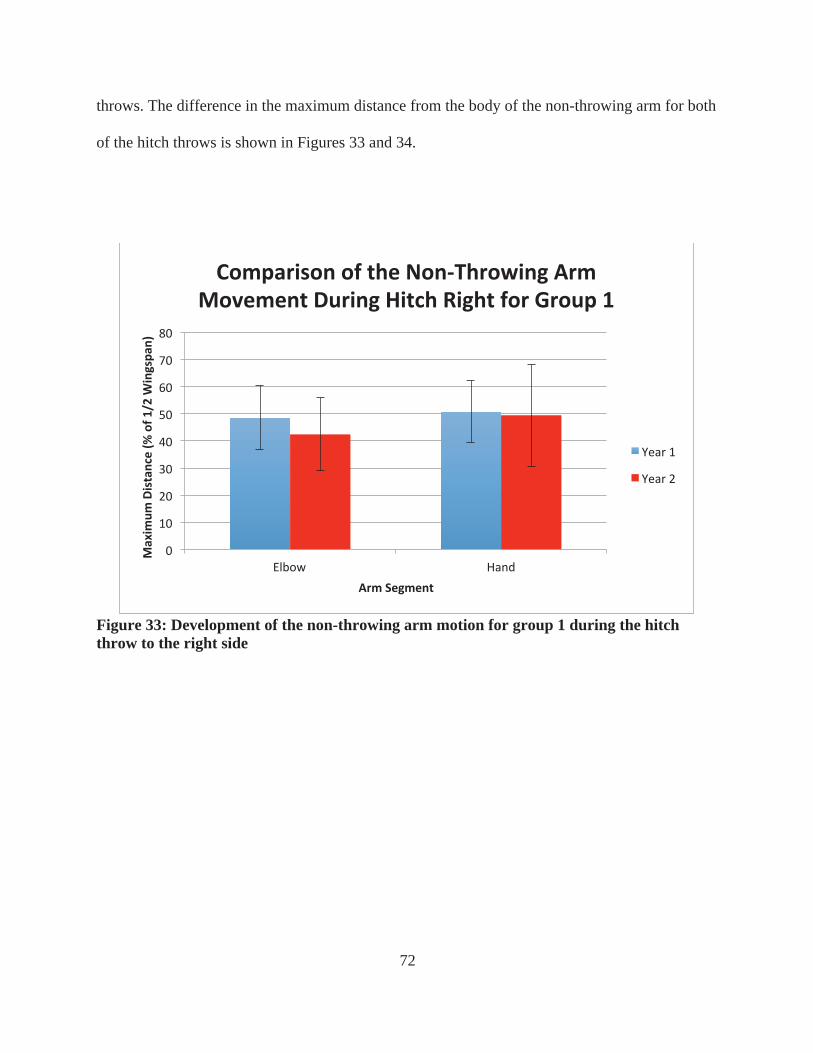
72
throws. The difference in the maximum distance from the body of the non-throwing arm for both
of the hitch throws is shown in Figures 33 and 34.
Figure 33: Development of the non-throwing arm motion for group 1 during the hitch throw to the right side
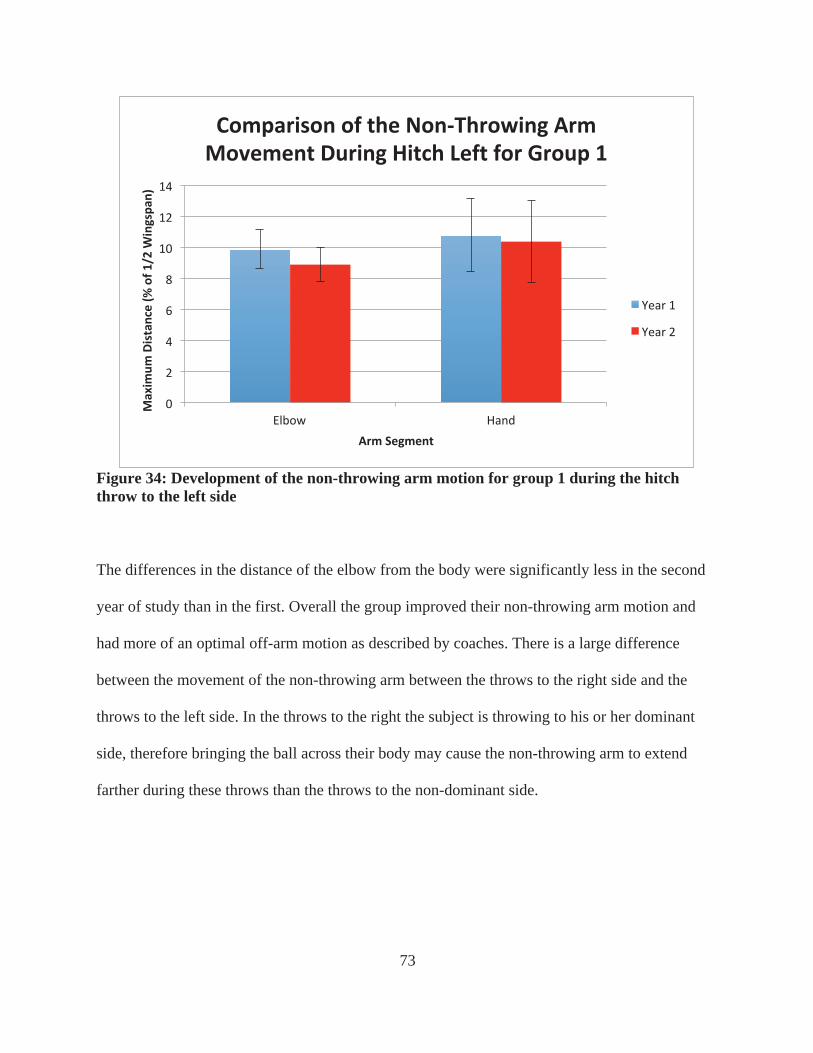
73
Figure 34: Development of the non-throwing arm motion for group 1 during the hitch throw to the left side
The differences in the distance of the elbow from the body were significantly less in the second
year of study than in the first. Overall the group improved their non-throwing arm motion and
had more of an optimal off-arm motion as described by coaches. There is a large difference
between the movement of the non-throwing arm between the throws to the right side and the
throws to the left side. In the throws to the right the subject is throwing to his or her dominant
side, therefore bringing the ball across their body may cause the non-throwing arm to extend
farther during these throws than the throws to the non-dominant side.
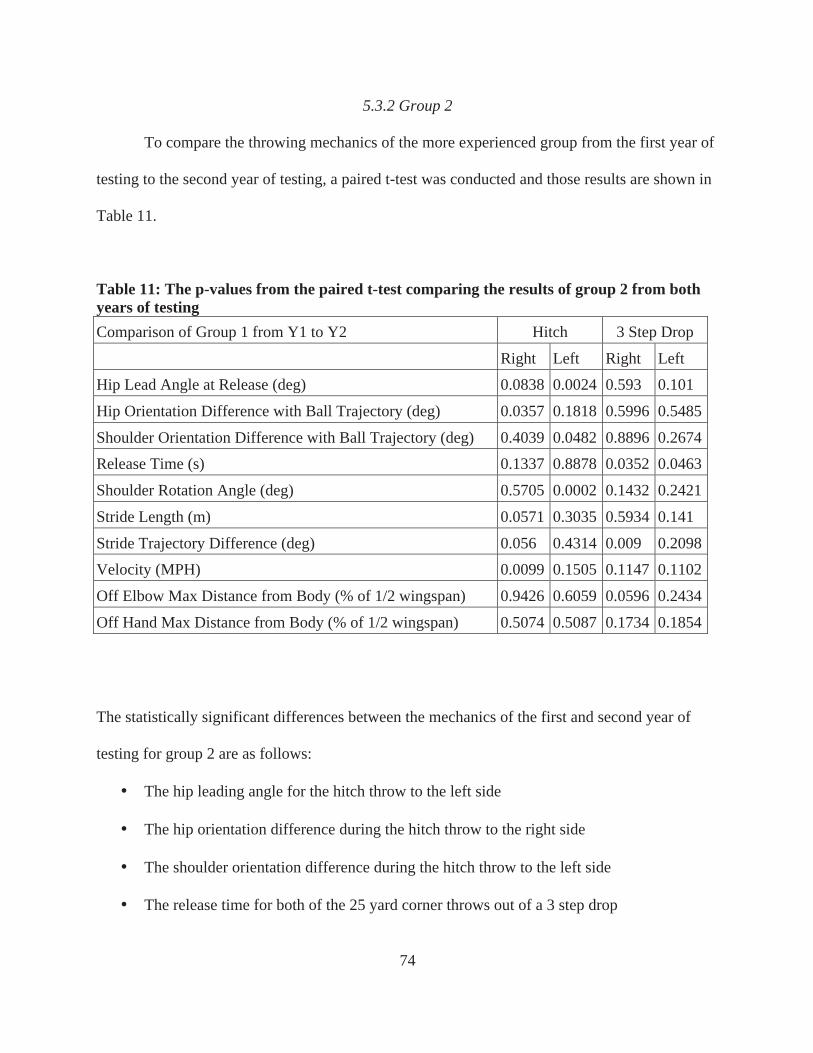
74
5.3.2 Group 2
To compare the throwing mechanics of the more experienced group from the first year of
testing to the second year of testing, a paired t-test was conducted and those results are shown in
Table 11.
Table 11: The p-values from the paired t-test comparing the results of group 2 from both years of testing Comparison of Group 1 from Y1 to Y2 Hitch 3 Step Drop
Right Left Right Left Hip Lead Angle at Release (deg) 0.0838 0.0024 0.593 0.101
Hip Orientation Difference with Ball Trajectory (deg) 0.0357 0.1818 0.5996 0.5485
Shoulder Orientation Difference with Ball Trajectory (deg) 0.4039 0.0482 0.8896 0.2674 Release Time (s) 0.1337 0.8878 0.0352 0.0463
Shoulder Rotation Angle (deg) 0.5705 0.0002 0.1432 0.2421
Stride Length (m) 0.0571 0.3035 0.5934 0.141
Stride Trajectory Difference (deg) 0.056 0.4314 0.009 0.2098 Velocity (MPH) 0.0099 0.1505 0.1147 0.1102
Off Elbow Max Distance from Body (% of 1/2 wingspan) 0.9426 0.6059 0.0596 0.2434
Off Hand Max Distance from Body (% of 1/2 wingspan) 0.5074 0.5087 0.1734 0.1854
The statistically significant differences between the mechanics of the first and second year of
testing for group 2 are as follows:
• The hip leading angle for the hitch throw to the left side
• The hip orientation difference during the hitch throw to the right side
• The shoulder orientation difference during the hitch throw to the left side
• The release time for both of the 25 yard corner throws out of a 3 step drop

75
• The shoulder internal/external rotation angle during the hitch throw to the left side
• The stride trajectory difference during the 25 yard corner to the right side
• The velocity during the hitch throw to the right side
In the second year of testing, the hip leading angle at release is greater than zero, meaning the
hips are “in front” of the shoulders at moment of release. Figure 35 shows the development of
the hip leading angle during the hitch throw to the left side for group 2.
Figure 35: Hip leading angle development for group 2 during the hitch throw to the left side
In the second year of testing, group 2 led with their hips significantly more at release and
led with their hips at a greater angle throughout the entire throwing motion. The drastic
improvement on the throws to the left side shows that the coaches still use this coaching point
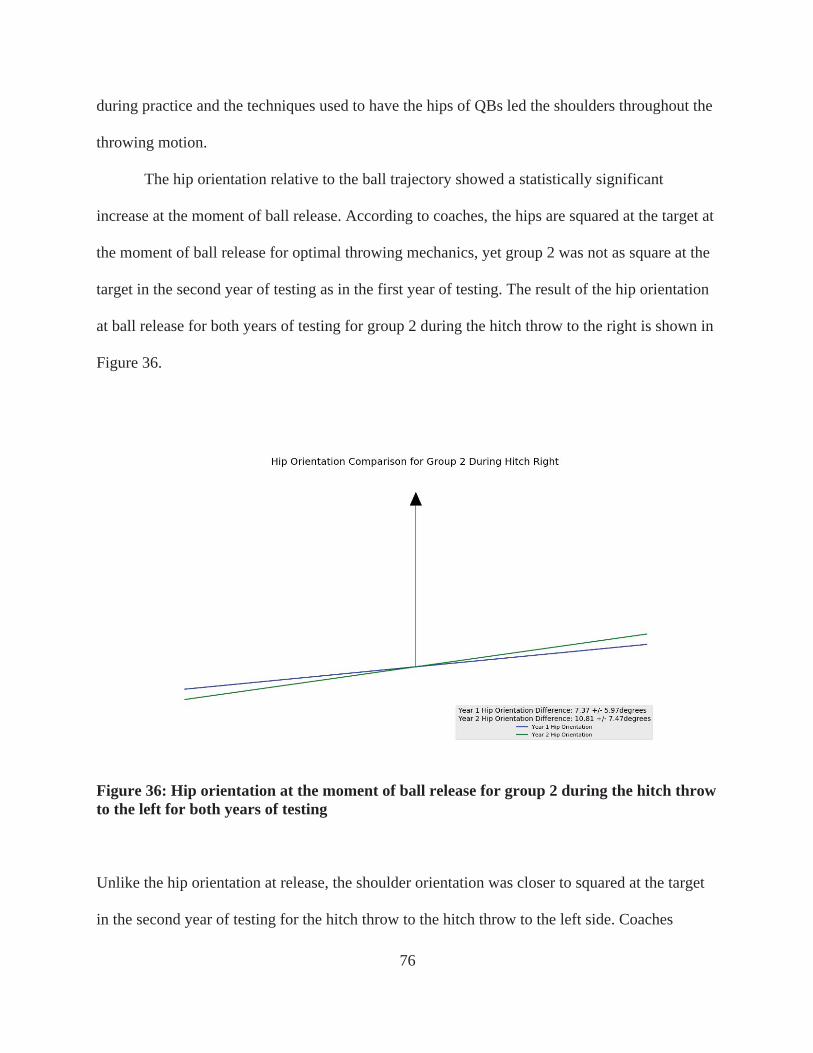
76
during practice and the techniques used to have the hips of QBs led the shoulders throughout the
throwing motion.
The hip orientation relative to the ball trajectory showed a statistically significant
increase at the moment of ball release. According to coaches, the hips are squared at the target at
the moment of ball release for optimal throwing mechanics, yet group 2 was not as square at the
target in the second year of testing as in the first year of testing. The result of the hip orientation
at ball release for both years of testing for group 2 during the hitch throw to the right is shown in
Figure 36.
Figure 36: Hip orientation at the moment of ball release for group 2 during the hitch throw to the left for both years of testing
Unlike the hip orientation at release, the shoulder orientation was closer to squared at the target
in the second year of testing for the hitch throw to the hitch throw to the left side. Coaches
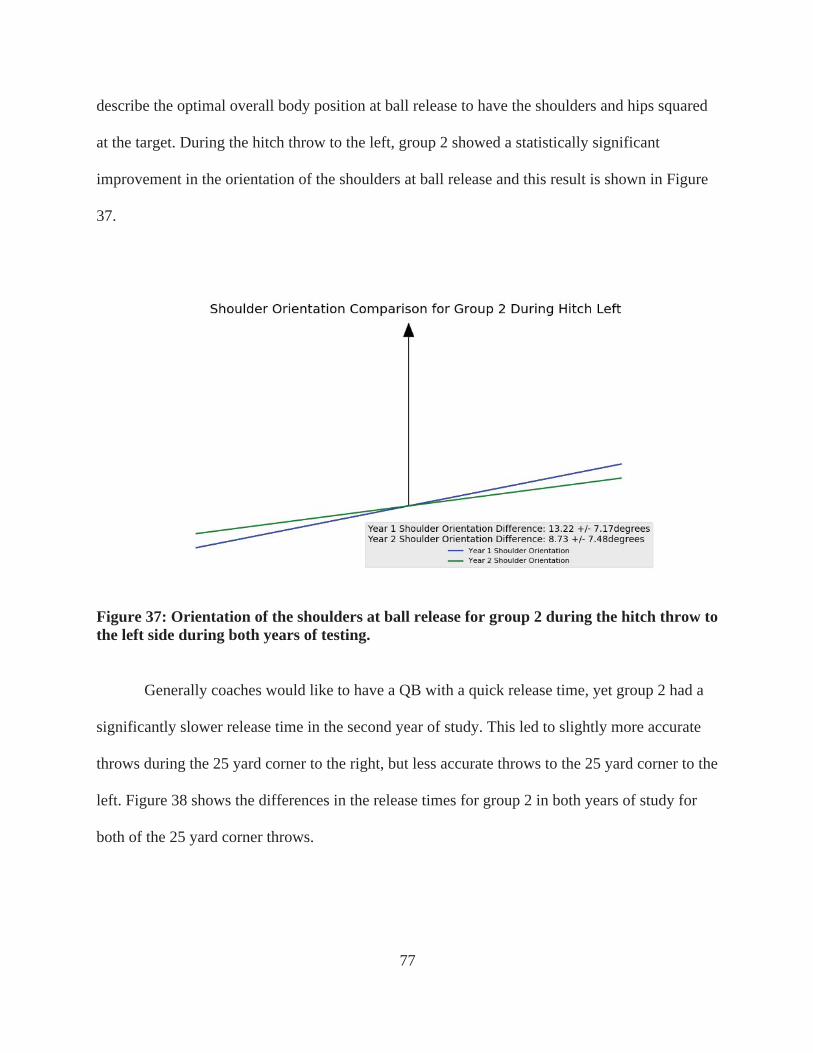
77
describe the optimal overall body position at ball release to have the shoulders and hips squared
at the target. During the hitch throw to the left, group 2 showed a statistically significant
improvement in the orientation of the shoulders at ball release and this result is shown in Figure
37.
Figure 37: Orientation of the shoulders at ball release for group 2 during the hitch throw to the left side during both years of testing.
Generally coaches would like to have a QB with a quick release time, yet group 2 had a
significantly slower release time in the second year of study. This led to slightly more accurate
throws during the 25 yard corner to the right, but less accurate throws to the 25 yard corner to the
left. Figure 38 shows the differences in the release times for group 2 in both years of study for
both of the 25 yard corner throws.
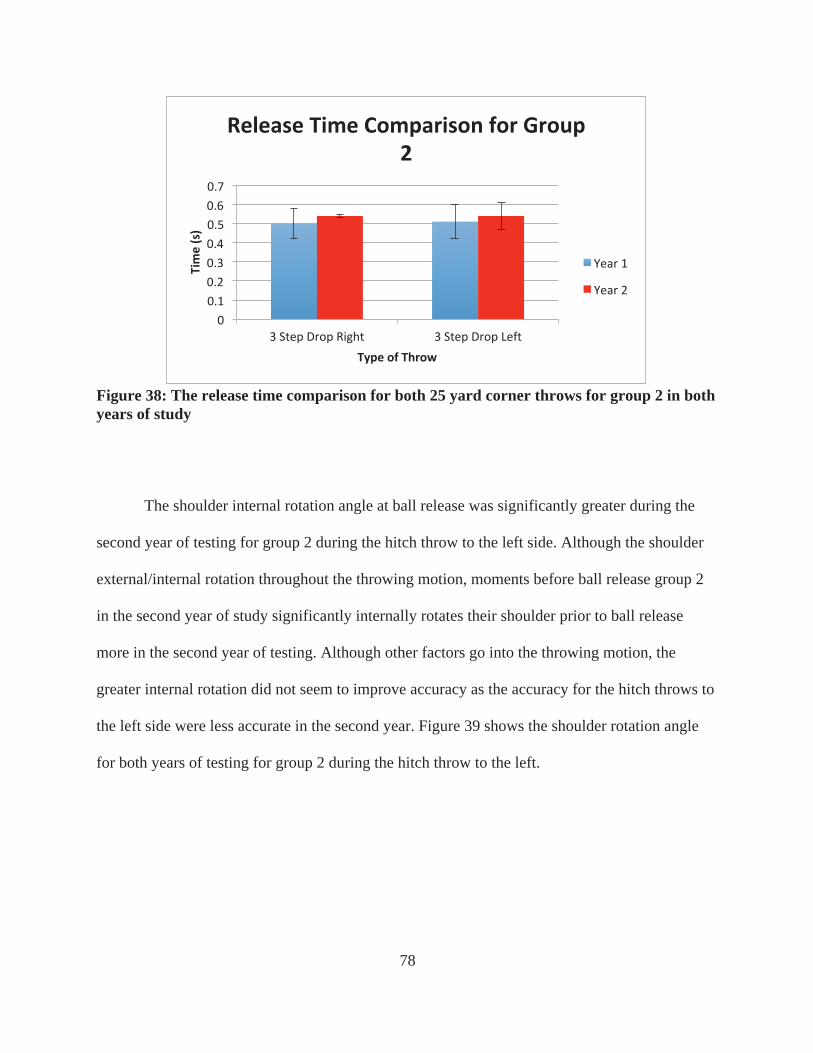
78
Figure 38: The release time comparison for both 25 yard corner throws for group 2 in both years of study
The shoulder internal rotation angle at ball release was significantly greater during the
second year of testing for group 2 during the hitch throw to the left side. Although the shoulder
external/internal rotation throughout the throwing motion, moments before ball release group 2
in the second year of study significantly internally rotates their shoulder prior to ball release
more in the second year of testing. Although other factors go into the throwing motion, the
greater internal rotation did not seem to improve accuracy as the accuracy for the hitch throws to
the left side were less accurate in the second year. Figure 39 shows the shoulder rotation angle
for both years of testing for group 2 during the hitch throw to the left.
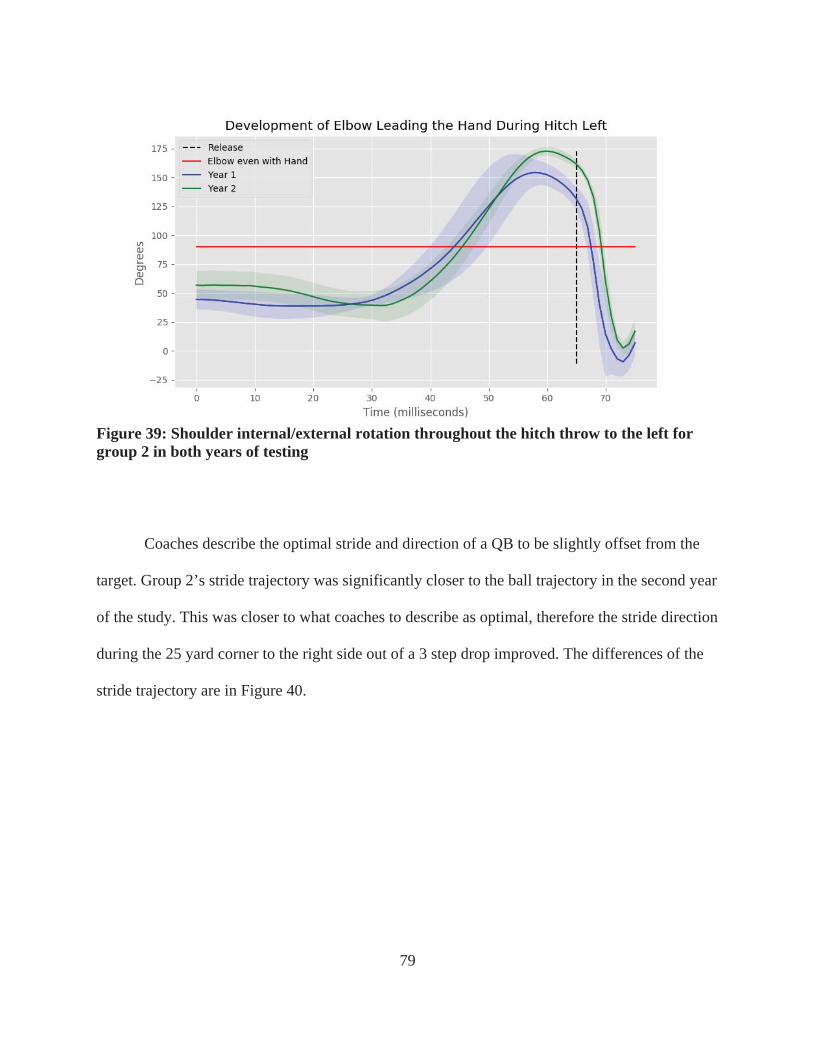
79
Figure 39: Shoulder internal/external rotation throughout the hitch throw to the left for group 2 in both years of testing
Coaches describe the optimal stride and direction of a QB to be slightly offset from the
target. Group 2’s stride trajectory was significantly closer to the ball trajectory in the second year
of the study. This was closer to what coaches to describe as optimal, therefore the stride direction
during the 25 yard corner to the right side out of a 3 step drop improved. The differences of the
stride trajectory are in Figure 40.
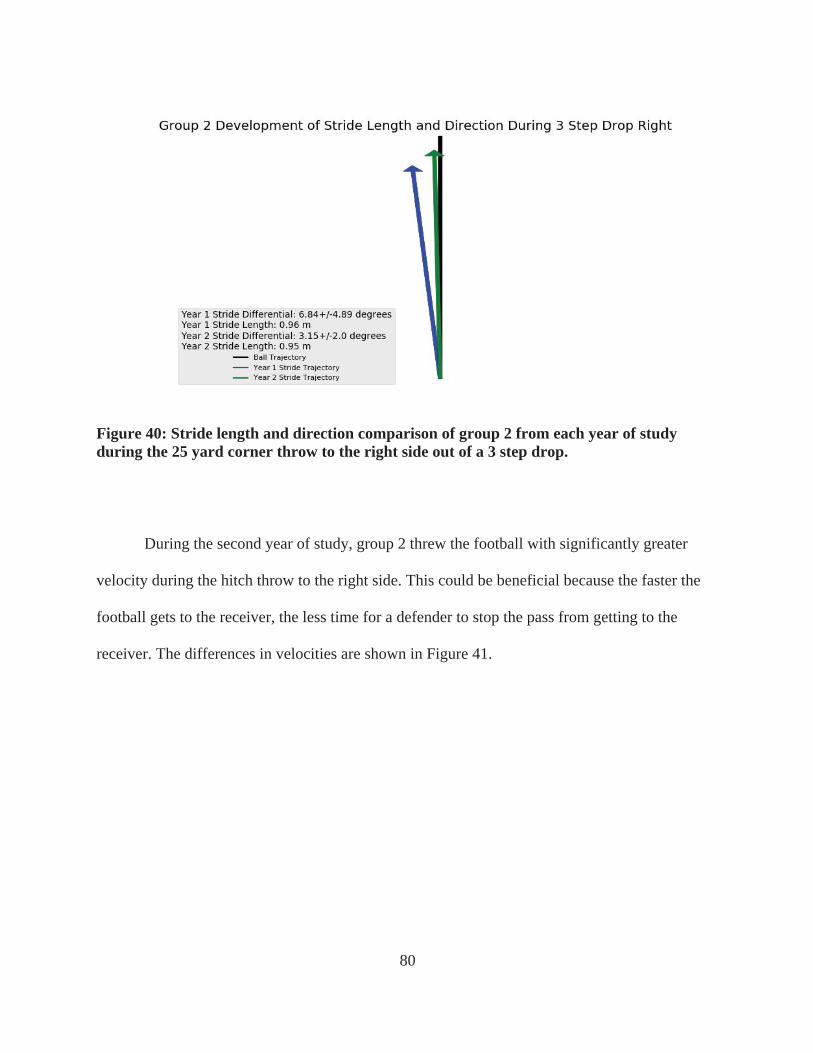
80
Figure 40: Stride length and direction comparison of group 2 from each year of study during the 25 yard corner throw to the right side out of a 3 step drop.
During the second year of study, group 2 threw the football with significantly greater
velocity during the hitch throw to the right side. This could be beneficial because the faster the
football gets to the receiver, the less time for a defender to stop the pass from getting to the
receiver. The differences in velocities are shown in Figure 41.
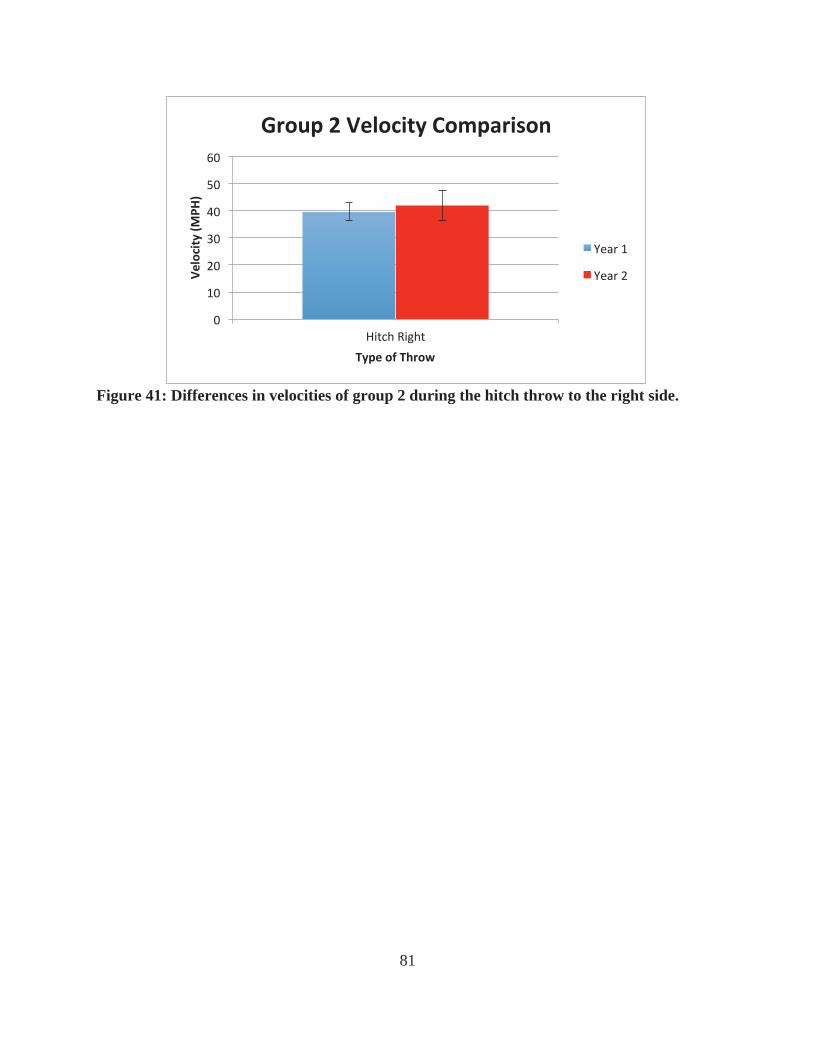
81
Figure 41: Differences in velocities of group 2 during the hitch throw to the right side.
82
CHAPTER VI
CONCLUSIONS
6.1 Limitations of the Study
Currently there is no true standard on the optimal throwing mechanics for quarterbacks
and no data to compare the current results to from previous literature. Previous literature [1-3]
analyzed a single throw, groups of elite collegiate QBs, or analyzed the mechanics based off of
scientific literature. In order to attempt to combat issues with previous studies, this study
attempted to replicate “game-like” scenarios. To replicate game-like scenarios, this study had
each subject attempt throws to the three most common receiver routes out of the three most
common foot patterns. Although this study had the subjects throw to the three most common
routes, subjects were not wearing the proper padding, did not have defensive players trying to
tackle them or deflect the pass, subjects were throwing to stationary targets, and the study
occurred indoors, not on a football field. The analysis conducted on this data was based on
previous interviews with coaches from a single district. Due to the small sample size of the
coaches interviewed there could be a possibility that coaches from different areas have different
techniques on improving their players throwing mechanics and different schemes requiring
different throwing patters from their QBs.
6.2 Future Developments of Study
6.2.1 Additional Analysis
Due to time constraints the scope of this research was limited to the analysis of the
throwing mechanics based on the coaching points deemed common through the interviews with
83
local middle school and high school football coaches. Some analysis can be conducted on
aspects of the mechanics that was not previously mentioned in the interviews and these analyses
can be created through the researcher’s intuition based on the interview results and visual
observations of the throwing motion. Some examples of these analyses that could be created are
the height of the release of the football, the elbow flexion during the throwing motion, the
transfer of weight throughout the throwing motion, and deeper analysis of the kinetic chain.
Coaches may want to see the analysis of the release point because the higher the release point of
the football by the QB the less of a chance for a defender to bat the ball down at the line and the
easier the QB can throw the ball over their offensive linemen. The analysis of the elbow flexion
can ensure the arm is extended at release and stays compact throughout the throwing motion
prior to release of the football. The analysis of the weight transfer will show that the QBs are
properly using their lower body to effectively throw the football. The analysis of the kinetic
chain will be another effective way to show the transfer of momentum from the lower
extremities to the upper extremities during the throwing motion.
6.2.2 Continue Longitudinal Analysis
In order to properly analyze the longitudinal development of subject’s throughout their
physical development, multiple time points will need to be obtained for multiple subjects. The
second year of study is a start of the longitudinal analysis, but the classification of these subjects
range from 7th grade to the 12th grade. The classification range leaves room for up to five years of
analysis for the youngest subjects. The additional time points will give more insight as to how a
QB’s develop based on the age and experience.
84
6.2.3 Analysis of QBs at Higher Levels
Currently the highest level, based on classification and experience, of data that has been
obtained is a high school senior. By obtaining a collegiate or professional QB, there will be a
comparison of the mechanics for the younger and less experienced subject’s to compare the
mechanics too. This will help give insight on throwing mechanics that have led to success in a
subject’s career. Although becoming a successful QB is not strictly based on the mechanics of
the throwing motion, the mechanics can assist with accuracy and then the success of the QB
relies on the scheme of the coach and decision making of determining a receiver to throw too.
6.3 Conclusions
Currently the results based on the common coaching points, shows that the subjects tested
have made improvements on their mechanics. Due to the small sample size of eight with multiple
time points, no real conclusions can be made but observations of the changes in mechanics can
be observed. Although no significant conclusions can be made, it should be of note that the
younger and less experienced group improved in the hip orientation difference with ball
trajectory for three of the four throws, the release time for three of the four throws, as well as the
maximum distance of their non-throwing arm for two of the four throws. The older and more
experienced group showed scattered improvement and even in some areas did not improve
according to what coaches describe as optimal throwing mechanics. The training techniques for
most aspects of the mechanics that coaches focus on based on the interviews previously
conducted, have proven to be effective for the younger group of QBs, but not as effective for the
older and more experienced group.
85
Improvements to the testing protocol can be made in order to further analyze the subjects
and create more a “game-like” scenario and the test can be tailored to each subject based on the
system and scheme of their coach. By continuing this study by collecting more time points of
subjects and collecting data from a more experienced player will allow for deeper analysis of the
throwing mechanics and analysis of how training techniques used by a coach can effect the
throwing mechanics of a developing youth.
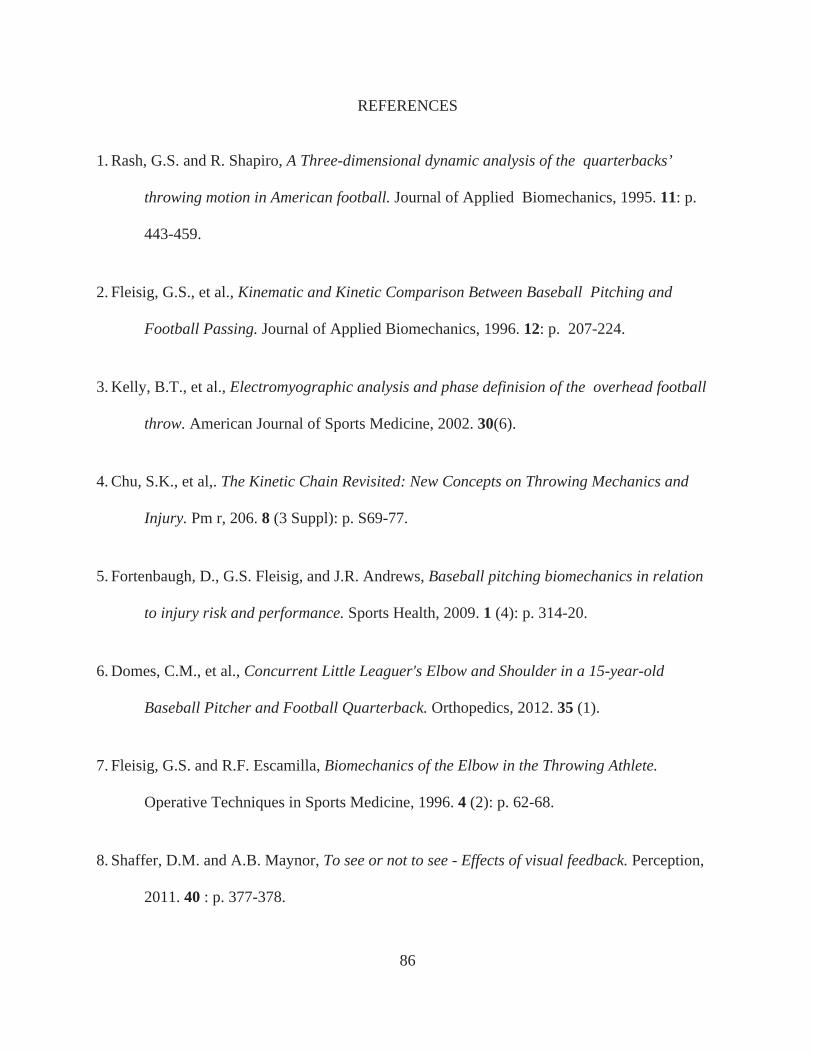
86
REFERENCES
1. Rash, G.S. and R. Shapiro, A Three-dimensional dynamic analysis of the quarterbacks’
throwing motion in American football. Journal of Applied Biomechanics, 1995. 11: p.
443-459.
2. Fleisig, G.S., et al., Kinematic and Kinetic Comparison Between Baseball Pitching and
Football Passing. Journal of Applied Biomechanics, 1996. 12: p. 207-224.
3. Kelly, B.T., et al., Electromyographic analysis and phase definision of the overhead football
throw. American Journal of Sports Medicine, 2002. 30(6).
4. Chu, S.K., et al,. The Kinetic Chain Revisited: New Concepts on Throwing Mechanics and
Injury. Pm r, 206. 8 (3 Suppl): p. S69-77.
5. Fortenbaugh, D., G.S. Fleisig, and J.R. Andrews, Baseball pitching biomechanics in relation
to injury risk and performance. Sports Health, 2009. 1 (4): p. 314-20.
6. Domes, C.M., et al., Concurrent Little Leaguer's Elbow and Shoulder in a 15-year-old
Baseball Pitcher and Football Quarterback. Orthopedics, 2012. 35 (1).
7. Fleisig, G.S. and R.F. Escamilla, Biomechanics of the Elbow in the Throwing Athlete.
Operative Techniques in Sports Medicine, 1996. 4 (2): p. 62-68.
8. Shaffer, D.M. and A.B. Maynor, To see or not to see - Effects of visual feedback. Perception,
2011. 40 : p. 377-378.
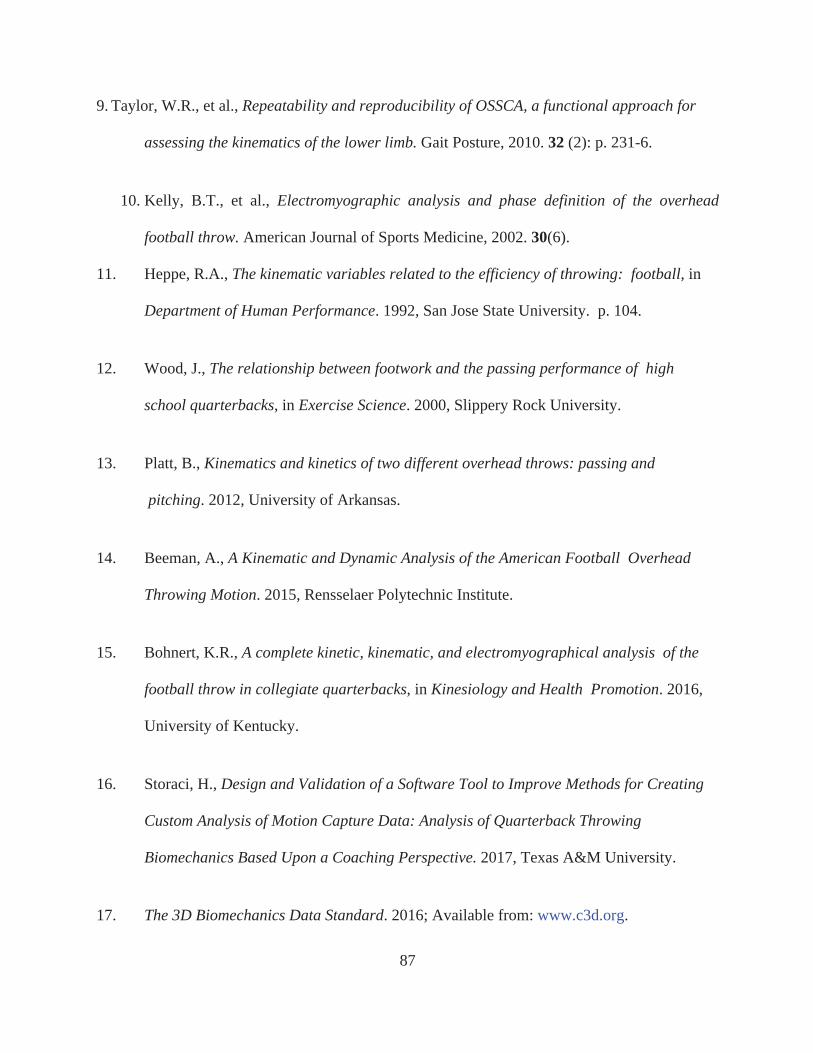
87
9. Taylor, W.R., et al., Repeatability and reproducibility of OSSCA, a functional approach for
assessing the kinematics of the lower limb. Gait Posture, 2010. 32 (2): p. 231-6.
10. Kelly, B.T., et al., Electromyographic analysis and phase definition of the overhead
football throw. American Journal of Sports Medicine, 2002. 30(6).
11. Heppe, R.A., The kinematic variables related to the efficiency of throwing: football, in
Department of Human Performance. 1992, San Jose State University. p. 104.
12. Wood, J., The relationship between footwork and the passing performance of high
school quarterbacks, in Exercise Science. 2000, Slippery Rock University.
13. Platt, B., Kinematics and kinetics of two different overhead throws: passing and
pitching. 2012, University of Arkansas.
14. Beeman, A., A Kinematic and Dynamic Analysis of the American Football Overhead
Throwing Motion. 2015, Rensselaer Polytechnic Institute.
15. Bohnert, K.R., A complete kinetic, kinematic, and electromyographical analysis of the
football throw in collegiate quarterbacks, in Kinesiology and Health Promotion. 2016,
University of Kentucky.
16. Storaci, H., Design and Validation of a Software Tool to Improve Methods for Creating
Custom Analysis of Motion Capture Data: Analysis of Quarterback Throwing
Biomechanics Based Upon a Coaching Perspective. 2017, Texas A&M University.
17. The 3D Biomechanics Data Standard. 2016; Available from: www.c3d.org.
88
18. Python object serialization – pickle. Last Updated Oct 06, 2018. Available from:
https://docs.python.org/3/library/pickle.html
19. Cappozzo, A., et al., Surface-marker cluster design criteria for 3-D bone movement
reconstruction. IEEE Trans Biomed Eng, 1997. 44(12): p. 1165-74.
20. C-Motion. Available from: http://www2.c-motion.com/products/visual3d/.
21. Seroyer, S.T., et al., The kinetic chain in overhand pitching: its potential role for
performance enhancement and injury prevention. Sports Health, 2010. 2(2): p. 135-46.
22. Hirashima, M., et al., Kinetic chain of overarm throwing in terms of joint rotations
revealed by induced acceleration analysis. Journal of Biomechanics, 2008. 41(13): p.
2874-2883.
23. QB 7-eyes from: https://myfootballmentor.com/the-seven-eyes-of-qb-throwing-
mechanics/
24. Toffan, A., et al., Comparison of the Technique of the Football Quarterback Pass
Between High School and University Athletics.
25. Planes of the body from: https://www.shutterstock.com/image-vector/median-coronal-
horizontal-sagittal-planes-human-130631345?src=wdR9gSTDMrVyla4BArsMvg-1-2