Can we be satisfied with our football team? Evidence from Spanish professional football
29
Can we be satisfied with our football team? Evidence from Spanish professional football Francisco González-Gómez Universidad de Granada. Dpto. Economía Aplicada. Facultad de Ciencias Políticas y Sociología. Campus de Cartuja. 18011 Granada (Spain). Email: [email protected] Andrés J. Picazo-Tadeo Universitat de València. Dpto. Economía Aplicada II Campus dels Tarongers. 46022 Valencia (Spain). Email: [email protected] 1
-
Upload
independent -
Category
Documents
-
view
0 -
download
0
Transcript of Can we be satisfied with our football team? Evidence from Spanish professional football

Can we be satisfied with our football team? Evidence from Spanish professional football
Francisco González-Gómez
Universidad de Granada. Dpto. Economía Aplicada. Facultad de Ciencias Políticas y Sociología. Campus de Cartuja. 18011 Granada
(Spain). Email: [email protected]
Andrés J. Picazo-Tadeo Universitat de València. Dpto. Economía Aplicada II
Campus dels Tarongers. 46022 Valencia (Spain). Email: [email protected]
1

Can we be satisfied with our football team? Evidence from Spanish professional football
Abstract. This paper assesses the sporting performance of Spanish professional football teams at
competition level, namely, League, King’s Cup and European competitions (Champions League
and UEFA Cup). Then, the gap between the result obtained by a team in a given competition and
that expected according to its potential is used as a proxy of the degree of satisfaction that fans
should feel: the narrower the gap the greater the level of satisfaction. Regarding methodology,
Data Envelopment Analysis techniques and directional distance functions are used. Results
reveal that most teams perform rather differently across competitions, the lower average
performance corresponding to the King’s Cup.
Keywords: Spanish football League; specific-competition performance; Data Envelopment
Analysis.
JEL Classification: L83, C61.
1. Introduction
Football is the most popular sport in many countries. In Europe and South America it is
by far the most widely followed sport. Judging from the income it generates, the number of
fans it has and the growing number of people who attend games in stadiums, it is clear that
there are a lot of people who find enormous satisfaction in this sport. The question is: Is it
possible to measure this satisfaction?
A review of the current literature reveals that there is wide variety of definitions of
satisfaction. The lack of consensus in this question has meant that researchers have tended to
select the most appropriate definition for the context of their analysis. Understood as a
process1, the approach we use in this paper assumes that consumer satisfaction is determined
1 For a thorough analysis of the different concepts of consumer satisfaction see Yi (1990), Peterson and Wilson (1992) and Tse et al. (2006).
2

by the difference that exists between the prior expectations of an individual and the
perception that this individual has after consuming or making use of a product or service
(Hunt, 1977; Engel and Blackwell, 1982; Tse and Wilton, 1988; Yi, 1990; Tse et al. 2006).
Adapted to any sport, satisfaction could be assessed by the difference between the
expectations of fans at the beginning of a season and the results obtained by the team at the
end of the season.
At the beginning of the season, football fans want their teams to obtain the best possible
results. In the best scenario, they can hope for their teams to win all competitions in which
they participate. If at the end of the season the team fulfils these expectations, undoubtedly
fans can feel fully satisfied and eager for the new season to start. Nevertheless, it is evident
that not all fans see their dreams fulfilled. Only one team can win each competition. From
this perspective, it is reasonable to assume that at the end of the season there will be more
fans who are dissatisfied rather than satisfied. But, do fans really think this way? Probably
not. If this were the case, the following season losing teams would have no fans and only the
winning team would keep its fans. There would be empty football stadiums, i.e. those
belonging to teams that have never won a competition. However, this does not occur in
practice.
It is more plausible to consider that fans, who are aware that not all teams can win the
competition, set different expectations according to the potential they assign to their team,
which is determined by the quality and effort made by players, along with the ability of the
trainer to combine the available resources in the best possible way. Thus, the gap between the
result obtained and the potential result could well be providing us with a measurement of the
satisfaction of a team’s fans. Here, we are proposing a measurement of the team’s
performance solely in the sporting context as a proxy of satisfaction.
3

Previous studies have evaluated performance in sport through different approaches. Some
papers analyse the specific efficiency of players (Mazur, 1994; Sueyoshi et al. 1999; Torgler
and Schmidt, 2007), while others measure the efficiency of trainers taking into account the
characteristics of the team (Fizel and D’Itri, 1997 and Dawson et al. 2000a,b). Other papers
are devoted to analysing the sporting performance of teams in the main national competition
in which they participate (Carmichael et al. 2000; Barros et al. 2008a). Furthermore, some
papers focus on the performance of a team in relation to their potential level taking into
account the relative attacking or defensive attitude of the players (Zak et al. 1979; Hofler and
Payne, 1997; Hadley et al. 2000; Espitia-Escuer and García-Cebrián, 2004, 2006; Boscá et al.
2006). Finally, Haas (2003a,b), Haas et al. (2004), Barros and Leach (2006a, 2007) and
Barros and García del Barrio (2008b) consider financial and sporting objectives in order to
measure performance.
In this paper, we measure performance focusing on the results obtained by football teams
at the end of the season in each competition they participate. We have focused on sporting
results, as the objective of the paper is to measure the degree of satisfaction of fans and,
undoubtedly, fans are much more interested in sporting results than financial results.2 As a
methodological approach, Data Envelopment Analysis (DEA) techniques and directional
distance functions are used on a set of data from the Spanish professional football teams that
have played in the First Division from season 2001/02 to season 2006/07. More specifically,
we calculate an indicator of the overall performance at team level, in addition to a specific
indicator of performance for each of the competitions in which each team has participated,
which constitutes a contribution to this field of research. As far as we are aware, existing
literature has only focused on measuring performance in the main competition in which a
2 Anyhow, sporting success ensures financial success.
4

football team participates, when common sense suggests that performance might well be
different among competitions, as might be the degree of satisfaction of their fans.
Some questions could be answered through the assessment of performance we made in
this paper: Can we be satisfied with the performance of our team? Are there any outstanding
cases of a team that does not fulfil expectations and whose fans should demand better results?
Do teams focus their efforts on improving performance in any particular competition?
Furthermore, the assessment of performance at competition level can also provide useful
information for team managers to design a strategy for player and trainer incentives
depending on the results expected and actually achieved in each competition.
The rest of the paper is organised as follows. Section 2 describes the main characteristics
of professional football in Spain. Section 3 describes football as a productive activity, whilst
Section 4 explains the methodology and presents the results. Finally, Section 5 concludes.
2. Professional football in Spain
Football is known as the king of all sports in Spain. According to the Spanish Royal
Federation of Football, on the 30th of June 2007 there were 697,795 players’ licenses and
40,987 teams officially registered. At quite some distance, basketball is the second most
played sport in Spain, with 340,855 players’ licences and 27,721 teams. The Spanish
Professional Football League3 estimates that professional football accounts for 1.7% of
Spanish Gross Domestic Product, employs directly and indirectly some 66,000 people and
generates an annual income of 821 million euros (Spanish Professional Football League,
3 The Spanish Professional Football League is a private sporting association which is composed entirely and obligatorily of Sporting Public Limited Companies and clubs who participate in official football competitions on a national, professional basis. The League is legally responsible for the organization of these competitions, in coordination with the Spanish Royal Football Federation.
5

2004).4 Although the English Premier League is the leading European football competition in
terms of income generated (Deloitte, 2008a), in season 2006/07 Real Madrid and Barcelona
occupied, respectively, the first and third place in the ranking of income for European
football teams (Deloitte, 2008b).
Professional football in Spain is organised around two main competitions: the National
Professional League Championship, popularly known as la Liga (the League), and the
Championship of Spain, better known as la Copa del Rey (the King’s Cup). The League is
made up of two competitions: the First Division (20 teams) and the Second Division (22
teams).5 The competition is based on points. In each division, all of the teams play each other
twice, once at home and once away. The winning team gets three points and both teams
receive a point for a draw. Teams that lose receive no points. Obviously, the League
champion at the end of the season is the team with most points.
In the King’s Cup, all of the teams in the two divisions of the Professional League must
take part, along with the best teams from lower divisions, Second Division B and Third
Division.6 The system is currently made up of eight knock-out stages. Lower division clubs
play each other first and teams from the First Division join the competition when there are
only 32 teams left in the competition. The early rounds are one-off games with the teams
from lower divisions being given home advantage. The round with 32 teams, the round with
16 teams, the quarter finals and semi-finals are played over two legs. The final is a one-off 4 Further evidence of just how important football is in Spain is that in 2007, seven of the ten most widely viewed television broadcasts were football matches. Among them, the Liverpool-Barcelona Champions League game (with a 45.7% audience share), the UEFA Cup final played between two Spanish teams, Espanyol and Sevilla (with a 45.8% audience share) and the Spanish League game between Real Madrid and Barcelona (with a 44.8% audience share) (Taylor Nelson Sofres, 2007). 5 The First Division is the most important competition in Spanish football and is followed by a large part of the Spanish population. In the 2006/07 season, the teams in the First Division had more than one million season-ticket holders (Liga de Fútbol Profesional, 2007). 6 The Second Division B is made up of 4 groups of 20 teams, whereas the Third Division is made up of 18 groups of 20 teams.
6

game played at a neutral venue. The winners qualify for the UEFA Cup the following season.
Matches in this competition are played midweek, from Tuesday to Thursday. Until the semi-
final stage, this competition has relatively little coverage in the media and, in general, has a
lower following than the League and European competitions.
Additionally, some professional teams also play in European competitions. The top four
teams in the League play in the following season’s Champions League.7 Furthermore, the
teams that finish fifth and sixth play in the UEFA Cup, along with the winner of the King’s
Cup. Teams that finish third in the first group stage of the Champions League also enter the
UEFA Cup directly in the last 32. In both cases, the competition format is mixed. There is
initially a group stage followed by a second phase of knock-out ties.
Since the 1999/2000 season, the Champions League has been contested by 32 teams. The
first round is made up of 8 groups of 4 teams. The teams play each other twice, home and
away. The top two in each group go on to the next stage. Until the 2002/03 season, there was
a second group stage which was removed in 2003/04. Since then, the 16 teams from the first
stage play 8 knock-out ties. Until the final, the competition is decided by two-legged, knock–
out ties. The final is played at a neutral venue chosen a year earlier by UEFA.
Traditionally, the UEFA Cup system was based on two-legged knock-out ties. Since
2000, the final has been decided by one game at a neutral venue. In 2004, UEFA introduced a
group stage in the second phase. In this second phase, there are 8 groups with 5 teams each
who play each other just once (each team plays two games at home and two games away).
The next stage of 32 teams is played by the first three teams in each group plus the third
placed teams from the first stage of the Champions League. From this stage onwards, the
7 The first two teams in The League directly enter the competition. The third and fourth place teams have to win a qualifying round to enter the Champions League.
7
competition is based on two-legged knock-out ties, except for the final which is played in one
game at a neutral venue.
Although the system of competition is not exactly the same in the Champions League and
the UEFA Cup, both competitions are composed of a first stage in which qualification is
based on groups and a second stage in which survival in the competition depends on two
legged knock-out ties. The final is played in one game at a pre-determined, neutral venue.
The matches in both European competitions are played midweek although they are much
more widely followed than the matches of the King’s Cup, particularly in the case of the
Champions League. The greater quality of the teams that participate and the prestige of being
the champion of a European competition explain the greater interest of fans and the media.
3. Football as a productive activity
The performance of a football team can be studied by analysing its results on the pitch.
Indeed, these results are normally much more important than financial results when assessing
the management of a club (Boscá et al. 2006). Furthermore, research in Europe frequently
assumes that clubs consider financial questions to be a restriction for the development of their
sporting activity, not as an objective in itself (Szymanski and Smith, 1997; Ascari and
Gagnepain, 2006). Following the initial proposal of Rottenberg (1956), which introduces the
notion of sport production function applied to baseball, and the first experimental work of
Scully (1974) applied to the same sport, there have been different approaches considering
sport as a productive process.8 Based on this consideration, a number of researchers have
studied the performance of different sports teams. In the field of football, recent studies
8 Dawson et al. (2000a) provides an exhaustive review related to production functions in the context of sport.
8
include Haas (2003a, b), Barros and Santos (2003) and Barros and Leach (2006a), Barros and
Leach (2006b, 2007), Barros and García del Barrio (2008).
The synthesis of the productive process can be resumed in the fact that football teams
must reach their maximum level of sporting performance in the various competitions in
which they participate making use of the resources available to them. Trainers must measure
out the efforts of players bearing in mind the number of games to be played over the season.
The planning of the trainer and the quality of the players will have a vital effect on results.
Furthermore, the quality of the trainer and the players will depend on the budget available
and on making good signings. On a sporting level, football teams can be considered multi-
output firms as they participate in two or more competitions. As noted in the introduction,
unlike most of previous literature on assessing football team performance, we take into
account the possibility of teams participating in various official competitions by contributing,
in addition to an indicator of overall team performance, a specific indicator of performance
for each competition.
As previously stated, professional teams in Spain can participate in up to three
competitions: the League, the King’s Cup and European competitions (Champions League or
UEFA Cup). Therefore, the description of the productive process must give a specific
measure of the output or the sporting result in each competition. Following the proposals
made in various previous studies, output in the League is measured by the number of points
obtained at the end of the season (Espitia-Escuer and Garcia-Cebrian, 2004, 2006; Dawson et
al. 2000a; Barros and Leach, 2006a). Secondly, as the King’s Cup competition is decided
through two-legged knockout ties, except for the final which is played in one game at a
neutral ground, success in this competition is measured by the number of qualifying rounds
9

each team plays in.9 Thus, a team’s performance in this competition is better depending on
the number of rounds played.10
Finally, it is necessary to define a variable to measure the result obtained in European
competitions, for those teams who participate in the Champions League or the UEFA Cup. To
model the participation in European competition no distinction has been made between both
competitions, which, however, introduces a couple of difficulties. Firstly, because the
qualification system is, as previously noted, slightly different. Secondly, because in both
cases some modifications have been introduced over the period analysed. In order to
homogenise the measurement of results in European competitions, we decided to include the
number of games played as a measure of output.11 A greater number of games played means
a team has gone further in the competition and that fans have enjoyed their team’s
performance more. Essentially, whatever the final position in the competition, the more
games a team plays, the more satisfied their fans will be.
Inputs reflect the potential of the team in different competitions. The first variable
introduced as an input is the number of squad players available throughout the season
(Espitia-Escuer and Garcia-Cebrian, 2004, 2006; Barros and Leach, 2006a). Although only
11 players can be on the pitch, on average squads tend to have over 25 players. One reason
9 Other studies which assess the performance of professional teams that participate in various competitions systematically neglect the results obtained in competitions decided on a knockout basis. 10 In the review of the literature, only Haas (2003a) incorporates a representative variable of the result in a competition which is parallel to the national league. Moreover, in Major League Soccer in USA, the main teams participate in the US Open Cup. The variable introduced by Haas allows us to distinguish between the champion and the losing finalist, and the teams that reach the semi-finals and the quarter-finals. 11 In the USA, sporting competitions on a national level have a certain similarity to the format of the Champions League and the UEFA Cup. Studies which assess performance in these competitions normally only take into account the team’s results in the first stage of the normal competition which decides which teams go on to the play-offs. For example, this is the case with the research made by Hofler and Payne (1997) for the National Basketball Association. Regarding similar research in the European context, the only study is that conducted by Haas (2003b), which incorporates a variable that gives information on whether or not the team has participated in the Champions League or the UEFA Cup.
10

for this is that in official games trainers can make up to three changes. Furthermore, the
season is very long and there may be injuries or the trainer may decide to measure out the
efforts of players and rotate the team when there are many games in a short period of time.
Normally, trainers require at least two players for each position in the team.
Representative variables for the financial capacity of teams have also been introduced.
This explains why greater income allows the signing of players and trainers with a higher
market value and, presumably, more ability and know-how. In other productive activities, it
is normally assumed that there are no significant differences in the price of factors, nor in
their productivity. Nevertheless, in the world of football there are huge differences in the
salaries of players and trainers and these are based on results. The relationship between the
sporting quality of a team (players and trainers) and the financial capacity of a club has been
analysed by Szymanski and Smith (1997). Furthermore, Dobson and Goddard (1998),
Szymanski and Kuypers (1999), Forrest and Simonns (2002) and Haas (2003a) have also
analysed the relationship between expenditure and team success.
The income of football teams in Spain comes from match-day turnover, broadcasting fees
and commercial sources such as merchandising. As a proxy of these sources of income, we
have incorporated as inputs the number of people who attend games, the number of trophies
won in official competitions and, finally, the number of seasons played in the First Division.
The number of spectators is a proxy of the income obtained from attendance to games both
through direct ticket sales and through season-ticket payments. This variable can also capture
the crowd’s capacity to intimidate the referee and influence his decisions. The number of
trophies in official competitions is a proxy of the income which a team can obtain from
broadcasting fees and commercial sources. It is logical to assume that greater sporting
success will be accompanied by greater income from these two sources of finance. As there
11

are teams that have never won a trophy in their entire history, we have also introduced the
number of seasons played in the top division in Spain. Furthermore, we might expect better
results from those teams with greater experience in the competition (Kahane, 2005).
The data used in this papers belong to the football teams that participated in the First
Division of the Spanish Football League from the 2001/02 season to the 2006/07 season, and
comes from the annual reports published by the Professional Football League. Observations
are pooled in a dataset that includes 120 observations (20 teams participating in the 6 seasons
studied). It is necessary to point out that the information does not refer to the same teams
throughout the whole period, as some teams were relegated and others were promoted. Some
descriptive statistics for the data are in Table 1.
Insert Table 1 about here
4. The performance of Spanish professional football teams
Assessing performance is a deep-rooted practice in the field of economics which, as shown
in the introduction, in recent years has also been applied to sports and, particularly, to
football. In analysing performance, several methodological approaches can be used, Data
Envelopment Analysis (DEA) techniques among them.
DEA is a non-parametric approach to measuring performance based on mathematical
programming that uses observed data on inputs and outputs of a sample of decision making
units, or football teams in our case, to set up a technological frontier representing best
practices. Then, a performance index of each football team within the sample can be
computed by comparing its observed performance with its potential performance or
maximum output that could have been attained given its endowment of resources, which is
determined by the technological frontier. DEA is a technique due to Charnes et al. (1978)
12

which has, to date, produced a wealth of contributions. Emrouznejad et al. (2007) review the
empirical literature on DEA, while further details on this approach to performance
measurement are in Cooper et al. (2007).
In this paper we consider, as justified in Section 3, that football can be treated as a
productive activity and that football teams can be regarded as decision making units whose
goal is, given their endowment of resources, to maximise output in terms of achieving
maximum sporting performance in each competition in which they participate. In more
technical words, a football team uses a set of x inputs to obtain a set of y outputs through a
technology that represents the relationship between inputs and outputs and can be defined as:
( ), : can produce T = ⎡⎣ x y x y⎤⎦ (1)
It is assumed that technology satisfies the usual properties initially suggested by Shephard
(1970). Based on this technology, the overall performance of a football team can be readily
computed by using the conventional Shephard output distance function, which is defined as:
( ), : ,⎡ ⎛ ⎞= ⎜ ⎟⎢ ⎝ ⎠⎣ ⎦OD Inf Tθ
θyx y x ⎤
∈ ⎥ (2)
This distance measures the maximum equiproportional expansion of all outputs that a
football team could attain given its inputs, thus assessing the chance of increasing its
performance without using additional resources. This indicator of performance is upper-
bounded to one, the lower the score the worse the performance.
In addition to assessing the overall performance of football teams, we might also be
interested, as in fact we are in this paper, in evaluating their particular performance in the
different competitions they participate in. This can be done by computing directional output
distance functions which, in contrast to conventional output distances, allow each output, i.e.
13

the performance in each competition, to be expanded along a direction previously specified
by the researcher. The general definition of the directional output distance function is (Färe
and Grosskopf, 2000):
( ) ( ), ; ,..., : , ,...,1 M 1 MO y y y yD g g Sup g g Tϕ ϕ⎡ ⎤ ⎡= = +⎣ ⎦ ⎣
ryx y g x y ⎤ ∈⎦ , (3)
where gy is the vector that determines the direction in which each output is increased, e.g. gy1
indicates in which direction output y1 expands.
Particularly, the direction vector to assess the performance of our favourite football team
in a given competition is that which allows for a particular output to be expanded, while
maintaining the remaining outputs constant, for given resources and technology. With this
direction vector, the directional output distance function of expression (3) becomes:
( ) ( ) ( ) ( ), , ; 1, : , , 1,O i i i iD y Sup y Tϕ ϕ− −⎡ ⎤= = + ∈⎡⎣⎣ ⎦0 0r
yx y g x y ⎤⎦ , (4)
where i denotes the output to be expanded, while –i stands for the remaining outputs.
Verbalising, computing directional distance functions allows us to evaluate the possibility
of improving the performance of a football team in a particular competition, namely the
League, without worsening its performance in the remaining competitions. Once again, the
upper limit of this indicator is one, the higher the score the better the performance.
In order to assess both overall and competition-specific performance, as noted in Section
3, all observations of Spanish football teams participating in the First Division of the League
over seasons 2001/02 to 2006/07 have been pooled, which makes a sample of t = 1,…,120
observations. Then, using DEA techniques, the overall performance of observation t’,
14

belonging to a particular team in a given season, arises from the solution to the following
linear programming problem12:
( ) 1
120
1120
1
120
1
1 2 3 4
1 2 3
0 1 120
1
t t 't' t' t'
O w ,
t' t tn nt
t' t' t tc ct
t
tt
D , Max
subject to:
x w x n , , , (i)
y w y c , , (ii)
w t ,..., ( iii )
w (
φφ
φ
−
=
=
=
=
≥ =
≤ =
≥ =
=
∑∑
∑
x y
iv )
(5)
where wt is a set of intensity variables determining the efficient combination of observations
team t’ is compared to. Moreover, xnt and yc
t stand for input n and output c of team t,
respectively.
Furthermore, the directional output distance function representing the performance of
observation t’ in competition i comes from the following problem:
( ) ( )
120
1120
1
120
1
120
1
1
1 2 3 4
1 2 3
1 2 3
0 1 120
1
t t 'i
t' t' t' t'O i i iw ,
t' t tn nt
t' t' t ti i it
t' t ti it
t
tt
D , y , ; , Max
subject to:
x w x n , , , (
y w y i c , , and i i (iii)
y w y i c , , (
w t ,...,
w
ϕϕ
ϕ
−
=
=
− −=
=
⎡ ⎤= =⎣ ⎦
≥ =
+ ≤ ∈ = ∉ −
≤ − ∈ =
≥ =
=
∑∑
∑
0yx y g
i)
iv)
( v )
( vi )
r
∑
(6)
Then, the performance of observation t’, belonging to a particular team in a given season
and competition, can be assessed by merely comparing the observed performance in that
12 Variable returns to scale are imposed (see Banker et al., 1984), so that pure managerial technical inefficiencies are evaluated. Barros and Leach (2006a) assess the performance of the English Premier Football League under the assumption of variable returns to scale and overall efficiency scores are decomposed into the combination of pure technical and scale inefficiencies.
15

competition with the maximum performance that could have been achieved given its
endowment of resources, while maintaining performance in the remaining competitions.
Formalising:
( )'
' '
tt' ii t t
i i
yCompetition-specific performacey
=+ϕ
(7)
Now the main insights of the methodology have been described, let us move on to
comment the results. In the first place, Table 2 ranks the 30 football teams in our sample
according to their overall performance scores, which account for potential proportional
increases of performance in all competitions in which they participate. The figures are the
average value for each team in each of the seasons in which they have played in the First
Division, with a maximum of six (see the last column in Table 2). As noted, values nearest to
one mean that the team obtained a result in accordance with its potential, whilst values
furthest from one mean worse performance in relation to expected results. Moreover, Figure
1 shows the evolution of the overall performance indicator for the three teams with the best
and worst results of those that played in the First Division of the League in at least five of the
seasons studied. This manner of presenting results allows us to analyse a team’s evolution
and observe the impact of any changes that may have been made in the sporting management
of the team.
Insert Table 2 and Figure 1 about here
Looking at the figures in Table 2, it is worth highlighting the presence of teams with few
resources and relatively little history, such as Numancia, Getafe and Villarreal, in the top
positions on attaining sporting results in the period studied really close to their potential. In
the case of Numancia, a team that belongs to a town of fewer than 40,000 inhabitants, it was
certainly a notable achievement to play in the First Division in season 2004/05 and to reach
16

the quarter-finals of the King’s Cup. Nevertheless, Getafe and Villarreal have undoubtedly
been two of the best performers in Spanish football at the beginning of the twenty first
century, whose fans should show a high degree of satisfaction.
On the one hand, Getafe was founded in 1983 in a city with just 150,000 inhabitants and
currently has around 11,000 season-ticket holders. It was promoted to the First Division in
the season 2003/04 and since then has not been relegated. Among its recent successes, it is
worth highlighting the semi-final of the UEFA Cup played in the 2007/08 season. On the
other hand, the performance of Villarreal over the last few seasons has also been noteworthy.
This football team belongs to a town with fewer than 50,000 inhabitants; with hardly any
history, it reached the First Division of Spanish football after promotion in the 1999/2000
season, and has stayed since then. The main achievement of Villarreal to date has been
reaching the semi-finals of the Champions League in the 2005/06 season.
Real Madrid and Barcelona, two of the teams with stronger tradition in Spanish football,
also show a high level of sporting performance, and, therefore, their fans should certainly feel
satisfied. The scores of overall performance for these teams show that they are reaching
96.8% and 95.3% of their potential, respectively. Nevertheless, the evolution of performance
of Real Madrid and Barcelona in the period analysed is rather different (see Figure 1). Whilst
Real Madrid seem to be showing the consequences of the end of the era of the galácticos13
since the 2003/04 season, Barcelona has improved their results on the field since Joan
Laporta became their President in June 2003.
Going ahead with the analysis of the figures in Table 2, the lowest scores of sporting
performance correspond to historic teams such as Murcia, Gimnàstic de Tarragona or
13 This is the nickname that the club acquired through their policy of signing stars such as Zidane, Figo, Beckham, Owen, Ronaldo or Robinho.
17

Tenerife, who were only able to play in the First Division in one of the seasons studied and
are linked to quite populous cities. The low observed performance of these teams in relation
to their potential would explain the dissatisfaction of their fans. Moreover, some other teams
with a great tradition in Spanish football also show poor performance. Among them, Atlético
de Madrid, a team with a very high budget and which signs promising and valuable new
players every year, has come to be regarded as a very unpredictable team. The team’s results
confirm this impression, at least in the period analysed, and it would seem that their signing
strategy is seriously flawed. A bad choice of players who perform worse than expected and a
lack of balance in terms of these signings could explain the team’s disappointing results.
Furthermore, two noteworthy cases are Real Sociedad and Athletic de Bilbao, whose
performance scores are below 0.7 and display a downward tendency (see again Figure 1).
Perhaps, one possible cause for these poor results could be a peculiar policy in terms of
signings which restricts the free signing of any player. Specifically, Athletic de Bilbao only
sign players born or raised in the Basque Country and Navarre.14
One of the main arguments of this paper is that football teams do not necessarily have to
perform at the same level in each of the competitions they participate, so that contributing an
assessment of performance at competition level might add relevant information in analysing
performance in Spanish professional football. Table 3 shows the computed scores of
competition-specific performance, which display a slightly different picture of performance,
bringing to light important insights that would have gone unnoticed with scores of overall
performance. Let us emphasise here again that specific-competition performance scores do
not indicate that performance could be simultaneously improved in all competitions, but
14 Traditionally, Real Sociedad’s signing policy has been similar to that Athletic de Bilbao. Nevertheless, since the 1989/90 season they have signed foreigners and non-Basque Spanish players, although the core of their squad is composed of players born in the Basque Country.
18

rather they measure the potential of improving the result in a particular competition, while
maintaining the performance in the other competitions.
Insert Table 3 about here
In the first place, the ranking of the Spanish professional football teams according to their
performance in the League is rather similar to that obtained from the overall performance
indicator, as shown by the result of performing a Spearman correlation test (the Spearman ρ
is 0.978, with p-value 0.000).15 The best performers are still some modest teams like
Numancia or Getafe, in addition to teams with stronger tradition in Spanish football such as
Real Madrid and Barcelona. Also, among teams with a great tradition in the First Division of
the League, the worst performance in this competition corresponds to Atlético de Madrid,
Real Sociedad and Atlétic Club de Bilbao. Things are somewhat different when rankings of
overall performance and performance in the King’s Cup are compared. Although the
Spearman test also leads to reject the null hypothesis of independence (in this case the
Spearman ρ is 0.846, with p-value 0.000), some teams experience important changes in their
position. For example, Barcelona goes down six positions in the ranking of the King’s Cup
with respect to the ranking of overall performance, while Cadiz Club rises fifteen positions.
Changes are also important for some teams when they are ordered according to their
performance in European competitions.
As a second result from the competition-specific assessment of performance, it is worth
highlighting the lower level of efficiency shown by teams in the King’s Cup. This
competition does not consider consistency in performance throughout the season. Instead
15 The scores of efficiency computed involve a certain number of ones, creating ties in the calculation of ranks. In order to take into account this circumstance, we have established a ranking of the efficient teams in accordance with their importance as benchmarks, measured as the number of times they act as a referent for other inefficient teams (Charnes et al., 1985).
19

continuity in the competition for First Division teams is based on two-legged knockout ties.
Furthermore, although club managers tend to hide this fact, the lower interest shown in this
competition tends to convert it into a secondary objective for clubs. Teams often use the
King’s Cup to rotate and let key players rest and also give minutes to other squad players who
do not usually make the first team.
Finally, and in order to make our analysis more specific, we have chosen the results for
Valencia, who play in all three competitions, as an example of the interest that team
managers could have in the information provided by specific-competition analysis.
Conventional evaluation of performance for this team, i.e. its score of overall performance,
indicates this team is achieving 90.8% of its potential in all competitions. In contrast,
competition-specific scores of performance are 0.884, 0.438 and 0.789 for League, King’s
Cup and European competition, respectively. Valencia occupies eighth place in a ranking of
teams ordered according to their scores of overall performance, while when Spanish football
teams are ranked by their result in the King’s Cup, it drops to twentieth position, and goes up
again to eighth when ranked according to its performance in League. These results reveal that
this team has a notable potential to increase its performance in the King’s Cup.
5. Summary and conclusions
Football is a mass market sport, that, particularly in Europe and Latin America, has
millions of fans and generates a huge volume of economic activity. Starting from the
consideration of football as a productive activity, the objective of this paper is to assess the
sporting performance of Spanish professional football teams. As for the methodological
approach, Data Envelopment Analysis techniques and directional distance functions are used.
Our main contribution to the literature in this field of research is the calculation of
competition-specific indicators of performance for the League, the King’s Cup and European
20

competitions. The difference between the results obtained at the end of the season and those
expected according to the team’s potential is used as a measurement of the satisfaction that
fans should feel: the narrower the gap, the greater the degree of satisfaction should be. In
addition, evaluation of performance at competition level might provide team managers with
sound information to find out where the greatest potential for improving performance is
hidden.
Considering the teams that have participated in the First Division in Spain in at least three
of the six seasons analysed, season 2001/02 to season 2006/07, the following results are
worth highlighting. Firstly, among teams with a lesser tradition, Getafe and Villarreal have
achieved results very close to their potential, so their supporters can feel a high degree of
satisfaction. Secondly, Real Madrid and Barcelona, clubs with a greater tradition and with the
highest income in Spain, also show a high level of performance. Finally, judging by the
results of the study, Atlético de Madrid, Real Sociedad and Athletic de Bilbao are the teams
whose fans should be most dissatisfied and, consequently, those who should make the most
changes in their management practice in order to improve performance.
In addition, computation of specific-competition performance scores provides our
research with some interesting extra results. In general, Spanish football teams perform worst
in the King’s Cup, a competition where smaller clubs, even from the Second Division, beat
larger clubs. The underperformance of First Division teams in the King’s Cup could be
caused by the fact that a competition based on knock-out ties tends to produce unexpected
results. Moreover, it could also be due to a question of sporting strategy. When teams have to
play many games in different competitions, trainers tend to rest their best players in the
King’s Cup, where teams seem not to be guided by the competitive spirit that should prevail
in any professional sport. This result could well be alerting of the need for some changes in
21

the King’s Cup competition system conducive to increasing the competitive spirit of
participating teams or, simply, to eliminate it from the calendar of Spanish professional
football.
References
Ascari, G. and P. Gagnepain (2006) “Spanish Football”, Journal of Sports Economics 7, pp.
76-89.
Banker, R.D.; A. Charnes and W.W. Cooper (1984) “Some models for estimating technical
and scale inefficiencies in Data Envelopment Analysis”, Management Science 30, pp.
1078-92.
Barros, C.P. and A. Santos (2003) “Productivity in sports organisational training activities: a
DEA study”, European Journal of Sport Management Quarterly 1, pp. 46-65.
Barros, C.P. and S. Leach (2006a) “Performance evaluation of the English Premier Football
League with data envelopment analysis”, Applied Economics 38, pp. 1449-1458.
Barros, C.P. and S. Leach (2006b) “Analysing the performance of the English F.A. Premier
League with an econometric frontier model”, Journal of Sport Economics 7, pp. 391-407.
Barros, C.P. and S. Leach (2007) “Technical efficiency in the English Football Association
Premier League with a stochastic cost frontier”, Applied Economics Letter 14, pp. 731-
741.
Barros, C.P.; J. del Corral and P. Garcia-del-Barrio (2008a) “Identification of segments of
soccer clubs in the Spanish League First Division with a latent class model”, Journal of
Sports Economics 9, pp. 451-469.
Barros, C.P. and P. García del Barrio (2008b) “Efficiency measurement of the English
football Premier League with a random frontier model”, Economic Modelling, doi:
10.1016/j.econmod.2008.01.004.
Boscá, J.E.; V. Liern; A. Martínez and R. Sala (2006) “Increasing offensive or defensive
efficiency? An analysis of Italian and Spanish football” Omega, doi:
10.1016/j.omega.2006.08.002.
22

Carmichael, F.; D. Thomas and R. Ward (2000) “Team performance: the case of English
premiership soccer”, Managerial and Decision Economics 21, pp. 31-45.
Charnes, A.; W.W. Cooper and E. Rhodes (1978) “Measuring the efficiency of decision
making units”, European Journal of Operational Research 2, pp. 429–44.
Charnes, A.; C.T. Clark; W.W. Cooper and B. Golany (1985) “A developmental study of
Data Envelopment Analysis in measuring the efficiency of maintenance units in the US air
forces”, Annals of Operations Research 2, pp. 95-112.
Cooper, W.W.; L. Seiford and K.Tone (2007) Data envelopment analysis: a comprehensive
text with models, applications, references and DEA-Solver software, Springer Verlag,
Boston.
Dawson, P.; S. Dobson and B. Gerrad (2000a) “Estimating coaching efficiency in
professional team sports: Evidence from English association football”, Scottish Journal of
Political Economy 47, pp. 399-421.
Dawson, P.; S. Dobson, S. and B. Gerrad (2000b) “Stochastic frontiers and the temporal
structure of managerial efficiency in English soccer”, Journal of Sports Economics 1, pp.
341-362.
Deloitte (2008a) Annual Review of football finance, United Kingdom.
Deloitte (2008b) Football money league, United Kingdom.
Dobson, S.M. and J.A. Goddard (1998) “Performance and revenue in professional league
football: evidence from Granger causality tests”, Applied Economics 30, pp. 1641-1651.
Emrouznejad, A.; B.R. Parker and G. Tavares (2007) “Evaluation of research in efficiency
and productivity: A survey and analysis of the first 30 years of scholarly literature in
DEA”, Socio-Economic Planning Sciences, doi:10.1016/j.seps.2007.07.002
Engel, J.F. and R.D. Blackwell. (1982) Consumer Behavior, New York, Dryden Press.
Espitia-Escuer, M. and L.I. García-Cebrián (2004) “Measuring the efficiency of Spanish
First-Division Soccer Teams”, Journal of Sports Economics, 5, pp. 329-346.
Espitia-Escuer, M. and L.I. García-Cebrián (2006) “Performance in sports teams. Results and
potential in the professional soccer league in Spain”, Management Decision 44, pp. 1020-
1030.
23

Färe, R. and S. Grosskopf (2000) “Theory and application of directional distance functions”,
Journal of Productivity Analysis 13, pp. 93-103.
Fizel, J. L. and M.P. D’Itri (1997) “Managerial efficiency, managerial succession and
organizational performance”, Managerial and Decision Economics 18, pp. 295-308.
Forrest, D. and R. Simmons (2002) “Team salaries and playing success in sports: a
comparative perspective”, Zeitschrift für Betriebswirtschaft 62, pp. 221–37.
Haas, D.J. (2003a) “Technical efficiency in Major League Soccer”, Journal of Sports
Economics 4, pp. 203-215.
Haas, D.J. (2003b) “Productive efficiency of English football teams: a data envelopment
approach”, Managerial and Decision Economics 24, pp. 403-410.
Haas, D.J.; M.G. Kocher and M. Sutter, M. (2004) “Measuring Efficiency of German
Football Teams by Data Envelopment Analysis Central European”, Journal of Operations
Research 12, pp. 251-268
Hadley, L.; M. Poitras; J. Ruggiero and S. Knowles (2000) “Performance evaluation of
National Football League teams”, Managerial and Decision Economics 21, pp. 63-70.
Hofler, R.A. and J.E. Payne (1997) “Measuring efficiency in the National Basketball
Association”, Economic Letters 55, pp. 293-299.
Hunt, H.K. (1977) “CS/D Overview and Future Research Directions”, in Conceptualization
and Measurement of Consumer Satisfaction and Dissatisfaction (Ed.) H.K., Hunt,
Cambridge: Marketing Science Institute, pp. 455-488.
Kahane, L.H. (2005) “Production Efficiency and Discriminatory Hiring Practices in the
National Hockey League: A Stochastic Frontier Approach”, Review of Industrial
Organization 27, pp. 47–71
Liga de Fútbol Profesional (2004) Impacto del fútbol profesional en la economía española.
LFP. Madrid. Spain. http://www.lfp.es/publicaciones/informes/informe1.htm (accessed in
April 2008).
Liga de Fútbol Profesional (2007) Memoria de la Liga de Fútbol Profesional, Madrid.
Mazur, M.J. (1994) “Evaluating the relative efficiency of baseball players”, in Data
Envelopment Analysis: theory, methodology and application, (Eds.) A. Charnes, W.W.
24

Cooper, A.Y. Lewin and L.M. Seiford, Boston. Kluwer Academic Publishers, pp. 369-
391.
Peterson, R.A. and W.R. Wilson (1992) “Measuring customer satisfaction: fact and artefact”,
Journal of the Academy of Marketing Science 20, pp. 61-71.
Rottenberg, S. (1956) “The baseball player’s labor-market”, Journal of Political Economy,
64, pp. 242–58.
Scully, G.W. (1974) Pay and performance in Major League Baseball. American Economic
Review, 64, 915-930.
Shephard, R.W. (1970) Theory of cost and production functions. Princeton University Press,
Princeton.
Sueyoshi, T., Ohnishi, K. and Kinasi, Y. (1999) A benchmark approach for baseball
evaluation, European Journal of Operational Research, 15, 429-448.
Szymanski, S. and Smith, R. (1997) The English football industry: profit, performance and
industrial structure. International Review of Applied Economics, 11, 135-153.
Szymanski, S. and T. Kuypers (1999) Winners and Losers. The business strategy of Football,
Penguin, London.
Taylor Nelson Sofres (TNS) (2007) Boletín Mensual de TNS Audiencia de Medios.
http://www.tns-global.es/actualidad/audiencia-tv.
Torgler, B. and S.L. Schmidt (2007) “What shapes player performance in soccer? Empirical
findings from a panel analysis”, Applied Economics 39, pp. 2355-2369.
Tse, D. and P.C. Wilton (1988) “Models of consumer satisfaction: An extension”, Journal of
Marketing Research 25, pp. 204–12.
Tse, D.K.; F.M. Nicosia and P.C. Wilton (2006) “Consumer satisfaction as a process”,
Psychology and Marketing 7, pp. 177-193.
Yi, Y. (1990) “A Critical Review of Consumer Satisfaction”, Review of Marketing 14, pp.
68-123.
Zak, T.A.; C.J. Huang and J.J. Siegfried (1979) “Production efficiency: The case of
professional basketball”, Journal of Business 52, pp. 379-392.
25

Table 1. Sample description. Averages from seasons 2001/02 to 2006/07.
Variable
Mean
Standard deviation
Maximum
Minimum
Outputs Points obtained in the League at the end of each season 51.8 12.8 84 24 Number of rounds played in the King’s Cup 3.0 1.7 7 1 Number of games played in European competitions
(Champions League or the UEFA Cup) 3.8 5.4 17 0
Inputs Number of players in each season 26.9 2.6 32 21 Average number of spectators per match 28,415 16,671 73,911 8,195 Number of seasons played in the First Division 41.0 25.9 76 1 Trophies in national and international competitions 10.9 18.8 68 0
26

Table 2. Overall performance of Spanish professional football teams. Average from seasons 2001/02 to 2006/07.
Position Team Overall
performance Number of seasons played
in the First Division*
1 Deportivo Numancia 1.000 1 1 Getafe 1.000 3 3 Huelva 0.985 2 4 Real Madrid 0.968 6 5 Villarreal 0.959 6 6 Barcelona 0.953 6 7 Deportivo de la Coruña 0.910 6 8 Valencia 0.908 6 9 Celta de Vigo 0.895 5
10 Zaragoza 0.845 5 11 Sevilla 0.842 6 12 Atlético Osasuna 0.838 6 13 Real Betis 0.809 6 14 Málaga 0.807 5 15 Espanyol 0.798 6 16 Mallorca 0.797 6 17 Deportivo Alavés 0.796 3 18 Valladolid 0.783 3 19 Santander 0.744 5 20 Rayo Vallecano 0.735 2 21 Levante 0.719 2 22 Atlético de Madrid 0.709 5 23 Real Sociedad 0.685 6 24 Cádiz Club 0.684 1 25 Atlétic Club de Bilbao 0.683 6 26 Las Palmas 0.639 1 27 Albacete Balompié 0.638 2 28 Club Deportivo Tenerife 0.591 1 29 Club Gimnàstic de Tarragona 0.509 1 30 Murcia 0.496 1
Mean 0.791 - Standard deviation 0.139 -
* This figure corresponds to the number of seasons played in the First Division during the period analysed in this paper, with a minimum of 1 and a maximum of 6.
27
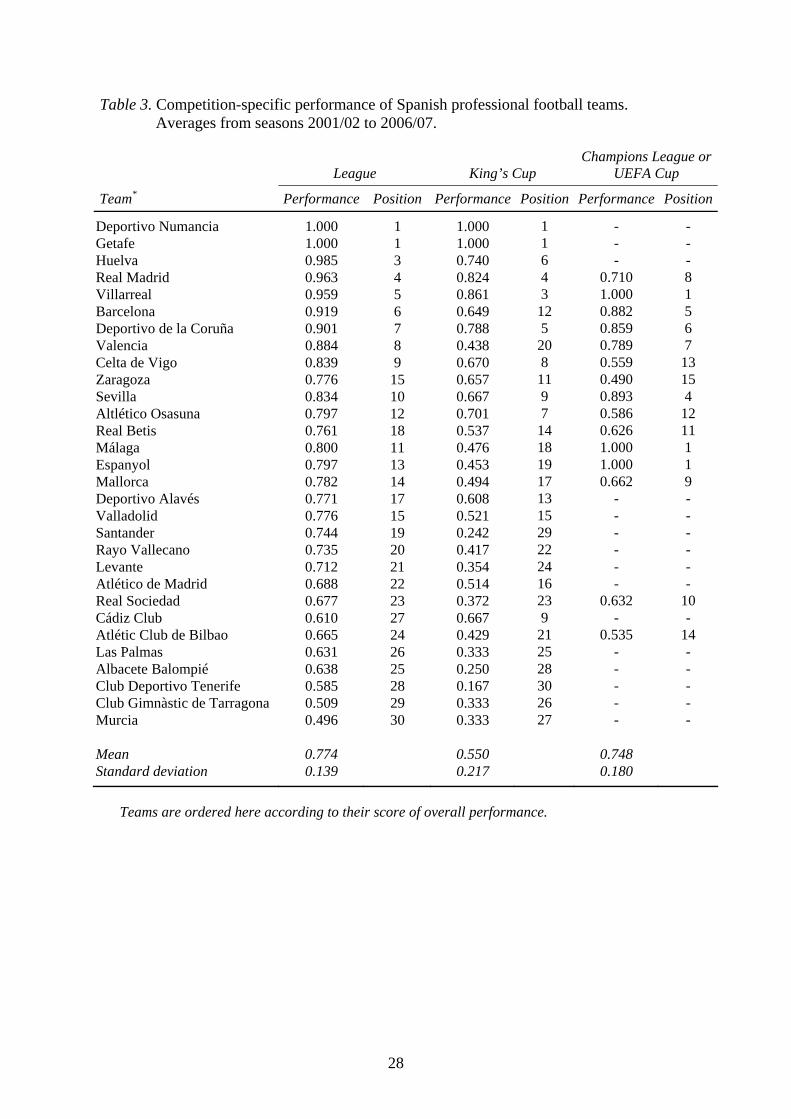
Table 3. Competition-specific performance of Spanish professional football teams. Averages from seasons 2001/02 to 2006/07.
League King’s Cup
Champions League or UEFA Cup
Team* Performance Position Performance Position Performance Position
Deportivo Numancia 1.000 1 1.000 1 - - Getafe 1.000 1 1.000 1 - - Huelva 0.985 3 0.740 6 - - Real Madrid 0.963 4 0.824 4 0.710 8 Villarreal 0.959 5 0.861 3 1.000 1 Barcelona 0.919 6 0.649 12 0.882 5 Deportivo de la Coruña 0.901 7 0.788 5 0.859 6 Valencia 0.884 8 0.438 20 0.789 7 Celta de Vigo 0.839 9 0.670 8 0.559 13 Zaragoza 0.776 15 0.657 11 0.490 15 Sevilla 0.834 10 0.667 9 0.893 4 Altlético Osasuna 0.797 12 0.701 7 0.586 12 Real Betis 0.761 18 0.537 14 0.626 11 Málaga 0.800 11 0.476 18 1.000 1 Espanyol 0.797 13 0.453 19 1.000 1 Mallorca 0.782 14 0.494 17 0.662 9 Deportivo Alavés 0.771 17 0.608 13 - - Valladolid 0.776 15 0.521 15 - - Santander 0.744 19 0.242 29 - - Rayo Vallecano 0.735 20 0.417 22 - - Levante 0.712 21 0.354 24 - - Atlético de Madrid 0.688 22 0.514 16 - - Real Sociedad 0.677 23 0.372 23 0.632 10 Cádiz Club 0.610 27 0.667 9 - - Atlétic Club de Bilbao 0.665 24 0.429 21 0.535 14 Las Palmas 0.631 26 0.333 25 - - Albacete Balompié 0.638 25 0.250 28 - - Club Deportivo Tenerife 0.585 28 0.167 30 - - Club Gimnàstic de Tarragona 0.509 29 0.333 26 - - Murcia 0.496 30 0.333 27 - - Mean 0.774 0.550 0.748 Standard deviation 0.139 0.217 0.180
Teams are ordered here according to their score of overall performance.
28
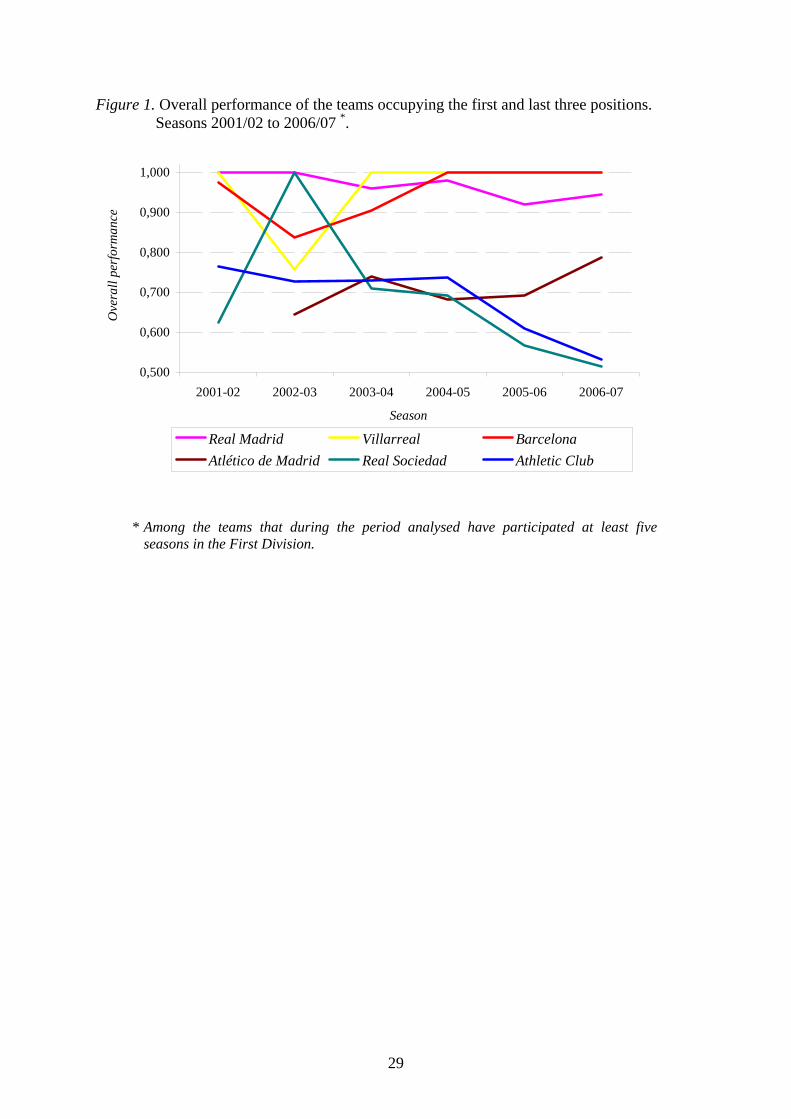
Figure 1. Overall performance of the teams occupying the first and last three positions. Seasons 2001/02 to 2006/07 *.
0,500
0,600
0,700
0,800
0,900
1,000
2001-02 2002-03 2003-04 2004-05 2005-06 2006-07
Season
Ove
rall
perf
orm
ance
Real Madrid Villarreal Barcelona Atlético de Madrid Real Sociedad Athletic Club
* Among the teams that during the period analysed have participated at least five seasons in the First Division.
29