ANALYSIS OF SPATIAL DISTRIBUTION OF PUBLIC PRIMARY SCHOOLS IN TARAUNI LOCAL GOVERNMENT AREA, KANO...
130
ANALYSIS OF SPATIAL DISTRIBUTION OF PUBLIC PRIMARY SCHOOLS IN TARAUNI LOCAL GOVERNMENT AREA, KANO STATE, NIGERIA TIJJANI ABDULAZIZ MAHMUD (PRS 313 006) FORWADED TO DR. OSARETIN OVIASU & MR. G. O. ENARUVBE A project submitted to the Department of Photogrammetry and Remote Sensing as part of the requirements for the award of Professional Masters in Geo-Information Production and Management (GPM). REGIONAL CENTRE FOR TRAINING IN AEROSPACE SURVEYS (RECTAS) (UNDER THE AUSPICES OF THE ECONOMIC COMMISSION FOR AFRICA (UNECA)
Transcript of ANALYSIS OF SPATIAL DISTRIBUTION OF PUBLIC PRIMARY SCHOOLS IN TARAUNI LOCAL GOVERNMENT AREA, KANO...

ANALYSIS OF SPATIAL DISTRIBUTION OF PUBLIC PRIMARY
SCHOOLS IN TARAUNI LOCAL GOVERNMENT AREA, KANO STATE,
NIGERIA
TIJJANI ABDULAZIZ MAHMUD(PRS 313 006)
FORWADED TO
DR. OSARETIN OVIASU
&
MR. G. O. ENARUVBE
A project submitted to the Department of
Photogrammetry and Remote Sensing as part of the
requirements for the award of Professional Masters in
Geo-Information Production and Management (GPM).
REGIONAL CENTRE FOR TRAINING IN AEROSPACE SURVEYS
(RECTAS)(UNDER THE AUSPICES OF THE ECONOMIC COMMISSION FOR AFRICA (UNECA)

OBAFEMI AWOLOWO UNIVERSITY
PMB 5545, ILE-IFE, NIGERIA.
August, 2014

TITLE PAGE
CERTIFICATION
a. (By the Student)
This is my original work and has not been presented elsewhere
for the award of a degree, or any other purposes.
Candidate’s
name...........................................................
...............................................................
...................
Signature........................................
Date..............................................

b. (By the Supervisors)
I certify that this work has been carried out by Tijjani,
Abdulaziz Mahmud in the Department of Photogrammetry and Remote
Sensing of Regional Centre for Training in Aerospace Survey,
Ile-Ife.
Supervisors
Name...........................................................
...............................................................
..................
Signature........................................
Date..............................................
Co-Supervisor’s
Name...........................................................
......................................................
Signature.......................................
Date..............................................
c. The Dean of Academics

Name...........................................................
...............................................................
..................
Signature............................................
Date..............................................
ACKNOWLEDGEMENTS
First, of all I would like to express my sincere gratitude to
my supervisors, Dr. Osaretin Oviasu and Mr. G. O. Enaruvbe, for
their intelligent guidance, time, and essential advices and
comments throughout the period I worked on my thesis.
My special thanks goes to the then Commissioner of Land &
Physical Planning Surv. Muhammed N, Yahaya FNSE for making it
possible of my study in RECTAS.
My thanks go to the Local Education Authority Tarauni, Tarauni
Local Government Council who gives me the necessary data, all
headmasters/mistress and teachers of the public primary schools
in Tarauni Local Government Area.
My undiluted appreciation goes to the Kano State Government for
financing my study in RECTAS.

My heart goes to my lovely wife, Halima Y. Ali Bashir and my
daughters Fatima (tasleem) and Ruqayyah (aman) for their
prayers, love, care, encouragement and patience all through
this program.
Final, I would like to thanks my Father, Tijjani Mahmud, my
Mother Rakiya Tijjani, my Father In-Law Yakubu Ali Bashir, my
Mother In-Law Fatima Yakubu, and my dear brothers, sisters and
the entire JANKADO family for the endless help and affection.
DEDICATION
This project is dedicated to God Almighty the maker of my soul
for His faithfulness, love, protection, provisions, grace,
mercies, and favour upon me and my entire family.
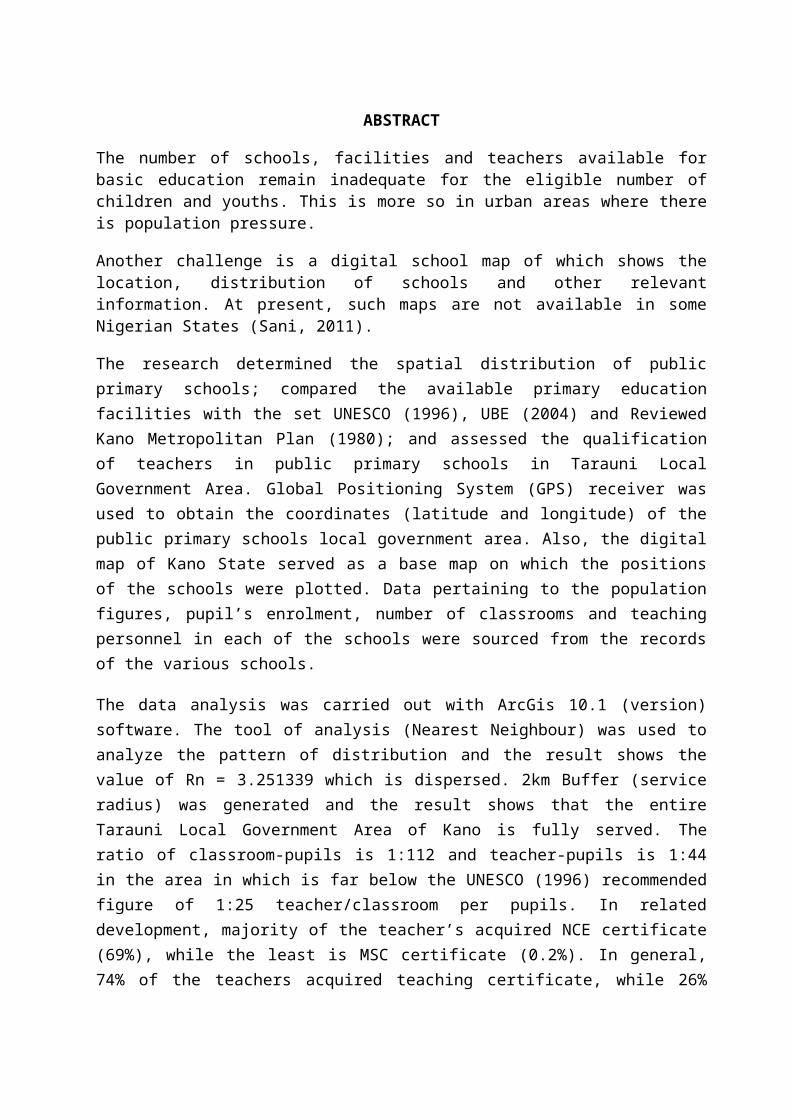
ABSTRACT
The number of schools, facilities and teachers available forbasic education remain inadequate for the eligible number ofchildren and youths. This is more so in urban areas where thereis population pressure. Another challenge is a digital schoolmap of which shows the location, distribution of schools and
other relevant information. At present, such maps are notavailable in some Nigerian States.
The research determined the spatial distribution of publicprimary schools; compared the available primary educationfacilities with the set UNESCO (1996), UBE (2004) and ReviewedKano Metropolitan Plan (1980); and assessed the qualificationof teachers in public primary schools in Tarauni LocalGovernment Area. Global Positioning System (GPS) receiver wasused to obtain the coordinates (latitude and longitude) of thepublic primary schools local government area. Also, the digitalmap of Kano State served as a base map on which the positionsof the schools were plotted. Data pertaining to the populationfigures, pupil’s enrolment, number of classrooms and teachingpersonnel in each of the schools were sourced from the recordsof the various schools.
The data analysis was carried out with ArcGis 10.1 (version)software. The tool of analysis (Nearest Neighbour) was used toanalyze the pattern of distribution and the result shows thevalue of Rn = 3.251339 which is dispersed. 2km Buffer (serviceradius) was generated and the result shows that the entireTarauni Local Government Area of Kano is fully served. Theratio of classroom-pupils is 1:112 and teacher-pupils is 1:44in the area in which is far below the UNESCO (1996) recommendedfigure of 1:25 teacher/classroom per pupils. In relateddevelopment, majority of the teacher’s acquired NCE certificate(69%), while the least is MSC certificate (0.2%). About 52% ofthe teachers are females, while 48% are male teachers.
The study concluded that, the end of Geographic InformationSystem (GIS) will be part of an Education Decision SupportSystem that provides the map of the study area with focus onthe school locations and all related information to assistgovernment in either expanding current schools suggesting sitesfor new schools in the study area and also for students andresources location/allocation.

It is recommended that, government should provide additionalclassrooms and teachers with teaching qualifications. Inaddition, courses and other appropriate facilities should be sodesigned as to enable teachers to improve their qualifications.Also, population figure is also recommended within the statemetropolitan area in the provision of public primary schools.Additional classrooms should be constructed within the premisesof each school. This will save the government from paying highcompensation to the affected land owners in case of schoolexpansion is required. Vertical approach (multi storey)buildings should be employed.
Table of Contents
Content
Page
CHAPTER ONE...................................................4
INTRODUCTION.................................................4
1.1 General Introduction...................................4
1.2 Statement of Research Problem..........................5
1.3 Aim and Objectives.....................................6
1.4 Justification for the study............................7
1.5 Scope and Limitation...................................7
1.6 Study Area.............................................8
CHAPTER TWO..................................................10
CONCEPTUAL FRAMEWORK AND LITERATURE REVIEW..................10
2.1 Operational Definition of Terms:......................10
2.2 Literature Review.....................................11
2.3 National Policy on Education..........................13
2.4 Universal Basic Education Statement:..................15
2.5 Laws and other Basic Regulations Concerning Education in
Nigeria...................................................15
2.6 The State of Education in Nigeria of the Nation.......17
2.7 Further Education for Teachers........................17
2.8 Standards.............................................17
2.9 School Mapping (SM)...................................18
2.10 Geographic Information System (GIS)...................19
2.11 Related Study.........................................19
2.12 Distribution of Schools...............................21
2.13 Road Network Pattern..................................21
CHAPTER THREE................................................23
METHODOLOGY.................................................23
3.1 Data Sources, Acquisition and Process.................23
3.2 Methods of Data Processing............................25
3.3 Conceptual framework..................................26
3.4 Research Design.......................................27
3.5 Procedures............................................27
3.6 Target Population.....................................30
3.7 Procedure.............................................30
CHAPTER FOUR.................................................35
RESULTS AND DISCUSSION......................................35
4.1 Spatial Distribution of Public Primary Schools........35
4.3 Assess the qualification of teachers in public primary
schools in Tarauni Local Government Area..................54
CHAPTER FIVE.................................................59
5.1 CONCLUSION AND RECOMMENDATIONS.........................59
5.2. RECOMMENDATIONS........................................61
REFERENCE:...................................................63
LIST OF FIGURES
Figure. 1.1: The study
area...........................................................
.................................................7

Figure 3.1: Flow chart
diagram........................................................
...........................................21
Figure 3.2: Political Wards of Tarauni Local Government
Area................................................29
Figure 4.1: Distribution of public primary schools in each ward
in
Tarauni Local Government Area,
(2014)....................................................
.............35
Figure 4.2: Population distribution in each ward in
Tarauni Local
Government ....................................................
.................................37
Figure 4.3: Average nearest neighbor analysis in
Tarauni Local Government Area,
(2014).........................................................
.........38

Figure 4.4: Distribution of boys & girls students in public
primary school in
Tarauni Local Government Area,
(2014).........................................................
..........................39
Figure 4.5: Boys & Girls total enrolment in public primary
schools
in Tarauni Local Government Area,
(2014).........................................................
....40
Figure 4.6: Distribution of teaching staff (male & female) in
each
public primary school in Tarauni Local Government
Area, (2014).........................41
Figure 4.7: Male & Female teaching staff in public primary
schools
in Tarauni Local Government Area,
(2014).................................................
..........42

Figure 4.8: Classrooms needed in each of the public primary
schools based on primary education facility set
standards of UNESCO (1996), UBE (2004) and RKMP (1908)
in Tarauni Local Government Area,
(2014)................................................
......................................................
...............43
Figure 4.9: Teacher-pupil ratio using UNESCO standard (1996),
UBE (2004) & RKMP (1980) in Tarauni Local Government
Area,
(2014).................................................
............44
Figure 4.10: Classroom capacity & no. of teachers using UNESCO
standard (1996) in Tarauni Local Government Area.,
(2014)................................................
...........................45
Figure: 4.11: Classroom capacity & no. of teachers using UBE
standard (2004) in Tarauni Local Government Area.,
(2014)...............................................
..........................46
Figure: 4.12: Classroom capacity & no. of teachers using RKMP
(1980) in Tarauni Local Government Area,
(2014)...............................................
.....................................47
Figure 4.13: Catchment area of public primary schools in Tarauni
L.G.A of using 2km
service radius of UNESCO
(1996)..................................................
.......................49
Figure 4.14: Catchment area of public primary schools in
Tarauni Local Government Area, using 3km service
radius of UBE
(2004)................................................
...............50
Figure 4.15: Catchment area of public primary schools in
Tarauni Local Government Area of using 5km service
radius of RKMP
(1980)................................................
...........51

Figure 4.16: Distribution of teacher’s qualification in each
public primary school in Tarauni Local Government Area
(2014)................................................
.............................52
Figure. 4.17: Distribution of teacher’s with and without
teaching qualification in each of the public primary
school in Tarauni Local Government Area
(2014).....................53
LIST OF TABLES
Table 3.1: The Adopted Data and
Sources........................................................
...................22
Table 3.2: The Adapted Data and
Process........................................................
...................23
Table 3.3: Public primary schools in Tarauni Local
Government Area with their year of establishment,
location and
coordinates..........................................
....................30
Table 3.4: Distribution of students in each of the pubic
primary school in
Tarauni Local Government
Area....................................................
.....................31
Table 3.5: Distribution of teaching staff in each pubic
primary school in
Tarauni Local Government
Area...................................................
......................32
Table 4.1: Number of public primary schools in each ward in
Tarauni L.G.A...................33
Table 4.2: Schools location identification number in each
ward in the study area..............34
Table 4.3: Population distributions in each ward in Tarauni
Local Government Area........36
Table 4.1: Comparison primary education facility with the
set standards UNESCO (1996), UBE (2004) and Reviewed
Kano Metropolitan Plan (1980).
.............................48
Table. 4.2: Teacher’s qualification of public primary school
in Tarauni Local Government
area.................................................
.....................................................
................54
ABSTRACT
The number of schools, facilities and teachers available forbasic education remain inadequate for the eligible number ofchildren and youths. This is more so in urban areas where thereis population pressure.
Another challenge is a digital school map of which shows thelocation, distribution of schools and other relevantinformation. At present, such maps are not available in someNigerian States (Sani, 2011).
The research determined the spatial distribution of publicprimary schools; compared the available primary educationfacilities with the set UNESCO (1996), UBE (2004) and ReviewedKano Metropolitan Plan (1980); and assessed the qualificationof teachers in public primary schools in Tarauni LocalGovernment Area. Global Positioning System (GPS) receiver wasused to obtain the coordinates (latitude and longitude) of thepublic primary schools local government area. Also, the digitalmap of Kano State served as a base map on which the positionsof the schools were plotted. Data pertaining to the populationfigures, pupil’s enrolment, number of classrooms and teachingpersonnel in each of the schools were sourced from the recordsof the various schools.
The data analysis was carried out with ArcGis 10.1 (version)software. The tool of analysis (Nearest Neighbour) was used toanalyze the pattern of distribution and the result shows thevalue of Rn = 3.251339 which is dispersed. 2km Buffer (serviceradius) was generated and the result shows that the entireTarauni Local Government Area of Kano is fully served. Theratio of classroom-pupils is 1:112 and teacher-pupils is 1:44in the area in which is far below the UNESCO (1996) recommendedfigure of 1:25 teacher/classroom per pupils. In relateddevelopment, majority of the teacher’s acquired NCE certificate(69%), while the least is MSC certificate (0.2%). In general,74% of the teachers acquired teaching certificate, while 26%

does not acquire the teaching certificate. 52% of the teachersare females, while 48% are male teachers.
The study concluded that, the end of Geographic InformationSystem (GIS) will be part of an Education Decision SupportSystem that provides the map of the study area with focus onthe school locations and all related information to assistgovernment in either expanding current schools suggesting sitesfor new schools in the study area and also for students andresources location/allocation.
It is recommended that, government should provide additionalclassrooms and teachers with teaching qualifications. Inaddition, courses and other appropriate facilities should be sodesigned as to enable teachers to improve their qualifications.Also, population figure is also recommended within the statemetropolitan area in the provision of public primary schools.Additional classrooms should be constructed within the premisesof each school. This will save the government from paying highcompensation to the affected land owners in case of schoolexpansion is required. Vertical approach (multi storey)buildings should be employed.

CHAPTER ONE
INTRODUCTION
1.1 Background to the study
Education is fundamental to development and growth. It is one
of the most important investments a country can make in its
people and its future and is critical to reducing poverty and
inequality (World Bank 2014). All over the world, primary
education has been regarded as the most important as well as
the most patronized by the people. This perhaps may be due to
the fact that it is the foundation of the whole educational
pursuit, which is expected to provide literacy and
enlightenment to the citizens. The importance of primary
education can therefore be seen in the sense that all
beneficiaries of the other levels of education by necessity
have to pass through his level (Labo-Popoola, 2009).
World Bank recommended that the following data were needed for
rationalizing and drawing up of both the urban and rural school
map. Schools which includes physical aspects, site, type of
building, usage, capacity, teachers (numbers, qualification,
and age), students enrolment in school, individual data on age,
sex, previous schools, home, location, mode of transport, time
taken in home/school journey, parental background, rural and
urban area data which include land use administration map on a
large scale, planning reports, settlement patterns etc. The
facility also includes classrooms, toilets, furnishings,
materials and supplies, fire suppression systems, security,
information technology etc. The school infrastructure consists
of mechanical, plumbing, electrical and power,
telecommunications etc (World Bank, 2014).
Several studies have examined the locational planning and their
attendant consequences on achievement of students in various
states of the Federation. The studies were intended to assist
decision makers of various states to decide where a particular
type of school should be located or the size of school in each
location, whether a new school should be built or otherwise
among others. Among the studies some has shown mapping the
distribution of facilities and analyzing to show how the
schools are distributed, it could be clustered, dispersed or
randomly distributed and to see whether the facilities serves
the people of the area (Olubadewo, 2013).
Geographic information system (GIS) application are tools that
allow users to create interactive queries, analyze spatial
information, edit data, maps and present results of such
operations. GIS Establishes a relationship between school
information and their geographical location. For example, when
determining the location of a school, the application of GIS
tool like Geographic Positioning System (GPS) will help to
identify the schools. GIS is a versatile tool that allows
schools information to be displayed as maps (Ige, 2009).
The focus of the project is to emphasize the use or
applicability of GIS in determining the location and facilities
of public primary schools, create school mapping and help
decision makers to know the problems which are related to
location and facilities in easily and quickly.
1.2 Statement of the Research Problem
The number of schools, facilities and teachers available for
basic education remain inadequate for the eligible number of
children and youths. This is more so in urban areas where there
is population pressure (UNICEF, 2014).
The federal government reported that the falling standard of
education in Nigeria is caused by "acute shortage of qualified
teachers in the primary school level" with a large number of
Grade II teachers and secondary school leavers teaching; uneven
distribution of teachers between urban and rural schools; poor
remuneration and motivation and low teacher support (Federal
Ministry of Education - FME, 2009).
Also, a digital school map of which shows the location,
distribution of schools and other relevant information. At
present, such maps are not available in some Nigerian States
(Sani, 2011).
Kano’s education system is under enormous pressure. The state
of educational facilities especially the public primary schools
has been overstretched and there has been a backdrop in the
manpower that assists in the running of these primary schools.
In addition, the schools facilities (classrooms, toilets,
libraries, reading materials etc) were not adequately provided,
as well some of the schools are associated with inadequate
infrastructure such as power supply, water supply,
telecommunication as well as bad roads leading to some schools
etc (Sani, 2014).
There are over 2 million primary school children in Kano State
(47.7% female and 52.3% male). About 30% of the public primary
schools in the urban areas run double shift to cope with the
demand, this is attributed to the population concentration
makes most of this areas. There are approximately 23,000
primary class rooms, 94.4% of which are usable, approximately
87 pupils per class room in primary, 35.4% of primary class
room have sufficient seating and 61.5 have a good blackboard.
Out of the 45,000 primary teachers, just 1 in 3 is qualified,
meaning there is 1 qualified teacher per 114 primary children.
Half of the primary schools have no safe drinking water. 47.4%
have no toilets; the average pupil to toilet ratio is 200:1.
The worst LGA for pupil to toilet ratio at primary level is
Nassarawa LGA with a ratio of 1214 pupil per toilet
(Educational Special System Programme in Nigeria – ESSPIN,
2012).
1.3 Aim and Objectives
1.3.1 Aim
The aim of this study is to analyze the spatial distribution of
public primary schools in Tarauni Local Government Area with a
view to aid planning and decision making.
1.3.2 Objectives
The specific objectives of the study are to:
1.Determine the spatial distribution of public primary
schools in Tarauni Local Government Area;
2.Compare the available primary education facilities with
the set standards of UNESCO, UBE and Reviewed Kano
Metropolitan Plan – RKMP (1980); and
3.Assess the qualification of teachers in public primary
schools in Tarauni Local Government Area.
1.4 Justification for the study
In the past, few attempts and initiatives involving GIS at the
State level by the Ministry of Land & Physical Planning at
which GIS unit was created but little was achieved. The main
issue is that there is inadequate digital infrastructure as
digital base maps, information technologies and
geographic/spatial coverage’s in metropolis. Though the lists
of all the public facilities are available, but lack of precise
knowledge of how they are spatially distributed, this makes
planning and decision making very difficult in the study area.
This necessitates the government in the creation and
establishment of Kano Geographic information System (KANGIS) in
2014, which is a parastatal under the same ministry.
As a step towards improving the standard of public primary
schools’ education in the study area, it will be necessary to
provide the public and decision makers of the state with
information such as location, staff strength, available
facilities, status of public primary school, to enhance proper
planning and decision making. The information provided will
enable the government and educationists in policy and decision
making such as planning for the future expansion, distribution
of materials or facilities among these schools in the study
area.
1.5 Scope and Limitation
The scope of this research is formal education and it is
limited to the distribution of public primary schools in
Tarauni Local Government Area, Kano State.
1.6 Study Area
1.6.1 Location
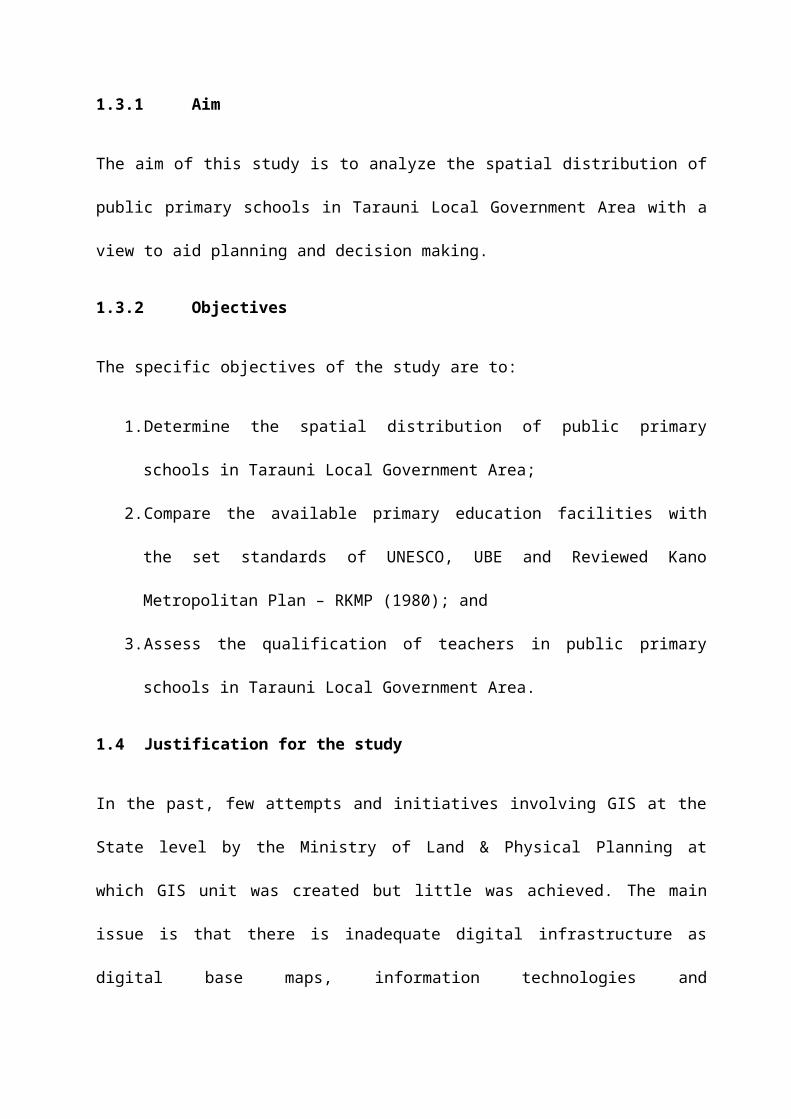
Tarauni is a Local Government Area in Kano State, Nigeria. Its
headquarters is in the locality of Unguwa Uku within the City
of Kano. The study area lies within the Latitudes 11057'00''N
and 12002'00''N and Longitudes 08033'00''E and 08036'00''E.
Tarauni Local Government Area has 10 political wards. Covering
an area of 28km2 and a population of 281,413 projected figure
2014.
Tarauni Local Government Area is bounded by the north by
Nassarawa Local Government, by the east and south by Kumbotso
Local Government and on the western by Municipal Local
Government. The study area is predominantly inhibited by
Hausa/Fulani tribe. Other ethnic groups in the local government
area include Yoruba, Igbo, Ebira, Kanuri etc.

1.6.2 Climate
The climate of the area is a microclimate setting of the
Nigeria as it is influenced by the movement of the two air
masses, the maritime air masses originating over Atlantic Ocean
and the dry air masses coming from the Sahara desert.
Consequently, the area is characterized by wet season (May -
September) which is characterized by south western maritime
winds that carry warm and humid air; the dry season (October –
April) is characterized by the tropical dry continental wind
(Harmattan) from north. In fact, it is a tropical wet and dry
type (AW) by Koppen’s classification (Umar, 2009).
1.6.2 Economy
Kano is the second largest industrial and commercial centre in
Nigeria after Lagos (Ahmed et al, 2012) it is referred as the
center of commerce in the country due to long flourished
marketing activities. This is based on the fact that marketing
and trading has been the dominant economic activity of the
populace of the metropolitan Kano.

1.6.3 Academic Institutions in the study area
The study area has a total of nineteen (19) public primary
schools, twenty two (22) public secondary schools, and eight
(8) existing institutions namely, School of Nursing, School of
Midwifery both managed by the state government. Also, Aminu
Kano Teaching Hospital (AKTH), Federal College of Agricultural
Produce Technology, Institute for Agricultural Research,
A.B.U., Kano Station, National Board for Technology Incubation
all these managed by the Federal Government. The International
Crops Research for the Semi-Arid Tropics and IITA Research to
Nourish Africa both managed privately.
Figure. 1.1: The study area: Tarauni Local Government Area (a), Kano State (b), Nigeria (c).

CHAPTER TWO
LITERATURE REVIEW
2.1 Operational Definition of Terms:
i. Primary Education: the first stage of formal education
in a range of basic subjects.
ii. Universal Primary Education (UPE): an educational
programme made compulsory by the Federal Government for
all children in the states of the federation in 1976.
iii. Universal Basic Education (UBE): a 9 year educational
programme starting from primary to junior secondary
level in Nigeria.
iv. School: a place of teaching and learning of skills,
knowledge and aptitudes.
v. School Location: the geographical location of the school.
vi. School Facility: are one of the basic educational requirements,
and it is necessary to maintain safe and high-quality school
facilities from the perspective of maintaining and improving
educational levels in line with the developmental stage.

vii. Pupil: A child at school, who is being taught in a
primary school.
viii. Teacher: All those persons in schools who are responsible for
the education of pupils.
ix. Pupil-Teacher ratio: Otherwise called “student-teacher
ratio” or “students per teacher”, this indicator
expresses the average number of pupils (students) per
teacher in a given school-year.
x. Pupil-Classroom ratio (PCR): The ratio of the number of
pupils (students) to the number of classrooms.
xi. UNESCO: United Nations Education Scientific and Cultural
Organization.
xii. UBE: Universal Basic Education.
xiii. RKMP: Reviewed Metropolitan Kano Plan.
2.2 Literature Review
2.2.1 Millennium Development Goal
In this priority area the millennium development goal is to
ensure that by the year 2015, children everywhere, boys and
girls alike, will be able to complete a full course of primary
schooling and those girls and boys will have equal access to
all levels of education (Susan, 2004).
2.2.2 Definition of Basic Education
United Nations Economic, Scientific, and Cultural Organization
(UNESCO) define basic education as the first nine years of
schooling; the first five or six years are often identified as
primary education and the rest as lower secondary education. It
also includes basic education for youth and adults who did not
have the opportunity to complete a full cycle of primary
education (Ikpasaja, 2014).
This is the education which every Nigerian receives between the
ages of three (3) and fourteen (14) years. It consists of the
Early Childhood, Primary, Junior Secondary, as well as Adult
and Non-Formal Education. The agency which coordinates the
affairs of this sub sector is the Universal Basic Education
Commission (UBEC). Other coordinating agencies in this sector
include National Commission for Nomadic Education and National
Mass Education Commission.

2.2.3 Primary Education
The successful acquisition of primary education and life skills
competencies is a prerequisite for secondary and higher
education and for many categories of vocational training, and
should build on the cognitive skills development of ECCE. Its
importance has been recognized in the global drive for
Education All (EFA) by the year 2015. The main goals and
objectives of primary education are as follows (Federal
Ministry of Education, 2003):
i. To develop proficiency in literacy, numeracy and
communication skills;
ii. To develop the individuals self-confidence and ability
to solve problems;
iii. To foster the development of a positive self-image and
self-worth;
iv. To nurture moral and spiritual development and
responsible action;
v. To develop independent critical thinking and creativity;
vi. To develop good interpersonal skills and in interaction
with family, community and others;

vii. To develop a culture and practice of conflict
resolution;
viii. To develop the ability to source information through
use of library and electronic devices;
ix. To nurture respect for the rights and dignity of others;
x. To develop a sense of appreciation, care and protection
for the environment;
xi. To develop health and physical fitness;
xii. To nurture sensitivity to cultural diversity;
2.3 National Policy on Education
2.3.1 Universal Primary Education (UPE)
Universal Primary Education (UPE) is a goal stated in many
national development plans and pursued with vigour by
governments of most developing countries. Primary education is
seen as the first step in laying the foundation for future
educational opportunities and lifelong skills. Through the
skills and knowledge imbued, primary education enables people
to participate in the social, economic and political activities
of their communities to their fullest potential (Globalisation
of Education Policies, 2000).

In 1976, the Universal Primary Education (UPE) programme was
introduced in the country and was launched on Monday 6th
September by the Olusegun Obasanjo Military Administration at
Oke Sunna Municipal Primary School, Lagos to provide free and
compulsory education to children at the primary school level.
Unfortunately, the Scheme was faced with several challenges
because structures were hurriedly put in place, teachers were
trained haphazardly and there was an inadequate funding of the
primary education sector. This however, brought about declining
enrolment in public primary school. Teachers to pupil’s ratio
were high and at the long run, education was meant only for the
wealthy children (not for all the children as proposed
earlier). Children who are supposed to be in the school
learning are outside the street hawking goods for their
parents. The vision of Education for All (EFA) regardless of
their socio-economic background was ignored (Omotere, 2010).
2.3.2 Universal Basic Education (UBE)
Universal Basic Education (UBE) is a reformed programme in
Nigeria’s basic education delivery (from primary one, all
through to junior secondary school class 3) and is to reinforce
the implementation of the National Policy on Education (NPE) in

order to provide greater access and ensure quality throughout
the Federation as it is free and compulsory (Adomeh et al,
2007).
Nigeria is adopting Universal Basic Education (UBE) and as a
process of fulfilling the aim of Education For All (EFA) as
endorsed at the World conference on education held in Jomtien,
1990 (Arhedo, 2009). The UBE Programme is a nine (9) year basic
educational programme, which was launched and executed by the
government and people of the Federal Republic of Nigeria to
eradicate illiteracy, ignorance and poverty as well as
stimulate and accelerate national development, political
consciousness and national integration. Former President
Olusegun Obasanjo flagged off UBE on 30th September 1999 in
Sokoto State.
The UBE scheme was put in place to improve on the limitations
of Universal Primary Education (UPE) of the 1970s (UBE 2014).
One of the objectives of the UBE scheme that bothers on
availability as relates to even spread (as stated by the
Federal Ministry of Education (1999) is developing in the
entire citizenry a strong consciousness for education and a
strong commitment to its various promotion. It is quite obvious

from the above phenomenon that the objective of developing the
entire citizenry cannot be achieve unless the public education
facilities are evenly distributed over the country’s landscape
taking into consideration the local population density and land
area coverage per school (Olamiju 2011).
According to Omotere (2010), Universal Basic Education is
broader than Universal Primary Education, which focused on
providing educational opportunities for primary school age
children. Universal Basic Education stresses the inclusion of
girls and women and a number of non-privilege groups: the poor,
street and working children, rural and remote populations,
nomads, migrant workers, indigenous people, minorities,
refugees and the disabled. It also extends to the first level
of secondary education (JSS 3).
2.4 Universal Basic Education Statement:
At the end of 9 year of continuous education, every child
through the system should have acquired appropriate level of
literacy, numeracy, communication, manipulative and life skills
and be employable, useful to himself and the society at large
by possessing relevant ethical, normal and civic skills. It

stated further that, Universal Basic Education shall: Serve as
a prime energizer of a national movement for the actualization
of the nation’s Universal Basic Education vision working in
contact with all stakeholders thus, mobilizing the nation’s
creative energies to ensure that, Education For All (EFA)
becomes the responsibility for all (UBE, 200).
Moreover, the objectives of the Universal Basic Education (UBE)
stated in the implementation guidelines are as follows (UBE,
2000):
i. Ensure unfettered access to nine (9) years of formal
basic education;
ii. The provision of free, Universal Basic Education for
every Nigerian child of school going age;
iii. Reducing drastically the incidence of drop-out from the
formal school system, through improved relevance,
quality and efficiency; and
iv. Ensuring the acquisition of appropriate levels of
literacy, numeracy, manipulative, communicative and life
skills as well as the ethical, moral and civic values
needed for laying a solid foundation for life-long
learning.
2.5 Laws and other Basic Regulations Concerning Education in
Nigeria
The National Policy on Education was enacted in 1977 and
undergone three revisions, the most recent one in 2003. Since
1981, a number of decrees have been passed providing the legal
framework of education in the country (International Bureau of
Education (IBE) - UNESCO, 2006).
i. The Decree No. 16 of 1985 places special emphasis on the
education of the gifted and talented children within the
National Policy on Education.
ii. The National Commission for Mass Literacy, Adult and
Non-formal Education, which was established by Decree
No. 17 of 26 June 1990 and formally inaugurated on 5
July 1991, is charged with the responsibility of
developing strategies, coordinating programmes,
monitoring and promoting literacy and post-
literacy programmes nationwide.
iii. The Decree No. 96 of 1993 re-established the National
Primary Education Commission (NPEC). It also provides
the arrangement for funding primary education in the
country.

iv. In 1993, the National Minimum Standards and
Establishments of Institution Amendments Decree No.
9 was promulgated. It provides for religious bodies,
non-governmental organizations and private individuals
to participate in the provision of tertiary education.
v. By a recent decree, all companies operating in Nigeria
which have up to 100 employees on their payroll shall
contribute 2% of their pre-tax earnings to the Education
Tax Fund for the funding of education.
vi. The most crucial strategy for sustainable education
development in Nigeria is the Universal Basic Education
(UBE) Scheme, which was launched in 1999. In May 2004,
the Nigerian Legislature passed the UBE bill into law.
The Universal Basic Education Act represents the most
significant reform and addresses comprehensively the
lapses of the Universal Primary Education (UPE) and the
issues of access, equality, equity, inclusiveness,
affordability and quality.
2.6 The State of Education in Nigeria of the Nation
The federal government reported that the falling standard of
education in Nigeria is caused by "acute shortage of qualified

teachers in the primary school level." It is reported that
about 23% of the over 400,000 teachers employed in the nation's
primary schools do not possess the Teachers' Grade Two
Certificate, even when the National Certificate of Education
(NCE) is the minimum educational requirement one should posses
to teach in the nation's primary schools (Africa Economic
Analysis (2008). Due to lack of teachers, however, holders of
the Teacher’s Grade II Certificates (TC II) are still allowed
to teach in some remote primary schools (Better Future
Foundation Amodu (BFFA) – Nigeria, (2014).
2.7 Further Education for Teachers
i. Courses and other appropriate facilities should be so
designed as to enable teachers to improve their
qualifications, to alter or enlarge the scope of their
work or seek promotion and to keep up to date with their
subject and field of education as regards to both
content and method.
ii. Measures should be taken to make books and other
material available to teachers to improve their general
education and professional qualifications (UNESCO and
Human Rights, 1996).

2.8 Standards
Standards are set of yardsticks in the units of measurement of
variables which appear in the statement of principles.
Standards are not absolute but relative and are more or less a
form of guides.
2.8.1 Standards for Setting of Public Primary School
i. United Nations Education Scientific and Cultural
Organization (UNESCO) standard (1996): (UNESCO) prescribed
the ratio of 1:25 in public primary schools. (Chukwu,
2011).
ii. Universal Basic Education Plan, (2010-2019): reveals that,
for effective teaching and learning, the teacher/pupils
ratio shall be 1.35 in primary schools (Kakuri, nd), and
with the walking distance (3-4km) for all learners of
primary school-going age Federal Ministry of Education -
FMoE (2009).
iii. Reviewed Kano Metropolitan Plan - RKMP (1980): reveals
that, the standards for the creation of public primary
school as 5km service radius, 50 pupils per class,
teacher-pupil’s ratio of 1:50, population threshold of 1-
16,000 and age bracket of 6-13 (Tijjani, 2005).
2.9 School Mapping (SM)
School Mapping (SM) is also to investigate and ensure the
efficient and equitable distribution of resources within and
between school systems when large‐scale reform or significant
expansion of an educational system takes place (Caillods,
1983).
Hite (2004) lamented that, school mapping as a technical
exercise has become a relatively normalized and
institutionalized practice in education’s planning. More than
simply being a tabular, graphical or cartographical
representation of a particular space or place, school mapping
involves the consideration and inclusion of various forms of
technical data that impact and populate the physical and social
context of analysis. School mapping comprises physical location
analysis of schools. In order for this to be accomplished
knowledge of the settlements and population of the area is
required.

2.10 Geographic Information System (GIS)
Geographic Information System (GIS) is a powerful set of tools
for collecting, storing, retrieving at will, transforming and
displaying spatial data from the real world for a particular
set of purposes (Burrough, 1998).
GIS is capable of acquiring spatially indexed data from a
variety of sources, changing the data into useful formats,
storing the data, retrieving and manipulating the data for
analysis, and then generating the output required by a given
(Fischer and Nijkamp, 1993).
GIS provides numerous benefits for the educational process,
including the development of students’ geographic skills by
helping them to think spatially and analyze spatial data, the
promotion of student and teacher motivation, and facilitation
of project-based teaching and learning (Sincekara and Karakuyu,
2010).
Geographic Information System is a discipline for capturing,
storing, analyzing, managing and presenting data and associated
attributes which are spatially referenced to Earth. The use of
GIS in Education involves combining statistical inferences to

geographic information. Statistics in education might be used
with GIS to present a clear picture of educational facilities
and activities such as ratio of students to teacher, number of
students in a class and student density in school and schools
distribution in district (Eray, 2012).
2.11 Related Study
In the study of Sule, Abdullahi and Bungwon (2012), private
primary school locations in Kaduna metropolis were determine by
the use of handheld GPS receiver. Thematic map, Nearest
neighbour and Buffer zone analysis reveals that, the schools
are not evenly distributed as some areas have the schools
concentrated at particular places while some areas have none,
and some settlements are deficient in private schools while
others have excess.
In another study in Yola North LGA, Adamawa state by Aliyu
(2013) clearly depicts the process of using Thematic map and
Nearest neighbour analysis in determining the distribution
pattern of the post-primary schools. The study reveals how the
schools were located on digital map and shows that random
pattern of distribution exists within the study area. The

potentials of GIS technology in database design and creation
has been demonstrated and found to be more efficient than the
manual approach.
The use of GIS for analyzing the distribution of facilities is
not new in Kano State, like the study of Ahmed M. et al (2013)
where thematic map and nearest neighbourhood analyses were used
and found out that the pattern of distribution of Police
Stations in Kano Metropolis is generally random and uneven,
with a little clustering at the center. One and two kilometre
buffer zones were generated and the result shows that the old
city of Kano and the eastern part of the metropolis were fully
served while the west and southern part were underserved.
Also, in another research conducted by, Kibon and Ahmed (2013),
where they made use of thematic map and nearest neighbour
analysis shows that, the distributions of Health facilities in
Kano Metropolis are in clustered.
The study of Olubadewo, Abdulkarim and Ahmed (2013), indicates
the use of technology (GIS) for education planning have proved
to be very important in the decision making in Fagge L.G.A by
providing the planners integrated geographic scenario of

location of school. The Thematic map and Nearest neighbour
analysis shows that the distribution of primary schools in the
area is more concentrated than other areas, while the buffer
zones show that schools are closer to roads and Markets. The
database shows there are 222 classrooms, 12,693 pupils and 558
teachers in the areas at which the result shows a perfect
significant relationship between the number of teacher and
pupils. The tool of the analysis (Nearest Neighbour) was used
to analyze the pattern of the distribution and the result shows
the schools are dispersed.
2.12 Distribution of Schools
Distribution of schools has an effect on the participation rate
in school education geographic location of primary schools as
indeed public facilities in Nigeria has not taken into account
inequalities among region, different social groups and
geographical area (Ikpasaja, 2014).
2.13 Road Network Pattern
Network pattern is referred to the geographical layout and
structure of a network, which is related to the connection,
direction, and combination features of roads in a road network
(Chao, 2012). Road networks which are set of interconnected
roadways on which movement takes place. The road network is
determined by the demand of the public. There is a simple road
network and a complex road network (UNESCO, 2014). Road network
patterns reflect the structure of a city (Cybergeo, 2011).
According to Heinzle (2014), urban development as well as the
construction of transportation routes follows usually
structural conditions. Economical rules, security issues or the
best possible utilisation of terrain are some basic principles
for the emergence of typical structures in road networks. The
knowledge of such patterns provides information about the
design, history and development of an urban area as well as the
functional organisation of a town. Urban geography is a domain
which studies the inner structure of cities, especially complex
patterns of distribution, movement, flows and interaction
within cities. It provides various categorisations of types of
cities on the basis of their historic development as well as on
the basis of their today’s appearance, functional and social
organisation
Some basic forms or patterns to be detected in urban road
networks are;
i. Strokes – as a linear configuration;
ii. Grids – as a cellular configuration;
iii. Stars – as a radial configuration, and
iv. Ring roads – as a cellular configuration, observed over
a wider area.
Usually roads play an important role in those categorisations,
because they constitute the linkage system between different
regions and land uses.
CHAPTER THREE
METHODOLOGY
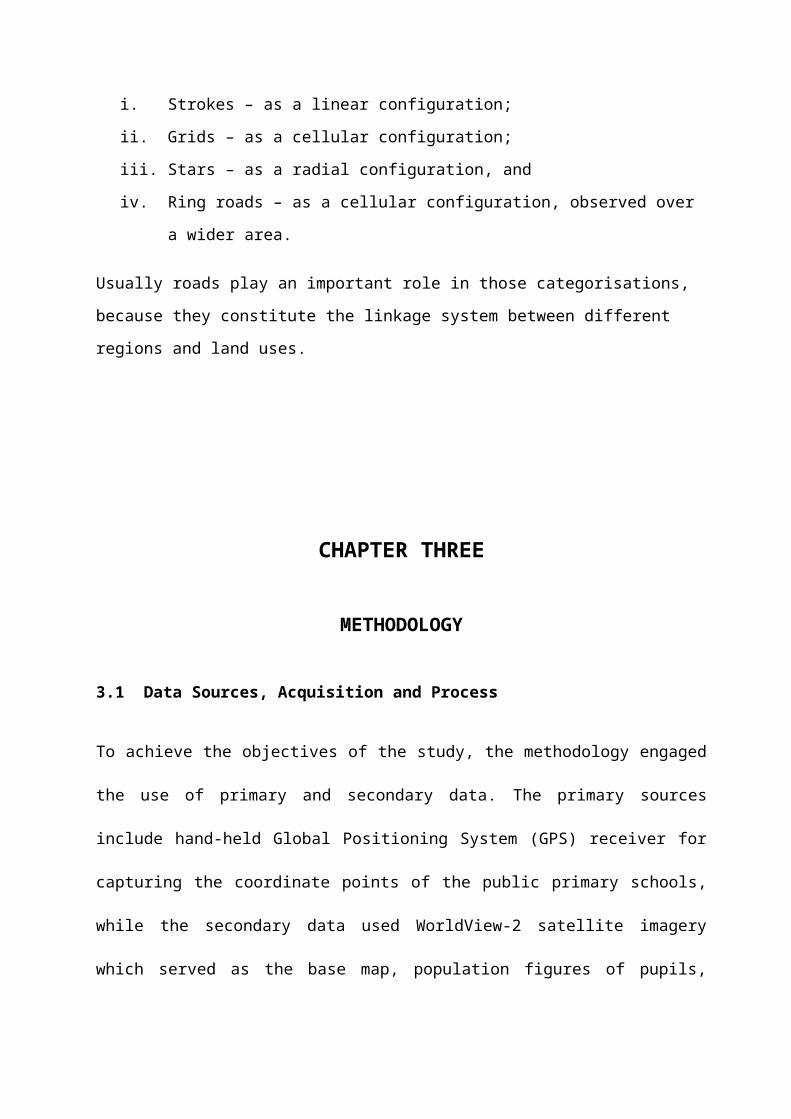
3.1 Data Sources, Acquisition and Process
To achieve the objectives of the study, the methodology engaged
the use of primary and secondary data. The primary sources
include hand-held Global Positioning System (GPS) receiver for
capturing the coordinate points of the public primary schools,
while the secondary data used WorldView-2 satellite imagery
which served as the base map, population figures of pupils,

teaching staff, names and address of the public primary schools
in Tarauni Local Government Area.
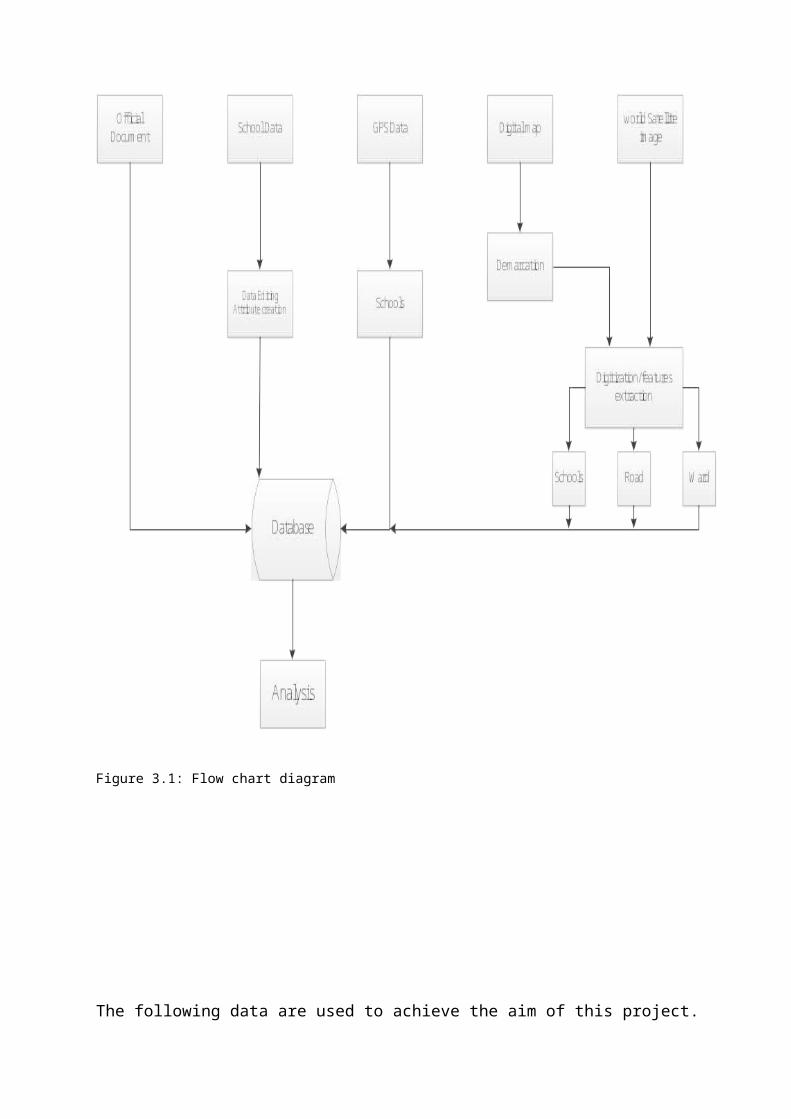
Figure 3.1: Flow chart diagram
The following data are used to achieve the aim of this project.
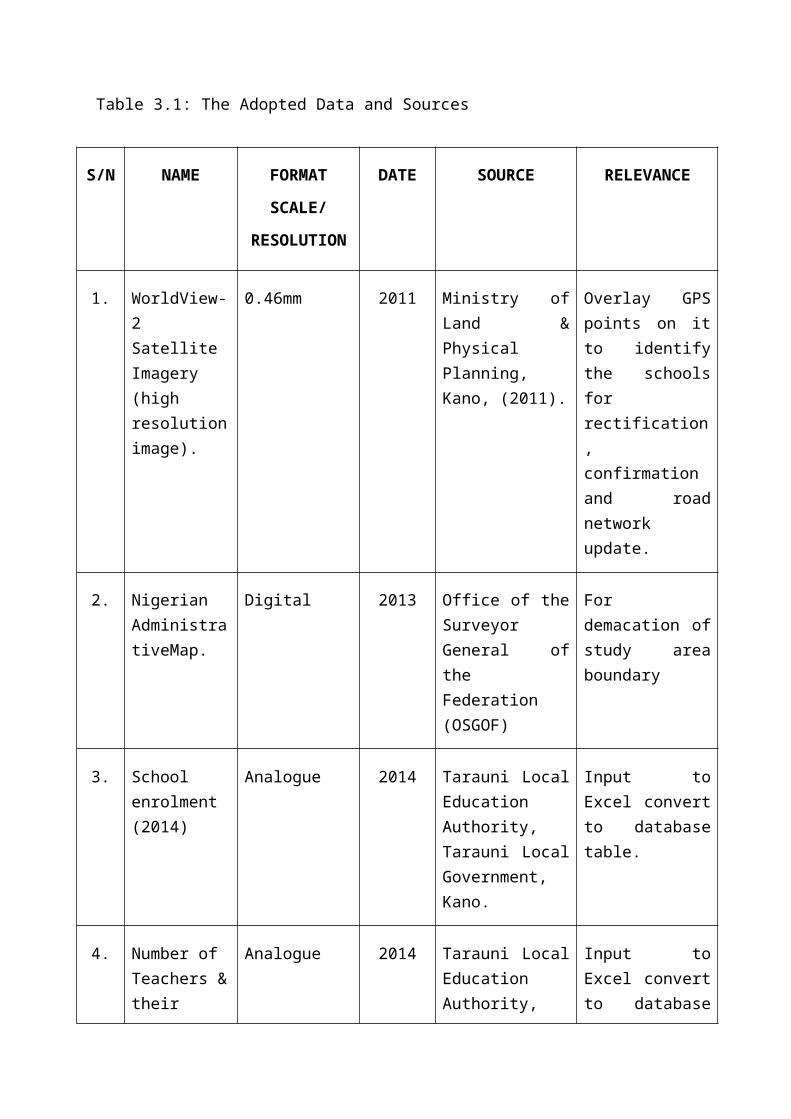
Table 3.1: The Adopted Data and Sources
S/N NAME FORMAT
SCALE/
RESOLUTION
DATE SOURCE RELEVANCE
1. WorldView-2 Satellite Imagery (high resolutionimage).
0.46mm 2011 Ministry ofLand &PhysicalPlanning,Kano, (2011).
Overlay GPSpoints on itto identifythe schoolsforrectification,confirmationand roadnetworkupdate.
2. Nigerian AdministrativeMap.
Digital 2013 Office of theSurveyorGeneral oftheFederation(OSGOF)
Fordemacation ofstudy areaboundary
3. School enrolment (2014)
Analogue 2014 Tarauni LocalEducationAuthority,Tarauni LocalGovernment,Kano.
Input toExcel convertto databasetable.
4. Number of Teachers &their
Analogue 2014 Tarauni LocalEducationAuthority,
Input toExcel convertto database
Qualifications (2014)
Tarauni LocalGovernment,Kano.
table.
5. GPSReciever(Etex 10,Garmin)Coordinates ofSpatialdata inthe studyarea
± 2maccuracy
2014 Field surveys Input toexcel convertto databasetable setspatialreferenceconvert topoints map
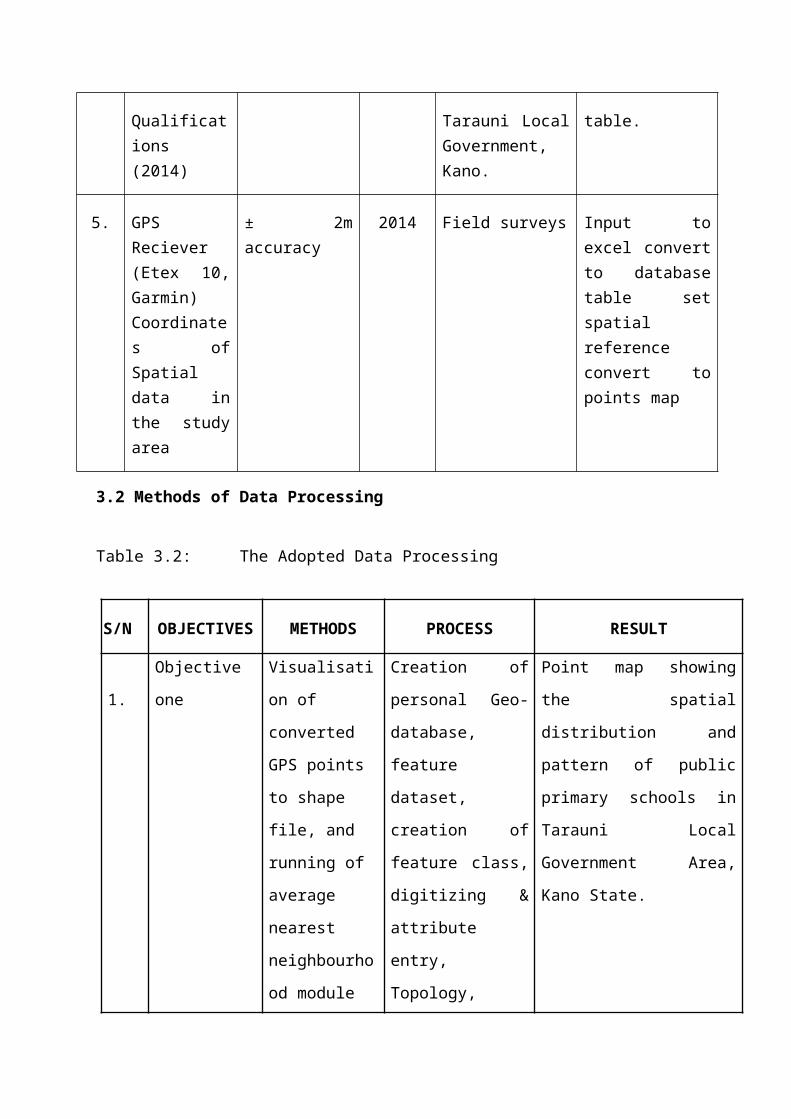
3.2 Methods of Data Processing
Table 3.2: The Adopted Data Processing
S/N OBJECTIVES METHODS PROCESS RESULT
1.
Objective
one
Visualisati
on of
converted
GPS points
to shape
file, and
running of
average
nearest
neighbourho
od module
Creation of
personal Geo-
database,
feature
dataset,
creation of
feature class,
digitizing &
attribute
entry,
Topology,
Point map showing
the spatial
distribution and
pattern of public
primary schools in
Tarauni Local
Government Area,
Kano State.
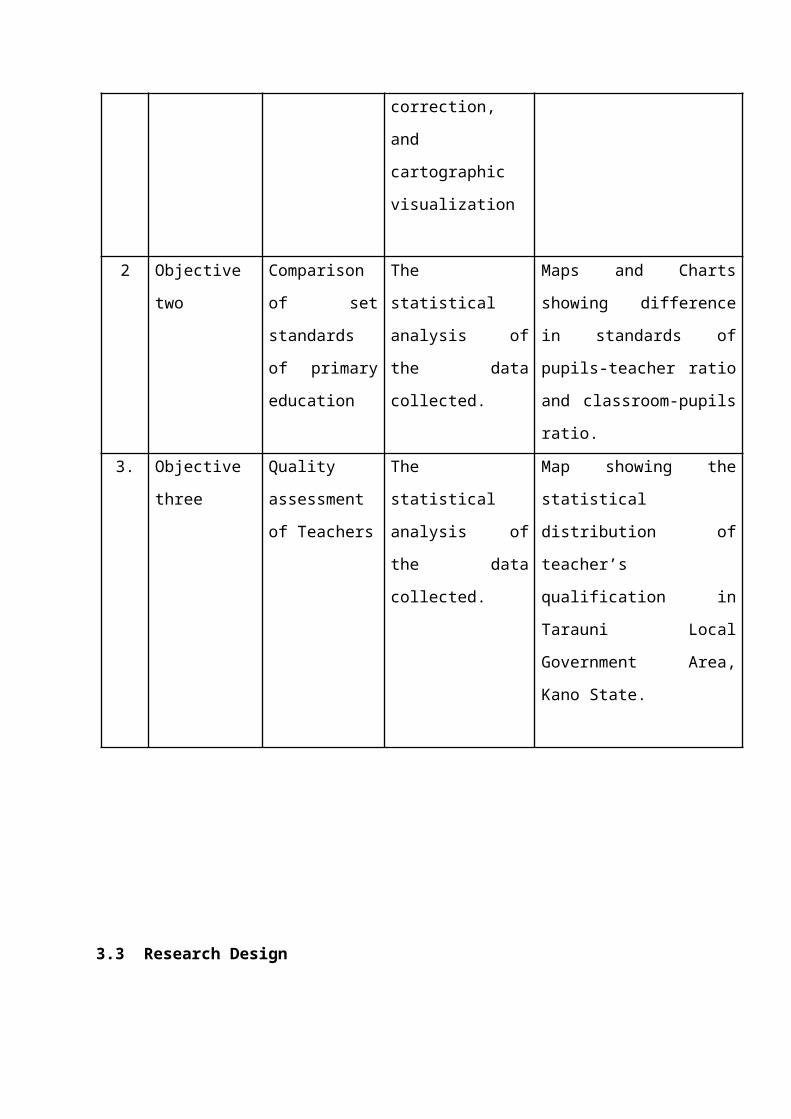
correction,
and
cartographic
visualization
2 Objective
two
Comparison
of set
standards
of primary
education
The
statistical
analysis of
the data
collected.
Maps and Charts
showing difference
in standards of
pupils-teacher ratio
and classroom-pupils
ratio.
3. Objective
three
Quality
assessment
of Teachers
The
statistical
analysis of
the data
collected.
Map showing the
statistical
distribution of
teacher’s
qualification in
Tarauni Local
Government Area,
Kano State.
3.3 Research Design
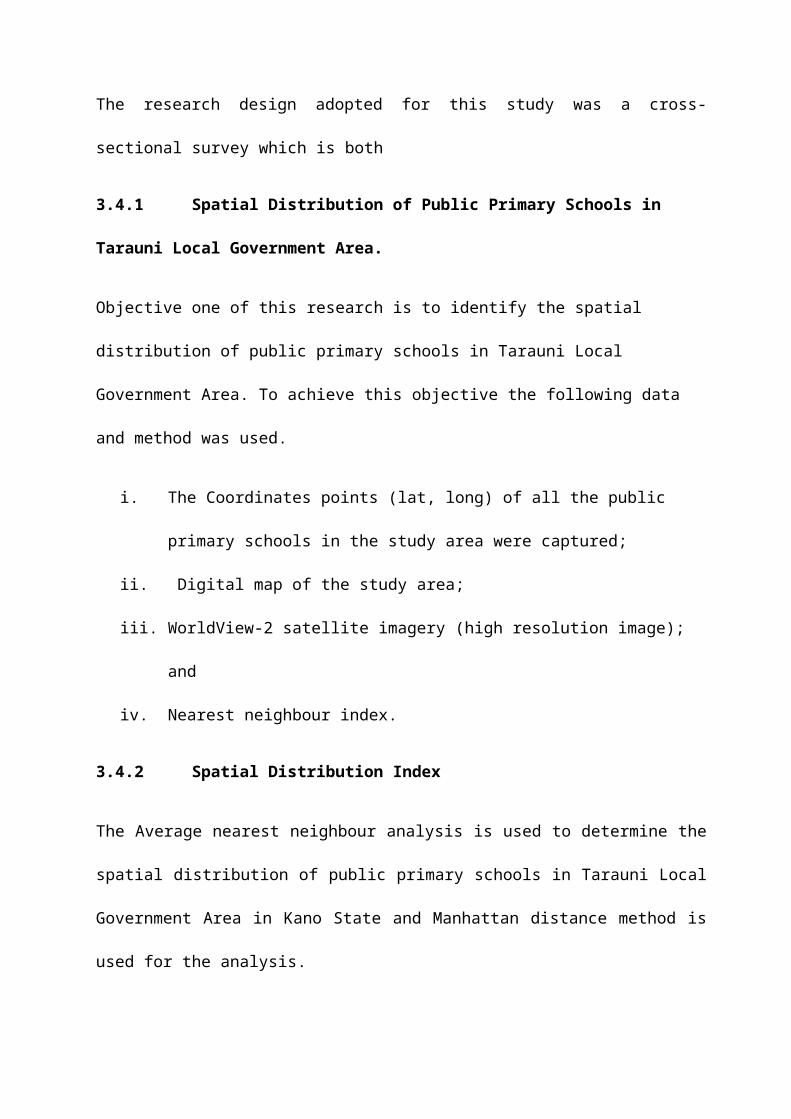
The research design adopted for this study was a cross-
sectional survey which is both
3.4.1 Spatial Distribution of Public Primary Schools in
Tarauni Local Government Area.
Objective one of this research is to identify the spatial
distribution of public primary schools in Tarauni Local
Government Area. To achieve this objective the following data
and method was used.
i. The Coordinates points (lat, long) of all the public
primary schools in the study area were captured;
ii. Digital map of the study area;
iii. WorldView-2 satellite imagery (high resolution image);
and
iv. Nearest neighbour index.
3.4.2 Spatial Distribution Index
The Average nearest neighbour analysis is used to determine the
spatial distribution of public primary schools in Tarauni Local
Government Area in Kano State and Manhattan distance method is
used for the analysis.

Its formula is given as:
Rn = d√na
Where
Rn = the nearest neighbour index
a = the size of the study area
d= the mean distance between primary schools
n= the number of public primary schools
The Rn values range from (when there is no distance at all) to
2.15 (when schools have a minimum spacing and regularly
distributed). A purely random distribution has an index of 10
value, above 1.0 indicate a tendency towards spacing and those
below 1.0 indicate clustering i.e.
Rn= 0: the distance is calculated
Rn= 1: the distance is random
Rn = 2.15: the distance is regular
Nearest neighbour index was used to determine the pattern of
distribution of public primary school in the study area that is

the distance between two points (which represent n), with the
exception to the wards that have only one school, the size of
the area (which is represented as a), and Manhattan distance
was used to determine the pattern of public primary schools in
study area and Rn value, Z score, Observed mean
distance/Expected mean Distance and P-value were all generated.
3.4.3 To Identify the Spatial Pattern of Public Primary
Schools in Tarauni Local Government Area.
To achieve this objective, the following stages are involved:
i. Data compilation which ranges from list of public
primary schools in Tarauni Local Government Area from
the Tarauni Local Education Authority Kano State,
WorldView-2 satellite imagery (high resolution image)
from the Ministry of Land & Physical Planning Kano
State, Digital map of Nigeria from OSGOF, and GPS points
of the schools location.
ii. Geo-referencing of the digital map to WGS 1984 UTM zone
32N, personal geo-database, feature dataset and feature
class for the existing roads and the ten (10) political
wards was created in Arc Catalogue. The existing roads

and wards are digitized from the geo-referenced
WorldView-2 satellite imagery (high resolution image
0.46m) using the above stated feature classes.
iii. The formulation of school total enrolment in Ms-Excel
spread sheet, which is converted to database and
exported to GIS environment to produce point map showing
the spatial distribution and pattern of public primary
schools in Tarauni Local Government Area, Kano State.
3.4.4 Determine the Standard of Spatial Redistribution of
Public Primary Schools in Tarauni Local Government Area.
i. The data used for to achieve this objective is acquisition
of list of all the public primary schools within the study
area from the Tarauni Local Education Authority (TLEA) to
extract information such as pupil’s enrolment, number of
classrooms in each school, number of teachers allocated to
each school.
ii. The information extracted was analyzed using UNESCO
standard, (1996), UBE standard, (2004) and Reviewed Kano
Metropolitan Plan (1980) models which sets the ratio of
teacher and classroom capacity of 1:25, 1:35 and 1:50. The
total enrolment of each school divided by the UNESCO

standard of 25, UBE standard of 35, and Reviewed Kano
Master Plan standard of 50 pupils per class to get extra
number of classrooms needed in each school, and also to
know the schools that followed the stated set standards.
3.4.5 Assess the Qualification of Teachers in Public
Primary Schools in Tarauni Local Government Area.
To achieve this objective, the lists of teachers with their
qualifications were obtained from the Statistics Unit of the
Planning Research and Statistics Department of TLEA to extract
information on their qualification and other relevant
information. The information was used to form a table showing
the teachers’ detailed information.
3.5 Target Population
The target population for this research are pupils from public
primary schools and teachers in Tarauni Local Government Area,
Kano State.
3.8 Procedure
Tarauni Local Government consists of ten (10) political wards.
All the wards were considered for the survey where all the
public primary schools within the local government were survey.
CHAPTER FOUR
RESULTS AND DISCUSSION
4.2 Spatial Distribution of Public Primary Schools
The location of primary schools in the study area is presented in the Table 4.1.
Table 4.1: Public primary schools in Tarauni Local GovernmentArea with their year of establishment, location and coordinates

S/N
NAME OF SCHOOL YEAROF
ESTAB.
LOCATION/
WARD
SCHOOL COORDINATELAT. LONG.
1. Kauyen MuhammaduSPS
2010 Kauyen Alu, Unguwa Uku Ward
453406 1322569
2. Rabi’atu SPS 2001 Kauyen Alu, Unguwa Uku Ward
453989 1321857
3. Hotoro Danmarke SPS
2000 Danmarke, Danmarke Ward
454344 1322085
4. Hotoron Maradi SPS
2013 Danmarke, Danmarke Ward 455392 1322103
5. Mal. Ibrahim Shekarau SciencePri.Sch.
2010 Unguwa Uku, Unguwa Uku Ward
452348 1321682
6. Unguwa Uku ModelPri. Sch.
2008 Unguwa Uku, Unguwa Uku Ward
452386 1321776
7. Kundila Estate SPS
1991 Behind KSHC, Daurawa Ward
451694 1322582
8. Daurawa SPS 1980 Daurawa, Daurawa Ward 451990 1323694
9. Gyadi-Gyadi SPS 1974 Gyadi-Gyadi, Gyadi-Gyadin Arewa Ward
450639 1323012
10.
Dr. Rabi'u M. Kwankwaso, Sc. Model Pri. Sch
2012 Gyadi-Gyadi, Gyadi-Gyadin Arewa Ward
450662 1322966
11.
Hausawa Model Pri. Sch.
1996 Hausawa Danfulani, Babban Giji Ward
449851 1322714
12.
Bashir Memorial II Nomdic Pri. Sch.
2002 Yar Akwa (Tudun Fulani), Darmanawa Ward
451526 1320200
13.
Unguwar Gano SPS 1977 Unguwar Gano, Unguwar Gano Ward
452497 1320114
14.
Darmanawa SPS 2003 Darmanawa, Darmanawa Ward
450536 1320768
15.
Dantsinke SPS 2013 Dantsinke, Darmanawa Ward
449926 1319180
16.
Babban Giji SPS 1977 , Karkasara, Darmanawa Ward
450574 1321857
17.
Sallari SPS 2003 Sallari Babban Giji, Babban Giji Ward
450213 1321660
18.
Hausawa SPS 1977 Hausawa, Babban Giji Ward
449926 1322596
19.
Unguwa Uku SPS 1960 Unguwa Uku (Cikin Gari), Unguwa Uku Ward
452426 1321784
Source: Field Survey, (2014).
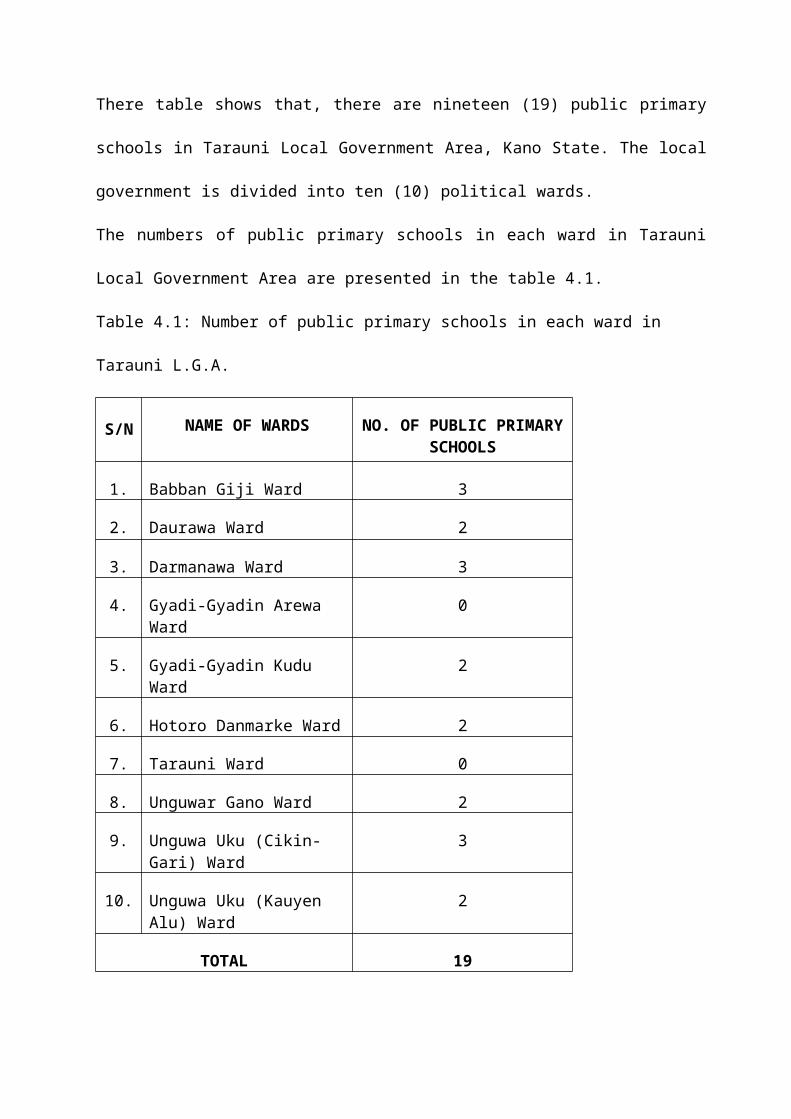
There table shows that, there are nineteen (19) public primary
schools in Tarauni Local Government Area, Kano State. The local
government is divided into ten (10) political wards.
The numbers of public primary schools in each ward in Tarauni
Local Government Area are presented in the table 4.1.
Table 4.1: Number of public primary schools in each ward in
Tarauni L.G.A.
S/N NAME OF WARDS NO. OF PUBLIC PRIMARYSCHOOLS
1. Babban Giji Ward 3
2. Daurawa Ward 2
3. Darmanawa Ward 3
4. Gyadi-Gyadin Arewa Ward
0
5. Gyadi-Gyadin Kudu Ward
2
6. Hotoro Danmarke Ward 2
7. Tarauni Ward 0
8. Unguwar Gano Ward 2
9. Unguwa Uku (Cikin-Gari) Ward
3
10. Unguwa Uku (Kauyen Alu) Ward
2
TOTAL 19

Source: Local Education Authority, Tarauni Local Government Council
(2014).
The above table shows the number of public primary schools in each political
ward in Tarauni Local Government Area.
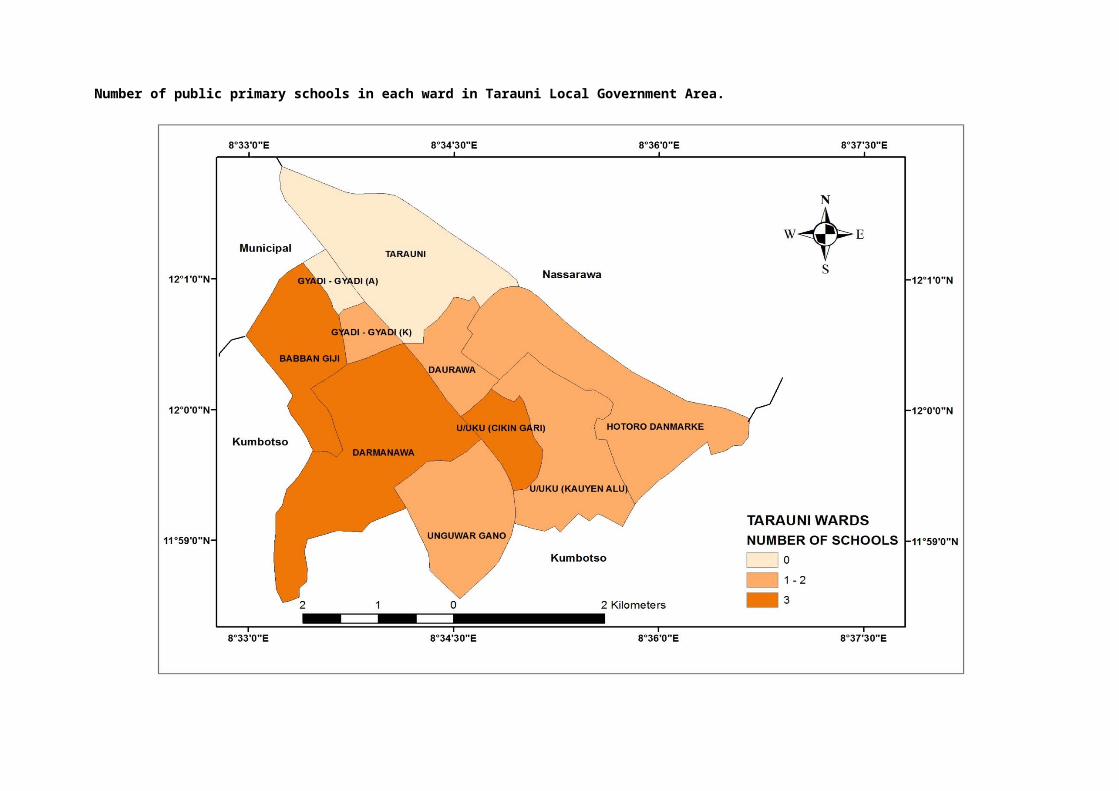
Number of public primary schools in each ward in Tarauni Local Government Area.
Figure. Distribution of public primary schools in each ward in the study area, (2014).
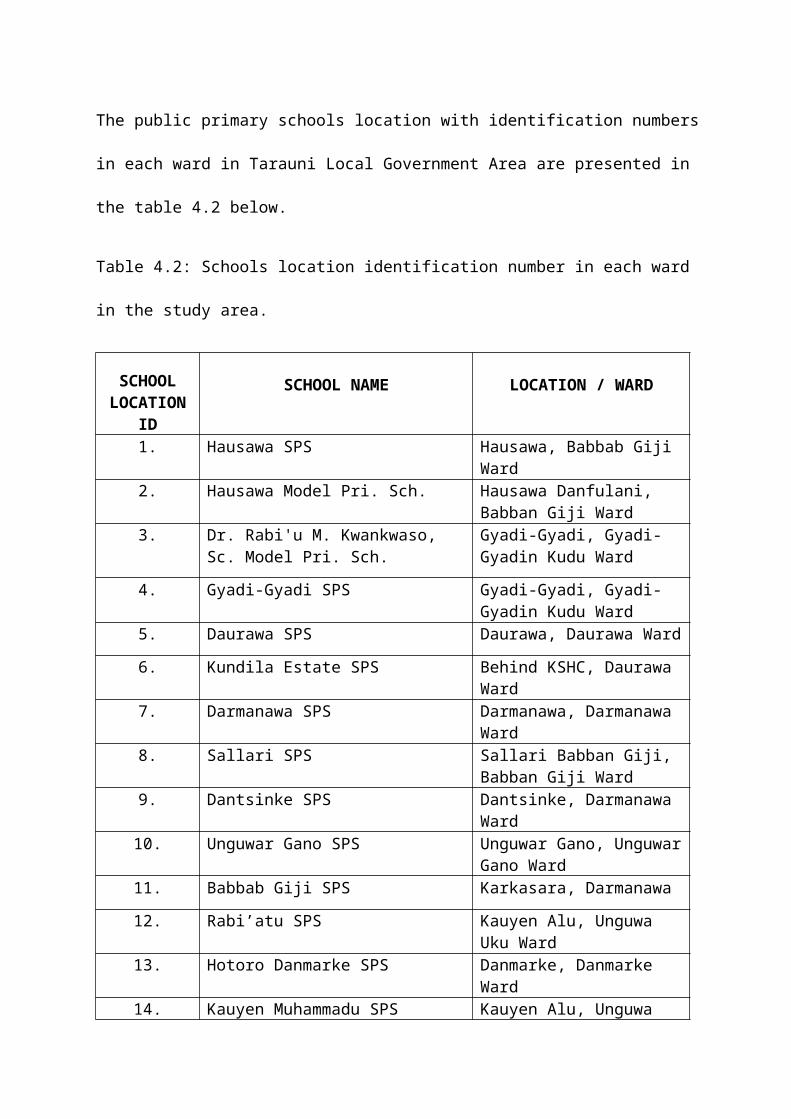
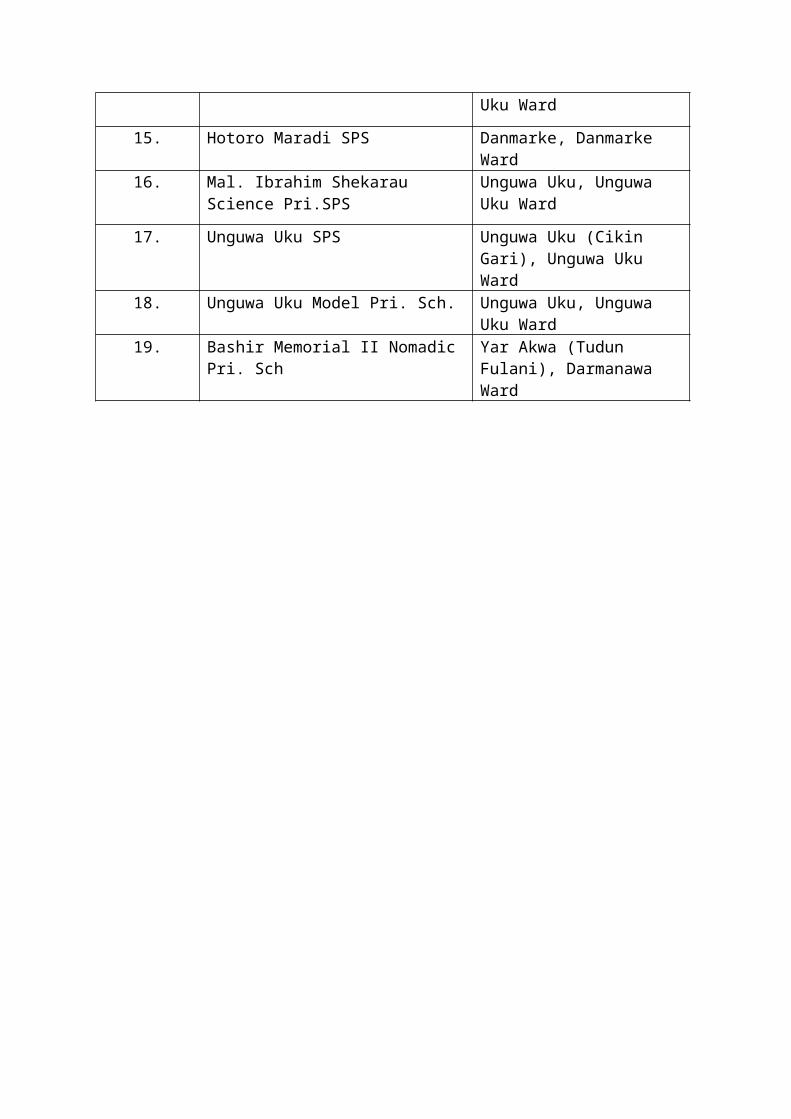
The public primary schools location with identification numbers
in each ward in Tarauni Local Government Area are presented in
the table 4.2 below.
Table 4.2: Schools location identification number in each ward
in the study area.
SCHOOLLOCATION
ID
SCHOOL NAME LOCATION / WARD
1. Hausawa SPS Hausawa, Babbab Giji Ward
2. Hausawa Model Pri. Sch. Hausawa Danfulani, Babban Giji Ward
3. Dr. Rabi'u M. Kwankwaso, Sc. Model Pri. Sch.
Gyadi-Gyadi, Gyadi-Gyadin Kudu Ward
4. Gyadi-Gyadi SPS Gyadi-Gyadi, Gyadi-Gyadin Kudu Ward
5. Daurawa SPS Daurawa, Daurawa Ward
6. Kundila Estate SPS Behind KSHC, Daurawa Ward
7. Darmanawa SPS Darmanawa, Darmanawa Ward
8. Sallari SPS Sallari Babban Giji, Babban Giji Ward
9. Dantsinke SPS Dantsinke, Darmanawa Ward
10. Unguwar Gano SPS Unguwar Gano, UnguwarGano Ward
11. Babbab Giji SPS Karkasara, Darmanawa
12. Rabi’atu SPS Kauyen Alu, Unguwa Uku Ward
13. Hotoro Danmarke SPS Danmarke, Danmarke Ward
14. Kauyen Muhammadu SPS Kauyen Alu, Unguwa
Uku Ward
15. Hotoro Maradi SPS Danmarke, Danmarke Ward
16. Mal. Ibrahim Shekarau Science Pri.SPS
Unguwa Uku, Unguwa Uku Ward
17. Unguwa Uku SPS Unguwa Uku (Cikin Gari), Unguwa Uku Ward
18. Unguwa Uku Model Pri. Sch. Unguwa Uku, Unguwa Uku Ward
19. Bashir Memorial II Nomadic Pri. Sch
Yar Akwa (Tudun Fulani), Darmanawa Ward
The distributions of public primary schools in the ten (10) political wards in Tarauni Local
Government Area are presented in figure 4.1

Figure 4.1: Distribution of public primary schools in each ward in Tarauni L.G.A., (2014).
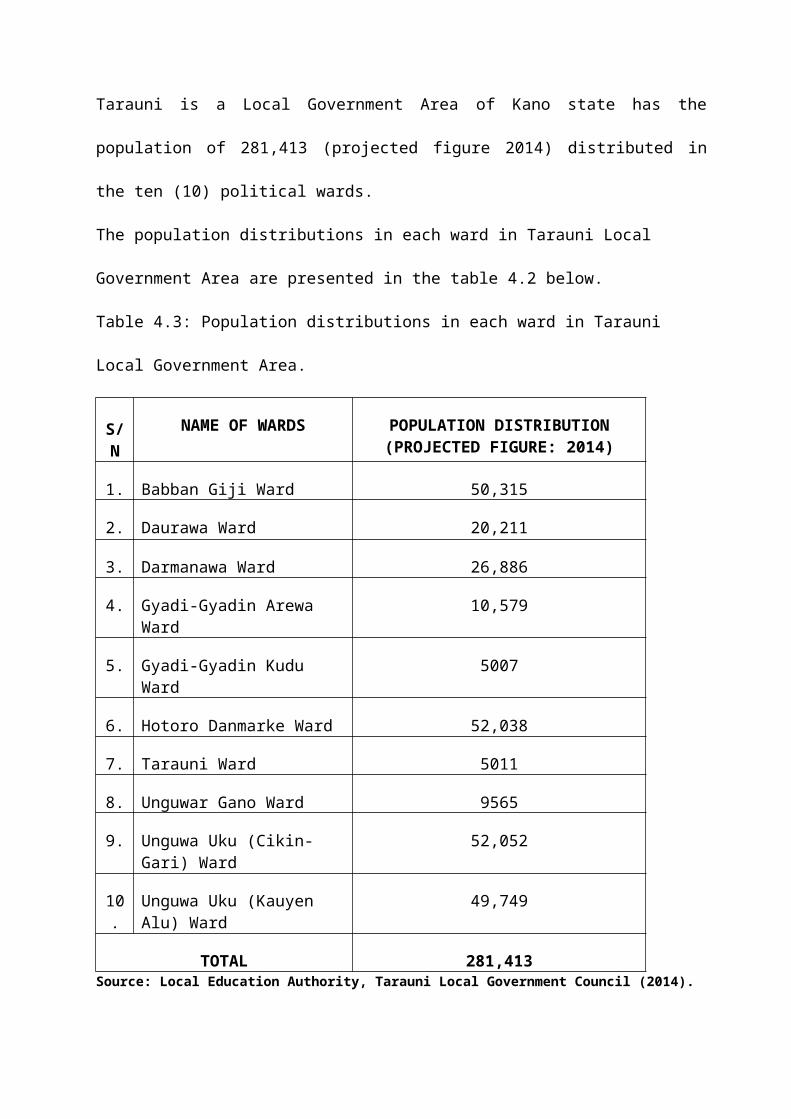
Tarauni is a Local Government Area of Kano state has the
population of 281,413 (projected figure 2014) distributed in
the ten (10) political wards.
The population distributions in each ward in Tarauni Local
Government Area are presented in the table 4.2 below.
Table 4.3: Population distributions in each ward in Tarauni
Local Government Area.
S/N
NAME OF WARDS POPULATION DISTRIBUTION(PROJECTED FIGURE: 2014)
1. Babban Giji Ward 50,315
2. Daurawa Ward 20,211
3. Darmanawa Ward 26,886
4. Gyadi-Gyadin Arewa Ward
10,579
5. Gyadi-Gyadin Kudu Ward
5007
6. Hotoro Danmarke Ward 52,038
7. Tarauni Ward 5011
8. Unguwar Gano Ward 9565
9. Unguwa Uku (Cikin-Gari) Ward
52,052
10.
Unguwa Uku (Kauyen Alu) Ward
49,749
TOTAL 281,413Source: Local Education Authority, Tarauni Local Government Council (2014).

Population distributions in the ten (10) political wards in Tarauni Local Government Area are
presented in Figure 4.2.
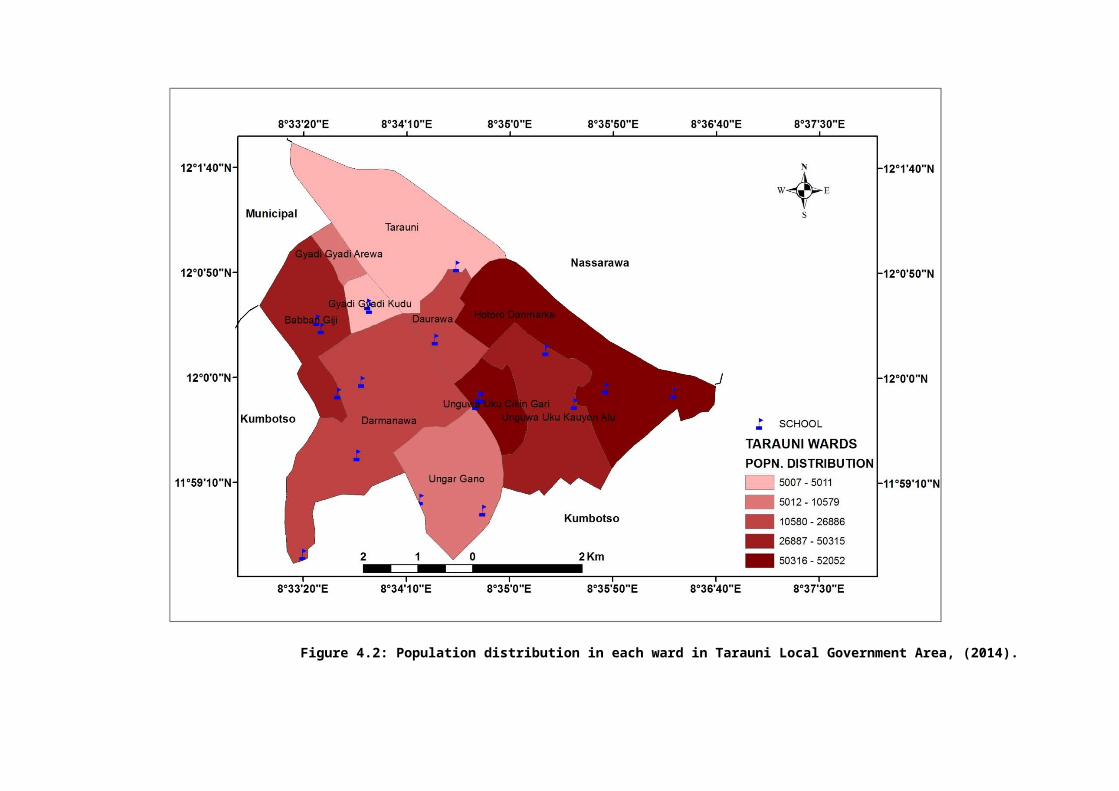
Figure 4.2: Population distribution in each ward in Tarauni Local Government Area, (2014).
The figure shows that, two (2) wards (Unguwa Uku cikin Gari and
Hotoro Danmarke) have the highest population while, two (2)
wards (Tarauni and Gyadi-Gyadin Kudu) have the lowest
population distribution in the study area.
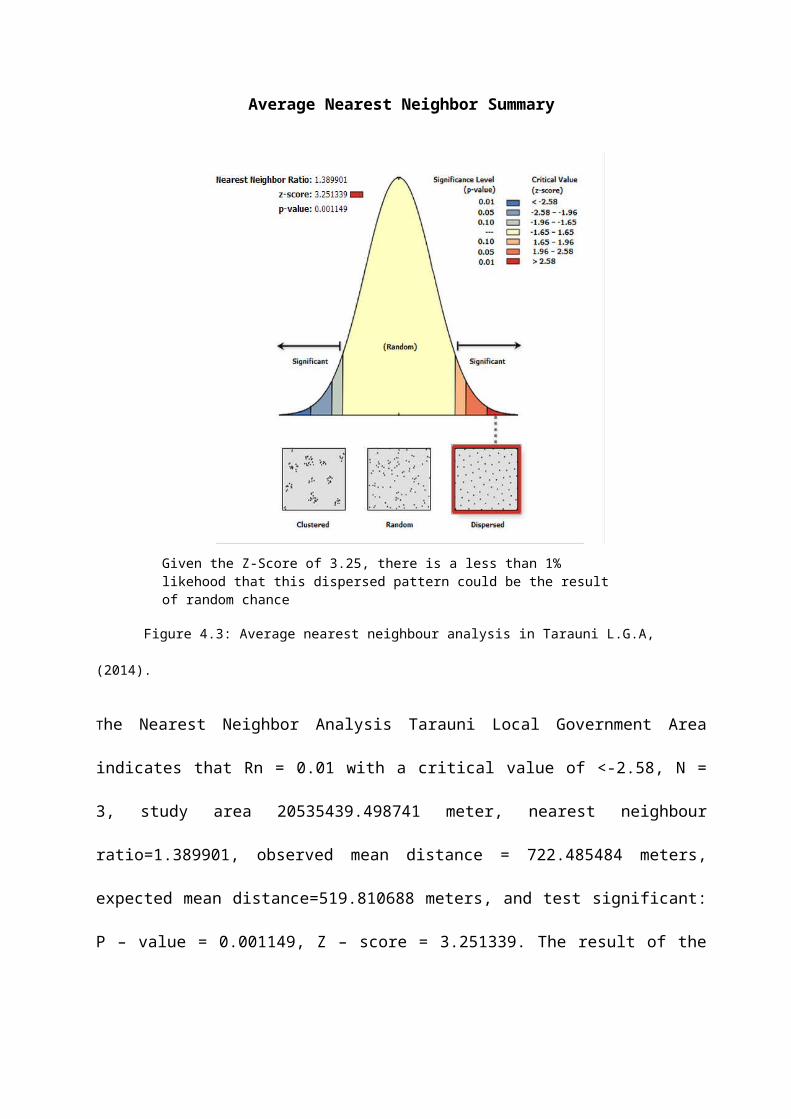
Average Nearest Neighbor Summary
Given the Z-Score of 3.25, there is a less than 1% likehood that this dispersed pattern could be the result of random chance
Figure 4.3: Average nearest neighbour analysis in Tarauni L.G.A,
(2014).
The Nearest Neighbor Analysis Tarauni Local Government Area
indicates that Rn = 0.01 with a critical value of <-2.58, N =
3, study area 20535439.498741 meter, nearest neighbour
ratio=1.389901, observed mean distance = 722.485484 meters,
expected mean distance=519.810688 meters, and test significant:
P – value = 0.001149, Z – score = 3.251339. The result of the
breakdown therefore shows that all the distribution public
primary schools are disperse.
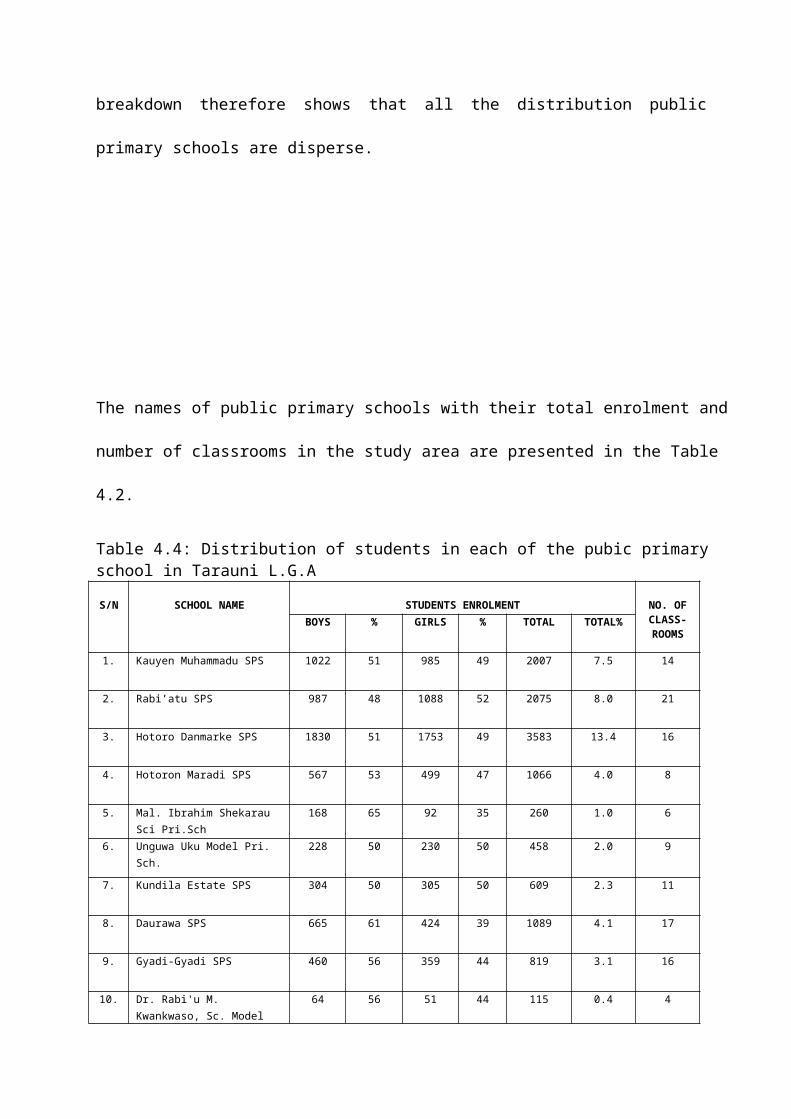
The names of public primary schools with their total enrolment and
number of classrooms in the study area are presented in the Table
4.2.
Table 4.4: Distribution of students in each of the pubic primary school in Tarauni L.G.A
S/N SCHOOL NAME STUDENTS ENROLMENT NO. OFCLASS-ROOMS
BOYS % GIRLS % TOTAL TOTAL%
1. Kauyen Muhammadu SPS 1022 51 985 49 2007 7.5 14
2. Rabi’atu SPS 987 48 1088 52 2075 8.0 21
3. Hotoro Danmarke SPS 1830 51 1753 49 3583 13.4 16
4. Hotoron Maradi SPS 567 53 499 47 1066 4.0 8
5. Mal. Ibrahim Shekarau Sci Pri.Sch
168 65 92 35 260 1.0 6
6. Unguwa Uku Model Pri. Sch.
228 50 230 50 458 2.0 9
7. Kundila Estate SPS 304 50 305 50 609 2.3 11
8. Daurawa SPS 665 61 424 39 1089 4.1 17
9. Gyadi-Gyadi SPS 460 56 359 44 819 3.1 16
10. Dr. Rabi'u M. Kwankwaso, Sc. Model
64 56 51 44 115 0.4 4
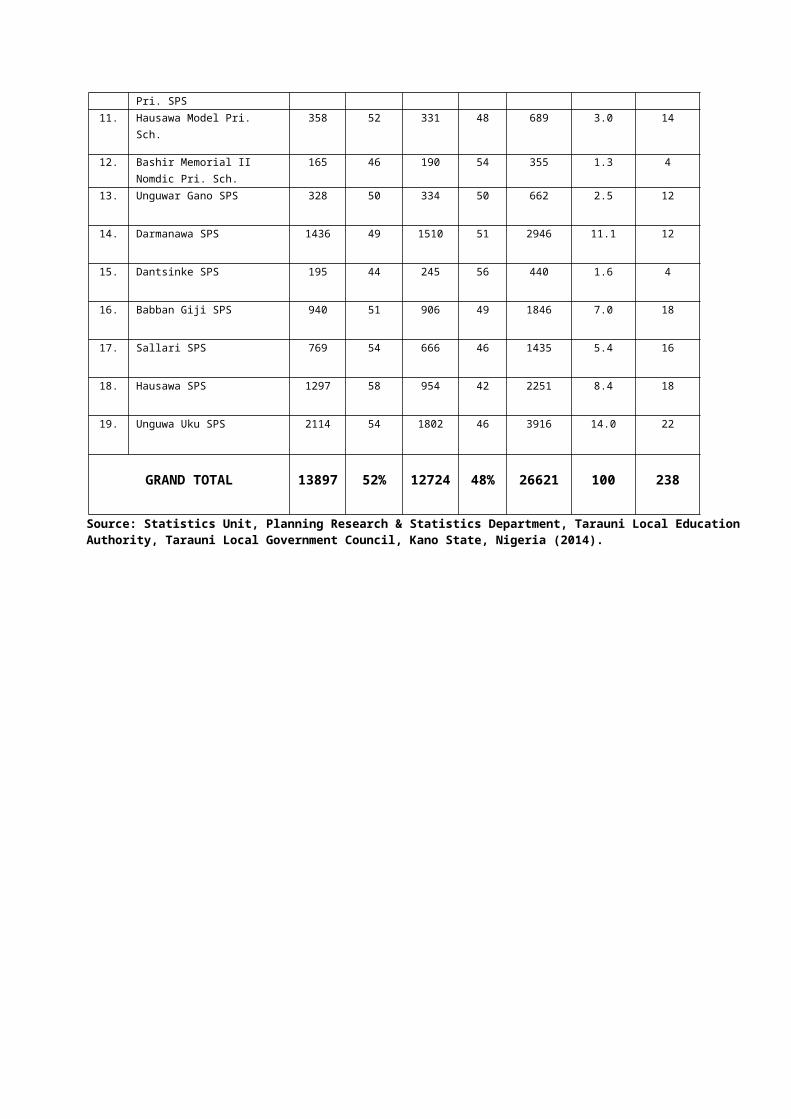
Pri. SPS11. Hausawa Model Pri.
Sch.358 52 331 48 689 3.0 14
12. Bashir Memorial II Nomdic Pri. Sch.
165 46 190 54 355 1.3 4
13. Unguwar Gano SPS 328 50 334 50 662 2.5 12
14. Darmanawa SPS 1436 49 1510 51 2946 11.1 12
15. Dantsinke SPS 195 44 245 56 440 1.6 4
16. Babban Giji SPS 940 51 906 49 1846 7.0 18
17. Sallari SPS 769 54 666 46 1435 5.4 16
18. Hausawa SPS 1297 58 954 42 2251 8.4 18
19. Unguwa Uku SPS 2114 54 1802 46 3916 14.0 22
GRAND TOTAL 13897 52% 12724 48% 26621 100 238
Source: Statistics Unit, Planning Research & Statistics Department, Tarauni Local Education Authority, Tarauni Local Government Council, Kano State, Nigeria (2014).
The pupils (boys and girls) enrolment in each of the pubic primary school in Tarauni Local
Government Area are presented in Figure 4.4.
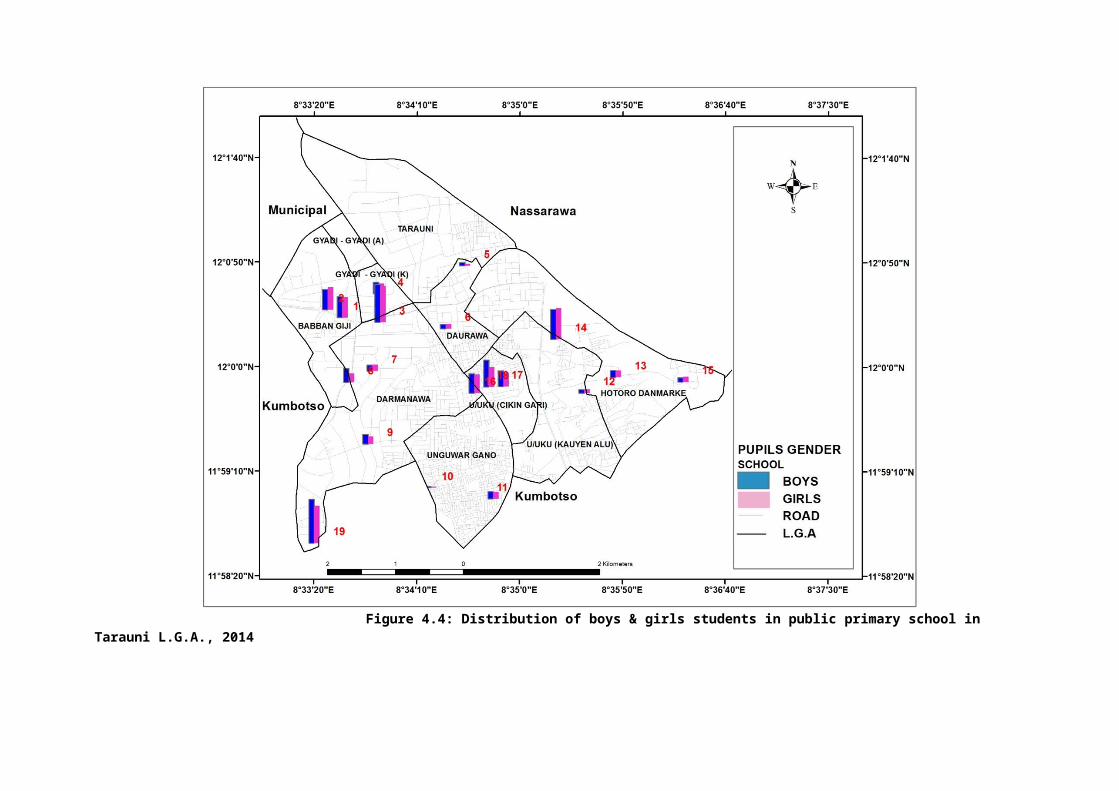
Figure 4.4: Distribution of boys & girls students in public primary school in Tarauni L.G.A., 2014
The figure shows that, the enrolment figure of boy’s student is
higher than that of the girl’s students in twelve (12) public
primary schools (Kauyen Muhammadu SPS, Hotoro Danmarke SPS,
Hotoro Maradi SPS, Malam Ibrahim Shekarau Sci. Model Pri. Sch.,
Daurawa SPS, Gyadi-Gyadi SPS, Dr. Rabi’u Musa Kwankwaso Sci.
Model Pri. Sch., Hausawa Model Pri Sch., Babban Giji SPS,
Sallari SPS, Hausawa SPS, Unguwa Uku SPS).
While the girl’s student are higher than that of the boy’s
students in remaining seven (7) public primary schools
(Rabi’atu SPS, Unguwa Uku Model Pri. Sch., Kundila SPS, Bashir
Memorial II Nomadic Pri. Sch., Unguwar Gano SPS, Darmanawa SPS,
Dantsinke SPS) in the study area.
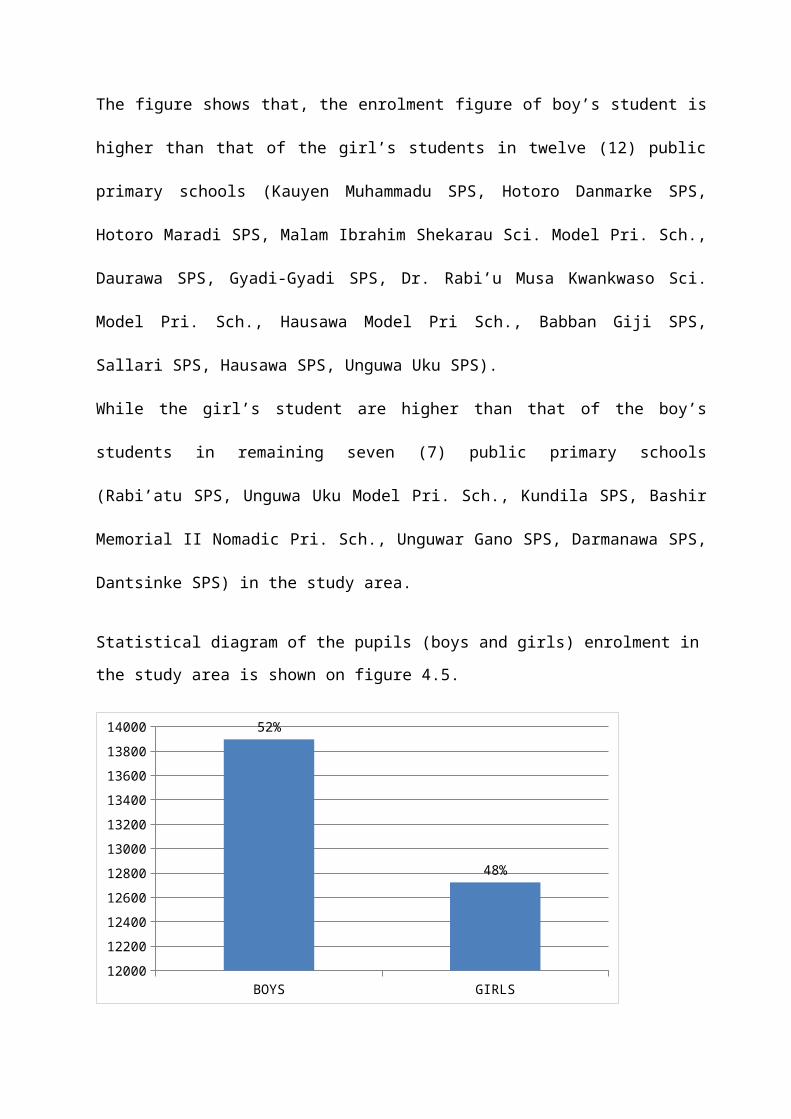
Statistical diagram of the pupils (boys and girls) enrolment in
the study area is shown on figure 4.5.
BOYS GIRLS1200012200124001260012800130001320013400136001380014000 52%
48%
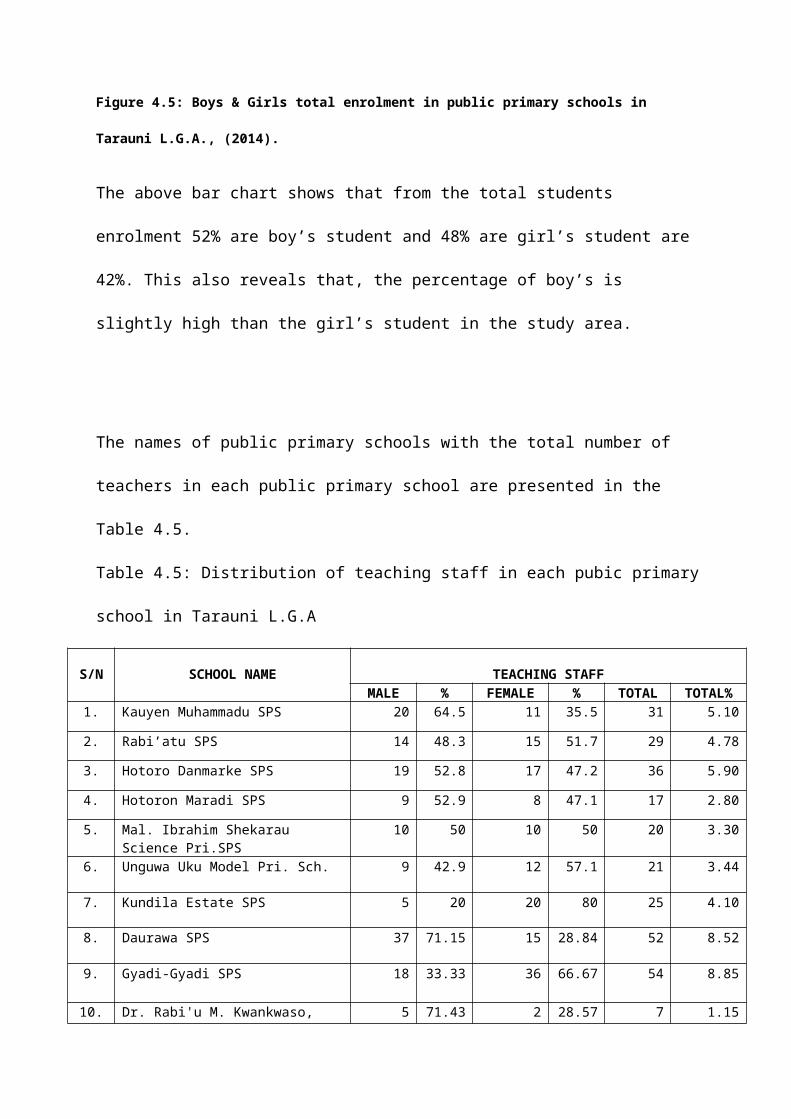
Figure 4.5: Boys & Girls total enrolment in public primary schools in
Tarauni L.G.A., (2014).
The above bar chart shows that from the total students
enrolment 52% are boy’s student and 48% are girl’s student are
42%. This also reveals that, the percentage of boy’s is
slightly high than the girl’s student in the study area.
The names of public primary schools with the total number of
teachers in each public primary school are presented in the
Table 4.5.
Table 4.5: Distribution of teaching staff in each pubic primary
school in Tarauni L.G.A
S/N SCHOOL NAME TEACHING STAFFMALE % FEMALE % TOTAL TOTAL%
1. Kauyen Muhammadu SPS 20 64.5 11 35.5 31 5.10
2. Rabi’atu SPS 14 48.3 15 51.7 29 4.78
3. Hotoro Danmarke SPS 19 52.8 17 47.2 36 5.90
4. Hotoron Maradi SPS 9 52.9 8 47.1 17 2.80
5. Mal. Ibrahim Shekarau Science Pri.SPS
10 50 10 50 20 3.30
6. Unguwa Uku Model Pri. Sch. 9 42.9 12 57.1 21 3.44
7. Kundila Estate SPS 5 20 20 80 25 4.10
8. Daurawa SPS 37 71.15 15 28.84 52 8.52
9. Gyadi-Gyadi SPS 18 33.33 36 66.67 54 8.85
10. Dr. Rabi'u M. Kwankwaso, 5 71.43 2 28.57 7 1.15
Sc. Model Pri. SPS
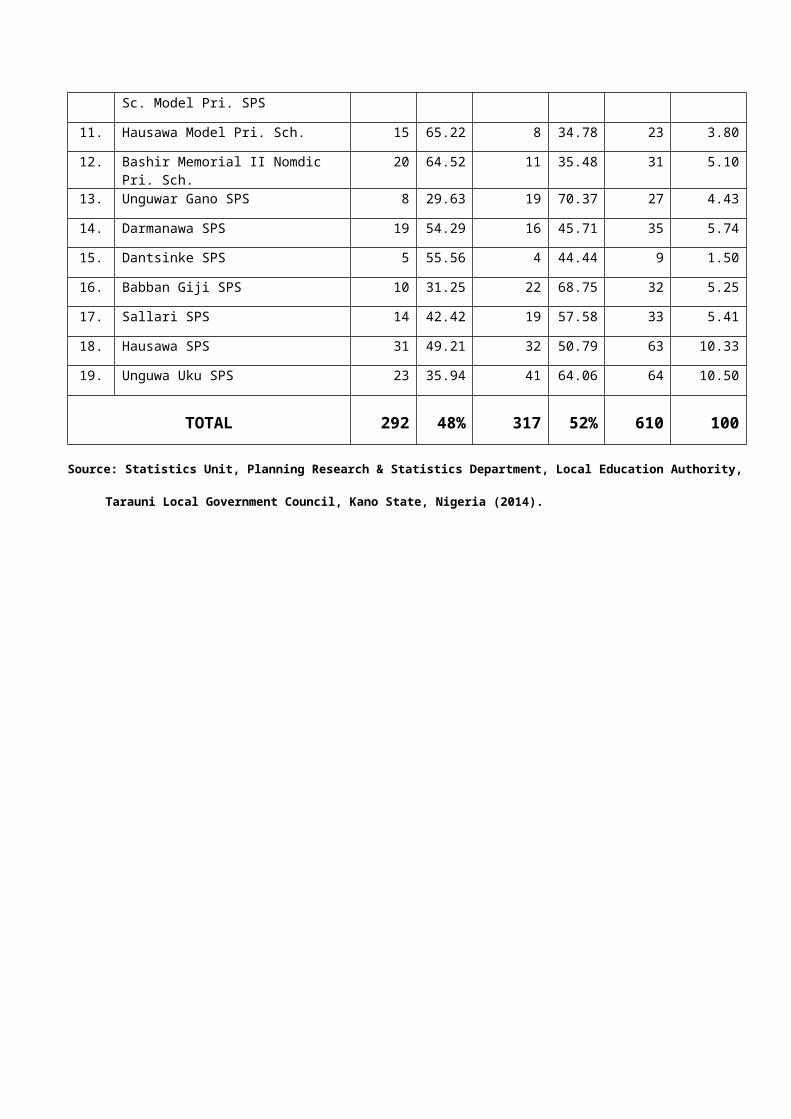
11. Hausawa Model Pri. Sch. 15 65.22 8 34.78 23 3.80
12. Bashir Memorial II Nomdic Pri. Sch.
20 64.52 11 35.48 31 5.10
13. Unguwar Gano SPS 8 29.63 19 70.37 27 4.43
14. Darmanawa SPS 19 54.29 16 45.71 35 5.74
15. Dantsinke SPS 5 55.56 4 44.44 9 1.50
16. Babban Giji SPS 10 31.25 22 68.75 32 5.25
17. Sallari SPS 14 42.42 19 57.58 33 5.41
18. Hausawa SPS 31 49.21 32 50.79 63 10.33
19. Unguwa Uku SPS 23 35.94 41 64.06 64 10.50
TOTAL 292 48% 317 52% 610 100
Source: Statistics Unit, Planning Research & Statistics Department, Local Education Authority,
Tarauni Local Government Council, Kano State, Nigeria (2014).
The teaching staff (male and female) distributions in each of the pubic primary school in
Tarauni Local Government Area are presented in
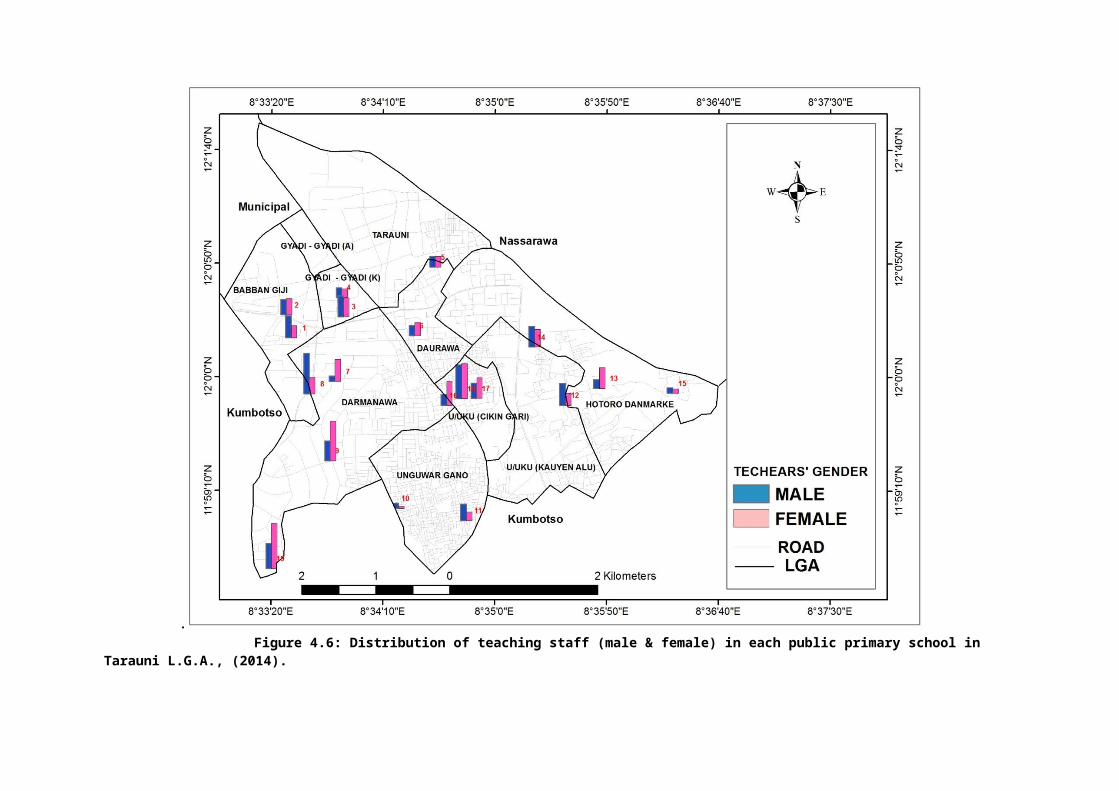
. Figure 4.6: Distribution of teaching staff (male & female) in each public primary school in
Tarauni L.G.A., (2014).

The figure shows that, male teachers are higher than female
teachers in nine (9) public primary schools (Kauyen Muhammadu
SPS, Hotoro Danmarke SPS, Hotoro Maradi SPS, Daurawa SPS, Dr.
Rabi’u Musa Kwankwaso Sci. Model Pri. Sch., Hausawa Model Pri
Sch., Bashir Memorial II Nomadic Pri. Sch., Darmanawa SPS,
Dantsinke SPS) in the study area.
While female teachers are higher than that of the male teachers
in remaining seven (7) public primary schools (Rabi’atu SPS,
Unguwa Uku Model Pri. Sch., Kundila SPS, Gyadi-Gyadi SPS,
Unguwar Gano SPS, Babban Giji SPS, Sallari SPS, Hausawa SPS,
Unguwa Uku SPS).
Both male and female teachers have equal number in one (1)
school (Malam Ibrahim Shekarau Sci. Model Pri. Sch.) in the
study area.
Statistical diagram of the teaching staff (male and female) in
the study area is shown on figure 4.7 below.
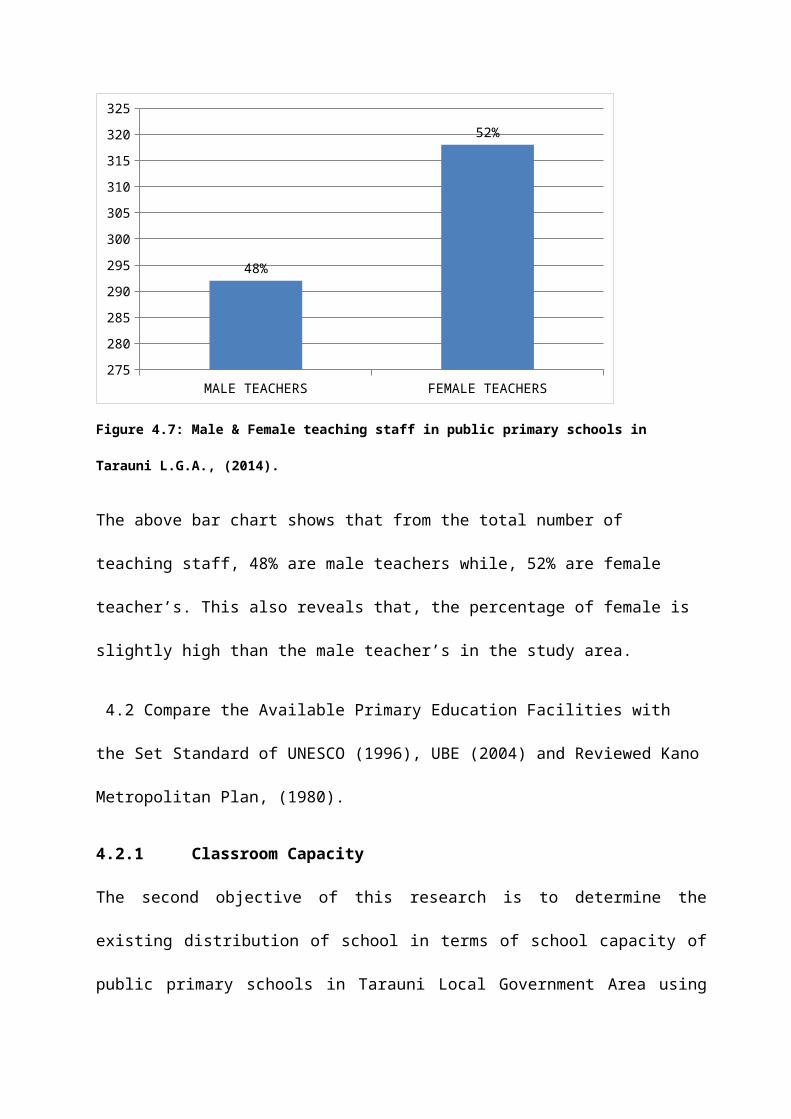
MALE TEACHERS FEMALE TEACHERS275280285290295300305310315320325
48%
52%
Figure 4.7: Male & Female teaching staff in public primary schools in
Tarauni L.G.A., (2014).
The above bar chart shows that from the total number of
teaching staff, 48% are male teachers while, 52% are female
teacher’s. This also reveals that, the percentage of female is
slightly high than the male teacher’s in the study area.
4.2 Compare the Available Primary Education Facilities with
the Set Standard of UNESCO (1996), UBE (2004) and Reviewed Kano
Metropolitan Plan, (1980).
4.2.1 Classroom Capacity
The second objective of this research is to determine the
existing distribution of school in terms of school capacity of
public primary schools in Tarauni Local Government Area using

UNESCO standard (1996) which put classroom capacity to one
teacher to thirty six (1:25) pupils in a class, UBE standard,
2004 (1:35) and RKMP, 1980 (1:50). Therefore to achieve this
objective, we divide the total enrolment by 25, 35 and 50
respectively.
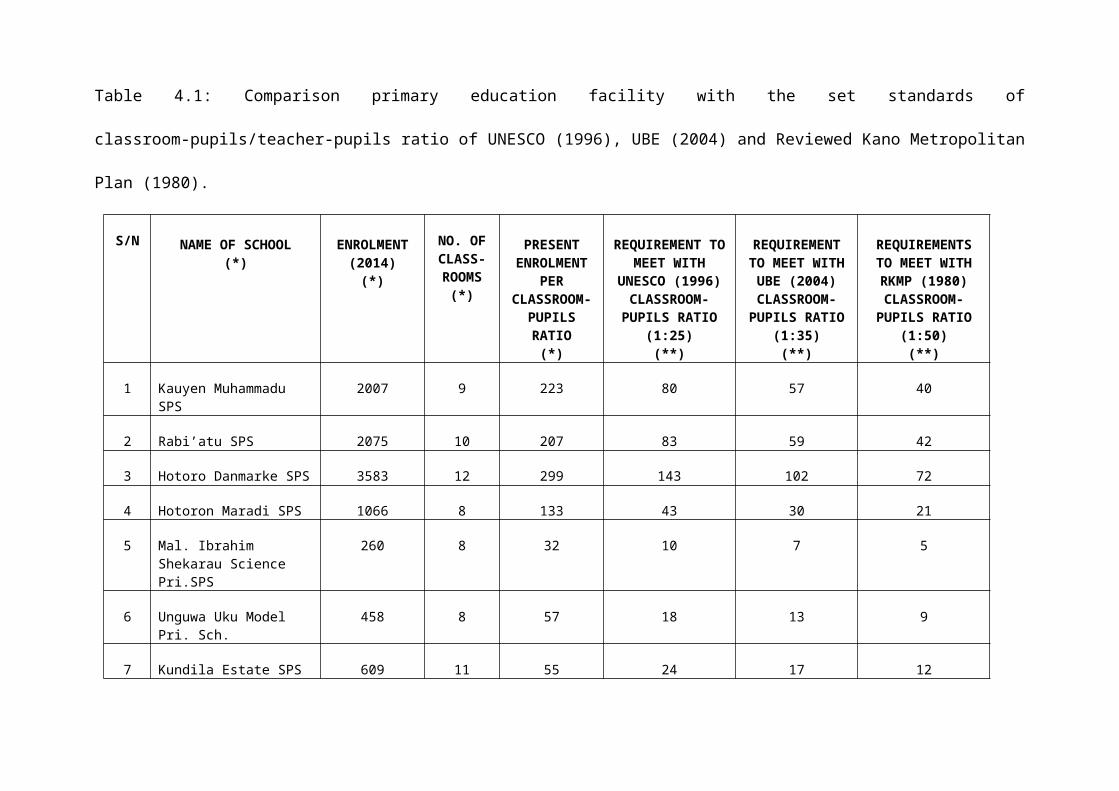
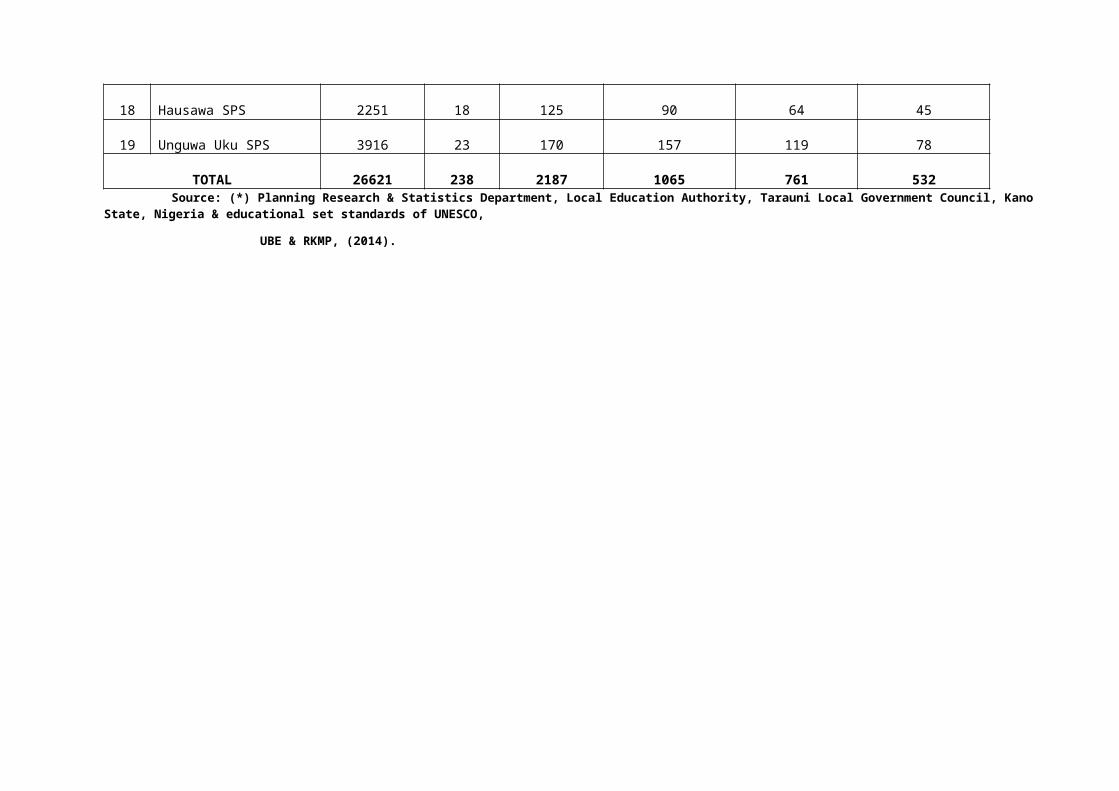
Table 4.1: Comparison primary education facility with the set standards of
classroom-pupils/teacher-pupils ratio of UNESCO (1996), UBE (2004) and Reviewed Kano Metropolitan
Plan (1980).
S/N NAME OF SCHOOL(*)
ENROLMENT(2014)(*)
NO. OFCLASS-ROOMS(*)
PRESENTENROLMENT
PERCLASSROOM-PUPILSRATIO(*)
REQUIREMENT TOMEET WITH
UNESCO (1996)CLASSROOM-PUPILS RATIO
(1:25)(**)
REQUIREMENTTO MEET WITHUBE (2004)CLASSROOM-PUPILS RATIO
(1:35)(**)
REQUIREMENTSTO MEET WITHRKMP (1980)CLASSROOM-PUPILS RATIO
(1:50)(**)
1 Kauyen Muhammadu SPS
2007 9 223 80 57 40
2 Rabi’atu SPS 2075 10 207 83 59 42
3 Hotoro Danmarke SPS 3583 12 299 143 102 72
4 Hotoron Maradi SPS 1066 8 133 43 30 21
5 Mal. Ibrahim Shekarau Science Pri.SPS
260 8 32 10 7 5
6 Unguwa Uku Model Pri. Sch.
458 8 57 18 13 9
7 Kundila Estate SPS 609 11 55 24 17 12

8 Daurawa SPS 1089 21 52 44 31 22
9 Gyadi-Gyadi SPS 819 23 36 33 23 16
10 Dr. Rabi'u M. Kwankwaso, Sc. Model Pri.
115 4 29 5 3 2
11 Hausawa Model Pri. Sch.
689 17 40 28 20 14
Cont.
S/N NAME OF SCHOOL(*)
ENROLMENT(2014)(*)
NO. OFCLASS-ROOMS(*)
PRESENTENROLMENT
PERCLASSROOM-PUPILSRATIO(*)
REQUIREMENT TOMEET WITH
UNESCO (1996)CLASSROOM-PUPILS RATIO
(1:25)(**)
REQUIREMENTTO MEET WITHUBE (2004)CLASSROOM-PUPILS RATIO
(1:35)(**)
REQUIREMENTSTO MEET WITHRKMP (1980)CLASSROOM-PUPILS RATIO
(1:50)(**)
12 Bashir Memorial II Nomdic Pri. Sch.
355 3 118 14 10 7
13 Unguwar Gano SPS 662 12 55 27 19 13
14 Darmanawa SPS 2946 14 210 118 84 59
15 Dantsinke SPS 440 4 110 18 13 9
16 Babban Giji SPS 1846 24 77 74 53 37
17 Sallari SPS 1435 9 159 57 41 29
18 Hausawa SPS 2251 18 125 90 64 45
19 Unguwa Uku SPS 3916 23 170 157 119 78
TOTAL 26621 238 2187 1065 761 532 Source: (*) Planning Research & Statistics Department, Local Education Authority, Tarauni Local Government Council, Kano
State, Nigeria & educational set standards of UNESCO,
UBE & RKMP, (2014).

In comparisons of educational facility set standard on public
primary schools, the table shows the required number of
classrooms in each of the public primary schools in relation to
UNESCO (1996) 1:25, UBE (2004) 1:35 and RKMP (1980) 1:50 in
Tarauni Local Government Area.

Classrooms needed in each public primary school in Tarauni Local Government Area.
Figure 4.8: Classrooms required in each of the public primary schools based on the standards of UNESCO (1:25), UBE (1:35) and
RKMP (1:50) in Tarauni L.G.A., (2014).

In comparison of the 3 primary education set standards (UNESCO,
UBE & RKMP) on classroom-pupils ratio which reveals that, none
of the public primary schools meet up with the UNESCO standard.
Only two (2) of the schools (Mal. Ibrahim Shekarau Model Sci
Pri. Sch and Dr. Rabi’u Musa Kwankwaso Model Sci pri. Sch) meet
up with UBE standard, and four (4) schools (Mal. Ibrahim
Shekarau Model Sci Pri, Gyadi-Gyadi SPS, Dr. Rabi’u Musa
Kwankwaso Model Sci pri. Sch, Hausawa Model Pri Sch) meet up
the standard RKMP (1980). While the remaining schools does not
meet with any of the standards in the study area.
Figure 4.8, 4.9 & 4.10 are the statistical diagrams showing the
number of classrooms and teachers needs in each of the public
primary school base on the set educational facilities standard.
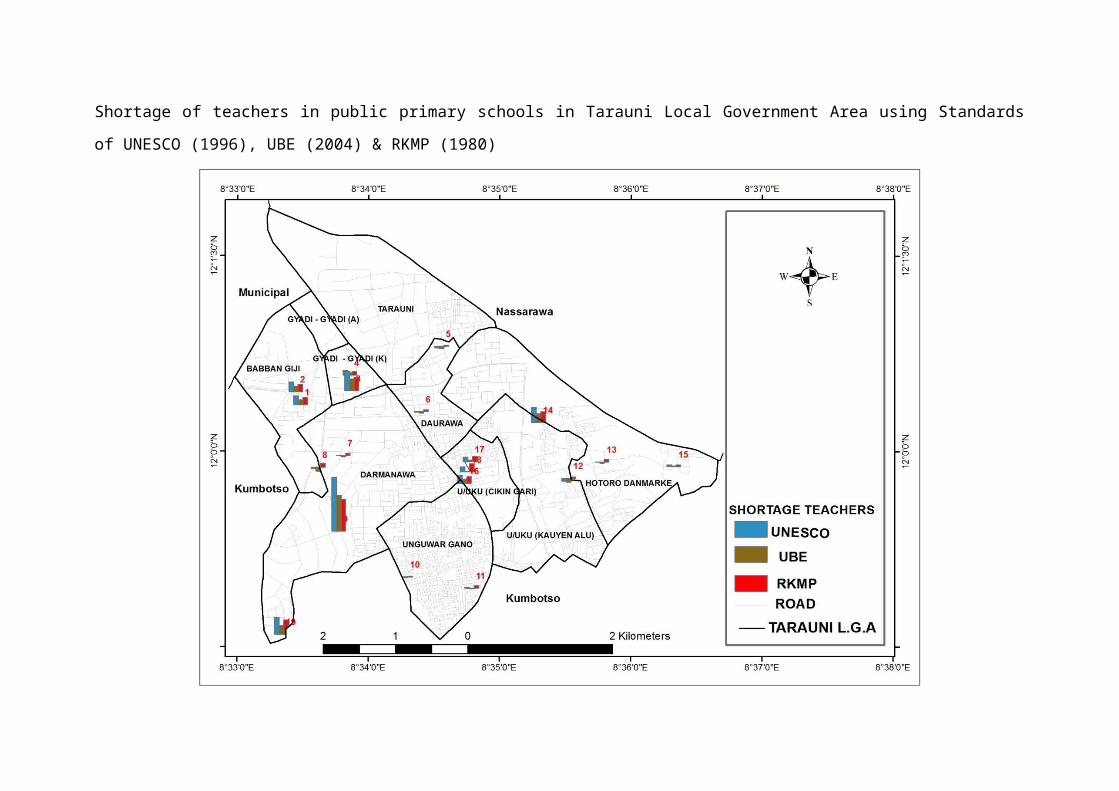
Shortage of teachers in public primary schools in Tarauni Local Government Area using Standards
of UNESCO (1996), UBE (2004) & RKMP (1980)

Figure 4.9: Shortage of Teacher in pupil primary schools ratio using standard teacher-pupil ratio of UNESCO (1:25), UBE (1:35) &
RKMP (1:50) in Tarauni LGA., (2014).

In comparison of the 3 primary education set standards (UNESCO,
UBE & RKMP) on teacher-pupils ratio which reveals that, eight
(8) of the public primary schools (Mal. Ibrahim Shekarau Model
Sci Pri., Unguwa Uku Model Pri Sch., Kundila Estate SPS,
Daurawa SPS, Gyadi-Gyadi SPS, Dr. Rabi’u Musa Kwankwaso Model
Sci pri. Sch., Bashir Memorial II Nomadic Pri Sch., and Unguwar
Gano SPS) meet up with the UNESCO standard, while the remaining
eleven (11) schools do not meet up.
Nine (9) of the schools (Mal. Ibrahim Shekarau Model Sci Pri.,
Unguwa Uku Model Pri Sch., Kundila Estate SPS, Daurawa SPS,
Gyadi-Gyadi SPS, Dr. Rabi’u Musa Kwankwaso Model Sci pri. Sch.,
Hausawa Model Pri. Sch, Bashir Memorial II Nomadic Pri Sch.,
and Unguwar Gano SPS) meets up the standard of UBE, while the
remaining ten (10) schools do not meet up.
In addition, ten (10) schools (Mal. Ibrahim Shekarau Model Sci
Pri., Unguwa Uku Model Pri Sch., Kundila Estate SPS, Daurawa
SPS, Gyadi-Gyadi SPS, Dr. Rabi’u Musa Kwankwaso Model Sci pri.
Sch., Hausawa Model Pri. Sch., Bashir Memorial II Nomadic Pri
Sch., Unguwar Gano SPS, and Dantsinke SPS) meet up with the
RKMP, while the remaining nine (9) schools do not meet up.

Figure 4.8, 4.9 & 4.10 are the statistical diagrams showing the
number of classrooms and teachers needs in each of the public
primary school base on the set educational facilities standard.
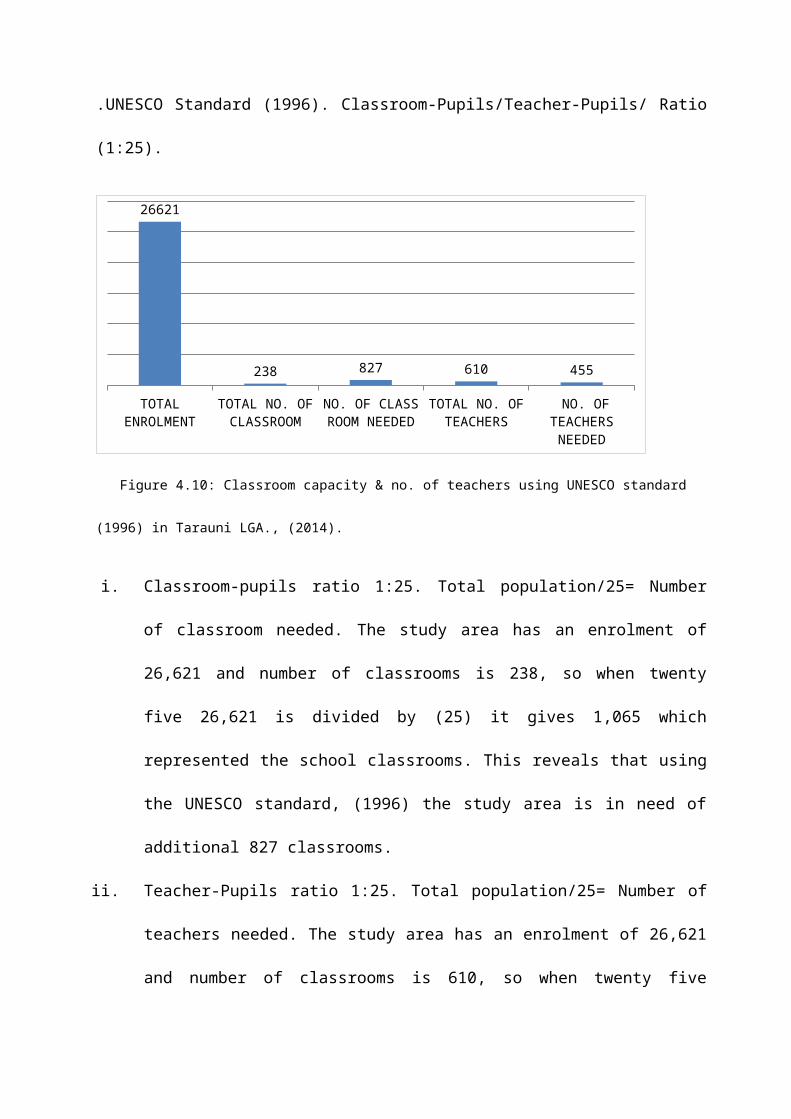
.UNESCO Standard (1996). Classroom-Pupils/Teacher-Pupils/ Ratio
(1:25).
TOTAL ENROLMENT
TOTAL NO. OF CLASSROOM
NO. OF CLASS ROOM NEEDED
TOTAL NO. OF TEACHERS
NO. OF TEACHERS NEEDED
26621
238 827 610 455
Figure 4.10: Classroom capacity & no. of teachers using UNESCO standard
(1996) in Tarauni LGA., (2014).
i. Classroom-pupils ratio 1:25. Total population/25= Number
of classroom needed. The study area has an enrolment of
26,621 and number of classrooms is 238, so when twenty
five 26,621 is divided by (25) it gives 1,065 which
represented the school classrooms. This reveals that using
the UNESCO standard, (1996) the study area is in need of
additional 827 classrooms.
ii. Teacher-Pupils ratio 1:25. Total population/25= Number of
teachers needed. The study area has an enrolment of 26,621
and number of classrooms is 610, so when twenty five
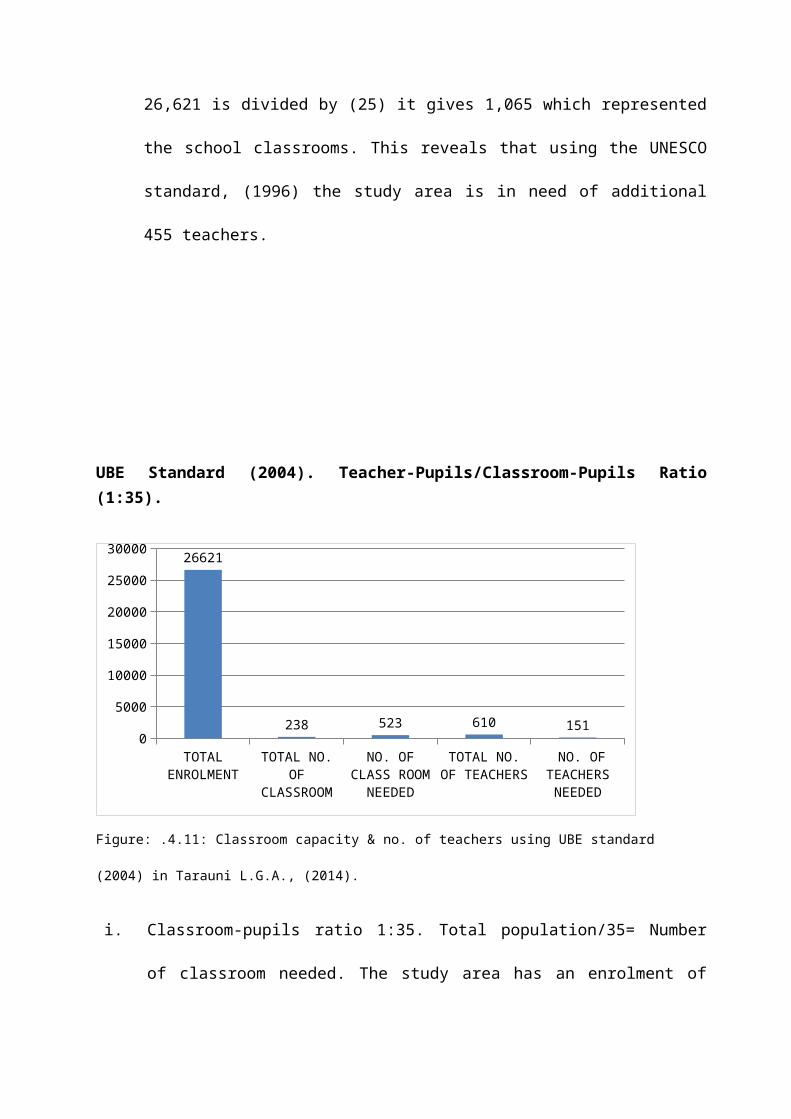
26,621 is divided by (25) it gives 1,065 which represented
the school classrooms. This reveals that using the UNESCO
standard, (1996) the study area is in need of additional
455 teachers.
UBE Standard (2004). Teacher-Pupils/Classroom-Pupils Ratio(1:35).
TOTAL ENROLMENT
TOTAL NO. OF
CLASSROOM
NO. OF CLASS ROOM NEEDED
TOTAL NO. OF TEACHERS
NO. OF TEACHERS NEEDED
0
5000
10000
15000
20000
25000
30000 26621
238 523 610 151
Figure: .4.11: Classroom capacity & no. of teachers using UBE standard
(2004) in Tarauni L.G.A., (2014).
i. Classroom-pupils ratio 1:35. Total population/35= Number
of classroom needed. The study area has an enrolment of

26,621 and number of classrooms is 238, so when twenty
five 26,621 is divided by (35) it gives 761 which
represented the school classrooms. This reveals that using
the UBE standard, (2004) the study area is in need of
additional 523 classrooms.
ii. Teacher-Pupils ratio 1:35. Total population/35= Number of
teachers needed. The study area has an enrolment of 26,621
and number of classrooms is 610, so when twenty five
26,621 is divided by (35) it gives 761 which represented
the school classrooms. This reveals that using the UBE
standard, (2004) the study area is in need of additional
151 teachers.
RKMP, (1980). Teacher-Pupil/Classroom-Pupils Ratio (1:50).
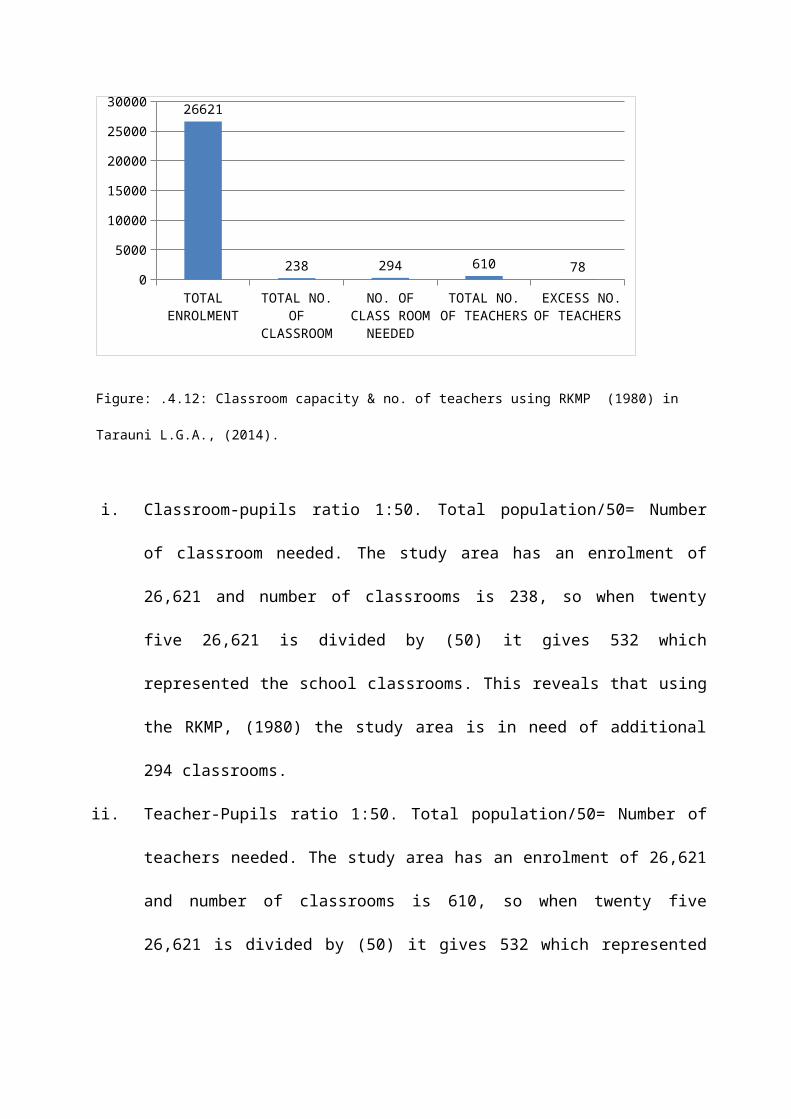
TOTAL ENROLMENT
TOTAL NO. OF
CLASSROOM
NO. OF CLASS ROOM NEEDED
TOTAL NO. OF TEACHERS
EXCESS NO. OF TEACHERS
0
5000
10000
15000
20000
25000
30000 26621
238 294 610 78
Figure: .4.12: Classroom capacity & no. of teachers using RKMP (1980) in
Tarauni L.G.A., (2014).
i. Classroom-pupils ratio 1:50. Total population/50= Number
of classroom needed. The study area has an enrolment of
26,621 and number of classrooms is 238, so when twenty
five 26,621 is divided by (50) it gives 532 which
represented the school classrooms. This reveals that using
the RKMP, (1980) the study area is in need of additional
294 classrooms.
ii. Teacher-Pupils ratio 1:50. Total population/50= Number of
teachers needed. The study area has an enrolment of 26,621
and number of classrooms is 610, so when twenty five
26,621 is divided by (50) it gives 532 which represented

the school classrooms. This reveals that using the RKMP,
(1980) the study area has an excess of 78 teachers.

UNESCO STANDARD (1996) 2km.

Figure 4.13: Catchment area of public primary schools in Tarauni L.G.A of using 2km service radius of UNESCO (1996).
The figure shows that, all the (19) public primary schools are
served with less than 2km service radius using UNESCO (1996)
standard. It’s also reveals that, the schools catchment area is
covered by large portion of areas out of the area study.
Whereas the remaining area not covered by the service radius is
purely an administrative area called Audu Bako Secretariat,
this is where the State Assembly, High court and Shari’a court
of appeal as well as Office of the Head Service, Civil Service
Commission, Ministries of Justice, Finance, Environment,
Information, Sport and Culture, Budget and Planning etc. This
also justifies that, all the existing 19 public primary schools
are served within the stipulated service radius of UBE (3km)
and RKMP (5km) in the study area.

Table. 4.2: TEACHERS QUALIFICATION OF PUBLIC PRIMARY SCHOOL IN
TARAUNI LOCAL GOVERNMENT AREA.
S/N
NAME OF SCHOOL QUALIFICATION PER SCHOOL TOTAL
MSC PGDE/
GRADUATE
NCE DIPLOMA GRADE
II
SSCE
1. Kauyen Muhammadu SPS
- 2 24 4 1 - 31
2. Rabi’atu SPS - - 20 6 2 1 29
3. Hotoro Danmarke SPS
- - 27 5 4 - 36
4. Hotoron Maradi SPS - - 13 1 3 - 17
5. Mal. Ibrahim Shekarau Sci. Pri.SPS
- 1 16 - - 3 20
6. Unguwa Uku Model Pri. Sch.
- 1 13 3 - 4 21
7. Kundila Estate SPS - 3 20 2 - - 25
8. Daurawa SPS - - 18 25 6 3 52
9. Gyadi-Gyadi SPS - 2 39 5 4 4 54
10.
Dr. Rabi'u M. Kwankwaso, Sci. Model Pri.
- 1 6 - - - 7

11.
Hausawa Model Pri.Sch.
- 5 14 3 1 - 23
12.
Bashir Memorial IINomdic Pri. Sch.
- 2 24 4 1 - 31
13.
Unguwar Gano SPS - 3 23 - - 1 27
14.
Darmanawa SPS 1 2 29 2 1 - 35
15.
Dantsinke SPS - - 9 1 - - 10
16.
Babban Giji SPS - 4 23 4 1 - 32
17.
Sallari SPS - 2 18 8 2 3 33
18.
Hausawa SPS - 5 45 8 5 - 63
19.
Unguwa Uku SPS - 6 42 12 2 2 64
GRAND TOTAL 1 39 423 93 33 21 610
Statistics Unit, Planning Research & Statistics Department, Local Education Authority, Tarauni Local Government Council, Kano State, Nigeria (2014).
The above table shows the distribution of teachers’
qualifications in each of the public primary schools in Tarauni
Local Government Area, (2014).

4.3 Assess the qualification of teachers in public primary schools in Tarauni Local Government
Area.
Teacher’s qualification in each of the public primary school in the study area.
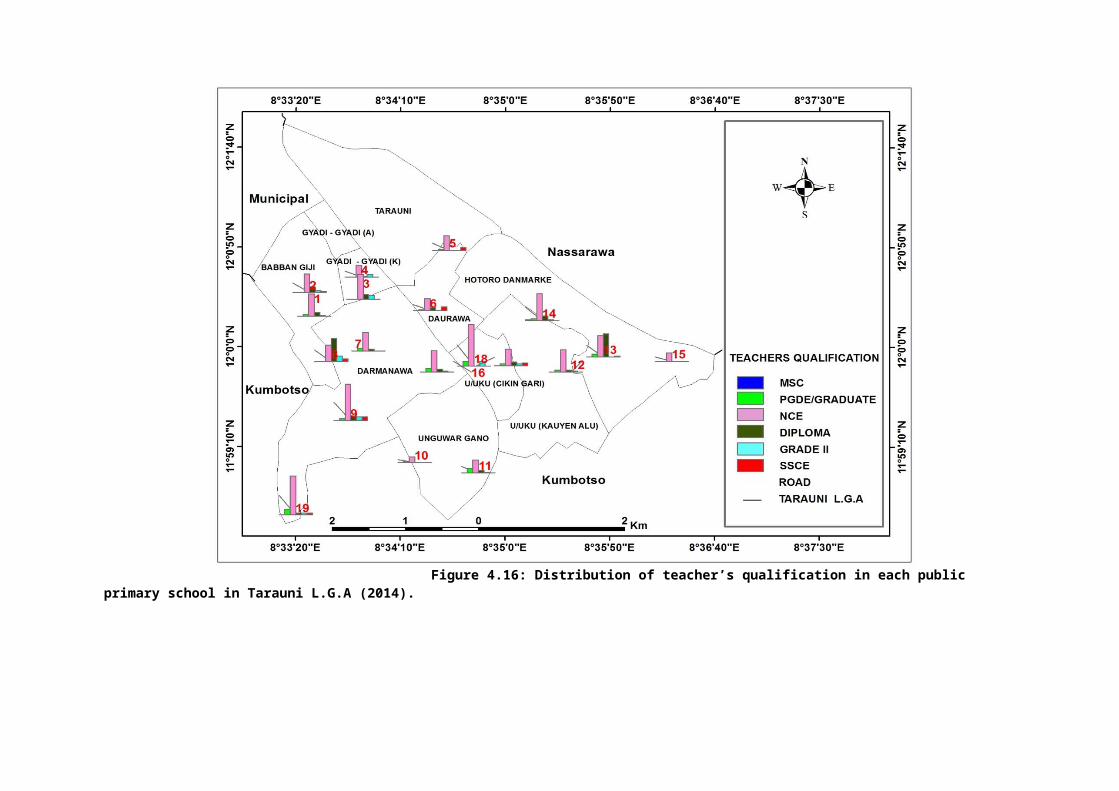
Figure 4.16: Distribution of teacher’s qualification in each public primary school in Tarauni L.G.A (2014).
The figure is a map showing the distribution of teacher’s with
their various qualification teaching in the public primary
schools in the study area. This reveals that, teachers with the
qualification of NCE certificates are higher in each of the
schools while one school (Darmanawa SPS) with only one (1) MSC
holder.

S/
N
NAME OF SCHOOL TEACHERS QUALIFICATIONQUALIFIED UNQUALIFIED TOTAL
MSC PGDE/GRADUATES
NCE TOTAL DIPLOMA GRADEII
SSCE TOTAL
1. Kauyen Muhammadu SPS
- 2 24 26 4 1 - 5 31
2. Rabi’atu SPS - - 20 20 6 2 1 9 293. Hotoro Danmarke SPS - - 27 27 5 4 - 9 364. Hotoron Maradi SPS - - 13 13 1 3 - 4 175. Mal. Ibrahim
Shekarau Sci. Pri.SPS
- 1 16 17 - - 3 3 20
6. Unguwa Uku Model Pri. Sch.
- 1 13 14 3 - 4 7 21
7. Kundila Estate SPS - 3 20 23 2 - - 2 258. Daurawa SPS - - 18 18 25 6 3 34 529. Gyadi-Gyadi SPS - 2 39 41 5 4 4 13 5410. Dr. Rabi'u M.
Kwankwaso, Sci. Model Pri.
- 1 6 7 - - - - 7
11. Hausawa Model Pri. Sch.
- 5 14 19 3 1 - 4 23
12. Bashir Memorial II Nomdic Pri. Sch.
- 2 24 26 4 1 - 5 31
13. Unguwar Gano SPS - 3 23 26 - - 1 1 27
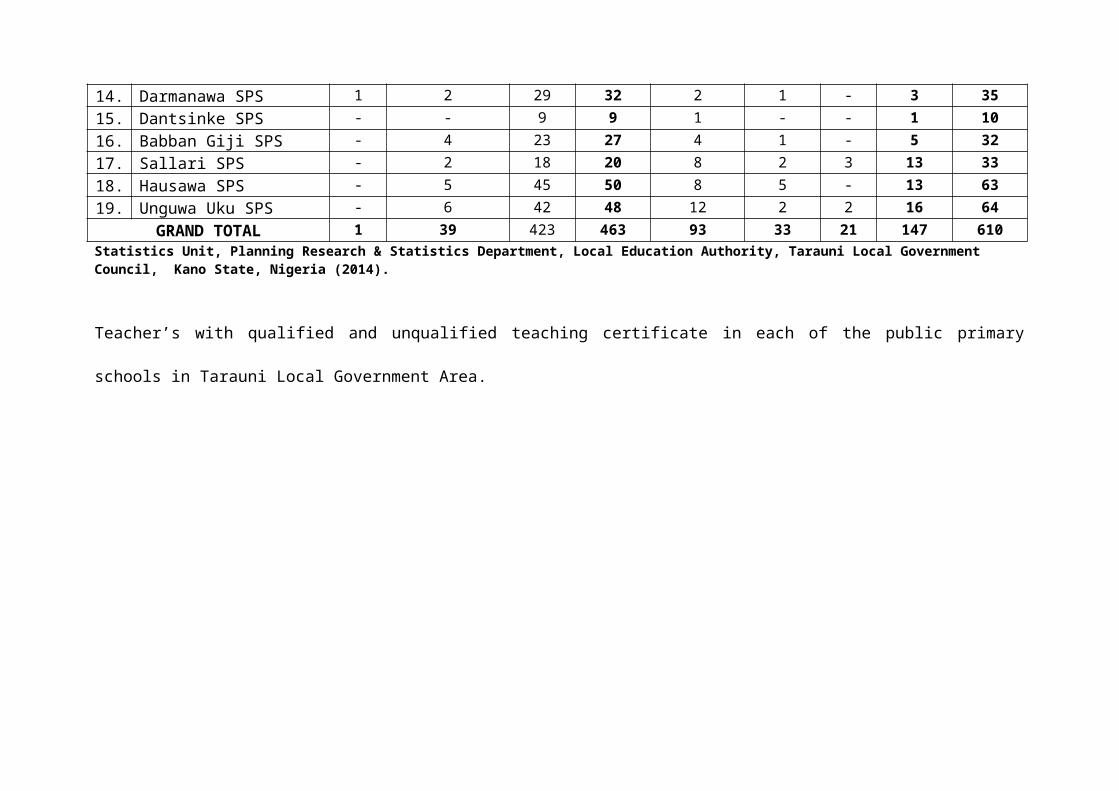
14. Darmanawa SPS 1 2 29 32 2 1 - 3 3515. Dantsinke SPS - - 9 9 1 - - 1 1016. Babban Giji SPS - 4 23 27 4 1 - 5 3217. Sallari SPS - 2 18 20 8 2 3 13 3318. Hausawa SPS - 5 45 50 8 5 - 13 6319. Unguwa Uku SPS - 6 42 48 12 2 2 16 64
GRAND TOTAL 1 39 423 463 93 33 21 147 610Statistics Unit, Planning Research & Statistics Department, Local Education Authority, Tarauni Local Government Council, Kano State, Nigeria (2014).
Teacher’s with qualified and unqualified teaching certificate in each of the public primary
schools in Tarauni Local Government Area.
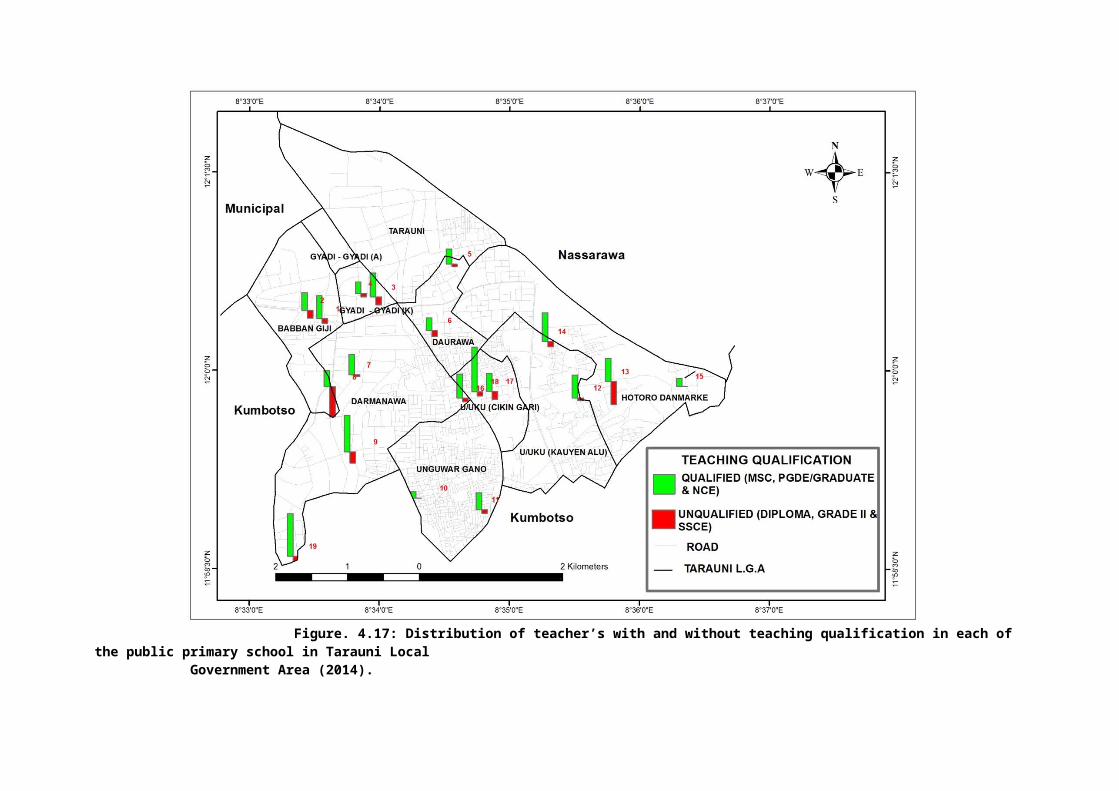
Figure. 4.17: Distribution of teacher’s with and without teaching qualification in each of the public primary school in Tarauni Local
Government Area (2014).
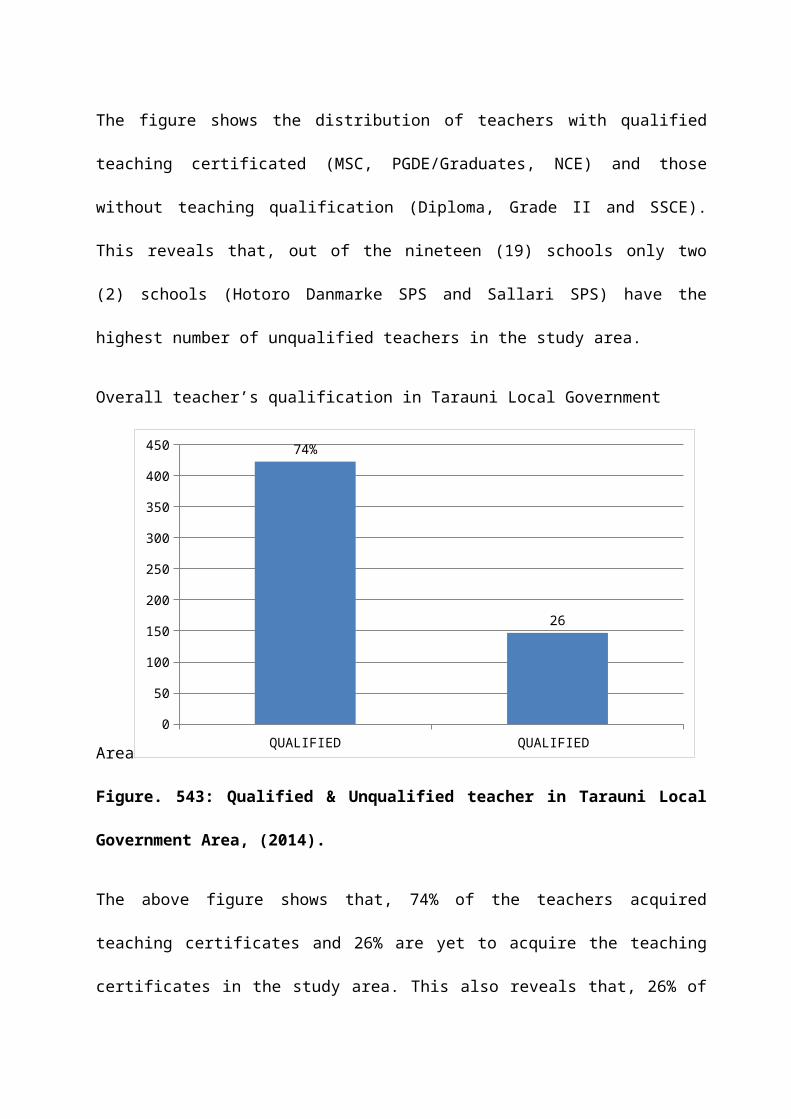
The figure shows the distribution of teachers with qualified
teaching certificated (MSC, PGDE/Graduates, NCE) and those
without teaching qualification (Diploma, Grade II and SSCE).
This reveals that, out of the nineteen (19) schools only two
(2) schools (Hotoro Danmarke SPS and Sallari SPS) have the
highest number of unqualified teachers in the study area.
Overall teacher’s qualification in Tarauni Local Government
Area QUALIFIED QUALIFIED 0
50
100
150
200
250
300
350
400
450 74%
26
Figure. 543: Qualified & Unqualified teacher in Tarauni Local
Government Area, (2014).
The above figure shows that, 74% of the teachers acquired
teaching certificates and 26% are yet to acquire the teaching
certificates in the study area. This also reveals that, 26% of
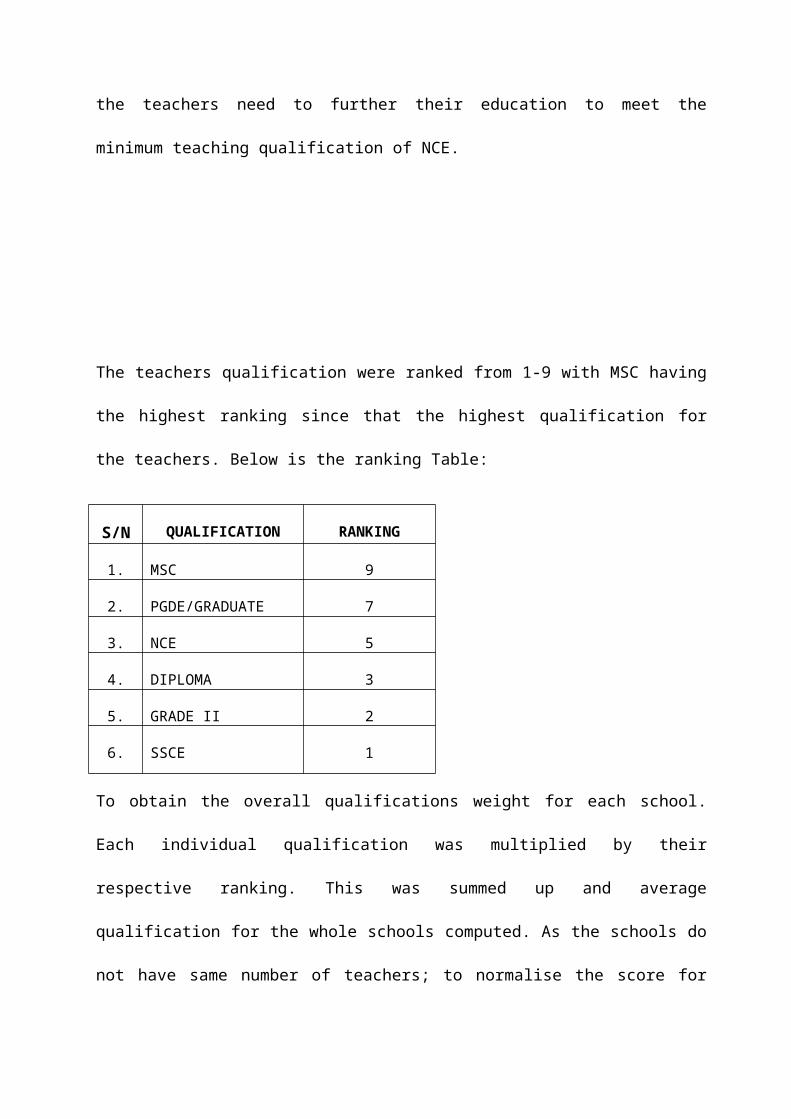
the teachers need to further their education to meet the
minimum teaching qualification of NCE.
The teachers qualification were ranked from 1-9 with MSC having
the highest ranking since that the highest qualification for
the teachers. Below is the ranking Table:
S/N QUALIFICATION RANKING
1. MSC 9
2. PGDE/GRADUATE 7
3. NCE 5
4. DIPLOMA 3
5. GRADE II 2
6. SSCE 1
To obtain the overall qualifications weight for each school.
Each individual qualification was multiplied by their
respective ranking. This was summed up and average
qualification for the whole schools computed. As the schools do
not have same number of teachers; to normalise the score for
individual school qualification weight, the individual average
qualification weight of schools was divided by sum of the
average of the schools. Geo-statistic analysis tool was
employed for the surface modelling. This gave a range of
qualification of teachers in the local government.
These normalized qualification weight or score was used as the
‘Z’ value and used for surface modelling of the study area.
CHAPTER FIVE
SUMMARY, CONCLUSION AND RECOMMENDATIONS
5.1 Summary
The study reveals that, there are nineteen (19) public primary
schools in the study area. The problem ranges from lack of
digital school map, inadequate classrooms and teachers.
The results from the study shows the disperse pattern of
distribution (3.25) exist and service radius (catchment area)
of 2km within the study area. All the public primary schools
did not meet with the UNESCO standard (1996) which put the
classroom capacity to one classroom/teacher to twenty five
pupils in a classroom (1:25), though the classrooms/teachers
are not enough (classroom/teacher - pupils ratio of 1:112).
There are still some cases of dilapidated classrooms suffering
from linkages from roofs when it rains, shortage of tables and
chairs.
The pupil’s enrolments (26621) are more than the available
teachers (610), and 26% of the teachers does not acquire

teaching certificates (MSC, PGDE/Graduate & NCE) as
investigation in this study.
The findings appeared to indicate that there is inadequate
number of classrooms and teachers in the public primary schools
which needs urgent attention by the government.
5.2 Conclusion
The research investigates the spatial distribution of public
primary schools in Tarauni Local Government Area, Kano State.
The study determined the spatial distribution of public primary
schools, compared the available primary education facilities
with the set standard of UNESCO (1996), UBE (2004) and Reviewed
Kano Metropolitan Plan (1980); and assessed the qualification
of teachers in public primary schools in Tarauni Local
Government Area.
The study clearly depicts the process of using Nearest
Neighbour and Buffer Zone Analysis in determining the
distribution pattern and catchment area of the public primary
schools. The coordinates of the public primary schools in
Tarauni Local Government were obtained using handheld GPS and
plotted using the ArcGis software. The map gave firsthand
information of their spatial distribution, and other relevant
information which would provide information that would help in
decision making and planning.
The problem ranges from inadequate classrooms and teachers. The
classrooms are overcrowded and teachers are overworked. This
implies that schools are yet to adhere to the teacher-pupils
ratio of UNESCO standard, 1996 (1:25) pupils in a class, and
majority (74%) of the public primary school teachers acquired
teaching certificates.
The research allows visualization of field survey results and
provides essential school information. The user-friendly GIS
mapping method demonstrated in this study is a practical and
feasible method for field government, educationist and
researches monitoring schools in a geographically academic
area.

5.3 Recommendations
Based on the analysis of result, research findings and
conclusion of this study, the following recommendations were
made.
1. Decongest the overcrowded classrooms to a smaller class
size.
2. Government should ensure that all schools are staffed
according to the UNESCO standard (1996) Minimum standards
for teacher-pupil ratio (1:25).
3. Government should construct modern classrooms equipped
with basic amenities so that there will be facilities for
the new nine years in the primary schools (9-3-5 system of
education).
4. Additional classrooms should be constructed within the
available schools premises except if there is no available
space.
5. Government should adopt the vertical approach (multi-
storey) building of classrooms in schools where there are
no space for future expansion.
6. Courses and other appropriate facilities should be so
designed as to enable teachers to improve their
qualifications.
7. Government should made emphasis on the provisions of
public primary schools base on population than service
radius within the metropolitan area.
8. Government should as well reduce the service radius to the
minimum of 1km within the metropolitan area.
12. That all the remaining local governments should
determine the location and distribution of their primary
schools using.
13. Government should use the finding as a guide together
with their policies in establishing schools.
14. Further research should be carried out to improve on
this work.
REFERENCE:
Adomeh, I.O.C, Arhedo, A. and Omoike, D. (2007). Comtemporaryissues in history of education in O.O. Aluede andD.Omoike (eds): trends in history of eduction in Nigeria(pp 221-139) Agbor: Krisbec Publications 121-139
Ahmed, M. N., M. U. Mohammed and Y. IDRIS (2013). A GIS-BasedAnalysis of Police Stations Distributions in KanoMetropolis. IOSR Journal of Computer Engineering (IOSR-JCE), Vol. 8,pp72-78.
Arhedo, Philip Azetta PhD, Adomeh, Ilu O.C. PhD and Aluede,Oyaziwo PhD (2009). School Councellors’ Roles in theImplementation of Universal Basic Education (UBE) Schemein Nigeria. Edo Journal of Counselling, Vol. 2.

Aliyu A., M. A. Shu’aibu and R. M. Aliyu (2013). Mapping andSpatial Distribution of Post Primary Schools in YolaNorth Local Government Area of Adamawa State, Nigeria.International Journal of Science and Technology, 2.
Better Future Foundation Amodu Nigeria (nd). Online document.Accessed on 12/07/2014.
Burrough, P. A. (1998). Principles of Geographic Information System,Oxford University Press, New York.
Caillods, F. (1983). School Mapping and micro‐planning in education,Module I: Training materials in educational planning, administration and facilities.IIEP/UNESCO 7 - 9, rue Eugene - Delacroix, 75116 Paris,France.
Chao Yang, Qi Liu (2012): Published Online (www.mecs-press.net).
Chukwu, Leonard C. (2011): Teacher/Pupils Ratio: AnIndispensable Variable in a Successful Universal BasicEducation (Ube) Scheme in the South East Zone of Nigeria.The Nigerian Journal of Research and Production. Vol.19, No. 1
Cybergeo (2011): An Evaluation of Road Network Patterns Basedon the Criteria for Fire-Fighting. European journal of geography.
Educational System Support in Nigeria – ESSPIN (2012). Kano Stateannual report (2011/12) on Primary education, accessed on29/04/2014.
Eray, Okan (2012). Application of Geographic Information System(GIS) in Education, Journal of Technical Science and Technologies.
Federal Ministry of Education - FMoE, Nigeria (2003): EducationSector Status report, Nigeria.
Federal Ministry of Education - FMoE, Nigeria (2006): StrategicPlan for Educational Enhancement and Development. Nigeria.
Federal Ministry of Education, - FMoE, Nigeria (2009). Roadmap for the Nigerian Education Sector.
Fischer, M. M. and P. Nijkamp (1993). Design and use of geographic information systems and spatial models, New York.
Globalisation of Education Policies (2000): Extent of ExternalInfluences on Contemporary Universal Primary EducationPolicies in Papua New Guinea - excerpts are from thecomplete text of Thomas Webster - book from the University ofPapua New Guinea Press.
Heinzle F., K.-H. Anders and M. Sester (2014). AutomaticDetection of Patterns in Road Networks - Methods andEvaluation. Institute of Cartography and Geoinformatics,University of Hannover, Appelstr. 9a, 30167 Hannover,Germany.
Hite, J. S. (2008). School Mapping and GIS in Educational Micro-Planning.International Institute for Education Planning. UnitedNations Educational, Scientific and Cultural Organization(UNESCO), Paris, France.
Ige, Olumide O.O. (2009). GIS for sustainable management of secondaryschools in Ife central local government, Osun state Nigeria. UnpublishedMSc project report, Regional Centre for Training inAerospace Survey (RECTAS) Library, Ile-Ife, Osun State,Nigeria.
Ikpasaja, Ernest (2014): Spatial Distribution and Accessibility to PublicPrimary School in Akwa-Ibom State: A case study of Uyo Local GovernmentArea. Unpublished MSc project report, Regional Centre forTraining in Aerospace Survey (RECTAS) Library, Ile-Ife,Osun State, Nigeria.
International Bureau of Education (IBE) – UNESCO, (2006): Lawsand other basic regulations concerning education.

Kibon Usman Ado and M. Ahmed (2013). Distribution of PrimaryHealth Care Facilities in Kano Metropolis Using GIS.Research Journal of Environmental and Earth Science.
Kukari, Arnold Dr. (nd), Policy Interventions for Fast Trackingthe Goal of Universal Basic Education. Senior ResearchFellow and Program Leader Universal Basic EducationResearch Program the National Institute. Online document.Accessed on 11/08/2014.
Labo-Popoola S.O., A. A. Bello and F. A. Atanda (2009).Universal Basic Education: Challenges and Way Forward.Medwell Journals, Scientific Research Publishing Company, 6, 252-259.
Olamiju Isaac Oluwadare and Olujimi Julius (2011). RegionalAnalysis of locations of Public Educational Facilities inNigeria: The Akure region experience. Journal of Geography andRegional Planning. Vol. 4(7), pp. 431.
Olubadewo O. O, I. A. Abdulkarim and M. Ahmed (2013). the Useof GIS as Educational Decision Support System (EDSS) ForPrimary Schools in Fagge Local Government Area of KanoState, Nigeria. Academic Research International, 4.
Omotere, Adunola (2010): The Challenges Affectingthe Implementation of Universal Basic Education in NigeriaChapter One. Published Online By: Ego Booster Books, OsunState, Nigeria.
Sani, Auwalu. Y. (2014). Personal interview. EducationalFacilities and Infrastructure in Public Primary Schoolsin Tarauni Local Government Area. At Tarauni LocalEducation Authority, Tarauni LGA Kano with Tijjani, A.M.,16 May 2014.
Sincekara, Suleyman and Karakuyu (2010). How are GeographicInformation Systems (GIS), Conferences at FaithUniversity contributing to education in Turkey, ScientificResearch and Essays, 5.
Sule J. O, H. S. Abdullahi and J. Bungwon (2012), Acquisitionof Geospatial Database for Primary Schools in KadunaMetropolis, Research Journal of Environmental and Earth Science.
Susan J. Peters (2004). Inclusive Education: An EFA Strategyfor All Children. World Bank. Online document.
Tijjani, Abdulaziz. M. (2005). Planning for Educational facilities in Kanowall city, Kano State, Nigeria. Unpublished Bachellor of Urban andRegional Planning (B. URP) project report, 1998/05. UPRDepartment Library, Ahmadu Bello University (ABU), Zaria.
UNESCO (2014). Gender Equality in Education. UNESCO Bnngkok.Online document. Accessed on 22/08/2014.
UNESCO and HUMAN RIGHTS (1996): Standard-Setting Instruments MajorMeeting Publications. Published by United Nations educational,Scientific and Cultural Organization, 7 place deFontenoy, Paris.
UNESCO - NIGERIA TVE PROJECT (2014): Instructional/teachingmaterials. Online document. Accessed on 19/07/2014.
Universal Basic Education - UBE (2014). The challenges affecting the implementation of Universal Basic Educationin Nigeria.
WORLD BANK (2014). Education is fundamental to development andgrowth. “The First 7”: Conference on Early Childhood Development Policies. World Bank.