Analysis of River Water and Air Pollution—Pljevlja as a “Hot ...
15
sustainability Article Analysis of River Water and Air Pollution—Pljevlja as a “Hot Spot” of Montenegro Miroslav Doderovi´ c 1 , Dragan Buri´ c 1, * , Ivan Mijanovi´ c 1 and Marijan Premovi´ c 2 Citation: Doderovi´ c, M.; Buri´ c, D.; Mijanovi´ c, I.; Premovi´ c, M. Analysis of River Water and Air Pollution—Pljevlja as a “Hot Spot” of Montenegro. Sustainability 2021, 13, 5229. https://doi.org/10.3390/ su13095229 Academic Editors: Elena Cristina Rada and Marc A. Rosen Received: 15 March 2021 Accepted: 1 May 2021 Published: 7 May 2021 Publisher’s Note: MDPI stays neutral with regard to jurisdictional claims in published maps and institutional affil- iations. Copyright: © 2021 by the authors. Licensee MDPI, Basel, Switzerland. This article is an open access article distributed under the terms and conditions of the Creative Commons Attribution (CC BY) license (https:// creativecommons.org/licenses/by/ 4.0/). 1 Department of Geografphy, Faculty of Philosophy, University of Montenegro, 81400 Nikši´ c, Montenegro; [email protected] (M.D.); [email protected] (I.M.) 2 Department of History, Faculty of Philosophy, University of Montenegro, 81400 Nikši´ c, Montenegro; [email protected] * Correspondence: [email protected] Abstract: The aim of the study was to gather information necessary for the examination of the river ´ Cehotina water quality as well as the air pollution in the urban area of Pljevlja (far north of Montenegro), from 2011 until 2018. The water quality of the ´ Cehotina River was observed by the Water Quality Index (WQI) method, based on ten physicochemical and microbiological parameters from five hydrological stations. In order to examine the air quality, we used data on the concentration of the PM 10 particles from the station located in the center of Pljevlja. The obtained results of river water quality indicate that the situation was disturbing (bad quality dominates). The results of the air quality analysis indicate that the situation has been alarming and Pljevlja itself as a “hot spot” of Montenegro. Annual, seasonal and daily mean concentrations of PM 10 particles were above the prescribed limit values, except during summer. Sources of pollution were mostly known, and in order to protect public health, it is necessary to take appropriate measures as soon as possible, primarily the introduction of modern exhaust gas treatment technology TPP “Pljevlja” and construction of a heating plant that would replace numerous individual (home) fireplaces in Pljevlja. Keywords: air and river water quality; PM 10 ; WQI; pljevlja; montenegro 1. Introduction Rapid population growth (e.g., in Asia, Africa and Latin America), accelerated eco- nomic development (e.g., Brazil, China, Russia, India, Turkey, Indonesia, Mexico, etc.) and socio-economic changes are the main drivers of increasing water demand, but also factors that pose a primary threat to water safety. Water-related problems, especially surface water quality, are ranked second as a serious threat to human society—energy issues are high [1]. Right now or in the near future, the water demand is higher than the supply in many countries [2]. Most studies dealing with this issue provide an analysis of river water quality, as one of the most important indicators for assessing the sustainability of a particular basin [3,4]. In addition to urban and industrial sources, surface and groundwater pollution also occurs due to various agricultural activities [5]. Various techniques were used to monitor and assess the quality of surface and ground- water, and the Water Quality Index (WQI) method was widely used [6,7]. There are different variants of this index, but most WQI methods treat all three groups of indicators— physical, chemical and biological parameters of water quality [8–11]. CWQI (Canadian Water Quality Index) or CCME WQI (Canadian Council of Ministers of the Environment Water Quality Index), OWQI (Oregon Water Quality Index), NSFWQI (US National San- itation Foundation Water Quality Index) and others are often used [12–15]. The water quality of the Motru River in Romania was observed using WQI, while the ecological status of natural waters in the Alps region was determined by analyzing phytoplankton as indicator—Brettum Index (BI) in Austria and Slovenia, Phytoplankton Saprobic Index (PSI) in Germany and Phytoplankton Trophic Index (PTI). In Italy [16] WQI methods are very Sustainability 2021, 13, 5229. https://doi.org/10.3390/su13095229 https://www.mdpi.com/journal/sustainability
-
Upload
khangminh22 -
Category
Documents
-
view
2 -
download
0
Transcript of Analysis of River Water and Air Pollution—Pljevlja as a “Hot ...
sustainability
Article
Analysis of River Water and Air PollutionmdashPljevlja as aldquoHot Spotrdquo of Montenegro
Miroslav Doderovic 1 Dragan Buric 1 Ivan Mijanovic 1 and Marijan Premovic 2
Citation Doderovic M Buric D
Mijanovic I Premovic M Analysis
of River Water and Air
PollutionmdashPljevlja as a ldquoHot Spotrdquo of
Montenegro Sustainability 2021 13
5229 httpsdoiorg103390
su13095229
Academic Editors Elena
Cristina Rada and Marc A Rosen
Received 15 March 2021
Accepted 1 May 2021
Published 7 May 2021
Publisherrsquos Note MDPI stays neutral
with regard to jurisdictional claims in
published maps and institutional affil-
iations
Copyright copy 2021 by the authors
Licensee MDPI Basel Switzerland
This article is an open access article
distributed under the terms and
conditions of the Creative Commons
Attribution (CC BY) license (https
creativecommonsorglicensesby
40)
1 Department of Geografphy Faculty of Philosophy University of Montenegro 81400 Nikšic Montenegrododemirt-comme (MD) urngissgmailcom (IM)
2 Department of History Faculty of Philosophy University of Montenegro 81400 Nikšic Montenegropremovicmarijanyahoocom
Correspondence draganburicmeteocome
Abstract The aim of the study was to gather information necessary for the examination of theriver Cehotina water quality as well as the air pollution in the urban area of Pljevlja (far north ofMontenegro) from 2011 until 2018 The water quality of the Cehotina River was observed by theWater Quality Index (WQI) method based on ten physicochemical and microbiological parametersfrom five hydrological stations In order to examine the air quality we used data on the concentrationof the PM10 particles from the station located in the center of Pljevlja The obtained results of riverwater quality indicate that the situation was disturbing (bad quality dominates) The results of theair quality analysis indicate that the situation has been alarming and Pljevlja itself as a ldquohot spotrdquoof Montenegro Annual seasonal and daily mean concentrations of PM10 particles were above theprescribed limit values except during summer Sources of pollution were mostly known and in orderto protect public health it is necessary to take appropriate measures as soon as possible primarilythe introduction of modern exhaust gas treatment technology TPP ldquoPljevljardquo and construction of aheating plant that would replace numerous individual (home) fireplaces in Pljevlja
Keywords air and river water quality PM10 WQI pljevlja montenegro
1 Introduction
Rapid population growth (eg in Asia Africa and Latin America) accelerated eco-nomic development (eg Brazil China Russia India Turkey Indonesia Mexico etc) andsocio-economic changes are the main drivers of increasing water demand but also factorsthat pose a primary threat to water safety Water-related problems especially surface waterquality are ranked second as a serious threat to human societymdashenergy issues are high [1]Right now or in the near future the water demand is higher than the supply in manycountries [2] Most studies dealing with this issue provide an analysis of river water qualityas one of the most important indicators for assessing the sustainability of a particularbasin [34] In addition to urban and industrial sources surface and groundwater pollutionalso occurs due to various agricultural activities [5]
Various techniques were used to monitor and assess the quality of surface and ground-water and the Water Quality Index (WQI) method was widely used [67] There aredifferent variants of this index but most WQI methods treat all three groups of indicatorsmdashphysical chemical and biological parameters of water quality [8ndash11] CWQI (CanadianWater Quality Index) or CCME WQI (Canadian Council of Ministers of the EnvironmentWater Quality Index) OWQI (Oregon Water Quality Index) NSFWQI (US National San-itation Foundation Water Quality Index) and others are often used [12ndash15] The waterquality of the Motru River in Romania was observed using WQI while the ecologicalstatus of natural waters in the Alps region was determined by analyzing phytoplankton asindicatormdashBrettum Index (BI) in Austria and Slovenia Phytoplankton Saprobic Index (PSI)in Germany and Phytoplankton Trophic Index (PTI) In Italy [16] WQI methods are very
Sustainability 2021 13 5229 httpsdoiorg103390su13095229 httpswwwmdpicomjournalsustainability
Sustainability 2021 13 5229 2 of 15
useful in the management of water resources and surface water catchments [17] so they arealso used in the region to which Montenegro belongs (Southeast Europe and the Balkans)Danube water quality assessment in Serbia [18ndash21] as well as its tributariesmdashthe riversTimok [22] and Tisa [23] was mostly done using the Serbian Water Quality Index (SWQI)
The WQI method was almost not considered in the assessment of surface and ground-water quality in Montenegro but other techniques were also used Though researchshowed that most surface waters in Montenegro were of good quality [24] For exampleDjuraškovic [25] pointed out that from 2005 to 2009 the water quality of Skadar Lakebelonged to class ldquoArdquo mostly Vukašinovic-Pešic et al [26] found an increase in surfacewater quality in Montenegro since 2012 but pointed out that there are significant differencesin the values of the considered chemical parameters between the rivers in the north (BlackSea basin) and in the south (Adriatic basin) Analysis of data from 2009 to 2018 indicatesthat the overall microbiological water quality in Montenegrin rivers is quite good [27]
Air pollution is now considered to be the worldrsquos largest environmental problemespecially in urban areas and industrial regions Back in 1958 the World Health Organiza-tion (WHO) recognized that air pollution is a significant risk factor for human health [28]Among the pollutants that have a very harmful effect on human health which can beboth short-term and long-term [2930] atmospheric aerosol particles or particulate mat-ter (PM) are noticeable They are classified as air pollutants that are directly emitted(primary particles) or formed in the atmosphere from precursor gases through reactions(secondary particles)
According to WHO data [31] 42 million premature deaths were registered world-wide in 2016 due to exposure to increased concentrations of PM25 particles The urbanpopulation is particularly endangered by PM particles because there are numerous sourcesin cities (traffic industry heating plants individual furnaces etc) that increase the concen-tration of these particles in the air [3233] In neighboring Serbia from 2011 to 2016 therewas a growing trend in the number of inhabitants exposed to higher concentrations ofPM25 particles because of urbanization [34] The particles were of natural (aquatic andbiological vaporizer volcanic ash dust etc) or anthropogenic origin (combustion of fossilfuels of domestic heating engine production) [35ndash37] The suspended PM10 tanks werea mixture of smoke fumes exhaust gases dust acids metals etc These particles have avery negative impact on the human body because they are inhaled and deposited in therespiratory system and some are carcinogenic or lethal especially as a consequence oflong-term exposure [38ndash41]
The subject of research (the Pljevlja municipality and the surroundings of the ruralsettlement) was industrially morphologically and climatically unique compared to the restof Montenegro In the morphological sense the city is located at the bottom of the valleywhere the river Cehotina flows The valley is surrounded by the sides of high mountainsand due to this closure in the colder part of the year temperature inversions are frequentie the formation of the so-called ldquocold air lakesrdquo Furthermore Pljevlja is the city with thehighest frequency of wind silence and the lowest amount of precipitation in MontenegroIn Pljevlja at the end of 1982 the thermal power plant (TPP) ldquoPljevljardquo started operatingThe plant still works today and is the only one in Montenegro TPP ldquoPljevljardquo is suppliedwith coal (lignite) from nearby mines and uses water from the Cehotina river system tocool turbines and other needs It returns the used water back to the system of the river In2018 TPP ldquoPljevljardquo produced 14438 GWh of energy [42] It is important to highlight thata numerous individual households use coal for house heating
Taking into consideration the mentioned characteristics (terrain configuration climaticcharacteristics and large coal combustion for the needs of TPPs and for heating housesmdashindividual fireboxes) Pljevlja is often under fog of smog and smoke in the colder part of theyear Therefore this paper aimed to obtain a more complete picture of the envirnomentalsituation in the area of Pljevlja through the assessment of river water and air quality Itis certain that the results obtained in this paper will have practical significance and thatthey can help decision makers above all to understand the seriousness of the situation
Sustainability 2021 13 5229 3 of 15
and need for fast response It would be desirable for this research to encourage expertsfrom other fields to consider the problem of pollution in the area of Pljevlja primarilymedical scientists who would indicate the degree of danger of the current situation tohuman health In general through a multidisciplinary approach it is necessary to startsolving the problem of water and air pollution in Pljevlja as soon as possible in order toprotect the health of the population
2 Research Area Materials and Methods21 Research Area
The study included an assessment of river water and air quality in Pljevlja the largestcity in the far north of Montenegro According to the last census from 2011 [43] themunicipality of Pljevlja (a city with surrounding rural settlements) had 31060 inhabitantsor 5 of the total population in Montenegro (625266 inhabitants)
The basin of the river Cehotina which flows through Pljevlja is located on the borderof Montenegro Serbia and Bosnia and Herzegovina (Figure 1) The area of the Cehotinariver basin is 1296 km2 and mostly belongs to Montenegro Cehotina is a right tributary ofthe river Drina and the Drina is a tributary of the Sava (the river Sava is a tributary of theDanube) which means that the river Cehotina belongs to the Black Sea basin The riverCehotina starts from a spring called Glava Cehotina (945 m above sea level) located on thenorthern slope of the mountain Stožer [44]
Sustainability 2021 13 x FOR PEER REVIEW 3 of 14
part of the year Therefore this paper aimed to obtain a more complete picture of the en-virnomental situation in the area of Pljevlja through the assessment of river water and air quality It is certain that the results obtained in this paper will have practical significance and that they can help decision makers above all to understand the seriousness of the situation and need for fast response It would be desirable for this research to encourage experts from other fields to consider the problem of pollution in the area of Pljevlja pri-marily medical scientists who would indicate the degree of danger of the current situation to human health In general through a multidisciplinary approach it is necessary to start solving the problem of water and air pollution in Pljevlja as soon as possible in order to protect the health of the population
2 Research Area Materials and Methods 21 Research Area
The study included an assessment of river water and air quality in Pljevlja the largest city in the far north of Montenegro According to the last census from 2011 [43] the mu-nicipality of Pljevlja (a city with surrounding rural settlements) had 31060 inhabitants or 5 of the total population in Montenegro (625266 inhabitants)
The basin of the river Ćehotina which flows through Pljevlja is located on the border of Montenegro Serbia and Bosnia and Herzegovina (Figure 1) The area of the Ćehotina river basin is 1296 km2 and mostly belongs to Montenegro Ćehotina is a right tributary of the river Drina and the Drina is a tributary of the Sava (the river Sava is a tributary of the Danube) which means that the river Ćehotina belongs to the Black Sea basin The river Ćehotina starts from a spring called Glava Ćehotina (945 m above sea level) located on the northern slope of the mountain Stožer [44]
Figure 1 Position of Montenegro (MNE) on the Balkan Peninsula and the studied area in MNE
According to the data of the State Institute of Hydrometeorology and Seismology of Montenegro (IHMSM) [45] the length of the river Ćehotina is 1285 km and on its course it receives a large number of streams and rivers On the profile of the hydrological station (HS) Gradac which is located in the central part of the flow the average annual flow of
Figure 1 Position of Montenegro (MNE) on the Balkan Peninsula and the studied area in MNE
According to the data of the State Institute of Hydrometeorology and Seismology ofMontenegro (IHMSM) [45] the length of the river Cehotina is 1285 km and on its course itreceives a large number of streams and rivers On the profile of the hydrological station (HS)Gradac which is located in the central part of the flow the average annual flow of Cehotinais 134 m3s while the extreme values range from 21 m3s (min) to 414 m3s (max)
According to the data of the main meteorological station in Pljevlja which is locatedat 788 m above sea level the average annual rainfall is 802 mm and the average annualtemperature is 85 C (mean years 1951ndash2020) Monthly precipitation amounts range from49 mm (March) to 86 mm (June) Otherwise Buric et al [46] point out that Pljevlja is the
Sustainability 2021 13 5229 4 of 15
city with the lowest annual rainfall in Montenegro Snow and the formation of snow coverare common in winter The average annual number of days with precipitation is 142 daysand the average annual number of days with snow cover is about 65 days Pljevlja ischaracterized by other meteorological features such as the highest frequency of silencein Montenegro (windless days) which is about 15 per year Let us add that the mostcommon winds are up to 1 ms (425 per year) Winds of over 5 ms are very rare (onaverage about 34 per year) The two mentioned facts (relatively small annual rainfalland high frequency of quiet and low wind days) along with the terrain configuration (thecity is located at the bottom of the valley closed by the sides of the mountains from 1500 to2238 m above sea level) have a great diminishing effect on natural air purification
22 Materials and Methods
For the purposes of this paper we used data from the annual reports on river waterquality (IHMSM) [45] and monthly reports on air quality of the Center for Eco-toxicologicalResearch of Montenegro (CETRM) [47] The analysis included a total of 5 hydrologicalstations (HS) where water samples were taken and 1 air quality station located in the centerof Pljevlja (see Figure 1) Data from HS in the Cehotina basin in Montenegro were usedwith two rivers Cehotina (4 stations) and Vezišnica (1 station) The Vezišnica River is a lefttributary of the Cehotina and is 15 km long The mouth of the Vezišnica in Cehotin is on theoutskirts of the town of Pljevlja and along the right bank of the lower course of the riverVezišnica is the TPP ldquoPljevljardquo The assessment of river water and air quality was done forthe period 2011ndash2018 A total of 10 parameters of physico-chemical and microbiologicalwater quality were considered from the 5 mentioned profiles (HS) oxygen saturation ()biochemical oxygen consumption for 5 days (BOD5 in mgL) ammonium ion (mgL) pHvalue total nitrogen oxides (mgL) orthophosphates (mgL) suspended solids (mgL)temperature (C) electrical conductivity (microScm) and coliform bacteria (MPN in 100 mL)
River water quality assessment was done using WQI methods In short all 10 men-tioned parameters were combined into one surface water quality indicator But the share ofeach of them in the total water quality did not have the same relative importance There-fore each of the 10 parameters got its weight or rank of implication (wi) and number orregistered value (qi) according to its share in endangering water quality Finally summingthe product (WQI = qi times wi) gave an index of 100 as the ideal sum of the quality shares ofall parameters [162348]
WQI = 110 (Σqi times wi) (1)
For the parameters used to calculate WQI data for their annual mean values wereavailable When it comes to PM10 particles which are 10 microns or less in diameter ormicrometers (le10 microm) for the purposes of this paper we had average daily concentrations(microgm3 (microgramcubic meter)) so except for the annual analysis performed both on aseasonal and daily basis In Pljevlja the concentration of PM10 suspended particles wasmeasured in the city center (Centar Station see Figure 1) and based on 24-h measurementsthe daily mean value was obtained As far as it is known no categorization (separationof classes) has been given for the concentration of PM10 particles but a limit value hasbeen adopted
The number and type of parameters for calculating WQI as well as their weightingcoefficients can be modified (adjusted) according to local or regional conditions [4950]hence there were differences in class intervals Consequently the classification of surfacewater quality according to WQI values (Figure 2) was applied which was officially inuse in Montenegro by the State Agency for Nature and Environmental Protection ofMontenegro (ANEPM)
Sustainability 2021 13 5229 5 of 15
Sustainability 2021 13 x FOR PEER REVIEW 5 of 14
hence there were differences in class intervals Consequently the classification of surface water quality according to WQI values (Figure 2) was applied which was officially in use in Montenegro by the State Agency for Nature and Environmental Protection of Monte-negro (ANEPM)
Figure 2 Classification of surface water quality by the water quality index method
It should also be mentioned that there were no missing data for WQI while a total of 75 of daily mean values for the entire observed period (2011ndash2018) were missing for PM10 but they were not included in the analysis Of the 75 of missing data for PM10 most of them referred to June and July (3 in total) ie October (14) while in other months the percentage of missing data was negligible For the purpose of more detailed analysis we calculated both parameters (WQI and PM10) the trend and correlation with precipitation and temperature The linear trend was calculated by the method of smallest amount of squares and its significance was examined using the Studentrsquos test (t-test) To examine the relationship with temperature and precipitation the Pearson correlation co-efficient was calculated and the significance of the test using the t-test
3 Results 31 Water Quality Index Analysis (WQI)
The analysis of the river Ćehotina was conducted at the measuring stations Rabitlja Below Pljevlja Below firth of Vezišnica and Gradac while on its left tributary Vezišnica the analysis was conducted at Firth Vezišnica HS located at the mouth of Ćehotina At the measuring station Rabitlja which is located upstream from Pljevlja outside the urban zone and the impact of TPP lsquolsquoPljevljarsquorsquo water quality in the entire observed period ranged from very good WQI = 86ndash89 (2012 2016 and 2017) to excellent WQI = 90ndash92 (2011 2013ndash2015 and 2018) Downstream from HS Rabitlja the river Ćehotina flows through the city area of Pljevlja and collects water from its tributaries Vezišnica so the water quality is deteriorating Thus at HS Below Pljevlja the water quality in the entire observed period had values ranging from 46 to 68 WQI (bad quality) At the mouth of the Vezišnica in Ćehotina (HS Firth Vezišnica) the average annual WQI values changed almost alternately from bad to good quality class bad quality classes belong to 2013 2015 and 2017 (WQI = 64ndash71) and good 2011 2012 2014 2016 and 2018 (WQI = 73ndash79) On the next HS below firth of Vezišnica which is located on the river Ćehotina downstream from the mouth of Vezišnica almost in the whole observed period the water was of bad quality (WQI = 44ndash68) and only 2018 belonged to the class of good (WQI = 74)
Figure 2 Classification of surface water quality by the water quality index method
It should also be mentioned that there were no missing data for WQI while a totalof 75 of daily mean values for the entire observed period (2011ndash2018) were missing forPM10 but they were not included in the analysis Of the 75 of missing data for PM10most of them referred to June and July (3 in total) ie October (14) while in othermonths the percentage of missing data was negligible For the purpose of more detailedanalysis we calculated both parameters (WQI and PM10) the trend and correlation withprecipitation and temperature The linear trend was calculated by the method of smallestamount of squares and its significance was examined using the Studentrsquos test (t-test)To examine the relationship with temperature and precipitation the Pearson correlationcoefficient was calculated and the significance of the test using the t-test
3 Results31 Water Quality Index Analysis (WQI)
The analysis of the river Cehotina was conducted at the measuring stations RabitljaBelow Pljevlja Below firth of Vezišnica and Gradac while on its left tributary Vezišnicathe analysis was conducted at Firth Vezišnica HS located at the mouth of Cehotina At themeasuring station Rabitlja which is located upstream from Pljevlja outside the urban zoneand the impact of TPP ldquoPljevljardquo water quality in the entire observed period ranged fromvery good WQI = 86ndash89 (2012 2016 and 2017) to excellent WQI = 90ndash92 (2011 2013ndash2015and 2018) Downstream from HS Rabitlja the river Cehotina flows through the city area ofPljevlja and collects water from its tributaries Vezišnica so the water quality is deterioratingThus at HS Below Pljevlja the water quality in the entire observed period had valuesranging from 46 to 68 WQI (bad quality) At the mouth of the Vezišnica in Cehotina (HSFirth Vezišnica) the average annual WQI values changed almost alternately from badto good quality class bad quality classes belong to 2013 2015 and 2017 (WQI = 64ndash71)and good 2011 2012 2014 2016 and 2018 (WQI = 73ndash79) On the next HS below firth ofVezišnica which is located on the river Cehotina downstream from the mouth of Vezišnicaalmost in the whole observed period the water was of bad quality (WQI = 44ndash68) and only2018 belonged to the class of good (WQI = 74)
The previously mentioned 4 HS (Rabitlja below Pljevlja firth Vezišnica and belowfirth of Vezišnica) are located in the urban zone of Pljevlja or in the immediate vicinity ofthe city ie they are located in the sector of the river Cehotina for a length of about 8 kmDownstream there was only one other measuring point in operation and that was on theprofile of Gradac HS which is about 15 km away in relation to the previously analyzed(below firth of Vezišnica) During the observed period (2011ndash2018) HS Gradac recorded
Sustainability 2021 13 5229 6 of 15
variations in water quality For 2011 good river water quality was obtained and for 2012bad (Table 1) In the period 2013ndash2015 water quality again belonged to the class of good(WQI = 73ndash82) and then in 2016 and 2017 it deteriorated and was classified in the class ofbad (WQI = 53ndash71) At the end of the observed period in 2018 there was a re-improvementof water quality at HS Gradac because the water of the river Cehotina was assessed asgood quality (WQI = 72)
Table 1 Mean annual values of WQI trend of WQI of the river Cehotina and its tributary Vezišnica correlation of WQIwith precipitation (P) and temperature (T) for the period 2011ndash2018
River HydrologicalStation
Mean Annual Values of WQI Trend(WQIyear)
Correlation
2011 2012 2013 2014 2015 2016 2017 2018 WQI-P WQI-T
Cehotina Rabitlja 90 68 90 90 92 89 86 94 014 010 036Cehotina Below Pljevlja 59 74 60 68 56 66 46 68 017 060 025
CehotinaBelow firth of
Vezišnica 64 72 59 65 59 68 44 74 019 049 019
Cehotina Gradac 75 78 73 75 82 71 53 72 minus113 001 minus026Vezišnica Firth Vezišnica 77 77 64 73 71 79 67 78 000 017 minus012
The obtained results indicated that the state of water quality of the river Cehotinaand its tributaries Vezišnica was alarming especially in the part of the flow through theurban zone of Pljevlja and downstream from the mouth of Vezišnica In almost all observedprofiles there were year-on-year variations in water quality which were most likely relatedto increaseddecreased amount of wastewater from settlements agricultural sources (eglivestock and poultry mini farms) and illegal disposal of garbage and other waste bothalong the stream and in the forest and in the river itself Year-on-year variations in WQI alsooccurred in part due to changes in hydrological conditions In years with an unfavorablehydrological situation (less rainfall and lower runoff than average) river water was ofpoorer quality (2011 and 2015) in general On the other hand the state of water quality in2018 was slightly better which can be related to higher water levels ie more favorablemeteorological conditions (higher precipitation and higher temperature compared to theaverage) It should also be mentioned that in recent years certain measures have beentaken to prevent pollution (eg the penal policy of illegal waste disposal) and this may beone of the reasons for improving the quality of river water for 2018 Of all the observedHS the worst quality is the water of the river Cehotina on the profile of below Pljevljaand this is the result of an increased amount of municipal wastewater (mostly untreated)from the urban area of Pljevlja Wastewater from TPP ldquoPljevljardquo low water levels andhuman activities along the stream are the primary causes of water pollution in Vezišnica(a tributary of Cehotina)
With the aim of analyzing WQI in more detail the trend was calculated and its signifi-cance for the period 2011ndash2018 was examined Calculations of the correlation coefficientbetween WQI and precipitation ie temperature (see Table 1) were also performed Nev-ertheless the value of the WQI trend is minor and has shown no significant bias in thedata used The lack of significance of the trend is likely related to the short record lengths(only 8 years 2011ndash2018) The absolute values of the correlation coefficients ranged from001 to 060 We are also sure that the reason for the weak correlation (lack of significance)between WQI and precipitation (temperature) is because the coefficient was calculated forannual values thus canceling the relationship between these two climate elements andWQI There is no doubt that this connection would be noticed on a monthly basis (probablyalso seasonally) but unfortunately we only had the annual WQI values
Observing the average annual WQI values for the whole observed period (calculatedas the arithmetic mean of annual WQI from 2011 to 2018) the calculation results showedthat the water quality of the river Cehotina was excellent (WQI = 90) and good (WQI = 73)at one HS and bad at 3 HS (Figure 3) Downstream from the city of Pljevlja and themouth of the river Vezišnica the water quality of the river Cehotina was deterioratingand this was a consequence of the discharge of municipal city water and wastewater from
Sustainability 2021 13 5229 7 of 15
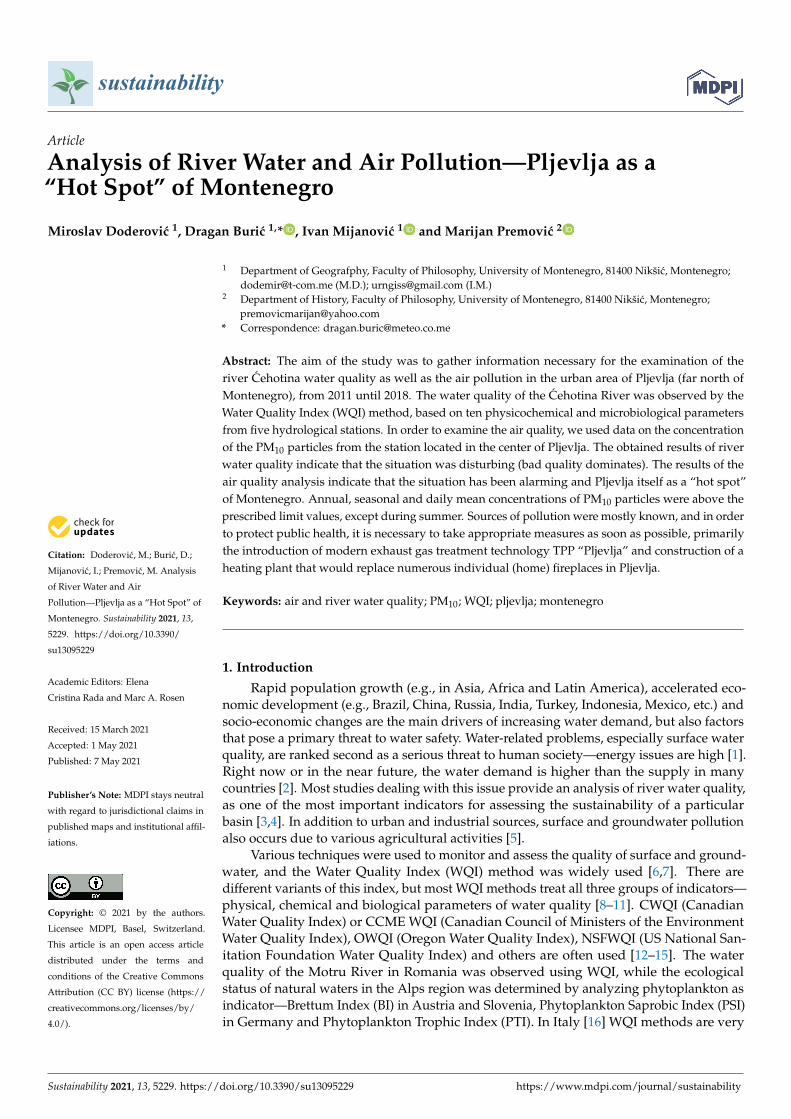
TPP ldquoPljevljardquo We should mention other factors that had a negative impact on the waterquality of the river Cehotina anthropogenic impact along its course (large amount ofvarious wastes in its bed and along the banks agricultural activities wastewater from minifarmsmdashlivestock and poultry etc) and low water level (especially tributaries of Vezišnica)
Sustainability 2021 13 x FOR PEER REVIEW 7 of 14
Observing the average annual WQI values for the whole observed period (calculated as the arithmetic mean of annual WQI from 2011 to 2018) the calculation results showed that the water quality of the river Ćehotina was excellent (WQI = 90) and good (WQI = 73) at one HS and bad at 3 HS (Figure 3) Downstream from the city of Pljevlja and the mouth of the river Vezišnica the water quality of the river Ćehotina was deteriorating and this was a consequence of the discharge of municipal city water and wastewater from TPP lsquolsquoPljevljarsquorsquo We should mention other factors that had a negative impact on the water qual-ity of the river Ćehotina anthropogenic impact along its course (large amount of various wastes in its bed and along the banks agricultural activities wastewater from mini farmsmdashlivestock and poultry etc) and low water level (especially tributaries of Vezišnica)
Figure 3 Average annual WQI values at measuring stations for the period 2011ndash2018
Comparing the data for the 10 mentioned physicochemical and microbiological pa-rameters used to obtain WQI it is noticeable that their values at HS are located in the part of the flow through the city area of Pljevlja and at the mouth of Vezišnica which is in line with the above Thus at HS Below Pljevlja and HS Firth Vezišnica there were higher con-centrations eg BOD5 and ammonium ions relative to the other 3 HS in general In addi-tion increased concentrations of BOD5 and ammonium ions were observed on almost all profiles for the years with the lowest WQI This was also logical because the value of BOD5 was an indicator of the biological activity of wastewater ie the degree of pollution with organic substances Ammonium ion concentrations are an indicator of pollution from agricultural sources and industrial facilities [51]
During hydrologically unfavorable years such as 2011 and 2015 the highest average annual concentrations of BOD5 and ammonium ions (up to 72 mgL and up to 133 mgL respectively) were registered at HS Below Pljevlja and HS Firth Vezišnica (see Table A1 in Appendix A) Therefore the quality of the river water quality of Ćehotina was worrying especially in the part of the flow that flows through the urban zone of Pljevlja and down-stream from the mouth of Vezišnica In the south of Montenegro the Morača river basin the situation was much better except in the part of the flow through the capital Podgorica [24]
There are two important benefits of using the WQI method Firstly several variables are included in one number and it gives the possibility to compare water quality of one water body in time and secondly we can compare several water objects in space The main disadvantages of this methodology are that it does not take into account data on some important parameters such as inorganic pollution (eg heavy metals) and that WQI can be calculated even if not all of the mentioned parameters are available [52] One of the parameters which indicates increased pollution of watercourses is the disturbed natural
Figure 3 Average annual WQI values at measuring stations for the period 2011ndash2018
Comparing the data for the 10 mentioned physicochemical and microbiological pa-rameters used to obtain WQI it is noticeable that their values at HS are located in the partof the flow through the city area of Pljevlja and at the mouth of Vezišnica which is inline with the above Thus at HS Below Pljevlja and HS Firth Vezišnica there were higherconcentrations eg BOD5 and ammonium ions relative to the other 3 HS in general Inaddition increased concentrations of BOD5 and ammonium ions were observed on almostall profiles for the years with the lowest WQI This was also logical because the value ofBOD5 was an indicator of the biological activity of wastewater ie the degree of pollutionwith organic substances Ammonium ion concentrations are an indicator of pollution fromagricultural sources and industrial facilities [51]
During hydrologically unfavorable years such as 2011 and 2015 the highest averageannual concentrations of BOD5 and ammonium ions (up to 72 mgL and up to 133 mgLrespectively) were registered at HS Below Pljevlja and HS Firth Vezišnica (see Table A1in Appendix A) Therefore the quality of the river water quality of Cehotina was worry-ing especially in the part of the flow that flows through the urban zone of Pljevlja anddownstream from the mouth of Vezišnica In the south of Montenegro the Moraca riverbasin the situation was much better except in the part of the flow through the capitalPodgorica [24]
There are two important benefits of using the WQI method Firstly several variablesare included in one number and it gives the possibility to compare water quality of onewater body in time and secondly we can compare several water objects in space The maindisadvantages of this methodology are that it does not take into account data on someimportant parameters such as inorganic pollution (eg heavy metals) and that WQI canbe calculated even if not all of the mentioned parameters are available [52] One of theparameters which indicates increased pollution of watercourses is the disturbed naturalCaMg ion ratio which is not taken into account when calculating WQI Therefore infuture research the WQI method should be used in combination with other methods toassess water quality
32 Analysis of PM10 Concentration of Suspended Particles
In the observed period (2011ndash2018) the lowest annual mean value of PM10 particleswas in 2014 (777 microgm3) and the highest in 2015 (1015 microgm3) It is a known fact thatthe air is cleaner after precipitation (rain snow) The highest precipitation in Pljevlja(9729 mm) was in 2014 while the lowest (6725 mm) was noticed in 2015 This impliesthat there should have been a significant correlation between these two parameters (PM10particle concentration and precipitation amount) However a relatively low and statistically
Sustainability 2021 13 5229 8 of 15
insignificant correlation coefficient (minus048) was obtained most likely due to the fact that itwas calculated between annual values
Air quality protection in Montenegro is regulated by new legislation For the purposesof this paper the lower thresholds for the concentration of PM10 particles were the valuesadopted by the State CETRM [47] based on the recommendations of EU Directives [53]and WHO [54] which are 40 microgm3 on an annual and seasonal level and 50 microgm3 on adaily basis CETRM has adopted 35 days per year as a tolerance limit which means thatexceedances above 35 times a year with a mean daily concentration gt50 microgm3 are notdesirable (Table 2)
Table 2 Limit values of PM10 particles according to Montenegrin legislation based on EU directivesand WHO recommendations
Parameter Limit Value Tolerance Limit
Daily mean (PM10) 50 microgm3 35 times per year
Annual mean (PM10) 40 microgm3
It is important to point out that the annual mean concentrations in the entire ob-served period (2011ndash2018) were above the prescribed limit value (50 microgm3) so it can beconcluded that at the annual level the air in Pljevlja is significantly polluted with PM10particles (Figure 4 left) When it comes to seasons (Figure 4 right) the winter (DecemberndashJanuaryndashFebruary) mean concentration of PM10 particles ranged from 730 microgm3 (2013)to 1965 microgm3 (2016) It should be noted that the winter of 2013 had an extreme amountof precipitation (274 mm) or 16 times higher than the average (170 mm) Regardingspring (MarchndashAprilndashMay) and summer (JunendashJulyndashAugust) 2012 with the highest meanconcentration of PM10 particles (spring = 676 microgm3 summer = 404 microgm3) and 2018with the lowest concentration (spring = 411 microgm3 summer = 207 microgm3) In the autumnseason 2018 also had the lowest average concentration of PM10 (592 microgm3) while thehighest average concentration was registered in 2011 (941 microgm3)
Sustainability 2021 13 x FOR PEER REVIEW 8 of 14
CaMg ion ratio which is not taken into account when calculating WQI Therefore in fu-ture research the WQI method should be used in combination with other methods to as-sess water quality
32 Analysis of PM10 Concentration of Suspended Particles In the observed period (2011ndash2018) the lowest annual mean value of PM10 particles
was in 2014 (777 μgm3) and the highest in 2015 (1015 μgm3) It is a known fact that the air is cleaner after precipitation (rain snow) The highest precipitation in Pljevlja (9729 mm) was in 2014 while the lowest (6725 mm) was noticed in 2015 This implies that there should have been a significant correlation between these two parameters (PM10 particle concentration and precipitation amount) However a relatively low and statistically in-significant correlation coefficient (minus048) was obtained most likely due to the fact that it was calculated between annual values
Air quality protection in Montenegro is regulated by new legislation For the pur-poses of this paper the lower thresholds for the concentration of PM10 particles were the values adopted by the State CETRM [47] based on the recommendations of EU Directives [53] and WHO [54] which are 40 μgm3 on an annual and seasonal level and 50 μgm3 on a daily basis CETRM has adopted 35 days per year as a tolerance limit which means that exceedances above 35 times a year with a mean daily concentration gt50 μgm3 are not desirable (Table 2)
Table 2 Limit values of PM10 particles according to Montenegrin legislation based on EU direc-tives and WHO recommendations
Parameter Limit Value Tolerance Limit Daily mean (PM10) 50 μgm3 35 times per year
Annual mean (PM10) 40 μgm3
It is important to point out that the annual mean concentrations in the entire observed period (2011ndash2018) were above the prescribed limit value (50 μgm3) so it can be con-cluded that at the annual level the air in Pljevlja is significantly polluted with PM10 parti-cles (Figure 4 left) When it comes to seasons (Figure 4 right) the winter (DecemberndashJanuaryndashFebruary) mean concentration of PM10 particles ranged from 730 μgm3 (2013) to 1965 μgm3 (2016) It should be noted that the winter of 2013 had an extreme amount of precipitation (274 mm) or 16 times higher than the average (170 mm) Regarding spring (MarchndashAprilndashMay) and summer (JunendashJulyndashAugust) 2012 with the highest mean con-centration of PM10 particles (spring = 676 μgm3 summer = 404 μgm3) and 2018 with the lowest concentration (spring = 411 μgm3 summer = 207 μgm3) In the autumn season 2018 also had the lowest average concentration of PM10 (592 μgm3) while the highest average concentration was registered in 2011 (941 μgm3)
Figure 4 Annual (left) and seasonal (right) mean values of PM10 in Pljevlja (2011ndash2018)
Previous results showed that the highest mean concentrations of PM10 particles were recorded during winter and autumn ie in the colder part of the year and the lowest
Figure 4 Annual (left) and seasonal (right) mean values of PM10 in Pljevlja (2011ndash2018)
Previous results showed that the highest mean concentrations of PM10 particles wererecorded during winter and autumn ie in the colder part of the year and the lowestwere recorded in summer This was to be expected because during the heating period ofhouses and flats (in winter and generally in the colder part of the year) the emission ofpollutants (from individual fireboxes) is much higher Additionally the meteorologicalfactor (temperature and precipitation) is important In Pljevlja there is less precipitationin winter temperatures are often below 0 C (average winter temperature is minus12 C theabsolute minimum is minus294 C recorded on 26 January 1954) and cold air is heavier so itsettles in the valley because poor air purification (frequent silences and days with lightwind) Though in summer the amount and frequency of precipitation is higher the warmair is lighter so it rises
The average concentration of PM10 particles of 40 microgm3 was accepted as a limit valueand at the level of seasons (up to 40 microgm3 allowed (acceptable) concentration and above
Sustainability 2021 13 5229 9 of 15
40 microgm3 dangerous concentration for human health) It was clear that during the winterautumn and spring the average concentration of PM10 particles in Pljevlja was above theallowed limit It could be argued that the situation was alarming in winter because theaverage values of PM10 particles were higher than 18 to as much as 49 times (2016) thanallowed (40 microgm3) In summer the mean concentration of PM10 particles was within thepermitted values The only exception is 2012 when the summer mean concentration ofPM10 particles was 404 microgm3 ie slightly above the permitted limit
The analysis of the number of days with the average concentration of PM10 particlesin the air in the urban zone of Pljevlja indicates that the situation was more than worryingSpecifically if we take the value of 35 times per year as the tolerance limit it could beargued that the situation was alarming because every year in the observed period (2011ndash2018) this threshold was exceeded from 37 to 54 times For instance in 2018 it had129 days with an average daily concentration of PM10 particles greater than 50 microgm3 andin 2011 it had as many as 189 such days (Figure 5) As already mentioned the biggest airpollution is in winter especially in January which is the coldest month of the year In theperiod 2011ndash2018 daily mean concentrations of PM10 particles in January ranged up to anenormous 7939 microgm3 (absolute daily maximum registered on 10012015) Rarely hasa day in January been without a high value In other words out of 248 January days forthe 8 mentioned years only 37 times (or 37 days) the daily mean concentration of PM10particles was below the prescribed limit value of 50 microgm3
Sustainability 2021 13 x FOR PEER REVIEW 9 of 14
were recorded in summer This was to be expected because during the heating period of houses and flats (in winter and generally in the colder part of the year) the emission of pollutants (from individual fireboxes) is much higher Additionally the meteorological factor (temperature and precipitation) is important In Pljevlja there is less precipitation in winter temperatures are often below 0 degC (average winter temperature is minus12 degC the absolute minimum is minus294 degC recorded on 26 January 1954) and cold air is heavier so it settles in the valley because poor air purification (frequent silences and days with light wind) Though in summer the amount and frequency of precipitation is higher the warm air is lighter so it rises
The average concentration of PM10 particles of 40 μgm3 was accepted as a limit value and at the level of seasons (up to 40 μgm3 allowed (acceptable) concentration and above 40 μgm3 dangerous concentration for human health) It was clear that during the winter autumn and spring the average concentration of PM10 particles in Pljevlja was above the allowed limit It could be argued that the situation was alarming in winter because the average values of PM10 particles were higher than 18 to as much as 49 times (2016) than allowed (40 μgm3) In summer the mean concentration of PM10 particles was within the permitted values The only exception is 2012 when the summer mean concentration of PM10 particles was 404 μgm3 ie slightly above the permitted limit
The analysis of the number of days with the average concentration of PM10 particles in the air in the urban zone of Pljevlja indicates that the situation was more than worrying Specifically if we take the value of 35 times per year as the tolerance limit it could be argued that the situation was alarming because every year in the observed period (2011ndash2018) this threshold was exceeded from 37 to 54 times For instance in 2018 it had 129 days with an average daily concentration of PM10 particles greater than 50 μgm3 and in 2011 it had as many as 189 such days (Figure 5) As already mentioned the biggest air pollution is in winter especially in January which is the coldest month of the year In the period 2011ndash2018 daily mean concentrations of PM10 particles in January ranged up to an enormous 7939 μgm3 (absolute daily maximum registered on 10012015) Rarely has a day in January been without a high value In other words out of 248 January days for the 8 mentioned years only 37 times (or 37 days) the daily mean concentration of PM10 parti-cles was below the prescribed limit value of 50 μgm3
Figure 5 Annual number of days with daily mean concentration of PM10 particles gt 50 μgm3
In the previous part the influence of the meteorological factor (precipitation and tem-perature) on the air quality was mentioned several times Therefore the results of the cal-culation of the correlation coefficients of PM10 particles with precipitation and tempera-ture are given below and the trend of PM10 concentration for the period 2011ndash2010 was also calculated It should be noted that the obtained results should be accepted with a certain dose of caution especially when it comes to the trend because it was too short a period Only in the winter season did the average concentration of PM10 particles increase
Figure 5 Annual number of days with daily mean concentration of PM10 particles gt 50 microgm3
In the previous part the influence of the meteorological factor (precipitation andtemperature) on the air quality was mentioned several times Therefore the results ofthe calculation of the correlation coefficients of PM10 particles with precipitation andtemperature are given below and the trend of PM10 concentration for the period 2011ndash2010was also calculated It should be noted that the obtained results should be accepted with acertain dose of caution especially when it comes to the trend because it was too short aperiod Only in the winter season did the average concentration of PM10 particles increase(045 microgm3year) but the trend was insignificant In other seasons as well as on anannual basis the linear trend was negative (Table 3)
Table 3 Trend of average seasonal and annual values of PM10 particles (microgm3year) and correlationcoefficients (C) of PM10 with precipitation (P) and temperature (T)
Parameter Winter Spring Summer Autumn Annual
Trend PM10 045 minus282 minus129 minus456 minus388 C (PM10 and P) minus051 020 minus076 minus054 minus048C (PM10 and T) 004 minus089 023 minus033 minus087
Significance p lt 005 and p lt 001
Sustainability 2021 13 5229 10 of 15
Consequently there was a decrease in the concentration of PM10 particles in theair This was an encouraging fact before the trend of decreasing PM10 particles meetsthe conditions of significance at the level of acceptance of the hypothesis of 95 (risklevel p lt 005) during the spring and annually (trend = minus282 microgm3year and trend =minus388 microgm3year) ie by 99 (p lt 001) in the autumn season (trend = minus456 microgm3year)When it comes to correlation in most cases negative values of the coefficients (C) wereobtained the higher the amount of precipitation (higher temperature) the lower the concen-tration of PM10 particles and vice versa The inverse correlation between PM10 particlesand precipitation was significant for the summer season (C = minus076) while in other casesit was insignificant A significant relationship was obtained with temperature for springminus089) and on an annual basis (C = minus087)
The WHO has not defined any value of the concentration of PM10 and PM25 particlesas a lower threshold below which the impact of these substances on human health wouldbe completely eliminated The limit values for the concentration of PM particles mentionedin the WHO document [54] are given as lower thresholds ie concentrations that can bereached in order to minimize the effects on human health
The previous analysis showed that during most of the year there was a lot of airpollution in the urban zone of Pljevlja Three groups of factors had a major impact onthe excessive concentration of PM10 particles in this city especially in the colder part ofthe year economic morphological and meteorological In addition to the usual economicelements such as exhaust gases from cars and small and medium enterprises that consumefossil fuels it can be concluded that the major impact had a huge combustion of coalfor the needs of TPP ldquoPljevljardquo and heating of individual households (houses) Whenit comes to the configuration of the terrain (morphological factor) Pljevlja is located atthe bottom of the depression (valley) which is surrounded and quite closed by the sidesof high mountains This form of relief makes natural air ventilation very difficult Theinfluence of morphological factors was reflected through temperature precipitation andfrequency and wind speed Pljevlja is the city with the lowest amount of precipitation thehighest cloudiness [55] and with the highest percentage of silences (days without wind orwith wind of negligible speed) in Montenegro Winters are long and cold ie negativetemperatures are frequent Higher amount and frequency of precipitation purifies theair and the same goes for higher frequency and wind speed Cold air is heavier so inconditions of lack of precipitation and wind it settles along the bottom of the Pljevlja valleyConsequently temperature inversions were of a common occurrence Along with the coldair at the bottom of the valley (in the ground layer of the atmosphere) pollutants werealso deposited
In addition to all the above Pljevlja is the city with the largest number of foggy daysin Montenegro (it is not uncommon to have about 200 days a year with low fog) Allthree groups of the mentioned factors contributed to the increase of the concentration ofpollutants in Pljevlja and frequent fogs of smog and smoke in the colder part of the yearThe primary sources of emission of suspended PM10 particles in Pljevlja were those relatedto coal exploitation and fossil fuel combustion (TPP ldquoPljevljardquo individual combustionplants motor vehicles and dust emitted from the surrounding coal mines) In the MORTAdocument [56] agriculture ie synthetic N-fertilizers was mentioned among the mainsources of PM10 particulate emissions
4 Conclusions
This study presents the results of the quality of river water (using WQI method) andair pollution in Pljevlja (one of the largest urban areas in the northern Montenegro) usingthe methods of categorization trends and correlations The results of the analysis of WQIand concentration of PM10 particles showed that the waters of the river Cehotina andits tributaries Vezišnica which flow through Pljevlja as well as the air in this city wereunacceptably polluted Pljevlja is a ldquohot spotrdquo in terms of water and especially air pollutionDuring the period under review (2011ndash2018) in most cases the water of the mentioned
Sustainability 2021 13 5229 11 of 15
rivers belonged to the class of bad quality The WQI trend is negligible ie showed nosignificant bias Likewise no significant relationship was obtained between air temperatureand precipitation on the one hand and WQI on the other The weak correlation is mostlikely due to the fact that WQI was considered only on an annual basis When it comes toPM10 particles we had daily data and the general conclusion is that the situation is morethan worrying Average concentrations of PM10 particles (daily seasonal and annual) wereabove the prescribed limit values (gt40 and 50 microgm3 respectively) except during summerPljevlja is a city with 129 to 189 days per year with a concentration of PM10 particles higherthan 50 microgm3 which is much higher than the legally adopted tolerance limit (35 days peryear) Nevertheless it is encouraging that the concentration of PM10 particles decreases(negative trend) during spring summer and autumn as well as on an annual basis Theresults further showed that the concentration of PM10 particles is significantly related tothe temperature in the spring season and at the annual level while the best connectionwith precipitation is during the summer The main disadvantages of the WQI method werethat it did not take into account data on some important parameters (eg on inorganicpollution) The drawback of this paper was the relatively short record lengths of water andair (2011ndash2018) on the observed profiles
Sources of pollution in this area awere wastewaters exhaust emissions from TPPldquoPljevljardquo individual furnaces motor vehicles then agricultural activities illegal garbagedisposal etc) Therefore it is compulsory to take certain measures as soon as possiblein order to improve the quality of both river water and air in Pljevlja and thus protecthuman health In order to obtain a more complete picture of the ecological condition (riverwater and air) not only in this city but also in other parts of Montenegro it is necessary tocontinue monitoring and work on developing citizensrsquo consciousness of the importance ofpreserving and improving water air and soil quality The protection of rivers and otherwater bodies air and land should be one of the priority tasks of the current generationsbecause pollution grows into a ldquomonsterrdquo that seriously endangers todayrsquos civilization
Author Contributions Conceptualization IM and DB data curation IM formal analysis MDInvestigation MD methodology DB and IM project administration MD and MP supervi-sion DB validation DB and IM writingmdashoriginal draft preparation DB and IM writingmdashreview and editing DB and MP All authors have read and agreed to the published version ofthe manuscript
Funding This research received no external funding
Institutional Review Board Statement Not applicable
Informed Consent Statement Not applicable
Data Availability Statement Data is not publicly available though the data may be made availableon request from the corresponding author
Conflicts of Interest The authors declare no conflict of interest
Sustainability 2021 13 5229 12 of 15
Appendix A
Table A1 Average annual values of 10 physicochemical and microbiological parameters used to obtain WQI on five considered hydrological stations (HS)
No Parameter HS Rabitlja HS Below Pljevlja
(Unit) 2011 2012 2013 2014 2015 2016 2017 2018 2011 2012 2013 2014 2015 2016 2017 2018
1 WT (C) 1275 1225 138 136 115 1065 1135 136 128 1455 1475 134 121 109 1205 13452 pH (0ndash14) 84 81 81 82 81 81 81 81 82 81 79 79 79 79 78 83 EC (microScm) 303 295 311 309 316 302 309 300 386 400 398 386 393 366 420 3644 SS (mgL) 0 5 1 3 4 4 4 3 6 10 2 1 44 34 17 35 OS () 1015 96 98 1045 1005 95 99 1035 885 765 795 935 825 90 40 8756 BOD5 (mgL) 15 22 18 14 18 19 54 19 72 68 73 48 6 37 74 467 NH4 (mgL) 003 012 012 006 008 003 004 001 133 130 089 053 107 065 129 0618 PO4 (mgL) 006 007 008 007 005 009 003 003 039 035 03 024 038 029 046 0259 NO3 (mgL) 178 187 198 302 224 257 194 146 29 38 306 535 418 4 307 28710 CB (MPN in 100 mL) 286 167 162 222 228 261 41 221 14550 3785 7175 6410 7770 3650 4000 1075
HS Below Firth of Vezišnica HS Gradac
2011 2012 2013 2014 2015 2016 2017 2018 2011 2012 2013 2014 2015 2016 2017 2018
1 WT (C) 13 1515 1515 14 127 1075 123 135 128 146 15 1335 119 107 123 132 pH (0ndash14) 83 82 79 81 82 8 8 8 84 83 82 83 83 82 82 813 EC (microScm) 385 387 386 385 389 377 504 399 359 365 373 366 376 351 423 3864 SS (mgL) 1 13 2 3 24 18 21 4 0 15 2 10 17 24 19 275 OS () 875 80 80 955 835 895 68 935 1145 102 102 110 105 895 74 1096 BOD5 (mgL) 39 56 67 54 46 37 67 31 29 4 43 3 28 41 67 447 NH4 (mgL) 103 141 106 063 1 052 354 041 029 023 039 025 008 032 167 038 PO4 (mgL) 039 036 039 034 048 036 426 024 024 06 027 018 011 015 093 0149 NO3 (mgL) 323 38 364 591 431 418 2237 427 457 88 453 468 542 386 492 42810 CB (MPN in 100 mL) 12250 2502 1400 705 1150 1035 10840 755 3195 1377 369 625 755 1990 3735 255
HS Firth Vezišnica
2011 2012 2013 2014 2015 2016 2017 2018 Definition
1 WT (C) 132 16 154 1385 127 111 127 135 WTmdashWater temperature2 pH (0ndash14) 85 86 87 84 88 83 87 85 pH value3 EC (microScm) 370 386 379 444 460 385 422 417 ECmdashElectrical conductivity4 SS (mgL) 13 6 10 39 12 17 6 9 SSmdashSuspended solids5 OS () 87 935 895 95 815 91 87 89 OSmdashOxygen saturation6 BOD5 (mgL) 17 39 58 26 22 18 53 25 BOD5mdashBiochemical oxygen consumption for 5 days7 NH4 (mgL) 025 022 047 026 046 021 046 034 NH4mdashAmmonium ion8 PO4 (mgL) 026 015 057 021 018 013 022 016 PO4mdashOrthophosphates9 NO3 (mgL) 224 249 429 354 382 322 293 221 NO3mdashTotal nitrogen oxides10 CB (MPN in 100 mL) 2325 4385 1728 1145 730 1250 1720 747 CBmdashColiform bacteria
Sustainability 2021 13 5229 13 of 15
References1 Dong H Geng Y Sarkis J Fujita T Okadera T Xue B Regional water footprint evaluation in China A case of Liaoning Sci
Total Environ 2013 442 215ndash224 [CrossRef]2 OrsquoConnell E Towards Adaptation of Water Resource Systems to Climatic and Socio-Economic Change Water Resour Manag
2017 31 2965ndash2984 [CrossRef]3 Kowalkowski T Zbytniewski R Szpejna J Buszewski B Application of chemometrics in river water classification Water Res
2006 40 744ndash752 [CrossRef] [PubMed]4 Coacuterdoba EB Martiacutenez AC Ferrer EV Water quality indicators Comparison of a probabilistic index and a general quality
index The case of the Confederacioacuten Hidrograacutefica del Juacutecar (Spain) Ecol Indic 2010 10 1049ndash1054 [CrossRef]5 Sasakova N Gregova G Takacova D Mojzisova J Papajova I Venglovsky J Szaboova T Kovacova S Pollution of Surface
and Ground Water by Sources Related to Agricultural Activities Front Sustain Food Syst 2018 2 1ndash11 [CrossRef]6 Kawo NS Karuppannan S Groundwater quality assessment using water quality index and GIS technique in Modjo River
Basin central Ethiopia J Afr Earth Sci 2018 147 300ndash311 [CrossRef]7 Farooqui KM Sar SK Diwan V Investigation of water quality in Ambur city by water quality indexing Holist Approach
Environ 2020 10 48ndash52 [CrossRef]8 Cude CG Oregon water quality index a tool for evaluating water quality management effectiveness Jawra J Am Water Resour
Assoc 2001 37 125ndash137 [CrossRef]9 Boyacioglu H Development of a water quality index based on a European classification scheme Water Sa 2009 33 101ndash106
[CrossRef]10 Rocha FC Andrade EM Lopes FB Water quality index calculated from biological physical and chemical attributes Environ
Monit Assess 2014 187 4163 [CrossRef]11 Abuzaid AS Evaluating surface water quality for irrigation in Dakahlia Governorate using water quality index and GIS J Soil
Sci Agric Eng Mansoura Univ 2018 9 481ndash49012 Khan H Khan AA Hall S The Canadian Water Quality Index A tool for water resources management In Proceedings of the
MTERM International Conference AIT Pathum Thani Thailand 6ndash10 June 2005 pp 1ndash813 Lumb A Halliwell D Sharma T Application of CCME Water Quality Index to Monitor Water Quality A Case Study of the
Mackenzie River Basin Canada Environ Monit Assess 2006 113 411ndash429 [CrossRef] [PubMed]14 Bharti N Katyal D Water quality indices used for surface water vulnerability assessment International journal of environmental
sciences 2011 1 154ndash17315 Sutadian AD Muttil N Yilmaz AG Perera B Development of river water quality indicesmdashA review Environ Monit Assess
2016 188 1ndash29 [CrossRef] [PubMed]16 Mititelu-Ionus O Water Quality IndexmdashAssessment method of the Motru river water quality (Oltenia Romaia) Univ Craiova
Ser Geogr 2010 13 74ndash8317 Yisa J Analytical Studies on Water Quality Index of River Landzu Am J Appl Sci 2010 7 453ndash458 [CrossRef]18 Jakovljevic D Serbian and Canadian water quality index of Danube river in Serbia in 2010 J Geogr Inst Jovan Cvijicsasa 2012 62
1ndash18 [CrossRef]19 Walker D JakovljeviC D Savic D Radovanovic M Multi-criterion water quality analysis of the Danube River in Serbia A
visualisation approach Water Res 2015 79 158ndash172 [CrossRef]20 Josimov-Dunderski J Savic R Grabic J Blagojevic B Water quality of the Danube River in the Pannonian part of its flow
through Serbia Letopis Naucnih RadovaAnn Agron 2016 40 8ndash1421 Mladenovic-Ranisavljevic II Žerajic SA Comparison of different models of water quality index in the assessment of surface
water quality Int J Environ Sci Technol 2017 15 665ndash674 [CrossRef]22 Milijasevic-Joksimovic D Gavrilovic B Lovic-Obradovic S Application of the water quality index in the Timok River basin
(Serbia) J Geogr Inst Jovan Cvijicsasa 2018 68 333ndash344 [CrossRef]23 Babic G Vukovic M Voza D Takic L Mladenovic-Ranisavljevic I Assessing Surface Water Quality in the Serbian Part of the
Tisa River Basin Pol J Environ Stud 2019 28 4073ndash4085 [CrossRef]24 Doderovic M Mijanovic I Buric D Milenkovic M Assessment of the water quality in the Moraca River basin (Montenegro)
using water quality index Glas Srp Geogr Drus 2020 100 67ndash81 [CrossRef]25 Djuraškovic P Water Quality IndexmdashWQI as Tool of Water Quality Assessment Available online httpbalwoiscomwp-
contentuploadsold_procffp-2026pdf (accessed on 12 February 2021)26 Vukašinovic-Pešic V Blagojevic N Savic A Tomic N Pešic V The Change in the Water Chemistry of the Rivers of Montenegro
over a 10-Year Period In The Handbook of Environmental Chemistry Springer Cham Switzerland 2019 Volume 93 pp 83ndash10927 Kolarevic S Kracun-Kolarevic M Jovanovic J Ilic M Paunovic M Kostic-Vukovic J Martinovic R Jokanovic S
Joksimovic D Pešic V et al Microbiological Water Quality of Rivers in Montenegro Handb Environ Chem 2019 93 135ndash155[CrossRef]
28 WHO Regional Office for Europe Evolution of WHO Air Quality Guidelines Past Present and Future WHO Regional Office forEurope Copenhagen Denmark 2017
Sustainability 2021 13 5229 14 of 15
29 Cohen AJ Brauer M Burnett R Anderson HR Frostad J Estep K Balakrishnan K Brunekreef B Dandona L DandonaR et al Estimates and 25-year trends of the global burden of disease attributable to ambient air pollution An analysis of datafrom the Global Burden of Diseases Study 2015 Lancet 2017 389 1907ndash1918 [CrossRef]
30 Vodonos A Abu Awad Y Schwartz J The concentration-response between long-term PM25 exposure and mortality Ameta-regression approach Environ Res 2018 166 677ndash689 [CrossRef]
31 WHO Burden of Disease from Ambient Air Pollution for 2016 Available online httpswwwwhointairpollutiondataAAP_BoD_results_May2018_finalpdf (accessed on 12 February 2021)
32 Karagulian F Belis CA Dora CFC Pruumlss-Ustuumln AM Bonjour S Adair-Rohani H Amann M Contributions to citiesrsquoambient particulate matter (PM) A systematic review of local source contributions at global level Atmos Environ 2015 120475ndash483 [CrossRef]
33 Yang D Ye C Wang X Lu D Xu J Yang H Global distribution and evolvement of urbanization and PM25 (1998ndash2015)Atmos Environ 2018 182 171ndash178 [CrossRef]
34 Stanojevic GB Miljanovic DN Doljak DL Curcic NB Radovanovic MM Malinovic-Milicevic SB Hauriak O Spatio-temporal variability of annual PM25 concentrations and population exposure assessment in Serbia for the period 2001-2016 JGeogr Inst Jovan Cvijicsasa 2019 69 197ndash211 [CrossRef]
35 Fuzzi S Baltensperger U Carslaw K Decesari S Van Der Gon HD Facchini MC Fowler D Koren I Langford BLohmann U et al Particulate matter air quality and climate Lessons learned and future needs Atmos Chem Phys Discuss2015 15 8217ndash8299 [CrossRef]
36 European Environmental Agency Air Quality in Europemdash2018 Report 2018 Available online httpswwweeaeuropaeupublicationsair-quality-in-europe-2018 (accessed on 12 February 2021)
37 Vicente E Alves C An overview of particulate emissions from residential biomass combustion Atmos Res 2018 199 159ndash185[CrossRef]
38 Beelen R Hoek G Brandt PAVD Goldbohm RA Fischer P Schouten LJ Jerrett M Hughes E Armstrong BBrunekreef B Long-Term Effects of Traffic-Related Air Pollution on Mortality in a Dutch Cohort (NLCS-AIR Study) EnvironHeal Perspect 2008 116 196ndash202 [CrossRef] [PubMed]
39 Samoli E Peng R Ramsay T Pipikou M Touloumi G Dominici F Burnett R Cohen A Krewski D Samet J et al AcuteEffects of Ambient Particulate Matter on Mortality in Europe and North America Results from the APHENA Study EnvironHeal Perspect 2008 116 1480ndash1486 [CrossRef]
40 Maciejewska K Short-term impact of PM25 PM10 and PMc on mortality and morbidity in the agglomeration of WarsawPoland Air Qual Atmos Health 2020 13 659ndash672 [CrossRef]
41 IARC Outdoor Air Pollution a Leading Environmental Cause of Cancer Deaths 2013 Available online httpswwwiarcwhointwp-contentuploads201807pr221_Epdf (accessed on 20 March 2021)
42 Osnovni Podaci o Termoelektrani ldquoPljevljardquo (Basic Information about Thermal Power Plant ldquoPljevljardquo) Available onlinehttpswwwepcgcomo-namatermoelektrana-pljevlja (accessed on 7 January 2021)
43 MONSTAT Zavod za Statistiku Crne Gore MONSTAT (First Results Census of Population Households and Dwellings inMontenegro) Available online httpswwwmonstatorguserfilesfilepopis2011saopstenjeknjiga_prvi20rezultati(1)pdf(accessed on 13 January 2021)
44 Hrvacevic S Resursi površinskih voda Crne Gore Elektroprivreda Crne Gore AD Nikšic Nikšic Podgorica 2004 p 33145 Zavod za Hidrometeorlogiju i Seizmologiju Crne Gore (Institute of Hydrometeorology and Seismology of Montenegro) Godišnji
Izvještaji za Period 2011ndash2018 (Annual Reports for the Period 2011ndash2018) Available online httpwwwmeteocome (accessedon 15 January 2021)
46 Buric D Ducic V Mihajlovic J The climate of Montenegro Modificators and types - part two Glas Srp Geogr Drus 2014 9473ndash90 [CrossRef]
47 Centar za Ekotoksikološka Istraživanja Crne Gore (Center for Eco-Toxicological Research of Montenegro) Godišnji Izvještaji zaPeriod 2011ndash2018 (Annual Reports for the Period 2011ndash2018) Available online httpmnecetime (accessed on 6 March 2021)
48 Lopes FB Teixeira AS Andrade EM Aquino DN Arauacutejo LFP Mapa da qualidade das aacuteguas do rio Acarauacute pelo empregodo IQA e Geoprocessamento (Map of Acarauacute River water quality by the use of WQI and GIS) Revista Ciecircncia Agronocircmica 200839 392ndash402
49 Hurley T Sadiq R Mazumder A Adaptation and evaluation of the Canadian Council of Ministers of the Environment WaterQuality Index (CCME WQI) for use as an effective tool to characterize drinking source water quality Water Res 2012 463544ndash3552 [CrossRef]
50 Garcia CAB Silva IS Mendonccedila MCS Garcia HL Evaluation of Water Quality Indices Use Evolution and FuturePerspectives Adv Environ Monit Assess 2019 18 [CrossRef]
51 Hernea C Teche-Constantinescu AM Variability of groundwater quality parameters from periurban area of Timisoara(Romania) J Environ Prot Ecol 2013 14 64ndash70
52 Lumb A Sharma TC Bibeault J-F A Review of Genesis and Evolution of Water Quality Index (WQI) and Some FutureDirections Water Qual Expo Health 2011 3 11ndash24 [CrossRef]
53 EU Directive on Ambient Air Quality and Cleaner Air for Europe Available online httpseur-lexeuropaeulegal-contentENTXTPDFuri=CELEX32008L0050ampfrom (accessed on 10 March 2021)
Sustainability 2021 13 5229 15 of 15
54 WHO Ambient (Outdoor) Air Pollution Available online wwwwhointmediacentrefactsheetsfs313enindexhtml (accessedon 6 March 2021)
55 Buric D Stanojevic G Trends and possible causes of cloudiness variability in Montenegro in the period 1961ndash2017 Clim Res2020 81 187ndash205 [CrossRef]
56 Ministarstvo Održivog Razvoja i Turizma Crne Gore (Ministry of Sustainable Development and Tourism of Montenegro)Nacionalna Strategija Upravljanja Kvalitetom Vazduha sa Akcionim Planom za Period 2013ndash2016 (National Air QualityManagement Strategy with Action Plan for the Period 2013ndash2016) Available online httpsNacionalna20strategija20upravljanja20kvalitetom20vazduha20sa20Akcionim20planompdf (accessed on 11 March 2021)
- Introduction
- Research Area Materials and Methods
-
- Research Area
- Materials and Methods
-
- Results
-
- Water Quality Index Analysis (WQI)
- Analysis of PM10 Concentration of Suspended Particles
-
- Conclusions
- References
-

Sustainability 2021 13 5229 2 of 15
useful in the management of water resources and surface water catchments [17] so they arealso used in the region to which Montenegro belongs (Southeast Europe and the Balkans)Danube water quality assessment in Serbia [18ndash21] as well as its tributariesmdashthe riversTimok [22] and Tisa [23] was mostly done using the Serbian Water Quality Index (SWQI)
The WQI method was almost not considered in the assessment of surface and ground-water quality in Montenegro but other techniques were also used Though researchshowed that most surface waters in Montenegro were of good quality [24] For exampleDjuraškovic [25] pointed out that from 2005 to 2009 the water quality of Skadar Lakebelonged to class ldquoArdquo mostly Vukašinovic-Pešic et al [26] found an increase in surfacewater quality in Montenegro since 2012 but pointed out that there are significant differencesin the values of the considered chemical parameters between the rivers in the north (BlackSea basin) and in the south (Adriatic basin) Analysis of data from 2009 to 2018 indicatesthat the overall microbiological water quality in Montenegrin rivers is quite good [27]
Air pollution is now considered to be the worldrsquos largest environmental problemespecially in urban areas and industrial regions Back in 1958 the World Health Organiza-tion (WHO) recognized that air pollution is a significant risk factor for human health [28]Among the pollutants that have a very harmful effect on human health which can beboth short-term and long-term [2930] atmospheric aerosol particles or particulate mat-ter (PM) are noticeable They are classified as air pollutants that are directly emitted(primary particles) or formed in the atmosphere from precursor gases through reactions(secondary particles)
According to WHO data [31] 42 million premature deaths were registered world-wide in 2016 due to exposure to increased concentrations of PM25 particles The urbanpopulation is particularly endangered by PM particles because there are numerous sourcesin cities (traffic industry heating plants individual furnaces etc) that increase the concen-tration of these particles in the air [3233] In neighboring Serbia from 2011 to 2016 therewas a growing trend in the number of inhabitants exposed to higher concentrations ofPM25 particles because of urbanization [34] The particles were of natural (aquatic andbiological vaporizer volcanic ash dust etc) or anthropogenic origin (combustion of fossilfuels of domestic heating engine production) [35ndash37] The suspended PM10 tanks werea mixture of smoke fumes exhaust gases dust acids metals etc These particles have avery negative impact on the human body because they are inhaled and deposited in therespiratory system and some are carcinogenic or lethal especially as a consequence oflong-term exposure [38ndash41]
The subject of research (the Pljevlja municipality and the surroundings of the ruralsettlement) was industrially morphologically and climatically unique compared to the restof Montenegro In the morphological sense the city is located at the bottom of the valleywhere the river Cehotina flows The valley is surrounded by the sides of high mountainsand due to this closure in the colder part of the year temperature inversions are frequentie the formation of the so-called ldquocold air lakesrdquo Furthermore Pljevlja is the city with thehighest frequency of wind silence and the lowest amount of precipitation in MontenegroIn Pljevlja at the end of 1982 the thermal power plant (TPP) ldquoPljevljardquo started operatingThe plant still works today and is the only one in Montenegro TPP ldquoPljevljardquo is suppliedwith coal (lignite) from nearby mines and uses water from the Cehotina river system tocool turbines and other needs It returns the used water back to the system of the river In2018 TPP ldquoPljevljardquo produced 14438 GWh of energy [42] It is important to highlight thata numerous individual households use coal for house heating
Taking into consideration the mentioned characteristics (terrain configuration climaticcharacteristics and large coal combustion for the needs of TPPs and for heating housesmdashindividual fireboxes) Pljevlja is often under fog of smog and smoke in the colder part of theyear Therefore this paper aimed to obtain a more complete picture of the envirnomentalsituation in the area of Pljevlja through the assessment of river water and air quality Itis certain that the results obtained in this paper will have practical significance and thatthey can help decision makers above all to understand the seriousness of the situation
Sustainability 2021 13 5229 3 of 15
and need for fast response It would be desirable for this research to encourage expertsfrom other fields to consider the problem of pollution in the area of Pljevlja primarilymedical scientists who would indicate the degree of danger of the current situation tohuman health In general through a multidisciplinary approach it is necessary to startsolving the problem of water and air pollution in Pljevlja as soon as possible in order toprotect the health of the population
2 Research Area Materials and Methods21 Research Area
The study included an assessment of river water and air quality in Pljevlja the largestcity in the far north of Montenegro According to the last census from 2011 [43] themunicipality of Pljevlja (a city with surrounding rural settlements) had 31060 inhabitantsor 5 of the total population in Montenegro (625266 inhabitants)
The basin of the river Cehotina which flows through Pljevlja is located on the borderof Montenegro Serbia and Bosnia and Herzegovina (Figure 1) The area of the Cehotinariver basin is 1296 km2 and mostly belongs to Montenegro Cehotina is a right tributary ofthe river Drina and the Drina is a tributary of the Sava (the river Sava is a tributary of theDanube) which means that the river Cehotina belongs to the Black Sea basin The riverCehotina starts from a spring called Glava Cehotina (945 m above sea level) located on thenorthern slope of the mountain Stožer [44]
Sustainability 2021 13 x FOR PEER REVIEW 3 of 14
part of the year Therefore this paper aimed to obtain a more complete picture of the en-virnomental situation in the area of Pljevlja through the assessment of river water and air quality It is certain that the results obtained in this paper will have practical significance and that they can help decision makers above all to understand the seriousness of the situation and need for fast response It would be desirable for this research to encourage experts from other fields to consider the problem of pollution in the area of Pljevlja pri-marily medical scientists who would indicate the degree of danger of the current situation to human health In general through a multidisciplinary approach it is necessary to start solving the problem of water and air pollution in Pljevlja as soon as possible in order to protect the health of the population
2 Research Area Materials and Methods 21 Research Area
The study included an assessment of river water and air quality in Pljevlja the largest city in the far north of Montenegro According to the last census from 2011 [43] the mu-nicipality of Pljevlja (a city with surrounding rural settlements) had 31060 inhabitants or 5 of the total population in Montenegro (625266 inhabitants)
The basin of the river Ćehotina which flows through Pljevlja is located on the border of Montenegro Serbia and Bosnia and Herzegovina (Figure 1) The area of the Ćehotina river basin is 1296 km2 and mostly belongs to Montenegro Ćehotina is a right tributary of the river Drina and the Drina is a tributary of the Sava (the river Sava is a tributary of the Danube) which means that the river Ćehotina belongs to the Black Sea basin The river Ćehotina starts from a spring called Glava Ćehotina (945 m above sea level) located on the northern slope of the mountain Stožer [44]
Figure 1 Position of Montenegro (MNE) on the Balkan Peninsula and the studied area in MNE
According to the data of the State Institute of Hydrometeorology and Seismology of Montenegro (IHMSM) [45] the length of the river Ćehotina is 1285 km and on its course it receives a large number of streams and rivers On the profile of the hydrological station (HS) Gradac which is located in the central part of the flow the average annual flow of
Figure 1 Position of Montenegro (MNE) on the Balkan Peninsula and the studied area in MNE
According to the data of the State Institute of Hydrometeorology and Seismology ofMontenegro (IHMSM) [45] the length of the river Cehotina is 1285 km and on its course itreceives a large number of streams and rivers On the profile of the hydrological station (HS)Gradac which is located in the central part of the flow the average annual flow of Cehotinais 134 m3s while the extreme values range from 21 m3s (min) to 414 m3s (max)
According to the data of the main meteorological station in Pljevlja which is locatedat 788 m above sea level the average annual rainfall is 802 mm and the average annualtemperature is 85 C (mean years 1951ndash2020) Monthly precipitation amounts range from49 mm (March) to 86 mm (June) Otherwise Buric et al [46] point out that Pljevlja is the
Sustainability 2021 13 5229 4 of 15
city with the lowest annual rainfall in Montenegro Snow and the formation of snow coverare common in winter The average annual number of days with precipitation is 142 daysand the average annual number of days with snow cover is about 65 days Pljevlja ischaracterized by other meteorological features such as the highest frequency of silencein Montenegro (windless days) which is about 15 per year Let us add that the mostcommon winds are up to 1 ms (425 per year) Winds of over 5 ms are very rare (onaverage about 34 per year) The two mentioned facts (relatively small annual rainfalland high frequency of quiet and low wind days) along with the terrain configuration (thecity is located at the bottom of the valley closed by the sides of the mountains from 1500 to2238 m above sea level) have a great diminishing effect on natural air purification
22 Materials and Methods
For the purposes of this paper we used data from the annual reports on river waterquality (IHMSM) [45] and monthly reports on air quality of the Center for Eco-toxicologicalResearch of Montenegro (CETRM) [47] The analysis included a total of 5 hydrologicalstations (HS) where water samples were taken and 1 air quality station located in the centerof Pljevlja (see Figure 1) Data from HS in the Cehotina basin in Montenegro were usedwith two rivers Cehotina (4 stations) and Vezišnica (1 station) The Vezišnica River is a lefttributary of the Cehotina and is 15 km long The mouth of the Vezišnica in Cehotin is on theoutskirts of the town of Pljevlja and along the right bank of the lower course of the riverVezišnica is the TPP ldquoPljevljardquo The assessment of river water and air quality was done forthe period 2011ndash2018 A total of 10 parameters of physico-chemical and microbiologicalwater quality were considered from the 5 mentioned profiles (HS) oxygen saturation ()biochemical oxygen consumption for 5 days (BOD5 in mgL) ammonium ion (mgL) pHvalue total nitrogen oxides (mgL) orthophosphates (mgL) suspended solids (mgL)temperature (C) electrical conductivity (microScm) and coliform bacteria (MPN in 100 mL)
River water quality assessment was done using WQI methods In short all 10 men-tioned parameters were combined into one surface water quality indicator But the share ofeach of them in the total water quality did not have the same relative importance There-fore each of the 10 parameters got its weight or rank of implication (wi) and number orregistered value (qi) according to its share in endangering water quality Finally summingthe product (WQI = qi times wi) gave an index of 100 as the ideal sum of the quality shares ofall parameters [162348]
WQI = 110 (Σqi times wi) (1)
For the parameters used to calculate WQI data for their annual mean values wereavailable When it comes to PM10 particles which are 10 microns or less in diameter ormicrometers (le10 microm) for the purposes of this paper we had average daily concentrations(microgm3 (microgramcubic meter)) so except for the annual analysis performed both on aseasonal and daily basis In Pljevlja the concentration of PM10 suspended particles wasmeasured in the city center (Centar Station see Figure 1) and based on 24-h measurementsthe daily mean value was obtained As far as it is known no categorization (separationof classes) has been given for the concentration of PM10 particles but a limit value hasbeen adopted
The number and type of parameters for calculating WQI as well as their weightingcoefficients can be modified (adjusted) according to local or regional conditions [4950]hence there were differences in class intervals Consequently the classification of surfacewater quality according to WQI values (Figure 2) was applied which was officially inuse in Montenegro by the State Agency for Nature and Environmental Protection ofMontenegro (ANEPM)
Sustainability 2021 13 5229 5 of 15
Sustainability 2021 13 x FOR PEER REVIEW 5 of 14
hence there were differences in class intervals Consequently the classification of surface water quality according to WQI values (Figure 2) was applied which was officially in use in Montenegro by the State Agency for Nature and Environmental Protection of Monte-negro (ANEPM)
Figure 2 Classification of surface water quality by the water quality index method
It should also be mentioned that there were no missing data for WQI while a total of 75 of daily mean values for the entire observed period (2011ndash2018) were missing for PM10 but they were not included in the analysis Of the 75 of missing data for PM10 most of them referred to June and July (3 in total) ie October (14) while in other months the percentage of missing data was negligible For the purpose of more detailed analysis we calculated both parameters (WQI and PM10) the trend and correlation with precipitation and temperature The linear trend was calculated by the method of smallest amount of squares and its significance was examined using the Studentrsquos test (t-test) To examine the relationship with temperature and precipitation the Pearson correlation co-efficient was calculated and the significance of the test using the t-test
3 Results 31 Water Quality Index Analysis (WQI)
The analysis of the river Ćehotina was conducted at the measuring stations Rabitlja Below Pljevlja Below firth of Vezišnica and Gradac while on its left tributary Vezišnica the analysis was conducted at Firth Vezišnica HS located at the mouth of Ćehotina At the measuring station Rabitlja which is located upstream from Pljevlja outside the urban zone and the impact of TPP lsquolsquoPljevljarsquorsquo water quality in the entire observed period ranged from very good WQI = 86ndash89 (2012 2016 and 2017) to excellent WQI = 90ndash92 (2011 2013ndash2015 and 2018) Downstream from HS Rabitlja the river Ćehotina flows through the city area of Pljevlja and collects water from its tributaries Vezišnica so the water quality is deteriorating Thus at HS Below Pljevlja the water quality in the entire observed period had values ranging from 46 to 68 WQI (bad quality) At the mouth of the Vezišnica in Ćehotina (HS Firth Vezišnica) the average annual WQI values changed almost alternately from bad to good quality class bad quality classes belong to 2013 2015 and 2017 (WQI = 64ndash71) and good 2011 2012 2014 2016 and 2018 (WQI = 73ndash79) On the next HS below firth of Vezišnica which is located on the river Ćehotina downstream from the mouth of Vezišnica almost in the whole observed period the water was of bad quality (WQI = 44ndash68) and only 2018 belonged to the class of good (WQI = 74)
Figure 2 Classification of surface water quality by the water quality index method
It should also be mentioned that there were no missing data for WQI while a totalof 75 of daily mean values for the entire observed period (2011ndash2018) were missing forPM10 but they were not included in the analysis Of the 75 of missing data for PM10most of them referred to June and July (3 in total) ie October (14) while in othermonths the percentage of missing data was negligible For the purpose of more detailedanalysis we calculated both parameters (WQI and PM10) the trend and correlation withprecipitation and temperature The linear trend was calculated by the method of smallestamount of squares and its significance was examined using the Studentrsquos test (t-test)To examine the relationship with temperature and precipitation the Pearson correlationcoefficient was calculated and the significance of the test using the t-test
3 Results31 Water Quality Index Analysis (WQI)
The analysis of the river Cehotina was conducted at the measuring stations RabitljaBelow Pljevlja Below firth of Vezišnica and Gradac while on its left tributary Vezišnicathe analysis was conducted at Firth Vezišnica HS located at the mouth of Cehotina At themeasuring station Rabitlja which is located upstream from Pljevlja outside the urban zoneand the impact of TPP ldquoPljevljardquo water quality in the entire observed period ranged fromvery good WQI = 86ndash89 (2012 2016 and 2017) to excellent WQI = 90ndash92 (2011 2013ndash2015and 2018) Downstream from HS Rabitlja the river Cehotina flows through the city area ofPljevlja and collects water from its tributaries Vezišnica so the water quality is deterioratingThus at HS Below Pljevlja the water quality in the entire observed period had valuesranging from 46 to 68 WQI (bad quality) At the mouth of the Vezišnica in Cehotina (HSFirth Vezišnica) the average annual WQI values changed almost alternately from badto good quality class bad quality classes belong to 2013 2015 and 2017 (WQI = 64ndash71)and good 2011 2012 2014 2016 and 2018 (WQI = 73ndash79) On the next HS below firth ofVezišnica which is located on the river Cehotina downstream from the mouth of Vezišnicaalmost in the whole observed period the water was of bad quality (WQI = 44ndash68) and only2018 belonged to the class of good (WQI = 74)
The previously mentioned 4 HS (Rabitlja below Pljevlja firth Vezišnica and belowfirth of Vezišnica) are located in the urban zone of Pljevlja or in the immediate vicinity ofthe city ie they are located in the sector of the river Cehotina for a length of about 8 kmDownstream there was only one other measuring point in operation and that was on theprofile of Gradac HS which is about 15 km away in relation to the previously analyzed(below firth of Vezišnica) During the observed period (2011ndash2018) HS Gradac recorded
Sustainability 2021 13 5229 6 of 15
variations in water quality For 2011 good river water quality was obtained and for 2012bad (Table 1) In the period 2013ndash2015 water quality again belonged to the class of good(WQI = 73ndash82) and then in 2016 and 2017 it deteriorated and was classified in the class ofbad (WQI = 53ndash71) At the end of the observed period in 2018 there was a re-improvementof water quality at HS Gradac because the water of the river Cehotina was assessed asgood quality (WQI = 72)
Table 1 Mean annual values of WQI trend of WQI of the river Cehotina and its tributary Vezišnica correlation of WQIwith precipitation (P) and temperature (T) for the period 2011ndash2018
River HydrologicalStation
Mean Annual Values of WQI Trend(WQIyear)
Correlation
2011 2012 2013 2014 2015 2016 2017 2018 WQI-P WQI-T
Cehotina Rabitlja 90 68 90 90 92 89 86 94 014 010 036Cehotina Below Pljevlja 59 74 60 68 56 66 46 68 017 060 025
CehotinaBelow firth of
Vezišnica 64 72 59 65 59 68 44 74 019 049 019
Cehotina Gradac 75 78 73 75 82 71 53 72 minus113 001 minus026Vezišnica Firth Vezišnica 77 77 64 73 71 79 67 78 000 017 minus012
The obtained results indicated that the state of water quality of the river Cehotinaand its tributaries Vezišnica was alarming especially in the part of the flow through theurban zone of Pljevlja and downstream from the mouth of Vezišnica In almost all observedprofiles there were year-on-year variations in water quality which were most likely relatedto increaseddecreased amount of wastewater from settlements agricultural sources (eglivestock and poultry mini farms) and illegal disposal of garbage and other waste bothalong the stream and in the forest and in the river itself Year-on-year variations in WQI alsooccurred in part due to changes in hydrological conditions In years with an unfavorablehydrological situation (less rainfall and lower runoff than average) river water was ofpoorer quality (2011 and 2015) in general On the other hand the state of water quality in2018 was slightly better which can be related to higher water levels ie more favorablemeteorological conditions (higher precipitation and higher temperature compared to theaverage) It should also be mentioned that in recent years certain measures have beentaken to prevent pollution (eg the penal policy of illegal waste disposal) and this may beone of the reasons for improving the quality of river water for 2018 Of all the observedHS the worst quality is the water of the river Cehotina on the profile of below Pljevljaand this is the result of an increased amount of municipal wastewater (mostly untreated)from the urban area of Pljevlja Wastewater from TPP ldquoPljevljardquo low water levels andhuman activities along the stream are the primary causes of water pollution in Vezišnica(a tributary of Cehotina)
With the aim of analyzing WQI in more detail the trend was calculated and its signifi-cance for the period 2011ndash2018 was examined Calculations of the correlation coefficientbetween WQI and precipitation ie temperature (see Table 1) were also performed Nev-ertheless the value of the WQI trend is minor and has shown no significant bias in thedata used The lack of significance of the trend is likely related to the short record lengths(only 8 years 2011ndash2018) The absolute values of the correlation coefficients ranged from001 to 060 We are also sure that the reason for the weak correlation (lack of significance)between WQI and precipitation (temperature) is because the coefficient was calculated forannual values thus canceling the relationship between these two climate elements andWQI There is no doubt that this connection would be noticed on a monthly basis (probablyalso seasonally) but unfortunately we only had the annual WQI values
Observing the average annual WQI values for the whole observed period (calculatedas the arithmetic mean of annual WQI from 2011 to 2018) the calculation results showedthat the water quality of the river Cehotina was excellent (WQI = 90) and good (WQI = 73)at one HS and bad at 3 HS (Figure 3) Downstream from the city of Pljevlja and themouth of the river Vezišnica the water quality of the river Cehotina was deterioratingand this was a consequence of the discharge of municipal city water and wastewater from
Sustainability 2021 13 5229 7 of 15
TPP ldquoPljevljardquo We should mention other factors that had a negative impact on the waterquality of the river Cehotina anthropogenic impact along its course (large amount ofvarious wastes in its bed and along the banks agricultural activities wastewater from minifarmsmdashlivestock and poultry etc) and low water level (especially tributaries of Vezišnica)
Sustainability 2021 13 x FOR PEER REVIEW 7 of 14
Observing the average annual WQI values for the whole observed period (calculated as the arithmetic mean of annual WQI from 2011 to 2018) the calculation results showed that the water quality of the river Ćehotina was excellent (WQI = 90) and good (WQI = 73) at one HS and bad at 3 HS (Figure 3) Downstream from the city of Pljevlja and the mouth of the river Vezišnica the water quality of the river Ćehotina was deteriorating and this was a consequence of the discharge of municipal city water and wastewater from TPP lsquolsquoPljevljarsquorsquo We should mention other factors that had a negative impact on the water qual-ity of the river Ćehotina anthropogenic impact along its course (large amount of various wastes in its bed and along the banks agricultural activities wastewater from mini farmsmdashlivestock and poultry etc) and low water level (especially tributaries of Vezišnica)
Figure 3 Average annual WQI values at measuring stations for the period 2011ndash2018
Comparing the data for the 10 mentioned physicochemical and microbiological pa-rameters used to obtain WQI it is noticeable that their values at HS are located in the part of the flow through the city area of Pljevlja and at the mouth of Vezišnica which is in line with the above Thus at HS Below Pljevlja and HS Firth Vezišnica there were higher con-centrations eg BOD5 and ammonium ions relative to the other 3 HS in general In addi-tion increased concentrations of BOD5 and ammonium ions were observed on almost all profiles for the years with the lowest WQI This was also logical because the value of BOD5 was an indicator of the biological activity of wastewater ie the degree of pollution with organic substances Ammonium ion concentrations are an indicator of pollution from agricultural sources and industrial facilities [51]
During hydrologically unfavorable years such as 2011 and 2015 the highest average annual concentrations of BOD5 and ammonium ions (up to 72 mgL and up to 133 mgL respectively) were registered at HS Below Pljevlja and HS Firth Vezišnica (see Table A1 in Appendix A) Therefore the quality of the river water quality of Ćehotina was worrying especially in the part of the flow that flows through the urban zone of Pljevlja and down-stream from the mouth of Vezišnica In the south of Montenegro the Morača river basin the situation was much better except in the part of the flow through the capital Podgorica [24]
There are two important benefits of using the WQI method Firstly several variables are included in one number and it gives the possibility to compare water quality of one water body in time and secondly we can compare several water objects in space The main disadvantages of this methodology are that it does not take into account data on some important parameters such as inorganic pollution (eg heavy metals) and that WQI can be calculated even if not all of the mentioned parameters are available [52] One of the parameters which indicates increased pollution of watercourses is the disturbed natural
Figure 3 Average annual WQI values at measuring stations for the period 2011ndash2018
Comparing the data for the 10 mentioned physicochemical and microbiological pa-rameters used to obtain WQI it is noticeable that their values at HS are located in the partof the flow through the city area of Pljevlja and at the mouth of Vezišnica which is inline with the above Thus at HS Below Pljevlja and HS Firth Vezišnica there were higherconcentrations eg BOD5 and ammonium ions relative to the other 3 HS in general Inaddition increased concentrations of BOD5 and ammonium ions were observed on almostall profiles for the years with the lowest WQI This was also logical because the value ofBOD5 was an indicator of the biological activity of wastewater ie the degree of pollutionwith organic substances Ammonium ion concentrations are an indicator of pollution fromagricultural sources and industrial facilities [51]
During hydrologically unfavorable years such as 2011 and 2015 the highest averageannual concentrations of BOD5 and ammonium ions (up to 72 mgL and up to 133 mgLrespectively) were registered at HS Below Pljevlja and HS Firth Vezišnica (see Table A1in Appendix A) Therefore the quality of the river water quality of Cehotina was worry-ing especially in the part of the flow that flows through the urban zone of Pljevlja anddownstream from the mouth of Vezišnica In the south of Montenegro the Moraca riverbasin the situation was much better except in the part of the flow through the capitalPodgorica [24]
There are two important benefits of using the WQI method Firstly several variablesare included in one number and it gives the possibility to compare water quality of onewater body in time and secondly we can compare several water objects in space The maindisadvantages of this methodology are that it does not take into account data on someimportant parameters such as inorganic pollution (eg heavy metals) and that WQI canbe calculated even if not all of the mentioned parameters are available [52] One of theparameters which indicates increased pollution of watercourses is the disturbed naturalCaMg ion ratio which is not taken into account when calculating WQI Therefore infuture research the WQI method should be used in combination with other methods toassess water quality
32 Analysis of PM10 Concentration of Suspended Particles
In the observed period (2011ndash2018) the lowest annual mean value of PM10 particleswas in 2014 (777 microgm3) and the highest in 2015 (1015 microgm3) It is a known fact thatthe air is cleaner after precipitation (rain snow) The highest precipitation in Pljevlja(9729 mm) was in 2014 while the lowest (6725 mm) was noticed in 2015 This impliesthat there should have been a significant correlation between these two parameters (PM10particle concentration and precipitation amount) However a relatively low and statistically
Sustainability 2021 13 5229 8 of 15
insignificant correlation coefficient (minus048) was obtained most likely due to the fact that itwas calculated between annual values
Air quality protection in Montenegro is regulated by new legislation For the purposesof this paper the lower thresholds for the concentration of PM10 particles were the valuesadopted by the State CETRM [47] based on the recommendations of EU Directives [53]and WHO [54] which are 40 microgm3 on an annual and seasonal level and 50 microgm3 on adaily basis CETRM has adopted 35 days per year as a tolerance limit which means thatexceedances above 35 times a year with a mean daily concentration gt50 microgm3 are notdesirable (Table 2)
Table 2 Limit values of PM10 particles according to Montenegrin legislation based on EU directivesand WHO recommendations
Parameter Limit Value Tolerance Limit
Daily mean (PM10) 50 microgm3 35 times per year
Annual mean (PM10) 40 microgm3
It is important to point out that the annual mean concentrations in the entire ob-served period (2011ndash2018) were above the prescribed limit value (50 microgm3) so it can beconcluded that at the annual level the air in Pljevlja is significantly polluted with PM10particles (Figure 4 left) When it comes to seasons (Figure 4 right) the winter (DecemberndashJanuaryndashFebruary) mean concentration of PM10 particles ranged from 730 microgm3 (2013)to 1965 microgm3 (2016) It should be noted that the winter of 2013 had an extreme amountof precipitation (274 mm) or 16 times higher than the average (170 mm) Regardingspring (MarchndashAprilndashMay) and summer (JunendashJulyndashAugust) 2012 with the highest meanconcentration of PM10 particles (spring = 676 microgm3 summer = 404 microgm3) and 2018with the lowest concentration (spring = 411 microgm3 summer = 207 microgm3) In the autumnseason 2018 also had the lowest average concentration of PM10 (592 microgm3) while thehighest average concentration was registered in 2011 (941 microgm3)
Sustainability 2021 13 x FOR PEER REVIEW 8 of 14
CaMg ion ratio which is not taken into account when calculating WQI Therefore in fu-ture research the WQI method should be used in combination with other methods to as-sess water quality
32 Analysis of PM10 Concentration of Suspended Particles In the observed period (2011ndash2018) the lowest annual mean value of PM10 particles
was in 2014 (777 μgm3) and the highest in 2015 (1015 μgm3) It is a known fact that the air is cleaner after precipitation (rain snow) The highest precipitation in Pljevlja (9729 mm) was in 2014 while the lowest (6725 mm) was noticed in 2015 This implies that there should have been a significant correlation between these two parameters (PM10 particle concentration and precipitation amount) However a relatively low and statistically in-significant correlation coefficient (minus048) was obtained most likely due to the fact that it was calculated between annual values
Air quality protection in Montenegro is regulated by new legislation For the pur-poses of this paper the lower thresholds for the concentration of PM10 particles were the values adopted by the State CETRM [47] based on the recommendations of EU Directives [53] and WHO [54] which are 40 μgm3 on an annual and seasonal level and 50 μgm3 on a daily basis CETRM has adopted 35 days per year as a tolerance limit which means that exceedances above 35 times a year with a mean daily concentration gt50 μgm3 are not desirable (Table 2)
Table 2 Limit values of PM10 particles according to Montenegrin legislation based on EU direc-tives and WHO recommendations
Parameter Limit Value Tolerance Limit Daily mean (PM10) 50 μgm3 35 times per year
Annual mean (PM10) 40 μgm3
It is important to point out that the annual mean concentrations in the entire observed period (2011ndash2018) were above the prescribed limit value (50 μgm3) so it can be con-cluded that at the annual level the air in Pljevlja is significantly polluted with PM10 parti-cles (Figure 4 left) When it comes to seasons (Figure 4 right) the winter (DecemberndashJanuaryndashFebruary) mean concentration of PM10 particles ranged from 730 μgm3 (2013) to 1965 μgm3 (2016) It should be noted that the winter of 2013 had an extreme amount of precipitation (274 mm) or 16 times higher than the average (170 mm) Regarding spring (MarchndashAprilndashMay) and summer (JunendashJulyndashAugust) 2012 with the highest mean con-centration of PM10 particles (spring = 676 μgm3 summer = 404 μgm3) and 2018 with the lowest concentration (spring = 411 μgm3 summer = 207 μgm3) In the autumn season 2018 also had the lowest average concentration of PM10 (592 μgm3) while the highest average concentration was registered in 2011 (941 μgm3)
Figure 4 Annual (left) and seasonal (right) mean values of PM10 in Pljevlja (2011ndash2018)
Previous results showed that the highest mean concentrations of PM10 particles were recorded during winter and autumn ie in the colder part of the year and the lowest
Figure 4 Annual (left) and seasonal (right) mean values of PM10 in Pljevlja (2011ndash2018)
Previous results showed that the highest mean concentrations of PM10 particles wererecorded during winter and autumn ie in the colder part of the year and the lowestwere recorded in summer This was to be expected because during the heating period ofhouses and flats (in winter and generally in the colder part of the year) the emission ofpollutants (from individual fireboxes) is much higher Additionally the meteorologicalfactor (temperature and precipitation) is important In Pljevlja there is less precipitationin winter temperatures are often below 0 C (average winter temperature is minus12 C theabsolute minimum is minus294 C recorded on 26 January 1954) and cold air is heavier so itsettles in the valley because poor air purification (frequent silences and days with lightwind) Though in summer the amount and frequency of precipitation is higher the warmair is lighter so it rises
The average concentration of PM10 particles of 40 microgm3 was accepted as a limit valueand at the level of seasons (up to 40 microgm3 allowed (acceptable) concentration and above
Sustainability 2021 13 5229 9 of 15
40 microgm3 dangerous concentration for human health) It was clear that during the winterautumn and spring the average concentration of PM10 particles in Pljevlja was above theallowed limit It could be argued that the situation was alarming in winter because theaverage values of PM10 particles were higher than 18 to as much as 49 times (2016) thanallowed (40 microgm3) In summer the mean concentration of PM10 particles was within thepermitted values The only exception is 2012 when the summer mean concentration ofPM10 particles was 404 microgm3 ie slightly above the permitted limit
The analysis of the number of days with the average concentration of PM10 particlesin the air in the urban zone of Pljevlja indicates that the situation was more than worryingSpecifically if we take the value of 35 times per year as the tolerance limit it could beargued that the situation was alarming because every year in the observed period (2011ndash2018) this threshold was exceeded from 37 to 54 times For instance in 2018 it had129 days with an average daily concentration of PM10 particles greater than 50 microgm3 andin 2011 it had as many as 189 such days (Figure 5) As already mentioned the biggest airpollution is in winter especially in January which is the coldest month of the year In theperiod 2011ndash2018 daily mean concentrations of PM10 particles in January ranged up to anenormous 7939 microgm3 (absolute daily maximum registered on 10012015) Rarely hasa day in January been without a high value In other words out of 248 January days forthe 8 mentioned years only 37 times (or 37 days) the daily mean concentration of PM10particles was below the prescribed limit value of 50 microgm3
Sustainability 2021 13 x FOR PEER REVIEW 9 of 14
were recorded in summer This was to be expected because during the heating period of houses and flats (in winter and generally in the colder part of the year) the emission of pollutants (from individual fireboxes) is much higher Additionally the meteorological factor (temperature and precipitation) is important In Pljevlja there is less precipitation in winter temperatures are often below 0 degC (average winter temperature is minus12 degC the absolute minimum is minus294 degC recorded on 26 January 1954) and cold air is heavier so it settles in the valley because poor air purification (frequent silences and days with light wind) Though in summer the amount and frequency of precipitation is higher the warm air is lighter so it rises
The average concentration of PM10 particles of 40 μgm3 was accepted as a limit value and at the level of seasons (up to 40 μgm3 allowed (acceptable) concentration and above 40 μgm3 dangerous concentration for human health) It was clear that during the winter autumn and spring the average concentration of PM10 particles in Pljevlja was above the allowed limit It could be argued that the situation was alarming in winter because the average values of PM10 particles were higher than 18 to as much as 49 times (2016) than allowed (40 μgm3) In summer the mean concentration of PM10 particles was within the permitted values The only exception is 2012 when the summer mean concentration of PM10 particles was 404 μgm3 ie slightly above the permitted limit
The analysis of the number of days with the average concentration of PM10 particles in the air in the urban zone of Pljevlja indicates that the situation was more than worrying Specifically if we take the value of 35 times per year as the tolerance limit it could be argued that the situation was alarming because every year in the observed period (2011ndash2018) this threshold was exceeded from 37 to 54 times For instance in 2018 it had 129 days with an average daily concentration of PM10 particles greater than 50 μgm3 and in 2011 it had as many as 189 such days (Figure 5) As already mentioned the biggest air pollution is in winter especially in January which is the coldest month of the year In the period 2011ndash2018 daily mean concentrations of PM10 particles in January ranged up to an enormous 7939 μgm3 (absolute daily maximum registered on 10012015) Rarely has a day in January been without a high value In other words out of 248 January days for the 8 mentioned years only 37 times (or 37 days) the daily mean concentration of PM10 parti-cles was below the prescribed limit value of 50 μgm3
Figure 5 Annual number of days with daily mean concentration of PM10 particles gt 50 μgm3
In the previous part the influence of the meteorological factor (precipitation and tem-perature) on the air quality was mentioned several times Therefore the results of the cal-culation of the correlation coefficients of PM10 particles with precipitation and tempera-ture are given below and the trend of PM10 concentration for the period 2011ndash2010 was also calculated It should be noted that the obtained results should be accepted with a certain dose of caution especially when it comes to the trend because it was too short a period Only in the winter season did the average concentration of PM10 particles increase
Figure 5 Annual number of days with daily mean concentration of PM10 particles gt 50 microgm3
In the previous part the influence of the meteorological factor (precipitation andtemperature) on the air quality was mentioned several times Therefore the results ofthe calculation of the correlation coefficients of PM10 particles with precipitation andtemperature are given below and the trend of PM10 concentration for the period 2011ndash2010was also calculated It should be noted that the obtained results should be accepted with acertain dose of caution especially when it comes to the trend because it was too short aperiod Only in the winter season did the average concentration of PM10 particles increase(045 microgm3year) but the trend was insignificant In other seasons as well as on anannual basis the linear trend was negative (Table 3)
Table 3 Trend of average seasonal and annual values of PM10 particles (microgm3year) and correlationcoefficients (C) of PM10 with precipitation (P) and temperature (T)
Parameter Winter Spring Summer Autumn Annual
Trend PM10 045 minus282 minus129 minus456 minus388 C (PM10 and P) minus051 020 minus076 minus054 minus048C (PM10 and T) 004 minus089 023 minus033 minus087
Significance p lt 005 and p lt 001
Sustainability 2021 13 5229 10 of 15
Consequently there was a decrease in the concentration of PM10 particles in theair This was an encouraging fact before the trend of decreasing PM10 particles meetsthe conditions of significance at the level of acceptance of the hypothesis of 95 (risklevel p lt 005) during the spring and annually (trend = minus282 microgm3year and trend =minus388 microgm3year) ie by 99 (p lt 001) in the autumn season (trend = minus456 microgm3year)When it comes to correlation in most cases negative values of the coefficients (C) wereobtained the higher the amount of precipitation (higher temperature) the lower the concen-tration of PM10 particles and vice versa The inverse correlation between PM10 particlesand precipitation was significant for the summer season (C = minus076) while in other casesit was insignificant A significant relationship was obtained with temperature for springminus089) and on an annual basis (C = minus087)
The WHO has not defined any value of the concentration of PM10 and PM25 particlesas a lower threshold below which the impact of these substances on human health wouldbe completely eliminated The limit values for the concentration of PM particles mentionedin the WHO document [54] are given as lower thresholds ie concentrations that can bereached in order to minimize the effects on human health
The previous analysis showed that during most of the year there was a lot of airpollution in the urban zone of Pljevlja Three groups of factors had a major impact onthe excessive concentration of PM10 particles in this city especially in the colder part ofthe year economic morphological and meteorological In addition to the usual economicelements such as exhaust gases from cars and small and medium enterprises that consumefossil fuels it can be concluded that the major impact had a huge combustion of coalfor the needs of TPP ldquoPljevljardquo and heating of individual households (houses) Whenit comes to the configuration of the terrain (morphological factor) Pljevlja is located atthe bottom of the depression (valley) which is surrounded and quite closed by the sidesof high mountains This form of relief makes natural air ventilation very difficult Theinfluence of morphological factors was reflected through temperature precipitation andfrequency and wind speed Pljevlja is the city with the lowest amount of precipitation thehighest cloudiness [55] and with the highest percentage of silences (days without wind orwith wind of negligible speed) in Montenegro Winters are long and cold ie negativetemperatures are frequent Higher amount and frequency of precipitation purifies theair and the same goes for higher frequency and wind speed Cold air is heavier so inconditions of lack of precipitation and wind it settles along the bottom of the Pljevlja valleyConsequently temperature inversions were of a common occurrence Along with the coldair at the bottom of the valley (in the ground layer of the atmosphere) pollutants werealso deposited
In addition to all the above Pljevlja is the city with the largest number of foggy daysin Montenegro (it is not uncommon to have about 200 days a year with low fog) Allthree groups of the mentioned factors contributed to the increase of the concentration ofpollutants in Pljevlja and frequent fogs of smog and smoke in the colder part of the yearThe primary sources of emission of suspended PM10 particles in Pljevlja were those relatedto coal exploitation and fossil fuel combustion (TPP ldquoPljevljardquo individual combustionplants motor vehicles and dust emitted from the surrounding coal mines) In the MORTAdocument [56] agriculture ie synthetic N-fertilizers was mentioned among the mainsources of PM10 particulate emissions
4 Conclusions
This study presents the results of the quality of river water (using WQI method) andair pollution in Pljevlja (one of the largest urban areas in the northern Montenegro) usingthe methods of categorization trends and correlations The results of the analysis of WQIand concentration of PM10 particles showed that the waters of the river Cehotina andits tributaries Vezišnica which flow through Pljevlja as well as the air in this city wereunacceptably polluted Pljevlja is a ldquohot spotrdquo in terms of water and especially air pollutionDuring the period under review (2011ndash2018) in most cases the water of the mentioned
Sustainability 2021 13 5229 11 of 15
rivers belonged to the class of bad quality The WQI trend is negligible ie showed nosignificant bias Likewise no significant relationship was obtained between air temperatureand precipitation on the one hand and WQI on the other The weak correlation is mostlikely due to the fact that WQI was considered only on an annual basis When it comes toPM10 particles we had daily data and the general conclusion is that the situation is morethan worrying Average concentrations of PM10 particles (daily seasonal and annual) wereabove the prescribed limit values (gt40 and 50 microgm3 respectively) except during summerPljevlja is a city with 129 to 189 days per year with a concentration of PM10 particles higherthan 50 microgm3 which is much higher than the legally adopted tolerance limit (35 days peryear) Nevertheless it is encouraging that the concentration of PM10 particles decreases(negative trend) during spring summer and autumn as well as on an annual basis Theresults further showed that the concentration of PM10 particles is significantly related tothe temperature in the spring season and at the annual level while the best connectionwith precipitation is during the summer The main disadvantages of the WQI method werethat it did not take into account data on some important parameters (eg on inorganicpollution) The drawback of this paper was the relatively short record lengths of water andair (2011ndash2018) on the observed profiles
Sources of pollution in this area awere wastewaters exhaust emissions from TPPldquoPljevljardquo individual furnaces motor vehicles then agricultural activities illegal garbagedisposal etc) Therefore it is compulsory to take certain measures as soon as possiblein order to improve the quality of both river water and air in Pljevlja and thus protecthuman health In order to obtain a more complete picture of the ecological condition (riverwater and air) not only in this city but also in other parts of Montenegro it is necessary tocontinue monitoring and work on developing citizensrsquo consciousness of the importance ofpreserving and improving water air and soil quality The protection of rivers and otherwater bodies air and land should be one of the priority tasks of the current generationsbecause pollution grows into a ldquomonsterrdquo that seriously endangers todayrsquos civilization
Author Contributions Conceptualization IM and DB data curation IM formal analysis MDInvestigation MD methodology DB and IM project administration MD and MP supervi-sion DB validation DB and IM writingmdashoriginal draft preparation DB and IM writingmdashreview and editing DB and MP All authors have read and agreed to the published version ofthe manuscript
Funding This research received no external funding
Institutional Review Board Statement Not applicable
Informed Consent Statement Not applicable
Data Availability Statement Data is not publicly available though the data may be made availableon request from the corresponding author
Conflicts of Interest The authors declare no conflict of interest
Sustainability 2021 13 5229 12 of 15
Appendix A
Table A1 Average annual values of 10 physicochemical and microbiological parameters used to obtain WQI on five considered hydrological stations (HS)
No Parameter HS Rabitlja HS Below Pljevlja
(Unit) 2011 2012 2013 2014 2015 2016 2017 2018 2011 2012 2013 2014 2015 2016 2017 2018
1 WT (C) 1275 1225 138 136 115 1065 1135 136 128 1455 1475 134 121 109 1205 13452 pH (0ndash14) 84 81 81 82 81 81 81 81 82 81 79 79 79 79 78 83 EC (microScm) 303 295 311 309 316 302 309 300 386 400 398 386 393 366 420 3644 SS (mgL) 0 5 1 3 4 4 4 3 6 10 2 1 44 34 17 35 OS () 1015 96 98 1045 1005 95 99 1035 885 765 795 935 825 90 40 8756 BOD5 (mgL) 15 22 18 14 18 19 54 19 72 68 73 48 6 37 74 467 NH4 (mgL) 003 012 012 006 008 003 004 001 133 130 089 053 107 065 129 0618 PO4 (mgL) 006 007 008 007 005 009 003 003 039 035 03 024 038 029 046 0259 NO3 (mgL) 178 187 198 302 224 257 194 146 29 38 306 535 418 4 307 28710 CB (MPN in 100 mL) 286 167 162 222 228 261 41 221 14550 3785 7175 6410 7770 3650 4000 1075
HS Below Firth of Vezišnica HS Gradac
2011 2012 2013 2014 2015 2016 2017 2018 2011 2012 2013 2014 2015 2016 2017 2018
1 WT (C) 13 1515 1515 14 127 1075 123 135 128 146 15 1335 119 107 123 132 pH (0ndash14) 83 82 79 81 82 8 8 8 84 83 82 83 83 82 82 813 EC (microScm) 385 387 386 385 389 377 504 399 359 365 373 366 376 351 423 3864 SS (mgL) 1 13 2 3 24 18 21 4 0 15 2 10 17 24 19 275 OS () 875 80 80 955 835 895 68 935 1145 102 102 110 105 895 74 1096 BOD5 (mgL) 39 56 67 54 46 37 67 31 29 4 43 3 28 41 67 447 NH4 (mgL) 103 141 106 063 1 052 354 041 029 023 039 025 008 032 167 038 PO4 (mgL) 039 036 039 034 048 036 426 024 024 06 027 018 011 015 093 0149 NO3 (mgL) 323 38 364 591 431 418 2237 427 457 88 453 468 542 386 492 42810 CB (MPN in 100 mL) 12250 2502 1400 705 1150 1035 10840 755 3195 1377 369 625 755 1990 3735 255
HS Firth Vezišnica
2011 2012 2013 2014 2015 2016 2017 2018 Definition
1 WT (C) 132 16 154 1385 127 111 127 135 WTmdashWater temperature2 pH (0ndash14) 85 86 87 84 88 83 87 85 pH value3 EC (microScm) 370 386 379 444 460 385 422 417 ECmdashElectrical conductivity4 SS (mgL) 13 6 10 39 12 17 6 9 SSmdashSuspended solids5 OS () 87 935 895 95 815 91 87 89 OSmdashOxygen saturation6 BOD5 (mgL) 17 39 58 26 22 18 53 25 BOD5mdashBiochemical oxygen consumption for 5 days7 NH4 (mgL) 025 022 047 026 046 021 046 034 NH4mdashAmmonium ion8 PO4 (mgL) 026 015 057 021 018 013 022 016 PO4mdashOrthophosphates9 NO3 (mgL) 224 249 429 354 382 322 293 221 NO3mdashTotal nitrogen oxides10 CB (MPN in 100 mL) 2325 4385 1728 1145 730 1250 1720 747 CBmdashColiform bacteria
Sustainability 2021 13 5229 13 of 15
References1 Dong H Geng Y Sarkis J Fujita T Okadera T Xue B Regional water footprint evaluation in China A case of Liaoning Sci
Total Environ 2013 442 215ndash224 [CrossRef]2 OrsquoConnell E Towards Adaptation of Water Resource Systems to Climatic and Socio-Economic Change Water Resour Manag
2017 31 2965ndash2984 [CrossRef]3 Kowalkowski T Zbytniewski R Szpejna J Buszewski B Application of chemometrics in river water classification Water Res
2006 40 744ndash752 [CrossRef] [PubMed]4 Coacuterdoba EB Martiacutenez AC Ferrer EV Water quality indicators Comparison of a probabilistic index and a general quality
index The case of the Confederacioacuten Hidrograacutefica del Juacutecar (Spain) Ecol Indic 2010 10 1049ndash1054 [CrossRef]5 Sasakova N Gregova G Takacova D Mojzisova J Papajova I Venglovsky J Szaboova T Kovacova S Pollution of Surface
and Ground Water by Sources Related to Agricultural Activities Front Sustain Food Syst 2018 2 1ndash11 [CrossRef]6 Kawo NS Karuppannan S Groundwater quality assessment using water quality index and GIS technique in Modjo River
Basin central Ethiopia J Afr Earth Sci 2018 147 300ndash311 [CrossRef]7 Farooqui KM Sar SK Diwan V Investigation of water quality in Ambur city by water quality indexing Holist Approach
Environ 2020 10 48ndash52 [CrossRef]8 Cude CG Oregon water quality index a tool for evaluating water quality management effectiveness Jawra J Am Water Resour
Assoc 2001 37 125ndash137 [CrossRef]9 Boyacioglu H Development of a water quality index based on a European classification scheme Water Sa 2009 33 101ndash106
[CrossRef]10 Rocha FC Andrade EM Lopes FB Water quality index calculated from biological physical and chemical attributes Environ
Monit Assess 2014 187 4163 [CrossRef]11 Abuzaid AS Evaluating surface water quality for irrigation in Dakahlia Governorate using water quality index and GIS J Soil
Sci Agric Eng Mansoura Univ 2018 9 481ndash49012 Khan H Khan AA Hall S The Canadian Water Quality Index A tool for water resources management In Proceedings of the
MTERM International Conference AIT Pathum Thani Thailand 6ndash10 June 2005 pp 1ndash813 Lumb A Halliwell D Sharma T Application of CCME Water Quality Index to Monitor Water Quality A Case Study of the
Mackenzie River Basin Canada Environ Monit Assess 2006 113 411ndash429 [CrossRef] [PubMed]14 Bharti N Katyal D Water quality indices used for surface water vulnerability assessment International journal of environmental
sciences 2011 1 154ndash17315 Sutadian AD Muttil N Yilmaz AG Perera B Development of river water quality indicesmdashA review Environ Monit Assess
2016 188 1ndash29 [CrossRef] [PubMed]16 Mititelu-Ionus O Water Quality IndexmdashAssessment method of the Motru river water quality (Oltenia Romaia) Univ Craiova
Ser Geogr 2010 13 74ndash8317 Yisa J Analytical Studies on Water Quality Index of River Landzu Am J Appl Sci 2010 7 453ndash458 [CrossRef]18 Jakovljevic D Serbian and Canadian water quality index of Danube river in Serbia in 2010 J Geogr Inst Jovan Cvijicsasa 2012 62
1ndash18 [CrossRef]19 Walker D JakovljeviC D Savic D Radovanovic M Multi-criterion water quality analysis of the Danube River in Serbia A
visualisation approach Water Res 2015 79 158ndash172 [CrossRef]20 Josimov-Dunderski J Savic R Grabic J Blagojevic B Water quality of the Danube River in the Pannonian part of its flow
through Serbia Letopis Naucnih RadovaAnn Agron 2016 40 8ndash1421 Mladenovic-Ranisavljevic II Žerajic SA Comparison of different models of water quality index in the assessment of surface
water quality Int J Environ Sci Technol 2017 15 665ndash674 [CrossRef]22 Milijasevic-Joksimovic D Gavrilovic B Lovic-Obradovic S Application of the water quality index in the Timok River basin
(Serbia) J Geogr Inst Jovan Cvijicsasa 2018 68 333ndash344 [CrossRef]23 Babic G Vukovic M Voza D Takic L Mladenovic-Ranisavljevic I Assessing Surface Water Quality in the Serbian Part of the
Tisa River Basin Pol J Environ Stud 2019 28 4073ndash4085 [CrossRef]24 Doderovic M Mijanovic I Buric D Milenkovic M Assessment of the water quality in the Moraca River basin (Montenegro)
using water quality index Glas Srp Geogr Drus 2020 100 67ndash81 [CrossRef]25 Djuraškovic P Water Quality IndexmdashWQI as Tool of Water Quality Assessment Available online httpbalwoiscomwp-
contentuploadsold_procffp-2026pdf (accessed on 12 February 2021)26 Vukašinovic-Pešic V Blagojevic N Savic A Tomic N Pešic V The Change in the Water Chemistry of the Rivers of Montenegro
over a 10-Year Period In The Handbook of Environmental Chemistry Springer Cham Switzerland 2019 Volume 93 pp 83ndash10927 Kolarevic S Kracun-Kolarevic M Jovanovic J Ilic M Paunovic M Kostic-Vukovic J Martinovic R Jokanovic S
Joksimovic D Pešic V et al Microbiological Water Quality of Rivers in Montenegro Handb Environ Chem 2019 93 135ndash155[CrossRef]
28 WHO Regional Office for Europe Evolution of WHO Air Quality Guidelines Past Present and Future WHO Regional Office forEurope Copenhagen Denmark 2017
Sustainability 2021 13 5229 14 of 15
29 Cohen AJ Brauer M Burnett R Anderson HR Frostad J Estep K Balakrishnan K Brunekreef B Dandona L DandonaR et al Estimates and 25-year trends of the global burden of disease attributable to ambient air pollution An analysis of datafrom the Global Burden of Diseases Study 2015 Lancet 2017 389 1907ndash1918 [CrossRef]
30 Vodonos A Abu Awad Y Schwartz J The concentration-response between long-term PM25 exposure and mortality Ameta-regression approach Environ Res 2018 166 677ndash689 [CrossRef]
31 WHO Burden of Disease from Ambient Air Pollution for 2016 Available online httpswwwwhointairpollutiondataAAP_BoD_results_May2018_finalpdf (accessed on 12 February 2021)
32 Karagulian F Belis CA Dora CFC Pruumlss-Ustuumln AM Bonjour S Adair-Rohani H Amann M Contributions to citiesrsquoambient particulate matter (PM) A systematic review of local source contributions at global level Atmos Environ 2015 120475ndash483 [CrossRef]
33 Yang D Ye C Wang X Lu D Xu J Yang H Global distribution and evolvement of urbanization and PM25 (1998ndash2015)Atmos Environ 2018 182 171ndash178 [CrossRef]
34 Stanojevic GB Miljanovic DN Doljak DL Curcic NB Radovanovic MM Malinovic-Milicevic SB Hauriak O Spatio-temporal variability of annual PM25 concentrations and population exposure assessment in Serbia for the period 2001-2016 JGeogr Inst Jovan Cvijicsasa 2019 69 197ndash211 [CrossRef]
35 Fuzzi S Baltensperger U Carslaw K Decesari S Van Der Gon HD Facchini MC Fowler D Koren I Langford BLohmann U et al Particulate matter air quality and climate Lessons learned and future needs Atmos Chem Phys Discuss2015 15 8217ndash8299 [CrossRef]
36 European Environmental Agency Air Quality in Europemdash2018 Report 2018 Available online httpswwweeaeuropaeupublicationsair-quality-in-europe-2018 (accessed on 12 February 2021)
37 Vicente E Alves C An overview of particulate emissions from residential biomass combustion Atmos Res 2018 199 159ndash185[CrossRef]
38 Beelen R Hoek G Brandt PAVD Goldbohm RA Fischer P Schouten LJ Jerrett M Hughes E Armstrong BBrunekreef B Long-Term Effects of Traffic-Related Air Pollution on Mortality in a Dutch Cohort (NLCS-AIR Study) EnvironHeal Perspect 2008 116 196ndash202 [CrossRef] [PubMed]
39 Samoli E Peng R Ramsay T Pipikou M Touloumi G Dominici F Burnett R Cohen A Krewski D Samet J et al AcuteEffects of Ambient Particulate Matter on Mortality in Europe and North America Results from the APHENA Study EnvironHeal Perspect 2008 116 1480ndash1486 [CrossRef]
40 Maciejewska K Short-term impact of PM25 PM10 and PMc on mortality and morbidity in the agglomeration of WarsawPoland Air Qual Atmos Health 2020 13 659ndash672 [CrossRef]
41 IARC Outdoor Air Pollution a Leading Environmental Cause of Cancer Deaths 2013 Available online httpswwwiarcwhointwp-contentuploads201807pr221_Epdf (accessed on 20 March 2021)
42 Osnovni Podaci o Termoelektrani ldquoPljevljardquo (Basic Information about Thermal Power Plant ldquoPljevljardquo) Available onlinehttpswwwepcgcomo-namatermoelektrana-pljevlja (accessed on 7 January 2021)
43 MONSTAT Zavod za Statistiku Crne Gore MONSTAT (First Results Census of Population Households and Dwellings inMontenegro) Available online httpswwwmonstatorguserfilesfilepopis2011saopstenjeknjiga_prvi20rezultati(1)pdf(accessed on 13 January 2021)
44 Hrvacevic S Resursi površinskih voda Crne Gore Elektroprivreda Crne Gore AD Nikšic Nikšic Podgorica 2004 p 33145 Zavod za Hidrometeorlogiju i Seizmologiju Crne Gore (Institute of Hydrometeorology and Seismology of Montenegro) Godišnji
Izvještaji za Period 2011ndash2018 (Annual Reports for the Period 2011ndash2018) Available online httpwwwmeteocome (accessedon 15 January 2021)
46 Buric D Ducic V Mihajlovic J The climate of Montenegro Modificators and types - part two Glas Srp Geogr Drus 2014 9473ndash90 [CrossRef]
47 Centar za Ekotoksikološka Istraživanja Crne Gore (Center for Eco-Toxicological Research of Montenegro) Godišnji Izvještaji zaPeriod 2011ndash2018 (Annual Reports for the Period 2011ndash2018) Available online httpmnecetime (accessed on 6 March 2021)
48 Lopes FB Teixeira AS Andrade EM Aquino DN Arauacutejo LFP Mapa da qualidade das aacuteguas do rio Acarauacute pelo empregodo IQA e Geoprocessamento (Map of Acarauacute River water quality by the use of WQI and GIS) Revista Ciecircncia Agronocircmica 200839 392ndash402
49 Hurley T Sadiq R Mazumder A Adaptation and evaluation of the Canadian Council of Ministers of the Environment WaterQuality Index (CCME WQI) for use as an effective tool to characterize drinking source water quality Water Res 2012 463544ndash3552 [CrossRef]
50 Garcia CAB Silva IS Mendonccedila MCS Garcia HL Evaluation of Water Quality Indices Use Evolution and FuturePerspectives Adv Environ Monit Assess 2019 18 [CrossRef]
51 Hernea C Teche-Constantinescu AM Variability of groundwater quality parameters from periurban area of Timisoara(Romania) J Environ Prot Ecol 2013 14 64ndash70
52 Lumb A Sharma TC Bibeault J-F A Review of Genesis and Evolution of Water Quality Index (WQI) and Some FutureDirections Water Qual Expo Health 2011 3 11ndash24 [CrossRef]
53 EU Directive on Ambient Air Quality and Cleaner Air for Europe Available online httpseur-lexeuropaeulegal-contentENTXTPDFuri=CELEX32008L0050ampfrom (accessed on 10 March 2021)
Sustainability 2021 13 5229 15 of 15
54 WHO Ambient (Outdoor) Air Pollution Available online wwwwhointmediacentrefactsheetsfs313enindexhtml (accessedon 6 March 2021)
55 Buric D Stanojevic G Trends and possible causes of cloudiness variability in Montenegro in the period 1961ndash2017 Clim Res2020 81 187ndash205 [CrossRef]
56 Ministarstvo Održivog Razvoja i Turizma Crne Gore (Ministry of Sustainable Development and Tourism of Montenegro)Nacionalna Strategija Upravljanja Kvalitetom Vazduha sa Akcionim Planom za Period 2013ndash2016 (National Air QualityManagement Strategy with Action Plan for the Period 2013ndash2016) Available online httpsNacionalna20strategija20upravljanja20kvalitetom20vazduha20sa20Akcionim20planompdf (accessed on 11 March 2021)
- Introduction
- Research Area Materials and Methods
-
- Research Area
- Materials and Methods
-
- Results
-
- Water Quality Index Analysis (WQI)
- Analysis of PM10 Concentration of Suspended Particles
-
- Conclusions
- References
-
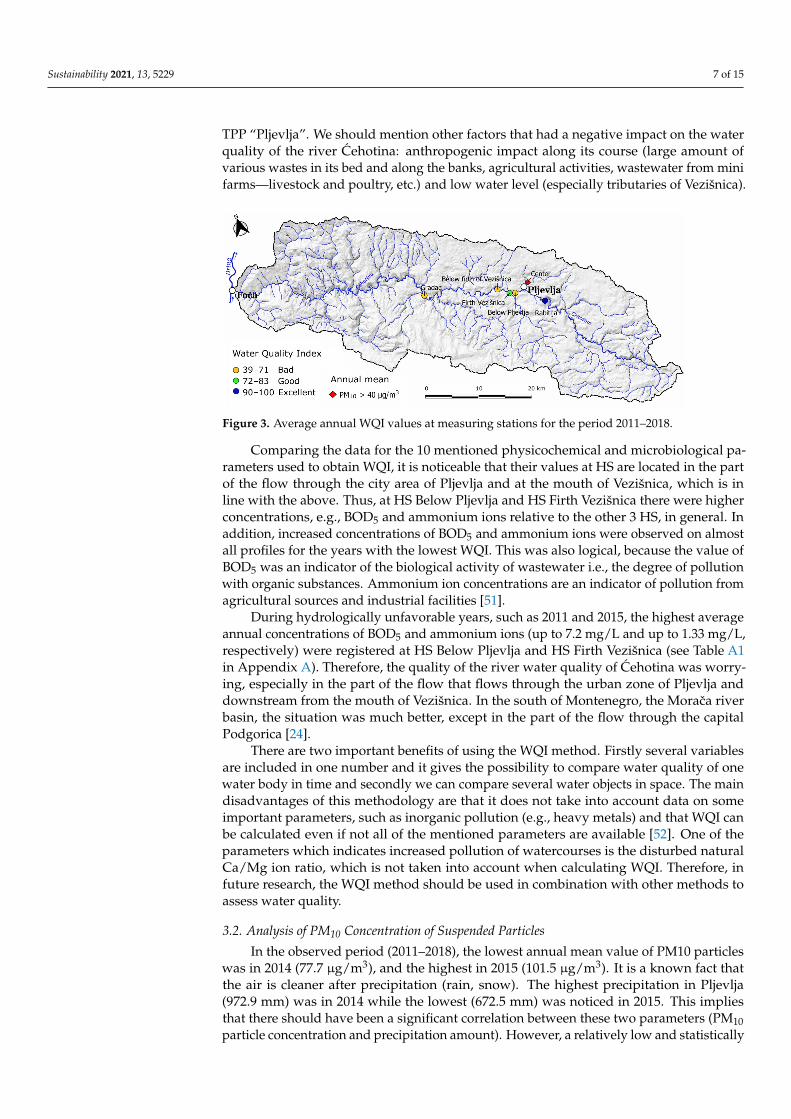
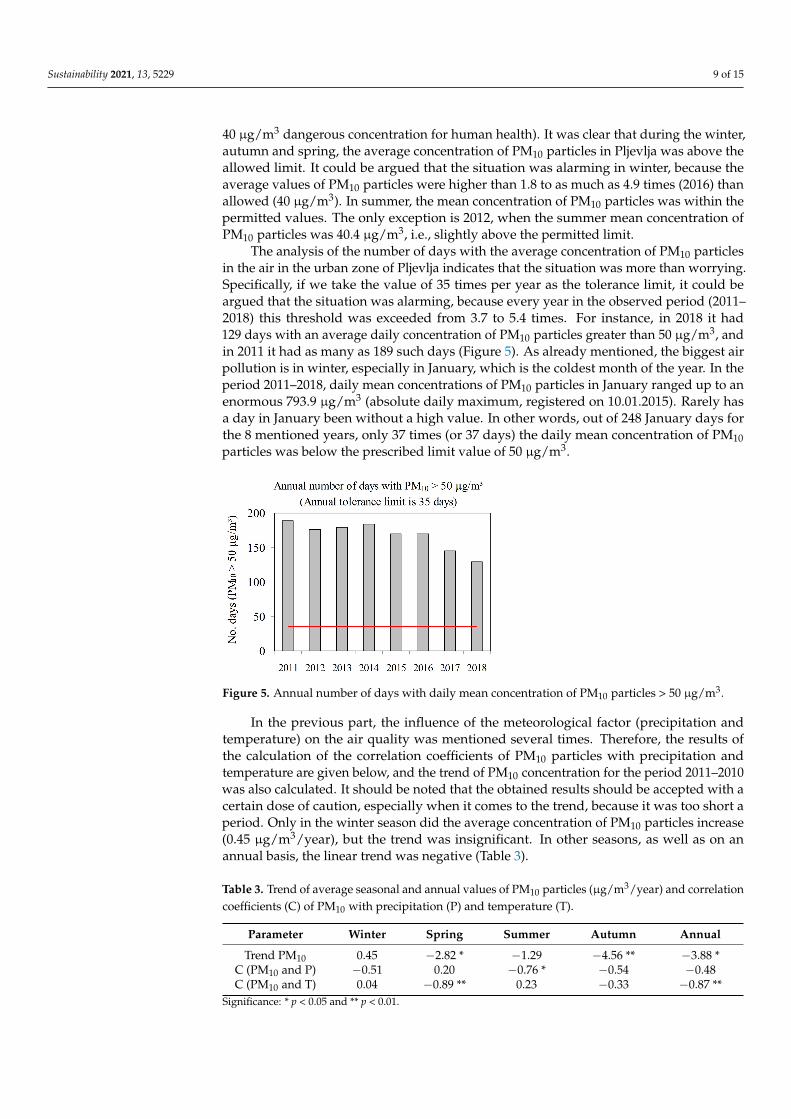
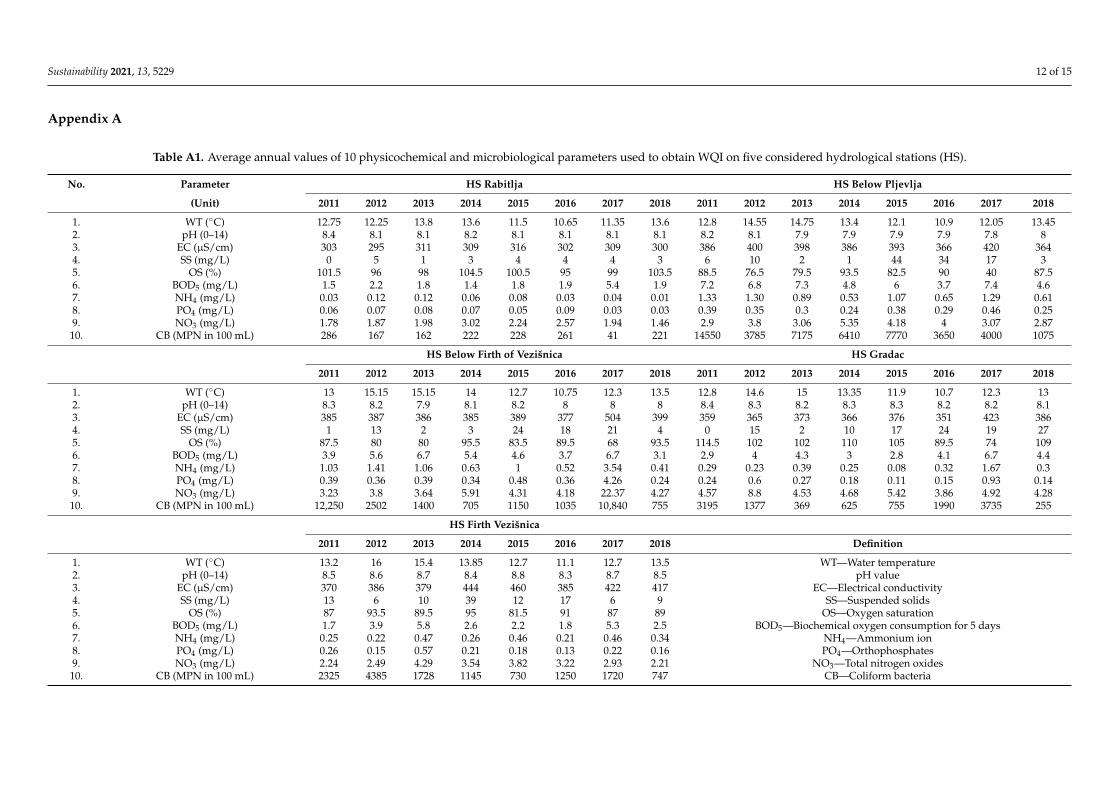