Analysis of Reform Models for Extending Health Care Coverage in New Mexico. Washington, DC:...
84
MPR Reference No.: 6429 Analysis of Reform Models for Extending Health Care Coverage in New Mexico Final Report March 2008 Deborah Chollet Mathematica Policy Research Lee Reynis Bureau of Business and Economic Research University of New Mexico Submitted to: State of New Mexico Legislative Council Service Suite 411, 490 Old Santa Fe Trail Santa Fe, NM 87501 Telephone: (505) 986-4671 Facsimile: (505) 986-4680 Project Officer: Raul E. Burciaga Submitted by: Mathematica Policy Research, Inc. 600 Maryland Ave., S.W., Suite 550 Washington, DC 20024-2512 Telephone: (202) 484-9220 Facsimile: (202) 863-1763 Project Director: Deborah Chollet
Transcript of Analysis of Reform Models for Extending Health Care Coverage in New Mexico. Washington, DC:...

MPR Reference No.: 6429
Analysis of Reform Models for Extending Health Care Coverage in New Mexico
Final Report March 2008 Deborah Chollet Mathematica Policy Research Lee Reynis Bureau of Business and Economic Research University of New Mexico
Submitted to: State of New Mexico Legislative Council Service Suite 411, 490 Old Santa Fe Trail Santa Fe, NM 87501 Telephone: (505) 986-4671 Facsimile: (505) 986-4680
Project Officer: Raul E. Burciaga
Submitted by:
Mathematica Policy Research, Inc. 600 Maryland Ave., S.W., Suite 550 Washington, DC 20024-2512 Telephone: (202) 484-9220 Facsimile: (202) 863-1763
Project Director: Deborah Chollet

PAGE IS INTENTIONALLY LEFT BLANK TO ALLOW FOR DOUBLE-SIDED COPYING

iii
ACKNOWLEDGEMENTS
We are indebted to a number of individuals whose participation and assistance in developing and producing this report have been essential and invaluable. Su Liu, who participated extensively in Mathematica’s earlier report for the Health Coverage for New Mexicans Committee, provided consultation and assistance in development of the new base case and estimates of expenditures in the reform models. Thomas Bell, initially a senior analyst at Scientific and Social Systems and currently a principal program analyst at Mathematica Policy Research, provided expert data management and programming assistance throughout the project. Allison Barrett, a research analyst at Mathematica Policy Research, helped to prepare the cost analyses and provided assistance in documentation and quality control. James Mays, Vice President for Management of Actuarial Research Corporation, and Monica Brenner developed actuarial induction factors for our earlier report, which were incorporated into the estimates presented in this report. Finally, Jackie McGee produced the report documents.
The Bureau of Business and Economic Research at the University of New Mexico would
like to thank staff economists Nicholas Potter and Daren Ruiz for modeling the complexities of each of the alternative reform models using IMPLAN, for the care with which they checked and cross-checked the numbers, and for their numerous insights throughout the process. Completing this project would have been impossible without their sustained focus and effort and that of our graduate student research assistant, Lucinda Sydow. Thanks also go to our economic forecaster Larry Waldman and staffer Richard Zimmerman, to Betsy Eklund, our administrator, and to students Micah Le Lugas and Stephanie Chu.
Of course, any errors or shortcomings of this report remain the responsibility of the authors.

PAGE IS INTENTIONALLY LEFT BLANK TO ALLOW FOR DOUBLE-SIDED COPYING

v
CONTENTS
Chapter Page
EXECUTIVE SUMMARY ........................................................................................ xi
I INTRODUCTION ....................................................................................................... 1
A. SUMMARY OF THE REFORM MODELS..................................................... 1
B. SPECIFICATIONS FOR DEVELOPING ESTIMATES ................................. 3
II METHODS .................................................................................................................. 7
A. THE MICROSIMULATION DATABASE...................................................... 7
1. Population Data ....................................................................................... 7 2. Expenditure Data ..................................................................................... 9 3. Benefit Design....................................................................................... 10 4. Nonmedical Cost Estimates................................................................... 11
B. THE MICROSIMULATION MODEL ........................................................... 13
III CURRENT-CASE COVERAGE AND COVERAGE IN THE REFORM
MODELS ................................................................................................................... 15
A. PROJECTED COVERAGE IN THE CURRENT CASE ............................... 15
B. COVERAGE ESTIMATES IN THE REFORM MODELS ........................... 19
1. Major Assumptions ............................................................................... 19 2. Sources of Coverage.............................................................................. 21 3. Changes in Coverage............................................................................. 24 4. Sources of Coverage for Uninsured New Mexicans ............................. 25

CONTENTS (continued)
Chapter Page
vi
IV EXPENDITURES IN THE CURRENT CASE AND IN THE REFORM MODELS ................................................................................................................... 27
A. TOTAL EXPENDITURES IN THE CURRENT CASE ................................ 27
B. CHANGE IN EXPENDITURES IN THE REFORM MODELS.................... 29
1. Major Assumptions ............................................................................... 29 2. Total Costs of the Reform Models ........................................................ 32 3. Changes in Cost by Major Payer ........................................................... 35
C. PROJECTED COST GROWTH ..................................................................... 37
V FINANCING.............................................................................................................. 41
A. FINANCING PROVISIONS OF THE REFORM MODELS......................... 41
B. ESTIMATES OF STATE FINANCING......................................................... 44
C. AFFORDABILITY AND COMPLIANCE..................................................... 46
D. FINANCING SUMMARY ............................................................................. 47
VI ECONOMIC IMPACTS OF IMPLEMENTING HEALTHSOLUTIONS NEW
MEXICO.................................................................................................................... 51
A. CHANGES UNDER HEALTHSOLUTIONS ................................................ 51
B. ESTIMATED ECONOMIC IMPACTS OF HEALTHSOLUTIONS ............ 55
C. ESTIMATED IMPACTS ON METRO AND NON-METRO AREAS.......... 59
APPENDIX A: NEW MEXICO HEALTH SOLUTIONS:
SPECIFICATIONS FOR COVERAGE, COST, AND FUNDING ESTIMATES............................................................A.1

vii
TABLES
Tables Page
II.1 AVERAGE ANNUAL MEDICAL COST GROWTH PER MEMBER PER MONTH, BY PAYER ................................................................................................... 10
II.2 MEASURES OF BENEFIT DESIGN: ESTIMATED AVERAGE COPAYMENT RATES BY SOURCE OF COVERAGE AND TYPE OF SERVICE IN THE CURRENT CASE.......................................................................................................... 11
II.3 MARGINAL COST OF PROGRAM ADMINISTRATION BY PLAN SPONSOR ... 12
II.4 TOTAL NONMEDICAL COST AS A PERCENT OF TOTAL COST BY PAYER IN THE CURRENT CASE............................................................................................ 13
III.1 CHARACTERISTICS OF THE INSURED AND UNINSURED POPULATIONS IN THE CURRENT CASE, PROJECTED FY2010 ..................................................... 18
III.2 ESTIMATED NUMBER AND PERCENT OF PERSONS IN THE CURRENT CASE AND SIMULATED REFORM MODELS BY SOURCE OF COVERAGE..... 22
III.3 SIMULATED SOURCES OF COVERAGE FOR CURRENTLY UNINSURED NEW MEXICAN IN THE REFORM MODELS, FY2010........................................... 26
IV.1 PROJECTED HEALTH CARE EXPENDITURES FOR NONINSTITUTIONALIZED CIVILIAN NEW MEXICANS UNDER AGE 65 BY SOURCE OF FUNDS IN THE CURRENT CASE, FY2010 ................................. 28
IV.2 ESTIMATED AMOUNT AND PERCENT OF TOTAL HEALTH CARE EXPENDITURES IN THE CURRENT CASE AND REFORM MODELS BY SOURCE OF PAYMENT, FY2010 .............................................................................. 33
IV.3 SIMULATED NET CHANGE IN 2007 TOTAL HEALTH CARE EXPENDITURES UNDER EACH REFORM MODEL COMPARED WITH THE CURRENT CASE, PROJECTED FY2010 ................................................................... 36
IV.4 PROJECTED DIFFERENCE IN TOTAL HEALTH CARE EXPENDITURES IN THE REFORM MODELS COMPARED WITH THE CURRENT CASE, FY2010-FY2014........................................................................................................................... 38
V.1 PROPOSED FINANCING OF THE REFORM MODELS .......................................... 43
V.2 ESTIMATED FINANCING OF STATE PROGRAMS IN THE REFORM MODELS ....................................................................................................................... 45

TABLES (continued)
Table Page
viii
V.3 ESTIMATED REVENUE FROM ALTERNATIVE LEVELS OF A HEALTHY WORKFORCE CONTRIBUTION: HEALTHSOLUTIONS, FY2010 ....................... 47
V.4 ESTIMATED TOTAL HEALTH CARE EXPENDITURES AND CHANGE FROM THE CURRENT CASE BY FEDERAL, STATE, AND PRIVATE SOURCES OF FUNDS: ALL REFORM MODELS, FY2010-FY2014 ...................... 49
VI.1 ESTIMATED COSTS OF HEALTH INSURANCE ADMINISTRATION BY PAYER TYPE: HEALTHSOLUTIONS COMPARED WITH THE CURRENT CASE, FY2010 .............................................................................................................. 52
VI.2 ESTIMATED CHANGES IN WHO PAYS: HEALTHSOLUTIONS COMPARED WITH THE CURRENT CASE, FY2010 .............................................. 53
VI.3 ESTIMATED CHANGES IN HOUSEHOLD EXPENDITURES FOR INDIVIDUAL AND EMPLOYEE HEALTH PREMIUMS AND OUT-OF-POCKET HEALTH CARE COSTS BY FAMILY INCOME CATEGORY: HEALTHSOLUTIONS, FY2010 .................................................................................. 54
VI.4 ESTIMATED EMPLOYER CONTRIBUTIONS BY FAMILY INCOME CATEGORY: HEALTHSOLUTIONS COMPARED WITH THE CURRENT CASE, FY2010 .............................................................................................................. 55
VI.5 ESTIMATED ECONOMIC IMPACTS: HEALTHSOLUTIONS, FY 2010............... 56
VI.6 ESTIMATED CHANGE IN WAGE AND SALARY EMPLOYMENT BY INDUSTRY GROUP: HEALTHSOLUTIONS, FY2010 ............................................ 57
VI.7 ESTIMATED CHANGES IN WAGE AND SALARY DISBURSEMENTS: HEALTHSOLUTIONS, FY2010 .................................................................................. 58
VI.8 ESTIMATED ECONOMIC IMPACTS IN METRO AND NON-METRO AREAS: HEALTHSOLUTIONS FY2010 ................................................................................... 60
ix
FIGURES
Figure Page
II.1 ESTIMATED PERCENT OF NEW MEXICANS UNDER AGE 65 WITH PRIVATE COVERAGE, 2000-2006............................................................................... 8
III.1 PROJECTED PERCENTAGE OF NEW MEXICANS UNDER AGE 65 BY PREDOMINANT SOURCE OF HEALTH COVERAGE, FY2010 ............................. 16
III.2 PROJECTED DISTRIBUTION OF NEW MEXICANS UNDER AGE 65 WITH EMPLOYER-SPONSORED COVERAGE BY SOURCE OF PLAN, IN THE CURRENT CASE (NO REFORM), FY2010 ................................................................ 17
III.3 PERCENTAGE OF NEW MEXICANS BY PREDOMINANT SOURCE OF HEALTH INSURANCE COVERAGE, CURRENT CASE AND SIMULATED REFORM MODELS FY2010........................................................................................ 23
III.4 SIMULATED NET CHANGE IN THE NUMBER OF INSURED NEW MEXICANS BY SOURCE OF COVERAGE COVERED IN THE REFORM MODELS, FY2010 ........................................................................................................ 25
IV.1 PROJECTED TOTAL EXPENDITURES BY FEDERAL, STATE, AND PRIVATE SOURCES OF FUNDS, FY2010................................................................. 35

PAGE IS INTENTIONALLY LEFT BLANK TO ALLOW FOR DOUBLE-SIDED COPYING

xi
EXECUTIVE SUMMARY
Despite New Mexico’s significant and ongoing effort to enroll residents who are eligible for Medicaid or SCHIP in those programs, the number of New Mexicans who are uninsured at least six months during the year is projected to reach 18 percent of the noninstitutionalized civilian population under age 65 by FY2010. Responding to concerns about the high and growing number of New Mexicans without coverage, the Legislative Council Service (LCS) requested that Mathematica Policy Research, Inc. develop estimates of the cost of four alternative reform models intended to ensure that all New Mexicans become and remain insured.
In an earlier report, Mathematica developed calendar year 2007 estimates for three reform
models—the Health Security Act, two versions of New Mexico Health Choices, and the Health Coverage Plan. This report updates those estimates to fiscal year (FY) 2010 and also provides estimates for a new reform model, HealthSolutions New Mexico, proposed by Governor Bill Richardson.
Mathematica’s estimates rely on a microsimulation model developed expressly for the
purpose of estimating health insurance coverage in New Mexico. The model simulates a source of coverage for each New Mexican under age 65 who is not residing in an institution such as a prison or medical facility. Each of the reform models would require that all New Mexicans obtain coverage through either a public program or private insurance, and each could adopt equally effective methods to ensure compliance. For the purpose of comparing the reform models, we assume that each achieves full compliance with the individual mandate.
Coverage Results
• Compared with the other reform models, HealthSolutions New Mexico would produce the highest rate of private insurance coverage: 54 percent of the noninstitutionalized civilian population under age 65 would be privately insured, predominantly in employer-based coverage. Approximately 44 percent of New Mexicans under age 65 would enroll in Medicaid, the State Children’s Health Insurance Program (SCHIP), or State Coverage Insurance (SCI).
• The Health Security Act would enroll 95 percent of the noninstitutionalized civilian population under age 65 in the Health Security Plan. Of these, more than half would be enrolled in Medicaid or SCHIP; SCI would be discontinued. Approximately 5 percent would remain in self-insured employer coverage.
• New Mexico Health Choices (versions 1 and 2) would entail the highest enrollment in Medicaid or SCHIP: these programs would cover 55 percent of the civilian noninstititionalized population under age 65. An additional 38 percent of the population would enroll in the new Health Choices program, and 5 to 12 percent would remain in self-insured employer-sponsored coverage. The difference in self-insured employer-sponsored coverage between the two versions of this reform model relates to differences in their financing strategies.

xii
• Similar to HealthSolutions, the Health Coverage Plan would enroll 53 percent of the noninstitutionalized civilian population under age 65 in private insurance; 45 percent would enroll in Medicaid, SCHIP, or SCI. Compared with HealthSolutions, the Health Coverage plan would enroll a slightly higher proportion of New Mexicans in Medicaid and SCHIP, reflecting more generous income disregards for determining eligibility.
Expenditures for Medical Services and Nonmedical Cost
• HealthSolutions New Mexico would increase total health expenditures—including expenditures for medical services and coverage administration—by an estimated $236 million in FY2010, with federal government paying nearly half of increase in total spending. State government would pay an additional $36 million, and the private sector would pay the remainder. The Health Coverage Plan would be similar in terms of the increase in expenditure, although the federal government would pick up a slightly higher proportion of the spending due to higher enrollment in Medicaid.
• The Health Security Act would result in reduced overall expenditures—even in the first year of implementation. While expenditures for direct patient care would increase, the Health Security Plan would realize significant savings in the administration of coverage, largely eliminating private health insurance and potentially also reducing provider administrative costs. The federal government would pick up a substantially larger share of total health care expenditures due to the substitution of Medicaid for some current private insurance. The State would assume responsibility for nearly all of the expenditure that now flows through the private sector.
• The largest increase in overall spending would occur under New Mexico Health Choices, reflecting the relatively high administrative cost of this reform model. Its higher anticipated administrative cost relates to two features: (1) the need to screen every New Mexican for the purpose of issuing income-related vouchers; and (2) the retention of private insurance carriers in the Alliance with no provision for limiting their nonmedical cost. By expanding eligibility for SCHIP coverage, it also would generate significant substitution of public coverage for private insurance.
All of the reform models have some provision that would address medical cost. The estimates assume that each of the reform models would adopt best practices in this area and would be equally effective, but only moderately so. Relative to the current case, the estimates assume that the reform models succeed in reducing the medical cost trend by just 1 percentage point below the current-case trend and sustaining the 1-point reduction over 5 years.
• By FY2014, HealthSolutions New Mexico would cost less than the current case—with no reform beyond the State’s current efforts to increase enrollment in Medicaid and SCHIP among New Mexicans who are eligible for those programs. Because Medicaid already constrains spending below the statewide medical cost trend, all of

xiii
the benefit of the overall lower medical cost trend would accrue to the private sector. Net federal spending would increase, and net state spending would equal just $4 million more than would occur in the current case, with no control on medical cost trend.
• The Health Security Act would achieve lower cost in the first year of implementation and cost savings would accumulate. The lower cost trend of the Health Security Act relates to its ability to divorce nonmedical cost from the medical cost trend. (In contrast, reform models that would retain private insurance are assumed to retain the convention of increasing nonmedical costs at the same rate as medical costs.) Consequently, the Health Security Plan would achieve much slower growth in nonmedical cost, assumed to equal average net earnings growth in New Mexico.
• New Mexico Health Choices also would achieve lower cost growth than the current case, but after five years, total expenditures would remain substantially higher than the current case. The higher cost growth of New Mexico Health Choices relative to either HealthSolutions or the Health Security Act relates to the retention of private insurers in the Alliance and to Health Choices’ including public program enrollees in the Alliance on the same basis other enrolled individuals.
• The Health Coverage Plan also would become less costly than the current case by FY2014. Because the Health Coverage Plan would rely more heavily on Medicaid and SCHIP—with lower medical cost growth and lower administrative expense than private insurance—it would reduce total expenditures more than HealthSolutions New Mexico.
Financing
• In addition to $155 million in new federal funding for Medicaid and SCHIP, HealthSolutions New Mexico would entail additional State appropriations for these programs and for the new Health Care Authority. Revenues to support additional state expenditures would come from SCI enrollee premiums ($20 million), employer contributions to a new Healthy Workforce Fund ($30 million), and the appropriation of premium tax revenue related to new coverage in SCI ($8 million).
• The Health Security Act would draw a larger increase in federal funding ($314 million to $391 million, depending on levels of provider reimbursement), as a result of much greater enrollment in Medicaid and SCHIP. Health Security Plan coverage for all other enrollees would be financed by premiums and a payroll tax. Premiums (not to exceed 6 percent of income) would finance approximately $1.5 billion of this expenditure, supplemented by an estimated payroll tax of 2.8 to 3.0 percent on all nonfederal workers.
• New Mexico Health Choices would enroll many more New Mexicans in Medicaid and SCHIP, drawing much more new federal expenditure—$835 million (version 2) to $849 million (version 2) in FY2010. Otherwise, version 1 would be entirely payroll tax financed—entailing an estimated 7.3 percent tax on all nonfederal workers. Version 2 would be partly financed with premiums—like the Health
xiv
Security Act, capped at 6 percent of family income. Premiums would finance $584 million of the estimated state cost, supplemented by an estimated tax of 4.7 percent on nonfederal payroll.
• The Health Coverage Plan anticipates $135 million in new federal revenues and $19 million in premiums from new SCI enrollees. In addition, all employers would make a Fair Share payment for each worker (full or part-time) whom they do not cover directly. A $300 Fair Share payment would create an estimated funding surplus of $59 million in FY2010.
Economic Impacts
Economic impacts are calculated only for HealthSolutions New Mexico in this report. We anticipate that the economic impacts of the Health Coverage Plan (updated to FY2010) would be very similar to those for HealthSolutions New Mexico, and that the relative impacts of the Health Security Plan and New Mexico Health Choices would be similar to those described in our earlier report.
• The net total impacts of HealthSolutions New Mexico on the economy would be small. Total wage and salary disbursements would increase approximately 0.2 percent in FY2010, compared with the current case. The greatest net impacts would occur in retail trade (including pharmacies and businesses that sell medical equipment and supplies), health care, and social assistance.
• HealthSolutions New Mexico’s limited net impacts on the economy reflect the relatively small projected net increase in federal government spending on health care ($114 million) compared with the current case. However, the current case reflects aggressive outreach to enroll eligible New Mexicans in Medicaid and SCHIP. If enrollment in these programs expanded more slowly in FY2008-FY2010, HealthSolutions New Mexico would cause a larger increase in total spending to achieve universal coverage, a larger infusion of federal funds, and greater growth in the New Mexico economy.
• Approximately 20 percent of the net economic impacts of HealthSolutions New Mexico would occur in nonmetropolitan areas, reflecting high projected enrollment in Medicaid, SCHIP, and SCI in nonmetropolitan areas in the current case. If the state’s ongoing efforts to enroll rural residents in these programs produces lower enrollment than is anticipated in the current case, the economic impacts of HealthSolutions in rural areas would be greater.

1
I. INTRODUCTION
The Legislative Council Service (LCS) requested that Mathematica Policy Research, Inc. project the cost of the four alternative reform models intended to insure all New Mexicans, relative to the current case with no reform. In an earlier report, Mathematica developed calendar year 2007 estimates for three reform models—the Health Security Act, two versions of New Mexico Health Choices, and the Health Coverage Plan. This report offers projections of these reform models to FY2010, as well as projections for a new reform model—HealthSolutions New Mexico, proposed by Governor Bill Richardson.
A. SUMMARY OF THE REFORM MODELS
The initial three reform models, described in documents developed by the Committee and made available to the project, are summarized below. The new reform model, HealthSolutions New Mexico, is described in documents available on the State of New Mexico web site.1 All of the reform models would require individuals to become and remain enrolled in coverage, and all would establish some entity to develop strategies for system-wide cost control.
• The Health Security Act would create a single statewide comprehensive health insurance plan—the Health Security Plan—similar to that provided to state employees. It would replace an array of state health insurance programs developed to enroll small-groups and individuals: the State Coverage Insurance Program (SCI), the Small Employer Insurance Program (SEIP), the Health Insurance Alliance (HIA), and the New Mexico Medical Insurance Pool (NMMIP). The Health Security Plan would enroll individuals, who would pay premiums scaled to income. Employers would pay a percentage of payroll to finance the plan, and self-insured employers could choose whether to participate. The Health Security Plan’s governing board would negotiate provider fees and facility budgets, and the state would seek federal waivers to integrate Medicaid beneficiaries and financing into the plan. The plan would exclude federal workers, and it would hope to become a Medicare Advantage plan. The Health Security Plan would cover all New Mexicans with specific exceptions—including federal employees and retirees, active or retired military personnel and their covered dependents, and individuals who may remain enrolled in self-insured employer plans. The Health Security Plan would finance care for all residents who enroll, as well as for homeless and transient persons in New Mexico.
• New Mexico Health Choices (hereafter, Health Choices) would create a single, statewide risk pool to replace the individual and group health insurance markets, as well as the current array of state coverage programs. Private insurers would offer coverage within the Alliance, which would operate as a purchasing cooperative. In alternative versions of this reform model, all coverage in the Alliance would be on an individual basis and all employers would contribute a payroll tax (version 1); or
1 See http://www.governor.state.nm.us/healthsolutions.php, accessed 2/1/08.

2
employers could continue to offer coverage and would be exempted from the payroll tax for any worker enrolled directly in their health plan (version 2).2 The state would provide vouchers to all residents to cover the cost of a limited benefit plan.3 Employers and/or individuals could supplement the vouchers to purchase a more comprehensive plan. Coverage in the Alliance would be pure-community-rated, with no geographic adjustment. The Alliance would operate a mutual risk-adjustment program to support carriers under this rating system.
• The New Mexico Health Coverage Plan (hereafter, the Health Coverage Plan) would expand access to existing sources of coverage using multiple strategies: (1) all adults to 100 percent of the federal poverty level (FPL) would be eligible for Medicaid or SCHIP (children would remain eligible at higher levels of income, per current program rules); (2) SCI would cover adults to 300 percent FPL, with cost sharing scaled to income; (3) nonprofit organizations with fewer than 100 workers could buy into SCI or SEIP without a waiting period if they are vendors for the state; (4) premium assistance would be provided to pregnant women and to children under age 18; (5) a new state reinsurance program would remove the current annual limit on covered benefits in SCI; (6) parents could continue to cover their unmarried children as dependents under private individual or group coverage to age 30; (7) incentives and subsidies would be developed to encourage the use of federal tax preferences for employer-sponsored coverage; and (8) a special low-cost private insurance product would be developed for healthy adults (ages 19 to 30). In addition, employers would be required to pay into a Fair Share Fund for any worker whom they did not directly cover; the Fair Share Fund would pay claims for uninsured individuals and/or subsidize reinsurance in SCI and SEIP.4
• HealthSolutions New Mexico (hereafter, HealthSolutions) calls for a number of health insurance market reforms—including (1) a minimum payout in insured benefits per premium dollar; (2) guaranteed issue of individual coverage without permanent exclusion of preexisting conditions; (3) a minimum cap on coverage of $100,000 per year; and (4) a curb on increases in small employer premiums to reflect the small group’s health status or claims experience. HealthSolutions New Mexico would require that every New Mexican obtain private health insurance coverage or if eligible, enroll in Medicaid, SCHIP, or SCI. Employers with at least 6 employees would be required to make a Healthy Workforce contribution for each full-time employee and a reduced contribution for each part-time employee; employers could offset these contributions by the total amount that they pay for employees’ health
2 In effect, version 2 differs from version 1 only with respect to self-insured employer plans. All
individual and fully insured plans would default to coverage in the Alliance, which would replace the individual and group insurance markets.
3 In both versions of New Mexico Health Choices, enhanced vouchers would be provided to residents below 400 percent of the federal poverty level (FPL) to purchase Alliance coverage with reduced cost sharing. In version 2, vouchers for families above 400 percent FPL would cap family premiums for low-option coverage as a percent of income.
4 Not directly related to coverage, the Health Coverage Plan also would increase funding for federally qualified health clinics (FQHCs) and primary care clinics.

3
benefits. In addition, employers would be required to offer a Section 125 plan, to help workers make pre-tax contributions to coverage. Finally, a Health Coverage Authority (HCA) would be established to set standards for qualified coverage, affordability guidelines, and performance standards. The HCA also would manage and coordinate public sector health coverage programs.
B. SPECIFICATIONS FOR DEVELOPING ESTIMATES
While the authors of each of the reform models had worked out many details, it was necessary to identify additional specific provisions of each model in order to make estimates of coverage, cost, and financing that could be compared across the reform models. The Health Security Act and Health Choices, in particular, left substantial detail to be developed by their respective governing bodies, once the models were implemented.
Therefore, we undertook a process of describing each model in more detail, and (through the
New Mexico Human Services Department) offered the models’ primary authors the opportunity to review and clarify the details of each model. The final specifications for the first three models are included in our earlier report (Chollet et al. 2007), and they are unchanged for the purpose of projecting their results to FY2010 in this report. Comparable specifications for HealthSolutions are included in Appendix A of this report.
To develop estimates that would help the Committee compare the reform models on the
same basis, we tailored the focus of each model and developed relatively precise specifications for key components of the models. The most significant decisions made to ensure comparability among the models include the following:
• The covered population. As in our earlier report, the estimates in this report relate only to the civilian population under age 65 who do not reside in an institution and are ineligible for Medicare.5 The Health Security Act, in particular, hopes to include both New Mexicans living in institutions and Medicare beneficiaries in the Health Security Plan. However, in each of the other reform models, Medicare beneficiaries and persons over age 65 would be covered in the same manner as in the current case.
• Subsidies to individuals. The Health Security Act and New Mexico Health Choices envision (respectively) income-related premiums and income-related vouchers to support the individual purchase of coverage. To develop the relatively precise information needed for estimating expenditures and financing, we specified a subsidy schedule similar to the SCI schedule, with persons under 100 percent FPL paying no premiums for coverage. For the Health Security Act, premiums are income-adjusted below 200 percent FPL and capped at 6 percent of income for families at 200 percent FPL or above. For Health Choices v.1, vouchers are scaled to income and calculated to fully finance high, medium, or low-option coverage, depending on the family’s income. In v.2, families above 400 percent FPL pay
5 The noninstitutionalized civilian population includes all New Mexicans except active military
personnel, inmates in penal institutions, and patients in long-term care facilities.

4
premiums, but their vouchers cap family premiums at 6 percent of family income. Finally, for the Health Coverage Plan and HealthSolutions, the current SCI premium schedule was extended to 300 percent FPL; above 300 percent FPL, employers and employees each pay $100 per month, and self-employed individuals pay $200 per month—but premiums are not otherwise be capped relative to income. With respect to these subsidies, HealthSolutions differs from the Health Coverage Plan only in that persons with income above 300 percent FPL may not enroll in SCI, even if application of income disregards (intended to encourage work effort) would yield net income below 300 percent FPL. Because of income disregards, some persons with income above 300 percent FPL are currently eligible to enroll in SCI, and the Health Coverage Plan would allow them to do so.
• Payments by employers. The Fair Share amount that employers would pay under the Health Coverage Plan was specified at $300 per employee per year, paid for each employee not directly enrolled in the employer’s own health plan, whether or not the employee is offered coverage or is eligible for an employer plan.6 Under HealthSolutions, employers with at least 6 employees would pay a Healthy Workforce contribution from which they deduct the total amount they currently pay toward coverage. Because the composition of coverage within firms is unknown and small employers with just a few covered workers could avoid paying any Healthy Workforce contribution, we developed a range of revenue estimates for each level of the Healthy Workforce contribution. These estimates indicate that employers would pay at least $100 per year for full-time workers and $50 per year for part time workers to finance HealthSolutions, but not more than $200 per year for full-time workers and $100 per year for part-time workers.
• Incentive payments and tax credits for employers. The Health Coverage Plan called for a system of incentives and subsidies to encourage the use of federal tax preferences for employer-sponsored coverage. Other states’ efforts to do this have had no appreciable impact on employer offer. As in our earlier report, this provision was dropped from the analysis.
• Special insurance products. The Health Coverage Plan calls for a special low-cost insurance product to be developed for healthy adults ages 19 to 30, and also expansion of eligibility for dependents benefits to age 30. In combination, these provisions could drive significant adverse selection in dependents coverage: under current law, insurers would have to issue dependents coverage regardless of the dependent’s health status, but could deny applicants for the special product based on their health status. In light of concerns about adverse selection when there is no provision to limit insurers’ underwriting for the special products, the introduction of special insurance products for healthy young adults was dropped from the specifications for the Health Coverage Plan, as in our earlier report.
6 This amount was derived from the fair share payments levied in Massachusetts ($295 per employee
per year) and Vermont ($350 per employee per year).

5
Finally, each of the reform models envisions some method of controlling health care costs and improving the quality of care. Under the Health Security Act and Health Choices, a commission or governing board would negotiate provider payment rates and develop strategies to improve health care quality and healthy behaviors. The Health Coverage Plan would create a Cost, Access and Quality Council to identify and develop ways to contain cost, increase the quality of care, and implement wellness and prevention activities. HealthSolutions calls for a Health Coverage Authority to reduce bureaucracy, create a single point of accountability for the operation of all state health coverage programs, and promote performance standards statewide. None of the strategies devised in any of the reform models is intrinsic to the model design. Instead, it seems reasonable that any of the reform models could devise a “best practice” approach to working with providers and covered New Mexicans to achieve the same goals. Therefore, as in our earlier report, our estimates and projections are not adjusted to reflect stated differences in governance among the models.
The following chapters describe our estimates of current-case health insurance coverage and
expenditures in New Mexico as well as estimates of coverage under the reform models. IN Chapter II, we document the methods used to update estimates and projections for this report. In Chapter III, estimates of coverage in the current case and in each of the reform models are presented. In Chapter VI, the projected cost of health care services and coverage for New Mexicans in the current case are compared with costs in each reform model; and in Chapter V, estimates of financing for each reform model are presented. Finally, Chapter VI includes an analysis of the economic impacts of HealthSolutions New Mexico, prepared by the Bureau of Business and Economic Research (BBER) at the University of New Mexico.

PAGE IS INTENTIONALLY LEFT BLANK TO ALLOW FOR DOUBLE-SIDED COPYING

7
II. METHODS
Our earlier report included an extensive discussion of methods, including (1) development of a microsimulation database to support estimates of current-case coverage and expenditures; and (2) development of microsimulation logic to estimate the coverage and expenditure changes associated with each reform model. The discussion below summarizes that presentation and describes the process used to update the estimates to FY2010.
A. THE MICROSIMULATION DATABASE
1. Population Data
For this report, we updated the microsimulation database to include the most recent year of the Current Population Survey (CPS), fielded in 2007 and reporting coverage in 2006. As in our earlier report, we merged CPS samples from five states (Arizona, Colorado, Nevada, New Mexico, and Texas) over three years, incorporating responses to survey questions fielded in 2005, 2006, and 2007.7 We adjusted the Census-calculated probability (or “weight”) for each person who was not drawn from a New Mexico sample to equal the probability of persons who appeared in the combined New Mexico sample in terms of a number of their characteristics—age, ethnicity, health status, family income and size, health insurance status, use of the Indian Health Service, and urban or rural location.8 The CPS identifies health insurance status as coverage at any time during the year from Medicare, Medicaid, employer-based coverage, or other private coverage. Persons without coverage from any of these sources (including those covered only by the Indian Health Service or other programs that provide direct services) were designated as uninsured.
Rates of private coverage were assumed to hold at 2006 levels in New Mexico, although
historically they have been declining. Since 2000, private coverage rates (estimated as a 3-year moving average of the privately insured population under age 65) have moved in apparent cycles, most recently peaking at about 65 percent (in 2002-2004) and declining below 63 percent in 2004-2006 leading into an expected economic recession.9 In effect, we have assumed that the
7 The United States Office of Management and Budget (OMB) defines metropolitan statistical areas according to published standards that are applied to Census Bureau data. The general concept of a metropolitan statistical area is that of a core area containing a substantial population nucleus, together with adjacent communities having a high degree of economic and social integration with that core. Metropolitan statistical areas are relatively freestanding and typically surrounded by nonmetropolitan counties. Current metropolitan statistical area definitions were announced by OMB effective June 6, 2003 (See http://www.census.gov/population/www/estimates/aboutmetro. Html, accessed 2/1/08).
8 Urban residents included those in metropolitan statistical areas (MSAs). In New Mexico, these include the Albuquerque MSA (including Bernalillo, Sandoval, Torrance, and Valencia County), Santa Fe MSA (i.e. Santa Fe County), Farmington MSA (i.e. San Juan County), and Las Cruces MSA (i.e. Dona Ana County). Rural residents included those in non-MSA counties.
9 See New Mexico Health Policy Commission, Quick Facts 2008 (http://hpc.state.nm.us/ documents/Quick%20Facts%202008.pdf, accessed 2/1/08).

8
rate of private coverage in FY2010 will recover to estimated 2006 levels, consistent with past cycles (Figure II.1).
FIGURE II.1
ESTIMATED PERCENT OF NEW MEXICANS UNDER AGE 65 WITH PRIVATE COVERAGE, 2000-2006
63.3% 63.1% 62.6%63.9%
62.9%
58.5%
65.1%
50%
55%
60%
65%
70%
2000 2001 2002 2003 2004 2005 2006
Source: Prepared from tabulations presented in the New Mexico Health Policy Commission, Quick Facts 2008 (http://hpc.state.nm.us/documents/Quick%20Facts%202008.pdf, accessed 2/1/08).
The population survey data did not identify specifically the many public programs that are available to small groups and individuals in New Mexico: SCI, the New Mexico Health Insurance Alliance (NMHIA), the New Mexico Medical Insurance Pool (NMMIP), and the Premium Assistance (PA) program. Therefore, it was necessary to assign individuals to each program on a probability basis, consistent with their reported source of coverage, family income, age, and health status characteristics. The resulting data file included families and individuals assigned to each program in numbers equal to the programs’ 2006 enrollment (by age, gender, and location if provided) in 2006. Self-employed and other individuals who were assigned to NMHIA and NMMIP included only those who reported good, fair, or poor health status—reflecting adverse selection into these programs commensurate with their cost experience.
To correct for underreporting of Medicaid and SCHIP enrollment and to project the current
case to FY2010, person records were re-weighted (concurrent with the population reweighting described above). Individuals eligible for assignment to Medicaid or SCHIP (or to SCI, as described below) were those who met New Mexico’s categorical requirements in combination with income requirements after application of earned income disregards.10 We then statistically
10 In general, earned income disregards subtract a significant share of earned income from the family’s adjusted gross income before calculating family income as a percent of FPL. The application of

9
matched records from the Household Component of the 2004 Medical Expenditure Panel Survey (MEPS-HC, the most recent year available) to obtain a history of enrollment months, and reweighted individuals by age, gender, and location to match New Mexico enrollment months projected to FY2010.
This process identified a large number of low-income New Mexicans who were enrolled in
Medicaid or SCHIP for just part of the year, consistent with the programs’ administrative data on the average number of months per enrollee. In FY2006, we estimated the average reported duration of enrollment in these programs was 6.7 months. However, in subsequent discussions with the New Mexico Human Services Department (HSD) we discovered that the average number of months per enrollee in FY2007 had increased. Consequently, based on the FY2006 estimate, our FY2010 projection of persons covered in Medicaid in the current case is likely to be high, However, the total number of enrolled months and total expenditures correspond to HSD projections to FY2010.
Finally, every worker in the data file was identified as having an employer offer of coverage or not, based on a logistic regression model estimated over all adult workers in the 2002 New Mexico Household Survey. The regression model considered the workers’ socio-demographics (age, gender, race, education, and marital status), health status, family characteristics (the presence of children, family size and level of family income), employment characteristics (industry, whether self-employed, and whether working full-time), and geographic location (in MSA or nonMSA).11 We ran the regression model twice to estimate separate probabilities of having an offer for single coverage and having an offer for family coverage. The coefficient estimates were used to predict the probability of a current employer offer of coverage for each adult worker in the population data file who was not already enrolled in employer coverage. Private-sector workers with employer-sponsored coverage were then randomly assigned to self-insured group coverage versus insured group coverage (within firm size and industry groups) to equal the proportion of private-sector workers in self-insured plans reported in the New Mexico sample of the 2004 Medical Expenditure Panel Survey—Insurance Component (MEPS-IC) (the most recent data available).
2. Expenditure Data
Expenditure estimates for each record in the microsimulation database also were obtained from the 2004 MEPS-HC. Two types of information were appended to each record in the population data file: (1) the number of months enrolled in a specific source of coverage; and (2) the amount of expenditure by source of payment and type of service.12 Sources of coverage and (continued) earned income disregards (which in New Mexico vary by the presence and age of children in the family) has the effect of qualifying categorically eligible persons for public coverage at higher levels of total income while encouraging work effort.
11 Because a number of these variables (employee age, gender and industry) determine the premium quoted to the employer, in effect the regression model estimated a reduced form specification of employer demand, including price.
12 Records were appended using “cold-deck” procedure, which statistically matched expenditures to person records controlling for age, health status, location, income, race, and insurance coverage.

10
payment included Medicaid/SCHIP, employer-based insurance, other private insurance, other federal programs, and other state programs. Types of services include inpatient and outpatient hospital care, emergency services, practitioner services, prescription drugs, home health care, vision and dental services, and other services and durable medical equipment.
Expenditure levels (which in MEPS-HC reflect, in effect, the national average) were scaled
to equal expenditure levels by source of payment in New Mexico, projected to FY2010. Rates of increase to FY2010 were calculated as the average annual rate of historical growth (typically from 2002 to 2007) in expenditures per member per month by source of payment. Assumed rates of growth (and other key parameters) are documented in Table II.1.
TABLE II.1
AVERAGE ANNUAL MEDICAL COST GROWTH PER MEMBER PER MONTH, BY PAYER
Payer Estimate Source
FEHBP and Self-Insured Employer Plans
8.8% Estimated as the average reported annual increase in FEHBP plan cost per member per month from CY2004 to CY2006.
Private Group Insurance 8.2% Estimated as the average reported annual increase in insured group plan cost per member per month from CY2004 to CY2006.
Individual (Nongroup) Private Insurance
10.4% Estimated as 2/3 the estimated average reported annual medical cost growth for self-employed enrollees in NMHIA.
Medicaid and SCHIP 5.6% NM Human Services Department. Estimated as the average reported annual increase in medical costs per member per month from FY2002 to FY2007.
NMHIA 11.1% NM Health Insurance Alliance. Estimated as the average reported annual increase in medical costs per member per month from FY2002 to FY2007, including group and self-employed enrollees.
NMMIP 5.2% NM Medical Insurance Pool. Estimated as the average reported annual increase in medical costs per member per month from FY2004 to FY2006.
SCI 11.1% Estimated as the average annual increase in medical costs per member per month in NMHIA from FY2002 to FY2007.
State Employee Health Plan 10.0% Data provided by state employee plan carriers. Estimated as the average annual increase in state employee plan cost per member per month from FY2002 to FY2006.
3. Benefit Design
To simulate benefit designs in each of the reform models we developed a summary measure for each of four major sources of coverage: (1) the state employee health plan; (2) private group insurance; (3) individual private insurance; and (4) Medicaid and SCHIP. For each source of coverage, we calculated average out-of-pocket spending as a percent of the total cost by type of service, among individuals with at least 10 months of coverage, while covered from that source.

11
Presented in Table II.2, these estimates did not change significantly from those in our earlier report, although they are based on the population projected to FY2010.13
TABLE II.2
MEASURES OF BENEFIT DESIGN: ESTIMATED AVERAGE COPAYMENT RATES BY SOURCE OF COVERAGE AND TYPE OF SERVICE IN THE CURRENT CASE
State Employees Private Group Private Individual Medicaid/SCHIP
(Percent of total expenditures) Inpatient 2.5% 2.2% 9.1% 0.0% Outpatient 7.2 5.0 15.6 0.5 Emergency Room 10.9 8.6 11.4 1.3 Physician 21.4 16.1 40.5 5.1 Prescription Drugs 34.8 35.3 59.6 15.7 Vision/Dental 50.7 45.8 71.8 25.7 Other Medical Services and Supplies 40.8 42.7 71.6 19.1 Home Health 9.9 11.2 25.2 0.0
Source: Mathematica Policy Research, Inc.
4. Nonmedical Cost Estimates
The nonmedical cost of coverage includes administrative activities undertaken by state agencies, private and public employers, and private health insurance plans (such as determination of eligibility for coverage, and enrollment and disenrollment from coverage), claims processing and provider relations, and insurer surplus and profit. Plan sponsors—both governments and employers—also incur direct nonmedical costs to administer health insurance plans.
Estimates of nonmedical costs in the current case, by plan sponsor, are documented in
Table II.3. These estimates are intended to approximate the additional cost that plan sponsors would incur as a percentage of medical cost, if enrollment increased. Conversely, a decline in enrollment would reduce administrative costs proportionate to the decline in medical expenditures. In the case of means-tested public coverage, the marginal cost of administration is estimated as a per-person cost of eligibility determination; other agency costs—including the cost of contracting with private managed care organizations and other costs of oversight—are regarded as overhead that would not increase significantly with an expansion of enrollment such
13 These estimated “copayment” rates are implicit in the current case. They are used explicitly to measure benefit designs in the reform models and, therefore, the responses of individuals to a change in their source of coverage. For example, individuals who move from uninsured status (with a copayment rate of 100 percent for all services) to Medicaid or SCHIP would experience a reduced copayment rate of 5.1 percent for physician services and 15.7 percent for prescription drugs in the reform model. Similarly, individuals who move from private group coverage in the current case to either the Health Security Plan or the New Mexico Health Choices Alliance “medium-option” standard benefit (both essentially patterned on the state employee health plan) would see an increase in their average copayment rate for hospital and physician services, but a somewhat lower copayment rate for prescription drugs.
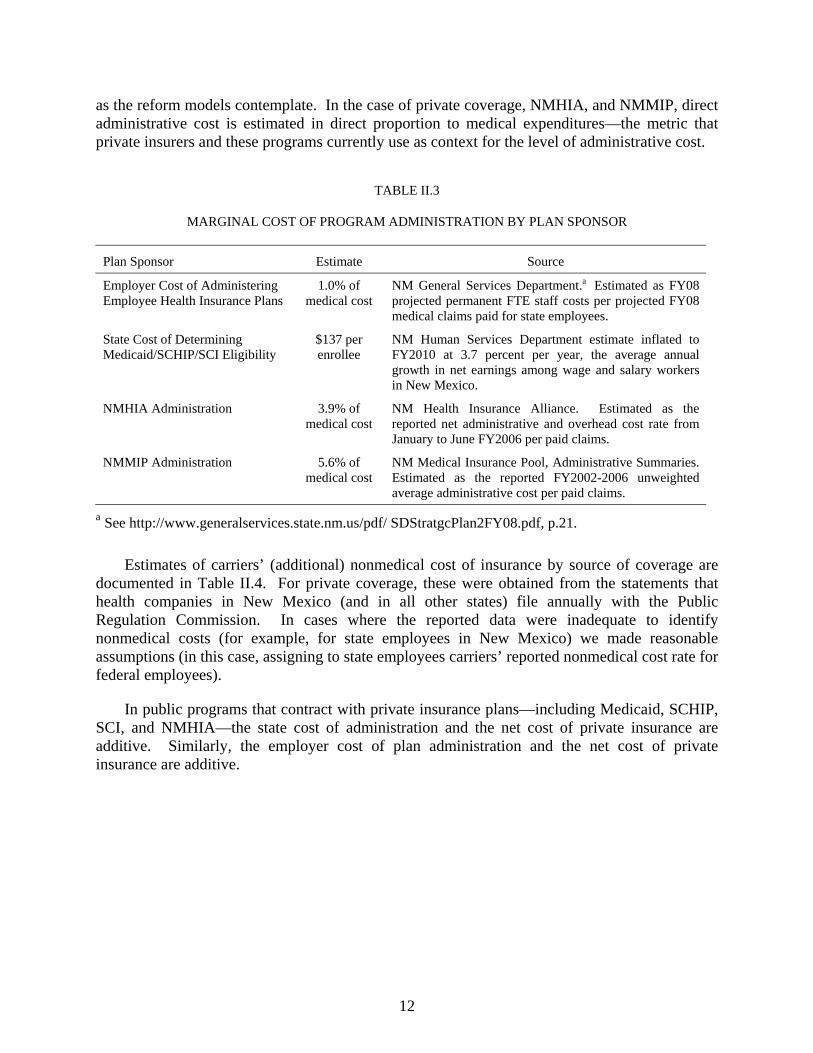
12
as the reform models contemplate. In the case of private coverage, NMHIA, and NMMIP, direct administrative cost is estimated in direct proportion to medical expenditures—the metric that private insurers and these programs currently use as context for the level of administrative cost.
TABLE II.3
MARGINAL COST OF PROGRAM ADMINISTRATION BY PLAN SPONSOR
Plan Sponsor Estimate Source
Employer Cost of Administering Employee Health Insurance Plans
1.0% of medical cost
NM General Services Department.a Estimated as FY08 projected permanent FTE staff costs per projected FY08 medical claims paid for state employees.
State Cost of Determining Medicaid/SCHIP/SCI Eligibility
$137 per enrollee
NM Human Services Department estimate inflated to FY2010 at 3.7 percent per year, the average annual growth in net earnings among wage and salary workers in New Mexico.
NMHIA Administration 3.9% of medical cost
NM Health Insurance Alliance. Estimated as the reported net administrative and overhead cost rate from January to June FY2006 per paid claims.
NMMIP Administration 5.6% of medical cost
NM Medical Insurance Pool, Administrative Summaries. Estimated as the reported FY2002-2006 unweighted average administrative cost per paid claims.
a See http://www.generalservices.state.nm.us/pdf/ SDStratgcPlan2FY08.pdf, p.21.
Estimates of carriers’ (additional) nonmedical cost of insurance by source of coverage are documented in Table II.4. For private coverage, these were obtained from the statements that health companies in New Mexico (and in all other states) file annually with the Public Regulation Commission. In cases where the reported data were inadequate to identify nonmedical costs (for example, for state employees in New Mexico) we made reasonable assumptions (in this case, assigning to state employees carriers’ reported nonmedical cost rate for federal employees).
In public programs that contract with private insurance plans—including Medicaid, SCHIP, SCI, and NMHIA—the state cost of administration and the net cost of private insurance are additive. Similarly, the employer cost of plan administration and the net cost of private insurance are additive.

13
TABLE II.4
TOTAL NONMEDICAL COST AS A PERCENT OF TOTAL COST BY PAYER IN THE CURRENT CASE
Payer Estimate Source
FEHBP 16.8% NM Public Regulation Commission. Estimated as the average CY2004-CY2006 nonmedical cost rate reported for FEHBP coverage in NM, weighted by earned premiums.
Self-Insured Employer Plans
17.8% Estimated as the average CT2004-CY2006 FEHBP nonmedical cost rate plus the employer cost of plan administration.
Group Private Insurance
19.5% NM Public Regulation Commission. Estimated as the average CY2004-CY2006 nonmedical cost rate for group health insurance reported by NM group health companies (weighted by earned premiums) plus the employer cost of plan administration.
Individual (Nongroup) Private Insurance
27.7% NM Public Regulation Commission. Average CY2004-CY2006 nonmedical cost rate for nongroup health insurance reported by NM nongroup health companies, weighted by earned premiums.
Medicaid and SCHIP
9.5% NM Human Services Department. Estimated as the average of (a) the allowed nonmedical cost of MCOs and (b) nonmedical cost for FFS reported by HSD, weighted by SFY2007 reported medical costs and converted to a percentage of total cost. Added to this amount is the HSD cost of eligibility determination ($137 per enrollee).
NMHIA 21.0% NM Health Insurance Alliance. Estimated as the sum of group private insurance nonmedical costs plus NMHIA administrative and overhead cost expressed as a percent of total cost.
NMMIP 5.3% NM Medical Insurance Pool. Estimated as the reported FY2002-FY2006 unweighted average administrative cost per paid claims, converted to a percentage of total cost.
SCI 18.5% NM Public Regulation Commission and NM Human Services Department. Estimated as the nonmedical cost of group insured plans plus the HSD cost of eligibility determination ($137 per enrollee).
State Employee Health Plan
17.8% NM Public Regulation Commission. Estimated as the average CY2004-CY2006 nonmedical cost rate reported for FEHBP coverage in NM weighted by earned premiums, plus the employer cost of plan administration.
B. THE MICROSIMULATION MODEL
The microsimulation uses a logic model that assigns individuals by coverage month to various sources of available coverage. It assumes that all individuals in New Mexico, when subject to a requirement that they have coverage, comply with that requirement.
All of the simulations assume that employers will not newly sponsor coverage if they do not
sponsor coverage in the current case. However, workers (and their dependents) may newly enroll in employer coverage if it remains available to them. Thus, any new enrollment in employer-sponsored is due to workers who, offered coverage in the current case but not enrolled, accept coverage in the reform model.

14
Because the model assumes that there is no new offer of employer-sponsored coverage, individuals who are eligible for Medicaid or SCHIP are in general first assigned to those programs for the full year. For the Health Security Act and Health Choices version 1 (where Medicaid and SCHIP enrollment would be automatic), other adults and children are assigned full year coverage in the Health Security Plan or Health Choices Alliance, respectively. For Health Choices version 2, the Health Coverage Plan, and HealthSolutions, the microsimulation assumes that, when there is a choice of plan, individuals enroll in the least expensive option.
Similarly, for New Mexico Health Choices version 2, the model assumes that self-insured employers buy insured coverage if the Alliance premium is less than they otherwise would pay per employee for coverage. In this reform model, employees that decline an offer of coverage from their employer either accept public coverage (if eligible) or enroll as individuals in the Alliance.
In the Health Coverage Plan and HealthSolutions, individuals accept Medicaid and SCHIP
coverage if eligible or accept an employer offer of coverage if it is available and requires no contribution to coverage. Otherwise they accept employer offer with an employee contribution to coverage, buy individually into SCI (if eligible), or buy individual coverage. NMMIP remains the insurer of last resort: individuals who are denied individual coverage (and otherwise are neither eligible for public coverage nor offered employer coverage) buy coverage in NMMIP.
In each of the simulations, American Indians and other Native Americans are assumed to
enroll as do other New Mexicans. Tribal participation in the programs—potentially with tribal contributions to coverage—is not assumed during the projection period.
Estimates of the change in health services use and expenditure that would occur as New
Mexicans changed their health insurance status and sources of coverage under each reform model are based the same actuarial induction factors and estimation methods as described in our earlier report, provided by the Actuarial Research Corporation.14 The resulting estimates approximate total spending by service type and source of payment, accounting for consumer response to changes in benefit design, if any, that they experience in the reform models.
14 An induction factor is a measure of the change in total spending associated with a change in out-
of-pocket costs. For example, if the induction factor is 0.5, this means that for every $1 decrease in out-of-pocket costs, covered charges will increase by $0.50. Conversely, every $1 increase in out-of-pocket costs results in a $0.50 decrease in total spending.

15
III. CURRENT-CASE COVERAGE AND COVERAGE IN THE REFORM MODELS
This chapter provides an overview of current sources of coverage in New Mexico. New Mexicans are categorized in terms of the source of coverage that they held for the longest period during the year—although many New Mexicans change coverage status during the year as their employment situation and public program eligibility status change. We then consider how New Mexicans coverage status and sources of coverage would change in each of the reform models.
A. PROJECTED COVERAGE IN THE CURRENT CASE
Coverage is not static—in every state, people move in and out of different coverage from various sources, and also gain and lose coverage during the year. In general, transitions in and out of coverage are more common among people with lower income and possibly also less stable employment.15 We identified individuals by their predominant source of coverage based on simulated months of coverage during the year. Individuals are categorized as predominantly uninsured if they were uninsured six months or more during the year. All others were assigned to their predominant source of coverage, defined as the source of coverage that they reported for the greatest number of months during the year.16
In FY2010, an estimated 45 percent of the state’s noninstitutionalized non-elderly
population—approximately 782 thousand New Mexicans—are projected to be predominantly covered by employer-sponsored insurance, including self-insured employer plans, private insured employer plans, and public employee plans (Figure III.1). Medicaid, SCHIP, and SCI are projected to cover an estimated 30 percent of New Mexicans under age 65.17, 18 Other
15 In a 2005 national survey of adults, 37 percent of adults with income below $20,000 were uninsured currently and another 16 percent had been uninsured in the past year. With income from $40,000 to $60,000, 9 percent were currently uninsured and another 9 percent had been uninsured in the past year. Above $60,000, just 4 percent were uninsured and another 3 percent had been uninsured in the past year. See: Commonwealth Fund Biennial Health Insurance Survey, 2005—Chartpack Figure ES-1: Uninsured Rates High Among Adults with Low and Moderate Incomes, 2001–2005 (http://www.commonwealthfund.org/usr_doc/Collins_gaps_hlt_ins_all-american_figures.pdf?section= 4056, accessed 1/25/08).
16 This method of identifying uninsured New Mexicans (based on MEPS-reported months of coverage) differs from the definition used in the CPS. The CPS defines individuals as uninsured if they are uninsured all year, but the similarity between the MEPS and CPS estimates has led many researchers to regard CPS as reporting point-in-time estimates. CPS estimates of uninsured in New Mexico in 2006 (24 percent of the noninstitutionalized population under age 65) are slightly lower than our MEPS-based estimates (26 percent).
17 In addition to these persons, Medicaid covers dually eligible Medicare beneficiaries in the community and income-qualified residents of nursing homes and facilities for mentally retarded residents. These beneficiaries were excluded from the analysis, in large part because their complex care needs and the federal rules that apply to these persons warrant separate consideration beyond the time and resources available to this project.
18 As noted in Chapter II, following development of the current case data, we discovered that the average number of months enrolled in Medicaid and SCHIP was greater than we had understood.

16
public programs—including the federal TRICARE program—are projected to cover covered about 5 percent of the population.19, 20 Eighteen percent of New Mexicans under age 65 are projected to be predominantly uninsured; more would be uninsured at some time during the year.
FIGURE III.1
PROJECTED PERCENTAGE OF NEW MEXICANS UNDER AGE 65 BY PREDOMINANT SOURCE OF HEALTH COVERAGE, FY2010
Private and public employer plans
45%
Individual private coverage
2%
Medicaid, SCHIP, and SCI
30%
Other federal and state programs
5%
Uninsured18%
Source: Mathematica Policy Research, Inc.
Notes: Data include only the noninstitutionalized population under age 65. Medicare beneficiaries and active military personnel are excluded. Individuals are identified as uninsured if they were uninsured at least 6 months during the year; all others are allocated to the source of coverage they reported for the greatest number of months.
Among New Mexicans projected to be predominantly covered by an employer-sponsored plan in FY2010, 88 percent are private-sector employees and their dependents. An estimated 33 percent of insured New Mexicans with employer-sponsored coverage (260 thousand workers and dependents) are enrolled in self-insured plans. These plans are governed by the federal
(continued) Consequently, the number of enrollees (and enrollees as a percent of the population) reported in the current case is somewhat greater than may be accurate. However, because the microsimulation actually models months of coverage, not covered persons, the expenditure and financing estimates are not affected by this misunderstanding.
19 While active military personnel were excluded from the analysis, a small number of military retirees and dependents reported benefits from TRICARE.
20 Indian Health Service (IHS), the Veterans Administration (VA) and some other public programs that directly pay for personal health care services are not considered health insurance programs. New Mexicans with only IHS- or VA-covered spending are considered uninsured.

17
Employee Retirement Income Security Act (ERISA) and are exempt from state regulation or taxation. The remaining 55 percent of New Mexicans with coverage from private employer plans (436 thousand workers and dependents) are enrolled in insured plans subject to state regulation, as are the 1 percent of workers and dependents (nearly 6 thousand persons) enrolled in coverage through the New Mexico Health Insurance Alliance (NMHIA). An additional 6 percent of covered workers and dependents are enrolled in the state employee plan.
FIGURE III.2
PROJECTED DISTRIBUTION OF NEW MEXICANS UNDER AGE 65 WITH EMPLOYER-SPONSORED COVERAGE BY SOURCE OF PLAN, IN THE
CURRENT CASE (NO REFORM), FY2010
Private-sector w orkers in self-insured plans
33%
State employees6%
NMHIA1%
Private sector employees
55%
Federal employees5%
Source: Mathematica Policy Research, Inc.
Notes: Data include only the noninstitutionalized population under age 65. Medicare beneficiaries and active military personnel are excluded. Individuals are allocated to the source of coverage they reported for the greatest number of months.
Detailed estimates of New Mexicans by their predominant sources of health coverage are reported in Table III.1. Several aspects of these estimates are of interest. First, more New Mexicans are projected to be uninsured at some time during the year (884 thousand) than are insured all year (865 thousand). Most of those who are projected to be uninsured at some time in FY2010 (789 thousand) will be uninsured just part of the year; 95 thousand New Mexicans are projected to be uninsured all year (estimates not shown).
Those projected to be uninsured part or all of the year are substantially younger than the
full-year insured population: 71 percent are under age 30, compared with 32 percent of the full-year insured population. It follows that compliance with an individual mandate in New Mexico would generally reduce the average age of the insured population, regardless of the reform model chosen. However, especially relative to their much younger age, the reported health status of the population that is uninsured part or all of the year suggests significant and probably unmet health

18
care needs: 42 percent report good, fair, or poor health status (not very good or excellent), compared with 38 percent of full-year insured New Mexicans.
TABLE III.1
CHARACTERISTICS OF THE INSURED AND UNINSURED POPULATIONS IN THE CURRENT CASE, PROJECTED FY2010
Total Population Full-Year Insured Part or Full-Year Uninsured
Number (000’s) Percent Number (000’s) Percent Number (000’s) Percent
Total 1,749.4 100.0% 865.1 100.0% 884.3 100.0%
Age 0-5 213.9 12.2% 33.6 3.9% 180.3 20.4% 6-18 357.2 20.4% 64.2 7.4% 293.1 33.1% 19-30 331.6 19.0% 176.0 20.3% 155.6 17.6% 31-44 335.9 19.2% 205.4 23.7% 130.5 14.8% 45-64 510.7 29.2% 385.9 44.6% 124.8 14.1%
Firm Size (Workers Only) <=10 817.2 68.4% 231.5 49.4% 585.7 80.6% 11-24 187.7 15.7% 112.4 24.0% 75.3 10.4% 25-99 77.9 6.5% 48.8 10.4% 29.1 4.0% >=100 112.7 9.4% 75.8 16.2% 36.9 5.1%
Health Status Excellent/very good 1,042.1 59.6% 532.8 61.6% 509.3 57.6% Good/fair/ poor 707.3 40.4% 332.3 38.4% 375.0 42.4%
Family Income 0-100% FPL 432.2 24.7% 88.8 10.3% 343.4 38.8% 100-185% FPL 293.3 16.8% 66.4 7.7% 226.9 25.7% 185-235% FPL 157.7 9.0% 77.2 8.9% 80.5 9.1% 235-300% FPL 183.8 10.5% 109.0 12.6% 74.8 8.5% 300% FPL + 682.4 39.0% 523.7 60.5% 158.7 17.9%
Location MSA 1,136.2 64.9% 548.5 63.4% 587.7 66.5% Non-MSA 613.3 35.1% 316.6 36.6% 296.7 33.5%
Source: Mathematica Policy Research, Inc. Notes: Data include the noninstitutionalized civilian population under age 65. Medicare beneficiaries and active
military personnel are excluded. Individuals are identified as uninsured if they were uninsured at least 6 months during the year; all others are allocated to the source of coverage they reported for the greatest number of months.
Other differences also are striking: while 49 percent of full-year insured New Mexicans are employed in very small firms, with fewer than 10 employees, nearly 81 percent of workers who are uninsured all or part of the year are employed in these firms. Conversely, just 9 percent of New Mexicans projected to be uninsured all or part of the year are employed in firms with more than 25 workers. Finally, those who are uninsured part or all of the year are nearly as likely to be located in nonmetropolitan areas (34 percent) as in metropolitan areas (37 percent). The
19
relatively low projected number of uninsured residents in rural areas reflects New Mexico’s ongoing efforts in rural communities to enroll adults in children in Medicaid, SCHIP, and SCI when eligible.
B. COVERAGE ESTIMATES IN THE REFORM MODELS
To compare the modeling results across the reform models in a meaningful way, we made a number of assumptions about program implementation and behavioral responses; these assumptions were consistently applied to each reform model. In this section, we summarize these assumptions and then present the simulation results. Qualitatively, the assumptions used to generate the coverage results in this report are the same as those in our earlier report.
1. Major Assumptions
Key assumptions that drive the coverage estimates in each reform model include the following:
• Every New Mexican becomes insured. Each reform model would require that every New Mexican become and remain insured. Although each reform model envisions a somewhat different approach to enforcement, we presume that a “best practice” enforcement strategy could be developed and applied with equal effect in each. We further assume that New Mexicans comply fully with the mandate—that is, every resident would obtain coverage from some available source.
• Immediate full implementation. Each reform model envisions the development of a governing body with different levels and types of authority and responsibility. Some further envision major changes in how providers are paid and how insurance markets would operate. All of these changes would require time to implement, and some reform models may take longer to reach full effect than others. However, there is no real basis for modeling such differences. Therefore, we assume immediate full implementation of each reform model.
• Maximum enrollment in Medicaid and SCHIP. In order to retain the significant federal funding of Medicaid and SCHIP in New Mexico, we assume that both programs continue. Moreover, we assume that every individual eligible for Medicaid or SCHIP would enroll in these programs unless they already are enrolled in an employer plan and that plan continues to be available to them. All currently uninsured New Mexicans who are eligible for Medicaid or SCHIP are assumed to enroll in the program.
• Self-insured employer decisions are driven by cost. Under Health Security Act and New Mexico Health Choices, self-insured employers are confronted with a decision to maintain their ERISA-protected self-insured plans or to close them in favor of having their employees enroll in a new statewide program. We assume that employers make this decision purely on a cost basis, allowing for some “drag” associated with making such a major change in compensation. As in our earlier

20
report, we assume that self-insured employers would terminate their plan in favor of a newly available coverage option if the per-member cost of the self-insured plan is at least 20 percent more than the per-member cost of the new coverage option. We believe that this assumption is conservative; over time if not immediately, self-insured employers might respond to a much lower difference in cost.
• Individual choices among coverage options are driven by cost. When individuals or their employers have more than one coverage option, we assume that they always choose the option that is of lowest cost to them. HealthSolutions and the Health Coverage Plan offer the most opportunities for individuals to make such choices. Under these reform models, we assume that uninsured workers who are eligible for both employer-sponsored coverage and individual enrollment in SCI choose employer coverage if it is less than the SCI individual premium (including the employer share of premium) by as little as $100 per person per year, a high level of sensitivity that reflects the low family income of individuals eligible for the program. Similarly, when they are not eligible for public coverage but have an employer offer of coverage available to them, we assume that they accept the employer offer before enrolling in individual coverage. Only individuals who are denied individual private coverage based on health status enroll in NMMIP. In all of the reform models, when uninsured individuals are eligible for Medicaid or SCHIP, we assume that they enroll in these programs rather than in private coverage (which, if offered, they in fact declined).
• Crowd out. Of the reform models, only New Mexico Health Choices envisions expanded eligibility for Medicaid beyond that assumed in the current case.21 However, in each of the models, insured children who are currently eligible for Medicaid or SCHIP could enroll in these programs, “crowding out” other coverage. With respect to HealthSolutions and the Health Coverage Plan, we reasoned that categorically eligible, privately insured individuals could already have enrolled in Medicaid or SCHIP but did not; therefore, we assume that they do not drop private coverage to enroll in Medicaid or SCHIP after reform. In New Mexico Health Choices, individuals who are eligible for Medicaid or SCHIP receive a voucher to participate in the Alliance, in the same way as other New Mexicans affected by the reform. As with the Health Security Act, the designation of Medicaid- or SCHIP-enrolled under New Mexico Health Choices is retained for the calculation of both federal matching and cost sharing when covered.
• Family coverage is preferred when available. We assume that coverage decisions are made at the family level. Thus, insurance family units (spouse and children) are not separated, unless either (1) program eligibility rules do not allow the entire family to enroll or (2) certain members are already enrolled in coverage (for
21 New Mexico Health Choices calls for Medicaid enrollment of all adults under 100 percent FPL;
estimates of coverage under this model assume that the state can obtain waiver authority to expand eligibility to these persons. Both the Health Security Act and the Health Coverage Plan would retain Medicaid eligibility for parents below 100 percent FPL (as presumed in the current case), as well as children to higher levels of family income. The Health Coverage Plan would enroll (as at present) adults without children in SCI, with reinsurance to cover expenditures above the current limit.

21
example, Medicaid or SCHIP) at lower cost. New Mexicans not living with a spouse or children make coverage decisions as individuals.
• Young adults first seek coverage on their own. The Health Coverage model envisions extending coverage to unmarried adults through age 30 as dependents. We assume that, if working, these young adults would take coverage from their own employers if it were offered, before taking coverage as a dependent on their parents’ policy.
• Native Americans enroll in coverage, as do all other New Mexicans. For the purpose of estimating coverage and cost in the reform models, we assume that all New Mexicans have the same enrollment opportunities and obligations—including Native Americans who live either in urban areas or on reservations. Similarly, we assume that noncitizens may enroll in coverage on the same basis as others living in New Mexico.
2. Sources of Coverage
Consistent with the assumption that every New Mexican becomes insured under each of the reform models, the simulations redistribute uninsured individuals into some source of coverage. In addition, in some reform models, individuals who are now covered by self-insured employer plans may change their source of coverage, if their employer terminates the self-insured plan in favor of the new statewide plan. The major features of each reform model that affect coverage are summarized below:
• The Health Security Act would introduce a new statewide plan intended to cover most of the population. The private insurance market would disappear in favor of coverage in the Health Security Plan. In addition, employers would terminate self-insured plans if Health Security Plan coverage were significantly less costly.
• Health Choices also would introduce a new statewide purchasing cooperative, the Health Choices Alliance. Under Health Choices v.1, the insured market would be folded into the Alliance; the model assumes that self-insured employers would convert to insured coverage, as it would be less costly for them to do so.22 Under Health Choices v.2, self-insured employers would terminate coverage only if Alliance coverage is substantially less costly.
• Both the Health Coverage Plan and Health Solutions would retain the current market and induce growth in each segment. With respect to the coverage results, the primary difference between these reform models is whether individuals would qualify for Medicaid, SCHIP, or SCI when their income exceeds 300 percent FPL,
22 Our earlier report raised concerns about ERISA preemption of the financing arrangement that
underlies this assumption for Health Choices v.1—as well as the Health Security Act and Health Choices v.2.

22
despite income disregards that could apply. The estimates for HealthSolutions assume that they would not.
In all of the reform models, federal employees would remain in FEHBP, and TRICARE enrollees also would remain in that program.
The coverage results of the simulations are summarized in Table III.2 and depicted in Figure III.3. In each of the reform models, enrollment in Medicaid and SCHIP would increase (even if eligibility for coverage would not), as uninsured individuals who are eligible but not enrolled in the current case would become enrolled.
TABLE III.2
ESTIMATED NUMBER AND PERCENT OF PERSONS IN THE CURRENT CASE AND SIMULATED REFORM MODELS BY SOURCE OF COVERAGE
Current
Case
Health Security
Act Health
Choices v.1
Health Choices
v.2
Health Coverage
Plan Health
Solutions
(Persons in thousands) Total 1,749.4 1,749.4 1,749.4 1,749.4 1,749.4 1,749.4
Uninsured 311.4 - - - - - Employer Sponsored Insurance 782.1 80.7 80.5 202.8 880.6 891.3 Individual Private Insurance 38.1 - - - 47.1 48.4 Medicaid, SCHIP 510.2 849.7 964.1 955.9 722.9 710.5 SCI 13.3 0.0 - - 64.9 65.3 Other Federal Programs 94.2 34.0 34.0 34.0 34.0 34.0 New Program - 785.1 670.9 556.8 - -
Including Medicaid and SCHIP - 1.6 1.6 1.5 - -
(Percents) Total 100.0% 100.0% 100.0% 100.0% 100.0% 100.0%
Uninsured 17.8% 0.0% 0.0% 0.0% 0.0% 0.0% Employer Sponsored Insurance 44.7% 4.6% 4.6% 11.6% 50.3% 50.9% Individual Private Insurance 2.2% 0.0% 0.0% 0.0% 2.7% 2.8% Medicaid, SCHIP 29.2% 48.6% 55.1% 54.6% 41.3% 40.6% SCI 0.8% 0.0% 0.0% 0.0% 3.7% 3.7% Other Federal Programs 5.4% 1.9% 1.9% 1.9% 1.9% 1.9% New Program 0.0% 44.9% 38.3% 31.8% 0.0% 0.0%
Including Medicaid and SCHIP 0.0% 93.4% 93.5% 86.5% 0.0% 0.0%
Source: Mathematica Policy Research, Inc.
Notes: Data include the noninstitutionalized civilian population under age 65. Medicare beneficiaries and active military personnel are excluded.
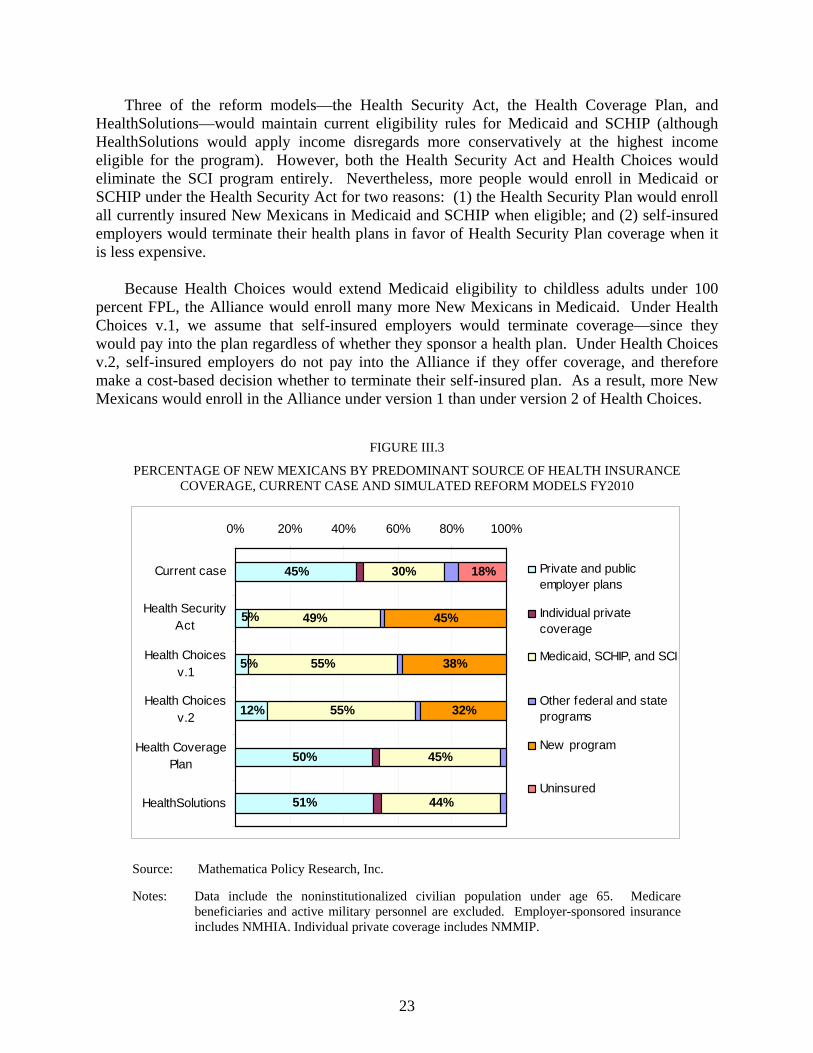
23
Three of the reform models—the Health Security Act, the Health Coverage Plan, and HealthSolutions—would maintain current eligibility rules for Medicaid and SCHIP (although HealthSolutions would apply income disregards more conservatively at the highest income eligible for the program). However, both the Health Security Act and Health Choices would eliminate the SCI program entirely. Nevertheless, more people would enroll in Medicaid or SCHIP under the Health Security Act for two reasons: (1) the Health Security Plan would enroll all currently insured New Mexicans in Medicaid and SCHIP when eligible; and (2) self-insured employers would terminate their health plans in favor of Health Security Plan coverage when it is less expensive.
Because Health Choices would extend Medicaid eligibility to childless adults under 100
percent FPL, the Alliance would enroll many more New Mexicans in Medicaid. Under Health Choices v.1, we assume that self-insured employers would terminate coverage—since they would pay into the plan regardless of whether they sponsor a health plan. Under Health Choices v.2, self-insured employers do not pay into the Alliance if they offer coverage, and therefore make a cost-based decision whether to terminate their self-insured plan. As a result, more New Mexicans would enroll in the Alliance under version 1 than under version 2 of Health Choices.
FIGURE III.3
PERCENTAGE OF NEW MEXICANS BY PREDOMINANT SOURCE OF HEALTH INSURANCE COVERAGE, CURRENT CASE AND SIMULATED REFORM MODELS FY2010
45%
50%
51%
30%
49%
45%
44%
12%
5%
5% 55%
55%
45%
38%
32%
18%
0% 20% 40% 60% 80% 100%
Current case
Health SecurityAct
Health Choicesv.1
Health Choicesv.2
Health CoveragePlan
HealthSolutions
Private and publicemployer plans
Individual privatecoverage
Medicaid, SCHIP, and SCI
Other federal and stateprograms
New program
Uninsured
Source: Mathematica Policy Research, Inc.
Notes: Data include the noninstitutionalized civilian population under age 65. Medicare beneficiaries and active military personnel are excluded. Employer-sponsored insurance includes NMHIA. Individual private coverage includes NMMIP.

24
HealthSolutions would result in the smallest proportion of the population enrolled in federally matched public coverage of any of the reform models, although the proportion enrolled in these programs still would increase markedly—from an estimated 30 percent of the population predominantly insured in these programs in the current case to 44 percent, as current eligibles became enrolled. Conversely, HealthSolutions would retain the largest proportion of the population in current forms of private coverage—increasing the percentage of New Mexicans with private coverage from 45 percent in the current case to 51 percent.
3. Changes in Coverage
The results reported above with respect to changes in coverage are summarized in Figure III.4. Because full compliance with the individual mandate is assumed, each of the reform models would cover all of the uninsured. However, the reform models differ substantially in the extent to which they would affect current sources of coverage.
The Health Security Act and New Mexico Health Choices v.1 would largely eliminate
employer-sponsored coverage and fully eliminate individual private coverage except for supplemental policies. Based on our cost estimates for the Health Security Act, very few employers that now offer self-insured coverage to workers and dependents would continue to do so, rather than pay into the Health Security Plan.
While some employer-based coverage would remain under Health Choices v.2, only under
HealthSolutions or the Health Coverage Plan would employer coverage expand to include workers and dependents over 300 percent FPL who are offered coverage but are not enrolled. Similarly, both HealthSolutions and the Health Coverage Plan would increase slightly the number of New Mexicans enrolled in individual coverage, including NMMIP.
As noted earlier, all of the reform models would increase coverage in Medicaid and
SCHIP—either within a new program (the Health Security Plan or the Alliance) or in the programs as they are currently configured. Because the New Mexico Health Choices models would extend Medicaid eligibility to childless adults under 100 percent FPL, the estimated increase in Medicaid and SCHIP enrollment is much greater than under the other reform models, despite Health Choices’ elimination of the SCI program.

25
FIGURE III.4
SIMULATED NET CHANGE IN THE NUMBER OF INSURED NEW MEXICANS BY SOURCE OF COVERAGE COVERED IN THE REFORM MODELS, FY2010
-750.0 -500.0 -250.0 0.0 250.0 500.0 750.0
Otherprivate
Medicaid,SCHIP, SCI
Newprogram
Persons in thousands
HealthSolutions
Health Coverage Plan
Health Choices v.2
Health Choices v.1
Health Security Act
Source: Mathematica Policy Research, Inc.
Notes: Data include the noninstitutionalized civilian population under age 65. Medicare beneficiaries and active military personnel are excluded. Employer-sponsored insurance includes NMHIA. Other private insurance includes NMMIP. Other public programs include SCI.
4. Sources of Coverage for Uninsured New Mexicans
Both the Health Security Act and Health Choices would substantially alter the sources of coverage for New Mexicans who are now insured, as well as provide coverage for New Mexicans who are now uninsured. Because all of the reform models would require uninsured New Mexicans to obtain coverage, it is useful to understand exactly how the uninsured population would fare in each.
The Health Security Act would cover all of the currently uninsured population in the Health
Security Plan. Similarly, New Mexico Health Choices v.1 would cover all uninsured in the Alliance (Table III.3). In both reform models, a substantial number of the uninsured would qualify for Medicaid or SCHIP and would enroll via the new program.
In New Mexico Health Choices v.2, some workers who are offered self-insured employer-
sponsored coverage but currently do not enroll could accept that coverage. However, the Alliance would offer generous subsidies to most of New Mexicans who are now uninsured. As a result, all of uninsured workers and dependents who have an offer of self-insured coverage in the current case are assumed to accept coverage in the Alliance under New Mexico Health Choices v.2, as well as in v.1.
Uninsured
Employer Plans

26
TABLE III.3
SIMULATED SOURCES OF COVERAGE FOR CURRENTLY UNINSURED NEW MEXICAN IN THE REFORM MODELS, FY2010
Health
Security ActHealth
Choices v.1Health
Choices v.2 Health
Coverage Plan Health
Solutions
(Persons in thousands) Total Uninsured in the Current Case 311.4 311.4 311.4 311.4 311.4 Employer-Sponsored Coverage - - - 82.6 92.5 Individual Insurance - - - 6.2 7.5 Medicaid/SCHIP 190.0 226.1 226.1 190.2 178.7 SCI - - - 32.5 32.8 New Program 121.5 85.4 85.4 - -
(Percent) Total Uninsured in the Current Case 100.0% 100.0% 100.0% 100.0% 100.0% Employer-Sponsored Coverage - - - 26.5% 29.7% Individual Insurance - - - 2.0% 2.4% Medicaid/SCHIP 61.0% 72.6% 72.6% 61.1% 57.4% SCI 0.0% 0.0% 0.0% 10.4% 10.5% New Program 39.0% 27.4% 27.4% - -
Source: Mathematica Policy Research, Inc.
Notes: Data include the noninstitutionalized civilian population under age 65. Medicare beneficiaries and active military personnel are excluded.
Only in HealthSolutions and the Health Coverage Plan do uninsured New Mexicans disperse among various sources of coverage. In HealthSolutions, nearly 30 percent of the uninsured enroll in employer-sponsored coverage—including some self-employed workers who enroll in NMHIA. These uninsured are in families with income above 300 percent FPL, and therefore are ineligible for Medicaid, SCHIP, or SCI. Most are currently offered employer-sponsored coverage but do not enroll.
In HealthSolutions, approximately 57 percent of the uninsured enroll in Medicaid or SCHIP—somewhat less than either the Health Security Act or the Health Coverage Plan (both approximately 61 percent). In all three models the uninsured New Mexicans who enroll in these programs are currently eligible but not enrolled.
Finally, in both HealthSolutions and the Health Coverage Plan, a small number of uninsured
New Mexicans would enroll in individual coverage, including NMMIP. Although all are in families with income above 300 percent FPL, this coverage nevertheless is likely to be very costly for them.

27
IV. EXPENDITURES IN THE CURRENT CASE AND IN THE REFORM MODELS
A. TOTAL EXPENDITURES IN THE CURRENT CASE
In FY2010, expenditures for personal health care services and health insurance and public coverage program administration in New Mexico are projected to exceed $6.9 billion for the noninstitutionalized, non-Medicare civilian population under age 65 (Table IV.1).23 Most of this amount will be paid privately—either through private insurers or out-of-pocket. Private insurers are projected to pay $3.1 billion for medical services and administration (44 percent of the total), while consumers will pay nearly $1.0 billion out of pocket (14 percent of the total) to cover medical costs that public or private insurance do not cover.
Together, federal and state government are projected to finance more than 41 percent of total health care expenditures for this population in FY2010—an estimated $2.9 billion. Federal government will finance nearly 70 percent of this amount—an estimated $2.0 billion.24
State expenditures to finance personal health care services for the noninstitutionalized, non-Medicare civilian population under age 65 are projected to reach $886 million in FY2010. Nearly all of this expenditure is for Medicaid, SCHIP, and SCI ($651 million) and for state employee health benefits ($206 million). In addition, the state operates a number of programs intended to help individuals who do not qualify for Medicaid or SCHIP. Expenditures for these programs are projected to reach $29 million in FY2010—approximately 3 percent of total state expenditures for health care services and administration.
23 This estimate excludes some funding for federal and state programs that individuals may not report
as paying for medical services—for example, some federal block grant programs that provide care directly or some Indian Health Services expenditures. Administrative records of expenditures exceed payments reported by households from those sources.
In addition, this estimate excludes federal government funding via Medicare reimbursement rates for medical education to teaching hospitals and special funding for “disproportionate-share hospitals” (DSH) as well as direct and indirect medical education payments. The federal government provides DSH funds recognizing that Emergency Medical Treatment and Active Labor Act (EMTALA) requires hospitals to care without regard to patients’ ability to pay. DSH payments to hospitals that serve a disproportionate number of low-income or uninsured patients are based on the hospital’s number of Medicare (Part A) days as well as the number of Medicaid days, the hospital’s size, and whether it is a sole community provider or rural referral hospital. In our earlier report, we estimated that hospitals in New Mexico received almost $55 million in federal medical education and DSH payments in 2007, with most of this funding (78 percent) directed to disproportionate share hospitals. Indirect medical education (IME) payments are based on Medicare inpatient cases, and are intended to compensate teaching hospitals for the extra patient care costs they incur. Additional Medicare payments for direct medical education (DME)—sometimes called graduate medical education, or GME—are based on the number of medical residents and help teaching hospitals to cover the direct costs of providing clinical education.
24 In New Mexico, Medicaid and SCHIP account for 85 percent of federal funds received by the state—estimated at nearly $1.2 billion in 2007.

28
TABLE IV.1
PROJECTED HEALTH CARE EXPENDITURES FOR NONINSTITUTIONALIZED CIVILIAN NEW MEXICANS UNDER AGE 65 BY SOURCE OF FUNDS IN THE CURRENT CASE, FY2010
Total Expenditures (in millions)
Expenditures for Medical
Services (in millions)
Nonmedical Cost
(in millions)
Expenditures by Source as a Percent of
Total Expenditures
Expenditures for Medical Services as a
Percent of Total
Expenditures
Nonmedical Cost as a Percent of
Total Expenditures
Total $ 6,921.8 $ 5,947.3 $ 974.5 100.0% 85.9% 14.1% Federal Government 1,977.4 1,710.9 266.5 28.6% 86.5% 13.5%
Medicaid and SCHIP 1,685.8 1,459.6 226.2 24.4% 86.6% 13.4% Federal employees 177.8 147.9 29.9 2.6% 83.2% 16.8% TRICARE 64.7 58.8 5.9 0.9% 90.8% 9.2% Other federal government 49.1 44.6 4.5 0.7% 90.8% 9.2%
State Government 886.0 762.5 123.5 12.8% 86.1% 13.9% Medicaid, SCHIP and SCI 651.4 564.2 87.3 9.4% 86.6% 13.4% State employees 205.9 171.1 34.8 3.0% 83.1% 16.9% Other state government 28.6 27.2 1.4 0.4% 95.0% 5.0%
Private 4,058.4 3,473.9 584.5 58.6% 85.6% 14.4%
Insured 3,067.4 2,482.9 584.5 44.3% 80.9% 19.1% SCI premiums 2.2 1.8 0.4 a 81.5% 18.5% NMMIP 31.3 29.6 1.7 0.5% 94.7% 5.3% NMHIA 49.2 38.5 10.6 0.7% 78.4% 21.6% Self-insured private 923.2 761.9 161.4 13.3% 82.5% 17.5% Commercial group 1,889.2 1,526.5 362.7 27.3% 80.8% 19.2% Commercial individual 172.3 124.5 47.7 2.5% 72.3% 27.7%
Out of Pocket 991.0 991.0 N/A 14.3% 100.0% 0.0%
Source: Mathematica Policy Research, Inc.
a Estimate is less than .05 percent.
All systems of health care financing entail nonmedical costs. For public programs, nonmedical costs include eligibility determination, negotiation and management of private health plan contracts, contract administrative services, provider relations, general administration and overhead. For privately insured or self-insured plans, nonmedical costs include claims processing, provider relations and contract management, marketing, general administration, surplus, and profit. In addition, plan sponsors—including employers that offer health insurance benefits—incur administrative cost associated with selecting, reviewing, and modifying coverage and enrolling and disenrolling employees from coverage when the enter, exit, or change coverage.
In New Mexico (as in other states), the Medicaid, SCHIP, and SCI programs contract with private managed care organizations (MCOs) to provide and coordinate care for enrollees. The

29
Human Services Department (HSD) allows MCOs a 15-percent margin over medical cost for these services. In addition, HSD conducts eligibility determination and enrollment and pays claims for beneficiaries in areas that contracting MCOs do not serve or who receive care from IHS providers.
Other programs (such as NMHIA) that contract with private insurers also have the same layering of nonmedical costs. In general, these programs view the additional nonmedical cost associated with contracting private insurers as cost effective; contractors are expected to ensure access to care, coordinate care effectively and efficiently, and monitor the quality of care that is provided.
In FY2010, the total nonmedical cost of state-based insurance programs and private insurance arrangements in New Mexico is projected to exceed $974 million—approximately 14 percent of total expenditures for health care among the civilian noninstitutionalized non-Medicare population under age 65. Privately insured groups and individuals pay the highest rate of nonmedical cost—19 and 28 percent, respectively. It is in part due to the high nonmedical cost of private insurance for small groups and individuals that small employers are least likely to offer coverage, and workers and dependents without an employer offer of coverage (unless eligible for public coverage) are most likely to be uninsured.
B. CHANGE IN EXPENDITURES IN THE REFORM MODELS
In this section, we present estimates of expenditures under each of the reform models. As with our coverage estimates, our expenditure estimates reflect a series of assumptions about the behavior of employers and consumers in New Mexico, as well as about the product designs and methods of payment implicit in each of the reform models. These assumptions, summarized below, are the same as were used in our earlier report.
1. Major Assumptions
To estimate the change in cost that would result from each of the reform models, we made a number of assumptions, as follow:
• Alternative benefit designs. All estimates rely essentially on four alternative benefit designs observed in the current case: (1) the state employee health plan; (2) average private group insurance; (3) average individual private insurance; and (4) Medicaid and SCHIP. Assuming the same benefit designs across the reform models makes the cost results somewhat more transparent and permits more direct comparison among the reform models. Specifically, the medical cost estimates vary only on the basis of the characteristics of individuals who enroll and the distribution of enrollment across sources of coverage. They do not differ based on the plan designs available to enrollees.
• “Low-option” coverage in New Mexico Health Choices. New Mexico Health Choices envisions “low option” benefit design which would be available to all, although only New Mexicans with income above 400 percent FPL would have an incentive to purchase it. However, the reform model offers no guidance about the

30
specific design intended for that plan. We estimated that all Alliance enrollees (like Health Security Plan enrollees) would enroll in a plan with cost sharing similar to the state employee plan—except those whom the new program would enroll in Medicaid or SCHIP, with lower cost sharing.
• Reduction in payments to reflect lower provider administrative cost. By reducing the number of payers in New Mexico’s health care system, the Health Security Act anticipates administrative cost savings and would attempt to capture them by reducing payments to providers. However, some have argued that provider costs in fact would not be reduced because multiple payers would remain in the system. Others have expressed concern that, regardless of any administrative savings, reduction in provider payment rates would pose a hardship for some providers who are marginally viable, especially in rural areas. We attempted to address these concerns in several ways:
− First, we assumed that there would be some saving in providers’ administrative costs, but only in urban areas of the state where there are now the greatest number of payers for care.
− Second, we assumed that the reduction in payments to providers in urban areas would be just half that estimated for providers in the Canadian health care system, as reported in the research literature.25 Accordingly, in urban areas we reduced payment rates to hospitals (for inpatient, outpatient, and emergency room services) by 5.7 percent, to office-based providers (including vision and dental services) by 5.4 percent, and to home health service providers by 9.6 percent.
− Third, we developed an alternative scenario for the Health Security Act that reflects no reduction in provider payments. Thus, we refer in this section to Health Security Act v.1 (which reduces payment rates to urban providers) and Health Security Act v.2 (which retains current average levels of payment).
• Nonmedical cost rates. Each of the reform models would entail different levels of nonmedical cost associated with retaining private insurers and screening individuals for program eligibility, as well as the general administration of programs under reform. In the current case as well as the reform models, the nonmedical cost of screening and enrolling Medicaid/SCHIP enrollees was estimated at $137 per enrollee in FY2010; other nonmedical costs were estimated as described in Chapter II. With respect to each reform model we assume additional nonmedical costs as follow:
25 Woolhandler, S. et al. (August 2003). Costs of Health Care Administration in the United States
and Canada. New England Journal of Medicine 349 (8): 768-775.

31
− Under the Health Security Act, the nonmedical cost of administering the Health Security Plan is estimated at $328 per enrollee. This amount is approximately 2.5 times Medicare’s FFS administrative cost experience per enrollee projected to FY2010, accounting for activities not included in Medicare’s administrative cost calculation.
− In Health Choices, nonmedical costs include an estimated $137 per person to administer an income-based voucher system; no additional cost is included for Medicaid or SCHIP eligibility determination. However, the Alliance would incur some unique costs—including an additional 1.015 percent per paid claim for administration of the Alliance (allowing for economies of scale, estimated as one-half the rate incurred by NMHIA exclusive of marketing and net of operating income which might also accrue to the Health Choices Alliance). Also, insurers in the Alliance would finance a reinsurance program to help manage guaranteed issue and pure community rating in the Alliance; this cost is estimated at 1 percent of medical cost. Finally, Health Choices calls for elimination of the premium tax, and would retain private insurers within the Alliance. Minus the 4 percent premium tax, the average net nonmedical cost for private group coverage in New Mexico is 15.8 percent of premiums, based on the most recent available data—somewhat lower than that estimated on the earlier data available for our previous report. The nonmedical cost rate for FEHBP (which is not subject to the premium tax) is 16.8 percent of premiums, calculated on more recent data. Considering the volatility in insured group nonmedical cost rates and in order to be consistent with our earlier estimates, we assumed the FEHBP rate (16.8 percent) to estimate private insurers’ nonmedical costs in the Alliance.
− Nonmedical costs for both HealthSolutions and the Health Coverage Plan are equal to the average historical nonmedical rates by payer, as reported in Chapter II.
• Medical management in the Health Security Act. While the Health Security Act hopes to eliminate some of the practices of private insurers—specifically, denial of claims—that now occur, we assume it would nevertheless develop Plan-wide management much like that in Medicaid MCOs currently. In the current case, Medicaid MCOs are paid 4.45 percent of medical cost (net of the premium tax and net of the administrative functions already captured in the first bullet above) to cover enrollment functions and claims. We assume that 2 percentage points of this amount are profit, and that the net amount—2.45 percent—approximates the cost of medical management and management of provider contracting. If the Health Security Plan were to conduct no medical management, medical cost would likely be significantly higher than our estimates indicate.
• Other federal sources of payment. Finally, we assume that some federal sources of payment for care in the current case—specifically, Veterans Administration facilities and the IHS—would charge insured New Mexicans in each of the reform models for care that they would have provided to uninsured patients without charge. Thus, each

32
of the reform models supplant these sources of federal funding, refinancing through various sources of coverage the care that the VA and IHS finance in the current case.
2. Total Costs of the Reform Models
In each of the reform models, additional coverage is expected to result in greater use of services and higher total expenditure for health care services. All else being equal, the effect of additional coverage would dominate and total expenditures would rise in all of the reform models. However, (in addition to the reduction in payment rates to urban providers in the Health Security Act v.1), two aspects of the estimates temper this result:
• In cases where employees and dependents with group coverage are moved into standard coverage patterned on the state employee health plan, the slightly higher average cost sharing estimated for the state employee plan forces slightly lower use of services. That is, our medical cost estimates for Health Security Plan or the Health Choices Alliance reflect slightly greater average cost sharing for currently insured New Mexicans, as well as substantially reduced cost sharing for individuals who enroll in Medicaid or SCHIP.
• Second, the estimated nonmedical costs of the reform models differ substantially. These differences in nonmedical costs also underlie the differences in estimated total cost among the models.
The net cost results of each of the reform models are summarized in Table IV.2. Federal and state spending would increase in all of the reform models because more New Mexicans would enroll in Medicaid and SCHIP. The Health Security Act would largely displace private insurance (with only some self-insured employer plans remaining), so that private insurance spending would largely disappear. Health Choices would retain private insurers within the Alliance; while privately insured, those expenditures appear in Table IV.2 as expenditures in the new program. Otherwise, private insurance expenditures in Health Choices v.2 are associated only with the self-insured employer plans that remain. In both HealthSolutions and the Health Coverage Plan, conventional private insurance expenditures would increase, reflecting greater enrollment in both group and individual health insurance plans. Because more New Mexicans would become insured, and because many would enroll in Medicaid or SCHIP with very low cost-sharing and comprehensive benefits, out-of-pocket spending is would decline in all of the reform models.
In summary, the cost results of each reform model relative to the current case are as follow:
• The Health Security Act v.1, which would reduce payments to urban providers, would reduce total health care spending in New Mexico. Total health care expenditures for the noninstitutionalized civilian population under age 65 would decline to $6.7 billion (from $6.9 billion in the current case). Reflecting expanded enrollment, Medicaid expenditures would increase to an estimated $2.8 billion, of which $790 million would be state spending; federal match would fund more than

33
$2.0 billion. Very few self-insured employers would remain, accounting for just $9.7 million in total expenditures; this estimate assumes that self-insured plans would reimburse providers at the same rates as in the current case.
TABLE IV.2
ESTIMATED AMOUNT AND PERCENT OF TOTAL HEALTH CARE EXPENDITURES IN THE CURRENT CASE AND REFORM MODELS BY SOURCE OF PAYMENT, FY2010
Current
Case
Health Security Act v.1
Health Security Act v.2
Health Choices
v.1
Health Choices
v.2
Health Coverage
Plan Health
Solutions
(Dollars in millions)
Total 6,921.8 6,720.1 6,854.7 7,402.7 7,414.0 7,159.8 7,157.9
Federal Medicaid/SCHIP 1,685.8 2,049.2 2,095.5 2,583.9 2,570.0 1,861.3 1,840.7
Other federal spending 291.6 242.5 242.5 242.5 242.5 251.2 251.2
State Medicaid/SCHIP/SCI 651.4 790.1 808.1 998.7 993.9 720.0 712.0
Other state spending 234.5 - - - - 210.2 210.2
New program - 2,693.9 2,764.2 2,686.2 2,297.7 - -
Private insurance 3,064.2 9.7 9.7 - 457.0 3,201.4 3,223.4
Out of pocket 994.2 934.7 934.7 891.3 853.1 915.7 920.5
(Percent of total)
Total 100.0% 100.0% 100.0% 100.0% 100.0% 100.0% 100.0%
Federal Medicaid/SCHIP 24.4% 30.5% 30.6% 34.9% 34.7% 26.0% 25.7%
Other federal spending 4.2% 3.6% 3.5% 3.3% 3.3% 3.5% 3.5%
State Medicaid/SCHIP/SCI 9.4% 11.8% 11.8% 13.5% 13.4% 10.1% 9.9%
Other state spending 3.4% 0.0% 0.0% 0.0% 0.0% 2.9% 2.9%
New program 0.0% 40.1% 40.3% 36.3% 31.0% 0.0% 0.0%
Private insurance 44.3% 0.1% 0.1% 0.0% 6.2% 44.7% 45.0%
Out of pocket 14.4% 13.9% 13.6% 12.0% 11.5% 12.8% 12.9%
Source: Mathematica Policy Research, Inc.
Notes: Data include the noninstitutionalized civilian population under age 65. Medicare beneficiaries and active military personnel are excluded. Other federal spending includes FEHBP and TRICARE.
• If the Health Security Plan maintained current levels of provider reimbursements (v.2), projected total expenditures still would be slightly less than in the current case. Medicaid expenditures would increase somewhat more—to an estimated $2.9 billion, of which $808 million would be state spending; federal match would fund $2.1 billion. As in v.1, few self-insured employers would remain, and they would account for a very small share of total health expenditures.

34
• Under Health Choices v.1, total expenditures would rise to $7.4 billion—largely reflecting the higher administrative cost of this reform model. Medicaid and SCHIP enrollment would peak, covering more than half of the civilian noninstitutionalized population under age 65. As a result, federal and state spending for Medicaid and SCHIP also would peak, reaching $3.6 billion. Of this amount, the state would finance an estimated $999 million, and federal matching would finance $2.6 billion. Medicaid and SCHIP would finance 42 percent of all health care spending in New Mexico for the civilian noninstitutionalized population under age 65. With the exception of federal workers and TRICARE dependents, all civilian workers and dependents currently enrolled in group coverage would move into the Alliance, as would New Mexicans enrolled in private individual coverage and state programs such as NMHIA, SCI, and NMMIP in the current case. The Alliance would finance a projected $2.8 billion in total expenditures for heath care.
• Under Health Choices v.2, self-insured employers would confront somewhat different incentives, and some are expected to remain self-insured. This difference in employer behavior leads to somewhat different cost estimates between Health Choices v.1 and v.2. Under v.2, self-insured plans would finance $457 million in health care costs in FY2010, 6 percent of total expenditures for the noninstitutionalized civilian population under age 65. Retaining workers and dependents in self-insured group coverage would reduce the number of New Mexicans who enrolled in Medicaid/SCHIP, compared with v.1. However, enrollment still would increase substantially compared with the current case, bringing combined federal and state expenditures in these programs to nearly $3.6 billion—approximately 43 percent of total expenditures for the civilian noninstitutionalized population under age 65. The Alliance would account for $2.3 billion—less than under v.1, but still accounting for nearly a third of total spending.
• The Health Coverage Plan would expand all current sources of coverage in New Mexico. Total expenditures would reach $7.2 billion, of which private insurance spending would total $3.2 billion—accounting for 45 percent of total expenditures for the noninstitutionalized civilian population under age 65. While the Health Coverage Plan would expand Medicaid and SCHIP enrollment, it would not displace private coverage in the same manner as either the Health Security Act or Health Choices. Federal and state spending for Medicaid, SCHIP, and SCI would increase to $2.6 billion, representing 36 percent of total health care expenditures for the noninstitutionalized civilian population under age 65. Of this amount, the state would finance $720 million, and the federal government would pay $1.9 billion.
• HealthSolutions also would expand all current sources of coverage, but compared with the Health Coverage Plan, more conservative administration of income disregards to determine SCHIP and SCI eligibility would slightly reduce enrollment these programs. Under HealthSolutions, total expenditures would be nearly $7.2 billion in FY2010 (approximately the same as in the Health Coverage Plan). Medicaid, SCHIP, and SCI would account for nearly $2.6 billion of this amount, with state expenditures paying $712 million and federal funding paying $1.8 billion. Private insurance expenditures would account for 45 percent of total expenditures, approximately $3.2 billion.

35
These results are depicted in Figure IV.1, summarized by federal, state, and private-sector sources of payment.
FIGURE IV.1
PROJECTED TOTAL EXPENDITURES BY FEDERAL, STATE, AND PRIVATE SOURCES OF FUNDS, FY2010
$2.0
$2.3
$2.3
$2.8
$2.8
$2.1
$2.1
$0.9
$3.5
$3.6
$3.7
$3.3
$0.9
$0.9
$4.1
$0.9
$0.9
$0.9
$1.3
$4.1
$4.1
$0.0 $2.0 $4.0 $6.0 $8.0
Current case (no reform)
Heallth Security Act v.1
Health Security Act v.2
NM Health Choices v.1
NM Health Choices v.2
NM Health Coverage
HealthSolutions
Dollars in billions
Federal
State
Private
Source: Mathematica Policy Research, Inc.
3. Changes in Cost by Major Payer
For each reform model, the change in cost relative to the current case is reported by major source of payment in Table IV.3. With the exception of the Health Security Act, which would reduce total health care spending by an estimated $67 million (v.2) to $202 million (v.1), each of the reform models would result in higher health care expenditures. Health Choices v.2 would result in the greatest increase: $492 million, or 7 percent more than the current case. The relatively low level of net expenditure associated with each of the reform models reflects both significant spending to finance care for New Mexico’s uninsured population in the current case and heavy reliance on Medicaid and SCHIP in all of the reform models; these programs pay less for health services than private insurance plans.
In light of the considerable increase in projected Medicaid, SCHIP, and SCI enrollment in the reform models, the relatively low increase in expenditures for these programs warrants explanation. Two factors drive these results. First, the average duration of enrollment in these programs in the current case is relatively low, and many New Mexicans who are predominantly uninsured are in fact enrolled in these programs part of the year. Therefore, despite adding what appears to be many more people to public programs in the reform models, they account for relatively few additional enrolled months. The Health Security Act and Health Choices,

36
respectively, would auto-enroll individuals in Medicaid and SCHIP through the Health Security Plan and the Alliance respectively—displacing full-year private coverage with Medicaid and SCHIP and adding many more months to those programs than would either the Health Coverage Plan or HealthSolutions.
TABLE IV.3
SIMULATED NET CHANGE IN 2007 TOTAL HEALTH CARE EXPENDITURES UNDER EACH REFORM MODEL COMPARED WITH THE CURRENT CASE, PROJECTED FY2010
Health Security Act
v.1
Health Security Act
v.2 Health
Choices v.1Health
Choices v.2
Health Coverage
Plan Health
Solutions
(Dollars in millions) Total -201.7 -67.1 481.0 492.3 238.1 236.2 Total Federal 314.4 360.6 849.0 835.1 135.2 114.5
Federal Medicaid/SCHIP 363.4 409.7 898.1 884.2 175.5 154.9 Total State 2,598.0 2,686.3 2,799.0 2,405.6 44.2 36.2
State Medicaid/SCHIP/SCI 138.7 156.7 347.3 342.4 68.6 60.6 Total Private -3,114.0 -3,114.0 -3,167.1 -2,748.4 58.7 85.5
Private insurance -3,054.5 -3,054.5 -3,064.2 -2,607.2 137.2 159.2 Out of pocket -59.5 -59.5 -102.9 -141.1 -78.5 -73.7
(Percent change from the current case) Total -2.9% -1.0% 6.9% 7.1% 3.4% 3.4% Total Federal 15.9% 18.2% 42.9% 42.2% 6.8% 5.8%
Federal Medicaid/SCHIP -16.8% -16.8% -16.8% -16.8% -13.8% -13.8% Total State -10.8% -8.8% 12.7% 12.2% 5.0% 4.1%
State Medicaid/SCHIP/SCI 21.3% 24.1% 53.3% 52.6% 10.5% 9.3% Total Private -76.7% -76.7% -78.0% -67.7% 1.4% 2.1%
Private insurance -99.7% -99.7% -100.0% -85.1% 4.5% 5.2% Out of pocket -6.0% -6.0% -10.3% -14.2% -7.9% -7.4%
Source: Mathematica Policy Research, Inc.
Notes: Expenditures are for the noninstitutionalized civilian population under age 65. Medicare beneficiaries and active military personnel also are excluded.
Second, many New Mexicans who currently are eligible for Medicaid, SCHIP, or SCI remain unenrolled. It is reasonable to expect that those who enroll in these programs in the current case—particularly adults, but also children—have lower health status than those who choose to remain uninsured, and our modeling reflects this assumption. Therefore, enrollees who respond to the individual mandate by newly enrolling in Medicaid, SCHIP, or SCI are on average healthier than those who are currently enrolled—and represent lower average expenditure per enrollee.

37
Both of these factors—low addition of months among the many New Mexicans whom we estimated are uninsured part-year, and low expected expenditures per new enrollee—produce a relatively modest increase in Medicaid and SCHIP expenditures for each of the reform models relative to the relatively large estimated increase in enrollees. Because neither the Health Coverage Plan nor HealthSolutions would displace private coverage, the increase in Medicaid and SCHIP expenditures for these reform models is lower than for the Health Security Act or Health Choices.
C. PROJECTED COST GROWTH
We projected the growth in total expenditures for the current case and each of the reform models. In the current case, the cost projections are based on historical growth in estimated cost per member per month for each source of payment, as described in Chapter II. In addition, we assume that all insured New Mexicans remain in the same sources of coverage as in FY2010, and that uninsured New Mexicans remain uninsured—although, at the current rate of premium growth relative to personal income, it is likely that New Mexicans would continue to lose coverage over the projection period. Nevertheless, in order not to distort comparison with the reform models, we assume no change in the uninsured rate during the projection period.26
The projected change in total expenditures from FY2010 through FY2014 is reported in Table IV.4 for each of the reform models. We assume that the entity formed to manage health care reform—variously, the Health Security Board, the Health Choices Alliance, and the New Mexico Health Care Authority—succeed in constraining medical cost growth 1 percentage point below the current trend. In each of the reform models, this reduces the total average annual rate of growth by less than 1 percentage point—but it is enough to slow overall spending growth noticeably. Results for each of the reform models are summarized below.
• Under the Health Security Act, the estimated level of expenditures is lower in FY2010, and slower growth than in the current case would produce much lower levels of total spending by FY2014—reducing total expenditures by $374 million in v.2 and $548 million in v.1 compared with the current case. In addition to the lower medical cost trend assumed for all of the reform models, the slower growth of expenditures in the Health Security Act reflects a decoupling of nonmedical costs from medical costs. In both versions of this reform model, nonmedical costs are constrained to grow at the average annual wage rate in New Mexico—not the medical cost growth rate, as is the common standard in the private sector and in public programs that contract with private carriers.
• While all of the other reform models anticipate higher total expenditures than the current case in FY2010, only Health Choices would have higher levels of
26 Further erosion of coverage would decrease total expenditures over time in the current case, so that
cost differences between the reform models and the current case would be less in the outlying years than we have estimated. However, at present, loss of coverage and growing enrollment in Medicaid or SCHIP (which have maintained low rates of expenditure growth per member per month) would be the only reasons to expect lower expenditure growth in the current case.

38
expenditure through FY2014. The higher ongoing cost of this reform model is explained by its high nonmedical cost rate. Because Health Choices would include private carriers in the Alliance with no constraint on nonmedical costs, those costs would remain pegged to the medical cost growth rate. Furthermore, because Medicaid and SCHIP would pay providers (and carriers) at the Alliance rate, per member per month expenditures in Medicaid and SCHIP are assumed to increase at the Alliance average. While this may reduce cost shifting from public to private payers, on net it seems likely to increase total expenditures by substantially more than it would reduce any cost shift.27
TABLE IV.4
PROJECTED DIFFERENCE IN TOTAL HEALTH CARE EXPENDITURES IN THE REFORM MODELS COMPARED WITH THE CURRENT CASE, FY2010-FY2014
FY2010 FY2011 FY2012 FY2013 FY2014
(Dollars in millions)
Health Security Act v1 (201.7) (260.7) (344.5) (439.6) (547.6) Health Security Act v2 (67.1) (117.1) (191.2) (276.2) (373.2) Health Choices v1 481.0 482.8 464.6 439.9 407.8 Health Choices v2 492.3 499.9 489.1 472.7 450.0 Health Coverage Plan 238.1 174.6 111.3 38.4 (45.8) HealthSolutions 236.2 177.9 115.9 44.5 (37.3)
(Percent change from the current case in each simulation year) Health Security Act v1 -2.9% -3.5% -4.3% -5.1% -6.0% Health Security Act v2 -1.0% -1.6% -2.4% -3.2% -4.1% Health Choices v1 6.9% 6.5% 5.8% 5.1% 4.4% Health Choices v2 7.1% 6.7% 6.1% 5.5% 4.9% Health Coverage Plan 3.4% 2.4% 1.4% 0.4% -0.5% HealthSolutions 3.4% 2.4% 1.5% 0.5% -0.4%
Source: Mathematica Policy Research, Inc.
Notes: Expenditures are for the noninstitutionalized civilian population under age 65. Medicare beneficiaries and active military personnel also are excluded.
• The Health Coverage Plan also would entail higher costs in the first several years following implementation. However, by FY2014, expenditures would be slightly less the current case, reflecting the slowing of medical cost growth in each of the reform models.
27 Various studies have found that cost shifting from public to private payers may be much less than
is conventionally assumed, especially in competitive markets with significant managed care penetration. For example, see: Robert M Dowless, “The Health Care Cost-Shifting Debate: Could Both Sides Be Right?” Journal of Health Care Finance 24(1) Fall 2007:64-71. In New Mexico, Medicaid and SCHIP are thought to pay providers at approximately the Medicare level.

39
• Similarly, HealthSolutions would entail higher expenditure in the initial years, but by FY2014 expenditures would fall below the current case. The primary difference in the cost trend for HealthSolutions versus the Health Coverage Plan relates to HealthSolutions’ somewhat heavier reliance on private insurance and, therefore, a slightly higher pattern of medical and nonmedical cost growth. While HealthSolutions also would entail a number of private insurance market reforms, we estimate that in FY2010 those reforms would not constrain premiums or payments to providers (other than the medical cost reduction assumed for all reform models). The projected simulation years assume a continuation of premium levels relative to medical cost equal to that in FY2010.

PAGE IS INTENTIONALLY LEFT BLANK TO ALLOW FOR DOUBLE-SIDED COPYING

41
V. FINANCING
Each of the reform models would be financed differently—variously, with payroll taxes, premiums, special assessments, or some combination of these. In this chapter, we present estimates of financing for each of the reform models and also identify unfunded costs, if any.
A. FINANCING PROVISIONS OF THE REFORM MODELS
Each reform model specifies a different system of financing:
• The Health Security Act would scale premiums for participation in the Health Security Plan to income. Below 200 percent FPL, premiums would be a fixed amount per person; otherwise, premiums would be capped at 6 percent of family income. A new statewide payroll tax, tiered by employer size to approximate the amount that employers now offering coverage pay as a percent of payroll, would cover any costs in excess of premium revenues. Only self-insured employers would be exempted—and only for workers that they cover directly.
• Health Choices v.1 and v.2 are distinguished by their financing and, in turn, self-insured employers’ incentives to maintain their plans rather than offer coverage through the Alliance. Health Choices v.1 would be financed entirely by a tax on payroll, tiered by firm size so as not to exceed the average amount that employers currently pay for coverage when they sponsor a health insurance plan. This reform model makes no provision for exempting employers from the payroll tax, even when they offer and enroll workers in a self-insured health plan.
• Health Choices v.2 would rely on both premiums and a payroll tax. Families below 400 percent FPL would not pay premiums. Those with higher incomes would pay the full cost of coverage, not to exceed 6 percent of family income.
• The Health Coverage Plan would retain all current sources of health care financing in New Mexico. In addition, it would expand subsidies to SCI for enrollees up to 300 percent FPL and require employers to make a Fair Share payment for all workers they do not cover. For the purpose of estimating financing, we assumed that Fair Share payments would equal $300 per year for each worker not enrolled in their own employer’s plan. We assume just one Fair Share payment per worker, in effect capping fair share payments for each worker at $300 per year even though some—including disproportionately the lowest-wage workers—may work multiple jobs and more than 40 hours per week. This is equivalent to assuming that the State would administer Fair Share payments so as not to disadvantage these workers.
• HealthSolutions also would retain all current sources of financing, expand subsidies to SCI for enrollees up to 300 percent FPL (with more conservative application of income disregards than the Health Coverage Plan), and assess all employers a Healthy Workforce contribution. Employers that offer a health insurance plan to any

42
of their workers could deduct from their Healthy Workforce contribution the total amount that they contribute to coverage—regardless of how many workers are enrolled.
In addition to these explicit sources of financing, both the Health Security Act and New Mexico Health Choices would eliminate the current state tax on health insurance premiums by exempting both the Health Security Plan and all Health Choices Alliance plans from premium tax. In contrast, both the Health Coverage Plan and HealthSolutions would generate increased premium tax revenue. Our estimates of financing for HealthSolutions assumes that the General Fund would allocate at least the additional premium tax revenue generated by increased public-program enrollment in MCOs to these programs.
These financing provisions, as well as assumptions about the federal funds that would be
available to the reform models, are summarized in Table V.1. For the Health Security Act, Health Choices, and the Health Coverage plan, these provisions are identical to those assumed in our earlier report.
Finally, as noted in our earlier report, how carriers would calculate insurance premiums
under each reform proposal is material to the estimation of both coverage and financing. Both the Health Security Act and New Mexico Health Choices would require that health insurance premiums be pure-community-rated with no geographic adjustment. This requirement would pose an incentive problem for self-insured employers, especially: those with the lowest-cost (that is, healthiest and/or youngest) employees would pay higher premiums in a pure community-rated market, and therefore would be reluctant to move into the new programs. Considering the large number of workers in New Mexico now enrolled in self-insured coverage, this selection effect would pose a serious problem for these reform models: the highest-cost employees would move into the new programs, bringing with them an unknown level of taxable payroll.
As in our earlier report, we developed the financing projections that minimize premium
payments at the expense of increasing payroll tax financing for these models in order to address this potentially serious problem of adverse selection. This strategy is implicit in our enrollment projections, and it is the reason that our estimates indicate that so many workers and dependents now enrolled in self-insured employer plans enroll in the Health Security Plan and New Mexico Health Choices. Increased adverse selection would not be an issue for either the Health Coverage Plan or HealthSolutions.

43
TAB
LE V
.1
PRO
POSE
D F
INA
NC
ING
OF
THE
REF
OR
M M
OD
ELS
In
divi
dual
s Em
ploy
ers
Stat
e Fe
dera
l
Hea
lth
Secu
rity
Act
• B
elow
200
% F
PL, p
rem
ium
s are
scal
ed to
in
com
e, n
ot to
exc
eed
$35
per m
embe
r per
mon
th
(as i
n SC
I).
• O
ther
wis
e, p
rem
ium
s are
cap
ped
at 6
% o
f fam
ily
inco
me
Tax
on p
ayro
ll, n
ot to
exc
eed
the
curr
ent c
ost f
or e
mpl
oyer
s tha
t of
fer c
over
age,
tier
ed b
y co
mpa
ny
size
.
Hea
lth S
ecur
ity P
lan
exem
pted
from
pre
miu
m ta
x.
Gen
eral
Fun
d ob
ligat
ion
for
unfu
nded
Hea
lth S
ecur
ity
Plan
exp
endi
ture
s.
Hea
lth
Cho
ices
v1
No
prem
ium
s for
stan
dard
Alli
ance
cov
erag
e.
Vol
unta
ry p
rem
ium
s for
impr
oved
ben
efits
. Es
timat
es a
ssum
e tw
o pl
an d
esig
ns a
nd n
o pu
rcha
se
in e
xces
s of w
aive
r am
ount
s.
Tax
on p
ayro
ll, n
ot to
exc
eed
the
curr
ent c
ost f
or e
mpl
oyer
s tha
t of
fer c
over
age,
tier
ed b
y co
mpa
ny
size
.
Hea
lth
Cho
ices
v2
Bel
ow 4
00%
FPL
, Hea
lth C
hoic
es A
llian
ce
prem
ium
s for
stan
dard
cov
erag
e =
$0
Abo
ve 4
00%
FPL
, fam
ily p
rem
ium
s are
cap
ped
at
6% o
f fam
ily in
com
e.
Tax
on p
ayro
ll, a
ppro
xim
atin
g av
erag
e co
st o
f the
hig
h-co
st-
shar
ing
plan
(for
com
paris
on
purp
oses
, est
imat
ed a
s the
stat
e em
ploy
ee h
ealth
pla
n de
sign
).
Off
erin
g em
ploy
ers a
re e
xem
pted
.
Hea
lth C
hoic
es A
llian
ce
exem
pted
from
pre
miu
m ta
x.
Gen
eral
Fun
d ob
ligat
ion
to
finan
ce in
com
e-ba
sed
vouc
hers
and
unf
unde
d N
M
Hea
lth C
hoic
es e
xpen
ditu
res.
Hea
lth
Cov
erag
e Pl
an
Indi
vidu
al c
ontri
butio
ns fo
r SC
I, in
divi
dual
co
vera
ge, N
MM
IP
• In
divi
dual
SC
I pre
miu
ms s
cale
d to
inco
me,
not
to
exce
ed fu
ll co
st.
If n
o em
ploy
er c
ontri
butio
n,
fam
ilies
at 2
50-3
00%
FPL
wou
ld p
ay a
s muc
h as
$2
00 p
er m
embe
r per
mon
th.
Indi
vidu
al c
ontri
butio
ns a
re re
duce
d by
em
ploy
er
cont
ribut
ions
(if a
ny)
Vol
unta
ry c
ontri
butio
ns to
co
vera
ge.
Empl
oyer
s pay
a F
air S
hare
co
ntrib
utio
n (e
stim
ated
at $
300)
pe
r em
ploy
ee n
ot d
irect
ly c
over
ed.
Gen
eral
Fun
d fo
r Med
icai
d,
SCH
IP, a
nd S
CI.
Hea
lth
Solu
tions
Indi
vidu
al c
ontri
butio
ns fo
r SC
I, in
divi
dual
co
vera
ge, N
MM
IP
• In
divi
dual
SC
I pre
miu
ms s
cale
d to
inco
me,
not
to
exce
ed fu
ll co
st.
If n
o em
ploy
er c
ontri
butio
n,
fam
ilies
at 2
50-3
00%
FPL
wou
ld p
ay a
s muc
h as
$2
00 p
er m
embe
r per
mon
th.
Indi
vidu
al c
ontri
butio
ns a
re re
duce
d by
em
ploy
er
cont
ribut
ions
(if a
ny)
Vol
unta
ry c
ontri
butio
ns to
co
vera
ge.
All
empl
oyer
s pay
a H
ealth
y W
orkf
orce
con
tribu
tion
(est
imat
ed
as a
ppro
xim
atel
y $1
00 p
er fu
ll-tim
e w
orke
r and
$50
per
par
t tim
e w
orke
r per
yea
r).
Empl
oyer
s de
duct
all
paym
ents
tow
ard
cove
rage
for a
ny o
f the
ir w
orke
rs.
Gen
eral
Fun
d fo
r Med
icai
d,
SCH
IP, a
nd S
CI.
Incr
ease
d ge
nera
l fun
d re
venu
e fr
om
MC
O ta
xes o
n pr
emiu
ms p
aid
by p
ublic
pro
gram
s is
earm
arke
d to
fund
thes
e pr
ogra
ms.
Fund
ing
cont
inue
s for
: •
Med
icar
e
• M
edic
aid/
SCH
IP
• Fe
dera
l em
ploy
ees
and
retir
ees a
nd
TRIC
AR
E •
Oth
er fe
dera
l pr
ogra
ms
Estim
ates
ass
ume
that
D
SH a
nd U
PL fu
nds
cont
inue
und
er
wai
ver a
utho
rity.
VA
and
IHS
char
ge
for s
ervi
ces p
rovi
ded
to in
sure
d pe
rson
s.

44
While the Health Coverage Plan would not alter private insurance rating rules in New Mexico, HealthSolutions would constrain initial rating and rate increases due to health status or claims experience to 110 percent of medical trend (phased in over five years), versus 120 percent as in current law. Carriers could continue to rate by age and geography within the current overall rate bands. While lower premium increases for health status might produce less premium variation related to health status over time than now exists in the small group market, we estimated no coverage or financing impact from this provision for two reasons. First, our work in other states suggests that age (which broadly predicts health status) is a much more important small-group rating factor than health status, and carriers could rate more aggressively on age within current rate bands. Second, small employers that changed their choice of plan or carrier would be re-underwritten—recalibrating premiums to the group’s current health status; how often small groups now change plans or carriers, or would do so with constraints on premium increases for health status, is unknown.
B. ESTIMATES OF STATE FINANCING
The role of federal funding for Medicaid and SCHIP is important to understanding the financing of the reform models. Both the Health Security Act and Health Choices would enroll Medicaid and SCHIP enrollees in, respectively, the Health Security Plan and standard Alliance plans with low cost sharing. For the purpose of estimation, we assumed the current Medicaid/SCHIP benefit design would continue for individuals now enrolled in those programs as well as for new enrollees after implementation of the reform models. Only the actual costs of Medicaid and SCHIP enrollees would qualify for federal matching—not the average cost of all enrollees in the new program.
In both the Health Security Act and Health Choices, the average cost of non-Medicaid/SCHIP enrollees in the new program is higher than the average cost of enrollees in Medicaid and SCHIP—in part, due to the relatively high proportion of children in Medicaid and SCHIP. Both reform models would require that coverage be pure-community-rated without geographic adjustment, so that the average premium for coverage in the new program would be the same for all participants when not enrolled in Medicaid or SCHIP. In calculating the financing for these programs, we assume that all net costs (after federal match for Medicaid and SCHIP enrollees) are pooled, any premium payments are accounted for, and remaining costs are financed with a tax on nonfederal payroll.
For all of the reform models, the amount of federal matching funds available to the state’s SCHIP program is capped at $66 million per year under New Mexico’s current waiver. HSD projects that the program will hit that cap by FY2010. Our current-case estimates reflect the department’s projected enrollment months, resulting in cost estimates for SCHIP in each simulation year that exceed the cap for the purpose of federal match. As a result, the effective federal matching rate for SCHIP in both the base case and the reform models is lower than that in our earlier report.
The components of financing for each of the reform models are summarized in Table V.2. Estimates of the financing required for the Health Security Act range from 2.8 percent (v.1) to 3.0 percent (v.2) of total nonfederal payroll. Relative to what employers that now sponsor coverage pay for health benefits—on average, more than 10 percent of payroll—the cost this

45
reform model is low indeed. Of course, employers and workers that do not now pay for coverage would begin to pay about 3 percent of payroll.
TABLE V.2
ESTIMATED FINANCING OF STATE PROGRAMS IN THE REFORM MODELS (Dollars in billions)
Health Security Act v1
Health Security Act v2
Health Choices v1
Health Choices v2
Health Coverage
Plan Health
Solutions
Total Cost $6.720 $6.855 $7.403 $7.414 $7.160 $7.158 Federal Funds a 2.292 2.338 2.826 2.812 2.113 2.092 State Funds
State funds obligated in the reform model 3.484 3.572 3.685 3.292 0.950 0.942 Medicaid, SCHIP and SCI 0.790 0.808 0.999 0.994 0.739 0.732 Other programs 2.694 2.764 2.686 2.298 0.210 0.210
Current funds net of enrollee premiums 0.886 0.886 0.886 0.886 0.886 0.886 Medicaid, SCHIP and SCI 0.651 0.651 0.651 0.651 0.651 0.651 Other programs 0.235 0.235 0.235 0.235 0.235 0.235
Net new obligated state funds 2.598 2.686 2.799 2.406 0.064 0.056 Other Sources of Funds
New program and SCI premiums 1.522 1.551 N/A 0.584 0.019 0.020 Employer payments N/A N/A N/A N/A 0.103 0.030 Tax on public program premium payments N/A N/A N/A N/A b 0.008
State Obligation Net of Revenues 1.076 1.136 2.799 1.821 (0.059) (0.001) Percent of taxable payrollc 2.8% 3.0% 7.3% 4.7% N/A N/A
Source: Mathematica Policy Research, Inc.
Notes: Detail may not add to totals due to rounding. State funds exclude state employee plan costs. State employees are included in New Program and SCI premiums, and state employee payroll is subject to a payroll tax if applicable to the reform model.
a Current-case reported expenditures covered by IHA and VA are excluded Estimates assume that the new program would not recoup these funds as coordination of benefits.
b This source of funds is not considered, but might be used to reduce employer Fair Share payments. c Based on projected nonfederal payroll of $35.9 billion in FY2010.
Compared with the Health Security Act, Health Choices would rely more heavily on payroll taxation in lieu of premium payments: enrollees would pay either no premiums for standard coverage regardless of income (v.1) or no premiums below 400 percent FPL (v.2). To cover the State cost in excess of premiums, Health Choices would require a tax on payroll of 4.7 percent (v.2) to 7.3 percent (v.1). While these amounts significantly exceed the payroll tax that would be required to support the Health Security Plan, the fact that all nonfederal employers would pay—including those that do not now offer coverage—would reduce the average net financial burden among employers that currently sponsor group coverage.

46
While the financing estimates the Health Security Act and Health Choices were developed to minimize adverse selection the new programs, the payroll tax estimates for these reform models remain sensitive to self-insured employer behavior. Within the time and resources available for this study, we were unable to model self-insured employer selection behavior and, therefore, the magnitude of the potential effects not only on cost, but also on financing. If self-insured employers continued coverage only for highly compensated workers (that is, those for whom contributions to coverage would be less than the estimated payroll tax), the payroll base would be less than is assumed in our calculations.
Estimates for the Health Coverage Plan and for Health Solutions suggest that the proposed financing for these models is likely to be adequate. For the Health Coverage Plan, a Fair Share payment of $300 per year obtained for every worker not enrolled in a plan sponsored by his or her own employer (similar to that levied in Massachusetts and Vermont) could produce a considerable surplus fund—an estimated $59 million in FY2010. For HealthSolutions, Healthy Workforce contributions are more difficult to estimate with precision because available data do not measure total employer expenditures for health benefits in firms that cover only some workers and the number of workers that such firms do not cover. Consequently, in smaller firms especially, it is unclear either how many employers would pay a Healthy Workforce contribution or the number of workers for whom they would pay.
Given this uncertainty, we produced high and low estimates of revenues for HealthSolutions, adopting extreme assumptions to test the maximum bounds of a Healthy Workforce contribution that would adequately finance this reform model (Table V.3). The high estimate assumes that payments are made for all nonfederal workers who are not offered coverage, as well as approximately half of workers that offering employers do not cover. The low estimate assumes that payments are made only for nonfederal workers who are not offered coverage. These estimates indicate that an annual Healthy Workforce contribution between $100 and $200 per year for full-time workers and $50 to $100 for part-time workers would be sufficient to generate the estimated $30 million needed to finance HealthSolutions.
C. AFFORDABILITY AND COMPLIANCE
Both the Health Security Act and Health Choices would limit enrollee premiums to 6 percent of family income for individuals who pay any premiums at all. Of course, in both reform models, cost sharing would increase family burden in excess of the premium cap.
In contrast, neither the Health Coverage Plan nor HealthSolutions limit premiums for individuals or families who are not enrolled in public coverage—Medicaid, SCHIP, or SCI. Consequently, those with family income above 300 percent FPL (and therefore ineligible for public coverage) may pay premiums substantially in excess of 6 percent of gross income, the amount that the Health Security Act and Health Choices envision as a de facto measure of premium affordability.

47
TABLE V.3
ESTIMATED REVENUE FROM ALTERNATIVE LEVELS OF A HEALTHY WORKFORCE CONTRIBUTION: HEALTHSOLUTIONS, FY2010
Low Estimate (in millions)
High Estimate (in millions)
Total Full-Time Workers
Part-Time Workers Total
Full-Time Workers
Part-Time Workers
Level of Contribution: Employers with 6 or More Employees
$100 $13.5 $11.2 $2.3 $30.1 $27.3 $2.8 $200 $26.9 $22.3 $4.6 $60.2 $54.5 $5.7 $300 $40.4 $33.5 $7.0 $90.3 $81.8 $8.5 $500 $67.4 $55.8 $11.6 $150.5 $136.3 $14.2
All Employers
$100 $15.8 $13.1 $2.7 $33.1 $29.7 $3.5 $200 $31.6 $26.2 $5.4 $55.2 $49.4 $5.8 $300 $47.4 $39.3 $8.1 $99.4 $89.0 $10.4 $500 $79.0 $65.5 $13.6 $165.7 $148.3 $17.4
This situation raises some concern about affordability and, therefore, compliance with the requirement that all New Mexicans have coverage, especially for families with incomes just above 300 percent FPL (in 2008, $63,600 for a family of four). The Health Coverage Plan would raise a significant surplus of Fair Share funds if set at $300 per worker without direct coverage. While these funds are intended to help individuals who are temporarily uninsured or otherwise exempted from compliance with the mandate, they would seem sufficient to also help finance care for many who would not reasonably afford private coverage, despite the individual mandate.
Conceivably, HealthSolutions could offer a somewhat different approach to the problem of
affordability. Under this reform model, a Health Care Authority in New Mexico would be charged with setting benefit standards and affordability standards for compliance, reducing cost escalation, and improving quality. Establishing a single point of accountability for these activities might help to guide the development of more affordable coverage options in New Mexico. In addition, a somewhat higher Healthy Workforce contribution level—such as that envisioned for the Health Coverage Plan—could provide a reserve fund to assist families who are ineligible for public coverage but still unable to afford private coverage.
D. FINANCING SUMMARY
Expenditures and sources of financing for each of the reform models and the current case are summarized in Table IV.4, projected from FY2010 to FY2014. Several aspects of the estimates for HealthSolutions especially (as well as for the Health Coverage Plan) are notable.

48
First, relative to the Health Security Act or Health Choices, HealthSolutions would entail the least disruption of current systems of health care financing in New Mexico. In FY2010, spending for health care would increase in the private sector (2 percent above the current case). This increase in private spending, while less than the projected increase in federal and state spending, is in marked contrast to either the displacement envisioned in the Health Security Act or the reorganization of private spending envisioned in Health Choices. By FY2014, private-sector expenditures under HealthSolutions (and also the Health Coverage Plan) would be slightly less than in the current case.
Second, the percentage increase in projected state expenditures to cover all New Mexicans
under HealthSolutions is relatively modest. Projected state expenditure would increase 4 percent relative to the current case in FY2010, and would approximately equal current-case spending by FY2014. This relatively modest increase in state spending reflects the retention of private coverage—so that Medicaid and SCHIP do not displace private coverage—as well as the use of current eligibility rules for Medicaid and SCHIP, with relatively low anticipated expenditure per person among those who are currently eligible but have not enrolled.
Finally, because HealthSolutions would preserve current private financing of health care
services and displace other state health care spending that does not draw federal match, federal spending would increase somewhat faster than state expenditures. Compared with the current case, estimated federal spending would increase 6 percent in FY2010, and would remain 2 percent above the current case in FY2014. It is this increase in federal spending that largely generates the modest economic growth associated with HealthSolutions, as described in the next chapter.

49
TAB
LE V
.4
ESTI
MA
TED
TO
TAL
HEA
LTH
CA
RE
EXPE
ND
ITU
RES
AN
D C
HA
NG
E FR
OM
TH
E C
UR
REN
T C
ASE
BY
FED
ERA
L, S
TATE
, AN
D
PRIV
ATE
SO
UR
CES
OF
FUN
DS:
ALL
REF
OR
M M
OD
ELS,
FY
2010
-FY
2014
To
tal S
pend
ing
($ in
mill
ions
) Pe
rcen
t of C
urre
nt C
ase
Cha
nge
from
Cur
rent
Cas
e ($
in m
illio
ns)
FY
2010
FY
2011
FY
2012
FY
2013
FY
2014
FY
2010
FY20
11FY
2012
FY20
13
FY20
14FY
2010
FY
2011
FY
2012
FY
2013
FY
2014
Hea
lth S
olut
ions
Tota
l $7
,157
.94
$7,5
92.6
4 $8
,076
.83
$8,5
93.6
0$9
,145
.24
103%
10
2%
101%
10
1%
100%
$2
36.1
9$1
77.9
4$1
15.9
4$4
4.54
-$37
.31
Fede
ral
$2,0
91.9
3 $2
,198
.61
$2,3
10.9
5$2
,429
.26
$2,5
53.8
710
6%
105%
10
4%
103%
10
2%
$114
.55
$101
.93
$87.
50$7
1.07
$52.
46
Stat
e $9
22.1
6 $9
72.6
9 $1
,026
.11
$1,0
82.6
1$1
,142
.36
104%
10
3%
102%
10
1%
100%
$3
6.19
$29.
56$2
2.00
$13.
41$3
.69
Priv
ate
$4,1
43.8
6 $4
,421
.34
$4,7
39.7
8$5
,081
.74
$5,4
49.0
010
2%
101%
10
0%
99%
98
%
$85.
45$4
6.45
$6.4
4-$
39.9
4-$
93.4
6
Hea
lth S
ecur
ity A
ct v
.1
Tota
l $6
,720
.10
$7,1
53.9
6 $7
,616
.44
$8,1
09.4
2$8
,634
.95
97%
96
%
96%
95
%
94%
-$
201.
65-$
260.
73-$
344.
46-$
439.
65-$
547.
61
Fede
ral
$2,2
91.7
4 $2
,438
.98
$2,5
95.9
7$2
,763
.38
$2,9
41.9
211
6%
116%
11
7%
117%
11
8%
$314
.36
$342
.30
$372
.52
$405
.20
$440
.51
Stat
e $3
,483
.96
$3,7
06.7
4 $3
,944
.06
$4,1
96.8
5$4
,466
.14
393%
39
3%
393%
39
3%
392%
$2
,597
.99
$2,7
63.6
2$2
,939
.95
$3,1
27.6
5$3
,327
.46
Priv
ate
$944
.41
$1,0
08.2
5 $1
,076
.41
$1,1
49.1
8$1
,226
.89
23%
23
%
23%
22
%
22%
-$
3,11
4.00
-$3,
366.
65-$
3,65
6.93
-$3,
972.
50-$
4,31
5.58
Hea
lth S
ecur
ity A
ct v
.2
Tota
l $6
,854
.70
$7,2
97.5
7 $7
,769
.66
$8,2
72.9
0$8
,809
.37
99%
98
%
98%
97
%
96%
-$
67.0
5-$
117.
12-$
191.
23-$
276.
17-$
373.
18
Fede
ral
$2,3
37.9
7 $2
,488
.30
$2,6
48.6
0$2
,819
.54
$3,0
01.8
411
8%
119%
11
9%
183%
18
3%
$360
.59
$391
.63
$425
.16
$1,9
46.0
1$2
,079
.26
Stat
e $3
,572
.33
$3,8
01.0
3 $4
,044
.67
$4,3
04.2
0$4
,580
.67
403%
40
3%
403%
40
3%
402%
$2
,686
.35
$2,8
57.9
1$3
,040
.56
$3,2
35.0
0$3
,442
.00
Priv
ate
$944
.41
$1,0
08.2
4 $1
,076
.39
$1,1
49.1
6$1
,226
.85
23%
23
%
23%
22
%
22%
-$
3,11
4.00
-$3,
366.
66-$
3,65
6.95
-$3,
972.
53-$
4,31
5.61
NM
Hea
lth C
hoic
es v
.1
Tota
l $7
,402
.73
$7,8
97.5
0 $8
,425
.50
$8,9
88.9
8$9
,590
.32
107%
10
7%
106%
10
5%
104%
$4
80.9
7$4
82.8
1$4
64.6
1$4
39.9
1$4
07.7
6 Fe
dera
l $2
,826
.41
$3,0
15.1
7 $3
,216
.68
$3,4
31.8
0$3
,661
.48
143%
14
4%
145%
14
6%
146%
$8
49.0
3$9
18.4
9$9
93.2
3$1
,073
.62
$1,1
60.0
7 St
ate
$3,6
84.9
8 $3
,930
.87
$4,1
93.1
8$4
,473
.01
$4,7
71.5
341
6%
417%
41
8%
418%
41
9%
$2,7
99.0
0$2
,987
.74
$3,1
89.0
7$3
,403
.81
$3,6
32.8
5 Pr
ivat
e $8
91.3
4 $9
51.4
7 $1
,015
.65
$1,0
84.1
7$1
,157
.32
22%
22
%
21%
21
%
21%
-$
3,16
7.06
-$3,
423.
43-$
3,71
7.69
-$4,
037.
52-$
4,38
5.15
NM
Hea
lth C
hoic
es v
.2
Tota
l $7
,414
.02
$7,9
14.6
3 $8
,449
.99
$9,0
21.8
0$9
,632
.55
107%
10
7%
106%
10
6%
105%
$4
92.2
7$4
99.9
4$4
89.0
9$4
72.7
3$4
50.0
0 Fe
dera
l $2
,812
.47
$3,0
00.3
1 $3
,200
.85
$3,4
14.9
4$3
,643
.51
142%
14
3%
144%
14
5%
146%
$8
35.0
9$9
03.6
4$9
77.4
0$1
,056
.76
$1,1
42.1
1 St
ate
$3,2
91.5
2 $3
,510
.46
$3,7
44.6
2$3
,994
.40
$4,2
60.8
737
2%
372%
37
3%
374%
37
4%
$2,4
05.5
5$2
,567
.34
$2,7
40.5
1$2
,925
.21
$3,1
22.1
9

TAB
LE V
.4 (c
ontin
ued)
50
To
tal S
pend
ing
($ in
mill
ions
) Pe
rcen
t of C
urre
nt C
ase
Cha
nge
from
Cur
rent
Cas
e ($
in m
illio
ns)
FY
2010
FY
2011
FY
2012
FY
2013
FY
2014
FY
2010
FY20
11FY
2012
FY20
13
FY20
14FY
2010
FY
2011
FY
2012
FY
2013
FY
2014
Priv
ate
$1,3
10.0
3 $1
,403
.85
$1,5
04.5
2$1
,612
.45
$1,7
28.1
732
%
32%
32
%
31%
31
%
-$2,
748.
37-$
2,97
1.04
-$3,
228.
82-$
3,50
9.23
-$3,
814.
29
NM
Hea
lth C
over
age
Tota
l $7
,159
.83
$7,5
89.2
9 $8
,072
.16
$8,5
87.4
2$9
,136
.73
103%
10
2%
101%
10
0%
100%
$2
38.0
7$1
74.6
0$1
11.2
6$3
8.36
-$45
.83
Fede
ral
$2,1
12.5
6 $2
,215
.73
$2,3
28.8
0$2
,447
.85
$2,5
73.2
410
7%
106%
10
5%
104%
10
3%
$135
.18
$119
.05
$105
.35
$89.
67$7
1.83
St
ate
$930
.21
$979
.37
$1,0
33.0
7$1
,089
.86
$1,1
49.2
910
5%
104%
10
3%
102%
10
1%
$44.
23$3
6.24
$28.
96$2
0.67
$10.
61
Priv
ate
$4,1
17.0
6 $4
,394
.20
$4,7
10.2
9$5
,049
.71
$5,4
14.2
010
1%
100%
10
0%
99%
98
%
$58.
65$1
9.30
-$23
.05
-$71
.98
-$12
8.26
Cur
rent
Cas
e (n
o re
form
)
Tota
l $6
,921
.75
$7,4
14.6
9 $7
,960
.90
$8,5
49.0
7$9
,182
.55
Fede
ral
$1,9
77.3
8 $2
,096
.68
$2,2
23.4
5$2
,358
.19
$2,5
01.4
1
St
ate
$885
.97
$943
.12
$1,0
04.1
1$1
,069
.20
$1,1
38.6
8
Pr
ivat
e $4
,058
.40
$4,3
74.8
9 $4
,733
.34
$5,1
21.6
9$5
,542
.47
Sour
ce:
MPR
mic
rosi
mul
atio
n es
timat
es o
f ref
orm
mod
els.

51
VI. ECONOMIC IMPACTS OF IMPLEMENTING HEALTHSOLUTIONS NEW MEXICO
In this chapter, estimates of economic impacts for HealthSolutions are presented by sector, location (metro area versus the rest of the state), and source of financing (federal government, the State of New Mexico, and the private sector). These estimates were produced by the Bureau of Business and Economic Research (BBER), based on Mathematica’s simulation results, as reported in earlier chapters. Economic impacts of the other reform models were included in our earlier report; we do not expect that they would change materially and therefore did not re-estimate them.
A. CHANGES UNDER HEALTHSOLUTIONS
Under HealthSolutions, spending for health care services and for prescription drugs and medical equipment in FY 2010 would total an estimated $6.1 billion: $174 million (2.9 percent) greater than the estimated baseline. BBER modeled the changes by category of health expenditure to develop estimates of the economic impacts.
BBER’s calculation of the estimated change in the cost of health insurance/administration is
presented in Table VI.1, for the federal government, the State, and for private sector entities providing health insurance coverage.28 The estimates reflect a decline in total federal government administrative costs, corresponding to less use of non-Medicaid programs like the Indian Health Service and Veterans Administration services. Conversely, increased participation in Medicaid and related programs would drive higher costs for State administration of these programs and for private insurance functions under contract to Salud. (Recall that federal government would pay most of these costs, while the funds and economic impact would flow through the State.)
28 Note that in each case, costs are associated with the entity actually performing the insurance or
administrative function, regardless of who may be underwriting the cost. For example, the federal match for Medicaid includes payment for program administration, but it is the State government that actually determines eligibility.

52
TABLE VI.1
ESTIMATED COSTS OF HEALTH INSURANCE ADMINISTRATION BY PAYER TYPE: HEALTHSOLUTIONS COMPARED WITH THE CURRENT CASE, FY2010
Current Case HealthSolutions Change from the
Current Case
(Dollars in millions) Federal Government $10.43 $6.66 -$3.77
Tricare, VA, other non-Medicaid 10.43 6.66 -3.77
State Government 91.98 108.78 16.80
Medicaid/SCHIP/SCI 89.65 106.28 16.63 State employees 0.35 0.34 0.00 Other state 1.98 0.89 -1.09 Health Care Authority 0.00 1.26 1.26
Private 872.05 922.29 50.24
Medicaid/SCHIP/SCI 223.63 246.92 23.30 Government employees 64.33 64.12 -0.21 Private insurance 584.10 611.24 27.15
Total Insurance Administrative Costs 974.46 1,037.73 63.27
Source: UNM BBER calculations from data provided by Mathematica Policy Research.
Estimates of who pays for the additional health costs related to expanded coverage under HealthSolutions are presented in Table VI.2. The financing plan anticipates $155 million in additional federal funding for Medicaid, for SCHIP and for SCI (over the FY 2010 baseline). The projected net increase in federal dollars is $114.5 million, as use of services in other federal programs (largely Indian Health Service and Veterans Administration services) is refinanced.29
29 Note that the increase in federal dollars for Medicaid and SCHIP reflects projected baseline
participation and program expenditures that are substantially higher in FY2010 than were estimated for CY2007 in our earlier report.

53
TABLE VI.2
ESTIMATED CHANGES IN WHO PAYS: HEALTHSOLUTIONS COMPARED WITH THE CURRENT CASE, FY2010
Current Case Health
Solutions Change from Current Case
(Dollars in millions) Total to be Funded $6,921.75 $7,159.20 $237.45
Federal Government 1,977.38 2,091.93 114.55
Medicaid/Schip 1,685.81 1,840.71 154.90 Federal employees 177.80 178.53 0.73 Tricare, VA, other 113.78 72.69 (41.09)
State Government 885.97 885.74 (0.23)
Medicaid/SCHIP/SCIa 651.43 674.32 22.89 State employees 205.92 203.94 (1.98) Other stateb 28.62 7.48 (21.14)
Private 4,058.40 4,181.54 85.45
Public programs 82.70 140.58 57.89 SCI 2.19 19.74 17.54 Healthy Workforce - 30.10 30.10 Change in premium tax, state programs - 7.58 7.58 Other 80.50 83.17 2.67
Private insurance 2,984.69 3,120.50 135.81 Self-insured 923.24 988.10 64.86 Group plans 1,889.17 1,940.03 50.86 Individual premiums 172.27 192.37 20.09
Out of pocket 991.02 920.46 (70.56)
Source: UNM BBER calculations from data provided by Mathematica Policy Research.
a Total is net of additional monies raised by Healthy Workforce Fund payments from employers and estimated insurance premium taxes on net changes in public programs subject to premium tax.
b Total includes net increase in State funding required for Health Coverage Authority.
In addition to the State monies used to support provision of health care coverage in the current case, additional funds would be needed for Medicaid and related programs as well as for the new Health Coverage Authority. Additional revenues to support these expenditures would come from premiums paid by additional SCI enrollees, employer contributions to the new Healthy Workforce Fund, and from additional premium taxes associated with coverage to participants in public programs.30 The change in health insurance premiums (including SCI) and
30 The additional insurance costs are budgeted as additional federal and state expenditures. Included here is the additional revenue that flows back to the State as a result of these expenditures, given the reliance on private contractors under Salud and on private insurance companies for other State programs (NMMIP and NMHIA).

54
out-of pocket expenses by level of family income are summarized in Table VI.3. Reductions in health-related expenditures result in additional discretionary income that can be used to purchase goods and services. Conversely, increases in these expenditures result in reduced income available for other types of spending.
TABLE VI.3
ESTIMATED CHANGES IN HOUSEHOLD EXPENDITURES FOR INDIVIDUAL AND EMPLOYEE HEALTH PREMIUMS AND OUT-OF-POCKET HEALTH CARE COSTS BY FAMILY INCOME CATEGORY:
HEALTHSOLUTIONS, FY2010
Insurance Premiums
Employee Individual Out-of-Pocket Expenditure
(Dollars in millions)
Family Income:
Less than $10,000 -$6.09 $1.69 -$27.98 $10,000 to $14,999 0.04 0.07 2.36 $15,000 to $24,999 3.72 4.41 7.42 $25,000 to $34,999 3.26 57.28 -7.28 $35,000 to $49,999 5.44 10.30 -8.63 $50,000 to $74,999 8.61 14.29 -20.93 $75,000 to $99,999 4.73 5.23 -5.17 $100,00 to $149,999 3.80 8.04 -8.62 $150,000 or more 2.57 3.87 -1.72
Total 26.07 105.17 -70.56
Source: UNM BBER calculations from data provided by Mathematica Policy Research.
For most income groups, estimated out of pocket expenses are projected to decline under HealthSolutions, while estimated premium payments generally increase. All estimates assume that employees pay premium contributions with pre-tax dollars (although some employers do not now offer salary reduction for payment of premium contributions). In contrast, individual premium payments and out-of-pocket expenses are assumed to be paid from after-tax dollars (although some employers may offer premium-only salary reduction plans or flexible spending accounts). Since the estimates assume that the federal government (via reduced federal taxes) in part pays the increase in employee premiums, a change in consumer outlays for employer-sponsored coverage has less impact on spending for other consumer goods and services than a change in consumer outlays for individual coverage.
Changes in employer contributions from the current case—including payments into a Healthy Workforce Fund for employees who are not offered health insurance—are reported in Table VI.4. Note that employer contributions would increase for workers in each income category except those with family income below $10,000. Higher contributions for employee health coverage are assumed to result in lower wage and salary income (so that total employee compensation is unchanged) and in turn, reduced household spending on other goods and services.

55
TABLE VI.4
ESTIMATED EMPLOYER CONTRIBUTIONS BY FAMILY INCOME CATEGORY: HEALTHSOLUTIONS COMPARED WITH THE CURRENT CASE, FY2010
Employer Premium Payments, Including SCI
Current
Case HealthSolutions Change from Current Case
Healthy Workforce
Contributions
Total Change from Current
Case
(Dollars in millions) Family Income:
Less than $10,000 $133.32 $112.58 -$20.73 $8.83 -$11.91 $10,000 to $14,999 13.25 13.39 0.14 1.19 1.33 $15,000 to $24,999 250.75 263.40 12.65 2.83 15.48 $25,000 to $34,999 284.11 295.20 11.09 2.71 13.80 $35,000 to $49,999 357.45 375.98 18.53 4.31 22.84 $50,000 to $74,999 597.62 626.95 29.33 4.90 34.23 $75,000 to $99,999 304.38 320.48 16.10 3.03 19.13 $100,00 to $149,999 253.54 266.46 12.92 1.72 14.64 $150,000 or more 160.58 169.32 8.74 0.59 9.33
Total 2,354.99 2,443.76 88.77 30.10 118.86
Source: UNM BBER calculations from data provided by Mathematica Policy Research.
B. ESTIMATED ECONOMIC IMPACTS OF HEALTHSOLUTIONS
The economic impacts of changes due to HealthSolutions were estimated using the Implan Pro-2 model, which is widely used for regional economic analysis. The individual components of change—including impacts on different groups within the private sector—were separately modeled and the results summed to determine total net impacts on employment, income, output, and value added. The estimates take into account both the overall increase in funding from the private sector and changes in the distribution of the funding burden on employers, employees and individuals at different levels of income.31
Various measures of economic impact are summarized in Table VI.5. For each measure,
direct, indirect, and induced effects are summed to produce an estimate of total impact for each measure. The expected net total economic impacts associated with HealthSolutions are positive—adding 2,400 jobs to the New Mexico economy, raising labor income by $101 million.
31 Expenditures financed by an inflow of federal dollars stimulate the economy without burden to the
private sector. Therefore, there is no need to model the inflow of federal dollars, only the expenditures made possible by this inflow. However, where the inflow of federal dollars requires an increase in State spending above current levels, the modeling accounts for additional taxes or other new revenues obtained from the private sector.

56
TABLE VI.5
ESTIMATED ECONOMIC IMPACTS: HEALTHSOLUTIONS, FY 2010
Direct Indirect Induced Total
Health Expenditures Employment (in thousands) 1.86 0.36 0.60 2.83 Labor Income (in millions) $76.11 $13.42 $19.45 $108.98 Output (in millions) $151.52 $39.05 $60.50 $251.06 Value Added (in millions) $95.02 $21.93 $34.84 $151.79
Private Insurance Employment (in thousands) 0.16 0.18 0.12 0.46 Labor Income (in millions) $8.95 $7.85 $3.98 $20.78 Output (in millions) $55.62 $22.56 $12.69 $90.88 Value Added (in millions) $12.69 $13.00 $7.18 $32.88
Federal Government program administration Employment (in thousands) -0.02 0.00 -0.03 -0.05 Labor Income (in millions) -$3.61 $0.00 -$0.90 -$4.51 Output (in millions) -$3.77 $0.00 -$2.85 -$6.61 Value Added (in millions) -$3.77 $0.00 -$1.62 -$5.38
State Administration Employment (in thousands) 0.09 0.07 0.06 0.21 Labor Income (in millions) $5.06 $2.22 $1.81 $9.09 Output (in millions) $15.54 $5.55 $5.74 $26.83 Value Added (in millions) $8.66 $3.21 $3.26 $15.13
Employer Contributions Employment (in thousands) -0.50 -0.13 -0.15 -0.78 Labor Income (in millions) -$15.32 -$4.98 -$4.90 -$25.21 Output (in millions) -$49.56 -$16.17 -$15.57 -$81.29 Value Added (in millions) -$29.16 -$8.35 -$8.84 -$46.34
Employee Premiums Employment (in thousands) -0.12 -0.03 -0.04 -0.19 Labor Income (in millions) -$3.60 -$1.18 -$1.15 -$5.93 Output (in millions) -$11.71 -$3.81 -$3.66 -$19.18 Value Added (in millions) -$6.90 -$1.97 -$2.08 -$10.95
Individual Premiums and Out-of-Pocket Payments Employment (in thousands) -0.04 -0.01 -0.01 -0.07 Labor Income (in millions) -$1.35 -$0.42 -$0.43 -$2.20 Output (in millions) -$4.00 -$1.38 -$1.36 -$6.74 Value Added (in millions) -$2.28 -$0.71 -$0.77 -$3.76
Net Total Impacts Employment (in thousands) 1.42 0.43 0.55 2.41 Labor Income (in millions) $66.22 $16.92 $17.85 $100.99 Output (in millions) $153.64 $45.81 $55.49 $254.94 Value Added (in millions) $74.26 $27.13 $31.98 $133.36
Source: UNM BBER calculations from data provided by Mathematica Policy Research.

57
However, in context, these impacts are small. Relative to BBER’s FY2010 economic forecasts with no reform, HealthSolutions would generate a net increase in employment of just 0.23 percent, with the greatest net impacts in retail trade and health care and social assistance (Table VI.6).32 (The retail trade sector includes pharmacies and other types of businesses that sell prescription drugs as well as businesses that sell various types of medical equipment and supplies.) Total wage and salary disbursements would increase just 0.2 percent (Table VI.7).33
TABLE VI.6
ESTIMATED CHANGE IN WAGE AND SALARY EMPLOYMENT BY INDUSTRY GROUP: HEALTHSOLUTIONS, FY2010
HealthSolutions
Current Case Number of Workers
(in thousands) Employment Change
(in thousands) Percent Change
Agriculture, Forestry, Fishing, Hunting 12.80 0.00 0.0%
Mining 20.05 0.00 0.0%
Construction 61.29 0.01 0.0%
Manufacturing 38.11 0.01 0.0%
Wholesale Trade 24.30 0.00 0.0%
Retail Trade 98.89 0.91 0.9%
Transport, Warehousing, Utilities 24.99 0.03 0.1%
Information 18.18 0.02 0.1%
Financial Activities 36.53 0.23 0.6%
Professional and Business 114.23 0.16 0.1%
Educational Services 14.28 0.00 0.0%
Health Care and Social Assistance 105.32 0.60 0.6%
Arts, Entertainment, and Recreation 8.71 0.00 0.0%
Accommodation and Food Services 82.20 0.00 0.0%
Other Services 29.92 0.00 0.0%
Government 204.34 -0.01 0.0%
Total 881.33 2.00 0.2%
Source: BBER FOR-UNM Employment Forecast and estimated employment impacts using IMPLAN.
32 BBER’s FY2010 forecast of wage and salary employment uses the FOR-UNM model. New
Mexico wage and salary employment is estimated as total employment reduced by the ratio of wage and salary employment to total employment as estimated by the federal Bureau of Economic Analysis.
33 In preparing these estimates, BBER used the FOR-UNM forecast of average weekly wages by industry to approximate an average annual wage.

58
TABLE VI.7
ESTIMATED CHANGES IN WAGE AND SALARY DISBURSEMENTS: HEALTHSOLUTIONS, FY2010
Current Case Wage and Salary Disbursements(Dollars in millions)
Change in Wage and Salary Disbursements (Dollars in millions)
Percent Change in Wage and Salary Disbursements
Agriculture, Forestry, Fishing, Hunting $389.00 -$0.02 -0.0%
Mining 1,265.00 -0.01 -0.0%
Construction 2,426.00 0.19 0.0%
Manufacturing 1,828.00 0.47 0.0%
Wholesale Trade 1,232.00 -0.03 -0.0%
Retail Trade 2,645.00 23.27 0.9%
Transport, Warehousing, Utilities 1,241.00 1.19 0.1%
Information 746.00 0.82 0.1%
Financial Activities 1,690.00 10.82 0.6%
Professional and Business 6,286.00 8.24 0.1%
Educational Services 328.00 -0.12 -0.0%
Health Care and Social Assistance 3,992.00 22.45 0.6%
Arts, Entertainment, and Recreation 195.00 0.03 0.0%
Accommodation and Food Services 1,348.00 0.04 0.0%
Other Services 998.00 -0.09 -0.0%
Public Administration 912.80 -0.40 -0.0%
Total 32,953.00 66.87 0.2%
Source: BBER FOR-UNM Employment Forecast and estimated employment impacts using IMPLAN.
In Table IV.5, the estimates of net change in value added can be viewed as a proxy for the net change in personal income that would result from implementation of HealthSolutions. Thus, personal income would be expected to increase by 0.19 percent in FY2010. In addition, the change in value added can be viewed as an estimate of the change in total New Mexico production. When compared with Global Insight’s forecast of the state’s Gross State Product for FY2010, the additional value added under HealthSolutions would amount to 0.16-percent net gain in total state production.
The low net economic impacts of HealthSolutions are not surprising. The only real way for a region to grow is by increasing the flow of dollars into the economy from outside the state or by increasing the local production of goods and services that had been imported. Under HealthSolutions, the major injection (federal government spending on health care) would increase by only $114 million (a $155 million gain in federal Medicaid and SCHIP minus $41 million in reduced spending in other federal programs).

59
To fund the additional $122 million in estimated program costs would require raising additional revenues from the private sector through premium payments and Healthy Workforce contributions. Our estimate assume that whatever the private sector spends on health care reduces the amount that can be spent on other goods and services, although the amount of the decrease depends on the extent that private sector businesses or households can use federal tax provisions to cover some of the costs of health insurance.
C. ESTIMATED IMPACTS ON METRO AND NON-METRO AREAS
In Table VI.8, the estimated economic impacts of HealthSolutions are allocated to (1) the metropolitan areas of Albuquerque, Santa Fe, Las Cruces, and Farmington and (2) the rural areas that comprise the rest of the state. Note that approximately 20 percent of the total net economic impacts of HealthSolutions would occur in rural areas—somewhat less than might be expected. This relatively low estimate is explained by high projected rural enrollment in Medicaid, SCHIP, and SCI in the current case, related to the state’s ongoing efforts to enroll rural residents in these programs. If these efforts produce lower enrollment than is anticipated in the current case, the economic impacts of HealthSolutions in rural areas would be greater.

60
TABLE VI.8
ESTIMATED ECONOMIC IMPACTS IN METRO AND NON-METRO AREAS: HEALTHSOLUTIONS FY2010
Program Administration
Health Care Expenditures Insurance Federal State
Employer Contributions
Worker Premiums
Individual Premiums and Out-of-Pocket Expenditure
Net Total
Impact
Metro/Rural Percent of
Total Impact
Metropolitan Areas Employment (in thousands) 2,115.4 391.0 (31.9) 191.0 (552.1) (132.6) (43.1) 1,937.8 80.4% Labor Income (in millions) $80.13 $17.67 -$2.76 $8.18 -$17.80 -$4.24 -$1.38 $79.79 79.0% Output (in millions) $187.33 $77.25 -$4.05 $24.14 -$57.39 -$13.71 -$4.21 $209.35 82.1% Value Added (in millions) $113.57 $27.95 -$3.29 $13.61 -$32.72 -$7.83 -$2.35 $108.93 81.7%
Rural Areas Employment (in thousands) 709.7 69.0 (20.2) 21.2 (229.9) (52.8) (25.9) 471.1 19.6% Labor Income (in millions) $28.85 $3.12 -$1.75 $0.91 -$7.41 -$1.69 -$0.83 $21.20 21.0% Output (in millions) $63.74 $13.63 -$2.57 $2.68 -$23.90 -$5.47 -$2.53 $45.59 17.9% Value Added (in millions) $38.23 $4.93 -$2.09 $1.51 -$13.63 -$3.12 -$1.41 $24.43 18.3%
Source: UNM BBER estimates using IMPLAN Model. Notes: Impacts were allocated to MSA’s as follows: (1) health expenditures and individual premiums and out of pocket
spending were modeled; (2) 85 percent of insurance expenditures were allocated to metro areas (health insurance carriers are concentrated in Bernalillo County) and agents, brokers and other insurance are assumed to be dispersed; (3) 61.2 percent of federal administration and 90 percent of state administration were allocated to metro areas; (4) employer contributions were prorated to earnings, such that 70.6 percent were allocated to metro areas; (5) worker premiums were prorated to wages, such that 71.5 percent were allocated to metro areas.

APPENDIX A
NEW MEXICO HEALTH SOLUTIONS: SPECIFICATIONS FOR COVERAGE, COST, AND FUNDING ESTIMATES

PAGE IS INTENTIONALLY LEFT BLANK TO ALLOW FOR DOUBLE-SIDED COPYING

A.3
NE
W M
EXI
CO
HE
ALT
H S
OLU
TIO
NS
: S
PE
CIF
ICAT
ION
S F
OR
CO
VE
RA
GE
, CO
ST,
AN
D F
UN
DIN
G E
STIM
ATE
S
Not
e:
Sha
ded
cells
indi
cate
ass
umpt
ions
that
are
effe
ctiv
ely
the
sam
e fo
r all
refo
rm m
odel
s. E
stim
ates
for a
ll m
odel
s re
flect
onl
y th
e no
nins
titut
iona
lized
pop
ulat
ion
unde
r age
65
and
not c
urre
ntly
rece
ivin
g M
edic
are.
Feat
ures
M
athe
mat
ica
Spe
cific
atio
n R
atio
nale
/Com
men
ts
Cur
rent
Cas
e
Non
inst
itutio
naliz
ed p
erso
ns u
nder
age
65
and
not
curre
ntly
cov
ered
by
Med
icar
e.
Exc
lusi
on o
f the
Med
icar
e po
pula
tion
in e
ach
mod
el is
eq
uiva
lent
to a
ssum
ing
that
the
Med
icar
e po
pula
tion
wou
ld n
ot c
ross
-sub
sidi
ze th
e no
n-M
edic
are
popu
latio
n un
der a
ge 6
5.
Inst
itutio
naliz
ed in
divi
dual
s (in
clud
ing
jaile
d an
d pr
ison
po
pula
tions
and
nur
sing
hom
e/IC
F/M
R p
opul
atio
ns) a
re n
ot
incl
uded
in a
ny p
opul
atio
n da
taba
se a
vaila
ble
to th
is s
tudy
. C
over
age
of th
e in
stitu
tiona
lized
pop
ulat
ion
will
not
be
estim
ated
, but
will
be
addr
esse
d as
a c
onsi
dera
tion.
Med
icar
e pa
ymen
ts w
ill n
ot b
e es
timat
ed fo
r any
mod
el w
ithin
tim
e an
d bu
dget
ava
ilabl
e fo
r the
pro
ject
, so
that
the
mod
els
can
be c
ompa
red
for t
he s
ame
popu
latio
ns a
t ris
k of
bei
ng
unin
sure
d.
Med
icai
d an
d ot
her f
eder
al, s
tate
, and
priv
ate
fund
s co
ver i
nstit
utio
naliz
ed p
opul
atio
ns.
IHS
-elig
ible
Nat
ive
Am
eric
ans
gain
cov
erag
e in
the
sam
e w
ays
as o
ther
resi
dent
s.
Insu
ranc
e ca
rrie
rs m
ust a
dmit
to th
eir n
etw
orks
IHS
an
d tri
bal 6
38 p
rovi
ders
that
mee
t qua
lity
and
cred
entia
ling
stan
dard
s, b
ut m
ay p
erm
it th
em to
ser
ve
only
fede
rally
def
ined
use
r pop
ulat
ions
for t
hese
pr
ovid
ers.
Spe
cific
atio
n is
con
sist
ent w
ith N
M fo
cus
grou
p fin
ding
s in
dica
ting
Nat
ive
Am
eric
an p
refe
renc
es.
IHS
-elig
ible
Nat
ive
Am
eric
ans
may
be
insu
red
or
unin
sure
d an
d/or
use
IHS
and
oth
er fa
cilit
ies.
SC
I and
SC
HIP
elig
ibili
ty a
s in
cur
rent
law
.
S
CI e
ligib
ility
for a
dults
(sm
all e
mpl
oyer
, sel
f-em
ploy
ed o
r HIP
AA
indi
vidu
al) t
o 20
0% F
PL
and
child
less
adu
lts to
100
% F
PL
who
hav
e be
en
unin
sure
d on
e ye
ar, a
nd a
re in
elig
ible
for
Med
icai
d or
oth
er p
ublic
or e
mpl
oyer
-spo
nsor
ed
heal
th in
sura
nce.
Elig
ible
Cov
erag
e fo
r sta
te, m
unic
ipal
, and
pub
lic e
duca
tion
retir
ees
will
ext
end
to d
omes
tic p
artn
ers.
Th
e R
HC
A b
oard
will
est
ablis
h co
nditi
ons
for c
over
age
of
dom
estic
par
tner
s, a
s re
com
men
ded
by a
pol
icy
advi
sory
bo
dy s
et u
p by
HC
A to
add
ress
sta
te e
mpl
oyee
and
retir
ee
bene
fits.
S
elf-i
nsur
ed e
mpl
oyer
s co
ntin
ue w
ithou
t cha
nge.
Sel
f-ins
ured
em
ploy
ers
are
prot
ecte
d by
ER
ISA
. Th
ey a
re e
xem
pt fr
om s
tate
taxa
tion
of th
eir
heal
th b
enef
its a
nd a
lso
from
sta
te re
gula
tion
of
bene
fit d
esig
n. E
RIS
A p
recl
udes
sta
tes
from
m
anda
ting
that
em
ploy
ers
offe
r cov
erag
e or
re
gula
te th
e te
rms
of o
ffer.

NE
W M
EX
ICO
HE
ALT
H S
OLU
TIO
NS
: S
PE
CIF
ICA
TIO
NS
FO
R C
OV
ER
AG
E, C
OS
T, A
ND
FU
ND
ING
ES
TIM
ATE
S (c
ontin
ued)
A.4
Feat
ures
M
athe
mat
ica
Spe
cific
atio
n R
atio
nale
/Com
men
ts
Cur
rent
Cas
e
All
fede
ral e
mpl
oyee
s an
d re
tiree
s an
d m
ilita
ry
empl
oyee
s w
ith fe
dera
l/mili
tary
retir
ee h
ealth
ben
efits
Nea
rly a
ll fe
dera
l em
ploy
ees
have
hea
lth
cove
rage
from
FE
HB
P, a
s do
fede
ral r
etire
es b
y de
finiti
on.
Als
o, n
early
all
mili
tary
em
ploy
ees
have
fede
ral/m
ilita
ry re
tiree
hea
lth b
enef
its.
Inst
itutio
naliz
ed p
erso
ns
Inst
itutio
naliz
ed in
divi
dual
s (in
clud
ing
jaile
d an
d pr
ison
po
pula
tions
and
nur
sing
hom
e/IC
F/M
R p
opul
atio
ns) a
re n
ot
incl
uded
in a
ny p
opul
atio
n da
taba
se a
vaila
ble
to th
is s
tudy
.
Cov
erag
e of
the
inst
itutio
naliz
ed p
opul
atio
n w
ill n
ot b
e es
timat
ed, b
ut w
ill b
e ad
dres
sed
as a
con
side
ratio
n.
Med
icai
d an
d ot
her f
eder
al, s
tate
, and
priv
ate
fund
s co
ver i
nstit
utio
naliz
ed p
opul
atio
ns.
Med
icar
e en
rolle
es
Med
icar
e pa
ymen
ts w
ill n
ot b
e es
timat
ed fo
r any
mod
el w
ithin
tim
e an
d bu
dget
ava
ilabl
e fo
r the
pro
ject
, so
that
the
mod
els
can
be c
ompa
red
for t
he s
ame
popu
latio
ns a
t ris
k of
bei
ng
unin
sure
d.
Exc
lusi
on o
f the
Med
icar
e po
pula
tion
is e
quiv
alen
t to
assu
min
g th
at th
e M
edic
are
popu
latio
n w
ould
not
cro
ss-
subs
idiz
e th
e no
n-M
edic
are
popu
latio
n un
der a
ge 6
5.
Med
icar
e co
vers
elig
ible
eld
erly
and
dis
able
d,
but d
oes
not c
over
all
serv
ices
(e.g
., m
enta
l he
alth
, den
tal,
visi
on) e
qual
ly.
Exc
lude
d or
no
npar
ticip
atin
g
Und
ocum
ente
d im
mig
rant
s
Res
iden
cy re
quire
men
t app
lies:
und
ocum
ente
d pe
rson
s ca
nnot
be
lega
l res
iden
ts.
Unc
ompe
nsat
ed c
are
for u
ndoc
umen
ted
imm
igra
nts
will
co
ntin
ue, b
ut m
ay b
e pa
id fr
om th
e “F
air S
hare
” fun
d if
not
paid
by
Med
icai
d or
MTA
LA fo
r em
erge
ncy
care
.
Hos
pita
ls c
ontin
ue to
rece
ive
fede
ral f
unds
for e
mer
genc
y ca
re (t
hrou
gh th
e st
ate)
and
MTA
LA c
are
(dire
ctly
).
Larg
ely
unin
sure
d.
Fede
ral a
llotm
ent o
f fun
ds to
hos
pita
l car
e fo
r un
docu
men
ted
pers
ons.

NE
W M
EX
ICO
HE
ALT
H S
OLU
TIO
NS
: S
PE
CIF
ICA
TIO
NS
FO
R C
OV
ER
AG
E, C
OS
T, A
ND
FU
ND
ING
ES
TIM
ATE
S (c
ontin
ued)
A.5
Feat
ures
M
athe
mat
ica
Spe
cific
atio
n R
atio
nale
/Com
men
ts
Cur
rent
Cas
e
H
omel
ess/
trans
ient
per
sons
incl
uded
in o
r exc
lude
d fro
m p
rogr
ams
as in
the
curr
ent c
ase.
Bec
ause
hom
eles
s an
d tra
nsie
nt p
erso
ns a
re n
ot in
clud
ed in
an
y po
pula
tion
data
base
sui
tabl
e fo
r thi
s st
udy,
cos
ts w
ill b
e es
timat
ed o
utsi
de th
e m
odel
.
Sam
e sp
ecifi
catio
n as
for t
he H
ealth
Cho
ices
and
the
Hea
lth
Cov
erag
e P
lan.
Hea
lth S
ecur
ity A
ct w
ould
cov
er th
ese
pers
ons.
Larg
ely
unin
sure
d.
Med
icai
d el
igib
ility
S
ame
as c
urre
nt c
ase.
Bro
kers
mus
t offe
r pub
lic c
over
age.
Indi
vidu
als
may
buy
into
Med
icai
d (S
alud
) at
subs
idiz
ed ra
tes,
if n
ot o
ther
wis
e el
igib
le fo
r a p
ublic
pr
ogra
m o
r for
insu
ranc
e w
ith a
n em
ploy
er
cont
ribut
ion.
Med
icai
d pa
ymen
t rat
es a
re u
pdat
ed, b
ased
on
FY20
07-
FY20
08 e
xper
ienc
e.
Cro
wd
out p
rovi
sion
s ap
ply
to th
e bu
y-in
pro
visi
on
To b
uy in
to S
ALU
D, i
ndiv
idua
ls a
t 201
%+
FPL
mus
t pay
a
prem
ium
cap
ped
at 6
per
cent
of f
amily
inco
me.
Chi
ldre
n <
18 to
185
% F
PL
with
inco
me
disr
egar
ds.1
Par
ents
to 1
00%
FP
L w
ith in
com
e di
sreg
ards
.
Pre
gnan
t wom
en to
185
% F
PL.
SC
I cur
rent
ly p
ays
brok
ers;
MC
Os
pay
~2%
one
-tim
e fe
e fo
r new
enr
ollm
ent.
Bro
kers
mus
t tel
l em
ploy
ers
abou
t HIA
, if t
he
empl
oyer
cho
oses
not
to ta
ke c
over
age.
SC
HIP
elig
ibili
ty
Sam
e as
cur
rent
cas
e.
Bro
kers
mus
t offe
r pub
lic c
over
age.
Indi
vidu
als
may
buy
into
SC
I at s
ubsi
dize
d ra
tes,
if n
ot
othe
rwis
e el
igib
le fo
r a p
ublic
pro
gram
or f
or in
sura
nce
with
an
empl
oyer
con
tribu
tion.
Fost
er c
hild
ren
from
age
19-
21 w
ill n
ot b
e in
clud
ed in
the
estim
ates
, unl
ess
still
resi
ding
with
a fo
ster
fam
ily.
Cro
wd
out p
rovi
sion
s ap
ply
to th
e bu
y-in
pro
visi
on
To b
uy in
to S
CI,
indi
vidu
als
at 2
01%
+ FP
L m
ust p
ay a
pr
emiu
m c
appe
d at
6 p
erce
nt o
f fam
ily in
com
e.
Chi
ldre
n <
18 1
85-2
35%
FP
L w
ith in
com
e di
sreg
ards
.
Fost
er c
hild
ren
to a
ge 1
8, fr
om 1
85-2
35%
FP
L,
as w
ell a
s fo
ster
chi
ldre
n fro
m 1
9-21
.
Adu
lts w
ithou
t chi
ldre
n <1
00%
FP
L w
ith in
com
e di
sreg
ards
, enr
olle
d in
SC
I.
1 H
SD
is in
the
proc
ess
of im
plem
entin
g M
edic
aid
and
SC
HIP
inco
me
disr
egar
ds fo
r chi
ldre
n ag
e 7
to 1
9, e
qual
to th
ose
in p
lace
for c
hild
ren
age
0 to
6.
This
cha
nge
is re
flect
ed in
the
curr
ent
case
.

NE
W M
EX
ICO
HE
ALT
H S
OLU
TIO
NS
: S
PE
CIF
ICA
TIO
NS
FO
R C
OV
ER
AG
E, C
OS
T, A
ND
FU
ND
ING
ES
TIM
ATE
S (c
ontin
ued)
A.6
Feat
ures
M
athe
mat
ica
Spe
cific
atio
n R
atio
nale
/Com
men
ts
Cur
rent
Cas
e
Par
ticip
atio
n an
d co
llect
ion
of
prem
ium
s
Indi
vidu
al c
over
age
is m
anda
ted
as o
f Jan
uary
201
0.
Indi
vidu
als
with
fam
ily in
com
e be
low
300
per
cent
FP
L ar
e ex
empt
, unl
ess
cove
rage
is o
ffere
d by
thei
r em
ploy
er o
r a p
ublic
pro
gram
, or i
s ot
herw
ise
deem
ed
affo
rdab
le b
y H
CA
.
Enf
orce
men
t will
com
men
ce J
uly
2010
for (
a)
indi
vidu
als
with
fam
ily in
com
e ov
er 4
00 p
erce
nt F
PL;
(b
) chi
ldre
n in
hou
seho
lds
unde
r 300
per
cent
FP
L w
ho
are
elig
ible
for M
edic
aid;
(c) w
orke
rs a
t ini
tiatio
n of
em
ploy
men
t and
dur
ing
empl
oyer
ope
n en
rollm
ent
perio
ds; a
nd (d
) out
of s
tate
app
lican
ts fo
r adm
issi
on
to N
M c
olle
ges
and
univ
ersi
ties.
Est
imat
es w
ill a
ssum
e fu
ll an
d im
med
iate
com
plia
nce.
Act
ual
com
plia
nce
with
pre
miu
m p
aym
ent w
ill li
kely
be
less
than
100
pe
rcen
t and
will
affe
ct fi
nanc
ing.
At a
ny p
oint
in ti
me
ther
e w
ill b
e ne
w re
side
nts
and
othe
rs
who
are
not
enr
olle
d an
d of
who
m th
e st
ate
is u
naw
are.
Th
ese
indi
vidu
als
will
be
iden
tifie
d in
the
mos
t effi
cien
t m
anne
r as
prop
osed
in a
ny o
f the
thre
e m
odel
s an
d en
rolle
d in
a p
lan
for w
hich
they
are
elig
ible
.
Any
unc
ompe
nsat
ed c
are
for t
hese
per
sons
will
be
paid
from
th
e Fa
ir S
hare
Fun
d.
Offe
r and
take
-up
of c
over
age
is v
olun
tary
. W
hen
prem
ium
s ar
e re
quire
d, c
over
age
is
cont
inge
nt o
n pa
ymen
t.
Cur
rent
rate
s of
priv
ate
and
publ
ic c
over
age
and
curr
ent t
rend
s ar
e as
sum
ed.
Rol
e of
priv
ate
insu
rers
S
mal
l gro
ups
may
buy
into
the
stat
e em
ploy
ee h
ealth
pl
an, w
ith th
e sa
me
ratin
g th
at n
ow a
pplie
s to
oth
er
grou
p bu
y-in
s.
In
sure
rs b
oth
bear
risk
and
act
as
finan
cial
in
term
edia
ries
for s
elf-i
nsur
ed p
rivat
e pl
ans
and
publ
ic p
rogr
ams.
Issu
e of
cov
erag
e C
arrie
rs m
ust g
uara
ntee
issu
e of
cov
erag
e to
all
indi
vidu
al a
pplic
ants
.
Per
man
ent e
xclu
sion
s ar
e pr
ohib
ited
in a
ll gr
oup
and
indi
vidu
al c
ompr
ehen
sive
pro
duct
s.
NM
MIP
(the
hig
h ris
k po
ol) w
ill c
ontin
ue a
nd m
ake
cove
rage
av
aila
ble
to a
ny a
pplic
ant q
uote
d a
rate
that
exc
eeds
125
pe
rcen
t of t
he s
tand
ard
rate
, as
dete
rmin
ed b
y N
MM
IP.
Con
tinua
tion
or re
new
al o
f pol
icie
s in
forc
e w
ith p
erm
anen
t ex
clus
ions
will
tem
pora
rily
rem
ain
in e
ffect
unt
il H
CA
de
term
ines
cre
dita
ble
cove
rage
for c
ompl
ianc
e w
ith th
e in
divi
dual
man
date
.
Car
riers
may
den
y in
divi
dual
app
lican
ts, b
ut m
ust
guar
ante
e is
sue
of c
over
age
to s
mal
l gro
ups
(2-
50).
NM
MIP
mus
t offe
r cov
erag
e to
any
indi
vidu
al
appl
ican
t quo
ted
a pr
emiu
m th
at e
xcee
ds th
e st
anda
rd ra
te fo
r a h
ealth
y in
divi
dual
by
125
perc
ent o
r mor
e. N
MM
IP u
ses
this
sta
ndar
d ra
te a
s a
basi
s fo
r est
ablis
hing
its
prem
ium
s.

NE
W M
EX
ICO
HE
ALT
H S
OLU
TIO
NS
: S
PE
CIF
ICA
TIO
NS
FO
R C
OV
ER
AG
E, C
OS
T, A
ND
FU
ND
ING
ES
TIM
ATE
S (c
ontin
ued)
A.7
Feat
ures
M
athe
mat
ica
Spe
cific
atio
n R
atio
nale
/Com
men
ts
Cur
rent
Cas
e
Rat
ing
Car
riers
mus
t mai
ntai
n a
min
imum
85-
perc
ent l
oss
ratio
, ave
rage
d ac
ross
3 c
onse
cutiv
e ye
ars.
Res
trict
ions
on
indi
vidu
al a
nd s
mal
l-gro
up ra
ting
base
d on
hea
lth s
tatu
s or
cla
ims
expe
rienc
e at
firs
t is
sue
or re
new
al:
• FY
2008
: + 2
0%
• FY
2009
: + 1
8%
• FY
2010
: + 1
6%
• FY
2011
: + 1
4%
• FY
2012
: + 1
2%
• FY
2013
: + 1
0%
A ri
sk e
qual
izat
ion
stra
tegy
will
spr
ead
cost
s am
ong
carr
iers
, sup
porti
ng in
divi
dual
gua
rant
eed
issu
e an
d co
mpr
essi
on o
f ind
ivid
ual a
nd s
mal
l gro
up ra
tes.
Min
imum
loss
ratio
app
lies
to a
ll co
mpr
ehen
sive
pro
duct
s:
larg
e, s
mal
l, an
d in
divi
dual
. N
onm
edic
al c
osts
incl
ude
the
stat
e pr
emiu
m ta
x, a
s w
ell a
s co
sts
for c
are
coor
dina
tion
and
utili
zatio
n re
view
/man
agem
ent d
esig
ned
to c
ontro
l pay
er
cost
s or
lim
it us
e of
ser
vice
s. N
onm
edic
al c
osts
exc
lude
ca
se o
r dis
ease
man
agem
ent,
heal
th e
duca
tion,
pre
vent
ive
serv
ices
, or o
ther
ser
vice
s pr
ovid
ed d
irect
ly to
cov
ered
in
divi
dual
s an
d de
sign
ed to
impr
ove
heat
h or
hea
lth
outc
omes
.
In th
e in
divi
dual
mar
ket,
carr
iers
wou
ld c
ontin
ue to
rate
on
age,
gen
der,
geog
raph
ic a
rea,
and
sm
okin
g ha
bits
. In
ad
ditio
n, n
ew ra
te b
ands
on
heal
th s
tatu
s/cl
aim
s ex
perie
nce
wou
ld b
e es
tabl
ishe
d, w
ith ra
ting
on a
ll fa
ctor
s co
nstra
ined
w
ithin
the
curr
ent o
vera
ll ra
te b
ands
of 2
.5:1
.
In th
e sm
all g
roup
mar
ket,
initi
al ra
tes
base
d on
hea
lth s
tatu
s w
ill b
e co
mpr
esse
d. C
urre
nt ru
les
rega
rdin
g re
new
al ra
ting
will
not
cha
nge.
Indi
vidu
als:
Ins
urer
s ar
e pe
rmitt
ed to
est
ablis
h ra
tes
that
var
y by
age
, gen
der,
geog
raph
ic a
rea
or s
mok
ing
habi
ts. T
here
is a
lim
it of
20%
in th
e ra
te a
djus
tmen
t for
gen
der a
t any
age
. A
dditi
onal
ly, r
ates
can
onl
y va
ry b
y 25
0% fr
om
the
low
est t
o th
e hi
ghes
t (th
e hi
ghes
t can
't ex
ceed
350
% o
f the
low
est)
for a
ll of
thes
e fa
ctor
s. O
nce
thes
e ra
tes
are
dete
rmin
ed, t
he
insu
rer h
as n
o lim
it on
ratin
g du
e to
hea
lth s
tatu
s or
indu
stry
cla
ssifi
catio
n.
Sm
all g
roup
s: R
ates
var
y on
age
, gen
der,
geog
raph
ic a
rea
and
smok
ing
habi
ts, w
ith th
e sa
me
limits
on
ratin
g fo
r gen
der a
nd o
vera
ll as
in
the
indi
vidu
al m
arke
t. In
add
ition
, rat
es c
an v
ary
+20%
bas
ed o
n he
alth
sta
tus
and
indu
stry
cl
assi
ficat
ion.
Ren
ewal
rate
incr
ease
s du
e to
cl
aim
s ex
perie
nce
cann
ot e
xcee
d 11
0% o
f m
edic
al tr
end,
sub
ject
to th
e ov
eral
l rat
e ba
nd o
n ne
w is
sues
and
rene
wal
s.

NE
W M
EX
ICO
HE
ALT
H S
OLU
TIO
NS
: S
PE
CIF
ICA
TIO
NS
FO
R C
OV
ER
AG
E, C
OS
T, A
ND
FU
ND
ING
ES
TIM
ATE
S (c
ontin
ued)
A.8
Feat
ures
M
athe
mat
ica
Spe
cific
atio
n R
atio
nale
/Com
men
ts
Cur
rent
Cas
e
Pre
miu
m
subs
idie
s M
edic
aid/
SC
HIP
chi
ldre
n an
d ad
ult p
rem
ium
s: z
ero
prem
ium
s.
SC
I:
Wor
kers
< 3
00%
FP
L w
ith e
mpl
oyer
offe
r rec
eive
ex
tend
ed S
CI s
ubsi
dy.
Afte
r $75
em
ploy
er
cont
ribut
ion,
net
pre
miu
ms
are:
• 0-
100%
FP
L: $
0/m
o
• 10
1-15
0% F
PL:
$20
• 15
1-20
0% F
PL:
$35
• 20
0% F
PL-
250%
: $75
• 25
0-30
0% F
PL:
Em
ploy
er p
ays
$100
/ em
ploy
ee
pays
$10
0
Sel
f-em
ploy
ed a
nd o
ther
indi
vidu
al e
nrol
lees
at o
r be
low
250
% F
PL
pay
$75/
mo
plus
abo
ve s
ched
ule,
no
t to
exce
ed fu
ll co
st.
Sel
f-em
ploy
ed a
nd o
ther
indi
vidu
al e
nrol
lees
251
-30
0% F
PL
pay
$100
/mo
plus
abo
ve s
ched
ule,
not
to
exce
ed fu
ll co
st.
Enr
ollm
ent i
s ca
pped
at 3
00%
FP
L, g
ross
inco
me.
Fa
mily
pre
miu
m is
not
cap
ped
rela
tive
to in
com
e.
The
assu
med
pre
miu
m s
ched
ule
is th
e sa
me
as fo
r NM
H
ealth
Cho
ices
and
the
Hea
lth C
over
age
Pla
n.
Initi
al b
uy-in
to th
e st
ate
empl
oyee
pla
n w
ill a
ssum
e pr
emiu
ms
equa
l to
curr
ent p
ublic
-em
ploy
ee a
vera
ge m
edic
al
cost
plu
s 12
0 pe
rcen
t of t
he p
ublic
em
ploy
ee p
lan
nonm
edic
al c
ost r
ate.
Med
icai
d/S
CH
IP c
hild
ren
and
adul
ts p
ay n
o pr
emiu
ms.
In S
CI:
• 0-
100%
FP
L: f
ull s
ubsi
dy
• 10
0-20
0% F
PL:
pre
miu
ms
<$35
/mo,
sca
led
to
inco
me.
• C
opay
men
ts c
appe
d at
5%
of f
amily
inco
me.
Pre
miu
m A
ssis
tanc
e:
• Fo
r chi
ldre
n in
fam
ilies
with
cou
ntab
le fa
mily
in
com
es a
bove
235
% F
PL
and
that
incl
ude
child
ren
to a
ge tw
elve
: 50%
of p
rem
ium
for
appr
oved
com
preh
ensi
ve p
lans
.
• Fo
r pre
gnan
t wom
en w
ith c
ount
able
fam
ily
inco
mes
abo
ve 2
35%
FP
L, a
nd fo
r onl
y pr
egna
ncy-
rela
ted
serv
ices
, pre
miu
m is
$15
0 in
mon
ths
1-5,
$30
0 in
mon
ths
6-9
Und
er fe
dera
l and
NM
tax
law
:
• V
olun
tary
em
ploy
er c
ontri
butio
ns a
re ta
x-ex
empt
.
• E
mpl
oyee
con
tribu
tions
pai
d th
roug
h a
Sec
tion
125
plan
are
tax-
exem
pt.
• S
elf-e
mpl
oyed
indi
vidu
als
may
ded
uct 1
00%
of
paym
ents
for h
ealth
insu
ranc
e fro
m ta
xabl
e in
com
e.
• O
ther
taxp
ayer
s w
ho d
o no
t ite
miz
e m
ay
dedu
ct in
sura
nce
paym
ents
that
, tog
ethe
r w
ith o
ther
unr
eim
burs
ed m
edic
al e
xpen
ses,
ex
ceed
7.5
% o
f adj
uste
d gr
oss
inco
me.
2
Loca
l-gov
ernm
ent g
roup
s m
ay b
uy in
to th
e S
tate
em
ploy
ee p
ool.
The
em
ploy
er c
hoos
es th
e pl
an
and
esta
blis
hes
the
cont
ribut
ion
perc
enta
ge.
In
mid
-200
7, 3
1,52
0 lo
cal p
ublic
em
ploy
ees
wer
e en
rolle
d in
the
Sta
te e
mpl
oyee
pla
n, c
ompa
red
with
47,
280
Sta
te e
mpl
oyee
s an
d de
pend
ents
.
2 T
his
prov
isio
n is
not
wid
ely
used
. S
ee: C
ongr
essi
onal
Res
earc
h S
ervi
ce (C
RS
) 200
4, T
ax B
enef
its fo
r Hea
lth In
sura
nce:
Cur
rent
Leg
isla
tion
[http
://w
ww
.sen
ate.
gov/
~hut
chis
on/IB
9803
7.pd
f].

NE
W M
EX
ICO
HE
ALT
H S
OLU
TIO
NS
: S
PE
CIF
ICA
TIO
NS
FO
R C
OV
ER
AG
E, C
OS
T, A
ND
FU
ND
ING
ES
TIM
ATE
S (c
ontin
ued)
A.9
Feat
ures
M
athe
mat
ica
Spe
cific
atio
n R
atio
nale
/Com
men
ts
Cur
rent
Cas
e
Em
ploy
er
cont
ribut
ion
Am
ong
offe
ring
empl
oyer
s, th
e cu
rren
t con
tribu
tions
to
cove
rage
.
Em
ploy
ers
elig
ible
for S
CI p
ay $
75 p
er w
orke
r per
m
onth
.
Em
ploy
ers
will
pay
an
annu
al fe
e se
t at $
500
per
empl
oyee
per
yea
r, ap
plic
able
to e
mpl
oyer
s w
ith 6
or
mor
e w
orke
rs.
The
fee
will
be
offs
et d
olla
r-for
dol
lar-
by th
e am
ount
the
empl
oyer
con
tribu
tes
to th
e em
ploy
ees’
hea
lth c
over
age.
3 IS
TH
E F
EE
P
RO
RA
TED
FO
R P
AR
T-TI
ME
/YE
AR
EM
PLO
YEE
S?
The
annu
al fe
e di
ffers
from
that
in th
e N
M H
ealth
Cov
erag
e pl
an, i
n th
at fi
rms
with
2-5
em
ploy
ees
are
exem
pt.
For S
CI,
empl
oyer
pre
miu
ms
are
capp
ed a
t $75
pm
pm.
For a
ll ot
her h
ealth
pla
ns, e
mpl
oyer
con
tribu
tion
varie
s by
firm
siz
e: 4
• Fo
r sin
gle
cove
rage
: 78
.8%
in fi
rms
<50
and
81.4
% in
larg
er fi
rms.
• Fo
r fam
ily c
over
age:
74.
8% in
firm
s <5
0 an
d 80
.7%
in la
rger
firm
s.
Sel
f-ins
ured
em
ploy
ers
are
prot
ecte
d by
ER
ISA
an
d ar
e ex
empt
from
sta
te ta
xatio
n or
regu
latio
n of
ben
efit
desi
gn.
Cov
ered
ben
efits
an
d co
st s
harin
g M
anda
ted
cove
rage
of p
reve
ntiv
e se
rvic
es, t
o be
de
term
ined
by
HC
A.
SC
I ben
efits
rem
ain
capp
ed a
s cu
rren
tly.
NM
MIP
will
cov
er p
regn
ancy
with
no
wai
ting
perio
d.
SC
I pro
visi
on d
iffer
s fro
m th
e N
M H
ealth
Cov
erag
e P
lan,
w
hich
wou
ld c
over
(or r
eins
ure)
ann
ual e
xpen
ses
abov
e $1
00,0
00.
Med
icai
d co
vers
vis
ion
and
dent
al fo
r chi
ldre
n,
but n
ot fo
r non
-dis
able
d ad
ults
.
Med
icai
d an
d ot
her f
eder
al, s
tate
, and
priv
ate
fund
s co
ver i
nstit
utio
naliz
ed lo
ng-te
rm c
are.
For o
ther
pub
lic p
rogr
am a
nd p
rivat
e in
sura
nce
enro
llees
, cov
ered
ser
vice
s an
d co
st s
harin
g va
ry b
y so
urce
of c
over
age.
Sup
plem
enta
l be
nefit
s N
o ch
ange
from
cur
rent
. N
ot re
leva
nt to
refo
rm m
odel
. S
tate
em
ploy
ee p
lan
incl
udes
sup
plem
enta
l de
ntal
and
vis
ion
optio
ns.
Pay
men
t of
prov
ider
s M
edic
al tr
end
rate
is e
stim
ated
as
the
Med
icar
e co
st
trend
per
mem
ber p
er m
onth
(7.7
%).5
Pro
vide
rs m
ust a
ccep
t pay
men
t fro
m a
ny c
arrie
r, an
d m
ust a
ccep
t pat
ient
s re
gard
less
of c
arrie
r, un
less
thei
r pr
actic
e is
full
or re
ferr
al is
med
ical
ly in
dica
ted.
P
rovi
ders
may
bal
ance
bill
with
in a
llow
able
fees
set
by
HC
A.
Med
ical
tren
d as
sum
ptio
n is
the
sam
e as
for a
ll ot
her
mod
els—
that
is, i
t ass
umes
that
the
HC
A w
ill m
itiga
te
med
ical
cos
t tre
nds.
The
spec
ifica
tions
for H
ealth
Sol
utio
ns, t
he H
ealth
Cov
erag
e P
lan
and
NM
Hea
lth C
hoic
es d
iffer
from
the
in H
ealth
S
ecur
ity A
ct m
odel
in th
at o
nly
the
Hea
lth S
ecur
ity A
ct
(ver
sion
1) a
ssum
es p
rovi
der a
dmin
istra
tive
cost
sav
ings
are
ca
ptur
ed in
pro
vide
r pay
men
t rat
es.
Pay
men
t lev
els
vary
by
heal
th p
lan.
3 In
Mas
sach
uset
ts, t
he fa
ir sh
are
paym
ent i
s as
sess
ed o
nly
on e
mpl
oyer
s w
ith m
ore
than
ten
empl
oyee
s if
the
empl
oyer
doe
s no
t “pr
ovid
e or
mak
e a
reas
onab
le c
ontri
butio
n to
hea
lth
insu
ranc
e fo
r the
ir em
ploy
ees
[http
://w
ww
.mas
s.go
v/le
gis/
sect
ions
]. T
he a
mou
nt m
ay n
ot e
xcee
d $2
95 p
er e
mpl
oyee
per
yea
r and
is p
rora
ted
for p
art-t
ime
empl
oyee
s. I
n V
T, th
e fa
ir sh
are
paym
ent i
s $3
50 p
er e
mpl
oyee
per
yea
r.
4 200
4 M
EP
S-IC
est
imat
e [h
ttp://
ww
w.m
eps.
ahrq
.gov
/mep
sweb
/dat
a_st
ats/
quic
k_ta
bles
_sea
rch.
jsp?
com
pone
nt =
2&su
bcom
pone
nt=2
].
5 The
ave
rage
ann
ual g
row
th in
Med
icar
e sp
endi
ng p
er c
apita
from
199
6 to
200
3 (e
st.)
was
4.2
%.
Est
imat
ed fr
om F
EH
BP
exp
endi
ture
com
pone
nts,
the
trend
wou
ld h
ave
been
at l
east
3.5
%ag
e po
ints
hi
gher
(b
ased
on
20
02-2
003
chan
ge),
had
FEH
BP
-leve
l dr
ug
cove
rage
be
en
incl
uded
(S
ourc
e:
ww
w.o
pm.g
ov/p
ress
rel/2
002/
fehb
/200
3_FE
HB
_Pre
miu
ms.
asp,
ci
ted
in
http
://w
ww
.kff.
org/
med
icar
e/up
load
/The
-Fed
eral
-Em
ploy
ees-
Hea
lth-B
enef
its-P
rogr
am-P
rogr
am-D
esig
n-R
ecen
t-Per
form
ance
-and
-Impl
icat
ions
-for-
Med
icar
e-R
efor
m-R
epor
t.pdf
).

NE
W M
EX
ICO
HE
ALT
H S
OLU
TIO
NS
: S
PE
CIF
ICA
TIO
NS
FO
R C
OV
ER
AG
E, C
OS
T, A
ND
FU
ND
ING
ES
TIM
ATE
S (c
ontin
ued)
A.10
Feat
ures
M
athe
mat
ica
Spe
cific
atio
n R
atio
nale
/Com
men
ts
Cur
rent
Cas
e
Out
of s
tate
pr
ovid
ers
Pai
d th
e sa
me
as c
urre
nt c
ase
rela
tive
to in
-sta
te
prov
ider
s.
Pro
posa
l is
sile
nt.
Pay
men
t lev
els
vary
by
heal
th p
lan.
Mis
c. o
ther
so
urce
s of
sav
ing
Pub
lic e
duca
tion
abou
t the
ben
efits
of w
elln
ess
and
prev
entio
n ac
tiviti
es a
nd h
ealth
cov
erag
e.
No
cost
est
imat
e an
ticip
ated
.
Red
uctio
n in
wor
kers
com
pens
atio
n an
d au
to in
sura
nce
may
oc
cur,
as w
ith o
ther
mod
els
that
man
date
indi
vidu
als
to b
e in
sure
d. N
o es
timat
e is
ant
icip
ated
for t
his
pote
ntia
l sav
ing.
Wor
kers
com
pens
atio
n an
d au
to in
sura
nce
incl
ude
med
ical
cov
erag
e th
at is
sol
e pa
yer f
or
pers
ons
who
are
uni
nsur
ed a
nd o
ther
wis
e m
ay
be s
ubro
gate
d to
priv
ate
med
ical
cov
erag
e.
P
rovi
ders
reta
in th
e va
lue
of u
ncom
pens
ated
car
e, to
th
e ex
tent
that
it is
shi
fted
to p
rivat
e-pa
y pa
tient
s—th
at
is, p
rivat
e-pa
y re
imbu
rsem
ents
are
not
adj
uste
d to
re
flect
the
redu
ctio
n in
unc
ompe
nsat
ed c
are.
NM
Hos
pita
l Ass
ocia
tion
estim
ates
that
50%
of
unco
mpe
nsat
ed c
are
is b
ad d
ebt a
nd 5
0% is
cha
rity
care
.6
Cou
nty
indi
gent
fund
s co
llect
ion
and
utili
zatio
n w
ill b
e th
e sa
me
as th
e cu
rren
t cas
e.
Unc
ompe
nsat
ed c
are
is p
aid
by c
ount
ies
and
med
ical
pro
vide
rs a
nd/o
r shi
fted
into
cha
rges
to
priv
atel
y in
sure
d pa
tient
s.
Qua
lity
impr
ovem
ent
All
prop
osal
s in
clud
e at
tent
ion
to q
ualit
y im
prov
emen
t an
d w
elln
ess.
Th
e sp
ecifi
catio
n as
sum
es th
at a
ll m
odel
s w
ill fo
llow
bes
t pr
actic
es re
late
d to
qua
lity
impr
ovem
ent a
nd w
elln
ess.
No
cost
est
imat
e is
ant
icip
ated
, but
impa
cts
will
be
addr
esse
d as
a c
onsi
dera
tion.
With
resp
ect t
o pr
even
tion
and
wel
lnes
s, g
reat
er p
rovi
sion
of
prev
entiv
e ca
re m
ay in
the
shor
t run
incr
ease
cos
t by
iden
tifyi
ng p
eopl
e w
ho n
eed
care
. A
ctua
rial e
xper
ienc
e w
ith
wel
lnes
s pr
ogra
ms
attri
bute
s lit
tle im
pact
of w
elln
ess
effo
rts
on h
ealth
car
e co
sts,
but
som
e st
ate
Med
icai
d pr
ogra
ms
have
ado
pted
inno
vatio
ns th
at a
re e
xpec
ted
to s
ave
cost
and
po
tent
ially
cou
ld b
e ex
pand
ed to
oth
er in
sure
d po
pula
tions
.
Larg
e pl
ans
may
hav
e qu
ality
impr
ovem
ent
proc
esse
s, b
ut th
ere
is n
ot c
urre
ntly
a s
tate
wid
e he
alth
car
e qu
ality
impr
ovem
ent p
roce
ss.
Sou
rces
of
reve
nue
Prim
ary
sour
ces
incl
ude:
• In
divi
dual
pre
miu
ms
net o
f sub
sidy
, lar
gely
taxa
ble
unde
r fed
eral
law
• E
mpl
oyer
con
tribu
tions
to p
rem
ium
s, ta
x ex
empt
un
der f
eder
al la
w
• E
mpl
oyer
con
tribu
tions
to a
Hea
lthy
New
Mex
ico
Wor
kfor
ce
• S
tate
gen
eral
fund
and
rete
ntio
n of
cur
rent
pre
miu
m
tax
for n
ew p
ublic
-pro
gram
enr
olle
es
• Fe
dera
l Med
icai
d an
d S
CH
IP m
atch
ing.
No
chan
ge in
sta
te ta
x co
de is
pre
sum
ed.
Indi
vidu
al, e
mpl
oyee
, and
em
ploy
er c
ontri
butio
ns a
re ta
x qu
alifi
ed, a
s in
cur
rent
fede
ral a
nd s
tate
law
.
Em
ploy
er c
ontri
butio
ns to
a H
ealth
y N
ew M
exic
o W
orkf
orce
ar
e as
sum
ed n
ot to
qua
lify
as c
ontri
butio
ns to
cov
erag
e un
der f
eder
al a
nd s
tate
tax
rule
s, b
ut q
ualif
y as
a c
ost o
f do
ing
busi
ness
.
The
DS
H li
mit
for e
ach
hosp
ital i
s eq
ual t
o its
loss
on
serv
ices
pro
vide
d to
Med
icai
d an
d un
insu
red
patie
nts
(incl
udin
g ho
mel
ess
and
trans
ient
). IH
S a
nd V
A fu
nds
rem
ain.
Prim
ary
sour
ces
incl
ude:
• E
mpl
oyee
con
tribu
tions
and
indi
vidu
al
prem
ium
s
• E
mpl
oyer
con
tribu
tions
• Fe
dera
l Med
icai
d an
d S
CH
IP m
atch
ing
• O
ther
fede
ral f
unds
(inc
ludi
ng D
SH
, MTA
LA,
and
adm
inis
trativ
e fu
nds
for N
MM
IP)
• S
tate
and
loca
l fun
ds
6 T
he A
mer
ican
Hos
pita
l Ass
ocia
tion
defin
ed b
ad d
ebt a
s se
rvic
es fo
r whi
ch h
ospi
tals
ant
icip
ated
but
did
not
rece
ive
paym
ent,
and
char
ity c
are
as s
ervi
ces
for w
hich
hos
pita
ls n
eith
er re
ceiv
ed,
nor e
xpec
ted
to re
ceiv
e, p
aym
ent b
ecau
se th
ey h
ad d
eter
min
ed th
e pa
tient
’s in
abili
ty to
pay
. In
pra
ctic
e, h
ospi
tals
hav
e di
fficu
lty in
dis
tingu
ishi
ng b
ad d
ebt f
rom
cha
rity
care
. N
egot
iate
d di
scou
nts
with
pay
ers
(incl
udin
g M
edic
are
and
Med
icai
d) a
re n
ot re
gard
ed a
s un
com
pens
ated
car
e [h
ttp://
ww
w.a
ha.o
rg/a
ha/c
onte
nt/2
005/
pdf/0
511U
ncom
pens
ated
Car
eFac
tShe
et.p
df].