Analysis of localized damage in EB-PVD/(Ni, Pt)Al thermal barrier coatings
10
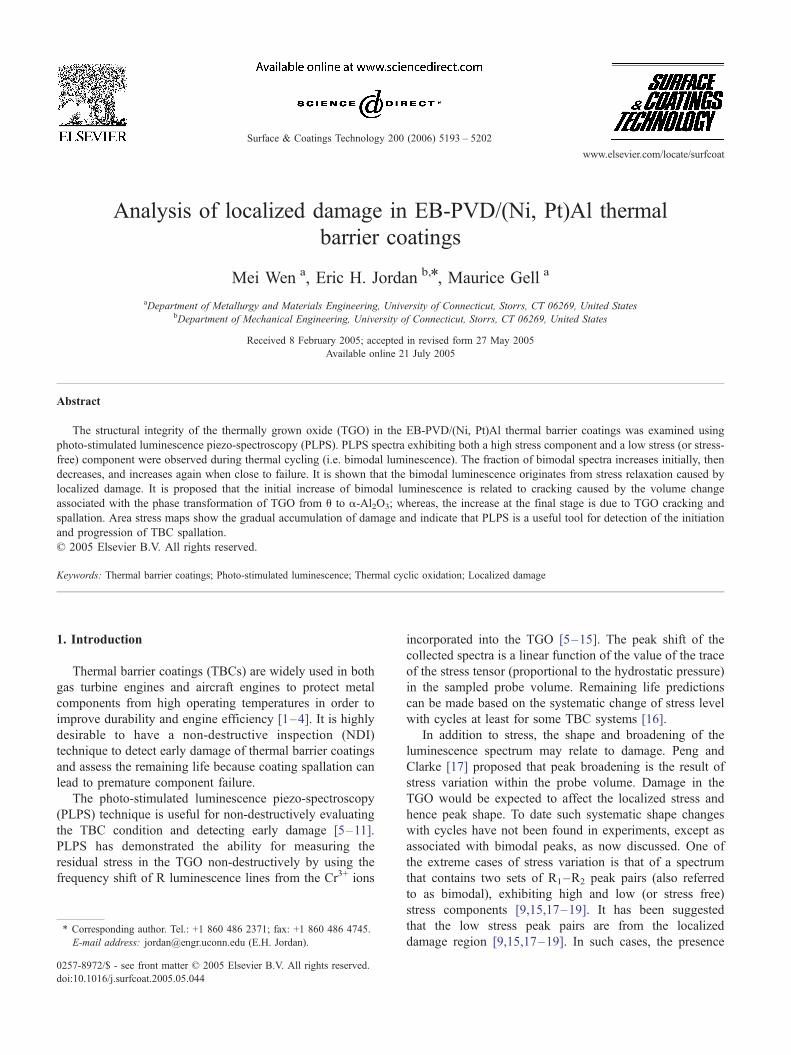
Analysis of localized damage in EB-PVD/(Ni, Pt)Al thermal barrier coatings Mei Wen a , Eric H. Jordan b, * , Maurice Gell a a Department of Metallurgy and Materials Engineering, University of Connecticut, Storrs, CT 06269, United States b Department of Mechanical Engineering, University of Connecticut, Storrs, CT 06269, United States Received 8 February 2005; accepted in revised form 27 May 2005 Available online 21 July 2005 Abstract The structural integrity of the thermally grown oxide (TGO) in the EB-PVD/(Ni, Pt)Al thermal barrier coatings was examined using photo-stimulated luminescence piezo-spectroscopy (PLPS). PLPS spectra exhibiting both a high stress component and a low stress (or stress- free) component were observed during thermal cycling (i.e. bimodal luminescence). The fraction of bimodal spectra increases initially, then decreases, and increases again when close to failure. It is shown that the bimodal luminescence originates from stress relaxation caused by localized damage. It is proposed that the initial increase of bimodal luminescence is related to cracking caused by the volume change associated with the phase transformation of TGO from u to a-Al 2 O 3 ; whereas, the increase at the final stage is due to TGO cracking and spallation. Area stress maps show the gradual accumulation of damage and indicate that PLPS is a useful tool for detection of the initiation and progression of TBC spallation. D 2005 Elsevier B.V. All rights reserved. Keywords: Thermal barrier coatings; Photo-stimulated luminescence; Thermal cyclic oxidation; Localized damage 1. Introduction Thermal barrier coatings (TBCs) are widely used in both gas turbine engines and aircraft engines to protect metal components from high operating temperatures in order to improve durability and engine efficiency [1–4]. It is highly desirable to have a non-destructive inspection (NDI) technique to detect early damage of thermal barrier coatings and assess the remaining life because coating spallation can lead to premature component failure. The photo-stimulated luminescence piezo-spectroscopy (PLPS) technique is useful for non-destructively evaluating the TBC condition and detecting early damage [5–11]. PLPS has demonstrated the ability for measuring the residual stress in the TGO non-destructively by using the frequency shift of R luminescence lines from the Cr 3+ ions incorporated into the TGO [5–15]. The peak shift of the collected spectra is a linear function of the value of the trace of the stress tensor (proportional to the hydrostatic pressure) in the sampled probe volume. Remaining life predictions can be made based on the systematic change of stress level with cycles at least for some TBC systems [16]. In addition to stress, the shape and broadening of the luminescence spectrum may relate to damage. Peng and Clarke [17] proposed that peak broadening is the result of stress variation within the probe volume. Damage in the TGO would be expected to affect the localized stress and hence peak shape. To date such systematic shape changes with cycles have not been found in experiments, except as associated with bimodal peaks, as now discussed. One of the extreme cases of stress variation is that of a spectrum that contains two sets of R 1 –R 2 peak pairs (also referred to as bimodal), exhibiting high and low (or stress free) stress components [9,15,17 – 19]. It has been suggested that the low stress peak pairs are from the localized damage region [9,15,17 – 19]. In such cases, the presence 0257-8972/$ - see front matter D 2005 Elsevier B.V. All rights reserved. doi:10.1016/j.surfcoat.2005.05.044 * Corresponding author. Tel.: +1 860 486 2371; fax: +1 860 486 4745. E-mail address: [email protected] (E.H. Jordan). Surface & Coatings Technology 200 (2006) 5193 – 5202 www.elsevier.com/locate/surfcoat
-
Upload
independent -
Category
Documents
-
view
0 -
download
0
Transcript of Analysis of localized damage in EB-PVD/(Ni, Pt)Al thermal barrier coatings
www.elsevier.com/locate/surfcoat
Surface & Coatings Technolog
Analysis of localized damage in EB-PVD/(Ni, Pt)Al thermal
barrier coatings
Mei Wen a, Eric H. Jordan b,*, Maurice Gell a
aDepartment of Metallurgy and Materials Engineering, University of Connecticut, Storrs, CT 06269, United StatesbDepartment of Mechanical Engineering, University of Connecticut, Storrs, CT 06269, United States
Received 8 February 2005; accepted in revised form 27 May 2005
Available online 21 July 2005
Abstract
The structural integrity of the thermally grown oxide (TGO) in the EB-PVD/(Ni, Pt)Al thermal barrier coatings was examined using
photo-stimulated luminescence piezo-spectroscopy (PLPS). PLPS spectra exhibiting both a high stress component and a low stress (or stress-
free) component were observed during thermal cycling (i.e. bimodal luminescence). The fraction of bimodal spectra increases initially, then
decreases, and increases again when close to failure. It is shown that the bimodal luminescence originates from stress relaxation caused by
localized damage. It is proposed that the initial increase of bimodal luminescence is related to cracking caused by the volume change
associated with the phase transformation of TGO from u to a-Al2O3; whereas, the increase at the final stage is due to TGO cracking and
spallation. Area stress maps show the gradual accumulation of damage and indicate that PLPS is a useful tool for detection of the initiation
and progression of TBC spallation.
D 2005 Elsevier B.V. All rights reserved.
Keywords: Thermal barrier coatings; Photo-stimulated luminescence; Thermal cyclic oxidation; Localized damage
1. Introduction
Thermal barrier coatings (TBCs) are widely used in both
gas turbine engines and aircraft engines to protect metal
components from high operating temperatures in order to
improve durability and engine efficiency [1–4]. It is highly
desirable to have a non-destructive inspection (NDI)
technique to detect early damage of thermal barrier coatings
and assess the remaining life because coating spallation can
lead to premature component failure.
The photo-stimulated luminescence piezo-spectroscopy
(PLPS) technique is useful for non-destructively evaluating
the TBC condition and detecting early damage [5–11].
PLPS has demonstrated the ability for measuring the
residual stress in the TGO non-destructively by using the
frequency shift of R luminescence lines from the Cr3+ ions
0257-8972/$ - see front matter D 2005 Elsevier B.V. All rights reserved.
doi:10.1016/j.surfcoat.2005.05.044
* Corresponding author. Tel.: +1 860 486 2371; fax: +1 860 486 4745.
E-mail address: [email protected] (E.H. Jordan).
incorporated into the TGO [5–15]. The peak shift of the
collected spectra is a linear function of the value of the trace
of the stress tensor (proportional to the hydrostatic pressure)
in the sampled probe volume. Remaining life predictions
can be made based on the systematic change of stress level
with cycles at least for some TBC systems [16].
In addition to stress, the shape and broadening of the
luminescence spectrum may relate to damage. Peng and
Clarke [17] proposed that peak broadening is the result of
stress variation within the probe volume. Damage in the
TGO would be expected to affect the localized stress and
hence peak shape. To date such systematic shape changes
with cycles have not been found in experiments, except as
associated with bimodal peaks, as now discussed. One of
the extreme cases of stress variation is that of a spectrum
that contains two sets of R1–R2 peak pairs (also referred
to as bimodal), exhibiting high and low (or stress free)
stress components [9,15,17–19]. It has been suggested
that the low stress peak pairs are from the localized
damage region [9,15,17–19]. In such cases, the presence
y 200 (2006) 5193 – 5202
M. Wen et al. / Surface & Coatings Technology 200 (2006) 5193–52025194
of a low stress (or stress free) component is an indication
of damage and it is potentially a means of quantifying
local damage in the TGO. Selcuk and Atkinson [15,19]
mapped the low stress regions for an EB-PVD/Pt diffusion
bond coat TBC and showed these regions were isolated at
first and tended to coalesce into larger regions toward the
end of life. They observed for some specimens that the
number and area fraction of low stress components
showed high initial level that gradually decreased before
increasing at the onset of spallation. Sohn et al. [9] also
found for an EB-PVD/MCrAlY system that the fraction of
low stress component increased initially, then gradually
decreased and then increased again when close to failure.
The increase close to failure can be related to TGO
spallation. However, the cause for the initial high values is
not clear.
In the present paper, we provide further experimental
evidence of the initial increase of bimodal spectra, followed
by a decrease, and finally an increase prior to failure for
another EB-PVD Pt modified NiAl bond coated TBC
system. Most significantly, direct evidence is presented
associating luminescence peaks having a stress free compo-
nent (bimodal spectra) with TGO cracks. The mechanisms
of TGO cracking in the different stages are studied as well.
(Ni, Pt)Al bond coats can form metastable alumina
phases, such as g,u-Al2O3, in early oxidation and then
transform to the stable a-Al2O3 phase. Besides stress
measurement and damage detection, PLPS can also be used
to determine the oxide type and its spatial distribution,
which makes it a valuable tool to study alumina phase
transformations [5,20,21].
2. Experimental procedure
The disk-shaped (2.54 cm in diameter and 0.32 cm in
thickness) TBC specimens investigated in this study were
supplied by an engine manufacturer. They consist of a 140
Am thick electron beam physical vapor deposited (EB-
PVD) 7 wt.% Y2O3 stabilized ZrO2 (YSZ) coating, a 50
Am thick grit blasted platinum-modified nickel-aluminide
bond coat [(Ni, Pt)Al] and a single crystal CMSX-4
superalloy substrate. The typical compositions of the
coating and the superalloy used in this study are shown
in Table 1. The specimens were bond coated on both sides
to allow study of the oxidation behavior of the bare bond
coat using the backside of specimens. The bond coats were
Table 1
Typical composition of various layers of the TBC system used in this study
Layer Material Composition (wt.%)
Substrate Single crystal
superalloy CMSX-4
9 Co, 6.5 Cr, 6.5 Ta, 5.6 Al,
6.0 W, 3.0 Re, 0.6 Mo,
0.1 Hf, 1.0 Ti, balance Ni
Bond coat Ni-rich Pt-Al 20 Pt, 21 Al, balance Ni
Ceramic TBC Yttria stabilized zirconia 7 Y2O3 in ZrO2
grit blasted prior to TBC deposition by the EB-PVD
process.
Cyclic oxidation tests were performed in air at 1151 -Cand 1121 -C in a CMi rapid temperature cycle furnace
(CM Inc., Bloomfield, NJ) [9]. The thermal cycles
consisted of a 10-min heat-up to peak temperature (1151
-C and 1121 -C), a 40-min hold at peak temperature (1151
-C and 1121 -C), followed by a 10-min forced air quench.
The temperature of 1121 -C was selected because it
corresponded to the sponsor’s goal temperature for the
future and 1151 -C was selected to correspond local hot
spots and to obtain result without having tests of excessive
duration. Specimens were removed at specified intervals to
perform PLPS measurements. A total of 12 specimens were
investigated and 8 of them were cycled to failure. Failure of
the specimen was defined by spallation of more than 50%
of the total area.
PLPS measurements were made using a RenishawiRamascopei 2000 (Renishaw, Glouchestershire, UK) in
conjunction with a Leicai DM/LM light microscope.
Detailed information on the experimental set-up can be
found elsewhere [9–11]. At specified intervals, a series of
spectra on either a coarse or a fine rectangular grid were
collected on each sample. The laser beam was focused on
the surface of YSZ and the spot was scanned over the
specimen by moving the computer controlled stage at the
specified step size. At each position, a luminescence
spectrum was acquired. The minimum step size possible is
1 Am. In coarse mapping, a total of 121 spectra were
acquired in a 12 mm�12 mm grid area, with a step size of
1.2 mm. In fine mapping, a total of 2601 spectra were
acquired in a 2 mm�2 mm grid area with a step size of 40
Am. For each specimen, the origin of the mapping was fixed
and matched so that the same general area was measured as
a function of thermal cycling. PLPS measurements can also
be made on polished cross sections, however in doing so
one must contend with the fact that cutting has changed the
stress state and local polishing damage must be ruled out as
an influence. Because of these issues such measurements
were not made in the present case. Such measurements
when done carefully have shown non-uniform stress
distribution in the direction of TGO thickness with higher
stress near the TGO/bond coat interface [22,23]. In the
present case the stresses reported were measured when the
laser penetrated through the YSZ top coat and are volume
averaged through the TGO thickness.
Spectra were analyzed by a constrained peak fitting
procedure. In this procedure, spectra are fitted using mixed
Gaussian-Lorentzian peaks, where the peak parameters
satisfy certain constraints. The constraints include the
relationship of R1–R2 peak spacing with peak position
and inequality constraints with respect to the R1–R2 peak
height ratio, the ratio of full width at half maximum height
of the R1 and R2 peak, and the Lorenzian/Gaussian
fractions. The best fit to the acquired spectra is assessed
by a merit function [15,19] and spectral characteristics can
0
5000
10000
15000
20000
25000
14300 14350 14400 14450 14500
Wavenumber (cm-1)
Wavenumber (cm-1)
Inte
nsi
ty (
a.u
.)
(a)
R 1
R 2
R 1
R 2
0
5000
10000
15000
20000
14300 14350 14400 14450 14500
Inte
nsi
ty (
a.u
.)
(b)
R 2 (Stress-Free)
R 1 (Stress-Free)
R 2 (Stressed)
R 1 (Stressed)
R 2 (Stress-Free)
R 1 (Stress-Free)
R 2 (Stressed)
R 1 (Stressed)
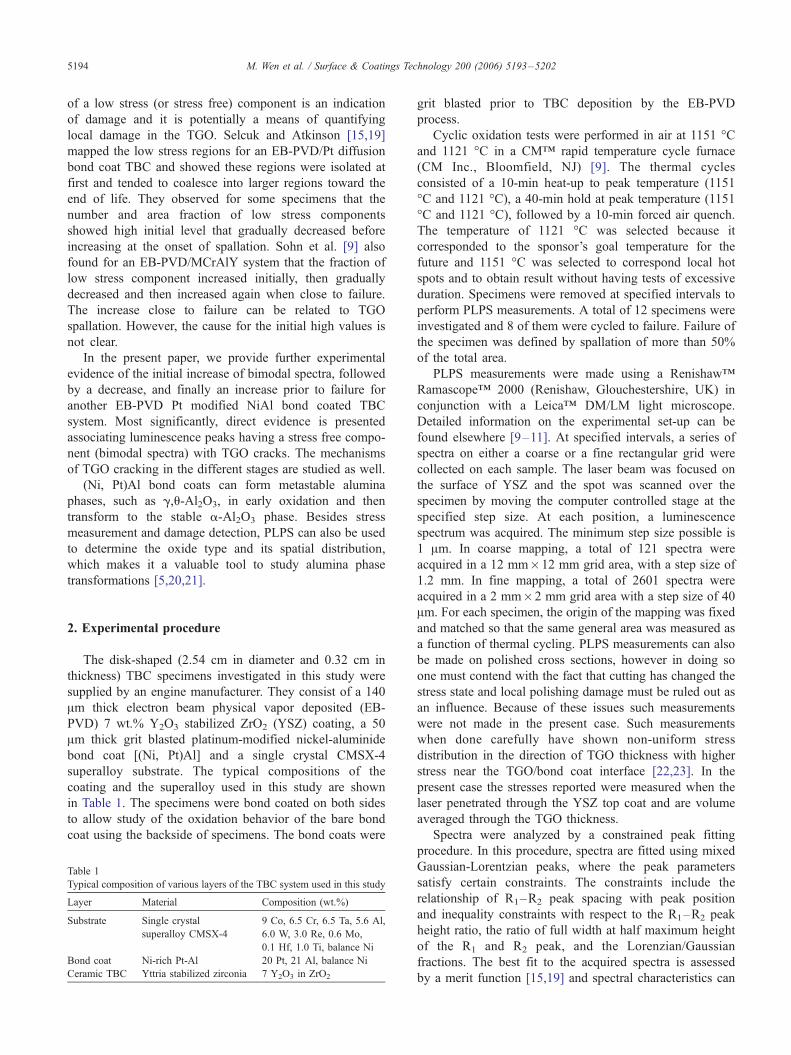
Fig. 1. Typical photoluminescence spectra showing (a) one set of peak pairs
and (b) two sets of peak pairs.
M. Wen et al. / Surface & Coatings Technology 200 (2006) 5193–5202 5195
be extracted from the fitting functions obtained. Detailed
information of some very similar procedures can be found in
Refs. [18,19]. The fraction of bimodal spectra (the spectra
exhibiting high and low (or stress free) stressed compo-
nents) is of particular interest, because the regions produc-
ing bimodal spectra may be related to localized damage. The
fraction of bimodal spectra were calculated according to the
equation:
Number fraction of bimodal¼Nbimodal= NunimodalþNbimodalð Þð1Þ
where: Nunimodal= the number of spectra that show only one
stress component; Nbimodal= the number of spectra that show
two stress components.
The oxidation of the bond coat was studied on the bond
coated only backside of one specimen. The sample was
polished before oxidation in order to remove the original
thin oxide layer. Then, it was subject to the same cyclic tests
at 1151 -C to form a new oxide layer. PLPS measurements
were carried out as mentioned before to study the fraction of
bimodal peak and the alumina phases and their spatial
distribution in oxide scales.
The microstructure of the sample surface was charac-
terized using a scanning electron microscope Philips
ESEM 2020. Quantitative analysis of crack density was
carried out using UNIX based image analysis software
microGOP 2000 (ContextVision, Linkoping, Sweden). The
SEM micrographs were converted into binary image in
which the black represents the cracks and the white
represents the region without cracks. The length for every
crack was measured for each image. The crack density was
calculated as the total length of cracks divided by the total
image area.
3. Experimental results
3.1. Typical luminescence spectra during cycling
PLPS measurements were carried out for as-coated TBC
specimens and for thermally cycled specimens at specified
intervals. Typically two types of spectra were observed in
the specimens. One type is the spectra showing only one
set of R1–R2 luminescence peaks and correspondingly
exhibiting one major stress level (i.e. unimodal lumines-
cence). The other type is the spectra showing two sets of
R1 and R2 luminescence peaks exhibiting two stress
components, with one of them being close to zero (i.e.
bimodal luminescence). Examples of each type of spectra
and the corresponding fitted peaks using the constrained
peak fitting procedure are shown in Fig. 1. After analyzing
the spectra, it was found that the stresses for the unimodal
spectra ranged from 1.2 to 2.5 GPa compression during
thermal cycling. Detailed information concerning the stress
evolution can be found in Ref. [24]. For the bimodal
spectra, the low stress component was usually close to zero
(below 0.5 GPa in compression), but occasionally reached
a maximum tension level of 0.8 GPa, whereas the high
stress component ranged from 1.6 to 3.0 GPa in
compression.
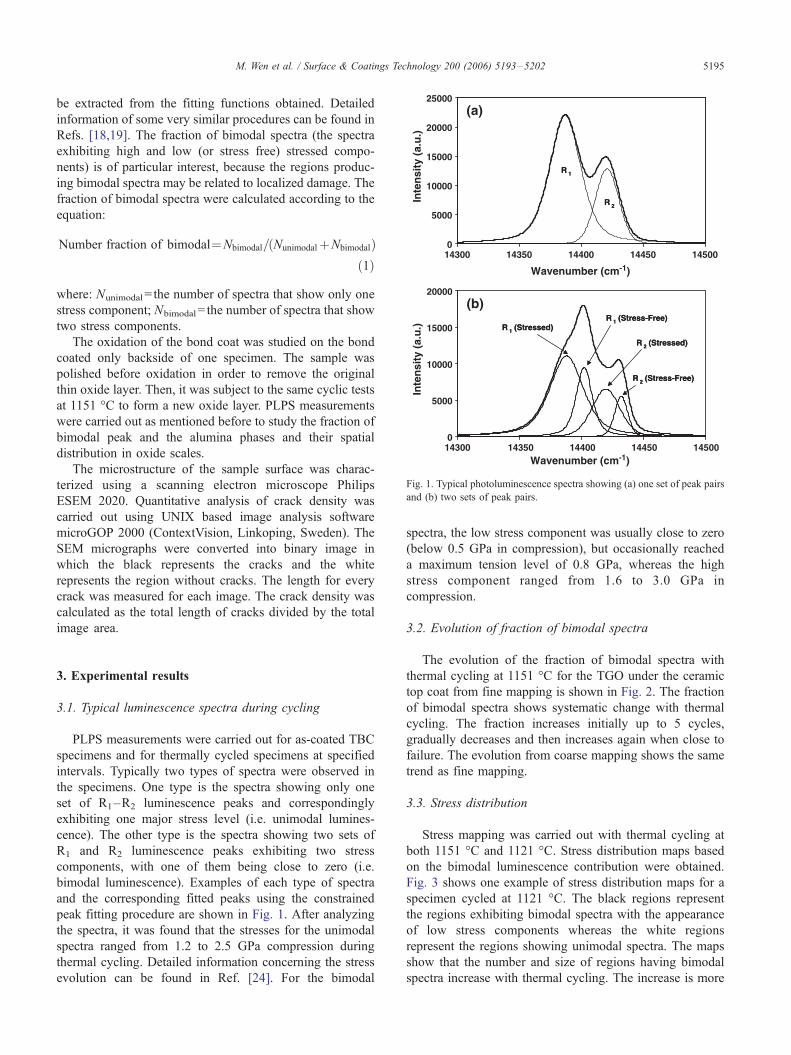
3.2. Evolution of fraction of bimodal spectra
The evolution of the fraction of bimodal spectra with
thermal cycling at 1151 -C for the TGO under the ceramic
top coat from fine mapping is shown in Fig. 2. The fraction
of bimodal spectra shows systematic change with thermal
cycling. The fraction increases initially up to 5 cycles,
gradually decreases and then increases again when close to
failure. The evolution from coarse mapping shows the same
trend as fine mapping.
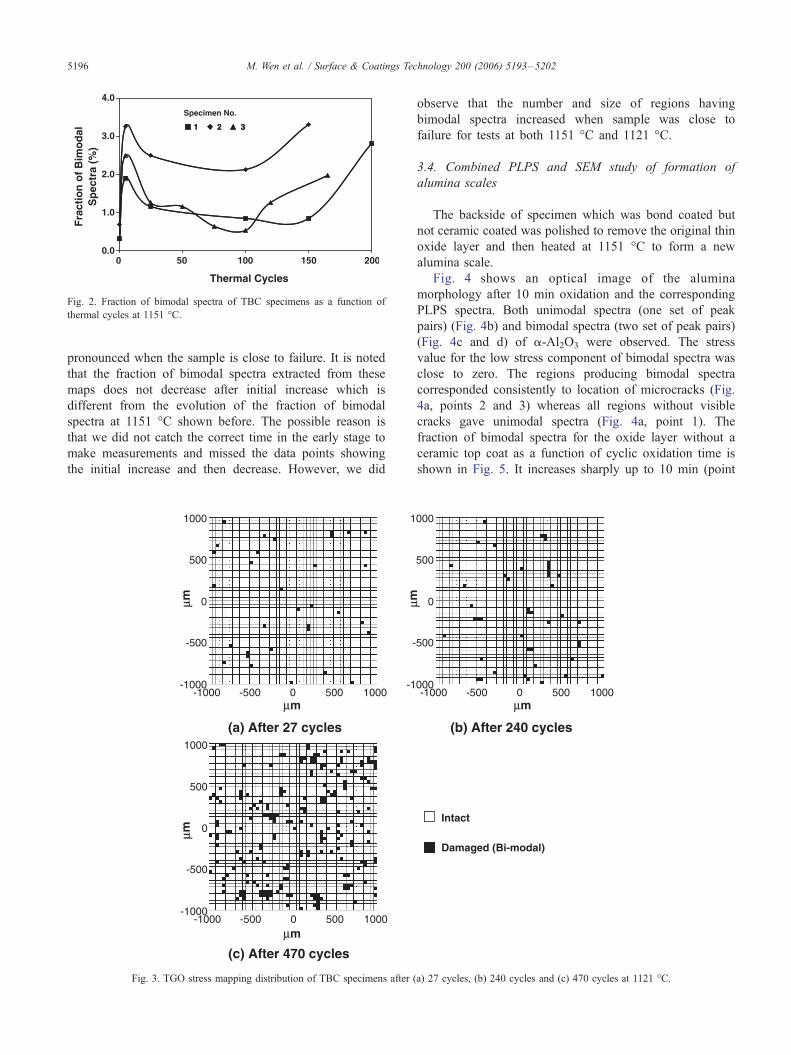
3.3. Stress distribution
Stress mapping was carried out with thermal cycling at
both 1151 -C and 1121 -C. Stress distribution maps based
on the bimodal luminescence contribution were obtained.
Fig. 3 shows one example of stress distribution maps for a
specimen cycled at 1121 -C. The black regions represent
the regions exhibiting bimodal spectra with the appearance
of low stress components whereas the white regions
represent the regions showing unimodal spectra. The maps
show that the number and size of regions having bimodal
spectra increase with thermal cycling. The increase is more
0.0
1.0
2.0
3.0
4.0
0 50 100 150 200
Specimen No.
1 2 3
Thermal Cycles
Fra
ctio
n o
f B
imo
dal
Sp
ectr
a (%
)
1 2 3
Fig. 2. Fraction of bimodal spectra of TBC specimens as a function of
thermal cycles at 1151 -C.
M. Wen et al. / Surface & Coatings Technology 200 (2006) 5193–52025196
pronounced when the sample is close to failure. It is noted
that the fraction of bimodal spectra extracted from these
maps does not decrease after initial increase which is
different from the evolution of the fraction of bimodal
spectra at 1151 -C shown before. The possible reason is
that we did not catch the correct time in the early stage to
make measurements and missed the data points showing
the initial increase and then decrease. However, we did
(c) After 470 cycles
μm
μm
μmμm
(a) After 27 cycles
1000
500
-500
-1000-1000 1000-500 0 500
0
1000
500
-500
-1000-1000 1000-500 0 500
0
1
-
-1
Fig. 3. TGO stress mapping distribution of TBC specimens after (
observe that the number and size of regions having
bimodal spectra increased when sample was close to
failure for tests at both 1151 -C and 1121 -C.
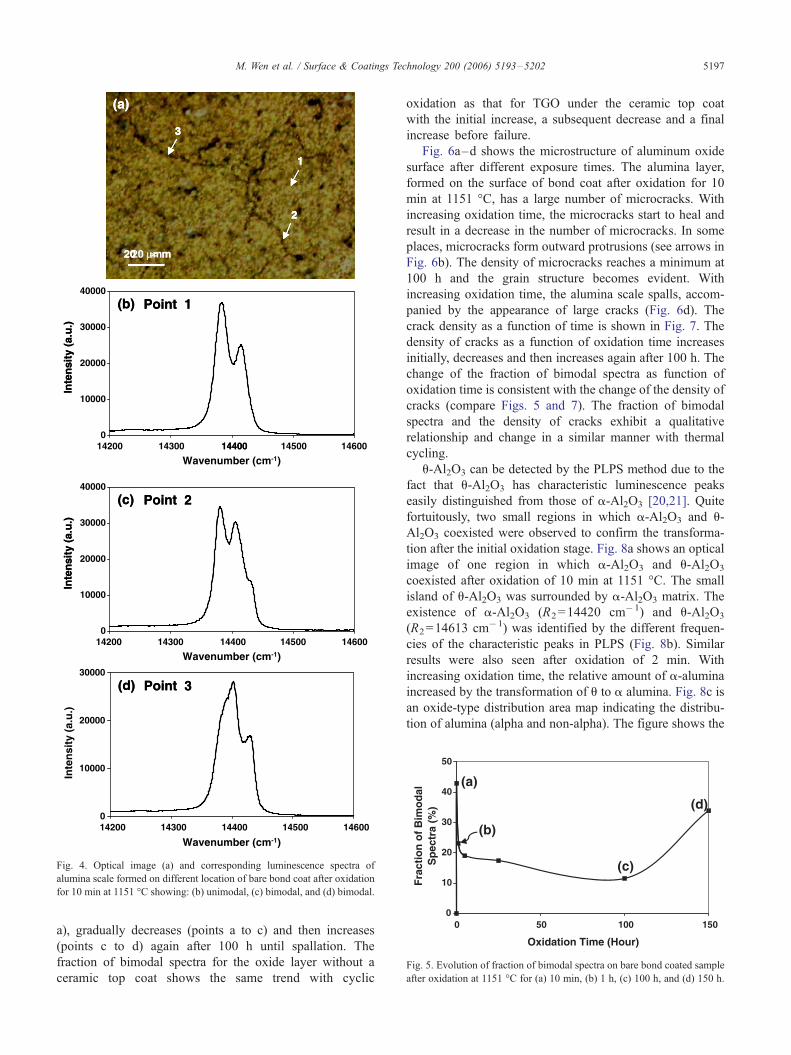
3.4. Combined PLPS and SEM study of formation of
alumina scales
The backside of specimen which was bond coated but
not ceramic coated was polished to remove the original thin
oxide layer and then heated at 1151 -C to form a new
alumina scale.
Fig. 4 shows an optical image of the alumina
morphology after 10 min oxidation and the corresponding
PLPS spectra. Both unimodal spectra (one set of peak
pairs) (Fig. 4b) and bimodal spectra (two set of peak pairs)
(Fig. 4c and d) of a-Al2O3 were observed. The stress
value for the low stress component of bimodal spectra was
close to zero. The regions producing bimodal spectra
corresponded consistently to location of microcracks (Fig.
4a, points 2 and 3) whereas all regions without visible
cracks gave unimodal spectra (Fig. 4a, point 1). The
fraction of bimodal spectra for the oxide layer without a
ceramic top coat as a function of cyclic oxidation time is
shown in Fig. 5. It increases sharply up to 10 min (point
(b) After 240 cycles
Intact
Damaged (Bi-modal)
μm
μm
000
500
500
000-1000 1000-500 0 500
0
a) 27 cycles, (b) 240 cycles and (c) 470 cycles at 1121 -C.
20 ∝∝ m
3
2
1
(a)
20 ∝ m
3
2
1
20 μm
3
2
1
(a)
014200 14300 14400 14500 14600
Wavenumber (cm-1)
Inte
nsi
ty (
a.u
.)
(b) Point 1
30000
40000
14400
Inte
nsi
ty (
a.u
.)
(b) Point 1
0
10000
20000
30000
40000
14200 14300 14400 14500 14600
Wavenumber (cm-1)
Wavenumber (cm-1)
Inte
nsi
ty (
a.u
.)
(c) Point 2
Inte
nsi
ty (
a.u
.)
(c) Point 2
0
10000
20000
30000
14200 14300 14400 14500 14600
(d) Point 3
Inte
nsi
ty (
a.u
.)
(d) Point 3
20000
10000
Fig. 4. Optical image (a) and corresponding luminescence spectra of
alumina scale formed on different location of bare bond coat after oxidation
for 10 min at 1151 -C showing: (b) unimodal, (c) bimodal, and (d) bimodal.
0
10
20
30
40
50
0 50 100 150
Oxidation Time (Hour)
(a)
(b)
(c)
(d)
Fra
ctio
n o
f B
imo
dal
Sp
ectr
a (%
)
Fig. 5. Evolution of fraction of bimodal spectra on bare bond coated sample
after oxidation at 1151 -C for (a) 10 min, (b) 1 h, (c) 100 h, and (d) 150 h.
M. Wen et al. / Surface & Coatings Technology 200 (2006) 5193–5202 5197
a), gradually decreases (points a to c) and then increases
(points c to d) again after 100 h until spallation. The
fraction of bimodal spectra for the oxide layer without a
ceramic top coat shows the same trend with cyclic
oxidation as that for TGO under the ceramic top coat
with the initial increase, a subsequent decrease and a final
increase before failure.
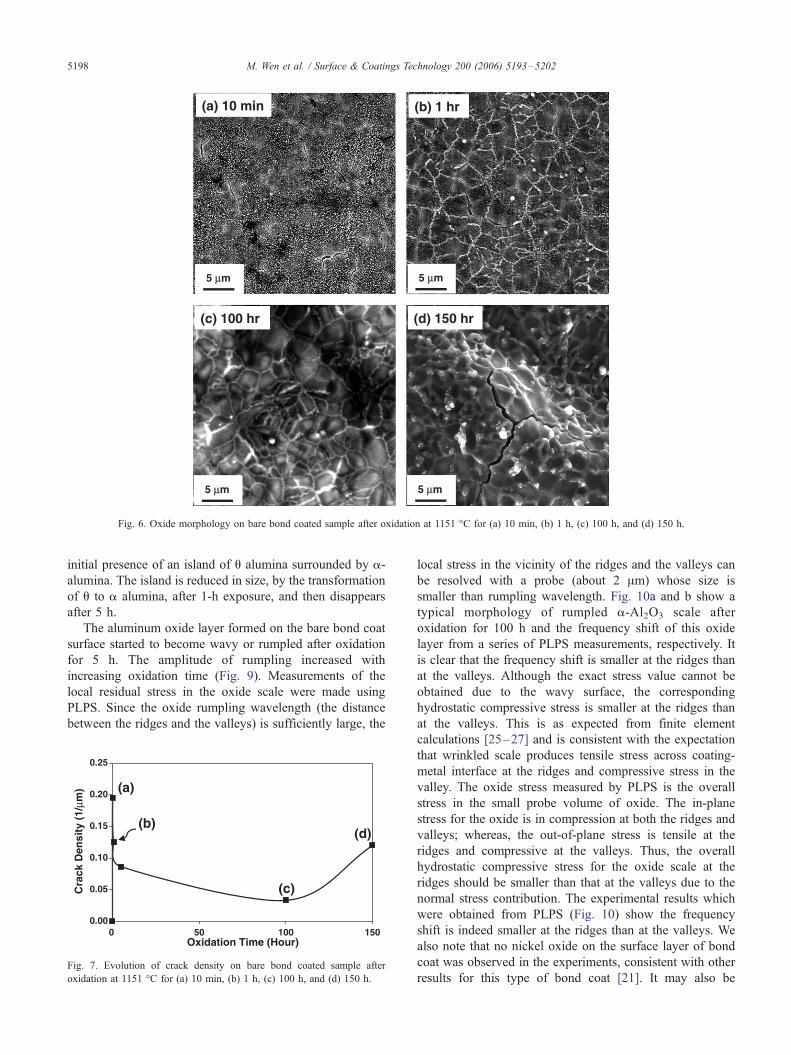
Fig. 6a–d shows the microstructure of aluminum oxide
surface after different exposure times. The alumina layer,
formed on the surface of bond coat after oxidation for 10
min at 1151 -C, has a large number of microcracks. With
increasing oxidation time, the microcracks start to heal and
result in a decrease in the number of microcracks. In some
places, microcracks form outward protrusions (see arrows in
Fig. 6b). The density of microcracks reaches a minimum at
100 h and the grain structure becomes evident. With
increasing oxidation time, the alumina scale spalls, accom-
panied by the appearance of large cracks (Fig. 6d). The
crack density as a function of time is shown in Fig. 7. The
density of cracks as a function of oxidation time increases
initially, decreases and then increases again after 100 h. The
change of the fraction of bimodal spectra as function of
oxidation time is consistent with the change of the density of
cracks (compare Figs. 5 and 7). The fraction of bimodal
spectra and the density of cracks exhibit a qualitative
relationship and change in a similar manner with thermal
cycling.
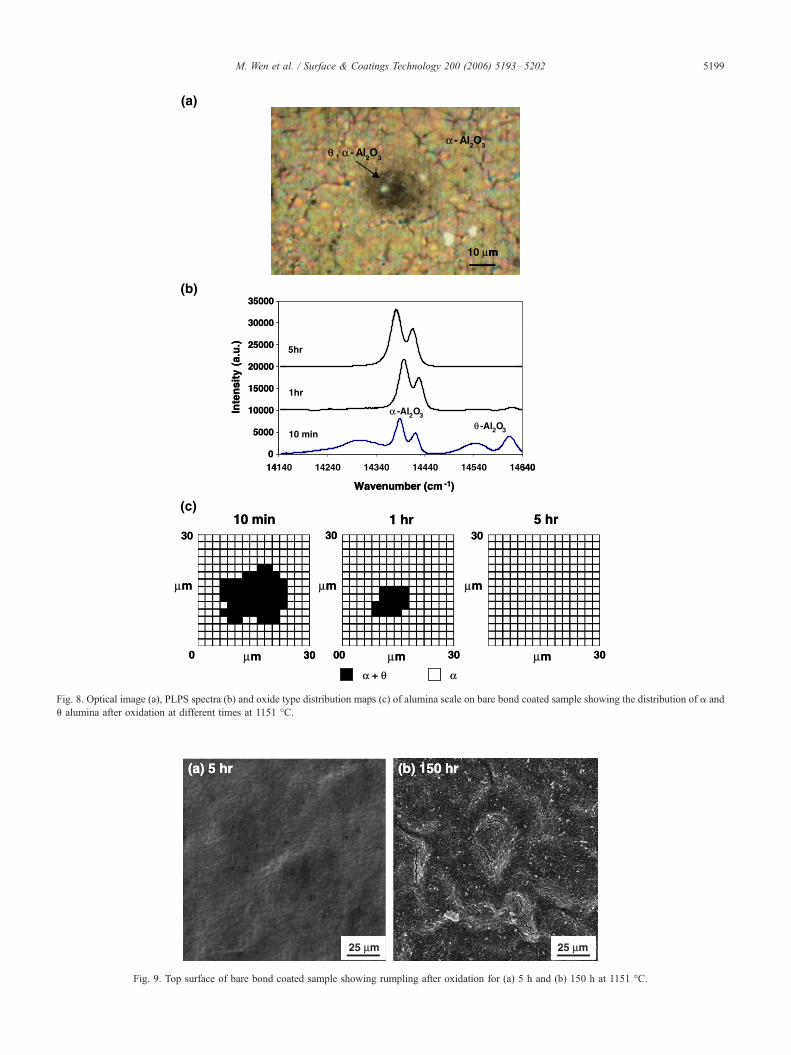
u-Al2O3 can be detected by the PLPS method due to the
fact that u-Al2O3 has characteristic luminescence peaks
easily distinguished from those of a-Al2O3 [20,21]. Quite
fortuitously, two small regions in which a-Al2O3 and u-
Al2O3 coexisted were observed to confirm the transforma-
tion after the initial oxidation stage. Fig. 8a shows an optical
image of one region in which a-Al2O3 and u-Al2O3
coexisted after oxidation of 10 min at 1151 -C. The small
island of u-Al2O3 was surrounded by a-Al2O3 matrix. The
existence of a-Al2O3 (R2=14420 cm�1) and u-Al2O3
(R2=14613 cm�1) was identified by the different frequen-
cies of the characteristic peaks in PLPS (Fig. 8b). Similar
results were also seen after oxidation of 2 min. With
increasing oxidation time, the relative amount of a-alumina
increased by the transformation of u to a alumina. Fig. 8c is
an oxide-type distribution area map indicating the distribu-
tion of alumina (alpha and non-alpha). The figure shows the
(a) 10 min (b) 1 hr
(c) 100 hr (d) 150 hr
5 ∝∝ m
5 ∝ m 5 ∝ m
(a) 10 min (b) 1 hr
(c) 100 hr (d) 150 hr
5 ∝ m5 μm
5 ∝ m5 μm 5 ∝ m5 μm
5 μm
Fig. 6. Oxide morphology on bare bond coated sample after oxidation at 1151 -C for (a) 10 min, (b) 1 h, (c) 100 h, and (d) 150 h.
M. Wen et al. / Surface & Coatings Technology 200 (2006) 5193–52025198
initial presence of an island of u alumina surrounded by a-
alumina. The island is reduced in size, by the transformation
of u to a alumina, after 1-h exposure, and then disappears
after 5 h.
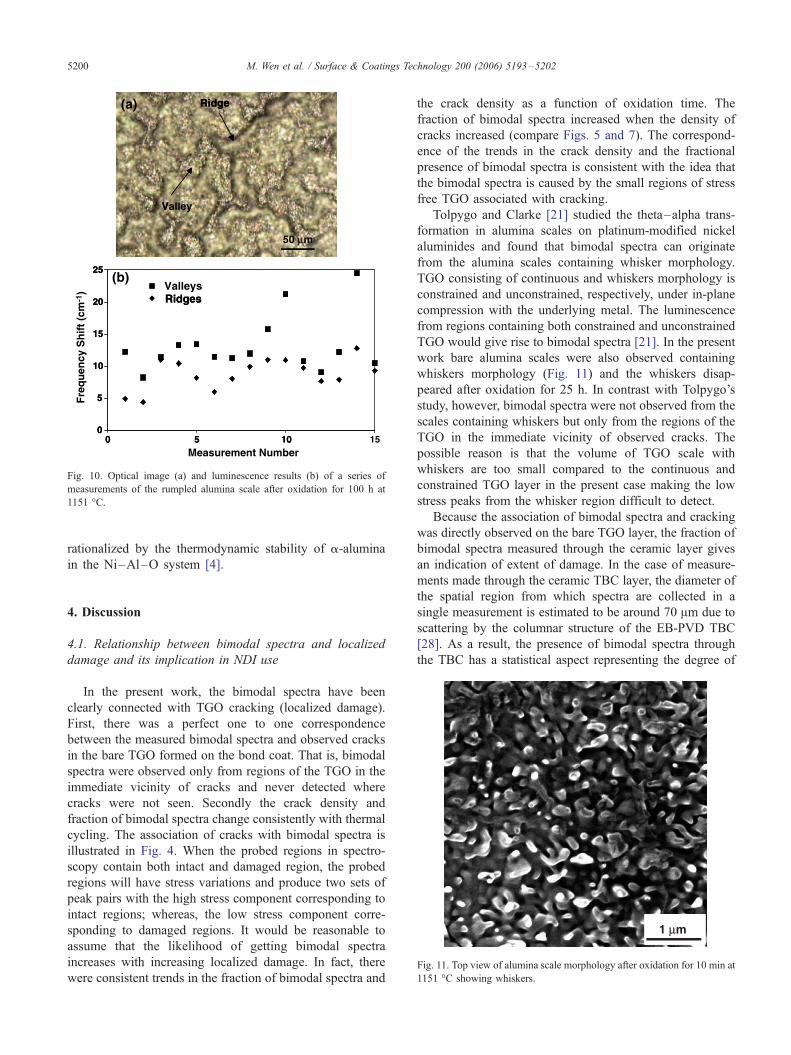
The aluminum oxide layer formed on the bare bond coat
surface started to become wavy or rumpled after oxidation
for 5 h. The amplitude of rumpling increased with
increasing oxidation time (Fig. 9). Measurements of the
local residual stress in the oxide scale were made using
PLPS. Since the oxide rumpling wavelength (the distance
between the ridges and the valleys) is sufficiently large, the
0.00
0.05
0.10
0.15
0.20
0.25
0 50 100 150
(a)
(b)
(c)Cra
ck D
ensi
ty (
1/μm
)
(d)
Oxidation Time (Hour)
Fig. 7. Evolution of crack density on bare bond coated sample after
oxidation at 1151 -C for (a) 10 min, (b) 1 h, (c) 100 h, and (d) 150 h.
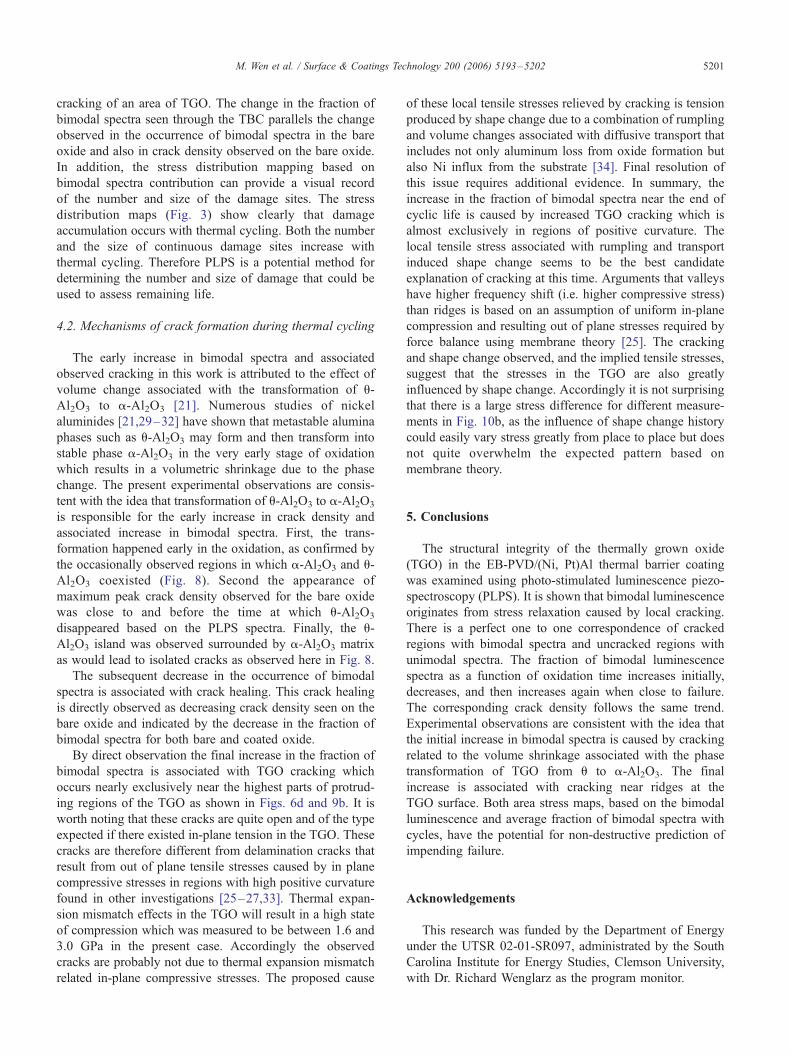
local stress in the vicinity of the ridges and the valleys can
be resolved with a probe (about 2 Am) whose size is
smaller than rumpling wavelength. Fig. 10a and b show a
typical morphology of rumpled a-Al2O3 scale after
oxidation for 100 h and the frequency shift of this oxide
layer from a series of PLPS measurements, respectively. It
is clear that the frequency shift is smaller at the ridges than
at the valleys. Although the exact stress value cannot be
obtained due to the wavy surface, the corresponding
hydrostatic compressive stress is smaller at the ridges than
at the valleys. This is as expected from finite element
calculations [25–27] and is consistent with the expectation
that wrinkled scale produces tensile stress across coating-
metal interface at the ridges and compressive stress in the
valley. The oxide stress measured by PLPS is the overall
stress in the small probe volume of oxide. The in-plane
stress for the oxide is in compression at both the ridges and
valleys; whereas, the out-of-plane stress is tensile at the
ridges and compressive at the valleys. Thus, the overall
hydrostatic compressive stress for the oxide scale at the
ridges should be smaller than that at the valleys due to the
normal stress contribution. The experimental results which
were obtained from PLPS (Fig. 10) show the frequency
shift is indeed smaller at the ridges than at the valleys. We
also note that no nickel oxide on the surface layer of bond
coat was observed in the experiments, consistent with other
results for this type of bond coat [21]. It may also be
m
θ θ , α α - Al
2O
3
α α - Al2O
3
10 μm
(a)
0
5000
10000
15000
20000
25000
30000
35000
14140 14240 14340 14440 14540 14640
-Al 2O 3
-Al 2O 310 min
1hr
5hr
Wavenumber (cm -1)
Inte
nsi
ty (
a.u
.)
0
5000
10000
15000
20000
25000
30000
35000
14140 14240 14340 14440 14540 14640
α -Al2O3
θ -Al2O310 min
1hr
5hr
Wavenumber (cm -1)
Inte
nsi
ty (
a.u
.)
(b)
m
30
m μm μm
10 min 1 hr 5 hr
0
30 30
30 30 3000 m mμm
30
μm m m
10 min 1 hr 5 hr
α α + θ α
0
30 30
30 30 3000 μm μm
(c)
Fig. 8. Optical image (a), PLPS spectra (b) and oxide type distribution maps (c) of alumina scale on bare bond coated sample showing the distribution of a and
u alumina after oxidation at different times at 1151 -C.
25 ∝∝m 25 ∝m
(a) 5 hr (b) 150 hr
25 ∝m25 μm 25 ∝m25 μm
(a) 5 hr (b) 150 hr
Fig. 9. Top surface of bare bond coated sample showing rumpling after oxidation for (a) 5 h and (b) 150 h at 1151 -C.
M. Wen et al. / Surface & Coatings Technology 200 (2006) 5193–5202 5199
Ridge
V
50 μm
Ridge
Valley
(a)
0
5
10
15
20
25
0 5 10 15
ValleysRidges
Measurement Number
0
5
10
15
20
25
0 5 10
(b)
Ridges
Fre
qu
ency
Sh
ift
(cm
-1)
Fig. 10. Optical image (a) and luminescence results (b) of a series of
measurements of the rumpled alumina scale after oxidation for 100 h at
1151 -C.
M. Wen et al. / Surface & Coatings Technology 200 (2006) 5193–52025200
rationalized by the thermodynamic stability of a-alumina
in the Ni–Al–O system [4].
1 ∝∝m1 μm
Fig. 11. Top view of alumina scale morphology after oxidation for 10 min at
1151 -C showing whiskers.
4. Discussion
4.1. Relationship between bimodal spectra and localized
damage and its implication in NDI use
In the present work, the bimodal spectra have been
clearly connected with TGO cracking (localized damage).
First, there was a perfect one to one correspondence
between the measured bimodal spectra and observed cracks
in the bare TGO formed on the bond coat. That is, bimodal
spectra were observed only from regions of the TGO in the
immediate vicinity of cracks and never detected where
cracks were not seen. Secondly the crack density and
fraction of bimodal spectra change consistently with thermal
cycling. The association of cracks with bimodal spectra is
illustrated in Fig. 4. When the probed regions in spectro-
scopy contain both intact and damaged region, the probed
regions will have stress variations and produce two sets of
peak pairs with the high stress component corresponding to
intact regions; whereas, the low stress component corre-
sponding to damaged regions. It would be reasonable to
assume that the likelihood of getting bimodal spectra
increases with increasing localized damage. In fact, there
were consistent trends in the fraction of bimodal spectra and
the crack density as a function of oxidation time. The
fraction of bimodal spectra increased when the density of
cracks increased (compare Figs. 5 and 7). The correspond-
ence of the trends in the crack density and the fractional
presence of bimodal spectra is consistent with the idea that
the bimodal spectra is caused by the small regions of stress
free TGO associated with cracking.
Tolpygo and Clarke [21] studied the theta–alpha trans-
formation in alumina scales on platinum-modified nickel
aluminides and found that bimodal spectra can originate
from the alumina scales containing whisker morphology.
TGO consisting of continuous and whiskers morphology is
constrained and unconstrained, respectively, under in-plane
compression with the underlying metal. The luminescence
from regions containing both constrained and unconstrained
TGO would give rise to bimodal spectra [21]. In the present
work bare alumina scales were also observed containing
whiskers morphology (Fig. 11) and the whiskers disap-
peared after oxidation for 25 h. In contrast with Tolpygo’s
study, however, bimodal spectra were not observed from the
scales containing whiskers but only from the regions of the
TGO in the immediate vicinity of observed cracks. The
possible reason is that the volume of TGO scale with
whiskers are too small compared to the continuous and
constrained TGO layer in the present case making the low
stress peaks from the whisker region difficult to detect.
Because the association of bimodal spectra and cracking
was directly observed on the bare TGO layer, the fraction of
bimodal spectra measured through the ceramic layer gives
an indication of extent of damage. In the case of measure-
ments made through the ceramic TBC layer, the diameter of
the spatial region from which spectra are collected in a
single measurement is estimated to be around 70 Am due to
scattering by the columnar structure of the EB-PVD TBC
[28]. As a result, the presence of bimodal spectra through
the TBC has a statistical aspect representing the degree of
M. Wen et al. / Surface & Coatings Technology 200 (2006) 5193–5202 5201
cracking of an area of TGO. The change in the fraction of
bimodal spectra seen through the TBC parallels the change
observed in the occurrence of bimodal spectra in the bare
oxide and also in crack density observed on the bare oxide.
In addition, the stress distribution mapping based on
bimodal spectra contribution can provide a visual record
of the number and size of the damage sites. The stress
distribution maps (Fig. 3) show clearly that damage
accumulation occurs with thermal cycling. Both the number
and the size of continuous damage sites increase with
thermal cycling. Therefore PLPS is a potential method for
determining the number and size of damage that could be
used to assess remaining life.
4.2. Mechanisms of crack formation during thermal cycling
The early increase in bimodal spectra and associated
observed cracking in this work is attributed to the effect of
volume change associated with the transformation of u-
Al2O3 to a-Al2O3 [21]. Numerous studies of nickel
aluminides [21,29–32] have shown that metastable alumina
phases such as u-Al2O3 may form and then transform into
stable phase a-Al2O3 in the very early stage of oxidation
which results in a volumetric shrinkage due to the phase
change. The present experimental observations are consis-
tent with the idea that transformation of u-Al2O3 to a-Al2O3
is responsible for the early increase in crack density and
associated increase in bimodal spectra. First, the trans-
formation happened early in the oxidation, as confirmed by
the occasionally observed regions in which a-Al2O3 and u-
Al2O3 coexisted (Fig. 8). Second the appearance of
maximum peak crack density observed for the bare oxide
was close to and before the time at which u-Al2O3
disappeared based on the PLPS spectra. Finally, the u-
Al2O3 island was observed surrounded by a-Al2O3 matrix
as would lead to isolated cracks as observed here in Fig. 8.
The subsequent decrease in the occurrence of bimodal
spectra is associated with crack healing. This crack healing
is directly observed as decreasing crack density seen on the
bare oxide and indicated by the decrease in the fraction of
bimodal spectra for both bare and coated oxide.
By direct observation the final increase in the fraction of
bimodal spectra is associated with TGO cracking which
occurs nearly exclusively near the highest parts of protrud-
ing regions of the TGO as shown in Figs. 6d and 9b. It is
worth noting that these cracks are quite open and of the type
expected if there existed in-plane tension in the TGO. These
cracks are therefore different from delamination cracks that
result from out of plane tensile stresses caused by in plane
compressive stresses in regions with high positive curvature
found in other investigations [25–27,33]. Thermal expan-
sion mismatch effects in the TGO will result in a high state
of compression which was measured to be between 1.6 and
3.0 GPa in the present case. Accordingly the observed
cracks are probably not due to thermal expansion mismatch
related in-plane compressive stresses. The proposed cause
of these local tensile stresses relieved by cracking is tension
produced by shape change due to a combination of rumpling
and volume changes associated with diffusive transport that
includes not only aluminum loss from oxide formation but
also Ni influx from the substrate [34]. Final resolution of
this issue requires additional evidence. In summary, the
increase in the fraction of bimodal spectra near the end of
cyclic life is caused by increased TGO cracking which is
almost exclusively in regions of positive curvature. The
local tensile stress associated with rumpling and transport
induced shape change seems to be the best candidate
explanation of cracking at this time. Arguments that valleys
have higher frequency shift (i.e. higher compressive stress)
than ridges is based on an assumption of uniform in-plane
compression and resulting out of plane stresses required by
force balance using membrane theory [25]. The cracking
and shape change observed, and the implied tensile stresses,
suggest that the stresses in the TGO are also greatly
influenced by shape change. Accordingly it is not surprising
that there is a large stress difference for different measure-
ments in Fig. 10b, as the influence of shape change history
could easily vary stress greatly from place to place but does
not quite overwhelm the expected pattern based on
membrane theory.
5. Conclusions
The structural integrity of the thermally grown oxide
(TGO) in the EB-PVD/(Ni, Pt)Al thermal barrier coating
was examined using photo-stimulated luminescence piezo-
spectroscopy (PLPS). It is shown that bimodal luminescence
originates from stress relaxation caused by local cracking.
There is a perfect one to one correspondence of cracked
regions with bimodal spectra and uncracked regions with
unimodal spectra. The fraction of bimodal luminescence
spectra as a function of oxidation time increases initially,
decreases, and then increases again when close to failure.
The corresponding crack density follows the same trend.
Experimental observations are consistent with the idea that
the initial increase in bimodal spectra is caused by cracking
related to the volume shrinkage associated with the phase
transformation of TGO from u to a-Al2O3. The final
increase is associated with cracking near ridges at the
TGO surface. Both area stress maps, based on the bimodal
luminescence and average fraction of bimodal spectra with
cycles, have the potential for non-destructive prediction of
impending failure.
Acknowledgements
This research was funded by the Department of Energy
under the UTSR 02-01-SR097, administrated by the South
Carolina Institute for Energy Studies, Clemson University,
with Dr. Richard Wenglarz as the program monitor.
M. Wen et al. / Surface & Coatings Technology 200 (2006) 5193–52025202
References
[1] R.A. Miller, Surf. Coat. Technol. 30 (1987) 1.
[2] N.P. Padture, M. Gell, E.H. Jordan, Science 296 (2002) 280.
[3] R.T. Jones, in: K.H. Stern (Ed.), Metallurgical and Ceramic Protective
Coatings, Chapman and Hall, London, 1996, p. 194.
[4] A.G. Evans, D.R. Mumm, J.W. Hutchinson, G.H. Meier, F.S. Pettit,
Prog. Mater. Sci. 46 (2001) 505.
[5] M. Gell, S. Sridharan, M. Wen, E. Jordan, Int. J. Appl. Ceram.
Technol. 1 (2004) 316.
[6] R.J. Christensen, D.M. Lipkin, D.R. Clarke, K.S. Murphy, Appl. Phys.
Lett. 69 (1996) 3754.
[7] D.R. Clarke, R.J. Christensen, V. Tolpygo, Surf. Coat. Technol. 94/95
(1997) 89.
[8] M. Gell, K. Vaidyanathan, B. Barber, J. Cheng, E. Jordan, Metall.
Mater. Trans., A Phys. Metall. Mater. Sci. 30 (1999) 427.
[9] Y.H. Sohn, K. Vaidyanathan, M. Ronski, E.H. Jordan, M. Gell, Surf.
Coat. Technol. 146–147 (2001) 102.
[10] L. Xie, Y.H. Sohn, E.H. Jordan, M. Gell, Surf. Coat. Technol. 176
(2003) 57.
[11] S. Sridharan, L. Xie, E.H. Jordan, M. Gell, Surf. Coat. Technol. 179
(2004) 286.
[12] Q. Ma, D.R. Clarke, J. Am. Ceram. Soc. 77 (1994) 298.
[13] Q. Ma, D.R. Clarke, J. Am. Ceram. Soc. 76 (1993) 1433.
[14] D.M. Lipkin, D.R. Clarke, Oxid. Met. 45 (1996) 267.
[15] A. Selcuk, A. Atkinson, Acta Mater. 51 (2003) 535.
[16] E.H. Jordan, Y.H. Sohn, W. Xie, M. Gell, L. Xie, F. Tu, K.R. Pattipati,
P. Willet, Autotestcon, IEEE, Valley Forge, PA, 2001, p. 593.
[17] X. Peng, D.R. Clarke, J. Am. Ceram. Soc. 83 (2000) 1165.
[18] J.A. Nychka, D.R. Clarke, Surf. Coat. Technol. 146–147 (2001)
110.
[19] A. Selcuk, A. Atkinson, Mater. Sci. Eng., A Struct. Mater.: Prop.
Microstruct. Process. 335 (2002) 147.
[20] Q. Wen, D.M. Lipkin, D.R. Clarke, J. Am. Ceram. Soc. 81 (1998)
3345.
[21] V.K. Tolpygo, D.R. Clarke, Mater. High Temp. 17 (2000) 59.
[22] T. Tomimatsu, S. Zhu, Y. Kagawa, Acta Mater. 51 (2003) 2397.
[23] T. Tomimatsu, S.J. Zhu, Y. Kagawa, Scr. Mater. 50 (2004) 137.
[24] M. Wen, E. Jordan, M. Gell, Mater. Sci. Eng., A Struct. Mater.: Prop.
Microstruct. Process 398 (2005) 99.
[25] X.Y. Gong, D.R. Clarke, Oxid. Met. 50 (1998) 355.
[26] A.G. Evans, M.Y. He, J.W. Hutchinson, Mater. Sci. Eng., A Struct.
Mater.: Prop. Microstruct. Process. 245 (1998) 168.
[27] J. Cheng, E. Jordan, M. Gell, Acta Mater. 46 (1998) 5839.
[28] J.A. Nychka, D.R. Clarke, S. Sridharan, E. Jordan, M. Gell, M.J.
Lance, C.J. Chunnilall, I.M. Smith, S.R.J. Saunders, R. Pillan, V.
Sergo, A. Selcuk, A. Atkinson, K.S. Murphy, Surf. Coat. Technol.
163–164 (2003) 87.
[29] D.M. Lipkin, D.R. Clarke, M. Hollatz, M. Bobeth, W. Pompe, Corros.
Sci. 39 (1997) 243.
[30] G.C. Rybicki, J.L. Smialek, Oxid. Met. 31 (1989) 275.
[31] M.W. Brumm, H.J. Grabke, Corros. Sci. 33 (1992) 1677.
[32] J. Doychak, M. Ruhle, Oxid. Met. 31 (1989) 431.
[33] K. Vaidyanathan, E. Jordan, M. Gell, Acta Mater. 52 (2004) 1107.
[34] M.W. Chen, M.L. Glynn, R.T. Ott, T.C. Hufnagel, K.J. Hemker, Acta
Mater. 51 (2003) 4279.