Spectrophotometric determination of metronidazole and tinidazole in pharmaceutical preparations
Analysis of errors in thin-film optical parameters derivedfrom spectrophotometric measurementsat normal light incidence
Ivan Konstantinov, Tzewatanka Babeva, and Snejana Kitova
A comparative analysis is made of the errors in deriving the optical parameters ~n, refractive index; k,absorption coefficient; d, film thickness! of thin films from spectrophotometric measurements at normallight incidence. The errors in determining n, k, and d by the ~TRfRb!, ~TRfRm!, ~TRbRm!, ~TRf !, ~TRm!,and T~k 5 0! methods are compared. It is shown that they are applicable to optical constants of thinfilms in the n . 1.5, k , 4.5, and dyl 5 ~0.02–0.3! range, and their combinations make possible thedetermination of n and k to an accuracy of better than 64%. To derive the optical constants in a widespectral range with high accuracy and isolate the correct physical solutions reliably, one should apply allmethods, using the relevant solutions with the lowest errors, as shown in this research, when determin-ing the optical constants of As2S3 and Sb2Se3 films. © 1998 Optical Society of America
OCIS codes: 120.0120, 120.4530, 120.6200, 310.0310, 310.6860.
1. Introduction
Recently, we published algebraic methods1–3 for cal-culating the optical parameters ~n, refractive index;k, absorption coefficient; d, film thickness! of thinfilms from combinations of three measured photomet-ric quantities at normal light incidence—the ~TRfRb!,~TRfRm!, ~TRbRm!, and T~k 5 0! method in the non-absorbing spectral range ~k 5 0!. Subscripts f, bdenote reflection R from the side of the thin film andthe substrate, and m is the reflection of the film ontoan opaque metal substrate. Now, analyzing the er-rors of the corresponding methods, we determinetheir acceptable fields of applicability, limited by theaccuracy of the photometric quantity measurement.
Generally, we cannot expect the accuracy of TRRmethods to be superior to that of TR methods. Sinceeach method has different precision, depending onthe values of n, k, and dyl, we should expect that thehigh-accuracy regions of the methods will be differ-ent, and hence every method will have its own appli-
The authors are with the Central Laboratory of Photoprocesses,Bulgarian Academy of Sciences, Academy G. Bonchev str., bl. 109,Sofia 1113, Bulgaria.
Received 2 October 1997; revised manuscript received 2 March1998.
0003-6935y98y194260-08$15.00y0© 1998 Optical Society of America
4260 APPLIED OPTICS y Vol. 37, No. 19 y 1 July 1998
cability, depending on the investigated object and thespectral range.
A major advantage of the TRR methods is the pos-sibility of determining the film thickness, thus ~1!eliminating additional measurements, i.e., additionalinstrumentation and appropriate experimentalskills, and ~2! giving an objective criterion for isolat-ing the correct solutions.
Methods of calculating the errors in n, k, and d,depending on the accuracy of the measured quanti-ties, are known.4–6 Most of the authors have, how-ever, applied the error assessment only for particulardeterminations or in a specific spectral range.4–6
Only Hansen7 has attempted a comparison of theaccuracy of the different methods but only on thebasis of concrete values of n, k, and dyl. The con-clusions are, however, not always correct for othervalues of n, k, and dyl because of their quite differenterrors.
In the present research we compare the maximumerrors in the calculation of n, k, and d by the TRRmethods with those of the TR and T~k 5 0! methodsin broad ranges of n, k, and dyl. Using concreteexperimental examples, we prove the necessity ofcombining the methods to determine more preciselythe optical constants in a wide spectral range.
2. Calculation of Errors in n, k, and d
Calculation of the absolute andyor relative maximumerror in determining n, k, and d arising from small

1 July 1998 y Vol. 37, No. 19 y APPLIED OPTICS 4261
experimental inaccuracies in the measured quanti-ties and in the substrate optical constants is a famil-iar procedure.4–6
In the TRRm methods, where R is either Rf or Rb,the absolute maximum errors are functions of thetype Dn, Dk, and Dd 5 f ~DT, DR, DRm, Dns, Dnm,Dkm!, where the symbols in parentheses are the un-certainties in the measured quantities. Since errorDl in wavelength is negligibly small ~Dl ' 0!, abso-lute errors Dn, Dk, and Dd can be expressed as
Dn 5 U]n]TUDT 1 U]n
]RUDR 1 U ]n]Rm
UDRm 1 U ]n]ns
UDns
1 U ]n]nm
UDnm 1 U ]n]km
UDkm,
Dk 5 U]k]TUDT 1 U]k
]RUDR 1 U ]k]Rm
UDRm 1 U ]k]ns
UDns
1 U ]k]nm
UDnm 1 U ]k]km
UDkm,
Dd 5 U]d]TUDT 1 U]d
]RUDR 1 U ]d]Rm
UDRm 1 U ]d]ns
UDns
1 U ]d]nm
UDnm 1 U ]d]km
UDkm. (1)
Since the partial derivatives cannot be evaluatednumerically, they must be expressed by derivativesthat can be calculated. For this purpose, simple lin-ear expressions are used, which for the TRRm meth-ods have the form
DT 5 S]T]nDDn 1 S]T
]kDDk 1 S]T]dDDd 1 S]T
]nsDDns,
DR 5 S]R]nDDn 1 S]R
]kDDk 1 S]R]dDDd 1 S]R
]nsDDns,
DRm 5 S]Rm
]n DDn 1 S]Rm
]k DDk 1 S]Rm
]d DDd
1 S]Rm
]nmDDnm 1 S]Rm
]kmDDkm. (2)
Using a more compact matrix expression, we writeEqs. ~2! as
S DTDRDRm
D 5 M1 p SDnDkDd
D 1 M2 p SDns
Dnm
Dkm
D . (3)
The solution is obtained by matrix multiplicationwith the inverse matrix M121:
SDnDkDd
D 5 u~M1!21u p S DTDRDRm
D 1 u~M1!21 p ~M2!u p SDns
Dnm
Dkm
D .
(4)
Thus we can use Eq. ~4! to calculate the derivativesin Eqs. ~1!, using the easy calculated derivatives inEqs. ~2! or Eq. ~3!.
The relative maximum errors, for example, Dnyn,are determined by
Dnn
5 uE11uDTT
1 uE21uDRR
1 uE31uDRm
Rm1 uE41u
Dns
ns
1 uE51uDnm
nm1 uE61u
Dkm
km, (5)
where the coefficients Eij are given in the errormatrix @Eq. ~6!#, similar to Hansen’s matrix7:
E 5 5Tn S]n
]TD Tk S]k
]TD T~dyl! F]~dyl!
]T GRn S]n
]RD Rk S]k
]RD R~dyl! F]~dyl!
]R GRm
n S ]n]Rm
D Rm
k S ]k]Rm
D Rm
~dyl! F]~dyl!
]RmG
ns
n S ]n]ns
D ns
k S ]k]ns
D ns
~dyl! F]~dyl!
]nsG
nm
n S ]n]nm
D nm
k S ]k]nm
D nm
~dyl! F]~dyl!
]nmG
km
n S ]n]km
D km
k S ]k]km
D km
~dyl! F]~dyl!
]kmG6 . (6)
In a similar way, Dkyk and Ddyd are calculated bythe corresponding columns of error matrix ~6!. Wementioned above that Dl is negligibly small, so therelative error Ddyd is equal to D~dyl!y~dyl!.
Similarly, for the T~k 5 0! method,
DT 5 S]T]nDDn 1 S]T
]dDDd 1 S]T]ns
DDns. (7)
Hence Dn is
Dn 5 uE1uDT 1 uE2uDd 1 uE3uDns,
E1 5 1YS]T]nD , E2 5 S]T
]dDYS]T]nD ,
E3 5 S]T]ns
DYS]T]nD . (8)
The relative error is
Dnn
5 UTn E1UDTT
1 Udn E2UDdd
1 Uns
nE3UDns
ns. (9)
The values of T and R of the thin film are calculatedfrom T and R, the transmission and the reflection of

the sample, which include the effect of the back sur-face of the substrate, by8
T 5T~Rs 2 1!
1 1 Rb Rs 2 2Rs,
Rf 5 Rf 2T2Rs
1 1 Rb Rs 2 2Rs, Rs 5 Sns 2 1
ns 1 1D2
,
Rb 5Rb 2 Rs
1 1 Rb Rs 2 2Rs, (10)
where ns is the refractive index of the nonabsorbingsubstrate.
DT and DR in Eq. ~5! @with respect to Eqs. ~1!–~4!#are then obtained from
DT 5 U]T]T
UDT 1 U ]T]Rb
UDRb 1 U ]T]Rs
UDRs,
DRf 5 U]Rf
]TUDT 1 U]Rf
]RfUDRf 1 U]Rf
]RbUDRb 1 U]Rf
]RsUDRs,
DRb 5 U]Rb
]RbUDRb 1 U]Rb
]RsUDRs. (11)
3. Maximum Errors in Photometric Methods forNormal Light Incidence
In the following considerations we present a sche-matic picture of the errors in the optical constantsand the thin-film thickness as dependent on the val-ues of n, k, and dyl. The experimental inaccuraciesassumed in the spectrophotometric quantities areDT 5 60.001 and DR 5 60.005, and the errors inthe refractive indices of the two substrates areDns 5 60.015, Dnm 5 60.03, and Dkm 5 60.02.Corresponding inaccuracies DT and DR are calcu-lated by Eqs. ~11!. The values of T, Rf, and Rm arecalculated by Fresnel equations ~Ref. 8, pp. 6–8!, andthe maximum errors are calculated by the equationsin Section 2. Because nonabsorbing substrate BK7glass is assumed, ns is calculated by the dispersionformula of Sellmeier ~Ref. 8, p. 134!:
ns 5 F1 1A
1 2 ~Byl!2G1y2
, A 5 1.26, B 5 98.94. (12)
The methods including Rm are made difficult by thenecessity of using a suitable metal film with knownnm and km. Our experience showed that carefullypolished Si wafers are appropriate. They are easilyaccessible, and if their surface is cleaned by theadopted procedure,9 they reproduce excellently thevalues of the reflectance calculated from the high-accuracy optical constants.10 This eliminates thenecessity of depositing an opaque metal film withreproducible optical constants, as well as their deter-mination, which is not always feasible by spectropho-tometric methods. The nm values of the Sisubstrate10 are evaluated by the dispersion formula
4262 APPLIED OPTICS y Vol. 37, No. 19 y 1 July 1998
@Eqs. ~12!# with coefficients A 5 10.43 and B 5 319.93,whereas the values of km are
km 5 1y~A 1 Bl2 1 Cl3!, A 5 5.86,
B 5 22.3 3 1024, C 5 5.2 3 1027. (13)
The numeric calculations are performed for valuesof ns, nm, and km at l 5 550 nm. Similar calcula-tions with corresponding values at different l withinthe 400–1000-nm range do not substantially changethe results discussed in Subsection 3.A.
This analysis enables us to draw only general con-clusions about the applicability of the methods used.Owing to the great number of quantities governingaccuracy, it is very difficult to present results from acomplete analysis, enabling the researcher to choosethe most suitable method in a given spectral range,depending on the accuracy of the measured photo-metric quantities. The practical approach is to eval-uate the error in each set of the obtained n, k, and dof the investigated thin film and to compare directlythe results from the various methods. This is illus-trated by the following examples.
A. Maximum Relative Errors in TRR Methods
In TRR methods three different combinations be-tween the photometric quantities are possible—~TRfRb!, ~TRfRm!, ~TRbRm!. The first combinationis the least applicable, since it is unusable forthe films in the spectral range around and beyondtheir absorption edge,1 where Rf 5 Rb. Besides, theanalysis performed showed that the errors in thiscombination are substantially higher than those inthe two other combinations. Because in the twocombinations with Rm the errors differ negligibly, inthe following we present the results on the ~TRfRm!method only.
1. Assessment of the Error Matrix TermsAccording to Hansen,7 the method for determiningthe optical constants is excellent if the error matrixterms @Eq. ~6!# are near unity or less. A value ofunity for each element of the matrix @Eq. ~6!# meansthat optical parameters n, k, and d are determined tothe same accuracy as the corresponding measuredquantities T, Rf, Rm, ns, nm, and km.
Figure 1 displays the regions in the n–k plane,defined by the terms of the first column of the errormatrix ~6! with values of #1, dictating the error in nat dyl 5 0.1. It is evident that the region in whichall terms are #1 is limited for n . 1.5 and k , 1.5.The terms T, ns, nm, and especially km make asmaller contribution to the error in the determinationof n. Note that the km terms have values smallerthan 0.1 over almost the whole n–k plane. Only thecontours with a value of 0.1 are drawn in Fig. 1~b!.Taking into account that the measurement of the filmtransmittance is much more accurate than that of thereflectance, as well as the high accuracy of ns, nm, andkm, obviously the regions of good accuracy are gov-erned by the terms of the reflectance. Besides, the
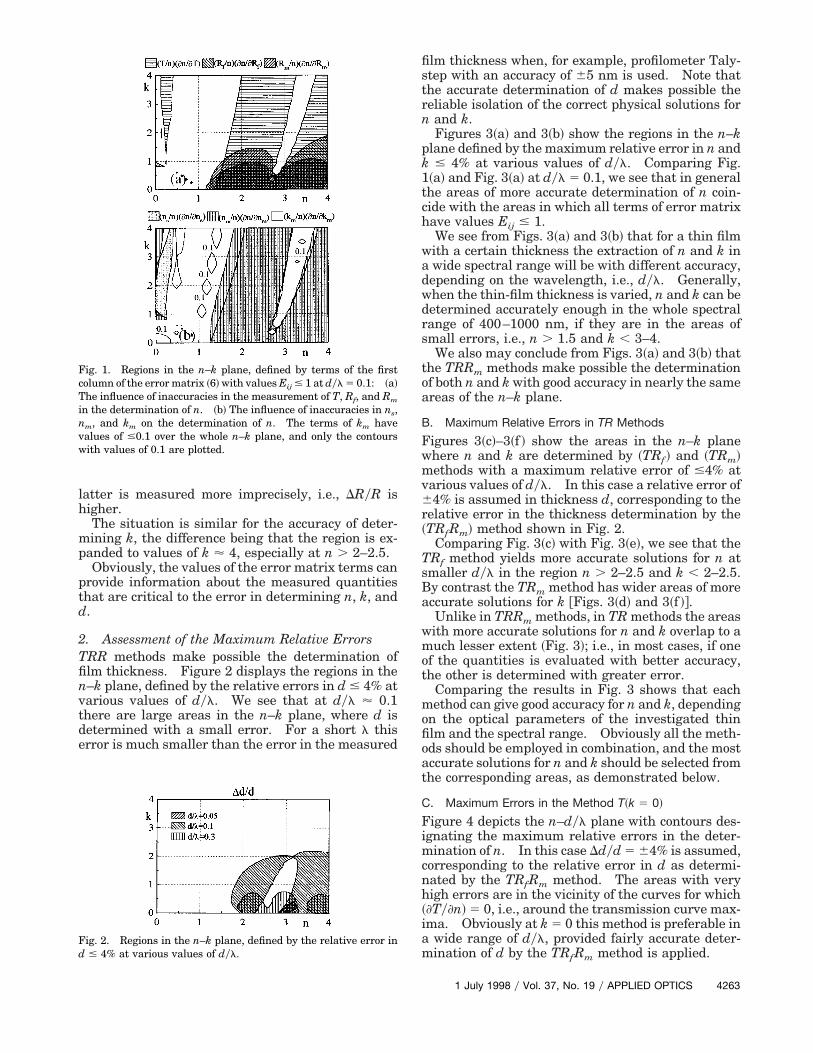
latter is measured more imprecisely, i.e., DRyR ishigher.
The situation is similar for the accuracy of deter-mining k, the difference being that the region is ex-panded to values of k ' 4, especially at n . 2–2.5.
Obviously, the values of the error matrix terms canprovide information about the measured quantitiesthat are critical to the error in determining n, k, andd.
2. Assessment of the Maximum Relative ErrorsTRR methods make possible the determination offilm thickness. Figure 2 displays the regions in then–k plane, defined by the relative errors in d # 4% atvarious values of dyl. We see that at dyl ' 0.1there are large areas in the n–k plane, where d isdetermined with a small error. For a short l thiserror is much smaller than the error in the measured
Fig. 1. Regions in the n–k plane, defined by terms of the firstcolumn of the error matrix ~6! with values Eij # 1 at dyl 5 0.1: ~a!The influence of inaccuracies in the measurement of T, Rf, and Rm
in the determination of n. ~b! The influence of inaccuracies in ns,nm, and km on the determination of n. The terms of km havevalues of #0.1 over the whole n–k plane, and only the contourswith values of 0.1 are plotted.
Fig. 2. Regions in the n–k plane, defined by the relative error ind # 4% at various values of dyl.
film thickness when, for example, profilometer Taly-step with an accuracy of 65 nm is used. Note thatthe accurate determination of d makes possible thereliable isolation of the correct physical solutions forn and k.
Figures 3~a! and 3~b! show the regions in the n–kplane defined by the maximum relative error in n andk # 4% at various values of dyl. Comparing Fig.1~a! and Fig. 3~a! at dyl 5 0.1, we see that in generalthe areas of more accurate determination of n coin-cide with the areas in which all terms of error matrixhave values Eij # 1.
We see from Figs. 3~a! and 3~b! that for a thin filmwith a certain thickness the extraction of n and k ina wide spectral range will be with different accuracy,depending on the wavelength, i.e., dyl. Generally,when the thin-film thickness is varied, n and k can bedetermined accurately enough in the whole spectralrange of 400–1000 nm, if they are in the areas ofsmall errors, i.e., n . 1.5 and k , 3–4.
We also may conclude from Figs. 3~a! and 3~b! thatthe TRRm methods make possible the determinationof both n and k with good accuracy in nearly the sameareas of the n–k plane.
B. Maximum Relative Errors in TR Methods
Figures 3~c!–3~f ! show the areas in the n–k planewhere n and k are determined by ~TRf ! and ~TRm!methods with a maximum relative error of #4% atvarious values of dyl. In this case a relative error of64% is assumed in thickness d, corresponding to therelative error in the thickness determination by the~TRfRm! method shown in Fig. 2.
Comparing Fig. 3~c! with Fig. 3~e!, we see that theTRf method yields more accurate solutions for n atsmaller dyl in the region n . 2–2.5 and k , 2–2.5.By contrast the TRm method has wider areas of moreaccurate solutions for k @Figs. 3~d! and 3~f !#.
Unlike in TRRm methods, in TR methods the areaswith more accurate solutions for n and k overlap to amuch lesser extent ~Fig. 3!; i.e., in most cases, if oneof the quantities is evaluated with better accuracy,the other is determined with greater error.
Comparing the results in Fig. 3 shows that eachmethod can give good accuracy for n and k, dependingon the optical parameters of the investigated thinfilm and the spectral range. Obviously all the meth-ods should be employed in combination, and the mostaccurate solutions for n and k should be selected fromthe corresponding areas, as demonstrated below.
C. Maximum Errors in the Method T~k 5 0!
Figure 4 depicts the n–dyl plane with contours des-ignating the maximum relative errors in the deter-mination of n. In this case Ddyd 5 64% is assumed,corresponding to the relative error in d as determi-nated by the TRfRm method. The areas with veryhigh errors are in the vicinity of the curves for which~]Ty]n! 5 0, i.e., around the transmission curve max-ima. Obviously at k 5 0 this method is preferable ina wide range of dyl, provided fairly accurate deter-mination of d by the TRfRm method is applied.
1 July 1998 y Vol. 37, No. 19 y APPLIED OPTICS 4263

Fig. 3. Regions in the n–k plane, defined by the relative error in n and k # 4%, at various values of dyl: ~a!, ~b!, ~TRfRm!; ~c!, ~d!, ~T Rf !;and ~e!, ~f !, ~TRm! method.
4. Application of the Error Analysis
Next we illustrate the application of the error anal-ysis to the method selection and to the most accuratedetermination of the thickness and the optical con-stants of thin films.
A. Sample Preparation and SpectrophotometricMeasurements
The thin films of As2S3 and Sb2Se3 were produced byvacuum thermal evaporation of the substances11,12 onplanetary moving substrates, which ensures excel-lent uniformity of the thin film. Pieces of Si wafers,whose surface was cleaned9 before film evaporation,were fixed to the preliminary cleaned glass sub-strates ~BK7! with high surface flatness.
The absolute reflectance and the transmittance ofthe samples were measured with a spectrophotome-ter Cary 5E at normal light incidence in the spectralrange of 400–1000 nm. The measured values of thetransmittance T and the absolute reflectance Rf, Rb,
Fig. 4. T~k 5 0! method: solid curves, contours of the relativeerror in n with the indicated values, plotted in the n–dyl plane;dashed curves, contours plotted for ~]Ty]n! 5 0, showing the areasof uncertainty of the method in extracting n.
4264 APPLIED OPTICS y Vol. 37, No. 19 y 1 July 1998
and Rm of the samples of As2S3 and Sb2Se3 thin films,deposited on BK7 and Si substrates, are given insteps of 50 nm in Table 1.
B. Determination of the Thickness and the OpticalConstants
T, Rf, and Rb of the thin films were evaluated fromthe photometric quantities by Eq. ~10!; n, k, and dwere determined by the ~TRfRm!, ~TRf !, and ~TRm!methods. Figure 5 displays all solutions for thick-ness d derived from the TRfRm method and the ac-curacy for the correct solutions. As seen, the onlysolutions with one and the same film thickness in thewhole spectral range are 58 6 1.6 nm for As2S3 and78 6 0.9 nm for Sb2Se3. The indicated values andthe maximum errors are taken from the spectralrange, corresponding to the most accurate determi-nation of d, marked with arrows in Figs. 5~b! and5~d!.
Obviously, the correct physical solutions for n andk correspond to these thicknesses, and they are givenin Figs. 6 and 7 with the corresponding absolute er-rors. In the same figures we also display the valuesof n and k evaluated by the ~TRf ! and ~TRm! methods,using the iteration Newton–Raphson’s method13 andthe corresponding errors calculated at the aforemen-tioned accuracy of d. Only values corresponding tothe true solutions from the ~TRfRm! methods wereaccepted.
Figure 8 presents the solutions obtained for n bythe T~k 5 0! method for the spectral range in whichk 5 0.
Figures 6–8 reveal that the methods used providesolutions with different accuracy in the spectralrange of 400–1000 nm. Obviously, for n of the As2S3film the most accurate solutions are from 400 to550 nm by the ~TRfRm! method and from 550 to 1000
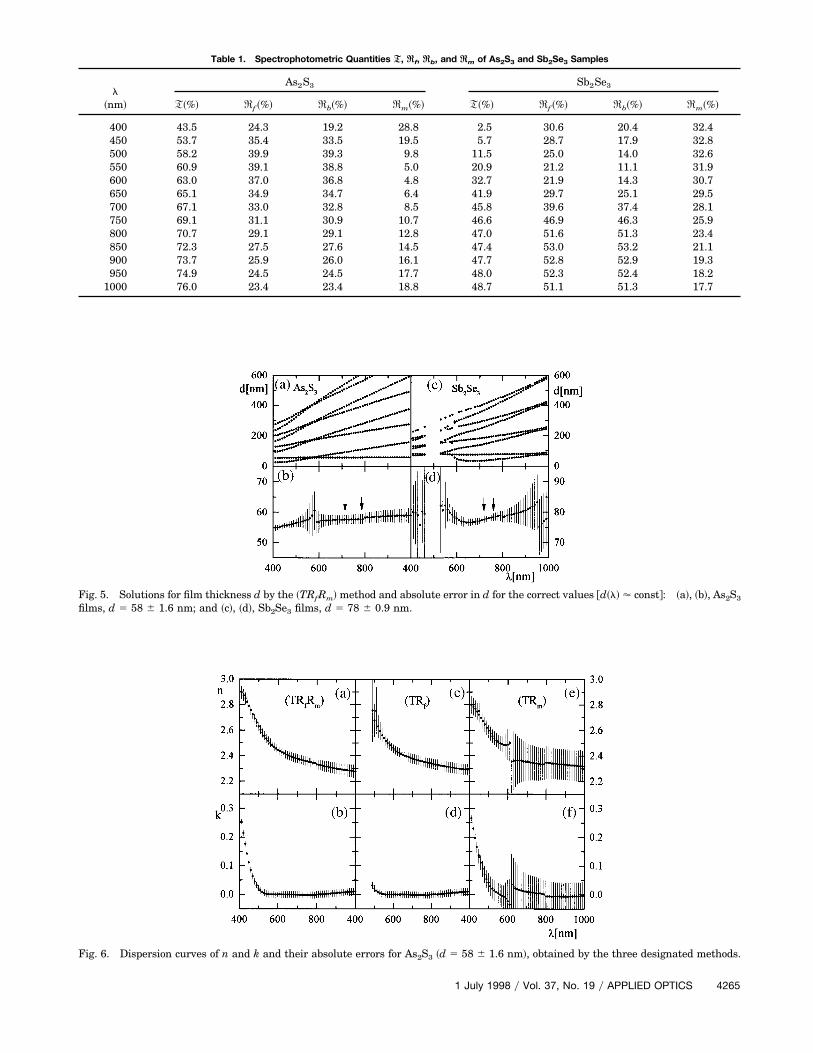
Table 1. Spectrophotometric Quantities TT, RRf, RRb, and RRm of As2S3 and Sb2Se3 Samples
l~nm!
As2S3 Sb2Se3
T~%! Rf ~%! Rb~%! Rm~%! T~%! Rf ~%! Rb~%! Rm~%!
400 43.5 24.3 19.2 28.8 2.5 30.6 20.4 32.4450 53.7 35.4 33.5 19.5 5.7 28.7 17.9 32.8500 58.2 39.9 39.3 9.8 11.5 25.0 14.0 32.6550 60.9 39.1 38.8 5.0 20.9 21.2 11.1 31.9600 63.0 37.0 36.8 4.8 32.7 21.9 14.3 30.7650 65.1 34.9 34.7 6.4 41.9 29.7 25.1 29.5700 67.1 33.0 32.8 8.5 45.8 39.6 37.4 28.1750 69.1 31.1 30.9 10.7 46.6 46.9 46.3 25.9800 70.7 29.1 29.1 12.8 47.0 51.6 51.3 23.4850 72.3 27.5 27.6 14.5 47.4 53.0 53.2 21.1900 73.7 25.9 26.0 16.1 47.7 52.8 52.9 19.3950 74.9 24.5 24.5 17.7 48.0 52.3 52.4 18.2
1000 76.0 23.4 23.4 18.8 48.7 51.1 51.3 17.7
Fig. 5. Solutions for film thickness d by the ~TRfRm! method and absolute error in d for the correct values @d~l! ' const#: ~a!, ~b!, As2S3
films, d 5 58 6 1.6 nm; and ~c!, ~d!, Sb2Se3 films, d 5 78 6 0.9 nm.
Fig. 6. Dispersion curves of n and k and their absolute errors for As2S3 ~d 5 58 6 1.6 nm!, obtained by the three designated methods.
1 July 1998 y Vol. 37, No. 19 y APPLIED OPTICS 4265

Fig. 7. Dispersion curves of n and k and their absolute errors for Sb2Se3 ~d 5 78 6 0.9 nm!, obtained by the three designated methods.
Fig. 8. Dispersion curves of n and the absolute errors, obtained bythe T~k 5 0! method for As2S3, d 5 58 6 1.6 nm and Sb2Se3, d 578 6 0.9 nm.
Fig. 9. Dispersion curves of n and k and the corresponding abso-lute errors, assembled from the spectral ranges with maximumaccuracy of the used methods for ~a!, As2S3, d 5 58 6 1.6 nm; and~b! Sb2Se3, d 5 78 6 0.9 nm.
4266 APPLIED OPTICS y Vol. 37, No. 19 y 1 July 1998
nm by the T~k 5 0! method, while for k they are in thewhole spectral range by the ~TRfRm! method.
For the Sb2Se3 thin films the most accurate solu-tions for n are from 400 to 760 nm by the ~TRm!method and from 760 to 1000 nm by the ~TRRm!method, whereas for k they are from 400 to 700 nm bythe ~TRm! method and from 700 to 1000 nm by the~TRfRm! method. Figure 9 displays the n and the kvalues and the maximum accuracy in the whole spec-tral range, assembled from the spectral ranges, spec-ified above.
5. Conclusions
Based on a complete analysis of the maximum errorsin extracting the optical constants and the thicknessof thin films, using photometric measurements atnormal light incidence in the spectral range of 400–1000 nm, we can draw the following major conclu-sions:
~1! Each method, ~TRfRm!, ~TRbRm!, ~TRf !, ~TRm!,and T~k 5 0!, can give good accuracy of n and k,depending on the optical parameters of the investi-gated thin film and the spectral range.
~2! In general, the methods using glass substrateswith ns ' 1.5 and the Si substrate are applicable tovalues of n . 1.5, k , 4–5, and dyl 5 ~0.02–0.3! withan accuracy of better than 64%.
~3! In evaluating the optical constants in a widespectral range and isolating the correct physical so-lutions reliably, the best approach is to apply allmethods, analyze the errors, and use the solutionswith the lowest errors in the corresponding spectralrange, as shown in the examples above.
~4! The coefficients in the error matrix can supplyinformation about the measured quantities that af-fect most critically the error in determining n, k, andd.
~5! The ~TRR! methods have the advantage thatthey make possible the very accurate determination

of the film thickness and the reliable isolation of thecorrect physical solutions of n and k.
The authors are particularly indebted to V. Panay-otov, who participated at the start of the presentinvestigation. We are also grateful to B. Medni-karov and D. Dimitrov for preparing the As2S3 andthe Sb2Se3 films.
This research was accomplished with the financialsupport of the Bulgarian Ministry of Education andSciences under contract X-624y96.
References1. V. Panayotov and I. Konstantinov, “Determination of thin film
optical parameters from photometric measurements: an al-gebraic solution for the ~T, Rf, Rb! method,” Appl. Opt. 30,2795–2800 ~1991!.
2. V. Panayotov and I. Konstantinov, “Algebraic determination ofthin-film optical constants from photometric ~T, Rf, Rm! and ~T,Rb, Rm! measurements,” in Optical Interference Coatings, F.Abeles, ed., Proc. SPIE 2253, 1070–1079 ~1994!.
3. V. Panayotov and I. Konstantinov, “Determination of thin filmoptical parameters from photometric measurements: alge-braic solutions for the ~T, Rf, Rm! and ~T, Rb, Rm! methods,”Bulg. Chem. Commun. 26, 612–624 ~1993!.
4. A. Hjortsberg, “Determination of optical constants of absorbingmaterials using transmission and reflection of thin films on
partially metallized substrates: analysis of the new ~T, Rm!technique,” Appl. Opt. 20, 1254–1262 ~1981!.
5. C. Nagendra and G. Thutupalli, “Determination of opticalproperties of absorbing materials: a generalized scheme,”Appl. Opt. 22, 587–591 ~1983!.
6. J. Pozo and L. Diaz, “Method for determination of optical con-stants of thin films: dependence on experimental uncertain-ties,” Appl. Opt. 31, 4474–4482 ~1992!.
7. W. Hansen, “Optical characterization of thin films: theory,”J. Opt. Soc. Am. 63, 793–802 ~1973!.
8. H. Liddell, Computer-Aided Techniques for Design of Multi-layer Filters ~Hilger, Bristol, UK, 1981!, Chap. 1, p. 19.
9. T. Yasuda and D. E. Aspnes, “Optical-standard surfaces ofsingle-crystal silicon for calibrating ellipsometers and reflec-tometers,” Appl. Opt. 33, 7435–7438 ~1994!.
10. D. E. Aspnes and A. A. Studna, “Dielectric functions and op-tical parameters of Si, GaP, GaAs, GaSb, InP, InAs, and InSbfrom 1.5 to 6.0 eV,” Phys. Rev. B 27, 985–1009 ~1983!.
11. M. Sachatchieva and B. Mednikarov, “Sensitivity of theevaporated photoresist—As2S3,” J. Inf. Rec. 23, 337–346~1996!.
12. D. Dimitrov, D. Tzocheva, and D. Kovacheva, “Calorimetricstudy of amorphous SbSe thin films,” Thin Solid Films ~to bepublished!.
13. F. Abeles and M. Theye, “Methode de calcul’ des constantesoptiques des couches minces absorbantes a partir de mesuresde reflexion et de transmission,” Surf. Sci. 5, 325–331 ~1966!.
1 July 1998 y Vol. 37, No. 19 y APPLIED OPTICS 4267
Copyright © 2022 FDOKUMEN