Ghid-de-practica_Marketing_2022.pdf - Universitatea "Artifex"
Upload
khangminh22Category
view
21download
0
ANALELE U N I V ER S I TĂŢ I I D I N C R A I O VA
VOL. XXIII (LIX) – 2018
ANNALES OF THE UNIVERSITY OF CRAIOVA
CRAIOVA – 2018 Editura UNIVERSITARIA
BIOLOGIEHORTICULTURĂ
TEHNOLOGIAPRODUSELOR AGRICOLE
INGINERIA MEDIULUI

GENERAL EDITOR: Prof.dr. Sina COSMULESCU
EDITOR: Conf.dr. Cristian MĂRĂCINEANU
SCIENTIFIC BOARD● Adrian ASĂNICĂ - University of Agronomic Sciences and Veterinary Medicine Bucharest,
Romania● Adrian BACIU - Faculty of Horticulture, University of Craiova, Romania● Valerian BĂLAN - Agrarian State University, Republic of Moldova● Constantin BĂDUCĂ - Faculty of Horticulture, University of Craiova, Romania● Mihai BOTU - Faculty of Horticulture, University of Craiova, Romania● Dorin CAMEN - Banat University of Agricultural Sciences and Veterinary Medicine Timisoara,
Romania● Daniela Doloris CICHI - Faculty of Horticulture, University of Craiova, Romania● Vily CIMPOIAȘU - Faculty of Horticulture, University of Craiova, Romania● Daniela CIUPEANU CĂLUGĂRU - Faculty of Horticulture, University of Craiova, Romania● Sina COSMULESCU - Faculty of Horticulture, University of Craiova, Romania● Marta DISZY - Universidad de la Rioja, Spain● Ana-Maria DODOCIOIU - Faculty of Horticulture, University of Craiova, Romania● Lucia DRAGHIA - University of Agronomic Sciences and Veterinary Medicine Iasi, Romania● Alin DOBREI - Banat University of Agricultural Sciences and Veterinary Medicine Timisoara,
Romania● Gheorghe GLĂMAN - President of the Romanian Horticultural Society, Romania● Stefano GREGO - University of Tuscia, Viterbo, Italy● Michèle GUILLOUX – BÉNATIER - Institut Universitaire de la Vigne et du Vin „Jules Guyot”,
Université Bourgogne, France● Dorel HOZA - University of Agronomic Sciences and Veterinary Medicine Bucharest, Romania● Stavros LALAS - Technological Education Institution of Thessaly, Larissa, Greece● Viorel MITRE - University of Agronomic Sciences and Veterinary Medicine Cluj-Napoca,
Romania● Ion MITREA - Faculty of Horticulture, University of Craiova, Romania● Mihai NICOLESCU - Romanian Academy A.S.A.S "Gheorghe Ionescu Şişeşti”, Romania● Violeta NOUR - Faculty of Horticulture, University of Craiova, Romania● Alexandros PAPACHATZIS - Technological Education Institution of Thessaly, Larissa, Greece● Jocelyne PÉRARD - Responsable de la Chaire UNESCO „Culture et tradition de Vin”, Université
Bourgogne, France● Aurel POPA - Faculty of Horticulture, University of Craiova, Romania● Daniela POPA - Faculty of Horticulture, University of Craiova, Romania● Daniel RĂDUȚOIU - Faculty of Horticulture, University of Craiova, Romania● Radu SESTRAŞ - University of Agronomic Sciences and Veterinary Medicine Cluj-Napoca,
Romania● Felicia TUŢULESCU - Faculty of Horticulture, University of Craiova, Romania
● Liviu Cristian Mărăcineanu - Faculty of Horticulture, University of Craiova, Romania
ANNALS OF THE UNIVERSITY OF CRAIOVA – DOLJ A.I.Cuza Street, No. 13, Code 200585 – Craiova, Romania
ISSN 1453 – 1275

Sections: HORTICULTURE
FOOD PRODUCTS PROCESSING TECHNOLOGY


5
COMPARATIVE ANALYSIS OF TOTAL ANTIOXIDANT POTENTIAL OF FOUR PURPLE POTATO GENOTYPES AND SEVERAL BERRIES FRUITS
Bădărău Carmen Liliana1,2*, Ştefan Floriana Maria1, Tican Andreea1
*National Institute of Research and Development for Potato and Sugar Beet, BraŞov2 Transilvania University from BraŞov, Faculty of Food and Tourism
* Correspondence author. E-mail: [email protected]
Keywords: purple potato, berries, antioxidant capacity, polyphenols, flavonoids.
ABSTRACT Potato tubers with purple flesh contain high levels of antioxidants as do some of many
berries fruits. This study evaluated the total antioxidant activity (TAC) of four potatoes genotypes with purple colored flesh tubers in comparison with cranberries, blueberries, blackberries and raspberries. The potential antioxidant activity (estimated by ABTS method and DPPH scavenging activity) of the purple potato tubers were closed to that obtained for raspberries. Compared to other rich sources of polyphenols like the berries, the purple potato consumption has as special advantages the bioavailability and economic considerations (lower price).
INTRODUCTION In terms of total phenols, total flavonoids and other food antioxidants (vitamin C,
carotenoids) are associated with total antioxidant capacity (TAC) (Kalita & Jayanty, 2014). However, the TAC consumed by an individual depends on the type and amount of food intake. Therefore, the estimation of TAC provides valuable information on potential health benefits (Wang et al., 1996; Ezekiel et al., 2013). Moreover, the marketing of so called superfoods is commonly based on their antioxidant potential. In fact, a superior antioxidant activity with health benefits has been claimed for a number of antioxidants foods on in vitro antioxidant assays. There is a great variability in the phenolic compounds and the antioxidant activity in the commercial fruits (Lim et al., 2007; Wu et al., 2004; Borges et al 2010). Cranberries, blackberries, black blueberries, raspberries are considered to be superfood because of their antioxidant activity. Because of their diverse range of valuable phytonutrients (as anthocyanins, pro-anthocyanins, phenolic acid and flavonoids), these berries have beneficial effects on human health including anti-neurodegenerative, anti-inflammatory, antidiabetic and anti-obesity effects (Duthie et al., 2000; Wang et al., 1996; Kalita & Jayanty, 2014].
In particular, as in the case of the fruits tested in this paper, potato antioxidants have been shown to have favorable impacts on several measures of cardio-metabolic health, including lowering blood pressure, improving lipid profiles and decreasing markers of inflammation (Valcarcel et al., 2015; Duthie et al., 2000; Wang et al., 2004). This impact could be strong especially for people where potato is the most important food crop and therefore would be of interest to consumers and producers (Valcarcel et al., 2015). New potato cultivars whit high level of antioxidant compounds is considered a realistic approach to increasing dietary antioxidant intake (Navarre et al., 2011; Perla et al., 2012; Lachman et al., 2005).
ANNALS OF THE UNIVERSITY OF CRAIOVA
Series: Biology Horticulture Food produce processing
technology Environmental engineering Vol. XXII I (LIX) - 2018
6
The main objective of this research work was to assess their potential antioxidant capacity (using two methods ABTS and DPPH) in purple potato tubers (four cultivars) and in cranberries, black blueberries, blackberries and raspberries.
MATERIAL AND METHODS
The following potato genotypes with strong colored flesh were studied: -‘Albastru Violet Galanesti ‘(‘Blue Purple of Galanesti’) -‘Blue Congo‘, ‘Blue de la Manche’, ‘Patraque Auvergne’
The berries fruits: cranberries (Vaccinium myrtillus L.), black blueberries (Ribes Nigrum L.), blackberries (Rubus fruticosus L.) and raspberries (Rubus idaeus L.) were purchased from commercial market.
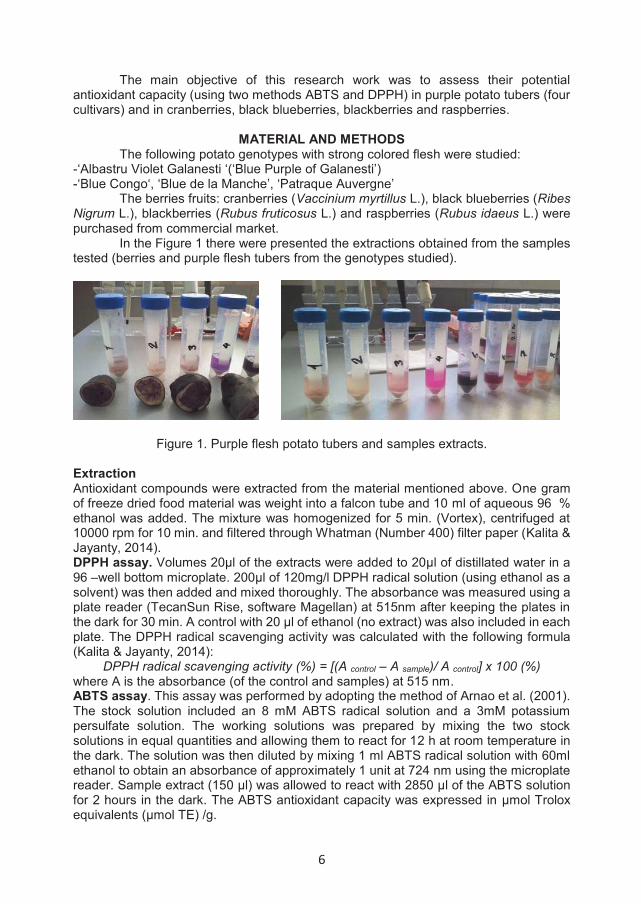
In the Figure 1 there were presented the extractions obtained from the samples tested (berries and purple flesh tubers from the genotypes studied).
Figure 1. Purple flesh potato tubers and samples extracts. Extraction Antioxidant compounds were extracted from the material mentioned above. One gram of freeze dried food material was weight into a falcon tube and 10 ml of aqueous 96 % ethanol was added. The mixture was homogenized for 5 min. (Vortex), centrifuged at 10000 rpm for 10 min. and filtered through Whatman (Number 400) filter paper (Kalita & Jayanty, 2014). DPPH assay. Volumes 20μl of the extracts were added to 20μl of distillated water in a 96 –well bottom microplate. 200μl of 120mg/l DPPH radical solution (using ethanol as a solvent) was then added and mixed thoroughly. The absorbance was measured using a plate reader (TecanSun Rise, software Magellan) at 515nm after keeping the plates in the dark for 30 min. A control with 20 μl of ethanol (no extract) was also included in each plate. The DPPH radical scavenging activity was calculated with the following formula (Kalita & Jayanty, 2014):
DPPH radical scavenging activity (%) = [(A control – A sample)/ A control] x 100 (%) where A is the absorbance (of the control and samples) at 515 nm. ABTS assay. This assay was performed by adopting the method of Arnao et al. (2001). The stock solution included an 8 mM ABTS radical solution and a 3mM potassium persulfate solution. The working solutions was prepared by mixing the two stock solutions in equal quantities and allowing them to react for 12 h at room temperature in the dark. The solution was then diluted by mixing 1 ml ABTS radical solution with 60ml ethanol to obtain an absorbance of approximately 1 unit at 724 nm using the microplate reader. Sample extract (150 μl) was allowed to react with 2850 μl of the ABTS solution for 2 hours in the dark. The ABTS antioxidant capacity was expressed in μmol Trolox equivalents (μmol TE) /g.

7
Statistical interpretation. The experiments were carried out in triplicates and statistical analysis was performed by one way analysis of variance (ANOVA) at p< 0.05 significance level using. Also, Duncan’s multiple range test were used.
RESULTS AND DISCUSSIONS DPPH radical-scavenging activity The reduction capability of DPPH radical was determined by decrease in
absorbance at 517 nm induced by antioxidants (included in the samples studied). Figure 2 presents the DPPH scavenging activity of the ethanol extracts of berries and potato tubers.
Figure 2. Antioxidant activity of cranberries, blueberries, blackberries, raspberries and different purple potato tubers (AVG = Albastru Violet de Galanesti – cv. ‘Blue Purple
of Galanesti’; BC = cv. ‘Blue Congo’; BM = cv. ‘Blue de la Manche’; PA = cv. ‘Patraque Auvergne’) by DPPH assay. Values not followed by the same letter are
significantly different (P=0.05) according to Duncan’s test. Abbreviations: DPPH=2, 2-diphenyl-1-picrylhydrazyl; SD=standard deviation.
As shown in this figure, the blueberries had the highest level of % DPPH inhibition, followed by cranberries, blackberries, purple potato AVG (Blue Purple of Galanesti), Patraque Auvergne, Blue Congo and Blue de la Manche (with significant variations p<0.05).The raspberries samples had close values of DPPH scavenging activity with some purple potato varieties
ABTS scavenging activity The DPPH assay was used for evaluate the free radical-scavenging ability of
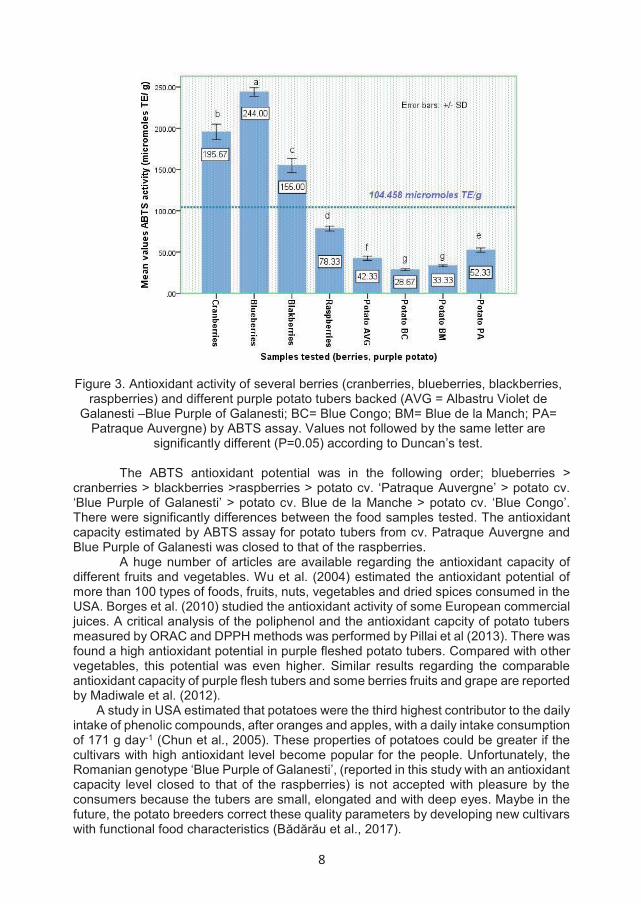
the extracts. But the DPPH antioxidant activity depends upon a lot of factors (reaction time, kind of the phenolic compounds and the redox potential of the extracts. ABTS free radicals are more active than DPPH free radicals and unlike reactions with these radicals occur in less than a millisecond. The analysis is based on the reduction of the blue green ABTS radical by hydrogen-donating antioxidants and the decomposition of the ABTS radical is observed by the determining the absorption at 600 nm. Figure 3 shows the ABTS radical cation-scavenging activity of the ethanol extract of berries fruits and purple potato tubers samples. The blueberries samples had the highest ABTS value (244.0±
8
Figure 3. Antioxidant activity of several berries (cranberries, blueberries, blackberries,
raspberries) and different purple potato tubers backed (AVG = Albastru Violet de Galanesti –Blue Purple of Galanesti; BC= Blue Congo; BM= Blue de la Manch; PA=
Patraque Auvergne) by ABTS assay. Values not followed by the same letter are significantly different (P=0.05) according to Duncan’s test.
The ABTS antioxidant potential was in the following order; blueberries >
cranberries > blackberries >raspberries > potato cv. ‘Patraque Auvergne’ > potato cv. ‘Blue Purple of Galanesti’ > potato cv. Blue de la Manche > potato cv. ‘Blue Congo’. There were significantly differences between the food samples tested. The antioxidant capacity estimated by ABTS assay for potato tubers from cv. Patraque Auvergne and Blue Purple of Galanesti was closed to that of the raspberries.
A huge number of articles are available regarding the antioxidant capacity of different fruits and vegetables. Wu et al. (2004) estimated the antioxidant potential of more than 100 types of foods, fruits, nuts, vegetables and dried spices consumed in the USA. Borges et al. (2010) studied the antioxidant activity of some European commercial juices. A critical analysis of the poliphenol and the antioxidant capcity of potato tubers measured by ORAC and DPPH methods was performed by Pillai et al (2013). There was found a high antioxidant potential in purple fleshed potato tubers. Compared with other vegetables, this potential was even higher. Similar results regarding the comparable antioxidant capacity of purple flesh tubers and some berries fruits and grape are reported by Madiwale et al. (2012).
A study in USA estimated that potatoes were the third highest contributor to the daily intake of phenolic compounds, after oranges and apples, with a daily intake consumption of 171 g day-1 (Chun et al., 2005). These properties of potatoes could be greater if the cultivars with high antioxidant level become popular for the people. Unfortunately, the Romanian genotype ‘Blue Purple of Galanesti’, (reported in this study with an antioxidant capacity level closed to that of the raspberries) is not accepted with pleasure by the consumers because the tubers are small, elongated and with deep eyes. Maybe in the future, the potato breeders correct these quality parameters by developing new cultivars with functional food characteristics (Bădărău et al., 2017).

9
CONCLUSIONS Significant differences between the samples of the food tested were observed
for the antioxidant potential measured by both methods (DPPH and ABTS scavenging activity). Higher antioxidant capacity were found in cranberries, black blueberries and blackberries and close value for raspberries and several intense colored fleshed potato tubers. Among the potato studied, the genotype ‘Blue Purple of Galanesti’ and the cv. ‘Patraque Auvergne’ (all with blue skin and purple flesh) had higher values percentage of DPPH inhibition and ABTS radicals scavenging activity, these value were closed to that obtained for raspberries samples. These properties of purple flesh potatoes could be greater if these cultivars with high antioxidant potential level become popular for the people. Therefore, colored potatoes contribute to the daily intake of antioxidants and their consumption thereby may have positive effects on the human health.
ACKNOWLEDGMENT This work was supported by the project ADER 2.1.1. “Obtain new potato varieties adapted to climate change and higher economic efficiency in the management of water resources and establish specific technological packages current market requirements and request farmers”.
REFERENCES Amao M.B., Cano A., Acosta M., 2001, The hydrophilic and lipophilic contribution
of total antioxidant activity, Food Chemistry 73, 239-244. Bădărău C.L., Stefan F.M., Stroe F., Canja C.M, 2017, Total phenolic content
in several potato cultivars (Brasov, 2015-2016). Annals of the University of Craiova- Agriculture, Montanology, Cadastre Series 47 (1), 12-18.
Borges G., Mullen W., Crozier A., 2010, Comparison of the polyphenol composition and antioxidant activity of European commercial fruit juices. Food Functional 1, 73-83
Chun O.K., Kim D.O., Smith N., Schroeder D., Han J.T., Lee C.Y., 2005, Daily consumption of phenolic and total antioxidant capacity from fruit and vegetables in the American diet. Journal of Sciences and Food Agriculture 85, 1715-1724.
Duthie G.G., Duthie S.J., Kyle J.A., 2000, Plant polyphenols in cancer and heart disease: implications as nutritional antioxidants. Nutrition Research Reviews 13, 79-106
Ezekiel R., Singh N., Sharma S., Kaur A., 2013, Beneficial phytochemicals in potato – a review. Food Research International 50, 487-496.
Kalita D. and Jayanty SS., 2014, Comparison of polyphenol content and antioxidant capacity of colored potato tubers, pomegranate and blueberries, Food Processing & Technology, 5(8), 1-7.
Lachman J. and K. Hamouz, 2005, Red and purple colored potatoes as significant antioxidant source of human nutrition – a review. Plant, Soil and Environment 51, 477-482.
Lim Y.Y., Lim T.T., Tee J.J., 2007, Antioxidant properties of some tropical fruits: a comparative study. Food Chemistry 103, 829-838.
Madiwale G.P., Reffivari L., Stone M., Holm D.G., Vanmala J., 2012, Combined effects of storage and processing on the bioactive compounds and proapoptotic properties of color fleshed potatoes in human colon cancer cells. Journal of Agricultural and Food Chemistry 60, 11088-11096.
Navarre Du R.A., Pillai S.S., Shakys R., Holden M.J., 2011, HPLC profiling of phenolic in diverse potato genotypes. Food Chemistry 127, 34-41.
Perla V., Holm D.G., Jayanty S.S., 2012, Effects of cooking methods on polyphenols, pigments and antioxidant activity in potato tubers. LWT-Food Science and Technology 45,161-171.
10
Pillai SS., Navarre Du R.A, Bamberg J., 2013, Analysis of polyphenols, anthocyanins and carotenoids in tubers from Solanum tuberosum group phureja, stenotomum and andigena. American Journal of Potato Research 90, 440-450
Valcarcel J., Reilly K., Gaffney M., O’Brien N.M., 2015, Antioxidant activity, total phenolic and total flavonoid content in sixty varieties of potato (Solanum tuberosum L.) grown in Ireland. Potato Research 58, 221-141.
Wang H., Cao. G.H, Prior RL., 1996, Total antioxidant capacity of fruits. Journal of Agricultural and Food Chemistry 44, 1996, 701-705.
Wu X., Beecher G.F., Holden J.M., Haytowitz D.B., Gebhardt S.E., 2004, Lipophilic and hydrophilic antioxidant capacity of common foods in the United States. Journal of Agricultural and Food Chemistry 52, 4026-4037.
11
RESEARCHES ON THE ENOLOGICAL POTENTIAL OF THE SAUVIGNON CULTIVAR IN HILLS WINE ZONES OF OLTENIA
Băducă Cîmpeanu C.1, Mazilu Mihaela Nicoleta2 1University of Craiova, Faculty of Horiculture
2University of Craiova, Faculty of Horiculture, Master Vine-Wine Expertise Correspondence author. E-mail: [email protected], [email protected]
Keywords: grapevine, climatic changes, vineyard, ripering
ABSTRACT The Sauvignon variety enjoys a good reputation on the international wine market, being
one of the most popular varieties for quality white wines worldwide. In the vineyards in the hilly area of Oltenia, the variety finds climatic conditions and soil that allow it to put its high quality potential well. Research carried out in the 2014-2017 period in 6 wine-growing areas in the hilly area of Oltenia shows that grapes maturation took place in very good conditions, so that the values of the main chemical constituents of the grapes (sugars, organic acids, flavors) fully suitable for obtaining high-quality wines. The qualitative potential of the variety in the 6 wine years studied was also well emphasized by the values of the analyzed technological indicators, starting with the yield, which had average values between 6.7 and 7.5 tons / ha.
INTRODUCTION The Sauvignon Blanc wines have undoubtedly achieved worldwide notoriety,
largely due to their aromatic character easily recognizable by many consumers around the world (Stoica Felicia, 2015). The main aromatic markers of these wines are known and have been the subject of many studies during the last 20 years. The varietal thiols at the base of the fruity typicality as well as 3-isobutyl-2-methoxypyrazine (IBMP) largely responsible for the more or less marked vegetable nature of these wines, have been particularly studied.
These compounds are of varietal origin and yet the scientific knowledge on vineyard practices influencing their content in wines are still limited (Suklje Katja e.a., 2016). Sauvignon wines have characteristic aromas that are often very intense. The specialists of this grape, experienced winemakers or enlightened amateurs, distinguish many shades, herbaceous to fruity sometimes even animal or empyreumatic, reminiscent of green pepper, ivy, tomato leaf, boxwood, broom, blackcurrant bud, the smell of tomcat, asparagus, grapefruit, white peach, passion fruit and finally wood smoke (Dubourdieu D., 1996).
Methoxypyrazines are present in the grapes of certain Vitis vinifera varieties including Sauvignon blanc and contribute herbaceous/green aromas to wine. Environmental factors such as light exposure and temperature can influence methoxypyrazine levels, and viticultural interventions such as canopy manipulation have the ability to reduce methoxypyrazine accumulation in grapes (Gregan S. and Jordan B., 2016).
In the Sauvignon Blanc variety, precursors were detected both in the skin and the pulp, while in Melon B., only S-3-(1-hexanol)glutathione was detected in pulp, any other precursors being exclusively found in skin. During an industrial pressing cycle,
ANNALS OF THE UNIVERSITY OF CRAIOVA
Series: Biology Horticulture Food produce processing
technology Environmental engineering Vol. XXII I (LIX) - 2018

12
extraction of thiol precursors was enhanced at the end of the cycle (highest pressures), thus producing more varietal thiols in the resulting wines (Roland Aurélie e.a., 2011).
Formation of wine thiol precursors is a dynamic process, which can be influenced by vineyard and winery processing operations. With the aim of increasing thiol precursor concentrations, a study of the effects of storing machine-harvested Sauvignon blanc grapes prior to crushing and pressing was undertaken on a commercial scale. 3-Mercaptohexan-1-ol (3-MH) precursors, 2-S-glutathionylcaftaric acid (grape reaction product, GRP), glutathione (GSH) and a number of C6 compounds were assessed at several time points during the experiment.
The concentration of the cysteine precursor to 3-MH doubled within 8 h and tripled after 30 h while the GSH and cysteinylglycine precursors increased in concentration roughly 1.5 times. (E)-2-Hexenal and GSH levels decreased as thiol precursors, GRP and C6 alcohols increased during storage.
Principal component analysis revealed that precursors contributed to most of the variation within the samples over the storage period, with additional influence, primarily from GSH and GRP, as well as (E)-2-hexenal and (Z)-3-hexen-1-ol. Early storage time points were associated with higher concentrations of GSH and some unsaturated C6 compounds while longer storage times were most closely associated with higher thiol precursor and GRP concentrations (Capone Dimitra e.a., 2012).
During recent years, Sauvignon winemaking methods have undergone many changes—including a return to barrel fermentation of musts originating in the best terroirs as well as on-lees aging of new wines, whatever the fermentation method (barrel or tank).
Current Chardonnay and Sauvignon winemaking methods are very similar, but malolactic fermentation is rarely practiced on Sauvignon wines (Ribéreau-Gayon P. e.a., 2006). The viticultural factors influencing the thiol content in the wines are better and better identified. Similarly, it is now accepted that a good sanitary condition of the harvest is the first step necessary to obtain thiols in the wines.
The terroir of course plays an incontestable role since a low to moderate hydric stress favors the presence of precursors. From an oenological point of view, the extraction of the precursors during the pre-fermentation operations is favored by the maceration and the stubulation on mud (Geffroy O. e.a., 2010).
Thiol compounds responsible for tropical fruit associated aroma have been extensively studied over the last 20 years. The occurrence of their non-aromatic precursors in grapes and musts is reported largely mainly for the cultivar Sauvignon Blanc. The presence of these thiols as precursors or free molecules in grape, juice, and wine has been reported in several different varieties, suggesting that they are more or less ubiquitous both for Vitis spp. and interspecific hybrids.
The biosynthetic pathways resulting in these compounds are yet to be completely elucidated, but, in the meantime, industry needs to improve technological knowledge to better manage winemaking steps to enhance the variety-dependent aroma of wine (Román T. e.a., 2018).
MATERIAL AND METHODS The study conducted between 2014 and 2017 had the following objectives: - Establishing the values of the main constituents of grape composition at the
technological maturity stage, in the vineyards: Drăgăşani, Vâlcea county; Sâmbureşti, Olt County; Segarcea and Cetate, Dolj county; Oreviţa-Stârrmina center Vânju Mare and Gârlă Drâncei center Oprişor, Mehedinţi County;
13
- Determination of the productivity parameters (kg/ha), the relative content in sugars (g/L), the yield in must on the primary winemaking (L/100 kg grapes), fermentable sugars in the obtained must (kg/ha) after the alcoholic fermentation (L/ha) at harvest;
- Establishing the values of the main constituents of Sauvignon wines obtained in winemaking as: S.C. Măr - Olt Hill (Isărescu Wine House, Drăgăşani Vineyard, S. Sâmbureşti - Bolovanu, Segarcea - Dolj Crown Domains, SC Viti-vinicola Vânju Mare - Mehedinţi.
The analyzes carried out on 3-4 samples for each wine year and zone concerned the contents in: alcohol (vol %), total acidity (g/L in H2SO4), volatile acidity (g/L in H2SO4), glycerol (g/L, residual sugar (g/L), low extract (g/L), ash (g/L). The specific flavor of Sauvignon wine was noted as follows:
xxxx - Specific intense flavor, persistent for a considerable time at tasting; xxx - Sauvignon's distinctive flavor; xx - Discrete flavor with the necessary presence of Sauvignon variety.
RESULTS AND DISCUSSIONS From the aspect of the sugars, acidity and aroma content of the grapes, which
essentially determines the quality of the wines, the years 2014, 2015, 2016 and 2017 proved to be favorable for Sauvignon, generally on all the main hillocks in Oltenia.
The carbohydrate contents of fairly high and limited variability over the years and the wine-growing centers are the guarantee of obtaining wines with constant alcoholic strengths between 12 and 13.5 % vol. The size of this constituent is between 214 g/L (Cetate, 2015) and 225 g/L (Cetate, 2017). The overall difference of only 11 g/L signifies the uniform behavior of the Sauvignon variety in the six large vineyards in the geographical area between Olt, Danube and Southern Carpathians.
Acidity, the second constituent of considerable importance for the compositional and organoleptic balance of the wines obtained, presents in all cases good and very good contents. Over the years and vineyards, the acidity content was between 3.97 g/L (Segarcea, 2014) and 4.93 g/L (Drăgăşani, 2016), the differences being insignificant (0.96 g/L in H2SO4).
The semi-aromatic character of the Sauvignon variety is clearly evidenced by the terpenic or sulphurous flavors, present in significant proportions in the grapes of all 6 vineyards, with an extra mark for the grapes in the center of the Olt Hill of Drăgăşani. Smaller flavors in the Cetate and Oprişor areas provide the specificity of the semi-aromatic category wine. Certainly it stands out, in terms of specific flavors of Sauvignon, the renowned center of the Olt Hill in the Drăgăşani vineyard.
In the vintages 2014, 2015, 2016 and 2017, the Sauvignon variety proved to be particularly advantageous in the wine-growing areas of Oltenia (Table 2 and 3) in terms of oenological productivity and yield.
In the target vineyards, apart from the Cetate, these parameters showed higher values in 2016, a normal year without climatic "accidents". Lower production in 2017, which determines the values of the other parameters, was due to the temperatures below 00C, which occurred in April, which destroyed much of the fruitful shoots. The grape production was between 6230 kg/ha (Cetate, 2017) and 8010 kg/ha (Drăgăşani - Olt Hill, 2016), the difference being 1780 kg/ha. With regard to general media, the differences in grape yields are narrowing. Thus, with the highest average yield, the Segarcea vineyard was recorded, with 7498 kg/ha, followed by the insignificant difference between the vineyard Oreviţa and Vânju Mare, with 7483 kg/ha. With the lowest average grape production is the Cetate center in Dolj County.
Given the relative sugars content, ranging from 214 g/L to 225 g/L for all vintage years and vineyards, all other yield parameters place the Sauvignon variety with a
14
considerable degree of profitability, which is justified by the average yield in must Primary vinification ranging from 67.4 % (Oreviţa) and 68.3 % (Drăgăşani), 68.4 % (Cetate).
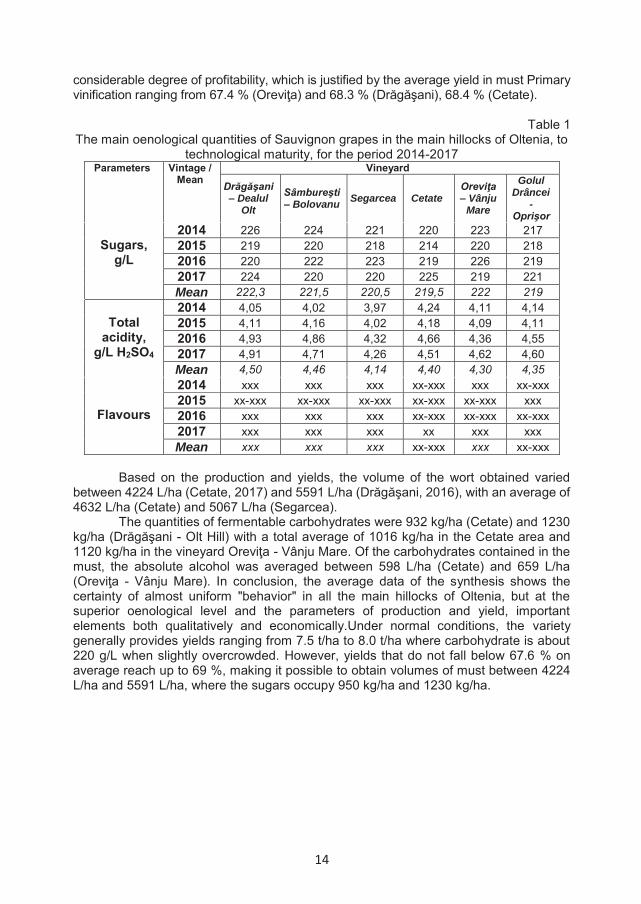
Table 1
The main oenological quantities of Sauvignon grapes in the main hillocks of Oltenia, to technological maturity, for the period 2014-2017
Parameters Vintage / Mean
Vineyard
Drăgăşani – Dealul
Olt Sâmbureşti – Bolovanu Segarcea Cetate
Oreviţa – Vânju
Mare
Golul Drâncei
- Oprişor
Sugars,
g/L
2014 226 224 221 220 223 217 2015 219 220 218 214 220 218 2016 220 222 223 219 226 219 2017 224 220 220 225 219 221 Mean 222,3 221,5 220,5 219,5 222 219
Total
acidity, g/L H2SO4
2014 4,05 4,02 3,97 4,24 4,11 4,14 2015 4,11 4,16 4,02 4,18 4,09 4,11 2016 4,93 4,86 4,32 4,66 4,36 4,55 2017 4,91 4,71 4,26 4,51 4,62 4,60 Mean 4,50 4,46 4,14 4,40 4,30 4,35
Flavours
2014 xxx xxx xxx xx-xxx xxx xx-xxx 2015 xx-xxx xx-xxx xx-xxx xx-xxx xx-xxx xxx 2016 xxx xxx xxx xx-xxx xx-xxx xx-xxx 2017 xxx xxx xxx xx xxx xxx Mean xxx xxx xxx xx-xxx xxx xx-xxx
Based on the production and yields, the volume of the wort obtained varied
between 4224 L/ha (Cetate, 2017) and 5591 L/ha (Drăgăşani, 2016), with an average of 4632 L/ha (Cetate) and 5067 L/ha (Segarcea).
The quantities of fermentable carbohydrates were 932 kg/ha (Cetate) and 1230 kg/ha (Drăgăşani - Olt Hill) with a total average of 1016 kg/ha in the Cetate area and 1120 kg/ha in the vineyard Oreviţa - Vânju Mare. Of the carbohydrates contained in the must, the absolute alcohol was averaged between 598 L/ha (Cetate) and 659 L/ha (Oreviţa - Vânju Mare). In conclusion, the average data of the synthesis shows the certainty of almost uniform "behavior" in all the main hillocks of Oltenia, but at the superior oenological level and the parameters of production and yield, important elements both qualitatively and economically.Under normal conditions, the variety generally provides yields ranging from 7.5 t/ha to 8.0 t/ha where carbohydrate is about 220 g/L when slightly overcrowded. However, yields that do not fall below 67.6 % on average reach up to 69 %, making it possible to obtain volumes of must between 4224 L/ha and 5591 L/ha, where the sugars occupy 950 kg/ha and 1230 kg/ha.
15
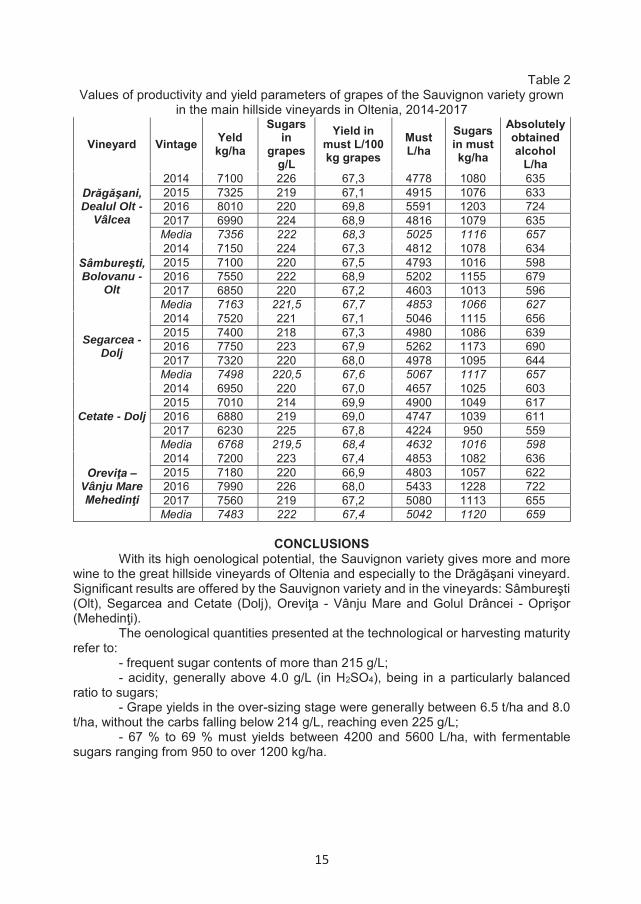
Table 2 Values of productivity and yield parameters of grapes of the Sauvignon variety grown
in the main hillside vineyards in Oltenia, 2014-2017
Vineyard Vintage Yeld kg/ha
Sugars in
grapes g/L
Yield in must L/100 kg grapes
Must L/ha
Sugars in must kg/ha
Absolutely obtained alcohol
L/ha
Drăgăşani, Dealul Olt -
Vâlcea
2014 7100 226 67,3 4778 1080 635 2015 7325 219 67,1 4915 1076 633 2016 8010 220 69,8 5591 1203 724 2017 6990 224 68,9 4816 1079 635 Media 7356 222 68,3 5025 1116 657
Sâmbureşti, Bolovanu -
Olt
2014 7150 224 67,3 4812 1078 634 2015 7100 220 67,5 4793 1016 598 2016 7550 222 68,9 5202 1155 679 2017 6850 220 67,2 4603 1013 596 Media 7163 221,5 67,7 4853 1066 627
Segarcea - Dolj
2014 7520 221 67,1 5046 1115 656 2015 7400 218 67,3 4980 1086 639 2016 7750 223 67,9 5262 1173 690 2017 7320 220 68,0 4978 1095 644 Media 7498 220,5 67,6 5067 1117 657
Cetate - Dolj
2014 6950 220 67,0 4657 1025 603 2015 7010 214 69,9 4900 1049 617 2016 6880 219 69,0 4747 1039 611 2017 6230 225 67,8 4224 950 559 Media 6768 219,5 68,4 4632 1016 598
Oreviţa – Vânju Mare Mehedinţi
2014 7200 223 67,4 4853 1082 636 2015 7180 220 66,9 4803 1057 622 2016 7990 226 68,0 5433 1228 722 2017 7560 219 67,2 5080 1113 655 Media 7483 222 67,4 5042 1120 659
CONCLUSIONS With its high oenological potential, the Sauvignon variety gives more and more
wine to the great hillside vineyards of Oltenia and especially to the Drăgăşani vineyard. Significant results are offered by the Sauvignon variety and in the vineyards: Sâmbureşti (Olt), Segarcea and Cetate (Dolj), Oreviţa - Vânju Mare and Golul Drâncei - Oprişor (Mehedinţi).
The oenological quantities presented at the technological or harvesting maturity refer to:
- frequent sugar contents of more than 215 g/L; - acidity, generally above 4.0 g/L (in H2SO4), being in a particularly balanced
ratio to sugars; - Grape yields in the over-sizing stage were generally between 6.5 t/ha and 8.0
t/ha, without the carbs falling below 214 g/L, reaching even 225 g/L; - 67 % to 69 % must yields between 4200 and 5600 L/ha, with fermentable
sugars ranging from 950 to over 1200 kg/ha.
16
REFERENCES Capone Dimitra, Black C., Jeffery D., 2012. Effects on 3-Mercaptohexan-1-ol
Precursor Concentrations from Prolonged Storage of Sauvignon Blanc Grapes Prior to Crushing and Pressing. Journal of Agriculture and Food Chemistry, vol. 60, nr. 13, pag. 3515–3523.
Dubourdieu D., 1996. Les arômes: Facteurs de qualité - Les arômes du Sauvignon - Valorisation par la vinification. Revue des Œnologues, nr. 79, pag. 18-20.
Geffroy O., Fauveau Céline, Bajard Sparrow Céline, Dufourcq T., 2010. Influence de l’utilisation d’enzymes de macération sur la teneur en thiols variétaux de vins de Sauvignon blanc produits dans les vignobles du Sud-Ouest. Revue des Œnologues, nr. 136, pag. 19-20.
Gregan S., Jordan B., 2016. Methoxypyrazine Accumulation and O-Methyltransferase Gene Expression in Sauvignon blanc Grapes: The Role of Leaf Removal, Light Exposure, and Berry Development. Journal of Agriculture and Food Chemistry, vol. 64, nr. 11, pag. 2200–2208.
Ribéreau-Gayon P., Dubourdieu D., Donèche B., Lonvaud Aline, 2006. Handbook of Enology. Volume 1. The Microbiology of Wine and Vinifications. 2nd Edition. John Wiley & Sons Ltd, The Atrium, Southern Gate, Chichester, England.
Roland Aurélie, Schneider R., Charrier Fr., Cavelier Fl., Rossignol M., Razungles A., 2011. Distribution of varietal thiol precursors in the skin and the pulp of Melon B. and Sauvignon Blanc grapes. Food Chemistry, vol. 125, nr. 1, pag. 139–144.
Román T., Tonidandel T., Larcher R., Celotti E., Nicolini G., 2018. Importance of polyfunctional thiols on semi-industrial Gewürztraminer wines and the correlation to technological treatments. European Food Research and Technology, vol. 244, nr. 3, pag. 379–386.
Suklje Katja, Antalick G., Coetzee Z., Lisjak K., Deloire A., 2016. Modification du profil aromatique des vins de Sauvignon blanc au vignoble. Nouvelles perspectives. Revue des Œnologues nr. 161, pag. 24-27.
Stoica Felicia, 2015. The main parameters and indicators that define the quality and authenticity of white wines from vineyard Drăgăşani - Romania, Carpathian Journal of Food Science and Technology, vol.7, nr. 4, pag. 139-144.

17
EXPERIMENTAL STUDY ON GRANULOMETRY OF CLEANED MATERIALS WITH THE CYLINDRICAL SELECTOR
Banica Mihai1*, Șugar Ioan Radu1, Giurgiulescu Liviu2
Faculty of Engineering, Technical University of Cluj-Napoca Faculty of Sciences, Technical University of Cluj-Napoca
*Corresponding author, E-mail: [email protected]
Keywords: cylindrical selector, granulometry, bootstrapping
ABSTRACT The cylindrical selector is a slightly inclined cylinder, provided with alveoli of the shape
close to the hemisphere, with a diameter slightly larger than that of the particles. Separation is based on the difference in the moment of drop in the alveoli. The aims of the present paper are to reduce the loss by using granulometric analysis and statistical analysis.
INTRODUCTION The first stone mills appeared in the Neolithic (3000BC), they were initially
handled by the force of human arms and then ran by animals, simultaneously switching from the consumption of boiled grains to the consumption of baked cakes made from broken grains (Tisan, 2009), (Tucu, 2007).
In the case of the cylindrical selector, separation is based on the difference in the moment of drop in the alveoli. During rotating the cylinder, the longest particles of larger size first separate, evacuating with a conveyor, while the shorter particles remain longer in the alveoli, falling later. The degree of separation of the grain mixture on the fractions depends on the level at which the upper edge of the collector gutter is fixed (Balc et al., 2016).
In terms of the intended purpose of separation, cylindrical selectors are classified into: long grains selectors and short grains cylinders. In long grains, the alveoli separate the main product mass, which may represent 95.98 % of the mixture. In the case of short grains, the alveoli separate 13 % of the mixture, the productivity being much higher.
Cylindrical selectors are provided with a cylindrical selector knob. It has the role of separating smaller bodies than wheat grains - wheat breaks, small grains of wheat - from the mixture of foreign bodies resulting from the first selector. The amount of foreign bodies resulting from the main selector may not exceed 10-15 % of its capacity. Depending on the amount of foreign bodies resulted from the first selection, the control selector is calculated, which is generally 1/3 (a third) of the main selector and a smaller diameter.
The separation process is influenced by the following factors: the loading mode; the shape and size of the sieve; the length of the particle road path on the screen; the speed and character of the material movement; the speed and character of the material movement; the thickness of the material layer; the state of the material (dry or wet).The loading has to be done at a uniform flow and layer corresponding to the productivity of the sieve used for the process.
ANNALS OF THE UNIVERSITY OF CRAIOVA
Series: Biology Horticulture Food produce processing
technology Environmental engineering Vol. XXII I (LIX) - 2018
18
The trior plate is made of stainless steel for the food industry.
Figure 1. Trior plate (http://www.rmig.com/ro/produse/perfora%C5%A3ii+rm/pl%C4%83ci+trior+rm)
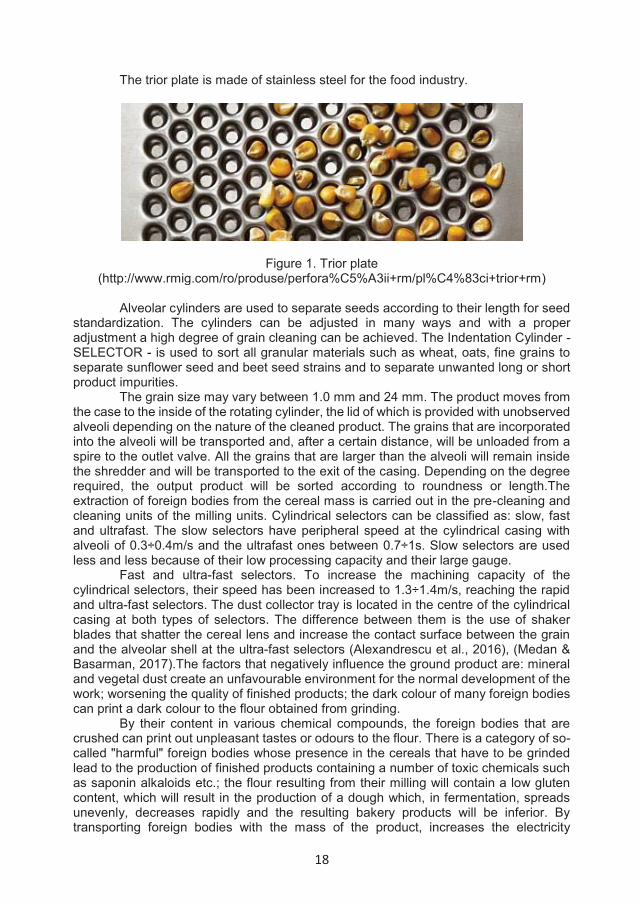
Alveolar cylinders are used to separate seeds according to their length for seed
standardization. The cylinders can be adjusted in many ways and with a proper adjustment a high degree of grain cleaning can be achieved. The Indentation Cylinder - SELECTOR - is used to sort all granular materials such as wheat, oats, fine grains to separate sunflower seed and beet seed strains and to separate unwanted long or short product impurities.
The grain size may vary between 1.0 mm and 24 mm. The product moves from the case to the inside of the rotating cylinder, the lid of which is provided with unobserved alveoli depending on the nature of the cleaned product. The grains that are incorporated into the alveoli will be transported and, after a certain distance, will be unloaded from a spire to the outlet valve. All the grains that are larger than the alveoli will remain inside the shredder and will be transported to the exit of the casing. Depending on the degree required, the output product will be sorted according to roundness or length.The extraction of foreign bodies from the cereal mass is carried out in the pre-cleaning and cleaning units of the milling units. Cylindrical selectors can be classified as: slow, fast and ultrafast. The slow selectors have peripheral speed at the cylindrical casing with alveoli of 0.3÷0.4m/s and the ultrafast ones between 0.7÷1s. Slow selectors are used less and less because of their low processing capacity and their large gauge.
Fast and ultra-fast selectors. To increase the machining capacity of the cylindrical selectors, their speed has been increased to 1.3÷1.4m/s, reaching the rapid and ultra-fast selectors. The dust collector tray is located in the centre of the cylindrical casing at both types of selectors. The difference between them is the use of shaker blades that shatter the cereal lens and increase the contact surface between the grain and the alveolar shell at the ultra-fast selectors (Alexandrescu et al., 2016), (Medan & Basarman, 2017).The factors that negatively influence the ground product are: mineral and vegetal dust create an unfavourable environment for the normal development of the work; worsening the quality of finished products; the dark colour of many foreign bodies can print a dark colour to the flour obtained from grinding.
By their content in various chemical compounds, the foreign bodies that are crushed can print out unpleasant tastes or odours to the flour. There is a category of so-called "harmful" foreign bodies whose presence in the cereals that have to be grinded lead to the production of finished products containing a number of toxic chemicals such as saponin alkaloids etc.; the flour resulting from their milling will contain a low gluten content, which will result in the production of a dough which, in fermentation, spreads unevenly, decreases rapidly and the resulting bakery products will be inferior. By transporting foreign bodies with the mass of the product, increases the electricity

19
consumption; sparks may occur when contacting parts of the work organs of the various cleaning equipment, with the risk of an explosion; advanced wear of the working parts of the cleaning and grinding machinery can occur, as these foreign bodies enter the stones and metallic impurities. Taking all of these into consideration, the necessity and obligation of seed cleaning and sorting is to be imposed in order to ensure optimal storage and marketing conditions for consumption or as sowing material (Sorica, 2011).
To determine the granulometry of the material, MAS 54.H maize cultivated by Maïsadour Semences was used. Mas 54.H is a hybrid with a very good level of silo production.
Figure 2. MAS 54.H
Four-point determinations were made from the cobs on four different plots of the parcel. There were taken a series of grains from the corn cobs and the gram size (grammes) of the grains was measured. Size measurements were made with a digital caliper of 0.01 mm RM selector plates are made of steel or stainless steel. The installation productivity increases due to the fact that the RM selector plates minimize the space between the alveoli to allow the maximum hourly flow rate.
STATISTICAL ANALYSIS AND BOOTSTRAPPING The measurements were made on four corns, picked from four different points
of the parcel. From each corn, one row of grains was taken, and the gram size of the grains was measured. The measurement was carried out with a digital calliper with an accuracy of 0.01mm.
QI Macros Add-In for Excel (KnowWare International, Inc.) was used for the statistical analysis:
1. Normality test concerning the samples: we used Anderson Darling's p-valueand Critical Value Method, α=0.05. Result: the samples have a non-normal distribution;
Table 1 Results of measurements
Sample1 Sample2 Sample3 Sample4 9.18, 10.26, 10.36, 10.76, 10.42, 10.68, 10.79, 12.23, 12.02, 11.90, 11.99, 11.23, 11.55, 12.52, 11.79, 10.83, 12.64, 12.63, 12.21, 11.93, 12.23, 12.45, 12.40, 12.25, 12.18, 12.22, 11.91, 10.37, 11.45, 11.47,
9.49, 10.20, 11.49, 12.08, 11.84, 11.77, 12.03, 11.55, 12.23, 12.58, 12.38, 12.65, 12.26, 12.52, 12.32, 11.79, 12.19, 12.09, 11.64, 11.53, 12.52, 11.99, 11.27, 11.16, 11.97, 11.57, 11.89, 11.78, 11.46, 11.39,
8.89, 9.84, 10.50, 10.37, 11.31, 11.86, 11.65, 11.31, 10.99, 11.94, 12.41, 12.00, 12.33, 12.45, 12.73, 12.87, 12.58, 12.55, 12.74, 12.01, 12.19, 12.04, 12.22, 11.85, 12.55, 12.44, 12.06, 11.94, 12.40, 11.70,
9.14, 10.72, 10.16, 11.05, 10.73, 11.84, 11.63, 12.48, 12.74, 11.66, 12.56, 12.39, 12.60, 12.04, 12.98, 12.01, 12.89, 12.64, 13.09, 12.56, 12.44, 13.19, 12.37, 12.33, 12.43, 12.45, 11.66, 12.11, 11.34, 11.38,
20
11.89, 10.64, 10.23, 8.74
11.30, 10.78, 10.41, 10.34, 9.54, 8.77
11.51, 10.79, 10.78, 10.27, 8.78
11.11, 11.59, 11.66, 11.36, 10.89, 10.65, 10.32, 9.53, 8.79
34 36 35 39 2. Test for “equality” of variances concerning the samples: because the data
comes from a non-normal distribution, we used Levene Test for Equality of Variances, α=0.05. Result: the p-value=0.699>0.05, so the variances are the same;
3. Test for “equality” of means concerning the samples: for the same reasons we used a non-parametric test, Tukey Test, α=0.05. Results: Sample1 vs. Sample2: p-value=0.500>0.054 (Total End Count=2<7); Sample1 vs. Sample3: p-value=0.250>0.054 (Total End Count=4<7); Sample1 vs. Sample4: p-value=0.094>0.054 (Total End Count=6<7); Sample2 vs. Sample3: p-value=0.250>0.054 (Total End Count=4<7); Sample2 vs. Sample4: p-value=0.094>0.054 (Total End Count=6<7); Sample3 vs. Sample4, p-value=0.156>0.054 (Total End Count=5<7), so the means are the same;
4. Test for “equality” of medians concerning the samples: we used the non-parametric Kruskal-Wallis Test, α=0.05. Results: Sample1 vs. Sample2 vs. Sample3: p-value=0.471>0.05; Sample1 vs. Sample2 vs. Sample4: p-value=0.377>0.05; Sample1 vs. Sample3 vs. Sample4: p-value=0.358>0.05; Sample2 vs. Sample3 vs. Sample4: p-value=0.490>0.05, so the medians are the same;
5. Because the means, dispersions and medians of the samples are the same (they do not differ significantly), we can conclude that the samples are extracted from the same population and can form a single sample;
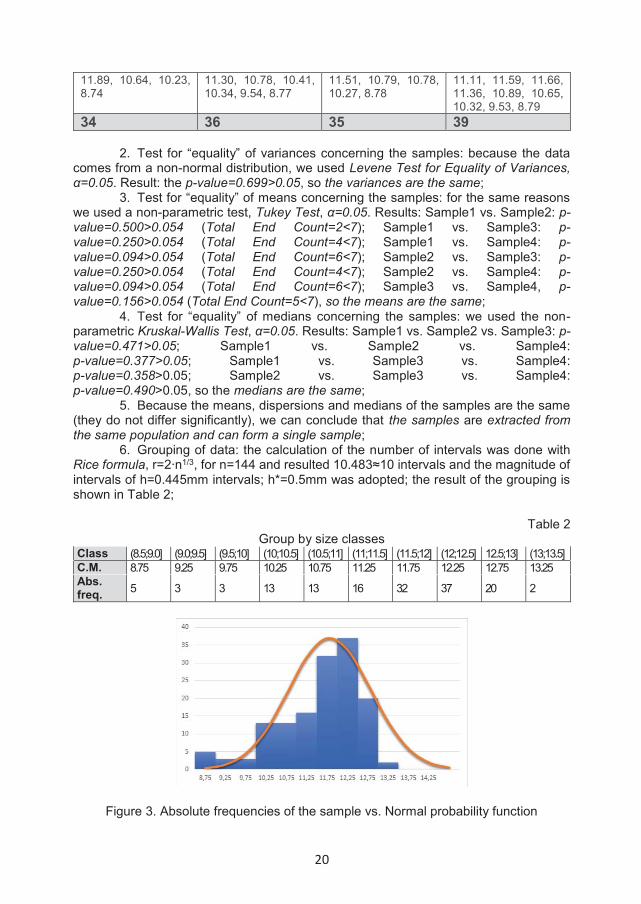
6. Grouping of data: the calculation of the number of intervals was done with Rice formula, r=2∙n1/3, for n=144 and resulted 10.483≈10 intervals and the magnitude of intervals of h=0.445mm intervals; h*=0.5mm was adopted; the result of the grouping is shown in Table 2;
Table 2
Group by size classes Class (8.5;9.0] (9.0;9.5] (9.5;10] (10;10.5] (10.5;11] (11;11.5] (11.5;12] (12;12.5] 12.5;13] (13;13.5] C.M. 8.75 9.25 9.75 10.25 10.75 11.25 11.75 12.25 12.75 13.25 Abs. freq. 5 3 3 13 13 16 32 37 20 2
Figure 3. Absolute frequencies of the sample vs. Normal probability function

21
Figure 4. Difference between the cumulative frequencies of the sample and the normal distribution function
7. Applying the Kolmogorov-Smirnov test (Tascu et al., 2008) results:max|Fn(x)–F0(x)|=0.106<1.36/SQRT(144)=0.1133, so the sample grouped in classes has a Gaussian distribution.
For estimating some maize grain statistical values, we have considered the Bootstrap technique. We used the “bootci” function from MATLAB (MathWorks, Inc.). For our application, the syntaxes are:
- [CImean]=bootci(20000,{@mean,x},'type','norm','alpha',0.05,'stderr',std(x))- [CIstdev]=bootci(20000,{@std,x},'type','norm','alpha',0.05,'stderr',std(x))- [CImax]=bootci(20000,{@max,x},'type','norm','alpha',0.05,'stderr',std(x))- [CImin]=bootci(20000,{@min,x},'type','norm','alpha',0.05,'stderr',std(x))
Table 3 Results of Bootstrapping
Confidence level (P=1–α)
Confidence interval Mean [mm] Stdv [mm] Max. [mm] Min. [mm]
P=0.95 (11.402; 11.729) (0.881; 1.143) (13.072; 13.422) (8.637; 8.809) P=0.99 (11.351; 11.782) (0.837; 1.184) (13.014; 13.480) (8.622; 8.826)
According to these results, with a probability of 0.95 (95 %), the maximum considered value of maize grains of MAS 54.H, cultivated on the parcel analysed, is between 13.0717mm and 13.4216mm and with a probability of 0.99 (99 %) is between 13.0140mm and 13.4799mm.
The meshes of the sieve will need to be designed/adjusted according to the resulting data.
CONCLUSIONS Granulometric analysis and bootspaping can reduce losses by using seed
coulters corresponding to the size of the seeds. By default, it reduces the consumption of energy consumed and increases the
cleaning capacity. The method can also be used in other corn varieties as well as wheat, barley,
oats, rye, rice, sugar beet.
22
REFERENCES Alexandrescu M., Cotetiu A., Daraba D., 2016, Correlations Regarding Lubricant
Film Thickness to the Narrow Sliding Radial Bearing Working under Hard Shocks, Scientific Bulletin Series C : Fascicle Mechanics, Tribology, Machine Manufacturing Technology; Baia Mare Vol. 30, pp. 2-5.
Balc G., Sugar I.R., Gaspar F., 2016, Maşini şi instalaţii pentru industria alimentară, Vol.II, Editura Risoprint, Cluj-Napoca.
Medan, N., Basarman, A.P., 2017, Optimizing the Equation of Impact Forces Produced by Water Jets Used in Sewer Cleaning. Magazine of Hydraulics, Pneumatics, Tribology, Ecology, Sensorics, Mechatronics, no. 2, ISSN 1453-7303, pp. 56-61.
Sorica F.C.M., 2011, Contribuţii la studiul procesului de condiţionare a cerealelor, Teza de doctorat, Universtatea Transilvania, Braşov.
Tascu, I., Pop, M.S., et al., 2008, Probabilități și statistică. Teorie și aplicații, ISBN 978-973-751-753-1, Editura Risoprint, Cluj-Napoca.
Tisan V., 2009, Utilaje în Industria Alimentară, Editura Risoprint, Cluj-Napoca. Tucu D., 2007, Panificaţia. Sisteme tehnologice şi structuri productive, Editura
Orizonturi, Universitare Timişoara.
23
ASSESSMENT OF THE INFLUENCE OF THE FACTORS VARIETY AND GREEN PRUNING TREATMENTS ON THE AVERAGE GRAPE YIELD
BASED ON THE MATHEMATICAL - STATISTICAL ANALYSIS
Belberova Yordanka*, Tsvetanov Emil, Simeonov Iliyan
Institute of Viticulture and Enology – Pleven * Correspondence author. E-mail: [email protected]
Keywords: vine, variety, yield, green pruning, two-factor analysis of variance
ABSTRACT The objective of the study was to determine the degree of influence of the factors variety
and green pruning on the average grape yield per vine by means of two-factor analysis of variance. The trial was carried out at the Experimental Base of IVE – Pleven in the period 2014 – 2016, with Storgozia and Muscat Kaylashki varieties. Factors A variants were the variety, and factor B - the vine green parts procedures, which were as follows: B1 - control - no summer hedging; B2 – topping in June; B3 – cluster thinning – removal of 1/3 (30 - 35 %) of the clusters in total for the variant; B4 – topping in July; B5 – defoliation in the cluster zone, B6 – variant with the most flower clusters. Asa result of the analysis, it could be concluded that in 2014 and 2016, the dominant impact on grape yield had the green pruning treatments while in 2015 the influence of the genetically determined fertility of the particular variety was dominant. If these results were referred to the climatic characteristics of the separate trial years, and considering the fact that all three years were wet, it might be argued that in cool years the influence of the green pruning treatments was dominant on the grape yield, and in hotter years the influence of the particular variety fertility dominated.
INTRODUCTION Agricultural crops productivity, including grapevine has depended mainly on the
genetic potential of the variety, the weather conditions during the vegetation period and the applied agricultural and technical practices (Simeonov, 2013).
The biological potential of the different vine varieties has been quite varied and underlies the scientific foundations of vine growing technologies. The produce could be improved by applying adequate procedures and maintaining optimal technological conditions. Therefore, the implementation of modern technologies that were economically efficient could ensure a sustainable raise of grapes production, both in quantity and quality (Ciobanu et al, 2012).
Most researches have been focused on the independent influence of the agricultural and technical factors on grapevine growth and development and its productive potential (Stoev and Lilov, 1957; Hale and Weaver, 1962; Todorov and Zankov, 1965; Popov et al., 1972; Kurtev et al., 1979; Schneider, 1985; Radulov, L. 1988; Iacono and Sparacio 1999; Hunter and Roux, 2000; Pisciotta et al., 2007; Pastore et al., 2011).
The contemporary development of research in all fields of plant-growing has increasingly led to the widespread use of complicated experimentation. That, on the one hand, was determined by the need to reduce the time, the place and the means for carrying out research experiments, and on the other as many scientific conclusions as
ANNALS OF THE UNIVERSITY OF CRAIOVA
Series: Biology Horticulture Food produce processing
technology Environmental engineering Vol. XXII I (LIX) - 2018

24
possible to be reached. In field trials, this development of research concerned not only the number of the tested variants and the actions of the individual factors, but also the need to study the degree of action of the specific factors (Barov and Naydenova, 1969).
The objective of the study was to determine the degree of influence of the factors – variety and green pruning on the average grape yield per vine.
MATERIAL AND METHODS
A trial was set in the years 2014, 2015, 2016 at the Experimental Base of IVE – Pleven in vineyards of Storgozia and Muscat Kaylashki varieties. It was set in four repetitions of 10 vines or 40 vines per variant. The soil type in the trial plantation was leached chernozem, formed on clayed loess (Krastanov and Dilkova, 1963).
The weather characteristics of the years were determined by the mathematical statistic methods (Sirakov, 1981).
The variants of the trial were, as follows: - Factor A (Variety): А1 – Muscat Kaylashki – medium ripening white wine variety, obtained through
interspecific hybridization by crossing Muscat Hamburgski x Villard Blanc 12375 (Roychev, 2012).
А2 – Storgozia – medium ripening red wine variety, obtained through interspecific hybridization by crossing Bouquet x Villard Blanc 12375 (Roychev, 2012).
- Factor В (Green pruning treatments): B1 - control - no summer hedging; B2 – topping in June; B3 – cluster thinning – removal of 1/3 (30 – 35 %) of the clusters in total for the variant; B4 – topping in July; B5 – defoliation in the cluster zone, B6 – variant with the most flower clusters.
The results were statistically processed by two-factor analysis of variance (ANOVA) (Dimova and Marinkov, 1999). The significance of the assessment and the power of impact of the factors were calculated by Plohinski method (Lakin, 1990).
RESULTS AND DISCUSSION
The climate elements had a strong and significant impact on the quantity and quality of grape yield each particular year. Summarized weather characteristics of each of the study years (2014 – 2016) regarding the precipitation probability and the average air temperatures are presented in Table 1.
Table 1
Probability (Р %) of precipitation and average air temperature for the period 2014 – 2016
Years 2014 2015 2016 N (V –IX)
% 14 (Very wet) 17 (Very wet) 35 (Wet)
Тᵒ(V –IX) 97 (Very cool) 29 (Hot) 56 (Average cool) Р – probability, N – precipitations, Тᵒ - average air temperature With a view of the average air temperatures, 2014 could be defined as very cool,
2015 – hot, and 2016 an average cool year. As for the sum of the precipitation, the years 2014 and 2015 were very wet and 2016 – wet.
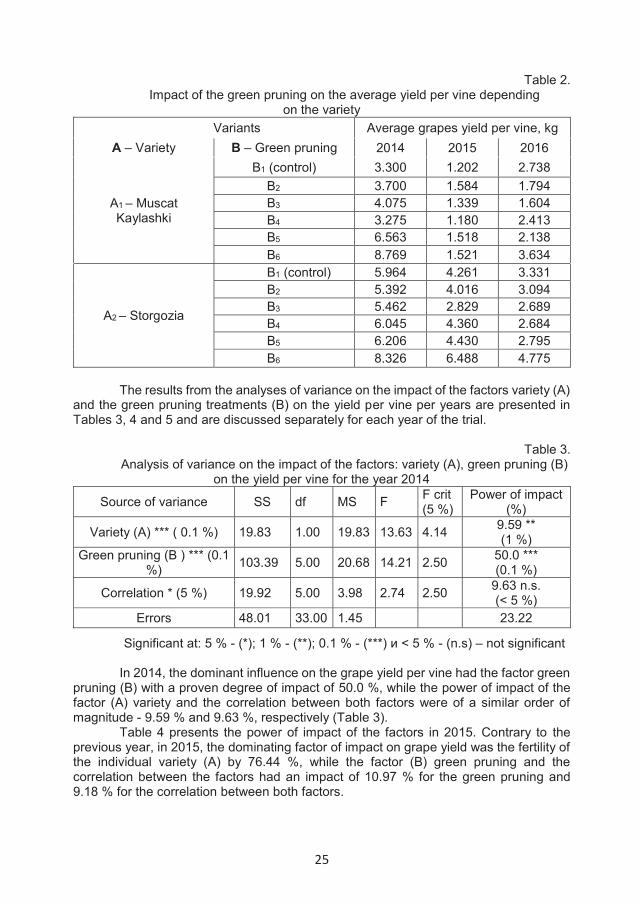
Table 2 presents the data on the average grape yields per vine, per variety and depending on the various green pruning treatments.
25
Table 2. Impact of the green pruning on the average yield per vine depending
on the variety Variants Average grapes yield per vine, kg
А – Variety В – Green pruning 2014 2015 2016
А1 – Muscat Kaylashki
В1 (control) 3.300 1.202 2.738 В2 3.700 1.584 1.794 В3 4.075 1.339 1.604 В4 3.275 1.180 2.413 В5 6.563 1.518 2.138 В6 8.769 1.521 3.634
А2 – Storgozia
В1 (control) 5.964 4.261 3.331 В2 5.392 4.016 3.094 В3 5.462 2.829 2.689 В4 6.045 4.360 2.684 В5 6.206 4.430 2.795 В6 8.326 6.488 4.775
The results from the analyses of variance on the impact of the factors variety (А) and the green pruning treatments (В) on the yield per vine per years are presented in Tables 3, 4 and 5 and are discussed separately for each year of the trial.
Table 3. Analysis of variance on the impact of the factors: variety (А), green pruning (В)
on the yield per vine for the year 2014
Source of variance SS df MS F F crit (5 %)
Power of impact (%)
Variety (А) *** ( 0.1 %) 19.83 1.00 19.83 13.63 4.14 9.59 ** (1 %)
Green pruning (В ) *** (0.1 %) 103.39 5.00 20.68 14.21 2.50 50.0 ***
(0.1 %)
Correlation * (5 %) 19.92 5.00 3.98 2.74 2.50 9.63 n.s. (< 5 %)
Errors 48.01 33.00 1.45 23.22
Significant at: 5 % - (*); 1 % - (**); 0.1 % - (***) и < 5 % - (n.s) – not significant
In 2014, the dominant influence on the grape yield per vine had the factor green pruning (B) with a proven degree of impact of 50.0 %, while the power of impact of the factor (A) variety and the correlation between both factors were of a similar order of magnitude - 9.59 % and 9.63 %, respectively (Table 3).
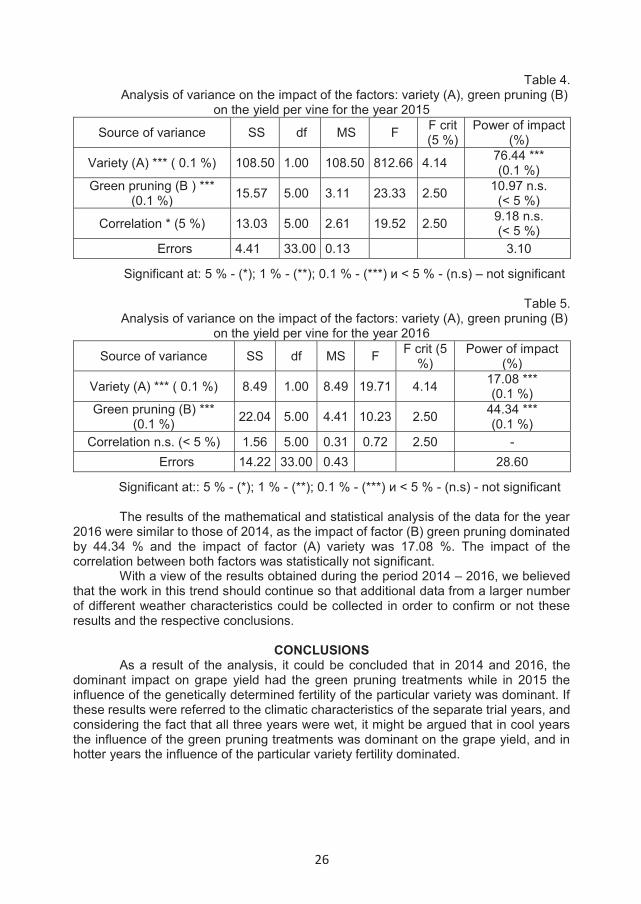
Table 4 presents the power of impact of the factors in 2015. Contrary to the previous year, in 2015, the dominating factor of impact on grape yield was the fertility of the individual variety (A) by 76.44 %, while the factor (B) green pruning and the correlation between the factors had an impact of 10.97 % for the green pruning and 9.18 % for the correlation between both factors.
26
Table 4. Analysis of variance on the impact of the factors: variety (А), green pruning (В)
on the yield per vine for the year 2015
Source of variance SS df MS F F crit (5 %)
Power of impact (%)
Variety (А) *** ( 0.1 %) 108.50 1.00 108.50 812.66 4.14 76.44 *** (0.1 %)
Green pruning (В ) *** (0.1 %) 15.57 5.00 3.11 23.33 2.50 10.97 n.s.
(< 5 %)
Correlation * (5 %) 13.03 5.00 2.61 19.52 2.50 9.18 n.s. (< 5 %)
Errors 4.41 33.00 0.13 3.10
Significant at: 5 % - (*); 1 % - (**); 0.1 % - (***) и < 5 % - (n.s) – not significant
Table 5. Analysis of variance on the impact of the factors: variety (А), green pruning (В)
on the yield per vine for the year 2016
Source of variance SS df MS F F crit (5 %)
Power of impact (%)
Variety (А) *** ( 0.1 %) 8.49 1.00 8.49 19.71 4.14 17.08 *** (0.1 %)
Green pruning (В) *** (0.1 %) 22.04 5.00 4.41 10.23 2.50 44.34 ***
(0.1 %) Correlation n.s. (< 5 %) 1.56 5.00 0.31 0.72 2.50 -
Errors 14.22 33.00 0.43 28.60
Significant at:: 5 % - (*); 1 % - (**); 0.1 % - (***) и < 5 % - (n.s) - not significant The results of the mathematical and statistical analysis of the data for the year
2016 were similar to those of 2014, as the impact of factor (B) green pruning dominated by 44.34 % and the impact of factor (A) variety was 17.08 %. The impact of the correlation between both factors was statistically not significant.
With a view of the results obtained during the period 2014 – 2016, we believed that the work in this trend should continue so that additional data from a larger number of different weather characteristics could be collected in order to confirm or not these results and the respective conclusions.
CONCLUSIONS
As a result of the analysis, it could be concluded that in 2014 and 2016, the dominant impact on grape yield had the green pruning treatments while in 2015 the influence of the genetically determined fertility of the particular variety was dominant. If these results were referred to the climatic characteristics of the separate trial years, and considering the fact that all three years were wet, it might be argued that in cool years the influence of the green pruning treatments was dominant on the grape yield, and in hotter years the influence of the particular variety fertility dominated.
27
REFERENCES Barov, V., Naydenova P., 1969, Statistical methods in field and vegetation trials.
Zemizdat, Sofia, p. 284. Ciobanu, F., Pop N., Iliescu M., Babeş A., Bunea I., Ardeban A. E., Lung M. L.,
Tripon A. F., 2012.Special green works influence on yield quantity and quality at grape varieyies for flavoured and semi-flavoured wines from S. C. D. V. V. blaj. Bulletin UASVM Horticulture, 69 (1), pp. 110 – 115.
Dimova, D. Marinkov E., 1999, Experimental work and biometry. Academic Publishing House of Higher Institute of Agriculture Plovdiv, p. 263.
Hale, C. R., Weaver R. I., 1962, Hulgardia, v. 33, 3. Hunter J. J., Roux D. J. le, 2000. Canopy management effects on yield, labour
input and growth compensation – new canopy composition perspectives. Acta Horticulturae, 2000, pp. 81 – 89.
Iacono F., Sparacio A., 1999, Influence of topping on productivity of cv. Cabernet Sauvignon (Vitis vinifera L.) cultivated in a hot and dry environment. Vignevini, vol. 26, № 3, pp. 90 – 93.
Krastanov, S., Dilkova, 1963, The soils in the experimental field of the Institute of Viticulture and Enology - Pleven. Institute of Soil Science N. Pushkarov, Sofia, 60.
Kurtev P., Tsankov B., Todorov H., 1979, Viticulture. Hristo G. Danov, Plovdiv. Lakin G., 1990, Biometrics, Higher School, Moscow, p. 350. Pastore C., Zenoni S., Tornielli G. B., Alegro G., Dal Santo S., Valentini G.,
Intrieri C., Pezzotti M., Filippetti I., 2011, 3 Increasing the sourse/sink ratio in Vitis vinifera (cv. Sangiovese) induces extensive transcriptome reprogramming and modifies bery ripening. BMC Genomics, Vol.12, Suppl. 2, pp. 631 – 653.
Pisciotta A., Barbagallo M. G., Lorenzo R. di, Vetere R. lo, Hunter J. J., 2007, Effect of Tipping and Topping on shoot uniformity: preliminary results on single cordon trained Cabernet Sauvignon and Merlot. Acta Horiculturae, 2007, pp. 175 – 178.
Popov T., Nikov M., Magriso Yu., Pavlov N., 1972, Agrotechnics of vine. Hristo G. Danov.
Radulov L., 1988, Green pruning – an important factor for higher grape yields. Lozarstvo I Vinarstvo, No. 2, p. 9 – 11.
Roychev V., 2012. Ampelography. Academic Publishing House of the Agrarian University, Plovdiv, p. 576.
Schneider C., 1985, Influence de la suppression des entre couers de souches de vigne sur la microclimat lumineux et la recolte. Connaissance de la Vigne et du Vin. 19:17 – 30.
Simeonov, I., 2013, Comparative evaluation of the indicators for yield from clones of Muscat Vrachanski variety. Selskostopanska Nauka, issue 3-4, 39-45.
Sirakov, D., 1981, Statistical methods in meteorology, University Publishing House “St. Kliment Ohridski” - Sofia, p. 269.
Stoev, K., Lilov D., 1957. To the physiology of vine green pruning. Scientific Papers Institute of Viticulture and Enology, Pleven, No. 1, 21-37.
Todorov H., Zankov Z., 1965. Formation of the leaf surface from vine lateral shoots and its impact on grapes quality and quantity. Gradinarska i Lozarska Nuka, year. II, No. 5, p. 631-641.
28
EFFECT OF STIMULANTS ON THE CAPACITY OF ROOTING OF THE SAMBUCUS NIGRA L. CUTTINGS FOR CONSERVATION
IN GERMPLASM COLLECTIONS
Bizera Mihaela1*, Mîndrilă Gheorghiţa2, Papachatzis Alexandros3, Botu Mihai2,4
1University of Craiova, Faculty of Horticulture, IRVA Doctoral School, Craiova, Romania
2University of Craiova, Faculty of Horticulture, Department of Horticulture and Food Science, Craiova, Romania 3Technological Educational Institute of Thessaly, Larissa, Greece
4University of Craiova - SCDP Vâlcea, Rm. Vâlcea, Romania * Correspondence author. E-mail: [email protected]
Keywords: Elderberry, selections, clonal propagation, rooting products
ABSTRACT In this experiment, the effect of rooting stimulants on Sambucus nigra cuttings was
evaluated. As rooting stimulants the following products were used: Radistim no. 2 (powder used for the rooting of hardy and semi-hardwood cuttings); Atonik, at a concentration of 0.25 ml/l and IBA (indolylbutyric acid), at a concentration of 0.5 mg/l. Cuttings were harvested from 4-5 year old plants, splitted in 5 groups depending on size and planted in a plastic tunnel on November 1st, 2017. The measurements were carried out on July 1st, 2018 and focused on the number of roots, roots length, number of shoots and length of shoots. The best results in terms of rooting have been obtained with the 4th variant (V4), with size of cuttings of 20-30 cm, treated with Radistim.
INTRODUCTION
Elderberry (Sambucus spp.) is a species that is found in both the spontaneous flora, and also cultivated in orchards, having a wide range of uses (Charlebois et al., 2010). Between the species of Sambucus genus, Sambucus nigra L. (black elder) is well known in Europe and in our country. If we consider the other sub-species, then its areal expands to Asia, Africa and North America (Botu, 1988).
Black elderberry has many uses, in horticulture, as ornamental shrub, and a food source for wild animals and humans (Valles et al. 2004; cited by Charlebois et al., 2010). Elderberry has also an ecological role, stabilizing the soil and the river banks (Paquet and Jutras, 1996; cited by Charlebois et al., 2010). Elderberries are rich in antioxidants and can be used as food or medicine (Prior, 2003; Willcox et al., 2004; Scalbert et al., 2005; Zafra-Stone et al., 2007; Seeram, 2008; cited by Charlebois et al., 2010).
The great diversity of elderberry existing in the spontaneous flora allows selection of valuable genotypes, which will be promoted in culture, or will be introduced in the germplasm collections, as potential sources of valuable genes for breeding programs. The genotypes selected in situ will be propagated, in this respect the identification and promotion of effective vegetative propagation methods are needed.
Research on the influence of stimulants for rooting both for elderberry and other species was carried out by Maughan et al. (2018), who tested the influence of
ANNALS OF THE UNIVERSITY OF CRAIOVA
Series: Biology Horticulture Food produce processing
technology Environmental engineering Vol. XXII I (LIX) - 2018
29
naphthylacetic acid (NAA) on rooting. Boyer and Graves (2009) studied the effect of 3-indolilbutiric acid (IBA) in a concentration of 3000 ppm and of naphthylacetic acid (NAA) on the hardwood cuttings of Nyssa aquatica and Nyssa ogeche, achieving a 93 % rooting of cuttings.
Sabo (2011), in her PhD thesis, experimented the influence of Radistim influence on rooting several species like Ligustrum vulgare, Buxus sempervirens and Taxus baccata, on different growing substrates. The best results in terms of rooting and shoots growth were obtained in case of tip cuttings treated with Radistim 2.
Murtić et al. (2015) have examined the influence of different concentrations (0.2; 0.4; 0.8 and 1.5 mg/l) of 3-indolilbutiric acid (IBA) on rooting of Sambucus nigra cuttings. The concentration of 0.8 mg/l of IBA influenced the most the parameters examined (fresh root mass, number of adventitious roots and leaf surface).
Researchers from the National Clonal Germplasm Repository (NCGR) in Corvallis - Oregon (U.S.A.) observed that for rooting cuttings of Sambucus racemosa L. in greenhouse conditions, no stimulation is required (Flessner and Trindle, 2003).
Gudeva et al. (2017) conducted a study on the influence of hormones in the process of rhizogenesis of Sambucus nigra L. cuttings planted in a tunnel covered with plastic foil. Only 14 % of the cuttings treated with IAA and 10 % of the cuttings treated with BAP have rooted.
In this study, we have tested the effect of various stimulants (IBA, Atonik and Radistim 2) on cuttings’ rooting and development of elderberry shoots.
MATERIALS AND METHODS The biological material used in the experiment consisted of hardwood cuttings
harvested on November 30, 2017, in Nicolae Bãlcescu locality in Vâlcea County, from Sambucus nigra L. shrubs, of 4-5 years old.
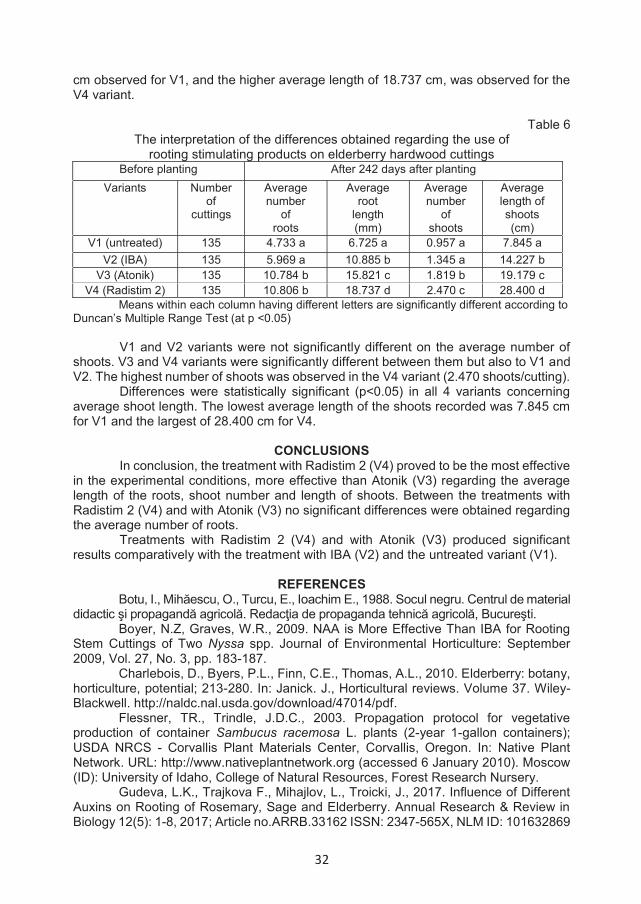
Elderberry hardwood cuttings were obtained from the middle part of the annual growth and were sized to the length of internode, having a basal node and one on top. Depending on the length and diameter of internode cuttings, the cuttings were divided into 5 groups of different sizes (Figure 1):
Group I: length of 30-35 cm and a diameter of 1.5-2.0 cm; Group II: length of 25-30 cm and a diameter of 1.0-1.5 cm; Group III: length of 20-30 cm and a diameter of 0.8-1.0 cm; Group IV: length of 20-25 cm and a diameter of 0.6-1.0 cm; Group V: length of 20-30 cm and a diameter of 0.5-0.8 cm. The experiment was designed as bifactorial type, with 4 types of treatment (V1-
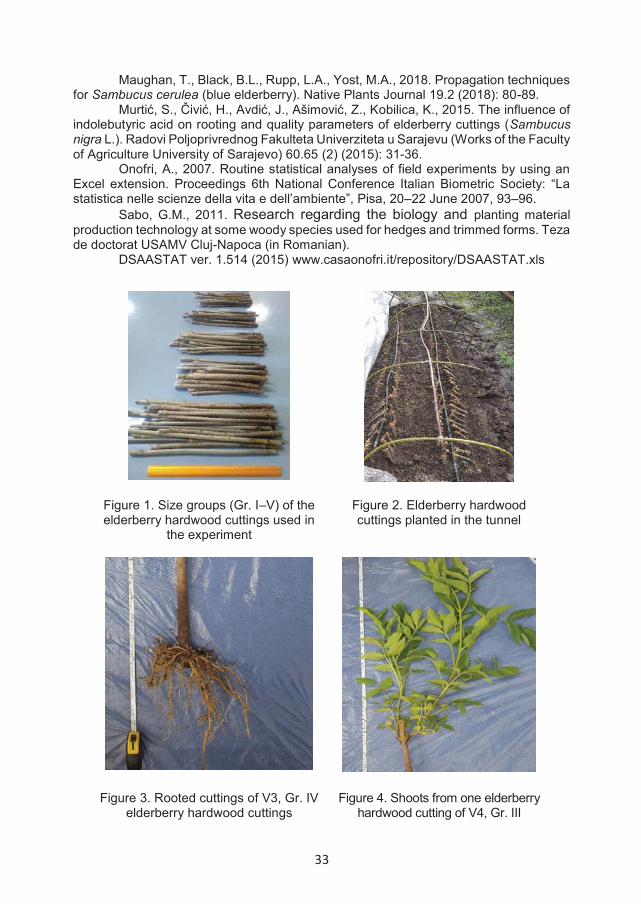
V5 variants) and 5 groups of cuttings’ sizes. Each variant was composed of 45 hardwood cuttings and was divided in 3 replications. The experiment was set in the trial fields of the Faculty of Horticulture at the Didactical and Experimental Station of Banu Mărăcine, near Craiova. The cuttings were held between November 1, 2017 - July 1, 2018. Cuttings were planted in a plastic tunnel, at 25 cm between rows and 10 cm between plants in the row (Figure 2).
Before planting, the soil was mobilized and peat and perlite were added in a ratio of 1:1 on the trench where the cuttings were planted in rows.
Cuttings were treated in advance with simulators, one of the variants (V1) did not benefit of any stimulant treatment. The basal part of the hardwood cuttings was dipped during 20 minutes into stimulant solutions of IBA and Atonik (Table 1).

30
Table 1 The stimulants used in the experiment
Encoding variants
Treatment type
Exposure time (minutes)
V1 Untreated - V2 IBA (0.5 mg/l) 20' V3 Atonik (0.25 ml/l) 20' V4 Radistim 2 -
IBA was applied on the variant V2, at a concentration of 0.5 mg/l. Atonik was
applied on variant V3, at a concentration of 0.25 ml/l. In case of variant V4, the basal part of the cuttings was distempered with Radistim 2. After the treatments, the hardwood cuttings were placed in the trench where peat and perlite were added in advance and then covered with the same mixture.
During the growing season, maintenance work has been applied: soil mobilization through the rows of cuttings, weed removal, phytosanitary treatments, irrigation and tunnel ventilation.
Observations were carried out after 242 days from planting and referred to: number of rooted cuttings, number of roots per cutting, root length, number and length of shoots on the cuttings.
MS Excel software was used for data analysis of variance (ANOVA) and DSAASTAT ver. 1.514 (2015) for Duncan’s Multiple Range Test at significance level of p<0.05. DSAASTAT is an Excel VBA Macro developed by Onofri (2007).
RESULTS OBTAINED The elderberry hardwood cuttings, treated with stimulant substances and
planted in the trial, were examined 242 days after planting. The results obtained were different depending on the treatment used and the size of the cuttings.
Thus, the highest average number of roots (21.1) were obtained at the hardwood cuttings from Group IV (length of 20-25 cm and 0.6-1.0 cm in diameter) treated with Atonik, at a concentration of 0.25 ml/l (V3) (Table 2, Figure 3).
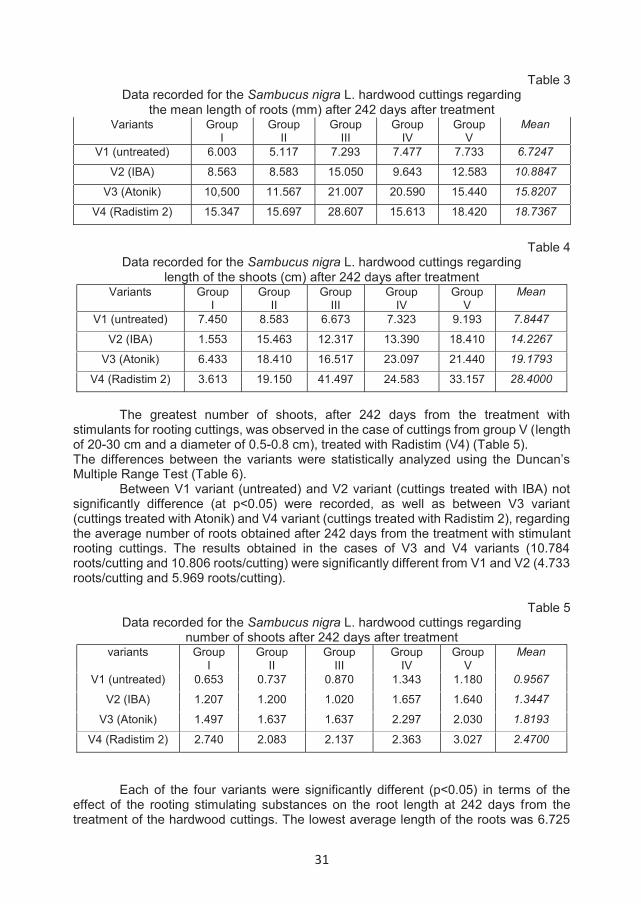
The highest value of the mean length of the roots of 28.607 cm were observed in the case of cuttings from the group III (length of 20-30 cm and a diameter of 0.8-1.0 cm), cuttings treated with Radistim 2 (V4) (Table 3).
The highest values of the mean length of the shoots of 41.497 cm were observed in the case of cuttings from the group III (length of 20-30 cm and diameter of 0.8-1.0 cm), cuttings treated with Radistim 2 (V4) (Table 4 and Figure 4).
Table 2 Data recorded for the Sambucus nigra L. hardwood cuttings regarding
the mean number of roots counted after 242 days after treatment Variants Group
I Group
II Group
III Group
IV Group
V Mean
V1 (untreated) 4.423 3.100 5.427 7.247 3.467 4.7327
V2 (IBA) 5.723 3.473 7,193 8.983 4.473 5.9693
V3 (Atonik) 7.583 5.367 8.327 21.100 11.543 10.7840
V4 (Radistim 2) 10.137 7.213 10.533 10.900 15.247 10.8060
31
Table 3 Data recorded for the Sambucus nigra L. hardwood cuttings regarding
the mean length of roots (mm) after 242 days after treatment Variants Group
I Group
II Group
III Group
IV Group
V Mean
V1 (untreated) 6.003 5.117 7.293 7.477 7.733 6.7247
V2 (IBA) 8.563 8.583 15.050 9.643 12.583 10.8847
V3 (Atonik) 10,500 11.567 21.007 20.590 15.440 15.8207
V4 (Radistim 2) 15.347 15.697 28.607 15.613 18.420 18.7367
Table 4 Data recorded for the Sambucus nigra L. hardwood cuttings regarding
length of the shoots (cm) after 242 days after treatment Variants Group
I Group
II Group
III Group
IV Group
V Mean
V1 (untreated) 7.450 8.583 6.673 7.323 9.193 7.8447
V2 (IBA) 1.553 15.463 12.317 13.390 18.410 14.2267
V3 (Atonik) 6.433 18.410 16.517 23.097 21.440 19.1793
V4 (Radistim 2) 3.613 19.150 41.497 24.583 33.157 28.4000
The greatest number of shoots, after 242 days from the treatment with stimulants for rooting cuttings, was observed in the case of cuttings from group V (length of 20-30 cm and a diameter of 0.5-0.8 cm), treated with Radistim (V4) (Table 5). The differences between the variants were statistically analyzed using the Duncan’s Multiple Range Test (Table 6).
Between V1 variant (untreated) and V2 variant (cuttings treated with IBA) not significantly difference (at p<0.05) were recorded, as well as between V3 variant (cuttings treated with Atonik) and V4 variant (cuttings treated with Radistim 2), regarding the average number of roots obtained after 242 days from the treatment with stimulant rooting cuttings. The results obtained in the cases of V3 and V4 variants (10.784 roots/cutting and 10.806 roots/cutting) were significantly different from V1 and V2 (4.733 roots/cutting and 5.969 roots/cutting).
Table 5 Data recorded for the Sambucus nigra L. hardwood cuttings regarding
number of shoots after 242 days after treatment variants Group
I Group
II Group
III Group
IV Group
V Mean
V1 (untreated) 0.653 0.737 0.870 1.343 1.180 0.9567
V2 (IBA) 1.207 1.200 1.020 1.657 1.640 1.3447
V3 (Atonik) 1.497 1.637 1.637 2.297 2.030 1.8193
V4 (Radistim 2) 2.740 2.083 2.137 2.363 3.027 2.4700
Each of the four variants were significantly different (p<0.05) in terms of the effect of the rooting stimulating substances on the root length at 242 days from the treatment of the hardwood cuttings. The lowest average length of the roots was 6.725
32
cm observed for V1, and the higher average length of 18.737 cm, was observed for the V4 variant.
Table 6
The interpretation of the differences obtained regarding the use of rooting stimulating products on elderberry hardwood cuttings
Before planting After 242 days after planting Variants Number
of cuttings
Average number
of roots
Average root
length (mm)
Average number
of shoots
Average length of shoots (cm)
V1 (untreated) 135 4.733 a 6.725 a 0.957 a 7.845 a V2 (IBA) 135 5.969 a 10.885 b 1.345 a 14.227 b
V3 (Atonik) 135 10.784 b 15.821 c 1.819 b 19.179 c V4 (Radistim 2) 135 10.806 b 18.737 d 2.470 c 28.400 d
Means within each column having different letters are significantly different according to Duncan’s Multiple Range Test (at p <0.05)
V1 and V2 variants were not significantly different on the average number of
shoots. V3 and V4 variants were significantly different between them but also to V1 and V2. The highest number of shoots was observed in the V4 variant (2.470 shoots/cutting).
Differences were statistically significant (p<0.05) in all 4 variants concerning average shoot length. The lowest average length of the shoots recorded was 7.845 cm for V1 and the largest of 28.400 cm for V4.
CONCLUSIONS
In conclusion, the treatment with Radistim 2 (V4) proved to be the most effective in the experimental conditions, more effective than Atonik (V3) regarding the average length of the roots, shoot number and length of shoots. Between the treatments with Radistim 2 (V4) and with Atonik (V3) no significant differences were obtained regarding the average number of roots.
Treatments with Radistim 2 (V4) and with Atonik (V3) produced significant results comparatively with the treatment with IBA (V2) and the untreated variant (V1).
REFERENCES
Botu, I., Mihăescu, O., Turcu, E., Ioachim E., 1988. Socul negru. Centrul de material didactic şi propagandă agricolă. Redacţia de propaganda tehnică agricolă, Bucureşti.
Boyer, N.Z, Graves, W.R., 2009. NAA is More Effective Than IBA for Rooting Stem Cuttings of Two Nyssa spp. Journal of Environmental Horticulture: September 2009, Vol. 27, No. 3, pp. 183-187.
Charlebois, D., Byers, P.L., Finn, C.E., Thomas, A.L., 2010. Elderberry: botany, horticulture, potential; 213-280. In: Janick. J., Horticultural reviews. Volume 37. Wiley-Blackwell. http://naldc.nal.usda.gov/download/47014/pdf.
Flessner, TR., Trindle, J.D.C., 2003. Propagation protocol for vegetative production of container Sambucus racemosa L. plants (2-year 1-gallon containers); USDA NRCS - Corvallis Plant Materials Center, Corvallis, Oregon. In: Native Plant Network. URL: http://www.nativeplantnetwork.org (accessed 6 January 2010). Moscow (ID): University of Idaho, College of Natural Resources, Forest Research Nursery.
Gudeva, L.K., Trajkova F., Mihajlov, L., Troicki, J., 2017. Influence of Different Auxins on Rooting of Rosemary, Sage and Elderberry. Annual Research & Review in Biology 12(5): 1-8, 2017; Article no.ARRB.33162 ISSN: 2347-565X, NLM ID: 101632869
33
Maughan, T., Black, B.L., Rupp, L.A., Yost, M.A., 2018. Propagation techniques for Sambucus cerulea (blue elderberry). Native Plants Journal 19.2 (2018): 80-89.
Murtić, S., Čivić, H., Avdić, J., Ašimović, Z., Kobilica, K., 2015. The influence of indolebutyric acid on rooting and quality parameters of elderberry cuttings (Sambucus nigra L.). Radovi Poljoprivrednog Fakulteta Univerziteta u Sarajevu (Works of the Faculty of Agriculture University of Sarajevo) 60.65 (2) (2015): 31-36.
Onofri, A., 2007. Routine statistical analyses of field experiments by using an Excel extension. Proceedings 6th National Conference Italian Biometric Society: “La statistica nelle scienze della vita e dell’ambiente”, Pisa, 20–22 June 2007, 93–96.
Sabo, G.M., 2011. Research regarding the biology and planting material production technology at some woody species used for hedges and trimmed forms. Teza de doctorat USAMV Cluj-Napoca (in Romanian).
DSAASTAT ver. 1.514 (2015) www.casaonofri.it/repository/DSAASTAT.xls
Figure 1. Size groups (Gr. I–V) of the elderberry hardwood cuttings used in
the experiment
Figure 2. Elderberry hardwood cuttings planted in the tunnel
Figure 3. Rooted cuttings of V3, Gr. IV elderberry hardwood cuttings
Figure 4. Shoots from one elderberry hardwood cutting of V4, Gr. III
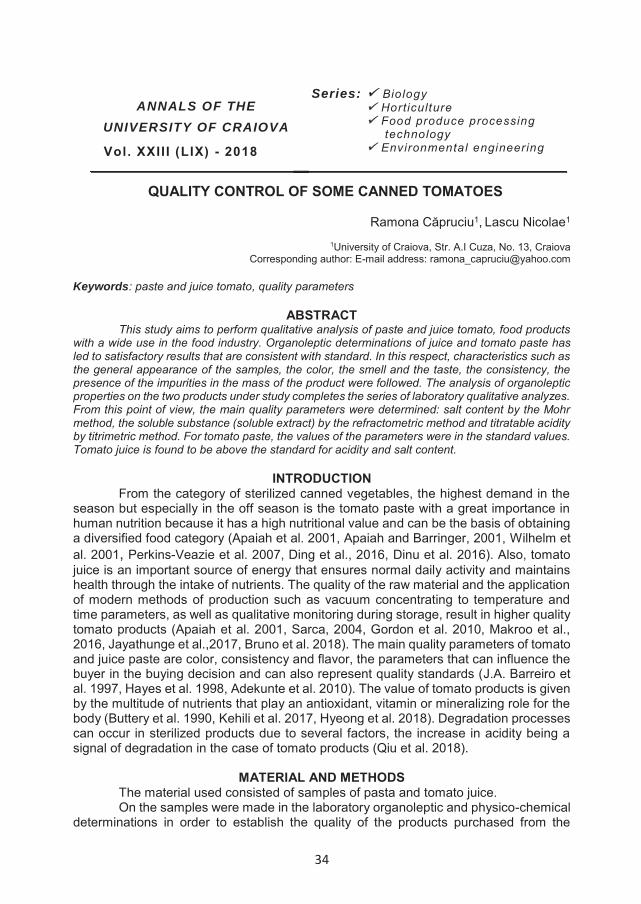
34
QUALITY CONTROL OF SOME CANNED TOMATOES
Ramona Căpruciu1, Lascu Nicolae1
1University of Craiova, Str. A.I Cuza, No. 13, Craiova Corresponding author: E-mail address: [email protected]
Keywords: paste and juice tomato, quality parameters
ABSTRACT This study aims to perform qualitative analysis of paste and juice tomato, food products
with a wide use in the food industry. Organoleptic determinations of juice and tomato paste has led to satisfactory results that are consistent with standard. In this respect, characteristics such as the general appearance of the samples, the color, the smell and the taste, the consistency, the presence of the impurities in the mass of the product were followed. The analysis of organoleptic properties on the two products under study completes the series of laboratory qualitative analyzes. From this point of view, the main quality parameters were determined: salt content by the Mohr method, the soluble substance (soluble extract) by the refractometric method and titratable acidity by titrimetric method. For tomato paste, the values of the parameters were in the standard values. Tomato juice is found to be above the standard for acidity and salt content.
INTRODUCTION From the category of sterilized canned vegetables, the highest demand in the
season but especially in the off season is the tomato paste with a great importance in human nutrition because it has a high nutritional value and can be the basis of obtaining a diversified food category (Apaiah et al. 2001, Apaiah and Barringer, 2001, Wilhelm et al. 2001, Perkins-Veazie et al. 2007, Ding et al., 2016, Dinu et al. 2016). Also, tomato juice is an important source of energy that ensures normal daily activity and maintains health through the intake of nutrients. The quality of the raw material and the application of modern methods of production such as vacuum concentrating to temperature and time parameters, as well as qualitative monitoring during storage, result in higher quality tomato products (Apaiah et al. 2001, Sarca, 2004, Gordon et al. 2010, Makroo et al., 2016, Jayathunge et al.,2017, Bruno et al. 2018). The main quality parameters of tomato and juice paste are color, consistency and flavor, the parameters that can influence the buyer in the buying decision and can also represent quality standards (J.A. Barreiro et al. 1997, Hayes et al. 1998, Adekunte et al. 2010). The value of tomato products is given by the multitude of nutrients that play an antioxidant, vitamin or mineralizing role for the body (Buttery et al. 1990, Kehili et al. 2017, Hyeong et al. 2018). Degradation processes can occur in sterilized products due to several factors, the increase in acidity being a signal of degradation in the case of tomato products (Qiu et al. 2018).
MATERIAL AND METHODS
The material used consisted of samples of pasta and tomato juice. On the samples were made in the laboratory organoleptic and physico-chemical
determinations in order to establish the quality of the products purchased from the
ANNALS OF THE UNIVERSITY OF CRAIOVA
Series: Biology Horticulture Food produce processing
technology Environmental engineering Vol. XXII I (LIX) - 2018
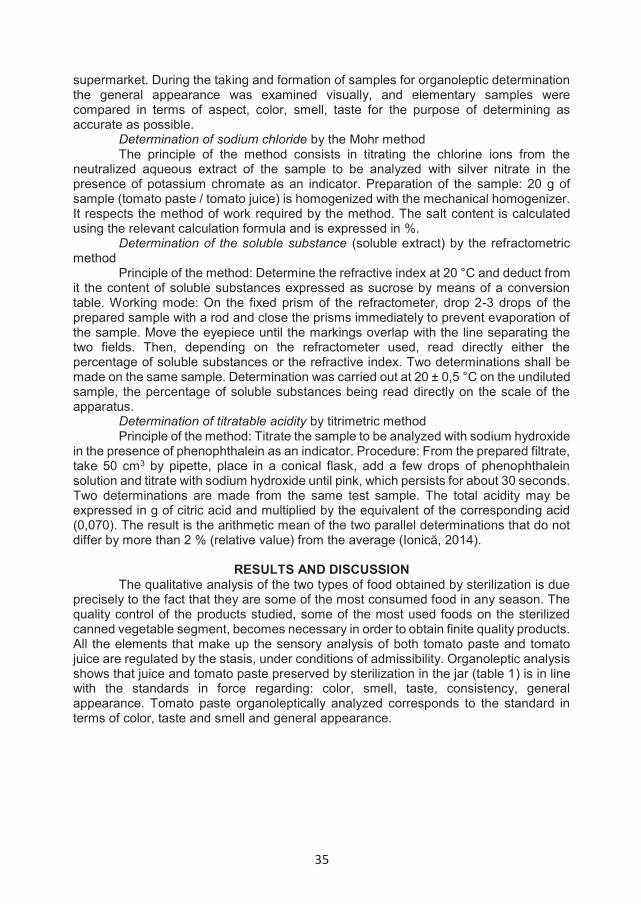
35
supermarket. During the taking and formation of samples for organoleptic determination the general appearance was examined visually, and elementary samples were compared in terms of aspect, color, smell, taste for the purpose of determining as accurate as possible.
Determination of sodium chloride by the Mohr method The principle of the method consists in titrating the chlorine ions from the
neutralized aqueous extract of the sample to be analyzed with silver nitrate in the presence of potassium chromate as an indicator. Preparation of the sample: 20 g of sample (tomato paste / tomato juice) is homogenized with the mechanical homogenizer. It respects the method of work required by the method. The salt content is calculated using the relevant calculation formula and is expressed in %.
Determination of the soluble substance (soluble extract) by the refractometric method
Principle of the method: Determine the refractive index at 20 °C and deduct from it the content of soluble substances expressed as sucrose by means of a conversion table. Working mode: On the fixed prism of the refractometer, drop 2-3 drops of the prepared sample with a rod and close the prisms immediately to prevent evaporation of the sample. Move the eyepiece until the markings overlap with the line separating the two fields. Then, depending on the refractometer used, read directly either the percentage of soluble substances or the refractive index. Two determinations shall be made on the same sample. Determination was carried out at 20 ± 0,5 °C on the undiluted sample, the percentage of soluble substances being read directly on the scale of the apparatus.
Determination of titratable acidity by titrimetric method Principle of the method: Titrate the sample to be analyzed with sodium hydroxide
in the presence of phenophthalein as an indicator. Procedure: From the prepared filtrate, take 50 cm3 by pipette, place in a conical flask, add a few drops of phenophthalein solution and titrate with sodium hydroxide until pink, which persists for about 30 seconds. Two determinations are made from the same test sample. The total acidity may be expressed in g of citric acid and multiplied by the equivalent of the corresponding acid (0,070). The result is the arithmetic mean of the two parallel determinations that do not differ by more than 2 % (relative value) from the average (Ionică, 2014).
RESULTS AND DISCUSSION The qualitative analysis of the two types of food obtained by sterilization is due
precisely to the fact that they are some of the most consumed food in any season. The quality control of the products studied, some of the most used foods on the sterilized canned vegetable segment, becomes necessary in order to obtain finite quality products. All the elements that make up the sensory analysis of both tomato paste and tomato juice are regulated by the stasis, under conditions of admissibility. Organoleptic analysis shows that juice and tomato paste preserved by sterilization in the jar (table 1) is in line with the standards in force regarding: color, smell, taste, consistency, general appearance. Tomato paste organoleptically analyzed corresponds to the standard in terms of color, taste and smell and general appearance.

36
Table 1 Organoleptic determinations of juice and tomato paste
Name characteristics
Actual analyzes Juice of tomato Tomato paste
The appearance of the product
Homogeneous fluid without suspension or
other fragments. It shows phase separation
Uniform, dense, smooth table without foreign objects or signs of
alteration
Color
Red brick, specific Intensive red, brick-like, uniform throughout the product
Smell and taste
Pleasant, sweet, odorless
and foreign taste
Specific, sweet, tasteless and foreign odor: smoked, burnt, fermented, mold, tasteless or
bitter Cşonsistency Liquid Normal, pasty, tied
Impurities Absence Absence
The determination of the physico-chemical properties (Table 2) for the analyzed products (tomato paste and tomato juice purchased from the market) is necessary for quality assurance and also helps to establish the nutritional value demanded by consumers.
The total acidity expressed in malic acid relative to the total dry substance has high values in tomato juice compared to tomato paste (12 g/100 cm3 vs. 8.3 g/100 cm3), which may indicate a product at the beginning of a process degradation. Salt is a qualitative factor needed to preserve and preserve the properties of a product. The study found a higher salt content in tomato juice, surpassing the values required by the standard. The tomato paste has been matched to the norms provided in the standard for all parameters analyzed. This may mean a masking of a manufacturing problem (inappropriate raw material), which may lead to increased acidity during storage.
Laboratory analyzes found that tomato paste had a lower content of sodium chloride than tomato juice (1.3 % versus 2.5 %) which had this parameter above the limit allowed by Stas (figure 1).
Table 2
Determination of physico-chemical characteristics for tomato paste and juice
Type canned
food
Physico-chemical characteristics Observations Soluble dry
substance (% refractometric) at 20˚C min.
Total acidity (expressed as malic acid) relative to
dry matter soluble (g/100 cm3, max.)
Sodium chloride
(%, max.)
Tomato paste
28 8.3 1.3 According to STAS
Juice of tomato
5.0
12
2.5
Acidity above STAS (admissible
10); sodium chloride above the STAS value
(admissible conditions of
1.0 %)

37
Figure 1 Determination of soluble dry matter content and sodium chloride for tomato juice
A high content of soluble dry substance was recorded in tomato paste (28 % versus 5.0 % in tomato juice).
CONCLUSIONS Tracking qualitative parameters for sterilized canned vegetables is important
because it is an important segment of the food industry, being widely used in the preparation of many culinary products, being used and appreciated both from a taste and a wealth of nutrients.
After the organoleptic analysis, it was found that both the general appearance and the color, the taste and the smell, the consistency of the pasta and tomato juice studied were in the parameters required by the standard in force.
With regard to qualitative analysis by physicochemical determinations, no quality deviations were found for tomato paste, which means that the stages of production have been respected, starting with the reception of raw materials up to the packaging and storage of finished products. The soluble dry matter content was standard. The total acidity expressed in malic acid relative to the total dry substance is high in the tomato juice (much higher than those given under the conditions of the standstill), which may indicate a product at the beginning of an altering process with all the evidence is valid.
Laboratory analyzes found that tomato paste had a low sodium chloride content compared to tomato juice having this parameter above the limit allowed by Stas. All of these have led to the addition of excess sodium chloride to increase product stability and increase consumption.
REFERENCES Adekunte A.O., Tiwari B.K., Cullen P.J., Scannell A.G.M., O’Donnell C.P., 2010,
Effect of sonication on colour, ascorbic acid and yeast inactivation in tomato juice, Food Chemistry, Volume 122, Issue 3, 1 October 2010, Pages 500-507.
Apaiah, R. K., Barringer, S. A., 2001, Quality loss during tomato paste production versus sauce storage. Journal of Food Processing and Preservation, 25: 237–250.
Apaiah, R. K., Goodman, C. L. And Barringer, S. A. 2001, Quality differences between fresh pack and remanufactured tomato sauce. Journal of Food Processing and Preservation, 25: 431–445.
0
1
2
3
4
5
Calculated values stas
5 5
2,5
1
% Soluble dry substance%
Sodium chloride,%, max.
38
Barreiro, J.A., M.Milano, A.J.Sandoval, 1997. Kinetics of colour change of double concentrated tomato paste during thermal treatment Journal of Food Engineering Volume 33, Issues 3–4, Pages 359-371.
Bruno Andreina, Miriana Durante, Pier Paolo Marrese, Danilo Migoni, Maura N. Laus, Elisabetta Pace, Donato Pastore, Giovanni Mita, Gabriella Piro and Marcello S. Lenucci, 2018. Shades of red: Comparative study on supercritical CO 2 extraction of lycopene-rich oleoresins from gac, tomato and watermelon fruits and effect of the α-cyclodextrin clathrated extracts on cultured lung adenocarcinoma cells’ viability, Journal of Food Composition and Analysis, 65, (23).
Buttery Ron G., Roy Teranishi, Louisa C. Ling, and Jean G. Turnbaugh, 1990. Quantitative and sensory studies on tomato paste volatiles Journal of Agricultural and Food Chemistry 38 (1), 336-340
Ding Xiaoxiao, Ying Guo, Yongnian Ni and Serge Kokot, 2016. A novel NIR spectroscopic method for rapid analyses of lycopene, total acid, sugar, phenols and antioxidant activity in dehydrated tomato samples, Vibrational Spectroscopy, 10.1016/j.vibspec.2015.10.004, 82, (1-9).
Dinu M., Rodica Soare, M.Gruia, 2016, Bioactive compounds and antioxidant activity in commercial cultivars of tomato (Lycopersicum esculentum L.).16th International Multidisciplinary Scientific GeoConference SGEM Conference Proceedings, ISBN 978-619-7105-66-7 / ISSN 1314-2704, Book 5 Vol. 2, pp.149-156.www.sgem.org.
Gordon E. Anthon And Diane M. Barrett, 2010, Changes in tomato paste during storage and the effects of heating on consistency of reconstituted tomato paste, Journal of Texture Studies p.1-17.
Hayes W.A., Smith PG, Morris AE, 1998, The production and quality of tomato concentrates Food Sci. Nutr. 557-64
Hyeong Sang Kim and Sun Jin Hur, 2018. Effects of in vitro Human Digestion on the Antioxidant Activity and Stability of Lycopene and Phenolic Compounds in Pork Patties Containing Dried Tomato Prepared at Different Temperatures, Journal of Food Science, 83, 7, (1816-1822).
Ionică M. E., 2014, Metode de analiză şi control al calităţii fructelor şi legumelor proaspete şi divers prelucrate. Editura Universitaria Craiova, Editura Prouniversitaria Bucureşti, ISBN 978-606-14-0867-2 ISBN 978-606-26-0121-8.
Jayathunge K.G.L.R., Alexandros Ch. Stratakos, Oliver Cregenzán-Albertia, Irene R. Grant, James Lyng and Anastasios Koidis, 2017. Enhancing the lycopene in vitro bioaccessibility of tomato juice synergistically applying thermal and non-thermal processing technologies, Food Chemistry, 221, (698).
Kehili Mouna, Marianne Kammlott, Sirine Choura, Ayachi Zammel, Carsten Zetzl, Irina Smirnova, Noureddine Allouche and Sami Sayadi, 2017. Supercritical CO2 extraction and antioxidant activity of lycopene and β-carotene-enriched oleoresin from tomato (Lycopersicum esculentum L.) peels by-product of a Tunisian industry, Food and Bioproducts Processing, 102, (340).
MaKroo H., Navin K Rastogi, Brijesh Srivastava, 2016 Enzyme Inactivation of Tomato Juice by Ohmic Heating and Its Effects on Physico-Chemical Characteristics of Concentrated Tomato Paste, Researchgate, DOI: 10.1111/jfpe.12464
Perkins-Veazie P., Warren Roberts & Julie K. Colins, 2007, Lycopene Content Among Organically Produced Tomatoes, Journal of vegetable science, Vol 12, Issue 4, Pag. 93-106

39
Qiu Jun, Jan-Eise Vuist, Remko M. Boom and Maarten A.I. Schutyser, 2018. Formation and degradation kinetics of organic acids during heating and drying of concentrated tomato juice, LWT - Food Science and Technology, 10.1016/j.lwt.2017.08.081, 87, Pag. 112-121.
Sarca Gh., 2004, Materii prime vegetale. Depozitare şi păstrare. Editura Universitați din Oradea.A
Wilhelm Stahl, Ulrike Heinrich, Sheila Wiseman, Olaf Eichler, Helmut Sies, Hagen Tronnier 2001. Dietary Tomato Paste Protects against Ultraviolet Light–Induced Erythema in Humans, The Journal of Nutrition, Volume 131, Issue 5, Pag. 1449–1451.
40
THE QUALITATIVE ASPECTS ON SOME SPECIALTIES OF BREAD WITH SEEDS
Ramona Căpruciu1*,Totâlcă Laurențiu1 Cristina Cuță2
1University of Craiova, Faculty of Horticulture Str. A.I Cuza, No. 13, Craiova
1MScStudent,University of Craiova, Faculty of Horticulture Str. A.I Cuza, , Master Food Safety and Consumer Protection, Str. A.I. Cuza No. 13, Craiova
2MScStudenUSAMV Bucharest, Faculty of Biotechnologies, Master Biotechnology and Food Safety, Str. Bulevardul Mărăşti No. 59
Corresponding author: E-mail address: [email protected]
Key words: flour, baking system, bread, seed, quality
ABSTRACT Making bread products based on two types of flour: Type 480 and Type 650 with the
addition of flaxseed and sunflower seeds and baking them in different baking systems as well as tracking their technological and nutritional behavior, are issues that are the subject of this study. The objectives set for the study are the realization of two bread specialties by flour 480 and flour 650 with flaxseed and sunflower seeds as well asorganoleptics and physico-chemical analysis and organoleptics of studied bread specialties in order to determine their quality.
INTRODUCTION The quality of the bread is given by the organoleptic, physicochemical and
microbiological properties of the finished product, as well as by the type of flour and yeast as the main raw material and water, salt and other elements as secondary raw materials. A special importance is given to the raw and auxiliary raw materials used in the doughs industry from the bakery industry, as they can influence the quality of the products obtained (Matuda et al., 2005, Leonte and Arus 2006, Burluc et al., 2011, Doblado-Maldonado et al., 2012, Woosung et al., 2014, Mi end Sang, 2017). Also, the method of baking and other elements of the technological flow of production can influence the main qualitative parameters of the bread: general appearance, crust appearance, volume, porosity, etc. (Primo-Martín et al., 2008, Banu et al. and Le-Bail, 2009, Shehzad et al., 2010, Upadhyay et al., 2012, Căpruciu, 2013), items of particular importance for the consumer.
MATERIALS AND METHODS
The material used consisted of two samples of commercially available flour, yeast, water, salt, flax seeds and sunflower seeds.
Determination of flour Ash content is an important quality indicator for flour. Determination of ash was
achieved by incineration in a calcination furnace at a temperature of 550 ° C, the choice of calcination temperature having a decisive influence on the ash content, because at too high temperatures the alkaline chlorides partially volatilize and the ash melting prevents the burning of the last coal residues included in the molten mass. Ash content C was reported for dry matter.
ANNALS OF THE UNIVERSITY OF CRAIOVA
Series: Biology Horticulture Food produce processing
technology Environmental engineering Vol. XXII I (LIX) - 2018
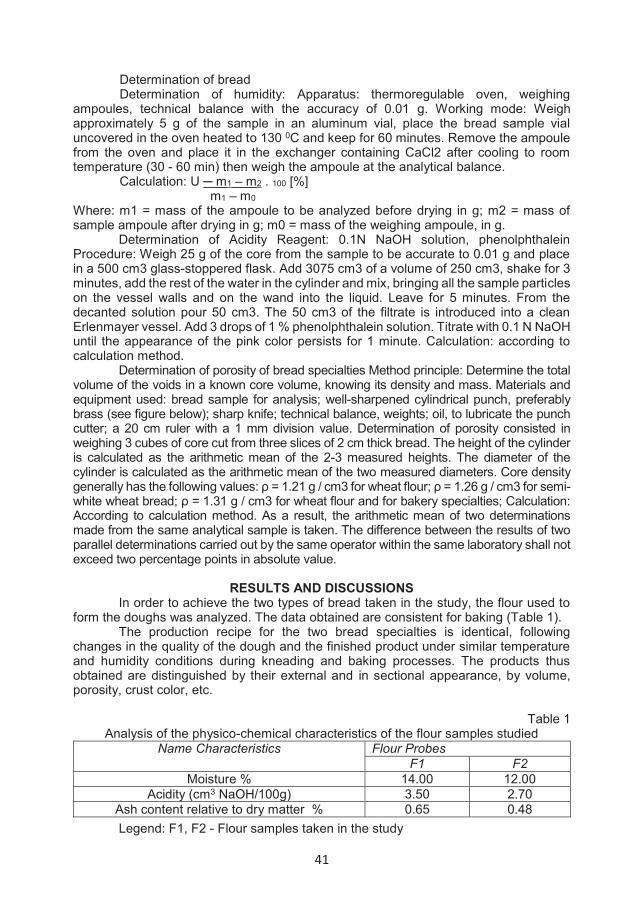
41
Determination of bread Determination of humidity: Apparatus: thermoregulable oven, weighing
ampoules, technical balance with the accuracy of 0.01 g. Working mode: Weigh approximately 5 g of the sample in an aluminum vial, place the bread sample vial uncovered in the oven heated to 130 0C and keep for 60 minutes. Remove the ampoule from the oven and place it in the exchanger containing CaCl2 after cooling to room temperature (30 - 60 min) then weigh the ampoule at the analytical balance.
Calculation: U ─ m1 – m2 . 100 [%] m1 – m0
Where: m1 = mass of the ampoule to be analyzed before drying in g; m2 = mass of sample ampoule after drying in g; m0 = mass of the weighing ampoule, in g.
Determination of Acidity Reagent: 0.1N NaOH solution, phenolphthalein Procedure: Weigh 25 g of the core from the sample to be accurate to 0.01 g and place in a 500 cm3 glass-stoppered flask. Add 3075 cm3 of a volume of 250 cm3, shake for 3 minutes, add the rest of the water in the cylinder and mix, bringing all the sample particles on the vessel walls and on the wand into the liquid. Leave for 5 minutes. From the decanted solution pour 50 cm3. The 50 cm3 of the filtrate is introduced into a clean Erlenmayer vessel. Add 3 drops of 1 % phenolphthalein solution. Titrate with 0.1 N NaOH until the appearance of the pink color persists for 1 minute. Calculation: according to calculation method.
Determination of porosity of bread specialties Method principle: Determine the total volume of the voids in a known core volume, knowing its density and mass. Materials and equipment used: bread sample for analysis; well-sharpened cylindrical punch, preferably brass (see figure below); sharp knife; technical balance, weights; oil, to lubricate the punch cutter; a 20 cm ruler with a 1 mm division value. Determination of porosity consisted in weighing 3 cubes of core cut from three slices of 2 cm thick bread. The height of the cylinder is calculated as the arithmetic mean of the 2-3 measured heights. The diameter of the cylinder is calculated as the arithmetic mean of the two measured diameters. Core density generally has the following values: ρ = 1.21 g / cm3 for wheat flour; ρ = 1.26 g / cm3 for semi-white wheat bread; ρ = 1.31 g / cm3 for wheat flour and for bakery specialties; Calculation: According to calculation method. As a result, the arithmetic mean of two determinations made from the same analytical sample is taken. The difference between the results of two parallel determinations carried out by the same operator within the same laboratory shall not exceed two percentage points in absolute value.
RESULTS AND DISCUSSIONS In order to achieve the two types of bread taken in the study, the flour used to
form the doughs was analyzed. The data obtained are consistent for baking (Table 1). The production recipe for the two bread specialties is identical, following
changes in the quality of the dough and the finished product under similar temperature and humidity conditions during kneading and baking processes. The products thus obtained are distinguished by their external and in sectional appearance, by volume, porosity, crust color, etc.
Table 1 Analysis of the physico-chemical characteristics of the flour samples studied
Name Characteristics Flour ProbesF1 F2
Moisture % 14.00 12.00Acidity (cm3 NaOH/100g) 3.50 2.70
Ash content relative to dry matter % 0.65 0.48Legend: F1, F2 - Flour samples taken in the study

42
Obtaining the bread specialty from flour 650 with seeds Ingredients: flour 650: 30 %, maia, 100g sunflower seeds, 300ml water, 15g salt,
dough hydration: 77.7 %, dough: bread to 1kg tray). The steps followed in order to make the bread specialty from flour 650 with seeds sunflower and flax seeds consisted of: all ingredients were brought to the worktop at 30 C 1 hour before the start of the process (direct method ). The dough was prepared: 30g of yeast to which 10 g of fermentable sugar, 300 g of flour 650 and 140 ml of water at 40 C were added. All of these ingredients were mixed and kneaded for 5 minutes. The vessel was sealed and kept at 40 ° C until the composition of the dish (the proper dish) reached the lid. The next step was the weighing of flax seeds and sunflower. A boiling water was added to the flax seed in a stainless steel vessel with lid and the vessel was covered to prevent evaporation. The seeds stood in the bowl until all the water was absorbed, increasing in volume (15 minutes). The seeds were mixed after cooling with water to form the dough. The flour was warm at least 1 hour prior to dough formation was introduced into a larger vase over which the previously formed mixture was added. The actual kneading process that lasted for 15 minutes followed. At half the kneading time dough, salt was introduced. In this way, the dough was passed to the raisinged, in a room with a temperature of 50-60°C, until the dough reached twice the initial volume, the period being about 1 hour. After raising, the dough is divided into two equal parts and is subjected to modeling. After modeling, the dough pieces were handled as follows: For the electric baking method, thedough pieces thus formed were placed in trays where another 10 minutes were left for final fermentation at a temperature of 50-60 °C, after which they were placed in the oven. For the baking method, the dough pieces were placed directly on the hearth at a distance of 20 cm from each other in order to avoid organoleptic defects (soldering and crackling).When cooked in electric oven where the temperature was controlled, the dough was initially kept at 80 °C in order to complete the yeast fermentation process with total carbon dioxide removal which resulted in a rheological dough formation. For 15 minutes at 80 °C the dough increased in volume. After 15 minutes, the temperature was raised by another 20 °C for 10 minutes to complete the baking process, during which time the baking of the core took place and the color of the crust was formed. The bread thus formed was removed from the oven, left for 5 minutes in trays to facilitate removal. The last step consisted in the gradual cooling of the bread until inside the core, the temperature recorded was similar to the room temperature (about 4 hours after being removed from the oven). After cooling, the two bread specialties obtained by baking in electric furnace were subjected to organoleptic and physico-chemical analyzes to determine the quality.
Obtaining the bread specialty from flour 480 with seeds Ingredients: flour 480: 30 %, maia, 100 g hydrated seeds, 100 g sunflower
seeds, 300 ml water, 15g salt, 80.1 % dough hydration: 1 780 g (two 1 kg loaves). Flax seeds were kept for about 15 minutes in boiling water for intense hydration, the process being the same as obtaining the specialty of 650-type flour bread with flax seed and sunflower seeds. The steps followed in order to make the bread specialty of 480 type flour with sunflower and flax seeds are also the same as obtaining the specialties of bread from 650 type flour V. Laboratory physicochemical analyzes (Table 2) reveal differences in the quality of bread specialties analyzed according to the type of flour andthe method of baking.
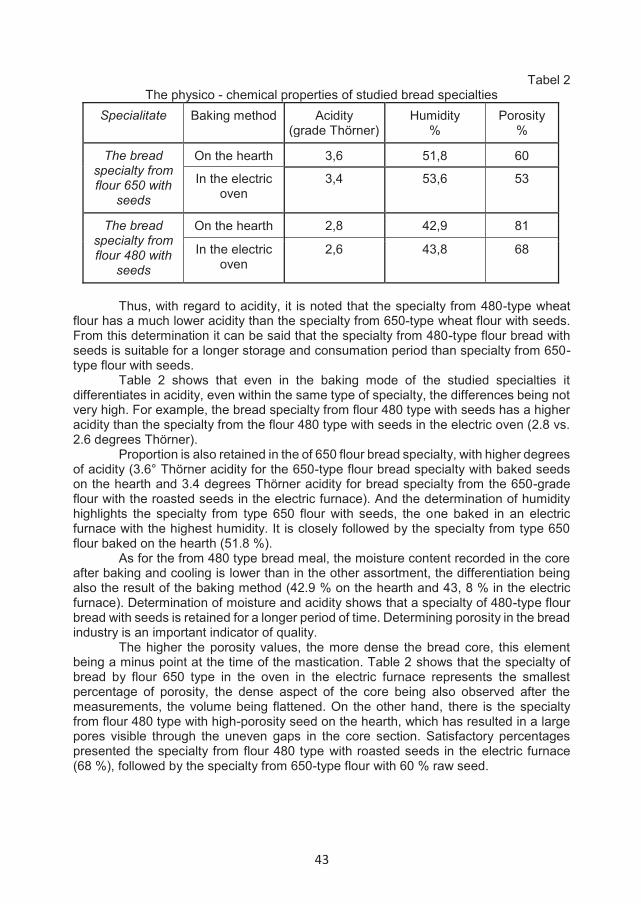
43
Tabel 2 The physico - chemical properties of studied bread specialties
Specialitate Baking method Acidity(grade Thörner)
Humidity%
Porosity%
The bread specialty from flour 650 with
seeds
On the hearth 3,6 51,8 60
In the electric oven
3,4 53,6 53
The bread specialty from flour 480 with
seeds
On the hearth 2,8 42,9 81
In the electric oven
2,6 43,8 68
Thus, with regard to acidity, it is noted that the specialty from 480-type wheat flour has a much lower acidity than the specialty from 650-type wheat flour with seeds. From this determination it can be said that the specialty from 480-type flour bread with seeds is suitable for a longer storage and consumation period than specialty from 650-type flour with seeds.
Table 2 shows that even in the baking mode of the studied specialties it differentiates in acidity, even within the same type of specialty, the differences being not very high. For example, the bread specialty from flour 480 type with seeds has a higher acidity than the specialty from the flour 480 type with seeds in the electric oven (2.8 vs. 2.6 degrees Thörner).
Proportion is also retained in the of 650 flour bread specialty, with higher degrees of acidity (3.6° Thörner acidity for the 650-type flour bread specialty with baked seeds on the hearth and 3.4 degrees Thörner acidity for bread specialty from the 650-grade flour with the roasted seeds in the electric furnace). And the determination of humidity highlights the specialty from type 650 flour with seeds, the one baked in an electric furnace with the highest humidity. It is closely followed by the specialty from type 650 flour baked on the hearth (51.8 %).
As for the from 480 type bread meal, the moisture content recorded in the core after baking and cooling is lower than in the other assortment, the differentiation being also the result of the baking method (42.9 % on the hearth and 43, 8 % in the electric furnace). Determination of moisture and acidity shows that a specialty of 480-type flour bread with seeds is retained for a longer period of time. Determining porosity in the bread industry is an important indicator of quality.
The higher the porosity values, the more dense the bread core, this element being a minus point at the time of the mastication. Table 2 shows that the specialty of bread by flour 650 type in the oven in the electric furnace represents the smallest percentage of porosity, the dense aspect of the core being also observed after the measurements, the volume being flattened. On the other hand, there is the specialty from flour 480 type with high-porosity seed on the hearth, which has resulted in a large pores visible through the uneven gaps in the core section. Satisfactory percentages presented the specialty from flour 480 type with roasted seeds in the electric furnace (68 %), followed by the specialty from 650-type flour with 60 % raw seed.

44
CONCLUSIONS There are different aspects regarding the qualitative characteristics, as follows: The pores of 650 type flour bread made on the hearth were very small, resulting
in a dense porosity. At the specialty breads from 480 type flour obtained on the hearth the pores were large, resulting in a high porosity. In the bread from the type 650 flour obtained in the electric oven the pores were of medium size, the core having a medium density porosity. In the bread specialty of 480 type wheat flour, the pores were of normal size, giving a normal breadth of bread, which resulted in a normal, characteristic volume.
Concerning acidity, it is noted that the specialty of 480-type flour bread has a much lower acidity than the specialty from 650-type flour bread with seeds, concluding that the first assortment is suitable for a longer shelf life and to slicing. It is also noted that the way of baking the studied bread specialties distinguishes both acidity and humidity and porosity within the same type of bread, the differences being very high in some cases. Determination of humidity highlights the bread specialty from the 650-type flour with the seeds baked in an electric furnace, followed closely by the bread specialty of the 650 flour on the hearth, assortments that are proposed for immediate consumption, increasing the shelf life leading to their depreciation. Determination of moisture and acidity shows that the specialty from 480 type flour with seed on the hearth is kept for a longer period, the disadvantage being the presence of high porosity. By performing a quality ranking, following the organoleptic and physico-chemical determinations, the situation of the bread specialties taken in the study is the following:
I - Bread specialty of 480 type flour with seeds baked in the electric oven; II - Bread specialty of the 650 type flour with seeds baked on the hearth; III - Bread specialty of 480 type flour with seeds baked on the hearth; IV - bread specialty of the 650 type bread with baked seeds in the electric oven. Although for the III place the specialty exhibits excessive porosity, it is preferred
to the IV place, where the low porosity led to a dense core with sticky conglomerate formation during the mastication.
REFERENCES
Banu Constantin, 2009, Tratat de industrie alimentară, Tehnologii alimentare, Editura ASAB, Bucureşti.
Burluc R. M., C. Vizireanu, O. Barna., 2011. Research on Buckwheat Flour Utilisation in Bread Making, Journal of Environmental Protection and Ecology, XII, No.3, 930-934, ISSN 1311-5065 Volume: 12 Issue: 3.
Căpruciu Ramona, 2013. Implicarea biotehnologiilor în industria alimentară. Editura Sitech. Craiova.
Doblado-Maldonado Andres F., Oscar A. Pike, Jess C. Sweley, Devin J. Rose, 2012, Key issues and challenges in whole wheat flour milling and storage, Journal of Cereal Science 56 (2012) Pag. 119-126.
Leonte M., Alisa Arus, 2006. Study concerning the influence of salt addition on bread’s quality Journal of Agroalimentary Processes and Technologies, XII( 2), 325-33.
Matuda, T. G., Parra, D. F., Lugão, A. B., Tadini, C.C., 2005. Influence of vegetable shortening and emulsifiers on the unfrozen water content and textural properties of frozen French bread dough. Lebensmittel Wissenschaft und-Technologie, 38, 275.
Mi Jeong Kim, Sang Sook Kim, 2017. Utilisation of immature wheat flour as an alternative flour with antioxidant activity and consumer perception on its baked product, Food Chemistry Volume 232, Pages 237-244.

45
Primo - Martín C., H. de Beukelaer R. J. Hamer T. Van Vliet, 2008, Fracture behaviour of bread crust: Effect of ingredient modification, Journal of Cereal Science,Volume 48, Issue 3, Pages 604-612.
Shehzad A. H.Chiron G.Della Valle K. Kansou A. Ndiaye A. L. Réguerre, 2010,Porosity and stability of bread dough during proofing determined by video image analysis for different compositions and mixing conditions, Food Research International, Volume 43, Issue 8, Pages 1999-2005.
Upadhyay Rutuja, Debjani Ghosal, Anurag Mehra, 2012, Characterization of bread dough: Rheological properties and microstructure, Journal of Food Engineering, Volume 109, Issue 1, Pages 104-113.
Woosung Bae, Bon Lee, Gary G. Hou and Suyong Lee, 2014. Physicochemical characterization of whole-grain wheat flour in a frozen dough system for bake off technology, Journal of Cereal Science, 60, 3, (520).
Zúñiga Rubén, Alain Le-Bail, 2009, Assessment of thermal conductivity as a function of porosity in bread dough during proving, Food and Bioproducts Processing,Volume 87, Issue 1, Pages 17-22.
46
SUITABILITY OF CLIMATIC AND BIOCLIMATIC FACTORS FOR TABLE GRAPES IN SIMNICU DE SUS VINEYARD
Cichi Daniela Doloris1*, Capruciu Ionela Simona2
University of Craiova, Faculty of Horticulture, Horticulture & Food Science Department
2 MSc. Vine-Winemaking Expertise, University of Craiova, Faculty of Horticulture * Correspondence author. E-mail: [email protected]
Keywords: table grapes, climat, phenological stages
ABSTRACT This paper provides research results considering the suitability of climatic resources of
the Simnicu de Sus vineyard for the table grapes varieties with early and mid-season ripening. The different climatic parameters and indices with influence on the growing and development of vine were used and calculated. Additionally, the vulnerability evaluation in different winter conditions, the influence of climatic conditions on the phenological characteristics and on the bio-productive potential of the table grape varieties were been measured. The need for growing-season sum of daily average temperatures above base temperature (GDD10) of the four varieties of table grapes provide valuable information on the timing of each phenological stage of individual grapevine varieties, but also on the organization of annual wine-growing activities.
INTRODUCTION The success of the production of table grapes depends not only on the cultivar's
performance but also on growing conditions and local climate. Climate has a pronounced effect on grape and wine composition and quality
(Bucur G.M. et al. 2017, Mosetti D. et al. 2016). Mesoclimate can differ between vineyards within a region and depends on factors such as slope, altitude, surrounding vegetation (Marais J. et al.1999, Irimia et al. 2013).
The variability of annual climate conditions influences vegetative growth (Costea D.C., 2006, Mărăcineanu L.C., 2011), phenology (Fraga H. et al. 2016, Van Leeuwen C., 2004), physiology of vine (Dinis L.T. et al. 2014, Greer D.H., 2012), phytosanitary status of vine (Bunea C.D. et al. 2013) and on the vintage variability (Băducă C. et al. 2011 and 2012, Costea D.C. et al. 2010, Teslić N. et al. 2018).
The current study was conducted during the 2015-2017 period, in a V-VII years old vineyard placed in Șimnicu de Sus. Șimnicu de Sus vine growing area is part of Dealurile Craiovei vineyard, in Dealurile Munteniei and Olteniei viticultural region (South-West of Romania). Geographically, the studied vineyard is located between the parallels of 44°24’23’’ Northern latitude and is crossed by the meridian of 23°48’09’’ Eastern longitude.
MATERIAL AND METHODS
Four table grapes varieties of Vitis vinifera L. have been studied, Cardinal and Victoria with early season ripening, Muscat de Hamburg and Alphonse Lavallée with mid-season ripening. They were grafted on Berlandieri x Riparia, Oppenheim 4 selection
ANNALS OF THE UNIVERSITY OF CRAIOVA
Series: Biology Horticulture Food produce processing
technology Environmental engineering Vol. XXII I (LIX) - 2018
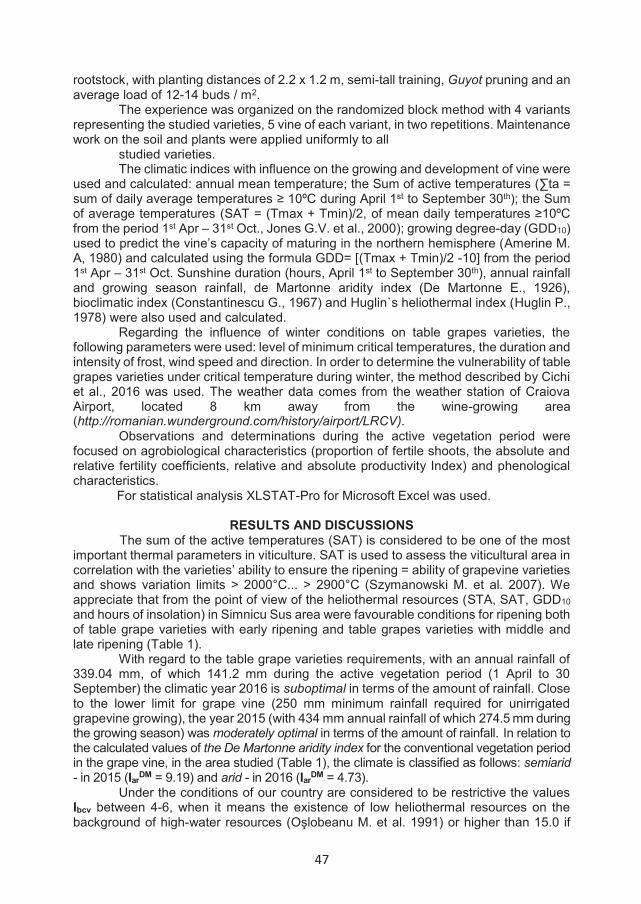
47
rootstock, with planting distances of 2.2 x 1.2 m, semi-tall training, Guyot pruning and anaverage load of 12-14 buds / m2.
The experience was organized on the randomized block method with 4 variants representing the studied varieties, 5 vine of each variant, in two repetitions. Maintenance work on the soil and plants were applied uniformly to all
studied varieties. The climatic indices with influence on the growing and development of vine were
used and calculated: annual mean temperature; the Sum of active temperatures (∑ta =sum of daily average temperatures ≥ 10ºC during April 1st to September 30th); the Sum of average temperatures (SAT = (Tmax + Tmin)/2, of mean daily temperatures ≥10ºC from the period 1st Apr – 31st Oct., Jones G.V. et al., 2000); growing degree-day (GDD10) used to predict the vine’s capacity of maturing in the northern hemisphere (Amerine M. A, 1980) and calculated using the formula GDD= [(Tmax + Tmin)/2 -10] from the period 1st Apr – 31st Oct. Sunshine duration (hours, April 1st to September 30th), annual rainfall and growing season rainfall, de Martonne aridity index (De Martonne E., 1926), bioclimatic index (Constantinescu G., 1967) and Huglin`s heliothermal index (Huglin P., 1978) were also used and calculated.
Regarding the influence of winter conditions on table grapes varieties, the following parameters were used: level of minimum critical temperatures, the duration and intensity of frost, wind speed and direction. In order to determine the vulnerability of table grapes varieties under critical temperature during winter, the method described by Cichi et al., 2016 was used. The weather data comes from the weather station of Craiova Airport, located 8 km away from the wine-growing area (http://romanian.wunderground.com/history/airport/LRCV).
Observations and determinations during the active vegetation period were focused on agrobiological characteristics (proportion of fertile shoots, the absolute and relative fertility coefficients, relative and absolute productivity Index) and phenological characteristics.
For statistical analysis XLSTAT-Pro for Microsoft Excel was used.
RESULTS AND DISCUSSIONS The sum of the active temperatures (SAT) is considered to be one of the most
important thermal parameters in viticulture. SAT is used to assess the viticultural area in correlation with the varieties’ ability to ensure the ripening = ability of grapevine varieties and shows variation limits ˃ 2000°C... ˃ 2900°C (Szymanowski M. et al. 2007). We appreciate that from the point of view of the heliothermal resources (STA, SAT, GDD10and hours of insolation) in Simnicu Sus area were favourable conditions for ripening both of table grape varieties with early ripening and table grapes varieties with middle and late ripening (Table 1).
With regard to the table grape varieties requirements, with an annual rainfall of 339.04 mm, of which 141.2 mm during the active vegetation period (1 April to 30 September) the climatic year 2016 is suboptimal in terms of the amount of rainfall. Close to the lower limit for grape vine (250 mm minimum rainfall required for unirrigated grapevine growing), the year 2015 (with 434 mm annual rainfall of which 274.5 mm during the growing season) was moderately optimal in terms of the amount of rainfall. In relation to the calculated values of the De Martonne aridity index for the conventional vegetation period in the grape vine, in the area studied (Table 1), the climate is classified as follows: semiarid - in 2015 (IarDM = 9.19) and arid - in 2016 (IarDM = 4.73).
Under the conditions of our country are considered to be restrictive the values Ibcv between 4-6, when it means the existence of low heliothermal resources on the background of high-water resources (Oşlobeanu M. et al. 1991) or higher than 15.0 if

48
there are no irrigation possibilities. Under the conditions of the vineyard year 2016 the bioclimatic index of vineyard (Ibcv) exceeded the value of 15, the calculated value being of 22.81 units on the background of increased heliothermal resources and of suboptimal water resources, thus requiring irrigation as a technological measure for the optimal realization of the cultivation of table grapes varieties.
Table 1 Evaluation of suitability of climatic and bioclimatic factors for table grapes in Simnicu
de Sus vineyard Year 2015 Year 2016
Climatic parameters/ Index Value Class Valori ClassAnnual mean temperature (ºC) 12.54 High
favorability12.12 High favorability
SAT (Sum of average active temperatures, April 1st to October 30th)
3798 High favorability
3710 High favorability
∑ta (Sum of daily average temperatures ≥ 10ºC, April 1st toSeptember 30th)
3565 High favorability
3614 High favorability
Sunshine duration (hours, April 1st to September 30th)
1678 High favorability
1631 High favorability
Annual Rainfall (mm) 436.6 Moderately optimal
339.04 Suboptimal
Rainfall in the growing season (mm, April 1st to September 30th)
274.5 Moderately optimal
141.2 Suboptimal
Martonne Index (IarDM) 9.19 Semiarid climate
4.73 Arid climate
Bioclimatic index Ibcl (Constantinescu)
11.90 Highfavorability
22.81 Restrictions -irrigation is
requiredHuglin`s heliothermal index (IH) 2503 IH5- Warm
climate2488 IH5- Warm
climate
In relation to the Huglin heliothermic index (IH) in 2015 and 2016, Şimnicu de Sus viticulture area is in the IH 5 - warm climate class, which indicates the existence of rich heliothermal resources, which ensure the ripening of the late varieties.
The critical winter conditions during the two dormant seasons (Table 2 and Table 3) caused considerable loss of buds to all table grape varieties studied. The resultsconcerning the buds freezing damages of table grapes during the dormant seasons 2015/2016 and 2016/2017 they are presented as mean ± standard deviation, for variability assessment. Among the varieties, the highest values of the percentage of non-viable buds, following the dormant season of vine of 2015-2016, were recorded in Cardinal variety (63.26 % primary killed buds and 35.38 % secondary killed buds) and Alphonse Lavallée (61.28 % primary killed buds and 37.19 % secondary killed buds). After the dormant season 2016-2017, the largest buds losses were recorded in Cardinal variety (62.31 % primary killed buds and 36.57 % secondary killed buds) and Victoria (60.16 % primary killed buds).

49
Table 2 The critical minimum temperatures in air during the dormant seasons 2015/2016
and 2016/ 2017 * Dormantseason
Absolute minimum temperature (° C)-15.0… -18.0 ° C -18.1… -22.0 ° C -22.1… -24.0 ° CDay Tma Day Tma Day Tma
2015/2016 20.I21.I23.I24.I25.I
- 18.0- 18.0- 18.0- 18.0- 18.0
19.I -19.0
2016/2017 8.I10.I12.I
- 16.0- 18.0- 16.0
9.I - 19.0
* Processing weather data http://romanian.wunderground.com/history/airport/LRCVTma- absolute minimum temperature
Table 3 Duration and intensity of freezing*
Day Duration offreezing
Temperature(°C)
Cold Wind(°C)
Winddirection
Wind speedmin.-max.
(m/s)2017 Year
8 January 9h 00min. -14.0...-16.0 -21.0 ...-24.2 W/ WSW 3.6 - 6.7 9 January 5h 30min. -14.0...-19.0 -20.0 ...-24.7 E/ NNE 1.0 - 2.1 10 January 9h 00min. -14.0...-19.0 -19.0 ...-23.5 N/ NNE 0.5 - 1.5 12 January 11h 00min. -11.0...-16.0 -16.7 ...-21.6 SW/ WSW 2.1 - 4.6
* Processing weather data http://romanian.wunderground.com/history/airport/LRCV
The triggering and the duration of the main phenophases of the annual biological cycle are variable from year to year, being influenced by the biological particularities of each variety, as well as by the climatic factors (temperature, insolation, rainfall, relative humidity). Table 5 shows the corresponding time periods with the phenological data for the 4 grapevine varieties selected for the current study, as well as growing grade-day (GDD10) needed for each phenological stage.
Table 4 Buds freezing damages of table grape cultivars during the dormant seasons 2015/2016
and 2016/ 2017Cultivars Primary Killed buds
(%) Secondary Killed buds
(%)2015/2016 2016/2017 2015/2016 2016/2017
X ±sX
X ±sX
X ±sX
X ±sX
Cardinal 63.26±5.89 62.31± 6.08 35.38±3.34 36.57±3.67Victoria 59.47±5.35 60.16±5.86 38.12±2.83 30.15±2.94Muscat Hamburg 53.68±6.81 57.39±5.67 31.75±3.46 37.43±3.08Alphonse Lavallée 61.28±6.37 49.52±5.18 37.19±2.14 37.45±2.75
X - mean; s X - standard deviation.
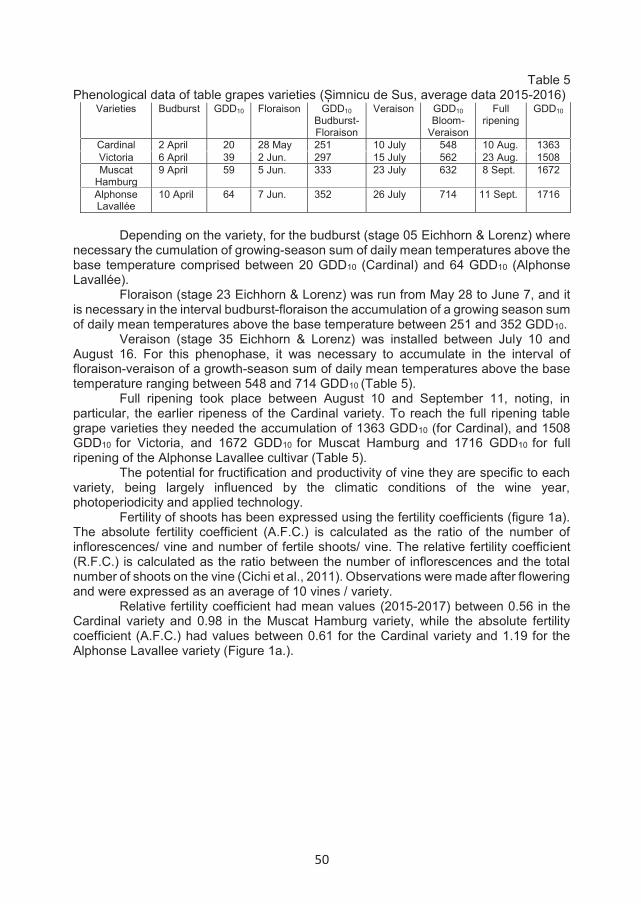
50
Table 5 Phenological data of table grapes varieties (Șimnicu de Sus, average data 2015-2016)
Varieties Budburst
GDD10 Floraison GDD10 Budburst- Floraison
Veraison
GDD10 Bloom-
Veraison
Full ripening
GDD10
Cardinal 2 April 20 28 May 251 10 July 548 10 Aug. 1363 Victoria 6 April 39 2 Jun. 297 15 July 562 23 Aug. 1508 Muscat
Hamburg 9 April 59 5 Jun. 333 23 July 632 8 Sept. 1672
Alphonse Lavallée
10 April 64 7 Jun. 352 26 July 714 11 Sept. 1716
Depending on the variety, for the budburst (stage 05 Eichhorn & Lorenz) where necessary the cumulation of growing-season sum of daily mean temperatures above the base temperature comprised between 20 GDD10 (Cardinal) and 64 GDD10 (Alphonse Lavallée). Floraison (stage 23 Eichhorn & Lorenz) was run from May 28 to June 7, and it is necessary in the interval budburst-floraison the accumulation of a growing season sum of daily mean temperatures above the base temperature between 251 and 352 GDD10. Veraison (stage 35 Eichhorn & Lorenz) was installed between July 10 and August 16. For this phenophase, it was necessary to accumulate in the interval of floraison-veraison of a growth-season sum of daily mean temperatures above the base temperature ranging between 548 and 714 GDD10 (Table 5). Full ripening took place between August 10 and September 11, noting, in particular, the earlier ripeness of the Cardinal variety. To reach the full ripening table grape varieties they needed the accumulation of 1363 GDD10 (for Cardinal), and 1508 GDD10 for Victoria, and 1672 GDD10 for Muscat Hamburg and 1716 GDD10 for full ripening of the Alphonse Lavallee cultivar (Table 5). The potential for fructification and productivity of vine they are specific to each variety, being largely influenced by the climatic conditions of the wine year, photoperiodicity and applied technology. Fertility of shoots has been expressed using the fertility coefficients (figure 1a). The absolute fertility coefficient (A.F.C.) is calculated as the ratio of the number of inflorescences/ vine and number of fertile shoots/ vine. The relative fertility coefficient (R.F.C.) is calculated as the ratio between the number of inflorescences and the total number of shoots on the vine (Cichi et al., 2011). Observations were made after flowering and were expressed as an average of 10 vines / variety.
Relative fertility coefficient had mean values (2015-2017) between 0.56 in the Cardinal variety and 0.98 in the Muscat Hamburg variety, while the absolute fertility coefficient (A.F.C.) had values between 0.61 for the Cardinal variety and 1.19 for the Alphonse Lavallee variety (Figure 1a.).
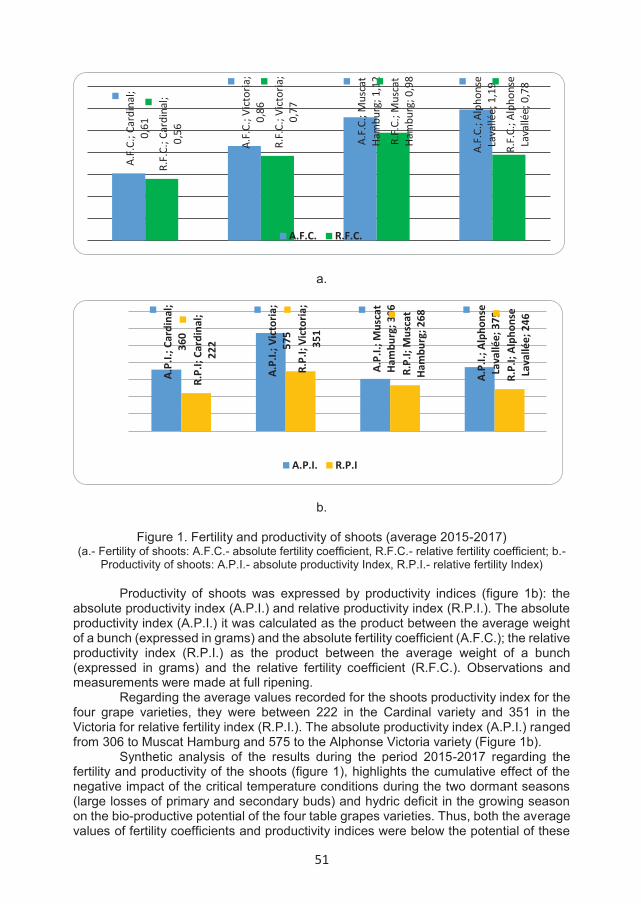
51
a.
b.
Figure 1. Fertility and productivity of shoots (average 2015-2017) (a.- Fertility of shoots: A.F.C.- absolute fertility coefficient, R.F.C.- relative fertility coefficient; b.-
Productivity of shoots: A.P.I.- absolute productivity Index, R.P.I.- relative fertility Index)
Productivity of shoots was expressed by productivity indices (figure 1b): the absolute productivity index (A.P.I.) and relative productivity index (R.P.I.). The absolute productivity index (A.P.I.) it was calculated as the product between the average weight of a bunch (expressed in grams) and the absolute fertility coefficient (A.F.C.); the relative productivity index (R.P.I.) as the product between the average weight of a bunch (expressed in grams) and the relative fertility coefficient (R.F.C.). Observations and measurements were made at full ripening.
Regarding the average values recorded for the shoots productivity index for the four grape varieties, they were between 222 in the Cardinal variety and 351 in the Victoria for relative fertility index (R.P.I.). The absolute productivity index (A.P.I.) ranged from 306 to Muscat Hamburg and 575 to the Alphonse Victoria variety (Figure 1b).
Synthetic analysis of the results during the period 2015-2017 regarding the fertility and productivity of the shoots (figure 1), highlights the cumulative effect of the negative impact of the critical temperature conditions during the two dormant seasons (large losses of primary and secondary buds) and hydric deficit in the growing season on the bio-productive potential of the four table grapes varieties. Thus, both the average values of fertility coefficients and productivity indices were below the potential of these
A.F.
C.; C
ardi
nal;
0,61
A.F.
C.; V
ictor
ia;
0,86
A.F.
C.; M
usca
t Ha
mbu
rg; 1
,12
A.F.
C.; A
lpho
nse
Lava
llée;
1,1
9
R.F.
C.; C
ardi
nal;
0,56
R.F.
C.; V
ictor
ia;
0,77
R.F.
C.; M
usca
t Ha
mbu
rg; 0
,98
R.F.
C.; A
lpho
nse
Lava
llée;
0,7
8
A.F.C. R.F.C.
A.P.
I.; C
ardi
nal;
360
A.P.
I.; V
ictor
ia;
575
A.P.
I.; M
usca
t Ha
mbu
rg; 3
06
A.P.
I.; A
lpho
nse
Lava
llée;
375
R.P.
I; Ca
rdin
al;
222
R.P.
I; Vi
ctor
ia;
351
R.P.
I; M
usca
t Ha
mbu
rg; 2
68
R.P.
I; Al
phon
se
Lava
llée;
246
A.P.I. R.P.I

52
varieties mentioned in the literature or recorded in Dealurile Craiovei vineyard (Cichi D.D. et al. 2011).
CONCLUSIONS
The studied viticulture area has rich heliothermal resources during the vegetation period, which gives it great availability for growing a diversified range of table grape varieties.
The annual climatic variability may generate periods with the negative thermal risk during the dormant season, with implications for vine production. In conclusion, it can be appreciated that in the critical winter conditions in the Şimnicu de Sus area, specific of the two dormant seasons, with hourly thermal values that dropped to -24.7°C at the level of the vine stocks due to the low speed wind, all table grape varieties studied fall into the group with low resistance to frost (over 50 % of the destroyed buds).
The results presented in this study on the need for growing-season sum of daily average temperatures above base temperature (GDD10) of the four varieties of table grapes provide valuable information on the timing of each phenological stage of individual grapevine varieties, but also on the organization of annual wine-growing activities.
REFERENCES
Amerine M. A., Berg H. W., Kunkee R.E., Ough C.S., Singleton V.I., Webb A.D.,1980, The technology of wine making (4th ed.). AVI Publishing Company, Inc., Westport, Conecticut, 795 pp.
Băducă C., Felicia Stoica, Camelia Muntean, 2011, The influence of climatic changes on quality of wines obtained from the Romanian varieties grapes. Lucrări Ştiinţifice USAMV Bucureşti, Seria B, vol. 55: 480-483.
Băducă Campeanu C., Beleniuc G., Simionescu V., Panaitescu L., Grigorica, L., 2012, Climate change effects on ripening process and wine composition in Oltenia's vineyards from Romania. Acta Hortic. 931:47-54.
Bucur Georgeta Mihaela, Liviu Dejeu, 2017, Researches on situation and trends in climate change in South part of Romania and their effects on grapevine, Scientific Papers. Series B, Horticulture. Vol. LXI:243-247
Bunea C.I., Popescu Daniela, Bunea Andrea, Ardelean M., 2013, Variation of attack degree of downy mildew (Plasmopara viticola) in five wine grape varieties, under conventional and organic control treatments, Journal: Food, Agriculture and Environment (JFAE), 2013, Vol.11 (3& 4 ) : 1166 – 1170.
Cichi Daniela Doloris, Monica Vintilescu, Giugea N. Costea D.C., Camelia Popa, 2011, Agrobiological and technological potential of sometable grape varieties in the Banu Maracine vineyard, Annals of the University of Craiova- Biology, Horticulture, Food Produce Processing Technology, Environmental Engineering, vol. XVI (LII): 87-92.
Cichi Daniela Doloris, Costea D.C., Gheorghiu N., 2016, The cold hardiness of some varieties of grapevine cultivated in the viticultural area Plenita (Southwestern Romania). Annals of the University of Craiova - Agriculture, Montanology, Cadastre Series, vol. 46 (no.1): 62-67.
Constantinescu G., 1967, Méthodes et principes de détermination des aptitudes viticoles d'une région et du choix des cépages appropriés. Bull. l'OIV, 441: 1179-1205.
Costea D.C., 2006, Regimul hidric al viței de vie (Cerințe, asigurare, studii) Edit. EUC, Craiova, 182p.
Costea D.C., Cichi Daniela Doloris, Genoiu Elena, Savescu P., Maracineanu L.C. Capruciu D.F., 2010, The influence of the climate variability on the main chemical
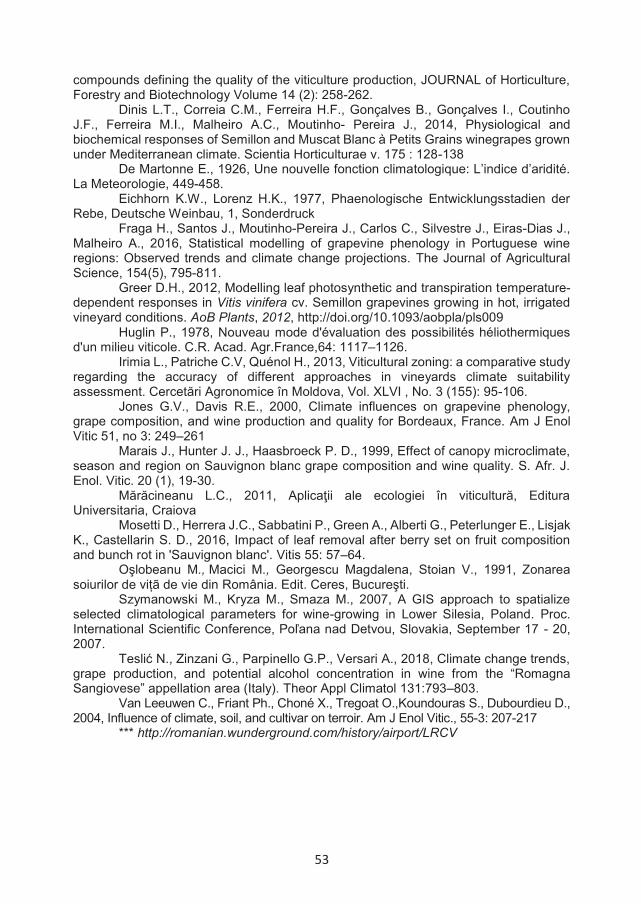
53
compounds defining the quality of the viticulture production, JOURNAL of Horticulture, Forestry and Biotechnology Volume 14 (2): 258-262.
Dinis L.T., Correia C.M., Ferreira H.F., Gonçalves B., Gonçalves I., Coutinho J.F., Ferreira M.I., Malheiro A.C., Moutinho- Pereira J., 2014, Physiological and biochemical responses of Semillon and Muscat Blanc à Petits Grains winegrapes grown under Mediterranean climate. Scientia Horticulturae v. 175 : 128-138
De Martonne E., 1926, Une nouvelle fonction climatologique: L’indice d’aridité. La Meteorologie, 449-458.
Eichhorn K.W., Lorenz H.K., 1977, Phaenologische Entwicklungsstadien der Rebe, Deutsche Weinbau, 1, Sonderdruck
Fraga H., Santos J., Moutinho-Pereira J., Carlos C., Silvestre J., Eiras-Dias J., Malheiro A., 2016, Statistical modelling of grapevine phenology in Portuguese wine regions: Observed trends and climate change projections. The Journal of Agricultural Science, 154(5), 795-811.
Greer D.H., 2012, Modelling leaf photosynthetic and transpiration temperature-dependent responses in Vitis vinifera cv. Semillon grapevines growing in hot, irrigated vineyard conditions. AoB Plants, 2012, http://doi.org/10.1093/aobpla/pls009
Huglin P., 1978, Nouveau mode d'évaluation des possibilités héliothermiques d'un milieu viticole. C.R. Acad. Agr.France,64: 1117–1126.
Irimia L., Patriche C.V, Quénol H., 2013, Viticultural zoning: a comparative study regarding the accuracy of different approaches in vineyards climate suitability assessment. Cercetări Agronomice în Moldova, Vol. XLVI , No. 3 (155): 95-106.
Jones G.V., Davis R.E., 2000, Climate influences on grapevine phenology, grape composition, and wine production and quality for Bordeaux, France. Am J Enol Vitic 51, no 3: 249–261
Marais J., Hunter J. J., Haasbroeck P. D., 1999, Effect of canopy microclimate, season and region on Sauvignon blanc grape composition and wine quality. S. Afr. J. Enol. Vitic. 20 (1), 19-30.
Mărăcineanu L.C., 2011, Aplicaţii ale ecologiei în viticultură, Editura Universitaria, Craiova
Mosetti D., Herrera J.C., Sabbatini P., Green A., Alberti G., Peterlunger E., Lisjak K., Castellarin S. D., 2016, Impact of leaf removal after berry set on fruit composition and bunch rot in 'Sauvignon blanc'. Vitis 55: 57–64.
Oşlobeanu M., Macici M., Georgescu Magdalena, Stoian V., 1991, Zonarea soiurilor de vițã de vie din România. Edit. Ceres, Bucureşti.
Szymanowski M., Kryza M., Smaza M., 2007, A GIS approach to spatialize selected climatological parameters for wine-growing in Lower Silesia, Poland. Proc. International Scientific Conference, Poľana nad Detvou, Slovakia, September 17 - 20, 2007.
Teslić N., Zinzani G., Parpinello G.P., Versari A., 2018, Climate change trends, grape production, and potential alcohol concentration in wine from the “Romagna Sangiovese” appellation area (Italy). Theor Appl Climatol 131:793–803.
Van Leeuwen C., Friant Ph., Choné X., Tregoat O.,Koundouras S., Dubourdieu D., 2004, Influence of climate, soil, and cultivar on terroir. Am J Enol Vitic., 55-3: 207-217
*** http://romanian.wunderground.com/history/airport/LRCV

54
CORRELATES REGARDING THE TECHNOLOGICAL QUALITIES OF THE SOME HYBRID ELITES FOR TABLE GRAPES COMPARED
WITH PARENTAL VARIETIES
Ciobotea Cristina-Magdalena1, Popa Camelia1
1*N.R.D.I.B.H. Stefanesti – Arges, Street Bucharest-Pitesti, No.37, [email protected]
Keywords: technological descriptors, hybrid elites, regression coefficients
ABSTRACT This paper aims to highlight the superior agrobiologic potential and technologically of 21
hybrid elites, obtained by the hybridization of the varieties Muscat Iantarnîi x Canner (codified HI), Victoria x Black Pearl (codified BP) and Victoria x Victoria (codified A) and compared with the genitors.
Since the hybrid elites selected from the experimental fields, have been highlighted by several descriptors, have been established correlations between all studied technological elements. The weight of the bunch and berry, content of the must in sugars and acidity. The graphical representation of relations between quantitative and qualitative characteristics of hybrid descendants appealing to function regression and the correlation coefficient has highlighted the connections and meaning of the variables.
INTRODUCTION
Because the selected hybrid elites in experimental fields, descendants of three types of hybridization, were highlighted by several descriptors, have been established the correlations between all studied agro biological and technological elements: viability of the buds, total and fertile shoots, the coefficients of fertility absolute and relative, the indices of productivity absolute and relative, the weight of the grapes and berry, content of the must in sugars and acidity (Onea Ciobotea Cristina-Magdalena, 2014). These determinations require experimental data processing by appropriate statistical methods, which helps to expressing general conclusions only on the basis of individual data. The obtained data are a selection of the ones possible. Based on the data obtained are made, by appropriate statistical and mathematical processing, the general conclusions regarding the behavior of the genotypes of grape vines in interaction with biotic and abiotic factors. It is known that there is a natural variability in all processes and phenomena involved (Gribaudo I., Grando M.S., 2005).
MATERIAL AND METHODS
Pearson correlation was applied (r) that establishing the degree of association between two variables measured on the scale of range / report and show, after a linear model, the intensity and direction of the simultaneously variance of the values of a variable in relation to the other. In case the variable seeks the values of the other variable in direct sense, ascending and descending, then it is manifesting the effect of the correlation of their. Area of variation of Pearson correlation coefficient (r) is between r = -1 (perfect negative correlation) and r = +1 (perfect positive correlation). The absence of
ANNALS OF THE UNIVERSITY OF CRAIOVA
Series: Biology Horticulture Food produce processing
technology Environmental engineering Vol. XXII I (LIX) - 2018
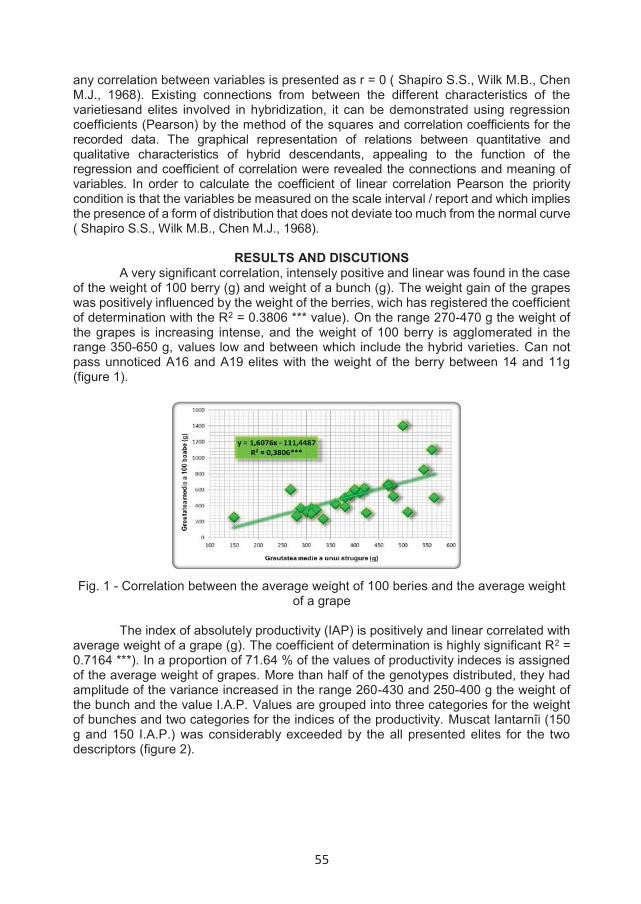
55
any correlation between variables is presented as r = 0 ( Shapiro S.S., Wilk M.B., ChenM.J., 1968). Existing connections from between the different characteristics of the varietiesand elites involved in hybridization, it can be demonstrated using regression coefficients (Pearson) by the method of the squares and correlation coefficients for the recorded data. The graphical representation of relations between quantitative and qualitative characteristics of hybrid descendants, appealing to the function of the regression and coefficient of correlation were revealed the connections and meaning ofvariables. In order to calculate the coefficient of linear correlation Pearson the priority condition is that the variables be measured on the scale interval / report and which implies the presence of a form of distribution that does not deviate too much from the normal curve ( Shapiro S.S., Wilk M.B., Chen M.J., 1968).
RESULTS AND DISCUTIONS A very significant correlation, intensely positive and linear was found in the case
of the weight of 100 berry (g) and weight of a bunch (g). The weight gain of the grapes was positively influenced by the weight of the berries, wich has registered the coefficient of determination with the R2 = 0.3806 *** value). On the range 270-470 g the weight of the grapes is increasing intense, and the weight of 100 berry is agglomerated in the range 350-650 g, values low and between which include the hybrid varieties. Can not pass unnoticed A16 and A19 elites with the weight of the berry between 14 and 11g (figure 1).
Fig. 1 - Correlation between the average weight of 100 beries and the average weight of a grape
The index of absolutely productivity (IAP) is positively and linear correlated with average weight of a grape (g). The coefficient of determination is highly significant R2 =0.7164 ***). In a proportion of 71.64 % of the values of productivity indeces is assigned of the average weight of grapes. More than half of the genotypes distributed, they had amplitude of the variance increased in the range 260-430 and 250-400 g the weight of the bunch and the value I.A.P. Values are grouped into three categories for the weight of bunches and two categories for the indices of the productivity. Muscat Iantarnîi (150 g and 150 I.A.P.) was considerably exceeded by the all presented elites for the two descriptors (figure 2).
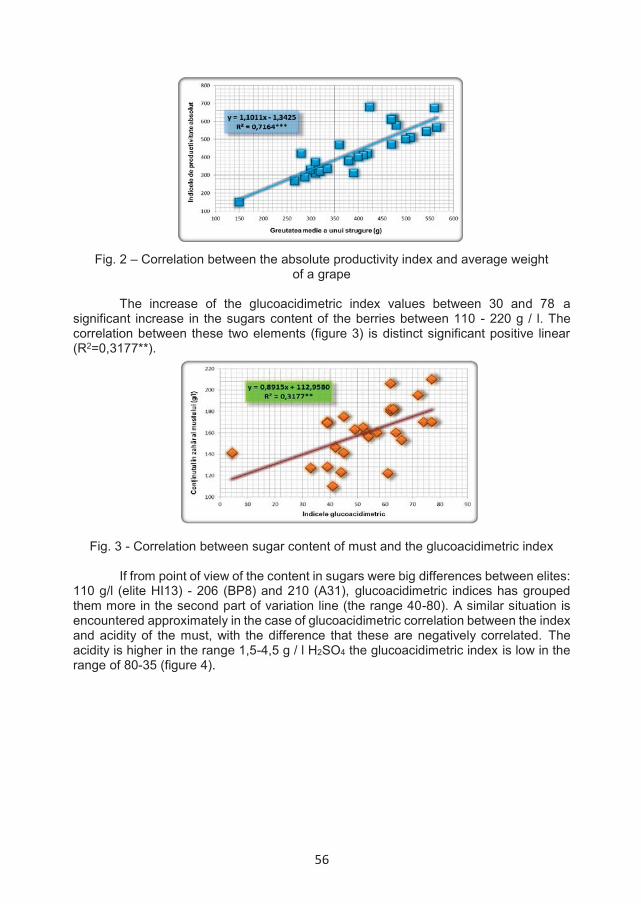
56
Fig. 2 – Correlation between the absolute productivity index and average weightof a grape
The increase of the glucoacidimetric index values between 30 and 78 asignificant increase in the sugars content of the berries between 110 - 220 g / l. Thecorrelation between these two elements (figure 3) is distinct significant positive linear (R2=0,3177**).
Fig. 3 - Correlation between sugar content of must and the glucoacidimetric index
If from point of view of the content in sugars were big differences between elites: 110 g/l (elite HI13) - 206 (BP8) and 210 (A31), glucoacidimetric indices has grouped them more in the second part of variation line (the range 40-80). A similar situation is encountered approximately in the case of glucoacidimetric correlation between the index and acidity of the must, with the difference that these are negatively correlated. The acidity is higher in the range 1,5-4,5 g / l H2SO4 the glucoacidimetric index is low in the range of 80-35 (figure 4).
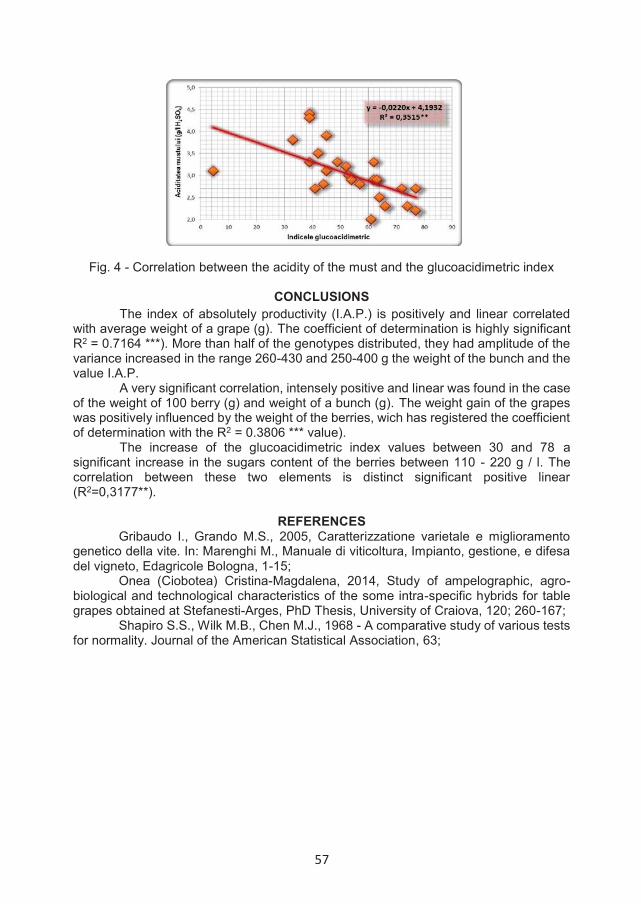
57
Fig. 4 - Correlation between the acidity of the must and the glucoacidimetric index
CONCLUSIONS The index of absolutely productivity (I.A.P.) is positively and linear correlated
with average weight of a grape (g). The coefficient of determination is highly significant R2 = 0.7164 ***). More than half of the genotypes distributed, they had amplitude of the variance increased in the range 260-430 and 250-400 g the weight of the bunch and the value I.A.P.
A very significant correlation, intensely positive and linear was found in the case of the weight of 100 berry (g) and weight of a bunch (g). The weight gain of the grapes was positively influenced by the weight of the berries, wich has registered the coefficient of determination with the R2 = 0.3806 *** value).
The increase of the glucoacidimetric index values between 30 and 78 asignificant increase in the sugars content of the berries between 110 - 220 g / l. The correlation between these two elements is distinct significant positive linear (R2=0,3177**).
REFERENCES Gribaudo I., Grando M.S., 2005, Caratterizzatione varietale e miglioramento
genetico della vite. In: Marenghi M., Manuale di viticoltura, Impianto, gestione, e difesa del vigneto, Edagricole Bologna, 1-15;
Onea (Ciobotea) Cristina-Magdalena, 2014, Study of ampelographic, agro-biological and technological characteristics of the some intra-specific hybrids for table grapes obtained at Stefanesti-Arges, PhD Thesis, University of Craiova, 120; 260-167;
Shapiro S.S., Wilk M.B., Chen M.J., 1968 - A comparative study of various tests for normality. Journal of the American Statistical Association, 63;
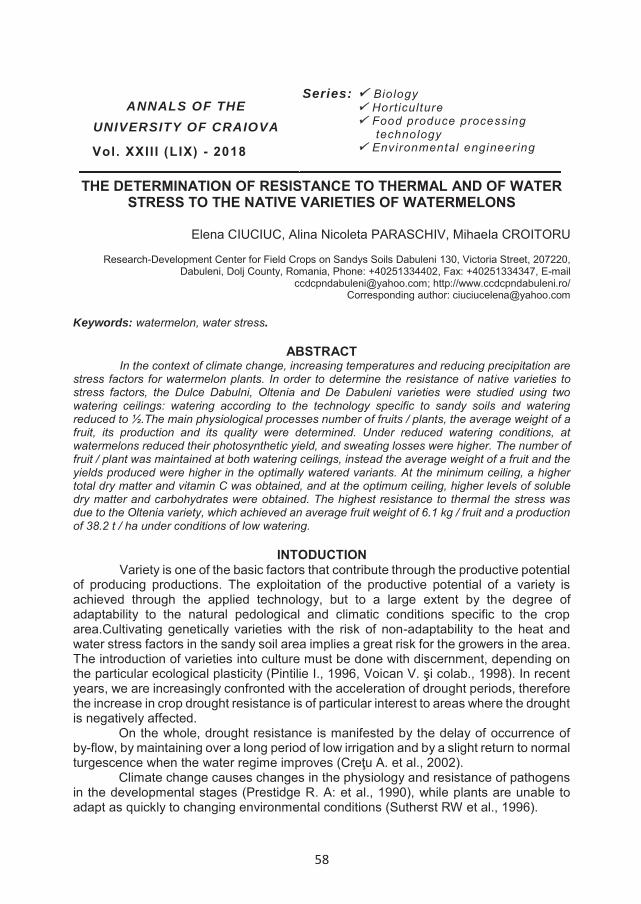
58
THE DETERMINATION OF RESISTANCE TO THERMAL AND OF WATER STRESS TO THE NATIVE VARIETIES OF WATERMELONS
Elena CIUCIUC, Alina Nicoleta PARASCHIV, Mihaela CROITORU
Research-Development Center for Field Crops on Sandys Soils Dabuleni 130, Victoria Street, 207220, Dabuleni, Dolj County, Romania, Phone: +40251334402, Fax: +40251334347, E-mail
[email protected]; http://www.ccdcpndabuleni.ro/ Corresponding author: [email protected]
Keywords: watermelon, water stress.
ABSTRACT In the context of climate change, increasing temperatures and reducing precipitation are
stress factors for watermelon plants. In order to determine the resistance of native varieties to stress factors, the Dulce Dabulni, Oltenia and De Dabuleni varieties were studied using two watering ceilings: watering according to the technology specific to sandy soils and watering reduced to ½.The main physiological processes number of fruits / plants, the average weight of a fruit, its production and its quality were determined. Under reduced watering conditions, at watermelons reduced their photosynthetic yield, and sweating losses were higher. The number of fruit / plant was maintained at both watering ceilings, instead the average weight of a fruit and the yields produced were higher in the optimally watered variants. At the minimum ceiling, a higher total dry matter and vitamin C was obtained, and at the optimum ceiling, higher levels of soluble dry matter and carbohydrates were obtained. The highest resistance to thermal the stress was due to the Oltenia variety, which achieved an average fruit weight of 6.1 kg / fruit and a production of 38.2 t / ha under conditions of low watering.
INTODUCTION Variety is one of the basic factors that contribute through the productive potential
of producing productions. The exploitation of the productive potential of a variety is achieved through the applied technology, but to a large extent by the degree of adaptability to the natural pedological and climatic conditions specific to the crop area.Cultivating genetically varieties with the risk of non-adaptability to the heat and water stress factors in the sandy soil area implies a great risk for the growers in the area. The introduction of varieties into culture must be done with discernment, depending on the particular ecological plasticity (Pintilie I., 1996, Voican V. şi colab., 1998). In recent years, we are increasingly confronted with the acceleration of drought periods, therefore the increase in crop drought resistance is of particular interest to areas where the drought is negatively affected.
On the whole, drought resistance is manifested by the delay of occurrence of by-flow, by maintaining over a long period of low irrigation and by a slight return to normal turgescence when the water regime improves (Creţu A. et al., 2002).
Climate change causes changes in the physiology and resistance of pathogens in the developmental stages (Prestidge R. A: et al., 1990), while plants are unable to adapt as quickly to changing environmental conditions (Sutherst RW et al., 1996).
ANNALS OF THE UNIVERSITY OF CRAIOVA
Series: Biology HorticultureFood produce processingtechnology
Environmental engineering Vol. XXII I (LIX) - 2018

59
The water supply of watermelon crops throughout the growing season is essential for high temperature production due to the lack of precipitation (Yesim E., et al., 2003).
MATERIAL AND METHOD At the Research-Development Station for Field Crops on Sandy Soils Dabuleni
was studie the three varieties of watermelon, creations of the unit (Dulce de Dabuleni, Dabuleni and Oltenia), under the application of two watering rules: reduced watering to 1/2 and applying the watering rules according to the technology .
Was determined: the main physiological processes, the fruit / plant number, the average fruit weight, the watermelon production achieved and the biochemical composition of the fruit
RESULTS AND DISCUSSIONS In the maximal thriving phenophase, the photosynthetic rate, foliar sweat rate,
active radiation in photosynthesis, leaf temperature using the LC Pro + instrument were determined.
Although watermelon is a pretentious species of temperature and is well tolerated by drought, the studied genotypes behave differently at the two watering ceilings.In the irrigated green watermelons according to the technology, at 9 o'clock the photosynthesis rate recorded values between 18.31 μmoli CO2 /m2/s at De Dabuleni and 21.91 μmol CO2/m2/s at Dulce de Dabuleni at an active radiation between 915 -1124 μmol/m2/s (Table 1).
Table 1 The daily variation of photosynthesis to watermelons
Watering level
The genotype
RAPhμmol/m2/s
Phμmol CO2/m2/s
RAPhμmol/m2/s
Phμmol CO2/m2/s
RAPhμmol/m2/s
Phμmol CO2/m2/s
Daily averagePh μmol CO2/m2
/s9 o'clock 129 o'clock 15 o'clock
Normal watering
Dulce de Dabuleni 915 21.91 1609 10.17 1678 22.25 18.11Oltenia 1124 20.88 1784 19.15 1552 18.10 19.37
DeDabuleni
936 18.31 1648 13.14 1681 17.93 16.46
Reduced
watering
Dulce de Dabuleni
1263 16.91 1766 16.18 1526 14.28 15.79
Oltenia 1039 15.81 1534 5.14 1756 16.17 12.37De
Dabuleni1397 18.33 1591 14.91 1475 12.69 15.31
Compared to these, the irrigated watermelons ½ of the normal ceiling recorded lower values of photosynthesis, with values ranging from 15.81-18.33 μmol CO2/m2/s. At 12 o'clock, as the leaf temperature increased (reaching an average of 380C), the amount of active radiation in photosynthesis increased, recording values between 1534-1784 μmol/m2/s. Under these conditions, the watermelons have reduced their photosynthetic yield due to the hydroactive closure of the stomata.
At 15 o'clock, although the leaf temperature reached 420C, the photosynthetic yield remained high, ranging from 17.93-22.25 μmol CO2/m2/s at the plants with the nomal watering and between 12.69-16.17 μmoli CO2/m2/s in plants with low watering.

60
The daily average of photosynthesis shows a more intense synthetic activity in tehnologic wetted plants than those with low watering. The highest rate of photosynthesis was recorded at the Oltenie variety under conditions of normal watering.
The elements that make up the structure of the leaf (mesophile, epidermis and cuticle thickness, number of stomata) play an important role in the photosynthesis process and are specific to each genotype. They generate differences between genotypes on photosynthetic activity under the same ecotope conditions.
Analyzing the diurnal variation of foliar sweat, it is noted that as the stressful action of environmental factors increases throughout the day, the intensity of this physiological process increases (Table 2).
Table 2 The diurnal variation of foliar sweating at green watermelons
Watering level
The genotype
T 0C Perspi-ration mmol H2O/m2/s
T 0C Perspi-ration mmol H2O/m2/s
T 0C Perspi-ration mmol H2O/m2/s
Daily averageperspi-ration μmol
CO2/m2
/s9 o'clock 129 o'clock 15 o'clock
Normal watering
Dulce de Dabuleni
28.3 2.13 32.6 1.68 38.3 5,603.13
Oltenia 28.9 2.94 32.9 3.11 38.7 5,41 3.82De
Dabuleni29.8 3.44 34.1 2.88 39.2 5,31
3.87Reduced watering
Dulce de Dabuleni
33.9 4.20 39.5 6.15 41.0 6,805.71
Oltenia 34.2 3.73 39.9 4.73 41.4 6,48 4.98De
Dabuleni34.4 2.39 40.5 5.28 41.4 4,80
4.15
The very high June temperatures (which at the leaf level are a few degrees higher than in the air), strong solar radiation, very low air humidity (less than 30 %) have acted as dehydrating forces on the foliar appliance, increasing water losses through foliar sweating.
The foliar sweat rate ranged between 2.13 - 3.44 mmol H2O/m2/s at 9 o'clock to optimal watering plants and between 2.39 - 4.20 mmol H2O/m2/s to low watering plants. At 12 o'clock, perspiration increased to plants with low watering, with the highest values being recorded at 15 o'clock due to the increase in temperatures. The daily average of sweat indicates the highest values for genotypes in the low-irrigation variant.
The total production of watermelon was determined by the average weight of a fruit according to the technological factors studied, namely the watering level (figure 3).

61
Figure : The influence of irrigation level and variety on the weight of a fruitand the production of watermelon
To all three varieties, the production in the technologically wetted version was well above those obtained in the low watering variant. The Dulce de Dăbuleni variety produced a production of 32.5 t/ha and an average fruit weight of 5.4 kg/fruit under reduced watering conditions and 44.3 t/ha and an average fruit weight of 6.6 kg / fruit under optimum watering conditions. The Oltenia variety achieved 38.1 t/ha and an average fruit weight of 6.1 kg/fruit at low watering and 48.8 t/ha and an average fruit weight of 8,8 kg/fruit at optimum watering, and in the Dăbuleni variety yields of 32.5 t/ha and an average fruit weight of 4.7 kg/fruit and 38.9 t/ha respectively were obtained and an average fruit weight of 6 kg/fruit.
It was detached by the weight of the fruit and by the production the Oltenia variety regardless of the level of watering.
In the experimental variants have determined the biochemical composition of watermelon fruits: water content, total dry substance, soluble dry matter, acidity, carbohydrate content and vitamin C (table 3).
The total dry substance showed higher values for the cultivars Dulce de Dăbuleni and Oltenia in the irrigated variant at the optimal ceiling (8.80 % and 8.85 %), but also at the minimum ceiling the fruits accounted for 8.46 % and 8.47 %.
At the De Dabuleni cultivar, a higher dry matter content in the irrigated version was determined in the fruit at the lowest ceiling (10.27 %).
In the fruit of the Dulce de Dăbuleni and Oltenia cultivars in the irrigated variant at the optimal ceiling was also determined a higher content of soluble dry substance and carbohydrates.
The acidity of the fruit of the watermelon was reduced and less influenced by the irrigation system. It ranged from 0.18 grams of malic acid per 100 grams of fresh matter to the Oltenia cultivar in the irrigated variant at the minimum ceiling and 0.42 grams of malic acid per 100 grams of fresh substance at the Dulce de Dabuleni cultivar at the minimum ceiling.
44 48.8 38.9 32.5 38.1 32.5
6.6
8.8
65.4
6.14.7
012345678910
0
10
20
30
40
50
60
Dulce deDăbuleni
Oltenia DeDăbuleni
Dulce deDăbuleni
Oltenia DeDăbuleni
Normal watwring Reduced watering
Production (t/ha) Fruit weight (kg)
62
Table 3 The biochemical composition of green melons in function
of variety and level of irrigation
Watering level
The genotype
Water(%)
Total dry
sub-stance
(%)
Soluble dry
sub-stance
(%)
Acidity(g malicacid at
100g fs)
Carbo-hidrates
(%)
CVitamin
(mg/100g fs)
Normal watering
Dulce de Dabuleni 91.54 8.46 8.20 0.42 6.85 9.68
Oltenia 91.53 8.47 8.20 0.18 6.80 9.68DeDabuleni 89.73 10.27 9.00 0.30 7.50 12.32
Normal watering
Dulce de Dabuleni 91.20 8.80 8.48 0.29 7.00 10.56
Oltenia 91.15 8.85 8.60 0.22 7.18 8.80DeDabuleni 91.32 8.68 8.50 0.26 7.10 11.44
Vitamin C content is a character of variety and may be influenced by culture and climatic conditions. It ranged between 8.80 mg / 100g of the fresh substance at the Oltenia cultivar in the irrigated variant at the optimal ceiling and 12.32 mg / 100g of fresh substance at the De Dabuleni cultivar in the irrigated variant at the minimum ceiling.
CONCLUSIONS The three cultivars, Dăbuleni Dulce de Dăbuleni and Oltenia were created at
CCDCPN Dabuleni respond very well to the climatic conditions in the area, even under conditions of thermal-hydro stress.
Applying a small amount of water to the irrigated water has led to the development of a stronger and deeper radicular system with a high absorption capacity, resulting in increased drought resistance to these genotypes.
Ensuring optimal irrigation water determines the photosynthesis process with positive implications for fruit weight, watermelon production and its quality.
ACKNOWLEDGMENT The paper is a part of the ADER Project 3.3.6. from Sectorial Programme
“ADER 2020”, funded by Ministry of Agriculture and Rural Development - Romania.
REFERENCES Creţu A., Creţu L., Simioniuc D., 2002 – Ameliorarea plantelor, producerea şi
multiplicarea seminţelor şi materialului săditor. Ed. Ion Ionescu de la Brad, ISBN 9738014069.
Pintilie I., 1996 - Linii noi de ardei gras la SCPL Iţalniţa. Anale ICLF Vidra, vol.XIV, Bucureşti, pg. 233-240.
Prestidge R. A. And Pottinger R. P., 1990 – The impact of Climate Cange on Pests, Diseases, Weeds and Beneficial Organism present in Mew Zealand. MAF Technology, Ruakura Agricultural Center, Hamilton, N.z.
Sutherst R. W., Yonow T., Chakraborty S., O, Donnell C. And White K., 1996 –A generic approach to dening impacts of climate change on pests, weeds and diseases in Australia. In Greenhause, Coping wth Climate Change. W. J. Buoma, G. I. Pearman and M.R. Manning, (Eds). CSIRO, Australia, pp 287-307.
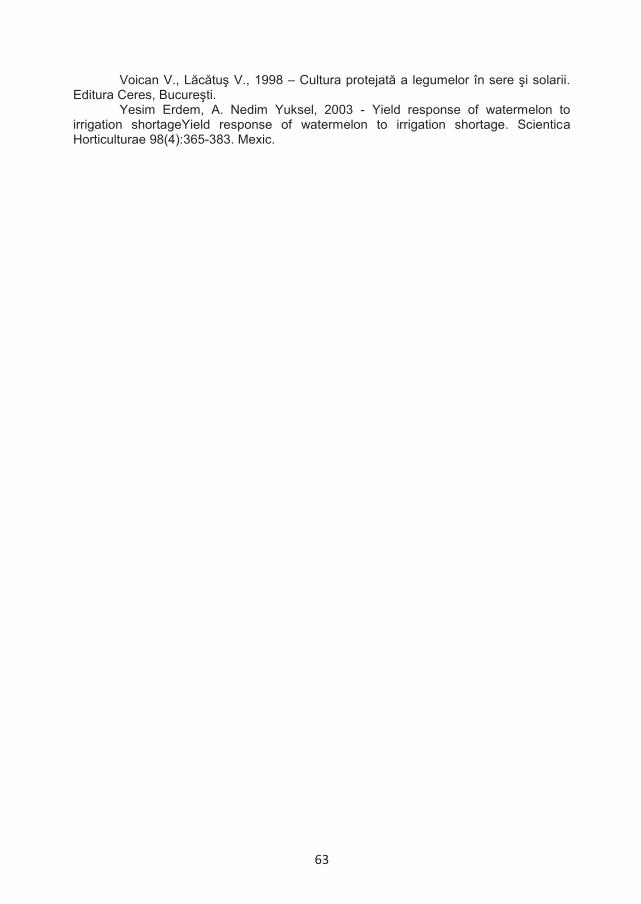
63
Voican V., Lăcătuş V., 1998 – Cultura protejată a legumelor în sere şi solarii. Editura Ceres, Bucureşti.
Yesim Erdem, A. Nedim Yuksel, 2003 - Yield response of watermelon to irrigation shortageYield response of watermelon to irrigation shortage. ScienticaHorticulturae 98(4):365-383. Mexic.

64
IN VITRO MICROPROPAGATION OF OSCULARIA DELTOIDES SPECIES AND OPPORTUNITIES TO USE IT IN SETTING-UP IN VITRO GARDENS
Cosmulescu Sina1,*, Mîndrilă Gheorghiţa1, Eciu Mihaela2
1Horticulture Faculty, University of Craiova, A.I.Cuza Street, 13, 200585, Craiova, Romania
2 1Horticulture Faculty, University of Craiova, Master Management and Consultancy in Horticulture and Rural Development Resources, A.I.Cuza Street, 13, 200585, Craiova, Romania
*Corresponding author’s email: [email protected]
Keywords: Oscularia deltoids, micropropagation, in vitro gardens
ABSTRACT To meet the needs of lovers of nature and beauty, and trying to reproduce the image of
a garden corner and bring it into enclosed spaces, the paper aimed to study the in vitro behavior and adaptation of some cactus and succulent plants species in different combinations. In setting-up the mini-gardens, the following species have been used: Oscularia deltoides, Opuntia microdasys, Mammillaria duwei and Hatiora salicornioides. Three weeks after inoculation, Oscularia deltoides developed and adapted best in association with Hatiora salicornioides, and the results prove that the studied species can be used successfully in setting up in vitro mini-gardens, both standing alone, and in association with other species. The following studies will focus on finding environmental variants that will keep plantlets alive for as long as possible, with moderate growth, given the limited culture area, as well as on setting-up other combinations with a high decorative effect.
INTRODUCTION
Many species can be micro-propagated in vitro, which enables the use of this technique in different areas/directions. One of the practical applications of in vitro cultures is to setting-up mini-gardens in closed glass vessels, in a completely sterile environment. Such mini-gardens have been set-up within by Jibou Biological Research Center, using insectivorous plants of Drosera and Pinguicula species. Drosera and Pinguicula species respond well to in vitro multiplication (Clapa et al., 2009, 2010). A proper micro-propagation protocol is required in order to set-up the gardens. A series of investigations have followed-up the behavior of succulent decorative species under in vitro culture. Estrada-Luna et al. (2008) have studied the response of Opuntia lanigera species to in vitro culture and have established a reliable and efficient micro-propagation protocol for this species. Juárez et al. (2002) have shown that Opuntia ellisiana can be successfully micro-propagated and easily acclimatized. Cereus peruvianus species was used as a source of explants in order to set-up effective conditions for inducing and keeping callus in a rapid growth state to obtain new plants (Oliveira et al., 1995). Although conventional micro-propagation methods are quite satisfactory for Hylocereous undatus species, a micro-propagation protocol has been developed in order to enable rapid creation of clones or improved genotypes (Drew et al., 2000). In Pelecyphora aselliformis, a Mexican cactus that is rare and highly appreciated on the commercial market, in vitro culture has been set-up using seeds as culture explants (Santos-Diaz et
ANNALS OF THE UNIVERSITY OF CRAIOVA
Series: Biology Horticulture Food produce processing
technology Environmental engineering Vol. XXII I (LIX) - 2018
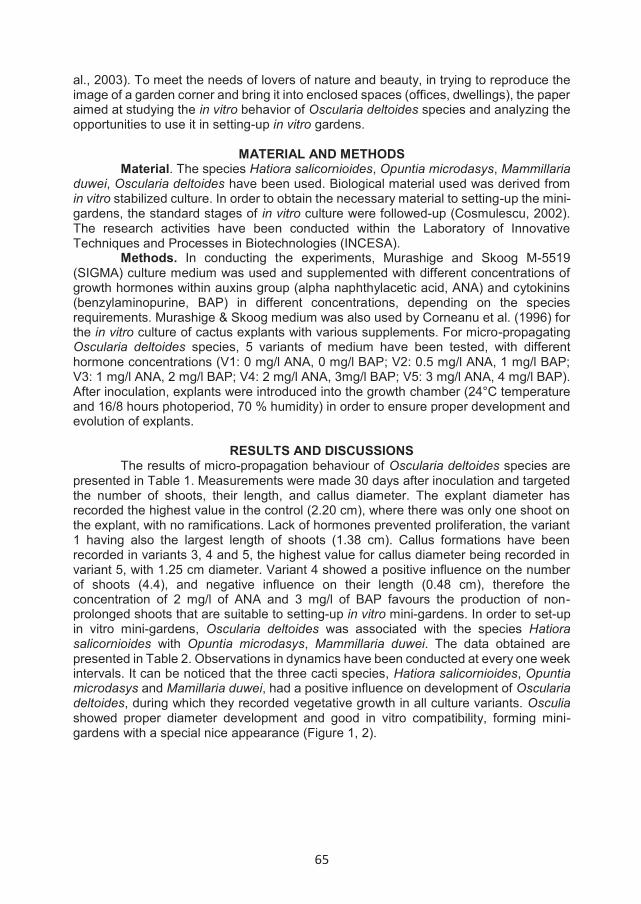
65
al., 2003). To meet the needs of lovers of nature and beauty, in trying to reproduce the image of a garden corner and bring it into enclosed spaces (offices, dwellings), the paper aimed at studying the in vitro behavior of Oscularia deltoides species and analyzing the opportunities to use it in setting-up in vitro gardens.
MATERIAL AND METHODS Material. The species Hatiora salicornioides, Opuntia microdasys, Mammillaria
duwei, Oscularia deltoides have been used. Biological material used was derived from in vitro stabilized culture. In order to obtain the necessary material to setting-up the mini-gardens, the standard stages of in vitro culture were followed-up (Cosmulescu, 2002). The research activities have been conducted within the Laboratory of Innovative Techniques and Processes in Biotechnologies (INCESA).
Methods. In conducting the experiments, Murashige and Skoog M-5519 (SIGMA) culture medium was used and supplemented with different concentrations of growth hormones within auxins group (alpha naphthylacetic acid, ANA) and cytokinins (benzylaminopurine, BAP) in different concentrations, depending on the species requirements. Murashige & Skoog medium was also used by Corneanu et al. (1996) for the in vitro culture of cactus explants with various supplements. For micro-propagating Oscularia deltoides species, 5 variants of medium have been tested, with different hormone concentrations (V1: 0 mg/l ANA, 0 mg/l BAP; V2: 0.5 mg/l ANA, 1 mg/l BAP; V3: 1 mg/l ANA, 2 mg/l BAP; V4: 2 mg/l ANA, 3mg/l BAP; V5: 3 mg/l ANA, 4 mg/l BAP). After inoculation, explants were introduced into the growth chamber (24°C temperature and 16/8 hours photoperiod, 70 % humidity) in order to ensure proper development and evolution of explants.
RESULTS AND DISCUSSIONSThe results of micro-propagation behaviour of Oscularia deltoides species are
presented in Table 1. Measurements were made 30 days after inoculation and targeted the number of shoots, their length, and callus diameter. The explant diameter has recorded the highest value in the control (2.20 cm), where there was only one shoot on the explant, with no ramifications. Lack of hormones prevented proliferation, the variant 1 having also the largest length of shoots (1.38 cm). Callus formations have been recorded in variants 3, 4 and 5, the highest value for callus diameter being recorded in variant 5, with 1.25 cm diameter. Variant 4 showed a positive influence on the number of shoots (4.4), and negative influence on their length (0.48 cm), therefore the concentration of 2 mg/l of ANA and 3 mg/l of BAP favours the production of non-prolonged shoots that are suitable to setting-up in vitro mini-gardens. In order to set-upin vitro mini-gardens, Oscularia deltoides was associated with the species Hatiora salicornioides with Opuntia microdasys, Mammillaria duwei. The data obtained are presented in Table 2. Observations in dynamics have been conducted at every one week intervals. It can be noticed that the three cacti species, Hatiora salicornioides, Opuntia microdasys and Mamillaria duwei, had a positive influence on development of Oscularia deltoides, during which they recorded vegetative growth in all culture variants. Osculiashowed proper diameter development and good in vitro compatibility, forming mini-gardens with a special nice appearance (Figure 1, 2).

66
Table 1 Mean biometric values recorded after 30 days
Var.
Mini-cuttings from shoot tips Ø explant
(cm) Diference No. of shoots Diference Length (cm)
Diference
Ø callus (cm).
1 2.20±0.29 - 1±0 - 1.38±0.16 - - 2 1.60±0.39 -0,60 3.2±1.92 +2.2 0.72±0.26 -0.66ººº - 3 1.60±1.38 -0.60 3.2±0.84 +2.2 0.62±0.16 -0.76ººº 1.1 4 1.62±0.54 -0.62 4.4±1.14 +3.4* 0.48±0.13 -0.90ººº 0.5 5 1.00±0.29 -1.20 2.6±0.89 +1.6 0.54±0.13 -0.84ººº 1.25
DL 5 % =0.96 DL 1 %=1.31
DL 0.1 %=1.82
DL 5 % =2.44 DL 1 %=6.34
DL 0.1 %=8.59
DL 5 % =0.22 DL 1 %=0.30
DL 0.1 %=0.41 Good behaviour in in vitro culture in the studied species was supported also by
other authors (Corneanu and Corneanu, 1994; Corneanu et al., 1996). Micro-propagation in Mammillaria prolifera was studied by Vyskot and Jara (1984) by cultivating shoots fragments, including axillary buds, on medium with addition of low concentrations (0.5-5 mg/l) auxins and cytokines, thus producing a direct production of new shoots of axillary meristems.
Table 2
Biometric data recorded in Oscularia deltoides in association with Hatiora salicornioides, Opuntia microdasys and Mamillaria duwei
Species
Dimensions of initiation explant
Observations in dynamics
I II III Ø
(mm) h
(mm) Ø
(mm) h
(mm) h
(mm) H
(mm) Ø
(mm) H
(mm) 1 Oscularia
deltoides 10 10 15.3 12.8 18.5 15.6 19.4 20.7
Hatiora salicornioides
10 10 12.4 12.6 12.6 13.7 13.2 13.9
2 Oscularia deltoides
10 10 13.6 12.1 13.2 14.3 15.7 16.8
Opuntia microdasys
10 10 12.2 16.9 15.5 20.5 17.1 23.4
3 Oscularia deltoides
10 10 11.7 14.4 13.1 19.1 14.5 20.2
Mamillaria duwei 10 10 11.3 11.3 11.5 11.7 11.9 12.1 Three weeks after inoculation, Oscularia deltoides developed and best adapted
in association with Hatiora salicornioides, and the explant increased so that the diameter reached 19.4 mm, with the height of 20.7 mm, i.e. a double increase relative to the explant size at inoculation. A rather rapid increase was also observed in Opuntia microdasys, the diameter reaches within 3 weeks the value of 17.1 mm, while the height reaches the value of 23.4 mm. Species of Opuntia genus develop well in in vitro culture. Juárez et al. (2002) showed that Opuntia ellisiana can be successfully micro-propagated, and the shoots obtained had an average length of 10.2 mm after 49 days of culture. The way of development, the colour of explants, the duration of decoration, all indicate that the studied species can be successfully used in in vitro mini-gardens (Figure 3.4) both alone and in combination with other species.
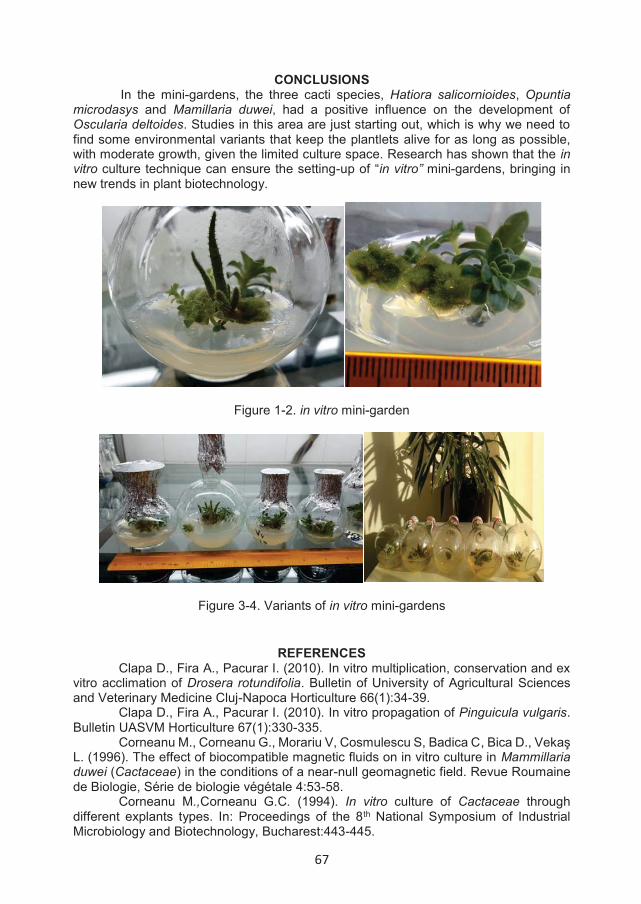
67
CONCLUSIONS In the mini-gardens, the three cacti species, Hatiora salicornioides, Opuntia
microdasys and Mamillaria duwei, had a positive influence on the development of Oscularia deltoides. Studies in this area are just starting out, which is why we need to find some environmental variants that keep the plantlets alive for as long as possible, with moderate growth, given the limited culture space. Research has shown that the in vitro culture technique can ensure the setting-up of “in vitro” mini-gardens, bringing in new trends in plant biotechnology.
Figure 1-2. in vitro mini-garden
Figure 3-4. Variants of in vitro mini-gardens
REFERENCES Clapa D., Fira A., Pacurar I. (2010). In vitro multiplication, conservation and ex
vitro acclimation of Drosera rotundifolia. Bulletin of University of Agricultural Sciences and Veterinary Medicine Cluj-Napoca Horticulture 66(1):34-39.
Clapa D., Fira A., Pacurar I. (2010). In vitro propagation of Pinguicula vulgaris.Bulletin UASVM Horticulture 67(1):330-335.
Corneanu M., Corneanu G., Morariu V, Cosmulescu S, Badica C, Bica D., Vekaş L. (1996). The effect of biocompatible magnetic fluids on in vitro culture in Mammillaria duwei (Cactaceae) in the conditions of a near-null geomagnetic field. Revue Roumaine de Biologie, Série de biologie végétale 4:53-58.
Corneanu M.,Corneanu G.C. (1994). In vitro culture of Cactaceae through different explants types. In: Proceedings of the 8th National Symposium of Industrial Microbiology and Biotechnology, Bucharest:443-445.
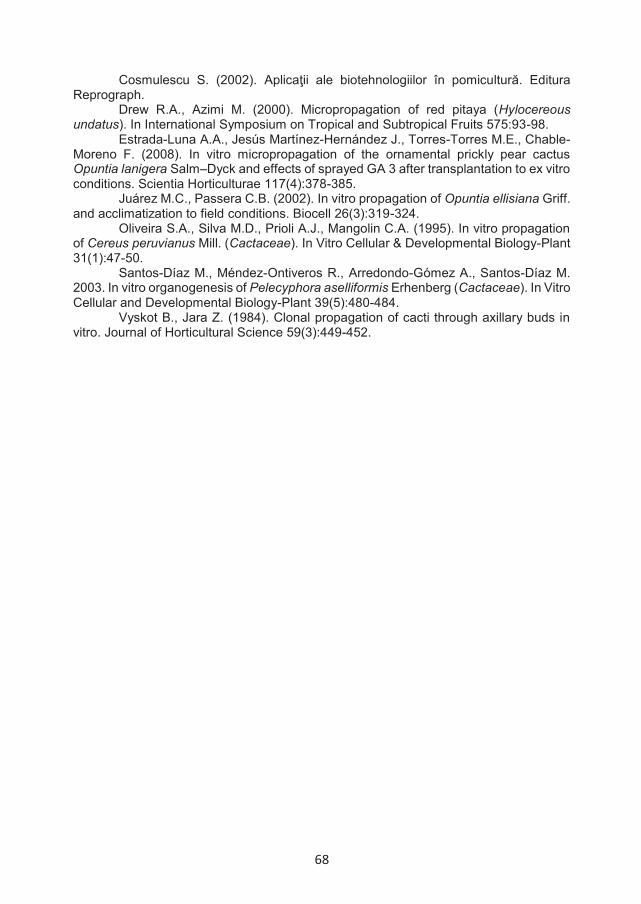
68
Cosmulescu S. (2002). Aplicaţii ale biotehnologiilor în pomicultură. Editura Reprograph.
Drew R.A., Azimi M. (2000). Micropropagation of red pitaya (Hylocereous undatus). In International Symposium on Tropical and Subtropical Fruits 575:93-98.
Estrada-Luna A.A., Jesús Martínez-Hernández J., Torres-Torres M.E., Chable-Moreno F. (2008). In vitro micropropagation of the ornamental prickly pear cactus Opuntia lanigera Salm–Dyck and effects of sprayed GA 3 after transplantation to ex vitro conditions. Scientia Horticulturae 117(4):378-385.
Juárez M.C., Passera C.B. (2002). In vitro propagation of Opuntia ellisiana Griff. and acclimatization to field conditions. Biocell 26(3):319-324.
Oliveira S.A., Silva M.D., Prioli A.J., Mangolin C.A. (1995). In vitro propagation of Cereus peruvianus Mill. (Cactaceae). In Vitro Cellular & Developmental Biology-Plant 31(1):47-50.
Santos-Díaz M., Méndez-Ontiveros R., Arredondo-Gómez A., Santos-Díaz M. 2003. In vitro organogenesis of Pelecyphora aselliformis Erhenberg (Cactaceae). In Vitro Cellular and Developmental Biology-Plant 39(5):480-484.
Vyskot B., Jara Z. (1984). Clonal propagation of cacti through axillary buds in vitro. Journal of Horticultural Science 59(3):449-452.

69
STUDIES ON THE EFFECT OF ECOCLIMATIC RESOURCES OF VITICULTURAL AREAS ON YOUNG GRAPEVINE GROWING
Costea Dorin Constantin1*, Iordan Roxana1,
*University of Craiova, Faculty of Horticulture,University of Craiova, Faculty of Horticulture, Master M.C.H.D.R
* Correspondence author. E-mail: [email protected]
Keywords: ecoclimatic resources, quality, grapevine growing
ABSTRACT The areas favourable to grapevine cultivation have most various pedoclimatic conditions
which, correlated with the ecological requirements of varieties and parent stocks, are key elements in obtaining high level production of grapes and wine in terms of both quantity and quality. The quality of viticultural and wine-making products depends to a great extent on the environmental conditions that leave their mark on production areas (regions, vineyards, viticultural centres, etc.).The paper presents the results obtained by applying the studies on young grapevine growing in the Banu Mărăcine viticultural centre
INTRODUCTION It is widely recognized that Vitis vinifera (L). is a specie very sensitive to climate
change, so that it has been elected as a valuable bio-indicator. Climate is a key terroir determinant that affects yearly productions, grape quality traits and, indirectly, resource management and vineyard agroecosystem (Biasi R, et al 2016)
The ecoclimatic conditions influence the development of the physiological and biochemical processes inside the plant, determine the length of the vegetation period, influence the hydro-mineral feeding system, the quality of crops, and offer singularity to the grapes and wines obtained on a certain area, expressed by the specificity of the viticultural area Grapevine cultivation with superior productive results requires, besides the biological characteristics of the cultivated soil, the continuous appreciation of the ecological favourablness of the space used for this purpose, in order to identify and then apply the most appropriate counter measures according to the variation of the ecoclimatic conditions Bora. et al(2014), Cichi D et al (2006,2016), Costea D.C. et al, (2008,2015,) Lung M et al (2012) .
In order to perform durable and sustainable viticulture, studies were made trying to identify the reaction of grapevine under conditions of the ecoclimatic resources.Vintners try to encourage the vine resistance and self-adaptation by restoring the complex ecological net of relations between the vine and its whole environment in order to enhance its compensation capacity Geneviève Teil,(2016), Giugea et al, (2015)Ollat N et all (2016), Schaller, K (2001), Seguin G. (1986), Stan, S et al (2011).
ANNALS OF THE UNIVERSITY OF CRAIOVA
Series: Biology HorticultureFood produce processingtechnology
Environmental engineering Vol. XXII I (LIX) - 2018
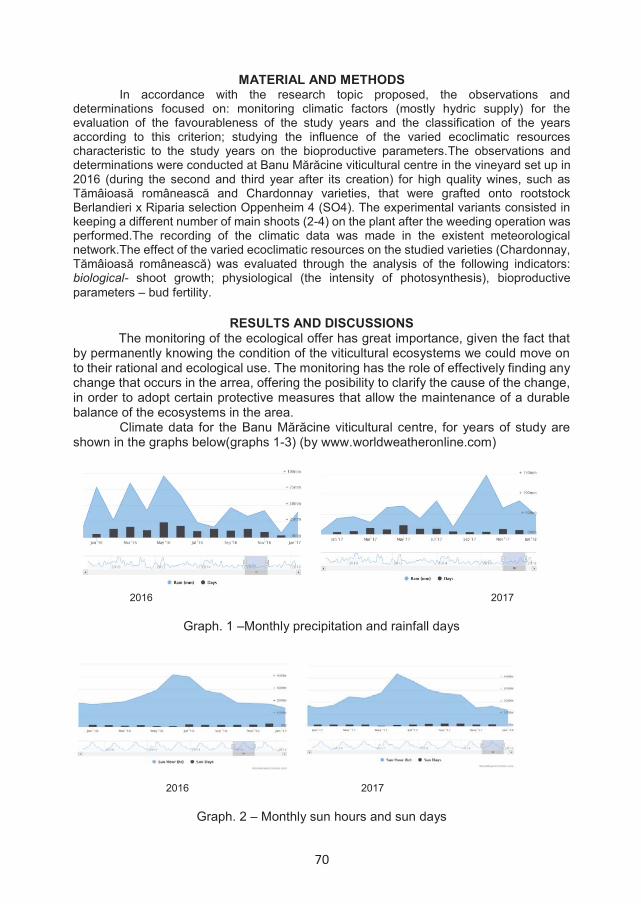
70
MATERIAL AND METHODS In accordance with the research topic proposed, the observations and
determinations focused on: monitoring climatic factors (mostly hydric supply) for the evaluation of the favourableness of the study years and the classification of the years according to this criterion; studying the influence of the varied ecoclimatic resources characteristic to the study years on the bioproductive parameters.The observations and determinations were conducted at Banu Mărăcine viticultural centre in the vineyard set up in 2016 (during the second and third year after its creation) for high quality wines, such as Tămâioasă românească and Chardonnay varieties, that were grafted onto rootstock Berlandieri x Riparia selection Oppenheim 4 (SO4). The experimental variants consisted in keeping a different number of main shoots (2-4) on the plant after the weeding operation was performed.The recording of the climatic data was made in the existent meteorological network.The effect of the varied ecoclimatic resources on the studied varieties (Chardonnay, Tămâioasă românească) was evaluated through the analysis of the following indicators: biological- shoot growth; physiological (the intensity of photosynthesis), bioproductive parameters – bud fertility.
RESULTS AND DISCUSSIONS
The monitoring of the ecological offer has great importance, given the fact that by permanently knowing the condition of the viticultural ecosystems we could move on to their rational and ecological use. The monitoring has the role of effectively finding any change that occurs in the arrea, offering the posibility to clarify the cause of the change, in order to adopt certain protective measures that allow the maintenance of a durable balance of the ecosystems in the area.
Climate data for the Banu Mărăcine viticultural centre, for years of study are shown in the graphs below(graphs 1-3) (by www.worldweatheronline.com)
2016 2017
Graph. 1 –Monthly precipitation and rainfall days
2016 2017
Graph. 2 – Monthly sun hours and sun days
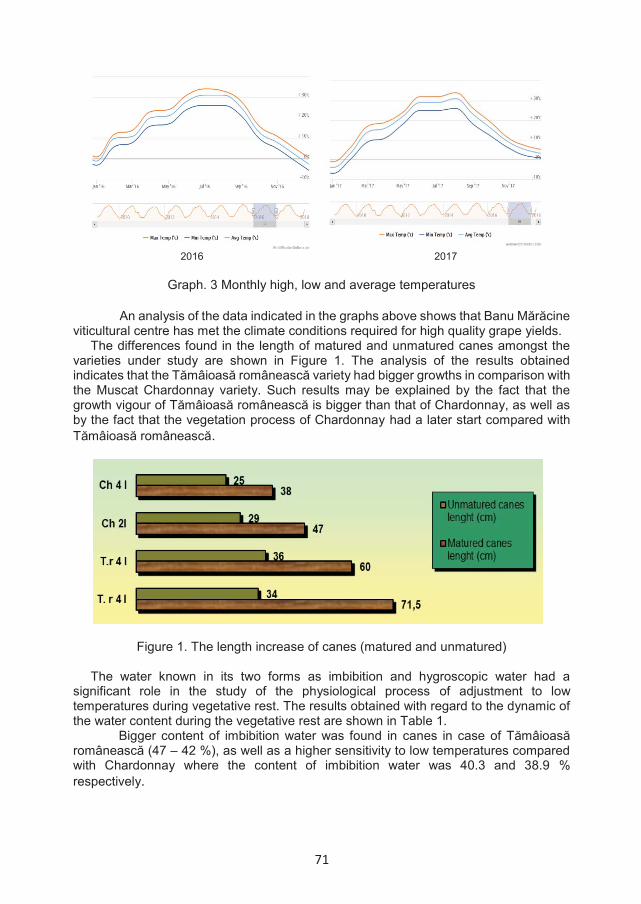
71
2016 2017
Graph. 3 Monthly high, low and average temperatures
An analysis of the data indicated in the graphs above shows that Banu Mărăcine viticultural centre has met the climate conditions required for high quality grape yields.
The differences found in the length of matured and unmatured canes amongst the varieties under study are shown in Figure 1. The analysis of the results obtained indicates that the Tămâioasă românească variety had bigger growths in comparison with the Muscat Chardonnay variety. Such results may be explained by the fact that the growth vigour of Tămâioasă românească is bigger than that of Chardonnay, as well as by the fact that the vegetation process of Chardonnay had a later start compared with Tămâioasă românească.
Figure 1. The length increase of canes (matured and unmatured)
The water known in its two forms as imbibition and hygroscopic water had a significant role in the study of the physiological process of adjustment to low temperatures during vegetative rest. The results obtained with regard to the dynamic of the water content during the vegetative rest are shown in Table 1.
Bigger content of imbibition water was found in canes in case of Tămâioasă românească (47 – 42 %), as well as a higher sensitivity to low temperatures compared with Chardonnay where the content of imbibition water was 40.3 and 38.9 % respectively.
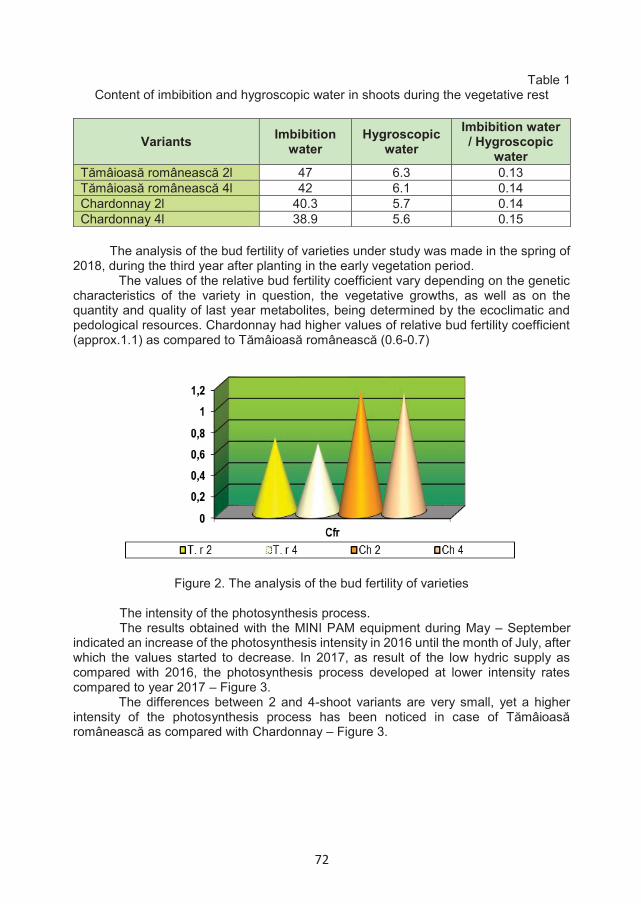
72
Table 1 Content of imbibition and hygroscopic water in shoots during the vegetative rest
Variants Imbibition water
Hygroscopic water
Imbibition water / Hygroscopic
water Tămâioasă românească 2l 47 6.3 0.13 Tămâioasă românească 4l 42 6.1 0.14 Chardonnay 2l 40.3 5.7 0.14 Chardonnay 4l 38.9 5.6 0.15
The analysis of the bud fertility of varieties under study was made in the spring of
2018, during the third year after planting in the early vegetation period. The values of the relative bud fertility coefficient vary depending on the genetic
characteristics of the variety in question, the vegetative growths, as well as on the quantity and quality of last year metabolites, being determined by the ecoclimatic and pedological resources. Chardonnay had higher values of relative bud fertility coefficient (approx.1.1) as compared to Tămâioasă românească (0.6-0.7)
Figure 2. The analysis of the bud fertility of varieties The intensity of the photosynthesis process. The results obtained with the MINI PAM equipment during May – September
indicated an increase of the photosynthesis intensity in 2016 until the month of July, after which the values started to decrease. In 2017, as result of the low hydric supply as compared with 2016, the photosynthesis process developed at lower intensity rates compared to year 2017 – Figure 3.
The differences between 2 and 4-shoot variants are very small, yet a higher intensity of the photosynthesis process has been noticed in case of Tămâioasă românească as compared with Chardonnay – Figure 3.
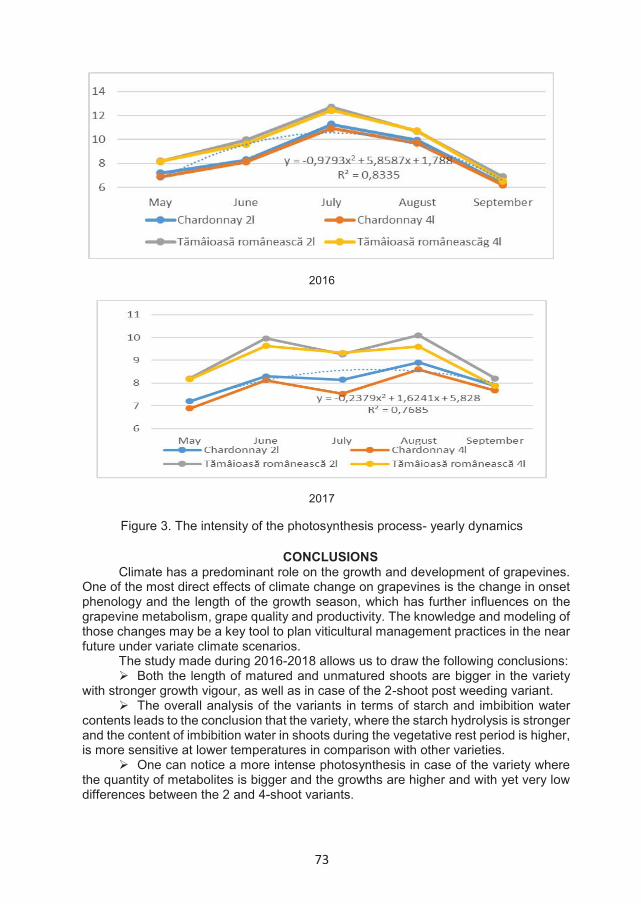
73
2016
2017
Figure 3. The intensity of the photosynthesis process- yearly dynamics
CONCLUSIONS Climate has a predominant role on the growth and development of grapevines.
One of the most direct effects of climate change on grapevines is the change in onset phenology and the length of the growth season, which has further influences on the grapevine metabolism, grape quality and productivity. The knowledge and modeling of those changes may be a key tool to plan viticultural management practices in the near future under variate climate scenarios.
The study made during 2016-2018 allows us to draw the following conclusions:Both the length of matured and unmatured shoots are bigger in the variety
with stronger growth vigour, as well as in case of the 2-shoot post weeding variant. The overall analysis of the variants in terms of starch and imbibition water
contents leads to the conclusion that the variety, where the starch hydrolysis is stronger and the content of imbibition water in shoots during the vegetative rest period is higher, is more sensitive at lower temperatures in comparison with other varieties.
One can notice a more intense photosynthesis in case of the variety wherethe quantity of metabolites is bigger and the growths are higher and with yet very low differences between the 2 and 4-shoot variants.
74
REFERENCES Biasi,R, Brunori E., L. Salvati, 2016. Climate change in a Mediterranean grape-
wine growing area: understanding variation in varietal phenology, berry maturation and health, Climwine international symposium, Bordeaux
Bora,F.D, Pop Tiberia Ioana, Bunea C.I, Delia-Elena Urcan, Anca Babeş, Cozmuta, I., Anca Mihaly-Cozmuta, Nastasia Pop,2014, Influence of ecoclimatic and ecopedological conditions on quality of white wine grape varieties from North-West of Romania, Bulletin UASVM Horticulture 71(2)
Cichi Daniela Doloris,2006, Modificările termice din ecosistemul viticol (cauze, efecte asupra viţei de vie), Editura Universitaria Craiova, 280 p
Cichi Daniela Doloris, Olteanu I, Costea D.C., 2006, Monitoring of the thermic stress parameters in Dealurile Craiovei vineyards and their impact on grape vines, Lucrări Ştiinţifice, Seria Horticultură, Anul XLIX vol. 1 (49): 693-699
Cichi Daniela Doloris, Costea D.C., Gheorghiu N., 2016, The cold hardiness of some varieties of grapevine cultivated in the viticultural area Plenita (Southwestern Romania). Annals of the University of Craiova - Agriculture, Montanology, Cadastre Series, vol. 46 (no.1): 62-67
Costea,D.C, Daniela Cichi, 2008. Cultura vitei de vie în conditiile modificărilor climatice, edit ARVES, Craiova, ISBN 978-606-518-068-0
Costea D., Daniela Doloris Cichi, Ramona Capruciu, Elena Genoiu, 2008- The influence of the hydro-termal regime over bioproductive parameters of Feteasca neagra variety cultivated at Banu Maracine viticultural centre, Bulletin UASMV Horticulture, vol. 65(1):530,I ISSN 1843-5254
Costea D.C, Căpruciu Ramona, Cichi Daniela Doloris, 2015. The influence of the variation of climate conditions over the growth and fruit bearing of Cabernet sauvignon variety, Analele Universitatii din Craiova, Seria Biologie, Horticultura, Tehnologia Prelucrarii Produselor Agricole, Ingineria mediului, pp 107-112, Vol. XX ,ISSN 1453-127
Giugea N., Mărăcineanu, L.C, Camelia Popa, 2015, The possibilities of multiple characterization of the ecological potential of a viticulture region by graphic and numerical methods., Journal of Horticulture, Forestry and Biotechnology, pp 74-78
Lung M, Pop N, Ciobanu F, Babeș A, Bunea CI, Lazar S, 2012. Environmental factors influence on quality of wine grape varieties in four different areas of culture. Bulletin UASMV Horticulture, 69(1):219-22
Ollat,N, Garcia de Cortazar Atauri, I, Touzard, J,M. 2016 Sustainable grape and wine production in the context of climate change, Climwine int. symp., Bordeaux
Schaller K ,2011. Quality of grapevines – Endogenous and exogenous factors and their differing influences. Bulletin UASVM Horticulture, 68(1): 177-184
Seguin G.1986. ”Terroirs” and pedology of vinegrowing. Experientia, 42:861-873 Stan S., Giugea N., Mărăcineanu L.,Costea D., Popa C, 2011 Dynamics of some
biotope factors that characterize the Viticultural center Banu Maracine, Analele Universitatii din Craiova, Seria Biologie, Horticultura, Tehnologia Prelucrarii Produselor Agricole, Ingineria mediului, Vol. XV (LXII) , pp 404-409, ISSN 1453-1275
Teil, Geneviève , 2016 Climate change and adaptation: Alsace and Loire Valley vintners’ challenging point of view, Climwine international symposium, Bordeaux
***https://www.worldweatheronline.com/craiova-weather-averages/dolj/ro.aspx
75
INFLUENCE OF PHYTOSANITARY TREATMENTS ON THE TUBERS PRODUCTION AND OF QUALITY AT SWEET POTATO (IPOMOEA
BATATAS [L] LAM.) CULTIVATED ON SANDY SOIL
Gh. Coteţ 1*, Aurelia Diaconu1, Reta Drăghici1, Mihaela Croitoru1, Rodi Mitrea2
1Research and Development Station for Plant Culture on Sands Dabuleni2University of Craiova, Faculty of Horticulture
*Corresponding author email : [email protected]
Keywords: sweet potato, phytosanitary treatment, quality, slips
ABSTRACTSweet potato (Ipomoea batatas) is a dicotyledonous plant belonging to the
Convolvulaceae family, being the only one of over 1,000 species of this family of major economic importance. Under the pedo-climatic conditions of 2017, RDSPCS DĂBULENI set up this experience, which shows the importance of planting the shoots obtained by planting the tubers in the previously disinfected solarium with Basamid 5G (Dazomet 97 %), applied at a dose of 5 kilograms/100 m 2.
Following the harvesting of the production on variants, the qualitative indices of the sweet potato tubers were established. The production obtained from applying the chemical treatments on the culture set up with shoots obtained on Basamid 5G-treated soil (20 days before the planting of the tubers in the solar) was distinctly significant compared to that obtained in the crop with shoots on untreated soil.
INTRODUCTION Sweet Potato (Ipomoea batatas [L.] Lam) is a drought-resistant plant with
vigorous growth and high productivity, adaptable to sandy soils (Iamandei Maria et al., 2014). It is one of the most important foods due to its high yields, high nutritional value and the ability to tolerate difficult environmental conditions (Date and Eronico, 1987; Waribo and Ogidi, 2014). Of the total of 105.2 million tones of sweet potato produced globally in 2016, 67 % was produced in China (70.6 million tones) (FAOSAT, 2018). From the point of view of the risk of disease and pests, the literature indicates that the most important symptoms appear on the tuberous roots. In North Carolina, the most important economic losses are those produced by viruses, nematodes, root fusariosis and root rot (Clark, C.A., and Moyer, J.W. 1988). Sweet potato is attacked by around 300 species of arthropods (Talekar, 1991) that of can cause severe to complete crop loss, as well as at Least 30 Diseases (Clark et al., 2013; Johnson & Gurr, 2016).
The significance of the quality of the biological material of sweet potato used in planting (shoots) is also reflected in the local researches carried out at INCDCSZ Braşov, (Cioloca Mihaela et al., 2013). Sweet potato is vulnerable to diseases caused by viruses, such as the Sweet Potato Feathery Mottle Virus (SPFMV), which causes the greatest loss of production (Karyeija et al., 1998, Usugi et al., 1994). Sweet potato production may be affected by viral diseases, harmful insects and weeds (Harrison and Jackson, 2011; Iamandei Maria et al., 2014). During the growing season, 51 species of anthropods
ANNALS OF THE UNIVERSITY OF CRAIOVA
Series: Biology HorticultureFood produce processingtechnology
Environmental engineering Vol. XXII I (LIX) - 2018
76
(Iamandei Maria et al., 2014) were identified in the sweet potato cultivated on the sandy soil of RDSPCS Dăbuleni in 2013. At the same fields, Fusarium stem rot was noticed in 2016 (Boiu-Sicuia Oana Alina et al., 2017).
MATERIAL AND METHODS Pests and diseases of sweetpotato are generally well controlled using
approaches such as clean planting material and monitoring with pheromone traps and pesticides (Clark et al., 2013). For the establishment of the experiment in the field, sweet potato shoots were obtained in solar conditions. In this regard, two variants of shoots were studied: planting of sweet potato tubers in untreated field and planting in field treated with Basamid 5G, a nematicide, insecticide, fungicide and herbicide soil sterilization. Basamid 5G has a fungical effect on Phytopthora parasitica, Fusarium spp. and Verticilium dahliae, and insecticide effect on Meloidogyne icognita. For this purpose, the product was applied at the beginning of March when the temperature exceeded 6° C in a dose of 5 kilograms/100 m2 by spreading on the wet soil surface, then being incorporated into the soil with the cultivator. To stimulate the herbicidal action and to retain the sterilizing gas for as long as possible in the soil, the treated soil surface was covered with PE foil until March 25th. At the planting, the Korean KSP1 sweet potato variety was used. After the planting of the tubers, the aim was to create an optimal microclimate in the solar, with temperatures of about 25-28° C during the day, through ventilation and irrigation works, and at 12o C minimum temperatures overnight by double protection in the tunnel, covered with PE foil. Sweet potato shoots were harvested about 40-45 days after the tuber planting, when they were 30-35 cm long and 6-7 knots. For ease of field planting, the shoots were bundled 100 pieces, kept for 24 hours at a temperature of 20° C, upright and planted in the field on the 2nd day after 17-18 o”clock. The experience has been placed on bilonated ground, under drip irrigation conditions, according to the two-factor subdivision parcel method. (Table 1). The planting was performed on a sandy soil with reduced natural fertility, being fertilized with N150P80K80prior to making the billoons. In order to ensure a high rooting percentage of the shoots, an optimal soil moisture was obtained before and after planting with about 200 m3 of water per hectare. The quantity and quality of tuber production was determined at 120 days from planting and the results obtained were interpreted by variance analysis and mathematical functions.
RESULTS AND DISCUSSIONS Under the pedo-climatic conditions of 2017, RDSPCS DĂBULENI we have set
up this experience, which shows the importance of planting the shoots obtained by planting the tubers in the previously disinfected solarium with Basamid 5G (Dazomet 97 %), applied at a dose of 5 kilograms/100 m 2. Following the harvesting of the production on variants, the qualitative indices of the sweet potato tubers were established. The production obtained from applying the chemical treatments on the culture set up with shoots obtained on Basamid 5G-treated soil (20 days before the planting of the tubers in the solar) was distinctly significant compared to that obtained in the crop with shoots on untreated soilThe dynamics of the vine green moth flight (Lobesia botrana Den et Schiff.) comprised 3 peaks corresponding to the three generations and for each there has been applied a treatment.
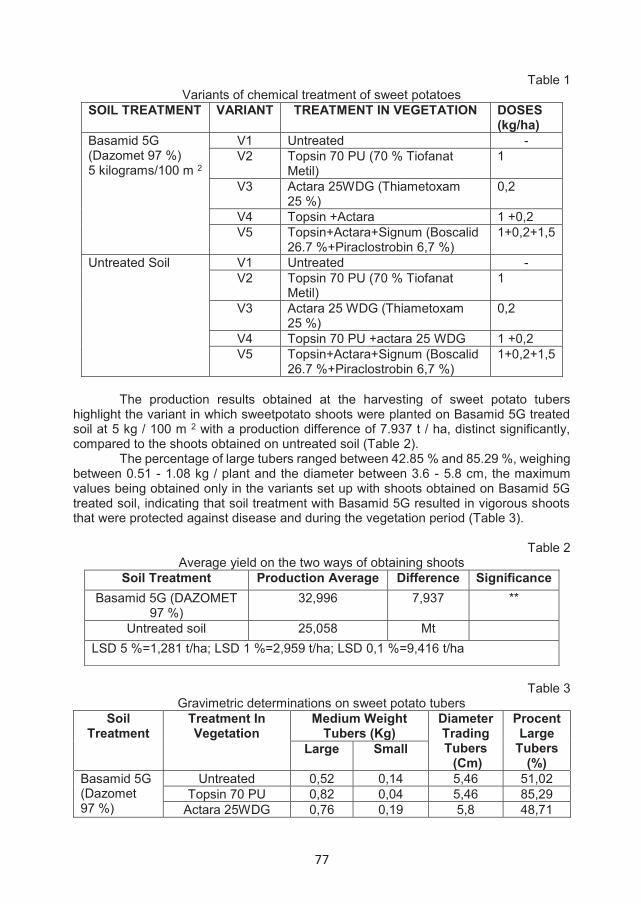
77
Table 1 Variants of chemical treatment of sweet potatoes
SOIL TREATMENT VARIANT TREATMENT IN VEGETATION DOSES (kg/ha)
Basamid 5G (Dazomet 97 %)5 kilograms/100 m 2
V1 Untreated -V2 Topsin 70 PU (70 % Tiofanat
Metil)1
V3 Actara 25WDG (Thiametoxam 25 %)
0,2
V4 Topsin +Actara 1 +0,2 V5 Topsin+Actara+Signum (Boscalid
26.7 %+Piraclostrobin 6,7 %)1+0,2+1,5
Untreated Soil V1 Untreated -V2 Topsin 70 PU (70 % Tiofanat
Metil)1
V3 Actara 25 WDG (Thiametoxam 25 %)
0,2
V4 Topsin 70 PU +actara 25 WDG 1 +0,2 V5 Topsin+Actara+Signum (Boscalid
26.7 %+Piraclostrobin 6,7 %)1+0,2+1,5
The production results obtained at the harvesting of sweet potato tubers highlight the variant in which sweetpotato shoots were planted on Basamid 5G treated soil at 5 kg / 100 m 2 with a production difference of 7.937 t / ha, distinct significantly, compared to the shoots obtained on untreated soil (Table 2).
The percentage of large tubers ranged between 42.85 % and 85.29 %, weighing between 0.51 - 1.08 kg / plant and the diameter between 3.6 - 5.8 cm, the maximum values being obtained only in the variants set up with shoots obtained on Basamid 5G treated soil, indicating that soil treatment with Basamid 5G resulted in vigorous shoots that were protected against disease and during the vegetation period (Table 3).
Table 2 Average yield on the two ways of obtaining shoots
Soil Treatment Production Average Difference SignificanceBasamid 5G (DAZOMET
97 %)32,996 7,937 **
Untreated soil 25,058 MtLSD 5 %=1,281 t/ha; LSD 1 %=2,959 t/ha; LSD 0,1 %=9,416 t/ha
Table 3 Gravimetric determinations on sweet potato tubers
Soil Treatment
Treatment In Vegetation
Medium Weight Tubers (Kg)
Diameter Trading Tubers
(Cm)
Procent Large
Tubers(%)
Large Small
Basamid 5G (Dazomet 97 %)
Untreated 0,52 0,14 5,46 51,02Topsin 70 PU 0,82 0,04 5,46 85,29
Actara 25WDG 0,76 0,19 5,8 48,71

78
Topsin 70 PU+Actara 25WDG
0,81 0,13 5,63 50
Topsin 70 PU+Actara
25WDG+Signum
1,08 0,05 5,43 78,78
Untreated soil
Untreated 0,50 0,10 3,56 50Topsin 70 PU 0,54 0,27 5,86 42,85
Actara 25WDG 0,62 0,08 5,7 74,07Topsin 70
PU+actara 25WDG0,51 0,12 4,76 52,94
Topsin 70 PU+Actara
25WDG+Signum
0,58 0,12 5,9 57,89
Analyzing the effect of soil treatment in the same chemical treatment in vegetation, the positive effect on the production of tubers in sweet potato of Basamid 5G 5 kg / 100 m2 is clearly distinguished. Thus, compared to the untreated witness, production differences of 3.071-12.026 t / ha, statistically assured as distinct and very significant (Table 4), were recorded through the planting of shoots obtained on the Basamid 5G treated soil. Soil treatment with Basamid 5G - as a technological element in the production of sweet potato shoots influenced not only the growth and development of the plants in the field but also the accumulation of assimilated in tubers. The results obtained are presented in Table 5. In the variants where the plants were treated with different pest and disease control products and the soil on which the plants were obtained was treated with Basamid, higher values of the main biochemical components studied were obtained . When the soil was untreated with Basamid, in all variants where disease and pest control treatments were performed, better tubercular quality results were obtained compared to the untreated control variant. The best results were obtained in the version treated with Topsin 1kg / ha + Actara 0.2kg / ha.
Table 4 Differences between treatment options depending on how the shoots are used for
planting Treatment in vegetation Soil
treatmentAverage
t/haDifference
t/haSignificance
Untreated Basamid 5G
29,281 7,712 ***
Untreated soil
21,568 Mt
Production Average 25,424Topsin 70 PU Basamid
5G33,738 5,633 ***
Untreated soil
28,104 Mt
Production Average 30,921Actara 25WDG Basamid
5G31,241 3,071 **
Untreated soil
28,169 Mt
Production Average 29,705
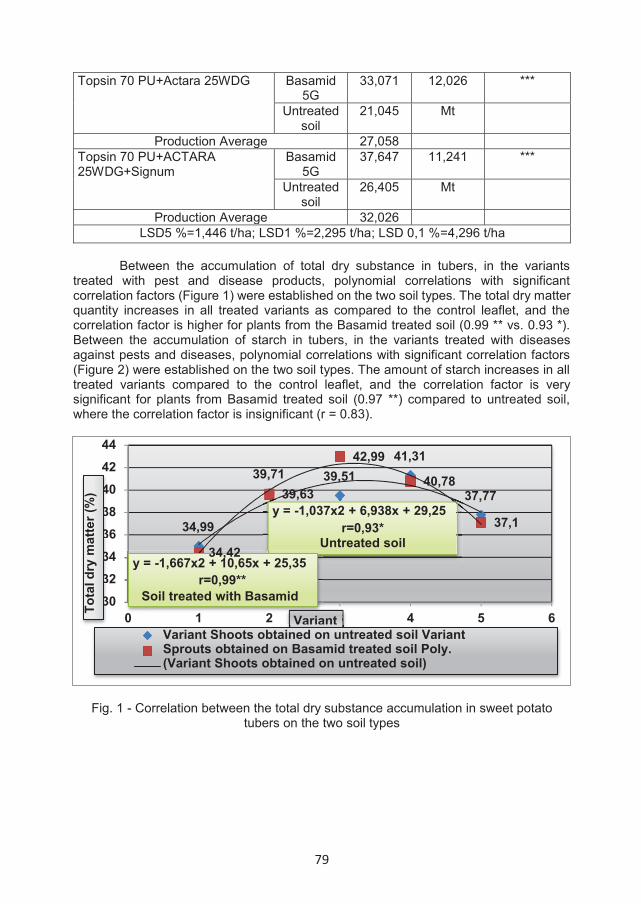
79
Topsin 70 PU+Actara 25WDG Basamid 5G
33,071 12,026 ***
Untreated soil
21,045 Mt
Production Average 27,058Topsin 70 PU+ACTARA 25WDG+Signum
Basamid 5G
37,647 11,241 ***
Untreated soil
26,405 Mt
Production Average 32,026LSD5 %=1,446 t/ha; LSD1 %=2,295 t/ha; LSD 0,1 %=4,296 t/ha
Between the accumulation of total dry substance in tubers, in the variants treated with pest and disease products, polynomial correlations with significant correlation factors (Figure 1) were established on the two soil types. The total dry matter quantity increases in all treated variants as compared to the control leaflet, and the correlation factor is higher for plants from the Basamid treated soil (0.99 ** vs. 0.93 *). Between the accumulation of starch in tubers, in the variants treated with diseases against pests and diseases, polynomial correlations with significant correlation factors (Figure 2) were established on the two soil types. The amount of starch increases in all treated variants compared to the control leaflet, and the correlation factor is very significant for plants from Basamid treated soil (0.97 **) compared to untreated soil, where the correlation factor is insignificant (r = 0.83).
Fig. 1 - Correlation between the total dry substance accumulation in sweet potato tubers on the two soil types
34,99
39,71 39,5141,31
37,77
42,99
40,78
37,1
39,63y = -1,037x2 + 6,938x + 29,25
r=0,93*Untreated soil
34,42y = -1,667x2 + 10,65x + 25,35
r=0,99**Soil treated with Basamid30
32343638404244
0 1 2 3 4 5 6333334
Tota
l dry
mat
ter (
%)
VariantVariantVariant Shoots obtained on untreated soil VariantSprouts obtained on Basamid treated soil Poly.(Variant Shoots obtained on untreated soil)
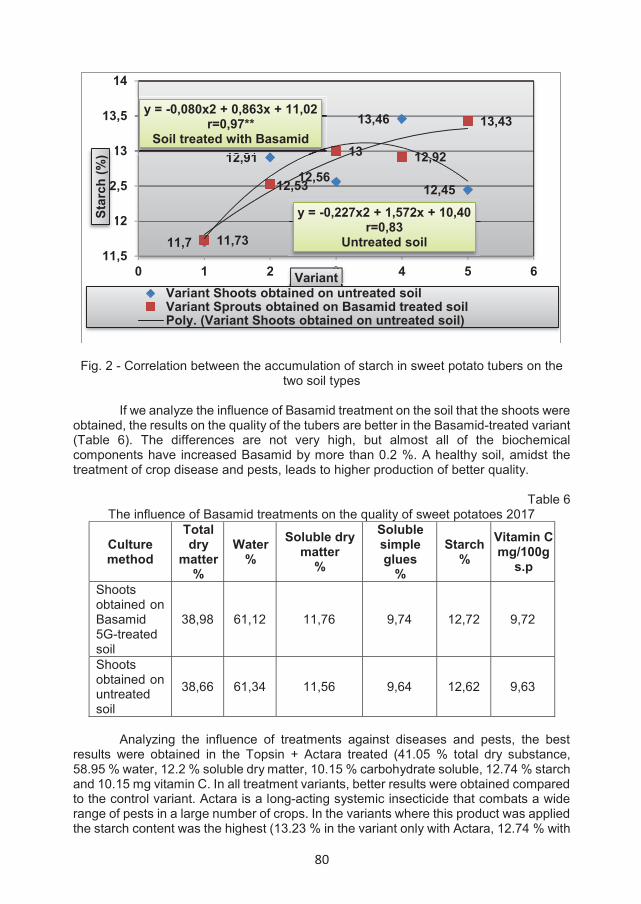
80
Fig. 2 - Correlation between the accumulation of starch in sweet potato tubers on the two soil types
If we analyze the influence of Basamid treatment on the soil that the shoots were
obtained, the results on the quality of the tubers are better in the Basamid-treated variant (Table 6). The differences are not very high, but almost all of the biochemical components have increased Basamid by more than 0.2 %. A healthy soil, amidst the treatment of crop disease and pests, leads to higher production of better quality.
Table 6
The influence of Basamid treatments on the quality of sweet potatoes 2017
Analyzing the influence of treatments against diseases and pests, the best
results were obtained in the Topsin + Actara treated (41.05 % total dry substance, 58.95 % water, 12.2 % soluble dry matter, 10.15 % carbohydrate soluble, 12.74 % starch and 10.15 mg vitamin C. In all treatment variants, better results were obtained compared to the control variant. Actara is a long-acting systemic insecticide that combats a wide range of pests in a large number of crops. In the variants where this product was applied the starch content was the highest (13.23 % in the variant only with Actara, 12.74 % with
11,7
12,9112,56
13,46
12,45
11,73
12,53
13 12,92
13,43
y = -0,227x2 + 1,572x + 10,40r=0,83
Untreated soil
12 91
y = -0,080x2 + 0,863x + 11,02r=0,97**
Soil treated with Basamid
11,5
12
12,5
13
13,5
14
0 1 2 3 4 5 6
1
2
1
Star
ch (%
)
3VariantVariant Shoots obtained on untreated soilVariant Sprouts obtained on Basamid treated soilPoly. (Variant Shoots obtained on untreated soil)
Culture method
Total dry
matter %
Water %
Soluble dry matter
%
Soluble simple glues
%
Starch %
Vitamin C mg/100g
s.p Shoots obtained on Basamid 5G-treated soil
38,98 61,12 11,76 9,74 12,72 9,72
Shoots obtained on untreated soil
38,66 61,34 11,56 9,64 12,62 9,63

81
Topsin + Actara and 12.94 % with Topsin + Actara + Signum (Table 7) Topsin also has fungicidal, contact and systemic action, being absorbed by plants through leaves and roots, having a very good preventive and curative effect.
Table 7 Influence of treatments with products for the control of diseases and pests on the
quality of sweet potato tubers
Culture method
Total dry
matter%
Water%
Soluble dry matter
%
Soluble simpleglues
%
Starch%
Vitamin Cmg/100g
s.p
Mt.(untreated) 34,71 62,29 11,3 9,37 11,72 9,63Topsin 1kg/ha 39,67 60,33 11,6 9,65 12,72 9,56Actara 0,2kg/ha 39,75 60,50 11,6 9,64 13,23 9,46
Topsin + Actara 41,05 58,95 12,2 10,15 12,74 10,15
Topsin+Actara+ Signum 37,44 62,56 11,6 9,64 12,94 9,58
Signum is a granular, systemic translaminar and protective fungicide based on boscalid and pyraclostrobin. Successfully combat Monilinia spp. and gray rot (Botrytis cinerea), but also other important diseases such as Rhizopus sp.
CONCLUSIONSThe production results obtained at the harvesting of sweet potato tubers
highlight the variant in which sunflower shoots were planted on Basamid 5G treated soil at a rate of 5 kg / 100 m2 with a production difference of 7.937 t / ha , distinctly significant, compared to the shoots obtained on untreated soil.
By planting the shoots obtained on the Basamid 5G soil, we recorded productions of 29,281 - 37,647 t / ha, depending on the chemical treatment applied to the vegetation, with the best results in the version treated with Topsin, 1 kg / ha + Actara, 0.2 % + Signum 1.5 kg / ha.
From the point of view of the quality of the crop, the chemical treatment in vegetation with Topsin 1 kg / ha + Actara 0,2 % (41,05 % total dry substance, 58,95 % water, 12,2 % soluble dry matter, 10, 15 % soluble carbohydrates, 12.74 % starch and 10.15 mg vitamin C).
Treatment with Basamid 5G did not significantly differentiate the quality of tubers.
REFERENCES Boiu-Sicuia Oana-Alina, Constantinescu Florica, Diaconu Aurelia, Drăghici Reta,
2017, Research approaches regarding biological control of Fusarium sp. Stem rot of sweet potato produced on sandy soils, Studii și comunicări.Stiinţele naturii, Muzeul Olteniei Craiova, Tom.33, no. 2/2017, ISSN 1454-6914
Clark, C.A., and J.W. Moyer. 1988. Compendium of sweet potato diseases. The American Phytopathological Society. 74 p.
Clark CA, Ferrin DM, Smith TP, Holmes GJ (eds.) 2013. Compendium of sweetpotato diseases, pests and disorders, Second edition, Minnesota : APS Press.
82
Cioloca Mihaela, Andreea Nistor, Nicoleta Chiru, Monica Popa,, 2013, Cartoful dulce – o alternativă în condiţiile schimbărilor climatice. Rezultate privind înmulţirea in vitro. Cartoful in Romania, Publicaţie de informare tehnică pentru cultivatorii de cartof, vol 22. nr 1, p:50-53
Date E.S. and Eronico P.S., 1987, Storage performance of some newly developed sweet potato hybrids, Radix 9(1) :p 3-5
Harrison HF Jr., Jackson DM, 2011, „Response of two sweet potato cultivars to weed interference”, Crop Protec. 30: 1291-1296
Iamandei Maria, Draghici Reta, Diaconu Aurelia, Drăghici I., Dima Milica, Cho Eun-Gi, 2014. Preliminary data on the arthropod biodiversity associated with sweet potato (Ipomoea batatas)crops under sandy soils conditions from southern Romania. Romanian Journal for Plant Protection, Vol. VII, 2014. ISSN 2248 – 129X; ISSN-L 2248 – 129X
Johnson AC, Gurr GM. 2016. Invertebrate pests and diseases of sweetpotato (Ipomoea batatas): a review and identification of research priorities for smallholder production. Annals of Applied Biology 168(3): 291-320.
Karyeija R.F., Gibson R.W. and Valkonen J.P.T. (1998), Resistance to sweet potato disease (SPVD) in wild East African Ipomoea.Ann. appl. Biol. 133: 39-44
Talekar NS. 1991. Integrated Control of Cylas formicarius. In: Jansson RK, Raman KV,eds. In Sweet potato pest management: a global perspective, San Francisco : Westview Press 139-156.
Usugi T., Nakano M., Maoka T. And Hayashi T. (1994) A new strain of sweetpotato feathery mottle virus that causes russet crack on fleshy roots of some Japanese cultivars of sweetpotato. Ann. Phitopatol. Soc. Jpn. 60: 545-554
Waribo C. And Ogidi I.A.,2014, ”Evolution of the performance of improved sweet potato (Ipomoea batatas L. LAM) varieties in Bayelsa State, Nigeria”, African Journal of Environmental Science and Technology, Vol. 8(1), pp 48-53
Food and Agriculture Organization of the United Nations, Statistic Division (FAOSAT), 2017, ”Sweet potato production in 2016;World Regions/Production Quantity from pick lists”, Retrived 25 April 2018, http://www.fao.org/faosat/en/#data/QC

83
RESEARCH ON THE INFLUENCE OF THE PLANTING EPOCH AND THE METHOD OF CULTURE ON THE NUTRITIONAL QUALITY OF POTATO CROP ON SANDY
SOILS IN SOUTHERN OLTENIA
Croitoru Mihaela1*, Diaconu Aurelia1, Dima Milica1,Drăghici I.1, Drăghici Reta1
1Research & Development Station for Plant Culture on Sandy Soils-Dabuleni,Romania *Corresponding author e-mail: [email protected]
Keywords: potato, sandy soils, quality
ABSTRACT The researches carried out at SCDCPN Dăbuleni at potato showed that the planting
period and the method of cultivation influenced both the production of tubers and their nutritional quality.The best results were obtained in the Belarosa variety planted in the 2nd age (09.03) both in the agril-protected version (21.74 % total dry matter, 4.30 % soluble dry matter, 15.84 % starch and 24.20mg C vitamin) and the unprotected (23.27 % total dry matter, 4.27 % soluble dry matter, 17.98 % starch and 19.95 mg C vitamin).
As far as he is concerned the influence of the planting age, the results show higher values of the biochemical indices studied at the second epoch (19.23 % total dry matter, 4.15 % soluble dry substance, 16.64 % starch and 19.60 mg C vitamin).
INTRODUCTIONThe planting period is an important factor for any crop. If the planting is in the
optimal period, the plant meets the favorable conditions for development and produces superior crops both in terms of quantity and quality.
This time depends on the temperature and humidity of the soil, but it is also correlated with the climatic conditions in the area, as stated by Ianoşi I.S., et al., 2002. The researches have shown that in the potato culture every day of delay after the optimal planting period leads to irreversible losses of production (Ianosi I.S., et al., 1989, Berindei, M., 2009). In an early planting, even if the period, planting-emergence lasts longer, tuberization begins earlier when the conditions of temperature, humidity and the length of the day are favorable to this process (Ianosi I.S., et al., 2002, Arab H. R., et al., 2012, Iliev P., 2016).
The planting season significantly influenced potato starch content in the Covasna area, meaning that a higher average content was recorded at the second planting season (end of April), 21.4 % versus 19.4 % as was achieved on average through early planting (early April) (Göncz E., 2011).
According to Rytel E., 2004 and Lisińska G., 2006, extension of the vegetation period depending on the planting season, has increased the starch content and the dry matter content of the potatoes, but the rate of their accumulation depends on the cultivar and the growing conditions.
Many authors (Blenkisop R.W., et al., 2002; Rymuza K.,et al.,, 2004; Hamouz K. J., et al., 2005; Wang Z. H., et al., 2008; Lombardo S., et al., 2013) consider that the quality of the tubers fluctuates significantly due to several factors (variety, climatic conditions, planting season, culture method, etc.).
ANNALS OF THE UNIVERSITY OF CRAIOVA
Series: Biology HorticultureFood produce processingtechnology
Environmental engineering Vol. XXII I (LIX) - 2018

84
MATERIAL AND METHODResearch has been conducted in Research and Development Station for Plant
Culture on Sandy Soils Dăbuleni during the three experimental years (2015, 2016, 2017). Factor A - the planting epoch: Factor B - method of culture:
a1- Epoch I (28 February) b1 - Protected with agril a2 - Epoch II (9 March) b2 – Unprotected
Factor C – variety: c1 –Riviera c3 -Evolution c2 –Carerra c4 -Belarosa
Location of the experience was based on the three-repeat subdivision parcel method. Samples were harvested at harvest maturity, and the following determinations were made in the laboratory:
• the water and the total dry matter (%) - gravimetric method;• soluble dry matter (%) - refractometric method;• C vitamin (mg / 100g fresh substance) - iodometric method;• starch (%) - colorimetric method;• production (t / ha);• recording climatic elements at the SCDCPN Dăbuleni weather station.
RESULTS AND DISCUSSIONS The epoch planting, as well as culture method have influenced both the
production of tubers and their nutritional quality. The results obtained are presented in Table 1.
The best results were obtained in the Belarosa variety, planted in the epoch II (9 March), both in the agril-protected version (21.74 % total dry substance, 4.30 % soluble dry substance, 15.84 % starch and 24.20mg C vitamin) and the unprotected (23.27 % total dry substance, 4.27 % soluble dry substance, 17.98 % starch and 19.95 mg C vitamin) .
A high starch content was also obtained in the varieties Evolution (18.22 %)cultivated in the epoch II (9 March), in a protected crop with agril and Riviera (18.11 %), also cultivated in the epoch II (9 March), in unprotected culture. The results obtained show a higher content of starch in most varieties studied, planted in the epoch II (9 March) irrespective of the protection system. Similar results have also been obtained by Göncz E., 2011, in the Covasna area (the planting season has significantly influenced potato starch content, meaning that a higher average content was recorded at the second planting period (end of April) (21.4 %) compared to 19.4 % on average on early planting (early April)). Analyzing the influence of the variety, the best in terms of quality behaved the Belarosa variety (21.95 % total dry matter, 4.29 % soluble dry matter, 15.36 % starch and 19.98mg / 100g fresh substance C vitamin ) (Table 2).
Table 1 Biochemical composition of potato tubers according to their epoch planting, method
of culture and variety (2015-2017)Planting epoch
Method of cultivation Variety
Total dry matter
(%)
Soluble dry matter
(%)
Starch(%)
C vitamin(mg/100g
f.s *)
Epoch I (28 February)
Protectedwith agril
Riviera 17.46 4.37 13.15 16.13Carerra 19.15 4.03 13.33 17.01
Evolution 17.70 3.13 14.94 12.91Belarosa 20.76 4.27 12.95 17.89
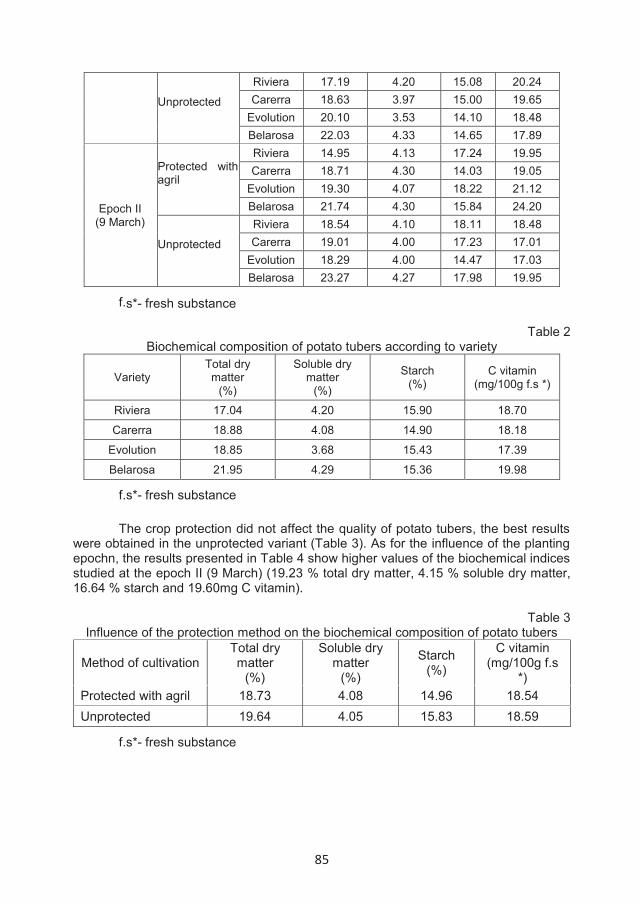
85
Unprotected
Riviera 17.19 4.20 15.08 20.24Carerra 18.63 3.97 15.00 19.65
Evolution 20.10 3.53 14.10 18.48Belarosa 22.03 4.33 14.65 17.89
Epoch II(9 March)
Protected with agril
Riviera 14.95 4.13 17.24 19.95Carerra 18.71 4.30 14.03 19.05
Evolution 19.30 4.07 18.22 21.12Belarosa 21.74 4.30 15.84 24.20
Unprotected
Riviera 18.54 4.10 18.11 18.48Carerra 19.01 4.00 17.23 17.01
Evolution 18.29 4.00 14.47 17.03Belarosa 23.27 4.27 17.98 19.95
f.s*- fresh substance
Table 2 Biochemical composition of potato tubers according to variety
VarietyTotal dry matter
(%)
Soluble dry matter
(%)
Starch(%)
C vitamin(mg/100g f.s *)
Riviera 17.04 4.20 15.90 18.70
Carerra 18.88 4.08 14.90 18.18
Evolution 18.85 3.68 15.43 17.39
Belarosa 21.95 4.29 15.36 19.98
f.s*- fresh substance
The crop protection did not affect the quality of potato tubers, the best results were obtained in the unprotected variant (Table 3). As for the influence of the planting epochn, the results presented in Table 4 show higher values of the biochemical indices studied at the epoch II (9 March) (19.23 % total dry matter, 4.15 % soluble dry matter, 16.64 % starch and 19.60mg C vitamin).
Table 3 Influence of the protection method on the biochemical composition of potato tubers
Method of cultivationTotal dry matter
(%)
Soluble dry matter
(%)
Starch(%)
C vitamin(mg/100g f.s
*)Protected with agril 18.73 4.08 14.96 18.54Unprotected 19.64 4.05 15.83 18.59
f.s*- fresh substance
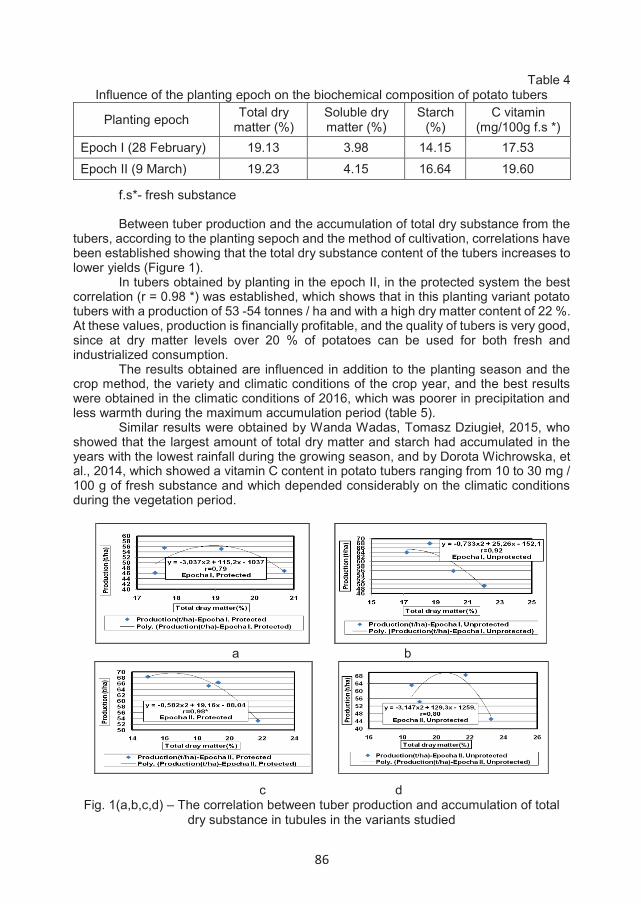
86
Table 4 Influence of the planting epoch on the biochemical composition of potato tubers
Planting epoch Total dry matter (%)
Soluble dry matter (%)
Starch(%)
C vitamin(mg/100g f.s *)
Epoch I (28 February) 19.13 3.98 14.15 17.53Epoch II (9 March) 19.23 4.15 16.64 19.60
f.s*- fresh substance
Between tuber production and the accumulation of total dry substance from the tubers, according to the planting sepoch and the method of cultivation, correlations have been established showing that the total dry substance content of the tubers increases tolower yields (Figure 1).
In tubers obtained by planting in the epoch II, in the protected system the best correlation (r = 0.98 *) was established, which shows that in this planting variant potato tubers with a production of 53 -54 tonnes / ha and with a high dry matter content of 22 %.At these values, production is financially profitable, and the quality of tubers is very good, since at dry matter levels over 20 % of potatoes can be used for both fresh and industrialized consumption.
The results obtained are influenced in addition to the planting season and the crop method, the variety and climatic conditions of the crop year, and the best results were obtained in the climatic conditions of 2016, which was poorer in precipitation and less warmth during the maximum accumulation period (table 5).
Similar results were obtained by Wanda Wadas, Tomasz Dziugieł, 2015, who showed that the largest amount of total dry matter and starch had accumulated in the years with the lowest rainfall during the growing season, and by Dorota Wichrowska, et al., 2014, which showed a vitamin C content in potato tubers ranging from 10 to 30 mg / 100 g of fresh substance and which depended considerably on the climatic conditions during the vegetation period.
a b
c d Fig. 1(a,b,c,d) – The correlation between tuber production and accumulation of total
dry substance in tubules in the variants studied

87
Table 5 Influence of years of study on the biochemical composition of potato tubers
YearTotal dry matter
(%)
Starch(%)
C vitamin(mg/100g
f.s *)
Rainfall(mm)
The sum of the degrees
of temperature
(0C)2015 18.48 12.73 18.93 134.2 6152016 19.58 16.75 25.18 53.2 7082017 19.69 16.71 11.45 17.4 720
CONCLUSIONS- The epoch planting and culture method have influenced both tuber production
and nutritional quality. - The best results were obtained in the Belarosa variety, planted in epoch II (9
March), both in the agril-protected version (21.74 % total dry matter, 4.30 % soluble dry matter, 15.84 % starch and 24.20mg Cvitamin ) and the unprotected (23.27 % total dry matter, 4.27 % soluble dry matter, 17.98 % starch and 19.95 mg C vitamin ) .
- As for the influence of the planting epoch, the results obtained show higher values of the biochemical indices studied in the tubers obtained during the epoch II (19.23 % total dry matter, 4.15 % soluble dry matter, 16.64 % starch and 19.60 mg C vitamin ).
- In tubers obtained by planting in the epoch II, in the protected variant, a significant correlation (r = 0.98 *) was established, which shows that in this planting variant potato tubers with a production can be obtained of 53-54 t / ha and with a high dry matter content of 22 %.
REFERENCES Arab H. R., et all., 2012, The effect of planting date, depth and density on yield
and yield components of potato in Shahrood (Iran), Journal of Research in Agricultural Science, nr. 7, p. 141-149.
Berindei M., 2009, Importanţa calităţii cartofului pentru sămânţă în obţinerea de producţii mari şi economice la cartoful pentru consum. Cartoful în România,vol. 18, nr.1,2, p. 14-19.
Blenkisop R. W., L. J. Copp, R. Y. Yada, A. G. Marangoni, 2002, Changes in composition parameters of tubers of potato during low-temperature storage and their relationship processing quality. J. Agric. Food Chem., 50: 4545-4553
Dorota Wichrowska, Elżbieta Wszelaczyńska, Jarosław Pobereżny, 2014, Effect of nutrient supply from different sources on some quality parameters of potato tubers, J. Elem. s. 217–230, DOI: 10.5601/jelem.2014.19.1.603
Göncz E., 2011, Perfecţionarea tehnologiei de cultivare a cartofului destinat procesării în condiţiile judeţului Covasna, Teză de Doctorat, Universitatea De Ştiinţe Agricole Şi Medicină Veterinară Cluj Napoca, Şcoala Doctorală Facultatea De Agricultură
Hamouz, K., J. Čepl and P. Dvořák, 2005. Influence of environmental conditions on the quality of potato tubers. Hort. Sci., Prague, 32 (3): 89-95
Ianoşi I.S., Ana Crăciun, I. Mezabrovsky, 1989, Modificarea elementelor de producţie funcţie de perioada de plantare a cartofului in zona de stepă în condiţii de irigare. Anale ICPC Braşov, voI. XVI, p. 69-91.
Ianosi I.S., Ianoşi Maria Elena, Plămădeală B., Popescu A., 2002, Cultura cartofului pentru consum. Braşov: Phoenix, 2002. 302 p.
88
Iliev P., 2016, Bazele ştiinţifico-practice de producere a cartofului in Republica Moldova Chişinău: “Reclama”, 2016. 420 p.
Lisińska G., 2006. Technological and nutritive value of the Polish potato cultivars (in Polish). Zesz. Probl. Post. Nauk Roln., 511: 81-94.
Lombardo S., A. Lo Monaco, G. Pandinio, B. Parisi, G. Maruomicale, 2013. The phenology yield and tuber composition of early crop potatoes: a comparison betweenorganic and conventional cultivation system. Renew. Agr. Food Syst., 28: 50-58.
Rymuza, K., A. Bombik, 2004, The effect of forecrop and mineral fertilisation on qualitative traits of selected potato cultivars. Fragm. Agron., 1 (81): 69-84 (Pl).
Rytel E., 2004, The effect of edible potato maturity on its after-cooking consistency (in Polish). Zesz . Probl . Post . Nauk Rol., 500: 465-473.
Wanda Wadas, Tomasz Dziugieł, 2015, Effect of complex fertilizers used in early crop potato culture on loamy sand soil Efekty stosowania nawozów kompleksowych w uprawie ziemniaka na wczesny zbiór na glebie piaszczysto-gliniastej, Journal of Central European Agriculture, 16(1), p. 23-40
Wang Z. H., S. Li, S. Malhi, 2008, Effects of fertilization and other agronomic measures on nutritional quality of crops. J. Sci. Food Agric., 88: 7-23.
89
TRENDS OF TABLE GRAPES PRODUCTION AND CONSUMPTION IN BULGARIA
Dimitrova Daniela1*, Dimitrov Vladimir1, Simeonov Iliyan1, Belberova Yordanka1
1Institute of Viticulture and Enology, Каla Tepe Street, № 1, Pleven 5800, Bulgaria * Correspondence author. E-mail: [email protected]
Keywords: table grapes, production, consumption
ABSTRACTGrapes (including wine and table grapes) took a leading place in the total value of fruit
production globally in 2014, according to information from the Food and Agriculture Organization (FAO). A strong positive trend has been observed in table grapes production, while determining at the same time its increased consumption. With a view of the high nutritional value of the table grapes, the achievement of positive consumption dynamics contributes to the realization of the EU strategic objectives on the prevention of increased morbidity of the population. On the basis of official statistics analysis, the dynamics of the production and the consumption of table grapes in Bulgaria was established. The tendency of lagging behind the level of table grapes consumption compared to the average for the country among the children and the working age population has been particularly worrying. Besides the reasons of economic nature, an impact has also the lack of eating habits for grapes consumption among the young people and the discrepancy between the consumers’ tastes and the qualitative indicators of the supplied grapes. The development of the domestic market for table grapes is directly related to updating of the variety structure and the production technological modernization in response to the growing consumers’ requirements.
INTRODUCTIONThe relatively low level of consumption of fruit and vegetables among the
population (especially children and adolescents globally is one of the main problems identified by the World Health Organization (WHO), in view of efforts to improve healthy and balanced nutrition and the prevention of a number of chronic diseases in the long term - hypertension, cardiovascular disease, stroke, diabetes, and some cancers (OECD/EU, 2016). According to the European Fresh Produce Association (Freshfel, 2017), average daily consumption of fruit and vegetables per capita in Bulgaria in 2014 amounted to 267.96 g (at the recommended 400 g per day according to the WHO guidelines). Pursuant to the average amount of fruit consumed per capita per day -134.58 grams, our country ranks 24th in the EU. This level is almost two times less than the highest values recorded in the European community - in Italy (288.68 g) and in Romania (263.39 g). Eurostat data (2016) showed that more than half of the inhabitants of our country aged 15 years old and over do not consumed daily fruits and vegetables. A study conducted in the 2013/2014 school year by the World Health Organization (2016), showed that in children at the age of 11 years the situation was almost similar -47.0 % of girls and 42.0 % of boys consumed fruits every day. Unfortunately, with the age increases, these percentages decreased, respectively, to 37.0 % of the girls at 13
ANNALS OF THE UNIVERSITY OF CRAIOVA
Series: Biology HorticultureFood produce processingtechnology
Environmental engineering Vol. XXII I (LIX) - 2018
90
years old and at 36.0 % of the boys respectively. Building healthy eating habits from early childhood is an important factor, and at the same time a prerequisite for improving the health status of the nation (OECD/EU, 2016).
Table grapes is the fruit with extremely valuable for health ingredients (Crupi et al., 2011; Percival, 2009; Stalev and Angelov, 2011; Zhou and Raffoul, 2012). Besides possessing diverse composition of vitamins and minerals, table grapes are also one of the richest sources of polyphenols among fruits (FAO-OIV, 2016). World production of table grapes over the last two decades had noted a steady growth trend - by 71 % in 2014 compared to 2000 (FAO-OIV, 2016). Increased production stimulates consumption growth - from 15 million tons to 26.2 million tons during this period (+ 73 %).
The aim of this study was to describe the long-term trends in the development of table grapes production and consumption in Bulgaria as an element of the healthy diet of the population.
MATERIAL AND METHODSThe analyses were based on official statistical data with sources from the
Ministry of Agriculture Food and Forestry (MAFF), Agricultural Statistics Department, Eurostat and the National Statistical Institute (NSI). The methods of comparative and dynamic analysis, index method and graphical method were applied (Petrov et al., 2004). The dynamics of the production of table grapes in the long run period was based on the indicators of harvested area of vines with table grapes varieties (ha), average yield (kg/ha), production (tons), gross output of table grapes at basic prices (EUR million). The rate of change of the relative share of the gross output of table grapes in the total value of the gross output of fruits was monitored.
The trend in the consumption of table grapes was derived from the consumed quantity per year on average per person from household (kg). According to the methodology used by the NSI it should be noted that this level was calculated on the basis of consumption at home and does not included the consumption in the mass caterers. In order to more detailed analysis that disclosing a part of the socio-demographic characteristics of the users of the fetus, the average consumption per household was considered according to two main criteria:
- availability of children under 18 years old in households;- presence of pensioners in households.
RESULTS AND DISCUSSIONSThe value of the gross output of table grapes in 2016 amounted to EUR 3,79
million, which was almost 3,2 times less than the reported value of the indicator in 2002 (fig. 1). The decrease was mainly due to the fall in the physical volume of production, with the lowest levels recorded in 2010, 2012 and 2014 (between 7989 and 8659 tonnes). During the period 2002-2016, the producer prices ranged between 11.87 and 50.54 euros per 100 kg, with a more significant increase in the price level observed after admission to EU membership of our country in 2007 with gainig access to the Single European Market. The increase in producer prices was happening at a slower rate than overall growth of production costs, along with the lack of manpower were of the main reasons for maintaining a low level of production of table grapes in the country.

91
Fig. 1: Dynamics of gross output of table grapes in the gross output of fruits in the 2002-2016 period, EUR million
Source: Eurostat, http://appsso.eurostat.ec.europa.eu/, extracted on 27.08.2018
The trend of decline in gross output of fresh fruits - by 6.2 % in 2016 compared to 2002 was unfavorable in general both in the stability of agricultural production and in satisfying the interests of consumers. At the same time, the share of table grapes in the gross output of fruits declined from 3.3 % to 2.1 % over the same period.
Considered in the long term, the decline in the production volume resulted both from the serious reduction in the harvested areas so because of to the lower level of the average yields. The data presented in Table 1 showed that on average for the period 1981-85 - years in which the table grapes had occupied not a small share in the export list of our country, the average level of the areas with fruit-bearing vineyards amounted to 16,100 ha. The harvested areas with table grapes vines in 2017 represented only 13.2 % of the indicated level. However, it should be noted that in recent years there has been some stabilization in terms of this the indicator under consideration, which to a certain extent can be explained by the subsidies granted under the coupled support scheme for fruits (plums and table grapes) from the beginning of 2015. The amount of financial support set for 2017 was EUR 582.42 per hectare for the first 30 ha eligible for aid and EUR 388.29 per hectare for the areas over 30 hectares.
In the three years from 2015 to 2017, there was an increase in average productivity per unit area, as reported average yield in 2015 - 7240 kg/ha was closest to the average for the period 1981-85, the - 7662 kg/ha. Although development of the indicator in dynamic emerging positive trend, significant annual fluctuations were the main problems facing the expansion of production in the country.
The quantity of table grapes produced in 2017 amounted to 14297 tonnes, which represented only 11,6 % of the production level during the baseline period. The production was insufficient to meet the needs of the internal market, which is expanding every year, under the impact of the positive development of tourism (Dimitrova, 2018). According to NSI data in the past year 9532 tons of table grapes were imported into the country, which exceeded 6 times the quantity of imports in 2007 - 1627 tons.
0 50 100 150 200 250
2002
2004
2008
2009
2010
2011
2012
2013
2014
2015
2016
Fruits, million euro Table grapes, million euro
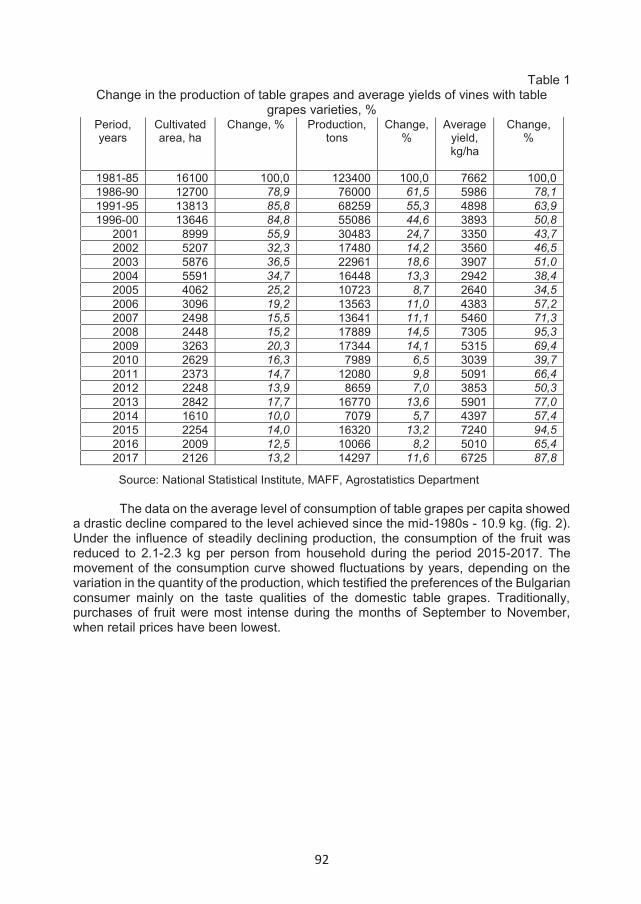
92
Table 1Change in the production of table grapes and average yields of vines with table
grapes varieties, %Period,years
Cultivated area, ha
Change, % Production, tons
Change, %
Average yield, kg/ha
Change, %
1981-85 16100 100,0 123400 100,0 7662 100,01986-90 12700 78,9 76000 61,5 5986 78,11991-95 13813 85,8 68259 55,3 4898 63,91996-00 13646 84,8 55086 44,6 3893 50,8
2001 8999 55,9 30483 24,7 3350 43,72002 5207 32,3 17480 14,2 3560 46,52003 5876 36,5 22961 18,6 3907 51,02004 5591 34,7 16448 13,3 2942 38,42005 4062 25,2 10723 8,7 2640 34,52006 3096 19,2 13563 11,0 4383 57,22007 2498 15,5 13641 11,1 5460 71,32008 2448 15,2 17889 14,5 7305 95,32009 3263 20,3 17344 14,1 5315 69,42010 2629 16,3 7989 6,5 3039 39,72011 2373 14,7 12080 9,8 5091 66,42012 2248 13,9 8659 7,0 3853 50,32013 2842 17,7 16770 13,6 5901 77,02014 1610 10,0 7079 5,7 4397 57,42015 2254 14,0 16320 13,2 7240 94,52016 2009 12,5 10066 8,2 5010 65,42017 2126 13,2 14297 11,6 6725 87,8
Source: National Statistical Institute, MAFF, Agrostatistics Department
The data on the average level of consumption of table grapes per capita showed a drastic decline compared to the level achieved since the mid-1980s - 10.9 kg. (fig. 2). Under the influence of steadily declining production, the consumption of the fruit was reduced to 2.1-2.3 kg per person from household during the period 2015-2017. The movement of the consumption curve showed fluctuations by years, depending on the variation in the quantity of the production, which testified the preferences of the Bulgarian consumer mainly on the taste qualities of the domestic table grapes. Traditionally, purchases of fruit were most intense during the months of September to November, when retail prices have been lowest.
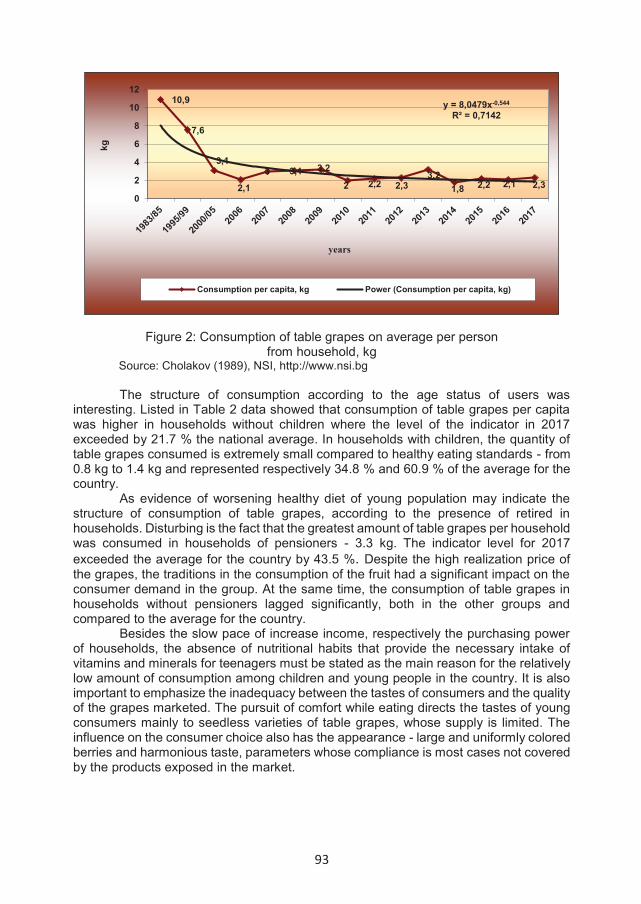
93
Figure 2: Consumption of table grapes on average per personfrom household, kg
Source: Cholakov (1989), NSI, http://www.nsi.bg
The structure of consumption according to the age status of users was interesting. Listed in Table 2 data showed that consumption of table grapes per capita was higher in households without children where the level of the indicator in 2017 exceeded by 21.7 % the national average. In households with children, the quantity of table grapes consumed is extremely small compared to healthy eating standards - from 0.8 kg to 1.4 kg and represented respectively 34.8 % and 60.9 % of the average for the country.
As evidence of worsening healthy diet of young population may indicate the structure of consumption of table grapes, according to the presence of retired in households. Disturbing is the fact that the greatest amount of table grapes per household was consumed in households of pensioners - 3.3 kg. The indicator level for 2017 exceeded the average for the country by 43.5 %. Despite the high realization price of the grapes, the traditions in the consumption of the fruit had a significant impact on the consumer demand in the group. At the same time, the consumption of table grapes in households without pensioners lagged significantly, both in the other groups and compared to the average for the country.
Besides the slow pace of increase income, respectively the purchasing power of households, the absence of nutritional habits that provide the necessary intake of vitamins and minerals for teenagers must be stated as the main reason for the relatively low amount of consumption among children and young people in the country. It is also important to emphasize the inadequacy between the tastes of consumers and the quality of the grapes marketed. The pursuit of comfort while eating directs the tastes of young consumers mainly to seedless varieties of table grapes, whose supply is limited. The influence on the consumer choice also has the appearance - large and uniformly colored berries and harmonious taste, parameters whose compliance is most cases not covered by the products exposed in the market.
10,9
7,6
3,1
2,1
3 3,1 3,2
2 2,2 2,33,2
1,8 2,2 2,1 2,3
y = 8,0479x-0,544
R² = 0,7142
0
2
4
6
8
10
12kg
years
Consumption per capita, kg Power (Consumption per capita, kg)
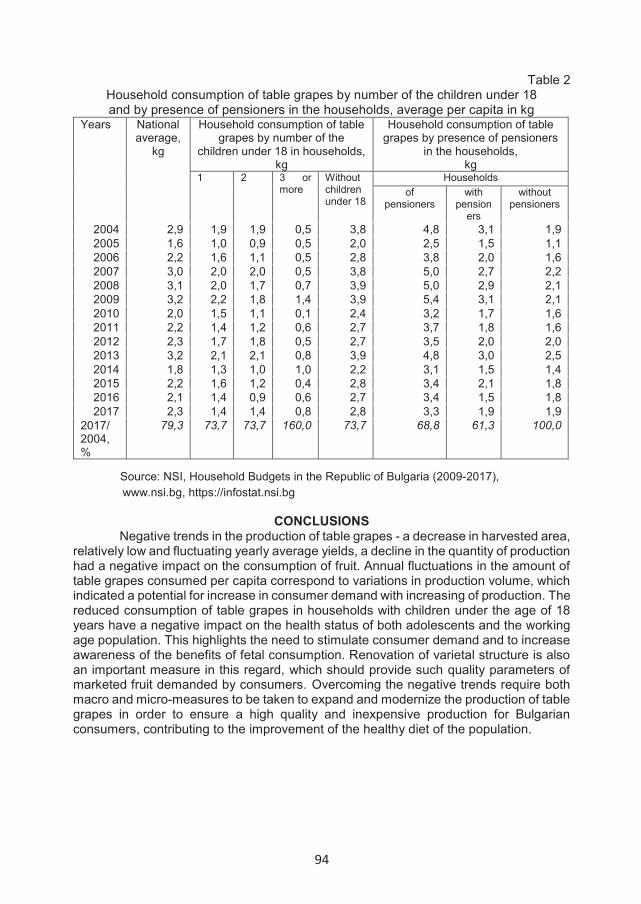
94
Table 2Household consumption of table grapes by number of the children under 18 and by presence of pensioners in the households, average per capita in kg
Years National average,
kg
Household consumption of table grapes by number of the
children under 18 in households,kg
Household consumption of table grapes by presence of pensioners
in the households,kg
1 2 3 or more
Without children under 18
Householdsof
pensionerswith
pensioners
without pensioners
2004 2,9 1,9 1,9 0,5 3,8 4,8 3,1 1,92005 1,6 1,0 0,9 0,5 2,0 2,5 1,5 1,12006 2,2 1,6 1,1 0,5 2,8 3,8 2,0 1,62007 3,0 2,0 2,0 0,5 3,8 5,0 2,7 2,22008 3,1 2,0 1,7 0,7 3,9 5,0 2,9 2,12009 3,2 2,2 1,8 1,4 3,9 5,4 3,1 2,12010 2,0 1,5 1,1 0,1 2,4 3,2 1,7 1,62011 2,2 1,4 1,2 0,6 2,7 3,7 1,8 1,62012 2,3 1,7 1,8 0,5 2,7 3,5 2,0 2,02013 3,2 2,1 2,1 0,8 3,9 4,8 3,0 2,52014 1,8 1,3 1,0 1,0 2,2 3,1 1,5 1,42015 2,2 1,6 1,2 0,4 2,8 3,4 2,1 1,82016 2,1 1,4 0,9 0,6 2,7 3,4 1,5 1,82017 2,3 1,4 1,4 0,8 2,8 3,3 1,9 1,9
2017/2004,%
79,3 73,7 73,7 160,0 73,7 68,8 61,3 100,0
Source: NSI, Household Budgets in the Republic of Bulgaria (2009-2017),www.nsi.bg, https://infostat.nsi.bg
CONCLUSIONSNegative trends in the production of table grapes - a decrease in harvested area,
relatively low and fluctuating yearly average yields, a decline in the quantity of production had a negative impact on the consumption of fruit. Annual fluctuations in the amount of table grapes consumed per capita correspond to variations in production volume, which indicated a potential for increase in consumer demand with increasing of production. The reduced consumption of table grapes in households with children under the age of 18 years have a negative impact on the health status of both adolescents and the working age population. This highlights the need to stimulate consumer demand and to increaseawareness of the benefits of fetal consumption. Renovation of varietal structure is also an important measure in this regard, which should provide such quality parameters of marketed fruit demanded by consumers. Overcoming the negative trends require both macro and micro-measures to be taken to expand and modernize the production of table grapes in order to ensure a high quality and inexpensive production for Bulgarian consumers, contributing to the improvement of the healthy diet of the population.
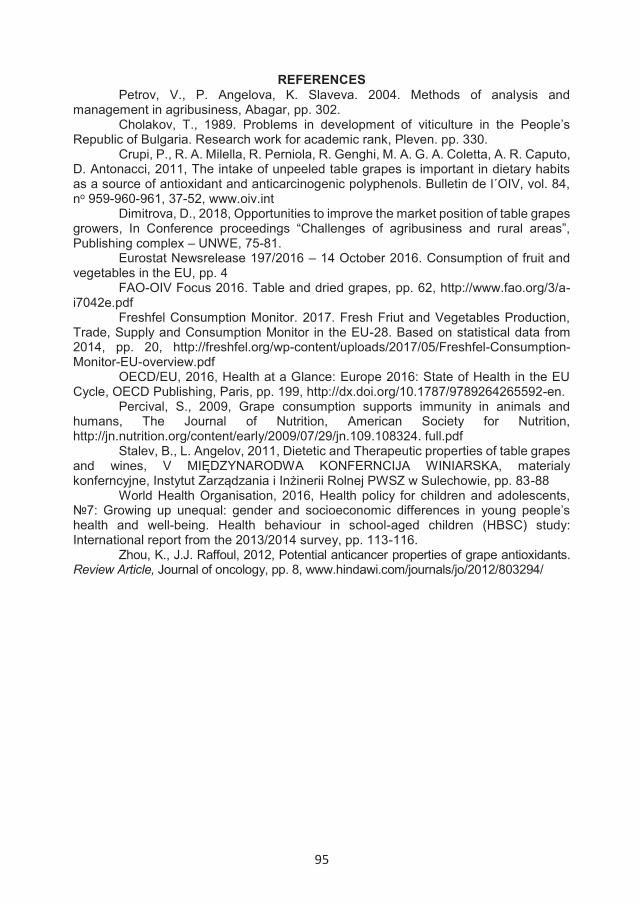
95
REFERENCESPetrov, V., P. Angelova, K. Slaveva. 2004. Methods of analysis and
management in agribusiness, Abagar, pp. 302. Cholakov, T., 1989. Problems in development of viticulture in the People’s
Republic of Bulgaria. Research work for academic rank, Pleven. pp. 330. Crupi, P., R. A. Milella, R. Perniola, R. Genghi, M. A. G. A. Coletta, A. R. Caputo,
D. Antonacci, 2011, The intake of unpeeled table grapes is important in dietary habits as a source of antioxidant and anticarcinogenic polyphenols. Bulletin de l´OIV, vol. 84, no 959-960-961, 37-52, www.oiv.int
Dimitrova, D., 2018, Opportunities to improve the market position of table grapes growers, In Conference proceedings “Challenges of agribusiness and rural areas”, Publishing complex – UNWE, 75-81.
Eurostat Newsrelease 197/2016 – 14 October 2016. Consumption of fruit and vegetables in the EU, pp. 4
FAO-OIV Focus 2016. Table and dried grapes, pp. 62, http://www.fao.org/3/a-i7042e.pdf
Freshfel Consumption Monitor. 2017. Fresh Friut and Vegetables Production, Trade, Supply and Consumption Monitor in the EU-28. Based on statistical data from 2014, pp. 20, http://freshfel.org/wp-content/uploads/2017/05/Freshfel-Consumption-Monitor-EU-overview.pdf
OECD/EU, 2016, Health at a Glance: Europe 2016: State of Health in the EU Cycle, OECD Publishing, Paris, pp. 199, http://dx.doi.org/10.1787/9789264265592-en.
Percival, S., 2009, Grape consumption supports immunity in animals and humans, The Journal of Nutrition, American Society for Nutrition, http://jn.nutrition.org/content/early/2009/07/29/jn.109.108324. full.pdf
Stalev, B., L. Angelov, 2011, Dietetic and Therapeutic properties of table grapes and wines, V MIĘDZYNARODWA KONFERNCIJA WINIARSKA, materialy konferncyjne, Instytut Zarządzania i Inżinerii Rolnej PWSZ w Sulechowie, pp. 83-88
World Health Organisation, 2016, Health policy for children and adolescents, №7: Growing up unequal: gender and socioeconomic differences in young people’s health and well-being. Health behaviour in school-aged children (HBSC) study: International report from the 2013/2014 survey, pp. 113-116.
Zhou, K., J.J. Raffoul, 2012, Potential anticancer properties of grape antioxidants. Review Article, Journal of oncology, pp. 8, www.hindawi.com/journals/jo/2012/803294/

96
STUDIES ON THE PEDOLOGICAL OFFER OF SOME AREAS IN NORTHERN OLTENIA FOR VINE CULTIVATION
Giugea Nicolae1., Cîrstea David1*, Mărăcineanu Liviu1
1University of Craiova, Faculty of Horticulture
*Correspondence author e-mail: [email protected]
ABSTRACT Within the depressions of the Sub-Carpathians of Oltenia, located along the axis: Drobeta
Turnu Severin, Corcova, Polovragi, Tg. Jiu, Horezu, Râmnicu Vâlcea, Jiblea-Călimăneşti, vineyard culture has been a major attraction for man’s preoccupations, which is why the vine is believed to have been adopted by man since his stage of picker when in the first gardens he set up he chose to store vineyards and fruit trees.
Our studies have highlighted the fact that in these depressions, the vine is still cultivated on large areas (2723 ha). Eleven types of soil were identified, in each of the seven areas their predominance is dependent on the conditions in which they were formed. We meet the calcic preluvosoil, eroded preluvosoil, typical luvisol, pelic faeziom, lithosols, regosols, podzols, etc.
Although most soil types have texture and structure that can be considered good, they need to be enriched by appropriate agro-technical measures for each situation.
The soil types in this area have a very good drainage, a very important aspect, especially since we find ourselves in an area where precipitation is significant over a year.
Vineyards are located on slopes with small angle of inclination, therefore, do not require land management terraces. In fact, these slopes are the sunniest, which is why the vine grows and fructifies in the best conditions.
INTRODUCTION
The soil and the subsoil with their chemical properties, but especially the physical ones, are those that regulate the water, air and temperature regime but also the permeability and the water retention capacity.
In cool vineyards, gravel soils provide a good drain of excess water and heat slightly, allowing for heat retention and better ripening of the grapes.
Also, the torrential rains that occur after the first fruit are less unfavorable if the soil is permeable and allows rapid infiltration in the depth of the water. Well-drained soils are a first major quality factor, especially in cool wine regions. The soil therefore has an important role in defining the composition and quality of grapes, a role that reaches the level of an obvious vocation to achieve certain high quality features. It is noteworthy that in the same favorable climatic area the quality of the grapes ceases to be excellent and becomes common, even if the soil is the same.
The scientific researches carried out over time in Romania (Bucur N., 1956, Chiriţă Constantin, 1966, Condei Gh., Popa P., 1977, Condei Gh., Et al., 2017, Dejeu L. 1984, Puiu et al, 1977, Teaci D., 1980, Teodorescu C.I., Băjescu N., 1956, Chiriţă C., et al., 1938, Urucu Justin, 2011), regarding the soil’s influence on the processes of growing and fruit-bearing of the vine they have highlighted the fact that high quality grapes are obtained on the limestone, skeletal and ferruginous soils. Our research aimed to highlight the predominant soil types and their properties in the northern Oltenia vineyards
ANNALS OF THE UNIVERSITY OF CRAIOVA
Series: Biology Horticulture Food produce processing
technology Environmental engineering Vol. XXII I (LIX) - 2018
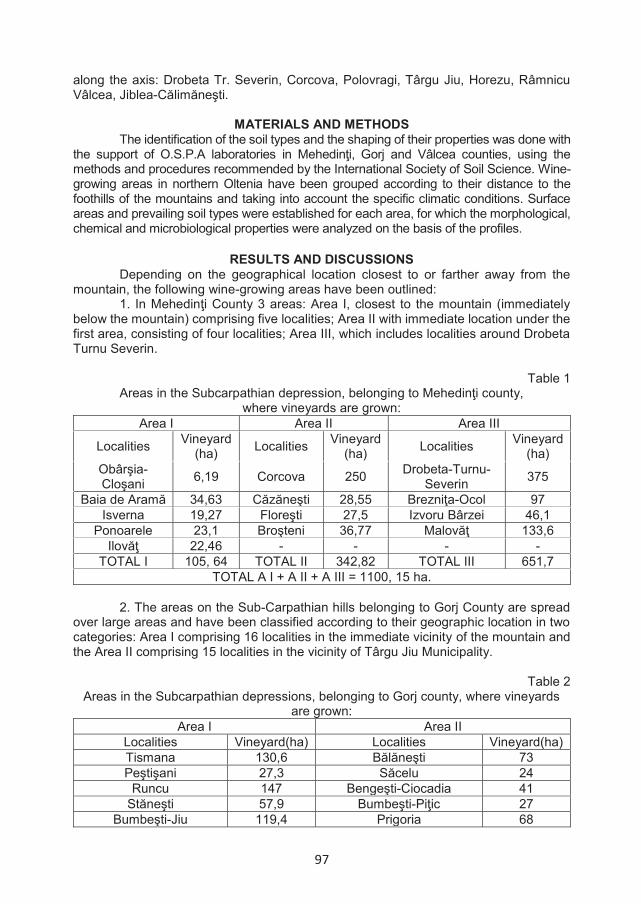
97
along the axis: Drobeta Tr. Severin, Corcova, Polovragi, Târgu Jiu, Horezu, Râmnicu Vâlcea, Jiblea-Călimăneşti.
MATERIALS AND METHODSThe identification of the soil types and the shaping of their properties was done with
the support of O.S.P.A laboratories in Mehedinţi, Gorj and Vâlcea counties, using the methods and procedures recommended by the International Society of Soil Science. Wine-growing areas in northern Oltenia have been grouped according to their distance to the foothills of the mountains and taking into account the specific climatic conditions. Surface areas and prevailing soil types were established for each area, for which the morphological, chemical and microbiological properties were analyzed on the basis of the profiles.
RESULTS AND DISCUSSIONSDepending on the geographical location closest to or farther away from the
mountain, the following wine-growing areas have been outlined:1. In Mehedinţi County 3 areas: Area I, closest to the mountain (immediately
below the mountain) comprising five localities; Area II with immediate location under the first area, consisting of four localities; Area III, which includes localities around Drobeta Turnu Severin.
Table 1 Areas in the Subcarpathian depression, belonging to Mehedinţi county,
where vineyards are grown:Area I Area II Area III
Localities Vineyard (ha) Localities Vineyard
(ha) Localities Vineyard (ha)
Obârşia-Cloşani 6,19 Corcova 250 Drobeta-Turnu-
Severin 375
Baia de Aramă 34,63 Căzăneşti 28,55 Brezniţa-Ocol 97Isverna 19,27 Floreşti 27,5 Izvoru Bârzei 46,1
Ponoarele 23,1 Broşteni 36,77 Malovăţ 133,6Ilovăţ 22,46 - - - -
TOTAL I 105, 64 TOTAL II 342,82 TOTAL III 651,7TOTAL A I + A II + A III = 1100, 15 ha.
2. The areas on the Sub-Carpathian hills belonging to Gorj County are spreadover large areas and have been classified according to their geographic location in two categories: Area I comprising 16 localities in the immediate vicinity of the mountain and the Area II comprising 15 localities in the vicinity of Târgu Jiu Municipality.
Table 2 Areas in the Subcarpathian depressions, belonging to Gorj county, where vineyards
are grown:Area I Area II
Localities Vineyard(ha) Localities Vineyard(ha)Tismana 130,6 Bălăneşti 73Peştişani 27,3 Săcelu 24
Runcu 147 Bengeşti-Ciocadia 41Stăneşti 57,9 Bumbeşti-Piţic 27
Bumbeşti-Jiu 119,4 Prigoria 68

98
Muşeteşti 66,9 Alimpeşti 14,2 Crasna 91,7 Tg. Jiu-Bârseşti 36,6 Novaci 43,2 Roşia de Amaradia 18,3
Baia de Fier 12,2 Albeni 11,6 Polovragi 21 Bustuchin 22,5 Godineşti 32,3 Târgu Cărbuneşti 32
Teleşti 17,2 Scoarţa 44,1 Băleşti 26,2 Dăneşti 53 Arcani 46,1 Drăgoţeşti 44,2
Turcineşti 44,5 Câlnic 17 Leleşti 15,3 - - TOTAL 898,8 TOTAL 526,5
TOTAL A I + A II = 1425,3 ha. 3. Areas on the Subcarpathian hills belonging to Vâlcea county have also been
grouped according to the geographical position in two categories: Area I refers to 13 localities located near Râmnicu Vâlcea and the Area II comprising 7 localities around the city Horezu.
It is found that in the depressions of the Sub-Carpathians of Oltenia the vines occupy 2723.7 hectares (1100 ha in Mehedinţi, 1425.3 ha in Gorj and 198.4 ha in Vâlcea), a surface that cannot be neglected and which says much about the vocation of these areas for the cultivation of the vine and the covenant between man and this plant.
In the wine-growing areas under study we identified, as the main 11 types of soil, which are presented, in order of predominance, in the table 4.
The soil type of calcic preluvosol (pseudo-rendzine brown clay) predominates in Drobeta Turnu Severin and Corcova, and in Târgu Jiu and Horezu it is the descending predominance, on the third place.
Table 3
Areas in the Subcarpathian depressions, belonging to Vâlcea county, where vineyards are grown:
Area I Area II Localities Vineyard(ha) Localities Vineyard(ha)
Călimăneşti-Jiblea 36 Mateeşti 8 Băile Olăneşti-Vlădeşti 7 Stroieşti 3
Runcu 4 Oteşani-Costeşti-Bistriţa 6 Stoeneşti 37 Alunu 5,5
Dăeşti 5 Berbeşti 5 Ocnele Mari 5 Copăceni 6,2 Rm. Vâlcea 13 Popeşti 9,4
Goleşti 10 Horezu-Măldăreşti 6 Frânceşti 10 - - Mihăeşti 3 - - Budeşti 6,3 - - Milcoiu 3,6 - -
Păuşeşti 9,4 - - TOTAL 149,3 TOTAL 49,1
TOTAL A I +A II = 198,4 ha.
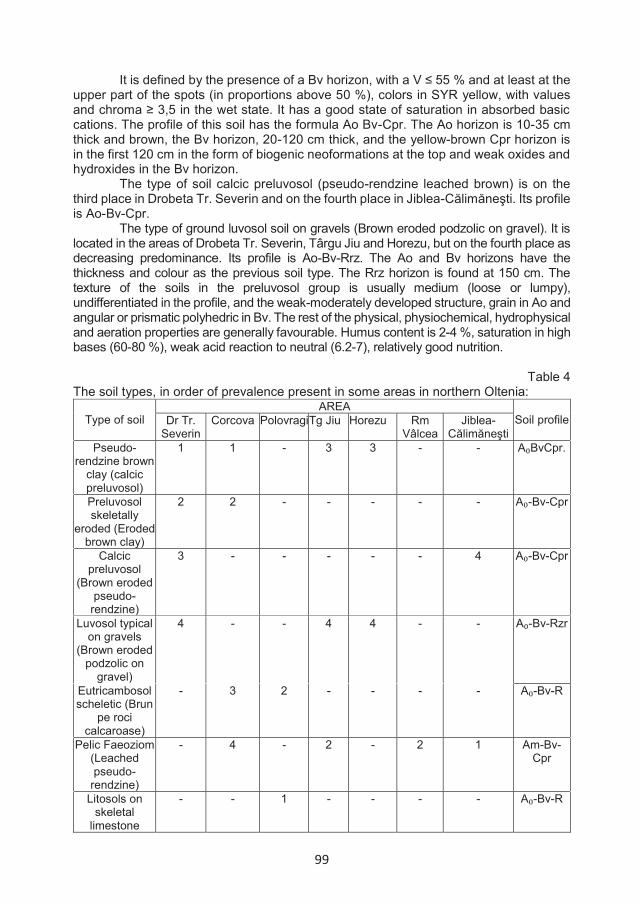
99
It is defined by the presence of a Bv horizon, with a V ≤ 55 % and at least at the upper part of the spots (in proportions above 50 %), colors in SYR yellow, with values and chroma ≥ 3,5 in the wet state. It has a good state of saturation in absorbed basic cations. The profile of this soil has the formula Ao Bv-Cpr. The Ao horizon is 10-35 cm thick and brown, the Bv horizon, 20-120 cm thick, and the yellow-brown Cpr horizon is in the first 120 cm in the form of biogenic neoformations at the top and weak oxides and hydroxides in the Bv horizon.
The type of soil calcic preluvosol (pseudo-rendzine leached brown) is on the third place in Drobeta Tr. Severin and on the fourth place in Jiblea-Călimăneşti. Its profile is Ao-Bv-Cpr.
The type of ground luvosol soil on gravels (Brown eroded podzolic on gravel). It is located in the areas of Drobeta Tr. Severin, Târgu Jiu and Horezu, but on the fourth place as decreasing predominance. Its profile is Ao-Bv-Rrz. The Ao and Bv horizons have the thickness and colour as the previous soil type. The Rrz horizon is found at 150 cm. The texture of the soils in the preluvosol group is usually medium (loose or lumpy), undifferentiated in the profile, and the weak-moderately developed structure, grain in Ao and angular or prismatic polyhedric in Bv. The rest of the physical, physiochemical, hydrophysical and aeration properties are generally favourable. Humus content is 2-4 %, saturation in high bases (60-80 %), weak acid reaction to neutral (6.2-7), relatively good nutrition.
Table 4 The soil types, in order of prevalence present in some areas in northern Oltenia:
Type of soilAREA
Soil profileDr Tr. Severin
Corcova PolovragiTg Jiu Horezu Rm Vâlcea
Jiblea-Călimăneşti
Pseudo-rendzine brown
clay (calcic preluvosol)
1 1 - 3 3 - - A BvCpr.
Preluvosol skeletally
eroded (Eroded brown clay)
2 2 - - - - - A -Bv-Cpr
Calcic preluvosol
(Brown eroded pseudo-
rendzine)
3 - - - - - 4 A -Bv-Cpr
Luvosol typical on gravels
(Brown eroded podzolic on
gravel)
4 - - 4 4 - - A -Bv-Rzr
Eutricambosol scheletic (Brun
pe roci calcaroase)
- 3 2 - - - - A -Bv-R
Pelic Faeoziom (Leached pseudo-
rendzine)
- 4 - 2 - 2 1 Am-Bv-Cpr
Litosols on skeletal
limestone
- - 1 - - - - A -Bv-R
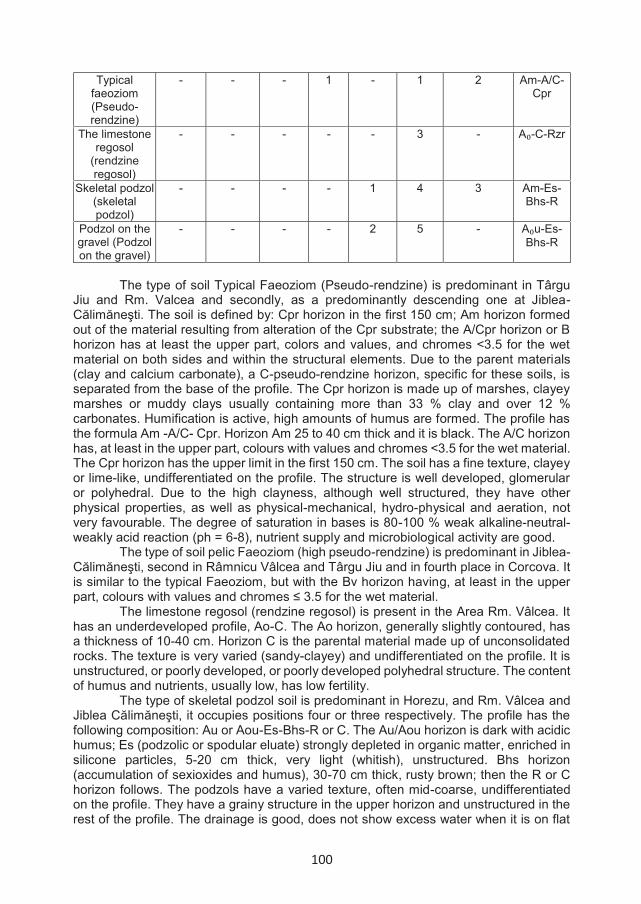
100
Typical faeoziom (Pseudo-rendzine)
- - - 1 - 1 2 Am-A/C-Cpr
The limestone regosol
(rendzine regosol)
- - - - - 3 - A -C-Rzr
Skeletal podzol (skeletal podzol)
- - - - 1 4 3 Am-Es-Bhs-R
Podzol on the gravel (Podzol on the gravel)
- - - - 2 5 - A u-Es-Bhs-R
The type of soil Typical Faeoziom (Pseudo-rendzine) is predominant in Târgu
Jiu and Rm. Valcea and secondly, as a predominantly descending one at Jiblea-Călimăneşti. The soil is defined by: Cpr horizon in the first 150 cm; Am horizon formed out of the material resulting from alteration of the Cpr substrate; the A/Cpr horizon or B horizon has at least the upper part, colors and values, and chromes <3.5 for the wet material on both sides and within the structural elements. Due to the parent materials (clay and calcium carbonate), a C-pseudo-rendzine horizon, specific for these soils, is separated from the base of the profile. The Cpr horizon is made up of marshes, clayey marshes or muddy clays usually containing more than 33 % clay and over 12 % carbonates. Humification is active, high amounts of humus are formed. The profile has the formula Am -A/C- Cpr. Horizon Am 25 to 40 cm thick and it is black. The A/C horizon has, at least in the upper part, colours with values and chromes <3.5 for the wet material. The Cpr horizon has the upper limit in the first 150 cm. The soil has a fine texture, clayey or lime-like, undifferentiated on the profile. The structure is well developed, glomerular or polyhedral. Due to the high clayness, although well structured, they have other physical properties, as well as physical-mechanical, hydro-physical and aeration, not very favourable. The degree of saturation in bases is 80-100 % weak alkaline-neutral-weakly acid reaction (ph = 6-8), nutrient supply and microbiological activity are good.
The type of soil pelic Faeoziom (high pseudo-rendzine) is predominant in Jiblea-Călimăneşti, second in Râmnicu Vâlcea and Târgu Jiu and in fourth place in Corcova. It is similar to the typical Faeoziom, but with the Bv horizon having, at least in the upper part, colours with values and chromes ≤ 3.5 for the wet material.
The limestone regosol (rendzine regosol) is present in the Area Rm. Vâlcea. It has an underdeveloped profile, Ao-C. The Ao horizon, generally slightly contoured, has a thickness of 10-40 cm. Horizon C is the parental material made up of unconsolidated rocks. The texture is very varied (sandy-clayey) and undifferentiated on the profile. It is unstructured, or poorly developed, or poorly developed polyhedral structure. The content of humus and nutrients, usually low, has low fertility.
The type of skeletal podzol soil is predominant in Horezu, and Rm. Vâlcea and Jiblea Călimăneşti, it occupies positions four or three respectively. The profile has the following composition: Au or Aou-Es-Bhs-R or C. The Au/Aou horizon is dark with acidic humus; Es (podzolic or spodular eluate) strongly depleted in organic matter, enriched in silicone particles, 5-20 cm thick, very light (whitish), unstructured. Bhs horizon (accumulation of sexioxides and humus), 30-70 cm thick, rusty brown; then the R or C horizon follows. The podzols have a varied texture, often mid-coarse, undifferentiated on the profile. They have a grainy structure in the upper horizon and unstructured in the rest of the profile. The drainage is good, does not show excess water when it is on flat
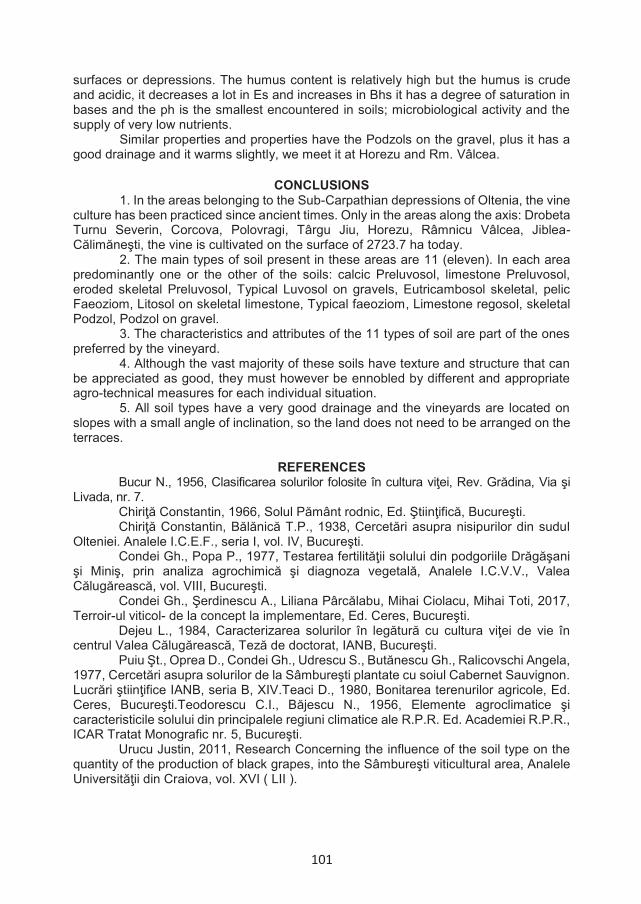
101
surfaces or depressions. The humus content is relatively high but the humus is crude and acidic, it decreases a lot in Es and increases in Bhs it has a degree of saturation in bases and the ph is the smallest encountered in soils; microbiological activity and the supply of very low nutrients.
Similar properties and properties have the Podzols on the gravel, plus it has a good drainage and it warms slightly, we meet it at Horezu and Rm. Vâlcea.
CONCLUSIONS 1. In the areas belonging to the Sub-Carpathian depressions of Oltenia, the vine
culture has been practiced since ancient times. Only in the areas along the axis: Drobeta Turnu Severin, Corcova, Polovragi, Târgu Jiu, Horezu, Râmnicu Vâlcea, Jiblea-Călimăneşti, the vine is cultivated on the surface of 2723.7 ha today.
2. The main types of soil present in these areas are 11 (eleven). In each areapredominantly one or the other of the soils: calcic Preluvosol, limestone Preluvosol, eroded skeletal Preluvosol, Typical Luvosol on gravels, Eutricambosol skeletal, pelic Faeoziom, Litosol on skeletal limestone, Typical faeoziom, Limestone regosol, skeletal Podzol, Podzol on gravel.
3. The characteristics and attributes of the 11 types of soil are part of the onespreferred by the vineyard.
4. Although the vast majority of these soils have texture and structure that canbe appreciated as good, they must however be ennobled by different and appropriate agro-technical measures for each individual situation.
5. All soil types have a very good drainage and the vineyards are located onslopes with a small angle of inclination, so the land does not need to be arranged on the terraces.
REFERENCES Bucur N., 1956, Clasificarea solurilor folosite în cultura viţei, Rev. Grădina, Via şi
Livada, nr. 7. Chiriţă Constantin, 1966, Solul Pământ rodnic, Ed. Ştiinţifică, Bucureşti.Chiriţă Constantin, Bălănică T.P., 1938, Cercetări asupra nisipurilor din sudul
Olteniei. Analele I.C.E.F., seria I, vol. IV, Bucureşti.Condei Gh., Popa P., 1977, Testarea fertilităţii solului din podgoriile Drăgăşani
şi Miniş, prin analiza agrochimică şi diagnoza vegetală, Analele I.C.V.V., Valea Călugărească, vol. VIII, Bucureşti.
Condei Gh., Şerdinescu A., Liliana Pârcălabu, Mihai Ciolacu, Mihai Toti, 2017, Terroir-ul viticol- de la concept la implementare, Ed. Ceres, Bucureşti.
Dejeu L., 1984, Caracterizarea solurilor în legătură cu cultura viţei de vie în centrul Valea Călugărească, Teză de doctorat, IANB, Bucureşti.
Puiu Şt., Oprea D., Condei Gh., Udrescu S., Butănescu Gh., Ralicovschi Angela, 1977, Cercetări asupra solurilor de la Sâmbureşti plantate cu soiul Cabernet Sauvignon. Lucrări ştiinţifice IANB, seria B, XIV.Teaci D., 1980, Bonitarea terenurilor agricole, Ed. Ceres, Bucureşti.Teodorescu C.I., Băjescu N., 1956, Elemente agroclimatice şi caracteristicile solului din principalele regiuni climatice ale R.P.R. Ed. Academiei R.P.R., ICAR Tratat Monografic nr. 5, Bucureşti.
Urucu Justin, 2011, Research Concerning the influence of the soil type on the quantity of the production of black grapes, into the Sâmbureşti viticultural area, Analele Universităţii din Craiova, vol. XVI ( LII ).

102
RESEARCH ON THE CLIMATIC SUPPLY OF SOME NORTHERN OLTENIA AREAS FOR THE VINEYARD CULTURE
Giugea Nicolae1, Cîrstea David1*, Mărăcineanu Liviu1
1University of Craiova, Faculty of Horticulture *Correspondence author e-mail: [email protected]
Keywords: viticulture, Oltenia, climate
SUMMARY In the Oltenia depressions under the mountains (Drobeta Tr. Severin, Corcova,
Polovragi, Târgu Jiu, Horezu, Rm. Vâlcea, Jiblea-Călimăneşti) the vine has sufficient climatic resources for growth and fructification.
In the Polovragi area, belonging to the Ao oenoclimatic area, the vine can offer: grapes for fresh consumption, grape stum or grape juice, white wines with geographical indication, sparkling and distilled raw materials, sometimes white wines with a designation of origin white Feteasca varieties, Crâmpoşie, Italian Riesling.
In the Tg. Jiu, Horezu, Rm. Valcea, Jiblea-Călimăneşti, belonging to the A2 oenoclimatic area can be obtained: table grapes, stum and grape juice; wines with a geographical indication, mistelles, wine alcohol, concentrated stum and white wines of dry white quality or dry descent with a designation of origin, quality rose wines or red wines with a designation of origin (priority varieties Fetească neagră, Pinot noir, Merlot), semi-dry, semi-sweet and sweet or liqueur wines (especially if there is noble rot), distilled wines (obsolete) with a designation of origin, sweet-flavoured wines with a designation of origin (mainly from Muscat Ottonel ).
INTRODUCTION Researches and studies conducted over time (Teodorescu C.I., 1939, 1968,
Teodorescu Ştefan, 1977, Teodorescu Ştefan et al., 1987, Popa A., 2012, 2014, Popa A. et al., 2015, Popa A. , Genoiu C., 2007, Condei Gh., Et al., 2017) pointed out that in the depressions of the Sub-Carpathians of Oltenia, the vine cultivation was practiced from the harvesting stage of the man, when in the “runes” of forests he protects plants vines and fruit trees, being of great use to him. Besides, the names of “Runcu” localities in Gorj and Vâlcea betray this.
As viticulture met the practice of technologies that involved mainly the mechanization of the works, the vineyards were planted mainly in the southern areas on the Getic Plateau where the new technologies could be used.
However, in the depressions of the Sub-Carpathians of Oltenia, the vine is still cultivated on the area of 2723 ha.
Through our researches we wanted to prove the climate offer that allowed the cultivation of vineyards to the foot of the Sub-Carpathians of Oltenia.
MATERIAL AND METHODSIn order to capture the climate offer for vine cultivation in some areas in the sub-
Carpathian depressions of Oltenia, we analyzed data on some elements of the climate
ANNALS OF THE UNIVERSITY OF CRAIOVA
Series: Biology HorticultureFood produce processingtechnology
Environmental engineering Vol. XXII I (LIX) - 2018
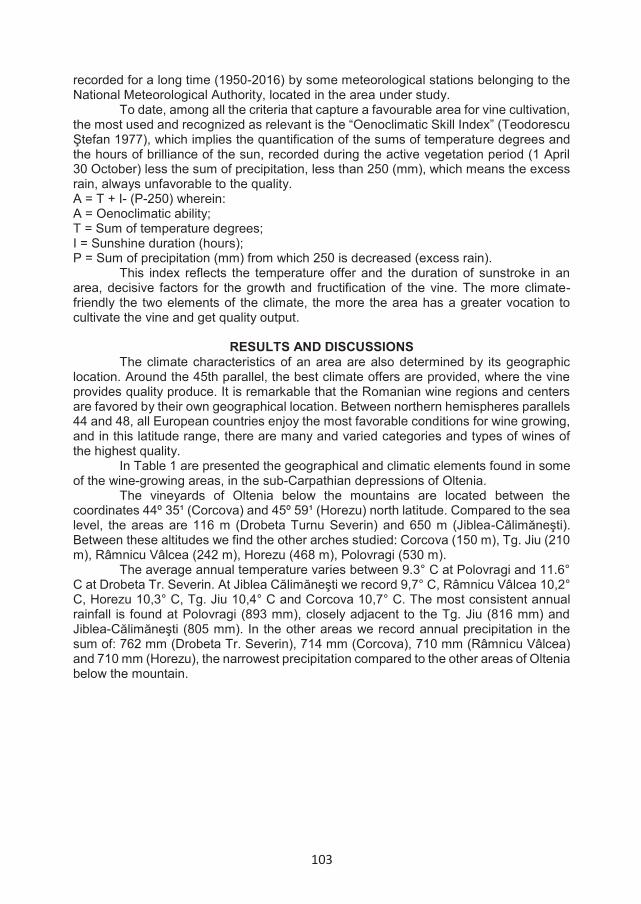
103
recorded for a long time (1950-2016) by some meteorological stations belonging to the National Meteorological Authority, located in the area under study.
To date, among all the criteria that capture a favourable area for vine cultivation, the most used and recognized as relevant is the “Oenoclimatic Skill Index” (Teodorescu Ştefan 1977), which implies the quantification of the sums of temperature degrees and the hours of brilliance of the sun, recorded during the active vegetation period (1 April 30 October) less the sum of precipitation, less than 250 (mm), which means the excess rain, always unfavorable to the quality.A = T + I- (P-250) wherein: A = Oenoclimatic ability; T = Sum of temperature degrees; I = Sunshine duration (hours); P = Sum of precipitation (mm) from which 250 is decreased (excess rain).
This index reflects the temperature offer and the duration of sunstroke in an area, decisive factors for the growth and fructification of the vine. The more climate-friendly the two elements of the climate, the more the area has a greater vocation to cultivate the vine and get quality output.
RESULTS AND DISCUSSIONSThe climate characteristics of an area are also determined by its geographic
location. Around the 45th parallel, the best climate offers are provided, where the vine provides quality produce. It is remarkable that the Romanian wine regions and centers are favored by their own geographical location. Between northern hemispheres parallels 44 and 48, all European countries enjoy the most favorable conditions for wine growing, and in this latitude range, there are many and varied categories and types of wines of the highest quality.
In Table 1 are presented the geographical and climatic elements found in some of the wine-growing areas, in the sub-Carpathian depressions of Oltenia.
The vineyards of Oltenia below the mountains are located between the coordinates 44º 35¹ (Corcova) and 45º 59¹ (Horezu) north latitude. Compared to the sea level, the areas are 116 m (Drobeta Turnu Severin) and 650 m (Jiblea-Călimăneşti). Between these altitudes we find the other arches studied: Corcova (150 m), Tg. Jiu (210 m), Râmnicu Vâlcea (242 m), Horezu (468 m), Polovragi (530 m).
The average annual temperature varies between 9.3° C at Polovragi and 11.6° C at Drobeta Tr. Severin. At Jiblea Călimăneşti we record 9,7° C, Râmnicu Vâlcea 10,2° C, Horezu 10,3° C, Tg. Jiu 10,4° C and Corcova 10,7° C. The most consistent annual rainfall is found at Polovragi (893 mm), closely adjacent to the Tg. Jiu (816 mm) and Jiblea-Călimăneşti (805 mm). In the other areas we record annual precipitation in the sum of: 762 mm (Drobeta Tr. Severin), 714 mm (Corcova), 710 mm (Râmnicu Vâlcea) and 710 mm (Horezu), the narrowest precipitation compared to the other areas of Oltenia below the mountain.
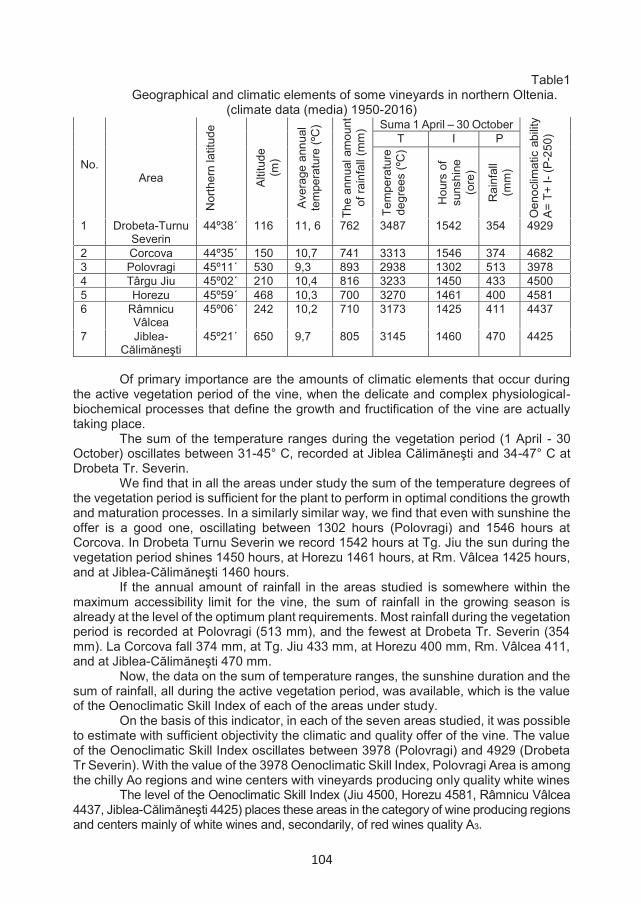
104
Table1 Geographical and climatic elements of some vineyards in northern Oltenia.
(climate data (media) 1950-2016)
No. Area
Nor
ther
n la
titud
e
Altit
ude
(m)
Aver
age
annu
al
tem
pera
ture
(ºC
)
The
annu
al a
mou
nt
of ra
infa
ll (m
m) Suma 1 April – 30 October
Oen
oclim
atic
abi
lity
A= T
+ I -
(P-2
50) T I P
Tem
pera
ture
de
gree
s (º
C)
Hou
rs o
f su
nshi
ne
(ore
)
Rai
nfal
l (m
m)
1 Drobeta-Turnu Severin
44º38´ 116 11, 6 762 3487 1542 354 4929
2 Corcova 44º35´ 150 10,7 741 3313 1546 374 4682 3 Polovragi 45º11´ 530 9,3 893 2938 1302 513 3978 4 Târgu Jiu 45º02´ 210 10,4 816 3233 1450 433 4500 5 Horezu 45º59´ 468 10,3 700 3270 1461 400 4581 6 Râmnicu
Vâlcea 45º06´ 242 10,2 710 3173 1425 411 4437
7 Jiblea-Călimăneşti
45º21´ 650 9,7 805 3145 1460 470 4425
Of primary importance are the amounts of climatic elements that occur during the active vegetation period of the vine, when the delicate and complex physiological-biochemical processes that define the growth and fructification of the vine are actually taking place.
The sum of the temperature ranges during the vegetation period (1 April - 30 October) oscillates between 31-45° C, recorded at Jiblea Călimăneşti and 34-47° C at Drobeta Tr. Severin.
We find that in all the areas under study the sum of the temperature degrees of the vegetation period is sufficient for the plant to perform in optimal conditions the growth and maturation processes. In a similarly similar way, we find that even with sunshine the offer is a good one, oscillating between 1302 hours (Polovragi) and 1546 hours at Corcova. In Drobeta Turnu Severin we record 1542 hours at Tg. Jiu the sun during the vegetation period shines 1450 hours, at Horezu 1461 hours, at Rm. Vâlcea 1425 hours, and at Jiblea-Călimăneşti 1460 hours.
If the annual amount of rainfall in the areas studied is somewhere within the maximum accessibility limit for the vine, the sum of rainfall in the growing season is already at the level of the optimum plant requirements. Most rainfall during the vegetation period is recorded at Polovragi (513 mm), and the fewest at Drobeta Tr. Severin (354 mm). La Corcova fall 374 mm, at Tg. Jiu 433 mm, at Horezu 400 mm, Rm. Vâlcea 411, and at Jiblea-Călimăneşti 470 mm.
Now, the data on the sum of temperature ranges, the sunshine duration and the sum of rainfall, all during the active vegetation period, was available, which is the value of the Oenoclimatic Skill Index of each of the areas under study.
On the basis of this indicator, in each of the seven areas studied, it was possible to estimate with sufficient objectivity the climatic and quality offer of the vine. The value of the Oenoclimatic Skill Index oscillates between 3978 (Polovragi) and 4929 (Drobeta Tr Severin). With the value of the 3978 Oenoclimatic Skill Index, Polovragi Area is among the chilly Ao regions and wine centers with vineyards producing only quality white wines
The level of the Oenoclimatic Skill Index (Jiu 4500, Horezu 4581, Râmnicu Vâlcea 4437, Jiblea-Călimăneşti 4425) places these areas in the category of wine producing regions and centers mainly of white wines and, secondarily, of red wines quality A3.

105
Corcova Area, with the value of the 4682 Oenoclimatic Skill Index, is part of the wine-growing centers and regions, belonging to the oenoclimatic zone A3, the sub-group of hills, producing mainly red and aromatic wines, and secondly by quality white wines.
The area of Drobeta-Tr. Severin has a high value (4929) of the Oenoclimatic Skill Index, which makes it part of the wine-growing regions and centers of the A3-hill-meridional oenoclimatic area, mainly producing red wines and, secondarily, quality white wines.
Growing and fructification processes, and especially grape-ripening, have proven to be the way of distribution (rainfall, sunshine duration and temperatures). Table 2 shows the monthly distribution during the vegetation period and precipitation.
Table 2 Monthly average precipitation (mm) during the vegetation period recorded in
vineyards in northern Oltenia (1950-2016).No. Area MONTH
April May June July August September October1 Drobeta- Tr.
Severin70 62 70 79 36 35 40
2 Corcova 65 67 74 82 44 39 323 Polovragi 68 99 106 105 78 56 434 Târgu Jiu 65 67 94 86 59 51 335 Horezu 64 66 89 76 49 42 356 Râmnicu
Vâlcea69 73 81 94 66 42 35
7 Jiblea-Călimăneşti
70 69 90 96 60 45 36
The overall proportion of precipitation over the entire period is rather abundant and their excess may cause difficulties; however, it is observed that during August and especially in September and October, the rainfall is the lowest, the rainfall reduction in these three months, where the grapes are matured, creates conditions for better soil heating, but more chosen to remove the risk of gray rot.
The monthly (average) hours of sunlight recorded in the areas under study are shown in Table 3.
Table 3 Hours of sunlight during the vegetation period, recorded in the vineyards in
northern Oltenia (average 1950-2016).No. Area MONTH
April May June July August September October1 Drobeta- Tr.
Severin173 186 275 316 302 217 173
2 Corcova 183 248 263 300 286 222 1733 Polovragi 165 202 219 255 248 213 1704 Târgu Jiu 182 236 253 290 276 221 1725 Horezu 185 240 256 292 286 230 1896 Râmnicu
Vâlcea183 222 247 283 272 217 181
7 Jiblea-Călimăneşti
191 247 249 249 240 219 187
It is noted that in all areas throughout the vegetation period, the vine has sufficient light, a decisive factor in the processes of chlorophyll assimilation, determining the processes of growth, fructification and maturation of the grapes.

106
Average monthly temperatures, the highest, are recorded in July. In August, near or after grape maturity, the temperature drops a little, but still retains a good level. In September, when finishing and defining the most delicate traits of composition and quality, when the grain skin is thinner and perishable for over-maturing and the installation of noble rot, the temperature drops by 3-4ºC, preventing important losses of valuable volatile compounds and significant combustion of organic acids. The same happens in October, the month with the least rainfall.
Table 4
Monthly average temperature recorded in vineyards in northern Oltenia during the growing season (average 1950-2016).
No.
Area
MONTH April May June July August September October
1 Drobeta- Tr. Severin
12,4 17,3 20,8 22,7 22,5 18,5 12,8
2 Corcova 11,6 16,5 19,8 27,8 27,4 17,4 11,8 3 Polovragi 10,9 14,5 17,7 19,4 19,0 15,6 10,5 4 Târgu Jiu 11,5 16,3 19,7 27,4 20,9 16,7 11,0 5 Horezu 11,4 16,9 19,6 27,8 20,9 16,9 12,0 6 Râmnicu
Vâlcea 11,2 15,8 19,2 20,9 20,3 16,4 11,0
7 Jiblea-Călimăneşti
11,7 16,5 19,5 20,0 19,9 16,6 11,2
Monthly average temperatures (Table 4), the highest, are recorded in July. In
August, near or after grape maturity, the temperature drops a little, but still retains a good level. In September, when finishing and defining the most delicate traits of composition and quality, when grain skins are thinner and more presumptive for over-maturing and noble rotation, the temperature drops by 3-4ºC, preventing important losses of valuable volatile compounds and significant combustion of organic acids. The same happens in October, the month with the least rainfall.
Also, the average of the maximum temperatures during August and September (Table 5) indicates a high enough level to satisfy the complex synthesis processes that occur in grapes at this stage. At the same time, the average of the absolute maximum temperatures in these two months marks small levels, far from being necessary to pay attention. The moderate average absolute temperature in August and September, as well as the difference between the absolute maximum and the absolute minimum temperature in August, remove the fear of essential shortcomings that might occur.
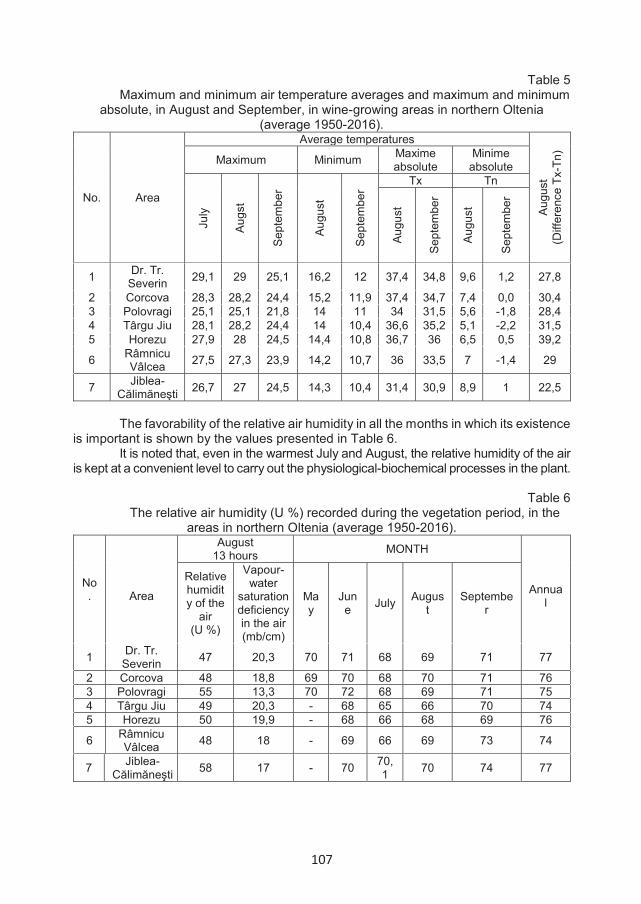
107
Table 5 Maximum and minimum air temperature averages and maximum and minimum
absolute, in August and September, in wine-growing areas in northern Oltenia (average 1950-2016).
No. Area
Average temperatures
Augu
st(D
iffer
ence
Tx-
Tn)
Maximum Minimum Maxime absolute
Minime absolute
July
Augs
t
Sept
embe
r
Augu
st
Sept
embe
r
Tx Tn
Augu
st
Sept
embe
r
Augu
st
Sept
embe
r
1 Dr. Tr. Severin 29,1 29 25,1 16,2 12 37,4 34,8 9,6 1,2 27,8
2 Corcova 28,3 28,2 24,4 15,2 11,9 37,4 34,7 7,4 0,0 30,43 Polovragi 25,1 25,1 21,8 14 11 34 31,5 5,6 -1,8 28,44 Târgu Jiu 28,1 28,2 24,4 14 10,4 36,6 35,2 5,1 -2,2 31,55 Horezu 27,9 28 24,5 14,4 10,8 36,7 36 6,5 0,5 39,2
6 Râmnicu Vâlcea 27,5 27,3 23,9 14,2 10,7 36 33,5 7 -1,4 29
7 Jiblea-Călimăneşti 26,7 27 24,5 14,3 10,4 31,4 30,9 8,9 1 22,5
The favorability of the relative air humidity in all the months in which its existence is important is shown by the values presented in Table 6.
It is noted that, even in the warmest July and August, the relative humidity of the air is kept at a convenient level to carry out the physiological-biochemical processes in the plant.
Table 6The relative air humidity (U %) recorded during the vegetation period, in the
areas in northern Oltenia (average 1950-2016).
No. Area
August13 hours MONTH
Annual
Relative humidity of the
air(U %)
Vapour-water
saturation deficiency in the air(mb/cm)
May
June July Augus
tSeptembe
r
1 Dr. Tr. Severin 47 20,3 70 71 68 69 71 77
2 Corcova 48 18,8 69 70 68 70 71 763 Polovragi 55 13,3 70 72 68 69 71 754 Târgu Jiu 49 20,3 - 68 65 66 70 745 Horezu 50 19,9 - 68 66 68 69 76
6 Râmnicu Vâlcea 48 18 - 69 66 69 73 74
7 Jiblea-Călimăneşti 58 17 - 70 70,
1 70 74 77
108
CONCLUSIONS 1. The vineyard culture in the depressions of the Subcarpathians of Oltenia is
one of the oldest preoccupations of man, still in his gathering phase; 2. The wine-growing areas in the depression of Sub-Carpathians in Oltenia are
the closest to the Romanian Carpathians; 3. The main climatic factors that determine the favorability of an area for vine
culture, the duration of sunshine and the precipitations present in the Sub-Carpathian depressions in Oltenia are manifested in the most suitable proportions for the vineyard culture;
4. The areas under study (Drobeta Tr. Severin, Corcova, Polovragi, Tg Jiu, Horezu, Rm. Vâlcea, Jiblea-Călimăneşti) through the Oenoclimatic Skill Index, between 3978 (Polovragi) and 4929 (Drobeta Tr., belong to the vineyard regions and centers: Ao (Polovragi), A2 (Tg Jiu, Horezu, Rm. Vâlcea, Jiblea-Călimăneşti), A3 (Corcova) and hill-meridional A3 (Drobeta Tr.
5. As a result of the values of the Oenoclimatic Skills Index, in the wine-growing areas of the Sub-Carpathian depressions in Oltenia can be obtained: quality white wines (Polovragi); white wines, dry, semi-sweet and aromatic (Tg. Jiu, Jiblea-Călimăneşti) such as Sauvignon, Muscat Ottonel, Italian Riesling, white Fetească, but also red wines of Pinot noir, Merlot and even Cabernet Sauvignon; red and aromatic wines of selected quality (Drobeta Tr. Severin, Corcova);
6. The vineyards of Oltenia below the mountains must be protected, rebuilt and developed.
REFERENCES
Condei Gh., Şerdinescu A., Pârcălău L., Ciolacu M., Toti M., 2017, Terroir-ul viticol- de la concept la implementare, Ed. Ceres, Bucureşti’
Popa A., Genoiu C., 2007, Oltenia Mica Românie Viticolă, Rev. Winex Spirit, nr. 15; 16; 17;18, Bucureşti;
Popa A., 2012, Viticultura din Oltenia între reconstrucţie şi dezvoltare, Ed. Alma, Craiova;
Popa A., 2014, Repere oenologice româneşti, Ed. Alma, Craiova; Popa A., Giugea N., Genoiu C., 2015, Oltenia Mica Românie Viticolă, Ed. Aius,
Craiova; Teodorescu C.I., 1939, Viile Daciei şi ale Principatelor Române, pg. 157
( manuscris ); Teodorescu C.I., 1968, Activites viticoles sur le territoire Dace, Redacţia
revistelor agricole, Bucureşti; Teodorescu Ştefan, 1977, Les vinglobs et les vins de Roumanie. Trav. Simpoz.
Intern. Oenologie, Bordeaux; Teodorescu Ştefan, Popa Aurel, Sandu Gheorghe, 1987, Oenoclimatul
României, Ed. Stiinţifică şi Pedagogică, Bucureşti.

109
EFFECT OF REPETED FRYING PROCESS ON CHEMICAL COMPOSITION OF EDIBLE VEGETABLE OILS
Giurgiulescu Liviu1*, Șugar Ioan Radu2, Bănică Mihai2, Timiș Elena1
*Department of Chemistry Biology, Faculty of Science, Technical University of Cluj Napoca, Victoriei StreetNo.76, 430122, Baia Mare, Romania
2Department of Engineering and Technologic Management, Faculty of Engineering, North University Center of Baia Mare, Technical University of Cluj Napoca,, Victor Babes 62A, 430083, Romania
* Correspondence author. E-mail: [email protected]
Keywords: edible oils, peroxide index, iodine index, organic acidity, mineral acidity
ABSTRACTThe main objective of the present study was to examine the effects of the multiple frying
process over the chemical composition of sun flower oil; olive oil and palm oil. In order for investigation vegetable oils have been passed by five frying cycles. Before and after each frying step it was determinate peroxide index, saponification index, iodine index. Peroxide index increase in all media treatments. Olive oil record low stability during the frying process. Palm oil present a constant stability in frying process. Sun flower oil record a medium stability.
INTRODUCTION Vegetable oils are substances extracted from plants which are obtained from oil
containing seeds, fruits, or nuts by different pressing methods, solvent extraction or a combination of these (Benion, 1995) There are numerous vegetable oils derived from various plants such as soybean, cottonseed, peanuts, sunflower, palm, palm kernel, coconut seed, castor seed and rapeseed oil. These oils can be further classified as edible and non- edible; edible oils are mostly used in cooking. Over the years, vegetable oils have been used in various methods of cooking (Chebet et al. 2016). Deep frying involves submerging the food in hot, liquid fat at a high temperature of 1500C-1900C. (Yamsaengsung et al., 2002). As deep fat frying is normally carried out at high temperatures (between 1500C and 1900C) and in the presence of air and moisture, these frying oils and fats will undergo physical and chemical deterioration which will affect their frying performance and the storage stability of the fried products (Fauziah et al., 2000).
After deep frying, many people are tempted to keep the oil to be reused for long periods of time. This causes adverse effects on flavor, stability, colour and texture of fried product and may be harmful to human health (Sharoba and Mohamed, 2012). Deterioration in the vegetable oils is reflected by the decrease in iodine value. Iodine value is used to measure unsaturation or the average number of double bonds in fats and oils (Chebet et al. 2016). Different physical and chemical parameters of edible oil were used to monitor the compositional quality of oils (Ceriani et al., 2008, Mousavi et al., 2012). These physicochemical parameters include iodine value (IV), saponification value (SV), viscosity, density and peroxide value (PV). Edible oils are one of the mainconstituents of the diet used for cooking purposes. Several researchers studied the impact of temperature on the stability, viscosity, peroxide value, and iodine value to assess the quality and functionality of the oil (Farhoosh et al., 2008, Jinfeng et al., 2011).
ANNALS OF THE UNIVERSITY OF CRAIOVA
Series: Biology HorticultureFood produce processingtechnology
Environmental engineering Vol. XXII I (LIX) - 2018
110
Deep frying is one of the most common methods used for the preparation of food. Repeated frying causes several oxidative and thermal reactions which results in change in the physicochemical, nutritional and sensory properties of the oil (Che Man and Jasvir, 2000). During frying, due to hydrolysis, oxidation and polymerization processes the composition of oil changes which in turn changes the flavor and stability of its compounds (Gloria and Aguilera, 1998).
During deep frying different reactions depend on some factors such as replenishment of fresh oil, frying condition, original quality of frying oil and decrease in their oxidative stability (Choe and Min, 2007). Atmospheric oxygen reacts instantly with lipid and other organic compounds of the oil to cause structural degradation in the oil which leads to loss of quality of food and is harmful to human health (Bhattacharya et al., 2008). Therefore, it is essential to monitor the quality of oil to avoid the use of abused oil due to the health consequences of consuming foods fried in degraded oil, to maintain the quality of fried foods and to minimize the production costs associated with early disposal of the frying medium (Vijayan et al., 1996).
The aim of the present study is the effect of temperature on the chemical composition of vegetable oils after heating and frying with potato pieces and used the same oil for five times in five frying passages.
MATERIAL AND METHODS
Material and chemicals Sodium hydroxide (NaOH), potassium hydroxide (KOH), sodium thiosulphate (Na2S2O3), hydrochloric acid (HCl), acetic acid (CH3COOH), iodobromine (IBr), potassium iodide (KI), potassium iodate (KIO3) indicators (phenolphthalein). Saponification (SV) value measurement The saponification value is determined by taking 1.0 g of oil sample in a conical flask to which is added 15 mL 1 N KOH and 10 mL of distilled water and heated under a reserved condenser for 30-40 min to ensure that the sample was fully dissolved. After this sample was cooled, phenolphthalein was added and titrated with 0.5 M of HCl until a pink endpoint was reached. A blank was determined with the same time conditions. (AOAC, 1984). Iodine value (IV) measurement A known weight of the oil sample is treated with an excess of iodobromine (IBr) in glacial acetic acid. Unreacted iodobromine is reacted with potassium iodide which converts it to iodine. The iodine concentration is then determined by titration with standard sodium thiosulphate.
(1) where b is the quantity of sodium thiosulphate used for blank, v is the quantity of thiosulphate for sample, N is the normality of thiosulphate solution, w is the wt of the oil sample and 126.9 is the molecular weight of iodine. (AOAC, 1984)
Peroxide value (PV) measurement Peroxide value is a measure of peroxides contained in the oil. PV is determined by measuring iodine released from potassium iodide. A known measured weight of oil samples is dissolved in acetic acid then chloroform and saturated KI mixture are added to the sample and the amount of iodine liberated from KI by the oxidative action of peroxides present in the oil is determined by titration with standard sodium thiosulphate using starch solution as an indicator. Titration was also performed for blanks.
(2)

111
where B is the volume of sodium thiosulphate used for blank,W is the weight of sample, S is the volume of sodium thiosulphate consumed by the sample oil and N is the normality of standard sodium thiosulphate (AOCS, 1993).
Frying process Potatoes were peeled and cut into pieces (appx 15 cm3) and were fried in the frying oil at constant temperature 1600C five frying times. Each frying passage used a quantity approximative 250 g potatoes. Frying experiments were conducted in duplicate in each frying medium. It used 3 types of vegetable oils (sun flower, olive and palm oil). For each sample was determinate organic acidity, mineral acidity, peroxide value (PV), saponification index (SV), iodine value (IV) before and after frying process.
RESULTS AND DISCUSSIONS Saponification value measurementSaponification value (SV) is an index to measure average molecular mass of the
fatty acids in oil composition. In generally saponification index decrease during frying treatment. A low value of saponification value (SV) suggests an oil with high content in ester bounds and low content in fatty acids with high number of carbon bounds.
Saponification index for sun flower oil and olive oil decrease from unfrying samples to first frying treatment. After first frying treatment saponification value increase for olive oil and continue to decrease for sun flower oil, but in low limits. Palm oil record a constant decrease of saponification value, in low variation for all of frying process.
Figure 1. Variation of saponification value (SV) due frying process at edible vegetable oils
This might imply that sun flower oil records a medium stability in the frying process; palm oil presents a high stability during frying process and olive oil records a low stability during frying process.

112
Figure 2. Variation of peroxide value (PV) due frying process at edible vegetable oils
Peroxide value (PV) is an indicator of the quality and stability of fats and oils
during preservation period. In the same way the peroxide index can offer information regarding vegetable edible oils during technological process or frying treatment in household. A lot of people used many times vegetable oils in food coking even then the oil decrease in quality and generate high quantity of unhealthy substances. Peroxide value offer information regarding the vegetable edible oils during frying treatment. A first remark all the vegetable oils take in view record an increase of peroxide value (PV) during frying process. Olive oil achieve high content in oxidative compounds. Sun flower oil present low value of peroxide index after first and second frying treatment, but at the end the peroxide value are similar with olive oils. Sun flower oil can be used with good results for one or two frying treatment, begin with the third, fourth or fifth frying treatment sun flower oil can be unsafe for healthy use. Palm oil can be used with good results in any frying process. Peroxide value for palm oil increase with low values from the first frying treatment to the fifth frying treatment. The only problem that can occur is related to the concentration of the saturated fatty acids in palm oil composition, with high impact over human health. There is a successive increase in PV when the same oil was used for frying with a piece of potato. The peroxide value determines the extent to which the oil has undergone rancidity. (Zahir et al., 2017)
Iodine value (IV) measures the degree of unsaturation in a fat or vegetable oil. It determines the stability of oils to oxidation and allows the overall unsaturation of the fat to be determined qualitatively (AOCS, 1993; Asuquo et al., 2012). It was observed that measured iodine values for Sun flower and Olive oil are 1.44 g and 0.695 g respectively after first frying process. These low iodine values may have contributed to its greater oxidative storage stability. The oxidative and chemical changes in oils during storage are characterized by an increase in free fatty acid contents and a decrease in the total unsaturation of oils (Perkin, 1992).
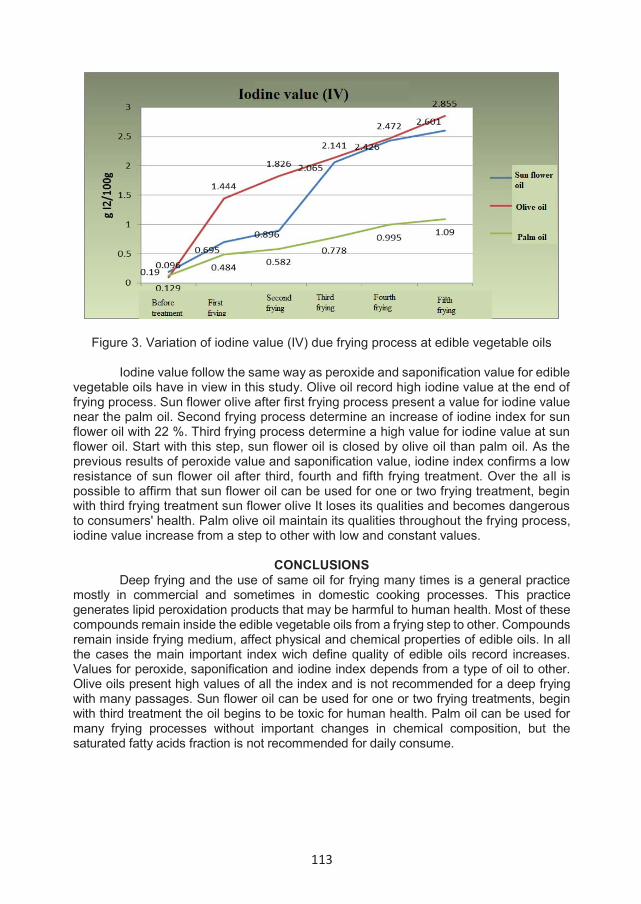
113
Figure 3. Variation of iodine value (IV) due frying process at edible vegetable oils
Iodine value follow the same way as peroxide and saponification value for edible vegetable oils have in view in this study. Olive oil record high iodine value at the end of frying process. Sun flower olive after first frying process present a value for iodine value near the palm oil. Second frying process determine an increase of iodine index for sun flower oil with 22 %. Third frying process determine a high value for iodine value at sun flower oil. Start with this step, sun flower oil is closed by olive oil than palm oil. As the previous results of peroxide value and saponification value, iodine index confirms a low resistance of sun flower oil after third, fourth and fifth frying treatment. Over the all is possible to affirm that sun flower oil can be used for one or two frying treatment, begin with third frying treatment sun flower olive It loses its qualities and becomes dangerous to consumers' health. Palm olive oil maintain its qualities throughout the frying process, iodine value increase from a step to other with low and constant values.
CONCLUSIONS Deep frying and the use of same oil for frying many times is a general practice
mostly in commercial and sometimes in domestic cooking processes. This practice generates lipid peroxidation products that may be harmful to human health. Most of these compounds remain inside the edible vegetable oils from a frying step to other. Compounds remain inside frying medium, affect physical and chemical properties of edible oils. In all the cases the main important index wich define quality of edible oils record increases. Values for peroxide, saponification and iodine index depends from a type of oil to other. Olive oils present high values of all the index and is not recommended for a deep frying with many passages. Sun flower oil can be used for one or two frying treatments, begin with third treatment the oil begins to be toxic for human health. Palm oil can be used for many frying processes without important changes in chemical composition, but the saturated fatty acids fraction is not recommended for daily consume.
114
REFERENCES AOAC, 1984, Official Methods of Analysis. Association of OfficialAnalytical
Chemists, Washington, DC. AOCS, 1993, In: Official Methods and Recommended Practice of the American
oil Chemist Society, fifth ed. AOAC Press, Champaign, IL. Asuquo, J.E., Anusiem, A.C.I., Etim, E.E., 2012. Extraction and characterization
of rubber seed oil. Int. J. Mod. Chem. 1 (3),109–115. Benion M., 1995, Introductory Foods.10th Edition. Prentice-Hall Inc., Upper
Saddle River, New Jersey, USA. Pp. 165-166 Bhattacharya A.B., Sajilata M.G., Tiwari S.R., Singhal R., 2008, Regeneration of
thermally polymerized frying oils with adsorbents Food Chem., 110, pp. 562-570 Ceriani R., Paiva F.R., Alves C.B.G., Batista E.A.C., Meirelles A.J.A. , 2008,
Densities and viscosities of vegetable oils of nutritional value Journal of Chemical and Engineering Data, 53 (8), pp. 1846-1853
Che Man Y.B., Jasvir I., 2000, Effect of rosemary and sage extracts on frying performance of refined, bleached and deodorized (RBD) palm olein during deep fat frying, Food Chem., 69, pp. 301-307
Chebet J., Kinyanjui T., Peter K. C., 2016,Impact of frying on iodine value of vegetable oils before and after deep frying in different types of food in Kenya, Journal of Scientific and Innovative Research, 5(5), 193-196
Choe E., Min D.B. ,2007, Chemistry of deep-fat frying oils J. Food Sci., 72 pp. 77-86 Farhoosh R., Moosai S.M.R., Sharif A.,2008, Investigation on frying oils quality
in terms of color index, refractive index and viscosity during frying process, J. Food Sci. Tech., 5 (1), pp. 13-19
Fauziah A, Razali I, Nor-Aini S., 2000, Frying performance of palm olein and high oleic sunflower oil during batch frying of potato crisps. Palm Oil Developments. 3: 1-7.
Gloria H., Aguilera J.M. 1998, Assessment of the quality of heated oils by differential scanning calorimetryJ. Agric. Food Chem., 46, pp. 1363-1368
Jinfeng P., Huixing S., Juan Y., Yong K.L., 2011, Changes in physiochemical properties of Myofibrillar protein from Silver Carp (Hypophthalmichthys mollitrix) during heat treatment, J. Food Biochem., 35 , pp. 939-952
Mousavi K., Shoeibi S., Ameri M., 2012, Effects of storage conditions and PET packaging on quality of edible oils in Iran, Adv. Environ. Biol., 6 (2), pp. 694-701
Perkin, E.G., 1992, Effect of lipid oxidation on oil and food quality in deep frying. In: Angels, A.J.S. (Ed.), Lipid Oxidation in Food, Chapter 18, ACS Symposium Series no. 500 ACS, American Chemical Society, Washington DC, pp. 310–321.
Sharoba A, Mohamed F.R., 2012, Impact of frying on fatty acid profile and rheological behavior of some vegetable oils. Journal of Food Process Technology. 3, pp. 7-8.
Vijayan J., Slaughter D.C., Paul S.R.,1996, Optical properties of corn oil during fryingInt. J. Food Sci. Technol., 31, pp. 353-358
Yamsaengsung R, Moreira R.G., 2002, Modeling the transport phenomena and structural changes during deep fat frying, Part II: model solution & validation. Journal of Food Engineering.;53, pp. 11-25
Zahir Erum, Saeed Rehana, Hameed Mehwish Abdul, Yousuf Anjum, 2017, Study of physicochemical properties of edible oil and evaluation of frying oil quality by Fourier Transform-Infrared (FT-IR) Spectroscopy, Arabian Journal of Chemistry 10, S3870–S3876
115
EFFECT OF RIPENING STAGE ON THE TOTAL PHENOLICS CONTENT, LYCOPENE AND ANTIOXIDANT ACTIVITY OF TOMATO FRUITS GROWN
TO A GEOTHERMAL GREENHOUSE
Gougoulias Nikolaos1*, Papachatzis Alexandros1, Lazou Evangelia1,Tsiountsioura Vassiliki2, Ntalla Maria-Nektaria3
1Department of Agronomy Technology, Technological Educational Institute of Thessaly, Larissa, Greece. 2Faculty of Medicine, University of Thessaly, Larissa, Greece.
3Department of Computer Science and Engineering, Data Analysis, Technological Educational Institute of Thessaly, Larissa, Greece.
*Correspondence author’s email: [email protected]
Keywords: Tomato; hydroponic culture; lycopene; total phenols; DPPH activity
ABSTRACT Total phenols, flavonoids, non-flavonoids and lycopene content have been evaluated in
hydroponically cultured tomato fruits cv. Sandin F1 of geothermal greenhouse for four stages ripening based on colour, as (mature green, mature pink, mature red and over ripening stage). Antiradical activity DPPH and the antioxidant activity FRAP were also assessed. The total phenols content ranged from 130.2 to 235 mg (GAE) kg-1 FW, flavonoids content ranged from 97.7 to 162.2 mg (GAE) kg-1 FW, non-flavonoids content ranged from 32.5 to 91.4 mg (GAE) kg-1 FW and lycopene content ranged from 12 to 143 mg kg-1 FW. The antioxidant activity FRAP ranged from 114 to 4970 μmol FRAP kg-1 FW, and the antiradical activity DPPH ranged from 62 to 989 μmol DPPH kg-1 FW. There were high correlation between lycopene and DPPH values (r2= 0.6937) and lycopene and FRAP values (r2= 0.8699).
INDRODUCTION Free radicals are highly reactive compounds that play an essential role in many
biological processes, both beneficial and deleterious. The excessive presence of free radicals induce cellular ageing and susceptibility to diseases (Sies 2015). This oxidative destruction of the biomolecules can be reduced by using natural antioxidants such as vitamin C, carotenoids and phenolic which are contained in fruits and vegetables (Valko et al. 2006).
Tomato consists a natural reservoir vitamin C, folic acid, carotenoids and phenolics compounds (Preedy and Watson 2009, Gougoulias et al. 2012). The carotenoids and phenolics compounds support and protect plant tissues, functioning as defence molecules in immunity, attractants for insect polinators, allelopathic agents and ultra violet protectants (Jaganath and Crozier, 2010). Lycopene is a long-chain unsaturated carotenoid which reflects the basis of the red colour of ripened tomato fruits, while it is the most powerful antioxidant member of the carotenoid family (Heuvelink, 2005). Furthermore, phenolic compounds affect the color and taste in many fruit, while exercising potent antioxidant properties (Alesiani et al. 2010). Generally, diets rich in carotenoids and in phenolic compounds are associated with low risk probability in some diseases, such as cardiovascular diseases and various types cancer (Zhang et al. 2016).
ANNALS OF THE UNIVERSITY OF CRAIOVA
Series: Biology HorticultureFood produce processingtechnology
Environmental engineering Vol. XXII I (LIX) - 2018
116
The ripeness degree markedly of fruits influence the quantity of the phenolic compounds. The degradation of some phenolic compounds it may be faster or slower than biosynthesis other phenolic compounds. According to some authors, phenolic acids content decrease during ripening, whereas flavonoid phenols content increase during ripening (Manach et al. 2004). Generally, agricultural, technological, and environmental factors influence in lycopene and phenolic compounds content of tomato fruits as well also and their antioxidant activity (Benton 2008, Tommonaro et al. 2008).
Greenhouses are one of the largest low-enthalpy energy consumers in agriculture. The development of today's hydroponic systems, is based on modern distribution systems of nutrient solution (Domingues et al. 2012, Gougoulias et al. 2015). Geothermal energy is derived by absorption of solar radiation, is stored from the earth's surface up to depth 200 m with a temperature of 10-18 °C. Geothermal energy provides economic benefits, and contributes to a reduction of greenhouse gases (Bloomfield et al. 2003).
The objective of our study was to determine at a geothermal greenhouse the total phenols content, flavonoids, nonflavonoids, lycopene, such as and the antioxidant activity of tomato fruits at different ripening stages.
MATERIAL AND METHODS Tomato cultivation: The experiment was conducted in closed type geothermal
greenhouse of Technological Educational Institute of Thessaly. The system water recycling, be based on shallow geothermal energy. The energy requirements of greenhouse for cooling, heating and converting the water vapor into water, covered by closed circuit exchangers that are constructed adjacent to the greenhouses at a depth of 100 meters. The greenhouse, for dehumidifying the air and for the water collection has a special metallic conduit that recycles part of the air in the greenhouse environment. For the air conditioning of greenhouse there is the optimal heating and cooling system with both heat pumps. The overall flow of water with in the greenhouse is controlled by modern automation, which continuously adjusts the flow in the system.
Tomato plants (var. Sandin F1) was cultivated in the hydroponic system during October 2015 to May 2016. Substrate stone wool slabs, were placed in double rows, with a distance of plants in each slab of 30 cm. Secondary pipes were placed in a specially designed table, in order to reduce heat loss to the environment and to heat the plants in the root zone. The crop was fertilized through a stably chemical nutritive solution at the rates of 58.9 ml/min for 3 repetitively 4 times a day. The nutritive solution consisted of Ca2+ =169meq/L, K+ = 253.4 meq/L, Mg2+ = 64.8meq/L, NH4+ = 18.3 meq/L, H+= 112meq/L, Fe2+ = 0.6 meq/L, N03- = 281.3meq/L, PO43- = 143.3 meq/L and S042- = 193.5 meq/L, while, its pH was about 6 and electrical conductivity EC about 2 dS /m.
Over the seasons examined, tomato fruits were collected were assessed during four ripening stages, based on color (S1,S2,S3, and S4), such as mature green, mature pink, mature red and over ripening stage, respectively. The annual production was 90 tn/ha (3.4 Kg/plant) with mean fruit weight 0.26 Kg.
Four tomato fruit with uniform size, shape and color were harvested for analysis at each maturity stage. Tomato fruits immediately were carefully cut in four equal parts, were frozen by pouring into liquid nitrogen and homogenized using a blender.
Preparation of the ethanol extracts: For the determination of phenols and antioxidant activity, 20 g of samples were two rounds treated by 20 ml of 80 % aqueous ethanol. Samples were incubated for 24 h in the extractant at stirring. The extract was gathered after centrifugation and filtration. The pellet was re-treated with 20 ml of 80 % aqueous ethanol for 2 h at stirring at ambient temperature. The extract was gathered
117
after centrifugation/filtration and the volume was made up to 50 ml with aqueous ethanol and used for further chemical analysis (Kanner et al. 1994).
Methods of analyses: The amount of total polyphenols (TP) in the tomato fruits was determined with the Folin-Ciocalteu (F.C.) reagent according to the method by (Singleton and Rossi, 1965) and were expressed as gallic acid equivalent (GAE) in mg kg-1 fresh weight.
The content of nonflavonoid phenols (NFP) was determined with the F.C. reagent after removing the flavonoid phenols with formaldehyde according to the method by (Kramling and Singleton, 1969) and was expressed as gallic acid equivalent (GAE) in mg kg-1 fresh weight.
The content of flavonoid phenols (FP) were determined as a difference between the content of total phenols and nonflavonoid phenols. Their amount was evaluated as gallic acid equivalent in mg kg-1 fresh weight.
The antiradical activity (DPPH) of the ethanol extracts were evaluated using the stable free radical 2,2′-diphenyl-1-pycrylhydrazyl radical (DPPH•), as a reagent, according to the method by (Brand-Williams et al. 1995) and the results were expressed as μmol DPPH kg -1 fresh weight.
The ferric reducing antioxidant power (FRAP) of fruits extracts was evaluated according to the method by (Benzie and Strain, 1999) and the results were expressed as μmol FRAP reagent kg-1 fresh weight.
The lycopene content was determined in fruit extract taken from 1.0 g homogenized fruit sample using 20 ml of acetone-ethanol-hexane in volume ratio 1:1:2, according to the method by (Ravelo-Perrez et al. 2008). The result was expressed in mg.kg-1 fresh weight.
Data analysis was made using the MINITAB (Ryan et al. 2005) statistical package. The results are means of four parallel samples. Analysis of variance was used to assess treatment effects. Mean separation was made using Tukey’s test when significant differences (P=0.05) between treatments were found.
RESULTS AND DISCUSSION The changes in total phenolic content of tomato fruits during ripening stages are
presented in Table 1. Ripening stages affects the content of the total phenols of tomato fruits. The content of TP of tomato fruits in the ripening stages studied ranges from 130.2 to 235.0 mg (GAE) kg-1 FW. In particular, in the mature red colour of tomato fruits the highest polyphenols content was observed, while in the mature green colour the lowest polyphenols content was observed. In addition, from the mature red colour to over ripening stage colour there was a significant reduction of total phenolic content of the fruits by 19 %. These results are consistent with to other studies, proving that the content of total phenols decreases after maturity stage of tomato fruits (Raffo et al. 2002).
The content of flavonoid phenols (FP) of tomato fruits in the ripening stages studied ranges from 97.7 to 162.2 mg (GAE) kg-1 FW (Table 1). In particular, in the mature red colour of tomato fruits the highest polyphenols content was observed, while in the mature green colour the lowest polyphenols content was observed. The FP content in the ripening stages studied constitute from 52 % to 75 % respectively of TP amount (Table 1). In addition, from the mature red colour to over ripening stage colour there was a significant reduction of flavonoid phenols content in the fruits by 39 %.
The content of nonflavonoid phenols (NFP) of tomato fruits in the ripening stages studied ranges from 32.5 to 91.4 mg (GAE) kg-1 FW. From the mature red colour to over ripening stage colour there was a significant increase of nonflavonoid phenols content in the fruits by 25.6 %.
118
The lycopene increased from 12 to 143 mg kg-1 FW during tomato ripening. In the first two maturity stages tomatoes had very small quantity of lycopene, while the red maturity stage had great quantity. The lycopene synthesis continued during over-ripe stage (143 mg kg-1 FW), on the contrary with other research finding (Kozukue andFriedman, 2003).
Table 1 Changes in total phenolic content, flavonoid phenols, nonflavonoid phenols and
lycopene at different ripening stages of tomato fruits Ripening stages
(colour)TP FP NFP FP % of TP Lycopene
mg (GAE) kg-1 FW mg kg-1 FWS1, mature green 130.2c 97.7c 32.5c 75 12dS2, mature pink 195.5b 136.9b 58.6b 70 31cS3, mature red 235.0a 162.2a 72.8b 69 112b
S4, over ripening stage 190.4b 99.0c 91.4a 52 143aColumns with the same letter do not differ significantly according to the Tukey’s test (P=0.05).
The changes in antioxidant activity FRAP of tomato fruits during maturation are presented in Table 2. The antioxidant activity FRAP from the mature green stage until the over-ripe stage, significantly increased from 114 to 24970 μmol FRAP kg-1 FW. The results showed that tomato fruits containing the highest total phenolics content do not containing and the highest antioxidant activity. The antioxidant FRAP activity was correlated with the quantity of lycopene and ТР and the following significance levels were obtained r2=0.8699 and 0.4119 respectively. High correlation between lycopene and antioxidant FRAP activity during ripening of tomato has reported and in other studies (Ilahy et al. 2011). The antiradical activity DPPH in the tomato fruits for the ripening stages studied ranged from 62 to 989 μmol DPPH kg-1 FW. The antiradical activity DPPH was correlated with lycopene and total phenols content and the following significance levels were obtained r2=0.6937 and 0.6776 respectively. The antiradical activity DPPH and the antioxidant activity FRAP in the tomatoes, obtained by the combination of all individual antioxidant compounds activity found in the tomatoes.
Table 2 Changes in antiradical activity DPPH and antioxidant activity FRAP at different ripening
stages of tomato fruits Ripening stages
(colour)DPPH FRAP
μmol DPPH kg-1 FW μmol FRAP kg-1 FWS1, mature green 62d 114dS2, mature pink 710c 2150cS3, mature red 822b 3100b
S4, over ripening stage 989a 4970aColumns with the same letter do not differ significantly according to the Tukey’s test (P=0.05).
CONCLUSIONS The results showed that in the first two ripening stages of hydroponically
cultivated tomato of geothermal greenhouse the total phenols are in high quantity, while the lycopene content is negligible. From green to over-mature stage the content of TP, NFT, FP and lycopene increased by 46.2 %, 181%, 1.3 % and 1091 % respectively.
In the over-ripening stage the total phenol and flavonoid content decreased compared to the red mature stage, while lycopene and nonflavonoid content increased compared to the red mature stage. Also, the DPPH assay and the Ferric reducing antioxidant power (FRAP) increased up to over-ripening fruit stage.
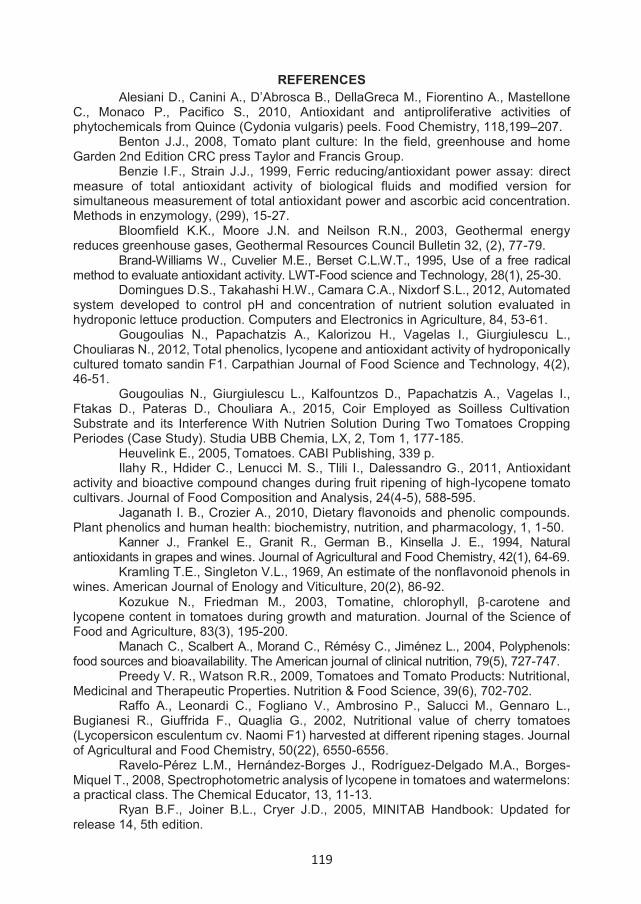
119
REFERENCES Alesiani D., Canini A., D’Abrosca B., DellaGreca M., Fiorentino A., Mastellone
C., Monaco P., Pacifico S., 2010, Antioxidant and antiproliferative activities of phytochemicals from Quince (Cydonia vulgaris) peels. Food Chemistry, 118,199–207.
Benton J.J., 2008, Tomato plant culture: In the field, greenhouse and home Garden 2nd Edition CRC press Taylor and Francis Group.
Benzie I.F., Strain J.J., 1999, Ferric reducing/antioxidant power assay: direct measure of total antioxidant activity of biological fluids and modified version for simultaneous measurement of total antioxidant power and ascorbic acid concentration. Methods in enzymology, (299), 15-27.
Bloomfield K.K., Moore J.N. and Neilson R.N., 2003, Geothermal energy reduces greenhouse gases, Geothermal Resources Council Bulletin 32, (2), 77-79.
Brand-Williams W., Cuvelier M.E., Berset C.L.W.T., 1995, Use of a free radical method to evaluate antioxidant activity. LWT-Food science and Technology, 28(1), 25-30.
Domingues D.S., Takahashi H.W., Camara C.A., Nixdorf S.L., 2012, Automated system developed to control pH and concentration of nutrient solution evaluated in hydroponic lettuce production. Computers and Electronics in Agriculture, 84, 53-61.
Gougoulias N., Papachatzis A., Kalorizou H., Vagelas I., Giurgiulescu L., Chouliaras N., 2012, Total phenolics, lycopene and antioxidant activity of hydroponically cultured tomato sandin F1. Carpathian Journal of Food Science and Technology, 4(2), 46-51.
Gougoulias N., Giurgiulescu L., Kalfountzos D., Papachatzis A., Vagelas I., Ftakas D., Pateras D., Chouliara A., 2015, Coir Employed as Soilless Cultivation Substrate and its Interference With Nutrien Solution During Two Tomatoes Cropping Periodes (Case Study). Studia UBB Chemia, LX, 2, Tom 1, 177-185.
Heuvelink E., 2005, Tomatoes. CABI Publishing, 339 p. Ilahy R., Hdider C., Lenucci M. S., Tlili I., Dalessandro G., 2011, Antioxidant
activity and bioactive compound changes during fruit ripening of high-lycopene tomato cultivars. Journal of Food Composition and Analysis, 24(4-5), 588-595.
Jaganath I. B., Crozier A., 2010, Dietary flavonoids and phenolic compounds. Plant phenolics and human health: biochemistry, nutrition, and pharmacology, 1, 1-50.
Kanner J., Frankel E., Granit R., German B., Kinsella J. E., 1994, Natural antioxidants in grapes and wines. Journal of Agricultural and Food Chemistry, 42(1), 64-69.
Kramling T.E., Singleton V.L., 1969, An estimate of the nonflavonoid phenols in wines. American Journal of Enology and Viticulture, 20(2), 86-92.
Kozukue N., Friedman M., 2003, Tomatine, chlorophyll, β carotene and lycopene content in tomatoes during growth and maturation. Journal of the Science of Food and Agriculture, 83(3), 195-200.
Manach C., Scalbert A., Morand C., Rémésy C., Jiménez L., 2004, Polyphenols: food sources and bioavailability. The American journal of clinical nutrition, 79(5), 727-747.
Preedy V. R., Watson R.R., 2009, Tomatoes and Tomato Products: Nutritional, Medicinal and Therapeutic Properties. Nutrition & Food Science, 39(6), 702-702.
Raffo A., Leonardi C., Fogliano V., Ambrosino P., Salucci M., Gennaro L., Bugianesi R., Giuffrida F., Quaglia G., 2002, Nutritional value of cherry tomatoes (Lycopersicon esculentum cv. Naomi F1) harvested at different ripening stages. Journal of Agricultural and Food Chemistry, 50(22), 6550-6556.
Ravelo-Pérez L.M., Hernández-Borges J., Rodríguez-Delgado M.A., Borges-Miquel T., 2008, Spectrophotometric analysis of lycopene in tomatoes and watermelons: a practical class. The Chemical Educator, 13, 11-13.
Ryan B.F., Joiner B.L., Cryer J.D., 2005, MINITAB Handbook: Updated for release 14, 5th edition.

120
Sies H., 2015, Oxidative stress: a concept in redox biology and medicine. Redox biology, 4, 180-183.
Singleton V.L., Rossi S.A., 1965, Colorimetry of Total Phenolics with Phosphomolibdic-phosphotungstic Acid Reagents. J Enol Viticult, 16, 144-158.
Tommonaro G., Nicolaus B., De Prisco R., De Giulio A., Strazzullo G., Poli, A., 2008, Antioxidant compound studies in different tomato cultivars. Tomatoes and tomato products: Nutritional, medicinal and therapeutic properties, 333.
Valko M., Rhodes C., Moncol J., Izakovic M. M., Mazur M., 2006, Free radicals, metals and antioxidants in oxidative stress-induced cancer. Chemico-biological interactions, 160(1), 1-40.
Zhang L., Yue P., Jiang J., Fan J., Gao X., 2016, Effect of phenolic compounds on antioxidant activity in 8 blueberry (Vaccinum spp.) juices. Carpathian Journal of Food Science and Technology, 8(2), 178-186.
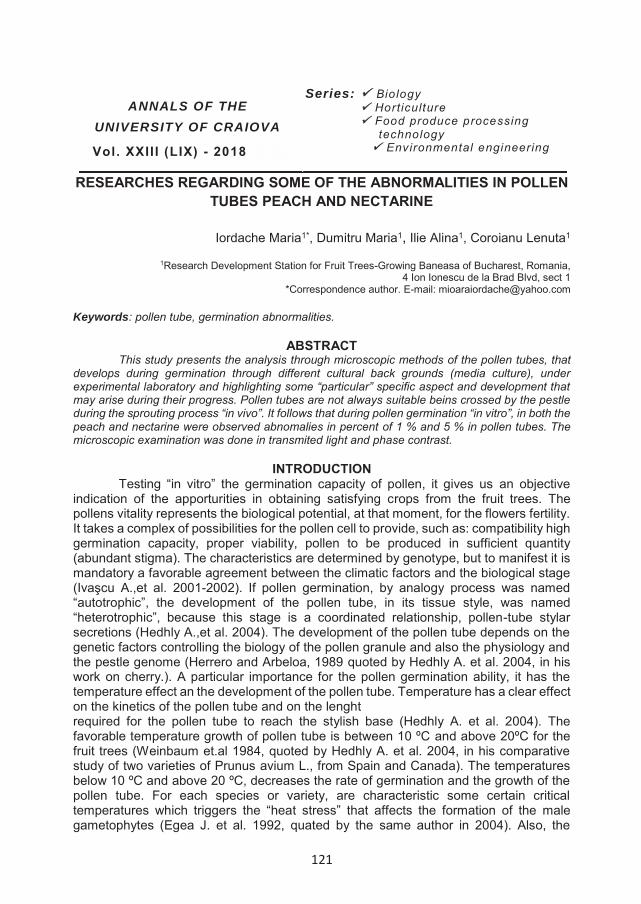
121
RESEARCHES REGARDING SOME OF THE ABNORMALITIES IN POLLENTUBES PEACH AND NECTARINE
Iordache Maria1*, Dumitru Maria1, Ilie Alina1, Coroianu Lenuta1
1Research Development Station for Fruit Trees-Growing Baneasa of Bucharest, Romania, 4 Ion Ionescu de la Brad Blvd, sect 1
*Correspondence author. E-mail: [email protected]
Keywords: pollen tube, germination abnormalities.
ABSTRACTThis study presents the analysis through microscopic methods of the pollen tubes, that
develops during germination through different cultural back grounds (media culture), under experimental laboratory and highlighting some “particular” specific aspect and development thatmay arise during their progress. Pollen tubes are not always suitable beins crossed by the pestle during the sprouting process “in vivo”. It follows that during pollen germination “in vitro”, in both the peach and nectarine were observed abnomalies in percent of 1 % and 5 % in pollen tubes. The microscopic examination was done in transmited light and phase contrast.
INTRODUCTION Testing “in vitro” the germination capacity of pollen, it gives us an objective
indication of the apporturities in obtaining satisfying crops from the fruit trees. The pollens vitality represents the biological potential, at that moment, for the flowers fertility. It takes a complex of possibilities for the pollen cell to provide, such as: compatibility high germination capacity, proper viability, pollen to be produced in sufficient quantity (abundant stigma). The characteristics are determined by genotype, but to manifest it is mandatory a favorable agreement between the climatic factors and the biological stage (Ivaşcu A.,et al. 2001-2002). If pollen germination, by analogy process was named “autotrophic”, the development of the pollen tube, in its tissue style, was named “heterotrophic”, because this stage is a coordinated relationship, pollen-tube stylar secretions (Hedhly A.,et al. 2004). The development of the pollen tube depends on the genetic factors controlling the biology of the pollen granule and also the physiology and the pestle genome (Herrero and Arbeloa, 1989 quoted by Hedhly A. et al. 2004, in his work on cherry.). A particular importance for the pollen germination ability, it has the temperature effect an the development of the pollen tube. Temperature has a clear effect on the kinetics of the pollen tube and on the lenghtrequired for the pollen tube to reach the stylish base (Hedhly A. et al. 2004). The favorable temperature growth of pollen tube is between 10 ºC and above 20ºC for the fruit trees (Weinbaum et.al 1984, quoted by Hedhly A. et al. 2004, in his comparative study of two varieties of Prunus avium L., from Spain and Canada). The temperatures below 10 ºC and above 20 ºC, decreases the rate of germination and the growth of the pollen tube. For each species or variety, are characteristic some certain critical temperatures which triggers the “heat stress” that affects the formation of the male gametophytes (Egea J. et al. 1992, quated by the same author in 2004). Also, the
ANNALS OF THE UNIVERSITY OF CRAIOVA
Series: Biology HorticultureFood produce processingtechnology
Environmental engineering Vol. XXII I (LIX) - 2018
122
germination process is stimulated by different temperatures other than those favorable to the pollen tubes growth in style, because they represent different stages in the fertilization process. The moderate temperature stimulates the stigma secretion, increases and favors the adhereance of pollen germination; slightly higher temperature accelerates the growth of the pollen tube (Hedhly A. et al. 2004). In studies of Vitis vinifera and Ampelopsis, the author (Pădureanu S. 2007), has analyzed the reasons for the abnormal forms that may occur during germination of the pollen tubes. Nationally, the nutrient environments of pollen cited in the consulted literature contain agar of 1,5 % with some exceptions. The sucrose concentration on which the pollen germination was tested, was generally 10 % - 20 % (Butac M. et al. 2006; Blidariu A. et al 2008; Ivaşcu A. 2001-2002, Cociu V., Oprea St., 1989).
Exceptionally the concentration of sucrose was of 25 % and 45 % (Pădureanu S. 1998-2000, of Ampelopsis brevipedunculata, Ampelopsis aconitifolia, Vitis vinifera). The germination temperatures wereon average of 18 ºC, 20 ºC, 25 ºC (Butac M. et al. 2006; Pădureanu S. 1998-2000; Blidariu A. etal 2008). The boric acid was added in a medium concentration of 0,01 % (Butac M. et al. 2006; Cociu V., Oprea St., 1989). It was studied the germination rate, which has been followed at every 3,6,12,24,36, hours. Generally, the maximum germination occurred within 6-12 hours (Butac M. et al. 2006). Staining methods of methyl blue and carmine acetic were used in pollen for apple, pear,cherry, plum trees. In this paper we have proposed “in vitro” pollen testing on a liquid environment in sight of its germination, aiming – pollen analysis by microscopic methods and determination of its vitality. As a novelty of this work, we wanted to point out the manifestation of some features “particularities” and development of pollen tubes that can occur during pollen germination using sucrose solutions of different concentrations and different methods of staining with methyl blue and separately with carmine acetic acid. The varieties of fruit trees investigated and evaluated are mainly Romanian peaches and nectarine. The analysis was based on the documentation referring to the research stage in the field concerned our research correlating with the specialized literature.
MATERIAL AND METHODS Sampling was done in the second decade of April 2011(the year of our
research). The peach flowering started on 18 April 2011 and the nectarine bloom started on 13 April 2011. The trials consisted in open flowers (at anthesis) and the blooming threshold in bud stage. It was analised the pollen of flowers from three varieties of peach, Amalia, Congres and Splendid and from two varieties of nectarine, Tina and Mihaela. It was also envisaged that to the choise of varieties, to be included all three periods of repening(early, medium and late).To represent more accurately the biological potential of pollen at the time, it was made homogenous for each variety, another one antheres sample, taken from several flowers. Both for evaluation of pollen viability (V %) and to asses the ability germinative (G %) of a certain variety, anthers with pollen were detached from the staminal filaments of floral buds and has been and then deposited (in multiple parallel copies) for each variety on a microscopic glass-slides /blade (port-object), in the presence of 2-3 drops of distilled wather for each, then the pollen to adhere better and to facilitate the release of pollen from the anthers. The content of pollen on each microscopic (slide) glass-blade, is an average trial (an experiment) for the species examined. According to experimental results from previous years (Iordache M. et al. 2010), it was chosen for seeding the media only with pre-hydrated pollen (Xie B. et al. 2010; Cresti M. 1978; Kaufmane E. 2004; Hedhly A. et al. 2004). For the viability assessment a method of specific enzimatic was applied, to determine pollens viability, using 2,3,5-TTC-triphenyl-tetrazolium-chloride (Andrei M.,Paraschivoiu R. 2003). Alwais
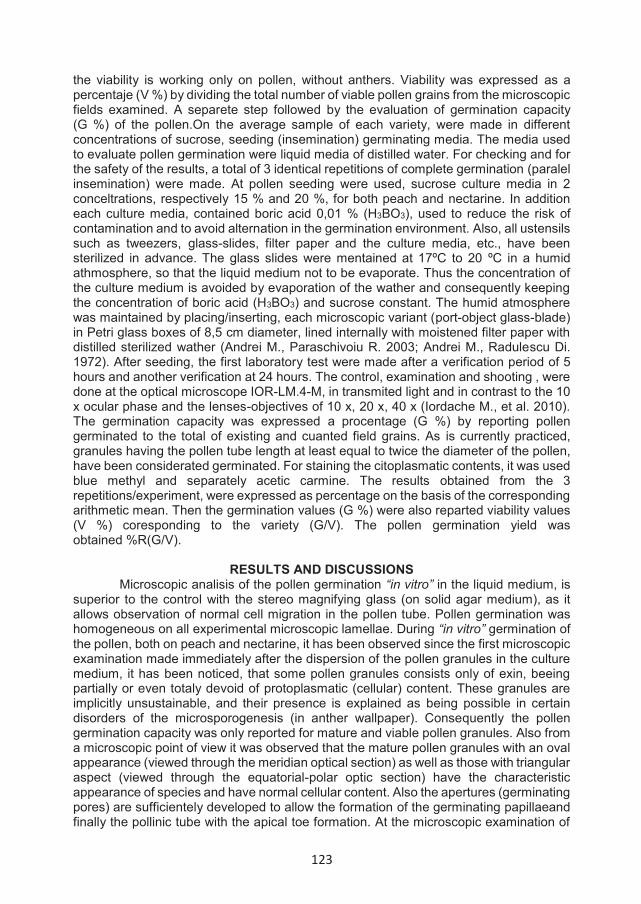
123
the viability is working only on pollen, without anthers. Viability was expressed as a percentaje (V %) by dividing the total number of viable pollen grains from the microscopic fields examined. A separete step followed by the evaluation of germination capacity (G %) of the pollen.On the average sample of each variety, were made in different concentrations of sucrose, seeding (insemination) germinating media. The media used to evaluate pollen germination were liquid media of distilled water. For checking and for the safety of the results, a total of 3 identical repetitions of complete germination (paralel insemination) were made. At pollen seeding were used, sucrose culture media in 2 conceltrations, respectively 15 % and 20 %, for both peach and nectarine. In addition each culture media, contained boric acid 0,01 % (H3BO3), used to reduce the risk of contamination and to avoid alternation in the germination environment. Also, all ustensils such as tweezers, glass-slides, filter paper and the culture media, etc., have been sterilized in advance. The glass slides were mentained at 17ºC to 20 ºC in a humid athmosphere, so that the liquid medium not to be evaporate. Thus the concentration of the culture medium is avoided by evaporation of the wather and consequently keeping the concentration of boric acid (H3BO3) and sucrose constant. The humid atmosphere was maintained by placing/inserting, each microscopic variant (port-object glass-blade) in Petri glass boxes of 8,5 cm diameter, lined internally with moistened filter paper with distilled sterilized wather (Andrei M., Paraschivoiu R. 2003; Andrei M., Radulescu Di. 1972). After seeding, the first laboratory test were made after a verification period of 5 hours and another verification at 24 hours. The control, examination and shooting , were done at the optical microscope IOR-LM.4-M, in transmited light and in contrast to the 10 x ocular phase and the lenses-objectives of 10 x, 20 x, 40 x (Iordache M., et al. 2010). The germination capacity was expressed a procentage (G %) by reporting pollen germinated to the total of existing and cuanted field grains. As is currently practiced, granules having the pollen tube length at least equal to twice the diameter of the pollen, have been considerated germinated. For staining the citoplasmatic contents, it was used blue methyl and separately acetic carmine. The results obtained from the 3 repetitions/experiment, were expressed as percentage on the basis of the corresponding arithmetic mean. Then the germination values (G %) were also reparted viability values (V %) coresponding to the variety (G/V). The pollen germination yield was obtained %R(G/V).
RESULTS AND DISCUSSIONS Microscopic analisis of the pollen germination “in vitro” in the liquid medium, is
superior to the control with the stereo magnifying glass (on solid agar medium), as it allows observation of normal cell migration in the pollen tube. Pollen germination was homogeneous on all experimental microscopic lamellae. During “in vitro” germination of the pollen, both on peach and nectarine, it has been observed since the first microscopic examination made immediately after the dispersion of the pollen granules in the culture medium, it has been noticed, that some pollen granules consists only of exin, beeing partially or even totaly devoid of protoplasmatic (cellular) content. These granules are implicitly unsustainable, and their presence is explained as being possible in certain disorders of the microsporogenesis (in anther wallpaper). Consequently the pollen germination capacity was only reported for mature and viable pollen granules. Also from a microscopic point of view it was observed that the mature pollen granules with an oval appearance (viewed through the meridian optical section) as well as those with triangular aspect (viewed through the equatorial-polar optic section) have the characteristic appearance of species and have normal cellular content. Also the apertures (germinating pores) are sufficientely developed to allow the formation of the germinating papillaeand finally the pollinic tube with the apical toe formation. At the microscopic examination of
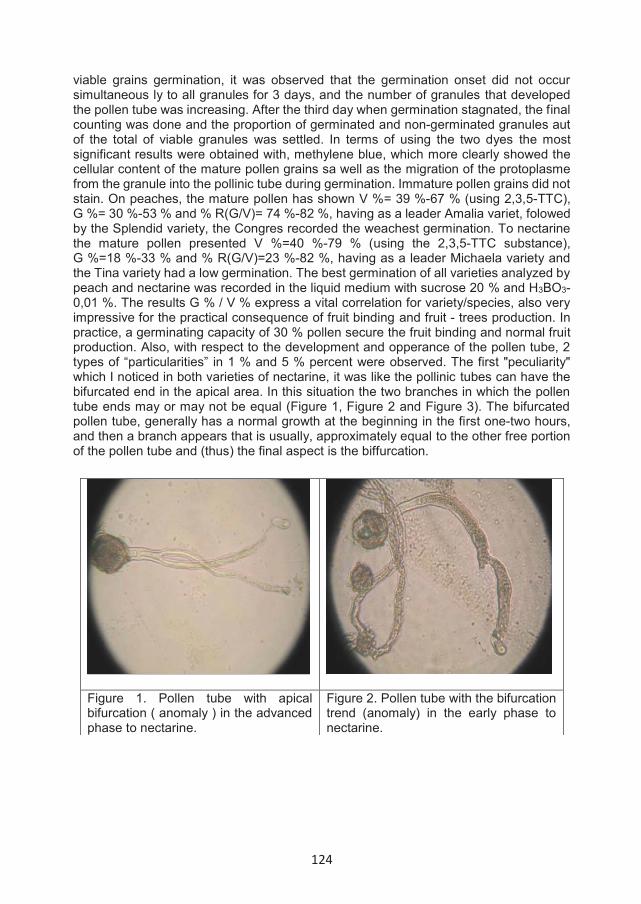
124
viable grains germination, it was observed that the germination onset did not occur simultaneous ly to all granules for 3 days, and the number of granules that developed the pollen tube was increasing. After the third day when germination stagnated, the final counting was done and the proportion of germinated and non-germinated granules aut of the total of viable granules was settled. In terms of using the two dyes the most significant results were obtained with, methylene blue, which more clearly showed the cellular content of the mature pollen grains sa well as the migration of the protoplasme from the granule into the pollinic tube during germination. Immature pollen grains did not stain. On peaches, the mature pollen has shown V %= 39 %-67 % (using 2,3,5-TTC), G %= 30 %-53 % and % R(G/V)= 74 %-82 %, having as a leader Amalia variet, folowed by the Splendid variety, the Congres recorded the weachest germination. To nectarine the mature pollen presented V %=40 %-79 % (using the 2,3,5-TTC substance), G %=18 %-33 % and % R(G/V)=23 %-82 %, having as a leader Michaela variety and the Tina variety had a low germination. The best germination of all varieties analyzed by peach and nectarine was recorded in the liquid medium with sucrose 20 % and H3BO3-0,01 %. The results G % / V % express a vital correlation for variety/species, also very impressive for the practical consequence of fruit binding and fruit - trees production. In practice, a germinating capacity of 30 % pollen secure the fruit binding and normal fruit production. Also, with respect to the development and opperance of the pollen tube, 2 types of “particularities” in 1 % and 5 % percent were observed. The first "peculiarity" which I noticed in both varieties of nectarine, it was like the pollinic tubes can have the bifurcated end in the apical area. In this situation the two branches in which the pollen tube ends may or may not be equal (Figure 1, Figure 2 and Figure 3). The bifurcated pollen tube, generally has a normal growth at the beginning in the first one-two hours, and then a branch appears that is usually, approximately equal to the other free portion of the pollen tube and (thus) the final aspect is the biffurcation.
Figure 1. Pollen tube with apical bifurcation ( anomaly ) in the advanced phase to nectarine.
Figure 2. Pollen tube with the bifurcation trend (anomaly) in the early phase to nectarine.
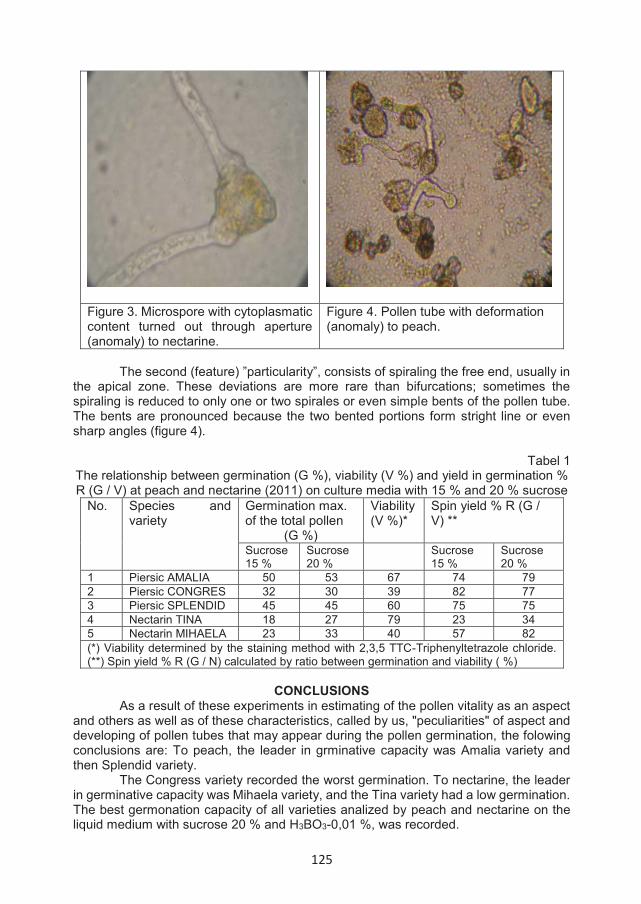
125
The second (feature) ”particularity”, consists of spiraling the free end, usually in the apical zone. These deviations are more rare than bifurcations; sometimes the spiraling is reduced to only one or two spirales or even simple bents of the pollen tube. The bents are pronounced because the two bented portions form stright line or even sharp angles (figure 4).
Tabel 1 The relationship between germination (G %), viability (V %) and yield in germination % R (G / V) at peach and nectarine (2011) on culture media with 15 % and 20 % sucrose
No. Species and variety
Germination max. of the total pollen
(G %)
Viability(V %)*
Spin yield % R (G / V) **
Sucrose 15 %
Sucrose 20 %
Sucrose 15 %
Sucrose 20 %
1 Piersic AMALIA 50 53 67 74 792 Piersic CONGRES 32 30 39 82 773 Piersic SPLENDID 45 45 60 75 754 Nectarin TINA 18 27 79 23 345 Nectarin MIHAELA 23 33 40 57 82(*) Viability determined by the staining method with 2,3,5 TTC-Triphenyltetrazole chloride.(**) Spin yield % R (G / N) calculated by ratio between germination and viability ( %)
CONCLUSIONSAs a result of these experiments in estimating of the pollen vitality as an aspect
and others as well as of these characteristics, called by us, "peculiarities" of aspect and developing of pollen tubes that may appear during the pollen germination, the folowing conclusions are: To peach, the leader in grminative capacity was Amalia variety and then Splendid variety.
The Congress variety recorded the worst germination. To nectarine, the leader in germinative capacity was Mihaela variety, and the Tina variety had a low germination. The best germonation capacity of all varieties analized by peach and nectarine on the liquid medium with sucrose 20 % and H3BO3-0,01 %, was recorded.
Figure 3. Microspore with cytoplasmatic content turned out through aperture (anomaly) to nectarine.
Figure 4. Pollen tube with deformation(anomaly) to peach.
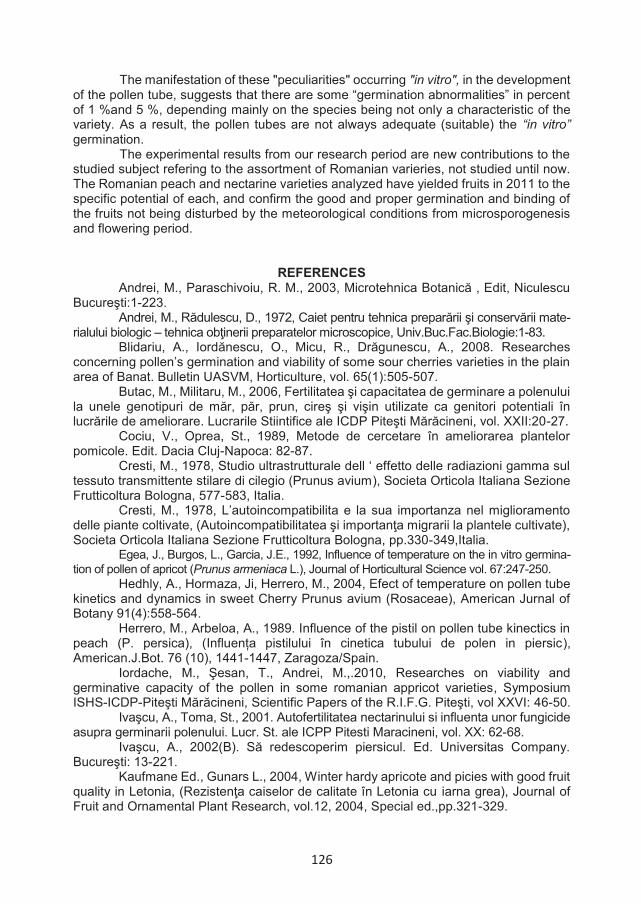
126
The manifestation of these "peculiarities" occurring "in vitro", in the development of the pollen tube, suggests that there are some “germination abnormalities” in percent of 1 %and 5 %, depending mainly on the species being not only a characteristic of the variety. As a result, the pollen tubes are not always adequate (suitable) the “in vitro” germination.
The experimental results from our research period are new contributions to the studied subject refering to the assortment of Romanian varieries, not studied until now. The Romanian peach and nectarine varieties analyzed have yielded fruits in 2011 to the specific potential of each, and confirm the good and proper germination and binding of the fruits not being disturbed by the meteorological conditions from microsporogenesis and flowering period.
REFERENCES
Andrei, M., Paraschivoiu, R. M., 2003, Microtehnica Botanică , Edit, Niculescu Bucureşti:1-223.
Andrei, M., Rădulescu, D., 1972, Caiet pentru tehnica preparării şi conservării mate-rialului biologic – tehnica obţinerii preparatelor microscopice, Univ.Buc.Fac.Biologie:1-83.
Blidariu, A., Iordănescu, O., Micu, R., Drăgunescu, A., 2008. Researches concerning pollen’s germination and viability of some sour cherries varieties in the plain area of Banat. Bulletin UASVM, Horticulture, vol. 65(1):505-507.
Butac, M., Militaru, M., 2006, Fertilitatea şi capacitatea de germinare a polenului la unele genotipuri de măr, păr, prun, cireş şi vişin utilizate ca genitori potentiali în lucrările de ameliorare. Lucrarile Stiintifice ale ICDP Piteşti Mărăcineni, vol. XXII:20-27.
Cociu, V., Oprea, St., 1989, Metode de cercetare în ameliorarea plantelor pomicole. Edit. Dacia Cluj-Napoca: 82-87.
Cresti, M., 1978, Studio ultrastrutturale dell ‘ effetto delle radiazioni gamma sul tessuto transmittente stilare di cilegio (Prunus avium), Societa Orticola Italiana Sezione Frutticoltura Bologna, 577-583, Italia.
Cresti, M., 1978, L’autoincompatibilita e la sua importanza nel miglioramento delle piante coltivate, (Autoincompatibilitatea şi importanţa migrarii la plantele cultivate), Societa Orticola Italiana Sezione Frutticoltura Bologna, pp.330-349,Italia.
Egea, J., Burgos, L., Garcia, J.E., 1992, Influence of temperature on the in vitro germina-tion of pollen of apricot (Prunus armeniaca L.), Journal of Horticultural Science vol. 67:247-250.
Hedhly, A., Hormaza, Ji, Herrero, M., 2004, Efect of temperature on pollen tube kinetics and dynamics in sweet Cherry Prunus avium (Rosaceae), American Jurnal of Botany 91(4):558-564.
Herrero, M., Arbeloa, A., 1989. Influence of the pistil on pollen tube kinectics in peach (P. persica), (Influența pistilului în cinetica tubului de polen in piersic), American.J.Bot. 76 (10), 1441-1447, Zaragoza/Spain.
Iordache, M., Şesan, T., Andrei, M.,.2010, Researches on viability and germinative capacity of the pollen in some romanian appricot varieties, Symposium ISHS-ICDP-Piteşti Mărăcineni, Scientific Papers of the R.I.F.G. Piteşti, vol XXVI: 46-50.
Ivaşcu, A., Toma, St., 2001. Autofertilitatea nectarinului si influenta unor fungicide asupra germinarii polenului. Lucr. St. ale ICPP Pitesti Maracineni, vol. XX: 62-68.
Ivaşcu, A., 2002(B). Să redescoperim piersicul. Ed. Universitas Company. Bucureşti: 13-221.
Kaufmane Ed., Gunars L., 2004, Winter hardy apricote and picies with good fruit quality in Letonia, (Rezistenţa caiselor de calitate în Letonia cu iarna grea), Journal of Fruit and Ornamental Plant Research, vol.12, 2004, Special ed.,pp.321-329.

127
Pădureanu S., 2007. Citologia germinarii polenului de Ampelopsis brevipedunculata(Maxim.) Trautv. Lucr. St. Universitatea Al. Ioan Cuza. Iaşi, vol. 50: 237-242.
Pădureanu, S., 2007. Anomalii aparute in procesul de germinare al polenului la unele Vitaceae, Lucr.St. Universitatea Al. Ioan Cuza Iaşi, vol. 50: 231-236.
Xie, B., Wang, X., Hong, Z., 2010, Precocious pollen germination in Arabidopsis plants with altered callose deposition during microsporogenesis, Springer, Planta 231:809-823.
128
EFFECT OF PLANT DENSITY, IRRIGATION AND N-FERTILIZATION LEVELS ON POLYPHENOL CONTENTS AND ANTIOXIDANT ACTIVITY
OF LEAVES CANNABIS SATIVA
Kamvoukou Christina- Anna1,2,3, Gougoulias Nikolaos1*, Wogiatzi Eleni1,Giannoulis Kyriakos1
1Department of Agronomy Technology, Technological Educational Institute of Thessaly, Larissa, Greece. 2School of Pharmacy, Aristotle University of Thessaloniki, Greece
3Department of Biochemistry and Biotechnology, University of Thessaly, *Correspondence author: email: [email protected]
Keywords: Cannabis; total phenols; ABTS•+ capacity; DPPH activity; FRAP activity
ABSTRACT Cannabis sativa cultivated at the Experimental Farm of the TEI of Thessaly, plant density
was at two different populations (160 plants m-2 and 80 plant m-2), N-fertilization at two levels (244 Kg N he-1 and 184 Kg N he-1), and irrigation at two levels (100 % and 60 % of ETo), at harvest have been studied the leaves for evaluating and comparing their polyphenols content and antioxidant properties. The content of TP in the leaves studied ranges from 24.48 to 30.25 mg (GAE) g-1 DW, FP from 15.91 to 22.69 mg (GAE) g-1 DW, NFP from 6.4 to 11.48 mg (GAE) g-1
DW, antioxidant activity FRAP varies within the limits of 44.3 to 61.5 μmol FRAP g-1 DW, antiradical activity DPPH from 7.9 to 12.8 μmol Trolox g-1 DW, and total antioxidant capacity from 51.5 to 69.5 μmol Trolox g-1 DW. The leaves Cannabis grown with plant density 160 plants m-2 using irrigation 100 % ETo and fertilization 244 Kg N he-1, they showed highest polyphenols content, antiradical activity DPPH and total antioxidant capacity, in comparison with the other treatments.
INDRODUCTION The increased interest in polyphenol compounds in the human and animal food
is associated with their numerous health benefits and first of all with their antioxidant properties. The generation of free radicals in the human and animal cells induces the oxidation of biological macromolecules as lipids, proteins and nucleic acids. Polyphenols of the plants and fruits neutralise the active free oxygen and nitrogen containing radicals (Pokorny et al. 2001). Polyphenols of the plants, manifest many nutritive actions as anti-inflammatory, antimicrobial, antifungal, etc. (Morello et al. 2002).
The leaves of many plant species contain polyphenols and have been used as spices, drinks or sources for the preparation of natural antioxidants (Benavente-Garcıa et al. 2000), whereas others are studied in view of possibilities for use as forages (Ruan et al. 2008). Leaves extracts from some fruit species, rich in essential oils and phenol compounds, are used as substitutes of the toxic synthetic pesticides in biological agriculture (Rhouma et al. 2009).
The Cannabis plant contain a large number of chemical compounds as cannabinoids, terpenes and polyphenols. The cannabinoids represents a group of C21 terpenophenolic compounds found in the cannabis sativa (Brenneisen 2007). Incannabis, about 20 flavonoids have been identified (Flores-Sanchez and Verpoorte,
ANNALS OF THE UNIVERSITY OF CRAIOVA
Series: Biology HorticultureFood produce processingtechnologyEnvironmental engineering Vol. XXII I (LIX) - 2018
129
2008), while phenolic compounds such as cannabisin D and bibenzyl stilbenes are contained also in Cannabis leaves (Marti et al. 2014).
The purpose of the present research is to evaluate the effect of plant density, irrigation and N-fertilization levels on polyphenol contents and antioxidant activity of leaves Cannabis sativa under environmental conditions of central Greece.
MATERIAL AND METHODS Cannabis sativa was cultivated at the Experimental Farm of the Technological
Educational Institute of Thessaly. A modern cereal seeding machine was used (on April 2017), applying 22.5 and 45 kg ha−1 of seed cv. Fibranova, in a row-distance of 25 and 12.5 cm, respectively. A split-plit-plot design 2 × 2 × 4 with four replications was used and the plot size was 14 m2. Plant density was at two different populations (D1 = 160 plants/m2 and D2 = 80 plant/m2). Two fertilization levels (F1= 244 Kg N per hectare and F2= 184 Kg N per hectare), and two irrigation levels were used (I1 = 100 % ETo, I2 = 60 % ETo, the evapotranspiration is 500 mm).
Complete weather data were recorded in an automatic meteorological station which was installed next to the experimental field. The study area is characterized by a typical Mediterranean climate with cold humid winters and hot-dry summers. In particular, the average air temperature ranged to 22.9 oC while the noticed precipitation was 290 mm during the growing period of cannabis.
At the harvest period the leaves from each combination of treatments were dried in a dark place at room temperature, finely ground and kept at 4oC.
Preparation of the ethanol extracts: Two g of finely ground leaves Cannabis were two rounds treated by 20 ml of 80 % aqueous ethanol. Samples were incubated for 24 h in the extractant at stirring; The extract was gathered after centrifugation and filtration. The pellet was re-treated with 20 ml of 80 % aqueous ethanol for 2 h at stirring at ambient temperature. The extract was gathered after centrifugation/filtration and the volume was made up to 50 ml with aqueous ethanol and used for further chemical analysis (Kanner et al. 1994).
Methods of analyses: Soil was analyzed using the following methods which are referred by (Page et al. 1982). The Texture of soils was determined by the method Bouyoucos. Soil pH and electrical conductivity, (EC), measured in the extract (1 part soil : 5 parts H2O). The calcium carbonate was determined by the method Bernard.
Organic matter was analyzed by chemical oxidation with 1 mol L-1 K2Cr2O7 and titration of the remaining reagent with 0.5 mol L-1 FeSO4. Inorganic nitrogen was extracted with 0.5 mol L-1 CaCl2 and estimated by distillation in the presence of MgO and Devarda's alloy, respectively.
Available P forms (Olsen P) was extracted with 0.5 mol L-1 NaHCO3 and measured by spectroscopy. Exchangeable form of potassium was extracted with 1 mol L-1 CH3COONH4 and measured by flame Photometer (Essex, UK).
The amount of total polyphenols (TP) in the leaves of Cannabis was determined with the Folin-Ciocalteu (F.C.) reagent according to the method of (Singleton and Rossi, 1965) and were expressed as gallic acid equivalent (GAE) in mg g-1 dry weight.
The content of nonflavonoid phenols (NFP) in the leaves of Cannabis was determined with the F.C. reagent after removing the flavonoid phenols (FP) with formaldehyde according to the method of (Kramling and Singleton, 1969) and was expressed as gallic acid equivalent (GAE) in mg g-1 DW. Flavanoid phenols (FP) in the in the leaves were determined as a difference between the content of total phenols (TP) and nonflavonoid phenols (NFP). Their amount was evaluated as gallic acid equivalentin mg g-1 DW.

130
The radical scavenging activities by antioxidants in the leaves extracts were evaluated using the stable free radical 2,2′-diphenyl-1-pycrylhydrazyl radical (DPPH•), as a reagent, according to the method by (Brand-Williams et al. 1995) and the results were expressed as μmol Trolox/g dry weight. The inhibition coefficient (IC50), represents 50 % reduction in the colour intensity of the DPPH radical by the total phenols in the studied extracts after plotting the dependence of the TP content on the bleaching of DPPH• solutions. The inhibition coefficient (IC50) was calculated using the following equation:
% inhibition = [(E0 – Ex)/E0] × 100 where Е0, is the extinction of the radical solution before the reaction and Ех,
after polyphenols addition (Yen and Duh, 1994), percent inhibition curves of extracts were used to determine of the inhibition coefficient (IC50).
The ferric reducing antioxidant power (FRAP) of the leaves was evaluated according to the method by (Benzie and Strain, 1999) and the results were expressed as μmol FRAP g-1 dry weight. The total antioxidant capacity (TAC) was determined using the stable radical cation ABTS•+ (2,2-azinobis-(3-ethylbenzothiazolin-6-sulphonic acid), according to the method of (Re et al. 1999) and was presented as Trolox equivalent in μmol Trolox g-1 dry weight.
Data analysis was made using the MINITAB (Ryan et al. 2005) statistical package. The results are means of four parallel samples. Analysis of variance was used to assess treatment effects. Mean separation was made using Tukey’s test when significant differences (P=0.05) between treatments were found.
Table 1 shows the chemical properties of the soil before sowing Cannabis.
Table 1 Soil chemical properties before the sowing of Cannabis
Properties Soil depth 0-30 cm Soil depth 30-60 cm Texture Sandy Clay Loam Sandy Clay Loam pH 7.26 ± 0.05 6.92 ± 0.04 EC, dS m-1 0.20 ± 0.01 0.15 ± 0.01 Organic matter (%) 1.44 ± 0.07 0.70 ± 0.03 Ν-inorganic (mg kg-1) 381.5 ± 17.8 490 ± 19.90 K-exchangeable (mg kg-1) 555.8 ± 30 390 ± 21.9 P -Olsen (mg kg-1) 17.2 ± 1.50 10.0 ± 1.10 CaCO3 (%) 2.42 ± 0.14 2.42 ± 0.11
Data represent average means and standard deviation (SD), n=4; Soil pH and Electrical conductivity (EC), measured in the extract (1 part soil : 5 parts H2O).
RESULTS AND DISCUSSION The content of total phenols (TP) in the leaves of Cannabis for all treatments
studied ranges from 24.48 to 30.25 mg (GAE) g-1 DW (Table 2). In particular, for plant density 160 plants m-2 (D1) using irrigation 100 % ETo and fertilization 244 Kg N per hectare, the highest polyphenols content was observed. For plant density 80 plants m-2 (D2) using irrigation 60 % ETo and fertilization 184 Kg N he-1, the highest polyphenols content was observed. Comparing all treatments in the two plant densities, in the plant density 80 plants m-2 (D2) using irrigation 100 % ETo and fertilization 184 Kg N he-1, the lowest polyphenols content was observed.
The content of flavonoid phenols (FP) in the leaves of Cannabis for all treatments studied ranges from 15.91 to 22.69 mg (GAE) g-1 DW (Table 2). In particular, for plant density 80 plants m-2 (D2) using irrigation 60 % ETo and fertilization 184 Kg N he-1, the highest flavonoid phenols content was observed, while for plant density 80
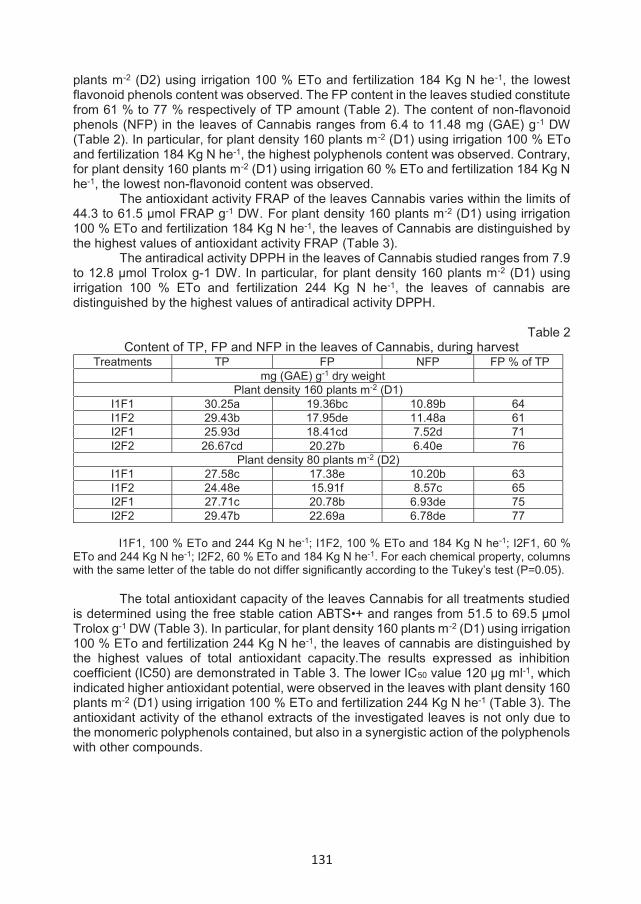
131
plants m-2 (D2) using irrigation 100 % ETo and fertilization 184 Kg N he-1, the lowest flavonoid phenols content was observed. The FP content in the leaves studied constitute from 61 % to 77 % respectively of TP amount (Table 2). The content of non-flavonoid phenols (NFP) in the leaves of Cannabis ranges from 6.4 to 11.48 mg (GAE) g-1 DW (Table 2). In particular, for plant density 160 plants m-2 (D1) using irrigation 100 % ETo and fertilization 184 Kg N he-1, the highest polyphenols content was observed. Contrary, for plant density 160 plants m-2 (D1) using irrigation 60 % ETo and fertilization 184 Kg N he-1, the lowest non-flavonoid content was observed.
The antioxidant activity FRAP of the leaves Cannabis varies within the limits of 44.3 to 61.5 μmol FRAP g-1 DW. For plant density 160 plants m-2 (D1) using irrigation 100 % ETo and fertilization 184 Kg N he-1, the leaves of Cannabis are distinguished by the highest values of antioxidant activity FRAP (Table 3).
The antiradical activity DPPH in the leaves of Cannabis studied ranges from 7.9 to 12.8 μmol Trolox g-1 DW. In particular, for plant density 160 plants m-2 (D1) using irrigation 100 % ETo and fertilization 244 Kg N he-1, the leaves of cannabis are distinguished by the highest values of antiradical activity DPPH.
Table 2 Content of TP, FP and NFP in the leaves of Cannabis, during harvest
Treatments TP FP NFP FP % of TPmg (GAE) g-1 dry weight
Plant density 160 plants m-2 (D1) I1F1 30.25a 19.36bc 10.89b 64I1F2 29.43b 17.95de 11.48a 61I2F1 25.93d 18.41cd 7.52d 71I2F2 26.67cd 20.27b 6.40e 76
Plant density 80 plants m-2 (D2)I1F1 27.58c 17.38e 10.20b 63I1F2 24.48e 15.91f 8.57c 65I2F1 27.71c 20.78b 6.93de 75I2F2 29.47b 22.69a 6.78de 77
I1F1, 100 % ETo and 244 Kg N he-1; I1F2, 100 % ETo and 184 Kg N he-1; I2F1, 60 % ETo and 244 Kg N he-1; I2F2, 60 % ETo and 184 Kg N he-1. For each chemical property, columns with the same letter of the table do not differ significantly according to the Tukey’s test (P=0.05).
The total antioxidant capacity of the leaves Cannabis for all treatments studied is determined using the free stable cation ABTS•+ and ranges from 51.5 to 69.5 μmol Trolox g-1 DW (Table 3). In particular, for plant density 160 plants m-2 (D1) using irrigation 100 % ETo and fertilization 244 Kg N he-1, the leaves of cannabis are distinguished by the highest values of total antioxidant capacity.The results expressed as inhibition coefficient (IC50) are demonstrated in Table 3. The lower IC50 value 120 μg ml-1, which indicated higher antioxidant potential, were observed in the leaves with plant density 160 plants m-2 (D1) using irrigation 100 % ETo and fertilization 244 Kg N he-1 (Table 3). The antioxidant activity of the ethanol extracts of the investigated leaves is not only due to the monomeric polyphenols contained, but also in a synergistic action of the polyphenols with other compounds.
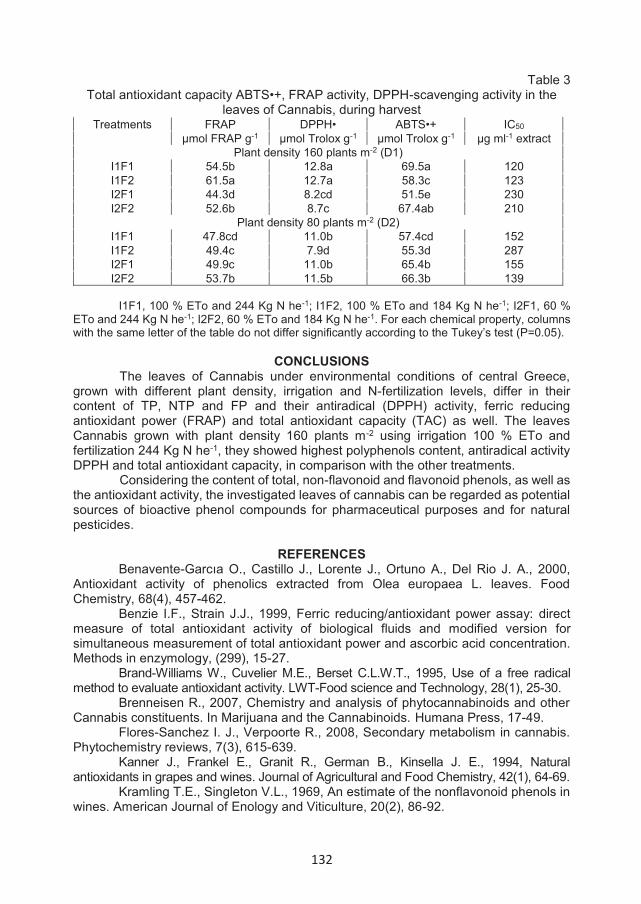
132
Table 3 Total antioxidant capacity ABTS•+, FRAP activity, DPPH-scavenging activity in the
leaves of Cannabis, during harvest Treatments FRAP DPPH• ABTS•+ IC50
μmol FRAP g-1 μmol Trolox g-1 μmol Trolox g-1 μg ml-1 extract Plant density 160 plants m-2 (D1)
I1F1 54.5b 12.8a 69.5a 120 I1F2 61.5a 12.7a 58.3c 123 I2F1 44.3d 8.2cd 51.5e 230 I2F2 52.6b 8.7c 67.4ab 210
Plant density 80 plants m-2 (D2) I1F1 47.8cd 11.0b 57.4cd 152 I1F2 49.4c 7.9d 55.3d 287 I2F1 49.9c 11.0b 65.4b 155 I2F2 53.7b 11.5b 66.3b 139
I1F1, 100 % ETo and 244 Kg N he-1; I1F2, 100 % ETo and 184 Kg N he-1; I2F1, 60 %
ETo and 244 Kg N he-1; I2F2, 60 % ETo and 184 Kg N he-1. For each chemical property, columns with the same letter of the table do not differ significantly according to the Tukey’s test (P=0.05).
CONCLUSIONS
The leaves of Cannabis under environmental conditions of central Greece, grown with different plant density, irrigation and N-fertilization levels, differ in their content of TP, NTP and FP and their antiradical (DPPH) activity, ferric reducing antioxidant power (FRAP) and total antioxidant capacity (TAC) as well. The leaves Cannabis grown with plant density 160 plants m-2 using irrigation 100 % ETo and fertilization 244 Kg N he-1, they showed highest polyphenols content, antiradical activity DPPH and total antioxidant capacity, in comparison with the other treatments.
Considering the content of total, non-flavonoid and flavonoid phenols, as well as the antioxidant activity, the investigated leaves of cannabis can be regarded as potential sources of bioactive phenol compounds for pharmaceutical purposes and for natural pesticides.
REFERENCES
Benavente-Garcıa O., Castillo J., Lorente J., Ortuno A., Del Rio J. A., 2000, Antioxidant activity of phenolics extracted from Olea europaea L. leaves. Food Chemistry, 68(4), 457-462.
Benzie I.F., Strain J.J., 1999, Ferric reducing/antioxidant power assay: direct measure of total antioxidant activity of biological fluids and modified version for simultaneous measurement of total antioxidant power and ascorbic acid concentration. Methods in enzymology, (299), 15-27.
Brand-Williams W., Cuvelier M.E., Berset C.L.W.T., 1995, Use of a free radical method to evaluate antioxidant activity. LWT-Food science and Technology, 28(1), 25-30.
Brenneisen R., 2007, Chemistry and analysis of phytocannabinoids and other Cannabis constituents. In Marijuana and the Cannabinoids. Humana Press, 17-49.
Flores-Sanchez I. J., Verpoorte R., 2008, Secondary metabolism in cannabis. Phytochemistry reviews, 7(3), 615-639.
Kanner J., Frankel E., Granit R., German B., Kinsella J. E., 1994, Natural antioxidants in grapes and wines. Journal of Agricultural and Food Chemistry, 42(1), 64-69.
Kramling T.E., Singleton V.L., 1969, An estimate of the nonflavonoid phenols in wines. American Journal of Enology and Viticulture, 20(2), 86-92.
133
Marti G., Schnee S., Andrey Y., Simoes-Pires C., Carrupt P. A., Wolfender J. L., Gindro K., 2014, Study of leaf metabolome modifications induced by UV-C radiations in representative Vitis, Cissus and Cannabis species by LC-MS based metabolomics and antioxidant assays. Molecules, 19(9), 14004-14021.
Morello M. J., Shahidi F., Ho C. T., 2002, Free Radicals in Foods: Chemistry, Nutrition, and Health. In ACS symposium series. Washington, DC; American Chemical Society; 1999, 1-11.
Page A.L, Miller R.H., Keeney D.R., 1982, Methods of Soil Analysis. Part 2, Chemical & Microbiological properties. Agronomy (9), ASSSA, Mad. Wisc. USA.
Pokorny J., Yanishlieva N., Gordon, M. H., 2001, Antioxidants in food: practical applications. CRC press.
Re R., Pellegrini N., Proteggente A., Pannala A., Yang M., Rice-Evans C., 1999, Antioxidant activity applying an improved ABTS radical cation decolorization assay. Free radical biology and medicine, 26(9-10), 1231-1237.
Rhouma A., Ben Daoud H., Ghanmi S., Ben Salah H., Romdhane M., Demak, M., 2009, Antimicrobial activities of leaf extracts of Pistacia and Schinus species against some plant pathogenic fungi and bacteria. Journal of Plant Pathology, 339-345.
Ruan Z. P., Zhang L. L., Lin Y. M., 2008, Evaluation of the antioxidant activity of Syzygium cumini leaves. Molecules, 13(10), 2545-2556.
Ryan B.F., Joiner B.L., Cryer J.D., 2005, MINITAB Handbook: Updated for release 14, 5th edition.
Singleton V.L., Rossi S.A., 1965, Colorimetry of Total Phenolics with Phosphomolibdic-phosphotungstic Acid Reagents. J Enol Viticult, 16, 144-158.
Yen G.C., Duh P.D., 1994, Scavenging effect of methanolic extracts of peanut hulls on free-radical and active-oxygen species. Journal of Agricultural and Food Chemistry, 42(3), 629-632.
134
FOLIAR FERTILIZATION IN EARLYTOMATOES CULTIVATED IN AN AREA OF N.P.K REDUCED AGROFOND, IN RESPECT
OF PRODUCTION AND RENTABILITY RATE
Lascu Nicolae, Căpruciu Ramona, Puţică Ionuţ Adrian
University of Craiova, Faculty of Horticulture, A.I. Cuza Street, No. 13, Craiova, e-mail: [email protected]
Keywords: hybrid tomatoes, foliar fertilization, production, rate of profitability
ABSTRACT
The paper presents preliminary results regarding the effect of foliar fertilization on the quantity and quality level of production as well as the rate of profitability. to the Tolstoi F1 hybrid grown in unprotected space on a reduced agrofond, namely N60 P60 K60, CROPMKAX products at a dose of 1 l / ha / application, Aminogreen 16 at a dose of 5 l / ha / application, and F-111 in a dose of 5 l / ha / application, and an amount of 500 l / ha / application. The application of three foliar fertilizations to an inerval for 10 - 12 days after planting resulted in an increase of the production per unit area by up to 10,1 t / ha, compared to the control variant, depending on the applied foliar fertilizer, an increase of fruit weight by up to 15.8 % and the rate of profitability was 143.1 % for the CROPMAX fertilized variant and 122.2 % for the F 111 fertilized variant.
INTRODUCTION
Research conducted at the USAMV Cluj-Napoca highlighted the fact that foliar fertilizers have a quantitative and qualitative effect on tomato production in technologies where they have been applied to base N.P.K fertilization, and an organic resource (residual compost from the mushrooms) (Crăciun Minerva,2011, p. 8). The application of N.P.K complex fertilizers to tomato field cultivation, the Unirea variety, has led to an increase in the efficiency of fruit production. The increase in tomato production was statistically ensured after the first fertilization with N100P100K100 and the maximum fruit production was obtained at fertilization with N200P200K200, reaching 62,40 t / ha (Heitz et al., 2011, p. 236) The foliar application of the Golden Foliar fertilizer to the tomato cultivar of Rome at a dose of 1600 ml / 100 L showed significant effects by increasing the average fruit weight from 80.77 g to 94.35 g, ascorbic acid from 16.35 mg / 100g to 17.14 mg / 100g, production at the surface of the plants in Peshawar agro-climatic conditions (Anwar Ali, 2015, Pakistan)
MATERIAL AND METHODS
The studies were carried out in a private property in the Izbiceni locality, Olt County, in 2017, the experience being placed in the field on chernozem soil in 4 rehearsals, and the early tomato hybrid TOLSTOI F1 was used as a biological material. Aminogreen foliar fertilizers 16 to 5 l / ha / application, F 111-5 l / ha / application and CROPMAX – 1 l/ha/application were tested compared to the control variant (foliar nefertilized water spray), the amount of solution used was 500 l / ha / application, the
ANNALS OF THE UNIVERSITY OF CRAIOVA
Series: Biology Horticulture Food produce processing
technology Environmental engineering Vol. XXII I (LIX) - 2018

135
first application being 14 days after planting, and the following at intervals of 10 - 12 days between them.
The N60 P60 K60 agrofond was carried out by basic fertilization with: Concentrated superphosphate Ca (H2PO4) 2N2O (38 % P2O5); Potassium Chloride KCl (60 % K2O); ammonium nitrate NH4NO3 (34.5 % NO3).
Determinations were made on average yield, average fruit weight for each experimental variation, calculation and interpretation of experimental data, and profit rate
RESULTS AND DISCUSSIONS The application of foliar fertilizers in tomato culture to vegetation on a N60 P60
K60 agrofond pointed out that under the pedo-climatic conditions of this year and the applied technology, the absolute yields obtained at the surface unit, on the experimental variants, at the the Tolstoi F1 hybrid cultivated in the unprotected system (Figure 1) was 42.6 t / ha for the foliage not fertilized, taken as a reference, by the applied foliar fertilizers determined an increase of the production per unit area by 7.5 % of 45.8 t / ha in the variant fertilized with Aminogreen 16, of 50.2 t / ha in the variant fertilized with F 111, and of 52.4 t / ha to 23.7 % in the variant fertilized with Cropmax.
Fig. 1. Tomato production (t / ha) based on experimental variants for the tomato Tolstoi F1 hybrid
Statistically analyzing the production results obtained on the experimental variants, the Tolstoi F1 hybrid versus the non-fertilized leaf variant (V1), taken as a reference, from the data in Table 1 it is shown that fertilization in vegetation with Cropmax (V4) led to obtaining the highest production at the experimental parcel, ie 31.6 kg / 6 m2, representing a 23.4 % increase, the positive difference of 6.3 kg / 6 m2 being statistically assured to a distinctly significant degree. Foliar fertilization with F 111 also showed an absolute production increase of 17.6 %, the positive difference of 4.5 kg / 6 m2 being statistically assured to a significant degree. Fertilization in vegetation with Aminogreen 16 resulted in a yield of 27.48 kg / 6 m2 t / ha, close to the witness, the positive difference of 1.9 kg / 6 m2 not being statistically assured, falling within the error variance limits.
0102030405060
Not Foliarfertilixation
Fertilized withAminogreen 16
42,650,2 45,8
52,7
t/ha
Experimental variants
Tomato production (t/ha)

136
Table no.1 The significance of the production differences
Foliar fertilized variant
Productionkg/6 m2
Relativ production
%Differences± kg/6 m2 Significance
Cropmax 31.6 123.4 + 6.3 * *
F 111 30.1 117.6 + 4.5 *
Aminogreen 16 27.5 107.4 + 1.9
Reference 25.6 100.0
DL 5 % = 4.26 kg/6 m2
DL 1 % = 5.21 kg/6 m2
DL 0,1% = 7.66 kg/6 m2
Figure 2 shows that foliar fertilization in vegetation with the three types of fertilizer applied 3 times to the Tolstoi F1 hybrid grown in unprotected system on a N60P60 K60 fertilizer agrofond resulted in an increased fruit weight from 114.9 g to 133.1 g. Thus, compared to the non-fertilized leaf variants (V1), fertilization in vegetation with F 111 (V2) resulted in an increase of fruit weight by 8.6 units Percentage fertilization in vegetation with Aminogree 16 (V3) caused the fruit weight to increase by 4.4 percentage points and the fertilization in vegetation with Cropmax (V4) caused the increase in fruit weight by 15.8 percentage points.
Graphically plotting the fruit weight variation on the Tolstoi F1 hybrid grown in unprotected system on a N100 P100 K100 crop fertilization agrofond, depending on the specificity of the experimental variants in Fig. no. 3 it is found that in the non-fertilized variant in vegetation, taken as a reference (V1), this production attribute showed an unevenness, namely, the graph has two peaks, one with the highest frequency at the center value of 115 g class, and the second peak at the value of the center of class 95g.
020406080
100120140160
Not FoliarFertilization
Fertilized withF 111
Fertilized withAminogreen 16
Fertilized withCropmax
114,9 124,8 120131,1
g/ frui
t
Experimental variants
The fruit weith
Fig. 2 Average fruit weight by experimental variants for the tomatoTolstoi F1 hybrid
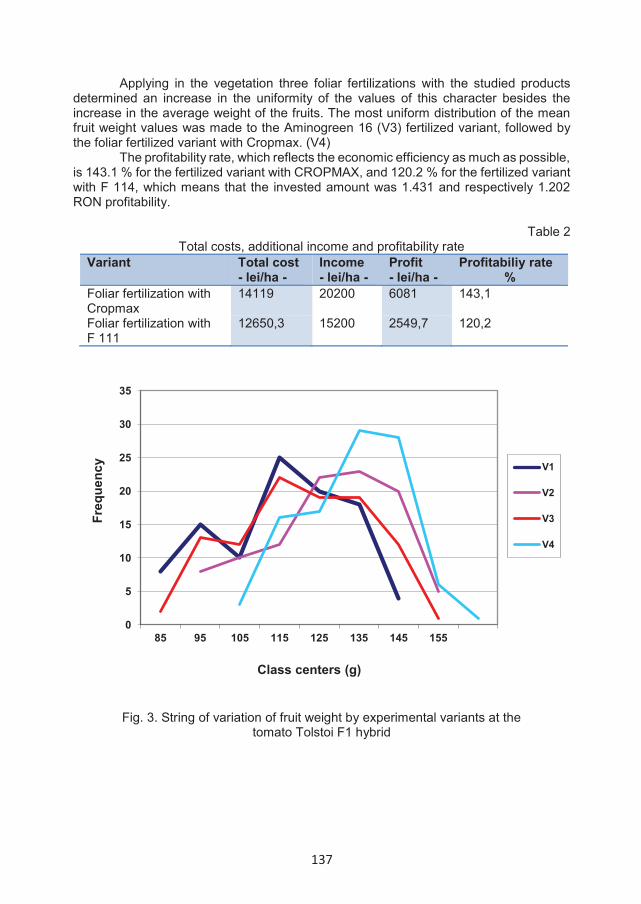
137
Applying in the vegetation three foliar fertilizations with the studied products determined an increase in the uniformity of the values of this character besides the increase in the average weight of the fruits. The most uniform distribution of the mean fruit weight values was made to the Aminogreen 16 (V3) fertilized variant, followed by the foliar fertilized variant with Cropmax. (V4)
The profitability rate, which reflects the economic efficiency as much as possible, is 143.1 % for the fertilized variant with CROPMAX, and 120.2 % for the fertilized variant with F 114, which means that the invested amount was 1.431 and respectively 1.202 RON profitability.
Table 2 Total costs, additional income and profitability rate
Variant Total cost- lei/ha -
Income- lei/ha -
Profit- lei/ha -
Profitabiliy rate%
Foliar fertilization with Cropmax
14119 20200 6081 143,1
Foliar fertilization with F 111
12650,3 15200 2549,7 120,2
Fig. 3. String of variation of fruit weight by experimental variants at the tomato Tolstoi F1 hybrid
0
5
10
15
20
25
30
35
85 95 105 115 125 135 145 155
Freq
uenc
y
Class centers (g)
V1
V2
V3
V4
138
- Applying the foliar fertilizers studied in tomato culture in vegetation, Tolstoi F1 hybrid cultivated in an unprotected system on a N60 P60 K60 fertilizer culture, pointed outthat under the pedo-climatic conditions of this year and the applied technology, the yields increased by up to 10.1 t / ha, from 42.6 t / ha to 52.7 t / ha respectively;
- Statistically analyzing the production results obtained on the experimental variants, it was found that the three-fold fertilization of the crop with Cropmax resulted in the highest production, representing a 23.7 % increase, and the fertilization with F 111 a production increase of 17.8 %, the positive differences being statistically ensured to a distinctly significant and significant degree compared to the non-fertilized foliar variant;
- The application of Cropmax fertilizer to vegetation resulted in an increase in the average weight of the fruit by 15.8 %, the fertilization with F 111 an increase of 8.6 %,and the fertilization with Aminogreen 16 a 4.4 % increase compared to the nonfertilized foliar variant ;
- The profitability rate, which reflects the economic efficiency as much as possible, is 143.1 % for the fertilized variant with CROPMAX, and 120.2 % for the variant fertilized with F 111, which means that 1 RON invested generated 1,43 lei and 1.20 lei profit respectively.
REFERENCES ANWAR Ali, Ijaz Hussain, Humaria Gul, Shah Masoud, Ayub Hhan, Fazli
Wahab, Junaid Khan,2015, Pakistan, Effect of different doses of foliar fertilizer on yield and physiochemical characteristics of tomato (Lycopersicon esculentum Mill) cultivars under the agro climatic condition of Peshawar.Tomato, Foliar fertilizer doses, Physiochemical Characteristics and Yield.International journal of bioscinces 3(10), 280 - 287. http://dx.doi.org/10.12692/ijb/3.10.28087.
CRĂCIUN, M. Minerva, 2011 Research on fertilization systems differentiated in tomato culture, Doctoral thesis. Summary, USAMV Cluj-Napoca, Faculty of Agriculture
HEITZ Minerva, Janina CĂPUŞAN, Alexander Kurt HEITZ, Lidia CHIPER, Aurelia RADU, Maria POJAR - FENESAN, 2011, Fertilization Systems in Tomato Crop in the Field, Scientific papers, B series - Volume 68 (ISSUE 1/2011), Horticulture USAMV- Cluj-Napoca;
CONCLUSIONS Based on the results obtained and their interpretation, the following conclusions
were drawn:
139
TRADITION AND QUALITY OF ROMANIAN VITICULTURE
Mărăcineanu Liviu1*, Giugea Nicolae1, Perţ Carmen1, Căpruciu Ramona1
*University of Craiova, Faculty of Horticulture,*Correspondence author e-mail: [email protected]
Keywords: viticulture, tradition, native varieties, oenotourism
ABSTRACTThe paper presents the result of a bibliographic study that focuses on the traditional and
current assortment of the Romanian viticulture. The old varieties contributed obviously to the prestige of the viticulture in Romania, although nowadays few varieties from that assortment are still cultivated on large surfaces. Some of them can only be identified on small areas belonging to small owners, others are lost or preserved in ampelographic collections. Therefore, an effort is needed to reevaluate them by introducing these varities into selection and improvement programs because the current assortment tends to be dominated by foreign varieties. The oenotourism can help to value these old varieties.
INTRODUCTIONThe vine culture dates back to few millennia in the history of Europe, being an
occupation that was practiced without major incidents. Each nation has obtained through empirical selection better and better varieties, more adapted to the local conditions and quality expectations. The alcoholic fermentation, once discovered, has boosted this activity, so that the viticulture gradually emerged as a profitable economic activity.
The main selling product was the wine, white or red. Each country has developed its own viticulture, based on native varieties, using customized cuttings, technologies and wine blends that have created the fame of the former wines. In France, a landmark of viticulture and oenology, in the Bordeaux region, the wine was and it is blended using the qualitative characteristics of Merlot and Cabernet - Sauvignon varieties. The same thing happened in Romania too. For example, the famous Drăgăşani wine consisted of a blend of Braghină (30 %), Crâmpoşie (30 %), Gordan (30 %) andTămăioasă Românească (10 %); the Mehedinţi wine was obtained by blending Negru vârtos (50 %) and Negru moale (50 %). Unfortunately, these wines can no longer be obtained, the main reason being the abandonment of the concerned varieties.
MATERIAL AND METHODS This paper represents a bibliographic study that allowed the assimilation of the
existing information and provided possibilities of critical interpretation, processing and synthesis of the bibliographic material. We consider that a proper number of credible sources were consulted when elaborating the paper, mainly specialized books or on-line sources. Their reading was carefully and critically conducted in both cases. The bibliographic study does not appeal to a marginal literature, the information included in the study is fully scientifically proven.
ANNALS OF THE UNIVERSITY OF CRAIOVA
Series: Biology HorticultureFood produce processingtechnologyEnvironmental engineering Vol. XXII I (LIX) - 2018
140
RESULTS AND DISCUSSIONS The Romanian viticulture has a tradition of over 2000 years. In the meantime, it
has mainly developed on the basis of native varieties until Europe faced a dangerous parasite for vines. In 1880, Arad was the first reported area in Romania for an insect whose presence proved unsustainable for viticulture: Phylloxera vastatrix. Four years later it reached the vineyards of Dealu Mare, later affecting all the viticulture of Romania, along with the European one (Mihalca A. cited by Oprea St., 1995).
What is worth mentioning for the Romanian viticulture during the pre-philoxic period is the fact that local varieties or associations of varieties have been used in each vineyard, the latter being considered by I.C. Teodorescu cited by Olteanu I in 2007 that they were so wisely conceived that it is almost impossible to recover the original state of the viticulture.
Indeed, the subsequent recover of viticulture has opened the way for the import of foreign, noble varieties or hybrid varieties used for production, amid the desire to accelerate the plantation periods and the insufficiency of native varieties seedlings. Some countries noticed very early the mediocre quality of hybrid varieties and decided to perpetuate the native ones by grafting. Let`s not forget the French argument that says the cultivation of such varieties compromises the tradition of the country's viticulture.
This reason is also apllied very well in the case of Romania, a country with a long viticultural tradition oriented on quality wine. In this way the vine growers' interest in our traditional varieties gradually diminished. As a result, much of the old Romanian varieties, which brought the fame to the old wines, are no longer in production or occupy small surfaces within the plantations of small owners, while others are now only in the ampelographic collections, while many are already lost (Table 1, after Puşcă I.M., 2006).
This trend continued on one hand due to the lack of vine seedlings from the old native varieties, and on the other hand, due to the lack of interest of the breeders that had to orient their research on these varieties, only with few exceptions, which do not have a large representation in production (Table 2, source MADR, 2018).
Among them, Crâmpoşia is still cultivated in the form of improved selected Crâmpoşie with some other prephiloxeric varieties: Fetească albă, Fetească neagră, Tămâioasă românească, Busuioacă de Bohotin, Zghihară de Huşi, Băbească neagră, Galbenă de Odobeşti and maybe others with a low share in plantations.
Table 1
The old Romanian varieties that are no longer cultivated Variety Technological characteristics Production
Alb mare Variety of high production white wines Berbecel 150-240 g / l carbohydrates, production up to 15-50 t / ha white wines Braghină 170-252 g/l sugars, 15-20 t/ha, wine acidity of 5-6 g/l
H2SO4 white and rosé wine
Bătută neagră 160-200 g/l carbohydrates, up to 40 t/ha white, red and rosé
wine Crâmpoşie max. 200 g/l providing a production of 10-20 t/ha; the
wines acidity max. 5.8 g/l H2SO4 white wines
Cruciuliţa 130-190 g/l sugars, 20-30 t/ha, acidity 4-4.5 g/l H2SO4 white wines Epuroaica Very productive variety White, rosé
and red wines
Gordan 160-200 g/l sugars, 25-50 t/ha, wine acidity of 4-5 g/l H2SO4
white wines
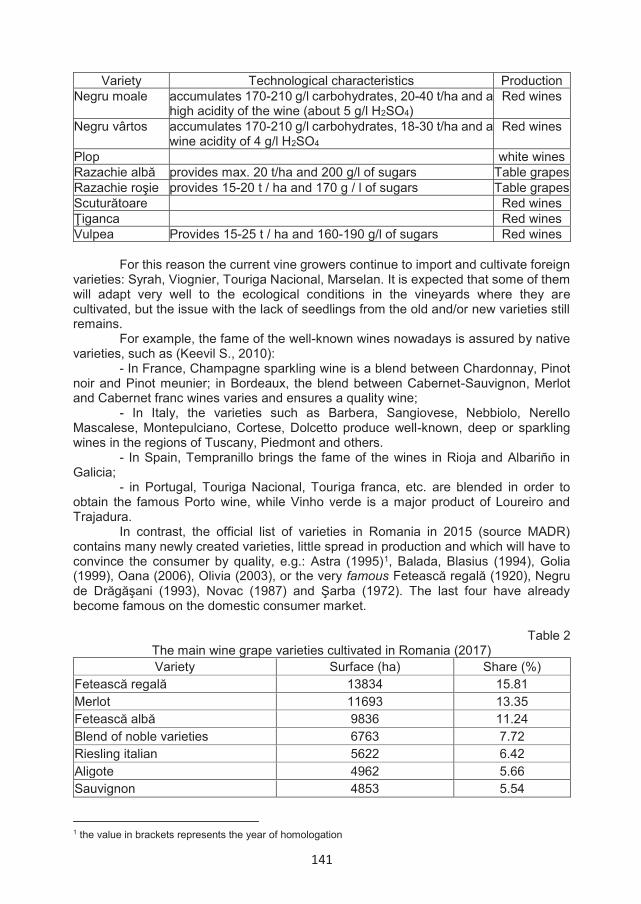
141
Variety Technological characteristics ProductionNegru moale accumulates 170-210 g/l carbohydrates, 20-40 t/ha and a
high acidity of the wine (about 5 g/l H2SO4)Red wines
Negru vârtos accumulates 170-210 g/l carbohydrates, 18-30 t/ha and a wine acidity of 4 g/l H2SO4
Red wines
Plop white winesRazachie albă provides max. 20 t/ha and 200 g/l of sugars Table grapesRazachie roşie provides 15-20 t / ha and 170 g / l of sugars Table grapesScuturătoare Red winesŢiganca Red winesVulpea Provides 15-25 t / ha and 160-190 g/l of sugars Red wines
For this reason the current vine growers continue to import and cultivate foreign varieties: Syrah, Viognier, Touriga Nacional, Marselan. It is expected that some of them will adapt very well to the ecological conditions in the vineyards where they arecultivated, but the issue with the lack of seedlings from the old and/or new varieties still remains.
For example, the fame of the well-known wines nowadays is assured by native varieties, such as (Keevil S., 2010):
- In France, Champagne sparkling wine is a blend between Chardonnay, Pinot noir and Pinot meunier; in Bordeaux, the blend between Cabernet-Sauvignon, Merlot and Cabernet franc wines varies and ensures a quality wine;
- In Italy, the varieties such as Barbera, Sangiovese, Nebbiolo, Nerello Mascalese, Montepulciano, Cortese, Dolcetto produce well-known, deep or sparkling wines in the regions of Tuscany, Piedmont and others.
- In Spain, Tempranillo brings the fame of the wines in Rioja and Albariño in Galicia;
- in Portugal, Touriga Nacional, Touriga franca, etc. are blended in order to obtain the famous Porto wine, while Vinho verde is a major product of Loureiro and Trajadura.
In contrast, the official list of varieties in Romania in 2015 (source MADR) contains many newly created varieties, little spread in production and which will have to convince the consumer by quality, e.g.: Astra (1995)1, Balada, Blasius (1994), Golia (1999), Oana (2006), Olivia (2003), or the very famous Fetească regală (1920), Negru de Drăgăşani (1993), Novac (1987) and Şarba (1972). The last four have already become famous on the domestic consumer market.
Table 2The main wine grape varieties cultivated in Romania (2017)Variety Surface (ha) Share (%)
Fetească regală 13834 15.81Merlot 11693 13.35Fetească albă 9836 11.24Blend of noble varieties 6763 7.72Riesling italian 5622 6.42Aligote 4962 5.66Sauvignon 4853 5.54
1 the value in brackets represents the year of homologation
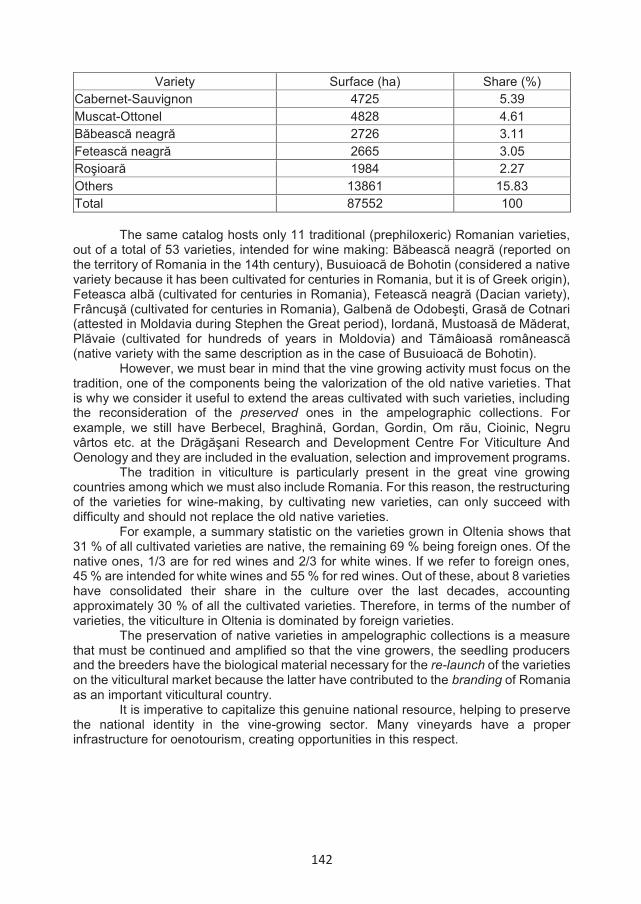
142
Variety Surface (ha) Share (%) Cabernet-Sauvignon 4725 5.39 Muscat-Ottonel 4828 4.61 Băbească neagră 2726 3.11 Fetească neagră 2665 3.05 Roşioară 1984 2.27 Others 13861 15.83 Total 87552 100
The same catalog hosts only 11 traditional (prephiloxeric) Romanian varieties,
out of a total of 53 varieties, intended for wine making: Băbească neagră (reported on the territory of Romania in the 14th century), Busuioacă de Bohotin (considered a native variety because it has been cultivated for centuries in Romania, but it is of Greek origin), Feteasca albă (cultivated for centuries in Romania), Fetească neagră (Dacian variety), Frâncuşă (cultivated for centuries in Romania), Galbenă de Odobeşti, Grasă de Cotnari (attested in Moldavia during Stephen the Great period), Iordană, Mustoasă de Măderat, Plăvaie (cultivated for hundreds of years in Moldovia) and Tămâioasă românească (native variety with the same description as in the case of Busuioacă de Bohotin).
However, we must bear in mind that the vine growing activity must focus on the tradition, one of the components being the valorization of the old native varieties. That is why we consider it useful to extend the areas cultivated with such varieties, including the reconsideration of the preserved ones in the ampelographic collections. For example, we still have Berbecel, Braghină, Gordan, Gordin, Om rău, Cioinic, Negru vârtos etc. at the Drăgăşani Research and Development Centre For Viticulture And Oenology and they are included in the evaluation, selection and improvement programs.
The tradition in viticulture is particularly present in the great vine growing countries among which we must also include Romania. For this reason, the restructuring of the varieties for wine-making, by cultivating new varieties, can only succeed with difficulty and should not replace the old native varieties.
For example, a summary statistic on the varieties grown in Oltenia shows that 31 % of all cultivated varieties are native, the remaining 69 % being foreign ones. Of the native ones, 1/3 are for red wines and 2/3 for white wines. If we refer to foreign ones, 45 % are intended for white wines and 55 % for red wines. Out of these, about 8 varieties have consolidated their share in the culture over the last decades, accounting approximately 30 % of all the cultivated varieties. Therefore, in terms of the number of varieties, the viticulture in Oltenia is dominated by foreign varieties.
The preservation of native varieties in ampelographic collections is a measure that must be continued and amplified so that the vine growers, the seedling producers and the breeders have the biological material necessary for the re-launch of the varieties on the viticultural market because the latter have contributed to the branding of Romania as an important viticultural country.
It is imperative to capitalize this genuine national resource, helping to preserve the national identity in the vine-growing sector. Many vineyards have a proper infrastructure for oenotourism, creating opportunities in this respect.
143
CONCLUSIONSThe viticultural activity on the territory of Romania is constant, but the varieties
structure is variable. The re-evaluation of the native varieties, especially the old ones, must be taken into account for the revival of the varieties and wines on the viticultural market that contributed to the branding of Romania as an important vine-growing country. This can be integrated into the oenotourism activities as many wine cellars in Romania have an adequate infrastructure for these activities.
REFERENCES Keevil S. (coord), 2010, Vinurile lumii. Edit. Litera, Bucureşti;Olteanu I., Mărăcineanu L.C., 2007, Agroecosistemele viticole şi protecţia
mediului. Edit. Sitech, Craiova; Oprea Şt., 1995, Cultura viţei de vie, Edit. Dacia, Cluj-Napoca; Puşcă I.M., 2006, Vechi soiuri româneşti de viţă de vie. Edit. Tipografia Intact,
Bucureşti;***http://www.madr.ro/horticultura/viticultura-vinificatie.html (accesat 16.09.18);*** MADR, ISTIS, Catalogul oficial al soiurilor de plante de cultură din Romania
pentru anul 2015.
144
XERISCAPING
Mandă Manuela1*, Salahoru Cătălina 1
*University of Craiova, Craiova, e-mail: [email protected]
Keywords: xeriscape, concept, principles, species
ABSTRACT
At present, more and more areas in Romania are characterized by high temperatures and low precipitation in the summer period. With an emphasis on water and energy conservation, xeriscape is a creative landscape approach addressed to this purpose. Even under these circumstances, the possibilities for arrangements of public green spaces or private gardens are extremely varied. This paper provides information on this concept which constitutes a practical and sustainable alternative in the design of gardens.
INTRODUCTION
Landscape is a vital component of the urban environment that can provide environmental, human health, psycho-social and economic benefits (Lee et al. 2015); it is also a large user of water (Lazarova et al. 2005). Water scarcity is a critical issue that affects more than 40 per cent of the global population (Karimian et al. 2017) and it is due to the increase in world population, climate change related to global warming, pollution and unconscious consumption of water resources. In landscaping, incorrect plant choices and the use of grass in expansive areas may also increase pressure on limited water resources. In summer, scenes of yellow, dry, and even dead landscaping designs are increasingly common where correct landscaping designs are not employed (Çetin et al. 2018).
The biggest consumption of water used especially in the urban green areas such as parks and gardens has required the development of new forms of landscaping (xeriscape approach) which is using water as little as possible (Sarı & Karaşah 2015).
The word and concept of xeriscape occurred in the south-west of the United States, during the drought at the beginning of the 1980s (Sovocool et al. 2006; Özyavuz A. & Özyavuz, M. 2012).
Xeriscaping, also known as "xerogardening" is, in essence, a type of landscape arrangement which requires a minimum amount of water (Hilaire et al. 2008) and incorporates seven water-conserving principles: 1. Planning and design; 2. Efficient irrigation systems, properly designed and maintained; 3. Use of mulch; 4. Soil preparation; 5. Turf alternatives and proper maintenance; 6. Water-efficient plant material; 7. Appropriate maintenance.
In addition, xeriscaping requires low cost maintenance, the use of species with resistance or tolerance to drought, it requires fewer fertilizers and herbicides, thus contributing to the conservation of the environment.
This method of green spaces arrangements is ideal in places where water is not easily available and in places where climatic conditions require the use of large
ANNALS OF THE UNIVERSITY OF CRAIOVA
Series: Biology Horticulture Food produce processing
technology Environmental engineering Vol. XXII I (LIX) - 2018
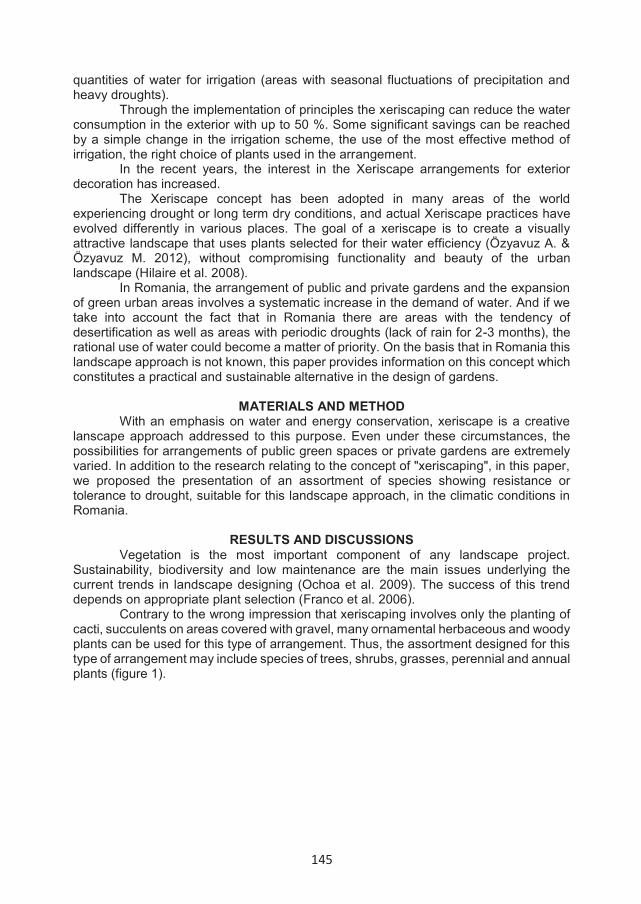
145
quantities of water for irrigation (areas with seasonal fluctuations of precipitation and heavy droughts).
Through the implementation of principles the xeriscaping can reduce the water consumption in the exterior with up to 50 %. Some significant savings can be reached by a simple change in the irrigation scheme, the use of the most effective method of irrigation, the right choice of plants used in the arrangement.
In the recent years, the interest in the Xeriscape arrangements for exterior decoration has increased.
The Xeriscape concept has been adopted in many areas of the world experiencing drought or long term dry conditions, and actual Xeriscape practices have evolved differently in various places. The goal of a xeriscape is to create a visually attractive landscape that uses plants selected for their water efficiency (Özyavuz A. & Özyavuz M. 2012), without compromising functionality and beauty of the urban landscape (Hilaire et al. 2008).
In Romania, the arrangement of public and private gardens and the expansion of green urban areas involves a systematic increase in the demand of water. And if we take into account the fact that in Romania there are areas with the tendency of desertification as well as areas with periodic droughts (lack of rain for 2-3 months), the rational use of water could become a matter of priority. On the basis that in Romania this landscape approach is not known, this paper provides information on this concept which constitutes a practical and sustainable alternative in the design of gardens.
MATERIALS AND METHOD With an emphasis on water and energy conservation, xeriscape is a creative
lanscape approach addressed to this purpose. Even under these circumstances, the possibilities for arrangements of public green spaces or private gardens are extremely varied. In addition to the research relating to the concept of "xeriscaping", in this paper, we proposed the presentation of an assortment of species showing resistance or tolerance to drought, suitable for this landscape approach, in the climatic conditions in Romania.
RESULTS AND DISCUSSIONS Vegetation is the most important component of any landscape project.
Sustainability, biodiversity and low maintenance are the main issues underlying the current trends in landscape designing (Ochoa et al. 2009). The success of this trend depends on appropriate plant selection (Franco et al. 2006).
Contrary to the wrong impression that xeriscaping involves only the planting of cacti, succulents on areas covered with gravel, many ornamental herbaceous and woody plants can be used for this type of arrangement. Thus, the assortment designed for this type of arrangement may include species of trees, shrubs, grasses, perennial and annual plants (figure 1).
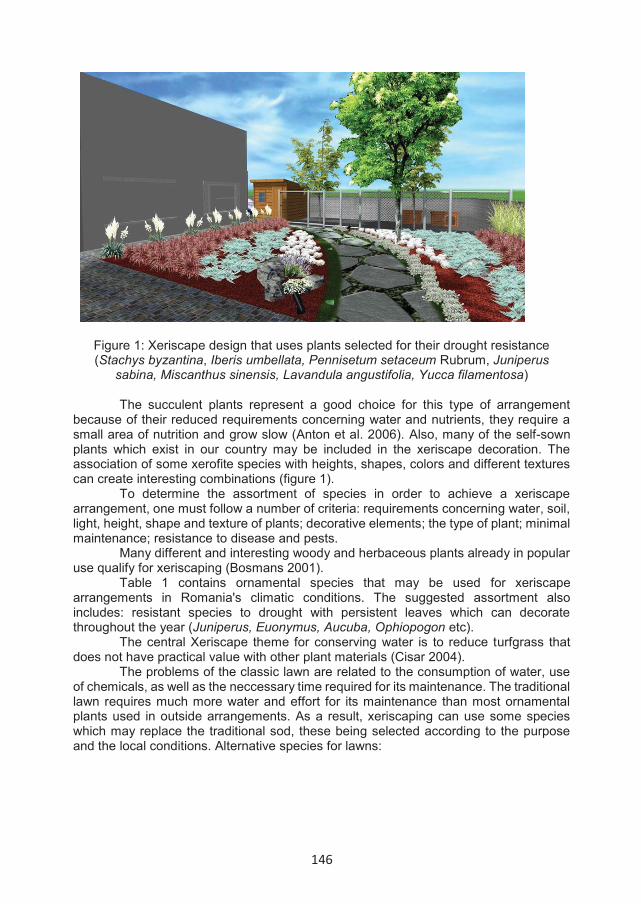
146
Figure 1: Xeriscape design that uses plants selected for their drought resistance (Stachys byzantina, Iberis umbellata, Pennisetum setaceum Rubrum, Juniperus
sabina, Miscanthus sinensis, Lavandula angustifolia, Yucca filamentosa) The succulent plants represent a good choice for this type of arrangement
because of their reduced requirements concerning water and nutrients, they require a small area of nutrition and grow slow (Anton et al. 2006). Also, many of the self-sown plants which exist in our country may be included in the xeriscape decoration. The association of some xerofite species with heights, shapes, colors and different textures can create interesting combinations (figure 1).
To determine the assortment of species in order to achieve a xeriscape arrangement, one must follow a number of criteria: requirements concerning water, soil, light, height, shape and texture of plants; decorative elements; the type of plant; minimal maintenance; resistance to disease and pests.
Many different and interesting woody and herbaceous plants already in popular use qualify for xeriscaping (Bosmans 2001).
Table 1 contains ornamental species that may be used for xeriscape arrangements in Romania's climatic conditions. The suggested assortment also includes: resistant species to drought with persistent leaves which can decorate throughout the year (Juniperus, Euonymus, Aucuba, Ophiopogon etc).
The central Xeriscape theme for conserving water is to reduce turfgrass that does not have practical value with other plant materials (Cisar 2004).
The problems of the classic lawn are related to the consumption of water, use of chemicals, as well as the neccessary time required for its maintenance. The traditional lawn requires much more water and effort for its maintenance than most ornamental plants used in outside arrangements. As a result, xeriscaping can use some species which may replace the traditional sod, these being selected according to the purpose and the local conditions. Alternative species for lawns:
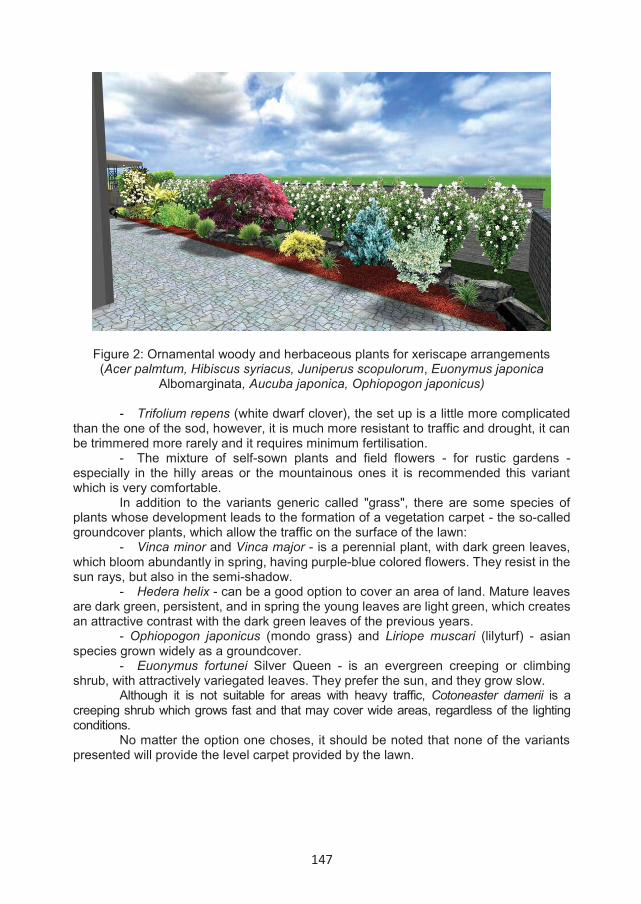
147
Figure 2: Ornamental woody and herbaceous plants for xeriscape arrangements (Acer palmtum, Hibiscus syriacus, Juniperus scopulorum, Euonymus japonica
Albomarginata, Aucuba japonica, Ophiopogon japonicus)
- Trifolium repens (white dwarf clover), the set up is a little more complicated than the one of the sod, however, it is much more resistant to traffic and drought, it can be trimmered more rarely and it requires minimum fertilisation.
- The mixture of self-sown plants and field flowers - for rustic gardens - especially in the hilly areas or the mountainous ones it is recommended this variant which is very comfortable.
In addition to the variants generic called "grass", there are some species of plants whose development leads to the formation of a vegetation carpet - the so-called groundcover plants, which allow the traffic on the surface of the lawn:
- Vinca minor and Vinca major - is a perennial plant, with dark green leaves, which bloom abundantly in spring, having purple-blue colored flowers. They resist in the sun rays, but also in the semi-shadow.
- Hedera helix - can be a good option to cover an area of land. Mature leaves are dark green, persistent, and in spring the young leaves are light green, which creates an attractive contrast with the dark green leaves of the previous years.
- Ophiopogon japonicus (mondo grass) and Liriope muscari (lilyturf) - asian species grown widely as a groundcover.
- Euonymus fortunei Silver Queen - is an evergreen creeping or climbing shrub, with attractively variegated leaves. They prefer the sun, and they grow slow.
Although it is not suitable for areas with heavy traffic, Cotoneaster damerii is a creeping shrub which grows fast and that may cover wide areas, regardless of the lighting conditions.
No matter the option one choses, it should be noted that none of the variants presented will provide the level carpet provided by the lawn.

148
Table 1 Ornamental species for xeriscape arrangements in the climatic conditions of Romania Species Trees Acer camperstre, Acer palmatum, Cercis canadensis, Fraxiunus americana,
Ginkgo biloba, Gleditsia triacanthos, Magnolia grandiflora, Quercus rubra, Picea pungens Glauca, Pinus sylvestris, Platanus occidentalis, Robinia pseudoacacia, Ulmus minor.
Shrubs Amelanchier alnifolia, Aucuba japonica, Berberis thunbergii, Buxus microphylla, Buxus sempervirens, Buddleia marrubifolia, Callicarpa bodinieri, Calycanthus floridus, Euonymus japonica, Hibiscus syriacus, Ilex sp., Jasminum nudiflorum, Juniperus chinensis, Juniperus sabina, Juniperus squamata, Juniperus scopulorum, Juniperus virginiana, Mahonia aquifolium, Osmanthus heterophyllus, Pinus mugo, Punica spp., Rhus typhina, Viburnum macrocephalum, Viburnum lantana.
Undergrowth Yucca filamentosa, Genista tinctoria, Ruscus aculeatus, Ruscus hypoglossum
Annual Centaurea cyanus, Dianthus chinensis, Eschscholzia californica, Gomphrena globosa, Helichrysum bracteatum, Portulaca grandifloria, Tithonia rotundifolia, Tagetes spp, Zinnia elegans
Perennials Achillea filipendula, A. millefolium, Aster sp., Aquilegia chrysantha, Bergenia cordifolia, Coreopsis spp, Echinacea purpurea, Echinops spp., Iberis umbellata, Gaillardia aristata, Gypsophila paniculata, Heuchera sanguinea, Lavandula angustifolia, Limonium latifolium, Kniphofia uvaria, Ophiopogon japonicus, Penstemon sp., Phlox subulata, Solidago spp., Rudbeckia hirta
Ornamental grasses
Festuca cinerea, Festuca glauca, Helictotrichon sempervirens, Miscanthus sinensis, Muhlenbergia rigens, Pennisetum setaceum
Mosaic plant Cerastium tomentosum, Cineraria maritima, Stachys byzantina Succulents Sedum spectabile, S. pallidum, S. spurium, S. rupestre, Sempervivum spp Lianas Lonicera japonica, Parthenocissus quinquefolia, Tecoma, Vitis sp., Wistera sp. Native plants Aster alpinus, Erigeron sp., Galium odoratum, Lychnis coronaria, Luzula
luzuloides, Salvia pratensis, Xeranthemum annuum
CONCLUSIONS There are numerous reasons why this type of arrangement should be taken into
consideration: lowered consumption of water, reduce maintenance and less cost to maintain, reduced waste and pollution, reduce fertilizer use (NPK).
A well-planned xeriscape landscape, besides the presented benefits can be as succesful as any other type of garden design. Although it involves conserving water it can be attractive, colorful and it utilizes a variety of styles (even formal style), shapes and textures.
Contrary to the impression that "xeriscaping" shall include only cacti and succulents, many ornamental herbaceous and woody plants can be used for this type of arrangement.
The common qualities of the plants intended for "xeriscape" landscapes justify the use of certain groups of ornamental plants, as well as species: spontaneous, succulent, decorative herbs, some perennial and annual species.
REFERENCES
Anton D., Nicu C., Mandă M., 2006, Floricultură specială – vol. II, Edit. Universitaria, Craiova.
Bosmans R., 2001, Xeriscaping and Conserving Water in the Landscape, University of Maryland Extension. https://extension.umd.edu/sites/
Cisar, J. L., 2004, Managing turf sustainably. In New directions for a diverse planet’in Proceedings of the 4th International Crop Science Congress, Vol. 26.
149
Çetin N., Mansuroğlu S., & Önaç A. K., 2018, Xeriscaping Feasibility as an Urban Adaptation Method for Global Warming: A Case Study from Turkey, Polish Journal of Environmental Studies, 27(3).
Hilaire R. S., Arnold M. A., Wilkerson D. C., Devitt D. A., Hurd B. H., Lesikar B. J., Pittenger D. R., 2008, Efficient water use in residential urban landscapes. HortScience, 43(7), 2081-2092.
Franco J. A., Martínez-Sánchez, J. J., Fernández J. A., & Bañón S., 2006, Selection and nursery production of ornamental plants for landscaping and xerogardening in semi-arid environments. The Journal of Horticultural Science and Biotechnology, 81(1), 3-17.
Karimian, Z., Samiei, L., & Nabati, J., 2017, Evaluation of drought resistance in Nitraria schoberi as a native plant by irrigation intervals for applying in arid urban landscape. Acta Scientiarum Polonorum-Hortorum Cultus, 16.
Lazarova, V., Bouwer, H., & Bahri, A., 2005, Water quality considerations. Water Reuse for Irrigation: Agriculture, Landscapes, and Turf Grasses, CRC Press, Boca Raton, FL, (0.2), 0-4.
Lee A. C. K., Jordan H. C., & Horsley J., 2015, Value of urban green spaces in promoting healthy living and wellbeing: prospects for planning. Risk management and healthcare policy, 8, 131.
Ochoa J., Munoz M., Vicente M. J., Martínez-Sánchez J., Franco, J. A., 2009, Native ornamental species for urban landscaping and xero-gardening in semi-arid environments. In II International Conference on Landscape and Urban Horticulture 881 (pp. 425-428).
Özyavuz, A. and Özyavuz, M., 2012, Xeriscape in Landscape Design, Landscape Planning, Dr. Murat Ozyavuz (Ed.), ISBN: 978-953-51- 0654-8, InTech.
Sarı, D., & Karaşah, B., 2015, Green Roofs and Xeriscape Planting that Contribute to Sustainable Urban Green Space. Conference: ICSAUD 2015: 17th International Conference on Sustainable Architecture and Urban DesignAt: Kyoto, JapanVolume: 17 (11).
Sovocool Kent A., Mitchell Morgan And Doug Bennett, 2006, An In-Depth Investigation Of Xeriscape As A Water Conservation Measure. Journal American Water Works Association, Vol. 98, No. 2, pp. 82-93.
150
VIBRATION METHOD FOR WALNUTS (JUGLANS REGIA L.) HARVESTING
Manthos Ioannis1*, Botu Mihai2,3, Tsampas Theodoros2, Rouskas Dimos1
1Institute of Plant Breeding & Genetic Resources, Dept. of Nut Trees,HAO-DEMETER, Lamia, Greece
2University of Craiova, Faculty of Horticulture, Department of Horticulture and Food Science, Craiova, Romania
3University of Craiova - SCDP Vâlcea, Rm. Vâlcea, Romania * Correspondending author. E-mail: [email protected]
Keywords: Juglans regia L., vibrator, mechanical harvesting
ABSTRACTThe aim of the present study was to evaluate the appropriate conditions for mechanical
harvesting of walnuts (Juglans regia L.), when vibration technique is applied. For the purpose of the study a vibrator of heavy-type was used. The vibrator was attached to the rear of a tractor and it carried a movable arm that ended into two cylinders, which were attached to the tree trunk. The tests were carried out on: (a) 20 year old trees of the Hartley and ‘Franquette’ varieties, and (b) on 20-year-old trees of the ‘Gustine’ and ‘Pedro’ lateral varieties. The results revealed that the appropriate stage for harvesting walnuts with the mechanical method of vibration is when about 80 % of the fruit presents cracks in the pericarp and mesocarp. Trunk vibration time for satisfactory harvesting is about 5 seconds, while the time required for approaching-vibrating-removing the vibrator from the tree is about 110-120 sec.
INTRODUCTION The walnut cultivation in Greece is in a developmental and transitional phase,
since the traditional cultivation consisting of native trees, are gradually being replaced by modern walnuts cultivation methods, in which excellent varieties are utilized. At the same time, a great effort is being made by the Department of Nut Trees (DNT) of Institute of Plant Breeding and Genetic Resources, HAO – DEMETER, so that the walnuts cultivation can be mechanized, as much as possible, concerning the required cultivation works and especially harvesting. However, in Greece in this sector, not only small cultivators, but also new cultivators, with a sustainable cultivated area, are lagging behind. In most cases, ripping is the only way to harvest walnuts, and in the case of failure, they are waiting for the walnuts to fall from the tree. The latter case results in severe deterioration of fruit quality. In studies implemented by DNT of HAO – DEMETER, it was found that experienced workers required for manually collecting fruit from the ground, emptying nuts, etc., about
a) 90 minutes for collecting the walnuts of a tree of ‘Hartley’ or ‘Franquette’variety, in full production of approximately 45 kg;
b) approximately 45 minutes for ‘Chandler’ and ‘Pedro’ variety with a productivityof approximately 30 kg. In contrast, the performance of tree vibrators ranges from 40 to 80 trees per hour (Rouskas, 2002; Karakosta, 2005).
Moreover, mechanical harvesting is of great importance, because it greatly reduces production costs, improves fruit quality and greatly facilitates the execution of the
ANNALS OF THE UNIVERSITY OF CRAIOVA
Series: Biology HorticultureFood produce processingtechnology
Environmental engineering Vol. XXII I (LIX) - 2018
151
work. In countries where the walnut is systematically harvested, the fruits are harvested in mechanical ways, the effectiveness of which will depend on the good organization of all the individual works. The size of trees, planting distances, the extent of the walnut, variety are some of the factors that a walnut cultivator must take seriously into account when select the appropriate harvesting method. Besides the problem of harvest time and cost, there is also the problem of finding seasonal staff and even experienced skills. Ultimate solution to the problem of harvesting is given by the vibration machines for tree trunk. The mechanical harvest of walnuts has been used by producers in France and California for years. Today the vibrators have evolved a lot and do not create any problem in the trunk and the root system of the tree (Rouskas, 2002; Karakosta, 2005).
The mechanization has brought many benefits in agriculture, but more research is necessary. Feasibility of performing mechanized harvesting at low costs also in steep ground, improvement of conditions for workers safety, are also essential matters to be solved (Rouskas, 2002).
The present study concerns the evaluation of the appropriate conditions for mechanical harvesting of walnuts, when vibration technique is applied.
MATERIAL AND METHODS The present study was implemented in the Department of Nut Trees of Institute
of Plant Breeding and Genetic Resources of Hellenic Agricultural Organization - DEMETER, in the framework of the mechanical harvest of walnuts trees (Juglans regiaL.). For the purpose of the study a vibrator (AMB Rousset Beaulieu, France) of heavy-type was used, along with an agricultural tractor with a hippo power of at least 80 HP. The vibrator was attached to the rear of the tractor, and was obtained movement from the tractor. It also carried a movable arm that ended into two cylinders of 35 cm diameter with adjustable opening, which were attached to the tree trunk (Figures 1 and 2). The trees were selected to have a clean trunk without branches, for at least 60 cm, so as to allow the vibrator arm to be applied.
The harvest criterion was walnuts having about 80 % cracked pericarp and mesocarp. The tests were carried out on:
(a) 20 years old trees of the ‘Hartley’ and ‘Franquette’ terminal varieties, trained as vase-shaped, at planting distances of 10 x 10 m, with an average tree height of about 8 m and a maximum crown width of 7.4 m;
(b) on 20 years old trees of the ‘Gustine’ and ‘Pedro’ lateral varieties, trained as free axis, at 9 x 8 m planting distances, with an average tree height of about 7 m and a maximum crown width of 6.4 m.
RESULTS AND DISCUSSIONS Regarding the results of the applications tested, it was observed that the specific
method of walnut harvesting with the particular vibrator creates a strong and wide oscillating space of an approximately inverted truncated cone shape. The oscillating diameter progressively increases according to the application zone of the vibrator arm to the trunk and is approximately the following:
a) 4 m at a height of 2 m from the application zone;b) 6 m at a height of 4 m from the application zone;c) 8 m at a height of 6 m from the application zone;d) 10 m at a height of 8 m from the application zone.The fall of ripe nuts was more effective when it was within the oscillation space. The
entire crown of trees, formed in free axis, was in the oscillation space. In the vase-shaped trees only a few nuts were located outside the swinging space, at a relatively low height (1.5 - 3 m above the ground), which accounted for about 8 % of the crown of the trees.

152
Figures 1 and 2. Mechanical harvesting of walnuts trees with a trunk vibrator
accessory to a tractor of hydraulic type. The most effective duration of vibration was 5 seconds in all cases. The total adjustment-vibration-removal time of the tree from the vibrator ranged from 90 to 110 seconds. The 1800 - 2000 revolutions of the agricultural tractor machine per minute gave the drive shaft coupled with the vibrator 400 - 440 rpm. At the above revolutions with vibration duration of five (5) seconds the drop of ripe walnuts, was achieved. Of these fallen walnuts, about 20 % - 30 % was released from their green pericarp. The 2000 to 2200 rpm of the engine, corresponding to 440 to 480 rpm on the drive shaft, with vibration duration of five (5) seconds, resulted to the fall of ripe and cracked walnuts. At the 2200 - 2400 rpm of the engine, which corresponds to 480 - 520 rpm of the drive shaft, with vibration duration of five (5) seconds, all ripe walnuts were dropped, even without any cracking of the pericarp and mesocarp.
Before the vibration, nets were placed around the tree. After vibration completed, workers furled net and gathered walnuts in plastic containers. Then, walnuts were transferred into hulling-washing facility, specialized for walnuts. The facility used (Figures 3-5) was of horizontal cylindrical type, 3 kilowatts / h power and approximately 300 kg walnuts (with pericarp and mesocarp) capacity. Hulling and washing time took 5-10 minutes. Hulling capacity was approximately 1000 kg per hour of clean product (hulled and washed).
Figures 3 - 5. Hulling and washing of walnuts.
The use of dehydrating facility provides a definitive solution and benefits in terms of saving labor and ensuring the quality of products, under all circumstances, in comparison to drying walnuts with the traditional method of sun drying. The dehydrating
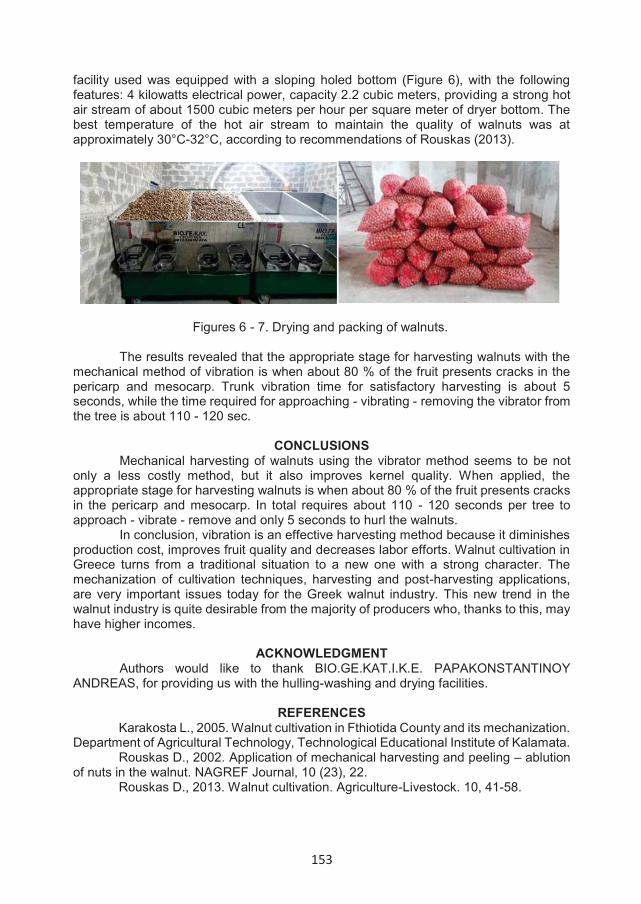
153
facility used was equipped with a sloping holed bottom (Figure 6), with the following features: 4 kilowatts electrical power, capacity 2.2 cubic meters, providing a strong hot air stream of about 1500 cubic meters per hour per square meter of dryer bottom. The best temperature of the hot air stream to maintain the quality of walnuts was at approximately 30°C-32°C, according to recommendations of Rouskas (2013).
Figures 6 - 7. Drying and packing of walnuts.
The results revealed that the appropriate stage for harvesting walnuts with the mechanical method of vibration is when about 80 % of the fruit presents cracks in the pericarp and mesocarp. Trunk vibration time for satisfactory harvesting is about 5 seconds, while the time required for approaching - vibrating - removing the vibrator from the tree is about 110 - 120 sec.
CONCLUSIONS Mechanical harvesting of walnuts using the vibrator method seems to be not
only a less costly method, but it also improves kernel quality. When applied, the appropriate stage for harvesting walnuts is when about 80 % of the fruit presents cracks in the pericarp and mesocarp. In total requires about 110 - 120 seconds per tree to approach - vibrate - remove and only 5 seconds to hurl the walnuts.
In conclusion, vibration is an effective harvesting method because it diminishes production cost, improves fruit quality and decreases labor efforts. Walnut cultivation in Greece turns from a traditional situation to a new one with a strong character. The mechanization of cultivation techniques, harvesting and post-harvesting applications, are very important issues today for the Greek walnut industry. This new trend in the walnut industry is quite desirable from the majority of producers who, thanks to this, may have higher incomes.
ACKNOWLEDGMENT Authors would like to thank BIO.GE.KAT.I.K.E. PAPAKONSTANTINOY
ANDREAS, for providing us with the hulling-washing and drying facilities.
REFERENCES Karakosta L., 2005. Walnut cultivation in Fthiotida County and its mechanization.
Department of Agricultural Technology, Technological Educational Institute of Kalamata. Rouskas D., 2002. Application of mechanical harvesting and peeling – ablution
of nuts in the walnut. NAGREF Journal, 10 (23), 22. Rouskas D., 2013. Walnut cultivation. Agriculture-Livestock. 10, 41-58.

154
CONTROL OF WINE QUALITY PARAMETERS AND THEIR DEVELOPMENT IN TIME
Muntean Camelia1*,Scarlat Elena Mihaela1,
*University of Craiova * Correspondence author. E-mail: [email protected]
Keywords: wine, maturation, physico-chemical constituents, anthocyanins, chromatic structure
ABSTRACT
Maturing refers to all wines, ranging from current consumption to high class. For quality red wines, their maturation can only be conceived naturally in oak wood vats, in specially designed environments, to obtain some the physico-chemical qualities and organoleptic characteristics corresponding to the type of wine proposed, regardless of the time required for this, given that they achieve very high quality levels that compensate for the losses incurred. At the end of maturation, the wine is personalized, that is, it is distinguished by its qualitative.
INTRODUCTION
The maturation phase is between the first prick and the bottling of the wine. At this stage, the essential factor that favors the processes that define it is oxygen (Gómez -Plaza, 2002). In the secondary, they can exert certain influences as well: temperature, some enzymes, elements with variable valences (iron and copper) which can cause changes in the oxidoreducting potential (Băducă, 2016).Changes in several wine composition sizes and indices, such as density, extract, ash content, alcohol, aldehydes, etc., as well as significant changes in sensory characteristics, are also taking place (Bueno, 2010).
Dissolves of wood constituents of the vessels do not occur under the action of alcohol and other constituents. Extracts, especially hydrolysable tannins and some aromatic substances, such as vanilla aldehyde and the syringes aldehyde, can give off the lilac flower odor (Stoica, 2015). There are still: transformation, condensation and deposition of phenolic compounds. The condensation and polymerization processes of the phenolic compounds occur via C-C type linkages.C-C bridges also produce the associations between anthocyanins and non-hydrolyzable (catechinic) tannins, but also the combinations of anthocyanins and the resulting products, in turn, by condensing leucoanthocyanidins with each other or with catechins. During maturation changes also occur on the contents of other constituents of wines: ethyl alcohol and terpenic compounds are decreasing; the acetic aldehyde may be enhanced by oxidation of the alcohol and may be reduced by combining with anthocyanins and ethyl alcohol in the case of acetal formation; acetals and esters know insignificant increases; volatile acidity increases, but differently depending on multiple conditions; Fixed acidity shows some decreases when precipitations of tartrates occur; diminutions know the contents in extract and ashes, but in limited (Vladu, 2007, Muntean, 2012).
ANNALS OF THE UNIVERSITY OF CRAIOVA
Series: Biology Horticulture Food produce processing
technology Environmental engineering Vol. XXII I (LIX) - 2018

155
MATERIAL AND METHODSThe study tracked the evolution of red wine during maturation, from the time of
alcoholic fermentation to bottling. The wine was obtained in the Drăgăşani vineyard ofMerlot grape variety 2016 production. The grapes were harvested on September 19,2016 and had sugar: 229 g/L and acidity of 4.30 g/L H2SO4
After the first prick, Merlot wine was stored for maturation in 3 different types ofpots: stainless steel pot, used wooden pot with a capacity of 2000 l and a new barrel with a capacity of 225 l. At the time of introduction into the container at 3, 9, and 12months, the wines were analyzed based on the basic physico-chemical constituents andthe polyphenolic composition. In each variant, the alcohol content was determined interms of volume, total and volatile acidity g/LH2SO4, non-reducing extract, mg/L anthocyanin content, participation of the three categories of pigments and chromatic properties, color intensity and temptation. The wine concentration in alcohol was determined by the ebuliometric method based on the principle of the difference between the boiling temperature of the water and that of the wine, the acidity of the wine was determined titrimetrically by neutralizing the acids from a quantity of wine with an alkaline solution of the known titre
Based on the amount of basic solution used for titration, the acidity of the wine was calculated. The volatile acidity of the wine was determined by a direct method based on the following principle: the volatile acids in the wine are separated by a repeated distillation process under special conditions, and then titrated in. The non-reducing extract was obtained by subtracting the total sugars from the total dry extract determined by the method of the densimetric method (Tabarie) based on the relationship between the density of the aqueous solution of the extract, the density of the wine and the densityof the alcoholic distillate. Wine anthocyanins were determined spectrophotometrically by pH difference (RibereauGayon - Stonestreet method). The color of the red wines was determined with a UV-VIS spectrophotometer in the visible field at the wavelengths of420, 520 and 620 nm. Based on readings at the three wavelengths, chromatic properties, color intensity and color tint were calculated.Ic = DO420 nm + DO 520 nm + DO 620 nm;Tc= DO420 nm/DO520 nm. The weight of each color in the overall color of the wine is given by the percentages of the optical densities relative to the color intensity.%yellowpigments DO420 nm/Ic) x 100 ; % red pigments (DO 520 nm/ Ic) x 100 ; % of blue pigments
(DO 620 nm/ Ic) x 100 .
RESULTS AND DISCUSSIONS The main physico-chemical characteristics of Merlot wine stored for maturation
in the stainless steel vessel, the used wooden vessel and the new barrier evolve over time according to the data given in Table1.
The degree of alcohol is continuously diminishing - from one stage to another - to all three types of recipients. At each stage, however, the smallest decreases occurred in the stainless steel container, and the largest ones at the barrier. Compared to the situation when the wine was introduced into the pot, alcohol losses in the 12 months maturation were: 0.40 % vol. - on the stainless steel vessel, 0.45 % vol. - for the used wood vat and 0.52 % for barrels.
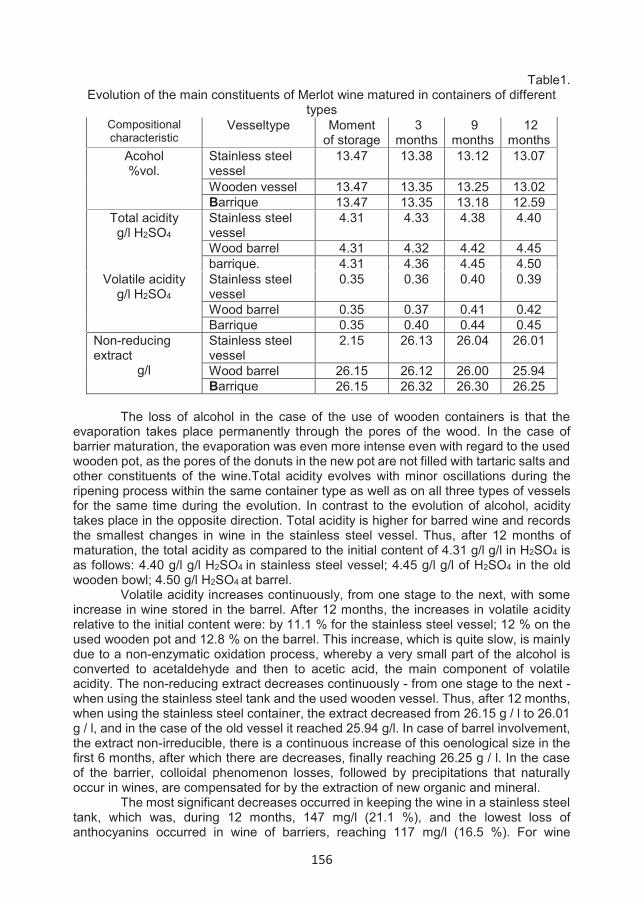
156
Table1. Evolution of the main constituents of Merlot wine matured in containers of different
types Compositional characteristic
Vesseltype Moment of storage
3 months
9 months
12 months
Acohol %vol.
Stainless steel vessel
13.47 13.38 13.12 13.07
Wooden vessel 13.47 13.35 13.25 13.02 Barrique 13.47 13.35 13.18 12.59
Total acidity g/l H2SO4
Stainless steel vessel
4.31 4.33 4.38 4.40
Wood barrel 4.31 4.32 4.42 4.45 barrique. 4.31 4.36 4.45 4.50
Volatile acidity g/l H2SO4
Stainless steel vessel
0.35 0.36 0.40 0.39
Wood barrel 0.35 0.37 0.41 0.42 Barrique 0.35 0.40 0.44 0.45
Non-reducing extract
g/l
Stainless steel vessel
2.15 26.13 26.04 26.01
Wood barrel 26.15 26.12 26.00 25.94 Barrique 26.15 26.32 26.30 26.25
The loss of alcohol in the case of the use of wooden containers is that the
evaporation takes place permanently through the pores of the wood. In the case of barrier maturation, the evaporation was even more intense even with regard to the used wooden pot, as the pores of the donuts in the new pot are not filled with tartaric salts and other constituents of the wine.Total acidity evolves with minor oscillations during the ripening process within the same container type as well as on all three types of vessels for the same time during the evolution. In contrast to the evolution of alcohol, acidity takes place in the opposite direction. Total acidity is higher for barred wine and records the smallest changes in wine in the stainless steel vessel. Thus, after 12 months of maturation, the total acidity as compared to the initial content of 4.31 g/l g/l in H2SO4 is as follows: 4.40 g/l g/l H2SO4 in stainless steel vessel; 4.45 g/l g/l of H2SO4 in the old wooden bowl; 4.50 g/l H2SO4 at barrel.
Volatile acidity increases continuously, from one stage to the next, with some increase in wine stored in the barrel. After 12 months, the increases in volatile acidity relative to the initial content were: by 11.1 % for the stainless steel vessel; 12 % on the used wooden pot and 12.8 % on the barrel. This increase, which is quite slow, is mainly due to a non-enzymatic oxidation process, whereby a very small part of the alcohol is converted to acetaldehyde and then to acetic acid, the main component of volatile acidity. The non-reducing extract decreases continuously - from one stage to the next - when using the stainless steel tank and the used wooden vessel. Thus, after 12 months, when using the stainless steel container, the extract decreased from 26.15 g / l to 26.01 g / l, and in the case of the old vessel it reached 25.94 g/l. In case of barrel involvement, the extract non-irreducible, there is a continuous increase of this oenological size in the first 6 months, after which there are decreases, finally reaching 26.25 g / l. In the case of the barrier, colloidal phenomenon losses, followed by precipitations that naturally occur in wines, are compensated for by the extraction of new organic and mineral.
The most significant decreases occurred in keeping the wine in a stainless steel tank, which was, during 12 months, 147 mg/l (21.1 %), and the lowest loss of anthocyanins occurred in wine of barriers, reaching 117 mg/l (16.5 %). For wine

157
preserved for aging in an old wooden vessel the losses were intermediate of 128 mg/l (18.5 %) (Figure 1). In the case of barrier, lower anthocyanin losses can be explained by the contribution of tannins extracted from the new wood to increasing the stability of anthocyanide coloring matter.
Based on the optical density values at 420 nm (yellow pigments), 520 nm (red pigments) and 620 nm (blue pigments) listed in (Table 2) the chromatic characteristicswere calculated: color intensity and color tint.
The color intensity developed by decreasing continuously over time and to all three types of containers, but differently (Table 3).For wine stored in stainless steel, the rate of dye reduction is more sustained, so this oenological size reaches 12 months from 1,530 to 0.992. In wooden pots, the decrease is slower, with a mention on the subject in the case of the new vessel, where after one year the intensity of the color intensity was the highest. This finding for swept wine in a new wooden vessel, some of which are more important in elagotanin, existing in the new oak tree. The color tone (Table 3), by constantly changing the relationship between the yellow-orange pigments and the red ones, grows, as the maturing time elapses, to all three types of containers. Thus, the stainless steel vessel grew from 0.713 at the time of storage at 0.741 to 12 months, the used wood vat reached 0.745 and in barrel at 0.752.
For equal maturation periods, it is found that the highest value of the color tone is recorded in the wine from barrel. This is due to the increase in the proportions of yellow-orange pigments, with higher rates than red pigments, although increases are also recorded in the latter. Analyzing the evolution of the chromatic complex it is found that this is particularly favorable to the color of the wine preserved in wooden pots and especially in the barrel.
CONCLUSIONSRed wine, as we know it, can be done in two extremely varied variants, both as
production technology and economically-qualitative: red consumer wines currently available to a wide range of consumers, purchased at a relatively low price and topquality red wines, obtained with strict preservation of the parameters in the case ofcorrect natural maturation, wines of exceptional quality appreciated on the national and international market, whose high price, their special organoleptic qualities justify full.
It is fully elucidated that high class red wines are obtained under conditions ofnatural preservation (6-12 months) in oak barrels, in specially arranged premises for obtaining the physico-chemical qualities and organoleptic characteristics corresponding tothe type the proposed wine is not supported by techniques or procedures for stimulating or improving quality by using different additives, which are considered as fraud.
The basic chemical composition of Merlot, ripened in containers of different types evolves positively but differently. Thus, the alcohol content continuously decreases in all three types of containers. The highest alcohol leakage, for the same period of time, is recorded at the barrier, due to continuous evaporation through pores. In the barrel situation, the evaporation was even more intense even with the used wooden vessel, as the pores of the stave in the new pot are not filled with tartaric salts and other constituents of the wine.
Volatile acidity increases with something extra in the case of the barrel, but the increase is insignificant. The non-reducing extract decrease from one stage to the next, in the use of stainless steel containers and even in old buds, and gradual increases in the wine retained in new barriers, extracting organic and mineral constituents from the new stave, surpassing the precipitous combinations specific to maturation.
In anthocyanins, after 12 months of maturation, the most significant decreases occur in the wine stored in the stainless steel vessel and the smallest is recorded in the
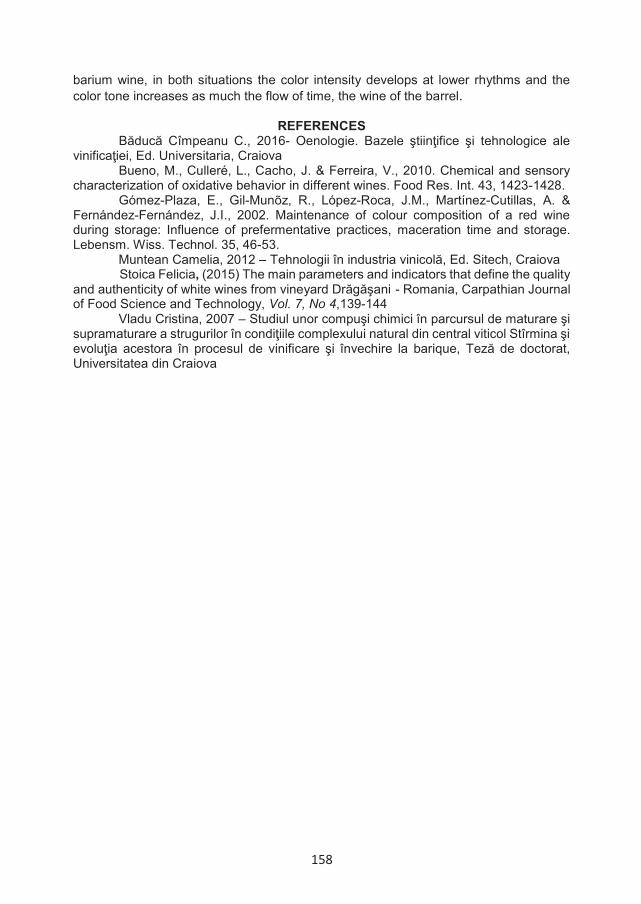
158
barium wine, in both situations the color intensity develops at lower rhythms and the color tone increases as much the flow of time, the wine of the barrel.
REFERENCES Băducă Cîmpeanu C., 2016- Oenologie. Bazele ştiinţifice şi tehnologice ale
vinificaţiei, Ed. Universitaria, CraiovaBueno, M., Culleré, L., Cacho, J. & Ferreira, V., 2010. Chemical and sensory
characterization of oxidative behavior in different wines. Food Res. Int. 43, 1423-1428. Gómez-Plaza, E., Gil-Munõz, R., López-Roca, J.M., Martínez-Cutillas, A. &
Fernández-Fernández, J.I., 2002. Maintenance of colour composition of a red wine during storage: Influence of prefermentative practices, maceration time and storage. Lebensm. Wiss. Technol. 35, 46-53.
Muntean Camelia, 2012 – Tehnologii în industria vinicolă, Ed. Sitech, CraiovaStoica Felicia, (2015) The main parameters and indicators that define the quality
and authenticity of white wines from vineyard Drăgăşani - Romania, Carpathian Journal of Food Science and Technology, Vol. 7, No 4,139-144
Vladu Cristina, 2007 – Studiul unor compuşi chimici în parcursul de maturare şi supramaturare a strugurilor în condiţiile complexului natural din central viticol Stîrmina şi evoluţia acestora în procesul de vinificare şi învechire la barique, Teză de doctorat, Universitatea din Craiova
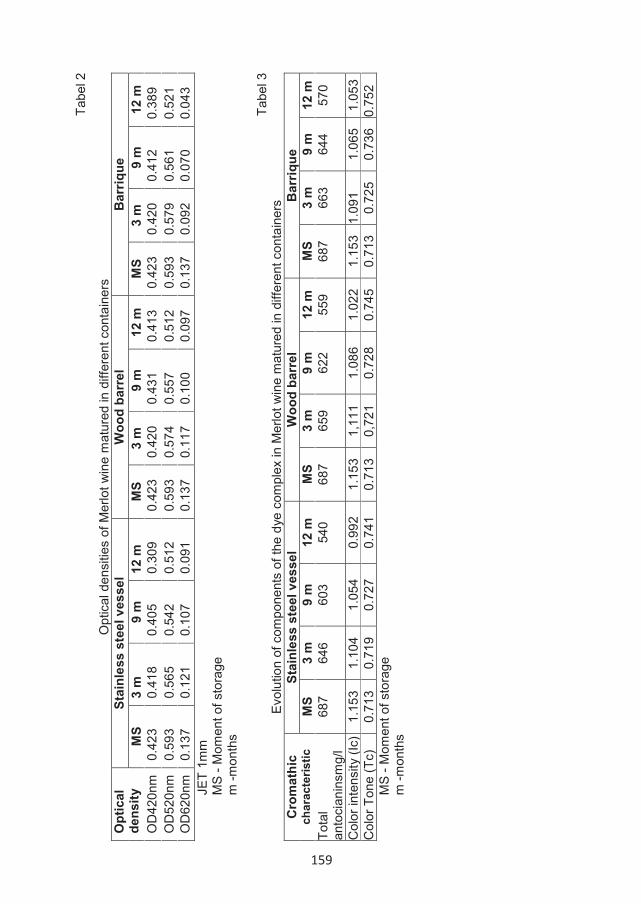
Tabe
l 2
Opt
ical
den
sitie
s of
Mer
lot w
ine
mat
ured
in d
iffer
ent c
onta
iner
s O
ptic
alde
nsity
Stai
nles
sst
eelv
esse
lW
ood
barr
elB
arriq
ueM
S3
m9
m12
mM
S3
m9
m12
mM
S3
m9
m12
mO
D42
0nm
0.42
30.
418
0.40
50.
309
0.42
30.
420
0.43
10.
413
0.42
30.
420
0.41
20.
389
OD
520n
m0.
593
0.56
50.
542
0.51
20.
593
0.57
40.
557
0.51
20.
593
0.57
90.
561
0.52
1O
D62
0nm
0.13
70.
121
0.10
70.
091
0.13
70.
117
0.10
00.
097
0.13
70.
092
0.07
00.
043
JET
1mm
M
S- M
omen
t of s
tora
ge
m-m
onth
s
Tabe
l 3Ev
olut
ion
of c
ompo
nent
s of
the
dye
com
plex
in M
erlo
t win
e m
atur
ed in
diff
eren
t con
tain
ers
Cro
mat
hic
char
acte
ristic
Stai
nles
sst
eelv
esse
lW
ood
barr
elB
arriq
ueM
S3
m9
m12
mM
S3
m9
m12
mM
S3
m9
m12
mTo
tal
anto
cian
insm
g/l
687
646
603
540
687
659
622
559
687
663
644
570
Col
or in
tens
ity (I
c)1.
153
1.10
41.
054
0.99
21.
153
1,11
11.
086
1.02
21.
153
1.09
11.
065
1.05
3C
olor
Ton
e (T
c)0.
713
0.71
90.
727
0.74
10.
713
0,72
10.
728
0.74
50.
713
0.72
50.
736
0.75
2M
S - M
omen
t of s
tora
ge
m-m
onth
s
1
160
STUDY ON THE USE OF ASFAK IN LACTUCA SATIVA L. CULTURE
Neață Gabriela1, Hoza Gheorghița1*, Dobrescu Aurelia1, Basarabă Adrian1,Mohammed Jasin Mohammed1
18 University of Agronomical Sciences and Veterinary Medicine Bucharest, Horticulture Department, Bd.Mărăști, 59, Bucharest, Romania, e-mail:[email protected]
* Correspondence author. E-mail e-mail:[email protected]
Keywords: biostimulator Asfac, lettuce culture, yield
ABSTRACTThe research was conducted in the solarium of the Department of Horticulture at USAMV
Bucharest in year 2017. Six varieties of Lactuca sativa L: Touareg, Analena, Shangore, Centore and Sotalis were used. The behavior of the Lactuca sativa L. was followed when the Asfak biostimulator was applied in different doses during vegetation periods. Phenological observations, biometric measurements, agrochemical determinations of Lactuca sativa L. quality, and production were recorded. The results were statistically interpreted.
INTRODUCTION In the last years the use of biostimulants in agriculture grow to $2 billion in sales
by 2018 (Calvo et al., 2014). So, it is neccesary to establish a legal framework for the marketing as products in EU (EBIC, 2012).Biostimulators are defined as “containing substance(s) and/or micro-organisms whose function when applied to plants or the rhizosphere is to stimulate natural processes to enhance/benefit nutrient uptake, nutrient efficiency, tolerance to abiotic stress, and crop quality.”( Patrick Brown and Sebastian Saa, 2015)
Accepting this definition, the biostimulants benefit plant productivity by interacting with plant signaling processes thereby reducing negative plant response to stress. This hypothesis recognizes the wealth of recent research demonstrating that plant response to stress is regulated by signaling molecules that may be generated by the plant or its associated microbial populations (Marasco et al., 2012; Bakker et al., 2014; Vandenkoornhuyse et al., 2015).
In Romania SC ROMCHIM PROTECT SA has been developing biostimulators for agricultural crops, horticultural resectation. These new products include ASFAC-BCO-4, a biodegradable product that has auxinic action in plant physiological processes, entering the plant's absorbing complex and favoring the growth of chlorophyll's essential component in the photosynthesis process.
The product has a role in increasing plant vigor and increasing production. It is used as a foliar fertilizer in different concentrations.
The research was conducted in the solarium of the Department of Horticulture at USAMV Bucharest in 2017. 6 varieties of Lactuca sativa L: Touareg, Alanis, Analena, Shangore, Centore and Sotalis were used. The behavior of the salad was followed when applying the Asfac biostimulator at different doses administered during vegetation.
ANNALS OF THE UNIVERSITY OF CRAIOVA
Series: Biology HorticultureFood produce processingtechnologyEnvironmental engineering Vol. XXII I (LIX) - 2018

161
MATERIAL AND METHODS Our proposed experience was in 2017 in the solariums of the Department of
Vegetables, the Faculty of Horticulture at the University of Agronomic Science and Veterinary Medicine Bucharest.
In the experiment, two variants of Asfac concentration of 0.1 % and 0.3 % respectively were applied to the Lactuca sativa L. plants in the first vegetation phases.
Table 1.Scheme of experimental variants
No. Cultivar Experimental variant Tratment1 TUAREG Control Control2 V1 Asfac 0.1 %3 V2 Asfac 0.3 %4 ALANIS Control Control5 V1 Asfac 0.1 %6 V2 Asfac 0.3 %7 SHANGORE Control Control8 V1 Asfac 0.1 %9 V2 Asfac 0.3 %10 ANALENA Control Control11 V1 Asfac 0.1 %12 V2 Asfac 0.3 %13 CENTORE Control Control14 V1 Asfac 0.1 %15 V2 Asfac 0.3 %16 SOTALIS Control Control17 V1 Asfac 0.1 %18 V2 Asfac 0.3 %
The biological material used was made up of 6 Lactuca sativa L. hybrids: Tuareg, Alanis, Analena, Shangore, Centore and Sotalis. Lactuca sativa L. was planted on March 6, 2017 with a 0.4 x 0.3m = 8plants / m2 plot. After planting, the two doses of Asfac 0.1 % and 0.3 % were sprayed twice at two weeks.At the harvest, the average diameter of the Lactuca sativa L. plant and average / head / variant weight were determined. At the same time, analyzes were made regarding the quality of Lactuca sativa L. for consumption and the amount of nitrates, phosphates and potasiu absorbed by the plants.The methods used in the analyzes were: Griess method, spectrophotometric for nitrates, nitrites and Duval reagent and spectrophotometric phosphorus dosing, and for flame spectrophotometry. These methods are according to the standards in our country: ISO 9001.( Metodologia de analiza a solului si plantei. ICPA, 1987). The results were statistically interpreted by variance analysis.
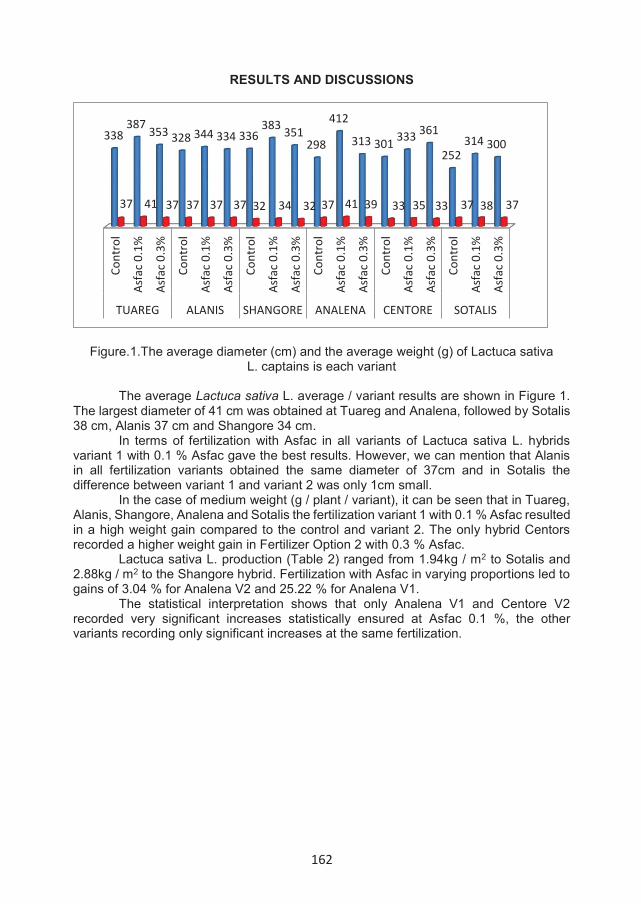
162
RESULTS AND DISCUSSIONS
Figure.1.The average diameter (cm) and the average weight (g) of Lactuca sativa L. captains is each variant
The average Lactuca sativa L. average / variant results are shown in Figure 1.
The largest diameter of 41 cm was obtained at Tuareg and Analena, followed by Sotalis 38 cm, Alanis 37 cm and Shangore 34 cm.
In terms of fertilization with Asfac in all variants of Lactuca sativa L. hybrids variant 1 with 0.1 % Asfac gave the best results. However, we can mention that Alanis in all fertilization variants obtained the same diameter of 37cm and in Sotalis the difference between variant 1 and variant 2 was only 1cm small.
In the case of medium weight (g / plant / variant), it can be seen that in Tuareg, Alanis, Shangore, Analena and Sotalis the fertilization variant 1 with 0.1 % Asfac resulted in a high weight gain compared to the control and variant 2. The only hybrid Centors recorded a higher weight gain in Fertilizer Option 2 with 0.3 % Asfac.
Lactuca sativa L. production (Table 2) ranged from 1.94kg / m2 to Sotalis and 2.88kg / m2 to the Shangore hybrid. Fertilization with Asfac in varying proportions led to gains of 3.04 % for Analena V2 and 25.22 % for Analena V1.
The statistical interpretation shows that only Analena V1 and Centore V2 recorded very significant increases statistically ensured at Asfac 0.1 %, the other variants recording only significant increases at the same fertilization.
Cont
rol
Asfa
c 0.1
%
Asfa
c 0.3
%
Cont
rol
Asfa
c 0.1
%
Asfa
c 0.3
%
Cont
rol
Asfa
c 0.1
%
Asfa
c 0.3
%
Cont
rol
Asfa
c 0.1
%
Asfa
c 0.3
%
Cont
rol
Asfa
c 0.1
%
Asfa
c 0.3
%
Cont
rol
Asfa
c 0.1
%
Asfa
c 0.3
%
TUAREG ALANIS SHANGORE ANALENA CENTORE SOTALIS
338387 353 328 344 334 336
383 351298
412
313 301 333 361
252314 300
37 41 37 37 37 37 32 34 32 37 41 39 33 35 33 37 38 37
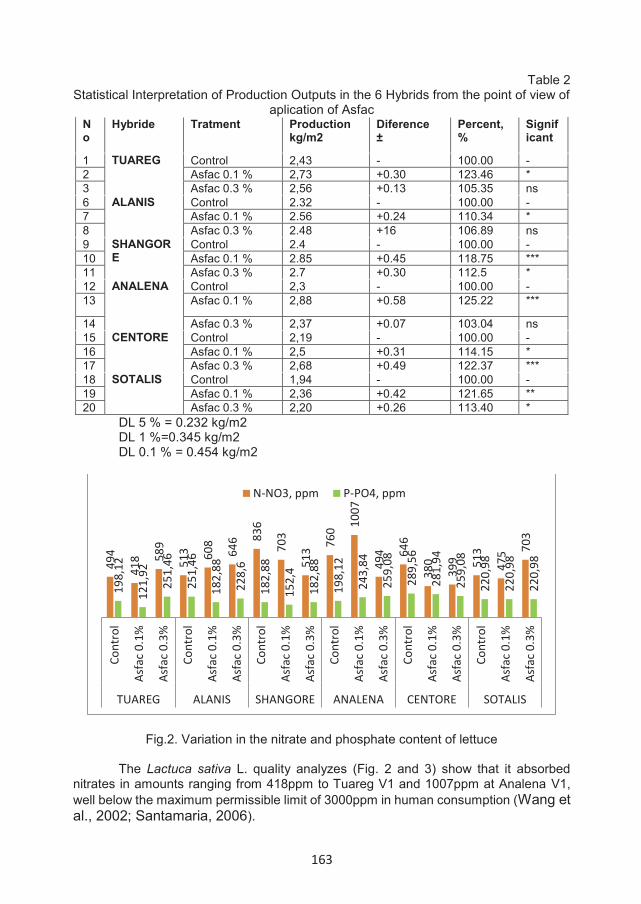
163
Table 2 Statistical Interpretation of Production Outputs in the 6 Hybrids from the point of view of
aplication of Asfac No
Hybride Tratment Production kg/m2
Diference±
Percent, %
Significant
1 TUAREG Control 2,43 - 100.00 -2 Asfac 0.1 % 2,73 +0.30 123.46 *3 Asfac 0.3 % 2,56 +0.13 105.35 ns6 ALANIS Control 2.32 - 100.00 -7 Asfac 0.1 % 2.56 +0.24 110.34 *8 Asfac 0.3 % 2.48 +16 106.89 ns9 SHANGOR
EControl 2.4 - 100.00 -
10 Asfac 0.1 % 2.85 +0.45 118.75 ***11 Asfac 0.3 % 2.7 +0.30 112.5 *12 ANALENA Control 2,3 - 100.00 -13 Asfac 0.1 % 2,88 +0.58 125.22 ***
14 Asfac 0.3 % 2,37 +0.07 103.04 ns15 CENTORE Control 2,19 - 100.00 -16 Asfac 0.1 % 2,5 +0.31 114.15 *17 Asfac 0.3 % 2,68 +0.49 122.37 ***18 SOTALIS Control 1,94 - 100.00 -19 Asfac 0.1 % 2,36 +0.42 121.65 **20 Asfac 0.3 % 2,20 +0.26 113.40 *
DL 5 % = 0.232 kg/m2 DL 1 %=0.345 kg/m2 DL 0.1 % = 0.454 kg/m2
Fig.2. Variation in the nitrate and phosphate content of lettuce
The Lactuca sativa L. quality analyzes (Fig. 2 and 3) show that it absorbed nitrates in amounts ranging from 418ppm to Tuareg V1 and 1007ppm at Analena V1, well below the maximum permissible limit of 3000ppm in human consumption (Wang et al., 2002; Santamaria, 2006).
494
418 58
9
513 60
8
646 83
6
703
513 76
0 1007
494 64
6
380
399 51
3
475 70
3
198,
12
121,
92
251,
46
251,
46
182,
88
228,
6
182,
88
152,
4
182,
88
198,
12
243,
84
259,
08
289,
56
281,
94
259,
08
220,
98
220,
98
220,
98
Cont
rol
Asfa
c 0.1
%
Asfa
c 0.3
%
Cont
rol
Asfa
c 0.1
%
Asfa
c 0.3
%
Cont
rol
Asfa
c 0.1
%
Asfa
c 0.3
%
Cont
rol
Asfa
c 0.1
%
Asfa
c 0.3
%
Cont
rol
Asfa
c 0.1
%
Asfa
c 0.3
%
Cont
rol
Asfa
c 0.1
%
Asfa
c 0.3
%
TUAREG ALANIS SHANGORE ANALENA CENTORE SOTALIS
N-NO3, ppm P-PO4, ppm
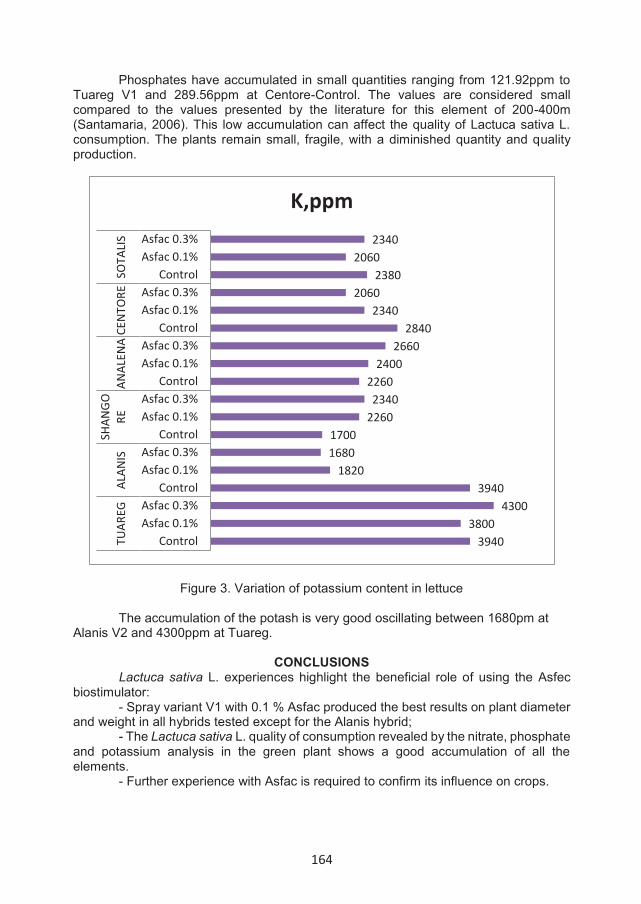
164
Phosphates have accumulated in small quantities ranging from 121.92ppm to Tuareg V1 and 289.56ppm at Centore-Control. The values are considered small compared to the values presented by the literature for this element of 200-400m (Santamaria, 2006). This low accumulation can affect the quality of Lactuca sativa L. consumption. The plants remain small, fragile, with a diminished quantity and quality production.
Figure 3. Variation of potassium content in lettuce
The accumulation of the potash is very good oscillating between 1680pm at Alanis V2 and 4300ppm at Tuareg.
CONCLUSIONS
Lactuca sativa L. experiences highlight the beneficial role of using the Asfec biostimulator:
- Spray variant V1 with 0.1 % Asfac produced the best results on plant diameter and weight in all hybrids tested except for the Alanis hybrid;
- The Lactuca sativa L. quality of consumption revealed by the nitrate, phosphate and potassium analysis in the green plant shows a good accumulation of all the elements.
- Further experience with Asfac is required to confirm its influence on crops.
39403800
43003940
182016801700
22602340
22602400
26602840
23402060
23802060
2340
ControlAsfac 0.1%Asfac 0.3%
ControlAsfac 0.1%Asfac 0.3%
ControlAsfac 0.1%Asfac 0.3%
ControlAsfac 0.1%Asfac 0.3%
ControlAsfac 0.1%Asfac 0.3%
ControlAsfac 0.1%Asfac 0.3%
TUAR
EGAL
ANIS
SHAN
GORE
ANAL
ENA
CENT
ORE
SOTA
LIS
K,ppm
165
REFERENCES Bakker M. G., Schlatter D. C., Otto-Hanson L., Kinkel L. L. (2014). Diffuse
symbioses: roles of plant-plant, plant-microbe and microbe-microbe interactions in structuring the soil microbiome. Mol. Ecol. 23, 1571–1583. 10.1111/mec.12571
Calvo P., Nelson L., Kloepper J. W. (2014). Agricultural uses of plant biostimulants. Plant Soil 383, 3–41. 10.1007/s11104-014-2131-8
EBIC (2012). What are biostimulants? Available online at: http://www.biostimulants.eu/about/what-are-biostimulants
Marasco R., Rolli E., Ettoumi B., Vigani G., Mapelli F., Borin S., et al. . (2012). A Drought resistance-promoting microbiome is selected by root system under desert farming. PLoS ONE 7:48479. 10.1371/journal.pone.0048479
Vandenkoornhuyse P., Quaiser A., Duhamel M., Le Van A., Dufresne A. (2015). The importance of the microbiome of the plant holobiont. New Phytol. 206, 1196–1206. 10.1111/nph.13312.
Wang Z.H., Zong Z.Q., Li S.X., Chen B.M. Nitrate accumulation in vegetables and its residual in vegetable fields. Environ. Sci. 2002;23:79–83.
Santamaria P. Nitrate in vegetables: Toxicity, content, intake and EC regulation. J. Sci. Food Agr. 2006;86:10–17. doi: 10.1002/jsfa.2351.
*** Metodologia de analiza a solului si plantei. ICPA, 1987 *** www.giberelina.ro***https://www.asfac.ro/
166
THE INFLUENCE OF POT SIZE AND CYCOCEL ON GROWTH AND FLOWERING OF ABUTILON HYBRIDUM Hort. ex Voss PLANTS
Nicu Carmen1*, Manda Manuela1
*University of Craiova, Faculty of Horticulture, e-mail: [email protected]
Key words: ornamental plant, height control, pot size, growth retardant, foliar treatment
ABSTRACT Abutilon x hybridum Hort. ex Voss is particularly appreciated for the flowers and the
attractive maple-like leaves, as a decorative potted indoor plant, but it can also be placed on terraces, balconies and even in the garden during the summer. The paper presents the results regarding the influence of the pot size (10, 12, 14 cm) and foliar treatments with Cycocel (1000 ppm) on vegetative growth and flowering of plants. The aim of the experiment was to control height and improve the decorative aspect of plants. The results obtained show that the main morphological characteristics were influenced by the reduction of substrate volume and the growth regulator application. The minimum values of the analyzed parameters were recorded by the plants grown in 14 cm diameter pots, to which foliar treatments with Cycocel 1000 ppm were applied, followed by the untreated plants cultivated in pots with a diameter of 10 cm.
INTRODUCTION The Abutilon genus of the Malvaceae family comprises about 150 species of
shrubs, small trees, perennial and annual plants from tropical and subtropical regions. Abutilon x hybridum Hort. ex Voss (sin. A. globosum) is a branched shrub of 1.5-
2 m high. The leaves are persistent, ovate, 3-lobed or 5-lobed, 10 to 20 cm in length and they are green or can be variegated with white and yellow. The solitary, cup-shaped or bell-shaped flowers have five overlapped petals, which are white, pink, red, yellow or orange, depending on the variety and an abundant and long-lasting flowering from spring until autumn.
One of the most important aspects in the production of ornamental plants grown in pots is the control of the plant growth. The growth control is required in order to maximize the production per unit area, to reduce the transportation costs and to obtain a desired visual quality (Bergstrand, 2017). The consumers generally prefer compact, well-branched plants, with rich flowering and high decorative value.
The flower industry uses plant growth regulators, considered as helping tool in the modern production system of ornamentals. Their exogenous application helps to improve the different economically important and market desirable characteristics of ornamental plants (Sajjad et al., 2017).
The use of plant growth regulators has many advantages such as high efficiency on plant growth and development, improved plant appearance by maintaining plant size in proportion with the pot, increase of the plant tolerance to temperature and drought stress and to handling and shipping (Latimer & Whipker, 2012).
The response of ornamental plants to growth regulators depends on the species and cultivar, the age and vigor of the plant, number of treatments applied, doses, frequency and method of application, environmental and cultural conditions.
ANNALS OF THE UNIVERSITY OF CRAIOVA
Series: Biology Horticulture Food produce processing
technology Environmental engineering Vol. XXII I (LIX) - 2018
167
Many growth retardants are commercially available for potted plant production in greenhouse. Researches on numerous flower species shows that chlormequat chloride (Cycocel) has led to the reduction of plant height (Warner & Erwin, 2003; Currey & Lopez, 2010; Wazir, 2015; Taherpazir & Hashemabadi, 2016), early flowering and higher flower numbers (Latimer & Whipker, 2012) and stimulate basal or lateral branching (Karunananda & Peiris, 2010; Renu & Srivastava, 2013; Manda & Nicu, 2016).
On the other hand, it is less effective under high temperature conditions, can lead to phytotoxic response (it causes discoloration of leaves) at higher concentrations, and the effect on plants is temporary, so in general there are necessary multiple applications.
In order to limit the environmental impact of chemical growth retardants, alternative methods of controlling the plant growth are used, such as: root restriction by using of small containers (Nesmith & Duval, 1998; Poorter et al., 2012); manipulation of photoperiod and light quality (Chapman & Lyons, 1988; Bergstrand & Schüssler, 2016); spectral filters (Lykas & Katsoulas, 2008); water deficit (Nicu & Manda, 2012; Alem et al., 2015); DIF- differential day/night temperatures (Kresten-Jensen & Andersen, 1992; Hendriks & Ueber, 1995); nutrient management - limiting the amount of nitrogen or phosphorus (Hansen & Nielsen, 2000); pinching; mechanical conditioning (Zheng et al., 2004).
The aim of this study was to evaluate the effect of pot size and treatments with Cycocel on growth and flowering of Abutilon x hybridum plants, in order to produce potted plants with high aesthetic and commercial value.
MATERIAL AND METHODS The biological material consisted of shoot tip cuttings derived from Abutilon
hybridum plants, grown in pots under greenhouse conditions. The cuttings were planted after rooting, in a substrate of peat and perlite (2:1), in pots of different sizes and they were pinched for branching.
The research was conducted between 2016 and 2017, in the greenhouse of the Floriculture discipline of the Faculty of Horticulture of Craiova.
The experimental variants were: V1 (control plant) - pots of 14 cm diameter/ untreated plants; V2 - pots of 14 cm diameter/plants treated with Cycocel 1000 ppm (three foliar treatments were applied at two weeks interval); V3 - pots of 12 cm diameter/untreated plants; V4 - pots of 10 cm diameter/untreated plants.
In order to evaluate the influence of the pot size and Cycocel treatments on the growth and flowering of plants, observations and biometric measurements were conducted, which took into account the average plant height, the average number of shoots/plant, the average length of the shoots, the average leaves sizes (length and width), the average diameter and length of flowers.
RESULTS AND DISCUSSIONS The plants of Abutilon x hybridum tend to grow excessively with long, thin stems
and a small number of leaves, so they need to be pinched regularly, during the intense growth period, in order to stimulate branching and flowering. Prunings are also made, in early spring or autumn, after the end of the flowering period in order to obtain quality, compact, small-sized plants with high ornamental value.
The results obtained show that the methods used for plant growth control, namely, the application of foliar treatments with growth retardants (the chemical method) and the reduction of the nutrition space, by using small pots (the alternative method), influenced the average height of plants of Abutilon x hybridum.
The plants treated with Cycocel 1000 ppm (V2) and those grown in a small volume of substrate (V4 - pot of 10 cm diameter), recorded the lowest values of this
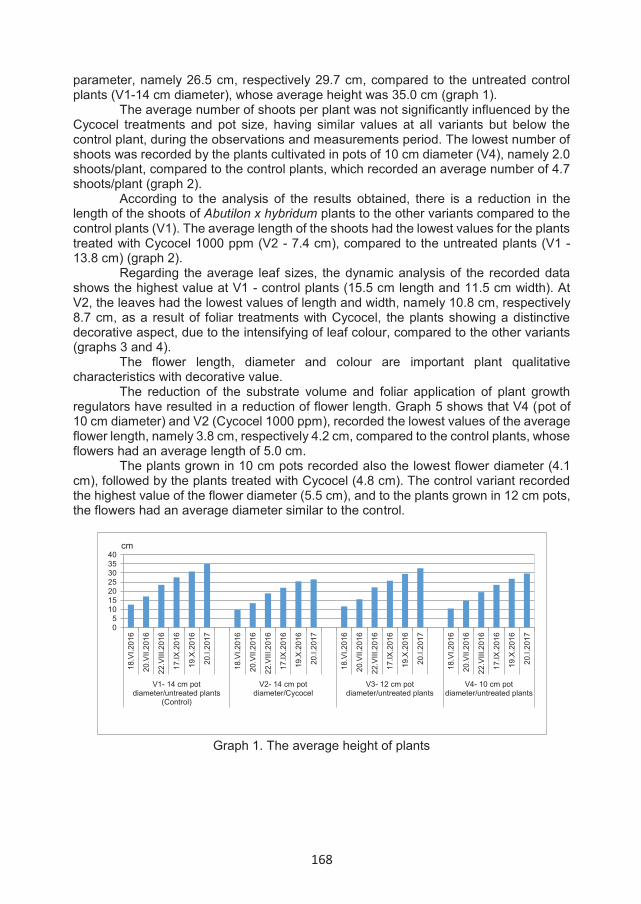
168
parameter, namely 26.5 cm, respectively 29.7 cm, compared to the untreated control plants (V1-14 cm diameter), whose average height was 35.0 cm (graph 1).
The average number of shoots per plant was not significantly influenced by the Cycocel treatments and pot size, having similar values at all variants but below the control plant, during the observations and measurements period. The lowest number of shoots was recorded by the plants cultivated in pots of 10 cm diameter (V4), namely 2.0 shoots/plant, compared to the control plants, which recorded an average number of 4.7 shoots/plant (graph 2).
According to the analysis of the results obtained, there is a reduction in the length of the shoots of Abutilon x hybridum plants to the other variants compared to the control plants (V1). The average length of the shoots had the lowest values for the plants treated with Cycocel 1000 ppm (V2 - 7.4 cm), compared to the untreated plants (V1 - 13.8 cm) (graph 2).
Regarding the average leaf sizes, the dynamic analysis of the recorded data shows the highest value at V1 - control plants (15.5 cm length and 11.5 cm width). At V2, the leaves had the lowest values of length and width, namely 10.8 cm, respectively 8.7 cm, as a result of foliar treatments with Cycocel, the plants showing a distinctive decorative aspect, due to the intensifying of leaf colour, compared to the other variants (graphs 3 and 4).
The flower length, diameter and colour are important plant qualitative characteristics with decorative value.
The reduction of the substrate volume and foliar application of plant growth regulators have resulted in a reduction of flower length. Graph 5 shows that V4 (pot of 10 cm diameter) and V2 (Cycocel 1000 ppm), recorded the lowest values of the average flower length, namely 3.8 cm, respectively 4.2 cm, compared to the control plants, whose flowers had an average length of 5.0 cm.
The plants grown in 10 cm pots recorded also the lowest flower diameter (4.1 cm), followed by the plants treated with Cycocel (4.8 cm). The control variant recorded the highest value of the flower diameter (5.5 cm), and to the plants grown in 12 cm pots, the flowers had an average diameter similar to the control.
Graph 1. The average height of plants
05
10152025303540
18.V
I.201
6
20.V
II.20
16
22.V
III.2
016
17.IX
.201
6
19.X
.201
6
20.I.
2017
18.V
I.201
6
20.V
II.20
16
22.V
III.2
016
17.IX
.201
6
19.X
.201
6
20.I.
2017
18.V
I.201
6
20.V
II.20
16
22.V
III.2
016
17.IX
.201
6
19.X
.201
6
20.I.
2017
18.V
I.201
6
20.V
II.20
16
22.V
III.2
016
17.IX
.201
6
19.X
.201
6
20.I.
2017
V1- 14 cm potdiameter/untreated plants
(Control)
V2- 14 cm potdiameter/Cycocel
V3- 12 cm potdiameter/untreated plants
V4- 10 cm potdiameter/untreated plants
cm

169
Graph 2. The influence of pot size and Cycocel on shoots length and number of shoots/plant
Graph 3. The average length of leaves
Graph 4. The average width of leaves
0
2
4
6
8
10
0
2
4
6
8
10
12
14
16
V1- 14 cm potdiameter/untreated
plants (Control)
V2- 14 cm potdiameter/Cycocel
V3- 12 cm potdiameter/untreated
plants
V4- 10 cm potdiameter/untreated
plants
the average length of shoots the average number of shoots/plant
cm no.
02468
1012141618
18.V
I.201
6
20.V
II.20
16
22.V
III.2
016
17.IX
.201
6
19.X
.201
6
20.I.
2017
18.V
I.201
6
20.V
II.20
16
22.V
III.2
016
17.IX
.201
6
19.X
.201
6
20.I.
2017
18.V
I.201
6
20.V
II.20
16
22.V
III.2
016
17.IX
.201
6
19.X
.201
6
20.I.
2017
18.V
I.201
6
20.V
II.20
16
22.V
III.2
016
17.IX
.201
6
19.X
.201
6
20.I.
2017
V1- 14 cm potdiameter/untreated plants
(Control)
V2- 14 cm potdiameter/Cycocel
V3- 12 cm potdiameter/untreated plants
V4- 10 cm potdiameter/untreated plants
cm
02468
101214
18.V
I.201
6
20.V
II.20
16
22.V
III.2
016
17.IX
.201
6
19.X
.201
6
20.I.
2017
18.V
I.201
6
20.V
II.20
16
22.V
III.2
016
17.IX
.201
6
19.X
.201
6
20.I.
2017
18.V
I.201
6
20.V
II.20
16
22.V
III.2
016
17.IX
.201
6
19.X
.201
6
20.I.
2017
18.V
I.201
6
20.V
II.20
16
22.V
III.2
016
17.IX
.201
6
19.X
.201
6
20.I.
2017
V1- 14 cm potdiameter/untreated plants
(Control)
V2- 14 cm potdiameter/Cycocel
V3- 12 cm potdiameter/untreated plants
V4- 10 cm potdiameter/untreated plants
cm
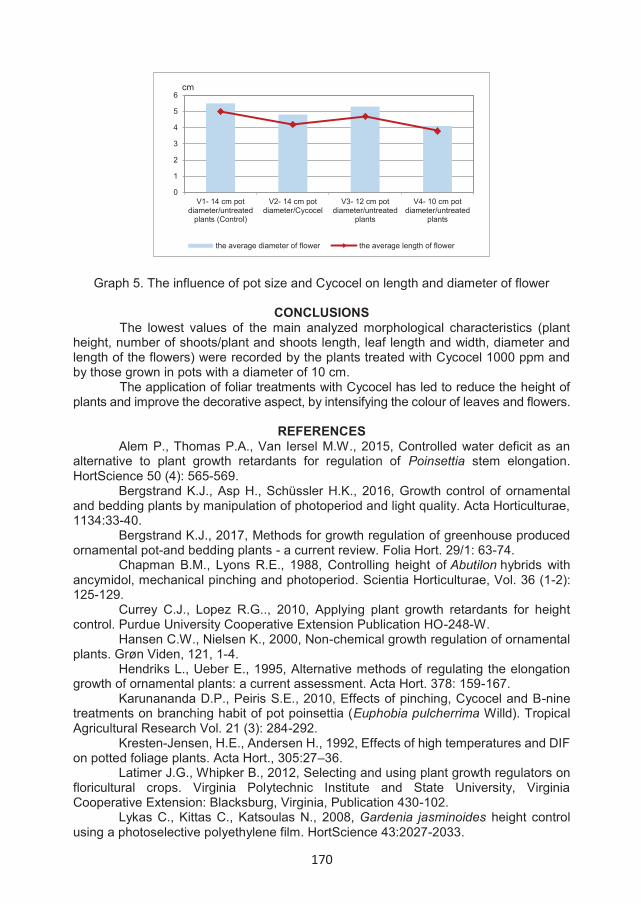
170
Graph 5. The influence of pot size and Cycocel on length and diameter of flower
CONCLUSIONS The lowest values of the main analyzed morphological characteristics (plant
height, number of shoots/plant and shoots length, leaf length and width, diameter and length of the flowers) were recorded by the plants treated with Cycocel 1000 ppm and by those grown in pots with a diameter of 10 cm.
The application of foliar treatments with Cycocel has led to reduce the height of plants and improve the decorative aspect, by intensifying the colour of leaves and flowers.
REFERENCES
Alem P., Thomas P.A., Van Iersel M.W., 2015, Controlled water deficit as an alternative to plant growth retardants for regulation of Poinsettia stem elongation. HortScience 50 (4): 565-569.
Bergstrand K.J., Asp H., Schüssler H.K., 2016, Growth control of ornamental and bedding plants by manipulation of photoperiod and light quality. Acta Horticulturae, 1134:33-40.
Bergstrand K.J., 2017, Methods for growth regulation of greenhouse produced ornamental pot-and bedding plants - a current review. Folia Hort. 29/1: 63-74.
Chapman B.M., Lyons R.E., 1988, Controlling height of Abutilon hybrids with ancymidol, mechanical pinching and photoperiod. Scientia Horticulturae, Vol. 36 (1-2): 125-129.
Currey C.J., Lopez R.G.., 2010, Applying plant growth retardants for height control. Purdue University Cooperative Extension Publication HO-248-W.
Hansen C.W., Nielsen K., 2000, Non-chemical growth regulation of ornamental plants. Grøn Viden, 121, 1-4.
Hendriks L., Ueber E., 1995, Alternative methods of regulating the elongation growth of ornamental plants: a current assessment. Acta Hort. 378: 159-167.
Karunananda D.P., Peiris S.E., 2010, Effects of pinching, Cycocel and B-nine treatments on branching habit of pot poinsettia (Euphobia pulcherrima Willd). Tropical Agricultural Research Vol. 21 (3): 284-292.
Kresten-Jensen, H.E., Andersen H., 1992, Effects of high temperatures and DIF on potted foliage plants. Acta Hort., 305:27–36.
Latimer J.G., Whipker B., 2012, Selecting and using plant growth regulators on floricultural crops. Virginia Polytechnic Institute and State University, Virginia Cooperative Extension: Blacksburg, Virginia, Publication 430-102.
Lykas C., Kittas C., Katsoulas N., 2008, Gardenia jasminoides height control using a photoselective polyethylene film. HortScience 43:2027-2033.
0
1
2
3
4
5
6
V1- 14 cm potdiameter/untreated
plants (Control)
V2- 14 cm potdiameter/Cycocel
V3- 12 cm potdiameter/untreated
plants
V4- 10 cm potdiameter/untreated
plants
the average diameter of flower the average length of flower
cm
171
Manda M., Nicu C., 2016, The influence of growth retardants and substrate volume on growth of Hemigraphys repanda L. Annals of the University of Craiova, Series Biology, Horticulture, Food produce processing technology, Environmental engineering, Vol. XXI (LVII), p. 131-136.
Nesmith D.S., Duval J., 1998, The effect of container size on plant growth. HortTechnology, October-December, 8 (4): 495-498.
Nicu C., Manda M., 2012, The influence of water stress and substrate volume on growth and development Beloperone guttata Brandeg. plants. Annals of the University of Craiova, Series Biology, Horticulture, Food produce processing technology, Environmental engineering, Vol. XVII (LIII), p. 281-286.
Poorter H., Bühler J., van Dusschoten D., Climent J., Postma J.A., 2012, Pot size matters: a meta-analysis of the effects of rooting volume on plant growth. Functional Plant Biology 39: 839-850.
Renu K., Srivastava R., 2013, Effect of cycocel and alar on the growth andflowering of poinsettia cv. SINGLE, Asian Journal of Horticulture, 8(1): 313-316.
Sajjad Y., Jaskani M.J., Asif M., Qasim M., 2017, Application of plant growth regulators in ornamental plants: a review. Pakistan Journal of Agricultural Sciences, Vol. 54 (2), 327-333.
Taherpazir S., Hashemabadi D., 2016, The effect of cycocel and pot size on vegetative growth and flowering of Zinnia (Zinnia elegans). Journal of Ornamental Plants, 6(2):107-114.
Warner, R.M., Erwin J.E., 2003, Effect of plant growth retardants on stem elongation of Hibiscus species. Horttechnology, 13(2): 293-296.
Wazir J.S., 2015, Studies on the effect of growth retardants on growth and flowering in potted Fuchsia. International Journal of Agricultural Sciences and Veterinary Medicine, Vol. 3 (1): 85-89.
Zheng C., Kim K., Matsui S., 2004, Effect of brushing on dwarfing, branching and flowering of Dendranthema indicum var. hortense. Horticultural Research, 3, 291-295.
172
EVALUATION OF POLYPHENOLS CONTENT AND ANTIOXIDANT ACTIVITY OF LEAVES FROM EIGHT VARIETIES ORANGE TREES UNDER ENVIRONMENTAL CONDITIONS OF PELOPONNESE REGION, GREECE
Papachatzis Alexandros1, Gougoulias Nikolaos1*, Stavropoulos Georgios-Christos1,
Koutinas Nikolaos2, Zakynthinos Georgios3, Ntalla Maria-Nektaria4
1Department of Agronomy Technology, Technological Educational Institute of Thessaly, Larissa, Greece.
2Department of Agronomy Technology, Technological Educational Institute of Thessaloniki, Greece. 3Department of Food Technology, Technological Educational Institute of Peloponnese, Kalamata, Greece.
4Department of Computer Science and Engineering, Technological Educational Institute of Thessaly, Larissa, Greece.
*Correspondence author: email: [email protected]
Keywords: Leaves fruit trees; total phenols; phenol fractions; ABTS•+ activity
ABSTRACT Leaves from eight varieties of orange trees (Navelina, Newhall, Merlin, Tarocco, Moro,
Valencia, Lane late and Salustiana) from Argos of Peloponnese region, Greece, were analysed for phenolics content and antioxidant activity, using ethanol extracts. It was found that the content of total phenols (TP), varied from 9.104 to 18.35 mg GAE/g DW, Non-flavonoid phenols (NFP) from 2965.0 to 6768.5 μg GAE/g, Flavonoid phenols (FP) from 6139.2 to 13800.0 μg GAE/g DW, and F-3-ols from 1295.3 to 3069.6 μg(CE) /g DW, depending on the variety of orange trees. The leaves of Valencia orange trees exhibited the highest total antioxidant capacity (TAC), equal to 1520.0 μg Trolox/g DW, while the leaves of Moro orange trees exhibited the lowest, equal to 826.0 μg Trolox/g. The leaves from the orange trees under consideration are regarded as potent sources of biologically active phenolic compounds for pharmaceutical purposes.
INTRODUCTION The creation of free radicals in human cells causes the oxidation of biological
macromolecules which are in the basis many debilitating diseases (Shahidi 1997, Pokorny et al. 2001). The increased interest of natural polyphenols is due to their capability to scavenge and neutralize the active free oxygen and nitrogen-containing radicals, reduce the risk of many contemporary diseases.
The leaves of many plant species contain polyphenols and essential oils, and have been used as spices or sources for the preparation of natural antioxidants for industry (Benavente-Garcıa et al., 2000).
The leaves of many wood species being rich in phenol compounds and tannin, are used for industrial purposes, whereas others are studied to be used as forage (Reddy and Elanchezhian 2008, Ruan et al., 2008).
Very few reports could be found about the antioxidant properties and phenol components of leaf mass at the end of vegetation in view of its more rational utilisation.
The purpose of the present research is to evaluate the antioxidant activity, the contents of total phenols and the major phenol fractions in the leaves from some varieties orange trees grown in the Peloponnese region at the end of their active photosynthesis period.
ANNALS OF THE UNIVERSITY OF CRAIOVA
Series: Biology Horticulture Food produce processing
technology Environmental engineering Vol. XXII I (LIX) - 2018

173
MATERIAL AND METHODS This study, was conducted in eight orange orchards where are they in the Argos
of Peloponnese region, Greece. The distance of the orange orchards from the sea is 5km, and the altitude 5m. The region of Argos (latitude 37036'N, longitude 22047'E) is characterized by a Mediterranean climate with mild dry winters and hot dry summers. Average winter temperature 10.2 0C, average summer temperature 26.3 0C and averageannual precipitation 480 mm.
Leaves from eight varieties orange trees (Citrus sinensis) were the subject, as of study (Navelina, Newhall, Merlin, Tarocco, Moro, Valencia, Lane Late and Salustiana). From all varieties orange trees, the leaves were collected in the first ten-day of September, where it is accepted that the active photosynthesis activity of the leaves is reduced, dried in the sun, ground with the leaf stems in size diameter < 0,15mm. The samples were stored at -18 oC and were further subjected to various analyses. The soil chemical properties of orange orchards are presented in Table 1 and Table 2.
Table 1 Chemical properties of soils for the respective varieties of orange trees
Varieties of orange trees
Soil depth (0-30) cmTexture pH EC CaCO3 Organic matter
dS m-1 % %Navelina CL 8.07± 0.37 0.35±0.02 17.08±0.90 2.48±0.15Newhall SCL 7.79±0.34 0.18±0.01 17.08±0.89 1.24±0.07Merlin SCL 8.46±0.40 0.19±0.01 23.75±1.32 1.91±0.10
Tarocco SCL 8.07±0.38 0.15±0.01 17.50±0.88 1.24±0.06Moro SCL 8.00±0.37 0.09±0.01 14.17±0.83 1.41±0.07
Valencia SL 8.15±0.37 0.14±0.01 59.17±3.13 1.04±0.06Lane Late SCL 7.79±0.41 0.20±0.01 26.25±1.19 1.47±0.07Salustiana CL 8.02±0.37 0.17±0.01 24.58±1.26 1.47±0.07
CL, Clay loam; SCL, Sandy clay loam; SL, Sandy loam; EC, Electrical conductivity and pH; extract (1part soil:5parts H2O). Data represent average means and standard deviation (SD), n=4.
Table 2 Chemical properties of soils for the respective varieties of orange trees
Varieties of orange trees
Soil depth (30-60) cmTexture pH EC CaCO3 Organic matter
dS m-1 % %Navelina CL 8.16±0.48 0.31±0.03 18.05±1.03 2.02±0.10Newhall SCL 7.88±0.38 0.16±0.01 18.33±0.94 1.14±0.06Merlin CL 8.55±0.41 0.20±0.01 23.33±1.26 1.84±0.09
Tarocco SCL 8.02±0.35 0.09±0.01 19.17±0.91 1.19±0.07Moro SCL 7.88±0.35 0.15±0.01 13.75±0.71 1.34±0.06
Valencia SL 8.23±0.36 0.18±0.01 60.12±2.86 0.96±0.05Lane Late SCL 7.93±0.42 0.19±0.01 25.83±1.34 1.37±0.08Salustiana SCL 7.76±0.40 0.18±0.01 25.42±1.27 1.41±0.07
CL, Clay loam; SCL, Sandy clay loam; SL, Sandy loam; EC, Electrical conductivity and pH; extract (1part soil:5parts H2O). Data represent average means and standard deviation (SD), n=4.

174
Preparation of the ethanol extracts Two g of finely ground leaves were two rounds treated by 20 ml of 80 % aqueous
ethanol. Samples were incubated for 24 h in the extractant at stirring; The extract was gathered after centrifugation and filtration. The pellet was re-treated with 20 ml of 80 % aqueous ethanol for 2 h at stirring at ambient temperature. The extract was gathered after centrifugation/filtration and the volume was made up to 50 ml with aqueous ethanol and used for further chemical analysis (Kanner et al. 1994).
Methods of analyses Total polyphenols (TP): The amount of total polyphenols (TP) was determined
with the Folin–Ciocalteu (F.C.) reagent according to the method of (Singleton and Rossi, 1965) using the microvariant proposed by (Baderschneider et al. 1999), and were expressed as gallic acid equivalent (GAE) in mg/g dry weight.
Nonflavonoid phenols (NFP): The content of NFP was determined with the F.C. reagent after removing the flavonoid phenols (FP) with formaldehyde according to the method of (Kramling and Singleton, 1969) and was expressed as gallic acid equivalent (GAE) in μg/g dry weight.
Flavonoid phenols (FP): Flavanoid phenols were determined as a difference between the content of total phenols (TP) and nonflavonoid phenols (NFP). Their amount was evaluated as gallic acid equivalent in μg/g dry weight.
The total flavanols (F-3-ols, catechins and procyanidins) were assayed using p-DMACA reagent after the method of (Li et al. 1996) and were presented as catechin equivalent (CE) in μg/g dry weight.
The total antioxidant capacity (TAC) was determined using the stable radical cation ABTS•+ (2,2-azinobis-(3-ethylbenzothiazolin-6-sulphonic acid), according to the method of (Re et al. 1999) and was presented as Trolox equivalent in μg/g dry weight.
Soil was analyzed using the following methods which are referred by (Page et al. 1982).
Organic matter was analyzed by chemical oxidation with 1 mol L-1 K2Cr2O7 and titration of the remaining reagent with 0.5 mol L-1 FeSO4. Soil pH is determined in (1:5) soil/water extract, pH value is measured by using glass electrode pH meter. Electrical conductivity, (EC) measured in (1:5) soil/water extract, using conductivity meter. The Texture of soils was determined by the method Bouyoucos. The calcium carbonate was determined by the method Bernard.
Data analysis was made using the MINITAB (Ryan et al. 2005) statistical package. The results are means of four parallel samples. Analysis of variance was used to assess treatment effects. Mean separation was made using Tukey’s test when significant differences (P=0.05) between treatments were found.
RESULTS AND DISCUSSION
The content of total phenols (TP) in the leaves orange trees from the varieties studied ranges from 9.104 to 18.35 mg GAE/g DW (Figure 1). The highest content was found in the leaves of Valencia orange trees, and the lowest in the leaves of Moro orange trees. These values are higher than those which correspond to leaves of other types fruit trees (Gougoulias, 2015). It has been established that the concentration of the total phenols and of phenol fractions in the leaves different tree species, varies and depends on the cultivar, the season, the climatic conditions, and agricultural techniques (Mayr et al. 1994).

175
Figure 1. Content of total phenols in the leaves orange trees of the varieties studied.
Columns with the same letter do not differ significantly according to the Tukeyʼs test (P=0.05).
The content of flavonoid phenols (FP) in the leaves orange trees from the varieties studied ranges from 6139.2 to 13800.0 μg GAE/g DW. The highest content was found in the leaves of Valencia orange trees, and the lowest in the leaves of Moro orange trees (Table 3). The FP content in the leaves of Salustiana, Valencia, Newhall, Merlin, Moro and Navelina orange trees constitute 76.3 %, 75.2 %, 70.4 %, 68.0 %, 67.4 % and 64.9 % respectively of TP amount, whereas for the leaves of Tarocco and Lane late orange trees reached 61.7 % % and 59.2 %, respectively. The content of non-flavonoid phenols (NFP) from the varieties studied is higher in the leaves of Lane late orange trees,and the lowest in the leaves of Moro orange trees (Table 3).
Due to the great interest towards the antioxidant properties of flavanols (catechin, epicatechin and procyanidins) we have determined them as a separate fraction.The flavanols is included in the flavonoid fraction. The content of F-3-ols determined as catechin equivalent (CE) in the leaves of orange trees from the varieties studied.The highest content was found in the leaves of Lane late orange trees, and the lowest in the leaves of Moro orange trees (Table 3).
Table 3 Flavonoid phenols (FP), Nonflavonoid phenols (NFP) and Total flavanols (F-3-ols)
content in the leaves different varieties of orange tress Varieties of
orange treesFP NFP F-3-ols
μg GAE/g DW μg GAE/g DW μg CE/g DWNavelina 8598.7bc 4643.8b 2214.5bcNewhall 8399.3c 3528.6c 1838.7dMerlin 9836.0b 4623.6b 2030.6cd
Tarocco 7077.0d 4388.4b 2414.5bMoro 6139.2e 2965.0d 1295.3e
Valencia 13800.0a 4554.4b 2374.6bLane late 9808.9b 6768.5a 3069.6a
Salustiana 10498.5b 3255.2cd 1601.9d
Columns with the same letter do not differ significantly according to the Tukey’s test (P=0.05).
The total antioxidant capacity (TAC) of the leaves orange trees from the varieties studied is determined using the free stable cation ABTS•+ and varies within the limits of

176
826–1520 μg Trolox /g DW (Figure 2). And again the leaves of Valencia orange trees are distinguished by the highest values of TAC and the leaves of Moro orange trees by the lowest.
Figure 2. Total antioxidant capacity (TAC) in the leaves different varieties orange tress.
Columns with the same letter do not differ significantly according to the Tukeyʼs test (P=0.05).
CONCLUSIONS The leaves of the investigated eight varieties of orange tree, differ in their content
of TP, NTP, FP, F-3-ols and total antioxidant capacity (TAC). The leaves of Valencia orange trees, contain the highest amount of TP and FP which correspond to the highest total antioxidant capacity (TAC). Considering the content of total, non-flavonoid and flavonoid phenols, as well as the antioxidant activity, the leaves from the investigated orange trees varieties can be regarded as potential sources of bioactive phenol compounds for pharmaceutical purposes, ecological farming and forage industry.
REFERENCES Baderschneider B., Luthria D., Waterhouse A.L., Winterhalter P., 1999,
Antioxidants in white wine (cv. Riesling): I. Comparison of different testing methods for antioxidant activity. Vitis, 38(3): 127-131.
Benavente-Garcıa O., Castillo J., Lorente J., Ortuno A., Del Rio J. A., 2000, Antioxidant activity of phenolics extracted from Olea europaea L. leaves. Food Chemistry, 68(4), 457-462.
Gougoulias N., 2015, Evaluation of antioxidant activity and polyphenol content of leaves from some fruit species. Oxidation Communications, 38(1), 35-45.
Kanner J., Frankel E., Granit R., German B., Kinsella J. E., 1994, Natural antioxidants in grapes and wines. Journal of Agricultural and Food Chemistry, 42(1), 64-69.
Kramling T.E. and Singleton V.L., 1969, An estimate of the nonflavonoid phenols in wines. American Journal of Enology and Viticulture, 20(2): 86-92.
Li Y.G., Tanner G., Larkin P., 1996, The DMACA–HCl protocol and the threshold proanthocyanidin content for bloat safety in forage legumes. Journal of the Science of Food and Agriculture, 70(1): 89-101.
Mayr U., Batzdorfer R., Treutter D. and Feucht W., 1994, Surfactant-induced Changes in Phenol Content of Apple Leaves and Fruit Skins. Acta Hortic, 381: 479 -487.
177
Page A.L, Miller R.H., Keeney D.R., 1982, Methods of Soil Analysis. Part 2, Chemical & Microbiological properties. Agronomy (9), ASSSA, Mad. Wisc. USA.
Pokorny J., Yanishlieva N., Gordon M. H., 2001, Antioxidants in food: practical applications. CRC press.
Re R., Pellegrini N., Proteggente A., Pannala A., Yang M., Rice-Evans C., 1999, Antioxidant activity applying an improved ABTS radical cation decolorization assay. Free radical biology and medicine, 26(9-10), 1231-1237.
Reddy, D. V., Elanchezhian, N., 2008, Evaluation of tropical tree leaves as ruminant feedstuff based on cell contents, cell wall fractions and polyphenolic compounds. Cellulose (ADF-ADL), 14(21.58), 17-52.
Ruan Z. P., Zhang L. L., Lin Y. M., 2008, Evaluation of the antioxidant activity of Syzygium cumini leaves. Molecules, 13(10), 2545-2556.
Ryan B.F., Joiner B.L., Cryer J.D., 2005, MINITAB Handbook: Updated for release 14, 5th edition. Brooks/Cole-Thomson Learning Inc., Kentaky, KY.
Shahidi F., 1997, Natural antioxidants: chemistry, health effects, and applications. The American Oil Chemists Society.
Singleton V.L. and Rossi S.A., 1965, Colorimetry of Total Phenolics with Phosphomolibdic-phosphotungstic Acid Reagents. J Enol Viticult, 16: 144-158.
178
EFFECT OF MATURITY STAGE ON THE PHENOLIC COMPOSITION, VITAMIN C AND ANTIOXIDANT ACTIVITY OF AGEN SKOPELOU PLUMS
Papachatzis Alexandros1, Gougoulias Nikolaos1*, Papachatzis Achilleas2,
Lazou Evangelia1, Tsiountsioura Vassiliki3
1Department of Agronomy Technology, Technological Educational Institute of Thessaly, Larissa, Greece. 2School of Agriculture, Aristotle University of Thessaloniki
3Faculty of Medicine, University of Thessaly, Larissa, Greece. *Correspondence author’s email: [email protected]
Keywords: Plum fruits; total phenols; total anthocyanins; vitamin C; FRAP activity
ABSTRACT ‘Agen Skopelou’ plums were analyzed for total phenols, total anthocyanins, vitamin C
and antioxidant activity FRAP at four different maturity stages based on color (S1,S2,S3, and S4), such as mature green, mature purple, mature blue and mature deep blue respectively. The total phenols content ranged from 2032.6 to 2400.5 mg (GAE) kg-1 FW. The total anthocyanins content ranged from 157 to 229 mg kg-1 FW, as cyanidin-3-glucoside equivalents. The vitamin C content ranged from 189.6 to 275.3 mg kg-1 FW. The antioxidant activity FRAP ranged from 19.38 to 29.64 μmol FRAP g-1 FW. The total anthocyanins content and the vitamin C content increased with maturity of ‘Agen Skopelou’ plums. On the contrary, the changes of antioxidant activity FRAP and the total phenols content evidenced lack of clear trend.
INDRODUCTION The reactive oxygen and nitrogen, which are formed in the human cells as strong
oxidants can cause oxidative damage of biomolecules and the occurrence of many diseases (Sies, 2015). The oxidative destruction of biomolecules can be reduced by using natural antioxidants such as (vitamins and polyphenols) which are contained in fruits and vegetables (Valko et al. 2006).
Phenolic compounds are secondary metabolites of the plants. They are components of many fruits and vegetables and affect the color and taste of the fruit, while exercising potent antioxidant and antimicrobial properties (Duthie 2007, Alesiani et al. 2010).
Plum fruits contain copious high amounts phenolic compounds, such as flavonoids, nonflavonoids, anthocyanins and others that are powerful antioxidants (Chun 2003, Kristl et al. 2011). The content and qualitative composition of phenolic compounds in the fruit depends on the genotype, cultivation techniques and the climatic conditions (Miletic et al. 2012).
In literature little information exists regarding the phenolic composition and the antioxidant activity during plum fruit ripening. The objective of our study was to determine the effect of maturity stage on the phenolic composition, vitamin C and the antioxidant activity of ‘Agen Skopelou’ plums.
ANNALS OF THE UNIVERSITY OF CRAIOVA
Series: Biology Horticulture Food produce processing
technology Environmental engineering Vol. XXII I (LIX) - 2018
179
MATERIAL AND METHODS Fruits of Agen plums were collected from a commercial orchard established in
2002 in island of Skopelos, Greece. Over the seasons examined, fruits were collected in 2016 from the farm Gripioti (3918oN2350oE) at four different stages maturation, based on colour (S1,S2,S3, and S4), such as mature green, mature purple, mature blue and mature deep blue respectively. 15 kg manure per plum tree was added, corresponding to 0.40 kg Nitrogen, 0.35 kg Potassium and 0.13 kg Phosphorus, while no irrigation was used. The area is characterized by a typical Mediterranean climate with cold humid winters and hot-dry summers. In particular, the average yearly air temperature ranges to 17 oC while the average yearly precipitation is 515 mm.
Thirty samples of fruits with no mechanical injuries or disease indications were selected from three trees on each sampling date, with the same sun exposure, position of the branch on the tree and position of fruit on the branch for best representative samples. The fruits they were stored at -20 °C until the analysis. The edible part of the fruit was used in the study. Plum fruits were carefully cut in four equal parts, were frozen by pouring into liquid nitrogen and homogenized using a blender.
Preparation of the ethanol extracts: Twenty g of samples were two rounds treated by 20 ml of 80 % aqueous ethanol. Samples were incubated for 24 h in the extractant at stirring; The extract was gathered after centrifugation and filtration. The pellet was re-treated with 20 ml of 80 % aqueous ethanol for 2 h at stirring at ambient temperature. The extract was gathered after centrifugation /filtration and the volume was made up to 50 ml with aqueous ethanol and used for further chemical analysis (Kanner et al. 1994).
Methods of analyses: Soil was analyzed using the following methods which are referred by (Page et al. 1982). The Texture of soils was determined by the method Bouyoucos. Organic matter was analyzed by chemical oxidation with 1 mol L-1 K2Cr2O7 and titration of the remaining reagent with 0.5 mol L-1 FeSO4. Soil pH and electrical conductivity, (EC), measured in the extract (1 part soil : 5 parts H2O). The calcium carbonate was determined by the method Bernard. Available P forms (Olsen P) was extracted with 0.5 mol L-1 NaHCO3 and measured by spectroscopy. Exchangeable form of potassium was extracted with 1 mol L-1 CH3COONH4 and measured by flame Photometer (Essex, UK). Inorganic nitrogen was extracted with 0.5 mol L-1 CaCl2 and estimated by distillation in the presence of MgO and Devarda's alloy, respectively.
The amount of total polyphenols (TP) in the plum fruits was determined with the Folin-Ciocalteu (F.C.) reagent according to the method of (Singleton and Rossi, 1965) and were expressed as gallic acid equivalent (GAE) in mg kg-1 fresh weight.
Anthocyanins determined with extracting solvent 95 % ethanol / 1.5 N HCl (85:15). The monomeric anthocyanin pigment content of the extracts was determined using the pH-differential method described by (Liu et al. 2002). Pigment content was calculated as mg of cyanidin-3-glucoside equivalents / kg fresh weight, using an extinction coefficient of 26,900 L/cm/mol and molecular weight of 449.2 g/mol.
The vitamin C determined using titrimetric method with 2,6-p-dichlorphenolindophenol. Method is based on vitamin C oxidation by 2,6-p-dichlorphenolindophenol into dehydroascorbic acid, until colour of reagent turns into colorless (AOAC, 2002).
The ferric reducing antioxidant power (FRAP) of the plums extracts was evaluated according to the method of (Benzie and Strain, 1999) and the results were expressed as μmol FRAP reagent g-1 fresh weight.
Data analysis was made using the MINITAB (Ryan et al. 2005) statistical package. The results are means of four parallel samples. Analysis of variance was used
180
to assess treatment effects. Mean separation was made using Tukey’s test when significant differences (P=0.05) between treatments were found.
RESULTS AND DISCUSSION The physicochemical characteristics of soil from studied orchard are presented
in Table 1.
Table 1 Soil chemical properties of plum orchard, before fertilizing application
Properties Soil depth 0-30 cm Soil depth 30-60 cm
Texture Sandy Loam Sandy Loam
pH 6.85 ± 0.06 7.45 ± 0.09
EC, dS m-1 1.12 ± 0.07 0.18 ± 0.02
Organic matter (%) 1.24 ± 0.06 0.72 ± 0.03
Ν-inorganic (mg kg-1) 61.5 ± 4.39 49.0 ± 4.08
K-exchangeable (mg kg-1) 85.8 ± 4.05 65 ± 3.42
P -Olsen (mg kg-1) 7.2 ± 0.65 4.0 ± 0.29
CaCO3 (%) 0.38 ± 0.02 0.38 ± 0.02
Data represent average means and standard deviation (SD), n=4.
The changes in total phenolic content of ‘Agen Skopelou’ fruits during maturation
are presented in Table 2. Maturity stage affects the content of the total phenols of fruits. The content of total phenols (TP) of the fruits in the maturation stages studied ranges from 2032.6 to 2400.5 mg (GAE) kg-1 fresh weight. In particular, in the mature blue colour of fruits the highest polyphenols content was observed, while in the mature green colour the lowest polyphenols content was observed. In addition, from the mature blue to mature deep blue colour there was a significant reduction of total phenolic content of the fruits. Therefore, the total phenolic content increased from S1 to S3 stages, and subsequently decrease until S4 stage. Similar results were obtained by other researches about the influence of maturity stage on phenolic content of Williams cultivars of pear fruits (Amiot et al. 1995).
In most fruits, ripeness degree markedly affected the quantity of the phenolics compounds. The degradation of some phenolics compounds it may be faster or slower than biosynthesis other phenolics compounds. According to other studies, phenolic acids concentrations decrease during ripening, whereas flavonoid phenols concentrations increase during ripening (Manach et al. 2004).
The total phenolics content in fruits of ‘Agen Skopelou’ which were studied was within the range reported in other plum cultivars (Chun et al. 2004). Furthermore, the total phenolic content in fruits of ‘Agen Skopelou’ was lower than that previously reported for Prunus salicina cultivars (Cevallos-Cavals et al. 2006), while was higher than that reported for Stanley cultivar (Kim et al. 2003).
181
Table 2 Changes in total phenolic content, anthocyanin, vitamin C and antioxidant activity
FRAP during maturity of Agen Skopelou plums
Maturity stage
(colour)
TP AC Vitamin C FRAP
mg (GAE) kg-1
fwmg cyanidin-3-
glucoside kg-1 fwmg kg-1 fw μmol g-1 fw
S1, mature green 2032.6d 157c 189.6d 23.89b
S2, mature purple 2234.7b 166c 218.6c 19.38c
S3, mature blue 2400.5a 189b 244.5b 26.46ab
S4, mature deep blue 2102.4c 229a 275.3a 29.64a
Columns with the same letter do not differ significantly according to the Tukey’s test (P=0.05).
The changes in total anthocyanin content during ripening of plums are presented in Table 2. The content of total anthocyanins of the fruits in the maturation stages studied ranges from 157 to 229 mg cyanidin-3-glucoside kg-1 fresh weight. In particular, from the maturity stages S1 to S4 total anthocyanins increased by 45.8 %. Also, fruit ripening isassociated with important changes in colour of fruits and in other quality features. These results show that the anthocyanin content in the plum fruits increases with maturity.
Similar results were obtained by other researches about the influence of maturity stage on anthocyanin content in fruits (Hui and Nip, 2006). The anthocyanin content in fruits of ‘Agen Skopelou’ which were studied was within the range reported in other plum cultivars (Miletic et al. 2012). Furthermore, the anthocyanin content in fruits of ‘Agen Skopelou’ was slightly lower than that reported for Prunus salicina cultivars (Cevallos-Cavals et al. 2006), while was higher than that reported for Prunus domestica cultivars (Franke et al. 2004).
The changes in vitamin C content during ripening of plums are presented in Table 2. The content of the vitamin C of ‘Agen Skopelou’ fruits in the maturation stages studied ranges from 189.6 to 275.3 mg kg-1 fresh weight. These results show that the vitamin C content in the plum fruits increases with maturity.
The changes in antioxidant activity FRAP of ‘Agen Skopelou’ fruits during maturation are presented in Table 2. Antioxidant capacity was also significantly affected by ripening stage of fruits. The antioxidant activity FRAP of the fruits in the maturation stages studied ranges from 19.38 to 29.64 μmol FRAP g-1 fresh weight. After the determination on the first sampling, the total antioxidativity of ‘Agen Skopelou’ fruitsslightly decreased and subsequently increased by 38 %. This increase is probably due to the increase of total anthocyanins and of vitamin C. The results showed that plum fruits containing the highest total phenolics content do not containing and the highest antioxidant activity.
DPPH -scavenging activity variations during five harvesting phases were reported by (Miletic et al. 2012) for Stanley plums, no trend being noticed during fruit development. According to Díaz-Mula et al. (2009), the variety during maturation of plum fruits grown under the same conditions has a significant role for antioxidant capacity.
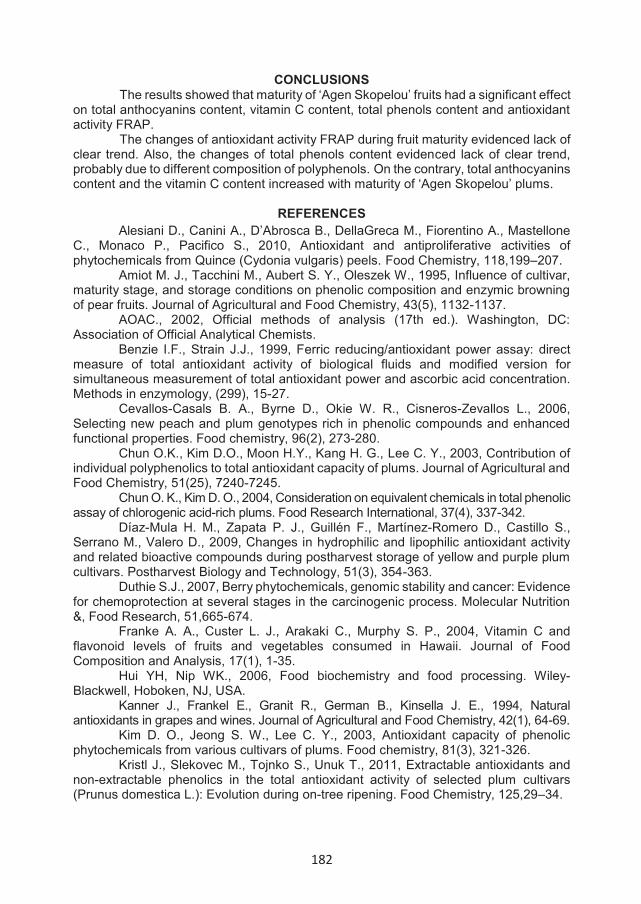
182
CONCLUSIONS The results showed that maturity of ‘Agen Skopelou’ fruits had a significant effect
on total anthocyanins content, vitamin C content, total phenols content and antioxidant activity FRAP.
The changes of antioxidant activity FRAP during fruit maturity evidenced lack of clear trend. Also, the changes of total phenols content evidenced lack of clear trend, probably due to different composition of polyphenols. On the contrary, total anthocyanins content and the vitamin C content increased with maturity of ‘Agen Skopelou’ plums.
REFERENCES Alesiani D., Canini A., D’Abrosca B., DellaGreca M., Fiorentino A., Mastellone
C., Monaco P., Pacifico S., 2010, Antioxidant and antiproliferative activities of phytochemicals from Quince (Cydonia vulgaris) peels. Food Chemistry, 118,199–207.
Amiot M. J., Tacchini M., Aubert S. Y., Oleszek W., 1995, Influence of cultivar, maturity stage, and storage conditions on phenolic composition and enzymic browning of pear fruits. Journal of Agricultural and Food Chemistry, 43(5), 1132-1137.
AOAC., 2002, Official methods of analysis (17th ed.). Washington, DC: Association of Official Analytical Chemists.
Benzie I.F., Strain J.J., 1999, Ferric reducing/antioxidant power assay: direct measure of total antioxidant activity of biological fluids and modified version for simultaneous measurement of total antioxidant power and ascorbic acid concentration. Methods in enzymology, (299), 15-27.
Cevallos-Casals B. A., Byrne D., Okie W. R., Cisneros-Zevallos L., 2006, Selecting new peach and plum genotypes rich in phenolic compounds and enhanced functional properties. Food chemistry, 96(2), 273-280.
Chun O.K., Kim D.O., Moon H.Y., Kang H. G., Lee C. Y., 2003, Contribution of individual polyphenolics to total antioxidant capacity of plums. Journal of Agricultural and Food Chemistry, 51(25), 7240-7245.
Chun O. K., Kim D. O., 2004, Consideration on equivalent chemicals in total phenolic assay of chlorogenic acid-rich plums. Food Research International, 37(4), 337-342.
Díaz-Mula H. M., Zapata P. J., Guillén F., Martínez-Romero D., Castillo S., Serrano M., Valero D., 2009, Changes in hydrophilic and lipophilic antioxidant activity and related bioactive compounds during postharvest storage of yellow and purple plum cultivars. Postharvest Biology and Technology, 51(3), 354-363.
Duthie S.J., 2007, Berry phytochemicals, genomic stability and cancer: Evidence for chemoprotection at several stages in the carcinogenic process. Molecular Nutrition &, Food Research, 51,665-674.
Franke A. A., Custer L. J., Arakaki C., Murphy S. P., 2004, Vitamin C and flavonoid levels of fruits and vegetables consumed in Hawaii. Journal of Food Composition and Analysis, 17(1), 1-35.
Hui YH, Nip WK., 2006, Food biochemistry and food processing. Wiley-Blackwell, Hoboken, NJ, USA.
Kanner J., Frankel E., Granit R., German B., Kinsella J. E., 1994, Natural antioxidants in grapes and wines. Journal of Agricultural and Food Chemistry, 42(1), 64-69.
Kim D. O., Jeong S. W., Lee C. Y., 2003, Antioxidant capacity of phenolic phytochemicals from various cultivars of plums. Food chemistry, 81(3), 321-326.
Kristl J., Slekovec M., Tojnko S., Unuk T., 2011, Extractable antioxidants and non-extractable phenolics in the total antioxidant activity of selected plum cultivars (Prunus domestica L.): Evolution during on-tree ripening. Food Chemistry, 125,29–34.
183
Liu M., Li X. Q., Weber C., Lee C. Y., Brown J., Liu R. H., 2002, Antioxidant and antiproliferative activities of raspberries. Journal of agricultural and food chemistry, 50(10), 2926-2930.
Manach C., Scalbert A., Morand C., Rémésy C., Jiménez L., 2004, Polyphenols: food sources and bioavailability. The American journal of clinical nutrition, 79(5), 727-747.
Miletic N., Popovic B., Mitrovic O., Kandic M., 2012, Phenolic content and antioxidant capacity of fruits of plum cv.'Stanley'('Prunus domestica'L.) as influenced by maturity stage and on-tree ripening. Australian Journal of Crop Science, 6(4), 681.
Page A.L, Miller R.H., Keeney D.R., 1982, Methods of Soil Analysis. Part 2, Chemical & Microbiological properties. Agronomy (9), ASSSA, Mad. Wisc. USA.
Ryan B.F., Joiner B.L., Cryer J.D., 2005, MINITAB Handbook: Updated for release 14, 5th edition.
Sies H., 2015, Oxidative stress: a concept in redox biology and medicine. Redox biology, 4, 180-183.
Singleton V.L., Rossi S.A., 1965, Colorimetry of Total Phenolics with Phosphomolibdic-phosphotungstic Acid Reagents. J Enol Viticult, 16, 144-158.
Valko M., Rhodes C., Moncol J., Izakovic M. M., Mazur M., 2006, Free radicals, metals and antioxidants in oxidative stress-induced cancer. Chemico-biological interactions, 160(1), 1-40.

184
THE INFLUENCE OF GROWTH REGULATORS ON INCREASING
THE DEGREE OF SETTING AND FRUIT PRODUCTION IN THE IDARED APPLE PLANTATION
Pesteanu Ananie1*
1Faculty of Horticulture, State Agrarian University of Moldova
Mircesti str. 48, Chisinau, Republic of Moldova; *Correspondence author e-mail: [email protected]
Keywords: Apple, degree of binding, productivity, quality.
ABSTRACT The experimental plot is placed in the orchard “Codru-ST” Ltd. founded in 2012 year. The
study subject of the experience was Idared apple variety grafted on M9 rootstock. The distance of plantation is 3.5x 0.8 m. The research was conducted during the period of 2016 year. The tested agents was Wuxal Bio Ascofol, 3.0 l/ha; Stimolante 66 f, 0.2 l/ha; Stimolante 66 f, 0.3 l/ha, which was sprayed in different period. During the research, it was studied the chlorophyll content in leaves, the quantity of flowers, the quantity of fruits, the fruit setting, the production at a tree and at a surface unit, the quality of the fruits. It was established that the higher results were obtained by treating apple trees with Stimolante 66 f at a dose of 0.3 l/ha, applied twice by foliar spraying. The first treatment should be done at the beginning of the flowering period, and the second after the fall of the petals.
INTRODUCTION
At present, apple cultivation imposes new tasks for fruit growers, which allow higher yields to be obtained from a surface area unit, with a lower capital investment (Babuc et al., 2013; Cimpoieş, 2012).
To solve these tasks, in modern fruit growing, the growth regulators are widely used (Curry and Greene, 1993). These products enhance metabolism in plants, increase the amount of amino acids, proteins, carbohydrates, vitamins and minerals that are actively involved in protecting trees from the influence of various biotic and abiotic stresses (Greene, 2007; Neamţu and Irimie, 1991; Watanabe M. et al.,2008).
In research conducted with the Antifriz product before flowering, the proportion of related reproductive organs increased by 2.1 % compared to the control, and in the variant where a treatment was performed during the fall of the petals, the increase was 10, 6 % (Алфёров, 2012).
Another stimulant growth regulator is Stimolante 66 f. Stimolante 66 f is a plant stimulator made up of various vegetal extracts, acid alpha naphthylacetic and a range of balanced microelements that influence metabolic functions, which cause plant growth, the binding of reproductive organs and improving the qualitative and quantitative characteristics of production. It helps overcome phases of stress and physiological stagnation due to frost, excess or lack of water, and prevent the loss of nutritional value of the fruit.
ANNALS OF THE UNIVERSITY OF CRAIOVA
Series: Biology Horticulture Food produce processing
technology Environmental engineering Vol. XXII I (LIX) - 2018
185
MATERIALS AND METHODS The researches were carried out during the year 2016, in the apple orchard,
founded in the autumn of 2012 at the company "Codru ST", with „knip boom” trees.The object of study of the experience was Idared apple variety grafted on the
M9 rootstock. The crown was conducting after the slender spindle system. Planting distance was 3.5x0.8 m.
Treatments on the experimental sector were performed according to the experience scheme (tab. 1).
Table 1 The scheme of experiments to determine the effectiveness of growth regulators on the
degree of setting of reproductive organs to apple trees Variants Application method
Control, without treatment -
Wuxal Bio Ascofol, 3.0 l/haBy sprinkling three foliar treatments: I - at the end of flowering; II - 30 days prior to harvest; III - 15 days before harvest
Stimolante 66 f, 0.2 l/ha By sprinkling two foliar treatments: I - at the beginning of flowering; II - after the fall of the petalsStimolante 66 f, 0.3 l/ha
Location of plots was made in blocks, each variant having 4 rehearsals. Each rehearsal consisted of 7 trees. At the border between parcels and experimental rehearsals, one untreated tree was left to avoid overlapping variants or rehearsals during the treatments.
Trees treatments were handled with the portable sprinkler in the hours without wind, in the morning. The amount of solution per tree was 0.3 liters, based on the number of trees per unit area and the recommended water quantity of 1000 l/ha.
Researches were conducted in the field and the laboratory conditions according to accepted methods of experiencing crop growth with growth regulators.
Statistical data processing was performed by the dispersion analysis method.
RESULTS AND DISCUSSIONS Auxins, cytokines and microelement solutions are actively involved in the
synthesis of chlorophyll, photosynthesis and plant vegetation. The investigations show that treatments with growth regulators positively affect
the content of chlorophyll "a" and "b" and their sum, as well as the content of carotenoids, determined at the end of the intensive growth phase of the shoots.
In the case of the control variant the content of chlorophyll "a" constituted 2.60 mg/dm2 and the chlorophyll "b" - 0.82 mg/dm2. The value of the chlorophyll "a" and "b" content was 3.42 mg/dm2, and carotenoids 1.22 mg/dm2 (tab. 2).
The application of the growth regulator Wuxal Bio Ascofol recorded an increase the content of chlorophyll and carotenoids in the leaves. The content of chlorophyll "a" and "b" in this variant constituted 2.94 and 0.93 mg/dm2 respectively, or an increase of 0.34 and 0.11 mg/dm2 as compared to the control variant. The amount of chlorophyll "a" and "b" and the amount of carotenoids in this variant constituted 3.87 and 1.33 mg/dm2,respectively.
In the variant treated with growth regulator Stimolante 66 f at the dose of 0.2 l/ha, the content of chlorophyll "a" in leaf constituted 2.90 mg/dm2, being practically at the level of Wuxal Bio Ascofol, but increased by 11.5 % compared to the control variant.

186
In this variant, the content of chlorophyll "b" and the sum of chlorophyll "a" + "b" recorded an increase of 10.9 % and 13.4 %, respectively, compared to the control variant. The amount of carotenoids in this variant was 1.30 mg/dm2.
In the variant treated with growth regulator Stimolante 66 f at a dose of 0.3 l/ha, the content of chlorophyll "a" increased by 4.4 % compared to the Wuxal Bio Ascofol variant and by 18.1 % compared to the control variant. On treatment with growth regulator Stimolante 66 f at a dose of 0.3 l/ha, the content of chlorophyll "b" in the leaves increased and constituted 1.01 mg/dm2, and the amount of chlorophyll "a" + "b" – 4.08 mg/dm2. Basically chlorophyll "b" increased by 23.1 % and the amount of chlorophyll "a" + "b" by 19.3 % compared to the control variant.
Table 2
Growth regulators' action on chlorophyll and carotenoid content in the leaves of Idared apple variety
Variants
Content of chlorophyll pigments, mg/dm2
Content of carotenoids,
mg/dm2 "a" "b" "a" + "b" Control, without treatment 2,60 0,82 3,42 1,22 Wuxal Bio Ascofol, 3.0 l/ha 2,94 0,93 3,87 1,33 Stimolante 66 f, 0.2 l/ha 2,90 0,91 3,81 1,30 Stimolante 66 f, 0.3 l/ha 3,07 1,01 4,08 1,43
Increasing treatment dose with the growth regulator Stimolante 66 f from the
dose 0.2 l/ha to 0.3 l/ha has insignificantly influenced chlorophyll content "a", "b", "a" + "b" and carotenoids from the leaves.
The investigations carried out during the vegetation period show that the Idared variety differentiated a sufficient quantity of fruit buds and blossomed from 760 to 780 flowers in the tree crown (tab. 3). The amount of flowering flowers shows us that the trees studied have constant values and experiences can be put into testing the growth regulators.
If, in the control variant, where the treatment was not performed, the quantity of flowers was 770 pcs/tree, then in the variants treated with growth regulators the values ranged from 760 to 780 pcs/tree.
In the variant treated with the Wuxal Bio Ascofol at the rate of 3.0 l/ha, the percentage of fruit setting was 9.3 %, or an increase of 0.6 %, compared to the control variant.
When treating with growth regulator Stimolante 66 f at the dose of 0.2 l/ha, the fruit setting was 9.2 %, or an increase of 0.5 % compared to the control variant and a decrease of 0.1 % versus the variant treated with Wuxal Bio Ascofol at the dose of 3.0 l/ha. Thus, the degree of fruit setting in the treatment with the growth regulator Stimolante 66 f at the dose of 0.2 l/ha is approximately identical to the values recorded in the version treated with Wuxal Bio Ascofol at the dose of 3.0 l/ha.
The highest values of the degree of fruit binding were recorded in the variant treated with growth regulator Stimolante 66 f at the dose of 0.3 l/ha, where the studied index constituted 9.9 %, or an increase of 0.6 % as compared with the variant treated with Wuxal Bio Ascofol at the dose of 3.0 l/ha and by 1.2 % compared to the control variant.
The smallest fruit quantity, of 67 pieces per tree, was recorded in the control variant, and the largest, in the variant treated with growth regulator Stimolante 66 f in the dose of 0.3 l/ha - 76 pieces per tree, or an increase compared to the variant treated with
187
Wuxal Bio Ascofol at the dose of 3.0 l/ha by 7.0 % and in the control variant by 13.4 %.This increase in the quantity of fruits in the tree crown was recorded as a result of the increase in the setting of the reproductive organs.
Table 3 Growth regulators influence on the quantity of flowers, fruits and their setting after the
physiological June fall to Idared apple trees
VariantsThe quantity of
flowers,pcs/tree
The degree offruits set, %
The quantity of fruits,
pcs/treeControl, without treatment 770 8,7 67Wuxal Bio Ascofol, 3.0 l/ha 760 9,3 71Stimolante 66 f, 0.2 l/ha 780 9,2 72Stimolante 66 f, 0.3 l/ha 765 9,9 76
LDS 0.05 32 - 3,2
In the variant treated with Stimolante 66 f growth regulator in the dose of 0.2 l/ha, we record that the number of fruits formed was at the same level as in the variant treated with Wuxal Bio Ascofol at a dose of 3.0 l/ha but with 7.5 % higher than the control variant.
The results obtained have shown that treatment with Stimolante 66f growth regulator at a dose of 0.3 l/ha has positively influenced the degree of setting of the reproductive organs and the amount of fruits in the tree crown.
The use of growth regulators Wuxal Bio Ascofol and Stimolante 66 f have a positive influence on the average weight of fruits and the fruit production at a tree and a surface unit.
The lowest number of fruits was obtained in the control variant, where the treatment was not performed being 67 pcs/tree, but the average weight of fruits recorded maximum values being 163.4 g (tab. 4). When using growth regulators with stimulating action, we recorded that the amount of fruits increased and the average weight of fruits ranged from 159.7 to 162.7 g.
The lowest fruit weight on variants treated with growth regulators was recorded in Stimolante 66 f at a dose of 0.3 l/ha being 159.7 g and the highest values were recorded when using Wuxal Bio Ascofol in dose 3.0 kg/ha - 162.7 g.
This decrease happened due to the higher degree of ovulation binding and the increase in the number of fruits. The average weight of a fruit obtained in the variants treated with growth regulators decreased by 0.5 - 2.3 % compared to the control variant, but most of the fruits were of high quality.
The smallest fruit production per tree and per unit area was obtained in the control variant, where it was 10.94 kg and 39.05 t / ha respectively.
In the variant treated with the growth regulator Wuxal Bio Ascofol at a rate of 3.0 l/ha, the fruit production on the tree increased to 11.55 kg and to one hectare to 41.23 tones.
The treatment with growth regulator Stimolante 66f in dose of 0.2 l/ha increased fruit production to 11.68, or 41.70 t/ha.
In the variant treated with Growth Stimulant 66 f in the dose 0.3 l/ha, we record that the fruit production increased compared to the control variant with 4.29 t/ha, or 11.0 %.

188
Table 4 The influence of growth regulators on average weight of fruits and fruit production in
Idared apple tree variety
Variants Average weight, g
Fruit production Difference compared to witness,
t/ha
In % compared to witness kg/tree t/ha
Witness, without treatment 163,4 10,94 39,05 - 100,0
Wuxal Bio Ascofol, 3.0 l/ha 162,7 11,55 41,23 +2,18 105,6
Stimolante 66 f, 0.2 l/ha 162,3 11,68 41,70 +2,65 106,7
Stimolante 66 f, 0.3 l/ha 159,7 12,14 43,34 +4,29 111,0
LDS 0.05 7,8 0,44 1,61 - - The smallest fruit production per tree and per unit area was obtained in the
control variant, where it was 10.94 kg and 39.05 t/ha respectively. In the variant treated with the growth regulator Wuxal Bio Ascofol at a rate of 3.0
l/ha, the fruit production on the tree increased to 11.55 kg and to one hectare to 41.23 tones.
The treatment with growth regulator Stimolante 66f in dose of 0.2 l/ha increased fruit production to 11.68, or 41.70 t/ha. In the variant treated with growth regulator Stimolante 66 f in the dose 0.3 l/ha, we record that the fruit production increased compared to the control variant with 4.29 t/ha, or 11.0 %.
Studying the influence of the treatment dose on the fruit production, we record that with the increase of the quantity of product administered from 0.2 l/ha to 0.3 l/ha, the study index increases by 1.64 t/ha, or 4.3 %.
The study focused not only on the knowledge of the average fruit diameter, but also on the distribution of the fruits in diameter from 5 to 5 mm in relation to variants of the experience. The data obtained in the control variant (tab. 5) shows that the fruits obtained are of high quality due to the optimal quantity of fruits in the tree crowns. Basically, in the control variant, the II category of fruits quality represented 5.7 %, the I category of quality constituted 24.3 %, and the highest weight of fruits (70.0 %) is attributed to the extra category of quality.
In the variant treated with the growth regulator Wuxal Bio Ascofol at the dose of 3.0 l/ha and in the variant treated with the growth regulator Stimolante 66 f at the dose of 0.2 l/ha, we recorded the same quality of fruits obtained in the tree crown. Thus, in these variants, the fruits of II category of quality was 6.4 and 6.7 % respectively, the fruits of I category of quality being 25.1 % and 25.7 % and the fruits of extra category of quality - 68.5 % and 67.6 %. The respective distribution of the fruits in the given variants is quite reasonable, taking into account the quantity to quality ratio.
In the variant treated with growth regulator Stimolante 66 f at the dose of 0.3 l/ha, the fruits have the smallest diameter compared to the other variants. Thus, 66.5 % of the harvested fruits are attributed to the extra category, and 33.5 % was et the I and II categories of quality. The insignificant diminution of the weight of the fruits of the extra category in favor of the fruits of I and II category of quality is explained by their higher quantity in the crown of the trees compared to the other variants.
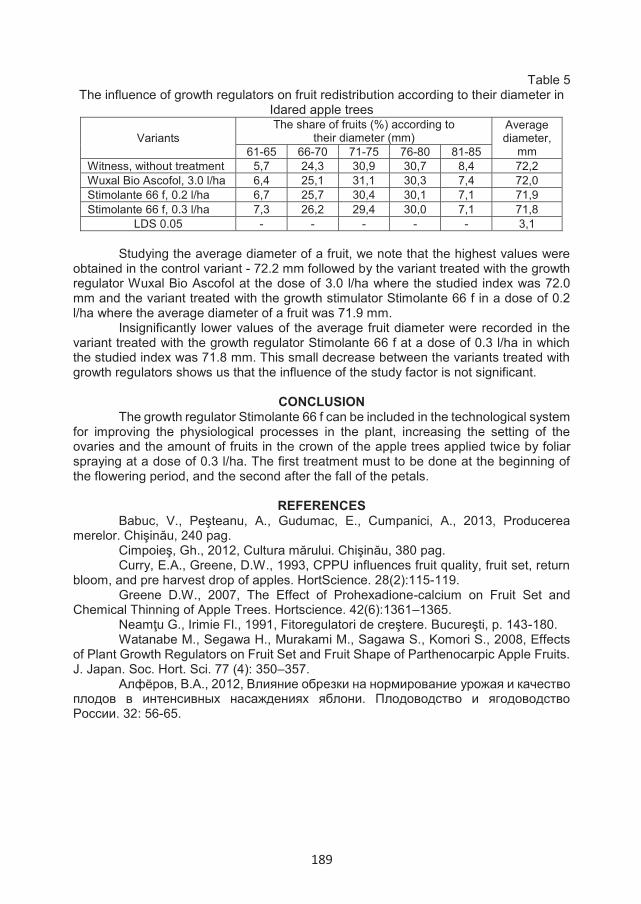
189
Table 5 The influence of growth regulators on fruit redistribution according to their diameter in
Idared apple trees
Variants The share of fruits (%) according to
their diameter (mm)Average diameter,
mm61-65 66-70 71-75 76-80 81-85Witness, without treatment 5,7 24,3 30,9 30,7 8,4 72,2Wuxal Bio Ascofol, 3.0 l/ha 6,4 25,1 31,1 30,3 7,4 72,0Stimolante 66 f, 0.2 l/ha 6,7 25,7 30,4 30,1 7,1 71,9Stimolante 66 f, 0.3 l/ha 7,3 26,2 29,4 30,0 7,1 71,8
LDS 0.05 - - - - - 3,1
Studying the average diameter of a fruit, we note that the highest values were obtained in the control variant - 72.2 mm followed by the variant treated with the growth regulator Wuxal Bio Ascofol at the dose of 3.0 l/ha where the studied index was 72.0 mm and the variant treated with the growth stimulator Stimolante 66 f in a dose of 0.2 l/ha where the average diameter of a fruit was 71.9 mm.
Insignificantly lower values of the average fruit diameter were recorded in the variant treated with the growth regulator Stimolante 66 f at a dose of 0.3 l/ha in which the studied index was 71.8 mm. This small decrease between the variants treated with growth regulators shows us that the influence of the study factor is not significant.
CONCLUSION The growth regulator Stimolante 66 f can be included in the technological system
for improving the physiological processes in the plant, increasing the setting of the ovaries and the amount of fruits in the crown of the apple trees applied twice by foliar spraying at a dose of 0.3 l/ha. The first treatment must to be done at the beginning of the flowering period, and the second after the fall of the petals.
REFERENCES Babuc, V., Peşteanu, A., Gudumac, E., Cumpanici, A., 2013, Producerea
merelor. Chişinău, 240 pag.Cimpoieş, Gh., 2012, Cultura mărului. Chişinău, 380 pag.Curry, E.A., Greene, D.W., 1993, CPPU influences fruit quality, fruit set, return
bloom, and pre harvest drop of apples. HortScience. 28(2):115-119.Greene D.W., 2007, The Effect of Prohexadione-calcium on Fruit Set and
Chemical Thinning of Apple Trees. Hortscience. 42(6):1361–1365.Neamţu G., Irimie Fl., 1991, Fitoregulatori de creştere. Bucureşti, p. 143-180. Watanabe M., Segawa H., Murakami M., Sagawa S., Komori S., 2008, Effects
of Plant Growth Regulators on Fruit Set and Fruit Shape of Parthenocarpic Apple Fruits. J. Japan. Soc. Hort. Sci. 77 (4): 350–357.
Алфёров, В.А., 2012, Влияние обрезки на нормирование урожая и качество плодов в интенсивных насаждениях яблони. Плодоводство и ягодоводство России. 32: 56-65.
190
STUDY OF PEDOCLIMATIC FACTORS WHICH CHARACTERIZE
THE VINEYARD AREAL FROM SEGARCEA
Popa Ion1*, Radu Valeriu1, Firica Marcela Alina1
1University of Craiova, Faculty of Horticulture, PhD student *Correspondence author e-mail: [email protected]
Keywords: horizon, soil, vine
ABSTRACT In the present paper there are presented geological aspects regarding the territory of the
commune Segarcea, which has a lithological substratum which is totally constituted from piedmont quarters and terraces, which rest on sedimentary marno-argil-sandy pliocene sediments, intersected only locally on the base of the slopes on the right of river Jiu.
INTRODUCTION
Soil exerts a major influence on the growth, birth and quality of production in vines. Unlike other cultivated species, the vine is less pretentious than the soil, easily adapting to difficult edaphic conditions (sands, stony soils) (Toti M. et al., 2017).
The territory of Segarcea commune belongs to the middle and upper Pleistocene represented by alluvial and loessoid deposits except the meadow belonging to holocene represented by alluvial deposits.
Holocene deposits are located in the river meadows and terraces, such as gravel, sands, loessoid tiles, or as wind sands on the terraces on the left of river Jiu downstream from the confluence with Amaradia, or as deluvio-coluvio-retreats on hill slopes.
MATERIAL AND METHOD
Sampling the soil profile, in the field: ~ in this phase measurements and observations made on the relief, the
morphology of the soil, the parent material, the water table level, texture horizons, the presence of occurrence of alkaline-earth carbonates by direct determination with 1/3 HCl and so on and it was made a preliminary diagnosis and classification of soils in accordance with the Study Methodology ,,Soil "(Florea N., Canarache A., 1986) and the official classification.
~ harvesting soil samples on genetic horizons. ~ packaging and labeling of each sample, ~ determination of the hygroscopicity coefficient - Micherlich method; ~ apparent density measurements (Da) have been performed; ~ specific density (D).
RESULTS AND DISCUSSIONS
County Dolj holds 3.9 % of the total agricultural area of the country with 585 515 ha, the situation of its distribution by modes of use being (Table 1):
ANNALS OF THE UNIVERSITY OF CRAIOVA
Series: Biology Horticulture Food produce processing
technology Environmental engineering Vol. XXII I (LIX) - 2018

191
Table 1Agricultural land repartition on modes of use
Arable 489096 haPastures 68414haHay areas 295 haVine 17178 hOrchards 7875 ha
The influence of the soil on the vine is due to its physical and chemical properties (Oşlobeanu M. et al., 1991)
Soil structure is a result obtained by associating soil granulometric fractions into complex aggregates with a high water and nutrient retention surface (3 to 30 million m2 retention area / m3 of soil). The most favorable for plant growth, including for vines, is the granular structure, represented by friable spherical glomeruli with a diameter of 2-4 mm (Popa A. , et al., 2015).
The Middle and Upper Pleistocene is developed west of river Jiu in the Craiova-Segarcea-Devesel region and in the East of Jiu in the Craiova-Piatra Olt- Craiova-Studina region, being represented by the deluvial, proluvial deposits of loessoid materials and alluvial deposits with accentuated variations texture. The deposits of the old terraces, the upper terraces, and the gravel, boulder, and sand of the lower terrace are attributed to the upper pleistocene. The holcen is represented by the loessoid deposits of the lower terrace, the low terraced deposits and the river beds.
Typical cernoziom (Photo no. 1), damp, low-leveled (mesocalcary), moderately deep, with loose texture, formed on conveyed materials and redeposited from wind deposits made up of medium materials, eubase, arable underlying rocks.
Morphological features:Ap orph 0-25 cm, gradual passage, gray-brown color (10 YR - 2.5 / 2), gluteous
texture, low glomerular structure, poorly developed, plasticity, adhesiveness, porosity, frequent roots, fine cracks to the base.
Amount 25-50 cm, gradual passage, dark brown, glossy texture, medium glomerular gloss and subangular polyhedral structure, developed medium, plasticity, adhesion, fine pores, biogenic neoformations in the form of coprolite, frequent thin roots, low compact .
Photo no. 1 - Soil profile Cernoziom

192
A / C horizon = 50-80 cm, dark yellowish brown color (10 YR - 4/3), soft texture, medium subangular polyhedron structure, weakly developed, plastic, adhesive, fine pores, low compact, .
Horizon C = 80-135 cm, dark yellowish color (10YR - 5/4), smooth texture, poorly structured, plastic, weak adhesive, fine pores, low effervescence at the bottom.
Physical features:On the Ap horizon, apparent density is small, the total porosity is moderate,
poorly settled soil, medium desiccation, medium permeability.On the Am horizon, apparent density is high, low porosity, poorly settled soil,
high wicking rate, low permeability.On the A / C horizon, apparent density is high, low porosity, moderate
compaction, high wicking rate, low permeability.Chemical characteristics:For the A2 horizon, the soil's reaction is poorly acidic, the total nitrogen content
is very low, the mobile phosphorus content is moderate, the mobile potassium content is medium, the low nitrogen index, the low humus content.
For horizon I, the reaction of the soil is weak ACTA very low total nitrogen content, phosphorus content is moderate, the mobile potassium content is medium index, low nitrogen, content of humus very small.
For horizon A / C, the reaction is slightly acidic soil, total nitrogen content is very low, phosphorus content is very small, mobile potassium content is moderate, the index of nitrogen is small, very low humus content.
From a climate perspective, Segarcea, falling in a climate temperate (with little impact on the Mediterranean, with mild winters, springs short and hot summers, long autumns drier with sufficient rainfall but unevenly distributed during the year, with moisture deficit and droughts in June, July, August, September and October). For the characterization of climatic conditions, meteorological data were used for the period 1961-2004.
Table 2Monthly and annual average temperature during 1961-2004
Weather station
I II III IV V VI VII VIII IX X XI XII Annual average
Băile
ști
1,6
0,7
5,7
12 17,6
21,2
22,8
22,2
17,5
11,3
5,2
0,1
11,2
The average multiannual average temperature is 11.2 oC (Table no. 2). The warmest month in July (22.8 oC) and the coldest month in December (0.1 oC).Average monthly and annual rainfall over the period 1961-2004
The sum of the average annual precipitation in the period 1961-2004Weather station
I II III IV V VI VII VIII IX X XI XII Annual amount
Băile
ști
37,9
35,8
39,4
52,1
59,5
58,9
52,8
36,1
39,3
37,7
50,4
49,1
549
The average annual rainfall (Table no. 3) is 549.0 mm, the richest month in rainfall is 59.5, and the poorest month in precipitation is February with 35.8 mm.
Table
193
CONCLUSIONSThe soils from the vineyard, starting from the northern area of the country and
reaching the Plain of Otenia, are of a great variety.The diversity of geological conditions found in the basement creates the
possibility of significant underground water reserves, highlighted by both drilling and natural manifestations.
The development of the steps relief from the south to the north (meadow, terrace, high piedmont plain and piedmont plain) as well as the great variety of the rocks, plus the changes that take place in the county climate in the same direction, explains the variety of soils and their geographical distribution.
REFERENCESFlorea N., Canarache A., 1986 - Metodologia de elaborare a Studiilor Pedologice
editată de Institutul de Cercetare pentru Pedologie și Agrochimie - BucureștiOşlobeanu M., Macici M., Georgescu Magdalena, Stoian V., 1991 – Zonarea
soiurilor de viţă de vie în România. Ed. Ceres, Bucureşti.Popa A., Giugea N., Genoiu T. C., 2015 – Oltenia mica Românie viticolă, Edit.
Aius, Craiova.Toti M., Dumitru M., Vlad Virgil, Calciu Irina, 2017 – Solul, element de bază al
conceptului de „Terroir”, Ed. Terra Nostra, Iași.
194
STUDY OF PEDOCLIMATIC FACTORS WHICH CHARACTERIZE THE VINEYARD AREAL FROM DĂBULENI
Popa Ion1*, Radu Valeriu1, Firica Marcela Alina1
1University of Craiova, Faculty of Horticulture, PhD student
*Correspondence author e-mail: [email protected]
Keywords: soil, texture, vine
ABSTRACT Through the open soil profile in the studied area was identified an epicaric, epicalcaric,
transported and redeposited psamosol (wind deposits) made of coarse, sandy-loamy / sandy texture with poor wind erosion.
INTRODUCTION
The perimeter studied is represented by a low-winded flat terrain, with a series of microdepressions.
From a geomorphologic point of view, the land is part of the Danube terrace. It generally has a slightly curved planar relief (waves due to the presence of generally dilated dunes and windstorms) but also microdepression dispersed throughout the surface (Irimia L., 2012).
In geological terms, the area, which includes the land under study, is Holocene age, and the parental rock is represented by wind deposits made of coarse or medium-sized materials (Toti M., 2017).
The climatic zone is part of the temperate continental climate province with Mediterranean influence, with warm summers, moderate winters, with precipitation throughout the year but unevenly distributed over the months. According to the data recorded by the Bechet weather station, the average multiannual temperature is 11.2 oC (Fig. 1), the multiannual average rainfall is 570 mm (Fig. 2).
The dominant winds are the Crivăţ, who is beating the eastern-north-eastern sector and Austrul, western winds.
The pedoclimatic conditions, presented succinctly, have oriented the process towards the formation of dominant soils usually grouped in the class of protisoils generally represented by psamosoils.
ANNALS OF THE UNIVERSITY OF CRAIOVA
Series: Biology Horticulture Food produce processing
technology Environmental engineering Vol. XXII I (LIX) - 2018

195
Fig. 1 - Monthly and annual average - Bechet Station
Fig. 2 - Monthly and annual average precipitation - Bechet Station
MATERIAL AND METHOD• Soil sampling: soil samples were collected on pedogenetic horizons in modified
structure and in natural structure;• The harvesting of the soil samples in the modified settlement, for the physico-
chemical-biological characterization, was done in bags, on the thickness of 10-15 cm of each horizon or subsoil of soil.
• The collection of unmodified samples for the characterization of physical andhydrophysical features was done in known volume cylinders (100 cm3) at the momentum soil moisture (Răuţă C. 1986).
RESULTS AND DISCUSSIONSEutric psamosol (Photo no. 1), with sandy-clayey / sandy texture, formed on
redeposited materials represented by wind deposits made of coarse materials (sand), having parental material underlying unsealed silicate rocks or poorly consolidated pre-holocene mesobasic (Florea N. 2012).
Media temperaturilor lunare si anuale - Statia Bechet
-1.7
0.7
5.8
12.1
17.621.2
23.0 22.2
17.5
11.3
5.2
0.1
11.3
-5.0
0.0
5.0
10.0
15.0
20.0
25.0
1 2 3 4 5 6 7 8 9
10
11
12
me
dia
a
nu
ală
lunile anului
va
lori
te
mp
era
turi
Precipitatii medii lunare si anuale - Statia Bechet
32.8 30.6 36.4 46.9 55.0 60.3 52.5 35.9 38.6 35.9 46.0 40.6
511.5
0.0
100.0
200.0
300.0
400.0
500.0
600.0
1 2 3 4 5 6 7 8 9 10 11 12
media
anua
lă
lunile anului
valo
ri pr
ecip
itatii
(mm
)
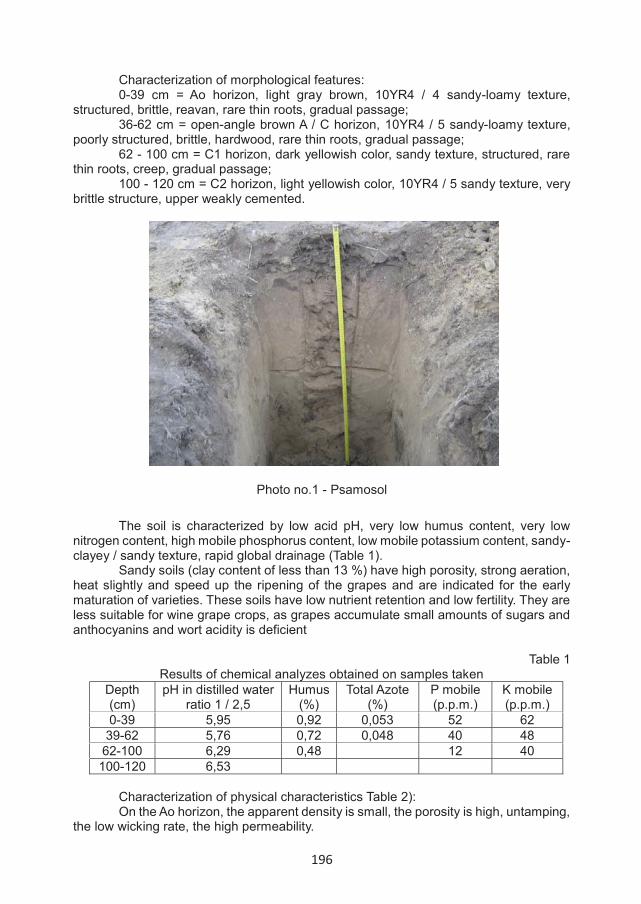
196
Characterization of morphological features:0-39 cm = Ao horizon, light gray brown, 10YR4 / 4 sandy-loamy texture,
structured, brittle, reavan, rare thin roots, gradual passage;36-62 cm = open-angle brown A / C horizon, 10YR4 / 5 sandy-loamy texture,
poorly structured, brittle, hardwood, rare thin roots, gradual passage;62 - 100 cm = C1 horizon, dark yellowish color, sandy texture, structured, rare
thin roots, creep, gradual passage;100 - 120 cm = C2 horizon, light yellowish color, 10YR4 / 5 sandy texture, very
brittle structure, upper weakly cemented.
Photo no.1 - Psamosol
The soil is characterized by low acid pH, very low humus content, very low nitrogen content, high mobile phosphorus content, low mobile potassium content, sandy-clayey / sandy texture, rapid global drainage (Table 1).
Sandy soils (clay content of less than 13 %) have high porosity, strong aeration, heat slightly and speed up the ripening of the grapes and are indicated for the early maturation of varieties. These soils have low nutrient retention and low fertility. They are less suitable for wine grape crops, as grapes accumulate small amounts of sugars and anthocyanins and wort acidity is deficient
Table 1Results of chemical analyzes obtained on samples taken
Depth (cm)
pH in distilled water ratio 1 / 2,5
Humus (%)
Total Azote (%)
P mobile (p.p.m.)
K mobile (p.p.m.)
0-39 5,95 0,92 0,053 52 6239-62 5,76 0,72 0,048 40 4862-100 6,29 0,48 12 40100-120 6,53
Characterization of physical characteristics Table 2):On the Ao horizon, the apparent density is small, the porosity is high, untamping,
the low wicking rate, the high permeability.
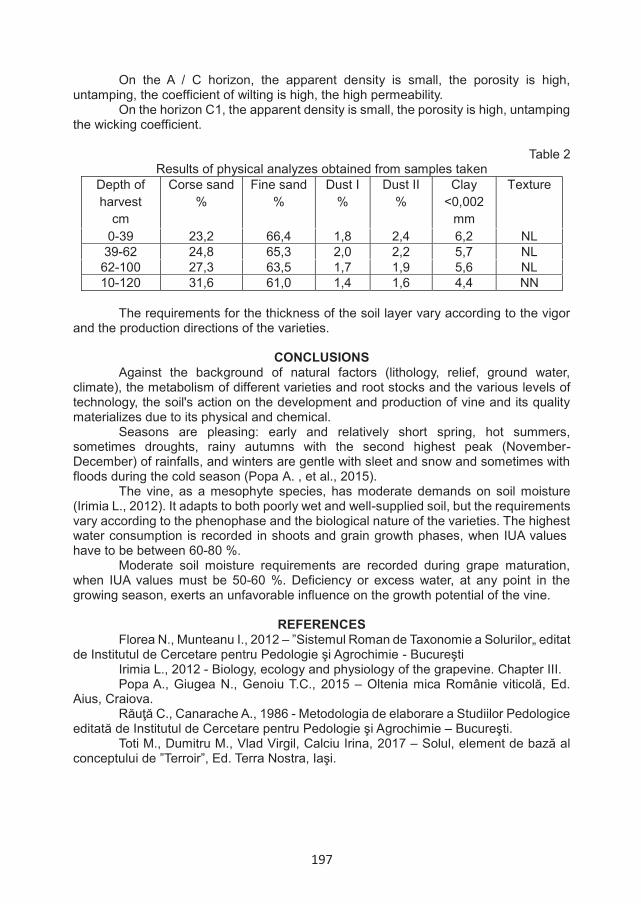
197
On the A / C horizon, the apparent density is small, the porosity is high, untamping, the coefficient of wilting is high, the high permeability.
On the horizon C1, the apparent density is small, the porosity is high, untamping the wicking coefficient.
Table 2Results of physical analyzes obtained from samples taken
Depth of harvest
cm
Corse sand%
Fine sand%
Dust I%
Dust II%
Clay<0,002
mm
Texture
0-39 23,2 66,4 1,8 2,4 6,2 NL39-62 24,8 65,3 2,0 2,2 5,7 NL62-100 27,3 63,5 1,7 1,9 5,6 NL10-120 31,6 61,0 1,4 1,6 4,4 NN
The requirements for the thickness of the soil layer vary according to the vigor and the production directions of the varieties.
CONCLUSIONSAgainst the background of natural factors (lithology, relief, ground water,
climate), the metabolism of different varieties and root stocks and the various levels of technology, the soil's action on the development and production of vine and its quality materializes due to its physical and chemical.
Seasons are pleasing: early and relatively short spring, hot summers, sometimes droughts, rainy autumns with the second highest peak (November- December) of rainfalls, and winters are gentle with sleet and snow and sometimes with floods during the cold season (Popa A. , et al., 2015).
The vine, as a mesophyte species, has moderate demands on soil moisture (Irimia L., 2012). It adapts to both poorly wet and well-supplied soil, but the requirements vary according to the phenophase and the biological nature of the varieties. The highest water consumption is recorded in shoots and grain growth phases, when IUA values have to be between 60-80 %.
Moderate soil moisture requirements are recorded during grape maturation, when IUA values must be 50-60 %. Deficiency or excess water, at any point in the growing season, exerts an unfavorable influence on the growth potential of the vine.
REFERENCESFlorea N., Munteanu I., 2012 – ”Sistemul Roman de Taxonomie a Solurilor„ editat
de Institutul de Cercetare pentru Pedologie şi Agrochimie - Bucureşti Irimia L., 2012 - Biology, ecology and physiology of the grapevine. Chapter III.Popa A., Giugea N., Genoiu T.C., 2015 – Oltenia mica Românie viticolă, Ed.
Aius, Craiova.Răuţă C., Canarache A., 1986 - Metodologia de elaborare a Studiilor Pedologice
editată de Institutul de Cercetare pentru Pedologie şi Agrochimie – Bucureşti.Toti M., Dumitru M., Vlad Virgil, Calciu Irina, 2017 – Solul, element de bază al
conceptului de ”Terroir”, Ed. Terra Nostra, Iaşi.

198
THE EFFECT OF THE LOAD OF FRUITS AT BLACK GRAPES AND THE TIME OF MACERATION-FERMENTATION ON PHENOLIC
COMPOUNDS FROM THE WINES.
Postolache Elena1, Ciubucă Aurel1, Bora Florin Dumitru1, Donici Iulian1*, Donici Alina1
1Research Station for Viticulture and Oenology Bujoru, GALATI * Correspondence author. E-mail: [email protected]
Research Station for Viticulture and Oenology Bujoru, GALATI
Keywords: phenolic compounds, wine, acidity, antocyanins
ABSTRACT In the technology of obtaining the red wines, maceration-fermentation is done in order to
extract colored phenolic compounds. During maceration, the coloring substances from the skin, the grains, diffuse in the gravy, the amount of anthocyanins extracted being dependent on the technology used. This process is based on the extraction of the colorants from the grapes, as a result of the accumulation of ethyl alcohol and the acidity that stabilizes the phenolic compounds. Phenolic compounds influence the organoleptic qualities of wines, making it worthwhile the astringency, the flavor, the hardness, the color, and so on. The color compounds expressed by total anthocyanins and highlighted by color intensity have the maximum at variants with 28 - 20 eye / hatch with the period of 8 days for maceration - fermentation versus 16 days of maceration - fermentation, which implies an optimal extraction period of 8 days.
INTRODUCTION
The research has been done on wines from the 2017 production at SCDVV for Bujoru for the black grapes (Black normal feteasca and ecological Merlot). The colour compounds from the black grapes have been determined and the phenolic potential both in terms of quality and quantity has been determined from the wine.(Postolache 2016, et al.)
The phenolic compounds help define organoleptic traits of wine and they reveal the most important qualities of wine givind its flavor, colour,softness, basically, defining the wine.(Artem 2016, et al.). From a chemical point of view, the wine is a compound made of water, ethanol, sugar, aminoacids, poliphenolic coumpounds, anthocyanins, organic and unorganic substances (Dalipi, 2015 et al., Karataş, 2015 et al.)
MATERIAL AND METHODS
The research followed the phisico-chemical evaluation of wines obtained in both conventional and ecological systems (anthocyanins, total poliphenols, the intensity of colour, the shade of colour, the study of phenolic profiles meaning the phenolic acids, flavonols, flavonols Stilbenes, anthocyanins etc). The reserach has been made on wines from the experimental varieties Black Feteasca and Merlot from the Dealu Bujorului vineyard.
ANNALS OF THE UNIVERSITY OF CRAIOVA
Series: Biology Horticulture Food produce processing
technology Environmental engineering Vol. XXII I (LIX) - 2018
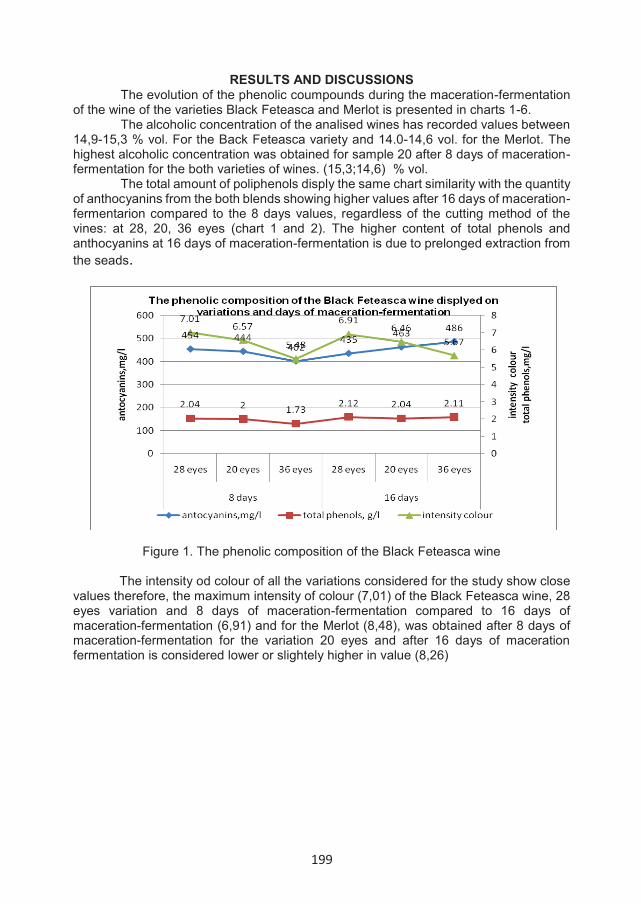
199
RESULTS AND DISCUSSIONS The evolution of the phenolic coumpounds during the maceration-fermentation
of the wine of the varieties Black Feteasca and Merlot is presented in charts 1-6.The alcoholic concentration of the analised wines has recorded values between
14,9-15,3 % vol. For the Back Feteasca variety and 14.0-14,6 vol. for the Merlot. The highest alcoholic concentration was obtained for sample 20 after 8 days of maceration-fermentation for the both varieties of wines. (15,3;14,6) % vol.
The total amount of poliphenols disply the same chart similarity with the quantity of anthocyanins from the both blends showing higher values after 16 days of maceration-fermentarion compared to the 8 days values, regardless of the cutting method of the vines: at 28, 20, 36 eyes (chart 1 and 2). The higher content of total phenols and anthocyanins at 16 days of maceration-fermentation is due to prelonged extraction from the seads.
Figure 1. The phenolic composition of the Black Feteasca wine
The intensity od colour of all the variations considered for the study show close values therefore, the maximum intensity of colour (7,01) of the Black Feteasca wine, 28 eyes variation and 8 days of maceration-fermentation compared to 16 days of maceration-fermentation (6,91) and for the Merlot (8,48), was obtained after 8 days of maceration-fermentation for the variation 20 eyes and after 16 days of maceration fermentation is considered lower or slightely higher in value (8,26)
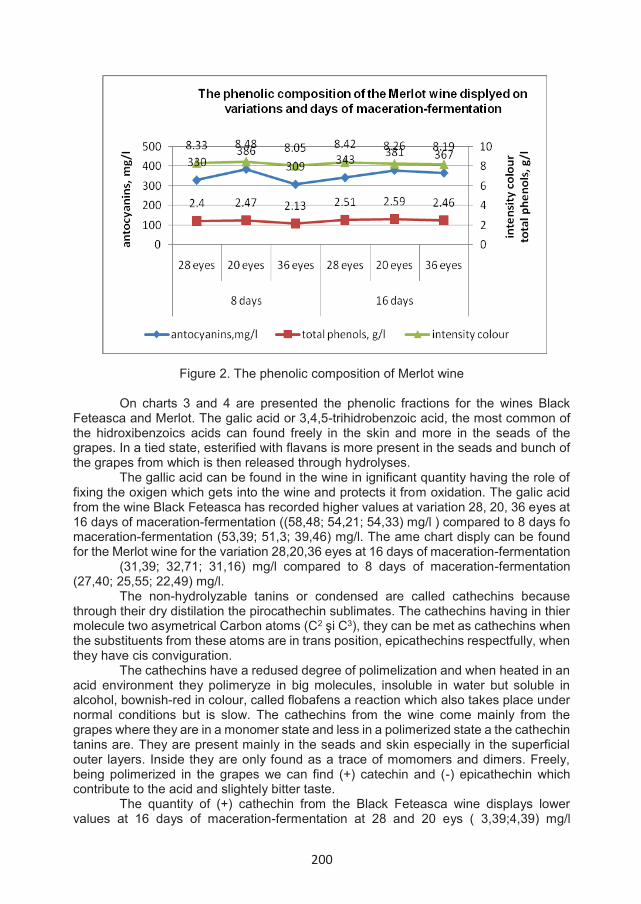
200
Figure 2. The phenolic composition of Merlot wine
On charts 3 and 4 are presented the phenolic fractions for the wines Black Feteasca and Merlot. The galic acid or 3,4,5-trihidrobenzoic acid, the most common of the hidroxibenzoics acids can found freely in the skin and more in the seads of the grapes. In a tied state, esterified with flavans is more present in the seads and bunch of the grapes from which is then released through hydrolyses.
The gallic acid can be found in the wine in ignificant quantity having the role of fixing the oxigen which gets into the wine and protects it from oxidation. The galic acid from the wine Black Feteasca has recorded higher values at variation 28, 20, 36 eyes at 16 days of maceration-fermentation ((58,48; 54,21; 54,33) mg/l ) compared to 8 days fo maceration-fermentation (53,39; 51,3; 39,46) mg/l. The ame chart disply can be found for the Merlot wine for the variation 28,20,36 eyes at 16 days of maceration-fermentation
(31,39; 32,71; 31,16) mg/l compared to 8 days of maceration-fermentation (27,40; 25,55; 22,49) mg/l.
The non-hydrolyzable tanins or condensed are called cathechins because through their dry distilation the pirocathechin sublimates. The cathechins having in thier molecule two asymetrical Carbon atoms (C2 şi C3), they can be met as cathechins when the substituents from these atoms are in trans position, epicathechins respectfully, when they have cis conviguration.
The cathechins have a redused degree of polimelization and when heated in an acid environment they polimeryze in big molecules, insoluble in water but soluble in alcohol, bownish-red in colour, called flobafens a reaction which also takes place under normal conditions but is slow. The cathechins from the wine come mainly from the grapes where they are in a monomer state and less in a polimerized state a the cathechin tanins are. They are present mainly in the seads and skin especially in the superficial outer layers. Inside they are only found as a trace of momomers and dimers. Freely, being polimerized in the grapes we can find (+) catechin and (-) epicathechin which contribute to the acid and slightely bitter taste.
The quantity of (+) cathechin from the Black Feteasca wine displays lower values at 16 days of maceration-fermentation at 28 and 20 eys ( 3,39;4,39) mg/l
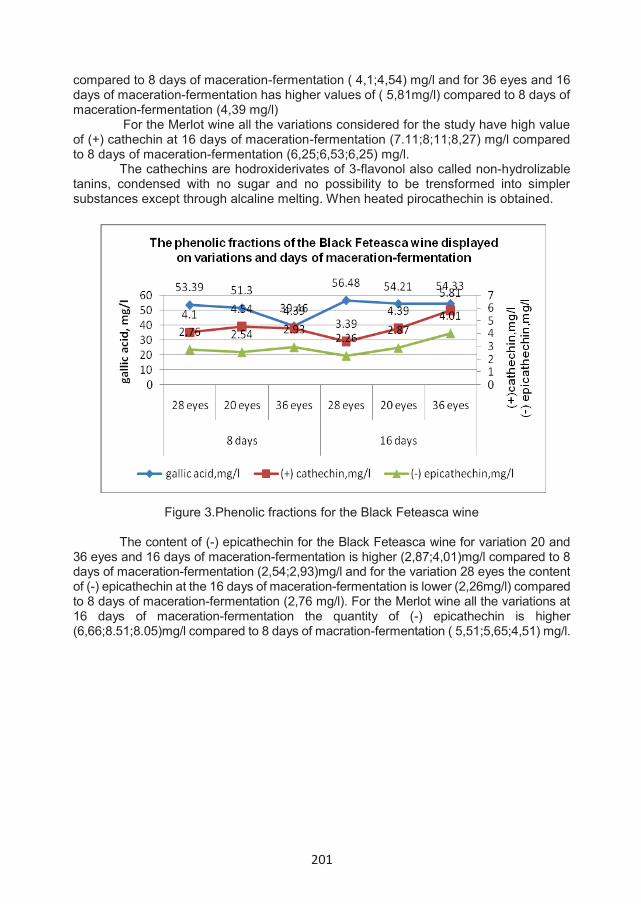
201
compared to 8 days of maceration-fermentation ( 4,1;4,54) mg/l and for 36 eyes and 16 days of maceration-fermentation has higher values of ( 5,81mg/l) compared to 8 days of maceration-fermentation (4,39 mg/l)
For the Merlot wine all the variations considered for the study have high value of (+) cathechin at 16 days of maceration-fermentation (7.11;8;11;8,27) mg/l compared to 8 days of maceration-fermentation (6,25;6,53;6,25) mg/l.
The cathechins are hodroxiderivates of 3-flavonol also called non-hydrolizable tanins, condensed with no sugar and no possibility to be trensformed into simpler substances except through alcaline melting. When heated pirocathechin is obtained.
Figure 3.Phenolic fractions for the Black Feteasca wine
The content of (-) epicathechin for the Black Feteasca wine for variation 20 and 36 eyes and 16 days of maceration-fermentation is higher (2,87;4,01)mg/l compared to 8 days of maceration-fermentation (2,54;2,93)mg/l and for the variation 28 eyes the content of (-) epicathechin at the 16 days of maceration-fermentation is lower (2,26mg/l) compared to 8 days of maceration-fermentation (2,76 mg/l). For the Merlot wine all the variations at 16 days of maceration-fermentation the quantity of (-) epicathechin is higher (6,66;8.51;8.05)mg/l compared to 8 days of macration-fermentation ( 5,51;5,65;4,51) mg/l.

202
Figure 4.Phenolic fractions for the Merlot wine
Figure 5. Phenolic fractions for the Black Feteasca wine
The content of syringic acid (chart 5) for the black Feteasca wine has registered high quantities for all variations (28,20,36) eyes especially at 16 days of maceration-fermentation (122,4; 113,34; 114,06) mg/l compared to 8 days of maceration-fermentation (105,58; 100,61; 68,01) mg/l. for the Merlot the quantity of syringic acid has the same chart display with higher values at 16 days of maceration-fermentation (46,5; 49,1; 47,16)mg/l compared to 8 days of maceration-fermentation (36,94; 33,7; 29,49) mg/l.
The syringic acid has a structured formula of a p-hydroxybenzoic acid, the same as the gallic acid. The syringic acid is formed through the degradation of anthocyanins (malvidin, oenidin), which makes the red wines have the highest quantity of phenolic acid.
On charts 5 and 6 there is displayed the content of resveratrol for the wines Black Feteasca and Merlot (mg/l). apart from the phenolic acids we can find within the
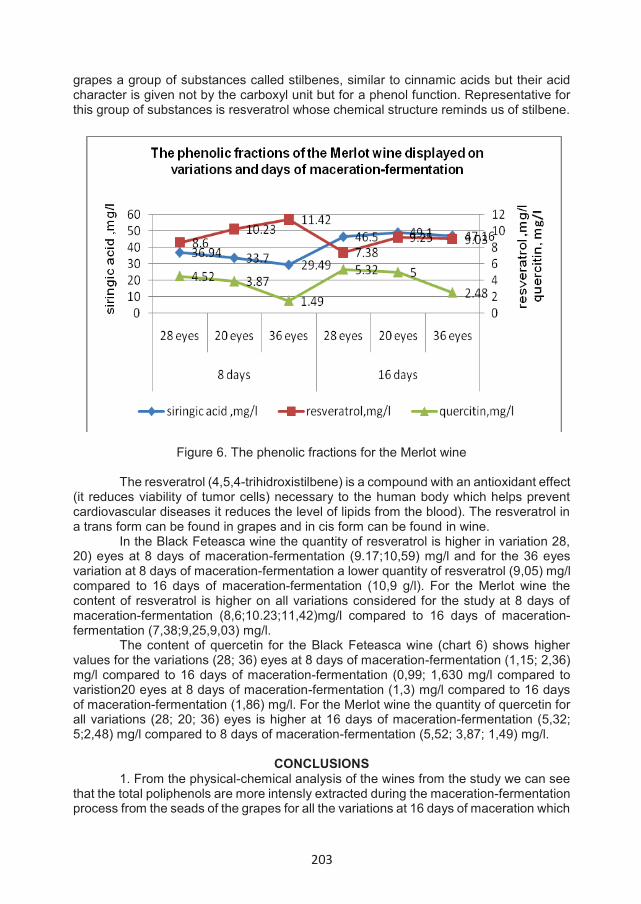
203
grapes a group of substances called stilbenes, similar to cinnamic acids but their acid character is given not by the carboxyl unit but for a phenol function. Representative for this group of substances is resveratrol whose chemical structure reminds us of stilbene.
Figure 6. The phenolic fractions for the Merlot wine
The resveratrol (4,5,4-trihidroxistilbene) is a compound with an antioxidant effect (it reduces viability of tumor cells) necessary to the human body which helps prevent cardiovascular diseases it reduces the level of lipids from the blood). The resveratrol in a trans form can be found in grapes and in cis form can be found in wine.
In the Black Feteasca wine the quantity of resveratrol is higher in variation 28, 20) eyes at 8 days of maceration-fermentation (9.17;10,59) mg/l and for the 36 eyesvariation at 8 days of maceration-fermentation a lower quantity of resveratrol (9,05) mg/l compared to 16 days of maceration-fermentation (10,9 g/l). For the Merlot wine the content of resveratrol is higher on all variations considered for the study at 8 days of maceration-fermentation (8,6;10.23;11,42)mg/l compared to 16 days of maceration-fermentation (7,38;9,25,9,03) mg/l.
The content of quercetin for the Black Feteasca wine (chart 6) shows higher values for the variations (28; 36) eyes at 8 days of maceration-fermentation (1,15; 2,36)mg/l compared to 16 days of maceration-fermentation (0,99; 1,630 mg/l compared to varistion20 eyes at 8 days of maceration-fermentation (1,3) mg/l compared to 16 days of maceration-fermentation (1,86) mg/l. For the Merlot wine the quantity of quercetin for all variations (28; 20; 36) eyes is higher at 16 days of maceration-fermentation (5,32; 5;2,48) mg/l compared to 8 days of maceration-fermentation (5,52; 3,87; 1,49) mg/l.
CONCLUSIONS 1. From the physical-chemical analysis of the wines from the study we can see
that the total poliphenols are more intensly extracted during the maceration-fermentation process from the seads of the grapes for all the variations at 16 days of maceration which
204
does not justify the extention of the maceration period from 8 to 16 days because they become very astringent.
2. The colour componds expressed through total anthocyanins and revealedthrough the intensity of colour are at maximum of representation at 8 days of maceration-fermentation. This means that the optimum period of extraction is at 8 days of maceration-fermentation.
3. From the organoleptic caractéristiques point of view of the wines, we obtainedextremely dry wines, harmonios, typical at 8 days of maceration-fermentation and by extending the period to 16 days we obtained hard, tannions and astringent wines.
4. By analysing the tannin fractions of the phenolic acids we notice o gooddisplay of galic acid, 3-4 hidroxibenzoic acid, (+) catéchine, (-) epicatechine and syringic acid which show an increase through extraction from 8 to 16 days of maceration-fermentation.
5. The tannin fraction represented by quercitrin and resveratrol show highquantities at 8 days of maceration-fermentation compared to 16 days of maceration-fermentation, therefore the best results are at 8 days of maceration-fermentation.
ACKNOWLEDGMENTThis study was financed by the Ministry of Agriculture and Rural Development
Bucharest Sectorial Plan, under ADER 3.3.10.Project.
REFERENCES R. Dalipi, L. Borgese, A. Zacco, K. Tsuji, E. Sangiorgi, R. Piro, E. Bontempi, Le
Depero, 2015- Determination of trace elements in Italian wines by means of total reflection X-ray fluorescence spectroscopy. Intern J Environ Anal Chem 95(1):1-11.
D. Değirmenci Karataş, F. Aydin, I. Aydin, H. Karataş, 2015- Elemental composition of red wines in Southeast Turkey. Czech J. Food Sci 33:228-236.
Elena Postolache, A. Ciubucă, F. D. Bora, Viorica Enache, 2016 - Evaluareapotentialului fenolic al strugurilor roşii din podgoria ,,Dealu Bujorului’’ în contextulschimbărilor climatice. Dezvoltarea Economico Socială Durabilă a Euroregiunilor şi a Zonelor Transfrontaliere’’. Ediţa a XII-a. Vol. XXVIII. Editura PERFORMATICA Iaşi. ISBN 978-606-685-476-4. pag.100-108 .
Victoria Artem, Arina Oana Antoce, Aurora Ranca, Ancuţa Nechita, Laura Enache, Elena Postolache, 2016- The Influence of Terroir on Phenolic Composition of Red Grapes. Bulletin UASVM Horticulture 73(2).Print ISSN 1843-5254, Electronic ISSN 1843-5394.DOI:10.15835/buasvmcn-hort:12173, pag.109-115.

205
STUDY OF PEDOLOGICAL FACTORS WHICH CHARACTERIZE THE WINE SURROUND OF ŞIMNIC
Radu Valeriu1*, Popa Ion1, Firica Marcela Alina1
University of Craiova, Faculty of Horticulture, PhD student * Correspondence author. E-mail [email protected]
Key words: vines, soil, profile
ABSTRACT The paper presents the determinations and observations made in this phase regarding
relief, morphological characters of the soil, parental material, groundwater level and horizon texture. The description of the soil profile is also presented.
INTRODUCTION Soil exerts a major influence on the growth, birth and quality of production in
vines. Unlike other cultivated species, the vine is less pretentious than the soil, adapting easily to difficult edaphic conditions (sands, stony soil; L.Irimia, 2012).
According to Romania, the vine is cultivated on the following types of soil (Oşlobeanu et al., 1991): psamosoils (Sadova-Corabia, Iveşti, Valea lui Mihai), balan soils / kastanozomes, rendzine (Murfatlar, Istria Babadag), regosoils, vertisoils, pseudorendzines, argiloiluvres (Târnave, Alba, Sebeş-Apold), cambic chernozems, chernozems, gray soils / grey faeisomes (Cotnari, Iasi, Huşi, Odobeşti, Panciu, Nicoreşti), argilo-illuvial chernozems / argirus, preluvisoils, brown luvic soils, and planosoils (Dealul Mare, Sîmbureşti, Drăgăşani, Craiova Hills), alluvial soils and alluvial protosoils (Panciu, Odobeşti, Coteşti).
The influence of soil on vines is due to its physical and chemical properties. The seasons are pleasing: early and relatively short spring, hot summers,
sometimes drought, rainy autumns with the second highest peak (November - December) of rainfall, and winters are gentle with sleet and snow, and sometimes with cold floods in the cold season (Popa A., et al., 2015).
MATERIAL AND METHODS Sampling of soil samples in the field: • At this stage, determinations and observations were made regarding the relief,
the morphological characteristics of the soils, the parental material, the phreatic level, the texture on the horizons, the presence of the alkaline-earth carbonates by direct determinations with HCl 1/3 and so on and a preliminary diagnosis and classification of soils was carried out according to the official classification (S.R.T.S. 2003).
• Harvesting soil samples on genetic horizons.• Packaging and labeling of each sample.In the laboratory or physicochemical analyzes, as follows: • humus ( %) - the Walkle-Blak method in the Donut;• determining the size SB - Kappen method;
ANNALS OF THE UNIVERSITY OF CRAIOVA
Series: Biology HorticultureFood produce processingtechnologyEnvironmental engineering Vol. XXII I (LIX) - 2018
206
• granulometric analysis (5 fractions) - Kacinski method; • determination of the hygroscopicity coefficient - Micherlich method (Florea N.,
Canarache A., 1987).
RESULTS AND DISCUSSIONS Description of soil profile, morphological characterization. Relief: - major unit: the southern extremity of the Getic piedmont; - subunit unit: the fourth terrace of Jiu (Şimnic); - elements of the main relief form: quasi-horizontal; - microrelief: quasi-horizontal surface with inclination below 2 % (with bumps
between 10-20 cm); - slope exhibition: ˂ 2 %. Parental material: River Pleistocene river basin deposits (red clays). Rocky underwater: pebbles, sands, clays. Depth of groundwater: ˃9. Global natural drainage: good. Bioclimatic area: Quercus frainetto and Quercus cerris. Current vegetation: agricultural crops with Convolvulus arvensis, Echinochloa
crus galli, Setaria glauca, Cirsium arvense, Chenopodium album. Land Use: Current: viticulture; Anterior: arable. Surface appearance: - soil: with cracks in dry periods; - land: slighty uneven. Description of the soil profile The soil was formed in a stacked loamy clay parental material, characteristically
inherited from the soil and experimented on a granulometric level and accentuated, in time, by the pedogenetic processes.
With regard to climatic data, characterized by summers as long hot periods, drought has become more common in the last 30 years. Long and warm autumn, mild winters, early spring.
The average annual temperature is 10.9 oC. Annual average rainfall is 531.7 mm. Morphological characterization Ap 0-29 cm: medium clay in wet and brown - pale brown in dry condition;
structure disturbed by agricultural works, unfolds in poorly developed polyhedrals; moderately compact; firmly in a wet state; very rough in dry condition; small pores - medium frequent; many vegetal remains uncompleted or undergoing decomposition.
Apt 29-43 cm: medium clay; brown - dark brown, dark brown and yellowish brown - light yellowish brown in dry condition; firmly wet, very rough in dry condition.
AB 43-61 cm: medium loamy clay; dark yellowish brown with brown spots, wet and brown brownish - light yellowish brown with brown spots in dry condition; wet; semi-angular and angular medium-high friable in wet condition; rough in dry condition.
Bt1 61-120 cm: medium loamy clay; dark yellowish brown with dark brown spots in wet and brown with brown spots in dry condition; wet;
Moderately compact; firmly in a wet state; very rough in dry condition. Bt2 120-161 cm: medium loamy clay, dark brown aggregate pearls and brown
inside wet aggregates, brown on aggregate sides and brown inside dry aggregates. wet; firmly in a wet state; very rough in dry condition.

207
BC 161-215 cm: loamy clay medium on the sides of the aggregates and brown inside the aggregates both wet and dry; moderately compact; firmly in a wet and very rough condition in a dry state.
Table 1 Physical attributes
Skyl
ine Depth
Coa
rse
sand Fine
sandDust
Clay
Text
ure
clas
s
Car
bona
tes
(internationalsystem)
skyline sample 2-0,2 mm
0,2-0,02 mm
0,02-0,002 mm
˂0,002 mm
˂0,01 mm
cm % g/g %Ap 0-29 5-20 7,2 39,5 25,3 31,6 43,8 LL -Apt 29-43 29-43 6,5 39,6 21,5 31,6 43,1 LL -AB 43-61 45-60 6,1 35,9 20,6 36,3 43,7 TT -Bt1 61-90 65-80 5,4 33,1 18,9 42,0 51,5 TT -
90-120 95-110 5,1 33,0 20,3 41,3 52,1 TT -Bt2 120-161 130-145 5,0 34,5 20,5 38,5 49,6 TT -BC 161-215 185-200 7,0 36,7 18,3 37,3 50,1 TT -Cn 215-235 215-230 6,6 40,1 19,1 33,6 43,5 TT -CK 235-250 235-250 7,6 40,2 19,1 32,1 42,4 LL 1,5
Cn 215-235 cm: Medium loamy clay, intense brown with brown spots in wet and yellow reddish brown spots in dry condition; friable in a wet condition; rough in dry condition.
Ck 235-250 cm: medium clay; gray oliv with brownish reddish brown spots and gray olives with reddish brown spots in dry condition; wet; massive; friable in a wet condition; rough in dry condition; moderately plastic; moderate adhesive; massive effervescence in the mass.
The physical attributes that make up the vocation vocation are: texture, structure, soil skeleton, thickness, porosity, aeration.
The texture or granulometric composition of the soil represents the quantitative weight of the granulometric fractions in the soil composition.
CONCLUSIONSThe studied fields are in the second-order class for vineyard culture and group
small soils when used as vineyards. In order to ameliorate the reactions, these soils can be improved by fertilization
with organic or chemical fertilizers at established dosages based on expected (programmed) production and plant variety requirements.
When used as vineyards, the reduced limitations are given by the following pedological factors:
Ground limitations imposed: • a moderately acidic reaction (pH with values of 5.5-5.8);• a medium-fine texture (lute-clayey);• a large edafic volume.Land limitations: - a moderately acidic reaction (pH 5.5-5.8); - a medium-fine texture (lute-clayey); - a large edafic volume;

208
Limitations imposed by the land: - low slope slope (5-10 %). - slightly uneven lands (requiring soil mobilizations below 500 m.c./ha). - poorly eroded land.
REFERENCES
Florea N., Canarache A., 1987 - Metodologia de elaborare a Studiilor Pedologice” editată de Institutul de Cercetare pentru Pedologie şi A grochimie - Bucureşti în anul;
Irimia L., 2012 - Biology, ecology and physiology of the grapevine. Chapter III. Oşlobeanu M., Macici M., Georgescu Magdalena, Stoian V., 1991 – Zonarea
soiurilor de viţă de vie în România. Ed. Ceres, Bucureşti. Popa A., Giugea N., Genoiu T. C., 2015 – Oltenia mica Românie viticolă, Ed.
Aius, Craiova. ”Sistemul Roman de Taxonomie a Solurilor '' S.R.T.S. editat de Institutul de
Cercetare pentru Pedologie şi Agrochimie - Bucureşti în anul 2003.
209
OBTAINING BIOLOGICAL MATERIAL BY IN VITRO MULTIPLICATION AT PHYSALIS PERUVIANA SPECIES, AN IMPORTANT MEDICINAL PLANT
Radomir Ana-Maria1*, Stan Ramona1, Vizitiu Diana Elena1
1National Research and Development Institute for Biotechnology in Horticulture Stefanesti *e-mail: [email protected]
Key words: Physalis peruviana, “in vitro” culture, explants, microshoots, growth regulators
ABSTRACT In this study it was aimed elaboration an “in vitro” propagation protocol for the Physalis
peruviana species using seeds as a source of explants. Following the research performed, a germination rate of 90 % was obtained. Regarding the “in vitro” multiplication rate of Physalis peruviana microshoots, the results obtained have been differentiated according to the hormonal balance used. The highest number of shoots/explant (5.25 microshoots/explant) and the highest average length of the shoots (7.23 cm) were obtained on the variant in which the nutrient medium was supplemented with 0.4 mg/l ANA. The shoots were multiplied by subcultivation on the same medium. The highest rate of rooting (95 %) was registered in the case of supplementing the nutrient medium with IBA in a concentration of 1 mg/l. The rooted vitroplants have successfully accommodated to “ex vitro” conditions, achieving an acclimatized rate of 92 %. The results obtained throughout the “in vitro” regeneration phases confirm that the micropropagation technique is an efficient method of multiplication for the Physalis peruviana species.
INTRODUCTION Physalis peruviana (golden berry) is a herbaceous annual plants belongs to the
family Solanaceae (Ramirez et al. 2013). According to the previous reports, this plant has a tremendous medicinal value for curing out different diseases: cancer, leukemia, diabetes, ulcers, malaria, asthma, hepatitis, dermatitis, rheumatism and several other diseases (Mayorga et al., 2002; Arun and Asha, 2007; Soares et al., 2003; Wu et al., 2004). The golden berry fruit tastes like a sweet tomato and includes high levels of vitamin C, vitamin A and the vitamin B-complex. The fruit was demonstrated to have both anti-inflammatory and antioxidant properties (Wu et al. 2006, Pardo et al. 2008). Golden berries are usually propagated by seeds, but the germination rate is small.Therefore, it is important to develop an efficient method for multiplication of P. peruvianaspecies. Till now the highest regeneration from leaf and nodal explants in golden berry tissue culture was observed at the highest concentration of BAP and Kinetin (Otroshy et al. 2013). To our knowledege, there is very limited previously published paper on in vitropropogation of P. peruviana. The present paper deals with the development of a protocol for in vitro multiplication of P. peruviana species using seeds as explant source.
MATERIALS AND METHODS The biological material used for the initiation of in vitro cultures consisted of
seeds sampled from Physalis peruviana fruits. The seeds were first washed with tap water and were sterilized in 6 % calcium hypochlorite for 10 minutes, after which were performed three rinses with sterile distilled water to remove traces of sterilizing agent.
ANNALS OF THE UNIVERSITY OF CRAIOVA
Series: Biology HorticultureFood produce processingtechnology
Environmental engineering Vol. XXII I (LIX) - 2018
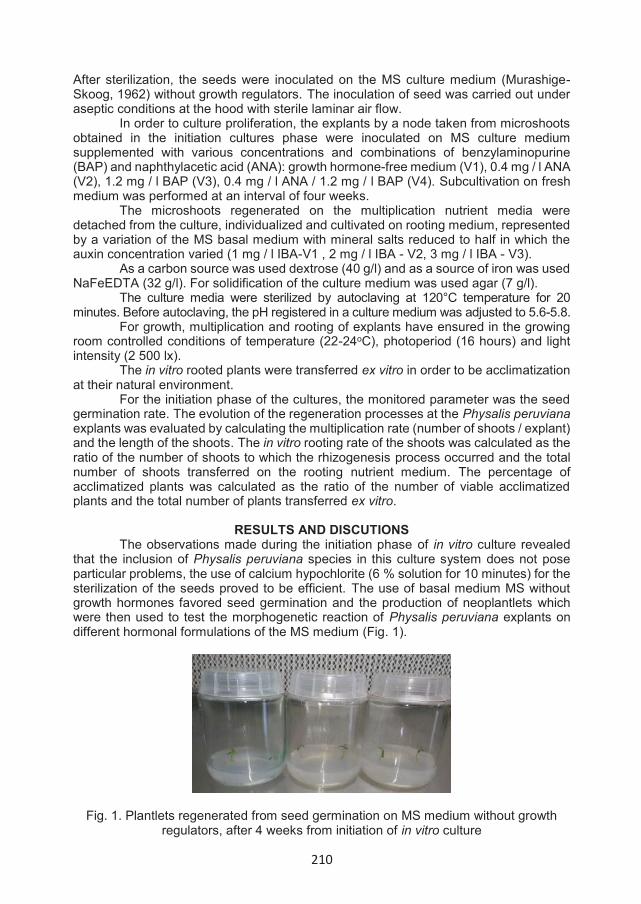
210
After sterilization, the seeds were inoculated on the MS culture medium (Murashige-Skoog, 1962) without growth regulators. The inoculation of seed was carried out under aseptic conditions at the hood with sterile laminar air flow. In order to culture proliferation, the explants by a node taken from microshoots obtained in the initiation cultures phase were inoculated on MS culture medium supplemented with various concentrations and combinations of benzylaminopurine (BAP) and naphthylacetic acid (ANA): growth hormone-free medium (V1), 0.4 mg / l ANA (V2), 1.2 mg / l BAP (V3), 0.4 mg / l ANA / 1.2 mg / l BAP (V4). Subcultivation on fresh medium was performed at an interval of four weeks. The microshoots regenerated on the multiplication nutrient media were detached from the culture, individualized and cultivated on rooting medium, represented by a variation of the MS basal medium with mineral salts reduced to half in which the auxin concentration varied (1 mg / l IBA-V1 , 2 mg / l IBA - V2, 3 mg / l IBA - V3). As a carbon source was used dextrose (40 g/l) and as a source of iron was used NaFeEDTA (32 g/l). For solidification of the culture medium was used agar (7 g/l). The culture media were sterilized by autoclaving at 120°C temperature for 20 minutes. Before autoclaving, the pH registered in a culture medium was adjusted to 5.6-5.8. For growth, multiplication and rooting of explants have ensured in the growing room controlled conditions of temperature (22-24oC), photoperiod (16 hours) and light intensity (2 500 lx). The in vitro rooted plants were transferred ex vitro in order to be acclimatization at their natural environment. For the initiation phase of the cultures, the monitored parameter was the seed germination rate. The evolution of the regeneration processes at the Physalis peruviana explants was evaluated by calculating the multiplication rate (number of shoots / explant) and the length of the shoots. The in vitro rooting rate of the shoots was calculated as the ratio of the number of shoots to which the rhizogenesis process occurred and the total number of shoots transferred on the rooting nutrient medium. The percentage of acclimatized plants was calculated as the ratio of the number of viable acclimatized plants and the total number of plants transferred ex vitro.
RESULTS AND DISCUTIONS
The observations made during the initiation phase of in vitro culture revealed that the inclusion of Physalis peruviana species in this culture system does not pose particular problems, the use of calcium hypochlorite (6 % solution for 10 minutes) for the sterilization of the seeds proved to be efficient. The use of basal medium MS without growth hormones favored seed germination and the production of neoplantlets which were then used to test the morphogenetic reaction of Physalis peruviana explants on different hormonal formulations of the MS medium (Fig. 1).
Fig. 1. Plantlets regenerated from seed germination on MS medium without growth regulators, after 4 weeks from initiation of in vitro culture
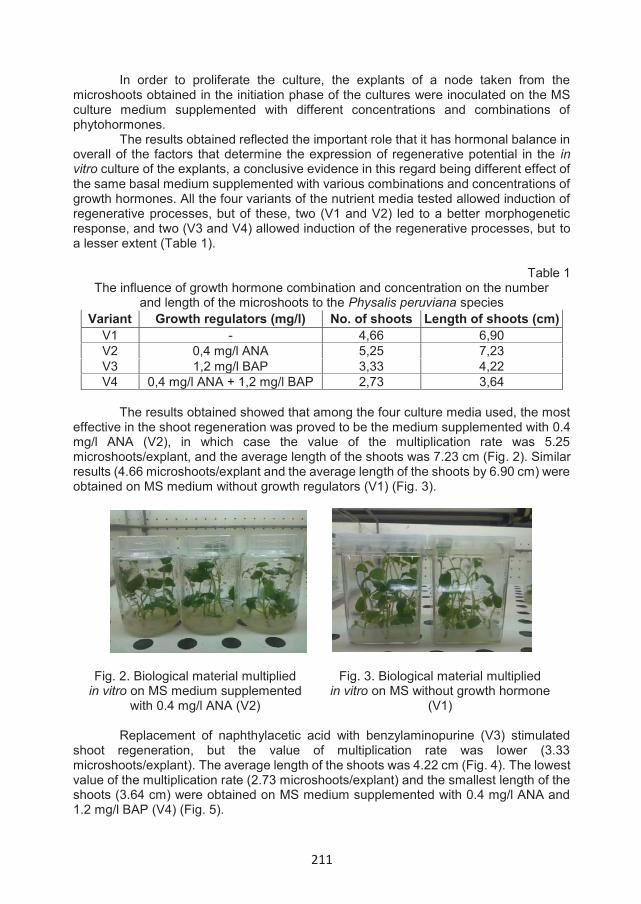
211
In order to proliferate the culture, the explants of a node taken from the microshoots obtained in the initiation phase of the cultures were inoculated on the MS culture medium supplemented with different concentrations and combinations of phytohormones.
The results obtained reflected the important role that it has hormonal balance in overall of the factors that determine the expression of regenerative potential in the in vitro culture of the explants, a conclusive evidence in this regard being different effect of the same basal medium supplemented with various combinations and concentrations of growth hormones. All the four variants of the nutrient media tested allowed induction of regenerative processes, but of these, two (V1 and V2) led to a better morphogenetic response, and two (V3 and V4) allowed induction of the regenerative processes, but to a lesser extent (Table 1).
Table 1 The influence of growth hormone combination and concentration on the number
and length of the microshoots to the Physalis peruviana species Variant Growth regulators (mg/l) No. of shoots Length of shoots (cm)
V1 - 4,66 6,90V2 0,4 mg/l ANA 5,25 7,23V3 1,2 mg/l BAP 3,33 4,22V4 0,4 mg/l ANA + 1,2 mg/l BAP 2,73 3,64
The results obtained showed that among the four culture media used, the most effective in the shoot regeneration was proved to be the medium supplemented with 0.4 mg/l ANA (V2), in which case the value of the multiplication rate was 5.25 microshoots/explant, and the average length of the shoots was 7.23 cm (Fig. 2). Similar results (4.66 microshoots/explant and the average length of the shoots by 6.90 cm) were obtained on MS medium without growth regulators (V1) (Fig. 3).
Fig. 2. Biological material multiplied in vitro on MS medium supplemented
with 0.4 mg/l ANA (V2)
Fig. 3. Biological material multiplied in vitro on MS without growth hormone
(V1)
Replacement of naphthylacetic acid with benzylaminopurine (V3) stimulated shoot regeneration, but the value of multiplication rate was lower (3.33 microshoots/explant). The average length of the shoots was 4.22 cm (Fig. 4). The lowest value of the multiplication rate (2.73 microshoots/explant) and the smallest length of the shoots (3.64 cm) were obtained on MS medium supplemented with 0.4 mg/l ANA and 1.2 mg/l BAP (V4) (Fig. 5).

212
Fig. 4. Biological material multiplied in vitro on MS medium supplemented
with 1.2 mg/l BAP (V3)
Fig. 5. Biological material multiplied
in vitro on MS medium supplemented with 0.4 mg/l ANA and 1.2 mg/l BAP (V4)
After approximately 30 days, the shoots obtained were transferred to fresh medium that supported the regenerative processes. From the qualitative point of view, the biological material resulting from the regeneration of explants had a normal morphology, without vitrification aspects, necrosis or callus differentiation. The microshoots regenerated on the multiplication medium were detached from the culture, individualized and cultured on rooting medium. Knowing the beneficial effect of auxins on the efficiency of the rhizogenesis process, were tested three variants of the rooting medium in which the auxin concentration varied (1-3 mg / l IBA). The highest value of the rooting rate (92 %) was registered in the V1 variant which is characterized by the presence of auxin IBA at a concentration of 1 mg / l. Although the rooting rate decreased with the increase of auxin concentration, and in the case of V2 and V3 variants the rooting of shoots was achieved in a fairly high percentage (88 %, respectively 70 %) (Table 2 and Figure 6).
Table 2
Effect of IBA concentration on the in vitro rooting capacity of Physalis peruviana microshoots
Variant Basic medium Growth regulators
Concentration (mg/l)
Rooting rate (%)
V1 Macroelemente MS½, microelemente MS½,
vitamine MS IBA
1 92 V2 2 88 V3 3 70
In vitro rooted plants were transferred ex vitro in order to accommodate to septic life conditions. The nutrient substrate has an important role on the success of Physalis peruviana plants acclimatization, the best results being obtained when were used pills of peat type Jiffy (V2) (95 % acclimated plants). When using the mixture of peat, perlite and manure in proportion of 2: 1: 1, the percentage of acclimatized plants was lower (77 %), this substrate however ensures a good fortification of acclimated plants (Table 3 and Fig. 7).
Table 3 Influence of the nutrient substrate on acclimatization to ex vitro conditions of Physalis
peruviana regenerants
Variant The nutrient substrate Rate of acclimatization (%)
V1 peat, perlite and manure (2:1:1) 77 V2 pills of peat 95

213
We conclude that the results obtained throughout the in vitro regeneration phases, certify that for the Physalis peruviana species, the micropropagation technique represents an advantageous alternative to the classic methods of propagation, which allows the rapid obtaining of high quality seedlings.
Figure 6. Rooting of Physalis peruvianamicroshoots on ½ MS medium supplemented with 1 mg/l IBA
Figure 7. Physalis peruviana plant fortified at pot
CONCLUSIONS• In vitro germination capacity of the Physalis peruviana seeds was good, the
germination rate being 90 %. • The most effective culture medium for the shoot regeneration was proved to
be the medium supplemented with 0.4 mg/l ANA, in which case the value of themultiplication rate was 5.25 microshoots/explant and the average length of the shoots was 7.23 cm.
• The highest percentage of rooted shoots (92 %) was obtained on the variantin which the nutrient medium was supplemented with 1 mg/l IBA.
• The highest acclimatization rate (95 %) was obtained using peat pills asnutritive substrate.
• The results obtained throughout the in vitro regeneration phases certify thatthe micropropagation technique constitutes an effective multiplication method for the species studied.
REFERENCESArun M., Asha V. V., 2007, Preliminary studies on anti-hepatotoxic effect of
Physalis peruviana L. (Solanaceae) against carbon tetrachloride induced acute lever injury in rats. J Ethnopharmacol 111: 110–114.1.
Mayorga H., Duque C., Knapp H., Winterhalter P., 2002, Hydroxyester disaccharides from fruit of Cape gooseberry (Physalis peruviana L.). Phytochemisty 59: 439–445.
Murashige T., Skoog F., 1962, A revised medium for rapid growth and bioassays with Tabacco tissue culture. Physiol. Plant. 15, 473-49.
Otroshy M., Arash M., Sayyed M.M.K., Amir-Hossein B., 2013, Direct regeneration from leaves and nodes explants of Physalis peruviana L. Int. J. Farm All. Sci., 2(9), 214–218.
214
Pardo J.M., Fontanilla M.R., Ospina L.F., Espinosa L., 2008, Determining the pharmacological activity of Physalis peruviana fruit juice on rabbit eyes and fibroblast primary cultures. Invest Ophthalmol. Vis. Sci., 49(7), 3074–3079.
Ramirez F., Fischer G., Davenport T.L., Augusto Pinzon J.C., Ulrichs C., 2013, Cape gooseberry (Physalis peruviana L.) phenology according to the BBCH phonological scale. Sci. Hortic., 162, 39–42.
Soares M.B.P., Bellintani M.C., Ribeiro I.M., Tomassini T.C.B., Santos R.R., 2003, Inhibition of macrophage activation and lipopolysaccarideinduced death by seco-steroids purified from Physalis angulate L. Eur J Pharmacol, 459(1): 107-12.
Wu S.J., Ng L.T., Chen C.H., Lin D.L., Wang S.S., Lin C.C., 2004, Antihepatoma activity of Physalis peruviana and P. peruviana extract and their effects on apoptosis in human Hep G2 cells. Life Sci 74: 2061–2073.
Wu S.J., Tsai J.Y., Chang S.P., Lin D.L., Wang S.S., Huang S.N., 2006, Supercritical carbon dioxide extract exhibits enhanced antioxidant and anti-inflammatory activities of Physalis peruviana. J. Ethnopharmacol., 108(3), 407–413.
215
INDIVIDUAL ANALYSIS OF THE DENDROMETRIC MEASUREMENTS OF MATURE PLATANUS X ACERIFOLIA WILLD.TREES
Sima Sanda (Petredeanu)1*, Baciu Aurelian Adrian 1
1Faculty of Horticulture, University of Craiova, 13 A.I. Cuza Street, 200585, Craiova, Romania *corresponding author, e-mail: [email protected]
Keywords: expertise, London Plan Tree, dendrometric features,
ABSTRACT Urban green spaces are defined as city areas where complex interaction of
environmental, human, socio-economic and cultural factors take place, that offer a dynamic perspective, but with some stability, given by the customs and values of a society under transformation. Valuable urban landscape, both culturally and in terms of urban life quality is a subject that can be reviewed based on climate, social and territorial changes, undergone by the city in its evolution, focusing on elements that serve as memorial landmarks, heritage landscape that can define and characterize the evolution of a society. The secular trees, or those with aesthetic, historical, memorial and social value, represent such cultural elements that require focus due to their importance, doubled by a lack of protection and preservation prospect from the view point of historical and landscape significance. The current study aims to analyze the evolution of the site, its history and creation, to identify the tree vegetation with historical, ecologic, social and memorial significance, verifying and updating the information within “The list of protected trees”, regarding the Platanus X acerifolia Willd trees found in The Plane Park of Bucharest.
INTRODUCTION Urban green spaces are considered to offer various benefits for cities and their
inhabitants. Besides offering recreational areas, they significantly influence the quality of the urban environment (Pickett and McDonnell 1993; Tyrväinen 2001, Rodenburg et al. 2002).
For cities, the energy and quality of urban life is determined and supported by the dynamic component of vegetation, especially the tree vegetation, with a role in regulating the urban ecosystem. The world becomes more enriched due to the memorable places where humans project their lives and buildings. (Simonds, 1967). The ecologic and cultural-historical principles of building and the analysis of urban landscape lead to conservation and protective measures in the case of valuable urban areas.
In the heart of Bucharest, on the right side of Dambovita river, there is a valuable landscape, dominated by the presence of special historical plane trees, of Platanus x acerifolia Willd. species, which actually gave the name of the land – The Plane Tree Park. The piece of land suffered progressive changes, currently belonging to the National Bank of Romania.
The management based on urban landscaping analysis and developmental control, allows a planned evolution of vegetation and vegetal assembly, taking into
ANNALS OF THE UNIVERSITY OF CRAIOVA
Series: Biology HorticultureFood produce processingtechnologyEnvironmental engineering Vol. XXII I (LIX) - 2018
216
account globalization principles and continuous analysis, evaluation and intervention activities (McIntyre et Al. 2000). Through the value of their landscaping properties, green areas offer identity to human settlements, creating “accessible art, easy to understand and relatable to all, because it uses natural elements which exert spontaneous attraction” (Iliescu A.F. 2006). The current study aims to investigate the evolution of the site, analyze the history and its creation, identify trees with historical, ecologic, social and memorial value, verifying and updating the information within “The list of protected trees, regarding the Platanus x acerifolia Willd trees found in The Plane Park of Bucharest. Following the identification of the heritage trees, the study aims to further continue the research, so as to achieve a complex analysis of the dendrometric characteristics of each tree, determining the functional, aesthetic and memorial value in order to preserve and protect the heritage of the site. This is why it is necessary in busy urban areas, such as Bucharest, for appropriate management of green spaces.
Specialized technical expertise reports must be created in order to determine the state of health, aesthetic, historic and functional values of the plane trees studied and to provide the correct maintenance measures.
MATERIALS AND METHODS
A study of 43 Platanus x acerifolia Willd. trees has been conducted, species which also gives the name of the land – The Plane Tree Park, some of which are secular, is represented by 31 monumental specimens in different health stages. These 31 specimens are included in the list of protected trees, managed by the Romanian Academy.
Each individual tree has been analyzed following a scheme drawn according to the principles of Sustainable Management and issued an Individual analysis sheet, containing morphological aspects (basic anatomical elements: crown, bark.), internal structure of the stem (considered following a tomography analysis), the health condition and aesthetic appearance. The time frame in which the study has been conducted refers to a period of 9 years (2008-2017).
To create the Individual analysis sheet the following dendrometric, phytopathological and aesthetic characteristics of the trees have been considered:
- Total height of the tree; - The tree’s crown diameter ; - Crown insertion height; - Diameter and width of the stalk; - Aesthetic, historic and functional value. The stalk of a removed tree has been found on the land and it had been analyzed
to determine the annual growth rate. It is 3.478mm radial, which is 6.96 diametric, allowing tree-age determination. Knowing the diameter of the analyzed trees their age was determined (Ø:0.696mm=year). The eldest plane tree (H-Pa-45) is 185 years old, which means it dates back to Tudor Vladimirescu’s time.
These have been considered to be the most important characteristics leading to objective determinations of the general well-being of the tree (health state, pathology, age), but also to establishing the global value of the analyzed specimen (historic importance, aesthetic and functional value).
Aesthetic value has been categorized on a scale of 1 to 4 with appropriate grades according to the overall visual offered, in which 1 stands for outstanding aesthetic value, while 4 stand for insignificant aesthetic value. The aesthetic value of the specimens refers to the individual value of the tree and not to that of the landscape it is part of.
217
The criteria for the interpretation of these appreciations have been: - The harmony in the shape of the habitus, given by a balanced report between
the stalk and the crown; - Compact and regular crown; - The verticality of the stalk or the plastic beauty of its inclination (keeping the
balance of shapes); - The integrity of the stark and crown (no lesions or visible flaws); - The balance and harmony of the perceived visuals (stalk, crown, bark,
foliage, sprouts); - The special architecture of the crowns (the insertion angles of the ridges, the
shape of the branches). The historical value has been determined according to the width of the stalk
and their record, found in the List of Protected Trees, comprised by the Romanian Academy.
In order to be considered a piece of heritage, these tree specimens must fulfill the following criteria:
- The age criteria: older than 100 years for long-lasting trees or older than 50 years for trees with a short life expectancy;
- The criteria referring to artistic value, urban (landscaping): value given by the way in which it is part of an urban setting – trees with an outstanding aesthetic and functional values, setting a pleasant atmosphere, with homogenous traits within the landscape;
- The frequency criteria (rarity and uniqueness): high value for species rarely seen in the common landscaping of an area, species with uniqueness value, protected species, endangered in a certain area;
- The criteria referring to the memorial-symbolic value: species which have been silent witnesses of memorable historic, literary, artistic events that have marked a certain stage in the development of a society etc.
These classification criteria, which apply to architectural historical monuments, in accordance to 422/2001 Law, further modified and added (GO 10/2016 to modify and add 422/2001 Law), could be easily adapted for landscaping historical monuments and protected trees.
Law protected trees, being natural monuments; have been marked in the Inventory records under the YES/NO mention.
The functional value of the analyzed tree vegetation has been ranked on a scale of 1 to 3, in which 1 represents high functional value, while 3 represents low functional value.
The basic criteria through which this functional value has been analyzed are: - The presence of the analyzed specimen in areas with a well-defined role and
landscaping function (casting shadow over parking areas, benches, path walks, roads and terraces);
- Supporting architectural elements, through the special volumetrics of the habitus (marking and signaling the entrance of a building, flanking a façade, marking the inflection of roads, creating surprise elements through screening and progressive revealing etc.);
- Taking part in defining the functional character of a specific area (visual screening, dominant wind protective screen etc.).
The vegetation state of the analyzed specimens has been ranked alphabetically from A to E, in which A represents an excellent state, while E represents dry pieces of vegetation.
The basic criteria through which this vegetative value has been analyzed are:
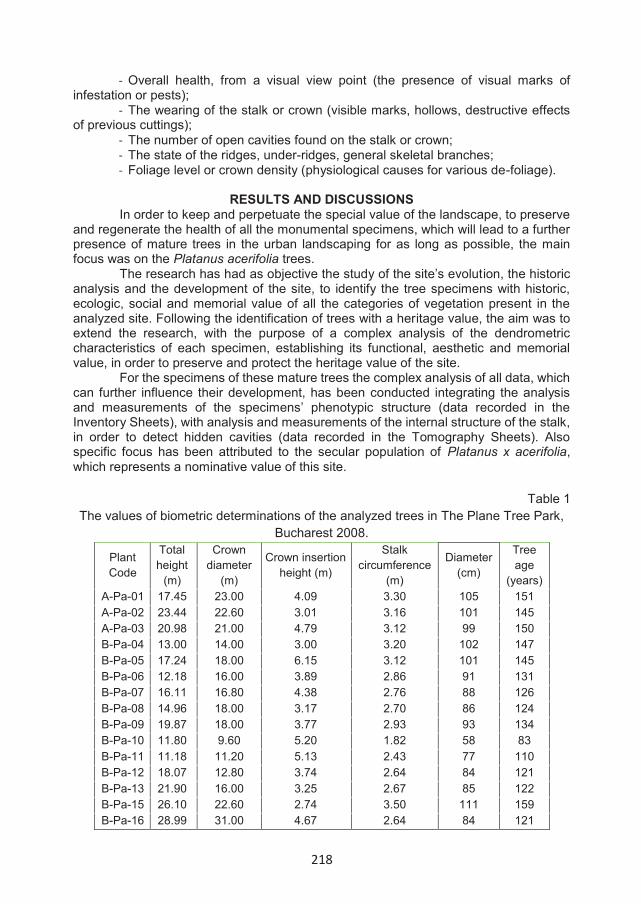
218
- Overall health, from a visual view point (the presence of visual marks of infestation or pests);
- The wearing of the stalk or crown (visible marks, hollows, destructive effects of previous cuttings);
- The number of open cavities found on the stalk or crown; - The state of the ridges, under-ridges, general skeletal branches; - Foliage level or crown density (physiological causes for various de-foliage).
RESULTS AND DISCUSSIONS
In order to keep and perpetuate the special value of the landscape, to preserve and regenerate the health of all the monumental specimens, which will lead to a further presence of mature trees in the urban landscaping for as long as possible, the main focus was on the Platanus acerifolia trees.
The research has had as objective the study of the site’s evolution, the historic analysis and the development of the site, to identify the tree specimens with historic, ecologic, social and memorial value of all the categories of vegetation present in the analyzed site. Following the identification of trees with a heritage value, the aim was to extend the research, with the purpose of a complex analysis of the dendrometric characteristics of each specimen, establishing its functional, aesthetic and memorial value, in order to preserve and protect the heritage value of the site.
For the specimens of these mature trees the complex analysis of all data, which can further influence their development, has been conducted integrating the analysis and measurements of the specimens’ phenotypic structure (data recorded in the Inventory Sheets), with analysis and measurements of the internal structure of the stalk, in order to detect hidden cavities (data recorded in the Tomography Sheets). Also specific focus has been attributed to the secular population of Platanus x acerifolia, which represents a nominative value of this site.
Table 1
The values of biometric determinations of the analyzed trees in The Plane Tree Park, Bucharest 2008.
Plant Code
Total height
(m)
Crown diameter
(m)
Crown insertion height (m)
Stalk circumference
(m)
Diameter (cm)
Tree age
(years) A-Pa-01 17.45 23.00 4.09 3.30 105 151 A-Pa-02 23.44 22.60 3.01 3.16 101 145 A-Pa-03 20.98 21.00 4.79 3.12 99 150 B-Pa-04 13.00 14.00 3.00 3.20 102 147 B-Pa-05 17.24 18.00 6.15 3.12 101 145 B-Pa-06 12.18 16.00 3.89 2.86 91 131 B-Pa-07 16.11 16.80 4.38 2.76 88 126 B-Pa-08 14.96 18.00 3.17 2.70 86 124 B-Pa-09 19.87 18.00 3.77 2.93 93 134 B-Pa-10 11.80 9.60 5.20 1.82 58 83 B-Pa-11 11.18 11.20 5.13 2.43 77 110 B-Pa-12 18.07 12.80 3.74 2.64 84 121 B-Pa-13 21.90 16.00 3.25 2.67 85 122 B-Pa-15 26.10 22.60 2.74 3.50 111 159 B-Pa-16 28.99 31.00 4.67 2.64 84 121
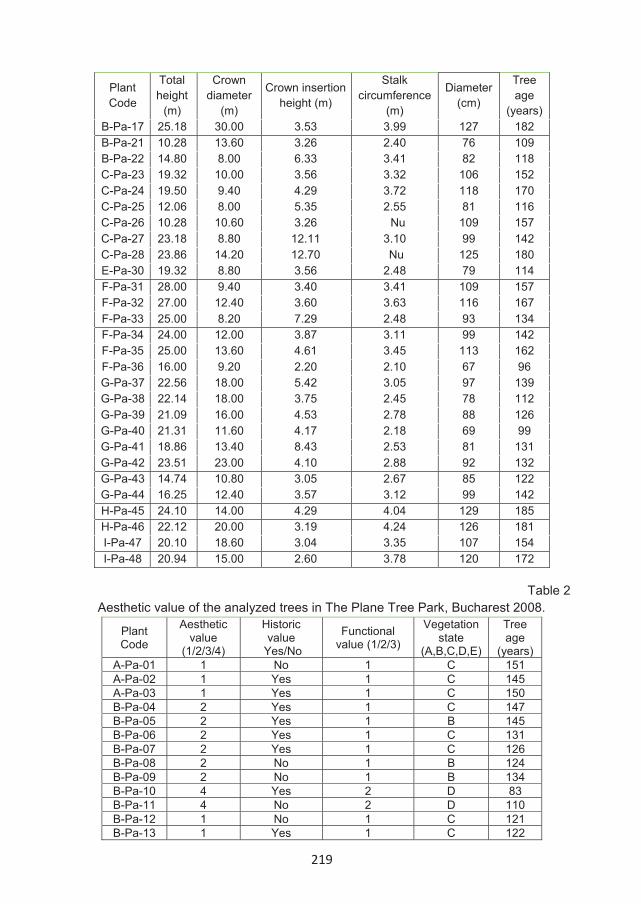
219
Plant Code
Total height
(m)
Crown diameter
(m)
Crown insertion height (m)
Stalk circumference
(m)
Diameter (cm)
Tree age
(years)B-Pa-17 25.18 30.00 3.53 3.99 127 182B-Pa-21 10.28 13.60 3.26 2.40 76 109B-Pa-22 14.80 8.00 6.33 3.41 82 118C-Pa-23 19.32 10.00 3.56 3.32 106 152C-Pa-24 19.50 9.40 4.29 3.72 118 170C-Pa-25 12.06 8.00 5.35 2.55 81 116C-Pa-26 10.28 10.60 3.26 Nu 109 157C-Pa-27 23.18 8.80 12.11 3.10 99 142C-Pa-28 23.86 14.20 12.70 Nu 125 180E-Pa-30 19.32 8.80 3.56 2.48 79 114F-Pa-31 28.00 9.40 3.40 3.41 109 157F-Pa-32 27.00 12.40 3.60 3.63 116 167F-Pa-33 25.00 8.20 7.29 2.48 93 134F-Pa-34 24.00 12.00 3.87 3.11 99 142F-Pa-35 25.00 13.60 4.61 3.45 113 162F-Pa-36 16.00 9.20 2.20 2.10 67 96G-Pa-37 22.56 18.00 5.42 3.05 97 139G-Pa-38 22.14 18.00 3.75 2.45 78 112G-Pa-39 21.09 16.00 4.53 2.78 88 126G-Pa-40 21.31 11.60 4.17 2.18 69 99G-Pa-41 18.86 13.40 8.43 2.53 81 131G-Pa-42 23.51 23.00 4.10 2.88 92 132G-Pa-43 14.74 10.80 3.05 2.67 85 122G-Pa-44 16.25 12.40 3.57 3.12 99 142H-Pa-45 24.10 14.00 4.29 4.04 129 185H-Pa-46 22.12 20.00 3.19 4.24 126 181I-Pa-47 20.10 18.60 3.04 3.35 107 154I-Pa-48 20.94 15.00 2.60 3.78 120 172
Table 2 Aesthetic value of the analyzed trees in The Plane Tree Park, Bucharest 2008.
Plant Code
Aesthetic value
(1/2/3/4)
Historic value
Yes/No
Functional value (1/2/3)
Vegetation state
(A,B,C,D,E)
Tree age
(years)A-Pa-01 1 No 1 C 151A-Pa-02 1 Yes 1 C 145A-Pa-03 1 Yes 1 C 150B-Pa-04 2 Yes 1 C 147B-Pa-05 2 Yes 1 B 145B-Pa-06 2 Yes 1 C 131B-Pa-07 2 Yes 1 C 126B-Pa-08 2 No 1 B 124B-Pa-09 2 No 1 B 134B-Pa-10 4 Yes 2 D 83B-Pa-11 4 No 2 D 110B-Pa-12 1 No 1 C 121B-Pa-13 1 Yes 1 C 122
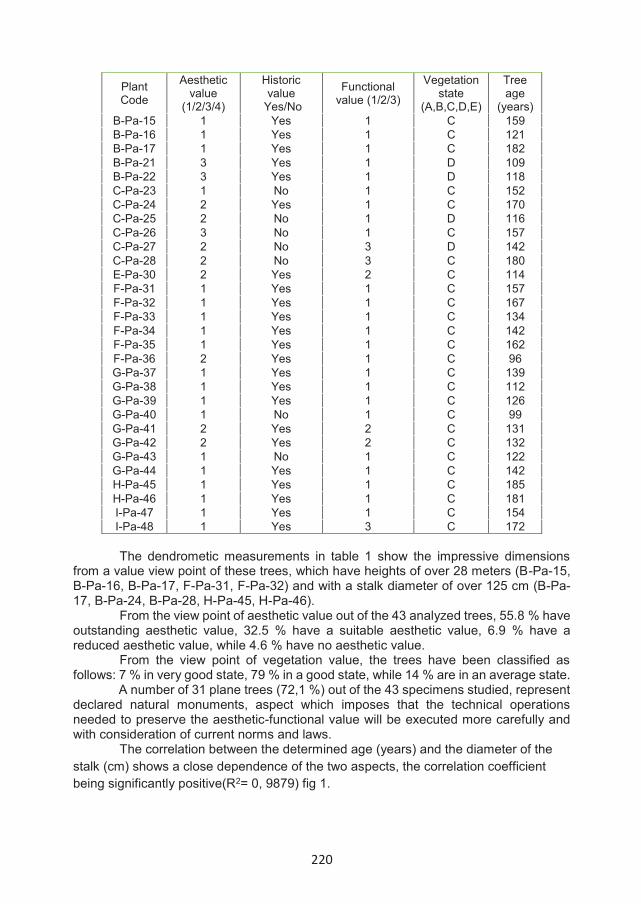
220
Plant Code
Aesthetic value
(1/2/3/4)
Historic value
Yes/No
Functional value (1/2/3)
Vegetation state
(A,B,C,D,E)
Tree age
(years) B-Pa-15 1 Yes 1 C 159 B-Pa-16 1 Yes 1 C 121 B-Pa-17 1 Yes 1 C 182 B-Pa-21 3 Yes 1 D 109 B-Pa-22 3 Yes 1 D 118 C-Pa-23 1 No 1 C 152 C-Pa-24 2 Yes 1 C 170 C-Pa-25 2 No 1 D 116 C-Pa-26 3 No 1 C 157 C-Pa-27 2 No 3 D 142 C-Pa-28 2 No 3 C 180 E-Pa-30 2 Yes 2 C 114 F-Pa-31 1 Yes 1 C 157 F-Pa-32 1 Yes 1 C 167 F-Pa-33 1 Yes 1 C 134 F-Pa-34 1 Yes 1 C 142 F-Pa-35 1 Yes 1 C 162 F-Pa-36 2 Yes 1 C 96 G-Pa-37 1 Yes 1 C 139 G-Pa-38 1 Yes 1 C 112 G-Pa-39 1 Yes 1 C 126 G-Pa-40 1 No 1 C 99 G-Pa-41 2 Yes 2 C 131 G-Pa-42 2 Yes 2 C 132 G-Pa-43 1 No 1 C 122 G-Pa-44 1 Yes 1 C 142 H-Pa-45 1 Yes 1 C 185 H-Pa-46 1 Yes 1 C 181 I-Pa-47 1 Yes 1 C 154 I-Pa-48 1 Yes 3 C 172
The dendrometic measurements in table 1 show the impressive dimensions
from a value view point of these trees, which have heights of over 28 meters (B-Pa-15, B-Pa-16, B-Pa-17, F-Pa-31, F-Pa-32) and with a stalk diameter of over 125 cm (B-Pa-17, B-Pa-24, B-Pa-28, H-Pa-45, H-Pa-46).
From the view point of aesthetic value out of the 43 analyzed trees, 55.8 % have outstanding aesthetic value, 32.5 % have a suitable aesthetic value, 6.9 % have a reduced aesthetic value, while 4.6 % have no aesthetic value.
From the view point of vegetation value, the trees have been classified as follows: 7 % in very good state, 79 % in a good state, while 14 % are in an average state.
A number of 31 plane trees (72,1 %) out of the 43 specimens studied, represent declared natural monuments, aspect which imposes that the technical operations needed to preserve the aesthetic-functional value will be executed more carefully and with consideration of current norms and laws.
The correlation between the determined age (years) and the diameter of the stalk (cm) shows a close dependence of the two aspects, the correlation coefficient being significantly positive(R2= 0, 9879) fig 1.

221
Figure 1. The correlation between the tree age and stalk diameter of the plane trees in The Plane Tree Park – RNB.
This aspect proves that fact that the older the trees become, the higher the quantity of stored biomass is, including the one stored in the stalk.
Figure 2. The correlation between the crown diameter and the age of the trees in The Plane Tree Park – RNB.
Out of figure 2, it is noticeable a value of R2 = 0,2692 between the correlation of the crown diameter of the plane trees and the age, which shows a weak interdependence between the two sets of values. The conclusion can be drawn that, in addition to the age of the trees, there are other elements that influence the health state of the trees (wounds – hollows, crown cutting in periodic interventions, placement, density etc.).
y = 1,4239x + 1,7452R² = 0,9879
y = 49,22e0,0106x
R² = 0,9703Ag
e of
the
tres
s (ye
ars)
Diameter of the stalk(cm)
The correlation between tree age and stalk diameter
y = 0,0615x + 6,5338R² = 0,0725
y = 0.0615x + 6.5338R² = 0,2692
Crow
n di
amet
er (m
)
Tree age (years)
The correlation between the crown diameter and the age of the trees
222
CONCLUSION All the research and field and archive analysis have led to the following
conclusions in relation to the differential and integrated management of the historic landscaping of The Plane Tree Park, as described:
1. The analysis of the vegetation has been conducted through a complexlandscaping method, focused on dendrometric measurements, functional, aesthetic, historic and landscaping value-identification analysis, and according to the health stare of the specimens. All of the data have been recorded in the Inventory Sheets. In addition to all of these measurements, there have been conducted analysis that refer to indirect factors, such as pedological and phytopathological analysis.
2. There is a need for a complex analysis of all data that can further influencethe development of the trees, integrating the analysis and measurements of the phenotypic structure of the specimens (recorded in the Inventory Sheets), with the analysis and measurements of the internal structure of the stalk, to track hidden cavities (tomography sheets).
3. All the dendrometric measurements and estimates to the value of thevegetation are necessary in order to comprise The Plan for the landscaping management and prioritized intervention.
4. There is a close connection between the determined age (years) of the trees andthe diameter of the stalk (cm) the correlation coefficient is significantly positive.
5. There is a need for a tomographic analysis of the internal structure in all the43 plane specimens considering the age of the trees (67 % are over 130 years old).
6. This analysis attributes the permanent monitoring of the specimens,conducting regenerative interventions and programming their replacement, before the trees become an imminent threat.
REFERENCES Iliescu A.F., 2003 – Arhitectura peisajeră. Editura Ceres, Bucureşti, pag. 103.McIntyre N.E., Knowles-Yánez K. & Hope D., 2000 – Urban ecology as an
interdisciplinary field: differences in the use of “urban” between the social and natural sciences. Urban Ecosystems 4: 5–24.
Simonds J.O., 1967 – Arhitectura peisajului (traducere din limba engleză: Moisescu A., Stoenescu Ş.), Editura tehnică Bucureşti.
Pickett S.T.A. & McDonnell M.J., 1993 - Humans as components of ecosystems: A synthesis. In: McDonnell M.J. & Pickett S.T.A. (eds.), Humans as components of ecosystems: The ecology of subtle human effects and populated areas, Springer-Verlag, New York, USA, pp. 310–316.
Rodenburg C., Baycan-Levent T., van Leeuwen E. & Nijkamp P. 2002. Urban economic indicators for green development in cities. In: Martinuzzi A. (ed.), Greener management international; evaluating sustainable development policy, Issue 36, Winter 2002, Greenleaf Publishing, Sheffield, UK, pp. 105–119.
Tyrväinen L. 2001 - Economic valuation of urban forest benefits in Finland. Journal of Environmental Management 62: 75–92.

223
PRELIMINARY RESULTS ON THE CULTURE OF ZUCCHINI PATTISON (CUCURBITA PEPO PATISSONIANA) ON SANDY SOILS IN SOUTHERN
OLTENIA
Sfîrloagă Loredana Mirela1, Diaconu Aurelia1, Dima Milica1,Novac Mihaela Gabriela1, Croitoru Mihaela1
1Research and Development Station for Plant Culture on Sands Dabuleni e-mail:ditaloredanamirela @yahoo.com
Keywords: zucchini, sandy soils, yield
ABSTRACT In the pedoclimatic conditions of the sandy soils in southern Oltenia it was found that
zucchini Patison behaves very well. The zucchini Patison (Ovari feher) produces large fruit production on sandy soils (53t / ha). The best period of establishment of the zucchini Patison crop is at the end of April, using seedlings obtained in alveolar trays.
The zucchini Patison culture is profitable on sandy soils. At a production of 53 t / ha and at an average price of 2.5 lei / kg a profit of 35500 lei / kg is obtained.
INTRODUCTION The Cucurbitaceae family is the second largest horticultural family in terms of
economic importance after Solanaceae. Includes several important crops such as Cucumis melo, Watermelon Citrullus lanatus, Cucumis sativus and many Cucurbita fruits with edible fruits (Jeffrey, 1980). The genus Cucurbita originates from the two Americas, comprises three species of important crops such as Cucurbita pepo, Cucurbita moschata and Cucurbita maxima grown in temperate, subtropical and tropical regions (Wang et al., 2011).
It is supposed to originate in Africa, from where it has spread to Europe and America. The area of culture is more limited, with large areas being cultivated in the US and Russia, but also with some expansion in the warmer countries of Western Europe. In our country it is cultivated on small areas in the household system. It has been known in Banat since 1960 and is a vegetable that is increasingly appreciated by consumers. Patison is cultivated for its fruits, consumed in different stages of technical maturity. Fruits are rich in carbohydrates, mineral salts, vitamins, as the nutritional value is higher and the range of products more diversified. Fruit that has passed the time of harvesting and those at physiological maturity are used in animal feed (Ciofu R., et al., 2003).
The use of Patison pulp in the range of plants cultivated at SCDCPN Dăbuleni ensures good anti-deflationary protection due to the high degree of land coverage over a large period of the year, as well as a source of income for small farmers.
MATERIAL AND METHOD Research has aimed behavior Patison zucchini, on sandy soils. Using zucchini
Patison in the range of cultivated plants to SCDCPN Dăbuleni provides good protection
ANNALS OF THE UNIVERSITY OF CRAIOVA
Series: Biology HorticultureFood produce processingtechnologyEnvironmental engineering Vol. XXII I (LIX) - 2018
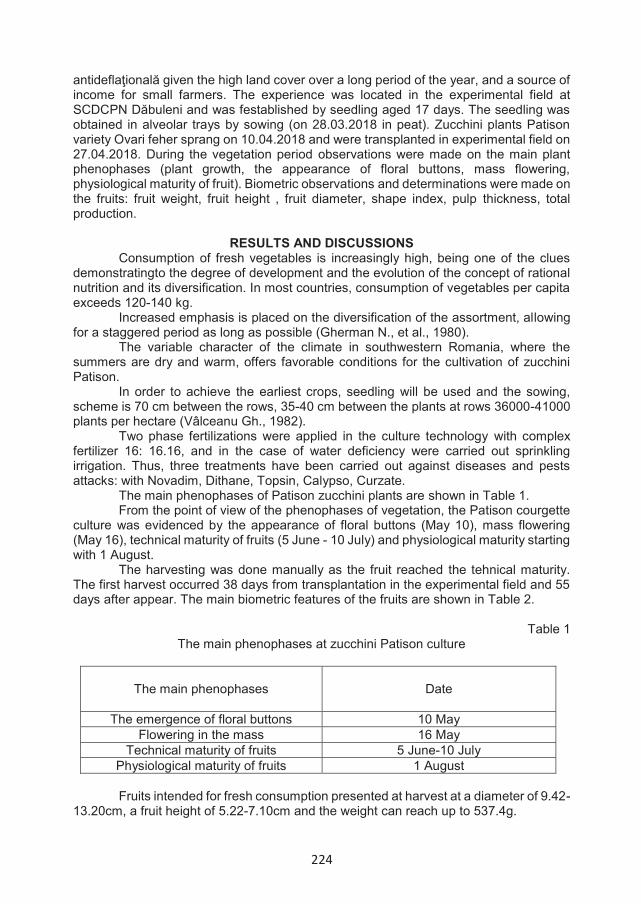
224
antideflaţională given the high land cover over a long period of the year, and a source of income for small farmers. The experience was located in the experimental field at SCDCPN Dăbuleni and was festablished by seedling aged 17 days. The seedling was obtained in alveolar trays by sowing (on 28.03.2018 in peat). Zucchini plants Patison variety Ovari feher sprang on 10.04.2018 and were transplanted in experimental field on 27.04.2018. During the vegetation period observations were made on the main plant phenophases (plant growth, the appearance of floral buttons, mass flowering, physiological maturity of fruit). Biometric observations and determinations were made on the fruits: fruit weight, fruit height , fruit diameter, shape index, pulp thickness, total production.
RESULTS AND DISCUSSIONS Consumption of fresh vegetables is increasingly high, being one of the clues
demonstratingto the degree of development and the evolution of the concept of rational nutrition and its diversification. In most countries, consumption of vegetables per capita exceeds 120-140 kg.
Increased emphasis is placed on the diversification of the assortment, allowing for a staggered period as long as possible (Gherman N., et al., 1980).
The variable character of the climate in southwestern Romania, where the summers are dry and warm, offers favorable conditions for the cultivation of zucchini Patison.
In order to achieve the earliest crops, seedling will be used and the sowing, scheme is 70 cm between the rows, 35-40 cm between the plants at rows 36000-41000 plants per hectare (Vâlceanu Gh., 1982).
Two phase fertilizations were applied in the culture technology with complex fertilizer 16: 16.16, and in the case of water deficiency were carried out sprinkling irrigation. Thus, three treatments have been carried out against diseases and pests attacks: with Novadim, Dithane, Topsin, Calypso, Curzate.
The main phenophases of Patison zucchini plants are shown in Table 1. From the point of view of the phenophases of vegetation, the Patison courgette
culture was evidenced by the appearance of floral buttons (May 10), mass flowering (May 16), technical maturity of fruits (5 June - 10 July) and physiological maturity starting with 1 August.
The harvesting was done manually as the fruit reached the tehnical maturity. The first harvest occurred 38 days from transplantation in the experimental field and 55 days after appear. The main biometric features of the fruits are shown in Table 2.
Table 1 The main phenophases at zucchini Patison culture
The main phenophases Date
The emergence of floral buttons 10 MayFlowering in the mass 16 May
Technical maturity of fruits 5 June-10 JulyPhysiological maturity of fruits 1 August
Fruits intended for fresh consumption presented at harvest at a diameter of 9.42-13.20cm, a fruit height of 5.22-7.10cm and the weight can reach up to 537.4g.
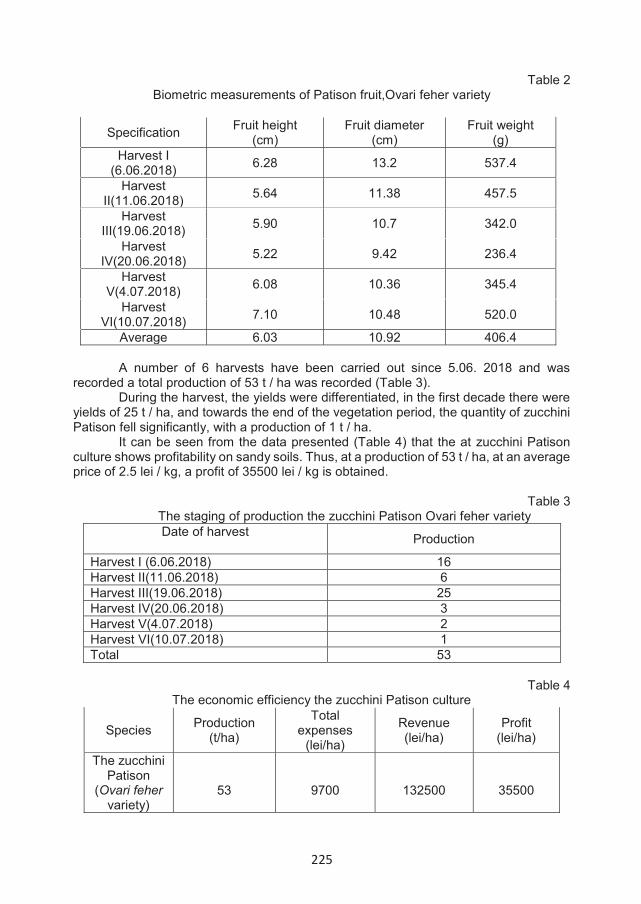
225
Table 2 Biometric measurements of Patison fruit,Ovari feher variety
Specification Fruit height(cm)
Fruit diameter(cm)
Fruit weight(g)
Harvest I (6.06.2018) 6.28 13.2 537.4
Harvest II(11.06.2018) 5.64 11.38 457.5
Harvest III(19.06.2018) 5.90 10.7 342.0
Harvest IV(20.06.2018) 5.22 9.42 236.4
Harvest V(4.07.2018) 6.08 10.36 345.4
Harvest VI(10.07.2018) 7.10 10.48 520.0
Average 6.03 10.92 406.4
A number of 6 harvests have been carried out since 5.06. 2018 and was recorded a total production of 53 t / ha was recorded (Table 3).
During the harvest, the yields were differentiated, in the first decade there were yields of 25 t / ha, and towards the end of the vegetation period, the quantity of zucchini Patison fell significantly, with a production of 1 t / ha.
It can be seen from the data presented (Table 4) that the at zucchini Patison culture shows profitability on sandy soils. Thus, at a production of 53 t / ha, at an average price of 2.5 lei / kg, a profit of 35500 lei / kg is obtained.
Table 3 The staging of production the zucchini Patison Ovari feher variety Date of harvest Production
Harvest I (6.06.2018) 16Harvest II(11.06.2018) 6Harvest III(19.06.2018) 25Harvest IV(20.06.2018) 3Harvest V(4.07.2018) 2Harvest VI(10.07.2018) 1Total 53
Table 4 The economic efficiency the zucchini Patison culture
Species Production (t/ha)
Total expenses
(lei/ha)
Revenue (lei/ha)
Profit (lei/ha)
The zucchini Patison
(Ovari fehervariety)
53 9700 132500 35500
226
CONCLUSIONS From the obtained results on the behavior of Patison zucchini in culture, in the
pedoclimatic conditions of the sandy soils in southern Oltenia, the following were found: -the zucchini Patison (Ovari feher) produces great productions of fruits on sandy
soils (53t/h); - the best period of foundation of the zucchini Patison culture is at the end of
April, using seedlings obtained in alveolar trays. - the zucchini Patison culture is profitable on sandy soils
At a production of 53 t / ha and at an average price of 2.5 lei / kg a profit of 35500 lei / kg is obtained.
REFERENCES Ciofu Ruxandra, Stan N., Popescu V., Chilom Pelaghia, Apahidean S., Horgoş
A., Berar V., Lauer F.K., Atanasiu N., 2003, Tratat de Legumicultură, Editura Ceres. Bucureşti, pag.855.
Gherman N., Huluţă M., Iancu I., 1980, Studiul agrobiologic, elemente de tehnologie si problemele extinderii în cultură a unor specii de ceapă, Simpozionul Naţional Cultura Legumelor Verdeţuri şi a Speciilor Mai Puţin Răspândite în Cultură.Tiparul I Institutul Agronomic ,,N. Bălcescuˮ, Bucureşti, Bacău, pag. 49.
Jeffrey C., 1980, A review of the Cucurbitaceae, Bot. J. Linn. Soc. 81, 233–247. Vâlceanu Gh., 1982, Cultura legumelor mai puţin răspândite. Editura Ceres.
Bucureşti, pag. 205-208. Wang Y. H., Behera T. K., Kole C., 2011, Genetics, Genomics and Breeding of
Cucurbits. CRC Press.
227
EVALUATION OF POLYPHENOLS CONTENT AND ANTIOXIDANT ACTIVITY IN FRESH ORANGE JUICES OF DIFFERENT VARIETIES,
AT THE MATURING STAGE OF THE FRUITS
Stavropoulos Georgios-Christos1, Gougoulias Nikolaos1*,Papachatzis Alexandros1, Koutinas Nikolaos2, Zakynthinos Georgios3,
Ntalla Maria-Nektaria4
1Department of Agronomy Technology, Technological Educational Institute of Thessaly, Larissa, Greece. 2Department of Agronomy Technology, Technological Educational Institute of Thessaloniki, Greece.
3Department of Food Technology, Technological Educational Institute of Peloponnese, Kalamata, Greece. 4Department of Computer Science and Engineering, Technological Educational Institute of Thessaly,
Larissa, Greece. *Correspondence author: email: [email protected]
Keywords: Orange juices; total phenols; phenolic fractions; DPPH activity; FRAP activity
ABSTRACT Orange juices from eight varieties of orange fruits (Navelina, Newhall, Merlin, Tarocco,
Moro, Valencia, Lane late and Salustiana) grown in Peloponnese region, have been studied for evaluating and comparing their polyphenols content and antioxidant properties. It has been established that total phenols (ТР) of the orange juices move in broad ranges depending on the variety type, chemical soil properties, and the ecological conditions of fruits cultivation. The content of TP in the orange juices ranged from 344.7 to 522.9 mg GAE L-1 juice, non-flavonoid phenols (NFP) ranged from 47.7 to 98.4 mg GAE L-1 juice and flavonoid phenols (FP) from 253.1 to 439.5 mg GAE L-1 juice. The lower IC50 values (22.7 and 23.8 μL orange juices), which indicated higher antioxidant potential, were observed for the orange juices from the Newhall and Salustiana varieties respectively, while the antioxidant activity FRAP ranged from 7.3 to 12.5 mM FRAP.
INTRODUCTION The creation of free radicals in human cells causes the oxidation of the biological
macromolecules. These changes of the biological macromolecules induce the occurrence of many diseases (Sies, 2015). Epidemiological investigations demonstrate that the oxidative destruction of biomolecules can be reduced by using endogen and exogenous antioxidants such as vitamins C, E, carotenoids, polyphenols, etc. which mainly are contained in fruits and vegetables (Valko et al. 2006). Fruit and vegetable rich food reduces the risk of degenerative diseases such as cardiovascular and cancer (Zhang et al. 2016).
Oranges and orange juices, is an important source of vitamin C and polyphenolic compounds such as are hydroxycinnamic acids and flavonoids. Citrus flavonoids have shown therapeutical properties such as antiinflammatory, antihypertensive, diuretic and analgesic (Monforte et al. 1995). According to some authors (Kanitsar et al. 2001, Belajova´ and Suhaj 2004), the content on hydroxycinnamic acids and flavanone in orange juices, depends on the variety of oranges, their ripeness and the technological processes of juices production.
ANNALS OF THE UNIVERSITY OF CRAIOVA
Series: Biology HorticultureFood produce processingtechnologyEnvironmental engineering Vol. XXII I (LIX) - 2018
228
The purpose of the present research is to evaluate the antioxidant activity and the contents of total phenols on the fresh orange juices from some orange varieties, at the maturing stage of the fruits, under environmental conditions of Peloponnese region, Greece.
MATERIAL AND METHODS This study, was conducted in eight orange orchards which are they in the Argos
of Peloponnese region, Greece. The distance of the orange orchards from the sea is 5km, and the altitude 5m. The region of Argos (latitude 37036'N, longitude 22047'E) is characterized by a Mediterranean climate with mild dry winters and hot dry summers. Average winter temperature 10.2 0C, average summer temperature 26.3 0C and average annual precipitation 480 mm.
Orange fruit from eight varieties (Citrus sinensis) were the subject, as of study (Navelina, Newhall, Merlin, Tarocco, Moro, Valencia, Lane Late and Salustiana). Each variety is grown in different orange orchards. From all orange varieties, the orange fruit were collected at the stage of maturing fruit. Five fruit of each variety were squeezed by a domestic juicer and the juice obtained, is filtered and used immediately for physicochemical analyses and antioxidant activity determination. For soil depth 0-30 cm, the pH all orange orchards ranged from 7.79 to 8.46, electrical conductivity from 0.09 to 0.35 dS m-1 and inorganic nitrogen from 14 to 31.5 mg/kg soil. For soil depth 30-60 cm, the pH all orange orchards ranged from 7.76 to 8.55, electrical conductivity from 0.09 to 0.34 dS m-1 and inorganic nitrogen from 9 to 21.0 mg/kg soil. Moreover, other soil chemical properties of orange orchards are presented in Table 1 and Table 2.
Methods of analyses: Soil was analyzed using the following methods which are referred by (Page et al. 1982). Organic matter was analyzed by chemical oxidation with 1 mol L-1 K2Cr2O7 and titration of the remaining reagent with 0.5 mol L-1 FeSO4. Soil pH and Electrical conductivity, (EC), measured in the extract (1 part soil : 5 parts H2O).The Texture of soils was determined by the method Bouyoucos. The calcium carbonate was determined by the method Bernard. Inorganic nitrogen was extracted with 0.5 mol L-1 CaCl2 and estimated by distillation in the presence of MgO and Devarda's alloy, respectively. Available P forms (Olsen P) was extracted with 0.5 mol L-1 NaHCO3 and measured by spectroscopy. Exchangeable form of potassium was extracted with 1 mol L-1 CH3COONH4 and measured by flame Photometer (Essex, UK).
The pH, the Brix degrees and the total acidity were measured in the orange juice. The Brix degrees by a Zeiss refract meter, while the total acidity by titration with 0.1N NaOH solution and expressed in g of citric acid per 100ml orange juice.
The amount of total polyphenols (TP) in the orange juice was determined with the Folin-Ciocalteu (F.C.) reagent according to the method of (Singleton and Rossi, 1965) using the microvariant proposed by (Baderschneider et al. 1999), and were expressed as gallic acid equivalent (GAE) in mg L-1 juice.
The content of nonflavonoid phenols (NFP) in the orange juice was determined with the F.C. reagent after removing the flavonoid phenols (FP) with formaldehyde according to the method of (Kramling and Singleton, 1969) and was expressed as gallic acid equivalent (GAE) in mg L-1 juice. Flavanoid phenols (FP) in the orange juice were determined as a difference between the content of total phenols (TP) and nonflavonoid phenols (NFP). Their amount was evaluated as gallic acid equivalent in mg L-1 juice.
DPPH• assay in the orange juice: The DPPH-scavenging activity of orange juice were evaluated using the stable free radical 2,2′-diphenyl-1-pycrylhydrazyl radical (DPPH•), as a reagent, according to the method by (Brand-Williams et al. 1995) and the results were expressed as percentage decrease against control. The reaction mixture contained 4mL 10−4M DPPH methanolic solution and different amounts of orange juice. The inhibition percentage for each sample was calculated using the following equation:
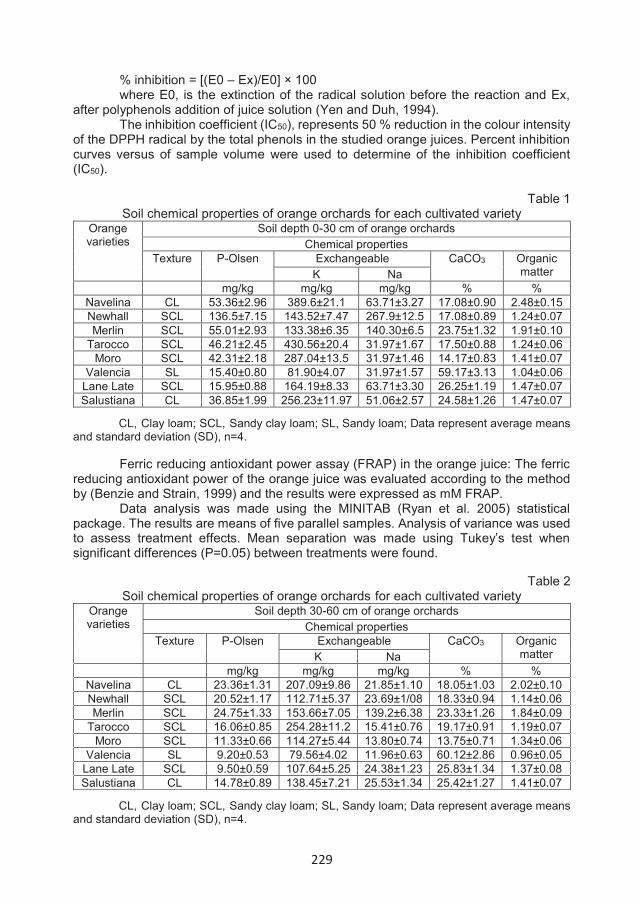
229
% inhibition = [(E0 – Ex)/E0] × 100 where Е0, is the extinction of the radical solution before the reaction and Ех,
after polyphenols addition of juice solution (Yen and Duh, 1994). The inhibition coefficient (IC50), represents 50 % reduction in the colour intensity
of the DPPH radical by the total phenols in the studied orange juices. Percent inhibition curves versus of sample volume were used to determine of the inhibition coefficient (IC50).
Table 1 Soil chemical properties of orange orchards for each cultivated variety
Orange varieties
Soil depth 0-30 cm of orange orchardsChemical properties
Texture P-Olsen Exchangeable CaCO3 Organic matterK Na
mg/kg mg/kg mg/kg % %Navelina CL 53.36±2.96 389.6±21.1 63.71±3.27 17.08±0.90 2.48±0.15Newhall SCL 136.5±7.15 143.52±7.47 267.9±12.5 17.08±0.89 1.24±0.07Merlin SCL 55.01±2.93 133.38±6.35 140.30±6.5 23.75±1.32 1.91±0.10
Tarocco SCL 46.21±2.45 430.56±20.4 31.97±1.67 17.50±0.88 1.24±0.06Moro SCL 42.31±2.18 287.04±13.5 31.97±1.46 14.17±0.83 1.41±0.07
Valencia SL 15.40±0.80 81.90±4.07 31.97±1.57 59.17±3.13 1.04±0.06Lane Late SCL 15.95±0.88 164.19±8.33 63.71±3.30 26.25±1.19 1.47±0.07Salustiana CL 36.85±1.99 256.23±11.97 51.06±2.57 24.58±1.26 1.47±0.07
CL, Clay loam; SCL, Sandy clay loam; SL, Sandy loam; Data represent average means and standard deviation (SD), n=4.
Ferric reducing antioxidant power assay (FRAP) in the orange juice: The ferric reducing antioxidant power of the orange juice was evaluated according to the method by (Benzie and Strain, 1999) and the results were expressed as mM FRAP.
Data analysis was made using the MINITAB (Ryan et al. 2005) statistical package. The results are means of five parallel samples. Analysis of variance was used to assess treatment effects. Mean separation was made using Tukey’s test when significant differences (P=0.05) between treatments were found.
Table 2 Soil chemical properties of orange orchards for each cultivated variety
Orange varieties
Soil depth 30-60 cm of orange orchardsChemical properties
Texture P-Olsen Exchangeable CaCO3 Organic matterK Na
mg/kg mg/kg mg/kg % %Navelina CL 23.36±1.31 207.09±9.86 21.85±1.10 18.05±1.03 2.02±0.10Newhall SCL 20.52±1.17 112.71±5.37 23.69±1/08 18.33±0.94 1.14±0.06Merlin SCL 24.75±1.33 153.66±7.05 139.2±6.38 23.33±1.26 1.84±0.09
Tarocco SCL 16.06±0.85 254.28±11.2 15.41±0.76 19.17±0.91 1.19±0.07Moro SCL 11.33±0.66 114.27±5.44 13.80±0.74 13.75±0.71 1.34±0.06
Valencia SL 9.20±0.53 79.56±4.02 11.96±0.63 60.12±2.86 0.96±0.05Lane Late SCL 9.50±0.59 107.64±5.25 24.38±1.23 25.83±1.34 1.37±0.08Salustiana CL 14.78±0.89 138.45±7.21 25.53±1.34 25.42±1.27 1.41±0.07
CL, Clay loam; SCL, Sandy clay loam; SL, Sandy loam; Data represent average means and standard deviation (SD), n=4.
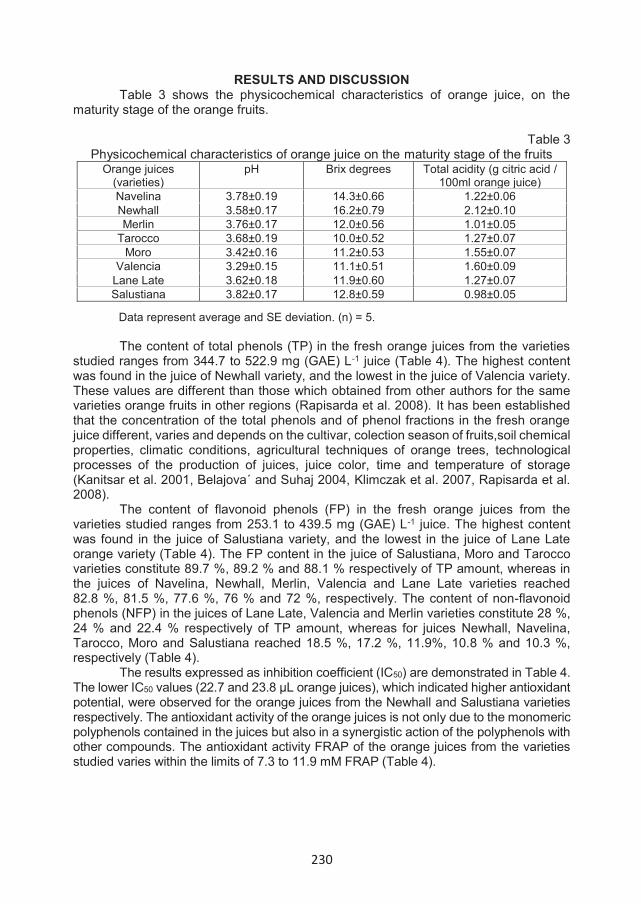
230
RESULTS AND DISCUSSION Table 3 shows the physicochemical characteristics of orange juice, on the
maturity stage of the orange fruits.
Table 3 Physicochemical characteristics of orange juice on the maturity stage of the fruits
Orange juices (varieties)
pH Brix degrees Total acidity (g citric acid / 100ml orange juice)
Navelina 3.78±0.19 14.3±0.66 1.22±0.06 Newhall 3.58±0.17 16.2±0.79 2.12±0.10 Merlin 3.76±0.17 12.0±0.56 1.01±0.05
Tarocco 3.68±0.19 10.0±0.52 1.27±0.07 Moro 3.42±0.16 11.2±0.53 1.55±0.07
Valencia 3.29±0.15 11.1±0.51 1.60±0.09 Lane Late 3.62±0.18 11.9±0.60 1.27±0.07 Salustiana 3.82±0.17 12.8±0.59 0.98±0.05
Data represent average and SE deviation. (n) = 5.
The content of total phenols (TP) in the fresh orange juices from the varieties
studied ranges from 344.7 to 522.9 mg (GAE) L-1 juice (Table 4). The highest content was found in the juice of Newhall variety, and the lowest in the juice of Valencia variety. These values are different than those which obtained from other authors for the same varieties orange fruits in other regions (Rapisarda et al. 2008). It has been established that the concentration of the total phenols and of phenol fractions in the fresh orange juice different, varies and depends on the cultivar, colection season of fruits,soil chemical properties, climatic conditions, agricultural techniques of orange trees, technological processes of the production of juices, juice color, time and temperature of storage (Kanitsar et al. 2001, Belajova´ and Suhaj 2004, Klimczak et al. 2007, Rapisarda et al. 2008).
The content of flavonoid phenols (FP) in the fresh orange juices from the varieties studied ranges from 253.1 to 439.5 mg (GAE) L-1 juice. The highest content was found in the juice of Salustiana variety, and the lowest in the juice of Lane Late orange variety (Table 4). The FP content in the juice of Salustiana, Moro and Tarocco varieties constitute 89.7 %, 89.2 % and 88.1 % respectively of TP amount, whereas in the juices of Navelina, Newhall, Merlin, Valencia and Lane Late varieties reached 82.8 %, 81.5 %, 77.6 %, 76 % and 72 %, respectively. The content of non-flavonoid phenols (NFP) in the juices of Lane Late, Valencia and Merlin varieties constitute 28 %, 24 % and 22.4 % respectively of TP amount, whereas for juices Newhall, Navelina, Tarocco, Moro and Salustiana reached 18.5 %, 17.2 %, 11.9%, 10.8 % and 10.3 %, respectively (Table 4).
The results expressed as inhibition coefficient (IC50) are demonstrated in Table 4. The lower IC50 values (22.7 and 23.8 μL orange juices), which indicated higher antioxidant potential, were observed for the orange juices from the Newhall and Salustiana varieties respectively. The antioxidant activity of the orange juices is not only due to the monomeric polyphenols contained in the juices but also in a synergistic action of the polyphenols with other compounds. The antioxidant activity FRAP of the orange juices from the varieties studied varies within the limits of 7.3 to 11.9 mM FRAP (Table 4).
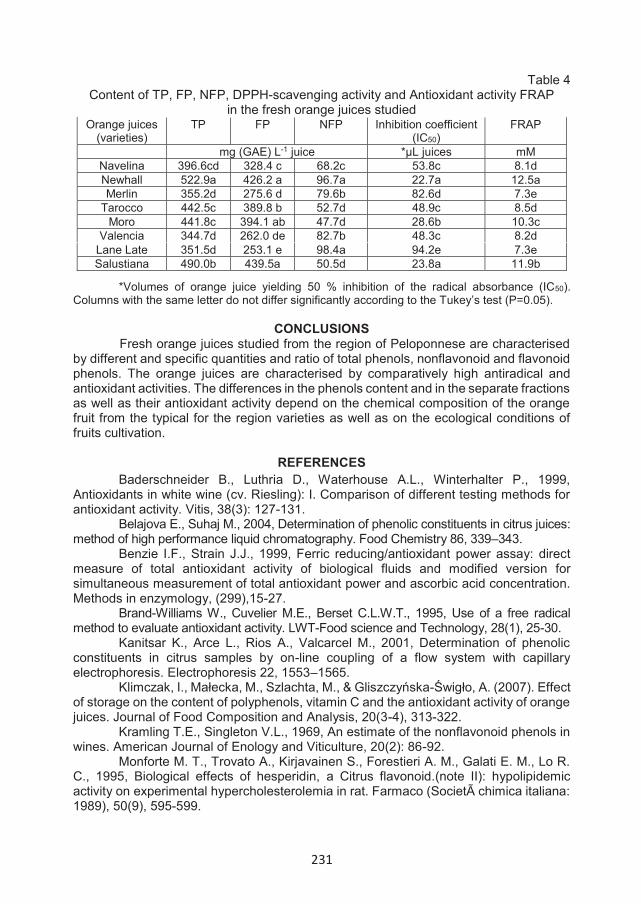
231
Table 4 Content of TP, FP, NFP, DPPH-scavenging activity and Antioxidant activity FRAP
in the fresh orange juices studied Orange juices
(varieties)TP FP NFP Inhibition coefficient
(IC50)FRAP
mg (GAE) L-1 juice *μL juices mMNavelina 396.6cd 328.4 c 68.2c 53.8c 8.1dNewhall 522.9a 426.2 a 96.7a 22.7a 12.5aMerlin 355.2d 275.6 d 79.6b 82.6d 7.3e
Tarocco 442.5c 389.8 b 52.7d 48.9c 8.5dMoro 441.8c 394.1 ab 47.7d 28.6b 10.3c
Valencia 344.7d 262.0 de 82.7b 48.3c 8.2dLane Late 351.5d 253.1 e 98.4a 94.2e 7.3eSalustiana 490.0b 439.5a 50.5d 23.8a 11.9b
*Volumes of orange juice yielding 50 % inhibition of the radical absorbance (IC50).Columns with the same letter do not differ significantly according to the Tukey’s test (P=0.05).
CONCLUSIONS Fresh orange juices studied from the region of Peloponnese are characterised
by different and specific quantities and ratio of total phenols, nonflavonoid and flavonoid phenols. The orange juices are characterised by comparatively high antiradical and antioxidant activities. The differences in the phenols content and in the separate fractions as well as their antioxidant activity depend on the chemical composition of the orange fruit from the typical for the region varieties as well as on the ecological conditions of fruits cultivation.
REFERENCES Baderschneider B., Luthria D., Waterhouse A.L., Winterhalter P., 1999,
Antioxidants in white wine (cv. Riesling): I. Comparison of different testing methods for antioxidant activity. Vitis, 38(3): 127-131.
Belajova E., Suhaj M., 2004, Determination of phenolic constituents in citrus juices: method of high performance liquid chromatography. Food Chemistry 86, 339–343.
Benzie I.F., Strain J.J., 1999, Ferric reducing/antioxidant power assay: direct measure of total antioxidant activity of biological fluids and modified version for simultaneous measurement of total antioxidant power and ascorbic acid concentration. Methods in enzymology, (299),15-27.
Brand-Williams W., Cuvelier M.E., Berset C.L.W.T., 1995, Use of a free radical method to evaluate antioxidant activity. LWT-Food science and Technology, 28(1), 25-30.
Kanitsar K., Arce L., Rios A., Valcarcel M., 2001, Determination of phenolic constituents in citrus samples by on-line coupling of a flow system with capillary electrophoresis. Electrophoresis 22, 1553–1565.
Klimczak, I., Małecka, M., Szlachta, M., & Gliszczyńska-Świgło, A. (2007). Effect of storage on the content of polyphenols, vitamin C and the antioxidant activity of orange juices. Journal of Food Composition and Analysis, 20(3-4), 313-322.
Kramling T.E., Singleton V.L., 1969, An estimate of the nonflavonoid phenols in wines. American Journal of Enology and Viticulture, 20(2): 86-92.
Monforte M. T., Trovato A., Kirjavainen S., Forestieri A. M., Galati E. M., Lo R. C., 1995, Biological effects of hesperidin, a Citrus flavonoid.(note II): hypolipidemic activity on experimental hypercholesterolemia in rat. Farmaco (Società chimica italiana: 1989), 50(9), 595-599.
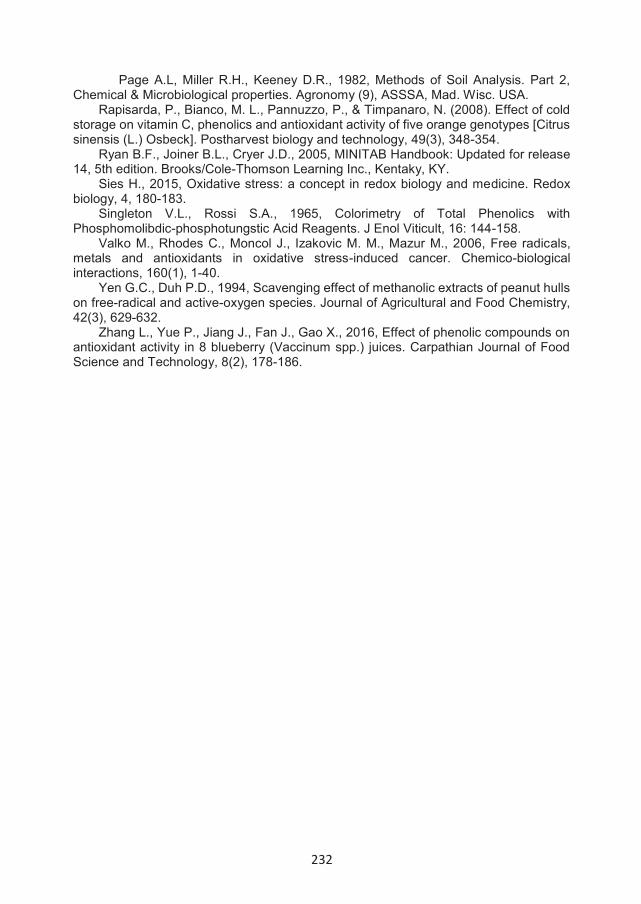
232
Page A.L, Miller R.H., Keeney D.R., 1982, Methods of Soil Analysis. Part 2, Chemical & Microbiological properties. Agronomy (9), ASSSA, Mad. Wisc. USA.
Rapisarda, P., Bianco, M. L., Pannuzzo, P., & Timpanaro, N. (2008). Effect of cold storage on vitamin C, phenolics and antioxidant activity of five orange genotypes [Citrus sinensis (L.) Osbeck]. Postharvest biology and technology, 49(3), 348-354.
Ryan B.F., Joiner B.L., Cryer J.D., 2005, MINITAB Handbook: Updated for release 14, 5th edition. Brooks/Cole-Thomson Learning Inc., Kentaky, KY.
Sies H., 2015, Oxidative stress: a concept in redox biology and medicine. Redox biology, 4, 180-183.
Singleton V.L., Rossi S.A., 1965, Colorimetry of Total Phenolics with Phosphomolibdic-phosphotungstic Acid Reagents. J Enol Viticult, 16: 144-158.
Valko M., Rhodes C., Moncol J., Izakovic M. M., Mazur M., 2006, Free radicals, metals and antioxidants in oxidative stress-induced cancer. Chemico-biological interactions, 160(1), 1-40.
Yen G.C., Duh P.D., 1994, Scavenging effect of methanolic extracts of peanut hulls on free-radical and active-oxygen species. Journal of Agricultural and Food Chemistry, 42(3), 629-632.
Zhang L., Yue P., Jiang J., Fan J., Gao X., 2016, Effect of phenolic compounds on antioxidant activity in 8 blueberry (Vaccinum spp.) juices. Carpathian Journal of Food Science and Technology, 8(2), 178-186.

233
CONTROL THE MAIN PARAMETERS OF QUALITY AND AUTHENTICITY OF WINES FROM OPRIŞOR
Stoica Felicia, Balaban Alin Constantin, Popescu Raluca Iulia*University of Craiova, Faculty of Horticulture
* Correspondence author. E-mail: [email protected]
Keywords: red wine, quality parameters, authenticity
ABSTRACTLately, it lays emphasis on achieving wine quality, natural and authentic. Besides the
analyzes modern, last generation HPLC, GC MS, GC FTIR, IRMS, NIR, quality and naturalness of the wines can be determined by analyzing the main parameters (alcohol, total acidity, extract, ash) and calculating the most important quality indicators (ratio alcohol / glycerol, alcohol / extract, extract / ash Halphen and Gautier). For this purpose were analyzed neutral red wines (Cabernet sauvignon, Fetească neagra si Merlot) from two different range, Caloian and La Cetate, from Oprisor wine center.
INTRODUCTION An important percent of wines sold around the world are fake (Loubry, 2015,
Stoica 2015), and may presenting business risk for companies and to consumer health. The authenticity of wine is a basic element in its certification both nationally and internationally. Basing on the fact that the term 'origin' is of considerable importance directly correlated with the quality of wines, ranking them in terms of geographical origin and variety became an issue of significant interest to the producers and consumers (Banu et al, 2013). The chemical composition of wine is affected by multiple factors, including production area, grape variety, soil type, climate (terroir) and viticole and oenological practices (Muntean et al., 2018). Moreover, these products must be offered to consumers in a state of perfect clarity and lasting stability over time (Băducă Cîmpeanu et al, 2007).
These factors play an important role in differentiating the wines according to their geographical origin and year of harvest (Cichi et al., 2009, Schlesier K et al., 2009).
MATERIAL AND METHODS For this study had the following objectives: 1. Analysis of the main quality parameters attesting the naturalness of some red
wines from the Oltenia Profunda - CALOIAN range and LA CETATE range 2. Analysis of the main indicators of quality and authenticity of some red wines
from Oltenia Profunda range CALOIAN and LA CETATE range. For this study we have analyzed the following red wines from Cabernet
Sauvignon, Merlot and Feteasca neagra. The first two wines are obtained from grape varieties of French origin and the last Romanian.
All the wines analyzed are obtained in the wine-growing center Oprişor, wine production 2016 and 2017.
ANNALS OF THE UNIVERSITY OF CRAIOVA
Series: Biology HorticultureFood produce processingtechnologyEnvironmental engineering Vol. XXII I (LIX) - 2018
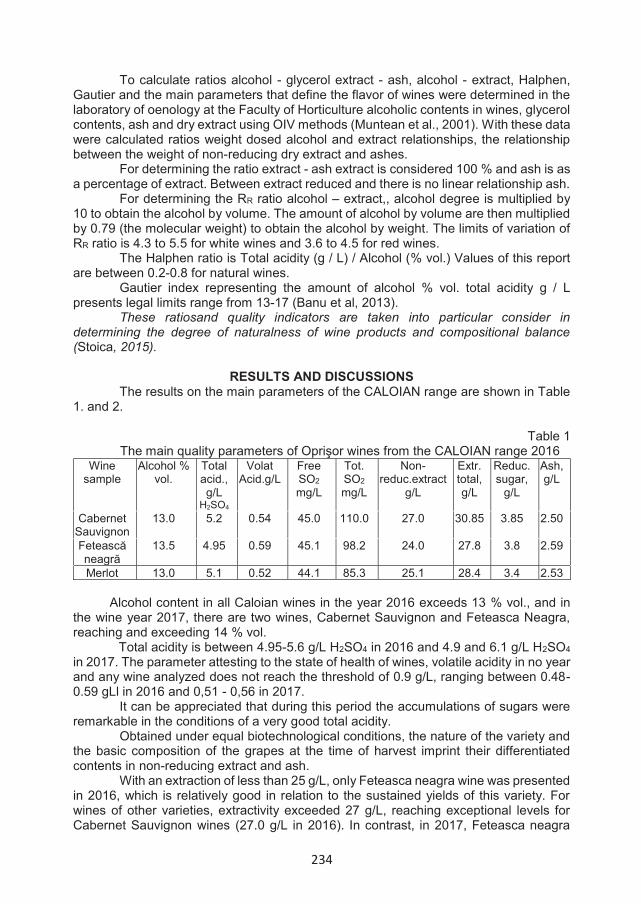
234
To calculate ratios alcohol - glycerol extract - ash, alcohol - extract, Halphen, Gautier and the main parameters that define the flavor of wines were determined in the laboratory of oenology at the Faculty of Horticulture alcoholic contents in wines, glycerol contents, ash and dry extract using OIV methods (Muntean et al., 2001). With these data were calculated ratios weight dosed alcohol and extract relationships, the relationship between the weight of non-reducing dry extract and ashes.
For determining the ratio extract - ash extract is considered 100 % and ash is as a percentage of extract. Between extract reduced and there is no linear relationship ash.
For determining the RR ratio alcohol – extract,, alcohol degree is multiplied by 10 to obtain the alcohol by volume. The amount of alcohol by volume are then multiplied by 0.79 (the molecular weight) to obtain the alcohol by weight. The limits of variation of RR ratio is 4.3 to 5.5 for white wines and 3.6 to 4.5 for red wines.
The Halphen ratio is Total acidity (g / L) / Alcohol (% vol.) Values of this report are between 0.2-0.8 for natural wines.
Gautier index representing the amount of alcohol % vol. total acidity g / L presents legal limits range from 13-17 (Banu et al, 2013).
These ratiosand quality indicators are taken into particular consider in determining the degree of naturalness of wine products and compositional balance (Stoica, 2015).
RESULTS AND DISCUSSIONS The results on the main parameters of the CALOIAN range are shown in Table
1. and 2.
Table 1 The main quality parameters of Oprişor wines from the CALOIAN range 2016
Wine sample
Alcohol % vol.
Total acid., g/L
H2SO4
Volat Acid.g/L
Free SO2mg/L
Tot. SO2mg/L
Non-reduc.extract
g/L
Extr.total, g/L
Reduc. sugar,
g/L
Ash,g/L
Cabernet Sauvignon
13.0 5.2 0.54 45.0 110.0 27.0 30.85 3.85 2.50
Fetească neagră
13.5 4.95 0.59 45.1 98.2 24.0 27.8 3.8 2.59
Merlot 13.0 5.1 0.52 44.1 85.3 25.1 28.4 3.4 2.53
Alcohol content in all Caloian wines in the year 2016 exceeds 13 % vol., and in the wine year 2017, there are two wines, Cabernet Sauvignon and Feteasca Neagra, reaching and exceeding 14 % vol.
Total acidity is between 4.95-5.6 g/L H2SO4 in 2016 and 4.9 and 6.1 g/L H2SO4in 2017. The parameter attesting to the state of health of wines, volatile acidity in no year and any wine analyzed does not reach the threshold of 0.9 g/L, ranging between 0.48-0.59 gLl in 2016 and 0,51 - 0,56 in 2017.
It can be appreciated that during this period the accumulations of sugars were remarkable in the conditions of a very good total acidity.
Obtained under equal biotechnological conditions, the nature of the variety and the basic composition of the grapes at the time of harvest imprint their differentiated contents in non-reducing extract and ash.
With an extraction of less than 25 g/L, only Feteasca neagra wine was presented in 2016, which is relatively good in relation to the sustained yields of this variety. For wines of other varieties, extractivity exceeded 27 g/L, reaching exceptional levels for Cabernet Sauvignon wines (27.0 g/L in 2016). In contrast, in 2017, Feteasca neagra
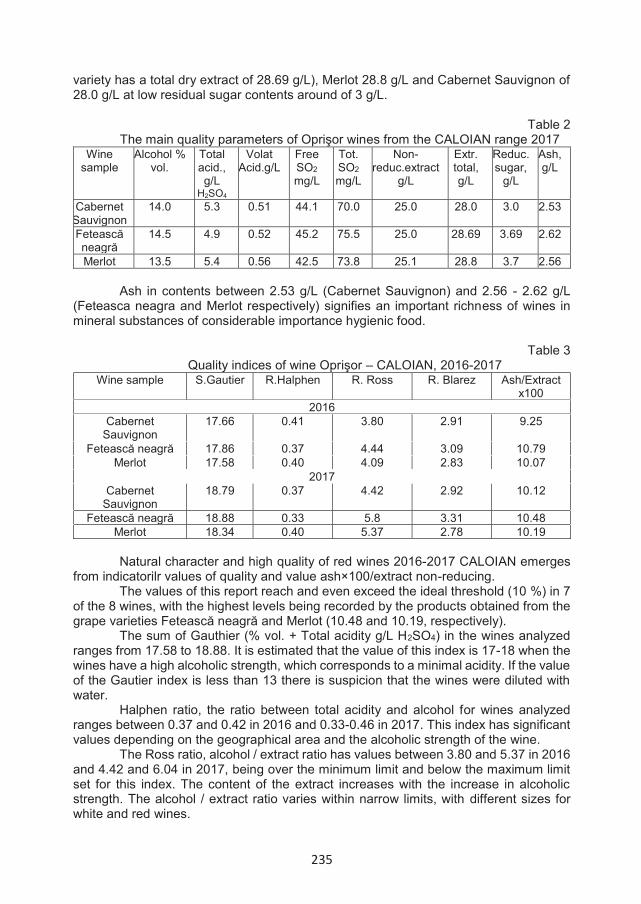
235
variety has a total dry extract of 28.69 g/L), Merlot 28.8 g/L and Cabernet Sauvignon of 28.0 g/L at low residual sugar contents around of 3 g/L.
Table 2 The main quality parameters of Oprişor wines from the CALOIAN range 2017
Wine sample
Alcohol % vol.
Total acid., g/L
H2SO4
Volat Acid.g/L
Free SO2mg/L
Tot. SO2mg/L
Non-reduc.extract
g/L
Extr.total, g/L
Reduc. sugar,
g/L
Ash,g/L
Cabernet Sauvignon
14.0 5.3 0.51 44.1 70.0 25.0 28.0 3.0 2.53
Fetească neagră
14.5 4.9 0.52 45.2 75.5 25.0 28.69 3.69 2.62
Merlot 13.5 5.4 0.56 42.5 73.8 25.1 28.8 3.7 2.56
Ash in contents between 2.53 g/L (Cabernet Sauvignon) and 2.56 - 2.62 g/L (Feteasca neagra and Merlot respectively) signifies an important richness of wines in mineral substances of considerable importance hygienic food.
Table 3 Quality indices of wine Oprişor – CALOIAN, 2016-2017
Wine sample S.Gautier R.Halphen R. Ross R. Blarez Ash/Extractx100
2016Cabernet
Sauvignon17.66 0.41 3.80 2.91 9.25
Fetească neagră 17.86 0.37 4.44 3.09 10.79Merlot 17.58 0.40 4.09 2.83 10.07
2017Cabernet
Sauvignon18.79 0.37 4.42 2.92 10.12
Fetească neagră 18.88 0.33 5.8 3.31 10.48Merlot 18.34 0.40 5.37 2.78 10.19
Natural character and high quality of red wines 2016-2017 CALOIAN emerges from indicatorilr values of quality and value ash×100/extract non-reducing.
The values of this report reach and even exceed the ideal threshold (10 %) in 7 of the 8 wines, with the highest levels being recorded by the products obtained from the grape varieties Fetească neagră and Merlot (10.48 and 10.19, respectively).
The sum of Gauthier (% vol. + Total acidity g/L H2SO4) in the wines analyzed ranges from 17.58 to 18.88. It is estimated that the value of this index is 17-18 when the wines have a high alcoholic strength, which corresponds to a minimal acidity. If the value of the Gautier index is less than 13 there is suspicion that the wines were diluted with water.
Halphen ratio, the ratio between total acidity and alcohol for wines analyzed ranges between 0.37 and 0.42 in 2016 and 0.33-0.46 in 2017. This index has significant values depending on the geographical area and the alcoholic strength of the wine.
The Ross ratio, alcohol / extract ratio has values between 3.80 and 5.37 in 2016 and 4.42 and 6.04 in 2017, being over the minimum limit and below the maximum limit set for this index. The content of the extract increases with the increase in alcoholic strength. The alcohol / extract ratio varies within narrow limits, with different sizes for white and red wines.
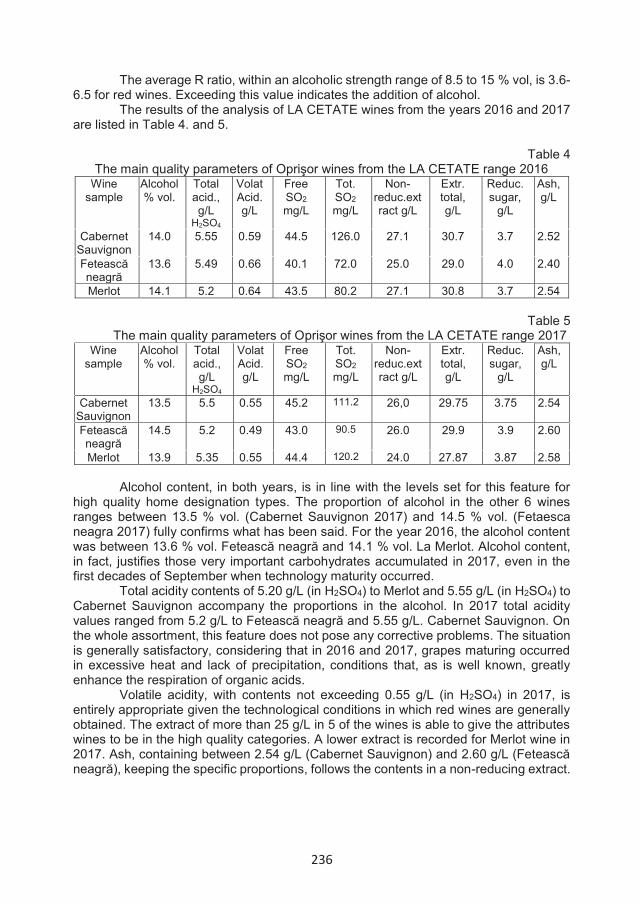
236
The average R ratio, within an alcoholic strength range of 8.5 to 15 % vol, is 3.6-6.5 for red wines. Exceeding this value indicates the addition of alcohol.
The results of the analysis of LA CETATE wines from the years 2016 and 2017 are listed in Table 4. and 5.
Table 4
The main quality parameters of Oprişor wines from the LA CETATE range 2016 Wine
sample Alcohol % vol.
Total acid., g/L
H2SO4
Volat Acid. g/L
Free SO2 mg/L
Tot. SO2 mg/L
Non-reduc.extract g/L
Extr. total, g/L
Reduc. sugar,
g/L
Ash, g/L
Cabernet Sauvignon
14.0 5.55 0.59 44.5 126.0 27.1 30.7 3.7 2.52
Fetească neagră
13.6 5.49 0.66 40.1 72.0 25.0 29.0 4.0 2.40
Merlot 14.1 5.2 0.64 43.5 80.2 27.1 30.8 3.7 2.54
Table 5 The main quality parameters of Oprişor wines from the LA CETATE range 2017
Wine sample
Alcohol % vol.
Total acid., g/L
H2SO4
Volat Acid.g/L
Free SO2 mg/L
Tot. SO2 mg/L
Non-reduc.extract g/L
Extr. total, g/L
Reduc. sugar,
g/L
Ash,g/L
Cabernet Sauvignon
13.5 5.5 0.55 45.2 111.2 26,0 29.75 3.75 2.54
Fetească neagră
14.5 5.2 0.49 43.0 90.5 26.0 29.9 3.9 2.60
Merlot 13.9 5.35 0.55 44.4 120.2 24.0 27.87 3.87 2.58
Alcohol content, in both years, is in line with the levels set for this feature for high quality home designation types. The proportion of alcohol in the other 6 wines ranges between 13.5 % vol. (Cabernet Sauvignon 2017) and 14.5 % vol. (Fetaesca neagra 2017) fully confirms what has been said. For the year 2016, the alcohol content was between 13.6 % vol. Fetească neagră and 14.1 % vol. La Merlot. Alcohol content, in fact, justifies those very important carbohydrates accumulated in 2017, even in the first decades of September when technology maturity occurred.
Total acidity contents of 5.20 g/L (in H2SO4) to Merlot and 5.55 g/L (in H2SO4) to Cabernet Sauvignon accompany the proportions in the alcohol. In 2017 total acidity values ranged from 5.2 g/L to Fetească neagră and 5.55 g/L. Cabernet Sauvignon. On the whole assortment, this feature does not pose any corrective problems. The situation is generally satisfactory, considering that in 2016 and 2017, grapes maturing occurred in excessive heat and lack of precipitation, conditions that, as is well known, greatly enhance the respiration of organic acids.
Volatile acidity, with contents not exceeding 0.55 g/L (in H2SO4) in 2017, is entirely appropriate given the technological conditions in which red wines are generally obtained. The extract of more than 25 g/L in 5 of the wines is able to give the attributes wines to be in the high quality categories. A lower extract is recorded for Merlot wine in 2017. Ash, containing between 2.54 g/L (Cabernet Sauvignon) and 2.60 g/L (Fetească neagră), keeping the specific proportions, follows the contents in a non-reducing extract.
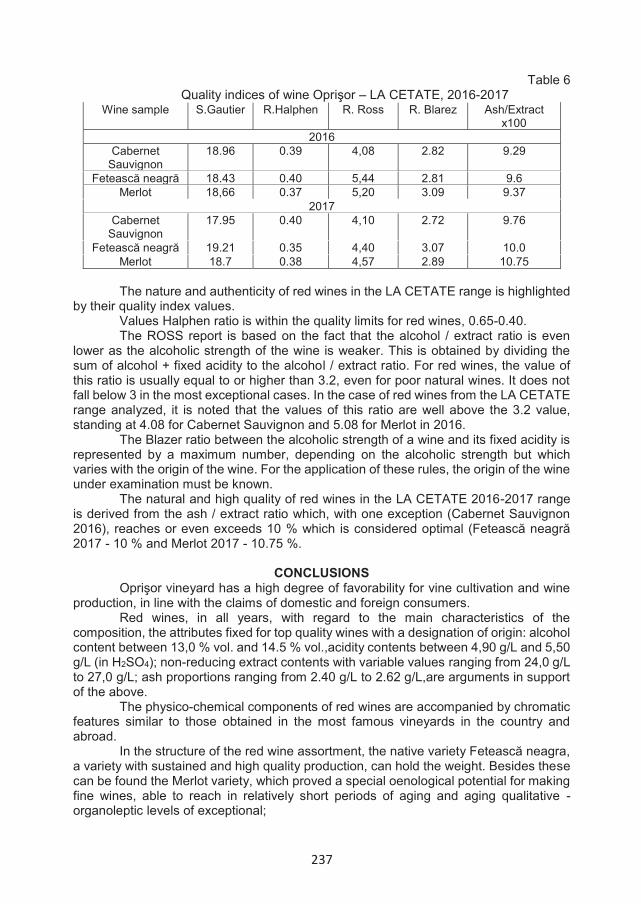
237
Table 6 Quality indices of wine Oprişor – LA CETATE, 2016-2017
Wine sample S.Gautier R.Halphen R. Ross R. Blarez Ash/Extractx100
2016Cabernet
Sauvignon18.96 0.39 4,08 2.82 9.29
Fetească neagră 18.43 0.40 5,44 2.81 9.6Merlot 18,66 0.37 5,20 3.09 9.37
2017Cabernet
Sauvignon17.95 0.40 4,10 2.72 9.76
Fetească neagră 19.21 0.35 4,40 3.07 10.0Merlot 18.7 0.38 4,57 2.89 10.75
The nature and authenticity of red wines in the LA CETATE range is highlighted by their quality index values.
Values Halphen ratio is within the quality limits for red wines, 0.65-0.40. The ROSS report is based on the fact that the alcohol / extract ratio is even
lower as the alcoholic strength of the wine is weaker. This is obtained by dividing the sum of alcohol + fixed acidity to the alcohol / extract ratio. For red wines, the value of this ratio is usually equal to or higher than 3.2, even for poor natural wines. It does not fall below 3 in the most exceptional cases. In the case of red wines from the LA CETATE range analyzed, it is noted that the values of this ratio are well above the 3.2 value, standing at 4.08 for Cabernet Sauvignon and 5.08 for Merlot in 2016.
The Blazer ratio between the alcoholic strength of a wine and its fixed acidity is represented by a maximum number, depending on the alcoholic strength but which varies with the origin of the wine. For the application of these rules, the origin of the wine under examination must be known.
The natural and high quality of red wines in the LA CETATE 2016-2017 range is derived from the ash / extract ratio which, with one exception (Cabernet Sauvignon 2016), reaches or even exceeds 10 % which is considered optimal (Fetească neagră 2017 - 10 % and Merlot 2017 - 10.75 %.
CONCLUSIONSOprişor vineyard has a high degree of favorability for vine cultivation and wine
production, in line with the claims of domestic and foreign consumers. Red wines, in all years, with regard to the main characteristics of the
composition, the attributes fixed for top quality wines with a designation of origin: alcohol content between 13,0 % vol. and 14.5 % vol.,acidity contents between 4,90 g/L and 5,50 g/L (in H2SO4); non-reducing extract contents with variable values ranging from 24,0 g/L to 27,0 g/L; ash proportions ranging from 2.40 g/L to 2.62 g/L,are arguments in support of the above.
The physico-chemical components of red wines are accompanied by chromatic features similar to those obtained in the most famous vineyards in the country and abroad.
In the structure of the red wine assortment, the native variety Fetească neagra, a variety with sustained and high quality production, can hold the weight. Besides these can be found the Merlot variety, which proved a special oenological potential for making fine wines, able to reach in relatively short periods of aging and aging qualitative - organoleptic levels of exceptional;

238
Also the Cabernet Sauvignon variety is desirable for getting "full", expressive and firmly defined wines.
It can be seen that the studied wines, obtained in the reputed Oprişor wine cellar from the long-lasting vineyard, Plaiurile Drîncei, are competitive both on the domestic and the foreign market, due to the special compositional and chromatic qualities and their naturalness and authenticity.
REFERENCES
Banu C., Bulancea M., Ianiţchi D., Bărăscu E., Stoica A (2013). Industria alimentară între adevăr şi fraudă, Editura ASAB, p. 359-392
Băducă Cîmpeanu C, (2007). A Survey of the Influence of Cultivar and Vineyard on Colour and Sensorial Characteristics of Some Romanian Red Wines. Acta Horticulturae, nr. 754, p. 463–468. ISSN 0567–7572. ISBN 978 90 6605 620 6.
Cichi Daniela Doloris, Costea D.C., Olteanu I., Camelia Popa, Giugea N., Maracineanu L.C., Cichi M., (2009). Adjustment of the viticultural assortment to the climatic restraints from several viticultural areas of Oltenia, Lucrari științifice USAMV Iasi seria Horticultură, anul LII, vol. 52, 701-706,
Loubry J-M. (2015).Traçabilité et protection contre la contrefaçon des vins. Panorama des solutions existantes et enjeux technologiques, La Revue des Œnologues, no. 157, 38-40
Muntean Camelia, Băducă C., Stoica Felicia, 2001 – Operaţii tehnologice şi metode de analiză şi control în industria vinicolă, Ed. Sitech, Craiova.
Muntean Camelia, Stoica Felicia, Băducă C., Cichi Daniela, (2018). Study of the anthocyanic potential of grapes varieties for red wines in Dranic wine center, Annals of U.S.A.M.V. Bucuresti, serie B, vol LXII, pag. 59-64
Schlesier K, Fauhl-Hassek C, Forina M, Cotea V, Kocsi E, Schoula R, van Jaarsveld F, Wittkowski R (2009) Characterisation and determination of the geographical origin of wines. Part I: overview. Eur Food Res Technol, 230:1–13.
Stoica Felicia, (2015) The main parameters and indicators that define the quality and authenticity of white wines from vineyard Drăgăşani - Romania, Carpathian Journal of Food Science and Technology, Vol. 7, No 4,139-144
239
RESEARCH REGARDING PATHOGEN CONTROL ON TOMATOES IN THE FIELD
Sovarel Gabriela, Costache Marcel
Research Development Institute for Vegetable and Flower Growing Vidra * Correspondence author. E-mail: [email protected]
Keywords: tomato, pathogen control, field
ABSTRACTThe main objective of this experience was to develop a program of treatments for the
control of tomato pests in the field. The experience was organized at RDIVFG Vidra on field conditions, in 5 variants, with 4 replicates, placed in randomized blocks. Depending on the favorability of climatic factors, there were applied 5 treatments (2 in May and 3 in June). The technological variants of control have been established according to the sequence of the occurrence of the pathogens. The best efficacy in the control of pathogens was 81.9 % for the following treatment (T) sequence: T1. Champ 77 WG 0.25 %, T2. Bravo 500 SC 0.2 %; T3. Copper Max 50 WP 0.25 %; T4. Ortiva Top 0.1 %; T5. Melody Compact 49 WG 0.2 % + Score 250 SC 0.05 %. The efficacy of treatments varied between 79.1 and 81.9 %.
INTRODUCTION In Romania, the most important pathogens of tomato crops (Costache, 2007)
are both soil borne pathogens as Fusarium oxysporum f.sp. lycopersici (Fusarium wilt) respectively Verticillium dahliae (verticillium wilt) and pathogens which attack the aerial part of the plants (leaves, stems, fruits) as Alternaria porri f.sp. solani (early blight), Botrytis cinerea (grey mold), Fulvia fulva (leaf mold), Erysiphe sp. (powdery mildew), Phytophthora infestans (late blight) etc. For the registration of tomato cultivars, disease resistance is evaluated against Fusarium oxysporum f. sp. lycopersici race 0 and 1 (FOL0 and FOL1), Verticillium dahliae, Tomato mosaic virus race 0 and Meloydogine incognita (Sigillo and Bravi, 2011). All Alternaria diseases are characterized by a short period of susceptibility in seedlings, a long period of resistance in young to intermediate -aged plant and increasing susceptibility in aging plant (Rotem, 1994). Sources of genetic resistance have been identified within tomato related wild species, in particular green-fruited L. hirsutum and red-fruited L. pimpinellifolium (Foolad, 2005). Resistant cultivars at Botrytis cinerea are not present (Heyens et al., 2011) and the solutions are sanitation, cultural measures and chemical control. Varieties with major gene resistanceto foliar fungal pathogens such as gray leaf spot and Cladosporium leaf mold (two genes usually used) are common, while a few varieties have resistance to some races of late blight (Scott, 2005).
ANNALS OF THE UNIVERSITY OF CRAIOVA
Series: Biology HorticultureFood produce processingtechnologyEnvironmental engineering Vol. XXII I (LIX) - 2018
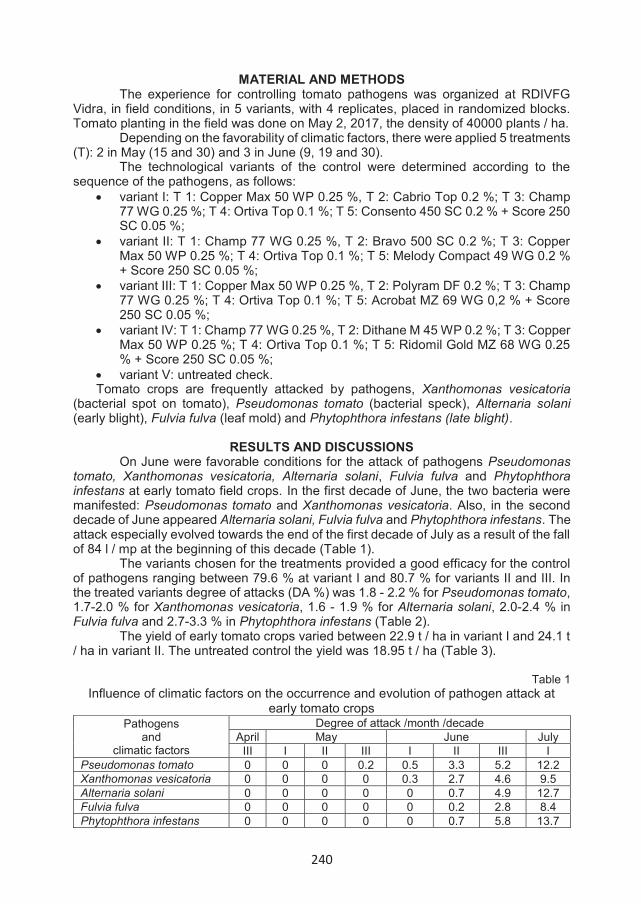
240
MATERIAL AND METHODS The experience for controlling tomato pathogens was organized at RDIVFG
Vidra, in field conditions, in 5 variants, with 4 replicates, placed in randomized blocks. Tomato planting in the field was done on May 2, 2017, the density of 40000 plants / ha.
Depending on the favorability of climatic factors, there were applied 5 treatments (T): 2 in May (15 and 30) and 3 in June (9, 19 and 30).
The technological variants of the control were determined according to the sequence of the pathogens, as follows:
variant I: T 1: Copper Max 50 WP 0.25 %, T 2: Cabrio Top 0.2 %; T 3: Champ77 WG 0.25 %; T 4: Ortiva Top 0.1 %; T 5: Consento 450 SC 0.2 % + Score 250SC 0.05 %;variant II: T 1: Champ 77 WG 0.25 %, T 2: Bravo 500 SC 0.2 %; T 3: CopperMax 50 WP 0.25 %; T 4: Ortiva Top 0.1 %; T 5: Melody Compact 49 WG 0.2 %+ Score 250 SC 0.05 %;variant III: T 1: Copper Max 50 WP 0.25 %, T 2: Polyram DF 0.2 %; T 3: Champ77 WG 0.25 %; T 4: Ortiva Top 0.1 %; T 5: Acrobat MZ 69 WG 0,2 % + Score250 SC 0.05 %;variant IV: T 1: Champ 77 WG 0.25 %, T 2: Dithane M 45 WP 0.2 %; T 3: CopperMax 50 WP 0.25 %; T 4: Ortiva Top 0.1 %; T 5: Ridomil Gold MZ 68 WG 0.25% + Score 250 SC 0.05 %;variant V: untreated check.
Tomato crops are frequently attacked by pathogens, Xanthomonas vesicatoria(bacterial spot on tomato), Pseudomonas tomato (bacterial speck), Alternaria solani (early blight), Fulvia fulva (leaf mold) and Phytophthora infestans (late blight).
RESULTS AND DISCUSSIONS On June were favorable conditions for the attack of pathogens Pseudomonas
tomato, Xanthomonas vesicatoria, Alternaria solani, Fulvia fulva and Phytophthora infestans at early tomato field crops. In the first decade of June, the two bacteria were manifested: Pseudomonas tomato and Xanthomonas vesicatoria. Also, in the second decade of June appeared Alternaria solani, Fulvia fulva and Phytophthora infestans. The attack especially evolved towards the end of the first decade of July as a result of the fall of 84 l / mp at the beginning of this decade (Table 1).
The variants chosen for the treatments provided a good efficacy for the control of pathogens ranging between 79.6 % at variant I and 80.7 % for variants II and III. In the treated variants degree of attacks (DA %) was 1.8 - 2.2 % for Pseudomonas tomato,1.7-2.0 % for Xanthomonas vesicatoria, 1.6 - 1.9 % for Alternaria solani, 2.0-2.4 % in Fulvia fulva and 2.7-3.3 % in Phytophthora infestans (Table 2).
The yield of early tomato crops varied between 22.9 t / ha in variant I and 24.1 t / ha in variant II. The untreated control the yield was 18.95 t / ha (Table 3).
Table 1 Influence of climatic factors on the occurrence and evolution of pathogen attack at
early tomato crops Pathogens
andclimatic factors
Degree of attack /month /decadeApril May June July
III I II III I II III IPseudomonas tomato 0 0 0 0.2 0.5 3.3 5.2 12.2Xanthomonas vesicatoria 0 0 0 0 0.3 2.7 4.6 9.5Alternaria solani 0 0 0 0 0 0.7 4.9 12.7Fulvia fulva 0 0 0 0 0 0.2 2.8 8.4Phytophthora infestans 0 0 0 0 0 0.7 5.8 13.7
241
Minimum temperature (ºC) 4.7 10.9 10.5 12.4 15.0 14.2 17.4 15.9Average temperature (ºC) 10.8 14.7 15.3 16.5 20.1 19.4 24.1 21.9Maximum temperature (ºC) 18.3 19.4 20.9 21.4 26.0 25.9 31.9 21.9Minimum relative humidity (%)
53.6 60.2 53.7 57.0 47.5 47.6 33.7 46.0
Average relative humidity (%)
65.4 70.3 63.1 66.9 56.9 56.2 52.6 57.9
Maximum relative humidity (%)
83.4 85.2 76.3 76.6 77.8 68.3 71.3 74.7
Rain (mm) 6.3 43.6 19.9 7.5 20.0 22.5 1.0 84.0
Table 2 Efficacy of some variants of fungicide treatments at early tomato crops
VariantDegree of attack (%) on leaves
Pseudomonas tomato
Xanthomonas vesicatoria
Alternaria solani
Fulvia fulva
Phytophthora infestans Total Efficacy (%)
I. 2.2 2.0 1.8 2.3 3.2 11.5 79.6II. 1.8 1.7 1.6 2.4 2.7 10.2 81.9III. 2.0 1.9 1.9 2.1 3.0 10.9 80.7IV. 2.1 1.8 1.7 2.0 3.3 10.9 80.7V. 12.2 9.5 12.7 8.4 13.7 56.5 -
Table 3 The influence of treatment variants on early tomato yield
Variant yieldkg/m2 t/ha %
I. 2.295 22.950 121.1II. 2.410 24.100 127.2III. 2.330 23.300 122.9IV. 2.310 23.100 121.9V. 1.895 18.950 100.0
CONCLUSIONSAny of the treatment options (efficacy ranging from 79.6 % to 81.9 %) can be
used in the field of early field tomatoes: variant II: T 1: Champ 77 WG 0.25 %, T 2: Bravo 500 SC 0.2 %; T 3: CopperMax 50 WP 0.25 %; T 4: Ortiva Top 0.1 %; T 5: Melody Compact 49 WG 0.2 %+ Score 250 SC 0.05 %;variant III: T 1: Copper Max 50 WP 0.25 %, T 2: Polyram DF 0.2 %; T 3: Champ77 WG 0.25 %; T 4: Ortiva Top 0.1 %; T 5: Acrobat MZ 69 WG 0.2 % + Score250 SC 0.05 %;variant IV: T 1: Champ 77 WG 0.25 %, T 2: Dithane M 45 WP 0.2 %; T 3: CopperMax 50 WP 0.25 %; T 4: Ortiva Top 0.1 %; T 5: Ridomil Gold MZ 68 WG 0.25% + Score 250 SC 0.05 %;variant I: T 1: Copper Max 50 WP 0.25 %, T 2: Cabrio Top 0.2 %; T 3: Champ77 WG 0.25 %; T 4: Ortiva Top 0.1 %; T 5: Consento 450 SC 0.2 % + Score 250SC 0.05 %;
ACKNOWLEDGMENT This work was made with the support of the Ministry of Agriculture and Rural
Development-Romania, through the Agriculture and Rural Development Programme ADER 2015-2018.

242
REFERENCES Costache M, Roman T, Costache C (2007). Diseases and pests of vegetable
crops, Editura Agris, Bucuresti. 47-55. Foolad MR, Sharma A , Ashrafi H, Lin G (2005). Genetics of early blight
resistance in tomato. ISHS Acta Horticulturae 914: 397 – 406. Heyens K, Aerts R, Seels B, Vogels L, Bruno PA (2011). Biological control of
Botrytis cinerea in tomato. ISHS Acta Horticulturae 914: 361-363. Rotem J.(1994). The genus Alternaria. Biology, epidemiology and pathogenicity.
APS Press. 201. Scott JW (2005). Perspectives on tomato disease resistance breeding: past,
present and future. ISHS Acta Horticulturae 695: 217-224. Sigillo, L, Bravi R (2011). Resistance tests to diseases of tomato cultivars for
listing in the common catalogue. ISHS Acta Horticulturae 914: 449-453

243
TRENDS IN THE EVOLUTION OF CRYPTOGAMIC DISEASES IN VINEYARDS IN THE BUJORU VINEYARD ECOSYSTEM,
IN THE CONTEXT OF CURRENT CLIMATE CHANGE
Tabaranu Gabriel1, Viorica Enache1, Alina Donici1
* Statiunea de Cercetare-Dezvoltare pentru Viticultura si Vinificatie Bujoru, judetul Galati, România* Correspondence author. E-mail: [email protected]
Keywords: grapevine, pathogens, vineyard.
ABSTRACTThis paper presents the The researches took place at the Bujoru Vine-Growing Research
and Development Stage in 1992-2016 and targeted the spread of the main pathogens and pests in the vineyard plantations, an ecological phenomenon that is influenced by ecological zonal factors and ecological plasticity, each species occurs in nature on a given territory occupying adetermined area. After analyzing the dynamics of the vineyard health status of the Bujoru viticulture ecosystem in the last 25 years, it is observed that the occurrence and evolution of the main pathogens were influenced by the climatic conditions area. In the vineyard plantations of the Bujoru vineyard, harmful fauna is relatively varied and numerous, but only a few pathogens (manna, mildew, gray rot) produce year-on-year significant economic damage. Pathogens were monitored by notaries observations and scores to determine the frequency (F), intensity (I) and attack rate (G.A %).
INTRODUCTION The wine-growing plants in Moldova are increasingly affected by the climate
changes that have taken place over the last decades. Changing environmental conditions causes changes in metabolism, growth and development processes, with positive or negative influences on plant quality and vitality.
Research supports the development of the capacity to assess and mitigate the impacts of climate change and other stress factors on the state of viticulture ecosystems and is based on a series of data over a 25-year period so that the tendency / periodicity of the elements climatic and natural resources and their influence on the behavior of the vine. In vine cultivation technology, pathogen control is one of the key technological links for obtaining high grape yields and high quality wine.
The emergence and evolution of the main pathogens of vineyards in the Dealu Bujorului vineyard is influenced by the direct and indirect effects of the technological and ecological zonal factors that affect the quality and quantity of the grapes (Mirica I. et Mirica Afrodita, 1976; Teodorescu Georgeta et al., 2003; Ulea E., 2003; Simion Cristina, 2003; Tabaranu G. et al. 2005).
ANNALS OF THE UNIVERSITY OF CRAIOVA
Series: Biology HorticultureFood produce processingtechnologyEnvironmental engineering Vol. XXII I (LIX) - 2018
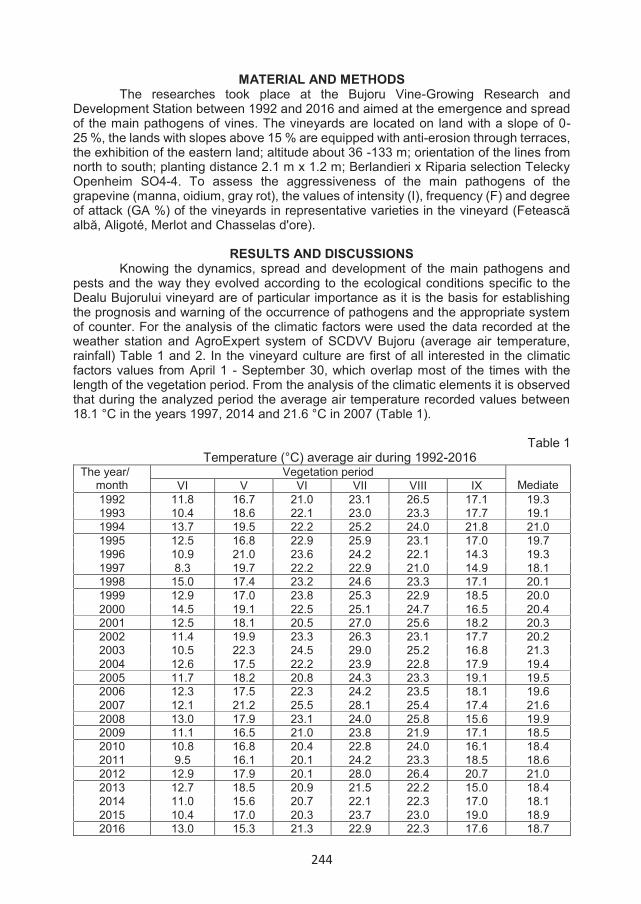
244
MATERIAL AND METHODS The researches took place at the Bujoru Vine-Growing Research and
Development Station between 1992 and 2016 and aimed at the emergence and spread of the main pathogens of vines. The vineyards are located on land with a slope of 0-25 %, the lands with slopes above 15 % are equipped with anti-erosion through terraces, the exhibition of the eastern land; altitude about 36 -133 m; orientation of the lines from north to south; planting distance 2.1 m x 1.2 m; Berlandieri x Riparia selection Telecky Openheim SO4-4. To assess the aggressiveness of the main pathogens of the grapevine (manna, oidium, gray rot), the values of intensity (I), frequency (F) and degree of attack (GA %) of the vineyards in representative varieties in the vineyard (Fetească albă, Aligoté, Merlot and Chasselas d'ore).
RESULTS AND DISCUSSIONS Knowing the dynamics, spread and development of the main pathogens and
pests and the way they evolved according to the ecological conditions specific to the Dealu Bujorului vineyard are of particular importance as it is the basis for establishing the prognosis and warning of the occurrence of pathogens and the appropriate system of counter. For the analysis of the climatic factors were used the data recorded at the weather station and AgroExpert system of SCDVV Bujoru (average air temperature, rainfall) Table 1 and 2. In the vineyard culture are first of all interested in the climatic factors values from April 1 - September 30, which overlap most of the times with the length of the vegetation period. From the analysis of the climatic elements it is observed that during the analyzed period the average air temperature recorded values between 18.1 °C in the years 1997, 2014 and 21.6 °C in 2007 (Table 1).
Table 1 Temperature (°C) average air during 1992-2016
The year/month
Vegetation periodMediateVI V VI VII VIII IX
1992 11.8 16.7 21.0 23.1 26.5 17.1 19.31993 10.4 18.6 22.1 23.0 23.3 17.7 19.11994 13.7 19.5 22.2 25.2 24.0 21.8 21.01995 12.5 16.8 22.9 25.9 23.1 17.0 19.71996 10.9 21.0 23.6 24.2 22.1 14.3 19.31997 8.3 19.7 22.2 22.9 21.0 14.9 18.11998 15.0 17.4 23.2 24.6 23.3 17.1 20.11999 12.9 17.0 23.8 25.3 22.9 18.5 20.02000 14.5 19.1 22.5 25.1 24.7 16.5 20.42001 12.5 18.1 20.5 27.0 25.6 18.2 20.32002 11.4 19.9 23.3 26.3 23.1 17.7 20.22003 10.5 22.3 24.5 29.0 25.2 16.8 21.32004 12.6 17.5 22.2 23.9 22.8 17.9 19.42005 11.7 18.2 20.8 24.3 23.3 19.1 19.52006 12.3 17.5 22.3 24.2 23.5 18.1 19.62007 12.1 21.2 25.5 28.1 25.4 17.4 21.62008 13.0 17.9 23.1 24.0 25.8 15.6 19.92009 11.1 16.5 21.0 23.8 21.9 17.1 18.52010 10.8 16.8 20.4 22.8 24.0 16.1 18.42011 9.5 16.1 20.1 24.2 23.3 18.5 18.62012 12.9 17.9 20.1 28.0 26.4 20.7 21.02013 12.7 18.5 20.9 21.5 22.2 15.0 18.42014 11.0 15.6 20.7 22.1 22.3 17.0 18.12015 10.4 17.0 20.3 23.7 23.0 19.0 18.92016 13.0 15.3 21.3 22.9 22.3 17.6 18.7
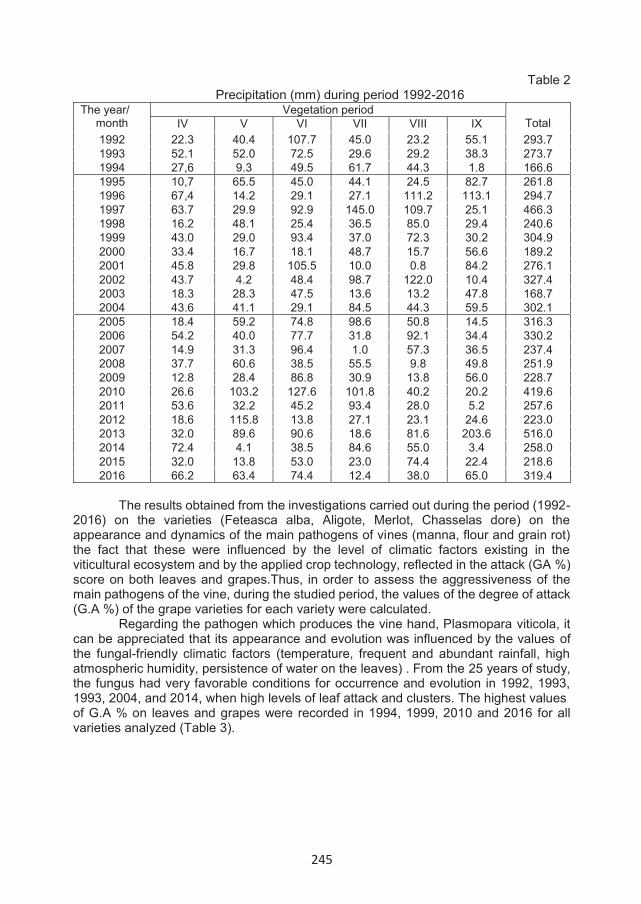
245
Table 2 Precipitation (mm) during period 1992-2016
The results obtained from the investigations carried out during the period (1992-2016) on the varieties (Feteasca alba, Aligote, Merlot, Chasselas dore) on the appearance and dynamics of the main pathogens of vines (manna, flour and grain rot) the fact that these were influenced by the level of climatic factors existing in the viticultural ecosystem and by the applied crop technology, reflected in the attack (GA %)score on both leaves and grapes.Thus, in order to assess the aggressiveness of the main pathogens of the vine, during the studied period, the values of the degree of attack (G.A %) of the grape varieties for each variety were calculated.
Regarding the pathogen which produces the vine hand, Plasmopara viticola, it can be appreciated that its appearance and evolution was influenced by the values ofthe fungal-friendly climatic factors (temperature, frequent and abundant rainfall, high atmospheric humidity, persistence of water on the leaves) . From the 25 years of study, the fungus had very favorable conditions for occurrence and evolution in 1992, 1993, 1993, 2004, and 2014, when high levels of leaf attack and clusters. The highest values of G.A % on leaves and grapes were recorded in 1994, 1999, 2010 and 2016 for all varieties analyzed (Table 3).
The year/month
Vegetation periodTotal IV V VI VII VIII IX
1992 22.3 40.4 107.7 45.0 23.2 55.1 293.71993 52.1 52.0 72.5 29.6 29.2 38.3 273.71994 27,6 9.3 49.5 61.7 44.3 1.8 166.61995 10,7 65.5 45.0 44.1 24.5 82.7 261.81996 67,4 14.2 29.1 27.1 111.2 113.1 294.71997 63.7 29.9 92.9 145.0 109.7 25.1 466.31998 16.2 48.1 25.4 36.5 85.0 29.4 240.61999 43.0 29.0 93.4 37.0 72.3 30.2 304.92000 33.4 16.7 18.1 48.7 15.7 56.6 189.22001 45.8 29.8 105.5 10.0 0.8 84.2 276.12002 43.7 4.2 48.4 98.7 122.0 10.4 327.42003 18.3 28.3 47.5 13.6 13.2 47.8 168.72004 43.6 41.1 29.1 84.5 44.3 59.5 302.12005 18.4 59.2 74.8 98.6 50.8 14.5 316.32006 54.2 40.0 77.7 31.8 92.1 34.4 330.22007 14.9 31.3 96.4 1.0 57.3 36.5 237.42008 37.7 60.6 38.5 55.5 9.8 49.8 251.92009 12.8 28.4 86.8 30.9 13.8 56.0 228.72010 26.6 103.2 127.6 101.8 40.2 20.2 419.62011 53.6 32.2 45.2 93.4 28.0 5.2 257.62012 18.6 115.8 13.8 27.1 23.1 24.6 223.02013 32.0 89.6 90.6 18.6 81.6 203.6 516.02014 72.4 4.1 38.5 84.6 55.0 3.4 258.02015 32.0 13.8 53.0 23.0 74.4 22.4 218.62016 66.2 63.4 74.4 12.4 38.0 65.0 319.4
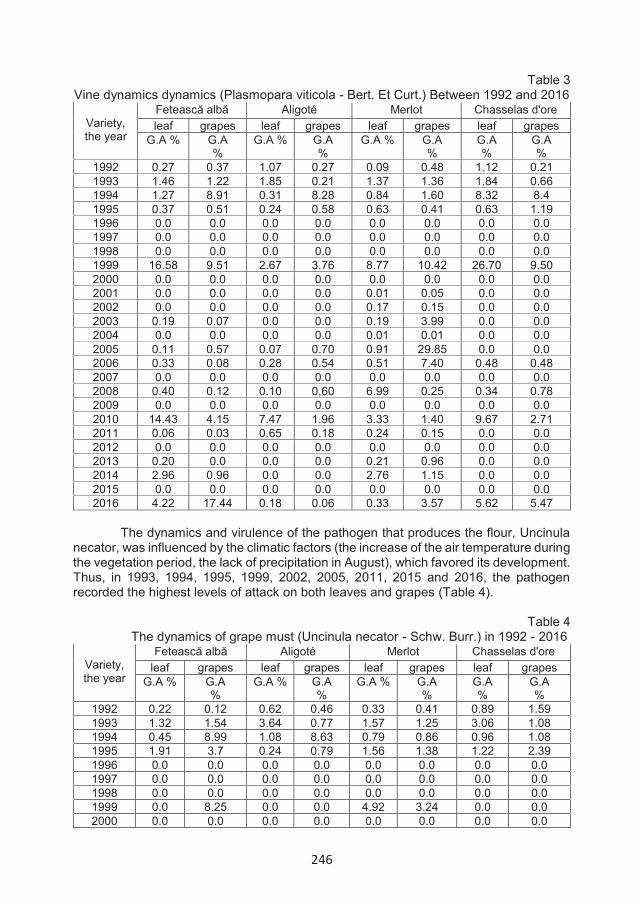
246
Table 3 Vine dynamics dynamics (Plasmopara viticola - Bert. Et Curt.) Between 1992 and 2016
Variety,the year
Fetească albă Aligoté Merlot Chasselas d'oreleaf grapes leaf grapes leaf grapes leaf grapes
G.A % G.A %
G.A % G.A%
G.A % G.A %
G.A %
G.A %
1992 0.27 0.37 1.07 0.27 0.09 0.48 1.12 0.211993 1.46 1.22 1.85 0.21 1.37 1.36 1.84 0.661994 1.27 8.91 0.31 8.28 0.84 1.60 8.32 8.41995 0.37 0.51 0.24 0.58 0.63 0.41 0.63 1.191996 0.0 0.0 0.0 0.0 0.0 0.0 0.0 0.01997 0.0 0.0 0.0 0.0 0.0 0.0 0.0 0.01998 0.0 0.0 0.0 0.0 0.0 0.0 0.0 0.01999 16.58 9.51 2.67 3.76 8.77 10.42 26.70 9.502000 0.0 0.0 0.0 0.0 0.0 0.0 0.0 0.02001 0.0 0.0 0.0 0.0 0.01 0.05 0.0 0.02002 0.0 0.0 0.0 0.0 0.17 0.15 0.0 0.02003 0.19 0.07 0.0 0.0 0.19 3.99 0.0 0.02004 0.0 0.0 0.0 0.0 0.01 0.01 0.0 0.02005 0.11 0.57 0.07 0.70 0.91 29.85 0.0 0.02006 0.33 0.08 0.28 0.54 0.51 7.40 0.48 0.482007 0.0 0.0 0.0 0.0 0.0 0.0 0.0 0.02008 0.40 0.12 0.10 0,60 6.99 0.25 0.34 0.782009 0.0 0.0 0.0 0.0 0.0 0.0 0.0 0.02010 14.43 4.15 7.47 1.96 3.33 1.40 9.67 2.712011 0.06 0.03 0.65 0.18 0.24 0.15 0.0 0.02012 0.0 0.0 0.0 0.0 0.0 0.0 0.0 0.02013 0.20 0.0 0.0 0.0 0.21 0.96 0.0 0.02014 2.96 0.96 0.0 0.0 2.76 1.15 0.0 0.02015 0.0 0.0 0.0 0.0 0.0 0.0 0.0 0.02016 4.22 17.44 0.18 0.06 0.33 3.57 5.62 5.47
The dynamics and virulence of the pathogen that produces the flour, Uncinula necator, was influenced by the climatic factors (the increase of the air temperature duringthe vegetation period, the lack of precipitation in August), which favored its development. Thus, in 1993, 1994, 1995, 1999, 2002, 2005, 2011, 2015 and 2016, the pathogen recorded the highest levels of attack on both leaves and grapes (Table 4).
Table 4 The dynamics of grape must (Uncinula necator - Schw. Burr.) in 1992 - 2016
Variety,the year
Fetească albă Aligoté Merlot Chasselas d'oreleaf grapes leaf grapes leaf grapes leaf grapes
G.A % G.A %
G.A % G.A%
G.A % G.A %
G.A %
G.A %
1992 0.22 0.12 0.62 0.46 0.33 0.41 0.89 1.591993 1.32 1.54 3.64 0.77 1.57 1.25 3.06 1.081994 0.45 8.99 1.08 8.63 0.79 0.86 0.96 1.081995 1.91 3.7 0.24 0.79 1.56 1.38 1.22 2.391996 0.0 0.0 0.0 0.0 0.0 0.0 0.0 0.01997 0.0 0.0 0.0 0.0 0.0 0.0 0.0 0.01998 0.0 0.0 0.0 0.0 0.0 0.0 0.0 0.01999 0.0 8.25 0.0 0.0 4.92 3.24 0.0 0.02000 0.0 0.0 0.0 0.0 0.0 0.0 0.0 0.0
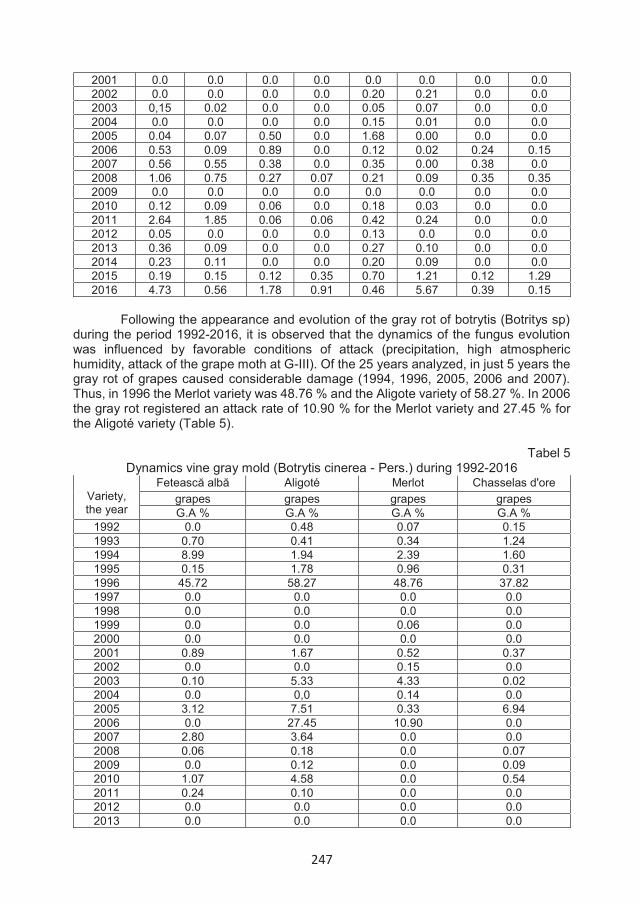
247
2001 0.0 0.0 0.0 0.0 0.0 0.0 0.0 0.02002 0.0 0.0 0.0 0.0 0.20 0.21 0.0 0.02003 0,15 0.02 0.0 0.0 0.05 0.07 0.0 0.02004 0.0 0.0 0.0 0.0 0.15 0.01 0.0 0.02005 0.04 0.07 0.50 0.0 1.68 0.00 0.0 0.02006 0.53 0.09 0.89 0.0 0.12 0.02 0.24 0.152007 0.56 0.55 0.38 0.0 0.35 0.00 0.38 0.02008 1.06 0.75 0.27 0.07 0.21 0.09 0.35 0.352009 0.0 0.0 0.0 0.0 0.0 0.0 0.0 0.02010 0.12 0.09 0.06 0.0 0.18 0.03 0.0 0.02011 2.64 1.85 0.06 0.06 0.42 0.24 0.0 0.02012 0.05 0.0 0.0 0.0 0.13 0.0 0.0 0.02013 0.36 0.09 0.0 0.0 0.27 0.10 0.0 0.02014 0.23 0.11 0.0 0.0 0.20 0.09 0.0 0.02015 0.19 0.15 0.12 0.35 0.70 1.21 0.12 1.292016 4.73 0.56 1.78 0.91 0.46 5.67 0.39 0.15
Following the appearance and evolution of the gray rot of botrytis (Botritys sp) during the period 1992-2016, it is observed that the dynamics of the fungus evolution was influenced by favorable conditions of attack (precipitation, high atmospheric humidity, attack of the grape moth at G-III). Of the 25 years analyzed, in just 5 years the gray rot of grapes caused considerable damage (1994, 1996, 2005, 2006 and 2007). Thus, in 1996 the Merlot variety was 48.76 % and the Aligote variety of 58.27 %. In 2006 the gray rot registered an attack rate of 10.90 % for the Merlot variety and 27.45 % for the Aligoté variety (Table 5).
Tabel 5 Dynamics vine gray mold (Botrytis cinerea - Pers.) during 1992-2016
Variety,the year
Fetească albă Aligoté Merlot Chasselas d'oregrapes grapes grapes grapesG.A % G.A % G.A % G.A %
1992 0.0 0.48 0.07 0.151993 0.70 0.41 0.34 1.241994 8.99 1.94 2.39 1.601995 0.15 1.78 0.96 0.311996 45.72 58.27 48.76 37.821997 0.0 0.0 0.0 0.01998 0.0 0.0 0.0 0.01999 0.0 0.0 0.06 0.02000 0.0 0.0 0.0 0.02001 0.89 1.67 0.52 0.372002 0.0 0.0 0.15 0.02003 0.10 5.33 4.33 0.022004 0.0 0,0 0.14 0.02005 3.12 7.51 0.33 6.942006 0.0 27.45 10.90 0.02007 2.80 3.64 0.0 0.02008 0.06 0.18 0.0 0.072009 0.0 0.12 0.0 0.092010 1.07 4.58 0.0 0.542011 0.24 0.10 0.0 0.02012 0.0 0.0 0.0 0.02013 0.0 0.0 0.0 0.0
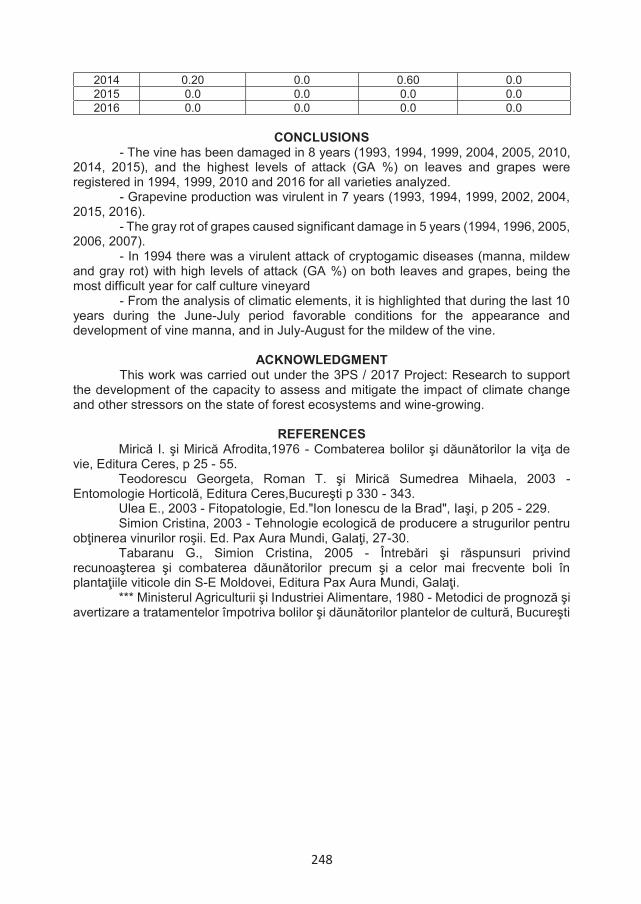
248
2014 0.20 0.0 0.60 0.02015 0.0 0.0 0.0 0.02016 0.0 0.0 0.0 0.0
CONCLUSIONS- The vine has been damaged in 8 years (1993, 1994, 1999, 2004, 2005, 2010,
2014, 2015), and the highest levels of attack (GA %) on leaves and grapes were registered in 1994, 1999, 2010 and 2016 for all varieties analyzed.
- Grapevine production was virulent in 7 years (1993, 1994, 1999, 2002, 2004, 2015, 2016).
- The gray rot of grapes caused significant damage in 5 years (1994, 1996, 2005, 2006, 2007).
- In 1994 there was a virulent attack of cryptogamic diseases (manna, mildew and gray rot) with high levels of attack (GA %) on both leaves and grapes, being the most difficult year for calf culture vineyard
- From the analysis of climatic elements, it is highlighted that during the last 10 years during the June-July period favorable conditions for the appearance and development of vine manna, and in July-August for the mildew of the vine.
ACKNOWLEDGMENT This work was carried out under the 3PS / 2017 Project: Research to support
the development of the capacity to assess and mitigate the impact of climate change and other stressors on the state of forest ecosystems and wine-growing.
REFERENCES Mirică I. şi Mirică Afrodita,1976 - Combaterea bolilor şi dăunătorilor la viţa de
vie, Editura Ceres, p 25 - 55.Teodorescu Georgeta, Roman T. şi Mirică Sumedrea Mihaela, 2003 -
Entomologie Horticolă, Editura Ceres,Bucureşti p 330 - 343. Ulea E., 2003 - Fitopatologie, Ed."Ion Ionescu de la Brad", Iaşi, p 205 - 229.Simion Cristina, 2003 - Tehnologie ecologică de producere a strugurilor pentru
obţinerea vinurilor roşii. Ed. Pax Aura Mundi, Galaţi, 27-30.Tabaranu G., Simion Cristina, 2005 - Întrebări şi răspunsuri privind
recunoaşterea şi combaterea dăunătorilor precum şi a celor mai frecvente boli în plantaţiile viticole din S-E Moldovei, Editura Pax Aura Mundi, Galaţi.
*** Ministerul Agriculturii şi Industriei Alimentare, 1980 - Metodici de prognoză şi avertizare a tratamentelor împotriva bolilor şi dăunătorilor plantelor de cultură, Bucureşti

249
FRUIT-TREES POTENTIAL IN SUBCARPATHIAN DEPRESSION AREFU-CORBENI, ARGES COUNTY
Denisa Elena Tudor1*, Doru Gabriel Bucur2
1Agency for Payments and Intervention in Agriculture Argeş2Office for Pedological and Agrochemical Researches Argeş County
* E-mail: [email protected]
Keywords: suitability, economic value, orchard, restrictions, soil
ABSTRACTEconomic efficiency in the agricultural field, as expressed by the level of production,
depends on a number of natural and anthropogenic factors. The work of evaluation and suitability focused on the quality of land in terms of productive efficiency for different established crops. In this paper we present agricultural land suitability in Arefu-Corbeni basin for the use of the orchard. At the same time highlight, the complex work of evaluation focuses on most suitable fruit trees species for the climatic conditions of the investigated area.
The results were obtained by analyzing the physic and chemical characteristics of the soil and geological substrate, specific lithology, relief, hydrographic elements, climate. For further study, of the plurality of soils characterized Arefu-Corbeni depression, a representative soil was selected and characterized morphological, physical and chemical.
INTRODUCTION The Arefu-Corbeni Depression is developing in the Getic Subcarpathian area,
between the northern peaks of the Frunţi and Ghiţu massifs in the Făgăraş Mountains and Subcarpathian foothills on south: Tămaşu and Chicera. It is crossed by the spectacular road of Transfăgărăsan (DN 7C), whose route crosses the gorge of Argeş and Făgăraş to Vidraru and glacial lake Bâlea.
This depression was first idenfied after large-scale research conducted by French geographer Emm. De Martonne (Tufescu, 1966), through a geological profile made in 1906 (Tufescu 1966, Ielenicz 2003). In literature, depression is known by many names: Arefu (Ielenicz 2003, Tufescu 1966), Arefu-Berindeşti (Tufescu 1966) or Arefu-Căpăţâneni (Pop 2006) or Căpăţânii-Arefu (Velcea & Savu 1982).
Growing fruit trees and shrubs is a very important economic sector for human society, if they have a life cycle of four years from strawberries, to 30-60 years for apple, pear and walnut (Mladin et al. 1996).
In the year 2011, orchards basin of Arefu and Corbeni totaled 353 hectares, of which 144 hectares were planted with apple species and 209 hectares of plum trees. Of these orchards, 11 % were present as young fruit orchards, 30 % and 59 % were recorded as fruit and in decline orchards.
Given the complicated conformation of subcarpathic relief and pronounced degree of fragmentation of land in studied area and as a result of the changes after 1990, the most cultivated fruit trees in the area were selected for study.
ANNALS OF THE UNIVERSITY OF CRAIOVA
Series: Biology HorticultureFood produce processingtechnology
Environmental engineering Vol. XXII I (LIX) - 2018

250
MATERIAL AND METHODS Research of Arefu-Corbeni Subcarpathian basin took place during the years
2011-2017. Reaching assumed depth study of all environmental factors, opening on the field of soil profiles and analysis of samples taken from these in Soil and Agrochemical Studies Office Argeş laboratory, in conjunction with the information from the archive of this institution. Since the basin covers the territories of Arefu and Corbeni communes, to obtain data of this work was necessary to define the investigated perimeter by different topographic base and soil considerations, establishing specific soil types and measuring each soil unit.
Native soils are very special regarding zoning of the evolutionary process, morphological and chemical properties, and can not always be an optimal support for same vegetation cover. Therefore, proper management and efficient production requires a proper assessment of the potential of these soils for this agricultural area.
RESULTS AND DISCUSSIONSDepression Arefu-Corbeni covers about 64 km2 (which includes the southern
corridor of the Argeş River - 6 km2). Of this area, 70 % is occupied by farmland, 23 % by forest and 7 % by urban and unproductive areas.
All forms of relief in the region bears the mark of geological composition and movements in which they were trained (Bucur & Buşu 2000). Asymmetry of slopes is evident in that valley where they origins is in the frame of northern massive, results intensive erosion and deposition of materials. taken from the mountain and seated at the foot of hills (aprons accumulation), while on south, less inclined slopes are affected by the landslides of all kinds, large waves and mounds - in most cases glimee (Hianu 2000); slides are semi-stabilized and relics, but the risk of reactivation is present in many areas.
The climate is temperate - continental, the annual average temperature is 9 0Cand the average annual precipitation of 730 mm.
With carpathian origin, Arges River is the main river of the area and pierce depression from north to the south.
On the Argeş valley and other affluents, ground-water tables is located between 1 and 4 meters deep, on terraces 4-10 meters and on the slopes and peaks are more confined to 10-30 meters. There are many areas with coastal springs, an important agent for triggering landslides. Springs are in many places captured and are the main sources of water supply to the villages.
For the hills that dominate the depression, it is representative nemoral forest (Fagus sylvatica) and oak (Quercus petraea).
Considered a raw, natural and sometimes with anthropogenic influences, soil is created by evolutionary cooperation of many factors: climate, hydrographic network, geomorphological processes, relief, slopes, substrate lythology, all in conjunction with wildlife and vegetation.
Assessments of field and laboratory tests revealed a range of sufficiently diversified soils.
In this context, the lowest depression areas represented by meadows, terraces with recent training, and aprons, they were formed soils with slowed progress, represented by fluvisols (12 % of agricultural land).
Upper third of slopes and long gentle hills from southwestern basin are dominated by districambosols (5 %).
Regosol (15 %) are imposed on the erosion-surfaces, medium-strongly inclined slopes. Some important sections of the heights of secondary peaks are support for preluvisols (10 %). Due to the high clay content, preluvisols have a pronounced compaction and poor overall drainage.

251
On valleys, terraces, and in some areas of the narrow side have developed eutricambosoils (58 %). Such a sol has been chosen for illustration, of which the physical, chemical and morphological characteristics are described in the Soil Profile.
The valuation of the use as orchard land in the studied area was done according to existing methodologies (MESP 1987). Final suitability class was given by the most restrictive factor for land - considered homogeneous in terms of the climatic conditions.
The study showed that the pedoclimatic factors of depression Arefu-Corbeni printing reduced limitations (grade II) and moderate limitations (Class III) for 71 % of the total agricultural evaluated land (Figure 1), because of the low and medium unevenness of the land, the average gradient of the slopes, acidic or alkaline reaction and the presence of calcium carbonate.
The land with severe restrictions (class IV) and very severe restrictions (class V) represents 24 % of fruit growing surface. In general, restrictive factors that havecontributed to include areas in these classes were graded by the marked inclination of the slopes, the unevenness of the land, the reaction (strongly acidic) in the soil profile, correlated with the presence of aluminum in small or medium quantities, and semi-active land-slides.
Non-recommended land to be cultivated with fruit species covers 5 % of the studied surface, the limitations are land-slides waves and the small active volume of soil on the bottoms of the valleys (Fluvisols). Location: Corbeni commune Coordinates: N latitude 45019'15”, E longitude 24039'38”, absolute altitude 636 metreRelief and microrelief: slope, southern exposure Main slope: 10-15 % and 15-20 %
Figure 1. Classes of suitability for the orchard of the Subcarpathian depression Arefu-Corbeni
Soil Profile Record Type: Typic Eutricambosol, loamy/ loamy
Surface: moderate inclined, weak unhomogenousBedrock: loams Depth of underground/water: more than 10 metre Land-use: apple tree and plum tree orchard
26%
45%
19%
5% 5%1st CLASS
2nd CLASS
3rd CLASS
4th CLASS
5th CLASS

252
Morphological characterizationLayer Ao (0-24 cm): 10 YR 4/3, loamy, very frequently thin and medium roots, little poor developed polyhedral agregates, moist, weak densely, softly, graduate pass; Layer AB (24-40 cm): 10 YR 4/4, loamy, rare thin and medium roots, moderate developed medium polyhedral agregates, damp, weak densely, softly, clear pass; Layer Bv (40-68 cm): 10 YR 5/4, loamy, very rare medium roots, poor developed medium polyhedral agregates, damp, weak densely, softly, graduate pass; Layer BC (68-83 cm): 10 YR 5/4 with 10 YR 4/6, loamy, very poor developed medium polyhedral agregates, damp, weak densely, softly, graduate pass; Layer Cn (sub 83 cm): 10 YR 4/6, loamy, medium polyhedral aggregates, very poor developed, damp, moderate densely, softly.
Analytic data of the soil profile shows a weak acid reaction on the profile. The soil has a large organic matter reserve (189 tones/ hectare), but the humus content is medium in layer A and small-very small in the depth of the profile. Mobile phosphorus insurance is small-very small, and those in mobile potassium is moderate in the first 40 cm and low in depth. The soil is mesobasic/eubasic (saturation in bases). The textural fractions are uniform on the profile, the texture is medium. Hydrolytic acidity is medium in horizon A and small in depth. The sum of the bases is medium-high. The nitrogen index is medium in the surface horizon and small in depth.
Analytical data and physico-chemical properties of the soil profile Layers Ao AB Bv BC Cn
Depth of sampling; cm 5-15 28-38 50-60 70-80 90-100
Bulk sand (2,0-0,2 mm); % 21.0 8.9 11.6 10.4 12.4Fine sand (0,2-0,02 mm); % 25.2 31.4 28.9 31.9 38.3Dust I (0,02-0,01 mm); % 10.6 11.3 11.8 13.7 10.8Dust II (0,01-0,002 mm); % 17.6 20.8 18.7 18.2 11.5Clay (below 0,002 mm); % 25.6 27.6 29.0 25.8 27.0Soil skeleton % - - - - -pH in Water 5.9 6.2 6.3 6.4 6.3Carbonates; % - - - - -Organic matter; % 3.7 1.9 1.1 1.0 0.8Nitrogen index (IN); 3.1 1.7 1.0 0.9 0.7Mobile Phosphorus; ppm 12.0 9.0 8.0 5.0 5.0Mobile Potassium; ppm 145.0 151.0 103.0 73.0 66.0Change Bases (SB); me/100 g sol 26.4 25.3 24.8 24.6 25.3Hydrolytic acidity (Ah); me/100g sol 5.0 3.8 3.3 2.8 2.6Changeable Hydrogen (SH 8,3 ); 8.8 7.0 6.1 5.6 5.7Cationic exchange capacity (TSh); 35.2 32.3 30.9 30.2 31.0Cationic exchange capacity (TAh); 31.4 29.1 28.1 27.4 27.9Saturation in bases (VAh); % 83.8 86.9 88.3 89.8 90.7Saturation in bases (VSh); % 75.0 78.3 80.3 81.5 81.6Mobile aluminum; me/100 g sol - - - - -
The assessment was very important in order to establish the economic value of orchards in atudied area.
Whole studied area, by processing indicators that participated in obtaining evaluation notes and calculation notes (weighted average notes), showed that apple (38 points) and plum (36 points), pear (32 points), cherry- sour cherry ( 29 points) belongs to quality class IV for orchard.

253
Among the indicators that influenced orchard notes of evaluation are quoted: annual rainfall regime, texture of sandy-loam soil, low edaphic volume, high groundwater depth, stagnogleyzation and landslides.
In terms of soil taken as a case-study, it has a deep substrate, is formed on the slant slopes, weak patchy, with groundwater at more than 10 meters deep, slightly acid pH (5.9 to 6.4). These features include the soil in class II of suitability, restrictive factor being poor land unevenness. Other parameters that participated in determining of suitability for orchard does not affect classification.
The assessment, showed that areas, characterized by this type of soil, meets a score typical for class II of quality - apple (73 points), plum (72 points), pear (65 points), and class III - sweet or sour cherry plantations (58 points).
CONCLUSIONS Factors with an important role in the inclusion of areas in a certain class of
suitability for orchard (figure 2) have been reflected in the pronounced inclination degree of the slopes, the unevenness of the land, the reaction of the soil on the profile to a depth of 100 cm and in some cases by landslides.
Following the work of the evaluation of agricultural land, it results that apple tree and plum tree have obtained slightly higher notes than pear, cherry and sour cherry. In fact, orchards of apple and plum are the most common in the area.
For typical eutricambosoil looked after evaluation, weighted average mark was 67 points of evaluation, which will include it in Class II of quality for orchard. Following the evaluation in terms of suitability, areas characterized by this type of soil have little limitation regarding fruit production.
In view presented in this work and that at the end of year 2017, in Argeş County, yield of fruit production was relatively low because of the approx. 20513 hectares, more than 50 % are physiological depleted, so it should be applied ameliorative works designed to correct some deficiencies and to increase productivity.
These works will be carried out in accordance with European standards laid down in Directive 91/676/EEC for the protection of waters against pollution caused by nitrates from agricultural sources.
LEGEND:1st CLASS 2nd CLASS 3rd
CLASS 4th CLASS 5th CLASS
Figure 2. Agricultural land suitability for the orchard in Subcarpathian depression Arefu-Corbeni
254
REFERENCES Bucur D., Buşu R., 2000, Studii şi cercetări asupra învelişului de soluri pe
teritoriul cadastral Corbeni (studiu pedologic şi agrochimic) - Arhiva Oficiului de Studii Pedologice Şi Agrochimice Argeş.
Hianu C., 2000, Studii şi cercetări asupra învelişului de soluri pe teritoriul cadastral Arefu (studiu pedologic şi agrochimic) - Arhiva Oficiului de Studii Pedologice şi Agrochimice Argeş.
Ielenicz M., Pătru I. G., Ghinea M., 2003, Subcarpaţii României, Edit. Universitară, Bucureşti, pp. 2, 211.
Mladin Gh., Mladin P., Pârlea M., 1996, Cum cultivăm şi îngrijim plantele pomicole, Editura TIPOMUR, Tg. Mureş, pp. 1,19.
Pop P. G., 2006, Carpaţii şi Subcarpaţii României, ediţia a II-a revizuită şi adăugită, Edit. Presa Universitară Clujeană, Cluj-Napoca, pp. 99-100.
Tufescu V., 1966, Subcarpaţii şi depresiunile marginale ale Transilvaniei, Editura Ştiinţifică, Bucureşti, pp. 27, 170.
Velcea V., Savu A., 1982, Geografia Carpaţilor şi a Subcarpaţilor Româneşti, Edit. didactică şi pedagogică, Bucureşti, pp. 148.
*** Directiva Consiliului din data de 12 decembrie 1991 privind protecţia apelor împotriva poluării cu nitraţi proveniţi din surse agricole (91/676/CEE).
*** Metodologia de Elaborare a Studiilor Pedologice (MES.P), 1987, partea I, partea a II-a, partea a III-a, Institutul de Cercetări pentru Pedologie şi Agrochimie Bucureşti.
255
ASPECTS OF INTERACTION BETWEEN FOLIAR FERTILISATION AND FRUITS THINNING ON APPLE TREES
Vamăşescu Sergiu1*
1State Agrarian University of Moldova *Correspondance author E-mail:[email protected]
Keywords: Apple, chemical thinning, foliar fertilization, harvest
ABSTRACT The research was carried out between 2013 and 2016 in the apple orchard planted in
2003 with the Idared variety grafted on the M26 rootstock, with a planting distance of 4x2 m. The trees are guided by the shape of a thin crown. In the experience foliar fertilization with Urea 46 % N was performed in concentration from 0.4 % to 1.2 % depending on the period of fruit development and 3 methods of fruit reduction: chemical when the central fruit in the inflorescence is 10 - 12 mm with Bioprzerzedzacz 060 SL at a concentration of 0.075 %, manually and mixed. At the highest concentrations of Urea 46 % N, the Idared variety yielded the largest fruit harvest in 2016 reaching 49.1 t / ha.
INTRODUCTION The fruit tree alternation is characterized by the presence of a large number of
fruit in a year, followed by a low-yielding year. As a result, the large number of fruits inhibits antogen induction and differentiation of fruit buds, leading to low production the following year. In intensive orchards, the correct adjustment of the fruit load is an indispensable measure for obtaining constant and quality produce (V. Babuc, 2012, Gh. Cimpoieș, 2016). This desideratum can also be achieved by chemical and manual norming of the fruit load correlated with maintenance and fructification cutting, fertilization and irrigation (V. Balan, R. Şaganian, 2008).
Chemical normalization is the method to correct the fastest load of fruit and can be used in complex with phytosanitary treatments. As a result, chemical preparations can influence anthogenic induction, differentiation of fruit buds, fruit blooming and fruit binding, productivity level and fruit quality. At the same time, the problem of the chemical scission of apple was treated abundantly and the results obtained were diverse and contradictory, which demonstrates the complexity of this subject in relation to the requirements of plants in different phases of vegetation (I. Gonda, 2003; V. Balan, S. Vamaşescu, 2013, 2014).
MATERIALS AND METHODS We have studied the interaction between foliar fertilization and fruiting, as the
main determinants of the quantity and quality of apple fruit. The study of the influence of fruit loading on growth norms and fruits in the apple orchard covered the period 2013-2016 in an experiment organized in an apple orchard in SA "Zubreşti" Straseni. I studied the Golden Delicious, Idared and Florina apple varieties grafted on the M 26 rootstock planted in 2003 at a distance of 4 m between the rows and
ANNALS OF THE UNIVERSITY OF CRAIOVA
Series: Biology HorticultureFood produce processingtechnology
Environmental engineering Vol. XXII I (LIX) - 2018
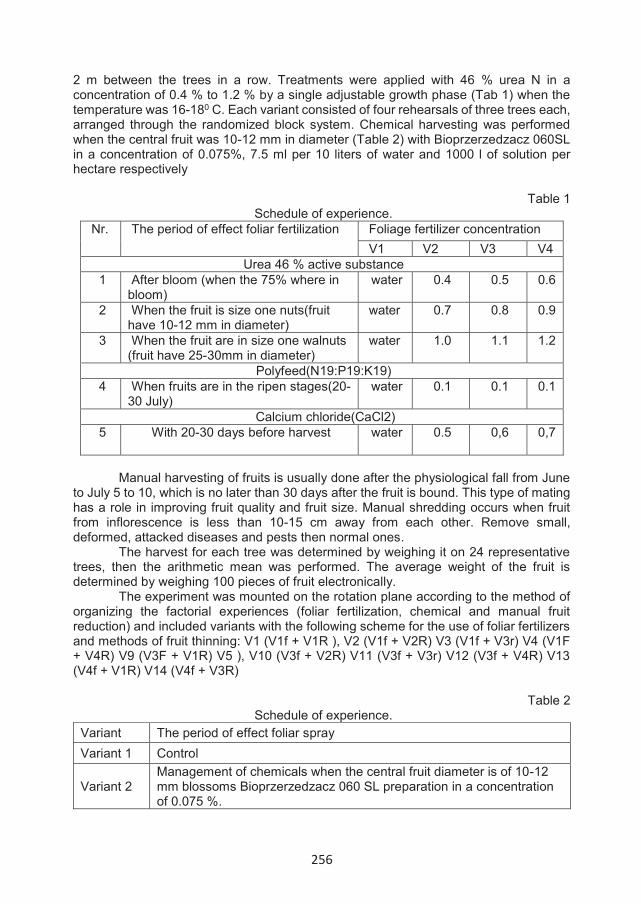
256
2 m between the trees in a row. Treatments were applied with 46 % urea N in a concentration of 0.4 % to 1.2 % by a single adjustable growth phase (Tab 1) when the temperature was 16-180 C. Each variant consisted of four rehearsals of three trees each, arranged through the randomized block system. Chemical harvesting was performed when the central fruit was 10-12 mm in diameter (Table 2) with Bioprzerzedzacz 060SL in a concentration of 0.075%, 7.5 ml per 10 liters of water and 1000 l of solution per hectare respectively
Table 1 Schedule of experience.
Nr. The period of effect foliar fertilization Foliage fertilizer concentrationV1 V2 V3 V4
Urea 46 % active substance1 After bloom (when the 75% where in
bloom) water 0.4 0.5 0.6
2 When the fruit is size one nuts(fruit have 10-12 mm in diameter)
water 0.7 0.8 0.9
3 When the fruit are in size one walnuts (fruit have 25-30mm in diameter)
water 1.0 1.1 1.2
Polyfeed(N19:P19:K19)4 When fruits are in the ripen stages(20-
30 July)water 0.1 0.1 0.1
Calcium chloride(CaCl2)5 With 20-30 days before harvest water 0.5 0,6 0,7
Manual harvesting of fruits is usually done after the physiological fall from June to July 5 to 10, which is no later than 30 days after the fruit is bound. This type of mating has a role in improving fruit quality and fruit size. Manual shredding occurs when fruit from inflorescence is less than 10-15 cm away from each other. Remove small, deformed, attacked diseases and pests then normal ones.
The harvest for each tree was determined by weighing it on 24 representative trees, then the arithmetic mean was performed. The average weight of the fruit is determined by weighing 100 pieces of fruit electronically.
The experiment was mounted on the rotation plane according to the method of organizing the factorial experiences (foliar fertilization, chemical and manual fruit reduction) and included variants with the following scheme for the use of foliar fertilizers and methods of fruit thinning: V1 (V1f + V1R ), V2 (V1f + V2R) V3 (V1f + V3r) V4 (V1F + V4R) V9 (V3F + V1R) V5 ), V10 (V3f + V2R) V11 (V3f + V3r) V12 (V3f + V4R) V13 (V4f + V1R) V14 (V4f + V3R)
Table 2 Schedule of experience.
Variant The period of effect foliar sprayVariant 1 Control
Variant 2Management of chemicals when the central fruit diameter is of 10-12mm blossoms Bioprzerzedzacz 060 SL preparation in a concentration of 0.075 %.
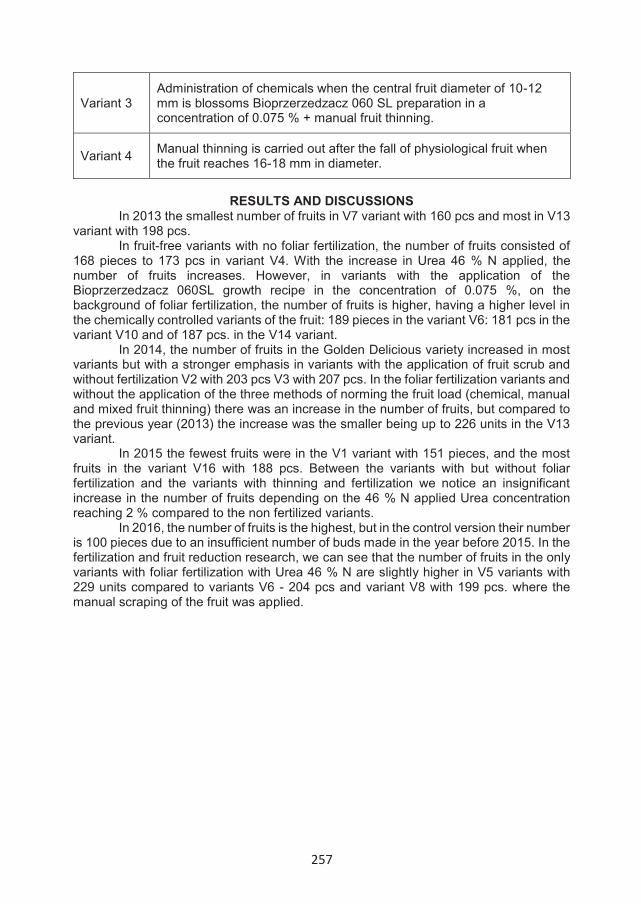
257
Variant 3Administration of chemicals when the central fruit diameter of 10-12 mm is blossoms Bioprzerzedzacz 060 SL preparation in a concentration of 0.075 % + manual fruit thinning.
Variant 4 Manual thinning is carried out after the fall of physiological fruit when the fruit reaches 16-18 mm in diameter.
RESULTS AND DISCUSSIONS In 2013 the smallest number of fruits in V7 variant with 160 pcs and most in V13
variant with 198 pcs. In fruit-free variants with no foliar fertilization, the number of fruits consisted of
168 pieces to 173 pcs in variant V4. With the increase in Urea 46 % N applied, the number of fruits increases. However, in variants with the application of the Bioprzerzedzacz 060SL growth recipe in the concentration of 0.075 %, on the background of foliar fertilization, the number of fruits is higher, having a higher level in the chemically controlled variants of the fruit: 189 pieces in the variant V6: 181 pcs in the variant V10 and of 187 pcs. in the V14 variant.
In 2014, the number of fruits in the Golden Delicious variety increased in most variants but with a stronger emphasis in variants with the application of fruit scrub and without fertilization V2 with 203 pcs V3 with 207 pcs. In the foliar fertilization variants and without the application of the three methods of norming the fruit load (chemical, manual and mixed fruit thinning) there was an increase in the number of fruits, but compared to the previous year (2013) the increase was the smaller being up to 226 units in the V13 variant.
In 2015 the fewest fruits were in the V1 variant with 151 pieces, and the most fruits in the variant V16 with 188 pcs. Between the variants with but without foliar fertilization and the variants with thinning and fertilization we notice an insignificant increase in the number of fruits depending on the 46 % N applied Urea concentration reaching 2 % compared to the non fertilized variants.
In 2016, the number of fruits is the highest, but in the control version their number is 100 pieces due to an insufficient number of buds made in the year before 2015. In the fertilization and fruit reduction research, we can see that the number of fruits in the only variants with foliar fertilization with Urea 46 % N are slightly higher in V5 variants with 229 units compared to variants V6 - 204 pcs and variant V8 with 199 pcs. where the manual scraping of the fruit was applied.
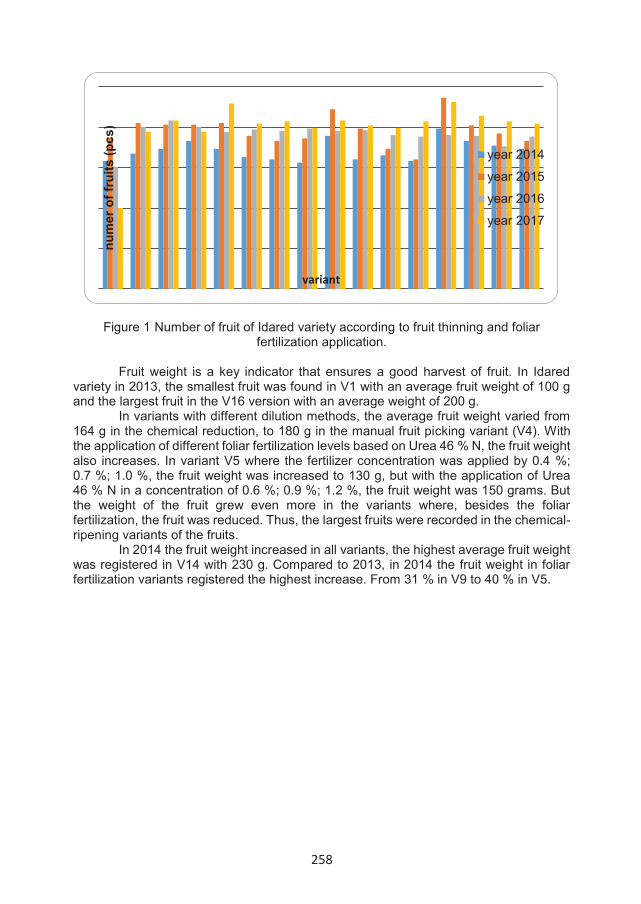
258
Figure 1 Number of fruit of Idared variety according to fruit thinning and foliar fertilization application.
Fruit weight is a key indicator that ensures a good harvest of fruit. In Idared variety in 2013, the smallest fruit was found in V1 with an average fruit weight of 100 g and the largest fruit in the V16 version with an average weight of 200 g.
In variants with different dilution methods, the average fruit weight varied from 164 g in the chemical reduction, to 180 g in the manual fruit picking variant (V4). With the application of different foliar fertilization levels based on Urea 46 % N, the fruit weight also increases. In variant V5 where the fertilizer concentration was applied by 0.4 %;0.7 %; 1.0 %, the fruit weight was increased to 130 g, but with the application of Urea 46 % N in a concentration of 0.6 %; 0.9 %; 1.2 %, the fruit weight was 150 grams. But the weight of the fruit grew even more in the variants where, besides the foliar fertilization, the fruit was reduced. Thus, the largest fruits were recorded in the chemical-ripening variants of the fruits.
In 2014 the fruit weight increased in all variants, the highest average fruit weight was registered in V14 with 230 g. Compared to 2013, in 2014 the fruit weight in foliar fertilization variants registered the highest increase. From 31 % in V9 to 40 % in V5.
num
er o
f fru
its (p
cs)
variant
year 2014
year 2015
year 2016
year 2017
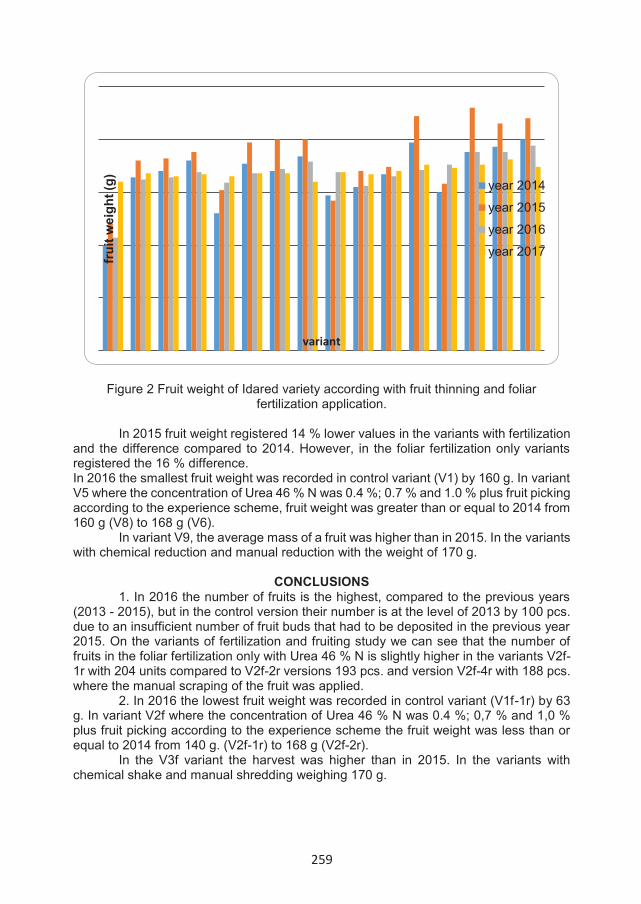
259
Figure 2 Fruit weight of Idared variety according with fruit thinning and foliar fertilization application.
In 2015 fruit weight registered 14 % lower values in the variants with fertilization and the difference compared to 2014. However, in the foliar fertilization only variants registered the 16 % difference. In 2016 the smallest fruit weight was recorded in control variant (V1) by 160 g. In variant V5 where the concentration of Urea 46 % N was 0.4 %; 0.7 % and 1.0 % plus fruit picking according to the experience scheme, fruit weight was greater than or equal to 2014 from 160 g (V8) to 168 g (V6).
In variant V9, the average mass of a fruit was higher than in 2015. In the variants with chemical reduction and manual reduction with the weight of 170 g.
CONCLUSIONS 1. In 2016 the number of fruits is the highest, compared to the previous years
(2013 - 2015), but in the control version their number is at the level of 2013 by 100 pcs. due to an insufficient number of fruit buds that had to be deposited in the previous year 2015. On the variants of fertilization and fruiting study we can see that the number of fruits in the foliar fertilization only with Urea 46 % N is slightly higher in the variants V2f-1r with 204 units compared to V2f-2r versions 193 pcs. and version V2f-4r with 188 pcs. where the manual scraping of the fruit was applied.
2. In 2016 the lowest fruit weight was recorded in control variant (V1f-1r) by 63g. In variant V2f where the concentration of Urea 46 % N was 0.4 %; 0,7 % and 1,0 %plus fruit picking according to the experience scheme the fruit weight was less than or equal to 2014 from 140 g. (V2f-1r) to 168 g (V2f-2r).
In the V3f variant the harvest was higher than in 2015. In the variants with chemical shake and manual shredding weighing 170 g.
frui
t wei
ght (
g)
variant
year 2014
year 2015
year 2016
year 2017

260
REFERENCES Babuc, V. 2012, Pomicultura. Chişinău: Tipografia Centrală 662 p. ISBN 978-
9975-53-067-.Balan, V., Şaganean, R. 2008, Orchard productivity in function of fruit thinning.
In: Lucrări ştiinţifice, USAMV „Ion Ionescu de la Brad”. Iaşi, anul LI, vol. 51: Horticultură, p. 675-678.
Balan, V., Vămăşescu S. 2014. Increase quantity and quality of apple fruit bynormalization of load by different methods of thinning. In: Lucrări ştiinţifice, USAMV Bucureşti, Vol. LV, p. 352-357. ISSN 2069- 6965.
Balan, V., Vămăşescu, S. 2013. Influence of foliar application of fertilization and fruit thinning on fruit production and quality. In: Lucrări ştiinţifice, USAMV „Ion Ionescu de la Brad”. Iaşi, Anul LIII, vol. 53(2): Horticultură, p. 219-224.
Cimpoieş, Gh. 2016, Cultura mărului. Chişinău: Bonus Offices, 382 p. ISBN 978-9975-80-547-6.
Gonda, I. 2003. Cultura eficientă a mărului de calitate superioară. Braşov: Gryp-hon, ISBN 973-604-015-1

261
THE INFLUENCE OF THE SOIL MAINTENANCE SYSTEM ON THE FAUNA FROM THE STEFANESTI VITICULTURAL CENTER
Vizitiu Diana Elena1*, Nedelea Gina1, Radomir Ana-Maria1
*University of Craiova, “Al. Buia” Botanical Garden, Craiova1 National Research and Development Institutefor Biotechnology in Horticulture Stefanesti Arges, Romania
* Correspondence author. E-mail: [email protected]
Keywords: Grapevine, Insect, Shannon, Simpson, Equitability
ABSTRACTSoil maintenance system has a direct effect on the diversity of fauna which is constantly
changing due to the intensification of anthropogenic activities which exert strong pressures on the environment. The aim of this study was to monitor the fauna from grapevine plantation with the different soil maintenance systems and to determine the Shannon, Simpson and Equitability indices. Thus, in 2016 were identified 18 species of insects (two of which are part of the beneficial insect) and in 2017 were identified 38 species of insects (of which 9 belong to beneficial insect).These belong to the Orthoptera, Coleoptera, Hymenoptera, Mecopera, Hemiptera, Megaloptera, Lepidoptera, Dermaptera, Diptera, and Araneae orders.
INTRODUCTION The grapevine because it is a perennial plant, occupy the soil for a long time,
which leads to the appearance of a large number of pests and diseases.In generally a vineyard is being managed intensely to obtain large quantities of
grapes and wine without taking into account the negative impact on biodiversity (Winter et al. 2018).
The addition of non-crop plants, especially flowering species, can attract and maintain natural enemies, and in some cases, this increase in agrobiodiversity and can lead to increased ecosystem services, including the biological control of pests (Wilson & Daane, 2017).
MATERIAL AND METHODS The study was conducted on the territory of the National Research and
Development Institute for Biotechnology in Horticulture Stefanesti Arges, Romania(INCDBH Stefanesti), which is located in the vineyard of Stefanesti (44°42 and 44°55north latitude), located in the southern central part of Muntenia sub-Carpathians (Fig. 1).
The microclimate of Stefanesti locality is relatively moist and is due to the neighborhood of forests in the north-east, the platform relief fragmented by the deep valleys disposed almost perpendicularly on the corridor formed by the Arges river on the one hand and the human settlements with woody vegetation on the other which shuts down the air currents to the south.
Assessment of the impact of conservative soil cultivation practices on harmful insects and useful insects was carried out in the following experimental variants:
ANNALS OF THE UNIVERSITY OF CRAIOVA
Series: Biology HorticultureFood produce processingtechnologyEnvironmental engineering Vol. XXII I (LIX) - 2018

262
- V1 – Permanent natural grassing of the soil (throughout the study). It was obtained by leaving the band between the rows with spontanous weeds; - V2 – Temporary natural grassing (after a certain number of years the land it plow and it is mantained few year as a black field, after which it is regrassing); - V3 – Artificial grassing in strips (between rows) with Trifolium repens var. silvestris (10 kg/ha). - V4 – Artificial grassing in strips (between rows) with Lotus corniculatus, Bull variety (18 kg/ha). - V5 – Black field. Conventional non-organic system.
Fig. 1 Location of experimental variants
In order to determine the insect species were mounted the adhesive traps on the rows of grapevine. The insects identification was done with an IPM Scope, then the data have been centralized and were calculated the Shannon, Simpson and Echitability diversity index depending on the soil maintenance system, but also according to order of which they are part.
RESULTS AND DISCUSSIONS
In the present, viticulture, like all agriculture, faces with pollution problems as a result of the application of unreasonable systems for the maintenance of vineyards. Soil maintenance systems it influences, besides the production of grapes, and the evolution of insects in vineyards.
In all five variants of soil maintenance, in 2016 were identified 18 species of insects: Poecilimon schmidti, Diplolepis rosae, Polistes dominula, Cantharis rustica, Lucanus cervus, Lytya versicatoria, Oryctes nasicornis, Panorpa sp., Sialis sp., Empoasca vitis, Eucarta amethystina, Diacrisia sannio, Thymelicus sylvestris, Pieris sp., Apatura clytie, Argynnis paphia, Coccinella septempunctata, Harmonia axyridis. In 2017 were identified 38 species of insects: Harmonia axyridis, Psyllobora 22-punctata, Coccinulla 14-punctata, Coccinulla 10-punctata, Coccinulla quatuordecimpustulata, Vibidia duodecimguttata, Scymnus frontalis, Cantharis rustica, Centrotus cornutus, Antaxia nitidula signaticollis, Antaxia nitidula, Agrillus sp., Dolomedes sp., Panorpa sp., Cercopis vulnerata, Apis melifera, Mordella sp., Forficula auricularia, Philaenus spumarius, Pirates hybridus, Cortodera diferens, Polistes dominulus, Anthomya procellaris, Paederus fuscipes, Sarcophaga sp., Andrena sp., Vespula vulgaris, Trichaetipyga juniperina, Tetigonia viridissima, Neomya cornicina, Cicadella viridis,

263
eiosimyza sp., Stenolopus teutonus, Heliophilus sp., Graphosoma lineatum, Oulema obscura, Dermestes murinus, Harpalus pubescens.
According to the Shanon index (Fig. 2 A) the best distribution of harmful insects was in 2016 at V2, V3 and V4 experimental variants and in the case of useful insects it was in 2017 for variants V3 and V4.
A B
C
Fig. 2 The Shannon (A), Simpson (B) and Equitability (C) indicesfrom experimental variants
Regarding the Simpson index, the data from Figure 2 B shows that the greatest diversity of harmful species was found both in 2016 and in 2017 for V2, V3 and V4 experimental variants, and in case of beneficial insects at variants 3 and 4 in 2017.
From the comparative analysis of all five variants of soil maintenance, it is noticed that both in 2016 and in 2017 the relative abundance of harmful insects was similar in variant 1. In the case of useful insects, the Equitability shows that the highest abundance of insect species was in case of variants 3 and 4 (Fig. 2 C).
The diversity indices (Shannon, Simpson, Equitability) were calculated also for harmful and useful insects grouped in order. After the identifications it was found that theinsects from all experimental variants belong to the Orthoptera, Coleoptera, Hymenoptera, Mecopera, Hemiptera, Megaloptera, Lepidoptera, Dermaptera, Diptera,and Araneae orders (Fig. 3). The insects belonging to the Orthoptera, Coleoptera, Hymenoptera, Mecopera, Hemiptera orders have been identified in both years of study, those in the Megaloptera and Lepidoptera only in 2016 (Figure 3 A) while those from Dermaptera, Dipter, and Araneae orders were collected only in 2017 (Figure 3 B).
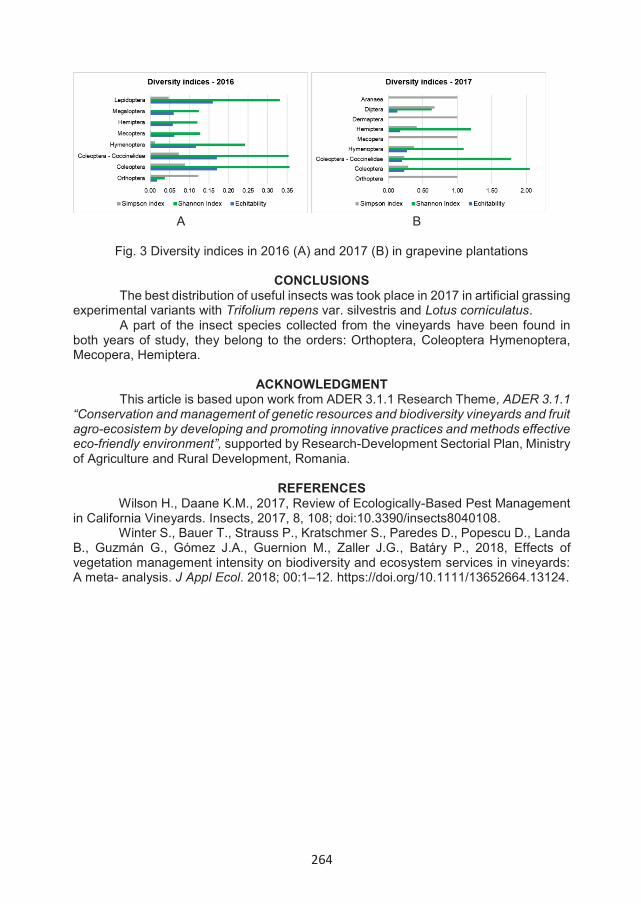
264
A B
Fig. 3 Diversity indices in 2016 (A) and 2017 (B) in grapevine plantations
CONCLUSIONS The best distribution of useful insects was took place in 2017 in artificial grassing
experimental variants with Trifolium repens var. silvestris and Lotus corniculatus. A part of the insect species collected from the vineyards have been found in
both years of study, they belong to the orders: Orthoptera, Coleoptera Hymenoptera, Mecopera, Hemiptera.
ACKNOWLEDGMENT
This article is based upon work from ADER 3.1.1 Research Theme, ADER 3.1.1 “Conservation and management of genetic resources and biodiversity vineyards and fruit agro-ecosistem by developing and promoting innovative practices and methods effective eco-friendly environment”, supported by Research-Development Sectorial Plan, Ministry of Agriculture and Rural Development, Romania.
REFERENCES
Wilson H., Daane K.M., 2017, Review of Ecologically-Based Pest Management in California Vineyards. Insects, 2017, 8, 108; doi:10.3390/insects8040108.
Winter S., Bauer T., Strauss P., Kratschmer S., Paredes D., Popescu D., Landa B., Guzmán G., Gómez J.A., Guernion M., Zaller J.G., Batáry P., 2018, Effects of vegetation management intensity on biodiversity and ecosystem services in vineyards: A meta- analysis. J Appl Ecol. 2018; 00:1–12. https://doi.org/10.1111/13652664.13124.

265
"HEALTH CLAIMS" ON WINE LABELS AND THEIR ILLEGALITY
Voinea-Mic Cătălin1*, Giugea Nicolae1, Mărăcineanu Liviu1
University of Craiova, Faculty of Horticulture, *Correspondance author e-mail: [email protected]
Keywords: nutrition claim, health claim, labels, misleading, easily digestible wine, foodstuff, consumer
ABSTRACTThe description and advertising of wine products through health claims can not be
accepted, referring to the situation where European legislation prohibits expressly the use of these claims in the case of beverages that exceed 1.2 % by volume of alcohol
INTRODUCTION Taking into consideration that the European legislation pays attention to the
protection of consumers within the framework of protecting the health of the European citizens, this paper aims to focus on the limits of the advertising forms in the case of alcoholic beverages, especially of wine, referring to the tendency of producers, traders to present the "health benefits" of these products under limited circumstances, ignoring consciously the legal prohibitions on this issue, including the indirect causal links to the "beneficial effect," links that may have a major impact on health.
Given the particular impact of these "claims", the European legislator has established strict rules for the use of the "health claims" in order to ensure a high level of consumer protection and to facilitate wittingly the choice by establishing ab initio that the products introduced on the market, including the imported products, should be safe and properly labeled.
Once it has been established that a balanced and varied diet is a prerequisite for good health and the products taken separately have a relative importance in the context of global nutrition, the European legislator has agreed to regulate how to use these forms of advertising, forms that include also the wines, a category on which we will focus in this study, starting with a case 2 brought to the Court of Justice of the European Communities.
The present study, after presenting the field of legal regulation, aims to analyze a concrete case of "health claim" applied on the label of a wine, a case whose release by the European Court of Justice of the European Communities comes to establish the limits of the use of health claims in advertisement, regardless of the form, especially in the case of alcoholic products.
Case C-544/10, REFERENCE for a preliminary ruling under Article 267 TFEU from the Bundesverwaltungsgericht (Germany).
ANNALS OF THE UNIVERSITY OF CRAIOVA
Series: Biology HorticultureFood produce processingtechnologyEnvironmental engineering Vol. XXII I (LIX) - 2018
266
MATERIAL AND METHODS This paper has used as a basis for the study, the European regulations and
European jurisprudence in the field, using the classic methods of legal interpretation of legislation and legal analysis of the text of parts of the procedural documents in some cases solved by the CJEU.
RESULTS AND DISCUSSIONS According to Regulation3 1924/2006 on nutrition and health claims made on
foods, all products placed on the market, including those imported, must present a "safety" characteristic and be labeled accordingly. It is well known that each trader is aiming to achieve high revenues from advertising that ensures a successful marketing of the product. Starting from the traders' tendency to maximize the qualities of the offered product, it is remarkable that there is an increased number of products that are subject to "special" publicity at the European Union level in the sense that the labels used in the presentation contain nutrition and health claims.
According to the Directive4 no. 13/2000 on the approximation of the laws of the Member States relating to the labelling, presentation and advertising of foodstuffs, the labelling rules should contain a prohibition on misleading the purchaser or to attribute "medicinal characteristics" to the foodstuffs. In order to be effective, this ban should be extended to the presentation of foodstuffs and their advertising.
It is common knowledge that wine is part of the foodstuffs. Thus, according to art. 2 of Regulation 178/2002 laying down the general principles and requirements of food law, establishing the European Food Safety Authority and laying down procedures in matters of food safety, the "food product" (or "foodstuff") means any product or substance, whether processed, partly processed or unprocessed, intended or reasonably expected to be ingested by humans. Also, according to the same paper, "foods" include beverages, chewing gum and any substance, including water, intentionally incorporated in food during their production, preparation or treatment.
In terms of “health claims", the above-mentioned Directive essentially prohibits the use of information by advertising likely to mislead the purchaser in relation to certain medicinal properties of foods.
The Directive 13/2000 EC generally prohibits the use of information that would mislead the purchaser or would attribute medicinal properties to foodstuffs. This Regulation aims to supplement the general principles of the Directive 13/2000 / EC and to lay down specific provisions on the use of nutrition and health claims on foods to be delivered as such.
According to Regulation (EC) no. 1924/2006, the food supplements (as defined in the Directive 2002/46/EC of the European Parliament and of the Council of 10 June 2002 on the approximation of the laws of the Member States relating to food supplements) presented in a liquid form and containing more than 1.2 % by volume of alcohol are not considered beverages.
It has also been established that health claims other than those referring to the reduction of disease risk and to children's development and health, based on generally accepted scientific evidence, should be subject to a different type of assessment and authorization. It is therefore necessary to adopt a Community list of such permitted claims, after consulting the European Food Safety Authority (hereinafter referred to as "the European Authority").
Published in the Official Journal of the European Union L. 404/ 26.12.2006. Published in the Official Journal of the European Union L. 109, 6.05.2000.
267
Furthermore, the health claims based on recently established scientific evidence should be subject to accelerated authorization procedures in order to stimulate innovation.
The Regulation introduces the terms "health claim" and "claim referring to the reduction of the disease risk".
Thus, the "health claim" means any statement that declares, suggests or implies that there is a relationship between a food category, a food or one of its constituents and health. The "disease risk reduction claim" means any health claim that states, suggests or implies that a risk factor in the development of a human disease is significantly reduced by the consumption of a food category, a food or one of its constituents.
The same Regulation establishes unequivocally that, in order for a health claim to be accepted, it must meet the following conditions:
- it should not be false, ambiguous or misleading,- it should not encourage or be able to tolerate excessive consumption of a food
product,- it should not be able to assert, suggest, or imply that a balanced and varied
diet can not generally provide the proper amounts of nutrients,- it should not refer to changes in the functions of the body which could induce
fears or exploit such fears to consumer, either in the form of texts or in the form of images, graphics or symbolic representations.
The health claims are prohibited unless they comply with the general requirements set out above, are authorized in accordance with the law and they are included in the lists of permitted claims acting in accordance with Regulation (EC) no. 1924/20065.
Thus, the label/form of advertising accompanying a product may not refer to the general, non-nutritional or food-specific benefits of good overall health or health related to well-being unless such reference is accompanied by a specific mention included in the lists acting in accordance with the procedures laid down in the Regulation.
The health claims are only allowed if the following information are included on the labels or in the presentation and advertising if there are no such labels:
- an indication of the importance of a varied and balanced diet and a healthy lifestyle;
- the quantity of food and consumption pattern required to achieve the mentioned beneficial effect;
- where appropriate, a claim to persons who should avoid using the food in question;
- an adequate warning for products that are likely to pose a health risk if theyare consumed in excess.
On the other hand, the Regulation stipulates that health claims are not subject to authorization if they describe or refer to:
- The role of a nutrient or other substance in the growth, development and functions of the organism
- Psychological and behavioral functions or- weight loss or weight control, or reduction of hunger, increased satiety or
decreased energy value of food, if they are based on generally accepted scientific evidence and are well understood by the average consumer in relation to the lists authorized at European level under this procedure.
Regarding the disease risk claims of children's development and health, the Regulation mentions that there may be suggestions on the reduction of disease risk and
See Art. 13 and 14 of the normative act.
268
claims on children's development and health if they have been authorized in accordance with the procedure set out in Regulations in order to be included in a Community list of such permitted claims, accompanied by all the conditions necessary for the use of these claims.
In addition to the general requirements set out in the Regulation, the requirements on labelling (presentation or advertising) in the case of disease risk claims, must be accompanied by a statement indicating that the disease to which the claim refers has multiple risk factors and that the change of one of these risk factors may or may not have a beneficial effect.
Continuing the "enactment", The European Commission issued the Regulation6
no. 155/2014 refusing to authorize certain health claims made on foods other than those referring to the disease risk reduction and on the development and health of children, establishing express cases of refusal of authorization for certain products in an annex for which an approval is sought for the inclusion of certain health claims.
We mention as an example the case of a request made by Nutrilinks Sarl, submitted pursuant to Article 13 (5) of Regulation (EC) No. 1924/2006, requesting the Authority to issue an opinion on a health claim related to the effects of the Vitis viniferaL. seed extract which was claimed to have a positive effect on the normal blood circulation. The mention proposed by the applicant was formulated, inter alia, as follows: "It contributes to the promotion of blood circulation in legs and feet".
On 14 December 2012, the Commission and the Member States received the scientific opinion from the Authority, which, on the basis of the data submitted, concluded that there was no cause-effect relationship between the consumption of the Vitis viniferaL. seeds extract and the claimed effect. Consequently, since the claim does not meet the requirements of Regulation (EC) No 1924/2006, it was decided that this "claim" should not be authorized.
Case Study. Court of Justice of the European Communities. Case "Deutsches Weintor eG against Land Rheinland-Pfalz". The legality of the "'easily digestible wine" claim
Taking into consideration that there is a European procedure for the authorization of health claims, the European legislator has also set some exceptions. Thus, the European legislation stipulates that health claims are not subject to authorization if they describe or refer to:
- The role of a nutrient or other substance in the growth, development and functions of the organism
- Psychological and behavioral functions or- weight loss or weight control, or reduction of hunger, increased satiety or
decreased energy value of food,if they are based on generally accepted scientific evidence and are well
understood by the average consumer in relation to the lists authorized at European level under this procedure.
According to Article 4 of Regulation No 1924/2006, beverages containing more than 1.2 % by volume of alcohol shall not bear health claims. Regarding the nutrition claims, only nutrition claims relating to low levels of alcohol or reducing the alcohol content or reducing the energy content of beverages containing more than 1,2 % by volume of alcohol are allowed. "
The case brought to the European Court of Justice of the European Communities has been the subject of a reference for a preliminary ruling on the interpretation of Article 2 (2) (5) and the first paragraph of Article 4 (3) of Regulation (EC) No 1924/2006 of the European Parliament and of the Council of 20 December 2006 on
Published in the Official Journal of the European Union L. 50/ 20.02.2014.
269
nutrition and health claims made on foods. It was sent by a German court on the dispute between a German winemaking cooperative and the competent authority to supervise the commercialization of alcoholic beverages on the right to use the presentation of a health claim on a label/material.
The Winemaking Cooperative marketed wines from the Dornfelder and Grauer / Weißer Burgunder grape varieties with the description "Edition Mild" (Mild Edition), accompanied by a statement of "low acidity". On the label of this wine it was mentioned, among other things, that: "The delicate taste is obtained by using our special procedure LO3 "(LO3 Schonverfahren zur biologischen Säurereduzierung) for biological deacidification." The label on the neck of the wine bottles featured the inscription: "Edition Mild bekömmlich" (Mild Edition, easily digestible). In the price catalog, the wine was described by the use of the phrase: "Edition Mild - sanfte SÄure / bekömmlich" (mild edition – gentle acidity/ easily digestible).
The German authority responsible for supervising the marketing of alcoholic beverages contested the use of the term 'easily digestible' on the ground that it constitutes a 'health claim' within the meaning of the European regulations in question7.
In its turn, the winemaking cooperative brought an action before a competent German administrative court requesting to be allowed to use the "easily digestible" description for the labelling of the concerned wines and for the advertising they make. In support of its action, it essentially stated that the description 'easily digestible' had no relation to health but merely referred to general well-being. It also claims that Regulation No 1924/2006 does not apply to descriptions traditionally used for food or beverages and which may have consequences for general well-being, such as the 'easily digestible' description of a digestible beverage.
On the basis of the initial situation that the wine is in the category of beverages containing more than 1.2 % by volume of alcohol, it should be pointed out that, according to the first paragraph of Article 4 (3) of Regulation No 1924/2006, the European Union legislature has prohibited without exception, any "health claim" in respect of this category of beverages.
In the deduction of judgment, it is noteworthy that the claim in dispute is capable of suggesting that, given the low acidity, the wine in question is adapted or acceptable for digestion. According to the claim included on the label / form of advertising, this wine would produce a beneficial nutritional or physiological effect. In other words, if you consume such a product, the digestion process will improve.
It is important to stress that the "improved" digestion process (commonly known as a medicine notion) is reported at the time immediately following the ingestion of the product, having a limited effect over time, as long as the consumed product is still found in the body of the consumer.
In relation to the case, it is questionable whether a description as 'easily digestible' can be qualified as a 'health claim', even if it does not imply a lasting improvement in the state of the body to which it derives the beneficial nutritional or physiological effect that the wine in question can produce.
The European Court of Justice, interpreting the rules of Regulation No 1924/2006, held that the "health claim" is defined on the basis of the relationship that must exist between the foodstuffs or one of its constituents on the one hand and the health, on the other hand. It must therefore be held that that the definition contains no indication either of the direct or indirect nature of that relationship, or of its intensity or duration. Under these circumstances, the term "relationship" must be understood in a broad sense.
Infringement of Article 2 (2) (5) of Regulation No 1924/2006, which does not allow such claims for alcoholic beverages under the first paragraph of Article 4 (3).
270
It is important to emphasize that the relationship between product consumption and health condition should not be seen only in terms of limited effect, ignoring the other effects of consumption of the product in question. Thus, the Court held that, on the one hand, the notion of 'health claim' must not only concern a relationship involving an improvement in the health status due to the consumption of foodstuffs but also any relationship involving the absence or limitation of negative effects or health hazards which accompany or will otherwise result in such consumption and therefore the simple maintainance of good health despite this potentially harmful consumption. It must also be understood that the term 'health claim' refers not only to the effects of a given consumption of a certain quantity of foodstuffs, which may normally only cause temporary or passive effects, but also repeated, regular, even frequent consumption of such foodstuffs and which, on the other hand, has no temporary or passive effects.
Starting from the situation whereby the indications that promote the food and which indicate a nutritional, physiological, or other health advantage in relation to similar products guide the choice of consumers, it is undeniable that this choice has a direct influence on the total quantity of different nutrients or other substances which they decide to absorb, thereby justifying the restrictions on the use of those claims imposed by that regulation.
Consequently, the European Court of Justice has held that when analyzing the effects of the product on health, there must be taken into account both the temporary and passive effects and the cumulative effects that the repeated and long-term consumption of a particular foodstuffs has on its physical condition.
Returning to the cause of the judgment, referring to the description made by the parties, the "health claim" suggests that the wine is digested and absorbed well, which translates to the fact that the digestive system, therefore, a part of the human body does not suffer or suffer a little because of it, and that this system remains relatively healthy and intact even after a repeated consumption of cumulative and long-lasting quantities as this wine is characterized by a low acidity. Thus, the claim in question may suggest a lasting beneficial physiological effect, which is to maintain a good state of the digestive system, contrary to other wines which are supposed to cause, in the case of cumulative consumption, negative long-lasting effects on the digestive system and, consequently, for health.
In conclusion, the European Court of Justice has held that, in accordance with all the special conditions that have to be met by such mentions, nutrition and health claims must not be false, ambiguous or misleading, the prohibition being imposed much more in the case of alcoholic beverages. It is therefore essential that all claims of these beverages to be unambiguous so that consumers can adjust their consumption taking into account all the intrinsic risks associated with that consumption and thus effectivelyprotect their health. The claims such as those in question from the main action are ambiguous, even misleading, if they relate to an alcoholic beverage. In fact, by stating only easily digestible, the mention in question is likely to encourage the consumption of the wine in question and, ultimately, to increase the inherent risks of uninterrupted consumption of any alcoholic beverages for the health of consumers. Therefore, the prohibition of such claims can be justified by the requirement to guarantee a high level of consumer health protection.
271
CONCLUSIONSIt is widely known that advertising is the engine of commerce. Any trader will try
to capitalize its products by explaining briefly, concisely and with major impact the benefits of the product, especially when the form of advertising is done using a "health claim". By addressing the fair competition rules, traders should analyze thoroughly the impact of the product on health, taking into account all major and secondary factors aimed at triggering the "beneficial health" mechanism, with particular emphasis on " time ", referring to the fact that even the abuse of drugs is harmful to health.
Thus, in relation to the case under consideration, even if the wine in question favours the digestion, the claim being correct from a medicinal point of view under this limited aspect, the same claim "forgets" to inform the consumer that the risks inherent of alcohol consumption are not removed by the "easily digestible" promoted phrase. This claim is "misleading" as long as it attempts to induce the idea that the product is beneficial only in terms of digestion and the insertion of a "health claim" on the label / forms of advertising that omits to make known also the related risks of the ingestion of that product is contrary to law.
It remains at the discretion of the authorities and why not, of the interested parties (competitors on the market) to identify and notify the competent bodies, including the courts, whenever there is a finding on the market of products that are marketed and contain labels / forms of advertising in which "health claims" are often inserted and very often hidden, such as: "long life", "good blood circulation", etc.
REFERENCES ***Case C-544/10, REFERENCE for a preliminary ruling under Article 267 TFEU
from the Bundesverwaltungsgericht (Germany);***Council Regulation (EC) 178/2002;***Council Regulation (EC) No. 1924/2006; ***Council Regulation (EC) no. 155/2014;***Directive no. 13/2000 on the approximation of the laws of the Member States
on the labelling, presentation and advertising of foodstuffs; ***Directive 2002/46 / EC of the European Parliament and of the Council of 10
June 2002.

Copyright © 2022 FDOKUMEN