PARTEA I - FEAA Craiova
290
-
Upload
khangminh22 -
Category
Documents
-
view
0 -
download
0
Transcript of PARTEA I - FEAA Craiova
Scientific Editorial Committee
Academician Gheorghe ZAMAN Romanian Academy Prof. Ph.D Dinu AIRINEI Faculty of Economics and Business
Administration, University „Al.I. Cuza IaŞi“
Prof. Ph.D Marioara AVRAM Ph. D Advisor, University of Craiova Prof. Ph.D George BLANAS Technological Educational Institute of
Larissa Prof. Ph.D Sorin BRICIU Ph. D Advisor, University “1
Decembrie 1918”, Alba Iulia Prof. Ph.D Adriana ŞCHIOPOIU
BURLEA Ph. D Advisor, University of Craiova
Prof. Ph.D Marijan CINGULA Ph. D Advisor, University of Zagreb Prof. Ph.D Mariana CISMAŞ Ph. D Advisor, West University of
Timisoara Prof. Ph.D Dumitru Horia
CRISTEA Ph. D Advisor, West University of Timisoara
Prof. Ph.D Cosmin DOBRIN The Bucharest University of Economic Studies
Prof. Ph.D Vasile GEORGESCU Ph. D Advisor, University of Craiova Prof. Ph.D Murat KASIMOGLU Canakkale Onsekiz Mart University Prof. Ph.D. Himayatullah KHAN University of Peshawar Prof. Ph.D Mehmet C.
KOCAKULAH University of Southern Indiana
Prof. Ph.D Gheorghe MATEI Ph. D Advisor, University of Craiova Prof. Ph.D Virginia MĂRĂCINE The Bucharest University of
Economic Studies Prof. Ph.D. Mihaela MUNTEAN Ph. D Advisor, West University of
Timisoara Prof. Ph.D Răzvan Liviu NISTOR Ph. D Advisor, BabeŞ-Bolyai
University, Cluj-Napoca Prof. Ph.D Tudor NISTORESCU Ph. D Advisor, University of Craiova Prof. Ph.D Marilen PIRTEA Ph. D Advisor, West University of
Timisoara Prof. Ph.D Ion POPA Ph. D Advisor, The Bucharest
University of Economic Studies Prof. Ph.D Michael REED Ph. D Advisor, University of
Kentucky Prof. Ph.D Ioan TALPOŞ Ph. D Advisor West University of
Timisoara Prof. Ph.D Adriana TIRON
TUDOR Ph. D Advisor, BabeŞ-Bolyai University, Cluj-Napoca
Prof. Ph.D Eleftherios THALASSINOS
Ph. D Advisor, University of Piraeus
Prof. Ph.D Eugeniu ŢURLEA Ph. D Advisor, The Bucharest University of Economic Studies
Prof. Ph.D Timothy WOODS University of Kentucky Prof. Ph.D Joachim ZENTES Ph. D Advisor, Saarland University
Editorial Committee � Scientific Director: Prof. Marian SIMINICĂ Ph. D. � Editor-in -chief : Associate prof. Cristian DRĂGAN Ph. D. � Deputy editor-in-chief: Associate prof. Laura VASILESCU Ph. D. � Editors:
- Amelia BĂDICĂ - Radu BRATU - Ion BULIGIU - Adina CONSTANTINESCU - Adriana IOŢA - Mihai NIŢOI
� Secretariat and international relations: - Alina MANTA
3
CONTENTS
Subjective nature of asset valuation yield method Marian SIMINICĂ, Mirela GANEA, Silviu CÂRSTINA ............................ 7
Actions to reduce unemployment in Romania Adriana TOTÎLCA, Raducu-Stefan BRATU ……………………………… 13
Measuring the efficiency in the romanian banking system through the method of the data envelopment analysis (DEA)
Alina Georgiana MANTA, Roxana Maria BĂDÎRCEA …………………... 23
Marketing study regarding internet services usage on smartphones Gheorghe MEGHISAN, Georgeta-Madalina MEGHISAN .......................... 35
The dark side of public sector efficiency Narcis Eduard MITU ..................................................................................... 41
Power thinqing model and ethics management Silvia PUIU ................................................................................................... 47
Logistics - source of competitive advantage Adriana SCRIOŞTEANU, Daniela POPESCU ............................................ 53
Contributions to optimize quality costs in the automotive industry Ion IONESCU ............................................................................................... 61
Reflections on Union European Banking Project Jenica POPESCU, Victoria FIRESCU .......................................................... 69
Social security system and pension systems – pilons of social cohesion Marieta STANCIU, Mădălina Giorgiana MANGRA ................................... 75
The impact of the public debt on the European Union member countries Gheorghe MATEI, Luiza APOSTOL ........................................................... 81
A combination with multiple organizational implications: Generation Y and knowledge management
Mihai VĂRZARU, Radu Florin OGARCĂ ................................................. 89
Storage – integral component of the logistic system Florin TUDOR, Andrei Bogdan BUDICĂ, Ilie BUDICĂ, Adrian Florin BUDICĂ ……………………………………………………………………
99
Food quality in all its forms Nataliţa Maria SPERDEA, Radu Cătălin CRIVEANU ................................ 107
Perspectives and trends regarding the key indicators of human resource performance management in Romania
Suzana DEMYEN, Ion Lala POPA ............................................................... 115
4
Managing brand equity risk: adding exogenous risks to an evaluation model
Cătălin Mihail BARBU, Sorin TUDOR, Dorian Laurenţiu FLOREA ......... 123
Study on the decision process of the mobile telecommunications services’ users
Georgeta-Mădălina MEGHIŞAN, Flaviu MEGHIŞAN ............................... 130
Role of ethics in teaching institutions Silvia PUIU ................................................................................................... 138
Impact of cyclical evolution on budget balance- Romania’s case Alexandru AVRAM, Veronel AVRAM, Roxana Adriana HETES-GAVRA ……………………………………………………………………
144
The use of qualitative variables in the risk assessment Daniel CÎRCIUMARU .................................................................................. 150
Excise in tax practice in the European Union Nicoleta Mihaela FLOREA, Stelian SELISTEANU .................................... 157
Young people and the labor market in Romania Adriana TOTÎLCA, Raducu Stefan BRATU ................................................ 164
Considerations regarding the accounting principles applied in insolvency proceedings
Marioara AVRAM, Veronel AVRAM …………………………………... 172
Control performance Through the design and implementtion of a budgetary system In SMEs in the Region South –West Oltenia
Anca Antoaneta VĂRZARU ......................................................................... 178
From ABC to Time Driven Activity Based Costing for outpatient clinics Constanţa IACOB, Camelia CONSTANTIN ................................................ 189
International statistical reporting– the duty of economic agents Magdalena MIHAI, Adriana IOŢA .............................................................. 197
Opportunities for optimizing the cost of quality Magdalena MIHAI, Adriana IOŢA, Oana STAICULESCU ........................ 203
Considerations regarding the quality cost of traded products and services in the context of performing management of the entity
Cristian DRĂGAN, Valeriu BRABETE ....................................................... 211
Flexible labor market in Romania - tactical and strategic coordinate Costin Daniel AVRAM ................................................................................. 217
Interactive decision support system based on analysis and synthesis of data - data warehouse
Georgeta ŞOAVĂ .......................................................................................... 223
5
Theoretical research on specific human resources in tourism. Features in Romania
Carmen Cristina ALBU, Dan Constantin VĂRZARU ................................. 233
Standardization and its role in prescribing quality Radu Cătălin CRIVEANU, Nataliţa Maria SPERDEA ................................ 246
On the professional reasoning Horia Dumitru CRISTEA .............................................................................. 254
Alternatives of the historic cost in the evaluation process of quality costs Valeriu BRABETE, Cristian DRĂGAN, Oana STĂICULESCU ...................... 259
The mechanism of payment requests - an instrument for facilitating the financing from structural funds of romanian public academic education institutions
Cristina-Petrina DRĂGUŞIN ........................................................................... 269
Risk measurement using the β (beta) coefficient for financial investment companies
Dorel BERCEANU, Nicolae SICHIGEA, Daniel MILITARU ......................... 279

7
SUBJECTIVE NATURE OF ASSET VALUATION YIELD METHOD
Prof. Marian Siminică Ph. D, University of Craiova Faculty of Economics and Business Administration, Craiova, Romania Lect. Mirela Ganea Ph. D, University of Craiova Faculty of Economics and Business Administration, Craiova, Romania Assist. Silviu Cârstina Ph. D Student, University of Craiova, Faculty of Economics and Business Administration, Craiova, Romania
Abstract: : This paper aims subjective nature of the valuation method by return on assets at an enterprise level. Starting from the evaluation principles and techniques used to determine the value of assets of an enterprise, we come upon the method the yield (revenue) by putting it into practice on an enterprise with agro-industrial activity. Value approached in this valuation technique is market value, being followed in the specific market region South-West region in which the undertaking operates. By addressing different market value starting from the comparables used have revealed how the value resulting from the efficiency of the method varies depending on how the evaluator expects and appreciates the value of comparables against the subject being assessed. All these techniques are highlighted through a case study of the agro-industrial companies in the county of Dolj.
JEL classification: G1,G12
Key words: evaluation, market value, yield, capitalization, assets
1. INTRODUCTION Evaluation method increasingly used in estimating the value of a credible
companies to develop and grow continuously with the interests and the changing economic environment. Based on a series of methods and techniques, and endpoint assessment is estimating a value. So we can say that the purpose of an evaluation consists in estimating a value as fair and objective as possible.
Objectivity value obtained after an assessment is just the starting point of this research work. How real and objective is the value obtained after the evaluation depends on the thoroughness and accuracy of assessment methods and techniques have been implemented.
Given the type of value but also the method of choice to determine this value, we can say, also demonstrating the real case study, the evaluation has a certain degree of subjectivity. The issue is how big or how small must be this level so its value does not have to suffer to be a value as real and as accurately determined for the subject being assessed.
Given the purpose of the evaluation report, the degree of subjectivity can be a decisive factor in terms of the level of trust that this report provides information on users. In most cases, evaluation reports aimed transmitting information on the degree of
8
marketability of a good market, especially by the amount by which the best would trade.
If we look to secure a loan to the value of the subject or subjects assessed, we can say that the evaluation report is an important factor of the decision granting or refusing the loan.
We can not say, however, that an appraiser can afford exaggeration or estimate an unjust, regardless of beneficiary assessment report, especially when its activity is regulated by laws and regulations, embodied in the Code of ethics of the profession of authorized evaluator and GO no. 24/2011, which make him liable for the metion in the evaluation report, going to the facts of criminal nature.
However practice shows a flexibility that is as narrower, in determining the value of a subject, this is demonstrated in our research work starting from a real case study on an agro-industrial company.
2. CONCEPT AND TERMS USED Before proceeding to the presentation of the case study used in research work,
we considered the need for establishing some specific terms valuation, terms such as assessment, market value, yield method.
Evaluation is defined as "a profession characterized by the fact that experience and knowledge are acquired and transmitted from generation to generation, that meet professional standards, a code of ethics specific to wide recognition of public utility." The final result of the evaluation is sent through an evaluation report, obtained through a complex process based on a particular type of value attributed to various real estate, personal property, financial assets.
Value is thus the goal of any evaluation process, regardless of methods and techniques used by the evaluator. Erich A. Helfert our attention on the existence of multiple value types such as economic value, market value, book value, liquidation value, value division, replacement value, collateral, estimated the value determined by experts the value of a business in the event of continuing business, shareholder value, value of bonds, etc..
Of all the values that I worked with in this report is market value, Erich A. Helfert defined as "the value of any asset or group of assets of any business, by trading on an organized market or negotiated between the parties , in a deal balanced ".
Determination of a complex composed of various evaluation methods and techniques and methods you need to fold the best objective course evaluation report according to the subject or subjects being valued.
IVS GN 6 - Evaluation enterprise approach based on income is defined as: "the general path of extimare the value of a company, shares or share using one or more methods by which value is estimated by converting anticipated benefits, the value capital (through technical update / capitalization) ". Of the two methods included in this approach, namely: method cash flow and net present income capitalization method, the one I applied it in the last case study, the income capitalization method.
3. METHODOLOGY To emphasize the subjectivity level yield method were present in a number of
necessary market analysis, analysis by course in the agro-industrial firms in the South West region.
9
It is presently a lack of storage space in the most specific agricultural undertakings in Romania which is why 70% of cereal production is sold immediately after harvest at very low prices.
A first step was to collect information about rents charged for the type of buildings and warehouses typical of various agro-industrial businesses in the area.
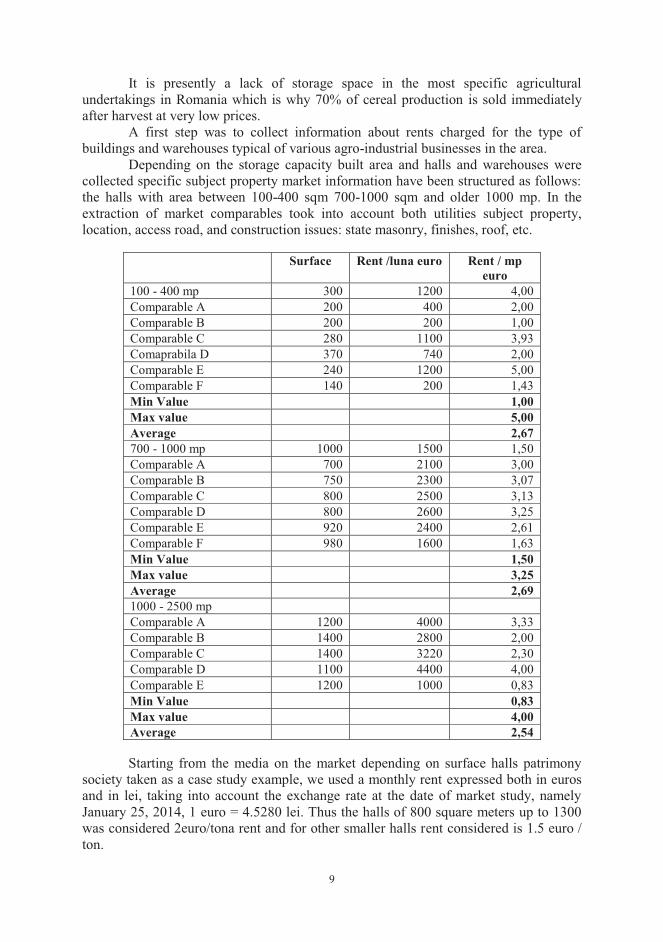
Depending on the storage capacity built area and halls and warehouses were collected specific subject property market information have been structured as follows: the halls with area between 100-400 sqm 700-1000 sqm and older 1000 mp. In the extraction of market comparables took into account both utilities subject property, location, access road, and construction issues: state masonry, finishes, roof, etc.
Surface Rent /luna euro Rent / mp euro
100 - 400 mp 300 1200 4,00 Comparable A 200 400 2,00 Comparable B 200 200 1,00 Comparable C 280 1100 3,93 Comaprabila D 370 740 2,00 Comparable E 240 1200 5,00 Comparable F 140 200 1,43 Min Value 1,00 Max value 5,00 Average 2,67 700 - 1000 mp 1000 1500 1,50 Comparable A 700 2100 3,00 Comparable B 750 2300 3,07 Comparable C 800 2500 3,13 Comparable D 800 2600 3,25 Comparable E 920 2400 2,61 Comparable F 980 1600 1,63 Min Value 1,50 Max value 3,25 Average 2,69 1000 - 2500 mp Comparable A 1200 4000 3,33 Comparable B 1400 2800 2,00 Comparable C 1400 3220 2,30 Comparable D 1100 4400 4,00 Comparable E 1200 1000 0,83 Min Value 0,83 Max value 4,00 Average 2,54
Starting from the media on the market depending on surface halls patrimony
society taken as a case study example, we used a monthly rent expressed both in euros and in lei, taking into account the exchange rate at the date of market study, namely January 25, 2014, 1 euro = 4.5280 lei. Thus the halls of 800 square meters up to 1300 was considered 2euro/tona rent and for other smaller halls rent considered is 1.5 euro / ton.
10
Occupation in months / year considered for our company is 50%, ie only half of the year the company would use these warehouses for grain storage, monthly occupancy is set at around 75% per year. By multiplying the two resulting total employment has been fixed at around 38%.
To estimate the capitalization rate were taken into account transaction prices per unit surface area of the property with the highest degree of comparability and rents charged for properties in the same area or similar areas. Based on these considerations, the capitalization rate related to agro-industrial real estate is between 12% and 14%.
In the present work, taking into account specific local conditions and the market value of comparable rents from real property and the risks associated with such an activity, we selected a capitalization rate of 12.5%.
4. CASE STUDY To argue the foregoing we conducted a case study starting from agro-industrial
company based in Craiova, considering halls which it owns. Initial evaluation report was conducted in order to request a bank loan, property owned by this company in heritage planning to constitution on part of the loan guarantee.
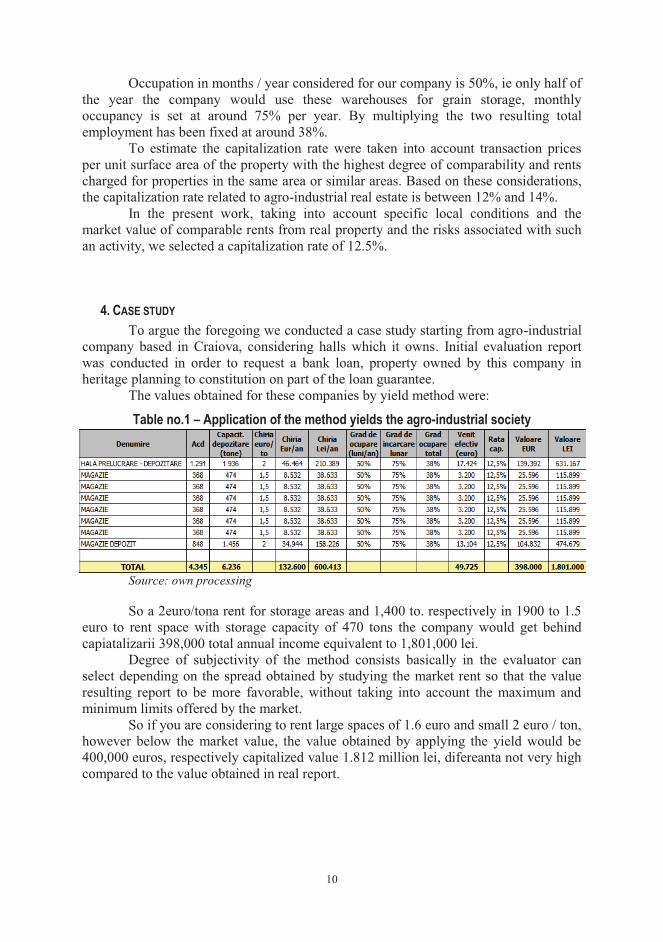
The values obtained for these companies by yield method were:
Table no.1 – Application of the method yields the agro-industrial society
Source: own processing
So a 2euro/tona rent for storage areas and 1,400 to. respectively in 1900 to 1.5 euro to rent space with storage capacity of 470 tons the company would get behind capiatalizarii 398,000 total annual income equivalent to 1,801,000 lei.
Degree of subjectivity of the method consists basically in the evaluator can select depending on the spread obtained by studying the market rent so that the value resulting report to be more favorable, without taking into account the maximum and minimum limits offered by the market.
So if you are considering to rent large spaces of 1.6 euro and small 2 euro / ton, however below the market value, the value obtained by applying the yield would be 400,000 euros, respectively capitalized value 1.812 million lei, difereanta not very high compared to the value obtained in real report.
11
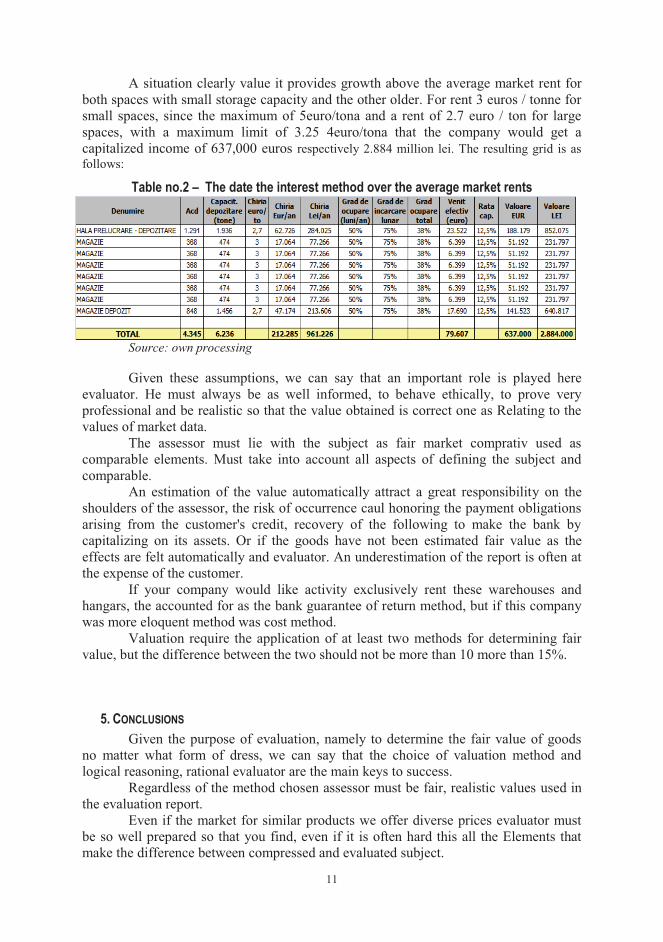
A situation clearly value it provides growth above the average market rent for both spaces with small storage capacity and the other older. For rent 3 euros / tonne for small spaces, since the maximum of 5euro/tona and a rent of 2.7 euro / ton for large spaces, with a maximum limit of 3.25 4euro/tona that the company would get a capitalized income of 637,000 euros respectively 2.884 million lei. The resulting grid is as follows:
Table no.2 – The date the interest method over the average market rents
Source: own processing
Given these assumptions, we can say that an important role is played here evaluator. He must always be as well informed, to behave ethically, to prove very professional and be realistic so that the value obtained is correct one as Relating to the values of market data.
The assessor must lie with the subject as fair market comprativ used as comparable elements. Must take into account all aspects of defining the subject and comparable.
An estimation of the value automatically attract a great responsibility on the shoulders of the assessor, the risk of occurrence caul honoring the payment obligations arising from the customer's credit, recovery of the following to make the bank by capitalizing on its assets. Or if the goods have not been estimated fair value as the effects are felt automatically and evaluator. An underestimation of the report is often at the expense of the customer.
If your company would like activity exclusively rent these warehouses and hangars, the accounted for as the bank guarantee of return method, but if this company was more eloquent method was cost method.
Valuation require the application of at least two methods for determining fair value, but the difference between the two should not be more than 10 more than 15%.
5. CONCLUSIONS Given the purpose of evaluation, namely to determine the fair value of goods
no matter what form of dress, we can say that the choice of valuation method and logical reasoning, rational evaluator are the main keys to success.
Regardless of the method chosen assessor must be fair, realistic values used in the evaluation report.
Even if the market for similar products we offer diverse prices evaluator must be so well prepared so that you find, even if it is often hard this all the Elements that make the difference between compressed and evaluated subject.
12
In this example we have shown how the same company with the same assets, may determine, starting from the method yield different values, far above the permissible practice of evaluation of 10-15%.
From this point of view we can say that the method has a high yield of bias, this is very hard to prove in a market where competition is unfair.
The value obtained at above average market rent, but well below the maximum, provides value ratio up to 60% higher than the actual value page of the report.
As a final conclusion we can say that there is a probelma yield method in evaluation but how it is applied. If an appraiser compare deliberately, but also wrong, though apparently two goods that appear to be identical, they are different in terms of characteristics, then surely yield method in terms of bias assessor will suffer, can offer a value that does not correspond to reality.
REFERENCES 1. Badescu, Gh.
Oancea-Negrescu, M.
Analiza investitiilor imobiliare, Ed. Economica, 2009, pag. 33
2. Circiumaru, D. Metode si tehnici de evaluare a intreprinderilor, Material pe suport electronic
3. Helfert,A.
Tehnici de analiza financiara, ghid pentru crearea valorii, Editia 11, Bestseller international, pag.378
4. Ennis, R. H. Critical Thinking: A Streamlined Conception. Teaching Philosophy, 1991
5. Frasineanu, C. Perfectionarea metodelor de evaluare a patrimoniului, Ed. ASE, Bucuresti, 2004, pag. 68
6. Maxim, E. Diagnosticarea sievaluarea organizatiilor, Ed. Sedcom Libris, Iasi, 2010, pag. 327
7. Stan, S. Evaluarea intreprinderii, Editia a doua revizuita, IROVAL Bucuresti, 2006, pag.232
8. * * * www.anevar.ro
"This work was partially supported by the grant number _24C__/2014,
awarded in the internal grant competition of the University of Craiova"
13
ACTIONS TO REDUCE UNEMPLOYMENT IN ROMANIA Adriana Totîlca, Ph. D Student University of Craiova Faculty of Economics and Business Administration Craiova, Romania Raducu-Stefan BRATU, Assist. Ph. D University of Craiova Faculty of Economics and Business Administration Craiova, Romania
Abstract: Globalization involves the gradual integration of economies and societies. Due to globalization were set up job quality and adequately paid in regions of the world where survival of the population was carried out mostly on agriculture. Globalization has created benefits unevenly distributed between countries and even within them. Unfortunately economic integration worldwide had unbalanced and unfavorable results of certain regions, sectors or workers. Only insofar as it provides a more equitable social development for all, globalization is truly sustainable. European society is changing is influenced by various factors, among which technological progress, globalization of trade and population aging. As regards employment and equal opportunities employment policies shall contribute to improving the living conditions of citizens, the objective being sustainable growth and greater social cohesion. In this respect the European Union introduced a legal framework aimed at protecting citizens. Policy of the European Union and Romania embraced priority aims high employment of labor, increased mobility, improved working conditions and better quality jobs, increased information and advice workers, finding solutions combating poverty and social exclusion, equality between men and women and ensuring modern social protection systems.
JEL classification: E20, E24
Key words: unemployment, labour market, market economy, working population, employment rate
1. INTRODUCTION To be out of a job means not to work officially, i.e. the absence of a job for a
period of time. Inactivity may also be however the individual will resultant, with a subjective motivation. Consequently, unemployment can be voluntary and involuntary1. Referring to voluntary unemployment, Keynes believes that this is due to labour bearer’s refusal and inability to accept a fee corresponding to the equilibrium wage. This refusal is based on certain statutory provisions, on social usages or on accords for negotiating collective agreements. This type of unemployment exists only for those who want a wage higher than the market as a form of expression of the demand – job offer. In contrast, involuntary unemployment designates the specific condition of 1 Ghe Pirvu, Macroeconomics, Universitaria Publishing House, Craiova, 2004, p. 198
14
unemployed persons who, although desire to work for a lower real wage, they cannot find available jobs2.
2. POLICIES AND MEASURES TO COMBAT UNEMPLOYMENT The rational employment is one of the essential objectives of economic policy
on the national level, without affecting the economic agents- sellers and labour users’ decisions. The need of state involvement in labour market management derives from the economic functions which it performs. Involvement is achieved through direct and indirect actions and aims to stimulate the creation of immediate jobs. Limiting the state intervention in the labour market results from the fact that in the economy the most activities are in private ownership, the content and level of these activities being freely determined by the owners, the governments having the role of developing national policies for employment3.
Economic policies which boost domestic investment, increase the production and the economic growth generally have as immediate implications the integral utilization of labour.
In this regard, we remember as concrete measures: - Increasing government spending; - Increasing households’ net income; - Actions to promote sales with effects on domestic demand growth; - National currency depreciation; - Protectionist policies (increased duties on some imports and customs duties
applied so as to equalize the import price with the domestic prices for goods of the same kind);
- Establish flexible wage rates through better cooperation between trade unions and employers;
- The method of students’ school extension and the employees’ early retirement has proven over a period of time as a non-effective and expensive measure;
- Creating jobs shorter than 8 hours for a post to be occupied by two persons. Active policy measures for reducing unemployment: - Working time flexibility, flexible wage rates by economic circumstances; - The employees’ training / retraining for finding a job; - Improving education at all levels; - Improving the youth’s educational and vocational guidance; - Stimulating the active persons’ mobility towards new jobs; - Ecological activities extension; - Earned profit reinvestment for creating new jobs; - Scientific research development to support the production. In many cases, active measures have the effect of increasing the number and
intensity of labour market barriers, increasing the unemployment. Eliminating all the labour market barriers (labour law specific rules) would result in the elimination of all forms of involuntary unemployment, increasing competition among employees for the best jobs (higher wages and working conditions), increased competition among employers for the best employees, the effects being the work productivity increase, the
2 J.M. Keynes, General theory of using labour, interest and money, Scientific Publishing House, Bucharest, 1970, p. 44. 3 Ghe Pirvu, Macroeconomics, Universitaria Publishing House, Craiova, 2004, p.203-204
15
bureaucracy reduction, the population’s real incomes increase and it would stimulate people's desire to train.
3. ACTIVE LABOR MARKET MEASURES IMPLEMENTED IN ROMANIA Active measures are key measures that have the effect of reducing
unemployment. These active (anti-unemployment) policies or measures have effects on short, medium and long term. An active measure has as effect the employment increase either by creating new jobs or by facilitating the access to job vacancies.
The most important active measures applied by the authorities were: Entrepreneurial associations of unemployed Short-term objectives of this action are materialized in providing work
opportunities on their own for the potential unemployed people and on long term in job creation, private sector development.
Job Club Creating a Job Club provides the ease of access to jobs and the reducion of
long-term unemployment, on short-term it supports those looking for a job. Business Incubator As long-term goals we can remember supporting the people who want to
develop small businesses to create new jobs, private sector development and on short term it is focused on jobs creation.
Labor mediation It does not intend to create jobs, but to facilitate the access to existing jobs.
Labour mediation has as objective to facilitate the access to jobs and the unemployment reducing as well as the job supply and demand correlation (in DG Employment and Social Protection Bureau there is a labour mediation that keeps a record of vacancies providing information to applicants).
Professional training of the jobs required on labour market The professional training is a classical measure to combat the unemployment.
For supporting the unemployed and those who desire retraining, particularly the unemployed training courses are reorganized.
Community services The objectives of such measures is focused on developing a sense of belonging
to a community and on short term it refers to the creation of services and facilities for the community, providing jobs for some groups .
Subsidies for jobs created for the unemployed by employers Long-term objectives are to stimulate employers to hire disadvantaged
unemployed, to creat jobs and on short-term it materializes in facilitating access to employment for disadvantaged unemployed.
Response services in the event of massive staff vacancy Job fair It offers the possibility of those who request and those who offer manpower to
meet directly and to present the offer. Support for small businesses SME sector is among the fastest growing sources of job creation. Services
dedicated to this sector development can substantially contribute to balance the supply and demand balance for labour. These services are focused on:
business consultancy; entrepreneurial training;
16
giving improved interest loans. Facilitating the transition from school to labour market The objectives of such active measure on long-term are: preventing youth
unemployment and the short-term effect is the future workforce entrepreneurship development from school.
Labour market information and documentation To achieve these active measures, necessary resources embodied in space,
equipment, personnel and financial capabilities are necessary.
4. EVOLUTION OF THE MAIN SOCIAL INDICATORS IN THE TRANSITION PERIOD Demographic trends, especially population aging, as well as reducing active
population rate led to significant changes in terms of economic dependency ratio, being observed in the increasing number of people who depend on the population contributing to social security and the state resources establishment.
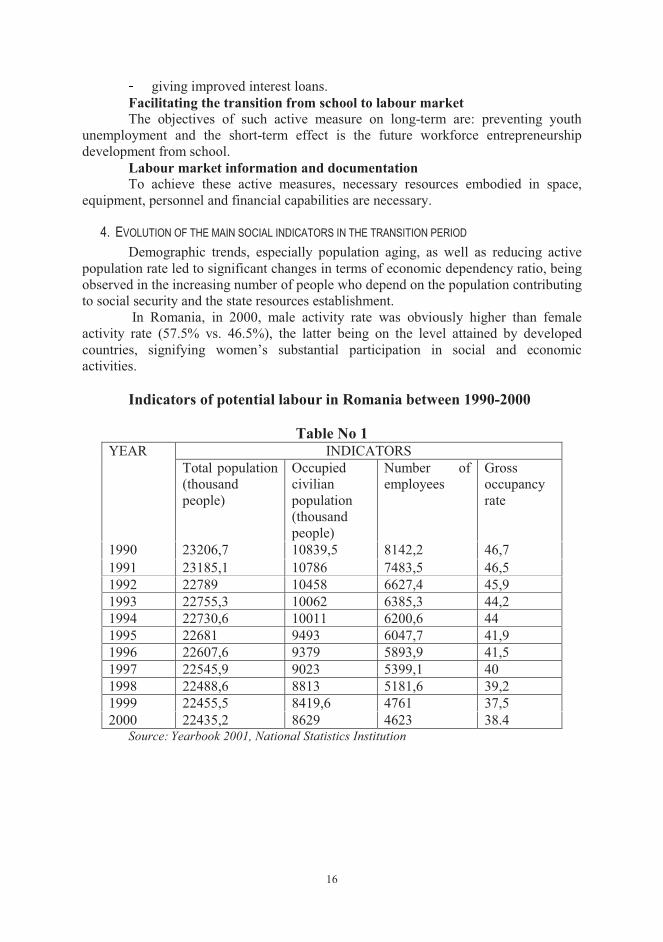
In Romania, in 2000, male activity rate was obviously higher than female activity rate (57.5% vs. 46.5%), the latter being on the level attained by developed countries, signifying women’s substantial participation in social and economic activities.
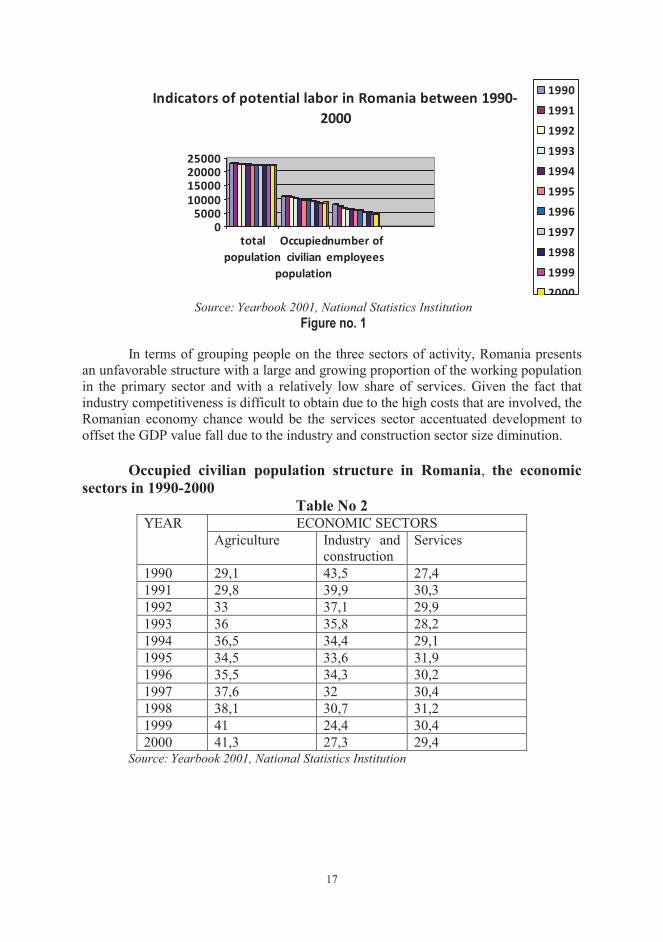
Indicators of potential labour in Romania between 1990-2000
Table No 1 YEAR INDICATORS
Total population (thousand people)
Occupied civilian population (thousand people)
Number of employees
Gross occupancy rate
1990 23206,7 10839,5 8142,2 46,7 1991 23185,1 10786 7483,5 46,5 1992 22789 10458 6627,4 45,9 1993 22755,3 10062 6385,3 44,2 1994 22730,6 10011 6200,6 44 1995 22681 9493 6047,7 41,9 1996 22607,6 9379 5893,9 41,5 1997 22545,9 9023 5399,1 40 1998 22488,6 8813 5181,6 39,2 1999 22455,5 8419,6 4761 37,5 2000 22435,2 8629 4623 38.4
Source: Yearbook 2001, National Statistics Institution
17
05000
10000150002000025000
totalpopulation
Occupiedcivilian
population
number ofemployees
Indicators of potential labor in Romania between 1990-2000
1990
1991
1992
1993
1994
1995
1996
1997
1998
1999
2000 Source: Yearbook 2001, National Statistics Institution
Figure no. 1 In terms of grouping people on the three sectors of activity, Romania presents
an unfavorable structure with a large and growing proportion of the working population in the primary sector and with a relatively low share of services. Given the fact that industry competitiveness is difficult to obtain due to the high costs that are involved, the Romanian economy chance would be the services sector accentuated development to offset the GDP value fall due to the industry and construction sector size diminution.
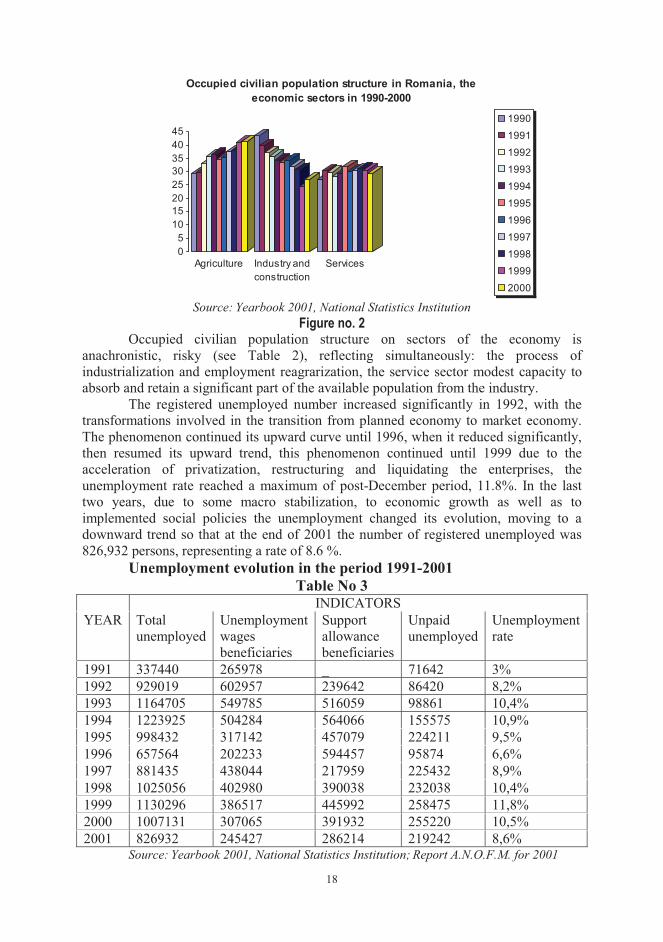
Occupied civilian population structure in Romania, the economic
sectors in 1990-2000 Table No 2
YEAR ECONOMIC SECTORS Agriculture Industry and
construction Services
1990 29,1 43,5 27,4 1991 29,8 39,9 30,3 1992 33 37,1 29,9 1993 36 35,8 28,2 1994 36,5 34,4 29,1 1995 34,5 33,6 31,9 1996 35,5 34,3 30,2 1997 37,6 32 30,4 1998 38,1 30,7 31,2 1999 41 24,4 30,4 2000 41,3 27,3 29,4
Source: Yearbook 2001, National Statistics Institution
18
05
1015202530354045
Agriculture Industry andconstruction
Services
Occupied civilian population structure in Romania, the economic sectors in 1990-2000
1990
1991
1992
1993
1994
1995
1996
1997
1998
1999
2000 Source: Yearbook 2001, National Statistics Institution
Figure no. 2 Occupied civilian population structure on sectors of the economy is
anachronistic, risky (see Table 2), reflecting simultaneously: the process of industrialization and employment reagrarization, the service sector modest capacity to absorb and retain a significant part of the available population from the industry.
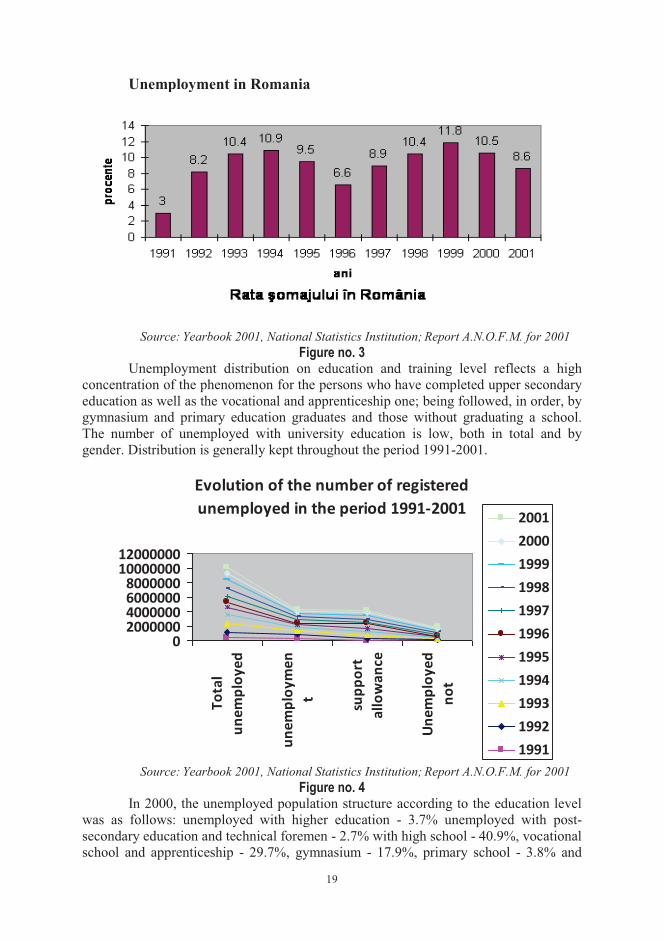
The registered unemployed number increased significantly in 1992, with the transformations involved in the transition from planned economy to market economy. The phenomenon continued its upward curve until 1996, when it reduced significantly, then resumed its upward trend, this phenomenon continued until 1999 due to the acceleration of privatization, restructuring and liquidating the enterprises, the unemployment rate reached a maximum of post-December period, 11.8%. In the last two years, due to some macro stabilization, to economic growth as well as to implemented social policies the unemployment changed its evolution, moving to a downward trend so that at the end of 2001 the number of registered unemployed was 826,932 persons, representing a rate of 8.6 %.
Unemployment evolution in the period 1991-2001 Table No 3
INDICATORS YEAR Total
unemployed Unemployment wages beneficiaries
Support allowance beneficiaries
Unpaid unemployed
Unemployment rate
1991 337440 265978 _ 71642 3% 1992 929019 602957 239642 86420 8,2% 1993 1164705 549785 516059 98861 10,4% 1994 1223925 504284 564066 155575 10,9% 1995 998432 317142 457079 224211 9,5% 1996 657564 202233 594457 95874 6,6% 1997 881435 438044 217959 225432 8,9% 1998 1025056 402980 390038 232038 10,4% 1999 1130296 386517 445992 258475 11,8% 2000 1007131 307065 391932 255220 10,5% 2001 826932 245427 286214 219242 8,6%
Source: Yearbook 2001, National Statistics Institution; Report A.N.O.F.M. for 2001
19
Unemployment in Romania
Source: Yearbook 2001, National Statistics Institution; Report A.N.O.F.M. for 2001
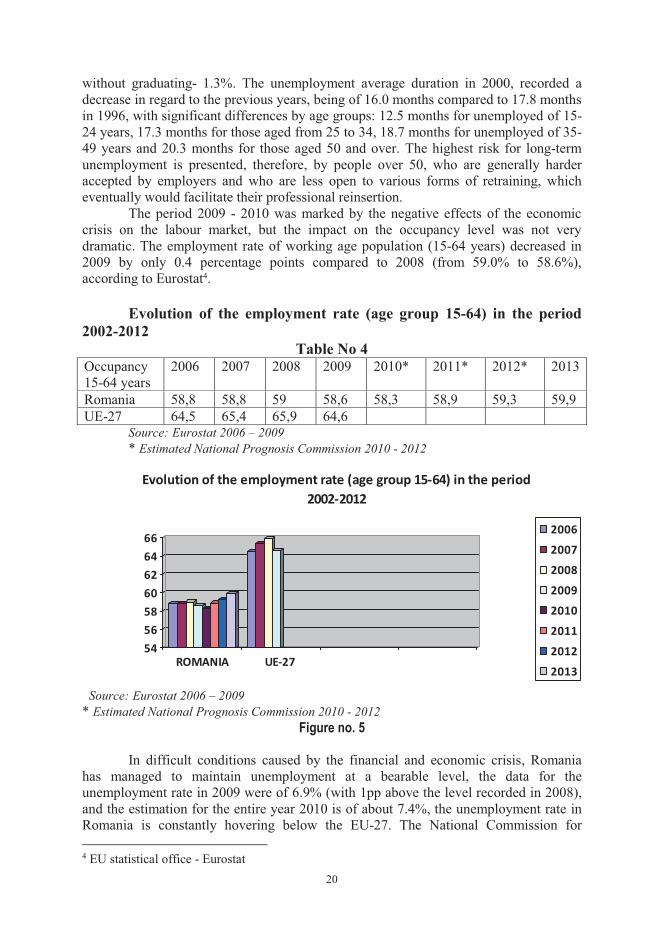
Figure no. 3 Unemployment distribution on education and training level reflects a high
concentration of the phenomenon for the persons who have completed upper secondary education as well as the vocational and apprenticeship one; being followed, in order, by gymnasium and primary education graduates and those without graduating a school. The number of unemployed with university education is low, both in total and by gender. Distribution is generally kept throughout the period 1991-2001.
Evolution of the number of registered unemployed in the period 1991-2001
02000000400000060000008000000
1000000012000000
Tota
lun
empl
oyed
unem
ploy
men
t supp
ort
allo
wan
ce
Unem
ploy
edno
t
20012000199919981997199619951994199319921991
Source: Yearbook 2001, National Statistics Institution; Report A.N.O.F.M. for 2001 Figure no. 4
In 2000, the unemployed population structure according to the education level was as follows: unemployed with higher education - 3.7% unemployed with post-secondary education and technical foremen - 2.7% with high school - 40.9%, vocational school and apprenticeship - 29.7%, gymnasium - 17.9%, primary school - 3.8% and
20
without graduating- 1.3%. The unemployment average duration in 2000, recorded a decrease in regard to the previous years, being of 16.0 months compared to 17.8 months in 1996, with significant differences by age groups: 12.5 months for unemployed of 15-24 years, 17.3 months for those aged from 25 to 34, 18.7 months for unemployed of 35-49 years and 20.3 months for those aged 50 and over. The highest risk for long-term unemployment is presented, therefore, by people over 50, who are generally harder accepted by employers and who are less open to various forms of retraining, which eventually would facilitate their professional reinsertion.
The period 2009 - 2010 was marked by the negative effects of the economic crisis on the labour market, but the impact on the occupancy level was not very dramatic. The employment rate of working age population (15-64 years) decreased in 2009 by only 0.4 percentage points compared to 2008 (from 59.0% to 58.6%), according to Eurostat4.
Evolution of the employment rate (age group 15-64) in the period
2002-2012 Table No 4
Occupancy 15-64 years
2006
2007
2008
2009 2010* 2011* 2012* 2013
Romania 58,8 58,8 59 58,6 58,3 58,9 59,3 59,9 UE-27 64,5 65,4 65,9 64,6
Source: Eurostat 2006 – 2009 * Estimated National Prognosis Commission 2010 - 2012
54565860626466
ROMANIA UE-27
Evolution of the employment rate (age group 15-64) in the period 2002-2012
2006
2007
2008
2009
2010
2011
2012
2013
Source: Eurostat 2006 – 2009 * Estimated National Prognosis Commission 2010 - 2012
Figure no. 5 In difficult conditions caused by the financial and economic crisis, Romania
has managed to maintain unemployment at a bearable level, the data for the unemployment rate in 2009 were of 6.9% (with 1pp above the level recorded in 2008), and the estimation for the entire year 2010 is of about 7.4%, the unemployment rate in Romania is constantly hovering below the EU-27. The National Commission for 4 EU statistical office - Eurostat
21
Prognosis estimates a downward trend of the ILO unemployment rate within 2011-2013 (from 7.2% in 2011 to 6.8% in 2013).
In the case of recorded unemployment (NEA), the annual average was of 6.3% in 2009, 2.3 percentage points higher than in 2008. The significant increase in the registered unemployed number in 2009 was accompanied by reversing the ratio between the paid and unpaid unemployed, the paid unemployed growth causing important pressure on the unemployment insurance budget. In 2010, the unemployment rate ranged from 8.36% in March and 6.87% in December.
5. CONCLUSIONS Unemployment, through its size and duration has negative consequences both
on each person affected by this imbalance and on the whole society. "Unemployment matters - Richard G. Lipsey emphasized. It reduces the aggregate production and income. The inequality increases as unemployed loses more than those who work. It erodes human capital. And finally, involves psychic loss. People need to be desired. Although unemployment increases leisure, this gain is largely offset by the pain of rejection "5. "Unemployment produces among the affected people indifference and depression, being more than a matter of money. Work gives everyone an occupation, the lack of work generates on the part of certain individuals acts of violence, vandalism, hooliganism, it increases the crime rate. Unemployment leads to advanced social degradation and to existence in squalid conditions of the involved families "6.
The main challenge facing Romania in the labour market is the low level of participation (activity rate). In 2009, the activity rate among people between 15-64 years old was only of 63.1% in Romania, compared to 71.1% which was the EU-27 average. Similarly, the employment rate for the same age group was, in 2009, 58.6% in Romania to 64.6% in the EU-27. This is determined by the level of activity and thus by lower employment among women reporting a difference of about 15 percentage points between the employment rate of men and of women. Young people face an unemployment level of about three times higher than adult unemployment.
From the perspective of national strategic framework and the Europe 2020 Strategy, the priority is to increase the employment rate of the labour force, which can be supported by improving professional skills, promoting occupational mobility and reducing the incidence of social exclusion through the social policy active approach. National policy objectives in employment domain is correlated to the priorities and specific targets set by Europe 2020, the 2020 national target being to achieve a 70% employment for people aged from 20 to 64.
The overall objective of increased employment of labour in Romania will be pursued within 2011-2013 through a series of action strands oriented on facilitating the transition from unemployment or inactivity to employment, improving the workforce professional skills and promoting labour mobility.
5 Lipsey G. Richard, Crystal K. Aleck, Principles of economy, Economica Publishing House, Bucharest, 2002, p.691. 6 Hardwich Philip, Langmead John, Khan Bahadur, Introduction to political economy, Polirom, Iasi, 2002, p.599-600.
22
REFERENCES 1. G.Lipsey R.,
Chrystal K.A. Principles of economics, Economic Publishing House, Bucharest, 2002, p. 691
2. Hardwich Philip, Langmead John, Khan Bahadur
Introduction to political economy, Polirom, Iasi, 2002, p.599-600.
3. J.M. Keynes, General theory of using labor, interest and money, Scientific Publishing House, Bucharest, 1970, p. 44.
4. Pirvu Ghe. Macroeconomics, Universitaria Publishing House, 2004, page 198.
5. Pirvu Ghe. Macroeconomics, Universitaria Publishing House, 2004, page 203-204.
6. Ristea C. Raboaca Ghe.
Efficient labor market and unemployment, ASE Bucharest Publishing House, 2001, pag.174.
7. * * * EU statistical office - Eurostat 8. * * * Yearbook 2001, National Statistics Institution; 9. * * * Report A.N.O.F.M. for 2001 10. * * * http://www.topcursuri.ro/files/cursuri/15_Somajul in
Romania.pdf 11. * * * http://www.mmuncii.ro/pub/imagemanager/images/file/Dom
enii/Politici publice/140211PSI 2011-2013.pdf 12. * * * http://www.scritube.com/management/EVOLUTII-PE-
PIATA-MUNCII34171.php 13. * * * http://www.scribd.com/doc/51099477/Somajul-in-Romania 14. * * * http://mpra.ub.uni-
muenchen.de/25239/3/Unemployment_in_Romania.pdf 15. * * * http://europa.eu/legislation_summaries/employment_and_so
cial_policy/index_ro.htm 16. * * * http://europa.eu/legislation_summaries/employment_and_so
cial_policy/international_dimension_and_enlargement/c11913_ro.htm
17. * * * http://europa.eu/pol/socio/index_ro.htm#top 18. * * * http://ec.europa.eu/europe2020/pdf/nd/swd2013_romania_ro.
23
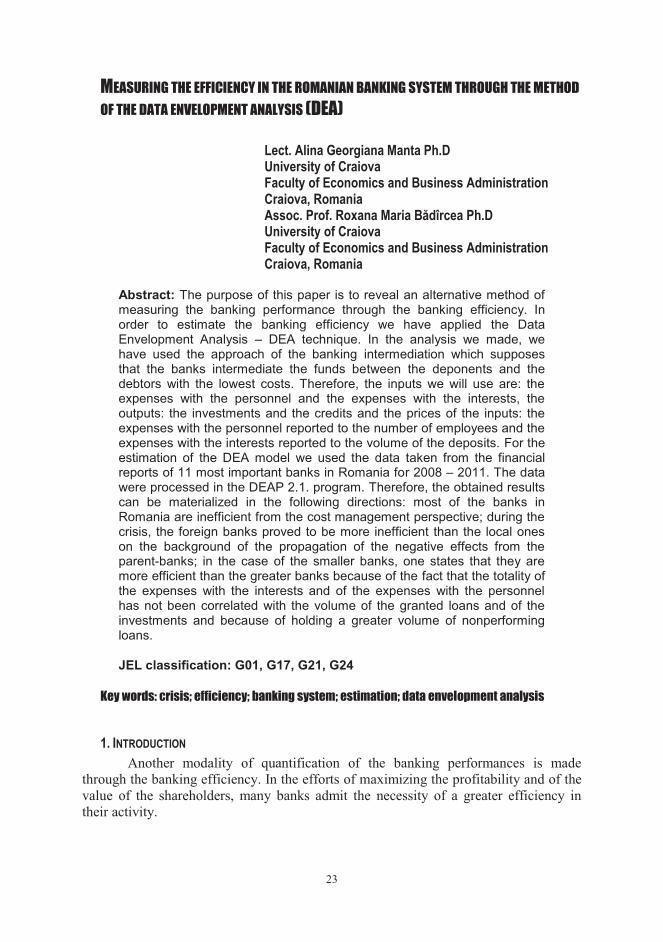
MEASURING THE EFFICIENCY IN THE ROMANIAN BANKING SYSTEM THROUGH THE METHOD
OF THE DATA ENVELOPMENT ANALYSIS (DEA)
Lect. Alina Georgiana Manta Ph.D University of Craiova Faculty of Economics and Business Administration Craiova, Romania Assoc. Prof. Roxana Maria Bădîrcea Ph.D University of Craiova Faculty of Economics and Business Administration Craiova, Romania
Abstract: The purpose of this paper is to reveal an alternative method of measuring the banking performance through the banking efficiency. In order to estimate the banking efficiency we have applied the Data Envelopment Analysis – DEA technique. In the analysis we made, we have used the approach of the banking intermediation which supposes that the banks intermediate the funds between the deponents and the debtors with the lowest costs. Therefore, the inputs we will use are: the expenses with the personnel and the expenses with the interests, the outputs: the investments and the credits and the prices of the inputs: the expenses with the personnel reported to the number of employees and the expenses with the interests reported to the volume of the deposits. For the estimation of the DEA model we used the data taken from the financial reports of 11 most important banks in Romania for 2008 – 2011. The data were processed in the DEAP 2.1. program. Therefore, the obtained results can be materialized in the following directions: most of the banks in Romania are inefficient from the cost management perspective; during the crisis, the foreign banks proved to be more inefficient than the local ones on the background of the propagation of the negative effects from the parent-banks; in the case of the smaller banks, one states that they are more efficient than the greater banks because of the fact that the totality of the expenses with the interests and of the expenses with the personnel has not been correlated with the volume of the granted loans and of the investments and because of holding a greater volume of nonperforming loans.
JEL classification: G01, G17, G21, G24
Key words: crisis; efficiency; banking system; estimation; data envelopment analysis
1. INTRODUCTION Another modality of quantification of the banking performances is made
through the banking efficiency. In the efforts of maximizing the profitability and of the value of the shareholders, many banks admit the necessity of a greater efficiency in their activity.
24
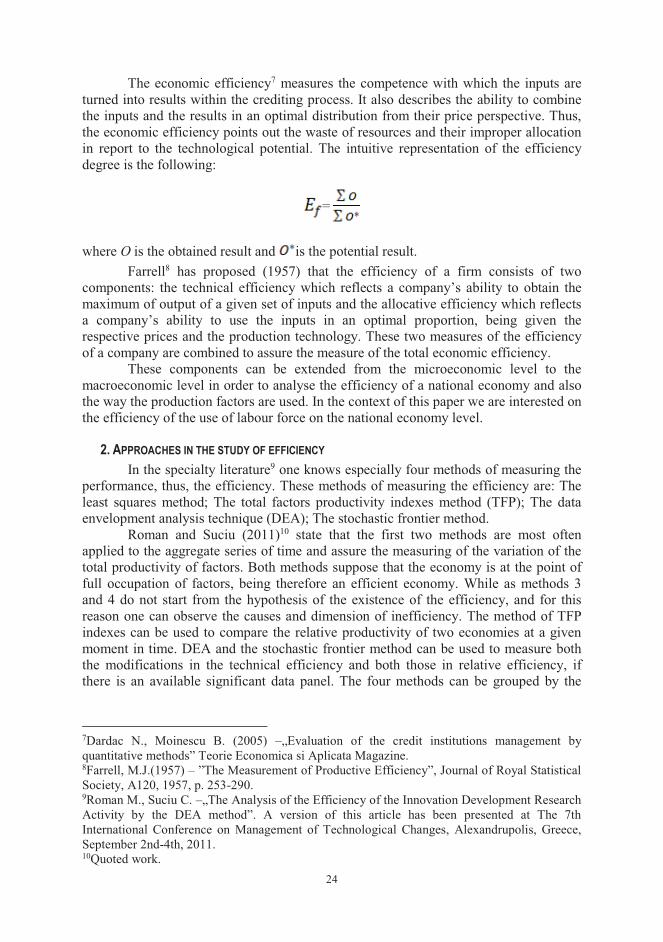
The economic efficiency7 measures the competence with which the inputs are turned into results within the crediting process. It also describes the ability to combine the inputs and the results in an optimal distribution from their price perspective. Thus, the economic efficiency points out the waste of resources and their improper allocation in report to the technological potential. The intuitive representation of the efficiency degree is the following:
=
where O is the obtained result and is the potential result.
Farrell8 has proposed (1957) that the efficiency of a firm consists of two components: the technical efficiency which reflects a company’s ability to obtain the maximum of output of a given set of inputs and the allocative efficiency which reflects a company’s ability to use the inputs in an optimal proportion, being given the respective prices and the production technology. These two measures of the efficiency of a company are combined to assure the measure of the total economic efficiency.
These components can be extended from the microeconomic level to the macroeconomic level in order to analyse the efficiency of a national economy and also the way the production factors are used. In the context of this paper we are interested on the efficiency of the use of labour force on the national economy level.
2. APPROACHES IN THE STUDY OF EFFICIENCY In the specialty literature9 one knows especially four methods of measuring the
performance, thus, the efficiency. These methods of measuring the efficiency are: The least squares method; The total factors productivity indexes method (TFP); The data envelopment analysis technique (DEA); The stochastic frontier method.
Roman and Suciu (2011)10 state that the first two methods are most often applied to the aggregate series of time and assure the measuring of the variation of the total productivity of factors. Both methods suppose that the economy is at the point of full occupation of factors, being therefore an efficient economy. While as methods 3 and 4 do not start from the hypothesis of the existence of the efficiency, and for this reason one can observe the causes and dimension of inefficiency. The method of TFP indexes can be used to compare the relative productivity of two economies at a given moment in time. DEA and the stochastic frontier method can be used to measure both the modifications in the technical efficiency and both those in relative efficiency, if there is an available significant data panel. The four methods can be grouped by the
7Dardac N., Moinescu B. (2005) –„Evaluation of the credit institutions management by quantitative methods” Teorie Economica si Aplicata Magazine. 8Farrell, M.J.(1957) – ”The Measurement of Productive Efficiency”, Journal of Royal Statistical Society, A120, 1957, p. 253-290. 9Roman M., Suciu C. –„The Analysis of the Efficiency of the Innovation Development Research Activity by the DEA method”. A version of this article has been presented at The 7th International Conference on Management of Technological Changes, Alexandrupolis, Greece, September 2nd-4th, 2011. 10Quoted work.
25
way in which they recognise the inefficiency, while the last two are part of the category of those through which the inefficiency can be recognised.
An alternative modality to group these methods is based on the way in which these methods use the econometric instruments. Methods 1 and 4 involve the econometric estimation of the parametric functions, while methods 2 and 3 do not require this estimation. The two so formed groups can be called “parametric methods” namely “non parametric methods”.
We will next approach the problem of measuring the efficiency from the perspective of the mathematical programming of the analysis of the efficiency by applying the Data Envelopment Analysis – DEA technique. Charnes, Cooper and Rhodes11 define the methodology of the data envelopment (DEA), in the study published in 1978, as being “a model of mathematical programming for observing the data which assure a new way of obtaining empirical estimates of the external relations such as the production functions and/or the surfaces of the efficient production possibilities which represent the fundamental stone of the modern economy”.
Farrell (1957) has proposed that the efficiency consists of two components: the technical efficiency which reflects the ability to obtain the maximum of output from a given set of inputs and the allocative efficiency which reflects the ability to use the inputs in an optimum proportion, being given the prices and the production technology. These two measures of the efficiency are combined to assure the total economical efficiency.
There are two types of models within DEA which refer to constant returns to scale (CRS) variable returns to scale (VRS) respectively. As it is indicated by the name itself, an implicit supposition regarding the returns to scale is associated to each type of surface and this way, the opportunity of a particular model is frequently determined by the economic or other suppositions made on the set of data which is to be analysed.
Although there are many ways to quantify the efficiency of the commercial banks, the data envelopment method is the most often used one. Dardac and Moinescu12 (2005) considered that the evaluation of the credit institutions management is based on quantitative estimations which can be most of the time subjective. That is why, this problem can be solved by using the DEA method. Also, there are studies which make comparisons between more countries. For instance, AndrieŞ and CocriŞ (2010)13 have analysed the efficiency of the main banks in Romania, Czech Republic and Hungary using both the non parametric DEA method, and also a parametric method SFA (scholastic frontier analysis). The obtained results show that the banks from the three analysed countries registered low levels of the technical efficiency and cost efficiency, especially in the banks from Romania. On the other hand, NiŢoi (2009)14 has analysed the efficiency and productivity of the banks from Romania during 2006-2008 and has showed that, although the efficiency of the commercial banks from Romania have improved starting from 2006, however the cost efficiency scores are quite low. On the 11Charnes, A., Cooper W.W.M, Rhodes ,E. – ”Measuring the Efficiency of Decisions Making Units”, in European Journal of Operations Research, 2, p. 429-444, 1978. 12Dardac N., Moinescu B. (2005) – quoted work. 13Andrieș A., Cocriș V. (2010) – ”A Comparative Analysis of the Efficiency of Romanian Banks”, Romanian Journal of Economic Forecasting, nr.4. 14Nițoi M. (2009) – ”Efficiency in the Romanian Banking System: An Application of Data Envelopment Analysis”, Romanian Journal of Economics, Vol. 29, no. 38, December, Pages: 162-176.
26
international level, Casu and Molyneux (2000)15 have used the DEA method to quantify the efficiency in the European banking systems. They started to analyse whether the efficiency in the European banking systems has improved at the same time with the European legislation harmonisation process. Murat and Kurtaran (2013)16 have measured the relative efficiency of 13 commercial banks from Turkey in 2011 and have reached the conclusion that the commercial banks with state capital are efficient in both variants of DEA model. However, the banks with foreign capital have registered weaker efficiency scores than the banks with state capital and also than the banks with private capital. Barr and others (2002)17 have evaluated the efficiency of the American commercial banks. The results of the study showed that there is a tight interdependence between efficiency and other indicators for measuring the banking performance, such as the banking ratings.
3. METHODOLOGY
3.1. THE DEA MODEL WITH CONSTANT RETURNS TO SCALE (CRS) Roman and Suciu (2011) believe that one of the intuitive ways to introduce the
DEA is given as a report. For each company, we wish to obtain a measure of the report between all the outputs and all the inputs, such as where u is an estimation vector for the dimension output Mx1 and v is an estimation vector for the dimension input Kx1.
The optimal estimations are obtaining by solving the program:
Solving this program involves finding those values for u and v so that we can maximise the efficiency of the company i under the restriction that all the efficiencies be unitary. Such a program can have an infinite number of solutions as where is the solution of the system. In order to avoid such a situation, we impose the restriction and we obtain a new program:
15Casu, B., Molyneux, P. (1998) - “A Comparative Study of Efficiency in European Banking”, Center for Financial Institutions Working Papers, University of Pennsylvania. 16Murat Ar I, Kurtaran A. (2013) – ”Evaluating the Relative Efficiency of Commercial Banks in Turkey: An Integrated AHP/DEA Approach”, International Business Research; Vol. 6, No. 4. 17Barr, R.S. (2002) - “Evaluating the productive efficiency and performance of U.S. commercial banks”, Managerial Finance, Vol. 28, No.8, pp.3-25.
27
The above program is known as multiplying form or multiple of a problem of DEA linear programming problem.
Using the duality from the linear programming, we can determine an equivalent covering form of this problem:
where is a scalar and represents a vector of dimension constants Nx1. The obtained value will measure the efficiency for the company i. If 1, where a value equal to 1 represents a point from the frontier thus a technically efficient company, we have the definition given by Farrell in 1957.
We remember the fact that the program must be solved N times, for each observed unit (company) at a time obtaining thus a value of .
3.2. THE DEA MODEL WITH VARIABLE RETURNS TO SCALE (VRS) Roman and Suciu (2011) observe that the supposition of the constant returns to
scale is possible only when the companies operate on an optimal scale. The imperfect competition, the financial restrictions, etc. can make a company not operate on optimum scale. Banker, Charnes and Cooper18 (1984) suggested an extension of the DEA model with constant returns to scale (DEA CRS) to explain the situations with variable returns to scale. The use of the CRS specification when not all the companies operate to optimal scale, results in the TE measuring which will be mistaken for the scale efficiencies (SE). The CRS linear programming problem to explain VRS, adding the convexity condition:
where is a vector with elements equal to 1, of dimension Nx1. A VRS covering surface forms a convex cover of plans which intersect and which cover more „tightly” the points represented by the data than the conical cover determined by the CRS covering surface.
If there are differences between the technical efficiency obtained with CRS respectively with VRS for a certain company, then the company has an inefficient scale which is given by the difference between TE obtained with VRS (noted TEVRS) and TE obtained with CRS (noted TECRS).
18Banker, R.D., Charnes, A., Cooper, W.W. (1984) – ”Some Methods for EstimatingTechnical and Scale Inefficiencies in Data Envelopment Analysis”, in Management Science,30:1078-1092.
28
The output oriented DEA models are similar to the corresponding input oriented models. For instance, an output oriented DEA model with variable returns to scale (DEAVRS) is given by the program:
where and -1 represents the proportional growth which can be brought to the output keeping constant the input level, for company i. The 1/ report defines the TE size which varies between zero and one.
We must remember the fact that, the input or output oriented models will estimate the same frontier and that is why, by definition, they will identify the same set of companies who are efficient. Only the sizes of the efficiencies associated to the inefficient companies obtained by the two methods can differ.
4. RESULTS OBTAINED REGARDING THE EFFICIENCY OF THE BANKING SYSTEM IN ROMANIA BY USING THE DEA METHOD
In order to determine the economic efficiency the choice of the input variables and the output variables included in the analysis has been imposed. There are more approaches to define the inputs and the outputs. The first of them considers that the banks are intermediaries between the shareholders and the beneficiaries of the respective funds (Sealey Şi Lindley (1977)19). The credits and other assets are considered the outputs of the bank, while the deposits and other liabilities are inputs in the intermediation process. Taylor (1997)20 has analysed the economic efficiency for a sample of 13 Mexican banks and used as inputs: the total deposits and the expenses of the bank, other than those with the interests and as output he considered the total incomes. On the other hand, Weiguo Şi Ming (2008)21 have evaluated five commercial banks and five Chinese commercial banks and used the operational expenses, the total deposits and the provisions for nonperforming loans as inputs for the American banks and the expenses with the personnel, the corporal assets and other funds borrowed as inputs for the Chinese banks. The used outputs were: the net profit and the total credits for the American banks and the incomes from interests and the incomes from other resources than the interests for the Chinese banks.
In the analysis we made, we have used the approach of the banking intermediation which supposes that the banks intermediate the funds between the deponents and the debtors with the lowest costs. Therefore, the inputs we will use are: the expenses with the personnel and the expenses with the interests; the outputs: the 19Sealey, C.W., Lindley J.T. (1977) - “Inputs, Outputs and a Theory of Production and Cost at Depository Financial Institutions,” Journal of Finance, Vol. 32, No. 4, pp. 1251-66. 20Taylor, W. M., Thompson, R. G., Thrall, R. M., Dharmapala, P. S. (1997) – ”DEA/AR efficiency and profitability of Mexican banks a total income model”, European Journal of Operational Research, 98, 346-363. http://dx.doi.org/10.1016/S0377-2217(96)00352-9. 21Weiguo, X., Ming, L. (2008) – ”Empiricalresearch of M&A impact on Chinese and American commercial banks’ efficiencybased on DEA method”, Management Science and Engineering, 2(1), 38-47.
29
investments and the credits; and the prices of the inputs: the expenses with the personnel reported to the number of employees and the expenses with the interests reported to the volume of the deposits. The justification of choosing these inputs and outputs is based on the difficult economic context generated by the international financial crises which was felt in the profit and loss accounts of the banks some of them registering massive profit decreases (almost half) obtaining losses. In this regard, the used program (DEAP 2.1) does not compile negative results. Therefore, the use of operational expenses as input and of the operational profit as output would not have been possible.
For the estimation of the DEA model we used the data taken from the financial reports of 11 most important banks in Romania for 2008 – 2011. The data were processed in the DEAP 2.1. program. The assets held by the banks included in the study represent more than 80% of the total of the assets held by the banks in Romania. Therefore, we consider that the results of this study are relevant. The estimation of the model will be made in the variant with constant returns to scale (CRS) and with variable returns to scale (VRS), both being input – oriented. If the VRS model, the efficiency scores of the banks are greater because the banks are analysed in accordance to banks of similar size. On the other hand, within the CRS model, the banks are compared on global level, not taking into consideration the size differences. The banks included in the study are pointed out in the table below:
Table no. 1.
The banks included in the study
1. BCR ERSTE 2. BRD GSG 3. BANCA TRANSILVANIA 4. BANCPOST 5. UNICREDIT ŢIRIAC BANK 6. ALPHA BANK 7. VOLSKBANK 8. RAIFFEISEN BANK 9. BANCA COMERCIALĂ CARPATICA
10. BANCA ROMÂNEASCĂ 11. OTP BANK
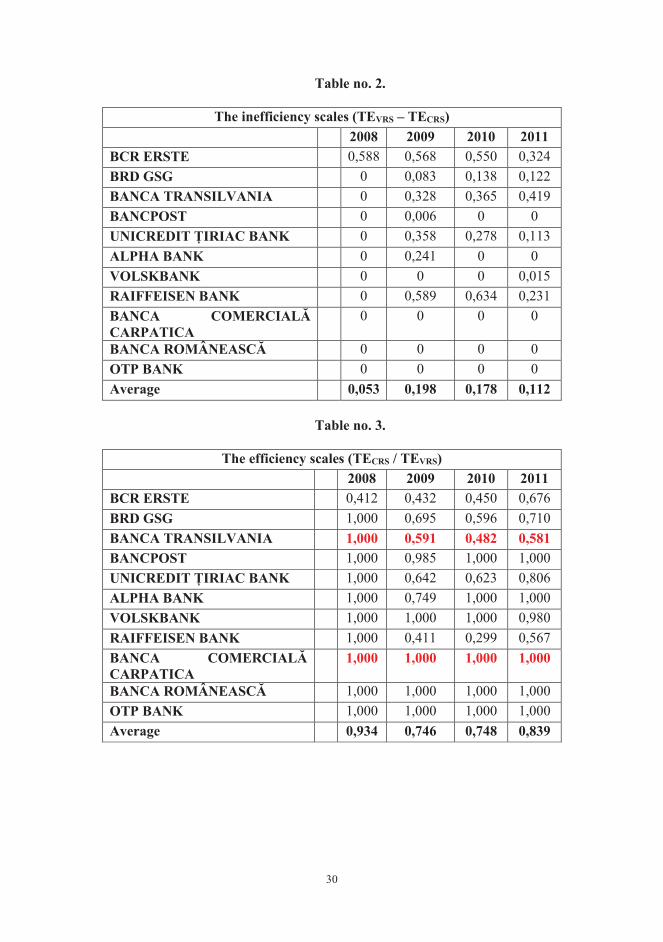
We have illustrated in the tables below the SE inefficiency scales calculated as
difference between the TE technical efficiency scores obtained within the VRS model and the TE technical efficiency scores obtained within the CRS model and the SE efficiency scales calculated as report between the TE technical efficiency scores obtained within the CRS model and the TE technical efficiency obtained within the VRS model.
30
Table no. 2.
The inefficiency scales (TEVRS – TECRS) 2008 2009 2010 2011 BCR ERSTE 0,588 0,568 0,550 0,324 BRD GSG 0 0,083 0,138 0,122 BANCA TRANSILVANIA 0 0,328 0,365 0,419 BANCPOST 0 0,006 0 0 UNICREDIT ŢIRIAC BANK 0 0,358 0,278 0,113 ALPHA BANK 0 0,241 0 0 VOLSKBANK 0 0 0 0,015 RAIFFEISEN BANK 0 0,589 0,634 0,231 BANCA COMERCIALĂ CARPATICA
0 0 0 0
BANCA ROMÂNEASCĂ 0 0 0 0 OTP BANK 0 0 0 0 Average 0,053 0,198 0,178 0,112
Table no. 3.
The efficiency scales (TECRS / TEVRS)
2008 2009 2010 2011 BCR ERSTE 0,412 0,432 0,450 0,676 BRD GSG 1,000 0,695 0,596 0,710 BANCA TRANSILVANIA 1,000 0,591 0,482 0,581 BANCPOST 1,000 0,985 1,000 1,000 UNICREDIT ŢIRIAC BANK 1,000 0,642 0,623 0,806 ALPHA BANK 1,000 0,749 1,000 1,000 VOLSKBANK 1,000 1,000 1,000 0,980 RAIFFEISEN BANK 1,000 0,411 0,299 0,567 BANCA COMERCIALĂ CARPATICA
1,000 1,000 1,000 1,000
BANCA ROMÂNEASCĂ 1,000 1,000 1,000 1,000 OTP BANK 1,000 1,000 1,000 1,000 Average 0,934 0,746 0,748 0,839
31
Table no. 4. Results obtained within the DEA model with constant returns to scale (CRS) –
input oriented
2008 2009 2010 2011
T.E. A.E. C.E. T.E. A.E. C.E. T.E. A.E. C.E. T.E. A.E. C.E.
1. 0.412 0.987 0.406 0.432 0.304 0.131 0.450 0.244 0.110 0.676 0.230 0.155
2. 0.285 0.862 0.246 0.189 0.360 0.068 0.204 0.300 0.061 0.299 0.290 0.087 3. 0.735 1.000 0.735 0.474 0.435 0.206 0.339 0.409 0.139 0.581 0.371 0.216 4. 1.000 1.000 1.000 0.390 0.316 0.123 0.387 0.302 0.117 0.402 0.294 0.118 5. 0.550 0.744 0.409 0.642 0.353 0.226 0.460 0.301 0.138 0.469 0.252 0.118 6. 0.721 0.420 0.303 0.720 0.170 0.122 0.504 0.151 0.076 0.502 0.160 0.081 7. 0.934 0.111 0.104 0.723 0.117 0.085 0.724 0.107 0.077 0.728 0.122 0.089 8. 0.829 1.000 0.829 0.411 0.767 0.316 0.270 0.585 0.158 0.302 0.465 0.140 9. 1.000 1.000 1.000 1.000 1.000 1.000 1.000 1.000 1.000 1.000 1.000 1.000
10. 0.872 0.511 0.446 0.580 0.368 0.213 0.643 0.313 0.201 0.675 0.325 0.219 11. 0.934 0.576 0.538 0.844 0.583 0.492 0.837 0.533 0.446 0.797 0.501 0.399
Average 0.752 0.746 0.547 0.582 0.434 0.271 0.529 0.386 0.229 0.584 0.365 0.238
Table no. 5. Results obtained within the DEA model with variable returns to scale (VRS) –
input oriented
2008 2009 2010 2011
T.E. A.E. C.E. T.E. A.E. C.E. T.E. A.E. C.E. T.E. A.E. C.E.
1. 1.000 1.000 1.000 1.000 1.000 1.000 1.000 1.000 1.000 1.000 1.000 1.000
2. 0.285 0.862 0.246 0.272 0.621 0.169 0.342 0.983 0.336 0.421 0.908 0.382 3. 0.735 1.000 0.735 0.802 0.716 0.574 0.704 1.000 0.704 1.000 1.000 1.000 4. 1.000 1.000 1.000 0.396 0.327 0.129 0.387 0.302 0.117 0.402 0.294 0.118 5. 0.550 0.744 0.409 1.000 0.650 0.650 0.738 0.943 0.696 0.582 0.681 0.396 6. 0.721 0.420 0.303 0.961 0.271 0.260 0.504 0.151 0.076 0.502 0.160 0.081 7. 0.934 0.111 0.104 0.723 0.117 0.085 0.724 0.107 0.077 0.743 0.143 0.106 8. 0.829 1.000 0.829 1.000 1.000 1.000 0.904 1.000 0.904 0.533 1.000 0.533 9. 1.000 1.000 1.000 1.000 1.000 1.000 1.000 1.000 1.000 1.000 1.000 1.000 10. 0.872 0.511 0.446 0.580 0.368 0.213 0.643 0.313 0.201 0.675 0.325 0.219 11. 0.934 0.576 0.538 0.844 0.583 0.492 0.837 0.533 0.446 0.797 0.501 0.399
Average 0.805 0.748 0.601 0.780 0.605 0.507 0.707 0.667 0.505 0.696 0.637 0.476
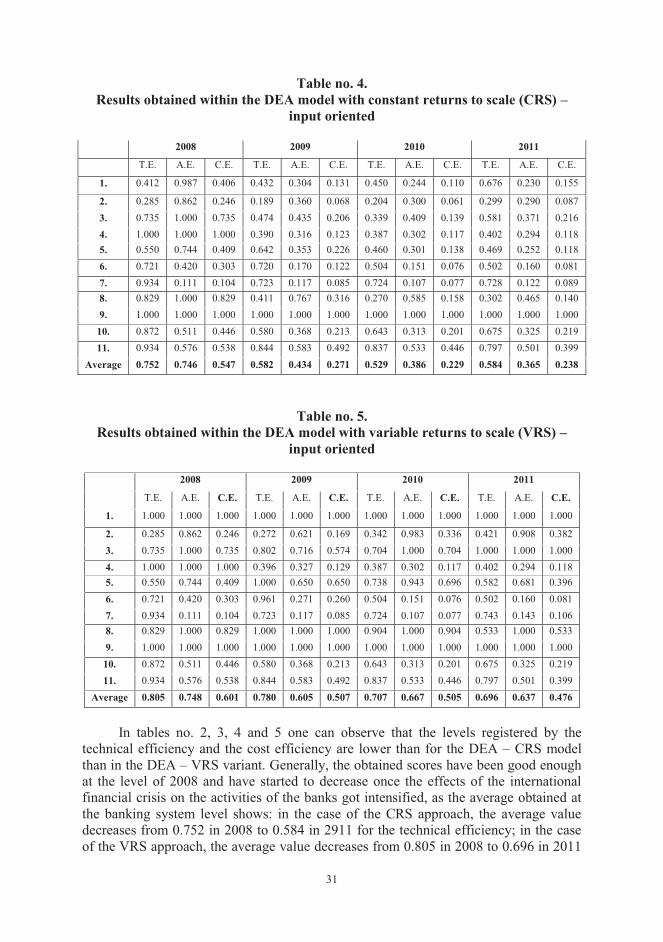
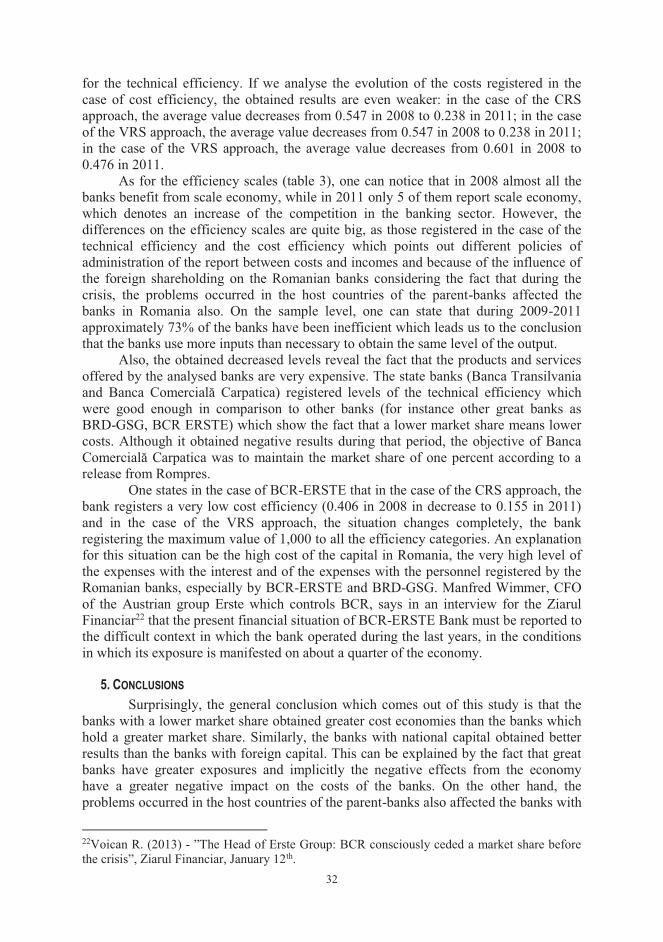
In tables no. 2, 3, 4 and 5 one can observe that the levels registered by the
technical efficiency and the cost efficiency are lower than for the DEA – CRS model than in the DEA – VRS variant. Generally, the obtained scores have been good enough at the level of 2008 and have started to decrease once the effects of the international financial crisis on the activities of the banks got intensified, as the average obtained at the banking system level shows: in the case of the CRS approach, the average value decreases from 0.752 in 2008 to 0.584 in 2911 for the technical efficiency; in the case of the VRS approach, the average value decreases from 0.805 in 2008 to 0.696 in 2011
32
for the technical efficiency. If we analyse the evolution of the costs registered in the case of cost efficiency, the obtained results are even weaker: in the case of the CRS approach, the average value decreases from 0.547 in 2008 to 0.238 in 2011; in the case of the VRS approach, the average value decreases from 0.547 in 2008 to 0.238 in 2011; in the case of the VRS approach, the average value decreases from 0.601 in 2008 to 0.476 in 2011.
As for the efficiency scales (table 3), one can notice that in 2008 almost all the banks benefit from scale economy, while in 2011 only 5 of them report scale economy, which denotes an increase of the competition in the banking sector. However, the differences on the efficiency scales are quite big, as those registered in the case of the technical efficiency and the cost efficiency which points out different policies of administration of the report between costs and incomes and because of the influence of the foreign shareholding on the Romanian banks considering the fact that during the crisis, the problems occurred in the host countries of the parent-banks affected the banks in Romania also. On the sample level, one can state that during 2009-2011 approximately 73% of the banks have been inefficient which leads us to the conclusion that the banks use more inputs than necessary to obtain the same level of the output.
Also, the obtained decreased levels reveal the fact that the products and services offered by the analysed banks are very expensive. The state banks (Banca Transilvania and Banca Comercială Carpatica) registered levels of the technical efficiency which were good enough in comparison to other banks (for instance other great banks as BRD-GSG, BCR ERSTE) which show the fact that a lower market share means lower costs. Although it obtained negative results during that period, the objective of Banca Comercială Carpatica was to maintain the market share of one percent according to a release from Rompres.
One states in the case of BCR-ERSTE that in the case of the CRS approach, the bank registers a very low cost efficiency (0.406 in 2008 in decrease to 0.155 in 2011) and in the case of the VRS approach, the situation changes completely, the bank registering the maximum value of 1,000 to all the efficiency categories. An explanation for this situation can be the high cost of the capital in Romania, the very high level of the expenses with the interest and of the expenses with the personnel registered by the Romanian banks, especially by BCR-ERSTE and BRD-GSG. Manfred Wimmer, CFO of the Austrian group Erste which controls BCR, says in an interview for the Ziarul Financiar22 that the present financial situation of BCR-ERSTE Bank must be reported to the difficult context in which the bank operated during the last years, in the conditions in which its exposure is manifested on about a quarter of the economy.
5. CONCLUSIONS Surprisingly, the general conclusion which comes out of this study is that the
banks with a lower market share obtained greater cost economies than the banks which hold a greater market share. Similarly, the banks with national capital obtained better results than the banks with foreign capital. This can be explained by the fact that great banks have greater exposures and implicitly the negative effects from the economy have a greater negative impact on the costs of the banks. On the other hand, the problems occurred in the host countries of the parent-banks also affected the banks with
22Voican R. (2013) - ”The Head of Erste Group: BCR consciously ceded a market share before the crisis”, Ziarul Financiar, January 12th.
33
mostly foreign capital from our country, being exposed to greater risks and costs than the banks with mostly national capital.
Therefore, the obtained results can be concretised in the following directions: most of the banks in Romania are inefficient from the cost management perspective; during the crisis, the foreign banks proved to be more inefficient than the local ones on the background of the propagation of the negative effects from the parent-banks; in the case of the smaller banks, one states that they are more efficient than the greater banks because of the fact that the totality of the expenses with the interests and of the expenses with the personnel has not been correlated with the volume of the granted loans and of the investments and because of holding a greater volume of nonperforming loans.
The results of the study must be correlated with the negative evolution obtained by the banking sector in Romania. In this regard, it is confirmed the fact that the banks acted in the conditions of a difficult economic environment, characterised by a low level of trust which affected the consumption, a weak external demand which hindered the growth of the exports and a weak performance of the agricultural sector, with a below average harvest. The economic difficulties reflected in the activity of the banking sector by reducing the volume of gross loans. At the same time, the companies limited their investments, inducing a negative impact in the loan demand.
On the other hand, the estimations obtained within the study can become very important from the perspective of the banks and of the regulatory authorities. This, in order to improve their efficiency, the banks must improve the quality of their assets held through the increase of the quality of the crediting process and the decrease of the weight of the nonperforming credits. At the same time, the banks must reduce their costs with the interests which had a negative effect on the cost efficiency. Also, in order to increase the efficiency of the banks, the monetary authorities should accelerate the liberalisation and reform process of the banking sector and consolidate their efforts to assure a lower inflation rate.
Acknowledgment: "This work was partially supported by the grant number 24C/2014, awarded in the internal grant competition of the University of Craiova".
REFERENCES 1. AndrieŞ, A.,
CocriŞ, V., ”A Comparative Analysis of the Efficiency of Romanian Banks”, Romanian Journal of Economic Forecasting, nr.4, 2010.
2. Barr, R.S. “Evaluating the productive efficiency and performance of U.S. commercial banks”, Managerial Finance, Vol. 28, No.8, pp.3-25, 2002.
3. Banker, R.D., Charnes, A., Cooper, W.W.
”Some Methods for EstimatingTechnical and Scale Inefficiencies in Data Envelopment Analysis”, in Management Science,30:1078-1092, 1984.
4. Casu, B., Molyneux, P.
“A Comparative Study of Efficiency in European Banking”, Center for Financial Institutions Working Papers, University of Pennsylvania, 1998.
5. Charnes, A., Cooper W.W.M, Rhodes ,E.
”Measuring the Efficiency of Decisions Making Units”, in European Journal of Operations Research, 2, p. 429-444, 1978.
34
6. Dardac, N., Moinescu, B.
„Evaluation of the credit institutions management by quantitative methods”, Teorie Economica si Aplicata Magazine, 2005.
7. Farell, M.J., ”The Measurement of Productive Efficiency”, Journal of Royal Statistical Society, A120, 1957, p. 253-290.
8. Murat A. I., Kurtaran A.,
”Evaluating the Relative Efficiency of Commercial Banks in Turkey: An Integrated AHP/DEA Approach”, International Business Research; Vol. 6, No. 4, 2013.
9. NiŢoi, M., ”Efficiency in the Romanian Banking System: An Application of Data Envelopment Analysis”, Romanian Journal of Economics, Vol. 29, no. 38, December, Pages: 162-176, 2009.
10. Roman, M., Suciu, C., Paul, R.
The Analysis of the Efficiency of the Innovation Development Research Activity by the DEA method”. A version of this article has been presented at The 7th International Conference on Management of Technological Changes, Alexandrupolis, Greece, September 2nd-4th, 2011.
11. Sealey, C.W., Lindley J.T.
“Inputs, Outputs and a Theory of Production and Cost at Depository Financial Institutions,” Journal of Finance, Vol. 32, No. 4, pp. 1251-66, 1977.
12. Taylor, W. M., Thompson, R. G., Thrall, R. M., Dharmapala, P. S.
”DEA/AR efficiency and profitability of Mexican banks a total income model”, European Journal of Operational Research, 98, 346-363. http://dx.doi.org/10.1016/S0377-2217(96)00352-9, 1997.
13. Voican, R., ”The Head of Erste Group: BCR consciously ceded a market share before the crisis”, Ziarul Financiar, January 12th, 2013.
14. Weiguo, X., Ming, L.
”Empiricalresearch of M&A impact on Chinese and American commercial banks’ efficiencybased on DEA method”, Management Science and Engineering, 2(1), 38-47, 2008.
35
MARKETING STUDY REGARDING INTERNET SERVICES USAGE ON
SMARTPHONES
Prof. Gheorghe Meghisan Ph. D University of Pitesti Faculty of Economic Sciences Pitesti, Romania Lecturer Georgeta-Madalina Meghisan Ph. D University of Craiova Faculty of Economics and Business Administration Craiova, Romania
Abstract: The main objectives associated to this research study are: establishing the usage of Internet on the main devices (smartphones, ipad, laptops, desktop computer), making an average of the free and paid applications that the users installed on their smartphones and ranking the usage of some services on mobile devices within the last year. The present study is based on the primary data gathered from youngsters aged between 18- 24, owners of a smartphone. The gathered data was analyzed using the SPSS Informatics program, based mainly on descriptive statistics. This marketing study was made during December 2013, using the questionnaire to gather the data, which was filled in by a sample of 50 persons.
JEL classification: M30, M31
Key words: consumer behavior, marketing study, mobile Internet services, mobile telecommunications services, quantitative study
1. INTRODUCTION Today, the mobile phone became present in our lives, “it is a device that many
consumers cannot seem to do without”. (Persaud A., Azhar I., 2012) According to a study made by Gfk Temax Romania, the sales of mobile telephones grew with 17% in 2013 compared to 2012, reaching the value of 99 million euro at the end of the year 2013. The sales of smartphones had the main importance, while the sales of mobile phones continued to decrease. (Mobile Communications Magazine, Aug.-Sept. 2013)
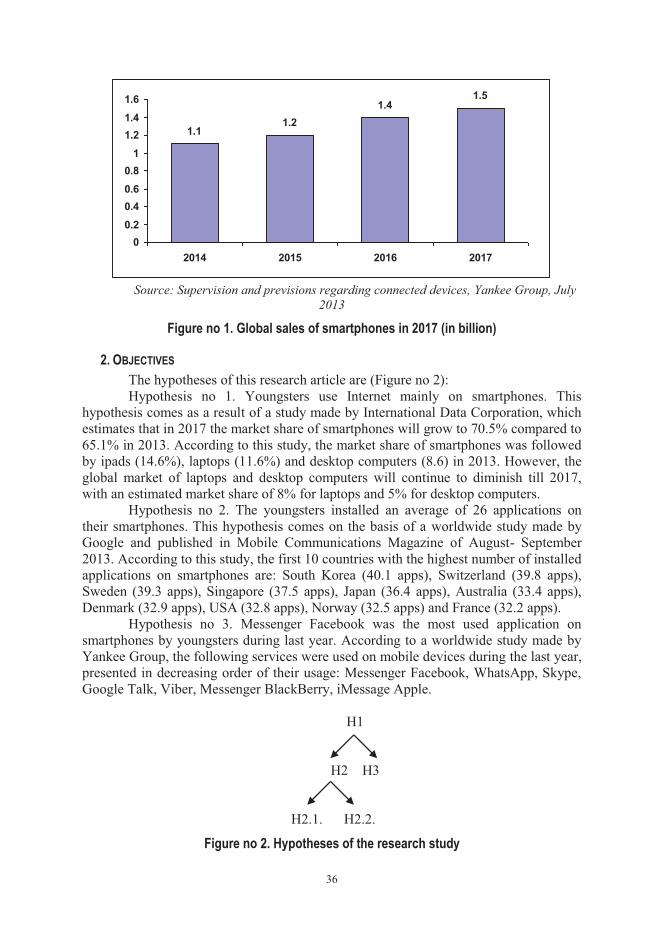
Another study issued by Yankee Group estimates that 1.5 billion people will use smartphones worldwide till the year 2017. (Figure no 1) However, the market share of Apple Company in terms of smartphones sales decreased to 13.6% in 2013, compared to a market share of 16.6% in 2012. Samsung maintained itself leader with a market share of 33.1%. (Mobile Communications Magazines, Aug.-Sept. 2013) Evonthough the sales of the Apple devices were decreasing, almost 55% of the Internet traffic using mobile devices was generated by Apple terminals, according to the NetMarketShare Company.
36
1.11.2
1.41.5
00.20.40.60.8
11.21.41.6
2014 2015 2016 2017
Source: Supervision and previsions regarding connected devices, Yankee Group, July 2013
Figure no 1. Global sales of smartphones in 2017 (in billion)
2. OBJECTIVES The hypotheses of this research article are (Figure no 2): Hypothesis no 1. Youngsters use Internet mainly on smartphones. This
hypothesis comes as a result of a study made by International Data Corporation, which estimates that in 2017 the market share of smartphones will grow to 70.5% compared to 65.1% in 2013. According to this study, the market share of smartphones was followed by ipads (14.6%), laptops (11.6%) and desktop computers (8.6) in 2013. However, the global market of laptops and desktop computers will continue to diminish till 2017, with an estimated market share of 8% for laptops and 5% for desktop computers.
Hypothesis no 2. The youngsters installed an average of 26 applications on their smartphones. This hypothesis comes on the basis of a worldwide study made by Google and published in Mobile Communications Magazine of August- September 2013. According to this study, the first 10 countries with the highest number of installed applications on smartphones are: South Korea (40.1 apps), Switzerland (39.8 apps), Sweden (39.3 apps), Singapore (37.5 apps), Japan (36.4 apps), Australia (33.4 apps), Denmark (32.9 apps), USA (32.8 apps), Norway (32.5 apps) and France (32.2 apps).
Hypothesis no 3. Messenger Facebook was the most used application on smartphones by youngsters during last year. According to a worldwide study made by Yankee Group, the following services were used on mobile devices during the last year, presented in decreasing order of their usage: Messenger Facebook, WhatsApp, Skype, Google Talk, Viber, Messenger BlackBerry, iMessage Apple.
H1
H2 H3
H2.1. H2.2.
Figure no 2. Hypotheses of the research study
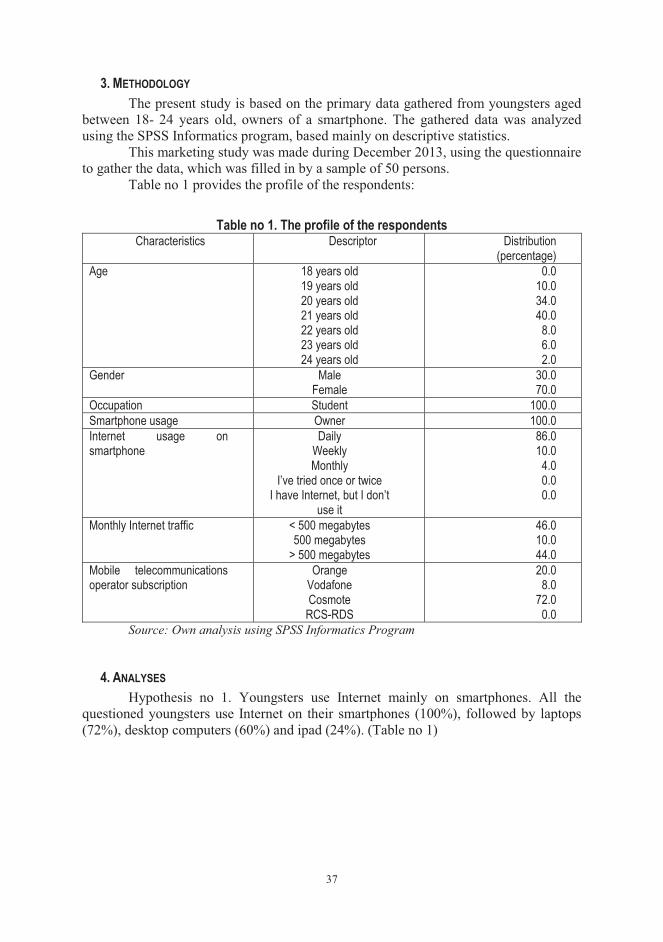
37
3. METHODOLOGY The present study is based on the primary data gathered from youngsters aged
between 18- 24 years old, owners of a smartphone. The gathered data was analyzed using the SPSS Informatics program, based mainly on descriptive statistics.
This marketing study was made during December 2013, using the questionnaire to gather the data, which was filled in by a sample of 50 persons.
Table no 1 provides the profile of the respondents:
Table no 1. The profile of the respondents Characteristics Descriptor Distribution
(percentage) Age 18 years old
19 years old 20 years old 21 years old 22 years old 23 years old 24 years old
0.0 10.0 34.0 40.0
8.0 6.0 2.0
Gender Male Female
30.0 70.0
Occupation Student 100.0 Smartphone usage Owner 100.0 Internet usage on smartphone
Daily Weekly Monthly
I’ve tried once or twice I have Internet, but I don’t
use it
86.0 10.0
4.0 0.0 0.0
Monthly Internet traffic < 500 megabytes 500 megabytes
> 500 megabytes
46.0 10.0 44.0
Mobile telecommunications operator subscription
Orange Vodafone Cosmote
RCS-RDS
20.0 8.0
72.0 0.0
Source: Own analysis using SPSS Informatics Program
4. ANALYSES Hypothesis no 1. Youngsters use Internet mainly on smartphones. All the
questioned youngsters use Internet on their smartphones (100%), followed by laptops (72%), desktop computers (60%) and ipad (24%). (Table no 1)
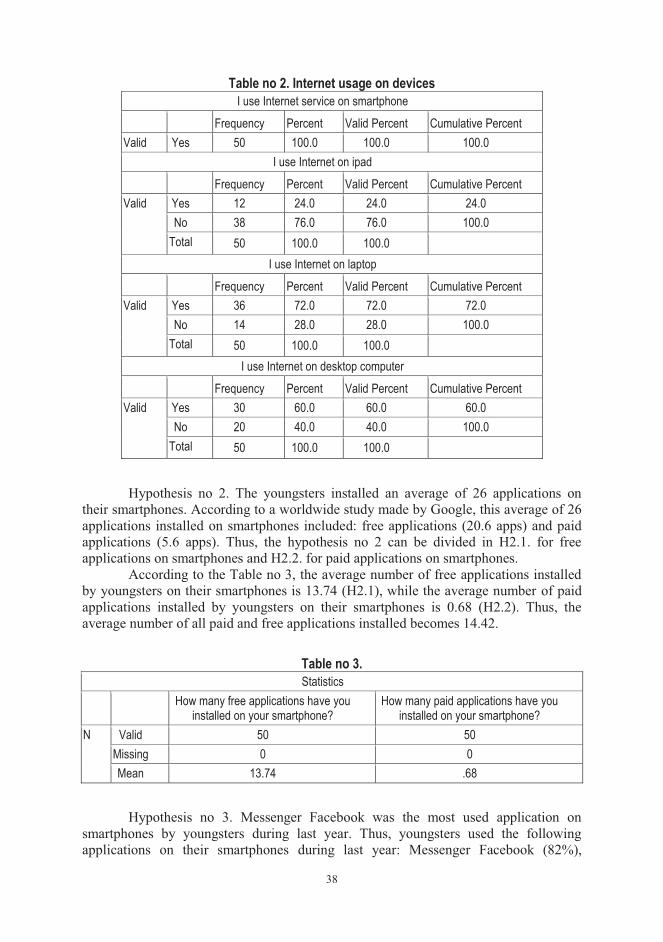
38
Table no 2. Internet usage on devices I use Internet service on smartphone
Frequency Percent Valid Percent Cumulative Percent Valid Yes 50 100.0 100.0 100.0
I use Internet on ipad Frequency Percent Valid Percent Cumulative Percent
Valid Yes 12 24.0 24.0 24.0 No 38 76.0 76.0 100.0
Total 50 100.0 100.0 I use Internet on laptop
Frequency Percent Valid Percent Cumulative Percent Valid Yes 36 72.0 72.0 72.0
No 14 28.0 28.0 100.0 Total 50 100.0 100.0
I use Internet on desktop computer Frequency Percent Valid Percent Cumulative Percent
Valid Yes 30 60.0 60.0 60.0 No 20 40.0 40.0 100.0
Total 50 100.0 100.0
Hypothesis no 2. The youngsters installed an average of 26 applications on
their smartphones. According to a worldwide study made by Google, this average of 26 applications installed on smartphones included: free applications (20.6 apps) and paid applications (5.6 apps). Thus, the hypothesis no 2 can be divided in H2.1. for free applications on smartphones and H2.2. for paid applications on smartphones.
According to the Table no 3, the average number of free applications installed by youngsters on their smartphones is 13.74 (H2.1), while the average number of paid applications installed by youngsters on their smartphones is 0.68 (H2.2). Thus, the average number of all paid and free applications installed becomes 14.42.
Table no 3. Statistics
How many free applications have you installed on your smartphone?
How many paid applications have you installed on your smartphone?
N Valid 50 50 Missing 0 0 Mean 13.74 .68
Hypothesis no 3. Messenger Facebook was the most used application on
smartphones by youngsters during last year. Thus, youngsters used the following applications on their smartphones during last year: Messenger Facebook (82%),
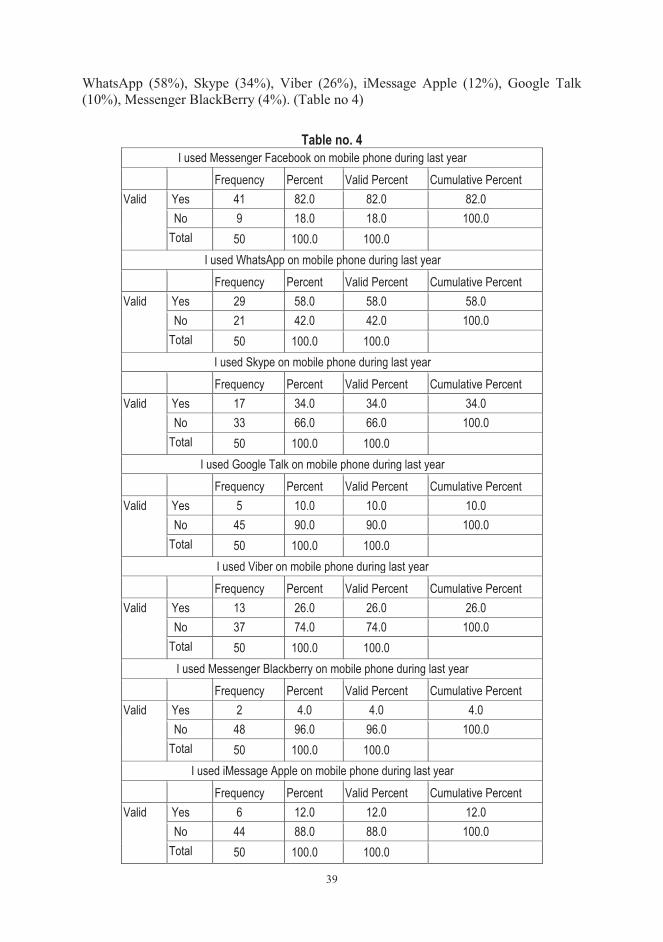
39
WhatsApp (58%), Skype (34%), Viber (26%), iMessage Apple (12%), Google Talk (10%), Messenger BlackBerry (4%). (Table no 4)
Table no. 4 I used Messenger Facebook on mobile phone during last year
Frequency Percent Valid Percent Cumulative Percent Valid Yes 41 82.0 82.0 82.0
No 9 18.0 18.0 100.0 Total 50 100.0 100.0
I used WhatsApp on mobile phone during last year Frequency Percent Valid Percent Cumulative Percent
Valid Yes 29 58.0 58.0 58.0 No 21 42.0 42.0 100.0
Total 50 100.0 100.0 I used Skype on mobile phone during last year
Frequency Percent Valid Percent Cumulative Percent Valid Yes 17 34.0 34.0 34.0
No 33 66.0 66.0 100.0 Total 50 100.0 100.0
I used Google Talk on mobile phone during last year Frequency Percent Valid Percent Cumulative Percent
Valid Yes 5 10.0 10.0 10.0 No 45 90.0 90.0 100.0
Total 50 100.0 100.0 I used Viber on mobile phone during last year
Frequency Percent Valid Percent Cumulative Percent Valid Yes 13 26.0 26.0 26.0
No 37 74.0 74.0 100.0 Total 50 100.0 100.0
I used Messenger Blackberry on mobile phone during last year Frequency Percent Valid Percent Cumulative Percent
Valid Yes 2 4.0 4.0 4.0 No 48 96.0 96.0 100.0
Total 50 100.0 100.0 I used iMessage Apple on mobile phone during last year
Frequency Percent Valid Percent Cumulative Percent Valid Yes 6 12.0 12.0 12.0
No 44 88.0 88.0 100.0 Total 50 100.0 100.0
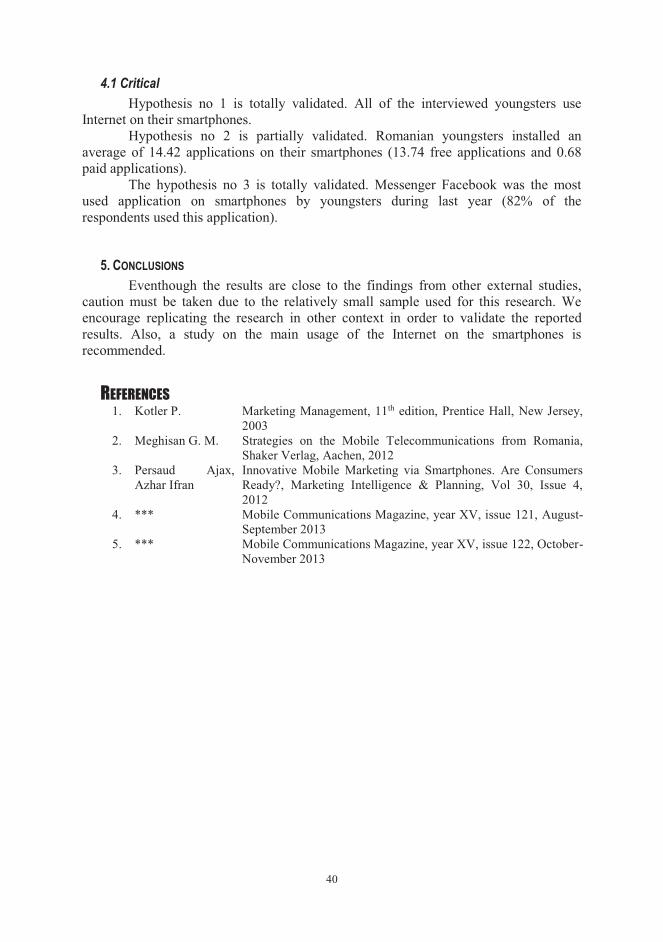
40
4.1 Critical Hypothesis no 1 is totally validated. All of the interviewed youngsters use
Internet on their smartphones. Hypothesis no 2 is partially validated. Romanian youngsters installed an
average of 14.42 applications on their smartphones (13.74 free applications and 0.68 paid applications).
The hypothesis no 3 is totally validated. Messenger Facebook was the most used application on smartphones by youngsters during last year (82% of the respondents used this application).
5. CONCLUSIONS Eventhough the results are close to the findings from other external studies,
caution must be taken due to the relatively small sample used for this research. We encourage replicating the research in other context in order to validate the reported results. Also, a study on the main usage of the Internet on the smartphones is recommended.
REFERENCES 1. Kotler P. Marketing Management, 11th edition, Prentice Hall, New Jersey,
2003 2. Meghisan G. M. Strategies on the Mobile Telecommunications from Romania,
Shaker Verlag, Aachen, 2012 3. Persaud Ajax,
Azhar Ifran Innovative Mobile Marketing via Smartphones. Are Consumers Ready?, Marketing Intelligence & Planning, Vol 30, Issue 4, 2012
4. *** Mobile Communications Magazine, year XV, issue 121, August- September 2013
5. *** Mobile Communications Magazine, year XV, issue 122, October- November 2013
41
THE DARK SIDE OF PUBLIC SECTOR EFFICIENCY
Assoc. Prof. Narcis Eduard Mitu Ph. D University of Craiova Faculty of Economy and Business Administration Craiova, Romania
Abstract: : In the public sector, efficiency is measured by the degree of serving the citizen, which becomes ”the clients” of the institution. This article aims to examine the limits of efficiency indicators. Even if efficiency in the public sector is an indicator that serves to the measurement the satisfaction of citizens, frequently there is a translation of the original objective. Often, when measured efficiency in the public domain, attention moves rather to the money, than that attention be targeted by humans.
JEL classification: A13, H11, H72.
Key words: public sector; performance; public institutions; efficiency; citizen satisfaction.
1. INTRODUCTION There are many reasons for which the public institutions should measure the
performance. If this is achieved properly, the performance measurement may bring many
benefits to the organization and the persons not working for it. The performance measurement exceeds the mere acknowledgement, its main
practical objective being the decision-making in order to improve the performance conditions.
The professional literature provides a plurality of reasons for which the performance must be measured. The distinct usability of the public institutions performance measurement results from the following considerations (Behn, 2003, pp 586-606):
- To evaluate: Public executives need to know well their agencies are performing. Thus, they collect the kinds of data that can be used to conduct a formal evaluation;
- To control: In theory, modern public executives don’t control peole or organizations. Modern executives – in the public, private, and nonprofit sectors – lead organizations. But do not be fooled. All three sectors still have their share of control freaques. And one way to exercise this control ist o measure what people are doing.
- To budget: which programs, activities and units deserve additional funding? Which ones – if we are to improve our agency’s overall performance – should lose funds? Performance measures can help managers to answer these questions.
- To motivate: Public executives are always looking for ways to motivate people – not just their own staff, but also their collaborators in other organizations, stakeholders, and citizens. And for this purpose, performance measures can be most helpful, for they can focus everyone’s attention on those aspects of their work that will indeed contribute the most to improved performance.
42
- To promote: All public managers need to convince elected officials, stakeholders, journalists, and citizens that they and their agency are doing a good job.
- To celebrate: Public executives need to publicly honor their significant accomplishments. Such celebrations are an importantorganizational ritual. Performance measures can provide the signal that the organization has, indeed, attained a truly meaningful objective.
- To learn: What is working? What isn’t? And how can the leaders of a public agency know? By measuring the performance not just of the entire agency, but also of the various units within the agency, its leaders can obtain some answers to these questions.
- To improve: The first seven reasons for measuring performance are all subordinate to the eight reason: to improve. After all, whether an agency’s managers are using their performance measures to budget, to motivate, or to learn, they are undertaking these managerial responsibilities in an effort to improve.
A public institution performance analysis supposes the determination of a
connection between the results, means and objectives. This is possible by using the performance indicators.
The performance indicators are the basic instruments of the performance measurement process and represent a method of quantifying the changes of the performance standards.
As such, the performance indicator may be defined as a number (a value) which measures and sends information on a specific aspect of a public institution or program dynamics.
The main criteria for a good set of performance measures (Kim & Kang, 2002, pp.243-244) is:
- valid; - reliable; - understandable; - resistant to perverse behavior; - comprehensive; - non-redundant; - accuracy; - focused on performance. Therefore, a good performance indicator must to be S.M.A.R.T (Doran, 1981,
pp. 35-36): - Specific – target a specific area for improvement; - Measurable – quantify or at least suggest an indicator of progress; - Assignable – specify who will do it; - Realistic – state what results can realistically be achieved, given available
resources; - Time-related – specify when the result(s) can be achieved.
2. EFFICIENCY - THE REVERSE OF THE MEDAL Even if at present everybody is aware of the performance level determination
requirement, most of the government sector institutions do not have an adequate
43
performance quantification methodology. The indicators used in the economic agents' private activity are often applied.
The indicator named efficiency is used many times. The efficiency expresses the results obtained from an economic and social
activity by using certain economic resources (material, financial and human). The efficiency indicators quantify the unit cost or expected yield in obtaining
the estimated result. They are expressed as an average unit cost, units of time etc. and they ought to mirror the progresses regarding the achieved performances.
The efficiency quantification may be carried out as a relation between the obtained effects (results) and the efforts (expenses) made in a unit of time, or vice-versa. The first hypothesis may be expressed by using the relation:
MRE f �
in which: Ef - efficiency; R - results (effects) obtained; M - means (effort) consumed.
According to the calculation model, the more supraunitary accentuated is the relation, the greater the efficiency will be.
This indicator based on the element called cost (effort) may not always be
successfully adapted to the public institutions. On the one hand, almost the entire professional literature confirms the fact that
the purpose of any private contractor is to obtain profit. On the other hand, (Matei, 2003, p.76) the compliance with the public interest
is the basic function of the public organizations, which materializes by providing public services to the citizens.
According to the professional literature (Prahoveanu & Matei, 2005, p.172), by public interest we mean the entire interests expressed by a human collectivity regarding the requirements of organization, cohabitation, social security, transport etc.
While the private sector focuses on obtaining profit, the government sector must emphasize the citizens' contentment. As such, in the government sector we must shift the focus from the money (the financial resource and its value - the cost) to the person. Consequently, the performance quantification methods which are perfectly viable in the private sector may not always be valid in the government sector.
For the citizens to be contented, the logic premise for the public institution is to identify what they want and then try to comply with it in a very efficient manner (Nedelea, 2006, p.103). The actual focus on citizens occurs when the state institutions are concerned to learn on the citizens' requirements in their division area / jurisdiction.
Does this happen? For the most part, this does not happen. Does anybody wants to know our opinion when financing decisions are being adopted for a specific project? They do, in theory; we are consulted by means of our elect (senators, deputies, councilmen etc.) or even directly, by opinion polls. In theory, because in actual fact there is a breach in communication between the public institutions and the citizens. Personally, as a citizen and taxpayer, I do not remember having attended to such a
44
consultation and having been asked to express my opinion regarding a public project financing decision.
In spite of the fact that the citizens want to attend to the public decision-making at a local level, for instance, at present, we notice the public administration inability to be available to the citizens, as many opinion polls and reports assert, both in the newspapers and audiovisual media. Most of the people who were consulted by means of the opinion polls think they cannot influence the elaboration of a project or decision of the city-hall or local council directly and some citizens stated they did not attend to the debate of a project or decision of the local council from the locality they lived in. Some people do not even know they have the right to attend to such meetings.
The current gap between the administration and the governed people is very big, therefore the Romanian administration authority crisis being confirmed. A series of opinion polls carried out in 2009-2011 were given as example, such as the research „The public relations barometer in the urban area”23 , from the opinion polls performed by the Sociological Research and Branding Company (CCSB/SRBC)24 in January and March – April 2011. The results of the opinion polls supported the fact that the citizens were not consulted when the local public authorities adopted decisions which may affect them.
We may say that a public utility service is high-class only when its features and provision are able to meet the expectations and requirements of the beneficiary (ultimately, of the citizen). But the supplier and the beneficiary do not have the same opinions on the service quality.
The provider/operator of the public utility service considers the quality by relating to the compliance with the specifications in the service documentation such as the standards, provisions in the conditions of contract, all this being assessed by means of the indicator called efficiency.
The user, the citizen estimates the quality of the service based on his requirements and necessities.
This dualism of approach often leads to aberrant and sometimes dreadful situations from the people's point of view.
What happens when, being assessed from the efficiency point of view, the person (the citizen) and the human existence become inefficient?
Hospitals are closed because the result of the ration between the achieved effects and used means is not the one expected by the government (the decision makers). Due to the same ration, schools are closed and streets are not asphalted, etc. But gyms are built in the villages located in Apuseni Mountains, where the access to such a gym is a prowess, as a result of the great distance between houses (specific to this geographic area), of the street infrastructure absence, etc. Pools never to be filled with water are built since the latter activity is no longer justified, if it is analyzed from the efficiency point of view. We may fill pages with more examples.
But are these decisions correct? Are they efficient? By closing a hospital financed by the state we simply externalize the costs. A
part of the costs is transferred (costs paid from public money, meaning from the 23 Study carried out by TOTEM Communication and BOSCH Communication Center for the Romanian Cities Association within the project: Operative ability development of the Romanian Cities Association by improving the efficiency of the organization and its members, date of issue: December 2010 - http://www.aor.ro 24 http://www.ccsb.ro
45
citizen's money) to the citizen, the one who suffers. He must pay additional costs for the medical assistance (the charges of transport to the new location, of accommodation until he is examined by a doctor, of losing one or more working days, etc.). Therefore, in order to obtain the expected efficiency, the state overwhelms the citizen even more. The state, by making such a decision in the name of efficiency, loses sight of the essential – contentment of the citizen and the compliance with his requirements – this leading to further immeasurable losses. A sick, illiterate and poor population will create a small added value because it will have a low productivity and quality of work. This will have a negative impact on the future financial resources of the village, which will have to close even more hospitals and schools.
3. CONCLUSIONS The public services reform must be dealt with in the context of the increase of
the citizen's level of involvement in the public decision-making, so that the citizen exceeds the stage of “subject” whose opinion is not required, even becoming ”the core of the problem”.
The public service efficiency principle supposes the achievement of the best ration between the cost and the services quantity and quality under conditions of complying with the public requirements. We also must mention the fact that this principle must be applied in strict relation with the tariff accessibility principle, which supposes that a general economic interest service must be provided at a price accessible to everybody (in other words, between the profit and the purpose of the public service to comply with the social requirements, the latter having priority).
Moreover, a complementary principle to the efficiency principle is the quantification principle, which supports the public service reform by developing a culture of the public service focused on the citizen/taxpayer.
The public service efficiency principle represents the level where the institution objectives are achieved concerning the public service quality and on the one hand, it supposes the preliminary objective determination and on the other hand, the desired result measurement or at least the assessment of the obtained result.
The detailed information provided to the citizens on the public utility services performance quantification represents a method of increasing the transparency of the governance and citizens' rights. Information regarding the services standards, promptitude, volume, accessibility, availability, accuracy, safety and opportunity. Most of the European states have declarations regarding the public services standards known as the Citizen's Charter or the Public Service Charter. The public services standards are connected to the technicalities regarding the performance measurement and management within the government sector organizations and to the relation between the citizens and the state.
Knowing the people and their issues leads to the creation of a strong bond between the community and local public authority because the office holders begin to identify themselves with the people they provide their services to. Therefore, the binding agent between the citizens and authorities is being created based on a broad dialogue and a high level of trust.
The closeness of the local public services to the population's requirements represents an essential requisite and the local public administration authorities play a key part in their provision. This generally supposes a high degree of decentralization and local autonomy, but also the local communities active involvement in decision-
46
making regarding these services provision. The public utility community services offer must be based on the requirements and expectations of the community and consequently, the local public administration authorities must take into account the persons who are to use the service, above all, when they determine the best manner to provide them. This is also underlined by a principle being the basis of the organization and operation of public services and public utility services, namely the quantification principle which is complementary to efficiency principle. The quantification principle supports the development of a public service culture focused on the user / beneficiary.
REFERENCES 1. Behn, R.D. Why measure performance? Different purposes require different
measures, Public Administration Review, Vol. 63, No. 5, 2003 2. Doran, G.T There's a S.M.A.R.T. way to write management's goals and
objectives. Management Review, Volume 70, Issue 11(AMA FORUM), 1981
3. Kim, J.S. & Kang, H.S.
Performance Measurement Initiative: A Status Report And Reflection, KonKung University and Seoul Development Institute, Seoul, 2002
4. Matei, A. Public economics. Economic analysis of the public decisions, Economic Publishing House, Bucharest, 2003
5. Prahoveanu, E. Matei, A.
Economics and economic policies, IIIrd revised and enlarged edition, Economic Publishing House, Bucharest, 2005
6. Nedelea, A. Marketing in the public administration, Management & Marketing, The official journal of the Society for Business Excellence, no. 2 / 2006
7. * * * http://www.aor.ro 8. * * * http://www.ccsb.ro
47
POWER THINQING MODEL AND ETHICS MANAGEMENT
Assist. Silvia Puiu Ph. D University of Craiova Faculty of Economics Craiova, Romania
Abstract: : The article tries to apply a relatively new concept – power thinqing – to ethics management in order to offer better solutions for managers from all domains, but especially from public sector. Power Thinqing methodologies are a trade mark of Marilee Adams, founder of the Inquiry Institute. The methodologies aim solutions, but starting with a brainstorming of questions, not answers. So, the key is the right question, not the right answer. This model changes a lot the perspective of management and ethics management and could be applied in organizations and government agencies and also at a personal level.
JEL classification: M10, M19
Key words: power thinqing model; ethics management; plagiarism; public sector; question thinking
1. INTRODUCTION The article presents the power thinqing model, a relatively new concept, that
can be applied in a lot of domains, at a personal or an organizational level. In my opinion, this model can be extended in the area of ethics management, leading to a new perspective on ethics.
Marilee Adams is the founder of Inquiry Institute from New Jersey and Power Thinqing Methodologies are a trade mark of hers. This model changes the perspective on how to find the best solutions. Most researchers seek answers to their problems, in order to get the best solution and this is made in a lot of situations, by methods similar to brainstorming, for example.
In Power Thinqing model, you have to ask the right questions, in order to get the solutions for a problem or a dilemma. The model is presented in figure no. 1 and highlights the tools used in this model and also its applications. The main tools are: The 5 questions, Choice Map, ABCD Switching Questions, Q-Storming, Top 12 Questions for Success, Win-Win Requests, Q-Goals, Q-Review, Learning & Project Planning, Power Thinqing Meeting Map, Q-Prep.
Applications are numerous, from personal to organizational level: personal development, meetings and conversations, project management, IT, culture, leadership and management, team work, sales, customer service, negotiation, innovation, decision making and so on.
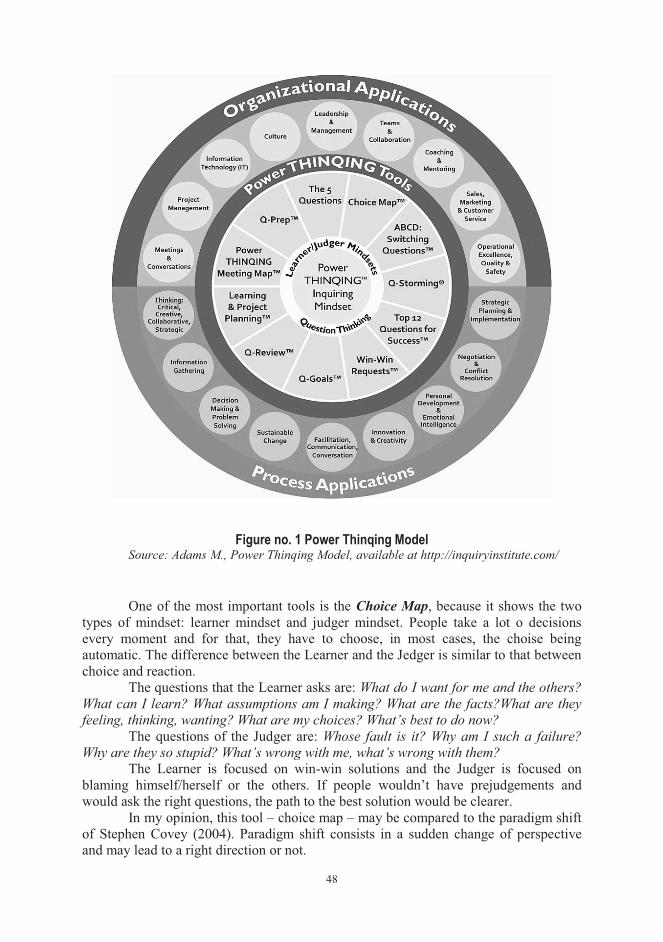
48
Figure no. 1 Power Thinqing Model Source: Adams M., Power Thinqing Model, available at http://inquiryinstitute.com/
One of the most important tools is the Choice Map, because it shows the two
types of mindset: learner mindset and judger mindset. People take a lot o decisions every moment and for that, they have to choose, in most cases, the choise being automatic. The difference between the Learner and the Jedger is similar to that between choice and reaction.
The questions that the Learner asks are: What do I want for me and the others? What can I learn? What assumptions am I making? What are the facts?What are they feeling, thinking, wanting? What are my choices? What’s best to do now?
The questions of the Judger are: Whose fault is it? Why am I such a failure? Why are they so stupid? What’s wrong with me, what’s wrong with them?
The Learner is focused on win-win solutions and the Judger is focused on blaming himself/herself or the others. If people wouldn’t have prejudgements and would ask the right questions, the path to the best solution would be clearer.
In my opinion, this tool – choice map – may be compared to the paradigm shift of Stephen Covey (2004). Paradigm shift consists in a sudden change of perspective and may lead to a right direction or not.
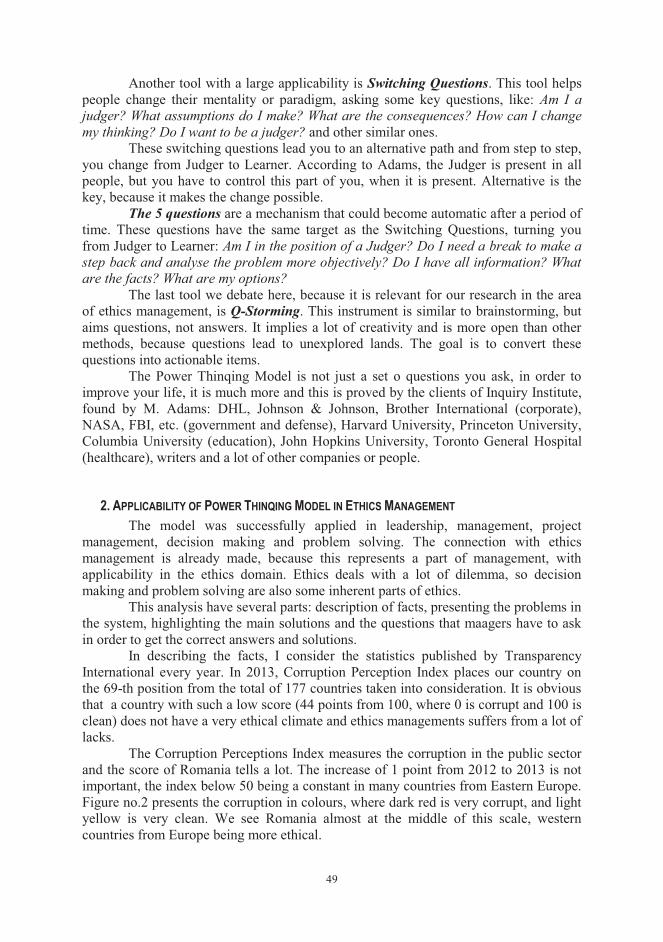
49
Another tool with a large applicability is Switching Questions. This tool helps people change their mentality or paradigm, asking some key questions, like: Am I a judger? What assumptions do I make? What are the consequences? How can I change my thinking? Do I want to be a judger? and other similar ones.
These switching questions lead you to an alternative path and from step to step, you change from Judger to Learner. According to Adams, the Judger is present in all people, but you have to control this part of you, when it is present. Alternative is the key, because it makes the change possible.
The 5 questions are a mechanism that could become automatic after a period of time. These questions have the same target as the Switching Questions, turning you from Judger to Learner: Am I in the position of a Judger? Do I need a break to make a step back and analyse the problem more objectively? Do I have all information? What are the facts? What are my options?
The last tool we debate here, because it is relevant for our research in the area of ethics management, is Q-Storming. This instrument is similar to brainstorming, but aims questions, not answers. It implies a lot of creativity and is more open than other methods, because questions lead to unexplored lands. The goal is to convert these questions into actionable items.
The Power Thinqing Model is not just a set o questions you ask, in order to improve your life, it is much more and this is proved by the clients of Inquiry Institute, found by M. Adams: DHL, Johnson & Johnson, Brother International (corporate), NASA, FBI, etc. (government and defense), Harvard University, Princeton University, Columbia University (education), John Hopkins University, Toronto General Hospital (healthcare), writers and a lot of other companies or people.
2. APPLICABILITY OF POWER THINQING MODEL IN ETHICS MANAGEMENT The model was successfully applied in leadership, management, project
management, decision making and problem solving. The connection with ethics management is already made, because this represents a part of management, with applicability in the ethics domain. Ethics deals with a lot of dilemma, so decision making and problem solving are also some inherent parts of ethics.
This analysis have several parts: description of facts, presenting the problems in the system, highlighting the main solutions and the questions that maagers have to ask in order to get the correct answers and solutions.
In describing the facts, I consider the statistics published by Transparency International every year. In 2013, Corruption Perception Index places our country on the 69-th position from the total of 177 countries taken into consideration. It is obvious that a country with such a low score (44 points from 100, where 0 is corrupt and 100 is clean) does not have a very ethical climate and ethics managements suffers from a lot of lacks.
The Corruption Perceptions Index measures the corruption in the public sector and the score of Romania tells a lot. The increase of 1 point from 2012 to 2013 is not important, the index below 50 being a constant in many countries from Eastern Europe. Figure no.2 presents the corruption in colours, where dark red is very corrupt, and light yellow is very clean. We see Romania almost at the middle of this scale, western countries from Europe being more ethical.
50
Figure no. 2 Corruption Perceptions Index Source: Transparency International, Corruption Perceptions Index 2013 Global Corruption Barometer 2013 also presents the evolution of Romania
during the last two years. 43% of the respondents consider that corruption increased a lot, 21% that it increased little, 27% that remained the same. If we add all these percentages that show there is corruption in Romania and it has not decreased, we get a worrying level of 91%.
If we analyze the institutions seen by people as being corrupt, we can understand why ethics and ethics management is in many cases like trying to teach algebra before learning numbers. We would expect that the legislative power – the Parliament, political parties and other public officials coordinate the ethics regulations, implementation of ethics in institutions and organizations.
When 76% of people think political parties are corrupt, 68% that Parliament is, 58% that judiciary is corrupt, 55% - medical system, 54% - police, 50% - public officials, 33% - education, we cannot expect that we have a clean public system, with a functioning ethics management.
At the question that the government’s measures to fight against corruption are effective or not, 83% of respondents consider them as ieffective. This shows a real management problem, at all levels, but mainly in ethics, because from lack of ethics (so from corruption in public service), we get into the point that our foreign partners do not trust us, as a country, do not invest in Romania and so on.
Starting from these facts, managers in public sector have to implement the tools of ethics management in a new manner, because ethics and its tools (ethics commitees, ethics codes, ethics councils) are not new, are not unknown, but definitely, they are not properly applied or communicated to people involved in a community.
In my opinion, we can apply the Power Thinqing Model in order to create a basis for further measures. To be more precise, I will take an example of non-ethical behavior in one public area, for example plagiarism in education system.
51
The Adams’ model consider that there are questions that a learner asks and other questions that a judger asks. In table no.1, we summarize these questions related to plagiarism in education.
Table no. 1 Power Thinqing model applicability in education (ethical issues) Learner’s questions Judger’s questions
What can I learn from this? Why he/she acted so wrong and unethical? What are my prejudgements? What is wrong with them? What are they feeling or thinking about the situation? Why this happened in my university? What can I do now? What is my mistake for this? What is the best thing to do for me, for them, for the institution?
What is his/her interest?
Source: own analysys based on Power Thinqing Model
The difference between the two sets of questions and thinking models is the perspective and, at the same time, the perception of managers regarding employees and their actions. When managers face with plagiarism in their institution, obviously they have to take strict measures, but the phenomenon may continue if they do not ask the right questions. The solutions will come after asking the correct answers and these arise when managers act like learners and not like judgers.
In order to prevent further plagiarism actions, managers in educational system have to change their mentality, their perspective and implements ethics management tools in a different manner. Maybe plagiarism should be avoided, if managers will communicate more often with his/her employees about this phenomenon and people would rather focurs on how to prevent than finding a guilt of someone and take some sanctions.
In many cases, young researchers comit plagiarism, not because they have bad intentions, but they are not familiar with some quotation rules. So, managers have to communicate better, organize some ethical trainings with this topic, in order to assure a more ethical climate in his/her institution.
3. CONCLUSIONS The Power Thinqing Model could be applied in a lot of domains, bringing a lot
of benefits for those managers who decide to implement it. In this paper, I took as an example the educational system with plagiarism fact. Applicability of the model does not mean that people who are found guilty of plagiarism should not be sanctioned, accordingly.
But, managers do not have to resume their actions just to some sanctions, because plagiarism is a phenomenon that could persist, without strong solutions taken by organization. This reality is just a little part from an enire system that, as Transparency International showed, is perceived like being corrupt.
This article focused on the Choice Map – the most important part of the model, in my opinion, but the research could be extended, including the Q-Storming. This tool, similar with Brainstorming, could offer new and innovative solutions to some problems that public managers cope with.
The importance of this model was highlighted by a lot o people, from managers, senators, professors to writers, trainers or learders of organizations. The
52
inquiry thinking proposed by Marilee Adams in her studies helps people to make inspiring choices and organize their work in a more productive way. Ethics management is a sensitive domain in Romania, taking into consideration our high level of corruption and unethical behaviors. Power Thinqing Model is just another tool that can be integrated by good managers, in order to improve the situation in the system.
ACKNOWLEDGEMENTS This work was partially supported by the grant number 25 C/ 2014, awarded in
the internal grant competition of the University of Craiova.
REFERENCES 1. Adams, M. Change Your Questions, Change your Life, 2nd ed, Berrett-
Koehler Publishers, 2009 2. Covey, S. The 7 Habits of Highly Effective People, New York, Free Press,
2004 3. Transparency
International Corruption Perceptions Index 2013 available at http://www.transparency.org/cpi2013/results
4. Transparency International
Global Corruption Barometer 2013 available at http://www.transparency.org/gcb2013/country/?country=romania
5. *** http://inquiryinstitute.com/
53
LOGISTICS - SOURCE OF COMPETITIVE ADVANTAGE
Adriana SCRIOŞTEANU Assistant Professor PhD University of Craiova Faculty of Economics and Business Administration, Craiova, Romania; Daniela POPESCU, Professor PhD University of Craiova Faculty of Economics and Business Administration, Craiova, Romania;
Abstract: This paper presents the logistics if source of competitive advantage. Logistics can offer a source of competitive advantage, such as a superior position compared to the competitors regarding cost reductions, service diversity and satisfaction of consumer requirements. The logistic activities generate cost and give value to the final product .Despite that the same logistic activity can be done in many ways, with different costs and performance , the evaluation of the activities and the links between them are essential for understanding the influence of logistics regarding the competitive advantage. The links in the chain of value show the synchronization of activities to obtain competitive advantage.
JEL classification: D0, D3, M0, M3
Key words: logistics, competitive advantage, customer service
1. INTRODUCTION In nowadays’ competitive market, whereas the marketing strategy insists on
costumers meeting demands and profit obtained by the producer, the logistics’ importance knows new dimensions. Logistics became a source of competitive advantage, a way of yield’s augmentation and of the enterprise’s market quotation. Many unites started to recognize the advantage that can be offered by a well organized logistics’ system and therefore they built logistics special departments, separated by the ones of marketing and production.
The activity of any enterprise is strongly influenced by the environment where it acts (the market, the materials and service providers and costumers). The enterprise’s reactions towards these changes are limited, particularly targeting the internal environment. For being able to face the quick changes, the enterprises know that they should adopt new attitudes in their working activities. Logistics is the area which can respond to the challenges that the external environment is generating.
2. OBJECTIVES At the level of an organization, the logistics includes the following components
[8]: Purchasing. The purchasing activities (acquirement, raise, assurance) of the
raw materials, the necessary components for achieving the enterprise’s targets are
54
logistics operations. This component of logistics is referring to the connections between enterprises and providers, representing the levels situated upstream of this.
Activities for the production maintenance. These activities include the material flows from the inside of the enterprise. The logistics’ contribution in the production area consists in providing the materials, the necessary parts for the production development, according to the pre-established production schedule (receipt, storage, stockpiling, materials manipulation and the planning of the materials’ internal transports).
Physical distribution. The connection between the producer and costumers is realized throughout the physical distribution which can insure the availability of the required products, representing certain activities of demand processing, stockpiling, storage and transportation.
For designing some logistics’ components, in specialized literature are used the concepts of „materials management” for „production maintenance activities” and „physical distribution management” for physical distribution. Other persons sustaining the concepts of „materials management” and „physical distribution management” are including these elements in the sphere of influence of „logistics management”.
Logistics supposes the connection between the seller and purchaser, regarding the acquisition and stockpiling of materials, the creation and physical distribution of products so that the enterprise could please the costumers meeting demands. The logistics offers an overall picture to the interflow of goods and services, from the provider to the final consumer and also a general view to the payments and information circulation on the opposite way. Between the sellers and buyers exist strong relations which allow the advantages’ identification from the strategically vision of the system’s functionality. The managerial attention must concentrate not only on its own organization but also on the interactions which give functionality to the logistics system.
The logistics efficiency supposes the correlation between the three components with the activities developed upstream and downstream. Each organization has its own methods to increase the efficiency of its logistics operations.
3. METHODOLOGY Integrating with the providers and the distributors Besides the better utilization of the production capacity, reduction of costs or
differentiation, integrating with providers represents another way to obtain the competitive advantage.
Logistics is the process through which a producer enterprise interacts with other external enterprises, providers, customers, specialized firms in transport or stockpiling activities and, because of that, it must not be realized on fragments. When the relations between the producer, provider and customers are complete, the logistics network will be easier to control because all the involved parts are interested in decreasing the costs. Initially the logistics components have been viewed and treated separately and this is way the logistics’ costs have increased and also the enterprise’s yield has been reduced.
There are correlations not only inside the value chain of an enterprise, but also between all these and the value chains of the providers and distribution chains. These links, which Porter names them as “vertical connections” are similar to those from the inside of the value chain and give an influence to the logistics ‘activity costs.
55
The providers accomplish a product which the merchant enterprise uses in its value chain and the activities developed by the provider (the frequent delivering can reduce the stocks’ level; the properly packing of the products can reduce handling’s costs) give an influence to the enterprise’s logistics activities costs. The enterprise’s connections with the providers determine their relationship not to be a worthless game, but a relationship from which, both can win. [6]
The enterprise’s connections with the suppliers are similar to the ones with the providers. The coordination and common optimization of distribution activities can reduce the logistics costs. Creating partnerships between the enterprises and other participants in the product’s chain is a benefit for a good functionality of the logistics system. These relationships are based, first of all, on common values and strategies, on a communication of plans and developed activities. Making strategic partnerships with the providers and distributors, it is an opportunity to get access to an unlimited profit logistics. The specialized transports enterprises could become partners with the producers or sellers from the logistics chain. Speaking of costs, it is more advantageous to appeal to the other enterprise’s services to cover the transportation.
Logistics and the chain of value Michael Porter used an instrument named „the chain of value” for classifying
the purchasers, the providers and also to organize the enterprise on different activities, but interdependent activities which are produce value. The concept of the value’s chain can be used to identify the sources of the competitive advantage and the modality throughout they are reporting to the value perceived by the purchaser. The value’s chain is not only a concept, but also a practical instrument used to establish the modality in which the competitive advantage must be sustained in the conditions of increased competition on market. [3]
Competitive advantage cannot be understood by looking at a firm as a whole. It stems from the many discrete activities a firm performs in designing, producing, marketing, delivering and supporting its product. Each of these activities can contribute to a firm's relative cost position and create a basis for differentiation. A firm gains competitive advantage by performing these strategically important activities more cheaply or better than its competitors. [7]
In Michael Porter’s vision, the value’s chain includes two categories of activities – elementary and supporting ones. In the elementary category are included [7]:
� The internal logistics, referring to reception, stockpiling and distribution of the production’s entrances;
� The operations or the production process transforms the entrances into the finished product;
� The external logistics suppose stockpiling, storage and transportation of the finished product towards the consumer;
� The marketing and the sales suppose advertising activities, promotion, fixing the prices, choosing the distribution chains;
� The service consists in maintenance activities of the functional product (installation, repairs, providing the spare parts).
The supporting activities are the following: � The purchasing, the acquisition of the material resources necessary for
the elementary activities’ development;
56
� The technological development with the research-projection activity of a product or a process;
� The human resources management with the activities of selection, recruitment, training, employers’ motivation;
� The enterprise’s infrastructure which includes the planning system, financing, the quality control.
The value’s chain theory helps us to determine the logistics part inside the profitable enterprises; this means that the theory includes two of the five elementary activities which give value to the product or services – the internal logistics and external logistics.
These activities are integrating functions that cut across the traditional functions of the organization. Competitive advantage is derived from the way in which organizations organize and perform these activities within the value chain. [6] To gain competitive advantage over its rivals, a organization must deliver value to its customers by performing these activities more efficiently than its competitors or by performing the activities in a unique way that creates greater differentiation.
The implication of Michael Porter’s thesis is that organizations should look at each activity in their value chain and assess whether they have a real competitive advantage in the activity. [6] If they do not, the argument goes, then perhaps they should consider outsourcing that activity to a partner who can provide that cost or value advantage. This logic is now widely accepted and has led to the dramatic upsurge in out sourcing activity that can be witnessed in almost every industry.
4. ANALYSES
Organizations that compete only on product characteristics have a big disadvantage against companies that enhance the basic product with value added services. The product in the hands of the customer is much more valuable than the product in the warehouse of the unit.[4] These benefits can be untouchable, for example the image or serving the clients.
If the product we offer doesn’t differ from the competitor’s, the clients will tend to choose the cheaper provider. So, adding additional value to the offer is a way to make it different from the competition’s one.The way through which the organization can differentiate their products from the competition’s is by segment approach of the market. In other words, different segments of clients give a different importance to the benefits offered by the organization.
While the objective of any logistic system is to provide the customer segments the service level which was established and negotiated, it should be acknowledged that there also should exist priorities in serving the customers. Since not all the customers of an organization are equally profitable nor products are equally profitable, key customers and key products should be offered an adequate level of service. Within the organization, profit varies by customer and by product. The indicator suitable for measuring should be the profit, and not sales revenue or sales volume. The reason is that sales revenue and volume could hide significant variations in service costs.
In other words, value adding by differentiating is a way to obtain the competitive advantage. Another way to add value is the service offered to the clients. The markets become more sensitive to services, which determine special challenges for logistics. It is getting harder and harder for any organization to compete on the market
57
only relying on their image, brand or fabrication technology. Thus the need of the organizations to differentiate their offers through offered services (delivery services, after sale services, financial packages) as a way to obtain a competitive margin.
A customer serving is a major component of the logistics politics because of the impact had on the economical results of the enterprises and its competitive advantage. The marketing target is to serve customers as well as the competition does or even better and also to obtain profit. To accomplish this target’s needs is made with the logistics’ help that has as elementary target the effective demand required by marketing. The enterprises are designed from interior to exterior and develop supplying, production and sales activities which are not always responding to the customers’ requirements. Because the enterprises are not created by the customers, but for customers, this is an opportunity for the services’ improving offered to customers. For enterprises, this supposes a permanent adjustment to the market’s changes and a logistics strategy well organized which can face and take over the customers’ demands. The managers’ ability in logistics to change and rule the change might have as an effect, the improvement of the customers’ demands, the sales and yield increasing.
The customers’ serving level gives an influence over the sales, costs and the enterprise’s profit. The connection between the logistics and the customers’ serving level determines the enterprise to choose from one of these two fundamental strategic options [7]:
� the leader position in the prices area, which supposes that the enterprise is the producer with the lowest cost from the area where it develops the activity;
� the eloquent differentiation which consists in visible differences over the competitors who present interests for the customers (the product’s superiority, delivering in the shortest time, quality services)
The logistics encourages costs advantage owning and contributes to the services’ differentiation. The correlation between logistics activities and diminishing of costs allows the establishment of competitive prices. Obtaining a competitive advantage can be realized even throughout providing quality services.
In case when the strategic option is becoming the competitor with the lowest cost, then major risks appear. The difficulty in combining the strategic option (competitor with the lower cost) with the operational one (the costumer’s serving level) is higher because the serving level offered to the customers must be close to the one of competitors, even when it is chosen the strategy with the lowest cost [3].
Approaching the customers and providing some quality services, based on the individual needs of the customers might contribute to the earning and maintenance of the competitive advantage of the enterprise. Decreasing the costs, finding the factor/service which keeps the customer fidelity, realizing a new product are modalities of differentiation of the enterprise’s for its competitors.
The enterprises can realize good products with efforts supported by promotion and low prices. If they do not succeed in accomplishing the customers’ demands on time and completely, the results will not be at the level of expectations and a decrease of sales and market quotation might be reported. The competitors could imitate a prices politics, but they can not also imitate services politics [2]. The prices’ problems are always important but they can not be rewarded by increasing the customers’ serving level. The highest price does not mean the best service offered to the customers. The
58
cost is in direct relation with the offered services, demand and offer are reflected in the total logistics costs.
The improving of the customers’ serving level regarding the increase of sales must be based on an analysis of the serving level’s impact over the cost and enterprise’s profit. The sales’ volume increasing is not equal with the augmentation of the profit. The assurance of a highest serving level is possible only when there are substantial increasing stocks. The approaching to the maxim serving level imposes higher stocks and determinate a precipitous increase of logistics costs [5].
The establishing of an adequate serving level supposes the quantification of supplementary income obtained from the offer of quality services to the client and determination of the report cost / profit for different serving levels [1].
In other words, obtaining the competitive advantage results not only from reducing costs, but also by increasing the number of services offered to the customers. We can say that logistics has the potential to help the organization in obtaining the advantage of cost and added value.
Logistics can offer a source of competitive advantage, such as a superior position than the competitor’s regarding the satisfaction of consumer requirements. The source of the competitive advantage appears from the capacity of the organization to differentiate it’s self from the competition and to manufacture some products at low prices. The search of a competitive advantage has become a concern for every manager because in the current conditions the idea that good products will sell or that the success obtained today will continue tomorrow is no longer true. This success is resulted form an advantage of price, value or an ideal situation, from both choices. [6]
Martin Christopher underlined: ”the competitor with the largest profit from any branch of the industry tends to be the producer with the lowest price or the provider that offers a product with the most perceived values of difference”. [6] This hypothesis is based on the fact that the producer with the lowest price, will have the biggest volume of sales from this sector, thanks to the big economy resulted from allocating the invariable cost on a larger volume of products.
Obtaining a competitive advantage of price doesn’t only result from increasing the selling volume and the scale economies, but with the help of logistics. Logistical costs hold an important part in the production’s total costs and by redesigning the logistical processes cost reductions can be obtained.
Logistics has a special importance for the enterprise’s costs, as well as, for identifying the relationships between the accomplishing modality of value creative activity and, the cost or performance of another activity. The connections within the value’s chain are reflecting the activities synchronization in order to obtain the competitive advantage. For example, delivering in time supposes a coordination of some activities classified in operations, external logistics, services and sales-marketing.
The value activities and accounting classifications are rarely identical. [7] Accounting classifications (direct expenses, general, administration) group costs that are part of the same activity.
Due to the fact that some logistics activities can be realized in many variants with different performances and costs, the activities’ evaluation and the connections
59
between them is essential for the comprehension of the logistics’ influence over the competitive advantage.
Apparently the most frequent decisions in reducing the logistics costs are those of the minimization of expenses that occupies the highest place, such as: transports, stockpiling, and storage. But not always this economic judgment takes us to obtain the highest effects. The logistics with low costs also suppose compromises (higher costs for transport but smaller costs, storage and stockpiling). If there is just one responsible person for all these logistics activities, an adequate decision can be easily taken. Because of the costs that every component activity involves, there is a detailed analysis for reducing all these and increasing the enterprise’s yield, because their reduction supposes the increasing of the others. For example reducing the transport costs by increasing the number of stockpiling places, will determinate the increase of the storage, launching and realization costs.
To decrease the logistics costs, a sever analysis of the effects which are generated by the relationships between the following elements must be taken into consideration:
� stocks and transport – stocks reducing leads to the number and frequency increasing of movements from providers or customers, meaning a growth of the transportation costs;
� storage and transport – storage reducing costs by giving up to some storage places, determining a high number of movements, in the conditions of the same activity volume and transportation costs;
� marketing and transport – using the transportation means to their full capacity means delivering higher quantities of products to reduce the transportation costs, but it might have negative effects in fulfilling the customers demands on time.
� stocks and marketing - the raise of the satisfaction degree of the customer’s demands, a priority target of marketing strategy involves a higher cost for stockpiling. A customer’s fulfilling demand on time supposes the existence of a certain products’ quantity.
� Stocks and production - finished products stocks are influenced by the customer’s demands and the enterprise’s production activity. The customer’s demands reduce the level of the finished products stocks and the production process increases their level. For the logistics system this situation can determine an increase of storage costs, if the products have a slow sale or the market demands were not tested before. Regarding the material resources, the decreasing of storage costs might generate discontinuities of the production process when irregularities in the yield’s process from the provider are reported.
5. CONCLUSIONS Logistics is the most important component of the organization which, if well
administrated, represents a source of competitive advantage. The organizations can respond to the challenges of a competitive environment
using logistics as a competitive weapon and not as a group as activities, generating costs.
Because of the fact that same logistics’ activity can be realized in many ways, with different performances and costs, the activity’s evaluation and the connection
60
between them are important for logistics’ influence on understanding on the competitive advantage.
REFERENCES 1. Ballou, R. H. Business Logistics Management, Prentice-Hall International, New
Jersey, 1992 2. Bălan, C. Logistica, Uranus Publishing, Bucharest, 2001 3. Gattorna J. L. Management and distribution of logistics, Teora Publishing ,
Bucharest, 1999 4. Kotler Ph.,
Keller K. L. Management marketing, Fifth Edition, Teora Publishing, Bucharest, 2008
5. Martin C. Developing Customer Service Strategies, Gower Publishing Company, Ltd.,1990
6. Martin C. Logistics and supply chain management, Third Edition, Prentice Hall, 2007
7. Porter M. Competitive Advantage, The Free Press, 1985 8. Scrioşteanu A. Logistics, Universitaria Publishing, Craiova, 2011
61
CONTRIBUTIONS TO OPTIMIZE QUALITY COSTS IN THE AUTOMOTIVE
INDUSTRY
Prof. Ion Ionescu Ph. D University of Craiova Faculty of Economics and Business Administration Craiova, Romania
Abstract: The main goal of the research is that one to present a way of organizing the management accounting, so that it allow the calculate of a cost for quality pertinent for each activity and on every product made in the automotive industry entities. We critically analyzed the current system used to determine and track quality costs at the studied entities, in order to emphasize the need of organization and implement a modern management accounting, which allows quality control costs and increase the entities performance in this area. The research made, revealed the fact that in present the quality calculation costing is organized in terms of using methods that do not comply with accounting principles, and that it is necessary to organize and implement a management accounting, based on the use of modern methods, respective the cost activities method. The major implications of the proposed system for the studied area consists in the determination of a pertinent cost quality oriented toward entity management, highlighting the shortcomings of the methods currently used to manage quality costs.
JEL classification: M41, M49
Keywords: quality costs , cost method on activities , inducers cost , poor quality , non-compliance.
1. INTRODUCTION Due to deep changes that have occurred in the economic and social
environment, such as, the development of the globalization phenomenons and the increased of the competition, the acceleration of the technological innovation, accentuated reduction of the raw material resources, the diversification of the production and various combinations of goods and services in order to satisfy the customer demand more differentiated, the developmentof the support activities in the current period, quality has become a permanent concern of all entities, including those in the automotive industry.
In the speciality literature are found many definitions of quality products and services, but most appropriate and comprehensive is one offered by standards from series ISO 9000, and "quality represent the whole of properties and characteristics of a product or service that gives its the ability to satisfy customer expresed and implied needs”.
In a broader sense, in addition to aspects of technical nature and customer satisfaction, which are resulting from this definition, the concept of quality must be approached also from the economically point of view and, respective of the costs involved with getting quality.
62
Regarding of the economic aspect of quality, is necessary to implement a methodology for tracking and managing quality costs, as an important component of total quality management system and at the same time as a previous step to optimize the quality cost in automotive industry entities.
2. OBJECTIVES The quality cost analysis is an important tool for management an entity,
because it could be constitute or turn into a potential source of profit maximization. From the perspective of cost optimization for the increase of the entities
performance from the engineering industry car, our study aims at improving the current calculation methodology of quality costs, by introducing an advanced calculation methods, more supple and more efficinetfor the entity management, taking into account the specific of the analysed domain. Following investigations, we concluded that the best methods for achieving the traced objectives are activities cost method (ABC) and target cost method (Target - costing), due to the many advantages which it offers in comparison to the methodology currently used for tracking and managing quality costs.
Target - costing is particularly adapted for the sectors in which the competitive pressure is high. This method is very effective in assembly activities, being less efficient in low range process activities.
In steps ABC it prefers to put on the first planethe overhead costs related to significant cost inductors. For here lies the main limitation of the target - costing over which the ABV method brings obscurity.
Based on these considerations, practically, in the entities engineering industry car it can be used the cost method activities (ABC) for the determination, analysis and quality costs control.
3. METHODOLOGY The investigation methodology include general and specific approaches,
especially analysis and synthesis, also qualitative research.We will take into account the existing calculation system in order to determine quality costs and vis a vis to this one we propose solutions for improvement.
Informational support of the study is the, besides the studied bibliography, the effect legislative and normative acts related with the field.
4. DETERMINIATION AND PERSUIT QUALITY COSTS Before proposing the implementation of an improved system for determining
and tracking quality costs is necessary to define quality costs and performing critical analysis of the current system used by the in automotive industry entities for the calcul and the persuit these costs.
4.1 Defining and structure quality costs In the specialized literature the quality costs are viewed with great interest,
given heir high percentage in the turnover. According to numerous estimates realized, the balance of quality costs as part of an entity varies between 5% and 40%, depending on the entity type, producer of material goods or services provider and the used modalities of determination and follow-up. In reality the level of these costs is even
63
higher, if we consider that a number of quality costs can not be measured, quantified. It is about of the so-called hidden costs, invisible or lost opportunity costs: costs with the lossof the current and potential customers, loss of entity reputation, loss of markets, etc.
At the mid-century the General Electric was the first entity that implemented a management system based on quality costs. Within this system, shown in 1953 at the VII Congress of the American Society for Quality Control, the quality costs were defined as represent "costs due to leavings, reshuffles, inspections, tests, deficiencies shown by the buyer, quality assurance, including training programs on quality, product quality audit, inspection and statistical analysis". In a broader sense, the cost of quality is the total expenses that the manufacturer carry, user and society at large about the quality of processes, products, services and environmental protection25.
Reporting to the quality costs, the European Organization for Quality - EOQ considers that these consist in expenses with prevention, evaluation as well as loss due to refuse found in the production process or at customers. In a similar manner, are defines the quality costs and German Society for Management Systems (Deutsche Gessellschaft fur Managementsystemen).
According provisions from standards in series ISO 9000, "the costs related to quality, are costs made for achieving proposed quality, providing the necessary confidence and the losses incurred when the proposed quality is not achieved"26.
On quality costs, must be accurate that, over the time, there were views according to which for the name for these costs would be more appropriate the terms "cost of poor quality", introduced by Juran or "price of non-compliance", introduced by Crosby27. These terms were used in connection with the way in which many experts have defined structure quality cost at a time.
However, in the current period, most of the expressed opinions in Romanian and foreign literature lead to the use of the term "quality costs", considering that this captures better the fact that in the structure of these costs are included, in addition to internal and external failure costs, also some expenses not related to realization of some products or services of poor quality, but it refers to the prevention of nonconformities or evaluation operations.
On the line of costs quality research we find that in the specialized literature there were multiple concerns, for which we retain the authors' opinion C. Mironeasa and S.Mironeasa (2009), which emphasizes that "quality costs approach is achieved by associating them with that costs that considering prevention, finding and correcting defects”28.
Referring to the quality cost, D. Popescu (2008) believes that they are "those costs associated with the nonconformity product quality or service as they were defined by the demands set by the organization and customer contracts, given the social conditions “29.
25 Ionita I. - Techno-Economic Quality Management Systems, ASE Publishing House, Bucharest, 2002. 26 Ionita I. – Op. cit. 27 Mironeasa C., Mironeasa S. - Quality costs, Matrix Rom Publishing House, Bucharest, 2009, p. 62. 28 Mironeasa C., Mironeasa S. – Op. cit., p. 58. 29 Popescu D. - Quality Management, Principles and Practice , Universitaria Publishing House, Craiova, 2008.
64
Another opinion concerning quality costs can be found at J.M. Juran, who groups them into 11 categories: involved cost of market research, products conception activity costs, research – design activity costs, costs of planning manufacturing activity, costs of maintaining the work accuracy of the processes and equipments, costs related to human resources and materials necessary for the control of the technological process, marketing costs, product evaluation costs, costs to prevent defects, loss due to lack of conformity, costs of personnel permanent information about activities related to quality. From all these, Juran considers that the first seven categories should be supported by the entity to realize a product and obtain incomes, and the other might be avoided to a certain extent.30
Vis - à -vis of the views expressed in the special literature, sometimes disputed, in our opinion, in the definition of quality costs should take into account the specifications required by the ISO 9000 standards, that include internal activity, also to include external beneficiaries.
In the special literature there have been debates on the classification and structure of the quality cost, being used different grouping criteria: purpose, resources nature, possibility of highlighting, the way of evolution, the place where they are registered. Any of the criteria listed assume classification from the practical point of view, of utility and not from the point of view in terms of compliance with strict accounting principles 31.
As far as we are concerned, we believe that the most appropriate classification of quality costs is that made from the point of view of the manufacturer, since this is the first responsable of quality assurance and, at the same time, is the leading and can optimize the quality through costs. We stopped at these classification of quality costs and from practical considerations for the objective of our approach, given its compatibility with implementing an improved system for determining and tracking quality costs .
In relation to this criterion, we have four categories of costs: - prevention costs include costs for all activities in an entity contributing to the
realization of some products, according to customer requests and quality specification; - evaluation costs, those costs realized by the producer as part of the
verification, inspection, testing and audit activities, having the role to discover products not correspondent from qualitative point of view;
- internal deficiencies costs include costs generating by machines break – down, insufficient personnel qualification, raw materials and materials that do not correspond from qualitative point of view, refuses, reframing, etc.;
- external deficiencies costs, those costs referring to product return, guarantee and post-guarantee costs, customer’s complaints, loss of orders, etc.
Moreover, this classification is very similar to the first group of quality costs that makes AV Feigenbaum 32 and is later adopted by the ISO standards.
30 Juran J. M., Gryna jr. F. M. – Products quality, Practical treaty of planning, designing, realization and control, Translation from English – USA, Technical Publishing House, Bucharest, 1973, p. 76-77. 31 Mironeasa C., Mironeasa S. – Op cit. p 67. 32 Mironeasa C, Mironeasa S.- Op. cit. p. 68.
65
4.2 . Critical analysis of the current system for determining and tracking quality costs Providing products and services of quality at the lowest costs possible should
be the main concern of any entity. To ensure the efficiency of this approach must have known his costs. Determining and tracking quality costs represents an important way to increase profits, through an appropriate program to reduce these costs.
Even at the present, most of entities ignore this opportunity, either due to exclusive focusing on production amount and aiming financial efficiency, either due to the difficulty of quantifying different components of the quality cost, which is generated also by defective organization of these costs accountancy.
In this context, it should be noted that the vast majority of entities have not implemented a modern system for determining and tracking quality costs, from types of costs, on products / services, on the activities, departments, enabling the establishment of responsibles and the causes of a high cost due the poor quality, in order to take appropriate corrective measures.
In fact, in practice, determination and tracking quality costs takes place extra- accountant and is limited to preparation of some operational accounts (reports) by the department that deals with issues of quality control within an entity and organizational is part of the structure of the production.
But quality costs are not specific only to the production function, but in a higher proportion or less, they are found in all activities, functions and entity compartments: conception, design, provision, production, marketing, delivery, etc.
Furthermore, from an accounting perspective, relying on the fact that some of the quality costs are difficult to identify and quantify, are pursued only part of the cost of quality, that cost is easily identified and quantified (costs with final scrap, with reshuffled scrap, costs incurred by the quality control department). Most often either these costs are not evidencied separately as quality costs, but are included in the total manufacturing costs.
In fact, the determination and quantification of the real cost of quality is a function solely accounting and as such, at the level of each entity for collecting and processing data regarding quality costs should be a close collaboration between the accounting department of quality with the quality control compartment and with other departments with the attributions on the line of quality assurance of products and services.
In conclusion, we can say that the current system for determining and tracking quality costs, existingin in the entities from the engineering industry car, the information provided by the accounting does not help much to reduce costs and improve quality. This is because quality costs are not provided by the entity's normal accounting system, and sometimes are being used methods for collecting and analyzing data that does not correspond to the principles of accounting. Therefore , we consider it necessary to implement a modern system for determining and tracking quality costs, which rely mostly on accounting entity, that provides the largest part of data on quality costs. Such data must be analyzed and supplemented by estimates of the hidden costs of quality, which are difficult to quantify through specific procedures of accounting.
Among the hidden costs of quality thye most difficult to assess is the cost of lost opportunities, which can be estimated by deeming the opportunity cost, respective lost profit by the cancellation of orders by customers for products and services of low quality.
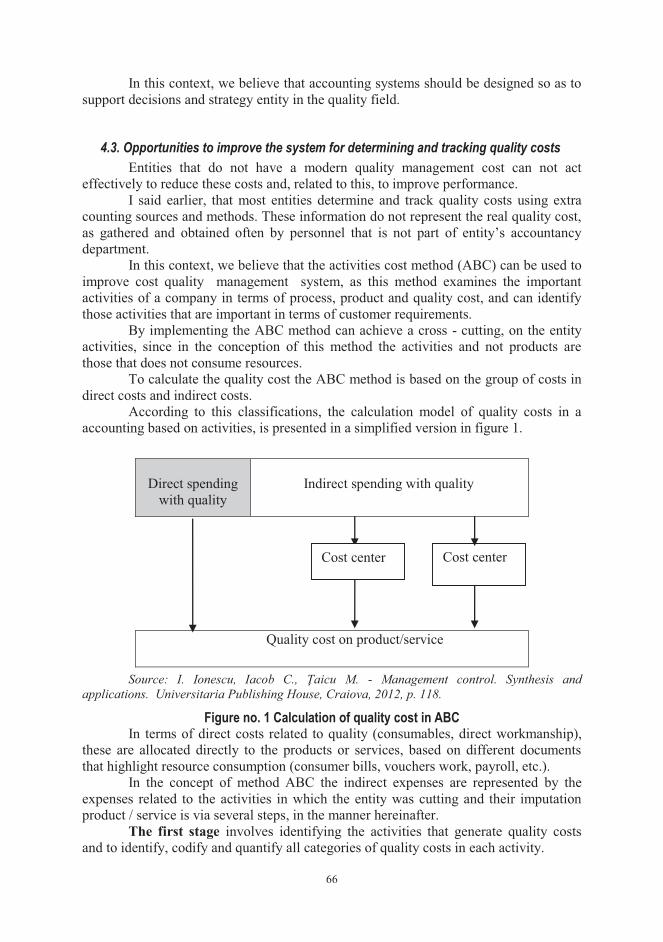
66
In this context, we believe that accounting systems should be designed so as to support decisions and strategy entity in the quality field.
4.3. Opportunities to improve the system for determining and tracking quality costs Entities that do not have a modern quality management cost can not act
effectively to reduce these costs and, related to this, to improve performance. I said earlier, that most entities determine and track quality costs using extra
counting sources and methods. These information do not represent the real quality cost, as gathered and obtained often by personnel that is not part of entity’s accountancy department.
In this context, we believe that the activities cost method (ABC) can be used to improve cost quality management system, as this method examines the important activities of a company in terms of process, product and quality cost, and can identify those activities that are important in terms of customer requirements.
By implementing the ABC method can achieve a cross - cutting, on the entity activities, since in the conception of this method the activities and not products are those that does not consume resources.
To calculate the quality cost the ABC method is based on the group of costs in direct costs and indirect costs.
According to this classifications, the calculation model of quality costs in a accounting based on activities, is presented in a simplified version in figure 1.
Source: I. Ionescu, Iacob C., Ţaicu M. - Management control. Synthesis and applications. Universitaria Publishing House, Craiova, 2012, p. 118.
Figure no. 1 Calculation of quality cost in ABC In terms of direct costs related to quality (consumables, direct workmanship),
these are allocated directly to the products or services, based on different documents that highlight resource consumption (consumer bills, vouchers work, payroll, etc.).
In the concept of method ABC the indirect expenses are represented by the expenses related to the activities in which the entity was cutting and their imputation product / service is via several steps, in the manner hereinafter.
The first stage involves identifying the activities that generate quality costs and to identify, codify and quantify all categories of quality costs in each activity.
Direct spending
with quality
Indirect spending with quality
Quality cost on product/service
Cost center Cost center
67
Quality costs are manifested throughout the life cycle of a product, which means that all activities in which decomposes an entity in the automotive industry, started with the conception and design of the new product and ending with its marketing and sales, give costs related with the quality.
The activities consume resources, but not always they are independent and cannot establish one responsible for each activity identified. The activity is found in a certain function of the entity in hierarchical upright cutting – functional of these, and therefore must be identified belonging responsibility center in order to be able to determine the person responsible for management decisions relating to the activity. Is necessary these relationship with the structure of responsibilities in order to enable cost control activities.
In the second stage proceed to the determination and delineation between the activities of all costs (indirect) relevant, that is, in fact, the cost of consumed resources by the activities. Quality costs are analyzed in terms of design, supply, production and the behavior way of the products at the consumer. This analysis is necessary to allocate the cost on the activities they generate.
The third stage involves identifying activities that have ties involving interdependence between them and that involves quality costs. For example, the supply department will seek to buy at the lowest costs, neglecting aspects of quality of the raw materials and materials, with consequences on product quality embodied in defective or scrap, as well in maintenance expenditures and higher repairs, which leads to unfavorable influences on the entity management. These costs should be allocated among the various interdependent activities using a distribution key, more or less arbitrary, which can lead to the obtaining inaccurate costs, and consequently, to poor decisions.
In the fourth stage is set factors that generating quality costs, so-called activities inductor cost. Cost inducers allow more accurate allocation of indirect costs with the quality on products or services, following the development of causal relationships between inducers and expenses subjected to allocation.
Correct identification of cost inducers preset a special importance to ensure the quality of accounting information. Any change in the cost inducers causes a change of the share of different quality costs in the total cost of carrier cost.
The penultimate stage the activities with the same inductor cost are grouped into a single cost center. This group is required because the establishment of an analysis center for each identified independent activity would lead to an extremely informational bulky accounting with hundreds of such centers, with all the consequences that result from here. Follows the calculating of the unitary cost of each inductor cost, by reporting total spending related to associated activities grouped in a group center cost to the respective inductor volume.
Please note, that after the first five stages were completed the first major objective is achieved of the method on activities (ABC) regarding the quality costs, respective determination and tracking quality costs on activities (cost centers), and within these on categories (ways) of quality costs.
The last atage regarding the treatment of indirect costs of quality in terms of implementing the ABC method, consists in allocating these expenses on carriers cost, which is obtained by weighting the unit cost of each inductor cost with the volume consumed inductores consumed by each carrier cost.
68
Finally, we get the full cost with quality on cost carriers (products, services, customers) by adding the cost of consumed activities at the direct expenditure with quality.
So, the second major objective of the ABC method is achieved regarding quality costs, respective determining and tracking quality costs on cost carriers, and within these on categories (types) of quality costs.
5. CONCLUSIONS The added value of this paper consist in making a rigorous study of
informational costs quality system in a very important sector for the Romanian economy.
The ABC model is relevant in order to help more radical change in way that aimed optimum reconfiguring of the quality cost management system.
We consider here that, in our view, the map activities that forms entity folds better on the calculation of some costs used by managers in taking decisions - riented on the final customer satisfaction of carriers (product, work, services).
Costs calculation per activities (ABC) can be useful to entities from vehicle constructing industry concerning analyze, execution and implementation of the strategies for quality problems, during the entire life cycle, starting with the activity of conception and design. The pattern of activities offers a realist basis for the forecast of indirect expenses with quality, employment from the phase of election of product manufacturing conception.
In conclusion, the ABC method is a method of administration and management that has specific tools for assessing and measuring the quality real cost on activities and products, also its impact on profit and on the performance of the entity.
REFERENCES 1. Iacob C.,
Ionescu I, Goagără D.
Management Accounting in line with international practice, Universitaria Publishing House, Craiova, 2007.
2. Ionescu I., Iacob C., Ţaicu M.
Management Control, Synthesis and Applications, Universitaria Publishing House, Craiova, 2012.
3. Ioniţa I.,
Techno-Economic Quality Management Systems, ASE Publishing House, Bucharest, 2002.
4. Juran J. M., Gryna jr. F. M.
Products quality, Practical treaty of planning, designing, realization and control, Translation from English – USA, Technical Publishing House, Bucharest, 1973.
5. Mironeasa C., Mironeasa. S..
Quality costs, Matrix Rom Publishing House, Buharest, 2009.
6. Paraschivescu, A. O.
Quality Management, Second Edition Revised and enlarged, Tehnopress Publishing, Iaşi, 2008.
7. Popescu D. Quality Management, Principles and Practice, Universitaria Publishing House, Craiova, 2008.
This work was partially supported by the grant number 4C/2014, awarded in
the internal grant competition of the University of Craiova.
69
REFLECTIONS ON UNION EUROPEAN BANKING PROJECT
Prof. Jenica Popescu Ph. D University of Craiova Faculty of Economics and Business Administration Craiova, Romania Assoc. Prof. Victoria Firescu Ph. D University of Pitesti Faculty of Economic Sciences Pitesti, Romania
Abstract: The international financial crisis has revealed malfunctioning of surveillance systems available until 2007-2008, as well as the relationship between banks and governments, which led to the idea of creating a European Banking Union, as a measure to prevent new negative phenomena. The project provides a centralized supervision of European banks, conducted by European Central Bank and the European Banking Authority, and common banking rules into European Union and the establishment of a common fund to guarantee bank deposits.
JEL classification: G01, G18
Key words: centralized supervision; common banking rules; banking union; resolution mechanism; banking crisis
1. INTRODUCTION To have a financial supervision and create preconditions for strengthening the
European banking sector under EU authority is necessary to have a Banking Union, which will be composed of two entities: the Unique Supervisory Mechanism of the Deposit Insurance and Resolution Mechanism for Credit Institutions. This Banking Union will try to break the link between banking crisis and sovereign debt crisis or, otherwise, between banks and national governments.
2. THE JUSTIFICATION TO CREATE EUROPEAN BANKING UNION European Banking Union has three pillars (see figure no. 1): (1) The Unique
Supervisory Mechanism; (2) The Unique Mechanism of Solving Situation for Banks in Trouble plus The Unique Resolution Fund and, also, (3) The Unique Deposit Guarantee Scheme. Each pillar has its pros and cons.
It will be a single manual of rules and it is important that it will have as less arbitrary factors of regulatory because, otherwise, the banks will go around the regulatory rules.
In essence, the Banking Union will have two tasks: supervision of banks and resolving banking crises. For that reason it was adopted the Regulation of Banking Supervision, and the Regulation of Bank Resolution (the resolution means an assisted by state restructuring for banks, to ensure the continue exercise of their functions in the economy).
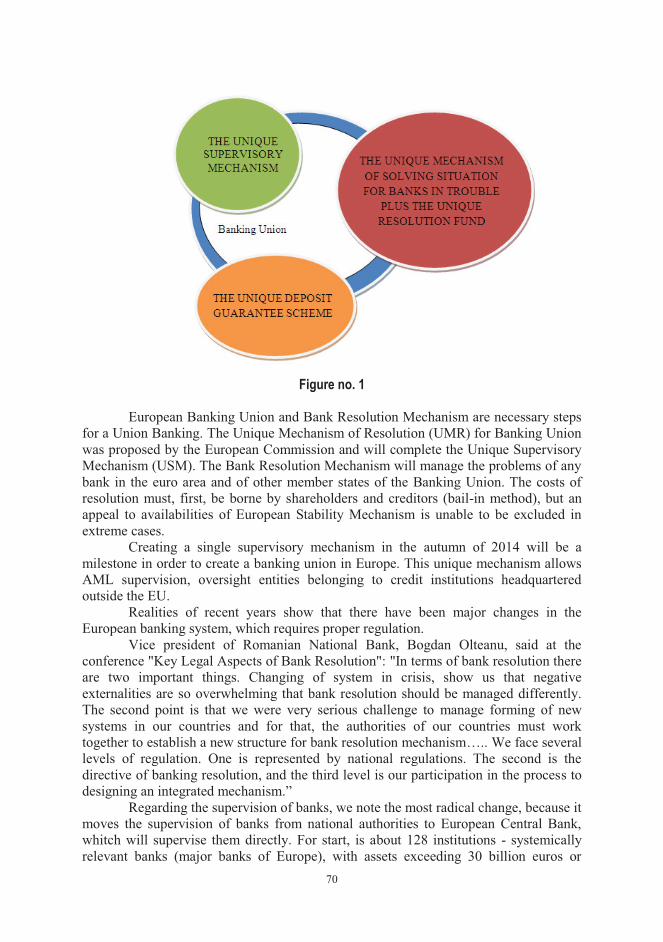
70
Figure no. 1
European Banking Union and Bank Resolution Mechanism are necessary steps
for a Union Banking. The Unique Mechanism of Resolution (UMR) for Banking Union was proposed by the European Commission and will complete the Unique Supervisory Mechanism (USM). The Bank Resolution Mechanism will manage the problems of any bank in the euro area and of other member states of the Banking Union. The costs of resolution must, first, be borne by shareholders and creditors (bail-in method), but an appeal to availabilities of European Stability Mechanism is unable to be excluded in extreme cases.
Creating a single supervisory mechanism in the autumn of 2014 will be a milestone in order to create a banking union in Europe. This unique mechanism allows AML supervision, oversight entities belonging to credit institutions headquartered outside the EU.
Realities of recent years show that there have been major changes in the European banking system, which requires proper regulation.
Vice president of Romanian National Bank, Bogdan Olteanu, said at the conference "Key Legal Aspects of Bank Resolution": "In terms of bank resolution there are two important things. Changing of system in crisis, show us that negative externalities are so overwhelming that bank resolution should be managed differently. The second point is that we were very serious challenge to manage forming of new systems in our countries and for that, the authorities of our countries must work together to establish a new structure for bank resolution mechanism….. We face several levels of regulation. One is represented by national regulations. The second is the directive of banking resolution, and the third level is our participation in the process to designing an integrated mechanism.”
Regarding the supervision of banks, we note the most radical change, because it moves the supervision of banks from national authorities to European Central Bank, whitch will supervise them directly. For start, is about 128 institutions - systemically relevant banks (major banks of Europe), with assets exceeding 30 billion euros or
71
exceed 20% of the GDP of the state of residence. The 128 banks hold about 85% of banking assets in the eurozone. Until November 2014 the ECB will carry out a comprehensive evaluation of their assets, involving both other European institutions (European Banking Authority - EBA) and national institutions (banks supervisors in euro area and in other member states of the EU).
The evaluation incude three phases that take place almost simultaneously. First, it will take place a risk oversight and evaluation, which includes qualitative and quantitative analysis of the main risk factors: liquidity, debts and funding. In the second phase is to evaluate asset quality, being involved also EBA. The third phase aims to do stress testing, according to the results obtained in the previous phase.
The ECB will have the power to revoke banking licenses, to fine the lenders who don't follow the rules, to decide whether if a bank should be bail out, but also to decide directly to supervise any bank or group of banks considered to be a potential source of systemic risk. In time, the ECB will probably ask that all banks in the euro area (about 6000) must to join in the system.
This means a transfer of sovereignty, justified by the existence of a single monetary zone and through the bad experience of countries such as Greece, Ireland, Spain, which demonstrated a lack of regulation, large lack in decisions of national regulatory authorities.
The second task - solving of banking crisis by recapitalization or by ordered bankruptcy of an institution - is an approach known or recommended by the international financial crisis of 2007-2008. A new banking authority will take up the restructuring process and not ECB, which becoming the lender of last resort.
The banking sector in countries signatory to the agreement must contribute to a bailout fund of 500 million euro. As measures proposed by the representatives of euro zone, in addition to establishing the resolution fund (which should accumulate financial resources, in the next decade, of about 55 billion euros in contributions from banks, by a system similar to the deposit guarantee fund each country) included also the appointment of an EU Agency responsible with decision for bank bankrupt, and which can develope procedures for sharing the costs of resolving a banking crisis.
3. SENSITIVITIES GENERATED BY THE ADDITIONAL RESPONSIBILITIES OF THE ECB Obviously, the creation of European Banking Union will generate some
sensitive issues. If a bank in a country goes to bankrupt, the money will be received from Brussels by the depositor, which means breaking the link between banks and national governments (taxpayers' money won't be used to rescue banks). In this respect there is a risk of asymmetric treatment between euro area countries and those outside it, but members of the European Banking Union.
EU Member States agreed standards for deposit guarantee schemes, but failed to coordinate on a bill that would tighten regulations on financial derivatives market.
Also, the new tasks of the ECB could affect UK banks. British finance minister, which supports European Banking Union project, said that Britain will not participate in a banking union which require British taxpayers to pay for recapitalize European banks. Not being a part of the euro area and as opposed to project for financial transaction tax, Britain is not interested of European Banking Union project. Special privileges for requirements on London financial market, without incurring any cost, are unacceptable for the EU.
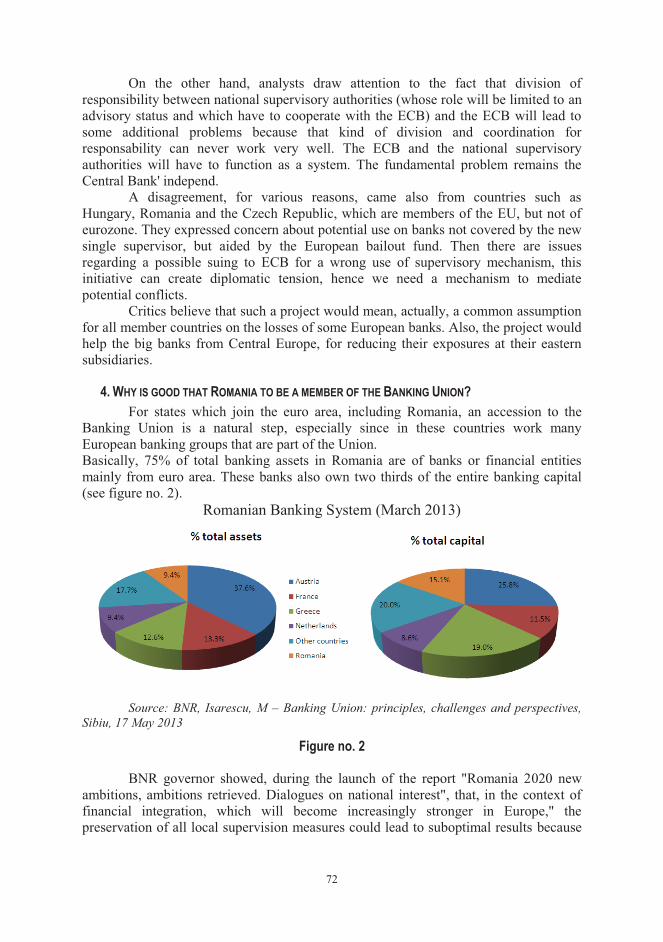
72
On the other hand, analysts draw attention to the fact that division of responsibility between national supervisory authorities (whose role will be limited to an advisory status and which have to cooperate with the ECB) and the ECB will lead to some additional problems because that kind of division and coordination for responsability can never work very well. The ECB and the national supervisory authorities will have to function as a system. The fundamental problem remains the Central Bank' independ.
A disagreement, for various reasons, came also from countries such as Hungary, Romania and the Czech Republic, which are members of the EU, but not of eurozone. They expressed concern about potential use on banks not covered by the new single supervisor, but aided by the European bailout fund. Then there are issues regarding a possible suing to ECB for a wrong use of supervisory mechanism, this initiative can create diplomatic tension, hence we need a mechanism to mediate potential conflicts.
Critics believe that such a project would mean, actually, a common assumption for all member countries on the losses of some European banks. Also, the project would help the big banks from Central Europe, for reducing their exposures at their eastern subsidiaries.
4. WHY IS GOOD THAT ROMANIA TO BE A MEMBER OF THE BANKING UNION? For states which join the euro area, including Romania, an accession to the
Banking Union is a natural step, especially since in these countries work many European banking groups that are part of the Union. Basically, 75% of total banking assets in Romania are of banks or financial entities mainly from euro area. These banks also own two thirds of the entire banking capital (see figure no. 2).
Romanian Banking System (March 2013)
Source: BNR, Isarescu, M – Banking Union: principles, challenges and perspectives,
Sibiu, 17 May 2013
Figure no. 2 BNR governor showed, during the launch of the report "Romania 2020 new
ambitions, ambitions retrieved. Dialogues on national interest", that, in the context of financial integration, which will become increasingly stronger in Europe," the preservation of all local supervision measures could lead to suboptimal results because
73
of the limited information had by local supervision authority about the results and activities of the parent banks."
Not be ignored that there are some undesirable implications for Romania, such as restriction of presence for credit institutions with foreign capital and, also, restriction for foreign banking's capital, parent banks withdrawing already over 70% of short-term financing for local banks. Therefore, the imperative for Romania is considered the further restructuring and privatization of state companies, increasing labor market flexibility, the liberalization of administered prices so as to increase their competitiveness.
5. CONCLUSIONS Banking Union was born as a result of the European Commission proposal that
wanted an integrated financial supervision at European Union level. By creating Banking Union, economic convergence within the European Union will be built on three pillars: Monetary Union, Fiscal Union and Banking Union.
To prevent situations in which the state "collaborate" with the banks in good times and must save them from bankruptcy in adverse times, it requires a Banking Union in Europe.
We subscribe to the view of the Dutch Minister of Finance, according to which the creation of a banking union will make that banking sector become responsible for the risks they take and for the losses they will record.
In the absence of a banking union, banks are perceived that having as assets debts of the states, as appreciates Romanian central bank governor. Banking Union ensure placement on a more healthy basis and will restore confidence in euro.
In a Banking Union, capital requirements, liquidity, protection of customers are unique and in case of insolvency, banks will be recapitalized from a special fund. This is essential, because it breaks the vicious circle in which the state and the banking system affect each other: the state debt accumulates by pumping billions euro into the banking system and banks are exposed to sovereign risk by financing sovereign loans.
A banking union would avoid the current fragmentation in the euro area, which leads now to fragmentation of the single market.
The domestic bank capital movements hinder the free movement of capital and complicate monetary policy transmission mechanism in the euro area.
Banking Union could become the biggest financial reform since the creation of the euro, reform that would transfer control of banks from national level to European level, and demonstrate that financial stability and financial integration are not compatible with the preservation of national surveillance.
Last but not least, people who deposited money in banks in danger of bankruptcy will be better protected in case of existing banking union, and the models to address failing banks and to protect depositors will be more easy to apply.
Common supervisory measures would strengthen the confidence of depositors and markets and reduce the vulnerability of the European banking sector. It means, including more efficient management of banking crises, so that to minimize the negative consequences on the economy and recourse to public funds. We believe that decisions taken in the euro area will be political.\
In conclusion, Bauking Union means more capital, less debt and thus moderate risk. In this construction, the credibility of the European Central Bank is, in our opinion, the key of European Banking Union. For all these reasons, we believe that by
74
creating of European Banking Union, European Union will demonstrate once again that it is a viable project and irreversible.
REFERENCES 1. Asmussen, J. Financial stability in Europe and the progress towards banking union,
speech at event “The Way Forward for the Eurozone and Europe: A Conversation with European Policymakers, Washington, April 18, 2013
2. Constancio, V. The nature and significance of Banking Union, speach at conference “Financial Regulation: Towards a global regulatory framework?”, London, March 11, 2013
3. Dănilă, N. Vision and action imposed by the Union Bank building, presentation in the Project „Academica BNR”, Sinaia, March 5, 2014
4. Georgescu, F. Reform of banking supervision to ensure financial stability and sustainable economic growth, Presentation in the symposium "Towards a new supervisory architecture of financial markets in the European Union", July 18, 2013
5. Isărescu, M. Union Banking: Principles, challenges, perspectives, dissertation presented at awarding the title of Doctor Honoris Causa, Sibiu, mai 17, 2013
6. Larosiere, J. “Future shape of the banking union in the EU”, speech at ECOFIN Council Reunion, Dublin, April 12, 2013
75
SOCIAL SECURITY SYSTEM AND PENSION SYSTEMS – PILONS OF SOCIAL
COHESION
Associate Professor Marieta Stanciu, PhD. University of Craiova Faculty of Economics and Business Administration Craiova, Romania Lecturer Mădălina Giorgiana Mangra, PhD. University of Craiova Faculty of Economics and Business Administration Craiova, Romania
Abstract: Economic and social cohesion is an expression of EU member states’ solidarity to achieve a balanced development of the European community by reducing disparities between regions and promoting equal opportunities for each region, this attitude being manifested through support to regions with structural problems, to overcome them and develop their economies, so that the results obtained would converge in the same direction as the rich regions. However, regional policy is a policy that is defined mainly by its instruments known as “structural instruments”, represented by the funds used to achieve the objective of reducing disparities between regions. Taking into account the prerequisites listed, the presentation of economic and social cohesion must be closely related to the development of regional policy and financial instruments of cohesion policy, but also to the extrapolation of regional policy’s objectives.
JEL classification: G22, H55
Keywords: social inclusion, social exclusion, economic and social cohesion
INTRODUCTION Closely related to the issue of combating unemployment, the fight against
poverty requires the elaboration and implementation of strategies able to combine actions meant to ensure jobs with social protection measures and social security for the categories of persons who are socially disadvantaged.
During this period, marked globally by a deep economic crisis, social services are a mean used for fighting poverty and maintaining social cohesion. Social services can help mitigate the negative effects of the economic crisis, resulting in a better standard of living but in the economic growth in the community as well, provided they are well organized, planned and financed.
Economic growth is a sine-qua-non condition for achieving social cohesion and the knowledge of the specifics of social services sector, regular updating of data for the beneficiaries of such services, suppliers and staff involved in this sector and the methods of organization and financing of services have become in this context priorities at European level.
The concept of social cohesion should be understood as a system designed to establish new forms of balance between EU regions, which are aimed at combating
76
poverty and social exclusion and improving the quality of life for all, so that it can be said the concept is a stabilizing factor for the whole community.
The interpenetration of social policy with economic cohesion is important for achieving social cohesion objective, which should be analyzed considering the following aspects 33:
� employment rate at both national and regional level; � poverty, calculated by reporting minimum income of the population to the
national and European average income; � level of education, established by weighting the population with a certain
educational level. Economic and social cohesion policy includes: � Regional development policy that is oriented towards reducing disparities
and regeneration of declining industrial zones; � Social policy is focused on combating long-term unemployment and
supporting the educational and continuous training process; � Assistance given to rural development. Cohesion remains an important driving force by taking priority actions to
strengthen social security systems and focusing policies on the individual person’s needs, human dignity and providing an environment and associated conditions for personal development. The base for efficient functioning of a system over other systems is represented by the consistent application of elements which are aimed at social cohesion: social disparities-inequalities-exclusion and social relations-interrelations- human capital.
Social cohesion is considering elements likely to unify society as a whole, being regarded by many as an ideal to which all contemporary societies aspire but it is unfortunately difficult to achieve.
ROLE OF SOCIAL SECURITY SYSTEM
Monitoring the situation of social services and the benefits they bring helps to continuously adjust national social policies.
Given the importance that the EU attaches to social assistance, two biennial reports have been developed by the European Commission on social services of general interest, which were published in 2008 and 2010, reports that provide comparative elements in the European Community, on the evolution, improvement trends and development of services related to social assistance34.
Moreover, the theme addressed in the reports mentioned above was the subject of national concern and was studied in the project "Increasing the level of implementation of legislation on social services at the local level in the context of decentralization", which was initiated by the Ministry of Labor, Family and Social 33*** Rolul coeziunii economice şi sociale în dezvoltarea Uniunii Europene/Role of the Economic and social cohesion in the evolution of European Union, www.rejournal.eu/portals/0arhiva/JE%2024/JE%2024%20Ionica. 34*** Comisia Europeană, primul raport biennal asupra serviciilor sociale de interes genera l(Biennial Report on Social Services of General Interest) COM(2008), 418 Final, htpp:/eur-lex.europa.eu/LexUriServ, Comisia Europeana 2010, al doilea raport bienal asupra serviciilor sociale de interes general (Second Biennial Report on social Services of General Interest, SEC(2010), 1284 Final, htpp:/ec.europa.eu/social/main)
77
Protection and financed from the European Social Fund within the Operational Program “Administrative Capacity Development 2007-2013”.
The European Commission has proposed the creation of a European Platform against Poverty and Social Exclusion that will establish a dynamic framework for action such as to ensure social and territorial cohesion so that benefits of economic growth and jobs are fairly distributed throughout the EU, and people experiencing poverty have the opportunity to engage in society. Alongside the European Platform against Poverty and Social Exclusion, social objectives envisaged in the Europe 2020 Strategy focus on the employment rate on one hand, and the level of education, on the other hand.
The term “social exclusion” has only recently been used in the field of social research, being preferred to the old term "poverty", just like the phrase "promoting social inclusion" replaced "measures to combat poverty."
The concept of social exclusion is viewed differently by specialists; some say that exclusion emerges due to poverty, others equate it with insufficient and inadequate social participation, or the inability of some people to act without assistance.
The social security system is designed to protect the most disadvantaged people, therefore needs an innovative reform, consisting of a set of family policies, policies to combat poverty and policies for people with disabilities and the elderly.
The principles for a reform strategy in social security are essentially the following35:
� Respect for human dignity, each individual person being guaranteed free development of personality;
� Social solidarity, where people who can not ensure their social needs are given support by the community to maintain and strengthen social cohesion;
� Subsidiarity, individuals or families who can not ensure their full social needs are helped by local community and associations and the state;
� Partnership, local and central public administration authorities cooperate in order to provide social benefits and services;
� Transparency, ensures the increasing accountability of central and local government to the citizen;
� Fairness, access is given to social security system to the citizens who are in a position of vulnerability;
� Focus, the social security system focuses on the needs of people in a state of vulnerability;
� Universality, each person is entitled to benefits and social services as provided by law. Regarding the National Strategy for Sustainable Development of Romania for
the years 2013-2020-203036, the EU sets the overall objective of "creating a society based on social inclusion by taking into account solidarity between and within 35*** Strategia privind reforma în domeniul asistenței sociale din România 2011-2013 elaborată de Ministerul Muncii, Familiei și Protecției Sociale, Legea nr. 47/2006, publicată în M.O. nr. 239-2006 / Strategy regarding the reform of social security system in Romania 2011-2013, elaborated by the Ministry of Labor, Family and Social Protection, Law n. 47/2006, published in the Official Gazette n. 239/2006 36*** “Asistenţa Socială, modalitate de respectare a egalităţii de şanse şi apărarea drepturilor persoanelor vârstnice”, ro.scribd.com/…/157381939 / “Social Security, a way to respect the equal opportunities and rights of older people”, ro.scribd.com/…/157381939.
78
generations and within them and improving the citizens’ quality of life as a precondition for lasting individual well-being."
The national target for 2013 was the creation of a legislative, institutional and participatory modern framework meant for reducing the risk of poverty and social exclusion and promoting social cohesion, equal opportunities and cultural diversity.
For 2020, the main objective is to promote consistently EU norms and standards relating to social inclusion, equal opportunities and actively supporting the disadvantaged.
The national target for 2030 is represented by the significant approximation to the EU average in terms of social cohesion and quality of social services.
The economic crisis has revealed that there are differences between labor market institutions and social protection systems capacities to cope with potential shocks of crisis.
At the suggestion of the European Commission, Member States must take into account the guidelines set in the "Social Investment Package," aimed at refocusing the states towards social investment, where it is necessary, by the optimal use of funds.
CURRENT STATE OF THE PENSION SYSTEM IN ROMANIA
Following the decline in the number of taxpayers and increase in the number of pensioners by the aging of population while birth rate is decreasing, the longer life span and early retirement (before term), the pension system in Romania was affected significantly towards an imbalance between receipts at the pension fund and the budget allocated for their payment.
In recent years a great pressure was exerted on the pension system due to the increasing number of retirees who seriously unbalanced the state budget.
Erroneous decisions were perpetuated over time, resulting in a collection rate getting lower, and the inconsistent policy concerning the calculation of basic rights for entry into the pension affected significantly certain segments of the workforce who was already enduring the populist measures of differential payments made in prior periods, which led to inequities in calculating pensions of persons.
To illustrate the above we can mention the following: � If in 1990 in Romania there were 8.1 million employees and 3.6 million
pensioners, the ratio has reversed dramatically and now there are currently 5.5 million pensioners and 4.5 million employees.
� Statistics show that in the year 2012 of the approx. 5.5 million pensioners only 3.8 million had reached full age limit to retire, of which only 2.1 million had both age limit as well as the complete contribution period.
� From a total population of approximately 21.5 million, according to official data, the retirees’ number amounts to approx. 5.5 million, including all forms of pension type, which are supported by the approximately 4.5 million taxpayers who will not be able to balance, on medium and long term, the imbalance created in the system. It must be emphasized that imbalances were significantly increased by:
� The 150000-200000 special pensions for which the allocated budget amounts to around one billion Euros annually, suffocating the social security budget;
79
� Social Security Budget can no longer sustain itself from the proceeds of the compulsory pension contributions due to the rise of pensions’ value by 50% in 2007;
� The 2 million inactive people, out of a total of 5.2 million persons, who are aged between 45 and 65 years;
� More than 40000 false disability pensions, obtained in violation of statutory provisions;
� The approximately 650000 survivor’s pensions. All these pensions mean approximately 10 billion Euros per year, money that
are paid from the contributions of more than four million employees, but also directly from the state budget since the budget pensions can not meet these expenses.
From the statistical point of view, every taxpayer maintains today the life of more than one retired, and this ratio is projected to reach more than two pensioners per taxpayer for in 2050.
Moreover, the prospects are bleak as the current pension system does not allow the accumulation and investment of amounts collected in the pension fund, because they are poor and primarily used for pension payments. In fact, there is no certainty that the state will have the resources necessary to ensure him a pension in conformity with his contribution payments when the taxpayer reaches retirement age.
CONCLUSIONS From the considerations mentioned above, the governmental policies relating to
the pension system aim to achieve a balance of the pension budget by 2020 so there will not longer be necessary the intervention of the state budget to support their payment.
Although the social policies depend on the competence of each Member State, the European Union supports those by completing the activities under the states’ responsibility.
Complementary to the national and community policies, the World Bank supports and promotes pension system reform in countries with which it has agreements, and the pension system promoted in Romania by it is based on the following three pillars37:
� Pillar I - it is the pension provided by the public pension system. � Pillar II – it is the privately managed pensions (mandatory private pensions). � Pillar III – is represented by the voluntary private pensions, consisting of
additional contributions of employees and employers. This material has tried to incorporate economic, social and financial aspects in an
effort to recognize the links and synergies between the pensions and "Europe 2020" global strategy for smart and sustainable development, favorable for social cohesion.
REFERENCES 1. *** www.rejournal.eu/portals/0arhiva/JE%2024/JE%2024%20Ionica. 2. *** Comisia Europeană, primul raport biennal asupra serviciilor sociale
de interes general (Biennial Report on Social Services of General
37*** Sisteme de Pensii/Pension Systems - Aegon Romania, www.aegon.ro/ro/RO-Homepage-pensia

80
Interest) COM(2008), 418 Final, htpp:/eur-lex.europa.eu/LexUriServ, Comisia European[ 2010, al doilea raport bienal asupra serviciilor sociale de interes general(Second Biennial Report on social Services of General Interest, SEC(2010), 1284 Final, htpp:/ec.europa.eu/social/main).
3. *** Strategia privind reforma în domeniul asistenŢei sociale din România 2011-2013 elaborată de Ministerul Muncii, Familiei
4. *** StrategiaNaŢionalăde DezvoltareDurabilă a Românieiîn perspective anilor 2013-2020-2030: Asistenţa Socială, modalitate de respectare a egalităţii de şanse şi apărarea drepturilor persoanelor vârstnice
5. *** Sisteme de Pensii - Aegon Romania, www.aegon.ro/ro/RO-Homepage-pensia
81
THE IMPACT OF THE PUBLIC DEBT ON THE EUROPEAN UNION MEMBER
COUNTRIES
Prof. Gheorghe MATEI, Phd, University of Craiova Faculty of Economics and Business Administration Craiova, Romania Lect. Luiza APOSTOL, Phd Student University of Pitesti Faculty of Economics Pitesti, Romania
Abstract. Developed countries are faced with significant risks based on the problem of the increasing public debt. The most recent assessments bring to the forefront clear perspectives regarding the expansion of the period of economic uncertainty until 2020, which is why certain countries, especially those in the Euro area, were forced to resort to a number of austerity measures. However, it is unlikely that the countries in distress will easily restore, only by austerity, manageable public debt levels, especially under the current population aging conditions. This paper comprises an analysis of the countries in the Euro zone that were the most affected by the economic and financial crisis from 2008-2010. Besides these countries I also made an analysis of the Romanian government debt.
JEL classification: H63, G01
Key words: public debt; debt crisis; economic recession.
1.INTRODUCTION The poor management of the public debt already present at global level and
also the use of the borrowed amounts for consumption, along with the reticence of the policy decision factors to make changes on the tax burden and/or on the public spending volume were the main causes of the increase in the degree of indebtedness of the countries.
Amid the world economic and financial crisis, of the decrease or even cancellation of the economic growth paces, the countries were forced to resort to financial aid, borrowing from the domestic or foreign capital markets. Unfortunately, however, even beyond the peak of the economic recession, the concerns of the countries are focused on economic recovery financed from new loans and not on solving the already contracted debt-related problems. In these circumstances, in January 2012, the volatility of the world financial markets increased due to the tax fragility in most developed countries, leading to the increase in the public debt cost and to new assessments concerning the increase of the degree of indebtedness of the states until 2019. (Ferrarini, B. et al., London, 2012, p. 160)
In the long term, this trend of the governments to support the economic growth through public debt refinancing could be the start point of a new stage of global macroeconomic decline since, even in the countries undergoing economic recovery,
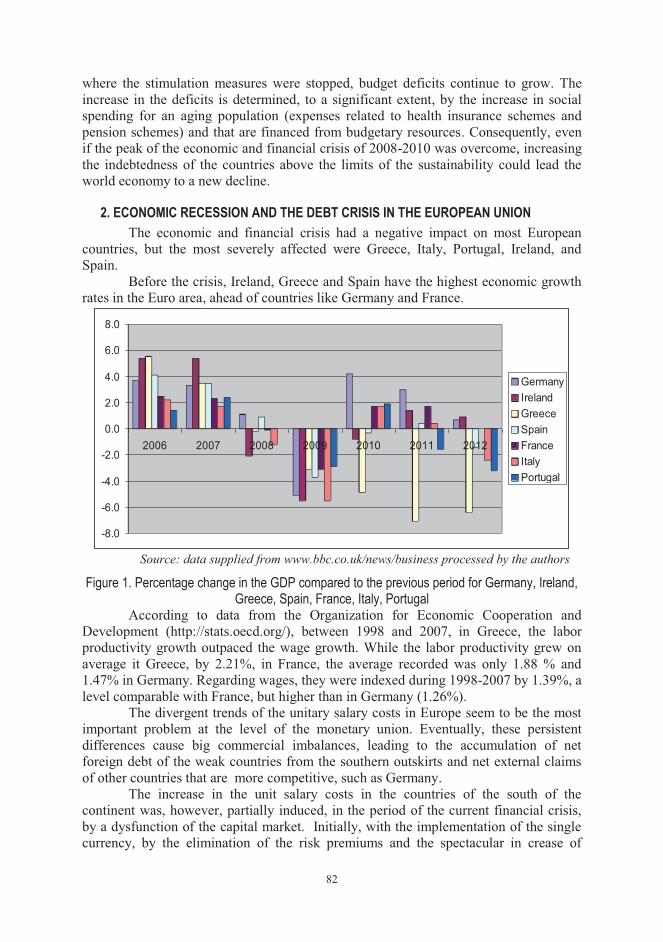
82
where the stimulation measures were stopped, budget deficits continue to grow. The increase in the deficits is determined, to a significant extent, by the increase in social spending for an aging population (expenses related to health insurance schemes and pension schemes) and that are financed from budgetary resources. Consequently, even if the peak of the economic and financial crisis of 2008-2010 was overcome, increasing the indebtedness of the countries above the limits of the sustainability could lead the world economy to a new decline.
2. ECONOMIC RECESSION AND THE DEBT CRISIS IN THE EUROPEAN UNION The economic and financial crisis had a negative impact on most European
countries, but the most severely affected were Greece, Italy, Portugal, Ireland, and Spain.
Before the crisis, Ireland, Greece and Spain have the highest economic growth rates in the Euro area, ahead of countries like Germany and France.
-8.0
-6.0
-4.0
-2.0
0.0
2.0
4.0
6.0
8.0
2006 2007 2008 2009 2010 2011 2012
GermanyIrelandGreeceSpainFranceItalyPortugal
Source: data supplied from www.bbc.co.uk/news/business processed by the authors
Figure 1. Percentage change in the GDP compared to the previous period for Germany, Ireland, Greece, Spain, France, Italy, Portugal
According to data from the Organization for Economic Cooperation and Development (http://stats.oecd.org/), between 1998 and 2007, in Greece, the labor productivity growth outpaced the wage growth. While the labor productivity grew on average it Greece, by 2.21%, in France, the average recorded was only 1.88 % and 1.47% in Germany. Regarding wages, they were indexed during 1998-2007 by 1.39%, a level comparable with France, but higher than in Germany (1.26%).
The divergent trends of the unitary salary costs in Europe seem to be the most important problem at the level of the monetary union. Eventually, these persistent differences cause big commercial imbalances, leading to the accumulation of net foreign debt of the weak countries from the southern outskirts and net external claims of other countries that are more competitive, such as Germany.
The increase in the unit salary costs in the countries of the south of the continent was, however, partially induced, in the period of the current financial crisis, by a dysfunction of the capital market. Initially, with the implementation of the single currency, by the elimination of the risk premiums and the spectacular in crease of
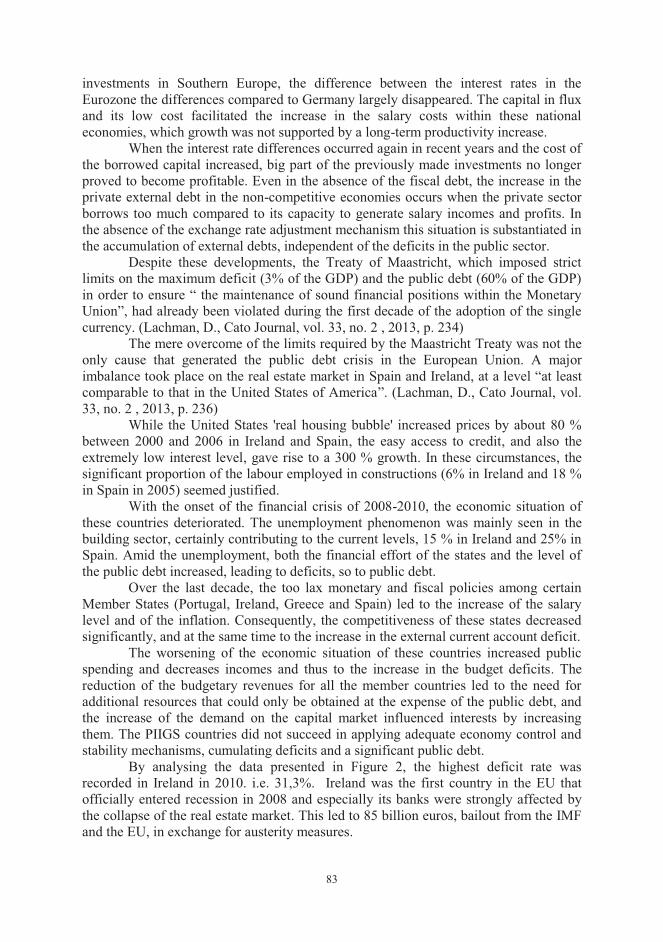
83
investments in Southern Europe, the difference between the interest rates in the Eurozone the differences compared to Germany largely disappeared. The capital in flux and its low cost facilitated the increase in the salary costs within these national economies, which growth was not supported by a long-term productivity increase.
When the interest rate differences occurred again in recent years and the cost of the borrowed capital increased, big part of the previously made investments no longer proved to become profitable. Even in the absence of the fiscal debt, the increase in the private external debt in the non-competitive economies occurs when the private sector borrows too much compared to its capacity to generate salary incomes and profits. In the absence of the exchange rate adjustment mechanism this situation is substantiated in the accumulation of external debts, independent of the deficits in the public sector.
Despite these developments, the Treaty of Maastricht, which imposed strict limits on the maximum deficit (3% of the GDP) and the public debt (60% of the GDP) in order to ensure “ the maintenance of sound financial positions within the Monetary Union”, had already been violated during the first decade of the adoption of the single currency. (Lachman, D., Cato Journal, vol. 33, no. 2 , 2013, p. 234)
The mere overcome of the limits required by the Maastricht Treaty was not the only cause that generated the public debt crisis in the European Union. A major imbalance took place on the real estate market in Spain and Ireland, at a level “at least comparable to that in the United States of America”. (Lachman, D., Cato Journal, vol. 33, no. 2 , 2013, p. 236)
While the United States 'real housing bubble' increased prices by about 80 % between 2000 and 2006 in Ireland and Spain, the easy access to credit, and also the extremely low interest level, gave rise to a 300 % growth. In these circumstances, the significant proportion of the labour employed in constructions (6% in Ireland and 18 % in Spain in 2005) seemed justified.
With the onset of the financial crisis of 2008-2010, the economic situation of these countries deteriorated. The unemployment phenomenon was mainly seen in the building sector, certainly contributing to the current levels, 15 % in Ireland and 25% in Spain. Amid the unemployment, both the financial effort of the states and the level of the public debt increased, leading to deficits, so to public debt.
Over the last decade, the too lax monetary and fiscal policies among certain Member States (Portugal, Ireland, Greece and Spain) led to the increase of the salary level and of the inflation. Consequently, the competitiveness of these states decreased significantly, and at the same time to the increase in the external current account deficit.
The worsening of the economic situation of these countries increased public spending and decreases incomes and thus to the increase in the budget deficits. The reduction of the budgetary revenues for all the member countries led to the need for additional resources that could only be obtained at the expense of the public debt, and the increase of the demand on the capital market influenced interests by increasing them. The PIIGS countries did not succeed in applying adequate economy control and stability mechanisms, cumulating deficits and a significant public debt.
By analysing the data presented in Figure 2, the highest deficit rate was recorded in Ireland in 2010. i.e. 31,3%. Ireland was the first country in the EU that officially entered recession in 2008 and especially its banks were strongly affected by the collapse of the real estate market. This led to 85 billion euros, bailout from the IMF and the EU, in exchange for austerity measures.
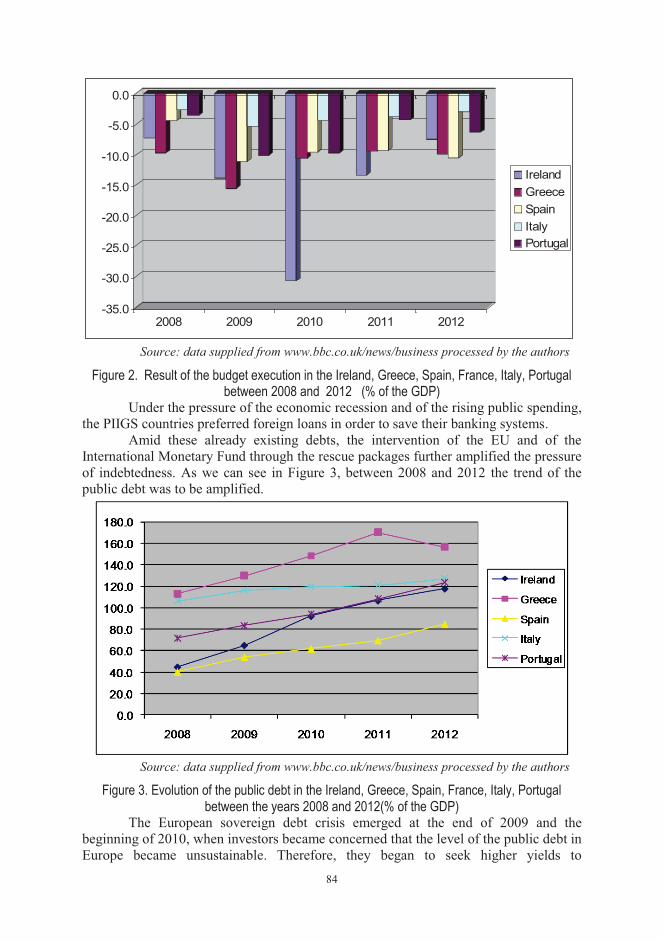
84
-35.0
-30.0
-25.0
-20.0
-15.0
-10.0
-5.0
0.0
2008 2009 2010 2011 2012
IrelandGreeceSpainItalyPortugal
Source: data supplied from www.bbc.co.uk/news/business processed by the authors
Figure 2. Result of the budget execution in the Ireland, Greece, Spain, France, Italy, Portugal between 2008 and 2012 (% of the GDP)
Under the pressure of the economic recession and of the rising public spending, the PIIGS countries preferred foreign loans in order to save their banking systems.
Amid these already existing debts, the intervention of the EU and of the International Monetary Fund through the rescue packages further amplified the pressure of indebtedness. As we can see in Figure 3, between 2008 and 2012 the trend of the public debt was to be amplified.
Source: data supplied from www.bbc.co.uk/news/business processed by the authors
Figure 3. Evolution of the public debt in the Ireland, Greece, Spain, France, Italy, Portugal between the years 2008 and 2012(% of the GDP)
The European sovereign debt crisis emerged at the end of 2009 and the beginning of 2010, when investors became concerned that the level of the public debt in Europe became unsustainable. Therefore, they began to seek higher yields to
85
compensate for the increasing bankruptcy risk.This has led to higher interest rates for the governments with problems and the beginning of a vicious cycle.
The most significant increase was recorded in Greece in 2011 when the public debt amounted to 170.3 % of the GDP as shown in Figure 3. Greece declared false economic data in order to align to the requirements of the Monetary Union. But in the end, the truth came out and the country was forced to accept a bailout package of 110 billion euros in May 2010 in exchange for the implementation of harsh austerity measures.
Portugal became the third member of the EU that requested a bailout in 2011 after it came close to bankruptcy.
The debt crisis in Europe evolved from being a local threat to putting pressure on the overall macroeconomic stability.
Between 2011 and 2012 in the EU there were many discussions related to the possible solutions to get out of the crisis of the Euro area. The pooling of the debt of the countries in the Euro area (by launching on the market the so- called Eurobonds) was indicated by some European leaders as a possible way out of the crisis.
However Germany openly opposed such measures, invoking the responsibility of each government for their own decisions and the need to take responsibility for the social and economic consequences by the nations that created those debts.
Although some states were reluctant to the prospect of keeping a supranational structure that tends to become more rigid and less conducive to economic growth efforts by committing unlimited budget deficits, however, in March 2012, 25 of the 27 European countries, including Romania, signed the Treaty on Stability, Coordination and Governance (TSCG) within the Economic and Monetary Union (http://european-council.europa.eu/media/639164/18_-_tscg.ro.12.pdf).
The treaty aims at strengthening the fiscal discipline by introducing penalties applied automatically and a stricter surveillance. The document sets out the structural deficit threshold limit of 0.5 %. The Member States are required to implement "a balanced budget rule" in the national budget law, preferably at constitutional level. The deadline for the fulfillment of this obligation is at most one year after the entry into force of the document, i.e. 1 January 2014, since the Treaty entered into force on January 1, 2013 after its ratification by Finland, the 12th state in the Euro zone that adopted the treaty.
If a country's public debt is significantly below 60 % of the GDP and there is no risk related to the long-term sustainability of the public finance, the structural deficit can be negotiated up to 1% of the GDP, the maximum cyclical budget deficit plus the structural one being within the limit of 3 % of the GDP.
According to TSCG, if deviations from these levels are noticed, an automatic correction mechanism will penalize the State in question at a rate of up to 0.1% of the GDP.
3 EVOLUTION OF THE GOVERNMENT DEBT IN ROMANIA Regarding Romania, this country underwent a new type of micro-transition in
the crisis years, from an economy based on increasing the consumption of resources borrowed heavily (the years 2007–2009), to an economy based on one hand on austerity (unemployment increase, restriction of social protection, reducing the incomes of the population) and on the other hand on the increase in the sectors with exportable productions (the years 2010–2012).
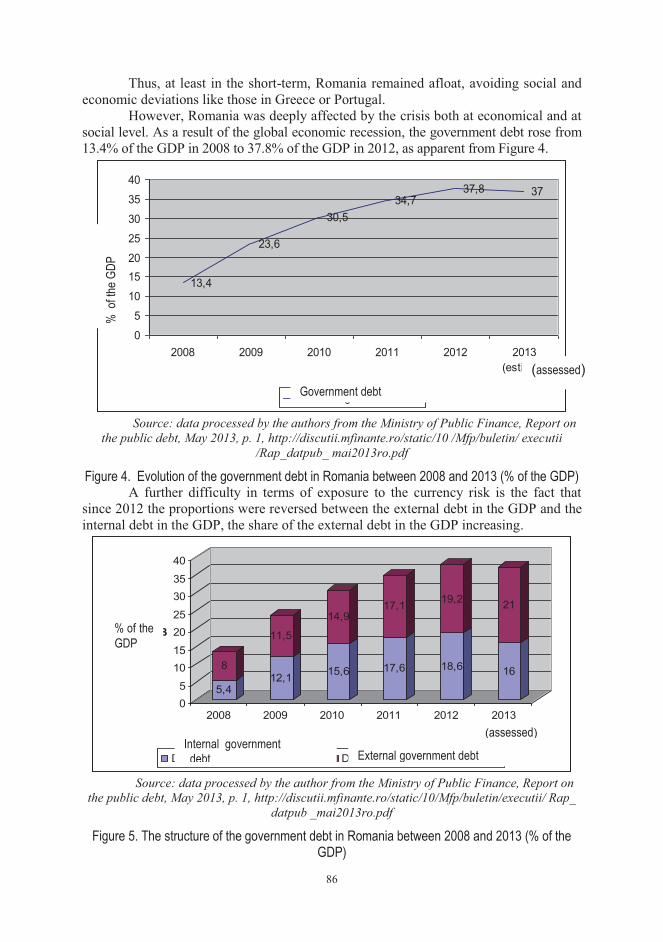
86
Thus, at least in the short-term, Romania remained afloat, avoiding social and economic deviations like those in Greece or Portugal.
However, Romania was deeply affected by the crisis both at economical and at social level. As a result of the global economic recession, the government debt rose from 13.4% of the GDP in 2008 to 37.8% of the GDP in 2012, as apparent from Figure 4.
13,4
23,6
30,534,7
37,8 37
0
5
10
1520
25
30
35
40
2008 2009 2010 2011 2012 2013(estimat)
% d
in P
IB
Datoria guvernamentală
Source: data processed by the authors from the Ministry of Public Finance, Report on the public debt, May 2013, p. 1, http://discutii.mfinante.ro/static/10 /Mfp/buletin/ executii
/Rap_datpub_ mai2013ro.pdf
Figure 4. Evolution of the government debt in Romania between 2008 and 2013 (% of the GDP) A further difficulty in terms of exposure to the currency risk is the fact that
since 2012 the proportions were reversed between the external debt in the GDP and the internal debt in the GDP, the share of the external debt in the GDP increasing.
5,4
812,1
11,5
15,6
14,9
17,6
17,1
18,6
19,2
16
21
05
1015
2025
3035
40
% din PIB
2008 2009 2010 2011 2012 2013(estimat)
Datorie guvernamentală internă Datorie guvernamentală externă
Source: data processed by the author from the Ministry of Public Finance, Report on the public debt, May 2013, p. 1, http://discutii.mfinante.ro/static/10/Mfp/buletin/executii/ Rap_
datpub _mai2013ro.pdf
Figure 5. The structure of the government debt in Romania between 2008 and 2013 (% of the GDP)
Government debt (assessed)
% of the GDP
(assessed) Internal government
debt External government debt
% o
f the G
DP
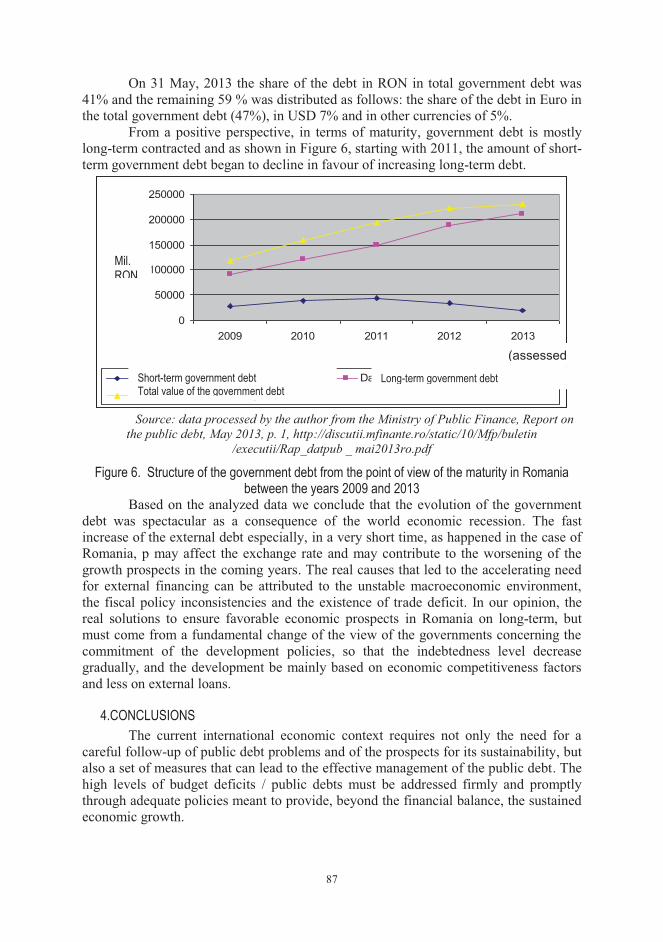
87
On 31 May, 2013 the share of the debt in RON in total government debt was 41% and the remaining 59 % was distributed as follows: the share of the debt in Euro in the total government debt (47%), in USD 7% and in other currencies of 5%.
From a positive perspective, in terms of maturity, government debt is mostly long-term contracted and as shown in Figure 6, starting with 2011, the amount of short-term government debt began to decline in favour of increasing long-term debt.
0
50000
100000
150000
200000
250000
2009 2010 2011 2012 2013(estimat)
mil. lei
Datorie guvernamentală pe termen scurt Datorie guvernamentală pe termen lungValoare totală a datoriei guvernamentale
Source: data processed by the author from the Ministry of Public Finance, Report on
the public debt, May 2013, p. 1, http://discutii.mfinante.ro/static/10/Mfp/buletin /executii/Rap_datpub _ mai2013ro.pdf
Figure 6. Structure of the government debt from the point of view of the maturity in Romania between the years 2009 and 2013
Based on the analyzed data we conclude that the evolution of the government debt was spectacular as a consequence of the world economic recession. The fast increase of the external debt especially, in a very short time, as happened in the case of Romania, p may affect the exchange rate and may contribute to the worsening of the growth prospects in the coming years. The real causes that led to the accelerating need for external financing can be attributed to the unstable macroeconomic environment, the fiscal policy inconsistencies and the existence of trade deficit. In our opinion, the real solutions to ensure favorable economic prospects in Romania on long-term, but must come from a fundamental change of the view of the governments concerning the commitment of the development policies, so that the indebtedness level decrease gradually, and the development be mainly based on economic competitiveness factors and less on external loans.
4.CONCLUSIONS The current international economic context requires not only the need for a
careful follow-up of public debt problems and of the prospects for its sustainability, but also a set of measures that can lead to the effective management of the public debt. The high levels of budget deficits / public debts must be addressed firmly and promptly through adequate policies meant to provide, beyond the financial balance, the sustained economic growth.
Mil. RON
Short-term government debt Total value of the government debt
Long-term government debt
(assessed
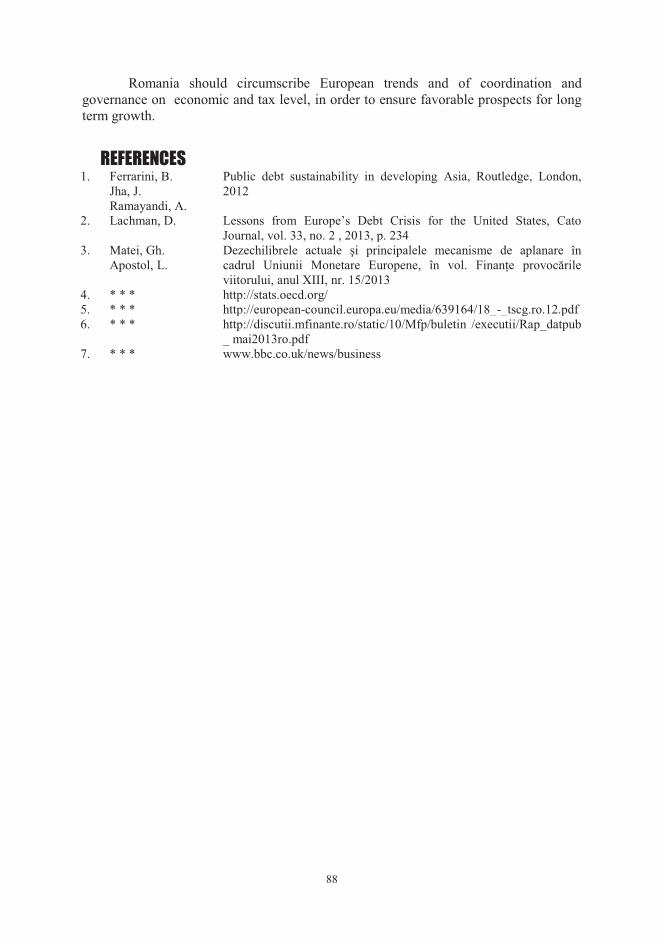
88
Romania should circumscribe European trends and of coordination and governance on economic and tax level, in order to ensure favorable prospects for long term growth.
REFERENCES 1. Ferrarini, B.
Jha, J. Ramayandi, A.
Public debt sustainability in developing Asia, Routledge, London, 2012
2. Lachman, D. Lessons from Europe’s Debt Crisis for the United States, Cato Journal, vol. 33, no. 2 , 2013, p. 234
3. Matei, Gh. Apostol, L.
Dezechilibrele actuale şi principalele mecanisme de aplanare în cadrul Uniunii Monetare Europene, în vol. Finanţe provocările viitorului, anul XIII, nr. 15/2013
4. * * * http://stats.oecd.org/ 5. * * * http://european-council.europa.eu/media/639164/18_-_tscg.ro.12.pdf 6. * * * http://discutii.mfinante.ro/static/10/Mfp/buletin /executii/Rap_datpub
_ mai2013ro.pdf 7. * * * www.bbc.co.uk/news/business
89
A COMBINATION WITH MULTIPLE ORGANIZATIONAL IMPLICATIONS: GENERATION Y AND KNOWLEDGE MANAGEMENT
Prof. Mihai Vărzaru Ph. D University of Craiova Faculty of Economics and Business Administration Craiova, Romania Lecturer Radu Florin Ogarcă University of Craiova Faculty of Economics and Business Administration Craiova, Romania
Abstract: Generation Y is the subject of numerous speeches in public, particularly in relation to the work, the expectations and behaviors in the organisation. Current management is surprised by the integration of these young people in the work environment. The solution of integration of these young people would be, as most specialists appreciate, in an management “between generations” to adapt their practices to the specific characteristics of each generation, an evolving technological environment and its ways of organizing work to reach for the model enterprise 2.0, according to the allegedly logic of action of youth. But this solution transfers a large part of the problem within the scope of knowledge management. This paper analyzes the new studies that were concerned with the need for the integration of young people who belong to generation Y in enterprises and the impact of this integration to achieve a new stage in the development of knowledge management that will increase organizational performance. The chosen research methodology is qualitative, imposed by the chosen issue and incorporeal nature phenomena to be observed; more precisely by identifying how the knowledge transfer occurs between generations within SMEs.
JEL classification: M50, M51,M54
Key words: Generation Y, knowledge transfer, integration, specifically in SMEs
1. INTRODUCTION Since the early nineties, the process of knowledge encounters many difficulties.
The latter are beginning to detach from material resources in favor of immaterial. The challenge for an enterprise now resides in its ability to identify, preserve, enhance, share and update its stock of knowledge. In recent years, by a particular interest was the study of knowledge transfer process and, in particular, in-between generations’ aspect, ie the exchange of knowledge and experience from the most experienced individuals of an organization to the young and vice versa in the largest organizations worldwide.
In the past, knowledge transfer between generations was mainly operated in one direction: an experienced person conveyed what he knew to a newcomer whose contribution become important only in the medium or long term. However, now the transfer is more susceptible to occur in both directions. Indeed, as stated by Heidi Anderson in Harvard Management Communication Letter, "rapid scientific and
90
technological breakthroughs make young workers have now invaluable knowledge for the workers with more experience."
New recruitment, coming from places high of technical knowledge or university, often contains explicit and tacit knowledge, which can be a source of innovation. These are basically new knowledge that elders do not necessarily hold. The analysis of in-between generations’ transfer of knowledge is the main objective of this paper. The research aims to bring a new vision for the transfer of knowledge to the intra-organizations with the integration of its generational specificity.
2. GENERATION Y: CHARACTERISTICS AND MOTIVATION Relevant studies of several professional agencies shows that Generation Y will
represent between 30-40 % of the active population of the EU countries over the next 2-5 years. It is estimated that the level reached by this generation will be 36% in the U.S. in 2014 and 46 % in 2020 (Business School of the University of North Carolina). Their arrival is therefore inevitable, massive and durable, and it becomes an emergency not only to understand, but also to take specific action to put the energy and creativity of these young people with many qualities in the service of creating value.
Generation Y represents an added value for organizations. Thirsty for knowledge, because they were incited from an early age to express preference for activities that enrich this perspective, the youth of this generation have grown up with these new technologies, the Internet, the social networks, and are used to access large amounts of information and take advantage of them according to their needs. Spontaneously they reflect, work and interact in a much collaborative way. Followers of forums, of brainstorming, have an ability to find innovative solutions together and offer fresh perspectives. The skills of "digitalis natives" to use social networking gives them instinctively, for example, a wide range of knowledge in areas where previous generations are less practical, ie. technological innovations such as digitalis, social media etc. Their reflection in the field is even more interesting, as it is about the strategic sectors for many organizations.
It was always believed that employees must be on the same wavelength with organization values. Most management experts agree that the new model will not longer be that of a company whose values are not necessarily required to its employees, and new solutions must be brought. The new generation carries values questioning current methods of enterprise management. Most managers are are looking for their identical people, their age, but new information and communication technologies have profoundly changed the society, behaviors, and the organization must be aware of these changes and adapt.
Many leaders do not take the trouble to provide the instruments and opportunities necessary for the develoment of the entire potential of their employees, and primarily young people. Influence that will have the arrival of this "digital generation" will not be limited only to its number but also requirements regarding instruments that young people want to use as part of their work. It is about applications and programs in connection with what they already use in everyday life. Any organization or any manager who will know how to adapt and provide lifestyle that generation Y seek to send a clear message of acceptance implementation of the potential candidates and will be successful in this regard.
91
To overcome the stage of a mere findings and reflect on the changes that organizations need to take in choosing the decision to resist or adapt to the enhancement of this new generation, may be used to analyze the motivation based on Maslow 's model (1954) , to identify some elements for undeerstanding and tracks of some solutions.
Regarding the need for security, Generation Y was built on a background of crisis in a troubled and uncertain economic environment. Exacerbated competition, rising unemployment and frequent restructuring creates doubt and fear, and the employer can no longer guarantee its protective role. In such a context Generation Y thinks that it must surely find this one. She understands and accepts the precarious environment where can be found, and learns that it is important to develop its autonomy. This is the mechanism that caused by the development of a self-centered attitude seeking immediate gratification and an emancipation from hierarchical authority, which it expects responsible behavior. His commitment becomes conditional, meaning that involvement is achieved if the requirements are fufilled, ie if the benefits are shared by both parties. Motivational lever is achieved by ensuring trust by proving the authenticity and courage.
The need for socialization is aimed at taking care of the individual to feel appreciated and accepted by the reference group. Nowadays the reference group and the membership do not necessarily coincide. Extension studies, adherence to various alumni associations and the emergence of social networks has as consequence an increase in membership in the social networks and reducing extra- effort to accommodate with the professional group membership, especially if it does not match the identity, values and does not integrate the personal life project. The absence of support from the person responsible will be perceived as a managerial incompetence, and the manager who does not listen enough will lose credibility and weaken its authority. Motivational lever consists in creating an atmosphere of trust by promoting empathy and by adopting ethical behavior.
The need for self-esteem requires a person to feel recognized, to enjoy the prestige and consideration as part of the group. Self-esteem is composed of three components. So far the self-image (social identity) was closely linked to professional identity, by means of which the individual has (compensation) and does (occupation). The rejection by Y culture, "what it has " and seeking of "doing" has as consequence the recognition signals expected mainly on what they are, than on what young do (strengths, potential development personal etc.). They want to be appreciated with objectivity, justice, equity and "humanity". Criticisms are voluntarily accepted, provided that they are based and followed by proposals for appropriate improvement actions. All young people of this generation wait for their manager to be together in the development of skills, to support the accumulation of new capabilities and to propose customized schemas and and polished by the evolution of the career.
In terms of self-love, generations X and Y have learned to connect to their emotions and understand the interest that this might have for them, unlike previous generations, forced to always be "the best","most powerful", "perfect" and not allowed to express emotions.
The need for achievement is exiting a purely material condition, to achieve personal fulfillment. What has changed in terms of aspiration are reporting on time, the value of work and interest in work. Generation Y has no time to lose, she wants to achieve "here and now" and be immediately happy. In fact, recording to her work is not
92
a task, nor an identity and an instrument to accumulate wealth, but a contributory factor to his personal fulfillment.
This new generation aspire to a balance between private and professional life. What motivates today are conditions of employment, working hours and organizations’ image. As such, managers must reconcile the pressure to meet targets and to improve working conditions, taking into account the specificities of each of the contributors. Motivational lever is to create appropriate working conditions to suit individual requirements and accepting that the work is no longer a purpose in itself.
3. THEORETICAL RESEARCH FRAMEWORK
In an environment as complex as that of the organization today, the concept of knowledge is not intuitive or immediately. Indeed, in the orgnization knowledge can be found everywhere and at all levels. Despite widespread use of the concept of knowledge, the problem of defining it continues to fuel debate among researchers. Presentation of important definitions can identify different facets of knowledge.
Kogut and Zander (1992) and Grant (1993) define knowledge as information bearing experience and distinguish three forms of knowledge: information, experience and understanding. Information refers to data, facts or symbols and can be changed according to the rules of standard syntax. Experience refers to the accumulated knowledge regarding the way to perform an action. It provides meaning to information by binding elements in a relationship of cause and effect. Understanding refers to the knowledge of the mechanisms underlying the causal relationships observed.
In terms of knowledge, definitions here are many and varied, but with a common point, linked to the distinction developed by Polyani (1980) between tacit and explicit knowledge. This distinction was thorough in the researches of Winter (1987), Zander and Kogut (1995), Nonaka (1992), Nonaka and Takeuchi (1992,1995), Simonin (1999) and Hall (2000). It is particularly important especially in terms of knowledge transfer, which can not be identical when it comes in the form of tacit or explicit. Explicit knowledge is encoded and easily transferable knowledge through information systems. They are already transcribes and therefore are easily captured and transmitted. Unlike explicit knowledge, implicit or tacit knowledge refers to experience, the skills and abilities that are not written, as it is found only in the minds of employees and transmitted orally. Since there are formalized, tacit knowledge is difficult to convey (Nonaka et Takeuchi, 1995), "being anchored in action, proceedings, values and emotions." Tacit knowledge is difficult or sometimes impossible to encode. Their assimilation by an individual involves a series of adjustments and transfer mechanisms enabling a richer communication compared with classical supports encoding.
The definition of knowledge according to their transfer facility is particularly important in the research management as knowledge transfer issues is a crucial challenge of management oforganizations.
Knowledge can also be characterized by its locality criterion. Kogut, Zander (1992) and Spender (1993) distinguish four levels of localization: individual, group, organization and network. From this perpective it cand be done a distinction between individual and collective knowledge.
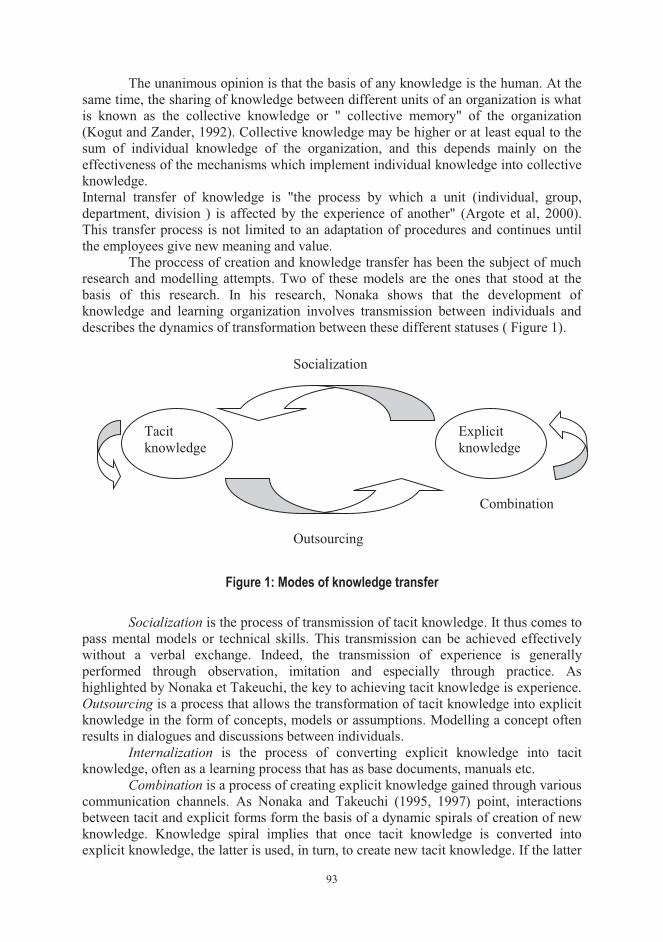
93
The unanimous opinion is that the basis of any knowledge is the human. At the same time, the sharing of knowledge between different units of an organization is what is known as the collective knowledge or " collective memory" of the organization (Kogut and Zander, 1992). Collective knowledge may be higher or at least equal to the sum of individual knowledge of the organization, and this depends mainly on the effectiveness of the mechanisms which implement individual knowledge into collective knowledge. Internal transfer of knowledge is "the process by which a unit (individual, group, department, division ) is affected by the experience of another" (Argote et al, 2000). This transfer process is not limited to an adaptation of procedures and continues until the employees give new meaning and value.
The proccess of creation and knowledge transfer has been the subject of much research and modelling attempts. Two of these models are the ones that stood at the basis of this research. In his research, Nonaka shows that the development of knowledge and learning organization involves transmission between individuals and describes the dynamics of transformation between these different statuses ( Figure 1).
Figure 1: Modes of knowledge transfer
Socialization is the process of transmission of tacit knowledge. It thus comes to pass mental models or technical skills. This transmission can be achieved effectively without a verbal exchange. Indeed, the transmission of experience is generally performed through observation, imitation and especially through practice. As highlighted by Nonaka et Takeuchi, the key to achieving tacit knowledge is experience. Outsourcing is a process that allows the transformation of tacit knowledge into explicit knowledge in the form of concepts, models or assumptions. Modelling a concept often results in dialogues and discussions between individuals.
Internalization is the process of converting explicit knowledge into tacit knowledge, often as a learning process that has as base documents, manuals etc.
Combination is a process of creating explicit knowledge gained through various communication channels. As Nonaka and Takeuchi (1995, 1997) point, interactions between tacit and explicit forms form the basis of a dynamic spirals of creation of new knowledge. Knowledge spiral implies that once tacit knowledge is converted into explicit knowledge, the latter is used, in turn, to create new tacit knowledge. If the latter
Tacit knowledge
Explicit knowledge
Socialization
Combination
Outsourcing
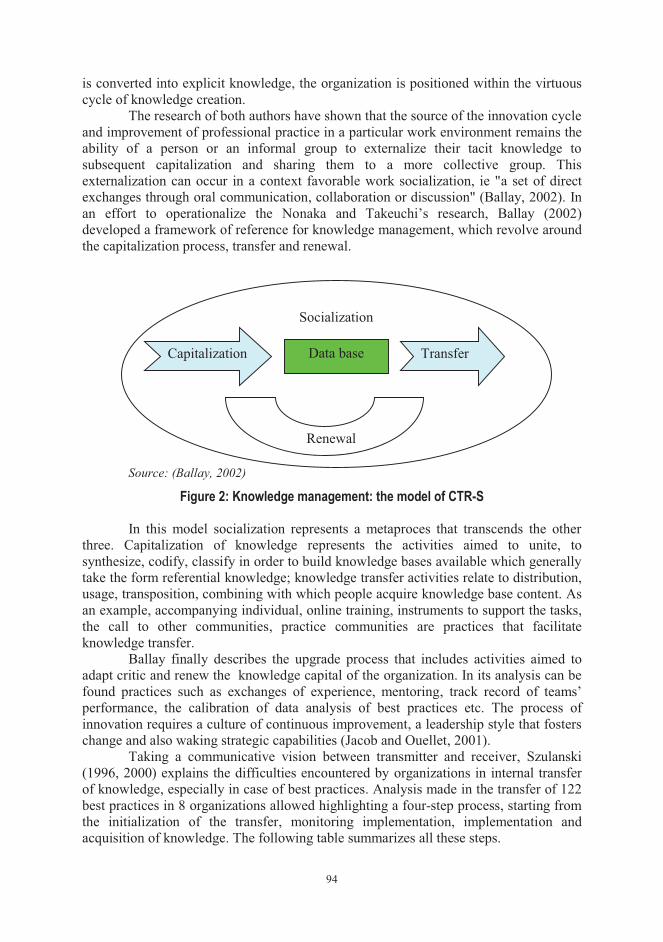
94
is converted into explicit knowledge, the organization is positioned within the virtuous cycle of knowledge creation.
The research of both authors have shown that the source of the innovation cycle and improvement of professional practice in a particular work environment remains the ability of a person or an informal group to externalize their tacit knowledge to subsequent capitalization and sharing them to a more collective group. This externalization can occur in a context favorable work socialization, ie "a set of direct exchanges through oral communication, collaboration or discussion" (Ballay, 2002). In an effort to operationalize the Nonaka and Takeuchi’s research, Ballay (2002) developed a framework of reference for knowledge management, which revolve around the capitalization process, transfer and renewal.
Source: (Ballay, 2002)
Figure 2: Knowledge management: the model of CTR-S In this model socialization represents a metaproces that transcends the other
three. Capitalization of knowledge represents the activities aimed to unite, to synthesize, codify, classify in order to build knowledge bases available which generally take the form referential knowledge; knowledge transfer activities relate to distribution, usage, transposition, combining with which people acquire knowledge base content. As an example, accompanying individual, online training, instruments to support the tasks, the call to other communities, practice communities are practices that facilitate knowledge transfer.
Ballay finally describes the upgrade process that includes activities aimed to adapt critic and renew the knowledge capital of the organization. In its analysis can be found practices such as exchanges of experience, mentoring, track record of teams’ performance, the calibration of data analysis of best practices etc. The process of innovation requires a culture of continuous improvement, a leadership style that fosters change and also waking strategic capabilities (Jacob and Ouellet, 2001).
Taking a communicative vision between transmitter and receiver, Szulanski (1996, 2000) explains the difficulties encountered by organizations in internal transfer of knowledge, especially in case of best practices. Analysis made in the transfer of 122 best practices in 8 organizations allowed highlighting a four-step process, starting from the initialization of the transfer, monitoring implementation, implementation and acquisition of knowledge. The following table summarizes all these steps.
Socialization
Data base Capitalization Transfer
Renewal
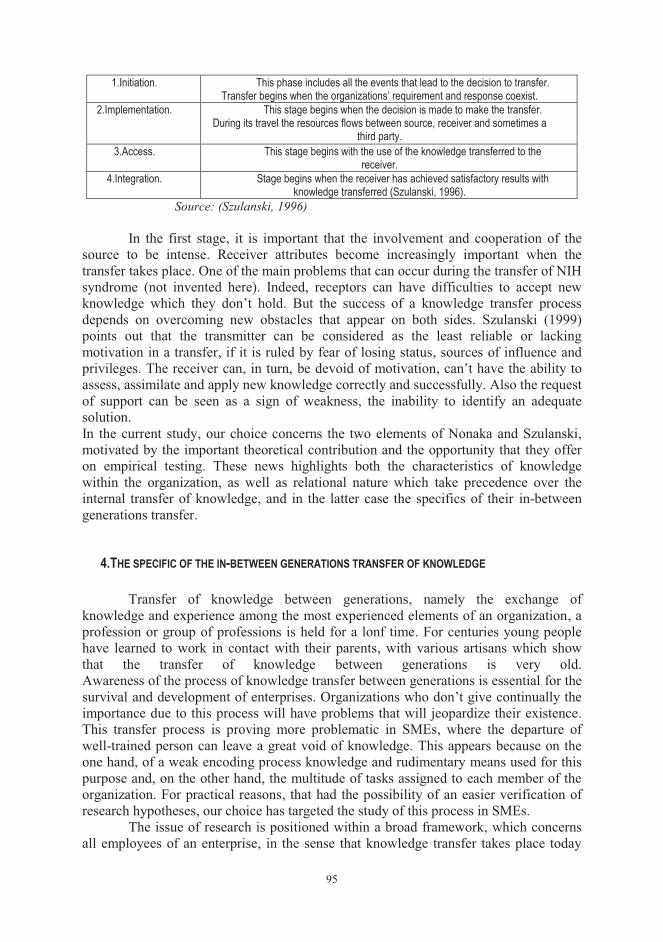
95
1.Initiation. This phase includes all the events that lead to the decision to transfer. Transfer begins when the organizations’ requirement and response coexist.
2.Implementation. This stage begins when the decision is made to make the transfer. During its travel the resources flows between source, receiver and sometimes a
third party. 3.Access. This stage begins with the use of the knowledge transferred to the
receiver. 4.Integration. Stage begins when the receiver has achieved satisfactory results with
knowledge transferred (Szulanski, 1996). Source: (Szulanski, 1996)
In the first stage, it is important that the involvement and cooperation of the
source to be intense. Receiver attributes become increasingly important when the transfer takes place. One of the main problems that can occur during the transfer of NIH syndrome (not invented here). Indeed, receptors can have difficulties to accept new knowledge which they don’t hold. But the success of a knowledge transfer process depends on overcoming new obstacles that appear on both sides. Szulanski (1999) points out that the transmitter can be considered as the least reliable or lacking motivation in a transfer, if it is ruled by fear of losing status, sources of influence and privileges. The receiver can, in turn, be devoid of motivation, can’t have the ability to assess, assimilate and apply new knowledge correctly and successfully. Also the request of support can be seen as a sign of weakness, the inability to identify an adequate solution. In the current study, our choice concerns the two elements of Nonaka and Szulanski, motivated by the important theoretical contribution and the opportunity that they offer on empirical testing. These news highlights both the characteristics of knowledge within the organization, as well as relational nature which take precedence over the internal transfer of knowledge, and in the latter case the specifics of their in-between generations transfer.
4.THE SPECIFIC OF THE IN-BETWEEN GENERATIONS TRANSFER OF KNOWLEDGE
Transfer of knowledge between generations, namely the exchange of knowledge and experience among the most experienced elements of an organization, a profession or group of professions is held for a lonf time. For centuries young people have learned to work in contact with their parents, with various artisans which show that the transfer of knowledge between generations is very old. Awareness of the process of knowledge transfer between generations is essential for the survival and development of enterprises. Organizations who don’t give continually the importance due to this process will have problems that will jeopardize their existence. This transfer process is proving more problematic in SMEs, where the departure of well-trained person can leave a great void of knowledge. This appears because on the one hand, of a weak encoding process knowledge and rudimentary means used for this purpose and, on the other hand, the multitude of tasks assigned to each member of the organization. For practical reasons, that had the possibility of an easier verification of research hypotheses, our choice has targeted the study of this process in SMEs.
The issue of research is positioned within a broad framework, which concerns all employees of an enterprise, in the sense that knowledge transfer takes place today
96
not only the most experienced employees to the new ones, but also vice versa, from the young to the older ones. From this point of view there are two main issues:
1 ) How can an organization retain and renew the expertise and the knowledge held by employees who retire and that are often implicit and not explicit?
2) How to integrate the new human resources more effectively which should ensure continuity in the functioning of organizations?
The reflections of this study will address these issues and their specificity in the SMEs in the romanian socio-economic context.
A brief review of the literature and research known to allow the formulation of hypotheses that can be confronted with the reality of the Romanian SMEs to verify to what extent they are confirmed or refuted by reality. The success of a transfer of knowledge between the employees of the enterprise depends largely on the extent to which the transmitter and receiver of the knowledge perceive interdependence between them. Psychological factors, bind, for example, age, level of expertise of older people, can really be considered obstacles to the effective integration of newcomers and the sharing of their knowledge and positive use.
Hypothesis 1: The atmosphere that exists within the organization staff can be a determining factor in the success of knowledge transfer between different generations of the company.
Moreover, it can forward the idea that the degree of transparency and the facile communication between organizations’ employees may have an impact in terms of making esay the process of in-between generation transfer of knowledge.
Hypothesis 2: An environment that facilitates communication between organizations’ staff or by specialized platforms, eitherr by organizational arrangements that facilitate communication can play a decisive role in the success of the knowledge transfer process in-between generations .
In order for a knowledge transfer to take place, first must take place a knowledge excange between individuals. Therefore, any enterprise should seek to ascertain whether these practices of human resource management fosters the exchanges of information and knowledge, or, conversely, discourage them.
Hypothesis 3: A transfer of knowledge between generations can be stimulated by human resources management levers such as classic mentoring, reverse mentoring, participation etc.
Knowledge transfer can operate by a shift and/or a change of networks or subnetworks reservoirs of knowledge (Szulanski, 1996). From this point of view we can advance the following hypothesis:
Hypothesis 4: In a smaller SME the process of internal mobility of an individual involves automatically the transfer the knowledge that he holds.
Communities of practice are groups of people facing together or virtual in order to share knowledge and experiences and learn from each other. They remain grouped by common interests in a sphere of knowledge and are driven by the desire and need to make the concerns, experiences, models, instruments and best practices. Community members deepen their knowledge by interacting on an ongoing basis and on long term, developing a set of best practices (Wenger, McDermott and Snyder, 2002). On this basis it can advance a new hypothesis.
Hypothesis 5: Communities of practice can create a favorable context for in-between generation transfer of knowledge.
97
In order to study basic issues facing the reality was tried in the first instance, to make a first contact by means of a questionnaire sent to HR directors and officers of 10 organizations from different industries, followed by semi-direct maintenance with the same people. Choosing to diversify the activity chosen is explained by the desire to have a general idea of the romanian productive environment.
The field investigated is presented in four parts of the questionnaire. The first chapter allows obtaining information on the organization, ie its status, sectoral characteristics, areas of activity, number of employees etc. The second part allows the recognition of the characteristics of employees and the level of qualification, age, seniority, level of external mobility, recruitment methods etc. Part three is interested in characterizing the working atmosphere, the type of relations between employees and communication policy. The final part seeks to provide information on measures to integrate young recruits and the policies adopted to preserve the expertise held by employees who leave or will leave the enterprise in the future.
The problem to which is desired a response is to identify how to operate the transfer of knowledge between the two generations, specifically how it integrates young diplomats in a sector that prevailed people with low schooling, which have an employment only through the experience gained here. It also sought a response linked to the old employees who wish to believe and accept that the new diplomats can offer, in turn, interesting and necessary knowledge. To respond to these problems has been chosen a qualitative research methodology. As underlined by Yin (1994), when problems must be answered starting with "how" and "why" must be preferred case studies. Or, in this research we are looking for an answer related to identify how such a transfer knowledge between generations takes place.
Furthermore, an adequate knowledge of reality and actors is required by the intangible nature of the phenomena to be observed. The case study appears from this point of view, the appropiate scoup of research.
Therefore our effort has focused on achieving of a device information and theories to enable the basic theoretical framework to be applied, validated and developed in order to obtain new knowledge through a field study. For operational research interests we have sought to establish a series of interim targets on the ground, such as setting portrait of in-between generations knowledge transfer issues in romanian SMEs’ sector through a series of maintenance and inquiries of employees involved, namely young recruits older workers, human resource managers etc. A future case study offers the opportunity to test the results of the series of questions in the questionnaire.
5. CONCLUSIONS Knowledge management is recognized today as indispensable for the survival
and development of enterprises. It helps the enterprise " not only to gain the skills, to identify, exploit them and to know how to manage interfaces in order to reach a smoother , faster , more present and recognized conjugation". The organization must, therefore, sensitize its members and encourage them to promote the exchange of information.
This project was built around two points. The first aspect is the demonstration of the interest of in-between generations transfer of knowledge to the organizations’ management and to increase organizational performance. Closely related to this issue is
98
addressed and highlight the relational dimension in the process of transfer. In this basis it is desired a research through a study which is less explored in regards to this issue.
In-between generation transfer of knowledge is, in our opinion, a new research trail to explore in a promising and booming field.
REFERENCES 1. Argote L., Organizational Learning: Creating, Retaining and Transfering
Knowledge, Kluwer Academic: Boston, MA, 1999 2. Ballay, J.F Tous managers du savoir . Paris, Editions d’organisation, 2002 3. Drucker P. The coming of the new organisation» Harvard Business Review, Jan
Fev, 1988. 4. Galunic D.C.,
Rodan S., Resources recobinations in the firm: knowledge structures and the potential for Schumpeterian innovation, Strategic Managemnt Journal 19(12), 1998
5. Grant R.M., Toward a knowledge-based theory of the firm, -Strategic Management Journal, 1996
6. Jacob R, Harvey S Jacob, R.,Ouellet P Nonaka. I Takeuchi. H Nonaka I, Takeuchi H, Ingham M
“La gestion des connaissances et le transfert intergénérationnel : une étude de cas au sein de la fonction publique québécoise “ Revue d’analyse comparée en administration publique, 2005 Globalisation, économie du savoir et compétitivité : tendances et enjeux stratégiques pour l’entreprise québécoise. Rapport de recherche commanditée. Observatoire DEC / INRPME-UQTR, 90,2001 The knowledge –creating company, Oxford University Press,New York, 1995 „La connaissance créatrice: le dynamique de l’entreprise apprenante” Editions De Boeck Université,1997
7. Zander U., Kogut B.
Knowledge of the firm and the evolutionary theory of the multinational corporation, Journal of International Business Studies, Fourth quarter, 1993
8. Zander U.
Knowledge and the Speed of the Transfer and Imitation of Organizational Capabilities: An Empirical Test, Organization Science, Vol. 6, No. 1, 1995
9. Wenger E., McDermott
Cultivating Communities of Practice: A Guide to Managing Knowledge, Harvard Business Press, 2002
10. Yin R.K. Case Study Research : Design and Methods, Thousand Oaks CA: Sage Publications, 1994
99
STORAGE – INTEGRAL COMPONENT OF THE LOGISTIC SYSTEM
Florin TUDOR, PhD Faculty of Economics and Business Administration University of Craiova Teaching Assistant, Ph.D., Andrei Bogdan BUDICĂ Faculty of Economics and Business Administration University of Craiova Professor, Ph.D., Ilie BUDICĂ Faculty of Economics and Business Administration University of Craiova, Romania PhD Candidate, Adrian Florin BUDICĂ Faculty of Economics and Business Administration University of Craiova
Abstract: A very important objective of logistics is the storage of material goods necessary to ensure the uninterrupted operation of activities to achieve successful missions . The typical definition of the concept of filing emphasizes that it is a space storage of stocks of goods. This paper aims to show the role and importance of storage in the logistics system. Storage related field has become a comprehensive economic category includes sizing issues, reducing expenditure and storage issues related to structure types, conservation and use of material.
The originality and value of this study comes from the suggestions that have been made about the concepts and methods that could improve the logistics business in order to secure material storage.
Keywords: storage, stocks, goods, management JEL classification: M11, M21
1.INTRODUCTION
The term "logistics" comes from the Greek word "Logistical", meaning "counting craftsmanship, skilled in making calculations". Cojocaru (1991) argues that logistics origin appears as the "logistics" title given to officials of the Roman and Byzantine armies. One of the oldest accepted definitions for logistics would be that all the preparations and actions are needed to supply the armed forces in the most effective manner of goods and supplies, leaving most favorable circumstances confrontations. One of the basic definitions of logistics is that of M. Christopher, showing that it is "the science that deals with strategic planning of supply, distribution, or storage of materials (associated with the flow of information), choosing the most appropriate channels marketing (distribution) to make maximum profits now and in the future with actual costs as low as possible. "(Balan, C. 2006). Currently all logistics in the military means all means necessary to apply strategic and tactical field decisions.
100
So , logistics is defined as the strategic management of the acquisition, movement and storage of materials, semi-finished and finished products (with corresponding information flows these processes) within public institutions and distribution channels in order to satisfy the lowest orders costs for the organization.
Hence, logistics is not limited exclusively to military life, more and more activities in the private sector and state owned logistics (business, manufacturing, education, research, medicine, tourism), it can be said that in a broader sense is found in all social activities as a necessary and crucial for their success. Logistics incorporates functions related to material management, distribution, storage, transport. Logistics, through its content, is a whole chain of several activities, the core of any economic strategy. Logistics is the science of planning and execution of movement, maintenance and includes issues related military operations: design and development, acquisition, storage, transportation, distribution, maintenance, evacuation and disposition of material (equipment, vehicles, weapons, ammunition, fuel, etc..) transport of personnel and materials; acquisition or construction, maintenance, operation and disposition of facilities; purchase or provision of services; medical and health service support. Storage of goods has a very important role in logistics gear. Without storage institutions could not carry out activities smoothly.
Storage of goods is equivalent to transport their time and not in space. It is an important component of the distribution of goods, and the need for storage and duration are determined by natural conditions considered economic and other considerations. Storage was initially considered a necessary but generating costs are substantially modifying conceptual during the twentieth century, reaching the XXI century to consider the ideal target in terms of storage, the relentless reduction of stocks of goods that are not moving until there will be a quasi-continuous motion. The ultimate goal will be removing the need to store in any point of the network, including between production units, between them and customers. Storage of goods will change in the future, under the influence of mutations in relations with suppliers, production and distribution.
2. Objectives: In logistic system of storage includes a set of support activities that help
achieve the necessary assurance of the staff of an institution. Perspective on the role and functions of store significant mutations in decades. Among the decisions taken by logisticians on deposits of goods includes determining the number of deposits, determining the location, sizing deposits and internal configuration . The warehouse is a space to store goods. He may belong to the manufacturer, a wholesaler, a retailer, a salesman or a public. Storage is a key logistics strategy , it directly affects customer service levels and costs that the company's profitability .
The strategic role of storage in making performance of the financial market and the firm's management determines finding the most efficient storage system must : provide discounts on transport costs; to achieve economies of distribution process ; maintain sources of supply and to streamline supply ; to adapt to changing market conditions : seasonal fluctuation in demand , competition , to mitigate differences of time and space that exists between producers and consumers to ensure the synchronization of transport in intermodal technologies due to the difference of the various modes of transport capacity . For example : automotive , rail - track - naval etc.
101
To achieve economies in production ; program to support JIT manufacturing firms , distributors and consumers. Storage has an important role for the distribution based on the concept of "speculation" according to which the manufacturer focuses on producing large quantities of stocks taken as distributors in exchange for price facilities and other facilities in the promotion and sale of products. In this situation, use indirect channels long and divided storage function between producers and distributors on minimum cost principle. (Bucklin, 1991). Heritage of public institutions is a public, state owned him, manager's mission and executive staff being to harness these resources and performance management processes to achieve the objectives of the institution, by responsible directly or indirectly.
2.1. Evolution of the concept of storage Deposit presence in logistic system is considered a necessity. The typical
definition of the concept of deposit emphasizes that it is a storage of stocks of goods. The deposit has been defined in the literature as a special place for housing for goods deposited for safekeeping. After the Second World War have appeared regional warehouses allowing extensive coverage of regional areas.
Modern storage equals not keeping goods in a special space for a long period. Storage operators specialized in offering a wide range of storage related services, such as: invoicing, labeling, packaging, evidence inventory, create promotional packages, transport a wide territorial area. Between 60 and 70 specialists in storage have focused on the need to promote new technologies to improve their operations. In the 80's, attention turned to improving the configuration warehouse and techniques for handling goods. In the 90's, keywords have become storage flexibility with respect to market changes and the effective use of information technology.
XXI century, the ideal objective in respect the storage is considered to be constant reduction of inventories of goods that are not moving until you achieve a quasi-continuous motion. Acquire new information technologies critical to inform the storage. With the disappearance of the need for storage, logistics systems managers must pursue permanent reduction of inventories as compared to current levels.
2.2. Role, functions and types of deposits. Storage is related the need to maintain stocks and is considered a support activity that contributes to the mission of ensuring the right product logistics in quantity and quality required, in the right place at the right time.
2.2.1. The role of the deposit consisting of: a) coordination of supply and demand, is to provide the quantities of products
needed to satisfy the demand in the following situations: uncertainty regarding the application; uncertainties cycle performance; seasonal demand; seasonal production.
b) achieving cost savings. Storing has an impact on costs in other fields of activity of companies can determine obtaining cost savings in the fields purchase; production; transport;
c) continuing or delaying production when the production or processing can continue in storage (eg some food: wine, cheese and fruit);
d) achievement of marketing objectives. The link between the storage and marketing is determined by the role storage spaces in satisfying customer demands so; reduced delivery time by placing werehouses near the customers thus ensuring reduced required timeframe for honoring the orders; adding value by offering special services in accordance with customer requirements, such as billing, packaging, creation of
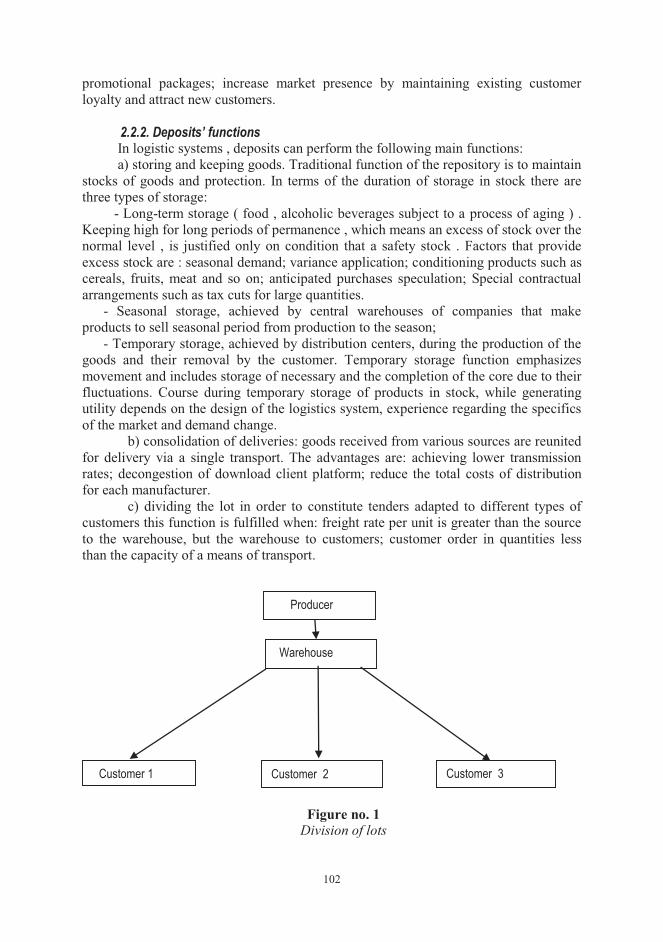
102
promotional packages; increase market presence by maintaining existing customer loyalty and attract new customers.
2.2.2. Deposits’ functions In logistic systems , deposits can perform the following main functions: a) storing and keeping goods. Traditional function of the repository is to maintain stocks of goods and protection. In terms of the duration of storage in stock there are three types of storage: - Long-term storage ( food , alcoholic beverages subject to a process of aging ) . Keeping high for long periods of permanence , which means an excess of stock over the normal level , is justified only on condition that a safety stock . Factors that provide excess stock are : seasonal demand; variance application; conditioning products such as cereals, fruits, meat and so on; anticipated purchases speculation; Special contractual arrangements such as tax cuts for large quantities. - Seasonal storage, achieved by central warehouses of companies that make products to sell seasonal period from production to the season; - Temporary storage, achieved by distribution centers, during the production of the goods and their removal by the customer. Temporary storage function emphasizes movement and includes storage of necessary and the completion of the core due to their fluctuations. Course during temporary storage of products in stock, while generating utility depends on the design of the logistics system, experience regarding the specifics of the market and demand change.
b) consolidation of deliveries: goods received from various sources are reunited for delivery via a single transport. The advantages are: achieving lower transmission rates; decongestion of download client platform; reduce the total costs of distribution for each manufacturer.
c) dividing the lot in order to constitute tenders adapted to different types of customers this function is fulfilled when: freight rate per unit is greater than the source to the warehouse, but the warehouse to customers; customer order in quantities less than the capacity of a means of transport.
Figure no. 1
Division of lots
Producer
Warehouse
Customer 1 Customer 2 Customer 3
103
d) creating an assortments structure is found in two variants, depending on the source of the products:
- production units of the same company. The warehouse receives goods from several factories of the same manufacturer and delivers many customers a wide assortment of products.
- production sites belonging to different companies. The warehouse creates assortment combinations from several suppliers.
e) movement of material goods; Movement function in turn consists of several activities: reception; transfer order selection and Sending.
Reception Activities include handling and unloading products received from the carrier, the record to date, and tracking of warehouse stocks, the establishment of damage and aging products in stock, check the records and inventory orders and shipments. The transfer includes: the physical movement of goods in the warehouse to sort and combine specialized places and shipping products to customers. Selecting commands refers to the group and a range of products in the quantities desired by customers, plus wrapping. The reference is to build and manage loading units as a means of reference (pallets, containers), loading vehicles, checking the expedition.
2.2.3. Types of deposits a) by type of goods stored and secured storage conditions : general warehouses
in which to store a wide range of products ; highly specialized warehouses is arranged for storing products that require special conditions such as foods stored in warehouses, cold stores, cellars ( basements ) and sheds .
b) fulfill the role we deposits after long term storage ( storage facilities ) and warehouse distribution center ;
c) after the warehouse meet private ownership : owned by the same company that owns management and ownership of the goods stored and handled in the warehouse ; public warehouse belonging to a company specializing in warehousing and logistics operations and provide services to interested customers in return for a fee; deposit contract : based on a long-term arrangement exclusively for a particular customer ; d) by destination: collecting deposits; Transit and transhipment warehouses; deposits seasonal and long-term storage, the state reserves include deposits, grain silos;
e) fire resistance warehouses fire resistant, made of concrete, bricks, etc. deposits less resistant to fire, which include construction and flammable materials; flammable deposits.
f) where the filing serviced warehouses directly serving production; warehouses serving the movement.
3. METHODOLOGY Location deposits. Variants and modern methods of placing the werehouses.
Conditions of design, the placement and arrangement of werehouses Designing and building a repository must have as starting point the following
elements of substantiating: type and size of warehouse (area, volume); type and destination area for warehouse space components (storage, packing, drying, cold, etc.). Main relations between different surfaces, namely the correlation between flows of
104
goods, packaging, transportation; functional ordering of deposit; structural characteristics of the deposit.
Location deposit. Basic criterion is the siting of a rational organization of leading products as short circuit distribution.
The place that builds the warehouse must meet certain conditions: a) land disposal conditions: be in or near the service area, but outside the
congestion; liberating to be away from areas of harmful agents; to close an artery of communication, the most easily accessible places; provide opportunities natural camouflage against air and ground observation; the election of the most suitable system for storage and use of modern means of transport - handling.
b) conditions on the properties of the land: to be dry slightly high and slightly tilted; not be subject to flooding from groundwater or gathered from rain and snowmelt runoff (upper level of groundwater to be at least 4-5 meters from the ground surface to remove such emergence and penetration of water into basements her construction capillary walls); have a strong power aotupurificare (coarse-grain soil).
The building will work the warehouse must meet certain conditions, namely: to be oriented north - south; have sufficient natural and artificial light; possibilities have water and electricity; be secured storage conditions set standards for each type of goods (typically should provide a storage temperature of between 0 and 25 ° C and a relative humidity of 50-85%); rooms to be clean, dry, with automatic or mechanical ventilation; area appropriate to the nature, volume and destination of products and allow proper organization of storage; include facilities and accommodation for performing specific operations storage; ensure product integrity and safety; correspond to the ecological, veterinary, labor protection and fire-fighting.
Determination of humidity and temperature warehouses will perform hygrometers and thermometers are installed on one of the interior walls to a height of 1.5 m from the floor.
Maintenance warehouses. Maintenance depots shall be: a) day - after the program handling the stores to be restored to working order,
swept (if possible using vacuum), airy, shutters or curtains left and the doors sealed. b) Weekly - airing is complete, in dry, recommended morning. Do not ventilate
warehouses fog, wind, storm, rain, snow, smoke or temperaturaeste -10 ° C or lower. c) Monthly - Clean dust and spiders nests on all materials and interior walls. d) annually - is whitewashing the interior walls (if is possible). Disinsectization and disinfection warehouses. Disinsectization and disinfecting
sheds are running to destroy insects, rodents, fungi and molds that attack stored materials and preventives. These operations are done twice in the period 1 September to 31 March in equal time intervals and monthly from 1 April to 31 August.
For destroying insects, larvae pupae, eggs, use chemical means as: naphthalene, insecticides or their equivalent.
To destroy rodents use mechanical means (racing and pitfalls of various kinds), chemical (arsenic, sulfur dioxide pliers, phosphorus, barium carbonate, thallium sulfate, lime or equivalent), biological (destruction with dogs and cats) and using microbial cultures associated with toxic chemicals under the supervision of specialized bodies and the observance of personal protective measures.
Factors that influence quality of stored products: The quality and quantity of stored products exert their influence a range of
factors relating both to the actual products and the storage space:
105
a) internal factors (product specific): nature and characteristics of products and materials; Physical and chemical properties; biological status and sanitation; technological processing stage;
b) external factors (related to storage space): temperature; humidity; brightness; maintenance status; packaging. A good storage must ensure equilibrium between internal factors and external storage space, so that changes are controlled within the limits of the rules.
4. ANALYSES
Today warehouse functions are more complex compared to the primary objective, which is to store material goods. Current storage systems must fit in modern production systems of type MPR (Material Requirement Planning), DRP (Distribution Requirement Planning), JIT (Just in Time) Kanban, contributing to their effectiveness by maximizing the utility of time, that the warehousing and storage costs. Storage costs are significant elements of the total cost of distribution.
Over the years, storage has evolved from a minimum based on the logistic system of the company, to be considered one of the most important functions.
As part of the logistics system, storage can be defined “safekeeping of products to and from points of production and consumption and providing information to company management about the situation, the conditions and status of assets held.”
The literature has introduced the term “distribution center”. Storage is a more general term, more comprehensive, while “distribution center” is defined in the narrower sense; “Like a warehouse of finished products and place orders can be made wholesale or retail.”
Gerry Hatton in “Logistics management and distribution” (1999) shows that in addition to semantic gap , using the term distribution center means a change of conception. The image repository is associated constant movement of goods to the final destination, helping to maximize the utility of time, that minimize storage time and reduce the corresponding costs.
5. CONCLUSIONS The main functions of the storage and distribution center are:
rocessing orders, checking goods, packaging and transport units handling, transportation from the place of storage to the load;
transportation to customers. Out of the four methods mentioned above the one that is most suitable to use in
public is Just in Time method. This method was first used in 1950 by the Japanese company Toyota aims to
reduce to zero if possible, materials stocks. Under this method the material goods are brought into the institution exactly when they are needed.
Just in Time improves the competitiveness of the institution will spend less by eliminating unnecessary organizational activities created by a traditional organization: stocks, handling, security, control, quality, reliability. It is seen as a philosophy of stock
106
control the purpose of maintaining the necessary quantities of material at the specified points at the right time to achieve the required amount of products and is a programming algorithm that the entire supply channel - retail is synchronized to meet production or customer requirements.
REFERENCES 1. Bălan,
Carmen Logistica, Ediţia a III –a revizuită şi adăugită, Editura Uranus, Bucureşti, 2006
2. Balaure,Virgil (coordonator)
Marketing, ediţia a II a, Editura Uranus, Bucureşti, 2000
3. Bucklin, L.P. Competition and Evaluation in the Distribution Trades, New Jersey, Prentice Hall, 1972
4. Budică Ilie Logistica mărfurilor, Editura Universitaria, Craiova, 2010 5. Charon,J-L.
Separi, S Organisation et gestion de l’entreprise, Dunod, Paris, 2004
6. Cristopher, M.
Logistics and Supply Chain Management, Pitman Publishing London, 1992
7. Dumitru, M. Managementul Logisticii, Editura Sitech, Craiova, 2005 8. Gattorna, J. Managementul Logisticii şi Distribuţiei, Editura Teora 1999, Bucureşti 9. Ilieş, Liviu Management logistic, Editura Dacia, 2003, Cluj-Napoca 10 Lambert,
D.M., Stock, J.R.,
Strategic Logistics Management, Richard D.Irwin, inc, Boston, 199
107
FOOD QUALITY IN ALL ITS FORMS
Lect. Nataliţa Maria Sperdea Ph. D University of Craiova Faculty of Economics and Business Administration Craiova, Romania Lect. Radu Cătălin Criveanu Ph. D University of Craiova Faculty of Economics and Business Administration Craiova, Romania
Abstract: : Increasing the quality of particular importance lately was driven mainly by increased competition, continuously increasing demands of customers and society, the increasing complexity of products and processes for their preparation. Quality of products and services is the result of a complex conjugate of economic, natural and social factors which are closely linked. It is a concept with a very wide use, making them extremely difficult to define in terms of science. Quality, utility, quality poses, are some of the approaches in this paper .
JEL classification: D11, L66
Key words: food; quality; quality hypostases; food functions; quality standards
1. DEFINITION AND EVOLUTION OF THE CONCEPT OF QUALITY The interdisciplinary concept of "quality" has led many disciplines such as
philosophy, economics and technical to define and give a different meaning of the term. In philosophy, the quality represents the "ownership or mode of being, good or
bad, of a person or thing" or "all traits and essential aspect, under which he is subject, this phenomenon, and not another." In logic, the term is used as a "logical criterion, then the predictive judgments fall into affirmative and negative." In economic practice, the concept of quality was initially significance of artistic beauty, and in terms of production craft, the "well done", "satisfying customer", "product availability", "a systematic approach to excellence," "conformity to specifications", "suitable for use" etc.38.
David A. Garvin, a professor at Harvard Business School revealed five main guidelines in defining product quality: transcendent, to product, to process, to costs, to the user.
Transcendent orientation. Under this guidance, Quality is an entity represents timeless, absolute, perceived subjectively by each individual. Such an approach does not allow a clear definition of quality items and its measurement
Product orientation. This is totally opposite of transcendent orientation, quality is considered a size that can be measured precisely. It is defined as ansamble of the characteristics of quality of the product.
38 Maxim, E., - Managementul şi economia calităţii, Editura Secom Libris, Iaşi, 1998
108
Orientation towards production process. Quality is from the perspective of manufacturer. For each product are specified requirements that to be met. Product is considered quality when it correspond within specifications. Any deviation from specifications means a reduction in quality. But for a user, the product may meet the specifications, but not quality.
Costs orientation. Product quality is defined thru costs and hence prices in that are commercialize. A product is considered to be quality when providing certain performance at an acceptable price.
User orientation. This orientation considered product quality as to be the ability of the to be suitable for use. Each user has individual preferences that can be satisfied by different quality characteristics of the products. Quality is seen through correspondence with customer requirements, requirements on functionality, cost, delivery, safety, reliability, environmental compatibility, service, cost of use, consultancy etc. All of these contribute to achieving product quality.
The ISO 8402 standard defines quality as “the totality of characteristics of an entity that bear upon its ability to satisfy stated and implied needs.” According to this definition:
- entity is what can be described and considered individually as being: a product, an activity or a process, system or person and a combination thereof.
- the quality is not expressed by a single feature, but by a set of features; - The quality is not independent, it exists only in relation to customer need. - Needs are expressed - that means that are formulated in economic contracts
provider-consumer type either in standards, they expressing and ensuring "an optimal level for the community in whole" - or implied, when in certain situations are identified and defined.
According to SR EN ISO 9000:2008, quality is "the extent to which a set of inherent characteristics meet the requests" And within this new definition: - The quality is not expressed by a single feature, but by a set of features; - Quality requirements exist in relation to consumer.
In the standard meaning, the term "quality" can be attributed adjectives such as "poor", "good" or "excellent" and the term "intrinsic" in opposition to the "attribute" means something that exists as a permanent feature39.
Quality has not a static character, strictly delimited to a particular request, but it has a dynamic character as its content evolves in step with practical needs, historically determined, both extensively (when varying number of features) and intensive (characteristics are improved product / service).
In addition to achievements in science and technology and engineering excellence, we can mention other factors that determine the dynamic nature of quality such as market trends, emergence of new demands of consumer research, design materialize, which therefore constitutes a dynamic commercial offer, namely:
Something that was good sometime, can not correspond to the present and, even more so in the future;
Something that is typical in a market or market segment can be completely refused elsewhere or in the future.
The dynamic nature of quality is given by the time evolution of the level of the main characteristics of the products, the consistency on their economic and technical
39 SR EN ISO 9000:2001 – Sisteme de management al calităţii. Principii de bază şi vocabular
109
circuit, from the supplier to the trade and from here to the consumer . On this route designed and manufactured quality may change, usually in a negative way, because the same factors specific to the movement of goods: packaging, handling, transport, storage, etc.
Product quality reflects increasing economic development and civilization and contribute to the increases well-being and quality of life.
Produsele şi serviciile – sub influenţa necesităţilor umane, a ştiinţei şi tehnologiei – evoluează calitativ, schimbându-şi în mod sistematic în timp caracteristicile şi modul de a fi percepute de către consumatori.
Regardless of the diversity of these changes, it is important to operationalize the concept of product quality through specific elements which lists terms specific meanings merceological quality domain Among the most commonly used terms of this type in the marketing of goods, it highlights: the quality of the product unit, quality of batch, the features, quality characteristics, quality indicators, technical parameters, quality indexes, quality requirements, defects and nonconformity.
Product quality is assessed in relation to its own specified model (designed approved) prescribing in a standard or norm. This view is especially important for the end user purchaser.
Batch's quality is assessed by the degree to which quality is reflected in the corporate unit of goods produced and is estimated by the proportion of the poor quality of the lot. This concept is particularly important in the contractual relations between the three partners: supplier, carrier and recipient.
Quality requirements are defined as being expressions of needs, the characteristics of an entity expressed in quantitative or qualitative terms, to enable execution and examination of entity.
Quality requirements relate equally to the market, the contractual and company requirements.
Particular importance is given to define the quality requirements of the company, which are obligations arising from laws, regulations, rules, codes etc.. also aims essentially to protect life, health and the environment.
The defect is a failure to satisfy requirements or reasonable expectations of intended use, including those relating to security. Noncompliance is deviation or absence of one or more quality features to the conditions specified. Initial difference between "non-compliance" and "defect" is that certain specified conditions may differ from conditions of use. The distinction between these two terms is considered important because the defects liability question to the product, incumbent, usually the manufacturer.
2. HYPOSTASES OF GOODS' QUALITY IN THE MARKETING PROCESS The activities related to the movement of products and production relationship -
consumer generated, in practice, a number of concepts and meanings deriving by quality called by some authors quality hypostases.
Quality, with a complex and dynamic character, must be regarded as a technical-economic category with manifestations and specific possibilities of transforming in operational elements, facilitating communication between operators.
Quality is found throughout the production logistics and movement of products in many specific hypostases of each phase of product movement, incorporating differences in content and implications for economic activity. These "facets" of quality
110
reflects how they are perceived and translated to beneficiaries regarding on product quality requirements during the technical-economic circuit of goods, starting from the preliminary specification, continuing with design and manufacture, ending with meeting these requirements use of the product to customer.
In relationships between providers and beneficiaries in practice, there are usually following quality's hypostases: designed quality, approved quality, prescribed quality, contracted quality and real quality40:
Designed quality and approved quality of one product must meet the requirements of customers / consumers in a country, area, region, etc.. We find it in the design stage / main approval prototype product variants.
Prescribed quality is found in the produc standardst (SR EN ISO, SR, SF, SP) or other normative documents.
Contracted quality is quality that is agreed by the contract partners. The delivered quality represents the beneficiary requirements under the
contract requirements at the time of delivery. Such of quality is found in the analysis bulletin or statement of compliance, quality certificate, technical certificate accompany the consignment of goods shipped (delivered).
The real quality of a product / batch is given by the quality of the product after delivery, as that have to meet the requirements of customers / consumers.
Optimum quality is the quality of a product to the highest level on the global / national at a time. (it is found in the product that reigns supreme in the world).
All these facets of quality must be equal, ie there is no difference between them.
The quality hypostases in terms of supplier and recipient, highlight certain characteristics, which expresses the main interests of producers and retailers on the market such:
Technical quality (industrial) expresses the consistency of the individual values of the properties (usually technical and functional) requirements to the standards and regulations in force, leaving the secondary plan other properties. It express the views of the manufacturer.
Commercial quality expresses the extent to which all sensory characteristics, the variety of its product range, the size of the warranty period, the activity of "service", the presentation and packaging, size and operating maintenance costs etc. satisfy consumer needs. This aspect represents the point of view of the consumer and is very important in making purchasing decision.
Between these two situations, there is currently a closer tendency because they are interrelated to each other for the sale of products in a competitive market.
Most products are not consumed where they are produced. Between production and consumption are a number of operations (packing, loading, shipping, transportation, unloading, storage, etc.) that are supported by the products and that can influence, usually negative, batch quality. Also, even if the conditions for carrying out these operations are correct, the quality may change due to the lability of the chemical composition of the product. Following are highlights two facets of quality, ie the statical quality or the actual quality of the lot, determined at a time and the dynamic quality, respectively the time evolution of quality product batch. The practical importance of dynamic quality resulting from its implications in a number of activities
40 Definition in SR EN ISO 9000/2001;
111
such as contracting, in determining the amount of quality features and delivery schedules, in determining the validity period and perishability, and taking correct action organization transport, storage and preservation of consignments.
In the practice of commercial activities operators will meet frequently with these facets of quality, having to operate with them in contractual relations.
Due to the specific activity for enterprises producing, the designed quality and prescribed quality are strategy operated in issues of quality and for quality assurance are critical contracted quality and delivered on time to the businesses operated contracted real, static and dynamic quality.
1. Some of the hypostases of quality can be more important at a given time, for example, in contractual conditions, but usually, it is considered that all contribute to the overall quality of the product.
3. THE CONSUMER AND ITS DEMANDS ON QUALITY The client is the recipient of a product or service and it may be: user,
beneficiary, purchaser or ultimate consumer. Product quality is a fundamental requirement of competitiveness and quality
assessment is a personal right of the consumer, because it has a direct effect on quality of life. The quality of a product can be defined as "best fit order" or only consumers can discover the real quality of a product, they are the ones who use it daily or consum it.
Today, consumers are increasingly exigent to product quality. They formulate a number of requirements on reliability and maintainability characteristics psycho, economic and sanogenetic etc products. They also want to be informed correctly and completely to knowingly choose products. Consumers expect their needs to be met through quality products.
Adressing quality of classic and modern point of view, we find that the concept of quality of products has expanded from simple content according to the documentation, to the market requirements, consumers, quality and expanded the scope of physical products the full range of products and services to consumers, quality requirements identified user needs, the consumer, some of which are expressed (in the contract), others are implicit, such as aesthetics, ease of use etc.
Quality can not be achieved only through rigorous and responsible contribution of all factors that ensure its construction in the industrial process, from marketing research to meeting consumer and end of product life cycle.
The main consequence of this approach is the concept of quality as perceived by the consumer who relies on two main arguments, namely:
- No longer limited quality, simplistically, compliance with product specifications, but it must be in accordance with consumer needs. Given this, we deduce that for achieving a level of quality an organization must first determine the specific needs of the consumer segment which is intended product / service ;
- Quality should be based not only on the elements that contribute to the production and control of them, but especially the items within the scope of use, in other words, quality is "fitness for use".
112
Consumer perception is that determines his attitude in the future to buy from the same company 41. For this reason, all organisations activities must be directed by consumer desires and continually need to follow his reaction to product quality.
The quality of products and services is, for the consumer of today, more than ever, essential criterion to prefer one company that has established itself in terms of quality.
Most consumers change their preferences for certain products because of their low quality and then, due to price or other reasons. Typically, the consumer is willing to pay extra to get better quality.
A product to be request to consumers is not enough to be only good quality, but more important is to match price with quality. Consumers have a choice (depending on the quality / price) necessary product which is generally so designed and constructed as not to endanger the health and life or the quality of the environment.
Typically, when the price / quality ratio is higher, the chances of a product to be sold are higher. Unsalable items usually exhibit a quality / low price is low quality due to either price too high, or both causes simultaneously.
Quality is the best argument to sell, although the price is often a decisive factor. Quality as fitness for purpose of a product, as seen, are by far the most important measures for customer satisfaction.
In conclusion, the quality will rely increasingly more on what is desired by the consumer ultimately
4. CORRELATION BETWEEN USE VALUE - QUALITY OF FOOD In the "Thematic Dictionary of economic ideas', the notion of" value "is defined
as:" an expression designating the intrinsic aspect of any economic good competition consists in the various categories of interests (producers - producers. Producers - consumers, purchasers - buyers), so in a social relationship, and expressed through price”42.
The ansamble of a product's functions give it use value, its utility. Thus, the utility of a product is given by the real or alleged ability of a good to satisfy a human need by using his time on the physical, chemical, psycho, which are intrinsic characteristics of food. All these properties useful function configures a product, utility itself.
The other features, the extrinsic, such as product image, consumption habits, and so on, determines expected utility, since they are purely human considerations, personal or group characterized by subjectivism.
Value in use, as evidenced by the above, is the synthesis properties (characteristics) seeking compliance with requirements, pre-formulated expectations. But any good but will also present properties that are undesirable conformity with the specifications, that such deficiencies of quality.
This whole complex of properties of a food, its features and shortcomings and inconsistencies in requirements, make quality product. Depending on these foods can fit into various classes, as it complies with the specifications.
41 Chisnall, P., M., - Marketing: a Behaviourial Analysis, Second edition, The McGraw-Hill Marketing Series, London, 1985 42 C. Petcu, Dicţionar tematic de idei economice, Editura Economică, Bucureşti, 2000;
113
Properties of food are prescribed in standards, any negative deviation from their values can make the product unusable. Of these, the most important are the properties of psycho, physico - chemical and microbiological. Microbiological properties may not be listed in the standards, but then legislation governing their level.
Food functions originate in the value in use (consumption) itself, being a manifestation of this, the role of food in the nutrition and health status of the population is achieved through a wide range of functions that are manifested in several ways and interrelated structure, chemical composition and properties of the product.
As food functions were determined to be: nutritional, plastic, energetical, catalytic protective and sanogenesis, therapeutic and psycho-aesthetic, hygienic-sanitary and symbolic function, all of which are directly related to product quality.
In Commodities science, utility in large sense (or use value) includes real utility and expected utility and utility narrowly refers to the function of a product useful. In narrow sense, for consumer is useful the product that best fits their immediate needs, the current, its quality being the one prescribed in standards or other specifications (rules, laws).
5. CONCLUSIONS The interdisciplinary concept of "quality" has led many disciplines such as
philosophy, economics and technical to define and give a different meaning of the term. David A. Garvin, a professor at Harvard Business School revealed five main guidelines in defining product quality: transcendent, to product, to process, to costs, to the user.
According to SR EN ISO 9000:2008, quality is "the extent to which a set of inherent characteristics meet the requests" And within this new definition:
- The quality is not expressed by a single feature, but by a set of features; - Quality requirements exist in relation to consumer. Quality has not a static character, strictly delimited to a particular request, but it
has a dynamic character as its content evolves in step with practical needs, historically determined, both extensively (when varying number of features) and intensive (characteristics are improved product / service).
The activities related to the movement of products and production relationship - consumer generated, in practice, a number of concepts and meanings deriving by quality called by some authors quality hypostases.
Quality, with a complex and dynamic character, must be regarded as a technical-economic category with manifestations and specific possibilities of transforming in operational elements, facilitating communication between operators.
In relationships between providers and beneficiaries in practice, there are usually following quality's hypostases: designed quality, approved quality, prescribed quality, contracted quality and real quality.
Product quality is a fundamental requirement of competitiveness and quality assessment is a personal right of the consumer, because it has a direct effect on quality of life. The quality of a product can be defined as "best fit order" or only consumers can discover the real quality of a product, they are the ones who use it daily or consum it.
Today, consumers are increasingly exigent to product quality. They formulate a number of requirements on reliability and maintainability characteristics psycho, economic and sanogenetic etc products. They also want to be informed correctly and completely to knowingly choose products. Consumers expect their needs to be met through quality products.
114
Quality is the best argument to sell, although the price is often a decisive factor. Quality as fitness for purpose of a product, as seen, are by far the most important measures for customer satisfaction.
In conclusion, the quality will rely increasingly more on what is desired by the consumer ultimately
REFERENCES 1. Chisnall, P., M., Marketing: a Behaviourial Analysis, Second edition, The McGraw-
Hill Marketing Series, London, 1985 2. Maxim, E., Managementul şi economia calităţii, Editura Secom Libris, Iaşi,
1998 3. C. Petcu Dicţionar tematic de idei economice, Editura Economică, Bucureşti,
2000 4. Sperdea, N. Calitatea produselor alimentare în cadrul circuitului tehnico –
economic, Ed. Universitaria, Craiova, 2010 5. *** SR EN ISO 9000:2001 – Sisteme de management al calităţii.
Principii de bază şi vocabular
115
PERSPECTIVES AND TRENDS REGARDING THE KEY INDICATORS OF HUMAN
RESOURCE PERFORMANCE MANAGEMENT IN ROMANIA
Assist. Suzana Demyen Ph. D candidate University “Eftimie Murgu” of Reşiţa Faculty of Economic Sciences Reşiţa, Romania PhD candidate at West University of Timişoara Faculty of Economics and Business Administration Timişoara, Romania Prof. Ion Lala Popa Ph. D West University of Timişoara Faculty of Economics and Business Administration Timişoara, Romania
Abstract: : Management of human resource performance, both as a field of its own, as well as a branch of general management performance becomes a more acute universal criterion widespread in organizations, whether we speak about large enterprises, or we relate to SMEs. Developments in human resources domain and also the need of aligning to the general standards requires finding common coordinates and a consensus between the perspectives developed by scholars, those belonging to practitioners, as well as the one developed by organizations were management is applied. Reporting to traditional indicators is no longer enough, imposing increasingly the taking into account of a set of criteria called KPI – Key Performance Indicators, in order to help shape a picture of the company performance.
JEL classification: M12, M54, O15
Key words: human resources, performance management, KPI, enterprise
1. INTRODUCTION One of the main objectives of an economic entity is to generate performance
whether we reffer to the individual level or speaking of teams. For this, however, it is necessary that the performance may be quantified by a set of indicators, traditional or, alternatively, new indicators in terms of their use.
2. OBJECTIVES Main objectives taken into consideration are to illustrate the differences
between traditional indicators, respective the modern ones in assessing the overall performance of human resources in Romanian companies. Labour productivity is considered as one of the main determinants of a company’s success and it can be determined as the ratio between turnover and number of employees, an indicator that became a basis for the activity of predicting the need of workforce in an organization.
116
Productivity, as well, can be defined in many ways, still the main points that need to be explained consist in the ratio between the effect of the process and the effort. Thus, the development of an enterprise is not possible without a continuous raise of this indicator. The objective of any organization, from this point of view, is to increase productivity and streamline business activity. When referring to the analysis of the level and dynamics of labour productivity can be determined in various forms, annual, daily and hourly. Modern indicators of human resource performance do not reffer to the ones stated above. They include specific aspects, speaking about the analysis of return on investment in human resources management, but also about the analisys of the key performance indicators, which were developed during the few past years, illustrating new trends in management generally and more specific in human resource management.
„During the last years, especially during the economic crisis, there can be identified a reduction of corporate profitability, be it in terms of financial aspects, whether it comes to human resources. If we analyze the data for 2011, for example, we find that the return on human capital decreased by about 9% over the previous year (PwC Saratoga study) (Nankervis, Compton & Baird, 2000). Labour costs rose quite high percentages (13%) compared to previous years, which complemented reduce business profitability. All this took place, amid a deepening fluctuation of staff, as well as labour mobility in all sectors.”(Demyen, Lala, 2013).
3. THE ANALYSIS An indicator of performance or as experts call it - KPI ( key performance
indicator ) is a way of assessing the performance, the main ways of using them being identified in determining the success of an organization . KPI can be mentioned both in terms of qualitative and quantitative indicators, input, output, or process assessment indicators, and so on.
KPI reflects the objectives of the organization, the need to follow the same "path", namenly SMART ( explained by Gabcanova, 2012) mentioned above. The principle that can be found at the basis of this system works considering the appreciation and analysis of performance indicators on human resources management and follows the idea that without taking measurements and comparisons there can not be created an overview of the current situation and can not be identified areas that require more attention and concern (Anderson, 2011).
The main objectives of an organization are stated as cost optimization, profitability increase, namely reorientation towards customers . All this can be achieved by creating a map of strategic human resource management aspects and issues. According to the authors that have previously considered this aspect in their research, we can sum up these issues as follows:
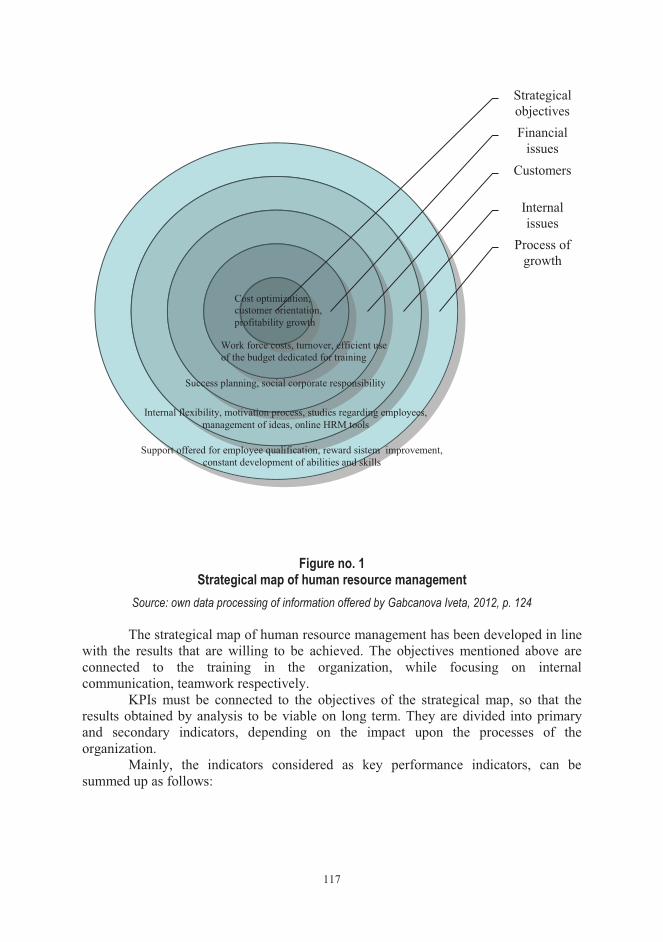
117
Figure no. 1
Strategical map of human resource management Source: own data processing of information offered by Gabcanova Iveta, 2012, p. 124
The strategical map of human resource management has been developed in line
with the results that are willing to be achieved. The objectives mentioned above are connected to the training in the organization, while focusing on internal communication, teamwork respectively.
KPIs must be connected to the objectives of the strategical map, so that the results obtained by analysis to be viable on long term. They are divided into primary and secondary indicators, depending on the impact upon the processes of the organization. Mainly, the indicators considered as key performance indicators, can be summed up as follows:
Process of growth
Internal issues
Customers
Financial issues
Strategical objectives
Cost optimization, customer orientation, profitability growth
Work force costs, turnover, efficient use of the budget dedicated for training
Success planning, social corporate responsibility
Internal flexibility, motivation process, studies regarding employees, management of ideas, online HRM tools
Support offered for employee qualification, reward sistem improvement, constant development of abilities and skills
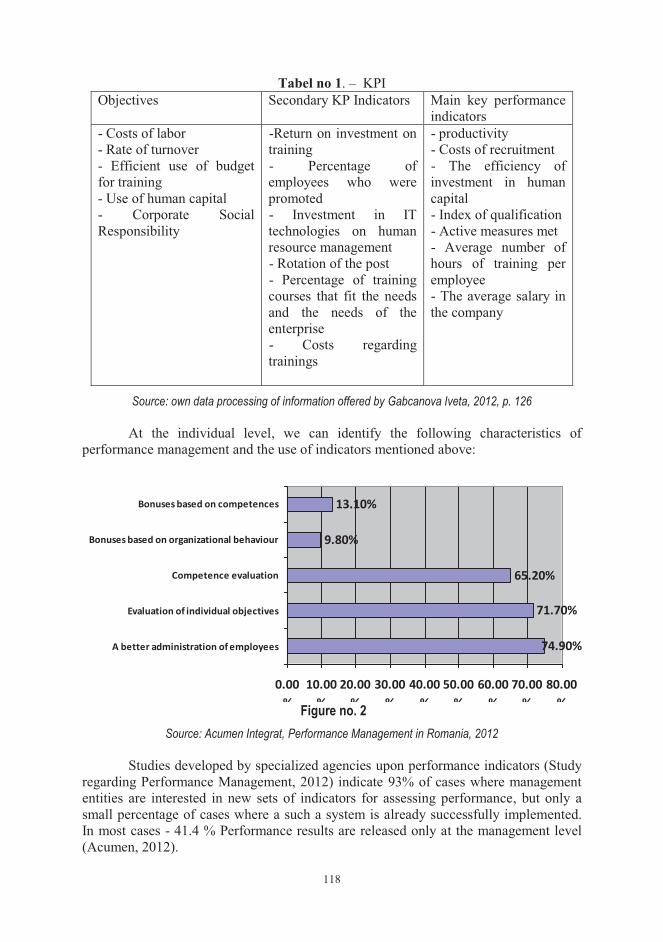
118
Tabel no 1. – KPI Objectives Secondary KP Indicators Main key performance
indicators - Costs of labor - Rate of turnover - Efficient use of budget for training - Use of human capital - Corporate Social Responsibility
-Return on investment on training - Percentage of employees who were promoted - Investment in IT technologies on human resource management - Rotation of the post - Percentage of training courses that fit the needs and the needs of the enterprise - Costs regarding trainings
- productivity - Costs of recruitment - The efficiency of investment in human capital - Index of qualification - Active measures met - Average number of hours of training per employee - The average salary in the company
Source: own data processing of information offered by Gabcanova Iveta, 2012, p. 126
At the individual level, we can identify the following characteristics of performance management and the use of indicators mentioned above:
74.90%
71.70%
65.20%
9.80%
13.10%
0.00%
10.00%
20.00%
30.00%
40.00%
50.00%
60.00%
70.00%
80.00%
A better administration of employees
Evaluation of individual objectives
Competence evaluation
Bonuses based on organizational behaviour
Bonuses based on competences
Figure no. 2 Source: Acumen Integrat, Performance Management in Romania, 2012
Studies developed by specialized agencies upon performance indicators (Study regarding Performance Management, 2012) indicate 93% of cases where management entities are interested in new sets of indicators for assessing performance, but only a small percentage of cases where a such a system is already successfully implemented. In most cases - 41.4 % Performance results are released only at the management level (Acumen, 2012).
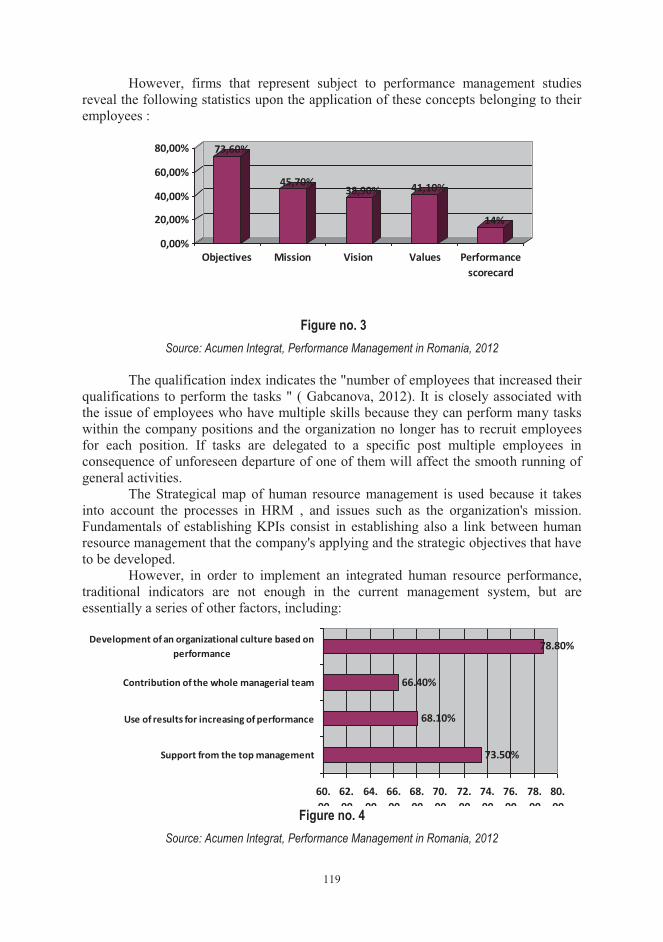
119
However, firms that represent subject to performance management studies reveal the following statistics upon the application of these concepts belonging to their employees :
73,60%
45,70%38,90% 41,10%
14%
0,00%
20,00%
40,00%
60,00%
80,00%
Objectives Mission Vision Values Performancescorecard
Figure no. 3 Source: Acumen Integrat, Performance Management in Romania, 2012
The qualification index indicates the "number of employees that increased their
qualifications to perform the tasks " ( Gabcanova, 2012). It is closely associated with the issue of employees who have multiple skills because they can perform many tasks within the company positions and the organization no longer has to recruit employees for each position. If tasks are delegated to a specific post multiple employees in consequence of unforeseen departure of one of them will affect the smooth running of general activities.
The Strategical map of human resource management is used because it takes into account the processes in HRM , and issues such as the organization's mission. Fundamentals of establishing KPIs consist in establishing also a link between human resource management that the company's applying and the strategic objectives that have to be developed.
However, in order to implement an integrated human resource performance, traditional indicators are not enough in the current management system, but are essentially a series of other factors, including:
73.50%
68.10%
66.40%
78.80%
60.00
62.00
64.00
66.00
68.00
70.00
72.00
74.00
76.00
78.00
80.00
Support from the top management
Use of results for increasing of performance
Contribution of the whole managerial team
Development of an organizational culture based onperformance
Figure no. 4
Source: Acumen Integrat, Performance Management in Romania, 2012
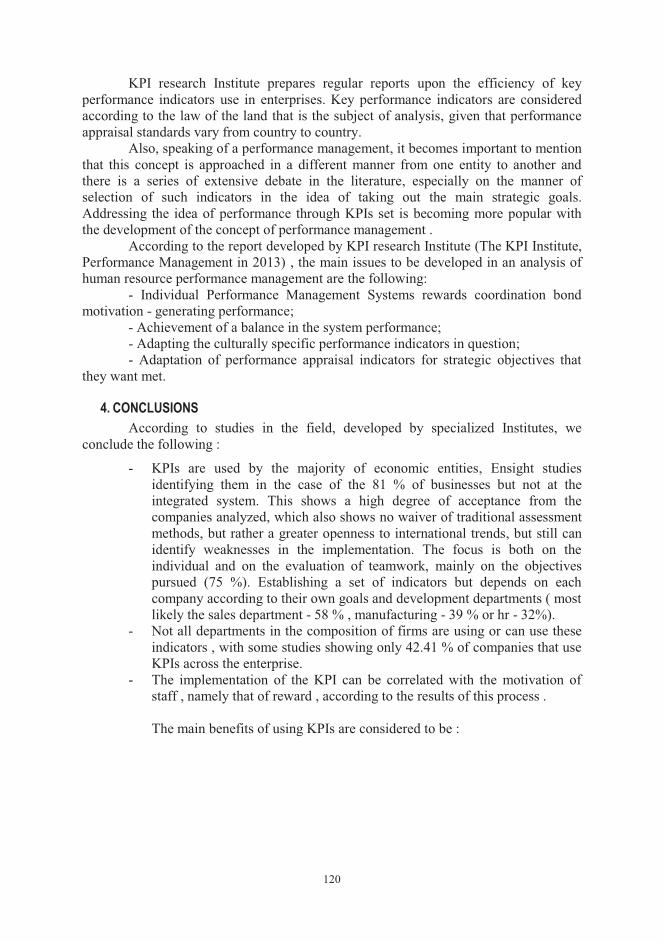
120
KPI research Institute prepares regular reports upon the efficiency of key performance indicators use in enterprises. Key performance indicators are considered according to the law of the land that is the subject of analysis, given that performance appraisal standards vary from country to country.
Also, speaking of a performance management, it becomes important to mention that this concept is approached in a different manner from one entity to another and there is a series of extensive debate in the literature, especially on the manner of selection of such indicators in the idea of taking out the main strategic goals. Addressing the idea of performance through KPIs set is becoming more popular with the development of the concept of performance management .
According to the report developed by KPI research Institute (The KPI Institute, Performance Management in 2013) , the main issues to be developed in an analysis of human resource performance management are the following:
- Individual Performance Management Systems rewards coordination bond motivation - generating performance;
- Achievement of a balance in the system performance; - Adapting the culturally specific performance indicators in question; - Adaptation of performance appraisal indicators for strategic objectives that
they want met.
4. CONCLUSIONS According to studies in the field, developed by specialized Institutes, we
conclude the following :
- KPIs are used by the majority of economic entities, Ensight studies identifying them in the case of the 81 % of businesses but not at the integrated system. This shows a high degree of acceptance from the companies analyzed, which also shows no waiver of traditional assessment methods, but rather a greater openness to international trends, but still can identify weaknesses in the implementation. The focus is both on the individual and on the evaluation of teamwork, mainly on the objectives pursued (75 %). Establishing a set of indicators but depends on each company according to their own goals and development departments ( most likely the sales department - 58 % , manufacturing - 39 % or hr - 32%).
- Not all departments in the composition of firms are using or can use these indicators , with some studies showing only 42.41 % of companies that use KPIs across the enterprise.
- The implementation of the KPI can be correlated with the motivation of staff , namely that of reward , according to the results of this process . The main benefits of using KPIs are considered to be :
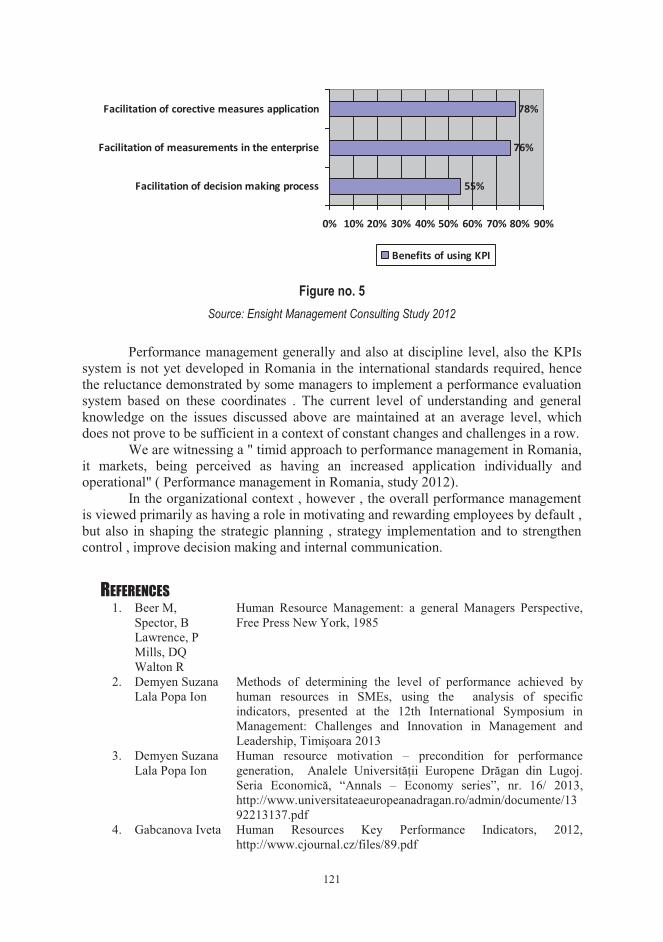
121
55%
76%
78%
0% 10% 20% 30% 40% 50% 60% 70% 80% 90%
Facilitation of decision making process
Facilitation of measurements in the enterprise
Facilitation of corective measures application
Benefits of using KPI
Figure no. 5 Source: Ensight Management Consulting Study 2012
Performance management generally and also at discipline level, also the KPIs
system is not yet developed in Romania in the international standards required, hence the reluctance demonstrated by some managers to implement a performance evaluation system based on these coordinates . The current level of understanding and general knowledge on the issues discussed above are maintained at an average level, which does not prove to be sufficient in a context of constant changes and challenges in a row.
We are witnessing a " timid approach to performance management in Romania, it markets, being perceived as having an increased application individually and operational" ( Performance management in Romania, study 2012).
In the organizational context , however , the overall performance management is viewed primarily as having a role in motivating and rewarding employees by default , but also in shaping the strategic planning , strategy implementation and to strengthen control , improve decision making and internal communication.
REFERENCES 1. Beer M,
Spector, B Lawrence, P Mills, DQ Walton R
Human Resource Management: a general Managers Perspective, Free Press New York, 1985
2. Demyen Suzana Lala Popa Ion
Methods of determining the level of performance achieved by human resources in SMEs, using the analysis of specific indicators, presented at the 12th International Symposium in Management: Challenges and Innovation in Management and Leadership, Timişoara 2013
3. Demyen Suzana Lala Popa Ion
Human resource motivation – precondition for performance generation, Analele Universităţii Europene Drăgan din Lugoj. Seria Economică, “Annals – Economy series”, nr. 16/ 2013, http://www.universitateaeuropeanadragan.ro/admin/documente/1392213137.pdf
4. Gabcanova Iveta Human Resources Key Performance Indicators, 2012, http://www.cjournal.cz/files/89.pdf
122
5. Jeong Yeon Kim, Hangbae Chang,
6. Nankervis, A. Compton, R. & Baird, M.
7. Youndt MA, Snell SA, Dean JW, Lepak DP
8. ***
9. ***
10. *** ţţ îî ââ
123
MANAGING BRAND EQUITY RISK: ADDING EXOGENOUS RISKS TO AN
EVALUATION MODEL
Lect. Cătălin Mihail Barbu Ph. D University of Craiova Faculty of Economics and Business Administration Craiova, Romania Lect. Sorin Tudor Ph. D University of Craiova Faculty of Economics and Business Administration Craiova, Romania Dorian Laurenţiu Florea Ph. D Student The Bucharest University of Economic Studies Faculty of Marketing Bucharest, Romania
Abstract: Risk can no longer be ignored when talking about brand management, as risk management can no longer disregard brands for manifold reasons. Building on the risk-based brand equity model, this paper contributes to the development of an evaluation model, by suggesting formulas for 3 exogenous risk sources related to the market and competitive structure: the new brand marketing effort, consumer behavior change, and the extant brands adaptation.
JEL classification: M 31
Key words: brand equity; brand-related risks; brand management; accounting researches
1. INTRODUCTION Risk is one of the most salient issues that have been tackled in the scientific
literature of the last three decades. Diverse expertise – from finance and stock markets to management and behavioral sciences - has been employed in order to gain insight of how risk can be evaluated, which are the risk sources and how companies and individuals can manage risks. Though, not the same interest has been shown for risk in branding. Scholars and practitioners have concentrated to emphasize the benefits of developing strong brands and the ways to do that, but have forgotten almost completely about the incumbent risks.
Thus, brands are unanimously seen as crucial assets for successful businesses in both business-to-consumer and business-to-business, and practically, any businessman would gladly want to rely its activity on a strong, well-known, reputable brand, able to enhance future profits. On the other hand, the more “hope” a company puts in its brands, the more likely is that an unwanted evolution of the brand causes serious damage on the business as a whole.
The duality profit - risk is common for any kind of economic assets, and so, brands are not an exception. Though, brand-related risks drive a particular inconvenient for the brand owner. Brands are considered “bridges” between past and future
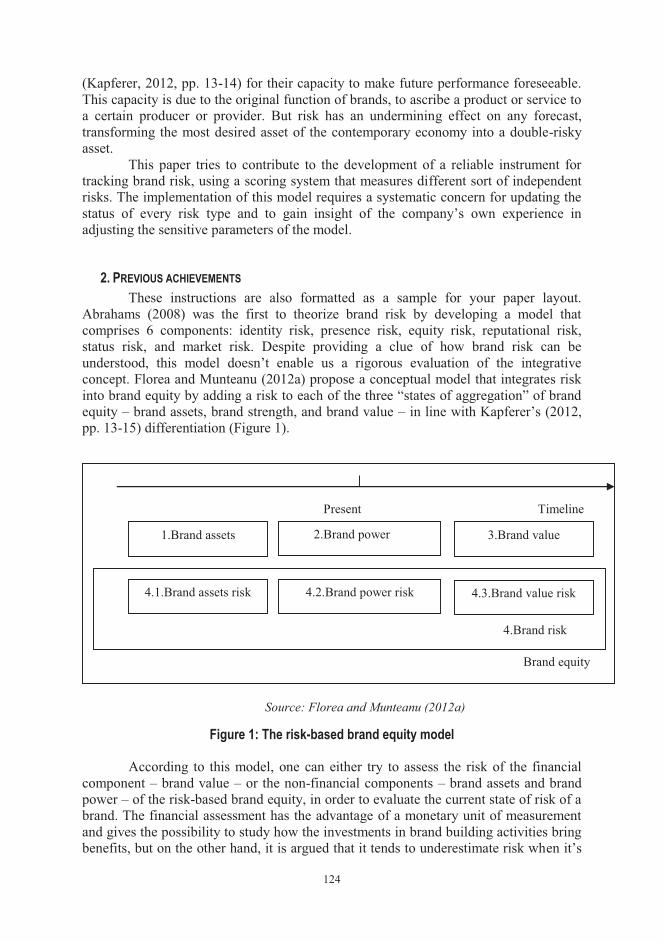
124
(Kapferer, 2012, pp. 13-14) for their capacity to make future performance foreseeable. This capacity is due to the original function of brands, to ascribe a product or service to a certain producer or provider. But risk has an undermining effect on any forecast, transforming the most desired asset of the contemporary economy into a double-risky asset.
This paper tries to contribute to the development of a reliable instrument for tracking brand risk, using a scoring system that measures different sort of independent risks. The implementation of this model requires a systematic concern for updating the status of every risk type and to gain insight of the company’s own experience in adjusting the sensitive parameters of the model.
2. PREVIOUS ACHIEVEMENTS These instructions are also formatted as a sample for your paper layout.
Abrahams (2008) was the first to theorize brand risk by developing a model that comprises 6 components: identity risk, presence risk, equity risk, reputational risk, status risk, and market risk. Despite providing a clue of how brand risk can be understood, this model doesn’t enable us a rigorous evaluation of the integrative concept. Florea and Munteanu (2012a) propose a conceptual model that integrates risk into brand equity by adding a risk to each of the three “states of aggregation” of brand equity – brand assets, brand strength, and brand value – in line with Kapferer’s (2012, pp. 13-15) differentiation (Figure 1).
Figure 1: The risk-based brand equity model
According to this model, one can either try to assess the risk of the financial
component – brand value – or the non-financial components – brand assets and brand power – of the risk-based brand equity, in order to evaluate the current state of risk of a brand. The financial assessment has the advantage of a monetary unit of measurement and gives the possibility to study how the investments in brand building activities bring benefits, but on the other hand, it is argued that it tends to underestimate risk when it’s
Present Timeline
Brand equity
1.Brand assets 2.Brand power 3.Brand value
4.Brand risk
4.1.Brand assets risk 4.2.Brand power risk 4.3.Brand value risk
Source: Florea and Munteanu (2012a)
125
very high and it’s biased by financial inertia (Florea and Munteanu, 2012b). Thus, the second direction was chosen for being closer to the marketing vision, although it has the drawback of not having a clear unit of measurement.
Brand assets risk was built by analyzing the propensity for variability of the 27 metrics that compose Lehmann and Keller’s model (2008). Three independent risks – reputational risk, presence and loyalty risk, and halo effect risk – were set in order to avoid the numerous covariance calculations that would appear otherwise (Florea and Munteanu, 2012b).
3. MODEL DEVELOPMENT Besides this endogenous risks, exogenous risks trouble brands from the fact
that they compete on the same market. Actually, two major channels of risk propagation can be set, based on Kapferer’s (2012, p.14) statement of brand strength meaning. The first channel is the market and competitive environment, which enforce a zero-sum game, at least for market share, if not also for sales, when the demand is saturated. In these situations, the actions of the competing brands have significant influence on a brand, even when the brand assets – which represent its inner side – are kept risk free. The second channel derived from brand strength definition is the business model that a firm implements in order to get profit from its activity. Despite being largely studied lately, we are interested in one single aspect of the concept of business model for the purpose of this research, still unexplored. A company can yield a higher or a lower role to its brands in profit making. Thus, the more important the role of brands is in value capture, the more impact a brand breakdown can have on the company’s performance. Only the first channel is to be further investigated in this section.
We choose to focus on market share in order to illustrate the two channels. From the above mentioned competitive behavioral indicators, market share is the one which insures stationarity. Moreover, working with more indicators would encumber the model, as this indicators are not independent.
Concerning market and competitive environment, a first situation that fit here is when a new brand enters the market or an extant brand is removed from the market. According to Fok and Franses (2004), 3 main factors can induce changes in the competitive structure: the new brand marketing effort, consumer behavior change, and the extant brands adaptation.
When modeling the influence of a new brand marketing effort, we need to have in mind that the same marketing expenditures can drive different outcomes, based on a bunch of reasons. Firstly, the average cost to get a customer to buy the new brand decreases the risk represented by that brand. It’s well known that it’s much more expensive to get a new customer than to retain one, but as the new brand doesn’t have any, it must direct the marketing budget completely to the acquisition of customers. The average cost per customer is a market-specific measure, depending mainly on the average loyalty level. For instance, on the chocolate market – like most FMCG hedonistic products – the loyalty level is lower than on bread market, so a new competitor in the case of chocolate market implies more risk than in the case of bread market. But not only the average matters when we talk about loyalty; the consumer categories that are targeted by the new brand’s marketing effort are important as well. We propose here the use of The BrandDinamics™ Pyramid to describe different levels of brand-customer relationship: presence, relevance, performance, advantage, and
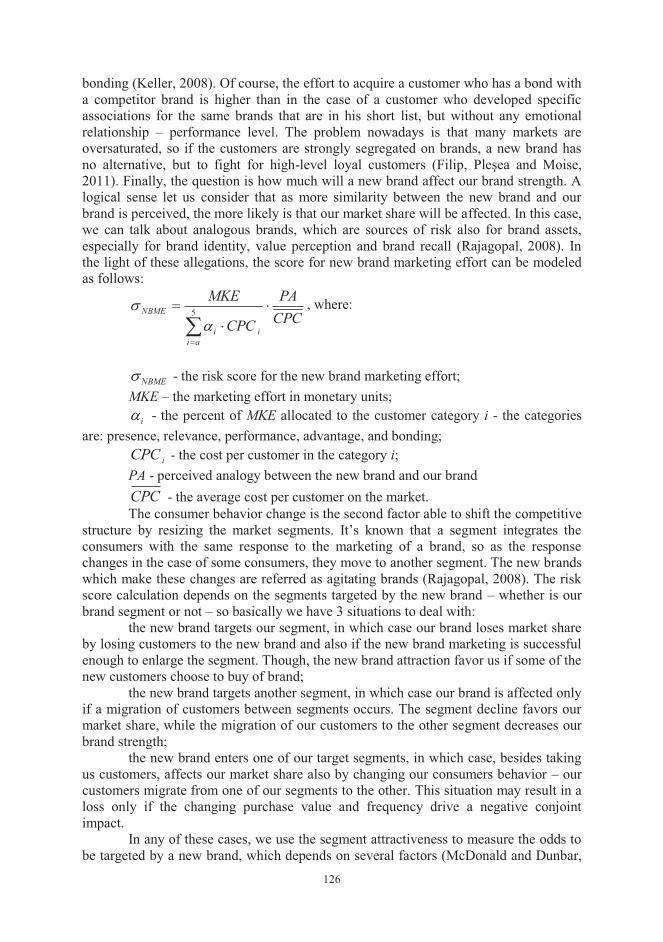
126
bonding (Keller, 2008). Of course, the effort to acquire a customer who has a bond with a competitor brand is higher than in the case of a customer who developed specific associations for the same brands that are in his short list, but without any emotional relationship – performance level. The problem nowadays is that many markets are oversaturated, so if the customers are strongly segregated on brands, a new brand has no alternative, but to fight for high-level loyal customers (Filip, Pleşea and Moise, 2011). Finally, the question is how much will a new brand affect our brand strength. A logical sense let us consider that as more similarity between the new brand and our brand is perceived, the more likely is that our market share will be affected. In this case, we can talk about analogous brands, which are sources of risk also for brand assets, especially for brand identity, value perception and brand recall (Rajagopal, 2008). In the light of these allegations, the score for new brand marketing effort can be modeled as follows:
CPCPA
CPC
MKE
aiii
NBME ��
�
��
5
�� , where:
NBME� - the risk score for the new brand marketing effort;
MKE – the marketing effort in monetary units; i� - the percent of MKE allocated to the customer category i - the categories
are: presence, relevance, performance, advantage, and bonding; iCPC - the cost per customer in the category i;
PA - perceived analogy between the new brand and our brand CPC - the average cost per customer on the market. The consumer behavior change is the second factor able to shift the competitive
structure by resizing the market segments. It’s known that a segment integrates the consumers with the same response to the marketing of a brand, so as the response changes in the case of some consumers, they move to another segment. The new brands which make these changes are referred as agitating brands (Rajagopal, 2008). The risk score calculation depends on the segments targeted by the new brand – whether is our brand segment or not – so basically we have 3 situations to deal with:
the new brand targets our segment, in which case our brand loses market share by losing customers to the new brand and also if the new brand marketing is successful enough to enlarge the segment. Though, the new brand attraction favor us if some of the new customers choose to buy of brand;
the new brand targets another segment, in which case our brand is affected only if a migration of customers between segments occurs. The segment decline favors our market share, while the migration of our customers to the other segment decreases our brand strength;
the new brand enters one of our target segments, in which case, besides taking us customers, affects our market share also by changing our consumers behavior – our customers migrate from one of our segments to the other. This situation may result in a loss only if the changing purchase value and frequency drive a negative conjoint impact.
In any of these cases, we use the segment attractiveness to measure the odds to be targeted by a new brand, which depends on several factors (McDonald and Dunbar,
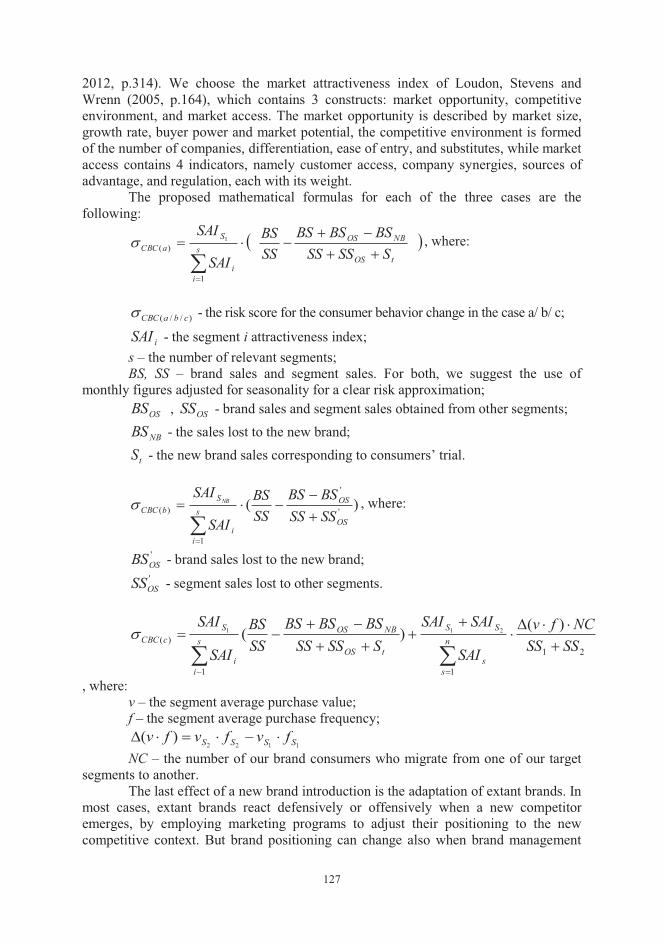
127
2012, p.314). We choose the market attractiveness index of Loudon, Stevens and Wrenn (2005, p.164), which contains 3 constructs: market opportunity, competitive environment, and market access. The market opportunity is described by market size, growth rate, buyer power and market potential, the competitive environment is formed of the number of companies, differentiation, ease of entry, and substitutes, while market access contains 4 indicators, namely customer access, company synergies, sources of advantage, and regulation, each with its weight.
The proposed mathematical formulas for each of the three cases are the following:
� tOS
NBOSs
ii
SaCBC SSSSS
BSBSBSSSBS
SAI
SAI�
���
��1
)(1� , where:
)//( cbaCBC� - the risk score for the consumer behavior change in the case a/ b/ c;
iSAI - the segment i attractiveness index; s – the number of relevant segments; BS, SS – brand sales and segment sales. For both, we suggest the use of
monthly figures adjusted for seasonality for a clear risk approximation; OSBS , OSSS - brand sales and segment sales obtained from other segments;
NBBS - the sales lost to the new brand;
tS - the new brand sales corresponding to consumers’ trial.
)( '
'
1
)(OS
OSs
ii
SbCBC SSSS
BSBSSSBS
SAI
SAINB
�
���
��
� , where:
'OSBS - brand sales lost to the new brand; 'OSSS - segment sales lost to other segments.
21
11
)()()( 211
SSSSNCfv
SAI
SAISAISSSSS
BSBSBSSSBS
SAI
SAIn
ss
SS
tOS
NBOSs
ii
ScCBC
����
�
��
����
�
, where: v – the segment average purchase value; f – the segment average purchase frequency;
1122)( SSSS fvfvfv ������
NC – the number of our brand consumers who migrate from one of our target segments to another.
The last effect of a new brand introduction is the adaptation of extant brands. In most cases, extant brands react defensively or offensively when a new competitor emerges, by employing marketing programs to adjust their positioning to the new competitive context. But brand positioning can change also when brand management
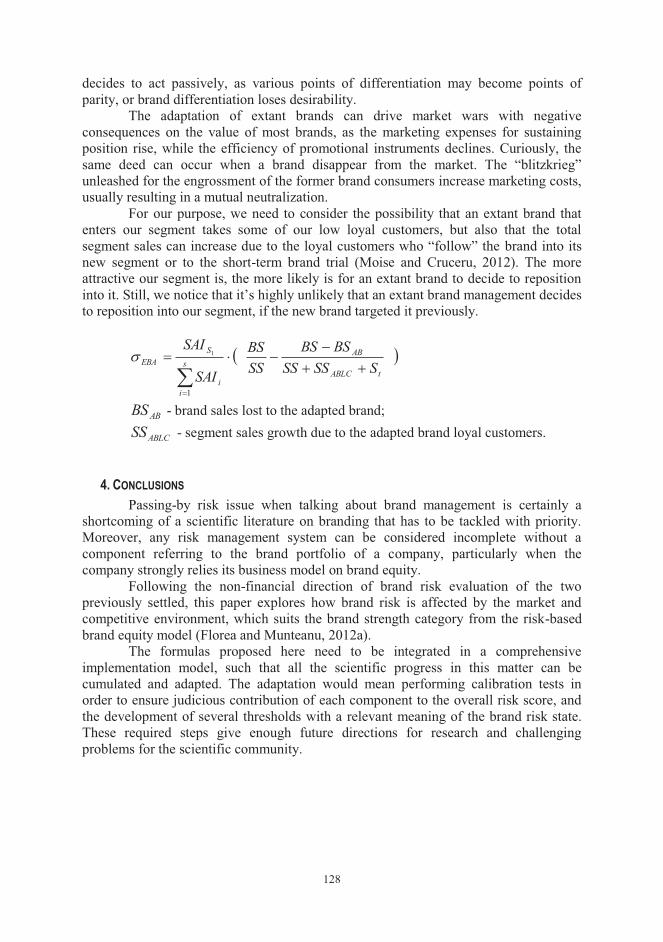
128
decides to act passively, as various points of differentiation may become points of parity, or brand differentiation loses desirability.
The adaptation of extant brands can drive market wars with negative consequences on the value of most brands, as the marketing expenses for sustaining position rise, while the efficiency of promotional instruments declines. Curiously, the same deed can occur when a brand disappear from the market. The “blitzkrieg” unleashed for the engrossment of the former brand consumers increase marketing costs, usually resulting in a mutual neutralization.
For our purpose, we need to consider the possibility that an extant brand that enters our segment takes some of our low loyal customers, but also that the total segment sales can increase due to the loyal customers who “follow” the brand into its new segment or to the short-term brand trial (Moise and Cruceru, 2012). The more attractive our segment is, the more likely is for an extant brand to decide to reposition into it. Still, we notice that it’s highly unlikely that an extant brand management decides to reposition into our segment, if the new brand targeted it previously.
� tABLC
ABs
ii
SEBA SSSSS
BSBSSSBS
SAI
SAI
����
��1
1�
ABBS - brand sales lost to the adapted brand;
ABLCSS - segment sales growth due to the adapted brand loyal customers.
4. CONCLUSIONS Passing-by risk issue when talking about brand management is certainly a
shortcoming of a scientific literature on branding that has to be tackled with priority. Moreover, any risk management system can be considered incomplete without a component referring to the brand portfolio of a company, particularly when the company strongly relies its business model on brand equity.
Following the non-financial direction of brand risk evaluation of the two previously settled, this paper explores how brand risk is affected by the market and competitive environment, which suits the brand strength category from the risk-based brand equity model (Florea and Munteanu, 2012a).
The formulas proposed here need to be integrated in a comprehensive implementation model, such that all the scientific progress in this matter can be cumulated and adapted. The adaptation would mean performing calibration tests in order to ensure judicious contribution of each component to the overall risk score, and the development of several thresholds with a relevant meaning of the brand risk state. These required steps give enough future directions for research and challenging problems for the scientific community.
129
REFERENCES
1. Ailawadi, K.L., Farris, P.W. and Parry, M.E.
Market share and ROI: Observing the effect of unobserved variables. International Journal of Research in Marketing. 16, 1999, pp. 17-33
2. Kapferer, J.N. The new strategic brand management, 5th Edition, Kogan Page, 2012 3. Filip, A.,
Pleşea, D., and Moise, D.
Relationship Marketing: Conceptualization and Main Economic Fields of Implementation. Annals of The Ovidius University, Economic Sciences Series, XI (1), 2011
4. Florea, D.L. and Munteanu, C.C.
A risk-based brand equity model. International Economic Conference Sibiu (IECS) 2012 Proceedings, 2012a
5. Florea, D.L. and Munteanu, C.C.
Managing brand equity risk: An evaluation model. International Conference on Applied Business and Economics (ICABE) 2012 Proceedings, 2012b
6. Fok, D. and Franses, P.H.
Analysing the effects of a brand introduction on competitive structure using a market share attraction model. International Journal of Research in Marketing. 21., 2004, pp. 159-177
7. Keller, K.L. Strategic brand management: building, measuring and managing brand equity. Third Edition. Prentice Hall: Boston, 2008
8. Loudon, D., Stevens, R., and Wrenn, B.
Marketing management. The Haworth Press: New York, 2005
9. McDonald, M. and Dunbar, I.
Market segmentation: How to do it and how to profit from it. Fourth Edition. John Wiley & Sons: Chichester, 2012
10. Moise, D. and Cruceru, A.
Redefined marketing communication through sales forces. Procedia – Social and Behavioral Sciences. 62., 2012, pp. 175-178
11. Rajagopal Measuring brand performance through metrics application. Measuring Business Excellence. 12(1)., 2008, pp. 29-38
130
STUDY ON THE DECISION PROCESS OF THE MOBILE
TELECOMMUNICATIONS SERVICES’ USERS
Lect. Georgeta-Mădălina Meghişan Ph. D University of Craiova Faculty of Economics and Business Administration Craiova, Romania Assoc. Prof. Flaviu Meghişan Ph. D University of Piteşti Faculty of Economics Piteşti, Romania
Abstract: : The current research has as starting point the decision process model and innovation adoption process, applied on the specific of mobile telecommunications users, focusing on mobile telephones/ smartphones. The decision process model has the following steps: perception of need, expectations, looking for information, alternatives evaluation, creation of preferences, choice, purchase, consumption, assessment after purchase. On the other hand, the model of innovation adoption focus on the following stages: innovators (the first to adopt innovations), early adopters (become convinced by innovations and quickly buy), early majority (first expect the experience of others and then buy), late majority (wait for the popularization of innovations before buying) and latecomers (the last to buy innovations). The research was made during March 2013, using a questionnaire based survey, which was filled in by 165 mobile telephones owners. The sample was calculated with the help of the probabilistic method. The hypotheses derived from the objectives of this research and were formulated taking into consideration the final results of the research paper: more than half of the respondents are open to new technology and have a smartphone; the brand with the highest success among mobile telephones owners is Samsung; most frequently, mobile telephones owners bought this product very quickly after its launch; most frequently, mobile telephones owners accorded main attention to the following stages of the buying decision process: information search and choice; most frequently, the mobile telephones owners were influenced in their decision process by family, friends, colleagues and sales force. The final results were obtained using statistical functions, such as: descriptive statistics and factor analysis, with the help of the SPSS 16.0 software for Windows XP.
JEL classification: M31, H12
Key words: mobile telephones buyers; buying decision process; innovations’ life cycle; mobile telecommunications; mobile telephone brand
131
1. INTRODUCTION According to Price Water House Cooper (1998) “80% of consumption sector
profile is made of 30% satisfied clients or 70% sales”. It is all ready common knowledge that an unsatisfied client speaks about that with 10 more people, while a satisfied client speaks about this with only 3 persons. That’s why, it is very important for a company to put into practice targeted marketing actions in order to form long term loyal clients.
This analysis has as starting point the decision process model developed by Van Laethem, Lebon, Durand-Megret (2007) with the following stages: perception of need, expectations, looking for information, alternatives evaluation, creation of preferences, choice, purchase, consumption, assessment after purchase. If we analyze the decision making behaviour of the consumer, we can say that the influence is higher from the “unconscious forces (thoughts and feelings), than those conscious ones, such as: images, sensations, stories”. (Meghisan, 2010)
Mobile telecommunications industry is in a continuous change from a technological point of view. Eventhough at a worldwide level, fixed telephony lines continue to decrease, the trend regarding mobile telephones is ascendant. That’s why, from the total number of the worldwide population (6.5 billion inhabitants at the beginning of the year 2007), there were 2.6 billion mobile telephones sold. (IDATE, 2007) Mobile telephones represent technical products that can be seen as innovations. Different authors described several stages in the process of the diffusion of an innovation. Rogers (1983) proposed a theory which became the base for a complementary approach developed by several authors. Jolibert (2001) takes into consideration the following stages regarding the adoption of an innovation: uninformed users, followed by potential adopters (users informed by advertising), rebuyers (users influenced by the innovations proposed by the competition that can readopt the innovation) and potential adopters (those that can choose the innovations proposed by the competition). At his turn, Moore (1991) developed a model of innovation adoption proposed by Bourne (1957), maintaining the following stages: innovators (the first to adopt innovations), early adopters (become convinced by innovations and quickly buy), early majority (first expect the experience of others and then buy), late majority (wait for the popularization of innovations before buying) and latecomers (the last to buy innovations)
The current research has as starting point the decision process model developed by Van Laethem, Lebon, Durand-Megret (2007) and innovation adoption process of Moore (1991), applied on the specific of mobile telecommunications users, focusing on mobile telephones/ smartphones.
2. OBJECTIVES The research was made during March 2013, using a questionnaire based survey,
which was filled in by 165 mobile telephones owners. The sample was calculated with the help of the probabilistic method:
� � personspptn 165
05.05.015.0*65.11*
2
2
2
2
��
�
�
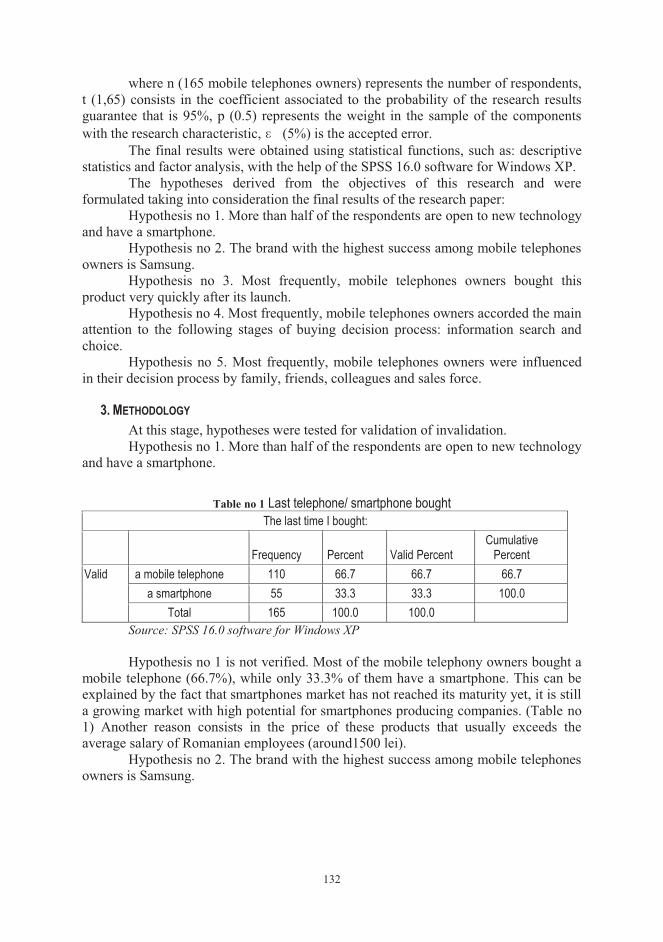
132
where n (165 mobile telephones owners) represents the number of respondents, t (1,65) consists in the coefficient associated to the probability of the research results guarantee that is 95%, p (0.5) represents the weight in the sample of the components with the research characteristic, (5%) is the accepted error.
The final results were obtained using statistical functions, such as: descriptive statistics and factor analysis, with the help of the SPSS 16.0 software for Windows XP.
The hypotheses derived from the objectives of this research and were formulated taking into consideration the final results of the research paper:
Hypothesis no 1. More than half of the respondents are open to new technology and have a smartphone.
Hypothesis no 2. The brand with the highest success among mobile telephones owners is Samsung.
Hypothesis no 3. Most frequently, mobile telephones owners bought this product very quickly after its launch.
Hypothesis no 4. Most frequently, mobile telephones owners accorded the main attention to the following stages of buying decision process: information search and choice.
Hypothesis no 5. Most frequently, mobile telephones owners were influenced in their decision process by family, friends, colleagues and sales force.
3. METHODOLOGY At this stage, hypotheses were tested for validation of invalidation. Hypothesis no 1. More than half of the respondents are open to new technology
and have a smartphone.
Table no 1 Last telephone/ smartphone bought The last time I bought:
Frequency Percent Valid Percent
Cumulative Percent
Valid a mobile telephone 110 66.7 66.7 66.7 a smartphone 55 33.3 33.3 100.0
Total 165 100.0 100.0 Source: SPSS 16.0 software for Windows XP Hypothesis no 1 is not verified. Most of the mobile telephony owners bought a
mobile telephone (66.7%), while only 33.3% of them have a smartphone. This can be explained by the fact that smartphones market has not reached its maturity yet, it is still a growing market with high potential for smartphones producing companies. (Table no 1) Another reason consists in the price of these products that usually exceeds the average salary of Romanian employees (around1500 lei).
Hypothesis no 2. The brand with the highest success among mobile telephones owners is Samsung.
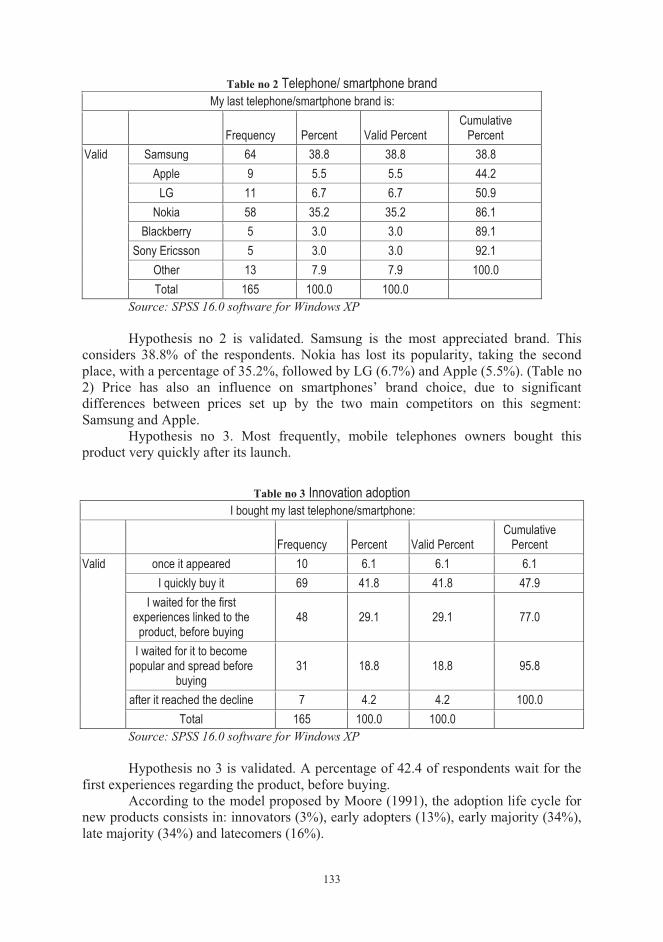
133
Table no 2 Telephone/ smartphone brand My last telephone/smartphone brand is:
Frequency Percent Valid Percent
Cumulative Percent
Valid Samsung 64 38.8 38.8 38.8 Apple 9 5.5 5.5 44.2
LG 11 6.7 6.7 50.9 Nokia 58 35.2 35.2 86.1
Blackberry 5 3.0 3.0 89.1 Sony Ericsson 5 3.0 3.0 92.1
Other 13 7.9 7.9 100.0 Total 165 100.0 100.0
Source: SPSS 16.0 software for Windows XP Hypothesis no 2 is validated. Samsung is the most appreciated brand. This
considers 38.8% of the respondents. Nokia has lost its popularity, taking the second place, with a percentage of 35.2%, followed by LG (6.7%) and Apple (5.5%). (Table no 2) Price has also an influence on smartphones’ brand choice, due to significant differences between prices set up by the two main competitors on this segment: Samsung and Apple.
Hypothesis no 3. Most frequently, mobile telephones owners bought this product very quickly after its launch.
Table no 3 Innovation adoption I bought my last telephone/smartphone:
Frequency Percent Valid Percent
Cumulative Percent
Valid once it appeared 10 6.1 6.1 6.1 I quickly buy it 69 41.8 41.8 47.9
I waited for the first experiences linked to the product, before buying
48 29.1 29.1 77.0
I waited for it to become popular and spread before
buying 31 18.8 18.8 95.8
after it reached the decline 7 4.2 4.2 100.0 Total 165 100.0 100.0
Source: SPSS 16.0 software for Windows XP Hypothesis no 3 is validated. A percentage of 42.4 of respondents wait for the
first experiences regarding the product, before buying. According to the model proposed by Moore (1991), the adoption life cycle for
new products consists in: innovators (3%), early adopters (13%), early majority (34%), late majority (34%) and latecomers (16%).
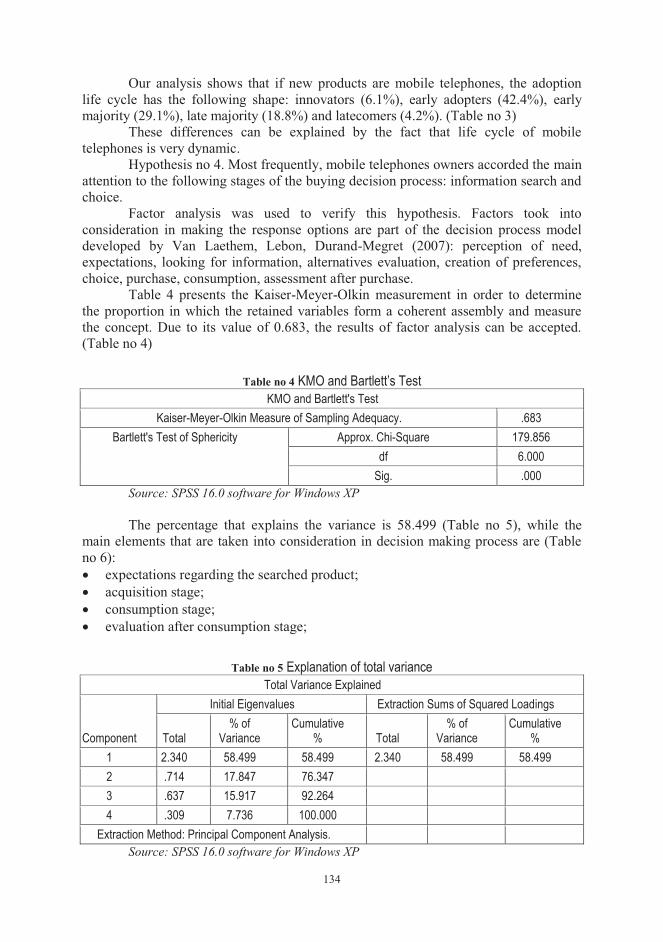
134
Our analysis shows that if new products are mobile telephones, the adoption life cycle has the following shape: innovators (6.1%), early adopters (42.4%), early majority (29.1%), late majority (18.8%) and latecomers (4.2%). (Table no 3)
These differences can be explained by the fact that life cycle of mobile telephones is very dynamic.
Hypothesis no 4. Most frequently, mobile telephones owners accorded the main attention to the following stages of the buying decision process: information search and choice.
Factor analysis was used to verify this hypothesis. Factors took into consideration in making the response options are part of the decision process model developed by Van Laethem, Lebon, Durand-Megret (2007): perception of need, expectations, looking for information, alternatives evaluation, creation of preferences, choice, purchase, consumption, assessment after purchase.
Table 4 presents the Kaiser-Meyer-Olkin measurement in order to determine the proportion in which the retained variables form a coherent assembly and measure the concept. Due to its value of 0.683, the results of factor analysis can be accepted. (Table no 4)
Table no 4 KMO and Bartlett’s Test KMO and Bartlett's Test
Kaiser-Meyer-Olkin Measure of Sampling Adequacy. .683 Bartlett's Test of Sphericity Approx. Chi-Square 179.856
df 6.000 Sig. .000
Source: SPSS 16.0 software for Windows XP The percentage that explains the variance is 58.499 (Table no 5), while the
main elements that are taken into consideration in decision making process are (Table no 6): � expectations regarding the searched product; � acquisition stage; � consumption stage; � evaluation after consumption stage;
Table no 5 Explanation of total variance Total Variance Explained
Component
Initial Eigenvalues Extraction Sums of Squared Loadings
Total % of
Variance Cumulative
% Total % of
Variance Cumulative
% 1 2.340 58.499 58.499 2.340 58.499 58.499 2 .714 17.847 76.347 3 .637 15.917 92.264 4 .309 7.736 100.000
Extraction Method: Principal Component Analysis. Source: SPSS 16.0 software for Windows XP
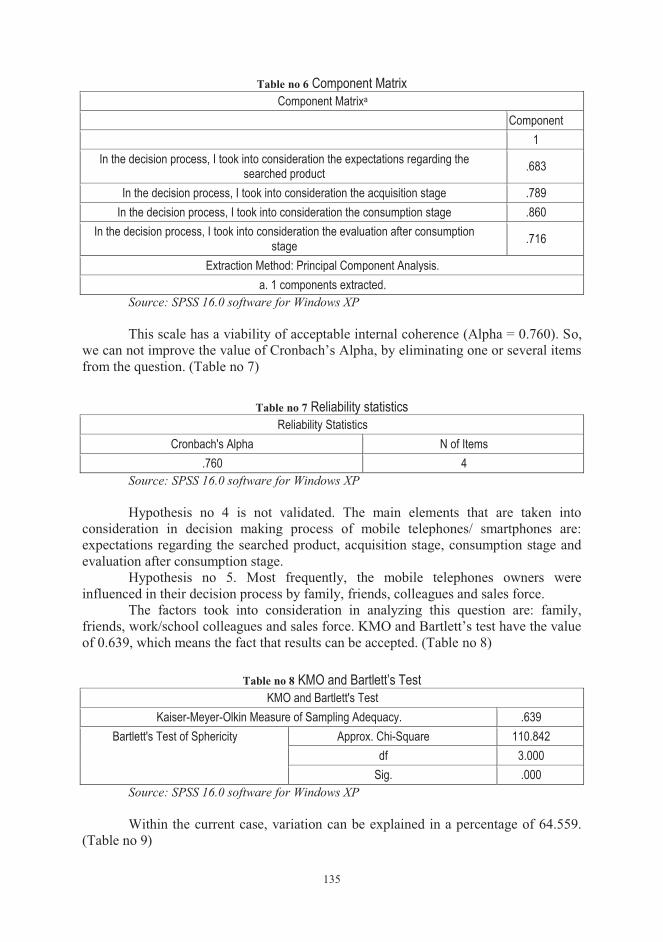
135
Table no 6 Component Matrix Component Matrixa
Component 1
In the decision process, I took into consideration the expectations regarding the searched product .683
In the decision process, I took into consideration the acquisition stage .789 In the decision process, I took into consideration the consumption stage .860
In the decision process, I took into consideration the evaluation after consumption stage .716
Extraction Method: Principal Component Analysis. a. 1 components extracted.
Source: SPSS 16.0 software for Windows XP This scale has a viability of acceptable internal coherence (Alpha = 0.760). So,
we can not improve the value of Cronbach’s Alpha, by eliminating one or several items from the question. (Table no 7)
Table no 7 Reliability statistics Reliability Statistics
Cronbach's Alpha N of Items .760 4
Source: SPSS 16.0 software for Windows XP Hypothesis no 4 is not validated. The main elements that are taken into
consideration in decision making process of mobile telephones/ smartphones are: expectations regarding the searched product, acquisition stage, consumption stage and evaluation after consumption stage.
Hypothesis no 5. Most frequently, the mobile telephones owners were influenced in their decision process by family, friends, colleagues and sales force.
The factors took into consideration in analyzing this question are: family, friends, work/school colleagues and sales force. KMO and Bartlett’s test have the value of 0.639, which means the fact that results can be accepted. (Table no 8)
Table no 8 KMO and Bartlett’s Test KMO and Bartlett's Test
Kaiser-Meyer-Olkin Measure of Sampling Adequacy. .639 Bartlett's Test of Sphericity Approx. Chi-Square 110.842
df 3.000 Sig. .000
Source: SPSS 16.0 software for Windows XP Within the current case, variation can be explained in a percentage of 64.559.
(Table no 9)
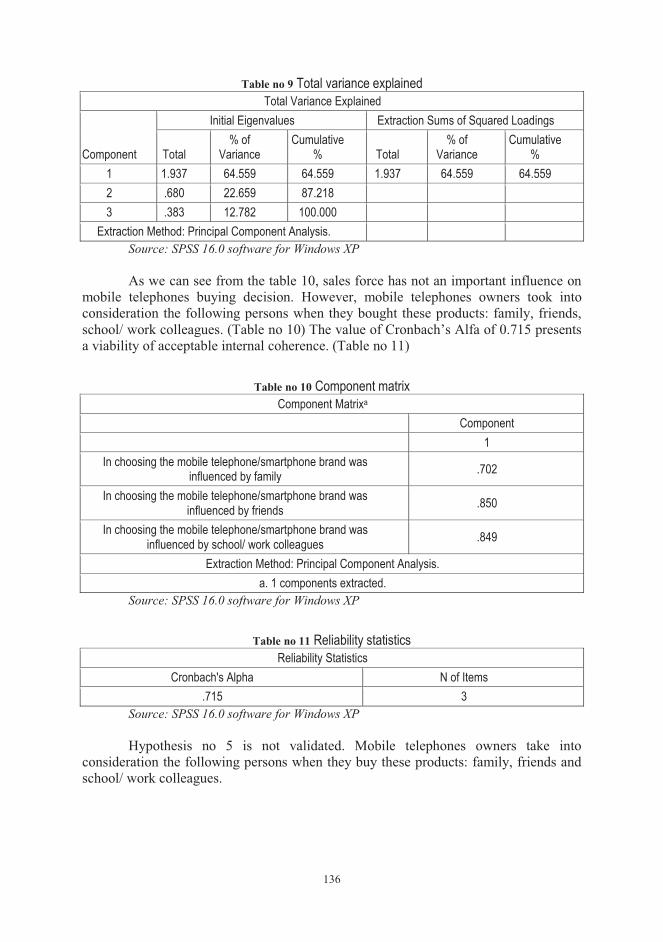
136
Table no 9 Total variance explained Total Variance Explained
Component
Initial Eigenvalues Extraction Sums of Squared Loadings
Total % of
Variance Cumulative
% Total % of
Variance Cumulative
% 1 1.937 64.559 64.559 1.937 64.559 64.559 2 .680 22.659 87.218 3 .383 12.782 100.000
Extraction Method: Principal Component Analysis. Source: SPSS 16.0 software for Windows XP
As we can see from the table 10, sales force has not an important influence on
mobile telephones buying decision. However, mobile telephones owners took into consideration the following persons when they bought these products: family, friends, school/ work colleagues. (Table no 10) The value of Cronbach’s Alfa of 0.715 presents a viability of acceptable internal coherence. (Table no 11)
Table no 10 Component matrix Component Matrixa
Component 1
In choosing the mobile telephone/smartphone brand was influenced by family .702
In choosing the mobile telephone/smartphone brand was influenced by friends .850
In choosing the mobile telephone/smartphone brand was influenced by school/ work colleagues .849
Extraction Method: Principal Component Analysis. a. 1 components extracted.
Source: SPSS 16.0 software for Windows XP
Table no 11 Reliability statistics Reliability Statistics
Cronbach's Alpha N of Items .715 3
Source: SPSS 16.0 software for Windows XP Hypothesis no 5 is not validated. Mobile telephones owners take into
consideration the following persons when they buy these products: family, friends and school/ work colleagues.
137
5. CONCLUSIONS Most of mobile telephony owners bought a mobile telephone (66.7%), while
only 33.3% of them have a smartphone. This can be explained by the fact that smartphones market has not reached its maturity yet, it is still a growing market with high potential for smartphones producing companies. Another reason consists in the price of these products that usually exceeds the average salary of Romanian employees (around 1500 lei).
Samsung is the most appreciated brand. This considers 38.8% of the respondents. Nokia has lost its popularity, taking the second place, with a percentage of 35.2%, followed by LG (6.7%) and Apple (5.5%). Price has also an influence on smartphones’ brand choice, due to the significant difference between prices set up by the two main competitors on this segment: Samsung and Apple.
However, a percentage of 42.4 of respondents wait for the first experiences regarding the product, before buying. Our analysis shows that if the new products are mobile telephones, the adoption life cycle has the following shape: innovators (6.1%), early adopters (42.4%), early majority (29.1%), late majority (18.8%) and latecomers (4.2%).
The main elements that are taken into consideration in decision making process of mobile telephones/ smartphones are: expectations regarding the searched product, acquisition stage, consumption stage and evaluation after consumption stage. Moreover, mobile telephones owners take into consideration the following persons when they buy these products: family, friends and school/ work colleagues.
REFERENCES 1. Carricano, M.
Poujol, F. Analyse de donnés avec SPSS, Paris: Pearson Education, 2008
2. Jolibert, A. Les grands auteurs en Marketing,Paris : Editions EMS, 2001 3. Meghisan, G. M. Strategies on the mobile telecommunications market from
Romania, Aachen: Shaker Verlag, 2012 4. Meghisan, F. Consumatorul – de la teorie la practica, Craiova: Universitaria,
2010 5. Moore, G. Crossing the Chasm, New York: HarperCollins Publishers, 1991 6. Rogers, E.M. Diffusion of innovations,New York: Free Press, 1983 7. Val Laethem, N.,
Lebon, Y. Durand-Mégret B.
La boîte à outils du Responsible Marketing, Paris : Dunod, 2007
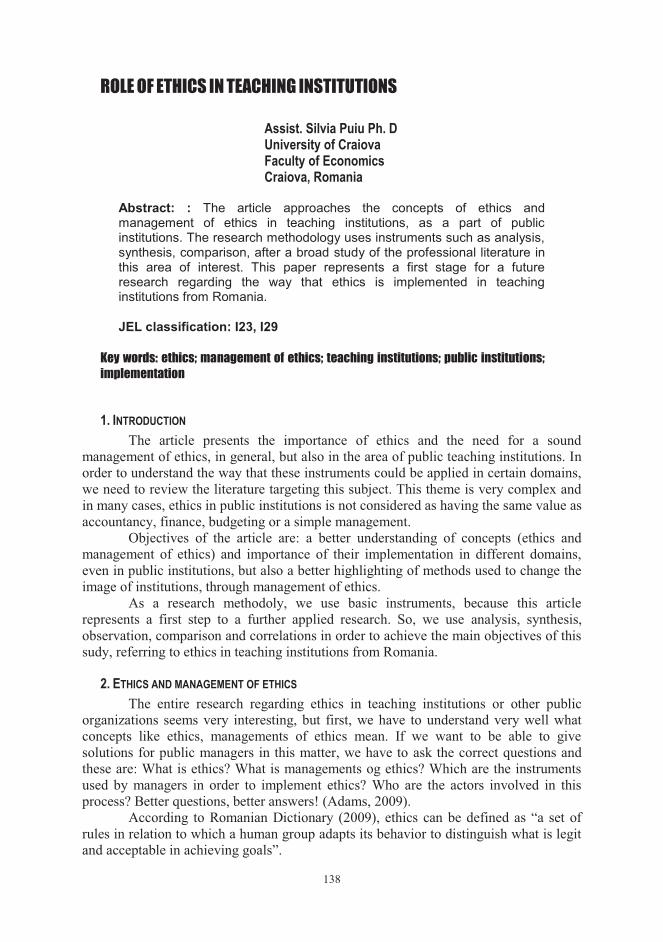
138
ROLE OF ETHICS IN TEACHING INSTITUTIONS
Assist. Silvia Puiu Ph. D University of Craiova Faculty of Economics Craiova, Romania
Abstract: : The article approaches the concepts of ethics and management of ethics in teaching institutions, as a part of public institutions. The research methodology uses instruments such as analysis, synthesis, comparison, after a broad study of the professional literature in this area of interest. This paper represents a first stage for a future research regarding the way that ethics is implemented in teaching institutions from Romania.
JEL classification: I23, I29
Key words: ethics; management of ethics; teaching institutions; public institutions; implementation
1. INTRODUCTION The article presents the importance of ethics and the need for a sound
management of ethics, in general, but also in the area of public teaching institutions. In order to understand the way that these instruments could be applied in certain domains, we need to review the literature targeting this subject. This theme is very complex and in many cases, ethics in public institutions is not considered as having the same value as accountancy, finance, budgeting or a simple management.
Objectives of the article are: a better understanding of concepts (ethics and management of ethics) and importance of their implementation in different domains, even in public institutions, but also a better highlighting of methods used to change the image of institutions, through management of ethics.
As a research methodoly, we use basic instruments, because this article represents a first step to a further applied research. So, we use analysis, synthesis, observation, comparison and correlations in order to achieve the main objectives of this sudy, referring to ethics in teaching institutions from Romania.
2. ETHICS AND MANAGEMENT OF ETHICS The entire research regarding ethics in teaching institutions or other public
organizations seems very interesting, but first, we have to understand very well what concepts like ethics, managements of ethics mean. If we want to be able to give solutions for public managers in this matter, we have to ask the correct questions and these are: What is ethics? What is managements og ethics? Which are the instruments used by managers in order to implement ethics? Who are the actors involved in this process? Better questions, better answers! (Adams, 2009).
According to Romanian Dictionary (2009), ethics can be defined as “a set of rules in relation to which a human group adapts its behavior to distinguish what is legit and acceptable in achieving goals”.
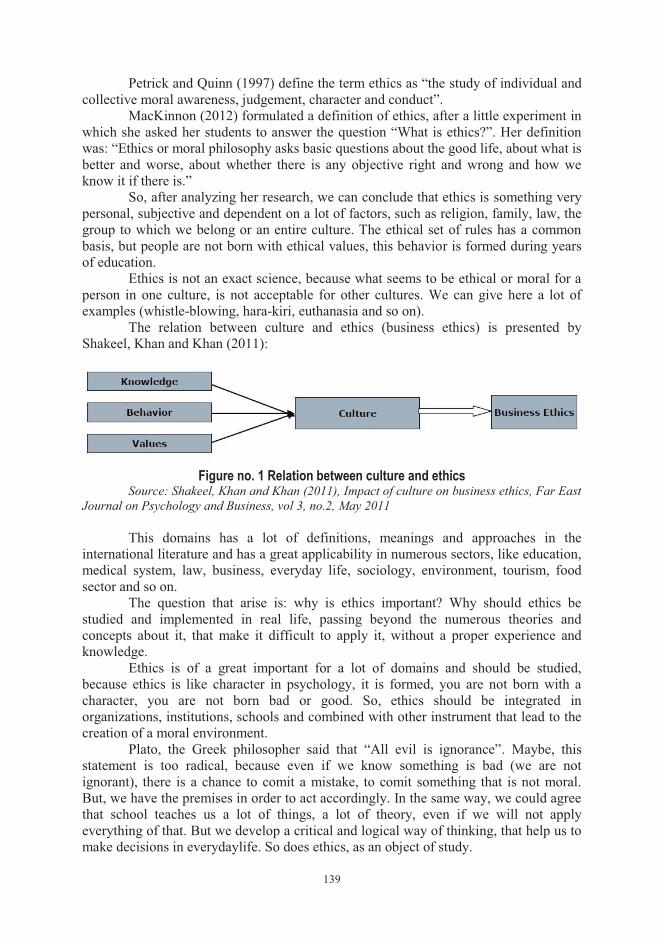
139
Petrick and Quinn (1997) define the term ethics as “the study of individual and collective moral awareness, judgement, character and conduct”.
MacKinnon (2012) formulated a definition of ethics, after a little experiment in which she asked her students to answer the question “What is ethics?”. Her definition was: “Ethics or moral philosophy asks basic questions about the good life, about what is better and worse, about whether there is any objective right and wrong and how we know it if there is.”
So, after analyzing her research, we can conclude that ethics is something very personal, subjective and dependent on a lot of factors, such as religion, family, law, the group to which we belong or an entire culture. The ethical set of rules has a common basis, but people are not born with ethical values, this behavior is formed during years of education.
Ethics is not an exact science, because what seems to be ethical or moral for a person in one culture, is not acceptable for other cultures. We can give here a lot of examples (whistle-blowing, hara-kiri, euthanasia and so on).
The relation between culture and ethics (business ethics) is presented by Shakeel, Khan and Khan (2011):
Figure no. 1 Relation between culture and ethics
Source: Shakeel, Khan and Khan (2011), Impact of culture on business ethics, Far East Journal on Psychology and Business, vol 3, no.2, May 2011
This domains has a lot of definitions, meanings and approaches in the
international literature and has a great applicability in numerous sectors, like education, medical system, law, business, everyday life, sociology, environment, tourism, food sector and so on.
The question that arise is: why is ethics important? Why should ethics be studied and implemented in real life, passing beyond the numerous theories and concepts about it, that make it difficult to apply it, without a proper experience and knowledge.
Ethics is of a great important for a lot of domains and should be studied, because ethics is like character in psychology, it is formed, you are not born with a character, you are not born bad or good. So, ethics should be integrated in organizations, institutions, schools and combined with other instrument that lead to the creation of a moral environment.
Plato, the Greek philosopher said that “All evil is ignorance”. Maybe, this statement is too radical, because even if we know something is bad (we are not ignorant), there is a chance to comit a mistake, to comit something that is not moral. But, we have the premises in order to act accordingly. In the same way, we could agree that school teaches us a lot of things, a lot of theory, even if we will not apply everything of that. But we develop a critical and logical way of thinking, that help us to make decisions in everydaylife. So does ethics, as an object of study.
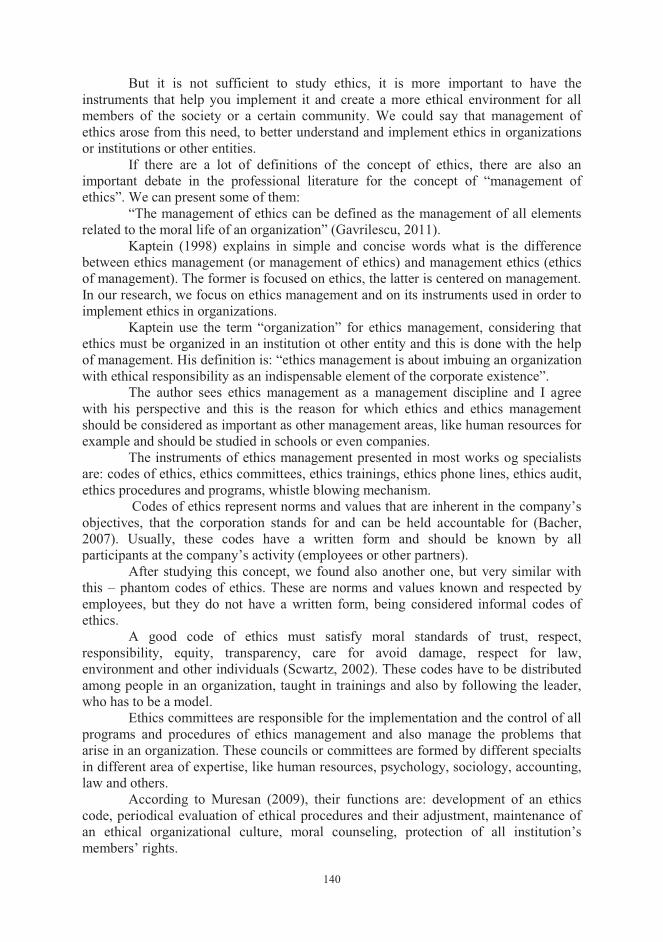
140
But it is not sufficient to study ethics, it is more important to have the instruments that help you implement it and create a more ethical environment for all members of the society or a certain community. We could say that management of ethics arose from this need, to better understand and implement ethics in organizations or institutions or other entities.
If there are a lot of definitions of the concept of ethics, there are also an important debate in the professional literature for the concept of “management of ethics”. We can present some of them:
“The management of ethics can be defined as the management of all elements related to the moral life of an organization” (Gavrilescu, 2011).
Kaptein (1998) explains in simple and concise words what is the difference between ethics management (or management of ethics) and management ethics (ethics of management). The former is focused on ethics, the latter is centered on management. In our research, we focus on ethics management and on its instruments used in order to implement ethics in organizations.
Kaptein use the term “organization” for ethics management, considering that ethics must be organized in an institution ot other entity and this is done with the help of management. His definition is: “ethics management is about imbuing an organization with ethical responsibility as an indispensable element of the corporate existence”.
The author sees ethics management as a management discipline and I agree with his perspective and this is the reason for which ethics and ethics management should be considered as important as other management areas, like human resources for example and should be studied in schools or even companies.
The instruments of ethics management presented in most works og specialists are: codes of ethics, ethics committees, ethics trainings, ethics phone lines, ethics audit, ethics procedures and programs, whistle blowing mechanism.
Codes of ethics represent norms and values that are inherent in the company’s objectives, that the corporation stands for and can be held accountable for (Bacher, 2007). Usually, these codes have a written form and should be known by all participants at the company’s activity (employees or other partners).
After studying this concept, we found also another one, but very similar with this – phantom codes of ethics. These are norms and values known and respected by employees, but they do not have a written form, being considered informal codes of ethics.
A good code of ethics must satisfy moral standards of trust, respect, responsibility, equity, transparency, care for avoid damage, respect for law, environment and other individuals (Scwartz, 2002). These codes have to be distributed among people in an organization, taught in trainings and also by following the leader, who has to be a model.
Ethics committees are responsible for the implementation and the control of all programs and procedures of ethics management and also manage the problems that arise in an organization. These councils or committees are formed by different specialts in different area of expertise, like human resources, psychology, sociology, accounting, law and others.
According to Muresan (2009), their functions are: development of an ethics code, periodical evaluation of ethical procedures and their adjustment, maintenance of an ethical organizational culture, moral counseling, protection of all institution’s members’ rights.
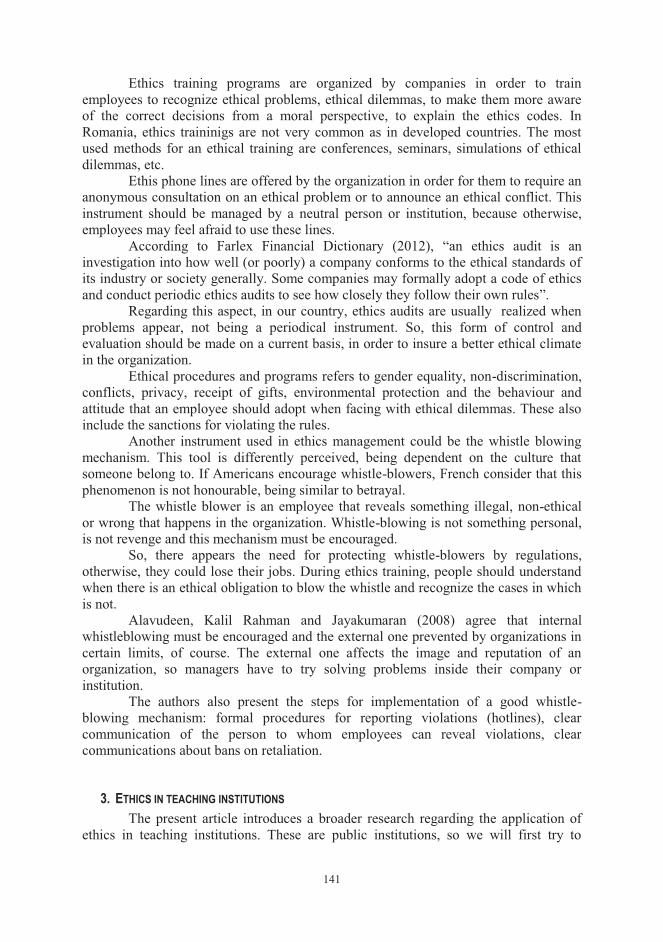
141
Ethics training programs are organized by companies in order to train employees to recognize ethical problems, ethical dilemmas, to make them more aware of the correct decisions from a moral perspective, to explain the ethics codes. In Romania, ethics traininigs are not very common as in developed countries. The most used methods for an ethical training are conferences, seminars, simulations of ethical dilemmas, etc.
Ethis phone lines are offered by the organization in order for them to require an anonymous consultation on an ethical problem or to announce an ethical conflict. This instrument should be managed by a neutral person or institution, because otherwise, employees may feel afraid to use these lines.
According to Farlex Financial Dictionary (2012), “an ethics audit is an investigation into how well (or poorly) a company conforms to the ethical standards of its industry or society generally. Some companies may formally adopt a code of ethics and conduct periodic ethics audits to see how closely they follow their own rules”.
Regarding this aspect, in our country, ethics audits are usually realized when problems appear, not being a periodical instrument. So, this form of control and evaluation should be made on a current basis, in order to insure a better ethical climate in the organization.
Ethical procedures and programs refers to gender equality, non-discrimination, conflicts, privacy, receipt of gifts, environmental protection and the behaviour and attitude that an employee should adopt when facing with ethical dilemmas. These also include the sanctions for violating the rules.
Another instrument used in ethics management could be the whistle blowing mechanism. This tool is differently perceived, being dependent on the culture that someone belong to. If Americans encourage whistle-blowers, French consider that this phenomenon is not honourable, being similar to betrayal.
The whistle blower is an employee that reveals something illegal, non-ethical or wrong that happens in the organization. Whistle-blowing is not something personal, is not revenge and this mechanism must be encouraged.
So, there appears the need for protecting whistle-blowers by regulations, otherwise, they could lose their jobs. During ethics training, people should understand when there is an ethical obligation to blow the whistle and recognize the cases in which is not.
Alavudeen, Kalil Rahman and Jayakumaran (2008) agree that internal whistleblowing must be encouraged and the external one prevented by organizations in certain limits, of course. The external one affects the image and reputation of an organization, so managers have to try solving problems inside their company or institution.
The authors also present the steps for implementation of a good whistle-blowing mechanism: formal procedures for reporting violations (hotlines), clear communication of the person to whom employees can reveal violations, clear communications about bans on retaliation.
3. ETHICS IN TEACHING INSTITUTIONS The present article introduces a broader research regarding the application of
ethics in teaching institutions. These are public institutions, so we will first try to
142
explain why it is important ethics for these entities and what is the ethics infrastructure used in order to better implement mechanisms of ethics management.
When we talk about public sector, we talk about public money, so the problem of ethics is even more stringent than in the private sector, because a lot of problems are of public interest. In most of the public institutions, there is a more direct connection between community and the people offering public services.
Public institutions refer both to a central and local level and comprises public agencies, governments, ministries, city halls, local administration, health care institutions, teaching institutions, justice, police, army and others. Besides, implementation of ethics needs a legal infrastructure and this is done within the public sector.
Ethics in the public sector reflects the moral attitude of citizens and is a mirror of the ethical climate of the society. So, ethics in these institutions lead to a social progress. Grigoruta (2005) shows that there is a strong relation between public reforms and ethics management, because a change in regulations, like a reduction of control, may lead to a wrong behavior or mistakes.
A better image of countries at European level starts with ethics, because an ethical climat means less corruption, a more efficient way of spending public money and all these create trust.
Ethics in teaching institutions has an important role for the entire society, because these entities create models, not just people with information. So, ethics can be taught by including a discipline in the curricula of the institution or even by offering ethical models in person of teachers, educators, professors and others. In order to create an improved ethical climat in these institutions, managers have to apply principles and methods specific to ethics management.
At a first look at the main teaching instution in Romania, we may conclude that ethics management is not very well known or implemented. We see codes of ethics, ethics committees or councils, but ethics management is not just these codes or committees, is much more.
These days, National Education Ministery of Romania launched for debates an Ethics Code needed in the preuniversitary system. This code is very strict and include normal and common sense rules, like: a teacher that was sanctioned one, will never be part of the teaching staff or the article stripulating that it is forbidden to offer private lessons to your own students. And in Law no1/2011 regarding national education system, we also have a chapter related to universitary ethics, ethics codes and ethics commission.
But all ethics codes are wright, common sense, of course they are not always perfect and have to be updated to the new changes. In my opinion, the problem of corruption or non-ethical behavior in eduction is not because we do not have rules, but because we do not know to disseminate these rules, to apply them and control their implementation. And even if we communicate all these ethics codes, it is not enough for having a good ethical climate. Teaching institutions have to “teach and learn” ethics, ethics management and management ethics, of course adapted for each level of education.
If public responsible do not understand the role of having an ethics management, not just an ethics code or commission, we will never improve our ethics background and our ethical image. And in Romania, implementation of an ethics management in public institutions is at a very low level.
143
5. CONCLUSIONS This article reached its objectives of knowing the terms of ethics, management
of ethics and the tools needed for a better implementation in teaching institutions from the public sector. We tried to explain these mechanisms in simple words, in order to better understand the great role and importance of ethics management for companies, organizations or public entities. This paper represents a fist stage for a further quantitative research regarding ethics and ethics management in higher education system in Romania. In my opinion, the public system suffers from an important lack of ethics management, so I think that there is a need for a question thinking orientation, using Power Thinking methodologies of Marilee Adams.
ACKNOWLEDGEMENTS This work was partially supported by the grant number 25 C/ 2014, awarded in
the internal grant competition of the University of Craiova.
REFERENCES 1. Adams, M. Change Your Questions, Change your Life, 2nd ed, Berrett-
Koehler Publishers, 2009 2. Alavudeen, A.,
Kalil Rahman, R., Jayakumaran, M.
Professional Ethics and Human Values, New Delhi, Laxmi Publications, 2008
3. Bacher, C. Corporate Codes of Ethics, Grin Verlag, 2007 4. Gavrilescu, L. Decizia etică: dificultă i i provocări, Anuarul Institului de
Istorie G.Bari iu din Cluj Napoca, Series Humanistica, tom IX, 2011
5. Grigoru ă, M.V. Etică, management i administra ie publică, Annals of University A.I.Cuza Iasi, Series Economics, tom L/LI, 2004/2005
6. Kaptein, M. Ethics Management: Auditing and Developing the Ehical Content of Organizations, Springer, 1998
7. MacKinnon, B. Ethics: Theory and Contemporary Issues, Boston, 2nd edition, Clark Baxter Publisher, 2012
8. Mure an, V Managementul eticii în organiza ii, Editura Universită ii din Bucure ti, 2009
9. Petrick, J.A., Quinn, J.F.
Management Ethics: Integrity at Work, USA, Sage Publications, 1997
10. Romanian Academy
Romanian Dictionary - DEX, Univers Enciclopedic Gold Publisher, 3rd edition, Bucharest, 2009
11. Scwartz, M.S. A Code of Ethics for Corporate Code of Ethics, Journal of Business Ethics, 41, 2002
12. Shakeel, M., Khan, M.M., Khan, M.A.
Impact of Culture on Business Ethics, Far East Journal on Psychology and Business, vol 3, no.2, May 2011
13. *** Farlex Financial Dictionary, 2012 14. *** http://media.hotnews.ro/media_server1/document-2012-04-13-
11990228-0-cod-etica-din-preuniversitar.pdf 15. *** Lex2013, Legea Educa iei Na ionale, no.1/2011, art.306
144
IMPACT OF CYCLICAL EVOLUTION ON BUDGET BALANCE- ROMANIA’S
CASE
Assist. Alexandru Avram Ph. D West University of Timisoara Faculty of Economics and Business Administration Timisoara, Romania Prof. Veronel Avram Ph. D University of Craiova Faculty of Economics and Business Administration Craiova, Romania Lect. Roxana Adriana Hetes-Gavra Ph. D West University of Timisoara Faculty of Economics and Business Administration Timisoara, Romania
Abstract: : History has provided sufficient evidence that economic activity does not grow linearly and economic cycles can be easily distinguished, in which periods of growth are followed by periods of recession, stagnation, rising unemployment and widening budget deficits. Cyclical evolution impact on macroeconomic equilibrium requires us to move to a multi-annual approach to budget balance and think about adjustments for the fiscal policy mix over the economic cycle, i.e. to pursue higher deficits in periods of recession as a result of tax incentives and some public investment expenditures absolutely necessary to resume growth and the deficits and public debt accumulated will be reduced in further periods.
JEL classification: G32, G39
Key words: macroeconomic balance, stability, economic growth, budget deficit, public debt
1. INTRODUCTION Both nature and society are constantly under contradictory forces whose
tendency is to achieve the balance/ equilibrium, as "essential moment of stability of dynamical systems." 43 Macroeconomic balance can characterize the state toward which the market system as a whole evolves, meaning the goods and services market, labor market, monetary market, trade with foreign countries44, under the action of economic agents as producers - sellers and buyers – consumers, each pursuing specific goals.
43 Mic dictionar filozofic, Editura Politica, Bucuresti, 1973, pag. 161 44 Avram C.D.- Economie generala, Editura Universitaria, Craiova 2012, pag. 228
145
2. METHODOLOGY To capture the impact of the cyclical evolution on macroeconomic balance, we
have used as investigative tool the "pentagonal of macro-stabilization", used in the last decade of the last century to chart the space described by five indicators that characterize macroeconomic stability, namely the economic growth, employment, budget balance, net exports and changes in purchasing power of the monetary unit.
3. ANALYSIS OF MACROECONOMIC BALANCE DURING THE PERIOD 2008-2011 To capture the impact of cyclical developments on the macroeconomic balance
in our country, we intend to analyze the Romanian economy during the period 2008 - 2011, taking into account the following indicators:
• the rate of economic growth / recession; • unemployment rate; • share of government deficit to GDP; • share of current account deficit to GDP; • inflation rate. The investigated period, 2008 - 2011, is covering the last year characterized by
economic growth (2008), recession years (2009-2010) and the year in which growth was resumed (2011) according to data in Table no. 1:
Table no. 1: Evolution of main economic indicators in Romania in the
period 2008 - 2011 %
2008 2009 2010 2011 The rate of economic growth / decrease 7.3 -6.6 -1.1 2.2 Unemployment rate 6.1 7.2 7.6 7.7 Share of budget deficit to GDP -5.7 -9 -6.8 -5.5 The share of current account deficit to GDP -13 -6 -5.7 -5.3 Inflation rate 7.85 5.59 6.09 5.79
Source: Eurostat For a graphical presentation of the evolution of all macroeconomic indicators
analyzed, we realized the pentagonal of macro-stabilization (Bergman, Rammi, 2000) for 2008-2009 and 2010-2011, according to Figures no.1 and no. 2.
Figure no. 1 emphasizes the moment when Romanian economy passed from a growth of 7.3% per year, to a restriction of economic activity, which led to an increase in the budget deficit from 5.7% of GDP to 9% of GDP and an increase of the unemployment rate by 1.1 percentage points. Time of crisis has positively influenced the current account deficit, meaning a halving of it, falling from 13% to 6%, while the decline in exports was exceeded by lower imports, as shown in Table no. 2.
Table no.2: Situation of current account deficit during 2008 – 2009
2008 2009 2009/2008 Total Exports (mil. euro) 42,532.30 36,169.60 -14.9% Total Imports (mil. euro) 60,757.00 43,309.70 -28.7% Total Current account deficit (mil.euro) -18,224.70 -7,140.10 -60.82%
Source: Processing data from Eurostat
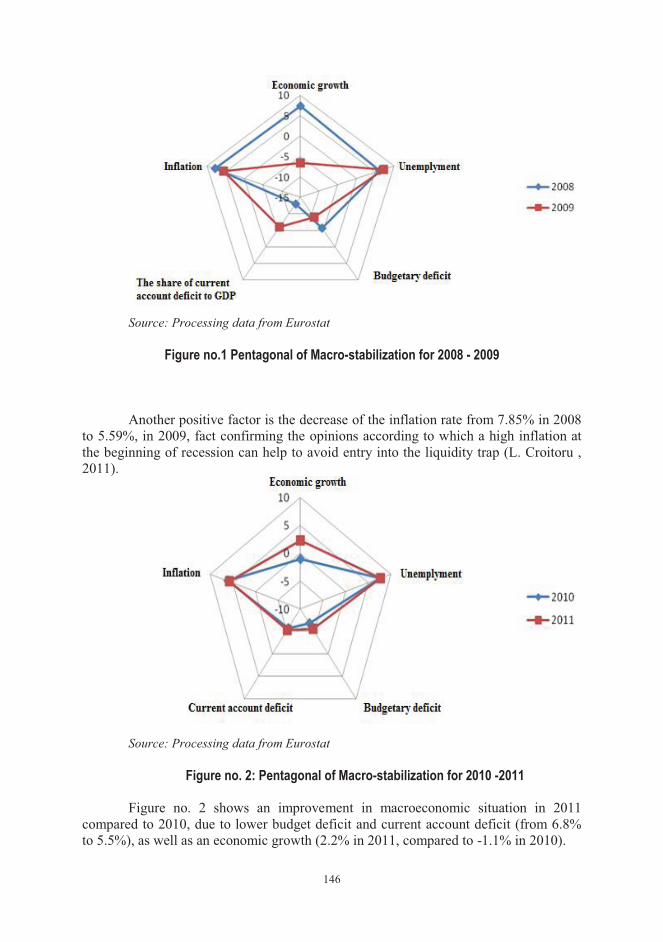
146
Source: Processing data from Eurostat
Figure no.1 Pentagonal of Macro-stabilization for 2008 - 2009
Another positive factor is the decrease of the inflation rate from 7.85% in 2008
to 5.59%, in 2009, fact confirming the opinions according to which a high inflation at the beginning of recession can help to avoid entry into the liquidity trap (L. Croitoru , 2011).
Source: Processing data from Eurostat
Figure no. 2: Pentagonal of Macro-stabilization for 2010 -2011 Figure no. 2 shows an improvement in macroeconomic situation in 2011
compared to 2010, due to lower budget deficit and current account deficit (from 6.8% to 5.5%), as well as an economic growth (2.2% in 2011, compared to -1.1% in 2010).
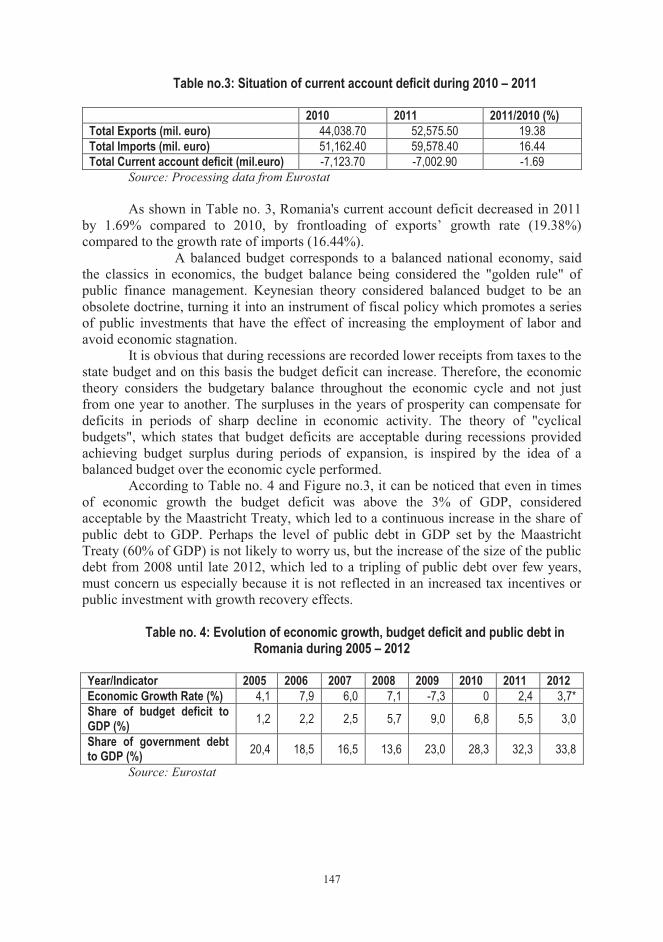
147
Table no.3: Situation of current account deficit during 2010 – 2011
2010 2011 2011/2010 (%) Total Exports (mil. euro) 44,038.70 52,575.50 19.38 Total Imports (mil. euro) 51,162.40 59,578.40 16.44 Total Current account deficit (mil.euro) -7,123.70 -7,002.90 -1.69
Source: Processing data from Eurostat As shown in Table no. 3, Romania's current account deficit decreased in 2011
by 1.69% compared to 2010, by frontloading of exports’ growth rate (19.38%) compared to the growth rate of imports (16.44%).
A balanced budget corresponds to a balanced national economy, said the classics in economics, the budget balance being considered the "golden rule" of public finance management. Keynesian theory considered balanced budget to be an obsolete doctrine, turning it into an instrument of fiscal policy which promotes a series of public investments that have the effect of increasing the employment of labor and avoid economic stagnation.
It is obvious that during recessions are recorded lower receipts from taxes to the state budget and on this basis the budget deficit can increase. Therefore, the economic theory considers the budgetary balance throughout the economic cycle and not just from one year to another. The surpluses in the years of prosperity can compensate for deficits in periods of sharp decline in economic activity. The theory of "cyclical budgets", which states that budget deficits are acceptable during recessions provided achieving budget surplus during periods of expansion, is inspired by the idea of a balanced budget over the economic cycle performed.
According to Table no. 4 and Figure no.3, it can be noticed that even in times of economic growth the budget deficit was above the 3% of GDP, considered acceptable by the Maastricht Treaty, which led to a continuous increase in the share of public debt to GDP. Perhaps the level of public debt in GDP set by the Maastricht Treaty (60% of GDP) is not likely to worry us, but the increase of the size of the public debt from 2008 until late 2012, which led to a tripling of public debt over few years, must concern us especially because it is not reflected in an increased tax incentives or public investment with growth recovery effects.
Table no. 4: Evolution of economic growth, budget deficit and public debt in
Romania during 2005 – 2012
Year/Indicator 2005 2006 2007 2008 2009 2010 2011 2012 Economic Growth Rate (%) 4,1 7,9 6,0 7,1 -7,3 0 2,4 3,7* Share of budget deficit to GDP (%) 1,2 2,2 2,5 5,7 9,0 6,8 5,5 3,0
Share of government debt to GDP (%) 20,4 18,5 16,5 13,6 23,0 28,3 32,3 33,8
Source: Eurostat
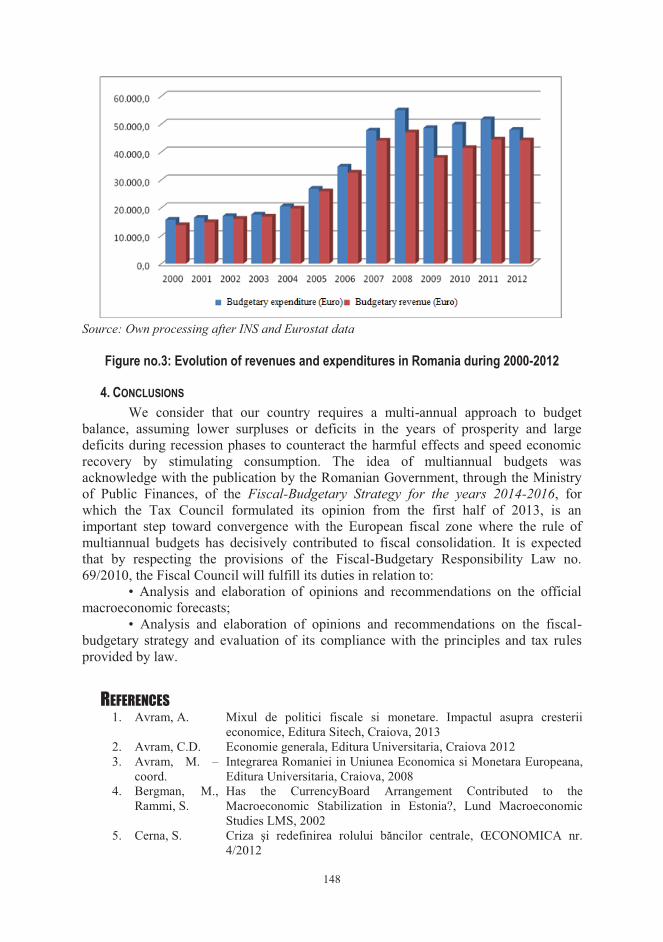
148
Source: Own processing after INS and Eurostat data
Figure no.3: Evolution of revenues and expenditures in Romania during 2000-2012
4. CONCLUSIONS We consider that our country requires a multi-annual approach to budget
balance, assuming lower surpluses or deficits in the years of prosperity and large deficits during recession phases to counteract the harmful effects and speed economic recovery by stimulating consumption. The idea of multiannual budgets was acknowledge with the publication by the Romanian Government, through the Ministry of Public Finances, of the Fiscal-Budgetary Strategy for the years 2014-2016, for which the Tax Council formulated its opinion from the first half of 2013, is an important step toward convergence with the European fiscal zone where the rule of multiannual budgets has decisively contributed to fiscal consolidation. It is expected that by respecting the provisions of the Fiscal-Budgetary Responsibility Law no. 69/2010, the Fiscal Council will fulfill its duties in relation to:
• Analysis and elaboration of opinions and recommendations on the official macroeconomic forecasts;
• Analysis and elaboration of opinions and recommendations on the fiscal-budgetary strategy and evaluation of its compliance with the principles and tax rules provided by law.
REFERENCES 1. Avram, A. Mixul de politici fiscale si monetare. Impactul asupra cresterii
economice, Editura Sitech, Craiova, 2013 2. Avram, C.D. Economie generala, Editura Universitaria, Craiova 2012 3. Avram, M. –
coord. Integrarea Romaniei in Uniunea Economica si Monetara Europeana, Editura Universitaria, Craiova, 2008
4. Bergman, M., Rammi, S.
Has the CurrencyBoard Arrangement Contributed to the Macroeconomic Stabilization in Estonia?, Lund Macroeconomic Studies LMS, 2002
5. Cerna, S. Criza şi redefinirea rolului băncilor centrale, ŒCONOMICA nr. 4/2012
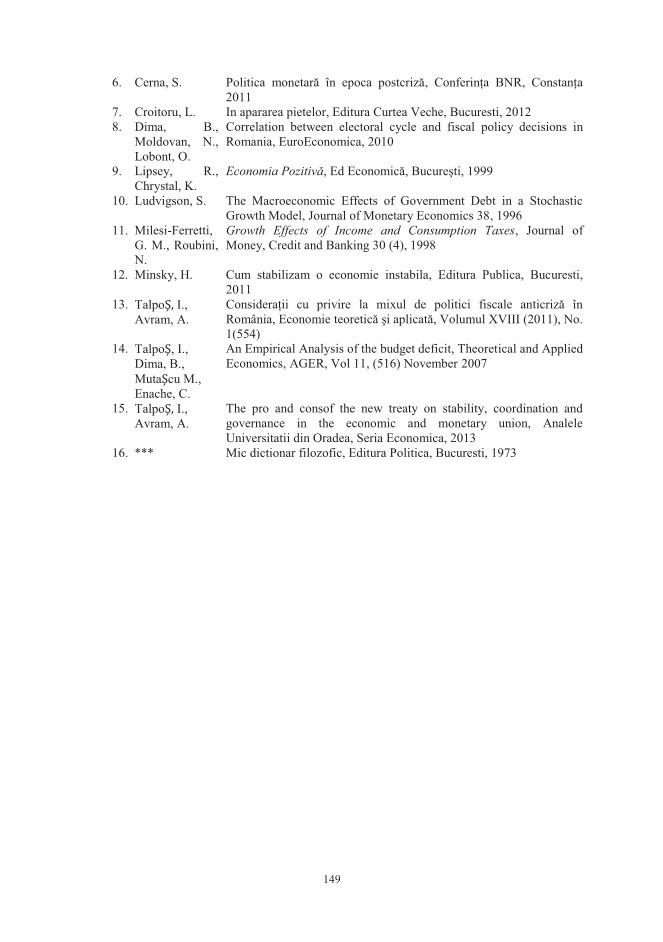
149
6. Cerna, S. Politica monetară în epoca postcriză, Conferinţa BNR, Constanţa 2011
7. Croitoru, L. In apararea pietelor, Editura Curtea Veche, Bucuresti, 2012 8. Dima, B.,
Moldovan, N., Lobont, O.
Correlation between electoral cycle and fiscal policy decisions in Romania, EuroEconomica, 2010
9. Lipsey, R., Chrystal, K.
Economia Pozitivă, Ed Economică, Bucureşti, 1999
10. Ludvigson, S. The Macroeconomic Effects of Government Debt in a Stochastic Growth Model, Journal of Monetary Economics 38, 1996
11. Milesi-Ferretti, G. M., Roubini, N.
Growth Effects of Income and Consumption Taxes, Journal of Money, Credit and Banking 30 (4), 1998
12. Minsky, H. Cum stabilizam o economie instabila, Editura Publica, Bucuresti, 2011
13. Talpo I., Avram, A.
Consideraţii cu privire la mixul de politici fiscale anticriză în România, Economie teoretică şi aplicată, Volumul XVIII (2011), No. 1(554)
14. Talpo , I., Dima, B., Muta cu M., Enache, C.
An Empirical Analysis of the budget deficit, Theoretical and Applied Economics, AGER, Vol 11, (516) November 2007
15. Talpo I., Avram, A.
The pro and consof the new treaty on stability, coordination and governance in the economic and monetary union, Analele Universitatii din Oradea, Seria Economica, 2013
16. *** Mic dictionar filozofic, Editura Politica, Bucuresti, 1973
150
THE USE OF QUALITATIVE VARIABLES IN THE RISK ASSESSMENT
Lect. Daniel Cîrciumaru Ph. D. University of Craiova Faculty of Economics of Business Administration Craiova, Romania
Abstract: In recent decades, the importance of qualitative variables in the assessment of the company’s risk has grown considerably, due to the growing importance of intangible assets. Currently, it is believed that the intangible assets are even more important than the tangible assets. The measurement of intangibles and their inclusion in the risk analysis became therefore mandatory. The financial ratios which were traditionally used to point out the financial distress are no longer sufficient. As a result, the classical score functions had to be adapted which led to other difficulties, related to the evaluation of intellectual capital. This paper presents the general considerations regarding the use of qualitative variables in the risk analysis and the global concerns in this respect. It is also presented a model of bankruptcy risk analysis based exclusively on qualitative variables.
JEL classification: G30, G33
Key words: intangible assets, intellectual capital, qualitative variables, bankruptcy risk
1. INTRODUCTION In recent decades, the importance of intangible assets (also called intellectual
capital) in the evaluation of the performances and the risk of the companies has increased considerably. Currently, it is considered that the intangible assets are even more important for an enterprise than the tangible assets. This is emphasized by the growing gap between the market value of the companies and the value of tangible assets. The advantageous purchase or sale contracts, the qualified employees, the information held, the innovation capacity, all these are crucial to business success in certain industries.
Unlike the tangible assets whose valuation and recognition in the balance sheet are easy to achieve, the intangibles are more difficult to identify and assess. Therefore the balance sheet only recognizes a small part of the intellectual capital a company holds, according to the law regulations.
2. LITERATURE REVIEW R. Petty, S. Cuganesan, N. Finch and G. Ford45 summarized the results of
several researchers and concluded that three main components of intellectual capital can be identified: 45 R. Petty, S. Cuganesan, N. Finch şi G. Ford, Intellectual Capital and Valuation: Challenges in the Voluntary Disclosure of Value Drivers, Journal of Finance and Accountancy, http://www.aabri.com/manuscripts/09177.pdf
151
- Human capital: knowledge, skills, training, education and experience of the staff;
- External capital: relationships with customers and suppliers, brands and reputation;
- Internal capital: knowledge related to business processes, patents, results of R&D.
The components of intellectual capital are difficult to estimate. Qualitative variables have to be used in this respect as the classical measures cannot be adapted to capture the intangible assets of the company. K.E. Sveiby46 reviewed the assessment tools of the intellectual capital from the specialized literature and concluded they can be divided into four approaches:
a) Direct Intellectual Capital Methods - identify and evaluate the components of intellectual capital individually or by aggregating them into a coefficient;
b) Market Capitalization Methods – the intellectual capital is the difference between the market value of the company and the shareholders’ equity;
c) Return on Assets Methods - calculate the difference between the average return on tangible assets of the company and the average return of the industry, which is further converted into the market value of intellectual capital through the capitalization method;
d) Scorecard Methods – use scorecards and graphs in order to identify and evaluate the components of intellectual capital through indicators or indices.
The first three methods have the advantage of evaluation in monetary units of the intangible assets. The disadvantages are related to the inherent limitations of the methods, namely the estimations of the earnings, market distortions, the difficulty of estimating the discounting rate etc. The scorecards methods are the most subjective as they are mainly based on decision makers’ assessments. At the same time the comparisons between companies are more difficult to make with the help of these methods.
Some of the most popular tools for measuring the intellectual capital are the scorecard, Sveiby’s Intangible Asset Monitor and Skandia Navigator.
The balanced scorecard was created by Kaplan and Norton as a management and strategic planning tool so that the organization aligns its strategy to the operational activities. The authors have combined the classical financial indicators with the qualitative ones in order to get an accurate image of the overall performances of the company. The balanced scorecard reflects the performance from four points of view (perspectives)47:
- Learning and Growth - this perspective emphasizes employee training as the only depositories of knowledge within the organization. The rapid technological progress requires the involvement of employees in continuous education programs, which can provide success for the company. The distinction between learning and training is also highlighted,
46 K. E. Sveiby, Methods for Measuring Intangible Assets, http://www.sveiby.com/articles/ IntangibleMethods.htm 47 http://www.balancedscorecard.org/BSCResources/AbouttheBalancedScorecard/tabid/55/Default.aspx
152
as the authors consider that, at the organizational level, learning is more important than training.
- Internal business processes - regard issues related to the way of running the business, allowing managers to identify the key internal processes for the development of the organization;
- Customers - focus on customer and its needs. The ways of satisfying the customer requirements are a major influencing factor for the future success of the business;
- Financial - the use of qualitative variables alongside with the financial indicators was considered a necessity in view of getting a complete picture of management performance and of how to meet the financial expectations of stakeholders. It is, however, considered the inclusion of issues beyond the classical range of indicators such as risk analysis and cost-benefit analyzes.
The balanced scorecard has the advantage of focusing the attention of managers on intangible assets considered as a source of generating long-term value to the organization, to the detriment of traditional financial indicators that rather reflect the short term performances.
Intangible Asset Monitor was conceived by K.E. Sveiby in 1994. It is a simple tool designed to be easy to apply, based only on intangible assets that are important to the company. The system sets as a goal to point out in a complete and realistic way the performances of the company and its potential for future development.
Sveiby classifies the intangible assets into internal capital, external capital and skills of employees. For each type of capital there are defined indicators of growth, indicators of renewal/innovation, indicators of efficiency/utilisation and indicators of risk/stability.
In order to be easy to apply, the author recommends that an organization should only use a few indicators from each category. By calculating the indicators in the model for several consecutive periods, one could notice an increase or decrease in the value of the firm's intellectual capital on the three components.
Skandia Navigator is a system for the valuation of the intangibles developed by Edvinsson and Malone in 1994. The two authors have considered the value of a company is given by the relationship between the financial capital (seen in the traditional way) and the intellectual capital. The latter includes human capital and structural capital.
The human capital is given by knowledge, skills, know-how, innovation
capacity, the culture and philosophy of the company. The human capital is closely linked to the organization's staff.
The structural capital includes hardware, software, databases, organizational structure, patents, trademarks etc. The structural capital is divided into customer capital and organizational capital. The organizational capital includes innovation capital (intellectual property rights) and capital related to internal operational processes. Unlike the human capital, the structural capital can be sold.
153
3. A RISK ASSESSMENT MODEL BASED ON QUALITATIVE VARIABLES The overall assessment of the risk began in the late 60's with the creation of the
first score function with the help of the discriminant analysis. This led to simple models, easy to apply by external stakeholders, based on data published by companies.
In the 60'-70', such models were sufficient to assess the bankruptcy risk. The deterioration of the financial ratios further influences the overall score calculated for a company using the score function. Later, however, the dematerialization of the assets increased the importance of the intangible assets that have exceeded the value of tangible assets. Thus the valuation of intangible assets and their inclusion in the bankruptcy risk analysis became mandatory. The financial ratios that emphasize the way the tangible assets are affected by the state of health or distress are no longer sufficient, as these assets are only 10 to 30% of the market value of the company.
Nowadays, the inclusion of intangible assets in this process has become a necessity. The banks and the rating agencies were among the first to have developed and implemented such mixed models, which take into account both the quantitative and the qualitative measures. The adaptation of the classical scores to this process implies, however, other issues. They were specifically developed for external users who only have access to the financial statements published by the company. In order to assess the intangibles it’s necessary to apply questionnaires to the company’s employees, to carry out discussions with the key personnel in the company, to analyse the strategies and the policies implemented by the company etc.. This requires a large volume of work and getting access to confidential information, inaccessible to most of the public.
The measurement of the qualitative variables, according to a conventional scale, is impossible to be made by a stakeholder who does not know the company under evaluation. Most of the times, the scoring functions are used by potential investors from the market, in order to develop the investment decisions. They don’t have access to information so as to use complex models based on qualitative variables.
The Romanian literature dedicated to the use of qualitative variables in building the risk assessment tools is still in its early phases. These tools are generally restricted to banking models. The reason is the difficulty to identify and evaluate the intellectual capital for Romanian companies both by internal and external users of information.
Banks may assess any issue that might influence the credit risk of their customers. As well, the banks can request and get all of the information they need from a company, both quantitative and qualitative, which is then included in the insolvency risk analysis models. The range of qualitative variables considered may be larger or smaller, depending on the importance given to these variables and on the expected impact on the risk.
Further below there is a model developed to evaluate the bankruptcy risk, based entirely on qualitative variables:
Table no. 1 Section Weight of
section Qualitative variable Weight of qualitative
variable 1. Management 35% 1.1. Business strategy 30%
1.2. Innovation capacity 25% 1.3. Organizational flexibility 15% 1.4. Resource efficiency 15% 1.5. Computerization degree 15%
2. Human resources 30% 2.1. Managers 60%
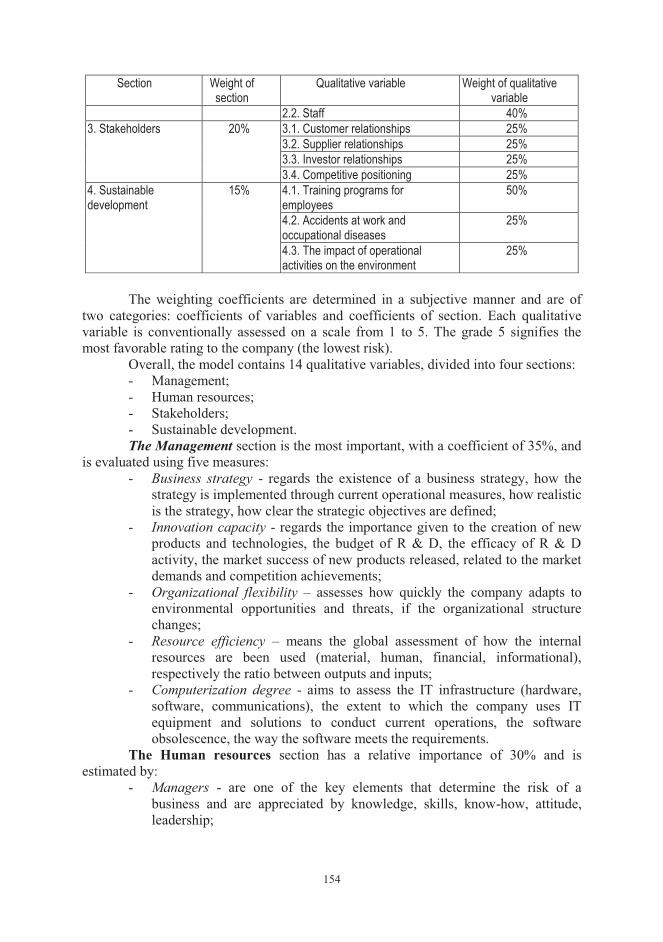
154
Section Weight of section
Qualitative variable Weight of qualitative variable
2.2. Staff 40% 3. Stakeholders 20% 3.1. Customer relationships 25%
3.2. Supplier relationships 25% 3.3. Investor relationships 25% 3.4. Competitive positioning 25%
4. Sustainable development
15% 4.1. Training programs for employees
50%
4.2. Accidents at work and occupational diseases
25%
4.3. The impact of operational activities on the environment
25%
The weighting coefficients are determined in a subjective manner and are of
two categories: coefficients of variables and coefficients of section. Each qualitative variable is conventionally assessed on a scale from 1 to 5. The grade 5 signifies the most favorable rating to the company (the lowest risk).
Overall, the model contains 14 qualitative variables, divided into four sections: - Management; - Human resources; - Stakeholders; - Sustainable development. The Management section is the most important, with a coefficient of 35%, and
is evaluated using five measures: - Business strategy - regards the existence of a business strategy, how the
strategy is implemented through current operational measures, how realistic is the strategy, how clear the strategic objectives are defined;
- Innovation capacity - regards the importance given to the creation of new products and technologies, the budget of R & D, the efficacy of R & D activity, the market success of new products released, related to the market demands and competition achievements;
- Organizational flexibility – assesses how quickly the company adapts to environmental opportunities and threats, if the organizational structure changes;
- Resource efficiency – means the global assessment of how the internal resources are been used (material, human, financial, informational), respectively the ratio between outputs and inputs;
- Computerization degree - aims to assess the IT infrastructure (hardware, software, communications), the extent to which the company uses IT equipment and solutions to conduct current operations, the software obsolescence, the way the software meets the requirements.
The Human resources section has a relative importance of 30% and is estimated by:
- Managers - are one of the key elements that determine the risk of a business and are appreciated by knowledge, skills, know-how, attitude, leadership;
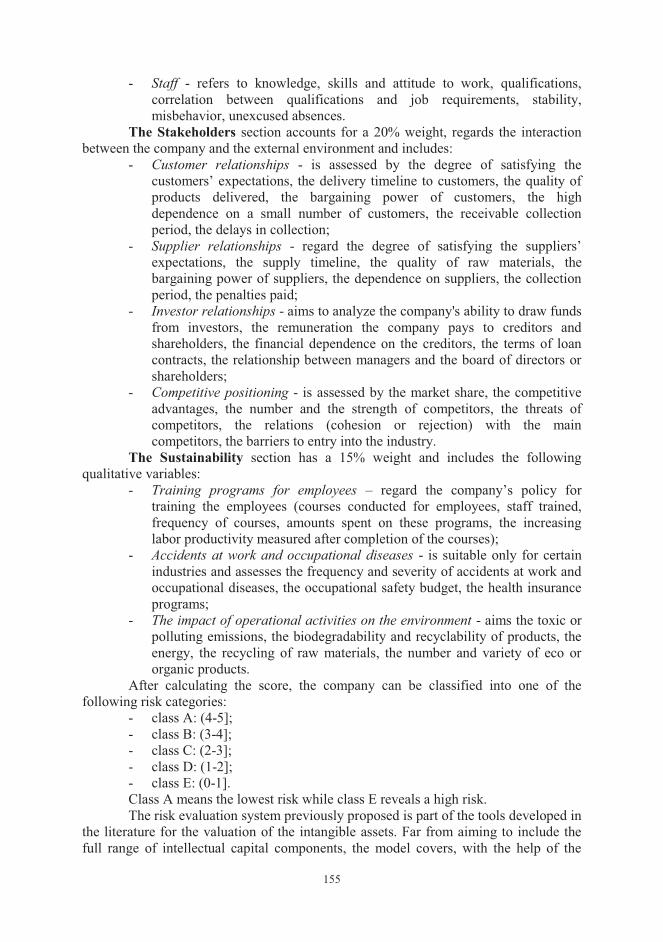
155
- Staff - refers to knowledge, skills and attitude to work, qualifications, correlation between qualifications and job requirements, stability, misbehavior, unexcused absences.
The Stakeholders section accounts for a 20% weight, regards the interaction between the company and the external environment and includes:
- Customer relationships - is assessed by the degree of satisfying the customers’ expectations, the delivery timeline to customers, the quality of products delivered, the bargaining power of customers, the high dependence on a small number of customers, the receivable collection period, the delays in collection;
- Supplier relationships - regard the degree of satisfying the suppliers’ expectations, the supply timeline, the quality of raw materials, the bargaining power of suppliers, the dependence on suppliers, the collection period, the penalties paid;
- Investor relationships - aims to analyze the company's ability to draw funds from investors, the remuneration the company pays to creditors and shareholders, the financial dependence on the creditors, the terms of loan contracts, the relationship between managers and the board of directors or shareholders;
- Competitive positioning - is assessed by the market share, the competitive advantages, the number and the strength of competitors, the threats of competitors, the relations (cohesion or rejection) with the main competitors, the barriers to entry into the industry.
The Sustainability section has a 15% weight and includes the following qualitative variables:
- Training programs for employees – regard the company’s policy for training the employees (courses conducted for employees, staff trained, frequency of courses, amounts spent on these programs, the increasing labor productivity measured after completion of the courses);
- Accidents at work and occupational diseases - is suitable only for certain industries and assesses the frequency and severity of accidents at work and occupational diseases, the occupational safety budget, the health insurance programs;
- The impact of operational activities on the environment - aims the toxic or polluting emissions, the biodegradability and recyclability of products, the energy, the recycling of raw materials, the number and variety of eco or organic products.
After calculating the score, the company can be classified into one of the following risk categories:
- class A: (4-5]; - class B: (3-4]; - class C: (2-3]; - class D: (1-2]; - class E: (0-1]. Class A means the lowest risk while class E reveals a high risk. The risk evaluation system previously proposed is part of the tools developed in
the literature for the valuation of the intangible assets. Far from aiming to include the full range of intellectual capital components, the model covers, with the help of the
156
qualitative variables considered, most of the intangibles of the company. The model is designated to be easy to apply and to integrate into the organization's management systems, allowing a rapid highlighting of its current progress.
REFERENCES 1. Ciobanu A. Analiza performantei intreprinderii, Bucure ti: Ed. ASE, 2006 2. Cîrciumaru, D. Analiza riscului firmei, Craiova: Ed. Universitaria, 2013 3. Petty R.,
Cuganesan S., Finch N., Ford G.
Intellectual Capital and Valuation: Challenges in the Voluntary Disclosure of Value Drivers, Journal of Finance and Accountancy http://www.aabri.com/manuscripts/09177.pdf
4. Sveiby, K. E. Methods for Measuring Intangible Assets, http://www.sveiby.com/articles/IntangibleMethods.htm
5. * * * http://www.balancedscorecard.org/BSCResources/AbouttheBalancedScorecard/tabid/55/Default.aspx
157
EXCISE IN TAX PRACTICE IN THE EUROPEAN UNION Assist. Nicoleta Mihaela Florea PH. D University of Craiova Faculty of Economics and Business Administration Craiova, Romania Assist. Stelian Selisteanu Ph. D University of Craiova Faculty of Economics and Business Administration Craiova, Romania
Abstract: : Special taxes on consumption is one of the oldest forms of taxation. The preference has been linked to their use for the collection facilities. Long established as fixed amounts per unit , they were easier to control especially for products such as oil , where production and distribution is highly concentrated or products subject to a monopoly , as if tobacco ( in France) or alcohol ( in some Nordic countries ) . Despite a strong tendency to focus on the three products (alcohol, tobacco and hydrocarbons) were maintained in many countries specific taxes considered obsolete. It is considered legitimate overcharge abuse alcohol and tobacco consumption because directly affects not only the health of the consumer but also those around you and involve significant expenditures from the budget to finance the costs of combating the effects of this large consumption, more than the proceeds realized by excising these products.
JEL classification: H83, H87
Key words: consumption taxes, excise revenue, tobacco excise, the excise duty on alcoholic beverages
1. INTRODUCTION The issue of harmonizing indirect taxes including excise, was laid in 1987,
when the Commission opted for their total unification. The solution was subsequently abandoned because there were situations extremely different from one country to another on the importance and weight of excise in GDP and tax revenues, but also in the level of taxation applied, so the impact of unification would have been extremely different for EU countries. Excise represented in Belgium only 3.1% of GDP and 6.9% of tax revenues, while their share in Portugal was three times higher, accounting for 9.2% of GDP and 26.6% of tax revenues, given that in the major developed countries they represented between 3% and 5% of GDP.
Excise structure and the level of taxation of various products were also very different from one country to another. For fuel, for example, the situation was totally different in Germany and the UK that charged relatively moderate taxes for gasoline, benefiting diesel very little in relation to countries such as France and Italy which practiced very high gas taxes, but applied very low taxes on gasoline.
Regarding alcohol the differences were even more important. There were basically three well defined areas: Northern Europe (Denmark, Ireland and the United Kingdom) which applied very high taxes; the Center (Belgium, the Netherlands,
158
Germany and France) with moderate taxes and the South (Spain, Italy, Greece and Portugal) which applied very low, almost null taxes. Such structures on products gave obvious advantage to local productions. For example, beer - producing countries, but which were not producing wine, favored beer consumption. The situation was reversed in the wine - producing countries, except for France and Germany which produce both products.
Regarding tobacco taxation was, generally, more homogeneous, the weight of taxes in the final price of cigarettes being between 70 and 75%. The difference appears here between producing and importing countries. France, for example, which produced brown tobacco, of a lower value, applied a proportional tax system, favoring its own products, instead importing countries charged fixed taxes which benefit blonde tobacco whose price is higher compared to brown tobacco.
As well as the value added tax, excise can affect the proper functioning of the single market in the absence of harmonization measures that eliminate potential competitive advantage of economic agents exempted by national authorities to pay all or part of these taxes. The harmonization of excise in the member states of the European Union represented a complementary measure to the introduction of the common system of the value added tax. To comply with the principle of fiscal neutrality, the European regulations regarding excise provide, as in the case of VAT, the use of the destination principle (excisable goods are taxed in the country of consumption) and establish, unlike VAT, a permanent and general regime on the holding, movement and control of excisable products (Moşteanu, T., Politici fiscale şi bugetare europene , p. 113). The community system regarding excise was introduced on January 1st 1993 with the creation of the single market. It was applied for the following categories of products: tobacco, alcohol and mineral oils.
2. CHARACTERISTICS OF EXCISE WHICH IMPOSE TAX HARMONIZATION AND THE OBJECTIVES OF HARMO
Excise presents, mainly, the following characteristics: a) there are taxes on the consumption of a small number of products and are practiced in all member states. Being an indirect tax, but directly connected to commercial transactions and free movement of goods in the single market, it is subject to tax harmonization;
b) normally, the products chosen to apply excise have a number of features: their production and sale are controlled by the state; the elasticity of demand in relation to the incomes is over-unit; the consumption of products causes negative externalities (health, environment costs increase, etc.), that is why excise is also used as a means of discouraging the consumption of those products;
c) excisable products are tobacco products, alcoholic beverages and energy and electricity products. The European Union allows also the application of some other taxes on these products (e.g. “green” taxes for environmental protection), if there are no barriers for trade in the single market. From one member state to another, we also meet other products bearing excise (see Directive 2008/118/EC). Harmonization aims, primarily, goods bearing excise in all member states, looking to uniform product definition, units of measurement and exceptions. The harmonization of excise on fuels, for example, is absolutely necessary given their major influence on production costs. Practicing different rates of taxation in the member states is likely to introduce major distortions in the competitive system;
159
d) excise is calculated based on percentages applied to price and/or fixed amounts per product unit. In the member states there are significant differences in the relative and absolute size of excise placed on the same product. The big differences in the rates of excise from one state to another are explained not only by policies to discourage consumption, but also because, for example, tobacco and wine present great importance in the agriculture of some member states with smaller excise. These differences, however, distort competition in the single market and constitute an important incentive for tax evasion (smuggling of cigarettes, alcohol, etc.). In addition, excise has a high potential of tax competition by attracting consumers from other states if there are lower levels of taxation. The harmonization of excise rates leads to the reduction of these negative effects. For the products that are part of the same group and which are in competition with each other, especially tobacco products and alcoholic beverages, it is necessary for excise to be relatively equal in order not to affect competition;
e) In the European Union, regardless of the member state making the goods carrying excise or imported ones, excise payment is made in the member state where the products are consumed. To this end, excise payment is considered suspended until those products are declared marketed for sale. The harmonization imposes uniform rules for the strict registration of the movement and storage of products bearing excise in the European Union.
However, the first measures to harmonize excise at community level were taken relatively late, with the establishment of the single market (1993). The delay can be explained by their lower importance as a source of budget revenue (compared with VAT), but also the relatively limited range of products to which it applies, which gives it a lower distortion potential of intra - community exchanges. On the other hand, there were frequent cases of discrimination against imports from other countries, especially alcoholic beverages by setting lower excise on domestic products that were easily substitutable with imported products (e.g. in France - Cognac versus whiskey, in England - beer versus wine, etc.). The harmonization of excise aimed three important objectives:
� tax base; � tax rates; � movement of excise bearing products between the member states.
The harmonization of the tax base was to prevent the establishment of a manner to favor domestic production at the expense of imports and included:
- establishing taxable goods through harmonized excise, namely tobacco products, alcoholic beverages, mineral oils, energy products and electricity. Member states may apply excise to other products as well (setting their list and the level of taxation) provided that this tax does not involve border formalities;
- defining the base for excise: the price for products with the largest consumption on the market - cigarettes; Pluto degrees - beer; hectoliter of pure alcohol in alcoholic beverages, which made it impossible to discriminate in favor of domestic products;
- setting the products exempt from tax or taxed at a reduced cost such as plane gas, energy products used as raw material or in areas such as agriculture, horticulture, fisheries, forestry, etc.
Regarding tax rates, although they have been introduced since 1992 with minimum levels of taxation in order to minimize distortions to the intra - community
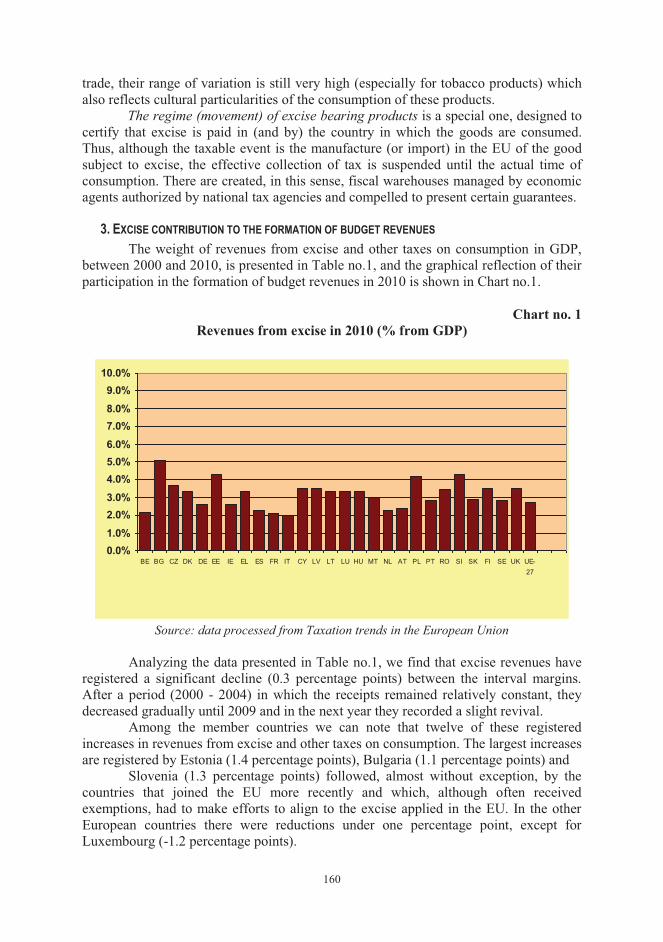
160
trade, their range of variation is still very high (especially for tobacco products) which also reflects cultural particularities of the consumption of these products.
The regime (movement) of excise bearing products is a special one, designed to certify that excise is paid in (and by) the country in which the goods are consumed. Thus, although the taxable event is the manufacture (or import) in the EU of the good subject to excise, the effective collection of tax is suspended until the actual time of consumption. There are created, in this sense, fiscal warehouses managed by economic agents authorized by national tax agencies and compelled to present certain guarantees.
3. EXCISE CONTRIBUTION TO THE FORMATION OF BUDGET REVENUES The weight of revenues from excise and other taxes on consumption in GDP,
between 2000 and 2010, is presented in Table no.1, and the graphical reflection of their participation in the formation of budget revenues in 2010 is shown in Chart no.1.
Chart no. 1
Revenues from excise in 2010 (% from GDP)
0.0%1.0%2.0%3.0%4.0%5.0%6.0%7.0%8.0%9.0%
10.0%
BE BG CZ DK DE EE IE EL ES FR IT CY LV LT LU HU MT NL AT PL PT RO SI SK FI SE UK UE-27
Source: data processed from Taxation trends in the European Union
Analyzing the data presented in Table no.1, we find that excise revenues have
registered a significant decline (0.3 percentage points) between the interval margins. After a period (2000 - 2004) in which the receipts remained relatively constant, they decreased gradually until 2009 and in the next year they recorded a slight revival.
Among the member countries we can note that twelve of these registered increases in revenues from excise and other taxes on consumption. The largest increases are registered by Estonia (1.4 percentage points), Bulgaria (1.1 percentage points) and
Slovenia (1.3 percentage points) followed, almost without exception, by the countries that joined the EU more recently and which, although often received exemptions, had to make efforts to align to the excise applied in the EU. In the other European countries there were reductions under one percentage point, except for Luxembourg (-1.2 percentage points).
161
In 2010, receipts from excise and other taxes on consumption exceed the European average (2.7 % of GDP) in nineteen states led by Bulgaria (5.1 %), Estonia (4.3 %) and Slovenia (4.3 %), while in the other eight states receipts are below average.
Table no.1
Revenues from excise and other taxes on consumption (% from GDP) between 2000 and 2010
2000 2001 2002 2003 2004 2005 2006 2007 2008 2009 2010 Belgium 2.4 2.3 2.3 2.4 2.4 2.4 2.2 2.2 2.1 2.1 2.2 Bulgaria 3.9 3.7 3.9 4.4 4.8 4.7 4.8 5.8 5.9 5.5 5.1
Czech Republic 3.1 3.1 3.1 3.3 3.4 3.6 3.6 3.9 3.3 3.7 3.7 Denmark 4.1 4.1 4.1 4.0 3.8 3.5 3.4 3.2 3.1 3.3 3.3 Germany 2.8 2.9 3.0 3.2 3.0 2.9 2.8 2.6 2.6 2.7 2.6 Estonia 3.0 3.3 3.2 3.1 3.6 3.7 3.4 3.6 3.3 5.0 4.3 Ireland 3.2 2.8 2.8 2.7 2.7 2.6 2.4 2.4 2.4 2.7 2.6 Greece 3.1 3.1 2.9 2.8 2.6 2.6 2.5 2.6 2.3 2.6 3.3 Spain 2.6 2.5 2.5 2.5 2.5 2.4 2.2 2.2 2.2 2.2 2.3 France 2.6 2.5 2.6 2.5 2.3 2.2 2.3 2.2 2.1 2.2 2.1 Italy 2.6 2.4 2.3 2.4 2.2 2.2 2.2 2.1 1.9 2.1 2.0 Cyprus 2.5 3.2 2.8 3.8 4.4 4.1 3.9 3.7 3.3 3.2 3.5 Latvia 3.5 3.1 3.1 3.3 3.5 3.6 3.3 2.9 3.2 3.7 3.5 Lithuania 3.2 3.3 3.2 3.3 3.0 2.9 2.9 2.9 3.0 3.5 3.3 Luxembourg 4.5 4.2 4.4 4.3 4.6 4.2 3.8 3.6 3.5 3.5 3.3 Hungary 4.0 3.7 3.6 3.7 3.3 3.2 3.3 3.4 3.4 3.6 3.3 Malta 2.5 2.8 2.6 2.6 2.8 3.1 3.1 3.4 3.1 3.0 3.0 Holland 2.6 2.5 2.5 2.4 2.6 2.5 2.5 2.4 2.4 2.3 2.3 Austria 2.7 2.7 2.7 2.8 2.8 2.7 2.5 2.5 2.5 2.5 2.4 Poland 3.7 3.7 4.0 4.1 4.2 4.2 4.0 4.2 4.4 3.8 4.2 Portugal 2.6 2.8 3.0 3.2 3.1 3.0 3.1 2.8 2.7 2.7 2.8 Romania 3.0 2.8 2.6 3.5 3.6 3.3 3.2 3.0 2.7 3.2 3.4 Slovenia 3.0 3.4 3.4 3.4 3.4 3.3 3.3 3.3 3.3 4.1 4.3 Slovakia 3.1 2.7 2.9 3.1 3.3 3.7 2.9 3.5 2.7 2.8 2.9 Finland 4.3 4.1 4.2 4.3 3.9 3.8 3.7 3.3 3.3 3.4 3.5 Sweden 3.1 3.1 3.2 3.2 3.0 3.0 2.8 2.7 2.7 2.9 2.8 Great Britain 4.0 3.8 3.7 3.6 3.5 3.4 3.2 3.2 3.2 3.5 3.5 EU-27 3.0 2.9 3.0 3.0 2.9 2.8 2.7 2.6 2.6 2.6 2.7
Source: http://ec.europa.eu/eurostat The dispersion among member states is very sharp, Bulgaria having a level of
receipts 2.5 times higher than Italy, where excise revenues represent only 2 % of GDP in 2010.
In 2010 excise revenues were for EU-27 about 7 % of the total tax levies and over a fifth (20.5 %) of revenues from indirect taxes, so a considerable contribution.
As it results from the data in Table no.2, an important contribution in the volume of revenues is brought by tobacco and alcohol excise, which in 2010 provides a third of the excise revenues in EU-27.
Table no.2
Weight of tobacco and alcohol excise from the excise total in 2010
Excise total and other taxes on consumption
(% from GDP)
Excise from tobacco and alcohol % from GDP % of the excise total and other
taxes on consumption Belgium 2.2 0.7 31.8 Bulgaria 5.1 2.5 49.0
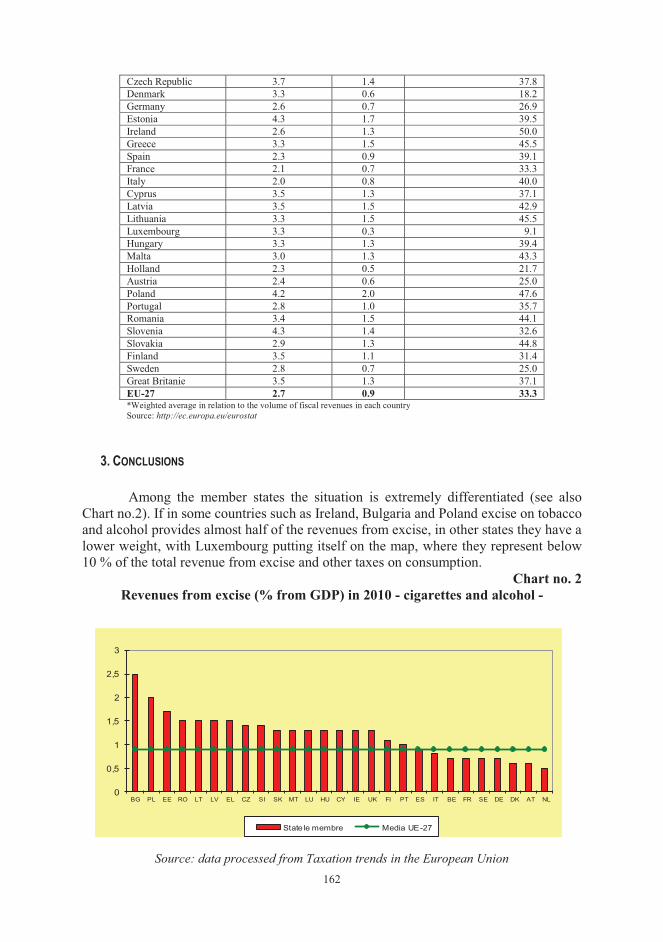
162
Czech Republic 3.7 1.4 37.8 Denmark 3.3 0.6 18.2 Germany 2.6 0.7 26.9 Estonia 4.3 1.7 39.5 Ireland 2.6 1.3 50.0 Greece 3.3 1.5 45.5 Spain 2.3 0.9 39.1 France 2.1 0.7 33.3 Italy 2.0 0.8 40.0 Cyprus 3.5 1.3 37.1 Latvia 3.5 1.5 42.9 Lithuania 3.3 1.5 45.5 Luxembourg 3.3 0.3 9.1 Hungary 3.3 1.3 39.4 Malta 3.0 1.3 43.3 Holland 2.3 0.5 21.7 Austria 2.4 0.6 25.0 Poland 4.2 2.0 47.6 Portugal 2.8 1.0 35.7 Romania 3.4 1.5 44.1 Slovenia 4.3 1.4 32.6 Slovakia 2.9 1.3 44.8 Finland 3.5 1.1 31.4 Sweden 2.8 0.7 25.0 Great Britanie 3.5 1.3 37.1 EU-27 2.7 0.9 33.3 *Weighted average in relation to the volume of fiscal revenues in each country Source: http://ec.europa.eu/eurostat
3. CONCLUSIONS Among the member states the situation is extremely differentiated (see also
Chart no.2). If in some countries such as Ireland, Bulgaria and Poland excise on tobacco and alcohol provides almost half of the revenues from excise, in other states they have a lower weight, with Luxembourg putting itself on the map, where they represent below 10 % of the total revenue from excise and other taxes on consumption.
Chart no. 2 Revenues from excise (% from GDP) in 2010 - cigarettes and alcohol -
0
0,5
1
1,5
2
2,5
3
BG PL EE RO LT LV EL CZ SI SK MT LU HU CY IE UK FI PT ES IT BE FR SE DE DK AT NL
State le membre Media UE-27
Source: data processed from Taxation trends in the European Union
163
Tax harmonization is a certainty for tax base and the movement of excise bearing goods within the EU. There is still no consensus among member states on the implementation of the single excise rate on the same product throughout the European Union (as proposed by the European Commission in 1987, in expectation of the transition to the single market).
Periodically, the European Commission analyzes the excise situation and presents proposals to the EU Council to deepen their harmonization, simplify regulations and prevent tax frauds.
REFERENCES 1. Brezeanu, P.,
Şimon, I., Celea, S.
Fiscalitate europeană, Editura Economică, Bucureşti, 2005
2. Drăcea, N.M. Politică şi armonizare fiscală în Uniunea Europeană, Ed. Universitaria, Craiova, 2012
3. Minea, M.Ş; Costaş, C. F.
Fiscalitatea în Europa la începutul mileniului III, Ed. Rosetti, Bucureşti, 2006
4. Mutaşcu, M. I.
Elemente de teorie fiscală, Editura Mirton, Timişoara, 2006
5. *** Taxation Trends in the European Union 2013
164
YOUNG PEOPLE AND THE LABOR MARKET IN ROMANIA Adriana Totîlca Ph. D Student University of Craiova Faculty of Economics and Business Administration Craiova, Romania Assist. Raducu Stefan Bratu Ph. D University of Craiova Faculty of Economics and Business Administration Craiova, Romania
Abstract: EU seeks to ensure economic development is accompanied by social progress. At the same time promotes adherence to core labor standards, rules considered as an integral part of human rights. Support defend equality, non-discrimination and promote equitable economic system. A dynamic, knowledge-based jobs requires that Europe must develop to face competition from new emerging economies. This requires investment in science and education and employment policies work. Employment policy, social inclusion and social affairs is the responsibility of both the European Union and Romania. Weak institutional capacity, poor quality and a low degree of coverage of employment services employment, inadequate level of basic skills acquired during compulsory education and a high rate of early school leavers, the mismatch between the skills provided by the education system and requirements of the labor market, the difficult transition from education to work, the low rate of participation in lifelong learning and adult education, plus an insufficient level of business investment in training are just a few issues a negative impact on employment.
JEL classification: E20, E24
Key words: labour market, market economy, human capital, manual work
1. INTRODUCTION An old saying says that young people are the future. That they can bring change
and that they can also decide the destiny of a country. After integration into the EU, a labour market danger is the well prepared workforce migration. So, one in four people (respectively 27%), takes into consideration to look for a job abroad in the next three years. Moreover, only 21% of young people believe that they can be professionally realized easier in Romania than in other countries. The mirage of work abroad affects approximately one-quarter of young professionals. In general, they consider that they have more opportunities abroad than in Romania48.
48 The Ministry of labor, family and equal opportunities Directorate programs and workforce Strategies, National Observatory of Employment and training of the workforce, the report "current problems of the young population in Romania", Bucharest, May 2007
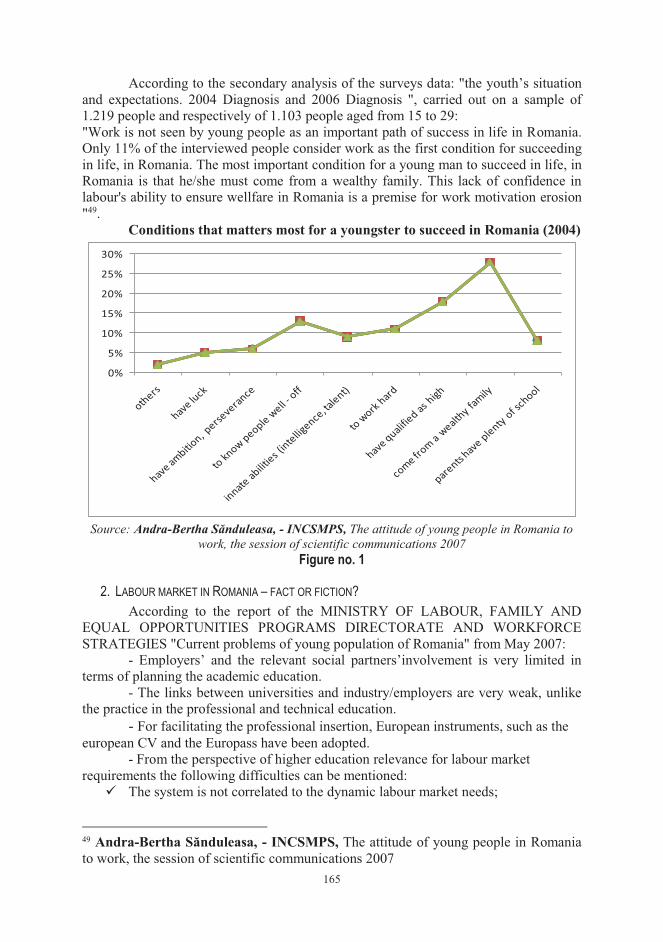
165
According to the secondary analysis of the surveys data: "the youth’s situation and expectations. 2004 Diagnosis and 2006 Diagnosis ", carried out on a sample of 1.219 people and respectively of 1.103 people aged from 15 to 29: "Work is not seen by young people as an important path of success in life in Romania. Only 11% of the interviewed people consider work as the first condition for succeeding in life, in Romania. The most important condition for a young man to succeed in life, in Romania is that he/she must come from a wealthy family. This lack of confidence in labour's ability to ensure wellfare in Romania is a premise for work motivation erosion "49.
Conditions that matters most for a youngster to succeed in Romania (2004)
0%
5%
10%
15%
20%
25%
30%
Source: Andra-Bertha Sănduleasa, - INCSMPS, The attitude of young people in Romania to work, the session of scientific communications 2007
Figure no. 1
2. LABOUR MARKET IN ROMANIA – FACT OR FICTION? According to the report of the MINISTRY OF LABOUR, FAMILY AND
EQUAL OPPORTUNITIES PROGRAMS DIRECTORATE AND WORKFORCE STRATEGIES "Current problems of young population of Romania" from May 2007:
- Employers’ and the relevant social partners’involvement is very limited in terms of planning the academic education.
- The links between universities and industry/employers are very weak, unlike the practice in the professional and technical education.
- For facilitating the professional insertion, European instruments, such as the european CV and the Europass have been adopted.
- From the perspective of higher education relevance for labour market requirements the following difficulties can be mentioned:
� The system is not correlated to the dynamic labour market needs;
49 Andra-Bertha Sănduleasa, - INCSMPS, The attitude of young people in Romania to work, the session of scientific communications 2007
166
� The absence of clear equivalences between the University and training criteria (skills-based and formal) on the labour market;
� The absence of systematic analysis and studies on the correlation between the university training offer and the labour market requirements both quantitatively (tuition figure is not based on an analysis of the evolution of demand) and structurally (on domains and skill levels);
� The use of narrow educational packages (over 270 degrees) caused numerous analogies, non-optimal financial resources utilization, difficulty in defining adequate teaching standards, and hindered the graduates‘ proper integration on the labour market;
� Inconsistencies in the strategy development to strengthen the partnership with the economic and social environment. Partnerships with the business community are insufficiently developed. - The biggest problem confronting graduates of higher education is related to
the "lack of experience". The companies, however, begin to drop this condition and offer jobs as long as young people go through several internships during college. A recent report of the World Bank, EDUCATION POLICY NOTES, tells us that, for the most part, the current state of Romanian education is due to the political class’ lack of will. And in the absence of urgent and coherent measures, young graduates will thicken the unemployed or will search "the lure of foreign countries". One in five young people under 25 years old in Romania has chosen in recent years of crisis, to go abroad, according to a recent study of Eurostat. About the same percentage applies to Polish. Unfortunately, there are no longer very many offers abroad, and the competition increased due to young people in southern Europe. In 2012, in just the first three months of the examinations completion, 12,000 graduates in addition to last year were submitted to the National Agency for employment. And according to the National Institute of statistics, nationally, 180,000 young people aged from 15 to 25 are, today, without a job. Most of these have a medium level of education and come from specialist schools and theoretical highschools. Past experience shows us that it is no laughing-matter with serious consequences of unemployment. The lack of a job leaves deep marks on the lives of everyone, confidence on the future and on personal success. And among other direct costs poverty, hopelessness and low expectations may be included. Arts and crafts school liquidation virtually cancelled any chance of many young people to get to know a job, given the fact that the theory is not enough to penetrate the job mysteries. Although in specialty programs there are tutorial classes and practical training classes, it remains at the discretion of the specialized or practical training teacher to carry out those hours in school workshops or at the trader. Mostly the trader is reticent in terms of receiving students in the unit, he/she was not motivated to complete these hours. It is a good initiative to try to set up the vocational schools, I could say a breath of oxygen to revive education for young people’s qualification in the desired jobs, for the job grasp. Among the factors that delay the young people’s insertion on the labour market we can include the lack of public information and professional relations. It means that most of the young graduates do not have any information about how labour market really looks like. And they choose their future careers superficially or according to some ideals in disaccord with reality. We also speak of communication skills lack, about uncertainty in themselves, about the employers’ dishonesty, but also about the lack of experience. In 2011, according to a
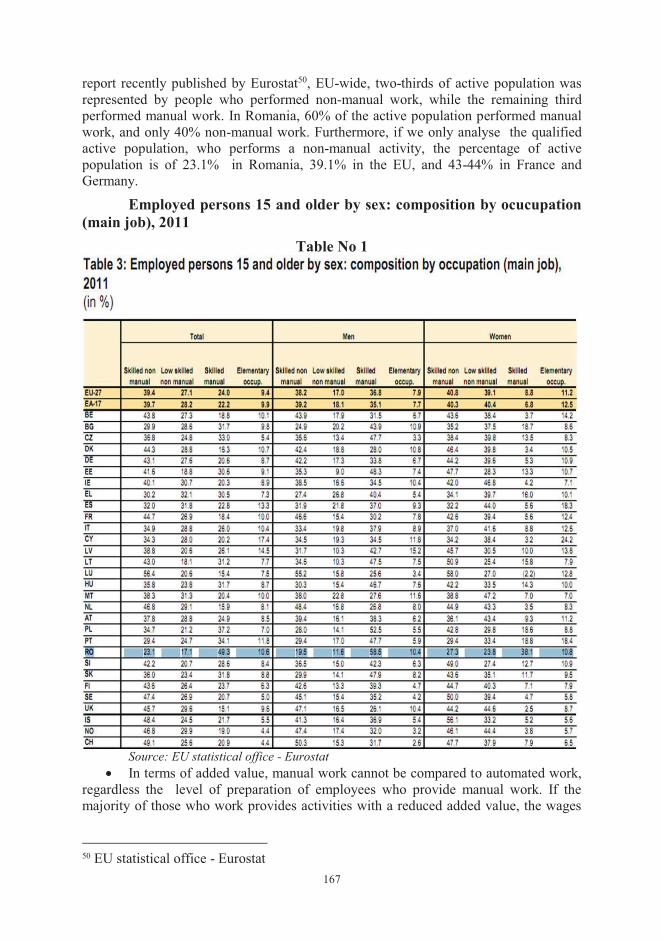
167
report recently published by Eurostat50, EU-wide, two-thirds of active population was represented by people who performed non-manual work, while the remaining third performed manual work. In Romania, 60% of the active population performed manual work, and only 40% non-manual work. Furthermore, if we only analyse the qualified active population, who performs a non-manual activity, the percentage of active population is of 23.1% in Romania, 39.1% in the EU, and 43-44% in France and Germany.
Employed persons 15 and older by sex: composition by ocucupation (main job), 2011
Table No 1
Source: EU statistical office - Eurostat
� In terms of added value, manual work cannot be compared to automated work, regardless the level of preparation of employees who provide manual work. If the majority of those who work provides activities with a reduced added value, the wages
50 EU statistical office - Eurostat
168
do not have how to be similar to those in Western countries, where the majority of those who work perform activities with a high added value.
� According to the previous mentioned report, Romania manages well in "the labour force’s degree of qualification " chapter – 72,4% of those who are working are qualified persons, compared to an average of 63% in the EU, Germany and France. On the other hand, however, the performed type of work decisively influences the added value generated by an employee (qualified or not), and the fact that Romanian workers primarily perform manual work is not likely to support high levels of payment.
� The type of work performed by the active population depends on the employers, not on employees. Most multinational corporations transfer in Romania "labour intensive" activities, respectively activities whose final price of sale to customers depends a lot on the wages of those who perform those activities.It rarely happens to transfer automated production lines in Romania, simply because their transfer from the West to the East determines only minor reductions of total costs of production.
� From the 4.3 million employees, less than 1 million work in multinational companies, 0.9 million for the State, and the rest in Romanian companies, many of those being poorly capitalized without know-how and with a very low labour productivity. Basically, the sustainable growth of wages cannot take place without significant investments in advanced production equipment, in research and development, in employees’training, but too few Romanian companies have the money for this. For the actual age, tertiary sector development, combination of national strategies with other local and regional strategies, as well as removing any obstacles in the free initiative way, are extra conditions, without which the balance on labour market can’t be insured51.
According to the INS in June (2012), the number of employees declared by employers has increased by 8.800, the growth recorded in the latest 12 months reaching thus 125.500. In the private sector, the number of employees has increased in the last year by 151.400, and in the public sector has fallen by 25.900. On the economic level, the number of employees began to grow in February 2011, but it should be noted that, at the same time, the number of unemployed also continued to grow, meaning that the economy cannot produce enough new jobs to absorb both the old unemployed and the young new entrants on the labour market. Between February 2011 and June 2012, the number of employees increased by 214.000 (the highest rate of growth after the Revolution), and the number of the unemployed reported according to the ILO methodology increased by nearly 39.000.
The number of employees versus the number of BIM unemployed
The number of BIM unemployed
The number of employees
51 Ghe Pirvu, Macroeconomics, Universitaria Publishing House, Craiova, 2004, p.206
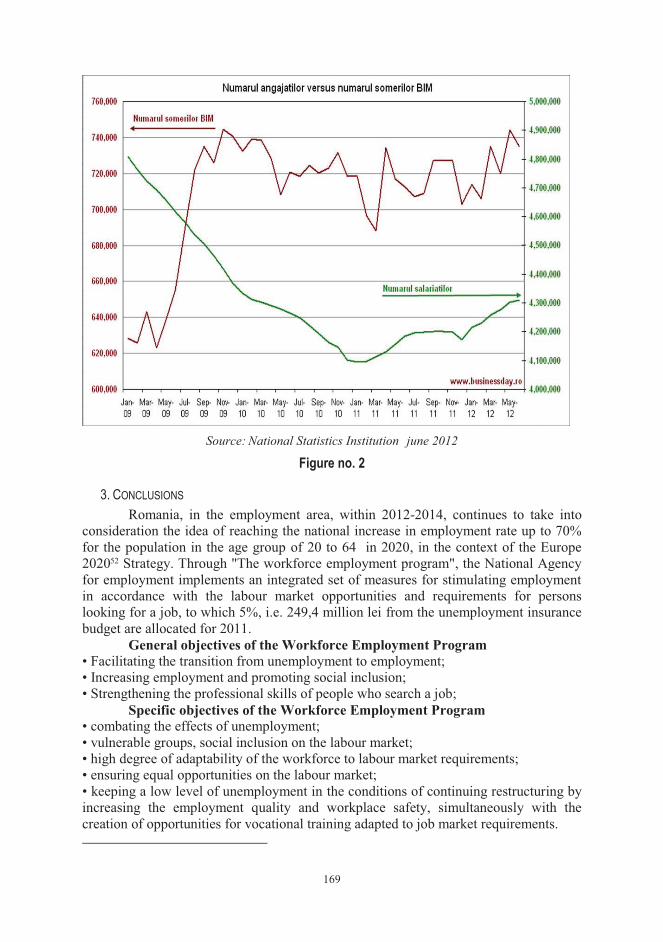
169
Source: National Statistics Institution june 2012
Figure no. 2
3. CONCLUSIONS Romania, in the employment area, within 2012-2014, continues to take into
consideration the idea of reaching the national increase in employment rate up to 70% for the population in the age group of 20 to 64 in 2020, in the context of the Europe 202052 Strategy. Through "The workforce employment program", the National Agency for employment implements an integrated set of measures for stimulating employment in accordance with the labour market opportunities and requirements for persons looking for a job, to which 5%, i.e. 249,4 million lei from the unemployment insurance budget are allocated for 2011.
General objectives of the Workforce Employment Program • Facilitating the transition from unemployment to employment; • Increasing employment and promoting social inclusion; • Strengthening the professional skills of people who search a job;
Specific objectives of the Workforce Employment Program • combating the effects of unemployment; • vulnerable groups, social inclusion on the labour market; • high degree of adaptability of the workforce to labour market requirements; • ensuring equal opportunities on the labour market; • keeping a low level of unemployment in the conditions of continuing restructuring by increasing the employment quality and workplace safety, simultaneously with the creation of opportunities for vocational training adapted to job market requirements.
170
The measures provided for implementation through the Workforce Employment Program • offering free services of mediation on vacancies or newly created job; • offering free information and professional advice services to people looking for a job; • stimulating the readmission in work by granting allowances for the unemployed people enclosed before the unemployment expiration; • stimulating labour mobility; • organizing training courses for persons looking for a job; • providing free consulting services and assistance in starting an independent activity or starting a business; • granting subsidies to employers for people’s employment belonging to disadvantaged categories or those with a more difficult access on the labour market; • providing customized accompaniment to young people with social marginalization risk.
Aimed to increase young people’s rate of participation in the labour market the Government adopted during the first part of 2011 a legislative project concerning the stimulation and development of micro-enterprises belonging to young entrepreneurs, beginners in business – starter business in debate in Parliament.
At the same time the law No. 106/2011 for amending and completing Law No. 279/2005 concerning apprenticeship at work was approved.
LABOUR AGENCY also included "Special Program for pupils and students"in the employment program for 2011.
The real remedy53 for diminishing real unemployment cannot be only the process of creating new jobs. This assumes that unemployment remains mainly a result of the way in which social reproduction process evolves. The production continuous diversification, modernization and renewal correlated to the workforce appropriate training, constitute reliable ways to limit unemployment. Investment in production must be correlated to that in a person, in his/her professional preparation and training.
The Romanian State should understand that it has to amortize investments in human resource also through the measures they will adopt further to motivate young graduates to remain in the country and to contribute to the wellfare of the country that has prepared them.
REFERENCES 1. Andra-Bertha
Sănduleasa, INCSMPS, The attitude of young people in Romania to work, the session of scientific communications 2007
2. Pirvu Ghe. Macroeconomics, Universitaria Publishing House, 2004, page 206.
3. * * * The Ministry of labor, family and equal opportunities Directorate programs and workforce Strategies, National Observatory of Employment and training of the workforce, the report "current problems of the young population in Romania", Bucharest, May 2007
4. * * * EU statistical office - Eurostat 5. * * * Budget tax strategy for the period 2012-2014 6. * * * National Statistics Institution, june 2012
53 Ghe Pirvu, Macroeconomics, Universitaria Publishing House, Craiova, 2004, p.206
171
7. * * * EU statistical office - Eurostat
8. * * * http://www.fes.ro/common/pdf/anticriza.pdf 9. * * * http://www.mmuncii.ro/pub/img/site/files/3ccf9ee520abaa7e
745cdb61c1b022e2.pdf 10. * * * http://www.realitatea.net/reporterii-realitatii-ce-sanse-mai-
au-tinerii-absolventi-la-un-loc-de-munca_1014182.html 11. * * * http://businessday.ro/10/2012/de-ce-avem-salarii-mici-60-
dintre-romanii-care-lucreaza-presteaza-o-munca-manuala-in-ue-media-este-de-33/
12. * * * http://businessday.ro/08/2012/piata-muncii-companiile-continua-sa-angajeze-personal-si-sa-majoreze-salariile/
13. * * * http://www.via-consiliere.ro/uploads/File/pdf/Studiu de perspectiva privind necesarul de forta de munca calificata.pdf
14. * * * http://discutii.mfinante.ro/static/10/Mfp/strategbug/SFB2012-2014.pdf
15. * * * http://www.adevarul.ro/actualitate/social/Absolventii_au_sanse_infime_de_angajare_0_777522566.html#
16. * * * http://europa.eu/legislation_summaries/employment_and_social_policy/international_dimension_and_enlargement/c11913_ro.htm
17. * * * http://europa.eu/pol/socio/index_ro.htm#top
18. * * * http://ec.europa.eu/europe2020/pdf/nd/swd2013_romania_ro.pdf
172
CONSIDERATIONS REGARDING THE ACCOUNTING PRINCIPLES APPLIED IN
INSOLVENCY PROCEEDINGS
Prof. Marioara Avram Ph. D University of Craiova Faculty of Economics and Business Administration Craiova, Romania) Prof. Veronel Avram Ph. D University of Craiova Faculty of Economics and Business Administration Craiova, Romania
Abstract: : The Romanian economy, after 1990, has undergone a comprehensive restructuring process from centrally planned economy to an economy governed by the rules of the market economy, rules of the game led to a competitive type economy, with winners and laggards, with winners and losers. In the first phase, the restructuring of the Romanian enterprises has known just the division into two or more independent entities. Subsequently, according to the model of Western economies, the economic entities in our country during the process of restructuring and reorganization adopted a second way, namely the merger with its two versions: the merger by absorption and merger by fusion. The permanent struggle to maintain the market segments owned or even more to conquer other market segments as well as tax regulations adopted by our country led to the insolvency of a large number of businesses. Recent regulations bring some new administrative and foremost procedures to prevent insolvency. Thus, borrowers in financial difficulty are able to choose one of the following procedures: ad-hoc mandate and the preventive arrangement.
JEL classification: M41, M49
Key words: critical; insolvency, ad-hoc mandate, preventive arrangement, reorganization, insolvency practitioner
1. INTRODUCTION The significant transformations which occurred in the Romanian economy after
1990 began a period of transition from a centrally planned economy to a market economy, the competition was brought on top as well as the need for performance and acceptance of the rules of market economy. If the first phase was focused on the establishment of law firms and independent utilities, later we had to go through a period of legislative gap until the moment of issuing a new bankruptcy law and we also had to wait more than a decade to organize professional insolvency practitioners. The competitive economic environment, the lack of the skills to work with market mechanisms, high interest rates, high levels of depreciation of the national currency and a tax system unfriendly, sometimes hostile, contributed to the increase in the number of bankruptcies. Otherwise, just by applying, in 2009, the flat tax and the work stopped or suspended about 175,000 undertakings. Only in the fall of 2013 began to take shape concerns about insolvency prevention with the advent GEO 91/4.10.2013 in regard to
173
the procedures to prevent insolvency. Although GEO 91/2013 was in force only two months, until it was declared unconstitutional by the decision CCR nr.417/17.12.2013 we appreciate that after removing the unconstitutional items, the new law will have to retain certain valuable elements related to the prevention of insolvency.
2. OBJECTIVES The general objective of this research paper is to shed light on an overview of
the procedures to prevent insolvency. In the context of an interesting and challenging topic, following the launch and withdrawal of regulatory insolvency the present study.
3. METHODOLOGY The research methodology used in the preparation of this paper is based on the
processing and interpretation of a variety of data and information collected from various sources such as regulations, specialty papers, information disseminated by professional bodies, and numerous opinions issued by specialized bodies with respect to subject matter of the investigation within. To achieve the objectives we use a constructive research methodology for details regarding procedures to prevent insolvency and empirical studies. The current research topic is being useful both for the professionals in the field and for teaching purposes with students, master and PhD.
4. THE FINANCIAL DIFFICULTIES Critical GEO nr.91/4.10.2013 insolvency procedures to prevent insolvency act
published in the Official Monitor 620/4.10.2013 brought a series of administrative novelties and foremost proceedings to prevent insolvency. Thus, borrowers in financial difficulty are able to choose one of the following procedures: • ad-hoc mandate • preventive arrangement.
Ad-hoc mandate
It may be set based on a request addressed by the debtor to the president of the court, according to this request the debtor proposes an ad hoc representative of insolvency from the body of practitioners authorized by law. The application must include a detailed description of the grounds which make the ad hoc appointment of a trustee. If it finds that the reasons are real and the nominee meets the conditions provided by law, the President shall appoint the ad hoc closure enforceable mandate proposed. The ad hoc trustee objective is to achieve within 90 days of the appointment an agreement between the debtor and one or more of its creditors to overcome the state of financial difficulty in which the debtor has its safeguarding, preserving places work and cover the existing debt. The ad hoc trustee may propose remittances, debt rescheduling or partial reduction, continuation or termination of ongoing contracts, staff reductions and other measures deemed necessary. At the proposal of the debtor and with the ad hoc trustee approval, the President shall establish a provisional fee which may be in the form of a fixed fee or a monthly fee. The accounting treatment of transactions initiated and completed by the agent starts the ad hoc nature of the operations and their effect on the debtor's assets.
By way of example, the following can happen:
174
• The rescheduling debt payment to a vendor in the amount of 1,000,000 lei in 10 equal monthly installments, without charging interest and penalties. Monthly payments will be made of 100,000 lei.
401 Suppliers = 512 Cash at bank • Reduce the amount of 1,000,000 lei bill purchases by 25%. The red invoice
received from the vendor will conduct registration:
% = Suppliers - 250.000 Stocks or Assets 4426 VAT deductible
� Debts relief related to previous years
Debts = 117 Retained earnings
The preventive arrangement The arrangement may be requested by a debtor in financial difficulty given that
is: • Has not benefited from a previous preventive arrangement in the past three
years that has failed; • If the debtor and / or shareholders / associates or its administrators has been
convicted for intentional crimes of property, corruption, forgery and offences under Law 22/1969, the Accounting Law 82/1991 as amended and supplemented, Law 78/2000, Law 656/2002, Law 571/2003, Law 241 / 2005 in the last 5 years
• If it hasn’t been ordered to bear a portion of the debtor's liabilities by members of the management and / or supervision.
Bankruptcy judge appoints provisional administrator of composition at the proposal of the debtor, the insolvency practitioners authorized by law. Project arrangement must show in detail the following:
• Analytical Statement of assets and liabilities certified by a chartered accountant or a certified auditor as appropriate under the law of the state of financial difficulty
• Causes of financial difficulty and the appropriate measures taken by the borrower until the application of the financial accounting
• Project on the financial-accountant development in the next 24 months • Recovery plan containing at least the following measures - the reorganization of the debtor,
- restructuring management - reducing staff - changing functional structure
- ways to overcome the financial difficulties - capital increase - bank loan, bond or other, - the creation or dissolution of workstations, - sale of assets.
175
- the claims deadline set by agreement should not exceed 24 months from the date of its finding or its approval according to judgment enforceable.
The accounting treatment of transactions initiated and completed during the period of the arrangement is based on the nature of their operations and their effect on the debtor's assets. By way of example there can be undertaken a series of activities that lead to overcoming financial difficulties.
5. WAYS TO OVERCOME THE FINANCIAL DIFFICULTIES The most important ways to overcome the financial difficulties of the economic
entities in financial difficulty are: increasing capital and obtaining bank loans, bonds or other.
• The capital increase is carried out with the approval of the AGM and respecting the right of first refusal. For example, the share capital is increased by 25%, issuing a new action every four old shares. The subscribed capital is paid up on the cashier unit.
456 Settlements with partners/shareholders on capital =1011 Subscribed capital not paid 531 Cash = 456 Transactions with shareholders/associates related to capital 1011 Subscribed capital not paid = 1012 Subscribed capital paid
• Bank loan, bond or otherwise. a) To complete an investment-objective found in technological trial it is negotiated a long-term loan (5 years) with mortgage - production halls - and the one-year grace period. 512 Cash at bank = 162 Long- term bank loans b) Coupon bond issue with an annual interest rate calculated by the formula: D = Interest ROBOR 12 months + 2 percentage points with the possibility of converting the shares at face value by adequate increasing of the social capital - issuing bonds 461 Sundry debtors =161 Debenture loans - Cashing the bonds 531 Cash = 461 Sundry debtors - Payment of periodic coupon interest 666 Interest expenses = 531 Cash
176
-Redemption of bonds at maturity
505 Redeemed debentures = 531 Cash or 512 Cash at bank a) cancellation of bond 161 Debenture loans = 505 Redeemed debentures b) conversion of bonds into shares 109 Own Shares =505 Redeemed debentures and simultaneously 161 Debenture loans = 1012 Subscribed capital paid
5. CONCLUSIONS In the current period the insolvency rate, economic entities increased
considerably. In fact, the insolvency of the debtor's assets is a state characterized by insufficiency of funds available for the payment of debts due. Bankruptcy proceedings imply collective insolvency proceedings which are applied to the debtor in order to eliminate its assets so that to be able to cover the liabilities - meaning the obligations - followed by removal of the debtor from the registry of registration. The increasing number of bankruptcies leads to market distortions of the capital goods currently experiencing an increase in supply due to the absence of a proper application of such goods. Those who have to lose out of this are not only creditors (mainly banks and the state budget) but also the broader economy which is facing an increase in unemployment by reducing the number of jobs. This is why we consider as necessary the reconsideration of the legislative process on a constitutional basis, as well as the legislation and implementation of procedures to prevent insolvency.
REFERENCES 1. Avram, M.,
Avram,A. Accountant & Fiscal Legislation, Universitaria Publishing House, Craiova, 2012;
2. Avram, V., Avram, C.D.
Gestiune si contabilitate bancara, Editura Universitaria, Craiova, 2010;
3. Arens, A., Loebbecke, J.
Audit. An Integrative Approach, ARC Publishing House, Bucureşti 2006;
4. Buşe, L. An Economical-Financial Analysis, The Economic Publishing House, Bucureşti, 2005;
5. Briciu, S. Contabilitate manageriala, Editura Economica, Bucuresti, 2006 6. Bunget, O.C.,
Dumitrescu, A.C.
Gestionarea crizei economico-financiare la nivelul IMM-urilor, Revista Contabilitatea expertiza si auditul afacerilor, Nr.1, 2011, pp.54-55;
7. Criveanu, M. Contabilitate publica, Ed. Universitaria, Craiova, 2010 8. Domnisoru, S. Audit si comunicare financiara, Ed. Universitaria, Craiova, 2009; 9. Iacob, C. Contabilitate de Gestiune, Ed. Universitaria, Craiova, 2009;
177
10. Muller, V.O., Matis, D., Ienciu, I.A.
Analiza reactiilor internationale la noua abordare propusa de IASB/FASB cu privire la prezentarea performantelor unei entitati, Revista Audit financiar, Nr.7, 2011, pp.38-39;
11. Mihai, M., Dragan, C., Ciumag, A., Iota, A.
Considerente privind capacitatea de implementare corespunzatoare a IFRS, Revista Audit Financiar Nr.8, 2011, pp. 40-41;
12. Tiron Tudor, A. Contabilitatea institutiilor publice, Ed. Dacia, Cluj-Napoca, 2002; 13. Togoe, G.D.
Mates, D., Manescu Dragotoiu, M.V.
Impact Of Ethical Values Promoted By Professional Accountants On The Organizational Culture, Analele Universitatii din Oradea, Seria Economica, Volumul nr.1/2013, pg.1280-1285;
14. *** www.mfinante.ro, accessed in January 2014; 15. *** www.just.ro, accessed in January 2014.
178
CONTROL PERFORMANCE THROUGH THE DESIGN AND IMPLEMENTTION OF A
BUDGETARY SYSTEM IN SMES IN THE REGION SOUTH –WEST OLTENIA
Lect. Anca Antoaneta Vărzaru, PhD. University of Craiova Faculty of Economics and Business Administration Craiova, Romania
Abstract: Although traditional economy more SMEs seem to be effective only run on intuition, judgments and experience, without recourse to another information system than the one represented by some accounting data as mandatory (Dupuy, 1987) , the frequent absence of these tools can explain more bankruptcies (Holmes et Nicholls, 1988, McMahon et Holmes, 1991; Calot et Michel, 1996). Hostility current business world, supported by the growing complexity and globalization, requires intuition coupling managers a more formal, sophisticated management tools (Chapellier, 1994) and modern accounting information systems, complex and active (Lavigne, 2002).
JEL classification: M41, M42
Key words: SME, organizational thresholds, accounting information system, budget costs, influence factors
1. INTRODUCTION Although in the traditional economy more SMEs seem to be driven effectively
only on the basis of intuition, judgments and experience, without appeal to another information system than the one represented by some accounting data as mandatory (Dupuy, 1987), the frequent absence of such instruments can explain more bankruptcies (Holmes and Nicholls, 1988, McMahon and Holmes, 1991; Calot and Michel, 1996). The hostility of the current business world, supported its increasing complexity and globalization, requires coupling intuition more managers with formal, sophisticated management tools (Chapellier, 1994) and modern accounting information systems, more complex and active (Lavigne, 2002).
2. THE EVOLUTION OF MANAGEMENT CONTROL SPHERE Discipline in full evolution, management control is a field of research which
have emerged two schools. The first school focuses on exercising control and power (Gervais, 2000) and emphasizes the need for a set of accounting tools which allow achieving predetermined results. The second school has a more pronounced behavioral dimension (Merchant and Van Der Stede, 2007) and claims that the primary function of a management control system is to influence behavior in order to increase the probability of achieving business objectives. The two schools have promoted two models within the scientific literature.
The limits of this model relate to its emphasis on accounting and financial dimensions in the management control system, on the exercise of power and its
179
consequences, separating management control of strategic and operational controls (Otley et al, 1995). Another limiting factor is its integration into a normative theory, that dominates the optimization of financial resources in order to achieve the objectives, and this vision makes sense only in a context of market stability, almost impossible nowadays.
The second model, the more behavioral in nature, describes the system as a process that allows influencing behaviors (Flamholtz et al., 1985) and to encourage collective cooperation of individuals and various groups in achieving congruent goals (Ouchi, 1979; Flamholtz, 1983).
Most definitions of management control integrates the processes of organizing resources in order to achieve the objectives arising from the strategic options chosen by the managers. Nonetheless, Merchant and Van Der Stede (2007) points out that the first function of the management control is the influence behaviours in order to increase the probability of achieving the objectives, and the latter must not be merely financial or quantified, nor any viewed from a deterministic perspective. The presence of these objectives serves as a means of identifying the aria of freedom of the actors involved. Over the past two decades the management control systems have evolved from a more formalized, quantitative and financial, to a greater extent, and that integrates both financial and non-financial aspects (Arnaud et al., 2001; Chenhall, 2003).
To characterize the management control systems, Santin and Van Caillie (2008) proposed a unifying grid characterization criteria of management control systems in the context of SMEs. Starting from their traditional or nontraditional nature (Ittner et Govindaraj, 1995; Arnaud and others, 2001), and continuing with the temporal expression of concentration, with their proactive or reactive nature, the degree of freedom towards employees (Merchant et Van Der Stede, 2007), with their level of formalism and ending with their mechanistic or organic form, the two researchers identify a wide sphere of control, which may include one or more of these criteria. However, they report that in their formal version, controls can be both mecanistic and organic, while informal controls can only be organic.
3. ACCOUNTING INFORMATION SYSTEMS DETERMINANTS IN SMES: A EMPIRICAL RESEARCH IN THE CONTEXT OF THE SOUTH-WEST OLTENIA REGION
3.1. Accounting information system Accounting information system is defined by a subjective manner. This term is
used mainly in shares of documentation and complements the expression «accounting practices». Chapellier (1996) considers that the practices are defined by two dimensions. The first objective, the size, refers to the system of available data, historical or forecast, which covers the general accounting, financial analysis and balanced scorecards. The subjective dimension refers to the use of such data by the manager, for its own requirements, and allows to assess their relevance for SMEs.
A description of the characteristics of accounting information systems of SMEs (Lavigne, 2002) grouped these in three dimensions, namely the annual financial statements, management accounting practices and internal dissemination of financial results. Referring to practices, Haldma and Laats (2002) include here the methods of calculation of costs, the links between the cost and the object costs (cost of administration), bugeting, performance measurement system and cost accounting (cost

180
variable, marginal contributor, ABC). For the sake of separation, accounting information system is considered all available information, based on historical accounts, or forecast, which covers the general accounting, management control, financial analysis and balanced scorecards.
3.2 Accounting practices in the SMEs Most of the empirical research aimed at identifying the accounting practices in
SMEs reveals the nuanced conclusions and partial results, sometimes contradictory, do not allow the release of generalizations. Some authors consider that the accounting information systems are mainly oriented towards the production of documents in order to meet the tax authorities (Holmes et Nicholls, 1989; Bajan-Banaszak, 1993), and yet others assert that SMEs are heterogeneous and do not represent reduced models of large businesses. The latter finding calls into question the vision of reducing these systems in SMEs (Chapellier, 1994; Lacombe-Saboly, 1994; Lavigne, 1999).
Management control practices.The increasing complexity SMEs environment and their evolution have caused uncertainty in recent years, the development of a management control function from the increasingly formalized, totally integrated within the enterprise information system (Raymond, 1995). Management control system is thus an integrative interface to several data that facilitate everyday management of SMEs. The profile and impact of SMEs managers upon the nature and the use of information management within any management control system, is highlighted by Chapellier (1997). The same author emphasizes the importance of a management control system and planning increasingly richer and evolving into a turbulent environment, such as the current one.
Nobre (2001) believes that the role and functions of a management controller within the SMEs must evolve towards its legal, financial and accounting part with which it is often assimilated to the organizational conception of growth and continuous performance analysis on various links and cost places. For his part, Van Caillie (2002) points out that the main tasks of a management control system in SMEs are fundamentally related to the method of costing.
General accounting practices. If the majority of SMEs have a passive behaviour in financial accounting matters, others cannot be neglected, using accounting information also for other purposes. Lavigne (1996, 2000) shows that the financial statements are useful not only for tax purposes, but also for setting goals, monitoring their implementation and corrective measures, in support of decision-making in investment and treasury management and also of the working capital.
Analytical accounting practices. Empirical research in analytical accounting in SMEs were not unanimous. One of the positions that have highlighted claims that analytical accounting instruments are not implanted in most SMEs, they have a rudimentary or even embryonic character and are not computerised (Bajan-Banaszak, 1993). In 1994, Chapellier claims that 77% of the managers interviewed within his study make calculations of costs, but only 23% of the cases it is an accounting system.
An investigation of Nobre (2001) demonstrated that 60% of the SMEs surveyed are using the full cost method. Lavigne (2002) identifies two characteristic ways of management accounting practices that are most used in SMEs, namely computerized calculation of the production cost (66%) and working capital preparation (61%). These
181
two important proportions reveal a new phenomenon in the field of small and medium-sized businesses.
Financial analysis practices. In terms of financial analysis (Chapelier, 1994), empirical studies are relatively rare, and the results are converging, pointing out that it is a widespread practice in SMEs, although the practice systems are different in terms of their complexity.
Development of balanced scorecards. The few studies conducted in this area reveals that the balanced scorecards are among the instruments most found in the SMEs. Set up essentially of accounting information, they present intermediate forecasts and intermediate situations and can be classified as general balanced scorecards and on functions. Same Chapelier studied the spread of balanced scorecards in SMEs and the typology of information contained in these instruments. The conclusion was that 23% of the SMEs had balanced scorecards of medium complexity, and 48.5% a great complexity, and that the information provided is related to the activity carried on at the margins obtained from staff costs, financial costs and to the working capital.
Bergeron (2002) emphasizes the prospective balanced scorecard, considered to be a useful instrument, on the one hand, the wording, the communication strategy of SMEs and setting objectives and, on the other hand, ensure coherence between the initiatives of the actors to achieve the objective desired and to pursue the strategy. His study sought to know whether the use of strategic integrated balanced scorecard, based on models of Kaplan and Norton improves performance measurement systems in SMEs.
3.3. The contingency factors of the accounting information systems in SMEs Research on determinants of accounting information systems in SMEs have
revealed two distinct perspectives: the contingency theory, i.e objective theory (or structural) and subjective theory (or behavioral). Recent research (Chapellier, 1994, 1996; Lavigne, 1999, 2000; Lacombe-Saboly, 1994) reveals the variety of such systems in SMEs and identifies several factors likely to influence the contingency in the elections.
Structural contingency. The factors invoked in most recent studies are usually the size, age, sector of activity and the degree of information of management.
a) The size of the enterprise More empirical research considers the size of the enterprise as a variable which
is likely to influence managers' behaviour in terms of accounting information system. The size is measured by several indicators, such as the turnover without VAT, sales volume or number of employees. Most researchers previously rememberd considered that accounting data systems grow as volume and complexity with the size of the enterprise. Can thus formulate hypothesis I1:
The use of accounting data of the SME increases with increasing size of the enterprise.
b) Age of the enterprise Holmes and Nicholls (1988) argue that the request and prepare a relatively
detailed accounting information diminishes as the age of the enterprise increases. The explanation given is that in the early years of its existence the enterprise leader is formed in this area, requesting more information, and then, after a certain period, this claim diminishes, then stabilize. You can formulate a new hypothesis, I2:
182
The use of accounting data by SME leaders diminishes as a result of the increase in the age of the enterprise.
c) The sector of activity Although Chapellier (1994) considers, as a result of his studies, that the type of
activity is not only partially related to accounting practices in SMEs, Holmes, Nicholls and others (1989) show that the economic sector in which it currently evolves has no effect on the production of non-mandatory accounting data within them. Bajan-Banaszak (1993) points out that in the construction sector shows gaps in management accounting, in contrast to the industrial sector and the services sector, which employs most of the accounting instruments. Nobre (2001) emphasises the need for a more concrete analysis to reflect the heterogeneity of SMEs and to avoid dividing the results. It can be proposed a third hypothesis, I3: there is a relationship between the type of activity and the use of accounting information in SMEs.
d) The level of informatization of the management Davis and Albrightl (2000) point out that the integration of new technologies
of information and communication implies considerable changes in the financial-accounting function which becomes more important in the context of organizational structure and whose actors are becoming more active in the decision-making process. Accounting computerization allows processing a higher volume of data in a more reduced period. In 1997, Chapelier reveals that the informatization management is only partially associated with the accounting practices of SMEs. As such, it can be formulated a new hypothesis, I4: the use the accounting data of the SME increases with the degree of computerization of management.
Behavorial contingency. Within this approach, behavioral characteristics of each actor involved are considered likely to influence accounting information systems of SMEs. This new orientation complements the objective approach by integrating the actors, who are becoming the center of interest and object of research. As contingency behavioral factors, the best known are the level of manager training, his age, his profesoinal experience, the mission accountant and his level of training.
a) The managers training Most authors assert that managers who have a higher level of training are
marked by a higher degree of use or more intense of accounting information. At the same time, even the type of training itself may explain the usability of this information. Thus, Chapellier (1994) points out that those managers who have a training in management/accounting presents a higher level in utilising the accounting information.
A new hypothesis, I5, can be formulated as follows: Managers who possess a higher level of training use more accounting information.
b) The managers experience The results of studies who analyzed the influence of this factor are not
unanimous, meaning that some authors consider that the utilization of accountancy data increases with experience of the managers, so that others can lie in an opposite position.
c) The age of the managers Most of the authors consider that the level of utilisation of accounting data
decreases as the managers’ age increases. The hypothesis to be verified, I7: Older managers use less accouting data.
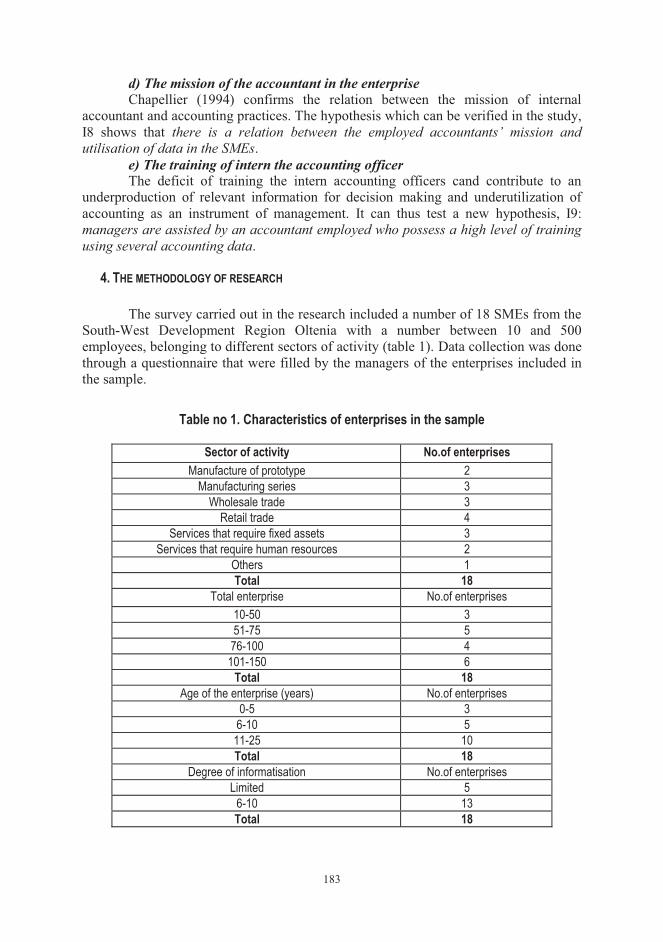
183
d) The mission of the accountant in the enterprise Chapellier (1994) confirms the relation between the mission of internal
accountant and accounting practices. The hypothesis which can be verified in the study, I8 shows that there is a relation between the employed accountants’ mission and utilisation of data in the SMEs.
e) The training of intern the accounting officer The deficit of training the intern accounting officers cand contribute to an
underproduction of relevant information for decision making and underutilization of accounting as an instrument of management. It can thus test a new hypothesis, I9: managers are assisted by an accountant employed who possess a high level of training using several accounting data.
4. THE METHODOLOGY OF RESEARCH The survey carried out in the research included a number of 18 SMEs from the
South-West Development Region Oltenia with a number between 10 and 500 employees, belonging to different sectors of activity (table 1). Data collection was done through a questionnaire that were filled by the managers of the enterprises included in the sample.
Table no 1. Characteristics of enterprises in the sample
Sector of activity No.of enterprises Manufacture of prototype 2
Manufacturing series 3 Wholesale trade 3
Retail trade 4 Services that require fixed assets 3
Services that require human resources 2 Others 1 Total 18
Total enterprise No.of enterprises 10-50 3 51-75 5
76-100 4 101-150 6
Total 18 Age of the enterprise (years) No.of enterprises
0-5 3 6-10 5
11-25 10 Total 18
Degree of informatisation No.of enterprises Limited 5
6-10 13 Total 18
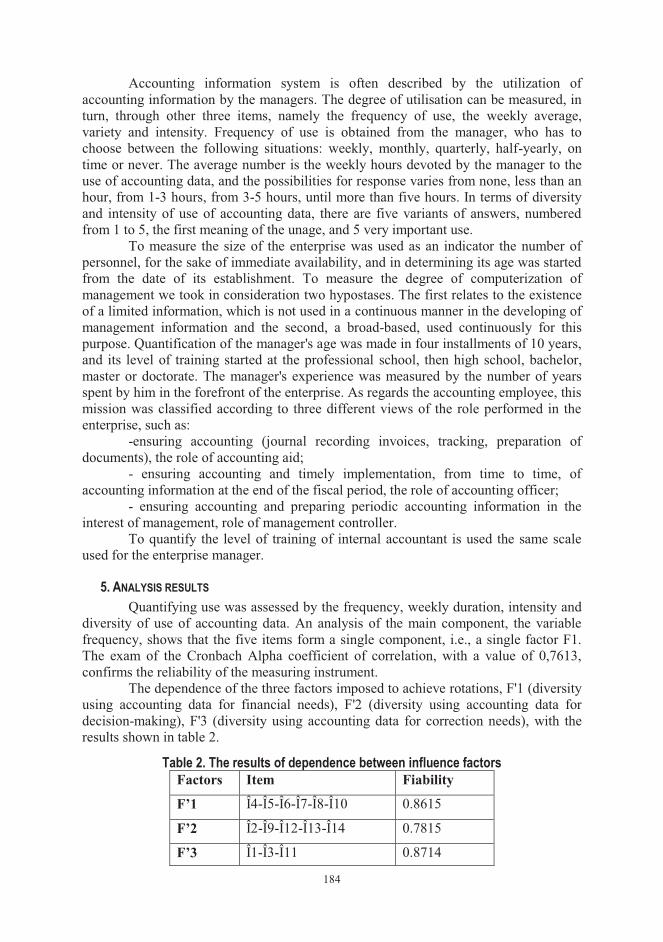
184
Accounting information system is often described by the utilization of accounting information by the managers. The degree of utilisation can be measured, in turn, through other three items, namely the frequency of use, the weekly average, variety and intensity. Frequency of use is obtained from the manager, who has to choose between the following situations: weekly, monthly, quarterly, half-yearly, on time or never. The average number is the weekly hours devoted by the manager to the use of accounting data, and the possibilities for response varies from none, less than an hour, from 1-3 hours, from 3-5 hours, until more than five hours. In terms of diversity and intensity of use of accounting data, there are five variants of answers, numbered from 1 to 5, the first meaning of the unage, and 5 very important use.
To measure the size of the enterprise was used as an indicator the number of personnel, for the sake of immediate availability, and in determining its age was started from the date of its establishment. To measure the degree of computerization of management we took in consideration two hypostases. The first relates to the existence of a limited information, which is not used in a continuous manner in the developing of management information and the second, a broad-based, used continuously for this purpose. Quantification of the manager's age was made in four installments of 10 years, and its level of training started at the professional school, then high school, bachelor, master or doctorate. The manager's experience was measured by the number of years spent by him in the forefront of the enterprise. As regards the accounting employee, this mission was classified according to three different views of the role performed in the enterprise, such as:
-ensuring accounting (journal recording invoices, tracking, preparation of documents), the role of accounting aid;
- ensuring accounting and timely implementation, from time to time, of accounting information at the end of the fiscal period, the role of accounting officer;
- ensuring accounting and preparing periodic accounting information in the interest of management, role of management controller.
To quantify the level of training of internal accountant is used the same scale used for the enterprise manager.
5. ANALYSIS RESULTS Quantifying use was assessed by the frequency, weekly duration, intensity and
diversity of use of accounting data. An analysis of the main component, the variable frequency, shows that the five items form a single component, i.e., a single factor F1. The exam of the Cronbach Alpha coefficient of correlation, with a value of 0,7613, confirms the reliability of the measuring instrument.
The dependence of the three factors imposed to achieve rotations, F'1 (diversity using accounting data for financial needs), F'2 (diversity using accounting data for decision-making), F'3 (diversity using accounting data for correction needs), with the results shown in table 2.
Table 2. The results of dependence between influence factors Factors Item Fiability
F’1 Î4-Î5-Î6-Î7-Î8-Î10 0.8615
F’2 Î2-Î9-Î12-Î13-Î14 0.7815
F’3 Î1-Î3-Î11 0.8714
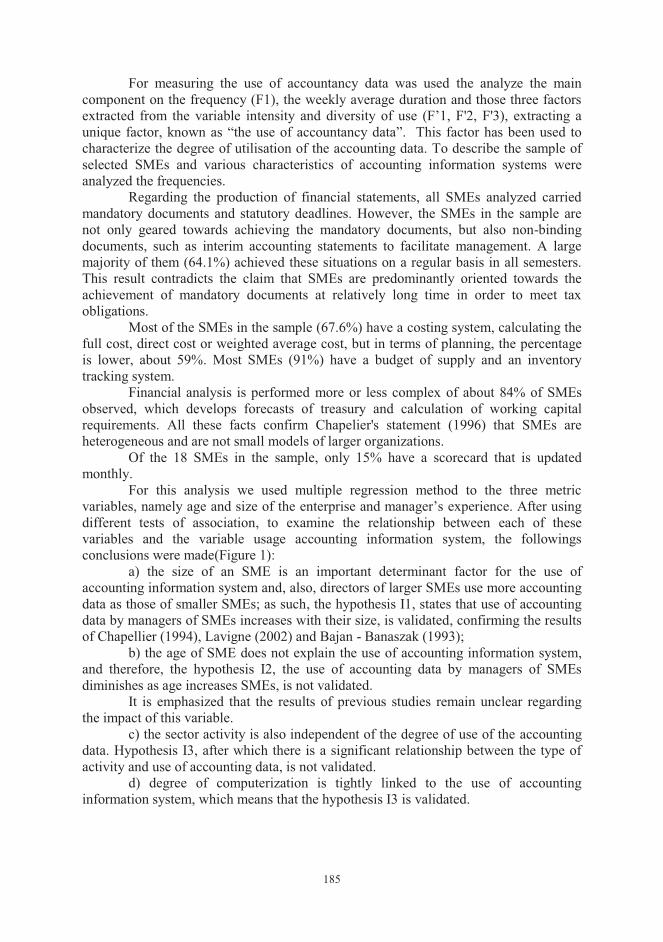
185
For measuring the use of accountancy data was used the analyze the main component on the frequency (F1), the weekly average duration and those three factors extracted from the variable intensity and diversity of use (F’1, F'2, F'3), extracting a unique factor, known as “the use of accountancy data”. This factor has been used to characterize the degree of utilisation of the accounting data. To describe the sample of selected SMEs and various characteristics of accounting information systems were analyzed the frequencies.
Regarding the production of financial statements, all SMEs analyzed carried mandatory documents and statutory deadlines. However, the SMEs in the sample are not only geared towards achieving the mandatory documents, but also non-binding documents, such as interim accounting statements to facilitate management. A large majority of them (64.1%) achieved these situations on a regular basis in all semesters. This result contradicts the claim that SMEs are predominantly oriented towards the achievement of mandatory documents at relatively long time in order to meet tax obligations.
Most of the SMEs in the sample (67.6%) have a costing system, calculating the full cost, direct cost or weighted average cost, but in terms of planning, the percentage is lower, about 59%. Most SMEs (91%) have a budget of supply and an inventory tracking system.
Financial analysis is performed more or less complex of about 84% of SMEs observed, which develops forecasts of treasury and calculation of working capital requirements. All these facts confirm Chapelier's statement (1996) that SMEs are heterogeneous and are not small models of larger organizations.
Of the 18 SMEs in the sample, only 15% have a scorecard that is updated monthly.
For this analysis we used multiple regression method to the three metric variables, namely age and size of the enterprise and manager’s experience. After using different tests of association, to examine the relationship between each of these variables and the variable usage accounting information system, the followings conclusions were made(Figure 1):
a) the size of an SME is an important determinant factor for the use of accounting information system and, also, directors of larger SMEs use more accounting data as those of smaller SMEs; as such, the hypothesis I1, states that use of accounting data by managers of SMEs increases with their size, is validated, confirming the results of Chapellier (1994), Lavigne (2002) and Bajan - Banaszak (1993);
b) the age of SME does not explain the use of accounting information system, and therefore, the hypothesis I2, the use of accounting data by managers of SMEs diminishes as age increases SMEs, is not validated.
It is emphasized that the results of previous studies remain unclear regarding the impact of this variable.
c) the sector activity is also independent of the degree of use of the accounting data. Hypothesis I3, after which there is a significant relationship between the type of activity and use of accounting data, is not validated.
d) degree of computerization is tightly linked to the use of accounting information system, which means that the hypothesis I3 is validated.
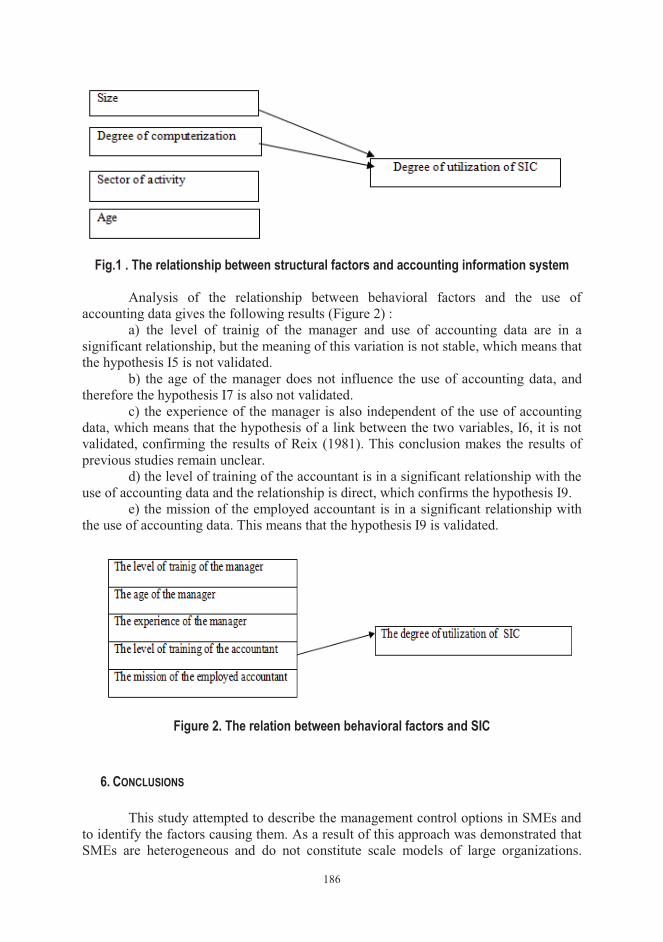
186
Fig.1 . The relationship between structural factors and accounting information system
Analysis of the relationship between behavioral factors and the use of
accounting data gives the following results (Figure 2) : a) the level of trainig of the manager and use of accounting data are in a
significant relationship, but the meaning of this variation is not stable, which means that the hypothesis I5 is not validated.
b) the age of the manager does not influence the use of accounting data, and therefore the hypothesis I7 is also not validated.
c) the experience of the manager is also independent of the use of accounting data, which means that the hypothesis of a link between the two variables, I6, it is not validated, confirming the results of Reix (1981). This conclusion makes the results of previous studies remain unclear.
d) the level of training of the accountant is in a significant relationship with the use of accounting data and the relationship is direct, which confirms the hypothesis I9.
e) the mission of the employed accountant is in a significant relationship with the use of accounting data. This means that the hypothesis I9 is validated.
Figure 2. The relation between behavioral factors and SIC
6. CONCLUSIONS This study attempted to describe the management control options in SMEs and
to identify the factors causing them. As a result of this approach was demonstrated that SMEs are heterogeneous and do not constitute scale models of large organizations.
187
Another observation is the fact that SMEs are predominantly oriented only towards achieving the mandatory accounting documents required by authorities.
Management control practices are heterogeneous and employees realize cost calculations and forecast budgets based on expenditure recorded on certain periods (a few months or years). General accounting comply with european rules and instruments are designed to inform management and fiscal authorities.
Regarding financial analysis results show that this practice is widespread in SMEs, but that it has empirical character and is not periodic. The use of scorecards in their classical form is not a common practice.
On identifying the factors that determine the content and structure of accounting information system in SMEs, the results generally confirm the hypotheses of research, particularly those relating to the size and degree of computerization of management. But there are specific assumptions refuted behavioral factors such as manager’s age and experience. The level of manager’s training is related to the degree of use of accounting data, but the meaning of this relationship is not known what remains in contradiction with the findings of other researchers. Tests confirm, however, the influence of internal accountant profile, ie its level of training and its mission on the use of accounting data.
With all this new information, the study has some limitations that can be avoided in future research. The first aspect is related to the size and structure of the sample, which can be considered quite low in statistical terms. Also, the research was based on a questionnaire and a face-to-face meetings and they have limits.
The method used to describe relationships between contingency factors and use of accounting data was based on multiple regression analysis. The other variables were the subject of an unidimensional description and statistical analysis. Selected contingency factors are also limited. Several variables were not considered in the model due to the difficult data collection and processing, subjective qualities of the manager in terms of the required objectives, his preferences in terms of information and influence other accounting actors.
REFERENCES 1. Anthony R. N. Planning and control Systems : a framework for analysis, Graduate
School of Business Administration, Harvard University, Boston, 1965
2.
Le contrôle de gestion en action, 2ème édition, Editions Liaisons, Paris, 2001.
3.
L’expert-comptable et le conseil en gestion, Revue Française de Comptabilité, n° 249,199
4. Bergeron H. La gestion stratégique et les mesures de la performance non financière des PME, 6° Congrès international Francophone sur la PME-Octobre-2002-HEC-Montréal
5. Chapellier, P. Comptabilités et systèmes d’information du dirigeant de PME, Thèse de Doctorat de Sciences de Gestion, Université de Montpellier ІІ, 1994
6. Chapellier, P. Données comptables de gestion et système d’information du dirigeant de PME », Revue Système d’information, Vol. 1, N°2, 1996
188
7. Chapellier, P. Profils de dirigeants et données comptables de gestion », Revue Internationale PME, vol. 10, n°1, 1997
8. Management control systems design within its organizational context: findings from contingency-based research and directions for the future », Accounting, Organizations and Society, vol. 28, n°2-3, 2003
9.
Contrôle de gestion
10. Accounting, budgeting and Control Systems in Their Organizational Context: Theoretical and Empirical Perspectives, Accounting, Organizations and Society, 1983
11. Contrôle de gestion, Economica, 7ème édition, Paris, 200012. Langfield-
Smith Management Control Systems and Strategy: A critical review, Accounting, Organisations and Society, Vol. 22, n°2, 1997
13. Contribution à l’étude de la genèse des systèmes d’information comptable des PME : une approche empirique, Actes du 23ème
Congrès de l’Association Française de Comptabilité, Toulouse, 200214. Le contrôle de gestion de le PME; Comptabilité – Contrôle – Audit,
Tome 7,Vol. 1, 200115. Research in Management Control: An Overview of its Development,
British Journal of Management, Vol. 6, Special Issue, 1995
16. A conceptual framework for the design of organizational control mechanisms, Management Science, vol.25, 1979
17. Les systèmes d’information, dans JULIEN (1994) (sous la direction de), Les PME: bilan et perspectives, Economica, 1ère édition, Paris, 1994
18. Enquête sur les pratiques et les besoins en matière de contrôle de gestion dans les PME wallonnes
.
189
From ABC to Time Driven Activity Based Costing for outpatient clinics
Prof. Constanţa Iacob, Ph.D. University of Craiova
Faculty of Economics Camelia Constantin, Ph.D.Student University of Craiova Faculty of Economics and Business Administration Craiova, Romania
Abstract : A good lead firm, said M.Jr.Harper, means being in control its future and to be master of the future is learning to work with the information. But one can not seriously claim that the accounting information fully meet all the information needs of different user groups, especially when it comes to accounting management whose role is perceived differently by each entity, depending on the purpose and objectives management. Given the complexity of public healthcare institutions, especially public hospital units, it becomes necessary to thorough knowledge of the organization and exercise management control as accurate determination of costs, determining the strengths and shortcomings of cost calculation and assessment information their implications on the performance of the entities is a constant imperative of decision making. In this context we want to point out that it is the method impact Time Driven Activity Based Costing over the management of the hospital units . JEL classification: M40, M41 Keywords: management control; calculation methods; decisions
1. INTRODUCTION Economic competition, today became increasingly fierce economic environment requires efficiency and performance. On the other hand, fulminant technologies require continuous upgrading of skills and new forms of organization and management of the activity. In this dynamic context, management accounting gain vitally important as organizations turn exert an influence on the social, economic and physical. Business decisions on the development of new products, the pricing policy in its recruitment and salary are dependent accounting information, and managers' behavior is influenced by accounting data (Horngren et &, 2005) because they have an impact on their possibilities for action managers while being producers and recipients of such information. New research in management accounting reveals a significant evolution of his fundamental concepts. They focus on the key issues of the activities managed directly related decisions. Analysis and costing, the priority objectives of management accounting is done in a much broader context, compared to the traditionally manner, meaning that there is now more closely specific elements of these activities on the organization's strategy. Thus, information on costs acquire a special role in the
190
development of more efficient strategies that give organizations a sustainable competitive advantage.
Therefore, in a market economy requires a new vision costs, meaning that the starting point should the market price and it is depending on it to be analyzed opportunity cost adjustment decision on the status of manufacturing a product, execution a work or provide a service. Such operation requires a lot of precision and economy on consumption that affect the cost, which by the information that it provides, it becomes decisive for decision making have been adopted to schedule and demanding control of operations and capitalization incurred in obtaining production.
We ask ourselves if we can copy and apply a management model as it was conceived? The answer is yes and no. Information systems and management accounting common forms are similar in different countries, but their associated management practices differ from country to country visible.
This distinction leads to the idea that the main differences occur between different countries and between Europe and the United States occur in the informal systems. Formal information systems, instruments are very close, in retaliation, management practices differ in terms of informal systems, the actors around accounting and management tools and other resources in different cultural contexts.
2. Objectives Some American researchers (R. Cooper, Kaplan, Porter, Miller) and French (Mevellec, Labas, Lorino), taking into account the disadvantages of traditionally costing methods were designed and developed another management system known as ABC (Activity Based Costing) or ABM (Activity Based Management). For the design of this model and so far have been more than 20 years which is why the model is considered unwieldy and outdated. This is the reason for which we want to bring into question another model, already known in the literature as the Time Driven Activity Based Costing model that folds very well on outpatient health system.
3. Methodology Methodology of investigation covers the main research methods, namely
qualitative research and quantitative research, by highlighting features of the study from the theoretical perspective, a descriptive-conceptual manner.
We felt that the best approach is deductive, proceeding from the general toward particularly, especially using comparative analysis of the concepts, tools, and specific methods of management accounting.
4. ASPECTE TEORETICO-METODOLOGICE ALE METODEI ABC/ABM Currently, mechanistic model of enterprises operating in opposition to the new
management logic is increasingly necessary in production. He tends to inhibit the development of enterprises, attitudes and representations are essentially much more tenacious than technologies.
Competition analysis was to demonstrate the merit of other possible strategies, in particularly differentiation strategy or isolation and prioritizes customer value problem. All processes must be geared towards customer satisfaction (internal or external), which assigns a value functionalities or services. This value creation must be achieved efficiently, ie with the lowest cost. Optimizing the value-cost relationship is the foundation of the new management reasons.
191
4.1 Metoda ABC In the mid-1980s, following the works published in CAM-I, the first systems
costs were applied activities in the United States. The key objective was to remedy distortions in costs observed in a large number of U.S. companies that leads to wrong decisions.
ABC concept initiated by R.Cooper and R.Kaplan starts from the observation that there are products that consume resources but activities and various activities of the company are used by the product.
Given the sequence of causation and cost allocation is not produced from conventionally distribution keys, we find that the firm should be seen as a network of activities in internal and external customer service and not as a body.
An activity is a set of basic tasks, homogeneous, which aims to create value for internal or external customer. A chain of activities that contribute to achieving a common goal called the "process".
A first step consists in tracing activities will be significant cost and performance support, knowing that the activities involving the consumption of resources and activities involving cost carriers.
In this perspective, activities can be classified as: � critical activities, that needed to achieve the strategic priorities; � main activities and primary, that sustains the company and will not be
abandoned without losing its identity; � secondary activities that the firm must possess for the normal conduct of its
object; � activities with added value for the customer, and will not be considered.
Once determined activities , resource allocation question consumed by them, as in classical methods . The difference is that , for expenses which are not directly from the center of activity , use " an inducer of resources " ( resource driver) , which plays the same role as distribution keys . Knowledge of available resources ( manpower, materials, information ) allows the estimation of " theoretical capacity " of an activity . In essence , the concept of theoretical capacity , or "normal" corresponds to the actual level of activity , even if it is often arbitrary center of activity and not be based on any specific activity . The work is supple enough to accommodate a large number of cost calculation cost carriers . Their choice varies depending on management issues to be solved or decisions to be taken . We can talk about products, customers , a project, an order, a responsibility center , an asset, value chain , etc. .
The frequency calculations may vary and should not correspond to accounting period. For each carrier costs will determine the list of tasks required, and for each of them, the number of drink drivers (for example, assembly activity required six welds, so we have six inducers or drivers). The method offers the possibility to build a matrix of costs dependent activity (EAD) in which the costs are in rows and column activity. It follows that a charge "j" identified in the work "i" is found in cell "ij", hence the next model down the amount of resources consumed (CTA) in the business "i":
j)(i,
n
1j(j)(i) Nx RCTA �
�
� (1) , în care :
R(j) = term consumption of a particularly resource category "j"
192
i = activity N(i,j) = input i, j of the matrix or activity-dependent costs (EAD)
A second step involves assigning activity costs to cost bearers (products, works, services). The unit of work, allowing the binding of the carriers cost will call "inducing activity" (driver activity) (a unit of work) on the basis of the unit cost is to be determined, namely:
da
(i)da N
CTA Cu � (2) , in which:
Cuda = unit cost of inducer activity (activity driver) Nda = number of inductors activity Knowing the unit cost of inducer activity, can determine the value of an activity "j" attributable to a product "i" (TCAP(j) ), according to the following relationship:
(i)da(j) Ndasx Cu TCAP � (3) , in which:
Ndas(i) = number of inducing specific activity of "i" With regard to the calculation of the cost of the product, the method offers the
possibility to build a second array of activities dependent on the item (APD) that work in "j" rows is, and the products "and" column. It follows that the values found in each product (TCPi) will be based on the following relationship:
j)(i,
n
1j(j)(i) APDx TCAPTCP �
�
� (4) , in which:
APD(i,j) = entry i, j in the matrix APD Inducer activity differs from conventional units by the will to restore a causal
link with the consumption of resources, so that we can distinguish four types of inductors:
� inducers bound volume manufactured products (machine hours, hours-workers kg consumables);
� inducers related operational organization (number of plots, number of orders, number of deliveries, number of invoices etc.);
� inducers of the existence of the product (number of technological cards, number drawings, number of manufacturing recipes, number of exemptions and so on, which are independent of the number of products is achieved);
� inducers of the existence of capacity (broadly, pubs, cars, people). It should be borne in mind that the last relationship computing (4) covers
indirect costs attributable to the product. To find the total cost completely (TCC(i)) of the product is
required the addition of direct costs per product (CDP(i)) according to the relationship: TCC(i) = TCP(i) + CDP(i) (5)
This cost modeling can lead to: � analyze margins on products / services, customers or couples products /
services, customers; � the traditional budgeting (enough to start deducting the amount expected
objectives and activities necessary to aggregate the budget centers);
193
� estimate the value chain by adding elements of all activities relating to the same subdivision (design, logistics, manufacturing, trade, services);
� grouping activities into centers of activity, corresponding to a process, a project, an action. An activity center can thus be constituted by a set of support activities, converging towards the same goal: budget, human resources management. But the cost of shipping carriers and their grouping should not become an
overriding concern because competitiveness is gained in the activities which must contain the key drivers of performance.
The performance of a task can be estimated mainly through the inductor cost, but also by other inducers such as the quality, range, and flexibility. Inductor (driver) costs must be distinguished from inducer activity, which is not always recognized by the literature based on ABC (Activity Based Costing). They correspond to the root causes of resource consumption at the level of activities and therefore constitutes the basic criterion of performance. Certainly not limited to ABC costing, while allowing relief activities by reducing resource consumption by eliminating certain activities or worthless.
4.2. Metoda ABM In the form in which it appeared, we can speak of " the cost of the first generation system " , which is why many authors have argued that , in essence , ABC brought nothing new and has long been equated with traditionally costing methods . Introducing the ABC method does not involve any one organizational change or a management concern . In its first stage , the method is limited to tracking activities within the centers or liability analysis and re-adding a stage in the allocation process . Interest method outlined ABC cost system of the second generation , ABM ( Activity Based Management ) is not limited to obtaining reliable and cost containment activities . The authors of the second generation is based on a different vision of the company, more cross that lead to calling into question the traditional centers of responsibility. Going beyond the traditionally boundaries of the enterprise and taking into account the global value chain strategic segment concerned ABM method becomes a genuine method to support the administration and management.
4.3. De la metoda ABC la metoda Time Driven Activity Based Costing While many authors have advocated the method ABC , as was previously mentioned , particularly in the health , Y.Lievens et al . , And M.King et al . , Believes that ABC systems have the disadvantage of involving a consuming additional time and resources to manage such systems . In this regard it is worth P.Everaert 's statement underlined et al . , Regarding the fact that " many managers have tried to implement ABC , including the health system, but abandoned the attempt in the face amount of lies and increased costs ." Looking to overcome their ABC system, R.S.Kaplan and S.Anderson have developed a new concept that they called TDABC (Time Driven Activity Based Costing) and are based only on two cost drivers, ie the unit cost of capacity used time the unit to carry out a transaction or activity. TDABC particularities as compared with the ABC method are shown in Table 1 .
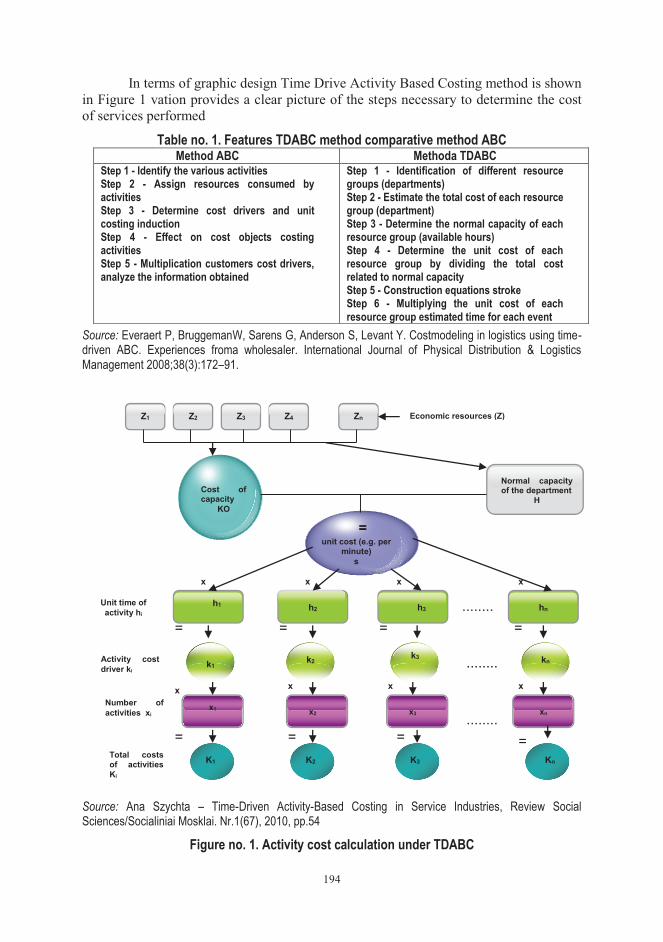
194
In terms of graphic design Time Drive Activity Based Costing method is shown in Figure 1 vation provides a clear picture of the steps necessary to determine the cost of services performed
Table no. 1. Features TDABC method comparative method ABC Method ABC Methoda TDABC
Step 1 - Identify the various activities Step 2 - Assign resources consumed by activities Step 3 - Determine cost drivers and unit costing induction Step 4 - Effect on cost objects costing activities Step 5 - Multiplication customers cost drivers, analyze the information obtained
Step 1 - Identification of different resource groups (departments) Step 2 - Estimate the total cost of each resource group (department) Step 3 - Determine the normal capacity of each resource group (available hours) Step 4 - Determine the unit cost of each resource group by dividing the total cost related to normal capacity Step 5 - Construction equations stroke Step 6 - Multiplying the unit cost of each resource group estimated time for each event
Source: Everaert P, BruggemanW, Sarens G, Anderson S, Levant Y. Costmodeling in logistics using time-driven ABC. Experiences froma wholesaler. International Journal of Physical Distribution & Logistics Management 2008;38(3):172–91.
Source: Ana Szychta – Time-Driven Activity-Based Costing in Service Industries, Review Social Sciences/Socialiniai Mosklai. Nr.1(67), 2010, pp.54
Figure no. 1. Activity cost calculation under TDABC
Cost of capacity
KO
Normal capacity of the department
H
unit cost (e.g. per minute)
s
h1 h2 h3 ........
........
........
hn
= = = =
k1 k2 k3 kn
x x x x
x x x x
K1 K2 K3 Kn
= = = =
Z1 Z2 Z3 Z4 Zn Economic resources (Z)
Unit time of activity hi
=
Activity cost driver ki
Number of activities xi
Total costs of activities Ki
x1 x2 x3 xn
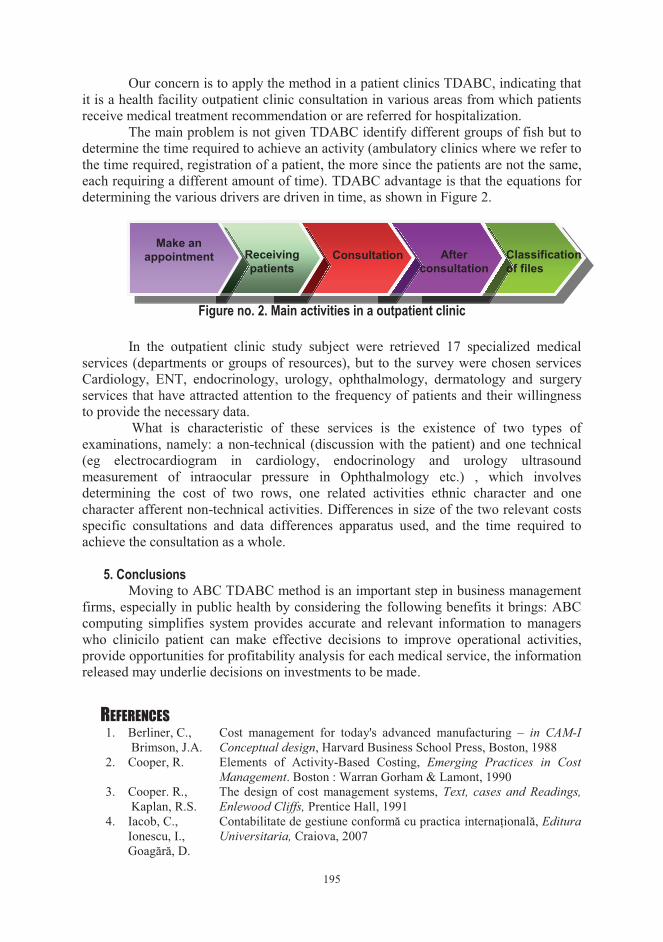
195
Our concern is to apply the method in a patient clinics TDABC, indicating that it is a health facility outpatient clinic consultation in various areas from which patients receive medical treatment recommendation or are referred for hospitalization.
The main problem is not given TDABC identify different groups of fish but to determine the time required to achieve an activity (ambulatory clinics where we refer to the time required, registration of a patient, the more since the patients are not the same, each requiring a different amount of time). TDABC advantage is that the equations for determining the various drivers are driven in time, as shown in Figure 2.
Figure no. 2. Main activities in a outpatient clinic
In the outpatient clinic study subject were retrieved 17 specialized medical services (departments or groups of resources), but to the survey were chosen services Cardiology, ENT, endocrinology, urology, ophthalmology, dermatology and surgery services that have attracted attention to the frequency of patients and their willingness to provide the necessary data. What is characteristic of these services is the existence of two types of examinations, namely: a non-technical (discussion with the patient) and one technical (eg electrocardiogram in cardiology, endocrinology and urology ultrasound measurement of intraocular pressure in Ophthalmology etc.) , which involves determining the cost of two rows, one related activities ethnic character and one character afferent non-technical activities. Differences in size of the two relevant costs specific consultations and data differences apparatus used, and the time required to achieve the consultation as a whole. 5. Conclusions
Moving to ABC TDABC method is an important step in business management firms, especially in public health by considering the following benefits it brings: ABC computing simplifies system provides accurate and relevant information to managers who clinicilo patient can make effective decisions to improve operational activities, provide opportunities for profitability analysis for each medical service, the information released may underlie decisions on investments to be made.
REFERENCES 1. Berliner, C.,
Brimson, J.A. Cost management for today's advanced manufacturing – in CAM-I Conceptual design, Harvard Business School Press, Boston, 1988
2. Cooper, R. Elements of Activity-Based Costing, Emerging Practices in Cost Management. Boston : Warran Gorham & Lamont, 1990
3. Cooper. R., Kaplan, R.S.
The design of cost management systems, Text, cases and Readings, Enlewood Cliffs, Prentice Hall, 1991
4. Iacob, C., Ionescu, I., Goagără, D.
Contabilitate de gestiune conformă cu practica internaţională, Editura Universitaria, Craiova, 2007
Make an appointment Consultation After
consultation Classification of files
Receiving patients
196
5. Iacob, C., Drăcea, R.M.
La méthode ABC/ABM dans une nouvelle vues - Revue Sciences de Gestion, 1er Congres Transatlantique de Comptabilite, Audit, Controle de Gestion, Gestion des Couts et Mondialisation, Lyon, Franţa, 2007
6. Johnson, H.T. Activity Based management : Past, Present, and Future, The Engineering Economist, Vol.36, No.2, (Spring 1991), pp.219-238
7. Kaplan, R.S. Activity-Based Costing. A4 of Cost management for service Industries, Ed.James B. Edwards. Boston : Warran Gorham & Lamont,, 1999
8. Mevellec, P. Outils de gestion – La pertinence retrouvée, Editions Malesherbes, 1990, pp.107
9. Porter. M. L'avantage competitife, Inter Edition, Paris, 1986 10. Roztocki, N.,
Valenzuela,J.F., Porter, J.D., Monk, R.M., Needy, K.
A Procedure for Smooth Implemenation of Activity Based Costing in Small Companies, ASEM National Conference Proceedings, Virginia Beach, October 21-23, 1999, pp.279-288
11. Everaert P, BruggemanW, De Creus G.
Sanac Inc.: from ABC to timedriven ABC (TDABC)—an instructional case. Journal of Accounting Education 2008;26:118–54.
12. Lievens Y, Van Den Bogaert W, Kesteloot K.
Activity-based costing: a practical model for cost calculation in radiotherapy. International Journal of Radiation Oncology Biology Physics 2003;57(2):522–35.
13. King M, Lapsley I, Mitchell F, Moyes J.
Costing needs and practices in a changing environment: the potential for abc in the National Health Service. Financial Accountability and Management 1994;10(2):143–60.
14. Demeere, N., Stouthuysen,K., Roodhooft, F.
Time-driven activity-based costing in an outpatient clinic environment : Development, relevance and managerial impact. Health Policy, volume 92, Issue 2, pp.296-304, 2009
197
INTERNATIONAL STATISTICAL REPORTING– THE DUTY OF ECONOMIC
AGENTS
Prof. Magdalena Mihai Ph. D University of Craiova Faculty of Economics and Business Administration Craiova, Romania Assist. Adriana Ioţa Ph. D Student University of Craiova Faculty of Economics and Business Administration Craiova, Romania
Abstract: The study effectuated has for purpose to present the importance of the accounting information in the development of the foreign trade activities, as well as its importance for the statistic system that studies this domain.
Thus, in the first part of our paper we will offer a short definition of the foreign trade, through which we try to synthesize the main operations performed in the reports abroad. An important step in this sense is represented by the enumeration of the units that can develop foreign trade activities, as well as by the way in which these units can take part at the international commercial activities.
Taking into consideration the obligation of the commercial agents to organize their own accounting, it is emphasized the fact that, in the commercial domain, the accountancy provides complex economical information, used for the statistic and fiscal reports.
In the last part, it is synthesized the connection between the accounting information and the reports performed by the economic agents which develop foreign trade activities, through a series of examples surged from their complexity.
JEL classification: M41, M42
Key words: foreign trade, accounting information, statistical reporting, commercial flux, intrastat
1. Introduction
Through the statistical reporting concerning the international trade with goods that measure the quantity and value of the goods transitioned between the European Union member states (intra-community or within the EU trade activities) and of the goods transitioned between the EU member states and other countries (extra-community or outside the EU trade activities). Statistical reporting represent the official source of information which concern the imports, exports and the commercial balance
198
of every EU member state, but also the way of centralizing them at the level of the Union.
In order to allow the accomplishment of a comparison at global level of the international trade statistics, the statistical reporting must be performed according to strict rules and the publishing of these statistics is performed for every reporting country in the relationship with the partner country. 54
Statistical reporting for the individual member states supposes the classification of the commercial fluxes according to their affiliation of the partner state, as it follows:
� commercial fluxes outside the EU (extra - community); � commercial fluxes within the EU (intra - community). The commercial fluxes outside the EU are characterized by: a. the import of goods from a country outside the EU, that enters statistically
on the EU territory and to which the custom procedures are applied immediately or after a period spend in a customs warehouse;
b. the shipping of goods which leave the statistic territory of a member state which finds itself in free circulation on the territory of the EU.
The source of the traditional statistical data concerning the international trade with goods is the customs evidence. At the same time with the appearance of the Unique Market, on the 1st of January 1993, the customs formalities between the member states have been eliminated and thus the necessity of a new system of data collection has surged; this system carries the name of Intrastat. From that moment on the basis of statistics regarding the trade developed within the EU is ensured through this system.
Starting with 2007, along with the ascension to the EU, the activities of the companies which develop commercial transactions with partners outside and within EU have suffered important modifications. Thus, modifications of the customs regulations, new obligations of the economic agents regarding the external billing with or without VAT, as well as statistical reporting in the Intrastat system have appeared. There is a series of incertitude in solving the problems imposed by the practice and this is why all these modifications have created new costs related to the professional training.
2. OBJECTIVES Starting with the observation that the statistical reporting through Intrastat still
raises problems to the economic agents and practitioners, we propose ourselves to present the most important aspects referring to the statistical reporting. Also, the main objective is that of clarifying some of the most special situations surged in the practice of the foreign trade with goods, according to the statistical reporting at the level of Intrastat.
3. METHODOLOGY The study effectuated for the achievement of this paper is based on data
collected from the specialized materials in the domain of statistical reporting, which prove their utility in solving certain case studies, imposed by the practice. The data collected have been analyzed and processed in order to create a paper useful to the readers and practitioners.
54 www.eurostat.ec.europa.eu/ Comerţul internaţional cu mărfuri
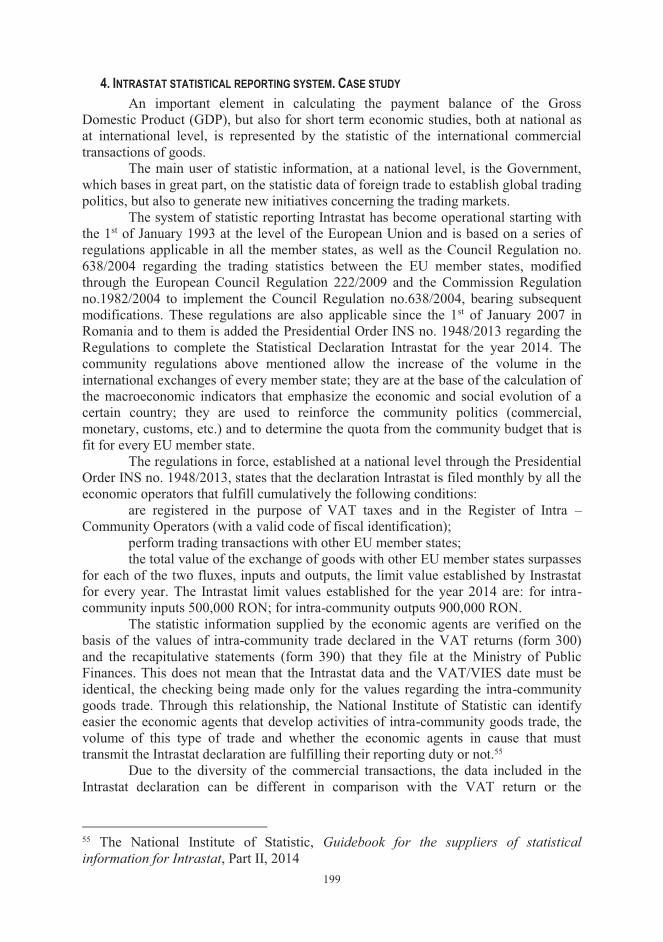
199
4. INTRASTAT STATISTICAL REPORTING SYSTEM. CASE STUDY An important element in calculating the payment balance of the Gross
Domestic Product (GDP), but also for short term economic studies, both at national as at international level, is represented by the statistic of the international commercial transactions of goods.
The main user of statistic information, at a national level, is the Government, which bases in great part, on the statistic data of foreign trade to establish global trading politics, but also to generate new initiatives concerning the trading markets.
The system of statistic reporting Intrastat has become operational starting with the 1st of January 1993 at the level of the European Union and is based on a series of regulations applicable in all the member states, as well as the Council Regulation no. 638/2004 regarding the trading statistics between the EU member states, modified through the European Council Regulation 222/2009 and the Commission Regulation no.1982/2004 to implement the Council Regulation no.638/2004, bearing subsequent modifications. These regulations are also applicable since the 1st of January 2007 in Romania and to them is added the Presidential Order INS no. 1948/2013 regarding the Regulations to complete the Statistical Declaration Intrastat for the year 2014. The community regulations above mentioned allow the increase of the volume in the international exchanges of every member state; they are at the base of the calculation of the macroeconomic indicators that emphasize the economic and social evolution of a certain country; they are used to reinforce the community politics (commercial, monetary, customs, etc.) and to determine the quota from the community budget that is fit for every EU member state.
The regulations in force, established at a national level through the Presidential Order INS no. 1948/2013, states that the declaration Intrastat is filed monthly by all the economic operators that fulfill cumulatively the following conditions:
are registered in the purpose of VAT taxes and in the Register of Intra – Community Operators (with a valid code of fiscal identification);
perform trading transactions with other EU member states; the total value of the exchange of goods with other EU member states surpasses
for each of the two fluxes, inputs and outputs, the limit value established by Instrastat for every year. The Intrastat limit values established for the year 2014 are: for intra-community inputs 500,000 RON; for intra-community outputs 900,000 RON.
The statistic information supplied by the economic agents are verified on the basis of the values of intra-community trade declared in the VAT returns (form 300) and the recapitulative statements (form 390) that they file at the Ministry of Public Finances. This does not mean that the Intrastat data and the VAT/VIES date must be identical, the checking being made only for the values regarding the intra-community goods trade. Through this relationship, the National Institute of Statistic can identify easier the economic agents that develop activities of intra-community goods trade, the volume of this type of trade and whether the economic agents in cause that must transmit the Intrastat declaration are fulfilling their reporting duty or not.55
Due to the diversity of the commercial transactions, the data included in the Intrastat declaration can be different in comparison with the VAT return or the
55 The National Institute of Statistic, Guidebook for the suppliers of statistical information for Intrastat, Part II, 2014
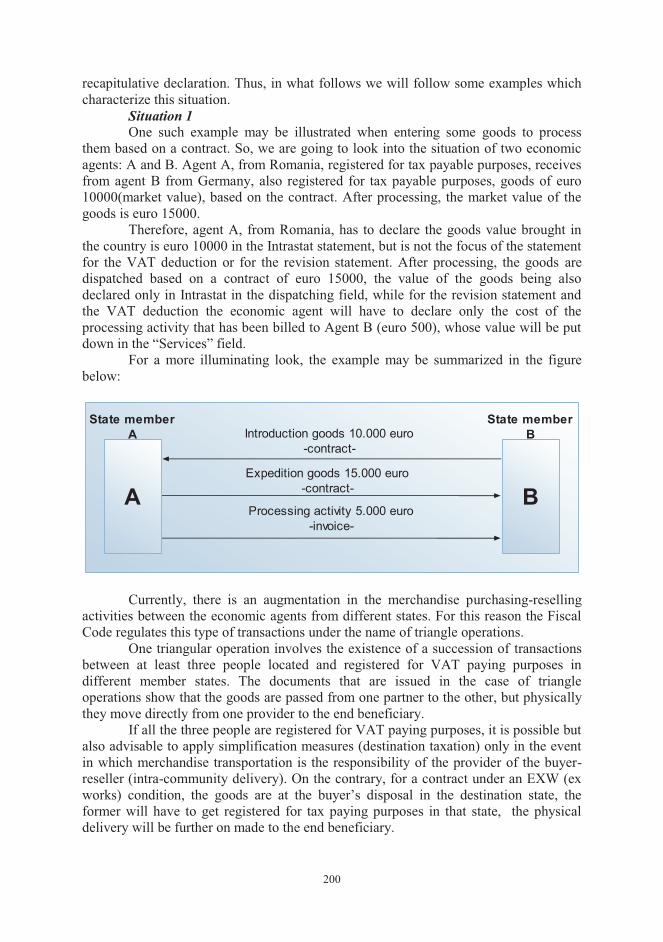
200
recapitulative declaration. Thus, in what follows we will follow some examples which characterize this situation.
Situation 1 One such example may be illustrated when entering some goods to process
them based on a contract. So, we are going to look into the situation of two economic agents: A and B. Agent A, from Romania, registered for tax payable purposes, receives from agent B from Germany, also registered for tax payable purposes, goods of euro 10000(market value), based on the contract. After processing, the market value of the goods is euro 15000.
Therefore, agent A, from Romania, has to declare the goods value brought in the country is euro 10000 in the Intrastat statement, but is not the focus of the statement for the VAT deduction or for the revision statement. After processing, the goods are dispatched based on a contract of euro 15000, the value of the goods being also declared only in Intrastat in the dispatching field, while for the revision statement and the VAT deduction the economic agent will have to declare only the cost of the processing activity that has been billed to Agent B (euro 500), whose value will be put down in the “Services” field.
For a more illuminating look, the example may be summarized in the figure below:
A B
Introduction goods 10.000 euro-contract-
Expedition goods 15.000 euro-contract-
Processing activity 5.000 euro-invoice-
State memberA
State memberB
Currently, there is an augmentation in the merchandise purchasing-reselling
activities between the economic agents from different states. For this reason the Fiscal Code regulates this type of transactions under the name of triangle operations.
One triangular operation involves the existence of a succession of transactions between at least three people located and registered for VAT paying purposes in different member states. The documents that are issued in the case of triangle operations show that the goods are passed from one partner to the other, but physically they move directly from one provider to the end beneficiary.
If all the three people are registered for VAT paying purposes, it is possible but also advisable to apply simplification measures (destination taxation) only in the event in which merchandise transportation is the responsibility of the provider of the buyer- reseller (intra-community delivery). On the contrary, for a contract under an EXW (ex works) condition, the goods are at the buyer’s disposal in the destination state, the former will have to get registered for tax paying purposes in that state, the physical delivery will be further on made to the end beneficiary.
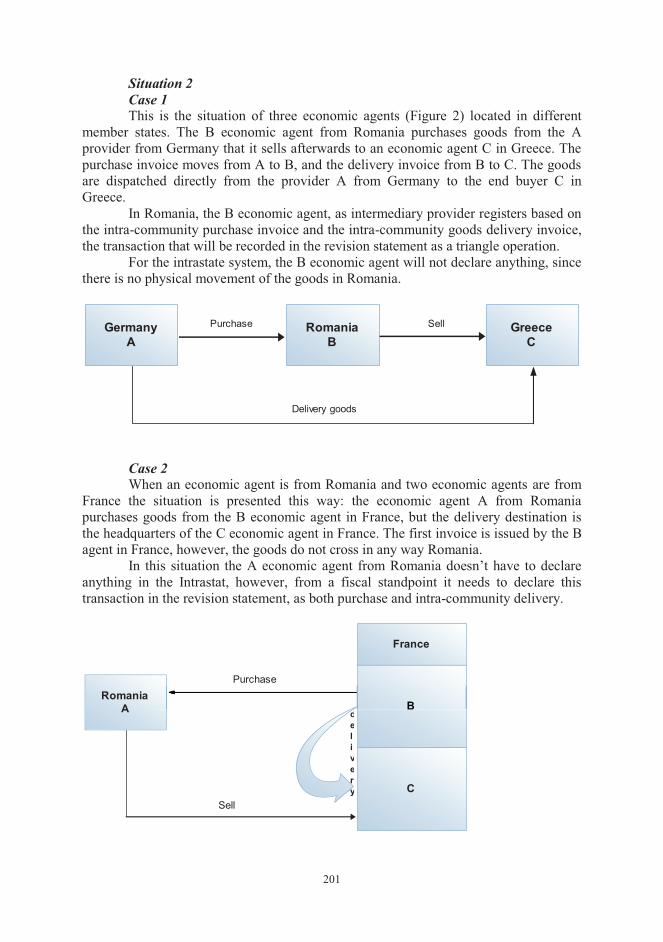
201
Situation 2 Case 1 This is the situation of three economic agents (Figure 2) located in different
member states. The B economic agent from Romania purchases goods from the A provider from Germany that it sells afterwards to an economic agent C in Greece. The purchase invoice moves from A to B, and the delivery invoice from B to C. The goods are dispatched directly from the provider A from Germany to the end buyer C in Greece.
In Romania, the B economic agent, as intermediary provider registers based on the intra-community purchase invoice and the intra-community goods delivery invoice, the transaction that will be recorded in the revision statement as a triangle operation.
For the intrastate system, the B economic agent will not declare anything, since there is no physical movement of the goods in Romania.
GermanyA
GreeceC
RomaniaB
Purchase Sell
Delivery goods
Case 2 When an economic agent is from Romania and two economic agents are from
France the situation is presented this way: the economic agent A from Romania purchases goods from the B economic agent in France, but the delivery destination is the headquarters of the C economic agent in France. The first invoice is issued by the B agent in France, however, the goods do not cross in any way Romania.
In this situation the A economic agent from Romania doesn’t have to declare anything in the Intrastat, however, from a fiscal standpoint it needs to declare this transaction in the revision statement, as both purchase and intra-community delivery.
RomaniaA
France
B
C
B
Purchase
Sell
delivery
202
Case 3 It is assumed that there is a situation when the A economic agent from
Romania sells goods to B economic agent from Italy, but the delivery takes place at the headquarters of C economic agent in Romania, In this case the A economic agent issues an invoice to agent B in Italy, but the goods never leave Romania.
So, the A agent from Romania does not have to declare anything in the Intrastat, however, it has to fiscally declare the transaction as intra-community goods delivery in the revision statement.
CONCLUSIONS The foreign trade and its activity forms constantly leave their mark on the
organization and management model of accounting in this important sector of the national economy.
So, we may say the organization and management model of accounting in foreign trade are influenced by factors such as: the foreign trade particulars, the variety of the units that carry on foreign trade activities and the connections between these ones.
Starting from the analysis of these factors, the accounting information, entered and processed, based on valid national and European regulations, reported by users, supporting also the fiscal and statistic information.
All in all, the focus is the quality of the accounting and statistic information, in the foreign trade area, as well as the possibility to compare it in the European Union, based on which there may be further suggestions for national and European rules and regulations.
REFERENCES
1. Brabete, V., Magdalena, M., Cristian, D.,
Contabilitatea activităţilor de comerţ, turism şi alimentaţie publică, Editura Universitaria, Craiova, 2013.
2. Radu, F., Paraschivescu, M.D.,
Contabilitatea opera iunilor de comer exterior, Editura Tehnopress, Ia i, 2007.
3. Sandu, M. Contabilitatea i fiscalitatea entită ilor economice, Editura Reprograph, Craiova, 2011
4. * * * Legea nr. 571/2003 privind Codul fiscal, cu modificările i completările ulterioare
5. * * * Manual pentru furnizorii de informa ii statistice Intrastat, Institutul Na ional de Statistică, Partea I, 2014
6. * * * Manual pentru furnizorii de informa ii statistice Intrastat, Institutul Na ional de Statistică, Partea II, 2014
7. * * * www.intrastat.ro 8. * * * www.mfinante.ro
203
OPPORTUNITIES FOR OPTIMIZING THE COST OF QUALITY
Prof. Magdalena Mihai Ph. D University of Craiova Faculty of Economics Craiova, Romania Assist. Adriana Iota Ph. D Student University of Craiova Faculty of Economics and Business Administration Craiova, Romania Assist. Oana Staiculescu Ph. D University of Craiova Faculty of Economics and Business Administration Craiova, Romania
Abstract: Nowadays, in front of an increasingly fierce competition, the center of gravity of any business in order to make a profit is customer satisfaction. For achieving this desideratum, companies, in their role as suppliers of goods and services, mostly aim to obtain economic and financial performance by improving quality and thus optimizing emergent costs. From this perspective, quality improvement within the economic entity must be a continuous activity which aims mainly to target the performance of processes, products and services in order to be more efficient and meet consumer demands. Therefore, the main interest consists in taking action to ensure effectiveness and efficiency, in equal measure for both economic entity, but also for the customer, through the application and selection of optimal solutions targeting decreasing costs. This paper aims to highlight that quality improvement becomes a very important process whose primary concern should be: discovering defects and quality cost optimization.
JEL classification: M40, M41
Key words: quality; quality cost; managerial accounting; optimization; continuous improvement
1. INTRODUCTION Optimizing the quality costs is a highly controversial issue often discussed in
the scientific literature. In fact any economic entity that aims to improve quality of products and services must take into account both implicit costs made in order to achieve customer satisfaction and how to achieve the objectives at the lowest possible cost. Therefore, in the following article, we come with the proposal of using specific quality tools, which once implemented within the company's processes facilitates managerial accounting approach regarding quality cost optimization.
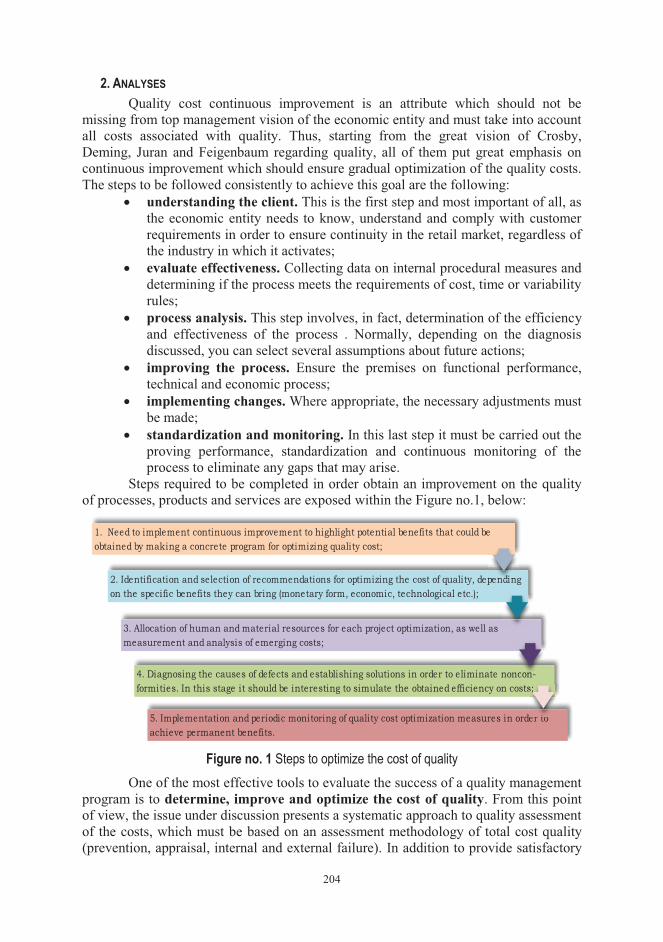
204
2. ANALYSES Quality cost continuous improvement is an attribute which should not be
missing from top management vision of the economic entity and must take into account all costs associated with quality. Thus, starting from the great vision of Crosby, Deming, Juran and Feigenbaum regarding quality, all of them put great emphasis on continuous improvement which should ensure gradual optimization of the quality costs. The steps to be followed consistently to achieve this goal are the following:
� understanding the client. This is the first step and most important of all, as the economic entity needs to know, understand and comply with customer requirements in order to ensure continuity in the retail market, regardless of the industry in which it activates;
� evaluate effectiveness. Collecting data on internal procedural measures and determining if the process meets the requirements of cost, time or variability rules;
� process analysis. This step involves, in fact, determination of the efficiency and effectiveness of the process . Normally, depending on the diagnosis discussed, you can select several assumptions about future actions;
� improving the process. Ensure the premises on functional performance, technical and economic process;
� implementing changes. Where appropriate, the necessary adjustments must be made;
� standardization and monitoring. In this last step it must be carried out the proving performance, standardization and continuous monitoring of the process to eliminate any gaps that may arise.
Steps required to be completed in order obtain an improvement on the quality of processes, products and services are exposed within the Figure no.1, below:
1. Need to implement continuous improvement to highlight potential benefits that could be obtained by making a concrete program for optimizing quality cost;
2. Identification and selection of recommendations for optimizing the cost of quality, depending on the specific benefits they can bring (monetary form, economic, technological etc.);
3. Allocation of human and material resources for each project optimization, as well as measurement and analysis of emerging costs;
pep ndidd ng
4. Diagnosing the causes of defects and establishing solutions in order to eliminate noncon-formities. In this stage it should be interesting to simulate the obtained efficiency on costs;
5. Implementation and periodic monitoring of quality cost optimization measures in order to achieve permanent benefits.
ncons;
d t
Figure no. 1 Steps to optimize the cost of quality
One of the most effective tools to evaluate the success of a quality management program is to determine, improve and optimize the cost of quality. From this point of view, the issue under discussion presents a systematic approach to quality assessment of the costs, which must be based on an assessment methodology of total cost quality (prevention, appraisal, internal and external failure). In addition to provide satisfactory
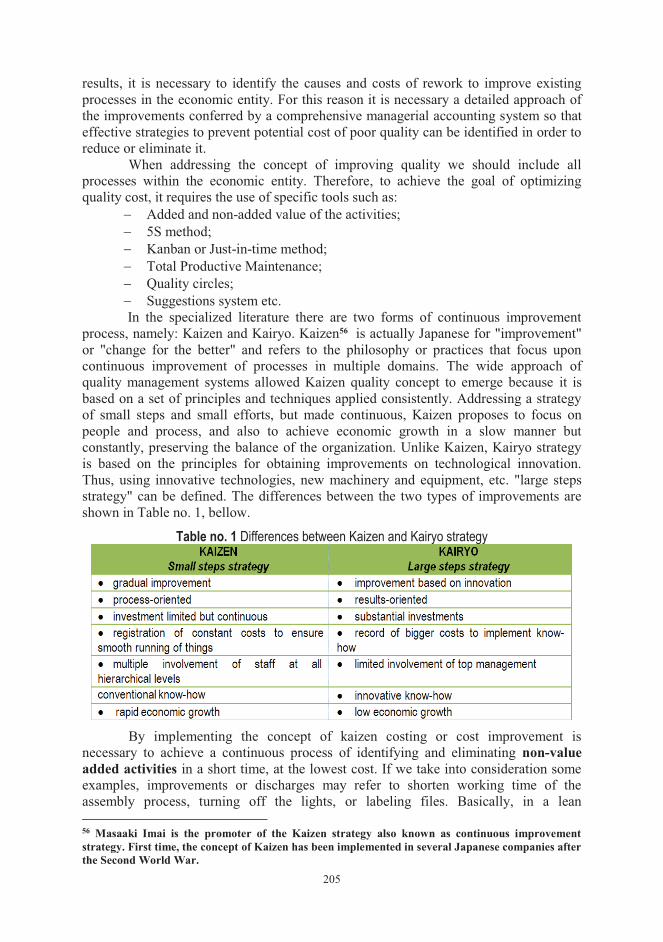
205
results, it is necessary to identify the causes and costs of rework to improve existing processes in the economic entity. For this reason it is necessary a detailed approach of the improvements conferred by a comprehensive managerial accounting system so that effective strategies to prevent potential cost of poor quality can be identified in order to reduce or eliminate it.
When addressing the concept of improving quality we should include all processes within the economic entity. Therefore, to achieve the goal of optimizing quality cost, it requires the use of specific tools such as:
� Added and non-added value of the activities; � 5S method; � Kanban or Just-in-time method; � Total Productive Maintenance; � Quality circles; � Suggestions system etc. In the specialized literature there are two forms of continuous improvement
process, namely: Kaizen and Kairyo. Kaizen56 is actually Japanese for "improvement" or "change for the better" and refers to the philosophy or practices that focus upon continuous improvement of processes in multiple domains. The wide approach of quality management systems allowed Kaizen quality concept to emerge because it is based on a set of principles and techniques applied consistently. Addressing a strategy of small steps and small efforts, but made continuous, Kaizen proposes to focus on people and process, and also to achieve economic growth in a slow manner but constantly, preserving the balance of the organization. Unlike Kaizen, Kairyo strategy is based on the principles for obtaining improvements on technological innovation. Thus, using innovative technologies, new machinery and equipment, etc. "large steps strategy" can be defined. The differences between the two types of improvements are shown in Table no. 1, bellow.
Table no. 1 Differences between Kaizen and Kairyo strategy
By implementing the concept of kaizen costing or cost improvement is
necessary to achieve a continuous process of identifying and eliminating non-value added activities in a short time, at the lowest cost. If we take into consideration some examples, improvements or discharges may refer to shorten working time of the assembly process, turning off the lights, or labeling files. Basically, in a lean 56 Masaaki Imai is the promoter of the Kaizen strategy also known as continuous improvement strategy. First time, the concept of Kaizen has been implemented in several Japanese companies after the Second World War.
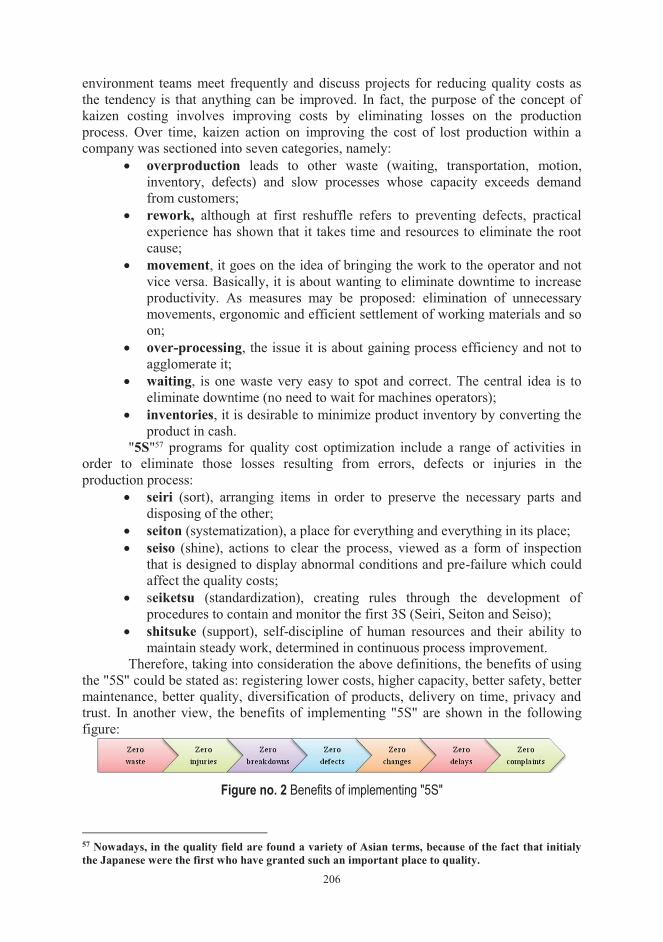
206
environment teams meet frequently and discuss projects for reducing quality costs as the tendency is that anything can be improved. In fact, the purpose of the concept of kaizen costing involves improving costs by eliminating losses on the production process. Over time, kaizen action on improving the cost of lost production within a company was sectioned into seven categories, namely:
� overproduction leads to other waste (waiting, transportation, motion, inventory, defects) and slow processes whose capacity exceeds demand from customers;
� rework, although at first reshuffle refers to preventing defects, practical experience has shown that it takes time and resources to eliminate the root cause;
� movement, it goes on the idea of bringing the work to the operator and not vice versa. Basically, it is about wanting to eliminate downtime to increase productivity. As measures may be proposed: elimination of unnecessary movements, ergonomic and efficient settlement of working materials and so on;
� over-processing, the issue it is about gaining process efficiency and not to agglomerate it;
� waiting, is one waste very easy to spot and correct. The central idea is to eliminate downtime (no need to wait for machines operators);
� inventories, it is desirable to minimize product inventory by converting the product in cash.
"5S"57 programs for quality cost optimization include a range of activities in order to eliminate those losses resulting from errors, defects or injuries in the production process:
� seiri (sort), arranging items in order to preserve the necessary parts and disposing of the other;
� seiton (systematization), a place for everything and everything in its place; � seiso (shine), actions to clear the process, viewed as a form of inspection
that is designed to display abnormal conditions and pre-failure which could affect the quality costs;
� seiketsu (standardization), creating rules through the development of procedures to contain and monitor the first 3S (Seiri, Seiton and Seiso);
� shitsuke (support), self-discipline of human resources and their ability to maintain steady work, determined in continuous process improvement.
Therefore, taking into consideration the above definitions, the benefits of using the "5S" could be stated as: registering lower costs, higher capacity, better safety, better maintenance, better quality, diversification of products, delivery on time, privacy and trust. In another view, the benefits of implementing "5S" are shown in the following figure:
Figure no. 2 Benefits of implementing "5S"
57 Nowadays, in the quality field are found a variety of Asian terms, because of the fact that initialy the Japanese were the first who have granted such an important place to quality.
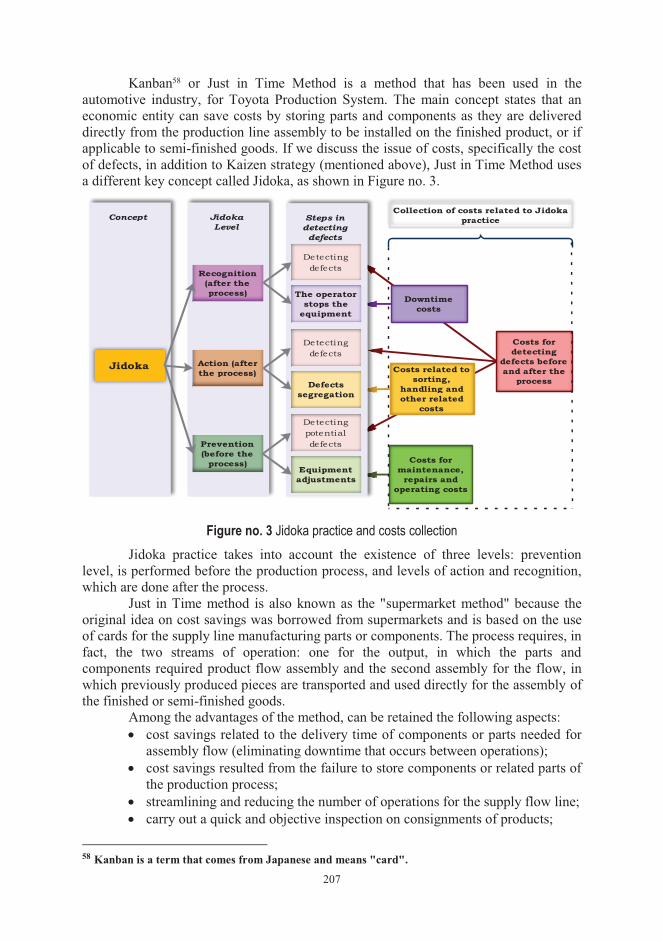
207
Kanban58 or Just in Time Method is a method that has been used in the automotive industry, for Toyota Production System. The main concept states that an economic entity can save costs by storing parts and components as they are delivered directly from the production line assembly to be installed on the finished product, or if applicable to semi-finished goods. If we discuss the issue of costs, specifically the cost of defects, in addition to Kaizen strategy (mentioned above), Just in Time Method uses a different key concept called Jidoka, as shown in Figure no. 3.
Steps in detecting defects
JidokaLevel
Concept
Jidoka Action (after the process)
Prevention(before the
process)
Detecting defects
Detecting potential defects
Equipment adjustments
Recognition (after the process)
Defects segregation
Detecting defects
The operator stops the
equipment
Downtime costs
Costs related to sorting,
handling and other related
costs
Costs for maintenance,
repairs and operating costs
Costs for detecting
defects before and after the
process
Collection of costs related to Jidoka practice
Figure no. 3 Jidoka practice and costs collection
Jidoka practice takes into account the existence of three levels: prevention level, is performed before the production process, and levels of action and recognition, which are done after the process.
Just in Time method is also known as the "supermarket method" because the original idea on cost savings was borrowed from supermarkets and is based on the use of cards for the supply line manufacturing parts or components. The process requires, in fact, the two streams of operation: one for the output, in which the parts and components required product flow assembly and the second assembly for the flow, in which previously produced pieces are transported and used directly for the assembly of the finished or semi-finished goods.
Among the advantages of the method, can be retained the following aspects: � cost savings related to the delivery time of components or parts needed for
assembly flow (eliminating downtime that occurs between operations); � cost savings resulted from the failure to store components or related parts of
the production process; � streamlining and reducing the number of operations for the supply flow line; � carry out a quick and objective inspection on consignments of products;
58 Kanban is a term that comes from Japanese and means "card".
208
� streamline the production process; � optimizing operational and informational system etc. Currently, given the positive impact on reducing cost and defects, Just in Time
method is particularly used in practice, especially in the automotive industry and other industries focused on the same production system.
Total Productive Maintenance. It is a method used primarily to improve the usability and lifetime of an equipment or machinery related to the production system. Improvement lies in a better allocation of production resources and achieving better quality products. The plan to implement this method presupposes going through 12 chronological steps, namely:
1. Announcing the desire of implementation total productive maintenance. First of all, top management must ensure that the implementation of such methods would be well received by the staff of the economic entity. Without the interference of the management, the initiative could fail due to implementation of skepticism and mentalities refractory;
2. Launching training programs and staff training with purpose of knowing the methodology, obtaining benefits and advantages but also disadvantages;
3. Creating an organizational support by setting up a group to promote and support the constantly improving of the quality cost through this method. The group also must be made of representatives of each manufacturing department to discuss and identify possible shortcomings of the production system;
4. Establishing policies and measurable objectives. Usually at this stage, setting targets is performed using SMART principle: Specific, Measurable, Attainable Realistic), Time;
5. Outlining a detailed plan for implementation. Through this plan should be properly identified and established the necesary resources, what kind of equipment or machines need to be improved, established the systems maintenance and the development of new technologies where appropriate;
6. This step marks the beginning of actually implementing the total productive maintenance program;
7. Improving the efficiency of equipment and machinery "piece by piece". At this stage, the working groups should analyze each component of equipment and machinery and to make necessary improvements;
8. Developing an autonomous repair program carried out by company's operators. Periodic cleaning and control helps to stabilize conditions and slow down the damage;
9. Developing a planned or preventive maintenance plan on each part or component;
10. Continuous training and staff awareness regarding the importance of maintenance of equipment and machinery;
11. Developing a cost management program for tooling and equipment in order to consider the changing perspective of the design due to manufacturing process;
12. The last stage envisages the realization of a plan that takes into account continuous improvement and cost optimization. Total productive maintenance advantages are:
� staff awareness on the efficient use of equipment and machinery from the manufacturing process;
� periodic review on the proper functioning of the equipment;
209
� increasing the quality of products and services; � optimization of maintenance and repair costs. Quality circles were originally developed in Japan as employee participation
programs, to improve quality. In the U.S., quality circles have developed participatory productivity improvement programs that focus on quantity and quality of output. Like in Japan, participation is voluntary and the employees are paid while participating during normal working hours or during overtime. The methodology is about selecting a group and a leader who will receive special training for cost problem solving, analysis and reporting. The group begins to meet to identify cost problems, collect and analyze data, recommend solutions in order to optimize the costs and implement the changes approved by management.
Suggestions system, very much like quality circles, is one of the easiest techniques to use which takes into accoun the collection of quality cost optimization proposals conducted by the employees of the economic entity. Steps of the implementation of such an extremely efficient system, are the following:
� The first stage consists in creating and implementation of a qualified staff training for knowledge and awareness of the importance of the production system, quality, concepts, strategy, costs etc.
� The second stage envisages encouraging staff at all levels of the economic entity to achieve certain proposals on improving processes, products or services;
� The third stage and also the last, must take into consideration the analysis proposals made by the staff of the entity, including all the possibilities regarding financial and economic impacts of each suggestion made.
Subsequently, if some proposals receive the approval of the senior management and the efficiency is demonstrated in the future will become applicable. The three steps seem to be particularly simple, but if they are not applied in this order the system itself can be compromised. There are also some disadvantages in terms of involving a large number of staff, in the sense that suggestion system becomes a solution quite difficult to implement taking into consideration a continuous flow of a manufacturing entity.
3. CONCLUSIONS Considering the largeness of the studied issue, opportunities for effective
optimization of the quality cost can be much more varied and diversified depending on the field of activity of any company. The practice regarding quality cost optimization determines that any economic entity should recognize and prioritize this issue as one of prime importance in ensuring quality of processes, products and services. In this way, every company aims to improve the cost of quality because the benefits are stated in reduction of the entity's costs as a whole and in increasing the company's profit.
REFERENCES 1Crosby, P.B Quality is still free: making quality certain in uncertain times, New
York: McGraw-Hill, 1996. 1Deming, W.E. Out of the crisis, Cambridge: MIT, Center for Advanced Engineering
Study, 1986. 1Drury, C. Management and Cost Accounting, 7th edition, Cengage Learning,
2008.

210
1Feigenbaum, A.V., Feigenbaum, D.S.
What Quality Means Today, MIT Sloan Management Review, Vol. 46, No. 2, 2005.
1Juran, J.M. Juran’s quality handbook – The complete guide to performance excellence, 6th ed, New York: McGraw Hill, 2010.
2Mironeasa, C., Mironeasa, S.
Costurile calităţii, Bucureşti: Matrix Rom, 2009.
Acknowledgement: “This work was partially supported by the grant number 4C/27.01.2014, awarded in the internal grant competition of the University of Craiova”
211
CONSIDERATIONS REGARDING THE QUALITY COST OF TRADED PRODUCTS
AND SERVICES IN THE CONTEXT OF PERFORMING MANAGEMENT OF THE ENTITY
Assoc. Prof. Cristian Drăgan Ph. D University of Craiova Faculty of Economics and Business Administration Craiova, Romania Assoc. Prof. Valeriu Brabete Ph. D University of Craiova Faculty of Economics and Business Administration Craiova, Romania
Summary: The quality of products and services offered and the costs of its assurance represent a major concern of the management of any entity, since the influence exerted on its activity is significant. The decisions concerning the quality costs have, on one hand, direct implications of the financial performance of the entity and, on the other hand, on the competitiveness of traded goods and services. In this context, this material proposes itself to illustrate the main aspects regarding the quality and the costs associated to it at the entity's level, which can represent elements which can be considered by the management in the administration of this matter.
JEL classification: M41, M49
Key words: cost of quality, managerial decisions, performing management
1. GENERAL THEORETICAL ELEMENTS CONCERNING THE QUALITY OF TRADED GOODS AND SERVICES The performing management of the entity represents the fundamental objective
of all the parties having financial interests within it but, particularly, of the management which ensures the current realization of all its activities.
An essential element in this respect, under the conditions of current markets globalization, is represented by the passing, to consumers, of some qualitative products and services, at a price which allows the maintenance of the market segments held or the access to new markets.
In this context, the quality insurance and the costs of its support acquire a crucial importance for the management and the decisions of this type need a rigorous grounding, at least from the point of view of the elements presented below.
A first aspect regarding the quality cost of the goods and the services granted to third parties refers to the fact that the managerial decisions shall consider the need for determining an optimum between the volume of the expenses of this type and the value of the defects or the deficiencies subsequently registered at beneficiary and for which remediation this last one bears the costs. Its assurance is realized in the context in which the amendment of any of the two components mentioned has as consequence the influence exerted on the financial performance of the entity. Thus, the increase of the
212
costs regarding the quality leads to the increase of the total volume of the expenses of the entity and, implicitly, to the diminution of its performance. In turn, the registration of some increased values of the expenses made by the beneficiaries in order to remedy the defects or the deficiencies appeared subsequently the acquirement of goods and services, involves decreases of market shares held by manufacturers or providers, with immediate effects on the turnovers registered and, as a consequence, the decrease of their financial performance.
Considering the elements previously exposed, we consider that the determination of the optimum presented supposes both the rigorous determination of the cost elements concerning the quality and the collection of data concerning the level of the expenses which are endured by beneficiaries during the post-guarantee period which, obviously, will generate additional costs for the collection and processing of respective data.
A second aspect concerns the fact that, together with the influence exerted on the financial performance, the quality becomes more and more a strong competitive instrument.
As the entities trade products and services based on the standards recognized in the field, it's possible the maintenance of the position obtained on certain markets or the extension of other new markets. With this in view, we remember that there is a continuous concern regarding the obtainment of the production under the conditions of observing some qualitative standards, aspect sustained, among others, by the elaboration of international quality standards, ISO 9000, by the International Organization for Standardization. These were adopted in more than 85 countries and represent the central element which shows the quality of products and services provided to third parties, by means of ISO 9000 certificate, which became a need for the obtainment of a place on the global market of goods and services. Herewith, the increase of quality standards leads to the specialization of the production with effects on the decrease of manufacture costs and, implicitly, of the obtainment of great profits. The importance of this system of standards is suggested, among others, by the successive revisions which took place since their apparition, in year 1987, until present.
Considering this aspect, we think that on managerial level, the quality insurance imposes taking some decisions which facilitate the consolidation of the market position of products and services which already meet the conditions imposed by the quality standards and, herewith, the renunciation to products and services realized by the entity, which would suppose significant financial efforts in order to be in line with the related quality standards.
A third aspect which, in our opinion, shall be carefully analyzed by the entity management is represented by the problematics concerning the assembly of characteristics of products and services realized by the entity from the point of view of the user’s needs and desires, which are constitutive in decisive elements in respect to the satisfaction degree of the customers and, as a consequence, determine their desire to purchase those goods and services.
2. CONCEPTUAL ASPECTS CONCERNING THE QUALITY COSTS
An approach frequently met in the specialty literature in respect to the quality costs from the perspective of producers is represented by the concentration on two
213
elements considered to be significant in this way which, as a synthesis, can be described as it’s presented below.
The designing of goods and services shall be realized according to the careful analysis of the way in which are met the customers desires and needs, according to their characteristics. Thus, in the designing phase, is imposed that the managerial decisions be grounded according to some rigorous market studies which faithfully intercept the desires and the needs of the users. Such an approach ensures that the management decisions in respect to the costs of goods and services obtained is oriented towards the beneficiary and, in this way, ensuring the premises for the realization of the contemplated sales volume. Herewith, the decisions of this nature can also take into account possible subsequently costs imposed by the development of the goods and services realized, considering the accentuated dynamics for the changing, in time, of the desires and the needs of buyers.
A second approach imposed to be considered under the aspects of the costs aims the fulfillment of all the features of a product or service traded in report to the elements for which it was designed. It's obviously that this type of managerial decisions also aims the satisfaction degree of the clients who are in strong relationship with the assurance of the conformity of goods and services with all the features provided in their technical specifications.
Starting from this approach, most of specialists group the quality costs on several categories, from which we retain as being relevant those presented in a reference paper from the field59:
Prevention costs, as the denomination suggests, refer to the costs needed in order to prevent the obtainment of some goods and services which don't correspond to the specifications.
Evaluation costs, which include all the elements of this type which are made in order to identify those goods which don't correspond to the specifications.
Internal dysfunction (error) costs, which aim the costs implied by a product with deficiencies before it be delivered to the clients.
External dysfunction (error) costs, which refer to those costs which the entity shall bear in order to, eliminated the deficiencies, after the delivery of goods to the clients.
A significant aspect concerning the quality costs refers to the fact that, in the practical activity, is needed an additional effort in order to group the accounting information on the components previously mention, in order to process and analyze them which, in turn, increase the total costs of the entity. Such information aim, among others, the rubbishes value, the reshuffling value of deficiencies found, under the aspect of manpower and of materials involved, the value of compensations granted to beneficiaries etc. The opinions expressed with this in view in the specialty literature, which we join, converge towards the fact that the increases of the costs generated by the processing of accounting information in the purpose mentioned is justified by the advantages obtained under the aspect of the delineation of an overall image of the problematics concerning the quality and also of the rigorous grounding of managerial decisions of this type. 59 Horngren C., Datar S., Foster G. – Contabilitatea costurilor, o abordare managerială (Costs management, a managerial approach), Second Edition, Arc Publishing House, 2006, pages 715-716.
214
The approaches between the specialists who had concerns related to the quality costs lead to the apparition of the concept of low quality cost, its promoters supporting the fact that the obtainment of some quality goods and services doesn't generate additional costs but, contrarily, the goods and the services of low quality determine additional costs for the entity.
3. MANAGEMENT OF QUALITY COST FROM MANAGERIAL PERSPECTIVE The management of the quality cost represents, in our opinion, a complex
approach to be realized by the management structures of the entity, which supposes, among others, the insurance of adequate conditions for the collection of the information needed in order to determine the four categories of costs previously presents, and also the careful analysis of these information made according to some specific methods for the identification of the problems of this nature, by means of which the decisions regarding the quality be grounded.
In respect to the collection of the information, we consider that the managerial activity can be oriented at least to certain significant considerations regarding the determination of the quality cost, as presented below.
The prevention costs are rigorously determined as far as they embed the costs related to the quality planning since the starting phases of the processes carried out by the entity which concern elements such as: the conception of execution rules, the adequate instruction of the staff, the elaboration of a quality manual, the performance of some comparative studies etc. With this in view, the management structures can follow the institutional procedures and the costs related to the evaluation of suppliers, including possible additional costs for taking over the raw materials which don't correspond from the qualitative point of view, supplied from the aggregated suppliers. A particular attention shall be granted to the costs generated by the tests and by the checking which take place during the realization of the processes.
The evaluation costs are managed in a corresponding way by assuming the elements of this nature concerning the supply and the maintenance of the inspection equipments, the performance of the laboratory tests, and the wages of the staff involved in this activity, the elaboration and the implementation of the methodology and the quality evaluation criteria etc.
The internal dysfunction costs suppose the collection of the information regarding the rubbish, the performance of reparations, the interruption of the processes as a consequence of some non-conformities which weren't discovered upon the reception of the raw material supplied, the storage of the goods which are inadequate from the qualitative point of view, including their manipulation and transport, the analysis of defects in order to establish the causes, possible problems concerning the pollution etc.
The external dysfunction costs aim the procurement of information regarding the cost for the management of customer’s complaints, of the expertise because of non-quality, the value of the delay penalties and compensations, including of the banking commissions in relation to these, the value of the insurance premiums used in order to cover the legal responsibility of the entity etc.
In turn, the analysis of the problems of the type of those presented is realized according to the methods known with this in view, among which we mention: the
215
control graphics, the Pareto diagrams, the cause-effect diagrams, the use of financial and non-financial indicators, etc.
The control graphics have the role to illustrate those defects appeared as a consequence of some system problems or, in other words, as a consequence of non-random variations appeared. By means of these statistical control instruments of the quality, the management structures from various hierarchical levels can investigate the variations registered outside the control limits established which usually enter in the category of non-random.
Pareto diagrams are instruments used in close relation with the control graphics, being elaborated according to the non-random elements found within them, arranged in a decreasing way depending of the frequency of its production.
The cause-effect diagrams complete the analysis made by means of the methods previously described, for the identification of the defects with the biggest frequency and, herewith, involving the highest costs, illustrating, as the denomination suggests, the potential causes of the registered defects.
As we can notice from the succinct description of these methods, the management of the entity shall ground its decisions on the use of some combinations between them, thus making possible the rigorous identification of the problems concerning the quality.
In the same order of ideas, the analysis of the costs regarding the quality are grounded on the use of non-financial indicators which, in the opinion of several specialists from the field, which we share, are essential in order to determine the long term performances of the entity. The use of this type of indicators is possible both in the area of the analysis of satisfaction degree of clients and of the costs specific for the designing activity or of those with external dysfunction. The non-financial indicators are several and they are customized for the area in which they will be applied. From these, we can mention as being relevant those concerning the information about the preferences and the satisfaction of the clients in relation to certain features of the goods delivered, to the number of complaints received from them, delays in the delivery of the goods, the number of the defects registered, on types of products, the satisfaction degree of the employees etc. It's obviously the fact that these indicators represent an important source for the grounding of managerial decisions concerning the quality.
4. CONCLUSIONS The aspects related to quality are analyzed with a particular attention in the
actual contexts, by the management of any entity, because they have significant implications both on its performance and also in respect to the maintenance or to the extension on new commodity markets. In this respect, it's unanimously recognized the fact that this is constituted in a factor with significant influence on the competitive environment.
The grounding of the decisions concerning the quality shall take into account the particularization of all the information which contribute to the determination of costs associated to it and, herewith, the combined use of various instruments which ensure the rigorous identification of the problematics of this nature. This fact imposes that the management structures on various hierarchical levels institute the procedures adequate for the collection of such information, thus making possible a determination, as more as possible, of the costs associated to the quality and, as a consequence, a pertinent analysis of these by means of the specific managerial techniques and methods.
216
5. BIBLIOGRAPHY
1. Horngren, C., Datar, S., Foster, G.
Contabilitatea costurilor (Costs accounting), 11th edition, Arc Publishing House, Chi inău 2006
2. Mironeasa, C., Mironeasa, S.
Costurile calită ii (Quality costs), Matrix Rom Publishing House, Bucharest, 2009
3. Oprean, C. Managementul calitatii (Quality management) – Economic Publishing House, Bucharest, 1999
4. Popescu, D.
Managementul calită ii. Principii i practice (Quality management. Principles and practices), Universitaria Publishing House, Craiova, 2008
Acknowledgement: This work was partially supported by the grant number 4C/27.01.2014, awarded in the internal grant competition of the University of Craiova
217
FLEXIBLE LABOR MARKET IN ROMANIA - TACTICAL AND STRATEGIC
COORDINATE
Lect. Costin Daniel Avram Ph. D University of Craiova Faculty of Economics and Business Administration Craiova, Romania
Abstract: : In the European Union had emerged flexicurity strategies to increase by increasing in tandem flexibility and safety. In Romania flexicurity will be achieved by rebalancing the relationship between flexibility and security in the sense of increasing flexibility that ultimately seems to have understood, the decision makers as a real job security can not be achieved by ignoring the interests of employers. This is exactly the sense that we can understand the analysis changes in labor legislation in recent years, when concerns about labor market flexibility have emerged.
JEL classification: M54, M59
Key words: flexibility, security, flexicurity, human capital
1. INTRODUCTION International Financial Crisis started in 2008 and has hit the labor market by
employment decrease and increase in unemployment across the EU, with different levels from one country to another. In this case the principles of flexicurity labor experienced a number of difficulties, the principles of flexicurity labor was beneficial for stability, while in countries with poor performance in labor flexicurity social climate deteriorated labor market has experienced unemployment high social instability, a low level of employment of labor. Beyond the differences of views flexicurity labor must remain a political strategy to ensure a sustainable social consensus on the labor market. The road from principles to implementation is not easy and can not be achieved without the involvement of civil society. Increasing labor flexibility should not be detrimental to the safety or security work as work increased labor flexibility should not affect the relationship can be managed in terms of "win - win" by the government, employers and trade unions.
2. OBJECTIVES This study is conducted within the research project "Strategies to increase firm
value under the impact of human capital as a source of competitive advantage" and aims to identify the coordinates of tactical and strategic process flexibility of the labor market in Romania, begins with changing Labour Code in 2011, the full economic and financial crisis.
3. METHODOLOGY Scientific research to achieve the goal, was targeted in the theoretical approach
to flexicurity labor market and finding solutions that aim to improve research
218
methodology flexicurity labor market. To achieve the goal, the scientific approach used to document research methods, comparative analysis, observation for the theoretical approach. The research suggests a number of interdisciplinary absolutely mandatory for shaping impact on flexicurity strategies work by studying the legal framework for the organization of the labor market, organizational culture, worker motivation and performance criteria and overall labor productivity. To achieve these objectives, we used the methodological and theoretical - the scientific literature presented in the flexicurity labor labor law in the EU and in our country, the findings obtained in the analysis of reports, statistics provided by national and international bodies (European Commission Organization for Economic Cooperation and Development, International Labour Office, National Statistical Institute, Institute for Research in Economic Sciences in Vienna).
4. FLEXIBLE LABOR MARKET IN ROMANIA IN THE LIGHT OF NEW REGULATIONS Flexibility of labor use in Romania is manifested primarily in the working day,
so in Romania working conditions: • full time during an average working week is 41.1 hours, while the EU 27
average duration is 40.4 hours, and the states of the euro area average length of the working week is 39.9 hours
• Part - time, the average length of a working week is 9.7 hours while in the EU 27 average duration is 18.5 hours and the duration of the euro area average working week is 19.9 hours.
Under the Law 53/2011 - Labour Code, working time shall mean any period during which the employee performs the work, is available to the employer and shall perform the duties and tasks, according to the individual employment contract, collective agreement applicable to his / or legislation. For full-time employees hired during the normal working time is 8 hours per day and 40 hours per week. For young people aged up to 18 years working time is 6 hours per day and 30 hours per week. Distribution of working time in the week is usually uniform, 8 hours per day for five days, two days of rest. Depending on the specific unit or work performed, may opt for an unequal distribution of working time, observing the normal working time of 40 hours per week. The maximum legal length of the working time may not exceed 48 hours per week, including overtime. By exception, working time, including overtime, may be extended beyond 48 hours per week, provided that the average working hours, calculated over a 4-month reference calendar does not exceed 48 hours per week.
For certain activities or professions established by the applicable collective agreement can be negotiated, reference periods greater than 4 months but not exceeding six months. Subject to compliance with regulations on health and safety at work of employees, for objective or technical regarding the organization of work, collective agreements may derogate from the reference period. For certain sectors, business or profession may be established through collective bargaining or individual or by specific acts daily duration of working time more or less than 8 hours. The daily working time of 12:00 will be followed by a rest period of 24 hours. Laying concrete way of working unevenly within the working week of 40 hours, and the compressed work week will be negotiated through collective labor contract the employer or, in his absence, will be provided in the rules of .
219
The employer may establish individualized work with the consent or at the request of the employee concerned. Individualized work programs involve a flexible organization of working time. The daily working time is divided into two periods:
• fixed period where staff are at work simultaneously and, • variable period, furniture, the employee chooses arrival and departure,
respecting working time daily. The employer is obliged to keep records of hours worked by each employee
and labor inspection control these records whenever requested. The new Labour Code brings an increase in labor market flexibility by preparing the individual for part time work and working from home.
4.1 Individual employment contract part time According to the individual employment contract part time, "part-time
employee is an employee whose normal number of hours of work, calculated weekly or monthly average is less than the number of normal working hours of a full-time employee comparable ". The employer may fall part-time employees with individual contracts of indefinite duration or fixed-called individual contracts of part-time employment. An individual employment contract shall be concluded only part time in writing. Comparable employee is full-time employee in the same establishment having the same type of individual employment contract, providing the same or a similar activity to that of the employee's individual employment contract employee part time, taking into account other considerations, such as seniority and qualifications or skills. When there is a comparable employee in the same unit, considering the provisions of the collective agreement or the applicable regulations in the field.
The individual part time work comprises Unless otherwise stipulated by the contract of employment to full-time individual:
• hours of work and allocation of working hours; • conditions that may change work program • The ban on overtime except in cases of force majeure or for other urgent
works to prevent accidents or to eliminate their consequences. An employee employed on part-time employment contract with employees
enjoying full rights. Labor rights are granted in proportion to the actual time worked, relative to the rights established for normal work.
The employer is required to the extent possible, to consider employee requests to transfer either a full-time job to part-time one, either a job part time a full-time job or increase their working hours, if the opportunity arise. The employer is also obliged to inform about the occurrence time jobs with part-time or full-time to facilitate transfers from full-time to part-time and vice versa.
4.2 Work at home and teleworking Under current regulations are considered "employees to work at home
employees who meet at their home, the duties of the office they hold. Duties in order to fulfill their duties, work at home employees set their own schedule thing ". The employer has the right to verify the employee to work from home business on the terms set by the individual employment contract. An individual employment contract shall be concluded only at home writing and contain Unless otherwise stipulated by the contract of employment to full-time individual:
• accurate expressly CA employee working at home
220
• the program under which the employer has the right to control employee's work and the actual method of control
• the employer's obligation to provide transportation to and from the employee's residence, where applicable, the materials first and the materials used in the activity, as well as finished products they carry.
Employee to work at home is enjoying all the rights recognized by law and collective agreements applicable to employees whose place of work is at the employer. By collective agreements or individual employment contracts may establish other specific conditions for work at home, in accordance with the law.
What customizes employment contract to work at home is not at the employer, but the employee's residence. ILO Convention no. 177/1996, whose ratification was held in 1998, was recommended by the European Commission Member States of the European Union since its provisions establish that the work place is not only the employee's residence but any other place chosen by the employee. Employer control over the activities of its employees is manifested by periodical visits to the workplace. If the employee does not allow representatives of employers, workplace, he commits a disciplinary offense.
Provisions of employment contracts may contain elements of flexibility in the work schedule. Current regulations to reduce parental leave from two years to one year requires flexible working hours greater compliance with the conditions of balancing parental responsibilities with career training. When negotiating labor confederations current legislation to ensure the safety at work of employees, insisted to conclude fixed-term contracts only in exceptional circumstances nature. Most member states of the European Union are widely used fixed-term contracts, their conclusion is left to employers and employees in relation to their specific needs.
Teleworking is a new form at the same time flexible work organization, job responsibilities being fulfilled by the use of computer technologies. Teleworking is an unusual way of organizing work. Between employers and unions representing Europe its over, at European level, an agreement - Frame on telemuncii. In the European Union member countries are widely used on-call contract (on request), providing a flexibility agreement employment contract, but still unenforceable under labor law in Romania.
5. CONCLUSIONS New technologies change job content and status of the profession and the
institutional changes required training permanent staff complicated by lifelong learning throughout life. In Romania, the reform of the education system was established by Ordinance 36/1997 National Council for Continuing Education and Training. No.129/2000 Government Ordinance, as amended and supplemented, the regulated activity CVT law ensuring the compatibility of the practice in Romania and the Union European. Professional bodies: CECCAR, CAFR, CCF, UNEAR, UNPIR through continuous training programs provide training of professionals in the various fields of activity as a result of compliance with national regulations in the field with EU regulations.
Correction of deficiencies in the education and training of professional lifelong complicated may influence the expansion and consolidation of the principles of flexicurity in the labor market in Romania. To achieve this required implementing the following measures:
• the involvement of universities in non-formal education;
221
• the involvement of social partners in the education and continuous training; • the involvement of professional bodies in education and professional
training; • tax incentives for companies that invest to increase the skill level of
employees; • increasing the role of various forms of formal, non-formal and informal in
the creation and development of professional skills and work habits. Achieving that goal requires fostering a culture of lifelong education since the time of initial and individual awareness of the benefits of such an approach;
• adoption of a coherent legislative framework on education and training system works professionally complicated continues a;
• preparation of studies on medium and long term impact on the effectiveness of different forms of adult education and continuing vocational training in particular;
• correlation content of education and training trends of technological change; • stimulating the development of adult education services in rural areas and
small towns • the increasing role of technology inform tional in learning throughout life; • increasing professional competence of the trainers involved adult education
processes; • up-skilling of employees and finding ways to continue preparing cost
recovery under greater flexibility.
REFERENCES 1. Avram, C.D. Dezvoltarea resurselor umane în sistemul bancar din România, Ed.
Universitaria, Craiova, 2010 2. Avram, C.D. Economie generală, Ed. Universitaria, Craiova, 2012 3. Baumohl, B. The secrets of economic indicators – Second Edition, Pearson
Education, New Jersey, 2008 4. Băbeanu M. Microeconomie - manual universitar, Editura Universitaria, Craiova,
2006 5. Băbăiţă I.,
Duţă A., Imbrescu I.,
Microeconomie, Editura Mirton, Timişoara, 2000
6. Băbăiţă, I., Silaşi, G., Duţă, A.
Macroeconomia, Editura Orizonturi Universitare, Timişoara, 2002
7. Cismaş, L. Microeconomia bunăstării, Editura Mirton, Timişoara, 2004 8. Cojocaru, C. Migraţia internaţională a forţei de muncă în context global, Ed.
Universitaria, Craiova, 2010 9. De Cenzo,
David. A, Robbins S.P.,
Personnel/Human Resources Management, Prentice Hall, Englewood Cliffs, 1988
10. Dinu, M. Economia de dicţionar. Exerciţii de îndemânare epistemică, Editura Economică, Bucureşti, 2010
11. Dinu, M.
Globalizarea şi aproximările ei, Editura Economică, Bucureşti, 2004
12. Dornbusch, R., Fischer, S.
Macroeconomia, Editura Sedona, Timişoara, 1997
13. Downs, A. An Economic Theory of Democracy, Editura Harger & Row, New York, 1957
222
14. Duţă, A., Cismaş, L. (coord)
Macroeconomie, Editura Universităţii de Vest, Timişoara, 2006
15. Gatumel, D. Le droit du travail en France, Editions Francis Lefebře, Paris, 2000 16. Grigore, L. Piaţa muncii pe plan mondial. Teorii, realită i i perspective,
Editura Lumina Lex, Bucure ti, 2001 17. Ignat, I.,
Pohoaţă, I., Clipa, N., Luţac, G.
Economie Politică, Ed. Economică, Bucureşti, 1998
18. Ionescu, C. Economie Vol. I Macroeconomie, Editura Economică, Bucureşti, 2007
19. Isărescu, M.,C. Reflecţii economice, Pieţe, Bani, Bănci, Editura Expert, Bucureşti, 2001
20. Jurcă C., Elena, S.
Flexicuritatea pieţei forţei de muncă, Editura BREN, Bucureşti, 2007
21. Ştefănescu, I.T. Dreptul muncii, Editura Lumina Lex, Bucureşti, 2002 22. Talpoş, I. Studiul evoluţiei politicii fiscale în ţările membre UE şi stadiul
adaptării politicii fiscale naţionale la Directivele europene, Editura Didactică şi Pedagocică, Bucureşti, 2011
23. Talpoş, I, Avram, A.
Current trends in the mix of fiscal and bugetary policies, International Conference on Tourism and Economic Development, Centrul Universitar Drobeta Turnu Severin, 27-29 octombrie 2011
24. Simion, D., Tobă, D., Siminică, M.
Analysis of Correlation between Labour Productivityand Determinants of its in Romania, Proceedings of the 1st International Conference on Tourism and Economic Development, University Center Drobeta Turnu Severin, Octombrie 27-29 2011
25. Tobă, D. Microeconomie - manual universitar, Editura Universitaria, Craiova, 2010
26. Tobă, D., Macroeconomie, Editura Universitaria, Craiova, 2011 27. Wilthagen T.,
Tros F. The concept of flexicurity a new approach to regulating emploiment and labour market’s Transfer, European Review of Labour and Research, nr. 10/2004
28. Wilthagen T., Rogowski, R.,
Legal Regulation of Tranzitional Labour Markets, Editura Cheltenham, 2002
223
INTERACTIVE DECISION SUPPORT SYSTEM BASED ON ANALYSIS AND
SYNTHESIS OF DATA - DATA WAREHOUSE
Prof. Georgeta Şoavă Ph. D University of Craiova Faculty of Economics and Business Administration, Craiova, Romania
Abstract: : Systems to assist decision are based on data analysis and synthesis makes merging, categorizing, linking and grouping data to obtain information to highlight positive or negative factors that influence company performance. Getting results in the form of reports are the result of special techniques to explore large amounts of data. These techniques lead to highlight correlations between data, make estimates and forecasts and warnings of the managers of dysfunction. To improve business performance, management should be centered on the client, to understand customer needs, so we considered appropriate approach to data warehouses that an interactive system to assist decisions based on data analysis and synthesis. I presented the concept of data warehouse and basic features, representation of data in the data warehouse, differences between data warehouse and database, and finally to address environment data storage and use of data warehouse and to conclude with a set of conclusions.
JEL classification: M15, C81
Key words: decision; data warehouse; business; decision support; performance
1. INTRODUCTION The solutions provided by information technologies for data synthesis, whose
volume explored is huge, and for which conventional methods have become ineffective, are specific and dedicated software; queries which allow data clustering by criteria established and provides functions for fields thus created, total and subtotal functions provided by the generators permit reports indicate grouping hierarchy criteria. In recent years, gained more ground modern technologies as data warehousing and OLAP (On-Line Analytical Processing) software as the media became transactional data support systems.
In a broader concept applies to new research (intelligence) business, BI (Business Intelligence) becomes a critical component of all daily operations of business, so you develop real-time data warehouse that provides USER final rapid updates and issuing alarm signals (alerts) generated from transactional systems (TPS). Data warehouses in real time, RTDW (Real-Time Data Warehouse), and BI supports business performance plan economic organization. A simple form of data analysis is to compare the data with similar data; comparison is made keeping all the same criteria, only one with different values. Comparison is made between comparable data sets and compared technologies are equipped with observation techniques for signaling patterns, correlations, association by similarity or notices deviations, exceptions. Computer came
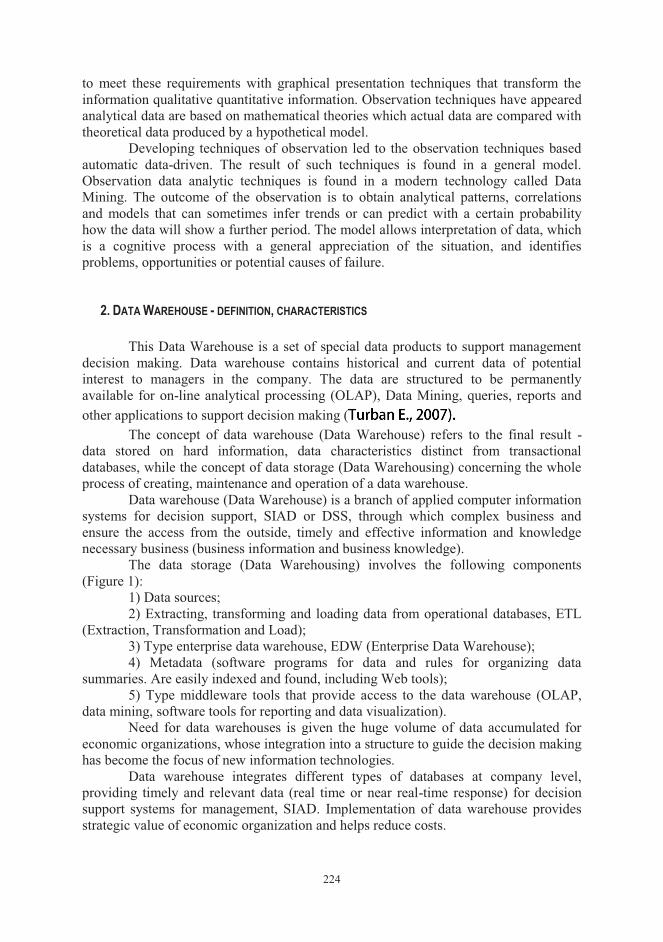
224
to meet these requirements with graphical presentation techniques that transform the information qualitative quantitative information. Observation techniques have appeared analytical data are based on mathematical theories which actual data are compared with theoretical data produced by a hypothetical model.
Developing techniques of observation led to the observation techniques based automatic data-driven. The result of such techniques is found in a general model. Observation data analytic techniques is found in a modern technology called Data Mining. The outcome of the observation is to obtain analytical patterns, correlations and models that can sometimes infer trends or can predict with a certain probability how the data will show a further period. The model allows interpretation of data, which is a cognitive process with a general appreciation of the situation, and identifies problems, opportunities or potential causes of failure.
2. DATA WAREHOUSE - DEFINITION, CHARACTERISTICS This Data Warehouse is a set of special data products to support management
decision making. Data warehouse contains historical and current data of potential interest to managers in the company. The data are structured to be permanently available for on-line analytical processing (OLAP), Data Mining, queries, reports and other applications to support decision making (
The concept of data warehouse (Data Warehouse) refers to the final result - data stored on hard information, data characteristics distinct from transactional databases, while the concept of data storage (Data Warehousing) concerning the whole process of creating, maintenance and operation of a data warehouse.
Data warehouse (Data Warehouse) is a branch of applied computer information systems for decision support, SIAD or DSS, through which complex business and ensure the access from the outside, timely and effective information and knowledge necessary business (business information and business knowledge).
The data storage (Data Warehousing) involves the following components (Figure 1):
1) Data sources; 2) Extracting, transforming and loading data from operational databases, ETL
(Extraction, Transformation and Load); 3) Type enterprise data warehouse, EDW (Enterprise Data Warehouse); 4) Metadata (software programs for data and rules for organizing data
summaries. Are easily indexed and found, including Web tools); 5) Type middleware tools that provide access to the data warehouse (OLAP,
data mining, software tools for reporting and data visualization). Need for data warehouses is given the huge volume of data accumulated for
economic organizations, whose integration into a structure to guide the decision making has become the focus of new information technologies.
Data warehouse integrates different types of databases at company level, providing timely and relevant data (real time or near real-time response) for decision support systems for management, SIAD. Implementation of data warehouse provides strategic value of economic organization and helps reduce costs.
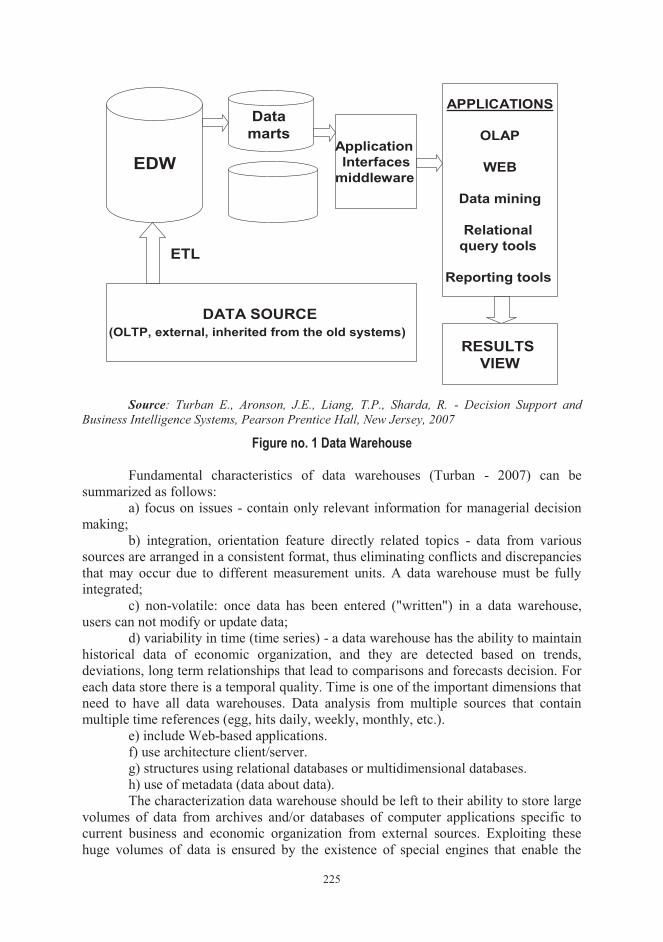
225
EDW
Data marts
Application Interfaces
middleware
APPLICATIONS
OLAP
WEB
Data mining
Relational query tools
Reporting tools
ETL
DATA SOURCE(OLTP, external, inherited from the old systems)
RESULTS VIEW
Source: Turban E., Aronson, J.E., Liang, T.P., Sharda, R. - Decision Support and
Business Intelligence Systems, Pearson Prentice Hall, New Jersey, 2007
Figure no. 1 Data Warehouse Fundamental characteristics of data warehouses (Turban - 2007) can be
summarized as follows: a) focus on issues - contain only relevant information for managerial decision
making; b) integration, orientation feature directly related topics - data from various
sources are arranged in a consistent format, thus eliminating conflicts and discrepancies that may occur due to different measurement units. A data warehouse must be fully integrated;
c) non-volatile: once data has been entered ("written") in a data warehouse, users can not modify or update data;
d) variability in time (time series) - a data warehouse has the ability to maintain historical data of economic organization, and they are detected based on trends, deviations, long term relationships that lead to comparisons and forecasts decision. For each data store there is a temporal quality. Time is one of the important dimensions that need to have all data warehouses. Data analysis from multiple sources that contain multiple time references (egg, hits daily, weekly, monthly, etc.).
e) include Web-based applications. f) use architecture client/server. g) structures using relational databases or multidimensional databases. h) use of metadata (data about data). The characterization data warehouse should be left to their ability to store large
volumes of data from archives and/or databases of computer applications specific to current business and economic organization from external sources. Exploiting these huge volumes of data is ensured by the existence of special engines that enable the
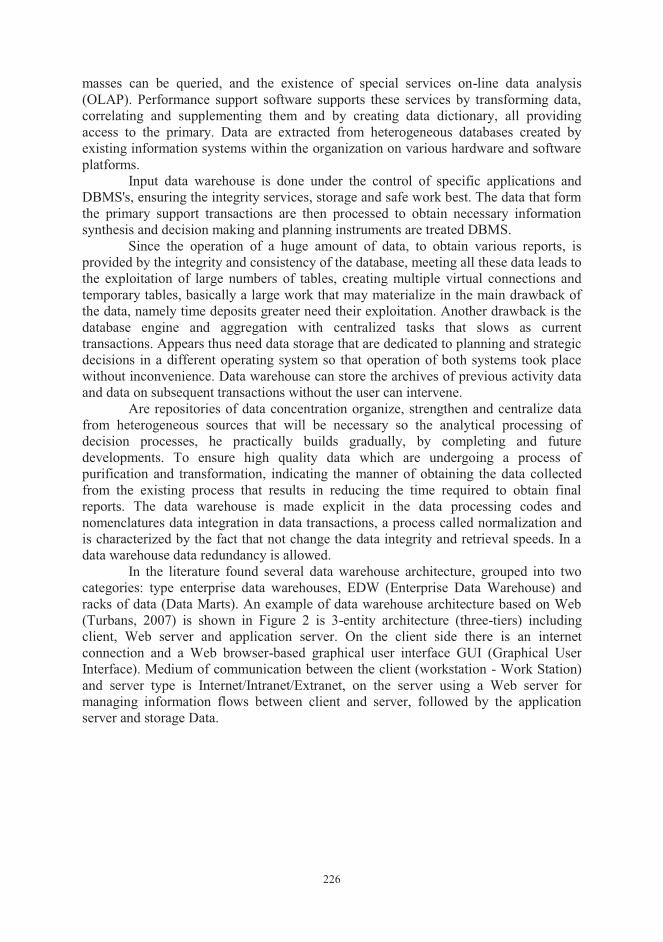
226
masses can be queried, and the existence of special services on-line data analysis (OLAP). Performance support software supports these services by transforming data, correlating and supplementing them and by creating data dictionary, all providing access to the primary. Data are extracted from heterogeneous databases created by existing information systems within the organization on various hardware and software platforms.
Input data warehouse is done under the control of specific applications and DBMS's, ensuring the integrity services, storage and safe work best. The data that form the primary support transactions are then processed to obtain necessary information synthesis and decision making and planning instruments are treated DBMS.
Since the operation of a huge amount of data, to obtain various reports, is provided by the integrity and consistency of the database, meeting all these data leads to the exploitation of large numbers of tables, creating multiple virtual connections and temporary tables, basically a large work that may materialize in the main drawback of the data, namely time deposits greater need their exploitation. Another drawback is the database engine and aggregation with centralized tasks that slows as current transactions. Appears thus need data storage that are dedicated to planning and strategic decisions in a different operating system so that operation of both systems took place without inconvenience. Data warehouse can store the archives of previous activity data and data on subsequent transactions without the user can intervene.
Are repositories of data concentration organize, strengthen and centralize data from heterogeneous sources that will be necessary so the analytical processing of decision processes, he practically builds gradually, by completing and future developments. To ensure high quality data which are undergoing a process of purification and transformation, indicating the manner of obtaining the data collected from the existing process that results in reducing the time required to obtain final reports. The data warehouse is made explicit in the data processing codes and nomenclatures data integration in data transactions, a process called normalization and is characterized by the fact that not change the data integrity and retrieval speeds. In a data warehouse data redundancy is allowed.
In the literature found several data warehouse architecture, grouped into two categories: type enterprise data warehouses, EDW (Enterprise Data Warehouse) and racks of data (Data Marts). An example of data warehouse architecture based on Web (Turbans, 2007) is shown in Figure 2 is 3-entity architecture (three-tiers) including client, Web server and application server. On the client side there is an internet connection and a Web browser-based graphical user interface GUI (Graphical User Interface). Medium of communication between the client (workstation - Work Station) and server type is Internet/Intranet/Extranet, on the server using a Web server for managing information flows between client and server, followed by the application server and storage Data.
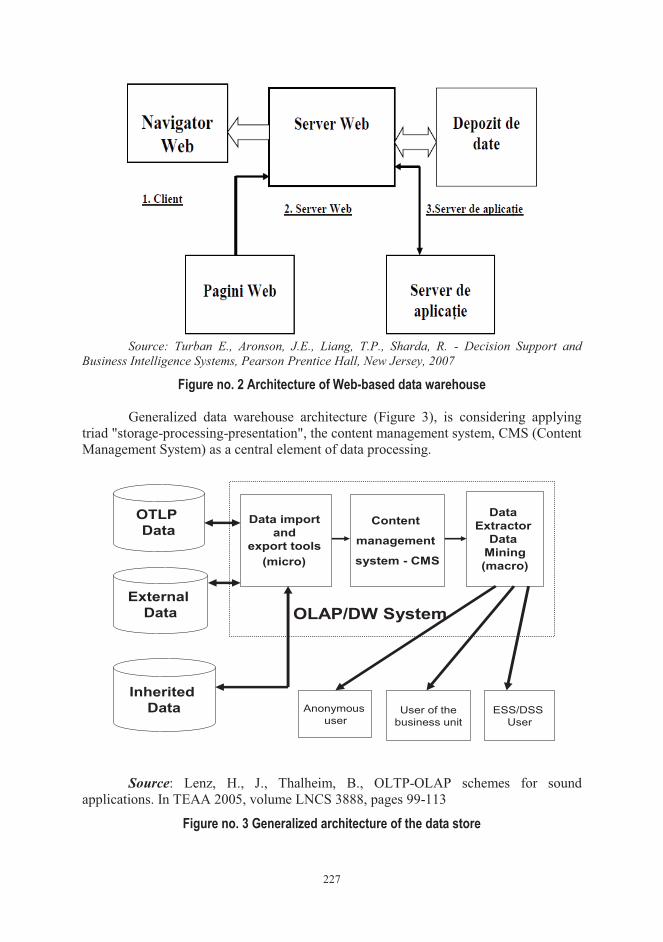
227
Source: Turban E., Aronson, J.E., Liang, T.P., Sharda, R. - Decision Support and
Business Intelligence Systems, Pearson Prentice Hall, New Jersey, 2007
Figure no. 2 Architecture of Web-based data warehouse Generalized data warehouse architecture (Figure 3), is considering applying
triad "storage-processing-presentation", the content management system, CMS (Content Management System) as a central element of data processing.
OTLP Data
External Data
InheritedData
OLAP/DW System
Anonymoususer
User of thebusiness unit
ESS/DSS User
Data import and
export tools (micro)
Content
management
system - CMS
Data Extractor
Data Mining(macro)
Source: Lenz, H., J., Thalheim, B., OLTP-OLAP schemes for sound
applications. In TEAA 2005, volume LNCS 3888, pages 99-113
Figure no. 3 Generalized architecture of the data store
228
A CMS consists of two basic elements: the content management application, CMA (Content Management Application) and application content delivery, CDA (Content Delivery Application) ( ). A CMS system indexes all data within the integrated economic organization, being used patterns or sets of patterns (templates) approved by the management organization, working as guides (wizards) and other tools to create and modify Web content.
The format management feature documents, CMS formats provide working with old documents (inherited), scanned paper documents that can be converted to HTML or PDF (Portable Document Format), so it can provide an update to the latest version document or restore a previous version document.
The decision to choose data warehouse architecture is influenced by several factors, of which there are:
- Information requirements of top management (top management); - Interdependence information between departments and functional entities of
economic organization; - The degree of limitation of resources economic organization; - Compatibility with existing systems already in operation in the organization; - Deep motivation of employees in developing a data warehouse. Integrating data in a data warehouse contains three major processes: a) access to data; b) achievement data federation; c) timely reflection on the data store of significant changes in the data from
data sources such enterprise. Data integration and metadata in a data warehouse there are several
technologies: 1) type enterprise application integration, EAI (Enterprise Application
Integration) provides unified way of taking data from various sources and storage in data warehouse type business, DEW. This type enterprise application integration is at the application programming interface, API (Application Programming Interface). EAI is combined with service-oriented architecture, SOA (Service-Oriented Architecture);
2) service oriented architecture, SOA (Service-Oriented Architecture) is focused on a coherent set of business processes oriented Web services;
3) extracting, transforming and loading data into the data warehouse, ETL (Extraction, Transformation and Load) is the integral component of any project centered organization, storage and processing, as data storage (Data Warehousing). Data extraction means for reading data from a data warehouse or more databases. Transforming data is extracted from its original data conversion in standard form required for storing the data warehouse or other database that works directly store data. Loading data storing means, previously transformed into standard form, clean and refined, the data warehouse. Data sources may be relevant for data storage (shelf data) transactional database (from the computer system transaction processing, TPS), data from ERP from CRM from Excel tables (in a broader framework, the specific database OAS), the specific knowledge base KWS, the string of messages from external files, etc..;
4) type enterprise information integration, EII (Enterprise Information Integration).
Data stored in data store are consistent (the standard form gained through ETL process) the business rules that define how to use the stored data, the rules of compiling
229
abstracts (summaries, reports), with standardization rules coded attributes, the rules for making calculations. All these rules are stored in a metadata database and are applied consistently throughout the data warehouse.
Turban (2007) distinguishes three main types of data warehouses: data racks, DM (Data Marts), operational data buffer memories, ODS (Operational Data Stores) and type enterprise data warehouses, EDW (Enterprise Data Warehouse).
3. MARTS DATA Starting from the organization of an enterprise, namely functional departments
and entities, and data are submitted on the shelves of data (data warehouse), DM (Data Marts). If the data warehouse (Data Warehouse) combines databases across economic organizations (i.e. the integrated system of economic organization), but data racks smaller than data warehouses, intended for a specific department of the company or a subject defined the end-user desire. Using data warehouses or shelves (Data Marts) leads to increased operational performance.
These repositories are usually built with relational technology, so most shelves are shelves dependent data (that are generated directly from the data store). There are, however, and independent data store shelves organization's data that are designed specifically for a strategic business unit, SBU (Strategic Business Unit) and not using data from the data store of economic organization. Shelf independent data can be an alternative "low cost" for companies which can afford the purchase, maintenance and operation of a data warehouse.
4. OPERATIONAL DATA BUFFER MEMORY Between operational databases (transactional) on the economic organizations
operational and data warehouse management on the organizational environment can provide operational data buffer memory, ODS (Operational Data Stores), which may serve, for example, for implementation and use customer information files, CIF (Customer Information File) can be updated according to the evolution of business. As a result, operational data buffer memories are used for decision support in the short term, especially in applications with critical points.
Memoirs of operational data buffer stores the latest data on the subject considered, data from multiple sources. Data from operational data buffer memories are data from various sources that have undergone a process of extraction, transformation and loading, ETL (Extraction, Transformation and Load), similar to the data warehouse. When operational data are analyzed multidimensional data buffer memories become operational shelf operational data (Operational marts) (Turban, 2007).
5. VERSUS DATA WAREHOUSE DATABASE An enterprise data warehouse type, EDW (Enterprise Data Warehouse) is an
integrated data warehouse widely, with a large volume of data that is used in environmental management and strategic levels to support decision making.
EDW data in standard format are coming from various sources, and are used as input for most types of economic systems for decision support.
Differences between data warehouse and database can be summarized as follows:
a) contained in a data processing system transactions, OLTP (On-Line Transaction Processing) type are operational and the data contained in a data warehouse
230
to assist specific decisions are centralized data derived from operational data, not change time and are intended for end users;
b) for transactional systems, performance refers to the integrity, confidentiality, reliability and response time as a large number of users enter data into the system, while for SIAD (i.e. repositories) number of end users (managers) is
very small. This security and reliability and are not subject to major risks, backup and recovery procedures being less used than when transactional systems;
c) transactional systems process data sets are relatively small, recently introduced compact, so that processing is fast enough. Decision-making processes, their data requirements are large, dispersed stored leading to slower processing;
d) built databases for transactional systems are designed and developed based on known and clear requirements, changes that occur due to system adapt to the changes repeat certain stages of life., but once implemented they work long periods without changes . The SIAD requirements are only partially known at the time of design and their realization, which require data storage requirements to adapt on the fly, so it is found that the data managed transactional systems are viewed as a whole, while those in the data warehouse are organized in sections as they are organized according to subject analysis;
e) transactional systems usually reflect the flow of data from current activities, while data warehouses are focused on topics such as egg resources, products, customers, suppliers.
f) The operational systems of the organization dedicated management areas, data are often fragmented, so that managers make decisions based on partial information (incomplete). Data stores eliminate this disadvantage by accessing, integrating and organizing operational data to key role in a form that is characterized by consistency, reliability, suitability, availability and quick reference while (Timely).
6. CONCEPTUAL MODELING OF DATA WAREHOUSE Data Warehouse is a collection of data oriented topics, integrated, correlated
and non-volatile while supporting the decision. Dumped deposit data are integrated using this convention for measurements, attributes. Structure that provides data warehouse provides identification data stored punctual and, especially, quick access to them. Designing data warehouse structure is multidimensional modeling, implementing its structure is a database that provides large amounts of data storage and quick access to them, so-called database client/server.
Population data warehouse is by taking the transactional systems, but will be subject to complex processes of transformation that meets the deposit structure was designed. After this stage the deposit to join the service to obtain analyzes and reports. The steps listed above (design, popular, mining) are assisted by specialized software from browsers and generating reports until specific data mining tools.
The current operation wills frequently stored information is new requirements that will inevitably the structure, the popular extensions including historical data and the integration of new data incorporated into analysis applications. During the existence of a data warehouse is incremental and cyclical.
The design phase of a data warehouse using dimensional models that groups data in relational tables or diagrams of star-snowflake. In these schemes can be found quantitative data such as quantities or values or grouped by various criteria (customer, by product, service types, etc.). Quantitative data in dimensional databases are of
231
average number of transactions, centralization by certain characteristics, and totals are measures of activity. On the other hand, the aggregation will be called dimensions. Measures identified by size will be stored in a relational table which is called facts table and associated codes or criteria used are data aggregation type classification tables are associated with tables of facts and thus will be of a relational schema star. If such schemes meet several star catalogs use the same pattern form a constellation. If classifications can be divided into sub-nomenclatures then there is dependence between them. Note that the same code there may be several alternative nomenclatures. If these overtones and size integrate alternative scheme creates a form of snowflake.
Type schemes star, snowflake or constellation are multidimensional conceptual models of data warehouses, with the role of data organization on topics necessary decision-making process are open, i.e., change throughout life data warehouse.
7. DATA STORAGE ENVIRONMENT AND HOW TO USE THE DATA STORE Environment that builds and operates a data warehouse contains the following
elements: sources of transactional data, design tools, development, extraction and transformation tool data management system of database access tools and data analysis and management tools ( ).
If belonging to Microsoft's suite, all listed components are integrated in a working environment for data storage (Data Warehousing) for various versions of SQL Server. This environment offers assistance to design, implement and manage repositories throughout their life cycle.
Using this framework for Data Warehousing provides an architecture that can be integrated relatively easily with products coming from other platforms, provides Services in the import-export data validation and transformation, provides integrated metadata repository design and manage support, task- and events.
If Oracle business suite, Oracle Express product is a database management multidimensional SGBDMD, which is based on multidimensional data model, the client / server, Web application development capabilities, which include the following architectural components : utilities for managing (Express Instance Manager, Express Administrator and Relational Access Manager), development tools (Oracle Express Analyzer, Oracle Express Objects, etc.) and core (Express programming language). Oracle Express OLAP tool called Analyzer provides selection, analysis and visualization of data stored in multidimensional database and Oracle Express Objects tool provides OLAP application development using Express programming language. The tool integration with Oracle Discoverer Oracle Express Objects is facilitated development of applications for research (smart) business (Integrated Oracle Business Intelligence Tools). There will also be a connection editor, Express Connection Editor, which provides the definition of multidimensional database connections.
For a data warehouse can be processed is necessary to have a specialized set of tools: physical and logical description of data sources, warehouses or data warehouse where they will be incorporated, validation, cleansing and transforming data to be stored in data warehouse, users, tools that allow them access to data stored in that site. These are specialized tools for application development environments, software and specialized data analysis applications personal (individual).
232
8. CONCLUSIONS Software tools for decision support have classic main purpose providing
analysis techniques, optimization and simulation and graphical representation of results. The new assistance systems using decision fusion techniques for the data stored in non-uniform structures to use default information not specified in existing data.
Data warehouses contain unique structures, integrated and cumulative process of decision necessary, assuming the administrator as its main task the establishment of shared access to the categories of managers by providing passwords and access rights.
Using data warehouse (Data Warehouse) may facilitate: - Improving the economic value of performance management organization
focused on customers, through a better understanding of customer needs; - Analysis of customer perceptions of value products and services offered or
that could be offered in the future; - Integrating marketing with information and communication technologies
(ICT), the operational data sources, achieving enterprise data warehouse type, EDW (Enterprise Data Warehouse);
- Contribute to increase the strategic value of economic organization. Data warehouse managers are selectively accessed according to their needs. In
this way creates specialized collections in various fields which are called data warehouses (Data Marts). Data warehouses can be used as an intermediate structure for collecting data from primary sources and whose content is periodically downloaded data warehouse. Data warehouses can take birth through comprehensive data storage of transactional systems for applying data mining technology. Using Data Mining technology means that data processing is done without user intervention, the background and the results are stored for future reference on request.
REFERENCES 1. Lenz, H.J.,
Thalheim, B. OLTP-OLAP schemes for sound applications. In TEAA 2005, volume LNCS 3888
2.
3.
Sisteme informatice pentru asistarea deciziei , Ed. Dual Tech, 2001
4. * * * http://www. 5. * * * http://www.
233
THEORETICAL RESEARCH ON SPECIFIC HUMAN RESOURCES IN TOURISM. FEATURES IN ROMANIA
Carmen Cristina Albu Ph. D Student Transilvania University Braşov, Romania Dan Constantin Vărzaru Ph. D Student University of Craiova Faculty of Economics and Business Administration Craiova, Romania
Abstract: Tourism is a sector of the economy in which the problems related to the jobs and necessary skills to exit the crisis are emphasized more sensitive than other sectors of the economy. This paper proposes a literature review based on the latest studies and research literature worldwide (USA, Canada, EU, etc.) and aims to identify the factors and trends influencing skill shortages in tourism and also the policies to mitigate this deficit. Tourism feels the chronic global shortage of human resources due to its seasonal activity and its lower efficiency. Most relied upon solutions are considering closer involvement of the Government in tourism support. An important role lies in defining the content engine training and education. The differences between the requirements of the tourism sector and content of vocational, technical and university learning is a problem in many countries. The situation remedy requires programme rethinking, teachers improving skills, creating practical programmes in terms of quality, preference in enterprises and establishment of the most appropriate bridge linking vocational (professional) education and higher education to open students’ clear and open opportunities. The paper lists the types of partnerships between public powers, the tourism sector and the educational sector at a global level and highlights their potential in connection with national and cultural specifics.
JEL classification: L80, L83
Key words: human resources, specific, mountain tourism, policies, Romania
1. INTRODUCTION Papers on the relationship between the human resources practice and the
organizational performance aim at studying the broader context of the evolution of human resources management, of the most important social trends and practice that have decisively influenced the relationship between enterprises and their managers, on the one hand, and employees, on the other hand. It’s under the circumstances of this declining evolution of the main challenges that we have to study tourism worldwide and in Romania.
This approach is necessary for a better understanding of the present context of human resources management in the tourism field, mainly in mountain balneo, spa and wellness tourism in Romania.
234
2. HUMAN RESOURCES IN TOURISM: SPECIFICITY AND CHALLENGES Tourism is a service activity, in which capitalist intensity is reduced. Therefore,
human resources play an essential part in the competitiveness of the companies and the tourists' interest for some destinations in terms of quality of greeting and services, etc. The tourist product means first of all pleasant experience and in this case, the human element is crucial when it comes to the quality of the service as it is perceived by the customer.
Beyond the quality of the product all that matters is enjoying using the product and mostly the relationship between the tourist and the specialist working in the tourism field. The human element represents the main vehicle of quality in tourism (Merasli, 2012). The new technology of communication and information, very important nowadays in tourism at the level of production, of distribution and of promotion led to an upheaval in point of skills needed by human resources.
The development of the activity especially towards highly specialized markets together with the importance of industrialized companies from the field of standardized production leads to a dichotomy between less qualified jobs and highly qualified ones in the tourism field. The last category is represented by part time seasonal jobs, thus less attractive from many viewpoints (Merasli, 2013).
The major challenge for tourism consists of the qualification and the availability of those seasonal part-time jobs in order to reach the quality goals required by visitors. That is why innovation in terms of organization, training and governance represents a strategic goal, i.e. improving actors’ competitiveness. Acquiring necessary skills is a priority, along with managing them and providing employees with permanent professional training that will allow human resources to become themselves an advantage in terms of performance and quality. More than in other fields of activity, managing knowledge represents a major competitiveness and organizational innovation axis, a vehicle of development, of sharing and managing knowledge, as it permits professional perspective, identifying and promoting synergies, easier access to knowledge competence and experience.
Tourism develops in a tormented environment, in which terrorism, natural catastrophes, climate changes and epidemics strongly lead to its weakening. More and more often, the security of the tourist environment plays an important part in the market dynamics and in the development of this economic sector.
Informing tourists becomes more and more complex and the tourists’ behaviour undergoes changes influenced by socio-demographic factors and by innovative tourist products. Today’s tourist is a very exigent customer. He/she is typically a highly educated person with decent incomes and much experience, able to assess the quality of the services he gets and to choose the best offer on the market. Today’s tourist wants to fully enjoy his spare time, to involve in the activities he participates in, not only to behave like a passive spectator. He constantly looks for a new, authentic experience.
Other challenges are related to the natural necessity to get into touch with foreign customers, necessity that requires additional language knowledge, a better understanding of the visitor’s culture and the development of special tourist products along with traditional offers. Personalized programmes are crucial.
As far as tourism companies are concerned, they react by promoting new business patterns. Thus, if at the beginning of the new century, low-cost airline companies didn’t have the position they have today on the market. Their present
235
position tends to a fact the market success of the big airline companies. N TIC’s presence on the market and the development of the Internet have completely revolutionized the process of gathering information and the ways of getting flight reservations.
Constant development becomes an imperative both for protecting product and protecting local jobs in order to preserve human resources. A new perception of the part to be played by an enterprise inside a company forces the latter to behave like a responsible citizen.
One of the first aspects that should be taken into account and that sometimes was considered a myth, sometimes reality, is represented by jobs in the tourism field, that are far away from what we can consider the security and stability of jobs. Such jobs are considered a problem due to non-typical timetables or due to the existence of many part-time jobs which are seasonal and underpaid as compared to other fields of economy.
Moreover, there are tendencies to extend tourist seasons which, despite all efforts, are difficult to set in and haven't led to necessary improvements in point of efficiency and better use of human resources. Likewise, we should not omit the fact jobs in the tourist sector are often considered, by employees, temporary activities and transitory steps towards other jobs. This extremely elevated mobility of the employees has a negative impact on the competitiveness of tourism.
This picture, far from being complete, must be associated with the sad economic projections concerning the lack of workers in tourism. The competition between different domains to attract workers will complicate even more the recruiting activity in tourism. Finally, employers will court potential employees. Aging will result in massive retirements and loss of experience. It will be harder to hire stuff and the exodus of the young towards big cities will worsen even more the present situation.
Considered a solution to the lack of qualified stuff, workers aged of 55 and over are facing all kinds of prejudices (high wages, reduced productivity, lack of abilities in technology, resistance to reformation, etc) and complicates even more the efficiency in touring companies. For countries with multi-ethnic population, as a result of immigration that last category and the people who are waiting for social reinsertion (those who abandon school or face hardships such as physical or intellectual disabilities, etc) will contribute to broadening labour, but will need special training and a certain probation and adaptation period.
Problems related to the qualified stuff in developed countries (Girard and Baillargeon, 2009), including the balneological variant in the mountain area, can be improved by assimilating new dynamics of jobs, dynamics that suppose:
-the attenuation of the differences between generations that would allow reconciling different profiles and expectations of the employees, a more harmonious use of everybody’s skills and avoiding conflicts;
-professional mobility in the sense that a person will hold various positions during his/her career;
-appointing retired stuff on the working market which requires working conditions adapted to people’s ages.
The same author notices that in the case of the countries that experienced a certain decline in the field of tourism, a lack of vision and of cooperation between different domains, areas and organisms that led to the present state of affairs. That lack
236
of synergy complicates the development of permanent full-time jobs by combining complementary activities of the type winter-summer, job bonus, etc.
A business in tourism is supported by small and medium-sized enterprises, whose managers must face different kinds of requirements and pressure coming from the entities involved. A first reaction is related to the profit requirements of the investors who expect immediate and consistent results. Following such a policy would mean giving up strategies and long time visions in favour of short time actions that lead to the increase of the profit earning capacity, but also to the impossibility to use the instruments of an efficient management of the business.
The lack of a definite perspective places managers in tourism in such a position as to react to immediate changes of the investment environment. Relatively small companies, rather poor in point of high qualification human resources specialists place managers in a permanent provisional situation as far as the recruitment process is concerned, the processes of hiring and selecting qualified stuff, but also when it comes to the other activities related to the stuff. Such a situation can, most of the time, affect the social climate and the motivation of the human resources of the enterprise.
Tourism is characterized by a definite intensity of labour, by the existence of certain seasonal activity cycles and by daily and weekly fluctuation of the demand. Those characteristics are restrictions justifying the use of an important part of the stuff in part-time, seasonal and occasional activities. Both the intensity of work and the working conditions complicate even more the difficulties of tourism enterprises in their effort to attract qualified employees and to increase their fidelity.
Most of the researchers, managers and specialists agree that most of the jobs in tourism are based on tasks requiring medium and reduced technical skills. The seventh frame-programme of the European Commission concerning Work and Life Quality in New and Growing Jobs (WALQING) established that approximately two thirds of the jobs in hotels and restaurants were less qualified (Holman and McClelland, 2011), contradicting conclusions drawn following certain studies performed in South Korea and Japan.
Just as in other fields of economy, jobs in tourism have enjoyed a significant technologic contribution that supports different services, on the one hand, and changes of those services, on the other hand. Technology has replaced repetitive jobs (airport registrations, hotel check-out procedures). On the other hand, it placed in the background certain skills such as hotel check-in procedures, preparing meals and so on. Apart from specialized and technical skills, that an employee generally acquires during training sessions, general and quality skills prove to be more and more important.
In the service domain generally speaking, and in that of tourism, the degree of exigency related to many jobs depends mostly on the relationship aspects rather than on the specific technical tasks it involves. Interpersonal relationships with customers and colleagues were described as part of the ‘emotional competence’. That competence describes ‘managing feelings that allow the transmission to the others of a certain facial and body image’ (Hochschild, 1983) and requires a high degree of craftsmanship and coordination (Bolton, 2004).
We must add to this exigency, an additional one ‘the aesthetic competence’, that is the capacity of transmitting an image of expressing thoughts and feelings and of behaving according to the job’s requirements and to the customer’s expectations (Warhurst et alii, 2000). Both types of skills, often named ‘the personality of the employee’ suppose a certain educational and cultural background in order to animate a
237
conversation with customers in domains such as politics, sports, and any other topics, often considering international points of view (Baum, 2007).
A group of countries elaborated training programmes based on skills, at the end of which the specialists should be able to prove possessing certain qualifications notified by a national certificate. Unfortunately, with very few exceptions those training sessions are not mandatory in order to work in a domain and their absence or insufficiency does not allow insuring a quality of the service and a higher productivity. In addition to those aspects, the public powers only accepted certain qualifications and certain providers of training sessions in the tourism field.
Customers’ demand for tourist products imposes unpleasant working conditions and unsocial schedules including working at weekends, at night and during holiday periods (Busquets, 2010). These conditions, specific to this domain, have not improved for 20 years, and they are worsened by an important number of underpaid, repetitive jobs, by reduced social advantages and limited promotion and professional development. These features explain the strong stuff rotation, especially in the case of executive positions and the bad image of tourism as a whole. There are quite few countries in which careers in tourism are highly appreciated. As for the rest of the world, jobs in tourism are neither worthwhile doing, nor considered sources of prestige by the employees.
The main hardships education and tourism professional training in tourism face are identified by many authors (Kusluvan et alii, 2010).
The skills and attitudes of human resources. The first aspect refers to the cultural shortage of training, in the sense that tourism considers training sessions rather from the point of view of costs than from that of the investment. The hesitations when it comes to investing in the development of human resources is directly related to the nature itself of the sector which registers high costs and little profits, its demand being unstable and insufficient. Some structural requirements and parameters can’t be achieved as its seasonality and the predominance of SMEs and a commercial strategy based on cutting costs (Kusluvan et alii, 2010).
The competition with other countries and sectors. Another constant feature tourism is the migration of graduate students and employees trained in the companies for which they work and holding executive and management positions in enterprises belonging to other sectors where the dimension of the services offered to customers plays an important part. Those domains come up with more attractive wages and better working conditions. In the Czech Republic, for instance, 80% of the university graduates have left this sector. Such a situation is due to better payment and working conditions elsewhere (in Western Europe) than in their native country. That state of affairs determines the qualified young to immigrate, thus emphasizing the lack of human resources in countries such as Romania, Poland or Hungary.
3. POLICIES AIMING AT REDUCING THE SKILL AND EMPLOYEE SHORTAGE IN TOURISM
The complexity of tourism and the interference of public and private entities
impose from central public authorities the elaboration of a long-term development strategy concerning human resources. It would be ideal if such a strategy proved to be part of a broader context making possible the improvement of the competitiveness and perenniality of tourism. Countries are facing a growing demand for high quality human
238
resources. As tourism is a transversal domain, that involves more ministries in the process of supervising actions that influence it, the strategy must promote an integrated governmental approach. At the same time, it must rely on partnerships with the private sector and with education and make them work.
Certain innovative approaches in some of the countries can set a good example for the other countries, as, for instance, the creation of a private institution ready to manage public financial programmes to support tourism (Austria), the deep prospective analysis in order to anticipate the next decisions authorities will make (Spain).
An important step in the process of improving the quality of human resources is represented by the creation of national professional standards and the validation of the training sessions and of the experience acquired while being at work. In tourism there are certain peculiarities that have lately become more obvious:
-only few of the professions on the market require a certain certification; -possessing a university diploma or a qualification that conditions less
obviously the way in which workers are paid and promoted; -there are few jobs for which the recruitment process depends on a certain
knowledge level; -many post-graduated students in other fields are recruited in the tourism field
without any previous experience in this field. That is why validation rules are, nevertheless less useful. At the same time,
rules can contribute to the creation of a validation programme that turns professional experience into acquired knowledge. In this way, those skills will be validated by institutions involved in public education. Consequently, those skills will receive public validation, which makes easier the recognition of professional degrees that employees in tourism possess, no matter if they obtained them in their native country or abroad.
Central and local public institutions, in partnership with the private sector can play an important part when it comes to improving information concerning tourism and career possibilities. The countries that did the best they could in this respect (Canada, Austria, The Czech Republic, Portugal and Australia) knew a positive evolution of the image of that sector and of the professional attractiveness of this domain.
As working in tourism is a seasonal, cyclic activity, a possible solution would be attracting foreign employees. Such a solution would allow tourism companies to develop and reduce their stuff according to the demand. Table no. 1 presents the variable proportions of foreign employees in hotels and restaurants as compared to the global percentage of the immigrants holding various ‘less qualified jobs’ and to ‘the total number of professions in all economic sectors’. The growing number of immigrant employees all over the world facilitates the recruitment in order to make up for the lack of human resources at the local level.
Such a situation has also led to an alarming growth of the insecurity associated to the positions held by the immigrants who agree to work at a very low income level, conditions that native workers of such a country would never accept (OIT, 2010a).
The recognition of foreign qualifications is imperative in order to facilitate the mobility of workers, mainly of international mobility. In the tourism sector, some countries have established national standards of competence and certification systems for certain professions, but most of them give an optional value to these criteria. The European certification framework seeks to solve this problem, because, once adopted, it should considerably facilitate the mobility of the employees.
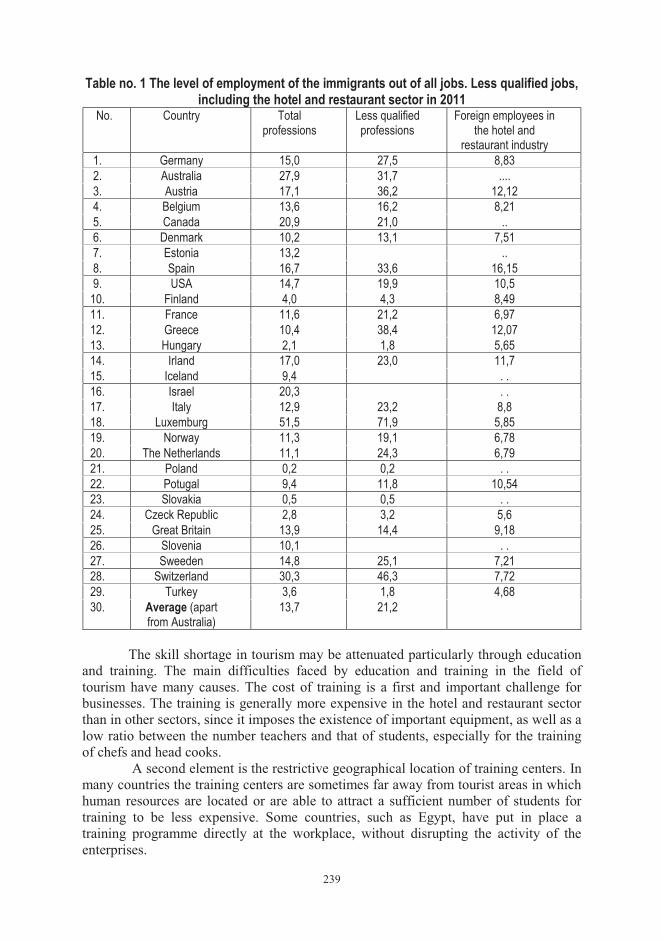
239
Table no. 1 The level of employment of the immigrants out of all jobs. Less qualified jobs, including the hotel and restaurant sector in 2011
No. Country Total professions
Less qualified professions
Foreign employees in the hotel and
restaurant industry 1. Germany 15,0 27,5 8,83 2. Australia 27,9 31,7 .... 3. Austria 17,1 36,2 12,12 4. Belgium 13,6 16,2 8,21 5. Canada 20,9 21,0 .. 6. Denmark 10,2 13,1 7,51 7. Estonia 13,2 .. 8. Spain 16,7 33,6 16,15 9. USA 14,7 19,9 10,5
10. Finland 4,0 4,3 8,49 11. France 11,6 21,2 6,97 12. Greece 10,4 38,4 12,07 13. Hungary 2,1 1,8 5,65 14. Irland 17,0 23,0 11,7 15. Iceland 9,4 . . 16. Israel 20,3 . . 17. Italy 12,9 23,2 8,8 18. Luxemburg 51,5 71,9 5,85 19. Norway 11,3 19,1 6,78 20. The Netherlands 11,1 24,3 6,79 21. Poland 0,2 0,2 . . 22. Potugal 9,4 11,8 10,54 23. Slovakia 0,5 0,5 . . 24. Czeck Republic 2,8 3,2 5,6 25. Great Britain 13,9 14,4 9,18 26. Slovenia 10,1 . . 27. Sweeden 14,8 25,1 7,21 28. Switzerland 30,3 46,3 7,72 29. Turkey 3,6 1,8 4,68 30. Average (apart
from Australia) 13,7 21,2
The skill shortage in tourism may be attenuated particularly through education
and training. The main difficulties faced by education and training in the field of tourism have many causes. The cost of training is a first and important challenge for businesses. The training is generally more expensive in the hotel and restaurant sector than in other sectors, since it imposes the existence of important equipment, as well as a low ratio between the number teachers and that of students, especially for the training of chefs and head cooks.
A second element is the restrictive geographical location of training centers. In many countries the training centers are sometimes far away from tourist areas in which human resources are located or are able to attract a sufficient number of students for training to be less expensive. Some countries, such as Egypt, have put in place a training programme directly at the workplace, without disrupting the activity of the enterprises.
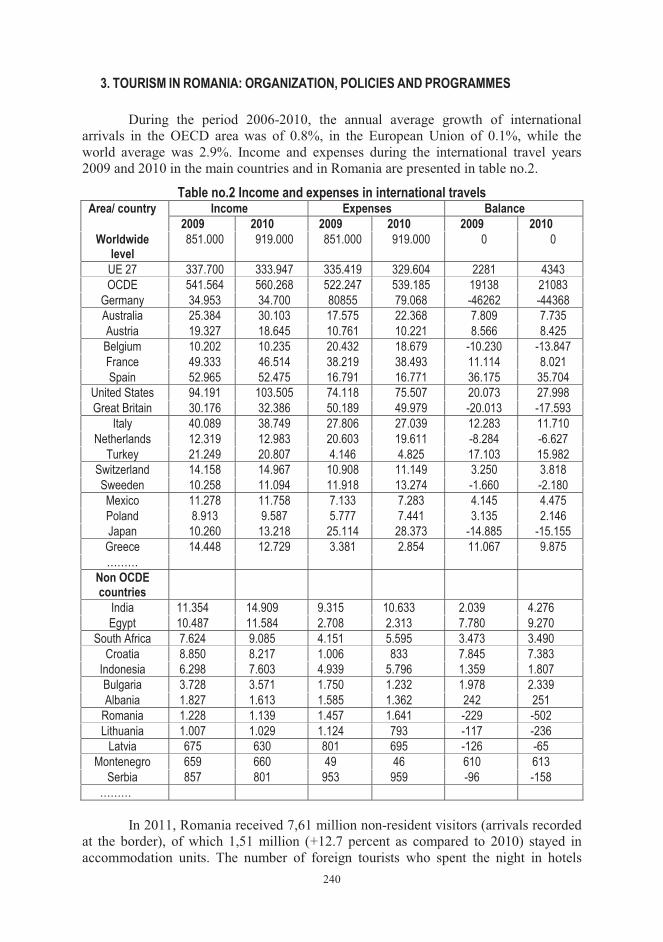
240
3. TOURISM IN ROMANIA: ORGANIZATION, POLICIES AND PROGRAMMES During the period 2006-2010, the annual average growth of international
arrivals in the OECD area was of 0.8%, in the European Union of 0.1%, while the world average was 2.9%. Income and expenses during the international travel years 2009 and 2010 in the main countries and in Romania are presented in table no.2.
Table no.2 Income and expenses in international travels Area/ country Income Expenses Balance
2009 2010 2009 2010 2009 2010 Worldwide
level 851.000 919.000 851.000 919.000 0 0
UE 27 337.700 333.947 335.419 329.604 2281 4343 OCDE 541.564 560.268 522.247 539.185 19138 21083
Germany 34.953 34.700 80855 79.068 -46262 -44368 Australia 25.384 30.103 17.575 22.368 7.809 7.735 Austria 19.327 18.645 10.761 10.221 8.566 8.425 Belgium 10.202 10.235 20.432 18.679 -10.230 -13.847 France 49.333 46.514 38.219 38.493 11.114 8.021 Spain 52.965 52.475 16.791 16.771 36.175 35.704
United States 94.191 103.505 74.118 75.507 20.073 27.998 Great Britain 30.176 32.386 50.189 49.979 -20.013 -17.593
Italy 40.089 38.749 27.806 27.039 12.283 11.710 Netherlands 12.319 12.983 20.603 19.611 -8.284 -6.627
Turkey 21.249 20.807 4.146 4.825 17.103 15.982 Switzerland 14.158 14.967 10.908 11.149 3.250 3.818 Sweeden 10.258 11.094 11.918 13.274 -1.660 -2.180 Mexico 11.278 11.758 7.133 7.283 4.145 4.475 Poland 8.913 9.587 5.777 7.441 3.135 2.146 Japan 10.260 13.218 25.114 28.373 -14.885 -15.155
Greece 14.448 12.729 3.381 2.854 11.067 9.875 ………
Non OCDE countries
India 11.354 14.909 9.315 10.633 2.039 4.276 Egypt 10.487 11.584 2.708 2.313 7.780 9.270
South Africa 7.624 9.085 4.151 5.595 3.473 3.490 Croatia 8.850 8.217 1.006 833 7.845 7.383
Indonesia 6.298 7.603 4.939 5.796 1.359 1.807 Bulgaria 3.728 3.571 1.750 1.232 1.978 2.339 Albania 1.827 1.613 1.585 1.362 242 251
Romania 1.228 1.139 1.457 1.641 -229 -502 Lithuania 1.007 1.029 1.124 793 -117 -236
Latvia 675 630 801 695 -126 -65 Montenegro 659 660 49 46 610 613
Serbia 857 801 953 959 -96 -158 ………
In 2011, Romania received 7,61 million non-resident visitors (arrivals recorded
at the border), of which 1,51 million (+12.7 percent as compared to 2010) stayed in accommodation units. The number of foreign tourists who spent the night in hotels

241
came to 3.06 million in 2011, which meant an increase of 11.2 percent in a single year. In addition, Romania counts 5.5 million domestic visitors (16.9 percent as compared to 2010) and 14.9 million visitors (+12.4%) who spent the night in hotels. The five main source markets (Germany, France, Hungary, Italy and the US) accounted for 43.6% of total foreign visitors who spent more than 24 hours (and spent the night in hotels).
According to the report The Travel& Tourism Competitiveness Index, published in 2012 by the World Economic Forum, the travel and tourism sector generated 7.7 billion RON in 2011 and represented 1.4% of the GDP. During the next 10 years, this contribution should increase with over 6.9% every year. In 2011, the total contribution of the tourism sector and travel accounted for 25.1 billion RON, i.e. 4.5% of GDP (if we take into account the indirect effects of investment, supply network and induced revenue).
Reorganized in 2013, the National Tourism Authority is the competent authority in tourism at the national level. Its main duties involve planning, territorial development at the regional and national levels, cross-border questions, cross-border and interregional cooperation and regional planning, urbanization, housing and tourism. The Authority coordinates the functions of Tourism Research and Development Institute (INCDT) and of the Advisory Committee, which includes representatives from the public and private sectors and the NGOs concerned. In addition, an Interministrial Commission for Tourism was created to provide an integrated development vision, a government travel policy. Public-private working groups were established, at the initiative of the Committee for tourism, hotels and restaurants specialized in human resource development.
At the national level, the Ministry is in charge of 25 territorial offices. Working groups ad hoc comprise representatives of the Central Administration at the national level, of the local communities, the private sector and the NGOs concerned, to deal with important issues of the tourism policy.
At the same level, the private sector is organized into associations which represent either a subsector (rural tourism, thermal tourism, business tourism, ecotourism), or a professional segment (travel agencies, hotels, guesthouses, tourist guides, cooks or pastries).
The necessary expenditure for the activities of the National Authority for tourism are borne entirely by the State budget through the budget of the Ministry of economy. In this respect, the authority proposes a draft budget to ensure the necessary financial resources and achieve the specific tasks.
The Authority manages the financial resources allocated through its own budget, following both the achievement of annual or multifunction objectives, and justification of the amounts received from the State budget through the budget of the Ministry of economy, according to the Governmental Decision no. 9 of 9 January 2013, concerning the organization and functioning of the National Authority for Tourism.
The main guidance document for this sector is the National Framework Plan for tourism development for the years 2007-2026. The strategic plan was divided into several components, resulting in the 2009 National Ecotourism Strategy and the National Strategy for Thermal Tourism. In 2011, the operational and strategic marketing plan 2011-2015 was completed within the regional operational Programme 2007-2013.
Many Romanian tourist associations initiated programmes offering stays at discounted prices in the spring and fall, and which, therefore, extend the tourist season.
242
Two other programmes were designed aiming at facilitating access to travel: the traveler's checks programme imposed on employees, which boosts domestic tourism and the early reservation programme, which offers discounts of up to 30% for each anticipated purchase of summer holidays (between 1 February and 31 March).
The development of cyclo-tourism is one of the priorities of the Ministry of Tourism. Thus, the Government, in collaboration with the Romanian Federation of Cycling, has drafted a proposal relative to a national network of special lanes. Studies have been carried out in order to substantiate the decisions and proposing the development plans of the two European itineraries transiting Romania: EuroVelo 13, also called the way of the Iron Curtain and EuroVelo 6, which links the Atlantic Ocean to the Black Sea, along the Danube.
The National Authority for Tourism keeps investing in tourism infrastructures according to the development plan in 2011. The investment includes harbours, beaches, tourist observers, skiing areas, mountain chalets, Spa complexes, tourist information centers, mountain rescue centers, mountain itineraries and cableways.
Within the framework of the national strategy for ecotourism, and under the auspices of a working group comprising the main organizations concerned, Romania currently develops specific criteria for the designation of ecotourism destinations. The promotion of products which comply with the criteria of sustainable tourism is permitted under two symbols: the European Eco-label, awarded by the Ministry of Environment and Forests, and the certification system established by the Association for Ecotourism in Romania.
The 2009-2010 project to improve 'clean' production technologies and the social responsibility of enterprises in the tourism sector has entered phase two (after a first phase in 2007-2008). Coordinated by the United Nations Organization for industrial development, the project has received financial support from the Swiss Government. Nationally, it is supported by the National Authority for Tourism and is managed by the Consortium Denkstatt Romania and Trend Hospitality. Since 2002, Romania has participated in the programme "Blue Flag", aiming at promoting the quality of the Romanian beaches on the Black Sea in accordance with international norms. Among other purposes, in order to raise awareness of sustainable tourism, the Ministry of Environment and Forests has published a guide of ecotourism.
Another form of sustainable tourism having a strong potential for development is hiking. In the project Datourway (the Transnational Strategy of Sustainable Territorial Development in the Danube basin, centred on tourism and financed by the transnational cooperation programme South-East Europe), a study was carried out for the development of the "green roads" along the Danube.
Under the Eurostat directive, National Institute of Statistics has implemented, in 2011, with the help of the National Tourism Authority and the Central Bank of Romania, a tourism satellite account in Romania. The information provided by this account is multiple, and tables no. 3-8.
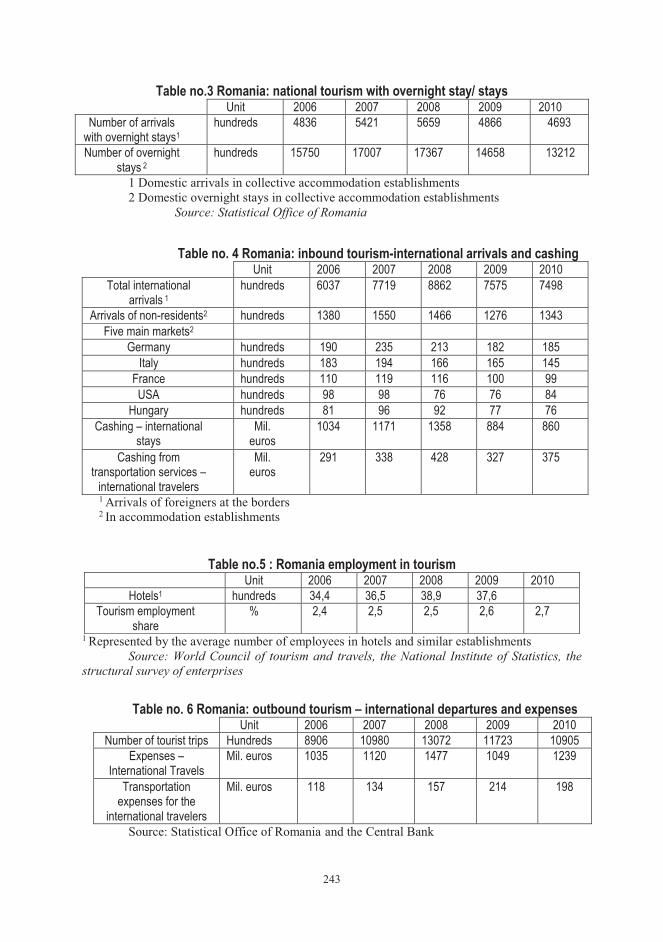
243
Table no.3 Romania: national tourism with overnight stay/ stays Unit 2006 2007 2008 2009 2010
Number of arrivals with overnight stays1
hundreds 4836 5421 5659 4866 4693
Number of overnight stays 2
hundreds 15750 17007 17367 14658 13212
1 Domestic arrivals in collective accommodation establishments 2 Domestic overnight stays in collective accommodation establishments
Source: Statistical Office of Romania Table no. 4 Romania: inbound tourism-international arrivals and cashing
Unit 2006 2007 2008 2009 2010 Total international
arrivals 1 hundreds 6037 7719 8862 7575 7498
Arrivals of non-residents2 hundreds 1380 1550 1466 1276 1343 Five main markets2
Germany hundreds 190 235 213 182 185 Italy hundreds 183 194 166 165 145
France hundreds 110 119 116 100 99 USA hundreds 98 98 76 76 84
Hungary hundreds 81 96 92 77 76 Cashing – international
stays Mil.
euros 1034 1171 1358 884 860
Cashing from transportation services –
international travelers
Mil. euros
291 338 428 327 375
1 Arrivals of foreigners at the borders
2 In accommodation establishments
Table no.5 : Romania employment in tourism
Unit 2006 2007 2008 2009 2010 Hotels1 hundreds 34,4 36,5 38,9 37,6
Tourism employment share
% 2,4 2,5 2,5 2,6 2,7
1 Represented by the average number of employees in hotels and similar establishments
Source: World Council of tourism and travels, the National Institute of Statistics, the structural survey of enterprises
Table no. 6 Romania: outbound tourism – international departures and expenses Unit 2006 2007 2008 2009 2010
Number of tourist trips Hundreds 8906 10980 13072 11723 10905 Expenses –
International Travels Mil. euros 1035 1120 1477 1049 1239
Transportation expenses for the
international travelers
Mil. euros 118 134 157 214 198
Source: Statistical Office of Romania and the Central Bank
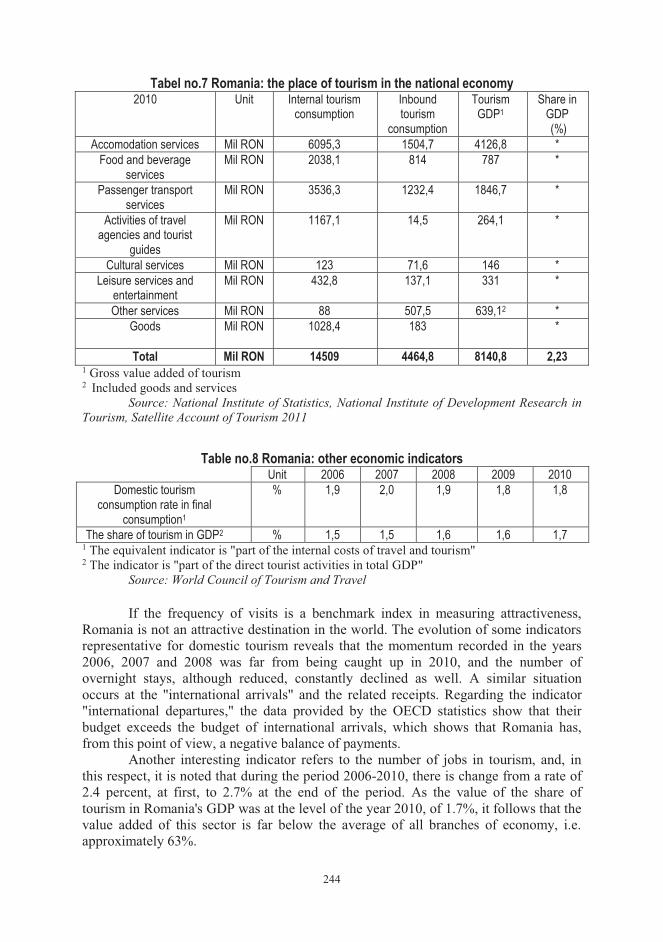
244
Tabel no.7 Romania: the place of tourism in the national economy 2010 Unit Internal tourism
consumption Inbound tourism
consumption
Tourism GDP1
Share in GDP (%)
Accomodation services Mil RON 6095,3 1504,7 4126,8 * Food and beverage
services Mil RON 2038,1 814 787 *
Passenger transport services
Mil RON 3536,3 1232,4 1846,7 *
Activities of travel agencies and tourist
guides
Mil RON 1167,1 14,5 264,1 *
Cultural services Mil RON 123 71,6 146 * Leisure services and
entertainment Mil RON 432,8 137,1 331 *
Other services Mil RON 88 507,5 639,12 * Goods
Mil RON 1028,4 183 *
Total Mil RON 14509 4464,8 8140,8 2,23 1 Gross value added of tourism 2 Included goods and services
Source: National Institute of Statistics, National Institute of Development Research in Tourism, Satellite Account of Tourism 2011
Table no.8 Romania: other economic indicators
Unit 2006 2007 2008 2009 2010 Domestic tourism
consumption rate in final consumption1
% 1,9 2,0 1,9 1,8 1,8
The share of tourism in GDP2 % 1,5 1,5 1,6 1,6 1,7 1 The equivalent indicator is "part of the internal costs of travel and tourism" 2 The indicator is "part of the direct tourist activities in total GDP"
Source: World Council of Tourism and Travel
If the frequency of visits is a benchmark index in measuring attractiveness, Romania is not an attractive destination in the world. The evolution of some indicators representative for domestic tourism reveals that the momentum recorded in the years 2006, 2007 and 2008 was far from being caught up in 2010, and the number of overnight stays, although reduced, constantly declined as well. A similar situation occurs at the "international arrivals" and the related receipts. Regarding the indicator "international departures," the data provided by the OECD statistics show that their budget exceeds the budget of international arrivals, which shows that Romania has, from this point of view, a negative balance of payments.
Another interesting indicator refers to the number of jobs in tourism, and, in this respect, it is noted that during the period 2006-2010, there is change from a rate of 2.4 percent, at first, to 2.7% at the end of the period. As the value of the share of tourism in Romania's GDP was at the level of the year 2010, of 1.7%, it follows that the value added of this sector is far below the average of all branches of economy, i.e. approximately 63%.
245
4.CONCLUSIONS The tourism sector is dominated by small and medium-sized enterprises, which
are characterized, most of them, by reduced input requirements both in terms of capital and skills.
Labor and skill shortages in most of the developed countries, should worsen the situation in tourism. They would incite employers to look for less skilled employees on the national market and abroad, at the expense of the quality of the services offered. International Labour Organization (2010b) showed that "this sector exceeds the porous borders separating the informal economy from the formal one, a number of formal organizations offering clandestine jobs.
The differences between the requirements of the tourism sector and the content of professional, technical and University education are a problem in many countries. Fixing this problem would require a rethinking of the syllabus, the improvement of the teachers' skills, the creation of practical training programmes, preferably in the enterprises, and the establishment of the most appropriate bridges between vocational education and higher education to create professional opportunities for today's students.
Partnerships between public powers, the tourism sector and the educational sector must be established in order to follow three important objectives:
- a new conception of training ; - the use of more reactive teaching methods and procedures; - the proposal of new, more flexible patterns, especially when it comes to
lifelong learning programmes and the improvement of qualifications.
REFERENCES 1. Baum, T Human resources in tourism: still waiting for change. Touism
Mamagement, no.28, 2007 2. Bolton, R.N. The Effect of Service Experiences over Time on a Supplier’s
Retention of Business Customers. Marketing Science Institute, 04–119, 2004
3. Busquets, J. Accommodation and consumption diversification in the sector of tourist accommodation and restaurant industries, and its effects on labor relations, Study commissioned by the ILO, 2010
4. Hochschild, A.R.
The managed heart: Commercialization of human feeling. Berkeley, CA: University of California Press, 1983
5. Hollman, D, McClelland, C.
Job Quality in growing and declining Economic sectors of the EU, WALQING project, 2011
6. * * * www.world-tourism.org 7. * * * www.worldtourism.org/code_ethics/pdf/languages/Codigo%20Etico
%20Fran.pdf 8. * * * www.unat.asso.fr 9. * * * OCDE, Ministerul Dezvoltării regionale şi Turismului, 2012 10. * * * H.G. nr.9/09.01.2013, privind reorganizarea şi funcţionarea
Autorităţii Naţionale pentru Turism- M.O. nr.40 din 18.01.2013
246
STANDARDIZATION AND ITS ROLE IN PRESCRIBING QUALITY
Lect. Radu Cătălin Criveanu Ph. D University of Craiova Faculty of Economics and Business Administration Craiova, Romania Lect. Nataliţa Maria Sperdea Ph. D University of Craiova Faculty of Economics and Business Administration Craiova, Romania
Abstract: : Standardization activity which by its applications, has an important impact on the economy and society, is the main tool for regulating the quality of products. Products' standardization must pursue simultaneously the requirements of producers, traders and consumers. The paper presents some aspects of standardization issues lead us to understand its importance in prescribing quality
JEL classification: L66, Q18
Key words: standardization, quality, food, ecological standards, European Union
1. INTRODUCTION Standardization is the main tool for regulating food quality. Standardization
applications relate inter alia: units used in prescribing quality, terminology and symbols, foods and methods for determining product quality (design and choice of food characteristics, methods of test and measurement, specification of product characteristics for defining quality, requirements for packaging, marking and labeling) safety of persons and property.
Romanian Standard SR 10000-1/199460, has presented the following definition of standardization: "Standardisation is the specific activity that are established for real and potential problems, provisions for common and repeated use, aimed at achieving optimum degree of order in a given context ". So standardization is essentially the drawing up and implementation of reference documents called standards.
The standard is a document established by consensus and approved by a recognized body that provides - for common and repeated - rules, guidelines or characteristics relating to activities or their results, guaranteeing an optimal level for the community as a whole61.
2. ABOUT STANDARD AND STANDARDIZATION According to EEC Directive 83/189, "standard is a technical specification
approved by a recognized standardization body used for repeated or continuous application, with which compliance is not mandatory".
60 Standardul SR 10000 - 1/1994 - Principiile şi metodologia standardizării. Termeni generali şi definiţiile lor privind standardizarea şi activităţile conexe. 61 Ghidului ISO/CEI 2/1996
247
The European Union is interested in preventing the occurrence of standards in terms of technical barriers to trade.
The main features of a standard, are as follows62: - the standard is not mandatory, because is based on a consensual agreement of
stakeholders (producers, distributors, consumers and government). The standard is designed for all those who want and is applied to all who want.
- the economic factors at the national, regional and international level have different technical and technological possibilities, many of them being below the standards achieved. It would be unfair for them to be removed by the mandatory standards. The production under standardized level can be less expensive, but these products are less demanded by the market, which negatively affects the activity of persons that acting to pursue this path. The consumer will be the one to decide whether to buy the product or not.
- the standard is elaborated by a recognized body may be national, regional or international.
- the standard is for common and repeated application, it giving it a great efficacity.
- the standard, through its content is a tool that provides an optimum degree of order in business, encouraging the creation and growth for the benefit of the community as a whole.
Standardization topics are chosen by the stakeholders, which mainly are: manufacturers, industrial users, consumers and public authorities. They participate active in standardization work due to the advantages they can provide it.
Through standardization it ensures 63: - simplify the increasing diversity of products and procedures for
standardization contributes to people's lives: remove items that complicated, difficult and expensive production and use, products characterized by essential properties.
- compatibility and interchangeability, which means that standardization allows for some game types and sizes of parts and compatible products in terms of dimensions, shapes and properties that allow dimensional and functional interchangeability (food being useful and standardization of packaging).
- security, health, life and environment protection because standards are included requirements concerning safe operation of machinery, equipment, buildings and installations and requirements that limit or remove the harmfulness of products or processes on the environment
- ensure consumer protection because: products bearing the brand standards offer a guarantee that they meet customers' needs through the features included in standards, product quality is guaranteed, and by prescribing conditions for packaging, transport, storage and storage ensures and maintaining technical quality throughout the circuit from producer to consumer.
- acilitating communication between producers and users, meaning that standardization provides a common language through terminology, coding and unique symbolizing in different areas internationally accepted.
- removing barriers to trade, assured by: references and references to standards that are in economic contracts, prevents technical barriers to trade, the use of
62 www.asro.ro 63 www.consumersinternational.org.
248
international standards or harmonized European may allow the elimination of obstacles to trade in goods.
- reducing market uncertainty means that the existence of appropriate and stable set of standards creates more transparency in competitive market situations and thus short-term investment decisions are more easily taken.
- efficient use of materials, energy and human resources because standardization is based on the combined results of science, technology and experience, providing the best solutions: better use of material and energy resources, using the maximum efficiency of production capacity, reducing consumption and manufacturing costs, and increase productivity.
After content standards are the following types of: - basic standard, which has a general application or which contains general
provisions for a particular area; - terminology standard, which specifies the terms, usually along with their
definitions and sometimes notes, illustrations, examples, etc. (eg. standard STR branch 3006-81 - Sensory analysis. principles, concepts, definitions.)
- test standard, which specifies test methods, sometimes accompanied by other provisions relating to the test, such as sampling, using statistical methods, order tests (eg, SR 90-97 - Wheat flour. methods of analysis);
- process standard that specifies the conditions that must be satisfied by a process;
- product standard, which specifies the conditions to be fulfilled by a product or group of products to ensure their usability (eg SR 13445-2001 - Wine. Technical condition of quality);
- service standard, which specifies the conditions that must be satisfied by a service, to ensure its usability;
- interface standards, which specify conditions relating to products or systems compatibility in their points of connection.
- data standards that can be set, which contains a list of features whose values are given for the description of a product, process or service;
Based on the standard classical typologies based on the nature and content, the conception of French origin on food standardization offers a better differentiation based on the scope:
a) standards specifications for the product; b) environmental standards of the products; c) standard method of analysis and testing; d) standards guidelines; This classification seems better adapted to the specific problems and
opportunities for development of standardization in this area of activity. After the standardization level, standards are:
- international standards adopted by the International Standards Organization (ISO);
- regional standards adopted by a regional organization for standardization, most notably being the European standards (EN);
- national standards adopted by a national standards body (SR); - professional standards adopted in certain industries, professional
organizations, legally established
249
- industry standards adopted by a certain sector of the economy (STR) (for ex. standards for milling and baking industry, dairy industry standards, etc.).;
- corporate standards adopted by companies, autonomous or other legal person (SF). They are based on professional standards.
Regulations (laws, decrees) are documents providing binding legislative rules. They are adopted by a legislative authority. When certain features are not specified in the standards, when reference is made to the rules governing the limits within which you must find the values of those characteristics.
Regarding international food standardization, we appreciate that ISO develop standard test methods, specifications and standards for agricultural raw materials. These standards must be distinguished from documents called "Codex" ( normes Codex ), which refers specifically to product specifications. Both ISO and the Codex, however, be taken into account when developing standards or technical regulations mandatory EEC to harmonize the common framework needed to promote trade and removing barriers them. As of July 1989, the Codex Alimentarius acknowledges that CEE accepted Codex standards as far as its member states have granted jurisdiction in the matter. Commission of the Member States pledged to seek delegation of powers to the EEC to accept Codex standards consistent with the objectives and regulations already adopted (eg fruit juice ).
The Codex Alimentarius Commission was created in 1962 under the patronage double FAO / WHO and comprising representatives from 133 countries. It aims to develop uniform as a recommendation, which include requirements on food hygiene, waste, pesticides, food additives, contaminants, labeling and presentation, methods of analysis and sampling. These rules published in a "Codex Alimentarius" are designed to facilitate international trade and ensure consumer health.
Its secretariat is located in the Division of FAO food and nutrition policy. Participation in the work of this organization is open to all members and associate members of FAO and WHO, and other nations who so requests. The Codex Alimentarius Commission has its own status and operating rules contained in the Manual of Procedure of the Commission. It operates through its various committees and subsidiary bodies which, like the Commission, intergovernmental. Codex work is divided between:
a) subsidiary bodies as it deems necessary to carry out project work completion standards: Joint FAO/WHO Expert governmental code of principles on milk and milk products (established since 1958);
b) subsidiary bodies as Codex Committees. Codex Alimentarius is a collection of international food standards adopted and
presented in a uniform manner, established to protect consumer health and ensure loyalty in trade in food items. Contains also provisions consultative form of user codes, directives and other guidelines for the Commission's goals. Publication has the aim coordinating and promoting the development and establishment of definitions and requirements to food, to harmonize and facilitate their international trade64.
The general structure of a Codex standard for processed food usually consists of the following sections:
� standard name;
64 www.europa.ro
250
� scope that defines the types of products, their presentation and their conservation and explanations of terminology;
� description, which includes: − definition of product (s), the structure of raw materials used, the specific
technological process that ensures storage stability and guarantee food security; − the presentation, both of the product and the packaging used, the type of
applied conditioning, size, dimension, size of the product pieces, if necessary. � essential composition and quality factors:
− essential ingredients; − optional ingredients; − predominant chemical composition; − critical factors of quality, organoleptic and physico-chemical features.
� ood additives nominees and expressed as maximum allowable concentration calculated on the net contents of the product;
� hygiene - are usually referring to the Code of Practice recommended international hygiene product concerned. Also recommended specific methods of sampling and types of microorganisms that are recommended to be analyzed;
� labeling - which includes appropriate provisions stipulated by the general rules of international recommended for labeling prepackaged food goods, developed by the Codex Alimentarius Commission, following: - Name of the product; - Presentation mode conditioning, size and preparation; - The list of ingredients; - Net weight; - Name and address of the manufacturer, distributor, importer, exporter or
seller; - Country of origin; - The deadline for consumption; - The identifier of the batch.
� methods of analysis and sampling, which are usually international arbitration in accordance with the methods, are clarified aspects of the types of defects and the acceptance criteria and methods for determining requirements for each type of product. Codex standards can be considered as international technical specifications
through their inclusion in international agreements to set minimum quality of the goods that are the subject of a contract or by taking them into account when developing national standards or regulations on food products .
Working Group UN / ECE for food standardization and quality improvement aims through its activities to promote industrial and commercial development by encouraging international harmonization of standards and technical regulations by removing and progressive reduction of technical barriers to trade and promoting scientific cooperation and technology through the development of standardization and related policies. UN / ECE program comprises three distinct activities : coordination, harmonization and conformity assessment, commercially last two are of particular interest .
Particular importance is given to standardization of perishable products. UN / ECE standards for perishable products is a harmonization of national standards in force. ECE standards which relate especially fruits and vegetables, are developed in the spirit
251
of other bodies, the "Working Group on Standardisation of Perishable Produce". They have the following structural elements:
a. standard name; b. Definition: each product must be defined by the species to which it belongs
and condition of sale; c. provision of quality: Minimum on health status, cleanliness, appearance,
moisture, no odor and / or flavor foreign, state of development and / or adulthood, you have to enable the product to withstand transport and storage to the destination; provisions on group graded "extra", "I" and "II", defined in terms of qualitative and presence of certain defects;
d. provisions on size, for those that may be subject calibrajului determine, as appropriate, diameter, circumference, length, mass and for the other, number of pieces / kg., the number of pieces in a pack led etc.
e. provisions on tolerances: quality tolerances, which shall not exceed 5% in the general categories of "I" and "II" tolerances, which must not exceed 10%;
f. provisions concerning the homogeneity of variety, variety, commercial type, presenting a strong enough package with a label is not printed with toxic;
3. QUALITY STANDARDS A key principle of the European Union market is the free movement of
industrial and agricultural products. For this, it was agreed to liberalize the movement of goods began with the formation of the customs union and removing other barriers than customs generically called "non-tariff barriers." Among these are technical barriers, fiscal, administrative, technical barriers referring mainly to standards.
Quality standards have become one of the most important barriers for products exported to developed countries. Standards, as I said, are descriptions of the technical characteristics of the products, their quality (content, weight, design, performance, durability, power consumption, handling, adaptability, environmental impact, etc..).
Purpose of these standards is to ensuring worker safety standards, consumer health protection, environmental protection, cost reduction through standardization. Standards and technical regulations are technical barriers to trade only if they are different from one country to another or not be recognized in other countries. As a result, the foreign market is narrower or wider access to cheaper or more expensive, and depending on the barriers of this nature. Ways to overcome barriers arising from the existence of different standards in these countries are either to establish common standards or to promote mutual recognition of standards.
There are organizations - public or private - that develops standards for products and services. Organisms that produce European standards are CEN (Comite Europeenne de Normalisation), CENELEC (Comite Européen de Normalisation ELECTROTECHNIQUE) and ETSI (European Tele-communication and Standardisation Institute). National standardization bodies and national electrotechnical committees and telecommunications are at the same time, members of the European standardization bodies.
From a legal perspective, standards are not mandatory, but adoption and compliance to export much easier because proving conformity of the product with an already known and accepted goods. As a result, the standards are "mandatory" from the point of view. This proves that the company has introduced quality management system that shows how the company operates in this area: as ensure quality of design,
252
production, installation, servicing, inspection and testing. The system must be accredited by accreditation bodies recognized and recorded. In many cases, these bodies will undertake a periodic re-accreditation of the system. This explains why it is recommended to adopt ISO series 9000/2001 and their subsections.
Treaty of Rome on technical barriers refers to the harmonization of legislation, which means the development and imposition of norms and standards. There were two problems:
� Establish common standards for all goods would be a huge task, impossible in a reasonable, given the wide variety of products and frequent changes, improvements in parameters.
� Develop common standards for all products would be largely useless because, as these developed countries, technical level and quality of products is close. The compromise solution was a dual approach . In the so-called " sectoral
approach " or the " old approach" , European Directives EEC introduced the specifications for the processing and packaging of a number of products such as toy safety , construction products , personal protective equipment , medical , materials chemical , food, human medicines (one of the most severely regulated sectors ) , veterinary medicines , telecommunications terminal equipment , all electrical items , standard licensing system for motor vehicles and their trailers became mandatory for new motor vehicles from January 1 . , 1996, etc . Some of these have already been introduced into national legislation. A product that is covered by a Community directive must meet the stipulations of that Directive to be sold legally in the EU , and that product is CE marked.
To sell products to the EU in the category mentioned above, non-Member States should create national structures licensing and certification attesting that the goods produced and offered to the market meet the criteria on quality and security. In the 'new approach' on the harmonization of the conditions to be met by the products, only the basic requirements such as security level to protect consumer health and the environment should be harmonized at EU level. To remove restrictions on imports of products not corresponding to national regulations, but which complied with Community rules on the protection of consumer health and / or environment, mutual recognition was adopted (mutual recognition) standards. To this solution was reached as a result of the European Court of Justice ruling in the famous case called "Cassis de Dijon" in 1979, which referred to a ban on sales in Germany of a certain liqueur French, on the grounds that it would not meet the degree requirements of the German alcohol. Other cases, become benchmark, are those of German beer, chocolate English and Italian pasta.
Mutual recognition means, in practice, the following: 1) Equivalent rules, technical specifications, certificates of inspection, testing
and analysis issued by the laboratory officially recognized in one of the member countries must be accepted by other EU.
2) An undertaking which has obtained authorization to produce in accordance with the assessment procedure of bodies, most of them private, will be allowed to sell the asset, across the EU.
3) A good that is produced and packaged as described, containing or packaging that are legal in one EU country cannot be banned from import into another EU country on the pretext of lack of compliance with existing regulations in the destination country or absence of certain content.
253
Introducing the principle of mutual recognition has contributed substantially to the free circulation of goods within the EU internal market. At the same time opened new export opportunities in the EU for non-members, as adoption of existing standards in one of the EU countries the export of those goods in any other European Union countries.
4. ECOLOGICAL STANDARDS Environmental protection is a global issue.
A quality product must meet consumers' needs without harming the environment. Along with quality standards, has developed an environmental management. First steps: British Standards Institute has developed the first standard in this area. The EU Eco voluntary scheme has been recommended and introduced on 1 January 1993, but with the intention of making it mandatory is under market pressure, either by inclusion in a Community directive. Initially, firms were only encouraged to produce and sell products and services. Publication of a list of honor with these companies the use of a specific logo were only incentives granted.
European internal market contains the following technical standards and environmental regulations: voluntary or mandatory.
Voluntary standards but usually belong to national legislation conform to international standards such as ISO. They are voluntary standards legally, but in fact are required for commercial reasons. They are governed by European Directives and mandatory for all companies who want to produce and sell in the EU, regardless of their origin.
Mandatory standards are mandatory for all companies, domestic or foreign, operating in the European Union.
In conclusion, the European Union's internal market is a huge market for companies able to meet the requirements - voluntary or mandatory - the quality or environmental.
REFERENCES 1. Sperdea, N. Calitatea produselor alimentare în cadrul circuitului tehnico –
economic, Ed. Universitaria, Craiova, 2010 2. *** SR 10000 - 1/1994 - Principiile şi metodologia standardizării.
Termeni generali şi definiţiile lor privind standardizarea şi activităţile conexe
3. * * * www.asro.ro 4. * * * www.consumersinternational.org 5. * * * www.europa.ro
254
ON THE PROFESSIONAL REASONING
Prof. Horia Dumitru Cristea Ph.D West University of TimiŞoara Faculty of Economics and Business Administration TimiŞoara, Romania
Abstract: This paper concerns the professional reasoning as an expression of the competence based on the scientific mastery of a certain field. Thus, we have approached competence as the skill of the capacity of the professional to give an opinion on a thing based on the profound knowledge of the problem. We have presented the professional reasoning as a logical train of judgements which lead to conclusions, one taking positive or negative decisions in line with the quality of these conclusions. We have underlined the necessity of the responsibility and moral conduct of the professional who must always come close to the truth.
JEL classification: B41, G38
Key words: reasoning, professionalism, competence, principles, opinions, solutions
1. GENERALITIES • Any profession is valuable, in the network of professions. • Professing is based on a basic principle, the one of the REASONING of the
profession or the JUDGEMENT of the professional. • THE JUDGEMENT, THE REASONING give the prestige to the professional. • The reasoning can be a correct or incorrect one, a positive or a negative one, a
light or a dark one and so on. • The conclusions, as results of the reason, and formulated, can be correct or
not, true or false. • Therefore, the conclusion, as result, depends on the processed parameters and
the processing model selected in the use. • The manner of obtaining conclusions is a matter of professionalism as a
corollary of the 3Rs, as ethical principles, namely: - R1 = self-esteem, - R2 = respect for others, - R3 = responsibility of own actions.
• Each principle has a translation in the professional reasoning: - R1 = is a matter of the training and behaviour of the professional, - R2 = means that those who use the opinions of the professional can be certain that these are correct, that they are not fake reasoning destined to manipulation, - R3 = reveals the capacity of the professional to assume the proposed solutions, the provided variants, not applying the law “the other one is to blame”.
• This is the only way we can talk about morality in the profession, whichever it may be.

255
• The reasoning is applied in an environment full of risks. • Part of these risks are among the major ones: 1. Legislation – incoherent, unstable, unclear, which leads to the lack of
credibility and the increase of the scepticism and prudence in valorising the judgments and solutions of the professional.
2. A second factor is the inconsistency which gives way to confusions and uncertainty for receivers, users. It is the result of precarious training or the use of means of alternation of the reasoning (see Lavinia Rorich: <New deformations of the reasoning>).
3. INCOMPETENCE unknown, hidden. Here we confirm the truth that nothing is what it seems. “Not knowing the limits of the capacity to give an opinion on a thing, on an aspect based on a profound knowledge” (see DEX 2012, p.212).
4. The fourth factor refers to the UNPROFESSIONALISM generated by the lack of a solid fundament of knowledge, of practice. It is a matter of the morality of the professional „Nothing is more immoral than practicing a profession we do not know” (Napoleon Bonaparte).
5. Another major factor is the MENTALITY. It is important, because it is a matter of internal, strongly conservatory resorts.
The mentality is based on the ATTITUDE born of EDUCATION. • Someone sent me, by electronic means, an interesting theme: “WHAT
MAKES THE DIFFERENCE”, of which I selected the 10 rules related to the EDUCATION which, when observed and applied, support a healthy, credible reasoning:
1. ETHICS, 2. ORDER AND CLEANNESS, 3. INTEGRITY AND HONOUR, 4. PUNCTUALITY, 5. RESPONSIBILITY, 6. WISH OF PERFECTING ONESELF, 7. OBSERVING THE RULES AND REGULATIONS, 8. RESPECT FOR RIGHTS OF OTHERS, 9. LOVE FOR WORK, 10. EFFORT FOR SAVING AND WISE SPENDING.
• Nothing in the world of professions cannot be performed by itself. Only three things evolve like this, says Kotler, namely:
1. disorder, 2. frictions, 3. anti-performance.
• Or, when a professional is the one which produces the confusion, he becomes undesirable for the family he belongs to.
• the reasoning can be based on science, independence morality or it can be a deformed one, generating scepticism, suspicion and high prudentiality, namely a manipulative one.
• The reasoning in its turn can have different value degrees in line with the comparison landmark.
• A judgement can be correct or incorrect; right or wrong; true or false; certain or uncertain. And the binary values can continue.
256
2. BENEFICIARIES: � Reasoning, as a judgement of something, is not something closed,
something opaque. It is something offered to others, for different purposes. It is the judgement reached by the professional upon processing the information regarding something, judgement which he makes public, this judgement is in its turn analysed, interpreted by the users.
� The solutions, resulted upon applying the professional reasoning, can be very, very diverse. Some of them accepted with no reserves, some of them received with caution, with scepticism or with suspicion. Why? What could be the cause?
� The users may or may not have faith in the professional in question or in the applied models and its results and interpretations.
� One must not forget that „in order to reach a dignified purpose, one must use dignified means” (said J. Nehru).
� The dignity of the professionalism depends on many elements, many factors: fidelity, individual value, professionalism, sciences, independence, morality, etc.
� The reasoning based on the values of the professional ethics gives safety to the users and the recognition of the impartial competence of the professional.
� The competence is acquired, it is not begged for. � But to be competent is not enough if there is independence and morality in
making conclusions, solutions. � The users do not accept damaged, manipulating, false reasoning which do
not support, do not help them in what they wish to accomplish (whether it is good or bad).
� When the users notice that the results of the professional’s reasoning are substantiated, based on science and morality, the trust in the professional is a high one. But when the professional’s reasoning is not a deep one, it is superficial and guided by interests unrecognised by the profession, that one is a professional only by name, meaning that he is not what he seems to be. This leads us to the solidity of the thing well-done and to deceiving appearances: “remember: Noah’s ark was built by amateurs, the Titanic was built by professionals”. Each of us can interpret this fact.
3. SATISFACTIONS: � The professional and the users too are glad when the former states that his
opinions, solutions are appreciated, used by the users and the user through the satisfaction to have a support in solving their problem/problems.
� Satisfaction, as pleasing feeling, can be found both in the positive plan of values and also in the negative one. That means it is something which depends on what is correct, true, sincere or false, incorrect, forged in order to do something unjust.
� The satisfaction generated by the professional reasoning is also given by the reputation of the professional and its superposition in the plan of reality.
� Reputation can be, in its turn, a positive one, dedicated to good and a negative one, dedicated to evil (namely the lack of good).
� Reputation also involves trust, based on competence, continual and significant development also on interpersonal level where trust lies at the basis of success in the inter-human relations.
257
� Satisfaction is also given by the level of the prestige and authority of the professional as a result of the intersection of the three plans in which the reasoning is manifested namely: Competence, Independence, Responsibility.
Competence is the capacity of the professional to give an opinion on a thing based on a deep knowledge of the matter. His training in the field, throughout knowledge is in question.
� Competence has different value degrees (high, average, below average) being real or hypothetical (of surface or of makeup).
Competence without independence does not provide the assurance of a reasoning based on integrity, objectivity, professionalism.
Compromise erodes competences, independence, responsibility and therefore the prestige of the professional.
Compromise leads to corruption which in its turn alternates the trust and satisfaction of those around, placing them in the state of abnormality, of uncertainty.
� Judgement, reasoning which distances itself from the positive values of the Ethic Code and Deontology of profession leads to wrong, false, unreal solutions and conclusions which lead to decisions, deeds, facts with undesired, reprehensible effects.
� The users are deceived in their expectations. Appearances can be deceitful.
4. CONCLUSIONS: � Reasoning is the expression of processing as “logic train of judgements,
which leads to a conclusion” (DEX 2012, p.914). � Conclusion, as a result, can be correct or incorrect, real or false, positive or
negative. � Those who use the conclusions, based on the argumentations of professionals,
can make decisions with positive or negative effects for themselves and the ones around them.
� So the dilemma remains: accepting the competence, the independence and the responsibility in line with the given, known training or a certain dose of scepticism and suspicion for the arguments used by the professional in judging and supporting a point of view, of a solution or an opinion.
� How responsible and profound is the one called to judge a problem for the use of the ones around him? It is a question awaiting an answer.
� Responsibility gives the professional in terms of moral independence which depends on the professional ethics.
� In applying the professional reasoning, the Conduct of the professional is based on Mülendorf Decalogue which, with adequacies proper to the field, gives trust in the solutions offered to the ones around:
1. Serve the case in itself, not the person 2. Be above the parties, as the judge you support. 3. Do not let yourself intimidated by the personal attack in your objective and impartial activity. 4. Do not consider yourselves infallible. 5. Refuse the questions that surpass your answer. 6. Use the objections against your observations not to defend yourselves but to discover the truth. 7. Right any wrong, even when done by you.
258
8. Be just and clear. 9. Strive first to understand the matter, otherwise no one will understand your answer. 10.Defend the prestige of the profession.
� It is clear that the professional’s reasoning depends on his moral depth of not harming the people around him.
� The value principles and features do not say who the professional is but how the professional who is to apply a correct reasoning in substantiating the solutions offered to the ones around them must be.
� The argued opinions, the formulated solutions, the reached conclusions must give certainty of the solidity of the thing made by the professional.
� There are not few examples in which the professional abandoned the principles to his own use, deeply damaging the ones he served.
� His goal can be noble, the path however can be wrong. � Observing the principles depends on the education and training of the
professional. Distancing oneself from them is equivalent to turning off the light of the profession and the death of the professional.
� Confusion must not dominate in the profession. � Confusion impedes, affects the clarity both in formulating the conclusions, the
opinions and the solutions promoted by the professional and also in their reception and use by the users, by the people interested.
� Suspicion occurs as lack of trust, of doubt regarding the correctness and logic of the reasoning applied by the professional.
� Distancing from principles and using “creative” arrangements leads to a disagreement with the ethical condition, to the exiting of the system of the professional ending up in manipulating the information and the users, to deceit and flawed presentation of his conclusions, solutions.
REFERENCES 1. Bunget, O.C.,
Cristea, D.H. The independent auditor's Raport, a product of the Audit engagement, AAP Conferance I, Timisoara, nov. 2012.
2. Cristea, H. Rationamente fiscale, Simpozionul Ciuce Pavel, Editia X-a, 2012, Arad-Moneasa (Fiscal reasoning Ciuce Pavel Symposium, 10th Edition, 2012, Arad-Moneasa).
3. Cristea, H., Toma, M.
Doctrina si deontologie in profesia contabila din Romania, Editura CECCAR, Bucuresti, 2001 (Doctrine and deontology in the accounting profession in Romania, CECCAR Publishing House, Bucharest, 2001).
4. Span, G. A. Fundamentarea rationamentului profesional in Auditul statutar, Teza de doctorat, 2012, UBB (Substantiation of the professional reasoning in the statutory audit, Doctoral thesis, 2012, UBB).
5. * * * www.Codul etic national al profesionistilor contabili, 2007 (www. The national ethical code of the accounting professionals, 2007).
259
ALTERNATIVES OF THE HISTORIC COST IN THE EVALUATION PROCESS OF
QUALITY COSTS
Assoc. Prof. Valeriu Brabete Ph. D University of Craiova Faculty of Economics and Business Administration Craiova, Romania Assoc. Prof. Cristian Drăgan Ph. D University of Craiova Faculty of Economics and Business Administration Craiova, Romania Assist. Oana Stăiculescu Ph. D University of Craiova Faculty of Economics and Business Administration Craiova, Romania
Abstract: The presence of the competition within various fields of activity constrains the economic entities to pay increased attention to the problematics concerning the quality of the products or the services granted to consumers. In this context, the credible evaluation of the quality cost inclines to become a major concern for all economic operators. This study is based on some working hypothesis which, among others, aim the fact that, on one hand, the date which represent the base of the determinations realized in order to evaluate the quality cost are based on the principle of historic costs and, on the other hand, the specialty literature shows some failures of the information expressed under this form. Starting from these realities, the research undertaken brings into discussion the possibility of using other evaluation bases which shall be considered in order to obtain the data needed for the credible determination of the quality cost.
JEL classification: M40, M41
Key words: evaluation bases, methods based on evaluation, quality cost, advantages, disadvantages
1. INTRODUCTION Since the environment in which the economic entities activate is a competitive
one, we assist to an increase of the concern showed by it for the general problem of quality. The entities which manufacture goods and also those which carry out their activity in the services field are forced by the manifestation of the competition, more and more severe, to optimize their processes which represent the base for the increase of their quality, thus the financial results obtained, translated into increases of the market shares and of the sales volume, be as good as possible.
Although there is a tendency to think that the determination of the quality costs is a difficult approach, without benefits, both the specialty literature and the practice from the field show a series of advantages which can be generated by this process at the entity's level. Thus, Mironeasa and Mironeasa (2009, p. 59) illustrate such advantages,
260
among which are mentioned only few of them, more representative: the support of the grounding process of managerial decisions; the identification of processes, products or services which need improvements and the support of the approaches aiming their correction; the creation of some opportunities in order to reduce the costs from the entity's level; the control of costs and the use of resources; the identification of the losses from the entity's level and the optimization of financial results etc.
As a consequence, we can mentioned the fact that, trough the general concept of quality cost is defined an indicator which reflects, in a specific manner, the entirety of the efforts made in order to maintain and to increase the quality, but also the losses which have as a cause the non-quality, without omitting the actions to be realized in order to rectify the existent situation.
Considering the fact that the meeting of the desired quality level shall be realized in strong correlation with the obtainment of the efficiency and of financial results expected, we can state that appears the need for finding an optimum between the generated costs and the quality obtained. In this context, the quality cost is associated, for many times, with an assembly of costs referring to aspects which concern, on one hand, the conformity costs, detailed in prevention costs and evaluation and control costs and, on the other hand, the non-conformity costs, which are delimited in internal and external costs regarding the non-quality.
The quantification of these costs, as they were previously grouped, supposes the realization of some fundamental approaches on data expressed in monetary rate, supplied, for the most part, by the accounting evidence of the entity. Under these conditions, we cannot allow for the fact that the recognition process of the elements from the annual financial statements act on the quality of the information supplied by the accountancy by means of the influences exercised, equally, by the principle of the historic cost and the principle of monetary quantification. The registration, in accountancy, of the assets, of own capitals and of debts is realized, according to the historic cost principle, at the entry (origin) cost, consigned in the justificatory documents, which is unchanged until de-recognition, except the situations when it is replaced with another cost or changed through reevaluation.
This historic cost represents a true value established on their entry in the entity and, in monetary terms, it means the effort realized in order to bring the good within the company and, if we report to the General conceptual framework for financial reporting, elaborated by IASB (2011, p. 50), it represents “the evaluation base most frequently adopted by entities in the elaboration of financial statements”.
2. OBJECTIVES Although it represents the evaluation base most frequently adopted for the
elaboration of financial statements and it has the advantage that it indicates the true value of the elements from the date of their recognition, the historic cost can subsequently generate certain failure, especially in case of the economics affected by an accentuated fluctuation of prices, materialized in the reflection of a value which is not current (true) anymore, but a value expressed in a previous purchase power, exceeded. Under these conditions, we can find the influence of the monetary quantification principle because of the unstable feature which the monetary rate can have in time, determined by the variation of its purchase power. Thus, under the conjugated action of the two principles, the balance structures are submitted to the loss of synchronism effect between the evaluation by the occasion of the initial recognition, based on the historic
261
cost, and the evaluation realized by the occasion of the derecognition, based on current value.
Starting from the reality that, on one hand, for the most part, data which is processed in order to determine the quality cost is obtained under the conditions of use, as evaluation base, of historic costs and, on the other hand, the use of this evaluation base shows considerable failures, our study aims to illustrate possible alternative solutions, whose application contributed to the significant elimination or diminution of the disadvantages previously signaled.
Among the multitude of evaluation bases which the literature brings into discussion, in our analysis we'll refer to the possibility to use the methods based on replacement (evaluation) costs, which are characterized by the fact that they present balance structures in current values, respectively in values of the present, they don't consider the historic values, use real bases for their expression and allow that the information provided by the financial statements shows the reality.
3. LITERATURE REVIEW AND PREVIOUS STUDIES The models based on evaluation are characterized by the fact that they keep the
nominal unit of measure, changing the evaluation basis of the assets, the objective aimed being that to get a result by means of which we ensure the maintenance of the operative capacity of economic entities.
A delicate aspect generated by the use of these methods refers even at their essence, respective to the change of the evaluation bases, because the replacement of the historic cost, considered an “expired” value, generates several debates both in respect to the terminology of a wide circulation, and in respect to the change and to the effective use of one of the variants possible from the theoretical point of view.
From the multitude of concepts invoked by the specialty literature, regarding to the problematics of the evaluation bases, we'll extract some examples considered suggestive, axing on the debate and on the aspect of the similitude which exists between various terms, which sometimes generates confusions.
A first category of definitions refers to the main base proposed within the accounting systems in current values, which is considered to the the replacement cost. According to its definition, the replacement cost represents the amount to be spend by the company in order to obtain an identical good or a good equivalent to that submitted for evaluation.
We meet similar definitions in the specialty literature for the notions of current cost, actual cost or current entry price, this last one being delimited, according to Lauzon (1984), in the following two variants:
- reconstitution cost, represented by the amount of money needed for the procurement, from an occasion market, of a good with the same functioning duration, which is in the same stage of use or the amount needed for the purchase of a good which offers the same potential of production as the good evaluated at the putting into service as a new one, to which is applied the related physical attrition rate, without the new good benefit from substantial technological improvements;
- replacement cost, formed of the amount needed for the acquisition of a good with a production capacity superior to the evaluated good, to which is applied the physical and moral attrition rate.
According to another point of view belonging to Belkaoui (1984, p. 229), the current entry price is separated in the following way:
262
- the occasion cost; - the reconstitution cost; - the replacement cost. Herewith, we considered needed the presentation of the opinion of some
authors, among which we mention Muţiu (2002, p. 185) and Ionaşcu (1997, p. 156), according to whom, under the conditions of the existence of technical progress, the replacement cost and the current cost cannot be equal.
In what concerns us, we agree with this point of view because we think that, on one hand, the technological process doesn't allow the identical replacement and, on the other hand, the replacement cost refers to the substitution of a good with an identical one from the point of view of performances, while the actual (current) cost is associated with the introduction, inside the enterprise, of a good whose current technical performances are superior to the performances of the replaced good. We consider that this controversial discussion can appear when it's about goods submitted to the moral attrition, because in case of the stocks, for example, the effect of the technological progress doesn't exercise any influence. Eventually, it could be used the notion of current replacement cost in order to determine the financial effort made in order to replace a good with another one, of the same type, but which, because of the recent, or relatively recent, technological discoveries, has improved performances in report to the replaced good.
As a matter of fact, in respect to this problem, in the Anglo-Saxon practice appeared the concept of modern equivalent asset by means of which the current replacement cost also includes an adjustment related to the technical improvements brought to the goods which serve as replacement criteria.
Another category of terms, which are used as evaluation bases within this type of methods, includes the general concept of realizable value and its following particular forms:
- the net realizable value expresses the difference between future collections from the sale of a good and the expenses occasioned by the sale operation;
- the realizable or the clearing value represents the size of liquidities or of the equivalents of liquidities which could be obtained, at the end of the year, through the sale of an asset in normal conditions;
- the current output price expresses the output price which can be obtained in case of the sale of an asset in normal conditions.
Analyzing all these definitions we can notice a similar content determined by the following elements:
- is supposed that the cession of the evaluated asset is realized under the conditions of meeting the principle of the continuity of the activity, but not in extreme situations, such is the liquidation;
- represent an uncertain, theoretical value, which can be defined depending on certain strict conditions, even for the same good;
- the determination of these values is difficult and leads to several interpretations, because it supposes to call the experts and to consult soma specialized databases (customs, fiscal, of financial capital markets, etc.), as Ţugui states (2000, p. 108).
Herewith, we also keep the point of view expressed by Muţiu (2002, p. 186) according to which, because of the fact that the adjustment based on evaluation has in consideration the retraction of the assets of the type of immobilizations and stocks, the
263
realizable value assigned to the stocks aimed for the sale will be maximum and that assigned to the immobilizations will be minimum, this failure making that the realizable (from the market) value not be accepted as evaluation base.
Continuing with the study of the concepts used as evaluation bases within the accounting systems based on the evaluation, we identify a third group of terms, which in the specialty literature received equivalent or quasi-equivalent definitions. We refer to those values which express the updated flows of liquidities to be generated as a consequence of the exploitation of a good in normal conditions, met in the specialty literature with the following denominations:
- updated value; - economic value; - current value of net treasury flows; - net updated value. The problems imposed by these evaluation bases, under the conditions of their
use refer especially to two aspects, namely: - subjective determinations of future treasury flows which can be generated by
a good, with direct influences on the credibility of the evaluation based on the economic value;
- difficulties in establishing the treasury flows for each asset in part, if there is a diversity of units which generate cash.
Among all the values which can be possibly used as alternatives of the historic cost, we appreciate that the most objective one is the current cost, reason for which the methods based on evaluation are also called methods in current costs. In order to determine this current cost, we can use various techniques, among which we mention:
- the most used way for determining the current cost consists in the multiplication of the value of the good to be evaluated with an index of the prices for the respective category of goods;
- the direct appreciation of the current cost by taking information which refers to a certain category of goods from the most recent sources, such as: official or producers price lists, specialized databases, prices from the market of the respective good, price devices etc.;
- the indirect appreciation of the current cost which is principally based on the method of the comparison of the production capacity, the method of the unitary cost on input or output unit and the evaluation method of the productive function, but which, because of the high degree of subjectivity, is less used;
- the updating of the financial flows which will be generated by an asset during its life span remained, at an updating rate specific to the field.
4. THE SPECIFIC METHODOLOGY OF THE MODELS BASED ON EVALUATION In general, the methods based on evaluation are characterized by some
definitive elements, which make them different from the other categories of methods, their general features referring, in essence, to the following more important aspects:
� the adjustment of the values of immobilizations and stocks belonging to the entity, following the calculation of the result adjusted with the influences of certain monetary elements;
� the re-treatment of the value of immobilizations and stocks follows their expression in the current cost from the performance date of the adjustment operation,
264
by taking into calculation the depreciations, the cost of the sales and of the consumption of corrected stocks;
� in order to perform adjustments, are used specific price indexes of the assets submitted for evaluation;
� the re-treated value of the assets is obtained through the multiplication of their historic cost with the conversion factor calculated as report between the specific index of the prices of the respective assets from the adjustment date and the same index from the entry date into entity of the evaluated elements, the resulting value being compared with the net realizable value of its stock, in case of immobilizations, with their true value, among which the lowest is chosen;
� the generation of two types of gains from the holding of assets, the realized holding gain (CDAR) and the non-realized holding gain (CDAN), which is calculated according to the following relations:
CDAR
= Expenses corresponding to the realized revenues, evaluated in
current costs
-
Expenses corresponding to the revenues realized in
historic costs
CDAN = Assets which weren't consumed in current costs
- Assets which weren't consumed in historic costs
The realized holding gain, named and resulting from the holding of consumed
assets, appears as a consequence of the evaluation at current cost, in respect to the historic cost, of the cost of sales, consumptions and depreciations, the difference between the two costs representing for the company a realized economy, because of the accounting of the expenses at historic cost. We shall mention that the value pulse found will affect, meaning will increase, the own capitals by means of a specific account and it won't be recognized in the profit and loss account, in order to maintain the productive capital.
In respect to the non-realized holding gain, also called result from the holding of the assets which weren't consumed, this is generated by the fact that the assets submitted for adjustment weren't consumed, the value pulse thus obtained being transferred in order to keep the capital.
The stages of the methodology which are based on the use of the current cost, as they are showed by various authors, among which we mention Muţiu (2002, p.188-191), are presented, in a suggestive way, as it follows:
1. The re-treatment of the tangible assets and of the stocks from the opening balance consists in the multiplication of the final balance of the accounts of tangible assets and stocks from 31.12.N-1, expressed in historic costs, with the conversion factor calculated as report between the specific index of the prices of the assets evaluated on the opening date of the financial year (31.12.N-1) and the specific index of the prices of the same elements from the entry date into entity.
For re-treatment, the amortization related to the tangible assets (in balance on 31.12.N-1), expressed in historic costs, is multiplied with the same conversion factor with which the respective assets were re-treated.
In respect to the adjustment of stocks, we consider necessary to mention the fact that, depending on the frequency of the entries during the year, the nominator of the conversion factor can be represented by the specific index of the average prices during
265
the year, if the entries are found during the entire financial year or by the specific index of the prices of each category of stocks from the deliveries date, if the entries are aleatory. Herewith, in case of a certain rhythm of the deliveries can be taken into account the rotation speed of the stocks in order to establish the date of the entry in the company.
The plus difference resulting from the adjustment will be accounted through the delivery of the assets accounts and the lending of the account regarding the capital maintenance reserve.
2. The re-treatment of the elements of the profit and loss account for the current financial year depending on the current cost of the assets which were consumed, of sold stocks, taking into account the conservation of the necessary of monetary floating asset.
a. For the re-treatment of the expenses with amortization is considered that this expresses a linear consumption during the entire year the adjustment being performed according to the relation showed below:
Amortization in current cost on
31.12. N
=
Amortization in historic cost on
31.12. N
x
ISP on 30.06.N �����������
ISP on the entry in the company
where ISP = specific prices index b. For the adjustment of the expenses regarding the stocks sold and consumed,
we start from the relation:
Starting balance (Si) + Inputs (I) - Final balance (Sf) = Outputs
From where results:
Expenses regarding row
materials, materials and
goods in current costs on 31.12.N
=
Starting balance in current costs x ISP on 30.06.N ������� ISP on the entry in the company
+
Deliveries x
ISP on 30.06.N ������� ISP on the entry in the company
-
Final balance x ISP on 30.06.N ������
ISP on the entry in the company
c. The determination of the result from the holding of the monetary exploitation floating asset needs, for the beginning, the calculation of the monetary exploitation floating asset (FRME) as difference between exploitation receivables and debts.
FRME variation is due, on one hand, to the increase of the volume of the exploitation necessary of the company and, on the other hand, to the price variations. The first component of FIRME variation is known as a consequence of the adjustments to which the tangible assets and the stocks were submitted. The second component, due to the change of the prices (∆FRMEP) is determined as a difference between the total variation of FRME expressed in historic costs (∆FRME) and FRME variation due to the increase of the volume of the exploitation necessary (∆FRMEV) thus:
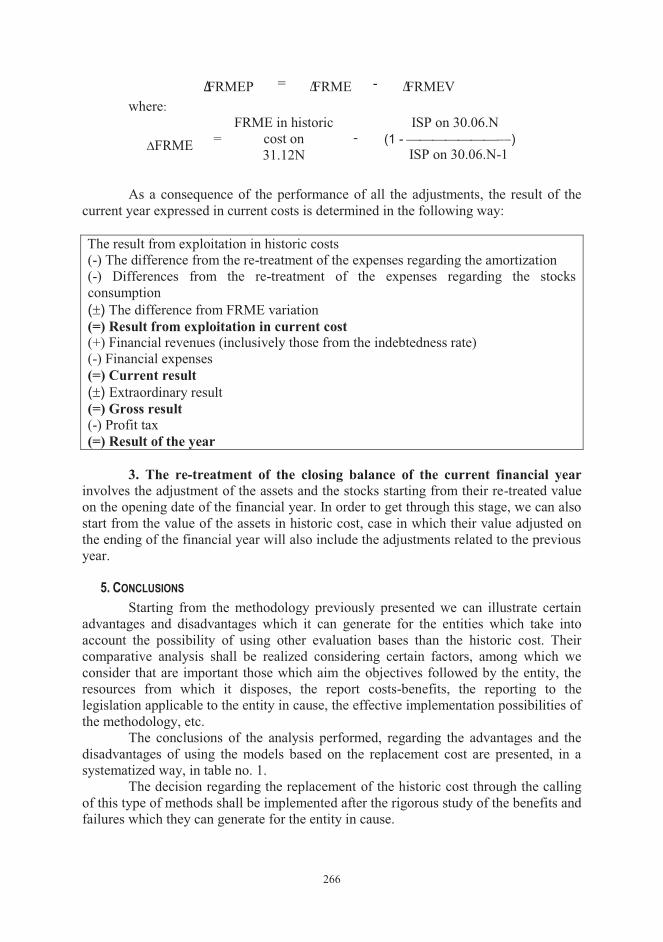
266
FRMEP = FRME - FRMEV where:
�FRME
=
FRME in historic cost on 31.12N
-
ISP on 30.06.N (1 - ���������) ISP on 30.06.N-1
As a consequence of the performance of all the adjustments, the result of the current year expressed in current costs is determined in the following way:
The result from exploitation in historic costs (-) The difference from the re-treatment of the expenses regarding the amortization (-) Differences from the re-treatment of the expenses regarding the stocks consumption (�) The difference from FRME variation (=) Result from exploitation in current cost (+) Financial revenues (inclusively those from the indebtedness rate) (-) Financial expenses (=) Current result (�) Extraordinary result (=) Gross result (-) Profit tax (=) Result of the year
3. The re-treatment of the closing balance of the current financial year
involves the adjustment of the assets and the stocks starting from their re-treated value on the opening date of the financial year. In order to get through this stage, we can also start from the value of the assets in historic cost, case in which their value adjusted on the ending of the financial year will also include the adjustments related to the previous year.
5. CONCLUSIONS Starting from the methodology previously presented we can illustrate certain
advantages and disadvantages which it can generate for the entities which take into account the possibility of using other evaluation bases than the historic cost. Their comparative analysis shall be realized considering certain factors, among which we consider that are important those which aim the objectives followed by the entity, the resources from which it disposes, the report costs-benefits, the reporting to the legislation applicable to the entity in cause, the effective implementation possibilities of the methodology, etc.
The conclusions of the analysis performed, regarding the advantages and the disadvantages of using the models based on the replacement cost are presented, in a systematized way, in table no. 1.
The decision regarding the replacement of the historic cost through the calling of this type of methods shall be implemented after the rigorous study of the benefits and failures which they can generate for the entity in cause.
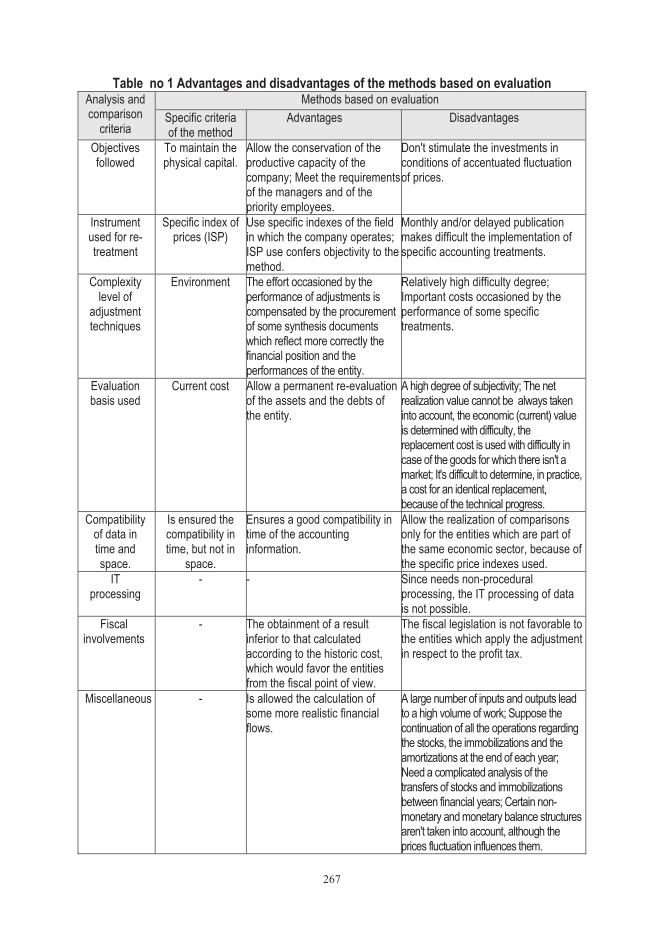
267
Table no 1 Advantages and disadvantages of the methods based on evaluation Analysis and comparison
criteria
Methods based on evaluation Specific criteria of the method
Advantages Disadvantages
Objectives followed
To maintain the physical capital.
Allow the conservation of the productive capacity of the company; Meet the requirements of the managers and of the priority employees.
Don't stimulate the investments in conditions of accentuated fluctuation of prices.
Instrument used for re-treatment
Specific index of prices (ISP)
Use specific indexes of the field in which the company operates; ISP use confers objectivity to the method.
Monthly and/or delayed publication makes difficult the implementation of specific accounting treatments.
Complexity level of
adjustment techniques
Environment The effort occasioned by the performance of adjustments is compensated by the procurement of some synthesis documents which reflect more correctly the financial position and the performances of the entity.
Relatively high difficulty degree; Important costs occasioned by the performance of some specific treatments.
Evaluation basis used
Current cost Allow a permanent re-evaluation of the assets and the debts of the entity.
A high degree of subjectivity; The net realization value cannot be always taken into account, the economic (current) value is determined with difficulty, the replacement cost is used with difficulty in case of the goods for which there isn't a market; It's difficult to determine, in practice, a cost for an identical replacement, because of the technical progress.
Compatibility of data in time and space.
Is ensured the compatibility in time, but not in
space.
Ensures a good compatibility in time of the accounting information.
Allow the realization of comparisons only for the entities which are part of the same economic sector, because of the specific price indexes used.
IT processing
- - Since needs non-procedural processing, the IT processing of data is not possible.
Fiscal involvements
- The obtainment of a result inferior to that calculated according to the historic cost, which would favor the entities from the fiscal point of view.
The fiscal legislation is not favorable to the entities which apply the adjustment in respect to the profit tax.
Miscellaneous
-
Is allowed the calculation of some more realistic financial flows.
A large number of inputs and outputs lead to a high volume of work; Suppose the continuation of all the operations regarding the stocks, the immobilizations and the amortizations at the end of each year; Need a complicated analysis of the transfers of stocks and immobilizations between financial years; Certain non-monetary and monetary balance structures aren't taken into account, although the prices fluctuation influences them.
268
REFERENCES 1. Belkaoui, A. Theorie comptable, deuxieme edition, PUQ, Quebec, 1984 2. Brabete, V. Managementul contabil în economia de tranziţie în viziune naţională
şi internaţională, Editura Universitaria, Craiova, 2007. 3. IASB Standardele Internaţionale de Raportare Financiară (IFRS), Editura
CECCAR, Bucureşti, 2011. 4. Ionaşcu, I. Epistemologia contabilităţii, Editura Economică, Bucureşti, 1997. 5. Lauzon, L. P. Information sur les effets des variations de prix, Gaetan Morin,
Quebec, 1984. 6. Mironeasa, C.,
Mironeasa, S. Costurile calităţii, Editura Matrix Rom, Bucureşti, 2009.
7. Muţiu, A. I. Contabilitatea inflaţiei, Editura Economică, bucureşti, 2002. 8. Ţugui, A. Contabilitatea inflaţiei, Editura Economică, Bucureşti, 2000.
Acknowledgement: This work was partially supported by the grant
number 4C/27.01.2014, awarded in the internal grant competition of the University of Craiova.
269
THE MECHANISM OF PAYMENT REQUESTS - AN INSTRUMENT FOR
FACILITATING THE FINANCING FROM STRUCTURAL FUNDS OF
ROMANIAN PUBLIC ACADEMIC EDUCATION INSTITUTIONS
Cristina-Petrina Drăguşin Ph. D Student University of Craiova Faculty of Economics and Business Administration Craiova, Romania
Abstract : Today, when the national academic education system is chronically underfinanced, the universities must identify, more than ever, in addition to their current resources, other funding sources that will contribute at reaching the assumed missions. A significant funding source is represented by the EU funds. Starting with the 4th trimester of 2013, the universities can use the mechanism of settlement for payment requests, as public beneficiaries that implement projects financed from structural funds. The paper focuses on the implementation of the payment requests mechanism by the public universities and presents itself as an applicative study through which we will highlight its methodology and steps, together with the accounting representation of its application, taking as landmark the University of Craiova. We considered mainly aspects related to the interpretation of the applicable referential in connection with its practical application, meaning the accounting valorization of the financing facilitated by the application of the mechanism.
JEL classification: I22, I29, M41, M48
Key words: payment request; reimbursement request; structural funds; operational programs; own contribution
1. INTRODUCTION In Romania, the academic education institutions from the public sector function
as universities funded from: the amounts from the State budget, extra-budgetary incomes and funds from other sources, all these resources being understood as own incomes, according to the valid law.65 Concerning the administration of these resources, it is essential that we highlight that, currently, the Romanian universities benefit from university financial autonomy, which gives them the right to manage their own resources, while respecting the valid legislation.
Lately, obtaining the financial resources necessary for the activities of the universities has become an issue of financial management and the university financial
65 National Education Law no. 1/2011, published in Romanian Official Gazette, Part I, no. 18 of 10 January 2011, as amended and completed by Government Emergency Ordinance no. 21/2012.
270
autonomy is manifested especially in obtaining and using the extra-budgetary incomes.66
A special category of extra-budgetary incomes is represented by the amounts obtained by universities from EU funds, as beneficiaries, according to the contracts.
Between 2007 and 2013, the application of the National Strategic Reference Framework, as an harmonizing objective of the national development priorities with the EU community level ones, was accomplished through operational programs financed by EU-funds inside the ,,Convergence’’ and the ,,European Territorial Cooperation” objectives.67
Today, a better absorbtion of the structural funds represents an important priority of the Romanian Government since it implies attracting significant amounts for investments, for finalizing and starting new infrastructure projects, for developing human resources, for creating new jobs.68
One of the measures adopted by the Romanian Government for increasing the absorption rate of EU-funds and for insuring the continuity in projects’ financing is to launch the mechanism of payment requests’ settlement.
This work is part of an extended research which will form part of the doctoral thesis called „The accounting and financial management of public higher education institutions”.
2. OBJECTIVES The general objective of this work is to highlight an image on the mechanism
of settlement for payment requests in public institutions of academic education which benefit for EU non-refundable funds.
In the context of an interesting and challenging thematic, as a result of the recent launching of the settlement mechanism, this study suggest the solution of the University of Craiova for the accounting valorizing of the financing facilitated by its application.
3. METHODOLOGY The research methodology used in elaborating this paper is based on the
processing and interpretation of a multitude of data and information collected from various sources such as: valid regulations, specialty works, reports published by the Ministry of European Funds, information spread by academic education public institutions, but also various points of view issued by the specialty organisms concerning the themes approached during the investigative process.
4. THE RELATION BETWEEN THE PAYMENT REQUESTS AND THE REIMBURSEMENT REQUESTS Both the payment requests mechanism and the reimbursement requests involve
a triple relations between the financer, the beneficiary and the suppliers (goods suppliers, service providers, executors etc.).
66 Avram, M., Drăguşin CP, The Current Status of Academic Education Financing in Romania, Annals of Faculty of Economics, University of Oradea, Vol. 1, Issue 1, pp. 837-845, 2013. 67 www.fonduri-ue.ro 68 www.gov.ro
271
Both mechanisms are based on a funding contract between the financer and the beneficiary. In its turn, the beneficiary, for realizing the financing contract’s object, concludes various contracts with thirds. Based on these contracts, the suppliers deliver goods, provide services, execute works or guarantee them through letters of bank guarantee and issue invoices or advance payment invoices.
In this stage comes the distinction between the two mechanisms: � In the first case, the beneficiary will proceed to pay the invoices and, based on
the payment documents, will make and submit to the financer the reimbursement request. After collecting it, the beneficiary will recover part of the consumed resources for paying the goods, the works, the services or advance payments. In other words, for this mechanism, the financing works based on the reimbursable principle, according to which the beneficiary will pay the expenses and then he asks back the amount for reimbursement. The main disadvantage is the great gap of time between the moment when the payments are made for the activities of the project and the moment when the money are actually received, thus appearing the necessity of insuring with liquid assets throughout the reimbursement period.
� In the second case, based on the invoices or advance payment invoices accepted for the payment, but not yet settled by the beneficiary, he will make and submit to the financer the payment request. The beneficiary will be able to make the payment towards the third suppliers only after covering the payment request by the management authority. Actually, the valid legislation defines the payment requests as „requests made by the beneficiaries of projects financed from structural instruments, through which they ask to the management authorities the amounts necessary for paying the reimbursable expenses, representing eligible expenses correspondent for the structural instruments and the public contribution insured from the State budget, and also for the payment of the VAT, considered non-eligible, correspondent for the eligible expenses.”69 We can now see the remarkable difference between the reimbursement request
and the payment request: the reimbursement request is based on already paid documents, while the payment request is made only based on non-reimbursed documents.
The two mechanisms will function simultaneously, giving the beneficiaries the possibility to choose either the classical system, either the new launched alternative.
5. THE STAGES OF THE MECHANISM OF PAYMENT REQUESTS Basically, the financing methodology specific for the mechanism of payment
requests, graphically represented in Figure no. 1, implies the following stages:
69 Government Emergency Ordinance no. 84/2013 for the amending and supplementing Government Emergency Ordinance no. 64/2009 regarding the financial management of structural instruments and their use for the convergence objective, published in Official Gazette no. 579 of 11 September 2013.
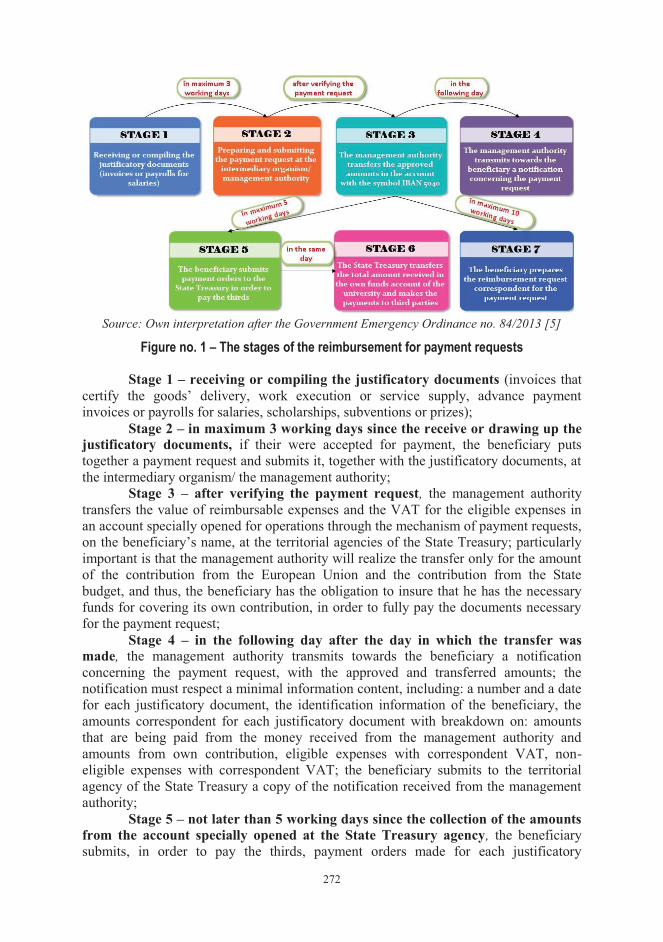
272
Source: Own interpretation after the Government Emergency Ordinance no. 84/2013 [5]
Figure no. 1 – The stages of the reimbursement for payment requests Stage 1 – receiving or compiling the justificatory documents (invoices that
certify the goods’ delivery, work execution or service supply, advance payment invoices or payrolls for salaries, scholarships, subventions or prizes);
Stage 2 – in maximum 3 working days since the receive or drawing up the justificatory documents, if their were accepted for payment, the beneficiary puts together a payment request and submits it, together with the justificatory documents, at the intermediary organism/ the management authority;
Stage 3 – after verifying the payment request, the management authority transfers the value of reimbursable expenses and the VAT for the eligible expenses in an account specially opened for operations through the mechanism of payment requests, on the beneficiary’s name, at the territorial agencies of the State Treasury; particularly important is that the management authority will realize the transfer only for the amount of the contribution from the European Union and the contribution from the State budget, and thus, the beneficiary has the obligation to insure that he has the necessary funds for covering its own contribution, in order to fully pay the documents necessary for the payment request;
Stage 4 – in the following day after the day in which the transfer was made, the management authority transmits towards the beneficiary a notification concerning the payment request, with the approved and transferred amounts; the notification must respect a minimal information content, including: a number and a date for each justificatory document, the identification information of the beneficiary, the amounts correspondent for each justificatory document with breakdown on: amounts that are being paid from the money received from the management authority and amounts from own contribution, eligible expenses with correspondent VAT, non-eligible expenses with correspondent VAT; the beneficiary submits to the territorial agency of the State Treasury a copy of the notification received from the management authority;
Stage 5 – not later than 5 working days since the collection of the amounts from the account specially opened at the State Treasury agency, the beneficiary submits, in order to pay the thirds, payment orders made for each justificatory
273
document, respecting the breakdown on the individualized elements during the fourth stage, according to the notification transmitted by the management authority;
Stage 6 – after all the necessary verifications, but in the same day in which the payment orders were received from the beneficiary, the territorial agency of the State Treasury transfers the total amount received from the management authority in the own incomes account of the beneficiary academic education institution, from where, based on the submitted payment orders, the transfers towards thirds will be made;
Stage 7 – not later than 10 working days from the collection of the amounts transferred by the management authority, the academic education institution must prepare the reimbursement request correspondent for the amounts paid through the mechanism of payment requests and to submit it at the intermediary organism/ management authority; if the amounts are not justified through a reimbursement request, these will be given back to the management authority.
5. THE GENERAL OPERATIONS FOR APPLYING THE MECHANISM OF PAYMENT REQUESTS REFLECTED IN ACCOUNTING
For the accounting reflection of the operations made by the academic education institutions through the mechanism of payment requests, in the following we will bring forward the case of the University of Craiova, as public beneficiary that implements projects financed from non-refundable external funds.
The University of Craiova is by far the most prestigious academic education public institution from the entire region of Oltenia. In recent years, the university was intensely focused on the challenging goal of attracting funds also from other sources than the ones coming from budgetary financing, following the identification of new financing opportunities in order to diversify the own income sources. A financing opportunity on competition fundaments was realized in accessing and starting implementing structural funds financed projects.
In order to implement strategic projects that generate added-value, the main objective of the University of Craiova implied: diversifying the range of partners, diversifying the major intervention directions accessed and optimal allocation of the financial, logistical and human efforts necessary for the ongoing of the projects.70
Between 2009-2013, the University of Craiova accessed and implemented 53 projects from which: 38 projects financed through the European Social Fund and 15 projects financed from the European Regional Development Fund.
For the projects financed from external non-reimbursable funds distinct accounting evidence is kept, using analytical accounts for each project. The projects are individualized on cost centers and on activities.
The funds come from the European Union (through the European Regional Development Fund or the European Social Fund) and from the national budget, through the national contribution allocated in order to reach the assumed objectives. To this, is added up the university’s own contribution, as a beneficiary of the added-value brought by the projects.
For the mechanism of payment requests, a distinct account was opened at the State Treasury with the symbol IBAN 5040 „Available for the mechanism of
70 Annual Report of the Rector of the University of Craiova regarding the institution status for 2012 available at http://www.ucv.ro/pdf/despre/strategie/Raport_de_activitate_2012-2013.pdf accessed on 02/01/2014
274
payment requests”, through which are received the amounts from the management authority, amounts that will be transferred subsequently by the Treasury in the university’s own incomes account. Particularly important is that, from the account with the symbol IBAN 5040, the beneficiaries cannot make withdrawals or transfers since the money that had arrived in this account, through the specially created mechanism, have a precise destination.
In this context, in the accounting of the University of Craiova, the following accounting registrations, specific for the mechanism of payments requests are made:
a) Based on the banking statements for the account opened at the Treasury with the symbol IBAN 5040, the following are being registered:
1. The collection of the amounts received from the management authority representing the counter value of the payment request, minus the part of the own contribution of the university. Records are distinct, respecting the percentages mentioned in the grant agreement.
5151
„Available in lei from external non-refundable funds’’
= 4585.2 (4585.3)
„Amounts from FEN (the state budget) in the mechanism of the payment request’’
2. The transfer of the amounts received from the management authority in the own incomes account of the University of Craiova (account opened at the Treasury and with the symbol IBAN 504601):
581
„Internal transfers”
= 5151
„ Available in lei from external non-refundable funds”
3. The correction of the artificially transferred rollovers with amounts that do not represent net payments:
5151
„ Available in lei from external non-refundable funds”
= 5151
„ Available in lei from external non-refundable funds”
With the
amount in red
b) Based on the bank statements correspondent for the treasury account with the symbol IBAN 504601, the following are registered:
1. The collection of the amounts transferred from the account with the symbol IBAN 5040:
5601
„Available for the institutions integral financed from own incomes”
Chapter 40.10.16 „Amounts received during the mechanism of payment requests”
= 581
„Internal transfers”
2. The payment of the amounts due to suppliers or fixed assets suppliers, while
the own contribution of the University of Craiova is supported from its own incomes; the payment towards thirds will be made simultaneously for the amounts transferred from the account with the symbol IBAN 5040 and for its own contribution, insuring the complete settlement of the assumed obligations, as follows:
275
401 „Suppliers”/
404 „Fixed assets suppliers”
= 5601
„ Available for the institutions integral financed from own incomes”
The chapter Operational Programmes
Expenses title 56 „Projects financed from external non-refundable EU funds’’ with the following breakdown:
56.xx.01 National financing
56.xx.02 External non-refundable financing
56.xx.03 Non-eligible expenses
where xx is 01 for ERDF and 02 for ESF c) After the payments, in accounting is registered the claim of the University of
Craiova towards the European Commission for payments made under the title 56 „Projects financed from external non-refundable EU funds” for part of the eligible expenses correspondent to the non-refundable external EU funds, thus:
4505.5 „Amounts received from the European Commission that represent incomes from the
general consolidated budget”
= 473.01 „Amounts that are to be requested for reimbursement”
d) When drawing up the reimbursement request, in accounting the amounts
correspondent for the structural instruments and those representing the state budget state contribution are distinctly highlighted, as it follows:
Amounts correspondent for the external EU non-refundable funds:
4583.1.1(4583.1.2)
„Amounts to receive from the Certification Authorities/ Management Authorities for payment made in the current year (in the previous year) – PROJECTS FINANCED
FROM EXTERNAL NON-REFUNDABLE EU FUNDS”
= 775
„Financing from external non-refundable EU funds”
Chapter 45 „Amounts received from EU in the made payments account” with the
following breakdown:
45.10.xx.01 Amounts received during the current year
45.10.xx.02 Amounts received during the previous years,
where xx is 01 for ERDF and 02 for ESF
Amounts correspondent for the budget funds:
276
4583.2.1(4583.2.2)
„ Amounts to receive from the Certification Authorities/ Management Authorities for payment made in the current year (in the
previous year) – BUDGET FUNDS”
= 778
„Incomes from the national contribution correspondent for the programmes/ projects financed from external non-
refundable funds”
Chapter: 42.10.39 „Subventions from the state budget to the institutions that are
completely financed from own incomes for projects financed from post-EU aderation projects” with the following breakdown:
42.10.39.01 for payments made during the current year
42.10.39.02 for payments made during the previous years
When submitting the reimbursement request to the management authority, the
claim of the University of Craiova towards the European Commission ends: 473.01 „Amounts that are to be requested for
reimbursement” = 4505.5 „Amounts that are to be received
from the European Commission representing incomes from the general
consolidated budget” e) Subsequently, the reduction of the amounts that are to be received from the
management authorities is registered with the amounts received through the mechanism of payment requests:
Amounts correspondent to external non-refundable funds: 4585.2
„Amounts from FEN in the mechanism of payment requests”
= 4583.1.1(4583.1.2)
Amounts to receive from the Certification Authorities/ Management Authorities for payment made in the current year (in the previous year) – PROJECTS FINANCED FROM EXTERNAL NON-REFUNDABLE
FUNDS” Amounts correspondent for the budget funds:
4585.3
„Amounts from the state budget in the mechanism of payment requests”
= 4583.2.1(4583.2.2)
„ Amounts to receive from the Certification Authorities/ Management Authorities for payment made in the current year (in the
previous year) – BUDGET FUNDS” f) The amounts received through the mechanism of payment requests are
regularized by reducing the amounts showed in the chapter “Amounts received in the payment requests mechanism” and highlighted in the chapter for incomes specific for that programme:
5601
„Availible for instututions completely financed from own incomes” Chapter: 40.10.16
= 581
„Internal transfers”
With the amount in
red
277
5601
„Availible for instututions completely financed from own incomes”
Chapter: 45.10 or 42.10.39
= 581
„Internal transfers”
With the amount in
black
5. CONCLUSIONS The mechanism of the reimbursement requests was one much disputed,
especially by public beneficiaries. In their quality of public beneficiaries, academic education institutions have experienced serious problems related to cash flow due to immobilization of some significant own resources to support projects financed from structural instruments.
In the pessimistic context in which universities face amplified budget pressure of non-refunding payments made for the implementation and project development, we believe that the mechanism of payment requests has emerged as a finance facilitating tool from non-refundable external funds, representing an effective alternative demarche for public beneficiaries.
Analyzing the comparison of the two mechanisms, tailored to the specific of the state universities, we find that the mechanism of reimbursement requests undoubtedly favors the financier and the providers and disadvantages the beneficiary university. Academic education institution bears all project costs, facing with the budgetary pressure. Instead, the financier enjoys total safety because he reimburses the counter value of certain goods, works or services effective paid by the beneficiary. Regarding the suppliers, they are advantaged by the shorter term of payment, fixed by the agreement with the beneficiaries, which, although they are submitted to budgetary pressure, they all have the interest to make the payment as soon as possible in order to request at the reimbursement the amounts spent. In case of the mechanism of the payment requests, we believe that only part situated in disadvantage are the suppliers. They will face with an eliminatory criterion at the public acquirement procedure that is longer payment terms set by the beneficiaries especially to apply the mechanism just recently released. Regarding the financier, in this case we may speak of total safety too because he will validate the payment of the delivered goods, done works, services provided or guaranteed, as appropriate. The indisputable advantage appears in case of the universities that enjoy in this situation a cash flow provided by the payment request.
Despite the significant advantages offered by the new mechanism, in case of the University of Craiova, by the end of 2013, only two projects have opted for its implementation. The main reason is not the lack of information, nor reluctance, but the fact that many projects were already completed and most are nearing of the completion. But, despite the difficult times faced, the University of Craiova tries an optimistic approach toward funding opportunities 2014-2020.
Finally, considering the advantages and disadvantages of the two mechanisms, we believe that the possibility of the beneficiaries to choose either the classic system or the new alternative, is an advantage, allowing the selection of reliable variant relating to the context, available resources, additional sources of financing and payment terms.
278
REFERENCES 1. * * * National Education Law no. 1/2011, published in Romanian Official
Gazette, Part I, no. 18 of 10 January 2011, as amended and completed by Government Emergency Ordinance no. 21/2012
2. Avram, M., Drăguşin, C.P.
The Current Status of Academic Education Financing in Romania, Annals of Faculty of Economics, University of Oradea, Vol. 1, Issue 1, pp. 837-845, 2013
3. * * * www.fonduri-ue.ro 4. * * * www.gov.ro 5. * * * Government Emergency Ordinance no. 84/2013 for the amending
and supplementing Government Emergency Ordinance no. 64/2009 regarding the financial management of structural instruments and their use for the convergence objective, published in Official Gazette no. 579 of 11 September 2013
6. * * * Annual Report of the Rector of the University of Craiova regarding the institution status for 2012 available at http://www.ucv.ro/pdf/despre/strategie/Raport_de_activitate_2012-2013.pdf accessed on 02/01/2014
279
RISK MEASUREMENT USING THE Β (BETA) COEFFICIENT FOR FINANCIAL
INVESTMENT COMPANIES
Assoc. Prof. Dorel Berceanu Ph. D Faculty of Economics and Business Administration Craiova, Romania Prof. Nicolae Sichigea Ph. D University of Craiova Faculty of Economics and Business Administration Craiova, Romania Daniel Militaru Ph. D
Abstract:This article addresses, in the current context, a very topical issue, namely that of the risk estimation by using the β coefficient at financial investment companies (FICs). Thus, of the 82 companies listed on the first three categories of the Bucharest Stock Exchange and the international securities section, the FICs are found in the structure of portfolios held by many investors. Therefore, we considered interesting to calculate the β coefficient for the five FICs, using historical data for the past four years to measure risk using the „volatility” of these securities in relation to the market. We consider the results obtained to be a useful tool for current and future capital market investors when „establishing” portfolios, according to the profile of each of them, reminding them at the same time that „the past is no guarantee of future”.
JEL classification: G32, G12
Key words: share, portfolio, risk, volatility, investment
1. INTRODUCTION By object, the investments can be grouped into: investments in financial assets,
especially shares and bonds, and investments in real assets that consist in allocating capital for the creation or acquisition of tangible or intangible assets.
The success of an investment largely depends on the skill of the decision maker in directing the future for the purposes of fulfilling the events they predict, although there are likely to be other unexpected events which, in a decisive way, can influence the expected results from an investment. So, the future is full with the unknown, and therefore, the investment no matter what type it is, involves the „risk” that must be commensurate and integrated into the investment process.
We generally define risk, as the variability of possible outcomes from what was expected, and the risk of an asset as the likely variability of the asset’s future profitability. Therefore, the risk is related to the probability of getting a lower than expected profitability. The lower it is the more risky the investment will be. In other words, riskier investments should have a higher expected return.
There is no news that investors like to have as big as possible output and they do not like the „risk”, i.e. they will invest in risky assets only if these assets offer a higher expected return. Therefore, the expectations of a particular investment are
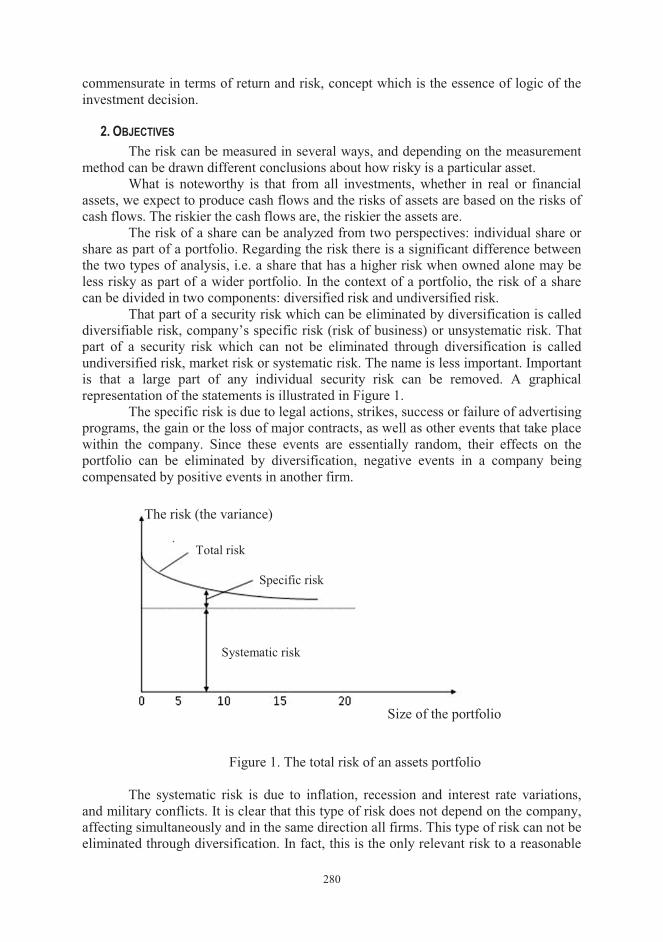
280
commensurate in terms of return and risk, concept which is the essence of logic of the investment decision.
2. OBJECTIVES The risk can be measured in several ways, and depending on the measurement
method can be drawn different conclusions about how risky is a particular asset. What is noteworthy is that from all investments, whether in real or financial
assets, we expect to produce cash flows and the risks of assets are based on the risks of cash flows. The riskier the cash flows are, the riskier the assets are.
The risk of a share can be analyzed from two perspectives: individual share or share as part of a portfolio. Regarding the risk there is a significant difference between the two types of analysis, i.e. a share that has a higher risk when owned alone may be less risky as part of a wider portfolio. In the context of a portfolio, the risk of a share can be divided in two components: diversified risk and undiversified risk.
That part of a security risk which can be eliminated by diversification is called diversifiable risk, company’s specific risk (risk of business) or unsystematic risk. That part of a security risk which can not be eliminated through diversification is called undiversified risk, market risk or systematic risk. The name is less important. Important is that a large part of any individual security risk can be removed. A graphical representation of the statements is illustrated in Figure 1.
The specific risk is due to legal actions, strikes, success or failure of advertising programs, the gain or the loss of major contracts, as well as other events that take place within the company. Since these events are essentially random, their effects on the portfolio can be eliminated by diversification, negative events in a company being compensated by positive events in another firm.
Figure 1. The total risk of an assets portfolio
The systematic risk is due to inflation, recession and interest rate variations,
and military conflicts. It is clear that this type of risk does not depend on the company, affecting simultaneously and in the same direction all firms. This type of risk can not be eliminated through diversification. In fact, this is the only relevant risk to a reasonable
Size of the portfolio
Systematic risk
Specific risk Total risk
The risk (the variance)
281
diversified investor, since was already eliminated the specific risk through diversification.
By summing specific risk and systematic risk we obtain the total risk. As the size of the portfolio increases, the total risk decreases. But over a certain number of assets (securities), 15-20 specifically, as we add more securities, the total risk will be reduced very slightly or not at all. Moreover, the extent to which the addition of new securities to the portfolio reduces its risk depends on the degree of correlation between securities. Generally, a portfolio of investments in the same industry is more risky than a portfolio of investments in projects belonging to different branches. Thus, for a risk mitigation is required a portfolio diversification in several industries.
One share with a high market risk can provide a higher expected return to attract investors. Investors generally have risk aversion, so they will not buy risky shares if they do not receive in compensation higher profitability.
When a share is individually owned (i.e., the portfolio consists of a single share) its risk can be measured by the standard deviation of expected return. To the extent that the share is part of a portfolio, as happens in most cases, the standard deviation is not a good measure of the risk. Therefore, it arises the question of measuring the risk of one share in the context of a portfolio.
The risk that remains when a share is part of a diversified portfolio is its contribution to market risk of the portfolio. This is commensurate to the extent of the share varies in relation to the market. The trend of a share to „move” in relation to the market is measured by the coefficient β.
Given the fact that FICs shares are part of most investors’ portfolios, as demonstrated by the fact that these shares have one of the largest turnovers on the capital market, and have a free float high, we considered useful to determine the risk for each of them, in the context of a portfolio, by using the coefficient β.
3. METHODOLOGY When we „build” a portfolio, in the initial phase, or we buy new shares it would
be ideal to know how these will evolve in the future, compared with the market. But since we can not look into the future we are often forced to resort to historical data and assume that historic β of the share gives us enough information about how the share will ″move″, by reporting to the market. β measures the volatility of a share by comparing it with the market.
If β = 1, then the share is defined as a medium-risk share, that moves up and down in pace with the market. So, this kind of share generally increases by 10% when the market increases by 10% and decreases by 10% when the market drops 10%.
A share with β = 2 is two times more volatile than an average share which means it is twice risky. This means that on a rising market you can quickly get rich and on a decreasing market you can impoverish just as fast.
On the other hand, a share with β = 0.5 is only half volatile compared with a medium share and such a portfolio will increase and decrease only half compared with the market. Most shares have β between 0.5 and 1.5, the average β for all shares is 1. If a share whose β> 1 is added to a portfolio with β = 1, then β portfolio and its default risk will increase. Vice versa, if a share with β <1 is added to a portfolio with β = 1, then β portfolio and its default risk will decrease. Thus, since β share reflects its contribution to the risk of a portfolio, we believe that β is the correct measure of the risk of a share.
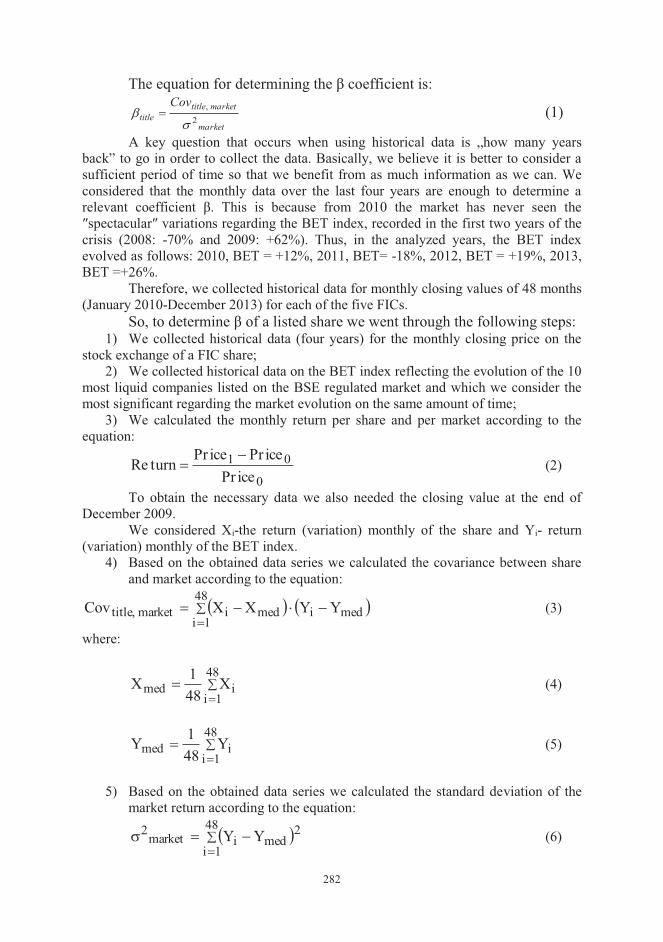
282
The equation for determining the β coefficient is:
market
markettitletitle
Cov2
,
�� � (1)
A key question that occurs when using historical data is „how many years back” to go in order to collect the data. Basically, we believe it is better to consider a sufficient period of time so that we benefit from as much information as we can. We considered that the monthly data over the last four years are enough to determine a relevant coefficient β. This is because from 2010 the market has never seen the ″spectacular″ variations regarding the BET index, recorded in the first two years of the crisis (2008: -70% and 2009: +62%). Thus, in the analyzed years, the BET index evolved as follows: 2010, BET = +12%, 2011, BET= -18%, 2012, BET = +19%, 2013, BET =+26%.
Therefore, we collected historical data for monthly closing values of 48 months (January 2010-December 2013) for each of the five FICs.
So, to determine β of a listed share we went through the following steps: 1) We collected historical data (four years) for the monthly closing price on the
stock exchange of a FIC share; 2) We collected historical data on the BET index reflecting the evolution of the 10
most liquid companies listed on the BSE regulated market and which we consider the most significant regarding the market evolution on the same amount of time;
3) We calculated the monthly return per share and per market according to the equation:
0
01icePr
icePricePrturnRe
�� (2)
To obtain the necessary data we also needed the closing value at the end of December 2009.
We considered Xi-the return (variation) monthly of the share and Yi- return (variation) monthly of the BET index.
4) Based on the obtained data series we calculated the covariance between share and market according to the equation:
� � ��
����48
1imedimedimarket,title YYXXCov (3)
where:
��
�48
1iimed X
481X (4)
��
�48
1iimed Y
481Y (5)
5) Based on the obtained data series we calculated the standard deviation of the
market return according to the equation:
� ��
���48
1i
2medimarket
2 YY (6)
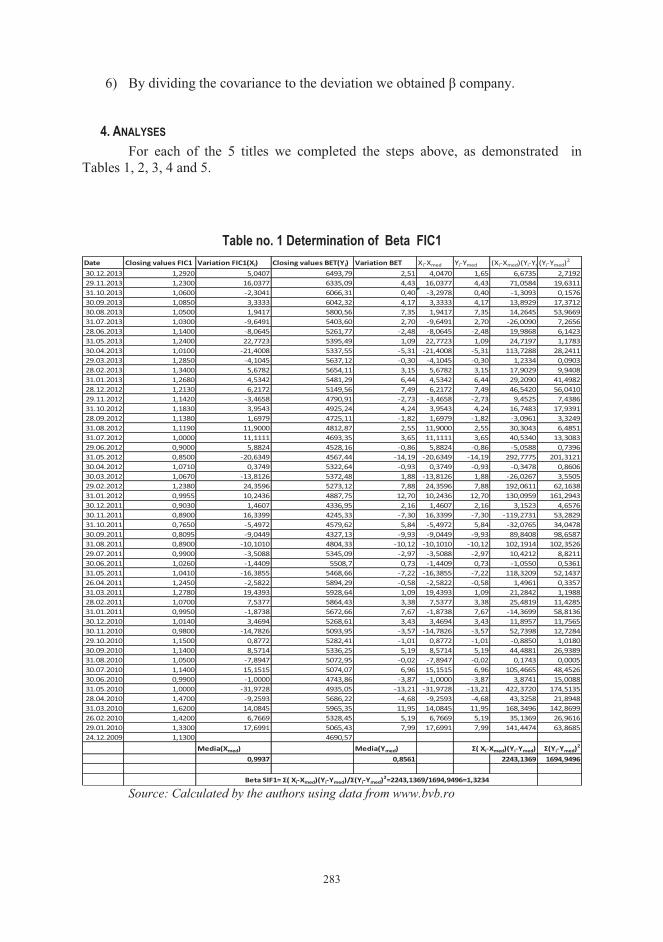
283
6) By dividing the covariance to the deviation we obtained β company.
4. ANALYSES For each of the 5 titles we completed the steps above, as demonstrated in
Tables 1, 2, 3, 4 and 5.
Table no. 1 Determination of Beta FIC1 Date Closing values FIC1 Variation FIC1(Xi) Closing values BET(Yi) Variation BET Xi-Xmed Yi-Ymed (Xi-Xmed)(Yi-Ym(Yi-Ymed)2
30.12.2013 1,2920 5,0407 6493,79 2,51 4,0470 1,65 6,6735 2,719229.11.2013 1,2300 16,0377 6335,09 4,43 16,0377 4,43 71,0584 19,631131.10.2013 1,0600 -2,3041 6066,31 0,40 -3,2978 0,40 -1,3093 0,157630.09.2013 1,0850 3,3333 6042,32 4,17 3,3333 4,17 13,8929 17,371230.08.2013 1,0500 1,9417 5800,56 7,35 1,9417 7,35 14,2645 53,966931.07.2013 1,0300 -9,6491 5403,60 2,70 -9,6491 2,70 -26,0090 7,265628.06.2013 1,1400 -8,0645 5261,77 -2,48 -8,0645 -2,48 19,9868 6,142331.05.2013 1,2400 22,7723 5395,49 1,09 22,7723 1,09 24,7197 1,178330.04.2013 1,0100 -21,4008 5337,55 -5,31 -21,4008 -5,31 113,7288 28,241129.03.2013 1,2850 -4,1045 5637,12 -0,30 -4,1045 -0,30 1,2334 0,090328.02.2013 1,3400 5,6782 5654,11 3,15 5,6782 3,15 17,9029 9,940831.01.2013 1,2680 4,5342 5481,29 6,44 4,5342 6,44 29,2090 41,498228.12.2012 1,2130 6,2172 5149,56 7,49 6,2172 7,49 46,5420 56,041029.11.2012 1,1420 -3,4658 4790,91 -2,73 -3,4658 -2,73 9,4525 7,438631.10.2012 1,1830 3,9543 4925,24 4,24 3,9543 4,24 16,7483 17,939128.09.2012 1,1380 1,6979 4725,11 -1,82 1,6979 -1,82 -3,0961 3,324931.08.2012 1,1190 11,9000 4812,87 2,55 11,9000 2,55 30,3043 6,485131.07.2012 1,0000 11,1111 4693,35 3,65 11,1111 3,65 40,5340 13,308329.06.2012 0,9000 5,8824 4528,16 -0,86 5,8824 -0,86 -5,0588 0,739631.05.2012 0,8500 -20,6349 4567,44 -14,19 -20,6349 -14,19 292,7775 201,312130.04.2012 1,0710 0,3749 5322,64 -0,93 0,3749 -0,93 -0,3478 0,860630.03.2012 1,0670 -13,8126 5372,48 1,88 -13,8126 1,88 -26,0267 3,550529.02.2012 1,2380 24,3596 5273,12 7,88 24,3596 7,88 192,0611 62,163831.01.2012 0,9955 10,2436 4887,75 12,70 10,2436 12,70 130,0959 161,294330.12.2011 0,9030 1,4607 4336,95 2,16 1,4607 2,16 3,1523 4,657630.11.2011 0,8900 16,3399 4245,33 -7,30 16,3399 -7,30 -119,2731 53,282931.10.2011 0,7650 -5,4972 4579,62 5,84 -5,4972 5,84 -32,0765 34,047830.09.2011 0,8095 -9,0449 4327,13 -9,93 -9,0449 -9,93 89,8408 98,658731.08.2011 0,8900 -10,1010 4804,33 -10,12 -10,1010 -10,12 102,1914 102,352629.07.2011 0,9900 -3,5088 5345,09 -2,97 -3,5088 -2,97 10,4212 8,821130.06.2011 1,0260 -1,4409 5508,7 0,73 -1,4409 0,73 -1,0550 0,536131.05.2011 1,0410 -16,3855 5468,66 -7,22 -16,3855 -7,22 118,3209 52,143726.04.2011 1,2450 -2,5822 5894,29 -0,58 -2,5822 -0,58 1,4961 0,335731.03.2011 1,2780 19,4393 5928,64 1,09 19,4393 1,09 21,2842 1,198828.02.2011 1,0700 7,5377 5864,43 3,38 7,5377 3,38 25,4819 11,428531.01.2011 0,9950 -1,8738 5672,66 7,67 -1,8738 7,67 -14,3699 58,813630.12.2010 1,0140 3,4694 5268,61 3,43 3,4694 3,43 11,8957 11,756530.11.2010 0,9800 -14,7826 5093,95 -3,57 -14,7826 -3,57 52,7398 12,728429.10.2010 1,1500 0,8772 5282,41 -1,01 0,8772 -1,01 -0,8850 1,018030.09.2010 1,1400 8,5714 5336,25 5,19 8,5714 5,19 44,4881 26,938931.08.2010 1,0500 -7,8947 5072,95 -0,02 -7,8947 -0,02 0,1743 0,000530.07.2010 1,1400 15,1515 5074,07 6,96 15,1515 6,96 105,4665 48,452630.06.2010 0,9900 -1,0000 4743,86 -3,87 -1,0000 -3,87 3,8741 15,008831.05.2010 1,0000 -31,9728 4935,05 -13,21 -31,9728 -13,21 422,3720 174,513528.04.2010 1,4700 -9,2593 5686,22 -4,68 -9,2593 -4,68 43,3258 21,894831.03.2010 1,6200 14,0845 5965,35 11,95 14,0845 11,95 168,3496 142,869926.02.2010 1,4200 6,7669 5328,45 5,19 6,7669 5,19 35,1369 26,961629.01.2010 1,3300 17,6991 5065,43 7,99 17,6991 7,99 141,4474 63,868524.12.2009 1,1300 4690,57
Media(Xmed) Media(Ymed) Σ( Xi-Xmed)(Yi-Ymed) Σ(Yi-Ymed)2
0,9937 0,8561 2243,1369 1694,9496
Beta SIF1= Σ( Xi-Xmed)(Yi-Ymed)/Σ(Yi-Ymed)2=2243,1369/1694,9496=1,3234 Source: Calculated by the authors using data from www.bvb.ro
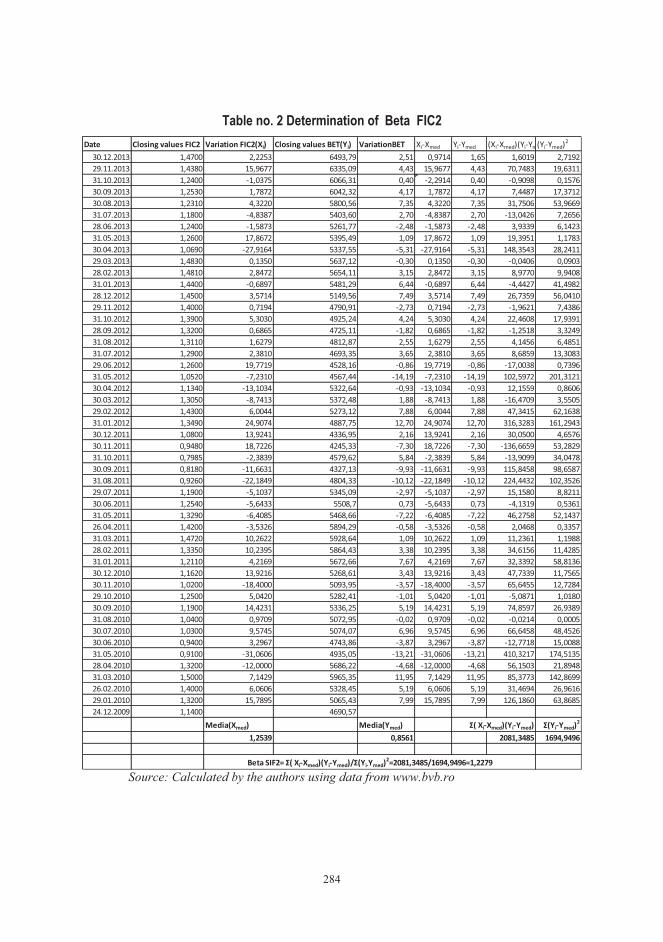
284
Table no. 2 Determination of Beta FIC2 Date Closing values FIC2 Variation FIC2(Xi) Closing values BET(Yi) VariationBET Xi-Xmed Yi-Ymed (Xi-Xmed)(Yi-Ym(Yi-Ymed)2
30.12.2013 1,4700 2,2253 6493,79 2,51 0,9714 1,65 1,6019 2,719229.11.2013 1,4380 15,9677 6335,09 4,43 15,9677 4,43 70,7483 19,631131.10.2013 1,2400 -1,0375 6066,31 0,40 -2,2914 0,40 -0,9098 0,157630.09.2013 1,2530 1,7872 6042,32 4,17 1,7872 4,17 7,4487 17,371230.08.2013 1,2310 4,3220 5800,56 7,35 4,3220 7,35 31,7506 53,966931.07.2013 1,1800 -4,8387 5403,60 2,70 -4,8387 2,70 -13,0426 7,265628.06.2013 1,2400 -1,5873 5261,77 -2,48 -1,5873 -2,48 3,9339 6,142331.05.2013 1,2600 17,8672 5395,49 1,09 17,8672 1,09 19,3951 1,178330.04.2013 1,0690 -27,9164 5337,55 -5,31 -27,9164 -5,31 148,3543 28,241129.03.2013 1,4830 0,1350 5637,12 -0,30 0,1350 -0,30 -0,0406 0,090328.02.2013 1,4810 2,8472 5654,11 3,15 2,8472 3,15 8,9770 9,940831.01.2013 1,4400 -0,6897 5481,29 6,44 -0,6897 6,44 -4,4427 41,498228.12.2012 1,4500 3,5714 5149,56 7,49 3,5714 7,49 26,7359 56,041029.11.2012 1,4000 0,7194 4790,91 -2,73 0,7194 -2,73 -1,9621 7,438631.10.2012 1,3900 5,3030 4925,24 4,24 5,3030 4,24 22,4608 17,939128.09.2012 1,3200 0,6865 4725,11 -1,82 0,6865 -1,82 -1,2518 3,324931.08.2012 1,3110 1,6279 4812,87 2,55 1,6279 2,55 4,1456 6,485131.07.2012 1,2900 2,3810 4693,35 3,65 2,3810 3,65 8,6859 13,308329.06.2012 1,2600 19,7719 4528,16 -0,86 19,7719 -0,86 -17,0038 0,739631.05.2012 1,0520 -7,2310 4567,44 -14,19 -7,2310 -14,19 102,5972 201,312130.04.2012 1,1340 -13,1034 5322,64 -0,93 -13,1034 -0,93 12,1559 0,860630.03.2012 1,3050 -8,7413 5372,48 1,88 -8,7413 1,88 -16,4709 3,550529.02.2012 1,4300 6,0044 5273,12 7,88 6,0044 7,88 47,3415 62,163831.01.2012 1,3490 24,9074 4887,75 12,70 24,9074 12,70 316,3283 161,294330.12.2011 1,0800 13,9241 4336,95 2,16 13,9241 2,16 30,0500 4,657630.11.2011 0,9480 18,7226 4245,33 -7,30 18,7226 -7,30 -136,6659 53,282931.10.2011 0,7985 -2,3839 4579,62 5,84 -2,3839 5,84 -13,9099 34,047830.09.2011 0,8180 -11,6631 4327,13 -9,93 -11,6631 -9,93 115,8458 98,658731.08.2011 0,9260 -22,1849 4804,33 -10,12 -22,1849 -10,12 224,4432 102,352629.07.2011 1,1900 -5,1037 5345,09 -2,97 -5,1037 -2,97 15,1580 8,821130.06.2011 1,2540 -5,6433 5508,7 0,73 -5,6433 0,73 -4,1319 0,536131.05.2011 1,3290 -6,4085 5468,66 -7,22 -6,4085 -7,22 46,2758 52,143726.04.2011 1,4200 -3,5326 5894,29 -0,58 -3,5326 -0,58 2,0468 0,335731.03.2011 1,4720 10,2622 5928,64 1,09 10,2622 1,09 11,2361 1,198828.02.2011 1,3350 10,2395 5864,43 3,38 10,2395 3,38 34,6156 11,428531.01.2011 1,2110 4,2169 5672,66 7,67 4,2169 7,67 32,3392 58,813630.12.2010 1,1620 13,9216 5268,61 3,43 13,9216 3,43 47,7339 11,756530.11.2010 1,0200 -18,4000 5093,95 -3,57 -18,4000 -3,57 65,6455 12,728429.10.2010 1,2500 5,0420 5282,41 -1,01 5,0420 -1,01 -5,0871 1,018030.09.2010 1,1900 14,4231 5336,25 5,19 14,4231 5,19 74,8597 26,938931.08.2010 1,0400 0,9709 5072,95 -0,02 0,9709 -0,02 -0,0214 0,000530.07.2010 1,0300 9,5745 5074,07 6,96 9,5745 6,96 66,6458 48,452630.06.2010 0,9400 3,2967 4743,86 -3,87 3,2967 -3,87 -12,7718 15,008831.05.2010 0,9100 -31,0606 4935,05 -13,21 -31,0606 -13,21 410,3217 174,513528.04.2010 1,3200 -12,0000 5686,22 -4,68 -12,0000 -4,68 56,1503 21,894831.03.2010 1,5000 7,1429 5965,35 11,95 7,1429 11,95 85,3773 142,869926.02.2010 1,4000 6,0606 5328,45 5,19 6,0606 5,19 31,4694 26,961629.01.2010 1,3200 15,7895 5065,43 7,99 15,7895 7,99 126,1860 63,868524.12.2009 1,1400 4690,57
Media(Xmed) Media(Ymed) Σ( Xi-Xmed)(Yi-Ymed) Σ(Yi-Ymed)2
1,2539 0,8561 2081,3485 1694,9496
Beta SIF2= Σ( Xi-Xmed)(Yi-Ymed)/Σ(Yi-Ymed)2=2081,3485/1694,9496=1,2279 Source: Calculated by the authors using data from www.bvb.ro
285
Table no. 3 Determination of Beta FIC3 Date Closing values FIC3 Variation FIC3(Xi) Closing values BET(Yi) Variation BET Xi-Xmed Yi-Ymed (Xi-Xmed)(Yi-Ymed) (Yi-Ymed)2
30.12.2013 0,6715 1,2821 6493,79 2,51 0,6128 1,65 1,0106 2,719229.11.2013 0,6630 10,5000 6335,09 4,43 10,5000 4,43 46,5224 19,631131.10.2013 0,6000 -0,2494 6066,31 0,40 -0,9186 0,40 -0,3647 0,157630.09.2013 0,6015 3,8860 6042,32 4,17 3,8860 4,17 16,1964 17,371230.08.2013 0,5790 7,3216 5800,56 7,35 7,3216 7,35 53,7860 53,966931.07.2013 0,5395 0,3721 5403,60 2,70 0,3721 2,70 1,0030 7,265628.06.2013 0,5375 -4,0179 5261,77 -2,48 -4,0179 -2,48 9,9577 6,142331.05.2013 0,5600 -14,1104 5395,49 1,09 -14,1104 1,09 -15,3171 1,178330.04.2013 0,6520 -7,2546 5337,55 -5,31 -7,2546 -5,31 38,5528 28,241129.03.2013 0,7030 -4,2886 5637,12 -0,30 -4,2886 -0,30 1,2887 0,090328.02.2013 0,7345 0,2046 5654,11 3,15 0,2046 3,15 0,6452 9,940831.01.2013 0,7330 3,0218 5481,29 6,44 3,0218 6,44 19,4661 41,498228.12.2012 0,7115 11,2588 5149,56 7,49 11,2588 7,49 84,2839 56,041029.11.2012 0,6395 4,1531 4790,91 -2,73 4,1531 -2,73 -11,3271 7,438631.10.2012 0,6140 9,9373 4925,24 4,24 9,9373 4,24 42,0891 17,939128.09.2012 0,5585 4,0037 4725,11 -1,82 4,0037 -1,82 -7,3006 3,324931.08.2012 0,5370 12,7441 4812,87 2,55 12,7441 2,55 32,4538 6,485131.07.2012 0,4763 6,3882 4693,35 3,65 6,3882 3,65 23,3046 13,308329.06.2012 0,4477 1,0838 4528,16 -0,86 1,0838 -0,86 -0,9320 0,739631.05.2012 0,4429 -40,9073 4567,44 -14,19 -40,9073 -14,19 580,4107 201,312130.04.2012 0,7495 5,1192 5322,64 -0,93 5,1192 -0,93 -4,7490 0,860630.03.2012 0,7130 0,9200 5372,48 1,88 0,9200 1,88 1,7336 3,550529.02.2012 0,7065 13,9516 5273,12 7,88 13,9516 7,88 110,0002 62,163831.01.2012 0,6200 9,3474 4887,75 12,70 9,3474 12,70 118,7141 161,294330.12.2011 0,5670 9,2486 4336,95 2,16 9,2486 2,16 19,9596 4,657630.11.2011 0,5190 15,3333 4245,33 -7,30 15,3333 -7,30 -111,9259 53,282928.10.2011 0,4500 2,7397 4579,62 5,84 2,7397 5,84 15,9864 34,047830.09.2011 0,4380 -8,7310 4327,13 -9,93 -8,7310 -9,93 86,7223 98,658731.08.2011 0,4799 -1,2551 4804,33 -10,12 -1,2551 -10,12 12,6982 102,352629.07.2011 0,4860 -5,2632 5345,09 -2,97 -5,2632 -2,97 15,6317 8,821130.06.2011 0,5130 -7,4842 5508,7 0,73 -7,4842 0,73 -5,4797 0,536131.05.2011 0,5545 -6,0169 5468,66 -7,22 -6,0169 -7,22 43,4487 52,143726.04.2011 0,5900 -5,1447 5894,29 -0,58 -5,1447 -0,58 2,9808 0,335731.03.2011 0,6220 13,5036 5928,64 1,09 13,5036 1,09 14,7852 1,198828.02.2011 0,5480 3,8863 5864,43 3,38 3,8863 3,38 13,1379 11,428531.01.2011 0,5275 -2,9439 5672,66 7,67 -2,9439 7,67 -22,5766 58,813630.12.2010 0,5435 6,5686 5268,61 3,43 6,5686 3,43 22,5223 11,756530.11.2010 0,5100 -12,8205 5093,95 -3,57 -12,8205 -3,57 45,7396 12,728429.10.2010 0,5850 0,0000 5282,41 -1,01 0,0000 -1,01 0,0000 1,018030.09.2010 0,5850 7,3394 5336,25 5,19 7,3394 5,19 38,0938 26,938931.08.2010 0,5450 -3,5398 5072,95 -0,02 -3,5398 -0,02 0,0781 0,000530.07.2010 0,5650 19,7034 5074,07 6,96 19,7034 6,96 137,1511 48,452630.06.2010 0,4720 -8,3495 4743,86 -3,87 -8,3495 -3,87 32,3471 15,008831.05.2010 0,5150 -31,3333 4935,05 -13,21 -31,3333 -13,21 413,9245 174,513528.04.2010 0,7500 -12,7907 5686,22 -4,68 -12,7907 -4,68 59,8501 21,894831.03.2010 0,8600 2,9940 5965,35 11,95 2,9940 11,95 35,7869 142,869926.02.2010 0,8350 6,3694 5328,45 5,19 6,3694 5,19 33,0729 26,961629.01.2010 0,7850 15,4412 5065,43 7,99 15,4412 7,99 123,4025 63,868524.12.2009 0,6800 4690,57
Media(Xmed) Media(Ymed) Σ( Xi-Xmed)(Yi-Ymed) Σ(Yi-Ymed)2
0,6692 0,8561 2168,7659 1694,9496
Beta SIF3= Σ( Xi-Xmed)(Yi-Ymed)/Σ(Yi-Ymed)2=2168,7659/1694,9496=1,2795 Source: Calculated by the authors using data from www.bvb.ro
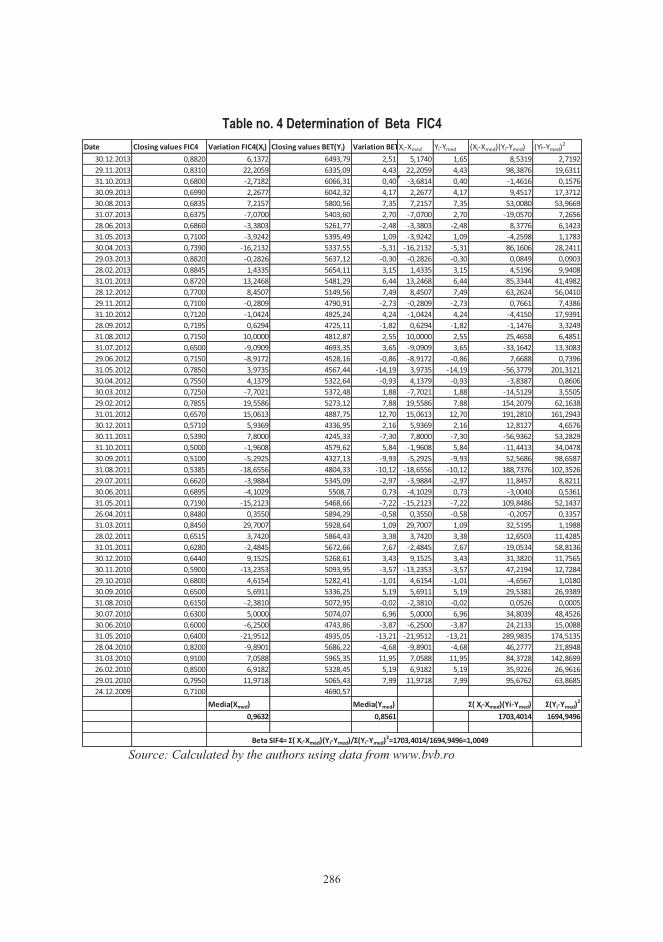
286
Table no. 4 Determination of Beta FIC4 Date Closing values FIC4 Variation FIC4(Xi) Closing values BET(Yi) Variation BETXi-Xmed Yi-Ymed (Xi-Xmed)(Yi-Ymed) (Yi-Ymed)2
30.12.2013 0,8820 6,1372 6493,79 2,51 5,1740 1,65 8,5319 2,719229.11.2013 0,8310 22,2059 6335,09 4,43 22,2059 4,43 98,3876 19,631131.10.2013 0,6800 -2,7182 6066,31 0,40 -3,6814 0,40 -1,4616 0,157630.09.2013 0,6990 2,2677 6042,32 4,17 2,2677 4,17 9,4517 17,371230.08.2013 0,6835 7,2157 5800,56 7,35 7,2157 7,35 53,0080 53,966931.07.2013 0,6375 -7,0700 5403,60 2,70 -7,0700 2,70 -19,0570 7,265628.06.2013 0,6860 -3,3803 5261,77 -2,48 -3,3803 -2,48 8,3776 6,142331.05.2013 0,7100 -3,9242 5395,49 1,09 -3,9242 1,09 -4,2598 1,178330.04.2013 0,7390 -16,2132 5337,55 -5,31 -16,2132 -5,31 86,1606 28,241129.03.2013 0,8820 -0,2826 5637,12 -0,30 -0,2826 -0,30 0,0849 0,090328.02.2013 0,8845 1,4335 5654,11 3,15 1,4335 3,15 4,5196 9,940831.01.2013 0,8720 13,2468 5481,29 6,44 13,2468 6,44 85,3344 41,498228.12.2012 0,7700 8,4507 5149,56 7,49 8,4507 7,49 63,2624 56,041029.11.2012 0,7100 -0,2809 4790,91 -2,73 -0,2809 -2,73 0,7661 7,438631.10.2012 0,7120 -1,0424 4925,24 4,24 -1,0424 4,24 -4,4150 17,939128.09.2012 0,7195 0,6294 4725,11 -1,82 0,6294 -1,82 -1,1476 3,324931.08.2012 0,7150 10,0000 4812,87 2,55 10,0000 2,55 25,4658 6,485131.07.2012 0,6500 -9,0909 4693,35 3,65 -9,0909 3,65 -33,1642 13,308329.06.2012 0,7150 -8,9172 4528,16 -0,86 -8,9172 -0,86 7,6688 0,739631.05.2012 0,7850 3,9735 4567,44 -14,19 3,9735 -14,19 -56,3779 201,312130.04.2012 0,7550 4,1379 5322,64 -0,93 4,1379 -0,93 -3,8387 0,860630.03.2012 0,7250 -7,7021 5372,48 1,88 -7,7021 1,88 -14,5129 3,550529.02.2012 0,7855 19,5586 5273,12 7,88 19,5586 7,88 154,2079 62,163831.01.2012 0,6570 15,0613 4887,75 12,70 15,0613 12,70 191,2810 161,294330.12.2011 0,5710 5,9369 4336,95 2,16 5,9369 2,16 12,8127 4,657630.11.2011 0,5390 7,8000 4245,33 -7,30 7,8000 -7,30 -56,9362 53,282931.10.2011 0,5000 -1,9608 4579,62 5,84 -1,9608 5,84 -11,4413 34,047830.09.2011 0,5100 -5,2925 4327,13 -9,93 -5,2925 -9,93 52,5686 98,658731.08.2011 0,5385 -18,6556 4804,33 -10,12 -18,6556 -10,12 188,7376 102,352629.07.2011 0,6620 -3,9884 5345,09 -2,97 -3,9884 -2,97 11,8457 8,821130.06.2011 0,6895 -4,1029 5508,7 0,73 -4,1029 0,73 -3,0040 0,536131.05.2011 0,7190 -15,2123 5468,66 -7,22 -15,2123 -7,22 109,8486 52,143726.04.2011 0,8480 0,3550 5894,29 -0,58 0,3550 -0,58 -0,2057 0,335731.03.2011 0,8450 29,7007 5928,64 1,09 29,7007 1,09 32,5195 1,198828.02.2011 0,6515 3,7420 5864,43 3,38 3,7420 3,38 12,6503 11,428531.01.2011 0,6280 -2,4845 5672,66 7,67 -2,4845 7,67 -19,0534 58,813630.12.2010 0,6440 9,1525 5268,61 3,43 9,1525 3,43 31,3820 11,756530.11.2010 0,5900 -13,2353 5093,95 -3,57 -13,2353 -3,57 47,2194 12,728429.10.2010 0,6800 4,6154 5282,41 -1,01 4,6154 -1,01 -4,6567 1,018030.09.2010 0,6500 5,6911 5336,25 5,19 5,6911 5,19 29,5381 26,938931.08.2010 0,6150 -2,3810 5072,95 -0,02 -2,3810 -0,02 0,0526 0,000530.07.2010 0,6300 5,0000 5074,07 6,96 5,0000 6,96 34,8039 48,452630.06.2010 0,6000 -6,2500 4743,86 -3,87 -6,2500 -3,87 24,2133 15,008831.05.2010 0,6400 -21,9512 4935,05 -13,21 -21,9512 -13,21 289,9835 174,513528.04.2010 0,8200 -9,8901 5686,22 -4,68 -9,8901 -4,68 46,2777 21,894831.03.2010 0,9100 7,0588 5965,35 11,95 7,0588 11,95 84,3728 142,869926.02.2010 0,8500 6,9182 5328,45 5,19 6,9182 5,19 35,9226 26,961629.01.2010 0,7950 11,9718 5065,43 7,99 11,9718 7,99 95,6762 63,868524.12.2009 0,7100 4690,57
Media(Xmed) Media(Ymed) Σ( Xi-Xmed)(Yi-Ymed) Σ(Yi-Ymed)2
0,9632 0,8561 1703,4014 1694,9496
Beta SIF4= Σ( Xi-Xmed)(Yi-Ymed)/Σ(Yi-Ymed)2=1703,4014/1694,9496=1,0049 Source: Calculated by the authors using data from www.bvb.ro
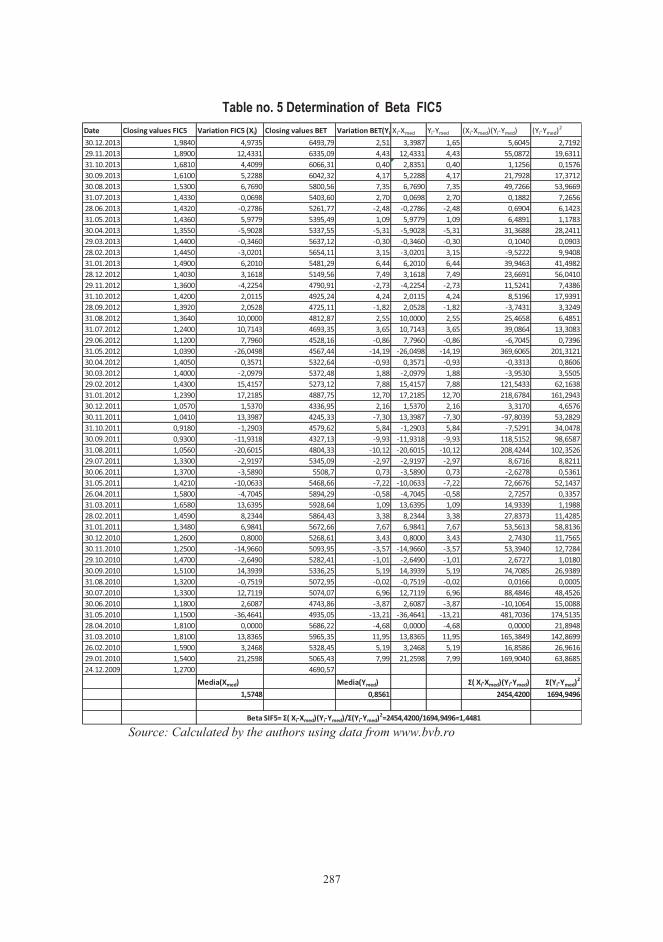
287
Table no. 5 Determination of Beta FIC5 Date Closing values FIC5 Variation FIC5 (Xi) Closing values BET Variation BET(Yi)Xi-Xmed Yi-Ymed (Xi-Xmed)(Yi-Ymed) (Yi-Ymed)2
30.12.2013 1,9840 4,9735 6493,79 2,51 3,3987 1,65 5,6045 2,719229.11.2013 1,8900 12,4331 6335,09 4,43 12,4331 4,43 55,0872 19,631131.10.2013 1,6810 4,4099 6066,31 0,40 2,8351 0,40 1,1256 0,157630.09.2013 1,6100 5,2288 6042,32 4,17 5,2288 4,17 21,7928 17,371230.08.2013 1,5300 6,7690 5800,56 7,35 6,7690 7,35 49,7266 53,966931.07.2013 1,4330 0,0698 5403,60 2,70 0,0698 2,70 0,1882 7,265628.06.2013 1,4320 -0,2786 5261,77 -2,48 -0,2786 -2,48 0,6904 6,142331.05.2013 1,4360 5,9779 5395,49 1,09 5,9779 1,09 6,4891 1,178330.04.2013 1,3550 -5,9028 5337,55 -5,31 -5,9028 -5,31 31,3688 28,241129.03.2013 1,4400 -0,3460 5637,12 -0,30 -0,3460 -0,30 0,1040 0,090328.02.2013 1,4450 -3,0201 5654,11 3,15 -3,0201 3,15 -9,5222 9,940831.01.2013 1,4900 6,2010 5481,29 6,44 6,2010 6,44 39,9463 41,498228.12.2012 1,4030 3,1618 5149,56 7,49 3,1618 7,49 23,6691 56,041029.11.2012 1,3600 -4,2254 4790,91 -2,73 -4,2254 -2,73 11,5241 7,438631.10.2012 1,4200 2,0115 4925,24 4,24 2,0115 4,24 8,5196 17,939128.09.2012 1,3920 2,0528 4725,11 -1,82 2,0528 -1,82 -3,7431 3,324931.08.2012 1,3640 10,0000 4812,87 2,55 10,0000 2,55 25,4658 6,485131.07.2012 1,2400 10,7143 4693,35 3,65 10,7143 3,65 39,0864 13,308329.06.2012 1,1200 7,7960 4528,16 -0,86 7,7960 -0,86 -6,7045 0,739631.05.2012 1,0390 -26,0498 4567,44 -14,19 -26,0498 -14,19 369,6065 201,312130.04.2012 1,4050 0,3571 5322,64 -0,93 0,3571 -0,93 -0,3313 0,860630.03.2012 1,4000 -2,0979 5372,48 1,88 -2,0979 1,88 -3,9530 3,550529.02.2012 1,4300 15,4157 5273,12 7,88 15,4157 7,88 121,5433 62,163831.01.2012 1,2390 17,2185 4887,75 12,70 17,2185 12,70 218,6784 161,294330.12.2011 1,0570 1,5370 4336,95 2,16 1,5370 2,16 3,3170 4,657630.11.2011 1,0410 13,3987 4245,33 -7,30 13,3987 -7,30 -97,8039 53,282931.10.2011 0,9180 -1,2903 4579,62 5,84 -1,2903 5,84 -7,5291 34,047830.09.2011 0,9300 -11,9318 4327,13 -9,93 -11,9318 -9,93 118,5152 98,658731.08.2011 1,0560 -20,6015 4804,33 -10,12 -20,6015 -10,12 208,4244 102,352629.07.2011 1,3300 -2,9197 5345,09 -2,97 -2,9197 -2,97 8,6716 8,821130.06.2011 1,3700 -3,5890 5508,7 0,73 -3,5890 0,73 -2,6278 0,536131.05.2011 1,4210 -10,0633 5468,66 -7,22 -10,0633 -7,22 72,6676 52,143726.04.2011 1,5800 -4,7045 5894,29 -0,58 -4,7045 -0,58 2,7257 0,335731.03.2011 1,6580 13,6395 5928,64 1,09 13,6395 1,09 14,9339 1,198828.02.2011 1,4590 8,2344 5864,43 3,38 8,2344 3,38 27,8373 11,428531.01.2011 1,3480 6,9841 5672,66 7,67 6,9841 7,67 53,5613 58,813630.12.2010 1,2600 0,8000 5268,61 3,43 0,8000 3,43 2,7430 11,756530.11.2010 1,2500 -14,9660 5093,95 -3,57 -14,9660 -3,57 53,3940 12,728429.10.2010 1,4700 -2,6490 5282,41 -1,01 -2,6490 -1,01 2,6727 1,018030.09.2010 1,5100 14,3939 5336,25 5,19 14,3939 5,19 74,7085 26,938931.08.2010 1,3200 -0,7519 5072,95 -0,02 -0,7519 -0,02 0,0166 0,000530.07.2010 1,3300 12,7119 5074,07 6,96 12,7119 6,96 88,4846 48,452630.06.2010 1,1800 2,6087 4743,86 -3,87 2,6087 -3,87 -10,1064 15,008831.05.2010 1,1500 -36,4641 4935,05 -13,21 -36,4641 -13,21 481,7036 174,513528.04.2010 1,8100 0,0000 5686,22 -4,68 0,0000 -4,68 0,0000 21,894831.03.2010 1,8100 13,8365 5965,35 11,95 13,8365 11,95 165,3849 142,869926.02.2010 1,5900 3,2468 5328,45 5,19 3,2468 5,19 16,8586 26,961629.01.2010 1,5400 21,2598 5065,43 7,99 21,2598 7,99 169,9040 63,868524.12.2009 1,2700 4690,57
Media(Xmed) Media(Ymed) Σ( Xi-Xmed)(Yi-Ymed) Σ(Yi-Ymed)2
1,5748 0,8561 2454,4200 1694,9496
Beta SIF5= Σ( Xi-Xmed)(Yi-Ymed)/Σ(Yi-Ymed)2=2454,4200/1694,9496=1,4481 Source: Calculated by the authors using data from www.bvb.ro
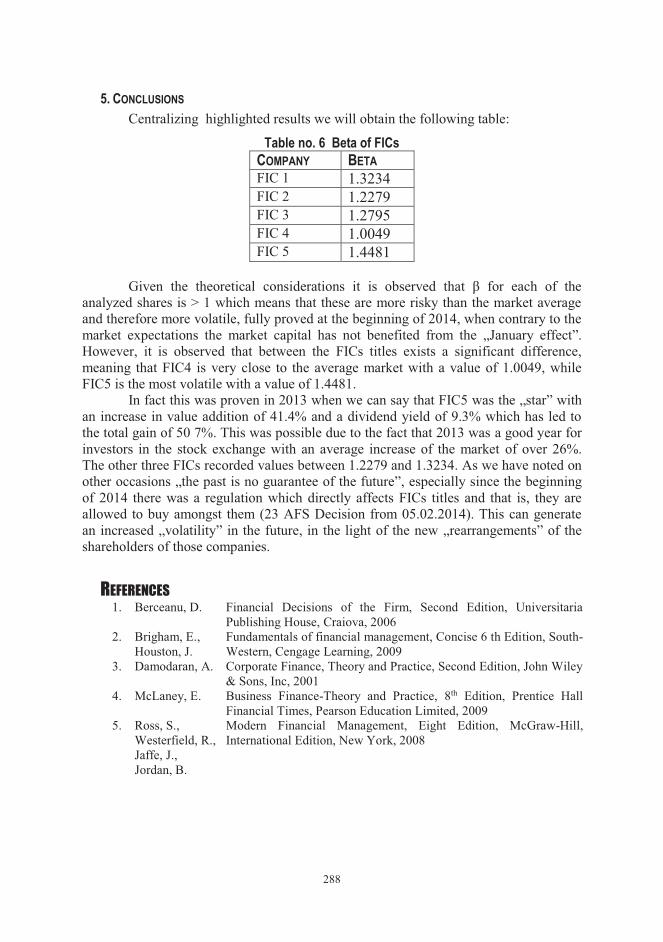
288
5. CONCLUSIONS Centralizing highlighted results we will obtain the following table:
Table no. 6 Beta of FICs COMPANY BETA FIC 1 1.3234 FIC 2 1.2279 FIC 3 1.2795 FIC 4 1.0049 FIC 5 1.4481
Given the theoretical considerations it is observed that β for each of the
analyzed shares is > 1 which means that these are more risky than the market average and therefore more volatile, fully proved at the beginning of 2014, when contrary to the market expectations the market capital has not benefited from the „January effect”. However, it is observed that between the FICs titles exists a significant difference, meaning that FIC4 is very close to the average market with a value of 1.0049, while FIC5 is the most volatile with a value of 1.4481.
In fact this was proven in 2013 when we can say that FIC5 was the „star” with an increase in value addition of 41.4% and a dividend yield of 9.3% which has led to the total gain of 50 7%. This was possible due to the fact that 2013 was a good year for investors in the stock exchange with an average increase of the market of over 26%. The other three FICs recorded values between 1.2279 and 1.3234. As we have noted on other occasions „the past is no guarantee of the future”, especially since the beginning of 2014 there was a regulation which directly affects FICs titles and that is, they are allowed to buy amongst them (23 AFS Decision from 05.02.2014). This can generate an increased „volatility” in the future, in the light of the new „rearrangements” of the shareholders of those companies.
REFERENCES 1. Berceanu, D. Financial Decisions of the Firm, Second Edition, Universitaria
Publishing House, Craiova, 2006 2. Brigham, E.,
Houston, J. Fundamentals of financial management, Concise 6 th Edition, South-Western, Cengage Learning, 2009
3. Damodaran, A. Corporate Finance, Theory and Practice, Second Edition, John Wiley & Sons, Inc, 2001
4. McLaney, E. Business Finance-Theory and Practice, 8th Edition, Prentice Hall Financial Times, Pearson Education Limited, 2009
5. Ross, S., Westerfield, R., Jaffe, J., Jordan, B.
Modern Financial Management, Eight Edition, McGraw-Hill, International Edition, New York, 2008