An overview and analysis of global zoogeography distribution of Blattodea
61
i AN OVERVIEW AND ANALYSIS OF GLOBAL ZOOGEOGRAPHY DISTRIBUTION OF BLATTODEA RYAN MITCHELL Supervisor: Dr. Pamela Worrall BSc, PhD, PGCE. A project submitted in partial fulfilment of the requirements for the Bachelor of Science Degree in Animal Conservation and Biodiversity for the University of Greenwich.
Transcript of An overview and analysis of global zoogeography distribution of Blattodea

i
AN OVERVIEW AND ANALYSIS OF GLOBAL ZOOGEOGRAPHY DISTRIBUTION
OF BLATTODEA
RYAN MITCHELL
Supervisor: Dr. Pamela Worrall BSc, PhD, PGCE.
A project submitted in partial fulfilment of the requirements for the Bachelor of
Science Degree in Animal Conservation and Biodiversity for the University of
Greenwich.

ii
DECLERATION
ACADEMIC SESSION: 2014-2015
PROJECT DECLARATION
“This project report is the result of the independent work of [name in full]. All
other work reported in the text has been attributed to the original authors and
is fully referenced in the text, and listed in the Reference Section”.
Student Name:-
Student Signature:-
Date:-

iii
AKNOWLEDGEMENT
I would like to thank and show my appreciation especially to Dr George Beccaloni for
letting me take on this project which I have thoroughly enjoyed. Without him and his
invaluable insight this project would have not been possible. From this project I have
come to appreciate cockroaches for what they truly are.
I would like to thank Dr Ben Price for proof reading my dissertation at a very stressful
period and the invaluable feedback which he provided. I would also like to thank him
for all the opportunities he has given me at the NHM.
I would also like to thank Dr Pam Worrall for becoming my Dissertation supervisor,
for providing advice, providing positive and constructive feedback, and making
herself available as much as possible for her students.
I also would like to thank my friends at Hadlow who supported me in the HE area
and kept me in a good mood throughout especially Paris Sadgrove, Alice Treharne,
David Courtneidge, Max Burford, and Michael James Lee.
Finally I would also like to thank my family for supporting me throughout the time of
writing my dissertation.

iv
ABSTRACT
Cockroaches are generally considered soil fauna their major role in the ecosystem is
the breakdown of complex carbohydrates (Bell et al, 2007), they also are vectors for
many species of fungi and bacteria (Fotedar et al, 1991). The majority of
cockroaches are known to be found in the tropics in study cockroaches biomass was
calculated at 24.3% higher than any other order (Basset, 2001). However they are
found in a wide variety of habitat across the world.
In this study the world distribution of cockroaches across the zoogeographic regions
was evaluated and analysed, the secondary data source was from the Cockroach
Species File (Beccaloni, 2013). This was used to see if there was a significant
difference between endemic species, species richness and genera richness between
zoogeographic regions (Holt et al, 2012). Also this study contains a world map of
species richness and is discussed in detail.
There was a significant difference between endemic species between zoogeographic
regions (T-test P=0.005), also provides evidence that the zoogeographic regions for
terrestrial invertebrates concept as endemic species percentages are very high in
the majority of the regions. The Nearctic region (52%) endemic species were as the
other regions have (74 %≥). This suggests the zoogeographic region boundary may
be not be positioned correctly in the case of cockroaches as the transitional zone is
very high and results in low endemism.
This study could be used to aid conservation and taxonomical efforts in specific
regions and countries which are highlighted in the study, with seemly unusually low
species richness and in some cases no data at all.
v
Table of Contents
DECLERATION ....................................................................................................... ii
AKNOWLEDGEMENT ............................................................................................ iii
ABSTRACT ............................................................................................................. iv
Table of Figures ..................................................................................................... vii
1.0 INTRODUCTION .............................................................................................. 1
2.0 LITRATURE REVIEW ....................................................................................... 2
2.1 Morphology ....................................................................................................... 2
2.1 Colouration ........................................................................................................ 2
2.2 Sexual Dimorphism ........................................................................................... 3
2.3 Life Cycle .......................................................................................................... 4
2.4.0 Behaviour ....................................................................................................... 5
2.4.1 Solitary Behaviour .......................................................................................... 5
2.4.2 Social Behaviour ............................................................................................ 5
2.4.3 Parental care .................................................................................................. 5
2.4.4 Defensive behaviour ...................................................................................... 6
2.5. Taxonomy ........................................................................................................ 7
2.6 Evolution ........................................................................................................... 9
2.6.1 Termite evolution ........................................................................................... 9
2.7 Ecology ........................................................................................................... 10
2.7.1 Forest ecology ............................................................................................. 11
2.7.2 Desert ecology ............................................................................................. 12
2.7.3 Aquatic Habitats ........................................................................................... 14
2.7.4 Predators ..................................................................................................... 14
2.7.5 Contribution to ecosystem services ............................................................. 15
2.7.5.1 Nitrogen fixation ........................................................................................ 15
2.7.5.2 Methane cycle ........................................................................................... 15
2.7.5.3 Pollination ................................................................................................. 15
2.7.5.4 Waste removal .......................................................................................... 16
2.8 World species Distribution ............................................................................... 16
2.9 Wallace and zoogeographical regions ............................................................ 17
2.10 Endemism and species richness ................................................................... 19

vi
2.11 Cockroach and Conservation ........................................................................ 19
2.12 Contributors to cockroach taxonomy and research ....................................... 20
2.12.1 Robert Walter Campbell Shelford .............................................................. 20
2.12.2 Karl Richard Hanitsch ................................................................................ 20
2.12.3 Dr Louis M. Roth ........................................................................................ 20
2.14 Lack of research Insect data ......................................................................... 21
3.0 AIMS AND OBJECTIVES ............................................................................... 21
3.1 Hypotheses ..................................................................................................... 22
3.1.1 Relationship between species richness and zoogeographic region ............. 22
3.1.2 Relationship between Genus richness and Zoogeographic region .............. 22
3.1.3 Relationship between endemic species and Zoogeographic Region ........... 22
3.1.4 Relationship between Genera richness and Species richness in relation to
zoogeographic region ........................................................................................... 22
4.0 METHODOLOGY ............................................................................................ 23
4.1.1 Data collection ............................................................................................. 23
4.1.2 Data analysis ............................................................................................... 24
4.2 Data statistical analysis ................................................................................... 25
4.2.1 Relationship between endemic species and Zoogeographic Region ........... 25
4.2.2 Relationship between Genus richness and Zoogeographic region .............. 25
4.2.3 Relationship between Species richness and Zoogeographic region ............ 25
4.2.4 Relationship between Genera richness and Species richness in relation to
zoogeographic region ........................................................................................... 25
4.3 RESULTS AND STATISTICS ......................................................................... 26
5.0 Discussion ....................................................................................................... 31
5.1 Percentage of Endemic species by zoogeographic region.............................. 31
5.2 World distribution map of species richness ..................................................... 32
5.3 Blattodea hotspots .......................................................................................... 35
5.4 Species richness by Zoogeographic region .................................................... 35
5.5 Relationship between Genus richness and Zoogeographic region ................. 37
5.6 Relationship between Genera and Species richness by Zoogeographic region
.............................................................................................................................. 37
5.8 How the study could be improved ................................................................... 38

vii
6.0 CONCLUSION ................................................................................................ 38
7.0 FURTHER RESEARCH .................................................................................. 40
8.0 REFRENCE LIST ............................................................................................ 41
9.0. APPENDICIES .................................................................................................. 48
9.0.1. Appendix 1 .................................................................................................. 48
9.0.2 Appendix 2 ................................................................................................... 54
Table of Figures
Figure 1 Sexual Dimorphism (Roth, 1991) ................................................................. 3
Figure 2 Life stages of Methana marginalis (Roth, 1991) ........................................... 4
Figure 3 Taxon Tree (Van der Wart, 2015) ................................................................ 7
Figure 4 Family taxonomy of the suborder Blattaria (Roth, 2003) .............................. 8
Figure 5 the addition termite sister group (Inward et al, 2007) ................................. 10
Figure 6 map of the world with tropical rainforest highlighted (Britannica, 1997) ..... 12
Figure 7 map of the world with the desert regions highlighted (Hendrix et al, 2014) 13
Figure 8 zoogeographic regions map and key (Beccaloni, 2014) ............................. 17
Figure 9 A revised world map of zoogeographic regions (Holt et al, 2013) .............. 18
Figure 10 Excel document master list ...................................................................... 23
Figure 11 Species richness by country ..................................................................... 24
Figure 12 World cockroach species richness by zoographical region ...................... 26
Figure 13 World cockroach genera richness by zoographical region ....................... 27
Figure 14 World Cockroach species and genera percentage comparison by
zoogeographic region ............................................................................................... 28
Figure 15 Species endemic percentage by zoogeographic region ........................... 28
Figure 16 Biodiversity hotspots of Blattodea of species diversity ............................. 29
Figure 17 World map of cockroach species richness by political region .................. 30

1
1.0 INTRODUCTION
Cockroaches are a relatively small order of insect with 4549 species (Cockroach
species file, 2014); they are generally considered pests and have a poor public
image. Cockroaches are an understudied order in the entomological field; they are a
highly diverse group they are found across the world in a large variety of different
habitats. The tropical rainforests are regions know for the highest cockroach diversity
(Bell et al, 2007).
Their main role in the ecosystem is they are responsible for breaking down
complex carbohydrates and extract minerals in decaying material back into the
ecosystems (Lavelle, 2002). They are also renowned for their ability to transport
bacteria, fungi and as vector, transporting these taxon species in leaf litter could
enhance and increase the nutrient recycling process (Fotedar et al, 1991).
There is a lack of knowledge about the global distribution and zoogeography of
insects in general with an estimate only 30% of arthropods are known (Scheffers,
2012). Only 25 species of cockroach are acknowledged on the IUCN red list and 15
of them are considered endangered or critically endangered (ICUN red list, 2014).
The conservation of cockroaches relies on knowledge of species populations and
species richness within a habitat or region.
The aim of the study will be able to assess the currently known species and genus
richness of zoogeographic regions. To evaluate species endemism in each
zoogeographic region to locate possible region which maybe phylogenetic distinct.
To produce a map of the world species richness by country and to critically
discussed to highlight areas of particular interest to enhance the study. The
secondary data in which the study is based is from the online source the cockroach
species file.

2
2.0 LITRATURE REVIEW
2.1 Morphology
Cockroaches are classified under the Class of Insecta they are readily identifiable
from there features 3 pairs of legs, three body parts head, thorax and abdomen and
one pair of antenna. The Class contains 25-30 orders which are found worldwide
(bugguide, 2015). The cockroach distinct features such as 10 segments of tergum
which are located upon the abdomen, other features such as two pairs of wings
(these are not present in all species) with the front pair are mesothoracic and are
called tegmina they dark and leathery in appearance have a protective. The hind
wings are membranous and transparent; there function is for flight these wings are
protected by the front tegimina. The Head is comprised of compound eyes which are
usually fully developed, however they are reduced or absent in cave dwelling
species. The antenna are many segmented and filament like, the mandibles are
strong and contain teeth. The thorax has a prothorax with a shield like pronotum
which occasionally overlaps the head (Roth, 1991). The pronotum it has become
adapted in many species into various tools such as a wedge, plug and ram, the
majority of species where the pronotum overlaps the head belong to digging species
(Bell et al, 2007).
The typical flat body shape of the cockroach is due to its ecological niche, this is
functionally related to their microhabitats in which they exist. Their body shape
allows them to occupy narrow and horizontal extents found within leaf litter and tree
crevices. Pancake syndrome is the typical look for many species this is where the
species is dorsoventrally compressed this gives protection against both abiotic and
biotic factors such as predation against ants (Mackerras, 1967b).The cockroaches
can become immobile by clamping down to a trees surface protecting their
vulnerable undersides and water retention in dry conditions (Grancolas et al, 1994).
2.1 Colouration
Cockroach colouration is determined by behavioural ecology such as Crypsis or
aposematic behaviour see (2.4.5 Defensive behaviour), the majority of species
possess dull and dark colours which are appropriate for their cryptic lifestyle within
decaying plant material and nocturnal behavioural activities. However it has been
found that a few species colouration changes due to environmental factors within the

3
ecosystem, the species Ectobius panzeri found in Britain are considerably darker in
higher altitude populations and females often turn darker in colour during the end of
breeding season (Brown, 1952). The species Panchlora nivea colouration changes
in their life stages as their behaviour changes the nymphs are browns where as in
the adult stage they are bright green (Roth and Willis, 1958b). The diurnal species
are generally more conspicuous they have three broad categories small colourful
species, aposematic species and Batesian mimics (Bell et al, 2007).
2.2 Sexual Dimorphism
Sexual dimorphism is present in many cockroach species, there are some species
this occurs as size, colouration or wing presence this can become extreme and
males and females appear to be different species see (Figure 1). There is a variety
of sexual dimorphic characteristic features in cockroaches. The different
morphological features in sexual dimorphism suggests that the demands of winning
a mate are highly determined upon they influence the morphological evolution of the
species (Roth, 1991).
Figure 1 Sexual Dimorphism (Roth, 1991)

4
2.3 Life Cycle
Figure 2 Life stages of Methana marginalis (Roth, 1991)
A cockroach’s lifecycle is comprised of three stages see Figure 3. Egg (ootheca) (A),
nymph (B, C, D) and Adult (E) this is known as incomplete metamorphosis or
hemimetabolism (Gullan, 1994). The eggs are deposited in groups they are enclosed
inside an ootheca which is a produced by the female. The ootheca is either carried
externally in oviparous species or internally in viviparous species. The oviparous
species tend to produce oothecas which are complete and generally quite resistant
to desiccation. However female viviparous species produce usually more flexible
walled ootheca’s with absent or simple keels (Cochran, 1999).
Once the cockroaches emerge from the ootheca, this is known as the nymph stage
of their lifecycle. They generally resemble the adults of their species although lack
wing structures and usually differ in colouration. They moult as they grow the
number of moult varies between taxa and sometimes differs between sex within the
same species (Roth, 1991). The moulting process is required as their rigid cuticle
restricts growth at each stage. The stages between moults are known as instars. The
outer cuticle periodically sheds as the cockroach in order for the cockroach to grow
and reach the imaginal instar or adult stage (Gullan, 1994).The most noticeable
change in the imaginal instar is usually the appearance of wings taxa and sex
dependent.

5
2.4.0 Behaviour
2.4.1 Solitary Behaviour
There is low number of truly solitary species of cockroaches that only meet other
members of the species in order to mate. Deep cave cockroaches come into this
category however they do occasionally congregate around food sources but they
have large ranges and only meet another cockroach in order to reproduce
(Langecker, 2000). Thanatophyllum akinetum is a species which exists in French
Guyana that has evolved a cryptic solitary lifestyle. This has allowed the species to
co-exist with army ants as they actively keep a set distance from other individuals
and spend their time motionless in the leaf litter avoiding attention from their
predators (Grandcolas, 1993).
2.4.2 Social Behaviour
The genera Gromphadorhina Madagascan hissing cockroaches live in social
systems they must be able to recognise dominate group members to avoid costly
contests between members. The males most noticeably have been observed to
show display behaviours such as thorax thrashing to reduce the chance of fighting,
they use also complex acoustic behaviours hence the common name. The social
system is based on dominance based territorial behaviour for mate choice, the males
are sexually dimorphic they have pronotal horns which are used in fighting
behaviour. The males appear to show associations with rank of individuals in the
hierarchy (Clark, 1993).
2.4.3 Parental care
Majority of cockroaches show a form of parental care this is a behaviour that
promotes survival, growth and development of nymph cockroaches. Cockroaches
are considered one of the largest groups of insects that show parental care
behaviours (Hinton, 1981). In both oviparous and viviparous female cockroaches the
embryos are protected and provisioned within the body of the cockroach. In
oviparous species the adults exhibited behaviour such as production of oothecal
case, the preparation of ootheca deposition site, concealment of ootheca and the
defending behaviour of protecting the ootheca. Brooding behaviour has also been

6
observed in oviparous females, this is where the nymphs cluster on and around the
female cockroach for periods of time after emergence (Grancolas, 1993).This
behaviour was witnessed for less than a day although this was observed in
laboratory conditions. This brooding behaviour is believed to protect the nymphs as
they are most vulnerable after hatching as their cuticle is soft for several hours and in
this state they are at high risk from predators and cannibalism. Another factor could
be the transferring of gut microbiota from the adult female to the nymphs through a
faecal meal, however there is currently a lack of research in this area to support the
brooding behaviour (bell et al, 2013).
Sub social behaviour on extreme form of this is shown by Byrostria fumigata the first
instars are able to recognise their mother and show a preference of aggregating
beneath the mother cockroach for the first 15 days after hatching. Other forms of
sub social behaviour these include species with adaptations in their morphology of
nymphs or the females facilitate care. These adaptations include appendages on
nymphs to help cling on to the female. Adaptations to mouth parts to facilitate unique
feeding behaviours such as the species Thorax porcellana, the nymphs obtain
nutrients from the mother with their specialised sharp mandibles. They pierce the
cuticle on her abdomen to feed on her haemolymph (Beccaloni, 2013). Some
species have evolved external brooding chambers under their wing cases (Bell et al,
2007). Species of the Perisphaerus genus have developed the ability to
(conglobulation) roll into a ball like a pill millipede to protect ventrally clinging
nymphs. The nymphs are born blind and have tubular mouth parts which are unique
in cockroaches; these mouth parts fit into appendages within the mothers mid and
hind legs. The nymphs are believed to extract nutrients from these pores; the
nymphs do not develop functioning eyes until the third instar (Beccaloni, 2013).
2.4.4 Defensive behaviour
Cockroaches are prey for a variety of arthropods species and numerous
entomophagous vertebrates, amphibians, birds and mammals. Cockroaches have
developed species specific defences such as aposematic mimicry of Coleoptera
especially coccinellids and chrysomelids however the majority of models are not
known (Wickler, 1968). Another example of aposematic mimicry is the species

7
Cardacopis shelfordi have the yellow and black colouration which mimics dangerous
hymenoptera species (Roth, 1988).
Other defence mechanisms are chemical secretions many of the polyzosteriinae
family share this method of defence they produce aliphatic compounds. Some
species of this family have developed a warning stance which they angle their bodies
vertically revealing bright warning colouration on their coxae and venters. The gland
opening is faced toward the threat if the warning stance is not effective it will
discharge its chemical defence, 2-methylbutanal is a chemical commonly expelled
(Roth, 1991).
2.5. Taxonomy
Figure 3 Taxon Tree (Van der Wart, 2015)

8
Cockroaches are in the higher classification the order Orthoptera. Cockroaches are
primitive orthopteran insects and are more generally placed into the suborder
Dictyoptera with Mantodea and Isoptera (Roth, 2003). Mckitterick developed a
taxonomic system which 4 morphological systems; female genetalia, male genetalia,
proventriculus and oviposition behaviour. From the studies conducted the conclusion
was there are 2 subfamilies evolved along two divergent lineages and have been
grouped into two superfamilies Blattoidea; comprised of two families Cryptocercidae
and Blattidae (Mckitterick, 1964). The other Blaberidae consist of the families
Polyphagidae, Blattellidae and Blaberidae, 20 subfamilies extend from these
superfamily lineages see (Figure 4) (Roth, 2003).
Figure 4 Family taxonomy of the suborder Blattaria (Roth, 2003)
Taxonomical issues with Blattodea especially in the superfamily Blattaria in relation
to the homogeneity of their morphological features. Some author’s species
descriptions which were used as diagnostic evidence were unnecessarily brief, when
describing morphological features or characters. This has now been discovered that
these features have no or little significance of species level identification, It has also
been noted that some species descriptions were so ambiguous it could relate to
other species and in some instances other genera (Fallia et al, 1987).

9
2.6 Evolution
Cockroaches are one of the earliest known group of winged insects; the first fossil
records date back to the carboniferous period 359.2 to 299 million years ago
(Kamhampati, 2005). There are numerous journals the Blattodea on prehistoric
species collected from fossil resins; these are mainly nymphs rather than much rare
adult specimens. However the taxonomic information from resin nymphs is no less
important than provided from adult impressions in rocks which contain wing venation
information (Gorokhov, 2006).
2.6.1 Termite evolution
Termites are believed to have evolved from the genus Cryptocercus which are a
group of wood feeding cockroaches as both shares symbiotic gut flagellates with
early evolved species of termites. The nymphs of both groups share similar
morphological features, the evolution occurred when nymphs of the Cryptocercus
required longer parental care as they are dependent on the transfer of gut flagellate
transfer through proctodeal trophallaxis. This evolutional adaptation to a eusocial
behaviour in termites eventually led to the loss of the ootheca, this was due to the
nesting behaviour this provided both protection and its regulated climate which made
it unnecessary to waste energy producing a ootheca. See (Figure 5) this is the
suggested placement of termitidae sister group into Blattodea order (Inward et al,
2007).

10
Figure 5 the addition termite sister group (Inward et al, 2007)
2.7 Ecology
Cockroaches have developed their stereotypical flattened shape due to their crevice
inhabiting niche within an ecosystem. This allows them to exploit narrow, horizontal
and spaces found within in ecosystems such as decaying leaf litter. Even distantly
related species occupy a very similar ecological niche however they differ through
changes of similar morphological features which reflects the demands of their
surrounding environment (Bell et al, 2007).

11
The majority of cockroaches are considered soil fauna because of their diet is
dependent on decaying matter of animals and plants. They occupy a range of niches
within the soil ecosystem e.g. upper litter horizon, burrowing species can be found in
the mineral soil level, other species live within the suspended soil (Eienbeis et al,
1985). Cockroaches on a global scale are responsible for breaking down complex
carbohydrates and mineralizing nutrients of plant decaying matter in all ecosystems
(Lavelle, 2002).
The cockroach has an important role as vectors of bacteria and fungi they are moved
from to different locations via the cuticle (Fotedar et al, 1991). However cockroaches
generally have clean external surfaces they have been observed grooming and
cleaning there extremities with their modified comb like legs up to 50% of the time.
This grooming behaviour is believed to be related to prevent disease spread within
their habitat; the bacterium which is digested might also have another benefit in
species which have gut bacteria which neutralize ingested pathogens (Arnold, 1974).
In species that allogroom in their development stage there is evidence to suggest
there is a nutritional reward for the groomer, this behaviour in social species also
keeps other individuals within the group free of infections (Dhanarajan, 1978).
2.7.1 Forest ecology
In a temperate forest environment cockroaches are usually restricted to a minor
niche within the soil biology due to low population densities such as ectobius sp in
European woodlands (Bell et al, 2007). However in samples collected from four
forest types in Gunug Mulu in Sarawak, cockroach biomass was recorded at 43% of
the invertebrate biomass in alluvial forest, 33% in Dipterocarp forest, 40% in Heath
forest and 2% in a forest located on limestone. The tropical rainforest however
provides many niches within the canopies and arboreal habitats, in a study that
reviewed arthropod composition of the canopy 5.3% of individuals collected where
cockroaches however when represented in biomass composition they were found to
represent 24.3% with hymenoptera second which was comprised mainly of
formicidae (Basset, 2001). The Rainforest canopy is a relatively difficult environment
to survive with high exposure to sunlight and radiation, also other factors such as
wind and heavy rainfall are common occurrences (Madigosky, 2004). The Central
American species Epilampra irmleri their ecological decomposition rate has been

12
quantified to consume an estimated 6% of the annual leaf litter in the inundation
forests (Irmler et al, 1979). See (Figure 6) show tropical rainforest regions around the
world this is where cockroach species richness is predicted to be highest (Bell et al,
2007).
Figure 6 map of the world with tropical rainforest highlighted (Britannica, 1997)
2.7.2 Desert ecology
Deserts excluding the Polar Regions cover around 25% of the earth’s surface,
deserts are defined by the amount of precipitation they receive on an annual basis.
By definition a desert is an area of region which receives less than 25cm of rainfall a
year (Hendrix et al, 2014). Figure 7 below shows a map of the world with the desert
regions highlighted and labelled. There are a number of cockroach species which
have adapted to more arid environments such as deserts. Deserts generally have
low and unpredictable precipitation, extreme contrasting temperatures and low soil
organic matter (Wall et al, 1999). The family Polyphagidae has the most desert
dwelling species compared to the other families, there are some species of blattellids
and a small number of blattids (Bell et al, 2007).

13
The behaviour of cockroaches in desert environments have evolved to survive by
‘sand swimming’, which is the ability to burrow quickly below the sand surface.
Moisture in deserts is found beneath the sand at a depth of 30-60cm also
temperature declines as with depth. This area is where cockroaches are
predominantly found in the day as the microclimate is favourable, with reduced
temperature and higher humidity levels prevents excess water loss and overheating
(Kinlow, 1999). During the night cockroaches’ move towards the surface to feed on
decaying leaves, roots and various other food sources, however they still remain
under the sand to avoid predators such as scorpions (Bell et al, 2007). The Sand
roach the genus Arenivaga this group of Polyphagidae has the ability to
osmoregulate to absorb water from the surrounding environment this is unusual due
to the size of the cockroach 800mg which is relatively large whereas most
osmoregulatory species are much smaller (Edeny, 1974). Around half of the known
deserts species are found within microhabitats created by vertebrate species such
as ground squirrels, gerbils and tortoises. However some species are not restricted
to these habitats as they are found across a variety of micro habitats e.g. Arenivaga
floridensis has been observed in mice burrows, loose sand and in vegetation
communities of scrub (Atkinson et al, 1991).
Cockroaches in deserts are known to contribute the breakdown of organic matter
and have an impact on the nutrient flow within this ecosystem. Anisogamia
Figure 7 map of the world with the desert regions highlighted (Hendrix et al, 2014)

14
tamerlana is a species found in Turkmenistan they consume around 17% their dry
body mass daily. They are known to improve soil fertility the faecal matter they
produce has up to 10 times the nitrogen content then their food source (El-Ayouty et
al, 1978). In habitats where other decomposers are less abundant such as millipedes
and earthworms cockroaches have filled the niche such as the Australian species
Dezmososteria cincta in the breakdown of eucalyptus leaf litter (Rentz, 1996)
2.7.3 Aquatic Habitats
There are two categories of aquatic cockroach species phytotelmata aquatic habitats
which exist on or within plants such as bromeliads, and species which exist in ponds,
rivers and streams. Cockroaches live at the surface of the water however submerge
to escape predators or to hunt for food. Sixty-two species alone have been found
within bromeliads however it is unknown how many are restricted and are dependent
on the microhabitat further research should be carried out in this area to help aid any
future conservation efforts (Roth et al, 1960). Many species of the Epilamprinae live
along streams and pool habitats they feed upon decaying vegetation around the
water’s edge.
Many aquatic cockroaches have adapted their behaviour to submerge into the water
when disturbed by movement or shadows this allows them to escape from possible
predators. They cling on to the vegetation or rocks under the water’s surface for up
to 15 minutes (Bell et al, 2007). In many aquatic species the abdomen tip has been
adapted to a snorkel; also trapping an air bubble has been observed to maintain an
air supply whilst submerged (Wiedner, 1969).
2.7.4 Predators
Cockroaches as a prey item feed a vast array of species such as pitcher plants
Nepenthes sp (Roth and Willis, 1960). There is evidence to show that the genus
Parcoblatta in South Carolina is the one of the main prey items of the endangered
Picoides borealis Red cockaded woodpecker (Horn and Hanula, 2002). Another

15
endangered species which is dependent on cockroaches as a food source is the
Copsychus sechellarum the magpie robin on the Seychelles (Komdeur, 1996).
2.7.5 Contribution to ecosystem services
2.7.5.1 Nitrogen fixation
Cockroaches potentially have influences into the biogeochemical cycles such as the
Nitrogen the Cryptocerus genus are the only known species of cockroach which
contain microbes which are able to fixated atmospheric nitrogen (Slaytor, 1992).
These species have a nitrogen fixation rate which equates to similar rates as
termites on a body weight basis. The ecological significance is currently unknown,
however where they occur in high prevalence such as the montane mesic forest the
Cryptocerus is the dominate wood feeding species (Bell et al, 2007).
2.7.5.2 Methane cycle
Methane seems to be a universal by-product because of the methanogenic bacteria
which is found within their hindgut (Hackstein, 1994). This occurs in tropical species
of cockroaches regardless of derivation, during laboratory testing in resting
cockroaches found methane, carbon dioxide and water where to be released
simultaneously suggesting the gases are respired. However due to variable such as
cockroach age and fibre content it is difficult to estimate methane production on a
global scale. It has been suggested that the cockroaches make a significant
contribution to atmospheric methane particularly in the tropic regions (Gijzen et al,
1992).
2.7.5.3 Pollination
Some cockroaches are found feeding upon nectar and pollen, in the forests of Japan
the adult Margattea sumana visit nectaries at the base of egg like inflorescences of
the root parasite balanophora sp. The visits coincided with the evening nectar
secretion, the pollen grains were observed to be attached to the tarsi and mouthparts
although the crosspollination success has yet to be measured assumptions of low
success rates in this species have been made because it’s a flightless species (Bell
et al, 2007). There is stronger evidence of cockroaches being effective pollinators in
the lowland mixed dipterocarp forest in Borneo, this area has low bee densities in the

16
canopies. Blattellid cockroaches where observed feeding on pollen of the species
Uvaria elmeri a member of the Annonaceae family. The pollen grains were found
both within the gut and on the surface of the head, and the timing of visits coincided
with nocturnal dehiscence of anthers. Therefore due to the lack of bees it has been
suggested that the cockroaches may have evolved to fill the ecological niche of the
pollinators (Basset, 2001).
2.7.5.4 Waste removal
Many cockroach species niche is feeding upon faecal and waste matter of a large
variety of various taxa. The species found in microhabitats such as bird nests,
mammal burrows and social insect nests provide sanitation services which opposes
their reputation of carrying diseases. Evidence suggests the Parcoblatta nymphs
prolong the colony cycle of Vespula squamosa, they remove debris, as well as
keeping bacterial and fungal population in low densities (Macdonald et al, 1983).
2.8 World species Distribution
World species distribution is not evenly spread across the world there are areas with
higher species richness and higher levels of endemism compared to other regions
(Mittermeier, 2008). Currently 44% of the world’s known species diversity is
endemic to 12% of the earth’s surface in 25 different locations which are known as
Hotspots (Kitching, 2000).
The total number of species and distribution data is essential to develop an
understanding of the species richness and patterns of biodiversity within
ecosystems, without this knowledge the future and conservation of these species
(Dolphin et al, 2001). To estimate world distribution maps can be difficult due to
completeness of global inventories for example estimates suggests mammals
around 97% known where as 30% in arthropods. Taxonomists are evenly
distributed through taxa however this is a disadvantage because there are over 100
times more invertebrates than vertebrates. Another underlying issue are the where
about of unidentified species this is a concern because of current habitat destruction
rates the chances of these species being discovered before their habitat is

17
destroyed is questionable (Scheffers, 2012). There has been no study in this field
for specifically cockroaches or invertebrate distribution in general on a world basis.
2.9 Wallace and zoogeographical regions
Alfred Russel Wallace was the joint publisher of the theory of evolution by natural
selection with Charles Darwin in 1858. He was a field biologist and specimen
collector who spent almost 8 years in the Malay Archipelago where he collected
110,000 insects, 7500 shells, 8050 bird skins and various other curiosities. During
his time there he wrote and published a book on his journey The Malay Archipelago
which became one of the most celebrated travel writings of the 19th century
(Beccaloni, 2008). In 1876 Wallace published a map of the global terrestrial
zoogeographical regions which was theorised upon both distribution and taxonomic
relationships between various taxon groups (Holt et al, 2012). Below shows a basic
map of the world divided into these 9 regions (Figure 8) is a key to colouration of the
zoogeographical regions.
Figure 8 zoogeographic regions map and key (Beccaloni, 2014)
Zoogeographic regions are hypothesised upon geological tectonic events which
occurred during the Mesozoic era where the continents Gondwana and Lauraisa.
Madagascar is a prime example of where geological isolation has driven evolutionary
distinctiveness. However new evidence suggests that environmental boundaries
which existed for long periods also act as historical barriers , Examples of

18
environmental barriers temperature and humidity Nearctic and Neotropical regions
(Proches, 2012).
Figure 9 A revised world map of zoogeographic regions (Holt et al, 2013)
A study was carried out on global phylogenetic and distribution relationships
between 21,037 vertebrate species this included amphibians, birds and mammals.
From this study it was concluded there where 11 larger zoogeographic regions the
new suggested regions are Sino-Japanese, Sharo-Arabian and Panamanian see
Figure 9 above (Holt et al, 2013).
This study was carried out on terrestrial vertebrates and not invertebrates this must
be taken into consideration for global zoogeographic studies as there maybe
difference in phylogeny and distribution relationships in comparison to vertebrate
groups. As many invertebrate species may have evolved earlier changing the
cladistics and how they have become distributed. The paper suggested the addition
of invertebrate data could affect the regions distribution (Holt et al, 2013) Only 9
regions will be included in this study as that is how the data is arranged and is
difficult to change into the new perceived system as no specific locality data is
included in the data sets. These 9 regions are used in various entomological
collections such as the as the Natural History Museum London as a method of
having zoogeographic distribution data easily displayed on draws as a colour code
system (Scoble, 2002).

19
2.10 Endemism and species richness
Endemic in an ecological term is a species which is unique to a geographic location,
nation or habitat and found nowhere else (Hogan, 2011). Endemic richness is a
fundamental to aid global conservation as understanding the levels of endemism can
prioritise areas which may previously be overlooked form a conservation protection.
Islands are known for high levels of endemism however there species richness is
known to be lower than the mainland, analysing both levels of endemism with
species richness can identify specific regions which are high in both and should be
priorities for conservation efforts (Keir, 2009). The traditional method of providing
evidence for conservation protection is species and genera richness the taxonomy is
assumed to be equivalent unit, Genera is preferred over species as generally there
are less taxonomic issues at this level (Perez-Losada, 2003). The loss of a species
with no or limited related extant species in comparison to a species with many
related species would be a much greater loss to genetic and phylogenetic diversity
and should be conservation efforts should prioritised over the other species.
2.11 Cockroach and Conservation
Cockroaches live in many areas where there are large conservation threats to
biodiversity such as deforestation, urbanisation, global warming and agricultural
practices. Cockroaches are not high on the agenda for invertebrate conservation as
they are not a popular or well-studied group of insects (Bell et al, 2007).There are 25
species of cockroach found on the IUCN redlist, all these species where assessed
by Gerlach and reviewed by Hochkrich (IUCN, 2015).
A quick breakdown of the 25 species they are all found in the Seychelles region.
One species is now considered extinct Margetteoidea amoena and has not been
seen in the wild since 1905. 8 species are critically endangered, 7 species
Endangered, 1 species data deficient and 8 least concern.
The Desroaches cockroach Delosia ornata a critically endangered species found
endemic to Desroaches Island. The population was last estimated in 2006 with less
than 300 adults and 600 nymphs and is threatened due to hotel development. The
species is currently surviving in woodland fragments <100m2, the island highest

20
point is less than 1m and is all so under threat of rising sea levels. There is currently
no conservation plan put in place for this species (Gerlach, 2012).The other species
Gerlach cockroach Nocticola gerlachi is located on the Seychelles granitic islands
which has a status of endangered it is located to a site of 10km2 of costal gardens
which is a secure habitat however at risk from rising sea levels (Gerlach, 2012).
2.12 Contributors to cockroach taxonomy and research
2.12.1 Robert Walter Campbell Shelford
Shelford was an entomologist who was born in Singapore in 1872; he was a curator
at the Sarawak museum for 7 years then became assistant curator at the hope
entomological collection in 1905. He published papers on a variety of orders
Lepidoptera, Orthoptera and Phasmantodea. He published his first paper on
cockroaches in 1906 (studies of the blattidae. Transactions of the entomological
society of London, 1906: 231-280) this paper described 38 species and 5 genera. In
8 years Shelford published 27 papers and described 284 new species, since only
13% of them have been synonymised this indicates his studies where thorough
(Cockroach Studies, 2006).
2.12.2 Karl Richard Hanitsch
Hanitsch was born in Germany in 1860; also studied other groups of organism like
Shelford did these included molluscs, sponges and Lepidoptera. He was a curator at
the raffles museum in Singapore and in 1919 became an associate curator at the
Hope entomological collections. In 1915 he produced his first Blattidae paper
(Malayan Blattidae) he only described 9 species, by the end of his career he
produced 36 papers on cockroaches and described 300 species. Since only 10% of
the species he described have been synonymised. Hanitsch contributed the most
specimens to the HEC collections compared to everyone else, with 162 type
specimens around 28% of the collections type material (Cockroach Studies, 2006).
2.12.3 Dr Louis M. Roth
Roth was a researcher at Harvard University he started his career studying
mosquitos for 30 years, whilst in Natick he became interested in cockroaches

21
because of their importance to the U.S military and the ease of rearing them. He
devoted his time into studying their behaviour and physiology; He was given an
office at Harvard University’s museum of zoology. Whilst at Harvard he worked on
cockroach taxonomy and described 400 species previously undescribed that he
collected from field trips and received in from researchers around the world. He also
named 20 genera and published over 40 papers during the 30 years he studied
cockroaches. He received an award for his achievements in insect systematics the
Thomas say award in 1995.He continued his research into his retirement and often
worked 7 days a week without pay his affection for cockroaches was truly admirable
(entsoc, 2012).
2.14 Lack of research Insect data
There are large gaps of knowledge in invertebrate global biodiversity this is generally
because there is a lack of comprehensive data sets of these orders these data sets
are generally available in vertebrates and plants in which most of world speciation
and zoogeography has been based upon and where research has predominantly
carried out (Economo et al, 2014).
3.0 AIMS AND OBJECTIVES
There has been no study in this area of cockroaches this is because the data until
recently has been difficult to obtain. The aim of the study will be able to assess
currently the known species and genus richness of zoogeographic regions, to assess
species endemic richness of zoogeographic region. To produce world map species
richness by political region this will indicate countries with high species richness and
ones with low species richness. From the data analysis of Blattodea world
distribution, assess areas for possible research and provide evidence to theories of
cockroach ecology and aid research for cockroach conservation.

22
3.1 Hypotheses
3.1.1 Relationship between species richness and zoogeographic
region
H1- There will be a significant difference between species diversity and
zoogeographic region
H0- There will be no significant difference between species diversity and
zoogeographic region
3.1.2 Relationship between Genus richness and Zoogeographic
region
H1- There will be a significant difference between genus distribution and
zoogeographic region
H0- There will be no significant difference between genus distribution and
zoogeographic region
3.1.3 Relationship between endemic species and Zoogeographic
Region
H1- There will be a significant difference between endemic species and non-endemic
species in each zoogeographic region
H0- There will be no significant difference between endemic species and non-
endemic species in each zoogeographic region
3.1.4 Relationship between Genera richness and Species richness
in relation to zoogeographic region
H1- There will be a significant difference between genera richness and species
richness in relation to zoogeographic region.
H0- There will be a no significant difference between genera richness and species
richness in relation to zoogeographic region

23
4.0 METHODOLOGY
For this study secondary data was used the Blattodea species world distribution
database on the Cockroach Species File online data in the form of an excel sheet
world valid cockroach species master file produced by Dr George Beccaloni.
4.1.1 Data collection
The secondary data is collected from various specimens from institutions around the
world such as the Natural History Museum London; this study’s data was collected
from the Cockroach species file which is a website and online database. This online
database has been created for international use for taxonomic study and online
management of the world’s cockroach data. This contains detailed information on
each species which has been data based into the system by various individuals who
are taxonomists and administrators of the website. This information has been
manually inserted into a Microsoft excel document which can be used to create an
appropriate table for the data this includes (Distribution, species, genus, Family,
original taxonomic name, author, year described) see (Figure 10) below once all the
data has been collected and input into excel document as a master list then then the
data can be configured into appropriate data sets which will be analysed and
statistically tested.
Figure 10 Excel document master list

24
4.1.2 Data analysis
Once the data has been complied into a master list it is ready to be sorted into
relevant data sets such as species diversity by zoogeographical region. The Data
was extracted from the master list into a separate excel document which contained
country data base with zoogeographical region See (Figure 11). The species number
can be added from the master list by using the search tool for each country will give
a number of cells with that country name you can look through the cells selected for
errors the number then can be added to the new spreadsheet. Once all the data has
been placed in to the spreadsheet the data can be used to create graphs which
show species distribution between the zoogeographical zones.
Figure 11 Species richness by country
This spread sheet can also be used to create a heat map using online programs
such as Target map which was used in this study, although other computer
programs such as ArcGIS. As all the geographical data and species number are both
in the spreadsheet. The data can be uploaded to create a map to show spatial
relationships between species richness and political geographical regions. The
genus distribution has been calculated from the master list the genus column can be
ordered into alphabetical order from this the zoogeological data can be exported
from each species within the genus. This shows genus distribution this can be data
can be placed into a new spreadsheet to make data the analysis process less
complicated spreadsheet. This data can be used to create a pie chart to show

25
percentages of genus diversity by zoogeological region. As the Master list data has
been entered by hand typing there is potential for spelling errors which could affect
the data results so care must be taken in overlooking especially distribution data and
zoogeographic region as these are the independent variables whereas the species
names are not as important as species richness is being measured (number of
species).
4.2 Data statistical analysis
4.2.1 Relationship between endemic species and Zoogeographic
Region
The statistical tests carried out upon the data were the T-test to show significance of
endemic species in comparison to non-endemic species in each zoogeographic
region
4.2.2 Relationship between Genus richness and Zoogeographic
region
T- Test was carried out to test the significance of genus richness compared to
zoogeographic region. The data has to be carried out upon the mean of species
richness as the t-test requires two sets of data to compare against.
4.2.3 Relationship between Species richness and Zoogeographic
region
T- Test was carried out to test the significance of species richness compared to
zoogeographic region. The data has to be carried out upon the mean of species
richness as the t-test requires two sets of data to compare against.
4.2.4 Relationship between Genera richness and Species richness
in relation to zoogeographic region
Chi-squared was used to test the significance between genera richness and species
richness to zoogeographic region.

26
4.3 RESULTS AND STATISTICS
Figure 12 Pie Chart: World cockroach species richness by zoographical region
The pie chart in (Figure 12) Cockroach species presence shown by zoogeographic
region, based on 4549 species on the Cockroach Species File. the T-test P=0.46.
AUSTRALASIAN 9.41%
AUSTRO-ORIENTAL
11.96%
ETHIOPIAN 24.52%
MALAGASIAN 2.51%
NEARCTIC 1.05%
NEOTROPICAL 30.01%
NEW ZEALAND & POLY. 0.71%
ORIENTAL 7.92%
PALAEARCTIC 11.30%
CICRUMTROPICAL 0.26%
UNKOWN 0.34%
World cockroach Species Richness by zoographical region

27
Figure 13 Pie Chart World cockroach genera richness by zoographical region
The The pie chart in (Figure 13) shows Cockroach genera presence shown by
zoogeographic region, based on genera data on the Cockroach Species File. The T-
test P=0.5.
AUSTRALASIAN 8.03%
AUSTRO-ORIENTAL
13.67%
ETHIOPIAN 17.87%
MALAGASIAN 8.63% NEARCTIC
2.64%
NEOTROPICAL 22.66%
NEW ZEALAND & POLY. 4.68%
ORIENTAL 14.99%
PALAEARCTIC 6.83%
World cockroach Genera Richness by zoographical region

28
Newzealand &
poly
Australasian
Austro-oriental
Oriental Palaearctic EthiopianMalagasia
nNeotropic
alNearctic
Non endemic 36 13 76 100 50 11 3 25 24
Endemic 93 556 668 487 276 746 164 1345 26
0%
10%
20%
30%
40%
50%
60%
70%
80%
90%
100%
Spe
cie
s p
erc
en
tage
of
en
de
mic
ne
ss
Species endemic percentage by zoogeographic region
0%
5%
10%
15%
20%
25%
30%
35%
40%
45%P
ece
nta
ge o
f to
tal g
lob
al r
ich
ne
ss
World Cockroach Species and Genera percentage comparison by zoogeographic region
Species Richness
Genera Richness
Figure 14 Bar Graph World Cockroach species and genera percentage comparison by zoogeographic region
This graph shows the relationship between species richness and genus richness
based on genera data on the Cockroach Species File. The Chi square P=0.00
This Bar chart shows species endemism in each zoogeographic region as
percentages of the overall species richness in each area. The T-test provided a P=
0.005
Figure 15 Bar Chart: Species endemic percentage by zoogeographic region

29
Figure 16 Bar Chart: Biodiversity hotspots of Blattodea of species diversity
This Figure shows countries with over 100 species of cockroaches these 14
countries represent the highest areas of cockroach species richness in the world
from the Cockroach species file Data.
574
574
379
190
185
180
165
142
136
124
123
116
115
109
0 100 200 300 400 500 600 700
Australia
Brazil
Indonesia
China
South Africa
Democratic Republic of the Congo
Malaysia
Cameroon
India
Madagascar
Suriname
Panama
Colombia
Mexico
Biodiversity Hotspots of Blattodea of species diversity
Species Number

30
World
map
tha
t sh
ow
s c
ockro
ach s
pe
cie
s ric
hn
ess b
y e
ach
ind
ivid
ua
l po
litica
l regio
n d
ata
use
d fro
m
co
ckro
ach
sp
ecie
s file
. Cre
ate
d b
y u
sin
g o
nlin
e s
oftw
are
Ta
rge
t ma
p
Figure 17 World map of cockroach species richness by political region
World
Map
of c
ockro
ach
sp
ecie
s ric
hn
ess b
y c
ou
ntry

31
5.0 Discussion
5.1 Percentage of Endemic species by zoogeographic region
This study showed a there was a significant difference in the percentage of endemic
species between regions (T-test P=0.005), thus the alternative hypothesis was
accepted and the null rejected. The highest percentage endemism (97% ≥) found in
Australasian, Ethiopian, Malagasy and Neotropical zoogeographic regions this
indicates these areas have the highest percentage of unique species in comparison
to the other regions. The high percentage of endemic species in each realm provides
further evidence that the zoogeographic regions are phylogenically distinct from
other regions (Holt et al, 2012).
The other regions Austro-oriental (89%), Oriental (82%) and Palearctic (84%) have
transitional zones where species overlap (Proches et al, 2012), New Zealand and
Polynesia have 74% endemic species. The reason for lower endemic species in this
region could be partly due to adventive species; cockroaches are renowned for their
survivability and could have got to the islands of Polynesia through various natural
pathways including surviving and travelling on drift wood or other plant material such
as coconuts. The other method is anthropogenic introduction, either intentionally or
inadvertently from travelling and surviving on shipping vessels or aircrafts (Vitousek,
1997).
This analysis of endemic richness can be used to help prioritise areas for future
conservation, when combined regions of high species richness this would assist in
identifying areas with high unique species (Keir et al, 2009). These regions can be
identified as areas which have a large contribution to Blattodea global biodiversity
such as the Neotropical region which boasts 98% (1345) endemic species.
The region where endemic species is lowest is in the Nearctic region with (52%
endemic species), which is considerably lower than any other region. However this
region has considerably lower species richness then the other regions. When this
lower percentage of endemics is combined with low species richness (50 species
and 26 endemic) it highlights the comparatively low diversity. This could suggest that
the Nearctic region is of a lower conservation importance of cockroaches
(Krishnamurthy, 2003). This comparison however does not take into consideration

32
higher phylogeny i.e. genera and family, if the 26 species belong to families unique
to the region it would increase their conservation status. This low endemic
percentage also suggests the border between Nearctic region and Neotropical
region is not in the correct location in the case of Blattodea as the transitional zone is
at too high level of crossover of species.
The (Figure 15) also provides evidence that the zoogeographic regions for terrestrial
invertebrates concept as endemic species percentages are very high in the majority
of the regions, although in some cases (New Zealand and Polynesia) can be
explained from adventive species or anthropogenic introductions.
5.2 World distribution map of species richness
The world distribution map (Figure 17) shows countries coloured by the number of
cockroach species present in each. The data was extracted from the Cockroach
Species File in 2014 and may not be a true representation of the world richness due
to species which have not yet been discovered or described. Mapping at the country
level using political boundaries has disadvantages, for example to cause a resolution
in Alaska being grouped with the remainder of America (with 50-80 species of
cockroach) this is not representative of Alaska. Spain is also another example as
Spain has many islands so mainland Spain cockroach species richness would differ
from the species found upon the islands. This also does not show geographical
barriers or distribution of the species within the country as a result of varied habitats.
However this gives a representation of species in each individual political region
rather than the actual distribution of the species. From the map countries with high
cockroach species can easily be identified such as Australia, Brazil and Indonesia as
these countries have 200 or more cockroach species. The countries with the most
species richness coincide with previously recognised biodiversity hotspot areas
primarily found within less economically developed countries (LEDCs). The map
also shows a disproportional species richness distribution as countries have
contrasting species richness, for example there is a higher majority of countries
above the Tropic of Cancer which have lower species richness (0-20 species) in
comparison to the equatorial zone especially in the southern hemisphere, with the
exception of parts of China and India.

33
Cockroaches are known to be found in tropical regions this map reinforces this know
perception as the countries with high species richness can be seen between the
Tropic of Capricorn and the Tropic of Cancer. There are the exceptions such as
Chad, Sudan and Angola however there could be a variety of reasons such as,
desert habitat is highly prevalent in these countries. The countries with low species
richness in Africa and the Middle East seem to correlate to the map of deserts in the
literature review Figure 7 (Hendrix et al, 2014). It has been noted that desert habitats
are less species diverse in comparison to other environments, as the Polyphagidae
family is the most prevalent in desert habitats in comparison to other families as
mentioned in the literature review (Edeny, 1974).
Other variables could be the lack of research carried out upon cockroaches, due in
part to the lack of taxonomists and funding within these countries. Europe and
Northern Asia and the Middle East are the areas where cockroach species richness
is lowest with the map showing 0-20 species in the vast majority of these areas.
These areas are dominated by temperate forest rather than tropical rainforest and
the low species richness is to be expected in these areas due to their minor
ecological role in temperate forests (Bell et al, 2007).
The counties with highlight in red in (200-574 species) Figure 17 areas have had the
most taxonomic research on Blattodea such as Australia by (Roth, 1991) China (Bey
–Bienko, 1970). These areas could have bias as there is a disproportional balance of
research and misrepresent countries with seemingly lower species richness
especially in the tropical regions. However without this invaluable research these
countries would possibly have considerably less known species and not be
highlighted with high species richness on the map. Also species bias is reduced in
the comparison of zoogeographic regions which is later discussed in more detail this
paper.
Other issues in which the raw data presented see appendix was countries such as
Yugoslavia no longer exist and these species have no specific locality on the
cockroach species file so cannot be reliably placed into 6 nations in which it has
become Bosnia- Hercegovina, Croatia, Macedonia, Montenegro, Serbia and
Slovenia (UN, 1996). This can become a problem with political regions overtime
they can change in size, split and change name for instance there are no Blattodea

34
records on the cockroach species file from South Sudan as it became the newest
nation in 2011 (UN, 2011). There are 21 species located in Sudan with a possible
proportion of those species distributed in the region in which South Sudan exists,
which is now not applicable of known cockroach species richness.
The map (Figure 17) also highlights countries with questionable species richness
which could indicate these countries need more research and exploration such as
Bangladesh which indicates it has 0-5 species of cockroach where as India has 120-
150 species. Honduras in Central America is another country which stands out from
the surrounding cockroach richness of 80-120 of Mexico and 50-80 Panama. The
Western Sahara region has no data at all and is shown as grey on the map, other
countries may have low data due to political, economic or social issues, countries
such as Yemen, Somalia and Syria these countries are currently very dangerous and
unstable due to political and economic issues so research is very difficult to conduct
in these specific regions (Collier, 2011). Identifying these regions could important for
the future and conservation cockroaches as these area can be revised and then
provide more data for analysis to improve the understanding and knowledge of
cockroach distribution and species presence.
Other consideration to take into account are habitat variation in each country for
example Gabon has lowland rainforest which covers 84% of the countries landmass
this is predominantly one habitat type (Butler, 2013), because of this the country
could have less species diversity in comparison to another with many different
habitat types such as Australia (Cousin et al, 2008). Other factors such as altitude
and climate cannot be seen as variables on species richness by country, also
historic data has been used so species which maybe locally extinct or extinct in the
wild maybe included and not truly represent global species richness however due to
data deficiency’s in Blattodea species population we currently do not know so are
presumed extant unless proven otherwise (Williams, 1996).
The map has its disadvantages previously mentioned; this map can be used as
reference point for global species richness as the data from the cockroach species
file which is a reliable source. The map shows the data currently known across the
world and therefore shows where there can be improvements and suggests areas for
research and focus conservation efforts for Blattodea. With only 24 species on the

35
IUCN redlist, this is a cause for concern as presumably all the other species are data
deficient (IUCN redlist, 2012).
5.3 Blattodea hotspots
The (Figure 16) shows countries with over 100 species of cockroach the highest
countries these should be focused upon for conservation of cockroaches as this is
where the majority of the world cockroach species are located and the ecosystem
services they provide is most likely to be highest (Bell et al, 2007).
The countries with the highest species richness are Brazil and Australia both
containing 574 species both of these countries cover very large areas, and contain
tropical rainforest and have a wide variety of habitat types. Also these countries are
more economically developed countries (MEDCs) and have provided funding and
facilities for taxonomists to research the same can be said for South Africa with 185
species. As previously mentioned the influence of taxonomists in specific countries
may introduce bias into the analyses (Sastre, 2009). The majority of countries are
less economically developed countries LEDCs according to the human development
reports (HDR, 2014) many of these countries have high deforestation rates with
Indonesia currently highest in the world with 840,000 hectares per year and
increasing deforested per year and Brazil second highest at 460,000 hectares per
year (Margono et al, 2014). This could potentially affect species richness in these
countries already however there is not enough data on the vast majority of species to
know whether they still are extant or not.
5.4 Species richness by Zoogeographic region
Understanding species richness is essential for conservation and understanding the
ecology of cockroaches, this gives a global overview of species richness by
zoogeographic region. (T-test P=0.46) thus the null hypothesis is accepted and the
alternative hypothesis was rejected.
However the species richness pie chart (Figure 12) shows how the cockroach
species are distributed around the world in each zoogeographic region. The

36
Neotropical region has the highest proportion of species; with 28.93% of the world
species are located in this region. This is to be expected as the Neotropical region
has the largest area of rainforest habitat in comparison to the other regions see map
in (Figure 12) in the literature review (Britannica, 1997). The Ethiopian region is
second highest with 15.98% and Austro-Oriental region 15.71% these regions both
have large areas of rainforest (Britannica, 1997). The regions with the lowest species
richness are Malagasy region with 3.53%, New Zealand and Polynesia 2.27% and
the lowest region Nearctic at 1.06%. These regions excluding the Nearctic are
mainly comprised of islands, islands are known for their low species richness
compared to mainland regions (Keir et al, 2009).
Species richness represented by zoogeographic region reduces bias from individual
countries with high taxonomic research excluding Australasian as it is only
comprised of Australia. As each country has species richness value an average can
be calculated over the entire region. Taxonomic bias occurs when taxonomists
regularly select areas with specific characteristics, this can affect the overall results
leading to a non-representative species richness of specific countries (Sastre, 2009).
The species with unknown distribution data are practically useless as there is no
locality data. Therefore they cannot be studied within the environment or
behaviourally and cannot be protected. However this is not a major issue as only
0.34% (21 species) of the known world Blattodea distribution data is unknown.
These species still have taxonomic importance as these species have been
described and catalogued. The lack of distribution information could have been down
to a variety of reasons such as poor curation practices; poor record keeping in the
field collecting or the data was just misplaced (Jahnke et al, 2012).
Phylogenetic variation and higher taxonomy level divergence such as families are
not taken in to consideration as only the species richness is measured. This must be
taken into consideration when comparing regions with species richness as this can
be misleading as the Neotropical region has the highest species richness. However,
when taking the phylogeny and higher taxonomy classes into account in the
Neotropical region which may have different conservation importance in comparison
to other regions.

37
5.5 Relationship between Genus richness and Zoogeographic
region
There was no significant difference in the richness of genera in comparison to
zoogeographic region. (T test P= 0.50) thus the null hypothesis is accepted and the
alternative hypothesis is rejected. The Pie chart in (Figure 13) represents genera
richness distribution by zoogeographic region; the regions with the highest proportion
of genera richness are the Neotropical with (30.20%) and Ethiopian region with
(24.67%).
The regions with the lowest percentage of global genera richness are New Zealand
and Polynesia (0.71%), Nearctic (1.06%) and Malagasy (2.52%). These regions all
have in common low species richness so is expected to be lower than the other
regions, also these regions are generally have less land mass and are made up of
predominantly islands excluding the Nearctic region. The other regions have similar
percentages Australasian (9.47%), Austro—Oriental (9.47%), Oriental (7.97%) and
Palearctic (11.37%).
When comparing genus richness often higher level relationships are no taken into
consideration as genera can vary in relation to one another, because they maybe in
different families. A Phylogenetic study by zoogeographic region would be a better
way of studying species divergence and would be able to provide greater evidence
of the zoogeographic theory in the terrestrial invertebrate’s field (Foottit et al, 2009).
5.6 Relationship between Genera and Species richness by
Zoogeographic region
There was a significant difference between genera and species richness in the
zoogeographic regions. (Chi squared P= 0.00) thus the alternative hypothesis is
accepted and the null hypothesis rejected. Comparing species richness to genera
richness by region can assist identifying regions which may be overlooked for their
importance to taxonomy. Species richness and Genera richness generally
correlates as there is low number of species in each genus (Adams, 2010).
The Neotropical region has both the highest percentage of genera and species
richness, however in relation to genera and species richness comparison overall is

38
noticeably higher on a global scale. This suggests that the Neotropical region may
not be as taxonomically important in comparison to other regions where genus
richness is greater than species richness. This is most obvious in the Malagasy and
the oriental region, where the proportion of genera is greater than the species
richness. This suggests these regions have higher phylogenetic diversity and also
could indicate these regions need more taxonomic research as there is a greater
potential for higher species undescribed or undocumented species.
5.8 How the study could be improved
The addition of Termitidae sister group data and a comparison on
distribution data would enhance the study this would improve the study from a
phylogenetic perspective by enabling the analysis of the relationship between
Blattidae and Termitidae distribution and zoogeological region (Eggleton, 2000). The
study of world termite distribution could be replicated however using the cockroach
data in order to make a meaningful comparison between the data two sets.
6.0 CONCLUSION
In conclusion the results showed there were significant differences in endemic
species in comparison to non-endemic species by zoogeographic region. This result
provided evidence for the zoogeographic region theory developed by Alfred Russel
Wallace however there was the anomaly of the Nearctic region, the results suggests
that the Nearctic region may not correctly placed for Blattodea. As there is high
percentage of non-endemic species as there is high transition between the Neotropic
region.
Overall the species richness in relation to zoogeographic region suggested there
was no significant difference this may be due to the vast amount of variables within
each region as these are not taken into account when comparing zoogeographic
regions. The data in which the analysis was based upon could possibly be improved
and therefore have an effect on the outcome of the statistical analysis. From the
various analyses of the zoogeographic differences these with notably Neotropical
region containing the most species. Regions with high species richness provide

39
evidence with the notion that cockroaches are predominantly a tropical species, the
regions with low tropical rainforest regions have lower species richness in
comparison shown in the Palearctic and Nearctic region. The evidence of species
richness corresponding cockroach world species richness map (Figure 16) with
habitat is shown with desert and tropical rainforest maps presented in the literature
review.
The future of cockroach species existence is unknown this is due to the lack of
conservation efforts for cockroaches is extremely poor with only two species with
data on the IUCN redlist (Gerlach, 2012). This most probably extends from the data
deficiency of species population and the overall disinterest of this order of insects.
More research has to be carried out for the data to be more reliable and accurate;
this would give a more up to date map of the species richness, as many of the
species from the current data set are presumed extant however many species could
be extinct locally or potentially globally extinct. The conservation of cockroaches is
dependent on this data to maintain future populations in a world which is changing
from a variety of anthropogenic effects such as global warming, deforestation and
pollution.
Brazil and Australia are pioneering examples of where taxonomic research has
produced vast amounts of detailed records with many of the records recorded to
regions within the countries. This level of taxonomic research was possible due to
the museum of natural history and research institutions and taxonomists specifically
interested in cockroaches. This has possibly caused country bias in cockroach
distribution, however the knowledge gained from this has been invaluable for
cockroach taxonomy and species richness.
However it must be taken into consideration that the data from the cockroach
species file is the currently known species distribution about the species may not
represent the actual global distribution. This is could be a significant issue as there
is a possible considerable difference in the knowledge of species distribution
currently then in the near future. The maps and graphs created in this study can be
used as a comparison in the future to see how the taxonomy and species richness
may have changed.
40
7.0 FURTHER RESEARCH
Countries which were highlighted in the world species richness map such as Bhutan,
Bangladesh, Cambodia and Honduras should be revised. As the species richness is
highly disproportional to the surrounding countries, there is potential for new species
to be described and to enhance the existing knowledge of species richness. This
would increase knowledge of species richness and create a more complete map in
the future in which the one in this study can be compared to see improvements of
taxonomic research.
The species richness map could be improved by using a different method such as
that used by Paul Williams on bumble bee distribution. He compiled a map of the
world into equal-area grid map excluding Antarctica with grid squares 611,000km
squared; this creates a map which is more specific for species richness to smaller
equal size areas rather than whole political regions which vary in size immensely.
This would be a better method when comparing areas as they are all the same size,
this still would not take into account habitat types however reduce the variables
which may affect species richness in each area (Williams, 1996).
Phylogenetic study in relation to zoogeographic regions would provide more
evidence to areas with higher taxonomic importance due to evolutionary uniqueness
and the clades in which the region contains. This data would drastically improve the
reliability of the study in order to prioritise areas for conservation and research efforts
(Holt et al, 2013). This could also provide data for studies such as the terrestrial
zoogeographic region update with invertebrate distribution data increasing the
accuracy of the zoogeographic regions to a wider range of taxa.

41
8.0 REFRENCE LIST
Adams, J. (2010). Species richness: patterns in the diversity of life. Springer Science
and Business Media.
Amazonia. 6:497–520
Arnold, J.W. 1974. Adaptive features on the tarsi of cockroaches. International
Journal of Insect Morphology and Embryology. 3:317–334.
Atkinson, T.H., P.G. Koehler, and R.S. Patterson. 1991. Catalogue and Atlas of the
Cockroaches (Dictyoptera) of North America North of Mexico.Miscellaneous
Publications
Basset, Y. (2001). Invertebrates in the canopy of tropical rain forests How much do
we really know?. In Tropical Forest Canopies: Ecology and Management (pp. 87-
107). Springer Netherlands.
Beccaloni, G. W (2013) Cockroaches: Amazing diversity. Cockroach species file
Available at: http://cockroach.speciesfile.org/HomePage/Cockroach/Diversity/Diversity.aspx
[Accessed: 20/02/2015]
Beccaloni, G. W., Scoble, M. J., Robinson, G. S., Downton, A. C. and Lucas, S. M. (2003)
Chapter 10: Computerising unit-level data in natural history card archives. In: Scoble,
M. J. (Ed.). ENHSIN: The European Natural History Specimen Information Network.
London: The Natural History Museum. 176pp.
Bei-Bienko, G.Y. 1970. New genera and species of cockroaches (Blattoptera)
fromtropical and subtropical Asia. Entomological Review. 48:528—548
Bell and Roth . Cockroaches Ecology, Behavior and Natural History. Baltimore: The
john Hopkins University Press, 2007.
Bode, M., Wilson, K. A., Brooks, T. M., Turner, W. R., Mittermeier, R. A., McBride, M.
F., ... and Possingham, H. P. (2008). Cost-effective global conservation spending is
robust to taxonomic group. Proceedings of the National Academy of
Sciences, 105(17), 6498-6501.
Britannica Kids (1997) tropical rainforest: prinicpal regions of tropical rainforests
Available at: http://kids.britannica.com/comptons/art-106870/Tropical-rainforests-are-found-
near-the-Equator-in-a-band
[Accessed: 12/03/2015]
Brown, E. B. (1952). Observations on the life history of the cockroach Ectobius
panzeri Stephens (Orth., Blattidae). Entomologist’s Monthly Magazine, 88, 209-212.

42
Bug Guide (2014) Class insecta
Available from: http://bugguide.net/node/view/52
[Accessed: 10/03/2015]
Butler. R (2013) The congo
Available from:http://rainforests.mongabay.com/congo/#.VTbbGSFVikp
[Accessed: 11/04/2013]
Clark, D C and Moore A J (1993). Social interactions and aggression among male
madagascarn hissing cockroaches (Gromphadorhina portentosa) in groups
(Dictyoptera: Blaberidea). Journal of insect behaviour. Vol 2 No2. 199-215.
Cochran, D. G, (1999). Cockroaches their biology, distribution and control, World
health organisation communicable diseases prevention and control WHO pesticide
evaluation scheme (WHOPES) 99(3).
Cochran, D. G. (1999). Cockroaches: their biology, distribution and control.
Cockroach studies Issue 1 (2006) The journal of the Blattodea culture group
Collier, P. (2011). Wars, guns and votes: Democracy in dangerous places. Random
House.
Cousin, J. A., and Phillips, R. D. (2008). Habitat complexity explains species-specific
occupancy but not species richness in a Western Australian woodland.Australian
journal of zoology, 56(2), 95-102.
Dhanarajan, G. 1978. Cannibalism and necrophagy in a subterranean
Dolphin, K., and Quicke, D. L. (2001). Estimating the global species richness of an
incompletely described taxon: an example using parasitoid wasps (Hymenoptera:
Braconidae). Biological Journal of the Linnean Society, 73(3), 279-286.
Dolphin, K., and Quicke, D. L. (2001). Estimating the global species richness of an
incompletely described taxon: an example using parasitoid wasps (Hymenoptera:
Braconidae). Biological Journal of the Linnean Society, 73(3), 279-286.
Economo, E. P., Klimov, P., Sarnat, E. M., Guénard, B., Weiser, M. D., Lecroq, B.,
and Knowles, L. L. (2015). Global phylogenetic structure of the hyperdiverse ant
genus Pheidole reveals the repeated evolution of macroecological
patterns. Proceedings of the Royal Society B: Biological Sciences, 282(1798),
20141416.
Edney, E. B. (1974). Desert arthropods. Desert biology, 2, 311-384.
Eggleton, P. (2000). Global patterns of termite diversity. In Termites: evolution,
sociality, symbioses, ecology (pp. 25-51). Springer Netherlands.
43
Eggleton, P. (2000). Global patterns of termite diversity. In Termites: evolution,
sociality, symbioses, ecology (pp. 25-51). Springer Netherlands.
El-Ayouty, E.Y., S.I. Ghabbour, and A.M. El-Sayyed. 1978. Role of litter and excreta
of soil fauna in the nitrogen status of desert soils. Journal of Arid Environments.
1:145–155.
Entomological society of America (2012) Louis M. Roth, ESA fellow (1952)
Available from http://www.entsoc.org/fellows/louis-m-roth-esa-fellow-1952
[Accessed: 01/04/2015]
Fallia M. C and Messina (1987) contribution of Blattaria to Biogeography of the
Mediterranean area. 12, 195-207
Foottit, R. G., and Adler, P. H. (Eds.). (2009). Insect biodiversity: science and
society. John Wiley and Sons.
Gerlach J (2012) Delosia ornate
Available from: http://www.iucnredlist.org/details/199490/0
[accessed: 20/03/2015]
Gerlach J (2012)
Available from:http://www.iucnredlist.org/details/199508/0
[accessed: 20/03/2015]
Gijzen, H. J., and Barugahare, M. A. R. T. I. N. (1992). Contribution of anaerobic
protozoa and methanogens to hindgut metabolic activities of the American
cockroach, Periplaneta americana. Applied and environmental microbiology,58(8),
2565-2570.
Gorokhov, A. V. (2007). New and little known orthopteroid insects (polyneoptera)
from fossil resins: Communication 2. Paleontological Journal,41(2), 156-166.
Grandcolas, P. (1993). Habitats of solitary and gregarious species in the neotropical
Zetoborinae (Insecta, Blattaria). Studies on neotropical fauna and
environment, 28(3), 179-190.
Grandcolas, P. (1993). Habitats of solitary and gregarious species in the neotropical
Zetoborinae (Insecta, Blattaria). Studies on neotropical fauna and
environment, 28(3), 179-190.
Grandcolas, P., and P. Deleporte. (1994). Escape from predation by army ants in
Lanxoblatta cockroach larvae (Insecta, Blattaria, Zetoborinae). Biotropica. 26:469–
472.
Gullan, P J and Cranston, P S (1994). The insect and outline of entomology. London,
United Kingdom. Chapman and Hall.

44
Hackstein, J. H., and Stumm, C. K. (1994). Methane production in terrestrial
arthropods. Proceedings of the National Academy of Sciences, 91(12), 5441-5445.
Hendricks, Thompson and Turk(2011) Earth 2 student edition
Hinton, H.E. 1981. Biology of Insect Eggs.Vol. 1. Pergamon Press, Oxford.
Hoekstra, T. W., and Shachak, M. (Eds.). (1999). Arid lands management: toward
ecological sustainability. University of Illinois Press.
Hogan M C(2011) Biogeography Endemism
Available from:http://www.eoearth.org/view/article/161345/
[Accessed: 20/03/2015]
Holt, B. G., Lessard, J. P., Borregaard, M. K., Fritz, S. A., Araújo, M. B., Dimitrov, D.,
... and Rahbek, C. (2013). An update of Wallace’s zoogeographic regions of the
world. Science, 339(6115), 74-78.
Holt, B. G., Lessard, J. P., Borregaard, M. K., Fritz, S. A., Araújo, M. B., Dimitrov, D.,
... and Rahbek, C. (2013). An update of Wallace’s zoogeographic regions of the
world. Science, 339(6115), 74-78.
Horn, S., and Hanula, J. L. (2002). Comparison of arthropod prey of red-cockaded
woodpeckers on the boles of longleaf and loblolly pines. Wildlife Society Bulletin,
131-138.
Human development index (2014) countries
Available from:http://hdr.undp.org/en/countries
[Accessed: 04/04/2015]
Inward. D , Beccaloni. G , Eggleton. P. Death of an order: a comprehensive
molecular phylogenetic study confirms that termites are eusocial cockroaches.
Biology Letters , v. 11, n. 2, p. 22, June 2007.
Irmler, U., and K. Furch. 1979. Production, energy and nutrient turnover of the
cockroach Epilampra irmleri Rocha e Silva and Aguiar, in Central-Amazonian
inundation forest.
IUCN (2014) Search cockroaches
Available from http://www.iucnredlist.org/search
[Accessed: 20/03/2015]
Jahnke, L. M., and Asher, A. Home› Publications› Reports› pub154› The Problem of
Data: Data Management and Curation Practices Among University Researchers.
Kambhampati. S A phylogeny of cockroaches and related insects based on DNA
sequence of mitochondrial ribosomal RNA genes. Proceedings of the National
Academy of Sciences, Manhattan, v. 92, p. 2017-2020, March 1995.

45
Kier, G., Kreft, H., Lee, T. M., Jetz, W., Ibisch, P. L., Nowicki, C., ... and Barthlott, W.
(2009). A global assessment of endemism and species richness across island and
mainland regions. Proceedings of the National Academy of Sciences, 106(23), 9322-
9327.
Kinlaw, A. (1999). A review of burrowing by semi-fossorial vertebrates in arid
environments. Journal of Arid Environments, 41(2), 127-145.
Kitching, R. (2000). Biodiversity, hotspots and defiance. Trends in Ecology and
Evolution, 15(12), 484-485.
Kitching, R. (2000). Biodiversity, hotspots and defiance. Trends in Ecology and
Evolution, 15(12), 484-485.
Komdeur, J. (1996). Breeding of the Seychelles magpie robin Copsychus
sechellarum and implications for its conservation. Ibis, 138(3), 485-498.
Krishnamurthy, K. V. (2003). Textbook of biodiversity. Science Publishers.
Langecker, T. G. (2000). The effects of continuous darkness on cave ecology and
cavernicolous evolution. Ecosystems of the world, 135-158.
Lavelle, P. 2002. Functional domains in soils. Ecological Research.17:441–450.
MacDonald, J.F., and R.W.Matthews. 1983. Colony associates of the southern
yellowjacket, Vespula squamosal (Drury). Journal of the Georgia Entomological
Society. 18:555–559.
Mackerras, M.J. 1968b. Neolaxta monteithi, gen. et sp. n. from eastern Australia
(Blattodea: Blaberidae). Journal ofthe Australian Entomological Society. 7:143–146.
Madigosky, S. R. (2004). Tropical microclimatic considerations. Forest canopies, 2nd
edn. Elsevier Academic Press, Burlington, 24-48.
Madigosky, S. R. (2004). Tropical microclimatic considerations. Forest canopies, 2nd
edn. Elsevier Academic Press, Burlington, 24-48.
Margono, B. A., Potapov, P. V., Turubanova, S., Stolle, F., and Hansen, M. C.
(2014). Primary forest cover loss in Indonesia over 2000-2012. Nature Climate
Change.
McKittrick, F. A. (1964). Evolutionary studies of cockroaches.
Mckittrick, F. A. Evolutionary studies of cockroaches. New York: New york state
college of agricultue , 1964. 1-197 p.
Mittermeier, R. A., Myers, N., Thomsen, J. B., Da Fonseca, G. A., and Olivieri, S.
(1998). Biodiversity hotspots and major tropical wilderness areas: approaches to
setting conservation priorities. Conservation biology, 12(3), 516-520.

46
Nixon, K. C., and Wheeler, Q. D. (1990). An amplification of the phylogenetic species
concept. Cladistics, 6(3), 211-223.
of the Entomological Society of America. 78:1–86.
Pérez-Losada, M., and Crandall, K. A. (2003). Can taxonomic richness be used as a
surrogate for phylogenetic distinctness indices for ranking areas for
conservation?. Animal biodiversity and conservation, 26(1), 77-84.
Procheş, Ş., and Ramdhani, S. (2012). The world's zoogeographical regions
confirmed by cross-taxon analyses. Bioscience, 62(3), 260-270.
Rentz, D. C. (1996). Grasshopper country: the abundant orthopteroid insects of
Australia. UNSW Press.
Roth, L M (1991). Blattodae. The insects of Australia. A textbookfor students and
research workers. Vol 1. 320-329. Melbourne university press, Melbourne.
Roth, L. M. (1991). Blattodea. Blattaria (Cockroaches). The insects of Australia. A
textguide for students and researchers, 1, 320-329.
Roth, L. M. (2003). Systematics and phylogeny of cockroaches (Dictyoptera:
Blattaria). Oriental Insects, 37(1), 1-186.
Roth, L. M. (2003). Systematics and phylogeny of cockroaches (Dictyoptera:
Blattaria). Oriental Insects, 37(1), 1-186.
Roth, L.M., and E.R.Willis. 1960. The biotic associations of cockroaches.
Smithsonian Miscellaneous Collections.141:1–470.
Sastre, P., and Lobo, J. M. (2009). Taxonomist survey biases and the unveiling of
biodiversity patterns. Biological Conservation, 142(2), 462-467.
Sastre, P., and Lobo, J. M. (2009). Taxonomist survey biases and the unveiling of
biodiversity patterns. Biological Conservation, 142(2), 462-467.
Scheffers, B. R., Joppa, L. N., Pimm, S. L., and Laurance, W. F. (2012). What we
know and don’t know about Earth's missing biodiversity. Trends in ecology and
evolution, 27(9), 501-510.
Scheffers, B. R., Joppa, L. N., Pimm, S. L., and Laurance, W. F. (2012). What we
know and don’t know about Earth's missing biodiversity. Trends in ecology and
evolution, 27(9), 501-510.
Scoble, M. J. (2002). New approaches to creating global species databases in
entomology. Towards a global biological information infrastructure, 34.

47
Slaytor, M. (1992). Cellulose digestion in termites and cockroaches: what role do
symbionts play?. Comparative Biochemistry and Physiology Part B: Comparative
Biochemistry, 103(4), 775-784.
termite (Reticulitermes lucifugus var. santonensis).
The Alfred Russel Wallace website (2008) introduction
Available from http://wallacefund.info/
[Accessed: 13/03/2015]
The Malayan Nature Journal. 31:237–251.
United Nations (1996) Former Yugoslavia – UNPR
http://www.un.org/en/peacekeeping/missions/past/unprof_b.htm
[Accessed: 29/03/2015]
United Nations (2011) United Nations mission in the republic south Sudan
http://www.un.org/en/peacekeeping/missions/unmiss/
[accessed: 27/03/2015]
Vitousek, P. M., D'antonio, C. M., Loope, L. L., Rejmanek, M., and Westbrooks, R.
(1997). Introduced species: a significant component of human-caused global
change. New Zealand Journal of Ecology, 21(1), 1-16.
Wall, D. H., and Virginia, R. A. (1999). Controls on soil biodiversity: insights from
extreme environments. Applied Soil Ecology, 13(2), 137-150.
Wall, D. H., and Virginia, R. A. (1999). Controls on soil biodiversity: insights from
extreme environments. Applied Soil Ecology, 13(2), 137-150.
Weidner, H. 1969. Rhabdoblatta stipata (Walker, 1868), eineim Wasser lebende
Schabe (translation by ChristofStumpf). Entomologische Zeitschrift. 79:101–106.
Williams, P. H. (1996). Mapping variations in the strength and breadth of
biogeographic transition zones using species turnover. Proceedings of the Royal
Society of London. Series B: Biological Sciences, 263(1370), 579-588.

48
9.0. APPENDICIES
9.0.1. Appendix 1
Country Name Region Species Number
Afghanistan PALAEARCTIC 6
Albania PALAEARCTIC 1
Algeria PALAEARCTIC 10
Andorra PALAEARCTIC 1
Angola ETHIOPIAN 15
Antigua and Barbuda NEOTROPICAL 2
Argentina NEOTROPICAL 30
Armenia PALAEARCTIC 0
Australia AUSTRALASIAN 574
Austria PALAEARCTIC 9
Azerbaijan PALAEARCTIC 4
Bahamas, The NEOTROPICAL 10
Bahrain PALAEARCTIC 0

49
Bangladesh ORIENTAL 0
Barbados NEOTROPICAL 4
Belarus PALAEARCTIC 0
Belgium PALAEARCTIC 4
Belize NEOTROPICAL 4
Benin ETHIOPIAN 8
Bhutan ORIENTAL 1
Bolivia NEOTROPICAL 38
Bosnia and Herzegovina PALAEARCTIC 1
Botswana ETHIOPIAN 26
Brazil NEOTROPICAL 574
Brunei AUSTRO-ORIENTAL 0
Bulgaria PALAEARCTIC 11
Burkina Faso ETHIOPIAN 0
Burma ORIENTAL 68
Burundi ETHIOPIAN 12
Cambodia ORIENTAL 16
Cameroon ETHIOPIAN 142
Canada NEARCTIC 1
Cape Verde ETHIOPIAN 5
Central African Republic ETHIOPIAN 7
Chad ETHIOPIAN 8
Chile NEOTROPICAL 14
China ORIENTAL
China PALAEARCTIC 190
Colombia NEOTROPICAL 115
Comoros MALAGASIAN 8
Costa Rica NEOTROPICAL 69
Côte d'Ivoire ETHIOPIAN 4
Croatia PALAEARCTIC 2
Cuba NEOTROPICAL 60
Cyprus PALAEARCTIC 3
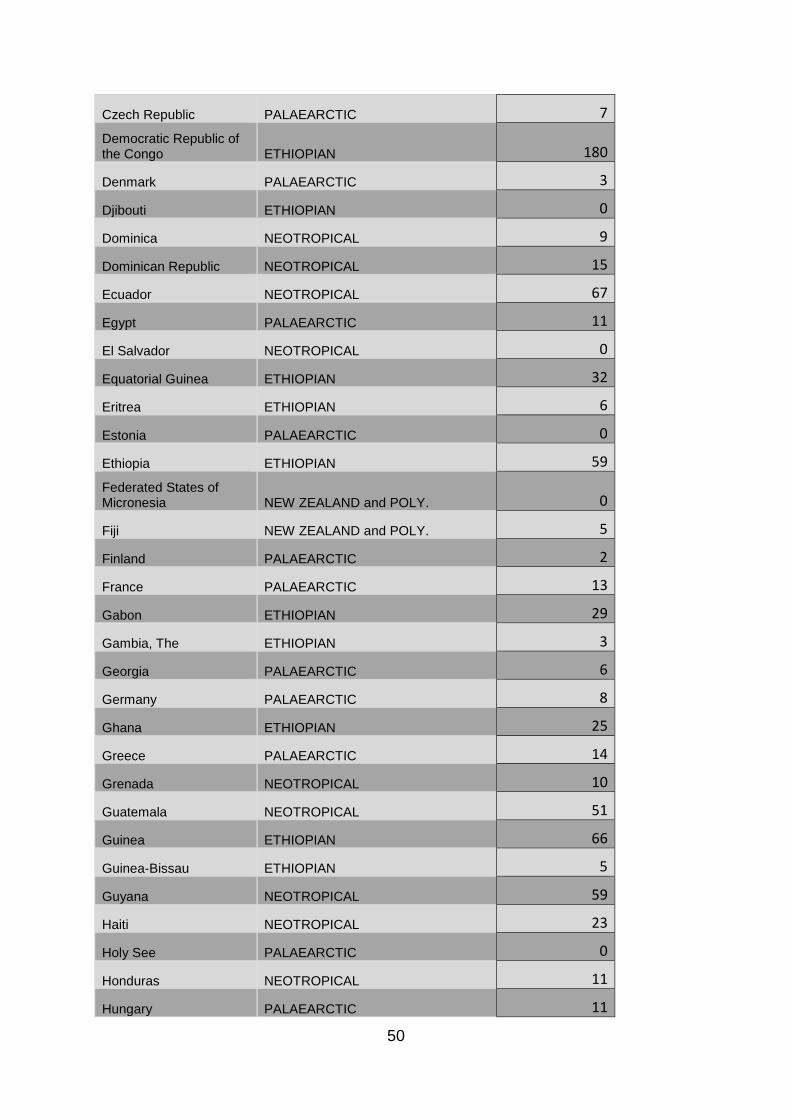
50
Czech Republic PALAEARCTIC 7
Democratic Republic of the Congo ETHIOPIAN 180
Denmark PALAEARCTIC 3
Djibouti ETHIOPIAN 0
Dominica NEOTROPICAL 9
Dominican Republic NEOTROPICAL 15
Ecuador NEOTROPICAL 67
Egypt PALAEARCTIC 11
El Salvador NEOTROPICAL 0
Equatorial Guinea ETHIOPIAN 32
Eritrea ETHIOPIAN 6
Estonia PALAEARCTIC 0
Ethiopia ETHIOPIAN 59
Federated States of Micronesia NEW ZEALAND and POLY. 0
Fiji NEW ZEALAND and POLY. 5
Finland PALAEARCTIC 2
France PALAEARCTIC 13
Gabon ETHIOPIAN 29
Gambia, The ETHIOPIAN 3
Georgia PALAEARCTIC 6
Germany PALAEARCTIC 8
Ghana ETHIOPIAN 25
Greece PALAEARCTIC 14
Grenada NEOTROPICAL 10
Guatemala NEOTROPICAL 51
Guinea ETHIOPIAN 66
Guinea-Bissau ETHIOPIAN 5
Guyana NEOTROPICAL 59
Haiti NEOTROPICAL 23
Holy See PALAEARCTIC 0
Honduras NEOTROPICAL 11
Hungary PALAEARCTIC 11

51
Iceland PALAEARCTIC 0
India ORIENTAL 136
Indonesia AUSTRO-ORIENTAL 379
Iran PALAEARCTIC 18
Iraq PALAEARCTIC 8
Ireland PALAEARCTIC 0
Israel PALAEARCTIC 1
Italy PALAEARCTIC 36
Jamaica NEOTROPICAL 35
Japan PALAEARCTIC 34
Jordan PALAEARCTIC 1
Kazakhstan PALAEARCTIC 6
Kenya ETHIOPIAN 74
Kiribati NEW ZEALAND and POLY. 0
Kuwait PALAEARCTIC 0
Kyrgyzstan PALAEARCTIC 8
Laos ORIENTAL 8
Latvia PALAEARCTIC 1
Lebanon PALAEARCTIC 0
Lesotho ETHIOPIAN 17
Liberia ETHIOPIAN 8
Libya PALAEARCTIC 8
Liechtenstein PALAEARCTIC 0
Lithuania PALAEARCTIC 0
Luxembourg PALAEARCTIC 2
Madagascar MALAGASIAN 124
Malawi ETHIOPIAN 29
Malaysia AUSTRO-ORIENTAL 165
Maldives ORIENTAL 0
Mali ETHIOPIAN 5
Malta PALAEARCTIC 0
Marshall Islands NEW ZEALAND and POLY. 0

52
Mauritania ETHIOPIAN 2
Mauritius MALAGASIAN 0
Mexico NEOTROPICAL 109
Moldova PALAEARCTIC 2
Monaco PALAEARCTIC 0
Mongolia PALAEARCTIC 1
Morocco PALAEARCTIC 38
Mozambique ETHIOPIAN 70
Namibia ETHIOPIAN 43
Nauru NEW ZEALAND and POLY. 0
Nepal ORIENTAL 11
Netherlands PALAEARCTIC 1
New Zealand NEW ZEALAND and POLY. 23
Nicaragua NEOTROPICAL 26
Niger ETHIOPIAN 23
Nigeria ETHIOPIAN 21
North Korea PALAEARCTIC 1
Norway PALAEARCTIC 1
Oman ETHIOPIAN 0
Pakistan ORIENTAL 2
Palau NEW ZEALAND and POLY. 1
Panama NEOTROPICAL 116
Papua New Guinea AUSTRO-ORIENTAL 68
Paraguay NEOTROPICAL 26
Peru NEOTROPICAL 92
Philippines AUSTRO-ORIENTAL 88
Poland PALAEARCTIC 4
Portugal PALAEARCTIC 14
Qatar PALAEARCTIC 0
Republic of the Congo ETHIOPIAN 18
Romania PALAEARCTIC 11
Russia PALAEARCTIC 6

53
Rwanda ETHIOPIAN 27
Saint Kitts and Nevis NEOTROPICAL 1
Saint Lucia NEOTROPICAL 3
Saint Vincent and the Grenadines NEOTROPICAL 10
Samoa NEW ZEALAND and POLY. 11
San Marino PALAEARCTIC 0
Sao Tome and Principe ETHIOPIAN 0
Saudi Arabia PALAEARCTIC 4
Senegal ETHIOPIAN 14
Seychelles MALAGASIAN 21
Sierra Leone ETHIOPIAN 13
Singapore AUSTRO-ORIENTAL 22
Slovakia PALAEARCTIC 3
Slovenia PALAEARCTIC 0
Solomon Islands AUSTRO-ORIENTAL 7
Somalia ETHIOPIAN 17
South Africa ETHIOPIAN 185
South Korea PALAEARCTIC 2
Spain PALAEARCTIC 64
Sri Lanka ORIENTAL 51
Sudan ETHIOPIAN 21
Suriname NEOTROPICAL 123
Swaziland ETHIOPIAN 21
Sweden PALAEARCTIC 0
Switzerland PALAEARCTIC 11
Syria PALAEARCTIC 10
Taiwan ORIENTAL 54
Tajikistan PALAEARCTIC 12
Tanzania ETHIOPIAN 96
Thailand ORIENTAL 41
The Former Yugoslav Republic of Macedonia PALAEARCTIC 1
Togo ETHIOPIAN 22

54
Tonga NEW ZEALAND and POLY. 1
Trinidad and Tobago NEOTROPICAL 40
Tunisia PALAEARCTIC 13
Turkey PALAEARCTIC 16
Turkmenistan PALAEARCTIC 4
Tuvalu NEW ZEALAND and POLY. 0
Uganda ETHIOPIAN 32
Ukraine PALAEARCTIC 4
United Arab Emirates ETHIOPIAN 0
United Kingdom PALAEARCTIC 3
United States of America NEARCTIC 63
Uruguay NEOTROPICAL 6
Uzbekistan PALAEARCTIC 7
Vanuatu NEW ZEALAND and POLY. 2
Venezuela NEOTROPICAL 78
Vietnam ORIENTAL 95
Yemen ETHIOPIAN 3
Yugoslavia PALAEARCTIC 16
Zambia ETHIOPIAN 36
Zimbabwe ETHIOPIAN 66
9.0.2 Appendix 2
See CD-ROM attached contains the Master world Cockroach species file