An orchestration approach for unwanted Internet traffic identification
27
An orchestration approach for unwanted Internet traffic identification Eduardo Feitosa a,b , Eduardo Souto b , Djamel H. Sadok a,⇑ a Informatics Center, Federal University of Pernambuco, 50740-540 Recife Pernambuco, Brazil b Institute of Computing, Federal University of Amazonas, 69077-000 Manaus Amazonas, Brazil article info Article history: Received 3 November 2010 Received in revised form 28 March 2012 Accepted 25 April 2012 Available online 9 May 2012 Keywords: Unwanted Internet traffic Orchestration Alert correlation Frequent episodes discovery Dempster–Shafer Theory abstract A simple examination of Internet traffic shows a wide mix of relevant and unwanted traffic. The latter is becoming increasingly harmful to network performance and service availabil- ity, while often consuming precious network and processing resources. Coordinated attacks, such as distributed denial-of-services (DDoS), large-scale scans, and worm out- breaks, occur in multiple networks simultaneously and become extremely difficult to detect using an individual detection engine. This paper presents the specification of a new orchestration-based approach to detect, and, as far as possible, to limit the actions of these coordinated attacks. Core to the proposal is a framework that coordinates the receiving of a multitude of alerts and events from detectors, evaluates this input to detect or prove the existence of anomalies, and consequently chooses the best action course. This framework is named Orchestration-oriented Anomaly Detection System (OADS). We also describe an OADS prototype implementation of the proposed infrastructure and analyze initial results obtained through experimentation with this prototype. Ó 2012 Elsevier B.V. All rights reserved. 1. Introduction An analysis of contemporary Internet traffic shows a wide array of known and unknown services, new and leg- acy applications, legitimate and illegitimate traffic, solic- ited and unsolicited data, highly relevant and unwanted traffic. Of these various types of data, unwanted Internet traffic is increasingly becoming harmful to network perfor- mance and service availability, often consuming precious network and processing resources. Typically, unwanted traffic is generated by backscatter 1 from spoofing activities, unsolicited electronic messages (spam), phishing attempts, denial of service attacks (DoS and its distributed form – DDoS), viruses and worms spreading, or device or software misconfiguration. Unwanted Internet traffic can be considered a plague, the consequences of which are reflected in financial losses around the world. Statistics provided by the Computer Security Institute (CSI) [1] and public security agencies such as the FBI in the United States indicate that the finan- cial losses caused by network attacks, intrusions and anomalies reached approximately US $252 million during the years 2005–2007 [2–4]. The Gartner Inc. [5] revealed that financial fraud hit 7.5% of Americans in 2008. The Radicati Group [6] estimated global losses equivalent to US $198 billion related to spam messages in 2007 only. In addition, they predicted that the number of spam mes- sages would reach 79% of the volume of global e-mail mes- sages in 2010. Recent studies prove that the proliferation of this traffic is so vast that 3G networks [7] are beginning to feel its negative effects. Despite both isolated and coordinated efforts to stem this tide, unwanted traffic continues to grow. Firstly, it rep- resents a wide range of user applications, network data types and harmful information with different objectives for its existence. Some of it may be pure nuisance such as spam messages, other unwanted traffic can consist of bulky multimedia content resulting from technological trends in applications, networks and users’ habits, includ- ing P2P file sharing (e.g., using Emule, Bit torrents), video 1389-1286/$ - see front matter Ó 2012 Elsevier B.V. All rights reserved. http://dx.doi.org/10.1016/j.comnet.2012.04.018 ⇑ Corresponding author. E-mail addresses: [email protected], [email protected] (E. Feitosa), [email protected] (E. Souto), [email protected] (D.H. Sadok). 1 Backscatter is the traffic received from victims that are responding to denial of service attacks. Computer Networks 56 (2012) 2805–2831 Contents lists available at SciVerse ScienceDirect Computer Networks journal homepage: www.elsevier.com/locate/comnet
Transcript of An orchestration approach for unwanted Internet traffic identification

Computer Networks 56 (2012) 2805–2831
Contents lists available at SciVerse ScienceDirect
Computer Networks
journal homepage: www.elsevier .com/ locate/comnet
An orchestration approach for unwanted Internet traffic identification
Eduardo Feitosa a,b, Eduardo Souto b, Djamel H. Sadok a,⇑a Informatics Center, Federal University of Pernambuco, 50740-540 Recife Pernambuco, Brazilb Institute of Computing, Federal University of Amazonas, 69077-000 Manaus Amazonas, Brazil
a r t i c l e i n f o a b s t r a c t
Article history:Received 3 November 2010Received in revised form 28 March 2012Accepted 25 April 2012Available online 9 May 2012
Keywords:Unwanted Internet trafficOrchestrationAlert correlationFrequent episodes discoveryDempster–Shafer Theory
1389-1286/$ - see front matter � 2012 Elsevier B.Vhttp://dx.doi.org/10.1016/j.comnet.2012.04.018
⇑ Corresponding author.E-mail addresses: [email protected], efeitos
(E. Feitosa), [email protected] (E. Souto(D.H. Sadok).
1 Backscatter is the traffic received from victims tdenial of service attacks.
A simple examination of Internet traffic shows a wide mix of relevant and unwanted traffic.The latter is becoming increasingly harmful to network performance and service availabil-ity, while often consuming precious network and processing resources. Coordinatedattacks, such as distributed denial-of-services (DDoS), large-scale scans, and worm out-breaks, occur in multiple networks simultaneously and become extremely difficult todetect using an individual detection engine. This paper presents the specification of anew orchestration-based approach to detect, and, as far as possible, to limit the actionsof these coordinated attacks. Core to the proposal is a framework that coordinates thereceiving of a multitude of alerts and events from detectors, evaluates this input to detector prove the existence of anomalies, and consequently chooses the best action course. Thisframework is named Orchestration-oriented Anomaly Detection System (OADS). We alsodescribe an OADS prototype implementation of the proposed infrastructure and analyzeinitial results obtained through experimentation with this prototype.
� 2012 Elsevier B.V. All rights reserved.
1. Introduction around the world. Statistics provided by the Computer
An analysis of contemporary Internet traffic shows awide array of known and unknown services, new and leg-acy applications, legitimate and illegitimate traffic, solic-ited and unsolicited data, highly relevant and unwantedtraffic. Of these various types of data, unwanted Internettraffic is increasingly becoming harmful to network perfor-mance and service availability, often consuming preciousnetwork and processing resources. Typically, unwantedtraffic is generated by backscatter1 from spoofing activities,unsolicited electronic messages (spam), phishing attempts,denial of service attacks (DoS and its distributed form– DDoS), viruses and worms spreading, or device or softwaremisconfiguration.
Unwanted Internet traffic can be considered a plague,the consequences of which are reflected in financial losses
. All rights reserved.
[email protected]), [email protected]
hat are responding to
Security Institute (CSI) [1] and public security agenciessuch as the FBI in the United States indicate that the finan-cial losses caused by network attacks, intrusions andanomalies reached approximately US $252 million duringthe years 2005–2007 [2–4]. The Gartner Inc. [5] revealedthat financial fraud hit 7.5% of Americans in 2008. TheRadicati Group [6] estimated global losses equivalent toUS $198 billion related to spam messages in 2007 only.In addition, they predicted that the number of spam mes-sages would reach 79% of the volume of global e-mail mes-sages in 2010. Recent studies prove that the proliferationof this traffic is so vast that 3G networks [7] are beginningto feel its negative effects.
Despite both isolated and coordinated efforts to stemthis tide, unwanted traffic continues to grow. Firstly, it rep-resents a wide range of user applications, network datatypes and harmful information with different objectivesfor its existence. Some of it may be pure nuisance suchas spam messages, other unwanted traffic can consist ofbulky multimedia content resulting from technologicaltrends in applications, networks and users’ habits, includ-ing P2P file sharing (e.g., using Emule, Bit torrents), video

2806 E. Feitosa et al. / Computer Networks 56 (2012) 2805–2831
sharing (e.g., Justin.tv, Joost, YouTube), and recreationaltraffic (e.g., MP3downloads, instant messaging, Skype,MSN). Finally, one finds specifically designed intrusive traf-fic such as worms, viruses, and denial of service attacksthat target networking resources and service availability.
A second reason for the existence of unwanted traffic isthe notorious inefficiency of current solutions for identify-ing and preventing such traffic as described in recentworks [8–10]. The increase in Internet link bandwidthand service mix makes the timely detection of unwantedtraffic a demanding task that does not scale easily as suchlinks increase in capacity. Further, typical existing solu-tions trigger high numbers of alarms often after damagehas already been perpetrated. More active strategies needto be put in place to speed up detection and response.
Lastly, a clear definition of unwanted traffic is needed.One party’s unnecessary or harmful traffic may be seenas someone else’s normal service. Recreational applicationssuch as online games, instant messages, P2P applications,VoIP and video services, and emerging social networkscan be considered normal activities by given ISPs, whileinappropriate in most enterprise networks.
In order to address the problems involving unwantedtraffic, many efforts [11–14] were made to correlate suspi-cious traffic (evidences) between different security ele-ments (sensors, detectors, IDSs and ADSs, for example) toimprove detection efficiency. Collaborative solutions havethe potential to detect intrusions and anomalies that occuracross the network (including the Internet) simultaneouslyby correlating events and alerts among different sub net-works. In addition, unlike isolated and individual solutions,where a huge number of false alarms can be produced, col-laborative solutions have the potential to reduce computa-tional costs by sharing detection resources betweennetworks and making a high level overview of the securitystate of the whole network available.
This work shares the view that combining pieces of evi-dence (on suspicious/anomalous network activity) frommultiple networks simultaneously makes it possible to de-tect attacks (coordinated or not), intrusions and anomaliesat an earlier stage, hopefully before they cause significantdamage. This paper presents a new approach based on con-trolled collaboration among different techniques to providean anomaly detection system. It includes understandinghow the different elements (sensors, alerts, techniques,etc.) collaborate and developing new methods to orches-trate such collaboration. We referred to this approach asOrchestration oriented Anomaly Detection Systems (OADS).
We summarize the contributions of this paper asfollows:
� We propose a new architecture designed to automati-cally manage and adapt the execution of various detec-tion instruments (IDS, ADS, remediation systems,firewalls, walled gardens, traffic analysis appliances,and so on) to achieve the desired effect of making thenetwork as secure as possible.� We implement a proof-of-concept prototype for evalu-
ating AODS architectural and performance characteris-tics. We use frequency based analysis (FEA) to buildrules and identify correlations between observations
made by different security and traffic analysis sensors.Moreover, we employ a data fusion strategy to helpthe detection of unwanted traffic. The initial resultsindicate that our idea for the composition of collabora-tive security services is practical and effective.
The remainder of this paper is organized as follows. Sec-tion 2 presents an overview of unwanted Internet traffic,including definitions, context problems and classification.In Section 3, the proposal of the Orchestration orientedAnomaly Detection System (OADS) is presented and dis-cussed. The idea behind this approach is to harmonize arange of components (anomaly detectors, informationbases, alert handlers, Analyzers, and Decision Service) viaan orchestration engine, emulating the interaction amongdifferent and distinct elements and increasing the accuracyof a diagnosis. Section 4 describes the implementation ofthe OADS prototype (all components), including an expla-nation of the orchestration heuristic. Section 5 presentsthe evaluation of our approach, where various experiments,representing and emulating different, real world scenarios,are conducted in order to test the OADS prototype. Section6 presents related works. Lastly, in Section 7, we presentour conclusions and make suggestions for future work.
2. Unwanted Internet traffic
Introduced as early as the 1980’s, the expression ‘‘un-wanted traffic’’ was always associated with incidentslinked to viruses, worms, intrusions and attacks. Some ofthe early examples of such traffic achieved global promi-nence, i.e. the Internet worm [15] and, more recently, Ama-zon and CNN.com DDoS attacks [16].
Lately, the term ‘‘unwanted traffic’’ has been used to de-fine any unsolicited, non-productive, undesirable, and ille-gitimate traffic. Xu et al. [17] characterize unwanted trafficas malicious or unproductive information that attempts tocompromise vulnerable hosts, propagate malware, spreadspam or deny the use of valuable services. Other existingnomenclatures are: ‘‘junk’’ traffic [18], background traffic[8], and abnormal traffic [19].
The above definitions fail to acknowledge a recent andimportant factor: financial gains. We define unwanted traf-fic as being: any unrequested and unexpected network traffic,which has a unique purpose or outcome of consuming net-work and computing resources, wasting communication, pro-cessing, storage time, or money of users or resource ownerswhile sometimes generating profitability for a party in someform [20].
2.1. Context of problem
For the duration of this paper, we use the terms anom-aly and unwanted traffic interchangeably. Novel unwantedtraffic classes may partially be detected through matchingtheir generated traffic with the patterns of traffic consid-ered to be a result of normal behavior (or acceptableprofile). For example in [8], an anomaly detection frame-work is presented where the random forests algorithmbuilds profiles for network services using traffic data.

E. Feitosa et al. / Computer Networks 56 (2012) 2805–2831 2807
Determining outliers related to the identified patterns candetect intrusions. Traffic falling outside such normalbehavior is seen at least as suspicious. In addition to thedetection of new attacks, the definition of behavior pat-terns or profiles can also be useful in identifying anomaliesrelated to hardware physical problems, application-specifi-cation errors and miss-configurations, wrongful policyusage, and so on.
Despite these definitions, there is no consensus yet onwhat unwanted traffic precisely represents. For example,China treats the traffic generated by the SkypeOut applica-tion, a service that allows Skype voice over IP users to ac-cess the worldwide public switched telephone (PSTN)lines, as illegal because it affects the profit of the govern-ment owned Telecommunication Company.
Similarly, many ISPs, Telecoms, public and privateenterprises began limiting the use of Peer-to-Peer (P2P)file sharing and video sharing (YouTube, for example).They argue that the traffic generated by these applica-tions is potentially a means for distributing maliciouscode such as viruses, worms, spyware, or bots. Inaddition, it breaches copyright protection, consumesunnecessary bandwidth, and wastes work-time ofemployees.
Similar views have been attributed to recreationalapplications (online games) and activities such as emerg-ing social networks (Orkut, MySpace, Facebook, for exam-ple) and relationship applications such as IRC (InternetRelay Chat), and instant messaging services (MSN and Goo-gle Talk, for example). A recent case involved the ComcastCompany, which, in October 2007, was discovered to se-cretly degrade several popular peer-to-peer applications,including BitTorrent [21].
2.2. Classification
Typically, the strategy for dealing with unwanted trafficis to, first, learn about it and, then, establish effective waysfor detecting and extracting it from the traffic mix. Butfirst, let us categorize and classify unwanted traffic interms of its nature (root causes, common types, targetsand effects).
The formal unwanted traffic taxonomy was specified atan IAB (Internet Architecture Board) [8], which suggestedthe classification of deliberately created unwanted trafficin enterprise networks into three categories: Nuisance,Malicious, and Unknown.
� Nuisance refers to background traffic that clogs band-width and resources like computing power and storage.Typical examples include Spam and P2P file sharing,since this kind of traffic normally carries malware orlures the user to access unreliable links.� Malicious traffic is responsible for spreading malware,
including viruses, worms, spyware, and others. Due toits potential high level of losses, this class of unwantedtraffic requires a fast and efficient response and gener-ally needs costly constant software updates. In addition,it is normally specific to targeting operating systems,router and other software vulnerabilities. To complicate
matters, there are even kits available in the Internet toteach any user how to create new versions of knownviruses and worms.� Unknown involves traffic that could not be identified. It
includes possibly malicious, encrypted or simplyunclassified traffic. Quiet worms like Storm [22] areanother example. They open backdoors on hosts andstay dormant for a long time. Generally, they result inhigh financial losses.
The classifications of unwanted traffic seen so far do notconsider one aspect: legitimate traffic. As previously men-tioned, the discussion about what is actually unwantedtraffic depends on where the traffic occurs and the struc-ture of the business and networks being used. Potentially,any traffic, even legitimate traffic, that infringes one’s busi-ness model is not welcome and is labeled as unwanted.
3. An orchestration oriented anomaly detection system
For a long time, Internet services relied on the informalagreements and goodwill of member sites in protectingand correctly forwarding each other’s traffic. Althoughlacking centralized control or ownership, the Internet isone of the few, if not the only, self-governing infrastruc-tures that manages to operate reasonably well under sucha paradigm.
Today, this trust model is coming under intense attackas a result of the diversified communities that comprisethe modern Internet. Can this way of life be maintained?At what price? And what can be done to make a networkadministrator’s work easier in handling problems? Onecannot simply blacklist the domains where unwanted traf-fic comes from. Moreover this kind of solution would onlybenefit those who are exploiting existing Internetweaknesses.
In an attempt to address these concerns, this sectionpresents the design of a new orchestration-based approachto detect, and as much as possible, to limit anomalous (un-wanted) traffic. Core to the proposal is a framework namedOrchestration-oriented Anomaly Detection System (OADS)that coordinates the reception of a multitude of alertsand events from detectors, evaluates this input to detector prove the existence of anomalies, and chooses the bestcourse of action.
Firstly, we provide an overview of the system to explainthe orchestration concept and how it is applied in this pro-posal. Next, some essential design requirements are pre-sented that differentiate OADS from other systems. Theseinclude features such as the collaboration between distinctnetwork domains to exchange vulnerabilities, attacks, andsecurity incidents. Then, all OADS architectural compo-nents will be individually detailed. Lastly, the benefitsand limitations of the proposed approach will be ex-plained, detailing how it will deal with special services.
3.1. OADS overview
The research in the field of collaborative anomaly andintrusion detection systems is extensive, but yet very

2808 E. Feitosa et al. / Computer Networks 56 (2012) 2805–2831
few integrated systems have been proposed. In addition,due to the technological trends and evolution of strate-gies and mechanisms for generating unwanted Internettraffic (anomalous traffic), the typical collaboration solu-tions can be considered deficient in dealing with the cur-rent level of Internet traffic, especially for high-speedlinks.
Orchestration is nothing but a modern metaphor thatdescribes an already well-known security network admin-istrator activity. Analogously to a concert maestro respon-sible for keeping the rhythm and cueing the differentplayers, security managers organize the harmony andrhythm of various detection instruments (IDS, ADS, reme-diation systems, firewall, walled gardens, traffic analysisappliances, and so on) to make the network as secure aspossible.
The idea behind the OADS approach is to automati-cally manage and adapt the execution of different anom-aly detectors that are traditionally unaware of eachother’s presence. In other words, the proposed approachpermits and explores the added benefits obtained fromthe collaboration and harmonization among differenttechniques against malicious activities. Collaboration en-ables two or more processes to work together towards acommon goal without the need for a pre-establishedleadership. In the music world, this occurs when musi-cians work on the same musical album or song. In theinformation security context, this work sees collaborationas a facilitator of relationships between different anom-aly detectors. For instance, two or more detectors canshare the same traffic base (traces) to perform analysisor the result of one detector can be used as input for an-other to help reach a better decision. Harmony, also seenas an interesting concept, means that two or more differ-ent sounds or notes fit well together. We show that pat-terns, in the form of decision tables, emerge among thedifferent security modules. Their use gives greater assur-ance to network managers in diagnosing unwantedtraffic.
Fig. 1. Orchestration ADS
3.2. OADS architecture
To better clarify the orchestration approach, Fig. 1 illus-trates its organization and shows its components.
The OADS architecture consists of four basic elements:the Alert Pre-Processor, OADS Analyzer, Decision Service,and an OADS Miner. In addition, OADS uses anomaly detec-tors as external input elements. This section explains in de-tails each one of them.
3.2.1. Anomaly detectorsAnomaly detectors may implement the intelligence
necessary to analyze traffic information and to identify po-tential attacks or abnormal events. They extract data re-lated to suspicious and anomalous traffic and supply theorchestration core of OADS approach with summaries oralerts.
In practical terms, anomaly detectors are logical devicesthat may be implemented in hardware or software. If inhardware, they are commonly aggregated with sensorsthat implement a variety of techniques such as samplingand filtering, packet level capture, flow aggregation, andDeep Packet Inspection (DPI). Currently, there are a num-ber of hardware-based products to capture and inspectnetwork traffic in real time. P-Series (Force 10 networks)[23], Orca-flow (Cetacea networks) [24], and Cloudshieldtechnologies [25] are some examples. Regarding soft-ware-based detectors, a number of tools, techniques, andsystems to process traffic may be used, including IDSs(Snort [26], BrO [27] and Prelude IDS [28]), honeypots(Honeyd [29] and Nepenthes [30]), and many other aca-demic open software prototypes.
3.2.2. Alert Pre-ProcessorThe Alert Pre-Processer component can be seen as the
front door of the OADS approach. Its role consists in receiv-ing information (raw alerts) from anomaly detectors andpreparing it for analysis. Basically, it performs twoactivities.
architecture view.

E. Feitosa et al. / Computer Networks 56 (2012) 2805–2831 2809
The first role of the Pre-Processor is determining theadequacy of alerts. Although the OADS approach adoptsthe Intrusion Detection Message Format (IDMEF) standard,there is still need for content adequacy towards IDMEFoutput. A good example involves two known free IDS soft-ware tools: Snort [26] and Prelude IDS [28]. Basically, theyhave different nomenclatures for alert identification. WhileSnort employs the standard nomenclature (Alert messa-geid), Prelude names this field as Alert ident for example.
The second is aggregation. Since attacks and anomaliesmight consist of one or more steps, and the anomaly detec-tors are capable of creating alerts for each of these steps,aggregation makes it easy to build hypotheses about theanomalies and possible defense strategies, and thereforereduces the volume of data. The Alert Pre-Processer compo-nent may employ aggregation schemes based on similarityand clustering. These explore the distance in time betweensimilar alerts and between determined alert fields. The ideais to fuse alerts if they are both close in time and typicalattributes such as Source IP, Source Port, Destination IP,Destination Port, Attack Class, and source detector.
3.2.3. OADS AnalyzerThe Analyzer is the brain of the proposed architecture.
It is a component that correlates incoming reports, tryingto confirm if there are or are not attacks and anomalies.Moreover, it is also capable of predicting future threatsand targets. In general terms, this component receivesaggregated alerts built by the Alert Pre-Processor, corre-lates them to increase their accuracy and consequently val-idates the assumptions contained in each one of them,while possibly even predicting their occurrence in the fu-ture with some level of confidence.
The idea behind this correlation is to build an anomalytraffic patterns base that can be used in the form of a deci-sion table. In other words, all confirmed positive diagnosis(true abnormal traffic) would generate rules that can bestored, for future consultation. Take, for example, a net-work scenario where a host is infected by a botnet inject-ing a low-rate TCP SYN attack on the network. Thisattack occurs constantly at 10 min intervals in a networkwhere there are two detectors. The first detector (ADS1)was deployed to evaluate the TCP message exchangebehavior pattern while the second one (ADS2) is special-ized in detecting massive traffic anomalies. When bothare put together to evaluate this anomalous traffic, only
Fig. 2. Example of attack evaluation by two anomaly detectors.
ADS1 detects the abnormality because it recognizes a pro-gressive growth in TCP connections as illustrated in Fig. 2.As a result, a generic rule will be created by the OADS Ana-lyzer to identify this anomalous behavior clearly perceivedon the picture. Such a rule must not only reflect the state ofADS1 responsible for the detection, but also factor in theequally important state of ADS2, which failed to do so.
3.2.4. Decision serviceThe Decision Service is responsible for the decision pro-
cess related to analyzed network traffic. For this, it uses aset of alerts sent by the OADS Alert Pre-Processor or a setof rules sent by an OADS Analyzer as input, evaluates themand then defines the next steps. The evaluation process(decision-making) follows finite state machines such asthe finite state automata, Markov chains, or stochastic reg-ular grammars. In our prototype, we used a finite state ma-chine to correlate the information received in possiblestates that could be used in enforcement actions. In Section4.4, this process will be explained in detail.
In addition, the Decision Service can perform attack andanomaly prediction. In the network security context, pre-diction is a technique that seeks to predict divergentbehavior of networks, systems, devices, and so on, compar-ing the features observed at the time with previously ob-served and defined patterns. The basic idea of predictionis that, after suffering a certain type of attack or anomaly,the sequence of events that generated the anomaly isstored (Decision service has a history base). If this patternis repeated, measures can be taken to avoid it. This way,the damage caused by these attacks and anomalies couldbe reduced. Typically, prediction solutions are based inprobabilistic or machine learning techniques. For instance,the works of Ye et al. [31], Pikoulas et al. [32] and Hu andHeywood [33] use, respectively, Markov chains, naı̈veBayes, and SVM (Support Vector Machine) and SOM (Self-Organizing Map).
3.2.5. OADS minerThe Miner receives queries and responds with summa-
rized and specific content based on information and anom-aly news obtained from the Internet and stored locally inan anomaly and vulnerability base.
This Miner is divided in two distinct modules. The firstone named OADS Crawler constantly gathers from theInternet new information about traffic anomalies and vul-nerabilities, attacks and their origins. This module acts likea crawler collecting and concentrating the maximum pos-sible of information available on the Internet (technicaland alert reports, summary traffic, black and white lists,and vulnerabilities’ databases) and stores it in a uniquerepository. All operation control like activation, deactiva-tion, and parameter change (number of pages searched,initial URLs, specific content, for example) of the OADSCrawler is made by the Decision Service component. Theconfiguration results are stored in a configuration file usingan XML-like description language.
The second module provides a differentiated search en-gine, which is designed to support the decision-making. Itis capable of receiving either general or specific querieselaborated from end-users (typically network and IT

2810 E. Feitosa et al. / Computer Networks 56 (2012) 2805–2831
managers) or other systems and tools, and returning spe-cific summarized information. This functionality is betterexplained by the following example. Assuming that manyanomaly detectors are reporting suspicious behavior in adetermined set of IP addresses and that our Alert Pre-Pro-cessor summarizes them in a same cluster. The DecisionService then decides to search for possible causes. For this,it consults the OADS Miner about information related withthis case. The OADS Miner executes the queries in itsanomaly and vulnerability base looking for any data simi-lar or peculiar to the behavior. Hence, all available infor-mation matched with the original query is retrieved,summarized to eliminate duplications or inconsistencies,and forwarded to the Decision Service to help concludewhether or not the suspicious behavior is anomalous.
4. Implementation
An initial AODS prototype has been developed. It consistsof the four main modules, namely, anomaly detectors, AlertPre-Processor, OADS Analyzers, and OADS Decision Service.
4.1. Anomaly detectors
As explained earlier, the core of this work is based onmaking use the known concept of orchestration to explorethe collaboration and harmonization among differentanomaly detectors. In other words, the essence of theOADS framework lies in the power gained from the clevercombination and coordinated orchestration of different at-tack detection modules. As a proof of that, the OADS proto-type combines modules from existing tested IDS tools suchas Snort [26], as well as new strategies we implementedsuch as Profiling [31] and the ChkModel [12], which willalso be described.
4.2. Alert Pre-Processor
In order to deal with the huge number of alerts trig-gered by numerous security and traffic analysis tools, theAlert Pre-Processor employs the clustering technique pro-posed by Xu et al. [34] for profiling Internet backbone traf-fic and discovering significant behavior patterns ofinterest. Entropy, an information-theoretic approach, is ta-ken to classify traffic into meaningful clusters and conse-quently to measure the amount of Relative Uncertainty(RU) contained in each data. For more details on how tocalculate the RU see [31].
Unlike the original work, we have refocused our workon extracting clusters needed to identify attacks andanomalies. Significant clusters are also used to reduce thenumber of alerts and to avoid the cognitive overloadingof managers. Moreover, the Xu et al. work uses the four-feature space (source IP address, destination IP address,source Port, and destination Port) to determine the com-munication patterns of the end hosts and services, ourAlert Pre-Processor adopts a feature-space composed ofthe three elements, source IP address (srcIP), destinationIP address (dstIP) and class of attack (class).2 The extracted
2 Class of attack is obtained from the IDMEF alerts.
srcIP and dstIP clusters represent a set of ‘‘interesting’’ hostbehaviors (communication patterns), while the class clusteryields a set of ‘‘interesting’’ class/impact information of theattack alerts. No use is made of source Port and destinationPort information in cluster identification, due to the fact thatsource port can be easily changed to hide an attack and des-tination port is normally related with the attack class field.
Fig. 3 depicts a functional diagram of the architecturalcomponents in accordance with their roles. The main enti-ties that compose Alert Pre-Processor are:
1. Handler Module – plays a role in receiving information(raw alerts) from different detectors and preparingthese for analysis. More specifically, it performs twoactivities:� Translation – converts alert messages from different
formats to the IDMEF standard format.� Ordering – performs the temporal ordering and syn-
chronization of alerts according to their timestamps.It is important to emphasize that this work considersthat all detectors employ some kind of time synchro-nization like the NTP (Network Time Protocol) or aGPS device.
2. Aggregation Module – is the core of the Alert Pre-Pro-cessor. It has the main task of aggregating alerts frommultiples sources (detectors) that have some commonfeature values. It receives ordered alerts and executesa cluster-based algorithm in order to extract only signif-icant alerts. The results (summarized alert information)are then forwarded for possible correlation analysis orexamination of the likelihood of attack or anomaly.
From an implementation view, the Alert Handler mod-ule employs a client/server approach, where the clientsand server are called Handler Agents (HA) and Handler Ser-ver (HS) respectively. The HAs are developed using Java(Version 1.6) and deployed together with anomaly detec-tors in the form of daemon processes. Their activities in-clude: (i) verification of the existence of alert filesgenerated by detectors. The typical interval of checking isset to 1 min; (ii) translation (conversion) of the originalalerts to the IDMEF format; (iii) sending the alerts, viasocket communication, to the HS. This receives the alertsfrom HAs, ordered according to their timestamps, and thenforwards these to the Aggregation Module.
The Aggregation Module receives ordered alerts fromthe Handler module and then processes them to extractthe most significant clusters. As a final result, a list com-posed of the following attributes: source IP address, source
Fig. 3. Functional diagram of OADS Alert Pre-Processor.

Fig. 4. Functional diagram of FER Analyzer.
Table 1Example of an event type table.
Eventtype
Event name Source IP
Destination IP
A Community SIP DNS no suchname treshold
172.16.112.100
172.16.115.20
B NETBIOS NT NULL session 172.16.112.100172.16.112.20
C ATTACK-RESPONSE directory listing 172.16.112.194172.16.112.100
D NETBIOS NT NULL session 172.16.112.20172.16.112.100
E ATTACK-RESPONSE Invalid URL 207.200.75.201
F WEB-MISC RBS ISP/new user access 134.205.131.13172.16.117.52
G WEB-MISC/doc/access 172.16.112.100135.13.216.191
H ATTACK-RESPONSE 403 Forbidden 172.16.113.204137.245.85.134
E. Feitosa et al. / Computer Networks 56 (2012) 2805–2831 2811
port, destination IP address, destination port, class ofattack, timestamp and alert severity is produced.
4.3. OADS Analyzer
To support the OADS Analyzer functionalities, we devel-oped two distinct modules: one to deal with alert correla-tion problems and the other for anomaly detectionuncertainty.
4.3.1. FER AnalyzerThe first solution to address alert correlation issues uses
the concept of Frequent Episodes Rules (FER) to performsequence analysis and, consequently, detect anomalies,including unknown attack patterns [35]. Proposed origi-nally by Mannila et al. [36] for monitoring alarms in tele-communication networks and finding relationshipsamong them, FER is based on the fact that the data subjectto analysis consists of a sequence of events. FER is em-ployed for observing and developing a specific knowledge,in the form of probabilistic rules, of the relationshipsamong events (alerts) that anticipate and make up a givenattack or anomaly. Not only is it capable of building adap-tive event basis signatures, but it also can be used to pre-dict the buildup and preparation towards a possibleattack before it is actually carried out, hence giving net-works managers a kind of early warning system. This mod-ule was entirely developed in Java language. Fig. 4 depicts afunctional diagram of the architectural components inaccordance with their roles.
4.3.1.1. Alert handler module. The alert handler moduleperforms alert translation into an internal format (valuesfrom a finite alphabet starting with A) supported foranalysis.
All received alerts are correlated (translated) to anevent type in preparation for establishing frequent episodediscovery. The selected and extracted attributes of eachalert are: class or type of attack, IP address and port num-ber of source system or host, and IP address and port num-ber of target system or host. A correspondence tablebetween events and alerts attributes is built as shown inTable 1.3
Another attribute selected and extracted from eachalert is the Timestamp. It is used in association with Table 1to build a list of formatted events time ordered (inseconds), as shown in Fig. 5.
Once completed, this list may then be sent to frequentepisodes analysis.
4.3.1.2. Frequent episode analysis module. The present Fre-quent Episode Analysis (FEA) module is used to generaterules needed to indicate the eminent occurrence of attacksas a result of observing some known sequences of events.
The FER parameters window analysis size and decisionthreshold are important for the precision of the results asshown in the algorithm description. Note that the process-
3 The events (alerts) presented in Table 1 are extracted from DARPA 2000dataset [37], LLDOS 1.0 inside scenario.
ing overhead is not a concern, as this processing may beperformed offline and only requires periodic occurrencein order to retrain the Frequent Episode Analysis (FEA)module. The analysis made by this module can be dividedinto four activities: event collector, candidate generator,generator of frequent episodes and rules generator.
4.3.1.2.1. Event collector. The Event collector scans the listwith the event types (Fig. 5) and identifies those that occurmost frequently. This process is an algorithm described in[36]. Basically, it receives a list of episodes of similar sizeand determines of these episodes occur most frequently.It verifies if each episode is contained in the global eventsequence. As a result, all frequent episodes are returned.
In the algorithm, an episode is represented as a lexico-graphically sorted array of event types.
4.3.1.2.2. Candidate generator. The candidate generator re-ceives a list of frequent episodes of size X and generates anew list with possible frequent episodes of size X + 1. Thisprocess describes the candidate’s generation for serial epi-sodes. This calculation demands a careful design, as it iscrucial make the search for frequent episodes as efficientas possible, considering that the number of possible fre-quent episodes grows exponentially with the increase ofthe window size.
In order to provide a better understanding of how thecandidate generator works, a simple example is explainedas follows. Given a frequent episodes list composed of fourelements {AA, AB, AC, AD}, the possible candidates of the

Fig. 5. Event sequence representation.
2812 E. Feitosa et al. / Computer Networks 56 (2012) 2805–2831
episode AB will be (ABA, ABB, ABC, ABD, . . ., ABZ) and eachone of them will be tested to generate possible candidates.Evaluating the first candidate, ABA, the subsets originatedfrom it are AB, BA and AA. So, to prove that the candidateABA is frequent, its subsets (AB, BA and AA) are matchedwith the frequent episodes list. As result, ABA is a possiblecandidate since AB, BA and AA are represented in the fre-quent episodes list by the episodes AA and AB. On the otherhand, the candidate ABZ is not since the subsets AZ and BZdo not have any representation in the frequent episodeslist.4.3.1.2.3. Generator of frequent episodes. A generator of fre-quent episodes can be seen as the driver for the previoustwo modules. It calculates all frequent episodes of all sizesusing the output from the candidate generator and eventcollector. Algorithm 1 [36] describes how to calculate a col-lection of frequent episodes from an event sequence E ofepisodes.
Algorithm 1. Calculating frequent episodes
Input: event sequence E, window size win andfrequency fr
01: C1 = {all elements in E with size equal to 1}02: candidateSize = 103: candidateVector = {all element 2 C1
andjelementj == 1}04: for candidateSize to win do05: /⁄ Checking for frequent episodes (Event Collector)
⁄/06: FrequentEpisodes = checkFrequentEpisodesInEvent
List (candidateVector, win, fr)07: AllFrequentEpisodes += FrequentEpisodes08: candidateSize++09: /⁄ Candidate generation (Candidate Generator) ⁄/10: candidateVector = generateCandidates
(FrequentEpisodes)11: end for12: return AllFrequentEpisodes
It starts with the definition of a set (C1) containing allelements from event sequence E with size equal to 1 (line1), a control variable candidateSize to permit computing fre-quent episodes according to the window size win (line 2)
and a structure candidateVector to receive all generated can-didates of frequent episodes (line 3). To calculate the fre-quent episodes, the algorithm keeps running until itachieves the window size limit (line 4). On each iteration,the algorithm first verifies the frequency of the candidateepisodes from the event sequence (line 6) calling the eventcollector module. As a result, the returned frequent episodesare stored in a general list AllFrequentEpisodes (line 7) andthe candidateSize variable is incremented by one. Next, itcalls the candidate generator module to generate the candi-dates for frequent episodes, returning all possible candi-dates episodes with size incremented by one (line 10). Thealgorithm finishes when returning all frequent episodes.4.3.1.2.4. Rule generator. A rule generator extracts the rulesidentified by the frequency analysis phase. It notifies anapplication, such as an IDS, as to how likely an attack oran anomaly is to commence. Three main advantages areimportant to mention here: considerable reduction of alertmessages; higher precision and confidence in alerts; andthe prediction of attacks and anomalies. The pseudo-codepresented in Algorithm 2 [36] is responsible for rulecalculation.
Algorithm 2. Rule calculation
Input: event sequence E, window size win, frequencyfr and confidence conf
01: rules = []02:/⁄ Find frequent episodes (Algorithm 1) ⁄/03: FreqEpisodes = calculateFrequentEpisodes (E, win, fr)04:/⁄ Generate rules ⁄/05: for all episode in FreqEpisodes do06: for all subepisode in episode do07: if frequency (episode)/frequency (subepisode) P
conf then08: rules += [episode, subepisode, confidence (episode/
subepisode)]09: end if10: end for11: end for12: return rules
This simple algorithm starts by calling the Algorithm 1(calculateFrequentEpisodes) to calculate frequent episodes(line 3) for a given event sequence E, when using a windowof size win and a frequency threshold fr. As a result, a list ofall frequent episodes is returned (FreqEpisodes). Next, thealgorithm performs the rule calculation process through aseries of iterations. The first iteration extracts episodes thatcompose a list of frequent episodes (line 5). The second ex-tracts sub-episodes relative to the parent episode (line 6).The extraction of sub-episodes says that if an episode isfrequent in an event sequence, then all its sub-episodesare also frequent. Next, with the episode and its sub-epi-sodes at hand, the algorithm tests if the relation (propor-tion) between an episode and its sub-episode is greaterthan or equal to a defined confidence threshold (line 7).If the result is true, then a new rule is generated as shownat line 8. The algorithm terminates by returning all gener-ated rules.

E. Feitosa et al. / Computer Networks 56 (2012) 2805–2831 2813
4.3.1.2.5. Rule reduction. Although functional and essentialto frequent episodes analysis, the calculation and genera-tion of rules typically results in a huge number of FERand, consequently, a high number of redundant or re-peated rules. In order to solve this inefficiency, Qin andHwang [38] propose an algorithm to reduce the rule spaceand to provide a simplified view of data patterns (see Algo-rithm 3). The idea is to establish if an FER is effective (morefrequently used) or ineffective (rarely used).
Algorithm 3. Simplified algorithm for rule calculation
Input: rules r01: reducedRules = [];newRules = [];02: for all rule in r do03:/⁄ Application of Transposition Law ⁄/04: newRules += TranspositionReduction (rule);05: end for06: for all rule in newRules do07: /⁄ Application of Elimination of Redundant Law ⁄/08: reducedRules += EliminationRedundant (rule);09: end for10: return reducedRules
The first law, transposition, asserts that given these twoFERs (A ? AAA and A ? AAAA), which describe behaviorsfor event A, the first is seen as being more effective thanthe second. This is because of its satisfaction of the transpo-sition law, that is, the first instance can induce the second.Therefore, the first rule is kept and the second one is re-moved. In general terms, the goal is to make the left handside (LHS) as short, or as general, as possible due, to the factthat shorter rules are often easier to apply or to compare.
The elimination of redundant laws also assumes thatrules with shorter LHSs are more effective than rules withlonger LHSs. This way, if there are two FERs (A ? B andB ? C) in the rule set and there is a very frequent rule(A ? BC), it is correct to assume that the rule (A ? BC) isredundant, since it can be reconstructed from the two pre-vious ones. Therefore, the two rules are kept and the lastone is removed. The result of the algorithm is a set of ruleswithout redundant elements.
4.3.2. ADS-fusionAnother solution used in the OADS Analyzer component
is based on a data fusion technique. Such a technique dealswith uncertainty or imprecision of anomaly detection re-sults and consequently increases the degree of confidenceof intrusive or malicious activities, allowing for more accu-rate decisions to be made.
ADS-Fusion [39] is based on Dempster–Shafer’s Theoryof Evidence (DST) [40–42]. DST is a well-known mathemat-ical model that represents uncertainty in knowledge-basedsystems. It focuses on solving problems and modelinguncertainty when using purely probabilistic methods. Un-like other Bayesian probabilistic theory, DST does not needprior knowledge of the probabilistic distributions of thestudied elements. This allows attributing beliefvalues – Basic Probability Assignment or simply bpa in
DST – for a subset of possibilities and not only for simpleevents.
Architecturally speaking, ADS-Fusion is a module thatreceives the outputs generated by anomaly detectors as in-put, makes data fusion of these inputs, and produces aninference with a greater degree of certainty than the uncer-tainty generated by anomaly detectors individually. It iscomposed of three elements: the collector, sensors, anddata fusion engine. The Collector is responsible for captur-ing network events. Sensor components are responsible foranalyzing data generated by the collector, detecting possi-ble anomalies, and assigning a belief for each generatedinference. The Data Fusion Engine is responsible for mak-ing decisions. It uses DST combination rules to associateand correlate the different analysis and results of distinctsensors to generate more accurate inferences with a great-er degree of accuracy.
ADS-Fusion was originally implemented by Lins et al.[39] in C++, but currently it is deployed in Java using JDS[43]. In addition, there was no need for the collector andsensor components in our architecture. Instead, the ADS-Fusion receives such information from the Alert Pre-Pro-cessor. It is important to explain the ADS-Fusion module’simportant role as a hypotheses generator about the possi-ble real network state. To create a valid working prototype,we also developed other traffic sensors, namely, Profiling[31] and ChkModel [12] in addition to the numerous Snortdetectors. It was necessary to adjust their alerts by assign-ing a well-calibrated bpa value for each alert type. Detailsof how this is made are explained below.
4.3.2.1. ChkModel. This is a protocol model checking mod-ule that identifies protocol violations or unfinished proto-col conversations. Rather than establishing the legitimacyof individual packets, ChkModel observes connection andsocket behavior and classifies them as being legitimate orattacks.
The premise of detection implemented in ChkModelwas proposed in [12]. However, to analyze the ratio be-tween incoming and outgoing TCP packets, an algorithmcalled Adaptive Threshold was implemented. When the ra-tio exceeds a certain threshold considered normal, analarm is triggered.
The bpa generation in ChkModel is based on the dis-tance among obtained values by applying an adaptivethreshold function. This way, the greater the distance be-tween the values of obtained and established thresholds,the greater is the belief in the existence of an attack.
Considering the example with an output that containsthe detection of an anomalous connection between58.33.126.229 and 192.168.0.163 IP addresses, wherethe threshold of packets exchange was calculated as 6.Supposing that for this network, the threshold for‘‘Normal’’ state is equal to 5, any connection that isabove this limit will be considered anomalous. By fixingthe belief of the normal state at 0.5, it is possible todetermine the belief of the attack as being the sum be-tween belief and the normal rate of increase (6/5 = 1.2,which represents a percentage increase of 20%), obtain-ing thus a bpa = 0.6.

Table 2Machine states of the Decision Service.
Profiling ChkModel Snort State
Good Good Good State-AGood Good Low State-B1Good Good Medium State-C1Good Good High State-DGood Suspicious Good State-B1Good Suspicious Low State-B2Good Suspicious Medium State-C1Good Suspicious High State-DGood Bad Good State-C1Good Bad Low State-C1Good Bad Medium State-C2Good Bad High State-DBad Good Good State-C1Bad Good Low State-C1Bad Good Medium State-C2Bad Good High State-DBad Suspicious Good State-C2Bad Suspicious Low State-C2Bad Suspicious Medium State-DBad Suspicious High State-DBad Bad Good State-DBad Bad Low State-DBad Bad Medium State-DBad Bad High State-D
Fig. 6. Mapping classifications and enforcement actions.
2814 E. Feitosa et al. / Computer Networks 56 (2012) 2805–2831
4.3.2.2. Profiling. Traffic profiling is a strategy based on theuse of entropy for the classification of traffic and the iden-tification of patterns. The bpa generation in profiling is of-fered by evaluating the behavior classification (BC), thefrequency of repetition between them and the quantityof flows associated with this classification. For example,considering dstIP as a cluster key, at the first interaction(default time slot) the IP destination 10.108.40.X (150flows) is classified as BC = 24 (DDoS attack for key group).On the second interaction, the BC for this IP remained thesame and the number of flows increased to 450, thereforeit is possible to increase the belief on this inference. Fixingthe belief of the normal state at 0.5, it is possible to deter-mine the belief of the attack as the sum between belief andthe normal rate of increase (450/150 = 3, which representsa percentage increase of 200%), obtaining thus a bpa = 1.0,i.e., the maximum possible value.
4.3.2.3. Snort. The bpa generation in Snort is based on theseverity field present in its alerts. For this, initial beliefsfor each possible value of this parameter are establishedas follows: Low corresponds to 0.5, Medium correspondsto 0.65 and High corresponds to 0.8. In addition, the fre-quency of repetition is also considered to increase thesevalues.
For example, in a sequence of alerts, the first five repre-sent the same attack and have the same features, includingseverity level equal to low. This way, the first alert to beevaluated will have an attribute bpa equal to 0.5. The sec-ond will increase the bpa in 0.01. Now the bpa is 0.51. Thenext three alerts also will be increasing the bpa. After thefive alerts have been evaluated, their combined bpa is0.55. For alerts with severity level equal to medium andhigh, the degree of increase is 0.05 and 0.1, respectively.
4.4. OADS Decision Service
The Decision Service receives two types of input. Thefirst is a set of reduced alerts sent by the Alert Pre-Proces-sor, whereas the second consists of rules sent by the OADSAnalyzer (made up of the FER Analyzer and ADS-Fusionmodules). Although, ultimately, both inputs have the samestructure composed of a source IP address, source port,destination IP address, destination port, class of attackand its severity level, the treatment given to each is differ-ent. This is because, unlike with the rules, the reducedalerts are typically received first and contain more reliableinformation, due to the process of significant clusterextraction.
For this reason, the Decision Service adopts two differ-ent strategies: one to deal with reduced alerts and a secondfor rule processing. The former translates alerts to basicfirewall rules for enforcement at other devices. Recall thatenforcement actions are not the focus of this work. Therules feed a simple finite state machine. It correlates theinformation processed by different analyzers in possiblestates that the Decision Service could take. Formal toolsfor state deterministic finite state machine analysis(DFA), verification and compression may be used.
Table 2 shows the machine states that can be assignedaccording to the used detectors.
Note that the information relative to the classification(good, bad, transient, low, medium and high) is trans-ported by IDMEF messages into its severity field. Fig. 6 de-picts the mapping between this information and a possibleenforcement of actions.
Possible values to the enforcement actions are: Limita-tion, during 60 s; Extreme Limitation, during 300 s; andBlocking of given traffic. Note that such mapping is usuallysubject to established network policies.
Regarding prediction, we are currently working with atechnique that uses the Active LeZi algorithm [45] so thatDecision Service realizes predictions using rules previouslygenerated by FER Analyzer.
The idea is to discover patterns in the sequence of gen-erated rules and to consequently improve the decision-making process. For this, a set of stored rules (history base)is evaluated by Active LeZi algorithm to calculate whatrules have the highest probability of occurring. The rulesthat are most likely to occur are presented for the securityteam for subsequent containment measures.
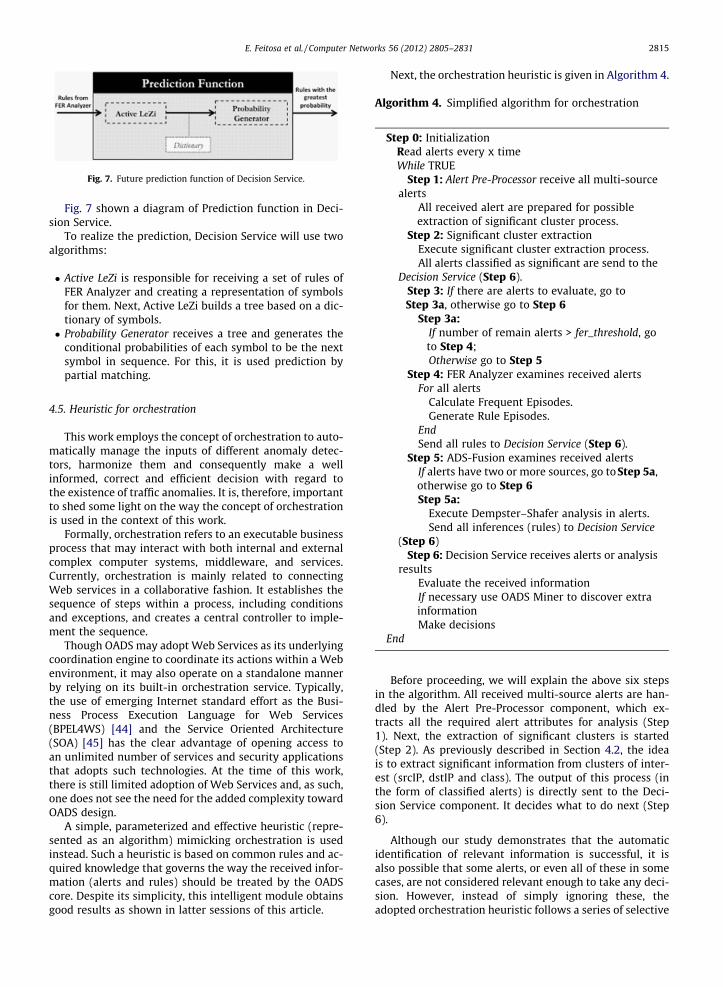
Fig. 7. Future prediction function of Decision Service.
E. Feitosa et al. / Computer Networks 56 (2012) 2805–2831 2815
Fig. 7 shown a diagram of Prediction function in Deci-sion Service.
To realize the prediction, Decision Service will use twoalgorithms:
� Active LeZi is responsible for receiving a set of rules ofFER Analyzer and creating a representation of symbolsfor them. Next, Active LeZi builds a tree based on a dic-tionary of symbols.� Probability Generator receives a tree and generates the
conditional probabilities of each symbol to be the nextsymbol in sequence. For this, it is used prediction bypartial matching.
4.5. Heuristic for orchestration
This work employs the concept of orchestration to auto-matically manage the inputs of different anomaly detec-tors, harmonize them and consequently make a wellinformed, correct and efficient decision with regard tothe existence of traffic anomalies. It is, therefore, importantto shed some light on the way the concept of orchestrationis used in the context of this work.
Formally, orchestration refers to an executable businessprocess that may interact with both internal and externalcomplex computer systems, middleware, and services.Currently, orchestration is mainly related to connectingWeb services in a collaborative fashion. It establishes thesequence of steps within a process, including conditionsand exceptions, and creates a central controller to imple-ment the sequence.
Though OADS may adopt Web Services as its underlyingcoordination engine to coordinate its actions within a Webenvironment, it may also operate on a standalone mannerby relying on its built-in orchestration service. Typically,the use of emerging Internet standard effort as the Busi-ness Process Execution Language for Web Services(BPEL4WS) [44] and the Service Oriented Architecture(SOA) [45] has the clear advantage of opening access toan unlimited number of services and security applicationsthat adopts such technologies. At the time of this work,there is still limited adoption of Web Services and, as such,one does not see the need for the added complexity towardOADS design.
A simple, parameterized and effective heuristic (repre-sented as an algorithm) mimicking orchestration is usedinstead. Such a heuristic is based on common rules and ac-quired knowledge that governs the way the received infor-mation (alerts and rules) should be treated by the OADScore. Despite its simplicity, this intelligent module obtainsgood results as shown in latter sessions of this article.
Next, the orchestration heuristic is given in Algorithm 4.
Algorithm 4. Simplified algorithm for orchestration
Step 0: InitializationRead alerts every x timeWhile TRUE
Step 1: Alert Pre-Processor receive all multi-sourcealerts
All received alert are prepared for possibleextraction of significant cluster process.
Step 2: Significant cluster extractionExecute significant cluster extraction process.All alerts classified as significant are send to the
Decision Service (Step 6).Step 3: If there are alerts to evaluate, go toStep 3a, otherwise go to Step 6
Step 3a:If number of remain alerts > fer_threshold, goto Step 4;Otherwise go to Step 5
Step 4: FER Analyzer examines received alertsFor all alerts
Calculate Frequent Episodes.Generate Rule Episodes.
EndSend all rules to Decision Service (Step 6).
Step 5: ADS-Fusion examines received alertsIf alerts have two or more sources, go to Step 5a,otherwise go to Step 6Step 5a:
Execute Dempster–Shafer analysis in alerts.Send all inferences (rules) to Decision Service
(Step 6)Step 6: Decision Service receives alerts or analysis
resultsEvaluate the received informationIf necessary use OADS Miner to discover extrainformationMake decisions
End
Before proceeding, we will explain the above six stepsin the algorithm. All received multi-source alerts are han-dled by the Alert Pre-Processor component, which ex-tracts all the required alert attributes for analysis (Step1). Next, the extraction of significant clusters is started(Step 2). As previously described in Section 4.2, the ideais to extract significant information from clusters of inter-est (srcIP, dstIP and class). The output of this process (inthe form of classified alerts) is directly sent to the Deci-sion Service component. It decides what to do next (Step6).
Although our study demonstrates that the automaticidentification of relevant information is successful, it isalso possible that some alerts, or even all of these in somecases, are not considered relevant enough to take any deci-sion. However, instead of simply ignoring these, theadopted orchestration heuristic follows a series of selective
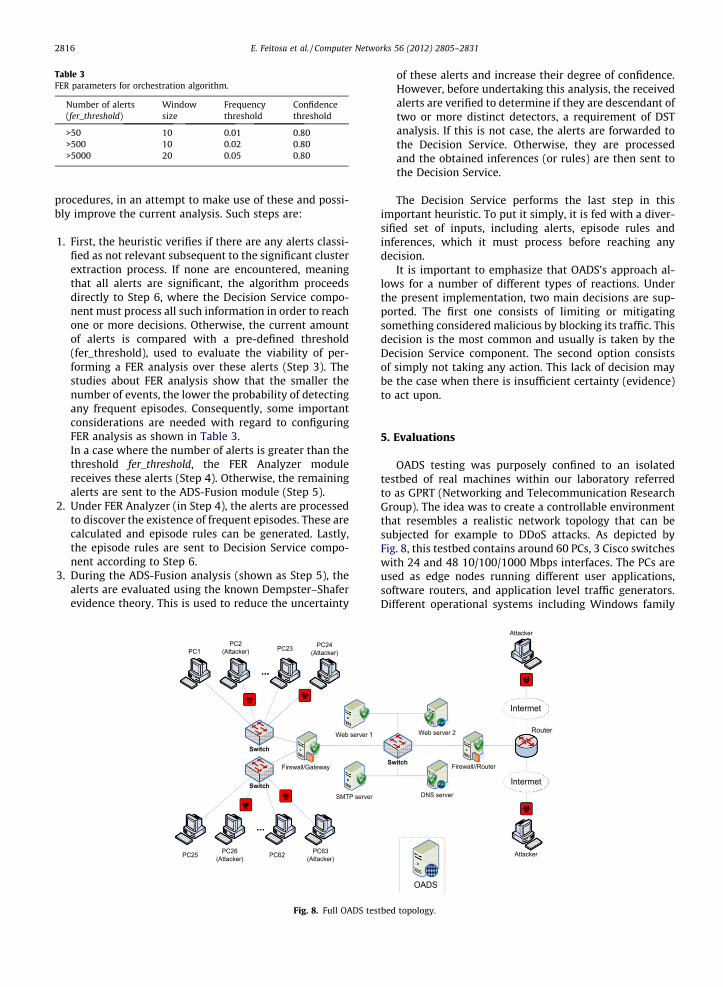
Table 3FER parameters for orchestration algorithm.
Number of alerts(fer_threshold)
Windowsize
Frequencythreshold
Confidencethreshold
>50 10 0.01 0.80>500 10 0.02 0.80>5000 20 0.05 0.80
2816 E. Feitosa et al. / Computer Networks 56 (2012) 2805–2831
procedures, in an attempt to make use of these and possi-bly improve the current analysis. Such steps are:
1. First, the heuristic verifies if there are any alerts classi-fied as not relevant subsequent to the significant clusterextraction process. If none are encountered, meaningthat all alerts are significant, the algorithm proceedsdirectly to Step 6, where the Decision Service compo-nent must process all such information in order to reachone or more decisions. Otherwise, the current amountof alerts is compared with a pre-defined threshold(fer_threshold), used to evaluate the viability of per-forming a FER analysis over these alerts (Step 3). Thestudies about FER analysis show that the smaller thenumber of events, the lower the probability of detectingany frequent episodes. Consequently, some importantconsiderations are needed with regard to configuringFER analysis as shown in Table 3.In a case where the number of alerts is greater than thethreshold fer_threshold, the FER Analyzer modulereceives these alerts (Step 4). Otherwise, the remainingalerts are sent to the ADS-Fusion module (Step 5).
2. Under FER Analyzer (in Step 4), the alerts are processedto discover the existence of frequent episodes. These arecalculated and episode rules can be generated. Lastly,the episode rules are sent to Decision Service compo-nent according to Step 6.
3. During the ADS-Fusion analysis (shown as Step 5), thealerts are evaluated using the known Dempster–Shaferevidence theory. This is used to reduce the uncertainty
Fig. 8. Full OADS tes
of these alerts and increase their degree of confidence.However, before undertaking this analysis, the receivedalerts are verified to determine if they are descendant oftwo or more distinct detectors, a requirement of DSTanalysis. If this is not case, the alerts are forwarded tothe Decision Service. Otherwise, they are processedand the obtained inferences (or rules) are then sent tothe Decision Service.
The Decision Service performs the last step in thisimportant heuristic. To put it simply, it is fed with a diver-sified set of inputs, including alerts, episode rules andinferences, which it must process before reaching anydecision.
It is important to emphasize that OADS’s approach al-lows for a number of different types of reactions. Underthe present implementation, two main decisions are sup-ported. The first one consists of limiting or mitigatingsomething considered malicious by blocking its traffic. Thisdecision is the most common and usually is taken by theDecision Service component. The second option consistsof simply not taking any action. This lack of decision maybe the case when there is insufficient certainty (evidence)to act upon.
5. Evaluations
OADS testing was purposely confined to an isolatedtestbed of real machines within our laboratory referredto as GPRT (Networking and Telecommunication ResearchGroup). The idea was to create a controllable environmentthat resembles a realistic network topology that can besubjected for example to DDoS attacks. As depicted byFig. 8, this testbed contains around 60 PCs, 3 Cisco switcheswith 24 and 48 10/100/1000 Mbps interfaces. The PCs areused as edge nodes running different user applications,software routers, and application level traffic generators.Different operational systems including Windows family
tbed topology.

Table 4Distribution of detectors in OADS testbed.
Server Detector
Firewall/gateway Snort (default configuration) + Profiling+ ChkModel
DNS server Snort (DNS configuration) + Profiling(1 min configuration)
SMTP server Snort (default configuration) + Profiling(1 min configuration)
Web server 1 Snort (default configuration) + ChkModelWeb server 2 Snort (emergent configuration)
+ ChkModelFirewall/router Snort (default configuration) + Profiling
+ ChkModel
Fig. 9. UPnP alerts time line analysis.
E. Feitosa et al. / Computer Networks 56 (2012) 2805–2831 2817
(XP, Vista and 7) and Ubuntu Linux were used. The mali-cious PCs also ran similar operating systems.
The OADS server is an Intel Core 2 Quad CPU, with 4processor Q6600 (2.40 GHz), 4 Gb of RAM, 500 GB of HDDand one network interface 10/100/1000. Although all OADScomponents (Alert preprocessor, FER Analysis, DST Ana-lyzer and Decision Service) were designed and imple-mented to work in a distributed setup, they arecollocated in the testbed server.
A range of detectors were used, including: various Snortmodules [26] version 2.8.6, Profiling [31] and ChkModel[12]. As depicted by Fig. 8, these detectors were spreadacross specific interest points of the network. All serversran Linux distributions, including Ubuntu and Debian.Our firewall/router server understandably ran the FreeBSDoperational system. Table 4 describes the localization andtype of employed detectors in the testbed.
It is important to emphasize several aspects of thesedetectors. Most Snorts were set up to execute only with de-fault configuration, provided by the Snort distribution. Twodifferent Snorts were set up to detect specific attacks. Thefirst one, located on a DNS server, had a configuration tai-lored for detecting DNS attacks and anomalies provided byEmergent Threats [46]. The second one, located on a Webserver 2, had a configuration set for the detection of Webattacks as well as anomalies also provided by EmergentThreats.
The ChkModel, was designed and used to evaluate onlyTCP packets and cannot be used to analyze connectionless(memoryless) UDP attacks. Additionally, two different Pro-filing configurations were used. Though both followed theoriginal specifications [31], the first one was set up to per-form evaluations over a time interval of five minutes(according to the original proposal) whereas the secondone was set up to operate over shorter time intervals ofone minute. Obviously, this difference will reflect on thenumber of generated alerts during the analysis.
5.1. Malicious traffic generation
In order to test different attacks and anomalies, twoadditional tools were deployed: a tool for packet injectionand a range of python scripts. The former, called PacketAnalysis and Injection Tool or simply Packit [47], is a net-work tool designed to customize, inject, monitor, andmanipulate IP traffic. It allows the spoofing of nearly allTCP, UDP, ICMP, IP, ARP, RARP, and Ethernet header
options. Packit is useful for testing firewalls, intrusiondetection/prevention systems, port scanning, simulatingnetwork traffic, and general TCP/IP auditing. Packit wasused to create customizable DoS and DDoS attack scripts.
The latter is a set of python scripts using Scapy [48], apowerful interactive packet manipulation python library.Scapy is able to forge or decode packets of a wide numberof protocols, send them on the wire, capture them, matchrequests and replies, and much more. It can easily handlemost classical tasks like scanning, trace routing, probing,unit testing, attacks or network discovery. In addition tothese solutions, an Internet script to perform SlowlorisHTTP DoS [49] attacks was also used.
5.2. Orchestrating analysis
Recall that the essence of the OADS approach lies in thepower gained from the clever combination and coordi-nated orchestration of different attack detection modules.In order to cover a variety of attacks and to fairly evaluatethe robustness of this work, different attack scenarios wereplanned. Those scenarios are described in the followingsection.
5.2.1. Scan UPnPThe first experiment for analysis is, in fact, an un-
planned event. It was comprised of residual traffic col-lected by a Snort detector, located on a Firewall/Gatewaycomputer, during three initial minutes of monitoring whilepreparing for a DNS cache poisoning attack (secondexperiment).
Snort (Firewall/Gateway) sent 61 alerts reporting‘‘SCAN UPnP’’ service discovery from a laboratory’s com-puter (150.161.192.X) to the Internet (239.255.255.250),during thirty minutes. Fig. 9 illustrates the time line ofthese alerts.
As established in Algorithm 4, for each time interval, theorchestration algorithm must evaluate the received alertsand make decisions about what course of action to take.At 15:01, 7 alerts are received by the Alert Pre-Processorcomponent for handling alerts (Step 1) and were then for-warded for significant cluster extraction (Step 2). The pro-cess begins with the calculation of the RU (RelativeUncertainty) value, considering all elements inside theset (in this case, 7 alerts). The results are RU(A)=0.502345126754 for class, srcIP and dstIP cluster. Con-sequently, these alerts were considered significant, sincethe RU value is less than our threshold b (0.9).
Thus, according to Algorithm 4, the next step consists ofsending the alerts to the Decision Service (Step 6). This ser-vice receives all alerts and employs its state machine in or-der to evaluate them. As explained in Table 2, the statescorrespond to the combination of the alert’s source

2818 E. Feitosa et al. / Computer Networks 56 (2012) 2805–2831
detectors and the level of severity of each one. In this case,all alerts have the same origin and same severity (high).The result of the state machine analysis is the transitionto state D, since it was assumed that it is a case whereProfiling is good, ChkModel is good and Snort is high.Ultimately, this decision could be translated to the follow-ing action: block any packet sent by IP address150.161.192.X, source port 56,134, destined to IP address239.255.255.250 with destination port 1900.
Since two additional identical alerts are received in thenext times (15:02 and 15:03), the same evaluation processis followed until Step 6.
5.2.2. DNS cache poisoningDNS cache poisoning is an attack that consists of chang-
ing or adding records to the resolver caches, either on theclient or the server. The attack is designed so that a DNSquery for a domain returns an IP address for an attacker’sdomain instead of the intended domain. According toHyatt [50], DNS cache poisoning results in pharming,which allows the attackers to perform identity theft, distri-bution of malware, dissemination of false information, andman-in-the-middle attacks.
5.2.2.1. The experiment. The current DNS cache poisoningexperiment aims to add a new domain named feitosa.tntinto the authoritative DNS server of the GPRT laboratory.In order to achieve this goal, two computers are used (bothrunning Linux distributions). They both execute a pythonscript (called DNScachepoisoning.py) that exploits the vul-nerability demonstrated by Dan Kaminsky [51]. This scriptsends fake recursive queries to insert a dummy record inthe vulnerable DNS server by guessing the transaction ID.It also inserts an Authority record for a valid record ofthe targeted domain. The script then uses a random sourceIP address, a source port number equal to 32,883 (the vul-nerable DNS port for recursive queries) and the transactionID starting with 1024 which then increases by 1 for eachinteraction.
This attack experiment targeted GPRT’s DNS server.Fig. 10 clearly shows the increase of packet numbers seenbefore and after the attack is started. The line plotted in thegraphic depicts the amount of UDP DNS packets during atime interval between 15:00 and 15:50 of June 02 2010,
Fig. 10. DNS cache poisoning attack without defense.
without the presence of any type of defense. Before the at-tack, there was a mean of 167 packets per second, whereasthis suddenly increased to 586 packets per second once theattack was launched.
The first thirty minutes corresponded to normal usertraffic while all detectors were running and without anyattack traffic. At the thirtieth minute, attacks are injectedinto the local area network. Hence, from now on, alert clas-sification, evaluation and decision processes all start takingplace. Ten minutes into the experiment, the attack traffic ishalted.
5.2.2.2. Analysis. The DNS cache poisoning attack tookplace at 15:30. As shown in Fig. 10, the average of receivedpackets per second suddenly increased from 167 to 586packets per second once the attack was launched.
During the first minute of the attack (15:31), our AlertPre-Processor received two alert files, in the IDMEF format.These represent alerts from the Snort (Firewall/Gateway)and Snort (DNS server), containing 6864 and 30 alertsrespectively. The Pre-Processor has to therefore performsignificant cluster extraction. On the other hand, our Chk-Model did not generate any alerts because it only supportsTCP inspection and not UDP packet monitoring. Profilingonly generated alerts after two time slots (in this case,two minutes). The Snort detector (Firewall/Gateway) gen-erated a huge number of alerts of type ‘‘DNS response forRFC1918,’’ via to the original DNS rule. In addition, theother Snort detector (DNS server) generated alerts classi-fied as ‘‘ET CURRENT_EVENTS DNS Query Responses with3 RR’s set (50+ in 2 s) – possible A RR Cache Poisoning At-tempt’’, via Emergent threat’s [46] DNS rule file. The differ-ence of the number of alerts between both Snort detectorsis due to the fact that the first one is located in the localLAN segment of the GPRT network (that uses NAT IP ad-dresses) and is therefore directly hit by the attack. The sec-ond Snort detector running at the DNS server, however, islocated on a Demilitarized Zone (DMZ) segment and onlyreceives the attack once it passes though the two hosts(Firewall/Gateway linking the LAN segment and the Gate-way of DMZ segment). Therefore, this reduces the numberof received packets by the second Snort detector. This re-sults in a scenario in which, when the second Snort gener-ates one alert every 2 s, the first one generates between 5and 8 alerts per second. Such a discrepancy reflects the dif-ferent rules employed in these detectors.
With regard to the orchestration analysis (Algorithm 6),all Snort alerts were considered significant according to thethree keys: srcIP, dstIP and class (all of them had RU(A)=0.303334312), and were consequently forwarded tothe Decision Service. After receiving these alerts, the Deci-sion Service performs a simple validation and eliminatesthose that are duplicated. Consequently, only two alertswere analyzed and the following decisions were made:
� To block any packet sent by IP address 150.161.192.253,source port 53, destined to DNS server with destinationport 32,883 and;� To block any packet sent by IP address 192.168.0.7 with
source port 53, destined to 150.161.192.2:32883.

E. Feitosa et al. / Computer Networks 56 (2012) 2805–2831 2819
At the third minute of the attack (15:02), the AlertPre-Processor received 1 alert file from the Profiling (DNSserver) and 44 alerts from Snort (Firewall/Gateway). TheProfiling alert (signaling entropy change) represents theincrease of the number of flows from IP address150.161.192.253 (gateway) to IP address 150.161.192.2(DNS server), as previously detected by the Snort (DNSserver). It is important to emphasize that the Profilingdetector (DNS server) needs at least two minutes to startgenerating alerts and its output is naturally summarized,thus explaining having only a single alert in our scenario.
The Snort alerts (Firewall/Gateway) are of the sameclassification as those from the previous (DNS responsefor RFC1918). However, the amount of generated alerts issmaller. This fact is directly related to the enforcement ofthe decisions by the firewall. These decisions block allpackets from 150.161.192.253:53 to 150.161.192.2:32883and all packets from 192.168.0.7:53 to 150.161.192.2:32883 from passing.
Considering the orchestration analysis, all Snort alertswere taken to be significant and sent to the Decision Ser-vice. Since we only had a single Profiling alert this was wellbelow the minimal FER threshold condition imposed byStep 3a of the orchestration algorithm, as a result it wasnot forwarded to the FER module. Ultimately, the DecisionService suggested blocking any packet sent by IP address150.161.192.253 with source port 53 destined to the DNSserver on port 32883.
Fig. 11 gives a closer view of the entire attack. The meannumber of packets before this attack was 167 per minute.Within the first minute of the attack, the mean number ofpackets increased suddenly to 1456 packets per minute.With the evaluation and decisions taken by the OADS heu-ristic, the attack’s effects were felt only during the first120 s. This time represents the average time that the archi-tecture requires to detect an anomaly and take action tomitigate its effects. From then on, only the ‘‘normal’’ pack-ets are seen in the network.
Note that the decisions taken by OADS (via DecisionService) are applied at the two firewalls of our test-bedtopology. Consequently, Profiling and Snort, located onthe DNS server, stop generating alerts through remainingduration of the attack, as the internal traffic with sourceport 32,883 was now blocked from getting into the DMZzone. The same also happens with Snort and Profilingdetectors located on the Firewall/Gateway computer.
Fig. 11. DNS cache poisoning attack with OADS actions.
5.2.3. SPAMThe next attack scenario is that of an e-mail spam flood-
ing towards an external SMTP Server. This experiment rep-resents a hypothetic scenario where computers corruptedby the Storm worm [22,52] try to infect others via e-mail.
5.2.3.1. The experiment. In order to achieve this setup, four(4) computers (running Linux distributions) ran a simpleshell script (called spamflood.sh) that uses the Packit tool[47] to initiate TCP communication (TCP SYN) with theGPRT SMTP server. For five minutes, the script uses forgedIP addresses (and subnets) with randomly allocated clientport numbers in the originator’s addressing fields.
Fig. 12 illustrates the number of packets destined toGPRT’s SMTP server during 15 min, between 09:15 and09:30 (the time of highest server activity) of June 092010. There is an increase in the amount of packets oncethe attack is started. Before this, the mean number of SMTPpackets was around 305 per minute, whereas it reachedapproximately 18,000 packets per minute once the attackwas launched. It is important to explain that this specifictime interval was chosen because it represents the periodwith increased SMTP activity by GPRT users.
5.2.3.2. Analysis. Before the attack, none of the four detec-tors acting in this experiment (see Table 3) reported anyalert. This changed quickly after the first minutes of theattack.
Approximately 5 s into the second minute (09:21), theAlert Pre-Processor received a single alert file from the Chk-Model (TCP Model Checker that monitors connection asym-metric traffic behavior) summarizing events that took placeduring the first minute. This file contained 1160 alerts andindicated SUSPICIOUS activities coming from differenthosts towards GPRT’s SMTP server (150.161.192.192). Sincethe ChkModel detection is based on the ratio of sent and re-ceived packets, these are marked as suspicious becausethere is a rate of 1 to 0 observed (no packets sent back).
Regarding the orchestration analysis, the significantcluster extraction process confirmed that all alerts weresignificant (using the destination address field as a key)and, for this reason, they were forwarded to the DecisionService. Here, the state machine was used to evaluatethem. Considering that the lack of Profiling and Snort alertsis represented by good state, the result of the statemachine analysis is the state B1 (represented by the
Fig. 12. SPAM attack without defense.

2820 E. Feitosa et al. / Computer Networks 56 (2012) 2805–2831
combination: Profiling = good, ChkModel = suspicious andSnort = good). Consequently, this decision was translatedto the following actions: limit during 60 s any packet des-tined to IP address 150.161.192.192 with destination port25.
In the next minute, (09:22) a change of roles occurs. TheChkModel detector, which had classified the initial e-mailtraffic as suspicious, adjusts its thresholds, and, from nowon, it considers all traffic as legitimate since the TCP hand-shake mechanism for connection establishment is usedcorrectly. For this reason, it did not generate any newalerts. On the other hand, Profiling generates 1 alert file(containing 1240 source IP addresses) about this ‘‘massive’’anomaly and sends it to the Alert Pre-Processor.
As the Profiling alert is composed by a unique IDMEFalert, it was not considered significant by the clusterextraction and also could not be applied in the FER analysisas it did not attend the minimal count requirement (num-ber of alerts > fer_threshold). Thus, it was sent to the DSTanalysis. However, it was also refused because it had a un-ique source (recall that at least two sources are required toinitiate DST analysis). Lastly, the only possible step wassending it to the Decision Service.
After evaluating the Profiling alert, the Decision Service,using the state machine analysis, attributes the state C1(combination of Profiling = bad, ChkModel = good andSnort = good). Consequently, this decision was translatedto the following actions: limit during 300 s any packet des-tined to IP address 150.161.192.192 with destination port25.
Observe that since the Profiling was developed to detectmassive anomalies, its alerts have more weight in the statemachine analysis.
For the next minutes (09:23, 09:24 and 09:25), until theend of the attack, only the Profiling detector continues togenerate alerts (containing 1055, 890 and 335 source IPaddresses, respectively) and sends them to be analyzed.The evaluations using our state machine are the same(state C1) and the decisions taken are also similar, namely,to limit during 300 s any packet destined to IP address150.161.192.192 at port 25.
Fig. 13 shows a complete view of this spam attack andits detection process. See that only the Profiling strategy
Fig. 13. SPAM attack with defense.
was capable of detecting the attack. This can be explainedby the fact that, for the ChkModel, spam e-mail is legiti-mate traffic, as it looks just like normal e-mail when mak-ing standard use of the TCP handshake mechanism forconnection establishment. In other words, spam emaildoes not violate the TCP model of connection establish-ment. It is its content that is harmful and wasteful of usertime, not the format. On the other hand, the Profilingmethod detects the attack as it senses a sudden increaseof the number of flows targeting a single SMTP server orIP address. However, the response time for the Profilingdetector remains relatively high as it borders the twominutes.
Fig. 13 is derived using flow information as parametersbecause both detectors (ChkModel and Profiling) employthis type of aggregation to perform their analysis andevaluations.
In summary, the decisions taken by OADS (via its ownDecision Service) in this experiment can be considered cor-rect and useful. However, it is undeniable that they are alsosomewhat inefficient. The actions of limiting any and allpackets targeting our SMTP server (150.161.192.192) withdestination port 25, although proven to be effective, alsostops legitimate and well-behaved connections. A solutionfor this issue could involve the use of Trusted IP Lists (TIL)[12]. The main idea of TIL consists in keeping a table withthe description of the history of ‘‘good’’ connections al-ready established with the network, so that, during attacksituations such as these, only known well-behaving part-ners are favored with most of the bandwidth available tothe detriment of unknown connections and/or possibleaggressors who will be limited by filters. Traffic shapingmay therefore be used to differentiate both types of TCPconnections.
5.2.4. SlowlorisSlowloris [49] is a low rate service denial attack (though
it really not is a DoS attack). It operates by sending legiti-mate but incomplete HTTP requests, very similar to SYNflood packets, but at the application layer. This results infewer packets needed and more granularity to collapse aWeb server.
A Slowloris attack takes advantage of Web server de-sign, typically protected from massive attacks (mainlyDDoS), occupying all available sockets, causing that theserver to continue ‘‘waiting for the rest of requests’’.Fig. 14 illustrates a Slowloris HTTP request.
What differentiates this example from a functionalHTTP request is the final line, where it should be finishedoff with an additional nrn n (Carriage Return and New Linecharacters). So the last line should be: X-a: b nrn nn rn n.This simple lack of the nrnn clause causes some web serv-ers to wait for completion, as maybe the missing carriage
Fig. 14. Typical Slowloris HTTP request.

Table 5
E. Feitosa et al. / Computer Networks 56 (2012) 2805–2831 2821
return/line feed (CRLF) is still on its way. Waiting is alsoone strategy for protecting the server against a brute forceattack such as DDoS. The problem is that, by default, someWeb servers will wait five minutes. This results in one re-source being occupied for five minutes, unnecessarily inthis case of Slowloris. However, it is important that eachresource is kept busy, so every so often a new header issent with the missing CRLF. If the exact form of this headeris changed in each iteration, writing intrusion detectionsignatures becomes significantly harder.
5.2.4.1. The experiment. In order to execute this experi-ment, two computers, one located in the Informatics Cen-ter of the Federal University of Pernambuco (UFPE/Brazil)and the other located in the Institute of Computing(IComp/Brazil) of the Federal University of Amazonas(UFAM) were used to attack GPRT’s Web servers as de-picted in Fig. 8. These attackers were set up to shoot simul-taneous attacks at the targets. In addition, in order toobserve the attacks and their effects, a vulnerable distribu-tion of the Apache Web server on the targets was installed.Understandably, it was decided to only enforce thedecisions to stop the attack on Web server 1 (150.161.192.192), as it is our production server.
It is important to explain that, although the Slowlorisscript uses random source IP addresses, the attackers werelocated at networks behind NAT servers. For this reason,only two distinct source IP addresses will be perceived inthis attack.
The experiment was initiated at 15:00 PM on June 17,2010, and lasted 20 minutes. Fig. 15 illustrates the increaseof the number of established connections to the Web ser-ver 2 (150.161.192.51), where clearly it is possible to seeafter the attack taking place, this Web server reaches itsmaximum capacity of connections, configured to 250.
5.2.4.2. Analysis. The Slowloris attack took place at 15:00.Two minutes into this attack (15:01), among the seven(7) detectors used in this scenario, Profiling and Snort setup to use emergent configuration (Emergent threats) wereunable to generate alerts. The explanation for this is sim-ple. As this attack has the same behavior of a low rateSYN flood, it generates a low number of flows and henceslips through the control of the Profiling technique.
Nonetheless, both Snort’s and ChkModel detectors sawa number of isolated ‘‘TCP SYN’’ packets going towards
Fig. 15. Slowloris attack without defense on WS2.
the same destination servers and therefore should be capa-ble of detecting the attack. In fact, the Alert Pre-Processorreceived 7 IDMEF alerts (4 for Web server 1 and 3 forWeb server 2). Snort classified the attack as ‘‘SPECIFIC-THREATS Slowloris http DoS tool’’ with severity equal to2, and ChkModel classified it as BAD.
Recall that according to Algorithm 4, the execution ofsignificant cluster extraction is the first step. However, atthe end of such process, all five alerts were considerednot significant since there were only a few of them andwere relatively similar to each other. Hence, the next stepis to verify if the FER Analyzer can evaluate these alerts.Again, due to their reduced number, these alerts also failedto pass this verification. Consequently, they are then sentto the DST Analysis (Step 5). Unlike other attacks, thisexperiment generated alerts from distinct detectors, mak-ing these alerts good candidates for evaluation using theDempster–Shafer Theory.
In the DST analysis, ADS_Fusion begins with the syn-chronization of alerts to establish connections amongthem. So, the received alerts are aggregated according totheir affinities. In our case, the alerts are split accordingto their targeting of Web server 1 or Web server 2. Afterthat, they are combined to generate bpa values. For this,their severity parameter, the number of equal alerts andthresholds are used. The two first are extracted from theSnort alert and the latter from the ChkModel alerts. Then,the bpa for each alert is calculated. Snort alerts (Firewall/Router and Web server 1) have only a single alert each withseverity as medium. This way, the calculated bpa for eachone is 0.65 (corresponding to medium severity as ex-plained in Section 4.4, Table 2). For the ChkModel alerts(Firewall/Router and Web server 1), the calculated bpa isbased on threshold values. So, the calculated bpa for eachone is 0.8. Tables 5 and 6 describe the bpavalues of allalerts.
The last step is inference generation. This step requiresthe definition of a frame of discernment, an element thatcontains the possible states of the network, and an evalua-tion of the hypothesis. In this work, all generated frames ofdiscernment have only two possible elements to representthe network state: Normal or Anomalous (h = {Normal,Anomalous}). In addition, the hypothesis to be questioned
Calculated bpa of Web server 1.
Detector Severity Threshold Bpa
Snort (firewall/router) Medium 0.65 0.65ChkModel (firewall/router) Bad 0.8 0.8Snort (Web server 1) Medium 0.65 0.65ChkModel (Web server 1) Bad 0.8 0.8
Table 6Calculated bpa of Web server 2.
Detector Severity Threshold Bpa
Snort (firewall/router) Medium 0.65 0.65ChkModel (firewall/router) Bad 0.8 0.8ChkModel (Web server 2) Bad 0.8 0.8

Fig. 16. Slowloris attack without defense on WS1.
Table 7Dempster combination for attack in WS 2.
Time Snort(firewall/router)
ChkModel(firewall/router)
ChkModel(Webserver 2)
DST (%)
15:00 0.65 0.80 0.80 8815:01 0.70 0.80 0.80 9015:02 0.75 0.80 0.80 9215:03 0.80 0.80 0.80 9415:04 0.85 0.80 0.80 9515:05 0.90 0.80 0.80 9715:06 0.95 0.80 0.80 9815:07 1.00 0.80 0.80 9915:08 1.00 0.80 0.80 99...15:19 1.00 0.80 0.80 99
2822 E. Feitosa et al. / Computer Networks 56 (2012) 2805–2831
always is if the network state is Anomalous, that is, thenetwork is under attack or (H = {Anomalous}).
Next, the belief, Bel (), and plausibility, Pl (), functionsare calculated, considering the hypothesis H and, as aconsequence, a range of belief, I (H), which expresses therange of values in which it is possible to believe in thehypothesis H.
Overall, DST analysis for Web server 1 assumes:
� m1as the mass function of the Snort attack evidence fromFirewall/Router, m2as the mass function of ChkModelattack evidence from Firewall/Router, m3as the mass func-tion of Snort attack evidence from Web server 1 and m4asthe mass function of ChkModel attack evidence from Webserver 1.� Frame of discernment ish = {Normal,Anomalous}, and:�m1(Anomalous) = 0.65 and m1(h) = 1 �m1(Anomalous) =
0.35� m2(Anomalous) = 0.8 and m2(h) = 1 �m2(Anomalous) =
0.20�m3(Anomalous) = 0.65 and m3(h) = 1 �m3(Anomalous) =
0.35� m4(Anomalous) = 0.8 and m4(h) = 1 � m4(Anomalous) =
0.20� The belief and plausibility for all mass functions are 1,
i.e., Bel ({Normal, Anomalous}) = 1 and Pl ({Normal,Anomalous}) = 1.
As result, the Dempster combination obtained the fol-lowing values: m1+m2+m3+m4({Anomalous})=0.881355and m1+m2+m3+m4({Normal})=0.118645.
Similarly, for Web server 2, DST analysis assumes:
� m1 as the mass function of Snort attack evidence fromFirewall/Router, m2 as the mass function of ChkModelattack evidence from Firewall/Router, and m3 as themass function of ChkModel attack evidence from Webserver 2.� Frame of discernment ish = {Normal,Anomalous}, and:�m1(Anomalous) = 0.65 and m1(h) = 1 �m1(Anomalous) =
0.35� m2(Anomalous) = 0.8 and m2(h) = 1 �m2(Anomalous) =
0.20� m3(Anomalous) = 0.8 and m3(h) = 1 � m3(Anomalous) =
0.20� The belief and plausibility for all mass functions are 1,
i.e., Bel ({Normal, Anomalous}) = 1 and Pl ({Normal,Anomalous}) = 1.
As result of the Dempster combination, the same valuesfor Web server 1, i.e., m1 + m2 + m3({Anomalous}) = 0.881355and m1 + m2 + m3({Normal}) = 0.118645, were obtained.
Since the inferences were generated, according to Algo-rithm 4, the next step is to send the results to the OADS’Decision Service. Note that they include the inferencesand original alerts. After a validation, the Decision Servicemakes the decision to block all packets sent by IP addresses150.161.2.53 (CIn/UFPE) and 200.17.49.5 (IComp/UFAM),destined to Web server (150.161.192.192) on port 80.
Ultimately, the Slowloris attack on Web server 1 isblocked and the detectors no longer generate any more
alerts. Fig. 16 demonstrates the effects of the attack onWeb server 1. Note that after the first minute of the attack,the enforcement actions are taken and the attack isblocked.
For the purposes of evaluation, it was decided not to ap-ply the enforcement actions destined to Web server 2. Inother words, the decisions to block the packets of theattackers were not enforced, hence allowing the monitor-ing of the subsequent alerts and their analysis by DST.Table 7 represents the individual belief of the detectorsand the Dempster combination for the hypothesis: ‘‘thenetwork is under attack’’.
Note that the belief of the Snort detector increases withthe number of repeated alerts received. For example, dur-ing the initial time period (15:00), a unique alert has its be-lief equal to 0.65. At the second minute (15:01), one moreequal alert was received. For this reason, its belief was 0.65(its severity) + 0.05 (second apparition of the same alert),totaling 0.7. As a result, the Dempster combination forthe hypothesis that the network is under attack also in-creases. At 15:07, after receiving 8 identical alerts fromSnort, the belief achieved the maximum level (1.0). Fromthis point on, DST analysis achieved almost 100% of belief(confidence) regarding the existence of an attack.
5.2.5. Multi-step attackThe last experiment (but not the least important one)
was composed of a set of attack actions; it was a multi-step
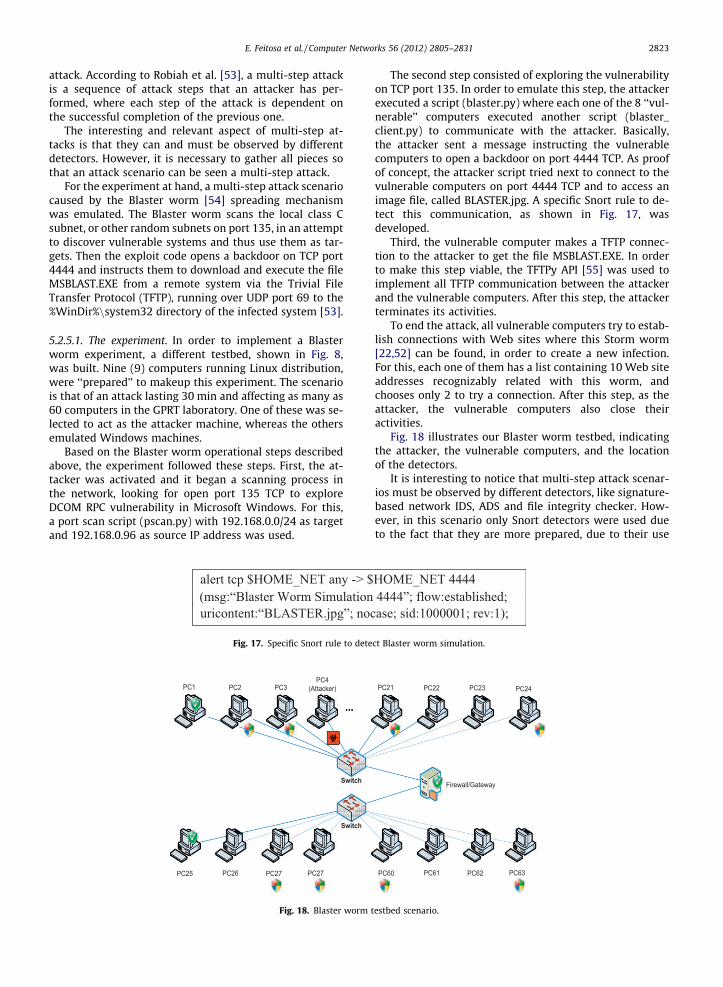
E. Feitosa et al. / Computer Networks 56 (2012) 2805–2831 2823
attack. According to Robiah et al. [53], a multi-step attackis a sequence of attack steps that an attacker has per-formed, where each step of the attack is dependent onthe successful completion of the previous one.
The interesting and relevant aspect of multi-step at-tacks is that they can and must be observed by differentdetectors. However, it is necessary to gather all pieces sothat an attack scenario can be seen a multi-step attack.
For the experiment at hand, a multi-step attack scenariocaused by the Blaster worm [54] spreading mechanismwas emulated. The Blaster worm scans the local class Csubnet, or other random subnets on port 135, in an attemptto discover vulnerable systems and thus use them as tar-gets. Then the exploit code opens a backdoor on TCP port4444 and instructs them to download and execute the fileMSBLAST.EXE from a remote system via the Trivial FileTransfer Protocol (TFTP), running over UDP port 69 to the%WinDir%nsystem32 directory of the infected system [53].
5.2.5.1. The experiment. In order to implement a Blasterworm experiment, a different testbed, shown in Fig. 8,was built. Nine (9) computers running Linux distribution,were ‘‘prepared’’ to makeup this experiment. The scenariois that of an attack lasting 30 min and affecting as many as60 computers in the GPRT laboratory. One of these was se-lected to act as the attacker machine, whereas the othersemulated Windows machines.
Based on the Blaster worm operational steps describedabove, the experiment followed these steps. First, the at-tacker was activated and it began a scanning process inthe network, looking for open port 135 TCP to exploreDCOM RPC vulnerability in Microsoft Windows. For this,a port scan script (pscan.py) with 192.168.0.0/24 as targetand 192.168.0.96 as source IP address was used.
alert tcp $HOME_NET any -> $(msg:“Blaster Worm Simulationuricontent:“BLASTER.jpg”; noc
Fig. 17. Specific Snort rule to dete
Fig. 18. Blaster worm t
The second step consisted of exploring the vulnerabilityon TCP port 135. In order to emulate this step, the attackerexecuted a script (blaster.py) where each one of the 8 ‘‘vul-nerable’’ computers executed another script (blaster_client.py) to communicate with the attacker. Basically,the attacker sent a message instructing the vulnerablecomputers to open a backdoor on port 4444 TCP. As proofof concept, the attacker script tried next to connect to thevulnerable computers on port 4444 TCP and to access animage file, called BLASTER.jpg. A specific Snort rule to de-tect this communication, as shown in Fig. 17, wasdeveloped.
Third, the vulnerable computer makes a TFTP connec-tion to the attacker to get the file MSBLAST.EXE. In orderto make this step viable, the TFTPy API [55] was used toimplement all TFTP communication between the attackerand the vulnerable computers. After this step, the attackerterminates its activities.
To end the attack, all vulnerable computers try to estab-lish connections with Web sites where this Storm worm[22,52] can be found, in order to create a new infection.For this, each one of them has a list containing 10 Web siteaddresses recognizably related with this worm, andchooses only 2 to try a connection. After this step, as theattacker, the vulnerable computers also close theiractivities.
Fig. 18 illustrates our Blaster worm testbed, indicatingthe attacker, the vulnerable computers, and the locationof the detectors.
It is interesting to notice that multi-step attack scenar-ios must be observed by different detectors, like signature-based network IDS, ADS and file integrity checker. How-ever, in this scenario only Snort detectors were used dueto the fact that they are more prepared, due to their use
HOME_NET 4444 4444”; flow:established; ase; sid:1000001; rev:1);
ct Blaster worm simulation.
estbed scenario.
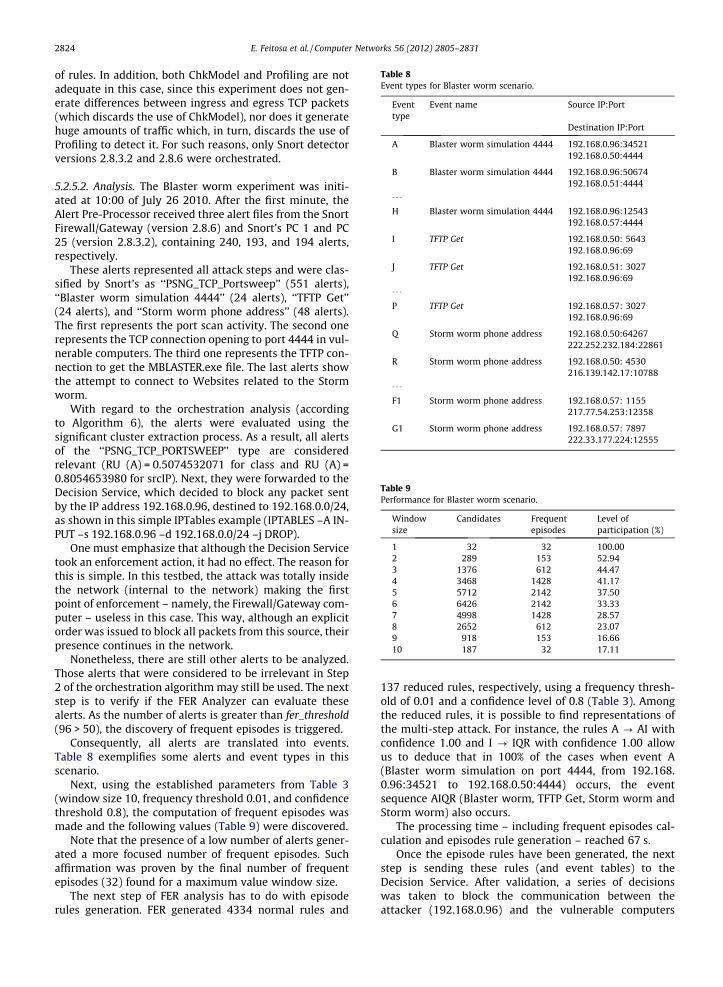
Table 8Event types for Blaster worm scenario.
Eventtype
Event name Source IP:Port
Destination IP:Port
A Blaster worm simulation 4444 192.168.0.96:34521192.168.0.50:4444
B Blaster worm simulation 4444 192.168.0.96:50674192.168.0.51:4444
. . .
H Blaster worm simulation 4444 192.168.0.96:12543192.168.0.57:4444
I TFTP Get 192.168.0.50: 5643192.168.0.96:69
J TFTP Get 192.168.0.51: 3027192.168.0.96:69
. . .
P TFTP Get 192.168.0.57: 3027192.168.0.96:69
Q Storm worm phone address 192.168.0.50:64267222.252.232.184:22861
R Storm worm phone address 192.168.0.50: 4530216.139.142.17:10788
. . .
F1 Storm worm phone address 192.168.0.57: 1155217.77.54.253:12358
G1 Storm worm phone address 192.168.0.57: 7897222.33.177.224:12555
Table 9Performance for Blaster worm scenario.
Windowsize
Candidates Frequentepisodes
Level ofparticipation (%)
1 32 32 100.002 289 153 52.943 1376 612 44.474 3468 1428 41.175 5712 2142 37.506 6426 2142 33.337 4998 1428 28.578 2652 612 23.079 918 153 16.6610 187 32 17.11
2824 E. Feitosa et al. / Computer Networks 56 (2012) 2805–2831
of rules. In addition, both ChkModel and Profiling are notadequate in this case, since this experiment does not gen-erate differences between ingress and egress TCP packets(which discards the use of ChkModel), nor does it generatehuge amounts of traffic which, in turn, discards the use ofProfiling to detect it. For such reasons, only Snort detectorversions 2.8.3.2 and 2.8.6 were orchestrated.
5.2.5.2. Analysis. The Blaster worm experiment was initi-ated at 10:00 of July 26 2010. After the first minute, theAlert Pre-Processor received three alert files from the SnortFirewall/Gateway (version 2.8.6) and Snort’s PC 1 and PC25 (version 2.8.3.2), containing 240, 193, and 194 alerts,respectively.
These alerts represented all attack steps and were clas-sified by Snort’s as ‘‘PSNG_TCP_Portsweep’’ (551 alerts),‘‘Blaster worm simulation 4444’’ (24 alerts), ‘‘TFTP Get’’(24 alerts), and ‘‘Storm worm phone address’’ (48 alerts).The first represents the port scan activity. The second onerepresents the TCP connection opening to port 4444 in vul-nerable computers. The third one represents the TFTP con-nection to get the MBLASTER.exe file. The last alerts showthe attempt to connect to Websites related to the Stormworm.
With regard to the orchestration analysis (accordingto Algorithm 6), the alerts were evaluated using thesignificant cluster extraction process. As a result, all alertsof the ‘‘PSNG_TCP_PORTSWEEP’’ type are consideredrelevant (RU (A) = 0.5074532071 for class and RU (A) =0.8054653980 for srcIP). Next, they were forwarded to theDecision Service, which decided to block any packet sentby the IP address 192.168.0.96, destined to 192.168.0.0/24,as shown in this simple IPTables example (IPTABLES –A IN-PUT –s 192.168.0.96 –d 192.168.0.0/24 –j DROP).
One must emphasize that although the Decision Servicetook an enforcement action, it had no effect. The reason forthis is simple. In this testbed, the attack was totally insidethe network (internal to the network) making the firstpoint of enforcement – namely, the Firewall/Gateway com-puter – useless in this case. This way, although an explicitorder was issued to block all packets from this source, theirpresence continues in the network.
Nonetheless, there are still other alerts to be analyzed.Those alerts that were considered to be irrelevant in Step2 of the orchestration algorithm may still be used. The nextstep is to verify if the FER Analyzer can evaluate thesealerts. As the number of alerts is greater than fer_threshold(96 > 50), the discovery of frequent episodes is triggered.
Consequently, all alerts are translated into events.Table 8 exemplifies some alerts and event types in thisscenario.
Next, using the established parameters from Table 3(window size 10, frequency threshold 0.01, and confidencethreshold 0.8), the computation of frequent episodes wasmade and the following values (Table 9) were discovered.
Note that the presence of a low number of alerts gener-ated a more focused number of frequent episodes. Suchaffirmation was proven by the final number of frequentepisodes (32) found for a maximum value window size.
The next step of FER analysis has to do with episoderules generation. FER generated 4334 normal rules and
137 reduced rules, respectively, using a frequency thresh-old of 0.01 and a confidence level of 0.8 (Table 3). Amongthe reduced rules, it is possible to find representations ofthe multi-step attack. For instance, the rules A ? AI withconfidence 1.00 and I ? IQR with confidence 1.00 allowus to deduce that in 100% of the cases when event A(Blaster worm simulation on port 4444, from 192.168.0.96:34521 to 192.168.0.50:4444) occurs, the eventsequence AIQR (Blaster worm, TFTP Get, Storm worm andStorm worm) also occurs.
The processing time – including frequent episodes cal-culation and episodes rule generation – reached 67 s.
Once the episode rules have been generated, the nextstep is sending these rules (and event tables) to theDecision Service. After validation, a series of decisionswas taken to block the communication between theattacker (192.168.0.96) and the vulnerable computers

Table 10Characteristics of SERPRO dataset.
#Traces Date #Alerts #Bytes (MB)
1 Nov, 10 2000 (anonimyzed) 99.531 1662 81.871 1333 51.782 844 117.790 1915 124.380 2036 28.431 467 140.924 2358 191.115 2019 124.595 20310 161.057 26711 117.790 19112 122.089 19913 28.431 4614 197.941 330
Total 1.515.727 2.38 GB
Table 11Top ten classes of alerts.
Class of Alerts #Alerts
icmp destination unreachable host unreachable 22.008.544et user_agents suspicious user agent (agent) 19.837.127et policy inbound http connect attempt on off port 19.327.368icmp ping windows 17.017.136icmp ping 16.247.183et scan potential vnc scan 5900 15.885.062et policy external mysql server connection 14.777.526et scan cisco torch snmp scan 13.848.440et policy suspicious inbound to mysql port 3306 13.240.588et worm potential mysql bot scanning for sql server 12.393.519et policy suspicious inbound to oracle sql port 1521 12.052.504et policy tls/ssl encrypted application data on
unusual port11.947.043
icmp echo reply 11.037.909
Total 199.619.949
Table 12Number of evaluated alerts from SERPRO dataset during 30 min ofexperiment.
#Time interval #Alerts #Time interval #Alerts
1 80.194 16 22.7772 81.071 17 23.871
E. Feitosa et al. / Computer Networks 56 (2012) 2805–2831 2825
(192.168.0.50–57). Note that these decisions had no effect.A solution would be reached through the use of an auto-matic access control mechanism as proposed in [56],where the authors employ 802.1x [57] to implement ac-cess control based on physical access device ports. Thisway, specific user traffic may be filtered out at layer twoaccess switches.
3 84.442 18 22.7824 88.090 19 23.7905 84.380 20 24.3806 88.431 21 22.4317 84.024 22 23.9248 81.115 23 23.1159 80.595 24 24.595
5.3. Experimenting with real traces
This section presents an evaluation of the OADS ap-proach when submitted to real malicious traffic traces.
10 76.057 25 22.05711 77.790 26 21.79012 72.089 27 22.58913 68.431 28 25.43114 59.554 29 25.45615 57.332 30 23.144
5.3.1. SERPRO datasetThe SERPRO dataset was obtained from the Brazilian
Federal Service of Data Processing (SERPRO) [58]. Thisdataset consists of alerts produced by 10 Snort IDS em-ployed to detect anomalies and intrusions in the SERPROpublic network, which includes Web Services, sites and do-mains of the Brazilian government. It contains about 1.5million alerts collected during 30 min. The main character-istics of this dataset are summarized in Table 10. It isimportant to explain that due to security and confidential-ity questions, information like dates, IP addresses and portswere anonymized.
The interesting and relevant aspect of this dataset is thediversity of the anomalies presented. Due to being col-lected in 10 IDS servers in different network locations,the generated alerts range from simple ICMP ping to SQLInjection and malicious code (cross-site scripting). Table11 describes the Top Ten classes of alerts presented inthe SERPRO dataset.
5.3.1.1. The experiment. In order to perform this experi-ment, we set up 10 computers, running Linux distributionand Snort 2.8.3.2 version, to represent the IDS servers inthe SERPRO environment.
Due to hardware differences between the PCs in theexperiment, we decided to distribute the traces as follows:Traces 1 and 2 to PC1; Traces 3 and 4 to PC2, Traces 5 and 6to PC3; Trace 7 to PC4; Trace 8 to PC5; Trace 9 to PC6; Trace10 to PC7; Trace 11 to PC8; Trace 12 to PC9; and Traces 13
and 14 to PC10. In addition, we configured all HA compo-nents (section 4.2.1) to generate alerts every 1 min.
5.3.1.2. Analysis. The experiment using the SERPRO datasetwas initiated at 10:00 on December 12, 2011. After the firstminute, the Alert Pre-Processor received 10 alert files con-taining a total of 80,194 alerts.
Among these alerts, the most representative are: ‘‘shell-code x86 Inc. ebx noop’’, a buffer overflow attack (77,910alerts), ‘‘shellcode x86 noop’’ (171 alerts), ‘‘et exploit zilabchat and instant messaging heap overflow vulnerability’’(127 alerts), ‘‘et policy suspicious inbound to oracle sqlport 1521’’ (109 alerts), ‘‘et policy external mysql serverconnection’’ (107), ‘‘et policy suspicious inbound to mysqlport 3306’’ (106 alerts), and ‘‘et worm potential mysql botscanning for sql server’’ (106 alerts).
With regard to the orchestration analysis (Algorithm 4),the alerts were first evaluated using the significant clusterextraction process. As a final result, from 80,194 alerts,80,152 were considered relevant and forwarded to theDecision Service. Nonetheless, there were still other alertsto be analyzed. The next step is to verify if these alerts canbe evaluated by the FER Analyzer. As the number of alerts
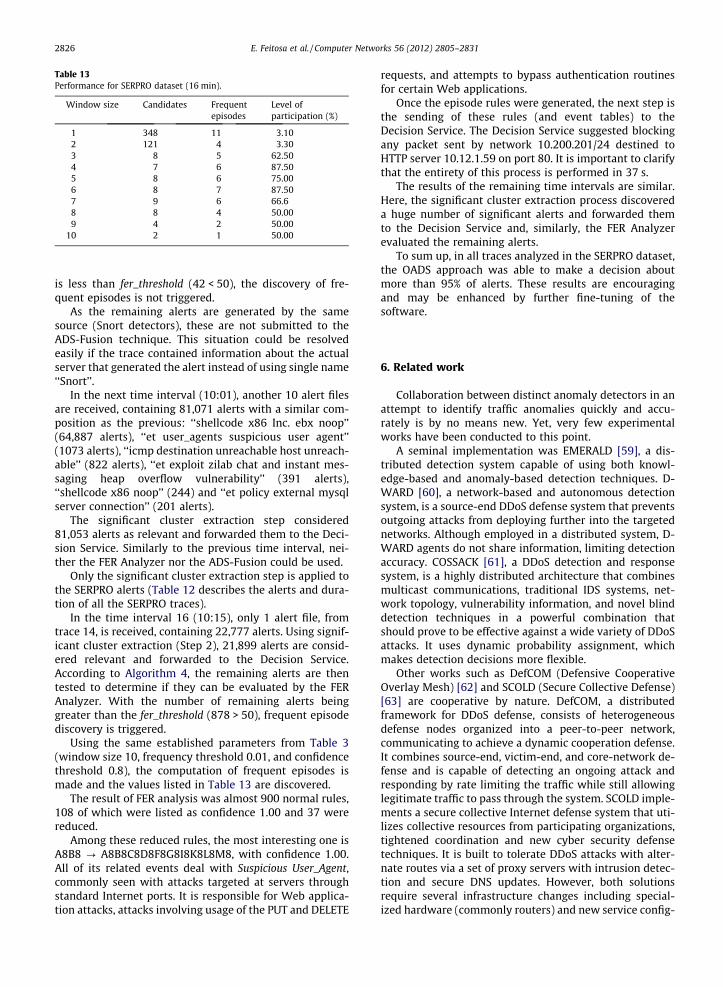
Table 13Performance for SERPRO dataset (16 min).
Window size Candidates Frequentepisodes
Level ofparticipation (%)
1 348 11 3.102 121 4 3.303 8 5 62.504 7 6 87.505 8 6 75.006 8 7 87.507 9 6 66.68 8 4 50.009 4 2 50.00
10 2 1 50.00
2826 E. Feitosa et al. / Computer Networks 56 (2012) 2805–2831
is less than fer_threshold (42 < 50), the discovery of fre-quent episodes is not triggered.
As the remaining alerts are generated by the samesource (Snort detectors), these are not submitted to theADS-Fusion technique. This situation could be resolvedeasily if the trace contained information about the actualserver that generated the alert instead of using single name‘‘Snort’’.
In the next time interval (10:01), another 10 alert filesare received, containing 81,071 alerts with a similar com-position as the previous: ‘‘shellcode x86 Inc. ebx noop’’(64,887 alerts), ‘‘et user_agents suspicious user agent’’(1073 alerts), ‘‘icmp destination unreachable host unreach-able’’ (822 alerts), ‘‘et exploit zilab chat and instant mes-saging heap overflow vulnerability’’ (391 alerts),‘‘shellcode x86 noop’’ (244) and ‘‘et policy external mysqlserver connection’’ (201 alerts).
The significant cluster extraction step considered81,053 alerts as relevant and forwarded them to the Deci-sion Service. Similarly to the previous time interval, nei-ther the FER Analyzer nor the ADS-Fusion could be used.
Only the significant cluster extraction step is applied tothe SERPRO alerts (Table 12 describes the alerts and dura-tion of all the SERPRO traces).
In the time interval 16 (10:15), only 1 alert file, fromtrace 14, is received, containing 22,777 alerts. Using signif-icant cluster extraction (Step 2), 21,899 alerts are consid-ered relevant and forwarded to the Decision Service.According to Algorithm 4, the remaining alerts are thentested to determine if they can be evaluated by the FERAnalyzer. With the number of remaining alerts beinggreater than the fer_threshold (878 > 50), frequent episodediscovery is triggered.
Using the same established parameters from Table 3(window size 10, frequency threshold 0.01, and confidencethreshold 0.8), the computation of frequent episodes ismade and the values listed in Table 13 are discovered.
The result of FER analysis was almost 900 normal rules,108 of which were listed as confidence 1.00 and 37 werereduced.
Among these reduced rules, the most interesting one isA8B8 ? A8B8C8D8F8G8I8K8L8M8, with confidence 1.00.All of its related events deal with Suspicious User_Agent,commonly seen with attacks targeted at servers throughstandard Internet ports. It is responsible for Web applica-tion attacks, attacks involving usage of the PUT and DELETE
requests, and attempts to bypass authentication routinesfor certain Web applications.
Once the episode rules were generated, the next step isthe sending of these rules (and event tables) to theDecision Service. The Decision Service suggested blockingany packet sent by network 10.200.201/24 destined toHTTP server 10.12.1.59 on port 80. It is important to clarifythat the entirety of this process is performed in 37 s.
The results of the remaining time intervals are similar.Here, the significant cluster extraction process discovereda huge number of significant alerts and forwarded themto the Decision Service and, similarly, the FER Analyzerevaluated the remaining alerts.
To sum up, in all traces analyzed in the SERPRO dataset,the OADS approach was able to make a decision aboutmore than 95% of alerts. These results are encouragingand may be enhanced by further fine-tuning of thesoftware.
6. Related work
Collaboration between distinct anomaly detectors in anattempt to identify traffic anomalies quickly and accu-rately is by no means new. Yet, very few experimentalworks have been conducted to this point.
A seminal implementation was EMERALD [59], a dis-tributed detection system capable of using both knowl-edge-based and anomaly-based detection techniques. D-WARD [60], a network-based and autonomous detectionsystem, is a source-end DDoS defense system that preventsoutgoing attacks from deploying further into the targetednetworks. Although employed in a distributed system, D-WARD agents do not share information, limiting detectionaccuracy. COSSACK [61], a DDoS detection and responsesystem, is a highly distributed architecture that combinesmulticast communications, traditional IDS systems, net-work topology, vulnerability information, and novel blinddetection techniques in a powerful combination thatshould prove to be effective against a wide variety of DDoSattacks. It uses dynamic probability assignment, whichmakes detection decisions more flexible.
Other works such as DefCOM (Defensive CooperativeOverlay Mesh) [62] and SCOLD (Secure Collective Defense)[63] are cooperative by nature. DefCOM, a distributedframework for DDoS defense, consists of heterogeneousdefense nodes organized into a peer-to-peer network,communicating to achieve a dynamic cooperation defense.It combines source-end, victim-end, and core-network de-fense and is capable of detecting an ongoing attack andresponding by rate limiting the traffic while still allowinglegitimate traffic to pass through the system. SCOLD imple-ments a secure collective Internet defense system that uti-lizes collective resources from participating organizations,tightened coordination and new cyber security defensetechniques. It is built to tolerate DDoS attacks with alter-nate routes via a set of proxy servers with intrusion detec-tion and secure DNS updates. However, both solutionsrequire several infrastructure changes including special-ized hardware (commonly routers) and new service config-

E. Feitosa et al. / Computer Networks 56 (2012) 2805–2831 2827
uration (DNS, for example) and it is unclear if they scale tohigh-speed links.
A recent decentralized, multi-dimensional alert correla-tion algorithm for CIDSs is proposed by Zhou et al. [64]. Amulti-dimensional alert clustering algorithm is used to ex-tract the significant intrusion patterns from raw intrusionalerts. First, the single-feature correlation is used to locallycorrelate the alerts on the basis of a single traffic feature(e.g. source IP address of the suspicious traffic), then a mul-ti-dimensional alert correlation algorithm is employed toreport patterns of alerts that are found based on multipletraffic features.
DSOC (Distributed Security Operation Center) [65] is ahierarchical architecture for collaborative intrusion detec-tion. DSOC is organized into three levels: in the first level,the data is collected by several data collection boxes (e.g.local and remote firewall/IDS). In the second level, localdetection engines are used to analyze the data collectedand generate alerts accordingly. Finally, all the generatedalerts are processed by a global intrusion detection engineto find more complex intrusions and give a global view ofthe network security.
In the same line as DSOC, Servin and Kudenko [66] pro-pose a hierarchical architecture based on Multi-AgentReinforcement Learning (MARL). The proposed approachuses an architecture of distributed sensor and decisionagents. Sensor agents extract network-state informationand send signals to Decision agents, which learn to inter-pret those signals to categorize different network states.
Certainly, the hierarchical architectures scale betterthan the centralized alternatives. However, nodes at thehigher levels in the hierarchy still limit the scalability ofthe CIDS and their failure can stop the operation of theirwhole sub-tree. MADIDF (Mobile Agents based Peer-to-Peer Distributed Intrusion Detection Framework) [67] at-tempts to overcome this limitation. In this framework,each component consists of four agents: a monitor agent,analysis agent, executive agent, and manager agent. Inaddition, a mobile agent migration strategy is applied inthe framework to allow agents not only to collect informa-tion from direct-linked ‘‘neighbours’’ but also from otherhosts in the network. While benefiting from agent andPeer-to-Peer techniques, this framework seems to be morescalable than DSOC and MARL but may lack real-time sup-port due to agent mobility.
Rehak et al. [68] propose a strategy in the same line asOADS. Based on multi-agents, the idea is to detect mali-cious traffic in high-speed networks and alert the operatorsefficiently. Basically, this architecture employs three layersto detect unwanted traffic aggregated in flows. The firstlayer, Traffic Acquisition and Preprocessing, is responsiblefor capturing and preprocessing network traffic, and pro-viding traffic features to upper layers. The second layer,Cooperative Threat Detection, is responsible for detectingtraffic anomalies by using trusting agents. For this, theyare based on the principles of trust modeling. The lastlayer, Operator and Analysis Interface, coordinates thedetection layer.
Architecturally speaking, both proposals seem similar,but the OADS approach contains some features that we be-lieve give it an advantage over others. Firstly, the traffic
acquisition and preprocessing layer has the same functionas the OADS anomaly detectors. In addition, this architec-ture is limited to processing captured flows to detectanomalies. Some types of anomalies, such as low-rate at-tacks, could pass undetected. Furthermore, OADS embracesa variety of techniques (detectors) to effectively discovertraffic anomalies. A look at the detection process offeredby Rehak’s architecture shows that all trusting agents re-ceive the same network flows and preprocessed statisticsin order to try to define anomalies. The result (list of anom-alies) is then forwarded to other agents. With this method,all trusting agents need to implement the same detectiontechniques. The amount of traffic exchanged flows mayoverload the network. In addition, it is not clear if collabo-ration in Rehak’s architecture is mandatory. Lastly, updatesor insertions of new detection techniques are not men-tioned in the Rehak’s architecture. OADS, due to its distrib-uted and collaborative design, permits the support ofupdates and the continuous insertion of new componentscovering new threats.
In summary, the orchestration provided by OADS con-sists of capturing rules and sequences of how and whenthe different techniques will collaborate with each other.Their orchestration consists of creating an executable pro-cess model, in the form of a workflow, which implements anew service by harmonizing preexisting services.
OADS can be effectively deployed within corporate net-works at a large scale. Its deployment in the public Internetrequires prior agreement among different domains. Suchagreements may be manually established or accomplishedthrough bilateral agreements such as SLAs.
We believe that the collaborative communication stylebetween the security services represents a significant steptoward the development of self-defending networks.
7. Lessons learned
7.1. OADS flexibility
Although it is intuitive that a collaborative approachshould yield better results than isolated techniques, theway these approaches interact in a workflow-like structuredetermines the quality and efficacy of the security diagno-sis. OADS design is flexible in that it allows for differentordering of and combinations of its components.
This is demonstrated by evaluating a database with realnetwork trace of Brazilian DNS traffic, courtesy from OARC(Operations, Analysis, and Research Center) DITL 2008,2009 and 2010 project [69]. Using Snort IDS, configuredwith DNS rules, and Profiling as detectors, we found thata combination using Alert Pre-Processor and FER Analyzerwas NOT efficient in identifying DNS attacks anomaliessuch as spam bots. The number of significant alerts wasvery low and consequently no rules were generated byFER Analyzer.
Nonetheless, as the alerts were generated mostly by theProfiling detector, which needs more time to find trafficanomalies, we decide to change the sequence of OADSanalysis components. This way, we use Alert Pre-Processorand ADS-Fusion, instead of Alert Pre-Processor and FER

2828 E. Feitosa et al. / Computer Networks 56 (2012) 2805–2831
Analyzer. As result, OADS was able to identify a largernumber of security DNS attacks such as spam bots orfast-flux domain.
Another aspect of OADS’ flexibility lies in the fact that itis entirely possible to add or change the techniques thatcomprise the OASD component implementation. Recently,we developed a new Alert Pre-Processor that uses K-med-oids clustering techniques to aggregate multi-source alerts[70]. Our tests show that the effectiveness of aggregationand prioritization of alerts is very similar to those imple-mented in OADS using entropy and relative uncertainty.However, a test combining these two techniques, applying,first, the relative uncertainty in a complete set of alerts ofDARPA 2000 and, in sequence, applying K-medoids in re-main alerts, showed that almost 95% of all alerts in all DAR-PA scenarios were aggregated and prioritized.
7.2. Detectors and IDMEF
There are, unquestionably, a large number of efficientsolutions for dealing with unwanted traffic. Their actualintegration and testing within an implementation setuprepresents many challenges often due to a lack of technicaldetails. When requested, the authors of many importantstrategies could not make their code available due to pri-vacy issues within their projects. Additionally, a Java parserwas written to convert the output of the detectors used inthis work into IDMEF format.
Regarding commercial and public detectors, we testedthree tools: Snort [26], BrO [27] and Prelude IDS [28].Although all seemed to offer similar services, we chooseSnort (version 2.8.3.2) due to its ease of installation, simplerules update mechanism and the existence of the Snort-ID-MEF plugin [74]. However, each time we upgraded to anew Snort version with more recent rules, the Snort-IDMEFplugin stopped working. As result, we ended up developingour own translator of Snort logs to the IDMEF format.
7.3. Know your traffic traces
Despite the OADS evaluation taking place using attackscenarios (originated from five experiments) and one realtraffic trace, we strongly believe that further evaluationsare needed to better demonstrate the effectiveness of ourapproach. However, despite the increased interest in secu-rity, partially due to the widespread use of social networks,it is now practically impossible to find traces for compre-hensive testing.
We initially used three (3) well known real traces toevaluate OADS approach. The first one was CAIDA’s 2007DDoS Attack Dataset [71]. This trace had approximatelyone hour of anonymized traffic traces from a DDoS attack,totalizing 21 GB, where only attack traffic to the victim andresponses to the attack from the victim are included.Although this trace contains bidirectional traffic, none ofthe detectors used in our testbed were able to identifyany attack. The reason was simple. Since the payload wasremoved from all packets in this trace, Snort detectors,for example, were unable to match any of their content-based signatures. Our own detectors ChkModel and
Profiling could not detect attacks due to the trace anony-mization process.
The second and third traces are UMass Gateway Link 3Trace [72] and MAWI 2006 sample-point B [73]. UMasstrace is listed as containing anomalous traffic, but no alertswere generated. MAWI trace does not indicate if therewere any attacks or anomalies in its data.
8. Future directions
8.1. Distributed support and cooperation
Collaboration between detection systems is necessaryfor improving, in both precision and scope, the process ofdetecting anomalies, suspicious events, and security inci-dents. This collaboration must be based on information ex-change (data and control) between local and remotedetection systems. Standard message formats and proto-cols such as IDMEF [74], IODEF [75] and IDXP [76] can beused for this purpose. Recently, the use of description lan-guages as WSDL (Web Service Description Language) [77]and OWL (Web Ontology Language) [78] have also beenadopted in the context of IDS collaboration.
8.2. Trusting IDMEF
To address the current unwillingness, for different rea-sons, to share security alerts across network providersand domains, some works have been proposed. Lincolnet al. [79] proposes a set of sanitization techniques to ob-scure sensitive fields including both IP addresses and data.Sensitive associations such as the configuration and de-fense coverage of a network site are also hidden. Xu andNing [80] proposed the use of concept hierarchies to bal-ance privacy requirements and the need for intrusion anal-ysis. Already Gross et al. [81] proposed a privacy-preservingmechanism using Bloom filters for use in a CAIDS. A secondconcern raises the use of authentication and data integrityto prevent wrong or forged information to be injected aspart of the generated messages by the CAIDS elements.The works described in [82,83] use certificates to authenti-cate the messages and thus to guarantee the security ofalerts and participants. In addition, these approaches usea central certificate authority unit that can cause scalabilityproblems. The proposal of Brandão et al. [84] describes aframework to integrate IDS, called IDS Composition, basedon Web Service technology, where a security service isestablished using WS-Security standard [85], XML-Encryp-tion [86], and XML-Signature [87] to deal with authentica-tion and access control of elements and to exchange IDMEFmessages.
8.3. Studies on distribution of the OADS orchestration
Further studies should be conducted on the feasibilityof distributing the orchestration functionality. Since thecollected traffic can easily exceed the processing capacityof a server, especially in broadband networks, OADSorchestration can be quickly overwhelmed by the hun-

E. Feitosa et al. / Computer Networks 56 (2012) 2805–2831 2829
dreds or thousands of alerts and diagnoses within a shorttime.
Intuitively, we can point out two solutions to solve theproblem. The first is to use more than one OADS orchestra-tion engine to share the responsibility for the analysis anddecisions. The second possible solution (more interesting,but more complex) exploits the concept of parallelism toharmonize multiple OADS orchestration. This harmoniza-tion requires cooperation based on the use of fixed timeintervals for making the analysis and would employ thesame dictionary of decisions. A clever division of OADSorchestration into parallel distributed and possibly inde-pendent orchestrations would be a solution to evaluatein the future.
8.4. Improving the orchestration algorithm
The study of other attack scenarios and the identifica-tion of new orchestration sequences are needed to enrichthe current proof of concept.
8.5. Design and implementation of an inter-domainadvertisement service
The authors are in the process of adding a controlledadvertisement service that could be shared across do-mains. All cooperating domains may then publically adver-tize the detection scope and types of defenses that theyoffer, creating opportunities for cooperation with otherdomains.
To initiate this activity, our information bases, includingalert (received and pre-processed), analysis of OADS com-ponents (FER Analyzer and ADS-Fusion, for example), his-tory of decisions and vulnerabilities reports and Internettraffic statistics (gathered by the OADS Miner) will bemade available in a shared storage space.
8.6. Information bases
To assist the anomaly detection process, one may lever-age the existence of many information bases to store avail-able and useful data about alerts and traffic summaries(anomaly detectors output), vulnerabilities and Internetanomalies, and history data. Orchestration tools may thenuse network state information to help in the decisionprocess.
In the OADS approach, two data structures (informationbases) that could improve orchestration are:
� Alert base contains the outputs of the analysis or trafficsummaries performed by anomaly detectors. The idea isto keep processed network traffic while respecting itsspecificities. This information can be used by OADS asimportant feedback for improving collaborative activi-ties, taking new decisions, or looking for new anomalypatterns based on these observed results. For instance,the OADS approach can determine that a detector spe-cialized in spam uses the generated alerts by the Profil-ing [31] detector to further evaluate those resultsconsidered suspicious and not yet confirmed involvingTCP port 25 (SMTP protocol). Such a feedback procedure
increases the chance of discovering previously unper-ceived anomalies and consequently enhancing the net-work security level.� History base contains all previous historical decisions
taken by the OADS approach for possible future pro-cessing. This way, when similar network situationsoccur, including the same network behavior and anom-aly detector activity, the OADS approach can be com-pared or even immediately take the same old decision.A strategy such as case based reasoning may be usedto carry out this processing.
9. Conclusions
A comprehensive definition of Unwanted Internet traf-fic and ways to minimize its effects are still topics for fur-ther discussion and study. The existence of an ‘‘evilindustry’’, coupled with the emergence of new servicesand applications, the constant technological evolution,and the population boom of new (and often unskilled)users imposes new challenges in the activity of detectionand limitation of unwanted traffic.
This work has made the case for studying unwantedInternet traffic and proposed an orchestration orientedanomaly detection system (OADS) approach to identifyingunwanted Internet traffic. It has also demonstrated theeffectiveness of the OADS approach in the identificationand mitigation of such traffic through different scenariosand experiments.
In this work, we generate rules and infer with a greaterdegree of certainty than the uncertainty generated byexisting isolated anomaly detectors. We may need to con-tinue our research in calibrating the beliefs for the usedsensors and their levels to reflect the fact that, in somecontexts, the diagnostic of a particular sensor can be moreimportant more accurate than others. Our decision tableneeds to grow to embrace new sensors and heuristics.
The problem of unwanted Internet traffic identificationis still far from being solved. We expect that this work con-tributes by providing background on the issue and intro-ducing new research for the design of new effectiveapproaches for unwanted traffic identification. The hopeis to see other more multi-step consolidated advanced ap-proaches emerging in the near future.
We imagine a future where such modules may be of-fered by different providers and one may choose (or com-pose) selectively among these using emerging WebServices technologies to build more complete and effectiveunwanted traffic detection models. The emerging ServiceOriented Architecture (SOA) may facilitate cooperationover the Internet and information sharing, a model thatis missing from today’s solutions.
With the emergence of OpenFlow [74] as an open inter-face for remotely controlling the forwarding tables forswitches, routers and access points, high levels of securitycontrols may be established at these devices running atwirespeed. Our proposal may therefore be extended tomake use of OpenFlow to enlist the help of routers andswitches in the identification and removal of unwantedtraffic.

2830 E. Feitosa et al. / Computer Networks 56 (2012) 2805–2831
References
[1] CSI, Computer Security Institute. <http://www.gocsi.com>.[2] L.A. Gordon, M.P. Loeb, W. Lucyshyn, R. Rich, 2005 CSI/FBI Computer
Crime Survey, in: 10th Annual Computer Crime and Security, 2005.[3] L.A. Gordon, M.P. Loeb, W. Lucyshyn, R. Rich, 2006 CSI/FBI Computer
Crime Survey, in: 11th Annual Computer Crime and Security, 2006.[4] R. Richardson, 2007 CSI/FBI Computer Crime Survey, in: 12th Annual
Computer Crime and Security, 2007.[5] Gartner, Gartner. <http://www.gartner.com>.[6] Radicati Group, Corporate Email Market 2006–2010. <http://
www.radicati.com>.[7] F. Ricciato, Unwanted traffic in 3G network, SIGCOMM Computer
Communications Review 36 (2) (2006) 53–56.[8] L. Anderson, E. Davies, L. Zhang, Report from the IAB workshop on
Unwanted Traffic March 9-10 2006, IETF, Internet Informational RFC4948, 2007.
[9] B. Krishnamurthy, Unwanted traffic: Important problems, researchapproaches, in: Internet Architecture Board Workshop, 2006.
[10] E. Davies, Unwanted traffic, IETF Journal (2007).[11] C.V. Zhou, C. Leckie, S. Karunasekera, A survey of coordinated attacks
and collaborative intrusion detection, Computer & Security 29 (1)(2010) 124–140.
[12] D. Sadok, E. Souto, E. Feitosa, J. Kelner, L. Westberg, RIP – a robust IPaccess architecture, Computers & Security 28 (6) (2009) 359–380.
[13] T. Gamer, M. Scharf, M. Schöller, Collaborative anomaly-based attackdetection, Self-Organizing Systems 4725/2007 (2007) 280–287.
[14] H.A. Ringberg, Privacy-Preserving Collaborative, Ph.D. thesis,Princeton University, 2009, p. 128.
[15] E.H. Spafford, The Internet worm program: an analysis, SIGCOMMComputer Communications Review 19 (1) (1989) 17–57.
[16] CNN, Cyber-attacks batter Web heavyweights. <http://www.cnn.com/2000/TECH/computing/02/09/cyber.attacks.01/index.html>.
[17] K. Xu, Z-L. Zhang, S. Bhattacharyya, Reducing unwanted traffic in abackbone network, in: Steps of Reducing Unwanted Traffic on theInternet Workshop (SRUTI), 2005.
[18] J. Yarden, Case study: how much does unwanted Internet trafficreally cost an organization? <http://articles.techrepublic.com.com/5100-10878_11-5967393.html>.
[19] R. Pang, V. Yegneswaran, P. Barford, V. Paxson, L. Peterson,Characteristics of Internet background radiation, in: Proceedings ofthe 4th ACM SIGCOMM Conference on Internet Measurement, 2004,pp. 27–40.
[20] E.L. Feitosa, E. Souto, D. Sadok, Unwanted Internet traffic: concepts,characterization, and solutions, in: Textbook of Mini courses of theVIII of the Brazilian Symposium on Information Security andComputing Systems (SBSeg’08), SBC, Porto Alegre, Brazil, 2008(Chapter 3).
[21] A. Brodsky, Comcast Case Is A Victory for the Internet. <http://www.publicknowledge.org/node/1686>.
[22] F-Secure, F-Secure Malware Information Pages: Small.DAM. <http://www.f-secure.com/v-descs/small_dam.shtml>.
[23] Force10 Networks, P-Series Overview, 2008. <http://www.force10networks.com/products/pseries.asp>.
[24] Cetacea Networks, OrcaFlow: Terabit-Class Network Traffic AnomalyDetection, 2008. <http://www.orcaflow.ca/orcaflow-ca>.
[25] CloudShield Technologies, Hardware Solutions, 2008. <http://www.cloudshield.com/platform/hardware.asp.
[26] Snort, 2009. <http://www.snort.org>.[27] NFS, Bro Intrusion Detection System, 2009. <http://bro-ids.org>.[28] Prelude-IDS Technologies, Prelude-IDS, 2009. <http://www.
prelude-ids.com>.[29] N. Provos, Honeyd, 2009. <http://www.honeyd.org>.[30] Nephentes, 2009. <http://nepenthes.carnivore.it>.[31] N. Ye, Q. Chen, C.M. Borror, EWMA forecast of normal system activity
for computer intrusion detection, IEEE Transactions on Reliability 53(4) (2004) 557–566.
[32] J. Pikoulas, W. Buchanan, M. Mannion, K. Triantafyllopoulos, Anagent-based bayesian forecasting model for enhanced networksecurity, in: IEEE International Conference on Engineering ofComputer-based Systems, 2001, pp. 247–254.
[33] P. Hu, M.I. Heywood, Predicting intrusion with local linear models,in: Proceedings of the International Joint Conference on NeuralNetworks, 2003, pp. 1780–1785.
[34] K. Xu, Z. Zhang, S. Bhattacharyya, Profiling Internet backbone traffic:behavior models and applications, in: 2005 Conference onApplications, Technologies, Architectures, and Protocols for
Computer Communications (SIGCOMM ’05), Philadelphia,Pennsylvania, USA, 2005, pp. 169–180.
[35] L.H. Vilaça, E.L. Feitosa, D. Sadok, J. Kelner, Applying the frequency ofepisodes in alert correlation, in: 10th Brazilian Symposium ofInformation Security and Computer Systems (SBSeg 2010), SBC,Fortaleza, Brazil, 2010, pp. 241–254.
[36] H. Mannila, H. Toivonen, A. Inkeri Verkamo, Discovery of frequentepisodes in event sequences, Data Mining and Knowledge Discovery1 (3) (1997) 259–289.
[37] MIT Lincoln Laboratory, DARPA Intrusion Detection Scenario SpecificData Sets, 2000. <http://www.ll.mit.edu/mission/communications/ist/corpora/ideval/data/index.html>.
[38] M. Qin, K. Hwang, Frequent episode rules for intrusive anomalydetection with internet data mining, in: USENIX SecuritySymposium, 2004.
[39] B. Lins, E.L. Feitosa, D. Sadok, Applying Dempster–Shafer evidencetheory in anomaly detection, in: XXVII Brazilian Symposium ofComputer Networks and Distributed Systems (SBRC’09), SBC, Recife,Brazil, 2009, pp. 583–596.
[40] A.P. Dempster, Upper and lower probabilities induced by amultivalued mapping, Annals Mathematics Statistics 38 (1967)325–339.
[41] A.P. Dempster, Upper and lower probability inferences based on asample from a finite univariate population, Biometrika 54 (1967)515–528.
[42] G. Shafer, A Mathematical Theory of Evidence, Princeton UniversityPress, Princeton, 1976.
[43] T. Reineking, Java Dempster Shafer Library, 2009. <http://sourceforge.net/projects/jds>.
[44] OASIS, Web Services Business Process Execution Language Version2.0, 2007. <http://docs.oasis-open.org/wsbpel/2.0/OS/wsbpel-v2.0-OS.html>.
[45] T. Erl, Service-Oriented Architecture: A Field Guide to IntegratingXML and Web Services, Prentice Hall PTR, 2004.
[46] Emerging Threats, 2010. <http://www.emergingthreates.net>.[47] Intrusense Packit, Network injection and capture, 2010. <http://
www.intrusense.com/software/packit>.[48] Scapy, 2010. <http://www.secdev.org/projects/scapy>.[49] Ha.ckers, Slowloris HTTP DoS, 2010. <http://ha.ckers.org/slowloris>.[50] R. Hyatt, Keeping DNS trustworthy, ISSA Journal (2006) 37–38.[51] D. Kaminsky, The emergency of a theme, 2008. <http://
www.doxpara.com/?p=1231>.[52] Symantec, Outbreak alert: storm trojan, 2007. <http://
www.symantec.com/outbreak/storm_trojan.html>.[53] Y. Robiah, S. Siti Rahayu, S. Shahrin, M.A. Faizal, M. Mohd Zaki, R.
Marliza, New multi-step worm attack model, Journal of Computing 2(1) (2010).
[54] CERT, CERT Advisory CA-2003-20 W32/Blaster worm, 2003. <http://www.cert.org/advisories/CA-2003-20.html>.
[55] TFTPy, TFTPy – A Pure Python TFTP Implementation, 2010. <http://tftpy.sourceforge.net>.
[56] E.L. Feitosa, L.E. Oliveira, B. Lins, A. Carvalho Jr., R. Melo, D. Sadok, U.Carmo, Security information architecture for automation and controlnetworks, in: 8th Brazilian Symposium of Information Security andComputer Systems, Rio Grande do Sul, SBC, Brazil, 2008, pp. 17–30.
[57] IEEE, Standards for Local and Metropolitan Area Networks: Portbased Network Access Control, IEEE Standard 802.1X-2001, June2001.
[58] SERPRO, Brazilian Federal Service of Data Processing, 2011. <http://www.serpro.gov.br>.
[59] P.A. Porras, P.G. Neumann, EMERALD: event monitoring enablingresponses to anomalous live disturbances, in: 20th NationalInformation System Security Conference, 1997, pp. 353–357.
[60] J. Mirkovic, P. Reiher, D-WARD: source-end defense againstdistributed denial-of-service attacks, IEEE Transactions onDependable and Secure Computing Archive 2 (3) (2005) 216–232.
[61] C. Papadopoulos, R. Lindell, J. Mehringer, A. Hussain, R. Govindan,Cossack: coordinated suppression of simultaneous attacks, in:Proceedings of 3rd DARPA information Survivability Conferenceand Exposition (DISCEX 2003), vol. 2, April 2003, pp. 94–96.
[62] J. Mirkovic, M. Robinson, P. Reiher, G. Kuenning, Forming alliance forDDoS defenses, in: Proceeding of the New Security ParadigmsWorkshop, ACM Press, 2003, pp. 11–18.
[63] C. Edward, Y. Cai, D. Wilkinson, Secure collective defense system,in: IEEE Global Telecommunications Conference, 2004, pp. 2245–2249.
[64] C.V. Zhou, C. Leckie, S. Karunasekera, Decentralized multi-dimensional alert correlation for collaborative intrusion detection,Journal of Network and Computer Applications (2009) 1106–1123.
E. Feitosa et al. / Computer Networks 56 (2012) 2805–2831 2831
[65] A.K. Ganame, J. Bourgeoisa, R. Bidou, F. Spiesa, A global securityarchitecture for intrusion detection on computer networks,Computers & Security 27 (2008) 30–47.
[66] A. Servin, D. Kudenko, Multi-agent reinforcement learning forintrusion detection, Lecture Notes in Computer Science 4865(2008) 211–223.
[67] Y.M.Z. Dayong, B. Quan, Z. Ye, P2P distributed intrusion detectionsby using mobile agents, in: Seventh IEEE/ACIS InternationalConference on Computer and Information Science, 2008 (ICIS 08),May 2008, pp. 259–65.
[68] M. Rehak, M. Pechoucek, P. Celeda, V. Krmicek, P. Minarik, D.Medvigy, Collaborative attack detection in high-speed networks, in:Proceedings of the 5th International Central and Eastern Europeanconference on Multi-Agent Systems and Applications (CEEMAS’07),Springer, Leipzig, Germany, 2007. pp. 73–82.
[69] CAIDA, A day in the life of the Internet, 2008. <http://www.caida.org/projects/ditl/>.
[70] B. Lins, An Aggregation and Prioritization Scheme for Multi-SourceAlerts, M.Sc. thesis, Federal University of Pernambuco, 2011.
[71] CAIDA, The CAIDA DDoS Attack 2007 Dataset, 2010. <http://www.caida.org/data/passive/ddos-20070804_dataset.xml>.
[72] UMASS Trace Repository, UMASS Trace Repository, 2010. <http://trace.cs.umass.edu>.
[73] MAWI, MAWI Working Group Traffic Archive, 2010. <http://mawi.wide.ad.jp/mawi>.
[74] H. Curry, D. Feinstein, B. Debar, The Intrusion Detection MessageExchange Format (IDMEF), IETF, Internet Experimental RFC 4765,2007.
[75] R. Danyliw, J. Meijer, Y. Demchenko, The Incident Object DescriptionExchange Format, IETF, Internet proposed standard RFC 5070, 2007.
[76] B. Feinstein, G. Matthews, The Intrusion Detection ExchangeProtocol, IETF, Internet experimental RFC 4767, 2007.
[77] W3C, WSDL W3C Recommendation, 2007. <http://www.w3.org/TR/wsdl20-primer>.
[78] W3C, OWL W3C Recommendation, 2004. <http://www.w3.org/TR/owl-features>.
[79] P. Lincoln, P. Porra, V. Shmatikov, Privacy-preserving sharing andcorrelation of security alert, in: 13th USENIX Security Symposium,2004, pp. 239–254.
[80] D. Xu, P. Ning, Privacy-preserving alert correlation: a concepthierarchy based approach, in: 21st Annual Computer SecurityApplications Conference (ACSAC), 2005, pp. 489–498.
[81] P. Gross, J. Parekh, G. Kaiser, Secure selecticast for collaborativeintrusion detection systems, in: 3rd International Workshop onDistributed Event-based Systems (DEBS), 2004.
[82] R. Janakiraman, M. Waldvogel, Q. Zhang, Indra: a peer-to-peerapproach to network intrusion detection and prevention, in: IEEEWETICE 2003 Workshop on Enterprise Security, Linz, Austria, 2003,pp. 226–231.
[83] V. Yegneswaran, P. Barford, S. Jha, Global intrusion detection in theDOMINO overlay system, Network and Distributed SecuritySymposium (NDSS), 2004.
[84] J.E.M.S. Brandão, J.S. Fraga, P.M. Mafra, R.R. Obelheiro, A WS-basedinfrastructure for integrating intrusion detection systems in large-scale environments, in: CoopIS/DOA/ODBASE/GADA, 2006.
[85] OASIS, Web services security: SOAP message security 1.0, 2009.<http://docs.oasis-open.org/wss/2004/01/oasis-200401-wss-soap-message-security-1.0.pfd>.
[86] T. Imamura, B. Dillaway, E. Simon. XML Encryption syntax andprocessing, W3C recommendation, 2002.
[87] D. Eastlake, J. Reagle, D. Solo, XML-signature syntax and processing,IETF, Standards Track RFC 3275, 2002.
Eduardo Feitosa is a Professor of ComputerScience at the Federal University of Amazonasin the North of Brazil. He obtained his Ph.D.recently from the Federal University of Per-nambuco while working on an orchestratedarchitecture for secure networking systems.His interests include work in the areas ofsecurity and intrusion detection systems.
Eduardo J. Souto is currently of a Professor ofComputer Science at the Federal University ofAmazonas in the North of Brazil. His interestsinclude work in the areas of sensor networks,wireless communications, security systemsand is actively involved in the development ofad hoc and emergency networks.
Djamel F.H. Sadok is currently Professor ofComputer Science at the Federal University ofPernambuco, Brazil. He obtained his Ph.D.from the University of Kent at Canterbury –UK in 1990. He leads a research group work-ing in close cooperation with industrial part-ners in Europe in the areas of TrafficMeasurement, Policy based management,security systems, next Internet architecturesand the design of emergency networks.