An observational study of oceanic eddy generation mechanisms by tall deep-water islands (Gran...
31
An observational study of oceanic eddy generation mechanisms by tall deep-water islands (Gran Canaria) Marc Piedeleu, 1 Pablo Sangrà, 1 Anna Sánchez-Vidal, 2 Joan Fabrés, 3 Carmen Gordo, 1 Antoni Calafat, 2 1 Facultad de Ciencias del Mar, Universidad de Las Palmas de Gran Canaria, Las Palmas 35017, Spain. 2 GRC Geociències Marines. Facultat de Geologia, Universitat de Barcelona. 08028 Barcelona, Spain 3 UNEP Shelf Programme, GRID-Arendal, 4802 Arendal, Norway
-
Upload
independent -
Category
Documents
-
view
0 -
download
0
Transcript of An observational study of oceanic eddy generation mechanisms by tall deep-water islands (Gran...
An observational study of oceanic eddy generation mechanisms by tall deep-water
islands (Gran Canaria)
Marc Piedeleu,1 Pablo Sangrà,1 Anna Sánchez-Vidal, 2 Joan Fabrés,3 Carmen Gordo, 1 Antoni
Calafat,2
1Facultad de Ciencias del Mar, Universidad de Las Palmas de Gran Canaria, Las Palmas 35017, Spain.
2GRC Geociències Marines. Facultat de Geologia, Universitat de Barcelona. 08028 Barcelona, Spain
3 UNEP Shelf Programme, GRID-Arendal, 4802 Arendal, Norway

Abstract 1
Oceanic eddy generation by tall deep-water islands is common phenomenon. It is recognized 2
that these eddies may have a significant impact on the marine system and related 3
biogeochemical fluxes. Hence, it is important to establish favourable conditions for their 4
generation. With this objective, we present an observational study on eddy generation 5
mechanisms by tall deep-water islands, using as a case study the island of Gran Canaria. 6
Observations show that the main generation mechanism is topographic forcing, which leads to 7
eddy generation when the incident oceanic flow is sufficiently intense. Wind shear at the 8
island wake may acts only as an additional eddy-generation trigger mechanism when the 9
impinging oceanic flow is not sufficiently intense. For the case of the island of Gran Canaria 10
we have observed a mean of ten generated cyclonic eddies per year. Eddies are more 11
frequently generated in summer coinciding with intense Trade winds and Canary Current. 12
13
1. Introduction 14
Island eddy generation has been observed at many deep-water tall islands such as the 15
Canary Islands [e.g. Arístegui et al., 1994; Sangrà et al., 2007], the Hawaiian Islands [e.g. 16
Benitez-Nelson et al., 2007], Barbados [Dietrich et al., 1996] and the Philippines [e.g Pullen 17
et al., 2008]. Island-generated eddies significantly affects ocean biogeochemistry by 18
enhancing nutrient supply and primary productivity [Aristegui and Montero, 2005; Arístegui 19
et al., 1997] and thus the efficiency of the biological pump [Benitez-Nelson et al., 2007]. As 20
island-generated eddies can be long-lived structures [Sangrà et al., 2005, 2007], they may 21
modulate the marine system both locally and regionally. Therefore, it is important to study the 22
main eddy generation mechanisms in order to establish the atmospheric and oceanic flow 23
conditions favourable for eddy generation. 24

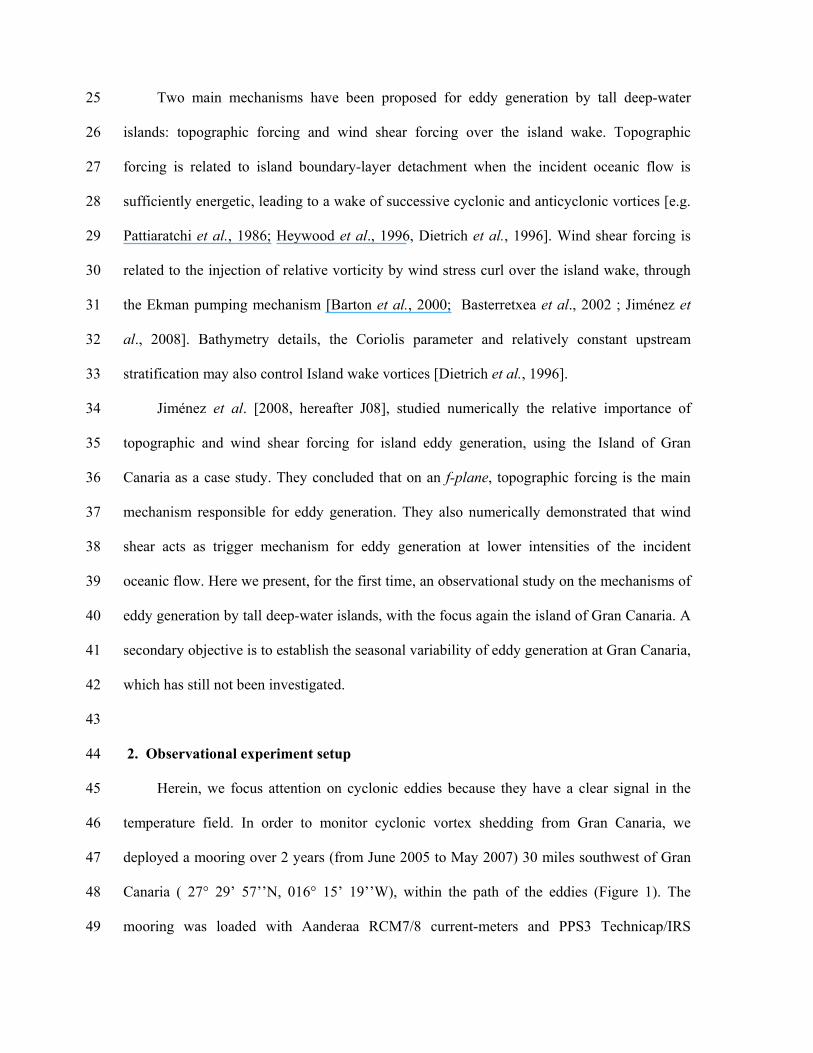
Two main mechanisms have been proposed for eddy generation by tall deep-water 25
islands: topographic forcing and wind shear forcing over the island wake. Topographic 26
forcing is related to island boundary-layer detachment when the incident oceanic flow is 27
sufficiently energetic, leading to a wake of successive cyclonic and anticyclonic vortices [e.g. 28
Pattiaratchi et al., 1986; Heywood et al., 1996, Dietrich et al., 1996]. Wind shear forcing is 29
related to the injection of relative vorticity by wind stress curl over the island wake, through 30
the Ekman pumping mechanism [Barton et al., 2000; Basterretxea et al., 2002 ; Jiménez et 31
al., 2008]. Bathymetry details, the Coriolis parameter and relatively constant upstream 32
stratification may also control Island wake vortices [Dietrich et al., 1996]. 33
Jiménez et al. [2008, hereafter J08], studied numerically the relative importance of 34
topographic and wind shear forcing for island eddy generation, using the Island of Gran 35
Canaria as a case study. They concluded that on an f-plane, topographic forcing is the main 36
mechanism responsible for eddy generation. They also numerically demonstrated that wind 37
shear acts as trigger mechanism for eddy generation at lower intensities of the incident 38
oceanic flow. Here we present, for the first time, an observational study on the mechanisms of 39
eddy generation by tall deep-water islands, with the focus again the island of Gran Canaria. A 40
secondary objective is to establish the seasonal variability of eddy generation at Gran Canaria, 41
which has still not been investigated. 42
43
2. Observational experiment setup 44
Herein, we focus attention on cyclonic eddies because they have a clear signal in the 45
temperature field. In order to monitor cyclonic vortex shedding from Gran Canaria, we 46
deployed a mooring over 2 years (from June 2005 to May 2007) 30 miles southwest of Gran 47
Canaria ( 27° 29’ 57’’N, 016° 15’ 19’’W), within the path of the eddies (Figure 1). The 48
mooring was loaded with Aanderaa RCM7/8 current-meters and PPS3 Technicap/IRS 49

sediment traps, at about 150, 275, 500 1000 and 2000 m depth. Maintenance checks were 50
made every six months. During the third six-month period (summer-fall 2006) the mooring 51
was relocated closer to Gran Canaria because of rough seas on the deployment date. Eddy 52
signals were obtained by combining current-meter temperature anomalies with sea surface 53
temperature (SST) and chlorophyll from satellite images. As seen in figures 2 and 3, negative 54
temperature anomalies and cyclones match well with SST anomalies in satellite images. 55
To address the importance of topographic forcing, we have calculated the intensity of 56
the incident flow (Canary Current) from two tide gauges located on the northern coasts of the 57
Island of Tenerife and Gran Canaria (Figure 1). Tidal and inertial oscillations were removed 58
by a 28-hour low-pass Fourier filter [Dick and Siedler, 1985; Siedler and Paul, 1991]. To 59
filter out the inverse barometer effect we have used atmospheric pressure data from 60
meteorological stations near the tide gauges. Geostrophic velocity was calculated from the sea 61
surface height gradient between the islands. The resulting time series were smoothed by 62
applying a three-tidal-cycle low-pass filter. We have also calculated the corresponding 63
Reynolds number: 64
HAULRe = 65
The flow Reynolds number is based on an upstream (Canary Current) velocity U, L (island 66
diameter) = 54x103 m, an eddy viscosity AH=100 m2s-1 (used by J08). 67
To estimate the atmospheric forcing we have calculated the wind shear between a 68
meteorological station located on the wind-accelerating flank of Gran Canaria and another 69
located downwind (Figure 1 and auxiliary material Figure S1). 70
71
3. Observations 72
Figures 2 and 3 show temperature anomalies, incident flow, Reynolds number and wind 73
shear time series from our two-year survey. Temperature anomalies allow us to monitor 74
cyclonic eddy generation. Incident flow time series allow us to get an idea of the importance 75
of the topographic forcing in relation with to the intensity of the Canary Current. Finally, 76
wind shear time series, allow us to get a semi-quantitative estimate of the importance of wind 77
shear forcing on eddy generation. 78
79
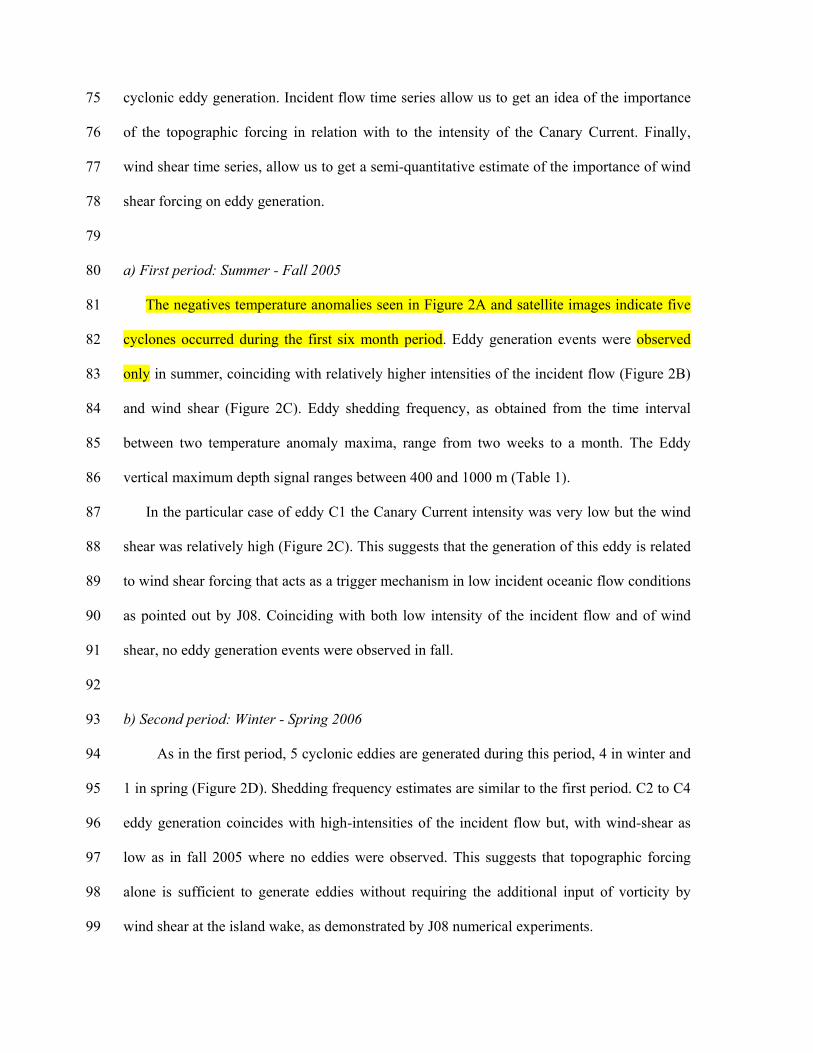
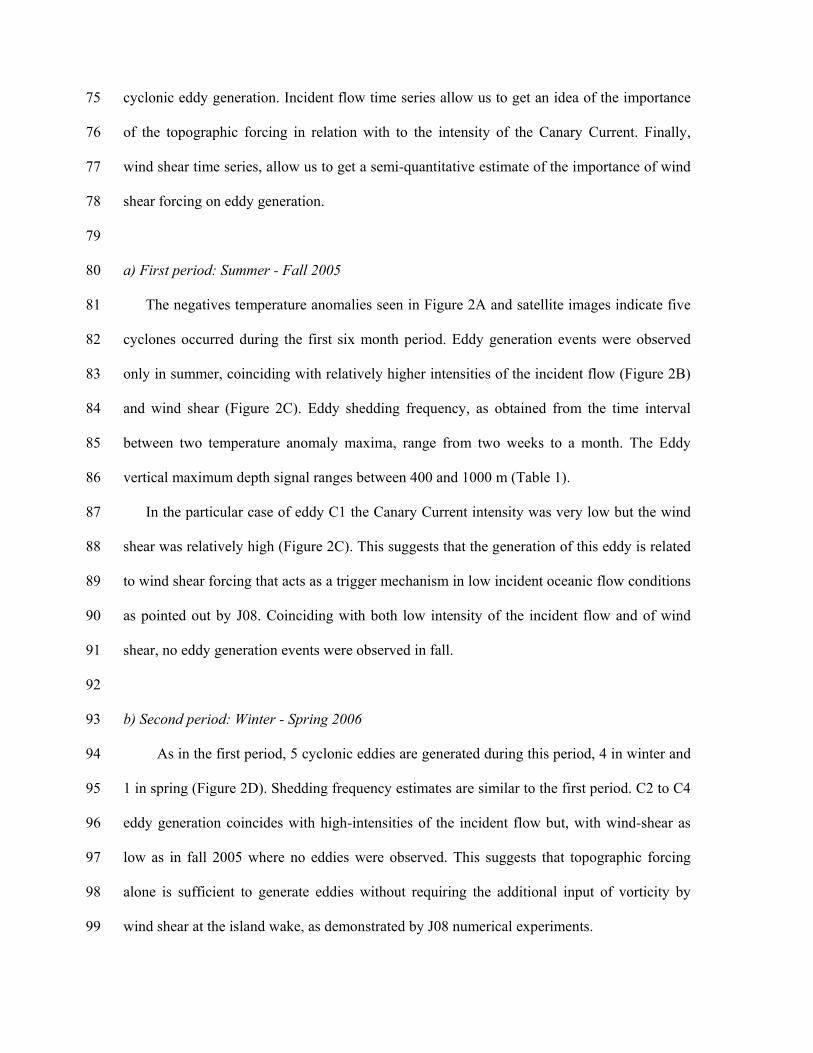
a) First period: Summer - Fall 2005 80
The negatives temperature anomalies seen in Figure 2A and satellite images indicate five 81
cyclones occurred during the first six month period. Eddy generation events were observed 82
only in summer, coinciding with relatively higher intensities of the incident flow (Figure 2B) 83
and wind shear (Figure 2C). Eddy shedding frequency, as obtained from the time interval 84
between two temperature anomaly maxima, range from two weeks to a month. The Eddy 85
vertical maximum depth signal ranges between 400 and 1000 m (Table 1). 86
In the particular case of eddy C1 the Canary Current intensity was very low but the wind 87
shear was relatively high (Figure 2C). This suggests that the generation of this eddy is related 88
to wind shear forcing that acts as a trigger mechanism in low incident oceanic flow conditions 89
as pointed out by J08. Coinciding with both low intensity of the incident flow and of wind 90
shear, no eddy generation events were observed in fall. 91
92
b) Second period: Winter - Spring 2006 93
As in the first period, 5 cyclonic eddies are generated during this period, 4 in winter and 94
1 in spring (Figure 2D). Shedding frequency estimates are similar to the first period. C2 to C4 95
eddy generation coincides with high-intensities of the incident flow but, with wind-shear as 96
low as in fall 2005 where no eddies were observed. This suggests that topographic forcing 97
alone is sufficient to generate eddies without requiring the additional input of vorticity by 98
wind shear at the island wake, as demonstrated by J08 numerical experiments. 99

Low incident oceanic flow velocities and wind shear estimated during December of 100
2005 don’t explain the initial negative anomaly associated with eddy C1. However, from 101
December to January the incident flow accelerates sharply, up to 10 cm/s within a week. In 102
early spring, eddy activity decreases, but an increment of the Canary Current and wind shear 103
in April 2006 allows the cyclone C5 to be generated. 104
The period from December 2005 to April 2006, where wind shear was low, allows 105
estimation of the minimum flow needed for eddy generation by topography alone. This 106
corresponds to a Re=50-60 (U =10 cms-1), which is in accordance with J08 numerical results 107
and laboratory experiments. In the complete times-series there is a time lag, about 10 days, 108
between the increase of the Canary Current and the signal of eddy-related temperature. This is 109
due to eddy spin-up time and the time required for their advection to the mooring position. 110
111
c) Third period: Summer - Fall 2006 112
As in this period the mooring was deployed closer to the island coast, no eddy signals 113
were observed in the mooring data. Eddy presence could be inferred only from SST and 114
chlorophyll images. Similar conditions to 2005 were observed (Figure 3A). Eddy-favourable 115
current and wind shear intensity from mid-spring to late summer allows the generation of 4 116
cyclonic vortex events, identified both in SST and chlorophyll images (not shown). As in 117
2005, the geostrophic incident oceanic flow velocity and wind shear increase trough the 118
summer. The Canary Current and wind shear decreases in fall coinciding with no eddy 119
generation. In late fall, an increase of the Canary Current up of to 10 cm/s generated a new 120
cyclone, C5, in low-wind-shear conditions. During the third week of September and the 121
second week of October, although there were intense wind pulses, no vortex shedding is 122
observed, coinciding with a low incident current. Zonal wind pulses can generate eddies 123

[Pullen et al., 2008] however; this seems not to be the case for wind pulses as in the case of 124
Gran Canaria. 125
126
d )Fourth period: Winter – Spring 2007 127
As in the previous periods, 5 signals of cyclonic eddies have been identified. Only three 128
eddies were observed during winter. For almost all events, good correlations between 129
temperature anomalies and increments of the incident geostrophic oceanic flow were observed. 130
Eddy C1 was generated in low current/high wind shear conditions (Figure 3 and Table 1), 131
suggesting again that wind shear acts as a trigger mechanism when the incident current 132
intensity is too low (Re< 50) for eddy generation by topographic forcing alone. During 133
January the wind shear and the Canary Current intensity were very low, and no cyclones were 134
generated. From February to May, wind shear conditions and Canary Current were highly 135
favourable, leading to the generation of eddies C2, C3, C4 and C5. 136
137
4. Summary and conclusions 138
For the case of the island of Gran Canaria we have observed a mean of ten generated 139
cyclonic eddies per year. Eddies are more frequently generated in summer, coinciding with 140
intense Trade winds and Canary Current. During fall the intensity of the Trades winds and the 141
Canary Current is very low, and no eddy generation was observed. In order to discuss the 142
relative importance of topographic and wind shear mechanisms on eddy generation by tall 143
deep-water islands we have synthesized in Table 1 the main parameters quantifying these 144
forcings for all four periods. 145
As observed in numerical modelling studies [Jiménez et al., 2008], only topographic 146
forcing may be responsible for eddy generation. This occurs when the impinging flow is 147
intense (Re≥50) and wind shear (WS) is low (WS<8 see Table 1). This is the case for the 148

sumer-fall 2005 eddy C5, the winter-spring 2006 eddies C2, C3, C4, the summer-fall 2006 149
eddy C5 and the winter-spring 2007 eddies C2, C3, C4. For lower impinging oceanic flow 150
intensities (Re<50), wind shear acts as trigger mechanism for eddy generation which 151
coincides with J08 numerical results. This occurs when WS is greater equal 8, this being the 152
case for the summer-fall 2005 eddy C1, C2, the winter-spring 2006 eddy C5, and the winter-153
spring 2007 eddy C1. 154
Previous observational and numerical studies [Chavanne et al 2003, Jiménez et al., 155
2008] show that when wind shear is nearly stationary, two counter-rotating stationary vortices 156
are generated at the island wake. However, when the wind pulsates, wind shear is able to 157
generate eddies that are self-advected westward due to the β-effect [Cushman-Roisin et al., 158
1990; Cedric Chavanne pers. com.]. In our case study, we have not observed this phenomena, 159
probably because the island of Tenerife prevents westward eddy propagation from Gran 160
Canaria, and because the wind forcing is oriented meriodionally instead of zonally, such as is 161
the case for the Philippine Archipelago [Pullen et al., 2008] and the Hawaiian Archipelago 162
[Chavanne et al., 2002] 163
164
Acknowledgements 165
We are grateful to Joan Puigdefabregas for his valuable help with mooring design and 166
maintenance. We express also our gratitude to the officers and crew of R/V Garcia del CID 167
and to the technicians of UTM-CSIC for supporting our work at sea. We also give thanks to 168
the “Agencia Estatal de Meteorologia” and to “Puertos del Estado” for providing 169
meteorological and tide gauges data. This work was supported by the Spanish Government 170
through project RODA (CTM2004-06842-CO3-03). 171
172
173

References 174
Arístegui, J., P. Sangrà, S. Hernández-León, M. Cantón, A. Hernández_Guerra, and J. L. 175
Kerling (1994), Island-induced eddies in the Canary Islands, Deep-Sea Res I, 44, 176
1509-1525 177
Arístegui, J., P. Tett, A. Hernández-Guerra, G. Basterretxea, M. F. Montero, K. Wild, P. 178
Sangrà, S. Hernández-León, M. Cantón, J. A. García-Braun, M. Pacheco, and E.D. 179
Barton (1997), The influence of island-generated eddies on chlorophyll distribution: a 180
study of mesoscale variation around Gran Canaria, Deep-Sea Res I, 44(1), 71-96. 181
Arístegui, J., and M. F. Montero (2005), Temporal and spatial changes in microplankton 182
respiration and biomass in the Canary Islands: the effects of mesoscale variability, J. 183
Mar. Syst. 54, 65-82. 184
Barton, E. D., G. Basterretxea, P. Flament, E. G. Mitchelson-Jacob, B. Jones, J. Arístegui, 185
and H. Felix (2000) Lee region of Gran Canaria, J. Geophys. Res, 105, 17173-17193. 186
Basterretxea G., E .D. Barton, P. Tett, P. Sangrà, E. Navarro-Perez, and J. Arístegui (2002), 187
Eddy and DCM response to wind-shear in the lee of Gran Canaria, Deep-Sea Res I, 49, 188
1087-1101. 189
Benitez-Nelson C.R., R.R. Bidigare, T.D. Dickey, M.R. Landry, C.L. Leonard, S.L. Brown, 190
F. Nencioli, Y.M. Rii, K. Maiti, J.W. Becker, T.S. Bibby, W. Black, W.J. Cai, C.A. 191
Carlson, F. Chen, V.S. Kuwahara, C. Mahaffey, P.M. McAndrew, P. D. Quay, M.S. 192
Rappé, K.E. Selph, M.P. Simmons, and E. J. Yang, (2007), Mesoscale eddies drive 193
increased silica export in the Subtropical Pacific Ocean, Science, 316. 1017 – 1021. 194
Chavanne, C, P. Flament, R. Lumpkin, B. Dousset and A. Betamy (2002), Sacatterometer 195
observations of wind variations induced by iceanic islands. Implications for wind-196
driven ocean circulation. Can. J. For. Res., 28, 466-474. 197
Cushman-Roisin, B., E. P. Chassignet, and B. Tang (1990), J. Phys. Oceanogr 198
Oceanography, 20, 758-768 199
Dick, G., and G. Siedler (1985), Barotropic tides in the northeast Atlantic inferred from 200
moored current meter data. Dtsch. Hydrogr. Z, 38, 7-22. 201
Dietrich, D.E., M.J. Bowman, C.A. Lin, and A. Mestas-Nunez, (1996). Numerical Studies of 202
Small Island Wakes. Geophys. Astrophys. Fluid Dyn., 83, 195-231. 203
Heywood, K. J., D. P. Stevens and R. B. Bigg (1996), Eddy formation behind the tropical 204
island of Aldabra, Deep-Sea Res I, 43, 555-578. 205
Jiménez, B., P. Sangrà, and E. Mason (2008), A numerical study of the relative importance of 206
wind and topographic forcing on oceanic eddies shedding by deep water islands, Oce. 207
Mod., 22, 146-157. 208
Pattiaratchi C, A. James and M. Collins (1986), Island wakes and headland eddies: a 209
comparison between remotely sensed data and laboratory experiments, J. Geophys. 210
Res., 92, 783-794. 211
Pullen, J., J. D. Doyle, P. May, C, Chavanne, P. Flament and R. A. Arnone (2008), Monsoon 212
surges trigger oceanic eddy formation and propagation in the lee of the Philippine 213
Islands. Geophys. Res. Lett., 35, L07604, 214
Sangrà P., J. L. Pelegrí, A. Hernández-Guerra, I. Arregui, J. M. Martín, A. Marrero-Díaz, A. 215
Martínez, A. W. Ratsimandresy, and A. Rodríguez-Santana (2005), Life history of an 216
anticyclonic eddy, J. Geophys. Res., 11, C03021. 217
Sangrà, P., M. Auladell, A. Marrero-Díaz, J. L. Pelegrí, E. Fraile-Nuez, A. Rodríguez-218
Santana, J. M. Martín, E. Mason, and A. Hernández-Guerra (2007), On the nature of 219
oceanic eddies shed by the island of Gran Canaria, Deep-Sea Res I, 54, 687-709. 220
Siedler, G., and U. Paul (1991), Barotropic and baroclinic tidal currents in the eastern basins 221
of the north Atlantic, .J. Geophys. Res., 96, 22249- 22271. 222
223
224
Figures Captions 225
Figure 1. Observational experiment setup. Location of the mooring (m); tide gauge at Santa 226
Cruz de Tenerife (a) and Las Palmas de Gran Canaria (b) and meteorological stations at 227
Puerto de Mogan (c) and Gando airport (d) superposed onto a sea surface temperature satellite 228
image. A cold cyclonic eddy generated by Gran Canaria is marked C1 and a warm 229
anticyclone is marked A1. Colour lines are buoys trajectorie deployed in A1 (see details in 230
Sangrà et al., 2005). 231
232
Figure 2. Parameter time series for the first year of data. (A and D) Time series of temperature 233
anomalies as obtained from the mooring. Superposed shaded grey intervals correspond to 234
observed periods of cyclones from SST images. (B and E). Time variation of the intensity of 235
the incident flow (Canary Current) as obtained from tide gauges (right axis). The grey line 236
shows the times-varying Reynolds number (Re, right axis). Increments of current intensity 237
associated with eddy generation are shown by red circles, and the corresponding eddy signal 238
in the mooring temperatures anomalies are shown by red arrows. (C and F) Time varying 239
semi-quantitative values for wind shear at the island wake. 240
241
Figure 3. Same as Figure 2 but now for the second year period. 242
243
244
245
246
247

248

Tables
Summer-Fall 2005 - Depth = 105m
Eddy code C1 C2 C3 C4 C5 Depth (m) >400 >400 1000 1000 <500 RE [V (m.s-1)] 37 [0.5] 40 [7.4] 55 [0.1] 55 [0.1] 65 [0.12] Wind Shear 8 >10 10 8 6
Winter-Spring 2006 - Depth = 135 m
Eddy code C1 C2 C3 C4 C5 pth (m) >500 >500 >500 1000 >500 RE [V (m.s-1)] / 59 [0.11] 59 [0.11] 50 [0.09] 44 [0.08] Wind Shear 1.5 3.2 3.7 3.2 8.3
Summer-Fall 2006 - Depth = 145 m
Eddy code C1 C2 C3 C4 C5 Depth (m) / / / / / RE [V (m.s-1)] 54 [0.1] 65 [0.12] 70 [0.13] 75 [0.14] 54 [0.1] Wind Shear 10 8 11.6 9.6 1.5
Winter-Spring 2007 - Depth = 120 m
Eddy code C1 C2 C3 C4 C5 Depth (m) >500 <500 >500 >500 1000 RE [V (m.s-1)] 38 [0.07] 50 [0.09] 65 [0.12] 65 [0.12] 54 [0.1] Wind Shear 8.5 3.2 6.4 5.1 9
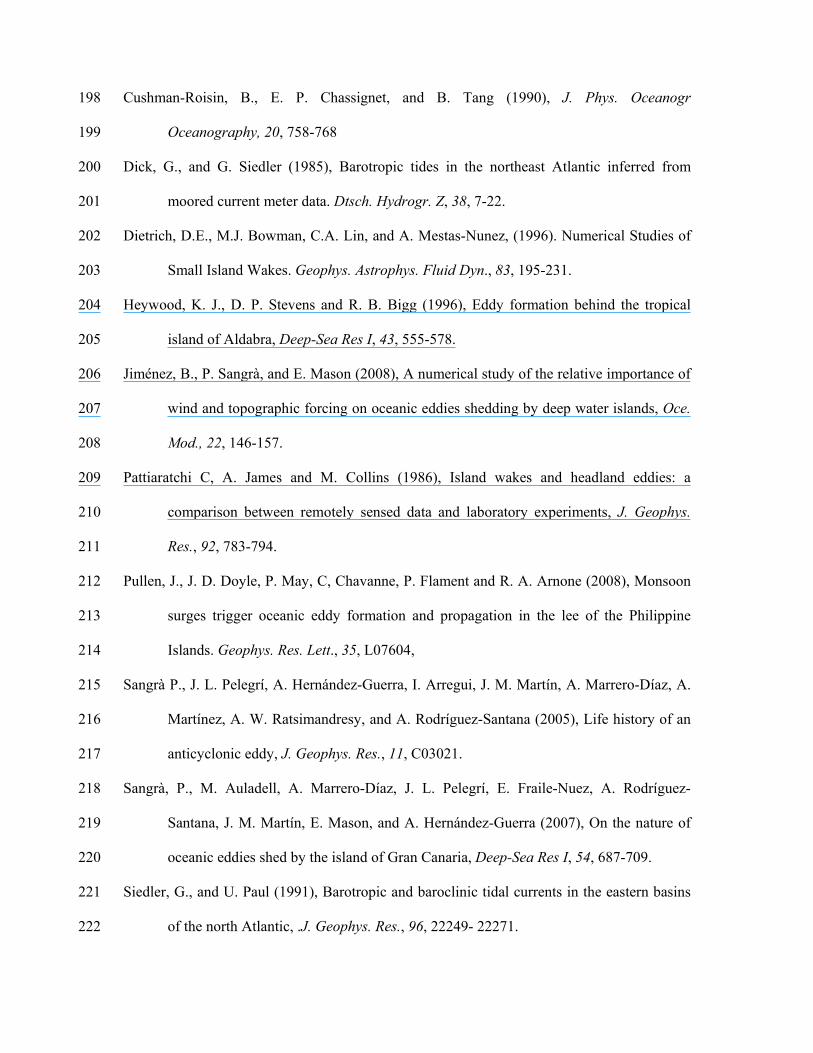
Table 1. Cyclonic eddy parameters: Depth: maximum eddy depth. Re: mean Reynolds number
and corresponding incident flow intensity (U), as obtained two weeks prior to eddy generation
event. Wind Shear: wind shear at the island wake as calculated from Gando and Puerto
Mogan meteorological stations.

An observational study of oceanic eddy generation mechanisms by tall deep-water
islands (Gran Canaria)
Marc Piedeleu,1 Pablo Sangrà,1 Anna Sánchez-Vidal, 2 Joan Fabrés,3 Carmen Gordo, 1 Antoni
Calafat,2
1Facultad de Ciencias del Mar, Universidad de Las Palmas de Gran Canaria, Las Palmas 35017, Spain.
2GRC Geociències Marines. Facultat de Geologia, Universitat de Barcelona. 08028 Barcelona, Spain
3 UNEP Shelf Programme, GRID-Arendal, 4802 Arendal, Norway
Abstract 1
Oceanic eddy generation by tall deep-water islands is common phenomenon. It is recognized 2
that these eddies may have a significant impact on the marine system and related 3
biogeochemical fluxes. Hence, it is important to establish favourable conditions for their 4
generation. With this objective, we present an observational study on eddy generation 5
mechanisms by tall deep-water islands, using as a case study the island of Gran Canaria. 6
Observations show that the main generation mechanism is topographic forcing, which leads to 7
eddy generation when the incident oceanic flow is sufficiently intense. Wind shear at the 8
island wake may acts only as an additional eddy-generation trigger mechanism when the 9
impinging oceanic flow is not sufficiently intense. For the case of the island of Gran Canaria 10
we have observed a mean of ten generated cyclonic eddies per year. Eddies are more 11
frequently generated in summer coinciding with intense Trade winds and Canary Current. 12
13
1. Introduction 14
Island eddy generation has been observed at many deep-water tall islands such as the 15
Canary Islands [e.g. Arístegui et al., 1994; Sangrà et al., 2007], the Hawaiian Islands [e.g. 16
Benitez-Nelson et al., 2007], Barbados [Dietrich et al., 1996] and the Philippines [e.g Pullen 17
et al., 2008]. Island-generated eddies significantly affects ocean biogeochemistry by 18
enhancing nutrient supply and primary productivity [Aristegui and Montero, 2005; Arístegui 19
et al., 1997] and thus the efficiency of the biological pump [Benitez-Nelson et al., 2007]. As 20
island-generated eddies can be long-lived structures [Sangrà et al., 2005, 2007], they may 21
modulate the marine system both locally and regionally. Therefore, it is important to study the 22
main eddy generation mechanisms in order to establish the atmospheric and oceanic flow 23
conditions favourable for eddy generation. 24
Two main mechanisms have been proposed for eddy generation by tall deep-water 25
islands: topographic forcing and wind shear forcing over the island wake. Topographic 26
forcing is related to island boundary-layer detachment when the incident oceanic flow is 27
sufficiently energetic, leading to a wake of successive cyclonic and anticyclonic vortices [e.g. 28
Pattiaratchi et al., 1986; Heywood et al., 1996, Dietrich et al., 1996]. Wind shear forcing is 29
related to the injection of relative vorticity by wind stress curl over the island wake, through 30
the Ekman pumping mechanism [Barton et al., 2000; Basterretxea et al., 2002 ; Jiménez et 31
al., 2008]. Bathymetry details, the Coriolis parameter and relatively constant upstream 32
stratification may also control Island wake vortices [Dietrich et al., 1996]. 33
Jiménez et al. [2008, hereafter J08], studied numerically the relative importance of 34
topographic and wind shear forcing for island eddy generation, using the Island of Gran 35
Canaria as a case study. They concluded that on an f-plane, topographic forcing is the main 36
mechanism responsible for eddy generation. They also numerically demonstrated that wind 37
shear acts as trigger mechanism for eddy generation at lower intensities of the incident 38
oceanic flow. Here we present, for the first time, an observational study on the mechanisms of 39
eddy generation by tall deep-water islands, with the focus again the island of Gran Canaria. A 40
secondary objective is to establish the seasonal variability of eddy generation at Gran Canaria, 41
which has still not been investigated. 42
43
2. Observational experiment setup 44
Herein, we focus attention on cyclonic eddies because they have a clear signal in the 45
temperature field. In order to monitor cyclonic vortex shedding from Gran Canaria, we 46
deployed a mooring over 2 years (from June 2005 to May 2007) 30 miles southwest of Gran 47
Canaria ( 27° 29’ 57’’N, 016° 15’ 19’’W), within the path of the eddies (Figure 1). The 48
mooring was loaded with Aanderaa RCM7/8 current-meters and PPS3 Technicap/IRS 49

sediment traps, at about 150, 275, 500 1000 and 2000 m depth. Maintenance checks were 50
made every six months. During the third six-month period (summer-fall 2006) the mooring 51
was relocated closer to Gran Canaria because of rough seas on the deployment date. Eddy 52
signals were obtained by combining current-meter temperature anomalies with sea surface 53
temperature (SST) and chlorophyll from satellite images. As seen in figures 2 and 3, negative 54
temperature anomalies and cyclones match well with SST anomalies in satellite images. 55
To address the importance of topographic forcing, we have calculated the intensity of 56
the incident flow (Canary Current) from two tide gauges located on the northern coasts of the 57
Island of Tenerife and Gran Canaria (Figure 1). Tidal and inertial oscillations were removed 58
by a 28-hour low-pass Fourier filter [Dick and Siedler, 1985; Siedler and Paul, 1991]. To 59
filter out the inverse barometer effect we have used atmospheric pressure data from 60
meteorological stations near the tide gauges. Geostrophic velocity was calculated from the sea 61
surface height gradient between the islands. The resulting time series were smoothed by 62
applying a three-tidal-cycle low-pass filter. We have also calculated the corresponding 63
Reynolds number: 64
HAULRe = 65
The flow Reynolds number is based on an upstream (Canary Current) velocity U, L (island 66
diameter) = 54x103 m, an eddy viscosity AH=100 m2s-1 (used by J08). 67
To estimate the atmospheric forcing we have calculated the wind shear between a 68
meteorological station located on the wind-accelerating flank of Gran Canaria and another 69
located downwind (Figure 1 and auxiliary material Figure S1). 70
71
3. Observations 72
Figures 2 and 3 show temperature anomalies, incident flow, Reynolds number and wind 73
shear time series from our two-year survey. Temperature anomalies allow us to monitor 74
cyclonic eddy generation. Incident flow time series allow us to get an idea of the importance 75
of the topographic forcing in relation with to the intensity of the Canary Current. Finally, 76
wind shear time series, allow us to get a semi-quantitative estimate of the importance of wind 77
shear forcing on eddy generation. 78
79
a) First period: Summer - Fall 2005 80
The negatives temperature anomalies seen in Figure 2A and satellite images indicate five 81
cyclones occurred during the first six month period. Eddy generation events were observed 82
only in summer, coinciding with relatively higher intensities of the incident flow (Figure 2B) 83
and wind shear (Figure 2C). Eddy shedding frequency, as obtained from the time interval 84
between two temperature anomaly maxima, range from two weeks to a month. The Eddy 85
vertical maximum depth signal ranges between 400 and 1000 m (Table 1). 86
In the particular case of eddy C1 the Canary Current intensity was very low but the wind 87
shear was relatively high (Figure 2C). This suggests that the generation of this eddy is related 88
to wind shear forcing that acts as a trigger mechanism in low incident oceanic flow conditions 89
as pointed out by J08. Coinciding with both low intensity of the incident flow and of wind 90
shear, no eddy generation events were observed in fall. 91
92
b) Second period: Winter - Spring 2006 93
As in the first period, 5 cyclonic eddies are generated during this period, 4 in winter and 94
1 in spring (Figure 2D). Shedding frequency estimates are similar to the first period. C2 to C4 95
eddy generation coincides with high-intensities of the incident flow but, with wind-shear as 96
low as in fall 2005 where no eddies were observed. This suggests that topographic forcing 97
alone is sufficient to generate eddies without requiring the additional input of vorticity by 98
wind shear at the island wake, as demonstrated by J08 numerical experiments. 99

Low incident oceanic flow velocities and wind shear estimated during December of 100
2005 don’t explain the initial negative anomaly associated with eddy C1. However, from 101
December to January the incident flow accelerates sharply, up to 10 cm/s within a week. In 102
early spring, eddy activity decreases, but an increment of the Canary Current and wind shear 103
in April 2006 allows the cyclone C5 to be generated. 104
The period from December 2005 to April 2006, where wind shear was low, allows 105
estimation of the minimum flow needed for eddy generation by topography alone. This 106
corresponds to a Re=50-60 (U =10 cms-1), which is in accordance with J08 numerical results 107
and laboratory experiments. In the complete times-series there is a time lag, about 10 days, 108
between the increase of the Canary Current and the signal of eddy-related temperature. This is 109
due to eddy spin-up time and the time required for their advection to the mooring position. 110
111
c) Third period: Summer - Fall 2006 112
As in this period the mooring was deployed closer to the island coast, no eddy signals 113
were observed in the mooring data. Eddy presence could be inferred only from SST and 114
chlorophyll images. Similar conditions to 2005 were observed (Figure 3A). Eddy-favourable 115
current and wind shear intensity from mid-spring to late summer allows the generation of 4 116
cyclonic vortex events, identified both in SST and chlorophyll images (not shown). As in 117
2005, the geostrophic incident oceanic flow velocity and wind shear increase trough the 118
summer. The Canary Current and wind shear decreases in fall coinciding with no eddy 119
generation. In late fall, an increase of the Canary Current up of to 10 cm/s generated a new 120
cyclone, C5, in low-wind-shear conditions. During the third week of September and the 121
second week of October, although there were intense wind pulses, no vortex shedding is 122
observed, coinciding with a low incident current. Zonal wind pulses can generate eddies 123

[Pullen et al., 2008] however; this seems not to be the case for wind pulses as in the case of 124
Gran Canaria. 125
126
d )Fourth period: Winter – Spring 2007 127
As in the previous periods, 5 signals of cyclonic eddies have been identified. Only three 128
eddies were observed during winter. For almost all events, good correlations between 129
temperature anomalies and increments of the incident geostrophic oceanic flow were observed. 130
Eddy C1 was generated in low current/high wind shear conditions (Figure 3 and Table 1), 131
suggesting again that wind shear acts as a trigger mechanism when the incident current 132
intensity is too low (Re< 50) for eddy generation by topographic forcing alone. During 133
January the wind shear and the Canary Current intensity were very low, and no cyclones were 134
generated. From February to May, wind shear conditions and Canary Current were highly 135
favourable, leading to the generation of eddies C2, C3, C4 and C5. 136
137
4. Summary and conclusions 138
For the case of the island of Gran Canaria we have observed a mean of ten generated 139
cyclonic eddies per year. Eddies are more frequently generated in summer, coinciding with 140
intense Trade winds and Canary Current. During fall the intensity of the Trades winds and the 141
Canary Current is very low, and no eddy generation was observed. In order to discuss the 142
relative importance of topographic and wind shear mechanisms on eddy generation by tall 143
deep-water islands we have synthesized in Table 1 the main parameters quantifying these 144
forcings for all four periods. 145
As observed in numerical modelling studies [Jiménez et al., 2008], only topographic 146
forcing may be responsible for eddy generation. This occurs when the impinging flow is 147
intense (Re≥50) and wind shear (WS) is low (WS<8 see Table 1). This is the case for the 148

sumer-fall 2005 eddy C5, the winter-spring 2006 eddies C2, C3, C4, the summer-fall 2006 149
eddy C5 and the winter-spring 2007 eddies C2, C3, C4. For lower impinging oceanic flow 150
intensities (Re<50), wind shear acts as trigger mechanism for eddy generation which 151
coincides with J08 numerical results. This occurs when WS is greater equal 8, this being the 152
case for the summer-fall 2005 eddy C1, C2, the winter-spring 2006 eddy C5, and the winter-153
spring 2007 eddy C1. 154
Previous observational and numerical studies [Chavanne et al 2003, Jiménez et al., 155
2008] show that when wind shear is nearly stationary, two counter-rotating stationary vortices 156
are generated at the island wake. However, when the wind pulsates, wind shear is able to 157
generate eddies that are self-advected westward due to the β-effect [Cushman-Roisin et al., 158
1990; Cedric Chavanne pers. com.]. In our case study, we have not observed this phenomena, 159
probably because the island of Tenerife prevents westward eddy propagation from Gran 160
Canaria, and because the wind forcing is oriented meriodionally instead of zonally, such as is 161
the case for the Philippine Archipelago [Pullen et al., 2008] and the Hawaiian Archipelago 162
[Chavanne et al., 2002] 163
164
Acknowledgements 165
We are grateful to Joan Puigdefabregas for his valuable help with mooring design and 166
maintenance. We express also our gratitude to the officers and crew of R/V Garcia del CID 167
and to the technicians of UTM-CSIC for supporting our work at sea. We also give thanks to 168
the “Agencia Estatal de Meteorologia” and to “Puertos del Estado” for providing 169
meteorological and tide gauges data. This work was supported by the Spanish Government 170
through project RODA (CTM2004-06842-CO3-03). 171
172
173

References 174
Arístegui, J., P. Sangrà, S. Hernández-León, M. Cantón, A. Hernández_Guerra, and J. L. 175
Kerling (1994), Island-induced eddies in the Canary Islands, Deep-Sea Res I, 44, 176
1509-1525 177
Arístegui, J., P. Tett, A. Hernández-Guerra, G. Basterretxea, M. F. Montero, K. Wild, P. 178
Sangrà, S. Hernández-León, M. Cantón, J. A. García-Braun, M. Pacheco, and E.D. 179
Barton (1997), The influence of island-generated eddies on chlorophyll distribution: a 180
study of mesoscale variation around Gran Canaria, Deep-Sea Res I, 44(1), 71-96. 181
Arístegui, J., and M. F. Montero (2005), Temporal and spatial changes in microplankton 182
respiration and biomass in the Canary Islands: the effects of mesoscale variability, J. 183
Mar. Syst. 54, 65-82. 184
Barton, E. D., G. Basterretxea, P. Flament, E. G. Mitchelson-Jacob, B. Jones, J. Arístegui, 185
and H. Felix (2000) Lee region of Gran Canaria, J. Geophys. Res, 105, 17173-17193. 186
Basterretxea G., E .D. Barton, P. Tett, P. Sangrà, E. Navarro-Perez, and J. Arístegui (2002), 187
Eddy and DCM response to wind-shear in the lee of Gran Canaria, Deep-Sea Res I, 49, 188
1087-1101. 189
Benitez-Nelson C.R., R.R. Bidigare, T.D. Dickey, M.R. Landry, C.L. Leonard, S.L. Brown, 190
F. Nencioli, Y.M. Rii, K. Maiti, J.W. Becker, T.S. Bibby, W. Black, W.J. Cai, C.A. 191
Carlson, F. Chen, V.S. Kuwahara, C. Mahaffey, P.M. McAndrew, P. D. Quay, M.S. 192
Rappé, K.E. Selph, M.P. Simmons, and E. J. Yang, (2007), Mesoscale eddies drive 193
increased silica export in the Subtropical Pacific Ocean, Science, 316. 1017 – 1021. 194
Chavanne, C, P. Flament, R. Lumpkin, B. Dousset and A. Betamy (2002), Sacatterometer 195
observations of wind variations induced by iceanic islands. Implications for wind-196
driven ocean circulation. Can. J. For. Res., 28, 466-474. 197
Cushman-Roisin, B., E. P. Chassignet, and B. Tang (1990), J. Phys. Oceanogr 198
Oceanography, 20, 758-768 199
Dick, G., and G. Siedler (1985), Barotropic tides in the northeast Atlantic inferred from 200
moored current meter data. Dtsch. Hydrogr. Z, 38, 7-22. 201
Dietrich, D.E., M.J. Bowman, C.A. Lin, and A. Mestas-Nunez, (1996). Numerical Studies of 202
Small Island Wakes. Geophys. Astrophys. Fluid Dyn., 83, 195-231. 203
Heywood, K. J., D. P. Stevens and R. B. Bigg (1996), Eddy formation behind the tropical 204
island of Aldabra, Deep-Sea Res I, 43, 555-578. 205
Jiménez, B., P. Sangrà, and E. Mason (2008), A numerical study of the relative importance of 206
wind and topographic forcing on oceanic eddies shedding by deep water islands, Oce. 207
Mod., 22, 146-157. 208
Pattiaratchi C, A. James and M. Collins (1986), Island wakes and headland eddies: a 209
comparison between remotely sensed data and laboratory experiments, J. Geophys. 210
Res., 92, 783-794. 211
Pullen, J., J. D. Doyle, P. May, C, Chavanne, P. Flament and R. A. Arnone (2008), Monsoon 212
surges trigger oceanic eddy formation and propagation in the lee of the Philippine 213
Islands. Geophys. Res. Lett., 35, L07604, 214
Sangrà P., J. L. Pelegrí, A. Hernández-Guerra, I. Arregui, J. M. Martín, A. Marrero-Díaz, A. 215
Martínez, A. W. Ratsimandresy, and A. Rodríguez-Santana (2005), Life history of an 216
anticyclonic eddy, J. Geophys. Res., 11, C03021. 217
Sangrà, P., M. Auladell, A. Marrero-Díaz, J. L. Pelegrí, E. Fraile-Nuez, A. Rodríguez-218
Santana, J. M. Martín, E. Mason, and A. Hernández-Guerra (2007), On the nature of 219
oceanic eddies shed by the island of Gran Canaria, Deep-Sea Res I, 54, 687-709. 220
Siedler, G., and U. Paul (1991), Barotropic and baroclinic tidal currents in the eastern basins 221
of the north Atlantic, .J. Geophys. Res., 96, 22249- 22271. 222

223
224
Figures Captions 225
Figure 1. Observational experiment setup. Location of the mooring (m); tide gauge at Santa 226
Cruz de Tenerife (a) and Las Palmas de Gran Canaria (b) and meteorological stations at 227
Puerto de Mogan (c) and Gando airport (d) superposed onto a sea surface temperature satellite 228
image. A cold cyclonic eddy generated by Gran Canaria is marked C1 and a warm 229
anticyclone is marked A1. Colour lines are buoys trajectorie deployed in A1 (see details in 230
Sangrà et al., 2005). 231
232
Figure 2. Parameter time series for the first year of data. (A and D) Time series of temperature 233
anomalies as obtained from the mooring. Superposed shaded grey intervals correspond to 234
observed periods of cyclones from SST images. (B and E). Time variation of the intensity of 235
the incident flow (Canary Current) as obtained from tide gauges (right axis). The grey line 236
shows the times-varying Reynolds number (Re, right axis). Increments of current intensity 237
associated with eddy generation are shown by red circles, and the corresponding eddy signal 238
in the mooring temperatures anomalies are shown by red arrows. (C and F) Time varying 239
semi-quantitative values for wind shear at the island wake. 240
241
Figure 3. Same as Figure 2 but now for the second year period. 242
243
244
245
246
247

248

Tables
Summer-Fall 2005 - Depth = 105m
Eddy code C1 C2 C3 C4 C5 Depth (m) >400 >400 1000 1000 <500 RE [V (m.s-1)] 37 [0.5] 40 [7.4] 55 [0.1] 55 [0.1] 65 [0.12] Wind Shear 8 >10 10 8 6
Winter-Spring 2006 - Depth = 135 m
Eddy code C1 C2 C3 C4 C5 pth (m) >500 >500 >500 1000 >500 RE [V (m.s-1)] / 59 [0.11] 59 [0.11] 50 [0.09] 44 [0.08] Wind Shear 1.5 3.2 3.7 3.2 8.3
Summer-Fall 2006 - Depth = 145 m
Eddy code C1 C2 C3 C4 C5 Depth (m) / / / / / RE [V (m.s-1)] 54 [0.1] 65 [0.12] 70 [0.13] 75 [0.14] 54 [0.1] Wind Shear 10 8 11.6 9.6 1.5
Winter-Spring 2007 - Depth = 120 m
Eddy code C1 C2 C3 C4 C5 Depth (m) >500 <500 >500 >500 1000 RE [V (m.s-1)] 38 [0.07] 50 [0.09] 65 [0.12] 65 [0.12] 54 [0.1] Wind Shear 8.5 3.2 6.4 5.1 9
Table 1. Cyclonic eddy parameters: Depth: maximum eddy depth. Re: mean Reynolds number
and corresponding incident flow intensity (U), as obtained two weeks prior to eddy generation
event. Wind Shear: wind shear at the island wake as calculated from Gando and Puerto
Mogan meteorological stations.


Temperatureanomaly 105 m depth
Incident flowintensity (cm/s)
Wind shear
Temperatureanomaly 135 m depth
Incident flowintensity (cm/s)
Wind shear
A
B
C
D
E
F

Temperatureanomaly 145 m depth
Incident flowintensity (cm/s)
Wind shear
Temperatureanomaly 120 m depth
Imcident flowintensity (cm/s)
Wind shear
A
B
C
D
E
F

Wind shear and wind times series for Period 1: Summer-Fall 2005
Summer-Fall 2005 - Depth = 105m
Eddy code C1 C2 C3 C4 C5 Depth (m) >400 >400 1000 1000 <500 RE [V (m.s-1)] 37 [0.5] 40 [7.4] 55 [0.1] 55 [0.1] 65 [0.12] Wind Shear 8 >10 10 8 6
Winter-Spring 2006 - Depth = 135 m
Eddy code C1 C2 C3 C4 C5 pth (m) >500 >500 >500 1000 >500 RE [V (m.s-1)] / 59 [0.11] 59 [0.11] 50 [0.09] 44 [0.08] Wind Shear 1.5 3.2 3.7 3.2 8.3
Summer-Fall 2006 - Depth = 145 m
Eddy code C1 C2 C3 C4 C5 Depth (m) / / / / / RE [V (m.s-1)] 54 [0.1] 65 [0.12] 70 [0.13] 75 [0.14] 54 [0.1] Wind Shear 10 8 11.6 9.6 1.5
Winter-Spring 2007 - Depth = 120 m
Eddy code C1 C2 C3 C4 C5 Depth (m) >500 <500 >500 >500 1000 RE [V (m.s-1)] 38 [0.07] 50 [0.09] 65 [0.12] 65 [0.12] 54 [0.1] Wind Shear 8.5 3.2 6.4 5.1 9