
An internal assessment of the thermal comfort and daylighting conditions of a naturally ventilated...
16
This article appeared in a journal published by Elsevier. The attached copy is furnished to the author for internal non-commercial research and education use, including for instruction at the authors institution and sharing with colleagues. Other uses, including reproduction and distribution, or selling or licensing copies, or posting to personal, institutional or third party websites are prohibited. In most cases authors are permitted to post their version of the article (e.g. in Word or Tex form) to their personal website or institutional repository. Authors requiring further information regarding Elsevier’s archiving and manuscript policies are encouraged to visit: http://www.elsevier.com/copyright
Transcript of An internal assessment of the thermal comfort and daylighting conditions of a naturally ventilated...
This article appeared in a journal published by Elsevier. The attachedcopy is furnished to the author for internal non-commercial researchand education use, including for instruction at the authors institution
and sharing with colleagues.
Other uses, including reproduction and distribution, or selling orlicensing copies, or posting to personal, institutional or third party
websites are prohibited.
In most cases authors are permitted to post their version of thearticle (e.g. in Word or Tex form) to their personal website orinstitutional repository. Authors requiring further information
regarding Elsevier’s archiving and manuscript policies areencouraged to visit:
http://www.elsevier.com/copyright

Author's personal copy
An internal assessment of the thermal comfort and daylighting conditions of anaturally ventilated building with an active glazed facade in a temperate climate
H. Altan a,*, I. Ward a, J. Mohelnikova b, F. Vajkay b
a School of Architecture, The University of Sheffield, The Arts Tower, Western Bank, Sheffield S10 2TN, United Kingdomb Faculty of Civil Engineering, Brno University of Technology, Veveri 95, Brno, Czech Republic
1. Introduction
The naturally ventilated high thermal mass building with anactive glazed facade is located in Sheffield, North of England, andthe building was chosen as a case study for investigation ofindoor environment due to its passive design strategies such asthe use of natural lighting and cooling. ICoSS building is the firstlarge scale dedicated facility for Social Sciences Research in theUK and designed for the University of Sheffield. It is a naturallyventilated and daylit building, and achieved an award not onlyfor its iconic design, but also for its green aspects such as theselection of building materials and the use passive solar designstrategies [1–7].
The glazed southern facade faces to a buffer zone with the stacknatural ventilation service. Solar radiation transmitted through theglazed facade heats the air which then rises and is vented out at thetop, and the replacement air is supplied via openings on the northfacade which provides cross ventilation across the building. Fig. 1shows the north facade of the building.
With such designs where the active facade drives the airupwards and the replacement air is supplied by the north facadeopenings in order to drive the passive cooling (natural ventilation)in the building, the research questions posed are that:
� Is the south facade capable of providing appropriate daylight intothe working environment?� Are the luminance distributions acceptable?� Are the thermal conditions within accepted comfort limits?� Are there potential overheating periods during warm seasons?
In order to answer these questions, a post-occupancy evalua-tion programme was put in place and consisted of measuring theinternal environment conditions including indoor air tempera-tures and humidity levels in the working environment, naturalventilation shaft, and the luminance distributions at selectedpositions of the work stations in a typical floor plan.
The design concept for the facade ventilation regime in thecontext with the ventilation strategy of the whole building ispresented in Fig. 2. The initial monitoring of the building which isreported here was aimed at establishing if the south facade (activefacade) was operating as expected and the daylighting levelsthrough glazed facades were sufficient. There are shading rollerblinds on the southern glazed facade and the ventilation louversare used on the top of the roof as a control device for the thermalregime in the investigated building (see Fig. 2).
2. Results of the thermal measurements
The first part of the post-occupancy monitoring programmeabout the effectiveness of the active facade involved observing theway in which the natural ventilation louvers operated to maintain
Energy and Buildings 41 (2009) 36–50
A R T I C L E I N F O
Article history:
Received 11 March 2008
Received in revised form 10 July 2008
Accepted 20 July 2008
Keywords:
Active facade
Natural ventilation
Indoor environment
Thermal comfort
Daylighting
A B S T R A C T
An active facade is often used to promote the flow of air through a building, however in order to ensure
that this process is effective the facade should face a southerly orientation. This means that not only solar
energy is transferred across the glazing but in sunny periods shading is needed to prevent excess
brightness levels occurring on the working areas where it may result in the luminance distributions not
complying with current lighting requirements. The building investigated is located in Sheffield, England
and is one of the University of Sheffield’s recently built green buildings. It has a high thermal mass which
is used to promote the use of night cooling. This paper reports the initial findings of an internal
assessment of the thermal comfort and daylighting conditions in such a building. The results have
indicated that such designs are to be commended for their passive use of solar energy and can provide a
high quality working environment.
� 2008 Elsevier B.V. All rights reserved.
* Corresponding author. Tel.: +44 114 222 0375; fax: +44 114 222 0315.
E-mail address: [email protected] (H. Altan).
Contents lists available at ScienceDirect
Energy and Buildings
journal homepage: www.e lsev ier .com/ locate /enbui ld
0378-7788/$ – see front matter � 2008 Elsevier B.V. All rights reserved.
doi:10.1016/j.enbuild.2008.07.009

Author's personal copy
the correct internal temperatures [8,9]. The design criteria werethat when the inside air temperature rose due mostly to theincidence of solar radiation then the louvers on both the north andsouth elevations would open to control the air temperatures. Alsothere was the intention that during the night the louvers wouldopen to cool the building.
The measurements were concentrated in the working areabut in order to estimate if the shaft was producing air attemperatures sufficient to set up a convective current tempera-tures were taken in the shaft and also between the glazing andthe internal shading devices. On average, the temperature in theshaft was in the region of 35 8C, and between the blinds and theglazing it raised to 40 8C. These measurements were taken onthe 4th floor that is near the top of the shaft. The air flow atthis level was also measured and found to be in the region of0.4 m/s. Aggregating this flow rate over the area of the shaftproduced a flow rate in the region of 7 m3/s which taken over
the volume of the building produced an air change rate in theregion of 4 h�1.
The monitored data is available for the autumn and early winterof 2005, spring and summer 2006, and extracts are shown toillustrate how the system was operating. The trends in internal airtemperatures for 17–23 November 2005 are clearly illustrated inFig. 3 and also show how the internal temperatures varied. Itseemed clear from this figure that there was a significant differencebetween the ground floor temperatures and the temperatures onthe 4th floor.
Fig. 1. The building investigated: ICoSS, Sheffield University, UK.
Fig. 2. The ventilation strategy concept used in the building.
Fig. 3. Indoor air temperatures recorded for time period between 17 and 23 November 2005.
H. Altan et al. / Energy and Buildings 41 (2009) 36–50 37
Author's personal copy
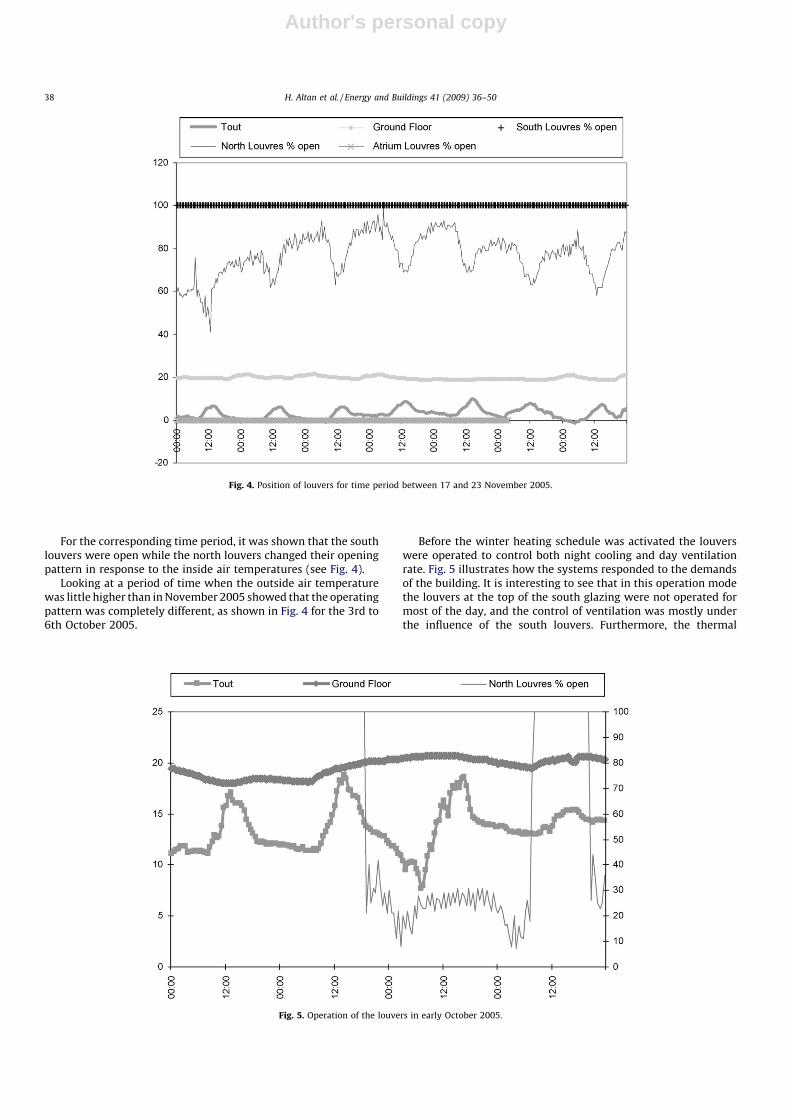
For the corresponding time period, it was shown that the southlouvers were open while the north louvers changed their openingpattern in response to the inside air temperatures (see Fig. 4).
Looking at a period of time when the outside air temperaturewas little higher than in November 2005 showed that the operatingpattern was completely different, as shown in Fig. 4 for the 3rd to6th October 2005.
Before the winter heating schedule was activated the louverswere operated to control both night cooling and day ventilationrate. Fig. 5 illustrates how the systems responded to the demandsof the building. It is interesting to see that in this operation modethe louvers at the top of the south glazing were not operated formost of the day, and the control of ventilation was mostly underthe influence of the south louvers. Furthermore, the thermal
Fig. 4. Position of louvers for time period between 17 and 23 November 2005.
Fig. 5. Operation of the louvers in early October 2005.
H. Altan et al. / Energy and Buildings 41 (2009) 36–5038
Author's personal copy
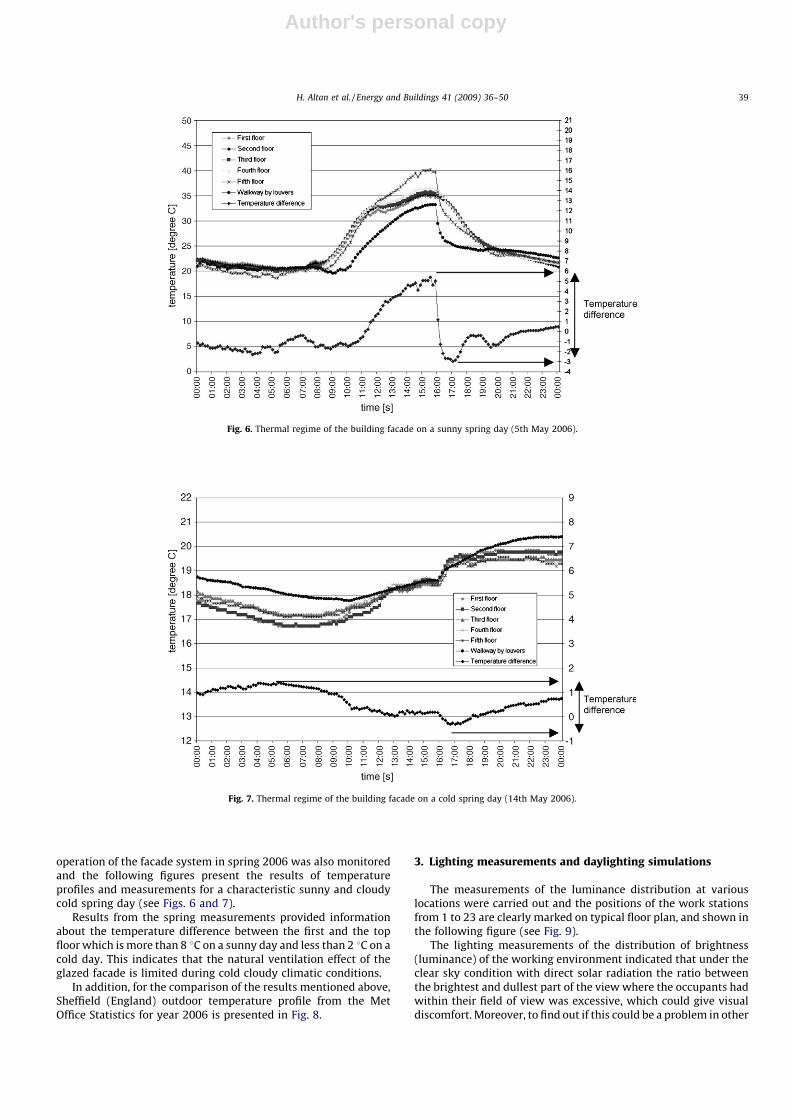
operation of the facade system in spring 2006 was also monitoredand the following figures present the results of temperatureprofiles and measurements for a characteristic sunny and cloudycold spring day (see Figs. 6 and 7).
Results from the spring measurements provided informationabout the temperature difference between the first and the topfloor which is more than 8 8C on a sunny day and less than 2 8C on acold day. This indicates that the natural ventilation effect of theglazed facade is limited during cold cloudy climatic conditions.
In addition, for the comparison of the results mentioned above,Sheffield (England) outdoor temperature profile from the MetOffice Statistics for year 2006 is presented in Fig. 8.
3. Lighting measurements and daylighting simulations
The measurements of the luminance distribution at variouslocations were carried out and the positions of the work stationsfrom 1 to 23 are clearly marked on typical floor plan, and shown inthe following figure (see Fig. 9).
The lighting measurements of the distribution of brightness(luminance) of the working environment indicated that under theclear sky condition with direct solar radiation the ratio betweenthe brightest and dullest part of the view where the occupants hadwithin their field of view was excessive, which could give visualdiscomfort. Moreover, to find out if this could be a problem in other
Fig. 7. Thermal regime of the building facade on a cold spring day (14th May 2006).
Fig. 6. Thermal regime of the building facade on a sunny spring day (5th May 2006).
H. Altan et al. / Energy and Buildings 41 (2009) 36–50 39

Author's personal copy
environments, luminance analysis was carried out in the admin-istrative part of the building on a typical floor. The evaluation ofvisual conditions in the working areas was required in order toinvestigate areas with very high and very low luminance that couldbe a possible cause for unwanted interior glare effects. Theluminance distribution on the working areas including work-
Fig. 10. (a) Luminance distribution over the working area close to the southern glazed facade (radiance lighting simulation). (b) Luminance distribution over the whole
working area (radiance lighting simulation).
Fig. 8. Outdoor temperature profile, Sheffield, year 2006.
Fig. 9. Typical floor plan where the measurements were taken in positions of the
work stations 1–23.
H. Altan et al. / Energy and Buildings 41 (2009) 36–5040

Author's personal copy
stations was evaluated with the use of the computer simulationprogramme Radiance [10], to establish the brightness levels overthe working areas, and some of the results of the study carried outare shown in Fig. 10a and b.
The southern facade is an objective of the investigation due tothe fact that it is one of the possible causes of glare effects anddirect solar gains which is also the cause of overheating.
However the design of the blind system on the south facaderesulted in gaps being seen between the blinds on different floors.These gaps allowed sunlight to penetrate in narrow shafts to theworking positions and there was some evidence from some of theoccupants that they found this situation disturbing, whichindicates visual discomfort, i.e. glare effect.
The computer simulations clearly demonstrated that there is awide range in brightness within the working environment whichmay cause visual discomfort to the occupants (see Fig. 10).
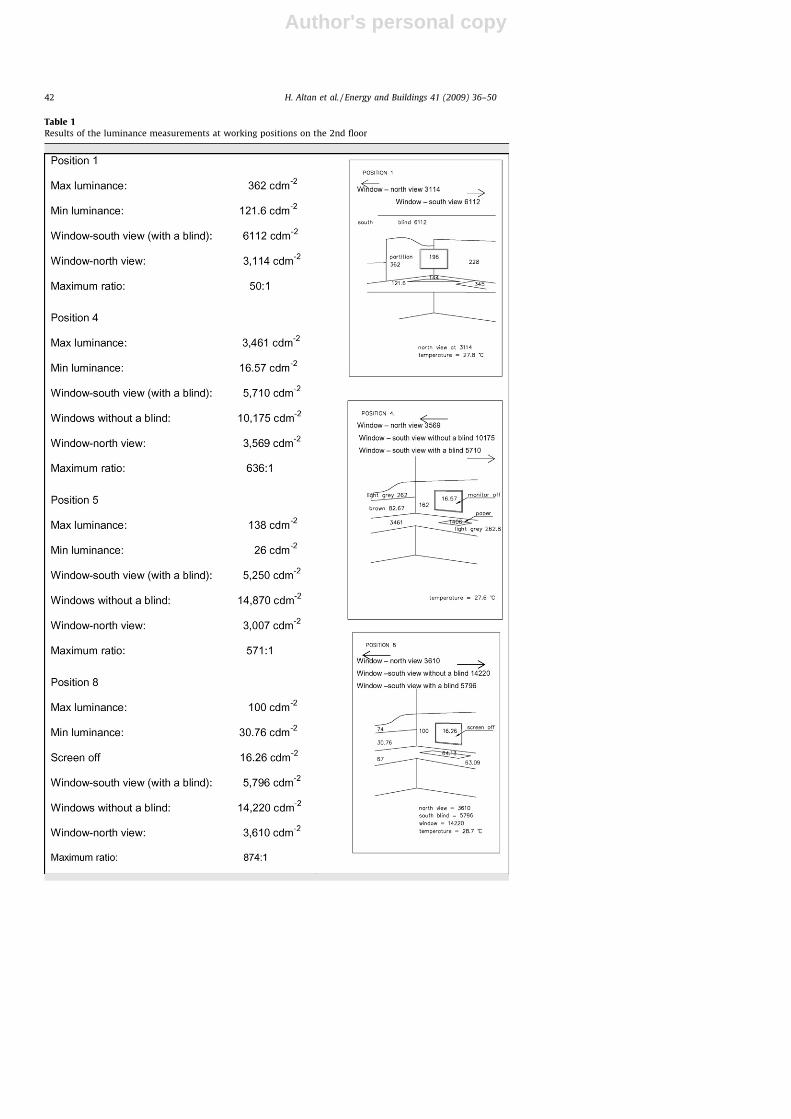
The results of the luminance measurements for various workingpositions (work stations) are shown in Table 1, which containsvalues along with the maximum range in luminance observedwithin the occupants view. These ratios do seem a little high whichprompted further investigations using Radiance lighting simula-tions.
The illuminance on the horizontal surfaces is usually taken asthe requirement for performing a visual task and according to the
CIBSE’s Lighting Design Guide [11], a value of 300 lux isrecommended as the minimum for the type of work being carriedout in this office environment, which is also supported by theBritish Standards [12].
Furthermore, the results of the illuminance distribution on theworking plane (850 mm over the floor level) are presented in thefollowing figure (see Fig. 11) with predicted variations for bothsummer overcast and summer clear sunny sky conditions, by theuse of Ecotect software [13].
4. Determination of overheating periods
In order to investigate and determine the overheating periods inthis naturally ventilated office building, a longitudinal thermaldata (inside temperature profiles) was required. As part of theongoing post-occupancy evaluation programme, the measure-ments of the indoor air temperatures in selected positions werealready obtained in the building during an annual period for thewhole year of 2006, and as a result by the use of chosen method [5],overheating analysis were conducted. The overheating periodswere determined for the season between July and October 2006 (intwo parts; July, August and September, October), and under theconditions that an indoor air temperature reaches and/or goesabove 27 8C for a duration of 2 consecutive hours (time interval)
Fig. 11. Illuminance distribution on the working plane 850 mm over the floor level (Ecotect lighting simulation), simulated for summer overcast and sunny sky conditions.
H. Altan et al. / Energy and Buildings 41 (2009) 36–50 41
Author's personal copy
Table 1Results of the luminance measurements at working positions on the 2nd floor
H. Altan et al. / Energy and Buildings 41 (2009) 36–5042

Author's personal copy
Table 1 (Continued )
H. Altan et al. / Energy and Buildings 41 (2009) 36–50 43
Author's personal copy
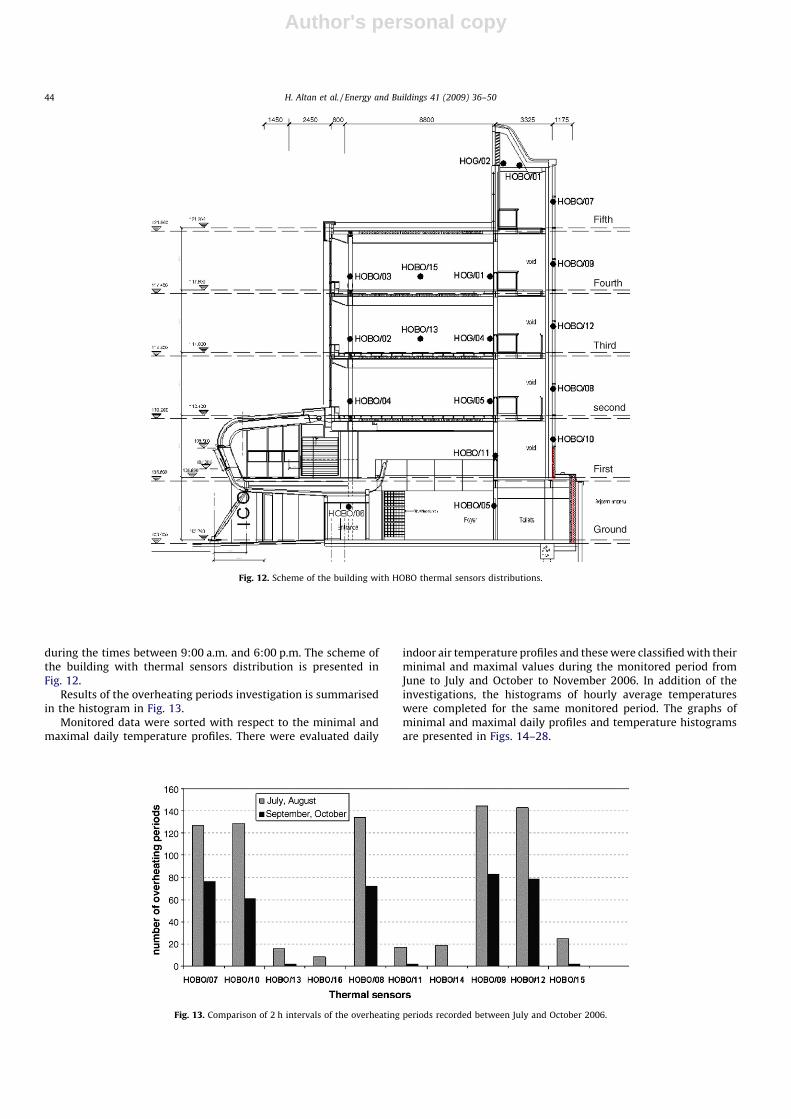
during the times between 9:00 a.m. and 6:00 p.m. The scheme ofthe building with thermal sensors distribution is presented inFig. 12.
Results of the overheating periods investigation is summarisedin the histogram in Fig. 13.
Monitored data were sorted with respect to the minimal andmaximal daily temperature profiles. There were evaluated daily
indoor air temperature profiles and these were classified with theirminimal and maximal values during the monitored period fromJune to July and October to November 2006. In addition of theinvestigations, the histograms of hourly average temperatureswere completed for the same monitored period. The graphs ofminimal and maximal daily profiles and temperature histogramsare presented in Figs. 14–28.
Fig. 12. Scheme of the building with HOBO thermal sensors distributions.
Fig. 13. Comparison of 2 h intervals of the overheating periods recorded between July and October 2006.
H. Altan et al. / Energy and Buildings 41 (2009) 36–5044

Author's personal copy
Fig. 14. Temperature profile of logger HOBO/02; day with minimal indoor air temperature profile—15th October 2006.
Fig. 15. Temperature profile of logger HOBO/02; day with maximal indoor air temperature—1st November 2006.
Fig. 16. Histogram of hourly average indoor air temperature; logger HOBO/02—October–November.
H. Altan et al. / Energy and Buildings 41 (2009) 36–50 45

Author's personal copy
Fig. 17. Temperature profile of logger HOBO/03; day with minimal indoor air temperature—7th July 2006.
Fig. 18. Temperature profile of logger HOBO/03; day with maximal indoor air temperature—17th July 2006.
Fig. 19. Histogram of hourly average indoor air temperature; logger HOBO/03—June–July 2006.
H. Altan et al. / Energy and Buildings 41 (2009) 36–5046
Author's personal copy
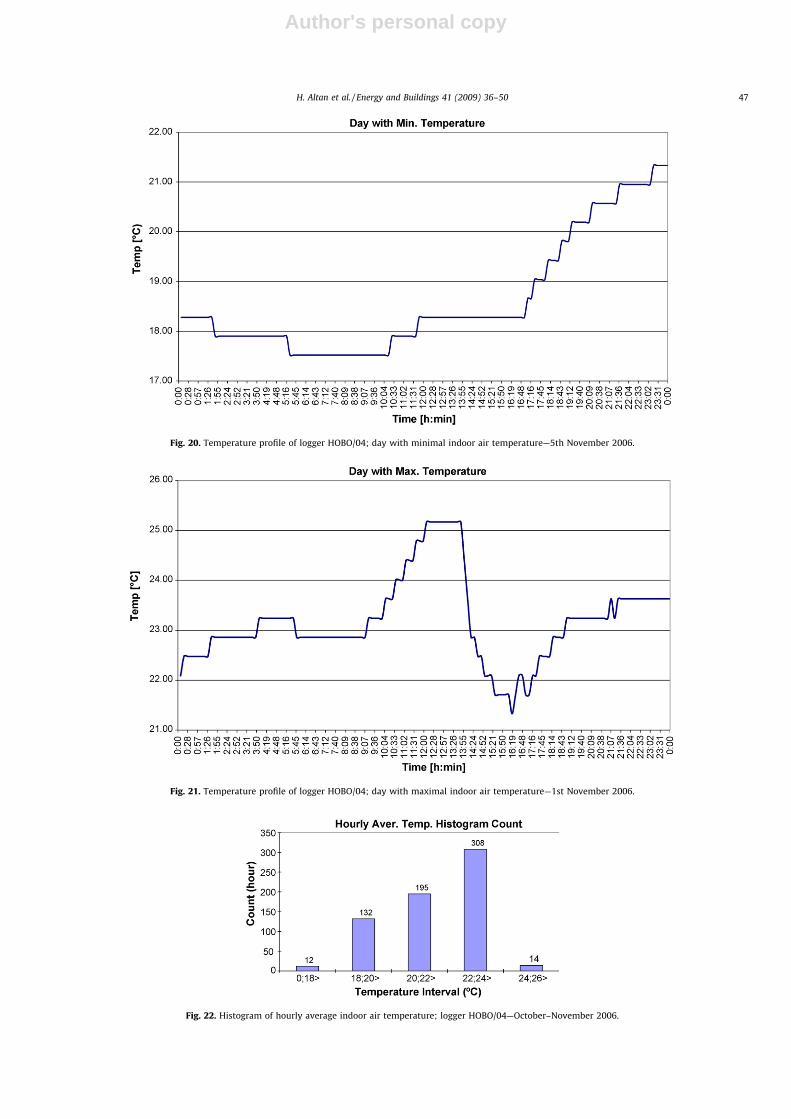
Fig. 20. Temperature profile of logger HOBO/04; day with minimal indoor air temperature—5th November 2006.
Fig. 21. Temperature profile of logger HOBO/04; day with maximal indoor air temperature—1st November 2006.
Fig. 22. Histogram of hourly average indoor air temperature; logger HOBO/04—October–November 2006.
H. Altan et al. / Energy and Buildings 41 (2009) 36–50 47
Author's personal copy
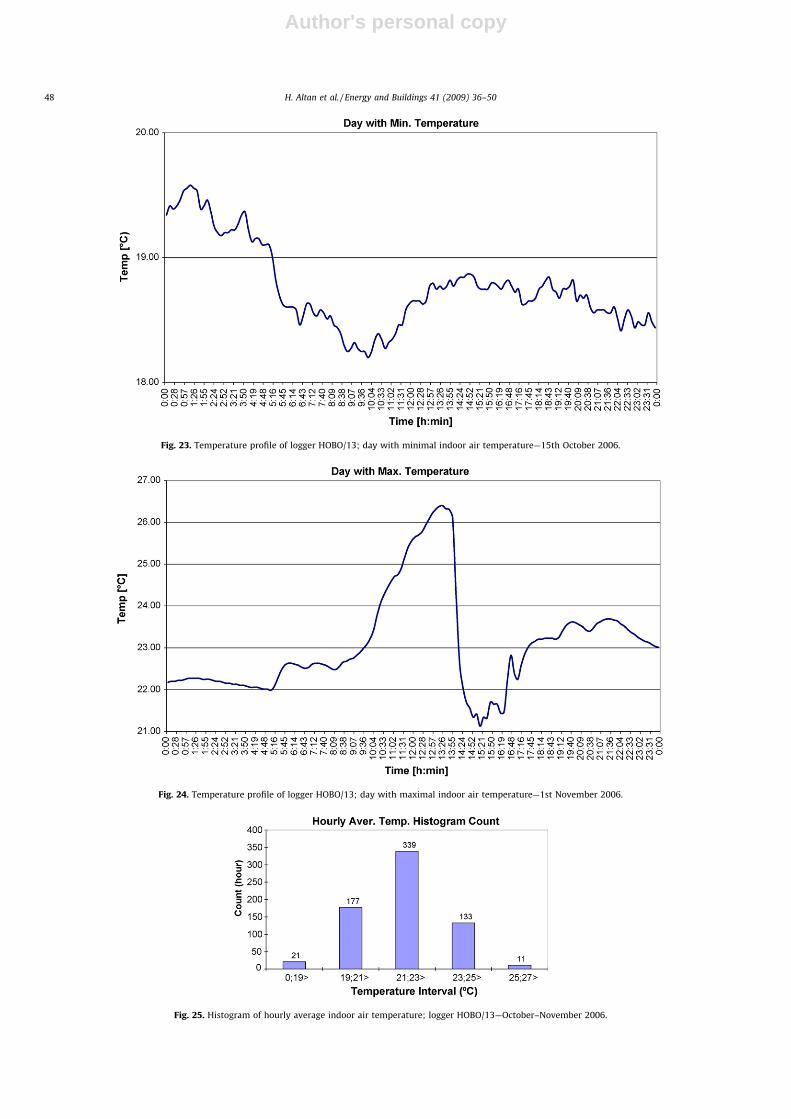
Fig. 23. Temperature profile of logger HOBO/13; day with minimal indoor air temperature—15th October 2006.
Fig. 24. Temperature profile of logger HOBO/13; day with maximal indoor air temperature—1st November 2006.
Fig. 25. Histogram of hourly average indoor air temperature; logger HOBO/13—October–November 2006.
H. Altan et al. / Energy and Buildings 41 (2009) 36–5048

Author's personal copy
Fig. 26. Temperature profile of logger HOBO/15; day with minimal indoor air temperature—22nd October 2006.
Fig. 27. Temperature profile of logger HOBO/15; day with maximal indoor air temperature—2nd November 2006.
Fig. 28. Histogram of hourly average indoor air temperature; logger HOBO/15—October–November 2006.
H. Altan et al. / Energy and Buildings 41 (2009) 36–50 49

Author's personal copy
5. Conclusion
The paper focused on an evaluation study of a glazed facade(active facade) and its influence on the indoor climate comfort andworking environment. It also reported the initial findings of aninternal assessment of the thermal comfort and daylightingconditions in such a building, and some of the results are listedbelow:
� There are obvious advantages of passive solar designs withvarious techniques such as using a fully glazed facade to bothdrive the natural ventilation and maximise the daylighting withhigh indoor illuminance in buildings.� In contrast, high intensity of solar radiation transmitting through
the glazed areas can also cause unwanted glare effect and interioroverheating during warm and sunny days, and therefore theefficient shading system should be in permanent operation [6].� The existing blinds do not create complete solar protection and
the part of the facade in the uncovered strip close to the soffit ofthe floor structure does cause bright pathway for sun patches,which again influences many working positions [7] (findingsfrom walk round survey).� The findings from the indoor climate study focusing on the
operation of the building has indicated that such designs are tobe commended for their passive use of solar energy and canprovide a high quality working environment provided that care istaken to ensure the natural ventilation strategy concept ismonitored continuously, and is also not compromised due tomaximising daylighting in the working areas or vice versa (inother words; optimising efficiency for not only natural ventila-tion but also for natural lighting).� At the time of this survey the louvers controlling the ventilation
rate appeared not to be operating but the calculated air changerate (about 4 h�1) seemed reasonable [8]. It was not sure howthis was achieved when the louvers appeared closed, however,the high internal air temperatures measured again indicated alack of control of the natural ventilation rates.
� The difference in operation of the building heating andventilation system is caused by ventilation regime of the wholebuilding; human factor covering occupancy behaviour, windowand door openings and blind controls as well as heating systemregulation patterns with respect to outdoor climatic conditions.
Further study
This study is continuing with a view to providing an operatingmanual for the building energy management system (BEMS) morein keeping design concepts and user behaviour.
Acknowledgements
The paper was completed in the collaboration within Erasmusprogramme bilateral agreement between The University ofSheffield and Brno University of Technology. Authors also thankARUP Yorkshire for providing consultancy on this project.
References
[1] I.C. Ward, Energy and Environmental Issues for the Practising Architects, ThomasTelford, London, 2004.
[2] K.S. Nick Baker, Energy and Environment in Architecture, E & FN Spon, 2000.[3] M. Santamouris, E. Allard, European Commission, Directorate-General for and A.
Programme Natural Ventilation in Buildings: A Design Handbook, James andJames (Science Publishers) Ltd., London, 1998.
[4] K.J. Lomas, Architectural design of an advanced naturally ventilated building form,Energy and Building 39 (2006) 166–181.
[5] N. Lechner, Heating, Cooling, Lighting Design Methods for Architects, John Wiley& Sons Inc., 2001.
[6] E. Perera, NatVent: Overview of Investigated Buildings, BRE, 1998.[7] H. Awbi, Ventilation of Building, Spon Press, 2003.[8] BS 5925 Code of Practice for Ventilation Principles and Designing for Natural
Ventilation, B.S.I., London, 1991.[9] ASHRAE Handbook 2001: Fundamentals, ASHRAE, G. Atlanta, 2001.
[10] Radiance Simulation Programme, http://radsite.lbl.gov/radiance/papers/sg94.1/.[11] CIBSE, Code of Lighting—CIBSE/SLL, 2002.[12] British Standards, BS 8206-2 Lighting for Buildings. Part 2. Code of Practice for
Daylighting, UK, 1992.[13] Ecotect, http://squ1.com/lighting.
H. Altan et al. / Energy and Buildings 41 (2009) 36–5050