Modeling the influence of glazed openings percentage and type of glazing on the thermal zone...
11
Modeling the influence of glazed openings percentage and type of glazing on the thermal zone behavior K.J. Kontoleon, D.K. Bikas * Laboratory of Building Construction and Physics, Department of Civil Engineering, Aristotle University of Thessaloniki, 540-06 Thessaloniki, Greece Received 27 August 2001; received in revised form 28 August 2001; accepted 28 August 2001 Abstract The selection of the type of glazing as well as its proportion to the total wall area are very important towards achieving a desirable indoor environment. This paper uses a dynamic thermal-circuit zone model to study the influence of the glazed openings percentage (GOP) and type of glazing on the maximum and minimum indoor temperatures, during and after solar hours. The model comprises of four major structural heat-flow paths, corresponding to the external and internal walls, glazing and horizontal slabs. The simulation is performed for winter and summer seasons and for a zone with and without a power plant, with an external wall having south orientation. In the latter case, the optimum GOP leading to the minimum energy consumption is determined. The zone formation comprises masonry walls with insulation in the center plane, concrete horizontal slabs with and without insulation and three different types of glazing (double, double with low emissivity (low-e) coating and double with reflective film). As GOP varies, computer results show how the type of glazing and the insulation of the slabs affect the indoor zone temperatures and energy efficiency. # 2002 Elsevier Science B.V. All rights reserved. Keywords: Thermal-circuit zone model; Glazing; Indoor temperature; Energy consumption 1. Introduction Solar energy is an inexhaustible energy source reaching earth in the form of electromagnetic waves. Glazed openings ranging from typical windows to large glazed building surfaces, have become a common feature in architecture, allowing natural light into the building, visual communica- tion with outdoors and a reduced wall load on the supporting structure. Although present day glazing systems provide good solutions for cold climates, and fairly effective ones for warm conditions, there is still no system with the flexibility required to provide a comfortable environment and an efficient energy response in climates where heating is essential in winter and cooling is required in summer. Thus, in buildings with near south (SE to SW) orientation, having large glazed openings, overheating is often observed. Etzion and Erell [1] proposed a ventilated reversible glazing system in response to the demands of winter and summer condi- tions. As they report, the summer configuration of the proposed reversible system may prevent overheating. The overheating observed in passive solar buildings has been studied by many researchers. In [2], some specific results are given in relation to the optimum aspect ratios for south window sizes, from a thermal performance point of view. An overview of computational methods is given in [3], where more specifically the positive effect of the thermal mass on the indoor conditions, during summer and winter, is pre- sented. As shown, the thermal mass causes a time lag of heat release to the indoor air and a time shift of the peak of cooling load. In [4], the impact of thermal mass, in terms of thermophysical properties and thickness of a wall, on time lag is specifically studied. Athienitis et al. [5] in their experimental study have used phase change materials (PCM) to store thermal energy. Their simulation and experi- mental results showed a significant reduction of mean room temperature. From the view of the above referred literature, it is clear that the extent of glazed areas in building surfaces, as well as their internal thermal mass, are directly affecting their indoor ambience. This paper considers the influence of the type of glazing and the glazed openings percentage (GOP) in the south wall of a zone in winter and summer, with and without a power plant. The main objectives of the present study are the following: 1. to model the zone in order to determine the influence of GOP on the maximum and minimum indoor tempera- tures during and after the solar hours, respectively; Energy and Buildings 34 (2002) 389–399 * Corresponding author. Tel.: þ30-31-995763, 995777; fax: þ30-31-420628. E-mail address: [email protected] (D.K. Bikas). 0378-7788/02/$ – see front matter # 2002 Elsevier Science B.V. All rights reserved. PII:S0378-7788(01)00125-6
Transcript of Modeling the influence of glazed openings percentage and type of glazing on the thermal zone...
Modeling the influence of glazed openings percentage and typeof glazing on the thermal zone behavior
K.J. Kontoleon, D.K. Bikas*
Laboratory of Building Construction and Physics, Department of Civil Engineering, Aristotle University of Thessaloniki, 540-06 Thessaloniki, Greece
Received 27 August 2001; received in revised form 28 August 2001; accepted 28 August 2001
Abstract
The selection of the type of glazing as well as its proportion to the total wall area are very important towards achieving a desirable indoor
environment. This paper uses a dynamic thermal-circuit zone model to study the influence of the glazed openings percentage (GOP) and
type of glazing on the maximum and minimum indoor temperatures, during and after solar hours. The model comprises of four major
structural heat-flow paths, corresponding to the external and internal walls, glazing and horizontal slabs. The simulation is performed for
winter and summer seasons and for a zone with and without a power plant, with an external wall having south orientation. In the latter case,
the optimum GOP leading to the minimum energy consumption is determined. The zone formation comprises masonry walls with
insulation in the center plane, concrete horizontal slabs with and without insulation and three different types of glazing (double, double with
low emissivity (low-e) coating and double with reflective film). As GOP varies, computer results show how the type of glazing and the
insulation of the slabs affect the indoor zone temperatures and energy efficiency. # 2002 Elsevier Science B.V. All rights reserved.
Keywords: Thermal-circuit zone model; Glazing; Indoor temperature; Energy consumption
1. Introduction
Solar energy is an inexhaustible energy source reaching
earth in the form of electromagnetic waves. Glazed openings
ranging from typical windows to large glazed building
surfaces, have become a common feature in architecture,
allowing natural light into the building, visual communica-
tion with outdoors and a reduced wall load on the supporting
structure. Although present day glazing systems provide
good solutions for cold climates, and fairly effective ones
for warm conditions, there is still no system with the
flexibility required to provide a comfortable environment
and an efficient energy response in climates where heating is
essential in winter and cooling is required in summer. Thus,
in buildings with near south (SE to SW) orientation, having
large glazed openings, overheating is often observed. Etzion
and Erell [1] proposed a ventilated reversible glazing system
in response to the demands of winter and summer condi-
tions. As they report, the summer configuration of the
proposed reversible system may prevent overheating. The
overheating observed in passive solar buildings has been
studied by many researchers. In [2], some specific results are
given in relation to the optimum aspect ratios for south
window sizes, from a thermal performance point of view. An
overview of computational methods is given in [3], where
more specifically the positive effect of the thermal mass on
the indoor conditions, during summer and winter, is pre-
sented. As shown, the thermal mass causes a time lag of heat
release to the indoor air and a time shift of the peak of
cooling load. In [4], the impact of thermal mass, in terms of
thermophysical properties and thickness of a wall, on time
lag is specifically studied. Athienitis et al. [5] in their
experimental study have used phase change materials
(PCM) to store thermal energy. Their simulation and experi-
mental results showed a significant reduction of mean room
temperature.
From the view of the above referred literature, it is clear
that the extent of glazed areas in building surfaces, as well as
their internal thermal mass, are directly affecting their
indoor ambience. This paper considers the influence of
the type of glazing and the glazed openings percentage
(GOP) in the south wall of a zone in winter and summer,
with and without a power plant. The main objectives of the
present study are the following:
1. to model the zone in order to determine the influence of
GOP on the maximum and minimum indoor tempera-
tures during and after the solar hours, respectively;
Energy and Buildings 34 (2002) 389–399
* Corresponding author. Tel.: þ30-31-995763, 995777;
fax: þ30-31-420628.
E-mail address: [email protected] (D.K. Bikas).
0378-7788/02/$ – see front matter # 2002 Elsevier Science B.V. All rights reserved.
PII: S 0 3 7 8 - 7 7 8 8 ( 0 1 ) 0 0 1 2 5 - 6

2. to find the impact of horizontal slab insulation and that
of various glazing types, such as double-glazing,
double-glazing with low emissivity (low-e) coating and
double-glazing with reflective film, on the maximum
and minimum indoor temperatures;
3. to examine the influence of GOP on the energy
consumption.
To accomplish the above objectives, the well-known analo-
gies between the thermal and electrical laws [6–9] are
employed, deriving a zone thermal-circuit model compris-
ing four heat-flow paths: the external and internal walls, the
glazed area and the horizontal slabs (floor, ceiling). The
model parameters are self-adjusting to cope with the variable
percentage of glazed openings. The thermal-circuit is ana-
lyzed in a computer program, which was developed for this
purpose, using the non-linear nodal approach. The solution
of non-linear equations is iterative, taking into account
the dependence of convection and radiation coefficients
from the indoor and surface temperatures. The dynamic
behavior of the thermal model is assessed in discrete time-
steps. The model formulation and a general description of
the computer program are given in the following sections.
Computer results from the application of the model in
different outdoor environmental conditions (winter and
summer), various types of glazing and percentages of glazed
areas are presented in detail.
2. Outline of the zone modeling
Various models have been used for the prediction of
thermal behavior, as for example those in [7–11] and the
references quoted therein. In this study, the modeling of the
thermal zone dynamic behavior is employing a lumped
capacitance one-dimensional network model in which dis-
tributed thermal resistances and capacitances are connected
to each other via a number of nodes. The one-dimensional
and three-dimensional representations of an external wall-
section with thickness dx and a cube of it with dimensions
dx, dy, dz are shown in Fig. 1(a) and (b); for simplicity, we
will refer to the sections on the x, y, z axes as dx, dy and dz
sections. As seen, the one-dimensional section is modeled
using three nodes. The elements denoted by dRx, dRy and dRz
represent the thermal resistances of a section at node i; Ci is
the thermal capacitance at node i. The number of sections in
the axes (i.e. the number of nodes) must, generally, be large
enough to ensure a good accuracy. As shown in Fig. 1(c), the
series combination of two adjacent sections in the x-axis
(e.g. nodes i and j) in order to model larger parts of the wall
materials is straightforward. The simplification of one-
dimensional models is generally applied in many thermal
analysis programs, as it has been practical from past experi-
ence [8].
A thermal-circuit developed in the way described above is
fully represented by its topological and algebraic matrices
and its behavior can be expressed by a system of differential
equations. The model can be used to simulate the combined
processes of conduction, convection and radiation in the zone,
under specific environmental conditions. Node voltages and
Nomenclature
A area (m2)
cp specific heat capacity (J/kg K)
C thermal capacitance (J/K)
d thickness of layer (m)
h heat transfer coefficient (W/m2 K)
k thermal conductivity (W/m K)
QL heating/cooling unit loads (W)
Qrad radiation heat load (W)
Qsol solar radiation load (W)
R thermal resistance (K/W)
t time (s)
T temperature (8C)
Tmax maximum temperature during the solar hours
(8C)
Tmin minimum temperature after the solar hours
(8C)
Vz zone volume (m3)
Greek letters
as solar absorptivity
e emissivity
r density (kg/m3)
Subscripts
e exterior surface
i interior surface
o outside
sa sol–air
v ventilation, infiltration
x type of material
Fig. 1. (a) One- and (b) three-dimensional representations of a wall-
section; (c) combination of two adjacent sections in the x-axis.
390 K.J. Kontoleon, D.K. Bikas / Energy and Buildings 34 (2002) 389–399
branch currents correspond to temperatures and heat-flows,
respectively. In the present formulation, instead of setting up
the state equations, we employ a system of algebraic equa-
tions by appropriately modeling the circuit capacitors with
resistances in series with time-varying voltage sources. The
dynamic solution of thermal-circuits with capacitive ele-
ments is formulated by considering the voltage–current
relationships across the capacitive elements at small time
increments, Dt. From the equation relating a capacitance’s
current i(t) and voltage e(t)
iðtÞ ¼ CdeðtÞ
dt(1)
or
iðtnÞC
¼ deðtÞdt
����t¼tn
(2)
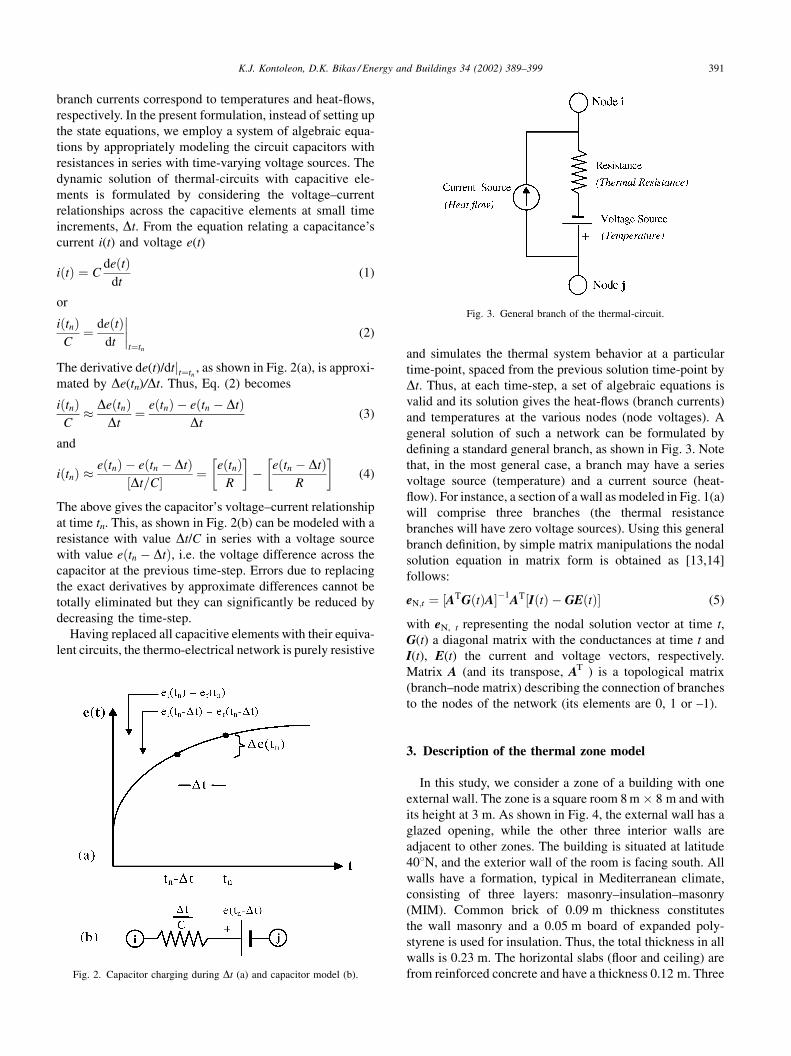
The derivative de(t)/dtjt¼tn, as shown in Fig. 2(a), is approxi-
mated by De(tn)/Dt. Thus, Eq. (2) becomes
iðtnÞC
� DeðtnÞDt
¼ eðtnÞ � eðtn � DtÞDt
(3)
and
iðtnÞ �eðtnÞ � eðtn � DtÞ
½Dt=C ¼ eðtnÞR
� �� eðtn � DtÞ
R
� �(4)
The above gives the capacitor’s voltage–current relationship
at time tn. This, as shown in Fig. 2(b) can be modeled with a
resistance with value Dt/C in series with a voltage source
with value eðtn � DtÞ, i.e. the voltage difference across the
capacitor at the previous time-step. Errors due to replacing
the exact derivatives by approximate differences cannot be
totally eliminated but they can significantly be reduced by
decreasing the time-step.
Having replaced all capacitive elements with their equiva-
lent circuits, the thermo-electrical network is purely resistive
and simulates the thermal system behavior at a particular
time-point, spaced from the previous solution time-point by
Dt. Thus, at each time-step, a set of algebraic equations is
valid and its solution gives the heat-flows (branch currents)
and temperatures at the various nodes (node voltages). A
general solution of such a network can be formulated by
defining a standard general branch, as shown in Fig. 3. Note
that, in the most general case, a branch may have a series
voltage source (temperature) and a current source (heat-
flow). For instance, a section of a wall as modeled in Fig. 1(a)
will comprise three branches (the thermal resistance
branches will have zero voltage sources). Using this general
branch definition, by simple matrix manipulations the nodal
solution equation in matrix form is obtained as [13,14]
follows:
eN;t ¼ ½ATGðtÞA�1AT½IðtÞ � GEðtÞ (5)
with eN, t representing the nodal solution vector at time t,
G(t) a diagonal matrix with the conductances at time t and
I(t), E(t) the current and voltage vectors, respectively.
Matrix A (and its transpose, AT ) is a topological matrix
(branch–node matrix) describing the connection of branches
to the nodes of the network (its elements are 0, 1 or –1).
3. Description of the thermal zone model
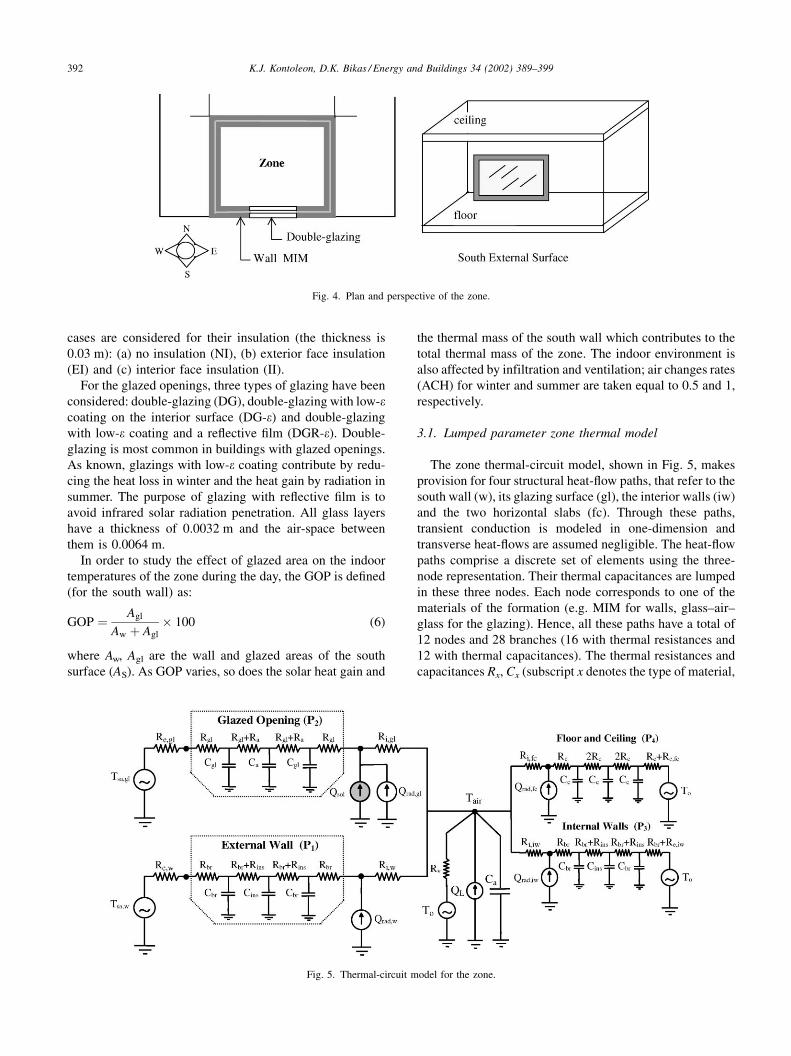
In this study, we consider a zone of a building with one
external wall. The zone is a square room 8 m 8 m and with
its height at 3 m. As shown in Fig. 4, the external wall has a
glazed opening, while the other three interior walls are
adjacent to other zones. The building is situated at latitude
408N, and the exterior wall of the room is facing south. All
walls have a formation, typical in Mediterranean climate,
consisting of three layers: masonry–insulation–masonry
(MIM). Common brick of 0.09 m thickness constitutes
the wall masonry and a 0.05 m board of expanded poly-
styrene is used for insulation. Thus, the total thickness in all
walls is 0.23 m. The horizontal slabs (floor and ceiling) are
from reinforced concrete and have a thickness 0.12 m. ThreeFig. 2. Capacitor charging during Dt (a) and capacitor model (b).
Fig. 3. General branch of the thermal-circuit.
K.J. Kontoleon, D.K. Bikas / Energy and Buildings 34 (2002) 389–399 391
cases are considered for their insulation (the thickness is
0.03 m): (a) no insulation (NI), (b) exterior face insulation
(EI) and (c) interior face insulation (II).
For the glazed openings, three types of glazing have been
considered: double-glazing (DG), double-glazing with low-ecoating on the interior surface (DG-e) and double-glazing
with low-e coating and a reflective film (DGR-e). Double-
glazing is most common in buildings with glazed openings.
As known, glazings with low-e coating contribute by redu-
cing the heat loss in winter and the heat gain by radiation in
summer. The purpose of glazing with reflective film is to
avoid infrared solar radiation penetration. All glass layers
have a thickness of 0.0032 m and the air-space between
them is 0.0064 m.
In order to study the effect of glazed area on the indoor
temperatures of the zone during the day, the GOP is defined
(for the south wall) as:
GOP ¼ Agl
Aw þ Agl
100 (6)
where Aw, Agl are the wall and glazed areas of the south
surface (AS). As GOP varies, so does the solar heat gain and
the thermal mass of the south wall which contributes to the
total thermal mass of the zone. The indoor environment is
also affected by infiltration and ventilation; air changes rates
(ACH) for winter and summer are taken equal to 0.5 and 1,
respectively.
3.1. Lumped parameter zone thermal model
The zone thermal-circuit model, shown in Fig. 5, makes
provision for four structural heat-flow paths, that refer to the
south wall (w), its glazing surface (gl), the interior walls (iw)
and the two horizontal slabs (fc). Through these paths,
transient conduction is modeled in one-dimension and
transverse heat-flows are assumed negligible. The heat-flow
paths comprise a discrete set of elements using the three-
node representation. Their thermal capacitances are lumped
in these three nodes. Each node corresponds to one of the
materials of the formation (e.g. MIM for walls, glass–air–
glass for the glazing). Hence, all these paths have a total of
12 nodes and 28 branches (16 with thermal resistances and
12 with thermal capacitances). The thermal resistances and
capacitances Rx, Cx (subscript x denotes the type of material,
Fig. 4. Plan and perspective of the zone.
Fig. 5. Thermal-circuit model for the zone.
392 K.J. Kontoleon, D.K. Bikas / Energy and Buildings 34 (2002) 389–399

i.e. br, ins, gl, a and c for brick, insulation, glazing, air and
concrete, respectively) depend on GOP and are calculated
by using their properties. For each type of material, it is
Rx ¼dx
kxAx
(7)
Cx ¼ rxcp;xdxAx (8)
and Ax represents the material surface area as a function of
GOP.
All the above four major paths, Pi (i ¼ 1–4), coincide at a
separate node, the air-node, through interior convective
resistances. The thermal capacitance of the air (Cair) is also
connected to this node. The temperature at the air node, Tair,
characterizes the interior zone space. The interior surface
convective resistances, Ri,w, Ri,gl, Ri,iw, Ri,fc, depend on GOP
as well as on the temperatures developed at their end-nodes,
to which they are connected. As shown in Fig. 6, at each
time-step during the solution procedure, their values are
adjusted iteratively in order to correspond to the tempera-
tures obtained at their end-nodes (boundaries). The itera-
tions terminate when their values, at the beginning and end,
are matching (convergence). Taking into account GOP and
the aspect ratio of the south wall glazing geometry (in the
present study, it is 8:3), the dependence of interior convec-
tive resistances from the temperatures at their end-nodes can
be easily expressed [6,12].
The radiation effects from all the interior zone surfaces
(Ax), which are proportional to emissivity (ex), are taken into
account by introducing four temperature dependent heat
sources, Qrad,x (current sources in Fig. 5), one for each
heat-flow path Pi. In addition, the penetrating solar radiation
at the interior of the glazing surface, is modeled with a time
dependent heat source Qsol. The QL source in Fig. 5 repre-
sents the heating/cooling unit, which is controlled by a
thermostat. The thermostat has a pair of set-points (Tupper,
Tlower), each one for heating and cooling, respectively. In
winter, when the indoor temperature is below the lower
limit, heating is provided until the indoor temperature
reaches the upper limit. The unit restarts its operation when
the indoor temperature falls below the lower limit. For
cooling, the unit operates when the indoor temperature is
higher than the upper limit, until the indoor temperature falls
below the lower limit.
Infiltration, ventilation and environmental control, as seen
in Fig. 5, are taken into account though Rv.
Rv ¼ 1
Vzraircp;airacs(9)
where Vz is the zone-volume and acs is the rate of air
changes per second.
For the external south wall and glazed opening, the forcing
functions Tsa,x(t), in Fig. 5 include the effect of solar radiation
on outside air temperature; Qsol is the incident solar irradia-
tion, as,x the solar absorptivity of the exterior surface material
x, ho the outer surface heat transfer coefficient, due to the
combined convection and radiation, and To the outside ambi-
ent-air temperature. The variation of sol–air temperature is
Tsa;xðtÞ ¼ ToðtÞ þas;xQsolðtÞ
ho;x(10)
The outside temperature is assumed to follow a sinusoidal
variation.
ToðtÞ ¼ Tav þ 12jTo-max � To-minj sin ot � 1
2p
� �(11)
where Tav represents the average outside temperature during
a day period (24 h). Note that the rotational velocity is
o ¼ 2pf , with f the radial frequency (f ¼ 1/86,400 s); To-
min, To-max represent the minimum and maximum outside
temperatures during the day.
3.2. Environmental conditions
In winter, heating is mainly required and cooling is rarely
needed, only when extended glazed surfaces exist. On theFig. 6. Flow chart of the solution procedure.
K.J. Kontoleon, D.K. Bikas / Energy and Buildings 34 (2002) 389–399 393

opposite, summer imposes an unwanted heat load and
cooling is regularly required because of overheating. The
above requirements cover fairly well the other seasons
where mostly heating or cooling is required, or vice versa.
Especially for south walls, the solar heat gain is large for
winter and supplements heat losses, while in summer the
solar gain is relatively small restricting the undesirable gain.
Besides the selection of south orientation for an external
wall which is the most desirable, the optimum GOP and the
type of glazing on heating/cooling demands depend on the
particular climatic conditions and the insulation of walls and
horizontal surfaces. The hourly variation values of solar
incident radiation, shown in Fig. 7(a), are taken for 21
January and July. These correspond to average days with
no clouds and to a particular location for a wall with south
orientation. The fraction of incident solar radiation that
enters through the glazing represents the solar heat gain
coefficient. The solar reflectance of the ground is assumed to
be 0.20 and the wall surfaces are taken to be light-colored
(as ¼ 0:40). The ambient air temperature in winter season,
for a typical day is between 0 and 10 8C, while in summer
temperatures range between 21 and 30 8C (meteorological
data). The ambient-air temperature, as shown in Fig. 7(b),
is assumed to emerge a sinusoidal variation during a day
period. The sol–air temperatures for both the south wall and
the glazed surfaces have been calculated using Eq. (10). At
each time-step, during the solution procedure, the outdoor
temperature constitutes the exterior forcing function affect-
ing the indoor ambience for the particular season.
4. Zone environment without a power plant
For winter and summer, we assume the zone without a
power plant and with the initial indoor temperature at 21 8C.
The selection of the initial indoor temperature aims at
assessing the zone thermal behavior during the day under
loaded conditions for the thermal-mass (external/internal
walls and horizontal slabs). The initial indoor temperature is
the starting temperature (at time-point t ¼ 0 during the
solution procedure), which in our simulation corresponds
to 3:00 a.m. The rate of air changes (ACH) for ventilation
and infiltration in winter and summer is assumed to be 0.5
and 1.0, respectively. The presumed values for ACH can
be higher in a zone with frequent opening of doors and
windows.
4.1. Indoor temperatures in winter
First, we consider the thermal zone without heating or
cooling. The GOP varies from 0 to 100% for the three types
of glazing (DG, DG-e, DGR-e) and for the three types of
horizontal slab insulation (NI, EI, II), as described in Section
3. Results concerning the maximum indoor temperature
during the solar hours, Tmax, and the minimum indoor
temperature after solar hours, Tmin, are discussed in the
following sections. The minimum and the maximum indoor
temperatures, when no insulation is present in the horizontal
slab surfaces (NI), are shown in Fig. 8(a). As expected, as
GOP increases, Tmax also increases, mainly due to the effect
of solar radiation. The variation of Tmin with GOP is
comparatively small. For all types of glazing, the minimum
day temperature after the solar hours shows a slight decrease
with the increase of GOP. Also for all GOP values, the DG-eglazing, compared to DG, achieves higher Tmin and Tmax. On
the other hand, the DGR-e glazing blocks a large amount of
solar penetrating radiation and Tmin, Tmax are lower for all
GOP values, compared to DG and DG-e glazing types. For
no glazing, Tmin is 6.42 8C and Tmax is 10.21 8C; thus, the
temperature swing is 3.79 8C. For GOP ¼ 100%, Tmin, Tmax
and the magnitude of the temperature swing are, respec-
tively: (a) 6.32, 20.53, 14.21 8C for DG; (b) 6.77, 20.96,
14.19 8C for DG-e and (c) 6.27, 16.76, 10.49 8C for DGR-e.Next are presented results concerning the influence of the
slab insulation on the zone indoor temperatures. Computer
results with slabs having insulation in their outer surfaces
and for DG-e glazing are given in Fig. 8(b). As GOP
increases, Tmax during the day rises from 15.59 to
26.53 8C. The variation of Tmin with GOP is small and its
range is within 12.87–14.41 8C. The increase of the tem-
perature swing with GOP is from 2.72 8C (for GOP ¼ 0%)
to 12.12 8C (for GOP ¼ 100%).
Finally, computer results for the II case and for DG-eglazing are given in Fig. 8(c). These show the impact of
outside temperature and solar radiation on the indoor envir-
onment. This formation is ideal for buildings requiring non-
periodic heating. As GOP increases, Tmax during the dayFig. 7. Meteorological data in winter and summer (south orientation): (a)
incident solar radiation; (b) ambient-air temperatures.
394 K.J. Kontoleon, D.K. Bikas / Energy and Buildings 34 (2002) 389–399

increases from 12.82 to 31.47 8C. As before, the variation of
Tmin with GOP is comparatively small and its value is kept
within 9.52–10.77 8C. The temperature swing increases with
GOP and its range is within 3.3 8C (for GOP ¼ 0%) to
20.7 8C (for GOP ¼ 100%). In overall, the following gen-
eral remarks can be made from the above discussed graphs:
� the increase of GOP for the DG-e type leads to higher
Tmin, Tmax, and temperature swing;
� without glazing, the EI case gives maximum Tmin and
Tmax (compared to the NI and II cases) as it keeps a low
indoor temperature swing;
� for GOP > 40%,the highest Tmax during the solar hours is
achieved for the II case;
� in all cases, the highest minimum indoor temperature after
the solar hours is obtained for the EI case;
� the DG-e glazing has the best performance, from the point
of view of Tmin, Tmax and temperature swing, during the
day. Overheating (T i > 25:5 8C) occurs when GOP is
above 70% and for the II case;
� in winter, the DGR-e glazing deteriorates the indoor
environment for all investigated cases.
4.2. Indoor temperatures in summer
Results for the zone thermal behavior in summer
(T i ¼ 21 8C), without floor/ceiling insulation (NI), are
shown in Fig. 8(d). As GOP increases, the penetrating solar
radiation progressively leads to overheating while the var-
iation of the minimum indoor temperature with GOP is
comparatively small. As seen in Fig. 8(d), the maximum
temperature during the solar hours without glazing
(GOP ¼ 0%) is 25.65 8C. For DG glazing, as GOP increases
the maximum temperature during solar hours rises to
30.24 8C (GOP ¼ 100%). The corresponding maximum
temperatures for the DG-e and DGR-e types are 29.90
and 28.21 8C, respectively (the DG and DG-e graphs are
fairly close to one another). As it can be seen, the maximum
indoor temperature during solar hours can be kept at 27.5 8Cwith the DG and DG-e but with a percentage of glazed
Fig. 8. Variation of Tmax and Tmin during the day vs. GOP in winter with (a) NI, (b) EI and (c) II; in summer with (d) NI, (e) EI and (f) II.
K.J. Kontoleon, D.K. Bikas / Energy and Buildings 34 (2002) 389–399 395

openings not exceeding 60%. By changing to the DGR-etype, this percentage can become as high as 80%.
The minimum day temperature after solar hours for DG,
shows a small increase with GOP and it increases from
23.98 8C (GOP ¼ 0%) to 24.57 8C (GOP ¼ 100%). On the
other hand, the DG-e gives a slightly higher Tmin compared
to that of DG. For GOP ¼ 100%, Tmin after solar hours is
24.71 8C. For the case of DGR-e, the reflective film restricts
the solar penetrating radiation and Tmin is 24.43 8C. Thus,
whereas the indoor temperature swing without glazing
is 25:65 � 23:98 ¼ 1:67 8C with DG, DG-e and DGR-e,the corresponding swings are 5.67, 5.19 and 3.78 8C(GOP ¼ 100%). For the same glazed areas, the DGR-e type
has a better performance, allowing lower Tmin, Tmax and
temperature swing values.
The influence of the floor/ceiling exterior face insulation
(EI) on the indoor environment is shown in Fig. 8(e). The EI
case delays the zone heating and the indoor ambience is
cooler. As in the previous case, the increase of GOP pro-
gressively leads to the overheating of the zone. The variation
of Tmin with GOP is comparatively small. From Fig. 8(e),
it can be seen that Tmax without glazing, during the solar
hours, is 23.09 8C. For double-glazing (DG), the maximum
temperature during solar hours rises to 28.67 8C (GOP ¼100%). The maximum temperatures for the DG-e and DGR-
e types are 28.22 and 26.35 8C, respectively and correspond
to GOP ¼ 100%. Thus, the maximum indoor temperature
during solar hours can be kept at 27.5 8C with the double-
glazing but with a percentage of glazing at 80%. With the
DG-e, this percentage can be risen to 90%, while for the
DGR-e, Tmax never exceeds 27.5 8C.
With DG glazing, the minimum day temperature after
solar hours, presents a small increase with GOP and its range
is in the interval 22.87 8C (GOP ¼ 0%) to 24.85 8C(GOP ¼ 100%). In contrast to the case of no insulation,
the DG-e gives a slightly lower Tmin compared to that of DG.
For GOP ¼ 100% the minimum temperature after solar
hours is 24.83 8C. For the case of DGR-e, the reflective
film gives a Tmin at 24.22 8C. In overall, the indoor tem-
perature swing without glazing is 0.22 8C and with DG, DG-
e and DGR-e the corresponding values are 3.82, 3.39 and
2.13 8C (GOP ¼ 100%).
Results corresponding to interior face insulation of floor/
ceiling (II), for the three types of glazing are given in
Fig. 8(f). The increase of GOP causes overheating while
the variation of the minimum indoor temperature is small.
Without glazing (GOP ¼ 0%), the maximum temperature
during the solar hours is 24.26 8C. This temperature for DG
glazing, as GOP increases, rises to 33.09 8C. The corre-
sponding Tmax for DG-e and DGR-e are 32.7 and 29.71 8C,
respectively. As can be seen, with the DG glazing the maxi-
mum indoor temperature during solar hours can be kept at
27.5 8C with a GOP not exceeding 40%. This percentage can
become 45 and 65%, respectively with DG-e and DGR-e.With DG glazing, the minimum day temperature after
solar hours, shows a small increase with GOP as it changes
from 23.56 8C (GOP ¼ 0%) to 25.16 8C (GOP ¼ 100%).
With DG-e glazing a slightly higher Tmin is achieved com-
pared to that of DG (with GOP ¼ 100% this temperature is
25.45 8C) while with the DGR-e glazing Tmin becomes
24.81 8C. Consequently, the indoor temperature swing with-
out glazing is 24:26 � 23:56 ¼ 0:7 8C and with DG, DG-eand DGR-e, the corresponding swings are 7.93, 7.25 and
4.9 8C (GOP ¼ 100%).
From the above discussion, we can extract the following
general remarks for the effect of the type of glazing, GOP
and horizontal slab (floor/ceiling) insulation on the zone
environment (summer):
� Large glazed openings with DGR-e can be used without
causing overheating. The extent of the openings depends
on the existence and the position of insulation (floor/
ceiling).
� The lower maximum indoor temperature during solar
hours corresponds to DGR-e and EI case.
� When large glazed openings are desirable, the II case
should be avoided as it causes overheating.
� Without glazing, the EI case gives the lowest Tmin and
Tmax.
5. Zone energy consumption
The power load demands in buildings constitute the most
important criterion for structure decisions, in order to
achieve a desirable indoor ambience with low energy con-
sumption. To satisfy the above condition, the thermal model
discussed earlier is used in a parametric study involving
GOP, glazing type and horizontal slab (floor/ceiling) insula-
tion (GOP is varied in steps of 10%). The load demands
during a day period are computed for winter and summer
using the meteorological data given in Section 3.2. In this
study, we assume a power plant capacity of 7.5 kW for
heating and cooling and an initial indoor zone temperature
T i ¼ 21 8C. In winter, the set-points of the thermostat of the
heating/cooling unit are set at 18–24 and 24.5–25.5 8C, for
heating and cooling, respectively. Thus, the unit operates for
heating when the indoor temperature falls below 18 8C and
for cooling when this temperature exceeds 25.5 8C. In
summer, where cooling is required, the settings are at 21–
25.5 8C. The total computer runs needed for calculating
the energy demands in this parametric study are 198 (11
GOP 3glazing types 3insulation positions 2seasons)
and have been carried out with a time-step of 60 s in a day
period.
5.1. Daily demands in winter
First, we present results concerning the duration of the
power plant operation during the day, in order to provide an
indoor temperature for the zone within the selected set-
points of the thermostat, as a function of GOP. This is shown
396 K.J. Kontoleon, D.K. Bikas / Energy and Buildings 34 (2002) 389–399
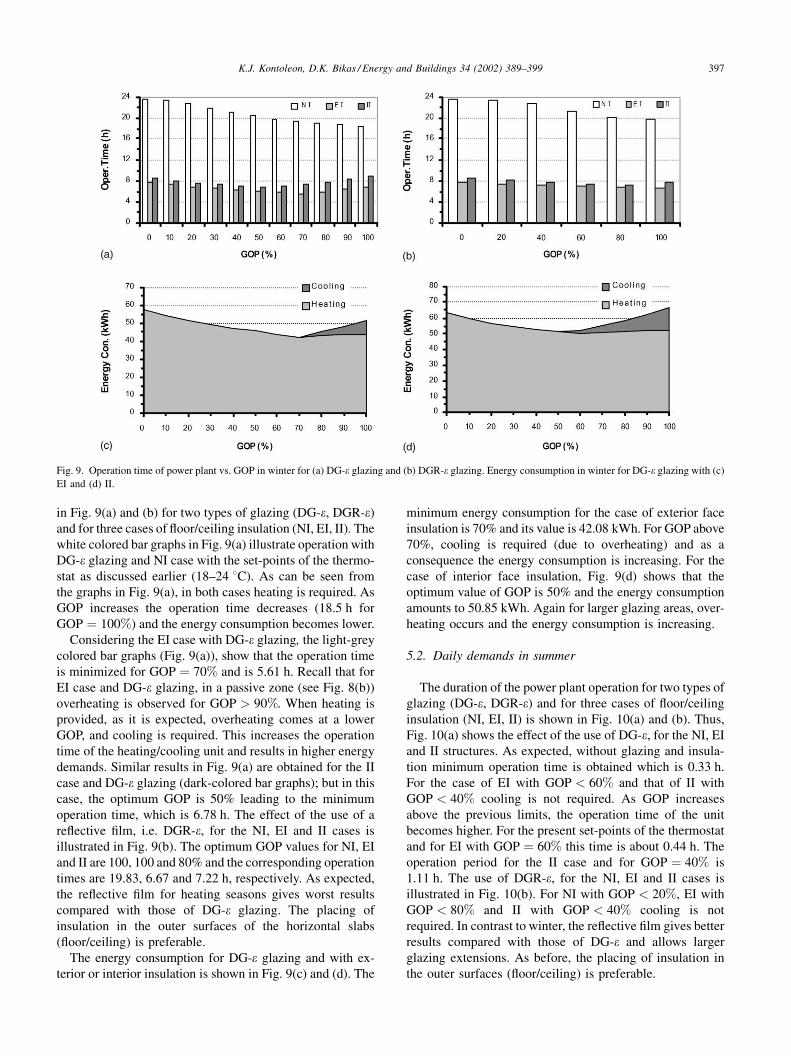
in Fig. 9(a) and (b) for two types of glazing (DG-e, DGR-e)and for three cases of floor/ceiling insulation (NI, EI, II). The
white colored bar graphs in Fig. 9(a) illustrate operation with
DG-e glazing and NI case with the set-points of the thermo-
stat as discussed earlier (18–24 8C). As can be seen from
the graphs in Fig. 9(a), in both cases heating is required. As
GOP increases the operation time decreases (18.5 h for
GOP ¼ 100%) and the energy consumption becomes lower.
Considering the EI case with DG-e glazing, the light-grey
colored bar graphs (Fig. 9(a)), show that the operation time
is minimized for GOP ¼ 70% and is 5.61 h. Recall that for
EI case and DG-e glazing, in a passive zone (see Fig. 8(b))
overheating is observed for GOP > 90%. When heating is
provided, as it is expected, overheating comes at a lower
GOP, and cooling is required. This increases the operation
time of the heating/cooling unit and results in higher energy
demands. Similar results in Fig. 9(a) are obtained for the II
case and DG-e glazing (dark-colored bar graphs); but in this
case, the optimum GOP is 50% leading to the minimum
operation time, which is 6.78 h. The effect of the use of a
reflective film, i.e. DGR-e, for the NI, EI and II cases is
illustrated in Fig. 9(b). The optimum GOP values for NI, EI
and II are 100, 100 and 80% and the corresponding operation
times are 19.83, 6.67 and 7.22 h, respectively. As expected,
the reflective film for heating seasons gives worst results
compared with those of DG-e glazing. The placing of
insulation in the outer surfaces of the horizontal slabs
(floor/ceiling) is preferable.
The energy consumption for DG-e glazing and with ex-
terior or interior insulation is shown in Fig. 9(c) and (d). The
minimum energy consumption for the case of exterior face
insulation is 70% and its value is 42.08 kWh. For GOP above
70%, cooling is required (due to overheating) and as a
consequence the energy consumption is increasing. For the
case of interior face insulation, Fig. 9(d) shows that the
optimum value of GOP is 50% and the energy consumption
amounts to 50.85 kWh. Again for larger glazing areas, over-
heating occurs and the energy consumption is increasing.
5.2. Daily demands in summer
The duration of the power plant operation for two types of
glazing (DG-e, DGR-e) and for three cases of floor/ceiling
insulation (NI, EI, II) is shown in Fig. 10(a) and (b). Thus,
Fig. 10(a) shows the effect of the use of DG-e, for the NI, EI
and II structures. As expected, without glazing and insula-
tion minimum operation time is obtained which is 0.33 h.
For the case of EI with GOP < 60% and that of II with
GOP < 40% cooling is not required. As GOP increases
above the previous limits, the operation time of the unit
becomes higher. For the present set-points of the thermostat
and for EI with GOP ¼ 60% this time is about 0.44 h. The
operation period for the II case and for GOP ¼ 40% is
1.11 h. The use of DGR-e, for the NI, EI and II cases is
illustrated in Fig. 10(b). For NI with GOP < 20%, EI with
GOP < 80% and II with GOP < 40% cooling is not
required. In contrast to winter, the reflective film gives better
results compared with those of DG-e and allows larger
glazing extensions. As before, the placing of insulation in
the outer surfaces (floor/ceiling) is preferable.
Fig. 9. Operation time of power plant vs. GOP in winter for (a) DG-e glazing and (b) DGR-e glazing. Energy consumption in winter for DG-e glazing with (c)
EI and (d) II.
K.J. Kontoleon, D.K. Bikas / Energy and Buildings 34 (2002) 389–399 397
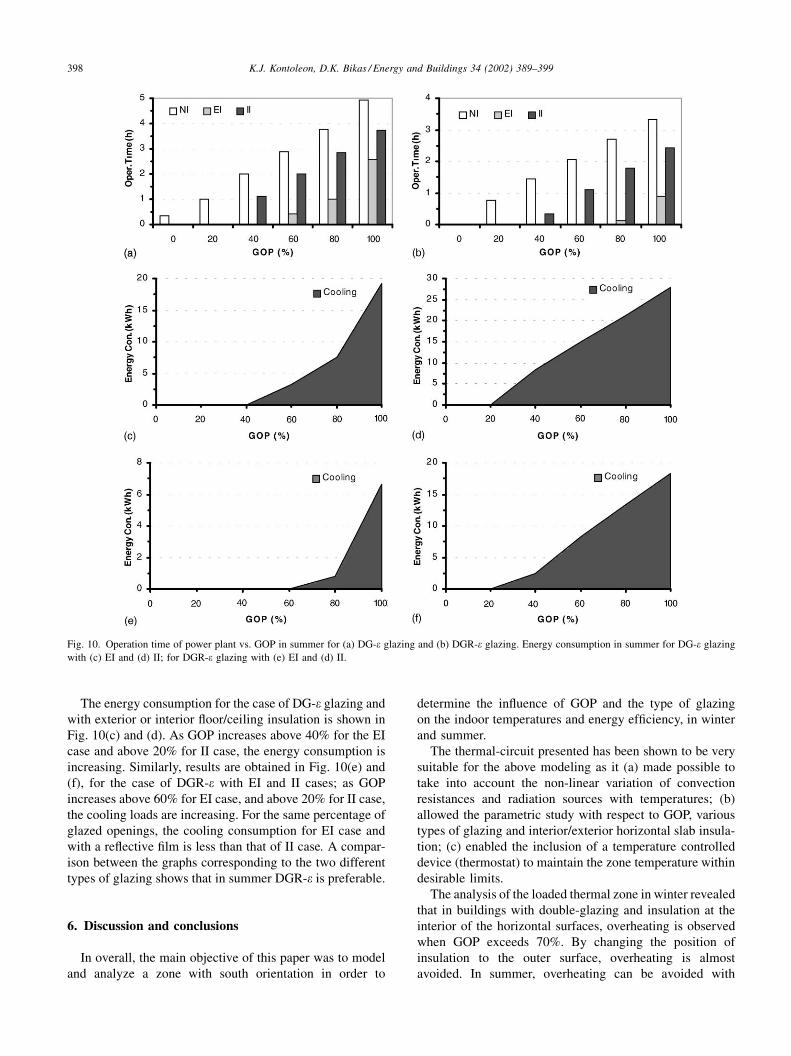
The energy consumption for the case of DG-e glazing and
with exterior or interior floor/ceiling insulation is shown in
Fig. 10(c) and (d). As GOP increases above 40% for the EI
case and above 20% for II case, the energy consumption is
increasing. Similarly, results are obtained in Fig. 10(e) and
(f), for the case of DGR-e with EI and II cases; as GOP
increases above 60% for EI case, and above 20% for II case,
the cooling loads are increasing. For the same percentage of
glazed openings, the cooling consumption for EI case and
with a reflective film is less than that of II case. A compar-
ison between the graphs corresponding to the two different
types of glazing shows that in summer DGR-e is preferable.
6. Discussion and conclusions
In overall, the main objective of this paper was to model
and analyze a zone with south orientation in order to
determine the influence of GOP and the type of glazing
on the indoor temperatures and energy efficiency, in winter
and summer.
The thermal-circuit presented has been shown to be very
suitable for the above modeling as it (a) made possible to
take into account the non-linear variation of convection
resistances and radiation sources with temperatures; (b)
allowed the parametric study with respect to GOP, various
types of glazing and interior/exterior horizontal slab insula-
tion; (c) enabled the inclusion of a temperature controlled
device (thermostat) to maintain the zone temperature within
desirable limits.
The analysis of the loaded thermal zone in winter revealed
that in buildings with double-glazing and insulation at the
interior of the horizontal surfaces, overheating is observed
when GOP exceeds 70%. By changing the position of
insulation to the outer surface, overheating is almost
avoided. In summer, overheating can be avoided with
Fig. 10. Operation time of power plant vs. GOP in summer for (a) DG-e glazing and (b) DGR-e glazing. Energy consumption in summer for DG-e glazing
with (c) EI and (d) II; for DGR-e glazing with (e) EI and (d) II.
398 K.J. Kontoleon, D.K. Bikas / Energy and Buildings 34 (2002) 389–399
GOP < 60% and exterior insulation in the horizontal sur-
faces, unless the DGR-e type of glazing is used; in this case,
overheating occurs for GOP > 80%.
From an energy consumption point of view, it has been
shown that in winter (with insulation in the outer face of the
slabs and double-glazing with low-e coating) the optimum
GOP which minimizes the energy consumption is 70%,
while in summer it drops to 40% with DG-e glazing and
to 60% with DGR-e glazing. Thus, for average days in other
seasons it is reasonable to expect that the optimum GOP lies
somewhere between the above limits.
The specific results given earlier and the above discussion
made it clear that overheating can be avoided and energy
savings can be obtained with the proper selection of GOP as
well as the type of glazing and position of slab insulation. It
is intended to use this zone model together with statistical
meteorological data for all months of the year for the
purpose of obtaining the optimum GOP that minimizes
the annual energy consumption.
References
[1] Y. Etzion, E. Erell, Controlling the transmission of radiant energy
through windows: a novel ventilated reversible glazing system,
Building and Environment 35 (2000) 433–444.
[2] M.N. Inanici, N. Demirbilek, Thermal performance optimization of
buildings aspect ratio and south window size in five cities having
different climatic characteristics of Turkey, Building and Environ-
ment 35 (2000) 41–52.
[3] C.A. Balaras, The role of thermal mass on the cooling load of
buildings. An overview of computational methods, Energy and
Building 24 (1996) 1–10.
[4] H. Asan, Y.S. Sancaktar, Effects of wall’s thermophysical properties
on time lag and decrement factor, Energy and Building 28 (1998)
159–166.
[5] A.K. Athienitis, C. Liu, D. Hawes, D. Banu, D. Feldman,
Investigation of the thermal performance of a passive solar test-
room with wall latent heat storage, Building and Environment 32
(1997) 405–410.
[6] Y. A. Cengel, Heat Transfer: A Practical Approach, Mc Graw-Hill,
New York, 1998.
[7] E.H. Mathews, Y. Etzion, E. Van Heerden, S. Weggelaar, E. Erell, D.
Pearlmutter, I.A. Meir, A novel thermal simulation model and its
application on naturally ventilated desert buildings, Building and
Environment 32 (1997) 447–456.
[8] C. Lombard, E.H. Mathews, A two-port envelope model for
building heat transfer, Building and Environment 34 (1999)
19–30.
[9] H. Boyer, J.P. Chabriat, B. Grondin-Perez, C. Tourrand, J. Brau,
Thermal building simulation and computer generation of nodal
models, Building and Environment 31 (1996) 207–214.
[10] P. Tuomaala, K. Piira, M. Vuolle, A rational method for the
distribution of nodes in modeling of transient heat conduction in
plane slabs, Building and Environment 35 (2000) 397–406.
[11] M.Lj. Bojic, D.L. Lovday, The influence on building thermal
behavior of the insulation/masonry distribution in at three-layered
construction, Energy and Building 26 (1997) 153–157.
[12] F.P. Incropera, D.P. DeWitt, Fundamentals of Heat and Mass
Transfer, Wiley, New York, 1996.
[13] D.A. Calahan, Computer-Aided Network Design, McGraw-Hill, New
York, 1968.
[14] F.F. Kuo, W.G. Magnuson, Computer Oriented Circuit Design,
Prentice-Hall, Englewood Cliffs, NJ, 1969.
K.J. Kontoleon, D.K. Bikas / Energy and Buildings 34 (2002) 389–399 399