An Integrative Multi-scale Analysis of the Dynamic DNA Methylation Landscape in Aging
21
RESEARCH ARTICLE An Integrative Multi-scale Analysis of the Dynamic DNA Methylation Landscape in Aging Tian Yuan 1‡ , Yinming Jiao 1‡ , Simone de Jong 2 , Roel A. Ophoff 2 , Stephan Beck 3 , Andrew E. Teschendorff 1,4 * 1 Key Laboratory of Computational Biology, CAS-MPG Partner Institute for Computational Biology, Chinese Academy of Sciences, Shanghai Institute for Biological Sciences, Shanghai, China, 2 Center for Neurobehavioral Genetics, Los Angeles, California, USA, 3 Medical Genomics Group, UCL Cancer Institute, University College London, London, United Kingdom, 4 Statistical Genomics Group, UCL Cancer Institute, University College London, London, United Kingdom ‡ These authors contributed equally to this work. * [email protected] (AET), [email protected] (AET) Abstract Recent studies have demonstrated that the DNA methylome changes with age. This epige- netic drift may have deep implications for cellular differentiation and disease development. However, it remains unclear how much of this drift is functional or caused by underlying changes in cell subtype composition. Moreover, no study has yet comprehensively explored epigenetic drift at different genomic length scales and in relation to regulatory elements. Here we conduct an in-depth analysis of epigenetic drift in blood tissue. We demonstrate that most of the age-associated drift is independent of the increase in the granulocyte to lymphocyte ratio that accompanies aging and that enrichment of age-hypermethylated CpG islands increases upon adjustment for cellular composition. We further find that drift has only a minimal impact on in-cis gene expression, acting primarily to stabilize pre-existing baseline expression levels. By studying epigenetic drift at different genomic length scales, we demonstrate the existence of mega-base scale age-associated hypomethylated blocks, covering approximately 14% of the human genome, and which exhibit preferential hypo- methylation in age-matched cancer tissue. Importantly, we demonstrate the feasibility of in- tegrating Illumina 450k DNA methylation with ENCODE data to identify transcription factors with key roles in cellular development and aging. Specifically, we identify REST and regula- tory factors of the histone methyltransferase MLL complex, whose function may be dis- rupted in aging. In summary, most of the epigenetic drift seen in blood is independent of changes in blood cell type composition, and exhibits patterns at different genomic length scales remi- niscent of those seen in cancer. Integration of Illumina 450k with appropriate ENCODE data may represent a fruitful approach to identify transcription factors with key roles in aging and disease. PLOS Genetics | DOI:10.1371/journal.pgen.1004996 February 18, 2015 1 / 21 OPEN ACCESS Citation: Yuan T, Jiao Y, de Jong S, Ophoff RA, Beck S, Teschendorff AE (2015) An Integrative Multi-scale Analysis of the Dynamic DNA Methylation Landscape in Aging. PLoS Genet 11(2): e1004996. doi:10.1371/ journal.pgen.1004996 Editor: John M. Greally, Albert Einstein College of Medicine, UNITED STATES Received: October 29, 2014 Accepted: January 10, 2015 Published: February 18, 2015 Copyright: © 2015 Yuan et al. This is an open access article distributed under the terms of the Creative Commons Attribution License, which permits unrestricted use, distribution, and reproduction in any medium, provided the original author and source are credited. Data Availability Statement: All data used in this work has been previously published. The DNA methylation data is available from GEO under accession number GSE31848. Funding: TY, YJ, and AETare supported by the Chinese Academy of Sciences. The funders had no role in study design, data collection and analysis, decision to publish, or preparation of the manuscript. Competing Interests: The authors have declared that no competing interests exist.
-
Upload
independent -
Category
Documents
-
view
0 -
download
0
Transcript of An Integrative Multi-scale Analysis of the Dynamic DNA Methylation Landscape in Aging

RESEARCH ARTICLE
An Integrative Multi-scale Analysis of theDynamic DNA Methylation Landscape inAgingTian Yuan1‡, Yinming Jiao1‡, Simone de Jong2, Roel A. Ophoff2, Stephan Beck3, AndrewE. Teschendorff1,4*
1 Key Laboratory of Computational Biology, CAS-MPG Partner Institute for Computational Biology, ChineseAcademy of Sciences, Shanghai Institute for Biological Sciences, Shanghai, China, 2 Center forNeurobehavioral Genetics, Los Angeles, California, USA, 3Medical Genomics Group, UCL Cancer Institute,University College London, London, United Kingdom, 4 Statistical Genomics Group, UCL Cancer Institute,University College London, London, United Kingdom
‡ These authors contributed equally to this work.* [email protected] (AET), [email protected] (AET)
AbstractRecent studies have demonstrated that the DNAmethylome changes with age. This epige-
netic drift may have deep implications for cellular differentiation and disease development.
However, it remains unclear how much of this drift is functional or caused by underlying
changes in cell subtype composition. Moreover, no study has yet comprehensively explored
epigenetic drift at different genomic length scales and in relation to regulatory elements.
Here we conduct an in-depth analysis of epigenetic drift in blood tissue. We demonstrate
that most of the age-associated drift is independent of the increase in the granulocyte to
lymphocyte ratio that accompanies aging and that enrichment of age-hypermethylated CpG
islands increases upon adjustment for cellular composition. We further find that drift has
only a minimal impact on in-cis gene expression, acting primarily to stabilize pre-existing
baseline expression levels. By studying epigenetic drift at different genomic length scales,
we demonstrate the existence of mega-base scale age-associated hypomethylated blocks,
covering approximately 14% of the human genome, and which exhibit preferential hypo-
methylation in age-matched cancer tissue. Importantly, we demonstrate the feasibility of in-
tegrating Illumina 450k DNA methylation with ENCODE data to identify transcription factors
with key roles in cellular development and aging. Specifically, we identify REST and regula-
tory factors of the histone methyltransferase MLL complex, whose function may be dis-
rupted in aging.
In summary, most of the epigenetic drift seen in blood is independent of changes in
blood cell type composition, and exhibits patterns at different genomic length scales remi-
niscent of those seen in cancer. Integration of Illumina 450k with appropriate ENCODE data
may represent a fruitful approach to identify transcription factors with key roles in aging
and disease.
PLOS Genetics | DOI:10.1371/journal.pgen.1004996 February 18, 2015 1 / 21
OPEN ACCESS
Citation: Yuan T, Jiao Y, de Jong S, Ophoff RA, BeckS, Teschendorff AE (2015) An Integrative Multi-scaleAnalysis of the Dynamic DNA Methylation Landscapein Aging. PLoS Genet 11(2): e1004996. doi:10.1371/journal.pgen.1004996
Editor: John M. Greally, Albert Einstein College ofMedicine, UNITED STATES
Received: October 29, 2014
Accepted: January 10, 2015
Published: February 18, 2015
Copyright: © 2015 Yuan et al. This is an openaccess article distributed under the terms of theCreative Commons Attribution License, which permitsunrestricted use, distribution, and reproduction in anymedium, provided the original author and source arecredited.
Data Availability Statement: All data used in thiswork has been previously published. The DNAmethylation data is available from GEO underaccession number GSE31848.
Funding: TY, YJ, and AETare supported by theChinese Academy of Sciences. The funders had norole in study design, data collection and analysis,decision to publish, or preparation of the manuscript.
Competing Interests: The authors have declaredthat no competing interests exist.
Author Summary
Two well-known features of aging are the gradual decline of the body’s ability to regeneratetissues, as well as an increased incidence of diseases like cancer and Alzheimers. One of themost recent exciting findings which may underlie the aging process is a gradual modifica-tion of DNA, called epigenetic drift, which is effected by the covalent addition and removalof methyl groups, which in turn can deregulate the activity of nearby genes. However, thisstudy presents the most convincing evidence to date that epigenetic drift acts to stabilizethe activity levels of nearby genes. This study shows that instead, epigenetic drift may actprimarly to disrupt DNA binding patterns of proteins which regulate the activity of manygenes, and moreover identifies specific regulatory proteins with key roles in cancer and Alz-heimers. The study also performs the most comprehensive analysis of epigenetic drift at dif-ferent spatial scales, demonstrating that epigenetic drift on the largest length scales is highlyreminiscent of those seen in cancer. In summary, this work substantially supports the viewthat epigenetic drift may contribute to the age-associated increased risk of diseases like can-cer and Alzheimers, by disrupting master regulators of genomewide gene activity.
IntroductionRecent studies, using Illumina Infinium beadarrays, have demonstrated that genome-wideDNAmethylation patterns change with age [1–6]. Further studies have indicated that this age-associated epigenetic drift may have deep implications for stem-cell biology [7], disease devel-opment [8] and possibly also human evolution [9, 10]. Thus, it has become of great interestand importance to study the detailed dynamics of the DNA methylation landscape in responseto aging.
In this regard however there are many pressing unanswered questions. First is the issue ofcellular heterogeneity. Although a number of studies have already indicated that a significantcomponent of the epigenetic drift is tissue-independent, and therefore unlikely to be caused byunderlying changes in cell subtype composition [2, 3, 6], this result remains unproven and con-trasts with a number of Epigenome-Wide Association Studies (EWAS) for specific diseases, no-tably Rheumatoid Arthritis [11] and cancer [12, 13], which have shown that in the diseasecontext, correction of intra-sample cellular heterogeneity can be critical [11, 14]. Indeed, anumber of statistical methods have emerged allowing correction for cell subtype compositionalchanges [15, 16]. However, to date no study has applied these algorithms in the context of age-ing to assess how much of the epigenetic drift is due to underlying changes in cell-type compo-sition. This is particularly pertinent in the context of blood tissue, since in this tissue it isknown that there is an age-associated increase in the granulocyte to lymphocyte ratio [12, 15].
Another outstanding issue concerns the characteristic genomic length-scales of epigeneticdrift. Cancer epigenome studies have demonstrated that cancer-associated DNA methylationchanges exhibit differential patterns at different length scales, with local hypermethylation atCpG islands (CGIs) often immersed within large-megabase scale blocks of widespread hypo-methylation [17, 18]. However, so far no study has comprehensively explored whether hypo-methylated blocks emerge in normal tissue as a function of age, and whether these bear anyresemblance to those seen in cancer or early neoplastic lesions. Given that age is a major riskfactor for many diseases, specially cancer, the existence of such blocks could provide an impor-tant indicator of future disease development.
Finally, epigenetic drift is thought to be one mechanism underlying the decline of stem-cellfunction with age, thus compromising normal homeostasis [7, 9]. That this might be the case is
Integrative Multi-scale Analysis of Epigenetic Drift
PLOS Genetics | DOI:10.1371/journal.pgen.1004996 February 18, 2015 2 / 21

further supported by a recent study of dynamic DNA methylation changes during cellular de-velopment [19], which showed that differentially methylated regions (DMRs) in developmentare strongly enriched for regulatory elements. Indeed, differential binding of transcription fac-tors as a result of differential DNA methylation at transcription factor binding sites (TFBSs)may be an important mechanism of cellular development and lineage specification. It followsthat age-associated epigenetic drift may compromise binding of key lineage-specifying tran-scription factors. Although there is already considerable evidence that developmental tran-scription factors represent targets of epigenetic drift [2, 3], no study has yet explored in detailwhich transcription factor binding profiles may be disrupted in aging as a result of drift.
More generally, the ability to detect putative differential binding of transcription factors bystudying DNAmethylation patterns around their TFBSs is specially important because, unlikeChIP-Seq, DNAmethylation can be reliably measured genome-wide from limited amounts ofDNA [20]. Thus, DNA methylation can be measured in large numbers of clinical or non-clinical specimens, allowing in principle transcription factors disrupted in disease and ageingto be identified [21]. Moreover, differential binding caused by differential DNAmethylationmay represent a more accurate way of assessing differential activity of transcription factors. Forinstance, assessing transcription factor activity from its mRNA or protein expression level isproblematic due to postranslational modifications [22]. Thus, DNA methylation may provideimproved or complementary information about transcription factor activity.
In this work we perform a comprehensive study of DNAmethylation drift addressing thecore issues mentioned above. We focus on blood because of its availability and the fact that thelargest studies to date have been performed in this tissue [4, 5]. By using a powerful algorithm tocorrect for cellular heterogeneity [15], we demonstrate that most of the epigenetic drift, speciallythe age-hypermethylated component of it, is not caused by changes in blood cell subtype com-position. We further demonstrate that age-associated DNAmethylation patterns exhibit spatialpatterns at different genomic length scales which are reminiscent of those seen in cancer. More-over, by integrating large-scale 450k DNAmethylation data with extensive TFBS informationfrom the ENCODE project [23–25], we demonstrate the feasibility of the Illumina 450k technol-ogy to identify important lineage-specific transcription factors. Having demonstrated the feasi-bility of this approach in the context of cellular development, we next apply the same method toaging, identifying novel transcription factors which may be implicated in the aging process.
Results
Overall patterns of age-associated DNAmethylation are independent ofchanges in blood cell subtype compositionAge-associated DNAmethylation changes have so far only been studied comprehensively atthe level of individual CpGs [1–6], and in whole blood tissue, a tissue for which the largest sam-ple collections are available [4, 5]. However, the interpretation of age-associated changes inwhole blood is problematic due to underlying age-associated changes in blood cell subtype pro-portions [12, 15]. To address these challenges, recent studies have developed methods thatallow more robust inference of differential DNA methylation at the level of genomic regions[26, 27] and which is independent of underlying changes in cell subtype composition [15, 16].
Here we decided to use one of these recent methods [15], to re-analyze one of the largestIllumina 450k DNA methylation data sets available, encompassing whole blood samples from656 individuals spanning a wide age range (19 to 101 year olds) [5]. In order to call differentialmethylation more robustly and to avoid any statistical biases caused by neighboring probes onthe beadarray, we decided to collapse neighboring probes in the genome into specific clusters[26], dividing all probes up into 3 different regional classes: CpG islands, shelves & shores and
Integrative Multi-scale Analysis of Epigenetic Drift
PLOS Genetics | DOI:10.1371/journal.pgen.1004996 February 18, 2015 3 / 21
open sea. Specifically, probes within a class and which were spatially close were grouped intoregions with an upper bound of 1.5Kb set on the size of these regions (Methods). This resultedin 239650 regional clusters, consisting of 109424 open sea, 90090 shelve/shore, and 40136 CpGisland regions. Probe methylation values within regions were averaged. Supervised linear re-gression analysis was performed for each of the 239650 regions, adjusting for plate and gender(plate was fully correlated with ethnicity in such a way that adjusting for plate also adjusts forethnicity (Methods)), which identified 124352 age-DMRs at an FDR< 0.05. Focusing on thetop 5% age-DMRs (a total of 11982), the far majority (75%) were hypomethylated with age,consistent with previous observations [4, 5]. Although the majority of the top 5% DMRs fellinto open sea and shore/shelf regions, CpG-islands were more strongly enriched given theiroverall lower numbers in the genome (Fig. 1A). We observed a marked difference betweenopen sea or shore/shelf regions and CpG islands, with approximately 90% of open sea/shore/shelf age-DMRs exhibiting hypomethylation, in contrast to age-DMRs mapping to CpG is-lands, which were overwhelmingly hypermethylated (87%) with age (Fig. 1B). We verified thatall these results remained unchanged had we used a less stringent Bonferroni correction thresh-old (26019 age-DMRs) (S1_Fig in S1 Text). Age-DMRs mapping to CpG islands predominant-ly exhibited low levels of DNAmethylation in the youngest individuals of our cohort (age
Fig 1. Age-DMRs are mostly enriched for CGIs and the enrichment of age-hypermethylated CGIs increases after adjustment for changes in bloodcell subtype composition. A) Probabilities that a randomly picked open-sea, shore/shelf and CpG-island region is an age-DMR (defined as the top 5% ofDMRs).B)Relative numbers of age-hypermethylated and age-hypomethylated DMRs within each regional class. C) Focusing on CpG-islands, density plotsof beta DNAm values of 2500 age-DMRs (red) vs. 2500 non-age associated DMRs (green) (P> 0.8). D) As A) but now for age-DMRs derived using thereference-based method of Houseman et al, which adjusts for putative changes in blood cell subtype proportions. E) As B), but now for the adjusted analysis.F) Scatterplot of the t-statistics of age-DMRs (defined here as those with FDR< 0.05 in the unadjusted analysis) (x-axis) against their corresponding t-statistics from the reference-based adjusted analysis (t(RefBased), y-axis). Green dashed lines indicate the lines of significance at FDR< 0.05.
doi:10.1371/journal.pgen.1004996.g001
Integrative Multi-scale Analysis of Epigenetic Drift
PLOS Genetics | DOI:10.1371/journal.pgen.1004996 February 18, 2015 4 / 21
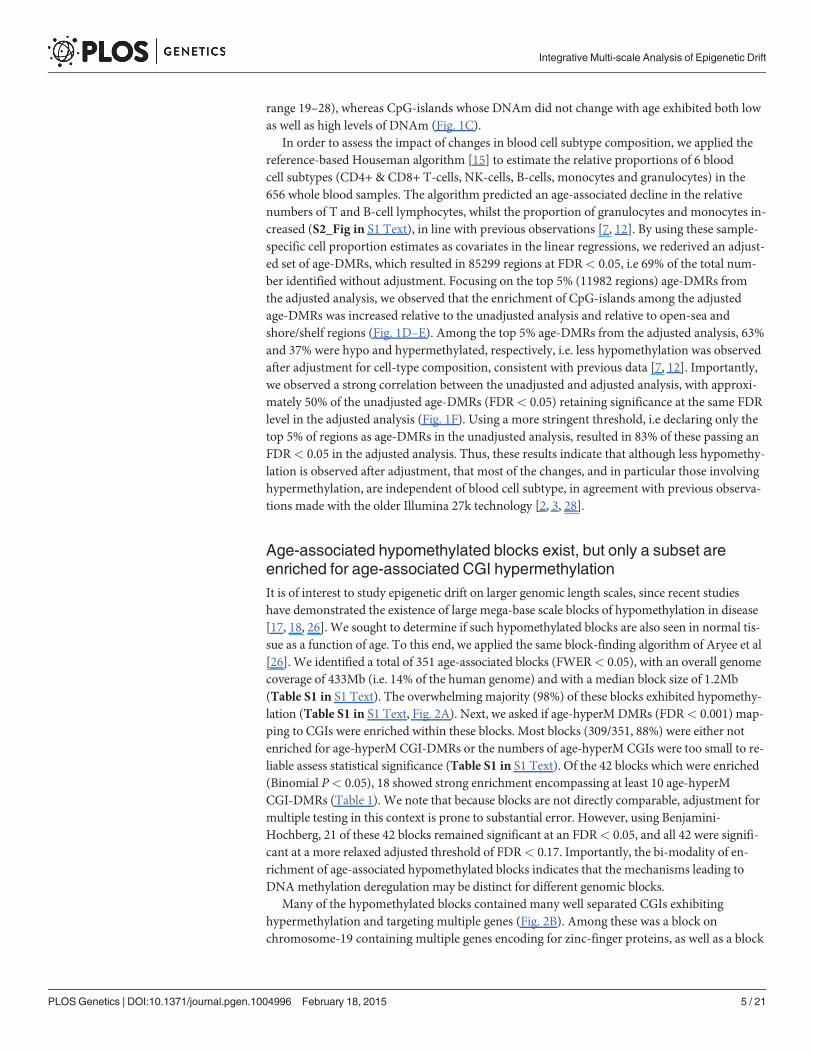
range 19–28), whereas CpG-islands whose DNAm did not change with age exhibited both lowas well as high levels of DNAm (Fig. 1C).
In order to assess the impact of changes in blood cell subtype composition, we applied thereference-based Houseman algorithm [15] to estimate the relative proportions of 6 bloodcell subtypes (CD4+ & CD8+ T-cells, NK-cells, B-cells, monocytes and granulocytes) in the656 whole blood samples. The algorithm predicted an age-associated decline in the relativenumbers of T and B-cell lymphocytes, whilst the proportion of granulocytes and monocytes in-creased (S2_Fig in S1 Text), in line with previous observations [7, 12]. By using these sample-specific cell proportion estimates as covariates in the linear regressions, we rederived an adjust-ed set of age-DMRs, which resulted in 85299 regions at FDR< 0.05, i.e 69% of the total num-ber identified without adjustment. Focusing on the top 5% (11982 regions) age-DMRs fromthe adjusted analysis, we observed that the enrichment of CpG-islands among the adjustedage-DMRs was increased relative to the unadjusted analysis and relative to open-sea andshore/shelf regions (Fig. 1D–E). Among the top 5% age-DMRs from the adjusted analysis, 63%and 37% were hypo and hypermethylated, respectively, i.e. less hypomethylation was observedafter adjustment for cell-type composition, consistent with previous data [7, 12]. Importantly,we observed a strong correlation between the unadjusted and adjusted analysis, with approxi-mately 50% of the unadjusted age-DMRs (FDR< 0.05) retaining significance at the same FDRlevel in the adjusted analysis (Fig. 1F). Using a more stringent threshold, i.e declaring only thetop 5% of regions as age-DMRs in the unadjusted analysis, resulted in 83% of these passing anFDR< 0.05 in the adjusted analysis. Thus, these results indicate that although less hypomethy-lation is observed after adjustment, that most of the changes, and in particular those involvinghypermethylation, are independent of blood cell subtype, in agreement with previous observa-tions made with the older Illumina 27k technology [2, 3, 28].
Age-associated hypomethylated blocks exist, but only a subset areenriched for age-associated CGI hypermethylationIt is of interest to study epigenetic drift on larger genomic length scales, since recent studieshave demonstrated the existence of large mega-base scale blocks of hypomethylation in disease[17, 18, 26]. We sought to determine if such hypomethylated blocks are also seen in normal tis-sue as a function of age. To this end, we applied the same block-finding algorithm of Aryee et al[26]. We identified a total of 351 age-associated blocks (FWER< 0.05), with an overall genomecoverage of 433Mb (i.e. 14% of the human genome) and with a median block size of 1.2Mb(Table S1 in S1 Text). The overwhelming majority (98%) of these blocks exhibited hypomethy-lation (Table S1 in S1 Text, Fig. 2A). Next, we asked if age-hyperM DMRs (FDR< 0.001) map-ping to CGIs were enriched within these blocks. Most blocks (309/351, 88%) were either notenriched for age-hyperM CGI-DMRs or the numbers of age-hyperM CGIs were too small to re-liable assess statistical significance (Table S1 in S1 Text). Of the 42 blocks which were enriched(Binomial P< 0.05), 18 showed strong enrichment encompassing at least 10 age-hyperMCGI-DMRs (Table 1). We note that because blocks are not directly comparable, adjustment formultiple testing in this context is prone to substantial error. However, using Benjamini-Hochberg, 21 of these 42 blocks remained significant at an FDR< 0.05, and all 42 were signifi-cant at a more relaxed adjusted threshold of FDR< 0.17. Importantly, the bi-modality of en-richment of age-associated hypomethylated blocks indicates that the mechanisms leading toDNAmethylation deregulation may be distinct for different genomic blocks.
Many of the hypomethylated blocks contained many well separated CGIs exhibitinghypermethylation and targeting multiple genes (Fig. 2B). Among these was a block onchromosome-19 containing multiple genes encoding for zinc-finger proteins, as well as a block
Integrative Multi-scale Analysis of Epigenetic Drift
PLOS Genetics | DOI:10.1371/journal.pgen.1004996 February 18, 2015 5 / 21

on chromosome-13 containingMYCBP2 and POU4F1. However, we also observed hypo-methylated blocks where the enrichment was driven by hypermethylated CGIs which were allin close proximity to each other, for example this was the case for a block on chromosome-4with all CGIs in the neighborhood of theHAND2 gene (S3_Fig in S1 Text), a gene which hasalready been linked to aging [1] and which has also been causally implicated in endometrialcarcinogenesis [29]. Thus, our analysis suggests that only a relatively small fraction of hypo-methylated blocks are enriched for age-hypermethylated CGIs, with a few of these blocks rep-resenting hotspots of CGI hypermethylation.
Age-associated hypomethylated blocks exhibit preferentialhypomethylation in cancer, independently of age and tissueNext, we asked if age-associated hypomethylated blocks overlap significantly with those seen incancer. To investigate this, we mapped the age-associated hypomethylated blocks onto cancer
Fig 2. Age-associated hypomethylated blocks enriched for hypermethylated CGIs. A) Example of a large genomic region on chromosome-19containing a significant age-associated hypomethylated block (indicated in green). y-axis gives the fit from the Bumphunter algorithm indicating themethylation change for an increase in 10 age-years, x-axis the genomic position. B) Selected age-hypomethylated blocks enriched for CGIs undergoinghypermethylation. Each plot shows the fit from the Bumphunter algorithm indicating the methylation change per 10 age-years (y-axis) as a function ofopensea probe position (x-axis). In blue we indicate the positions of CGIs, and in red those that are significantly hypermethylated with age. Some of thegenes associated with the age-hypermethylated CGIs are indicated in red.
doi:10.1371/journal.pgen.1004996.g002
Integrative Multi-scale Analysis of Epigenetic Drift
PLOS Genetics | DOI:10.1371/journal.pgen.1004996 February 18, 2015 6 / 21

DNAmethylation data from the TCGA [30], comparing average DNAmethylation levels ofopen sea probes within blocks between normal and age-matched cancer tissue. Blocks showedsignificantly lower DNAm levels in cancer tissue compared to age-matched normal samples,independently of tissue type (Fig. 3). Next, we randomly picked open sea blocks which did notshow significant age-associated hypomethylation in blood and recomputed statistics of differ-ential methylation for these blocks. Comparing the distribution of the statistics of differentialDNAm for the age-associated blocks to these randomly picked blocks, revealed significantlylarger negative statistics (Kolmogorov-Smirnov P< 1e − 10) for the age-associated hypoMblocks (Fig. 3). Thus, this extends previous observations made at the level of CGIs to the mega-base scale block level, further supporting the view that much of the cancer-associated deregula-tion of DNA methylation may already be present in aged normal tissue [31].
Most age-DMRs do not affect expression of target genesNext, we decided to shed further light on the potential functional effect of epigenetic drift. Al-though a recent study, which performed matched Illumina 450k and gene expression profilingfor the same blood samples, concluded that most drift does not cause gene expression changes,this study was significantly underpowered [32]. Thus, given that another unmatched study didreport a weak association between age-DMRs and gene expression [5], the functional signifi-cance of epigenetic drift remains unclear. To address this question, we analysed one of the larg-est whole blood gene expression datasets available, encompassing over 200 samples [33](Methods). We focused on DNAm levels in CpG island probe clusters with probes mapping to
Table 1. 18 Age-associated hypomethylated open sea blocks enriched for CGIs undergoing age-associated hypermethylation, and containing atleast 10 such CGIs.
Chr Length(Mb) Probes FWER(hypoM) Obs(AgeHyperCGI) Exp(AgeHyperCGI) P(Enr)
16 4.88 204 < 0.002 36 28.20 0.034
19 1.97 181 < 0.002 38 24.42 6e-04
13 4.23 133 < 0.002 10 4.65 0.001
5 2.02 112 < 0.002 13 7.56 0.007
2 1.24 79 < 0.002 16 9.01 0.002
2 2.27 88 < 0.002 12 6.69 0.005
12 2.32 135 0.002 38 14.83 3e-12
13 1.96 63 0.002 11 6.98 0.025
14 1.58 51 0.002 12 5.23 2e-04
4 2.08 27 0.002 11 6.40 0.011
4 0.70 15 0.002 10 5.52 0.008
6 3.18 188 0.004 21 12.79 0.003
2 2.28 94 0.004 20 13.66 0.017
20 1.97 77 0.004 32 22.97 0.011
5 2.58 113 0.006 10 4.07 2e-04
8 1.91 60 0.008 20 7.85 2e-07
7 1.22 50 0.028 25 18.32 0.026
7 0.55 51 0.034 17 9.01 7e-04
Columns label chromosome, length of block (Mb), number of contiguous open sea regions defining hypomethylated block, the family wise error rate
(FWER) for the hypomethylated block, observed number of age-hyperM CGIs within block, expected number of age-hyperM CGIs within block and
Binomial P-value of enrichment of age-hyperM CGIs within block. In bold-face we indicate those significant under adjustment for multiple testing
(Benjamini-Hochberg FDR < 0.05).
doi:10.1371/journal.pgen.1004996.t001
Integrative Multi-scale Analysis of Epigenetic Drift
PLOS Genetics | DOI:10.1371/journal.pgen.1004996 February 18, 2015 7 / 21

Fig 3. Age-associated hypomethylated blocks exhibit preferential hypomethylation in cancer. Left boxplots show the average beta methylation levelsover open-sea regions within an age-associated hypomethylated block on Chr-10 in normal tissue and age-matched cancers from the TCGA. (A)Endometrial Cancer (UCEC),B) Lung Adenoma Carcinoma (LUAD), C) Breast Cancer,D) Lung Squamous Cell Carcinoma (LSCC). P-values in boxplots arefrom aWilcoxon rank sum test. Number of samples in each group is indicated. Right panel depicts the density distribution of the t-statistics of all age-hypomethylated blocks (magenta), as assessed between normal and age-matched cancer tissue. The cyan curve represents the corresponding statistics fora random set of non-age associated blocks, matched for number and length distribution of the observed age-hypomethylated blocks. P-value is from aKolmogorov-Smirnov test.
doi:10.1371/journal.pgen.1004996.g003
Integrative Multi-scale Analysis of Epigenetic Drift
PLOS Genetics | DOI:10.1371/journal.pgen.1004996 February 18, 2015 8 / 21

within 200bp of the transcription start site (TSS) or 1st exon, since it was shown previouslythat Illumina 450k probes mapping to these regions provide the best predictive power of a cor-responding gene’s expression level [34]. However, we did not find any global statistical signifi-cance between the statistics of differential DNAmethylation and those of differentialexpression (S4_Fig in S1 Text).
To understand why, we posited that age hyperM CGI-DMRs may preferentially target geneswhich are normally not expressed in blood, whilst age-hypoM CGI-DMRs may corresponding-ly target more highly expressed genes. To test this hypothesis it is important to first obtain esti-mates of the baseline levels of expression in blood, ideally at birth. To this end, we obtained anexpression data set of cord blood and placenta samples [35]. Confirming our hypothesis, weobserved a highly significant trend with genes undergoing age-hypermethylation around theirTSSs exhibiting significantly lower levels of expression than genes exhibiting age-associatedhypomethylation (Fig. 4A). Thus, age-associated modulation of DNAmethylation is unlikelyto cause widespread in-cis expression alterations, because the direction of DNAm change mayonly act to stabilize pre-existing expression levels. To validate this result, we decided to repeatthis analysis in the de Jong et al cohort [33], separately on young and old age groups. Remark-ably, we observed a similar trend as in the cord blood and placenta data (Fig. 4B). Importantly,we can also observe no difference in the expression levels of age-hyperM or age-hypoM genesbetween the younger and older individuals (Fig. 4B).
In order to validate these results further, we collected another relatively large gene expres-sion data set of 198 whole blood samples, albeit this cohort consisted of significantly older indi-viduals [36]. Confirming our earlier result, we did not find that genes mapping to age-hyperMDMRs exhibited age-associated decreases in gene expression, and similarly that genes mappingto age-hypoM DMRs did not exhibit gene expression increases (S4_Fig in S1 Text). Important-ly, in this cohort we also observed a significantly higher level of expression of genes undergoingage-associated hypoM in their promoters compared to those undergoing age-associatedhyperM, a result which was also independent of age-group (Fig. 4C).
Integration of Illumina 450k DNAmethylation and ENCODE data toidentify transcription factors associated with cellular phenotypesA recent study used whole-genome bisulfite sequencing (WGBS) to demonstrate that differen-tial DNA methylation can be a powerful means of identifying regulatory elements, includingtranscription factors, which play key roles in cellular development [19]. Similarly, we positedthat differential DNAmethylation changes associated with age, if enriched for transcriptionfactor binding sites (TFBS), may allows us to identify transcription factors whose differentialbinding and activity patterns become disrupted with age.
In order to assess the potential of the Illumina 450k platform to identify relevant transcrip-tion factors through differential DNAm patterns, we first considered the case of cellular devel-opment and lineage specification, where key transcription factors are already known.Specifically, we collected an Illumina 450k DNA methylation data set of 153 samples, encom-passing human embryonic stem cell (hESCs) and induced pluripotent stem cell (iPSCs) lines,as well as somatic (differentiated) tissue specimens (Methods) [37]. We derived DMRs betweenthe hESCs and the differentiated cell types from a total of 244347 regional clusters (Fig. 5A).Focusing on the top 5% of DMRs (all passed FDR< 0.001), we observed that the majority werehypomethylated in differentiated cells, with open sea regions generally exhibiting hypomethy-lation, in contrast to shore/shelf and CGIs which were mostly hypermethylated (Fig. 5B). Toassess enrichment of TFBS among the DMRs, we first mapped 450k probes onto binding sitesof 58 transcription factors (TFs), as assessed by the ENCODE consortium [23] in the H1 hESC
Integrative Multi-scale Analysis of Epigenetic Drift
PLOS Genetics | DOI:10.1371/journal.pgen.1004996 February 18, 2015 9 / 21

line (Methods). The average fraction of 450k probe CpGs mapping within a binding site of oneof the 58 TFs was 3% (* 16316 probes), with Pol2 exhibiting the largest overlap (12%) andBCL11A the lowest (< 0.01% i.e. less than 454 probes) (S5_Fig in S1 Text). Enrichment analy-sis was then performed for each one of the 58 ENCODE transcription factors, and separately,on the hypermethylated and hypomethylated DMRs (Table S2 in S1 Text). Confirming the re-sults of Ziller et al [19], we observed that DMRs which exhibited lower levels of methylation inhESCs were massively enriched for binding sites of well-known pluripotency factors such as
Fig 4. Age-associated hypermethylation (hypomethylation) targets lowly (highly) expressed genes. A) Boxplots of mRNA expression levels in cordblood and placenta samples, for three sets of genes: (i) genes undergoing age-associated hypomethylation in their CGI promoters (AgeHypoM), (ii) genesnot undergoing any age-associated DNAm changes (NonAgeDMR), and (iii) genes undergoing age-associated hypermethylation in their CGI promoters(AgeHyperM). P-values shown between groupds are from aWilcoxon-rank sum test comparing the respective neighboring gene classes. The number ofgenes in each class is indicated below plot. The P-value from a linear regression of expression against gene-class is also indicated in red. B) Left panel: AsA) but for the whole blood samples of de Jong et al 2014, for individuals under the age of 30. Right panel: As left panel, but now for 49 whole blood samplesfrom people over the age of 50. C) As B) but now for the expression data set of Beineke et al 2012.
doi:10.1371/journal.pgen.1004996.g004
Integrative Multi-scale Analysis of Epigenetic Drift
PLOS Genetics | DOI:10.1371/journal.pgen.1004996 February 18, 2015 10 / 21

POU5F1 and NANOG (Fisher-test P< 10−10, Fig. 5C). Out of the 58 TFs considered, besidesOCT4 and NANOG, only 7 others (BCL11A, HDAC2, SP1, MAFK, c-JUN, CtBP2 and RXRA)showed specific enrichment (all significant with Fisher-test P< 10−5 and with Benjamini-Hochberg (BH) adjusted P< 0.05) among DMRs hypomethylated in hESCs. A total of 5 TFs(TCF12, p300, TEAD4, ATF2, JUN-D) showed bivalent enrichment in both hypermethylatedand hypomethylated DMRs. The rest of TFs showed specific enrichment among the DMRshypomethylated in differentiated cells (Fig. 5C). Notably, CTCF was the most strongly en-riched TF among DMRs losing methylation in differentiated cells. It is also noteworthy thatcomponents of the polycomb complex (e.g. SUZ12 or EZH2) were not enriched in either thehypermethylated or hypomethylated DMRs (Fig. 5C), suggesting that polycomb binding doesnot play a major role in cellular differentiation. Confirming the robustness of the results and
Fig 5. Identification of pluripotent and lineage-specific TFs by integration of Illumina 450k DNAmwith ENCODE data. A) Probabilities that a randomlypicked open-sea, shore/shelf and CpG-island region is a DMR between pluripotent and differentiated cells (defined as the top 5% of DMRs).B) Relativenumbers of DMRs hypomethylated within hESCs and differentiated cell types and within each regional class. C) Enrichment heatmap of transcription factorbinding sites (as assessed in H1-hESC) for 58 TFs, among the DMRs hypomethylated in hESCs (HypoESC) and DMRs hypomethylated in differentiatedcells (HypoDIFF). D) Enrichment heatmap of transcription factor binding sites (HepG2 line) for the top ranked 58 TFs, among DMRs hypomethylated inhESCs (HypoESC) and DMRs hypomethylated in liver cells (HypoLIV). In C-D), TFs have been ranked according to the significance of enrichment amongHypoESCDMRs. Color codes: white (P> 0.01), pink (P< 0.01), red (P< 1e − 5), brown (P< 1e − 10). ChIP-Seq binding profiles of the same TF butgenerated by different labs are distinguished by an abbreviation of the corresponding lab: SF (Stanford), HA (Hudson-Alpha).
doi:10.1371/journal.pgen.1004996.g005
Integrative Multi-scale Analysis of Epigenetic Drift
PLOS Genetics | DOI:10.1371/journal.pgen.1004996 February 18, 2015 11 / 21

reliability of the ENCODE data, we observed that ChIP-Seq binding profiles of the same TFbut generated by different laboratories had very similar enrichment values (Fig. 5C).
Among the 60 somatic tissue samples, some tissues were represented in sufficient numbersto also allow for tissue-specific analyses. To see whether differential DNAmethylation wouldallow us to infer lineage-specific transcription factors, we considered the case of liver-tissue[19]. Because ChIP-Seq for a reasonable number of TFs (more than 50) has only been per-formed for a liver cancer cell line (HepG2), we used the binding site profiles as determined inthis cell-line. We identified a total of 1547 DMRs hypomethylated in hESCs compared to nor-mal liver samples (n = 4), compared to as many as 10670 DMRs which were hypomethylatedin the normal liver cells. TFBS enrichment analysis revealed massive enrichment of FOXA1,FOXA2, CEBPB, HNF4A and HNF4G binding sites (Fisher test P< 10−10, BH-adjustedP< 0.05) among the liver-specific hypomethylated regions (Fig. 5D & Table S3 in S1 Text),once again consistent with previous observations [19] and with the previously documentedrole of these TFs in liver specification [38, 39].
Differential DNA methylation patterns identify REST and chromatinorganization factors as key targets of disruption during agingHaving validated our algorithm in the context of cellular development, we next asked if specificTFBSs may be enriched among age-associated DMRs. Using ENCODE TFBSs as assessed inthe H1-hESC line, we found that even though only the minority (3036 DMRs, 25%) of age-DMRs were hypermethylated, that these were more strongly enriched (Table S2 in S1 Text).The transcription factors most strongly enriched among age-hypermethylated DMRs were twopolycomb components (EZH2, SUZ12), as well as RBBP5 and NRSF/REST (Fig. 6A). Far fewerTFs were enriched among age-hypomethylated DMRs, but most of these also showed enrich-ment of binding sites among age-hypermethylated DMRs (e.g. RAD21, ZNF143, CTCF)(Fig. 6A, Table S4 in S1 Text). We note that most of the enrichments were highly significant(Fisher-test P< 10−10, BH-adjusted P< 0.05, Fig. 6A, Table S4 in S1 Text).
Because many transcription factors co-bind at specific sites, we next performed a multivari-ate regression analysis to assess if the association of a given TF binding profile with age-associated DNA methylation is independent of co-binding by other TFs (Methods). We notethat no pair of distinct TFs exhibited a Jaccard Coefficient overlap higher than 0.7, thus allow-ing us to use all distinct TF binding profiles in the multivariate analysis, which largely con-firmed the previous enrichment analysis (Fig. 6B). Specifically, the polycomb factors (EZH2,SUZ12) were once again highly enriched among age-hyperM DMRs, as well as RBBP5, TAF1,NRSF/REST, CTBP2 and EGR1. TFs whose binding sites were enriched among age-hypoMDMRs included as before RAD21 and ZNF143, but now also ATF2, CEBPB and JARID1A. Weverified that results were largely unchanged had we used the age-DMRs from the cellular het-erogeneity adjusted analysis (SI, S6_Fig in S1 Text).
Next, we asked if particular TFs have binding sites enriched within the previously identifiedage-associated hypomethylated blocks. Not unsurprisingly, this revealed TFs whose bindingsites we previously found to be enriched within age-hypoM DMRs (e.g. RAD21, ZNF143,CTCF, S7_Fig in S1 Text). However, it also identified a number of TFs whose binding siteswere enriched only among age-hyperM DMRs, specifically this was the case for SIN3A, TBPand TAF1. Interestingly, these specific TFs also had substantially more binding sites withinopen-sea regions, in comparison to say the polycomb factors (EZH2,SUZ12) which exhibitedthe least enrichment of binding sites within blocks (S7_Fig in S1 Text).
In summary, our integrative DNAmethylation ENCODE analysis not only points towardsan age-associated disruption of PRC2 binding, but also of that of important transcription
Integrative Multi-scale Analysis of Epigenetic Drift
PLOS Genetics | DOI:10.1371/journal.pgen.1004996 February 18, 2015 12 / 21

Fig 6. Enrichment of TFBSs among age-DMRs. A) Left top panel depicts the age of the individuals from which the blood samples were taken, sorted byincreasing age. Heatmap depicts relative DNAmethylation levels for the top 500 age-hypomethylated and top 500 age-hypermethylated DMRs (blue =relative high DNAmethylation, yellow = relative low DNAmethylation), with samples sorted by increasing age. Right panel depicts (with black lines) whichDMRs overlap with transcription factor binding sites (TFBS) for a number of TFs which exhibited highly significant enrichment either for age-hypermethylatedor age-hypomethylated DMRs (or both). Below the panels we give the odds ratios (OR) and Fisher-test P-values (P) of enrichment of the correspondingTFBSs among age-hypermethylated and age-hypomethylated regions of the top 5% of age-DMRs. B)Combinatorial enrichment analysis of TFBSs. TFshave been sorted according to the strength of association (P-value) of their binding profile with the association of a region’s DNAmethylation with age, asassessed from a multivariate linear regression model. Color code for P-values: white (P> 0.01), pink (P< 0.01), red (P< 1e − 5), brown (P< 1e − 10). BelowP-value bar we show the corresponding estimated t-statistic in the multivariate analysis (magenta = strongly significant (P< 0.001) positive values, cyan =strongly significant (P< 0.001) negative values).
doi:10.1371/journal.pgen.1004996.g006
Integrative Multi-scale Analysis of Epigenetic Drift
PLOS Genetics | DOI:10.1371/journal.pgen.1004996 February 18, 2015 13 / 21

factors like REST, which has recently been strongly implicated in Alzheimer’s [40], and RBBP5,which interacts with members of the histone methyltransferase MLL complex. In addition, thedata points towards a potential binding site redistribution of other transcription factors likeRAD21, ZNF143 and the chromatin organization factor CTCF. Of note, pluripotency factors,which were strongly enriched in the previous cellular development/differentiation analysis,were not so in the aging analysis (Tables S2 & S4 in S1 Text & Fig. 6).
DiscussionGiven the emerging importance of age-associated epigenetic drift, we decided to conduct anin-depth novel integrative multi-scale analysis of this epigenetic phenomenon in whole bloodtissue, the tissue for which the largest data set is available. Our analysis makes a number of im-portant novel observations, whilst also confirming some earlier findings made with the lesscomprehensive Illumina 27k arrays [41].
First, we have demonstrated that most of the epigenetic drift is not caused by underlyingchanges in blood cell subtype proportions. Indeed, focusing on the 5% most significant age-associated DNAmethylation changes, we observed that over 80% of these changes retained sta-tistical significance in an analysis adjusted for shifts in blood cell subtype proportions. Intrigu-ingly, we observed that age-DMRs were enriched most strongly for CpG islandhypermethylation and that this enrichment increased upon adjustment for cellular heterogene-ity (Fig. 1). We note that although opensea and shore/shelf probes were generally much morenumerous among age-DMRs (Figs. 1B & 1E), that this seems to only reflect the bias of the 450karray towards this class of probes. Normalizing for this bias, as we did here, shows that CGIshave the highest probability of being an age-DMR (Figs. 1A & 1D). The stronger enrichment ofCGIs in the adjusted analysis is also consistent with two previous observations: First, that themain age-associated shift in blood cell subtype composition, ie. an increase in the granulocyteto lymphocyte ratio, is accompanied by a global loss of methylation [7], and secondly, that asignificant proportion of developmental DMRs are distal to promoter CGIs and TSSs [19].Thus, if a substantial proportion of the myeloid/lymphoid cell subtype specificity is conveyedby DNAmethylation patterns in shore/shelf and open-sea regions, then this would explainwhy these regions are less enriched after adjustment for the age-associated myeloid/lymphoidskewing. All these are important observations, because it suggests that the mechanisms leadingto the age-associated modulation of the DNAmethylome are very distinct to those implicatedin development and differentiation. This is perhaps not surprising, since otherwise drift, whichis already prominent in early life [42, 43], would have a dramatic effect on normal tissue ho-meostasis well before the normal aging effects become visible [10]. Our integrative analysiswith a large blood gene expression data set further supports this view, since we found that driftdoes not significantly alter in-cis gene expression levels, a result which is also consistent with arecent age-related gene expression study conducted in lymphoblastoid cell-lines [44]. In fact,quite remarkably, we observed that drift may act to stabilize pre-existing baseline levels of geneexpression. Indeed, we found that age-associated hypermethylation at CGIs preferentially tar-gets genes that are not expressed in blood tissue, whereas age-associated hypomethylation cor-respondingly targets more highly expressed genes (Figs. 4A & B). This confirms an earlierobservation made by Day et al with the older Illumina 27k beadarrays [41], and was further val-idated in another large gene expression data set (Fig. 4B).
It is important to point out that our observation that a significant proportion of epigeneticdrift is not caused by changes in blood-cell type composition does not contradict the observa-tions and recommendations of Jaffe and Irizarry [14]. As shown here, adjustment for blood-cell type composition does remove some of the epigenetic drift attributable to the increase in
Integrative Multi-scale Analysis of Epigenetic Drift
PLOS Genetics | DOI:10.1371/journal.pgen.1004996 February 18, 2015 14 / 21
the granulocyte to lymphocyte ratio (Fig. 1F & S2_Fig in S1 Text). Most importantly, however,it should be clear that the effect of cell type compositional changes on inferred DNA methyla-tion patterns will depend on two main factors: the tissue type and the phenotype being consid-ered. Thus, when comparing patterns of DNA methylation in blood tissue between cancerpatients and healthy controls, there is a strong need for adjustment because the presence of thetumour induces dramatic changes in blood-cell type composition [12, 14, 15]. Likewise, whencomparing DNAm patterns in blood of Rheumatoid Arthritis (RA) patients to that of controls,adjustment is critical as demonstrated by Liu et al [11]. Our data strongly supports the viewthat age has a much less dramatic effect on changes in blood cell type composition, comparedto cancer-presence or RA.
Another important contribution is the demonstration of large megabase-scale blocks of age-associated hypomethylation, covering 14% of the genome, and, importantly, that only a subsetof these blocks are enriched for age-associated CGI hypermethylation (Fig. 2, Table S1 in S1Text). Interestingly, we also found that age-associated hypomethylated blocks preferentiallyundergo hypomethylation in cancer compared to other open sea regions which do not changewith age (Fig. 3). However, we also observed some differences in relation to what has been ob-served in cancer. Notably, in cancer most hypomethylated blocks are enriched for CGI hyper-methylation [18]. In contrast, CGI hypermethylation within age-hypomethylated blocks wasonly seen for a relatively small fraction of blocks. Given that most of the age-associated CGIhypermethylation is independent of blood cell subtype, it is highly plausible that these specificchanges are also present in other tissue types. Indeed, that the age-hypermethylated componentof drift appears to be specially independent of tissue type was an observation made by us previ-ously with Illumina 27k beadarrays [2] and further confirmed by others [28]. Thus, it is of in-terest to consider the specific genes targeted for aberrant DNAmethylation within theseblocks. For instance, we identified a hypomethylated block on chromosome-4, containing age-hypermethylated CGIs targeting the promoter of the HAND2 gene. This transcription factorhas been shown to be causally implicated, through DNAm induced silencing, in the develop-ment of endometrial cancer [29]. SpecificallyHAND2mediates the tumour suppressive effectsof progesterone [29]. Interestingly, age is also one of the main risk factors for endometrial can-cer, hence it is plausible that age-associatedHAND2 promoter methylation, if present in endo-metrial tissue, could be a contributing factor to endometrial cancer risk. Indeed, there isalready prior evidence that HAND2’s promoter undergoes age-associated DNA hypermethyla-tion in epithelial tissues [1]. Interestingly, the effect of HAND2methylation on endometrialcancer risk is mediated by methylation and silencing of HAND2 in endometrial stromal non-immune cells, increasing paracrine signaling through release of fibroblast growth factors thussensitizing the endoemtrial epithelial cells to oncogenic estrogen [29]. That the DNAmethyla-tion ofHAND2 in cancer tissue is not attributable to immune cell infiltration, is an importantobservation because it suggests that some of the common hypermethylation seen in aged bloodtissue and in cancer tissue may not be due to immune-cell activation and tumour-infiltrationof these activated immune cells.
In this work we also performed an integrative analysis of epigenetic drift, as measured withIllumina 450k beadarrays, with ENCODE data, and specifically with ChIP-Seq transcriptionfactor binding site data for a total of 58 TFs as determined in a human embryonic stem cellline. This analysis not only identified specific polycomb factors (SUZ12, EZH2), previously al-ready known to be targeted by age-associated DNA hypermethylation [2, 3], but also several in-teresting regulatory factors, including RBBP5, NRSF, SIN3A, TAF1, EGR1 and CTBP2, some ofwhich (e.g. RBBP5) have not been previously implicated in aging. For instance, RBBP5 (retino-blastoma binding protein-5), a protein whose role in aging is only implied from homology(JenAge AgeFactDB database) [45], is part of the MLL1/MLL complex, whose role is to
Integrative Multi-scale Analysis of Epigenetic Drift
PLOS Genetics | DOI:10.1371/journal.pgen.1004996 February 18, 2015 15 / 21

methylate/di-methylate lysine-4 of histone H3, which is a tag for epigenetic transcriptionalactivation. Thus, age-induced impairment of RBBP5 binding could lead to functional disrup-tion of the MLL complex and hence to loss of H3K4 methylation, a well-known aging effect[46, 47]. Interestingly, RBBP5 has also been shown to interact with TAF1, TAF7 and TBP, allmembers of the transcription factor IID (TFIID) multiprotein complex, and all of which hadbinding sites enriched among age-hyperM DMRs, even in the multivariate analysis (Fig. 6B &S8_Fig in S1 Text). Both TAF1 and TBP have entries in the GenAge HAGR database [48], withTAF1 being essential for cell cycle progression. Another TF with an entry in the GenAgeHAGR database is SIN3A: interestingly, SIN3A has been shown to function in histone deacety-lase pathways [49] (S9_Fig in S1 Text), as well as in the deacetylation of the c-MYC protein,thus contributing to its repression [50]. Of note,MXI1, an interacting partner of SIN3A, wasalso enriched in our TFBS analysis (Table S4 in S1 Text), although it lost the enrichment in themultivariate analysis (Fig. 6B). Yet another TF with enriched binding sites among age-hyperMDMRs and with an entry in the GenAge database is EGR1. This gene is an important regulatorof the cell-cycle, with pro-apoptotic functions and acting upstream of TP53 (S9_Fig in S1 Text).Finally, our list also included NRSF/REST, which has a role in suppressing genes which promoteAlzheimer’s disease [40]. Thus, our data suggests age-associated functional disruption of REST,which may allow Alzheimer promoting genes to be expressed. In addition, we observed thatCTCF was one of a few number of transcription factors whose binding sites were enrichedamong both age-hypomethylated DMRs, suggesting a global redistribution of chromatin pat-terns with age. Thus, overall, our integrative analysis points towards an age-associated disrup-tion of DNA binding of transcription factors with important roles in histone deacetylation,histone methylation, chromatin architecture and tumour suppressor pathways. In this regard, itis worth emphasizing some of the key differences with the corresponding integrative ENCODEanalysis performed in the context of cellular differentiation. For instance, pluripotency factorssuch asNANOG or OCT4. and chromatin factors such asHDAC2 or CTCF2, all of which playkey roles in differentiation from hESCs, played a much less significant role in the context ofaging, wheras the opposite is true for the polycomb factors EZH2 and SUZ12.
ConclusionsIn summary, this work has shown that age-associated DNA methylation changes seen in bloodare largely independent of changes in blood cell type composition, and reflect patterns ofchange at different genomic length scales which are reminiscent of those seen in cancer. By in-tegrating Illumina 450k with ENCODE data we have furthermore identified a number of can-didate key transcription factors whose regulatory potential may be disrupted during aging.
Methods
DNAmethylation data setsFor the analysis of aging we used one of the largest available data sets, which profiled over 656whole blood samples using Illumina Infinium 450k beadarrays [5]. Data was downloaded fromGEO and subjected to a stringent quality control analysis, including imputation of missing val-ues, type-2 probe bias correction using BMIQ [51], as well as assessment of the sources ofinter-sample variation using a Singular Value Decomposition [12]. The top component of vari-ation correlated with Source site of samples (i.e. laboratory sample was processed), plate andethnicity. Lower ranked components correlated with gender and age. Samples came from 4 dif-ferent labs, were processed on 9 different plates (indexed here as 1,2,3,5,6,8,9,10,11) and camefrom 2 different ethnic groups (white caucasian and hispanic) [5].
Integrative Multi-scale Analysis of Epigenetic Drift
PLOS Genetics | DOI:10.1371/journal.pgen.1004996 February 18, 2015 16 / 21

For the analysis relating to cellular development and differentiation, we downloaded theIllumina 450k data of GSE31848 from the GEO website. This data consisted of a total of 153samples, encompassing human embryonic stem cell lines, induced pluripotent stem cells, pri-mary cell lines and somatic differentiated samples from a range of different tissue types. Probeswith more than 5% missing values across the samples were removed from analysis. Rest ofmissing data was imputed using the k-nearest neighbour procedure, as implemented in the im-pute R-package [52]. Because of the inherent bias of type-2 probes and our desire to analyseDNAmethylation patterns spatially, we also adjusted this data using the BMIQ algorithm [51].
Cross-reactive probes and probes with SNPs in them were kept in the DNAmethylationdata analysis. We verified that the main results of this work are independent of whether theseprobes are included or removed.
ENCODE dataTranscription Factor ChIP-seq Uniform Peaks .narrowPeak files were downloaded from theUCSC ENCODE website (http://hgdownload.cse.ucsc.edu/goldenPath/hg19/encodeDCC/wgEncodeAwgTfbsUniform/). This track contains 690 ChIP-seq datasets representing 161 uniqueregulatory factors (generic and sequence-specific factors). The dataset spans 91 human celltypes and various treatment conditions. These datasets were generated by the five ENCODETFBS ChIP-seq production groups: Broad, Stanford/Yale/UC-Davis/Harvard, HudsonAlpha In-stitute, University of Texas-Austin and University of Washington, and University of Chicago.Some TFs were generated by more than one group, or selected by different antibodies. In allcases, human Illumina 450K CpGs were mapped to TF binding sites. Only CpGs falling withinthe ChIP-Seq peak boundaries were considered as defining an overlap. Here we consideredmainly two cell-lines: H1-hESC and HepG2. The number of profiled TFs were 58 (H1-hESC)and 75 (HepG2).
mRNA expression dataTo integrate the blood DNA methylation data from Hannum et al, with gene expression, wefirst used a whole blood data set (233 samples) generated using the Illumina HumanRef-12v3array [33]. The normalized data was provided at the probe-level. Probes mapping to the sameEntrez gene ID were averaged resulting in a 16345×233 gene expression data matrix. This datamatrix underwent further quality control using a Singular Value Decomposition (SVD) meth-od [12] to assess the sources of inter-sample variation. We found that the top PC correlatedwith beadchip and not age. In deriving differentially expressed genes (DEGs) associated withage using a linear regression model, we also observed statistical confounding, as deduced fromthe shape of the P-value histogram [53]. To address this problem, we identified and rankedage-DEGs using the ISVA-algorithm [53].
As a validation of the gene expression analysis, we also downloaded another relatively largegene expression data of 198 whole samples [36]. This data was generated with Agilent WholeHuman Genome Microarrays [36]. The normalized data was provided at the probe-level.Probes mapping to the same Entrez gene ID were averaged resulting in a 19751×198 gene ex-pression data matrix. This data matrix underwent further quality control using a SingularValue Decomposition (SVD) method [12] to assess the sources of inter-sample variation. Inderiving differentially expressed genes (DEGs) associated with age using a linear regressionmodel, we adjusted for sex, case/control status and smoking status.
In order to obtain estimates of baseline levels of gene expression in blood we collected an ex-pression data of cord blood and placenta samples [35]. This data was generated with IlluminaHuman Ref-8 beadarrays [35]. The normalized data was provided at the probe-level. Probes
Integrative Multi-scale Analysis of Epigenetic Drift
PLOS Genetics | DOI:10.1371/journal.pgen.1004996 February 18, 2015 17 / 21

mapping to the same Entrez gene ID were averaged resulting in a 18342×183 gene expressiondata matrix. This data matrix underwent further quality control using a Singular Value Decom-position (SVD) method [12] to assess the sources of inter-sample variation. In this data setthere were 64 cord blood samples, 54 placenta samples and 65 maternal blood samples. We re-stricted to analysis of cord blood and placenta samples from non-smokers (n = 45 cord blood,n = 37 placenta).
Age-DMR analysisTo identify age-DMRs in the Hannum et al data [5], we used linear regressions with plate andgender as covariates. Note that we did not include source and ethnicity as covariates becausethese were fully correlated with plate. Indeed, plates-1, 2, 3, 8, 10 and 11 contained only cauca-sian samples, specifically their numbers were 90, 84, 69, 81, 17 and 85. The other plates, i.e.plates-5, 6 and 9 only contained hispanics (90, 92 and 48). It follows from this design that ad-justing for plate automatically adjusts for ethnicity, but not vice-versa. Similarly, plate and labwere fully correlated, thus adjusting for plate also adjusts for source-site. Moreover, it is wellknown that adding highly correlated covariates in multivariate regressions may cause singularor near-singular predictor matrices and thus compromise statistical inference. For these rea-sons, and given that lower ranked SVD components also correlated with gender (gender wasequally distributed across plates, with each plate containing males and females), we used as co-variates plate and gender.
The linear regressions above were performed at the level of regional probe clusters, follow-ing the procedure of Aryee et al [26]. Specifically, 450k probes were first divided into 3 regionalclasses: open-sea, shore/shelves and CpG Islands (CGIs). We then used the boundedCluster-Maker function withmaxGap = 500 andmaxClusterWidth = 1500 on probes within each ofthese 3 classes, separately, resulting in probe clusters within each class. Beta-values for probeswithin a cluster were averaged, and linear regressions were performed for these averaged val-ues, i.e one linear regression for each probe cluster.Finally, we also remark that we chose a line-ar model, mainly because previous works have shown how well linear models are able topredict age across a wide range of tissue types [2, 6].
Correction for cellular heterogeneityWe followed the reference-based procedure of Houseman et al [15], using the R-scripts and ref-erence CpG list provided in that publication. To clarify, we ran the Reference-Based methodusing reference profiles for CD8+ T-cells, NK-cells, Monocytes, CD4+ T-cells, B-cells andGranulocytes, to infer cell-type proportions in the individual samples. These were subsequentlyused as covariates in the linear regression analysis.
Block Age-DMR analysisIn order to see if age-associated DMRs occur on longer length (i.e megabase) scales, we followedthe procedure of Aryee et al [26], focusing on the previously constructed regional clusters map-ping only to open-sea probes. To define blocks we used the clusterMaker function of the bum-phunter package [26, 27] withmaxGap = 250000 and using the previously constructed regionalopen sea clusters as input. To find extended DMRs (specifically hypomethylated block regions)we used the bumphunter algorithm with bpSpan = 250000 and 500 bootstrap iterations.
Association of transcription factor binding sites with age-DMRsTo test enrichment of transcription factor binding sites among age-hypermethylated and age-hypomethylated DMRs we used a one-tailed Fisher’s exact test. However, since two
Integrative Multi-scale Analysis of Epigenetic Drift
PLOS Genetics | DOI:10.1371/journal.pgen.1004996 February 18, 2015 18 / 21

transcription factors can share the same binding sites, we devised a simple mulitvariate frame-work to assess if the association of a given TF binding site profile with age-DMRs is indepen-dent of the other TF binding site profiles. Specifically, denoting by tr the t-statistic derivedfrom a linear regression of a regional cluster’s (r) average DNA methylation level against age,and denoting by bf the binding site profile of a given transcription factor f (so that bfr = 1 if abinding site of the TF falls within region r, bfr = 0 otherwise), we performed the multivariate re-gression
t ¼ a0 þP
f
bfaf þ � ð1Þ
It follows from standard multivariate regression analysis, that the t-statistics associated withthe estimated parameters a
fassess the association of any given TF’s binding profile with age-
DMRs independently of other TF’s binding profiles.
Supporting InformationS1 Text. The Supplementary Information Text S1 document contains all supplementaryfigures and tables plus their legends/captions.(PDF)
Author ContributionsConceived and designed the experiments: AET SB. Performed the experiments: RAO. Ana-lyzed the data: TY YJ AET SdJ. Contributed reagents/materials/analysis tools: YJ AET RAO.Wrote the paper: AET.
References1. Maegawa S, Hinkal G, Kim HS, Shen L, Zhang L, et al. (2010) Widespread and tissue specific age-
related DNAmethylation changes in mice. Genome Res 20: 332–340. doi: 10.1101/gr.096826.109PMID: 20107151
2. Teschendorff AE, Menon U, Gentry-Maharaj A, Ramus SJ, Weisenberger DJ, et al. (2010) Age-dependent DNAmethylation of genes that are suppressed in stem cells is a hallmark of cancer.Genome Res 20: 440–446. doi: 10.1101/gr.103606.109 PMID: 20219944
3. Rakyan VK, Down TA, Maslau S, Andrew T, Yang TP, et al. (2010) Human aging-associated DNAhypermethylation occurs preferentially at bivalent chromatin domains. Genome Res 20: 434–439. doi:10.1101/gr.103101.109 PMID: 20219945
4. Heyn H, Li N, Ferreira HJ, Moran S, Pisano DG, et al. (2012) Distinct DNAmethylomes of newbornsand centenarians. Proceedings of the National Academy of Sciences.
5. HannumG, Guinney J, Zhao L, Zhang L, Hughes G, et al. (2013) Genome-wide methylation profiles re-veal quantitative views of human aging rates. Mol Cell 49: 359–67. doi: 10.1016/j.molcel.2012.10.016PMID: 23177740
6. Horvath S (2013) DNAmethylation age of human tissues and cell types. Genome Biol 14: R115. doi:10.1186/gb-2013-14-10-r115 PMID: 24138928
7. Beerman I, Bock C, Garrison BS, Smith ZD, Gu H, et al. (2013) Proliferation-dependent alterations ofthe DNAmethylation landscape underlie hematopoietic stem cell aging. Cell Stem Cell 12: 413–25.doi: 10.1016/j.stem.2013.01.017 PMID: 23415915
8. Teschendorff AE, Jones A, Fiegl H, Sargent A, Zhuang JJ, et al. (2012) Epigenetic variability in cells ofnormal cytology is associated with the risk of future morphological transformation. GenomeMed 4: 24.doi: 10.1186/gm323 PMID: 22453031
9. Teschendorff AE, West J, Beck S (2013) Age-associated epigenetic drift: implications, and a case ofepigenetic thrift? HumMol Genet 22: R7–R15. doi: 10.1093/hmg/ddt375 PMID: 23918660
10. West J, Widschwendter M, Teschendorff AE (2013) Distinctive topology of age-associated epigeneticdrift in the human interactome. Proc Natl Acad Sci U S A 110: 14138–43. doi: 10.1073/pnas.1307242110 PMID: 23940324
Integrative Multi-scale Analysis of Epigenetic Drift
PLOS Genetics | DOI:10.1371/journal.pgen.1004996 February 18, 2015 19 / 21
11. Liu Y, Aryee MJ, Padyukov L, Fallin MD, Hesselberg E, et al. (2013) Epigenome-wide association dataimplicate DNAmethylation as an intermediary of genetic risk in rheumatoid arthritis. Nat Biotechnol 31:142–7. doi: 10.1038/nbt.2487 PMID: 23334450
12. Teschendorff AE, Menon U, Gentry-Maharaj A, Ramus SJ, Gayther SA, et al. (2009) An epigenetic sig-nature in peripheral blood predicts active ovarian cancer. PLoS One 4: e8274. doi: 10.1371/journal.pone.0008274 PMID: 20019873
13. Langevin SM, Houseman EA, AccomandoWP, Koestler DC, Christensen BC, et al. (2014) Leukocyte-adjusted epigenome-wide association studies of blood from solid tumor patients. Epigenetics 9: 884–95. doi: 10.4161/epi.28575 PMID: 24671036
14. Jaffe AE, Irizarry RA (2014) Accounting for cellular heterogeneity is critical in epigenome-wide associa-tion studies. Genome Biol 15: R31. doi: 10.1186/gb-2014-15-2-r31 PMID: 24495553
15. Houseman EA, AccomandoWP, Koestler DC, Christensen BC, Marsit CJ, et al. (2012) DNAmethyla-tion arrays as surrogate measures of cell mixture distribution. BMC Bioinformatics 13: 86. doi: 10.1186/1471-2105-13-86 PMID: 22568884
16. Houseman EA, Molitor J, Marsit CJ (2014) Reference-free cell mixture adjustments in analysis of DNAmethylation data. Bioinformatics 30: 1431–9. doi: 10.1093/bioinformatics/btu029 PMID: 24451622
17. Berman BP, Weisenberger DJ, Aman JF, Hinoue T, Ramjan Z, et al. (2012) Regions of focal DNAhypermethylation and long-range hypomethylation in colorectal cancer coincide with nuclear lamina-as-sociated domains. Nat Genet 44: 40–6. doi: 10.1038/ng.969
18. TimpW, Bravo HC, McDonald OG, Goggins M, Umbricht C, et al. (2014) Large hypomethylated blocksas a universal defining epigenetic alteration in human solid tumors. GenomeMed 6: 61. doi: 10.1186/s13073-014-0061-y PMID: 25191524
19. Ziller MJ, Gu H, Muller F, Donaghey J, Tsai LT, et al. (2013) Charting a dynamic DNAmethylation land-scape of the human genome. Nature 500: 477–81. doi: 10.1038/nature12433 PMID: 23925113
20. Beck S (2010) Taking the measure of the methylome. Nat Biotechnol 28: 1026–8. doi: 10.1038/nbt1010-1026 PMID: 20944589
21. Hovestadt V, Jones DT, Picelli S, WangW, Kool M, et al. (2014) Decoding the regulatory landscape ofmedulloblastoma using DNAmethylation sequencing. Nature 510: 537–41. doi: 10.1038/nature13268PMID: 24847876
22. Essaghir A, Toffalini F, Knoops L, Kallin A, van Helden J, et al. (2010) Transcription factor regulationcan be accurately predicted from the presence of target gene signatures in microarray gene expressiondata. Nucleic Acids Res 38: e120. doi: 10.1093/nar/gkq149 PMID: 20215436
23. Bernstein BE, Birney E, Dunham I, Green ED, Gunter C, et al. (2012) An integrated encyclopedia ofDNA elements in the human genome. Nature 489: 57–74. doi: 10.1038/nature11247
24. Gerstein MB, Kundaje A, Hariharan M, Landt SG, Yan KK, et al. (2012) Architecture of the human regu-latory network derived from encode data. Nature 489: 91–100. doi: 10.1038/nature11245 PMID:22955619
25. Thurman RE, Rynes E, Humbert R, Vierstra J, Maurano MT, et al. (2012) The accessible chromatinlandscape of the human genome. Nature 489: 75–82. doi: 10.1038/nature11232 PMID: 22955617
26. Aryee MJ, Jaffe AE, Corrada-Bravo H, Ladd-Acosta C, Feinberg AP, et al. (2014) Minfi: a flexible andcomprehensive bioconductor package for the analysis of infinium DNAmethylation microarrays. Bioin-formatics 30: 1363–9. doi: 10.1093/bioinformatics/btu049 PMID: 24478339
27. Jaffe AE, Feinberg AP, Irizarry RA, Leek JT (2012) Significance analysis and statistical dissection ofvariably methylated regions. Biostatistics 13: 166–78. doi: 10.1093/biostatistics/kxr013 PMID:21685414
28. Horvath S, Zhang Y, Langfelder P, Kahn RS, Boks MP, et al. (2012) Aging effects on DNAmethylationmodules in human brain and blood tissue. Genome Biol 13: R97. doi: 10.1186/gb-2012-13-10-r97PMID: 23034122
29. Jones A, Teschendorff AE, Li Q, Hayward JD, Kannan A, et al. (2013) Role of DNAmethylation and epi-genetic silencing of hand2 in endometrial cancer development. PLoS Med 10: e1001551. doi: 10.1371/journal.pmed.1001551 PMID: 24265601
30. Network CGA (2012) Comprehensive molecular portraits of human breast tumours. Nature 490: 61–70. doi: 10.1038/nature11412
31. Nejman D, Straussman R, Steinfeld I, Ruvolo M, Roberts D, et al. (2014) Molecular rules governing denovo methylation in cancer. Cancer Res 74: 1475–83. doi: 10.1158/0008-5472.CAN-13-3042 PMID:24453003
32. SteegengaWT, Boekschoten MV, Lute C, Hooiveld GJ, de Groot PJ, et al. (2014) Genome-wide age-related changes in DNAmethylation and gene expression in human pbmcs. Age (Dordr) 36: 9648. doi:10.1007/s11357-014-9648-x
Integrative Multi-scale Analysis of Epigenetic Drift
PLOS Genetics | DOI:10.1371/journal.pgen.1004996 February 18, 2015 20 / 21

33. de Jong S, Neeleman M, Luykx JJ, ten Berg MJ, Strengman E, et al. (2014) Seasonal changes in geneexpression represent cell-type composition in whole blood. HumMol Genet 23: 2721–8. doi: 10.1093/hmg/ddt665 PMID: 24399446
34. Jiao Y, Widschwendter M, Teschendorff AE (2014) A systems-level integrative framework for genome-wide DNAmethylation and gene expression data identifies differential gene expression modules underepigenetic control. Bioinformatics 30: 2360–6. doi: 10.1093/bioinformatics/btu316 PMID: 24794928
35. Votavova H, MMMD, Fejglova K, Vasikova A, Krejcik Z, et al. (2011) Transcriptome alterations in ma-ternal and fetal cells induced by tobacco smoke. Placenta 32: 763–770. doi: 10.1016/j.placenta.2011.06.022 PMID: 21803418
36. Beineke P, Fitch K, Tao H, Elashoff MR, Rosenberg S, et al. (2012) A whole blood gene expression-based signature for smoking status. BMCMed Genomics 5: 58. doi: 10.1186/1755-8794-5-58 PMID:23210427
37. Nazor KL, Altun G, Lynch C, Tran H, Harness JV, et al. (2012) Recurrent variations in DNAmethylationin human pluripotent stem cells and their differentiated derivatives. Cell Stem Cell 10: 620–34. doi: 10.1016/j.stem.2012.02.013 PMID: 22560082
38. Lee CS, Friedman JR, Fulmer JT, Kaestner KH (2005) The initiation of liver development is dependenton foxa transcription factors. Nature 435: 944–7. doi: 10.1038/nature03649 PMID: 15959514
39. Cereghini S (1996) Liver-enriched transcription factors and hepatocyte differentiation. FASEB J 10:267–82. PMID: 8641560
40. Lu T, Aron L, Zullo J, Pan Y, Kim H, et al. (2014) Rest and stress resistance in ageing and alzheimer’sdisease. Nature 507: 448–54. doi: 10.1038/nature13163 PMID: 24670762
41. Day K, Waite LL, Thalacker-Mercer A, West A, Bamman MM, et al. (2013) Differential DNA methylationwith age displays both common and dynamic features. Genome Biol 14: R102. doi: 10.1186/gb-2013-14-9-r102 PMID: 24034465
42. Alisch RS, Barwick BG, Chopra P, Myrick LK, Satten GA, et al. (2012) Age-associated DNAmethylationin pediatric populations. Genome Res 22: 623–32. doi: 10.1101/gr.125187.111 PMID: 22300631
43. Martino D, Loke YJ, Gordon L, Ollikainen M, Cruickshank MN, et al. (2013) Longitudinal, genome-scaleanalysis of DNAmethylation in twins from birth to 18 months of age reveals rapid epigenetic change inearly life and pair-specific effects of discordance. Genome Biol 14: R42. doi: 10.1186/gb-2013-14-5-r42 PMID: 23697701
44. Glass D, Vinuela A, Davies MN, Ramasamy A, Parts L, et al. (2013) Gene expression changes withage in skin, adipose tissue, blood and brain. Genome Biol 14: R75. doi: 10.1186/gb-2013-14-7-r75PMID: 23889843
45. Huehne R, Thalheim T, Suehnel J (2014) Agefactdb–the jenage ageing factor database–towards dataintegration in ageing research. Nucleic Acids Res 42: D892–6. doi: 10.1093/nar/gkt1073
46. Walter D, Matter A, Fahrenkrog B (2014) Loss of histone h3 methylation at lysine 4 triggers apoptosis insaccharomyces cerevisiae. PLoS Genet 10: e1004095. doi: 10.1371/journal.pgen.1004095 PMID:24497836
47. Lui JC, ChenW, Cheung CS, Baron J (2014) Broad shifts in gene expression during early postnatal lifeare associated with shifts in histone methylation patterns. PLoS One 9: e86957. doi: 10.1371/journal.pone.0086957 PMID: 24489814
48. Tacutu R, Craig T, Budovsky A, Wuttke D, Lehmann G, et al. (2013) Human ageing genomic resources:integrated databases and tools for the biology and genetics of ageing. Nucleic Acids Res 41: D1027–33. doi: 10.1093/nar/gks1155 PMID: 23193293
49. Ayer DE (1999) Histone deacetylases: transcriptional repression with siners and nurds. Trends CellBiol 9: 193–8. doi: 10.1016/S0962-8924(99)01536-6 PMID: 10322454
50. Nascimento EM, Cox CL, MacArthur S, Hussain S, Trotter M, et al. (2011) The opposing transcriptionalfunctions of sin3a and c-myc are required to maintain tissue homeostasis. Nat Cell Biol 13: 1395–405.doi: 10.1038/ncb2385 PMID: 22101514
51. Teschendorff AE, Marabita F, Lechner M, Bartlett T, Tegner J, et al. (2013) A beta-mixture quantile nor-malization method for correcting probe design bias in illumina infinium 450 k DNAmethylation data. Bio-informatics 29: 189–96. doi: 10.1093/bioinformatics/bts680 PMID: 23175756
52. Troyanskaya O, Cantor M, Sherlock G, Brown P, Hastie T, et al. (2001) Missing value estimation meth-ods for DNAmicroarrays. Bioinformatics 17: 520–525. doi: 10.1093/bioinformatics/17.6.520 PMID:11395428
53. Teschendorff AE, Zhuang J, Widschwendter M (2011) Independent surrogate variable analysis todeconvolve confounding factors in large-scale microarray profiling studies. Bioinformatics 27: 1496–1505. doi: 10.1093/bioinformatics/btr171 PMID: 21471010
Integrative Multi-scale Analysis of Epigenetic Drift
PLOS Genetics | DOI:10.1371/journal.pgen.1004996 February 18, 2015 21 / 21