An integrated microstructural, sensory and instrumental approach to describe potato texture
12
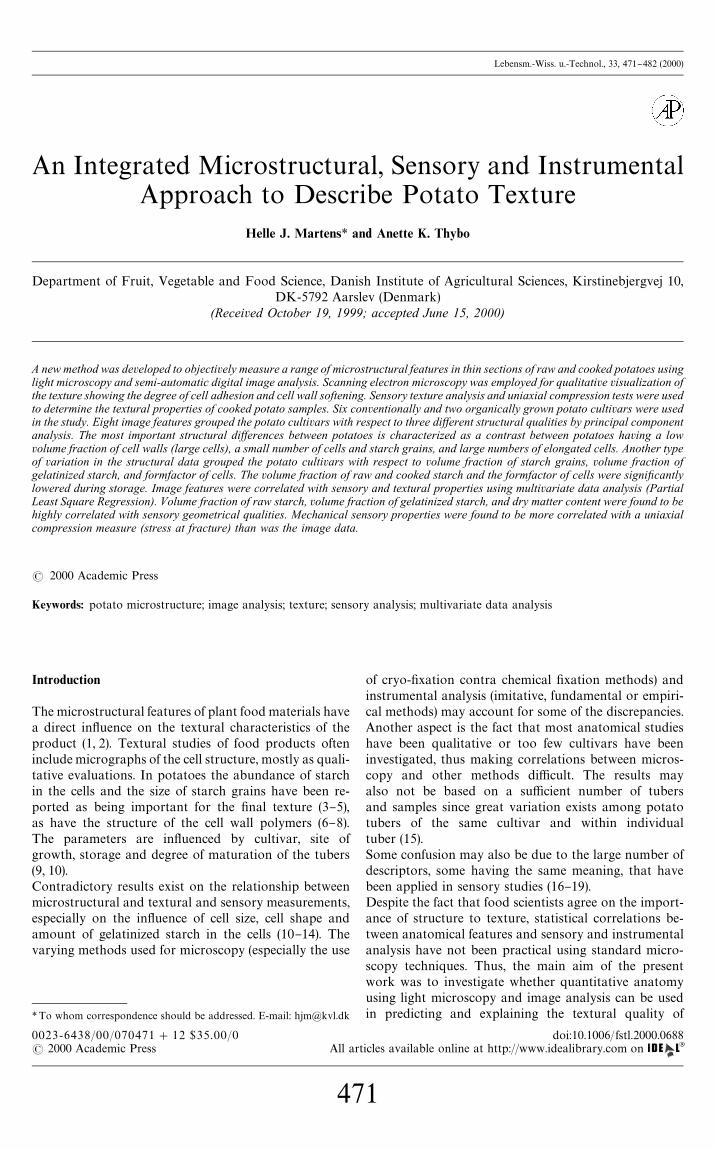
* To whom correspondence should be addressed. E-mail: hjm@kvl.dk Lebensm.-Wiss. u.-Technol., 33, 471 } 482 (2000) An Integrated Microstructural, Sensory and Instrumental Approach to Describe Potato Texture Helle J. Martens* and Anette K. Thybo Department of Fruit, Vegetable and Food Science, Danish Institute of Agricultural Sciences, Kirstinebjergvej 10, DK-5792 Aarslev (Denmark) (Received October 19, 1999; accepted June 15, 2000) A new method was developed to objectively measure a range of microstructural features in thin sections of raw and cooked potatoes using light microscopy and semi-automatic digital image analysis. Scanning electron microscopy was employed for qualitative visualization of the texture showing the degree of cell adhesion and cell wall softening. Sensory texture analysis and uniaxial compression tests were used to determine the textural properties of cooked potato samples. Six conventionally and two organically grown potato cultivars were used in the study. Eight image features grouped the potato cultivars with respect to three diwerent structural qualities by principal component analysis. The most important structural diwerences between potatoes is characterized as a contrast between potatoes having a low volume fraction of cell walls (large cells), a small number of cells and starch grains, and large numbers of elongated cells. Another type of variation in the structural data grouped the potato cultivars with respect to volume fraction of starch grains, volume fraction of gelatinized starch, and formfactor of cells. The volume fraction of raw and cooked starch and the formfactor of cells were signixcantly lowered during storage. Image features were correlated with sensory and textural properties using multivariate data analysis (Partial Least Square Regression). Volume fraction of raw starch, volume fraction of gelatinized starch, and dry matter content were found to be highly correlated with sensory geometrical qualities. Mechanical sensory properties were found to be more correlated with a uniaxial compression measure (stress at fracture) than was the image data. ( 2000 Academic Press Keywords: potato microstructure; image analysis; texture; sensory analysis; multivariate data analysis Introduction The microstructural features of plant food materials have a direct in#uence on the textural characteristics of the product (1, 2). Textural studies of food products often include micrographs of the cell structure, mostly as quali- tative evaluations. In potatoes the abundance of starch in the cells and the size of starch grains have been re- ported as being important for the "nal texture (3}5), as have the structure of the cell wall polymers (6} 8). The parameters are in#uenced by cultivar, site of growth, storage and degree of maturation of the tubers (9, 10). Contradictory results exist on the relationship between microstructural and textural and sensory measurements, especially on the in#uence of cell size, cell shape and amount of gelatinized starch in the cells (10 }14). The varying methods used for microscopy (especially the use of cryo-"xation contra chemical "xation methods) and instrumental analysis (imitative, fundamental or empiri- cal methods) may account for some of the discrepancies. Another aspect is the fact that most anatomical studies have been qualitative or too few cultivars have been investigated, thus making correlations between micros- copy and other methods di$cult. The results may also not be based on a su$cient number of tubers and samples since great variation exists among potato tubers of the same cultivar and within individual tuber (15). Some confusion may also be due to the large number of descriptors, some having the same meaning, that have been applied in sensory studies (16}19). Despite the fact that food scientists agree on the import- ance of structure to texture, statistical correlations be- tween anatomical features and sensory and instrumental analysis have not been practical using standard micro- scopy techniques. Thus, the main aim of the present work was to investigate whether quantitative anatomy using light microscopy and image analysis can be used in predicting and explaining the textural quality of 0023-6438/00/070471 #12 $35.00/0 doi:10.1006/ fstl.2000.0688 ( 2000 Academic Press All articles available online at http://www.idealibrary.com on 471
-
Upload
independent -
Category
Documents
-
view
5 -
download
0
Transcript of An integrated microstructural, sensory and instrumental approach to describe potato texture
Lebensm.-Wiss. u.-Technol., 33, 471}482 (2000)
An Integrated Microstructural, Sensory and InstrumentalApproach to Describe Potato Texture
Helle J. Martens* and Anette K. Thybo
Department of Fruit, Vegetable and Food Science, Danish Institute of Agricultural Sciences, Kirstinebjergvej 10,DK-5792 Aarslev (Denmark)
(Received October 19, 1999; accepted June 15, 2000)
A new method was developed to objectively measure a range of microstructural features in thin sections of raw and cooked potatoes usinglight microscopy and semi-automatic digital image analysis. Scanning electron microscopy was employed for qualitative visualization ofthe texture showing the degree of cell adhesion and cell wall softening. Sensory texture analysis and uniaxial compression tests were usedto determine the textural properties of cooked potato samples. Six conventionally and two organically grown potato cultivars were usedin the study. Eight image features grouped the potato cultivars with respect to three diwerent structural qualities by principal componentanalysis. The most important structural diwerences between potatoes is characterized as a contrast between potatoes having a lowvolume fraction of cell walls (large cells), a small number of cells and starch grains, and large numbers of elongated cells. Another typeof variation in the structural data grouped the potato cultivars with respect to volume fraction of starch grains, volume fraction ofgelatinized starch, and formfactor of cells. The volume fraction of raw and cooked starch and the formfactor of cells were signixcantlylowered during storage. Image features were correlated with sensory and textural properties using multivariate data analysis (PartialLeast Square Regression). Volume fraction of raw starch, volume fraction of gelatinized starch, and dry matter content were found to behighly correlated with sensory geometrical qualities. Mechanical sensory properties were found to be more correlated with a uniaxialcompression measure (stress at fracture) than was the image data.
( 2000 Academic Press
Keywords: potato microstructure; image analysis; texture; sensory analysis; multivariate data analysis
Introduction
The microstructural features of plant food materials havea direct in#uence on the textural characteristics of theproduct (1, 2). Textural studies of food products ofteninclude micrographs of the cell structure, mostly as quali-tative evaluations. In potatoes the abundance of starchin the cells and the size of starch grains have been re-ported as being important for the "nal texture (3}5),as have the structure of the cell wall polymers (6}8).The parameters are in#uenced by cultivar, site ofgrowth, storage and degree of maturation of the tubers(9, 10).Contradictory results exist on the relationship betweenmicrostructural and textural and sensory measurements,especially on the in#uence of cell size, cell shape andamount of gelatinized starch in the cells (10}14). Thevarying methods used for microscopy (especially the use
*To whom correspondence should be addressed. E-mail: [email protected]
0023-6438/00/070471#12 $35.00/0( 2000 Academic Press All art
47
of cryo-"xation contra chemical "xation methods) andinstrumental analysis (imitative, fundamental or empiri-cal methods) may account for some of the discrepancies.Another aspect is the fact that most anatomical studieshave been qualitative or too few cultivars have beeninvestigated, thus making correlations between micros-copy and other methods di$cult. The results mayalso not be based on a su$cient number of tubersand samples since great variation exists among potatotubers of the same cultivar and within individualtuber (15).Some confusion may also be due to the large number ofdescriptors, some having the same meaning, that havebeen applied in sensory studies (16}19).Despite the fact that food scientists agree on the import-ance of structure to texture, statistical correlations be-tween anatomical features and sensory and instrumentalanalysis have not been practical using standard micro-scopy techniques. Thus, the main aim of the presentwork was to investigate whether quantitative anatomyusing light microscopy and image analysis can be usedin predicting and explaining the textural quality of
doi:10.1006/fstl.2000.0688icles available online at http://www.idealibrary.com on
1
lwt/vol. 33 (2000) No. 7
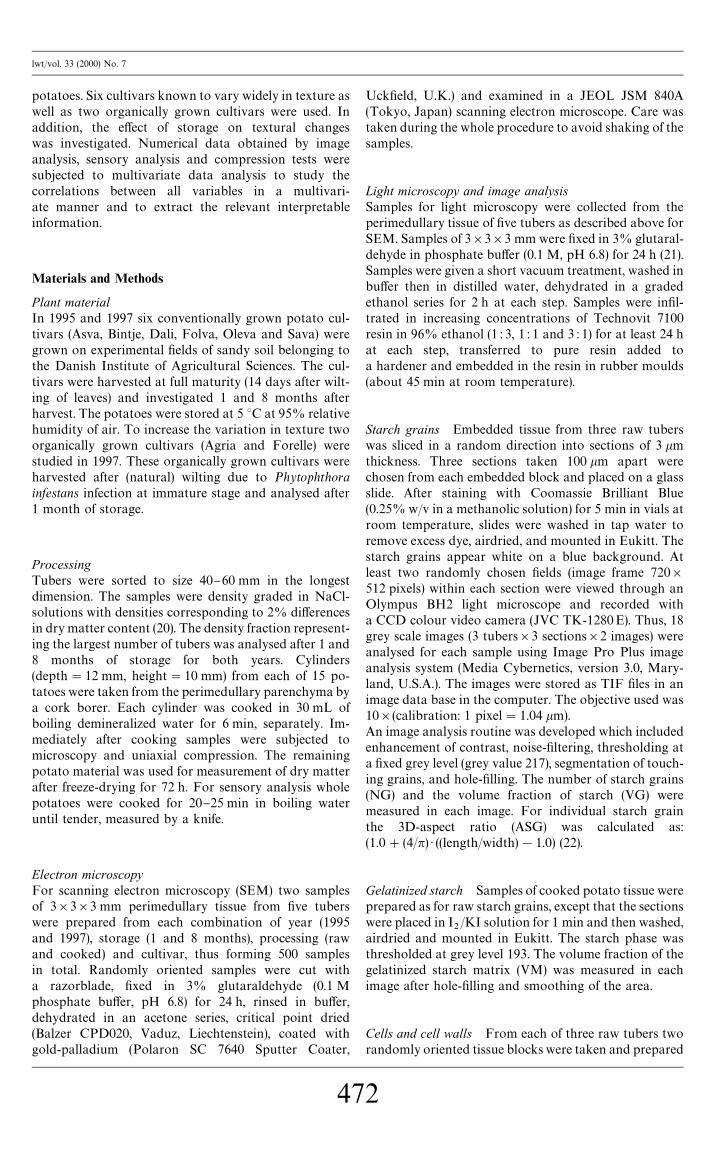
potatoes. Six cultivars known to vary widely in texture aswell as two organically grown cultivars were used. Inaddition, the e!ect of storage on textural changeswas investigated. Numerical data obtained by imageanalysis, sensory analysis and compression tests weresubjected to multivariate data analysis to study thecorrelations between all variables in a multivari-ate manner and to extract the relevant interpretableinformation.
Materials and Methods
Plant materialIn 1995 and 1997 six conventionally grown potato cul-tivars (Asva, Bintje, Dali, Folva, Oleva and Sava) weregrown on experimental "elds of sandy soil belonging tothe Danish Institute of Agricultural Sciences. The cul-tivars were harvested at full maturity (14 days after wilt-ing of leaves) and investigated 1 and 8 months afterharvest. The potatoes were stored at 5 3C at 95% relativehumidity of air. To increase the variation in texture twoorganically grown cultivars (Agria and Forelle) werestudied in 1997. These organically grown cultivars wereharvested after (natural) wilting due to Phytophthorainfestans infection at immature stage and analysed after1 month of storage.
ProcessingTubers were sorted to size 40}60 mm in the longestdimension. The samples were density graded in NaCl-solutions with densities corresponding to 2% di!erencesin dry matter content (20). The density fraction represent-ing the largest number of tubers was analysed after 1 and8 months of storage for both years. Cylinders(depth"12 mm, height"10 mm) from each of 15 po-tatoes were taken from the perimedullary parenchyma bya cork borer. Each cylinder was cooked in 30 mL ofboiling demineralized water for 6 min, separately. Im-mediately after cooking samples were subjected tomicroscopy and uniaxial compression. The remainingpotato material was used for measurement of dry matterafter freeze-drying for 72 h. For sensory analysis wholepotatoes were cooked for 20}25 min in boiling wateruntil tender, measured by a knife.
Electron microscopyFor scanning electron microscopy (SEM) two samplesof 3]3]3 mm perimedullary tissue from "ve tuberswere prepared from each combination of year (1995and 1997), storage (1 and 8 months), processing (rawand cooked) and cultivar, thus forming 500 samplesin total. Randomly oriented samples were cut witha razorblade, "xed in 3% glutaraldehyde (0.1 Mphosphate bu!er, pH 6.8) for 24 h, rinsed in bu!er,dehydrated in an acetone series, critical point dried(Balzer CPD020, Vaduz, Liechtenstein), coated withgold-palladium (Polaron SC 7640 Sputter Coater,
47
Uck"eld, U.K.) and examined in a JEOL JSM 840A(Tokyo, Japan) scanning electron microscope. Care wastaken during the whole procedure to avoid shaking of thesamples.
Light microscopy and image analysisSamples for light microscopy were collected from theperimedullary tissue of "ve tubers as described above forSEM. Samples of 3]3]3 mm were "xed in 3% glutaral-dehyde in phosphate bu!er (0.1 M, pH 6.8) for 24 h (21).Samples were given a short vacuum treatment, washed inbu!er then in distilled water, dehydrated in a gradedethanol series for 2 h at each step. Samples were in"l-trated in increasing concentrations of Technovit 7100resin in 96% ethanol (1 : 3, 1 : 1 and 3 : 1) for at least 24 hat each step, transferred to pure resin added toa hardener and embedded in the resin in rubber moulds(about 45 min at room temperature).
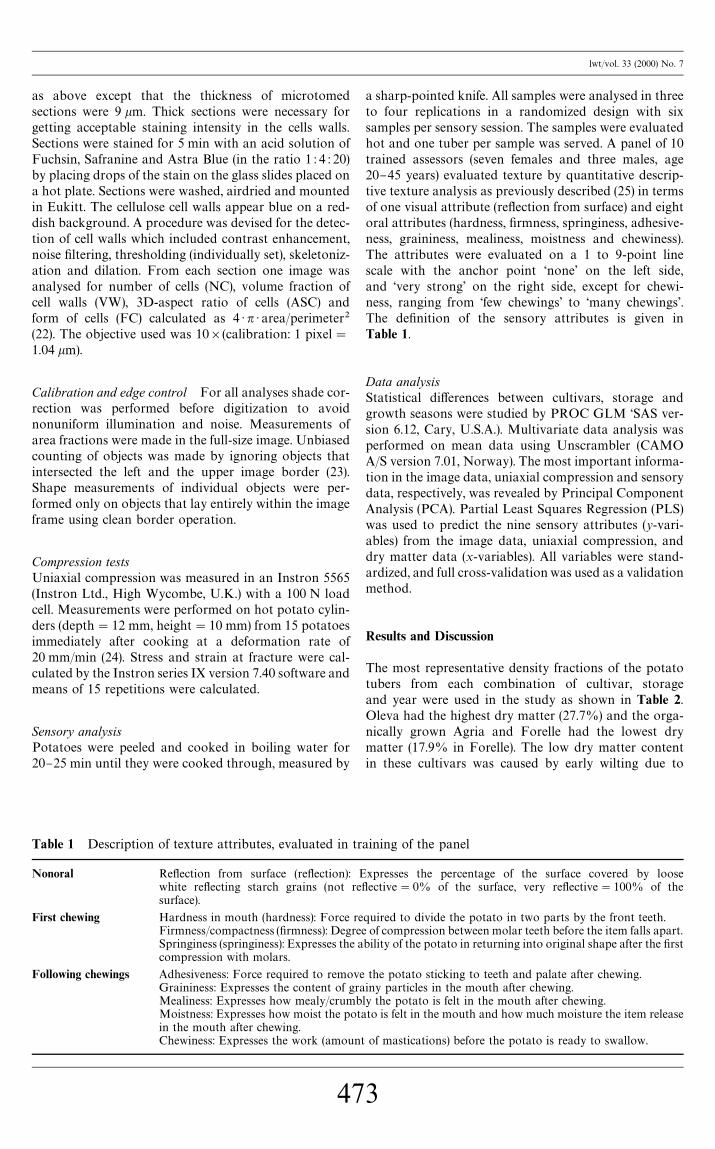
Starch grains Embedded tissue from three raw tuberswas sliced in a random direction into sections of 3 kmthickness. Three sections taken 100 km apart werechosen from each embedded block and placed on a glassslide. After staining with Coomassie Brilliant Blue(0.25% w/v in a methanolic solution) for 5 min in vials atroom temperature, slides were washed in tap water toremove excess dye, airdried, and mounted in Eukitt. Thestarch grains appear white on a blue background. Atleast two randomly chosen "elds (image frame 720]512 pixels) within each section were viewed through anOlympus BH2 light microscope and recorded witha CCD colour video camera (JVC TK-1280E). Thus, 18grey scale images (3 tubers]3 sections]2 images) wereanalysed for each sample using Image Pro Plus imageanalysis system (Media Cybernetics, version 3.0, Mary-land, U.S.A.). The images were stored as TIF "les in animage data base in the computer. The objective used was10](calibration: 1 pixel"1.04 km).An image analysis routine was developed which includedenhancement of contrast, noise-"ltering, thresholding ata "xed grey level (grey value 217), segmentation of touch-ing grains, and hole-"lling. The number of starch grains(NG) and the volume fraction of starch (VG) weremeasured in each image. For individual starch grainthe 3D-aspect ratio (ASG) was calculated as:(1.0#(4/n) ) ((length/width)!1.0) (22).
Gelatinized starch Samples of cooked potato tissue wereprepared as for raw starch grains, except that the sectionswere placed in I
2/KI solution for 1 min and then washed,
airdried and mounted in Eukitt. The starch phase wasthresholded at grey level 193. The volume fraction of thegelatinized starch matrix (VM) was measured in eachimage after hole-"lling and smoothing of the area.
Cells and cell walls From each of three raw tubers tworandomly oriented tissue blocks were taken and prepared
2
lwt/vol. 33 (2000) No. 7
as above except that the thickness of microtomedsections were 9 km. Thick sections were necessary forgetting acceptable staining intensity in the cells walls.Sections were stained for 5 min with an acid solution ofFuchsin, Safranine and Astra Blue (in the ratio 1 : 4 : 20)by placing drops of the stain on the glass slides placed ona hot plate. Sections were washed, airdried and mountedin Eukitt. The cellulose cell walls appear blue on a red-dish background. A procedure was devised for the detec-tion of cell walls which included contrast enhancement,noise "ltering, thresholding (individually set), skeletoniz-ation and dilation. From each section one image wasanalysed for number of cells (NC), volume fraction ofcell walls (VW), 3D-aspect ratio of cells (ASC) andform of cells (FC) calculated as 4 ) n ) area/perimeter2(22). The objective used was 10](calibration: 1 pixel"1.04 km).
Calibration and edge control For all analyses shade cor-rection was performed before digitization to avoidnonuniform illumination and noise. Measurements ofarea fractions were made in the full-size image. Unbiasedcounting of objects was made by ignoring objects thatintersected the left and the upper image border (23).Shape measurements of individual objects were per-formed only on objects that lay entirely within the imageframe using clean border operation.
Compression testsUniaxial compression was measured in an Instron 5565(Instron Ltd., High Wycombe, U.K.) with a 100 N loadcell. Measurements were performed on hot potato cylin-ders (depth"12 mm, height"10 mm) from 15 potatoesimmediately after cooking at a deformation rate of20 mm/min (24). Stress and strain at fracture were cal-culated by the Instron series IX version 7.40 software andmeans of 15 repetitions were calculated.
Sensory analysisPotatoes were peeled and cooked in boiling water for20}25 min until they were cooked through, measured by
Table 1 Description of texture attributes, evaluated in tr
Nonoral Re#ection from surface (re#ection):white re#ecting starch grains (not resurface).
First chewing Hardness in mouth (hardness): Force rFirmness/compactness ("rmness): DegreSpringiness (springiness): Expresses the acompression with molars.
Following chewings Adhesiveness: Force required to removGraininess: Expresses the content of grMealiness: Expresses how mealy/crumbMoistness: Expresses how moist the potin the mouth after chewing.Chewiness: Expresses the work (amoun
47
a sharp-pointed knife. All samples were analysed in threeto four replications in a randomized design with sixsamples per sensory session. The samples were evaluatedhot and one tuber per sample was served. A panel of 10trained assessors (seven females and three males, age20}45 years) evaluated texture by quantitative descrip-tive texture analysis as previously described (25) in termsof one visual attribute (re#ection from surface) and eightoral attributes (hardness, "rmness, springiness, adhesive-ness, graininess, mealiness, moistness and chewiness).The attributes were evaluated on a 1 to 9-point linescale with the anchor point &none' on the left side,and &very strong' on the right side, except for chewi-ness, ranging from &few chewings' to &many chewings'.The de"nition of the sensory attributes is given inTable 1.
Data analysisStatistical di!erences between cultivars, storage andgrowth seasons were studied by PROC GLM &SAS ver-sion 6.12, Cary, U.S.A.). Multivariate data analysis wasperformed on mean data using Unscrambler (CAMOA/S version 7.01, Norway). The most important informa-tion in the image data, uniaxial compression and sensorydata, respectively, was revealed by Principal ComponentAnalysis (PCA). Partial Least Squares Regression (PLS)was used to predict the nine sensory attributes (y-vari-ables) from the image data, uniaxial compression, anddry matter data (x-variables). All variables were stand-ardized, and full cross-validation was used as a validationmethod.
Results and Discussion
The most representative density fractions of the potatotubers from each combination of cultivar, storageand year were used in the study as shown in Table 2.Oleva had the highest dry matter (27.7%) and the orga-nically grown Agria and Forelle had the lowest drymatter (17.9% in Forelle). The low dry matter contentin these cultivars was caused by early wilting due to
aining of the panel
Expresses the percentage of the surface covered by loose#ective"0% of the surface, very re#ective"100% of the
equired to divide the potato in two parts by the front teeth.e of compression between molar teeth before the item falls apart.bility of the potato in returning into original shape after the "rst
e the potato sticking to teeth and palate after chewing.ainy particles in the mouth after chewing.ly the potato is felt in the mouth after chewing.ato is felt in the mouth and how much moisture the item release
t of mastications) before the potato is ready to swallow.
3
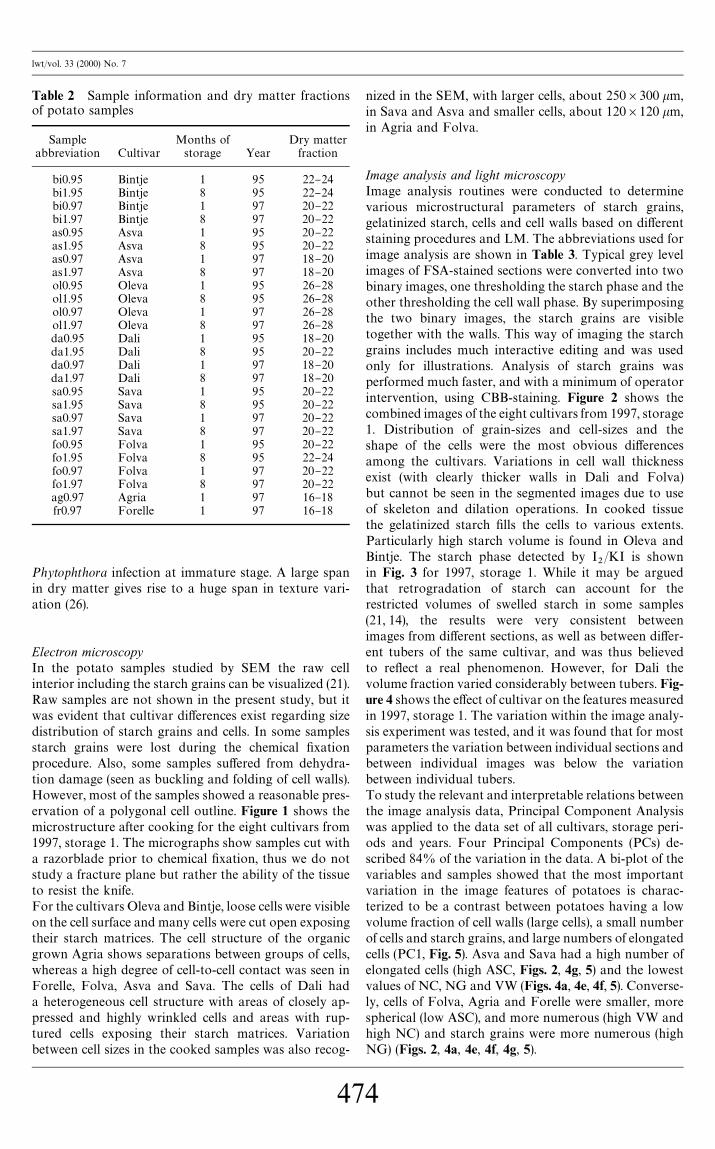
Table 2 Sample information and dry matter fractionsof potato samples
Sample Months of Dry matterabbreviation Cultivar storage Year fraction
bi0.95 Bintje 1 95 22}24bi1.95 Bintje 8 95 22}24bi0.97 Bintje 1 97 20}22bi1.97 Bintje 8 97 20}22as0.95 Asva 1 95 20}22as1.95 Asva 8 95 20}22as0.97 Asva 1 97 18}20as1.97 Asva 8 97 18}20ol0.95 Oleva 1 95 26}28ol1.95 Oleva 8 95 26}28ol0.97 Oleva 1 97 26}28ol1.97 Oleva 8 97 26}28da0.95 Dali 1 95 18}20da1.95 Dali 8 95 20}22da0.97 Dali 1 97 18}20da1.97 Dali 8 97 18}20sa0.95 Sava 1 95 20}22sa1.95 Sava 8 95 20}22sa0.97 Sava 1 97 20}22sa1.97 Sava 8 97 20}22fo0.95 Folva 1 95 20}22fo1.95 Folva 8 95 22}24fo0.97 Folva 1 97 20}22fo1.97 Folva 8 97 20}22ag0.97 Agria 1 97 16}18fr0.97 Forelle 1 97 16}18
lwt/vol. 33 (2000) No. 7
Phytophthora infection at immature stage. A large spanin dry matter gives rise to a huge span in texture vari-ation (26).
Electron microscopyIn the potato samples studied by SEM the raw cellinterior including the starch grains can be visualized (21).Raw samples are not shown in the present study, but itwas evident that cultivar di!erences exist regarding sizedistribution of starch grains and cells. In some samplesstarch grains were lost during the chemical "xationprocedure. Also, some samples su!ered from dehydra-tion damage (seen as buckling and folding of cell walls).However, most of the samples showed a reasonable pres-ervation of a polygonal cell outline. Figure 1 shows themicrostructure after cooking for the eight cultivars from1997, storage 1. The micrographs show samples cut witha razorblade prior to chemical "xation, thus we do notstudy a fracture plane but rather the ability of the tissueto resist the knife.For the cultivars Oleva and Bintje, loose cells were visibleon the cell surface and many cells were cut open exposingtheir starch matrices. The cell structure of the organicgrown Agria shows separations between groups of cells,whereas a high degree of cell-to-cell contact was seen inForelle, Folva, Asva and Sava. The cells of Dali hada heterogeneous cell structure with areas of closely ap-pressed and highly wrinkled cells and areas with rup-tured cells exposing their starch matrices. Variationbetween cell sizes in the cooked samples was also recog-
47
nized in the SEM, with larger cells, about 250]300 km,in Sava and Asva and smaller cells, about 120]120 km,in Agria and Folva.
Image analysis and light microscopyImage analysis routines were conducted to determinevarious microstructural parameters of starch grains,gelatinized starch, cells and cell walls based on di!erentstaining procedures and LM. The abbreviations used forimage analysis are shown in Table 3. Typical grey levelimages of FSA-stained sections were converted into twobinary images, one thresholding the starch phase and theother thresholding the cell wall phase. By superimposingthe two binary images, the starch grains are visibletogether with the walls. This way of imaging the starchgrains includes much interactive editing and was usedonly for illustrations. Analysis of starch grains wasperformed much faster, and with a minimum of operatorintervention, using CBB-staining. Figure 2 shows thecombined images of the eight cultivars from 1997, storage1. Distribution of grain-sizes and cell-sizes and theshape of the cells were the most obvious di!erencesamong the cultivars. Variations in cell wall thicknessexist (with clearly thicker walls in Dali and Folva)but cannot be seen in the segmented images due to useof skeleton and dilation operations. In cooked tissuethe gelatinized starch "lls the cells to various extents.Particularly high starch volume is found in Oleva andBintje. The starch phase detected by I
2/KI is shown
in Fig. 3 for 1997, storage 1. While it may be arguedthat retrogradation of starch can account for therestricted volumes of swelled starch in some samples(21, 14), the results were very consistent betweenimages from di!erent sections, as well as between di!er-ent tubers of the same cultivar, and was thus believedto re#ect a real phenomenon. However, for Dali thevolume fraction varied considerably between tubers. Fig-ure 4 shows the e!ect of cultivar on the features measuredin 1997, storage 1. The variation within the image analy-sis experiment was tested, and it was found that for mostparameters the variation between individual sections andbetween individual images was below the variationbetween individual tubers.To study the relevant and interpretable relations betweenthe image analysis data, Principal Component Analysiswas applied to the data set of all cultivars, storage peri-ods and years. Four Principal Components (PCs) de-scribed 84% of the variation in the data. A bi-plot of thevariables and samples showed that the most importantvariation in the image features of potatoes is charac-terized to be a contrast between potatoes having a lowvolume fraction of cell walls (large cells), a small numberof cells and starch grains, and large numbers of elongatedcells (PC1, Fig. 5). Asva and Sava had a high number ofelongated cells (high ASC, Figs. 2, 4g, 5) and the lowestvalues of NC, NG and VW (Figs. 4a, 4e, 4f, 5). Converse-ly, cells of Folva, Agria and Forelle were smaller, morespherical (low ASC), and more numerous (high VW andhigh NC) and starch grains were more numerous (highNG) (Figs. 2, 4a, 4e, 4f, 4g, 5).
4
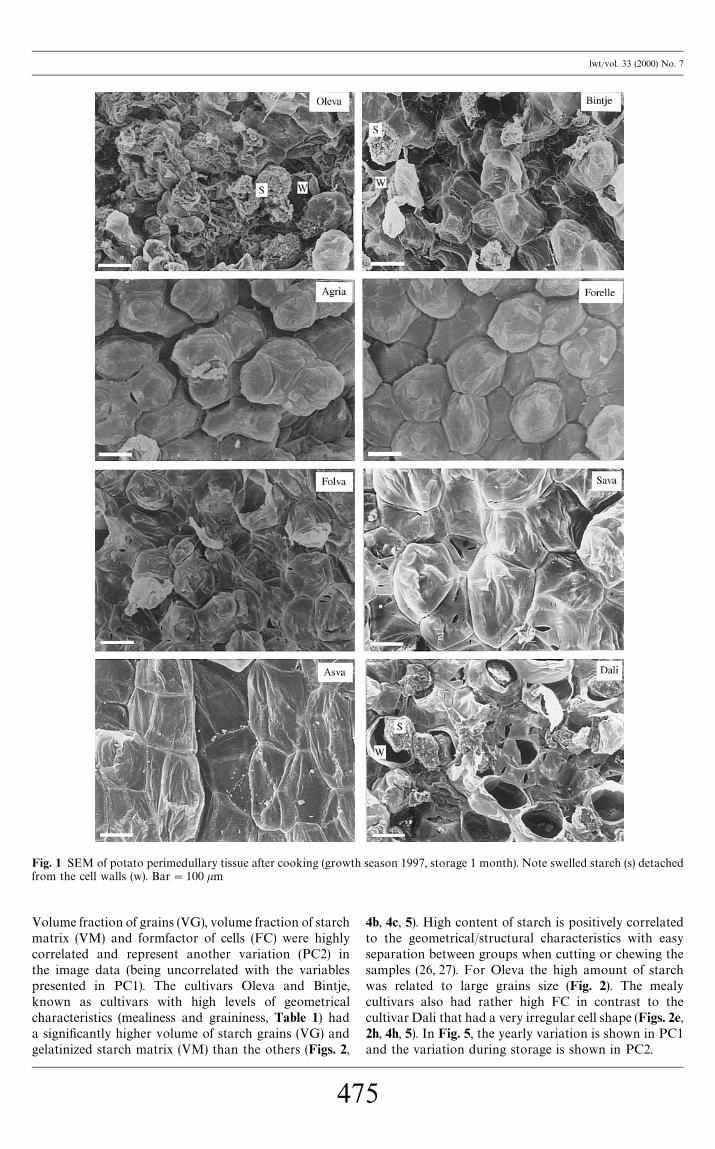
Fig. 1 SEM of potato perimedullary tissue after cooking (growth season 1997, storage 1 month). Note swelled starch (s) detachedfrom the cell walls (w). Bar"100 km
lwt/vol. 33 (2000) No. 7
Volume fraction of grains (VG), volume fraction of starchmatrix (VM) and formfactor of cells (FC) were highlycorrelated and represent another variation (PC2) inthe image data (being uncorrelated with the variablespresented in PC1). The cultivars Oleva and Bintje,known as cultivars with high levels of geometricalcharacteristics (mealiness and graininess, Table 1) hada signi"cantly higher volume of starch grains (VG) andgelatinized starch matrix (VM) than the others (Figs. 2,
47
4b, 4c, 5). High content of starch is positively correlatedto the geometrical/structural characteristics with easyseparation between groups when cutting or chewing thesamples (26, 27). For Oleva the high amount of starchwas related to large grains size (Fig. 2). The mealycultivars also had rather high FC in contrast to thecultivar Dali that had a very irregular cell shape (Figs. 2e,2h, 4h, 5). In Fig. 5, the yearly variation is shown in PC1and the variation during storage is shown in PC2.
5
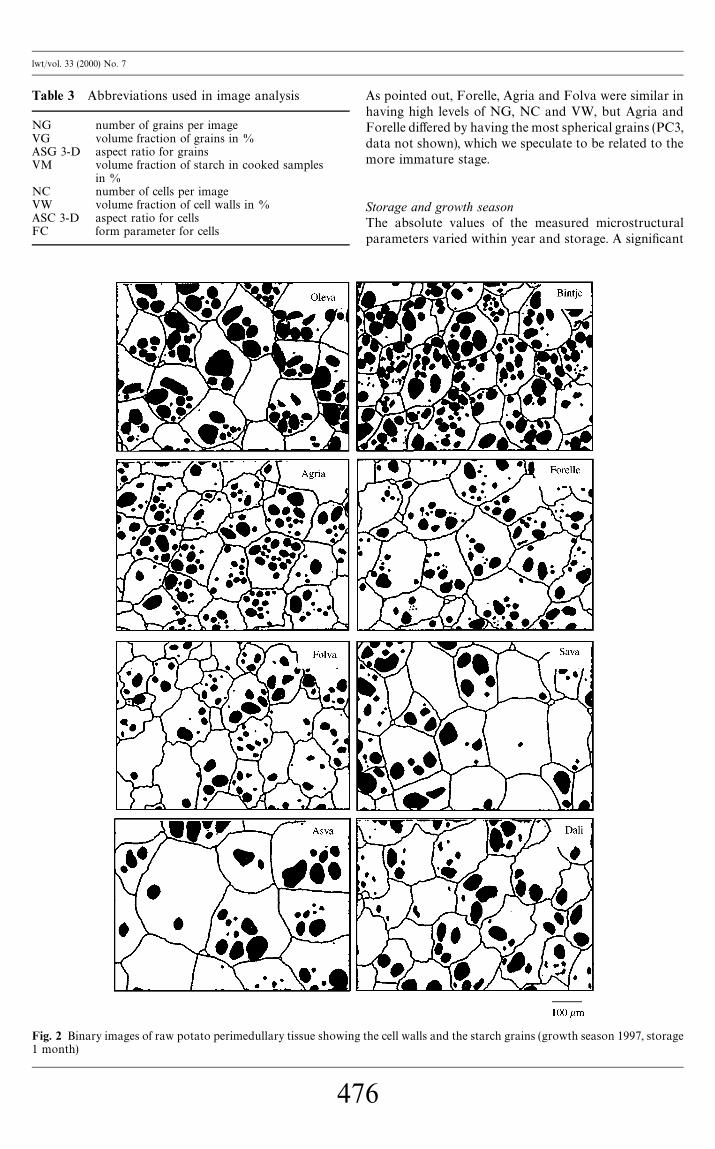
Fig. 2 Binary images of raw potato perimedullary tissue showing1 month)
Table 3 Abbreviations used in image analysis
NG number of grains per imageVG volume fraction of grains in %ASG 3-D aspect ratio for grainsVM volume fraction of starch in cooked samples
in %NC number of cells per imageVW volume fraction of cell walls in %ASC 3-D aspect ratio for cellsFC form parameter for cells
lwt/vol. 33 (2000) No. 7
47
As pointed out, Forelle, Agria and Folva were similar inhaving high levels of NG, NC and VW, but Agria andForelle di!ered by having the most spherical grains (PC3,data not shown), which we speculate to be related to themore immature stage.
Storage and growth seasonThe absolute values of the measured microstructuralparameters varied within year and storage. A signi"cant
the cell walls and the starch grains (growth season 1997, storage
6

Fig. 3 Binary images of cooked potato perimedullary tissue showing the starch phase (growth season 1997, storage 1 month)
lwt/vol. 33 (2000) No. 7
e!ect of cultivar, storage and year on the image data wasobserved, but interaction between cultivars and storagewas signi"cant for some parameters (NG, VG, FC andASC) indicating that the cultivars behaved di!erentlywith respect to those parameters during storage.Yearly variation was due to di!erences in climatic factorsre#ecting the compositional and structural qualities ofpotatoes and through di!erences in maturity at harvest.Yearly variation is a common observation in the study ofpotato crops.During the storage of potato tubers, starch is degradedand used as substrates for respiration (28). This was
47
recognized in our experiment on sectioned samples asa slight decrease in the number of grains, volume fractionof grains and gelatinized starch matrix after 8 months ofstorage (Table 4 and Fig. 5, PC2). The results are inaccordance with size-distributions of isolated grainsmade by Banks and Greenwood (29) showing that themean grain diameter decreased after the sprouting stage.However, virtually no signs of erosion on the surface ofgrains could be recognized by traditional SEM duringstorage, as found by (30) using cryo-SEM. The 3D-aspectratio of grains, expressing the elongation of the grains,was found to be more dependant upon growth season
7
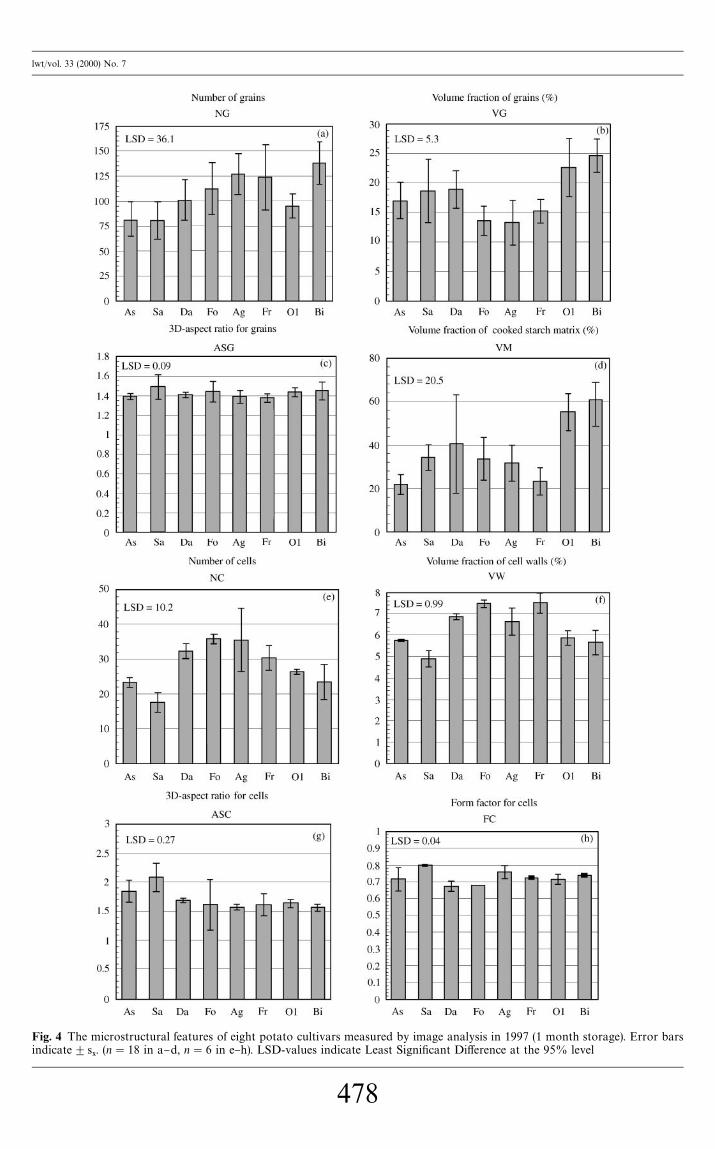
Fig. 4 The microstructural features of eight potato cultivars measured by image analysis in 1997 (1 month storage). Error barsindicate$s
9. (n"18 in a}d, n"6 in e}h). LSD-values indicate Least Signi"cant Di!erence at the 95% level
lwt/vol. 33 (2000) No. 7
478

lwt/vol. 33 (2000) No. 7
than on storage as seen in Table 4 and con"rmed inFig. 5 as no e!ect of storage was observed in PC1.Concomitant with the decrease in starch features, cellsbecame more irregular and indented during storage,measured as lower FC-values (Table 5). These "ndingsare con"rmed in Fig. 5 in PC2 as described above, but itis obvious that the cultivar di!erences account for themajority of the variation in the image data. The observedchanges are believed to re#ect the breakdown of themiddle lamella resulting in separation of neighbouringcell walls. Together with the decreased volume of gela-tinized starch (Fig. 5, PC2), the loss in rigidity of the cellwall is hypothesized to contribute to altered texturalproperties during storage.
Fig. 5 PCA bi-plot of the eight image features and the twenty-six potato samples. Abbreviations are shown in Tables 2 and 3
Table 5 E!ect of storage on the cell featuresa
Number of cells Volumper image of cel
(NG) image
1995 Storage 1 month 26$61 5.9Storage 8 months 26$81 6.2
1997 Storage 1 month 26$71 5.9Storage 8 months 25$71 6.3
aMeans and standard deviation of 36 images for each storage grosigni"cantly (P'0.05).
Table 4 E!ect of storage on the starch featuresa
Number of Volugrains per image of g
(NG) imag
1995 Storage 1 month 97$271 1Storage 8 months 86$262 1
1997 Storage 1 month 104$221 1Storage 8 months 101$362 1
aMeans and standard deviation of 108 images for each storage grosigni"cantly (P'0.05).
47
Uniaxial compression dataThe varieties di!ered signi"cantly in stress and strain atfracture in 1995 and 1997. Comparing all varieties, signif-icantly lower stress was required to fracture Asva andOleva and signi"cantly higher stress was required tofracture Forelle, Sava and Dali (Fig. 6a). Strain at frac-ture was lowest for Asva and highest for Sava (Fig. 6b).The e!ect of storage on uniaxial compression data wasmostly re#ecting strain at fracture. Strain at fractureincreased after 8 months of storage as the rigidity of cellsdecreases due to weakening of the middle lamellae in thenoncooked tissue (31).
Sensory dataResults from ANOVA showed all potato cultivars to besigni"cantly di!erent for all sensory attributes. No e!ectof storage time was observed, which either re#ected thatno di!erences were observable, or that the assessorscould not remember the exact scoring level in 7 months.The main information in the sensory data was studied byPrincipal Component Analysis. The most importantvariation in the sensory data was described by PC1grouping potatoes with respect to mealiness, graininessand re#ection from surface vs. "rmness and springiness(Fig. 7). This texture variation described 77% of the totalvariation in the data and was thought to be the mostimportant type of variation. Oleva and Bintje were verymealy and grainy and had high re#ection from starchgrains on surface and low "rmness and springiness incontrast to the cultivars Dali, Sava, Folva, Forelle andAgria. Furthermore, stored potatoes seemed to be less
e fraction 3-D Aspect Ratiol walls per for cells Formfactor for(VG) [%] (ASC) cells (FC)
$0.81 1.94$0.081 0.71$0.201$1.01 1.88$0.071 0.69$0.132
$0.92 1.98$0.041 0.72$0.211$1.01 1.92$0.011 0.67$0.112
up. Means assigned with di!erent number in the same cell di!er
me fraction 3-D Aspect Volume fraction ofrains per Ratio for gelatinized starch
e (VG) [%] grains (ASG) per image (VM) [%]
8$31 1.50$0.031 40$1214$42 1.50$0.031 34$82
9$41 1.43$0.031 41$2118$41 1.44$0.021 34$191
up. Means assigned with di!erent number in the same cell di!er
9
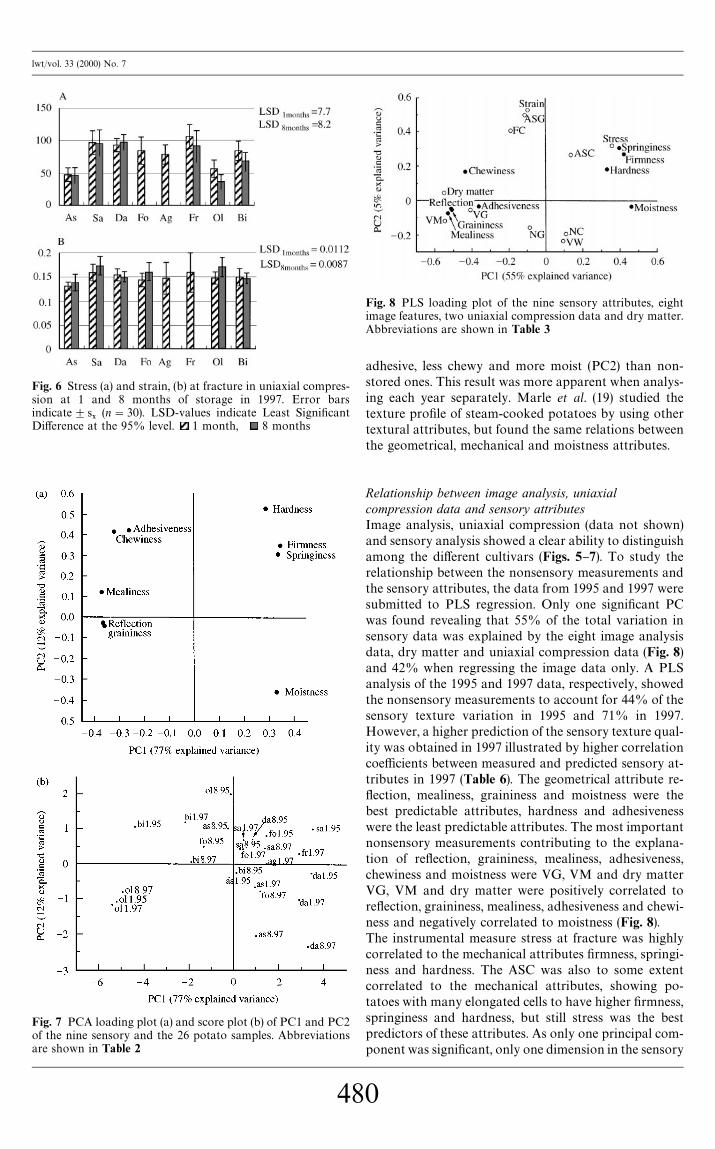
Fig. 6 Stress (a) and strain, (b) at fracture in uniaxial compres-sion at 1 and 8 months of storage in 1997. Error barsindicate$s
9(n"30). LSD-values indicate Least Signi"cant
Di!erence at the 95% level. 1 month, 8 months
Fig. 7 PCA loading plot (a) and score plot (b) of PC1 and PC2of the nine sensory and the 26 potato samples. Abbreviationsare shown in Table 2
Fig. 8 PLS loading plot of the nine sensory attributes, eightimage features, two uniaxial compression data and dry matter.Abbreviations are shown in Table 3
lwt/vol. 33 (2000) No. 7
48
adhesive, less chewy and more moist (PC2) than non-stored ones. This result was more apparent when analys-ing each year separately. Marle et al. (19) studied thetexture pro"le of steam-cooked potatoes by using othertextural attributes, but found the same relations betweenthe geometrical, mechanical and moistness attributes.
Relationship between image analysis, uniaxialcompression data and sensory attributesImage analysis, uniaxial compression (data not shown)and sensory analysis showed a clear ability to distinguishamong the di!erent cultivars (Figs. 5}7). To study therelationship between the nonsensory measurements andthe sensory attributes, the data from 1995 and 1997 weresubmitted to PLS regression. Only one signi"cant PCwas found revealing that 55% of the total variation insensory data was explained by the eight image analysisdata, dry matter and uniaxial compression data (Fig. 8)and 42% when regressing the image data only. A PLSanalysis of the 1995 and 1997 data, respectively, showedthe nonsensory measurements to account for 44% of thesensory texture variation in 1995 and 71% in 1997.However, a higher prediction of the sensory texture qual-ity was obtained in 1997 illustrated by higher correlationcoe$cients between measured and predicted sensory at-tributes in 1997 (Table 6). The geometrical attribute re-#ection, mealiness, graininess and moistness were thebest predictable attributes, hardness and adhesivenesswere the least predictable attributes. The most importantnonsensory measurements contributing to the explana-tion of re#ection, graininess, mealiness, adhesiveness,chewiness and moistness were VG, VM and dry matterVG, VM and dry matter were positively correlated tore#ection, graininess, mealiness, adhesiveness and chewi-ness and negatively correlated to moistness (Fig. 8).The instrumental measure stress at fracture was highlycorrelated to the mechanical attributes "rmness, springi-ness and hardness. The ASC was also to some extentcorrelated to the mechanical attributes, showing po-tatoes with many elongated cells to have higher "rmness,springiness and hardness, but still stress was the bestpredictors of these attributes. As only one principal com-ponent was signi"cant, only one dimension in the sensory
0
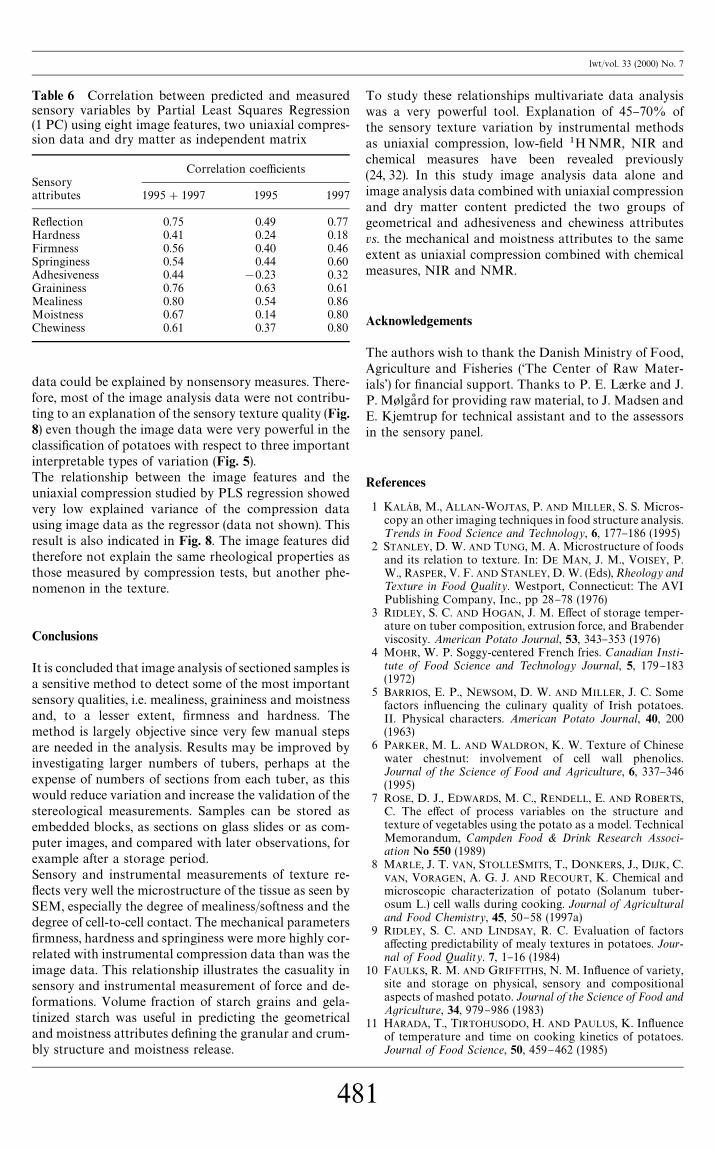
Table 6 Correlation between predicted and measuredsensory variables by Partial Least Squares Regression(1 PC) using eight image features, two uniaxial compres-sion data and dry matter as independent matrix
Correlation coe$cientsSensoryattributes 1995#1997 1995 1997
Re#ection 0.75 0.49 0.77Hardness 0.41 0.24 0.18Firmness 0.56 0.40 0.46Springiness 0.54 0.44 0.60Adhesiveness 0.44 !0.23 0.32Graininess 0.76 0.63 0.61Mealiness 0.80 0.54 0.86Moistness 0.67 0.14 0.80Chewiness 0.61 0.37 0.80
lwt/vol. 33 (2000) No. 7
data could be explained by nonsensory measures. There-fore, most of the image analysis data were not contribu-ting to an explanation of the sensory texture quality (Fig.8) even though the image data were very powerful in theclassi"cation of potatoes with respect to three importantinterpretable types of variation (Fig. 5).The relationship between the image features and theuniaxial compression studied by PLS regression showedvery low explained variance of the compression datausing image data as the regressor (data not shown). Thisresult is also indicated in Fig. 8. The image features didtherefore not explain the same rheological properties asthose measured by compression tests, but another phe-nomenon in the texture.
Conclusions
It is concluded that image analysis of sectioned samples isa sensitive method to detect some of the most importantsensory qualities, i.e. mealiness, graininess and moistnessand, to a lesser extent, "rmness and hardness. Themethod is largely objective since very few manual stepsare needed in the analysis. Results may be improved byinvestigating larger numbers of tubers, perhaps at theexpense of numbers of sections from each tuber, as thiswould reduce variation and increase the validation of thestereological measurements. Samples can be stored asembedded blocks, as sections on glass slides or as com-puter images, and compared with later observations, forexample after a storage period.Sensory and instrumental measurements of texture re-#ects very well the microstructure of the tissue as seen bySEM, especially the degree of mealiness/softness and thedegree of cell-to-cell contact. The mechanical parameters"rmness, hardness and springiness were more highly cor-related with instrumental compression data than was theimage data. This relationship illustrates the casuality insensory and instrumental measurement of force and de-formations. Volume fraction of starch grains and gela-tinized starch was useful in predicting the geometricaland moistness attributes de"ning the granular and crum-bly structure and moistness release.
48
To study these relationships multivariate data analysiswas a very powerful tool. Explanation of 45}70% ofthe sensory texture variation by instrumental methodsas uniaxial compression, low-"eld 1HNMR, NIR andchemical measures have been revealed previously(24, 32). In this study image analysis data alone andimage analysis data combined with uniaxial compressionand dry matter content predicted the two groups ofgeometrical and adhesiveness and chewiness attributesvs. the mechanical and moistness attributes to the sameextent as uniaxial compression combined with chemicalmeasures, NIR and NMR.
Acknowledgements
The authors wish to thank the Danish Ministry of Food,Agriculture and Fisheries (&The Center of Raw Mater-ials') for "nancial support. Thanks to P. E. Lvrke and J.P. M+lgas rd for providing raw material, to J. Madsen andE. Kjemtrup for technical assistant and to the assessorsin the sensory panel.
References
1 KALAD B, M., ALLAN-WOJTAS, P. AND MILLER, S. S. Micros-copy an other imaging techniques in food structure analysis.¹rends in Food Science and ¹echnology, 6, 177}186 (1995)
2 STANLEY, D. W. AND TUNG, M. A. Microstructure of foodsand its relation to texture. In: DE MAN, J. M., VOISEY, P.W., RASPER, V. F. AND STANLEY, D. W. (Eds), Rheology and¹exture in Food Quality. Westport, Connecticut: The AVIPublishing Company, Inc., pp 28}78 (1976)
3 RIDLEY, S. C. AND HOGAN, J. M. E!ect of storage temper-ature on tuber composition, extrusion force, and Brabenderviscosity. American Potato Journal, 53, 343}353 (1976)
4 MOHR, W. P. Soggy-centered French fries. Canadian Insti-tute of Food Science and ¹echnology Journal, 5, 179}183(1972)
5 BARRIOS, E. P., NEWSOM, D. W. AND MILLER, J. C. Somefactors in#uencing the culinary quality of Irish potatoes.II. Physical characters. American Potato Journal, 40, 200(1963)
6 PARKER, M. L. AND WALDRON, K. W. Texture of Chinesewater chestnut: involvement of cell wall phenolics.Journal of the Science of Food and Agriculture, 6, 337}346(1995)
7 ROSE, D. J., EDWARDS, M. C., RENDELL, E. AND ROBERTS,C. The e!ect of process variables on the structure andtexture of vegetables using the potato as a model. TechnicalMemorandum, Campden Food & Drink Research Associ-ation No 550 (1989)
8 MARLE, J. T. VAN, STOLLESMITS, T., DONKERS, J., DIJK, C.VAN, VORAGEN, A. G. J. AND RECOURT, K. Chemical andmicroscopic characterization of potato (Solanum tuber-osum L.) cell walls during cooking. Journal of Agriculturaland Food Chemistry, 45, 50}58 (1997a)
9 RIDLEY, S. C. AND LINDSAY, R. C. Evaluation of factorsa!ecting predictability of mealy textures in potatoes. Jour-nal of Food Quality. 7, 1}16 (1984)
10 FAULKS, R. M. AND GRIFFITHS, N. M. In#uence of variety,site and storage on physical, sensory and compositionalaspects of mashed potato. Journal of the Science of Food andAgriculture, 34, 979}986 (1983)
11 HARADA, T., TIRTOHUSODO, H. AND PAULUS, K. In#uenceof temperature and time on cooking kinetics of potatoes.Journal of Food Science, 50, 459}462 (1985)
1

lwt/vol. 33 (2000) No. 7
12 STERLING, C. AND ALDRIDGE, M. L. Mealiness and soggi-ness in sweet potato. Food Chemistry, 2, 71}76 (1977)
13 MCCOMBER, D. R., HORNER, H. T., CHAMBERLIN, M. A.AND COX, D. F. Potato cultivar di!erences associated withmealiness. Journal of Agricultural and Food Chemistry, 42,2433}2439 (1994)
14 DAVIS, E. A. AND GORDON, J. Application of low temper-ature microscopy to food systems. Journal of Microscopy,112, 205}214 (1978)
15 BOG HLER, G., ESCHER, F. AND SOLMS, J. Evaluation of cook-ing quality of potatoes using sensory and instrumentalmethods. II. Instrumental evaluation. ¸ebensmittel-=issen-schaft und-¹echnologie, 20, 207}216 (1987)
16 WOODMAN, J. S. AND WARREN, D. S. Texture of cannedpotatoes: Use of new objective methods to separate theattributes of mouthfeel and breakdown. Journal of ¹extureStudies, 23, 455}476 (1972)
17 LEUNG, H. K., BARRON, F. H. AND DAVIS, D. C. Texturaland rheological properties of cooked potatoes. Journal ofFood Science, 48, 1470}1474, 1496 (1983)
18 BOG HLER, G., ESCHER, F. AND SOLMS, J. Evaluation of cook-ing quality of potatoes using sensory and instrumentalmethods. I. Sensory evaluation. ¸ebensmittel-=issenschaftund-¹echnologie, 19, 338}343 (1986)
19 MARLE, J. T. VAN, VUURST DE VRIES, R. VAN DER, WILKIN-
SON, E. C. AND YUKSEL, D. Sensory evaluation of thetexture of steam-cooked table potatoes. Potato Research, 40,79}90 (1997b)
20 NISSEN, M. Karto#ers vvgt i vand. ¹idsskrift for Planteavl,57, 121}164 (1953)
21 THYBO, A. K., MARTENS, H. J. AND LYSHEDE, O. B. Textureand microstructure of steam cooked, vacuum packed po-tatoes. Journal of Food Science, 63, 692}695 (1998)
22 RUSS, J. C. Computer-Assisted Microscopy. ¹he Measurementand Analysis of Images. New York: Plenum Press (1990)
48
23 WEIBEL, E. R. Stereological Methods, <ol. 1: PracticalMethods for Biological Morphometry. New York: AcademicPress (1980)
24 THYBO, A. K. AND MARTENS, M. Instrumental and sensorycharacterization of cooked potato texture. Journal of ¹ex-ture Studies, 30, 259}278 (1999)
25 THYBO, A. K. AND MARTENS, M. Development of a sensorytexture pro"le of cooked potatoes by multivariate dataanalysis. Journal of ¹exture Studies, 29, 453}468 (1998)
26 BURTON, W. G. ¹he Potato. Essex, England: LongmanScienti"c & Technical (1989)
27 MARLE, J. T. VAN; CLERKX, A. C. M. AND BOEKESTEIN, A.Cryo-scanning electron microscopy investigation of thetexture of cooked potatoes, Food Structure, 11, 209}216(1992)
28 GALLIARD, T. AND BOWLER, P. Morphology and composi-tion of starch. In: GALLIARD, T. (Ed.), Starch: Properties andPotential, Critical Reports on Applied Chemistry <ol. 13.(1987)
29. BANKS, W. AND GREENWOOD, C. T. The starch of the tuberand shoots of the sprouting potato. Biochemistry, 73,237}241 (1959)
30 COTTRELL, J. E., DUFFUS, C. M., MACKAY, G. R. AND
ALLISON, M. J. Changes in surface morphology of starchgranules of the cultivated potato, Solanum tuberosum L.,during storage. Potato Research, 36, 119}125 (1993)
31 REEVE, R. M. Relationship of histological structure to tex-ture of fresh and processed fruits and vegetables. Journal of¹exture Studies, 1, 247}282 (1970)
32 THYBO, A. K., BECHMANN, I. E., MARTENS, M. AND ENGEL-
SEN, S. B. (accepted). Prediction of sensory texture quality ofcooked potatoes from he raw material using uniaxial com-pression, near infrared (NIR) spectroscopy and low "eld1HNMR spectroscopy using chemometrics. ¸ebensmittel-=issenschaft und-¹echnologie
2