Paper Six: Towards an Instrumental Urban Model
36
Paper Six: Towards an Instrumental Urban Model Many runs of the script have been produced by testing the effects of varying the generative parameters and their combinations and keeping a log book of observations on the growing systems, but only a limited number will be presented in the ensuing sections. Screenshots of every 300 added cells have been taken to record these systems at different stages of growth. The final stages are recorded as a DXF file for Rhino or AutoCAD manipulations. In addition, recording the growth as a video can be achieved by selecting the option at the beginning of each run. For the purpose of the presentation, the simulations are grouped in terms of the variations in the main generative parameters, and their effects discussed. 1. the Cell-Joining Probabilities, the X-Cell Clustering (closed units representing a building) and the Y-Cell Joining (open units representing building thresholds) and their combinations; 2. the ‘Effect of Numbers of Agents’ parameter, namely the maximum number of agents per cell allowed to ‘walk the system’; 3. the “Effect of Neighbours’ Pixels” parameter; 4. the ‘Effect of Y-Cell Pixels’ parameters; 5. the ‘Agent Path Effect’ parameter. Cell-Joining Probabilities X-Cell clustering (PX) and Y-Cell joining (PY) probability factors have been varied from 0 to 100% and the results discussed against the ‘Witness Sketch’ in which cell joining is randomized. Many combinations have been generated to see their effect on the growing morphologies (see Fig. 5.1; 5.2). Fig. 5.1: Witness Sketch
-
Upload
independent -
Category
Documents
-
view
4 -
download
0
Transcript of Paper Six: Towards an Instrumental Urban Model

Paper Six: Towards an Instrumental Urban Model
Many runs of the script have been produced by testing the effects of varying the generative
parameters and their combinations and keeping a log book of observations on the growing
systems, but only a limited number will be presented in the ensuing sections. Screenshots of
every 300 added cells have been taken to record these systems at different stages of growth.
The final stages are recorded as a DXF file for Rhino or AutoCAD manipulations. In
addition, recording the growth as a video can be achieved by selecting the option at the
beginning of each run.
For the purpose of the presentation, the simulations are grouped in terms of the variations in
the main generative parameters, and their effects discussed.
1. the Cell-Joining Probabilities, the X-Cell Clustering (closed units representing a building)
and the Y-Cell Joining (open units representing building thresholds) and their
combinations;
2. the ‘Effect of Numbers of Agents’ parameter, namely the maximum number of agents per
cell allowed to ‘walk the system’;
3. the “Effect of Neighbours’ Pixels” parameter;
4. the ‘Effect of Y-Cell Pixels’ parameters;
5. the ‘Agent Path Effect’ parameter.
Cell-Joining Probabilities
X-Cell clustering (PX) and Y-Cell joining (PY) probability factors have been varied from 0 to
100% and the results discussed against the ‘Witness Sketch’ in which cell joining is
randomized. Many combinations have been generated to see their effect on the growing
morphologies (see Fig. 5.1; 5.2).
Fig. 5.1: Witness Sketch

Fig. 5.2: Witness Sketch
The random cell allocation with X-Cell clustering and Y-Cell joining probability factors set to
0% generate dense systems with no dominant recognizable features, in which Y-Cells form a
continuous sinuous and winding structure through the entire surface with no apparent order,
and X-Cell structure constituting blocks of various sizes and shapes.

X-Led Formations
In these systems, the predominant generative rule is X-Cell clustering which restricts growth
by increasing boundary sharing. Systems generated by maximizing X-Cell clustering are
inherently characterised by long and sinuous blocks of closed cells separated by large areas of
unallocated space and with more fragmented structure of Y-Cells. On the other hand, the
agents’ movements create a regular network of paths which, due to the dense massing of X-
Cells and the fragmentation of the Y-Cells, appears superposed on the surface. The growth
process becomes that of infill nature. When X-Clustering probability is set to 100% that is
the system grows by always attaching a new X-Cell to at least one existing X-Cell, the
resulting systems are characterised by a continuous surface of closed cells separated by areas
of unallocated space (see Fig. 5.5).
Fig. 5.3: X-Led Morphologies –PX99PY0

Fig. 5.4: X-Led Morphologies –PX99PY0
Fig. 5.5: X-Led Morphologies –PX100PY0
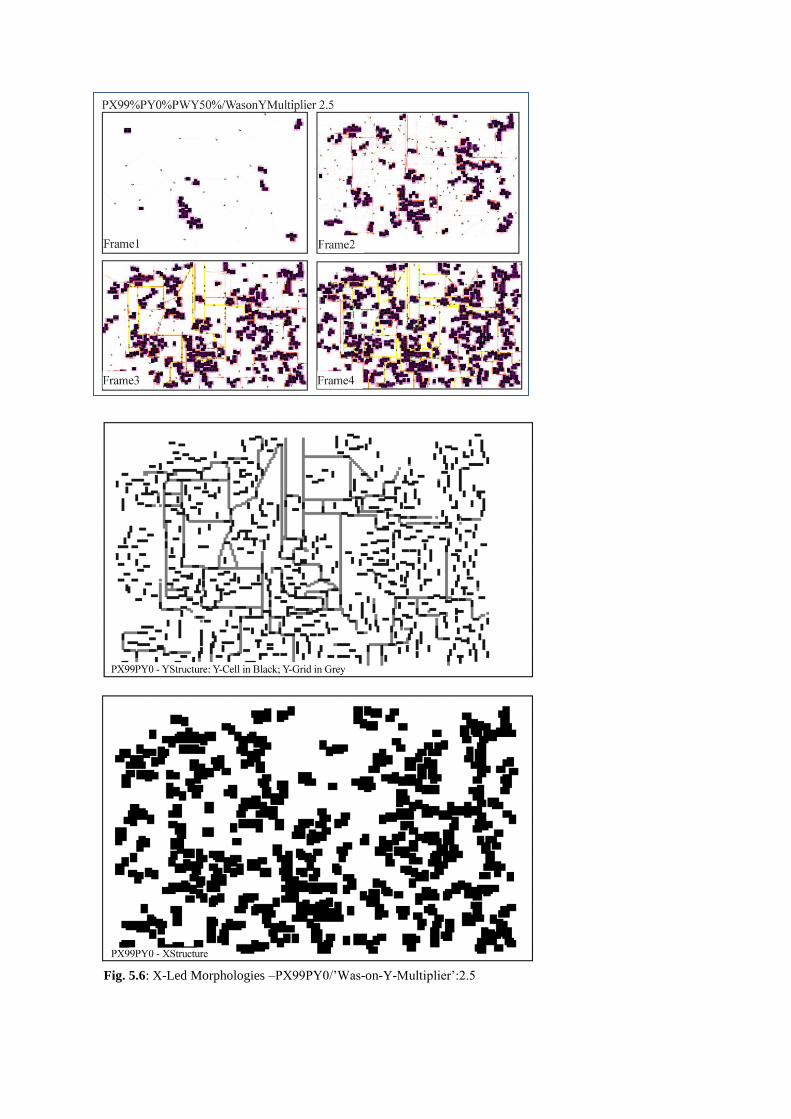
Fig. 5.6: X-Led Morphologies –PX99PY0/’Was-on-Y-Multiplier’:2.5
Similarly the increase of dependency on Y-Cells for the agents’ movements has little effect on
the morphology when X clustering is very high. The Agents trace a network with hardly any
interface with the open cells. In Figures 5.5 and 5.6, the probability value of X clustering is
99% while Y joining is random and ‘Was-on-Y’ is amplified by 2.5. The paths network is
almost independent from the Y-Cell system.
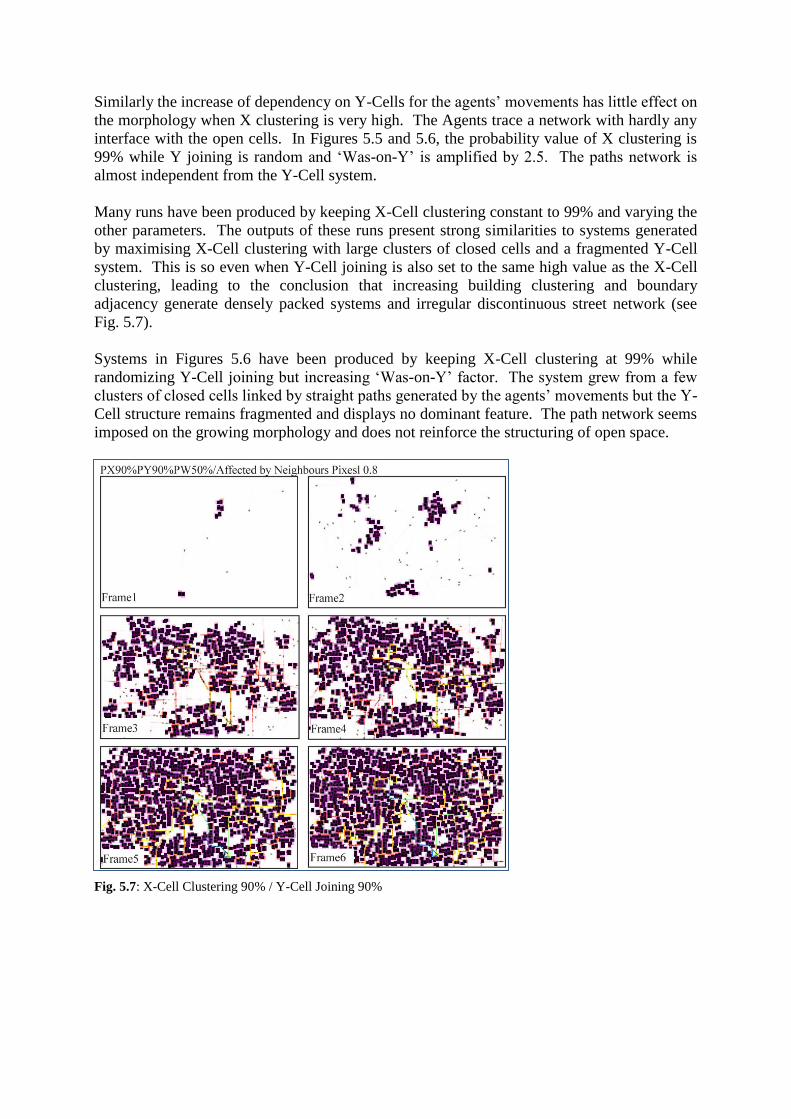
Many runs have been produced by keeping X-Cell clustering constant to 99% and varying the
other parameters. The outputs of these runs present strong similarities to systems generated
by maximising X-Cell clustering with large clusters of closed cells and a fragmented Y-Cell
system. This is so even when Y-Cell joining is also set to the same high value as the X-Cell
clustering, leading to the conclusion that increasing building clustering and boundary
adjacency generate densely packed systems and irregular discontinuous street network (see
Fig. 5.7).
Systems in Figures 5.6 have been produced by keeping X-Cell clustering at 99% while
randomizing Y-Cell joining but increasing ‘Was-on-Y’ factor. The system grew from a few
clusters of closed cells linked by straight paths generated by the agents’ movements but the Y-
Cell structure remains fragmented and displays no dominant feature. The path network seems
imposed on the growing morphology and does not reinforce the structuring of open space.
Fig. 5.7: X-Cell Clustering 90% / Y-Cell Joining 90%

Fig. 5.8: X-Cell Clustering 90% / Y-Cell Joining 90%
In conclusion, the increase of X-Cell clustering tends to create morphologies with larger
blocks, a fragmented Y structure and a ‘parallel’ network of paths.

Y-Led Formations
On the other hand, in Y-Led systems the dominant generative rule is Y-Joining and systems
generated by maximizing Y-Cell Joining probability factors are characterized by a regular
formation of the Y-structure with more linear extension of the open cells, resulting in more
elongated blocks of X-Cells. When Y-Cell Joining factor is set to 100%, it forms a long
linear structure of open cells (see Fig. 5.11).
Fig. 5.9: Y-Led Morphologies –PX0PY991
1 These frames have been generated using Zaatari Refugee Camp Site Plan as a Background.

Fig. 5.10: Y-Led Morphologies –PX0PY99
Fig. 5.11: Y-Led Morphologies –PX0PY100

Number of Agents
The role of feedback from agents’ paths in structuring the open space structure will be
demonstrated by varying the number of agents walking the system. Before the introduction of
agents’ movements into the script, the generated morphologies displayed discontinuous
structures of open space (in Grey), sometimes completely isolated by closed cells (Black) (see
Fig. 5.12).
Fig. 5.12: Script Output without inputs from Agents Paths (Y-Cells in Grey)
In the following, two runs have been carried out by varying the maximum number of agents
from 50 and 1000 in the first and second run respectively while keeping all the other
parameters constant.
Fig. 5.13: Generation PX30PY60PWY50 - Maximum Number of Agents:50

Fig. 5.14: Generation PX30PY60PWY50 - Maximum Number of Agents:50
The examination of the first set of frames in Figures 5.13 and 5.14, executed with only 50
agents, show:
- practically no emergence of paths linking Y-Cells;
- a completely fragmented Y system despite the dense packing of cells;
- the output is just an aggregate of cells with no specific spatial characteristics.
On the other hand, systems generated with a growing number of agents develop continuity
and a network of paths traversing the surface (see Fig. 5.15). The core starts emerging from
the early stages of the simulation and develops into a structure which spans over the surface.
The higher maximum number of agents interacting with the connectivity factor creates strong
lines of Y pixels forming a core covering at first the centre of the surface.
Fig. 5.15: Generation PX30PY60PWY50 - Maximum Number of Agents:1000

It can safely be concluded from the above results that the mobile agents’ actions contribute in
the building of a continuous structure of open space (see Fig. 5.14 and 5.16). Continuity in
the open space structure is not an obvious property for systems generated only on the basis of
local rules defining connectivity between the component elements. The agents’ movements
introduce continuity and higher order properties.
Fig. 5.16: Generation PX30PY60PWY50 - Maximum Number of Agents: 1000
The Neighbours’ Effect
In the first set of frames, the movements of the agents are always affected by the neighbouring
pixels as the ‘Affected by Neighbours’ Pixels’ parameter is set to 1, which means that if there
is a Y-Pixel in the immediate surroundings of the agents position, the agent will always move
to the closest. When there is more than one pixel available, the selection is random.

Fig. 5.17: ‘Affected by Neighbours Pixels’ Parameter
2
Fig. 5.18: ‘Affected by Neighbours Pixels’ Parameter
3
On the other hand, the following drawings have been generated by setting up ’Affected by the
Neighbours’ Pixels’ parameter to 0 which means that there is no influence on the agents’
movements from the neighbours’ pixels.
2 When this parameter is set to 1, agents will always choose existing Y-Cells whenever possible for their path
3 When this parameter is set to 1, agents will always choose existing Y-Cells whenever possible for their path

Fig. 5.19: No Effect by Neighbours Pixels
The above drawings clearly show the strong impact the neighbours’ pixels have on the Y-
system. The Y-Cells in the first set is continuously connected and reinforced by the agents
paths compared to the second set where the agents paths are randomly generated, the Y-
structure is more fragmented as the paths do not build on the existing Y-Cells and create new
Y-Pixels.
The Y-Cells Effect on Agents Movements
In the next runs, the effects Y-Cells exert on the agents’ movements will be explored. The
parameter, referred to as ‘Was-on-Y-Multiplier’ in the script, controls the relationship
between an existing Y-Cell and the immediate adjacent pixels by amplifying the threshold of
these pixels becoming Y-Cell pixels when crossed by an agent. In other words, this parameter
controls the degree to which un-allocated pixels in the surrounding of Y-Cells are likely to
becoming Y pixels, the higher the value of this parameter the more likely this is occurring.
This factor increases thus the interface between the agents’ paths and the Y structure
generated by the connectivity parameters.
The first set of frames presented below, have been generated by setting the ‘Was-on-Y’ factor
to 10 and the results are quite interesting:
- an emergence of a grid structure at a very early stage, displaying strong axial lines;
- the agents’ actions continue dividing the surface into smaller areas as more cells are
added;
- the X-Cells form long linear clusters as expected from a high connectivity of Y-Cells;
- relatively larger ‘blobs’ of Y pixels start occurring at later stages of the run.
- a continuous Y system created by both, the Y-Cells and the paths, one adding to the
other as the system grows;

Fig. 5.20: Agents Affecting the Neighbouring Pixels –‘Was-on-Y’ Factor 10
Fig. 5.21/5.22: Agents Affecting the Neighbouring Pixels –‘Was-on-Y’ Factor 10- Y-System

Figures 5.24 and 5.25 show simulations where the agents’ actions on the neighbouring pixels
are randomized by setting the ‘Was-on-Y’ factor to 0. The result are most apparent in the
structure of the Y system which forms a discontinuous arrangement of Y segments and the Y
grid of the agents paths creates only isolated links. The X clusters are very long as the high
connectivity of Y cells is not rectified by the agents’ inputs.
Fig. 5.24: Agents Affecting the Neighbouring Pixels –‘Was-on-Y’ Parameter 0

Fig. 5.25: Agents Affecting the Neighbouring Pixels –‘Was-on-Y’ Parameter 0
The above experiments demonstrated the implications of each of the generative rules and
restrictions on the morphologies and their prevailing dispositions in creating typical
characteristics. However, the principle aim of the present study is to develop a model capable
of generating systems displaying a kind of higher order from the application of only local
rules. A large number of runs have been carried out by adjusting and varying the values of
the parameters to find out the implications of the combined effect of these parameters on the
growing morphologies in the hope of establishing tendencies in spatial formations and thereby
typologies.
The following sketches have been produced by adjusting values of the parameters to uncover
their interactive influences on the morphologies. These runs are examined in terms of:

i) Density
- Similar numbers of cells in the respective frames created by recording the generation
stages at Initial/100Cells/400/700/1000/Last at saturation;
- Coverage achieved by examining the un-allocated pixels and their structures whether or
not they form small patches throughout the surface.
ii) Continuity of the Open Cell Structure
- Y-Cell Structure4
- Interface between Y-Cell Structure and Paths
iii) Grid Formation
- Emergence of Lattice Structure of the most ‘travelled’ pixels
- Structure of the lattice, in the sense that the ‘most walked’ pixels form a ‘Traversing
Core’ or an isolated ‘Internal Core’, its linearity and degree of deformation of the
lattice covering the whole surface…
iv) Block Types
- Clusters
- Linear
- Combination of the two types
Some abbreviations have been adopted to present the outputs:
- PX: refers to the X-Cell joining probability factor
- PY: Y-Cell joining probability factor
- PWY: Joining probability factor for the width of Y-Cells
- ‘WasonY’ Agents affecting neighbouring pixels
- ‘WasonYDegrad’: Degrading factor for the pixels adjacent to Y-Cells
- ‘AgtAffbyNeighPixel’: Agent Affected by the neighbours’ pixels
4 The words ‘structure’ or ‘system’ are used purely to denote a set of components, all of the X or Y cells
together and look for any prevailing characteristics.

Generative Parameters and Spatial Tendencies
PX30PY90PWY90
- Agent Path Effect: 0.02
- Degrading Factor: 0.005
- ‘WasonYMult’ Factor: 0.8
- ‘WasonY’ Degrading Factor: 0.05
- Agents Affected by Neighbours’ Pixels: 0.5
- Maximum Agents 250
Fig. 5.26: Joining Probability of X and Y Cells: 30% - 90%
The combined effect of these values generate:
- dense formations with a tendency for both X and Y-Cells to cluster creating blocks of
various sizes covering the whole surface and with very few un-allocated pixels;
- a clear tendency for axiality due to the high joining probability of Y-Cells which form
larger interstices surrounding un-allocated areas which will eventually turn into
‘squares’ through the agents’ movements;
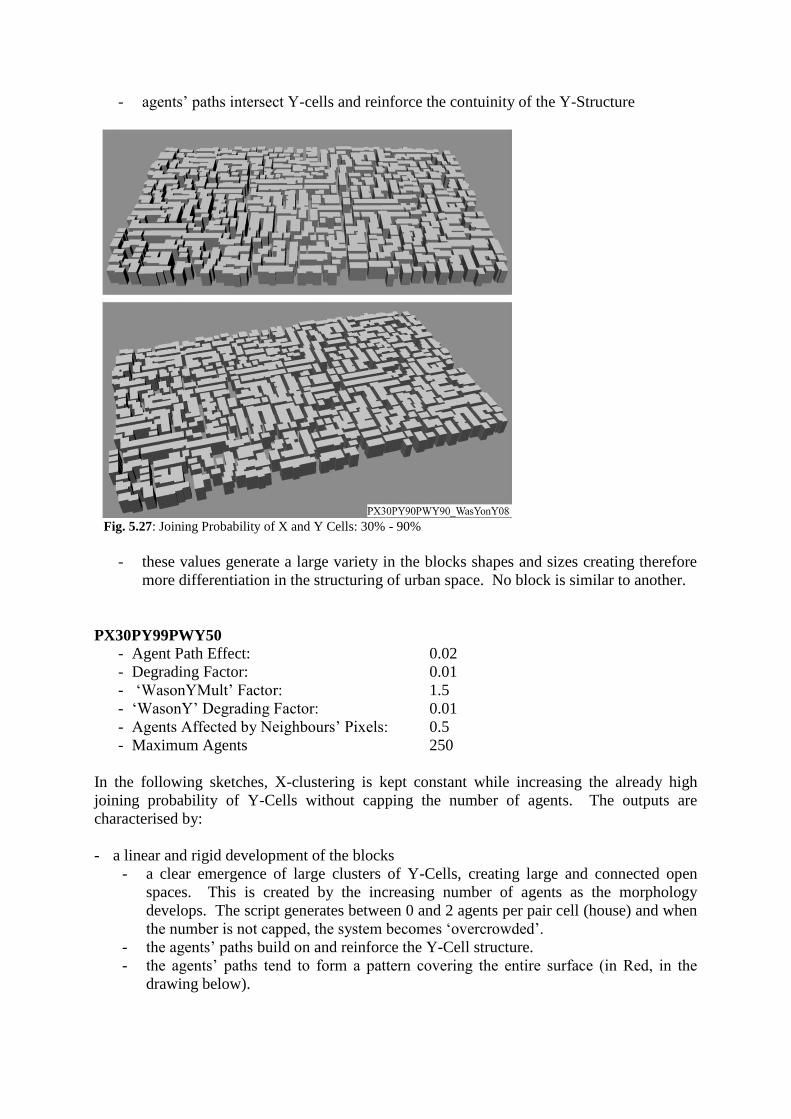
- agents’ paths intersect Y-cells and reinforce the contuinity of the Y-Structure
Fig. 5.27: Joining Probability of X and Y Cells: 30% - 90%
- these values generate a large variety in the blocks shapes and sizes creating therefore
more differentiation in the structuring of urban space. No block is similar to another.
PX30PY99PWY50
- Agent Path Effect: 0.02
- Degrading Factor: 0.01
- ‘WasonYMult’ Factor: 1.5
- ‘WasonY’ Degrading Factor: 0.01
- Agents Affected by Neighbours’ Pixels: 0.5
- Maximum Agents 250
In the following sketches, X-clustering is kept constant while increasing the already high
joining probability of Y-Cells without capping the number of agents. The outputs are
characterised by:
- a linear and rigid development of the blocks
- a clear emergence of large clusters of Y-Cells, creating large and connected open
spaces. This is created by the increasing number of agents as the morphology
develops. The script generates between 0 and 2 agents per pair cell (house) and when
the number is not capped, the system becomes ‘overcrowded’.
- the agents’ paths build on and reinforce the Y-Cell structure.
- the agents’ paths tend to form a pattern covering the entire surface (in Red, in the
drawing below).

This emergent property will be investigated further to find out its relationship with the
number of agents and the other parameters governing their movements, and the extent to
which these emergent patterns, if any, can be considered as a ‘global’ characteristic of the
generative process.
Fig. 5.30: Probability of X and Y Cells: 30% - 99%
Fig. 5.31: PX/PY 30% / 99% - Rigid Development

PX30PY99PWY50
- Agent Path Effect: 0.01
- Degrading Factor: 0.05
- ‘WasonYMult’ Factor: 2
- ‘WasonY’ Degrading Factor: 0.05
- Agents Affected by Neighbours’ Pixels: 0.5
- Maximum Agents 250
In this run, the cell probability factors are the same as in the first set, but the ‘Was-on-Y’
factor is set to 2 and the ‘Was-on-Y Degrading’ factor to 0.05. The results display:
- a certain regularity in the Y-Cell structure characterized by long strings of Y-Cells;
- a clear ‘core’ of the most ‘travelled’ pixels, shown in blue in the figures below. This
core covers the central part of the surface and extends with axes towards the edges.
- a continuity in the Y-Cell structure created by both, the high connectivity of Y-Cells
and the agents paths strongly connecting to the Y-Cell structure (see Fig. 4.35);
- a large variety of clusters and blocks.
- a tendency to create large ‘blobs’ of un-allocated pixels scattered on the surface, criss-
crossed by the agents’ paths. The remaining spaces are too small to accommodate
new X-Cells;
Fig. 5.32/33: Joining Probability of X and Y Cells: 30% - 90% / Was-on-Y-Multiplier 2
This tendency towards a linear arrangement of the cells is created by the combined effect of
the high probability of Y-Cell joining and the strong effect of existing Y-Cells on the agents’
movements. The higher the value of Y-Cell joining the more axial is the formation. But the
square feature is mostly the result of the combined effect of high connectivity of Y-Cells and
the neighbours’ pixels affecting and being affected by the agents’ paths.

PX30PY90PWY90
- Agent Path Effect: 0.02
- Degrading Factor: 0.00025
- ‘WasonYMult’ Factor: 5
- ‘WasonY’ Degrading Factor: 0.05
- Agents Affected by Neighbours’ Pixels: 0.5
- Maximum Agents 250
Fig. 5.34: Joining Probability of X and Y Cells: 30% - 90% / Was-on-Y-Multiplier 5
In this run, only the ‘Was-on-Y’ parameters have been varied, increasing the factor to 5 and
10 in the second run of this combination, and setting the ‘Was-on-Y’ degrading effect to 0.05,
while keeping the maximum number of agents to 250.
A first examination of these runs shows an interesting feature emerging: a lattice formation
expending through the entire surface (see Fig. 5.34; 5.35) but also large ‘blobs’ of open cells
creating a less dense structure. This feature is more emphasized in the second run where
‘Was-on-Y’ factor was set to 10, giving precedence for pixels adjacent to Y-Cells to
becoming Y pixels. In these frames, the agents’ actions ‘work’ with the Y-Cell joining
probability to create the ‘lattice’ or grid, always reinforcing and consolidating the Y structure.

Fig. 5.35: Joining Probability of X and Y Cells: 30% - 90% / Was-on-Y-Multiplier 10
Fig. 5.36: Joining Probability of X and Y Cells: 30% - 90% / Was-on-Y-Multiplier 10
In the following runs, more experiments will be carried out to highlight the extent to which
the model generates tendencies to lattice formation and uncover the underlying spatial
mechanisms driving theses tendencies. Clearly, inputs and feedbacks from the agents’
movements create these tendencies, but the question that arises is which of the parameters that
enter in the control the agents’ behaviour are likely to lead to these formations.

PX30PY90PWY80
- Agent Path Effect: 0.5
- Degrading Factor: 0.00025
- ‘WasonYMult’ Factor: 1.5
- ‘WasonY’ Degrading Factor: 0.01
- Agents Affected by Neighbours’ Pixels: 0.8
- Maximum Agents 250
Fig. 5.37: Joining Probability of X and Y Cells: 30% - 90% / Was-on-Y-Multiplier 1.5
- At the early stages of the generation, the agents create a dense network of
interconnected path trails which becomes a lattice subdividing the surface into large
areas of un-allocated pixels. The process becomes that of in-fill.
- The axial development is due to the high connectivity of Y-Cells.
- With these values, the model is capable of generating a grid, a global property
emerging from the pure application of local rules directing the cell connectivity and
the agents’ movements. The emergence of this property is of important consequences
for urban space design as an intrinsic link has been established between the generative
process and the global urban form and its constituent parts.

Fig. 5.38: Joining Probability of X and Y Cells: 30% - 90% / Was-on-Y-Multiplier 1.5
Fig. 5.39: Joining Probability of X and Y Cells: 30% - 90% / Was-on-Y-Multiplier 1.5

PX30PY60PWY80
- Agent Path Effect: 0.1
- Degrading Factor: 0.001
- ‘WasonYMult’ Factor: 1.5
- ‘WasonY’ Degrading Factor: 0.05
- Agents Affected by Neighbours’ Pixels: 1
- Maximum Agents 250
Fig. 5.41/42/43: Joining Probability of X and Y Cells: 30% - 60% / Was-on-Y-Multiplier 1.5
In this run, the Y-Cell connectivity potential has been reduced while keeping the other
parameters constant. This variation resulted in
- a highly connected lattice forming small to medium size blocks with fewer dead-end
configurations;
- emergence of some regular axes running through the surface;
- the agents’ paths build on the Y structure and add to their connectedness;
- the agents’ paths form a lattice clearly visible in the early stages of the simulation.

These simulations showed that the model does produce higher order properties in the form of
grid/lattice structures from the interactions of the connectivity factors and the control
mechanisms of the agents’ movements. These control mechanisms are only based on the
conditions and properties of the immediate surroundings in which these actions take place.
The agents move ‘randomly’ and take their cues from their immediate environment changing
direction ‘randomly’ when spatial boundaries are encountered.
PX30PY90PWY80
- Agent Path Effect: 0.02
- Degrading Factor: 0.00025
- ‘WasonYMult’ Factor: 1.5
- ‘WasonY’ Degrading Factor: 0.01
- Agents Affected by Neighbours’ Pixels: 0.8
- Maximum Agents 200
Fig. 5.44: Joining Probability of X and Y Cells: 30% / 90% / ‘WasonY’ 1.5: Emergence of Lattice
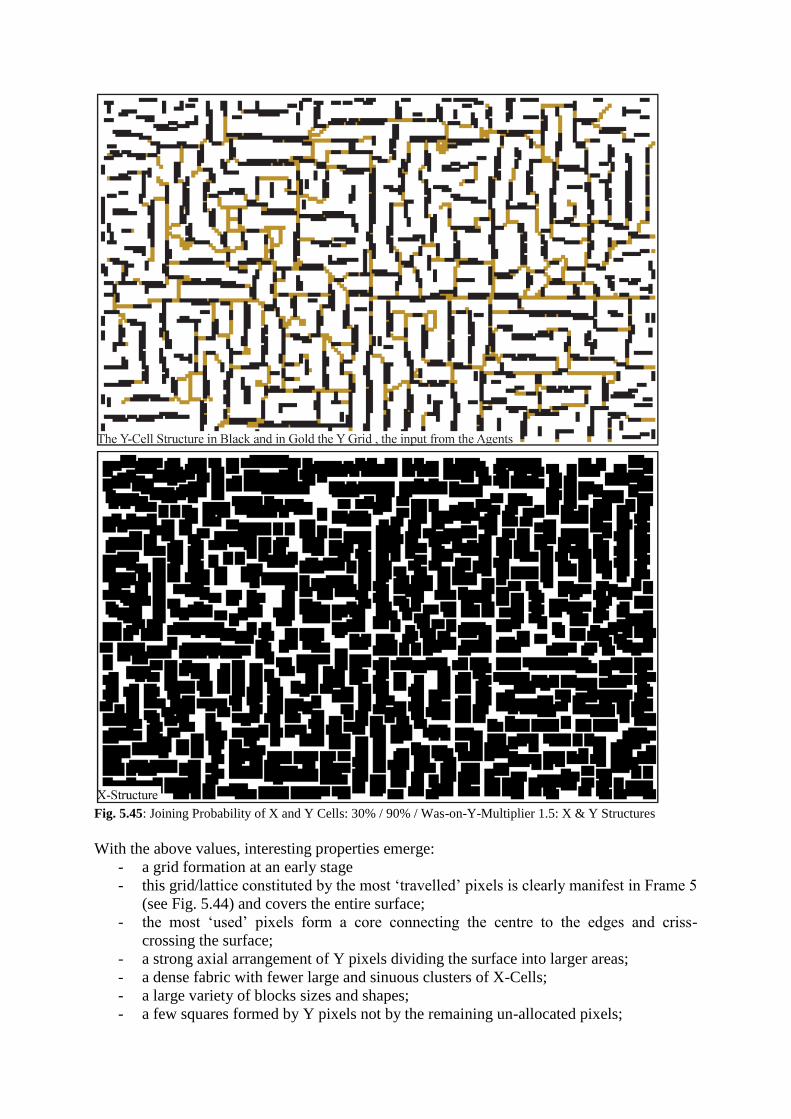
Fig. 5.45: Joining Probability of X and Y Cells: 30% / 90% / Was-on-Y-Multiplier 1.5: X & Y Structures
With the above values, interesting properties emerge:
- a grid formation at an early stage
- this grid/lattice constituted by the most ‘travelled’ pixels is clearly manifest in Frame 5
(see Fig. 5.44) and covers the entire surface;
- the most ‘used’ pixels form a core connecting the centre to the edges and criss-
crossing the surface;
- a strong axial arrangement of Y pixels dividing the surface into larger areas;
- a dense fabric with fewer large and sinuous clusters of X-Cells;
- a large variety of blocks sizes and shapes;
- a few squares formed by Y pixels not by the remaining un-allocated pixels;
The combination of the above values led to interesting outcomes, the most promising is the
emergence of lattice/grid formation. For these reasons, other simulations using the same
parameter values will be carried out in order to corroborate these results and find out whether
these properties are inherent to the interactions between the different parameters involved in
the process.
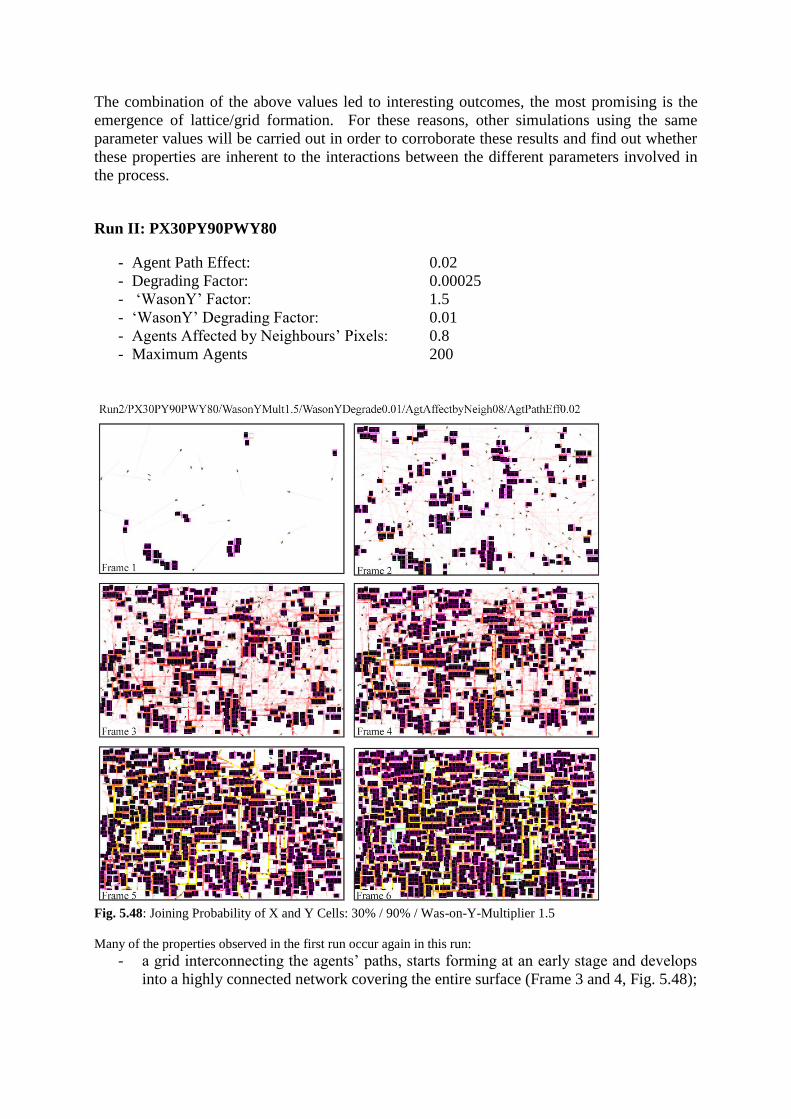
Run II: PX30PY90PWY80
- Agent Path Effect: 0.02
- Degrading Factor: 0.00025
- ‘WasonY’ Factor: 1.5
- ‘WasonY’ Degrading Factor: 0.01
- Agents Affected by Neighbours’ Pixels: 0.8
- Maximum Agents 200
Fig. 5.48: Joining Probability of X and Y Cells: 30% / 90% / Was-on-Y-Multiplier 1.5
Many of the properties observed in the first run occur again in this run:
- a grid interconnecting the agents’ paths, starts forming at an early stage and develops
into a highly connected network covering the entire surface (Frame 3 and 4, Fig. 5.48);
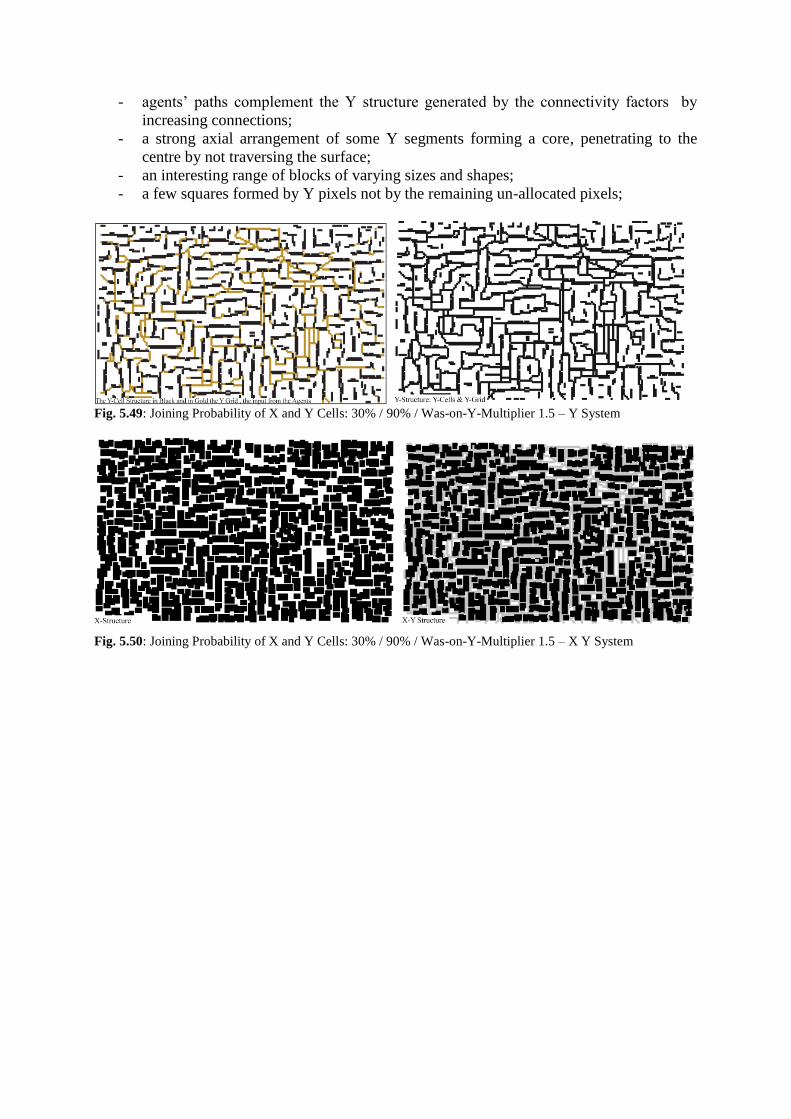
- agents’ paths complement the Y structure generated by the connectivity factors by
increasing connections;
- a strong axial arrangement of some Y segments forming a core, penetrating to the
centre by not traversing the surface;
- an interesting range of blocks of varying sizes and shapes;
- a few squares formed by Y pixels not by the remaining un-allocated pixels;
Fig. 5.49: Joining Probability of X and Y Cells: 30% / 90% / Was-on-Y-Multiplier 1.5 – Y System
Fig. 5.50: Joining Probability of X and Y Cells: 30% / 90% / Was-on-Y-Multiplier 1.5 – X Y System

PX30PY90PWY80
- Agent Path Effect: 0.01
- Degrading Factor: 0.00025
- ‘WasonY’ Factor: 5
- ‘WasonY’ Degrading Factor: 0.05
- Agents Affected by Neighbours’ Pixels: 0.8
- Maximum Agents 250
Fig. 5.52: Screenshots of Generated Morphologies -PX30% PY90% ‘Was-on-Y’ 5
Fig. 5.53/54: Y-System of Generated Morphologies -PX30% PY90% ‘Was-on-Y’ 5

Run II: PX30PY90PWY80
- Agent Path Effect: 0.02
- Degrading Factor: 0.00025
- ‘WasonY’ Factor: 5
- ‘WasonY’ Degrading Factor: 0.01
- Agents Affected by Neighbours’ Pixels: 0.8
- Maximum Agents 200
The following frames have been produced by increasing the ‘WasOnY’ factor to 5 and
keeping all the other parameters to the same values as the last experiments. They clearly
show that the increase in the ‘weight’ of ‘Was-on-Y’ parameter from 1.5 to 5 corroborates the
results seen in the last runs, that is the formation of ‘lattice’ covering the whole surface with
strong penetrating axes linking the lattice to the edges. The Y-structure also displays the
emergence of few squares.
Fig. 5.55: Screenshots of Generated Morphologies -PX30% PY90% ‘Was-on-Y’ 5

Fig. 5.56: X-Y System of Generated Morphologies -PX30% PY90% ‘WasonY’ 5
PX40PY80PWY50
- Agent Path Effect: 0.01
- Degrading Factor: 0.00025
- ‘WasonYMult’ Factor: 1.5
- ‘WasonY’ Degrading Factor: 0.04
- Agents Affected by Neighbours’ Pixels: 0.2
- Maximum Agents 200
Fig. 5.58: Joining Probability of X and Y Cells: 40% / 80% / Was-on-Y-Multiplier 1.5
This run is characterized by
- a relatively denser fabric with larger blocks and no tendency of any axial arrangement
of the Y-Cells as in the previous run despite the relatively high Y joining probability
factor of 80%;
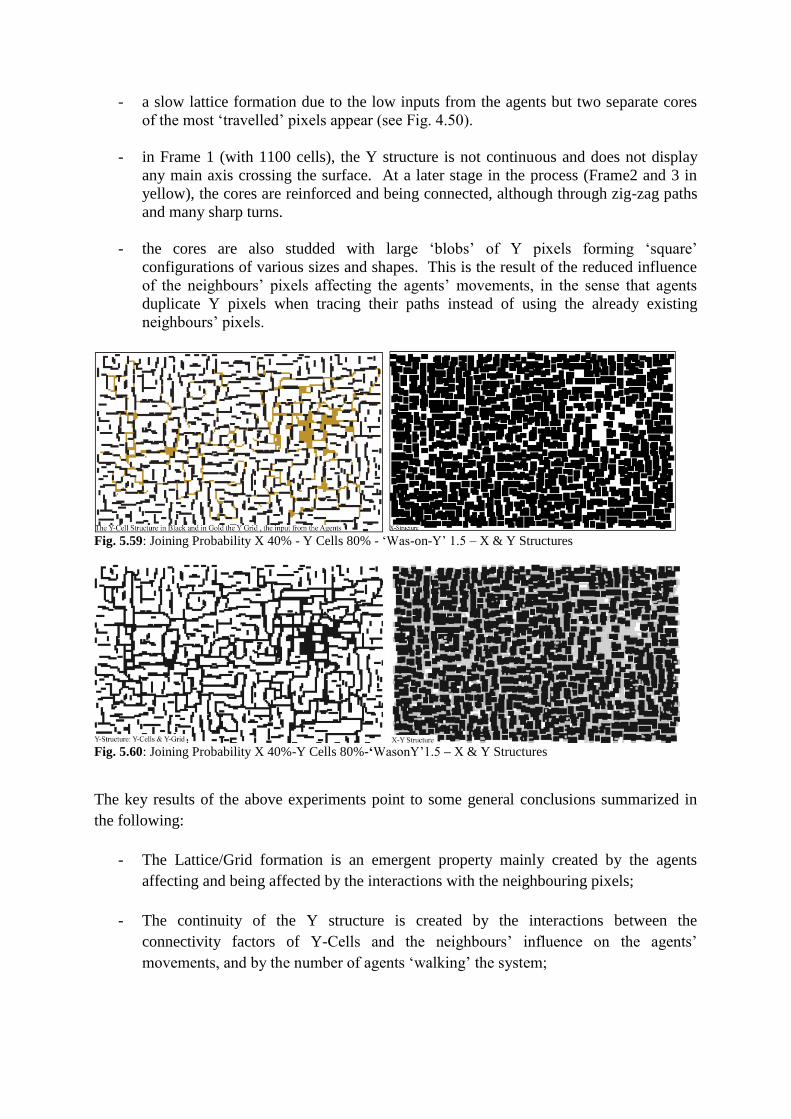
- a slow lattice formation due to the low inputs from the agents but two separate cores
of the most ‘travelled’ pixels appear (see Fig. 4.50).
- in Frame 1 (with 1100 cells), the Y structure is not continuous and does not display
any main axis crossing the surface. At a later stage in the process (Frame2 and 3 in
yellow), the cores are reinforced and being connected, although through zig-zag paths
and many sharp turns.
- the cores are also studded with large ‘blobs’ of Y pixels forming ‘square’
configurations of various sizes and shapes. This is the result of the reduced influence
of the neighbours’ pixels affecting the agents’ movements, in the sense that agents
duplicate Y pixels when tracing their paths instead of using the already existing
neighbours’ pixels.
Fig. 5.59: Joining Probability X 40% - Y Cells 80% - ‘Was-on-Y’ 1.5 – X & Y Structures
Fig. 5.60: Joining Probability X 40%-Y Cells 80%-‘WasonY’1.5 – X & Y Structures
The key results of the above experiments point to some general conclusions summarized in
the following:
- The Lattice/Grid formation is an emergent property mainly created by the agents
affecting and being affected by the interactions with the neighbouring pixels;
- The continuity of the Y structure is created by the interactions between the
connectivity factors of Y-Cells and the neighbours’ influence on the agents’
movements, and by the number of agents ‘walking’ the system;

- The emergence of a ‘core’ of the most used pixels is created mainly by the agents
impact on the neighbouring pixels;
- Axial developments mainly result from the interactions of high connectivity of Y-
Cells and the agents’ impact on the neighbouring pixels, and the influence these latter
have on the agents’ paths;
- Blocks’ sizes and shapes are the outcome of connectivity factors. However, the
tendency to form clusters or rows is generated by the X and Y connectivity factors
respectively;
- ‘Squares’ or the emergence of large clusters of Y pixels is solely related to the agents’
interactions with their immediate surroundings and the parameters controlling these
actions, such as the number of agents and the effect their movements have on space.
Summary and Conclusions
The aim of this section was to find out the extent to which the generative model and its
inherent local rules can produce systems that exhibit properties that are not programmed in
the script, properties suggestive of Emergent nature. The examination of the many runs of the
model showed a clear emergence of ‘Lattice’ formation, a global characteristic resulting from
the probabilistic application of local spatial rules defining the degree of connectivity between
the basic components and their implications on the movements of mobile agents. This
property is of paramount importance as it not only provides an intrinsic link between the
urban forms and the underlying processes of building aggregations, but it also establishes the
foundation for using a generative approach to inform the design of urban forms. It showed a
deep rooted property where movements are on the one hand, informed and transformed by the
local properties of space organisation; and on the other they create a higher order by acting
and transforming space locally.